ap-42 section number: reference number - us epa · current florida department of environmental...
TRANSCRIPT

AP-42 Section Number: 1.8
Reference Number: 24
Title: Source Test Report Number 5 Boiler Impingement Wet Scrubber Particulate Emissions: Sugar Cane Growers Cooperative of Florida
December 1990

'I
SOURCE T E S T REPORT NUMBER 5 B O I L E R
IMPINGEMENT WET SCRUBBERS PARTICULATE E M I S S I O N S
SUGAR CANE GROWERS COOPERATIVE OF FLORIDA BELLE GLADE,FLORIDA
DECEMBER 5 , 1 9 9 0
PREPARED FOR: SUGAR CANE GROWERS COOPERATIVE OF FLORIDA
BELLE GLADE, FLORIDA
PREPARED BY: A I R CONSULTING and ENGINEERING, I N C .
2106 N.W. 6 7 t h PLACE S U I T E 4
G A I N E S V I L L E , FLORIDA 3 2 6 0 7 __.. .
1 4 6 4 2 FLAMINGO D R I V E WEST PALM BEACH, FLORIDA
3 3 4 7 0

TABLE OF CONTENTS
SECTION ------- PAGE ---- 1 . 0 I N T R O D U C T I O N . . . . . . . . . . . . . . . . . . . . . . . . . . . . . . . . . . . . . . . 1
2 . 0 SUMMARY AND D I S C U S S I O N OF RESULTS. ................. 2
3 . 0 PROCESS D E S C R I P T I O N AND O P E R A T I O N . . . . . . . . . . . . . . . . . . 4
4 . 0 SAMPLING P O I N T L O C A T I O N . . . . . . . . . . . . . . . . . . . . . ........ 5
5 . 0 F I E L D AND ANALYTICAL P R O C E D U R E S . . . . . . . . . . . . . . . . . . . . 7
APPENDICES
APPENDIX A--COMPLETE E M I S S I O N DATA AND SAMPLE CALCULATIONS
APPENDIX B - - F I E L D DATA SHEETS
APPENDIX C--LABORATORY ANALYSES
APPENDIX D--QUALITY ASSURANCE AND CHAIN OF CUSTODY
APPENDIX E--PRODUCTION RATE C E R T I F I C A T I O N
APPENDIX F--PROJECT P A R T I C I P A N T S

L I S T O F T A B L E S
1 SUMMARY OF PARTICULATE MATTER E M I S S I O N S . ........... . 3
L I S T OF F I G U R E S
FIGURE ------ 1 SAMPLING P O I N T
2 EPA 5 SAMPLING
LOCATION
T R A I N . . . ............................. 6
............................. 0

and ngineering, Inc
REPORT CERTIFICATION
To the best of my knowledge, all applicable field and analytical
procedures comply with Florida Department of Environmental Regulation
requirements and all test data and plant operating data are true and correct.
J - L k- LL-4 Stephen/ L. Neck. P.E.
State of Florida Registration No. 20020
SEAL
iii
2106 N.W. 67th Place. Suite 4 Gainesville. Florida 32606 (904) 335-1889

1.0 INTRODUCTION
P e r s o n n e l from A i r C o n s u l t i n g a n d Engineering,INC.(ACEI)
per formed a n n u a l s o u r c e emission c o m p l i a n c e t e s t i n g f o r t h e Sugar Cane
Growers C o o p e r a t i v e of Flor ida(SCGC0F) o n December 5 , 1 9 9 0 . T e s t i n g
was per formed a t t h e Number 5 B o i l e r d u a l w e t s c r u b b e r ou t l e t s .
T e s t i n g was d e s i g n e d t o f u l f i l l " s p e c i f i c c o n d i t i o n s ' of t h e
c u r r e n t F l o r i d a Depar tment o f Env i ronmen ta l R e g u l a t i o n (FDER)
o p e r a t i n g permit.
T h r e e U n i t e d S t a t e s Env i ronmen ta l P r o t e c t i o n Agency (USEPA)
Method 5 p a r t i c u l a t e m a t t e r (PM) t e s t r u n s were conduc ted w h i l e t h e
p l a n t was documented t o b e o p e r a t i n g w i t h i n 1 0 % o f p e r m i t t e d
p r o d u c t i o n .
Mr. B 3s Mar I o f SCGCOF !rved t e e C x d i d
c e r t i f i e d p r o d u c t i o n r a t e s .
Messrs. Ajaya K . S a t y a l and J e f f Koerner o f t h e P a l m Beach
County H R S w i t n e s s e d a p o r t i o n o f t h e t e s t i n g .
1
2.0 SUMMARY and DISCUSSION of RESULTS
Results of the emission testing are provided in Table 1.
Complete emission data are located in the report appendices.
The source was found to be operating within full compliance of
permit conditions. Stack emissions averaged 5 4 . 9 5 pounds per hour
(LB/HR) and 0.189 pounds per million btu(LB/MMBTU) heat input against
a "process rate" basis allowable emission of 0.238 LB/MMBTU. Permit
conditions limit emissions to 0.10 LB/MMBTU from oil and 0 . 2 5 LB/NMBTU
from residue firing.
Production rate summaries are provided in Appendix A . These data
were taken from control room recordings of steam flow,temperature,and
pressure as well as feedwater temperature and pressure(Appendix E).
Residue integrator and oil meter readings were recorded at the
beginning and end of each particulate test run by ACE1 personnel.
2

TABLE 1 EM1 SS ION SUMMARY SUGAR GROWERS COOPERATIVE OF FLORIDA NUMBER 5 B O I L E R DECEMBER 5 , 1990
RUN NUMBER TIME
1 0744-0932 I '' 55.62 0.188 70.92 0.240
2 0956-1144 1.f 59.69 0.204 69.08 0.236
3 1213-1413 11' 49.53 0.176 66.56 0.237
54.95 0.189 68.85 0.238 -/
AVERAGES --------- Ilk
3

3 . 0 PROCESS DESCRIPTION AND OPERATION
The Number 5 Boiler at Sugar Cane Growers Cooperative is a
spreader stoker design used primarily for residue fuel firing.
Supplemental oil firing was also utilized for the emission test. The
boiler averaged 170,277 pounds per hour steam production over the
three run test period.
Oil meters, steam integrators, and other production monitoring
devices were rigorously.calibrated prior to the production season.
4

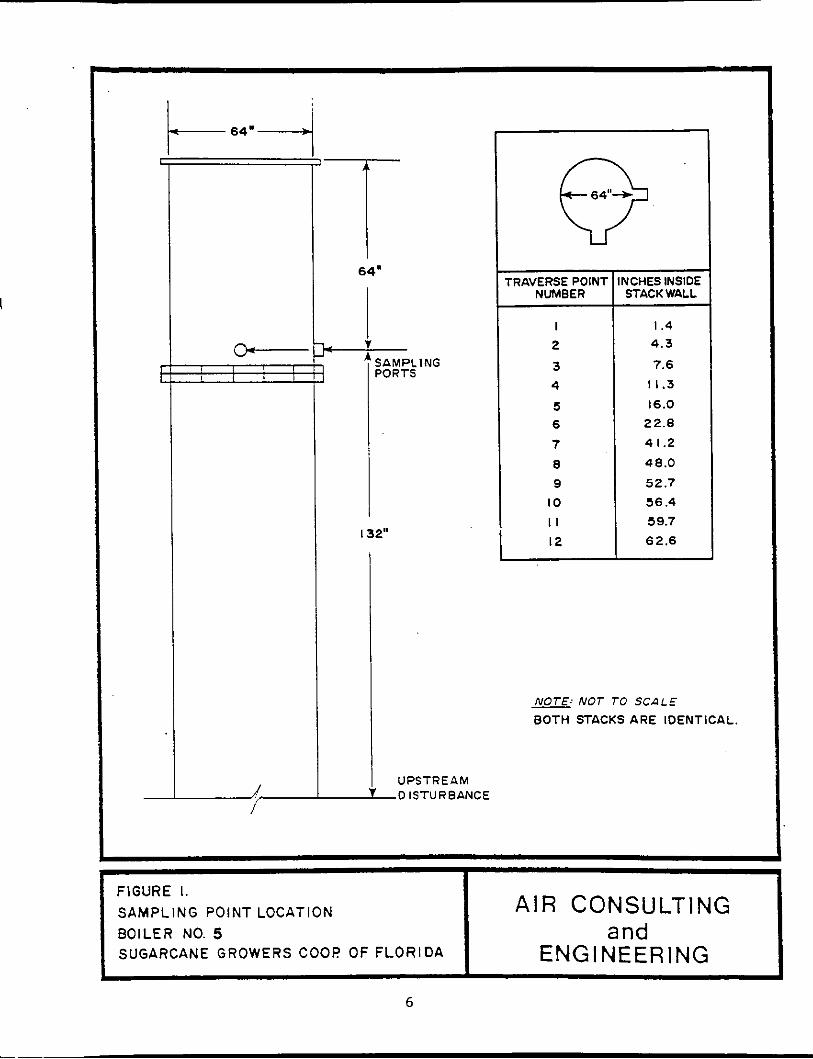
4.0 SAMPLING POINT LOCATION
The sampl ing p o i n t l o c a t i o n c o n s i s t s o f d u a l s c r u b b e r o u t l e t
S t a c k s , e a c h 64" i n d i a m e t e r . Each s t a c k h a s two sample p o r t s 9 0
d e g r e e s a p a r t . The p o r t s on t h e b o t h s t a c k s a r e l o c a t e d 165" from a n
ups t r eam d i s t u r b a n c e a n d 6 4 " from t h e o u t l e t .
Twenty-four t e s t p o i n t s were sampled on each s t a c k f o r e a c h t e s t
run . The t r a v e r s e were l o c a t e d a s shown i n F i g u r e 1. The s t a c k
c o n f i g u r a t i o n i s s u c h t h a t t h e r e i s n o r e a s o n t o e v a l u a t e t h e p r e s e n c e
o f c y c l o n i c f low.
5
1-
FIGURE I. SAMPLING POINT LOCATION BOILER NO. 5 SUGARCANE G R O W E R S COOP OF FLORIDA
I
AIR CONSULTING and
ENGINEERING
I 64.
4 V SAMPLING PORTS
132"
64"+ 0'
I UPSTREAM -0 ISTURBANCE
'RAVERSE POIN1 NUMBER
I
2
3 4
5 6
7 8 9
I O
I I 12
4CHES INSIDE STACK WALL
I .4 4.3
7.6
11.3
16.0 22.8
41.2
48.0
52.7
56.4
59.7
62.6
-: NOT TO SCALE
BOTH STACKS ARE IDENTICAL
6

5.0 FIELD and ANALYTICAL PROCEDURES- USEPA METHOD 5
P a r t i c u l a t e m a t t e r s a m p l e s were c o l l e c t e d by t h e e m i s s i o n measurement
method s p e c i f i e d by t h e Un i t ed S t a t e s Env i ronmen ta l P r o t e c t i o n Agency.
A s c h e m a t i c d i a g r a m o f t h e s a m p l i n g t r a i n u s e d i s p r o v i d e d i n F i g u r e
2 . A l l p a r t i c u l a t e m a t t e r c a p t u r e d from t h e n o z z l e t o and i n c l u d i n g
t h e f i l t e r was i n c l u d e d i n t h e c a l c u l a t i o n o f t h e emission r a t e o f
p a r t i c u l a t e m a t t e r .
PREPARATION O F EQUIPMENT
1. FILTERS- Gelman t y p e "A" g l a s s f i b e r f i l t e r s were p l a c e d i n a d r y i n g oven f o r two h o u r s . a t 1 0 5 d e g r e e s C , removed and p l a c e d i n a s t a n d a r d d e s i c c a t o r c o n t a i n i n g i n d i c a t i n g s i l i c a g e l , a l l o w e d t o cool f o r two h o u r s , and weighed t o t h e n e a r e s t 0 . 1 mg. T h e f i l t e r s were t h e n r e - d e s i c c a t e d f o r a minimum o f s i x h o u r s a n d weighed t o a c o n s t a n t w e i g h t (less t h a n 0 . 5 mg change from p r e v i o u s w e i g h i n g ) . The a v e r a g e of t h e two c o n s t a n t w e i g h t s was u s e d a s t h e t a r e v a l u e .
2 . N O Z Z L E , FILTER HOLDER, AND SAMPLING PROBE - The n o z z l e , f i l t e r h o l d e r , a n d s a m p l i n g p r o b e were washed v i g o r o u s l y w i t h s o a p y w a t e r and b r u s h e s , r i n s e d w i t h d i s t i l l e d w a t e r and a c e t o n e , and d r i e d p r o r t o t h e t e s t program. A l l o p e n i n g s o n t h e equ ipmen t were s e a l e d w h i l e i n t r a n s i t t o t h e t e s t s i t e .
3. I M P I N G E R S - The Greenburg-Smith i m p i n g e r s were c l e a n e d , r i n s e d , and d r i e d a s i n 2 . The i m p i n g e r s were a l s o s e a l e d d u r i n g t r a n s i t .
TEST PROCEDURE
p r i o r t o p e r f o r m i n g t h e a c t u a l p a r t i , c u l a t e matter sample r u n s , c e r t a i n
s t a c k and s t a c k g a s parameters were measured . These p r e l i m i n a r y
measurements i n c l u d e d t h e a v e r a g e g a s t e m p e r a t u r e , t h e s t a c k g a s
v e l o c i t y h e a d , t h e s t a c k g a s m o i s t u r e c o n t e n t , and t h e d i m e n s i o n s a t
t h e p o i n t where t h e tes ts were t o b e pe r fo rmed . T h e s t a c k t e m p e r a t u r e
was d e t e r m i n e d u s i n g a b i - m e t a l l i c t he rmocoup le and c a l i b r a t e d
I
7

'I U W
E L
U W 0
I d
W 5 m 3 !- z 0 J I& r W -I
X W -I Y
m

pyrometer . V e l o c i t y head measurements were made w i t h a c a l i b r a t e d t y p e
" S " p i t o t t u b e and a n i n c l i n e d manometer. V e l o c i t y head measurements
Of 0 .05 i n c h e s R2O or l e s s were measured u s i n g a micromonometer.
The s a m p l i n g t r a v e r s e p o i n t s were s e l e c t e d so t h a t a r e p r e s e n t a t i v e
Sample c o u l d be e x t r a c t e d from t h e gas s t r e a m . The t r a v e r s e p o i n t s
were l o c a t e d i n t h e c e n t e r of e q u a l a r e a s , t h e number o f which were
d e p e n d e n t upon t h e d i s t a n c e u p s t r e a m o r downstream from f l o w
dis turbances.USEPA Methods 1 and 2 were u t i l i z e d f o r t h i s t a s k .
Each p a r t i c u l a t e m a t t e r t e s t r u n c o n s i s t e d o f s ampl ing f o r a s p e c i f i c
amount o f time a t e a c h p o i n t . The t y p e "s" p i t o t t u b e was c o n n e c t e d t o
t h e s a m p l i n g p r o b e so t h a t a n i n s t a n t a n e o u s v e l o c i t y head measurement
c o u l d b e made a t e a c h t r a v e r s e p o i n t w h i l e c o n d u c t i n g t h e t es t run.
The s t a c k g a s t e m p e r a t u r e was a l s o measured a t e a c h t r a v e r s e p o i n t .
Toge the r w i t h assumed m o i s t u r e and o r s a t knowledge a s w e l l a s known
n o z z l e area, c a l c u l a t i o n s o f ' i s o k i n e t i c " ( e q u a l e n e r g y o r v e l o c i t y )
were q u i c k l y made and e f f e c t e d f o r e a c h t r a v e r s e p o i n t d u r i n g t h e t e s t
run.
The g a s e s sampled p a s s e d t h r o u g h t h e f o l l o w i n g components: a s t a i n l e s s
s t e e l n o z z l e and g l a s s p r o b e ; a g l a s s f i b e r f i l t e r ; t w o impingers
cha rged w i t h 1 0 0 ml of d i s t i l l e d w a t e r e a c h ; one d r y impinge r ; one
impinge r w i t h 2 0 0 grams of s i l i c a g e l d e s i c c a n t ; a f l e x i b l e l e n g t h of
t u b i n g ; a l e a k f r e e pump; a c a l i b r a t e d d r y g a s meter: a n d , f i n a l l y , a
c a l i b r a t e d f l o w o r i f i c e .
I
I I
9 1

Sample r e c o v e r y was accompl i shed i n t h e f o l l o w i n g manner:
1. The p r e - t a r e d f i l t e r was removed f rom i t s h o l d e r and p l a c e d i n C o n t a i n e r 1 and s e a l e d . ( T h i s is u s u a l l y per formed i n t h e l a b ) .
2. A l l sample-exposed surfaces p r i o r t o t h e f i l t e r were washed w i t h a c e t o n e and p l a c e d i n C o n t a i n e r 2 . The c o n t a i n e r was t h e n s e a l e d and t h e l i q u i d l e v e l marked.
3. The volume o f water f rom t h e f i r s t t h r e e i m p i n g e r s was measured f o r t h e p u r p o s e of c a l c u l a t i n g t h e m o i s t u r e c o n t e n t of t h e s t a c k g a s e s , t h e n d i s c a r d e d .
4 . The s i l i c a g e l f rom t h e f o u r t h i m p i n g e r . w a s t r a n s f e r r e d t o t h e o r i g i n a l t a r e d c o n t a i n e r and s e a l e d .
LABORATORY A N A L Y S I S
The t h r e e sample c o n t a i n e r s from e a c h sample r u n were a n a l y z e d a c c o r d i n g t o t h e f o l l o w i n g p r o c e d u r e s :
1. The f i l t e r was e i t h e r d r i e d f o r two h o u r s a t 105 d e g r e e s C o r d e s i c c a t e d for 2 4 h o u r s a t ambien t t e m p e r a t u r e . Fo l lowing d e s i c c a t i o n , t h e f i l t e r was weighed t o t h e nea res t 0.1 mg. A minimum o f two s u c h w e i g h i n g s s i x h o u r s a p a r t w e r e made w i t h a v a r i a n c e o f l e s s t h a n 0.5 mg.
2 . The a c e t o n e f rom C o n t a i n e r 2 was t r a n s f e r r e d t o a t a r e d b e a k e r , e v a p o r a t e d t o d r y n e s s , and weighed i n t h e same manner a s above .
3. The u s e d s i l i c a g e l i n i t s t a r e d c o n t a i n e r was weighed t o t h e n e a r e s t 0 .1 gram.
The t o t a l sample w e i g h t i n c l u d e d t h e w e i g h t g a i n s f rom Sample
c o n t a i n e r s 1 and 2 .
DATA
~ l l r e l e v e n t f i e l d and l a b d a t a s h e e t s a s w e l l a s e m i s s i o n
c a l c u l a t i o n s a r e p r o v i d e d i n t h e repor t a p p e n d i c e s .
10

APPENDIX A
COMPLETE EMISSION DATA
AND
SAMPLE CALCULATIONS

A I R CONSULTING & ENGINEERING,INC. C o m p l e t e Emission Data
TOTAL HEAT INPUT ( O I L ) ------------- TOTAL HEAT I N P U T (NON-OIL)
ALLOWABLES : ALLOWABLE E M I S S I O N ( O I L ) ----------- I ALLOWABLE EMISSION (NON-OIL)
I TOTAL ACTUAL EMISSION TOTAL ALLOWABLE EMISSION-----------
TOTAL ALLOWABLE EMISSION----------- TOTAL ACTUAL EMISSION
108 MINUTES
5760 5530
1
61062 60937 2500
580 DEGREES F 430 P S I G 445 PSIA
260 DEGREES F 600 PSIG 615 P S I A
1291.2 BTU/LB 228.6 BTU/LB
1062.6 BTU/LB 173611 LB/kR
29 5.17 MMBTUH 62.5 %
1.00
127.78 GPH 150000 BTU/GAL
19lz7.'MMBTUH '.2 7 6.0 0 MMBTUH L- -,
.10 LB/MMBTU
.25 LB/MMBTU
70.92 LB/AR 55.62 LB/HR
0.240 LB/MMBTU 0.18 8 LB/MMBTU

A I R CONSULTING & ENGINEERING, INC. C o m p l e t e E m i s s i o n D a t a
TOTAL BEAT I N P U T ( O I L ) ------------- TOTAL HEAT INPUT (NON-OIL)
ALLOWABLES : ALLOWABLE E M I S S I O N ( O I L ) ----------- ALLOWABLE EM1 SS I O N (NON-0I.L)
TOTAL ALLOWABLE EMISSION----------- TOTAL ACTUAL EMISSION
TOTAL ALLOWABLE EMISSION----------- TOTAL ACTUAL EMISSION
108 MINUTES
56140 55810 .
61214 61090 2500 580 DEGREES F 430 PSIG 445 PSIA
260 DEGREES F 600 PSIG 615 PSIA
1291.2 BTU/LB 228.6 BTU/LB
1062.6 BTU/LB 172222 LB/HR
292.81 MMBTUH 62.5 %
1 .oo 183.33 G P H 150000 BTU/GAL
27.50 MMBTUH 265.31 MMBTUH
.lo LB/MMBTU
.25 LB/MMBTU
69.08 LB/HR 59.69 LB/HR
0.236 LB/MMBTU 0.204 LB/MMBTU

A I R CONSULTING 6 ENGINEERING,INC. C o m p l e t e E m i s s i o n Data
61380 61248 2500 580 DEGREES F 425 PSIG 440 PSIA
260 DEGREES F 600 PSIG 615 PSIA
1291.7 BTU/LB 228.6 BTU/LB
1063.1 BTU/LB 165000 LB/HR
280.66 MMBTUH 62.5 %
1.00
TOTAL HEAT INPUT ( O I L ) ------------- 24.00 MMBTUH TOTAL HEAT I N P U T (NON-OIL) 256.66 MMBTUE
ALLOWABLES : ALLOWABLE EM1 SS ION (01 L) --- -------- . l o LB/MMBTU ALLOWABLE EMISSION (NON-01 L ) .2s LB/MMBTU
TOTAL ALLOWABLE EMISSION----------- 66.56 LB/HR I TOTAL ACTUAL EMISSION 49.53 LB/HR
TOTAL ALLOWABLE EMISSION----------- 0.237 LB/MMBTU I TOTAL ACTUAL EMISSION 0.17 6 LB/MMBTU

AIR CONSJLTItG AND EX-, I=.
Caaplete hission Results ---- -__-I- ------- Plant: SUGAR c;RcwERs OmPERATIVE FL. Location: BE- GIADE,FCORIW Date: 12-5-90 Stack: NZPDBER 5 BOILER Ihln 1 From 0748 - 0927 ----- - --- Y Factor 0.994 Nozzle Diameter 0.274 In 'petal Time 96.00 Min Nozzle Area 0.000409 Ft- Stack kea 44.680 Ft- Baranetric Pressure 30.16 In Rg Stack Temperature 152.2 -F Meter Temperature 74.8 -F Stack Pressure 30.16 In Hg Meter Orifice Diff 1.731 In A20 Stack Avg - Vel &ad 0.653 In 30 Meter Volume 62.343 CF
Condensate Vol 395.10 m l
1. Volume Water Vapor Sampled 18.597 SCF 2. Volume Standard Dry Gas Sampled 61.907 SCF 3. lbtal Standard Sample Volume 80.505 SCF 4. Percent Moisture 23.100 5. Percent Dry Air 76.900 6. Molecular Weight of Dry Flue Gas 30.154 7. Molecular Weight of Wet Flue Gas 27.346
9. Percent Oxygen [O I 8.25 10. Percent Carbon Diohde [C02] 11.40 11. Percent Excess Air 63.646 12. Velocity of Flue Gas 40.401 FPS 13. Actual Vollrmetric Flow Rate 108306.9 ACM 14. Dry VolLPnetric Flow Rate 83288.0 ACFMD 15. Standard Volmetric Flow Rate 72405.6 SCFMD 16. Emission Concentration 0.0896 gr/SCF 17. hission Concentration 0.0599 gr/ACF 18. Emission Rate 55.62 ltsfir 19. Percent Isokinetic 97.2
Probe/Nozzle Wash 70.2 mg Filter 289.4 mg Total 359.6 mg
8. Specific Gravity Flue Gas 0.95
. . . . . . . . . . . . . . . . . . . . . . . . . . . . . . . . ___-
A I R CONSULTIEX; AND ENGINEERING, IC.
Complete hission R e s u l t s _----I--_____--________________I________
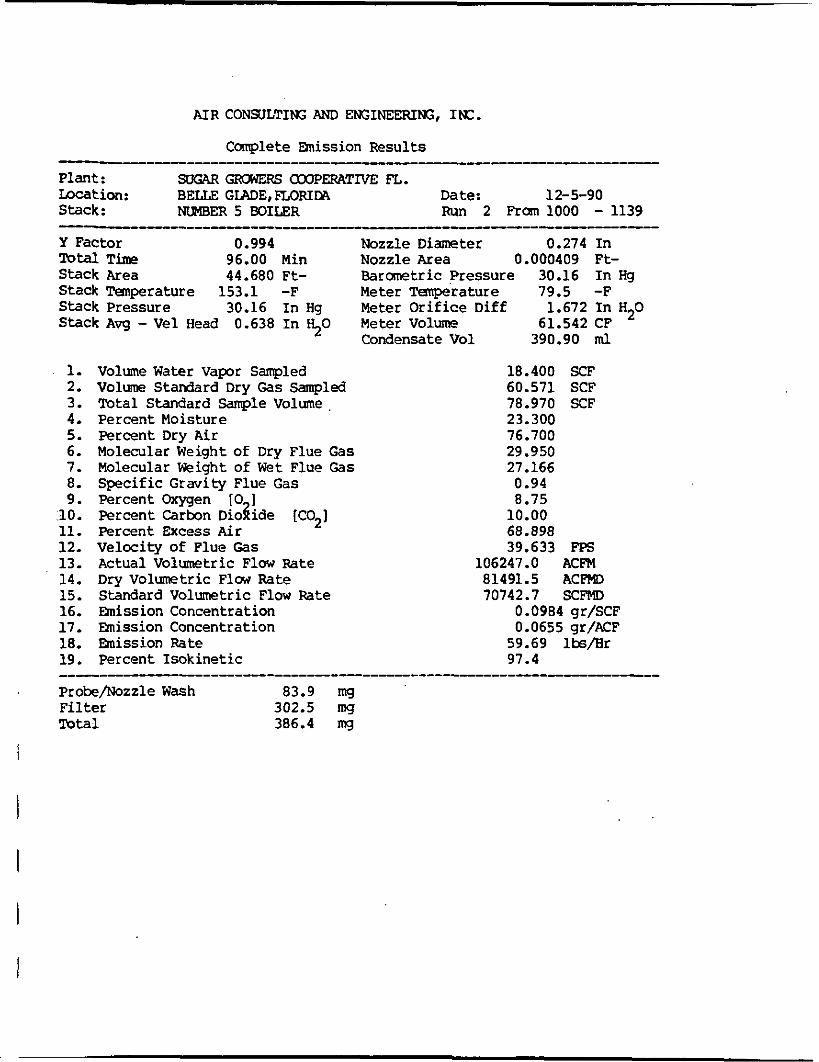
Plant: SDGAR GROWERS cIx)pERATIvE n. Location: BELLE GIADE,FLORIW Date: 12-5-90 Stack: NLPlBER 5 BOILER Run 2 Rm 1000 - 1139
Y Factor 0.994 Nozzle Diameter 0.274 In Tow Time 96.00 Min Nozzle Area 0.000409 Ft- Stack Area 44.680 Ft- Ba rme t r i c Pressure 30.16 In Hg Stack Temperature 153.1 -F Meter Temperature 79.5 -F Stack Pressure 30.16 I n Hg Meter Orif ice Diff 1.672 I n H20 Stack Avg - V e l Head 0.638 In 50 Meter Volume 61.542 CF
Condensate Vol 390.90 ml
1. 2. 3. 4. 5. 6. 7. 8. 9.
I O . 11. 12. 13. 14. 15. 16. 17. 18. 19.
Volume Water Vapor Sampled Volume Standard Dry Gas Sampled Total Standard sample Volume. Percent Moisture Percent Dry A i r Molecular Weight of Dry Flue Gas Molecular Weight of Wet Flue Gas Specific Gravity Flue Gas Percent Oxygen IO I Percent Carbon Diogide [C02] Percent Excess Air Velocity of F lue Gas Actual Volumetric Flow Fate Dry Volumetric Flow Rate Standard Volumetric Flow Rate Emission Concentration h i s s i o n Concentration Emission Rate Percent Isokinetic
18.400 SCF 60.571 SCF 78.970 SCF 23.300 76.700 29.950 27.166
0.94 8.75
10.00 68.898 39.633 FF5
106247.0 ACFM 81491.5 ACFMD 70742.7 SCFMO
0.0984 gr/SCF 0.0655 gr/ACF
59.69 lbs/Hr 97.4
Pr&/Nozzle Wash 83.9 mg F i l t e r 302.5 mg Total 386.4 n g
I

AIR CCNSULTING AND EEx;MEERIffi, INC.
Canplete mission ksults _I - -- -
Plant: S U W GKNERS COapEWLTIVE FL. Location: BELLE GLADE,FIDRIDA ’ Date: 12-5-90 Stack: NUMBER 5 BOILER Run 3 F K ~ 1222 - 1408
Y Factor 0.994 Nozzle Di-teK 0.274 I n
Stack Area 44.680 Ft- Baranetric Pressure 30.16 In Hg
Stack Pressure 30.16 I n Hg Meter Orif ice D i f f 1.758 I n H 2 0 Stack Avg - V e l Head 0.655 In 50 Meter Volume 63.876 CF
Condensate V o l 391.00 ml
-----__--__ll____-l-------~l----------
Total Time 96.00 Hin Nozzle Area 0.000409 Ft-
Stack Temperature 153.6 -F Meter ‘&iI@fXatUKe 80.4 -F
1. 2. 3. 4. 5. 6. 7. 8. 9.
10. 11. 12. 13. 14. 15. 16. 17. 18. 19.
Volune Water Vapor Sampled
Total Standard Sample Volume Percent Moisture Percent Dry Air Molecular Weight of Dry Flue Gas Molecular Weight of W e t Flue Gas Specific Gravity Flue Gas Percent m e n [O I Percent Carbon Diohde [C02] Percent Excess Air Velocity of Flue Gas Actual Volumetric Flow Fate Dry Volumetric F l w Rate Standard Vollnnetric Flow Rate Bnission Concentration mission Concentration Emission Rate Percent Isokinetic
VOlUme Standard Dry Gas Salnpled 18.404 SCF 62.776 SCF 81.181 SCF 22.700 77.300 29.950 27.237 0.94 8.75
10.00 68.898 40.652 FPS
108980.2 ACFW 84241.7 A C M 73073.1 SCFMD
0.0791 gr/SCF 0.0530 gK/ACF
49.53 Itsfir 97.7
P r o b e B z z l e Wash 27.4 mg F i l t e r 294.3 mg Total 321.7 mg

S q l e Calculations Run 1 Page 1
Plant: SUGAR GROWERS c0c)PERATIVE FL.
Seck: MIMBER 5 BOILER
W V o l w Water Vapr Sampled W = 0.04707 x 395.1 = 18.597 SCF
VMStd VMStd = 17.64 x 62.343 x 0.994 x
Date: 12-5-90
Volume Standard Dry Gas Sampled
[ 30.16 + ( 1.731 / 13.6)] / ( 74.8 + 460) = 61.907 SCF
V t Total Stmdard Sample Volme V t = 18.597 + 61.907 = 80.505 SCF
W Percent Water = ( 18.597 / 80.505) x 100 = 23.1 %
EDA Percent D r y A i r = (1 - 0.231) x 100 = 76.9 %
Ma Md = (0.44 X 11.40 %CO ) + (0.32 X 8.25 $0 ) +
Molecular Weight of Dry Stack Gas
(0.28 X (80.35 %s2 + 0.00 OCO)] = 230.154
Ms Molecular Weight of Wet Stack Gas ( 30.154 x 0.769 ) + ( 18 x 0.231 ) = 27.346
SG Specific Gravity Stack Gas SG = 27.346 / 28.84 = 0.95
Ea Percent Excess Air Ea = ( ( 8.25 $02)-( 0 %CO / 2) X 100)
[ ( .264 X ( 80.35 %N2)) - ( 8.25 %02)-( 0 %CO / 211 ------------I
E a = 63.646
Vs V e l o c i t y of Stack VS = (85.49 x 0.84 x 0.653) x - [ ( 152.2 + 460) / ( 30.16 x 27.346)1 Vs = 40.401
Qa Actual Vo lmt r i c F l m Q a = ( 44.680 x 40.401 x 60 ) = 108306.9 ACE74
Q3 D r y Volumetric Flow
Qsd Standard Volumetric Flow
= ( 108306.9 x 0.769 ) = 83288.0 ACFMD
= 108306.9 x 0.769 x [ 528 / ( 152.2 + 460 ) ] x ( 30.16 / 29.92 ) = 72405.6 SCFMD

Sample Calculations Run 1 Page 2
P lant : SUGAR cI?#IwERs COllPERATNE E'L. Date: 12-5-90 Stack: tKlIW3R 5 BOILER
Esrp Emission Rate gr/SCF = [ 0.01543 x ( 70.2 + 289.4 1 1 / ( 61.907 ) gr/SCF = 0.0896
*/fir Rnission Rate LbsfEr = 0.0896 / 7000 x 72405.6 x 60 = 55.62
I Percent Isokinetic I = 100 x ( 152.2 + 460) x t(0.002669 x 395.1) + ( 62.343 x 0.994 /
( 74.8 + 460)) x ( 30.16 + ( 1.731 / 13.6) ) l / (60 x 96 x 40.401 x 30.16 x 0.000409)
I = 97.2 %

Plant: SUGRR GRCW2FfS COOPERATIVE FL. Date: 12-5-90 Stack: NUMBER 5 BOILER RunNunber: 1
Average SQR Velocity Head Velocity Head Inpts :
0.2000 0.2300 0.5700 0.6300 0.3200 0.5500 0.5800 0.3400 0.5800 0.5000 0.2600 0.2100 0.5000 0.6000
= 0.653
0.3300 0.4700 0.5400 0.5200 0.4500 0.5100 0.4000 0.3800 0.1900 0.2400 0.5500 0.5500 0.4500 0.5500 0.6000 0.2400 0.2700 0.2700 0.4000 0.5000 0.4300 0.4300 0.5300 0.5300 0.6000 0.2500 0.3000 0.4200 0.4700 0.5000 0.6200 0.5800 0.4200 0.4000
Average Orifice Pressure = 1.731 Orifice Pressure Inputs:
1.3400 1.5400 1.2200 1.6500 1.9000 2.1000 1.8000 2.3000 2.5000 2.0500 1.6000 1.5000 0.7600 1.0000 1.3000 2.2000 2.2000 2.2000 1.8000 2.2000 2.4000 2.3000 1.4000 1.0000 1.1000 1.1000 1.6000 2.0000 2.3000 2.0000 1.7000 1.7000 2.1000 2.1000 2.2000 1.0000 0.8400 1.0000 1.2000 1.7000 1.9000 2.0000 2.0000 2.0000 2.0000 2.0000 1.7000 1.6000
Average Stack Temperature = 152.2 Stack Tenperatwe Inputs:
151 152 150 150 150 152 152 152 152 152 15 2 152 152 152 152 153 152 152 153 153 154 154 152 15 2 152 153 153 153 153 155 154 153 153 153 153 152 153 152 15 2 152 154 154 151 151 150 150 151 152
Average Meter Temperature = 74.8 Meter M p r a t u c e Inputs:
67 67 67 68 68 69 70 70 70 71 72 73 73 73 74 75 75 76 76 76 77 77 77 78 78 78 79 79 79 79 79 79 80 80 80
68 69 72 72 75 75 77 77 7a 78 79 79 80

Plant: SUGAR GRUERS COOPERA!l'IVE FL. Date: 12-5-9 0 Stack: NUMBER 5 B3ILER IhlnNwlber: 2
Average SQR Velocity Head = 0.638 Velocity Head Inplts:
0.2100 0.2100 0.2600 0.3400 0.4700 0.6300 0.6800 0.6000 0.3000 0.4400 0.5400 0.5200 0.6300 0.3200 0.2500 0.2400 0.5300 0.5300 0.4100 0.4800 0.2500 0.2200 0.2200 .0.3400 0.4600 0.5400 0.6300 0.4600
Average Orifice Pressure = Orifice Pressure Inputs:
0.8400 0.8400 1.9000 2.5000 1.2000 1.7500 2.5000 1.3000 2.1000 2.1000 1.0000 0.8800 1.8000 2.2000
1.672
1.0400 1.3500 2.7000 2.4000 2.1500 2.1000 1.0000 1.0000 1.6500 1.9000 0.8800 1.3600 2.5000 1.8000
Average Stack Temperature = 153.1 Stack Temperature Inputs:
153 151 151 151 153 153 153 153 153 155 153 154 155 156 153 154 154 154 155 156 152 152 151 151 154 154 153 152
Average Meter Temperature = 79.5 Meter Tenperatwe Inputs:
76 76 76 76 76 77 77 77 78 79 79 79 80 80 80 80 81 81 81 81 81 81 81 81 82 82 a2 . a2
0.4600 0.4500 0.5200 0.2700 0.5200 0.4000 0.3800
1.8500 1.8000 2.1000 1.1000 2.1000 1.6000 1.5000
151 153 153 154 155 151 152
76 78 79 80 81 82 82
0.5800 '
0.2200 0.4600 0.3500 0.5200 0.4600 0 -3400
2.3000 0 .E800 1.8000 1.4000 2.1000 1 .EO00 1.3600
154 151 155 154 151 152 152
0.5600 0.2500 0.5900 0.3500 0.2600 0.4600
2.2000 1 .oooo 2.3600 1.4000 1.0500 1 .EO00
156 151 156 155 151 153
76 76 78 78 79 80 80 80 81 81
82 a2 a2

Plant: SUGAR c;RowERS CWlpERATIVE FL. Date: 12-5-90 Stack: NUMBER 5 BOILER RunN\rmber: 3
Average SQR Velocity Head = 0.655 VehCity Head Inputs:
0.2100 0.2700 0.3200 0.4400 0.6200 0.6000 0.5000 0.5600 0.5800 0.6600 0.4600 0.3400 0.2400 0.2800 0.3400 0.5700 0.6000 0.5700 0.4800 0.5600 0.6200 0.5800 0.3300 0.2600 0.2600 0.2900 0.3000 0.5200 0.5800 0.5400 0.5400 0.5000 0.4800 0.5600 0.2800 0.2200 0.2200 0.2700 0.3200 0.3800 0.4400 0.5000 0.5000 0.5500 0.5800 0.5600 0.4200 0.3400
Average Orifice Pressure = 1.758 Orifice Pressure Inputs:
0.8400 1.1000 1.3000 1.7600 2.5000 2.4000 2.0000 2.2000 2.3000 2.6000 1.8000 1.4000 1.0000 1.1000 1.3500 2.3000 2.4000 2.3000 1.9000 2.3000 2.5000 2.3000 1.3000 1.3000 1.0000 1.1600 1.2000 2.1000 2.3000 2.2000 2.2000 2.0000 2.0000 2.1000 1.1000 0.8800 0.8800 1.1000 1.3000 1.5000 1.8000 2.0000 2.0000 2.0000 2.0000 2.0000 1.8000 1.5000
Average Stack Temperature = 153,6 Stack Tenperatwe Inputs:
153 153 153 154 155 155 155 156 155 155 150 154 155 155 155 155 155 157 156 156 157 156 156 156 152 153 153 152 153 153 154 154 153 153 152 151 153 151 151 152 152 152 153 153 149 153 151 152
Average Meter Temperature = Meter Taoperatwe Inputs:
77 77 78 78 80 80 81 82 81 81 81 82 82 82
80.4
77 77 78 79 80 80 82 81 81 81 82 82 82 83
77 79 81 81 81 82 83
77 77 80 80 81 81 81 81 81 81 82 82 83

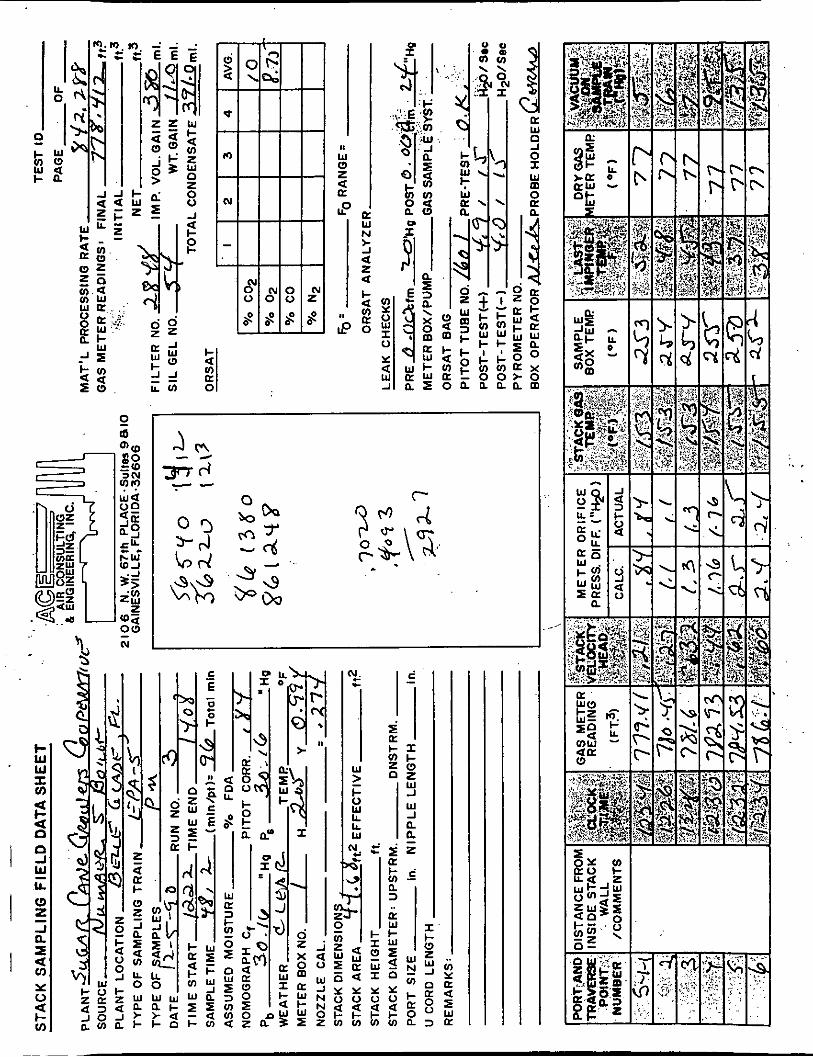
APPENDIX B
FIELD DATA SHEETS

I e O1
P
k g w a t -a
.~ . ...
u N
. . ,. . . .. :: . I ; _ . I .
a 0
W 0 z a a 0 U
rp
\
M r. 3- ...
5" t;z- n̂
m 9 50
aa (3
. .


2 m


, . . . . .
APPENDIX C
LABORATORY ANALYSES

4

c c r I
r I
c
-
1: c 1. I. 1. I. I- I: 1: 1. I: 1: c I:
. . . . . . . .
. . . . , ' I . . . . . . . ' . . i . . . . . .
. . . . . . . . . . . . . . . . . . . . . . . . [ * ' >! ; _. . . . I
. . . . . _ ' ' , . . . . ~ , .
. . . . . . . . . .
-. . . . , ,
: / : e.., . .
. . , _ . -i . .
. . ,i . . 1 . . . . . . . . . . . . , .
, I . . 1..
. . . I .
I
I
APPENDIX D
QUALITY ASSURANCE
AND
CHAIN OF CUSTODY
. .
. . ' . i
STANDARD METER CALIBRATION Meter Number 1040616
Air Consulting and Engineering. Inc. (ACE) uses a dry gas meter for the callbration standard. This meter has been calibrated against a wet test meter in triplicate. curve (see next page). Field meter calibrations are corrected to this curve using the following formula:
This data was used to generate a standard meter calibration
Ya x Ys = Y
Y = actual ratio of field meter to standard meter
Ys = ratio of standard meter to wet test meter at a given
Y = corrected ratio of field meter
a
flow rate (fron Calibration Curve)
The dry standard meter was calibrated on November 23. 1990, and is checked and/or recalibrated at least annually.

STANDARD METER CALIBRATION CURVE
METER S E R I A L NO. 1040616 (SOUTH)
NOVEMBER 23, 1990
A IR CONSULTING and
ENGINEERING

o m - c o m c c b-,ocIc c . . . . 4 c - 3
N U N m c c c c p c c c 0 . . . 334 3
P4.n.n u c c c c ,.coc c . . . 3 4 - r3

( D O m N Q - o o m m m m > o o m m ? m A A O O O O
~ m o m ) v ) m m o m m a m m > o m m m m m i - 0 0 0 0 0
. . . . . . i
NNOC9DI . I m o o o o o o > o o o o o o . . . . . .
- I . I - - - -
* m m 0
N
m 0
m
N O 0
.-(
In 0 N

l - N v )
+ m m o I
0 0 -
m m o . . .
i m n m
m m m m : + m m m , . . . I 0 0 0 ~
v)
0,
0
m
v)
0,
0
m
0 0 0
0 01 m N
.. z r 2
.. .
F m 0 W I- a a m a ..I
V

W
3 I-
C 0 c a
m
CP- q 0 W I- 4 u J .z 0
W t- 4 0
m
I- O I- - n
In . 2
W m 3 I- I- O I- - a K!
1
m 9
V
0- 0 V
O W u 3 0 W
z 0 I- 4
- a
-
a m - J 4 0 ln
2
I- z w 2l d
a Y 0 Y

.
iu I 0 a > n
a 0 E
0 N, M
6
c
21 W
I-
r

I I ~ I I I I . 3%
o" YIP - u'
3.11 PROBE &min WARMUP)
5 2% - 5 zu) - I- 4
0. Y
E m - u -I
0 g 1w -
50- INLET. 150 O F - p I l l I I l l
= L
I LL
~
0 20 40 60 m POWERSTAT SETTING. :
I l l 1 1
150
loa =E $0
INLET, 250 OF
0 I 1 1 - 1 I I 1 J 0 M 40 60 m
POWERSTAT SETTING. :
1 1 1 1 1 1 1 1.11. PROBE (1O.min WARMUP)
I I I I I I I I 0 M 40 a 60
POWERSTAT SETTING. %
INLET AMBIENT.
INLET; IM OF -1 0 ,I I I I I I 1 I I
0 20 4 60 60 POWERSTAT S T I N G . Z
wl
e m W a
a 250
4
gm
2 100 w c
Y A
-150
Y
g so a 4.
0
7 4 PROBE ( 1 5 4 n WARMUP)
I 0 m 4 60 80
POWERSTAT SETTING. :
N O T E Flow talc hcld consunl a1 0.75: 54: chrnic in ilm talc bas link ellecl on Kobe Icweralufc.
prow temperatures.

\IR CONSULTING AND ENGINEERING, Inc. I S A M P L E RECOVERY A N D CHAIN OF CUSTODY
f 2 - 5-70 PLANT NAME dLW TEST DATE
SOURCE NAME
T Y P E OF SAMPLE PI rM, PARTICULATE ANALYSES BY st dm #o.@ SAMPLE RECOVERED BY #if& LLL- ' /L /vL-rclc
S A M P L E RECOVERY
CONTAINER LlOUlO LEVEL NO. MARKED
.p.J 1/
P d L
pw L/
&
28'77
R U N NO.
I
COMMENTS
a
3
FILTER BLANK d6/7
SILICA GEL CONTAINER FINAL WT INIT. WT. N E T WT.
NO. ( P I ( g ) ( g ) RUN NO. COLOR
3 54' 2/Lo 200.0 /Lo 0. k, 200.0
200.0
200.0
200.0
200.0

APPENDIX E
PRODUCTION RATE
CERTIFICATION

BOILER OFEHATION FARAMETERS l i
F I N 6 L INTEGRATOR w 6 0 &_- I N I T 1 A L INTEGRATOR _ ~ ~ _ ~ - ~ ~ ? _ _ _ _ _ _
:T IME I O I L ~ _ _ _ _ _ ~ _ _ _ _ _ _ _ _ _ _ _
I METER I REAOING ___________
I '
_________'___________I__________

~~ ~ ~
BO I L E R OPERAT I ON PARAMETERS
PPI( i f appl i c a b l e :) , ______
; iabb !

.L1
E:OILER OPERATIOI\I PARAMETERS

...... ..... . ?..... 3 . . ............ ...,. >,.. . . . . . . . . . . . .ii .. . . . . . ... . . . . . . . . . . ..... .. .:., . . . . . . .
APPENDIX F
PROJECT PARTICIPANTS
1:

GERARD GAUTHREAUX
BLAS MARIN
PALM BEACH COUNTY: ----------------- M A Y A K . SATYAL
J E F F KOERNER
PROJECT P A R T I C I P A N T S
F I E L D T E S T I N G REPORT PREPARTION
F I E L D T E S T I N G
PROJECT COORDINATOR
T E S T COORDINATOR
T E S T OBSERVER
T E S T OBSERVER