ap42 chapter 1 reference - us epa · current florida department of environmental regulation ......
TRANSCRIPT

AP-42 Section Number: 1.8
Reference Number:
Title:
25
Source Test Report Number 8 Boiler Impingement Wet Scrubber Particulate Emissions: Sugar Cane Growers Cooperative of Florida
December 1990
/ ’
i7 //
SOURCE T E S T R E P O R T NUMBER 8 B O I L E R
IMPINGEMENT WET SCRUBBER P A R T I C U L A T E E M I S S I O N S
SUGAR CANE GROWERS C O O P E R A T I V E O F F L O R I D A B E L L E G L A D E , F L O R I D A
DECEMBER 12, 1990
P R E P A R E D FOR: SUGAR CANE GROWERS C O O P E R A T I V E O F F L O R I D A
B E L L E G L A D E , F L O R I D A
P R E P A R E D BY: A I R CONSULTING and E N G I N E E R I N G , I N C .
2106 N . W . 67th PLACE S U I T E 4
G A I N E S V I L L E , F L O R I D A 32607
14642 FLAMINGO D R I V E WEST PALM BEACH, F L O R I D A
33470
and
ngineering, tnc.
To the best of my know1
procedures comply with Florida
requirements and all test data
REPORT CERTIFICATION ._.
.edge, all applicable field and analytical
Department of Environmental Regulation
and plant operating data are true and correct
Stephen I . Neck, P.E. State of Florida Registration No. 20020
SEAL
iii
2106 N.W. 67th Place, Suite 4 Gainesville. Florida 32606 (904) 335-1889
TABLE OF CONTENTS
.*. ... PAGE ----
1.0 INTRODUCTION................................,...... 1
2.0 SUMMARY AND DISCUSSION OF RESULTS.................. 2
3.0 PROCESS DESCRIPTION AND OPERATION.................. 4
4.0 SAMPLING POINT LOCATION............................ 5
5.0 FIELD AND ANALYTICAL PROCEDURES.................... 7
APPENDICES
APPENDIX A--COMPLETE EMISSION DATA AND SAMPLE CALCULATIONS
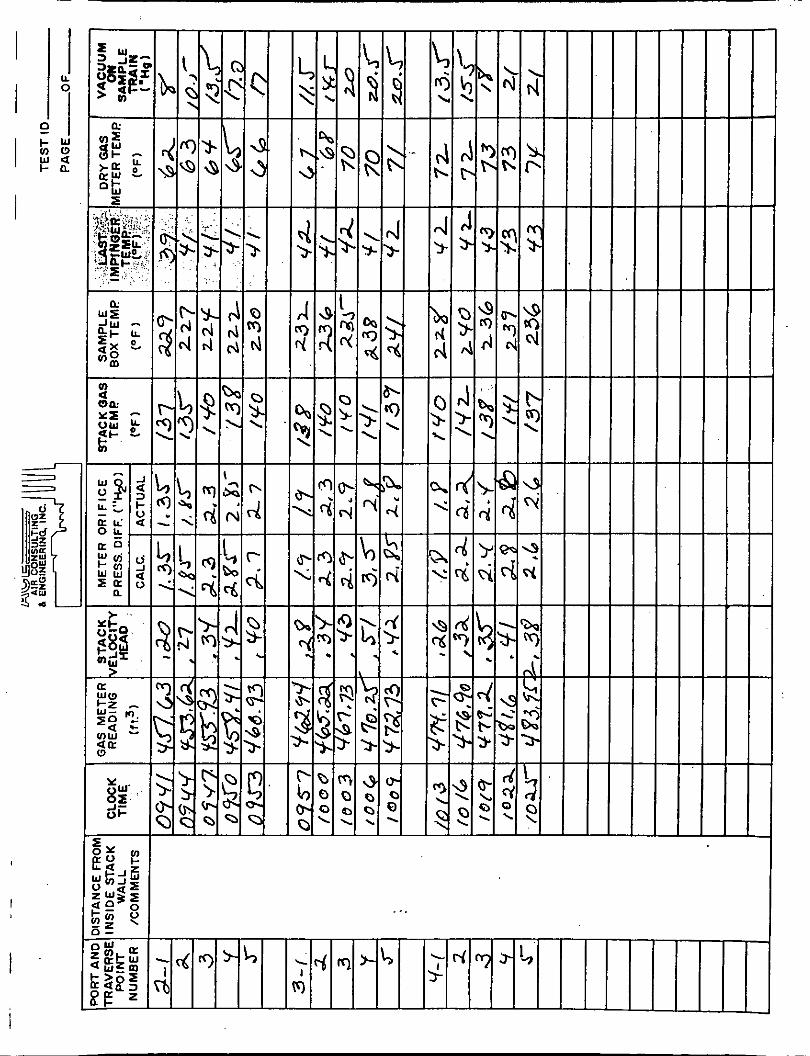
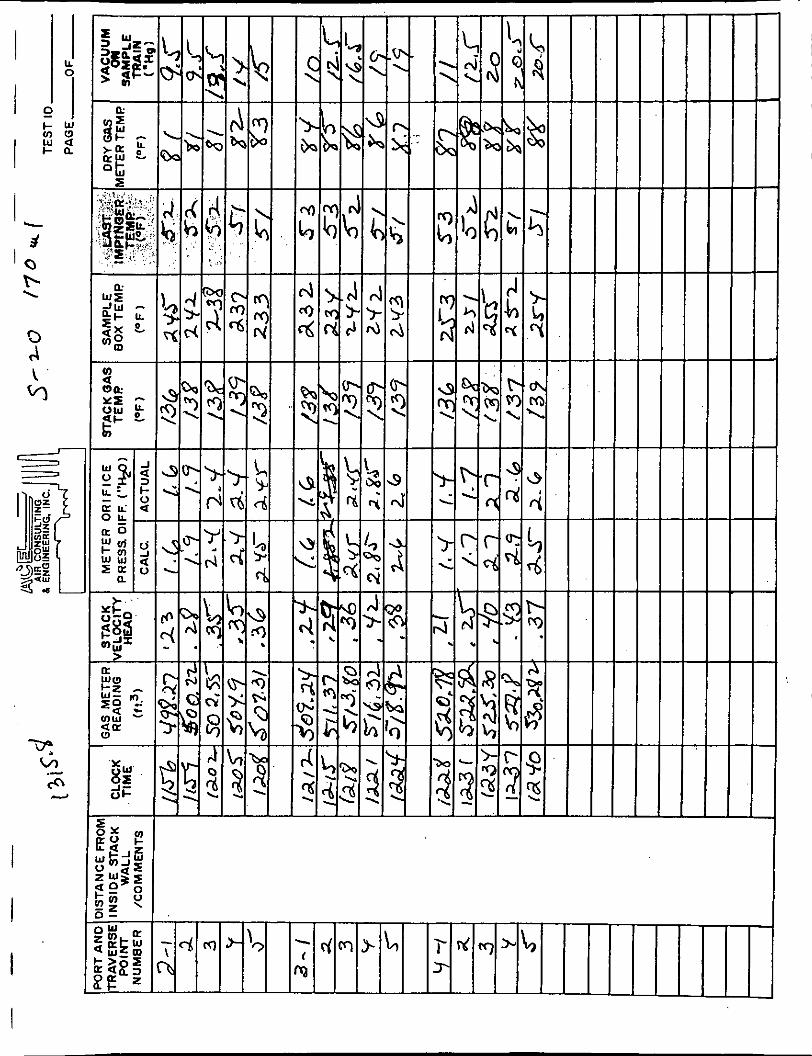
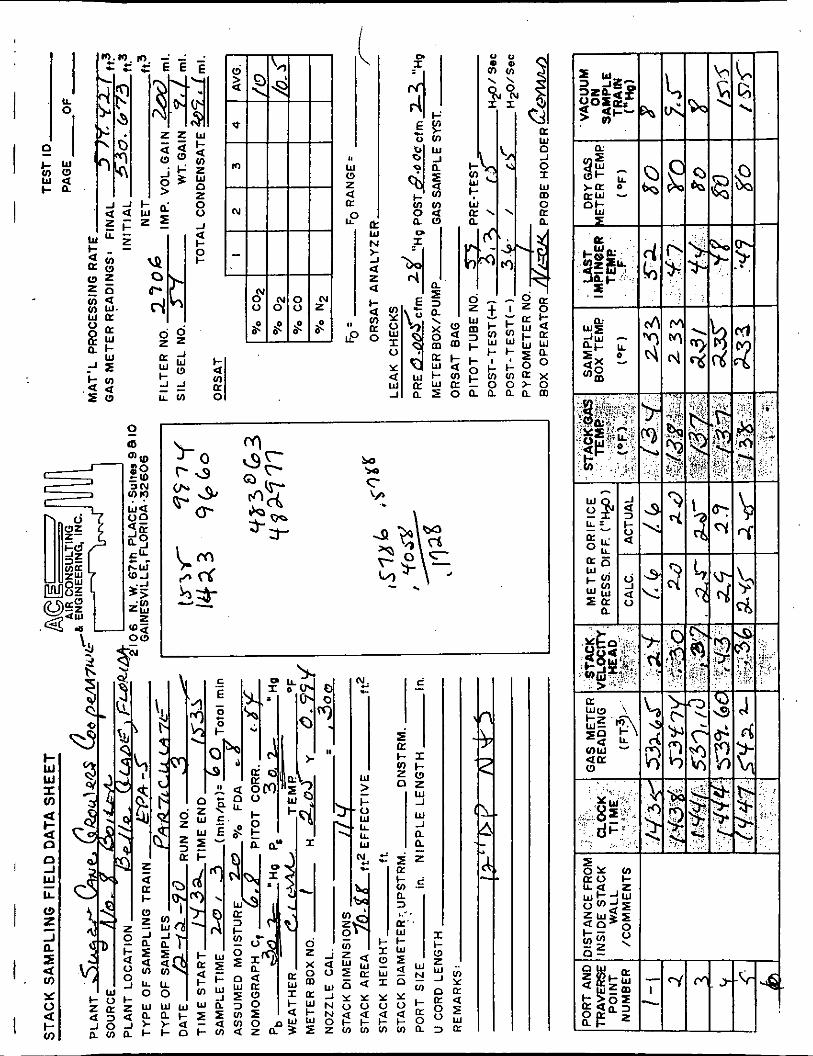
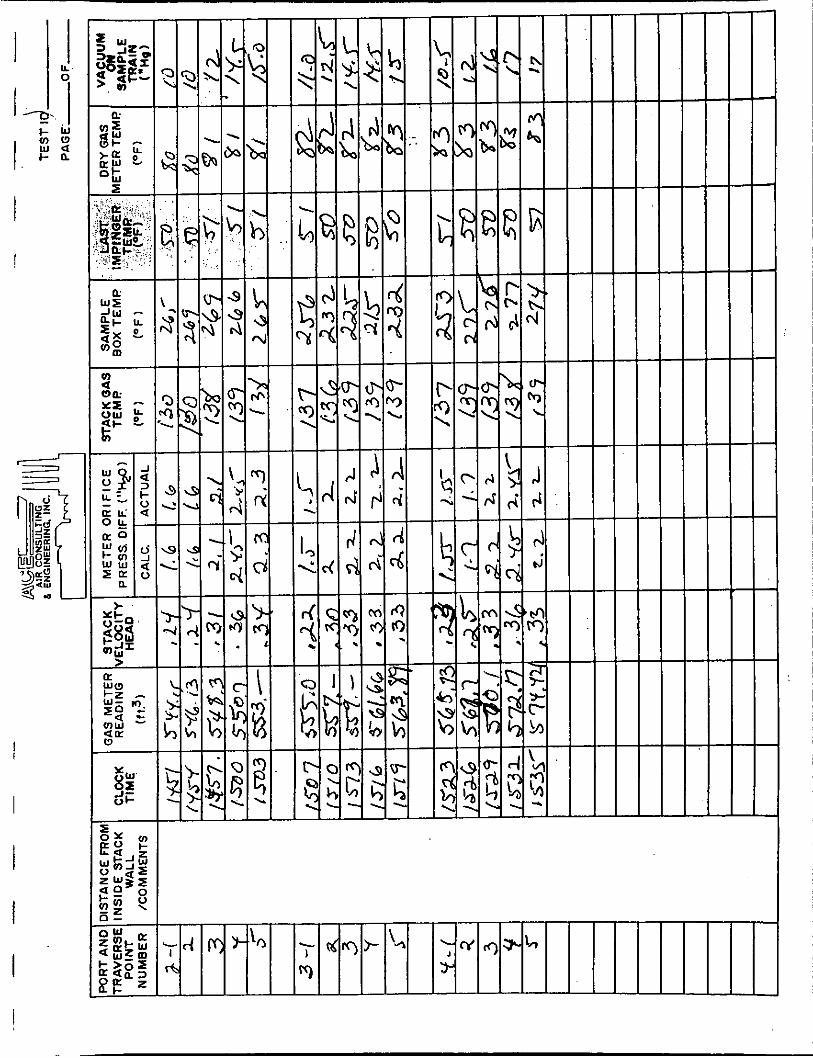
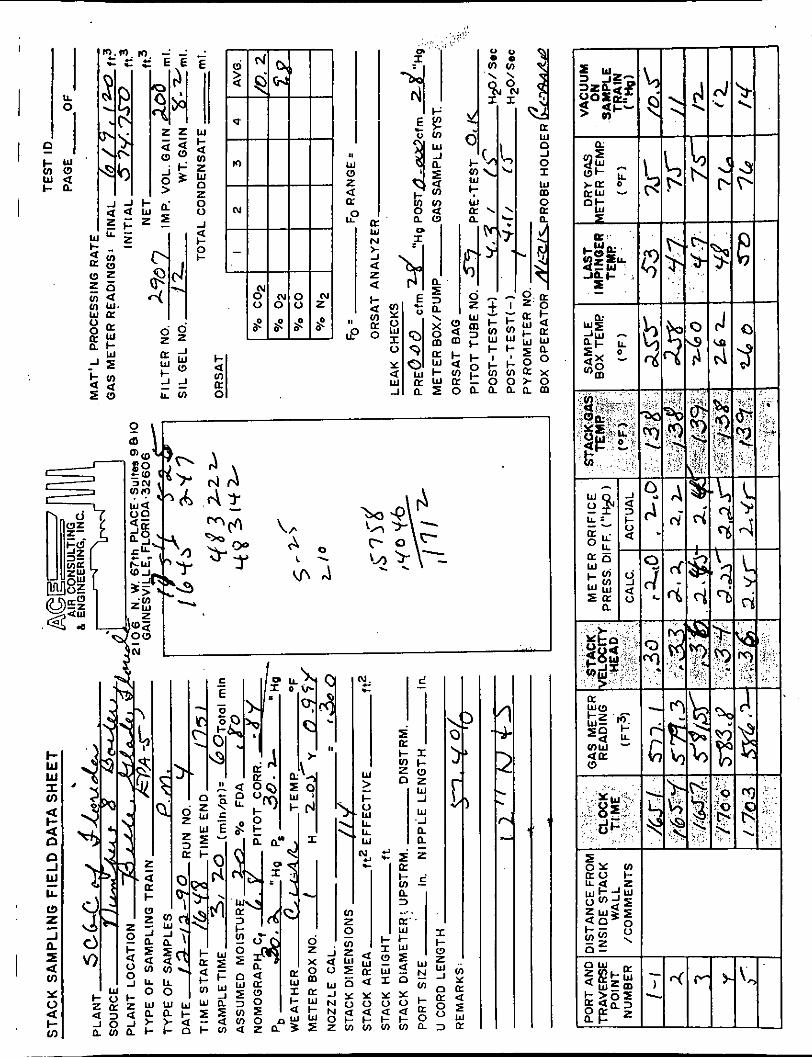
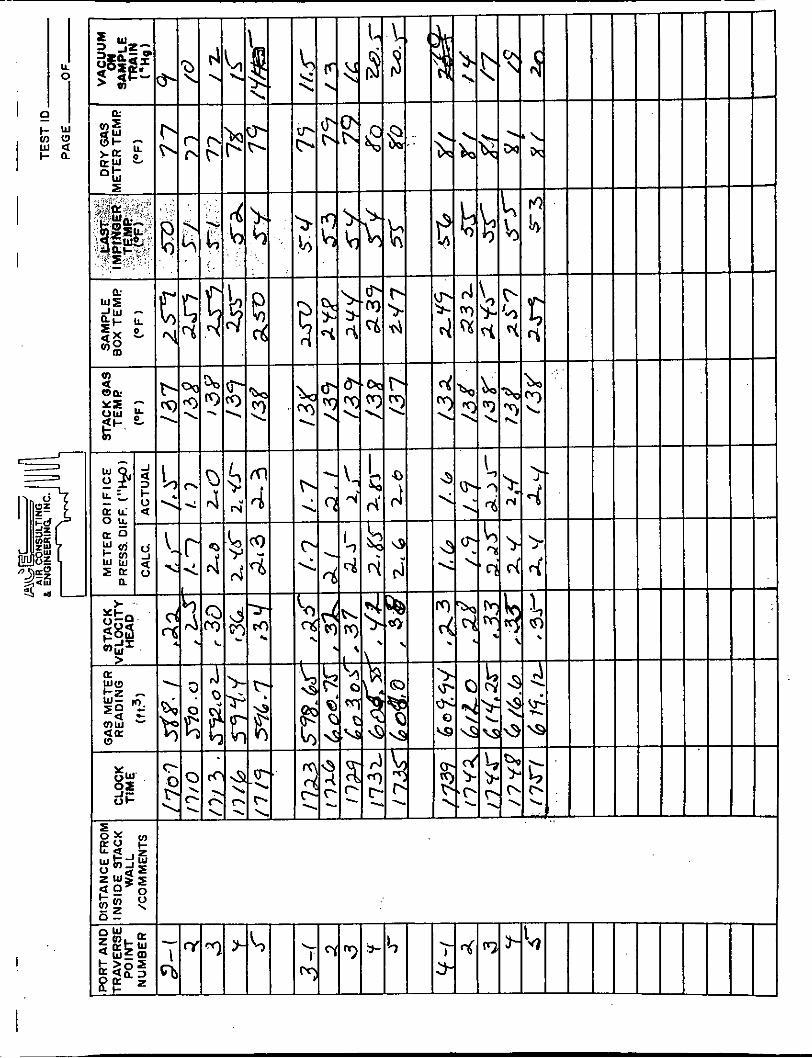
APPENDIX B--FIELD DATA SHEETS
APPENDIX C--LABORATORY ANALYSES
APPENDIX D--QUALITY ASSURANCE AND CHAIN OF CUSTODY
APPENDIX E--PRODUCTION RATE CERTIFICATION
APPENDIX F--PROJECT PARTICIPANTS
LIST OF TABLES
1 SUMMARY OF PARTICULATE MATTER EMISSIONS.............3
LIST OF FIGURES
FIGURE _----- 1
2 EPA 5 SAMPLING TRAIN ................................. 8
SAMPLING POINT LOCATION............ .................. 6
..
1.0 INTRODUCTION
Personnel from Air Consulting and Engineering,INC.(ACEI)
performed annual source emission compliance testing for the Sugar Cane
Growers Cooperative of Florida(SCGC0F) on December 12, 1990. Testing
was performed at the Number 8 Boiler wet scrubber outlet.
Testing was designed to fulfill "specific conditions" of the
current Florida Department of Environmental Regulation (FDER)
operating permit.
Four United States Environmental Protection Agency (USEPA)
Method 5 particulate matter (PM) test runs were conducted while the
plant was documented to be operating within 10% of permitted
production.
Mr. Blas Marin of SCGCOF served as test coordinator and
certified production rates.
Mr. Ken Tucker of the Florida Department of Environmental
Regulation and Mr. Jeff Koerner of the Palm Beach County Health
Department witnessed the entire testing period.
1
I
2 . 0 SUKMARY and DISCUSSION of RESULTS I Results of the emission testing are provided in Table 1.
Complete emission data are located in the report appendices.
The source was found to be operating within compliance of permit
conditions. Stack emissions averaged 59.20 pounds per hour (LB/HR) and
0 . 1 4 4 pounds per million btu(LB/MMBTU) heat input against a "process
rate" basis allowable emission of 0.145 LB/HMBTU. Permit conditions
limit emissions to 0.10 LB/MMBTU from oil and 0.15 LB/MMBTU from
residue firing.
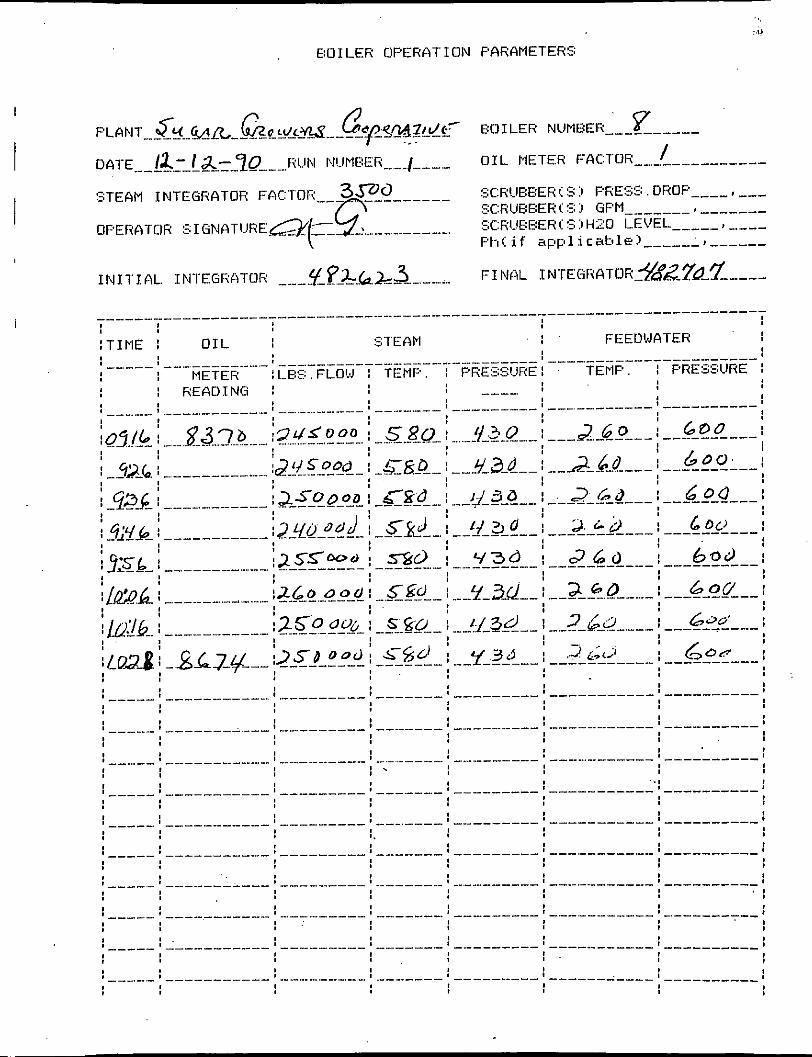
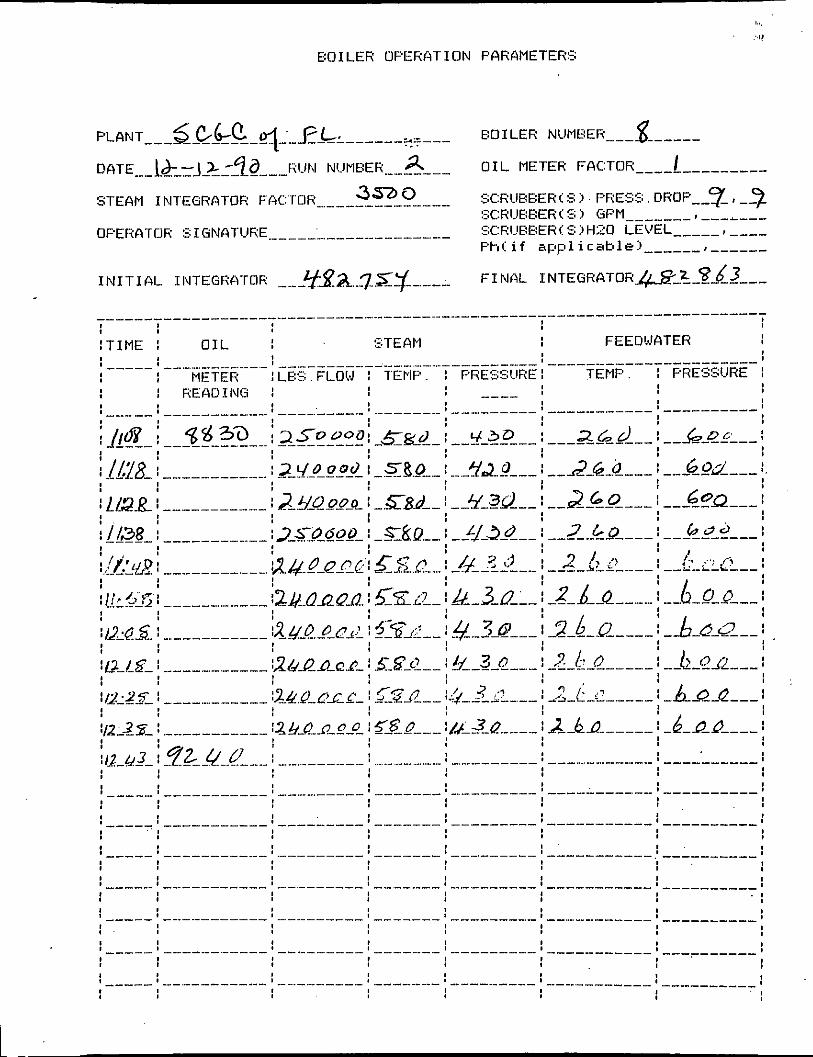
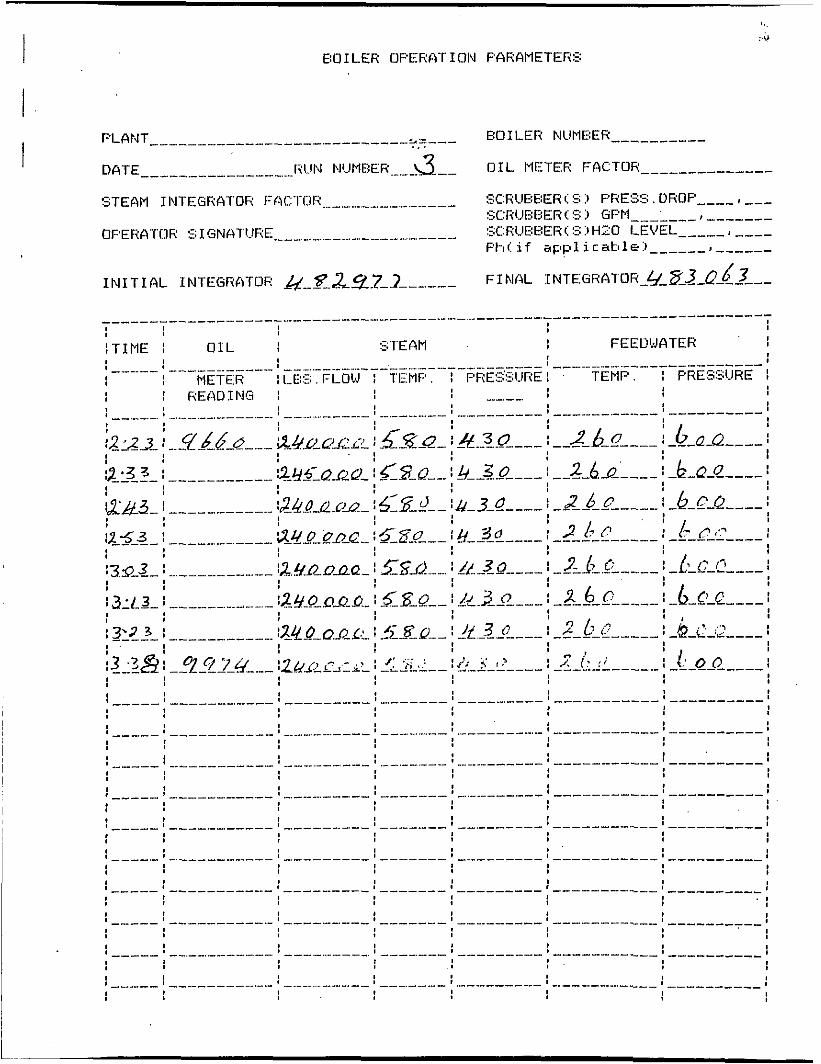
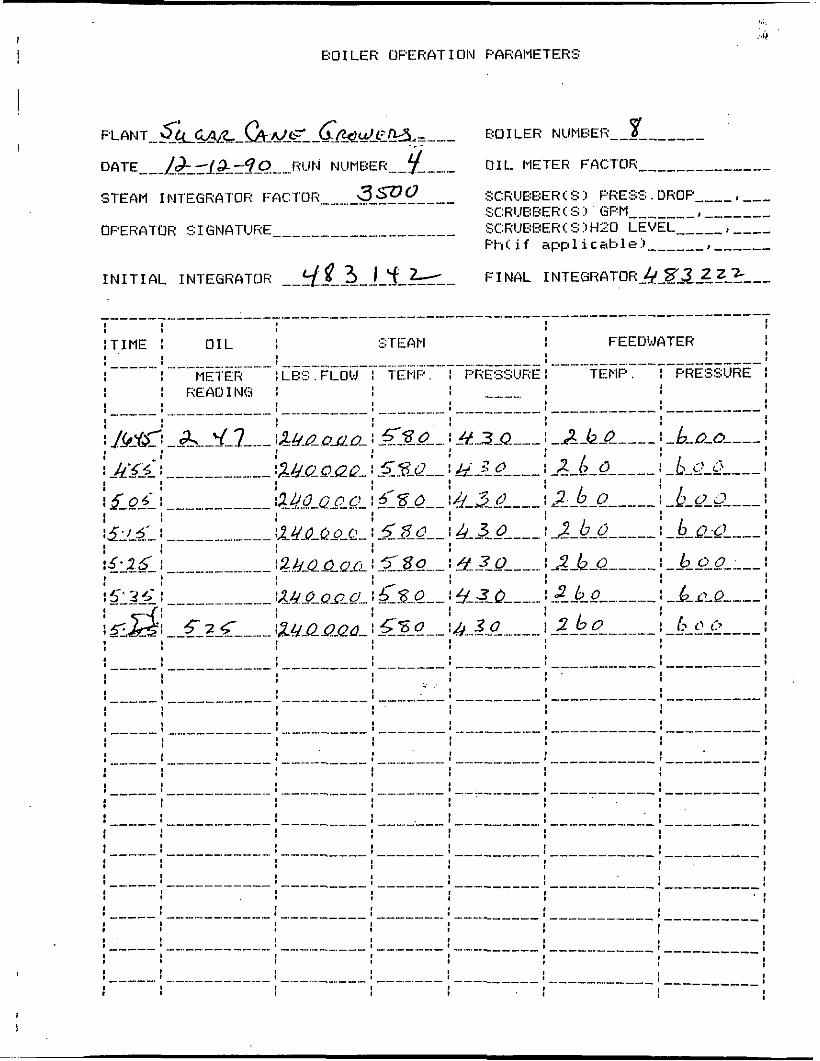
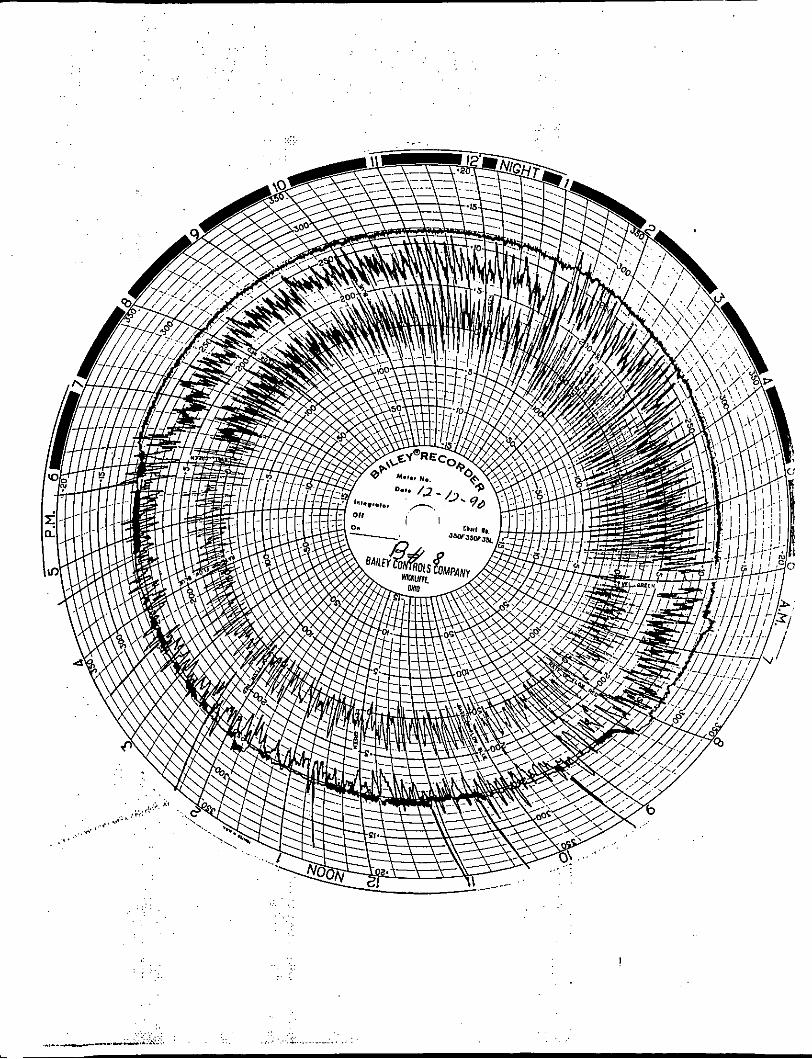
Production rate summaries are provided in Appendix A . These data
were taken from control room recordings of steam flow, temperature,
and
E). Residue integrator and oil meter readings were recorded at the
beginning and end of each particulate test run by ACE1 personnel.
pressure as well as feedwater temperature and pressure(Appendix
Preliminary filter weighing6 for test runs 1 and 2 resulted in a
situation where demonstration of compliance appeared to be marginal.
The probe wash catches for those runs were subsequently evaporated and
an initial field weighing performed after test run 3. The tentative
test results were favorable for compliance demonstration. Another test
run (number 4 ) was conducted, however, because a boiler upset
condition during test run number 1 was noted by plant personnel. Such I conditions are not indicative of steady-state operations.
All test results are reported in Table 1. I
2
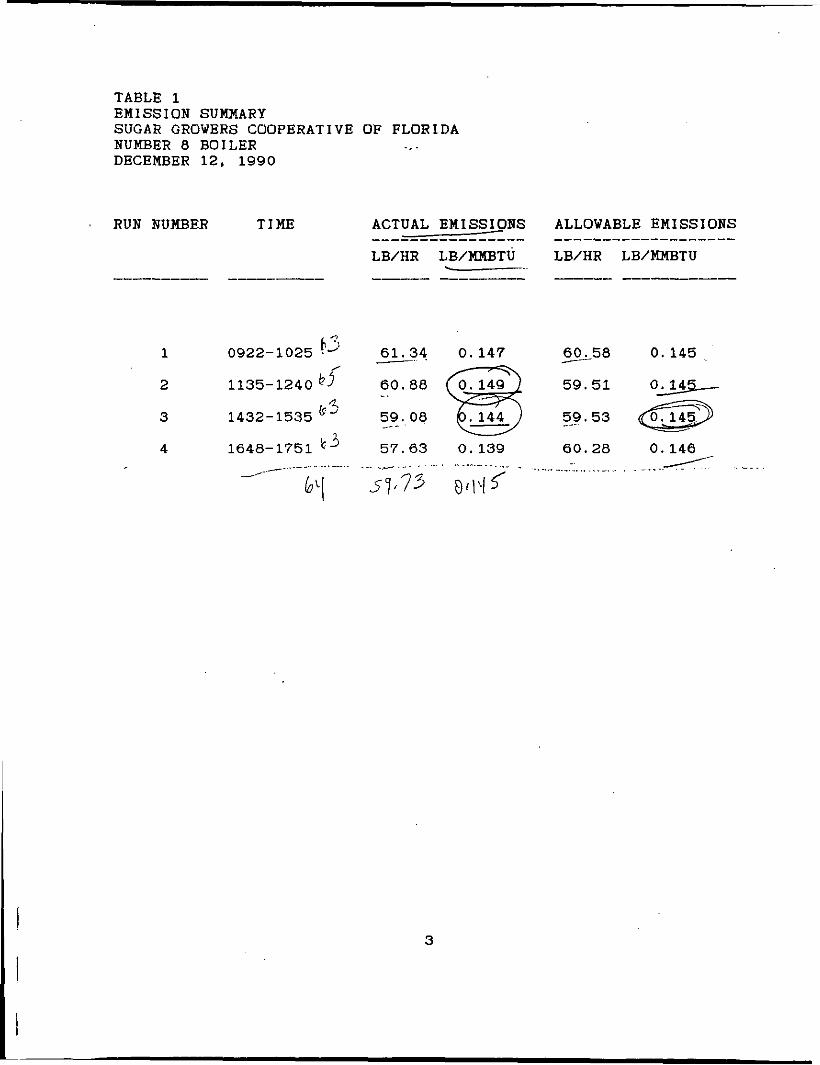
TABLE 1 EMISSION SUMMARY SUGAR GROWERS COOPERATIVE OF FLORIDA NUMBER 8 BOILER ._. DECEMBER 12, 1990
h
1 0922-1025 bJ 60.58 0.145 61.34 0.147
2
3 1432-1535 '' 59. 08
4 1648-1751 l c3 57.63 0.139 60.28 0.140
/ - 1135- 1240 hJ 60.88 @ 59.51 O*
59.53 - - .-
3

3 . 0 PROCESS DESCRIPTION AND OPERATION
The Number 8 Boiler at Sugar Can Grower Cooper is a
spreader stoker design currently used primarily for residue fuel
firing. Supplemental oil firing was also utilized for the emission
test. The boiler averaged 2 4 2 , 5 5 6 pounds per hour steam production
over the three run test period.
Oil meters, steam integrators, and other production monitoring
devices were rigorously calibrated prior to the production season.
4
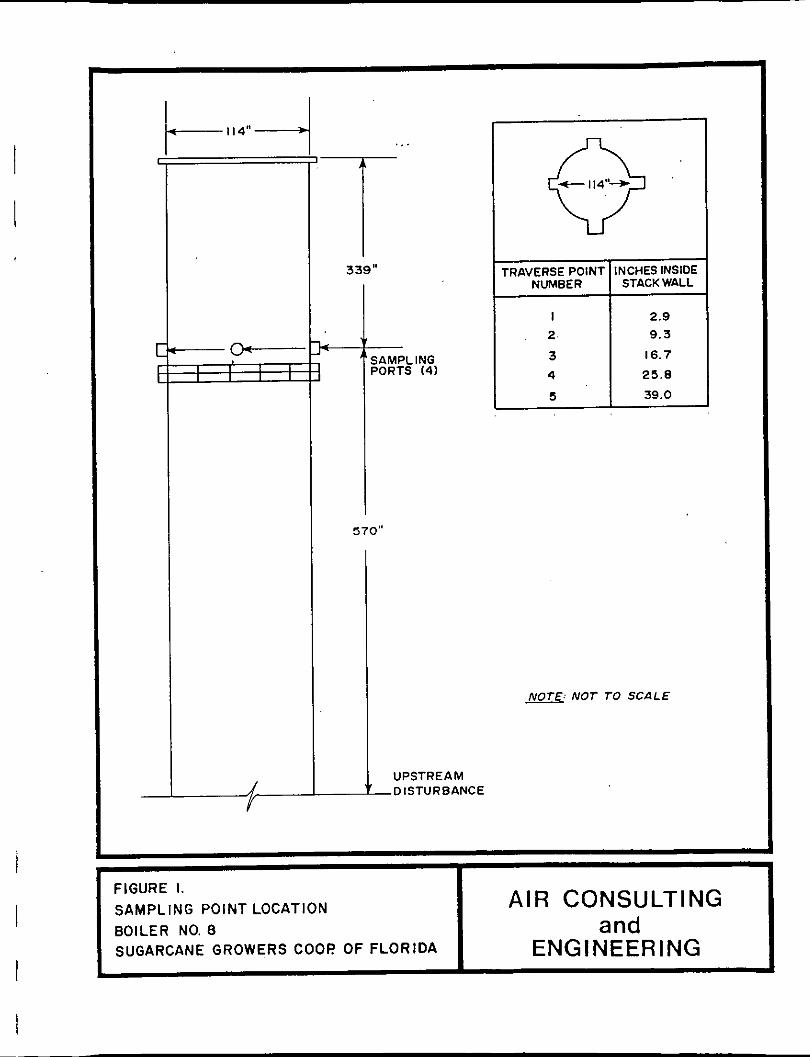
4.0 SAMPLING POINT LOCATION
T h e sampl ing po
1 1 4 " i n d i a m e t e r . The
The p o r t s a r e l o c a t e d
t h e o u t l e t .
I
n t l o c a t i o n .,. i s a s i n g l e s c r u b b e r o u t l e t s t a c k ,
s t ack h a s f o u r sample po r t s 9 0 d e g r e e s a p a r t .
570" from a n ups t r eam d i s t u r b a n c e and 339" from
Twenty t e s t p o i n t s were sampled f o r each t e s t r u n . The t raverse
were l o c a t e d a s shown i n F i g u r e 1. The s t a c k c o n f i g u r a t i o n is such
t h a t t h e r e i s no r e a s o n t o e v a l u a t e t h e p r e s e n c e of c y c l o n i c f low.
5
-114"-
-+-
339"
SAMPLING PORTS (4) T 570"
NOTE: NOT TO SCALE -
t D ISTURBANCE
A IR CONSULTING
ENGINEERING
FIGURE 1. SAMPLING POINT LOCATION
SUGARCANE GROWERS COOP OF FLORIDA BOILER NO. 8 and
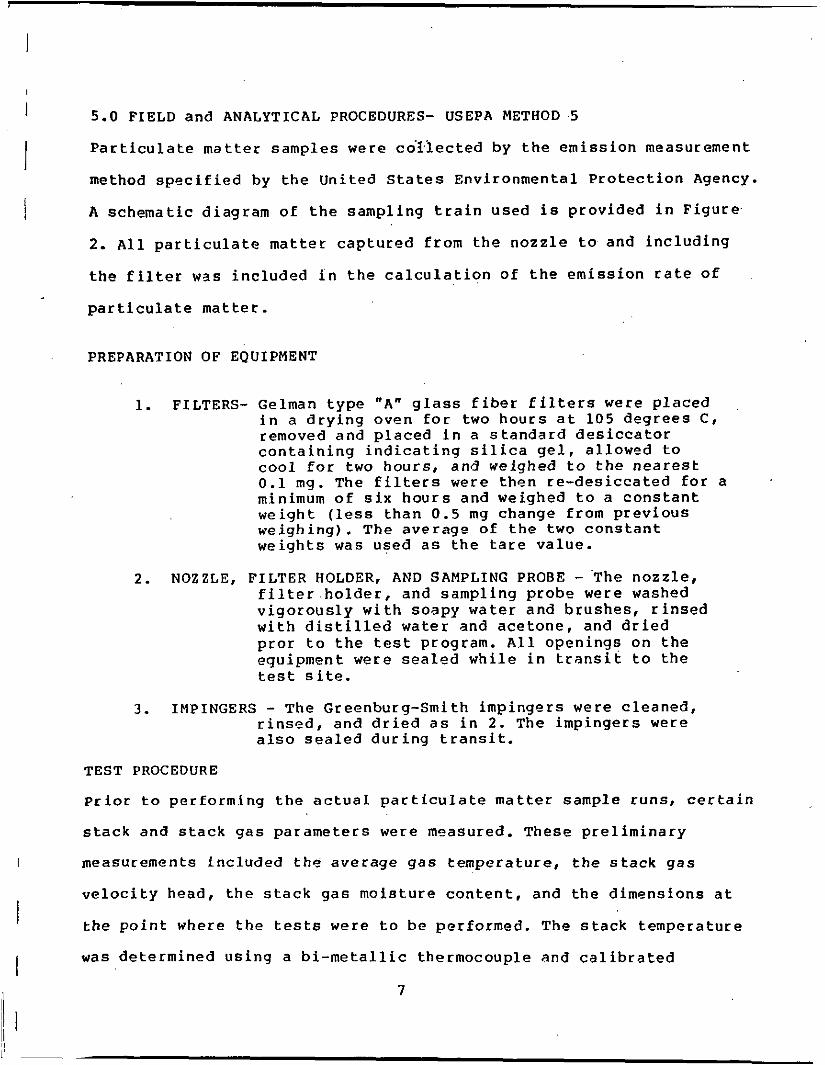
5.0 FIELD and ANALYTICAL PROCEDURES- USEPA METHOD 5
P a r t i c u l a t e m a t t e r s amples were c o l l e c t e d by t h e emission measurement
method s p e c i f i e d by t h e United S t a t e s Environmental P ro tec t ion Agency.
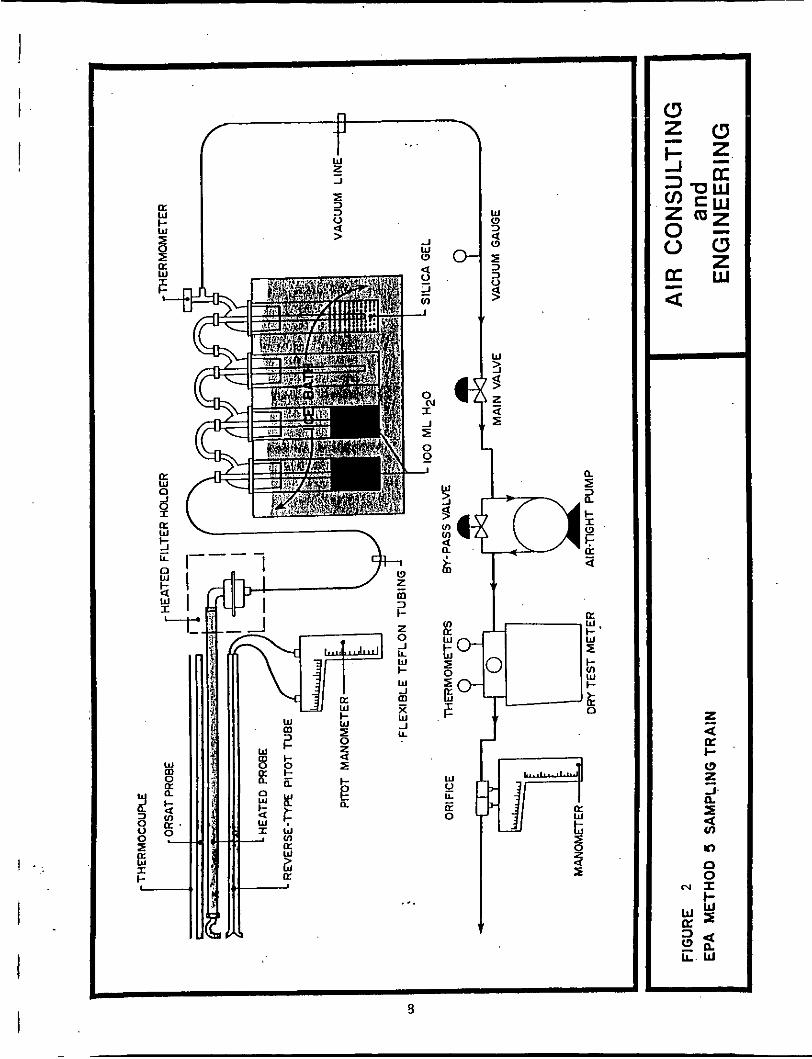
A schematic d iagram of t h e sampl ing t r a i n used i s p rov ided i n F i g u r e
2. A l l p a r t i c u l a t e mat ter c a p t u r e d from t h e n o z z l e t o and i n c l u d i n g
t h e f i l t e r was i n c l u d e d i n t h e c a l c u l a t i o n o f t h e emiss ion r a t e of
p a r t i c u l a t e matter.
I
I I
PREPARATION OF EQUIPMENT
1. FILTERS- Gelman t y p e "A" g l a s s f i b e r f i l t e r s were p l a c e d i n a d r y i n g oven f o r two h o u r s a t 105 d e g r e e s C , removed and p l a c e d i n a s t a n d a r d des icca tor c o n t a i n i n g i n d i c a t i n g s i l i c a g e l , a l lowed to cool f o r two h o u r s , and weighed t o t h e n e a r e s t 0 .1 mg. The f i l t e r s were t h e n r e - d e s i c c a t e d f o r a minimum o f s i x h o u r s and weighed t o a c o n s t a n t weight ( l e s s t h a n 0 .5 mg change from p r e v i o u s we igh ing) . T h e a v e r a g e oE t h e two c o n s t a n t we igh t s was used a s t h e t a r e v a l u e .
f i l t e r h o l d e r , and sampl ing p robe were washed v i g o r o u s l y w i t h soapy water and b rushes , r i n s e d w i t h d i s t i l l e d water and acetone, and d r i e d p r o r t o t h e t es t program. A l l openings on t h e equipment were s e a l e d w h i l e i n t r a n s i t t o t h e t e s t s i t e .
2. NOZZLE, FILTER HOLDER, AND SAMPLING PROBE - The n o z z l e ,
3. IMPINGERS - The Greenburg-Smith impingers were c l e a n e d , r i n s e d , and d r i e d a s i n 2 . The impingers were a l s o s e a l e d d u r i n g t r a n s i t .
TEST PROCEDURE
P r i o r t o per forming t h e a c t u a l p a r t i c u l a t e m a t t e r sample runs , c e r t a i n
s t ack and s t a c k g a s p a r a m e t e r s were measured. These p r e l i m i n a r y
I measurements i n c l u d e d t h e a v e r a g e g a s t empera tu re , t h e s t a c k g a s
v e l o c i t y head , t h e s t a c k g a s m o i s t u r e c o n t e n t , and t h e d imens ions a t
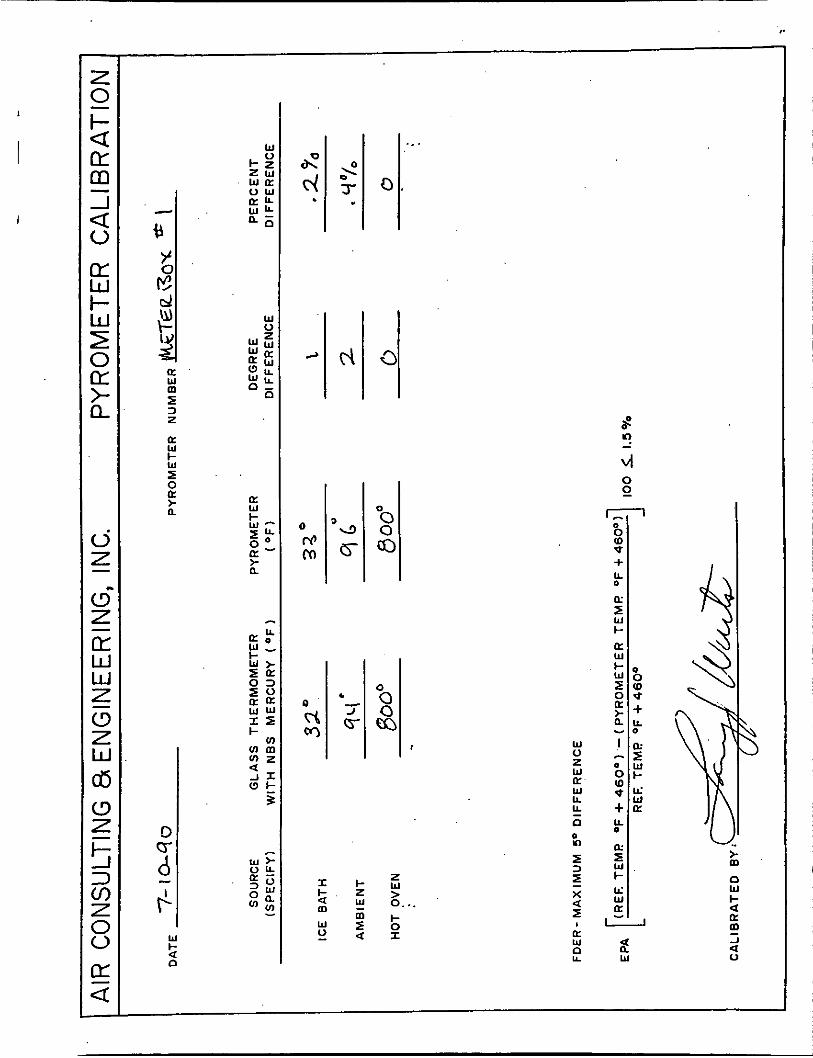
t h e p o i n t where t h e tests were t o b e performed. The s t a c k t empera tu re
was de te rmined u s i n g a b i - m e t a l l i c thermocouple and c a l i b r a t e d
I I
7
a W I-
.. I W
J r 5 3 0
> a J w (3 0-
a W
5
W -I
X W -I LL
m I L 5
a W
z I a
.I
s 2 In
-J
R I J I 0 0 J
W (3 3
9 4 9 3 0
W 3 B
W
LL
0
I! z
a
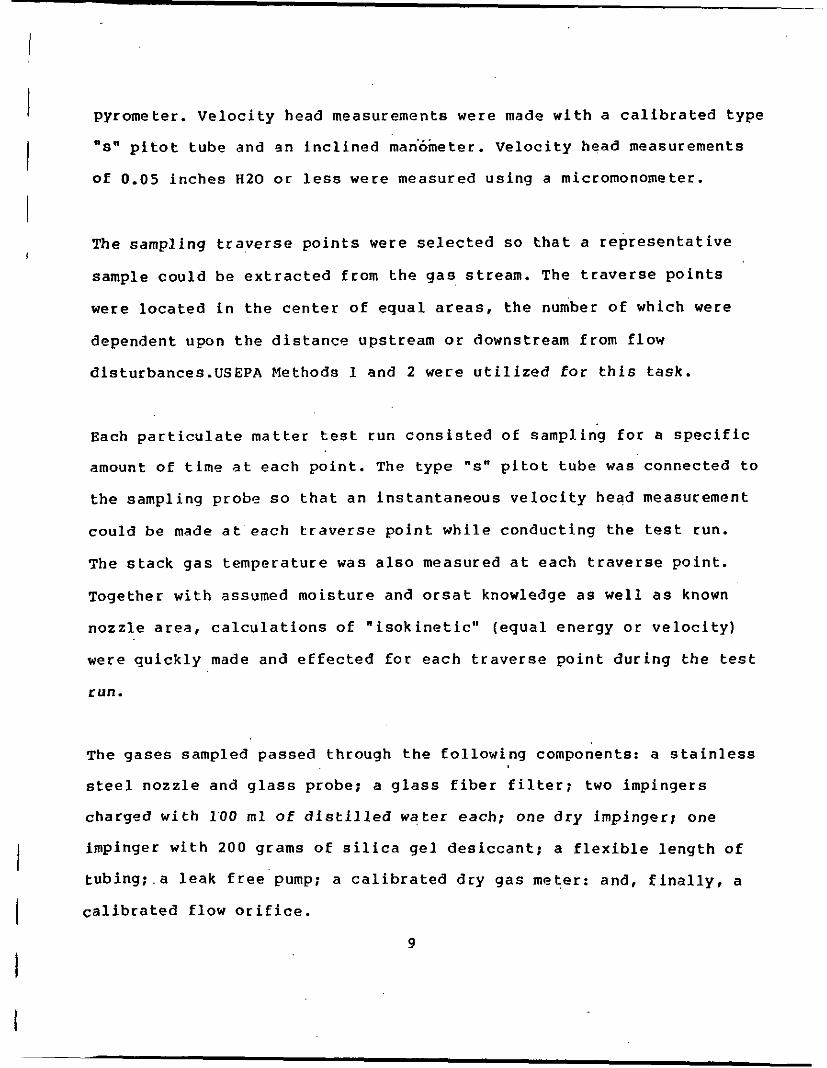
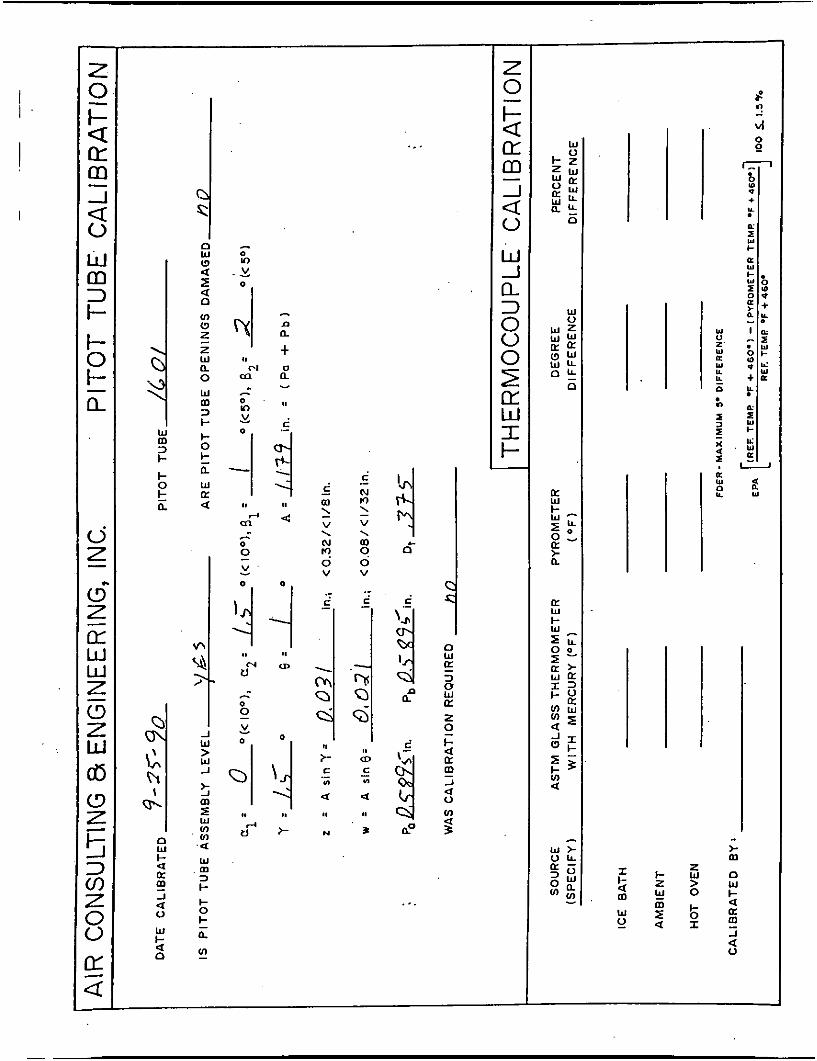
pyrometer. V e l o c i t y head measurements were made w i t h a c a l i b r a t e d t y p e
"s" p i t o t t ube and an i n c l i n e d man'ometer. V e l o c i t y head measurements
Of 0 . 0 5 i n c h e s H20 o r l e s s were measured u s i n g a miCrOmOnOmeter.
The sampl ing t r a v e r s e p o i n t s were s e l e c t e d so t h a t a r e p r e s e n t a t i v e
sample c o u l d be e x t r a c t e d from t h e g a s s t r eam. T h e t r a v e r s e p o i n t s
were l o c a t e d i n t h e c e n t e r o f e q u a l a r e a s , t h e number o f w h i c h were
dependent upon t h e d i s t a n c e upstream o r downstream from f low
disturbances.USEPA Methods 1 and 2 were u t i l i z e d f o r t h i s task.
Each p a r t i c u l a t e m a t t e r t e s t r u n c o n s i s t e d of sampling f o r a s p e c i f i c
amount of t ime a t each p o i n t . The t y p e "s" p i t o t t u b e was connec ted t o
t h e sampl ing probe so t h a t an i n s t a n t a n e o u s v e l o c i t y head measurement
c o u l d be made a t each t r a v e r s e p o i n t w h i l e conduc t ing t h e t es t run .
The s t a c k g a s t e m p e r a t u r e was a l s o measured a t each t r a v e r s e p o i n t .
Together w i t h assumed m o i s t u r e and o r s a t knowledge a s well a s known
n o z z l e a r e a , c a l c u l a t i o n s o f " i s o k i n e t i c " ( e q u a l energy o r v e l o c i t y )
were q u i c k l y made and e f f e c t e d f o r each t r a v e r s e p o i n t d u r i n g t h e test
run.
T h e g a s e s sampled passed through t h e f o l l o w i n g components: a s t a i n l e s s
s t e e l n o z z l e and g l a s s probe: a g l a s s f i b e r f i l t e r : two impingers
charged w i t h 1'00 m l of d i s t i l l e d wa te r each: one d r y impinger; one
impinger w i t h 2 0 0 grams of s i l i c a g e l d e s i c c a n t : a f l e x i b l e l e n g t h of
t u b i n g : . a l e a k f r e e pump; a c a l i b r a t e d d r y g a s meter : and , f i n a l l y , a
c a l i b r a t e d f low o r i f i c e .
I I
9
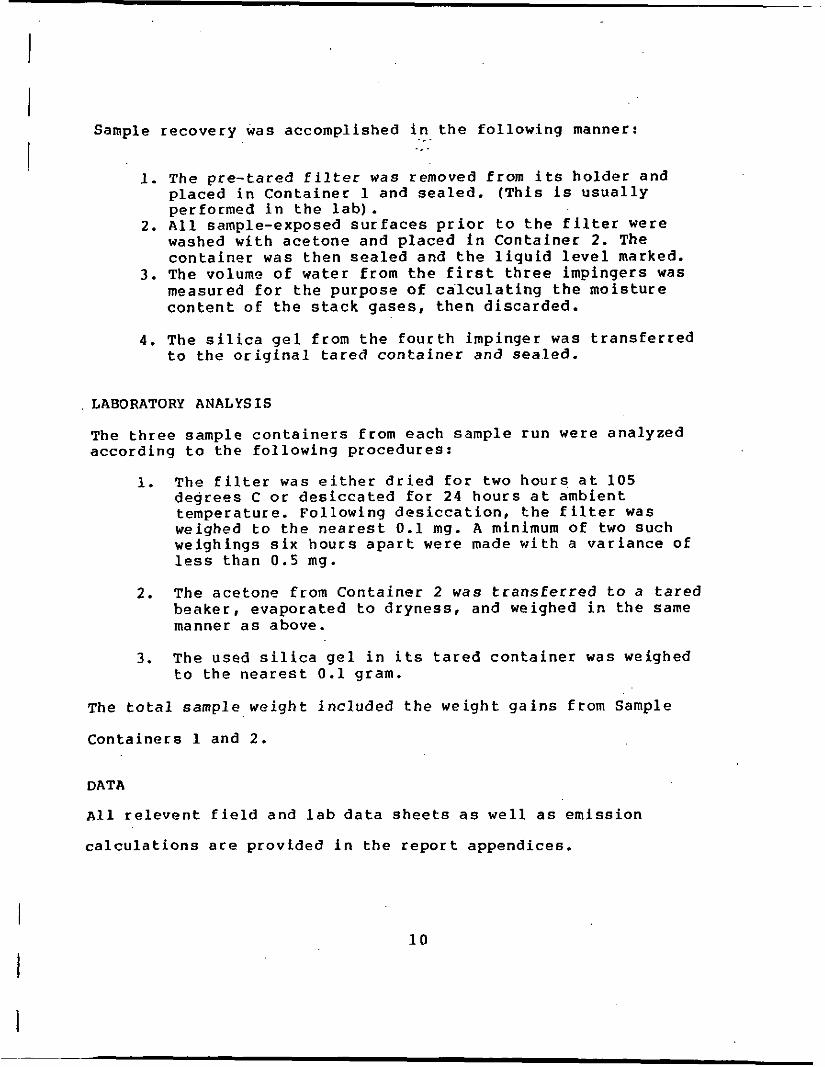
Sample r ecove ry was accomplished i n t h e f o l l o w i n g manner: ... ._.
1. T h e p r e - t a r e d f i l t e r was removed from i t s h o l d e r and p l aced i n Con ta ine r 1 and s e a l e d . ( T h i s is u s u a l l y performed i n t h e l a b ) .
2 . A l l sample-exposed s u r f a c e s p r i o r t o t h e f i l t e r were washed w i t h a c e t o n e and p l a c e d i n C o n t a i n e r 2. The c o n t a i n e r was t h e n s e a l e d and t h e l i q u i d l e v e l marked.
3. T h e volume o f water from t h e f i r s t th ree impingers was measured f o r t h e pu rpose of c a l c u l a t i n g t h e m o i s t u r e c o n t e n t o f t h e s t a c k g a s e s , t h e n d i s c a r d e d .
4 . T h e s i l i c a g e l from t h e f o u r t h impinger was t r a n s f e r r e d t o t h e o r i g i n a l t a r e d c o n t a i n e r and s e a l e d .
I
LABORATORY ANALYSIS
The t h r e e sample c o n t a i n e r s from each sample run were ana lyzed acco rd ing t o t h e f o l l o w i n g p rocedures :
1. T h e f i l t e r was e i t h e r d r i e d f o r two h o u r s a t 105 d e g r e e s C o r d e s i c c a t e d f o r 2 4 h o u r s a t ambient tempera ture . Fol lowing d e s i c c a t i o n , t h e f i l t e r was weighed t o t h e n e a r e s t 0.1 mg. A m i n i m u m o f two s u c h weighings s i x h o u r s a p a r t were made w i t h a v a r i a n c e of l e s s t h a n 0 . 5 mg.
2 . T h e a c e t o n e from C o n t a i n e r 2 was t r a n s f e r r e d t o a t a r e d b e a k e r , evapora t ed t o d r y n e s s , and weighed i n t h e same manner a s above.
3. T h e used s i l i c a g e l i n i t s t a r e d c o n t a i n e r was weighed t o t h e n e a r e s t 0 .1 gram.
The t o t a l sample weight i n c l u d e d t h e we igh t g a i n s from Sample
C o n t a i n e r s 1 and 2 .
DATA
~ l l r e l e v e n t f i e l d and l a b d a t a s h e e t s a s w e l l a s e m i s s i o n
c a l c u l a t i o n s a r e p rov ided i n t h e r e p o r t append ices .
10
L
1 i
.
.
.
. j
. .. . . I
._.
.. . ;I. . .
. .
APPENDIX A
COMPLETE EMISSION DATA
AND
SAMPLE CALCULATIONS
1:

...
AIR CONSULTING & ENGINEERING,INC. Complete Emission Data
TOTAL HEAT INPUT (OIL)------------- TOTAL HEAT INPUT (NON-OIL)
ALLOWABLES : ALLOWABLE EMISSION (OIL)----------- ALLOWABLE EMISSION (NON-OIL)
TOTAL ALLOWABLE EMISSION----------- TOTAL ACTUAL EMISSION
TOTAL ALLOWABLE EMISSION----------- TOTAL ACTUAL EMISSION
445 PSIA
260 DEGREES F 600 PSIG 615 PSIA
1.2 BTU/LB
2.6 BTU/LB 8.6 BTU/LB
000 LB/HR 2.5 % .54 MMBTUH
253.33 GPH 150000 BTU/GAL
38.00 MMBTUH 378.54 MMBTUH
.10 LB/MMBTU
.15 LB/MMBTU
60.58 LB/HR 61.34 LB/HR
0.145 LB/MMBTU 0.14 7 LB/MMBTU

AIR CONSULTING & ENGINEERING,INC. Complete Emission Data
I
TOTAL HEAT INPUT (OIL)------------- TOTAL HEAT INPUT (NON-OIL)
ALLOWABLES : ALLOWABLE EMISSION (OIL)----------- ALLOWABLE EMISSION (NON-OIL)
TOTAL ALLOWABLE EMISSION----------- TOTAL ACTUAL EMISSION
TOTAL ALLOWABLE EMISSION----------- TOTAL ACTUAL EMISSION
I
95 MINUTES
9240 8830
1
482863 482754
3500 580 DEGREES F 430 PSIG 445 PSIA
260 DEGREES F 600 PSIG 615 PSIA
1291.2 BTU/LB 228.6 BTU/LB
1062.6 BTU/LB 240947 LB/HR
409.65 MMBTUH 62.5 % -
258.95 GPH m T U / G A L -
38.84 MMBTUH 370.81 MMBTUH
.10 LB/MMBTU
.15 LB/MMBTU
59.51 LB/HR 60.88 LB/HR
0.145 LB/MMBTU 0.149 LB/MMBTU
A I R CONSULTING & E N G I N E E R I N G , I N C . Complete'Emission Data
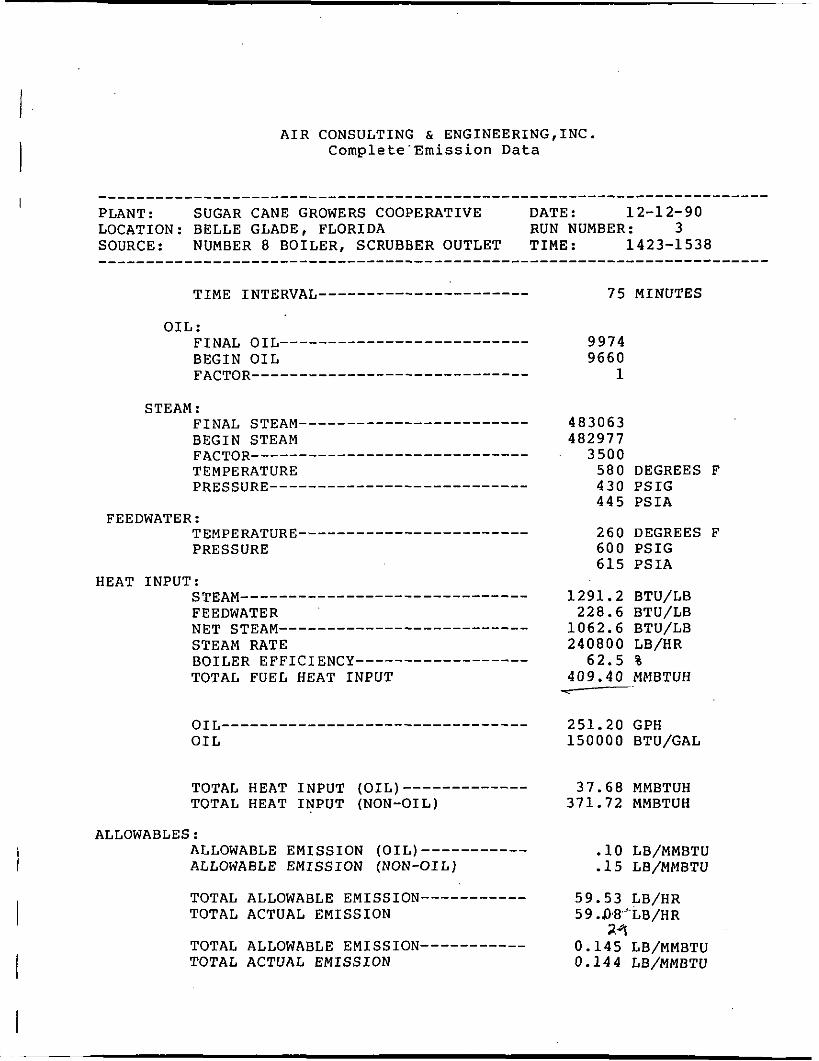
I ________________________________________------------------------------ PLANT: SUGAR CANE GROWERS COOPERATIVE DATE : 12-1 2-90
SOURCE: NUMBER 8 B O I L E R , SCRUBBER OUTLET T I M E : 1423-1538 LOCATION: B E L L E GLADE, F L O R I D A RUN NUMBER: 3
TOTAL HEAT INPUT (OIL)------------- TOTAL HEAT I N P U T (NON-OIL)
ALLOWABLES : ALLOWABLE E M I S S I O N (OIL)----------- ALLOWABLE E M I S S I O N (NON-OIL)
TOTAL ALLOWABLE EMISSION----------- TOTAL ACTUAL E M I S S I O N
TOTAL ALLOWABLE EMISSION----------- TOTAL ACTUAL E M I S S I O N
75 MINUTES
9974 9660
1
483063 482977
3500 580 DEGREES F 430 P S I G 445 P S I A
260 DEGREES F 600 P S I G 615 P S I A
1291.2 BTU/LB
1062.6 BTU/LB 240800 LB/HR
228.6 BTU/LB
62.5 % 409.40 MMBTUH
--
251.20 GPH 150000 BTU/GAL
37.68 MMBTUH 371.72 MMBTUH
. l o LB/MMBTU -15 LB/MMBTU
59.53 LB/HR 59 .DE'-LB/HR
0.145 LB/MMBTU 0.144 LB/MMBTU
2.9
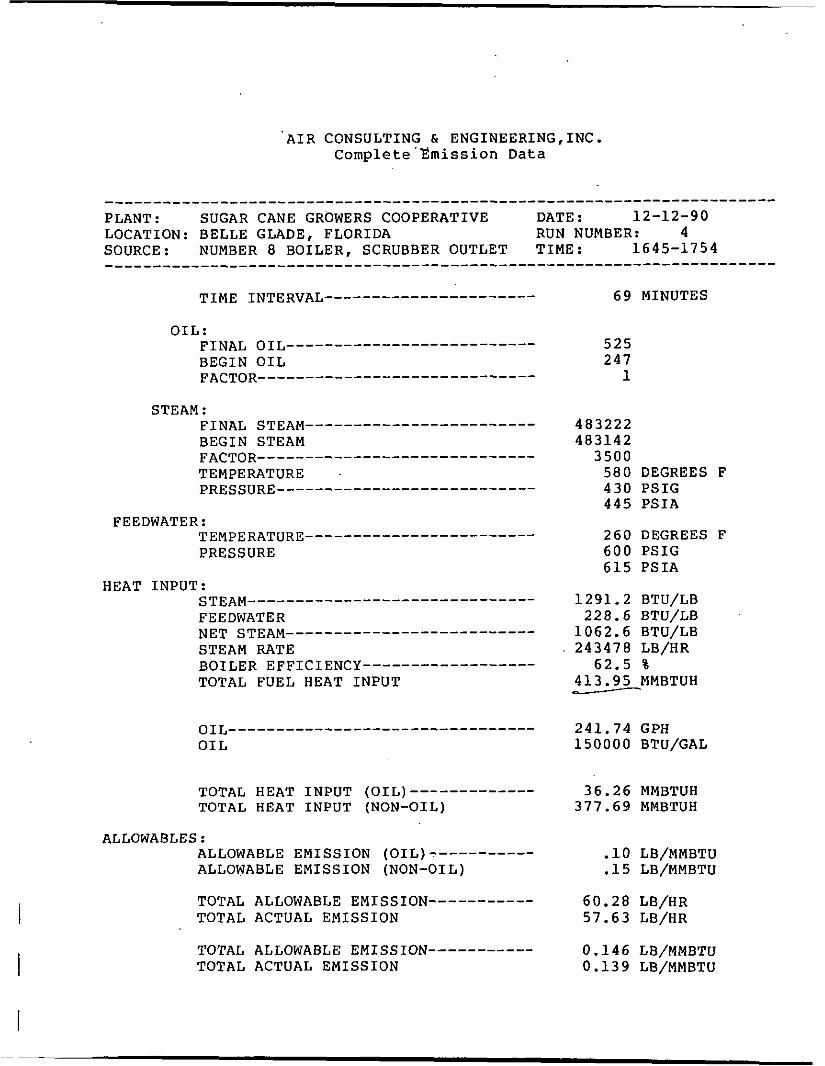
'AIR CONSULTING & ENGINEERING,INC. Complete'Emission Data
TOTAL HEAT INPUT (OIL)------------- TOTAL HEAT INPUT (NON-OIL)
ALLOWABLES: ALLOWABLE EMISSION (OIL)----------- ALLOWABLE EM1 SSION (NON-01 L)
TOTAL ALLOWABLE EMISSION----------- TOTAL ACTUAL EMISSION
TOTAL ALLOWABLE EMISSION----------- TOTAL ACTUAL EMISSION I
69 MINUTES
525 247
1
483222 483142
3500 580 DEGREES F 430 PSIG 445 PSIA
260 DEGREES F 600 PSIG 615 PSIA
1291.2 BTU/LB 228.6 BTU/LB
1062.6 BTU/LB 243478 LB/HR
62.5 % 413.95 MMBTUH w
241.74 GPH 150000 BTU/GAL
36.26 MMBTUH 377.69 MMBTUH
.lo LB/MMBTU
.15 LB/MMBTU
60.28 LB/HR 57.63 LB/HR
0.146 LB/MMBTU 0.139 LB/MMBTU

..
I
AIR CONSULTING AND ENGINEERING, INC.
Complete Emission Results ________________________________________---------------------------------- Plant: SUGAR CANE GROWERS COOPERATIVE Location: BELLE GLADE, FLORIDA Date: 12-12-90 Stack: NUMBER 8 BOILER Run 1 From 0922 - 1025 Y Factor 0.994 Nozzle Diameter . 0.300 In Total Time 60.00 Min Nozzle Area 0.000491 Ft- Stack Area 70.880 Ft- Barometric Pressure 30.20 In Hg Stack Temperature 138.9 -F Meter Temperature 66.4 -F Stack Pressure 30.20 In Hg Meter Orifice Diff 2.415 In H20 Stack Avg - Vel Head 0.592 In H20 Meter Volume 45.527 CF
Condensate Vol 228.10 ml
1. Volume Water Vapor Sampled 10.737 SCF 2. Volume Standard Dry Gas Sampled 46.067 SCF 3. Total Standard Sample Volume 56.804 SCF 4 . Percent Moisture 18.900 5 . Percent Dry Air 81.100 6. Molecular Weight of Dry Flue Gas 30.060 7. MOleCUlaK Weight of Wet Flue Gas 27.781 8. Specific Gravity Flue Gas 0.96 9. Percent Oxygen [021 9.50 10. Percent Carbon Dioxide (C021 10.50 11. Percent Excess Air 81.756 12. Velocity of Flue Gas 35.918 FPS 13. Actual Volumetric Flow Rate 152753.4 ACFM 14. Dry Volumetric Flow Rate 123883.0 ACFMD 15. Standard Volumetric Flow Rate 110248.6 SCFMD 16. Emission Concentration 0.0649 gr/SCF 17. Emission Concentration 0.0469 gr/ACF 18. Emission Rate 61.34 lbs/Hr 19. Percent Isokinetic 100.6
probe/Nozzle Wash 9.2 mg Filter 184.6 mg Total 193.8 mg
________________________________________----------------------------------
.......................................................................... I

I AIR CONSULTING AND ENGINEERING, INC.
Complete Emission Results ________________________________________--------------------__------------ Plant: SUGAR CANE GROWERS COOPERATIVE Location : BELLE GLADE, FLORIDA Date: 12-12-90
1 NUMBER 8 BOILER Run 2 From 1135 - 1240 Stack: I
________________________________________--_-----------_------------------- Y Factor 0.994 Nozzle Diameter 0- Total Time 60.00 Min Nozzle Area 0.000491 Ft- Stack Area 70.880 FX- Barometric Pressure 30.20 In Hg Stack Temperature 138.0 -F Meter Temperature 83.2 -F Stack Pressure 30.20 In Hg Meter Orifice Diff 2.260 In H20 Stack Avg - Vel Head 0.575 In H20 Meter Volume 35.421 CF
Condensate Vol 2 0 4 . 0 0 ml
1. 2. 3. 4. 5 . 6. 7. 8. 9. 10. 11. 12. 13. 14. 15. 16. 17. 18. 19.
Volume Water Vapor Sampled Volume Standard Dry Gas Sampled Total Standard Sample Volume Percent Moisture Percent Dry Air Molecular Weight of Dry Flue Gas Molecular Weight of Wet Flue Gas Specific Gravity Flue Gas Percent Oxygen [021 Percent Carbon Dioxide [C02] Percent Excess Air Velocitv of Flue Gas Actual tolumetric Flow Rate Dry Volumetric Flow Rate Standard Volumetric Flow Rate Emission Concentration Emission Concentration Emission Rate Percent Isokinetic
9.602 SCF 44.522 SCF 54.124 SCF 17.700 82.300 30.004 27.879 0.97 10.10 10.00 91.872 34.799 FPS
41994.6 ACFM j121799.6-.’ ACFMD ~~
108548.5 SCFMD 0.0654 gr/SCF 0.0480 gr/ACF 60.88 lbS/Hr 98.8
Probe/Nozzle Wash Filter Total
I AIR CONSULTING AND ENGINEERING, INC.
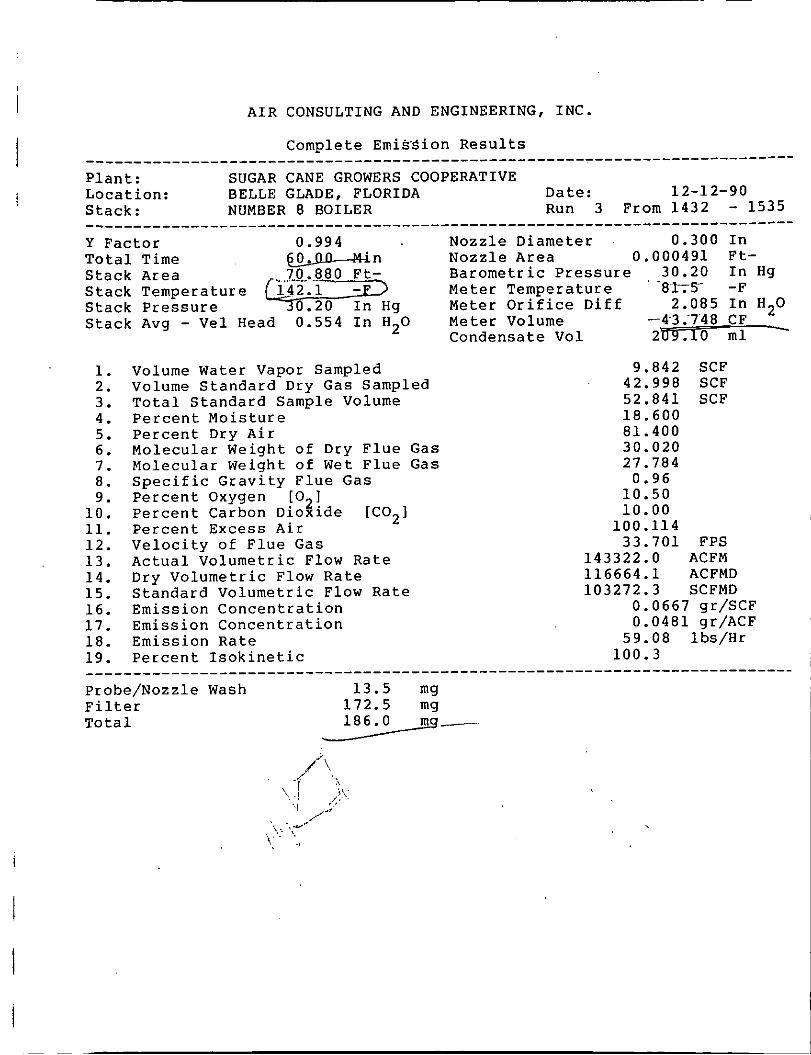
Complete Emission Results _____________________-----___----__---------------_--------_-------------- Plant: SUGAR CANE GROWERS COOPERATIVE Locat ion: BELLE GLADE, FLORIDA Date: Stack: NUMBER 8 BOILER Run 3 From 1432 - 1535 Y Factor 0.994 Total Time 'n Nozzle Area
Stack Pressure 0.20 In Hg Meter Orifice Diff 2.085 In H20
Condensate Vol 2m.10 ml -
12-1 2-90
1 i
____________________---_-------______-----_---_-_------------------------- Nozzle Diameter 0.300 In
Barometric Pressure 30.20 In Hg 0.000491 Ft-
Stack Area 7-0-.880 Ft- . . Stack Temperature %m Meter Temperature 8 1 2 7 -F
Stack Avg - Vel Head 0.554 In H20 Meter Volume ---4-3;748 CF
1. Volume Water Vapor Sampled 9.842 SCF 2. Volume Standard Dry Gas Sampled 42.998 SCF 3. Total Standard Sample Volume 52.841 SCF 4. Percent Moisture 18.600 5. Percent Dry Air 81.400 6. Molecular Weight of Dry Flue Gas 30.020 7. Molecular Weight of Wet Flue Gas 27.784 8. Specific Gravity Flue Gas 0.96 9. Percent Oxygen [021 10.50
11. Percent Excess Air 100.114 12. Velocity of Flue Gas 33.701 FPS 13. Actual Volumetric Flow Rate 143322.0 ACFM
116664.1 ACFMD 14. Dry Volumetric Flow Rate 15. Standard Volumetric Flow Rate 103272.3 SCFMD 16. Emission Concentration 17. Emission Concentration 18. Emission Rate 19. Percent Isokinetic 100.3
Probe/Nozzle Wash 13.5 mg Filter 172.5 mg Total
10. Percent Carbon Dioxide [C021 10.00
0.0667 gr/SCF 0.0481 gr/ACF 59.08 lbs/Hr
_____________________---___-----_--___----____----____---------__-----_-_-
186-----
AIR CONSULTING AND ENGINEERING, INC. I
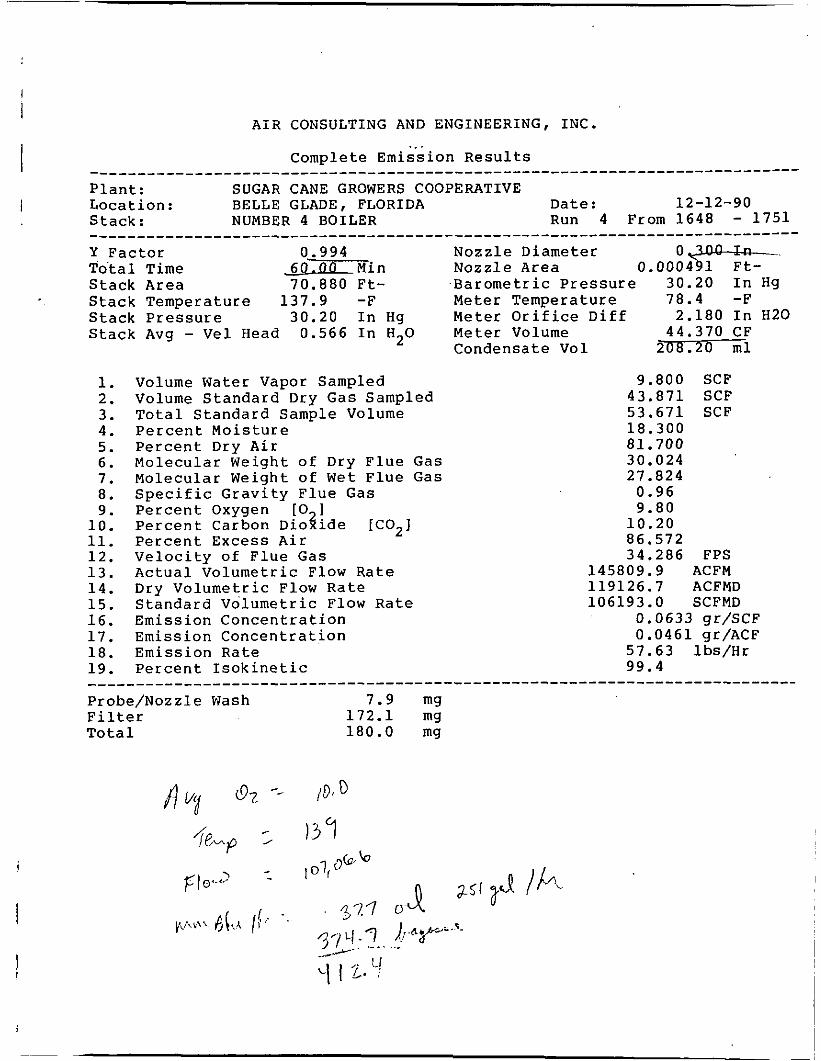
I Complete Emission Results ____________________---__---__---__---_---_------__-----_----------------- Plant: SUGAR CANE GROWERS COOPERATIVE Location : BELLE GLADE, FLORIDA Stack: NUMBER 4 BOILER
Date: 12-12-90 Run 4 From 1648 - 1751 I
-___________________--_----_----__----_-----__------_--------------------- Y Factor 0.994 Nozzle Diameter Total Time 60.00 Min Nozzle Area Stack Area 70.880 Ft- Barometric Pressure 30.20 In Hg Stack Temperature 137.9 -F Meter Temperature 78.4 -F Stack Pressure 30.20 In Hg Meter Orifice Diff 2.180 In H20 Stack Avg - Vel Head 0.566 In H20 Meter Volume 44.370 CF
Condensate Vol 208.20 ml
1. 2. 3. 4. 5. 6. 7. 8. 9. 10. 11. 12. 13. 14. 15. 16. 17. 18. 19.
Volume Water Vapor Sampled Volume Standard Dry Gas Sampled Total Standard Sample Volume Percent Moisture Percent Dry Air Molecular Weight of Dry Flue Gas Molecular Weight of Wet Flue Gas Specific Gravity Flue Gas Percent Oxygen [021 Percent Carbon Dioxide IC0,I Percent Excess Air Velocity of Flue Gas Actual Volumetric Flow Rate Dry Volumetric Flow Rate Standard Volumetric Flow Rate Emission Concentration Emission Concentration Emission Rate Percent Isokinetic
9.800 SCF 43.871 SCF 53.671 SCF 18.300 81.700 30.024 27.824 0.96 9.80 10.20 86.572 34.286 FPS
145809.9 ACFM 119126.7 ACFMD 106193.0 SCFMD
0.0633 qr/SCF 0.0461 qr/ACF 57.63 lLs/Hr 99.4
Probe/Nozzle Wash 7.9 mg Filter 172.1 mg Total 180.0 mg
/ le-p c , 13 7 , 01,
37.1

I Plant: SUGAR CANE GROWERS COOPERATIVE Date: 12-12-90 Stack: NUMBER 8 BOILER Run Number: 1
I I .. .
Average SQR Velocity Head = 0.592 Velocity Head Inputs:
0.270C 0.2600 0.3200 0.3800 0.3800 0.4200 0.2000 0.3400 0.4200 0.4000 0.2800 0.3400 0.4300 0.510C 0.4200 0.2600 0.3200 0.4100 0.3500 0.3800
Average Orifice Pressure = 2.415 Orifice Pressure Inputs: c
1.7500 2.2000 2.6000 2.6000 2.8500 1.3500 1.850C 2.3000 2.8500 2.7000 1 .goo0 2.3000 2.9000 3.500C 2.8500 1.8000 2.2000 2.4000 2.8000 2.6000
Average Stack Temperature = Stack Temperature Inputs:
139 138 137 139 138 137 135 140 138 140 138 140 140 141 139 140 142 138 141 137
Average Meter Temperature = 66.4 Meter Temperature Inputs:
58 59 60 64 65 66 71 72 72
60 61 62 63 67 68 70 70 73 73 74
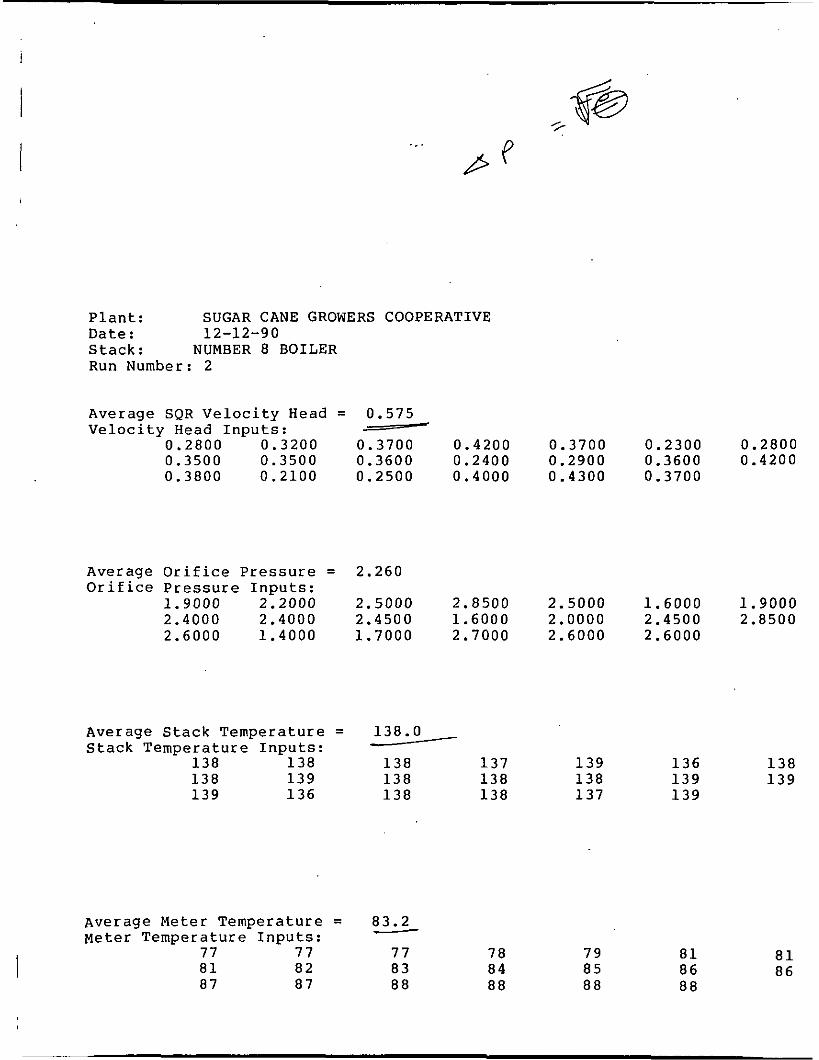
Plant: SUGAR CANE GROWERS COOPERATIVE Date: 12-12-90 Stack: NUMBER 8 BOILER Run Number: 2
Average SQR Velocity Head = 0.575 Velocity Head Inputs: -
0.2800 0.3200 0.3700 0.4200 0.3700 0.2300 0.2800 0.3500 0.3500 0.3600 0.2400 0.2900 0.3600 0.4200 0.3800 0.2100 0.2500 0.4000 0.4300 0.3700
Average Orifice Pressure = 2.260 Orifice Pressure Inputs:
1.9000 2.2000 2.5000 2.8500 2.5000 1.6000 1.9000 2.4000 2.4000 2.4500 1.6000 2.0000 2.4500 2.8500 2.6000 1.4000 1.7000 2.7000 2.6000 2.6000
Average Stack Temperature = 138.0 Stack Temperature Inputs: /
138 138 138 137 139 136 138 138 139 138 138 138 139 139 139 136 138 138 137 139
Average Meter Temperature = 83.2 Meter Temperature Inputs: J
77 77 77 78 79 81 81 82 83 84 85 86 87 87 88 88 88 88
I 81 86
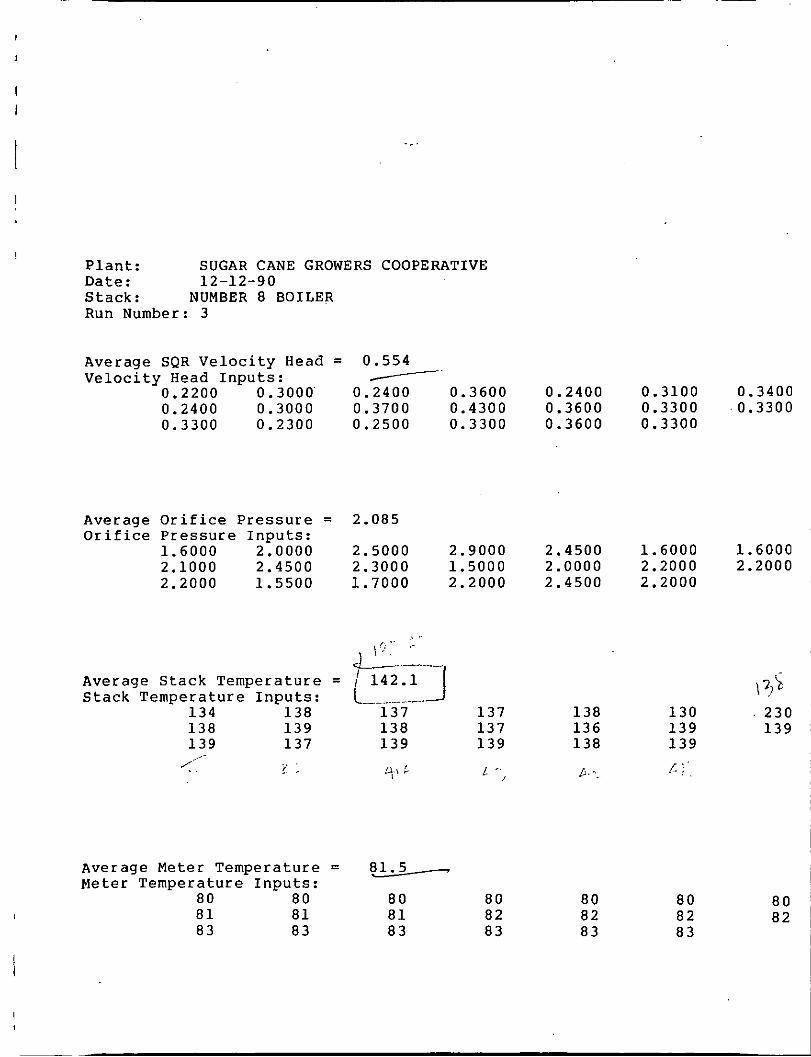
I Plant: SUGAR CANE GROWERS COOPERATIVE Date: 12-12-90 Stack: NUMBER 8 BOILER Run Number: 3
Average SQR Velocity Head = 0.554 Velocity Head Inputs: /
0.2200 0.3000 0.2400 0. 600 0.2400 0.3000 0.3700 0.4300 0.3300 0.2300 0.2500 0.3300
Average Orifice Pressure = 2.085 Orifice Pressure Inputs:
1.6000 2.0000 2.5000 2.9000 2.1000 2.4500 2.3000 1.5000 2.2000 1.5500 1.7000 2.2000
Average Stack Temperature =
137 137 137
134 138 138 139 138 139 137 139 139
Stack Temperature Inputs: -.-..
Average Meter Temperature = 81.5 - Meter Temperature Inputs:
80 80 80 80 81 81 81 82 83 83 83 83
0.2 D O 0.3600 0.3600
2.4500 2.0000 2.4500
0. 100 0. 00 0.3300 .0.3300 0.3300
1.6000 1.6000 2.2000 2.2000 2.2000
\ 7 s ,? .’
138 130 230 136 139 139 138 139
80 80 80 82 82 82 83 83
._ .
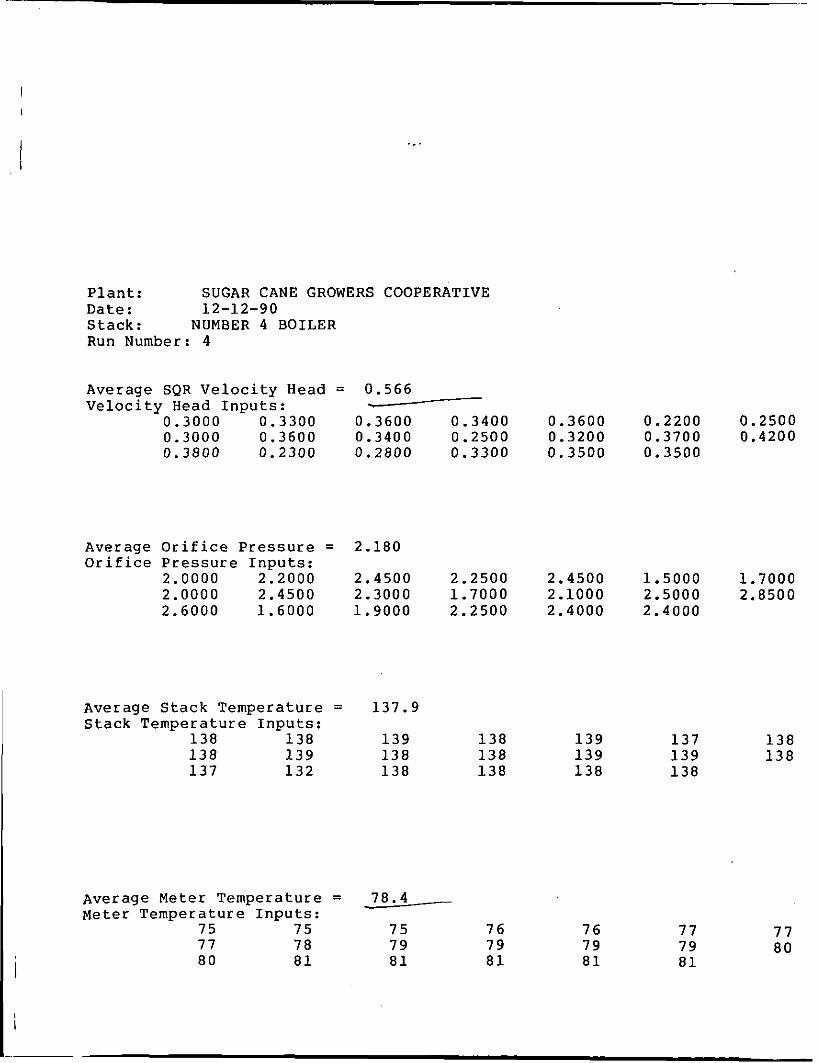
Plant: SUGAR CANE GROWERS COOPERATIVE Date: 12-12-90 Stack: NUMBER 4 BOILER Run Number: 4
Average SQR Velocity Head = 0.566 Velocity Head Inputs: w
0.3000 0.3300 0.3600 0.3400 0.3600 0.2200 0.2500 0.3000 0.3600 0.3400 0.2500 0.3200 0.3700 0.4200 0.3800 0.2300 0.2800 0.3300 0.3500 0.3500
Average Orifice Pressure = 2.180 Orifice Pressure Inputs:
2.0000 2.2000 2.4500 2.2500 2.4500 1.5000 1.7000 2.0000 2.4500 2.3000 1.7000 2.1000 2.5000 2.8500 2.6000 1.6000 1.9000 2.2500 2.4000 2.4000
Average Stack Temperature = 137.9 Stack Temperature Inputs:
138 138 139 138 138 139 138 138 137 132 138 138
Average Meter Temperature = 78.4 Meter Temperature Inputs:
75 75 75 76 77 78 79 79 80 81 81 81 i
139 137 138 139 139 138 138 138
76 77 77 79 79 80 81 81

Sample Calculations Run 1 Page 1
t Plant: SUGAR CANE GROWERS COOPERATIVE , Date: 12-12-90
Stack: NUMBER 8 BOILER ._.
Vwv Volume Water Vapor Sampled Vwv = 0.04707 x 228.1 = 10.737 SCF
VMs td Volume Standard Dry Gas Sampled VMstd = 17.64 x 45.527 x 0.994 x
I
[ 30.20 + ( 2.415 / 13.6)l / ( 66.4 + 460) = 46.067 SCF
Vt Total Standard Sample Volume Vt = 10.737 + 46.067 = 56.804 SCF
W Percent Water = ( 10.737 / 56.804) x 100 = 18.9 %
FDA Percent Dry Air = (1 - 0.189) x 100 = 81.1 %
Md Molecular Weight of Dry Stack Gas Md = (0.44 X 10.50 %CO ) + (0.32 X 9.50 %02) +
Ms Molecular Weight of Wet Stack Gas Ms = ( 30.060 x 0.811 ) + ( 18 x 0.189 ) = 27.781
SG Specific Gravity Stack Gas SG = 27.781 / 28.84 = 0.96
Ea Percent Excess Air Ea =
[0.28 x (80.00 %&2 + 0.00 %CO)l = 30.060
( ( 9.5 %02)-( 0 %CO / 2) X 100)
[ ( .264 x Ea = 81.756
____________________---------------------------- ( 80 %N2)) - ( 9.5 %02)-( 0 %CO / 2)]
Vs Velocity of Stack Vs = (85.49 x 0.84 x 0.592) x - [ ( 138.9 + 460) / ( 30.20 x 27.781) I vs = 35.918
Qa Actual Volumetric Flow Qa = ( 70.880 x 35.918 x 60 ) = 152753.4 ACFM
Qd Dry Volumetric Flow Qd = ( 152753.4 x 0.811 ) = 123883.0 ACFMD
Qsd Standard Volumetric Flow Qsd = 152753.4 x 0.811 x [ 528 / ( 138.9 + 460 ) I x
( 30.20 / 29.92 ) = 110248.6 SCFMD
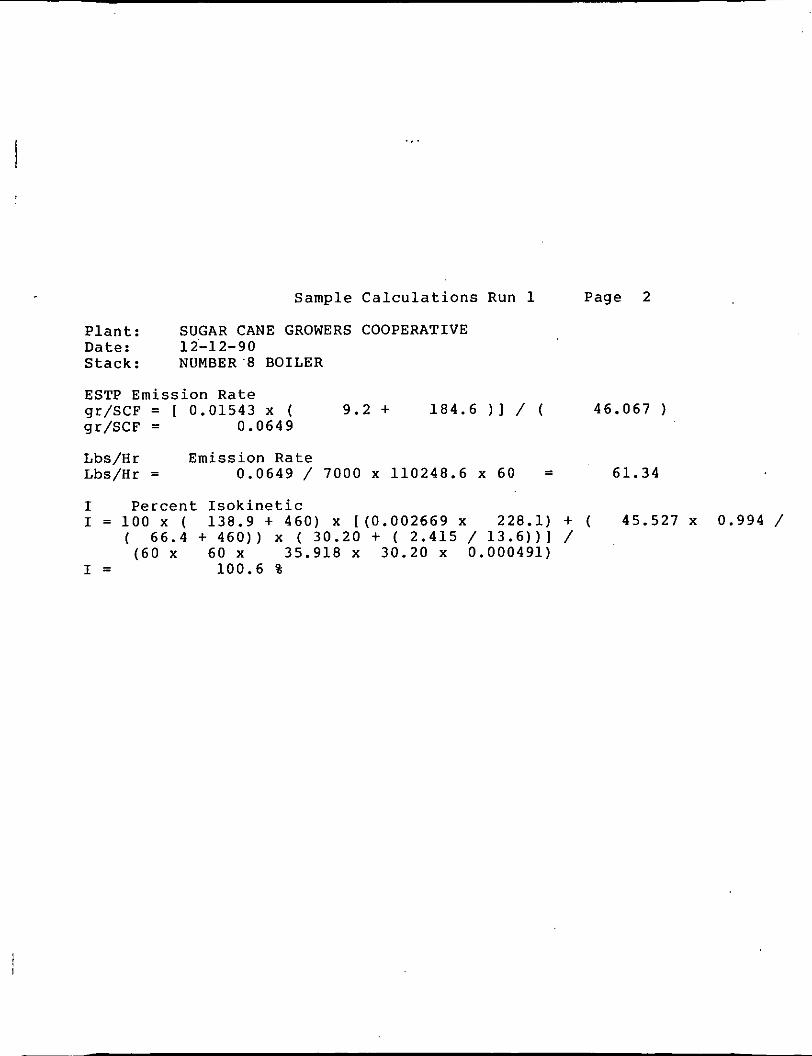
Sample C a l c u l a t i o n s R u n 1 P a g e 2
P l a n t : SUGAR CANE GROWERS COOPERATIVE D a t e : 12'-12-90 S t a c k : NUMBER .8 BOILER
ESTP E m i s s i o n Rate q r / S C F = [ 0.01543 X ( 9.2 + 184.6 1 1 / ( 46.067 ) i r / S C F = 0.0649
Lbs/Hr E m i s s i o n Rate Lbs/Hr = 0.0649 / 7000 x 110248.6 x 60 = 61.34
I P e r c e n t I s o k i n e t i c I = 1 0 0 x ( 138.9 + 460) x [(0.002669 x 228.1) + ( 45.527 x 0.994 /
( 66.4 + 460)) x ( 30.20 + ( 2.415 / 13.6))l / (60 x 60 x 35.918 x 30.20 x 0.000491)
I = 100.6 %
I
BI
. rl
. .. . . . . .
. , .. ._.
. .
APPENDIX E
FIELD DATA SHEETS
Y I 3lWl u T
Q
..

c
L 1
I I
I
U 0
i
: :
n - tl w I-
I u
O/ w (3
i?
- E
2 In z W
z 0 0 A
n
2 e - :: 51 a 0
I- W w I (0
Y 0 4 ' Z
.
W (3 z a a
u?
D

II ..... L . .
... e - . . . . L
. . . ' i , . . . . . . . . .
. . . . . ' . . . .
-.. . . . . . . .
. I
I ' - . . . 1 . . . : . , .'..
. I . . . . . . . . .
_ . . . . .
. . , ' . I
APPENDIX C
LABORATORY ANALYSIS

. . . .
1.
APPENDIX D
QUALITY ASSURANCE
AND
CHAIN OF CUSTODY
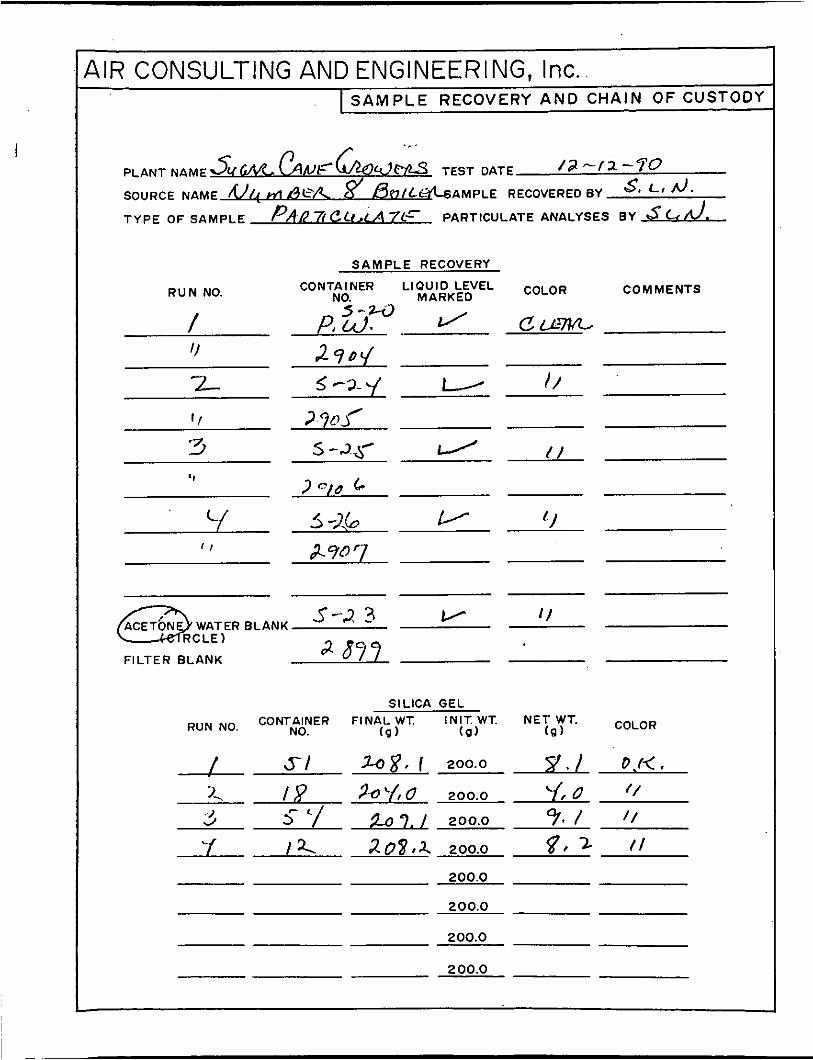
4IR CONSULTING AND ENGINEERING, Inc. I S A M P L E RECOVERY A N D CHAIN OF CUSTODY
.,. PLANT NAME 3vaGlv F LC3m TEST DATE
$. L, d. SOURCE NAME /c//{ Wl &.A BOFIILLGAMPLE RECOVERED BY
T Y P E OF SAMPLE PA0 XCit,C/I17L-
/ a --I2 -70
PARTICULATE ANALYSES BY c
S A M P L E RECOVERY
CONTAINER L I Q U I D LEVEL NO. MARKED C O M M E N T S R U N NO.
1 COLOR
e u-m 5-zi3 J
PdLCl. .
-L
3-2 3 v
FILTER BLANK
SILICA GEL RUN NO, CONTAINER F INAL W T I N I T W T
NO. (P) ( 9 ) N E T WT.
(R 1 COLOR
200.0
200.0
200.0
200.0
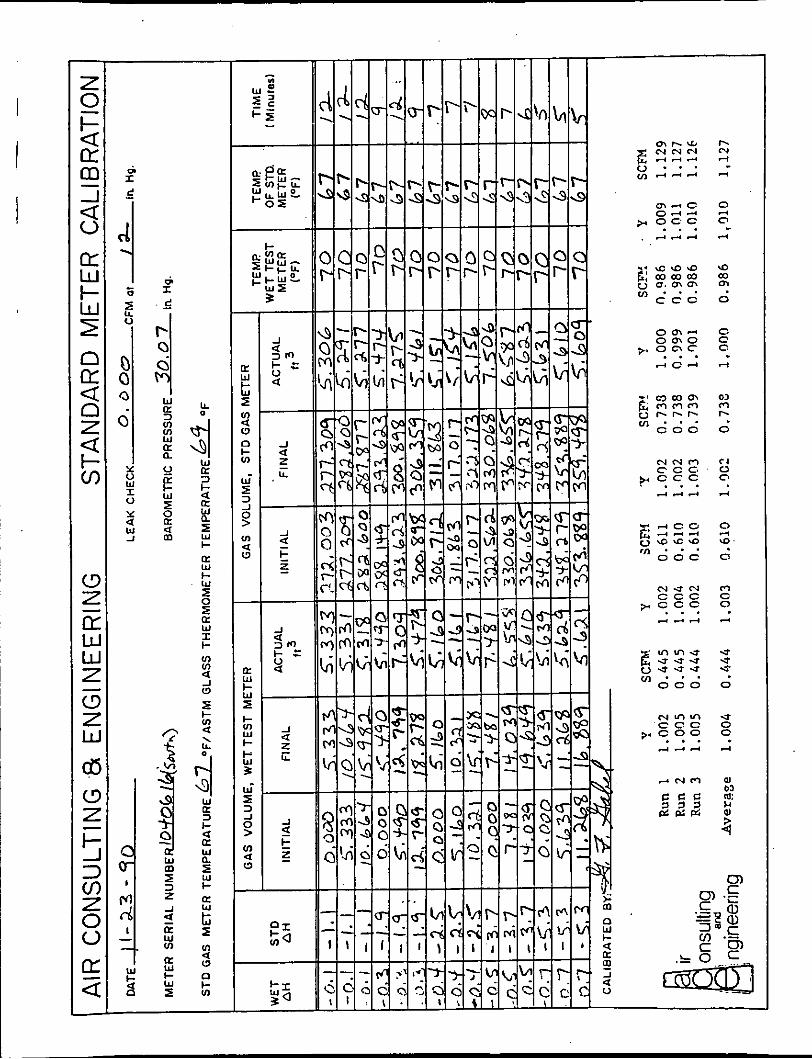
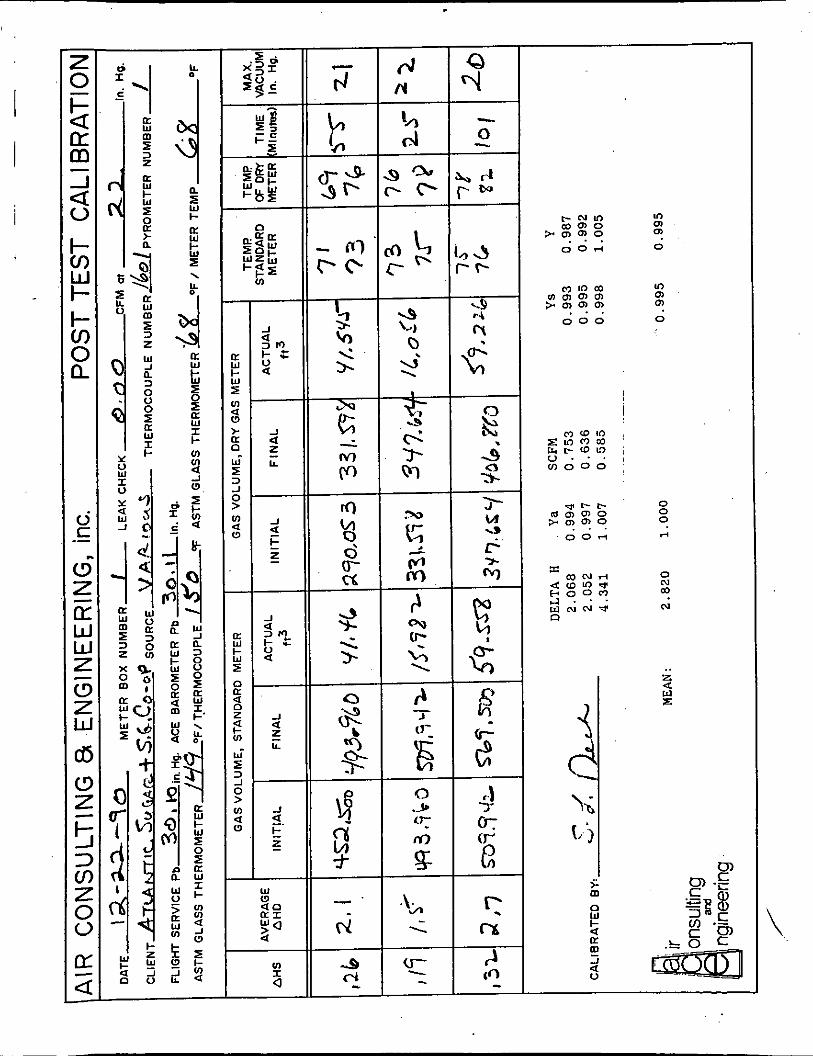
STANDARD METER CALIBRATION ._. .,.
Air Consulting and Engineering, Inc. (ACE) uses a dry gas meter for the calibration standard. This meter has been calibrated against a wet test meter in triplicate. curve (see next page). using the following formula:
I
This data was used to generate a standard meter calibration Field meter calibrations are corrected to thls curve
Y, x Y. = Y
Y, = actual ratio of field meter to standard meter
Y. = ratio of standard meter to wet test meter at a given flow rate (from Calibration Curve)
Y = corrected ratio of field meter
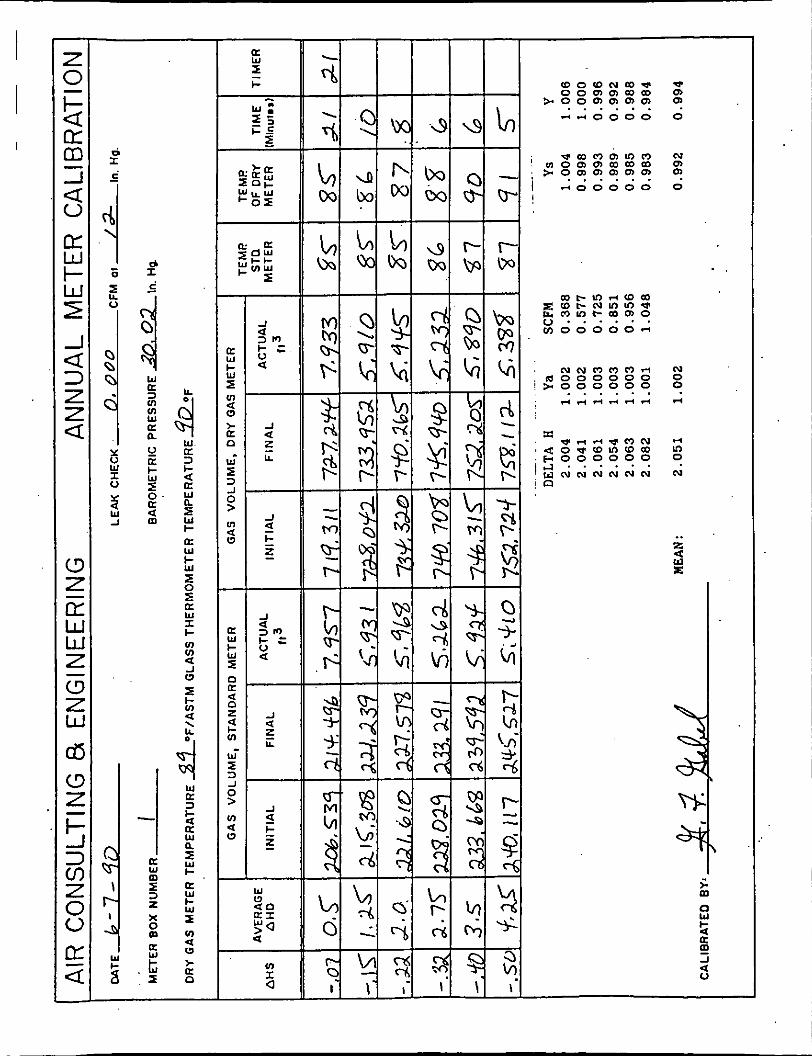
The dry standard meter was calibrated on April 26. 1990. and is checked and/or recalibrated at least annually.
& I
. d 1 W
VI VI W a a
3
2 W
E 0 a a m
LI 0
4 W
a 3
a 5 k! z e a w c W E 0 E a W I c ln
-I W
z
~ m r n V " " " i: m m m
D O C ul
N N O c c 0 p c c c . . .
-4 -4
- m u E u u u u u u u m . . . O C O
I
c c c 2 2 2
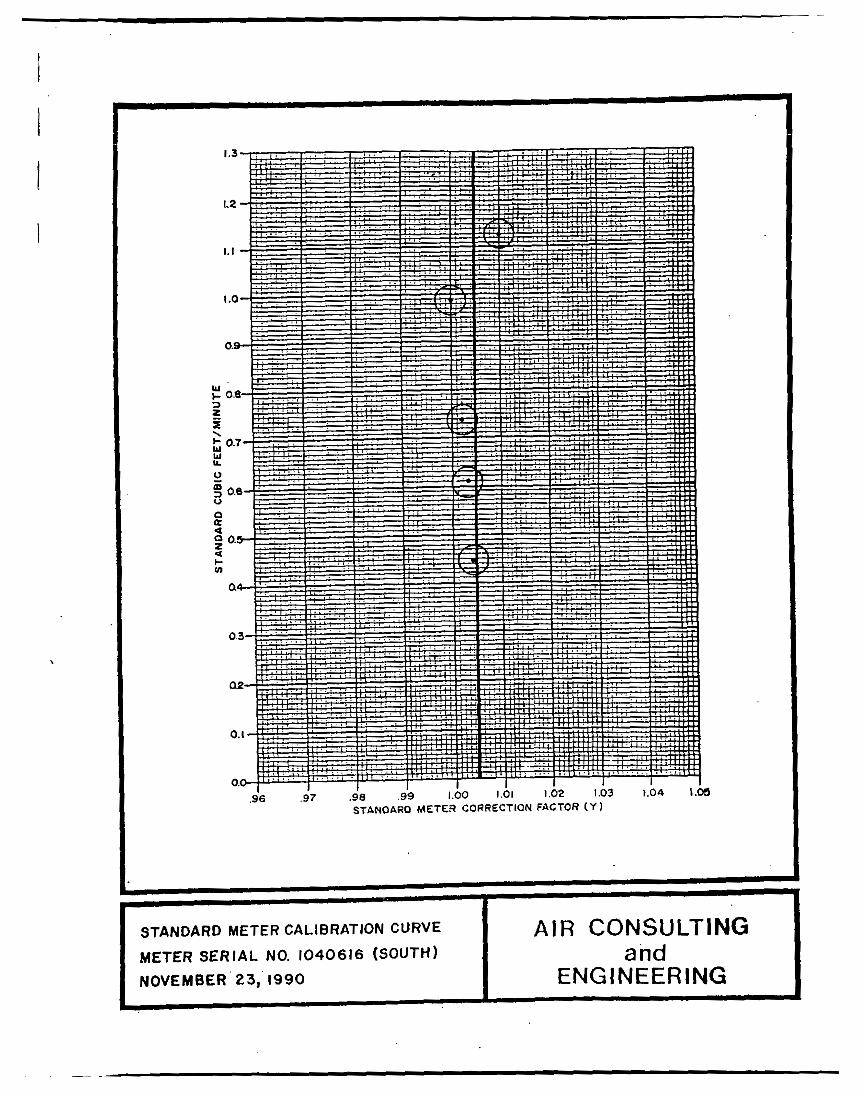
STANDARD METER CALIBRATION CURVE
METER SERIAL NO. 1040616 (SOUTH)
NOVEMBER 23, 1990
AIR CONSULTING and
ENGl NEER ING
d I c
i W U
3 ul In W U a 2 a c
2 2
- K W m 5 2 2 x 0 m (I:
, E I
W [I: 3 I- 4 U W
k
t;
W I- U W
E 0 5 a W I c v) ln -1 P
a
E Li :
4 W
a
a
a
3 I-
U W
5 I- U W c W I UI
0 > 0
a
a
-
K W
kl 5
a
a n W I 3 J 0 >
v)
0 >
.
v)
0 a
-
K W I- z 0 K
0 z
In
a
2 li I 3 J 0 > ln
0 a
-
v) I 0
m o m ~ m - o o m m m m % o o m m m m . . . . . .
- M o o 0 0
~ 0 0 0 0 0
o . . . . . . v ) 0 0 0 0 0 ~
N N O C 9 0 M (11000000 % 0 0 0 0 0 0
M * M d M M . . . . . .
0
N m m 0
N 0 0 .-I
In 0 N
.. 2 w E
In m t-NIn m m o o
+ m ? o o o r l 0
In m m
m IO co m o o m + m ? m 0 0 0 0
W
I3 I-
I- O
rn
c a
n
a m a
W I-
a J
u W I- 0 a
ln a
z W
0 W
=I I- I- O
5 a
m
k a a a W
...
P I m . - 0 n x
4 m r
0 0 - v -
W . m 3 I- I- O I- a -
E
u-
(I W
L - 5 : (I-
a >
a W c
I I- a m W L!
I- z w a E"
W 0 z W U W IL
LL a n I a z X 4 r U w Y n
,.
W U
t - Z z w w a o w E k
W t- a n
i 2
d
0
rl, M
0 P 3-
"
c
0
0 0 4)
I,,I
0 =I
i
I .“ NO 2m
0
0
e a
I 1.11 PROBE (5.min WAAYUP)
... ._.
I
IHLET. 1M O F d
I I .I
0 20 40 60 m POWERSTAT SEl-rIHC. 5
1 I I ‘ 1 . 1 I I 5-11 PROBE (10inin WARhlUP)
IHLET. 250 O F
INLET AMBIENT.
INLET. 150 OF
I I 1 I I I I 0 n UI 60 84
POWERSTAT SEl-rlHC. :
so . L
O.3m
r; 250
w a a cc W e w I-
€ mo
5 1% I- a IO0
g so W 0.
0
0
6-11 PROBE (15-min WARMUP) m INLET. 2% OF
INLET, Is0 O F
0 M 40 M 80 POWERSTAT SETrIHC. 5
Y a 250
4 a w
w 2 200
E M w -8
0 w
5 100
g so a e
0
IHLET.AMBIEHT.
0 10 UI 60 m POWERSTAT SEl l IHC. :
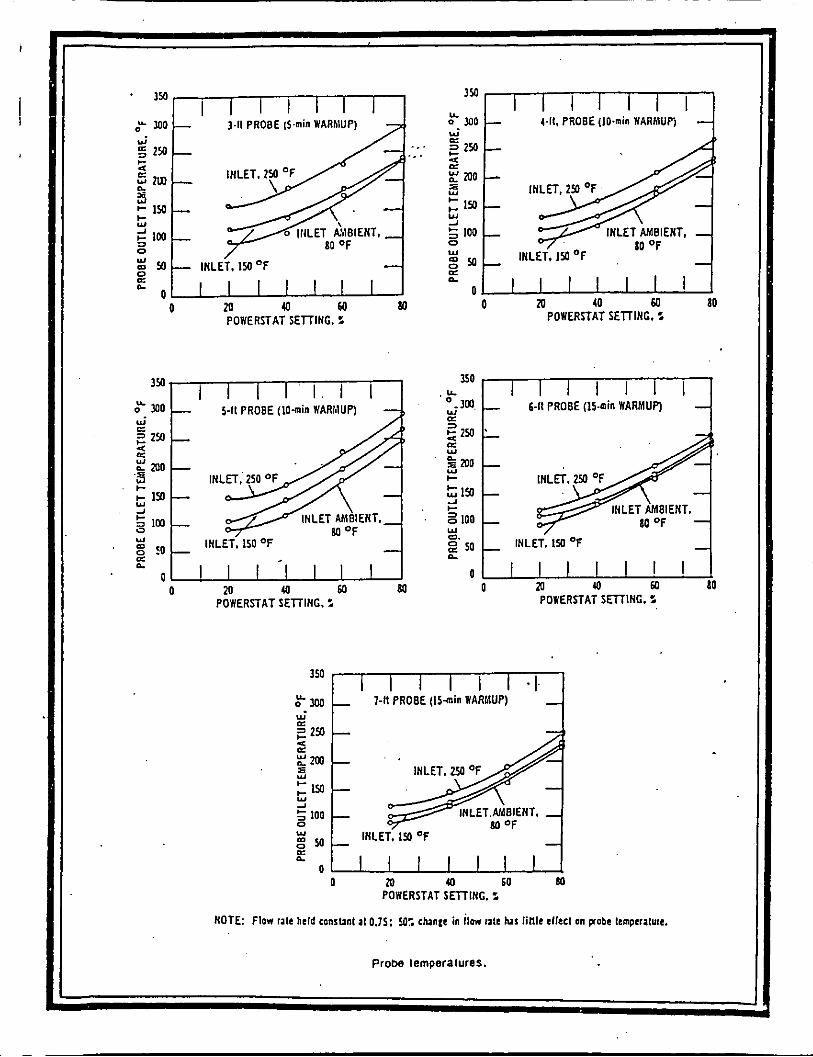
N O T E Flow talc held constant 11 0.75: 3’; c h i c in ilw tale has link ellecl on pobe Imperalure.
prow temperatures.
._
'.
1 -
P..
APPENDIX E
PRODUCTION RATE
CERTIFICATION
E:UILER OPERATION PARAMETERS
I FEEDWATER . I I
I T I M E I O I L STEW1 I
' TEMP. I PRESSllRE I --
~~
BOILER OPERATICIN PARAMETERS
I,..
:.,I
I N I T I A L I NTEGiRATOR vgA,.y.s$ - F I N A L I N T E G R A T O R ~ - & _ % $ ~ _ _ _
STEAM FEEOIUATER I T I M E I O I L ------
TEMP. I PRESSURE I I
I !
E O 1 LER UFEFtAT ION PARRllETEHS
FEEOWATEH :TIME I O I L :swAri
. . . ..: '
. . . . . . . . ./;
. . .. .. ... .:. . . .... .. .
. .. .:. . . . . .
. . . . . . .
. . . . .
. . . , .
.. .. ! . .. . . . . . .~ . . . . ..
. . .. . .. . .. . . _ . .
APPENDIX F
PROJECT FARTICIFANTS
P R O J E C T P A R T I C I P A N T S
I
I I I I
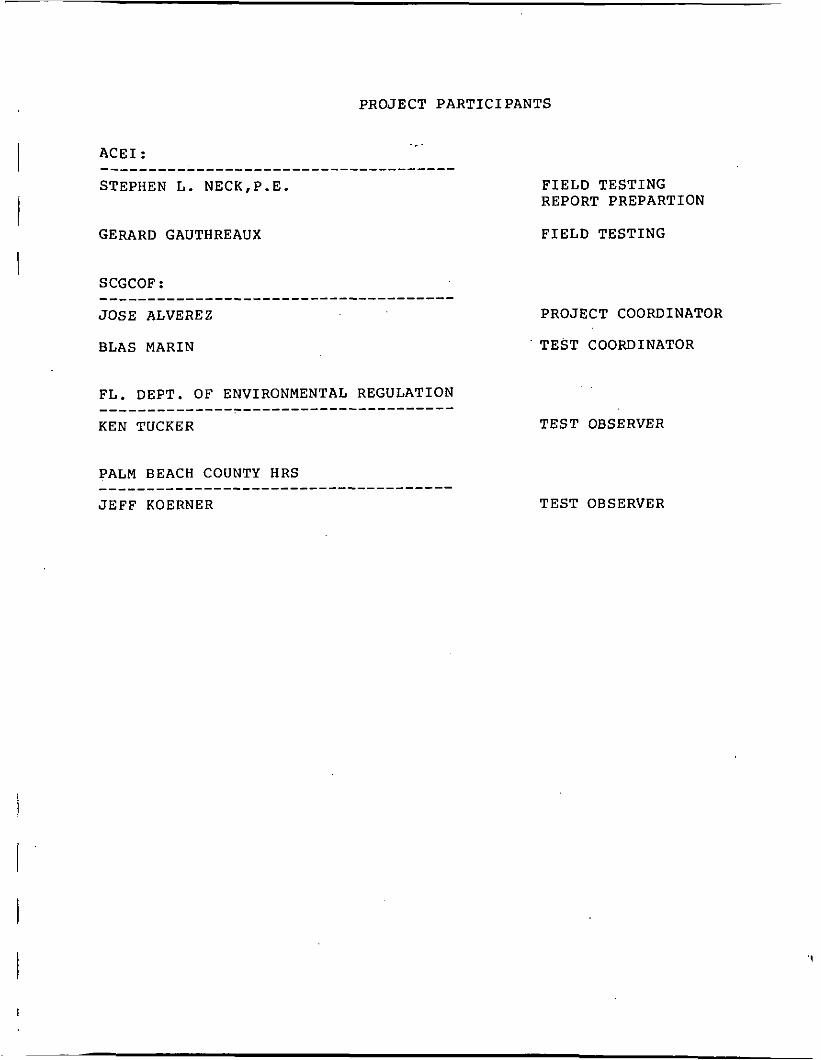
._. A C E 1 :
S T E P H E N L . N E C K , P . E . F I E L D T E S T I N G ____________________---___-_---------
R E P O R T P R E P A R T I O N
GERARD GAUTHREAUX F I E L D T E S T I N G
SCGCOF : _______________________-----__------- J O S E ALVEREZ P R O J E C T COORDINATOR
BLAS MARIN T E S T COORDINATOR
FL. D E P T . O F ENVIRONMENTAL REGULATION
KEN TUCKER ____________________--___----__--___-
PALM BEACH COUNTY H R S
J E F F KOERNER ____________________--__---____------
TEST OBSERVER
T E S T OBSERVER