“personnel forcecasting strategic workforce...
TRANSCRIPT

d I-
“PERSONNEL FORCECASTING STRATEGIC WORKFORCE PLANNING” A PROPOSED SIMULATION COST MODELING METHODOLOGY
Stephen R. Parker John A. Marriott
National Imagery and Mapping Agency Studies and Analysis Division ‘
14675 Lee Road Chantilly, Virginia 20151-1715, U.S.A.
ABSTRACT
A unique approach is developed for evaluating personnel requirements of the National Imagery and Mapping Agency (NIMA). With this approach new ways of measuring personnel availability are proposed and available to ensure that NIMA remains ready to provide timely, relevant, and accurate imagery, imagery intelligence and geospatial information in support of the national security objectives of the United States during the projected defense draw down beyond the year 2000.
The development of this analysis methodology was established as an alternative approach to existing studies to determine appropriate hiring and attrition rates, under all categories, to maintain appropriate personnel levels of effectiveness to support existing and future mission requirements.
The contribution of this research is a prescribed method .for the strategic analyst to incorporate a personnel and cost simulation model, which can be used to project personnel requirements and evaluate workforce sustainment, at least cost, through time. This will allow various personnel managers to evaluate multiple resource strategies, present and future, maintaining near perfect hiringlattrition policies to support a 9000+ NIMA workforce.
Key words: Reduction In Force (RIF), Program Objective Memorandum (POM), Enterprise Resource Planning (ERP), Human Resource Management System (HRMS), and Inflation Percent Growth (IPG).
1 INTRODUCTION
Strategic Workforce Planning is an ongoing analysis within the NIMA community to evaluate the future needs fur imagery and providing a path to achieve optimal placement of imagery analysts in various specialties throughout the agency. In addition to identifying the proper size, location, and specialties, the real underlying
challenge is maintaining absolute levels of expertise in these ‘locations’ despite the constantly changing personnel environment. Imagery analysts are unique, highly qualified individuals where not only is education critical, but there is also no substitute for experience. Today’s commercial-off-the-shelf Enterprise Resource Planning (ERP) software packages, such as PEOPLES0E;T or SYTELINE, provides Human Resource Management System (HRh4S) capabilities. However, these systems fall short in analyzing the present and future force levels and associated capital expenditures as they change through time. Force levels constantly change due to changes in promotions, retirements, losses within the agency, losses outside the agency; just to name a few, all in conjunction with percentages and duration for such variables.
Some of the inputs into Forcecasting may include:
Hiring growth fractions, 0 Inflation pay growth fractions,
Attrition (retirements, losses, relocations), 0 Benefits & Bonuses,
PolicyEvaluations,
0 Sudden “Death” Scenarios (salaries, hiring, promotions, retirements), and
(rifs, buyouts, sudden losses).
Outputs from the model provides extensive use of graphs and tables to depict detailed information regarding each of three major directorates, all business offices, as well as each payband within the business office.
Such statistical outputs may include at a minimum:
0 Personnel Levels (Directorate, Office, and Payband),
0 Personnel Levels vs. Pay (NIMA Wide), 0 Attrition Status (NIMA Wide), 0 Pay (InitialiBonus/Benefits/Growth), and
Pay Band Information (NIMA Wide).
-
It takes ten minutes through the user-friendly control panel to change two variables and run three separate simulations. It then takes fifteen minutes to transfer the output to an analytical software package. Within an hour you can develop a full-blown analysis for the decision- maker including charts, data tables, graphs and slides.
Forcecasting proposes various solution sets and management alternatives to the decision-maker by integrating system dynamics and combined simulation. The result is a more suitable methodology to adequately predict and control a proper balance between competing fu-ture imagery requirements; identifying personnel and monetary shortfalls thus helping to plan and support the personnel base for future operations.
2 SOLUTIONS THROUGH INTEGRATION
The objective of system dynamics, as utilized in this paper, is to study the causal relationships bearing on the personnel domain, and effectively identify the variables which will effect the force structure balance (Parker 1994).
The application of system dynamics to problem solving entails several important features not usually found in standard open loop simulation architecture.
First, such problems are looked at as being dynamic, involving quantities, which continually change over time. Next-event simulation alone may not accurately portray the constantly changing variables or quantities under investigation. Such quantities are expressed in terms of graphs of variables over time. The oscillating levels of various government and military specialties, over a projected time period are non-linear and dynamic.
Personnel maturation is a dynamic problem, concerning the full spectrum of personnel management and the events impacting it, such as relocation, promotion, attrition, unexpected RIF scenarios, past experience, new personnel, changing strategies, and other measures associated with personnel changes. Applying the theory of economics, time value of money,
' to the problem complicates the issues, requiring the simulation model to incorporate economic analysis (Pritsker 1999), (Parker 1997). Typical static approaches, such as linear programming, to solving such allocation problems often cannot be used where the problem scenario changes continuously through time.
For example, it may be advantageous to model an increase in demand, (a sudden increased need for affiliate imagery analysts), in order to determine how quickly the personnel inventory levels return to steady state, particularly in a situation where a large commitment of specialty personnel have been relocated to a new sector. These and similar questions can only be answered efficiently with a simulation method which
can cope with delays, flows of information, and material, obviously lending itself to the study of transient phenomena.
When such a simulation model is developed, the state variables are continuously changing and their time variation may depend on other state variables, both discrete and continuous. The dynamic behavior of these variables describes the real system and their computational relationship is critical to achieving reliable results. A second feature, and the most critical, to solving force structure problems to which the system dynamics perspective applies involves the notion of feedback (Coyle 1977). Essentially, feedback is the transmission and return of information. A feedback loop is a closed sequence of causes and effects. A series of interconnected sets of feedback loops is a feedback system. A sudden change in status 'or the level of a specialty may trigger the input or recruitment of new . personnel. Such a triggering may 'have great impact on the maturation of senior personnel at the tail end of the resource spectrum. Indirectly, such interference with the system may necessitate adding bonuses to specialities to adequately close the gap of a sudden loss. Thus, understanding the behavior of feedback systems is a goal of the system dynamics approach (Forrester 1961).
3 MODEL DEVELOPMENT
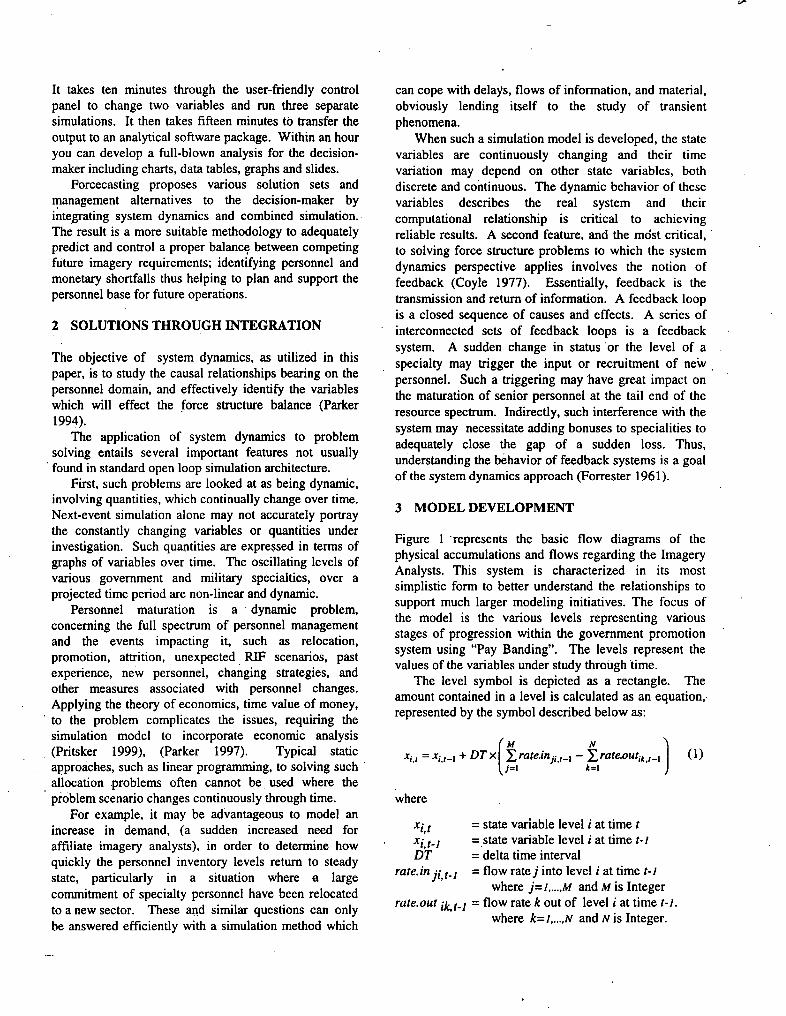
Figure 1 .represents the basic flow diagrams of the physical accumulations and flows regarding the Imagery Analysts. This system is characterized in its most simplistic form to better understand the relationships to support much larger modeling initiatives. The focus of the model is the various levels representing various stages of progression within the government promotion system using "Pay Banding". The levels represent the values of the variables under study through 'time.
The amount contained in a level is calculated as an equation,. represented by the symbol described below as:
'
The level symbol is depicted as a rectangle.
where
-5, t
DT = delta time interval
= state variable level i at time t = state variable level i at time t-1
= flow ratej into level i at time t-1
t-1
rute.inji,t-l
rute.out jk,+l = flow rate k out of level i at time t-1. where j = l ..... M and M is Integer
where k=l, ..., N and N is Integer.
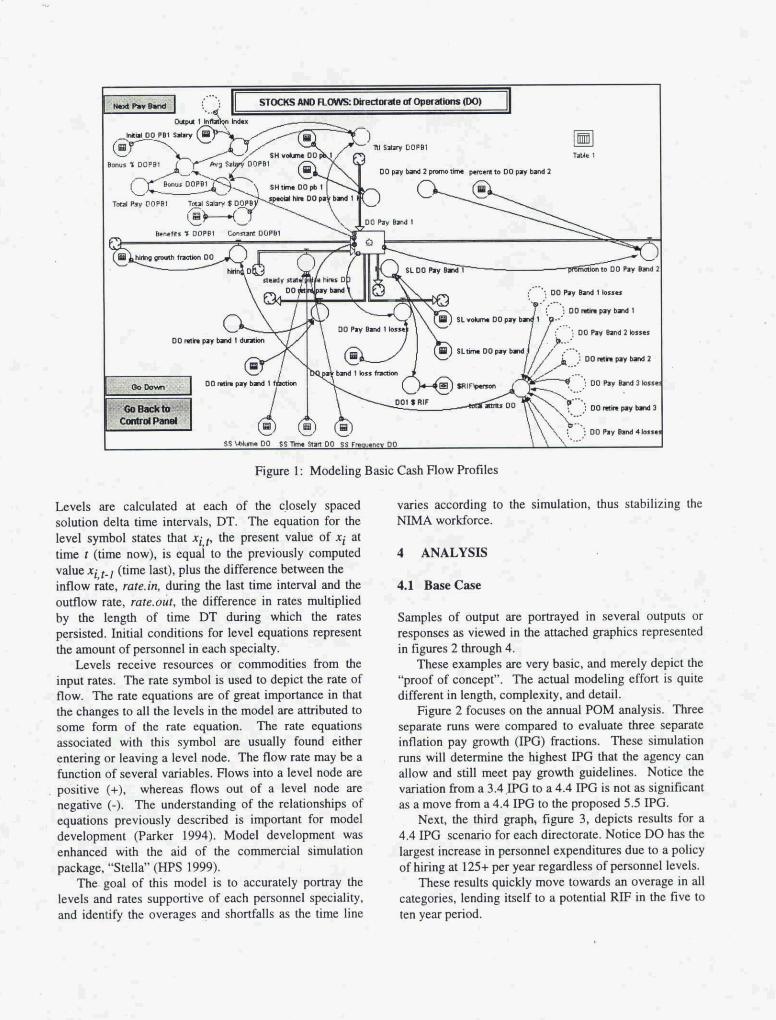
Figure 1: Modeling Basic Cash Flow F’mfiles
Levels are calculated at each of the closely spaced solution delta time intervals. DT. The equation for the level symbol states that xi the present value of xi at time r (time now), is quai to the previously computed value~i,~., (time last), plus the difference between the inflow rate, mre.in, during the last time interval and the oumow rate, rure.our, the differcnce in rates multiplied by the length of time DT during which the rates persisted. Initial conditions for level equations represent the amount of personnel in each specialty.
Levels receive resources or commodities from the input rates. The rate symbol is used to depict the rate of flow. Thc rate equations are of great importancc in that the changes to all the levels in the model are attributed to some form of the rate equation. ’Ihe rate equations associated with this symbol are usually found either entering or leaving a level node. The flow rate may be a function of several variables. Flows into a level node are positive (+), whereas flows out of a level node are negative (-). The understanding of the relationships of equations previously described is important for model development (Parker 1994). Model development was enhanced with the aid of the commercial simulation package, ‘‘Stella” (IPS 1999).
The goal of this model is to accurately portray the levels and rates supportive of each personnel speciality, and identify the overages and shortfalls as the time line
varies according to the simulation, thus stabilizing the ”4 workforce.
4 ANALYSIS
4.1 B w C w
Samples of output are portrayed in several outputs or responses as viewed in the attached graphics represented in figures 2 through 4.
These examples are very basic, and merely depict the ”proof of concept”. The actual modeling effort is quite different in length, complexily. and detail.
Figure 2 focuses on the annual POM analysis. Three separate m s were compand to evaluate tbree separate inflation pay growth (IF’G) fractions. These simulation IUIIS will determine the highest IPG that the agency can allow and still meet pay growth guidelines. Notice the variation from a 3.4.IPG to a 4.4 IPG is not as signifcant as a move from a 4.4 IPG to the proposed 5.5 IPG.
Next, the third mph, figure 3. depicts resub for a 4.4 IPG scenario for eacb directorate. Notice DO has the largest increase in personnel expenditures due to a policy of hiring at 125+ per year regardless of personnel levels.
These results quickly move towards an overage in all categories, lending itself to a potential RIF in the five to ten year period.

6th Yr POU Pay
Figure 2: Five-year POM Scenario/PG Comparison
Figure 3 Total Pay by Directorate with 4.4 IPG
Figure 4 depicts the relationship between personnel and pay at the 4.4 P G . In theory it may be an initial goal to have personnel levels remain at a relatively horizontal position throughout the simulation.
Figure 4 NIMA Personnel vs. Pay Over Ten Years
This would translate into the idea that all personnel inputs and outputs are relatively stable.
However this graph shows the inputs are increasing higher than the amition. and therefore will eventually cause the agency to bccome management top heavy.
Additionally interesting in this same graph is the pay line also increasing to the point of intersection. Perhaps the ideal situation would depict a slightly increasing pay
growth line to a relatively stable (horizontal) personnel level through time.
4.2 ContinnedAnalyda
The model user may vary the input parameters, perform comparative analysis of the simulation outputs. and evaluate various policies. Thus, sensitivity analysis is used to adequately predict the effects associated with a change in the input or output flow rates as modeled under these current scenario majors.
With additional variable changes, we can eventually identify the proper HR policy to implement throughout the NIMA work force.
Such analyses provides a more reasonable depiction of the future of the work force. Additionally. the costs or salaries associated with occupational specialties are analyzed dong with various scenarios to project icquired salaries through time integrating future costs and inflation factors, bonuses, and benefits, and incentive Pays.
A detailed control panel provides the analyst the capability to modify variables under investigation. Thus, performing sensitivity analysis is very user-friendly.
5 VERIFICATION ANDVALIDATION
Verification and validation are ongoing throughout model development. Verification is continuously performed comparing computer results with hand- cdcht ions to insure mathematical rigor. Special cire has been taken to insure the quality of statistics used in sampling from distributions. For example, in figure 5, is a sample set of data has been compiled for analysis using histograms and incorporating statistical testing procedures. such as the chi-square Goodness-of-Fit test, to sample appropriately the sppropriate random statistics.
Validation is also ongoing, comparing computer results to historical output and to current POM analysis provided by the HR teams within NIMA.
6 SUMMARY
There are s e v d major contributions, which stem from this research. Fmt, a result of this rcscsrch is a prescribed method
for the strategic analyst. to develop a personnel flow diagram which can be used to simulate and analyze personnel requirements to project and evaluate force size, capabilities, and costs through time. As part of the method, this symbolic network representative language was implemented which combines the continuous variable features of system dynamics and the discrete event features of conventional simulation techniques.

Figure 5: Statistical Analysis of Demographics (Melissa Buckmaster)
Secondly, as a simulator to evaluate the steady-state flow of personnel thmugh time. This wiU allow the analyst to evaluate various strategies to support Strategic Workforce and POM planning. Such strategies may include maximizing personnel sangth at least cost, or comparing relocation strategies.
Enhanced visualization techniques are. currently under development to export data sets from the simulation results. Statistical analysis tools provide more detailed analysis and mathematical confirmation Of results. These results provide opportunities to evaluate the long-term strategies with which o w decision-makers are confronted with today’s changing workforce environment.
REFERENCES Coyle, R. G. 1977. Management Systems Dynamics.
New York John Wiley & Sons. Forrester, J. W. 1961. InduStrial Dynamics. New York John Wiley & Sons.
High Performance Systems @IPS), Inc.. Stella, Hanover, NH, 1999. -
Parker, S . R. 1997. ‘Torcecasting Investment Opportunities Through Dynamic Simulations”, 1997 Winter Simulation Conference Proceedings. pp. 1251- 1257.
Parker, S. R. 1994. Military Force Structure and Realignment “Sharpening the Edge” Through Dynamic Simulation, DYNASIM. unpublished Ph.D. Dissertation, Purdue University, West Lafayette. Indiana.
Pritsker. A. A. B. 1999; Simulation with Visual S M and AweSim 2d Edition. New York Halsted Press, pp 768-116.
AUTHORS BIOGRAPiIIEs
STEPHJXN R PARKER, is a Senior Operattons Research Analyst with the Programs Studies and Analysis (PAS) Division, National Imagery and Mapping Agency, Chantilly, Virginia. He earned a B.S. degree in Engineering from the United States Military Academy, West Point, New York; a Master’s degree in Industrial Engineering (Operations Research) from Texas A&M University; and a Ph.D. in Industrial Engineering (Modeling & Simulation) from Purdue University. The author is a senior member of the Institute of Industrial Engineers, as well as a Certified Professional Engineer, currently registered in the state of Virginia
I.. JOHN A. MARRIO’lT is a Senior Operations Research Analyst with the Programs Studies and Analysis (PAS) Division, National Imagery and Mapping Agency, Chantilly, Virginia. He emed a B.S. degree in mathematics and economics from Widener University, Chester, Pennsylvania, and a Master’s degree in Systems Management from the Universi~ of Southern Califomia, Los Angeles, California. He has held a myriad of senior ORSA positions at V Corp. the Office of the Chief of Staff (BRAC 9 3 , and positions with the Army Secretariat (DUSA-OR).