“electrical performance & environmental...
TRANSCRIPT

“Electrical Performance & Environmental Solutions”
Presented By:-Rohitash Sharma, Engineer- Electrical, email:[email protected]
1 x 80 MW Captive Power Plant - Zawar , Hindustan Zinc limited1
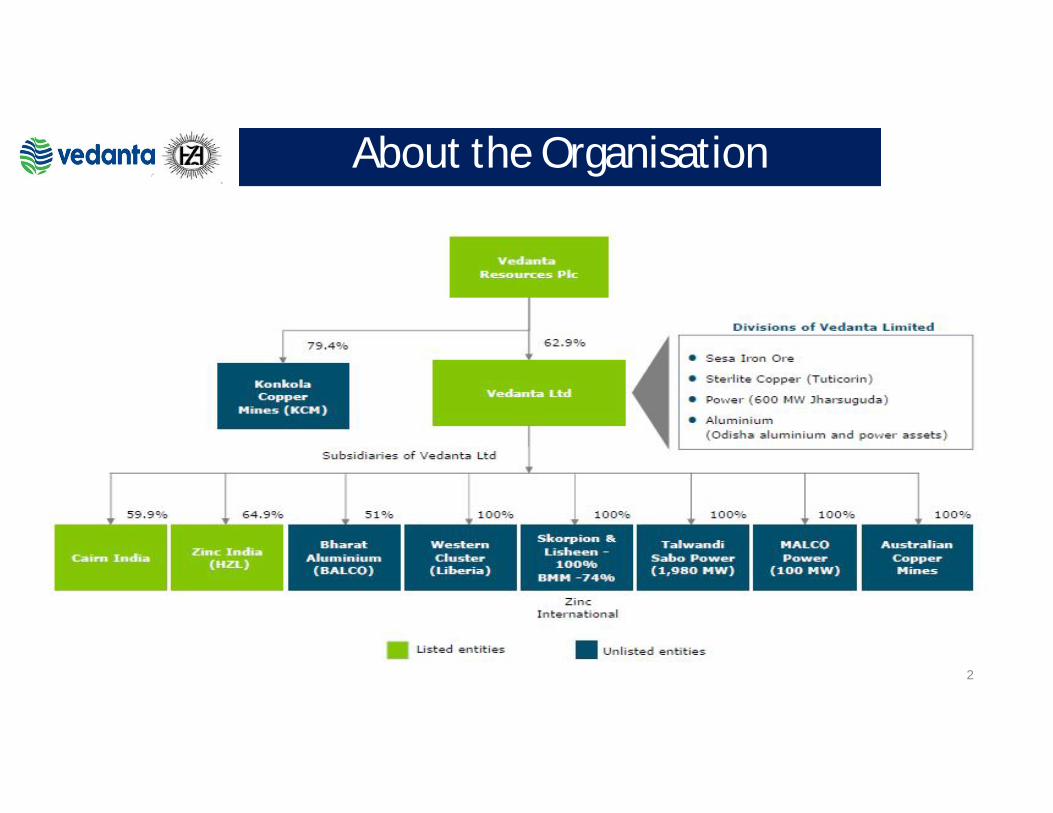
About the Organisation
2
a. 3 or 4 key aspects you would like to tell about your organisation)
b. Certifications it possesses (like ISO 9001, 50001 etc)c. Some interesting facts about your organisation

About Hindustan Zinc Ltd - CPP
3
Hindustan Zinc Limited is having 6 units of 80 MW at 3 Locations i.e Chanderiya, Dariba & Zawar Mineswhich uses coal as fuel to generate power. Our 2 units of 77 MW were installed in 2005 & 3rd unit wasinstalled in 2008 at Chanderiya. Unit-4 at Zawar was synchronized in December-2008.In 2010 furtherexpansion of Mines and smelters leads to commissioning of unit 5th & 6th at Dariba The units have beencontinuously in operation and determined for Energy conservation through the savings by variousimprovement projects. Company have undertaken various initiatives to reduce the Energy Consumption(Coal, Oil, APC), which is the main cost driver. These initiatives include optimising coal blend, keeping theCoal, Oil & auxiliary consumption at a minimum and operating the power plants at high plant load factor.

ISO & 5S Certified Company
4
ISO 9001:2008 ISO 14001:2004 OHSAS 18001:2007
First Issue: 29.06.2011Current Issue: 26.06.2017Expiry Date: 15.09.2018
First Issue: 30.06.2011Current Issue: 26.06.2017Expiry Date: 15.09.2018
First Issue: 30.06.2011Current Issue: 27.06.2017Expiry Date: 29.06.2020
Certified by QCFI
First Issue: 25.04.2018Current Issue: 25.04.2018Expiry Date: 30.04.2021

5
Electrical Safety & Performance

Electrical Safety
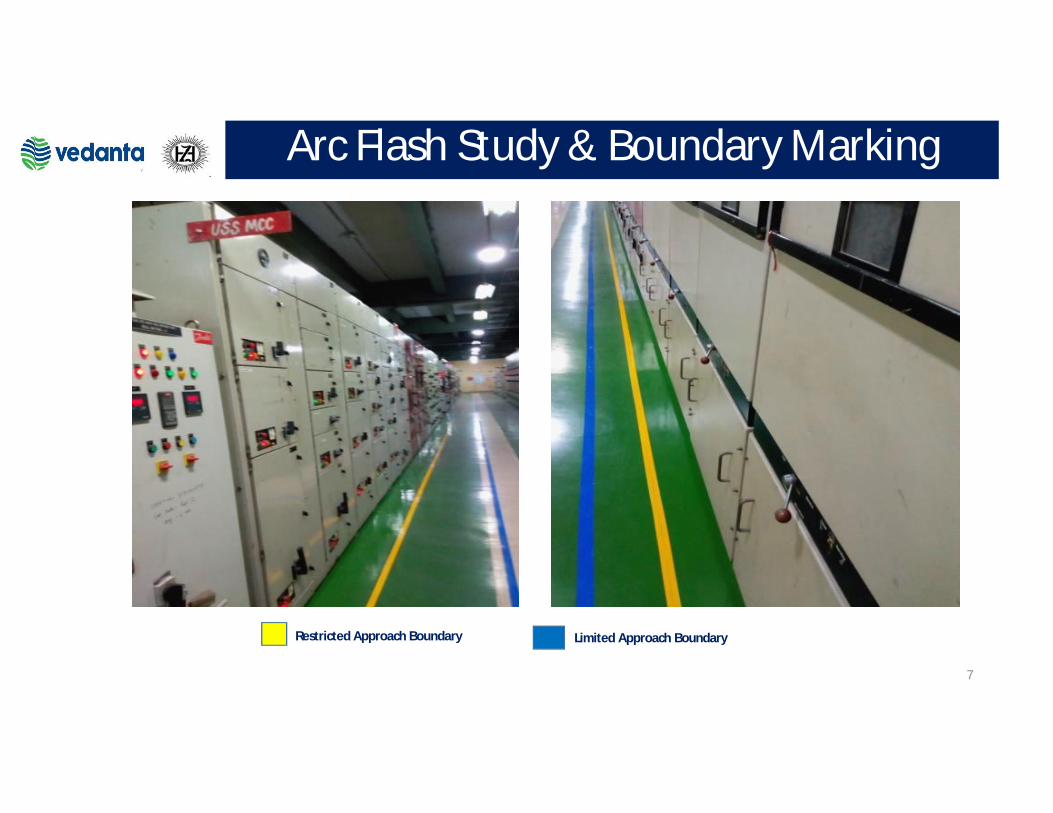
6
During maintenance in HT/LT panels, it was observed that due to some reasons there may be risk of flashhazards in electrical panels which can cause severe shock & burn injuries to person working at panels.
Initiatives Taken:
1. Arc Flash study & boundary marking for all MCC panels.
2. Replacement of old SFUs to MPCB/MCCB in all LT feeders.
3. Replacement of existing metallic plates to Bakelite sheets in all panels.
4. Use of Arc flash suit, face shield inside the flash hazard boundary.
5. Use of T pro voltage detector for voltage testing jobs.
6. Rear Door interlocking in HT panels.
7. Red Colour painting on Incomers & Bus-coupler panels.
7
Arc Flash Study & Boundary Marking
Restricted Approach Boundary Limited Approach Boundary

8
Arc Flash Analysis provides awareness of maximum incident energy of a panel in case of any fault.
Arc Flash Analysis provide awareness to keep safe distance from an energized part or conductor to the each of these boundaries increases as the nominal voltage increases. Also helps to provide proper selection of PPEs required as per the flash energy.
Limited Approach Boundary :- This is the minimum permitted distance that unqualified and unprotected personnel may approach an energized component. Before crossing the limited approach boundary and entering the limited space, a suitably qualified person must use the appropriate PPE and be trained to perform the required work.
Restricted Approach Boundary:-To cross the restricted boundary and access the restricted space, personnel need to have been trained in shock protection techniques, be wearing the correct PPE and have a written and approved plan for any work in the zone.
Benefits of Arc Flash Study & Boundary Marking

9
Replacement of metallic plates with bakelite sheets inside panels
Metallic face place provided in feeders, which can cause risk of creating flash in case any lose live part gets touched to
plate.
Bakelite plate installed in place of MS plate to eliminate
electrical hazards
Before After

10
To minimize electrical hazards like Short circuit and flash over. To avoid electrical shock while removing power fuse from SFU. To protect leakage current path by providing insulation medium. Elimination of risk of flashover that can be caused due to contact of any live
part with metal sheets.
Benefits of installing Bakelite sheets

11
SFU to MPCB replacement
Before feeder with SFU After MPCB Installation
Before After

12
To avoid electrical shock due to SFU Malfunction, since it has mechanical contact mechanism.
To avoid electrical hazard while removing power fuse. Interlocking with panel door with MPCB selector switch. Integrated protections inside MPCB for motor over current and short
circuit. Elimination of risk Hazard caused due to SFU fuse replacement and
operating mechanism Failure.
Benefits of FSU to MPCB Replacement

13
Red Painting & Labelling on Incomers & Buscouplers

Uniqueness of the project and take away for audience/company from the project
14
Reduction in incidents caused due to electrical flash hazard in Panels.
Cost saving due to less system failures & increased system reliability.
Improved confidence & safety of people working on electrical panels inside MCCs.

15
Auxiliary Power Consumption Analysis

0
2
4
6
8
10
12
Auxiliary Power Consumption
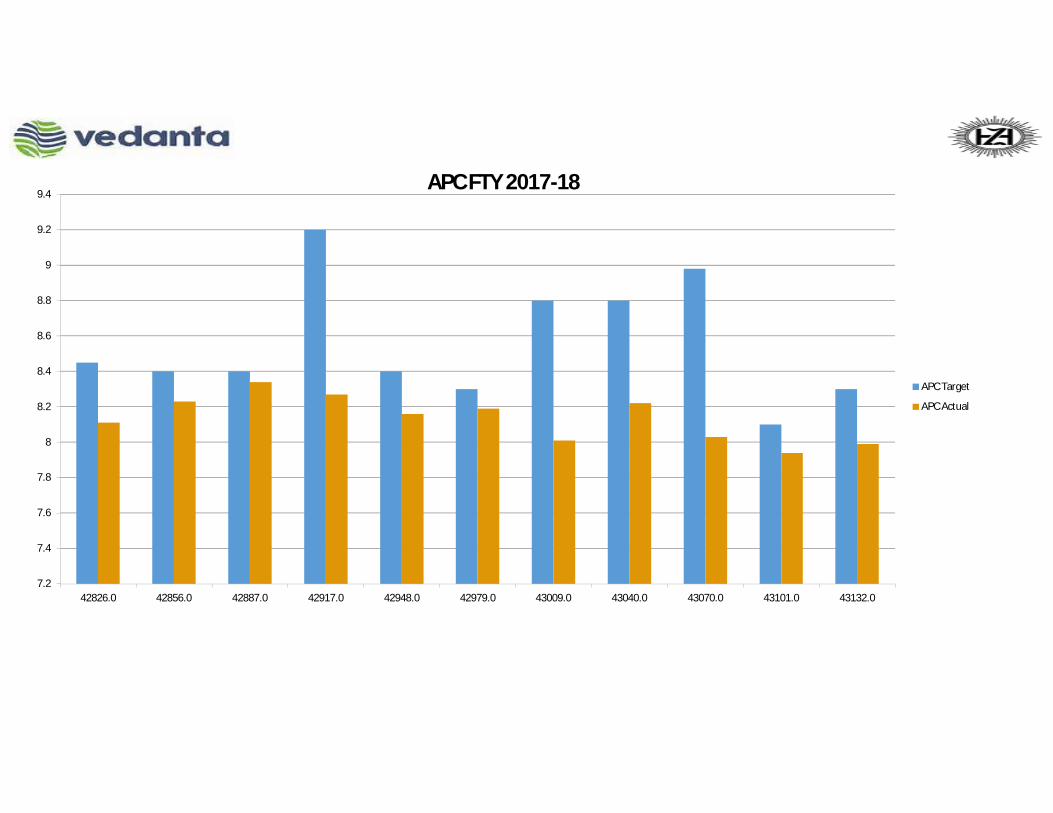
APC FTY 2017-18
7.2
7.4
7.6
7.8
8
8.2
8.4
8.6
8.8
9
9.2
9.4
42826.0 42856.0 42887.0 42917.0 42948.0 42979.0 43009.0 43040.0 43070.0 43101.0 43132.0
APC Target
APC Actual
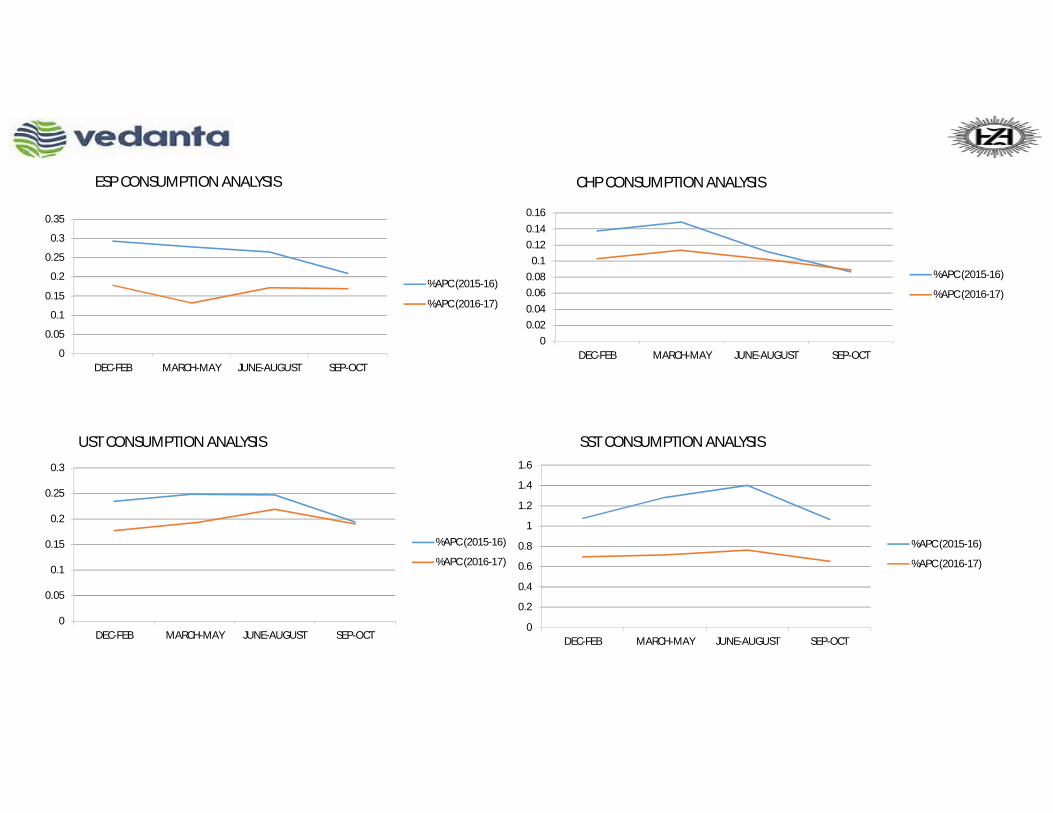
ESP CONSUMPTION ANALYSIS
0
0.05
0.1
0.15
0.2
0.25
0.3
0.35
DEC-FEB MARCH-MAY JUNE-AUGUST SEP-OCT
%APC (2015-16)
%APC (2016-17)
00.020.040.060.08
0.10.120.140.16
DEC-FEB MARCH-MAY JUNE-AUGUST SEP-OCT
%APC (2015-16)
%APC (2016-17)
CHP CONSUMPTION ANALYSIS
0
0.05
0.1
0.15
0.2
0.25
0.3
DEC-FEB MARCH-MAY JUNE-AUGUST SEP-OCT
%APC (2015-16)
%APC (2016-17)
UST CONSUMPTION ANALYSIS SST CONSUMPTION ANALYSIS
0
0.2
0.4
0.6
0.8
1
1.2
1.4
1.6
DEC-FEB MARCH-MAY JUNE-AUGUST SEP-OCT
%APC (2015-16)
%APC (2016-17)

WST CONSUMPTION ANALYSIS
0
0.02
0.04
0.06
0.08
0.1
0.12
DEC-FEB MARCH-MAY JUNE-AUGUST SEP-OCT
%APC (2015-16)
%APC (2016-17)
0
0.1
0.2
0.3
0.4
0.5
0.6
0.7
DEC-FEB MARCH-MAY JUNE-AUGUST SEP-OCT
%APC (2015-16)
%APC (2016-17)
CTT CONSUMPTION ANALYSIS
0
0.2
0.4
0.6
0.8
1
1.2
1.4
1.6
DEC-FEB MARCH-MAY JUNE-AUGUST SEP-OCT
%APC (2015-16)
%APC (2016-17)
CWP CONSUMPTION ANALYSIS CEP CONSUMPTION ANALYSIS
0
0.05
0.1
0.15
0.2
0.25
0.3
0.35
DEC-FEB MARCH-MAY JUNE-AUGUST SEP-OCT
%APC (2015-16)
%APC (2016-17)

20
APC Reduction Initiatives
1 Optimisation of Instrument Air compressor loading & unloading hrs.
2 Bottom ash system timer based operation on basis of ash percentage in coal to optimise running hours.
3 Replacement of Flourescent lamps with LED lights
4 Lighting optimization using motion sensor in all MCCs
5 Operation of AHU, Exhaust fan, Chiller system as per temperature of DPU to optimise consumption during night hours.
6 CT fans operation on basis of Cooling water temperature
7 Optimisation of ESP by maintaining charge ratio as per SPM and coal quality
8 Start & stop taken from DCS for LP ammonia and hydrazine to reduce manual operating time
9 HIPO dosing system automation
10 Delta to star connection of some LT motors

21
Instrument Air Compressor Optimisation
Actions Taken to optimize IAC loading :-
• Local Operation of Compressor Stopped and Operation started from DCS with
protection start based upon header pressure
• Automation of DM Plant Instrument Air line based upon DM Plant Operation
• Optimization of compressor loading and unloading set points
• Optimization of DE System (4 No's) purging time.
• Air Leakages attended in Boiler and DM plant area.

22
Before After
Compressor-1 Compressor-2 Compressor-3 Compressor-1 Compressor-2 Compressor-3
Condition Continuously in Loading Loading and Unloading as per Air req. Stand by Continuously in
Loading Stand by Stand by
Power Consumption 141 KW per Hour 90 KW per hour 0 143 KW per Hour 0 0
Before After
Total Power Consumption ( kWh ) 231 143
Total Saving Achieved due to IAC optimization 88 kW/hr
Instrument Air Compressor Optimisation

23
0
500
1000
1500
2000
2500
Power consumption with Flourescent
Power consumption after LED lights installation
Power Consumption after LED lights installation
Total Saving (kWh): 30.4 kWh/day
0
2
4
6
8
10
12
14
16
18
20
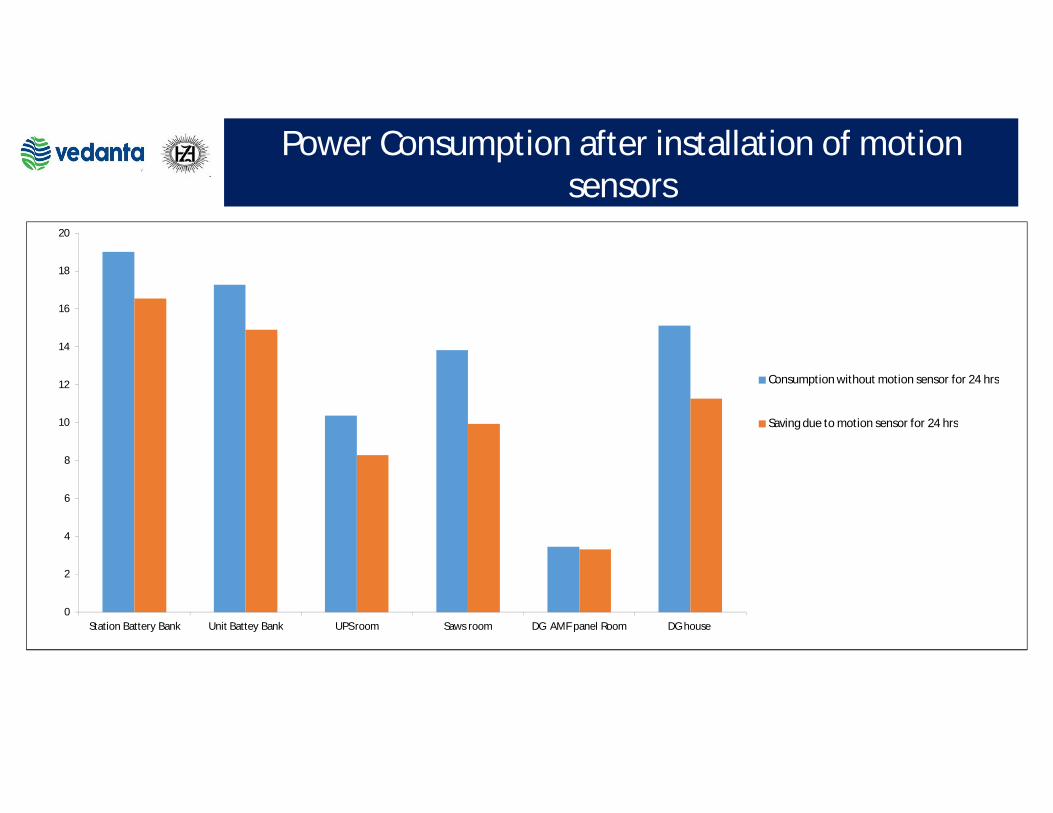
Station Battery Bank Unit Battey Bank UPS room Saws room DG AMF panel Room DG house
Consumption without motion sensor for 24 hrs
Saving due to motion sensor for 24 hrs
Saving due to Motion Sensor based Lighting Power Consumption after installation of motion sensors

Before After Consumption In 24 Hr
Amp 11.5A 10A Before After
Kw 7.026075 6.10963 Kw 169 147
135
140
145
150
155
160
165
170
175
Before
Kw
Kw
LP water pump Consumption Analysis after changing it's connection from delta to star

26
Composite Islanding & Load Monitoring System
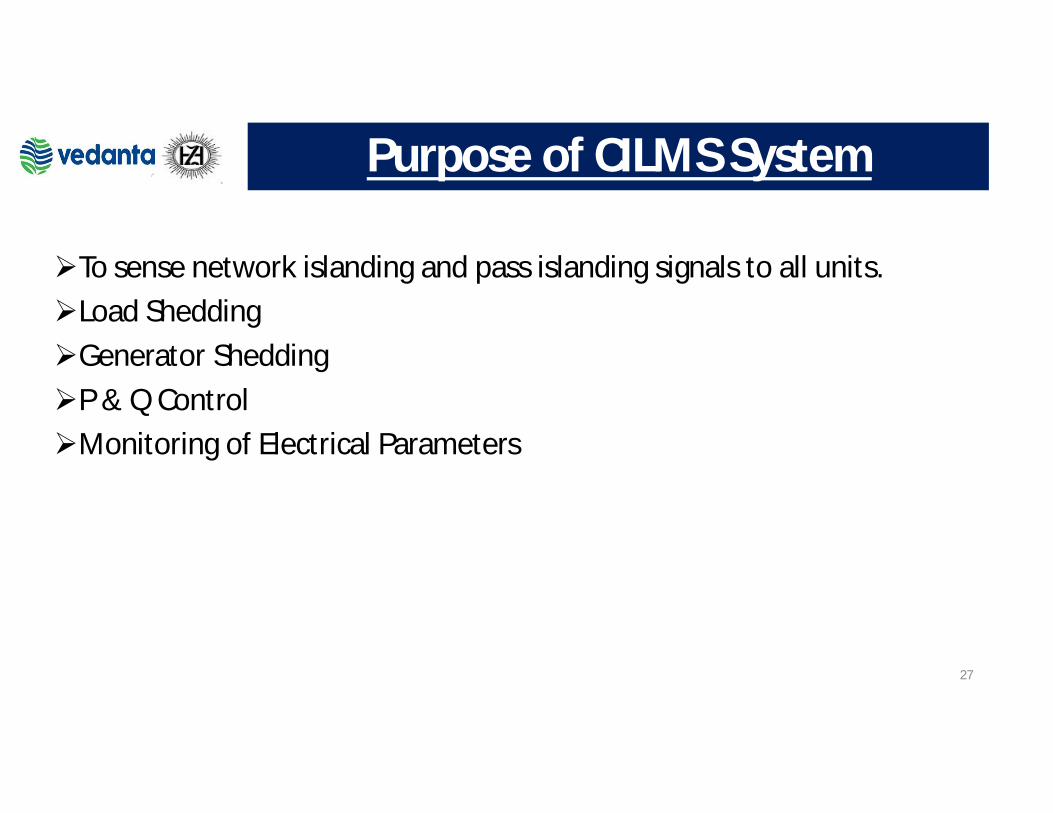
27
To sense network islanding and pass islanding signals to all units.Load SheddingGenerator SheddingP & Q ControlMonitoring of Electrical Parameters
Purpose of CILMS System

28
Concept of Islanding1. Complex Islanded:It will be sensed when all our system get disconnected with RSEB Grid.
2. Unit Islanded:It will be sensed if any unit gets disconnected from network & the respective unitwill sense unit islanded.
3. CPP Islanded:It will be sensed when both CPP-NZP lines gets disconnected

29
Concept of Load Shedding & GenereatorShedding
Purpose:-
To Maintain system frequency within the permissible limits during islandingcondition.To maintain the RSEB-Grid line load within the limit.To maintain the CPP-NZP lines load within the limit.To protect electrical system from black-out.To keep reliability of the electrical system

30
Load Shedding
Load shedding is triggered during following cases:
Grid MW Import Violated.Grid MVA in Import mode Violated.Electrical network islanded during import condition.Bus under frequency relay operated condition.Generator trippedBus coupler trippedCPP-NZP Line Tripped condition.RSEB Tie line tripped condition.

31
Genereator Shedding
Generator shedding is triggered during following cases :Grid MW Export Violated.Grid MVA in Export mode Violated.Electrical network islanded during export conditionRectifiers trippedBus coupler trippedCPP-NZP Line Tripped conditionRSEB Tie line tripped condition

32
Environmental Monitoring Systems & Solutions
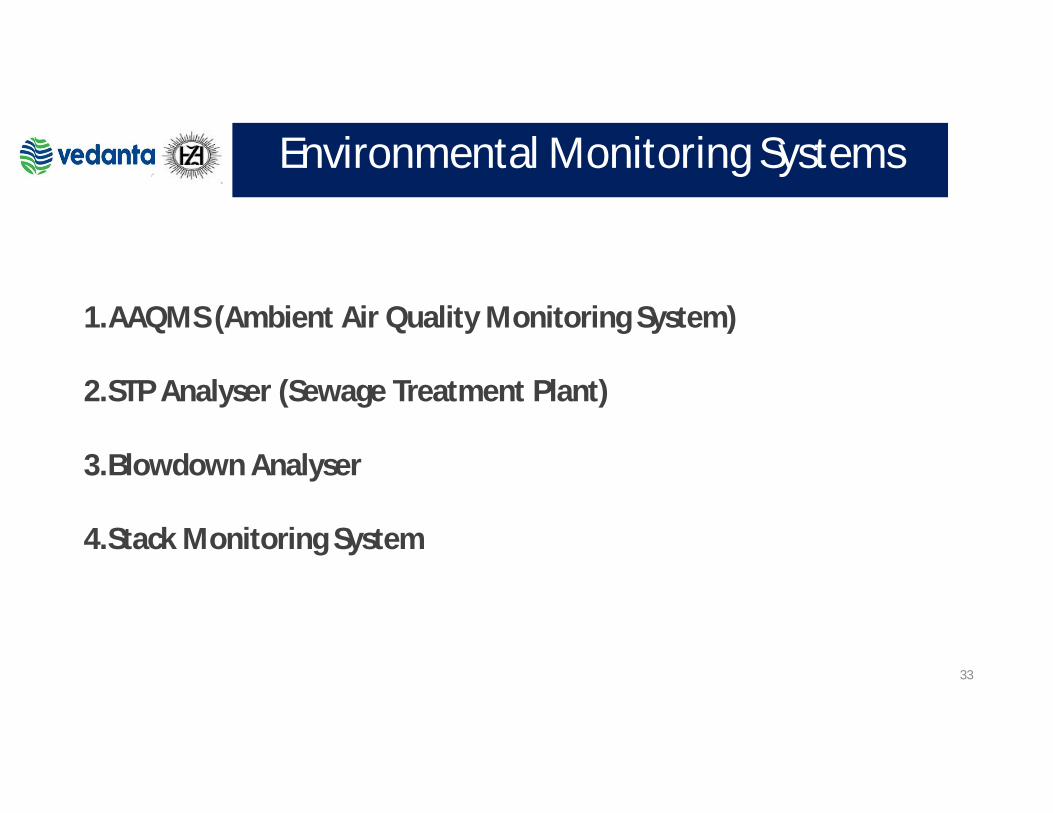
33
Environmental Monitoring Systems
1.AAQMS (Ambient Air Quality Monitoring System)
2.STP Analyser (Sewage Treatment Plant)
3.Blowdown Analyser
4.Stack Monitoring System

34
AAQMS (Ambient Air Quality Management System)
Purpose :- AAQMS system is used to measure & monitor ambient air quality in the plant.
Monitoring Parameters:-
1. PM2.52. PM103. CO4. SOx5. NOx
Make:- Thermo Fisher

35
STP Analyser (Sewage Treatment Plant)
Purpose:- This system is used to measure the water quality of sewage water.
Measuring Parameters:-
1. pH 2. COD3. BOD4. TSS
Make/Vendor:- ABB, i Scan /Axis Nano
36
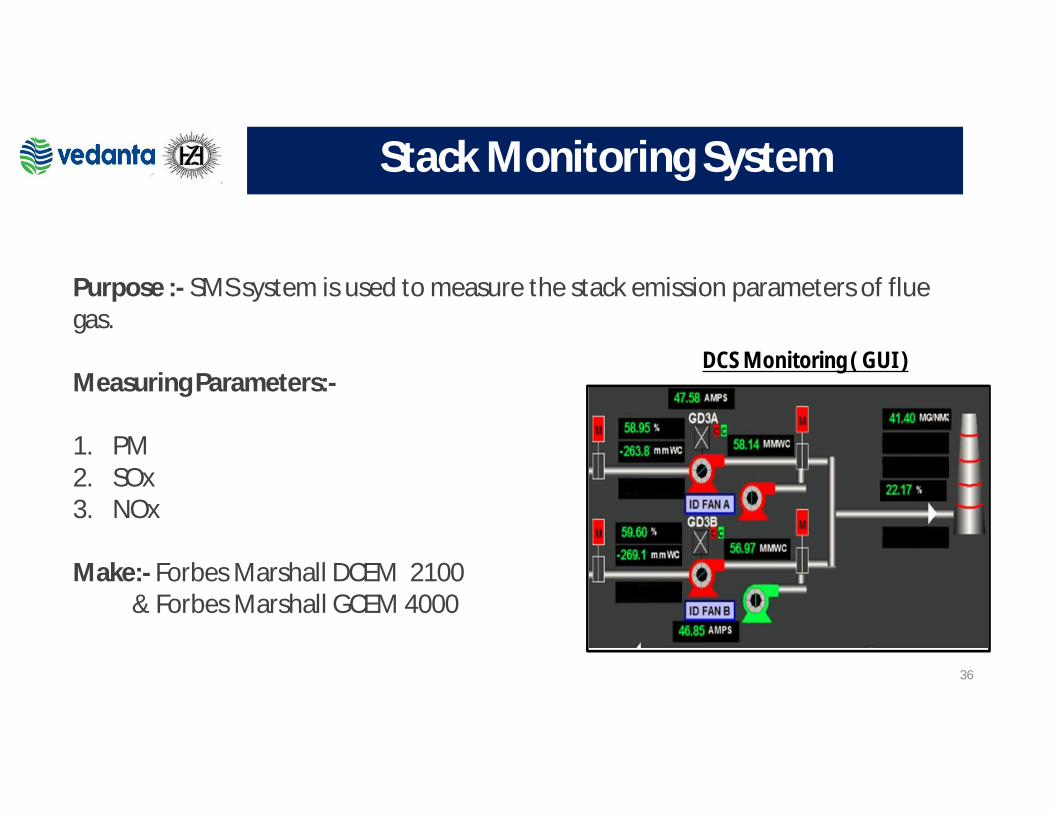
Stack Monitoring System
Purpose :- SMS system is used to measure the stack emission parameters of flue gas.
Measuring Parameters:-
1. PM2. SOx3. NOx
Make:- Forbes Marshall DCEM 2100 & Forbes Marshall GCEM 4000
DCS Monitoring ( GUI )

37
Blow Down Analyser
Purpose :- This system is used to measure the water quality of blow down system.
Measuring Parameters:-
1. TSS2. pH
Make/Vendor:- ABB, I scan/ Axis Nano
TSS Analyser

38
Environmental Solutions Implemented
1. 100 % utilisation of Fly Ash & Bottom ash.
2. Zero waste water discharge.
3. Implementation of Ammonia Flue Gas Conditioning System to control SPM emission.
4. Implementation of Rain Water Harvesting System at 3 locations inside the plant area.
5. Regular monitoring of air quality in and around the plant.
6. To control and minimize the fugitive air pollution at coal handling plant, dust
extraction system has been provided in all the transfer towers as well as crusher
house. Dust Suppression system has been provided at Coal yard & Ash SILO area for
suppression of coal & ash dust.
7. Blow down water usage for plantation and green belt management.

39
Way Forward
• Installation of Variable frequency drives for ID, FD & PA Fans.
• Installation of Flue gas Desulphurizer to reduce SOx emission.

Thank you !
40