hindustan zinc limited - greenbusinesscentre.com award... · hindustan zinc limited ... optimized...
TRANSCRIPT

HINDUSTAN ZINC LIMITEDRAMPURA AGUCHA MINE
National Energy Award for Excellence in Energy Management
Presented By
R S SarupriaAGM (EOHS)
R P GovilAGM (Electrical)
ISO-9001,14001, OHSAS-18001 , SA-8000 & 5S Certified Unit and Four Star Rating for Safety & Health by British Safety Council
HINDUSTAN ZINC LIMITEDRAMPURA AGUCHA
Open Cast Lead and Zinc Mechanized Mine

Hindustan Zinc is India’s largest and the world’s second largest integrated producer of zinc & lead, with a global share of approximately 6.0% in zinc.
VISION
Be a world-class company, creating value, leveraging mineral resources and related core competencies
MISSIONq Be a globally lowest cost zinc producer, maintaining market leadership
q One million tonne Zinc-Lead metal capacity by 2010.
q Be innovative, customer oriented, and eco-friendly
q maximizing stake-holder value.
Hindustan Zinc Limited
Hindustan Zinc –Mining AssetsRajpura Dariba Mine
Lead-Zinc R&R: Reserves 7.85 Mt Resources: 53.36 MtReserve Grade Zn: 3.66% Reserve Grade Pb: 1.95% Ore Production Capacity:1.2 mtpaCPP: 80 MW
Zawar Mining Complex
Rampura Agucha Mine
Lead-Zinc Ore R&R: Reserves: 75.71 MtResources: 44.65 MtReserve Grade Zn: 14.23% Reserve Grade Pb: 1.99%Ore Production Capacity:6.15 mtpa.
Lead-Zinc Ore R&R:Reserves: 7.80 Mt Resources: 34.41 MtReserve Grade Zn: 6.25% Reserve Grade Pb: 1.40%Ore Production Capacity: 0.9 mtpa.
Sindesar Khurd Mine
Lead-Zinc Ore R&R:Reserves: 10.74 Mt Resources: 50.08 MtReserve Grade Zn: 5.45% Reserve Grade Pb: 2.95%Ore Production Capacity:0.3 mtpa. Will increase to 1.5mtpa
Note: Map not to scale
Resources: 9.01 Mt, Avg: 10.6%, Zn,1.7% Pb0.35 mtpa Capacity
Kayar Mine (Planned)Rock Phosphate Mine0.18 mtpa Capacity
Maton Mine
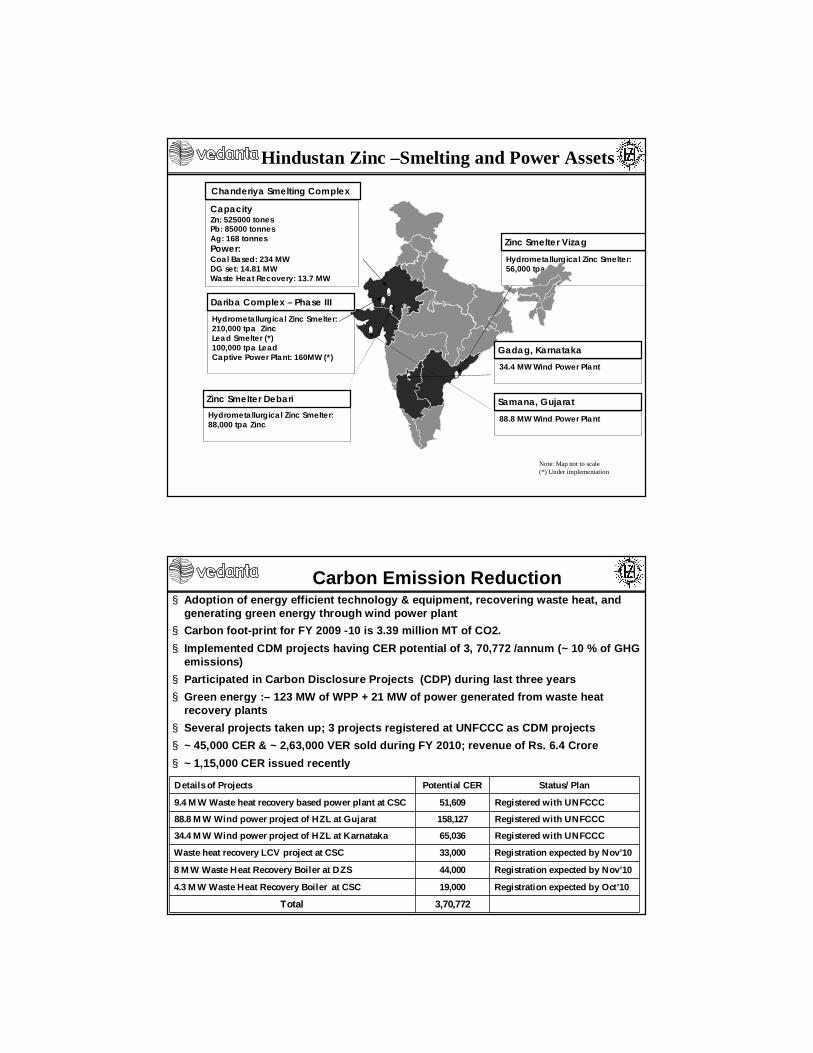
Hindustan Zinc –Smelting and Power Assets
Dariba Complex – Phase III
Chanderiya Smelting Complex
Zinc Smelter Debari
CapacityZn: 525000 tones Pb: 85000 tonnesAg: 168 tonnesPower:Coal Based: 234 MWDG set: 14.81 MWWaste Heat Recovery: 13.7 MW
Hydrometallurgical Zinc Smelter: 210,000 tpa ZincLead Smelter (*)100,000 tpa Lead Captive Power Plant: 160MW (*)
Hydrometallurgical Zinc Smelter: 56,000 tpa Zinc
Hydrometallurgical Zinc Smelter: 88,000 tpa Zinc
Zinc Smelter Vizag
88.8 MW Wind Power Plant
Samana, Gujarat
34.4 MW Wind Power Plant
Gadag, Karnataka
Note: Map not to scale(*) Under implementation
Details of Projects Potential CER Status/ Plan
9.4 MW Waste heat recovery based power plant at CSC 51,609 Registered with UNFCCC
88.8 MW Wind power project of HZL at Gujarat 158,127 Registered with UNFCCC
34.4 MW Wind power project of HZL at Karnataka 65,036 Registered with UNFCCC
Waste heat recovery LCV project at CSC 33,000 Registration expected by Nov’10
8 MW Waste Heat Recovery Boiler at DZS 44,000 Registration expected by Nov’10
4.3 MW Waste Heat Recovery Boiler at CSC 19,000 Registration expected by Oct’10
Total 3,70,772
§ Adoption of energy efficient technology & equipment, recovering waste heat, and generating green energy through wind power plant
§ Carbon foot-print for FY 2009 -10 is 3.39 million MT of CO2. § Implemented CDM projects having CER potential of 3, 70,772 /annum (~ 10 % of GHG
emissions)§ Participated in Carbon Disclosure Projects (CDP) during last three years§ Green energy :– 123 MW of WPP + 21 MW of power generated from waste heat
recovery plants§ Several projects taken up; 3 projects registered at UNFCCC as CDM projects§ ~ 45,000 CER & ~ 2,63,000 VER sold during FY 2010; revenue of Rs. 6.4 Crore§ ~ 1,15,000 CER issued recently
Carbon Emission Reduction

Renewable Energy
• Towards our efforts to produce green energy, 123.2 MW of wind power plants have been installed and commissioned at Gujarat and Karnataka.
• We have obtained United Nations Framework Convention on Climate Change (UNFCCC) registration for both of our wind power plants
Total wind power capacity 123.2 MW88.8 MW commissioned in Samana, Gujarat34.4 MW commissioned in Gadag, Karnataka
Replacement of Thermal Energy with RES• HZL is aiming to generate 21 MW through waste heat recovery. • Presently we have 16.7 MW of power generation capacity from our waste
heat recovery plants at Chanderiya and Debari unit and have obtained United Nations Framework Convention on Climate Change (UNFCCC) registration for above project.
RAM – An overview
Mining(Drilling, Blasting, Loading
And Hauling)
Crushing(Primary Secondary
& Tertiary)
Beneficiation(Ore Concentrating)
Dispatch(To Smelters)
World Class AssetüLargest Zinc Mine in WorldüOne of the lowest cost zinc mineüModern efficient mining operation

RAM – An overviewCommissioned : 1991 (0.9 Mtpa)
Ore Production : 6.15 mtpa (2009-10)
Ore Beneficiation : 6.50 mtpa (2009-10)
Power Requirement : 50 MW/Year
Reserve & Resource : 120.36 Million Ton
(As on 1/4/2010) 13.69% Zn,1.95% Pb
Machineries Capacity
Mine
Dumper : 95 MT, 240 MT
Excavator : 15 m3, 34 m3
Mill
SAG Mill : 3 nos
Ball Mill : 6 nos
Cont..
Ranking of Mines
2010
Note: All figures are in Kt Zn metalsSource: Brook Hunt 2010 Q1
Rampura Agucha - Largest Zinc Mine in the world Rampura Agucha
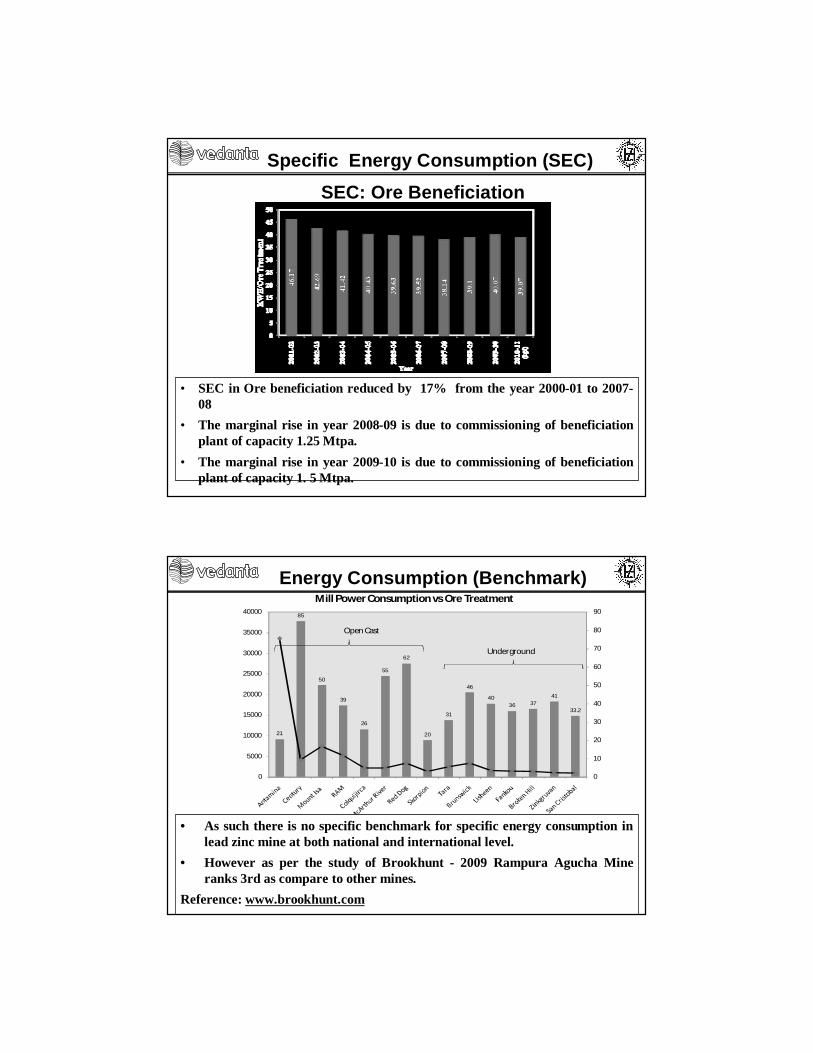
Specific Energy Consumption (SEC)
• SEC in Ore beneficiation reduced by 17% from the year 2000-01 to 2007-08
• The marginal rise in year 2008-09 is due to commissioning of beneficiation plant of capacity 1.25 Mtpa.
• The marginal rise in year 2009-10 is due to commissioning of beneficiation plant of capacity 1. 5 Mtpa.
SEC: Ore Beneficiation
21
85
50
39
26
55
62
20
31
46
4036 37
41
33.2
0
10
20
30
40
50
60
70
80
90
0
5000
10000
15000
20000
25000
30000
35000
40000
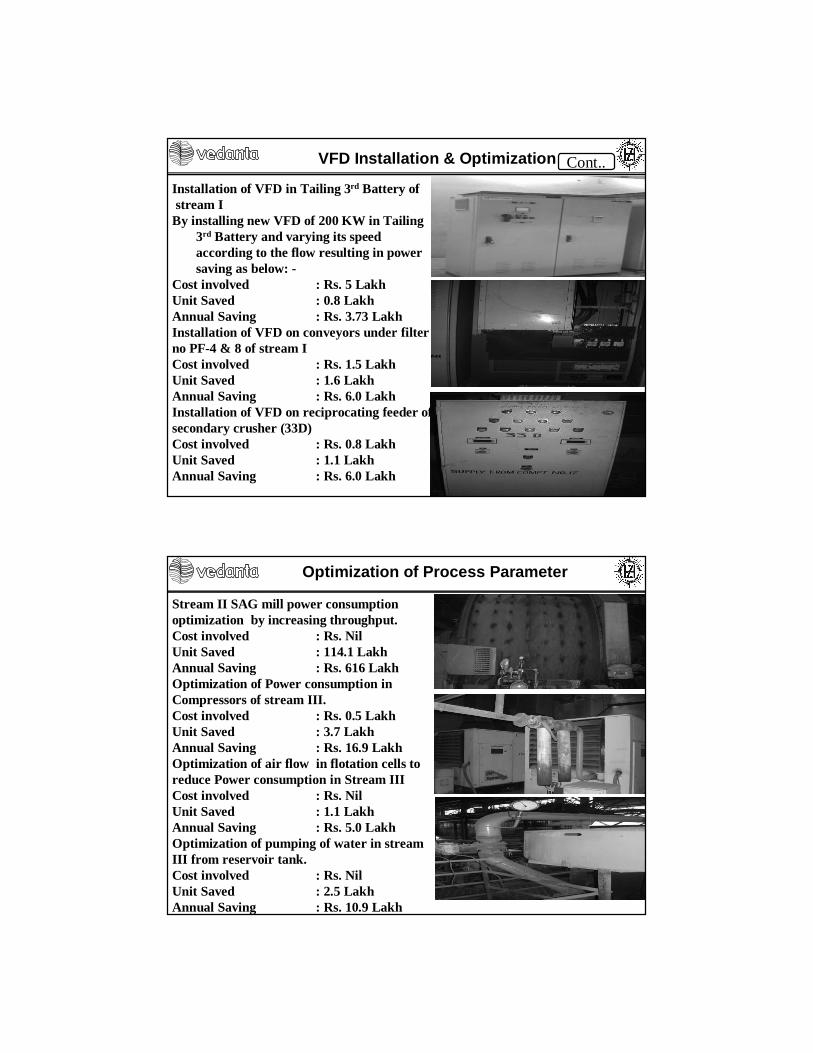
Mill Power Consumption vs Ore Treatment
Mill Power Consumed kwh/ t Ore Treated kt
Open Cast
Underground
• As such there is no specific benchmark for specific energy consumption in lead zinc mine at both national and international level.
• However as per the study of Brookhunt - 2009 Rampura Agucha Mine ranks 3rd as compare to other mines.
Reference: www.brookhunt.com
Energy Consumption (Benchmark)

q Energy Policy formulation
q External & Internal Energy Audits
q Implementation of effective energy monitoring system
q Generation of daily MIS and structured reporting system.
q Implementation of energy improvement projects scheme
q Installation of variable frequency drives (VFD) & its optimization
q Installation, Replacement & Modification in existing energy
consuming equipments.
q Enhancement in capacity utilization of machineries/equipment
q Optimization of process parameters
q Better maintenance planning and use of latest condition monitoring
tools.
q Capacity expansion of Zn-Pb beneficiation plant
Road Map to Achieve Global Best
Installation of Vertical Turbine (VT) pump at Banas Pump House
Storage at SahapuraReservoir
Storage at BanasReservoir
Pumping From Radial Well
Storage at RA Mine Reservoir
Water pumping from Banas pumping station to Shapura pumping station.q Pumping of water from radial well to reservoir at Banas.q Pumping of water from Banas Reservoir to Shahpura pump house reservoir.Improvement Actionq Installation of Vertical Turbine pump to obtain single stage pumpingq Higher efficiency pump was installed to consume less power.
Cost involved : Rs. 1.2 milionUnit Saved : 0.98 millionAnnual Saving : Rs 5.2 million
Installation, Replacement & Modification
Before
Present Pumping From Radial Well Storage at
Sahapura Reservoir

Project: Reduction of Specific LT power consumption in stream III compressorsTechnical Details:
Before modificationq Loading % of 132 KW : 75q Loading % of 90 KW : 35
After Modificationq Loading % of 132 KW :
83q Loading % of 90 KW : 0Benefits:
qReduce the LT power consumption q Complete Stoppage of 90 KW compressorq Complete elimination of spare consumption and maintenance cost of 90 KW compressor.q Additional option for dryer usage.
Cost involved : Rs. 0.35 LakhUnit Saved : 1.8 LakhAnnual Saving : Rs. 8.2 Lakh
Energy Audit: Project ImplementedEnergy Audit by CII: CII has conducted energy audit for all the three streams and recommended various measures.
Optimized the power consumption in all cooling tower pumps by installing VFD
Ball Mills cooling
Gear Box Cooling
Oil cooling Hot Well Sump
q Flow Optimization across each userq Maintaining of temp diff. around 4 – 60C depending on critical requirementq VFD Installation to the pumpq Maintaining constant pressure
Cost involved : Rs. 1.25 LakhUnit Saved : 1.1 LakhAnnual Saving : Rs. 6.16 Lakh
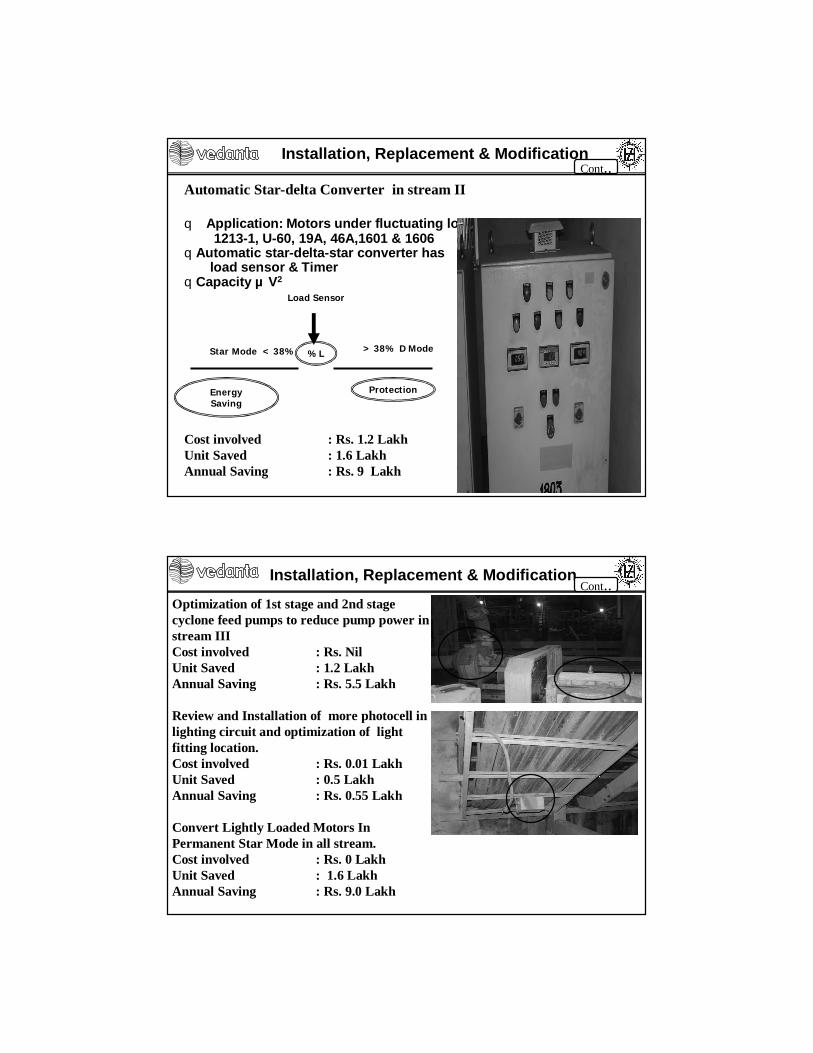
VFD Installation & Optimization
VFD Installation & Optimization
Installation of VFD in Tailing 3rd Battery ofstream I
By installing new VFD of 200 KW in Tailing 3rd Battery and varying its speed according to the flow resulting in power saving as below: -
Cost involved : Rs. 5 LakhUnit Saved : 0.8 LakhAnnual Saving : Rs. 3.73 LakhInstallation of VFD on conveyors under filter no PF-4 & 8 of stream ICost involved : Rs. 1.5 LakhUnit Saved : 1.6 LakhAnnual Saving : Rs. 6.0 LakhInstallation of VFD on reciprocating feeder of secondary crusher (33D)Cost involved : Rs. 0.8 LakhUnit Saved : 1.1 LakhAnnual Saving : Rs. 6.0 Lakh
Cont..
Stream II SAG mill power consumption optimization by increasing throughput.Cost involved : Rs. NilUnit Saved : 114.1 LakhAnnual Saving : Rs. 616 LakhOptimization of Power consumption in Compressors of stream III.Cost involved : Rs. 0.5 LakhUnit Saved : 3.7 LakhAnnual Saving : Rs. 16.9 LakhOptimization of air flow in flotation cells to reduce Power consumption in Stream IIICost involved : Rs. NilUnit Saved : 1.1 LakhAnnual Saving : Rs. 5.0 LakhOptimization of pumping of water in stream III from reservoir tank.Cost involved : Rs. NilUnit Saved : 2.5 LakhAnnual Saving : Rs. 10.9 Lakh
Optimization of Process Parameter

Optimization of fans and Interlocking of dust disposal pump with dust draft fan – Primary & Secondary crusher
Cost involved : Rs. 2.0 LakhUnit Saved :2.6 LakhAnnual Saving : Rs. 14 Lakh
Installation, Replacement & Modification
Conveyor
U 56, U 71
Venturi
scrubberU 48, Draft fan 90 kW
Sy.crusher, Tertiary
U 56, U 71
Venturi
scrubberU 77, Draft fan 160 kW
Disposal tank
Raw water pipe line
MCC
MCC
MCC
Motor
Interlock
Primary dust disposal pump
Cont..
Installation Energy Saver to Optimize Lighting Voltage at 210 VLighting LoadqPower Consumption Depends Directly on Voltage Applied
qIllumination reduces slightly with reduction in Voltage
Lowering the voltage by 10% resulted in
qSmall reduction (1 to 2%) in illumination
qProportional ( 10% ) reduction in power consumption.
qImproved life of Lamps
Cost involved : Rs. 1.0 LakhUnit Saved : 1.8 LakhAnnual Saving : Rs. 9.5 Lakh
Installation, Replacement & ModificationCont..
Automatic Star-delta Converter in stream II
q Application: Motors under fluctuating load1213-1, U-60, 19A, 46A,1601 & 1606
qAutomatic star-delta-star converter has load sensor & Timer
qCapacity ∝ V2
Cost involved : Rs. 1.2 LakhUnit Saved : 1.6 LakhAnnual Saving : Rs. 9 Lakh
Installation, Replacement & Modification
Energy Saving
Protection
%LStar Mode < 38% > 38% ∆ Mode
Load Sensor
Cont..
Installation, Replacement & Modification
Optimization of 1st stage and 2nd stage cyclone feed pumps to reduce pump power in stream IIICost involved : Rs. NilUnit Saved : 1.2 LakhAnnual Saving : Rs. 5.5 Lakh
Review and Installation of more photocell in lighting circuit and optimization of light fitting location.Cost involved : Rs. 0.01 LakhUnit Saved : 0.5 LakhAnnual Saving : Rs. 0.55 Lakh
Convert Lightly Loaded Motors In Permanent Star Mode in all stream.Cost involved : Rs. 0 LakhUnit Saved : 1.6 LakhAnnual Saving : Rs. 9.0 Lakh
Cont..
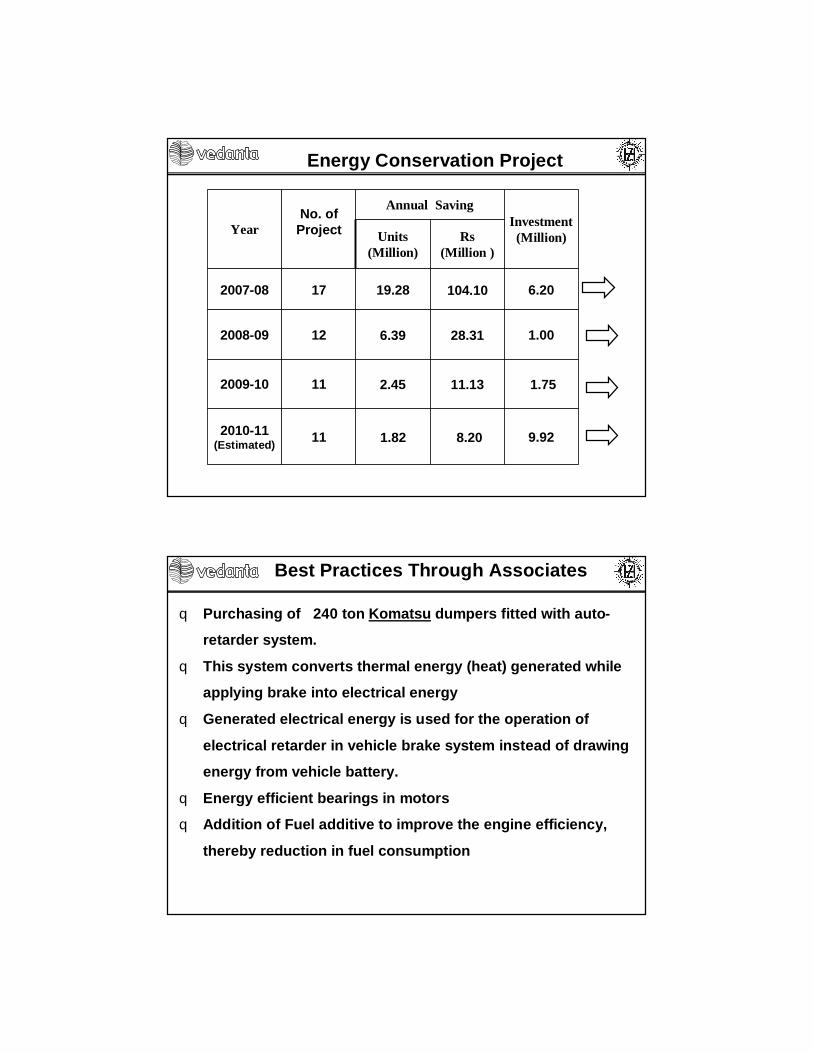
YearNo. of
Project
Annual SavingInvestment
(Million)Units (Million)
Rs(Million )
2007-08 17 19.28 104.10 6.20
2008-09 12 6.39 28.31 1.00
2009-10 11 2.45 11.13 1.75
2010-11(Estimated) 11 1.82 8.20 9.92
Energy Conservation Project
Best Practices Through Associates
q Purchasing of 240 ton Komatsu dumpers fitted with auto-
retarder system.
q This system converts thermal energy (heat) generated while
applying brake into electrical energy
q Generated electrical energy is used for the operation of
electrical retarder in vehicle brake system instead of drawing
energy from vehicle battery.
q Energy efficient bearings in motors
q Addition of Fuel additive to improve the engine efficiency,
thereby reduction in fuel consumption
Employees Involvement & Team Work SystemEmployees Involvement
q Training: on energy conservation and environmental awareness q Audit: Internal & External energy auditq Improvement Project: Promoting more and more energy
conservation projects and rewarding the project teamq Workshop: Participation in technical workshop relevant to
energy conservation (eg OEM)q Othersq Periodic circulation of Do’s and Don’ts for the effective use of
power at colony and mines, Banners and Posters.Team WorkMost of the energy projects are executed by inter departmental
team
Monitoring & Reporting Systemsq Energy conservation projects are reviewed on monthly basisq There is a standard format for registering a energy project. q Periodic monitoring are done as per the milestone setup for the
project.q The monitoring of projects is governed by the project head along
with the respective department headq The time schedule and methodology adopted for monitoring is
decided by the project leaderq The reporting system for projects at unit level is operational review
(OR) meeting chaired by unit headq At corporate level project report is presented on monthly basis in
front of COO of company by corporate EOHS head.Sample Reporting Format
S.No Activity Potential
(KWH) Owner Remarks

Vendors/ Associates & Recognitions
Energy Conservation Technology/ AuditsEnergy Audits by Confederation of Indian Industries (CII)VendorsABBSiemensL&TCGL etc.
Recognitionsq CII-National Award for Excellence in Water Management, 2009q Energy Award in 20th Mine Environment and Mineral Conservation
Week, 2010.q Golden Peacock Environment Management Award, 2009q National Energy Conservation Award, 2006q FIMI Environmental Excellence Award, 2007 q Greentech Environment Gold Award, 2007
National Energy AwardExcellence Water Management Award
Recognitions
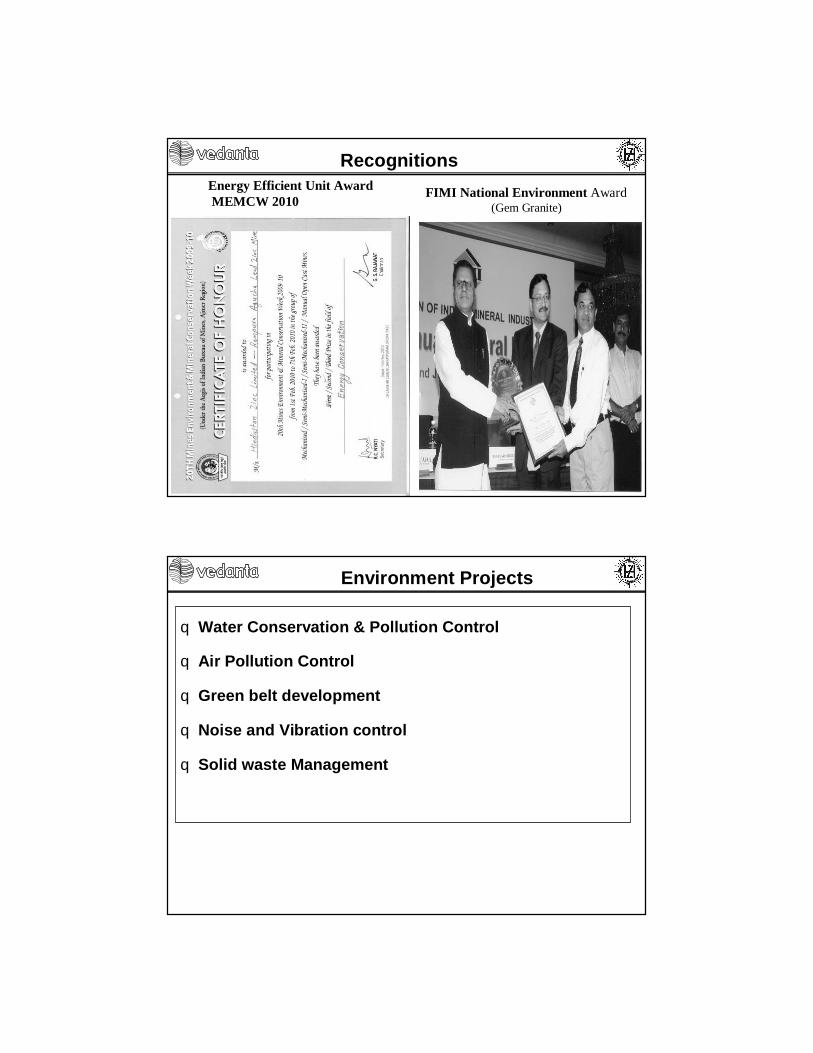
FIMI National Environment Award (Gem Granite)
Energy Efficient Unit AwardMEMCW 2010
Recognitions
Environment Projects
qWater Conservation & Pollution Control
q Air Pollution Control
qGreen belt development
q Noise and Vibration control
q Solid waste Management

Water Conservation & Pollution Control
1.98
0.98
0.66
0.55
0
0.53
0.47 0.47
0.40
2003-04 2004-05 2005-06 2006-07 2007-08 2008-09 2009-10 2010-11(target)
q Continuous reduction in Specific water consumption. Whereas beneficiation plant capacity enhanced by more than 6.0 foldsqUse of Water Evaporation Retardant Chemical on tailing dam water surfaceqInstallation of 2 nos of STP at mine and colony.q Construction of reclaim reservoir of capacity 50000 m3.qAll spillages from the industrial area are collected recycle back to processqRecycling of mine pit & tailing dam water to reclaim reservoir
qGarland Drains around the mine pit and dump for collection and reuse of run off water.
q Maintaining zero discharge outside mine premises
Air Pollution Control Sources of Pollutionq Drilling & Blastingq Haulingq Crushing & Transportationq Concentrate Stock PileManagement Practicesq Wet drilling operationsq Use of chemical wetting agents for dust
suppression on haul roadsq Truck / dumper tyre washing system at weigh
bridgeq Dust extraction systems at primary, secondary
crusher and fine ore binsq Semi-Autogenous Grinding (SAG) Mill to
eliminate dry secondary and tertiary crushingq Covered conveyor belts q Mechanical road sweeperq Plantation on inactive waste dump benches
Before Chemical Treatment
After Chemical Treatment
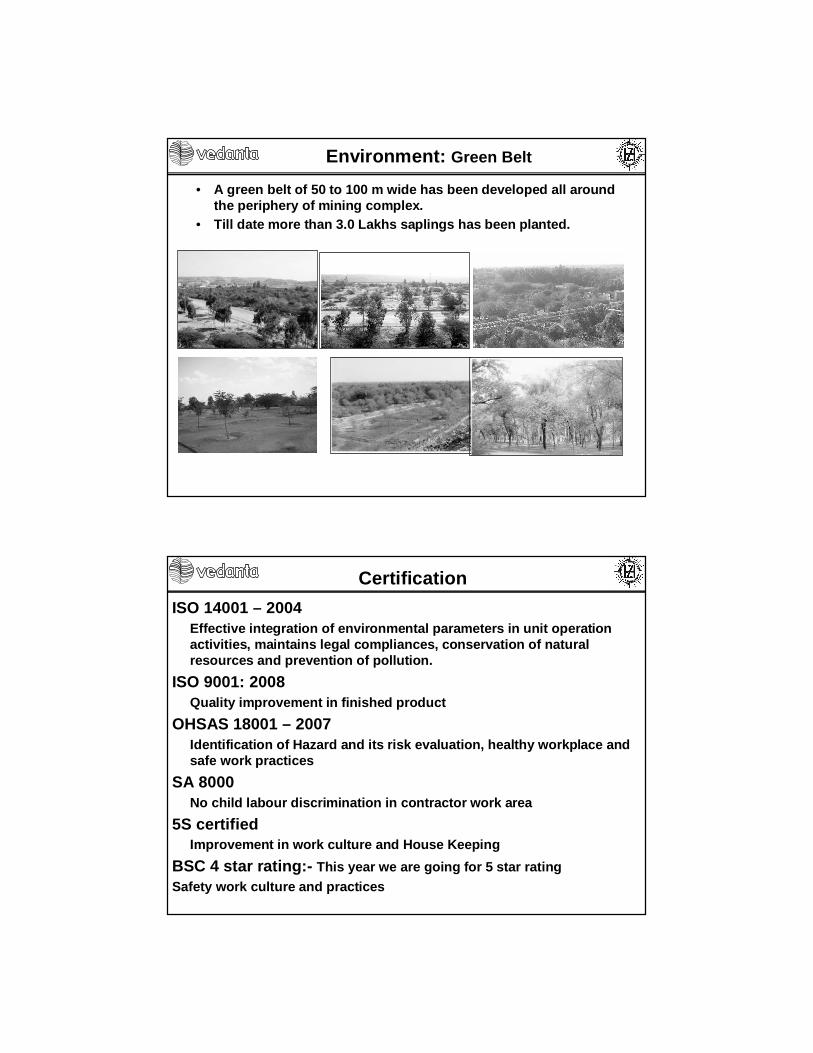
• A green belt of 50 to 100 m wide has been developed all around the periphery of mining complex.
• Till date more than 3.0 Lakhs saplings has been planted.
Environment: Green Belt
ISO 14001 – 2004Effective integration of environmental parameters in unit operation activities, maintains legal compliances, conservation of naturalresources and prevention of pollution.
ISO 9001: 2008Quality improvement in finished product
OHSAS 18001 – 2007Identification of Hazard and its risk evaluation, healthy workplace and safe work practices
SA 8000No child labour discrimination in contractor work area
5S certifiedImprovement in work culture and House Keeping
BSC 4 star rating:- This year we are going for 5 star ratingSafety work culture and practices
Certification

THANKS
Energy Conservation Project (2007-08)
S. No Projects
Annual Saving Investment Made Rs (million)
Payback Period
(month)Units
(million) Rs (million)
1 Water reclamation through open channel 4.08 22.0 2.15 1.2
2 SAG mill power optimization through throughput increase. 11.41 61.6 Nil 0
3By passing of regrinding mill discharge pump in case of idling of regrinding mill 0.20 1.1 0.03 1.2
4Lighting optimization in grinding & reagent area 0.33 1.8 0.025 1.2
5 Interlocking of DE fan and magnets 0.05 0.3 Nil 0
6Installation of VFD on conveyors under filter PF-4 & 8 0.16 0.9 0.15 1.2
7 Installation of VFD on feeder 33D 0.11 0.6 0.08 1.2
8Replacement of Existing Mill overhead Tank pump by energy efficient pumps 0.33 1.8 0.30 1.2
9 Installation of VT pump at Banas 0.98 5.3 1.2 1.2
10 Interlock the dust disposal pump with dust draft fan – Primary & Secondary crusher 0.26 1.4 0.2 1.2
Cond..
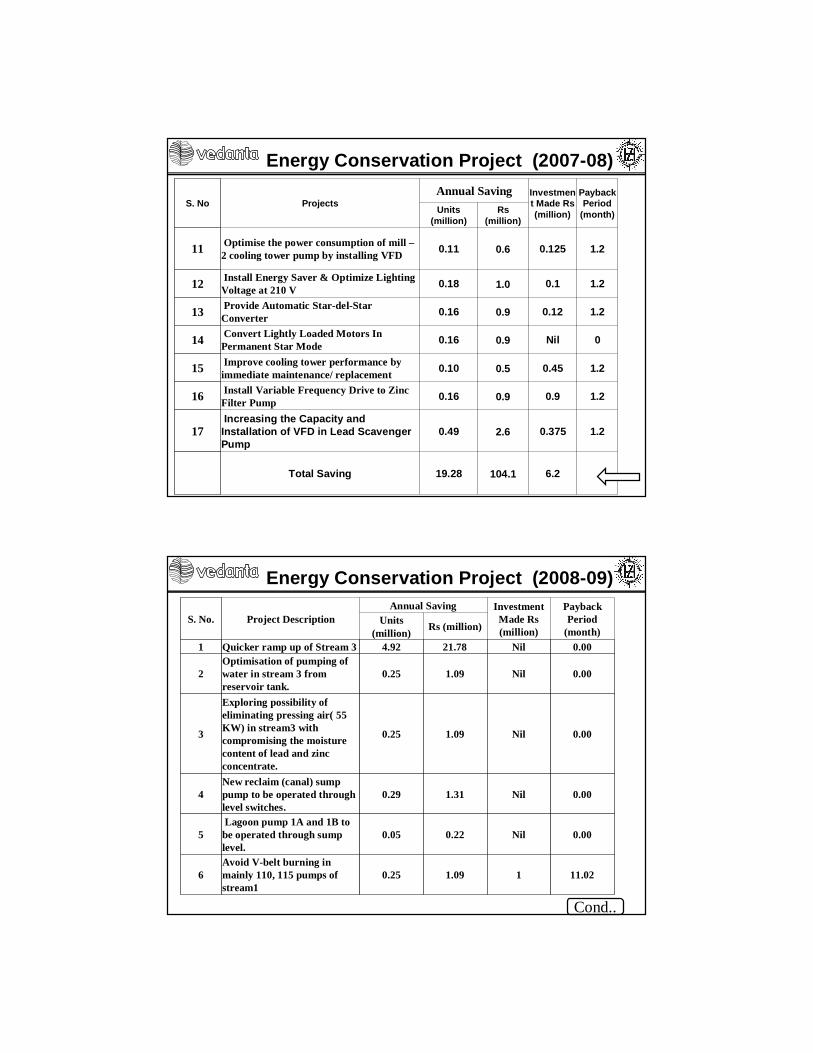
S. No ProjectsAnnual Saving Investmen
t Made Rs (million)
Payback Period
(month)Units (million)
Rs (million)
11 Optimise the power consumption of mill –2 cooling tower pump by installing VFD 0.11 0.6 0.125 1.2
12 Install Energy Saver & Optimize Lighting Voltage at 210 V 0.18 1.0 0.1 1.2
13 Provide Automatic Star-del-Star Converter 0.16 0.9 0.12 1.2
14 Convert Lightly Loaded Motors In Permanent Star Mode 0.16 0.9 Nil 0
15 Improve cooling tower performance by immediate maintenance/ replacement 0.10 0.5 0.45 1.2
16 Install Variable Frequency Drive to Zinc Filter Pump 0.16 0.9 0.9 1.2
17Increasing the Capacity and Installation of VFD in Lead Scavenger Pump
0.49 2.6 0.375 1.2
Total Saving 19.28 104.1 6.2
Energy Conservation Project (2007-08)
Energy Conservation Project (2008-09)
S. No. Project DescriptionAnnual Saving Investment
Made Rs (million)
Payback Period
(month)Units
(million) Rs (million)
1 Quicker ramp up of Stream 3 4.92 21.78 Nil 0.00
2Optimisation of pumping of water in stream 3 from reservoir tank.
0.25 1.09 Nil 0.00
3
Exploring possibility of eliminating pressing air( 55 KW) in stream3 with compromising the moisture content of lead and zinc concentrate.
0.25 1.09 Nil 0.00
4New reclaim (canal) sump pump to be operated through level switches.
0.29 1.31 Nil 0.00
5Lagoon pump 1A and 1B to be operated through sump level.
0.05 0.22 Nil 0.00
6Avoid V-belt burning in mainly 110, 115 pumps of stream1
0.25 1.09 1 11.02
Cond..

S. No. Project DescriptionAnnual Saving Investment
Made Rs (million)
Payback Period
(month)Units
(million) Rs (million)
7Streamlining of level switches in wherever VFD is installed
0.10 0.44 Nil 0.00
8Operation of 303 A./B pump and cooling tower fans to be optimized.
0.10 0.44 Nil 0.00
9 Making 1205 VFD on line 0.05 0.22 Nil 0.00
10
Identify the lightly loaded sump pump and convert them to permanent star connection.
0.05 0.22 Nil 0.00
11More photocell in lighting circuit, Relocation of light fittings.
0.05 0.22 Nil 0.00
12 Optimizing crusher conveyor area lighting . 0.05 0.22 Nil 0.00
Total Saving 6.39 28.31 1
Energy Conservation Project (2008-09)
Energy Conservation Project (2009-10)
S. No. Project DescriptionAnnual Saving Investment
Made Rs (million)
Payback (month)
Units (million) Rs (million)
1Optimisation of Power consumption in Compressors of stream3
0.37 1.69 0.05 0.35
2Modification of Present cooling Tower system in Stream3
0.11 0.52 0.1 2.30
3 Air audit of stream1 process and Instrument air. 0.30 1.37 0.6 5.3
4 Installation of Air compressor Exhaust Duct 0.03 0.13 0.1 9.4
5Reduction of existing power
consumption by maintaining BP throughput in Stream3
0.57 2.59 NIL 0
6 Installation of VFD in Tailing 3rd battery . 0.08 0.37 0.5 16.38
Cond..

S. No. Project DescriptionAnnual Saving Investment
Made Rs (million)
Payback (month)
Units (million) Rs (million)
7Optimisation of air in floation cells to reduce Power in Stream3
0.11 0.50 NIL 0
8
Optimisation of 1st stage and 2nd stage cyclone feed pumps to reduce pump power in stream3
0.12 0.55 NIL 0
9Reduction of power by avoiding double running of pumps in stream3.
0.15 0.68 NIL 0
10
Reduction in Running of Spillage Pumps to reduce power consumption in stream3
0.10 0.46 NIL 0
11 Energy audit for stream 1,2 & 3 0.50 2.28 0.4 1
Total 2.45 11.13 1.75
Energy Conservation Project (2009-10)
S. No Project DescriptionAnnual Saving Investment
Rs (million)Anticipated (Million) Rs (million)
1 VFD in lead Scavanger Concentrate Pump 1205 B (30 KW ) 0.03
0.14 0.15
2Star Delta converter in 1209 Lead III cleaner concentrate pump to save power . 0.05
0.23 0.10
3Running of One higher rating pump (110kw) instead of two pumps ( 90 Kw ) in 1310 A/B 0.288
1.30 0.30
4Installation of VFD in 25 Mtr thickener flocculant dosing pump to optimise running of pump. 0.006
0.03 0.03
5Installation of VFD in 55 Mtr thickener flocculant dosing pumpto optimise running of pump. 0.006
0.03 0.03
6 Optimisation of running hours of Sump Pump 1801 0.06
0.27
Energy Conservation Project (2010-11)
Cond..
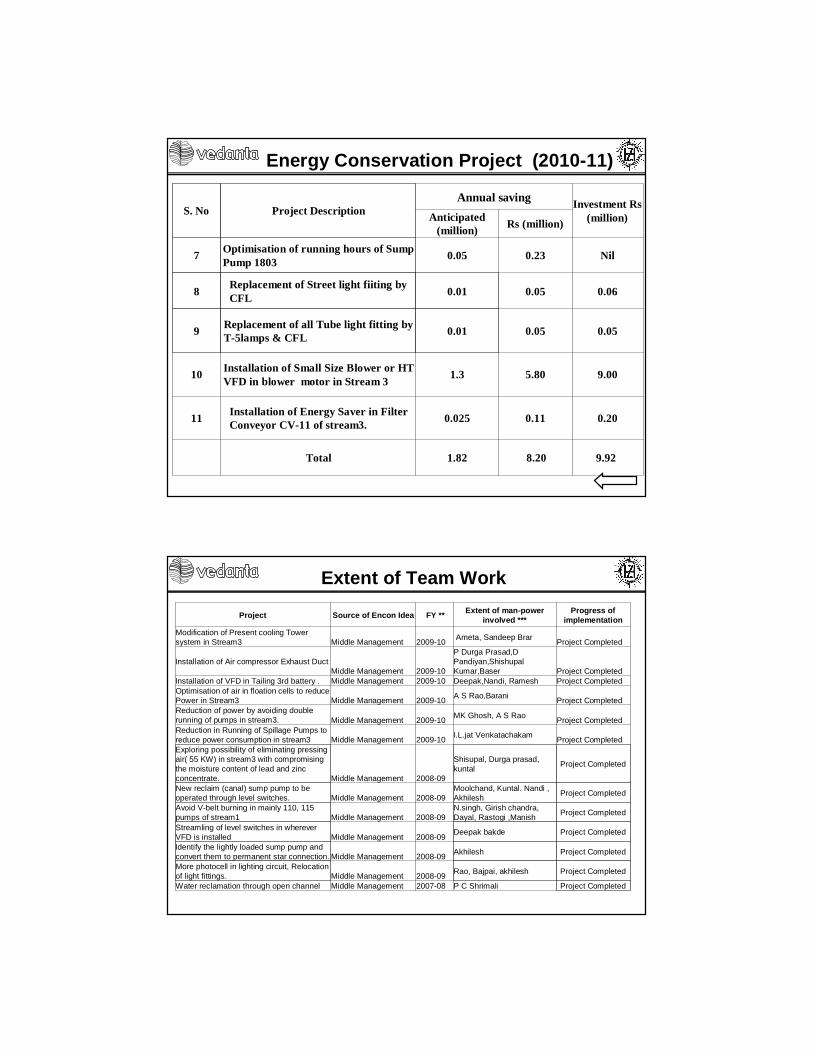
S. No Project DescriptionAnnual saving Investment Rs
(million)Anticipated (million) Rs (million)
7 Optimisation of running hours of Sump Pump 1803 0.05 0.23 Nil
8 Replacement of Street light fiiting by CFL 0.01 0.05 0.06
9 Replacement of all Tube light fitting by T-5lamps & CFL 0.01 0.05 0.05
10 Installation of Small Size Blower or HT VFD in blower motor in Stream 3 1.3 5.80 9.00
11 Installation of Energy Saver in Filter Conveyor CV-11 of stream3. 0.025 0.11 0.20
Total 1.82 8.20 9.92
Energy Conservation Project (2010-11)
Project Source of Encon Idea FY ** Extent of man-power involved ***
Progress of implementation
Modification of Present cooling Tower system in Stream3 Middle Management 2009-10 Ameta, Sandeep Brar Project Completed
Installation of Air compressor Exhaust DuctMiddle Management 2009-10
P Durga Prasad,D Pandiyan,Shishupal Kumar,Baser Project Completed
Installation of VFD in Tailing 3rd battery . Middle Management 2009-10 Deepak,Nandi, Ramesh Project CompletedOptimisation of air in floation cells to reduce Power in Stream3 Middle Management 2009-10 A S Rao,Barani Project CompletedReduction of power by avoiding double running of pumps in stream3. Middle Management 2009-10 MK Ghosh, A S Rao Project CompletedReduction in Running of Spillage Pumps to reduce power consumption in stream3 Middle Management 2009-10 I.L.jat Venkatachakam Project CompletedExploring possibility of eliminating pressing air( 55 KW) in stream3 with compromising the moisture content of lead and zinc concentrate. Middle Management 2008-09
Shisupal, Durga prasad, kuntal Project Completed
New reclaim (canal) sump pump to be operated through level switches. Middle Management 2008-09
Moolchand, Kuntal. Nandi , Akhilesh Project Completed
Avoid V-belt burning in mainly 110, 115 pumps of stream1 Middle Management 2008-09
N.singh, Girish chandra, Dayal, Rastogi ,Manish Project Completed
Streamling of level switches in wherever VFD is installed Middle Management 2008-09 Deepak bakde Project Completed
Identify the lightly loaded sump pump and convert them to permanent star connection. Middle Management 2008-09 Akhilesh Project Completed
More photocell in lighting circuit, Relocation of light fittings. Middle Management 2008-09 Rao, Bajpai, akhilesh Project Completed
Water reclamation through open channel Middle Management 2007-08 P C Shrimali Project Completed
Extent of Team Work
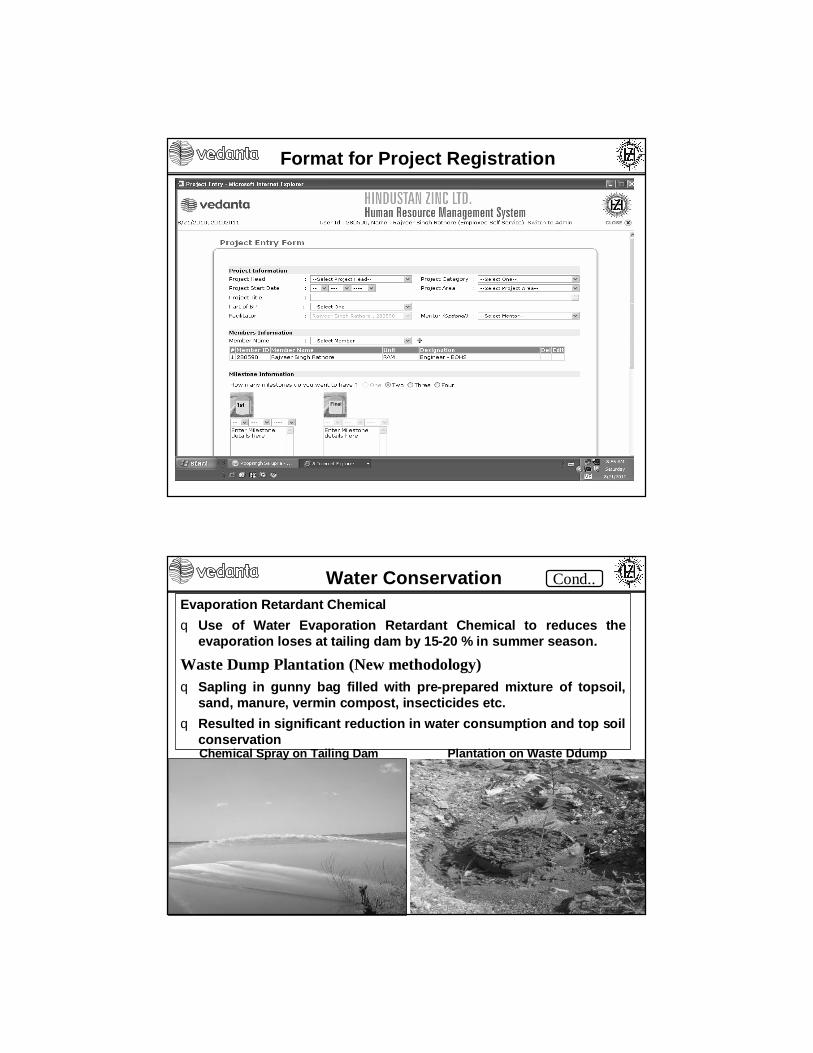
Format for Project Registration
Water ConservationEvaporation Retardant Chemicalq Use of Water Evaporation Retardant Chemical to reduces the
evaporation loses at tailing dam by 15-20 % in summer season.
Waste Dump Plantation (New methodology)q Sapling in gunny bag filled with pre-prepared mixture of topsoil,
sand, manure, vermin compost, insecticides etc. q Resulted in significant reduction in water consumption and top soil
conservationChemical Spray on Tailing Dam Plantation on Waste Ddump
Cond..

Water Conservation & Pollution Control
Source§ Mine Pit Water§ Run-off water from mine and waste dump area§ All spillages, overflows and other wash water§ Beneficiation Plant tailings§ Sewage Water§ Tailing Dam Control Measures• Mine water is pumped to reclaim water reservoir and gets recycled• Waste dump is being made in 5 lifts of 20 m with final slope of 27o
• Garland Drains around the mine pit and dump for collection and reuse of run off water
• All spillages from the industrial area are collected recycle back to process.• Beneficiation Plant tailings discharged in tailing dam, and supernatant
water reclaimed and reused in plant.• Treated sewage water is used for Plantation and Horticulture work,
maintaining zero discharge . • Clay lining at bottom of Tailing dam and LDPE lining on side embankment.
Cond..
Reclaim Reservoir Tailing Dam
Runoff Water Collection Sump Mechanical Road Sweeper
Industrial areaIndustrial Area Spillage Sump
Thickner Retrofitting
Water Conservation & Pollution Control
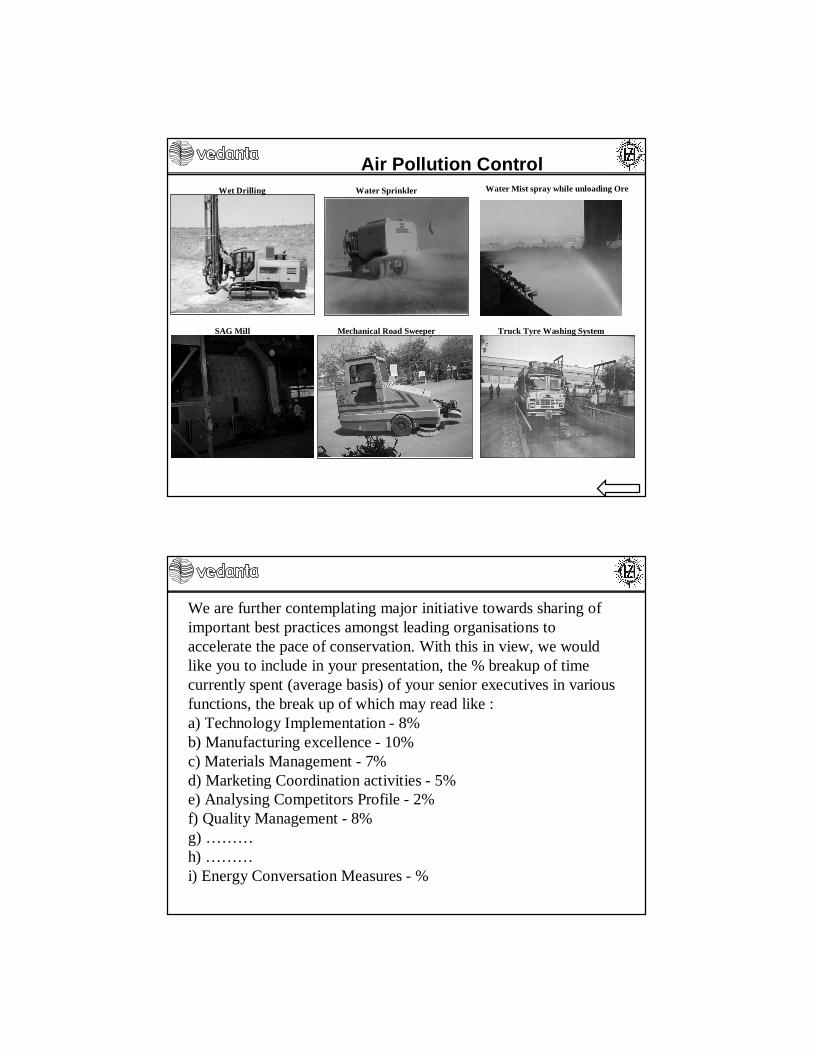
Wet Drilling Water Sprinkler Water Mist spray while unloading Ore
SAG Mill Mechanical Road Sweeper Truck Tyre Washing System
Air Pollution Control
We are further contemplating major initiative towards sharing ofimportant best practices amongst leading organisations to accelerate the pace of conservation. With this in view, we wouldlike you to include in your presentation, the % breakup of time currently spent (average basis) of your senior executives in various functions, the break up of which may read like : a) Technology Implementation - 8%b) Manufacturing excellence - 10%c) Materials Management - 7%d) Marketing Coordination activities - 5%e) Analysing Competitors Profile - 2%f) Quality Management - 8%g) ………h) ………i) Energy Conversation Measures - %