anti-inflammatory effects of metformin irrespective of ... filetreatment naive diabetes mellitus...
TRANSCRIPT

652
Metformin is the first-line drug in type 2 diabetes mellitus because compared with other type 2 diabetes mellitus
treatments, in both clinical trials and in observational studies,
metformin monotherapy is associated with fewer adverse car-diovascular events,1,2 and in some studies, a reduced risk of cancer.3 The reasons for this relative benefit are unclear, and
Clinical Track
Circulation Research is available at http://circres.ahajournals.org DOI: 10.1161/CIRCRESAHA.116.308445
Rationale: The diabetes mellitus drug metformin is under investigation in cardiovascular disease, but the molecular mechanisms underlying possible benefits are poorly understood.
Objective: Here, we have studied anti-inflammatory effects of the drug and their relationship to antihyperglycemic properties.
Methods and Results: In primary hepatocytes from healthy animals, metformin and the IKKβ (inhibitor of kappa B kinase) inhibitor BI605906 both inhibited tumor necrosis factor-α–dependent IκB degradation and expression of proinflammatory mediators interleukin-6, interleukin-1β, and CXCL1/2 (C-X-C motif ligand 1/2). Metformin suppressed IKKα/β activation, an effect that could be separated from some metabolic actions, in that BI605906 did not mimic effects of metformin on lipogenic gene expression, glucose production, and AMP-activated protein kinase activation. Equally AMP-activated protein kinase was not required either for mitochondrial suppression of IκB degradation. Consistent with discrete anti-inflammatory actions, in macrophages, metformin specifically blunted secretion of proinflammatory cytokines, without inhibiting M1/M2 differentiation or activation. In a large treatment naive diabetes mellitus population cohort, we observed differences in the systemic inflammation marker, neutrophil to lymphocyte ratio, after incident treatment with either metformin or sulfonylurea monotherapy. Compared with sulfonylurea exposure, metformin reduced the mean log-transformed neutrophil to lymphocyte ratio after 8 to 16 months by 0.09 U (95% confidence interval, 0.02–0.17; P=0.013) and increased the likelihood that neutrophil to lymphocyte ratio would be lower than baseline after 8 to 16 months (odds ratio, 1.83; 95% confidence interval, 1.22–2.75; P=0.00364). Following up these findings in a double-blind placebo controlled trial in nondiabetic heart failure (trial registration: NCT00473876), metformin suppressed plasma cytokines including the aging-associated cytokine CCL11 (C-C motif chemokine ligand 11).
Conclusion: We conclude that anti-inflammatory properties of metformin are exerted irrespective of diabetes mellitus status. This may accelerate investigation of drug utility in nondiabetic cardiovascular disease groups.
Clinical Trial Registration: Name of the trial registry: TAYSIDE trial (Metformin in Insulin Resistant Left Ventricular [LV] Dysfunction). URL: https://www.clinicaltrials.gov. Unique identifier: NCT00473876. (Circ Res. 2016;119:652-665. DOI: 10.1161/CIRCRESAHA.116.308445.)
Key Words: cardiovascular diseases ■ diabetes mellitus ■ heart failure ■ inflammation ■ metabolism ■ metformin ■ NF-kappa B
Original received February 3, 2016; revision received July 11, 2016; accepted July 13, 2016. In June 2016, the average time from submission to first decision for all original research papers submitted to Circulation Research was 13.08 days.
From the Division of Molecular and Clinical Medicine, Ninewells Hospital and Medical School (A.R.C., D.L., M.M., C.F., C.B., A.D.M., A.K.F.W., C.C.L., G.R.) and Division of Neuroscience, Ninewells Hospital and Medical School (D.J.K.B.), MRC Protein Phosphorylation and Ubiquitylation Unit, College of Life Sciences (K.S.), University of Dundee, Scotland, United Kingdom; Institute of Biotechnology, University of Helsinki, Finland (V.L.M., T.S., S.C.F.); INSERM U1016, Institut Cochin, CNRS UMR8104, Université Paris Descartes, Sorbonne Paris Cité, France (B.V., M.F.); and Institute of Infection, Immunity, and Inflammation, University of Glasgow, United Kingdom (V.L.M.).
Current address for C.B.: Institute of Biomedical and Clinical Science, University of Exeter Medical School, RILD Building (Level 4) Room 4.06, Barrack Road, Exeter EX2 5DW, United Kingdom.
Current address for K.S.: Nestlé Institute of Health Sciences SA, EPFL Innovation Park, Bâtiment G, 1015 Lausanne, Switzerland.The online-only Data Supplement is available with this article at http://circres.ahajournals.org/lookup/suppl/doi:10.1161/CIRCRESAHA.
116.308445/-/DC1.Correspondence to Chim C. Lang, MD, FACC, or Graham Rena, BSc, PhD, Division of Molecular and Clinical Medicine, Ninewells Hospital and
Medical School, University of Dundee, Dundee, Scotland DD1 9SY, United Kingdom. E-mail [email protected] or [email protected]© 2016 The Authors. Circulation Research is published on behalf of the American Heart Association, Inc., by Wolters Kluwer. This is an open access
article under the terms of the Creative Commons Attribution License, which permits use, distribution, and reproduction in any medium, provided that the original work is properly cited.
Anti-Inflammatory Effects of Metformin Irrespective of Diabetes Status
Amy R. Cameron, Vicky L. Morrison, Daniel Levin, Mohapradeep Mohan, Calum Forteath, Craig Beall, Alison D. McNeilly, David J.K. Balfour, Terhi Savinko, Aaron K.F. Wong,
Benoit Viollet, Kei Sakamoto, Susanna C. Fagerholm, Marc Foretz, Chim C. Lang, Graham Rena
by guest on Novem
ber 2, 2016http://circres.ahajournals.org/
Dow
nloaded from
by guest on Novem
ber 2, 2016http://circres.ahajournals.org/
Dow
nloaded from
by guest on Novem
ber 2, 2016http://circres.ahajournals.org/
Dow
nloaded from
by guest on Novem
ber 2, 2016http://circres.ahajournals.org/
Dow
nloaded from
by guest on Novem
ber 2, 2016http://circres.ahajournals.org/
Dow
nloaded from
by guest on Novem
ber 2, 2016http://circres.ahajournals.org/
Dow
nloaded from
by guest on Novem
ber 2, 2016http://circres.ahajournals.org/
Dow
nloaded from
by guest on Novem
ber 2, 2016http://circres.ahajournals.org/
Dow
nloaded from
by guest on Novem
ber 2, 2016http://circres.ahajournals.org/
Dow
nloaded from
by guest on Novem
ber 2, 2016http://circres.ahajournals.org/
Dow
nloaded from
by guest on Novem
ber 2, 2016http://circres.ahajournals.org/
Dow
nloaded from
by guest on Novem
ber 2, 2016http://circres.ahajournals.org/
Dow
nloaded from
by guest on Novem
ber 2, 2016http://circres.ahajournals.org/
Dow
nloaded from
by guest on Novem
ber 2, 2016http://circres.ahajournals.org/
Dow
nloaded from
by guest on Novem
ber 2, 2016http://circres.ahajournals.org/
Dow
nloaded from
by guest on Novem
ber 2, 2016http://circres.ahajournals.org/
Dow
nloaded from
by guest on Novem
ber 2, 2016http://circres.ahajournals.org/
Dow
nloaded from
by guest on Novem
ber 2, 2016http://circres.ahajournals.org/
Dow
nloaded from
by guest on Novem
ber 2, 2016http://circres.ahajournals.org/
Dow
nloaded from
by guest on Novem
ber 2, 2016http://circres.ahajournals.org/
Dow
nloaded from
by guest on Novem
ber 2, 2016http://circres.ahajournals.org/
Dow
nloaded from
by guest on Novem
ber 2, 2016http://circres.ahajournals.org/
Dow
nloaded from
by guest on Novem
ber 2, 2016http://circres.ahajournals.org/
Dow
nloaded from
by guest on Novem
ber 2, 2016http://circres.ahajournals.org/
Dow
nloaded from
by guest on Novem
ber 2, 2016http://circres.ahajournals.org/
Dow
nloaded from
by guest on Novem
ber 2, 2016http://circres.ahajournals.org/
Dow
nloaded from

Cameron et al Anti-Inflammatory Effects of Metformin 653
metformin’s molecular action is a vigorous area of current re-search.4–7 Metformin’s chemical properties include a strongly hydrophilic character, metal-binding properties, and a pK
a within
the physiological pH range.6–8 The key clinical hallmark of met-formin’s antihyperglycemic action is suppression of hepatocyte gluconeogenesis.4,5,9 The most likely cellular effect underlying this response is inhibition of mitochondrial enzymes, including complex I in the electron transport chain.10,11 More recently, mi-tochondrial glycerophosphate dehydrogenase has been suggested as an alternative target.12 Mitochondrial inhibition activates AMP-activated protein kinase (AMPK),13 and recent work suggests that duodenal AMPK contributes toward effects of the drug on hepatic glucose production.14 Other studies indicate that metformin also suppresses glucose production by AMPK-independent mecha-nisms,12,15,16 but more broadly, AMPK may still contribute to metformin-dependent regulation of other aspects of metabolic control, such as lipogenic gene expression.4
The mechanism(s) underlying metformin’s advantage in incidence of cardiovascular disease (CVD) are unlikely to de-pend on effects of the drug on hyperglycemia, which is con-trolled equally well by metformin and insulin secretagogues.2 In addition, in animals, metformin suppresses infarct size and adverse remodeling in diabetic and nondiabetic rodents17–21 and retards heart failure progression in nondiabetic dogs.22 A better understanding of such glucose-independent proper-ties might foster a more rational, less empirical exploitation of metformin in nondiabetic CVD. Inflammation, including nuclear factor-κB (NF-κB) signaling, is increasingly recog-nized as a significant contributing factor to diabetes mellitus (DM) and CVD,23,24 and several previous studies have found that metformin inhibits NF-κB signaling, including in vascu-lar tissue25 and recently in hepatocytes.26 In the current study, we have used multiple approaches, including human studies, to define anti-inflammatory actions of metformin that may be separated from its antihyperglycemic action.
MethodsAnimal and Cell StudiesMetformin and rapamycin came from calbiochem, 5-aminoimid-azole-4-carboxamide riboside (AICAR) and A769662 (Tocris), tumor necrosis factor-α (TNF-α) (e-bioscience), recombinant
CINC1/chemokine (C-X-C motif) ligand (CXCL) 1, C-C motif chemokine ligand (CCL)-11, interleukin (IL)-2, IL-4, stromal cell–derived factor and CCL22 (R&D systems), mouse IL-6 (Sigma), and recombinant mouse IL-1β (Life Technologies). The phospho–acetyl-CoA carboxylase Ser79 antibody was a generous gift from the DSTT (University of Dundee). The total acetyl-CoA carboxyl-ase (Cat. number 3662), total AMPKα (2603), phospho-AMPKα Thr172 (2535), total S6 (2217), phospho-S6 Ser240/244 (2215), total p70 S6 kinase (2708), phospho-p70 S6 kinase Thr389 (9205), phospho-Raptor Ser 792 (2083), phospho inhibitor of kappa B ki-nase (IKK) α/β Ser176/177 (2078), IKKα/β Ser176/180 (2697), total IκB, pNF-κB, total IKKα, and total IKKβ (NF-κB sampler kit 9936) antibodies were from CST. Antisheep horseradish per-oxidase (31480) and antirabbit horseradish peroxidase (31460) both came from Thermo and antimouse horseradish peroxidase was from Calbiochem (JA1200). BI605906 was generously gifted by Prof Sir Philip Cohen (Dundee).
Animal CareC57BL/6 female mice (Charles River; 8–41 weeks) were maintained under a 12 hours:12 hours light:dark cycle (holding room lights on at 06:00 and off at 18:00) at 22±1°C and 50% humidity. Mice had ad libitum access to standard chow diet (7.5% fat, 75% carbohydrate, and 17.5% protein by energy [RM1 diet; Special Diet Services]) and water. All animal care protocols and procedures were performed in accordance with current regulations.
Cell Culture and Lysis for ImmunoblottingAll cells were grown in an incubator at 37°C and 5% CO
2. Primary
mouse hepatocytes were extracted and maintained essentially as de-scribed previously.6,15
Bone marrow–derived macrophages (BMDMs) were grown from mouse bone marrow in RPMI 1640 medium supplemented with 10% fetal bovine serum (Life Technologies) and 10-ng/mL macrophage colony-stimulating factor (R&D systems). Cells were given fresh medium and growth factor on day 3 of culture. On day 6, BMDM cultures were supplemented with 100-ng/mL interferon γ (for M1 dif-ferentiation; R&D systems), 20-ng/mL IL-4 (for M2 differentiation; R&D systems), or 100-ng/mL lipopolysaccharide (for activation; premium grade from Sigma, expected to activate toll-like receptor [TLR]-2 and TLR4) in the presence or absence of drug treatments for the final 24 hours.
Before SDS-PAGE, cells were lysed by scraping into buffer A (50 mmol/L Tris acetate pH 7.5, 1% (wt/vol) Triton X100, 1 mmol/L EDTA, 1 mmol/L EGTA, 0.27 mol/L sucrose, 50 mmol/L NaF, 1 mmol/L sodium orthovanadate, 10 mmol/L β-glycerophosphate, 5 mmol/L sodium pyrophosphate, 1 mmol/L benzamidine, 0.2 mmol/L phenylmethylsulfonyl fluoride, and 0.1% (v/v) β-mercaptoethanol) and then prepared for SDS-PAGE as described in the previous work.6 Immunoblot densitometry for each antibody was performed with Image Studio Lite version 5.2 (LI-COR). Each blot is representative of experiments preformed at least 3×.
Glucose AssayTreatment of cells for hepatocyte glucose production was performed essentially as described previously, using primary mouse hepatocytes plated in 12-well plates (1.25×10⁵ cells per well).6,15,27 Glucose pro-duction was determined after a 12-hour incubation period in glucose-free DMEM (11966; Life Technologies) supplemented with 1% pen/strep, lactate (Sigma)/pyruvate (Life Technologies; 10:1 mmol/L), and 100 nmol/L dexamethasone (dex; Merck) with or without drugs/cytokines under investigation. At the end of the incubation period of 12 hours, 500 μl of medium was collected and glucose concentra-tion determined by GAGO assay (glucose [glucose oxidase]; Sigma) by a modified protocol scaled down to a 96-well plate format. Each column consists of data from at least 12 wells of cells, 6 each from 2 mice.
Real-Time-Polymerase Chain ReactionTotal RNA from primary mouse hepatocytes was extracted using QIAshredder (Qiagen) and Rneasy MINI KIT (Qiagen). cDNA was
Nonstandard Abbreviations and Acronyms
AICAR 5-aminoimidazole-4-carboxamide riboside
AMPK AMP-activated protein kinase
BMDM bone marrow–derived macrophages
BMI body mass index
CCL C-C motif chemokine ligand
CVD cardiovascular disease
CXCL chemokine (C-X-C motif) ligand
DM diabetes mellitus
FIRI Fasting Insulin Resistance Index
IR insulin resistant
NFκB nuclear factor κ-light-chain-enhancer of activated B cells
NLR neutrophil to lymphocyte ratio
TLR toll-like receptor
TNFα tumor necrosis factor-α
by guest on Novem
ber 2, 2016http://circres.ahajournals.org/
Dow
nloaded from

654 Circulation Research August 19, 2016
synthesized using RQ1 Rnase-Free Dnase kit (Promega) and ImProm-II Reverse Transcription System (Promega). Nucleospin RNA II Total RNA isolation kit (Macherey-Nagel) was used to isolate RNA from macrophages. cDNA was synthesized using High Capacity cDNA Reverse Transcription Kit (4368814, Thermo Fisher Scientific). Real-time polymerase chain reaction was performed using the 7900HT Fast Real-Time PCR System (Applied Biosystems) using TaqMan 2× Universal PCR Master Mix (Applied Biosystems) and primer/probes mixes as stated (Applied Biosystems). Primer sets used were as follows: IL-6 Mm00446190_m1, CXCL1 Mm04207460_m1, 18S Hs03003631_g1, IL-1β Mm00434228_m1, CXCL2 Mm00436450_m1, peroxisome proliferator–activated receptor-γ m01184322_m1, fatty acid synthase Mm00662319_m1, CCL22 Mm00436439_ml, CXCL12 Mm00445553_ml, TATA-binding protein Mm01277042_m1, and sterol regulatory element-binding protein 1c Mm00550338_m1. Cycling conditions were as follows: 50°C for 2 minutes, 95°C for 10 minutes, followed by 40 cycles of 95°C for 15 s and 60°C for 1 minute. Expression is expressed relative to 18s mRNA for hepatocytes and TATA-binding protein for macrophages (Applied Biosystems) using the 2-ΔΔCt method. Each column is composed of data from at least 3 separate experiments.
BMDM AnalysisBMDMs were harvested from culture plates using 4 mmol/L EDTA in PBS for 10 minutes at 37°C. Cells were washed in flow cytom-etry buffer (PBS with 2% fetal bovine serum and 1 mmol/L EDTA) and stained using the following antibodies (all BD Bioscience unless stated): F4/80 (BM8; e-bioscience), CD11c (HL3), CD206 (C068C2; Biolegend), CD69 (H1.2F3), and CD40 (3/23). Fc block (4.4G2) was included in all stains. Data were acquired on a LSR II flow cytometer (Becton Dickinson) and analyzed using FlowJo software (TreeStar). BMDM culture supernatants were collected after 24-hour treatment with the differentiation or activation conditions. Levels of cytokines were quantified by standard sandwich ELISA using paired antibody kits (e-bioscience).
Validation in Clinical PatientsWe validated the animal study findings in clinical patients utilizing 2 approaches: a retrospective population cohort study and a random-ized placebo-controlled study of metformin. All patients provided written informed consent to participate in these clinical studies that were approved the local ethics committee.
Population Cohort Study: Metformin Exposure in DM Patients and Neutrophil to Lymphocyte Ratio.In the population cohort study, we investigated whether the anti-in-flammatory signature of metformin could be detected in humans with DM, using the GoDARTS (Genetics of Diabetes Audit and Research in Tayside Scotland) DM register.28 We compared the effect of metfor-min and sulfonylureas on the neutrophil to lymphocyte ratio (NLR), a marker of inflammation derived from a combination of hematologi-cal components of the systemic inflammatory response29,30 that has recently been found to be a predictor of all-cause mortality and car-diac events.31 We analyzed data from type 2 diabetes mellitus patients recruited in Tayside, Scotland, UK, between October 1, 1997, and March 1, 2010. Of the 9205 subjects with DM within the GoDARTS study, we chose 3575 treatment naive patients who were either inci-dent metformin users or incident sulfonylurea users (but not both) and noninsulin users. Incident use meant at least 6 months before first observed metformin/sulfonylurea prescription date during which they were observable for drugs. Of these 670 patients (mean [SD]: age, 65 [11] years; 54% men) had derived NLR values both at base-line (up to 120 days before first metformin/sulfonylurea prescription) and follow-up (8–16 months after baseline). NLR was calculated as the ratio of the neutrophil:lymphocyte count, both obtained from the same blood sample. A total of 498 (74%) patients were treated with metformin and 172 (26%) with sulfonylurea. Multivariate linear and logistic regression models were run on the 8- to 16-month follow-up NLR against the treatment group, controlling for covariates including age, sex, and baseline NLR value.
Randomized Placebo-Controlled Study: Metformin Exposure and Cytokine Levels in Nondiabetic Heart Failure PatientsThe anti-inflammatory effects of metformin were investigated in a randomly selected subset of patients who had participated in a double-blind, placebo-controlled study (www.clinicaltrials.gov: NCT00473876) that had evaluated the impact of metformin on in-sulin resistant (IR) and exercise capacity in nondiabetic patients with congestive heart failure.32 Every patient had provided written informed consent before participation in this study, which was ap-proved by the East of Scotland Research Ethics Service. The subset of patients selected for this study involved 33 nondiabetic IR congestive heart failure patients (mean age, 63±7.0 years; men, 85%; New York Heart Association class I/II/III/IV, 04/28/01/0) who were randomized to receive either 4 months of metformin (n=20; 2 g/d) or matching placebo (n=13). IR was defined by a fasting insulin resistance index (FIRI) of ≥2.7. The effect of metformin on plasma inflammatory cy-tokines was examined by investigating changes from baseline to final visit after 4 months in the study.
Cytokine AssayHuman plasma was analyzed using the Bio-Plex Pro Human Chemokine 40-Plex Panel (171-AK99MR2, Bio-Rad). The assay was performed following the manufacturer’s instructions using the Bio-Plex 200 system (Bio-Rad). Freeze–thaw cycling of samples was avoided to prevent cytokine degradation, and they were diluted 1:4 (12.5 μL of plasma) for the assay.
Statistical AnalysesResults in bar graphs are expressed as mean±SEM. Comparisons be-tween groups were made by 1-way ANOVA with Dunnett or Tukey post hoc test using Prism. Differences were considered statistically significant if P<0.05: ***P<0.001, **P<0.01, and *P<0.05 unless otherwise stated. For studies on the plasma, statistical analyses of data were performed using SPSS 14.1. ANOVA and Pearson correla-tion coefficients were calculated.
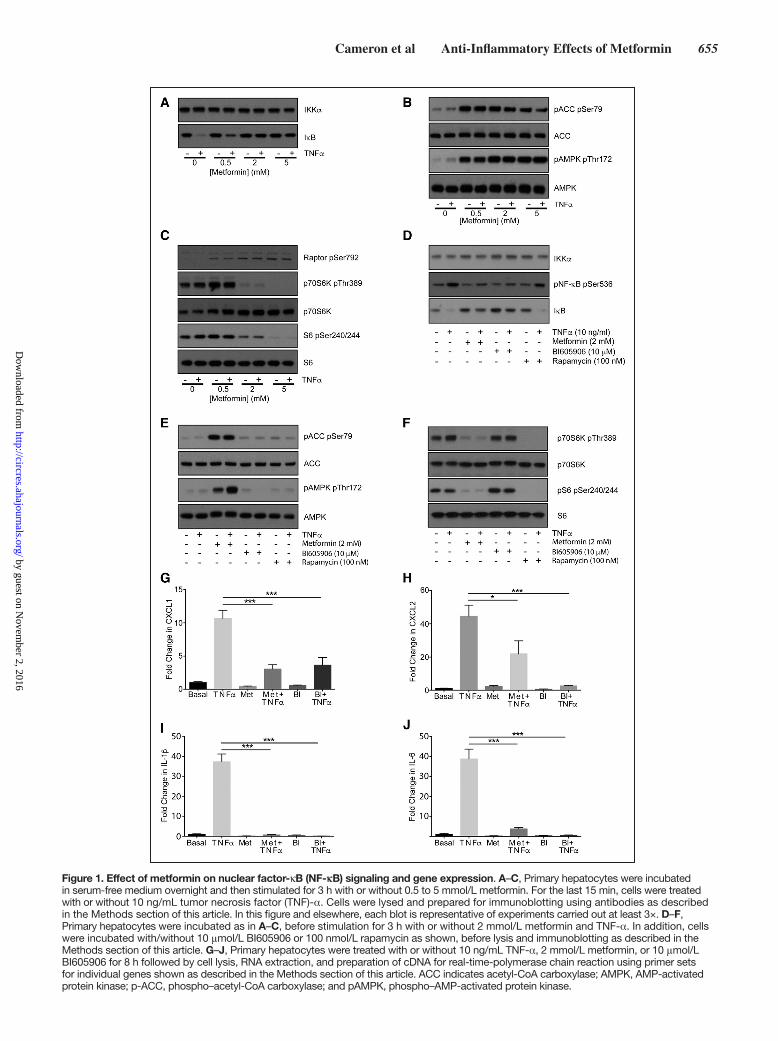
ResultsMetformin Inhibits TNF-α–Dependent NF-κB Inflammatory Signaling, Comparably With the Specific IKKβ Inhibitor BI605906In primary mouse hepatocytes, the main target of metformin’s antihyperglycemic effects, we compared metformin with the specific IKKβ inhibitor BI605906.33 Metformin treatment for 3 hours suppressed TNFα-induced degradation of the NF-κB negative regulator IκB, while modulating AMPK and mamma-lian target of rapamycin signaling in a dose-dependent man-ner (Figure 1A through 1C; all densitometry appears in the Online Data Supplement). The magnitude of the effect on IκB was comparable with BI605906 (Figure 1A and 1D). Unlike metformin, BI605906 did not suppress signaling downstream of mammalian target of rapamycin nor did it activate AMPK (Figure 1E and 1F). We were unable to detect any effect of rapamycin on NF-κB signaling either (Figure 1D), suggesting that the effect of metformin on NF-κB and mammalian tar-get of rapamycin occurs independently. Consistent with these signaling results, TNF-α–dependent expression of CINC-1/CXCL1, CXCL2, IL-1β, and IL-6 was strongly inhibited by both metformin and BI605906 (Figure 1G through 1J).
AMPK-Independent Regulation of NF-κB in Primary HepatocytesTo determine whether metformin directly regulated kinase activity that may mediate its effects on NF-κB signaling, a
by guest on Novem
ber 2, 2016http://circres.ahajournals.org/
Dow
nloaded from
Cameron et al Anti-Inflammatory Effects of Metformin 655
Figure 1. Effect of metformin on nuclear factor-κB (NF-κB) signaling and gene expression. A–C, Primary hepatocytes were incubated in serum-free medium overnight and then stimulated for 3 h with or without 0.5 to 5 mmol/L metformin. For the last 15 min, cells were treated with or without 10 ng/mL tumor necrosis factor (TNF)-α. Cells were lysed and prepared for immunoblotting using antibodies as described in the Methods section of this article. In this figure and elsewhere, each blot is representative of experiments carried out at least 3×. D–F, Primary hepatocytes were incubated as in A–C, before stimulation for 3 h with or without 2 mmol/L metformin and TNF-α. In addition, cells were incubated with/without 10 μmol/L BI605906 or 100 nmol/L rapamycin as shown, before lysis and immunoblotting as described in the Methods section of this article. G–J, Primary hepatocytes were treated with or without 10 ng/mL TNF-α, 2 mmol/L metformin, or 10 μmol/L BI605906 for 8 h followed by cell lysis, RNA extraction, and preparation of cDNA for real-time-polymerase chain reaction using primer sets for individual genes shown as described in the Methods section of this article. ACC indicates acetyl-CoA carboxylase; AMPK, AMP-activated protein kinase; p-ACC, phospho–acetyl-CoA carboxylase; and pAMPK, phospho–AMP-activated protein kinase.
by guest on Novem
ber 2, 2016http://circres.ahajournals.org/
Dow
nloaded from

656 Circulation Research August 19, 2016
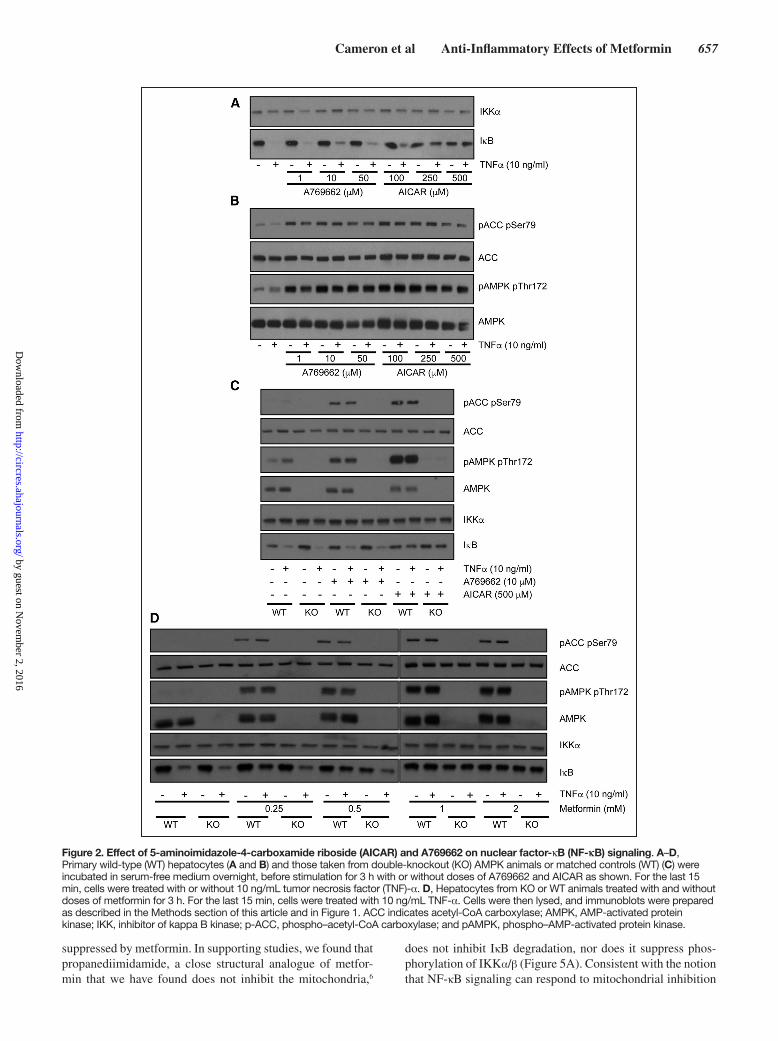
cell-free kinase profiling assay was performed. Metformin did not directly inhibit the upstream NF-κB regulator IKKβ, and most other kinases exhibited little, if any, inhibition by metformin and none were inhibited >50% (data available on the profiling website http://www.kinase-screen.mrc.ac.uk/). These results suggest that metformin is unlikely to exert ef-fects on NF-κB through direct IKKβ inhibition or inhibition of other kinases. The lack of effect of metformin on kinase activ-ity led us to explore the possibility that IκB regulation might occur as a consequence of AMPK activation,13 which occurs after mitochondrial inhibition by the drug.10,11 In side-by-side experiments, we treated primary hepatocytes with AICAR (an AMP mimetic) and A769662, a direct AMPK activator. Compared with AICAR, which suppressed IκB degradation, there was little, if any, effect of A769662 on IκB degrada-tion at the doses used (Figure 2A), but both agents induced phosphorylation of the AMPK substrate acetyl-CoA carbox-ylase (Figure 2B). To investigate possible reason(s) for this difference, we investigated primary liver cells from AMPK catalytic subunit-deficient mice.15 In these cells, AICAR still suppressed IκB degradation (Figure 2C), suggesting that AICAR effect is AMPK independent. Consistent with this, the effect of metformin on IκB signaling was similar in both genotypes (Figure 2D).
Dissociation of Anti-Inflammatory Responses From Effects of Metformin on Hepatic Glucose Production and Lipogenic Gene ExpressionMetformin’s main antihyperglycemic effect is to reduce he-patic glucose production. To determine whether metformin-regulated cytokines directly altered glucose production, we incubated hepatocytes with and without metformin, IL-6, IL-1β, CXCL1, and TNFα. CXCL1 significantly increased glucose production (Figure 3A). In all groups, metformin re-duced glucose production to below control levels (basal) in the presence or absence of cytokine. Incubation of hepatocytes with BI605906 did not mimic the effect of metformin, nor was there any modulation of metformin’s suppression of glucose production (Figure 3B).
Next, we compared the effect of metformin and BI605906 on lipogenesis, which is an another metabolic response known to be regulated by metformin. Proinflammatory cy-tokines including TNF-α are known to induce lipogenesis.34 This prompted us to study the effects of TNF-α on lipogenic genes sterol regulatory element-binding protein 1c, peroxi-some proliferator–activated receptor-γ, and fatty acid syn-thase, which are known to be regulated by metformin in hepatocytes.13,32,35 TNF-α significantly increased fatty acid synthase mRNA expression, with a trend toward increased expression of sterol regulatory element-binding protein 1c and peroxisome proliferator–activated receptor-γ (Figure 3C through 3E). Metformin reduced mRNA expression of all 3 genes and prevented TNF-α–induced increases. In con-trast to the inflammatory genes, coincubation of BI605906 and TNF-α increased lipogenic gene expression (Figure 3C through 3E). BI605906 alone did not alter sterol regulatory element-binding protein 1c, fatty acid synthase, or peroxi-some proliferator–activated receptor-γ; however, this com-pound significantly augmented TNF-α–induced expression
of each gene. This may be related to the existence of negative feedback loops in NF-κB signaling.33
Direct Anti-Inflammatory Effect of Metformin on Macrophage Cytokine SecretionOur evidence that metformin inhibits inflammatory respons-es in hepatocytes independently of some metabolic actions prompted us to study inflammatory responses in extrahepatic tissues. Macrophages may undergo classical proinflammatory M1 activation in response to cues including lipopolysaccha-ride and interferon γ. However, in response to agents including IL-13 and IL-4, they may become M2 cells, which are gener-ally thought of as having anti-inflammatory or tissue repair ac-tions.36 We studied the effects of metformin and another drug biguanide (structurally this drug is the same as metformin ex-cept that it lacks the 2 methyl groups present in metformin), which we have found previously acts similar to metformin on hepatocytes.6 We investigated 3 aspects: macrophage differ-entiation, activation, and secretion of cytokines. We measured effects on bone marrow–derived macrophage (BMDM) differ-entiation into M1 and M2 macrophages, using expression of CD11c as a marker of M1 differentiation and CD206 as a mea-sure of M2 differentiation. In addition, we investigated mac-rophage activation in response to lipopolysaccharide, which acts on the toll-like receptor TLR4, increasing expression of CD69 and CD40. There was no significant effect of the drugs on expression of any of these markers (Figure 4A and 4B). As in hepatocytes, metformin suppressed IL-1β gene expression in macrophages (Online Figure IIIA), but somewhat reminis-cent of the effect of BI605906 on lipogenic genes, metformin increased expression of the other cytokines we had studied in hepatocytes (Online Figure IIIB–IIID). We did, however, observe further drug-induced reductions when we measured cytokine secretion, to investigate macrophage activity and dif-ferentiation more directly. The 3 cytokines we studied were inflammatory cytokines IL-12p40, IL-6, and the anti-inflam-matory cytokine IL-10 in these TLR-triggered cells. Both drugs reduced IL-12p40 and IL-6 secretion but were without effect on IL-10 secretion (Figure 4C through 4E).
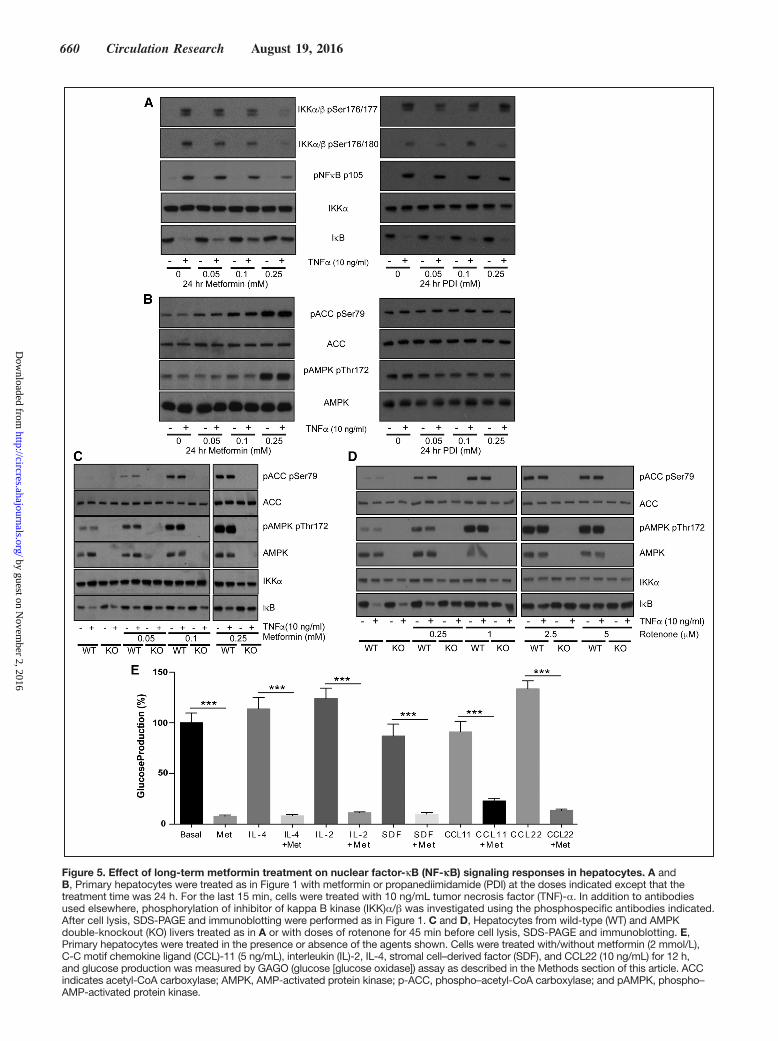
Chronic Treatment of Hepatocytes With Low Doses of Metformin Triggers Anti-Inflammatory Signaling Responses Similar to Those Resulting From High-Dose Acute TreatmentPlasma levels of metformin in the clinical setting are under-stood to be in the low micromolar range.4,9 Consequently, metformin-treated individuals may have lower intracellular concentrations of metformin than in our cell experiments, but the duration of exposure will be much longer. Discrepancies in effective concentrations of metformin likely occur because of the length of exposure, as the drug must accumulate in active mitochondria over several hours.10,37 In hepatocytes, long-term (24 hours) effects of the drug on NF-κB signaling occurred at concentrations close to the physiological range and this was unaffected by genotype (Figure 5A through 5C).
To provide more insight into the site of metformin ac-tion, we investigated signaling further upstream of IKK (Figure 5A). We found that TNF-α–induced phosphoryla-tion of the upstream kinase site p176/17738 on IKKα/β was
by guest on Novem
ber 2, 2016http://circres.ahajournals.org/
Dow
nloaded from
Cameron et al Anti-Inflammatory Effects of Metformin 657
suppressed by metformin. In supporting studies, we found that propanediimidamide, a close structural analogue of metfor-min that we have found does not inhibit the mitochondria,6
does not inhibit IκB degradation, nor does it suppress phos-phorylation of IKKα/β (Figure 5A). Consistent with the notion that NF-κB signaling can respond to mitochondrial inhibition
Figure 2. Effect of 5-aminoimidazole-4-carboxamide riboside (AICAR) and A769662 on nuclear factor-κB (NF-κB) signaling. A–D, Primary wild-type (WT) hepatocytes (A and B) and those taken from double-knockout (KO) AMPK animals or matched controls (WT) (C) were incubated in serum-free medium overnight, before stimulation for 3 h with or without doses of A769662 and AICAR as shown. For the last 15 min, cells were treated with or without 10 ng/mL tumor necrosis factor (TNF)-α. D, Hepatocytes from KO or WT animals treated with and without doses of metformin for 3 h. For the last 15 min, cells were treated with 10 ng/mL TNF-α. Cells were then lysed, and immunoblots were prepared as described in the Methods section of this article and in Figure 1. ACC indicates acetyl-CoA carboxylase; AMPK, AMP-activated protein kinase; IKK, inhibitor of kappa B kinase; p-ACC, phospho–acetyl-CoA carboxylase; and pAMPK, phospho–AMP-activated protein kinase.
by guest on Novem
ber 2, 2016http://circres.ahajournals.org/
Dow
nloaded from

658 Circulation Research August 19, 2016
independently of AMPK, we found that the complex I inhibi-tor rotenone prevented TNF-α–dependent IκB degradation in both genotypes (Figure 5D).
Anti-Inflammatory Effects of Metformin in a DM Population CohortNext, we compared the effect of metformin and sulfonyl-ureas on the NLR, a marker of inflammation that has recently been found to be a predictor of all-cause mortality and car-diac events.31 To test the hypothesis that metformin reduces
inflammation using the GoDARTS diabetic cohort, we chose individuals prescribed metformin alone (without sulfonylurea or insulin) or sulfonylurea alone (without metformin or insu-lin), and for whom NLR measurements were available in the 120 days before first metformin/sulfonylurea prescription (the baseline measure) and 12 months after the first prescription (within a 8–16-month window). There were 498 people in met-formin group and 172 in sulfonylurea group. Baseline charac-teristics of the 2 groups are shown in Table 1. Comparison
Figure 3. Effects of cytokines on glucose production and lipogenic gene expression in primary hepatocytes. A and B, Primary hepatocytes were treated with/without metformin (2 mmol/L), interleukin (IL)-6 (5 ng/mL), IL-1β (10 ng/mL), chemokine (C-X-C motif) ligand (CXCL) 1 (100 ng/mL) and tumor necrosis factor (TNF)-α (10 ng/mL) for 12 h, and glucose production was measured by GAGO (glucose [glucose oxidase]) assay as described in the Methods section of this article. C–E, Primary hepatocytes were treated with or without 10 ng/mL tumor necrosis factor (TNF)-α, 2 mmol/L metformin, and 10 μmol/L BI605906 for 8 h followed by cell lysis, RNA extraction, and preparation of cDNA for real-time polymerase chain reaction using primer sets for individual genes shown as described in the Methods section of this article. FASN indicates fatty acid synthase; PPAR, peroxisome proliferator–activated receptor; and SREBP, sterol regulatory element-binding protein.
by guest on Novem
ber 2, 2016http://circres.ahajournals.org/
Dow
nloaded from

Cameron et al Anti-Inflammatory Effects of Metformin 659
of the 2 groups showed a significant effect of metformin exposure compared to sulfonylurea, with 12-month log-transformed NLR 0.09 lower in the metformin group (95% confidence interval [CI], 0.02–0.17; P=0.01), controlling for baseline values. This is equivalent to a 9% (95% CI, 2–15) lower geometric mean NLR. In addition, a logistic regression of 12-month NLR being lower than the baseline NLR gave an odds ratio of 1.83 (95% CI, 1.22–2.75; P=0.0034) for the met-formin group compared with the sulfonylurea group (Tables 2 and 3). Body mass index (BMI) both nearest baseline and fol-low-up (4% missing) was not a significant variable (P=0.7), so was excluded. Inclusion of baseline HbA1c (19% missing) in the models resulted in similar effects. To examine the effect of metformin on high values on NLR, the models were rerun including only subjects with baseline NLR above the respec-tive group median values (Tables 4 and 5). These showed a stronger metformin effect in the linear model, equivalent to a 15% (95% CI, 5–23) lower geometric mean NLR and an unchanged metformin effect for the logistic model, odds ratio of 1.91 (1.02–3.59). These results are summarized in Table 6.
To control for the different characteristics of the met-formin and sulfonylurea groups, further analyses following propensity-score matching were performed. Nearest-neighbor one-to-one matching on DM duration, BMI, age, and angio-tensin-converting enzyme exposure at baseline resulted in a
reduced matched cohort of 318 (47% of original). Refitting the linear model using this cohort showed a similar effect of metformin exposure compared with sulfonylurea, with 12-month log-transformed NLR 0.10 lower in the metformin group (95% CI, 0.01–0.20; P=0.03). The logistic model for 12-month NLR lower than the baseline NLR gave an odds ratio of 1.53 for the metformin group compared with the sul-fonylurea group; however, this effect was not statistically sig-nificant (95% CI, 0.93–2.52; P=0.096).
Effect of Metformin on Inflammation in Nondiabetic Heart FailureGiven evidence that the anti-inflammatory effects of met-formin may be dissociated from some metabolic responses in cells and from glycemic responses in DM, we further in-vestigated the anti-inflammatory effects of metformin in a placebo-controlled clinical trial of metformin in a group of nondiabetic IR heart failure patients.39 In this study, com-pared with placebo, metformin significantly improved FIRI and resulted in a significant reduction in weight loss of 1.9 kg and BMI. Metformin treatment also reduced the prespeci-fied secondary end point of the slope of the ratio of minute ventilation:carbon dioxide production.39 We analyzed plasma from 33 patients who took part in this study and performed multivariate ANOVA on all 40 cytokines with treatment (with and without metformin, 20 allocated to metformin and 13 to
Figure 4. Effect of metformin and its analogue biguanide on bone marrow–derived macrophages: phenotypic markers and cytokine secretion. A, Macrophages were treated with/without metformin (2 mmol/L) or biguanide (BIG 2 mmol/L) to determine the effect on the M1 and M2 phenotypes of macrophages, which was measured by flow cytometry for CD11c and CD206 expression. The colors denote the following: red, undifferentiated; blue, differentiated, untreated; orange, differentiated, metformin; green, differentiated, BIG. B, Macrophages were treated with/without metformin (2 mmol/L) or biguanide (BIG, 2 mmol/L) to determine the effect on activation in response to 100 ng/mL lipopolysaccharide (LPS), which was measured by studying CD69 and CD40 expression. Histograms are representative of n=4. The colors denote the following: red, unactivated; blue, activated, untreated; orange, activated, metformin; green, activated, BIG. C–E, Macrophages were treated with/without metformin (Met) or BIG (2 mmol/L) to determine the effect of these drugs on IL-6 (C), IL-12p40 (D), and IL-10 (E) production (n=4).
by guest on Novem
ber 2, 2016http://circres.ahajournals.org/
Dow
nloaded from
660 Circulation Research August 19, 2016
Figure 5. Effect of long-term metformin treatment on nuclear factor-κB (NF-κB) signaling responses in hepatocytes. A and B, Primary hepatocytes were treated as in Figure 1 with metformin or propanediimidamide (PDI) at the doses indicated except that the treatment time was 24 h. For the last 15 min, cells were treated with 10 ng/mL tumor necrosis factor (TNF)-α. In addition to antibodies used elsewhere, phosphorylation of inhibitor of kappa B kinase (IKK)α/β was investigated using the phosphospecific antibodies indicated. After cell lysis, SDS-PAGE and immunoblotting were performed as in Figure 1. C and D, Hepatocytes from wild-type (WT) and AMPK double-knockout (KO) livers treated as in A or with doses of rotenone for 45 min before cell lysis, SDS-PAGE and immunoblotting. E, Primary hepatocytes were treated in the presence or absence of the agents shown. Cells were treated with/without metformin (2 mmol/L), C-C motif chemokine ligand (CCL)-11 (5 ng/mL), interleukin (IL)-2, IL-4, stromal cell–derived factor (SDF), and CCL22 (10 ng/mL) for 12 h, and glucose production was measured by GAGO (glucose [glucose oxidase]) assay as described in the Methods section of this article. ACC indicates acetyl-CoA carboxylase; AMPK, AMP-activated protein kinase; p-ACC, phospho–acetyl-CoA carboxylase; and pAMPK, phospho–AMP-activated protein kinase.
by guest on Novem
ber 2, 2016http://circres.ahajournals.org/
Dow
nloaded from

Cameron et al Anti-Inflammatory Effects of Metformin 661
placebo) as the main factor and change in BMI as a covariate. This covariate analysis identified 5 cytokines that were signifi-cantly suppressed by metformin, after controlling for change in BMI (Table 7). Investigating these cytokines further, we performed Pearson correlations to identify cytokines signifi-cantly affected by metformin that correlated with a change in BMI. Among the 5 cytokines, correlations were observed for 2 of the 5 cytokines, CCL22 and CXCL12 (Table 8). Metformin improved insulin sensitivity as shown by significant reduction in FIRI (t=2.765, df=30.762; P<0.01) when an independent sample t test (equal variances not assumed) is performed; however, there was no significant correlation between change in FIRI and any change in the cytokines in the panel using a Pearson correlation. When a second correction for change in FIRI was applied, in addition to change in BMI, 4 of the 5
original cytokines remained significantly different with treat-ment (Table 7).
Most of the cytokines suppressed by metformin in plasma were not measurable in hepatocytes or macrophages and for those that could be measured, metformin did not inhibit their expression in these cell types (Online Figure IV). Similar to our earlier studies, these cytokines had little, if any, ef-fect on inducing glucose production in hepatocytes and met-formin could still suppress this parameter in their presence (Figure 5E). All details of cytokine changes, metabolic, hemo-dynamic, and other parameters of these patients are described in Online Tables I and II.
DiscussionWe have used pharmacological and genetic approaches to isolate anti-inflammatory effects of metformin from those on glucose in cells, plasma, patient records, and in a place-bo-controlled study. Initiating the study in hepatocytes, we separated signaling effects of metformin on the metabolic regulator AMPK from effects on inflammatory signaling. Although the AMPK activator AICAR induced similar ef-fects to metformin on IκB degradation, AMPK was not re-quired for these effects. In long-term treatment, effects of metformin on NF-κB signaling occurred at concentrations toward the physiological range, and in further studies, we found that propanediimidamide, a close structural analogue of metformin that does not inhibit the mitochondria,6 does not inhibit IκB degradation, nor does it increase phosphory-lation of IKKα/β as is observed with metformin. Consistent with the possibility that NF-κB signaling can respond to
Table 1. Baseline Measurements of GoDARTS (Genetics of Diabetes Audit and Research in Tayside Scotland) Diabetes Cohort
VariableMetformin (n=498)
Sulfonylurea (n=172) P Value
Age, y* 65 (57–72) 69 (61–76) 0.042
Sex (% of men) 55 51.2 0.432
Diabetes mellitus duration, y*
2.1 (0.2–5) 0.95 (0.1–4.2) 0.00193
Body mass index, kg/m2*
32 (29–35.98) 27.2 (24.4–31.05) 2.26E−14
HbA1c, %* 8.2 (7.6–9.1) 8.4 (7.5–9.6) 0.471
Neutrophil to lymphocyte ratio*
1.94 (1.5–2.62) 2.56 (1.868–3.89) 2.47E−06
Neutrophils (×109/L)* 4.2 (3.3–5.5) 4.8 (3.775–6.225) 0.00103
Lymphocyes (×109/L)*
2.1 (1.7–2.8) 1.8 (1.4–2.3) 1.19E−05
Platelets (×109/L)* 236 (199–280) 251.5 (198–305.5) 0.133
C- reactive protein, mg/L*
10 (5–16.75) 10 (4.1–20) 0.854
Creatinine, μmol/L 86 (75–98) 94.5 (78–120.8) 0.000172
Bilirubin, μmol/L* 9(7–13) 9 (7–11.75) 0.069
Albumin, g/L* 44(42–45) 41(38–43) 1.35E−10
Urea, mmol/L* 5.8 (4.8–6.8) 6.6 (5.075–9.325) 0.000644
Medications, n (%)
Angiotension-converting enzyme inhibitors
41 23.8 8.53E−05
Angiotensin receptor blockers
11.8 7 0.0999
β-blocker 32.1 28.5 0.428
Digoxin 4.4 9.9 0.0143
Anticoagulants 6 10.5 0.0758
Calcium channel blocker
30.5 24.4 0.154
Antiplatelets 37.3 31.4 0.19
*Median (inter-quartile range).
Table 2. Regression Coefficients of Linear Model (log-NLR)
Estimate SE 95% CI P Value
Sex, men 0.054775 0.031656 −0.00727 to 0.117 0.084038
Age, y −0.035556 0.012157 −0.0594 to −0.0117 0.003567
Age2, y 0.000281 0.000095 9.51e−05 to 0.000467
0.003163
log(NLR) at baseline
0.498068 0.030933 0.437 to 0.559 <10–5
Group: metformin
−0.093859 0.037702 −0.168 to −0.0200 0.013037
CI indicates confidence interval; and NLR, neutrophil to lymphocyte ratio.
Table 3. Regression Coefficients of Logistic Model (NLR_12<NLR_0)
Estimate SE 95% CI P Value
Sex, men −0.2280 0.1703 −0.562 to 0.106 0.1804
Age, y 0.1450 0.0669 0.0139 to 0.276 0.0302
Age2, y −0.0012 0.0005 −0.00218 to −0.000133
0.0267
log(NLR) at baseline
1.9456 0.2128 1.528 to 2.363 <10–5
Group: metformin
0.6054 0.2078 0.198 to 1.013 0.0036
CI indicates confidence interval; and NLR, neutrophil to lymphocyte ratio.
by guest on Novem
ber 2, 2016http://circres.ahajournals.org/
Dow
nloaded from

662 Circulation Research August 19, 2016
mitochondrial inhibition independently of AMPK, we found that metformin and rotenone each prevented TNF-α–dependent IκB degradation in an AMPK-independent man-ner. Considering information from these pharmacological and genetic experiments, our data indicate that metformin acts upstream of IKKα/β through an AMPK-independent mechanism dependent on mitochondrial inhibition. This mechanism is fully consistent with our other observations that metformin does not directly inhibit IKK in vitro. These studies do not exclude the possibility of AMPK-dependent mechanisms contributing to anti-inflammatory actions of metformin in other ways. Effects of metformin on anti-in-flammatory signaling pathways were separable from other metabolic responses to the drug. Inhibition of NF-κB signal-ing had little effect, for example, on glucose production or lipogenic gene expression, 2 key metabolic actions of met-formin. Moreover, addition of cytokines suppressed by met-formin in hepatocytes, plasma, or macrophages did not block the effect of the drug on glucose production. Taken together, these results define a dual action of metformin, with anti-in-flammatory effects occurring alongside known antihypergly-cemic and other metabolic effects. These 2 strands are both likely to be triggered by a mitochondrial target of the drug.
The evidence that metformin can suppress inflammatory signaling independently of some of its metabolic effects led us to investigate nonhepatic anti-inflammatory responses. Previous studies have suggested that inflammatory signal-ing on macrophages influences insulin sensitivity in other tissues. Loss of the lipopolysaccharide receptor TLR4, for example, confers some protection from insulin resistance fol-lowing a high-fat diet.40 In addition, M2 macrophages domi-nate in adipose tissue in lean mice, whereas M1 macrophages
accumulate in adipose tissue during obesity and are thought to contribute to systemic insulin resistance.41 At the level of gene expression, there were some differences between the effect of metformin in hepatocytes and macrophages although IL-1β was suppressed in both cell types. Studying cytokine secre-tion from macrophages, we found that metformin acted highly selectively to reduce proinflammatory cytokine secretion from activated macrophages, without affecting anti-inflammatory cytokine secretion and markers of macrophage differentiation and activation. This targeted mechanism may allow selective ablation of the ability of M1 macrophages to induce systemic insulin resistance in obesity. Taken together with the results in hepatocytes, this work suggests that metformin’s anti-in-flammatory actions are likely to be qualitatively different from conventional NSAIDs.
We wished to establish whether the effects of metformin could be detected in humans and we started with a DM co-hort. Investigating the GoDARTS patient database, we found evidence of metformin reducing subclinical inflammation as measured by NLR in patients. It is noteworthy that our find-ings support previous reports that metformin is capable of suppressing markers of inflammation such as high-sensitivity C-reactive protein in prediabetic individuals42 and TNF-α in IR individuals.43 NLR has recently been identified as a predic-tor of all-cause mortality and cardiovascular events,31 whereas previous studies demonstrated a substantial beneficial effect of metformin therapy on cardiovascular outcomes.2,44,45 Together, these results suggest that suppression of chronic inflammation
Table 4. Regression Coefficients of Linear Model: Baseline NLR>Median
Estimate SE 95% CI P Value
Sex, men 0.1202 0.0427 0.0364 to 0.204 0.0052
Age, y −0.0268 0.0149 −0.0561 to 0.00241 0.0730
Age2, y 0.0002 0.0001 −1.037e−05 to 0.000444
0.0623
log(NLR) at baseline
0.2758 0.0559 0.166 to 0.385 <10–5
Group: metformin
−0.1596 0.0551 −0.268 to −0.0517 0.0040
CI indicates confidence interval; and NLR, neutrophil to lymphocyte ratio.
Table 5. Regression Coefficients of Logistic Model: Baseline NLR>Median
Estimate SE 95% CI P Value
Sex, M −0.4841 0.2419 −0.958 to −0.00992 0.0454
Age, y −0.0090 0.0104 −0.0294 to 0.0114 0.3869
log(NLR) at baseline
2.2827 0.4423 1.416 to 3.15 <10–5
Group: metformin
0.6478 0.3219 0.0168 to 1.279 0.0442
CI indicates confidence interval; and NLR, neutrophil to lymphocyte ratio.
Table 6. Summary of GoDARTS (Genetics of Diabetes Audit and Research in Tayside Scotland) Analyses, Comparing NLR in Metformin and Sulfonylurea Groups
Group Analyzed
12-mo Geometric Mean NLR Metformin
vs Sulfonylurea % Difference (95% CI)
12-mo NLR<0 mo NLR Odds Ratio, Metformin vs Sulfonylurea (95%
CI)
All subjects −9% (2–15) 1.83 (1.22–2.75)
NLR above group median
−15% (5–23) 1.91 (1.02–3.59)
CI indicates confidence interval; and NLR, neutrophil to lymphocyte ratio.
Table 7. ANOVA of Heart Failure Cohort With Treatment (Without or With Metformin) as Main Factor With Covariate Analysis
Change in Cytokine
Covariate
∆BMI ∆BMI and ∆FIRI
Eotaxin/CCL11 F(1,26)=9.881; P=0.004* F(1,26)=9.135; P=0.006*
IL-2 F(1,26)=9.089; P=0.006* F(1,26)=8.078; P=0.009*
IL-4 F(1,26)=8.324; P=0.008* F(1,26)=7.148; P=0.014
MDC/CCL22 F(1,26)=9.887; P=0.004* F(1,26)=9.846; P=0.005*
SDF1αβ/CXCL12 F(1,26)=16.468; P=0.000* F(1,26)=14.661; P=0.001*
BMI indicates body mass index; CCL, C-C motif chemokine ligand; CXCL, chemokine (C-X-C motif) ligand; FIRI, Fasting Insulin Resistance Index; IL, interleukin; and SDF, stromal cell–derived factor-1.
Significance is taken as *P<0.01 (n=27).
by guest on Novem
ber 2, 2016http://circres.ahajournals.org/
Dow
nloaded from

Cameron et al Anti-Inflammatory Effects of Metformin 663
by metformin might contribute to the difference in outcomes between these 2 treatment modalities.
Finally, given the evidence from cells that anti-inflam-matory and metabolic effects of the drug can be separated, we studied a nondiabetic insulin-resistant heart failure cohort from a randomized controlled trial. Our research question was to determine whether metformin suppressed plasma cy-tokines. We observed a general trend of metformin treatment lowering cytokine concentrations. Correcting for change in BMI, 5 cytokines were significantly suppressed by metformin but only 2 of these, CCL22 and stromal cell–derived factor 1αβ, also correlated with change in BMI in follow-up analysis, suggesting that in individuals with established CVD, metfor-min exerts anti-inflammatory effects that are at least in part independent of BMI. Four of the 5 cytokines remained sig-nificant after additional correction for FIRI, and there was no significant correlation between change in FIRI and any of the cytokines in the panel using a Pearson correlation, even though metformin did reduce FIRI. Together these data strongly suggest that metformin has effects above and beyond the known effects on BMI and insulin sensitivity. The identity of these 5 cytokines signpost ways in which anti-inflammatory effects of metformin could exert DM-independent therapeutic effects in CVD. One earlier cohort study, for example, found that a Thr/Ala substitution in the CCL11 gene increases risk of myocardial infarction independently of BMI and DM.46 Blockade of CCL11 can suppress aspects of age-related cel-lular dysfunction,47 and it is possible that observed effects of metformin on mammalian longevity,48,49 where suppression of NF-κB is also observed,49 may owe at least in part to suppres-sion of this cytokine. The other cytokines stromal cell–derived factor 1αβ, IL-2, IL-4, and CCL22 are each implicated in reso-lution of pancreatic β cell inflammation50–53 and stromal cell–derived factor 1αβ, IL-2, and IL-4 are additionally upregulated in plasma from type 2 DM individuals.54,55 Further work will be required to determine how the effects on macrophages and hepatocytes that we have measured contribute to the changes in plasma cytokines observed. Changes in other inflammatory cell types, particularly neutrophils given the change in NLR, or in cell–cell interactions, may need to be taken into account. Altogether our results are consistent with metformin exert-ing a potentially cardioprotective anti-inflammatory effect in patients with CVD, suppressing both age and metabolic in-flammatory stress markers, independently of effects on BMI, insulin sensitivity, and without the onset of frank DM.
We recognize the limitations that are inherent in retrospec-tive, nonrandomized, observational cohort data. It was impos-sible to account for all possible confounding influences that may have biased the observed differences between the groups considered. For example, the BMI of the 2 groups is differ-ent, consistent with historical prescribing patterns (Tables 7 and 8). We have sought to minimize these as far as practicable by 3 different sensitivity analyses. First, by using a multi-variate model adjusting for potential confounders; second, by performing a propensity score–matched analysis; and third, we detected an anti-inflammatory signal in a randomized, double-blinded, placebo-controlled trial, providing definitive evidence of anti-inflammatory effects of metformin in this group of patients. The propensity score–matched analysis has been shown to eliminate as much as 90% of treatment bias in observational studies.56 Because of the small size of the clinical trial, this proof-of-concept study was designed and powered only to investigate the study-specific end point of peak oxygen uptake in patients with heart failure and not on clinical outcome. However, we have previously shown in a large population-based cohort study that patients with DM and heart failure who were treated with metformin alone or in combination with sulfonylureas were at significantly lower risk of all-cause mortality during 1 year and long-term follow-up than those who were treated with sulfonylurea alone.44 Our findings on metformin and inflammation will now similarly need to be confirmed in other patient cohorts.
In summary, cross-species evidence from cells, plasma, patient records, and a randomized placebo-controlled study strongly suggest that anti-inflammatory effects should be in-vestigated further as a potentially important aspect of metfor-min’s clinical pharmacology that may particularly accelerate investigation of their utility in nondiabetic cohorts. There is overwhelming evidence that inflammation contributes to the development of CVD24 but counterbalancing this is evidence from meta-analysis of randomized control trials that existing NSAIDs tend to exacerbate risk of CVD.57 If inflammation is to be targeted successfully in CVD, new treatment paradigms will need to be established. It is likely, for example, that agents targeting only selected aspects of inflammation will need to be identified. Our work identifying discrete anti-inflammatory effects of metformin on cell signaling and plasma parameters independently of DM supports ongoing and prospective inves-tigation into repurposing metformin in a broader spectrum of patients with CVD.
AcknowledgmentsWe thank Dr Kashyap Patel (Exeter) for demonstrating hepatocyte extraction. In addition, Dr Andy Cassidy and Dr Ritu Sharma (both Dundee) assisted set-up of real-time polymerase chain reaction.
Sources of FundingG. Rena acknowledges funding from MRC (MR/K012924/1) and the Diabetes UK RW and JM Collins studentship, supporting C. Forteath (12/0004625). S.C. Fagerholm acknowledges funding from the Academy of Finland and Biocentrum Helsinki. M. Foretz acknowl-edges funding from the Région Ile de France-CORDDIM and by the Société Francophone du Diabète. C.C. Lang acknowledges support from the British Heart Foundation (grant number PG/06/143/21897 and PG/14/4/30539). A.K.F. Wong acknowledges support from the
Table 8. Correlation Between Change in Body Mass Index and the Cytokines That Were Significantly Affected by Metformin Treatment
Change in Cytokine
With Metformin (n=20) Without Metformin (n=13)
Correlation Coefficient P Value
Correlation Coefficient P Value
MDC/CCL22 −0.625 0.003* 0.077 0.804 ns
SDF1αβ/CXCL12 −0.620 0.004* −0.103 0.738 ns
A Pearson correlation was used. Significance is only noted with drug treatment for those listed (P<0.01). CCL indicates C-C motif chemokine ligand; and SDF, stromal cell–derived factor-1.
by guest on Novem
ber 2, 2016http://circres.ahajournals.org/
Dow
nloaded from
664 Circulation Research August 19, 2016
British Heart Foundation (grant number PG/06/143/21897). M. Mohan. acknowledges fellowship support from the British Heart Foundation (grant number PG/14/4/30539). V.L. Morrison was supported by the Ella and Georg Ehrnrooth foundation and D.J.K. Balfour acknowledges funding from Alzheimer’s Research UK, grant number ART-EXT-2010–2. C. Beall is an RD Lawrence Fellow (Diabetes UK grant number: 13/00004647).
DisclosuresNone.
References 1. Evans JM, Ogston SA, Emslie-Smith A, Morris AD. Risk of mortal-
ity and adverse cardiovascular outcomes in type 2 diabetes: a compari-son of patients treated with sulfonylureas and metformin. Diabetologia. 2006;49:930–936. doi: 10.1007/s00125-006-0176-9.
2. UK Prospective Diabetes Study (UKPDS) Group. Effect of intensive blood-glucose control with metformin on complications in overweight patients with type 2 diabetes (UKPDS 34). Lancet 1998;352:854–865.
3. Evans JM, Donnelly LA, Emslie-Smith AM, Alessi DR, Morris AD. Metformin and reduced risk of cancer in diabetic patients. BMJ. 2005;330:1304–1305. doi: 10.1136/bmj.38415.708634.F7.
4. Rena G, Pearson ER, Sakamoto K. Molecular mechanism of action of metformin: old or new insights? Diabetologia. 2013;56:1898–1906. doi: 10.1007/s00125-013-2991-0.
5. Viollet B, Guigas B, Sanz Garcia N, Leclerc J, Foretz M, Andreelli F. Cellular and molecular mechanisms of metformin: an overview. Clin Sci (Lond). 2012;122:253–270. doi: 10.1042/CS20110386.
6. Logie L, Harthill J, Patel K, Bacon S, Hamilton DL, Macrae K, McDougall G, Wang HH, Xue L, Jiang H, Sakamoto K, Prescott AR, Rena G. Cellular responses to the metal-binding properties of metformin. Diabetes. 2012;61:1423–1433. doi: 10.2337/db11-0961.
7. Repiščák P, Erhardt S, Rena G, Paterson MJ. Biomolecular mode of action of metformin in relation to its copper binding properties. Biochemistry. 2014;53:787–795. doi: 10.1021/bi401444n.
8. Quan X, Uddin R, Heiskanen A, Parmvi M, Nilson K, Donolato M, Hansen MF, Rena G, Boisen A. The copper binding properties of metfor-min–QCM-D, XPS and nanobead agglomeration. Chem Commun (Camb). 2015;51:17313–17316. doi: 10.1039/c5cc04321b.
9. Rena G, Pearson ER, Sakamoto K: Molecular action and pharmacoge-netics of metformin: current understanding of an old drug. Diabetes Management 2012;2:439–452
10. Owen MR, Doran E, Halestrap AP. Evidence that metformin exerts its anti-diabetic effects through inhibition of complex 1 of the mitochondrial respiratory chain. Biochem J. 2000;348 Pt 3:607–614.
11. El-Mir MY, Nogueira V, Fontaine E, Avéret N, Rigoulet M, Leverve X. Dimethylbiguanide inhibits cell respiration via an indirect effect targeted on the respiratory chain complex I. J Biol Chem. 2000;275:223–228.
12. Madiraju AK, Erion DM, Rahimi Y, et al. Metformin suppresses gluco-neogenesis by inhibiting mitochondrial glycerophosphate dehydrogenase. Nature. 2014;510:542–546. doi: 10.1038/nature13270.
13. Zhou G, Myers R, Li Y, Chen Y, Shen X, Fenyk-Melody J, Wu M, Ventre J, Doebber T, Fujii N, Musi N, Hirshman MF, Goodyear LJ, Moller DE. Role of AMP-activated protein kinase in mechanism of metformin action. J Clin Invest. 2001;108:1167–1174. doi: 10.1172/JCI13505.
14. Duca FA, Côté CD, Rasmussen BA, Zadeh-Tahmasebi M, Rutter GA, Filippi BM, Lam TK. Metformin activates a duodenal Ampk-dependent pathway to lower hepatic glucose production in rats. Nat Med. 2015;21:506–511. doi: 10.1038/nm.3787.
15. Foretz M, Hébrard S, Leclerc J, Zarrinpashneh E, Soty M, Mithieux G, Sakamoto K, Andreelli F, Viollet B. Metformin inhibits hepatic gluco-neogenesis in mice independently of the LKB1/AMPK pathway via a decrease in hepatic energy state. J Clin Invest. 2010;120:2355–2369. doi: 10.1172/JCI40671.
16. Miller RA, Chu Q, Xie J, Foretz M, Viollet B, Birnbaum MJ. Biguanides suppress hepatic glucagon signalling by decreasing production of cyclic AMP. Nature. 2013;494:256–260. doi: 10.1038/nature11808.
17. Calvert JW, Gundewar S, Jha S, Greer JJ, Bestermann WH, Tian R, Lefer DJ. Acute metformin therapy confers cardioprotection against myocardial infarction via AMPK-eNOS-mediated signaling. Diabetes. 2008;57:696–705. doi: 10.2337/db07-1098.
18. Gundewar S, Calvert JW, Jha S, Toedt-Pingel I, Ji SY, Nunez D, Ramachandran A, Anaya-Cisneros M, Tian R, Lefer DJ. Activation of
AMP-activated protein kinase by metformin improves left ventricular function and survival in heart failure. Circ Res. 2009;104:403–411. doi: 10.1161/CIRCRESAHA.108.190918.
19. Yin M, van der Horst IC, van Melle JP, Qian C, van Gilst WH, Silljé HH, de Boer RA. Metformin improves cardiac function in a nondiabet-ic rat model of post-MI heart failure. Am J Physiol Heart Circ Physiol. 2011;301:H459–H468. doi: 10.1152/ajpheart.00054.2011.
20. Xu X, Lu Z, Fassett J, et al. Metformin protects against systolic overload-induced heart failure independent of AMP-activated pro-tein kinase α2. Hypertension. 2014;63:723–728. doi: 10.1161/HYPERTENSIONAHA.113.02619.
21. Cittadini A, Napoli R, Monti MG, Rea D, Longobardi S, Netti PA, Walser M, Samà M, Aimaretti G, Isgaard J, Saccà L. Metformin prevents the development of chronic heart failure in the SHHF rat model. Diabetes. 2012;61:944–953. doi: 10.2337/db11-1132.
22. Sasaki H, Asanuma H, Fujita M, et al. Metformin prevents progression of heart failure in dogs: role of AMP-activated protein kinase. Circulation. 2009;119:2568–2577. doi: 10.1161/CIRCULATIONAHA.108.798561.
23. Hotamisligil GS. Inflammation and metabolic disorders. Nature. 2006;444:860–867. doi: 10.1038/nature05485.
24. Pearson TA, Mensah GA, Alexander RW, Anderson JL, Cannon RO 3rd, Criqui M, Fadl YY, Fortmann SP, Hong Y, Myers GL, Rifai N, Smith SC Jr, Taubert K, Tracy RP, Vinicor F; Centers for Disease Control and Prevention; American Heart Association. Markers of inflammation and cardiovascular disease: application to clinical and public health practice: A statement for healthcare professionals from the Centers for Disease Control and Prevention and the American Heart Association. Circulation. 2003;107:499–511.
25. Isoda K, Young JL, Zirlik A, MacFarlane LA, Tsuboi N, Gerdes N, Schönbeck U, Libby P. Metformin inhibits proinflammatory re-sponses and nuclear factor-kappaB in human vascular wall cells. Arterioscler Thromb Vasc Biol. 2006;26:611–617. doi: 10.1161/01.ATV.0000201938.78044.75.
26. Woo SL, Xu H, Li H, et al. Metformin ameliorates hepatic steatosis and inflammation without altering adipose phenotype in diet-induced obesity. PLoS One. 2014;9:e91111. doi: 10.1371/journal.pone.0091111.
27. Patel K, Foretz M, Marion A, et al. The LKB1-salt-inducible kinase pathway functions as a key gluconeogenic suppressor in the liver. Nat Commun. 2014;5:4535. doi: 10.1038/ncomms5535.
28. Morris AD, Boyle DI, MacAlpine R, Emslie-Smith A, Jung RT, Newton RW, MacDonald TM. The diabetes audit and research in Tayside Scotland (DARTS) study: electronic record linkage to create a diabetes register. DARTS/MEMO Collaboration. BMJ. 1997;315:524–528.
29. Zahorec R. Ratio of neutrophil to lymphocyte counts–rapid and simple parameter of systemic inflammation and stress in critically ill. Bratisl Lek Listy. 2001;102:5–14.
30. Pinato DJ, Stavraka C, Flynn MJ, Forster MD, O’Cathail SM, Seckl MJ, Kristeleit RS, Olmos D, Turnbull SJ, Blagden SP. An inflammation based score can optimize the selection of patients with advanced cancer con-sidered for early phase clinical trials. PLoS One. 2014;9:e83279. doi: 10.1371/journal.pone.0083279.
31. Wang X, Zhang G, Jiang X, Zhu H, Lu Z, Xu L. Neutrophil to lymphocyte ratio in relation to risk of all-cause mortality and cardiovascular events among patients undergoing angiography or cardiac revascularization: a meta-analysis of observational studies. Atherosclerosis. 2014;234:206–213. doi: 10.1016/j.atherosclerosis.2014.03.003.
32. Bhalla K, Hwang BJ, Dewi RE, Twaddel W, Goloubeva OG, Wong KK, Saxena NK, Biswal S, Girnun GD. Metformin prevents liver tumorigen-esis by inhibiting pathways driving hepatic lipogenesis. Cancer Prev Res (Phila). 2012;5:544–552. doi: 10.1158/1940-6207.CAPR-11-0228.
33. Clark K, Peggie M, Plater L, Sorcek RJ, Young ER, Madwed JB, Hough J, McIver EG, Cohen P. Novel cross-talk within the IKK family controls in-nate immunity. Biochem J. 2011;434:93–104. doi: 10.1042/BJ20101701.
34. Grunfeld C, Dinarello CA, Feingold KR. Tumor necrosis factor-alpha, in-terleukin-1, and interferon alpha stimulate triglyceride synthesis in HepG2 cells. Metabolism. 1991;40:894–898.
35. Sozio MS, Lu C, Zeng Y, Liangpunsakul S, Crabb DW. Activated AMPK inhibits PPAR-{alpha} and PPAR-{gamma} transcriptional activity in hepatoma cells. Am J Physiol Gastrointest Liver Physiol. 2011;301:G739–G747. doi: 10.1152/ajpgi.00432.2010.
36. Martinez FO, Sica A, Mantovani A, Locati M. Macrophage activation and polarization. Front Biosci. 2008;13:453–461.
37. Bridges HR, Jones AJ, Pollak MN, Hirst J. Effects of metformin and other biguanides on oxidative phosphorylation in mitochondria. Biochem J. 2014;462:475–487. doi: 10.1042/BJ20140620.
by guest on Novem
ber 2, 2016http://circres.ahajournals.org/
Dow
nloaded from

Cameron et al Anti-Inflammatory Effects of Metformin 665
38. Zhang J, Clark K, Lawrence T, Peggie MW, Cohen P. An unexpected twist to the activation of IKKβ: TAK1 primes IKKβ for activation by autophos-phorylation. Biochem J. 2014;461:531–537. doi: 10.1042/BJ20140444.
39. Wong AK, Symon R, AlZadjali MA, Ang DS, Ogston S, Choy A, Petrie JR, Struthers AD, Lang CC. The effect of metformin on insulin resistance and exercise parameters in patients with heart failure. Eur J Heart Fail. 2012;14:1303–1310. doi: 10.1093/eurjhf/hfs106.
40. Poggi M, Bastelica D, Gual P, Iglesias MA, Gremeaux T, Knauf C, Peiretti F, Verdier M, Juhan-Vague I, Tanti JF, Burcelin R, Alessi MC. C3H/HeJ mice carrying a toll-like receptor 4 mutation are protected against the devel-opment of insulin resistance in white adipose tissue in response to a high-fat diet. Diabetologia. 2007;50:1267–1276. doi: 10.1007/s00125-007-0654-8.
41. Lumeng CN, Bodzin JL, Saltiel AR. Obesity induces a phenotypic switch in adipose tissue macrophage polarization. J Clin Invest. 2007;117:175–184. doi: 10.1172/JCI29881.
42. Goldberg RB, Temprosa MG, Mather KJ, Orchard TJ, Kitabchi AE, Watson KE; Diabetes Prevention Program Research Group. Lifestyle and metformin interventions have a durable effect to lower CRP and tPA levels in the diabetes prevention program except in those who develop diabetes. Diabetes Care. 2014;37:2253–2260. doi: 10.2337/dc13-2471.
43. Evia-Viscarra ML, Rodea-Montero ER, Apolinar-Jiménez E, Muñoz-Noriega N, García-Morales LM, Leaños-Pérez C, Figueroa-Barrón M, Sánchez-Fierros D, Reyes-García JG. The effects of metformin on inflam-matory mediators in obese adolescents with insulin resistance: controlled randomized clinical trial. J Pediatr Endocrinol Metab. 2012;25:41–49. doi: 10.1515/jpem-2011-0469.
44. Evans JM, Doney AS, AlZadjali MA, Ogston SA, Petrie JR, Morris AD, Struthers AD, Wong AK, Lang CC. Effect of Metformin on mortality in patients with heart failure and type 2 diabetes mellitus. Am J Cardiol. 2010;106:1006–1010. doi: 10.1016/j.amjcard.2010.05.031.
45. Holman RR, Paul SK, Bethel MA, Matthews DR, Neil HA. 10-year follow-up of intensive glucose control in type 2 diabetes. N Engl J Med. 2008;359:1577–1589. doi: 10.1056/NEJMoa0806470.
46. Zee RY, Cook NR, Cheng S, Erlich HA, Lindpaintner K, Lee RT, Ridker PM. Threonine for alanine substitution in the eotaxin (CCL11) gene and the risk of incident myocardial infarction. Atherosclerosis. 2004;175:91–94. doi: 10.1016/j.atherosclerosis.2004.01.042.
47. Villeda SA, Luo J, Mosher KI, et al. The ageing systemic milieu negatively regulates neurogenesis and cognitive function. Nature. 2011;477:90–94. doi: 10.1038/nature10357.
48. Bannister CA, Holden SE, Jenkins-Jones S, Morgan CL, Halcox JP, Schernthaner G, Mukherjee J, Currie CJ. Can people with type 2 diabetes live longer than those without? A comparison of mortality in people initi-ated with metformin or sulphonylurea monotherapy and matched, non-di-abetic controls. Diabetes Obes Metab. 2014;16:1165–1173. doi: 10.1111/dom.12354.
49. Martin-Montalvo A, Mercken EM, Mitchell SJ, et al. Metformin improves healthspan and lifespan in mice. Nat Commun. 2013;4:2192. doi: 10.1038/ncomms3192.
50. Hulme MA, Wasserfall CH, Atkinson MA, Brusko TM. Central role for interleukin-2 in type 1 diabetes. Diabetes. 2012;61:14–22. doi: 10.2337/db11-1213.
51. Bischoff L, Alvarez S, Dai DL, Soukhatcheva G, Orban PC, Verchere CB. Cellular mechanisms of CCL22-mediated attenuation of auto-immune diabetes. J Immunol. 2015;194:3054–3064. doi: 10.4049/jimmunol.1400567.
52. Cameron MJ, Arreaza GA, Zucker P, Chensue SW, Strieter RM, Chakrabarti S, Delovitch TL. IL-4 prevents insulitis and insulin-dependent diabetes mellitus in nonobese diabetic mice by potentiation of regulatory T helper-2 cell function. J Immunol. 1997;159:4686–4692.
53. Yano T, Liu Z, Donovan J, Thomas MK, Habener JF. Stromal cell de-rived factor-1 (SDF-1)/CXCL12 attenuates diabetes in mice and promotes pancreatic beta-cell survival by activation of the prosurvival kinase Akt. Diabetes. 2007;56:2946–2957. doi: 10.2337/db07-0291.
54. Ip B, Cilfone N, Zhu M, Kuchibhatla R, Azer M, McDonnell M, Apovian C, Lauffenburger D, Nikolajczyk B: An inflammatory T cell signature predicts obesity-associated type 2 diabetes (HUM3P.262). J. Immunol. 2015;194:121.122
55. Derakhshan R, Arababadi MK, Ahmadi Z, Karimabad MN, Salehabadi VA, Abedinzadeh M, Khorramdelazad H, Balaei P, Kennedy D, Hassanshahi G. Increased circulating levels of SDF-1 (CXCL12) in type 2 diabetic patients are correlated to disease state but are unrelated to poly-morphism of the SDF-1β gene in the Iranian population. Inflammation. 2012;35:900–904. doi: 10.1007/s10753-011-9391-8.
56. D’Agostino RB Jr. Propensity score methods for bias reduction in the comparison of a treatment to a non-randomized control group. Stat Med. 1998;17:2265–2281.
57. Trelle S, Reichenbach S, Wandel S, Hildebrand P, Tschannen B, Villiger PM, Egger M, Jüni P. Cardiovascular safety of non-steroidal anti-inflam-matory drugs: network meta-analysis. BMJ. 2011;342:c7086.
What Is Known?
• Observational studies have repeatedly shown benefit of metformin in reducing incidence of CVD events in DM.
• Inflammation is understood to contribute to CVD cause, but it has been difficult to harness anti-inflammatory effects for CVD therapy.
What New Information Does This Article Contribute?
• Metformin exhibits an anti-inflammatory action in cells and patients, in addition to its known antihyperglycemic effects.
• Anti-inflammatory effects of metformin are exerted irrespective of dia-betes status, providing a nonempirical rationale for further testing of the drug in nondiabetic CVD.
Inflammation is understood to contribute to CVD cause, but ex-isting NSAIDs have shown limited utility in CVD treatment. This suggests that other agents, with different anti-inflammatory
mechanisms, need to be identified for CVD. Observational studies have repeatedly shown benefit of metformin in reducing incidence of CVD events in diabetes, which do not seem to depend on an-tihyperglycemic effects alone. In this study, we investigated anti-inflammatory effects of metformin, as these may contribute to the CVD benefit of this drug. We find that this drug acts by inhibiting the NF-κB signaling pathway upstream of IKKβ. In further work, we find that anti-inflammatory effects of metformin are exerted ir-respective of diabetes status, including suppression of the ageing-related cytokine CCL11 in a nondiabetic heart failure cohort. These results suggest that metformin suppresses chronic inflammation by a different mechanism to NSAIDs and provide a nonempirical rationale for further testing of the drug in nondiabetic CVD.
Novelty and Significance
by guest on Novem
ber 2, 2016http://circres.ahajournals.org/
Dow
nloaded from
Viollet, Kei Sakamoto, Susanna C. Fagerholm, Marc Foretz, Chim C. Lang and Graham RenaCraig Beall, Alison D. McNeilly, David J.K. Balfour, Terhi Savinko, Aaron K.F. Wong, Benoit
Amy R. Cameron, Vicky L. Morrison, Daniel Levin, Mohapradeep Mohan, Calum Forteath,Anti-Inflammatory Effects of Metformin Irrespective of Diabetes Status
Print ISSN: 0009-7330. Online ISSN: 1524-4571 Copyright © 2016 American Heart Association, Inc. All rights reserved.is published by the American Heart Association, 7272 Greenville Avenue, Dallas, TX 75231Circulation Research
doi: 10.1161/CIRCRESAHA.116.3084452016;119:652-665; originally published online July 14, 2016;Circ Res.
Free via Open Access http://circres.ahajournals.org/content/119/5/652
World Wide Web at: The online version of this article, along with updated information and services, is located on the
http://circres.ahajournals.org/content/suppl/2016/07/14/CIRCRESAHA.116.308445.DC1.htmlData Supplement (unedited) at:
http://circres.ahajournals.org//subscriptions/
is online at: Circulation Research Information about subscribing to Subscriptions:
http://www.lww.com/reprints Information about reprints can be found online at: Reprints:
document. Permissions and Rights Question and Answer about this process is available in the
located, click Request Permissions in the middle column of the Web page under Services. Further informationEditorial Office. Once the online version of the published article for which permission is being requested is
can be obtained via RightsLink, a service of the Copyright Clearance Center, not theCirculation Researchin Requests for permissions to reproduce figures, tables, or portions of articles originally publishedPermissions:
by guest on Novem
ber 2, 2016http://circres.ahajournals.org/
Dow
nloaded from

Supplementary Materials
Expanded Methods
I. Animal and Cell Studies
Metformin and rapamycin came from Calbiochem, AICAR and A769662 (Tocris),
TNFα (e-bioscience), recombinant CINC1/CXCL1, CCL-11, IL-2, IL-4, SDF and
CCL22 (R&D systems), mouse IL-6 (Sigma) and recombinant mouse IL-1β (Life
Technologies). The phospho-acetyl-CoA carboxylase (ACC) Ser79 antibody was a
generous gift from the DSTT (University of Dundee). The total ACC (Cat. number
3662), total AMPKα (2603), phospho-AMPKα Thr172 (2535), total S6 (2217),
phospho-S6 Ser240/244 (2215), total p70 S6 kinase (2708), phospho-p70 S6 kinase
Thr389 (9205), phospho-Raptor Ser 792 (2083), phospho IKKα/β Ser176/177
(2078), IKKα/β Ser176/180 (2697), total IκB, pNF-κB, total IKKα and total IKKβ (NF-
κB sampler kit 9936) antibodies were from CST. Anti-sheep HRP (31480) and anti-
rabbit HRP (31460) both came from Thermo and anti-mouse HRP was from
Calbiochem (JA1200). BI605906 was a generous gift from Prof Sir Philip Cohen.
Animal Care
C57BL/6 female mice (Charles River, 8-41 weeks) were maintained under a 12
hours:12hours light:dark cycle (holding room lights on at 06:00; off at 18:00) at
22±1◦C and 50% humidity. Mice had ad libitum access to standard chow diet (7.5%
fat, 75% carbohydrate and 17.5% protein by energy (RM1 diet; Special Diet
Services) and water. All animal care protocols and procedures were performed in
accordance with current regulations.
AMPKα1α2-null (AMPK KO) mice were maintained under a 12-hour light/12-hour
dark cycle with free access to water and standard mouse diet (in terms of energy:
65% carbohydrate, 11% fat, 24% protein). These AMPK catalytic subunit deficient
mice were generated as previously described (1). All procedures were performed in
accordance with the principles and guidelines established in the European
Convention for the Protection of Vertebrate Animals Used for Experimental and
Other Scientific Purposes (Council of Europe, ETS no. 123, 1991).
Hepatocyte Extraction
Mice were killed by cervical dislocation following guidelines set out by the Animals
(Scientific Procedures) Act 1986. An incision into the abdomen was followed by
dissection of the skin, abdominal cavity and diaphragm to expose the liver, kidney,
inferior vena cava and portal vein. The superior vena cava was clamped to isolate
the hepatic system and the inferior vena cava was cannulated just above the kidney
with a 25G butterfly needle and clamped in place. Immediately after cannulation, the
portal vein was cut. Successful cannulation was determined when the liver cleared
quickly of blood and became pale throughout. The liver was perfused with 50ml pre-
warmed perfusion buffer (137mM NaCl, 7mM KCl, 0.7mM Na2HPO4, 10mM HEPES
pH 7.65 filter sterilized (0.2 µm) with 0.1% EDTA 0.5M pH 8 added just prior to use)
at a rate of 5ml/min. After 10 min, the liver was perfused with 50ml digestion buffer
(perfusion buffer without EDTA with 5.1mM CaCl2 and 20mg collagenase (from
Clostridium histolyticum type IV, Sigma)); added at a rate of 5ml/min. After digestion,
the liver was excised from the abdominal cavity and transferred to a cell culture hood
in a 10cm dish. The liver was resuspended in 10ml of plating media (440ml M199 +
Glutamax (1x), Invitrogen; 5ml Pen/Strep (100x), Invitrogen; 6.7ml BSA (7.5%),
Invitrogen; 50ml FBS (foetal bovine serum); 7.7µl Insulin Actrapid (100U/ml), Novo
Nordisk; 100µl T3 (thyroid hormone 1mM stock), Sigma; 25µl Dexamethasone
(10mM stock), Merck) and the hepatocytes isolated by gently agitating the liver. Cells
were filtered through a 100 µm cell strainer and this process was repeated 4 more
times until a final volume of 50ml was obtained. Hepatocytes were pelleted by
centrifugation at 400 rpm for 5 min using no acceleration or braking. The supernatant
was discarded and the cell pellet resuspended in 25ml plating media by gentle
inversion. Cell viability was determined by 0.04% Trypan blue staining and the cell
number determined using a haemocytometer. Cell viability of >90% was required for
experimental use. Cell Culture and Lysis for Immunoblotting
All cells were maintained in an incubator at 37ºC and 5% CO2. For lysate and RT-
PCR experiments, primary mouse hepatocytes were plated in 6-well plates (2.5 x 10⁵
cells/well in 2ml media) while for glucose assay experiments, primary mouse
hepatocytes were plated in 12-well plates (1.25 x 10⁵ cells/well in 1ml media). After 4

hours, plating media was removed, cells were washed with warmed PBS and
overnight media (500ml M199 + Glutamax (1x); 5ml Pen/Strep (100x); 25µl
Dexamethasone (10mM stock)) was added at 2ml per well. Cells were incubated
overnight and experiments were performed the following day.
BMDMs were grown from mouse bone marrow in RPMI 1640 medium supplemented
with 10% FBS (Life Technologies) and 10ng/ml M-CSF (R&D systems). Cells were
given fresh medium and growth factor on day 3 of culture. On day 6, BMDM cultures
were supplemented with 100ng/ml IFNγ (for M1 differentiation; R&D systems),
20ng/ml IL-4 (for M2 differentiation; R&D systems), or 100ng/ml LPS (for activation;
premium grade from Sigma, expected to activate TLR2 and TLR4) in the presence or
absence of drug treatments for the final 24h.
Prior to SDS-PAGE, cells were lysed by scraping into buffer A: (50mM Tris acetate
pH7.5, 1% (w/v) Triton X100, 1mM EDTA, 1mM EGTA, 0.27M sucrose, 50mM NaF,
1mM sodium orthovanadate, 10mM β-glycerophosphate, 5mM sodium
pyrophosphate, 1mM benzamidine, 0.2mM phenylmethylsulfonyl fluoride (PMSF)
and 0.1% (v/v) β-mercaptoethanol) then prepared for SDS-PAGE as follows. The
lysates were centrifuged at 13 000 g for 15 min, and the supernatants were
removed. Protein concentration was determined by Bradford assay (Bio-Rad). The
supernatant was loaded in equal amounts of protein and subjected to 4-20%
gradient SDS-PAGE and subsequently were transferred to nitrocellulose
membranes. Primary antibody incubations were performed at dilutions
recommended by the manufacturer or determined by us in 5% milk TBS-T. All
incubations were done at 4°C, overnight after a 1 hr block in 5% milk TBS-T. The
secondary antibody was used at 1:5000 dilution for 1 hr at room temperature.
Proteins were visualised using the enhanced chemiluminescence (ECL) system
(Amersham) onto X-ray film (Kodak). Immunoblot densitometry for each antibody
was performed with Image Studio Lite version 5.2 (LI-COR). Each blot is
representative of experiments carried out at least three times.
Glucose Assay
Treatment of cells for hepatocyte glucose production was performed using primary
mouse hepatocytes plated in 12-well plates (1.25 x 10⁵ cells/well in 1ml media).
Glucose production was determined after a 12 hour incubation period in 750µl
glucose-free DMEM (11966; Life Technologies) supplemented with 1% Pen/Strep,
lactate (Sigma)/pyruvate (Life Technologies) (10:1 mM) and 100nM dexamethasone
(dex; Merck) with or without drugs/cytokines under investigation. At the end of the
incubation period of 12 hours, 500µl of medium was collected and glucose
concentration determined by GAGO assay (GAGO-20; Sigma) by a modified
protocol scaled down to a 96-well plate format. 50µl of sample medium followed by
100µl assay reagent was added to each well with no time delay. Following incubation
at 37oC for 30 minutes, 100µl 12N H2SO4 was added to each well and mixed using a
multi-well pipette. Absorbance was measured at 540 nm. Each column consists of
data from at least 12 wells of cells, six each from two mice.
RT-PCR
Primary mouse hepatocytes were incubated for 8 hours in 1ml glucose-free DMEM
(11966; Life Technologies) supplemented with 1% pen/strep, lactate
(Sigma)/pyruvate (Life Technologies) (10:1 mM) and 100nM dexamethasone (dex;
Merck) with or without drugs under investigation. After this incubation period, media
was removed and cells were washed once with warmed PBS. 350µl of Buffer RLT
from the Rneasy MINI KIT (Qiagen) plus 10% β-mercaptoethanol was added to each
well. Plates were then placed on ice for 10 min, followed by a cell harvest and
samples were snap-frozen immediately in LN2. Total RNA was extracted using
QIAshredder (Qiagen) and Rneasy MINI KIT (Qiagen) as per the manufacturer’s
instructions. cDNA was synthesized from 1µg RNA using RQ1 Rnase-Free Dnase kit
(Promega) and ImProm-II Reverse Transcription System (Promega). cDNA was
diluted in nuclease-free water 1:10 prior to use.
Nucleospin RNA II Total RNA isolation kit (Macherey-Nagel) was used to isolate
RNA from macrophages. cDNA was synthesized from 0.5µg RNA using High
Capacity cDNA Reverse Transcription Kit (4368814, Thermo Fisher Scientific).
cDNA was diluted in nuclease-free water 1:2 prior to use.
Real-time PCR was carried out using the 7900HT Fast Real-Time PCR System
(Applied Biosystems) using TaqMan 2x Universal PCR Master Mix (Applied
Biosystems) and primer/probes mixes as stated (Applied Biosystems). Primer sets

used were: IL-6 Mm00446190_ml; CXCL1 Mm04207460_m1; 18S Hs03003631_g1;
IL-1β Mm00434228_m1; CXCL2 Mm00436450_m1; PPARγ Mm01184322_m1;
FASN Mm00662319_m1; CCL22 Mm00436439_ml; CXCL12 Mm00445553_ml; TBP
Mm01277042_m1 and SREBP-1c Mm00550338_m1. Cycling conditions were: 50°C
for 2 min, 95°C for 10 min, followed by 40 cycles of 95°C for 15 s and 60°C for 1 min.
Expression is expressed relative to 18s mRNA for hepatocytes and TBP for
macrophages (Applied Biosystems) using the 2-ΔΔCt method. Control samples were
set at a value of 100% and results for all experimental samples were graphed as
relative expression compared to control. Each column is composed of data from at
least three separate experiments.
BMDM studies
BMDMs were harvested from culture plates using 4mM EDTA in PBS for 10min at
37°C. Cells were washed in flow cytometry buffer (PBS with 2% FBS and 1mM
EDTA) and stained using the following antibodies (all BD Bioscience unless stated):
F4/80 (BM8; e-bioscience), CD11c (HL3), CD206 (C068C2; Biolegend), CD69
(H1.2F3) and CD40 (3/23). Fc block (4.4G2) was included in all stains. Data were
acquired on a LSR II flow cytometer (Becton Dickinson) and analysed using FlowJo
software (TreeStar). BMDM culture supernatants were collected after 24 hours
treatment with the differentiation or activation conditions. Levels of cytokines were
quantified by standard sandwich ELISA using paired antibody kits (e-bioscience),
according to the manufacturer’s instructions.
Statistical Analyses
Results in bar graphs are expressed as mean ± SEM. Comparisons between groups
were made by one-way ANOVA with Dunnett’s or Tukey post-hoc test using Prism.
Differences were considered statistically significant if P was less than 0.05. ***
denotes p<0.001; ** denotes p<0.01 and * denotes p<0.05. For studies on the
plasma, statistical analyses of data were performed using SPSS 14.1. ANOVA and
Pearson correlation coefficients were calculated.
II. Validation in Clinical Patients
Population Cohort Study: Diabetes Patient Metformin Exposure and Neutrophil-to-Lymphocyte Ratio (NLR).
Sample Ascertainment
Patients were ascertained from the Diabetes Audit and Research in Tayside
Scotland (DARTS) study, which has previously been described in detail (2). In brief,
all the participants were linked through to the Health Informatics Centre Database to
retrieve validated prescribing information, clinical information system, all
haematological and biochemistry data and the Scottish Care Information–Diabetes
Collaboration (SCI-DC) (REF) that provide additional clinical phenotypic data back to
1992. Prospective longitudinal data were also collected on these patients. The study
was approved by the Tayside Regional Ethics Committee, and informed consent was
obtained from all subjects since 1997 to DNA and serum collection as part of the
Wellcome Trust United Kingdom Type 2 Diabetes Case Control Collection. Over
17,000 subjects have participated in this Genetics of DARTS (Go-DARTS) study till
date, of whom over 9,000 have diabetes.
Hematological Measurements.
We analysed the electronically linked records of routine laboratory investigations of
all the participants from the regional biochemistry and hematological database. The
total and differential leucocyte counts (including the neutrophils and lymphocytes)
were determined from peripheral venous blood samples using an automated
Siemens’ high-volume hematology analyzer, the ADVIA® 2120i System (peroxidase
method) (3). NLR was calculated as the ratio between (percentage of) neutrophils
and total lymphocyte counts in the study subjects.
Statistical Analysis
For the population cohort study, characteristics of patients with or without metformin
therapy were compared by the chi-square test for categorical variables and by the t
test or Mann-Whitney U test for continuous variables as appropriate. The effect of
metformin therapy on NLR were examined together with the significant differences
found at baseline using linear and logistic regression analysis. The following
covariates were included: age, sex, HbA1c, BMI, duration of followup, prior
hospitalisation for COPD, Atrial Fibrilation or Hypertension, and baseline NLR. To
minimize confounding influences, we performed two different sensitivity analysis.
First, by using a multivariate model adjusting for potential confounders; second we
determined a propensity score using a logistic regression model to control for the
different characteristics of the metformin and sulfonylurea groups. A P-value of <0.05
was considered significant and all statistical analysis for this cohort study were
performed using R for windows (v3.2.0).
Randomised Placebo Controlled Study
The effect of metformin on plasma inflammatory cytokines were further investigated
in a subset of chronic heart failure (CHF) patients who had participated in a double-
blind, placebo-controlled study of metformin, which has previously been described in
detail (4). In brief, this study was designed and powered to evaluate the impact of
metformin on IR and its effects on exercise capacity in non-diabetic IR patients with
CHF. Every patient who participated in this study, provided written informed consent
prior to participation in this study, which was approved by the East of Scotland
Research Ethics Service (www.clinicaltrials.gov: NCT00473876). In this study we
had shown that metformin treatment significantly improved IR but had no significant
effect on the primary endpoint of exercise capacity, as measured by peak VO2.
However, metformin treatment did result in a significant improvement in the minute
ventilation − carbon dioxide production relationship (VE/VCO2 slope), a pre-specified
secondary endpoint of this proof of concept study which is of prognostic significance
in patients with CHF, and in some studies, it has outperformed peak VO2 (5).
Cytokine Assay
We analysed plasma from 33 non-diabetic insulin resistant heart failure patients who
took part in a placebo controlled clinical trial of metformin (4). The plasma was
analysed using the Bio-Plex Pro Human Chemokine 40-Plex Panel (171-AK99MR2,
Bio-Rad). The assay was performed following the manufacturer’s instructions using
the Bio-Plex 200 system (Bio-Rad). Freeze-thaw cycling of samples was avoided to
prevent cytokine degradation and they were diluted 1:4 (12.5µl of plasma) for the
assay.
References
(1) Foretz M, Hébrard S, Leclerc J, Zarrinpashneh E, Soty M, Mithieux G, Sakamoto K, Andreelli F, Viollet B: Metformin inhibits hepatic gluconeogenesis in mice independently of the LKB1/AMPK pathway via a decrease in hepatic energy state. J Clin Invest 2010;120:2355-2369.
(2) Morris AD, Boyle DI, MacAlpine R, Emslie-Smith A, Jung RT, Newton RW, MacDonald TM: The diabetes audit and research in Tayside Scotland (DARTS) study: electronic record linkage to create a diabetes register. DARTS/MEMO Collaboration. BMJ 1997;315:524-528
(3) ADVIA 2120i Hematology System with Autoslide. SIEMENS Healthineers website. http://www.healthcare.siemens.com/hematology/systems/advia-2120-hematology-system-with-autoslide. Updated September 9, 2015. Accessed July 7, 2016.
(4) Wong AKF, Symon R, Alzadjali MA, Ang DSC, Ogston S, Choy AM, Petrie JR, Struthers AD, Lang CC: The effect of metformin on insulin resistance and exercise parameters in patients with heart failure. European Journal of Heart Failure 2012;14:1303-1310
(5) Arena R, Myers J, Aslam SS, Varughese EB, Peberdy MA. Peak VO2 and VE/VCO2 slope in patients with heart failure: a prognostic comparison. Am Heart J 2004; 147: 354–360.

Supplementary table I. Cytokine measurements
Baseline Placebo (n=13) Metformin (n=20)
Cytokine (pg/ml) Average SD Average SD CCL21/6Ckine 5454.29 2067.61 5890.92 1853.73BCA-1/CXCL13 28.52 9.54 35.02 13.22 CTACK/CCL27 1723.32 583.41 1973.63 815.37 ENA-78/CXCL5 642.91 213 781.07 321.26 Eotaxin/CCL11 51.4 13.67 60.8 17.69
Eotaxin-2/CCL24 685.11 518.81 640.79 402.68 Eotaxin-3/CCL26 56.27 18.48 74.93 60.97
Fractalkine/CX3CL1 172.05 61.95 237.93 93.3 GCP-2/CXCL6 20.34 8.37 26.27 14.34
GM-CSF 128.91 50.39 137.67 52.51 Gro-α/CXCL1 348.61 83.78 336.15 76.27 Gro-β/CXCL2 153.61 74.54 235.74 178.19 I-309/CCL1 83.83 17.2 92.43 18.49
IFNγ 64.35 20.88 75.98 27.42 IL-1β 7.53 3.66 9.33 3.84 IL-2 15.96 5.21 18.87 6.48 IL-4 32.19 7.45 33.4 9.48 IL-6 14.14 3.89 17.81 8.58
IL-8/CXCL8 14.19 4.16 16.9 4.72 IL-10 46.74 21.99 54.49 22.46 IL-16 329.73 120.54 364.8 130.41
IP-10/CXCL10 173.62 67.61 206.57 114.88 I-TAC/CXCL11 18.02 6.86 23.33 7.83 MCP-1/CCL2 69.92 33.76 86.03 52.74 MCP-2/CCL8 56.84 21.19 70.44 38.9 MCP-3/CCL7 126.6 35.08 146.64 53.26
MCP-4/CCL13 77.59 46.32 69.26 39.3 MDC/CCL22 1014.65 290 1151.86 505.54
MIF 6303.03 5822.99 5681.16 3323.86MIG/CXCL9 296.66 136.95 404.71 277.22
MIP-1α/CCL3 10.5 2.02 12.22 3.69 MIP-1δ/CCL15 7487.28 3978.97 7716.92 4125.49MIP-3α/CCL20 34.9 79.52 37.84 43.88 MIP-3β/CCL19 353.04 252.2 463.93 308.82 MPIF-1/CCL23 446.78 221.81 494.74 211.13
SCYB16/CXCL16 503.06 216.96 567.01 228.79 SDF-1α+β/CXCL12 1257.91 423.96 1487.04 500.84

TARC/CCL17 113.29 81.29 138.35 94.4 TECK/CCL25 759.25 248.21 896.76 327.17
TNFα 46.33 10.03 51.18 15.66
Change after 4 months metformin treatment
Placebo (n=13) Metformin (n=20) BMI (p value)
BMI & FIRI (p value) Cytokine (pg/ml) Average SD Average SD
CCL21/6Ckine 99.20 756.47 55.16 2595.81 0.857 0.8 BCA-1/CXCL13 3.92 7.29 2.34 14.28 0.036 0.029 CTACK/CCL27 54.09 401.40 -128.67 902.78 0.022 0.032 ENA-78/CXCL5 29.79 148.93 -60.30 375.81 0.02 0.025 Eotaxin/CCL11 5.18 8.94 -0.36 17.00 0.004 * 0.006 *
Eotaxin-2/CCL24 32.73 258.03 -21.23 210.01 0.309 0.356 Eotaxin-3/CCL26 6.54 13.67 -11.50 54.48 0.038 0.053
Fractalkine/CX3CL1 0.93 56.10 -25.89 107.44 0.085 0.081 GCP-2/CXCL6 0.91 6.29 1.05 13.11 0.169 0.216
GM-CSF 1.52 34.36 3.15 55.77 0.051 0.05 Gro-α/CXCL1 11.01 54.90 5.89 80.00 0.101 0.106 Gro-β/CXCL2 32.80 56.92 9.41 120.75 0.317 0.365 I-309/CCL1 6.16 10.89 -0.69 17.79 0.011 0.014
IFNγ 6.28 16.04 -1.85 29.38 0.019 0.025 IL-1β 0.16 2.90 -0.96 4.15 0.116 0.098 IL-2 1.47 3.17 -0.95 6.96 0.006 * 0.009 * IL-4 1.33 4.55 -2.67 11.90 0.008 * 0.014 IL-6 0.86 3.43 2.75 14.94 0.022 0.027
IL-8/CXCL8 1.87 3.94 0.20 8.25 0.07 0.072 IL-10 6.79 14.29 -4.43 27.19 0.019 0.024 IL-16 32.62 82.96 -19.07 149.55 0.013 0.021
IP-10/CXCL10 -3.82 52.93 16.13 118.54 0.958 0.893 I-TAC/CXCL11 2.22 7.06 3.73 13.73 0.989 0.955 MCP-1/CCL2 12.78 26.27 -5.34 35.48 0.039 0.055 MCP-2/CCL8 9.01 16.58 -2.92 38.04 0.048 0.071 MCP-3/CCL7 13.07 31.37 -7.03 55.42 0.025 0.029
MCP-4/CCL13 -3.31 25.83 3.02 37.95 0.377 0.418 MDC/CCL22 93.18 244.23 -47.75 453.81 0.004 * 0.005 *
MIF -1711.46 5475.63 -829.75 3572.37 0.436 0.464 MIG/CXCL9 52.40 128.26 -3.84 200.65 0.016 0.019
MIP-1α/CCL3 0.72 1.66 -0.52 2.67 0.013 0.013 MIP-1δ/CCL15 -300.03 2502.48 515.34 4045.71 0.505 0.368 MIP-3α/CCL20 -16.84 61.17 -4.44 45.65 0.832 0.991 MIP-3β/CCL19 97.36 212.33 -77.06 343.62 0.018 0.024 MPIF-1/CCL23 -16.10 95.08 -29.21 177.39 0.26 0.214
SCYB16/CXCL16 -11.35 114.84 30.26 203.08 0.083 0.11 SDF-1α+β/CXCL12 103.67 198.81 -49.25 409.72 0 * 0.001 *
TARC/CCL17 29.45 72.26 -20.89 96.02 0.022 0.03

Supplementary table II. Metabolic, haemodynamic and other characteristics of patients
Baseline
Placebo (n=13) Metformin (n=20) p value
Sex Male 12; Female
1 Male 16; Female 4 Average SD Average SD
Age 64.23 6.99 62.70 7.04 0.408 Metabolism Parameters
Body Mass Index 29.37 5.11 30.19 5.23 0.319 Insulin (mU/L) 22.63 11.54 27.47 15.29 0.144 Glucose (mmol/L) 5.37 0.42 5.61 0.66 0.331 Fasting Insulin Resistance Index (log) 4.90 2.57 6.32 3.92 0.134
Severity of Heart Failure
Brain Natriuretic Peptide (pg/ml) 116.27 131.98 139.09 197.95 0.750
Ejection Fraction (%) 28.82 8.29 37.29 7.93 0.016 Haemodynamic Conditions
Resting Systolic Blood Pressure (mmHg) 116.54 21.05 107.60 9.68 0.101
Resting Diastolic Blood Pressure (mmHg) 75.15 10.38 69.35 7.15 0.178
Resting Heart Rate 70.08 21.22 68.60 14.44 0.992 Peak VO2 (mL/kg/min) 18.02 5.94 19.72 4.75 0.776 VE/VCO2 slope 30.65 5.31 31.64 6.03 0.244 Total exercise duration (s) 954.15 355.64 1063.80 204.51 0.469
TECK/CCL25 54.31 180.75 -57.17 354.85 0.019 0.026 TNFα 4.91 8.98 0.09 18.93 0.03 0.036
Significance taken as * p < 0.01.
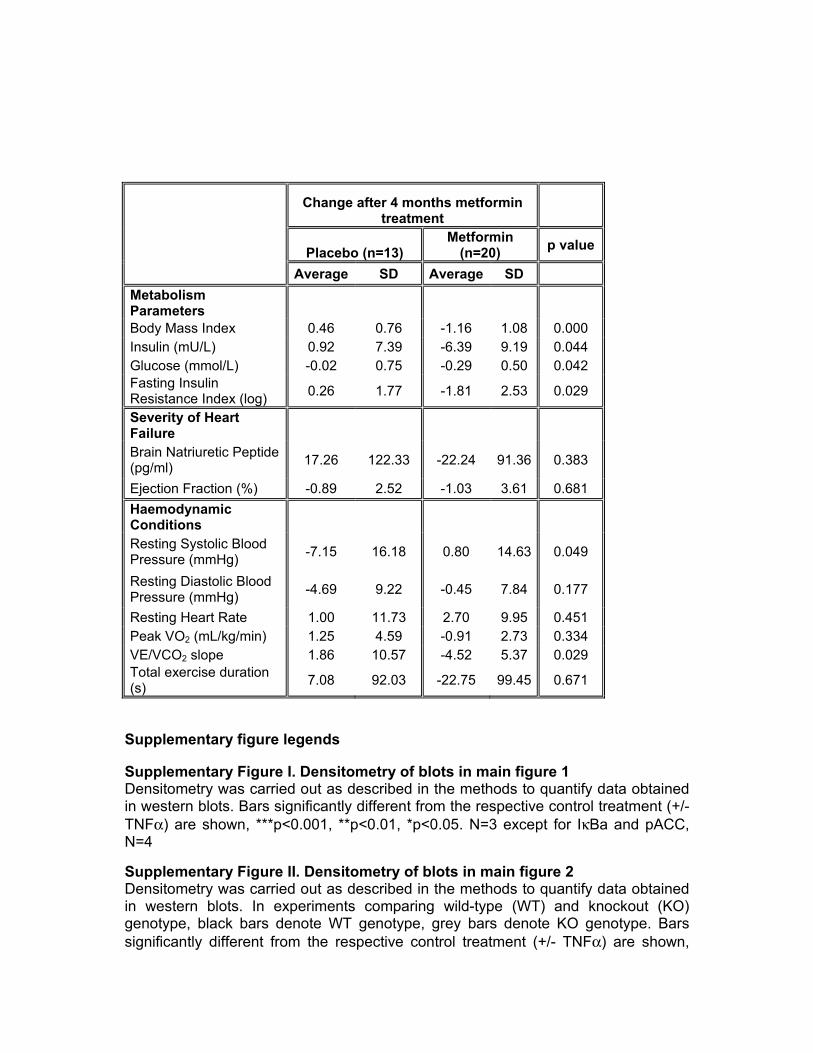
Change after 4 months metformin
treatment
Placebo (n=13) Metformin
(n=20) p value
Average SD Average SD Metabolism Parameters Body Mass Index 0.46 0.76 -1.16 1.08 0.000 Insulin (mU/L) 0.92 7.39 -6.39 9.19 0.044 Glucose (mmol/L) -0.02 0.75 -0.29 0.50 0.042 Fasting Insulin Resistance Index (log) 0.26 1.77 -1.81 2.53 0.029
Severity of Heart Failure
Brain Natriuretic Peptide (pg/ml) 17.26 122.33 -22.24 91.36 0.383
Ejection Fraction (%) -0.89 2.52 -1.03 3.61 0.681 Haemodynamic Conditions
Resting Systolic Blood Pressure (mmHg) -7.15 16.18 0.80 14.63 0.049
Resting Diastolic Blood Pressure (mmHg) -4.69 9.22 -0.45 7.84 0.177
Resting Heart Rate 1.00 11.73 2.70 9.95 0.451 Peak VO2 (mL/kg/min) 1.25 4.59 -0.91 2.73 0.334 VE/VCO2 slope 1.86 10.57 -4.52 5.37 0.029 Total exercise duration (s) 7.08 92.03 -22.75 99.45 0.671
Supplementary figure legends
Supplementary Figure I. Densitometry of blots in main figure 1 Densitometry was carried out as described in the methods to quantify data obtained in western blots. Bars significantly different from the respective control treatment (+/- TNFα) are shown, ***p<0.001, **p<0.01, *p<0.05. N=3 except for IκBa and pACC, N=4
Supplementary Figure II. Densitometry of blots in main figure 2 Densitometry was carried out as described in the methods to quantify data obtained in western blots. In experiments comparing wild-type (WT) and knockout (KO) genotype, black bars denote WT genotype, grey bars denote KO genotype. Bars significantly different from the respective control treatment (+/- TNFα) are shown,
***p<0.001, **p<0.01, *p<0.05, except in knockout experiments, where significance between genotypes is depicted. N=3
Supplementary Figure III. Effect of metformin on gene expression in macrophages: genes regulated in hepatocytes Macrophages were treated with or without 100ng/ml LPS +/- 2mM metformin for 8h followed by cell lysis, RNA extraction and preparation of cDNA for RTPCR using primer sets for individual genes shown, as described in the methods. Bars significantly different from control treatment, or between two annotated bars are shown, ***p<0.001, *p<0.05 Supplementary Figure IV. Effect of metformin on gene expression in macrophages and hepatocytes: genes changed by metformin in human plasma Macrophages (a,b) were treated with/without 100ng/ml LPS +/- 2mM metformin, while hepatocytes (c) were treated with/without 10ng/ml TNFα +/- 2mM metformin or 10mM BI605906 as shown, for 8h followed by cell lysis, RNA extraction and preparation of cDNA for RTPCR using primer sets for individual genes shown, as described in the methods. Bars significantly different from control treatment, or between two annotated bars are shown, ***p<0.001, **p<0.01, *p<0.05 Supplementary Figure V. Densitometry of blots in main figure 5 Densitometry was carried out as described in the methods to quantify data obtained in western blots. In experiments comparing wild-type (WT) and knockout (KO) genotype, black bars denote WT genotype, grey bars denote KO genotype. Bars significantly different from the respective control treatment (+/- TNFα) are shown, ***p<0.001, **p<0.01, *p<0.05, except in knockout experiments, where significance between genotypes is depicted. N=3

Supplementary Fig. I
A B
B C
C C

Supplementary Fig. I
D D
E E
F F

Supplementary Fig. II
A B
B
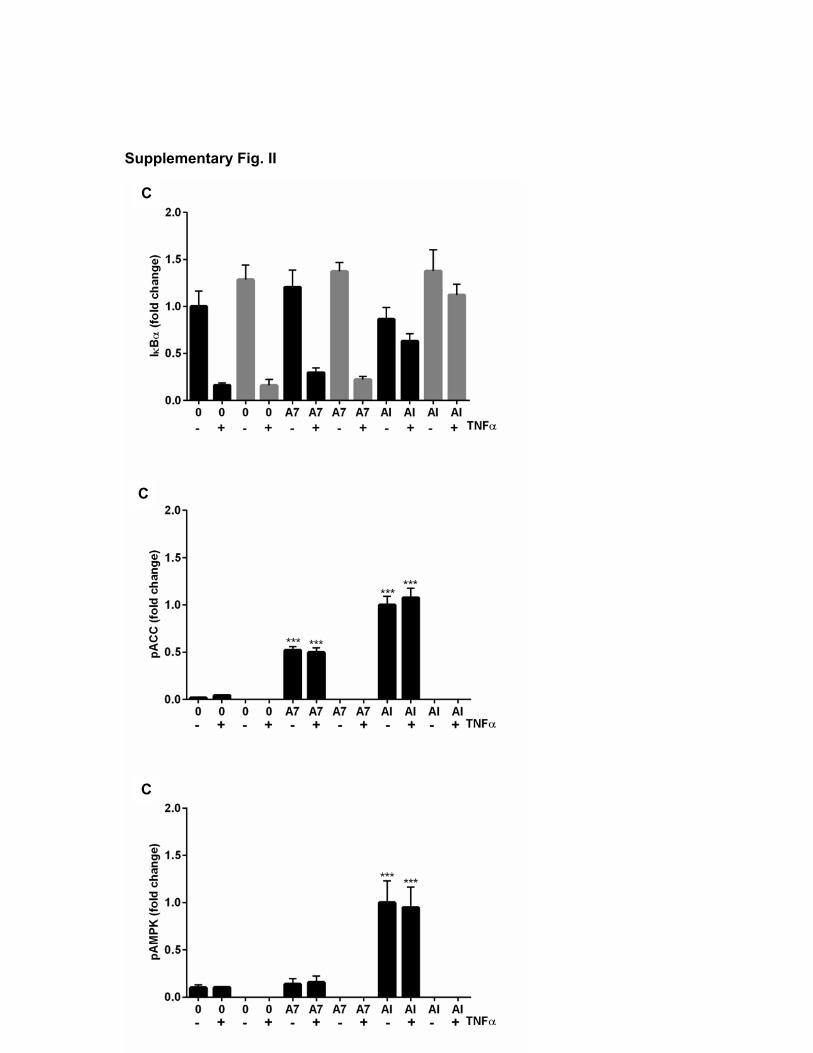
Supplementary Fig. II
C
C
C

Supplementary Fig. II
D
D
D

Supplementary Fig. III
A B
C D

Supplementary Fig. IV
MACROPHAGES
HEPATOCYTES
A B
C

Supplementary Fig. V
A A
A A
A A
A A

Supplementary Fig. V
B B
B B

Supplementary Fig. V
C
C
C
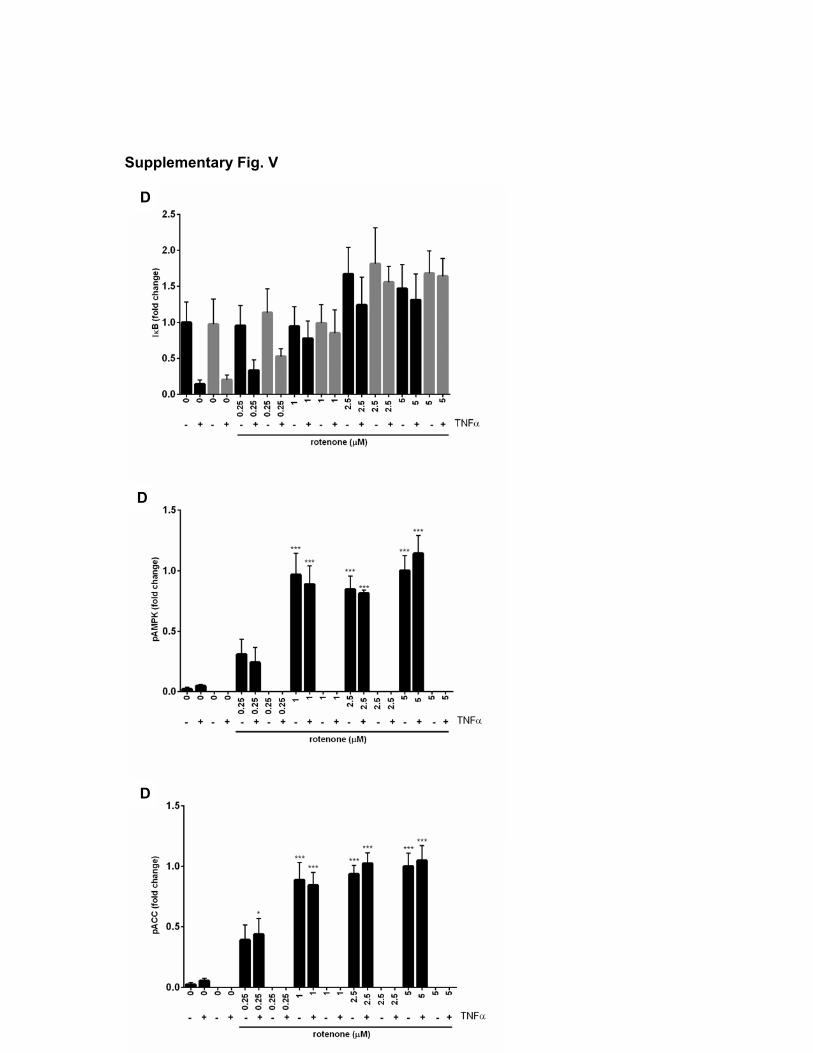
Supplementary Fig. V
D
D
D