ant routing in mobile ad hoc networks - tu delft · ant routing in mobile ad hoc networks ... study...
TRANSCRIPT

Ant Routing in Mobile Ad Hoc Networks
S. S. Dhillon, X. Arbona and P. Van MieghemDelft University of Technology
Faculty of Electrical Engineering, Mathematics and Computer ScienceP.O. Box 5031, 2600 GA, Delft, The Netherlands
s.dhillon, [email protected] and [email protected]
Abstract
We study the performance of ant routing for static anddynamic network topologies. We also compare the per-formance of ant routing with AODV and DSR for ad hocnetworks. The simulations show that the ant routing al-gorithm performs well for static topologies. However, therouting overhead in ant routing is more than AODV andDSR. Therefore, ant routing performs worse than AODVand DSR in ad hoc networks because of the limited capacityand restrictions on the buffer size. Moreover, with mobility,a large number of data packets in ant routing experienceloops that degrade the end-to-end performance.
1. Introduction
Routing consists of a routing protocol and a routing algo-rithm [15]. The routing protocol is used to exchange infor-mation about topology and link weights while the routingalgorithm computes the paths between nodes. An exam-ple of the classical approach to routing is the Open ShortestPath First (OSPF). In OSPF, the routers exchange link-stateinformation by flooding and the link state updates are gen-erated only when the link status changes. Once a node hasobtained topology information of the entire network, Dijk-stra’s and Bellman-Ford’s algorithms are generally used tocompute the shortest path [15].
A relatively new approach to routing is the mobile agentbased routing (MABR) or ant routing [5, 4] which com-bines the routing protocol and the routing algorithm intoa single entity. In MABR, the nodes maintain probabilis-tic routing tables which are updated periodically by mobileagents (ants) based on the quality of paths. The quality ofpaths is expressed in terms of metrics such as hopcount,end-to-end delay, packet loss etc. The probabilistic routingtables contain the probability of choosing a neighbor as thenext hop for any destination. Data packets are forwardedaccording to the probabilistic routing tables, and therefore,
no additional routing algorithm is required to compute thepaths.
There are a number of differences between the abovetwo approaches. MABR is a hop-by-hop routing approach.In MABR, traffic across the network is continuously moni-tored by the mobile agents. Due to the probabilistic routingin MABR, the paths are not loop-free and oscillations mightoccur. The hop-by-hop nature of routing in MABR cannotreserve paths that satisfy QoS constraints [15]. However,MABR provides soft-QoS since different paths are continu-ously monitored and quality of paths is reflected in the rout-ing table values. In OSPF, traffic fluctuations and the end-to-end delay are not measured. MABR has been shown toperform load balancing, i.e. distribute traffic along multiplepaths, and automatic adaptation to node or link failure instatic topologies [5, 14, 4].
In ad hoc and mesh networks [1], mobile nodes commu-nicate with each other using multihop wireless links. A keychallenge in these networks is the development of routingprotocols that can efficiently find routes between commu-nicating nodes. In addition, in ad hoc networks the routingprotocol must be able to cope with the node mobility thatchanges the network topology frequently. We refer to thefrequently changing network topology as dynamic topol-ogy. Routing protocols for ad-hoc networks can be clas-sified into different categories such as Pro-active or tabledriven (e.g. DSDV [3]) and Reactive or on-demand (e.g.AODV [11] and DSR [9]) based on the routing informationstored at the nodes. In on-demand protocols, routes are cre-ated only when desired by the source node. In table-drivenrouting protocols, each node maintains one or more tablesto store routing information and attempts to maintain con-sistent, up-to-date view of the network topology. In general,on-demand protocols perform better than reactive protocolsin ad hoc networks [3] and mesh networks [1].
The performance of MABR for mobile ad hoc networksis an open issue. MABR algorithms do not take into ac-count the mobility of the nodes. Moreover, load balancingfor frequently changing topologies is a challenging issue.
Load balancing involves distributing traffic along multiplepaths depending on the traffic conditions such that the con-gested nodes or the unavailable links are by-passed. Withnode mobility, the paths are not stable making load balanc-ing difficult. Furthermore, characteristics of traffic in adhoc networks is not known. In this paper, our aim is tostudy whether MABR algorithms can be applied for routingin mobile ad hoc networks.
We study the performance of a MABR algorithm(W_AntNet) described in Section 3, for static and mo-bile wireless networks. W_AntNet is an adaptation of theAntNet algorithm proposed by Di Caro and Dorigo [5]. Insection 4, we compare the performance of W_AntNet al-gorithm with Dijkstra’s shortest path algorithm for statictopology. We also compare the performance of W_AntNetwith ad hoc routing protocols AODV [11] and DSR [9].
2. Related Work
A variety of MABR algorithms have been proposed forwired and ad hoc networks. AntNet and Ant-Based Control(ABC) proposed by Schoonderwoerd et al. [14] are exam-ples of MABR algorithms for wired networks. AntNet [5]has been shown to perform better than OSPF under vary-ing and near saturation traffic loads. In addition, AntNethas been shown to converge to the shortest path with non-varying traffic loads [4]. ABC is similar to AntNet but itis designed for load balancing in circuit-switched networksand uses one-directional mobile agents [14].
MABR algorithms for ad hoc networks, such as An-tHocNet [6], Ad hoc Networking with Swarm Intelligence(ANSI) [12], Ant-Colony-Based Routing Algorithm (ARA)[7], Ant-AODV [10] and Termite [13], use on-demand mo-bile agents for discovering routes. The on-demand flood-ing of mobile agents is similar to flooding of route request(RREQ) packets in on-demand protocols AODV and DSR.In ANSI, ARA and Termite, the pheromone decays and as aresult after a certain period the routing tables are empty. Thedecay of routing table values is similar to AODV where thepaths are valid for a certain duration of time. Thus, the pathsobtained by using AODV or ANSI, ARA and Termite areidentical. In addition, if a link breaks in ANSI, AntHocNet,Ant-AODV and ARA routing protocols inject route errorpackets similar to on-demand protocols. Indeed, the perfor-mance of ANSI, ARA and Ant-AODV is similar to AODVand DSR [7, 10, 12]. In our view, these algorithms are avariation of the on-demand protocols and deviate from theoriginal idea of MABR algorithms in which routing tablesare sufficient for routing data packets. We do not considerthe performance of MABR algorithms that use on-demandflooding of mobile agents in this paper.
Routing table
Local Traffic Statistics
Networknode
N; N; WN…2; 2; W21; 1; W1
N....21
N; N; WN…2; 2; W21; 1; W1
N....21
Network nodes
Net
wor
k no
des
Neighbor nodesx
y
z
Tk=
pzNpyNpxN
…pz2py2px2
pz1py1px1
pzNpyNpxN
…pz2py2px2
pz1py1px1
Mk =
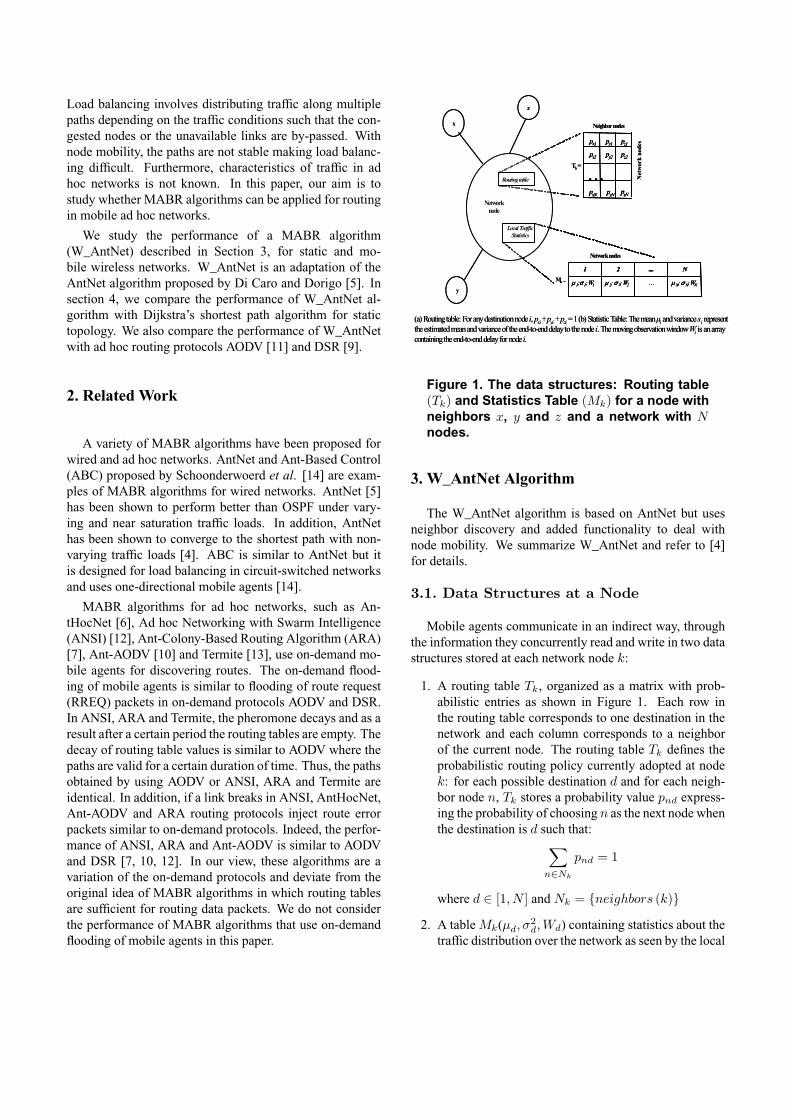
(a) Routing table: For any destination node i, pxi+pyi +pzi = 1 (b) Statistic Table: The mean µi and variance si represent the estimated mean and variance of the end-to-end delay to the node i. The moving observation window Wi is an array containing the end-to-end delay for node i.
Routing table
Local Traffic Statistics
Networknode
N; N; WN…2; 2; W21; 1; W1
N....21
N; N; WN…2; 2; W21; 1; W1
N....21
Network nodes
Net
wor
k no
des
Neighbor nodesx
y
z
Tk=
pzNpyNpxN
…pz2py2px2
pz1py1px1
pzNpyNpxN
…pz2py2px2
pz1py1px1
Mk =
(a) Routing table: For any destination node i, pxi+pyi +pzi = 1 (b) Statistic Table: The mean µi and variance si represent the estimated mean and variance of the end-to-end delay to the node i. The moving observation window Wi is an array containing the end-to-end delay for node i.
Figure 1. The data structures: Routing table( ) and Statistics Table ( ) for a node withneighbors , and and a network withnodes.
3. W_AntNet Algorithm
The W_AntNet algorithm is based on AntNet but usesneighbor discovery and added functionality to deal withnode mobility. We summarize W_AntNet and refer to [4]for details.
3.1. Data Structures at a Node
Mobile agents communicate in an indirect way, throughthe information they concurrently read and write in two datastructures stored at each network node :
1. A routing table , organized as a matrix with prob-abilistic entries as shown in Figure 1. Each row inthe routing table corresponds to one destination in thenetwork and each column corresponds to a neighborof the current node. The routing table defines theprobabilistic routing policy currently adopted at node
: for each possible destination and for each neigh-bor node , stores a probability value express-ing the probability of choosing as the next node whenthe destination is such that:X
= 1
where [1 ] and = { ( )}2. A table ( 2 ) containing statistics about the
traffic distribution over the network as seen by the local

node . For each destination in the network, the ta-ble contains a moving observation window , anestimated mean and an estimated variance 2 Themoving observation window , of size , rep-resents an array containing the trip times of lastforward ants that travel from the node to the destina-tion . The moving observation window is used tocompute the best trip time i.e., the best trip timeexperienced by a forward ant travelling from the node
to the destination among the last forwardants that travel from the node to the destination .The mean and variance 2 represent the mean andvariance of the trip times experienced by the forwardants to move from the node to the destination nodeand are calculated using the exponential model:
+ ( ) (1)
2 2 +³( )
2 2´
(2)
In (1) and (2), represents the newly observedforward ant’s trip time to travel from the node to thedestination node and (0 1] is a factor that weighsthe number of recent samples that will affect the mean
and the variance 2.
3.2. AntNet Algorithm
The AntNet algorithm [5] can be described as follows:
1. At regular intervals, from every network node , a for-ward ant is launched with a randomly selecteddestination node . While travelling towards their des-tination nodes, the identifier of every visited nodeand the time elapsed since the launching time of theforward ant to arrive at this -th node are pushed ontoa memory stack stored in the data field of theforward ant. Forward ants share the same queues asdata packets, so they experience the same traffic de-lays as data packets.
2. At each node , each forward ant chooses the nextnode as follows:
• If all the neighboring nodes have not been visited,then the next neighbor is chosen among the nodesthat have not been visited as:
0 =+
1 + (| | 1)(3)
In (3), represents the set of neighbors ofthe current node and | | the cardinality ofthat set, i.e., the number of neighbors while the
heuristic correction is a normalized value [0 1]such that 1 is proportional to the length ofthe queue of the link connecting the node withits neighbor :
= 1 P| |0=1 0
(4)
The value of in (3) weighs the importance ofthe instantaneous state of the node’s queue withrespect to the probability values stored in therouting table.
• If all the neighboring nodes have been visitedpreviously, then the next node is chosen uni-formly among all the neighbors. In this case,since all the neighbors have been visited previ-ously the forward ant is in a loop (cycle).
• With a small probability , the next node is cho-sen uniformly among all the neighboring nodes.The parameter ensures that the network is be-ing constantly explored, though it introduces anelement of inefficiency in the algorithm [4].
3. If a cycle is detected, the cycle’s nodes are poppedfrom the ant’s stack and all memory about the cycle isdestroyed. If the cycle lasted longer than the lifetimeof the forward ant before entering the cycle, the ant isdestroyed. The lifetime of a forward ant is defined asthe total time since the forward ant was generated.
4. When the destination node is reached, the forwardant generates a backward ant . The for-ward ant transfers all the memory contained in thestack to the backward ant, and dies. The back-ward ant takes the same path as the corresponding for-ward ant, but in the opposite direction. At each node ,the backward ant pops the stack to move to thenext node. Backward ants use high priority queues toquickly propagate to the routing tables the informationcollected by the forward ants.
5. Arriving at a node coming from a neighbor node ,the backward ant updates the two main data structuresof the node, the local model of the traffic and therouting table , for all the entries corresponding tothe destination node .
• The mean and variance 2 entries in the localmodel of traffic are modified using (1) and(2). If the newly observed forward ant’s trip time
from the node to the destination is lessthen , then is replaced by
• The routing table is changed by increment-ing the probability 0 (i.e., the probability of

choosing neighbor when destination is 0) anddecrementing, by normalization, the other proba-bilities 0 The probability 0 is increased bythe reinforcement value as:
0 0 + (1 0) (5)
The probabilities 0 of the other neighboringnodes for destination 0 are decreased by thenegative reinforcement as:
0 0 0 6= (6)
Thus, in AntNet, every path found by the forwardants receives a positive reinforcement.
The reinforcement value used in (5) and (6) is a di-mensionless constant (0 1] and is calculated as:
= 1 + 2( ) + ( )
(7)In (7), the parameter represents a better estimate ofmean and is calculated as:
= +1
p| | (8)
where is the confidence level [4]. The first term in (7)evaluates the ratio between the current trip time and thebest trip time observed over the moving observation win-dow. The second term is a correction factor and indicateshow far the value of is from in relation to theextension of the confidence interval [5]. The values of 1and2 indicate the relative importance of each term.
The value calculated in (7) is finally transformed bymeans of a squash function ( ) defined by:
( ) =1
1 + exp³
| |´ where (0 1] R+
(9)( )
(1)(10)
The squash function ( ) is used so that small values ofwould have negligible effect in updating the routing tables[5]. Due to the squash function ( ), the low values ofare reduced further, and therefore do not contribute in theupdate of routing tables1. Figure 2 shows the effect of co-efficient on the squash function ( ). Figure 2 showsthat if the value of coefficient is less than 1, then evenlow values of get incremented due to the squash function( ). Thus, the value of parameter should be chosen such
that the coefficient is greater than 1.
1Low values of indicate sub-optimal paths.
1.0
0.8
0.6
0.4
0.2
0.0
s(r)
/s(1
)
1.00.80.60.40.20.0r
a / Nk = 0.5
a / Nk = 1
a / Nk = 2
a / Nk = 4
a / Nk = 8
a / Nk = 16
a / Nk = 32
a / Nk = 64
Figure 2. The squash function ( ) for differ-ent values of the coefficient .
Data packets use different routing tables than the forwardants for travelling from the source node to the destinationnode. The routing table values for data packets are obtainedby re-mapping the routing table entries used by forward antsby means of a power function ( ) and re-normalizing theseentries.
( ) = 1 (11)
The power function ( ) prevents the data packets fromchoosing links with very low probability. The data packetshave a fixed time to live (TTL); if the data packets do notarrive at the destination within the TTL, they are dropped.Table 1 lists the optimized values of different parametersused in W_AntNet [4].
Table 1. The values of different parametersused in W_AntNet.
Name, symbol Valueused in (5) 0.2
0.1
1 used in (9) 0.7
2 used in (9) 0.3used in (11)used in (13) 3
Confidence interval ( ) used in (10) 0.95

3.3. Neighbor Discovery Protocol
At regular intervals, hello messages are exchanged be-tween neighboring nodes. When the neighbors are lost ornew neighbors are added, the routing tables are updated andthe probability values are re-normalized. The forward antpackets and data packets waiting in the buffer are reroutedif the next hop neighbor is lost. However, the backward antpackets are dropped if the next hop neighbor is lost. Thisensures that only paths that are stable during a sufficientlylong time interval, i.e. the time between the creation of for-ward ant and the receipt of the backward ant appear in therouting tables.
3.4. Routing Overhead for W_AntNet
The routing overhead for obtaining a path to any destina-tion is ( ) in AODV and DSR since both these protocolsuse controlled flooding or sequence numbers. To computethe complexity of W_AntNet, we use the fact that ad-hocwireless networks can be modeled as a geometric randomgraph (or random graph) [8]. In W_AntNet, the forwardants perform random walks to search for the destination.Therefore, the worst-case routing overhead for a single up-date of the routing tables [2] is ( log ). Moreover, thenumber of updates required for routing table convergence,i.e. probability for one of the entries in routing tables tobe one, depends on the quality of different paths, networktopology and the routing table update function. We showthat multiple backward ants are needed for the routing ta-bles to converge.
Consider a node with neighboring nodes. At = 0,the probability of choosing neighbor as the next hop fordestination , (0) = 1 . We assume that only therouting table values for neighbor i.e., receive posi-tive reinforcement. Under these assumptions, the probabil-ity ( + 1) is,
( + 1) = ( ) + ( ) (12)
where is a constant. After updates,
( ) = (0) (1 + )
Since the routing table converges when ( ) 1, thevalue of is :
=log ( )
log (1 + )(13)
where is the number of neighbors of node . Thus, theoverhead for routing tables to converge in W_AntNet underthe given assumptions is ( log log ). The value of
varies from for a complete mesh to ( 1) for arandom graph or geometric random graph [8]. The geomet-ric random graph is almost surely connected [8] if the linkdensity log when is large and therefore, theminimum value of = log .
4. Results
We performed extensive simulations of W_AntNet us-ing our simulator [4] and NS-2 simulator2. Using NS-2, wecompare the performance of W_AntNet with AODV andDSR. The simulations are performed for the benchmark sce-nario [3]: 50 nodes moving over an area of 1500 × 300for 900 s. In W_AntNet, there is training period (T.P.) atbeginning of simulations during which data packets are notgenerated. The values of various parameters in W_AntNetare taken from [5, 4]. The mobility model in the simula-tions is random waypoint [3]. A pause time of 0s corre-sponds to continuous motion while a pause time of 900scorresponds to the static scenario. We assume a transmis-sion range of 250m for each node in our simulator. Usingthese parameters, the average node degree is 2 =50 (250)2
1500 300 22 and the network diameter or worst case
hopcount is 15002+3002
250 6.
4.1. Static versus Dynamic Topology
We compare the performance of W_AntNet for static anddynamic topologies. The MAC layer is ignored in thesesimulations. Moreover, we assume that each node is ableto remove 1 packet/ms from the queue and no TTL is setfor data packets. The routing tables are updated based onthe hopcount between the source and destination nodes sothat the performance is independent of the packet size, ca-pacity of the links and the queueing delays. Thus, insteadof (3), 0 = + is used for choosing the next hop.Figure 3 shows the probability distribution of hopcount forW_AntNet with different pause times. To verify our analy-sis, we also plot the number of connectivity changes in oursimulation model and the model used by Broch et al. [3](insert in Figure 3).
The legend in Figure 3 shows expected hopcount forW_AntNet for different pause times. Figure 3 shows thatW_AntNet performs similar to the Dijkstra’s algorithm ina static topology. However, when mobility is introduced(pause time is less than 900s) the expected hopcount in-creases which points to a significant amount of packets inloops. Figure 4 shows the percentage of data packets withloops as a function of the pause time. Figure 4 also showsresults for W_AntNet with look-ahead3. The increase ofdata packets in loops with increased mobility in W_AntNetis in sharp contrast to AODV and DSR that are shown tobe loop-free [11, 9]. Sequence numbers in AODV excludesloops at all times while DSR uses source routing that is in-herently loop-free. Figure 4 also shows that look-ahead re-
2NS-2 NETWORK SIMULATOR, http://www.isi.edu/nsnam/ns, 2005.3Look-ahead means that if the destination is among the neighbors, then
the destination is chosen as the next hop

0.20
0.15
0.10
0.05
0.00
Pr[
H =
k]
252015105
hop k
W_AntNet pause_time = 0 E[H] = 22.2 pause_time = 30 E[H] = 21.0 pause_time = 60 E[H] = 22.6 pause_time = 120 E[H] = 19.3 pause_time = 300 E[H] = 12.8 pause_time = 600 E[H] = 7.3
Static Topology W_AntNet E[H] = 4.3 Dijkstra's algorithm E[H] = 2.9
N = 50
12x103
10
8
6
4
2
0
Nu
mb
er o
f co
nn
ecti
vit
y c
han
ges
8006004002000
pause time (sec)
our Simulation model Broch et al. [5] model
N = 50
Figure 3. The probability distribution of hop-count for W_AntNet algorithm as a functionof pause time. The legend shows the ex-pected hopcount for different values of pausetimes.
duces the percentage of data packets in loops at increasedmobility.
4.2. NS-2 Simulations
The default settings for all the experiments and the simu-lation code and parameters for AODV, DSR are taken fromthe CMU/Monarch extensions for NS-2 [3]. The MAC layeris 802.11 and the interface queue size is assumed to be 100packets. The number of CBR sources is 10 and the datarate is 4 packets/sec. The capacity of links is 2 Mbps. InW_AntNet, we assume that each node can store 50 packetsin the low and high priority queues.
4.2.1 Case Study 1: Static Network
We compare the packet delivery ratio (PDR) and the end-to-end delay for AODV, DSR and W_AntNet for a sta-tic scenario. The size of data packets is varied from 64bytes to1024 bytes. We also show results for W_AntNetwhen the forward ants are generated only during the T.P.(W_AntNet_antsTP). This reduces the number of controlpackets in the network. Since the topology is static and theamount of data traffic is small, the generation of forwardants only during T.P. is sufficient for routing under theseconditions.
The PDR and end-to-end delay in Figure 5 show thatW_AntNet performs similar to AODV and DSR when for-ward ants are generated only during the T.P. However,
40
30
20
10
0
Perc
enta
ge o
f da
ta p
acke
ts in
loop
s
8006004002000pause time (s)
W_AntNet look_W_AntNet
4
5
6
7
8
9
10
2
E[H
]
8006004002000
pause time (s)
look_W_AntNet W_AntNet
N = 50
40
30
20
10
0
Perc
enta
ge o
f da
ta p
acke
ts in
loop
s
8006004002000pause time (s)
W_AntNet look_W_AntNet
4
5
6
7
8
9
10
2
E[H
]
8006004002000
pause time (s)
look_W_AntNet W_AntNet
N = 50
Figure 4. Percentage of data packets with aloop in their path as a function of pause timefor W_AntNet (look_W_AntNet). The insertshows the expected hopcount in W_AntNetfor different pause times.
as the forward ant generation rate is increased from 0(W_AntNet_onlyTP) to 2 forward ants/s, the routing over-head causes congestion in the queues. Thus, W_AntNetcauses a dual problem in ad hoc networks. A large num-ber of forward ants cause congestion in the network. How-ever, with increasing mobility, more forward ants need to begenerated to account for frequent changes in the topology.
4.2.2 Case Study 2: Mobile Scenario
We study the performance of different routing proto-cols with mobility. The packet size is assumed to be64 bytes. Figure 6 shows the PDR, end-to-end delayand the routing overhead (measured in number of bytessince the size of control packets varies in W_AntNet)for AODV, DSR, W_AntNet and W_AntNet with look-ahead (W_AntNet_look). We also reduce the routing over-head in W_AntNet by generating forward ants only fromsource-destination pairs that have data packets to send(W_AntNet_onlysrc). Thus, the remaining nodes in the net-work do not maintain up-to-date routing tables.
Figure 6 shows that with high node degree, AODV andDSR perform well in terms of PDR and end-to-end delay.Figure 6 shows that using optimizations such as look-aheadand generating ants only from source-destination pairs re-duces the overhead in W_AntNet. However, the routingoverhead is still more than in AODV and DSR. As a re-sult, the PDR for W_AntNet_look and W_AntNet_onlysrc

Figure 5. The PDR and end-to-end delay forW_AntNet, AODV and DSR for static topol-ogy.
is still lower than AODV and DSR.
4.2.3 Case Study 3: Large Area Network (SparseGraph Topology)
In this case, we compare the performance of different pro-tocols in a larger area with the same number of nodes ( =50). The area over which the nodes move is 2000×2000 2.Under these conditions, the average node degree is 2 5 andthe worst case hopcount is given by 11. The number of CBRsources is also increased to 20. Figure 7 shows the PDRand end-to-end delay for AODV, DSR and W_AntNet. Thepacket size is assumed to be 64 bytes.
This scenario leads to a sparse graph topology and an in-crease in network diameter. As a result, the performance ofall three protocols degrades considerably. Thus, the simula-tions show that all three protocols have scalability problems.To improve the scalability of routing protocols, additionalschemes such as clustering need to be implemented [15].Figure 7 also shows that the use of look-ahead does not im-
Figure 6. The PDR, end-to-end delay and rout-ing overhead for W_AntNet, AODV and DSRfor mobile network of 50 nodes moving in anarea 1500×300m2.

prove the performance of W_AntNet since the average nodedegree is small.
Figure 7. The PDR and end-to-end delay forW_AntNet, AODV and DSR for different val-ues of the pause time. Nodes are moving inan area 2000m×2000m.
5. Conclusion
The performance of W_AntNet is comparable to theshortest path algorithm for static topology but is dependenton the buffer size at the nodes. Since forward ants share thesame queue as data packets in W_AntNet, a high ant gen-eration rate leads to congestion in the network. This causesW_AntNet to perform poorly compared to AODV and DSRwhen the size of the buffer is small. In a dynamic topology,a significant amount of packets in W_AntNet have loops.This can be attributed to the non-convergence of routing ta-
bles in W_AntNet. Therefore, with mobility, the perfor-mance of W_AntNet deteriorates in comparison to AODVand DSR that are loop-free.
References
[1] I. F. Akyildiz, X. Wang, and W. Wang. Wireless mesh net-works: a survey. Computer Networks, 47:445–487, 2005.
[2] C. Avin and G. Ercal. On the cover time of random geomet-ric graphs. Lecture notes in computer science ISSN 0302-9743, 2005.
[3] J. Broch, D. A. Maltz, D. B. Johnson, Y. Hu, and J. Jetcheva.A performance comparison of multi-hop wireless ad hocnetwork routing protocols. Proc. IEEE/ACM MOBICOM,47:445–487, 1998.
[4] S. S. Dhillon and P. Van Mieghem. Performance analysis ofthe AntNet algorithm. Computer Networks, in print, 2007.
[5] G. Di Caro and M. Dorigo. AntNet: Distributed stigmergeticcontrol for communication networks. Journal of ArtificialIntelligence Research, 9:317–365, 1998.
[6] G. Di Caro, F. Ducatelle, and L. M. Gambardella. AntHoc-Net: an ant-based hybrid routing algorithm for mobile adhoc networks. Proc. 8th International Conf. on ParallelProblem Solving from Nature, pages 461–470, 2004.
[7] M. Günes and O. Spaniel. Routing algorithms for mobilemulti-hop ad-hoc networks. Proc. IFIP Conf. on NetworkControl and Engineering for QoS (Net-Con), pages 120–138, 2003.
[8] R. Hekmat and P. Van Mieghem. Study of connectivity inwireless ad-hoc networks with an improved radio model.Proc. International Symposium on Modeling and Optimiza-tion in Mobile, Ad Hoc, and Wireless Networks (WiOpt),2004.
[9] D. Johnson, D. Maltz, Y.-C. Hu, and J. Jetcheva. Thedynamic source routing protocol for mobile ad hoc net-works. Internet Draft, draft-ietf-manet-dsr09-11.txt, workin progress, April 2003.
[10] S. Marwaha, C. Tham, and D. Srinivasan. Mobile agentsbased routing protocol for mobile ad hoc networks. Proc.IEEE Globecom, 2002.
[11] C. Perkins, E. Royer, and S. Das. Ad hoc on demand dis-tance vector routing. Internet Draft, draft-ietf-manet-aodv-11.txt, work in progress, August 2002.
[12] S. Rajagopalan and C. Shen. ANSI: A unicast routing pro-tocol for mobile ad hoc networks using swarm intelligence.Proc. International Conf. on Artificial Intelligence, pages24–27, 2005.
[13] M. Roth and S. Wicker. Termite: Emergent ad-hoc network-ing. Proc. 2 MedHocNet, 2003.
[14] R. Schoonderwoerd, O. Holland, and J. Bruten. Ant-like agents for load balancing in telecommunication net-works. Proc. First International Conf. on Autonomousagents, 1997., 1997.
[15] P. Van Mieghem. Data Communications Networking.Techne Press, Amsterdam, The Netherlands, 2006.