annual student achievement report us... · introduction ... gender gaps – osslt ... the 2015-2016...
TRANSCRIPT

2015–2016 Annual Student Achievement Report 1
ANNUAL STUDENT ACHIEVEMENT REPORT
2015–2016
Revised 11/8-2016
Ottawa-Carleton District School Board 2015–2016 Annual Student Achievement Report
Contents
Introduction ..................................................................................................................... 1
Literacy (K-12): .......................................................................................................................................... 1
Numeracy (K-12): ...................................................................................................................................... 1
Pathways to Success (7-12): ...................................................................................................................... 1
Literacy (K-12)................................................................................................................. 2
Education Quality and Accountability Office (EQAO) Assessments .......................................................... 2
Student Characteristics – Primary/Junior ............................................................................................. 2
Student Characteristics – Ontario Secondary School Literacy Test (OSSLT) ......................................... 3
Overall Performance – Primary/Junior ................................................................................................. 5
Overall Performance – OSSLT ............................................................................................................... 6
Cohort Tracking Over Time – Primary to Junior .................................................................................... 7
Cohort Tracking – Junior to Grade 10 (First-time Eligible) .................................................................... 8
Gender Gaps1 – Primary/Junior .......................................................................................................... 10
Gender Gaps – OSSLT .......................................................................................................................... 11
Achievement Gaps for Other Identified Groups of Students – Primary, Junior and OSSLT................ 12
Secondary Report Card Data – Grades 9 and 10: English, Core French, Geography, and History .......... 16
Student Characteristics ....................................................................................................................... 16
Overall Performance ........................................................................................................................... 17
Achievement Gaps for Identified Groups of Students ........................................................................ 17
Numeracy (K-12)........................................................................................................... 19
Education Quality and Accountability Office (EQAO) Assessments ........................................................ 19
Student Characteristics – Primary/Junior ........................................................................................... 19
Student Characteristics – Grade 9 Mathematics ................................................................................ 20
Overall Performance – Primary/Junior & Grade 9 .............................................................................. 21
Cohort Tracking Over Time – Primary to Junior .................................................................................. 23
Cohort Tracking Over Time – Junior to Grade 9 Mathematics ........................................................... 24
Gender Gaps – Primary/Junior & Grade 9 .......................................................................................... 26

Ottawa-Carleton District School Board 2015–2016 Annual Student Achievement Report 1
Achievement Gaps for Other Identified Groups of Students – Primary, Junior, Grade 9 Mathematics ............................................................................................................................................................ 27
Secondary Report Card Data – Grades 9 and 10 Math and Science ....................................................... 30
Student Characteristics ....................................................................................................................... 30
Overall Performance ........................................................................................................................... 30
Achievement Gaps for Identified Groups of Students ........................................................................ 31
Pathways (7-12) ............................................................................................................ 33
Secondary Report Card Data – Grade 10 Civics and Careers .................................................................. 33
Student Characteristics ....................................................................................................................... 33
Overall Performance ........................................................................................................................... 33
Achievement Gaps for Identified Groups of Students ........................................................................ 34
Grade 10 Credit Accumulations .............................................................................................................. 35
Student Characteristics ....................................................................................................................... 35
Overall Performance ........................................................................................................................... 35
Achievement Gaps for Identified Groups of Students ........................................................................ 36
Cohort Graduation Rate .......................................................................................................................... 36
Student Characteristics ....................................................................................................................... 36
Overall Performance ........................................................................................................................... 37
Achievement Gaps for Identified Groups of Students ........................................................................ 37
Annual Certification Rate (ACR) .............................................................................................................. 38
Student Characteristics ....................................................................................................................... 38
Overall Performance ........................................................................................................................... 38
Achievement Gaps for Identified Groups of Students ........................................................................ 39
Grade 12 French Proficiency: Diplôme d’études en langue française (DELF) ......................................... 39
Student Characteristics ....................................................................................................................... 39
Overall Performance ........................................................................................................................... 40
Achievement Gaps for Identified Groups of Students ........................................................................ 40
Summary and Concluding Remarks.............................................................................. 41
Literacy (K-12) ......................................................................................................................................... 41
Numeracy (K-12) ..................................................................................................................................... 42
Pathways (7-12) ...................................................................................................................................... 43
Next Steps ............................................................................................................................................... 44
IntroductionThe 2015-2016 Annual Student Achievement Report incorporates information from provincial assessments and local sources of data (e.g., report card data) and, where applicable, places them in the context of national and international trends. The report is divided into three main sections that reflect student achievement in the areas of literacy (K-12), numeracy (K-12), and pathways to success (7-12). Within each section, information is presented as an overview of the progress made towards improving student achievement and closing gaps in achievement for identified groups of students which are among the core priorities of both the Ministry of Education and the Ottawa-Carleton District School Board (OCDSB).
Literacy (K-12): Achievement in the area of literacy is measured by OCDSB student performance on the provincial assessments in primary and junior reading and writing, and on the Ontario Secondary School Literacy Test (OSSLT). Results are provided for: all students; identified groups of students (i.e., females/males, English language learners, students with special needs, students who have self-identified as First Nations, Métis, or Inuit (FNMI), and students residing in lower-income neighbourhoods (SES)); and, specific cohorts of students as they move through the education system. An analysis of grades 9 and 10 report card data for English, French, Geography and History are also presented.
Numeracy (K-12): Achievement in the area of numeracy is measured by OCDSB student performance on the provincial assessments in primary, junior, and grade 9 mathematics, as well as analyses of grades 9 and 10 report card data for Mathematics and Science. Across these indicators, results are presented for all students and for five identified groups of students. In the case of provincial assessments, cohort analyses have been undertaken as they transition through the education system.
Pathways to Success (7-12): This section of the report includes an analysis of secondary school report card data for grade 10 Civics and Careers courses. Information is also presented that spans across multiple subject areas that serve as indicators of progress towards successful high school completion (e.g., grade 10 credit accumulation, cohort graduation rate, and annual certification rate). Finally, results on the Grade 12 French proficiency test - Diplôme d’études en langue française (DELF) – are included. Disaggregation for identified groups of students has been included for all indicators.

2 Ottawa-Carleton District School Board 2015–2016 Annual Student Achievement Report 3
Literacy (K-12)Education Quality and Accountability Office (EQAO) Assessments
Student Characteristics – Primary/JuniorThe table below provides information about students in grade 3 and grade 6 who were eligible to participate in the 2015-16 EQAO assessments of reading, writing, and mathematics. Results are presented for the OCDSB and for the province.
Table 1: Student Characteristics, Primary and Junior EQAO Assessments
Number of
Students
Participation Rate
Fully Exempt
Gender Students with
Special Education
Needs (Excluding
Gifted)
English Language Learners
(ELL)
French Immersion StudentsFemale Male
OCDSB
Grade 3 4,781 96% 3% 49% 51% 18% 18% 55%
Grade 6 5,001 97% 2% 49% 51% 21% 21% -
ProvinceGrade 3 125,484 97% 2% 49% 51% 17% 13% 16%
Grade 6 123,685 97% 2% 48% 52% 21% 10% -
In comparison to the previous three-year average, this information has changed in the following ways for OCDSB students eligible to participate in these assessments:
• no change in the participation rate for the grade 3 assessment, but down for grade 6 (1%);
• full exemptions (i.e., an exemption from all three components of the assessment) were up for both grade 3 (1%) and grade 6 (2%);
• a higher percentage of grade 3 students were male (1%) and a lower percentage were female (1%); no change in the gender distribution for grade 6 students;
• a higher percentage of grade 3 students had a special education need (excluding gifted; 6%), but there was no change for grade 6;
• a lower percentage of grade 3 students were ELLs (6%), whereas a higher percentage of grade 6 students were ELLs (2%); and
• higher percentages of students in grades 3 and 6 enrolled in a French immersion program (i.e., 5% and 7%, respectively).
Compared to the province, the OCDSB has substantially higher proportions of ELLs and students enrolled in a French immersion program.
Student Characteristics – Ontario Secondary School Literacy Test (OSSLT)The table below provides information about the students eligible to participate in the Ontario Secondary School Literacy test in March 2016. Results are presented for the OCDSB and for the province for both first-time eligible (FTE) and previously eligible (PE) students.
Table 2: Student Characteristics, OSSLT
Number of
Students
Participation Rate Absent Deferred
Gender Students with
Special Education
Needs (Excluding
Gifted)
English Language Learners
(ELL)Female Male
OCDSBFirst Time Eligible
5,101 93% 2% 5% 50% 50% 22% 21%
Previously Eligible
2,023 53% 10% 18% 41% 59% 35% 37%
ProvinceFirst Time Eligible
135,111 92% 2% 6% 49% 51% 19% 7%
Previously Eligible
55,284 48% 9% 11% 39% 61% 40% 17%
In comparison to the previous three-year average, this information has changed in the following ways for OCDSB students eligible to participate in these assessments:
• no change in the participation rate for FTE students, but 4% lower for PEstudents. A higher proportion of PE students, however, attained the literacy requirement through the Ontario Secondary School Literacy Course (OSSLC).
• no change in deferral rates for either FTE or PE students.• FTE students were comprised of 1% fewer males and 1% more females,
whereas there were 1% more males and 1% fewer females who were PE.• the percentage of students with a special education need was 2% higher for FTE
students; there was no change for PE students.• the percentage of ELLs who were FTE and PE was higher (7% and 4%,
respectively).

4 Ottawa-Carleton District School Board 2015–2016 Annual Student Achievement Report 5
Compared to the province, the OCDSB has: a substantially higher deferral rate for PE students; higher proportions of ELLs in both FTE and PE groups of students, but a lower percentage of students with special education needs (excluding gifted) in the PE group; and, a higher percentage of students enrolled in academic level English (84% vs. 73%) and a lower percentage in applied (10% vs. 20%).
Overall Performance – Primary/JuniorThe graphs below show the percentage of elementary students in the District and the province who met the provincial standard in reading and writing over the last five years.
Observations: Reading
• Compared to the province, a higher % of our grade 3 and grade 6 students met the provincial standard in reading in 2015-2016.
• A higher % of our grade 3 and grade 6 students met the provincial standard in reading in 2015-2016 compared to 2013-2014. o These improvements in the District
results were equivalent to those for the province in grade 3 and exceeded them in grade 6.
Grade 3 Reading
Grade 6 Reading
Grade 3 Writing
Grade 6 Writing
Observations: Writing
• Compared to the province, an equivalent % of our grade 3 and a higher % of our grade 6 students met the provincial standard in writing in 2015-2016.
• A lower % of our grade 3 and a higher % our grade 6 students met the provincial standard in writing in 2015-2016 compared to 2013-2014.
o The decline for the District in grade 3 was less than that observed provincially, whereas the increase in grade 6 exceeded that of the province.
Note: Achievement results for the 2014-15 primary/junior assessments are not available due to a labour disruption.

6 Ottawa-Carleton District School Board 2015–2016 Annual Student Achievement Report 7
Overall Performance – OSSLTThe graphs below show success rates for secondary students, in the District and the province, on the Ontario Secondary School Literacy Test (OSSLT) for first-time eligible (FTE) and previously eligible (PE) students over the last five years.
Observations
• Compared to the province, a higher % of FTE and PE students were successful on the OSSLT in 2015-2016.
• A lower % of FTE students and a higher % of PE students were successful on the OSSLT in 2015-2016 vs. 2014-2015. o The decline for FTE students at the
District level was larger than that for the province. Similarly, the increase for PE students at the District level was larger than the province.
First Time Eligible
Previously Eligible
Literacy Links to National/International Studies - HighlightsStudents are randomly selected to participate in several national and international assessments on a 3-5 year cyclical basis. Results are reported at the country level and, where there are sufficient numbers of participating students, at the provincial level.
Across four literacy based assessments, Ontario students have been shown to be among the most successful in the world:
o Ontario was the only province with results above the Canadian average in reading on the Pan-Canadian Assessment Program (PCAP in 2013);
o Ontario students have sustained high scores in overall reading achievement since 2000 on the Programme for International Student Assessment (PISA in 2012);
o Ontario students continue to be highly successful on the Progress in International Reading Literacy Study (PIRLS); and
o Students in Ontario scored significantly higher than the international average on the International Computer and Information Literacy Study (ICILS in 2013).
Cohort Tracking Over Time – Primary to JuniorFor the elementary assessments, cohort tracking follows a group of students as they move from grade 3 to grade 6. The graphs below show the reading and writing achievement for five cohorts of OCDSB students who wrote the junior assessments and for whom grade 3 EQAO results are available. Provincial cohort results for the most recent cohort of students (i.e., those who wrote the junior assessments of reading and writing in 2015-16 in relation to their achievement on the primary assessments in 2012-13) have been included at the top of the graph for comparative purposes. Results are displayed as the percentage of students who: maintained, rose to, dropped from, or never met the provincial standard.
Reading - Cohort Tracking from Grade 3 to Grade 6
Writing – Cohort Tracking from Grade 3 to Grade 6
61%
62%
65%
67%
64%
21%
19%
17%
18%
17%
3%
4%
4%
3%
4%
15%
15%
14%
11%
15%
0% 20% 40% 60% 80% 100%
Grade 3 in 2008-09 & Grade 6 in 2011-12
Grade 3 in 2009-10 & Grade 6 in 2012-13
Grade 3 in 2010-11 & Grade 6 in 2013-14
Grade 3 in 2011-12 & Grade 6 in 2014-15
Grade 3 in 2012-13 & Grade 6 in 2015-16
Grade 3 in 2012-13 & Grade 6 in 2015-16(Province)
Maintained standard Rose to standard Dropped from standard Never met standard
62%
64%
66%
69%
68%
17%
15%
14%
14%
12%
8%
8%
9%
7%
9%
13%
13%
11%
10%
11%
0% 20% 40% 60% 80% 100%
Grade 3 in 2008-09 & Grade 6 in 2011-12
Grade 3 in 2009-10 & Grade 6 in 2012-13
Grade 3 in 2010-11 & Grade 6 in 2013-14
Grade 3 in 2011-12 & Grade 6 in 2014-15
Grade 3 in 2012-13 & Grade 6 in 2015-16
Grade 3 in 2012-13 & Grade 6 in 2015-16(Province)
Maintained standard Rose to standard Dropped from standard Never met standard

8 Ottawa-Carleton District School Board 2015–2016 Annual Student Achievement Report 9
Cohort Tracking – Junior to Grade 10 (First-time Eligible)For the OSSLT, cohort tracking follows a group of students as they move from grade 6 to grade 10. The graphs below show the reading and writing achievement for five cohorts of first-time eligible OCDSB students who wrote the OSSLT and for whom grade 6 EQAO results are available. Provincial cohort results for the most recent cohort of first-time eligible students (i.e., those who wrote the OSSLT in 2015-16 in relation to their achievement on the junior assessments or reading and writing in 2011-12) have been included at the top of the graph for comparative purposes. Results are displayed as the percentage of students who: maintained, rose to, dropped from, or never met the provincial standard.
Observations: OCDSB
• A total of 4,482 students took part in the grade 3 assessments of reading and writing in 2012-2013 and the grade 6 assessment of reading and writing in 2015-2016.
• Compared to the average of the previous 3 years the % of students in the 2015-2016 cohort who:
o maintained standard from grade 3 to grade 6 increased (by 4% for reading and 5% for writing);
o rose to standard from grade 3 to grade 6 decreased (by 1% for both reading and writing);
o dropped from standard from grade 3 to grade 6 decreased (by 1% for both reading and writing); and,
o never met standard in either grade 3 or grade 6 decreased (by 4% for reading and 2% for writing).
• Compared to the province, higher proportions of OCDSB students maintained or rose to standard on the most recent junior assessments of reading and writing.
Cohort Tracking – Grade 6 Reading to Grade 10 (OSSLT)
Cohort Tracking – Grade 6 Writing to Grade 10 (OSSLT)
72%
75%
78%
79%
80%
72%
17%
12%
11%
10%
8%
9%
3%
3%
3%
4%
5%
6%
9%
9%
8%
8%
8%
12%
0% 20% 40% 60% 80% 100%
Grade 6 in 2007-08 & Grade 10 in 2011-12
Grade 6 in 2008-09 & Grade 10 in 2012-13
Grade 6 in 2009-10 & Grade 10 in 2013-14
Grade 6 in 2010-11 & Grade 10 in 2014-15
Grade 6 in 2011-12 & Grade 10 in 2015-16
Grade 6 in 2011-12 & Grade 10 in 2015-16(Province)
Maintained standard Rose to standard Dropped from standard Never met standard
70%
71%
73%
75%
76%
70%
19%
17%
15%
13%
11%
11%
4%
4%
4%
4%
6%
8%
8%
9%
8%
8%
7%
11%
0% 20% 40% 60% 80% 100%
Grade 6 in 2007-08 & Grade 10 in 2011-12
Grade 6 in 2008-09 & Grade 10 in 2012-13
Grade 6 in 2009-10 & Grade 10 in 2013-14
Grade 6 in 2010-11 & Grade 10 in 2014-15
Grade 6 in 2011-12 & Grade 10 in 2015-16
Grade 6 in 2011-12 & Grade 10 in 2015-16(Province)
Maintained standard Rose to standard Dropped from standard Never met standard
Observations: OCDSB
• A total of 3,992 students took part in the grade 6 assessments of reading and writing in 2011-2012 and the OSSLT in 2015-2016.
• Compared to the average of the previous 3 years, the % of students in the 2015-2016 cohort who:
o maintained standard increased by 3% in both reading and writing; o rose to standard decreased by 3% in reading and by 4% in writing;o dropped from standard increased by 2% in both reading and writing; and,o never met standard remained the same in reading and decreased by 1%
in writing.• Compared to the province, higher proportions of first-time eligible OCDSB
students maintained the standard, whereas lower proportions dropped from or never met standard.

10 Ottawa-Carleton District School Board 2015–2016 Annual Student Achievement Report 11
Gender Gaps1 – Primary/JuniorThe graphs below show the District’s progress in narrowing the elementary achievement gaps in reading and writing for female and male students over the last five years.
Observations
• Our female students achieved at higher levels in reading compared to our male students. Compared to the province our achievement gaps are 1% larger for grade 3 and 1% smaller for grade 6.
• Compared to the average gap for the previous 3 years, our gender gaps in reading have:o widened for grade 3, and we have
made less progress than the province in narrowing these gaps.
o narrowed for grade 6, and we have made similar progress to the province in narrowing these gaps.
Reading – Gender Gaps in Achievement
Grade 3
Grade 6
Observations
• Our female students achieved at higher levels in writing compared to our male students. Compared to the province, our achievement gaps are 2% larger for grade 3 and 2% smaller for grade 6.
• Compared to the average gap for the previous 3 years, our gender gaps in writing have: o widened for grade 3, and we have
made less progress than the province in narrowing these gaps.
o narrowed for grade 6, and we havemade similar progress to the province in narrowing these gaps.
Writing – Gender Gaps in Achievement
Grade 3
Grade 6
Gender Gaps1 – OSSLTThe graphs below show the District’s progress in narrowing the secondary achievement gaps on the OSSLT for first-time eligible female and male students over the last five years.
OSSLT – Gender Gaps in Achievement
1 It should be noted that the District recognizes that gender is not a binary construct (see OCDSB Gender Identity and Gender Expression Guide to Support Our Students), however, current data collection and reporting practices locally and provincially preclude the disaggregation of gender data beyond the gender binary male-female distinction.
First Time Eligible
Previously Eligible
Observations
• Success rates were higher for our female students compared to our male students. Compared to the province our achievement gaps are 1% smaller for FTE students and 4% smaller for PE students.
• Compared to the average gap for the previous 3 years, our gender gaps on the OSSLT have:o widened by 1% for FTE students,
and we have made less progress than the province in narrowing these gaps.
o neither widened nor narrowed the gap for PE students. The same was true for the province.
12 Ottawa-Carleton District School Board 2015–2016 Annual Student Achievement Report 13
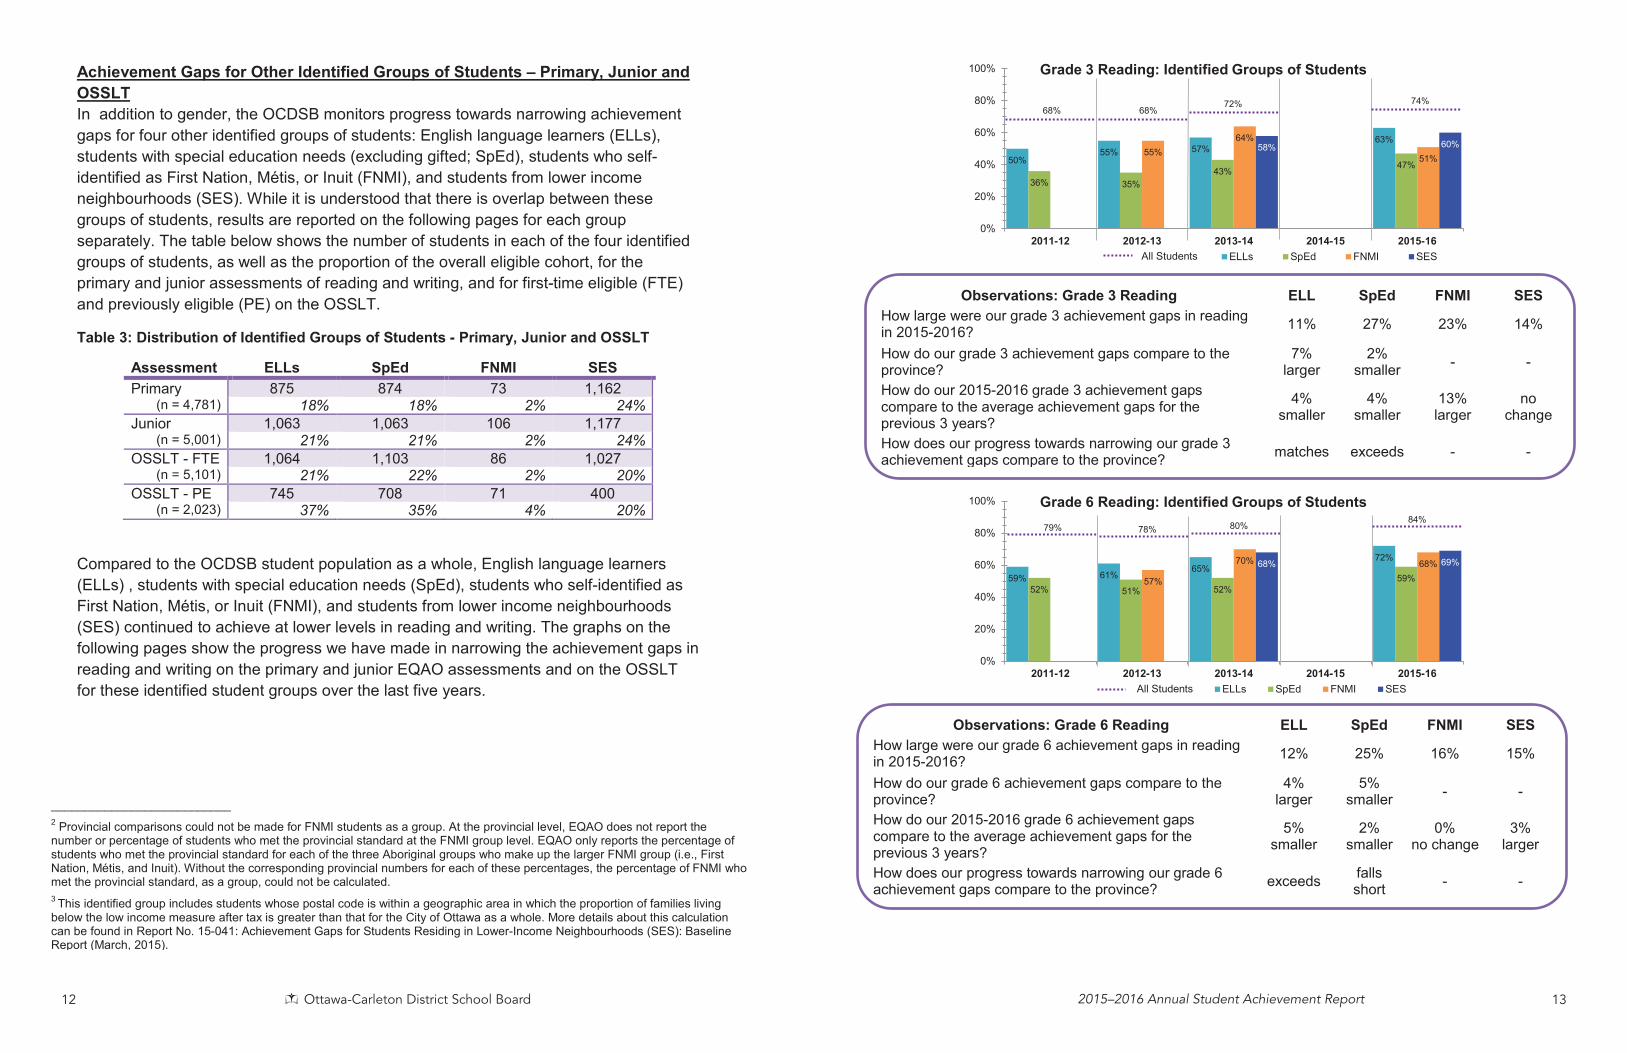
Achievement Gaps for Other Identified Groups of Students – Primary, Junior and OSSLTIn addition to gender, the OCDSB monitors progress towards narrowing achievement gaps for four other identified groups of students: English language learners (ELLs), students with special education needs (excluding gifted; SpEd), students who self-identified as First Nation, Métis, or Inuit (FNMI), and students from lower income neighbourhoods (SES). While it is understood that there is overlap between these groups of students, results are reported on the following pages for each group separately. The table below shows the number of students in each of the four identifiedgroups of students, as well as the proportion of the overall eligible cohort, for the primary and junior assessments of reading and writing, and for first-time eligible (FTE) and previously eligible (PE) on the OSSLT.
Table 3: Distribution of Identified Groups of Students - Primary, Junior and OSSLT
Assessment ELLs SpEd FNMI SESPrimary 875 874 73 1,162
(n = 4,781) 18% 18% 2% 24%Junior 1,063 1,063 106 1,177
(n = 5,001) 21% 21% 2% 24%OSSLT - FTE 1,064 1,103 86 1,027
(n = 5,101) 21% 22% 2% 20%OSSLT - PE 745 708 71 400
(n = 2,023) 37% 35% 4% 20%
Compared to the OCDSB student population as a whole, English language learners (ELLs) , students with special education needs (SpEd), students who self-identified as First Nation, Métis, or Inuit (FNMI), and students from lower income neighbourhoods (SES) continued to achieve at lower levels in reading and writing. The graphs on the following pages show the progress we have made in narrowing the achievement gaps in reading and writing on the primary and junior EQAO assessments and on the OSSLT for these identified student groups over the last five years.
___________________________2 Provincial comparisons could not be made for FNMI students as a group. At the provincial level, EQAO does not report the number or percentage of students who met the provincial standard at the FNMI group level. EQAO only reports the percentage ofstudents who met the provincial standard for each of the three Aboriginal groups who make up the larger FNMI group (i.e., First Nation, Métis, and Inuit). Without the corresponding provincial numbers for each of these percentages, the percentage of FNMI who met the provincial standard, as a group, could not be calculated. 3 This identified group includes students whose postal code is within a geographic area in which the proportion of families living below the low income measure after tax is greater than that for the City of Ottawa as a whole. More details about this calculation can be found in Report No. 15-041: Achievement Gaps for Students Residing in Lower-Income Neighbourhoods (SES): Baseline Report (March, 2015).
50%55% 57%
63%
36% 35%43%
47%55%
64%
51%58% 60%
0%
20%
40%
60%
80%
100%
2011-12 2012-13 2013-14 2014-15 2015-16
Grade 3 Reading: Identified Groups of Students
ELLs SpEd FNMI SES
59% 61%65%
72%
52% 51% 52%59%57%
70% 68%68% 69%
0%
20%
40%
60%
80%
100%
2011-12 2012-13 2013-14 2014-15 2015-16
Grade 6 Reading: Identified Groups of Students
ELLs SpEd FNMI SES
Observations: Grade 3 Reading ELL SpEd FNMI SESHow large were our grade 3 achievement gaps in reading in 2015-2016? 11% 27% 23% 14%
How do our grade 3 achievement gaps compare to the province?
7% larger
2% smaller - -
How do our 2015-2016 grade 3 achievement gaps compare to the average achievement gaps for the previous 3 years?
4% smaller
4% smaller
13%larger
nochange
How does our progress towards narrowing our grade 3 achievement gaps compare to the province? matches exceeds - -
All Students
68% 68%72% 74%
All Students
79% 78% 80%84%
Observations: Grade 6 Reading ELL SpEd FNMI SESHow large were our grade 6 achievement gaps in reading in 2015-2016? 12% 25% 16% 15%
How do our grade 6 achievement gaps compare to the province?
4%larger
5% smaller - -
How do our 2015-2016 grade 6 achievement gaps compare to the average achievement gaps for the previous 3 years?
5% smaller
2% smaller
0%no change
3% larger
How does our progress towards narrowing our grade 6 achievement gaps compare to the province? exceeds falls
short - -

14 Ottawa-Carleton District School Board 2015–2016 Annual Student Achievement Report 15
All Students
77% 77% 79% 82%
66% 67% 68% 68%
52% 52%57% 56%59%
69%
52%
66% 63%
0%
20%
40%
60%
80%
100%
2011-12 2012-13 2013-14 2014-15 2015-16
Grade 3 Writing: Identified Groups of Students
ELLs SpEd FNMI SES
61%65%
71% 73%
50% 47%51%
55%57%
67%75%
71% 68%
0%
20%
40%
60%
80%
100%
2011-12 2012-13 2013-14 2014-15 2015-16
Grade 6 Writing: Identified Groups of Students
ELLs SpEd FNMI SES
All Students
75% 75% 76% 74%
Observations: Grade 3 Writing ELL SpEd FNMI SESHow large were our grade 3 achievement gaps in writing in 2015-2016? 6% 18% 22% 11%
How do our grade 3 achievement gaps compare to the province?
4% larger
3% smaller - -
How do our 2015-2016 grade 3 achievement gaps compare to the average achievement gaps for the previous 3 years?
2% smaller
4% smaller
11% larger
1% larger
How does our progress towards narrowing our grade 3 achievement gaps compare to the province? matches exceeds - -
Observations: Grade 6 Writing ELL SpEd FNMI SESHow large were our grade 6 achievement gaps in writing in 2015-2016? 9% 27% 7% 14%
How do our grade 6 achievement gaps compare to the province?
5% larger
2% smaller - -
How do our 2015-2016 grade 6 achievement gaps compare to the average achievement gaps for the previous 3 years?
3% smaller
1% smaller
9%smaller
6% larger
How does our progress towards narrowing our grade 6 achievement gaps compare to the province? exceeds falls
short - -
68% 65%
75% 78%74%
69% 67% 68% 70% 70%
50%
80% 81%75%
79% 78%73%
0%
20%
40%
60%
80%
100%
2011-12 2012-13 2013-14 2014-15 2015-16
First Time Eligible: Identified Groups of Students
ELLs SpEd FNMI SES
41%47% 47%
40%46%
39%43% 43%
52%45%
50% 52% 55%46%44%
49%
0%
20%
40%
60%
80%
100%
2011-12 2012-13 2013-14 2014-15 2015-16
Previously Eligible Students
ELLs SpEd FNMI SES
Observations: OSSLT FTE ELL SpEd FNMI SESHow large were our achievement gaps for FTE students in 2015-2016? 12% 16% 11% 13%
How do these achievement gaps compare to the province?
2% larger
12% smaller - -
How do these achievement gaps compare to our previous 3-year average gaps?
2% smaller
3% smaller
6% smaller
4% larger
How does our progress towards narrowing these achievement gaps compare to the province? exceeds exceeds - -
Observations: OSSLT PE ELL SpEd FNMI SESHow large were our achievement gaps for PE students in 2015-2016? 11% 9% 11% 8%
How do these achievement gaps compare to the province?
6% larger
3% smaller - -
How do these gaps compare to our previous 3-year average gaps? 0%
3% larger
8% larger
3% smaller
How does our progress towards narrowing these achievement gaps compare to the province? exceeds falls
short - -
All Students
87% 86% 87% 86%88%
All Students
53% 55% 56% 57%55%

16 Ottawa-Carleton District School Board 2015–2016 Annual Student Achievement Report 17
Secondary Report Card Data – Grades 9 and 10: English, Core French, Geography, and History
Student CharacteristicsTable 4 (below) shows the total number of students enrolled in each of grades 9 and 10 academic and applied level English, core French, Geography and History courses, as well as a breakdown for each of the identified groups of students. Enrolment in academic level courses is four times that of applied level courses, with the exception of core French. Compared to academic level courses, applied level courses also tend to have modestly higher proportions of boys and students who self-identified as FNMI, and substantially higher proportions of ELLs, students with special education needs (excluding gifted), and students residing in lower income neighbourhods. This information will help to provide context for the achievement results that follow.
Table 4: Enrolment Distribution, Grades 9 and 10 Compulsory Courses - English, French, Geography & History
Course Males ELLs SpEd FNMI SESENG1D 2,055 505 603 67 866
(n = 4,273) 48% 12% 14% 2% 20%ENG1P 420 112 386 27 270
(n = 677) 62% 17% 57% 4% 40%FSF1D 807 241 267 18 360
(n = 1,606) 50% 15% 17% 1% 22%FSF1P 524 203 313 26 297
(n = 830) 63% 24% 38% 3% 36%CGC1D 1,972 485 560 66 814
(n = 4,096) 48% 12% 14% 2% 20%CGC1P 563 309 470 25 407
(n = 939) 60% 33% 50% 3% 43%ENG2D 2,189 618 667 65 934
(n = 4,577) 48% 14% 15% 1% 20%ENG2P 562 232 375 39 405
(n = 922) 61% 25% 41% 4% 44%FSF2D 387 135 139 14 217
(n = 912) 42% 15% 15% 2% 24%FSF2P 43 12 25 * 27
(n = 78) 55% 15% 32% <2% 35%CHC2D 2,033 534 608 55 837
(n = 4,217) 48% 13% 14% 1% 20%CHC2P 624 322 410 41 413
(n = 1,017) 61% 32% 40% 4% 41%*fewer than 10
Overall PerformanceOCDSB pass rates in grades 9 and 10 compulsory English, Core French, and Geography courses have remained constant or increased in 10 of 12 courses over 2014-2015 results. Similarly, the proportion of students meeting/exceeding the provincial standard have increased or remained the same in 9 of 12 courses. Despite evidence of improved outcomes for students in applied level courses, performance is still lower compared to academic level courses.
Table 5: Grades 9 and 10 Pass Rates and Percentages of Students Achieving at Level 3 or 4 in Compulsory Credits Based on Full Year Report Card Data, June 20162
Pass Rates Percentage of Students Achieving at Level 3 or 4
Course3 Level 2011-12 2012-13 2013-14 2014-15 2015-16 2011-12 2012-13 2013-14 2014-15 2015-16
Grade 9 English(ENG)
Academic 98% 98% 98% 98% 98% 71% 76% 78% 79% 78%
Applied 87% 89% 86% 84% 86% 44% 46% 48% 45% 50%
Grade 10 English(ENG)
Academic 97% 98% 96% 94% 97% 71% 76% 75% 76% 77%
Applied 84% 83% 80% 84% 87% 40% 39% 36% 42% 48%
Grade 9 Core French(FSF)
Academic 98% 98% 100% 99% 99% 68% 69% 71% 76% 77%
Applied 91% 95% 92% 94% 96% 51% 60% 54% 59% 58%
Grade 10 Core French(FSF)
Academic 98% 97% 99% 99% 99% 74% 74% 78% 79% 81%
Applied 93% 96% 98% 96% 95% 59% 63% 74% 80% 77%
Grade 9 Geography(CGC)
Academic 97% 98% 98% 98% 99% 74% 75% 77% 78% 79%
Applied 84% 88% 85% 87% 87% 42% 45% 44% 46% 48%
Grade 10 History(CHC)
Academic 97% 97% 97% 97% 97% 73% 77% 74% 78% 78%
Applied 86% 85% 84% 85% 83% 40% 40% 42% 46% 49%
increase
nochange
decrease
Achievement Gaps for Identified Groups of StudentsWhile achievement gaps for our five identified groups of students persist, progress has been made in narrowing achievement gaps for many, as indicated on the following page. Of particular note is the narrowing of the achievement gap for:
• students with special education needs (excluding gifted) in meeting/exceeding the provincial standard in four of six academic level courses;
• students who have self-identified as FNMI in meeting/exceeding the provincial standard in all six applied level courses; and,
• students residing in lower income neighbourhoods in pass rates, as well as meeting/exceeding the provincial standard, in four of six applied level courses.
2 Data was extracted from the Trillium Student Information System in August 2016. 3 Course codes are designated by the Ministry of Education for reporting purposes. The first three characters identify the subject and are indicated in brackets in the table below. The number in the fourth position of the course code indicates the grade level (1=grade 9, 2=grade 10, etc.), whereas the character in the fifth position indicates the level. In this section of the report, only academic (D) and applied (P) level courses are included.

18 Ottawa-Carleton District School Board 2015–2016 Annual Student Achievement Report 19
Observations: Pass Rates Gender ELL SpEd FNMI SES
How large were our achievement gaps in academic level English, French, Geography and History in 2015-2016?
0-3% 0-3% 1-3% 1-6% 0-3%
In which academic level courses has progress been made in narrowing the achievement gaps over the past few years?
ENG1DFSF1DCGC1D
FSF1DCGC1DCHC2D
FSF1DCHC2D
ENG1DFSF1DFSF2D
ENG1D
How large were our achievement gaps in applied level English, French, Geography and History in 2015-2016?
In which applied level courses has progress been made in narrowing the achievement gaps over the past few years?
1-6%
CGC1P
0-12%
FSF1PCGC1PCHC2P
1-3%
ENG1PENG2PFSF2P
5-16%
FSF1PFSF2PCHC2P
0-6%
ENG2PFSF1PFSF2PCHC2P
Observations: Provincial Standard Gender ELL SpEd FNMI SES
How large were our achievement gaps in academic level English, French, Geography and History in 2015-2016?
8-16% 1-18% 8-20% 3-31% 3-13%
In which academic level courses has progress been made in narrowing the achievement gaps over the past few years?
FSF2DCGC1D
FSF2DCGC1D
ENG2DFSF1DFSF2DCHC2D
ENG2DCHC2D
ENG1DFSF1DCGC1D
How large were our achievement gaps in applied level English, French, Geography and History in 2015-2016?
In which applied level courses has progress been made in narrowing the achievement gaps over the past few years?
3-26%
ENG1PFSF1PCHC2P
0-44%
ENG2PFSF1PCHC2P
1-10%
FSF2P
0-23%
ENG1PENG2PFSF1PFSF2PCGC1PCHC2P
1-7%
ENG2PFSF1PCGC1PCHC2P
Numeracy (K-12)Education Quality and Accountability Office (EQAO) Assessments
Student Characteristics – Primary/JuniorThe table below provides information about students in grade 3 and grade 6 who were eligible to participate in the 2015-16 EQAO assessments of reading, writing, and mathematics. Results are presented for the OCDSB and for the province.
Table 4: Student Characteristics, Primary and Junior EQAO Assessments
Number of
Students
Participation Rate
Fully Exempt
Gender Students with
Special Education
Needs (Excluding
Gifted)
English Language Learners
(ELL)
French Immersion StudentsFemale Male
OCDSB
Grade 3 4,781 96% 3% 49% 51% 18% 18% 55%
Grade 6 5,001 97% 2% 49% 51% 21% 21% -
ProvinceGrade 3 125,484 97% 2% 49% 51% 17% 13% 16%
Grade 6 123,685 97% 2% 48% 52% 21% 10% -
Compared to the previous three-year average, this information has changed in the following ways for OCDSB students eligible to participate in these assessments:
• no change in the participation rate for the grade 3 assessment, but down for grade 6 (1%);
• full exemptions (i.e., an exemption from all three components of the assessment) were up for both grade 3 (1%) and grade 6 (2%);
• a higher percentage of grade 3 students were male (1%) and a lower percentage were female (1%); no change in the gender distribution for grade 6 students;
• a higher percentage of grade 3 students had a special education need (excluding gifted; 6%), but there was no change for grade 6; and
• a lower percentage of grade 3 students were ELLs (6%), whereas a higher percentage of grade 6 students were ELLs (2%).
Compared to the province, the OCDSB has substantially higher proportions of ELLs and students enrolled in a French immersion program.

20 Ottawa-Carleton District School Board 2015–2016 Annual Student Achievement Report 21
Student Characteristics – Grade 9 MathematicsThe table below provides information about the students eligible to participate in the grade 9 EQAO mathematics assessments during the 2015-2016 school year.
Table 5: Student Characteristics, Grade 9 EQAO Mathematics Assessments
Number of Students
Participation Rate
Gender Students with special education
needs (excluding gifted)
ELLFemale Male
OCDSB
Academic 4,041 99% 51% 49% 12% 13%
Applied 915 95% 45% 55% 46% 19%
Province
Academic 97,347 99% 51% 49% 7% 6%
Applied 36,005 96% 44% 56% 41% 10%
Compared to the previous three-year average, this information has changed in the following ways for OCDSB students eligible to participate in these assessments:
• no change in the participation rates for either academic or applied level courses;• the gender distribution of participating students was more evenly split in both
academic and applied level courses, however, there continues to be a marginally higher proportion of males to females in grade 9 applied level mathematics;
• the percentages of students with a special education need taking part in the grade 9 assessments of mathematics were higher (i.e., 4% in applied, 2% in academic); and
• the percentages of ELLs taking part in the grade 9 assessments of mathematics were higher (i.e., 9% in applied, 6% in academic).
Compared to the province, the OCDSB has substantially higher proportions of students with special education needs (excluding gifted) and ELLs in both academic and applied level mathematics courses.
Overall Performance – Primary/Junior & Grade 9The graphs below show the percentage of elementary and secondary students in the District and the province who met the provincial standard in mathematics over the last five years.
Grade 9 Academic Math
70% 65% 67% 62%
68% 67% 67% 63%
0%
20%
40%
60%
80%
100%
2011-12 2012-13 2013-14 2014-15 2015-16
OCDSB Province
86% 86% 87% 87%
84% 84% 85% 83%
0%
20%
40%
60%
80%
100%
2011-12 2012-13 2013-14 2014-15 2015-16OCDSB Province
42% 42% 45% 45%
44% 44% 47% 45%
0%
20%
40%
60%
80%
100%
2011-12 2012-13 2013-14 2014-15 2015-16
Grade 9 Applied Math
OCDSB Province
Observations: Primary/Junior
• Compared to the province, a lower % of our grade 3 students and a higher % of our grade 6 students met the provincial standard in mathematics in 2015-2016.
• A lower % of our grade 3 and grade 6 students met the provincial standard in mathematics in 2015-2016 vs. 2013-2014. o The declines at the District level
were larger in grade 3, but smaller in grade 6, as compared to the province.
Grade 3 Mathematics
Grade 6 Mathematics
Observations: Grade 9 Math
• Compared to the province, a higher % of students in academic level mathematics and a lower % of students in applied level mathematics achieved at or above the provincial standard I 2015-2016.
• There was no change in the proportion of students who met/exceeded the provincial standard in either academic or applied level mathematics in 2015-2016 vs. 2013-2014. o Provincially there were declines
in both academic and applied levels.

22 Ottawa-Carleton District School Board 2015–2016 Annual Student Achievement Report 23
Numeracy Links to National/International Studies - HighlightsStudents are randomly selected to participate in several national and international assessments on a 3-5 year cyclical basis. Results are reported at the country and, where there are sufficient numbers of participating students, provincial level.Across three numeracy based assessments, Ontario students have been shown to perform exceptionally well:
o Performance was higher for Ontario students compared to the Canadian average on the Pan-Canadian Assessment Program (PCAP in 2013);
o Ontario’s student achievement for mathematics and science was similar to other provinces and frequently exceeded the OECD average on the Programme for International Student Assessment (PISA in 2012); and
o There continues to be significant increases in the percentage of students meeting the Intermediate benchmark for mathematics and science on the Trends in International Mathematics and Science Study (TIMSS in 2011).
Cohort Tracking Over Time – Primary to JuniorFor the elementary assessments, cohort tracking follows a group of students as they move from grade 3 to grade 6. The graphs below show the mathematics achievement for five cohorts of OCDSB students who wrote the grade 6 mathematics assessment and for whom grade 3 EQAO results are available. Provincial cohort results for the most recent cohort of students (i.e., those who wrote the grade 6 mathematics assessment in 2015-2016 in relation to their achievement on the primary assessment in 2012-2013) have been included at the top of the graph for comparative purposes. Results are displayed as the percentage of students who: maintained, rose to, dropped from, or never met the provincial standard.
Mathematics - Cohort Tracking from Grade 3 to Grade 6
56%
56%
52%
49%
46%
7%
6%
6%
6%
4%
15%
15%
18%
18%
21%
23%
23%
25%
28%
28%
0% 20% 40% 60% 80% 100%
Grade 3 in 2008-09 and Grade 6 in 2011-12
Grade 3 in 2009-10 and Grade 6 in 2012-13
Grade 3 in 2010-11 and Grade 6 in 2013-14
Grade 3 in 2011-12 and Grade 6 in 2014-15
Grade 3 in 2012-13 and Grade 6 in 2015-16
Grade 3 in 2012-13 and Grade 6 in 2015-16(Province)
Maintained standard Rose to standard Dropped from standard Never met standard
Observations
• A total of 4,489 students took part in both the grade 3 mathematics assessments in 2012-2013 and the grade 6 mathematics assessments in 2015-2016.
• Compared to the average of the previous 3 years, the % of students in the 2015-2016 cohort who:
o maintained standard in mathematics from grade 3 to grade 6 decreased by 6%;
o rose to standard in mathematics from grade 3 to grade 6 remained unchanged;
o dropped from standard in mathematics from grade 3 to grade 6 increased by 2%; and
o never met standard in mathematics in either grade 3 or grade 6 increased by 4%.
• Compared to the province, higher proportions of OCDSB students maintained or rose to standard on the most recent grade 6 assessment of mathematics.

24 Ottawa-Carleton District School Board 2015–2016 Annual Student Achievement Report 25
Cohort Tracking Over Time – Junior to Grade 9 MathematicsFor the grade 9 mathematics assessments, cohort tracking follows a group of students as they move from grade 6 to grade 9. The graphs below show the mathematics achievement for five cohorts of OCDSB students who wrote the grade 9 mathematics assessment and for whom grade 6 EQAO results are available. Provincial cohort results for the most recent cohort of students (i.e., those who wrote the grade 9 mathematics assessment in 2015-2016 in relation to their achievement on the junior assessment in 2012-2013) have been included at the top of the graph for comparative purposes.Results are displayed as the percentage of students who: maintained, rose to, dropped from, or never met the provincial standard.
Cohort Tracking – Grade 6 Mathematics to Grade 9 Mathematics (Academic)
75%
73%
73%
72%
69%
12%
15%
15%
17%
15%
5%
5%
4%
4%
6%
8%
8%
8%
8%
10%
0% 20% 40% 60% 80% 100%
Grade 6 in 2008-09 & Grade 9 in 2011-12
Grade 6 in 2009-10 & Grade 9 in 2012-13
Grade 6 in 2010-11 & Grade 9 in 2013-14
Grade 6 in 2011-12 & Grade 9 in 2014-15
Grade 6 in 2012-13 & Grade 9 in 2015-16
Grade 6 in 2012-13 & Grade 9 in 2015-16(Province)
Maintained standard Rose to standard Dropped from standard Never met standard
Observations
• A total of 3,418 OCDSB students took part in both the grade 6 mathematics assessment in 2012-2013 and the grade 9 academic level mathematics assessment in 2015-2016.
• Compared to the average of the previous 3 years, the % of OCDSB students in the 2015-2016 cohort who:
o maintained standard decreased by 2%;o rose to standard increased by 3%;o dropped from standard decreased by 1%; ando never met the standard remained the same.
• Compared to the province, higher proportions of OCDSB students maintained or rose to standard on the most recent grade 9 academic level mathematics assessment.
Cohort Tracking – Grade 6 Mathematics to Grade 9 Mathematics (Applied)
18%
18%
17%
13%
15%
28%
30%
31%
38%
33%
7%
7%
4%
3%
4%
47%
45%
49%
46%
48%
0% 20% 40% 60% 80% 100%
Grade 6 in 2008-09 & Grade 9 in 2011-12
Grade 6 in 2009-10 & Grade 9 in 2012-13
Grade 6 in 2010-11 & Grade 9 in 2013-14
Grade 6 in 2011-12 & Grade 9 in 2014-15
Grade 6 in 2012-13 & Grade 9 in 2015-16
Grade 6 in 2012-13 & Grade 9 in 2015-16(Province)
Maintained standard Rose to standard Dropped from standard Never met standard
Observations
• A total of 640 OCDSB students took part in both the grade 6 mathematics assessment in 2012-2013 and the grade 9 applied level mathematics assessment in 2015-2016.
• Compared to the average of the previous 3 years, the % of OCDSB students in the 2015-16 cohort who:
o maintained standard decreased by 5%;o rose to standard increased by 8%;o dropped from standard decreased by 3%; ando never met the standard decreased by 1%.
• Compared to the province, lower proportions of OCDSB students maintained the standard and higher proportions rose to standard on the most recent grade 9 applied level mathematics assessment.

26 Ottawa-Carleton District School Board 2015–2016 Annual Student Achievement Report 27
Gender4 Gaps – Primary/Junior & Grade 9The graphs below show the District’s progress in narrowing the achievement gaps in mathematics for female and male students over the last five years.
4 It should be noted that the District recognizes that gender is not a binary construct (see OCDSB Gender Identity and Gender Expression Guide to Support Our Students), however, current data collection and reporting practices locally and provincially preclude the disaggregation of gender data beyond the gender binary male-female distinction.
85% 85% 87% 86%
86% 87% 87% 87%
0%
20%
40%
60%
80%
100%
2011-12 2012-13 2013-14 2014-15 2015-16Female Male
38% 38% 40% 40%
46% 46% 48% 48%
0%
20%
40%
60%
80%
100%
2011-12 2012-13 2013-14 2014-15 2015-16Female Male
Observations: Primary/Junior
• In grade 3, our female students outperformed our male students in mathematics. This gap is larger for the District than for the province (2%).
• The gender gap in mathematics was eliminated for our grade 6 students. The same result was observed provincially.
• Compared to the previous 3-year average gap, our gender gaps in math have:o widened for grade 3 and less progress
has been made in narrowing this gap compared to the province; and
o been eliminated for grade 6.
Grade 3 Mathematics
Grade 6 Mathematics
Observations: Grade 9 Mathematics
• Our male students achieved at higher levels in both applied (8%) and academic (1%) level mathematics. Compared to the province our gender gaps are larger in applied mathematics (4%), and the same in academic mathematics.
• Compared to the average gap for theprevious 3 years, our gender gaps have stayed the same for students in both the academic and applied level mathematics programs, whereas there has been a 1% widening of the gender gap for the province over the same time period.
Grade 9 Academic Mathematics
Grade 9 Applied Mathematics
Achievement Gaps for Other Identified Groups of Students – Primary, Junior,Grade 9 MathematicsIn addition to gender, the OCDSB monitors progress towards narrowing achievement gaps for four other identified groups of students: English language learners (ELLs), students with special education needs (excluding gifted; SpEd), students who self-identified as First Nation, Métis, or Inuit (FNMI), and students from lower income neighbourhoods (SES). While it is understood that there is overlap between these groups of students, results are reported on the following pages for each group separately. The table below shows the number of students in each of the four identified groups of students, as well as the proportion of the overall eligible cohort, for the primary, junior, and grade 9 mathematics assessments – academic and applied.
Table 6: Distribution of Identified Groups of Students - Primary, Junior and Grade 9EQAO Mathematics Assessments
Assessment ELLs SpEd FNMI SESPrimary 875 874 73 1,162
(n = 4,781) 18% 18% 2% 24%Junior 1,063 1,063 106 1,177
(n = 5,001) 21% 21% 2% 24%Academic Math 733 531 55 818
(n = 4,041) 18% 13% 1% 20%Applied Math 265 460 30 367
(n = 915) 29% 50% 3% 40%
Compared to the OCDSB student population as a whole, (ELLs) , students with special education needs (SpEd), students who self-identified as First Nation, Métis, or Inuit (FNMI), and students from lower income neighbourhoods (SES) continued to achieve at lower levels in mathematics. The graphs on the following pages show the progress we have made in narrowing the elementary and secondary achievement gaps in mathematics for these identified student groups over the last five years.

28 Ottawa-Carleton District School Board 2015–2016 Annual Student Achievement Report 29
58%54% 55%
51%
38%33%
38%30%
59%53%
32%
51% 48%
0%
20%
40%
60%
80%
100%
2011-12 2012-13 2013-14 2014-15 2015-16
Grade 3 Mathematics: Identified Groups of Students
ELLs SpEd FNMI SES
45% 46% 44% 44%
27% 28%20% 22%
26%
43%39%41%
37%
0%
20%
40%
60%
80%
100%
2011-12 2012-13 2013-14 2014-15 2015-16
Grade 6 Mathematics
ELLs SpEd FNMI SES
All Students
70%65% 67%
62%
Observations: Grade 3 Mathematics ELL SpEd FNMI SESHow large were our grade 3 achievement gaps in mathematics in 2015-2016? 11% 32% 30% 14%
How do our grade 3 achievement gaps compare to the province?
8% larger
2% smaller - -
How do our 2015-2016 grade 3 achievement gaps compare to the average achievement gaps for the previous 3 years?
1% smaller
1% larger
19%larger
2% smaller
How does our progress towards narrowing these grade 3 achievement gaps compare to the province? matches falls
short - -
All Students
61% 60%56% 53%
Observations: Grade 6 Mathematics ELL SpEd FNMI SESHow large were our grade 6 achievement gaps in mathematics in 2015-2016? 9% 31% 14% 16%
How do our grade 6 achievement gaps compare to the province?
5% larger
equal to - -
How do our 2015-2016 grade 6 achievement gaps compare to the average achievement gaps for the previous 3 years?
5% smaller
3% smaller
11%smaller
1% larger
How does our progress towards narrowing these grade 6 achievement gaps compare to the province? exceeds falls
short - -
Grade 9 Academic Math: Identified Groups of Students
Grade 9 Applied Math: Identified Groups of Students
70%76% 76%
80%74%
78% 77% 78%75%84%
71%77% 76%
0%
20%
40%
60%
80%
100%
2011-12 2012-13 2013-14 2014-15 2015-16ELLs SpEd FNMI SES
25%20%
28% 31%37% 40% 40% 42%
33%
50% 47%
37% 37%
0%
20%
40%
60%
80%
100%
2011-12 2012-13 2013-14 2014-15 2015-16ELLs SpEd FNMI SES
All Students
85% 86% 87% 87%
Observations: Grade 9 Academic Math ELL Spec Ed FNMI SESHow large were our achievement gaps for students in the academic course in 2015-2016? 7% 9% 16% 11%
How do these achievement gaps compare to the province?
1% larger
7% smaller - -
How do these achievement gaps compare to our previous 3-year average gaps?
5% smaller
1% smaller
10%larger
1% larger
How does our progress towards narrowing these achievement gaps compare to the province? exceeds exceeds - -
Observations: Grade 9 Applied Math ELL Spec Ed FNMI SESHow large were our achievement gaps for students in the applied course in 2015-2016? 14% 3% 2% 8%
How do these achievement gaps compare to the province? 6% larger
6% smaller - -
How do these achievement gaps compare to our previous 3-year average gaps?
5% smaller
1% smaller
0%direction change
0% no change
How does our progress towards narrowing these achievement gaps compare to the province? exceeds exceeds - -
All Students
42% 42% 45% 45%

30 Ottawa-Carleton District School Board 2015–2016 Annual Student Achievement Report 31
Secondary Report Card Data – Grades 9 and 10 Math and Science
Student CharacteristicsTable 9 (below) shows the total number of students enrolled in each of grades 9 and 10 academic and applied level mathematics and science courses, as well as a breakdown for each of the identified groups of students. Enrolment in academic level courses is three to four times that of applied level courses. Compared to academic level courses, applied level courses also tend to have modestly higher proportions of boys and students who self-identified as FNMI, and substantially higher proportions of ELLs, students with special education needs (excluding gifted), and students residing in lower income neighbourhods. This information will help to provide context for the achievement results that follow.
Table 9: Enrolment Distribution, Grades 9 and 10 Mathematics and Science Courses
Course Males ELLs SpEd FNMI SESMPM1D 2,052 601 528 56 872
(n = 4,131) 50% 15% 13% 1% 21%MFM1P 583 371 455 36 515
(n = 1,150) 51% 32% 40% 3% 45%SNC1D 2,090 565 581 64 881
(n = 4,252) 49% 13% 14% 2% 21%SNC1P 461 270 429 34 373
(n = 842) 55% 32% 51% 4% 44%MPM2D 1,959 635 479 48 824
(n = 3,998) 49% 16% 12% 1% 21%MFM2P 760 351 482 47 526
(n = 1,420) 54% 25% 34% 3% 37%SNC2D 2,118 680 574 55 878
(n = 4,336) 49% 16% 13% 1% 20%SNC2P 547 261 407 35 391
(n = 992) 55% 26% 41% 4% 39%
Overall PerformanceOCDSB pass rates and the proportion of students meeting/exceeding the provincial standard in grades 9 and 10 compulsory Mathematics and Science courses have remained constant or increased over 2014-2015 results in all areas with the exception of grade 9 applied level mathematics. Students in academic level courses continue to outperform their peers in applied level courses.
Table 10: Grades 9 and 10 Pass Rates and Percentages of Students Achieving at Level 3 or 4 in Compulsory Credits Based on Full Year Report Card Data, June 20165
Pass Rates Percentage of Students Achieving at Level 3 or 4
Course6 Level 2011-12 2012-13 2013-14 2014-15 2015-16 2011-12 2012-13 2013-14 2014-15 2015-16
Grade 9 Math
(MPM/MFM)
Academic 94% 95% 96% 96% 96% 64% 69% 66% 71% 71%
Applied 86% 89% 87% 86% 86% 41% 40% 43% 45% 43%
Grade 9 Science(SNC)
Academic 96% 97% 98% 97% 98% 66% 71% 71% 73% 73%
Applied 83% 87% 88% 84% 87% 35% 39% 41% 40% 48%
Grade 10 Math
(MPM/MFM)
Academic 93% 94% 94% 94% 95% 62% 61% 62% 65% 66%
Applied 86% 88% 88% 86% 87% 43% 40% 45% 48% 49%
Grade 10 Science(SNC)
Academic 95% 97% 97% 96% 96% 63% 67% 67% 68% 69%
Applied 86% 87% 89% 87% 88% 36% 37% 38% 38% 43%
increase
nochange
decrease
Achievement Gaps for Identified Groups of StudentsWhile achievement gaps for our five identified groups of students persist, progress has been made in narrowing achievement gaps for many, as indicated on the following page. Of particular note is the narrowing of the achievement gap in pass rates for:
• ELLs and students residing in lower income neighbourhoods in three of four applied level courses; and
• students who have self-identified as FNMI in three of four academic level courses.
Similarly, achievement gaps have narrowed with respect to meeting/exceeding the provincial standard for:
• students who have self-identified as FNMI, as well as those residing in lower income neighbourhoods, in three of four applied level courses; and
• students with special education needs (excluding gifted) in three of four academic level courses.
5 Data was extracted from the Trillium Student Information System in August 2016. 6 Course codes are designated by the Ministry of Education for reporting purposes. The first three characters identify the subject and are indicated in brackets in the table below. The number in the fourth position of the course code indicates the grade level (1=grade 9, 2=grade 10, etc.), whereas the character in the fifth position indicates the level. In this section of the report, only academic (D) and applied (P) level courses are included.

32 Ottawa-Carleton District School Board 2015–2016 Annual Student Achievement Report 33
Observations: Pass Rates Gender ELL SpEd FNMI SES
How large were our achievement gaps in academic level Math and Science in 2015-2016?
1-2% 2-6% 3-4% 0-3% 3-7%
In which academic level courses has progress been made in narrowing the achievement gaps over the past few years?
MPM2D MPM1DMPM2D
MPM2D MPM1DMPM2DSNC2D
-
How large were our achievement gaps in applied level Math and Science in 2015-2016?
In which applied level courses has progress been made in narrowing the achievement gaps over the past few years?
0-6%
MFM1PMFM2P
0-2%
MFM1PSNC1PSNC2P
0-3%
MFM1PMFM2P
5-22%
MFM1P
2-6%
MFM1PMFM2PSNC1P
Observations: Provincial Standard Gender ELL SpEd FNMI SES
How large were our achievement gaps in academic level Math and Science in 2015-2016?
4-12% 9-12% 15-19% 1-25% 10-12%
In which academic level courses has progress been made in narrowing the achievement gaps over the past few years?
MPM1D MPM1DMPM2D
MPM1DMPM2DSNC2D
MPM2DSNC2D
MPM1DSNC1D
How large were our achievement gaps in applied level Math and Science in 2015-2016?
In which applied level courses has progress been made in narrowing the achievement gaps over the past few years?
2-10%
SNC1PSNC2P
1-9%
MFM1PSNC1P
2-4%
MFM1PSNC2P
3-6%
MFM1PSNC1PSNC2P
4-10%
MFM1PSNC1PSNC2P
Pathways (7-12)
Secondary Report Card Data – Grade 10 Civics and Careers
Student CharacteristicsTable 11 (below) shows the total number of students enrolled in grade 10 open level Civics and Careers, as well as a breakdown for each of the identified groups of students. This information will help to provide context for the achievement results that follow.
Table 11: Enrolment Distribution, Grade 10 Civics and Careers
Course Males ELLs SpEd FNMI SESCHV2O 2,402 761 985 99 1,188
(n = 4,513) 53% 17% 22% 2% 26%GLC2O 2,651 831 1,091 114 1,318
(n = 5,003) 53% 17% 22% 2% 26%
Overall PerformanceOCDSB pass rates and the proportion of students meeting/exceeding the provincial standard in grade 10 Civics and Careers have increased over 2014-2015 rates. As was the case in both literacy and numeracy, achievement gaps tend to be wider with respect to meeting/ exceeding the provincial standard compared to pass rates.
Table 12: Grades 9 and 10 Pass Rates and Percentages of Students Achieving at Level 3 or 4 in Compulsory Credits Based on Full Year Report Card Data, June 20167
Pass Rates Percentage of Students Achieving at Level 3 or 4
Course8 2011-12 2012-13 2013-14 2014-15 2015-16 2011-12 2012-13 2013-14 2014-15 2015-16
Grade 10 Civics (CHV)
94% 95% 92% 93% 95% 64% 69% 66% 69% 74%
Grade 10 Careers (GLC)
93% 94% 94% 93% 95% 70% 73% 74% 73% 77%
increase
nochange
decrease
7 Data was extracted from the Trillium Student Information System in August 2016. 8 Course codes are designated by the Ministry of Education for reporting purposes. The first three characters identify the subject and are indicated in brackets in the table below. The number in the fourth position of the course code indicates the grade level (2=grade 10), whereas the character in the fifth position indicates the level. In this section of the report, only open (O) level courses are included.

34 Ottawa-Carleton District School Board 2015–2016 Annual Student Achievement Report 35
Achievement Gaps for Identified Groups of StudentsWhile achievement gaps for our five identified groups of students persist, progress has been made in narrowing achievement gaps for:
• ELLs and students with special education needs (excluding gifted) – in terms of both pass rates and the proportion of students meeting/exceeding the provincial standard;
• students residing in lower income neighbourhoods in terms of pass rates; and• students who have self-identified as FNMI in terms of meeting/exceeding the
provincial standard.
Observations: Pass Rates Gender ELL SpEd FNMI SES
How large were our achievement gaps in Civics and Careers in 2015-2016?
In which course(s) has progress been made in narrowing the achievement gaps over the past few years?
3%
-
1-2%
CHV2OGLC2O
3%
CHV2OGLC2O
8-13%
-
3-5%
CHV2OGLC2O
Observations: Provincial Standard Gender ELL SpEd FNMI SES
How large were our achievement gaps in Civics and Careers in 2015-2016?
In which course(s) has progress been made in narrowing the achievement gaps over the past few years?
15%
-
6-10%
CHV2OGLC2O
14-16%
CHV2OGLC2O
15-17%
CHV2OGLC2O
9-13%
-
Grade 10 Credit Accumulations
Student CharacteristicsTable 13 shows the total number of students included in the measure of grade 10 credit accumulation for 2015-2016, as well as a breakdown for each of the identified groups of students. This information will help to provide context for the results that follow.
Table 7: Enrolment Distribution, Grade 10 Credit Accumulation (2015-2016)
Outcome Males ELLs SpEd FNMI SESCredit Accumulation 2,648 859 1,106 93 1,229
(n = 5,259) 50% 16% 21% 2% 23%
Overall PerformanceGrade 10 credit accumulation serves as an important indicator in targeting students who may be at risk for dropping out of high school prior to earning a diploma.9 In the OCDSB, more than three-quarters of OCDSB students across the past five years have attained16 credits by the end of grade 10. OCDSB rates have been marginally higher than provincial rates for the past two years.
In 2015-2016, 4,096 of the 5,259 grade 10 students had achieved 16 or more credits by the end of June 2016.
Grade 10 Credit Accumulation, OCDSB and Province
9 Zegarac, G. & Franz, R. (2007) Secondary School Reform in Ontario and the Role of Research, Evaluation and
Indicator Data. Paper presented at the American Educational Research Association, Chicago, IL. http://www.edu.gov.on.ca/eng/research/SSreform.pdf
76% 78% 79% 81% 78%
76% 78% 78% 79%
0%
20%
40%
60%
80%
100%
2011-12 2012-13 2013-14 2014-15* 2015-16
OCDSB Province
36 Ottawa-Carleton District School Board 2015–2016 Annual Student Achievement Report 37
Achievement Gaps for Identified Groups of StudentsWhile achievement gaps are evident across all five identified groups of students, progress has been made in narrowing the gap across all groups as shown in the table below.
Observations Gender ELL SpEd FNMI SES
How large were our gaps in grade 10 credit accumulation?
How do these gaps compare to our previous year’s gaps?
4%
2% smaller
15%
1% smaller
16%
4% smaller
12%
6% smaller
16%
1% smaller
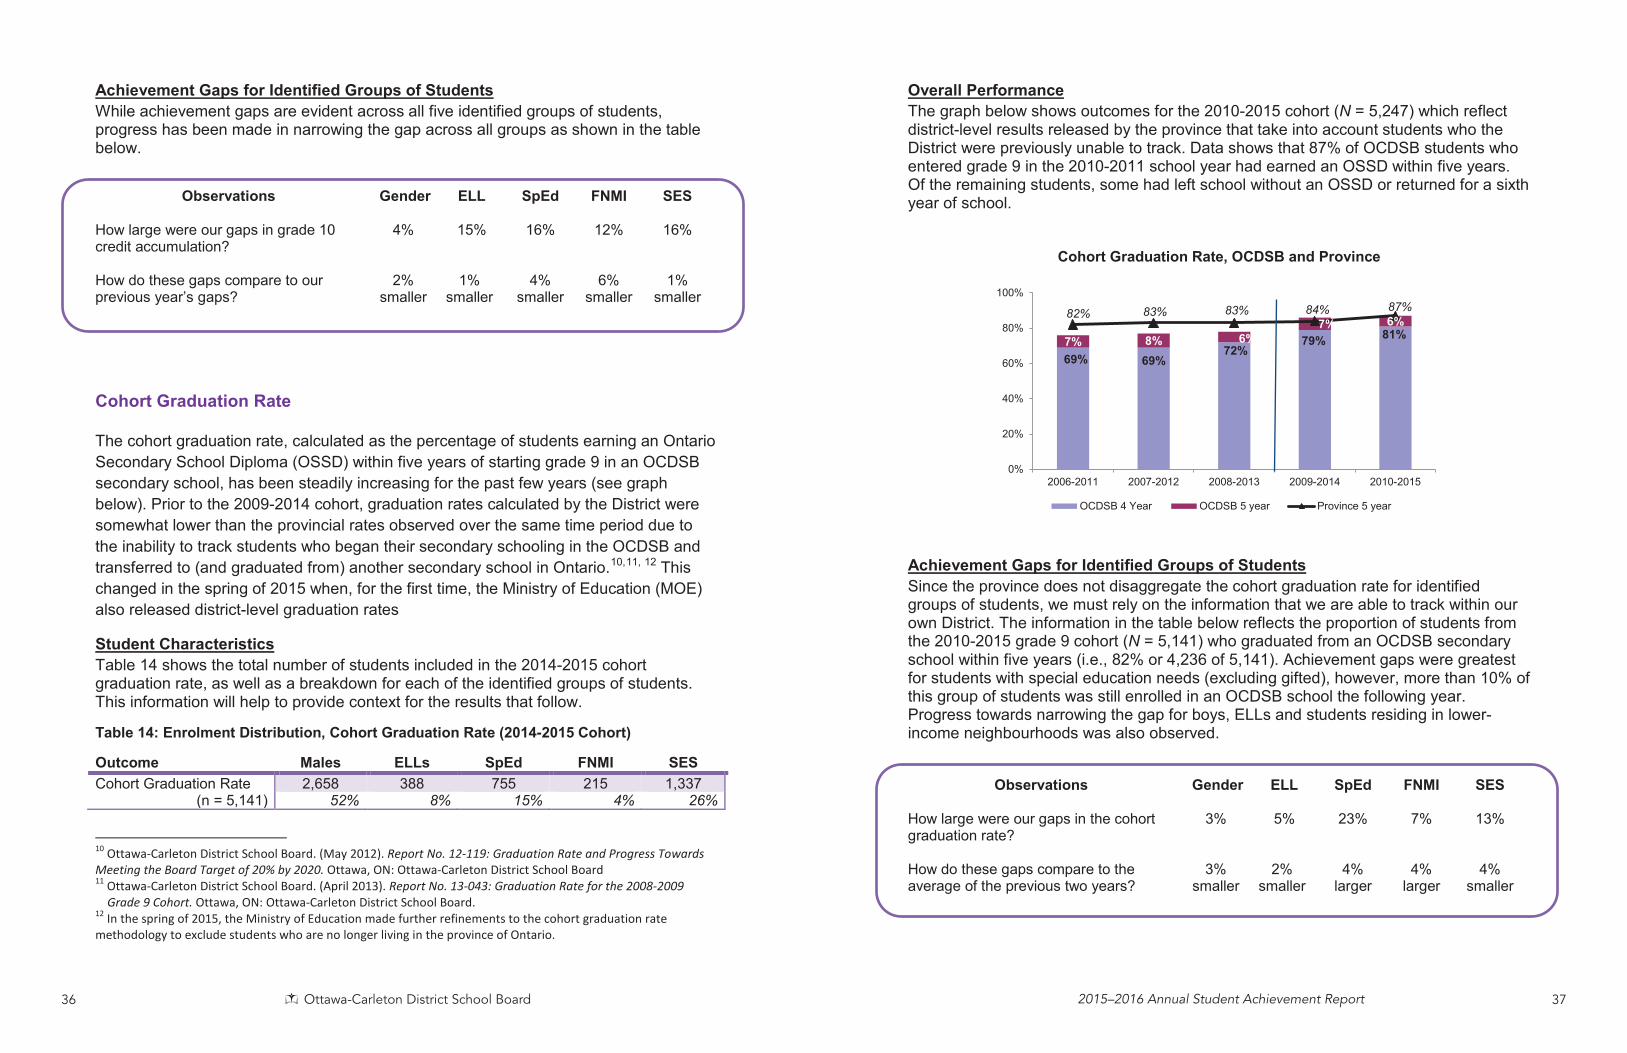
Cohort Graduation Rate The cohort graduation rate, calculated as the percentage of students earning an Ontario Secondary School Diploma (OSSD) within five years of starting grade 9 in an OCDSB secondary school, has been steadily increasing for the past few years (see graph below). Prior to the 2009-2014 cohort, graduation rates calculated by the District were somewhat lower than the provincial rates observed over the same time period due to the inability to track students who began their secondary schooling in the OCDSB and transferred to (and graduated from) another secondary school in Ontario.10,11, 12 This changed in the spring of 2015 when, for the first time, the Ministry of Education (MOE) also released district-level graduation rates
Student CharacteristicsTable 14 shows the total number of students included in the 2014-2015 cohort graduation rate, as well as a breakdown for each of the identified groups of students.This information will help to provide context for the results that follow.
Table 14: Enrolment Distribution, Cohort Graduation Rate (2014-2015 Cohort)
Outcome Males ELLs SpEd FNMI SESCohort Graduation Rate 2,658 388 755 215 1,337
(n = 5,141) 52% 8% 15% 4% 26%
10 Ottawa-Carleton District School Board. (May 2012). Report No. 12-119: Graduation Rate and Progress Towards Meeting the Board Target of 20% by 2020. Ottawa, ON: Ottawa-Carleton District School Board 11 Ottawa-Carleton District School Board. (April 2013). Report No. 13-043: Graduation Rate for the 2008-2009
Grade 9 Cohort. Ottawa, ON: Ottawa-Carleton District School Board. 12 In the spring of 2015, the Ministry of Education made further refinements to the cohort graduation rate methodology to exclude students who are no longer living in the province of Ontario.
Overall PerformanceThe graph below shows outcomes for the 2010-2015 cohort (N = 5,247) which reflect district-level results released by the province that take into account students who the District were previously unable to track. Data shows that 87% of OCDSB students who entered grade 9 in the 2010-2011 school year had earned an OSSD within five years. Of the remaining students, some had left school without an OSSD or returned for a sixthyear of school.
Cohort Graduation Rate, OCDSB and Province
Achievement Gaps for Identified Groups of StudentsSince the province does not disaggregate the cohort graduation rate for identified groups of students, we must rely on the information that we are able to track within our own District. The information in the table below reflects the proportion of students from the 2010-2015 grade 9 cohort (N = 5,141) who graduated from an OCDSB secondary school within five years (i.e., 82% or 4,236 of 5,141). Achievement gaps were greatest for students with special education needs (excluding gifted), however, more than 10% of this group of students was still enrolled in an OCDSB school the following year. Progress towards narrowing the gap for boys, ELLs and students residing in lower-income neighbourhoods was also observed.
Observations Gender ELL SpEd FNMI SES
How large were our gaps in the cohort graduation rate?
How do these gaps compare to the average of the previous two years?
3%
3% smaller
5%
2% smaller
23%
4% larger
7%
4% larger
13%
4% smaller
69% 69%72%
79% 81%7% 8% 6%7% 6%82% 83% 83% 84% 87%
0%
20%
40%
60%
80%
100%
2006-2011 2007-2012 2008-2013 2009-2014 2010-2015
OCDSB 4 Year OCDSB 5 year Province 5 year

38 Ottawa-Carleton District School Board 2015–2016 Annual Student Achievement Report 39
Annual Certification Rate (ACR)
The Annual Certification Rate13 reflects the proportion of students who have earned an OSSD, an Ontario Secondary School Certification (OSSC), or a Certificate of Accomplishment (COA) from an OCDSB secondary school (or Crystal Bay and Clifford Bowey) in what is theoretically their final year of school.
Student CharacteristicsTable 15 shows the total number of students included in calculation of the annual certification rate for 2015-2016, as well as a breakdown for each of the identified groups of students. This information will help to provide context for the results that follow.
Table 15: Enrolment Distribution, Annual Certification Rate (2015-2016)
Outcome Males ELLs SpEd FNMI SESAnnual Certification Rate 2,394 461 907 139 1,105
(n = 4,836) 50% 10% 19% 3% 23%
Overall PerformanceThe graph below shows annual certification rates for the OCDSB since the establishment of baseline in 2013-2014. Across all three years, the majority of students (99%) had earned an OSSD. In 2015-2016, the remaining 1% of students earned either an OSSC (n = 18) or a COA (n = 38), representing modest increases in the number of these types of certificates being granted to students over previous years.
Annual Certification Rate, OCDSB
13 Detailed methodology for this calculation can be found in Report No. 15-023: 2013-2014 Annual Certification Rate (March 2015). Subsequent to this report being released, the Ministry of Education made refinements to the methodology used to calculate the cohort graduation rate (i.e., to exclude students who are no longer living in the province of Ontario). This modification has been applied to the 2014-2015 ACR calculation, and will be used moving forward.
88% 88% 89%
0%
20%
40%
60%
80%
100%
2013-14 2014-15 2015-16
Achievement Gaps for Identified Groups of StudentsWith the exception of students with special education needs, achievement gaps are evident for the other identified groups of students. Progress has been made, however, in narrowing these gaps for students who have self-identified as FNMI and those students residing in lower-income neighbourhoods.
Observations Gender ELL SpEd FNMI SES
How large were our gaps in the annual certification rate?
How do these gaps compare to the average of the previous two years?
5%
2%larger
6%
nochange
0%
2% larger
8%
3% smaller
8%
1% smaller
Grade 12 French Proficiency: Diplôme d’études en langue française (DELF)
The Diplôme d’études en langue française (DELF) is an internationally recognized test for candidates whose first language is not French. It is based on the Common European Framework of Reference (CEFR), which defines language proficiency along six global levels: A1, A2, B1, B2, C1, and C2 (least to most difficult) and measures four competencies: listening (comprehension de l’oral), speaking (production oral), reading (comprehension des écrits), and writing (production écrite).
In the OCDSB, the DELF is administered biannually (November and April) and all students enrolled in a Grade 12 FSL course are invited to challenge the DELF at a test level of their choice (A2, B1, or B2). Student interest in taking the DELF has continued to grow each year.
Student CharacteristicsTable 16 shows the total number of students who participated in the DELF during the 2015-2016 school year, as well as a breakdown for each of the identified groups of students. This information will help to provide context for the results that follow.
Table 16: Enrolment Distribution, DELF Participation (2015-2016)
Outcome Males ELLs SpEd FNMI SESFrench Proficiency (DELF) 415 72 87 17 202
(n = 1,174) 35% 6% 7% 1% 17%

40 Ottawa-Carleton District School Board 2015–2016 Annual Student Achievement Report 41
Overall PerformanceSuccess rates for students who choose to participate in the DELF remain high, as evidenced in the table below.
Table 8: Success Rates on the DELF, OCDSB
Year # Eligible Students # Students who Completed DELF # Successful Students
2013-2014 1,614 940 (58.2%) 906 (96.4%)
2014-2015 1,569 1,177 (75.0%) 1,132 (96.2%)
2015-2016* 1,669 1,174 (70.3%) 1,088 (92.7%)*A labour disruption at the beginning of this year resulted in unforeseen changes to the administration of the DELF. Such changes may account for the divergence from consistent results over the previous testing administrations (e.g., discrepancy between registration for and completion of the DELF as well as success rate).
Achievement Gaps for Identified Groups of StudentsAnalysis of overall results for identified groups of students reveals modest gaps ranging from 1-4%. Progress towards narrowing these gaps for students who self-identified as FNMI and those residing in lower-income neighbourhoods has been observed.
Observations Gender ELL SpEd FNMI SES
How large were our gaps in the overall success rate on the DELF?
How do these gaps compare to the average of the previous two years?
3%
2%larger
3%
2% larger
4%
2%larger
1%
4% smaller
2%
8%smaller
Summary and Concluding Remarks
The Annual Student Achievement Report is intended to provide an overview of OCDSB student achievement across multiple data sources, and in relation to the provincial, national and international contexts. The following summarizes student achievement trends across the areas of literacy, numeracy and pathways, based on the most recent evidence available.
Literacy (K-12)
Provincial Assessments. Results for OCDSB students on the most recent provincial assessments (i.e. 2015-2016) increased between 2 and 4 percentage points in four of six assessments of literacy (primary and junior reading, junior writing, and previously eligible students on the OSSLT). Results for the OCDSB were equal to or higher than the province in all six assessments of literacy.
Cohort analyses that track student achievement over time also suggest improvements for the most recent cohort of grade 6 OCDSB students with smaller proportions of them either dropping from standard, or never having met the standard, in reading and writing between grade 3 and 6. For first-time eligible students on the OSSLT, however, cohort analyses were mixed. Specifically, while there was a decrease in the proportion of first-time eligible students who did not meet the standard in grade 6 writing and who were unsuccessful on the OSSLT, there was a small increase in the proportion of students who dropped from standard in both reading and writing between grade 6 and grade 10.
Analyses of data for our five identified groups of students show persisting achievement gaps for boys, ELLs, students with special needs, students who have self-identified as FNMI, and for students residing in lower-income neighbourhoods. Achievement gaps tend to be widest for students with special education needs (excluding gifted) on the primary and junior assessments of reading and writing. Nevertheless, achievement gaps for this group of students are narrower than those observed provincially, and a faster rate of progress towards narrowing these gaps for students in the primary division is evident. Similarly, achievement gaps for ELLs have narrowed on the majority of literacy assessments, yet gaps for this group of students remain larger than those observed provincially. Progress towards narrowing the achievement gap for ELLs either matches or exceeds provincial efforts.
District Data (Report Card Marks). Analyses of report card data for grades 9 and 10 compulsory credits in English, Core French, Geography, and History continue to reflect high levels of achievement with pass rates staying the same or increasing over 2014-2015 data in 10 of 12 courses, and the proportion of students meeting/exceeding the provincial standard increasing or remaining the same in 9 of 12 courses. Despite evidence of improved outcomes for students in applied level courses, performance is still lower compared to academic level courses. Report card data continues to show achievement gaps for our five identified groups of students, however, substantial progress has been made in narrowing achievement gaps in meeting/exceeding the

42 Ottawa-Carleton District School Board 2015–2016 Annual Student Achievement Report 43
provincial standard for students with special education needs in academic level courses, and for students who have self-identified as FNMI in applied-level courses. For students residing in lower-income neighbourhoods, a narrowing of the achievement gap was observed for pass rates and in meeting/exceeding the provincial standard.
Numeracy (K-12)
Provincial Assessments. Results for OCDSB students on the most recent provincialassessments (i.e., 2015-2016) decreased between 3 and 5 percentage points in two of four assessments of numeracy (primary and junior mathematics). Results for the OCDSB were higher than the province in junior and academic level mathematics, within 1% of provincial results in primary, and the same in applied level mathematics.
Cohort analyses that track student achievement over time suggest that continued focus in the area of mathematics is necessary in order to improve learning outcomes for students. For the most recent cohort of grade 6 students, for example, increases in the proportion of students who dropped from standard and those who never met the standard in mathematics were observed. Improvements in grade 9 applied level mathematics, however, were also observed with the proportion of students who rose to standard increasing by 8 percentage points.
Analyses of data for our five identified groups of students show persisting achievement gaps particularly for ELLs, students with special needs, students who have self-identified as FNMI, and for students residing in lower-income neighbourhoods. Modest gender gaps are also evident. Specifically, in the primary mathematics assessments girls performed 2% higher compared to boys. In grade 9, however, gaps turn in favour of boys with the widest gender gap observed in grade 9 applied level mathematics at 8%. For the remaining groups of students, achievement gaps tend to be widest forstudents with special education needs (excluding gifted) on the primary and junior assessments of mathematics, for students who self-identify as FNMI on the grade 9 academic mathematics assessment, and for ELLs on the grade 9 applied level mathematics assessment. For students with special education needs, the gaps observed in the OCDSB student population are equal to or smaller than those observed provincially and a narrowing of the gap was observed for students in grade 6. For FNMI students in grade 9 academic mathematics, gaps have increased over the average of the previous three years (provincial comparisons are unavailable), and for ELLs in grade 9 applied level mathematics, a narrowing of the gap has occurred over the previous three years.
District Data (Report Card Marks). Analyses of report card data for grades 9 and 10 compulsory credits in Mathematics and Science continue to reflect high levels of achievement. Specifically, both pass rates and the proportion of students meeting/exceeding the provincial standard have remained the same or increased over 2014-2015 results in all areas with the exception of grade 9 applied level mathematics. As was the case in literacy, improved outcomes for students in applied level courses are evident although performance is still lower compared to those in academic level
courses. Report card data continues to show achievement gaps for our five identified groups of students, however, substantial progress has been made in narrowing achievement gaps for: (i) ELLs, students residing in lower-income neighbourhoods, and students who self-identify as FNMI in applied level courses; and, (ii) students who have self-identified as FNMI and students with special education needs (excluding gifted) in academic level courses.
Pathways (7-12)
District Data (Report Card Marks). Increases in both the pass rates and the proportion of students meeting/exceeding the provincial standard in grade 10 Civics and Careerswere observed in 2015-2016. Achievement gaps are largest for students who self-identify as FNMI for both pass rate and in meeting/exceeding the provincial standard,however progress has been made in narrowing the gap for this group of students in terms of meeting/exceeding the provincial standard. In addition, a narrowing of achievement gaps with respect to pass rates, meeting/exceeding the provincial standard, or both, have occurred for ELLs, students with special education needs (excluding gifted), and students residing in lower-income neighbourhoods.
District Data (Credit Accumulation, Cohort Graduation Rate, Annual Certification Rate). Successful student outcomes are often measured through credit accumulation or attainment of a graduation diploma/certificate. In 2015-2016, 78% of OCDSB students earned 16 credits by the end of grade 10 compared to 81% the previous year. OCDSB credit accumulation rates typically mirror provincial rates. Research has suggested that students who do not earn 16 credits by 16 years of age (i.e., typically by the end ofgrade 10) are at risk of not graduating from high school within the expected timeframe. The cohort graduation rate for OCDSB students entering grade 9 for the first time in 2010-2011, and who graduated within five years, was 87% compared to the provincialrate of 86%. In 2015-2016, the Annual Certification Rate, which reflects the proportion of students who have earned an OSSD, OSSC, or COA from an OCDSB secondary school (or Crystal Bay or Clifford Bowey) in what is theoretically their final year of school, indicates an 89% success rate which represents an increase of 1% from the previous two years.
Analysis of this data for our five identified groups of students indicates that while gaps persist, there has been some progress made in narrowing the gaps for many across these multiple indicators. For students residing in lower-income neighbourhoods, in particular, the gap has narrowed across all three measures.
District Data (Grade 12 French Proficiency – DELF). OCDSB students who continue to study French to grade 12 have an opportunity to participate in an assessment designed to measure French proficiency outcomes across four competencies –speaking, reading, writing, and listening. Upon successful completion of this test, students are well positioned to pursue a range of post-secondary pathways of their choosing. Nearly three-quarters of eligible students have chosen to participate in the DELF over the past two years, and overall success rates have been above 90% for the

44 Ottawa-Carleton District School Board 2015–2016 Annual Student Achievement Report 45
past few. Participation rates and the success rates for our identified groups of students are comparable to those for all students.
Next Steps
Generally speaking, OCDSB students have demonstrated sustained improvement in the areas of literacy and program pathways, however, continued efforts to narrow the achievement gaps for our identified groups of students are required. Our continued decline in the area of mathematics and numeracy, however, reinforces the need to focus on Mathematics as a priority area. Implementation of the provincial Renewed Math Strategy as part of the Board Improvement Plan for Student Achievement (BIPSA) is a critical component of this work. Similarly, every school in our District will be required to include mathematics as an area of focus in their School Learning Plans.
Key aspects of the action plan for numeracy provides for new forms of support for all schools, and increased or intensive support for some. The focus aligns with the District approach to ensuring a balanced mathematics program in all our classrooms – one that combines operational skills and problem-solving – and will emphasize purposeful practice of mathematical concepts and skills along with the thoughtful utilization of resources.

Published by Communications and Information Services in collaboration with Quality Assurance— October 2016
133 Greenbank Road • Ottawa, ON K2H 6L3 • Phone: 613-721-1820 Fax: 613-820-6968 • Website: www.ocdsb.ca