annual stream runoff and climate in minnesota's river basins
TRANSCRIPT

ST. ANTHONY FALLS LABORATORY Engineering, Environmental and Geophysical Fluid Dynamics
Project Report No. 543
Annual Stream Runoff and Climate in Minnesota’s River Basins
by
Todd R. Vandegrift
and
Heinz G. Stefan
September 2010 Minneapolis, Minnesota
i
ABSTRACT
Stream flows recorded by the USGS from 1946 to 2005 at 42 gauging stations in the five
major river basins of Minnesota and tributaries from neighboring states were analyzed and
related to associated climate data. Goals of the study were (1) to determine the strength of the
relationships between annual and seasonal runoff and climatic variables in these river basins, (2)
to make comparisons between the river basins of Minnesota, and (3) to determine trends in
stream flows over time. Climatic variables were air temperature, precipitation, the Palmer
Drought Severity Index (PDSI), and the Palmer Hydrological Drought Index (PHDI); the latter
are common indices of soil moisture. Water year averages showed stronger correlations than
calendar year averages. Precipitation was a good predictor of stream flow, but the PDSI was the
best predictor and slightly better than PHDI when linear regressions at the annual timescale were
used. With an exponential regression PDSI gave a significantly better fit to runoff data than
PHDI. Five-year running averages made precipitation almost as good a predictor of stream flow
(runoff) as PDSI.
A seasonal time scale analysis revealed a logical stronger dependence of stream flow on
precipitation during summer and fall than during the winter and spring, but all relationships for
seasonal averages were weaker than for annual (water year) averages. Dependence of stream
runoff on PDSI did not vary significantly by season.
On a monthly timescale the strength of correlation between precipitation and runoff
dropped off significantly, while PDSI was still a decent predictor in all months but the spring.
Annual stream flow in the Upper Mississippi River Basin, including the Minnesota River
Basin, had the strongest dependence on precipitation and PDSI. The Red River of the North
Basin showed lower than average dependence on precipitation and average dependence on PDSI.

ii
The Rainy River Basin and the Lake Superior Basin showed the weakest dependence of annual
stream flow on precipitation and PDSI.
The relationship between stream flow and precipitation can be expressed most easily by
an annual average runoff coefficient, i.e. the ratio of runoff to precipitation in a year. Runoff
coefficients vary significantly across the state of Minnesota, from more than 0.4 in the northeast
to less than 0.1 in the northwest. Trends in runoff coefficients were estimated from averages for
20-year periods from 1926-1945 to 1986-2005, although data for 1926-1945 were sparse.
According to our analysis, runoff coefficients in some of the major river basins of Minnesota
have increased significantly during the last 40 years.
The Lake Superior and Rainy River Basins have high and invariant characteristic runoff
coefficients around 0.35. The Red River Basin has the lowest characteristic runoff coefficient at
~0.14 but its value has consistently increased from the beginning of the record. The Mississippi
Headwaters Basin characteristic runoff coefficient has increased to ~0.24. The Minnesota River
Basin runoff coefficient (from the Minnesota River at Jordan, MN station) has also increased
significantly and consistently to 0.19. The largest increases in runoff coefficients were found in
the Red River and the Minnesota River Basins, the two basins with the lowest runoff
coefficients; runoff coefficients in some tributary or sub-watersheds have doubled. In the Lake
Superior and Rainy River Basins, and in the St. Croix River watershed, little change in runoff
coefficients was found.
Overall runoff coefficients drop significantly from east to west in Minnesota. This
distribution does not seem to have changed over time. Increases in runoff coefficients over time
have been highest in the west, and lowest in the east of Minnesota. One can hypothesize that
changes in stream flow in Minnesota’s west are mainly due to land use changes that have lead to
iii
faster and easier surface runoff from the land since the beginning of European settlement. An
explanation based on climatological factors can, however, also be offered. Precipitation has
increased in all of the river basins of Minnesota over the time period of 1926 to 2005, but the
largest changes have occurred in the south and west and little change in the northeast of
Minnesota.
Changes in total annual runoff (in/yr) between 1946 - 1965 and 1986 – 2005 increased at
38 of 42 stream gaging stations analyzed. Only 4 gaging stations, 3 in the Lake Superior and
Rainy River Basins showed decreases, with all being less than 3%. The largest increases in
average annual runoff were at 19 gaging stations in the Red River and Minnesota River Basins;
at 17 of these, increases were from 60% to 132%, and at the remaining two stations the increases
were 19% and 20%. The southern Minnesota watersheds with the largest increases in runoff also
had the largest increases in precipitation.
Overall, stream flow, expresses as annual runoff (in/yr), has increased since the
beginning of stream gaging in Minnesota and the Upper Midwest, although periods of
substantially lowered stream flows have occurred, e.g. in the drought period of the 1930s. Not
only has the runoff (cm/yr) increased, but runoff coefficients, i.e. the ratio of runoff to
precipitation, have also increased. When viewed as a percent change of annual runoff, the largest
stream flow changes have occurred in the western part and the lowest in the eastern part of
Minnesota. Increases in absolute values of annual runoff, percent of runoff, and runoff
coefficients have been quantified in this study.

iv
TABLE OF CONTENTS
ABSTRACT..................................................................................................................................... i
2. OBJECTIVES AND METHODS............................................................................................... 6
3. DATA ....................................................................................................................................... 10
3.1. STREAM FLOW DATA .......................................................................................................... 10 3.2. CLIMATE DATA................................................................................................................... 11
4. RESULTS ................................................................................................................................. 13
4.1. CORRELATIONS AT THE ANNUAL (CALENDAR AND WATER YEAR) TIME SCALE ................ 13 4.2. CORRELATIONS AT THE SEASONAL TIME SCALE ................................................................. 16 4.3. CORRELATIONS AT THE MONTHLY TIME SCALE ................................................................. 17 4.4. ANALYSIS OF RUNOFF COEFFICIENTS ................................................................................. 19
5. INTERPRETATIONS OF RESULTS...................................................................................... 21
6. SUMMARY AND CONCLUSIONS ....................................................................................... 27
6.1 RELATIONSHIPS BETWEEN STREAM FLOW AND CLIMATE PARAMETERS .............................. 27 6.2 GEOGRAPHIC DISTRIBUTION AND CHANGES IN ANNUAL RUNOFF AND RUNOFF COEFFICIENTS... 29
ACKNOWLEDGMENTS ............................................................................................................ 31
REFERENCES ............................................................................................................................. 32
TABLES……………………………………………………………………………………….T - 1
FIGURES……………………………………………………………………………………... F - 1
APPENDIX………………………………………………………………………………...….A - 1

v
LIST OF TABLES
TABLE 1: INFORMATION ON USGS STREAM GAUGING STATIONS STUDIED..................................T - 1
TABLE 2: COEFFICIENTS OF DETERMINATION (R2) FOR REGRESSIONS BETWEEN WATER YEAR
AVERAGE CLIMATIC VARIABLES AND STREAM RUNOFF AT USGS STREAM GAGING STATIONS. BASIN
AVERAGES ARE ALSO GIVEN........................................................................................................T - 3
TABLE 3: AVERAGE ANNUAL (WATER YEAR) PRECIPITATION IN THE WATERSHED OF EACH USGS
STREAM GAGING STATION FOR DIFFERENT TIME PERIODS AND THE PERIOD OF RECORD (P.O.R.). CHANGE IN AVERAGE RUNOFF FROM THE 1946-1965 TO THE 1986-2005 PERIOD IS ALSO GIVEN.T - 5
TABLE 4: AVERAGE ANNUAL (WATER YEAR) RUNOFF AT EACH USGS STREAM GAGING STATION
FOR DIFFERENT TIME PERIODS AND THE PERIOD OF RECORD (P.O.R.). CHANGE IN AVERAGE RUNOFF
FROM THE 1946-1965 TO THE 1986-2005 PERIOD IS ALSO GIVEN................................................T - 7
TABLE 5: AVERAGE ANNUAL (WATER YEAR) RUNOFF COEFFICIENTS FOR THE WATERSHEDS OF THE
USGS STREAM GAGING STATIONS FOR DIFFERENT TIME PERIODS AND THE PERIOD OF RECORD
(P.O.R.). CHANGE IN AVERAGE RUNOFF FROM THE 1946-1965 TO THE 1986-2005 PERIOD IS ALSO
GIVEN..........................................................................................................................................T - 9

vi
LIST OF FIGURES
FIGURE 1: MAJOR RIVER BASINS OF THE UPPER MIDWEST AND USGS STREAM GAGE LOCATIONS. MISSISSIPPI HEADWATERS AND THE MINNESOTA RIVER BASINS ARE PART OF THE UPPER
MISSISSIPPI RIVER BASIN. .......................................................................................................... F - 1
FIGURE 2: WATERSHED BOUNDARIES FOR EACH USGS STREAM GAGE. MAJOR RIVER BASINS (BOLD
LINES) ARE DIVIDED INTO TRIBUTARY WATERSHEDS (THIN LINES). ............................................. F - 2
FIGURE 3: UPPER MIDWEST CLIMATE DIVISIONS (NOAA), MAJOR RIVER BASINS, AND USGS
STREAM GAGING STATIONS STUDIED. .......................................................................................... F - 3
FIGURE 4: ANNUAL AVERAGE RUNOFF IN THE MISSISSIPPI RIVER NEAR PRESCOTT, WI, VS. ANNUAL
PRECIPITATION IN THE WATERSHED AT THE WATER YEAR TIME SCALE........................................ F - 4
FIGURE 5: ANNUAL AVERAGE RUNOFF IN THE MISSISSIPPI RIVER NEAR PRESCOTT, WI, VS. ANNUAL
AVERAGE PDSI IN THE WATERSHED AT THE WATER YEAR TIME SCALE....................................... F - 5
FIGURE 6: ANNUAL AVERAGE RUNOFF IN THE RUM RIVER NEAR ST. FRANCIS, MN, VS. ANNUAL
PRECIPITATION IN THE WATERSHED AT THE WATER YEAR TIME SCALE........................................ F - 6
FIGURE 7: ANNUAL AVERAGE RUNOFF IN THE RUM RIVER NEAR ST. FRANCIS, MN, VS. ANNUAL
AVERAGE PDSI IN THE WATERSHED AT THE WATER YEAR TIME SCALE....................................... F - 7
FIGURE 8: ANNUAL AVERAGE RUNOFF IN THE PIGEON RIVER AT GRAND PORTAGE, MN, VS. ANNUAL PRECIPITATION IN THE WATERSHED AT THE WATER YEAR TIME SCALE.......................... F - 8
FIGURE 9: AVERAGE ANNUAL RUNOFF IN THE PIGEON RIVER AT GRAND PORTAGE, MN, VS. ANNUAL AVERAGE PDSI IN THE WATERSHED AT THE WATER YEAR TIME SCALE......................... F - 9
FIGURE 10: AVERAGE WATER YEAR VS. CALENDAR YEAR CORRELATION STRENGTHS BETWEEN
RUNOFF AND PRECIPITATION, PDSI, OR PHDI. ......................................................................... F - 10
FIGURE 11: EXPONENTIAL REGRESSION CORRELATION VS. LINEAR REGRESSION CORRELATION
STRENGTHS BETWEEN RUNOFF AND PRECIPITATION, PDSI AND PHDI AT THE WATER YEAR TIME
SCALE. ...................................................................................................................................... F - 11
FIGURE 12: PHDI VS. PDSI CORRELATION STRENGTHS AS PREDICTORS OF RUNOFF AT THE WATER
YEAR TIME SCALE...................................................................................................................... F - 12
FIGURE 13: CORRELATION STRENGTH BETWEEN RUNOFF AND PRECIPITATION OR PDSI VS. DRAINAGE AREA AT THE WATER YEAR TIME SCALE................................................................... F - 13
FIGURE 14: BASIN AVERAGE STRENGTHS OF CORRELATIONS BETWEEN RUNNING AVERAGE RUNOFF
AND PRECIPITATION AT THE 1-YEAR TO 20-YEAR RUNNING AVERAGE TIME SCALES. ................ F - 14
FIGURE 15: BASIN AVERAGE STRENGTHS OF CORRELATIONS BETWEEN RUNNING AVERAGE RUNOFF
AND PDSI AT THE 1-YEAR TO 20-YEAR RUNNING AVERAGE TIME SCALE. ................................. F - 15
FIGURE 16: STRENGTHS OF CORRELATION BETWEEN AVERAGE RUNOFF AND PDSI VS. STRENGTHS
OF CORRELATION BETWEEN AVERAGE RUNOFF AND PRECIPITATION AT THE 1-YEAR TO 20-YEAR
RUNNING AVERAGE TIME SCALES. ............................................................................................. F - 16
FIGURE 17: OVERALL AVERAGE CORRELATION STRENGTHS BETWEEN CLIMATIC VARIABLES AND
RUNOFF AT SEASONAL TIME SCALES. EARLIER RESULTS FOR THE ANNUAL TIME SCALE ARE GIVEN
ON THE LEFT FOR COMPARISON. ................................................................................................ F - 17

vii
FIGURE 18: OVERALL AVERAGE CORRELATION STRENGTHS BETWEEN CLIMATIC VARIABLES AND
STREAM RUNOFF AT THE MONTHLY TIME SCALE. EARLIER RESULTS FOR THE ANNUAL TIME SCALE
ARE GIVEN ON THE LEFT FOR COMPARISON. .............................................................................. F - 18
FIGURE 19: RUNOFF COEFFICIENTS FOR STREAMS IN THE LAKE SUPERIOR AND RAINY RIVER
BASINS OVER FOUR TIME PERIODS............................................................................................. F - 19
FIGURE 20: RUNOFF COEFFICIENTS FOR STREAMS IN THE RED RIVER BASIN OVER FOUR TIME
PERIODS. ................................................................................................................................... F - 20
FIGURE 21: RUNOFF COEFFICIENTS FOR STREAMS IN THE MISSISSIPPI HEADWATERS BASIN OVER
FOUR TIME PERIODS................................................................................................................... F - 21
FIGURE 22: RUNOFF COEFFICIENTS FOR STREAMS IN THE MINNESOTA RIVER BASIN OVER FOUR
TIME PERIODS............................................................................................................................ F - 22
FIGURE 23: RUNOFF COEFFICIENTS FOR STREAMS IN THE UPPER MISSISSIPPI RIVER BASIN BELOW
THE CONFLUENCE WITH THE MINNESOTA RIVER OVER FOUR TIME PERIODS. ............................ F - 23
FIGURE 24: RUNOFF COEFFICIENTS FOR LOWEST MAIN STEM STREAM IN THE MAJOR RIVER BASINS
OF MINNESOTA OVER FOUR TIME PERIODS. ............................................................................... F - 24
FIGURE 25: AVERAGE PRECIPITATION (BLACK) AND AVERAGE RUNOFF (WHITE) IN SPECIFIC RIVER
BASINS OF MINNESOTA OVER FOUR TIME PERIODS. ................................................................... F - 25
FIGURE 26: GEOGRAPHIC DISTRIBUTION OF AVERAGE RUNOFF COEFFICIENTS FOR THE 1946-1965
TIME PERIOD.............................................................................................................................. F - 26
FIGURE 27: GEOGRAPHIC DISTRIBUTION OF AVERAGE RUNOFF COEFFICIENTS FOR THE 1986-2005
TIME PERIOD.............................................................................................................................. F - 27
FIGURE 28: GEOGRAPHIC DISTRIBUTION OF AVERAGE RUNOFF COEFFICIENT CHANGE (IN PERCENT)
BETWEEN THE 1946-1965 AND 1986-2005 TIME PERIODS. ........................................................ F - 28
FIGURE 29: GEOGRAPHIC DISTRIBUTION OF AVERAGE ANNUAL PRECIPITATION FOR THE 1946-1965
TIME PERIOD.............................................................................................................................. F - 29
FIGURE 30: GEOGRAPHIC DISTRIBUTION OF AVERAGE ANNUAL PRECIPITATION FOR THE 1986-2005
TIME PERIOD.............................................................................................................................. F - 30
FIGURE 31: GEOGRAPHIC DISTRIBUTION OF AVERAGE ANNUAL PRECIPITATION CHANGE (IN CM)
BETWEEN THE 1946-1965 AND 1986-2005 TIME PERIODS. ........................................................ F - 31
FIGURE 32: GEOGRAPHIC DISTRIBUTION OF AVERAGE ANNUAL PRECIPITATION CHANGE (IN
PERCENT) BETWEEN THE 1946-1965 AND 1986-2005 TIME PERIODS......................................... F - 32
FIGURE 33: GEOGRAPHIC DISTRIBUTION OF AVERAGE ANNUAL RUNOFF FOR THE 1946-1965 TIME
PERIOD. ..................................................................................................................................... F - 33
FIGURE 34: GEOGRAPHIC DISTRIBUTION OF AVERAGE ANNUAL RUNOFF FOR THE 1986-2005 TIME
PERIOD. ..................................................................................................................................... F - 34
FIGURE 35: GEOGRAPHIC DISTRIBUTION OF AVERAGE ANNUAL RUNOFF CHANGE (IN CM) BETWEEN
THE 1946-1965 AND 1986-2005 TIME PERIODS. ........................................................................ F - 35
FIGURE 36: GEOGRAPHIC DISTRIBUTION OF AVERAGE ANNUAL RUNOFF CHANGE (IN PERCENT)
BETWEEN THE 1946-1965 AND 1986-2005 TIME PERIODS. ........................................................ F - 36

viii
FIGURE 37: HISTORICAL ANNUAL FLOW AND PRECIPITATION RECORDS FOR THE MISSISSIPPI RIVER
AT ST. PAUL, MN...................................................................................................................... F - 37
FIGURE 38: RUNOFF COEFFICIENT VS. PRECIPITATION FOR THE MISSISSIPPI RIVER AT ST. PAUL, MN
FOR THE 5-YEAR RUNNING AVERAGE TIME SCALE. .................................................................... F - 38
FIGURE 39: RUNOFF COEFFICIENT VS. PDSI FOR THE MISSISSIPPI RIVER AT ST. PAUL, MN FOR THE
5-YEAR RUNNING AVERAGE TIME SCALE. .................................................................................. F - 39
FIGURE 40: STRENGTH OF CORRELATIONS BETWEEN RUNOFF COEFFICIENT AND PRECIPITATION OR
PDSI AT THE 5-YEAR RUNNING AVERAGE TIMESCALE VS. THE ANNUAL TIME SCALE. ............... F - 40
FIGURE A.1: ANNUAL AVERAGE TEMPERATURES AND ANNUAL PRECIPITATION IN MINNESOTA FOR
THE PERIOD 1895-2007. STUDY TIME PERIODS 1946-1965 AND 1986-2005 ARE HIGHLIGHTED IN
GRAY. (FROM DADASER-CELIK AND STEFAN (2009))............................................................... F - 41

1
1. INTRODUCTION
Minnesota is the headwaters region of rivers that drain into the Gulf of Mexico, the Gulf
of St. Lawrence and into Hudson Bay. Water originating in Minnesota’s river basins is important
not only to the state, but also to other U.S. states and Canadian provinces. Historical annual
stream flow and climate data of Minnesota and its neighboring states are analyzed in this report.
Stream flow information is needed to assess water balances, to plan water supplies, to
design river bank and flood protection works, to manage water quality and recreational water
uses, and more. The availability of fresh water is affected by urbanization, agricultural land use
changes, and global climate change; freshwater availability is of increasing concern in many
regions of the world. Many cities, including several in Minnesota, get their water supply from
rivers or groundwater, and discharge treated wastewater into rivers. Streams and rivers in
Minnesota are also used for hydropower and recreation (e.g., boating and fishing). The
Mississippi and the Minnesota River are navigable waterways. Stream flows depend on
climatologic, geographic, geologic, and anthropogenic factors. Land use changes, especially
urbanization and agriculture, affect the amount of rainfall that is lost to evapotranspiration and
infiltration and therefore affect the amount of runoff and the time over which the runoff occurs.
Urban development and agricultural drainage tends to increase runoff and leads to higher flow
rates in the streams and rivers that receive the runoff. Stream flow is without doubt important to
Minnesota, and analyzing and projecting stream flows is therefore of interest.
The hydrologic cycle is driven by meteorological variables, notably precipitation and
evaporation. Precipitation in the form of rain and snow is the major water input for the vast
majority of watersheds in the world. Air temperature affects evapotranspiration in many types of

2
watersheds of different climate, vegetation, and land use. Changes in precipitation and air
temperature can be expected to play roles in changes of stream flow.
The hydrologic cycle also responds strongly to watershed characteristics. Indices have
been developed to assess the overall moisture conditions of regions on different spatial and
temporal scales. Some of these indices have been created to determine when an area is
experiencing drought and when it is experiencing water surplus. A well known and widely used
index is the Palmer Drought Severity Index (PDSI) (Palmer 1965). The PDSI is region-specific
and is based on a supply and demand model of soil moisture. PDSI is calculated based on the
hydrologic characteristics of the region and on the precipitation and temperature data recorded
during and preceding the time period of interest. The PDSI is centered at zero; negative numbers
indicate that the region is experiencing drought and positive numbers indicate wetter than normal
conditions. It is to be expected that PDSI is correlated with stream flow. Other indices such as
the Palmer Hydrological Drought Index (PHDI) and the Standardized Precipitation Index (SPI)
also give indications of the moisture availability of a region. Weber and Nkemdirim (1998)
reviewed the PDSI and PHDI indices and recommended that PDSI be used for future hydrologic
planning such as reservoir operation as it responds at least one month faster to changing moisture
conditions. Their study, however, did not look at the relationship between the indices and stream
flows.
There has been much speculation on the impact of global climate change on global water
resources. Increases in global air temperatures are expected to create a more active hydrologic
cycle, leading to more intense and larger precipitation events as well as increasing
evapotranspiration rates (IPCC 2007). If strong relationships between climatic variables and
stream flows can be determined from past records, the projected climatic variables can be used to

3
estimate future stream flow rates. Kletti and Stefan (1997) attempted to model seasonal flows in
three Minnesota streams using just four climatic parameters and no watershed inputs and had
disappointing results, although they did obtain some decent fits (max r2 = 0.69). Climate inputs
from global circulation models have been used to project climate change effects on runoff (Kletti
and Stefan, 1997) and water quality (Hanratty and Stefan, 1998) with differing results. Models
for predicting future stream flows from historical relationships with minimal to no model input
about the geology, topography, and land use of a basin could be simpler and more reliable than
existing process-based hydrologic runoff models, for example the U.S. Department of
Agriculture’s Soil and Water Assessment Tool (SWAT) or the Army Corps of Engineers
Hydrologic Modeling System (HEC-HMS). One of the objectives of this study is to look for
direct relationships between flows in Minnesota’s streams and rivers, and climatic variables that
could be used for future modeling.
Previous studies have shown that stream flows in Minnesota’s watersheds and around the
United States are changing. Novotny and Stefan (2007) found that peak summer flows in gaged
Minnesota streams are increasing, as are the number of high flow days and base flow rates, while
spring stream flows fed by snowmelt runoff are remaining relatively constant. Dadaser-Celik and
Stefan (2009) analyzed flow duration curves created with daily flow data for two time periods,
1946-1965 and 1986-2005, and found that average annual and low flows in the Minnesota,
Upper Mississippi, and Red River basins have increased from mid-1900s flows. Just north of
Minnesota, with a major input from the Rainy River basin, mean annual flows in the Winnipeg
River have increased by 58% since 1924, due mostly to increased winter flows (St. George,
2007).

4
In the Great Lakes Region, between 1956 and 1988, Southern Wisconsin and mainland
Michigan streams saw linearly increasing mean annual flows due to increases in fall and winter
runoff, while New York and eastern Ohio streams displayed sharply increased fall flows
(Johnston and Shmagin, 2008). In Indiana, there have been increases in low and medium flows
but high flows have remained relatively unchanged (Kumar et al., 2009). In the Pacific
Northwest the variance in annual flows has increased, mainly due to lower flows in dry years,
however, 75-percentile flows have remained largely unchanged (Luce and Holden, 2009).
We are not only interested in absolute runoff values, but also in runoff coefficients. A
runoff coefficient is a dimensionless ratio of the volume of runoff during a time period to the
volume of precipitation over the watershed in the same time period. A runoff coefficient shows
the relationship between runoff and precipitation in a watershed over a certain time period, e.g. a
year. Runoff coefficients can be calculated for individual watersheds over any time period in
which flow and precipitation data were measured converted to height (e.g., mm) of water over
the entire. Runoff coefficients theoretically vary between 0 and 1.0 and depend on geology,
topography, soils, and land use, particularly perviousness and vegetation cover within the
watershed, as well as rainfall intensities. Snowfall often produces no immediate runoff, and the
short-term runoff coefficient is 0; melting snow will contribute to the long-term runoff
coefficient; if precipitation runs off a paved surface without losses, the runoff coefficient is 1.0.
Changes in runoff coefficients for given basins with respect to time can give insight into the
effects of land use or climate change that have occurred.
An objective of this study is to analyze stream flows, and to determine annual runoff
coefficients for the major river basins of Minnesota. We also want to determine if, where and by

5
how much runoff (in/yr) and runoff coefficients (-) have changed over the time that stream flow
has been gaged in Minnesota.
Changes in runoff coefficients in the Upper Midwest in the past 150 years are most likely
more related to the dramatic land use changes that have occurred rather than climate changes.
However, historical stream flow records cover only a much shorter period of 50 to 100 years,
including potentially significant climate change effects in the recent 20 years. Our analysis of
runoff and runoff coefficients in Minnesota may show significant changes, but may not fully
explain the causes of the observed changes, because changes in climate, land use, and water use
are potential causes of stream flow changes. Only in watersheds and over time periods in which
two of the three have not changed, will the cause of stream flow change be obvious. In other
situations, more detailed analysis will be necessary. Brief descriptions of the major river basins
and the climate of Minnesota and the Upper Midwest are given in Dadaser-Celik and Stefan
(2009) and are reproduced in Appendix A.
This report will present the methods, results, interpretations, and conclusions of an
analysis of historic stream flows and climatic data in Minnesota. The report focuses on stream
flow and different climatic variables and indices. Strengths of empirical relationships (correlation
r2 values), geographic distributions in Minnesota, and historical trends will be analyzed. Results
will be given in terms of absolute values of annual stream flows (runoff) and precipitation, runoff
coefficients, and historical trends and changes in terms of absolute values or percentages for the
watersheds of Minnesota and portions of surrounding states.

6
2. OBJECTIVES AND METHODS
Stream flows recorded by the USGS from 1926 to 2005 at gauging stations in the major
river basins of Minnesota and its tributaries from neighboring states will be analyzed and related
to associated climate data. Goals of the study are (1) to determine the strength of the
relationships between annual and seasonal runoff and climatic variables in river basins and
tributary watersheds, (2) to determine trends in stream flows over time, and (3) to make
comparisons between the major river basins of Minnesotae. In a previous version of this report
stream flow was quantified in terms of cfs and precipitation in terms of inches per year. In this
study stream flow will be analyzed in terms of runoff in cm/year; a dimensionless annual runoff
coefficient will be calculated as the ratio of annual runoff to annual precipitation; change of
runoff will be calculated as the difference between different periods, or as a percentage of
previous stream flows. Climatic variables will be air temperature, precipitation, the Palmer
Drought Severity Index (PDSI), and the Palmer Hydrological Drought Index (PHDI).
One major objective of this study is to determine relationships between climatic variables
and stream runoff at different time scales in watersheds across the state of Minnesota. The
analysis will be completed using stream flow data from USGS gaging stations across the state
and a few from neighboring states. The climatic variables used in the analysis will come from a
variety of sources, mostly through the Minnesota State Climatology Office at the University of
Minnesota and National Climatic Data Center (NCDC) of the National Oceanic and Atmospheric
Administration (NOAA), and will include precipitation, air temperature, Palmer Drought
Severity Index (PDSI), and Palmer Hydrological Drought Severity Index (PHDI).
The easiest way to express the overall relationship between precipitation and runoff in a
watershed is by a runoff coefficient. The runoff coefficient is the ratio of runoff to precipitation

7
for a watershed over a time period. It includes the cumulative effects of several watershed and
rainfall characteristics, such as topography, surface geology, soil characteristics (permeability,
porosity), vegetation cover and land use. The runoff coefficient is a dimensionless number and
gives the fraction of the precipitation that runs off from a watershed over a given time period.
The runoff analysis will be completed mainly on the annual time scale, including the
annual calendar (January-December) and water year (October-September) scales, but the
seasonal and the monthly time scales will not be ignored. Overall period of record (P.O.R.)
averages will be calculated as well as time period averages to analyze how runoff and runoff
coefficients have changed over time. The time periods used were 1926-1945, 1946-1965, 1966-
1985, and 1986-2005 for consistency with past analysis. The 1926-1945 period spans a period
largely characterized by widespread and longterm drought. The 1946-1965 and 1986-2005 time
periods were used earlier for change analysis as the 40 year difference between the period
centers was considered sufficient to highlight changes that have occurred recently (Dadaser-
Celik and Stefan, 2009).
Many large land use changes, including the conversion of vast areas of prairie and forests
and drainage of wetlands for agriculture, basin wide clear-cut logging, mining, and initial urban
development occurred well before the USGS and other agencies began continuously monitoring
the stream flows in Minnesota, and thus data is unavailable to calculate historic runoff
coefficients, although this information would no doubt be incredibly useful in determining land
use change effects and the extent of hydrologic change that human settlement and development
have caused.
The analysis will first be conducted for an annual time scales. Annual runoff will be
correlated with annual precipitation, annual average temperature, and annual average PDSI and
8
PHDI for each basin. Correlation strength is described by the coefficient of determination (r2). In
first approximation the data will be described with a best fit linear regression, however
exponential fits will also be explored. Running averages of average runoff, precipitation, and
PDSI will be computed and analyzed to reveal relationships between multi-year parameter
averages. It is hypothesized that total annual precipitation, PDSI, and PHDI are well correlated
with annual runoff. There is little expectation that average temperatures would be well correlated
with runoff.
The analysis will be expanded to seasonal and monthly time scales. Cool months are
defined as November through April and warm months are defined as May through October.
Winter months are December, January, and February, when air temperatures are mostly below
freezing, and precipitation is in the form of snow which does not immediately run off. Stream
flow in the winter is fed mostly by groundwater (baseflow) and infrequent snowmelt events. The
relationship between precipitation and runoff in Minnesota in winter is expected to be poor.
Stream flows in spring are very much controlled by snowmelt runoff and are therefore also not
expected to have a good relationship with monthly precipitation and other monthly climatic
variables, although air temperature may show correlation due to its role in snowmelt. Stream
flow in the summer and fall months are expected to have the strongest relationships with climatic
variables. Precipitation is a major contributor to stream flow and PDSI, calculated on a monthly
scale, will be a good measure of general water availability in the region. Analyses will also be
completed for individual months.
A gage will be required to have a minimum of 18 years of data for a 20-year period to be
considered representative and used in calculations, with the exception of the earliest time period
where 15 years will be accepted for the purpose of including more gages in the period when

9
many gages were being installed. Average flow at a gage will be converted to total runoff in
height of water (mm) over the watershed by determining the total flow volume and dividing by
the watershed area. The total runoff will be divided by the total precipitation (also in mm) to
calculate the runoff coefficient during the specific time period.
The accuracy of the runoff coefficient calculations depends on the accuracy of the
watershed area. Digital information on watershed boundaries for each stream gage were needed
for averaging of climatic variables from multiple weather stations, and for determining drainage
areas needed for runoff coefficient calculations. In most cases, the locations of stream gages did
not agree well with watershed boundaries defined in readily available GIS datasets (e.g., MN
DNR) as the gages were not usually located at the watershed outlet. The USGS’s National
Elevation Dataset (NED) contains a 30-meter gridded digital elevation model (DEM) that covers
the majority of the United States. NED data was obtained and used in ESRI ArcGIS 9.2 for semi-
automatic watershed boundary delineation using the gage locations as watershed outlets. GIS
tools (e.g., fill) were used to hydrologically correct the DEM. Flow direction and flow
accumulation grids were generated and used to generate contributing watersheds for each gage
location. The generated watershed shapefiles and calculated areas were compared to watershed
boundary shapefiles and information published by the USGS (e.g., 8 digit HUCs) and MN DNR
(“Major Watershed Index”). The DEM generated watershed boundaries agreed very well with
published watershed boundaries and provided the watershed area contributing to flow at the
gage. The calculated areas agreed very well with the gage areas published by the USGS,
typically within 1%. To maintain consistency and repeatability, the areas given by the USGS
gage information will be used for runoff coefficient calculation.

10
3. DATA
3.1. Stream Flow Data
Forty-two (42) U.S. Geological Survey (USGS) stream gaging stations in the states of
Minnesota, Wisconsin, and North and South Dakota were used in this study. Thirty-six of the
stations match those used by Novotny and Stefan (2007) and Dadaser-Celik and Stefan (2009),
and six stations were added to better represent the drainage areas contributing to the flow in
Minnesota’s streams and rivers. The stations were selected based on record length and record
completeness. All records used end with 2008, and record lengths vary from 59 to 108 full years
of data. The 42 gaging stations are spread across five major river basins of the Upper Midwest.
Twelve (12) stations are located in the Minnesota River Basin, five (5) stations in the Mississippi
Headwaters Basin (those above the confluence with the Minnesota River), eleven (11) stations in
the remaining Upper Mississippi Basin (those below the confluence with the Minnesota River),
seven (7) stations in the Red River of the North Basin, five (5) stations in the Rainy River Basin,
and two (2) stations in the Lake Superior Basin. Daily stream flow data were extracted from the
USGS Water Data website for all 42 gaging stations and averaged into the needed time scales.
Annual and monthly averages were calculated only for full records; no incomplete records were
used. Monthly flow data was converted into total runoff (in mm) by integrating over time and
dividing by the drainage area of the stream gage’s watershed. The locations of the stream gaging
stations and the major river basins are shown in Figure 1. Figure 2 shows the watershed
boundaries that were delineated for each stream gaging station. Table 1 gives the name and
general information for each USGS gaging station including drainage area and period of record.

11
3.2. Climate Data
Historical climatic data for the Upper Midwest are available from a variety of sources.
Many of the records are from networks of volunteer observers or small weather stations. Some
are short, inconsistent, incomplete, and unverified. After a review of potential sources, data from
the National Climatic Data Center (NCDC) of the National Oceanic and Atmospheric
Administration (NOAA) were selected for the analysis. The NCDC uses networks of volunteer
observers as well as NOAA weather stations to reliably and accurately estimate precipitation and
temperature data as single values across climate divisions on a monthly scale, with records
dating back to 1895. The Minnesota State Climatologist’s Office (University of Minnesota)
makes compilations and analyses of this weather data available via the internet. The NCDC
climate division data also include the PDSI and PHDI calculated for each climate division for the
length of the record. It is assumed that a single value across a climate division is a good estimate,
meaning that on annual or monthly time scales the precipitation and mean temperatures do not
vary significantly across each climate division. To estimate the total precipitation and average
temperature in the watershed of each USGS stream gage, area-weighted averages of the climate
division data were calculated based on the watershed’s area fraction in each climate division.
The calculations were completed using ArcGIS to overlay the stream gage watersheds (described
previously) and the climate division shapefiles to determine the resulting component areas. A
few watersheds in northern Minnesota have contributing drainage area in Canada. Because
historic monthly climate data for Canada were unavailable, it was assumed that the climate
division data for Minnesota Climate Division 3 would be representative of the climate data in
Canada. The climate divisions as defined by NOAA in the regions studied are shown in Figure 3
along with the stream gage locations and major river basin boundaries.

12
An additional source for climate data is the United States Historical Climatology
Network (USHCN). The USHCN dataset provides daily and monthly precipitation and
temperature data across the US. The stations are not uniformly distributed and do not contain as
long a record as the NCDC climate division dataset. Interpolating watershed-specific information
for the USGS gaging stations for continuous time periods would be very time consuming and
was not completed. In analyses at time scales shorter than a month, however, the USHCN data
could be very useful.

13
4. RESULTS
4.1. Correlations at the Annual (Calendar and Water Year) Time Scale
Annual (January-December) and water year (October-September) average runoff was
plotted against mean annual air temperature, total annual precipitation, and average PDSI and
PHDI (determined by averaging the monthly values over the course of each year) for all 42
stream gaging stations. The coefficients of determination (r2) between runoff and each of the
climate variables were calculated. Figures 4 to 9 show examples of the plots for precipitation and
PDSI for the Mississippi River near Prescott, WI, the Rum River near St. Francis, MN, and the
Pigeon River near Grand Portage, MN. The correlations for the Mississippi River near Prescott,
WI were among the best observed, those for the Rum River were about average, and those for
the Pigeon River were among the worst found in the analysis.
Correlations between average annual air temperature and runoff were always very weak,
as had been expected; average and maximum r2-values of 0.07 and 0.20, respectively, were
found. Correlations of runoff against precipitation, PDSI, and PHDI were significantly stronger;
PDSI and PHDI were better predictors of runoff than precipitation. The overall average and
maximum r2-values between precipitation and runoff for all 42 stations were 0.39 and 0.57,
respectively. The overall average and maximum coefficients of determination between PDSI and
runoff were 0.67 and 0.88, respectively (0.67 and 0.87 for PHDI). Table 2 lists the r2-values of
the correlations between water year average climatic variables and runoff for each gaging station
as well as basin averages. Water year averages were found, on average, to have slightly better
correlations than annual (calendar year) averages (Figure 10). Water year averages were retained
for subsequent analysis.
14
The best correlations between total precipitation or average PDSI or PHDI and runoff
were found in the Upper Mississippi River Basin below the confluence with the Minnesota
River; the strongest correlations were for stream gaging stations on the main stem of the
Mississippi River (e.g., r2 = 0.88 at Prescott, WI and Winona, MN between PDSI and runoff).
The importance of average moisture conditions throughout river basin drainage area and the
compounded effect of the smaller drainage areas that feed them is illustrated by this result.
In the Minnesota River Basin, runoff showed above average correlation strength with
precipitation (r2 = 0.44) and average strength with PDSI (r2 = 0.67). In the Mississippi
Headwaters Basin runoff showed below average strength with precipitation (r2 = 0.34) and above
average strength with PDSI (r2 = 0.72). The weakest correlations between runoff and
precipitation were observed in the Rainy River Basin and the Red River Basin with averages of
r2 = 0.27 and 0.38, respectively. The Lake Superior Basin had the lowest average correlation
strength between runoff and PDSI, with an r2 = 0.47, while the Rainy River Basin averaged r2 =
0.57, and the Red River Basin had r2 = 0.66.
That runoff correlates more strongly with PDSI than with precipitation reinforces the
concept that overall moisture conditions play a larger role in generating runoff than precipitation
events alone. Soil infiltration capacity and groundwater levels are controlled by antecedent
moisture conditions, and in turn provide baseflow to streams. For example, a rainfall event with
significant precipitation will create more surface runoff during a wet time than a drought period
because the amount of new water that can be stored in the watershed (in soils, groundwater,
wetlands, ponds, etc.) will be lower in a wet period than a dry period.
Precipitation was found to have the highest correlations, on average, with linear
regression, while PDSI and PHDI gave the best fit to runoff with exponential regressions, i.e.,

15
linear regression with the log of runoff (Figure 11). Exponential regressions were used between
the drought indices and runoff for the remainder of the analyses. On average, PDSI and PHDI
were equally good predictors of runoff (Figure 12). Because Weber and Nkemdirim (1998)
found that PDSI responds at least one month faster than PHDI to changing moisture conditions,
PDSI was used in subsequent analyses.
It was found that watershed size, i.e. the contributing drainage area at the stream gage
location, had little influence on the strength of correlation between stream runoff and
precipitation or PDSI (Figure 13). However, runoff at stream gaging stations with the largest
drainage areas did tend to have stronger correlations, especially with PDSI.
Five- , ten- , and twenty-year running averages of the climatic variables and stream flows
were also computed and analyzed. The average strength of the correlation between runoff and
precipitation rose significantly when water year averages were replaced by 5-year running
averages, but did not improve much further when 10- and 20-year running averages were used
(Figure 14). Using running averages of PDSI did not change the correlation strengths
significantly (Figure 15). The 5-year average of precipitation was, on average, a slightly worse
predictor of runoff than the 5-year average of PDSI, and the 10- and 20-year averages of
precipitation were slightly better predictors than the 10- and 20-year averages of PDSI (Figure
16).
These results suggest that PDSI and PHDI capture moisture conditions in a watershed
well enough for runoff projection at the annual time scale as well as longer time scales. By
comparison, precipitation data have to be extended from the annual scale to a multi-year (5-year)
scale to become representative of soil moisture conditions in the watershed for runoff projection.

16
4.2. Correlations at the Seasonal Time Scale
From the annual (calendar year and water year) time scale, our analysis was extended to a
seasonal time scale. Cool months were defined as November through April and warm months
were defined as May through October. Winter months are December, January, and February,
when air temperatures are mostly below freezing, precipitation is in the form of snow and does
not immediately run off, and stream flow is fed mostly by groundwater (baseflow) and
infrequent snowmelt events. Stream flow in spring (March, April, and May) is very much
controlled by snowmelt runoff. Stream flow in the summer (June, July, and August) and fall
(September, October, and November) is fed largely by rainfall and stored water.
In the analysis, seasonal runoff was related to seasonal average air temperature, seasonal
average PDSI, and total seasonal precipitation for all 42 stream gaging stations. In addition,
winter and spring climate variables were related to spring runoff in an attempt to capture the
snowpack that accumulates over the winter and runs off during spring snowmelt. The
coefficients of determination (r2) were determined between the seasonal stream flow and each of
the three climate variables.
Figure 17 shows the overall average correlation strengths (as r2) of air temperature,
precipitation, and PDSI against runoff for the seasonal time scales. The average water year r2-
values are given for comparison. In each of the river basins, the average correlation strengths at
the seasonal time scale showed the same patterns as those at the annual time scale given in the
previous section of this report. The Rainy River and Lake Superior Basins had the weakest
correlations and the Upper Mississippi below the Minnesota and the Minnesota River Basins had
the strongest. As in the yearly time scale analysis, the correlation strengths for PDSI were
obtained by an exponential fit (i.e., linear regression with the log of runoff).

17
The correlation strengths (r2-values) between seasonal average air temperature and stream
runoff were again very weak. On average, the correlation strengths between precipitation and
runoff were slightly higher during the warm months than the cool months. This is also reflected
in the significantly higher average r2-values between precipitation and runoff in the summer and
fall months, compared to the winter and spring months, which is due to the importance of
precipitation for generating stream flow in summer and fall. On the other hand, winter and spring
precipitation regressed against spring runoff gave significantly higher r2-values than just spring
precipitation against spring runoff, because the snowpack runs off in spring. None of the average
correlation strengths between precipitation and runoff at the seasonal time scales were higher
than those found for the annual time scale. As in the water year analysis, PDSI was a much better
predictor of runoff than precipitation. Average correlation strengths were similar in the cool and
warm months and in summer and spring. Average correlation strengths in the fall were slightly
higher, and average correlation strengths in the winter were slightly lower, implying a slightly
higher importance of moisture conditions in generating fall runoff, and slightly smaller
importance for generating winter runoff, which is typical for the Upper Midwest.
4.3. Correlations at the Monthly Time Scale
After analysis of annual and seasonal time scales, the analysis was extended to the
monthly time scale, i.e. data were averaged over individual months and analyzed. Average
monthly runoff at each of the 42 stream gaging stations was regressed against average monthly
air temperature, monthly total precipitation, and monthly PDSI for each month of the year for the
entire period of record. Figure 18 shows the overall average correlation strengths (as r2) of air
temperature, precipitation, and PDSI against runoff for individual months with the average water
18
year r2-values for comparison. Comparison of average correlation strengths by river basin at the
monthly time scale and at the annual time scale showed the same patterns, The Rainy River and
Lake Superior Basins showed the weakest correlations and the Upper Mississippi below the
Minnesota and the Minnesota River Basins showed the strongest.
The best relationships were once again observed between PDSI and stream flow. Overall,
r2-values at the monthly time scale were weaker than at the annual time scale. Noticeably
stronger correlations were observed in the summer, fall, and winter months than in the spring
months. The lower correlation strengths in the spring months are attributed to the fact that the
major contributor to stream flow in spring is snow melt runoff, and the amount of snowmelt
water is not well correlated with PDSI.
Correlations between precipitation and stream flow were very weak; the best month was
June, with an average r2 = 0.25. Lag time between precipitation and runoff at the gaging station
was not accounted for in the analysis. The monthly timescale seems too short to capture the
precipitation vs. runoff relationship, especially in the larger watersheds. An analysis of
watershed time of concentration and appropriate lagging of precipitation events in the analysis
could increase the strength of the correlations at the monthly timescale. The r2-values between
precipitation and runoff in the winter months were the very weakest, with averages from 0.01 to
0.04, because precipitation falls as snow in these months and produces little direct runoff.
The r2-values between air temperature and flow were again very low indicating almost no
correlation between runoff and air temperature at the monthly timescale. Small increases were
observed in the correlations between temperature and runoff in February and March indicating a
very slight dependence; however the average r2 = 0.13 in March. The small increase may reflect
the dependence of snowmelt on air temperature.
19
Overall, the monthly timescale is too short to relate stream runoff in major watersheds to
climate variables. On shorter time scales watershed specific topography, ecology, geology, and
land use cause a lag, and play much larger roles in determining runoff from precipitation events.
More complex hydrologic runoff models must be applied to accurately predict runoff at the
monthly time scale.
4.4. Analysis of Runoff Coefficients
The easiest way to express the overall relationship between precipitation and runoff in a
watershed is by a runoff coefficient. For each of the 42 stream gaging stations and for each water
year of record annual runoff coefficients were calculated by dividing the total observed annual
runoff from the watershed during the year by the total annual precipitation. Averages for the
period of record (P.O.R.) as well as 20-year averages were calculated. The 20-year periods used
were 1926-1945, 1946-1965, 1966-1985, and 1986-2005. In Tables 3, 4, and 5 the average
precipitation (cm), the runoff (cm), and the runoff coefficients (dimensionless), respectively, are
listed for each stream gage and its associated watershed over the P.O.R. as well as over the
shorter time scales. Figures 19 to 23 show the change in runoff coefficients in increments of 20-
year periods from 1926 to 2005. Stream gaging stations are divided according to river basins:
Tributaries of Lake Superior and the Rainy River Basin (Figure 19), the Red River Basin (Figure
20), the Mississippi Headwaters Basin (Figure 21), the Minnesota River Basin (Figure 22), and
the Upper Mississippi Basin below the confluence with the Minnesota River (Figure 23).
A comparison of average runoff coefficients in the six furthest down river (most
encompassing) river basins and their changes over the period 1926 to 2005 is given in Figure 24.
The trend in runoff coefficients is upward in all river basins, except the Lake Superior Basin.
20
Annual average precipitation (cm/yr) and average annual average runoff (cm/yr) for the same
basins and time periods are given in Figure 25. Note the overall upward trends in both
precipitation and runoff in every major basin in Figure 25. For runoff coefficients to increase, the
increase in runoff must be more severe than the increase in precipitation.
Figures 26 and 27 display maps that shows the geographic distribution of the runoff
coefficients for the 1946-1965 and the 1986-2005 time periods, and Figure 28 shows the
associated percent change in runoff coefficient per stream gage from the 1946-1965 period to the
1986-2005 period. Similarly, Figures 29 - 32 show maps of the distribution of values and
changes in average annual precipitation (in both cm and percent) in and between the same time
periods, and Figures 33 – 36 show the same for average annual runoff.

21
5. INTERPRETATIONS OF RESULTS
In the Lake Superior Basin both stream gaging stations had high average runoff
coefficients (~ 0.43) in the period from 1966-1985 after an increase from the previous period, but
subsequently runoff coefficients decreased back to their earlier averages (~ 0.36). Only the
Pigeon River has a long enough record to obtain a runoff coefficient for the 1926-1945 period,
which was actually higher (~ 0.44) than for the 1966-1985 period, despite considerable overlap
with the drought period of the 1930s. The Rainy River Basin was also characterized by high
runoff coefficients (0.3 to 0.4), with the maximum values in the 1966-1985 period. The Lake
Superior and Rainy River Basins have no doubt seen the least amount of agricultural conversion
and urbanization of the watersheds studied and both remain heavily forested. In both basins soil
column lengths are short because the most recent glaciation scoured to bedrock, which is
exposed in many areas. Both areas are considered part of the Canadian Shield, and have many
lakes and wetlands. These features can explain both the high runoff coefficients and the relative
lack of change observed over the time periods.
In the Red River Basin runoff coefficients have increased over time, some very
significantly. Initial runoff coefficients were much lower than those of the Rainy River and Lake
Superior Basin, ranging from ~0.03 to 0.08. Since the 1946-65 period, runoff coefficients have
increased significantly to a range between ~0.08 to 0.15; the runoff coefficient for the Sheyenne
River increased by 109%. The Red River Basin is characterized by very fine grained soils and
flat topography as much of it was once the bottom of glacial Lake Agassiz. The land use in the
basin is primarily agricultural. The Red Lake River near Crookston, MN and the Roseau River
near Malung, MN watersheds both saw relatively little change in runoff coefficients between the
time periods. The Roseau River watershed was the sole exception to low runoff coefficients and

22
provided a value of ~0.33. Both the Red Lake River and the Roseau River watersheds are on the
eastern side of the basin and likely have topography, geology, and land use characteristics more
similar to the Rainy River and Mississippi Headwaters Basins than the rest of the Red River
Basin.
In the Mississippi Headwaters Basin typical runoff coefficients were between 0.20 and
0.26 and were relatively stable between the 1946-1965 and 1986-2005 periods. Notable
exceptions to this stability are the Mississippi River at Grand Rapids, MN, which is the only
station with a record going back to the 1926-1945 period, and a significant leap from ~0.12 to
0.21 from that period to the next, and the Crow River at Rockford, MN, whose runoff coefficient
increased steadily from ~0.12 to 0.21 from 1926-1945 to 1986-2005. Significant urbanization
has occurred in the Crow River watershed, and some near Grand Rapids, while the main land
uses in the Mississippi Headwaters Basin are forests and agriculture.
The most significant increases in runoff coefficients were obtained for the Minnesota
River Basin, where agriculture makes up 92% of the basins area. In the 1946-1965 period, the
runoff coefficients were from ~0.06 to 0.15 and many increased slightly or decreased in the
1966-1985 period. In the most recent period (1986-2005), however, the runoff coefficients
jumped to between ~0.09 and 0.26. At many stream gaging stations runoff coefficients increased
by ~70 to 80%; the Chippewa River at Milan, MN showed a 115% increase. The two stations
that have longer records (Minnesota River at Montevideo, MN and Minnesota River at Mankato,
MN) show even lower initial runoff coefficients (0.03-0.06) in the 1926-1945 time period. Both
the Le Sueur River and the Blue Earth River at Rapidan, MN showed higher initial runoff
coefficients than were typical of the Minnesota River Basin for each time period, but both stream
gaging sites also had significant increases in runoff coefficients over time.

23
For stream gaging stations in the Upper Mississippi River Basin below the confluence
with the Minnesota River runoff coefficients show two different patterns. The stream gaging
stations on the St. Croix River that drains eastern central Minnesota and northwestern Wisconsin
and the stations on the Chippewa River that drains western and central Wisconsin showed high
runoff coefficients ranging from ~0.34 to 0.42. The St. Croix River watershed is heavily forested
but interestingly the Chippewa River watershed is heavily used for agriculture, in particular dairy
farming, and thus does not have the same basin characteristics that likely cause the high runoff
coefficients found in northern Minnesota. The runoff coefficients in these watersheds have also
remained relatively stable with time. The remaining stream gaging stations in the Upper
Mississippi Basin below the confluence with the Minnesota River are in the ‘Driftless Area’, the
area of southeastern Minnesota, western Wisconsin, and northern Iowa and Illinois that were not
covered by glaciers during the last ice age, including two southern Minnesota streams that flow
through Iowa before joining the Mississippi River further downstream. For each of these stream
gaging stations runoff coefficients increased over time, from ~0.1 - 0.23 in 1946-1965 to a range
of ~0.2 - 0.33 in 1986-2005.
Interesting results emerge by studying the runoff coefficients that are “characteristic”
(most down-river) for the major river basins of Minnesota and surrounding states. In the north,
the Lake Superior and Rainy River Basins have high and invariant characteristic runoff
coefficients around 0.36 and 0.34, respectively. The Red River Basin in northwestern Minnesota
and eastern North Dakota has the lowest characteristic runoff coefficient at ~0.14 but has
consistently increased from 0.04 near the beginning of the period of record. The Mississippi
Headwaters Basin characteristic runoff coefficient has increased to ~0.24 from 0.12 in the
earliest time period. The Minnesota River Basin characteristic runoff coefficient (from the

24
Minnesota River at Jordan, MN station) has also increased significantly and consistently from
0.06 to 0.19. The low runoff coefficients from the Minnesota River combine with the higher
runoff coefficients coming out of the Mississippi Headwaters and the even higher runoff
coefficients coming out of the St. Croix and Chippewa River watersheds such that the basin
characteristic runoff coefficient for the Upper Mississippi River Basin (from the Mississippi
River at Winona, MN station) has increased to ~0.27.
Overall runoff coefficients increase significantly from west to east in the Upper Midwest
region studied (Figures 26 and 27). This distribution does not seem to have changed over time.
Increases in runoff coefficients have, however, been highest in the west, and lowest in the east of
the geographic region studied (Figure 28). One can hypothesize that this gradient is mainly due
to land use changes that have been more incisive in the west, and have lead to faster and easier
surface runoff from the land in the west since the beginning of European settlement. An
explanation based on climatological factors may, however, also be reasonable. It was found that
precipitation has increased in all of the river basins studied over the time period of 1926 to 2005
(see Figures 25, 31, and 32) with the largest changes occurring in the southernmost of the
watersheds studied and very little change being observed in northeastern Minnesota. If the
relative increase in runoff is more than the relative increase in precipitation, than the runoff
coefficients have increased.
The geographical distribution of average annual runoff (Figures 33 – 36) is similar to the
distribution of the runoff coefficients, with the highest values occurring in the east and
decreasing values to the west. When the change in total runoff (Figure 35) is expressed as the
total difference between the 1946 - 1965 and 1986 – 2005 time periods, the largest changes in
runoff are seen in the southernmost watersheds that also saw the largest increases in

25
precipitation. These southern Minnesota watersheds also saw significant changes in runoff
coefficients. These observations could lead to the hypothesis that much of the additional
precipitation is directly running off into streams and rivers, without much additional infiltration.
This can be illustrated using the Root River and the Cedar River watersheds; both have seen very
similar increases in average annual precipitation and average annual runoff of 10 - 14 cm.
When the change in runoff is viewed as a percent change from the earlier period (Figure
36), the watersheds in the Red River Basin and the more upriver watersheds in the Minnesota
River Basin are seen to have higher relative changes than the watersheds with the largest total
runoff. The geographic distribution of the percent change, also displays an obvious east to west
gradient, this time with the highest changes occurring in the west and the lowest in the east.
Overall, runoff, i.e. stream flow, has increased since the beginning of stream gaging in
Minnesota and the Upper Midwest in the watersheds studied (see Figures 33 – 36), although
periods of substantially lower stream flows have occurred, e.g. in the drought period of the
1930s, which is illustrated in the historical flow and precipitation records for the Mississippi
River at St. Paul, MN in Figure 37. Not only has the runoff (cm/yr) increased but runoff
coefficients, i.e. the ratio of runoff to precipitation, have also increased. Increases in runoff
coefficients have been documented in this study. Further study is needed to conclusively
determine the underlying causes of these findings, particularly research regarding land use, water
use, and climate changes. In a specific watershed with given topography, geology and vegetation
cover, runoff coefficients depend both on land use and precipitation (amount and intensity).
Figures 38 and 39 show the relationships between 5-year average annual (water year)
precipitation and runoff coefficient, and PDSI and runoff coefficient, respectively, for the
Mississippi River at St. Paul, MN. A strong positive relationship (r2 = 0.71 and 0.66,

26
respectively) is observed at this station and similar results are seen at other stations. The
strengths of the relationships at each stream gage between precipitation and PDSI against runoff
coefficient are compared for the 5-year running averages and annual time scales (Figure 40). It is
apparent that the 5-year running averages of precipitation have significantly stronger
relationships with the runoff coefficient than at the annual time scale, highlighting the effects
that antecedent moisture conditions have on runoff coefficients. At both time scales PDSI is an
overall better predictor of runoff coefficient. The dramatic increase in correlation strength is not
evident between PDSI and runoff coefficients from annual to 5-year running average scales,
which is consistent with earlier findings that 5-year running averages of precipitation approach
the general moisture conditions indicated by annual average PDSI. Low runoff coefficients in the
1926-1945 are representative of a dry period. Higher runoff coefficients in the 1986-2005 period
may be due to increased precipitation leading to water surplus (and thus higher PDSI) and less
available storage in the watershed.

27
6. SUMMARY AND CONCLUSIONS
Historical stream flow and climate data for major river basins in Minnesota and
tributaries from neighboring states were analyzed. Stream flow data came from 42 USGS
gauging stations. A goal of the study was to determine the strength of the relationship between
runoff and climatic variables. Another goal was to study how stream flow in Minnesota has
changed since the beginning of data collection and how changes related to changes in climatic
variables. The climatic variables analyzed included precipitation, PDSI and PHDI, two common
drought indices. A third goal was to compare streamflow and its changes in the vastly different
major river basins of Minnesota. The analysis was conducted at annual (calendar and water
year), multi-year (running averages), seasonal, and monthly time scales. The following
conclusions were drawn from this study.
6.1 Relationships between Stream Flow and Climate Parameters
1) The drought indices (PDSI and PHSI) were determined to be much better predictors of
stream flow (runoff) than precipitation alone; runoff showed a slightly higher dependence on
PDSI than PHDI. This result highlights the importance on antecedent moisture conditions on the
generation of runoff and stream flows.
2) Correlation strengths were improved significantly by using an exponential fit between
runoff and the drought indices; correlations between runoff and precipitation were stronger with
a simple linear model.
3) Drainage area does not have a crucial effect on the relationship between runoff (cm/yr)
and climatic variables; however some of the strongest dependences were obtained for the furthest
downstream gaging stations of the Mississippi River (e.g., Prescott, WI and Winona, MN).
28
4) Water year (October – September) averages showed slightly stronger correlations between
the climatic variables and runoff than calendar year (January – December) averages.
5) Multi-year running averages improve the correlation strengths between precipitation and
runoff significantly, but not between PDSI and runoff. Five-year running averages of (water
year) precipitation are sufficient. A precipitation average over several years appears to account
for the overall soil moisture conditions, as the drought indices do at shorter, e.g. the annual, time
scales.
6) The seasonal time scale analysis yielded only some useful results: a strong dependence of
runoff on precipitation during summer and fall, but a much weaker dependence during the
winter. The correlation strength between PDSI and runoff did not differ greatly by season. PDSI
can be a good indicator of moisture conditions when precipitation is falling as snow.
7) At the monthly time scale the dependence of runoff on precipitation was even more
decreased. Precipitation was not a good predictor of runoff in any month. The snow melt months
February and March had the weakest dependence of runoff on PDSI.
8) Among the river basins studied, the Upper Mississippi River Basin below the confluence
with the Minnesota River has the strongest dependence on precipitation and PDSI. Runoff from
the Minnesota River Basin showed above average dependence on precipitation and average
dependence on PDSI, while runoff in the Mississippi Headwaters Basin showed below average
dependence on precipitation and above average dependence on PDSI. The Red River of the
North Basin showed lower than average dependence on precipitation and average dependence on
PDSI. The Rainy River Basin and the Lake Superior Basin showed the weakest dependences of
precipitation and PDSI on runoff. Geology, topography, and land use contribute to the
differences observed between river basins.

29
6.2 Geographic Distribution and Changes in Annual Runoff and Runoff Coefficients
1) Annual average runoff coefficients, i.e. the ratio of runoff to precipitation averaged over at
least 50 years, vary significantly across the state of Minnesota, from 0.4 in the northeast to less
than 0.1 in the northwest. It was also found that runoff coefficients averaged over 20-year
periods have increased during the last 40 years in many of the river basins in Minnesota and the
Upper Midwest. The largest increase in runoff coefficients was found in the Red River of the
North and the Minnesota River Basins, the two basins with the lowest runoff, located in the
former prairie regions. Runoff coefficients in some tributary or sub-watersheds have doubled;
there is more runoff and more total stream flow for the same amount of precipitation in these
basins in more recent times. The smallest change in runoff coefficients was found in the Lake
Superior and Rainy River Basins, and in the St. Croix River and Chippewa River (Wisconsin)
watersheds, all in the eastern part of the region studied.
2) The highest observed precipitation and runoff changes in total amount (cm) were in some
of the southernmost watersheds studied, while the most relative changes in percent (%) of
previous annual precipitation and runoff values were in the western watersheds of Minnesota.
3) Some sub-watersheds in southern Minnesota have experienced increases in total runoff (in
cm) that are similar in magnitude to the observed increase in precipitation. This suggests that
most of the recently seen increase in precipitation could be running directly off to streams and
rivers, with little new loss to infiltration or evapotranspiration.
4) The most significant increases in runoff are in basins that likely saw the largest land use
changes in the form of agricultural practices and urbanization during the time period studied
(Land use was not part of this study). An increase in average precipitation was, however, also
observed in the river basins across the Upper Midwest, and the high correlations found between

30
precipitation and runoff suggest that this precipitation change has contributed significantly to the
increases in stream flows.
5) Future analyses need to examine the combined role of land use changes and climate
change on changing runoff. Annual runoff (cm/yr) and annual runoff coefficients (cm of runoff
divided by cm of precipitation per year) are influenced by the topography, geology, soils,
vegetation cover, land use, and water use of the watershed, but also by climatic variables such as
total rain- and snow- fall, rainfall intensities, and dew points. In a given watershed, climate
change alters several of the climate parameters, including precipitation amounts and intensities,
and antecedent soil moisture conditions, and thereby affects the runoff and steam flow. At the
same time, land use changes by agricultural conversion and urbanization, including drainage
water withdrawals and applications for irrigation, industrial and domestic uses in several of
Minnesota’s river basins have been profound. Multi-parameter analysis techniques and
hydrologic modeling are two approaches to partition the interactions of climate change and land
use.

31
ACKNOWLEDGMENTS
This study was conducted by the senior author as part of his undergraduate honors
program and continued into his graduate degree program with the second author as advisor. Tim
Erickson also provided much help and insight in the study. Funding for this study was provided
by the Environmental and Natural Resources Trust Fund as recommended by the Legislative-
Citizens Commission on Minnesota Resources (LCCMR), St. Paul, MN. The grant was
coordinated by Lucinda Johnson from the Natural Resources Research Institute in Duluth.
Weather data were extracted from the database of the State Climatologist Office. Long-term
stream flow data was extracted from the USGS National Water Information System (NWIS). We
thank these institutions and individuals for their help and co-operation.
32
REFERENCES
Dadaser-Celik, F. and H.G. Stefan. 2009. Stream flow response to climate in Minnesota. St. Anthony Falls Laboratory Project Report No.510, University of Minnesota, February 2009, 120 pp. Hanratty, M. P. and H. G. Stefan, “Simulating Climate Change Effects in a Minnesota
Agricultural Watershed,” Jour. Environmental Quality, 27:1524-1532, Nov/Dec 1998.
Intergovernmental Panel on Climate Change (IPCC). 2001. Climate Change 2001.
Impacts, Adaptation, and Vulnerability. Contribution of Working Group II to the Third Assessment Report of the IPCC. Cambridge University Press, Cambridge, UK. 1032pp.
Intergovernmental Panel on Climate Change (IPCC). 2001. Climate Change 2001. The
Scientific Basis. Contribution of Working Group I to the Third Assessment Report of the IPCC. Cambridge University Press, Cambridge, UK. 881 pp.
Intergovernmental Panel on Climate Change (IPCC). 2007. Climate Change 2007: The
Physical Science Basis. Summary for Policy Makers. Contribution of Working Group I to the Fourth Assessment Report of the IPCC. Cambridge University Press, Cambridge, UK.
Johnston, C.A. and B.A. Shmagin. 2008. Regionalization, seasonality, and trends of streamflow in the U.S. Great Lakes basin. Journal of Hydrology 362: 69-88.
Kletti, L.L. and H.G. Stefan. 1997. Correlations of Climate and Streamflow in Three Minnesota Streams. Climatic Change 37: 575-600.
Kumar, S., V. Merwade, J. Kam, and K. Thurner. 2009. Streamflow trends in Indiana: Effects of
long term persistence, precipitation and subsurface drains. Journal of Hydrology 374: 171-183.
Luce, C.H. and Z.A. Holden. 2009. Declining annual streamflow distributions in the Pacific Northwest United States, 1948-2006. Geophysical Research Letters, Vol. 36, L16401.
MPCA, 2000. Upper Mississippi River Basin Information Document, Minnesota Pollution Control Agency, St. Paul, MN. MPCA, 2001. Rainy River Basin Information Document, Minnesota Pollution Control Agency,
St. Paul, MN. MSCO Historical Climate Data. Minnesota Climatology Working Group, State
Climatology Office – DNR Waters, University of Minnesota. http://www.weather. umn.edu/doc/historical.htm, accessed May 8, 2010.

33
NCDC Climate Divisional Data, NCDC: Climate Monitoring. http://www.ncdc.noaa.gov/ oa/climate/ research/monitoring.html. Accessed May 8, 2010.
Novotny, E.V. and H.G. Stefan. 2007. Stream flow in Minnesota: Indicator of climate
change. Journal of Hydrology 334: 319-333.
Ojakangas, R.W. 2001. Minnesota's Geology. University of Minnesota Press, Minneapolis, MN. Paakh, B., Goeken, W. and Halvorson, D., 2006. State of the Red River of the North:
Assessment of the 2003/2004 Water Quality Data for the Red River and its Major Minnesota Tributaries, Minnesota Pollution Control Agency and Red River Watershed Management Board.
Palmer, W.C.. 1965. Meteorological drought. Research Paper No. 45. U.S.D. Weather Bureau. US Dept. of Commerce. Washington, D.C.
St. George, S. 2007. Streamflow in the Winnipeg River basin, Canada: Trends, extremes and climate linkages. Journal of Hydrology 332: 396-411.
U.S. Geological Survey. 2010. National Water Information System (NWISWeb) data available
on the World Wide Web, accessed May 8, 2010, at URL http://waterdata.usgs.gov/nwis/. USHCN Climate Data. Long Term Daily and Monthly Climate Records from Stations
Across the Contiguous United States. http://cdiac.ornl.gov/epubs/ndp/ushcn/ newushcn.html, accessed May 8, 2010.
Waters, T.F. 1977. The Streams and Rivers of Minnesota. University of Minnesota Press, Minneapolis, MN.
Weber, L. and L. Nkemdirim. 1998. Palmer’s Drought Indices Revisited. Geografiska
Annaler 80A:153-172.

T -1
Table 1: Information on USGS stream gauging stations studied.
USGS No. Station Name Period of Full Years Drainage Contributing Climate
Record of Record Area (km2) Divisions Tributaries to Lake Superior Basin 04010500 Pigeon River near Grand Portage, MN 1924-2008 85 1577 MN 3 04024000 St. Louis River at Scanlan, MN 1908-2008 100 8884 MN 2,3,6 Red River of the North Basin 05054000 Red River of the North at Fargo, ND 1902-2008 107 17612 MN 1,4; SD 3; ND 6,9 05059500 Sheyenne River at West Fargo, ND 1903-2008 81 8003 ND 2,3,5,6,9 05062000 Buffalo River near Dilworth, MN 1931-2008 77 2525 MN 1,4 05079000 Red Lake River at Crookston, MN 1902-2008 107 13649 MN 1,2 05082500 Red River of the North at Grand Forks, ND 1904-2008 104 77959 MN1,2,4; SD3; ND 2,3,5,6,9 05092000 Red River of the North at Drayton, ND 1950-2008 59 90132 MN1,2,4; SD3; ND 2,3,5,6,9 05104500 Roseau River near Malung, MN 1947-2008 62 653 MN 1,2 Rainy River Basin 05127500 Basswood River near Winton, MN 1931-2008 76 4507 MN 3 05128000 Namakan River at outlet of Lac La Croix, MN 1923-2008 86 13390 MN 3 05130500 Sturgeon River near Chisholm, MN 1943-2008 66 466 MN 2,3 05131500 Little Fork River at Littlefork, MN 1929-2008 85 4351 MN 2,3 05133500 Rainy River at Manitou Rapids, MN 1929-2008 80 50246 MN 2,3 Mississippi Headwaters Basin 05211000 Mississippi River at Grand Rapids, MN 1912-2008 107 8728 MN 1,2 05227500 Mississippi River at Aitkin, MN 1946-2008 63 15903 MN 1,2,3,6 05280000 Crow River at Rockford, MN 1935-2008 82 6838 MN 4,5,6 05286000 Rum River near St. Francis, MN 1934-2008 76 3522 MN 5,6 05288500 Mississippi River near Anoka, MN 1932-2008 85 49469 MN 1,2,3,4,5,6

T -2
Table 1: Continued. USGS No. Station Name Period of Full Years Drainage Contributing Climate
Record of Record Area (km2) Divisions Minnesota River Basin 05291000 Whetstone River at Big Stone City, SD 1932-2008 77 1031 SD 3 05292000 Minnesota River at Ortonville, MN 1939-2008 70 3004 MN 4; SD 3 05304500 Chippewa River near Milan, MN 1938-2008 71 4869 MN 4,5 05311000 Minnesota River at Montevideo, MN 1930-2008 87 16006 MN 4,5,7; SD 3,7 05313500 Yellow Medicine River at Granite Falls, MN 1940-2008 72 1720 MN 4,7; SD 7 05315000 Redwood River near Marshall, MN 1941-2008 68 671 MN 7 05316500 Redwood River near Redwood Falls, MN 1936-2008 74 1629 MN 4, 7 05317000 Cottonwood River near New Ulm, MN 1939-2008 74 3367 MN 7,8 05320000 Blue Earth River near Rapidan, MN 1950-2008 65 6242 MN 7,8; IA 1,2 05320500 Le Sueur River near Rapidan, MN 1950-2008 65 2875 MN 8 05325000 Minnesota River at Mankato, MN 1930-2008 87 38591 MN 4,5,7,8; SD 3,7; IA 1,2 05330000 Minnesota River near Jordan, MN 1935-2008 74 41958 MN 4,5,7,8; SD 3,7; IA 1,2 Upper Mississippi River Basin (below Minnesota River) 05331000 Mississippi River at St. Paul, MN 1907-2008 108 95312 MN 1-9; SD 3,7; IA 1,2 05333500 St. Croix River near Danbury, WI 1914-2008 91 4092 WI 1 05340500 St. Croix River at St. Croix Falls, WI 1902-2008 98 16162 MN 6, WI 1 05344500 Mississippi River at Prescott, WI 1929-2008 79 116032 MN 1-9; SD 3,7; WI 1,4; IA 1,2 05356500 Chippewa River near Bruce, WI 1913-2008 94 4274 WI 1,2 05365500 Chippewa River at Chippewa Falls, WI 1888-2008 93 14634 WI 1,2,4 05369500 Chippewa River at Durand, WI 1928-2008 80 23336 WI 1,2,4 05378500 Mississippi River at Winona, MN 1929-2008 80 153328 MN1-9; SD 3,7; WI 1,2,4; IA 1,2 05385000 Root River at Houston, MN 1909-2008 75 3238 MN 9 05457000 Cedar River near Austin, MN 1945-2008 69 1033 MN 8,9 05476000 Des Moines River at Jackson, MN 1936-2008 73 3238 MN 7

T -3
Table 2: Coefficients of determination (r2) for regressions between water year average climatic variables and stream runoff at USGS stream gaging stations. Basin averages are also given.
USGS No Station Name Temp vs. Runoff Precip vs. Runoff PDSI vs. Runoff PHDI vs. Runoff Linear Regression Linear Regression Exp. Regression Exp. Regression
r2 r2 r2 r2 Tributaries to Lake Superior Basin 04010500 Pigeon River near Grand Portage, MN 0.15 0.26 0.37 0.33 04024000 St. Louis River at Scanlan, MN 0.03 0.40 0.57 0.58 Basin Averages 0.09 0.33 0.47 0.46 Red River of the North Basin 05054000 Red River of the North at Fargo, ND 0.01 0.28 0.67 0.69 05059500 Sheyenne River at West Fargo, ND 0.01 0.26 0.72 0.72 05062000 Buffalo River near Dilworth, MN 0.01 0.24 0.60 0.62 05079000 Red Lake River at Crookston, MN 0.01 0.22 0.61 0.66 05082500 Red River of the North at Grand Forks, ND 0.00 0.27 0.69 0.72 05092000 Red River of the North at Drayton, ND 0.04 0.29 0.72 0.74 05104500 Roseau River near Malung, MN 0.09 0.38 0.58 0.53 Basin Averages 0.02 0.28 0.66 0.67 Rainy River Basin 05127500 Basswood River near Winton, MN 0.15 0.21 0.55 0.52 05128000 Namakan River at outlet of Lac La Croix 0.12 0.19 0.51 0.51 05130500 Sturgeon River near Chisholm, MN 0.20 0.30 0.63 0.60 05131500 Little Fork River at Littlefork, MN 0.11 0.40 0.52 0.44 05133500 Rainy River at Manitou Rapids, MN 0.18 0.26 0.62 0.54 Basin Averages 0.15 0.27 0.57 0.52 Mississippi Headwaters Basin 05211000 Mississippi River at Grand Rapids, MN 0.01 0.15 0.49 0.53 05227500 Mississippi River at Aitkin, MN 0.10 0.30 0.82 0.80 05280000 Crow River at Rockford, MN 0.02 0.47 0.76 0.77 05286000 Rum River near St. Francis, MN 0.01 0.37 0.67 0.75 05288500 Mississippi River near Anoka, MN 0.01 0.43 0.84 0.86 Basin Averages 0.03 0.34 0.72 0.74
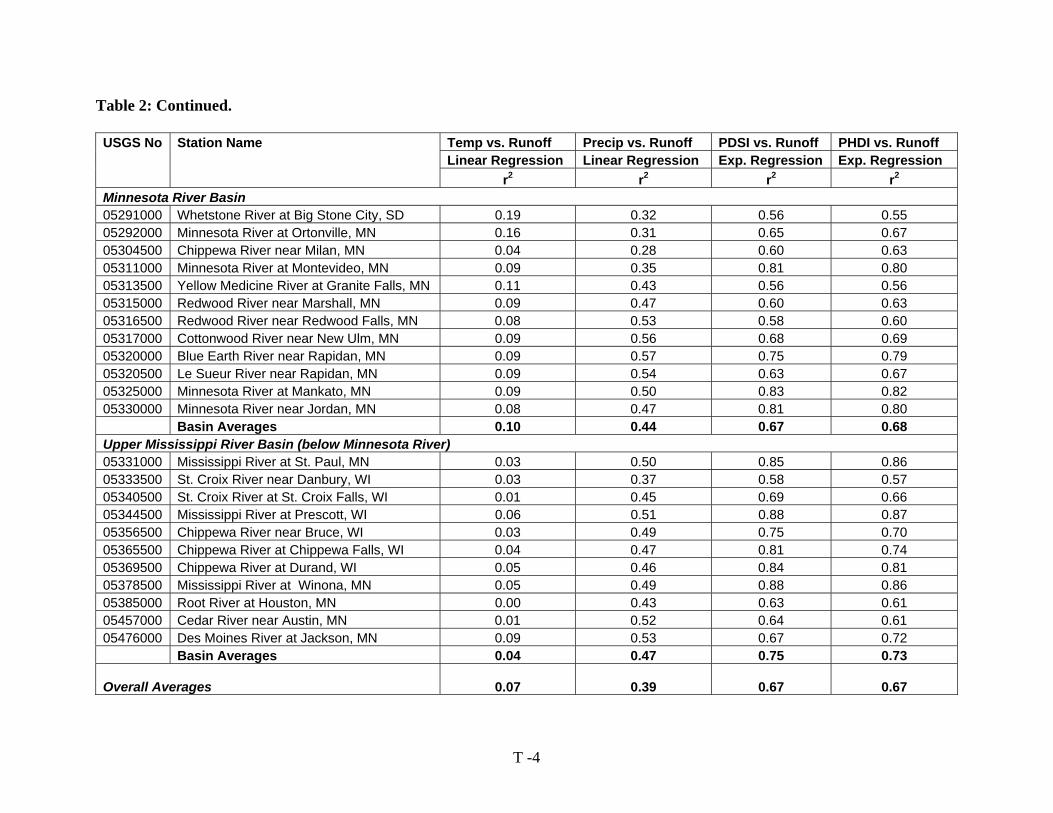
T -4
Table 2: Continued. USGS No Station Name Temp vs. Runoff Precip vs. Runoff PDSI vs. Runoff PHDI vs. Runoff Linear Regression Linear Regression Exp. Regression Exp. Regression
r2 r2 r2 r2 Minnesota River Basin 05291000 Whetstone River at Big Stone City, SD 0.19 0.32 0.56 0.55 05292000 Minnesota River at Ortonville, MN 0.16 0.31 0.65 0.67 05304500 Chippewa River near Milan, MN 0.04 0.28 0.60 0.63 05311000 Minnesota River at Montevideo, MN 0.09 0.35 0.81 0.80 05313500 Yellow Medicine River at Granite Falls, MN 0.11 0.43 0.56 0.56 05315000 Redwood River near Marshall, MN 0.09 0.47 0.60 0.63 05316500 Redwood River near Redwood Falls, MN 0.08 0.53 0.58 0.60 05317000 Cottonwood River near New Ulm, MN 0.09 0.56 0.68 0.69 05320000 Blue Earth River near Rapidan, MN 0.09 0.57 0.75 0.79 05320500 Le Sueur River near Rapidan, MN 0.09 0.54 0.63 0.67 05325000 Minnesota River at Mankato, MN 0.09 0.50 0.83 0.82 05330000 Minnesota River near Jordan, MN 0.08 0.47 0.81 0.80 Basin Averages 0.10 0.44 0.67 0.68 Upper Mississippi River Basin (below Minnesota River) 05331000 Mississippi River at St. Paul, MN 0.03 0.50 0.85 0.86 05333500 St. Croix River near Danbury, WI 0.03 0.37 0.58 0.57 05340500 St. Croix River at St. Croix Falls, WI 0.01 0.45 0.69 0.66 05344500 Mississippi River at Prescott, WI 0.06 0.51 0.88 0.87 05356500 Chippewa River near Bruce, WI 0.03 0.49 0.75 0.70 05365500 Chippewa River at Chippewa Falls, WI 0.04 0.47 0.81 0.74 05369500 Chippewa River at Durand, WI 0.05 0.46 0.84 0.81 05378500 Mississippi River at Winona, MN 0.05 0.49 0.88 0.86 05385000 Root River at Houston, MN 0.00 0.43 0.63 0.61 05457000 Cedar River near Austin, MN 0.01 0.52 0.64 0.61 05476000 Des Moines River at Jackson, MN 0.09 0.53 0.67 0.72 Basin Averages 0.04 0.47 0.75 0.73 Overall Averages 0.07 0.39 0.67 0.67

T -5
Table 3: Average annual (water year) precipitation in the watershed of each USGS stream gaging station for different time periods and the period of record (P.O.R.). Change in average runoff from the 1946-1965 to the 1986-2005 period is also given. USGS No. Station Name Water Year Average (St. Dev.) Precip (cm) % Change from
1926-1945 1946-1965 1966-1985 1986-2005 P.O.R 1946 - 1965 to
1986 - 2005 Tributaries to Lake Superior Basin 04010500 Pigeon River near Grand Portage, MN 25.65 (3.23) 27.84 (3.19) 28.67 (3.34) 28.25 (3.94) 27.74 (3.62) 1.46 04024000 St. Louis River at Scanlan, MN 25.65 (3.27) 27.78 (3.15) 28.65 (3.35) 28.31 (3.88) 27.72 (3.61) 1.91 Red River of the North Basin 05054000 Red River of the North at Fargo, ND 20.21 (4.19) 22.20 (3.11) 21.65 (3.25) 23.67 (4.33) 21.78 (3.62) 6.61 05059500 Sheyenne River at West Fargo, ND 17.40 (3.92) 18.50 (2.49) 18.12 (2.48) 20.20 (3.47) 18.66 (3.05) 9.17 05062000 Buffalo River near Dilworth, MN 20.58 (4.00) 22.46 (2.97) 22.73 (3.30) 23.98 (3.95) 22.50 (3.51) 6.76 05079000 Red Lake River at Crookston, MN 21.95 (4.04) 23.43 (3.05) 24.09 (3.43) 24.81 (3.85) 23.69 (3.59) 5.85 05082500 Red River of the North at Grand Forks, ND 19.67 (3.96) 21.18 (2.66) 21.14 (2.84) 22.85 (3.47) 21.25 (3.21) 7.90 05092000 Red River of the North at Drayton, ND 19.53 (3.92) 20.97 (2.66) 20.95 (2.77) 22.63 (3.44) 21.08 (3.17) 7.91 05104500 Roseau River near Malung, MN 21.3 (4.01) 22.81 (3.04) 23.42 (3.43) 24.33 (3.91) 23.10 (3.57) 6.66 Rainy River Basin 05127500 Basswood River near Winton, MN 25.65 (3.23) 27.84 (3.19) 28.67 (3.34) 28.25 (3.94) 27.74 (3.62) 1.46 05128000 Namakan River at outlet of Lac La Croix 25.65 (3.23) 27.84 (3.19) 28.67 (3.34) 28.25 (3.94) 27.74 (3.62) 1.46 05130500 Sturgeon River near Chisholm, MN 25.45 (3.29) 27.55 (3.12) 28.38 (3.31) 28.01 (3.88) 27.48 (3.59) 1.69 05131500 Little Fork River at Littlefork, MN 24.76 (3.60) 26.59 (3.07) 27.41 (3.32) 27.25 (3.77) 26.62 (3.61) 2.50 05133500 Rainy River at Manitou Rapids, MN 24.83 (3.57) 26.69 (3.07) 27.51 (3.31) 27.33 (3.78) 26.71 (3.60) 2.42 Mississippi Headwaters Basin 05211000 Mississippi River at Grand Rapids, MN 23.58 (4.24) 25.01 (3.38) 25.80 (3.61) 26.00 (3.90) 25.19 (3.83) 3.99 05227500 Mississippi River at Aitkin, MN 24.33 (4.18) 25.75 (3.24) 26.78 (3.66) 27.19 (3.84) 26.04 (3.83) 5.60
05280000 Crow River at Rockford, MN 24.22 (4.52) 27.01 (4.50) 28.25 (4.54) 28.88 (5.65) 26.76 (4.82) 6.92 05286000 Rum River near St. Francis, MN 26.20 (4.70) 27.75 (4.11) 29.42 (4.48) 30.55 (5.34) 28.26 (4.67) 10.08 05288500 Mississippi River near Anoka, MN 24.33 (4.24) 26.39 (3.48) 27.49 (3.93) 28.15 (4.44) 26.43 (4.12) 6.69

T -6
Table 3: Continued. USGS No Station Name Water Year Average (St. Dev.) Precip (cm) % Change from 1926-1945 1946-1965 1966-1985 1986-2005 P.O.R 1946-65 to 1986-05 Minnesota River Basin 05291000 Whetstone River at Big Stone City, SD 19.67 (4.16) 20.01 (3.47) 19.42 (3.56) 23.10 (4.70) 20.16 (3.95) 15.46 05292000 Minnesota River at Ortonville, MN 20.02 (4.18) 20.89 (3.43) 20.28 (3.55) 23.53 (4.68) 20.81 (3.90) 12.61 05304500 Chippewa River near Milan, MN 21.77 (4.53) 24.87 (3.71) 24.31 (4.15) 25.63 (4.93) 23.88 (4.25) 3.03 05311000 Minnesota River at Montevideo, MN 21.12 (4.33) 23.60 (3.52) 23.03 (3.88) 24.92 (4.74) 22.85 (4.02) 5.58 05313500 Yellow Medicine River at Granite Falls, MN 23.03 (3.92) 25.07 (3.66) 25.59 (4.32) 26.75 (5.05) 24.74 (4.18) 6.71 05315000 Redwood River near Marshall, MN 23.89 (3.90) 25.29 (3.96) 26.55 (4.87) 27.57 (5.51) 25.39 (4.49) 9.01 05316500 Redwood River near Redwood Falls, MN 23.88 (3.90) 25.29 (3.96) 26.54 (4.87) 27.56 (5.50) 25.38 (4.48) 9.00 05317000 Cottonwood River near New Ulm, MN 24.65 (3.90) 25.96 (3.80) 27.27 (4.45) 28.50 (5.57) 26.18 (4.40) 9.78 05320000 Blue Earth River near Rapidan, MN 27.57 (4.25) 28.38 (3.88) 29.99 (3.61) 31.63 (6.07) 29.10 (4.45) 11.44 05320500 Le Sueur River near Rapidan, MN 27.53 (4.38) 28.5 (4.03) 30.01 (3.56) 32.04 (6.27) 29.20 (4.58) 12.39 05325000 Minnesota River at Mankato, MN 23.72 (4.00) 25.61 (3.38) 26.08 (3.61) 27.70 (5.01) 25.45 (4.00) 8.17 05330000 Minnesota River near Jordan, MN 23.87 (4.02) 25.77 (3.41) 26.32 (3.62) 27.90 (5.04) 25.64 (4.03) 8.26 Upper Mississippi River Basin (below Minnesota River) 05331000 Mississippi River at St. Paul, MN 24.18 (4.06) 26.16 (3.33) 27.04 (3.7) 28.12 (4.58) 26.14 (3.98) 7.48 05333500 St. Croix River near Danbury, WI 29.42 (4.32) 29.88 (4.48) 32.42 (3.84) 31.64 (4.87) 30.73 (4.31) 5.89 05340500 St. Croix River at St. Croix Falls, WI 27.89 (4.42) 28.82 (4.05) 30.95 (4.01) 31.19 (4.98) 29.55 (4.35) 8.19 05344500 Mississippi River at Prescott, WI 24.88 (4.04) 26.65 (3.32) 27.77 (3.7) 28.70 (4.55) 26.78 (3.96) 7.70 05356500 Chippewa River near Bruce, WI 30.05 (4.31) 30.11 (4.28) 32.54 (3.78) 31.71 (4.71) 31.02 (4.17) 5.30 05365500 Chippewa River at Chippewa Falls, WI 30.92 (4.40) 30.42 (4.09) 32.69 (3.79) 31.81 (4.58) 31.42 (4.07) 4.55 05369500 Chippewa River at Durand, WI 30.67 (4.40) 30.18 (4.04) 32.73 (3.75) 32.08 (4.33) 31.37 (4.00) 6.27 05378500 Mississippi River at Winona, MN 26.20 (3.95) 27.41 (3.26) 28.95 (3.51) 29.65 (4.39) 27.86 (3.80) 8.16 05385000 Root River at Houston, MN 29.49 (5.09) 29.02 (4.66) 32.5 (4.27) 33.59 (5.66) 30.92 (4.83) 15.76 05457000 Cedar River near Austin, MN 28.72 (4.60) 28.81 (4.16) 31.52 (3.72) 32.98 (5.58) 30.24 (4.51) 14.44 05476000 Des Moines River at Jackson, MN 23.89 (3.90) 25.29 (3.96) 26.55 (4.87) 27.57 (5.51) 25.39 (4.49) 9.01

T -7
Table 4: Average annual (water year) runoff at each USGS stream gaging station for different time periods and the period of record (P.O.R.). Change in average runoff from the 1946-1965 to the 1986-2005 period is also given. USGS No Station Name Water Year Average (St. Dev.) Runoff (cm) % Change from
1926-1945 1946-1965 1966-1985 1986-2005 P.O.R 1946 - 1965 to
1986 - 2005 Tributaries to Lake Superior Basin 04010500 Pigeon River near Grand Portage, MN 11.20 (2.45) 10.51 (3.84) 12.51 (3.15) 10.30 (3.19) 11.04 (3.40) - 2.03 04024000 St. Louis River at Scanlan, MN 8.62 (2.42) 9.53 (2.83) 11.03 (3.42) 10.40 (3.04) 9.42 (3.16) 9.12 Red River of the North Basin 05054000 Red River of the North at Fargo, ND 0.57 (0.68) 1.31 (0.78) 1.45 (0.87) 2.50 (1.39) 1.44 (1.15) 90.74 05059500 Sheyenne River at West Fargo, ND 0.47 (0.32) 0.77 (0.52) 1.02 (0.48) 1.78 (1.11) 1.05 (0.82) 132.02 05062000 Buffalo River near Dilworth, MN 2.06 (1.01) 2.13 (1.38) 3.31 (1.83) 2.30 (1.56) 60.42 05079000 Red Lake River at Crookston, MN 1.69 (1.30) 3.18 (1.81) 4.13 (1.67) 3.82 (2.32) 3.11 (1.91) 20.22 05082500 Red River of the North at Grand Forks, ND 0.73 (0.58) 1.48 (0.85) 1.90 (0.90) 2.52 (1.38) 1.59 (1.09) 70.12 05092000 Red River of the North at Drayton, ND 1.45 (1.04) 1.87 (0.90) 2.45 (1.35) 1.98 (1.16) 68.81 05104500 Roseau River near Malung, MN 7.26 (4.31) 8.19 (5.18) 8.64 (5.82) 7.91 (5.04) 19.00 Rainy River Basin 05127500 Basswood River near Winton, MN 10.53 (4.20) 12.37 (3.45) 10.24 (3.05) 10.74 (3.62) - 2.78 05128000 Namakan River at outlet of Lac La Croix 9.20 (2.86) 10.21 (3.56) 11.60 (3.39) 9.92 (2.94) 10.02 (3.50) - 2.92 05130500 Sturgeon River near Chisholm, MN 8.47 (2.56) 10.13 (2.92) 9.42 (3.09) 9.33 (2.88) 11.26 05131500 Little Fork River at Littlefork, MN 7.17 (2.83) 8.24 (2.71) 10.22 (3.36) 8.59 (2.91) 8.54 (3.11) 4.33 05133500 Rainy River at Manitou Rapids, MN 7.60 (2.66) 9.08 (2.66) 10.25 (3.18) 9.14 (2.91) 9.05 (2.99) 0.65 Mississippi Headwaters Basin 05211000 Mississippi River at Grand Rapids, MN 2.79 (1.97) 5.17 (1.98) 5.97 (2.10) 5.92 (2.16) 4.94 (2.30) 14.53 05227500 Mississippi River at Aitkin, MN 6.14 (2.23) 6.82 (2.36) 6.65 (2.16) 6.44 (2.24) 8.33 05280000 Crow River at Rockford, MN 3.30 (2.25) 5.01 (2.93) 6.20 (3.37) 4.30 (3.00) 88.04 05286000 Rum River near St. Francis, MN 5.96 (2.75) 7.65 (2.83) 6.93 (3.02) 6.41 (2.96) 16.38 05288500 Mississippi River near Anoka, MN 5.52 (2.01) 6.76 (2.34) 6.80 (2.21) 5.80 (2.39) 23.33

T -8
Table 4: Continued. USGS No Station Name Water Year Average (St. Dev.) Runoff (cm) % Change from
1926-1945 1946-1965 1966-1985 1986-2005 P.O.R 1946 - 1965 to
1986 - 2005 Minnesota River Basin 05291000 Whetstone River at Big Stone City, SD 1.80 (1.37) 1.8 (1.46) 2.97 (2.47) 2.07 (1.82) 65.34 05292000 Minnesota River at Ortonville, MN 1.30 (1.04) 1.11 (1.05) 2.27 (1.91) 1.62 (1.46) 74.95 05304500 Chippewa River near Milan, MN 1.94 (1.40) 2.69 (1.77) 4.25 (2.45) 2.77 (2.07) 119.29 05311000 Minnesota River at Montevideo, MN 0.72 (0.76) 1.83 (1.13) 1.98 (1.37) 3.39 (2.24) 2.05 (1.69) 85.29 05313500 Yellow Medicine River at Granite Falls, MN 2.42 (1.86) 2.83 (2.66) 4.13 (3.06) 2.94 (2.52) 71.00 05315000 Redwood River near Marshall, MN 2.55 (1.71) 3.13 (3.22) 5.51 (5.12) 3.70 (3.61) 116.25 05316500 Redwood River near Redwood Falls, MN 2.56 (1.70) 3.22 (2.96) 5.14 (3.91) 3.36 (2.99) 101.14 05317000 Cottonwood River near New Ulm, MN 2.85 (1.93) 3.98 (3.52) 5.97 (4.31) 4.05 (3.41) 109.72 05320000 Blue Earth River near Rapidan, MN 4.20 (2.95) 5.94 (3.92) 7.94 (5.51) 6.20 (4.33) 88.89 05320500 Le Sueur River near Rapidan, MN 4.48 (3.53) 6.99 (3.89) 8.86 (5.19) 6.85 (4.41) 97.86 05325000 Minnesota River at Mankato, MN 1.52 (1.27) 2.81 (1.58) 3.53 (2.12) 5.23 (3.12) 3.34 (2.44) 86.37 05330000 Minnesota River near Jordan, MN 2.92 (1.57) 3.78 (2.17) 5.45 (3.24) 3.82 (2.53) 86.73 Upper Mississippi River Basin (below Minnesota River) 05331000 Mississippi River at St. Paul, MN 2.76 (1.60) 4.21 (1.67) 5.26 (2.05) 6.06 (2.49) 4.43 (2.18) 43.71 05333500 St. Croix River near Danbury, WI 10.44 (2.34) 11.84 (2.29) 11.94 (1.84) 11.73 (2.12) 11.27 (2.24) - 0.97 05340500 St. Croix River at St. Croix Falls, WI 8.26 (2.96) 9.92 (2.80) 11.17 (2.7) 10.62 (2.92) 9.51 (3.05) 7.08 05344500 Mississippi River at Prescott, WI 3.75 (1.88) 5.24 (1.76) 6.26 (1.99) 6.78 (2.39) 5.57 (2.24) 29.32 05356500 Chippewa River near Bruce, WI 11.89 (3.80) 11.45 (2.96) 13.71 (2.28) 12.52 (3.52) 12.16 (3.25) 9.30 05365500 Chippewa River at Chippewa Falls, WI 12.26 (4.09) 11.28 (3.00) 13.29 (2.76) 11.92 (3.16) 12.03 (3.29) 5.69 05369500 Chippewa River at Durand, WI 11.40 (3.69) 10.41 (2.44) 12.87 (2.16) 11.92 (2.71) 11.56 (2.87) 14.54 05378500 Mississippi River at Winona, MN 5.09 (1.97) 6.08 (1.74) 7.56 (1.94) 8.18 (2.39) 6.78 (2.29) 34.51 05385000 Root River at Houston, MN 7.23 (2.06) 6.68 (1.91) 8.89 (3.53) 11.24 (2.67) 8.31 (3.06) 68.22 05457000 Cedar River near Austin, MN 5.77 (2.72) 8.68 (4.38) 11.18 (5.31) 8.53 (4.70) 93.74 05476000 Des Moines River at Jackson, MN 2.77 (1.98) 4.17 (4.02) 6.07 (5.07) 4.32 (3.88) 118.69

T -9
Table 5: Average annual (water year) runoff coefficients for the watersheds of the USGS stream gaging stations for different time periods and the period of record (P.O.R.). Change in average runoff from the 1946-1965 to the 1986-2005 period is also given. USGS No. Station Name Water Year Average (St. Dev.) Runoff Coefficients % Change from
1926-1945 1946-1965 1966-1985 1986-2005 P.O.R 1946 - 1965 to
1986 - 2005 Tributaries to Lake Superior Basin 04010500 Pigeon River near Grand Portage, MN 0.44 (0.09) 0.38 (0.12) 0.44 (0.1) 0.36 (0.09) 0.40 (0.11) -4.05 04024000 St. Louis River at Scanlan, MN 0.34 (0.08) 0.34 (0.09) 0.38 (0.1) 0.36 (0.07) 0.34 (0.09) 6.25 Red River of the North Basin 05054000 Red River of the North at Fargo, ND 0.03 (0.03) 0.06 (0.03) 0.07 (0.04) 0.1 (0.05) 0.06 (0.05) 77.58 05059500 Sheyenne River at West Fargo, ND 0.03 (0.02) 0.04 (0.02) 0.06 (0.03) 0.08 (0.05) 0.05 (0.04) 108.97 05062000 Buffalo River near Dilworth, MN 0.09 (0.04) 0.09 (0.06) 0.13 (0.07) 0.10 (0.06) 48.43 05079000 Red Lake River at Crookston, MN 0.07 (0.06) 0.13 (0.07) 0.17 (0.07) 0.15 (0.08) 0.13 (0.07) 10.47 05082500 Red River of the North at Grand Forks, ND 0.04 (0.03) 0.07 (0.03) 0.09 (0.04) 0.11 (0.05) 0.07 (0.04) 55.07 05092000 Red River of the North at Drayton, ND 0.07 (0.04) 0.09 (0.04) 0.1 (0.05) 0.09 (0.05) 56.06 05104500 Roseau River near Malung, MN 0.31 (0.16) 0.34 (0.2) 0.33 (0.21) 0.32 (0.19) 8.28 Rainy River Basin 05127500 Basswood River near Winton, MN 0.38 (0.13) 0.43 (0.11) 0.36 (0.09) 0.38 (0.11) -3.97 05128000 Namakan River at outlet of Lac La Croix 0.36 (0.11) 0.37 (0.11) 0.4 (0.11) 0.35 (0.1) 0.36 (0.11) -3.98 05130500 Sturgeon River near Chisholm, MN 0.31 (0.08) 0.36 (0.09) 0.33 (0.09) 0.33 (0.09) 8.11 05131500 Little Fork River at Littlefork, MN 0.29 (0.09) 0.31 (0.08) 0.37 (0.11) 0.31 (0.08) 0.32 (0.1) 0.98 05133500 Rainy River at Manitou Rapids, MN 0.31 (0.1) 0.34 (0.09) 0.37 (0.1) 0.33 (0.09) 0.34 (0.1) -2.26 Mississippi Headwaters Basin 05211000 Mississippi River at Grand Rapids, MN 0.12 (0.08) 0.21 (0.07) 0.23 (0.08) 0.22 (0.07) 0.2 (0.09) 9.09 05227500 Mississippi River at Aitkin, MN 0.24 (0.07) 0.25 (0.08) 0.24 (0.06) 0.24 (0.07) 2.53 05280000 Crow River at Rockford, MN 0.12 (0.06) 0.17 (0.08) 0.21 (0.09) 0.15 (0.09) 78.75 05286000 Rum River near St. Francis, MN 0.21 (0.08) 0.26 (0.09) 0.22 (0.08) 0.22 (0.09) 7.20 05288500 Mississippi River near Anoka, MN 0.21 (0.06) 0.24 (0.07) 0.24 (0.05) 0.21 (0.07) 16.32
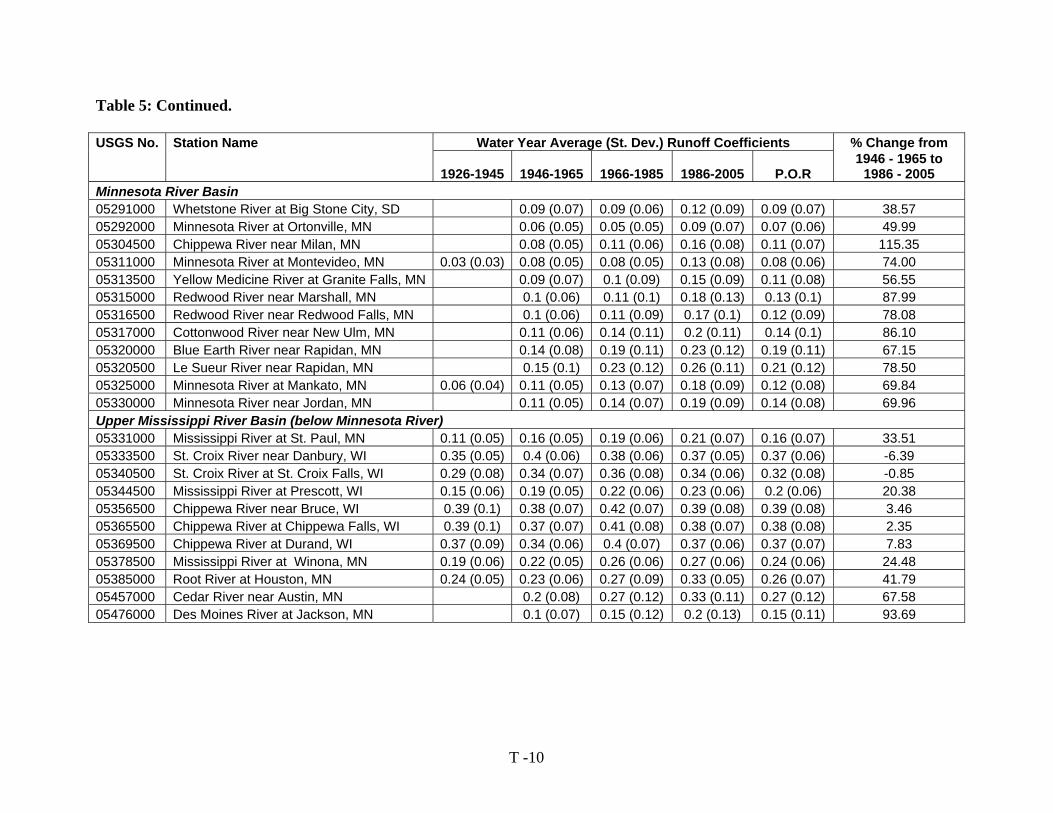
T -10
Table 5: Continued. USGS No. Station Name Water Year Average (St. Dev.) Runoff Coefficients % Change from
1926-1945 1946-1965 1966-1985 1986-2005 P.O.R 1946 - 1965 to
1986 - 2005 Minnesota River Basin 05291000 Whetstone River at Big Stone City, SD 0.09 (0.07) 0.09 (0.06) 0.12 (0.09) 0.09 (0.07) 38.57 05292000 Minnesota River at Ortonville, MN 0.06 (0.05) 0.05 (0.05) 0.09 (0.07) 0.07 (0.06) 49.99 05304500 Chippewa River near Milan, MN 0.08 (0.05) 0.11 (0.06) 0.16 (0.08) 0.11 (0.07) 115.35 05311000 Minnesota River at Montevideo, MN 0.03 (0.03) 0.08 (0.05) 0.08 (0.05) 0.13 (0.08) 0.08 (0.06) 74.00 05313500 Yellow Medicine River at Granite Falls, MN 0.09 (0.07) 0.1 (0.09) 0.15 (0.09) 0.11 (0.08) 56.55 05315000 Redwood River near Marshall, MN 0.1 (0.06) 0.11 (0.1) 0.18 (0.13) 0.13 (0.1) 87.99 05316500 Redwood River near Redwood Falls, MN 0.1 (0.06) 0.11 (0.09) 0.17 (0.1) 0.12 (0.09) 78.08 05317000 Cottonwood River near New Ulm, MN 0.11 (0.06) 0.14 (0.11) 0.2 (0.11) 0.14 (0.1) 86.10 05320000 Blue Earth River near Rapidan, MN 0.14 (0.08) 0.19 (0.11) 0.23 (0.12) 0.19 (0.11) 67.15 05320500 Le Sueur River near Rapidan, MN 0.15 (0.1) 0.23 (0.12) 0.26 (0.11) 0.21 (0.12) 78.50 05325000 Minnesota River at Mankato, MN 0.06 (0.04) 0.11 (0.05) 0.13 (0.07) 0.18 (0.09) 0.12 (0.08) 69.84 05330000 Minnesota River near Jordan, MN 0.11 (0.05) 0.14 (0.07) 0.19 (0.09) 0.14 (0.08) 69.96 Upper Mississippi River Basin (below Minnesota River) 05331000 Mississippi River at St. Paul, MN 0.11 (0.05) 0.16 (0.05) 0.19 (0.06) 0.21 (0.07) 0.16 (0.07) 33.51 05333500 St. Croix River near Danbury, WI 0.35 (0.05) 0.4 (0.06) 0.38 (0.06) 0.37 (0.05) 0.37 (0.06) -6.39 05340500 St. Croix River at St. Croix Falls, WI 0.29 (0.08) 0.34 (0.07) 0.36 (0.08) 0.34 (0.06) 0.32 (0.08) -0.85 05344500 Mississippi River at Prescott, WI 0.15 (0.06) 0.19 (0.05) 0.22 (0.06) 0.23 (0.06) 0.2 (0.06) 20.38 05356500 Chippewa River near Bruce, WI 0.39 (0.1) 0.38 (0.07) 0.42 (0.07) 0.39 (0.08) 0.39 (0.08) 3.46 05365500 Chippewa River at Chippewa Falls, WI 0.39 (0.1) 0.37 (0.07) 0.41 (0.08) 0.38 (0.07) 0.38 (0.08) 2.35 05369500 Chippewa River at Durand, WI 0.37 (0.09) 0.34 (0.06) 0.4 (0.07) 0.37 (0.06) 0.37 (0.07) 7.83 05378500 Mississippi River at Winona, MN 0.19 (0.06) 0.22 (0.05) 0.26 (0.06) 0.27 (0.06) 0.24 (0.06) 24.48 05385000 Root River at Houston, MN 0.24 (0.05) 0.23 (0.06) 0.27 (0.09) 0.33 (0.05) 0.26 (0.07) 41.79 05457000 Cedar River near Austin, MN 0.2 (0.08) 0.27 (0.12) 0.33 (0.11) 0.27 (0.12) 67.58 05476000 Des Moines River at Jackson, MN 0.1 (0.07) 0.15 (0.12) 0.2 (0.13) 0.15 (0.11) 93.69

F - 1
Figure 1: Major river basins of the Upper Midwest and USGS stream gage locations. Mississippi Headwaters and the Minnesota River Basins are part of the Upper Mississippi River Basin.

F - 2
Figure 2: Watershed boundaries for each USGS stream gage. Major river basins (bold lines) are divided into tributary watersheds (thin lines).
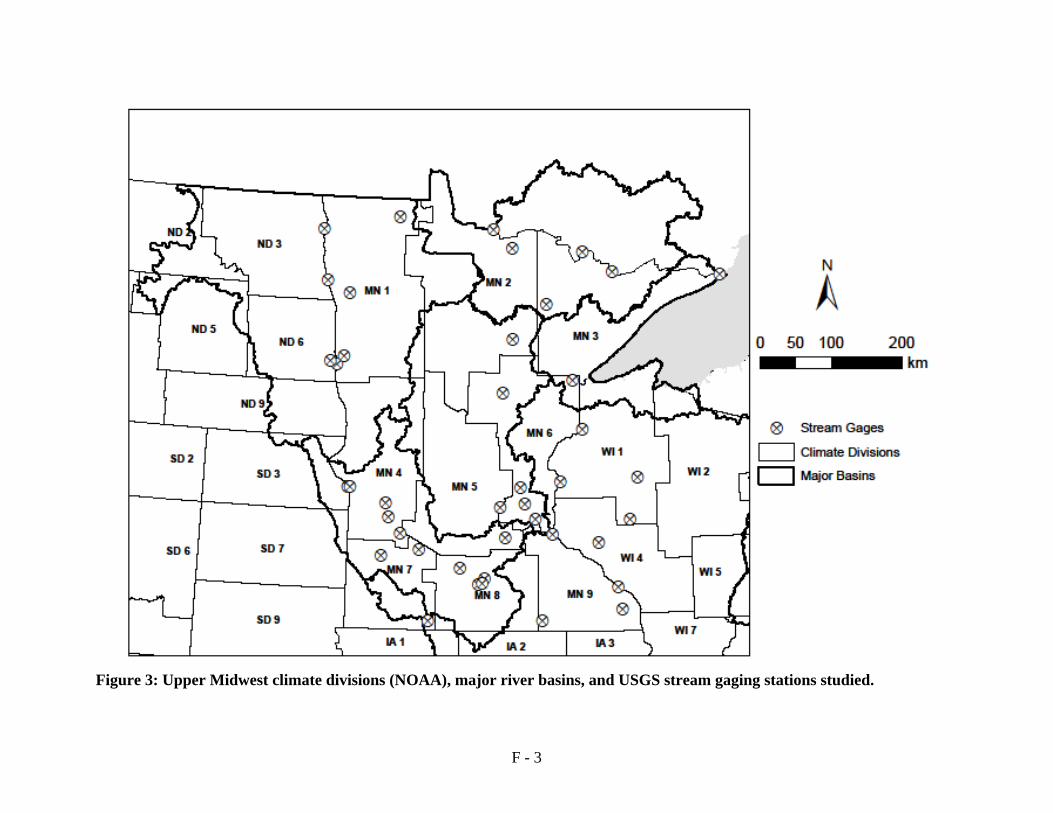
F - 3
Figure 3: Upper Midwest climate divisions (NOAA), major river basins, and USGS stream gaging stations studied.
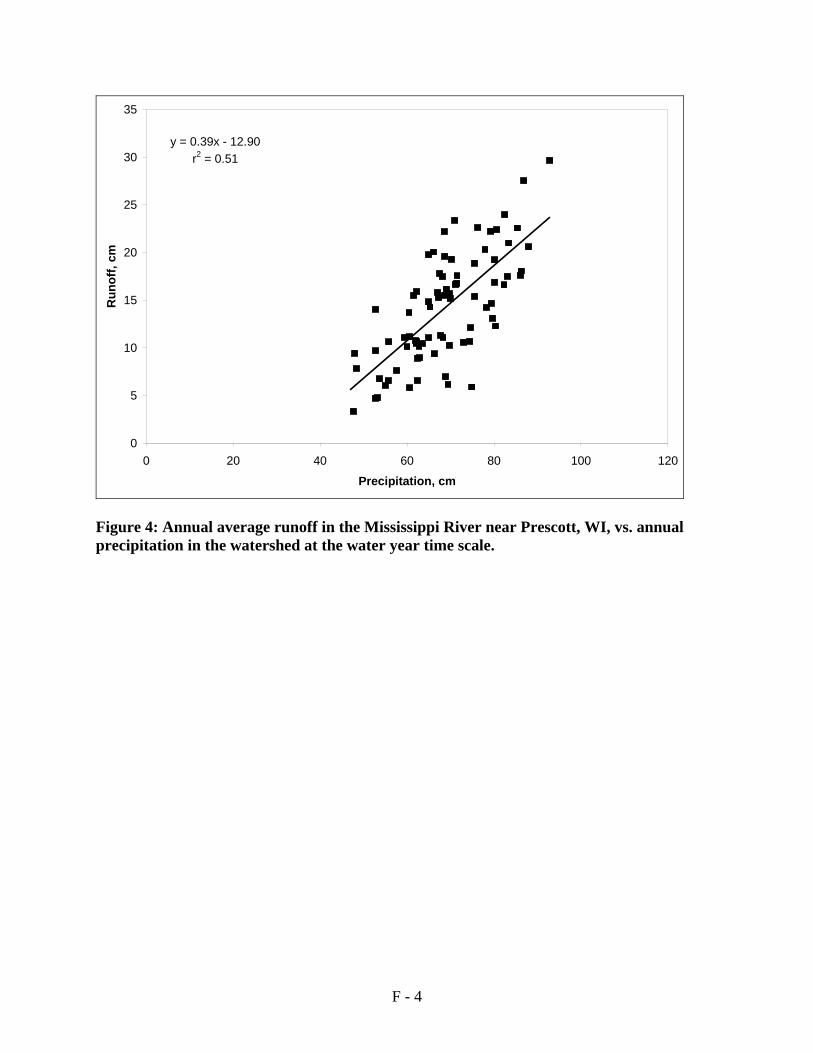
F - 4
y = 0.39x - 12.90r2 = 0.51
0
5
10
15
20
25
30
35
0 20 40 60 80 100 120
Precipitation, cm
Ru
no
ff,
cm
Figure 4: Annual average runoff in the Mississippi River near Prescott, WI, vs. annual precipitation in the watershed at the water year time scale.

F - 5
y = 12.08exp(0.23x)r2 = 0.88
0
5
10
15
20
25
30
35
-6 -4 -2 0 2 4 6
PDSI
Ru
no
ff, c
m
Figure 5: Annual average runoff in the Mississippi River near Prescott, WI, vs. annual average PDSI in the watershed at the water year time scale.

F - 6
y = 0.38x - 11.57r2 = 0.37
0
5
10
15
20
25
30
35
40
45
0 20 40 60 80 100 120
Precipitation, cm
Ru
no
ff,
cm
Figure 6: Annual average runoff in the Rum River near St. Francis, MN, vs. annual precipitation in the watershed at the water year time scale.
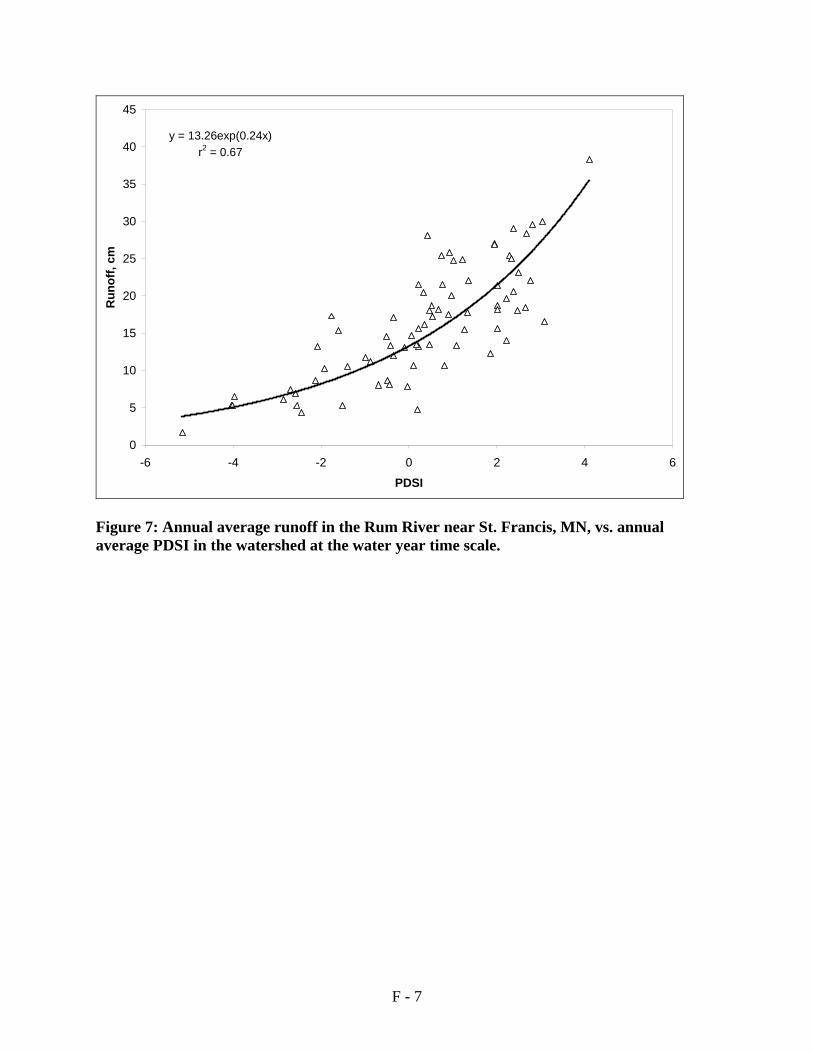
F - 7
y = 13.26exp(0.24x)r2 = 0.67
0
5
10
15
20
25
30
35
40
45
-6 -4 -2 0 2 4 6
PDSI
Ru
no
ff, c
m
Figure 7: Annual average runoff in the Rum River near St. Francis, MN, vs. annual average PDSI in the watershed at the water year time scale.

F - 8
y = 0.44x - 6.58r2 = 0.26
0
5
10
15
20
25
30
35
40
45
0 20 40 60 80 100 120
Precipitation, cm
Ru
no
ff,
cm
Figure 8: Annual average runoff in the Pigeon River at Grand Portage, MN, vs. annual precipitation in the watershed at the water year time scale.

F - 9
y = 20.62exp(0.18x)r2 = 0.20
0
5
10
15
20
25
30
35
40
45
-5 -4 -3 -2 -1 0 1 2 3 4
PDSI
Ru
no
ff, c
m
Figure 9: Average annual runoff in the Pigeon River at Grand Portage, MN, vs. annual average PDSI in the watershed at the water year time scale.

F - 10
y = 1.11xr2 = 0.54
y = 1.03xr2 = 0.82
y = 0.98xr2 = 0.85
0
0.1
0.2
0.3
0.4
0.5
0.6
0.7
0.8
0.9
1
0 0.1 0.2 0.3 0.4 0.5 0.6 0.7 0.8 0.9 1
Correlation (r^2) in Annual Averages
Co
rrel
atio
n (
r^2)
in
Wat
er Y
ear
Ave
rag
es
Precip vs Runoff
PDSI vs Runoff (expreg)
PHDI vs Runoff (expreg)
Figure 10: Average water year vs. calendar year correlation strengths between runoff and precipitation, PDSI, or PHDI.

F - 11
y = 0.92xr2 = 0.92
y = 1.09xr2 = 0.77
y = 1.11xr2 = 0.74
0
0.1
0.2
0.3
0.4
0.5
0.6
0.7
0.8
0.9
1
0 0.1 0.2 0.3 0.4 0.5 0.6 0.7 0.8 0.9 1
Linear Regression Correlation (r^2)
Exp
on
enti
al R
egre
ssio
n C
orr
elat
ion
(r^
2)
Precip vs Runoff
PDSI vs Runoff
PHDI vs Runoff
Figure 11: Exponential regression correlation vs. linear regression correlation strengths between runoff and precipitation, PDSI and PHDI at the water year time scale.

F - 12
y = 1.00xr2 = 0.92
0
0.1
0.2
0.3
0.4
0.5
0.6
0.7
0.8
0.9
1
0 0.1 0.2 0.3 0.4 0.5 0.6 0.7 0.8 0.9 1Correlation (r^2) between PDSI and Runoff
Co
rrel
atio
n (
r^2)
bet
wee
n P
HD
I an
d R
un
off
Figure 12: PHDI vs. PDSI correlation strengths as predictors of runoff at the water year time scale.

F - 13
y = 5E-07x + 0.38r2 = 0.02
y = 2E-06x + 0.63r2 = 0.35
0
0.1
0.2
0.3
0.4
0.5
0.6
0.7
0.8
0.9
1
0 20,000 40,000 60,000 80,000 100,000 120,000 140,000 160,000 180,000Drainage Area, km^2
Co
rrel
atio
n (
r^2)
Precip vsRunoff
PDSI vsRunoff
Figure 13: Correlation strength between runoff and precipitation or PDSI vs. drainage area at the water year time scale.

F - 14
0
0.1
0.2
0.3
0.4
0.5
0.6
0.7
0.8
0.9
1
1 5 10 20
Years in Running Average
Bas
in A
vera
ged
Co
rrel
atio
n (
r^2)
bet
wee
n P
reci
p a
nd
R
un
off
Tribs of Lake Superior/Rainy River
Red River
Mississippi Headwaters
Minnesota River
Upper Mississippi
Figure 14: Basin average strengths of correlations between running average runoff and precipitation at the 1-year to 20-year running average time scales.

F - 15
0
0.1
0.2
0.3
0.4
0.5
0.6
0.7
0.8
0.9
1
1 5 10 20Years in Running Average
Bas
in A
vera
ged
Co
rrel
atio
n (
r^2)
bet
wee
n P
DS
I a
nd
R
un
off
Tribs of Lake Superior/Rainy River
Red River
Mississippi Headwaters
Minnesota River
Upper Mississippi
Figure 15: Basin average strengths of correlations between running average runoff and PDSI at the 1-year to 20-year running average time scale.

F - 16
y = 1.06xr2 = 0.50
y = 1.01xr2 = 0.59
y = 0.96xr2 = 0.73
y = 1.64xr2 = 0.21
0
0.1
0.2
0.3
0.4
0.5
0.6
0.7
0.8
0.9
1
0 0.1 0.2 0.3 0.4 0.5 0.6 0.7 0.8 0.9 1Correlation (r^2) between Precip and Runoff
Co
rrel
atio
n (
r^2
) b
etw
een
PD
SI
an
d R
un
off
1 Year
5 Year
10 Year
20 Year
Figure 16: Strengths of correlation between average runoff and PDSI vs. strengths of correlation between average runoff and precipitation at the 1-year to 20-year running average time scales.
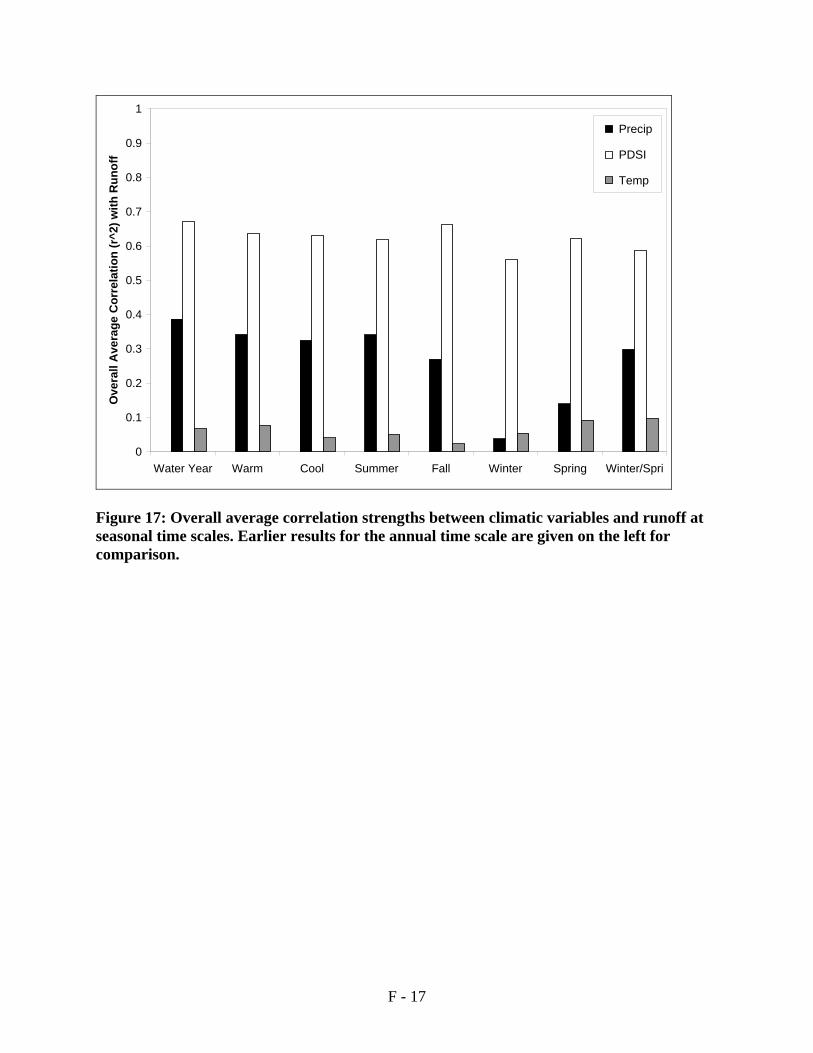
F - 17
0
0.1
0.2
0.3
0.4
0.5
0.6
0.7
0.8
0.9
1
Water Year Warm Cool Summer Fall Winter Spring Winter/Spri
Ove
rall
Ave
rag
e C
orr
elat
ion
(r^
2) w
ith
Ru
no
ff Precip
PDSI
Temp
Figure 17: Overall average correlation strengths between climatic variables and runoff at seasonal time scales. Earlier results for the annual time scale are given on the left for comparison.

F - 18
0
0.1
0.2
0.3
0.4
0.5
0.6
0.7
0.8
0.9
1
WaterYear
Jan Feb Mar Apr May Jun Jul Aug Sep Oct Nov Dec
Ove
rall
Av
erag
e C
orr
ela
tio
n (
r^2)
wit
h R
un
off
Precip
PDSI
Temp
Figure 18: Overall average correlation strengths between climatic variables and stream runoff at the monthly time scale. Earlier results for the annual time scale are given on the left for comparison.

F - 19
0
0.1
0.2
0.3
0.4
0.5
1926-1945 1946-1965 1966-1985 1986-2005Time Period
Per
iod
Ave
rag
ed R
un
off
Co
effi
cien
t
Pigeon River near Grand Portage, MNSt. Louis River at Scanlan, MNBasswood River near Winton, MNNamakan River at outlet of Lac La CroixSturgeon River near Chisholm, MNLittle Fork River at Littlefork, MNRainy River at Manitou Rapids, MN
Figure 19: Runoff coefficients for streams in the Lake Superior and Rainy River Basins over four time periods.
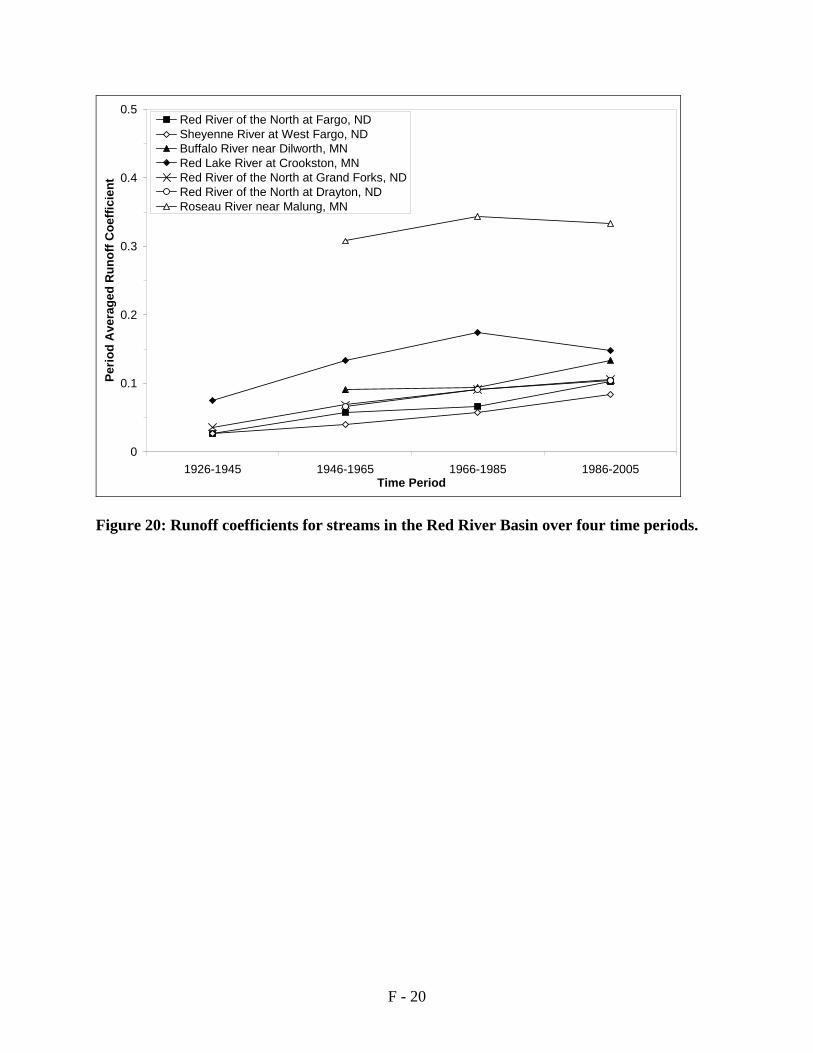
F - 20
0
0.1
0.2
0.3
0.4
0.5
1926-1945 1946-1965 1966-1985 1986-2005Time Period
Per
iod
Ave
rag
ed R
un
off
Co
effi
cien
tRed River of the North at Fargo, NDSheyenne River at West Fargo, NDBuffalo River near Dilworth, MNRed Lake River at Crookston, MNRed River of the North at Grand Forks, NDRed River of the North at Drayton, NDRoseau River near Malung, MN
Figure 20: Runoff coefficients for streams in the Red River Basin over four time periods.
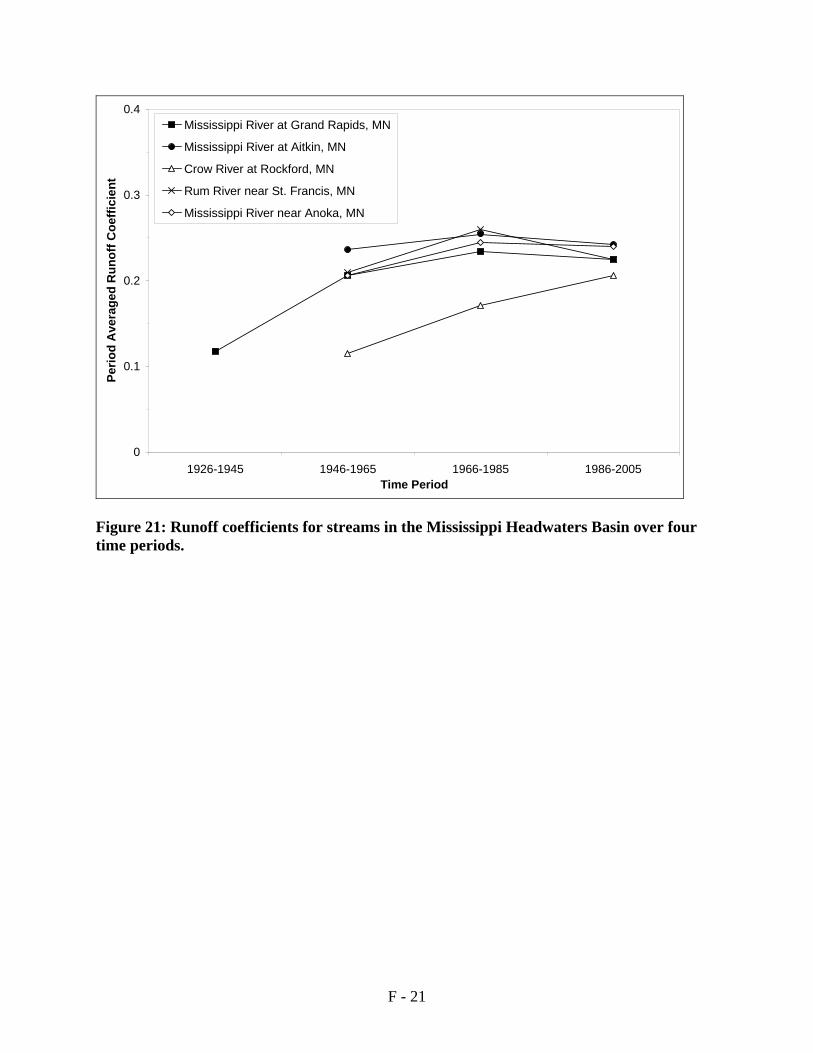
F - 21
0
0.1
0.2
0.3
0.4
1926-1945 1946-1965 1966-1985 1986-2005Time Period
Per
iod
Ave
rag
ed R
un
off
Co
effi
cie
nt
Mississippi River at Grand Rapids, MN
Mississippi River at Aitkin, MN
Crow River at Rockford, MN
Rum River near St. Francis, MN
Mississippi River near Anoka, MN
Figure 21: Runoff coefficients for streams in the Mississippi Headwaters Basin over four time periods.
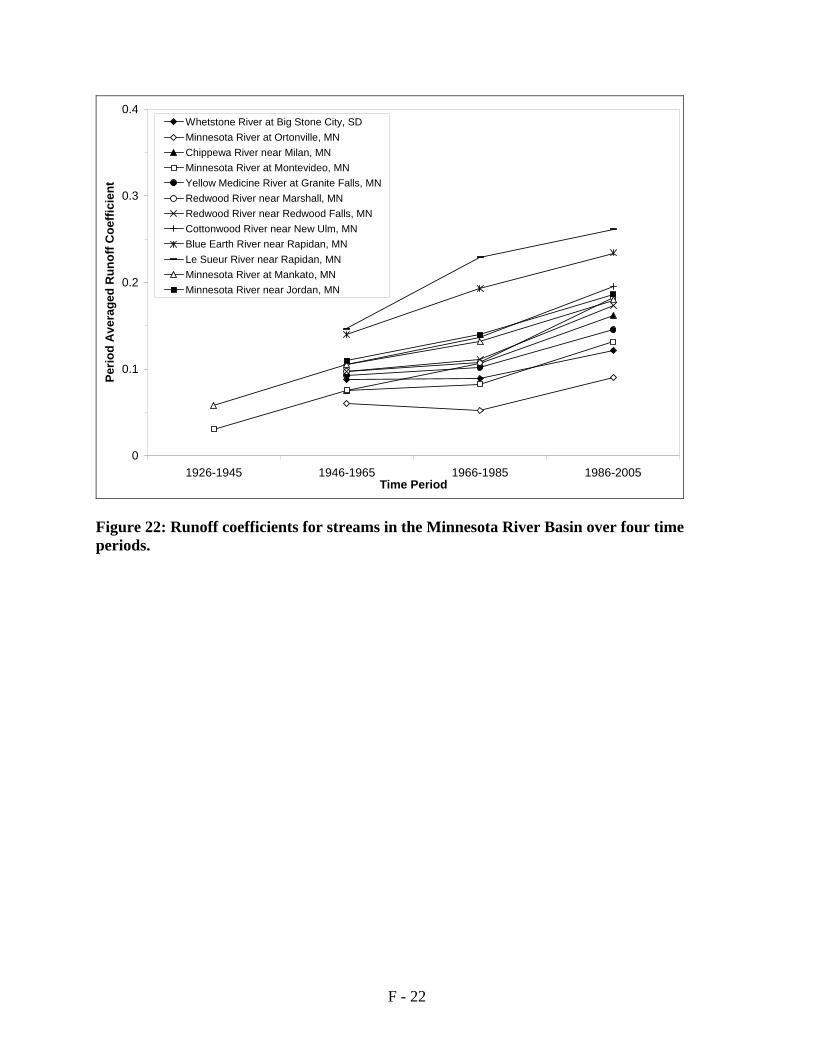
F - 22
0
0.1
0.2
0.3
0.4
1926-1945 1946-1965 1966-1985 1986-2005Time Period
Per
iod
Ave
rag
ed R
un
off
Co
effi
cien
tWhetstone River at Big Stone City, SDMinnesota River at Ortonville, MNChippewa River near Milan, MNMinnesota River at Montevideo, MNYellow Medicine River at Granite Falls, MNRedwood River near Marshall, MNRedwood River near Redwood Falls, MNCottonwood River near New Ulm, MNBlue Earth River near Rapidan, MNLe Sueur River near Rapidan, MNMinnesota River at Mankato, MNMinnesota River near Jordan, MN
Figure 22: Runoff coefficients for streams in the Minnesota River Basin over four time periods.

F - 23
0
0.1
0.2
0.3
0.4
0.5
0.6
1926-1945 1946-1965 1966-1985 1986-2005Time Period
Pe
rio
d A
ver
aged
Ru
no
ff C
oef
fici
ent
Mississippi River at St. Paul, MN Mississippi River at Prescott, WIMississippi River at Winona, MN Root River at Houston, MNCedar River near Austin, MN Des Moines River at Jackson, MNSt. Croix River near Danbury, WI St. Croix River at St. Croix Falls, WIChippewa River near Bruce, WI Chippewa River at Chippewa Falls, WIChippewa River at Durand, WI
Figure 23: Runoff coefficients for streams in the Upper Mississippi River Basin below the confluence with the Minnesota River over four time periods.

F - 24
0
0.1
0.2
0.3
0.4
0.5
0.6
1926-1945 1946-1965 1966-1985 1986-2005Time Period
Per
iod
Ave
rag
ed R
un
off
Co
eff
icie
nt
Tribs of Lake Superior Rainy River
Red River Mississippi Headwaters
Minnesota River Upper Mississippi
Figure 24: Runoff coefficients for lowest main stem stream in the major river basins of Minnesota over four time periods.

F - 25
0
10
20
30
40
50
60
70
80
90
1926-1945 1946-1965 1966-1985 1986-2005Time Period
Bas
in C
har
acte
rist
ic P
reci
p,
cm
0
10
20
30
40
50
60
70
80
90
Ba
sin C
haracteristic R
un
off, cm
Tribs of Lake Superior Rainy RiverRed River Mississippi HeadwatersMinnesota River Upper Mississippi
Figure 25: Average precipitation (black) and average runoff (white) in specific river basins of Minnesota over four time periods.

F - 26
Figure 26: Geographic distribution of average runoff coefficients for the 1946-1965 time period.

F - 27
Figure 27: Geographic distribution of average runoff coefficients for the 1986-2005 time period.

F - 28
Figure 28: Geographic distribution of average runoff coefficient change (in percent) between the 1946-1965 and 1986-2005 time periods.

F - 29
Figure 29: Geographic distribution of average annual precipitation for the 1946-1965 time period.

F - 30
Figure 30: Geographic distribution of average annual precipitation for the 1986-2005 time period.

F - 31
Figure 31: Geographic distribution of average annual precipitation change (in cm) between the 1946-1965 and 1986-2005 time periods.

F - 32
Figure 32: Geographic distribution of average annual precipitation change (in percent) between the 1946-1965 and 1986-2005 time periods.

F - 33
Figure 33: Geographic distribution of average annual runoff for the 1946-1965 time period.

F - 34
Figure 34: Geographic distribution of average annual runoff for the 1986-2005 time period.

F - 35
Figure 35: Geographic distribution of average annual runoff change (in cm) between the 1946-1965 and 1986-2005 time periods.

F - 36
Figure 36: Geographic distribution of average annual runoff change (in percent) between the 1946-1965 and 1986-2005 time periods.

F - 37
0
10
20
30
40
50
60
70
80
90
1890 1900 1910 1920 1930 1940 1950 1960 1970 1980 1990 2000 2010Year
Pre
cip
, cm
-100
100
300
500
700
900
1100
1300
1500
Flo
w, m
3/s
Precip Flow
Figure 37: Historical annual flow and precipitation records for the Mississippi River at St. Paul, MN.

F - 38
y = 0.007x - 0.31R2 = 0.71
0
0.05
0.1
0.15
0.2
0.25
0.3
50 55 60 65 70 75 80 85Precip, cm
Ru
no
ff C
oef
fici
ent,
cm
/cm
Figure 38: Runoff coefficient vs. precipitation for the Mississippi River at St. Paul, MN for the 5-year running average time scale.

F - 39
y = 0.03x + 0.16R2 = 0.66
0
0.05
0.1
0.15
0.2
0.25
0.3
-5 -4 -3 -2 -1 0 1 2 3 4 5PDSI
Ru
no
ff C
oef
fici
ent,
cm
/cm
Figure 39: Runoff coefficient vs. PDSI for the Mississippi River at St. Paul, MN for the 5-year running average time scale.
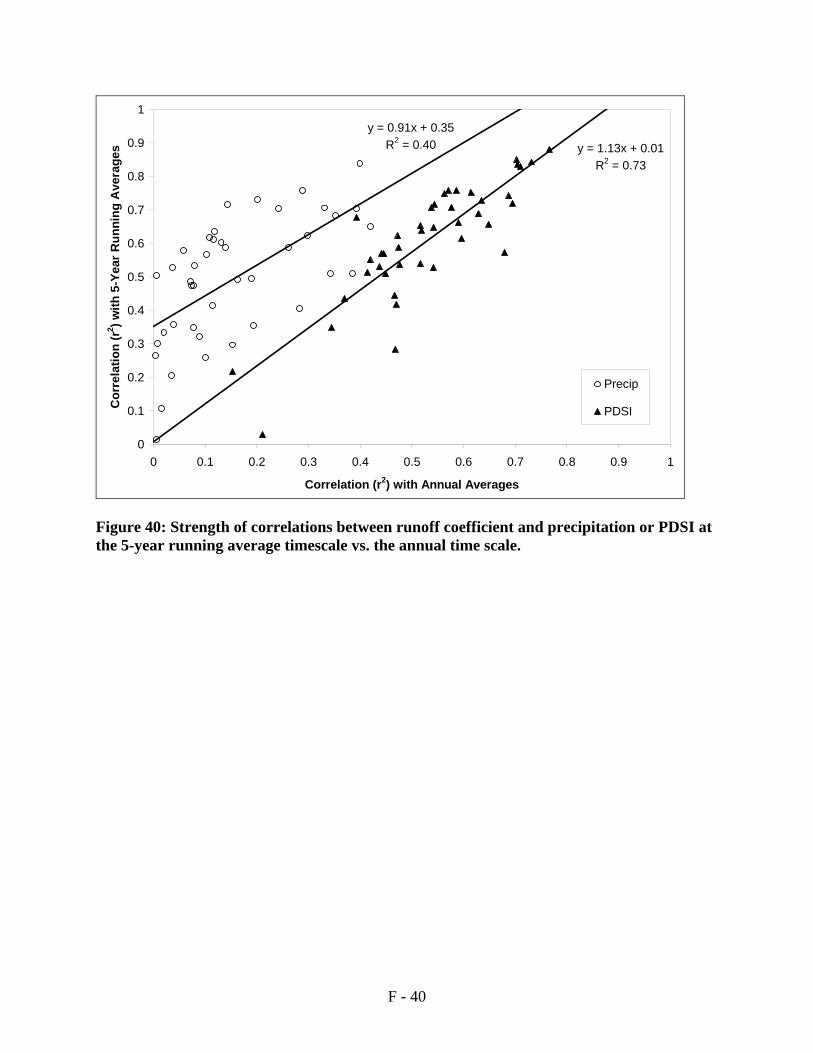
F - 40
y = 0.91x + 0.35R2 = 0.40 y = 1.13x + 0.01
R2 = 0.73
0
0.1
0.2
0.3
0.4
0.5
0.6
0.7
0.8
0.9
1
0 0.1 0.2 0.3 0.4 0.5 0.6 0.7 0.8 0.9 1
Correlation (r2) with Annual Averages
Co
rrel
atio
n (
r2 ) w
ith
5-Y
ear
Ru
nn
ing
Ave
rag
es
Precip
PDSI
Figure 40: Strength of correlations between runoff coefficient and precipitation or PDSI at the 5-year running average timescale vs. the annual time scale.

F - 41
Note: 1 in = 25.4 mm and 1.8 oF = 1.0 oC Figure A.1: Annual average temperatures and annual precipitation in Minnesota for the period 1895-2007. Study time periods 1946-1965 and 1986-2005 are highlighted in gray. (From Dadaser-Celik and Stefan (2009)).

A - 1
APPENDIX: DESCRIPTION OF MINNESOTA’S RIVER BASINS AND CLIMATE
The following descriptions of Minnesota’s major river basins and climate are provided by
Dadaser-Celik and Stefan (2009).
A.1 Study Area
Minnesota is located in the Upper Midwest of the U.S. is in the headwaters of three
continental drainage systems, although its elevation is relatively low, ranging from about 180 m
(600 ft) to 690 m (2300 ft) amsl. The state’s drainage area is 223,000 km2 (87,000 square miles).
Major rivers and river basins, as well as USGS stream gauging stations are shown in Figure 1.
Ice sheets sculpted most of the states current landscape; the last glaciation ended 12,000 years
ago. Glaciers covered all of Minnesota except the far southeast, known as the Driftless Area and
left behind 15 m (50 ft) or more of glacial till as they retreated (Ojakangas, 2001).
Besides being the Land of 10,000 Lakes (11,840 lakes over 10 acres in size) Minnesota
also has about 42,900 km² of wetlands, and 6,560 natural streams and rivers that cumulatively
flow for 111,000 km (69,000 miles). Because continental divides meet in north-central
Minnesota, surface runoff can follow the Mississippi River south to the Gulf of Mexico, the St.
Lawrence Seaway east to the Atlantic Ocean, or the Hudson Bay watershed to the Arctic Ocean.
The Mississippi River begins at Lake Itasca and is joined by the Minnesota River at Fort
Snelling, by the St. Croix River near Hastings, by the Chippewa River at Wabasha, and by many
smaller streams. The Red River of the North drains the northwest part of the state northward
toward Hudson Bay and the Rainy River forms the U.S. border with Canada.

A - 2
Minnesota’s streams and rivers were described by Waters (1977), and are important as
wildlife habitat, for recreation, as a source of water supply, and as recipients of waste water.
There are five major river basins of substantially different geologic, topographic, ecologic and
land use characteristics. The five basins are named after the Minnesota River, the Red River of
the North, the Rainy River, Lake Superior and the Upper Mississippi River, and are
hydrologically quite different. They will be described and analyzed below.
The Minnesota River Basin covers about 16,770 square miles, and is located in southern
Minnesota (http://mrbdc.mnsu.edu/mnbasin/fact_sheets/fastfacts.html), except for small portions
that extend into South Dakota and Iowa (Figure 1). 92% of the basin area is used for agriculture.
A large range of climatic, hydrologic, landscape and soil characteristics can be seen in the
Minnesota River Basin. Annual precipitation ranges from 22 inches in the northwestern to 32
inches in the southeastern portion of the basin. Annual runoff ranges from 2 inches in the west to
6 inches in the east (http://www.soils.umn.edu/research/mn-river/doc/mbtext.html). Soil drainage
ranges from well drained to poorly-drained. The basin includes an extensive network of
agricultural drainage tiles and man-made ditches. Other hydrologic features include lakes,
wetlands, and permanent and intermittent streams. Sediments deposited during recent glacial
recessions are continuing to be eroded. Erosion potential of agricultural cropland and stream
banks is significant. The Minnesota River valley was formed by the post-glacial River Warren
which drained the former gigantic Lake Agassiz southward towards the Mississippi River.
The Red River of the North Basin comprises 37,100 square miles of land in Minnesota,
South Dakota and North Dakota. 17,730 square miles of it is in Minnesota. The majority of the
land in the Minnesota is used for agriculture (66%), some land on the fringes of the basin is
covered by forests (12%), and some is urban land (8%) mostly in North Dakota (Paakh et al.,

A - 3
2006). The Red River flows towards the north across the lakebed of the former Lake Agassiz.
The river itself began after Lake Agassiz drained, about 9,500 years ago. The river’s floodplain
is remarkably flat and has a gradient of about 1:5000 from its origin in Minnesota to the
international border. When water levels of Red River rise, “overland flooding” appears across
the floodplain. Several floods occurred in the Red River of the North Basin in the past following
heavy snows or rains on saturated or frozen soil and they were often made worse when snowmelt
started in the warmer south, and northward flowing water was dammed or slowed by ice
(http://en.wikipedia.org/wiki/Red_River_of_the_North).
The Rainy River Basin covers a total area of 27,114 square miles, of which 11,244
square miles are located in northern Minnesota, and the remainder in Ontario, Canada. The
majority of the Rainy River Basin is covered by forests, lakes, and wetlands (MPCA, 2001). The
Rainy River drains Rainy Lake and discharges into Lake of the Woods, a distance of about 135
km (85 miles). The basin is in the Canadian Shield region, and is characterized by thin soil
covers. Most of the water storage is in surface water bodies.
The Lake Superior Watershed Basin in Minnesota is 6,200 square miles in size, and is
covered mainly by forests, with little agriculture and several urban areas. It is also in the
Canadian Shield formation.
The Upper Mississippi River Basin covers 30,800 square miles entirely within the state
of Minnesota. Land cover in this part of the Upper Mississippi River Basin ranges from conifer
and hardwood forests to agriculture where corn, soybean, and forage crops are cultivated
(MPCA, 2000). In St. Paul the Minnesota River discharges into the Mississippi River and puts its
imprint on Mississippi River flows. Downstream from St. Paul the St. Croix River, which drains
portions of eastern Minnesota and western Wisconsin, enters the Mississippi River at Prescott,

A - 4
WI. Downstream from Prescott additional portions of western Wisconsin and southeastern
Minnesota become part of the Mississippi River drainage (Figure 1). The Twin Cities
metropolitan area is in the Mississippi River drainage.
A small piece of southwestern Minnesota (Figure 1) drains into the Missouri River, and
another into the Upper Mississippi River through Iowa; both are not included in the study.
A.2 Climate
Minnesota has a continental climate with cold winters and warm summers. The state's
location in the Upper Midwest causes a wide variety of weather with four distinct seasons.
Normal precipitation is lowest in winter (1-3 inches in Dec to Feb) and highest in summer (9 to
13 inches in June to Aug). Mean annual precipitation for the entire state has been on the rise
(Figure A.1) and has reached approximately 28 inches/yr. The lowest annual average
precipitation (510 mm or 20 in/yr) occurs in the northwest of the state and the highest (890 mm
or 35 in/yr) in the southeast. Snow is the main form of precipitation from Nov to March, and a
snow cover of 1inch (25mm) or more exists for 110 days per year on average.
Average annual air temperature for the state has risen to 5.5 oC or 42 oF, but mean annual
air temperatures in the north (3oC or 37.4 oF in International Falls) and in the south (9 oC or 49 oF
in Winona) are substantially different. Minnesota extends from 43o34’ to 49o23’ latitude, a
distance of 650 km (407 miles), and is divided into 9 climate divisions shown in Figure 3.
Climate (precipitation and air temperature) in the five major river basins differs substantially
because of geographic location, and seasonal variations are significant as well.