annual statistical digest - st. louis fed · the annual statistical digest is designed as a compact...
TRANSCRIPT

Board of Governors of the Federal Reserve System, Washington, D.C.
ANNUAL STATISTICAL DIGEST
1980
Digitized for FRASER http://fraser.stlouisfed.org/ Federal Reserve Bank of St. Louis

November 1981
Copies of this publication may be obtained from Publications Services, Board ofGovernors of the Federal Reserve System, Washington, D.C. 20551. The price is$10.00 per copy. Remittances should be made payable to the order of the Board ofGovernors of the Federal Reserve System in a form collectible at par in U.S.currency. Stamps and coupons are not accepted.
Digitized for FRASER http://fraser.stlouisfed.org/ Federal Reserve Bank of St. Louis

Preface
The ANNUAL STATISTICAL DIGEST is designed as acompact source of economic-and, especially, financial-data. The object is to lighten the burden of assemblingtime series by providing a single source of historical con-tinuations of the statistics carried regularly in the FederalReserve Bulletin. The DIGEST also offers a continuationof series that formerly appeared regularly in the Bulletin,as well as certain special, irregular tables, which theBulletin also once carried. The domestic nonfinancialseries included are those for which the Board of Gover-nors is the primary source.
This issue of the DIGEST covers only 1980 unless datawere revised for earlier years. It serves to maintain thehistorical series first published in Banking and MonetaryStatistics, 1941-1970, and the DIGEST, 1970-1979. Seriesoriginating at the Board or in U.S. government agencies
include revisions to all the data available through August1981; for others, revisions are complete through mid-July. The current coverage of the series, any changes inthe coverage, and other pertinent details are given inPart 3-Notes to Tables.
The numbering system for the tables contained in thisissue differs slightly from those in previous issues of theDIGEST and in the Bulletin. As a guide to tables that coverthe same material in these three publications, theBoard's staff has prepared a concordance, which isavailable free of charge on request from PublicationsServices, Board of Governors of the Federal ReserveSystem, Washington, D.C. 20551.
Please note that the index refers to table numbers, notpage numbers.
Digitized for FRASER http://fraser.stlouisfed.org/ Federal Reserve Bank of St. Louis

Symbols and Abbreviations
CDs Certificates of deposit SMSAsFHA Federal Housing Administration VAIPCs Individuals, partnerships, and corporations *n.e.c. Not elsewhere classifiedNOW Negotiable order of withdrawalREITs Real estate investment trustsRPs Repurchase agreementsSDR Special drawing right n.a.
Standard metropolitan statistical areasVeterans AdministrationAmount is less than one-half the smallestunit in the table (for example, less than50,000 when the unit is millions and data areshown to one decimal place).Not applicableNot available
"U.S. government securities" may include issues of U.S. government agencies."State and local government" also includes municipalities, special districts, and other political subdivisions.In some of the tables details do not add to totals because of rounding.
Digitized for FRASER http://fraser.stlouisfed.org/ Federal Reserve Bank of St. Louis

Contents
Unless specifically noted in the "Contents," the data shown in this issue of the DIGEST are for 1980. The exceptions areindicated in parentheses after the table titles.
Part 1-Regular Tables
1. Monetary and credit aggregates and interest ratesA.l. Quarterly changes (monetary and credit aggregates) (1977-80) 3A.2. Quarterly (interest rates) 3B. Monthly changes (monetary and credit aggregates only) (1977-80) 4
2. Factors affecting member bank reservesA. Annual and monthly averages 6B. Weekly averages of daily figures 7C. Wednesday figures 10D. End-of-year and end-of-month figures 13
3. Reserves and borrowings of member banksA. Annual and monthly averages 14B. Weekly averages of daily figures 15
4. Federal funds and repurchase agreements of large member banks 205. Federal Reserve Bank interest rates
A. Short-term adjustment credit to depository institutions 22B. Extended credit to depository institutions 22C. Emergency credit to all others under last paragraph of Section 13 23
6. Depository institutions reserve requirements 237. Margin requirements (1968-80) .. 248. Maximum interest rates payable on time and savings deposits at federally insured institutions 249. Federal Reserve open market transactions 25
10. Federal Reserve BanksA. Consolidated condition statement 26B. Federal Reserve note statement 28C. Maturity distribution of loans and securities held 28
11. Demand deposits, debits, and deposit turnover, by major banking group (1979-80)A. Seasonally adjusted 29B. Not seasonally adjusted 29
12. Savings deposits, debits, and deposit turnover, by type of depositor (1979-80) 3013. Measures of the money stock (1977-80)
A. Seasonally adjusted 31B. Not seasonally adjusted 32
14. Aggregate reserves of depository institutions and member bank depositsA. Reserves 33B. Deposits 33
15. Loans and securities of all commercial banks (1979-80) 34
Digitized for FRASER http://fraser.stlouisfed.org/ Federal Reserve Bank of St. Louis
Contents - continued
16. Commercial bank assets and liabilities-Last-Wednesday-of-month series (1979-80)A. Domestically chartered commercial banks 36B. All commercial banking institutions 38
17. Insured commercial banks with assets of $100 million or over-Domestic and foreign officesA. March 31, 1980 40B. June 30, 1980 42C. September 30, 1980 44D. December 31, 1980 46
18. Insured commercial banks with assets of $100 million or over-Domestic officesA. March 31, 1980 48B. June 30, 1980 50C. September 30, 1980 52D. December 31, 1980 54
19. Insured commercial bank assets and liabilities-Domestic officesA. March 31, 1980 56B. June 30, 1980 58C. September 30, 1980 60D. December 31, 1980 62
20. All large weekly reporting commercial banksA. Assets and liabilities 64B. Balance sheet memoranda 70C. Total commercial and industrial loans classified by industry 72
21. Gross demand deposits of individuals, partnerships, and corporations 7222. Commercial paper and bankers dollar acceptances outstanding
A. Commercial paper, seasonally adjusted (1970-80) 73B. Bankers dollar acceptances, not seasonally adjusted 75
23. Prime rate charged by banks on short-term business loans 7524. Terms of lending at commercial banks-Based on survey of loans made 7625. Interest rates in money and capital markets
A. Annual and monthly averages 77B. Weekly averages 78
26. Stock market-Selected statisticsA. Stock prices and trading 83B. Customer financing 83C. Margin-account debt at brokers 83D. Special miscellaneous-account balances at brokers 84
27. Selected assets and liabilities of savings institutionsA. Savings and loan associations (1979-80) 84B. Mutual savings banks (1979-80) 85C. Life insurance companies 86D. Credit unions (1979-80) 86
28. Federal fiscal and financing operations 8729. U.S. budget
A. Receipts 88B. Outlays 89
30. Federal debt subject to statutory limit-Types and ownership 9031. Gross public debt of the U.S. Treasury-Types and ownership 90
Digitized for FRASER http://fraser.stlouisfed.org/ Federal Reserve Bank of St. Louis

32. U.S. government marketable securities-Ownership, by maturityA. All maturities 91B. Total maturing within 1 year 91C. Bills maturing within 1 year 91D. Other than bills maturing within 1 year 92E. 1- to 5-year maturities 92F. 5- to 10-year maturities 92G. 10- to 20-year maturities T 93H. Over 20-year maturities 93
33. U.S. government securities dealersA, Transactions 94B. Positions '. 97C.I. Sources of financing 98C.2. Financing 98
34. Debt of federal and federally sponsored credit agencies 9935. New security issues of state and local governments 10036. New security issues of corporations 10137. Open-end investment companies , 10138. Corporate profits and their distribution (1970-80) 10239. Current assets and liabilities of nonfmancial corporations (1976-80) 10340. Total nonfarm business expenditures on new plant and equipment (1970-80) 10441. Domestic finance companies-Assets and liabilities 10642. Business credit of domestic finance companies
A. Accounts receivable , 106B. Extensions and repayments 106
43. Mortgage markets 10744. Mortgage debt outstanding, by type of holder and type of property (1978-80) 10845. Installment credit-Total outstanding, and net change 11046. Installment credit-Extensions and liquidations 11247. Flow of funds accounts-Financial assets and liabilities, December 31,1980
A. All sectors , 114B. Private nonbank financial institutions, r , . , . , . . , . , 116
48. Flow of funds accounts, 1971-80A. Summary of credit market debt outstanding, by sector 118B. Direct and indirect claims on credit market debt 120C. Sector statements of financial assets and liabilities T 122
49. Selected measures of nonfmancial business activity 12450. Output, capacity, and capacity utilization (1979-80)
A. Output 125B. Capacity 125C. Capacity utilization 125
51. Industrial production (1979-80) 12652. Summary of U.S. international transactions (1979-80) 13053. U.S. reserve assets (1979-80) 13154. Selected U.S. liabilities to foreign official institutions (1978-80)
A. By type 132B. By area 133
Digitized for FRASER http://fraser.stlouisfed.org/ Federal Reserve Bank of St. Louis

Contents - continued
55. Liabilities to foreigners, payable in U.S. dollars, reported by banks in the United States(1978-80)A. By holder and type of liability ; 134B. By area and country 138
56. Banks' own claims on foreigners, payable in U.S. dollars, reported by banks in the United States(1978-80) ; . . ' . 142
57. Banks' own and domestic customers' claims on foreigners, payable in U.S. dollars, reported bybanks in the United States (1978-80) 145
58. Banks' own claims on unaffiliated foreigners, payable in U.S. dollars, reported by banks in theUnited States (1978-80) 147
59. Liabilities to and claims on foreigners, payable in foreign currencies, reported by banks in theUnited States (1978-80) 148
60. Marketable U.S. Treasury bonds and notes-Foreign holdings and transactions (1978-80) 14861. Foreign official assets held at Federal Reserve Banks 15162. Foreign transactions in securities (1978-80) 15263. Liabilities to unaffiliated foreigners, reported by nonbanking business enterprises in the
United States (1978-80) 15564. Claims on unaffiliated foreigners, reported by nonbanking business enterprises in the
United States (1978-80) 15665. Assets and liabilities of foreign branches of U.S. banks 15766. Claims on foreign countries held by U.S. offices and foreign branches of U.S.-chartered banks
(1978-80) . 15967. Discount rates of foreign central banks 16068. Foreign short-term interest rates 16069. Index of weighted-average value of U.S. dollar 16070. Foreign exchange rates 161
Part 2-Special Tables
71. Statement of condition of Federal Reserve Banks, December 31, 1980 16572. Earnings and expenses of Federal Reserve Banks 16873. Banks and branches-Number in operation, December 31, 1980, by state 17074. Number of par banking offices 17275. Banking offices in the United States-Number, and changes in number
A. Banks (head offices)* by type. 172B. Branches, additional offices, and facilities, by type of bank 173
76. Changes in offices of commercial banks and nondeposit trust companies during 1980-Summary,by state 174
77. Percentage of total assets and total deposits held by 10 largest banking organizations (allcommercial banks and trust companies), by state 175
Digitized for FRASER http://fraser.stlouisfed.org/ Federal Reserve Bank of St. Louis

78. Banking offices, assets, and deposits of banks in holding company groupsA. Summary totals and comparisons 186B. Multibank and one-bank classifications-Summary 186C. Details by state 187D. Multibank, one-bank, and all commercial bank comparisons by state 194
79. Consolidated report of incomeA. All insured commercial banks 201B. Insured commercial banks with foreign offices 204
80. Income, expenses, and dividends of member banks, by Federal Reserve DistrictA. All member banks 206B. Large banks 208C. Other-than-large banks 210
81. Selected assets and liabilities of minority-owned banks, by size of bank, December 31, 1980 21282. Denominations of U.S. currency in circulation 21383. Assets of pension funds
A. Totals for private and public funds 213B. Types held by private noninsured funds 213
84. Finance rates on selected types of installment credit 21385. Security credit reported by nonbank lenders subject to margin regulations, June 30, 1980 21386. Detailed debit and credit balances at brokers carrying margin accounts 21487. Commitments of life insurance companies for income-property mortgages (1979-80) 215
Part 3-Notes to Tables
Notes to regular tables 219Notes to special tables 234
Part 4-Index to Tables
Index to-tables 239
Digitized for FRASER http://fraser.stlouisfed.org/ Federal Reserve Bank of St. Louis

Part 1-Regular Tables
Digitized for FRASER http://fraser.stlouisfed.org/ Federal Reserve Bank of St. Louis

1. Monetary and credit aggregates and interest ratesA.I. Quarterly changes (monetary and credit aggregates)Annual rate of change, seasonally adjusted, in percent1
Member bank reserves1 Total2 Required .3 Nonborrowed . . . .4 Monetary base2
Concepts of money and liquid assets'*5 Ml-A6 Ml-B7 M2 . . .8 M39 L .. .
Time and savings depositsCommercial banks
10 Total. .11 Savings4
12 Small-denomination time^13 Large-denomination time6.14 Thrift institutions7
15 Total loans and securities at commercial banks^
Member bank reserves1 Total2 Required3 Nonborrowed4 Monetary base2
Concepts of money and liquid assets^5 Ml-A6 Ml-B7 M28 M39 L
Time and savings depositsCommercial banks
10 Total11 Savings4 . *12 Small-denomination time^13 Large-denomination time**14 Thrift institutions7
15 Total loans and securities at commercial banks8
Qi
4 34.64 27.3
9.095
14212.811 9
11.021 910.7-4214 9
10 5
Ql
—3 0-2.9-3 5
6.6
45 57.895
12 1
80-13 0
19.5196100
16.4
19
Q2
3.33.82.17.6
6.97.1
11.211.511.6
9.49.4
12.95.5
129 '
103
19
Q2
-2 9-2.8-7.3
5.6
7.110210.29.5
13 1
2.0-7.721.5-6.2
74
11.5
77
Q3
6.55.9
.59,0
6.46.89.7
11.912.4
10.95.47.2
23.813 8
106
79
Q3
5 35.07.59.3
7.89 1
10.210.7124
9.7-3.224.6
8.173
13.8
Q4
4.54.71.68.1
8.18.69.1
11.912.8
10.64,62.1
29.112 8
11 1
Q4
11 110.44.68.6
4.0466.17.98 1
10.8-16.8
30.716.85 1
8.8
Ql
9.69.5
16.010.2
7.2758.0
10.811.5
12.54 65.7
30.610 1
11 7
Ql
4 35.13 38.4
5.2688.79 199
8.7-160
27.51044 3
9.9
19
Q2
6.26.9
i8.6
8.89 27.7
11.412.1
13.92 85.9
36.690
13 0
19
Q2
4.7
7 45.6
-5.0-3 1
5.15.968
10.6-21 8
32.813 14 7
.1
78
Q3
676.74.48.5
7.77 98.1
10.411.2
11.9-1 812.128010 1
126
80
Q3
675.8
1249.5
11 413 915.413 1100
6.122 12.1
-1210 1
6.7
Q4
1.91.74.57.8
5.27,18.7
10.511.9
9.4-3.914.419.510.9
13.6
Q4
16.515.27.2
10.6
8.11088.1
11.311 5
15,41.6
16.225.49.7
14.6
A.2. Quarterly (interest rates)Level, percent per annum
Short-term rates1 Federal funds9
2 Discount window borrowing^3 Treasury bills (3-month market yield)11
4 Commercial paper (3-month)11-
Long-term ratesBonds
5 U S government1-^6 State and local government14
7 Aaa utility (new issue)1^8 Conventional mortgages16
Ql
15 0512 5113.3514.54
11 788.23
13.2214.32
19
Q2
126912459.62
11.18
10 587.95
11.7712.70
80
Q3
9 8310 359.159.65
10 958.58
12.2013.12
Q4
15.8511 7813.6115.26
12239.59
13.4914.62
Digitized for FRASER http://fraser.stlouisfed.org/ Federal Reserve Bank of St. Louis
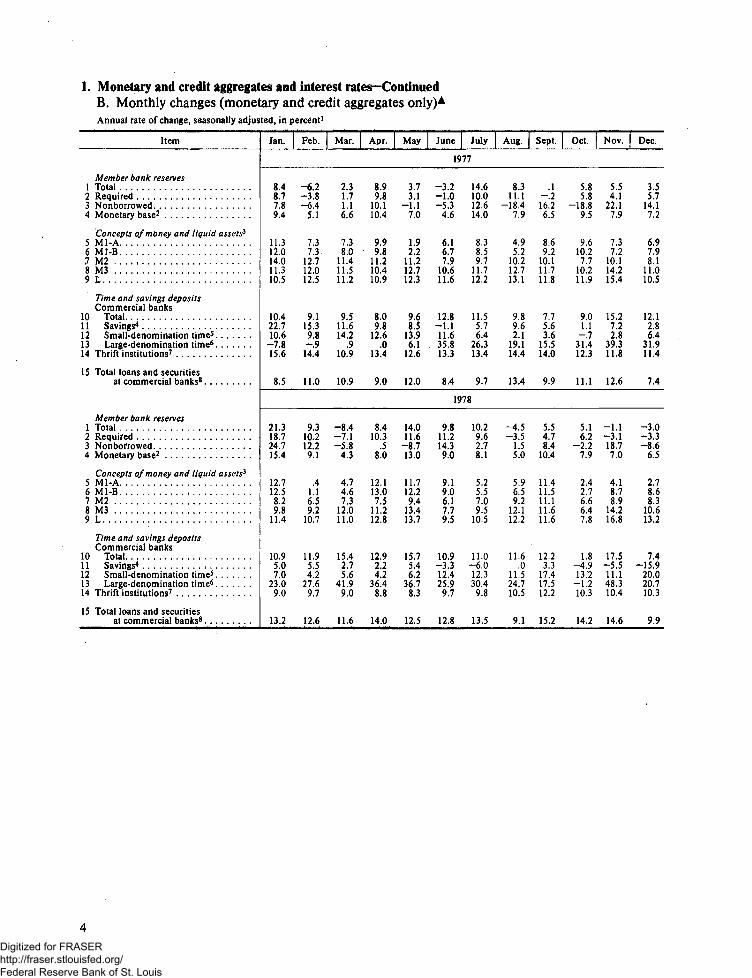
1. Monetary and credit aggregates and interest rates—ContinuedB. Monthly changes (monetary and credit aggregates only)*Annual rate of change, seasonally adjusted, in percent1
Item
Member bank reserves1 Total . . . . . . .2 Required3 Nonborrowed4 Monetary base^ .
Concepts of money and liquid assets*5 Ml-A ,6 Ml-B7 M2 t , .8 M39 L
Time and savings depositsCommercial banks
10 Total11 Savings4
12 Small-denomination time^13 Large-'denomination time**14 Thrift institutions7
15 Tptal loans and securitiesat commercial banks*
Member bank reserves1 Total2 Required .3 Nonborfowed.4 Monetary base2 *
Concepts of money and liquid assets*5 Ml-A6 Ml-B, , i • •7 M28 M39 L
Time and savings depositsCommercial banks
10 Total
12 Small-denomination time^13 Large-denomination time*"14 Thrift institutions7
15 Total loans and securitiesat commercial banks8
Jan.
848.7789,4
11 312.014011.3105
10422.7106
-7.815 6
8.5
21.318724.7154
12712 5829.8
11.4
10.95 07 0
23,090
13.2
Feb.
-62^3.8—64
5.1
737.3
12712.0125
9 115398-.9144
11,0
9.310212,29 1
41 16.59.2
10.7
11.95 54 2
27.697
12.6
Mar.
2.31.71.16.6
7.38.0
11,411.511.2
9.511.6142
,910.9
10.9
-8.4-7.1-5.8
4.3
4.74 67,3
12.011.0
15.42 756
41.99.0
11.6
Apr.
8.99.8
10.110,4
9.99.8
11.210.410.9
809.8
126.0
134
9.0
8.4103
,58.0
12 113 075
11.212,8
12.92 24 2
36.48 8
14.0
May
3,73.1
-1.17.0
1.92.2
11.212.712.3
9.68.5
1396.1
126
12.0
14.011 6
-8.713.0
11.715,29.4
13.413.7
15.75 46 2
36.783
12.5
June
19
-3.2-1.0-5,3
4.6
6.16.77.9
10.611.6
128-1.111 635.8133
8.4
19
9.811 214.39.0
9 1906.17.79,5
10.9-3 312425.997
12.8
July
77
14.610.012.614.0
8 38.597
11.712,2
11 55.764
26.3134
9.7
78
10.2962.78.1
5.25 5709.5
10.5
11.0-6 012 330.4
9 8
13.5
Aug.
8.311.1
-18.47.9
4 95.2
10212.713 1
9 89.62 1
19.1144
13.4
-4.5-3 5
1.55.0
5 96592
12.112.2
11.6o11 524.7105
9.1
Sept.
.1-216.26.5
869.2
10 111.711 8
7 75.636
15.5140
9.9
5.54 78.4
104
11 411 511 111.611 6
12.23 3
17417.5122
15.2
Oct.
5 85.8
-1889.5
9610.27 7
10.211 9
901.1
— 731.4123
11.1
5.162
-2.27.9
2 42 7666.47,8
1.8—4 913 '2
-1.2103
14,2
Nov.
5.54.1
22.17.9
7.37.2
10.114.215.4
15,27.22,8
39.311.8
12.6
-1.1-3.118.77.0
4.18 78.9
14.216.8
17.5—5 511 148.310.4
14.6
Dec.
3.55.7
14.17.2
6.97.98.1
11.010.5
12 12.864
31.911.4
7.4
-3.0-3.3-8.6
6.5
2.78 68.3
10.613.2
7.4—15 9
20020.710.3
9.9
Digitized for FRASER http://fraser.stlouisfed.org/ Federal Reserve Bank of St. Louis

1. Monetary and credit aggregates and interest rates—ContinuedB. Monthly changes (monetary and credit aggregates only)A-ContinuedAnnual rate of change, seasonally adjusted, in percent1
Item
Member bank reserves1 Total . . . .2 Required3 Nonborrowed4 Monetary base^
Concepts of money and liquid assets*5 Ml-A6 Ml-B7 M28 M39 L
Time and savings depositsCommercial banks
10 Total11 Savings4
12 Small-denomination time^13 Large-denomination time**14 Thrift institutions7
15 Total loans and securitiesat commercial banks'* .
Member bank reserves1 Total . . . .2 Required3 Nonborrowed4 Monetary base^
Concepts of money and liquid assets3
5 Ml-A6 Ml-B7 M28 M39 L
Time and savings depositsCommercial banks
10 Total .1 1 Savings4
12 Small-denomination time^13 Large-denomination time**14 Thrift institutions7
15 Total loans and securitiesat commercial banks8
Jan. | Feb.
5.3 -15.960 -158
.9 -15.3103 17
-3.4 -1.420 3.66.4 7.57 7 8 7
10.4 10.5
10.7 2.9-167 -11.3
28.5 11.222 6 9.4
9.7 10.0
25 0 13.5
2 6 -2.25 2 —10
10.5 -16.1111 7.4
5 5 906.8 12.8
106 11.5111 13 113.2 13.4
92 11 5-9.9 -16.923 4 23.410.0 22.44 2 4.0
13.4 17.8
Mar.
-3.9-22-4.6
5 1
6.89 8
10.193
12.7
1.3-8014.1-1 1
9.5
9 1
2 53 3
-36.666
-22-.64 85 06.3
11 0-32.3
41 213.02 0
3.9
Apr.
0
-1.51.66.5
13.518.211.710.012.8
2.5-9.826.1-7.7
6.0
13.8
1.3.9
14.11.8
-20.4-17.2
-4.6—1 14.2
13.8-43.6
51.917.72.3
-3.0
May
.61 8
-28.755
-1,30
8.28 5
12.7
1.7-4624.3
-12.75.1
8.6
-.0— 4
48.19 1
1 0.9
11 31057.2
9 2-4.714.613.088
-6.7
June
19
-1.1-3.811.17.7
13.412.811.410.716.5
1.7-3.523.9
-14.58.2
12.8
19
-.8-1 620.2
5.9
10.411.016.11257.8
1.724.4-1.3
-11.39.6
-2.6
July
79
8.386
17.399
9.611.710.295
10.1
12.0-1.221.715.37.4
14.2
80
3.59
3.18.8
9 613.418.613 69.5
2 633.2-1.8
-15.49.7
7.7
Aug.
8.27.9
11.511.0
5.37.2
10.211.710.3
14.8-2.326.919.67.0
12.0
15.314.97.0
14.2
19.822.814.415.214.2
11.022.6
2.212.111.3
18.0
Sept
8.09.1-.510.6
5.25.99.2
13.613.9
16.1-9.325.829.77.3
22.3
21.322.9
.78.8
11,314.58.49.69,2
12.37.07.5
22.510.5
12.6
Oct.
17.815.1
-5.09.2
2.02.53.26.26.6
9.6-24.1
28.421.53.1
7.0
5.26.85.49.3
11.513.16.69.89.1
10.01.3
11.315.2
8.2
13.0
Nov.
3.54.57.84.7
4.94.75.03.64.4
°8.6-23.4
42.52.64.4
-2.0
35.927.013.215.7
3.78.1
10.514.415.8
25.56.9
29.834.4
9.7
17.6
Dec.
14.812.230.5
7.7
4.95.66.46.55.9
3.6-13.5
20.81.16.0
5.4
1.6.0
13.43.8
-11.0-10.0
.67.9
10.8
20.4-39.5
32.551.310.1
12.9
Digitized for FRASER http://fraser.stlouisfed.org/ Federal Reserve Bank of St. Louis

2. Factors affecting member bank reservesA. Annual and monthly averages, 1980Millions of dollars
Factor
SUPPLYING RESERVE FUNDS
1 Reserve Bank credit outstanding . . , ,
2 U S government securities1
3 Bought outright . . . .4 Held under repurchase agreements5 Federal agency securities6 Bought outright7 Held under repurchase agreements8 Acceptances. . . . , . . . . . . . .9 Loans
10 Float11 Other Federal Reserve assets
12 Gold stock13 Special drawing rights certificate account. . . .14 Treasury currency outstanding2
ABSORBING RESERVE FUNDS
15 Currency in circulation16 Treasury cash holdings
Deposits, other than member bank reserves,with Federal Reserve Banks
17 Treasury18 Foreign19 Other5 . .
20 Other Federal Reserve liabilities and capital. . . . . . .21 Reserve accounts4 . . . . . .
SUPPLYING RESERVE FUNDS
1 Reserve Bank credit outstanding. . . .
2 U.S. government securities1
3 Bought outright. . . . . . . . . . . . . . . .4 Held under repurchase agreements5 Federal agency securities6 Bought outright7 Held under repurchase agreements8 Acceptances9 Loans . . . . . . . . . . .
10 Float11 Other Federal Reserve assets . . . . . . . .
12 Gold stock13 Special drawing rights certificate account. . . . . . . . . . .14 Treasury currency outstanding^
ABSORBING RESERVE FUNDS
15 Currency in circulation . . . . . . . . . . .16 Treasury cash holdings . . . . . .
Deposits, other than member bank reserves,with Federal Reserve Banks
17 Treasury . .18 Foreign19 Other*
20 Other Federal Reserve liabilities and capital21 Reserve accounts4
1980
139,865
119378118798
5808 8188672
146134
1,42044705,645
11 1683030
13,263
127 332499
3015330559
480930,782
Jan.
138,843
117 855117493
36283838 216
167104
1,2645 8135,424
11 1562,064
12,978
122 934441
3 110331434
508032,712
July
141,744
122,060121 662
3988,9378 874
6374
3954 7025,576
11 1723 053
13 305
128,182512
3 119324
1 051
4,70231,384
Feb.
135,485
115028114,842
1868,2998 216
8367
1,6605,6124,818
11 1722,968
13,059
121 591477
3 379322324
4,71331,878
Aug.
139,235
119,092118,823
2698,9788 873
10571
6595 0845,351
11 1723,215
13 310
128,969480
3 297301475
4,48828,923
Mar.
136,504
115 902115,473
4298,3418,212
12976
2,8284,6584,699
11 1722,968
13,132
122 437535
2,773346403
4,88132,400
Sept.
139,993
119,826119,692
1348,8588,809
4942
1,3114 7685,188
11 1703,268
13 344
129,744468
3 237309367
4,48629,164
Apr.
139,098
118 636118,268
3688,9108,833
7755
2,4433,9035,151
11 1722,968
13,209
123 708593
2,647346500
4,99033,663
Oct.
141,695
121,455119,866
1,5899,2068,769
437353
1,3353 7225,624
11 1653,268
13 369
130,582464
3,196284330
4,66529,976
May
139,561
120689120 282
40789748877
9775
1,0283 6425,153
11 1722968
13,258
124 730577
2 828377643
507832,726
Nov.
142,984
120,656119,094
1 5629,0878761
326397
2 15642886,400
11 1633 325
13439
132,787458
2 964314401
4,77229,215
June
141,182
122336121 623
7139,0208 875
145171380
39185,357
11 1722,986
13,288
126334543
2923354
1,378
4.97132,125
Dec.
143,250
119,074118,548
5268,8218743
78124
1 6175 7977,817
11 1613,313
13 409
135,663447
2,722353403
4,88126,664
Digitized for FRASER http://fraser.stlouisfed.org/ Federal Reserve Bank of St. Louis

2. Factors affecting member bank reserves—ContinuedB. Weekly averages of daily figures, 1980Millions of dollars; end-of-week dates
Factor
SUPPLYING RESERVE FUNDS
1 Reserve Bank credit outstanding
2 U S government securities^3 Bought outright4 Held under repurchase agreements5 Federal agency securities6 Bought outright7 Held under repurchase agreements8 Acceptances9 Loans
10 Float11 Other Federal Reserve assets
12 Gold stock13 Special drawing rights certificate account. . . .14 Treasury currency outstanding2
ABSORBING RESERVE FUNDS
15 Currency in circulation16 Treasury cash holdings
Deposits, other than member bank reserves,with Federal Reserve Banks
17 Treasury18 Foreign19 Other'
20 Other Federal Reserve liabilities and capital. .21 Reserve accounts^
SUPPLYING RESERVE FUNDS
1 Reserve Bank credit outstanding
2 U S government securities^3 Bought outright4 Held under repurchase agreements5 Federal agency securities6 Bought outright7 Held under repurchase agreements8 Acceptances9 Loans . . . . . . . . . . .
10 Float1 1 Other Federal Reserve assets
12 Gold stock13 Special drawing rights certificate account. . . .14 Treasury currency outstanding2
ABSORBING RESERVE FUNDS
15 Currency in circulation . . . .16 Treasury cash holdings
Deposits, other than member bank reserves,with Federal Reserve Banks
17 Treasury . . . .1 8 Foreign. . . . . . .19 Other3
20 Other Federal Reserve liabilities and capital. .21 Reserve accounts4
Jan. 2
143,360
119,035117,496
1,53988058,216
589826
1,4317,6425,622
11,1121,800
12,947
125,475426
3,607351820
5,40233 137
Mar. 5
134,863
114 901114,487
41482698,216' 5 3129
2,5064 5614,496
11 1722,968
13 162
121,657521
2,658360356
4,71031,902
Jan. 9
140,973
118,789118,798
08 2168,216
o0
7307,6105,628
11,1211,800
12,956
124,841432
2,812372432
4,74133 219
Mar. 12
134,969
114220113,925
2958 2898,214' 7 5
133,43845044,506
11 1722,968
13 108
122,444525
2,940328385
4,83930,755
Jan. 16
139,548
118 713118,713
082168,216
00
1,2276,0695,324
11,1721,800
12,973
123 368437
3,281283321
5,00632 797
Mar. 19
137,163
115653115,653
08 2118,211
00
3,0005 5994,699
11 1722,968
13 127
122,783532
2,514346535
4,84032,879
Jan. 23
138,063
117,695117,323
37284818,216
26561
1,2035,2665,357
11,1721,800
12,989
122 060444
3,073320346
5,16632 616
Mar. 26
137,181
116837116,638
19984208,211
20936
2,6594 3724,857
11 1722,968
13 146
122,503540
3,243359400
4,92432,499
Jan. 30
135,771
115,644684
8,216241143
1,8193,6145,409
11,1722,801
12,998
121,000453
3,039313313
5,35732 267
Apr. 2
136,944
117,315116,235
1,08084478,211
236187
2,2663 7245,005
11 1722,969
13,193
122,847576
2,211341378
5,04432,878
Feb. 6
134,890
115,570115,570
082168,216
o0
7584,9855,362
11,1722,968
13,040
121,094467
2,976322367
5,05631 790
Apr. 9
137,953
117,629116,987
6428 9408,879
6182
2,3844,0294,890
11,1722,968
13,186
123,807585
2,258379328
4,93332,988
Feb. 13
134,465
114,574114,431
1438,3038,216
8740
1,2394,9815,328
11,1722,968
13,036
121,714475
3,727363286
4,64130436
Apr. 16
137,871
117,688117,688
08,8778,877
00
2,2763,8815,144
11,1722,968
13,209
124,097593
1,256323447
4,90733,597
Feb. 20
137,473
116,924116,383
5418,4688,216
252207
2,1925,2914,390
11,1722,968
13,066
121,962482
3,369335291
4,75633 485
Apr. 23
141,479
120,823119,886
9379,1468,877
269155
2,5533,5405,263
11,1722,968
13,218
123,740593
3,362315625
5,11735,086
Feb. 27
135,559
113,242113,242
082168,216
00
2,0607,7184,323
11,1722,968
13,076
121,533503
3,682217349
4,56431 867
Apr. 30
139,982
119,509119,509
08 8778,877
00
2,6633,6095,324
11 1722,968
13 229
123,280590
3,845365571
5,00733,692
Digitized for FRASER http://fraser.stlouisfed.org/ Federal Reserve Bank of St. Louis
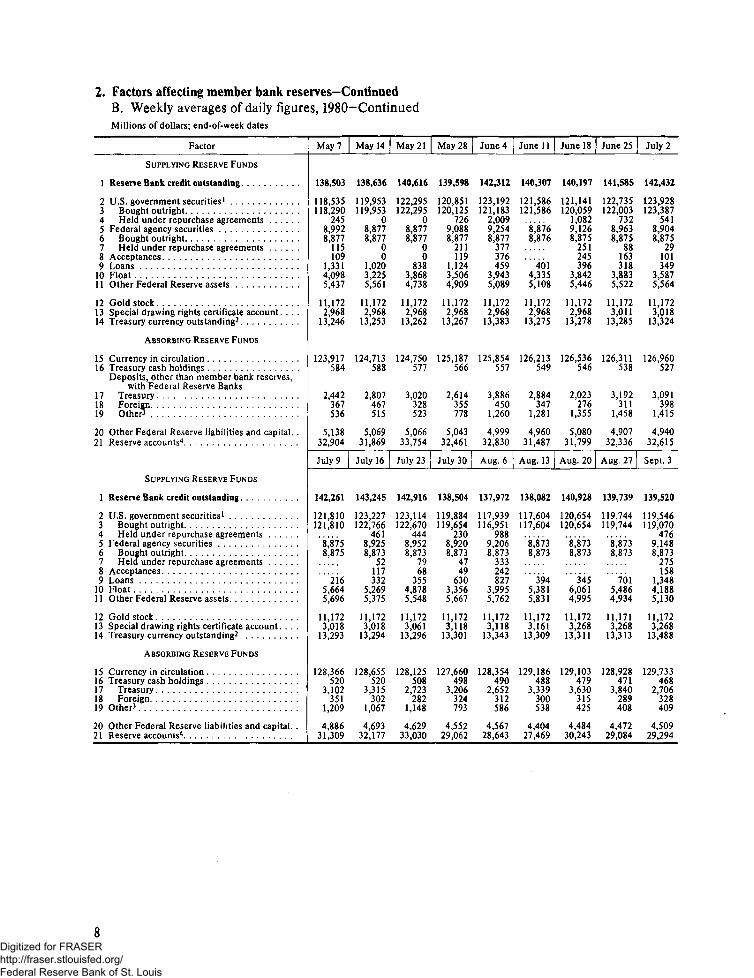
2. Factors affecting member bank reserves—ContinuedB. Weekly averages of daily figures, 1980~ContinuedMillions of dollars; end-of-week dates
Factor
SUPPLYING RESERVE FUNDS
1 Reserve Bank credit outstanding
2 U S. government securities1
3 Bought outright4 Held under repurchase agreements5 Federal agency securities6 Bought outright7 Held under repurchase agreements8 Acceptances .9 Loans
10 Float11 Other Federal Reserve assets
12 Gold stock13 Special drawing rights certificate account. . . .14 Treasury currency outstanding^
ABSORBING RESERVE FUNDS
15 Currency in circulation16 Treasury cash holdings
Deposits, other than member bank reserves,with Federal Reserve Banks
17 Treasury . . .18 Foreign19 Other5
20 Other Federal Reserve liabilities and capital. .21 Reserve accounts4
SUPPLYING RESERVE FUNDS
1 Reserve Bank credit outstanding . . . .
2 U.S. government securities1
3 Bought outright . . .4 Held under repurchase agreements5 Federal agency securities . . .6 Bought outright7 Held under repurchase agreements8 Acceptances9 Loans
10 Float11 Other Federal Reserve assets
12 Gold stock . . .13 Special drawing rights certificate account. . . .14 Treasury currency outstanding^ .
ABSORBING RESERVE FUNDS
15 Currency in circulation16 Treasury cash holdings17 Treasury . . . .18 Foreign19 Other*
20 Other Federal Reserve liabilities and capital. .21 Reserve accounts4
May 7
138,503
118 535118,290
2458,9928 877
115109
13314,0985437
11 1722,968
13246
123 917584
2442367536
5,13832,904
July 9
142,261
121,810121 810
88758 875
2165 6645,696
11 1723,018
13293
128 366520
3 102351
1,209
4,88631,309
May 14
138,636
119,953119,953
o8,8778,877o
01,0203,2255,561
11,1722,968
13253
124713588
2,807467515
5,06931,869
July 16
143,245
123,227122 766
46189258 873
52117332
52695,375
11 1723,018
13294
128,655520
3 315302
1,067
4,69332,177
May 21
140,616
122,295122,295
08,8778,877
00
8383,8684738
11 1722,968
13262
124 750577
3,020328523
5,06633,754
July 23
142,916
123,114122 670
44489528 873
7968
35548785,548
11 1723,061
13296
128 125508
2 723282
1,148
4,62933,030
May 28
139,598
120,851120,125
7269,0888,877
211119
1,1243,5064,909
11,1722,968
13,267
125,187566
2,614355778
5,04332,461
July 30
138,504
119,884119654
2308 9208 873
4749
6303 3565,667
11 1723,118
13,301
127,660498
3 206324793
4,55229,062
June 4
142,312
123,192121,183
2,0099,2548,877
377376459
3,9435 089
11,1722,968
13 383
125 854557
3,886450
1,260
4,99932,830
Aug. 6
137,972
117,939116951
98892068 873
333242827
3 9955,762
11 1723,118
13 343
128,354490
2 652312586
4,56728,643
June 11
140,307
121,586121,586
8,8768,876
4014,3355,108
11,1722,968
13,275
126,213549
2,884347
1,281
4,96031,487
Aug. 13
138,082
117,604117 604
8 8738 873
3945 3815,831
11 1723,161
13,309
129,186488
3 339300538
4,40427,469
June 18
140,197
121,141120,059
1,0829,1268,875
251245396
3,8425,446
11,1722,968
13,278
126,536546
2,023276
1,355
5,08031,799
Aug. 20
140,928
120,654120,654
8,8738 873
3456,0614,995
11 1723,268
13,311
129,103479
3,630315425
4,48430,243
June 25
141,585
122,735122,003
7328,9638,875
88163318
3,8835,522
11,1723,011
13,285
126,311538
3,192311
1,458
4,90732,336
Aug. 27
139,739
119,744119744
8 8738 873
70154864,934
11 1713,268
13 313
128,928471
3 840289408
4,47229,084
July 2
142,432
123,928123,387
5418,9048,875
29101349
3,5875564
11 1723,018
13 324
126960527
3,091398
1,415
4,94032,615
Sept. 3
139,520
119,546119070
4769 1488 873
275158
1 3484 1885,130
11 1723,268
13488
129733468
2706328409
4,50929,294
Digitized for FRASER http://fraser.stlouisfed.org/ Federal Reserve Bank of St. Louis

2. Factors affecting member bank reserves—ContinuedB. Weekly averages of daily figures, 1980-ContinuedMillions of dollars; end-of-week dates
Factor
SUPPLYING RESERVE FUNDS
1 Reserve Bank credit outstanding
2 U.S. government securities1
3 Bought outright4 Held under repurchase agreements .5 Federal agency securities6 Bought outright ,7 Held under repurchase agreements8 Acceptances9 Loans
10 Float1 1 Other Federal Reserve assets . .
12 Gold stock .13 Special drawing rights certificate account. . . .14 Treasury currency outstanding2 . .
ABSORBING RESERVE FUNDS
15 Currency in circulation . . . .1 6 Treasury cash holdings
Deposits, other than member bank reserves,with Federal Reserve Banks
17 Treasury18 Foreign. .19 Other^
20 Other Federal Reserve liabilities and capital. .21 Reserve accounts^
SUPPLYING RESERVE FUNDS
1 Reserve Bank credit outstanding
Sept. 10 Sept. 17
139,048 139,898
118,560 119,679118,560 119,679
8,860 8,7828,860 8,782
594 1,2115,996 5,0665,037 5,151
11,171 11,1713,268 3,268
13,328 13,332
130,209 130,088468 468
3,033 3,032341 312365 438
4,433 4,42827,967 28,894
2 U S government securities1 . .3 Bought outright4 Held under repurchase agreements .5 Federal agency securities6 Bought outright7 Held under repurchase agreements .8 Acceptances9 Loans . . . . ,
10 Float . . . .11 Other Federal Reserve assets
12 Gold stock . .13 Special drawing rights certificate account14 Treasury currency outstanding2 . .
ABSORBING RESERVE FUNDS
15 Currency in circulation16 Treasury cash holdings
Deposits, other than member bank reserves,with Federal Reserve Banks
17 Treasury . . . . . .18 Foreign19 Other'
20 Other Federal Reserve liabilities and capital21 Reserve accounts4
Nov. 12
143,252
120,365118,847
1,5189,2348,761
473623
2,0674,3386,625
11,1633,268
13,376
132,525465
3,062309332
4,70829,658
Sept. 24
140,188
120,099120,099
8,7828,782
1,6304,3625,315
11,1693,268
13,337
129,419468
3,126267325
4,54129,817
Nov. 19
142,641
120,131118,976
1,1558,9148,761
153195
1,9795,1076,315
11,1633,354
13,376
133,159476
3,468308375
4,67428,072
Oct. 1
141,495
121,641120,819
8229,0568,781
275227
1,8733,3465,351
11,1683,268
13,387
129,217466
4,268309421
4,59030,047
Nov. 26
142,123
121,150118,974
2,1769,0838,761
322312
2,2153,2096,154
11,1633,368
13,376
133,080454
2,946309387
4,78528,068
Oct. 8
140,043
120,650118,237
2,4139,3548,779
575327
1,2493,147
' 5,316
11,1673,268
13,346
129,992464
3,302299283
4,63228,852
Dec. 3
142,557
119,126118,111
1,0158,9778,757
220279
2,1425,5616,472
11,1623,368
13,554
134,256450
2,845323472
4,78527,510
Oct. 15
141,199
121,879120,314
1,5659,1018,776
325357
1,1113,3485,403
11,1653,268
13,350
131,001468
3,306299306
4,62628,975
Dec. 10
141,255
118,947117,991
9568,8438,750
93215
1,7864,4826,982
11,1623,368
13,399
134,892448
2,228284384
4,85126,096
Oct. 22
143,233
121,830120,895
9359,2628,761
501167
1,1985,1235,653
11,1653,268
13,363
130,886465
3,201287303
4,74231,145
Dec. 17
143,982
121,322120,724
5988,8818,739
142112
1,5054,2217,941
11,1613,368
13,408
135,365445
2,784386391
4,97727,572
Oct. 29
141,755
121,472120,037
1,4359,0708,761
309487
1,4353,3145,976
11,1643,268
13,371
130,459460
3,190231305
4,65430,258
Dec. 24
144,173
119,337119,071
2668,7498,739
1030
1,6496,0388,370
11,1613,368
13,410
135,960446
2,287395392
4,97427,659
Nov. 5
141,887
121,048119,893
1,1559,0778,761
316430
1,8783,0386,416
11,1633,268
13,522
131,134460
2,291310447
4,78530,412
Dec. 31
145,857
117,608117,098
5108,8378,739
98191
1,6279,0498,544
11,1613,125
13,426
136,912445
3,286375416
4,85727,277
Digitized for FRASER http://fraser.stlouisfed.org/ Federal Reserve Bank of St. Louis

2. Factors affecting member bank reserves—ContinuedC. Wednesday figures, 1980Millions of dollars; end-of-week dates
Factor
SUPPLING RESERVE FUNDS
1 Reserve Bank credit outstanding
2 U.S. government securities1
3 Bought outright. . . . . .4 Held under repurchase agreements5 Federal agency securities6 Bought outright7 Held under repurchase agreements . . . .8 Acceptances9 Loans
10 Float11 Other Federal Reserve assets
12 Gold stock13 Special drawing rights certificate account. . . .14 Treasury currency outstanding2
ABSORBING RESERVE FUNDS
15 Currency in circulation ,16 Treasury cash holdings
Deposits, other than member bank reserves,with Federal Reserve Banks
17 Treasury18 Foreign19 Othep
20 Other Federal Reserve liabilities and capital. .21 Reserve accounts4
SUPPLYING RESERVE FUNDS
1 Reserve Bank credit outstanding
2 U S, government securities1
3 Bought outright4 Held under repurchase agreements5 Federal agency securities6 Bought outright7 Held under repurchase agreements8 Acceptances9 Loans .
10 Float11 Other Federal Reserve assets
12 Gold stock13 Special drawing rights certificate account. . . .14 Treasury currency outstanding2
ABSORBING RESERVE FUNDS
15 Currency in circulation16 Treasury cash holdings
Deposits, other than member bank reserves,with Federal Reserve Banks
17 Treasury18 Foreign19 Other*
20 Other Federal Reserve liabilities and capital. .21 Reserve accounts4
Jan. 2
146,060
119,070116406
2,66493388 2161,1221 0782,0608 7775,737
11,1121,800
12,947
125,590426
3 961379
1 821
4,90534 837
Mar. 5
134,517
113 442113442
082168216
0o
2 1796 1984482
11 1722,968
13 106
122 286517
3 769232298
4,55630.105
Jan. 9
139 987
117,639117639
082168 216
00
1 2507 5775305
11 1721,800
12970
124286434
3 472299324
4,90732 207
Mar. 12
130,631
110378110378o
8,2118 211o
o3 0804 3064656
11 1722,968
13 118
123 098525
1 976291468
4,52127.009
Jan. 16
136,420
114,774114 774
08 2168 216o
o1 74063935,297
11,1721,800
12,979
122,959438
3 468250307
4,98629963
Mar. 19
132,506
111 808111 808o
8 2118 211o
o2 8594 7384 890
11 1722,968
13 146
122 948530
3 827284492
4,64627.065
Jan. 23
140,386
118,610116950
1,6609,1238 216
907327
1 1165 8315,379
11,1721,800
12,989
121,781448
3 309242357
5,34534 865
Mar. 26
139,097
117 830117 830o
8 2118 211o
o4 6513 3825023
11 1722',968
13 146
122 874540
2 998368342
4,77334.488
Jan. 30
131,672
112,478112478
08 2168 216
00
9244 4685 586
11 1722,968
13 006
121,182457
3 051249261
5,34928 269
Apr. 2
133,204
113 803113 803
08 2118 211
0o
2 1083 9785 104
11 1722,968
13 186
123 533580
2 057325322
4,67829.035
Feb. 6
131,648
111,849111 849
08 2168216
0o
3435 8895,351
11,1722,968
13,035
121,642471
3 733362275
4,51227 828
Apr. 9
133,627
112 561112561o
8,8798 879o
o1 8905 0515 246
11 1722,968
13 186
124 502587
1 410276283
4,66229.233
Feb. 13
140,739
117,659116660
9998 8238216
607281
3,3245 2025,450
11,1722,968
13,044
122,198482
3 395343281
4,68736 537
Apr. 16
139,391
117 015117015o
8,8778 877o
o3 5794 6395,281
11 1722,968
13 218
124410591
3 164*342494
4,84832.900
Feb. 20
140,706
118,416116,182
2,23489248 216
708825
1 1017 0844356
11 1722,968
13 066
122 170483
2 461294332
4,77137401
Apr. 23
140,713
119611119402
2099 1258877
248o2 9623 6465369
11 1722,968
13 218
123 688592
5 212322571
4,98332.703
Feb. 27
134,002
112,301112301
o82168216
00
431847344,433
11 1722,968
13,076
121,722513
4478245330
4,43829492
Apr. 30
141,107
118 825118825o
8,8778 877o
o4 7703 0725 563
11 1722,968
13 244
123 796585
4 561'648553
5,06633.282
10Digitized for FRASER http://fraser.stlouisfed.org/ Federal Reserve Bank of St. Louis
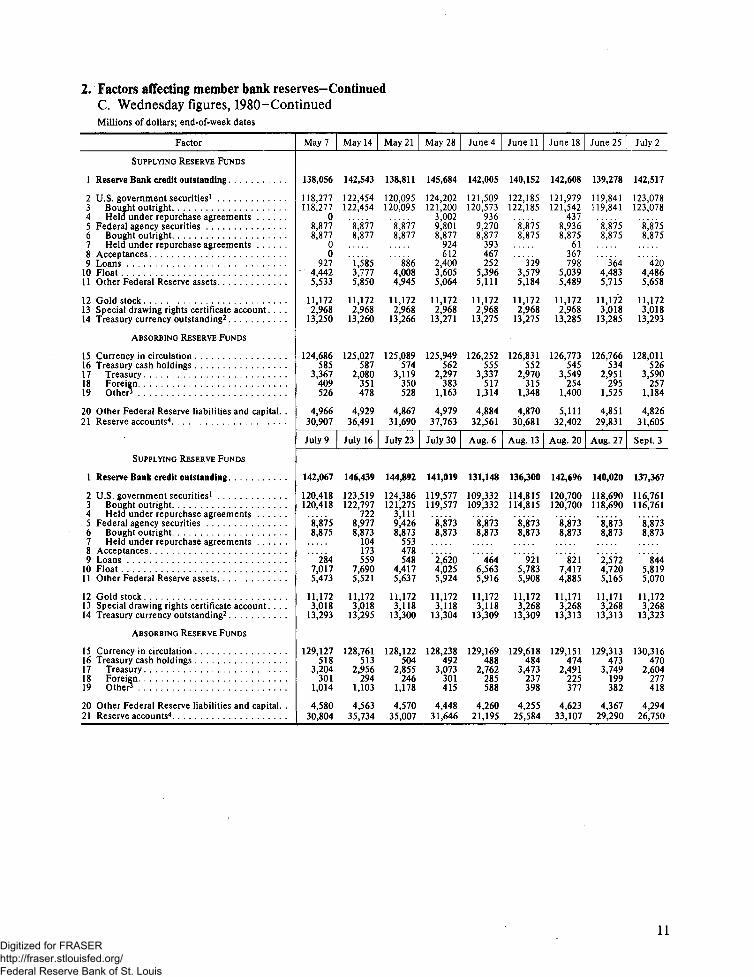
2. Factors affecting member bank reserves—ContinuedC. Wednesday figures, 1980-ContinuedMillions of dollars; end-of-week dates
Factor
SUPPLYING RESERVE FUNDS
1 Reserve Bank credit outstanding
2 U S government securities1 . . . . .3 Bought outright4 Held under repurchase agreements5 Federal agency securities6 Bought outright7 Held under repurchase agreements8 Acceptances9 Loans . .
10 Float11 Other Federal Reserve assets
12 Gold stock13 Special drawing rights certificate account. . . .14 Treasury currency outstanding^
ABSORBING RESERVE FUNDS
15 Currency in circulation .16 Treasury cash holdings17 Treasury18 Foreign19 OtherJ
20 Other Federal Reserve liabilities and capital. .21 Reserve accounts**
SUPPLYING RESERVE FUNDS
1 Reserve Bank credit outstanding , .
2 U.S. government securities1 . . . .3 Bought outright4 Held under repurchase agreements5 Federal agency securities6 Bought outright7 Held under repurchase agreements8 Acceptances9 Loans
10 Float11 Other Federal Reserve assets
12 Gold stock .13 Special drawing rights certificate account. . . .14 Treasury currency outstanding2
ABSORBING RESERVE FUNDS
15 Currency in circulation16 Treasury cash holdings17 Treasury18 Foreign19 Othep
20 Other Federal Reserve liabilities and capital. .21 Reserve accounts4
May?
138,056
118,277118,277
08,8778,877
00
9274,4425,533
11,1722,968
13,250
124,686585
3,367409526
4,96630,907
July 9
142,067
120,418120,418
8,8758,875
2847,0175,473
11,1723,018
13,293
129,127518
3,204301
1,014
4,58030.804
May 14
142,543
122,454122,454
' 8J8778,877
"U853,7775,850
11,1722,968
13,260
125,027587
2,080351478
4,92936,491
July 16
146,439
123,519122,797
7228,9778,873
104173559
7,6905,521
11,1723,018
13,295
128,761513
2,956294
1,103
4,56335.734
May 21
138,811
120,095120,095
'M778,877
'"8864,0084,945
11,1722,968
13,266
125,089574
3,119350528
4,86731,690
July 23
144,892
124,386121,275
3,1119,4268,873
553478548
4,4175,637
11,1723,118
13,300
128,122504
2,855246
1,178
4,57035.007
May 28
145,684
124,202121,200
3,0029,8018,877
924612
2,4003,6055,064
11,1722,968
13,271
125,949562
2,297383
1,163
4,97937,763
July 30
141,019
119,577119,577
8,8738,873
2,6204,0255,924
11,1723,118
13,304
128,238492
3,073301415
4,44831.646
June 4
142,005
121,509120,573
9369,2708,877
393467252
5,3965,111
11,1722,968
13,275
126,252555
3,337517
1,314
4,88432,561
Aug. 6
131,148
109,332109,332
8,8738,873
4646,5635,916
11,1723,118
13,309
129,169488
2,762285588
4,26021.195
June 11
140,152
122,185122,185
8,8758,875
3293,5795,184
11,1722,968
13,275
126,831552
2,970315
1,348
4,87030,681
Aug. 13
136,300
114,815114,815
8,8738,873
9215,7835,908
11,1723,268
13,309
129,618484
3,473237398
4,25525.584
June 18
142,608
121,979121,542
4378,9368,875
61367798
5,0395,489
11,1722,968
13,285
126,773545
3,549254
1,400
5,11132,402
Aug. 20
142,696
120,700120,700
8,8738,873
8217,4174,885
11,1713,268
13,313
129,151474
2,491225377
4,62333,107
June 25
139,278
119,841119,841
'M758,875
'"3644,4835,715
11,1723,018
13,285
126,766534
2,951295
1,525
4,85129,831
Aug. 27
140,020
118,690118,690
8,8738,873
2,5724,7205,165
11,1713,268
13,313
129,313473
3,749199382
4,36729,290
July 2
142,517
123,078123,078
'M758,875
' ' '4204,4865,658
11,1723,018
13,293
128,011526
3,590257
1,184
4,82631,605
Sept. 3
137,367
116,761116,761
8,8738,873
8445,8195,070
11,1723,268
13,323
130,316470
2,604111418
4,29426.750
11Digitized for FRASER http://fraser.stlouisfed.org/ Federal Reserve Bank of St. Louis

2. Factors affecting member bank reserves—ContinuedC. Wednesday figures, 1980-ContinuedMillions of dollars; end-of-week dates
Factor
SUPPLYING RESERVE FUNDS
t Reserve Bank credit outstanding
2 U.S. government securities1
3 Bought outright4 Held under repurchase agreements , . .5 Federal agency securities6 Bought outright7 Held under repurchase agreements8 Acceptances.9 Loans
10 Float . . . .11 Other Federal Reserve assets
12 Gold stock13 Special drawing rights certificate account. . . .14 Treasury currency outstanding2
ABSORBING RESERVE FUNDS
15 Currency in circulation16 Treasury cash holdings17 Treasury18 Foreign19 Other*
20 Other Federal Reserve liabilities and capital. .21 Reserve accounts^
SUPPLYING RESERVE FUNDS
1 Reserve Bank credit outstanding . . .
2 U.S. government securities^3 Bought outright4 Held under repurchase agreements5 Federal agency securities6 Bought outright .7 Held under repurchase agreements8 Acceptances9 Loans .
10 Float1 1 Other Federal Reserve assets.
12 Gold stock13 Special drawing rights certificate account14 Treasury currency outstanding2
ABSORBING RESERVE FUNDS
15 Currency in circulation16 Treasury cash holdings17 Treasury18 Foreign19 Other* . .
20 Other Federal Reserve liabilities and capital21 Reserve accounts4
Sept 10
138,765
117724117,724
8,7828 782
9906 1545,115
11 1703,268
13,331
130593469
3023272421
4,30227455
Sept. 17
139,983
118541118,541
8,7828 782
59067455325
11 1693,268
13,336
130 057468
3 328234423
4,37628 871
Nov. 12
141,979
118 050117,014
1 0369 2838 761
522429
20955 2026920
11 1633268
13 376
133 381465
2,763398311
460827,859
Sept. 24
142,830
120713120,713
8,7828782
3,6174 1715,547
11 1683,268
13,341
129 530467
3 928301286
4,43031 666
Nov. 19
144,379
121 690119,145
2,5458 9048,761
143374
2,46849815,962
11 1633,368
13,376
133 351455
3,477236363
4 65829,746
Oct. 1
145,284
122 058119,509
2 5499,7258 779
946623
3,2643 9735,641
11 1683,268
13,341
129 756462
4 125313
1 210
4,73432461
Nov. 26
144,197
120 642119,161
1,48190868,761
325387
3 9853 5996,498
11 1623,368
13 376
133 823451
2,323279461
4 62130,144
Oct. 8
135,865
117 173117,173
8 7798 779
6233 8225,468
11 1663,268
13,347
130 798470
3 331272286
4,37224 117
Dec. 3
135,751
114677114,677
8 7528,752
1,3553 8667,101
11 1623,368
13,396
134 875450
3,116283391
446120,101
Oct. 15
140,219
119460119,460
8,7618 761
5675 8055,626
11 1653,268
13,362
131 520467
2 898325320
4,56227921
Dec. 10
138,306
114,992114,992
8 7398,739
2,10149347,540
11 1613,368
13,408
134 630446
1,516272466
461623,297
Oct. 22
143,583
121 472121472
8,7618 761
3 9663 5035,881
11 1643,268
13,368
130 945465
3 228236321
4,50631 682
Dec. 17
148,364
122,123120,069
2,0549 1288,739
389327
1,61665618,609
11 1613,368
13,408
135 904441
2,653287403
5 00931,604
Oct. 29
143,384
121 436120515
9218 9288 761
167426
2 7403 6866 168
11 1633,268
13 376
130 989460
2 877260316
4,51831 770
Dec. 24
147,075
118 308118,308
87398,739
1,38896738,967
11 1613,368
13,423
136 771447
2,540413379
4 74129,735
Nov. 5
145 967
121 314119988
1 32689198 761
158441
33715 2176705
11 1633,'268
13376
131 904'470
3 064236421
4,50133 177
Dec. 31
146,382
121 328119,299
202992648,739
525776
1 80944678,738
11 1612,518
13427
136 829441
3,062411617
467127,456
12Digitized for FRASER http://fraser.stlouisfed.org/ Federal Reserve Bank of St. Louis

2. Factors affecting member bank reserves—ContinuedD. End-of-year and end-of-month figures, 1980Millions of dollars
Factor
SUPPLYING RESERVE FUNDS
1 Reserve Bank creditoutstanding
2 U.S. governmentsecurities*
3 Bought outright4 Held under repurchase
agreements5 Federal agency securities .6 Bought outright7 Held under repurchase
agreements8 Acceptances9 Loans
10 Float11 Other Federal Reserve
assets
12 Gold stock13 Special drawing rights
certificate account . . .14 Treasury currency
outstanding^
ABSORBING RESERVE FUNDS
15 Currency in circulation . . .16 Treasury cash holdings . . .
Deposits, other thanmember bank reserves,with Federal ReserveBanks
17 Treasury18 Foreign19 Other*
20 Other Federal Reserveliabilities .and capital .
21 Reserve accounts^
Jan.
135,202
116311116 311
08,2168 216
00
8284610
5,237
11,172
2,968
13 169
121,157472
2 931440339
5,68231 492
Feb.
134,555
115 171114 550
6218,2478216
31205
3 3643,154
4,414
11,172
2,968
13 259
121,436525
2,417450350
4,66832 108
Mar.
136,313
116,657115 734
9238,2918 211
80171
25023,682
5,010
11,172
2,968
13 178
122,788572
2,334468313
4,88632 270
Apr.
141,107
118,825118825
08,8778 877
o0
47703,072
5,563
11,172
2,968
13 410
123,963584
4,561648553
5,06633 282
May
142,105
124,277121 371
2,9069,2308,877
353366602
2,475
5,155
11,172
2,968
13 271
125,430559
4,523380
1,160
5,08332 382
June
143,741
124,515124,058
4578,9128,875
37373215
4,167
5,559
11,172
3,018
13,293
126,859528
3,199691
1,332
5,00333 612
July
138,316
119,563118497
1,0669,4048873
531310562
2,808
5,669
11,172
3,118
13 570
128,337489
3,954436500
4,54027 920
Aug.
139,791
119,848119014
8349,3558873
482277
1 5153,468
5,328
11,172
3,268
13 614
129,667467
2,742336383
4,57029 680
Sept.
140,011
120,711119418
1,2939,0538 782
271499982
3,192
5,574
11,168
3,268
13 341
129,594465
4,102460363
4,65928 146
Oct.
141,189
121,482119852
1,6309,2208 761
459566
1 5672,194
6,160
11,163
3,268
13 716
131,075460
1,864368338
4,71330 518
Nov.
146,115
120,812118936
1,8769,1658 761
404523
22846,792
6,539
11,162
3,368
13 779
134,104449
2,435368478
5,06131 528
Dec.
146,382
121,328119299
2,0299,2648 739
525776
1 8094,467
8,738
11,161
2,518
13,427
136,829441
3,062411617
4,67127 456
13Digitized for FRASER http://fraser.stlouisfed.org/ Federal Reserve Bank of St. Louis

3. Reserves and borrowings of member banks1
A. Annual and monthly averages, 1980Millions of dollars
Reserve classification
All member banksReserves
1 At Reserve Banks . . . .2 Currency and coin. . . .3 Total held4 Required5 Excess
Borrowings atReserve Banks2
6 Total. ,-7 Seasonal
Large banks inNew York City
8 Reserves held9 Required
10 Excess11 Borrowings2
Large banks in Chicago12 Reserves held13 Required14 Excess15 Borrowings2
Other large banks16 Reserves held17 Required18 Excess19 Borrowings2 .
All other banks20 Reserves held21 Required22 Excess23 Borrowings2.
Edge corporations24 Reserves held25 Required26 Excess
U.S. agencies andbranches
27 Reserves held28 Required29 Excess
Year
30,11,42,42,
1,
A
n
^
894563545368277
42173
L
a.
r
Jan.
32,71212,28345,17044,928
242
1,24175
7,7587,760
-226
2,0512,063-12
60
18,07818,065
13647
16,90416,692
212508
339323
16
402515
Feb.
31,87811,06343,15642,966
190
1,65596
7,1687,205-37125
1,9681,941
2797
17,24617,265
-19729
16,40316,229
174704
328303
25
4323
, 20
Mar.
32,15610,71843,09742,911
186
2,824150
7,1897,193
-457
1,9641,967
140
17,18717,168
191,483
16,34116,197
1441,144
322301
21
94859
Apr. May
33,777 32,75510,889 10,99944,877 43,96844,683 43,785
194 183
2,455 1,018155 63
7,686 7,6617,623 7,646
63 1583 31
2,170 1,9092,180 1,906-10 3
60 28
18,006 17,55718,041 17,558
-35 -11,278 798
16,483 16,34616,335 16,213
148 1331,034 161
334 332311 309
23 23
198 163193 153
5 10
Reserve classification
1 Reserve balances with Reserve Bank
2 Total vault cash3 Vault cash at institutions4 Vault cash equal to requ5 Surplus vault cash at oth
6 Reserve balances + total vj7 Reserve balances + total \£
reserve requirements6-8 Required reserves
with req*red reserer institut
tult cash6
mlt cash i7
9 Excess reserve balances at Reserve I10 Total borrowings at Reserve Banks11 Seasonal borrowings at Reserve
s3
aired reserve balam^es at other institutjons^
;es4 . . .ons . . .
ised to satisfy
JanksM. .
Banks
Dec.
26,664
18,14912,602
7044,843
44,940
40,09740,067
301,617
116
June
32,12511,14143,47943,268
211
38012
7,5807,586
-618
1,8691,868
15
17,24417,205
39327
16,31016,168
14230
36634125
110100
10
July
31,38411,28742,85942,575
284
3957
7,3167,275
4161
1,8651,866•»
18
16,86316,819
44298
16,37316,203
17018
378353
25
64595
Aug.
28,92311,26240,37340,071
302
65910
6,5066,507
-1100
1,5961,590
627
15,85315,781
72453
16,08315,883
20079
33531025
000
Sept.
29,16411,81141,16440,908
256
1,31126
6,6866,661
25177
1,6581,657
1109
16,10716,073
34725
16,37816,207
171300
335310
25
000
Oct.
29,97611,67841,81541,498
317
1,33567
6,7106,741-31
0
1,6541,687-33
0
16,18816,347
-1590
16,46616,392
740
346331
15
000
Reserve classification
Larg12 Rese13 Re14 E>
Sma15 Rese16 Re17 E>
U.S.18 Rese19 Re20 E>
Allc21 Rese22 Re23 E>
e commerrves heldquired .[cess
/ commerrves heldquired .tcess . . .
agencies trves heldquired .ccess
)ther instirves heldquired ..cess . . .
zial banks
cial banks
ind branches
rut ions
Nov.
29,12,41,40,
2,
A
n
i
215315678723955
15699
L
a.
r
Dec.
24,94025,819
-879
13,71913,523
196
260230
30
494495-1
14Digitized for FRASER http://fraser.stlouisfed.org/ Federal Reserve Bank of St. Louis

3. Reserves and borrowings of member banks1—ContinuedB. Weekly averages of daily figures, 1980Millions of dollars; end-of-week dates
Reserve classification
All member banksReserves
1 At Reserve Banks2 Currency and coin, ,3 Total held4 Required .5 Excess
Borrowings at Reserve Banks2
6 Total7 Seasonal . . .
Large banks in New York City8 Reserves held .9 Required
10 Excess .11 Borrowings2 . .
Large banks in Chicago12 Reserves held13 Required . . . . . . . .14 Excess15 Borrowings2 . . .
Other large banks16 Reserves held17 Required . .18 Excess19 Borrowings2 . .
Ail other banks20 Reserves held21 Required22 Excess23 Borrowings2
Edge corporations24 Reserves held25 Required . . . .26 Excess
U.S. agencies and branches27 Reserves held28 Required . . . .29 Excess
Jan. 2
33 13711,4394473744,185
552
1,43164
7,5787,464
114129
2,1262069
57111
17 70617 680
26666
16,95216643
309525
34931534
261412
Jan. 9
33,21911,26844,67144,543
128
73061
7,6157,753-138
33
2,0762,088-12
0
1800017,919
81316
16,60416,435
169381
341328
13
352015
Jan. 16
32,79713,44646,41446,031
383
1,22774
8,3978,299
9846
2,0982,118-20
0
18,49918,483
16772
17,01116,725
286409
368368
0
4138
3
Jan. 23
32,61612,48345,27145,145
126
1,20378
7,6697,681-18
0
2,0462,044
20
18 15118,172
-21658
17,04216,926
116545
314280
34
493613
Jan. 30
32,26712,25344,69244,449
243
1,81987
7,4607,469
-90
2,0132,010
3236
17,90317,894
9892
16,93116,748
183691
341318
23
441034
Feb. 6
31,79011,73143,73643,224
512
75873
7,4007,175
2250
1,9831,988
-50
1742217,371
51264
16,56616,358
208494
331318
13
341420
Feb. 13
30,43611,66842,31942,371
-52
1,23991
6,8937,053-143
81
1,9041,904
0125
16,96517,093
-128552
16,15415,998
156481
348310
38
553025
Feb. 20
33,48510,29043,99243,450
542
2,192100
7,5797,428
121226
2,0242,006
18148
17,58317,441
142996
16,46216,260
202822
309294
15
352114
Feb. 27
31,86710,71142,79242,999
-207
2,060109
7,0617,244-183
207
1,8831,893-10
47
17,04417,231-187
908
16,45516,314
141898
309298
11
401921
15Digitized for FRASER http://fraser.stlouisfed.org/ Federal Reserve Bank of St. Louis

3. Reserves and borrowings of member banks1—ContinuedB. Weekly averages of daily figures, 1980-ContinuedMillions of dollars; end-of-week dates
Reserve classification
All member banksReserves
1 At Reserve Banks2 Currency and coin3 Total held-4 Required . ^5 Excess
Borrowings at Reserve Banks2
6 Total7 Seasonal . . .
Large banks in New York City8 Reserves held.9 Required
10 Excess .1 1 Borrowings2
Large banks in Chicago12 Reserves held13 Required14 Excess15 Borrowings2 . .
Other large banks16 Reserves held17 Required . . . . .18 Excess19 Borrowings2 . . .
All other banks20 Reserves held21 Required . . . . . .22 Excess23 Borrowings2
Edge corporations24 Reserves held25 Required26 Excess
U.S. agencies and branches27 Reserves held . . .28 Required29 Excess
Mar. 5
31,90210,8834299842,467
531
2506114
7,0536963
9013
1 9221,899
23291
17 25117054
1971,187
1640216229
1731 015
307111
30
634518
Mar. 12
30,75511,42542,40942,331
78
3438140
7,0227055-33
29
1,8911,909-18288
1684616,926
-802,021
1623616060
1761,100
319296
23
958510
Mar. 19
32,87910,3394344543,265
180
3000155
7,3867413-27
80
20092,006
30
17 30317251
521 664
1629016 160
1301 256
356338
18
101974
Mar. 26
32,49910,24842,97242,991
-19
2659177
7,0747070
471
1,9851,994
-9117
17 10617,229-1231,343
1640816,321
871,128
298287
11
1019011
Apr. 2
32,87810,75143,84343,556
287
2,266165
7,4417,482-41
89
2,0142,024-10
13
17,55417,421
133967
1640316,232
1711,197
326296
30
105101
4
Apr. 9
32,98811,08844,29044,132
158
2,384154
7,5847,452
1320
2,2672,267
010
17,52917,705-1761,332
16,20816,026
1821,042
328306
22
374376-2
Apr. 16
33,59711,03744,84344,636
207
2,276140
7,6857,712-27194
2,2332,244-11
68
1804317,966
771,049
1630316,155
148965
364348
16
215211
4
Apr. 23
35,08610,18745,49145,254
237
2,553159
7,8587,714
14444
2,1182,143-25
54
18,36618,412
-461,339
16,67516,551
1241,116
32630026
14813414
Apr. 30
33,69211,28545,19445,034
160
2,663172
7,6887,654
3491
2,1062,109
-3122
18,24018,259
-191,483
16,76116,640
121967
318296
22
81765
16Digitized for FRASER http://fraser.stlouisfed.org/ Federal Reserve Bank of St. Louis

3. Reserves and borrowings of member banks1—ContinuedB. Weekly averages of daily figures, 1980-ContinuedMillions of dollars; end-of-week dates
Reserve classification
AH member banksReserves
1 At Reserve Banks2 Currency and coin3 Total held4 Required5 Excess
Borrowings at Reserve Banks2
6 Total ,7 Seasonal .
Large banks in New York City8 Reserves held9 Required
10 Excess , .1 1 Borrowings2 *
Large banks in Chicago12 Reserves held13 Required , .14 Excess15 Borrowings2 . . . .
Other large banks16 Reserves held17 Required18 Excess , , .19 Borrowings2
A 11 other banks20 Reserves held21 Required . . . .22 Excess23 Borrowings2
Edge corporations24 Reserves held25 Required26 Excess
U.S. agencies and branches27 Reserves held28 Required29 Excess
May 7
3290411,4154453044,202
328
1,331155
76497,495
154o
1,9471 921
2611
1793617,934
2861
16,58016448
132459
315302
13
103102
1
May 14
31 86911,41043,48843,453
35
1,02047
73207,445-125
89
1,8761 903-27o
1757117,555
16831
16,20416085
119100
32929732
18816820
May 21
33,75410,19644,15943,880
279
83841
8,0067,829
177o
1,9851,955
300
17,36317,460
-97774
16,32516,193
13264
32129526
15914811
May 28
3246110,92543,59543,614
-19
1,12429
74717,661-190
48
1,8381 859-21108
1743917,401
38899
16,31016 175
13569
350328
22
187190-3
June 4
32,83011,11444,15143,766
385
45921
8 1188,007
111o
1,8881,871
1711
17,28517,282
393
16,30416,103
20155
36734126
18916227
June 11
31 48711,2544294842,809
139
40115
7 3687,478-110o
1,8481 857
-9o
17 09716,994
103378
16,02815 902
12623
39036822
217210
7
June 18
31 79911,4074341343,268
145
39611
7 6117,619
-8g
1,9081 902
60
17 15817,210
-52291
16,30116 132
16927
37535520
605010
June 25
3233610,69543,24043,080
160
318g
73917,352
390
1,8201 825
-5o
17,20917,203
6297
16,41516,335
8021
34731532
5850
8
July 2
3261511,2574406943,778
291
3497
7 6647680-16o
1,9001 891
921
1751817,433
85298
16,60216412
11030
343326
17
3936
3
17Digitized for FRASER http://fraser.stlouisfed.org/ Federal Reserve Bank of St. Louis

3. Reserves and borrowings of member banks1—ContinuedB, Weekly averages of daily figures, 1980-ContinuedMillions of dollars, end-of-week dates
Reserve classification
All member banksReserves
1 At Reserve Banks . . .2 Currency and coin3 Total held4 Required5 Excess
Borrowings at Reserve Banks2
6 Total7 Seasonal
Large banks in New York City8 Reserves held9 Required
10 Excess11 Borrowings2
Large banks in Chicago12 Reserves held13 Required14 Excess15 Borrowings2
Other large banks16 Reserves held17 Required18 Excess .19 Borrowings2
All other banks20 Reserves held21 Required22 Excess23 Borrowings2
Edge corporations24 Reserves held25 Required26 Excess
U.S. agencies and branches27 Reserves held28 Required29 Excess
July 9
31 30911 55643,05842 556
502
2165
74997,324
1750
1,8531 858
-50
1695416 878
76203
16,30416 084
22013
374337
37
8075
5
July 16
32 17711 49843,86343 596
267
3325
77647,706
580
20132009
464
1722217238
-16258
16,36116 167
19410
388371
17
114105
9
July 23
33,03010,50943,72443,713
11
3555
7,1827,330-148
0
2,0042,005
-10
17,37617365
11342
16,67316,555
11813
41538530
8173
8
July 30
29,06211,55540,80140,492
309
6307
6,8306,729
101241
1,6191,629-10
5
15,83315796
37356
16,16716,005
16228
350333
17
0o0
Aug. 6
28,64311,54340,36939,759
610
8277
6,5636,554
9214
1,6021,542
6021
15,81815 577
241518
16,06615,779
28774
320307
13
0o0
Aug. 13
27,46911,74239,39939,305
94
3946
6,2696,332-63
63
1,5481,570-22
0
15,51715512
5315
15,74715,596
15116
318295
23
0o0
Aug. 20
30,24311,47840,91240,588
314
3456
6,7806,747
330
1,6111,611
07
16,04715 951
96315
16,12715,949
17823
347330
17
0o0
Aug. 27
29,08411,13640,41040285
125
70110
6,3876,376
11161
1,5791,604-25
80
15,88015 917
-37338
16,20616,069
137122
358319
39
000
Sept 3
29,29411 59241,07540601
474
1,34820
6,5636,552
1161
1,6711 635
3629
16,10716019
881,041
16,40816,104
304217
326291
35
o00
Sept. 10
27,9671206840,22440046
178
59414
65206,538-18195
1,6021 613-11
0
1569815 643
55279
16,06115929
132120
34332320
0o0
18Digitized for FRASER http://fraser.stlouisfed.org/ Federal Reserve Bank of St. Louis
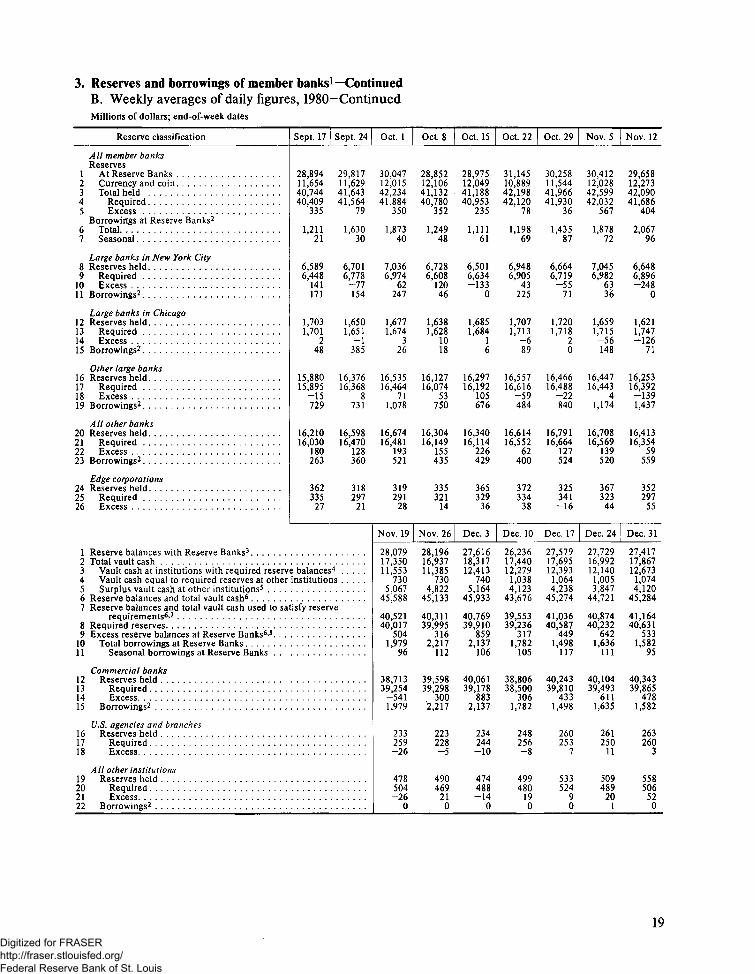
3. Reserves and borrowings of member banks1—ContinuedB. Weekly averages of daily figures, 1980-ContinuedMillions of dollars; end-of-week dates
Reserve classification
All member banksReserves
1 At Reserve Banks2 Currency and coin . . .3 Total held4 Required . . .5 Excess
Borrowings at Reserve Banks2
6 Total. .7 Seasonal . .
Large banks in New York City8 Reserves held .9 Required
10 Excess1 1 Borrowings2
Large banks in Chicago12 Reserves held13 Required14 Excess . .15 Borrowings2
Other large banks16 Reserves held , ,17 Required . .18 Excess19 Borrowings2 . . . .
All other banks20 Reserves held21 Required22 Excess23 Borrowings2 , ,
Edge corporations24 Reserves held25 Required26 Excess
1 Reserve balances with Reserve Banks^
Sept. 17
28,89411,65440,74440,409
335
1,21121
6,5896,448
141171
1,7031,701
248
15,88015,895
-15729
16,21016,030
180263
362335
27
2 Total vault cash3 Vault cash at institutions with required reserve balances4 Vault cash equal to required reserves at other institutio5 Surplus vault cash at other institutions^6 Reserve balances and total vault cash6
Sept. 24 Oct. 1
29,817 30,04711,629 12,01541,643 42,23441,564 41,884
79 350
1,630 1,87330 40
6,701 7,0366,778 6,974-77 62154 247
1,650 1,6771,651 1,674
-1 3385 26
16,376 16,53516,368 16,464
8 71731 1,078
16,598 16,67416,470 16,481
128 193360 521
318 319297 291
21 28
«is
7 Reserve balances and total vault cash used to satisfy reserverequirements6'^
8 Required reserves9 Excess reserve balances at Reserve Banks6'8. . .
10 Total borrowings at Reserve Banks11 Seasonal borrowings at Reserve Banks
Commercial banks12 Reserves held13 Required14 Excess15 Borrowings2
U.S. agencies and branches16 Reserves held . .17 Required18 Excess
All other institutions19 Reserves held20 Required21 Excess22 Borrowings2
Nov. 19
28,07917,35011,553
7305,067
45,588
40,52140,017
5041,979
96
38,71339,254
-5411,979
233259-26
478504-26
0
Oct. 8
28,85212,10641,13240,780
352
1,24948
6,7286,608
12046
1,6381,628
1018
16,12716,074
53750
16,30416,149
155435
335321
14
Nov. 26
28,19616,93711,385
7304,822
45,B3
40,31139,995
3162,217
112
39,59839,298
3002,217
223228-5
490469
210
Oct. 15
28,97512,04941,18840,953
235
1,11161
6,5016,634-133
0
1,6851,684
16
16,29716,192
105676
16,34016,114
226429
365329
36
Dec. 3
27,61618,31712,413
7405,164
45,933
40,76939,910
8592,137
106
40,06139,178
8832,137
234244-10
474488-14
0
Oct. 22
31,14510,88942,19842,120
78
1,19869
6,9486,905
43225
1,7071,713
-689
16,55716,616
-59484
16,61416,552
62400
372334
38
Dec. 10
26,23617,44012,279
1,0384,123
43,676
39,55339,236
3171,782
105
38,80638,500
3061,782
248256-8
499480
190
Oct. 29
30,25811,54441,96641,930
36
1,43587
6,6646,719-55
71
1,7201,718
20
16,46616,488
-22840
16,79116,664
127524
325341-16
Dec. 17
27,57917,69512,393
1,0644,238
45,274
41,03640,587
4491,498
117
40,24339,810
4331,498
260253
7
533524
90
Nov. 5
30,41212,02842,59942,032
567
1,87872
7,0456,982
6336
1,6591,715-56148
16,44716,443
41,174
16,70816,569
139520
36732344
Dec. 24
27,72916,99212,140
1,0053,847
44,721
40,87440,232
6421,636
111
40,10439,493
6111,635
261250
11
509489
201
Nov. 12
29,65812,27342,09041,686
404
2,06796
6,6486,896-248
0
1,6211,747-126
71
16,25316,392
-1391,437
16,41316,354 .
59559
352297
55
Dec. 31
27,41717,86712,673
1,0744,120
45,284
41,16440,631
5331,582
95
40,34339,865
4781,582
263260
3
558506520
19Digitized for FRASER http://fraser.stlouisfed.org/ Federal Reserve Bank of St. Louis

4. Federal funds and repurchase agreements of large member banks1
Averages of daily figures, in millions of dollars
Maturity and source
One day and continuing contract1 Commercial banks in United States2 Other depository institutions, foreign
banks and foreign official institutions,and U S government agencies
3 Nonbank securities dealers4 All other
All other maturities5 Commercial banks in United States6 Other depository institutions, foreign
banks and foreign official institutions,and U S government agencies
7 Nonbank securities dealers8 All other .
MEMO: Federal funds and resale agree-ment loans in maturities of one day orcontinuing contract
9 Commercial banks in United States10 Nonbank securities dealers
One day and continuing contract1 Commercial banks in United States2 Other depository institutions, foreign banks
and foreign official institutions, andU.S. government agencies
3 Nonbank securities dealers4 All other
A li other maturities5 Commercial banks in United States6 Other depository institutions, foreign banks
and foreign official institutions, andU.S. government agencies
7 Nonbank securities dealers8 All other
MEMO: Federal funds and resale agree-ment loans in maturities of one dayor continuing contract
9 Commercial banks in United States .10 Nonbank securities dealers
One day and continuing contract1 Commercial banks in United States2 Other depository institutions, foreign banks
and foreign official institutions, andU.S. government agencies
3 Nonbank securities dealers4 All other . .
Ail other maturities5 Commercial banks in United States6 Other depository institutions, foreign banks
and foreign official institutions, andU.S. government agencies
7 Nonbank securities dealers8 All other
MEMO: Federal funds and resale agree-ment loans in maturities of one day orcontinuing contract
9 Commercial banks in United States10 Nonbank securities dealers
1980, week ending Wednesday
Mar. 5
46,899
12,8571,664
13,694
5,303
6,6182,188
10,165
14,8702,293
May?
46,389
12,0211,076
13,264
6,107
7,2142,4639,614
16,1971,890
July 9
54,232
16,1591,585
14,992
3,706
6,3032,8569,444
16,4402,444
Mar, 12
48,455
13,3281,846
13,819
5,000
6,7932,201
10,309
12,8782,294
May 14
46,768
13,804962
12,496
5,981
7,0182,337
10,161
15,6062,051
July 16
52,267
17,7172,128
16,030
3,861
6,3432,955
10,067
16,0222,457
Mar, 19
45,867
13,2271,625
14,552
4,865
6,5352,3028,851
13,4612,269
May 21
47,069
15,2191,233
13,197
6,034
6,9632,5688,536
16,6692,129
July 23
48,524
17,7892,341
16,635
3,779
6,2913,0329,637
13,0732,317
Mar 26
42,376
13,7161,556
13,852
5,006
6,5492,2909,450
13,6031,828
May 28
45,310
14,3721,178
14,059
6,558
7,2522,4989,233
14,8601,850
July 30
47,341
17,1982,374
16,119
3,760
6,1783,314
10,921
13,2782,507
Apr. 2
44,241
12,9241,585
13,748
5,140
6,8762,2849,403
14,2941,970
June 4
46,855
17,4641,587
14,582
6,092
6,8012,7049,317
16,3591,964
Aug. 6
52,923
16,8673,112
16,090
3,957
6,0283,481
10,927
15,5212,559
Apr. 9
50,603
11,3651,090
12,271
6,324
7,3222,156
10,545
16,2101,816
June 11
51,239
16,181968
13,595
5,392
6,9162,829
10,592
16,2752,921
Aug. 13
53,760
16,8082,377
15,440
3,669
6,1543,665
11,391
14,3322,579
Apr 16
48,984
11,170998
13,199
5,752
6,9303,0538,973
14,9382,217
June 18
50,202
17,0301,048
13,394
4,847
6,7332,8079,104
17,0982,617
Aug. 20
52,133
17,4042,462
16,253
3,399
6,1183,585
10,161
13,9462,852
Apr. 23
46,354
11,7841,263
13,202
6,128
6,9082,4949,077
14,2432,261
June 25
47,244
17,5131,545
14,975
4,420
6,4262,8099,470
15,2242,173
Aug. 27
49,813
15,6872,708
16,612
3,625
5,9663,517
10,756
11,4582,418
Apr. 30
42,431
11,9781,155
13,125
6,282
7,1032,3688,869
13,9712,275
July 2
47,699
17,0361,242
15,568
3,980
6,4322,9569,164
15,6422,117
Sept. 3
51,764
14,7322,717
17,829
3,601
5,8213,416
10,777
12,7872,322
20Digitized for FRASER http://fraser.stlouisfed.org/ Federal Reserve Bank of St. Louis

4. Federal funds and repurchase agreements of large member banks1—ContinuedAverages of daily figures, in millions of dollars
Maturity and source
One day and continuing contract1 Commercial banks in United States .2 Other depository institutions, foreign banks
and foreign official institutions, andU S government agencies
3 Nonbank securities dealers4 All other
A 11 other maturities5 Commercial banks in United States6 Other depository institutions, foreign banks
and foreign official institutions, andU S government agencies
7 Nonbank securities dealers8 All other
MEMO: Federal funds and resale agree-ment loans in maturities of one day orcontinuing contract
9 Commercial banks in United States10 Nonbank securities dealers
One day and continuing contract1 Commercial banks in United States
1980, week ending Wednesday
Sept 10 Sept. 17
56,030 54,901
15,465 15,7792,216 2,268
16,758 16,684
3,751 3,702
5,689 6,0183,143 3,134
11,078 10,494
13,361 14,9382,813 2,150
2 Other depository institutions, foreign banksand foreign official institutions, andU S government agencies
3 Nonbank securities dealers4 All other
All other maturities5 Commercial banks in United States6 Other depository institutions, foreign banks
and foreign official institutions, andU.S. government agencies
7 Nonbank securities dealers8 All other
MEMO: Federal funds and resale agree-ment loans in maturities of one dayor continuing contract
9 Commercial banks in United States10 Nonbank securities dealers
Nov. 12
52,886
15,2802,694
15,873
4,781
7,9274,186
10,790
12,5452,731
Sept. 24
50,341
15,1912,847
16,587
3,484
6,2163,524
10,091
12,9451,702
Nov. 19
51,545
15,9862,635
17,505
3,868
7,4384,1749,874
14,8722,787
Oct. 1
50,759
15,1891,978
16,914
3,625
6,3863,937
10,613
14,3782,020
Nov. 26
47,910
15,5732,790
17,067
4,112
7,2834,240
10,611
11,3162,547
Oct. 8
54,831
15,2722,203
16,823
3,259
6,3883,681
10,256
13,8732,465
Dec. 3
51,213
14,2052,581
15,484
4,501
7,2254,494
12,147
14,6972,721
Oct. 15
53,527
15,8351,740
15,775
5,159
6,8783,805
11,342
15,1382,266
Dec. 10
52,762
14,3842,355
17,964
4,001
7,3004,139
10,304
14,1412,976
Oct. 22
49,832
15,9732,007
17,144
3,730
7,1004,020
10,536
12,5042,484
Dec. 17
51,140
14,0762,864
17,847
4,070
7,5344,1369,981
14,4112,950
Oct. 29
47,442
15,2302,200
17,232
3,828
7,2164,570
10,956
12,2002,126
Dec. 24
46,737
13,8982,682
16,656
4,324
7,7504,495
.10,820
13,3853,254
Nov. 5
49,000
14,1392,669
16,584
4,645
7,7904,051
10,987
13,3052,774
Dec. 31
45,865
13,8462,242
14,598
5,266
7,7384,491
13,847
15,5322,763
21Digitized for FRASER http://fraser.stlouisfed.org/ Federal Reserve Bank of St. Louis

5. Federal Reserve Bank interest ratesA. Short-term adjustment credit to depository institutions1
Percent per annum. Figures in parentheses indicate day of month new rate became effective.
Year and month
1979 -In effect December 31. .
1980-FebruaryMay. . . .JuneJulySeptemberNovemberDecember . . .
In effect December 31. .
Boston
12
(19) 13(30) 12(16) 11(29) 10(26) 11(17) 12
(8) 13
13
NewYork
12
(15) 13(29) 12(13) 11(28) 10(26) 11(17) 12
(5) 13
13
Phila-delphia
12
(19) 13(29) 12(13) 11(29) 10(26) 11(17) 12(8) 13
13
Cleve-land
12
(15) 13(29) 12(13) 11(28) 10(26) 11(17) 12
(5) 13
13
Rich-mond
12
(15) 13(29) 12(13) 11(28) 10(26) 1 1(17) 12(5) 13
13
Atlanta
12
(15) 13(29) 12(16) 11(28) 10(26) 1 1(17) 12(5) 13
13
Chicago
12
(15) 13(29) 12(13) 11(28) 10(26) 1 1(17) 12
(8) 13
13
St.Louis
12
(15) 13(29) 12(13) 11(28) 10(26) 11(17) 12(5)13
13
Minne-apolis
12
(15) 13(29) 12(13) 11(28) 10(26) 11(17) 12
(5) 13
13
KansasCity
12
(19) 13(29) 12(13) 11(28) 10(26) 11(17) 12
(5) 13
13
Dallas
12
(15) 13(29) 12(13) 11(28) 10(26) 1 1(17) 12
(8) 13
13
SanFran-cisco
12
(15) 13(29) 12(13)11(28) 10(26) 11(17) 12
(5) 13
13
B. Extended credit to depository institutionsPercent per annum. Figures in parentheses indicate day of month new rate became effective.
Year and month
1979-In effect December 31. .
1980— FebruaryMayJuneJulySeptember . .NovemberDecember
In effect December 31. .
Boston NewYork
Phila-delphia
Cleve-land
Rich-mond Atlanta Chicago St.
LouisMinne-apolis
KansasCity Dallas
SanFran-cisco
Seasonal credit
(19,(30](16;(29](26(1c
12
13121110111213
13
12
(15) 13(29) 12(13)11(28) 10(26)11(17) 12(5)13
13
12
(19) 13(29) 12(13)11(29) 10(26)11(17) 12(8)13
13
12
15)1329) 1213)11
(28) 10(26)11(17) 12
(5)13
13
12
(15) 13(29) 12(13)11(28) 10(26)11(17) 12(5)13
13
12
(15) 13(29) 12(16)11(28) 10(26)11(17) 12(5)13
13
12
(15) 13(29) 12(13)11(28) 10(26)11(17) 12(8)13
13
12
(15) 13(29) 12(13)11(28) 10(26)11(17) 12
(5)13
13
12
(15)13(29) 12(13)11(28) 10(26) 11(17) 12
(5)13
13
12
19)1329)1213) 1128)10
(26) 11(17) 12(5)13
13
(15(29(13
88(S
12
13121110111213
13
12
(15) 13(29) 12(13)11(28) 10(26) 11(17) 12(5)13
13
22Digitized for FRASER http://fraser.stlouisfed.org/ Federal Reserve Bank of St. Louis

5. Federal Reserve Bank interest rates—ContinuedB. Extended credit to depository institutions-ContinuedPercent per annum. Figures in parentheses indicate day of month new rate became effective.
Year and month
1979-In effect December 31. .
1980 -FebruaryMayJuneJulySeptemberNovemberDecember
In effect December 31. .
Boston NewYork
Phila-delphia
Cleve-land
Rich-mond Atlanta Chicago St.
LouisMinne-apolis
Kansas TCity l Dallas
SanFran-cisco
Special circumstances1
13
(19) 14(30) 13(16) 12(29)11(26) 12(17) 13(8)14
14
(15(29
(5
13
)14> 13
1211121314
14
(19](29](13(29(26(17
(8
13
14131211121314
14
13
(15) 14(29) 13(13) 12(28)11(26) 12(17)13(5)14
14
(15(29(13(28(26(17(5
13
) 14)13
12111213
)14
14
13
(15) 14(29) 13(16) 12(28) 11(26) 12(17) 13(5)14
14
13
(15) 14(29) 13(13) 12(28) 11(26) 12(17) 13(8)14
14
13
(15) 14(29) 13(13) 12(28) 11(26) 12(17) 13(5)14
14
13
(15) 14(29) 13(13) 12(28)11(26) 12(17) 13(5)14
14
(19](29](13(28(26(17(5
13
14 (H3 (
12 (11 (12 (13 (14
14
13
15 1429 1313 1228 1126 12
14
13
(15) 14(29) 13(13) 12(28)11(26) 12(17) 13(5)14
14
C. Emergency credit to all others under last paragraph of Section 131
Percent per annum. Figures in parentheses indicate day of month new rate became effective.
Year and month
1979-In effect December 31. .
1980-FebruaryMay. . .JuneJulySeptemberNovemberDecember
In effect December 31. .
Boston
15
(19) 16(30) 15(16) 14(29) 13(26) 14(17) 15
(8) 16
16
NewYork
15
(15) 16(29) 15(13) 14(28) 13(26) 14(17) 15
(5) 16
16
Phila-delphia
15
(19) 16(29) 15(13) 14(29) 13(26) 14(17) 15(8) 16
16
Cleve-land
15
(15) 16(29) 15(13) 14(28) 13(26) 14(17) 15
(5) 16
16
Rich-mond
15
(15) 16(29) 15(13) 14(28) 13(26) 14(17) 15
(5) 16
16
Atlanta
15
(15) 16(29) 15(16) 14(28) 13(26) 14(17) 15
(5) 16
16
Chicago
15
(15) 16(29) 15(13) 14(28) 13(26) 14(17) 15
(8) 16
16
St.Louis
15
(15) 16(29) 15(13) 14(28) 13(26) 14(17) 15
(5) 16
16
Minne-apolis
15
(15) 16(29) 15(13) 14(28) 13(26) 14(17) 15
(5) 16
16
KansasCity
15
(19) 16(29) 15(13) 14(28) 13(26) 14(17) 15
(5) 16
16
Dallas
15
(15) 16(29) 15(13) 14(28) 13(26) 14(17) 15
(8) 16
16
SanFran-cisco
15
(15) 16(29) 15(13) 14(28) 13(26) 14(17) 15
(5) 16
16
6. Depository institutions reserve requirements1
Percent of deposits
Type of deposit, and depositinterval in millions of dollars
Net demand2
0-22-1010-100100-400Over 400
Time and savings2^Savings
Time*0-5, by maturity
30-179 days180 days to 4 years4 years or more
Over 5, by maturity30-179 days180 days to 4 years4 years or more
Member bank requirementsbefore implementation of the
Monetary Control Act
Percent
79V2
H3/4123/416V4
3
2V21
62V21
Effective date
12/30/7612/30/7612/30/7612/30/7612/30/76
3/16/67
3/16/671/8/76
10/30/75
12/12/741/8/76
10/30/75
Type of deposit, anddeposit interval
Net transaction accounts^$0-$25 millionOver $25 million
Nonpersonal time deposits^By original maturity
Less than 4 years4 years or more
Eurocurrency liabilitiesAll types
Depository institution require-ments after implementation of
the Monetary Control Act5
Percent
312
30
3
Effective date
11/13/8011/13/80
11/13/8011/13/80
11/13/80
23Digitized for FRASER http://fraser.stlouisfed.org/ Federal Reserve Bank of St. Louis

7. Margin requirements1
Percent of market value; effective dates shown.
Type of security or sale
1 Margin stocks2 Convertible bonds ....3 Short sales4 Writing options2
Mar. 11, 1968
705070
June 8, 1968
806080
May 6, 1970
655065
Dec. 6, 1971
555055
Nov. 24, 1972
655065
Jan. 3, 1974
505050
Jan. 1, 1977
50505030
8. Maximum interest rates payable on time and savings deposits at federally insured institutions1
Percent per annum
Type and maturity of deposit
1 Savings2 Negotiable order of withdrawal
accounts3
Time accounts4
Fixed ceiling rates by maturity^1
3 14-89 days°4 90 days to 1 year5 1 to 2 years8
6 2 to 2 72 years8
7 2V2 to 4 years8
8 4 to 6 years9 .9 6 to 8 years9
10 8 years or more9
11 Issued to governmental units(all maturities)11
12 Individual retirement accounts andKeogh (H.R. 10) plans (3 yearsor more)11'
Special variable ceiling rates by maturity13 6-month money market
time deposits13
14 2Y2 years or more
Commercial banks
In effect Dec. 31, 1980
Percent
5V4
5V4
5V453/4
66V27*/4
%8
8
(14)
(15)
Effectivedate
7/1/79
12/31/80
8/1/791/1/807/1/737/1/73
11/1/7312/23/74
6/1/78
6/1/78
6/1/78
(14)
(15)
Previous maximum
Percent
5
5
i*$53/4(1°)7V4(7)
73/4
73/4
ffl
Effectivedate
7/1/73
1/1/74
7/1/737/1/73
1/21/701/21/701/21/70
11/1/73
12/23/74
7/6/77
(14)(16)
Savings and loan associations andmutual savings banks
In effect Dec. 31, 1980
Percent
5V2
5l/4
(?6'/2
63/47l/273/48
8
8
(14)
O5)
Effectivedate
7/1/79
12/31/80
1/1/80(2)(2)
11/1/7312/23/74
6/1/786/1/78
6/1/78
6/1/78
(14)
(15)
Previous maximum
Percent
5V4
5
Q53/453/466TO7V2(7)73/4
73/4
(14)(.6)
Effectivedate
(2)
1/1/74
1/21/701/21/701/21/70
11/1/73
12/23/74
7/6/77
(14)(16)
24Digitized for FRASER http://fraser.stlouisfed.org/ Federal Reserve Bank of St. Louis

9* Federal Reserve open market transactionsMillions of dollars
Type of transaction1
U.S. GOVERNMENTSECURITIES
Outright transactions(excluding matchedtransactions)
Treasury bills1 Gross purchases . . .2 Gross sales3 Exchange4 Redemptions
Others within 1 year5 Gross purchases . . .6 Gross sales7 Maturity shift8 Exchange9 Redemptions
/ to 5 years10 Gross purchases . . .11 Gross sales12 Maturity shift13 Exchange . . .
5 to 10 years14 Gross purchases . . .15 Gross sales16 Maturity shift17 Exchange
Over 10 years18 Gross purchases . . .19 Gross sales20 Maturity shift21 Exchange .
A 11 maturities22 Gross purchases . . .23 Gross sales24 Redemptions
Matched transactions25 Gross sales26 Gross purchases . . .
Repurchase agreements27 Gross purchases . . .28 Gross sales
29 Net change in govern-ment securities . .
FEDERAL AGENCYOBLIGATIONS
Year
7,6687,331
03,389
912o12,427
-182510
2,1380
-8,90913,412
7030
-3,0922970
8110
-4261 869
12,2327,3313,389
674 000675,496
113,902113 040
3,869
Jan.
01,722
0790
0o383
-4030
00
-383403
0000
000o
01,722
790
5302555,557
5,7046,872
-1,148
Feb.
1871,590
0400
0o1,822
-2 1770
00
-3741,377
00
-1,364450
00
-84350
1871,590
400
54 54154,584
5,4074,787
-1,140
Mar.
1,370000
2920
921-809
0
3550
-921809
107000
81000
2,20600
55,65854,636
6,6826,379
1,486
Apr.
2,428108
00
1090
179-459
0
3730
-179459
6200o
64000
3,036108
0
5731657,479
3,0293 952
2,168
May
838232
00
1550
1,670-5 276
0
4050
-1,3023,000
1330
-251 300
2160
-342976
1,747232
0
49 93450,965
7,7174 811
5,452
1980
June
322000
1210
412-1,479
0
4650
-4121,479
164000
12900o
1,20000
5059052,076
12,81015 258
238
July
02,264
0950
00
311-788
0
00
-311788
000o
0000
02,264
950
48 37046,023
10,71910 110
^,952
Aug.
04700
1370
2,423-3,134
0
5410
-7201,750
2360
-1,7031,000
32000
384
1,23447
0
7231571,645
2,7833016
284
Sept.
200237
00
00
589-1,459
0
00
-5891,459
0000
0000
200237
0
55 76656,207
3,2032,743
863
Oct.
991531
0700
00
596-420
0
00
-596420
000o
0o0o
991531700
55 78756,462
20,14519 808
771
Nov.
0600
0500
00
2,368-879
0
00
-2,368500
000
220
000
159
0600500
40 94441,129
24,16923 924
-670
Dec.
1,33100
49
100o754
-9670
00
-754967
000o
000o
1,4310
49
7975478,734
11,53411 381
516
Outright transactions30 Gross purchases . . .31 Gross sales32 Redemptions
Repurchase agreements33 Gross purchases . . .34 Gross sales
35 Net change in agencyobligations
BANKERS ACCEPTANCES
36 Outright transactions,net
37 Repurchase agreements,net
38 Net change in bankersacceptances
39 Total net change inSystem OpenMarket Account . .
668 00 0
145 0
0 6680 05 2
00
91
00
21
00
22
28,895 3,049 2,403 1,883 483 1,611 3,035 1,737 1,082 977 5,922 4,825 1,88928,863 3,543 2,372 1,834 563 1,258 3,351 1,242 1,132 1,188 5,734 4,880 1,767
555 -494 31 45 586 353 -318 492 -50 -302 167 -55 99
0 0 0
73 -704 205
0 0 0
-34 -171 366
0 0 0
-64 -33 222
73 -704 205 -34 -171 366 -64 -33 222
0 0 0
67 -43 253
67 -43 253
4,497 -2,345 -903 1,497 2,582 6,171 -73 -4,523 202 784 1,005 -768 868
25Digitized for FRASER http://fraser.stlouisfed.org/ Federal Reserve Bank of St. Louis
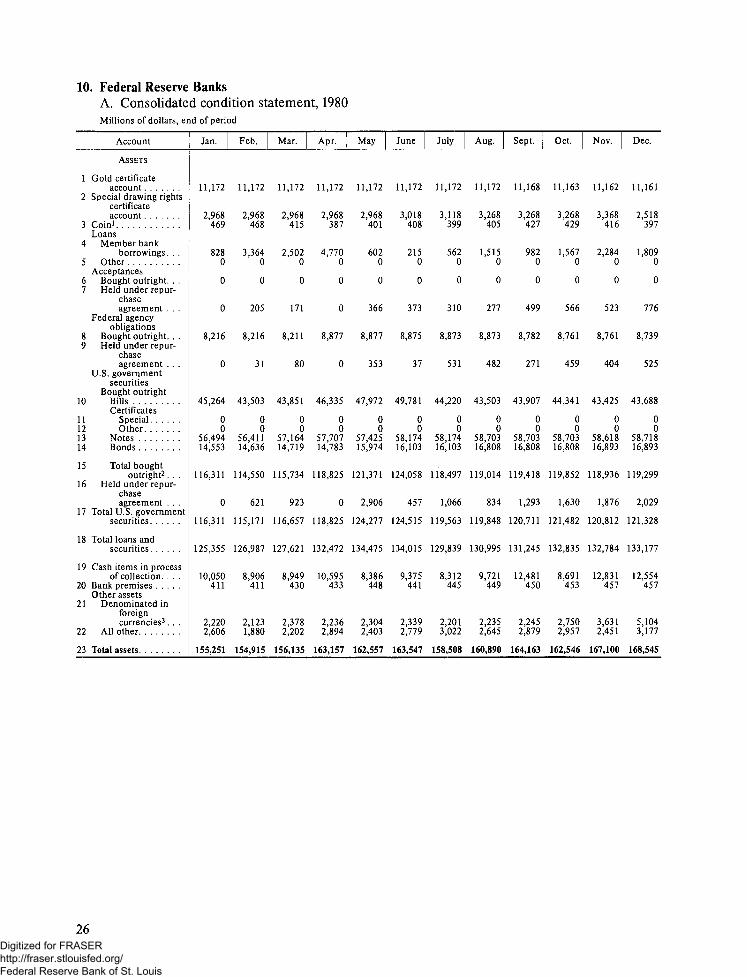
10. Federal Reserve BanksA. Consolidated condition statement, 1980Millions of dollars, end of period
Account
ASSETS
1 Gold certificateaccount
2 Special drawing rightscertificateaccount
3 Coin1
Loans4 Member bank
borrowings . . .5 Other
Acceptances6 Bought outright. . .7 Held under repur-
chaseagreement . . .
Federal agencyobligations
8 Bought outright. . ,9 Held under repur-
chaseagreement . . .
U.S. governmentsecurities
Bought outright10 Bills
Certificates11 Special12 Other13 Notes14 Bonds
15 Total boughtoutright2 . . .
16 Held under repur-chaseagreement . . .
17 Total U.S. governmentsecurities
18 Total loans andsecurities . .
19 Cash items in processof collection. . . .
20 Bank premisesOther assets
21 Denominated inforeigncurrencies^ . . .
22 All other
23 Total assets
Jan.
11,172
2,968469
8280
0
0
8,216
0
45,264
00
56,49414,553
116,311
0
116,311
125,355
10,050411
2,2202,606
155.251
Feb.
11,172
2,968468
3,3640
0
205
8,216
31
43,503
00
56,41114,636
114,550
621
115,171
126,987
8,906411
2,1231,880
154.915
Mar.
11,172
2,968415
2,5020
0
171
8,211
80
43,851
00
57,16414,719
115,734
923
116,657
127,621
8,949430
2,3782,202
156.135
Apr.
11,172
2,968387
4,7700
0
0
8,877
0
46,335
00
57,70714,783
118,825
0
118,825
132,472
10,595433
2,2362,894
163.157
May
11,172
2,968401
6020
0
366
8,877
353
47,972
00
57,42515,974
121,371
2,906
124,277
134,475
8,386448
2,3042,403
162.557
June
11,172
3,018408
2150
0
373
8,875
37
49,781
00
58,17416,103
124,058
457
124,515
134,015
9,375441
2,3392,779
163.547
July
11,172
3,118399
5620
0
310
8,873
531
44,220
00
58,17416,103
118,497
1,066
119,563
129,839
8,312445
2,2013,022
158,508
Aug.
11,172
3,268405
1,5150
0
277
8,873
482
43,503
00
58,70316,808
119,014
834
119,848
130,995
9,721449
2,2352,645
160,890
Sept.
11,168
3,268427
9820
0
499
8,782
271
43,907
00
58,70316,808
119,418
1,293
120,711
131,245
12,481450
2,2452,879
164,163
Oct.
11,163
3,268429
1,5670
0
566
8,761
459
44,341
00
58,70316,808
119,852
1,630
121,482
132,835
8,691453
2,7502,957
162,546
Nov.
11,162
3,368416
2,2840
0
523
8,761
404
43,425
00
58,61816,893
118,936
1,876
120,812
132,784
12,831457
3,6312,451
167,100
Dec.
11,161
2,518397
1,8090
0
776
8,739
525
43,688
00
58,71816,893
119,299
2,029
121,328
133,177
12,554457
5,1043,177
168,545
26Digitized for FRASER http://fraser.stlouisfed.org/ Federal Reserve Bank of St. Louis

10. Federal Reserve Banks—ContinuedA. Consolidated condition statement, 1980-ContinuedMillions of dollars, end of period
Account
LIABILITIES
24 Federal Reservenotes** . .
Deposits25 Member bank
reserveaccounts . .
26 Edge Actcorporations . .
27 U.S. agencies andbranches offoreign banks .
28 Total29 U.S. Treasury-
Generalaccount . . .
30 Foreign31 Other
32 Total deposits
33 Deferred availabilitycash items
34 Other liabilities andaccrueddividends5 . .
35 Total liabilities . . .
CAPITAL ACCOUNTS
36 Capital paid in37 Surplus38 Other capital
accounts
Jan.
108 927
31 232
244
1631492
2,931440339
35,202
5,440
2425
151,994
1,1531,145
959
Feb.
109,170
31,725
328
5532,108
2,417450350
35,325
5,752
2,106
152,353
1,1531,145
264
Mar.
110,597
31,870
308
9232270
2,334468313
35,385
5,267
2,173
153,422
1,1591,145
409
Apr.
Ill 524
32,927
315
4033 282
4,561648553
39,044
7,523
2,470
160,561
1,1621,145
289
May
113,118
31,804
376
20232,382
4,523380
1,160
38,445
5,911
2,389
159,863
1,1641,145
385
June
114,502
33,187
397
2833 612
3,199691
1,332
38,834
5,208
2,250
160,794
1,1691,145
439
July
115,654
27,548
372
027,920
3,954436500
32,810
5,504
1,957
155,925
1,1751,145
263
Aug.
116,925
29,338
342
029,680
2,742336383
33,141
6,254
1,879
158,199
1,1801,145
366
Sept.
117,144
28,146
0
028,146
4,102460363
33,071
9,289
1,877
161,381
1,1841,145
453
Oct.
118,248
30,518
0
030,518
1,864368338
33,088
6,497
2,042
159,875
1,1991,145
327
Nov.
121,191
31,528
0
031,528
2,435368478
34,809
6,039
2,317
164,356
1,1991,145
400
Dec.
124,241
27,456
0
027,456
3,062411617
31,546
8,087
2,265
166,139
1,2031,203
0
39 Total liabilities andcapitalaccounts
40 MEMO: MarketableU.S. governmentsecurities held incustody forforeign and inter-national account.
155,251 154,915 156,135 163,157 162,557 163,547 158,508 160,890 164,163 162,546 167,100 168,545
81,039 80,625 77,566 74,045 75,691 82,226 82,862 84,331 84,526 86,150 90,529 91,795
27
Digitized for FRASER http://fraser.stlouisfed.org/ Federal Reserve Bank of St. Louis

10. Federal Reserve Banks—ContinuedB. Federal Reserve note statement, 1980Millions pf dollars, end of period
Account
1 Federal Reserve notesoutstanding (is-sued to Bank) . .
2 Less-Notes held byReserve Bank1 .
3 Federal Reservenotes, net. . . .
Collateral held againstnotes outstanding
4 Gold certificateaccount
5 Special drawing rightscertificateaccount
6 Other eligible assets .7 U.S. government
securities . .
8 Total collateral
Jan.
125,707
n,a.
n.a.
11,172
2,968635
110,932
125,707
Feb.
127,046
n.a.
n.a.
11,172
2,9681,473
111,433
127,046
Mar.
128,418
n.a.
n.a.
11,172
2,9681,665
112,613
128,418
Apr.
130,478
n.a.
n.a.
11,172
2,9681,613
114,725
130,478
May
131,334
n.a.
n.a.
11,172
2,96842
117,152
131,334
June
132,861
n.a.
n.a.
11,172
3,01829
118,642
132,861
July
134,545
n.a.
n.a.
11,172
3,11886
120,169
134,545
Aug.
134,781
n.a,
n.a.
11,172
3,268553
119,788
134,781
Sept.
137,292
20,148
117,144
11,168
3,2680
102,708
117,144
Oct.
137,871
19,623
118,248
11,163
3,2680
103,817
118,248
Nov.
138,699
17,508
121,191
11,162
3,3680
106,661
121,191
Dec.
140,184
15,943
124,241
11,161
2,5180
110,562
124,241
C. Maturity distribution of loans and securities held, 1980Millions of dollars, end of period
Type and maturitygrouping
1 Loans . .2 Within 15 days . . .3 16 days to 90 days .4 91 days to 1 year. .
5 Acceptances6 Within 15 days . . .7 16 days to 90 days .8 91 days to 1 year. .
9 U.S. governmentsecurities
10 Within 15 days*. . .1 1 16 days to 90 days .12 91 days to 1 year . .13 Over 1 year to
5 years . .14 Over 5 years to
10 years15 Over 10 years . . . .
16 Federal agencyobligations. . . .
17 Within 15 days 17. .18 16 days to 90 days .19 91 days to 1 year. .20 Over 1 year to
5 years21 Over 5 years to
10 years22 Over 10 years . . . .
Jan.
828813
150
0000
116,3113,878
22,81536,211
27,885
12,77412,748
8,21679
5461,277
4,238
1,356720
Feb.
3,3643,324
400
205205
00
115,1713,086
27,70830,615
28,888
11,86013,014
8,247—119
2681,480
4,242
1,318720
Mar.
2,5022,458
440
171171
00
116,6574,238
25,31932,907
29,131
11,96713,095
8,291- 224
2791,478
4,337
1,253720
Apr.
4,7704,716
540
0000
118,8257,519
22,17934,155
29,784
12,02913,159
8,87748
4091,627
4,778
1,271744
May
602594
80
366366
00
124,2774,821
28,36331,349
32,298
13,43714,009
9,230528417
1,612
4,670
1,259744
June
215211
40
373373
00
124,5153,633
28,03931,686
33,418
13,60114,138
8,912223518
1,499
4,663
1,265744
July
562560
20
310310
00
119,5634,693
21,90831,328
33,895
13,60114,138
9,404615761
1,310
4,770
1,204744
Aug.
1,5151,510
50
277277
00
119,8483,394
20,30232,139
36,037
13,13414,842
9,355769607
1,249
4,802
1,184744
Sept.
982973
90
499499
00
120,7113,168
22,47930,751
36,336
13,13514,842
9,053522508
1,312
4,818
1,149744
Oct.
1,5671,550
170
566566
00
121,4822,993
24,05930,293
36,160
13,13514,842
9,22063
1,0031,558
4,771
1,140685
Nov.
2,2832,272
110
523523
00
120,8125,494
23,08628,934
34,942
13,35415,002
9,165556467
1,495
4,870
1,092685
Dec.
1,8091,757
520
776776
00
121,3284,780
23,49930,187
34,505
13,35515,002
9,264705426
1,519
4,837
1,092685
28Digitized for FRASER http://fraser.stlouisfed.org/ Federal Reserve Bank of St. Louis

11. Demand deposits, debits, and deposit turnover, by m^jor banking groupA. Seasonally adjusted
Period
1979-JanuaryFebruaryMarchAprilMayJuneJulyAugustSeptemberOctoberNovemberDecember
1980-JanuaryFebruaryMarchAprilMayJuneJulyAugustSeptemberOctoberNovemberDecember
Demand deposits1
(billions of dollars)
Allbanks
297,7295.0294.4301.0299.9304.6306.7306.1313.1313.1311.2311.2
310.6312.1310.6 .294.5301.9305,0309.1317.5321.2323.4319.5314.2
MajorN.YC. banks
28.027.327.427.327.428.828.528,729,730.829.930.0
31.031.131,129.529.330.330.231.131.932.631.831.6
Otherbanks
273.7267,7267.1276.4272.5275.8278.2277.4283.5282.3281.3281.3
279.6281.0279.6265.0272.6274.7278.8286.4289.3290.8287.7282.6
Debits1
(annual rate, billions of dollars)
Allbanks
44,799.644,153.045,326.046,772.447,777.950,478,052,030.952,816.654,498.653,170,551,666.253,809.8
58,797.259,369.959,186.757,889.361,493.461,790.263,257.865,498.265,258.665,346.767,621.469,950.2
MajorN.Y.C. banks
16,345.515,428.815,637.716,898.417,212.619,748.519,992.520,364.121,119.019,679.619,224.320,500.8
23,679.823,036.522,937,823,792.725,509.224,789.625,540.926,708.426,104.726,035.026,821.827,352.2
Otherbanks
28,454.128,724.229,688.229,874.130,565.430,729.532,038.432,452.533,379.633,490.932,441.933,309.1
35,117.536,333.436,248.934,096.635,984.237,000.637,716.938,789.839,154.039,311.740,799.642,598.0
Deposit turnover (annual rate,ratio of debits to deposits)
Allbanks
150.5149.7153.9155.4159,3165,7169.6172.5174,0169.8166.0172.9
189.3190.2190.5196.6203.7202.6204.7206.3203,2202,1211.6222.7
MajorN.Y.C. banks
584.3565.1571.7618.3628.3685.5700.7709.1711.5639.1643,0684.0
763.4741.2738.0805.9871.8817.1844.6859.7818.6799.5842.2865.8
Otherbanks
105.5107.3111.2109.2112.2111.4115.2117.0117.8118.6115.3118.4
125.6129.3129.7128.7132.0134.7135.3135.4135.3135.2141.8150.8
B. Not seasonally adjusted
Period
1979-JanuaryFebruaryMarchAprilMayJune . .JulyAugustSeptemberOctoberNovemberDecember
1980-JanuaryFebruaryMarchAprilMayJuneJulyAugustSeptemberOctoberNovemberDecember
Demand deposits1
(billions of dollars)
Allbanks
305.5290.3290.3303.7294.5304.3307.3300.0311.9312.1313.4321.5
318.8307.5306.9297.7297.0305.2310.3311.1319.9322.4321.8324.5
MajorN.Y.C. banks
29.227.427.527.326.929.128.927,329.329.930.131.2
32.431.431.229.528.730.630.629.631.531.632.132.9
Otherbanks
276.3262.9262,8276.4267.6275.3278.5272,7282.6282.3283.3290.3
286.4276.3275.7268.2268.3274.6279.7281.5288.4290.8289.7291.6
Debits1
(annual rate, billions of dollars)
Allbanks
47,442.740,090,947,139.046,912.748,590.150,831.451,510.653,503.249,648.255,616.350,994,655,047.5
62,325.154,679.758,950.060,494.260,386.561,913.765,282.061,306.364,214.568,810.161,332.677.294.9
MajorN.Y.C. banks
17,309.914,382.816,797.717,008.817,413.519,487.319,280.020,077.119,072.520,316.919,169.021,538.6
25,311.221,761.623,389.824,761.024,762.124,728.225,867.924,106.925,373.827,532.824,245.731,076,2
Otherbanks
30,132.825,708.230,341.429,903.931,176,731,344.132,230.633,426.130,575,735,299.431,825.533,508.9
37,013.832,918.135,560.235,733.235,624.437,185,539,414.237,199.438,840.741,277.337,086.946.218.8
Deposit turnover (annual rate,ratio of debits to deposits)
Allbanks
155.3150.5162.4154.5165.0167.0167.6178.3159.2178.2162.7171,2
195.6178.0192.5203.6203.7203.2210.8197.1200.7213.4190.6238.2
MajorN.Y.C. banks
592,0584.3610.7623.0647,3670.7667.8735.1651.4680.5636.7689.4
781.6698.8749.5838.7861.8808.6845.9814.8806.2871.5756.1944.1
Otherbanks
109.4105.5115.4108.2116.5113.9115.7122.6108.2125.0112.3115.4
129.3119.3129.3133.5133.1135.6141.2132.1134.7141.9128.0158.5
29
Digitized for FRASER http://fraser.stlouisfed.org/ Federal Reserve Bank of St. Louis

12. Savings deposits, debits, and deposit turnover, by type of depositorNot seasonally adjusted
Period
1979_januaryFebruaryMarchApril . . , ,MayJuneJulyAugustSeptemberOctoberNovemberDecember
1980— JanuaryFebruaryMarchAprilMay . . ,JuneJulyAugustSeptemberOctoberNovemberDecember
Savings deposits1
(billions of dollars)
Alldepositors
217.8215.9216,5217.7216.0217.1219.1218.4216.6213.3206.6204.6
203.8200,4196.8192.3190.6196.3204.0208.3210.2210.9210.7204.5
Business2
11.010.410.510.710.710.610.711.111.210.810.510.2
9.89.59.08.78.99.6
10.411.011.111.311.310.6
Other
200.2197.8197.3197.1194.9195.8197.0195.1193.1190.0183.6181.8
180.7177.6174.1169.8167.9171.2176.9179.7180.5180.4178,9173.0
Debits(annual rate, billions of dollars)
Alldepositors
596.8438.4587.6687.0726.6654.4766.0721.9663.4833.4765.0733.4
874.2762.8826.3908.3765.6766.6809.8793.2921.1973.8842.8
1,041.6
Business2
75,355.478.275.174.175.878.181.377.590.781.784,3
91,784.090.692.785,588.490.387.495.8
100.195.6
119.2
Other
468.3332.3448.6535.5568.4494.7605.6548.8492,5629.7577.3545.1
640.5560.8610.4647.9542.3525.4560.8560.3649.0688.2573.7704,2
Deposit turnover (annual rate,ratio of debits to deposits)
Alldepositors
2.72.02.73.23.43.03.53.33.13.93.73.6
4.33,84.24.74,03.94,03.84.44.64.05.1
Business2
6.85.37,47.06.97.17.37.36.98.47.88.3
9.48.8
10.110.69.69,28.78.08.68.88.5
11.3
Other
2.31.72.32,72.92.53.12.82.63.33.13.0
3.53.23.53.83.23.13.23.13.63.83.24.1
30
Digitized for FRASER http://fraser.stlouisfed.org/ Federal Reserve Bank of St. Louis

13. Measures of the money stock1
A. Seasonally adjustedBillions of dollars
Year and month
1977 -"January .FebruaryMarchAprilMayJuneJulyAugust. . . , . .SeptemberOctoberNovemberDecember
1978-January .FebruaryMarchAprilMayJune . . .JulyAugust. .SeptemberOctober .NovemberDecember
1979-JanuaryFebruaryMarchAprilMayJune , , .JulyAugust. .SeptemberOctoberNovemberDecember
1980-January .FebruaryMarch . .AprilMayJune . . .JulyAugustSeptemberOctoberNovemberDecember
Measures
Ml-A
310.6312,5314.4317.0317.5319.1321.3322.6324.9327.5329.5331.4
334.9335.0336.3339.7343.0345.6347,1348.8352.1352.8354.0354.8
353.8353.4355.4359.4359,0363.0365,9367.5369.1369.7371.2372.7
374.4377.2376.5370.1370.4373.6376.6382.8386.4390.1391.3387.7
Ml-B
314.2316.1318.2320.8321.4323.2325.5326.9329.4332.2334.2336.4
339.9340.2341.5345.2348.7351.3352.9354.8358.2359.0361.6364.2
364.8365.9368.9374.5374.5378.5382.2384.5386.4387.2388.7390.5
392.7396.9396.7391.0391.3394.9399.3406.9411.8416.3419.1415.6
M2
1,183.01,195.51,206.91,218.21,229.61,237,71,247.71,258.31,268.91,277.01,287.71,296.4
1,305.31,312.4,320.4,328.6,339.0,345.8,353.7,364.1,376.7,384.3,394.6
1,404.2
1,411.71,420.51,432.51,446.51,456.41,470.21,482,71,495.31,506.81,510.8,517.1
1,525.2
1,538.71,553.41,559.61,553.61,568.21,589.31,614.01,633,41,644.91,654.01,668.51,669.4
M3
1,314.61,327.71,340.41,352.01,366.31,378.41,391.81,406.51,420.21,432.31,449.21,462.5
1,474.41,485.71,500.61,514.61,531.51,541.31,553.51,569.11,584.21,592.71,611.51,625.7
1,636.11,648.01,660.71,674.61,686.51,701.51,714.91,731.61,751.21,760.21,765,51,775.1
1,791.51,811.01,818.61,816.91,832.81,851.91,872.91,896.71,911.91,927.51,950.71,963.5
L
1,542.31,558.31,572.81,587.11,603.41,618.91,635.31,653.21,669,51,686,11,707.71,722.7
1,739.01,754,51,770.61,789.51,809.91,824.21,840.11,858.81,876.81,889.01,915.41,936.5
1,953.21,970.31,991.12,012.42,033.72,061.72,079.02,096.82,121.12,132.82,140.62,151.1
2,174.72,198.92,210.42,218.22,231.52,245.92,263.72,290,52,308.12,325.62,356.12,377.4
Components
Currency
81.381.982.483.183.784.285.285.786.487.187.888.6
89,289.990.791.292.292.993.494.195.095.796.597.4
98.298.999.6
100.3101,0101.9102.7103.7104.6105.2105.6106.1
107.3108.1108.9109.1110.4111.1112.1113.4113,8114.9115.7116.1
Demanddeposits
226.6227.7229.2230.9230.8231.9233.1233.9235.5237.3238.6239.7
242.5242.0242.5245.3247.6249,4250.3251.3253.7253.7254.0253.9
252.1251.1252.3255.5254.3257.5259.6260.1260.8260.8261.8262.8
263.3265.2263.8257.1256.1258.7260.7265,4268.6271.2271.6267.4
Traveler'schecks2
2.82.82.92.92.93,03.03.03.03.13.13.1
3.13.13.23,23.33.33.33.43.43.43.53.5
3.53.53.63.63.73.63.63.63.73.73.73.8
3.83.83.83.83.83.83.83.94.04.04.14.2
Savingsdeposits
453.8458.8461,9465.6468.3469.3471.8475.4478.2480.3483.9486.5
488.8491.7493.1494.0495.1492.6487.7486.3486.4484.2480.8475.5
468.0462,7459.4454.9451.4450.1449.3447.5442.3430.6420.1416.5
412.6406.4396.0381.9377.7384.6395.9404.6407.9407.8406.1393.0
Smalltime
deposits3
401.9406.7412.0417.2423.0429.0434.1438.5443.3446.8450,1453.8
457.1459.9463.4467.0471.3479.3489.3497.1505,9513.9523.0533,3
546.5555.9564.7574.6583.3591.0598.1606.8618.0630.8645.8652.7
660.4669,2683.5702.2712.9714.1712.6713.6718.1724.0738.0756.8
Largetime
deposits4
117.7117.8118.3118.5119.1123.4126.4129.6132.2136.3140.7145.1
148.7152.2158.0163.6169.0173.6177.1180.8183.5183.9190.8194.0
197.4200.0199.9198.8198.6198.9200.3204,2210.8216,7218.1219.7
222.8227.5230.2234.4235.9233.3228.2229.6233.4237.7245.4256,8
31Digitized for FRASER http://fraser.stlouisfed.org/ Federal Reserve Bank of St. Louis

13. Measures of the money stock1—ContinuedB. Not seasonally adjustedBillions of dollars
Year and month
1977— JanuaryFebruaryMarchAprilMayJuneJulyAugustSeptember . . . .OctoberNovember . . . .December . . . .
1978-JanuaryFebruaryMarchAprilMayJune . .JulyAugust,September . . . .OctoberNovember . . . .December . . . .
1979- JanuaryFebruaryMarchApril . . .MayJuneJulyAugustSeptember . . . .OctoberNovember . . . .December . . . .
1980-JanuaryFebruaryMarch . .AprilMayJune . .JulyAugustSeptember . . . .OctoberNovember . . . .December . . . .
Measures
Ml-A
314,9306.1309.3319.5312.6318.4322.9320.8324.2328.3331.7340.1
339.4327,8330.5343.0337.7344.7349,1346,9352.0354.4356.5364.2
358.0345.5348.8362.7353.4362.1367.9365,8369.2371.5373.8382.5
378.4368.5369,5373.3364.6372.7378.7381.1386.6391.7394.1397.7
Ml-B
318.4309.7313.1323.4316.4322.5327.1325.1328.8333.0336.5345.1
344.5332.9335.8348.4343.3350.4354.9352.9358.1360.6364,1373.6
369.0357.5362.0377.4368.2377.9384.5383.0386.8389.2391.4400.6
397.2387.5389.1393.9384.7394.3401.8405,4412,3418.4421.9425.9
M2
1,184.41,187.21,204.31,225,61,227.21,241.11,253.71,256.51,266.61,277,61,284.51,299.0
1,307.61,302,61,316.61,336.11,335.01,348.41,360.11,362.71,375.81,387.31,392.91,409.0
1,413.61,409.11,427.11,453.11,450,61,472.4,488.6
1,493.71,505.81,514.31,516.11,531,3
1,541.31,541.81,554.21,560.81,562.6,591.3,619.4,630.7,643.3,657.5,666.9,675.2
M3
1,317.21,319.91,338.21,358.51,363.51,379.91,395.91,404.41,417.51,432.91,446.81,467.7
1,478.51,477.31,498,01,521.11,526.91,540.91,557.01,566.41,582.21,595.71,611.71,634.6
1,640.31,638.51,657.31,680.31,680.01,699.91,717.61,728,21,748.71,763.21,766.71,785.5
1,796.61,801.41,815.41,822.91,826.41,849.51,874.91,891.91,908.71,930.51,951,71,974.0
L
1,544.71,552.11,572.31,594.61,601.91,619,61,637.91,650.41,666.01,686.31,704.81,726.7
1,742.51,747.51,769.91,797.51,807.31,823.81,842.41,855.51,873.81,891.21,914.61,943.6
1,955.91,962.21,989.82,020.02,030.42,061.02,080.22,092.62,117.62,134.42,139.92,158.8
2,177.72,190.72,210.02,227.02,229.42,245.32,264.12,284.82,303.92,326,52,354.12,384.0
Components
Cur-rency
80.780.981.782.983.584.385.785.886.287.088.590.3
88.688.989.990.991.992.994.094.394.995.797,499.4
97,597.798.799.9
100.7101.9103.2103.9104,5105,2106.6108.3
106.6106.8107.9108.7109.9111.1112.7113.7113.7114.9116.7118.4
De-mand
de-posits
231.5222.5224.8233.9226.2231.1233.8231.6234.8238.3240,2247,0
247.8236.0237.6249.0242.6248.5251.3248.8253.5255.3255.7261.5
257.2244.5246.7259.3249.2256.5260.6257.8260,8262.5263.7270.8
268.3258.1257.9260.9251,0257.6261.7263.0268.6272.8273.5275.4
Travel-er's
checks2
2.62.72.72.72.83.13.43.43.23.13.02.9
2.93.03.03.03.13.43.83.83.63.53.33.3
3.33.33.43.43.53.84.04.13.93.83.63.5
3.63.63.63.63.74.04.34.44.34.13.93.9
Othercheck-
able de-posits5
3.63.73.83,93.94.14.24.44.64.74.85.0
5.15.25.35.55.65.85.96.06.16.37.69.4
11.112.013.314.814.915.916.717.217.717.717.718.2
18.819.119.720,720.221.723.224.425.926.828.028.3
Over-night
RPsandEuro-
dollars6
12.412.913.813.816.115.515.716.817.217.018.618.6
18.118.619,719,520.418.719.521.020.721.322.823.9
23.524.525.926.728.729.328.528.729.928.925.825,4
27.527.826.322.023.425.329.631.733.032.732.832.4
Moneymarketmutualfunds
3.63.83.83.73.63.53.43.43.53.53.63.8
4.24.85.35.86.36.87.27.88.48.99,4
10.3
12.114.516.819.221.824.628.031.233.736.940.443.6
49.156.760.960.466.874,280.680.778.277.477.075.8
Savingsdeposits
451.0455.0461.9467.9469.4472.7476.1477.1478.8481.3481.5483.1
485.9486.7491.9495.1495.0495.4492.5489.2488.8487.2479,3472.6
464.6456.9457.1454.7450.2452.1454.0450,9445.4434.4419.1413.9
409.6400.7393.3381.4376,4386.3400.3408.0411.4411.9405.0390.2
Smalltimede-
posits3
401.9408.6414.6419.7424.4429.7434,1436.8441.1445.5447.1451.3
457.8462.4466.6470.0472.8479.8488.9494.8502.7512.4520.3531.7
547.4558.8568.6578.5584.9591.7596.9603.3613.5628.5643.1651.4
661.5672.7688.3706.9715.2715.1711,1709.0712.5721.2734.6755.2
Largetimede-
posits4
118.9118.4118.7117.6118.7121.6124.6129.2131.8136.3141.5147.7
150.5153.5159.3162.7168.3170.6174.2179.4182.4183.7192.7198.1
199.7201.9201.8197.9197.9195.1197.1202.3209.3216.2220.5223.9
225.3229.5232.5233.1235.0228.9224.8227.4231.8237.4248.0261.4
32Digitized for FRASER http://fraser.stlouisfed.org/ Federal Reserve Bank of St. Louis

14. Aggregate reserves of depository institutions and member bank depositsA. Reserves, 19801
Month
JanuaryFebruary . . .MarchApril . . . . . . .MayJune . . . . 'JulyAugust . ,SeptemberOctoberNovemberDecember
Seasonally adjusted
Totalreserves
Non-borrowed Required Monetary
base2
Not seasonally adjusted
Totalreserves
Non-borrowed Required Monetary
base2
Billions of dollars
43,44243,35043,66944,84644,44543,95942,78140,74941,51741,72741,25140.127
42,20141,69540,84642,39143,42743,58042,38740,09040,20640,41739,19138,437
43,19243,13943,48344,64944,26743,75642,49740,44741,26241,52140,73139.659
154.7155.6156.7158.0158.8159.1158.9158.2159.4160.7160.5159.4
45,17943,17743,09644,88043,96343,47242,85940,37341,16441,70441,24440.614
43,93841,52240,27342,42542,94543,09242,46439,71539,85240,39439,18438.924
44,92842,96642,91044,68343,78543,26842,57540,07140,90841,49840,72340.146
155.9154.0154.9157.5157.8158.6159.6158.0159.0160.6161,6162.4
Excess Borrow-ings
Millions of dollars
251211186197178203284302256206521468
1,2411,6552,8232,4551,018
379. 395
6581,3111,3102,059L690
B. Deposits, 1980Billions of dollars
Month
January . . . .FebruaryMarchAprilMayJuneJulyAugustSeptember. .OctoberNovember. .December
Seasonally adjusted
Deposits subject to reserve requirements1
Total
644.1647.2649.1655.4656.8658.0658.5667.8678.2684.7694.3701.8
Timeand
savings
452.3454.4457.9464.2467.6467.9467.0474.2482.0486.7494.1504.0
Private demand
Total
189.5190.9189.4188.7187.3188.4189.1191.5194.5195.6198.0195.9
Netinter-bank
13.614.515.617.217.116.916.614.415.916.517.317.5
Other
176.0176.4173.9171.5170.2171.5172.5177.1178.6179.1180.6178.4
U.S.gov-ern-
mentdemand
Not seasonally adjusted
Deposits subject to reserve requirements1
Total
2.3 652.51.9 643.91.8 648.02.4 657.71.8 651.51.7 656.92.5 658.22.1 662.51.8 675.62.4 684.22.2 694.51.9 710.3
Timeand
savings
455.0455,8460.6464.7467.7467.4466.0471.8479.6485.7493.2505.0
Private demand
Total
195.4186.2185.5190.4182.1187.2190.0189.0193.9196.4199.5203.2
Netinter-bank
14.514.315.216.816.216.616.814.215.916.518.018.2
Other
180.9172.0170.4173,6165,9170.6173.2174.8178.0179.8181.5185.0
U.S.gov-ern-
mentdemand
2.11.81.92.61.72.32.21.72.12.11.92.1
33Digitized for FRASER http://fraser.stlouisfed.org/ Federal Reserve Bank of St. Louis

15. Loans and securities of all commercial banks1
Billions of dollars; averages of Wednesday figures
Category
1 Total loans and securities? . . . .
2 U.S, Treasury securities . . . .3 Other securities4 Total loans and leases2
5 Commercial andindustrial loans
6 Real estate loans7 Loans to individuals8 Security loans9 Loans to nonbank financial
institutions. . . .10 Agricultural loans . . . . . . .11 Lease financing receivables12 All other loans
MEMO13 Total loans and securities
plus loans sold2' 4
14 Total loans plusloans sold2* 4 . . ,
15 Total loans soldto affiliates4
16 Commercial and industrialloans plus loans sold4. . .
17 Commercial and industrialloans sold4
18 Acceptances held19 Other commercial and
industrial loans20 To U.S. addressees5
21 To non*U,S. addressees5 . .22 Loans to foreign banks23 Loans to commercial banks
in the United States . . . .
1 Total loans and securities2 . . .
2 U.S. Treasury securities . . . .3 Other securities . . , , ,4 Total loans and leases2
5 Commercial and industrialloans
6 Real estate loans7 Loans to individuals8 Security loans9 Loans to nonbank financial
institutions10 Agricultural loans11 Lease financing receivables12 All other loans
MEMO13 Total loans and securities
plus loans sold2' 4
14 Total loans plusloans sold2- 4
15 Total loans sold toaffiliates4
16 Commercial and industrialloans plus loans sold4. . .
17 Commercial and industrialloans sold4
18 Acceptances held19 Other commercial and
industrial loans20 To U.S. addressees5.21 To non-U,S. addressees5 . .22 Loans to foreign banks23 Loans to commercial banks
in the United States . . . .
Seasonally adjusted Not seasonally adjusted
1979
Jan. Feb.
1,029.73 1,041.3
92.8 93.1177.7 178.6759.23 769.6
251.33 256.2212.63 214.9167.0 169,420,0 21.0
26.83 26.628.5 28.67.5 7.6
45.5 45.4
1,033.33 1,044.9
762,83 773.2
3.6 3.6
253.93 258.7
2.5 2,56.8 7.3
244.5 248.9229.4 233,3
15,1 15.622.0 21.8
54,1 53.1
July
1,093.0
95,5183.0814.5
275.0227.3178.0
23,4
27.829.7
8.345.1
1,096.7
818.3
3.7
277.7
2.87.9
267.0249.7
17.320,8
67.7
Aug,
1,104.0
94.5185.3824.2
279.1229.8178.9
23.0
28,329.8
8.546.9
1,107.7
827.9
3.7
281.8
2.87.7
271.3253.3
18.120.7
71.0
Mar.
1,049.3
93.8179.5776.0
259.3217.1171.720.9
26.428.67.7
44.2
1,052.8
779.5
3,5
261.8
2.57.0
252.4236,0
16,421.4
57,1
Sept.
1,124.6
95,3187,6841.7
285.0232.6180.5
23.4
28-530-1
8.752.9
1,128,3
845.4
3.7
287.7
2.78.3
276,7258.0
18.623.8
74.7
Apr.
1,061.3
93.9180.2787.2
263.6219.2174.0
22.2
26.728.97.8
44.6
1,064.9
790.8
3.6
266.2
2.67,0
256.6240.1
16.520,9
60.3
Oct.
1,131,2
95.5188.9846.8
287.9235.8181.8
20.6
29.530.5
8.851,8
1,134.8
850,4
3.6
290.5
2,77,7
280.2260.7
19.522.9
74.3
May
1,068.8
94,1181,0793.7
267.4221.4175.322.6
27.029.2
8.042.8
1,072.5
797.4
3.7
270.0
2,77,0
260.4243,9
16.519.9
61,3
Nov.
1,129.4
94.5190.3844.6
288.4238.1183.3
18,5
29,430,99,0
47,0
1,133.0
848.2
3.6
291.0
2.57.6
280,8261.5
19.319.5
72,6
June
1,080,2
95.0181.4803.8
270.9223.9177.0
22.7
27.229.5
8.144,4
1,083.9
807.6
3.8
273.8
2.87.3
263.7246.9
16.720.8
66.2
Dec.
1,134.6
93.8191.8848.9
291.1241.3184.9
18.6
28,831.1
9,344,0
1,137,66
851.96
3.0$
293.16
2.06
8.2
282.9264.1
18.818,5
75.0
Jan. Feb.
1,029.53 Ito31.5
93.6 93.7177,3 177.7758,53 760.1
250.53 253,3212.63 214,0167,0 167.8
20,3 20.5
26,63 26.028.2 28.1
7.5 7.646.0 42.7
1,033.13 1,035.1
762,13 763.7
3,6 3.6
253.03 255,8
2.5 2,57.2 7.2
243.3 246.1227.7 230.4
15.6 15.723.0 20.5
56.2 55.8
July
1,094.5
93.8182.8817.9
276,4227.5178,4
22.5
28.130.1
8.346.6
1,098.2
821.6
3,7
279.1
2,87.6
268,8251.5
17.321.8
64,5
Aug.
1,103.9
92.6184.9826.4
278.8230.5180.623,0
28.630,48.5
46.0
1,107,6
830.1
3,7
281.6
2.87,3
271.6253.7
17,920,4
66.4
Mar.
1,044.0
95.7178.9769.4
257.8215.8169.1
20.7
25.828.17.7
44.3
1,047.5
772.9
3.5
260.3
2.57.0
250.8234.8
16.020.9
59.0
Sept.
1,126.4
93.6187.7845.1
284.9233.8182.7
23.6
28.930.78.7
52.0
1,130.2
848.9
3,7
287.6
2.77.7
277.2258.5
18.723.5
72,3
Apr.
1,060.0
96.9180,5782,6
264.2218.1171.721.9
26.428.5
7.844.0
1,063.6
786,2
3,6
266,8
2.66.8
257.4241.1
16.320.4
62.5
Oct.
1,133.1
93.3189.1850,6
287.7237.0183.8
20,8
29,730.88,8
52,0
1,136.7
854.2
3.6
290.3
2.77.6
280.1260.9
19.222.4
72.1
May
1,066.4
94.7181.3790.3
268,1220.5173.921,6
26.929,1
8.042.4
1,070.0
794.0
3.7
270.8
2.76,8
261,3245,0
16,319,2
58.6
Nov.
1,131.5
93.5190.6847.4
288.4239.3184.8
18.9
29,530,9
9.046.6
1,135.0
851,0
3.6
291.0
2.57.9
280.5261.1
19.419.0
74.0
June
1,083.6
95.3181.9806.3
272.5223.7176.522.8
27.429.68.1
45.7
1,087.3
810.1
3.8
275,3
2.87.2
265.3248.6
16.721.6
65.3
Dec.
1,145.0
95.0192.6857.4
293.0241,8186,019.8
29.330.9
9.347.3
1,148.06
860.46
3.06
295.06
2.06
9,1
283.9264.1
19.820.0
78,9
34Digitized for FRASER http://fraser.stlouisfed.org/ Federal Reserve Bank of St. Louis

15. Loans and securities of all commercial banks1—ContinuedBillions of dollars; averages of Wednesday figures
Category
1 Total loans and securities2 . . .
2 U.S. Treasury securities . . . .3 Other securities , .4 Total loans and leases2
5 Commercial andindustrial loans
6 Real estate loans , . .7 Loans to individuals8 Security loans9 Loans to nonbank financial
institutions10 Agricultural loans11 Lease financing receivables12 All other loans
MEMO13 Total loans and securities
plus loans sold2- 4
14 Total loans plusloans sold2. 4
15 Total loans sold toaffiliates4
16 Commercial and industrialloans plus loans sold4. . .
17 Commercial and industrialloans sold4
18 Acceptances held19 Other commercial and
industrial loans20 To U.S addressees5.21 To non-U,S. addressees5 . .22 Loans to foreign banks23 Loans to commercial banks
in the United State's
1 Total loans and securities2 . . .
2 U.S. Treasury securities . . . .3 Other securities4 Total loans and leases2
5 Commercial and industrialloans t
6 Real estate loans . . .7 Loans to individuals8 Security loans9 Loans to nonbank financial
institutions10 Agricultural loans .11 Lease financing receivables12 All other loans
MEMO13 Total loans and securities
plus loans sold2' 4 .
14 Total loans plusloans sold2* 4
15 Total loans sold toaffiliates4
16 Commercial and industrialloans plus loans sold4. . .
17 Commercial and industrialloans sold4
18 Acceptances held . . . . . . .19 Other commercial and
industrial loans.20 To U S addressees5.21 To non-U.S. addressees5 . .22 Loans to foreign banks23 Loans to commercial banks
in the United States
Seasonally adjusted
Jan.
1,147.2
93.4193.6860.2
296.8244.0185.7
17.9
28.931.29.6
46.1
1,149.9
862.9
2.7
298.5
1.78.1
288.7268.9
19.818.5
74.7
July
1,163.6
102.0204.1857.5
298.0251.6176.7
14.9
26.330.910.448.8
1,166.4
860.3
2,8
299.9
1.99,5
288.5268.5
20.019,7
92.6
Feb.
1,164.4
95.1195.3874.1
301.7247.5186.9
17,5
29.431.39.7
50.1
1,167.0
876.7
2.6
303.4
1.78.8
292,8272,6
20.219.7
75.3
Aug.
1,180.9
105.7206.9868.4
303.3252.6175.5
15.7
26.630.910.553.3
1,183.8
871.3
2.9
305.3
1.910.0
293.4272.8
20.621.5
99.5
Mar.
1,168.2
95.0196.1877.1
304.2249.6186.6
16.4
30.131.29.9
49.2
1,170.8
879.7
2.6
305.9
1.78.0
296.2275,7
20.619.6
76.0
Sept.
1,193.4
107.7207.5878.1
308.4253.6175,3
15.3
26.931.010.657.1
1,196.3
881.1
2.9
310.3
1.99.9
298.4277.9
20.522.8
94.7
Apr.
1,165.3
93.8196.8874.6
303.4250.8184.6
16.1
29.231,110,049.6
1,167.9
877,3
2.6
305.1
1.77.9
295.5275.1
20.320.3
80.8
Oct.
1,206.5
109.1209.9887,6
313.9256.0175.1
15.8
27.631,310.757.3
1,209.3
890.3
2.8
315.7
1.89.3
304.6282.9
21.723.1
95.1
May
1,158.7
95.5200.1863.2
299.1250.9181.6
15.4
27.131.210,147,6
1,161.4
865.8
2.7
300.8
1.78.4
290.7270.7
20.020.9
89.3
Nov.
1,224.3
110.5212.1901,7
320.8258.1174.8
16.7
28.231.510.860.8
1,226.9
904.4
2.6
322.5
1.79.0
311.8289.4
22.423.8
n.a.
Not seasonally adjusted
1980
June
1,156.0
98,1201,7856.3
296.9250.7178.7
15.7
26,030.910.347.0
1,158.8
859.1
2,8
298.8
1.98.9
288.0268,2
19.819,5
90.2
Dec.
1,237.2
110.7213,9912.7
324.9260.6175.2
17.6
28.731.610,963.3
1,239,9
915.4
2.7
326.6
1.88.2
316.7295.2
21.523,1
n.a.
Jan.
1,147.1
94.3193.2859.6
295.9244.0185,7
18.2
28.630.99.6
46.8
1,149.8
862.3
2.7
297.6
1.78.6
287,3267.020,319.4
77,6
July
1,165.1
100.1203.9861.0
299.5251.8177.1
14.3
26,631.310.450.0
1,167.9
863,8
2.8
301.4
1.99,1
290,4270.420.020.6
88.3
Feb.
1,153.2
95.7194.3863.2
298.3246.5185.217.1
28,730.79.7
46.9
1,155.8
865,8
2.6
300.0
1.78.8
289.5269.3
20.218.5
79.1
Aug.
1,180.5
103.6206.5870.5
303.1253.4177,0
15.7
26.931.510,552.4
1,183.4
873.4
2,9
305,0
1,99.3
293.8.273.2
20.621.2
93.2
Mar.
1,162.0
96.8195.5869.7
302.4248.1183.8
16.3
29,430.69.9
49.2
1,164.6
872.3
2.6
304.1
1.78.0
294.4274.2
20.219,1
78.5
Sept.
1,195.1
105.9207.5881,6
308.3254.8177.4
15.4
27.331,610.656.3
1,198.0
884.6
2.9
310.2
1.99.3
299.0278.4
20.622.4
91.7
Apr,
1,163.4
96.7197.2869.5
304.0249.5182.215.8
28.930.610.048,6
1,166.0
872.1
2.6
305.7
1,77.7
296.3276.220.119.7
83.8
Oct.
1,208.3
106.6210.1891.6
313.7257.2177.0
16.0
27.731.710.757.6
1,211.0
894.3
2,8
315.5
1.89.1
304.5283.2
21.422.7
92.3
May
1,155.8
96.1200.5859.3
299.8249.9180.1
14.7
27.031.110.146.5
1,158.5
862.0
2.7
301,6
1,78.0
291.8271.9
20.020.1
85.3
Nov.
1,226.3
109.3212.3904.7
320.8259.4176.2
17.1
28.331.610.860.6
1,229.0
907.3
2.6
322.5
1,79.3
311.5289.0
22.523.2
n.a.
June
1,159.6
98.4202.3858.9
298.6250.5178,2
15.7
26.231.110.348.4
1,162.4
861.7
2.8
300.4
1.98.8
289.8270,0
19.820.1
89.0
Dec.
1,248.8
112.1214.8922.0
327.0261.1176.218.8
29.231.410.967.3
1,251.5
924,7
2.7
328.8
1.88.8
318,2295.2
23.024.8
n.a.
35Digitized for FRASER http://fraser.stlouisfed.org/ Federal Reserve Bank of St. Louis

16. Commercial bank assets and liabilities—Last-Wednesday-of-month seriesA. Domestically chartered commercial banks1
Billions of dollars
Account
1 Loans and securities,excludinginterbank
2 Loans, excludinginterbank
3 Commercial andindustrial . . . .
4 Other5 U.S. Treasury
securities. ,6 Other securities . . . .
7 Cash assets, total . . .8 Currency and
coin9 Reserves with Re-
serve Banks . .10 Balances with depos-
itory institutions11 Cash items in
process ofcollection . . . .
12 Other assets
13 Total assets/total liabil-ities and capital .
14 Deposits15 Demand16 Savings17 Time
18 Borrowings19 Other liabilities2. . . .20 Residual (assets less
liabilities)2
21 U.S. Treasury notebalances includedin borrowing . . . .
Jan.
976.8
708.7
220.9487.8
920176.2
140.0
15.2
29.8
40.3
54.7
1054
1,222.2
9608347.621493984
111 756.6
93.1
11.9
Feb.
983.6
713.9
224.8489.1
930176.7
147.6
15.0
29.7
42.9
59.9
1046
1,235.8
970035252150402 5
111 959.0
950
3.9
Mar.
990.4
718.6
228.2490.4
936178.2
135.8
15,2
30.0
36.5
54.0
101 5
1,227.7
956 23357216 54040
115 160.9
955
4.8
Apr.
1,004.8
730.7
233.2497.5
943179.8
139.5
15.6
33.9
38.2
51.7
1004
1,244.6
964 8348.521544009
123 460,8
95.6
5.9
May
1,013.7
740.1
236.8503.3
93 3180.3
159.1
16.0
32.8
44.5
65.9
98 3
1,271.1
9760358,2215 3402 5
131 865.3
98.0
4,9
June
19
1,025.5
7527
240.8511.9
91 7181.1
147.1
163
32.6
41,4
56.8
1007
1,273.3
971 93528216 1403 0
136865.3
99?
12.9
July
79
1,034.6
760.7
241.8518,8
923181,6
140.3
16.0
29.6
41.1
53.7
101 7
1,276.6
97603529218 14050
136864.7
992
11.9
Aug.
1,045,4
770.4
243.5526.9
908184.2
145.5
168
33.7
40.8
54.3
104 2
1,295.1
9834352721624145
140 169.8
101 7
8.6
Sept.
1,060.1
781 9
248.9533.0
91 9186.3
148.2
166
31.6
40.5
59.5
1106
1,318.9
997 6358 8213 2425 7
146671.0
103 7
17.8
Oct.
1,067.8
7879
250.2537.7
91 7188,2
160.5
165
34,1
45,4
64.5
111 8
1,340.0
1 024 8376 5207 3441 0
136 874.0
104 3
8.4
Nov.
1,067,5
7860
248.5537.4
920189.5
157.9
18 1
34.7
43.8
61.4
111 0
1,336.4
1 018 83648204 8449 2
134 878.7
104 1
5.0
Dec.
1,082.8
799 1
254.3544.9
926191,1
146.5
17 8
28.4
37,8
62.5
122 8
1,352.2
1 032 5377 5203 3451 7
139 674.5
105 6
12,8
36Digitized for FRASER http://fraser.stlouisfed.org/ Federal Reserve Bank of St. Louis

16. Commercial bank assets and liabilities—Last-Wednesday-of-month series—ContinuedA. Domestically chartered commercial banks1-ContinuedBillions of dollars
Account
1 Loans and securities,excludinginterbank. . . .
2 Loans, excludinginterbank. . . .
3 Commercial andindustrial . . . .
4 Other5 U.S. Treasury
securities6 Other securities . . . .
7 Cash assets, total . . .8 Currency and
coin9 Reserves with Re-
serve Banks . .10 Balances with
depositoryinstitutions. . .
11 Cash items inprocess ofcollection . . . .
12 Other assets
13 Total assets/total liabil-ities and capital .
14 Deposits15 Demand . . .16 Savings17 Time
18 Borrowings19 Other liabilities2. . . .20 Residual (assets less
liabilities)2
21 U.S. Treasury notebalances includedin borrowing . . .
Jan.
1,078.3
794.2
252.8541.4
92.6191.5
148.3
17.2
28.3
43.9
58,8
119.3
1,345.9
1,023.6361.6200.1461.9
142.077.3
103.0
15.0
Feb.
1,087.7
800.7
256.4544.3
94.0193.0
149.9
17,0
30.6
43.6
58.7
122.4
1,359.9
1,030.2358.2199.6472.5
143.781.3
104,7
7.9
Mar.
1,090.6
801.5
259.4542.1
94.8194.3
153,9
16.7
34.2
43.3
59.8
121.3
1,365.8
1,034.93543196.3484.3
140.983.7
106.4
9.6
Apr.
1,093.5
801.7
259.7541.9
94,3197,6
168.5
16.7
33.2
50.0
68.6
135.8
1,397.8
1,063.9377.5189.2497.2
144.780.5
108.7
14.5
May
1,087.0
792,5
256.6535.9
94.8199.8
172.7
17.7
37.9
48,3
68.9
140.1
1,399.8
1,060.9370.3192.4498.2
152.677.9
108.5
5.2
June
19
1,090.5
793.2
256.9536.4
96.2201.1
150.6
17.3
29.5
45.8
58.1
143.8
1,384.9
1,048.1358.1197.7492.4
151.075.9
109,8
13.3
July
80
1,095.3
793.4
257.1536.3
98.7203.3
154.3
17.5
32.2
45.0
59.6
143.5
1,393.1
1,053.1363.5205.5484,2
157.074.0
109.0
7.6
Aug.
1,108.5
801.9
259.5542.4
101.4205.2
148.8
18.2
29.0
45,9
55.8
150.3
1,407.7
1,062.8363.4208.5490,9
158,575.4
111.0
8.7
Sept.
1,117.9
809.1
263.9545.2
103.2205.6
156.6
17.8
31.1
46.8
60,9
154.4
1,428.9
1,077.2369.7209.1498.5
163.775.6
112.3
15.7
Oct.
1,134.8
821.6
269.0552.6
104.4208.9
155.9
18.3
31.7
47.2
58.8
151.3
1,442.1
1,092.9375.7210.9506.2
161.774.7
112,7
11.5
Nov.
1,150.8
832.8
275.7557.1
107.1210.9
175.6
16.9
30.4
56.1
72.2
151.3
1,477.7
1,126.2393.0209.5523.7
157.378.1
116.1
4.4
Dec.
1,177.1
851.4
281.5569.9
111.2214.6
194.2
19.9
28.2
63.0
83,0
166.6
1,538.0
1,187.4432.2201.3553.8
155.379.0
116.3
9.5
37Digitized for FRASER http://fraser.stlouisfed.org/ Federal Reserve Bank of St. Louis

16. Commercial bank assets and liabilities—Last-Wednesday-of-month series—ContinuedB. All commercial banking institutions3
Billions of dollars
Account
1 Loans and securities,excludinginterbank
2 Loans, excludinginterbank
3 Commercial andindustrial . . . .
4 Other5 U.S. Treasury
securities6 Other securities . . . .
7 Cash assets, total . . .8 Currency and
coin9 Reserves with Re-
serve Banks . .10 Balances with depos-
itory institutions11 Cash items in
process ofcollection . . . .
12 Other assets . . .
13 Total assets/total liabil-ities and capital .
14 Deposits15 Demand16 Savings17 Time
18 Borrowings19 Other liabilities2
20 Residual (assets lessliabilities)2
21 U.S. Treasury notebalances includedin borrowing . . .
Jan.
1,027.6
757 1
250.5506 6
93 1177.4
157.9
152
30.4
56.3
56.0
1307
1,316.2
993.63629215 64150
138 689.0
94.9
11.9
Feb.
1,034.4
762.3
255.05073
942178.0
166.9
15.1
30.3
60.3
61.3
1306
1,331.8
1,002.73679215 8419.0
137 594.8
96.8
3.9
Mar.
1,046.5
772.1
259.95122
948179.6
156.8
15.2
30.7
55.6
55.4
1306
1,334.0
995.3356,32177421.3
141 399.9
97.4
4.8
Apr.
1,058,2
781.3
264.7516.7
95.6181.2
156.0
15.6
34.6
53.0
52.9
128.4
1,342.6
997.8362.52164418.9
150 197.1
97.5
5.9
May
1,069.3
792.9
269.0523.9
94,8181.7
176.8
16,0
33.5
60.2
67.2
129.3
1,375.5
1,013.7376.22165420.9
159 0102.8
100.0
4.9
June
19
1,086.7
811.0
274.7"536.4
93.2182.5
168.6
16.3
33.4
60.9
58.0
131.2
1,386.5
1,016.3376.8216.9422.6
1649104.1
101.2
12.9
July
79
1,093.1
816.5
276,5540,0
93.6183.0
160,5
16.0
30.4
59.2
55.0
130.1
1,383.7
1,013.1370.0218.8424.2
165.1104.3
101.2
11.9
Aug.
1,107.0
829.3
279.6549,7
92.1185,6
165.9
16.8
34,5
59.1
55.5
134.9
1,407.8
1,021.6369.4217 1435.1
1690113.4
103.8
8.6
Sept.
1,130.2
848.5
287.3561.2
93.5188.2
171.9
16.6
32.5
62.2
60.6
145.7
1,447.8
1,045,0383.3213.9447.8
181 0115,9
105.9
17.8
Oct.
1,132.1
848.8
288.4560.4
93.3189.9
179,5
16.5
34.8
62.5
65.7
148,2
1,459.8
1,063,8394.1208.0461.7
170.8118.6
106.5
8.4
Nov.
1,131.0
$46.1
288.2558,0
93.7191.2
176.8
18.1
35.5
60,6
62.6
149.8
1,457.6
1,060.0384.8205 7469.5
1689122.4
106.3
5.0
Dec.
1,151.5
864.4
295,6568.8
94.5192,6
169.6
17.9
29.0
59.1
63,7
160.1
1,481.2
1,078.0400.3203.7473.9
1794116.0
107.8
12.8
38Digitized for FRASER http://fraser.stlouisfed.org/ Federal Reserve Bank of St. Louis
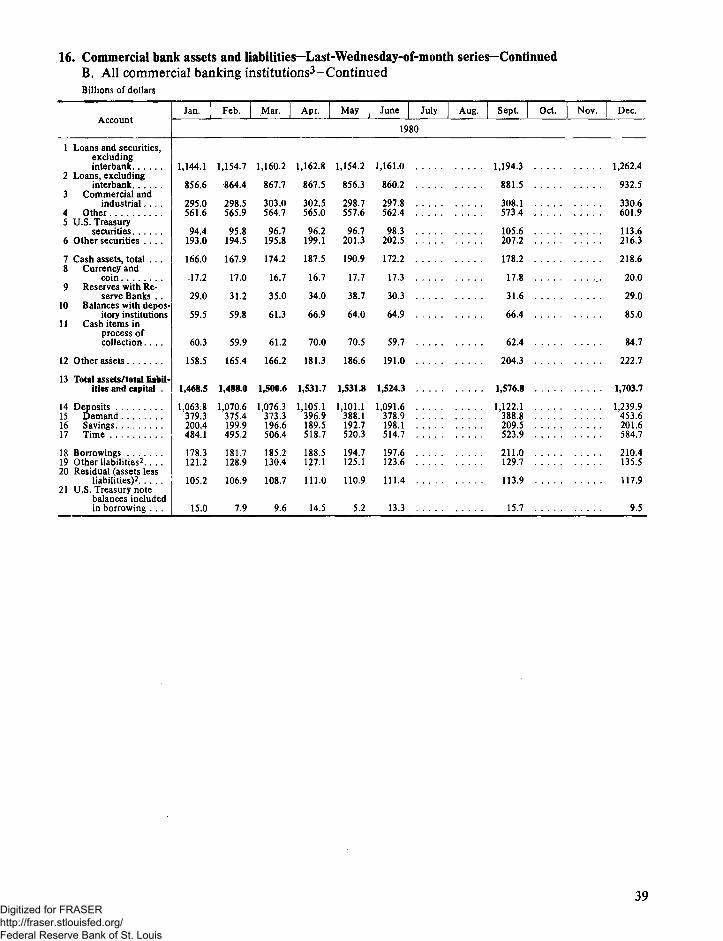
16. Commercial bank assets and liabilities—Last-Wednesday-of-month series—ContinuedB. All commercial banking institutions3-ContinuedBillions of dollars
Account
1 Loans and securities,excludinginterbank
2 Loans, excludinginterbank.
3 Commercial andindustrial
4 Other5 U.S. Treasury
securities6 Other securities
7 Cash assets total8 Currency and
coin9 Reserves with Re-
serve Banks10 Balances with depos-
itory institutions11 Cash items in
process ofcollection
12 Other assets
13 Total assets/total liabil-ities and capital .
14 Deposits15 Demand16 Savings17 Time . .
18 Borrowings . . .19 Other liabilities2
20 Residual (assets lessliabilities)2
21 U.S. Treasury notebalances includedin borrowing . . .
Jan.
1,144,1
8566
2950561 6
9441930
1660
.172
290
595
603
158 5
1,468.5
1 063.837932004484 1
178.3121 2
1052
15.0
Feb.
1,154.7
864,4
2985565 9
95 81945
1679
170
31 2
598
599
165 4
1,488.0
1 070.637541999495 2
181.7128 9
1069
7.9
Mar.
1,160.2
867.7
303.0564 7
96 7195 8
1742
167
350
61 3
61 2
1662
1,500.6
1,076.3373 319665064
185.21304
1087
9.6
Apr.
1,162.8
867.5
302.55650
962199.1
1875
16 7
340
669
700
181 3
1,531.7
1,105.13969189 5518.7
188.5127 1
111.0
14.5
May | June July
1980
1,154.2 1,161.0
856.3 860.2 . .
298.7 297.8 . .557.6 562.4
96 7 98 3201.3 202,5 . .
190,9 172.2 . .
17 7 17,3 . .
38,7 30.3 . .
64 0 64.9 . .
70 5 59,7
1866 191.0
1,531.8 1,524.3 . . . . .
1,101.1 1,091.6388 1 378.9 . .192 7 198 1520.3 514.7 . .
194.7 197.6125 1 123.6
110.9 111.4 . .
5.2 13.3
Aug. Sept. Oct.
1,194.3
. . . . 881.5
. . . , 308.15734
105 6207.2
178.2 . . . .
17.8 . . . .
31.6 . . . .
66.4
624
204.3
1,576.8
1,122.1388.82095
. . . . 523.9
211.0129.7
. . . , 113,9
15.7
Nov. Dec.
1,262.4
932.5
330.6601 9
113 6216.3
. . . . 218.6
20.0
29.0
85.0
847
2227
1,703.7
1,239.9. . . . 453.6
201 6584.7
210.4135.5
117.9
9.5
39Digitized for FRASER http://fraser.stlouisfed.org/ Federal Reserve Bank of St. Louis

17. Insured commercial banks with assets of $100 million or over—Domestic and foreign offices1
A. March 31,1980Millions of dollars, except for number of banks
Item
1 Total assets. .'
2 Cash and due from depository institutions3 Currency and coin (U S and foreign)4 Balances with Federal Reserve Banks5 Balances with other central banks6 Demand balances with commercial banks in United States7 All other balances with depository institutions in United States and
with banks in foreign countries8 Time and savings balances with commercial banks in United States . . . .9 Balances with other depository institutions in United States
10 Balances with banks in foreign countries11 Foreign branches of other U S banks12 Other banks in foreign countries . . . . . . .13 Cash items in process of collection
14 Total securities, loans, and lease financing receivables
15 Total securities book value .16 US Treasury17 Obligations of other U S government agencies and corporations18 Obligations of states and' political subdivisions in United States19 All other securities . . . , . . .20 Other bonds notes and debentures21 Federal Reserve and corporate stock . . . .22 Trading account securities «
23 Federal funds sold and securities purchased under agreements to resell, ,
24 Total loans, gross . . . . .25 LESS* Unearned income on loans . . . . . .26 Allowance for possible loan loss27 EQUALS- Loans net . .
Total loans, gross, by category28 Real estate loans . . , , . . . . . . . . .29 Construction and land development30 Secured by farmland . .31 Secured by residential properties32 1- to 4-family33 FHA-insured or VA-guaranteed . . .34 Conventional35 Multifamily . . . . . .36 FHA-insured37 Conventional38 Secured by nonfarm nonresidential properties . . . .
39 Loans to financial institutions . .40 REITs and mortgage companies in United States41 Commercial banks in United States42 US branches and agencies of foreign banks . .43 Other commercial banks44 Banks in foreign countries . . . . . . . . . . . . .45 Foreign branches of other U S banks46 Other47 Finance companies in United States48 Other financial institutions . . . .49 Loans for purchasing or carrying securities50 Brokers and dealers in securities . . . . . . . .5 1 Other. . . . . . .52 Loans to finance agricultural production and other loans to farmers53 Commercial and industrial loans54 U.S. addressees (domicile)55 Non-U.S. addressees (domicile)
56 Loans to individuals for household, family, and other personal expenditures . .57 Installment loans . . . . . . . . .58 Passenger automobiles . . . . . . . . .59 Credit cards and related plans60 Retail (charge account) credit card61 Check and revolving credit62 Mobile homes . . . . . . .63 Other installment loans . .64 Other retail consumer goods , . . . . . . .65 Residential property repair and modernization66 Other installment loans for household, family, and other
personal expenditures67 Single-payment loans .68 All other loans . . . . . . . . .69 Loans to foreign governments and official institutions .70 Other
Insured
1,340,965
270,21810,93429,028
2,96136,934
112,9774,120
354108,503
(4)(4)
77,384
981,424
198,68155,69629,83892,38020,7679,5791,6359,553
40,474
752,86914,9217,580
730,368
178,082(4)
888(4)(4)
70,3146,4415,220
(4}
29,441(4)
#10318,10912,5848,4634,1229,174
310,832
8130,705
(4)
8(4)
I(4)(4)(4)
41,178(4)(4)
Banks with foreign offices2
Total
989,322
230,5626,126
22,1832,961
26,170
109,3591,832
291107,23627,94479,29263,763
682,975
112,33928,76715,29750,17818,0977,7491,1869,163
23,331
550,7628,2865,437
537,039
103,920(4)
818
67,3415,6904,7071,7972,910
29,215570
28,64610,66217,06610,8348,1952,6385,198
254,255157,12597,130
71,297
88I(4)(4)(4)
37,91724,52613,391
Foreignoffices3
323,137
116,381245508
2,9403,979
106,2191,344
146104,72827,18577,5432,491
171,634
7,866245
78484
7,0606,120
171769
547
163,0171,476
215161,325
5,510
8s?8S3
29,622109735354381
22,412283
22,129530
5,836
1,011737274537
94,9315,182
89,749
Ti>8(4)
(4)(4)
26,00622,627
3,379
Domesticoffices
696,583
114,1805,881
21,67521
22,191
3,140488144
2,507759
1,74861,272
511,342
104,47328,52215,21949,69411,038
1,6281,0168,394
22,784
387,7456,8105,222
375,714
98,41119,665
65558,06055,011
4,12650,885
3,049224
2,82520,030
37,7195,5823,9721,4432,5296,803
2876,516
10,13211,230
9,8237,4592,3644,661
159,325151,943
7,38165,89656,26818,60718,68415,1003,5843,460
15,5174,1093,596
7,8129,628
11,9111,899
10,013
Bankswithoutforeignoffices
351,643
39,6564,8086,845
10,764
3,6182,288
631,267
813,621
298,449
86,34226,92914,54142,203
2,6701,830
449391
17,143
202,1076,6352,143
193,329
74,1628,4371,204
41,71239,6692,064
37,6052,043
931,950
22,809
2,974751513
(4)
^25
8441
1,043
1,751267
1,4833,976
56,577
859,40750,48222,5089,2667,9661,3013,501
15,2063,5163,596
8,0948,9253,261(4)(4)
40Digitized for FRASER http://fraser.stlouisfed.org/ Federal Reserve Bank of St. Louis

17-A. Continued
Item
71 Lease financing receivables72 Bank premises, furniture and fixtures, and other assets representing
bank premises73 Real estate owned other than bank premises. . . .74 All other assets75 Investment in unconsolidated subsidiaries and associated companies76 Customers' liability on acceptances outstanding77 U S addressees (domicile)78 Non-U S addressees (domicile)79 Net due from foreign branches, foreign subsidiaries, Edge and Agreement
subsidiaries80 Other
81 Total liabilities and equity capital4 . . . .
82 Total liabilities excluding subordinated debt
83 Total deposits84 Individuals partnerships and corporations85 U.S. government86 States and political subdivisions in United States87 All other88 Foreign governments and official institutions89 Commercial banks in United States90 U S branches and agencies of foreign banks91 Other commercial banks in United States . . . .92 Banks in foreign countries93 Foreign branches of other U S. banks.94 Other banks in foreign countries95 Certified and officers' checks, traveler's checks, and letters of credit
sold for cash
96 Federal funds purchased and securities sold under agreements to repurchasein domestic offices and Edge and Agreement subsidiaries
97 Interest-bearing demand notes issued to U.S. Treasury and other liabilitiesfor borrowed money . . .
98 Interest-bearing demand notes (note balances) issued to U.S. Treasury. . . .99 Other liabilities for borrowed money . . . . . .
100 Mortgage indebtedness and liability for capitalized leases101 All other liabilities102 Acceptances executed and outstanding. .103 Net due to foreign branches, foreign subsidiaries, Edge and Agreement
subsidiaries104 Other
105 Subordinated notes and debentures
106 Total equity capital^107 Preferred stock108 Common stock . . . , ,109 Surplus110 Undivided profits and reserve for contingencies and other capital reserves .Ill Undivided profits112 Reserve for contingencies and other capital reserves
MEMODeposits in domestic offices
113 Total demand . .114 Total savings115 Total time116 Time deposits of $100,000 or more117 Certificates of deposit in denominations of $100,000 or more118 Other119 Savings deposits authorized for automatic transfer and NOW accounts120 Money market time certificates of $10,000 and less than $100,000
with original maturities of 26 weeks, . .121 Demand deposits adjusted**
122 Standby letters of credit, total123 U S addressees (domicile)124 Non-U S addressees (domicile)125 Standby letters of credit conveyed to others through participations (included
in total standby letters of credit)126 Holdings of commercial paper included in total gross loans
Average for 30 calendar days (or calendar month) ending with report date127 Total assets128 Cash and due from depository institutions . . , . .129 Federal funds sold and securities purchased under agreements to resell130 Total loans131 Total deposits132 Time CDs in denominations of $100,000 or more in domestic offices133 Federal funds purchased and securities sold under agreements to repurchase,134 Other liabilities for borrowed money
135 Number of banks
Insured
11,901
17,2111,612
70,5001,131
36,305(4)(4)
33,065
1,340,965
1,265,856
1,047,097722,488
2,36053,819
253,32742,37568,818
8"(r(4)15,104
106,499
36,9215,704
31,2181,824
73,51436,504
(4)37,010
5,270
69,83994
14,31725,03130,39729,498
898
308,682130,563328,150183,017160,35222,66511,612
80,484184,853
37,121(4)(4)
1,865(4)
1,318,393257,00238,722
733,0141,021,370
160,768115,80729,964
1,429
Banks with foreign offices2
Total
10,266
10,3071,169
64,3091,094
35,89912,28823,611
27(3,6
989,322
940,874
753,214468,273
1,52826,950
244,64642,15460,73411,98848,746
141,75929,750
112,008
11,817
84,885
33,9474,263
29,6831,253
67,57636,098
31,478
3,543
44,90510
9,17215,51320,21119,759
452
210,93466,793
195,784129,388110,705
18,6827,113
37,718107,903
34,69121,88512,806
1,778(4)
971,057221,455
21,537537,620732,783
(4)93,21728,527
169
Foreignoffices3
1,895
994117
34,010664
7,447(4)(4)
16,7789,121
(4)322,849
279,70295,288
236396
181,30135,85913,9653,807
10,158131,47729,726
101,752
2,480
535
13,039
13,03939
29,5336,463
13,6209,450
288
(4)
1(4'(4'
0000000
00
8,549
8385
(4)
297,026115,081
500161,766281,243
(4)473
11,980
169
Domesticoffices
8,371
9,3121,051
60,697430
28,452(4)(4)
13,62018,196
(4)648,423
473,512372,985
1,29226,55363,345
6,29546,769
8,18138,58810,281
10,256
9,337
84,349
20,9084,263
16,6441,213
68,44129,635
16,77822,028
3,255
8i210,934
66,793195,784129,388110,70518,6827,113
37,718107,903
26,142
81,393
217
674,032106,37421,037
375,854451,540110,77092,74416,547
169
Bankswithoutforeignoffices
1,635
6,904443
6,19137
406
8(4)5,748
351,643
324,982
293,883254,215
83226,869
8,681222
8,084
8376
(4)(4)
3,286
21,614
2,9751,4411,534
5725,938
406
5%2
1,728
24,93384
5,1459,518
10,1869,740
446
97,74963,769
132,36553,63049,647
3,9834,499
42,76676,951
2,430
-887
280
347,33635,54717,185
195,393288,58749,99822,590
1,437
1,260
41Digitized for FRASER http://fraser.stlouisfed.org/ Federal Reserve Bank of St. Louis
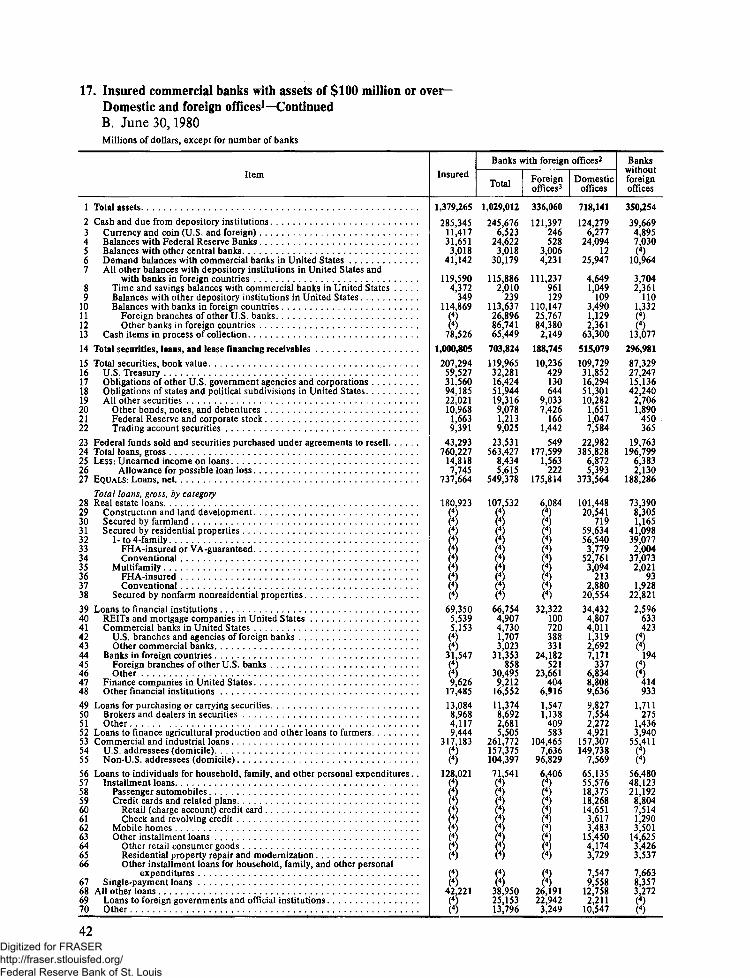
17. Insured commercial banks with assets of $100 million or over-Domestic and foreign offices1—ContinuedB. June 30,1980Millions of dollars, except for number of banks
Item
1 Total assets
2 Cash and due from depository institutions3 Currency and coin (U S and foreign)4 Balances with Federal Reserve Banks5 Balances with other central banks6 Demand balances with commercial banks in United States .7 All other balances with depository institutions in United States and
with banks in foreign countries . . . .8 Time and savings balances with commercial banks in United States9 Balances with other depository institutions in United States
10 Balances with banks in foreign countries11 Foreign branches of other U S banks12 Other banks in foreign countries13 Cash items in process of collection . , .
14 Total securities, loans, and lease financing receivables
15 Total securities book value16 U S Treasury . . . . . .17 Obligations of other U.S. government agencies and corporations18 Obligations of states and political subdivisions in United States19 All other securities20 Other bonds notes and debentures21 Federal Reserve and corporate stock22 Trading account securities . ,
23 Federal funds sold and securities purchased under agreements to resell24 Total loans gross . . . . . .25 LESS* Unearned income on loans26 Allowance for possible loan loss27 EQUALS- Loans net
Total loans, gross, by category28 Real estate loans29 Construction and land development ,30 Secured by farmland . . *31 Secured by residential properties ,32 1- to 4-family33 FHA-insured or VA-guaranteed34 Conventional35 Multifamily . . . .36 FHA-insured37 Conventional . . .38 Secured by nonfarm nonresidential properties
39 Loans to financial institutions . . .40 REITs and mortgage companies in United States41 Commercial banks in United States42 US branches and agencies of foreign banks43 Other commercial banks44 Banks in foreign countries . . . .45 Foreign branches of other U S banks , . .46 Other47 Finance companies in United States . . . . . . .48 Other financial institutions . . . . .
49 Loans for purchasing or carrying securities50 Brokers and dealers in securities51 Other52 Loans to finance agricultural production and other loans to farmers53 Commercial and industrial loans . . .54 U.S. addressees (domicile). ,55 Non-U S addressees (domicile) . .
56 Loans to individuals for household, family, and other personal expenditures . .57 Installment loans58 Passenger automobiles59 Credit cards and related plans60 Retail (charge account) credit card61 Check and revolving credit62 Mobile homes . . .63 Other installment loans64 Other retail consumer goods65 Residential property repair and modernization66 Other installment loans for household, family, and other personal
expenditures .67 Single-payment loans . . . .68 All other loans69 Loans to foreign governments and official institutions70 Other
Insured
1,379,265
285,34511,41731,6513,018
41,142
119,5904,372
349114,869
(4)(4)
78,526
1,000,805
207,29459,52731,56094,18522,02110,9681,6639,391
43,293760,227
14,8187,745
737,664
180,923(4)(4)(4)(4)
S869,350
5,5395,153(4)&i,17,485
13,0848,9684,1179,444
317,183
8128,021
•i>4)
I88
42,221(4)(4)
Banks with foreign offices2
Total
1,029,012
245,6766,523
24,6223,018
30,179
115,8862,010
239113,63726,89686,74165,449
703,824
119,96532,28116,42451,94419,3169,0781,2139,025
23,531563,427
8,4345,615
549,378
I4)
88
66,7544,9074,7301,7073,023
31,353858
30,4959,212
16,552
11,3748,6922,6815,505
261,772157,375104,39771,541(4):>4<
'4;
I(4)
38,95025,15313,796
Foreignoffices3
336,060
121,397246528
3,0064,231
111,237961129
110,14725,76784,3802,149
188,745
10,236429130644
9,0337,426
1661,442
549177,599
1,563222
175,814
6,084(4)
88(4)88
32,322100720388331
24,182521
23,661404
6,916
1,5471,138
409583
104,4657,636
96,829
6,406(4)(4)(4)(4)(4)(4)(4)(4)(4)
JL22,942
3,249
Domesticoffices
718,141
124,2796,277
24,09412
25,947
4,6491,049
1093,4901,1292,361
63,300
515,079
109,72931,85216,29451,30110,2821,6511,0477,584
22,982385,828
6,8725,393
373,564
101,44820,541
71959,63456,540
3,77952,7613,094
2132,880
20,554
34,4324,8074,0111,3192,6927,171
3376,8348,8089,636
9,8277,5542,2724,921
157,307149,738
7,569
65,13555,57618,37518,26814,6513,6173,483
15,4504,1743,729
7,5479,558
12,7582,211
10,547
Bankswithoutforeignoffices
350,254
39,6694,8957,030(4)
10,964
3,7042,361
1101,332
,1296,981
87,32927,24715,13642,240
2,7061,890
450365
19,763196,799
6,3832,130
188,286
73,3908,3051,165
41,09839,077
2,00437,073
2,02193
1,92822,821
2,596633423
ii
933
1,711275
1,4363,940
55,411(4)(4)
56,48048,12321,192
8,8047,5141,2903,501
14,6253,4263,537
7,6638,3573,272
842
Digitized for FRASER http://fraser.stlouisfed.org/ Federal Reserve Bank of St. Louis

17-B. Continued
Item
71 Lease financing receivables72 Bank premises, furniture and fixtures, and other assets representing
bank premises73 Real estate owned other than bank premises74 All other assets75 Investment in unconsolidated subsidiaries and associated companies76 Customers' liability on acceptances outstanding77 US addressees (domicile)78 Non-U S addressees (domicile)79 Net due from foreign branches, foreign subsidiaries, Edge and
Agreement subsidiaries80 Other
81 Total liabilities and equity capital5
82 Total liabilities excluding subordinated debt
83 Total deposits84 Individuals partnerships and corporations85 U S government86 States and political subdivisions in United States ? . , ,87 All other88 Foreign governments and official institutions89 Commercial banks in United States90 U.S. branches and agencies of foreign banks91 Other commercial banks in United States92 Banks in foreign countries93 Foreign branches of other U S banks94 Other banks in foreign countries95 Certified and officers' checks, travelers' checks, and letters of credit
sold for cash
96 Federal funds purchased and securities sold under agreements to repurchasein domestic offices and Edge and Agreement subsidiaries
97 Interest-bearing demand notes issued to U.S. Treasury and otherliabilities for borrowed money . .
98 Interest-bearing demand notes (note balances) issued to U.S. Treasury. . . .99 Other liabilities for borrowed money
100 Mortgage indebtedness and liability for capitalized leases101 All other liabilities .102 Acceptances executed and outstanding103 Net due to foreign branches, foreign subsidiaries, Edge and Agreement
subsidiaries104 Other
105 Subordinated notes and debentures
106 Total equity capital5
107 Preferred stock108 Common stock109 Surplus1 10 Undivided profits and reserve for contingencies and other capital reserves .I l l Undivided profits112 Reserve for contingencies and other capital reserves
MEMODeposits in domestic offices
113 Total demand1 14 Total savings115 Total time116 Time deposits of $100 000 or more117 Certificates of deposit in denominations of $100,000 or more118 Other119 Savings deposits authorized for automatic transfer and NOW accounts120 Money market time certificates of $10,000 and less than $100,000 with
original maturities of 26 weeks121 Demand deposits adjusted**122 Standby letters of credit, total123 U.S. addressees (domicile)124 Non-U S addressees (domicile)125 Standby letters of credit conveyed to others through participation (included in
total standby letters of credit)126 Holdings of commercial paper included in total gross loans.
Average for 30 calendar days (or calendar month) ending with report date127 Total assets128 Cash and due from depository institutions , . .129 Federal funds sold and securities purchased under agreements to resell130 Total loans131 Total deposits132 Time CDs in denominations of $100,000 or more in domestic offices133 Federal funds purchased and securities sold under agreements to repurchase.134 Other liabilities for borrowed money135 Number of banks
Insured
12,554
17,7121,674
73,7291,237
39,713(4)(4)
32,780
1,379,265
1,301,913
1,067,151739,481
2,24751,294
258,71644,71973,470
8140,528
(4)(4)
15,413
119,402
37,3239,791
27,5321,829
76,20740,028
36,178
5,765
71,58896
14,41725,38431,69230,828
864
321,011132,947328,572177,255155,26921,98612,700
86,650192,329
39,727
8c¥31
1,343,557260,56144,022
738,8011,032,182
157,893126,08626,727
1,439
Banks with foreign offices2
Total
10,950
10,7371,212
67,5631,200
39,44613,93425,512
$9,71,029,012
978,448
775,242486,870
1,48424,942
249,87844,45465,21013,86951,341
140,21427,015
113,199
12,068
97,459
33,9887,334
26,6541,253
70,50539,761
(4)30,744
4,064
46,50010
9,33315,91621,24120,800
441
223,15969,151
198,310127,004109,02317,9817,764
41,851115,024
37,19724,13813,059
2,064(4)
998,709225,934
23,689547,731746,389
102,80125,811
173
Foreignoffices3
2,145
1,031137
24,750854
8,363(4)(4)
5,46910,063
(4)335,764
284,622100,183
203550
181,41336,17015,6223,759
11,863129,62226,981
102,641
2,272
557
13,083(4)
13,08343
37,4607,076
19,72010,664
295
(4)
888
0000000
00
8,721
8381
(4)
310,355120,266
692173,079285,703
%11,411
173
Domesticoffices
8,805
9,7051,075
68,003345
31,083
819,72016,854
(4)667,873
490,620386,687
1,28124,39268,465
8,28449,58910,11139,47810,592
3310,559
9,796
96,902
20,9057,334
13,5711,211
58,23432,685
5,46920,080
3,769
88(4)(4)(4)
223,15969,151
198,310127,004109,02317,9817,764
41,851115,024
28,476(4)(4)
1,682249
688,355105,66822,997
374,652460,686110,742102,02314,400
173
Bankswithoutforeignoffices
1,604
6,976462
6,16637
267
8&2
350,254
323,465
291,909252,611
76326,3528,838
2658,259
8314
(4)(4)
3,345
21,943
3,3352,457
878576
5,702267
as1,701
25,08886
5,0849,468
10,45110,027
423
97,85263,796
130,26250,25146,2464,0054,936
44,79977,305
2,530(4)(4)
67355
344,84734,62820,332
190,070285,79347,15023,286
9171,266
43
Digitized for FRASER http://fraser.stlouisfed.org/ Federal Reserve Bank of St. Louis

17. Insured commercial banks with assets of $100 million or over-Domestic and foreign offices1—ContinuedC. September 30,1980Millions of dollars, except for number of banks
Item
1 Total assets. .2 Cash and due from depository institutions3 Currency and coin (U S and foreign)4 Balances with Federal Reserve Banks5 Balances with other central banks . . . .6 Demand balances with commercial banks in United States7 All other balances with depository institutions in United States and
with banks in foreign countries8 Time and savings balances with commercial banks in United States9 Balances with other depository institutions in United States
10 Balances with banks in foreign countries . . . .11 Foreign branches of other U.S. banks12 Other banks in foreign countries13 Cash items in process of collection14 Total securities, loans, and lease financing receivables . . . .15 Total securities book value16 U S Treasury17 Obligations of other U S government agencies and corporations18 Obligations of states and political subdivisions in United States19 All other securities . . . .20 Other bonds, notes, and debentures21 Federal Reserve and corporate stock .22 Trading account securities23 Federal funds sold and securities purchased under agreements to resell. ,24 Total loans, gross25 LESS Unearned income on loans. . . . .26 Allowance for possible loan loss27 EQUALS- Loans, net
Total loans, gross, by category28 Real estate loans29 Construction and land development30 Secured by farmland . . . .31 Secured by residential properties . . .32 1- to 4-family33 FHA-insured or VA -guaranteed. . .34 Conventional35 Multifamily36 FHA-insured37 Conventional38 Secured by nonfarm nonresidential properties39 Loans to financial institutions40 REITs and mortgage companies in United States . . . .41 Commercial banks in United States42 U.S. branches and agencies of foreign banks43 Other commercial banks44 Banks in foreign countries45 Foreign branches of other U.S. banks46 Other47 Finance companies of other U.S banks48 Other financial institutions49 Loans for purchasing or carrying securities50 Brokers and dealers in securities51 Other52 Loans to finance agricultural production and other loans to farmers53 Commercial and industrial loans54 U S addressees (domicile)55 Non-U S. addressees (domicile)56 Loans to individuals for household, family, and other personal expenditures . .57 Installment loans58 Passenger automobiles59 Credit cards and related plans60 Retail (charge account) credit card61 Check and revolving credit . . . . .62 Mobile homes63 Other installment loans64 Other retail consumer goods65 Residential property repair and modernization66 Other installment loans for household, family, and other personal
expenditures67 Single-payment loans68 All other loans , . .69 Loans to foreign governments and official institutions70 Other
Insured
1,403,264282,330
12,42425,5672,637
38,395
126,4715,482
395120,594
76,8351,027,609
214,09863,07731,92897,43321,66011,591
1,6428,427
45,568777,187
14,3287,889
754,970
184,931
18(4)8
73,5166,216
r2
33,860(4)(4)9,519
17,93011,1787,2593,9199,901
326,686(4)(4)
128,3891(4)(4)(4)(4)
(4)(4)
42,585(4)(4)
Banks with foreign offices2
Total
1,048,130242,842
7,23518,5772,637
27,393
121,7242,759
250118,71526,74991,96675,276
725,672123,14233,86815,91154,48718,8769,6211,2008,056
24,599580,303
7,9875,770
566,546
inpi
888(4)8
70,6005,4785,4132,2033,211
33,616401
33,2149,080
17,0149,4546,9672,4885,880
270,960163,031107,929
ft74
8;4)'4)
(4)(4)
39,29425,66113,633
Foreignoffices3
343,261126,383
277330
2,5734,405
116,7891,503
113115,17325,66889,5062,008
192,94210,305
38725
6519,2438,005
1491,089
260182,006
1,642226
180,138
T%
18
33,858126746360386
25,718229
25,490349
6,9191,3991,040
359677
106,6277,054
99,5736,585(4)
1(4)(4)(4)(4)
(4}
26,63523,5303,105
Domesticoffices
735,102116,459
6,95818,247
6422,988
4,9351,256
1373,5421,0812,460
63,268532,730112,83733,48215,88653,8369,6331,6151,0516,967
24,339398,297
6,3455,544
386,409
105,51622,031
77261,69858,3964,080
54,3153,302
2103,092
21,01636,7425,3514,6671,8422,8257,897
1737,7258,730
10,0968,0555,9272,1285,203
164,333155,977
8,35665,78955,69518,02118,5214,9793,5423,456
15,6974,3613,751
7,58510,09412,6592,131
10,528
Bankswithoutforeignoffices
355,13439,4885,1896,991(4)
11,011
4,7472,723
1451,879(4)
I&9301,93790,95529,20916,01742,9462,7831,970
442371
20,969196,884
6,3412,119
188,424
73,1918,0211,161
41,25439,2542,075
37,1782,00111
1,88922,7552,916
738579
8244
1916
1,724292
1,4324,022
55,726
856,01447,45820,6178,7187,3881,3293,411
14,7133,4593,599
7,6548,5563,291(4)(4)
44
Digitized for FRASER http://fraser.stlouisfed.org/ Federal Reserve Bank of St. Louis

17-C. Continued
Item
71 Lease financing receivables . . ,72 Bank premises, furniture and fixtures, and other assets representing
bank premises73 Real estate owned other than bank premises74 All other assets . . . .75 Investment in unconsolidated subsidiaries and associated companies76 Customers' liability on acceptances outstanding77 U.S. addressees (domicile)78 Non-U S addressees (domicile)79 Net due from foreign branches, foreign subsidiaries, Edge and Agreement
subsidiaries80 Other . . . ,
8 1 Total liabilities and equity capital5
82 Total liabilities excluding subordinated debt
83 Total deposits . . .84 Individuals, partnerships, and corporations85 U S government . . .86 States and political subdivisions in United States87 All other . . . .88 Foreign governments and official institutions89 Commercial banks in United States90 U S branches and agencies of foreign banks91 Other commercial banks in United States . ,92 Banks in foreign countries93 Foreign branches of other U.S. banks94 Other banks in foreign countries95 Certified and officers' checks, travelers' checks, and letters of credit sold
for cash . .
96 Federal funds purchased and securities sold under agreements to repurchasein domestic offices and Edge and Agreement subsidiaries
97 Interest-bearing demand notes issued to U.S. Treasuryand other liabilities for borrowed money . . .
98 Interest- bearing demand notes (note balances) issued to U.S. Treasury. . . .99 Other liabilities for borrowed money
100 Mortgage indebtedness and liability for capitalized leases101 All other liabilities102 Acceptances executed and outstanding . . . .103 Net due to foreign branches, foreign subsidiaries, Edge and Agreement
subsidiaries104 Other ;
105 Subordinated notes and debentures
106 Total equity capital5
107 Preferred stock108 Common stock109 Surplus110 Undivided profits and reserve for contingencies and other capital reserves .I l l Undivided profits112 Reserve for contingencies and other capital reserves
MEMODeposits in domestic offices
1 13 Total demand1 14 Total savings115 Total time116 Time deposits of $100 000 or more117 Certificates of deposit in denominations of $100 000 or more118 Other119 Savings deposits authorized for automatic transfer and NOW accounts120 Money market time certificates of $10,000 and less than $100,000 with original
maturities of 26 weeks121 Demand deposits adjusted** .
122 Standby letters of credit total123 U.S. addressees (domicile)124 Non-U. S. addressees (domicile)125 Standby letters of credit conveyed to others through participation (included in
total standby letters of credit)126 Holdings of commercial paper included in total gross loans
Averages for 30 calendar days (or calendar month) ending with report date127 Total assets128 Cash and due from depository institutions129 Federal funds sold and securities purchased under agreements to resell ,130 Total loans131 Total deposits132 Time CDs in denominations of $100 000 or more in domestic offices133 Federal funds purchased and securities sold under agreements to repurchase.134 Other liabilities for borrowed money . . .
135 Number of banks
Insured
12,973
18,1591,660
73,5081,496
39,612(4)(4>
(4)32,400
1,403,264
1,324,113
1,071,469749,841
2,36549,808
254,73141,60069,906(4}
143,225
814,724
129,551
46,35316,05930,294
1,80574,93439,728
(4)35,206
5,778
73,37495
14,58925,86132,82831,964
864
312,252139,609333,867183,241167,78815,45315,218
84,552188,365
42,544(4)(4)
2,138(4)
1,377,849269,26245,602
754,0901,048,951
165,775133,99529,178
1,427
Banks with foreign offices2
Total
11,384
11,0961,177
67,3431,458
39,29813,71325,585
(4)26,587
1,048,130
996,052
777,481493,236
1,65324,903
246,29741,41861,99511,36550,630
142,88426,792
116,093
11,392
106,084
41,73012,52829,202
1,22469,53339,414
(4)30,118
4,094
47,98410
9,53216,32522,11621,701
415
213,99473,078
204,668133,488121,90311,5849,072
41,087108,929
39,75925,70814,052
2,008(4)
1,027,036233,422
23,463564,292758,934
(4)110,06628,105
177
Foreignoffices3
2,239
1,027135
22,775956
8,241
83,8639,714
(4)
342,969
285,741100,662
226547
182,04833,49115,4483,613
11,835133,10926,746
106,363
2,259
394
14,278(4)
14,27813
42,5426,580
26,3709,592
292
!'4<'4"
0000000
00
9,104
8.265
(4)
316,014123,663
485179,364284,592
^913,297
177
Domesticoffices
9,145
10,0691,042
74,801502
31,057(4)(4)
26,37016,872
(4)
683,317
491,740392,574
1,42724,35664,2497,927
46,5477,752
38,7959,775
469,729
9,133
105,690
27,45212,52814,9241,211
57,22432,834
3,86320,527
3,802
ii(4>
I:213,994
73,078204,668133,488121,90311,5849,072
41,087108,929
30,655
81,743
212
711,022109,75822,978
384,927474,342119,997109,70714,808
111
Bankswithoutforeignoffices
1,589
7,062483
6,16538
314(4)(4)
(4)5,813
355,134
328,060
293,988256,605
71224,905
8,433182
7,911(4)
(14,83,332
23,467
4,6233,5311,093
5815,402
314
&71,684
25,39085
5,0579,536
10,71210,263
449
98,25866,531
129,19949,75345,885
3,8696,146
43,46679,437
2,785
8130425
350,81335,84022,139
189,798290,01745,77823,929
1,073
1,250
45
Digitized for FRASER http://fraser.stlouisfed.org/ Federal Reserve Bank of St. Louis

17. Insured commercial banks with assets of $100 million or over-Domestic and foreign offices1—ContinuedD. December 31,1980Millions of dollars, except for number of banks
Item
1 Total assets. .
2 Cash and due from depository institutions3 Currency and coin (U.S. and foreign)4 Balances with Federal Reserve Banks5 Balances with other central banks6 Demand balances with commercial banks in United States7 All other balances with depository institutions in United States and
with banks in foreign countries8 Time and savings balances with commercial banks in United States9 Balances with other depository institutions in United States
10 Balances with banks in foreign countries11 Foreign branches of other U S banks12 Other banks in foreign countries13 Cash items in process of collection
14 Total securities, loans, and lease financing receivables
15 Total securities, book value16 U S Treasury17 Obligations of other U.S. government agencies and corporations18 Obligations of states and political subdivisions in United States19 All other securities20 Other bonds notes, and debentures21 Federal Reserve and corporate stock22 Trading account securities , , .
23 Federal funds sold and securities purchased under agreements to resell24 Total loans gross25 LESS- Unearned income on loans26 Allowance for possible loan loss .27 EQUALS' Loans net . . .
Total loans, gross, by category28 Real estate loans . .29 Construction and land development30 Secured by farmland31 Secured by residential properties32 1- to 4-family33 FHA-insured or VA-guaranteed34 Conventional35 Multifamily36 FHA-insured37 Conventional . .38 Secured by nonfarm nonresidential properties
39 Loans to financial institutions40 REITs and mortgage companies in United States41 Commercial banks in United States42 U S branches and agencies of foreign banks43 Other commercial banks44 Banks in foreign countries45 Foreign branches of other U S banks46 Other47 Finance companies in United States48 Other financial institutions
49 Loans for purchasing or carrying securities50 Brokers and dealers in securities51 Other52 Loans to finance agricultural production and other loans to farmers, .53 Commercial and industrial loans54 U.S. addressees (domicile).55 Non-U S addressees (domicile)
56 Loans to individuals for household, family, and other personal expenditures . .57 Installment loans58 Passenger automobiles59 Credit cards and related plans , .60 Retail (charge account) credit card61 Check and revolving credit62 Mobile homes63 Other installment loans64 Other retail consumer goods65 Residential property repair and modernization66 Other installment loans for household, family, and other personal
expenditures . .67 Single-payment loans68 All other loans69 Loans to foreign governments and official institutions70 Other
Insured
1,461,449
293,85914,35126,6362,800
37,617
132,7256,634
497125,593
(4)(4)
79,730
1,069,655
220,29465,66532,94499,20022,48511,3861,7189,380
47,745809,875
13,8778,018
78,980
189,916
88(4)
!79,8145,6657,291(4)(4)
37,054(4)(4)10,71619,089
13,0849,0374,0489,903
342,309(4)(4)
129,521
?(4)
i(4)(4)
45,327
8
Banks with foreign offices2
Total
1,091,408
249,3178,421
20,0622,800
26,316
125,4062,472
300122,63426,67195,96366,311
758,718
126,33234,93015,84555,80819,7499,4201,2799,050
26,833607,465
7,9845,843
593,638
115,624
888(4)(4)(4)
76,0954,9636,0812,4823,599
36,708714
35,99310,25818,084
11,2548,6822,5735,983
283,233171,776111,457
9514
1(4)(4)(4)
(4)(4)
41,76227,35214,410
Foreignoffices3
353,763
130,527308389
2,7414,656
120,2551,422
122118,71125,56293,149
2,177
197,752
10,489403
9751
9,3267,751
1681,408
306186,542
1,678235
184,629
6,741(4)(4)
881
35,003104678282396
26,751324
26,427382
7,088
1,259857402709
109,3966,255
103,141
6,448(4)(4)(4)
i!88
26,98524,572
2,412
Domesticoffices
768,687
118,7908,113
19,67459
21,660
5,1511,050
1783,9231,1092,814
64,134
560,966
115,84334,52715,83655,05710,423
1,6701,1117,643
26,528420,923
6,3075,607
409,009
108,88323,009
83863,51160,2713,887
56,3843,240
2213,019
21,524
41,0924,8595,4032,2003,2039,956
3919,5669,877
10,996
9,9957,8252,1715,273
173,837165,521
8,316
67,06656,20117,64819,34415,7973,5463,471
15,7394,3003,880
7,55910,86514,7772,780
11,997
Bankswithoutforeignoffices
370,041
44,5425,9306,573(4)
11,301
7,3194,163
1972,958(?
13,420
310,937
93,96230,73517,09943,392
2,7361,966
440330
20,911202,410
5,8922,176
194,342
74,2928,2131,183
41,91539,9242,034
37,8911,990
991,891
22,982
3,720702
1,209(4)(4)
347(4)(4)
4571,005
1,830355
1,4753,920
59,076
856,00746,82919,9789,1537,8131,3403,316
14,3823,3113,581
7,4899,1783,566
846
Digitized for FRASER http://fraser.stlouisfed.org/ Federal Reserve Bank of St. Louis
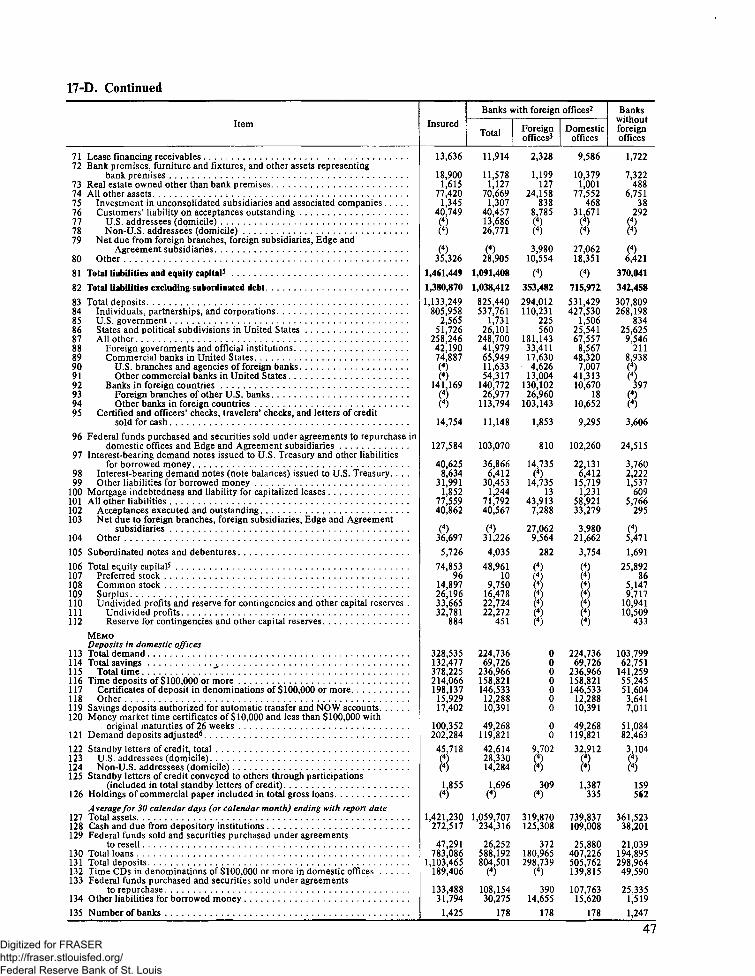
17-D. Continued
Item
71 Lease financing receivables72 Bank premises, furniture and fixtures, and other assets representing
bank premises73 Real estate owned other than bank premises . . . .74 All other assets . . ; .75 Investment in unconsolidated subsidiaries and associated companies76 Customers' liability on acceptances outstanding77 U S addressees (domicile)78 Non-U S addressees (domicile)79 Net due from foreign branches, foreign subsidiaries, Edge and
Agreement subsidiaries. . . .80 Other
81 Total liabilities and equity capital5 . . . .
82 Total liabilities excluding subordinated debt
83 Total deposits84 Individuals partnerships and corporations85 US government86 States and political subdivisions in United States . . . .87 All other88 Foreign governments and official institutions89 Commercial banks in United States90 US branches and agencies of foreign banks91 Other commercial banks in United States92 Banks in foreign countries . . .93 Foreign branches of other U S banks94 Other banks in foreign countries95 Certified and officers' checks, travelers' checks, and letters of credit
sold for cash
96 Federal funds purchased and securities sold under agreements to repurchase indomestic offices and Edge and Agreement subsidiaries
97 Interest-bearing demand notes issued to U.S. Treasury and other liabilitiesfor borrowed money
98 Interest-bearing demand notes (note balances) issued to U.S. Treasury. . . .99 Other liabilities for borrowed money
100 Mortgage indebtedness and liability for capitalized leases101 All other liabilities102 Acceptances executed and outstanding103 Net due to foreign branches, foreign subsidiaries, Edge and Agreement
subsidiaries104 Other . . .
105 Subordinated notes and debentures
106 Total equity capital5 .107 Preferred stock108 Common stock109 Surplus110 Undivided profits and reserve for contingencies and other capital reserves .I l l Undivided profits112 Reserve for contingencies and other capital reserves
MEMODeposits in domestic offices
113 Total demand . . . .1 14 Total savings . .115 Total time "*116 Time deposits of $100,000 or more117 Certificates of deposit in denominations of $100,000 or more118 Other . . .119 Savings deposits authorized for automatic transfer and NOW accounts120 Money market time certificates of $10,000 and less than $100,000 with
original maturities of 26 weeks121 Demand deposits adjusted**
122 Standby letters of credit, total . . .123 U S addressees (domicile). . . . . . . .124 Non-U S addressees (domicile)125 Standby letters of credit conveyed to others through participations
(included in total standby letters of credit)126 Holdings of commercial paper included in total gross loans
Average for 30 calendar days (or calendar month) ending with report date127 Total assets128 Cash and due from depository institutions129 Federal funds sold and securities purchased under agreements
to resell .130 Total loans131 Total deposits132 Time CDs in denominations of $100,000 or more in domestic offices133 Federal funds purchased and securities sold under agreements
to repurchase134 Other liabilities for borrowed money
135 Number of banks
Insured
13,636
18,9001,615
77,4201,345
40,749
8#326
1,461,449
1,380,870
1,133,249805,958
2,56551,726
258,24642,19074,887(4)(4)
141,169(4)(4)
14,754
127,584
40,6258,634
31,9911,852
77,55940,862
(4)36,697
5,726
74,85396
14,89726,19633,66532,781
884
328,535132,477378,225214,066198,13715,92917,402
100,352202,284
45,718
81,855(4)
1,421,230272,517
47,291783,086
1,103,465189,406
133,48831,794
1.425
Banks with foreign offices2
Total
11,914
11,5781,127
70,6691,307
40,45713,68626,771
(4)28,905
1,091,408
1,038,412
825,440537,761
1,73126,101
248,70041,97965,94911,63354,317
140,77226,977
113,794
11,148
103,070
36,8666,412
30,4531,244
71,79240,567
(4)31,226
4,035
48,96110
9,75016,47822,72422,272
451
224,73669,726
236,966158,821146,53312,28810,391
49,268119,821
42,61428,33014,284
1,696(4)
1,059,707234,316
26,252588,192804,501
(4)
108,15430,275
178
Foreignoffices3
2,328
1,199127
24,158838
8,785(4)(4)
3,98010,554
(4)353,482
294,012110,231
225560
181,14333,41117,6304,626
13,004130,10226,960
103,143
1,853
810
14,735(4)
14,73513
43,9137,288
27,0629,564
282
(4)
88(4)(4)
0000000
o0
9,702
8309
(4)
319,870125,308
372180,965298,739
(4)
39014,655
178
Domesticoffices
9,586
10,3791,001
77,552468
31,671
827,06218,351
(4)715,971
531,429427,530
1,50625,54167,557
8,56748,320
7,00741,31310,670
1810,652
9,295
102,260
22,1316,412
15,7191,231
58,92133,279
3,98021,662
3,754
•'4;
i224,736
69,726236,966158,821146,533
12,28810,391
49,268119,821
32,912
81,387
335
739,837109,008
25,880407,226505,762139,815
107,76315,620
178
Bankswithoutforeignoffices
1,722
7,322488
6,75138
292(4)(4)
(4)6,421
370,041
342,458
307,809268,198
83425,6259,546
2118,938
8397
(4)(4)
3,606
24,515
3,7602,2221,537
6095,766
295
(4)5,471
1,691
25,89286
5,1479,717
10,94110,509
433
103,79962,751
141,25955,24551,6043,6417,011
51,08482,463
3,104
8159562
361,52338,201
21,039194,895298,96449,590
25,3351,519
1.247
47Digitized for FRASER http://fraser.stlouisfed.org/ Federal Reserve Bank of St. Louis

18. Insured commercial banks with assets of $100 million or over—Domestic offices1
A. March 31,1980Millions of dollars, except for number of banks
Item
1 Total assets
2 Cash and due from depository institutions. . . .3 Currency and coin (U S and foreign)4 Balances with Federal Reserve Banks5 Balances with other central banks6 Demand balances with commercial banks in United States . . . .7 All other balances with depository institutions in United States and
with banks in foreign countries , , .8 Time and savings balances with commercial banks in United States9 Balances with other depository institutions in United States
10 Balances with banks in foreign countries11 Cash items in process of collection . . . .
12 Total securities, loans, and lease financing receivables
13 Total securities, book value14 U S Treasury . . . . .15 Obligations of other U.S. government agencies and corporations16 Obligations of states and political subdivisions in United States17 All other securities18 Other bonds notes and debentures19 Federal Reserve and corporate stock ,20 Trading account securities . . . . . .
21 Federal funds sold and securities purchased under agreements to resell
22 Total loans gross23 LESS- Unearned income on loans24 Allowance for possible loan loss . . . . . . . .25 EQUALS- Loans net
Total loans, gross, by category26 Real estate loans27 Construction and land development . . . .28 Secured by farmland29 Secured by residential properties .30 I- to 4 -family31 FHA-insured or VA -guaranteed32 Conventional33 Multifamily34 FHA-insured35 Conventional36 Secured by nonfarm nonresidential properties
37 Loans to financial institutions38 REITs and mortgage companies in United States39 Commercial banks in United States40 Banks in foreign countries41 Finance companies in United States42 Other financial institutions
43 Loans for purchasing or carrying securities44 Brokers and dealers in securities . . . .45 Other46 Loans to finance agricultural production and other loans to farmers .47 Commercial and industrial loans .
48 Loans to individuals for household, family, and other personal expenditures . .49 Installment loans . . . . . . . .50 Passenger automobiles51 Credit cards and related plans52 Retail (charge account) credit card53 Check and revolving credit54 Mobile homes .55 Other installment loans . . . .56 Other retail consumer goods57 Residential property repair and modernization58 Other installment loans for household, family, and other personal
expenditures59 Single-payment loans60 All other loans . . . . . . .
61 Lease financing receivables . .62 Bank premises, furniture and fixtures, and other assets representing
bank premises63 Real estate owned other than bank premises64 All other assets65 Investment in unconsolidated subsidiaries and associated companies66 Customers' liability on acceptances outstanding \ .67 Net due from foreign branches, foreign subsidiaries, Edge and Agreement
subsidiaries . . . . . . .68 Other
Insured
1,048,226
153,83710,68928,520
2132,955
6,7582,777
2073,774
74,893
809,790
190,81555,45129,76091,89713,7083,4591,4648,785
39,927
589,85213,4457,365
569,042
172,57328,103
. 1,85999,77294,680
6,19088,4905,092
3174,775
42,839
40,6926,3334,4857,028
10,57312,273
11,5747,7263,8488,637
215,901125,304106,75041,11527,95123,0664,8856,962
30,7237,6247,192
15,90618,55315,172
10,006
16,2171,494
66,889467
28,858
13,62023.944
Member banks
Total
898,474
140,2409,128
28,52021
26,064
3,9521,223
462,684
72,554
680,478
152,86342,68823,06974,93212,174
2,2171,2918,667
34,435
501,13310,718
6,451483,965
138,14323,584
1,39780,71576,726
5,59171,1343,990
2583,731
32,446
38,9976,0364,0156,792
10,31311,841
11,0087,4943,5147,804
190,499
100,84885,79831,56325,10920,8984,2115,691
23,4356,1145,346
11,97515,05013,835
9,215
13,3721,311
63,072440
28,336
12,98521.311
National
675,482
94,2057,063
21,03521
13,891
3,0241,056
291,938
49,172
522,590
116,51832,28817,99857,0849,1491,695
9596,494
25,132
387,7978,8514,869
374,077
113,17818,5451,275
67,12864,1324,762
59,3712,995
1412,854
26,230
24,7924,6002,3293,4986,7537,611
6,2173,5732,6437,306
143,607
82,80070,94826,14820,77917,5583,2215,183
18,8375,2534,404
9,18011,8529,897
6,864
10,8971,062
46,727368
20,127
10,49515.737
State
222,992
46,0352,0657,485
*12,173
92916716
74523,382
157,888
36,34610,4015,071
17,8483,026
522332
2,172
9,303
113,3361,8671,581
109,888
24,9655,040
12213,58812,593
82911,764
994117877
6,216
14,2051,4361,6863,2943,5604,229
4,7913,921
870498
46,892
18,04714,8505,4154,3303,340
989508
4,597861941
2,7963,1973,937
2,352
2,475249
16,34572
8,209
2,4915.574
Non-memberinsured
149,752
13,5971,561
**
6,891
2,8061,554
1621,0912,338
129,312
37,95112,7626,691
16,9651,5331,242
173118
5,492
88,7192,727
91585,078
34,4304,518
46219,05717,954
59917,356
1,10258
1,04410,393
1,695297470236260432
566232334833
25,402
24,45620,952
9,5522,8422,167
6751,2717,2881,5101,847
3,9313,5041,338
790
2,845183
3,81627
522
6352.633
48Digitized for FRASER http://fraser.stlouisfed.org/ Federal Reserve Bank of St. Louis

18-A. Continued
Item
69 Total liabilities and equity capital2 . . . . . .
70 Total liabilities excluding subordinated debt
71 Total deposits72 Individuals partnerships and corporations73 U.S government74 States and political subdivisions in United States . , . .75 All other76 Foreign governments and official institutions77 Commercial banks in United States78 Banks in foreign countries . . . . ,79 Certified and officers' checks, travelers' checks, and letters of credit
sold for cash80 Demand deposits8 1 Mutual savings banks . • . . . . . .82 Other individuals partnerships and corporations8 3 U S government . . , . . . . . . . .84 States and political subdivisions in United States8 5 A l l other . . . . . . . . .86 Foreign governments and official institutions87 Commercial banks in United States . . . . .88 Banks in foreign countries89 Certified and officers' checks, travelers' checks, and letters of credit
sold for cash
90 Time deposits . , . . . . . .91 Mutual savings banks92 Other individuals, partnerships, and corporations . . . .93 U S government94 States and political subdivisions in United States . . . .95 All other96 Foreign governments and official institutions97 Commercial banks in United States98 Banks in foreign countries . . . .99 Savings deposits
100 Mutual savings banks . . . .101 Other individuals partnerships and corporations102 Individuals and nonprofit organizations103 Corporations and other profit organizations104 U S government .105 States and political subdivisions in United States . . . . .106 All other107 Foreign governments and official institutions108 Commercial banks in United States109 Banks in foreign countries
110 Federal funds purchased and securities sold under agreements to repurchase.I l l Interest-bearing demand notes issued to U.S. Treasury and other liabilities
for borrowed money . . .112 Interest-bearing demand notes (note balances) issued to U.S. Treasury. . . .113 Other liabilities for borrowed money . . . . .114 Mortgage indebtedness and liability for capitalized leases . .115 All other liabilities .116 Acceptances executed and outstanding117 Net due to foreign branches, foreign subsidiaries, Edge and Agreement
subsidiaries . . . .118 Other119 Subordinated notes and debentures . .
120 Total equity capital2. . . . .
MEMO121 Time deposits of $100 000 or more122 Certificates of deposit in denominations of $100 000 or more . .123 Other . . . . .124 Savings deposits authorized for automatic transfer and NOW accounts125 Money market time certificates of $10,000 and less than $100,000 with
original maturities of 26 weeks . .126 Demand deposits adjusted^ . . .127 Total standby letters of credit . .128 Conveyed to others through participation (included in standby letters
of credit)129 Holdings of commercial paper included in total gross loans
Average for 30 calendar days (or calendar month) ending with report date130 Total assets . . .131 Cash and due from depository institutions • •132 Federal funds sold and securities purchased under agreements to resell133 Total loans134 Total deposits . .135 Time CDs in denominations of $100,000 or more in domestic offices136 Federal funds purchased and securities sold under agreements to repurchase.137 Other liabilities for borrowed money . .
138 Number of banks
Insured
1,048,226
973,405
767,395627,200
2,12353,42272,026
6,51754,85310,657
12,623308,682
1,224223,846
1,43110,28659,2722,203
47,5069,563
12,623
328,150406
272,798646
41,56012,7404,3067,3411,094
130,563*
128,925122,749
6,17647
1,5771376*
105,963
23,8825,704
18,1791,785
74,37930,041
16,77827,5604,983
69,839
183,017160,35222,66511,612
80,484184,853
28,572
1,480497
1,021,367141,92138,222
571,248740,127160,768115,333
17,984
1,429
Member banks
Total
898,474
834,718
639,715516,618
1,78740,89969,475
6,30352,89310,280
10,936269,255
1,063189,827
1,2298,367
57,8332,170
46,2499,414
10,936
267,083398
223,225517
31,31411,6294,1256,638
866103,378
*102,10597,4894,616
411,218
1376*
99,187
23,0625,239
17,8231,522
71,23229,519
16,63325,0813,956
59,800
154,337133,32621,011
9,458
62,739149,222
27,359
1,442269
873,109130,33832,410
485,291614,546133,715108,42117,636
932
National
675,482
627,232
484,864405,657
1,37633,49338,1983,826
29,4854,888
6,139188,733
589144,511
9716,722
29,8001,167
24,2974,336
6,139
213,349309
178,436366
25,8508,3872,6545,182
55282,782
*81,81078,145
3,66539
9211156*
74,695
14,3673,887
10,4791,245
52,06221,238
11,65819,1662,741
45,509
119,604101,987
17,6187,106
52,498114,293
18,048
1,178229
659,18087,29124,602
375,333468,123102,40080,40010,738
771
State
222,992
207,486
154,851110,961
4117,406
31,2772,476
23,4085,392
4,79680,522
47345,316
2581,645
28,0331,003
21,9525,078
4,796
53,73488
44,789152
5,4633,2411,4711,456
31420,595
020,29519,344
9501
29722**
24,492
8,6951,3527,343
27719,1718,281
4,9755,9151,216
14,291
34,73331,3393,3932,352
10,24134,929
9,311
26440
213,92943,047
7,808109,958146,423
31,31428,022
6,897
161
Non-memberinsured
149,752
138,687
127,680110,581
33712,5232,551
2141,960
377
1,68839,428
16234,019
2021,9191,439
331,257
149
1,688
61,0678
49,573129
10,2461,111
181703228
27,1850
26,82025,260
1,5606
359****
6,777
821465356263
3,147522
1462,4791,026
10,039
28,68027,026
1,6542,154
17,74535,631
1,213
38228
148,25811,5835,812
85,957125,58127,054
6,912348
497
49Digitized for FRASER http://fraser.stlouisfed.org/ Federal Reserve Bank of St. Louis

18. Insured commercial banks with assets of $100 million or over—Domestic offices1—ContinuedB. June 30,1980Millions of dollars, except for number of banks
Item
1 Total assets
2 Cash and due from depository institutions3 Currency and coin (U S and foreign)4 Balances with Federal Reserve Banks5 Balances with other central banks .6 Demand balances with commercial banks in United States7 All other balances with depository institutions in United States and with
banks in foreign countries8 Time and savings balances with commercial banks in United States9 Balances with other depository institutions in United States
10 Balances with banks in foreign countries . ,11 Cash items in process of collection
12 Total securities loans, and lease financing receivables . . . .
13 Total securities book value ,14 U S Treasury15 Obligations of other U S government agencies and corporations16 Obligations of states and political subdivisions in United States17 All other securities18 Other bonds notes and debentures19 Federal Reserve and corporate stock20 Trading account securities
21 Federal funds sold and securities purchased under agreements to resell
22 Total loans gross23 LESS- Unearned income on loans .24 Allowance for possible loan loss25 EQUALS- Loans net
Total loans, gross, by category26 Real estate loans27 Construction and land development28 Secured by farmland29 Secured by residential properties30 1- to 4-family31 FHA-insured or VA -guaranteed32 Conventional .33 Multifamily34 FHA-insured . . .35 Conventional .36 Secured by nonfarm nonresidential properties
37 Loans to financial institutions38 REITs and mortgage companies in United States39 Commercial banks in United States40 Banks in foreign countries41 Finance companies in United States42 Other financial institutions43 Loans for purchasing or carrying securit es44 Brokers and dealers in securities45 Other46 Loans to finance agricultural production and other loans to farmers47 Commercial and industrial loans .
48 Loans to individuals for household, family, and other personal expenditures . .49 Installment loans50 Passenger automobiles51 Credit cards and related plans .52 Retail (charge account) credit card53 Check and revolving credit54 Mobile homes55 Other installment loans56 Other retail consumer goods .57 Residential property repair and modernization58 Other installment loans for household, family, and other personal
expenditures59 Single-payment loans60 All other loans61 Lease financing receivables . . . .62 Bank premises, furniture and fixtures, and other assets representing
bank premises . . . .63 Real estate owned other than bank premises .64 All other assets65 Investment in unconsolidated subsidiaries and associated companies66 Customers' liability on acceptances outstanding67 Net due from foreign branches, foreign subsidiaries, Edge and Agreement
subsidiaries68 Other
Insured
1,068,395
163,94811,17131,123
1236,911
8,3533,411
2204,723
76,377
812,060
197,05759,09931,43093,54112,9883,5421,4977,949
42,745
582,62713,2557,522
561,850
174,83828,846
1,884100,73295,617
5,78489,833
5,115306
4,80943,376
37,0295,4394,4337,3659,222
10,56911,5377,8303,7088,861
212,718
121,614103,69939,56727,07222,165
4,9076,983
30,0767,6007,265
15,21017,91616,030
10,408
16,6811,537
74,169382
31,350
19,72022,717
Member banks
Total
916,076
149,0839,555
31,10312
29,024
5,3141,797
893,428
74,075
681,948
158,28446,17924,42876,32211,3552,2551,3187,782
37,100
494,11710,5656,592
476,960
140,09424,298
1,41981,53677,510
5,18772,3234,026
2473,779
32,841
35,4195,1644,0387,1298,992
10,097
10,8517,4993,3537,975
187,303
97,86383,29730,39724,29020,070
, 4,2195,686
22,9246,1005,407
11,41714,56614,612
9,603
13,7201,348
69,977356
30,768
18,84720,006
National
688,333
97,1387,396
22,08312
15,524
4,0511,573
742,405
48,072
527,741
119.89234^3919,15258,039
7,9611,650
9735,338
29,597
384,7898,7354,951
371,103
114,84919,082
1,29367,94764,896
4,38860,508
3,051133
2,91726,526
23,0403,9162,4833,9445,8886,8096,7524,1902,5627,453
142,346
80,31568,78825,12620,04216,8193,2235,179
18,4405,2074,434
8,79911,52810,035
7,149
11,1801,077
51,197283
21,899
14,50214,513
State
227,743
51,9452,1589,021
*13,500
1,263224
161,023
26,004
154,207
38,39311,4405,276
18,2833,394
605345
2,444
7,503
109,3281,8301,641
105,857
25,2455,216
12613,58912,615
79911,816
975114861
6,314
12,3801,2481,5553,1853,1043,2884,0993,309
790522
44,957
17,54814,5095,2714,2473,251
996507
4,484893973
2,6183,0394,577
2,454
2,541271
18,77973
8,869
4,3445,493
Non-memberinsured
152,319
14,8651,617
20*
7,887
3,0391,614
1301,2942,302
130,112
38,77312,9197,002
17,2191,6331,286
180167
5,644
88,5102,690
93084,889
34,7454,548
46619,19618,107
59617,510
1,08959
1,03010,535
1,609276395236230472
686331355886
25,415
23,75120,402
9,1702,7832,095
6881,2977,1511,5001,858
3,7933,3491,418
805
2,961189
4,19226
582
8732,711
50Digitized for FRASER http://fraser.stlouisfed.org/ Federal Reserve Bank of St. Louis

18-B. Continued
Item
69 Total liabilities and equity capital2 .
70 Total liabilities excluding subordinated debt . . . .
71 Total deposits ' . . .72 Individuals partnerships and corporations73 US government . . .74 States and political subdivisions in United States75 All other . . . .76 Foreign governments and official institutions77 Commercial banks in United States78 Banks in foreign countries79 Certified and officers' checks, travelers' checks, and letters of credit
sold for cash80 Demand deposits81 Mutual savings banks82 Other individuals partnerships and corporations . . . .83 U S government84 States and political subdivisions in United States85 All other86 Foreign governments and official institutions ,87 Commercial banks in United States88 Banks in foreign countries . . .89 Certified and officers' checks, travelers' checks, and letters of credit
sold for cash
90 Time deposits91 Mutual savings banks . . . .92 Other individuals partnerships and corporations . . .93 U S government94 States and political subdivisions in United States . . .95 AH other . .96 Foreign governments and official institutions . . .97 Commercial banks in United States . . . .98 Banks in foreign countries .99 Savings deposits
100 Mutual savings banks .101 Other individuals partnerships and corporations . .102 Individuals and nonprofit organizations103 Corporations and other profit organizations . . . .104 U S government105 States and political subdivisions in United States106 All other . . . .107 Foreign governments and official institutions108 Commercial banks in United States109 Banks in foreign countries . . . .
110 Federal funds purchased and securities sold under agreements to repurchase.I l l Interest-bearing demand notes issued to U.S. Treasury and other liabilities
for borrowed money112 Interest-bearing demand notes (note balances) issued to U.S. Treasury. . . .113 Other liabilities for borrowed money .114 Mortgage indebtedness and liability for capitalized leases115 All other liabilities116 Acceptances executed and outstanding117 Net due to foreign branches, foreign subsidiaries, Edge and Agreement
subsidiaries . . . .118 Other119 Subordinated notes and debentures
120 Total equity capital2
MEMO121 Time deposits of $100 000 or more122 Certificates of deposit in denominations of $100 000 or more123 Other124 Savings deposits authorized for automatic transfer and NOW accounts125 Money market time certificates of $10,000 and less than $100,000 with original
maturities of 26 weeks . . . .126 Demand deposits adjusted^ . . . .
127 Total standby letters of credit128 Conveyed to others through participation (included in standby
letters of credit)129 Holdings of commercial paper included in total gross loans
Average for 30 calendar days (or calendar month) ending with report date130 Total assets131 Cash and due from depository institutions . .132 Federal funds sold and securities purchased under agreements to resell133 Total loans . . . . .134 Total deposits . . .135 Time CDs in denominations of $100 000 or more in domestic offices136 Federal funds purchased and securities sold under agreements to repurchase.137 Other liabilities for borrowed money . .
138 Number of banks
Insured
1,068,395
991,338
782,530639,298
2,04450,74477,3038,549
57,84810,906
13,141321,011
1,234230,260
1,50111,21663,6592,995
50,8049,860
13,141
328,572420
276,375483
37,67313,6215,5377,0381,046
132,947*
131,009124,263
6,74660
1,85522176*
118,845
24,2409,791
14,4491,787
63,93632,952
5,46925,515
5,469
71,588
177,255155,26921,98612,700
86,650192,329
31,006
1,750603
1,033,202140,29543,329
564,722746,478157,893125,30815,317
1,439
Member banks
Total
916,076
850,338
653,246527,428
1,69138,41174,358
8,26755,57610,514
11,358280,243
1,055195,663
1,2639,047
61,8562,924
49,2479,685
11,358
267,697412
226,514372
27,92012,4805,3276,324
829105,306
*103,78498,7375,047
561,444
22166*
111,700
23,1669,038
14,1281,509
60,71732,370
5,34023,0084,439
61,299
149,755129,36820,38710,418
67,887155,657
29,695
1,709337
883,964128,63337,239
479,248620,059131,742118,43514,948
938
National
688,333
638,485
492,368412,191
1,32731,68440,893
5,04631,0484,798
6,273194,366
545147,261
1,0217,297
31,9681,406
26,2754,287
6,273
213,875339
181,048251
23,3318,9053,6264,767
51184,127
*82,99779,0013,995
551,056
20146*
84,663
14,7616,5958,1661,231
45,46223,361
4,82417,2783,261
46,588
115,80998,58917,2207,834
56,825118,998
19,076
1,406230
667,88185,39928,011
372,419470,866100,35088,830
8,728
772
State
227,743
211,853
160,879115,237
3646,728
33,4653,221
24,5285,716
5,08585,877
51048,402
2421,751
29,8881,518
22,9725,399
5,085
53,82273
45,465121
4,5893,5751,7011,556
31721,179
020,78719,736
1,0511
38822**
27,036
8,4052,4435,962
27815,2569,009
5165,7301,178
14,712
33,94630,7803,1662,585
11,06236,660
10,619
303107
216,08243,234
9,228106,830149,19331,39229,604
6,220
166
Non-memberinsured
152,319
141,000
129,283111,871
35312,3332,945
2822,272
392
1,78240,768
17934,597
2372,1691,803
711,557
175
1,782
60,8758
49,861111
9,7531,141
210714217
27,6410
27,22525,526
1,6995
411****
7,146
1,075753321278
3,219582
1302,5071,030
10,289
27,50025,901
1,5992,281
18,76236,672
1,311
41267
149,23811,6626,091
85,473126,42026,151
6,874369501
51Digitized for FRASER http://fraser.stlouisfed.org/ Federal Reserve Bank of St. Louis
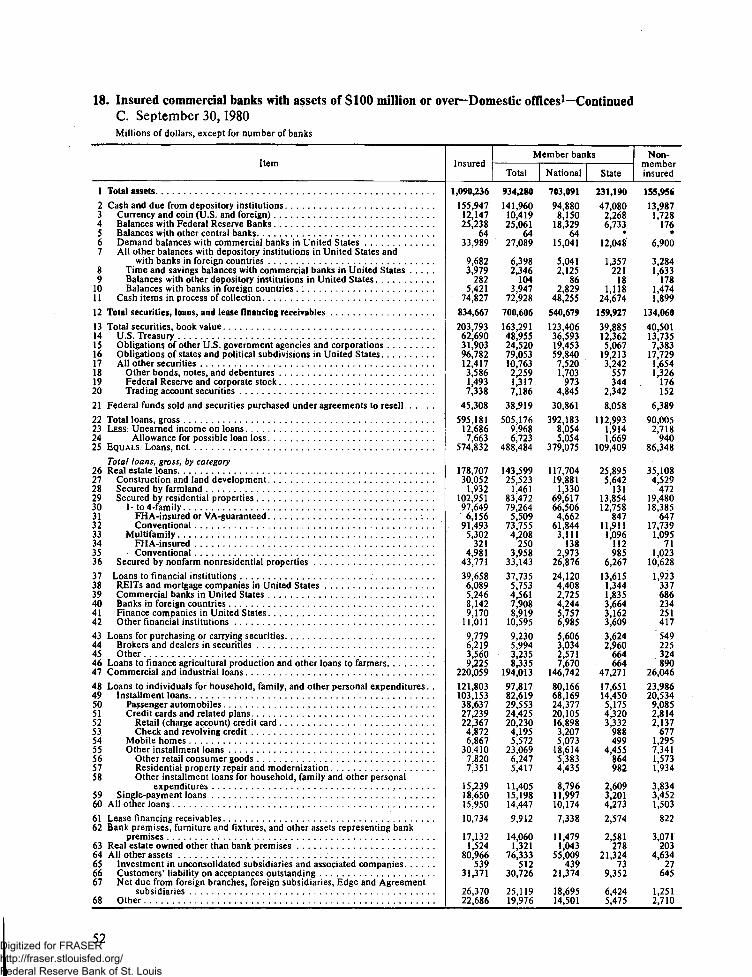
18. Insured commercial banks with assets of $100 million or over-Domestic offices1—ContinuedC. September 30,1980Millions of dollars, except for number of banks
Item
1 Total assets
2 Cash and due from depository institutions. . , . . . . .3 Currency and coin (U S. and foreign)4 Balances with Federal Reserve Banks . . . .5 Balances with other central banks6 Demand balances with commercial banks in United States . .7 All other balances with depository institutions in United States and
with banks in foreign countries . . . .8 Time and savings balances with commercial banks in United States9 Balances with other depository institutions in United States
10 Balances with banks in foreign countries . . . .11 Cash items in process of collection
12 Total securities, loans, and lease financing receivables . . . . , . .
13 Total securities, book value14 U.S. Treasury . . . .15 Obligations of other U.S. government agencies and corporations16 Obligations of states and political subdivisions in United States17 All other securities .18 Other bonds, notes, and debentures19 Federal Reserve and corporate stock . . . . .20 Trading account securities
21 Federal funds sold and securities purchased under agreements to resell
22 Total loans, gross23 LESS- Unearned income on loans24 Allowance for possible loan loss . . . . .25 EQUALS- Loans net
Total loans, gross, by category26 Real estate loans . . .27 Construction and land development28 Secured by farmland29 Secured by residential properties . . . . . . .30 l-to4-family3 1 FH A-insured or VA -guaranteed32 Conventional . . . . .33 Multifamily34 FHA-insured35 • Conventional . . . .36 Secured by nonfarm nonresidential properties . . .
37 Loans to financial institutions ,38 REITs and mortgage companies in United States . . . . .39 Commercial banks in United States40 Banks in foreign countries41 Finance companies in United States42 Other financial institutions . . .
43 Loans for purchasing or carrying securities . .44 Brokers and dealers in securities45 Other46 Loans to finance agricultural production and other loans to farmers47 Commercial and industrial loans . . . .
48 Loans to individuals for household, family, and other personal expenditures . .49 Installment loans . . .50 Passenger automobiles51 Credit cards and related plans52 Retail (charge account) credit card53 Check and revolving credit . . . . . . . .5 4 Mobile homes . . . . . . .55 Other installment loans56 Other retail consumer goods57 Residential property repair and modernization58 Other installment loans for household, family and other personal
expenditures . .59 Single-payment loans60 All other loans
61 Lease financing receivables . . .62 Bank premises, furniture and fixtures, and other assets representing bank
premises63 Real estate owned other than bank premises6 4 A l l other assets . . .65 Investment in unconsolidated subsidiaries and associated companies66 Customers* liability on acceptances outstanding . . . . . . .67 Net due from foreign branches, foreign subsidiaries, Edge and Agreement
subsidiaries . . . .68 Other
Insured
1,090,236
155,94712,14725,238
6433,989
9,6823,979
2825,421
74,827
834,667
203,79362,69031,90396,78212,4173,5861,4937,338
45,308
595,18112,6867,663
574,832
178,70730,052
1,932102,95197,649
6,15691,4935,302
3214,981
43,771
39,6586,0895,2468,1429,170
11,011
9,7796,2193,5609,225
220,059
121,803103,15338,63727,23922,3674,8726,867
30,4107,8207,351
15,23918,65015,950
10,734
17,1321,524
80,966539
31,371
26,37022.686
Member banks
Total
934,280
141,96010,41925,061
6427,089
6,3982,346
1043,947
72,928
700,606
163,29148,95524,52079,05310,7632,2591,3177,186
38,919
505,1769,9686,723
488,484
143,59925,523
1,46183,47279,264
5,50973,7554,208
2503,958
33,143
37,7355,7534,5617,9088,919
10,595
9,2305,9943,2358,335
194,013
97,81782,61929,55324,42520,2304,1955,572
23,0696,2475,417
11,40515,19814,447
9,912
14,0601,321
76,333512
30,726
25,11919.976
National
703,091
94,8808,150
18,32964
15,041
5,0412,125
862,829
48,255
540,679
123,40636,59319,45359,840
7,5201,703
9734,845
30,861
392,1838,0545,054
379,075
117,70419,8811,330
69,61766,5064,662
61,8443,111
1382,973
26,876
24,1204,4082,7254,2445,7576,985
5,6063,0342,5717,670
146,742
80,16668,16924,37720,10516,8983,2075,073
18,6145,3834,435
8,79611,99710,174
7,338
11,4791,043
55,009439
21,374
18,69514.501
State
231,190
47,0802,2686,733
*12,048
1,357221
181,118
24,674
159,927
39,88512,3625,067
19,2133,242
557344
2,342
8,058
112,9931,9141,669
109,409
25,8955,642
13113,85412,758
84711,911
1,096112985
6,267
13,6151,3441,8353,6643,1623,609
3,6242,960
664664
47,271
17,65114,4505,1754,3203,332
988499
4,455864982
2,6093,2014,273
2,574
2,581278
21,32473
9,352
6,4245.475
Non-memberinsured
155,956
13,9871,728
176*
6,900
3,2841,633
1781,4741,899
134,060
40,50113,7357,383
17,7291,6541,326
176152
6,389
90,0052,718
94086,348
35,1084,529
47219,48018,385
64717,739
1,09571
1,02310,628
1,923337686234251417
"549225324890
26,046
23,98620,534
9,0852,8142,137
6771,2957,3411,5731,934
3,8343,4521,503
822
3,071203
4,63427
645
1,2512.710
52Digitized for FRASER http://fraser.stlouisfed.org/ Federal Reserve Bank of St. Louis

18-C. Continued
Item
69 Total liabilities and equity capital2
70 Total liabilities excluding subordinated debt
71 Total deposits72 Individuals, partnerships, and corporations73 US government74 States and political subdivisions in United States75 All other76 Foreign governments and official institutions77 Commercial banks in United States78 Banks in foreign countries79 Certified and officers* checks, travelers' checks, and letters of credit
sold for cash , . . (80 Demand deposits81 Mutual savings banks. .82 Other individuals partnerships and corporations83 U.S. government84 States and political subdivisions in United States85 All other86 Foreign governments and official institutions87 Commercial banks in United States '.88 Banks in foreign countries89 Certified and officers' checks, travelers' checks, and letters of credit
sold for cash
90 Time deposits91 Mutual savings banks92 Other individuals, partnerships, and corporations93 U S government94 States and political subdivisions in United States95 All other96 Foreign governments and official institutions97 Commercial banks in United States98 Banks in foreign countries99 Savings deposits .
100 Mutual savings banks101 Other individuals, partnerships and corporations102 Individuals and nonprofit organizations103 Corporations and other profit organizations104 U S government105 States and political subdivisions in United States106 Allother107 Foreign governments and official institutions108 Commercial banks in United States109 Banks in foreign countries
110 Federal funds purchased and securities sold under agreements to repurchase.I l l Interest-bearing demand notes issued to U.S. Treasury and other liabilities
for borrowed money112 Interest-bearing demand notes (note balances) issued to U.S. Treasury. . . .113 Other liabilities for borrowed money114 Mortgage indebtedness and liability for capitalized leases115 All other liabilities116 Acceptances executed and outstanding117 Net due to foreign branches, foreign subsidiaries, Edge and Agreement
subsidiaries118 Other119 Subordinated notes and debentures
120 Total equity capital2
MEMO121 Time deposits of $100 000 or more ,122 Certificates of deposit in denominations of $100 000 or more123 Other124 Savings deposits authorized for automatic transfer and NOW accounts125 Money market time certificates of $10,000 and less than $100,000 with original
maturities of 26 weeks126 Demand deposits adjusted3
127 Total standby letters of credit128 Conveyed to others through participation (included in standby letters of
credit)129 Holdings of commercial paper included in total gross loans
Average for 30 calendar days (or calendar month) ending with report date130 Total assets131 Cash and due from depository institutions132 Federal funds sold and securities purchased under agreements to resell133 Total loans134 Total deposits135 Time CDs in denominations of $100,000 or more in domestic offices136 Federal funds purchased and securities sold under agreements to repurchase.137 Other liabilities for borrowed money .
138 Number of banks
Insured
1,090,236
1,011,377
785,728649,179
2,14049,26172,682
8,10854,45810,116
12,466312,252
1,132227,679
1,55910,55258,8652,301
47,5019,063
12,466
333,867360
282,135513
37,05913,8005,7956,9521,052
139,609*
137,872130,329
7,54368
1,65118135*
129,157
32,07516,05916,016
1,79262,62533,148
3,86325,6145,486
73,374
183,241167,78815,45315,218
84,552188,365
33,440
1,872637
1,061,835145,59945,117
574,726764,359165,775133,63615,881
1.427
Member banks
Total
934,280
867,142
653,803533,832
1,81337,35870,1077,860
52,5499,698
10,694271,064
965192,133
1,3488,584
57,3402,201
46,2988,841
10,694
272,356334
231,339404
27,52912,7505,6476,246
857110,384
*109,060103,436
5,62461
1,24517125*
122,062
30,30814,88515,423
1,48859,48132,503
3,71423,2644,408
62,731
155,263141,28813,97612,342
66,199150,490
31,883
1,761389
907,918132,86838,501
487,719634,265139,534126,434
15,367
928
National
703,091
652,138
495,553417,884
1,36630,48639,5394,853
30,2384,448
6,278190,398
532144,923
1,0646,840
30,760917
25,9663,877
6,278
216,822242
184,844243
22,7308,7633,9254,266
57188,334
*87,34382,8564,487
59916
16115*
91,569
20,20511,1109,0951,211
43,59923,091
2,97717,5313,225
47,727
119,561108,752
10,8099,444
55,475115,113
21,764
1,498280
684,25888,72330,630
379,216483,555107,73795,1108,695
769
State
231,190
215,004
158,250115,948
4466,872
30,5683,007
22,3115,250
4,41680,666
43347,210
2841,745
26,579 •1,284
20,3324,963
4,416
55,53493
46,495160
4,7983,9871,7221,979
28622,050
021,71720,580
1,1382
32921**
30,493
10,1033,7756,328
27715,8829,412
7375,7331,182
15,003
35,70332,536
3,1662,898
10,72435,377
10,119
262109
223,66044,145
7,870108,503150,70931,79731,323
6,672
159
Non-memberinsured
155,956
144,235
131,925115,347
32711,9042,576
2481,910
417
1,77241,188
16735,546
2111,9671,525
1001,203
222
1,772
61,51226
50,796109
9,5301,050
148707195
29,2250
28,81226,893
1,9197
4061***
7,095
1,7671,174
593304
3,145645
1492,3501,078
10,643
27,97826,500
1,4772,876
18,35337,876
1,557
112248
153,91712,7306,616
87,006130,09426,241
7,203514
499
53Digitized for FRASER http://fraser.stlouisfed.org/ Federal Reserve Bank of St. Louis

18. Insured commercial banks with assets of $100 million or over-Domestic offices1—ContinuedD. December 31,1980Millions of dollars, except for number of banks
Item
1 Total assets
2 Cash and due from depository institutions3 Currency and coin (U S and foreign)4 Balances with Federal Reserve Banks5 Balances with other central banks6 Demand balances with commercial banks in United States7 All other balances with depository' institutions in United States and
with banks in foreign countries8 Time and savings balances with commercial banks in United States9 Balances with other depository institutions in United States
10 Balances with banks in foreign countries11 Cash items in process of collection
12 Total securities, loans, and lease financing receivables
13 Total securities, book value ,14 U S Treasury15 Obligations of other U.S. government agencies and corporations16 Obligations of states and political subdivisions in United States17 All other securities18 Other bonds notes and debentures . . . . .19 Federal Reserve and corporate stock20 Trading account securities . . .
21 Federal funds sold and securities purchased under agreements to resell
22 Total loans gross23 LESS- Unearned income on loans : . .24 Allowance for possible loan loss . , .25 EQUALS- Loans net
Total loans, gross, by category26 Real estate loans27 Construction and land development . . . .28 Secured by farmland29 Secured by residential properties30 1- to 4-family31 FHA-insured or VA-guaranteed .32 Conventional33 Multifamily34 FHA-insured35 Conventional36 Secured by nonfarm nonresidential properties
37 Loans to financial institutions38 REITs and mortgage companies in United States39 Commercial banks in United States . ,40 Banks in foreign countries . . .41 Finance companies in United States42 Other financial institutions
43 Loans for purchasing or carrying securities44 Brokers and dealers in securities *45 Other . . . . .46 Loans to finance agricultural production and other loans to farmers47 Commercial and industrial loans
48 Loans to individuals for household, family, and other personal expenditures . .49 Installment loans ,50 Passenger automobiles51 Credit cards and related plans . . . . .52 Retail (charge account) credit card53 Check and revolving credit54 Mobile homes55 Other installment loans56 Other retail consumer goods57 Residential property repair and modernization . . .58 Other installment loans for household, family, and other personal
expenditures59 Single-payment loans60 All other loans
61 Lease financing receivables62 Bank premises, furniture and fixtures, and other assets representing bank
premises ,63 Real estate owned other than bank premises64 All other assets65 Investment in unconsolidated subsidiaries and associated companies66 Customers' liability on acceptances outstanding67 Net due from foreign branches, foreign subsidiaries, Edge and Agreement
subsidiaries68 Other
Insured
1,138,728
163,33214,04326,247
5932,961
12,4695,212
3756,881
77,553
871,903
209,80565,26232,93598,44913,1593,6361,5517,972
47,439
623,33312,1997,783
603,351
183,17431,222
2,021105,426100,196
5,92194,275
5,230320
4,91044,506
44,8115,5616,613
10,30310,33412,001
11,8258,1803,6469,193
232,913
123,073103,03137,62728,49723,610
4,8876,786
30,1217,6117,461
15,04920,04218,343
11,308
17,7011,489
84,303506
31,963
27,06224.772
Member banks
Total
975,380
147,43412,05526,093
5925,735
8,4703,207
1485,115
75,023
732,839
168,26451,02725,04280,63011,5642,3311,3807,854
40,705
529,8709,6086,822
513,440
147,41026,510
1,54085,64281,486
5,28476,2024,157
2533,904
33,718
42,3225,2615,5419,936
10,09811,486
11,1537,8523,3028,326
204,89299,00582,71728,76025,59321,393
4,2005,526
22,8386,0815,499
11,25816,28816,762
10,430
14,4811,283
79,344480
31,301
25,79821.765
National
733,083
100,8749,479
20,73058
14,519
6,5802,833
1023,645
49,509
562,417
128,28838,27820,08761,302
8,6211,7751,0325,814
30,988
408,1427,6095,129
395,404
120,85620,678
1,40971,56068,373
4,43563,938
3,187144
3,04327,209
26,7164,1093,5005,3746,3667,368
6,1263,5472,5797,616
154,480
81,08168,15723,64721,03317,8303,2035,033
18,4445,2124,502
8,73012,92411,267
7,737
11,7941,030
56,968452
21,736
19,01615.763
State
242,297
46,5602,5775,363
*11,216
1,89037346
1,47125,514
170,422
39,97612,7494,956
19,3282,943
556348
2,040
9,717
121,7281,9991,693
118,037
26,5545,832
13014,08213,112
84912,264
970109861
6,509
15,6061,1522,0424,5623,7334,118
5,0274,305
723710
50,41217,92414,5605,1124,5603,563
997493
4,395869997
2,5293,3645,4952,692
2,687253
22,37628
9,564
6,7826.002
Non-memberinsured
163,348
15,8981,987
1540
7,227
3,9992,006
2281,7662,531
139,064
41,54114,2357,892
17,8191,5951,305
171119
6,734
93,4632,591
96089,911
35,7654,712
48119,78418,710
63618,073
1,07468
1,00610,788
2,489300
1,071367236515
672328344867
28,021
24,06820,314
8,8672,9042,217
6871,2617,2831,5301,962
3,7903,7541,581
878
3,220206
4,96026
663
1,2643.007
54Digitized for FRASER http://fraser.stlouisfed.org/ Federal Reserve Bank of St. Louis

18-D. Continued
Item
69 Total liabilities and equity capital2
70 Total liabilities excluding subordinated debt
71 Total deposits72 Individuals, partnerships, and corporations73 U.S. government . .74 States and political subdivisions in United States75 All other76 Foreign governments and official institutions77 Commercial banks in United States78 Banks in foreign countries79 Certified and officers' checks, travelers' checks, and letters of credit
sold for cash80 Demand deposits81 Mutual savings banks.82 Other individuals partnerships and corporations83 U.S. government84 States and political subdivisions in United States85 All other86 Foreign governments and official institutions87 Commercial banks in United States88 Banks in foreign countries89 Certified and officers' checks, travelers' checks, and letters of credit
sold for cash
90 Time deposits. . . . . . . . . .91 Mutual savings banks92 Other individuals, partnerships and corporations93 U.S. government94 States and political subdivisions in United States95 All other96 Foreign governments and official institutions97 Commercial banks in United States . .98 Banks in foreign countries99 Savings deposits . . . . . . . .
100 Mutual savings banks101 Other individuals, partnerships and corporations102 Individuals and nonprofit organizations103 Corporations and other profit organizations104 U.S. government . . .105 States and political subdivisions in United States106 All other107 Foreign governments and official institutions108 Commercial banks in United States109 Banks in foreign countries
110 Federal funds purchased and securities sold under agreement to repurchase .Ill Interest-bearing demand notes issued to U.S. Treasury and other liabilities
for borrowed money112 Interest-bearing demand notes (note balances) issued to U.S. Treasury. . . .113 Other liabilities for borrowed money114 Mortgage indebtedness and liability for capitalized leases115 All other liabilities116 Acceptances executed and outstanding117 Net due to foreign branches, foreign subsidiaries, Edge and Agreement
subsidiaries .118 Other . . . .119 Subordinated notes and debentures . . . . . . . .
120 Total equity capital2
MEMO121 Time deposits of $100 000 or more122 Certificates of deposit in denominations of $100,000 or more123 Other124 Savings deposits authorized for automatic transfer and NOW accounts125 Money market time certificates of $10,000 and less than $100,000 with
original maturities of 26 weeks126 Demand deposits adjusted^
127 Total standby letters of credit .128 Conveyed to others through participation (included in standby letters
of credit)129 Holdings of commercial paper included in total gross loans.
Average for 30 calendar days (or calendar month) ending with report date130 Total assets131 Cash and due from depository institutions132 Federal funds sold and securities purchased under agreements to resell133 Total loans134 Total deposits . . .135 Time CDs in denominations of $100,000 or more in domestic offices136 Federal funds purchased and -securities sold under agreements to repurchase.137 Other liabilities for borrowed money
138 Number of banks
Insured
1,138,728
1,058,430
839,238695,727
2,34151,16677,103
8,77857,25811,067
12,901328,535
1,139241,762
1,74911,45859,526
2,61246,949
9,965
12,901
378,225660
321,318531
38,16017,5566,151
10,3041,101
132,477*
130,849124,117
6,73260
1,5472115
5*
126,775
25,8908,634
17,2561,839
64,68733,574
3,98027,133
5,445
74,854
214,066198,137
15,92917,402
100,352202,284
36,016
1,546897
1,101,360147,20946,919
602,121804,726189,406133,098
17,139
1.425
Member banks
Total
975,380
907,112
700,959574,733
1,95539,20874,2038,485
55,17410,544
10,861285,247
1,005204,789
1,4919,274
57,8282,490
45,6589,680
10,861
310,721651
264,577415
28,72216,3565,9809,511
864104,991
*103,71098,664
5,04650
1,21220155*
118,820
24,5307,810
16,7201,522
61,28032,908
3,73424,638
4,331
63,937
183,003168,439
14,56414,069
78,649163,076
34,331
1,477581
942,084133,67640,236
512,549670,493160,546124,917
16,600
930
National
733,083
681,297
531,731447,298
1,48132,20843,869
5,53133,780
4,557
6,876201,267
539153,261
1,1827,615
31,7941,089
26,6884,017
6,876
246,394455
209,944251
23,68812,0564,4287,088
54084,070
*83,09979,0544,044
48905
19145*
88,979
14,4825,5788,9041,243
44,86223,288
3,16818,4063,143
48,643
140,104129,248
10,85610,993
65,643123,889
22,976
1,031499
708,20188,97030,514
395,008508,616122,68392,668
8,782
766
State
242,297
225,816
169,229127,434
4757,000
30,3352,955
21,3935,987
3,98583,980
46551,528
3091,659
26,0341,401
18,9705,663
3,985
64,327196
54,634164
5,0344,3001,5522,423
32420,921
020,61119,610
1,0012
30721**
29,841
10,0482,2327,816
28016,4189,620
5666,2321,187
15,294
42,89939,191
3,7083,076
13,00639,187
11,355
44682
233,88344,706
9,722117,540161,87737,86332,249
7,818164
Non-memberinsured
163,348
151,317
138,278120,995
38511,9582,900
2932,084
522
2,04043,288
13436,973
2582,1841,698
1221,291
286
2,040
67,5049
56,740116
9,4381,200
171793237
27,4860
27,13925,453
1,68610
33611**
7,955
1,360824536317
3,407666
2462,4951,114
10,917
31,06329,697
1,3653,333
21,70439,208
1,686
69315
159,27613,5336,683
89,572134,23328,860
8,181539
495
55Digitized for FRASER http://fraser.stlouisfed.org/ Federal Reserve Bank of St. Louis

19. Insured commercial bank assets and liabilities—Domestic offices1
A. March 31,1980Millions of dollars, except for number of banks
Item
1 Total assets
2 Cash and due from depository institutions ,3 Currency and coin (U S and foreign)4 Balances with Federal Reserve Banks5 Balances with other central banks6 Demand balances with commercial banks in United States7 All other balances with depository institutions in United States
and with banks in foreign countries8 Cash items in process of collection
9 Total securities) loans, and lease financing receivables
10 Total securities book value11 U S Treasury12 Obligations of other U S government agencies and corporations13 Obligations of states and political subdivisions in United States14 All other securities . . .
15 Federal funds sold and securities purchased under agreements to resell
16 Total loans gross .17 LESS- Unearned income on loans18 Allowance for possible loan loss19 EQUALS- Loans, net
Total loans, gross, by category20 Real estate loans. . . . . . .21 Construction and land development22 Secured by farmland . . . . . . . . . . . .23 Secured by residential properties24 1- to 4-family25 Multifamily26 Secured by nonfarm nonresidential properties
27 Loans to financial institutions28 Loans for purchasing or carrying securities29 Loans to finance agricultural production and other loans to farmers30 Commercial and industrial loans
31 Loans to individuals for household, family, and other personal expenditures . ,32 Installment loans . . .33 Passenger automobiles34 Credit cards and related plans . . .35 Mobile homes36 All other installment loans for household, family, and other
personal expenditures37 Single-payment loans38 All other loans . . .
39 Lease financing receivables . , . . . . .40 Bank premises, furniture and fixtures, and other assets representing bank
premises41 Real estate owned other than bank premises42 All other assets
Insured
1,402,712
185,40115,32533,008
2148,258
10,71178,078
1,120,239
287,45687,10250,544
134,31015,501
58,216
794,02620,525
9,266764,235
248,60933,4238,516
145,386139,117
6,27061,284
41,41412,15730,476
259,785
183,316152,37166,78829,17910,633
45,77130,94618,269
10,332
23,1221,949
72,001
Member banks
Total
1,046,822
155,18011,25233,006
2130,960
5,24174,700
808,742
193,01455,56031,22193,28112,952
41,858
585,41913,6717,265
564,483
169,70925,469
3,644100,56796,1324,434
40,030
39,28611,19416,291
208,619
125,154104,97842,28325,689
7,387
29,61920,17615,166
9,387
16,2691,464
65,167
National
800,819
106,9518,872
24,86721
18,124
4,16550,903
630,802
150,53143,04224,92272,7729,795
31,431
458,73711,3635,560
441,815
139,40720,190
3,07483,50780,1443,363
32,637
25,0446,380
14,251159,106
103,51587,33635,32021,2926,650
24,07316,17911,034
7,025
13,3551,185
48,526
State
246,003
48,2292,3803,138
*12,836
1,07623,797
177,941
42,48312,5186,299
20,5093,157
10,428
126,6822,3081,705
122,668
30,3025,279
57017,06015,9881,0727,393
14,2424,8142,040
49,513
21,63917,6436,9644,397
737
5,5453,9974,132
2,361
2,914279
16,642
Non-memberinsured
355,890
30,2214,073
2*
17,298
5,4703,377
311,497
94,44231,54219,32341,028
2,549
16,358
208,6076,8542,001
199,752
78,9007,9554,872
44,82042,984
1,83521,254
2,127963
14,18651,166
58,16247,39324,5043,4903,245
16,15310,7703,103
945
6,853485
6,834
56Digitized for FRASER http://fraser.stlouisfed.org/ Federal Reserve Bank of St. Louis

19. Insured commercial bank assets and liabilities—Domestic offices1—ContinuedA. March 31, 1980-ContinuedMillions of dollars, except for number of banks
Item
43 Total liabilities and equity capital2
44 Total liabilities excluding subordinated debt
45 Total deposits46 Individuals partnerships and corporations47 US government . .48 States and political subdivisions in United States49 All other50 Certified and officers' checks, travelers' checks, and letters of credit
sold for cash . .
51 Demand deposits . . .52 Individuals partnerships and corporations53 U S, government . .54 States and political subdivisions in United States55 All other56 Certified and officers' checks, travelers' checks, and letters of credit
sold for cash
57 Time deposits58 Other individuals partnerships and corporations59 US government60 States and political subdivisions in United States61 All other . . . .
62 Savings deposits63 Corporations and other profit organizations64 Other individuals partnerships and corporations65 US government . .66 States and political subdivisions in United States67 All other
68 Federal funds purchased and securities sold under agreementsto repurchase . . .
69 Interest-bearing demand notes (note balances) issued to U.S. Treasuryand other liabilities for borrowed money
70 Mortgage indebtedness and liability for capitalized leases71 All other liabilities
72 Subordinated notes and debentures
73 Total equity capital2
MEMO74 Time deposits of $100 000 or more . . . .75 Certificates of deposit in denominations of
$100 000 or more76 Other77 Savings deposits authorized for automatic transfer and NOW accounts78 Money market time certificates of $10,000 and less than $100,000 with
original maturities of 26 weeks . . . .79 Demand deposits adjusted3
80 Standby letters of credit
Average for 30 calendar days (or calendar month) ending with report date81 Total deposits
82 Number of banks
Insured
1,402,712
1,297,209
1,081,136907,331
2,87182,24473,088
15,601
401,728307,838
1,96616,32359,999
15,601
482,667406,187
84162,58513,053
196,7418,713
184,59264
3,33636
110,087
24,9002,105
78,981
5,785
99,719
218,738
192,66726,07114,016
143,643273,455
29,395
1,051,373
14,382
Member banks
Total
1,046,822
970,361
770,472634,209
2,08052,06369,962
12,158
308,351225,596
1,44510,93558,216
12,158
330,125278,640
58539,18011,720
131,9955,653
124,32049
1,94825
101,381
23,6921,643
73,173
4,284
72,177
168,142
145,80122,34110,605
88,919185,573
27,676
743,987
5,415
National
800,819
741,896
595,379504,937
1,63442,99438,626
7,187
222,271174,887
1,1588,905
30,133
7,187
266,495225,028
42832,567
8,471
106,6134,548
100,47447
1,52222
76,546
14,9061,342
53,723
3,033
55,890
131,497
112,73118,7678,084
74,559145,579
18,323
577,534
4,437
State
246,003
228,465
175,093129,272
4469,068
31,336
4,971
86,08050,708
2872,030
28,083
4,971
63,63153,612
1576,6123,249
25,3821,105
23,846
4263
24,835
8,786301
19,450
1,251
16,287
36,645
33,0713,5742,521
14,36039,994
9,354
166,452
978
Non-memberinsured
355,890
326,848
310,664273,122
79130,182
3,126
3,443
93,37782,242
5215,3881,782
3,443
152,541127,547
25623,405
1,333
64,7463,060
60,27314
1,38811
8,706
1,208461
5,808
1,500
27,542
50,596
46,8663,7303,410
54,72487,882
1,719
307,386
8,967
57Digitized for FRASER http://fraser.stlouisfed.org/ Federal Reserve Bank of St. Louis

19. Insured commercial bank assets and liabilities—Domestic offices1—ContinuedB. June 30,1980Millions of dollars, except for number of banks
Item
1 Total assets
2 Cash and due from depository institutions3 Currency and coin (U S. and foreign)4 Balances with Federal Reserve Banks5 Balances with other central banks. .6 Demand balances with commercial banks in United States7 All other balances with depository institutions in United States and with
banks in foreign countries8 Cash items in process of collection. . . .
9 Total securities, loans, and lease financing receivables
10 Total securities, book value11 U S Treasury12 Obligations of other U S government agencies and corporations13 Obligations of states and political subdivisions in United States14 All other securities
15 Federal funds sold and securities purchased under agreements to resell. .
16 Total loans gross17 LESS' Unearned income on loans18 Allowance for possible loan loss19 EQUALS- Loans net.
Total loans, gross, by category20 Real estate loans21 Construction and land development22 Secured by farmland23 Secured by residential properties24 l-to4-family25 Multifamily . .26 Secured by nonfarm nonresidential properties
27 Loans to financial institutions . . .28 Loans for purchasing or carrying securities29 Loans to finance agricultural production and other loans to farmers30 Commercial and industrial loans
3 1 Loans to individuals for household, family, and other personal expenditures . .32 Installment loans . .33 Passenger automobiles34 Credit cards and related plans. .35 Mobile homes36 All other installment loans for household, family, and other personal
expenditures .37 Single-payment loans38 All other loans
39 Lease financing receivables40 Bank premises, furniture and fixtures, and other assets representing bank
premises41 Real estate owned other than bank premises42 All other assets
Insured
1,429,203
196,70416,02535,695
1253,033
12,37179,568
1,126,975
296,30690,63953,559
137,30214,807
63,920
785,62920,183
9,437756,008
250,74333,952
8,432146,438140,109
6,33061,920
37,74512,11531,060
257,168
177,741147,81764,16028,26510,597
44,79529,92419,056
10,741
23,8262,028
79,670
Member banks
Total
1,066,631
164,37411,78135,663
1234,091
6,61476,213
811,830
199,28058,91233,10395,13212,132
46,114
577,52413,4487,414
556,661
171,45926,054
3,619101,35296,8754,477
40,434
35,69411,03016,578
205,669
121,194101,74340,63424,852
7,331
28,92619,45115,900
9,776
16,6941,515
72,217
National
815,724
110,1979,283
25,96712
19,907
5,20349,825
637,470
154,69545,37826,54074,1688,609
37,196
455,10811,1895,653
438,267
140,94120,618
3,05484,30280,880
3,42232,966
23,2796,910
14,489158,104
100,24084,59233,91220,541
6,600
23,54015,64811,145
7,312
13,7121,211
53,133
State
250,907
54,1762,4979,696
*14,184
1,41126,388
174,360
44,58413,5346,563
20,9643,523
8,918
122,4152,2601,762
118,394
30,5185,436
56517,05015,996
1,0547,468
12,4144,1212,089
47,565
20,95417,1516,7224,312
732
5,3863,8024,755
2,464
2,982304
19,084
Non-memberinsured
362,572
32,3304,244
32*
18,943
5,7573,354
315,145
97,02731,72720,45642,170
2,675
17,806
208,1056,7352,023
199,347
79,2847,8984,813
45,08643,233
1,85321,486
2,0521,085
14,48251,499
56,54746,07323,527
3,4133,265
15,86910,4743,156
965
7,131513
7,453
58Digitized for FRASER http://fraser.stlouisfed.org/ Federal Reserve Bank of St. Louis

19. Insured commercial bank assets and liabilities—Domestic offices1—ContinuedB. June 30,1980-ContinuedMillions of dollars, except for number of banks
Item
43 Total liabilities and equity capital2
44 Total liabilities excluding subordinated debt
45 Total deposits . . .46 Individuals partnerships and corporations . . .47 U S government . . .48 States and political subdivisions in United States49 AH other50 Certified and officers' checks, travelers' checks, and letters of credit
sold for cash . . .
51 Demand deposits52 Individuals partnerships and corporations53 U S government .54 States and political subdivisions in United States . . .55 All other , .56 Certified and officers' checks, travelers' checks, and letters of credit
sold for cash
57 Time deposits . . .58 Other individuals partnerships and corporations59 U S government60 States and political subdivisions in United States . . .61 All other
62 Savings deposits . . .63 Corporations and other profit organizations64 Other individuals partnerships and corporations . . .65 US government . . .66 States and political subdivisions in United States67 AH other
68 Federal funds purchased and securities sold under agreements to repurchase. .69 Interest-bearing demand notes (note balances) issued to U.S. Treasury
and other liabilities for borrowed money70 Mortgage indebtedness and liability for capitalized leases . . . .71 All other liabilities
72 Subordinated notes and debentures . . .73 Total equity capital2 .
MEMO74 Time deposits of $100 000 or more75 Certificates of deposit in denominations of $100 000 or more . .76 Other '77 Savings deposits authorized for automatic transfer and NOW accounts . . .78 Money market time certificates of $10,000 and less than $100,000
with original maturities of 26 weeks . . .79 Demand deposits adjusted-* . . .
80 Standby letters of credit
Average for 30 calendar days (or calendar month) ending with report date81 Total deposits . . .
82 Number of banks
Insured
1,429,203
1,320,698
1,100,989923,658
2,93679,81478,339
16,243
414,843314,370
2,17817,66864,384
16,243
486,133413,160
67758,38813,907
200,0139,469
186,65980
3,75848
123,081
25,7402,109
68,779
6,257102,248
212,710187,03625,67415,490
153,368281,571
31,897
1,061,614
14.395
Member banks
Total
1,066,631
987,972
785,705646,333
2,03549,82474,855
12,657
319,647231,356
1,53011,84162,262
12,657
331,779283,073
44035,70912,557
134,2796,156
125,74865
2,27436
113,940
23,9351,629
62,763
4,76073,899
163,406141,60121,80511,748
95,411192,251
30,037
750,820
5.407
National
815,724
755,000
604,479512,711
1,62941,44341,307
7,389
228,205177,614
1,2529,654
32,295
7,389
267,959228,637
31530,030
8,978
108,3144,941
101,51962
1,75934
86,546
15,4321,328
47,215
3,54857,176
127,622109,181
18,4418,973
80,016150,526
19,370
581,528
4,426
State
250,907
232,972
181,226133,622
4068,381
33,549
5,268
91,44253,742-
2782,187
29,967
5,268
63,82054,436
1255,6793,579
25,9651,215
24,2303
5153
27,394
8,503301
15,548
1,21216,724
35,78432,420
3,3632,776
15,39541,726
10,667
169,292
981
Non-memberinsured
362,572
332,726
315,284277,325
90129,9903,483
3,585
95,19683,014
6485,8272,122
3,585
154,354130,087
23722,679
1,350
65,7343,313
60,91015
1,48411
9,141
1,805480
6,016
1,49828,348
49,30445,435
3,8693,742
57,95789,320
1,860
310,795
8.988
59Digitized for FRASER http://fraser.stlouisfed.org/ Federal Reserve Bank of St. Louis

19. Insured commercial bank assets and liabilities—Domestic offices1—ContinuedC. September 30,1980Millions of dollars, except for number of banks
Item
1 Total assets
2 Cash and due from depository institutions3 Currency and coin (U S and foreign) . . . .4 Balances with Federal Reserve Banks5 Balances with other central banks ,6 Demand balances with commercial banks in United States7 All other balances with depository institutions in United States and
with banks in foreign countries . . .8 Cash items in process of collection. ,
9 Total securities, loans, and lease financing receivables . .
10 Total securities book value11 U S Treasury12 Obligations of other U S government agencies and corporations13 Obligations of states and political subdivisions in United States14 All other securities
15 Federal funds sold and securities purchased under agreements to resell
16 Total loans gross17 LESS- Unearned income on loans. . .18 Allowance for possible loan loss19 EQUALS- Loans net
Total loans, gross, by category20 Real estate loans21 Construction and land development22 Secured by farmland23 Secured by residential properties24 1- to 4-family25 Multifamily26 Secured by nonfarm nonresidential properties
27 Loans to financial institutions . . .28 Loans for purchasing or carrying securities29 Loans to finance agricultural production and other loans to farmers , .30 Commercial and industrial loans
31 Loans to individuals for household, family, and other personal expenditures . .32 Installment loans33 Passenger automobiles34 Credit cards and related plans35 Mobile homes36 All other installment loans for household, family, and other personal
expenditures37 Single-payment loans38 All other loans
39 Lease financing receivables40 Bank premises, furniture and fixtures, and other assets representing
bank premises41 Real estate owned other than bank premises42 All other assets
Insured
1,462,137
187,02117,29429,923
6448,600
13,60777,533
1,161,877
309,77297,52355,488
142,45214,309
69,013
801,39519,7879,593
772,015
255,76535,188
8,493149,439142,917
6,52362,644
40,46610,34531,581
265,518
178,621147,61763,11128,45010,507
45,54831,00419,098
11,077
24,5472,051
86,641
Member banks
Total
1,089,335
156,71612,80029,647
6431,708
7,72674,771
835,324
207,18463,08933,84698,67611,573
48,747
589,77312,9177,555
569,301
175,40327,2833,672
103,58498,9174,668
40,864
38,0339,412
17,003212,685
121,465101,23039,75325,0017,219
29,25620,23515,773
10,093
17,1391,504
78,652
National
833,801
107,41610,16322,237
6419,025
6,17649,750
654,103
160,54948,32727,37576,650
8,197
39,103
463,26310,5565,763
446,944
144,06021,396
3,09086,18582,693
3,49233,389
24,3845,762
14,756162,697
100,29484,05133,10120,6146,489
23,84816,24211,311
7,507
14,0871,191
57,003
State
255,534
49,3002,6367,410
*12,683
1,54925,021
181,221
46,63514,7626,471
22,0263,375
9,644
126,5092,3621,791
122,357
31,3435,887
58117,40016,2241,1767,475
13,6493,6502,247
49,988
21,17117,1796,6534,386
731
5,0493,9924,462
2,586
3,052313
21,649
Non-memberinsured
372,801
30,3054,494
276*
16,892
5,8812,762
326,553
102,58834,43421,64243,776
2,736
20,266
211,6236,8702,038
202,715
80,3627,9054,821
45,85544,000
1,85521,780
2,433934
14,57852,834
57,15746,38723,3583,4493,288
16,29210,7703,325
984
7,407547
7,989
60Digitized for FRASER http://fraser.stlouisfed.org/ Federal Reserve Bank of St. Louis

19. Insured commercial bank assets and liabilities—Domestic offices1—ContinuedC. September 30,1980-ContinuedMillions of dollars, except for number of banks
Item
43 Total liabilities and equity capital2
44 Total liabilities excluding subordinated debt
45 Total deposits46 Individuals partnerships and corporations47 U.S. government. .48 States and political subdivisions in United States49 All other . . . .50 Certified and officers' checks, travelers' checks, and letters of credit
sold for cash. . . . . .
51 Demand deposits . . . . . . . . . . . . . .52 Individuals, partnerships, and corporations53 U S government54 States and political subdivisions in United States55 All other . . . . .56 Certified and officers' checks, travelers' checks, and letters of credit
sold for cash . .
57 Time deposits . . . . . . . . . .58 Other individuals, partnerships and corporations59 U.S. government. . . . . . . . .60 States and political subdivisions in United States61 All other
62 Savings deposits63 Corporations and other profit organizations64 Other individuals partnerships and corporations65 U.S. government66 States and political subdivisions in United States67 All other
68 Federal funds purchased and securities sold under agreements to repurchase. .69 Interest-bearing demand notes (note balances) issued to U.S. Treasury
and other liabilities for borrowed money70 Mortgage indebtedness and liability for capitalized leases71 All other liabilities
72 Subordinated notes and debentures
73 Total equity capital2. . .
MEMO74 Time deposits of $100 000 or more75 Certificates of deposit in denominations of $100 000 or more76 Other . . . . . . . . . . . . .77 Savings deposits authorized for automatic transfers and NOW accounts78 Money market time certificates of $10,000 and less than $100,000
with original maturities of 26 weeks79 Demand deposits adjusted3
80 Standby letters of credit
Average for 30 calendar days (or calendar month) ending with report date81 Total deposits
82 Number of banks
Insured
1,462,137
1,350,738
1,114,575944,602
2,95277,45573,790
15,776
409,783315,591
2,14816,63159,637
15,776
493,303421,220
71357,26214,108
211,48910,765
197,02690
3,56345
133,437
33,4342,128
67,164
6,267
105,132
219,730200,678
19,05219,025
150,599281,831
34,464
1,091,095
14,415
Member banks
Total
1,089,335
1,008,832
790,452657,211
2,13348,43470,614
12,059
311,900229,300
1,58311,21957,739
12,059
337,157288,674
47935,16112,842
141,3956,922
132,31571
2,05433
124,344
31,0401,617
61,379
4,728
75,776
169,337153,97215,36514,122
93,383188,850
32,261
770,059
5,411
National
833,801
771,631
610,770521,782
1,64539,92139,975
7,446
225,326176,448
1,2649,071
31,097
7,446
271,333232,918
31329,2548,848
114,1115,584
106,83267
1,59630
93,503
20,8351,313
45,210
3,511
58,659
131,678119,66412,01410,968
78,280148,009
22,091
598,063
4,425
State
255,534
237,201
179,682135,429
4888,513
30,639
4,613
86,57552,852
3192,149
26,642
4,613
65,82355,756
1665,9073,995
27,2841,338
25,4834
4572
30,841
10,205305
16,168
1,217
17,117
37,65934,3093,3513,154
15,10340,840
10,171
171,996
986
Non-memberinsured
372,801
341,906
324,123287,391
81829,021
3,176
3,717
97,88386,291
5655,4121,898
3,717
156,146132,546
23422,101
1,266
70,0943,843
64,71119
1,50912
9,093
2,394511
5,785
1,539
29,356
50,39246,706
3,6874,904
57,21692,982
2,203
321,036
9,004
61Digitized for FRASER http://fraser.stlouisfed.org/ Federal Reserve Bank of St. Louis

19. Insured commercial bank assets and liabilities—Domestic offices1—ContinuedD. December 31,1980Millions of dollars, except for number of banks
Item
I Total assets
2 Cash and due from depository institutions . . . .3 Currency and coin (U S and foreign)4 Balances with Federal Reserve Banks5 Balances with other central banks6 Demand balances with commercial banks in United States7 All other balances with depository institutions in United States and
with banks in foreign countries8 Cash items in process of collection . . . .
9 Total securities, loans, and lease financing receivables . . . .
10 Total securities book value11 US Treasury12 Obligations of other U.S. government agencies and corporations13 Obligations of states and political subdivisions in United States14 All other securities
15 Federal funds sold and securities purchased under agreements to resell
16 Total loans, gross17 LESS Unearned income on loans18 Allowance for possible loan loss19 EQUALS- Loans net
Total loans, gross, by category20 Real estate loans21 Construction and land development22 Secured by farmland23 Secured by residential properties24 1- to 4-family25 Multifamily26 Secured by nonfarm nonresidential properties
27 Loans to financial institutions28 Loans for purchasing or carrying securities29 Loans to finance agricultural production and other loans to farmers30 Commercial and industrial loans .
31 Loans to individuals for household, family, and other personal expenditures . .32 Installment loans . . .33 Passenger automobiles34 Credit cards and related plans35 Mobile homes36 All other installment loans for household, family, and other
personal expenditures37 Single-payment loans38 All other loans
39 Lease financing receivables40 Bank premises, furniture and fixtures, and other assets
representing bank premises41 Real estate owned other than bank premises . . .42 All other assets
Insured
1,525,565
199,10819,79129,972
5949,096
19,48780,703
1,208,686
322,340103,46058,805
144,85615,219
69,853
833,82719,2139,766
804,848
261,40636,416
8,545152,727146,260
6,46763,719
46,10312,43131,539
280,645
179,945146,80061,47029,69810,336
45,29633,14521,757
11,644
25,3442,047
90,380
Member banks
Total
1,135,649
163,60114,68829,775
5930,781
11,21077,088
871,118
214,66666,57235,220
100,46512,409
50,216
615,79912,4957,662
595,643
179,59328,234
3,747106,047101,416
4,63141,565
42,86511,33817,004
224,265
122,529100,90938,67526,134
7,104
28,99521,62018,205
10,593
17,6351,479
81,816
National
868,450
114,70211,71723,871
5818,861
8,99851,197
678,990
167,52751,19628,73178,281
9,319
39,009
480,47110,0635,843
464,566
147,55122,179
3,16188,36184,783
3,57833,850
27,1926,285
14,729171,081
101,14683,72432,14621,506
6,393
23,67817,42212,487
7,889
14,4711,188
59,099
State
267,199
48,8992,9715,904
11,920
2,21225,891
192,128
47,14015,3766,489
22,1853,090
11,207
135,3282,4321,819
131,077
32,0426,055
58617,68616,633
1,0537,714
15,6735,0542,275
53,184
21,38317,1866,5304,628
711
5,3174,1985,717
2,704
3,164291
22,718
Non-memberinsured
389,916
35,5085,103
1980
18,315
8,2773,615
337,568
107,67436,88823,58644,390
2,810
19,637
218,0286,7182,104
209,206
81,8148,1824,797
46,68044,844
1,83622,154
3,2381,093
14,53656,380
57,41645,89122,794
3,5633,232
16,30211,5253,553
1,051
7,709568
8,564
62Digitized for FRASER http://fraser.stlouisfed.org/ Federal Reserve Bank of St. Louis

19. Insured commercial bank assets and liabilities—Domestic offices1—ContinuedD. December 31,1980-ContinuedMillions of dollars, except for number of banks
Item
43 Total liabilities and equity capital2
44 Total liabilities excluding subordinated debt
45 Total deposits .46 Individuals partnerships and corporations47 U S government48 States and political subdivisions in United States49 All other50 Certified and officers' checks, travelers' checks, and letters of credit
sold for cash
51 Demand deposits52 Individuals partnerships and corporations53 U S government .54 States arid political subdivisions in United States . . . .55 All other56 Certified and officers' checks, travelers' checks, and letters of credit
sold for cash
57 Time deposits .58 Other individuals partnerships and corporations59 US government60 States and political subdivisions in United States61 All other
62 Savings deposits63 Corporations and other profit organizations64 Other individuals partnerships and corporations65 US government66 States and political subdivisions in United States67 All other
68 Federal funds purchased and securities sold under agreement to repurchase . .69 Interest-bearing demand notes (note balances) issued to U.S. Treasury and
other liabilities for borrowed money70 Mortgage indebtedness and liability for capitalized leases71 All other liabilities
72 Subordinated notes and debentures
73 Total equity capital2
MEMO74 Time deposits of $100 000 or more75 Certificates of deposit in denominations of $ 100 000 or more76 Other77 Savings deposits authorized for automatic transfer and NOW accounts78 Money market time certificates of $10,000 and less than $100,000 with
original maturities of 26 weeks79 Demand deposits adjusted3
80 Standby letters of credit
Average for 30 calendar days (or calendar month) ending with report date81 Total deposits
82 Number of banks
Insured
1,525,565
1,412,195
1,181,3971,003,205
3,23380,35978,234
16,366
429,969332,607
2,43618,15260,409
16,366
551,761474,466
72158,79217,782
199,6679,911
186,22276
3,41543
131,612
27,3992,207
69,580
6,183
107,187
253,912234,476
19,43522,036
178,191299,000
37,199
1,142,039
14,421
Member banks
Total
1,135,649
1,053,819
842,247702,441
2,31350,5-2074,713
12,260
327,364242,882
1,76912,09858,355
12,260
380,899327,648
48836,43616,327
133,9856,336
125,57457
1,98631
121,225
25,3711,660
63,316
4,614
77,216
198,150182,247
15,90316,221
110,596202,321
34,757
809,853
5,421
National
868,450
805,259
651,065555,085
1,79241,85544,274
8,059
237,322185,597
1,42110,02032,226
8,059
305,571262,918
31730,31612,019
108,1725,136
101,43454
1,51929
91,015
15,2201,354
46,606
3,392
59,799
153,245141,213
12,03212,858
92,474157,584
23,344
626,307
4,424
State
267,199
248,560
191,183147,356
5218,665
30,439
4,201 .
90,04157,286
3472,078
26,130
4,201
75,32864,730
1716,1204,308
25,8131,200
24,1403
4672
30,210
10,151306
16,710
1,222
17,417
44,90541,035
3,8713,363
18,10244,737
11,413
183,546
997
Non-memberinsured
389,916
358,377
339,150300,764
92029,839
3,521
4,106
102,60689,725
6676,0542,053
4,106
170,862146,818
23322,356
1,455
65,6823,574
60,64719
1,42912
10,387
2,028547
6,265
1,569
29,971
55,76152,229
3,5325,815
67,59596,680
2,441
332,185
9,000
63Digitized for FRASER http://fraser.stlouisfed.org/ Federal Reserve Bank of St. Louis
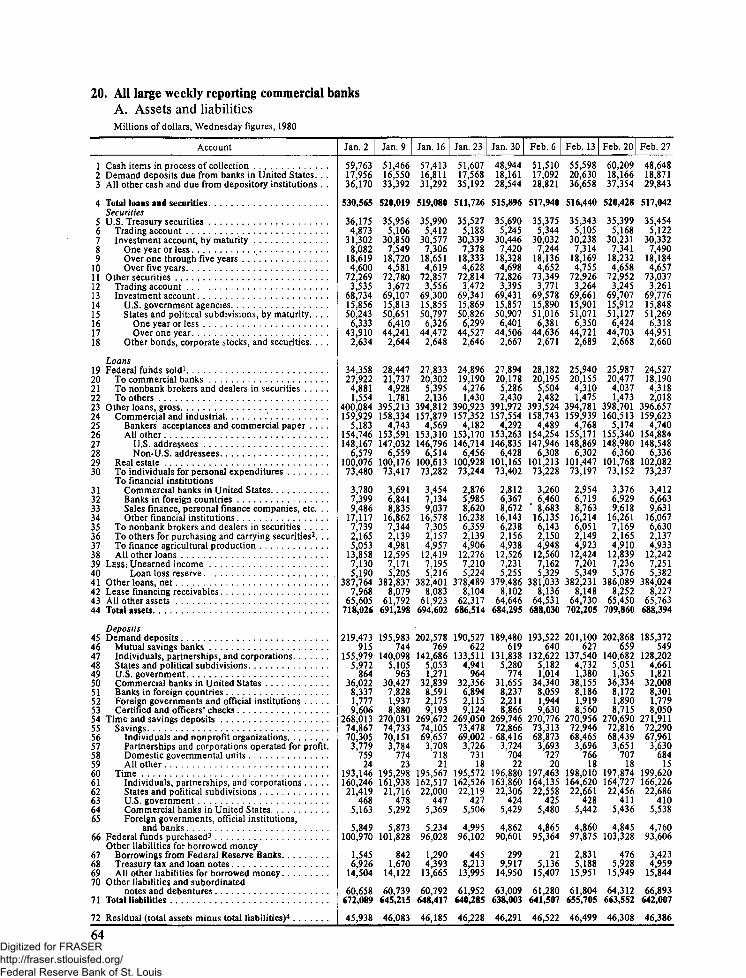
20. All large weekly reporting commercial banksA, Assets and liabilitiesMillions of dollars, Wednesday figures, 1980
Account
1 Cash items in process of collection . . ,2 Demand deposits due from banks in United States. . .3 All other cash and due from depository institutions . .
4 Total loans and securitiesSecurities
5 U S Treasury securities6 Trading account .7 Investment account by maturity8 One year or less9 Over one through five years
10 Over five years1 1 Other securities12 Trading account .13 Investment account14 US government agencies . . . .15 States and political subdivisions, by maturity. . . .16 One year or less17 Over one year18 Other bonds, corporate stocks, and securities. . . .
Loans19 Federal funds sold1 . . . .20 To commercial banks21 To nonbank brokers and dealers in securities22 To others . . .23 Other loans gross .24 Commercial and industrial25 Bankers acceptances and commercial paper . . . .26 All other27 US addressees28 Non-U S addressees29 Real estate . .30 To individuals for personal expenditures
To financial institutions31 Commercial banks in United States32 Banks in foreign countries33 Sales finance, personal finance companies, etc. . .34 Other financial institutions35 To nonbank brokers and dealers in securities36 To others for purchasing and carrying securities2. . .37 To finance agricultural production .38 All other loans39 LESS Unearned income . . . . . , ,40 Loan loss reserve41 Other loans, net ,42 Lease financing receivables43 All other assets44 Total assets. . .
Deposits45 Demand deposits46 Mutual savings banks .47 Individuals partnerships and corporations48 States and political subdivisions49 U S government50 Commercial banks in United States51 Banks in foreign countries52 Foreign governments and official institutions53 Certified and officers' checks54 Time and savings deposits55 Savings. . . . , ,56 Individuals and nonprofit organizations57 Partnerships and corporations operated for profit.58 Domestic governmental units59 All other . .60 Time61 Individuals partnerships and corporations . . . . .62 States and political subdivisions63 U.S. government64 Commercial banks in United States65 Foreign governments, official institutions,
and banks66 Federal funds purchased^
Other liabilities for borrowed money67 Borrowings from Federal Reserve Banks68 Treasury tax and loan notes69 All other liabilities for borrowed money70 Other liabilities and subordinated
notes and debentures71 Total liabilities
72 Residual (total assets minus total liabilities)4
Jan. 2
59,76317,95636,170
530,565
36 1754,873
31 3028,082
18 6194,600
72,2693,535
6873415,85650,243
633343,910
2,634
34,35827,922
4,8811,554
400,084159,929
5,183154 746148,167
6579100,07673,480
3,78073999,486
17,1177,7392,1655,053
13 8587,1305,190
387,7647,968
65,605718,026
219473915
155 9795,972
86436022
8,3371,7779,606
268,01374,86770,305
3,779759
24193,146160,24621 419
4685,163
5,849100,970
1,5456,926
14,504
60,658672,089
45,938
Jan. 9
51,46616,55033,392
520,019
35,9565,106
30,8507,549
18 7204,581
72,7803,672
69 10715,81350,651
6,41044,241
2,644
28,44721,737
4,9281,781
395,213158,334
4,743153,591147,032
6,559100,17673,417
3,69168418,835
16,8627,3442,1394,981
12,5957,1715,205
382,8378,079
61,792691,298
195,983744
140,0985,105
96330,427
7,8281,9378,880
270,03174,73370,151
3,784774
23195,298161,93821,716
4785,292
5,873101,828
8421,670
14,122
60,739645,215
46,083
Jan. 16
57,41316,81131,292
519,080
359905,412
305777,306
18 6514,619
72,8573,556
6930015,85550,797
632644,472
2,648
27,83320,302
5,3952,136
394,812157,879
4,569153 310146,796
6514100,61373,282
3,4547 1349,037
16,5787,3052,1574,957
124197,1955 216
382,4018083
61,923694,602
202 578769
142 6865,0531 271
32 8398,5912,1759,193
269,67274,10569657
3,70871821
195,567162,51722 000
4475,369
523496028
1,2904,393
13,665
60,792648,417
46,185
Jan. 23
51,60717,56835,192
511,726
35,5275,188
30,3397,378
18 3334,628
72,8143,472
6934115,86950,826
6,29944,527
2,646
24,89619,1904,2761,430
390,923157,352
4,182153,170146,714
6,456100,92873,244
2,87659858,620
16,2386,3592,1394,906
122767,2105,224
378,4898,104
62,317686,514
190 527622
133,5114,941
96432356
6,8942,1159,124
269,05073,47869,002
3,726731
18195,572162,52622 119
4275,506
4,99596,102
4458,213
13,995
61,952640,285
46,228
Jan. 30
48,94418,16128,544
515,896
35,6905,245
30,4467,420
18,3284,698
72,8263,395
6943115,85750,907
6,40144,506
2,667
27,89420,178
5,2862,430
391,972157,554
4,292153,263146,835
6,428101,16573,402
2,8126,3678,672
16,1436,2382,1564,938
12,5267,2315,255
379,4868,102
64,646684,295
189,480619
131,8385,280
77431,655
8,2372,2118,866
269,74672,86668,416
3,724704
22196,880163,86022,306
4245,429
4,86290,601
2999,917
14,950
63,009638,003
46,291
Feb. 6
51,51017,09228,821
517,940
35,3755,344
30,0327,244
18,1364,652
73,3493,771
69,57815,89051,016
6,38144,636
2,671
28,18220,195
5,5042,482
393,524158,743
4,489154,254147,946
6,308101,21373,228
3,2606,460
' 8,68316,1356,1432,1504,948
12,5607,1625,329
381,0338,136
64,531688,030
193,522640
132,6225,1821,014
34,3408,0591,9449,630
270,77673,31368,8733,693
12120
197,463164,13522,558
4255,480
4,86595,364
215,136
15,407
61,280641,507
46,522
Feb. 13
55,59820,63036,658
516,440
35,3435,105
30,2387,314
18,1694,755
72,9263,264
69,66115,90151,071
6,35044,721
2,689
25,94020,1554,3101,475
394,781159,939
4,768155,171148,869
6,302101,44773,197
2,9546,7198,763
16,2146,0512,1494,923
12,4247,2015,349
382,2318,148
64,730702,205
201,100627
137,5404,7321,380
38,1558,1861,9198,560
270,95672,94668,465
3,696766
18198,010164,62022,661
4285,442
4,86097,875
2,8315,188
15,951
61,804655,705
46,499
Feb. 20
60,20918,16637,354
520,428
35,3995,168
30,2317,341
18,2324,658
72,9523,245
69,70715,91251,127
6,42444,703
2,668
25,98720,477
4,0371,473
398,701160,513
5,174155,340148,980
6,360101,76873,152
3,3766,9299,618
16,2617,1692,1654,910
12,8397,2365,376
386,0898,252
65,450709,860
202,868659
140,6825,0511,365
36,3348,1721,8908,715
270,69072,81668,439
3,651707
18197,874164,72722,456
4115,436
4,845103,328
4765,928
15,949
64,312663,552
46,308
Feb. 27
48,64818,87129,843
517,042
35,4545,122
30,3327,490
18,1844,657
73,0373,261
69,77615,84851,269
6,31844,951
2,660
24,52718,1904,3182,018
396,657159,623
4,740154,884148,548
6,336102,08273,237
3,4126,6639,631
16,0676,6302,1374,933
12,2427,2515,382
384,0248,227
65,763688,394
185,372549
128,2024,6611,821
32,0088,3011,7798,050
271,91172,29067,961
3,630684
15199,620166,22622,686
4105,538
4,76093,606
3,4234,959
15,844
66,893642,007
46,386
64Digitized for FRASER http://fraser.stlouisfed.org/ Federal Reserve Bank of St. Louis

20. All large weekly reporting commercial banks—ContinuedA. Assets and liabilities-ContinuedMillions of dollars, Wednesday figures, 1980
Account
1 Cash items in process of collection . .2 Demand deposits due from banks in United States. . .3 All other cash and due from depository institutions . .
4 Total loans find securitiesSecurities
5 U S Treasury securities6 Trading account . . . . .7 Investment account by maturity8 One year or less .9 Over one through five years
10 Over five years.11 Other securities12 Trading account . .13 Investment accountH U S government agencies15 States and political subdivisions, by maturity. . . .16 One year or less '17 Over one year18 Other bonds, corporate stocks, and securities. . . .
Loans19 Federal funds sold1 . . . . . . . .20 To commercial banks21 To nonbank brokers and dealers in securities22 To others23 Other loans gross. . .24 Commercial and industrial25 Bankers acceptances and commercial paper . . . .26 All other27 US addressees -28 Non-U S addressees29 Real estate30 To individuals for personal expenditures
To financial institutions31 Commercial banks in United States .32 Banks in foreign countries33 Sales finance, personal finance companies, etc. . .34 Other financial institutions35 To nonbank brokers and dealers in securities36 To others for purchasing and carrying securities2. . .37 To finance agricultural production38 All other loans . . .39 LESS- Unearned income40 Loan loss reserve41 Other loans net . .42 Lease financing receivables43 All other assets . . . .44 Total assets
Deposits45 Demand deposits . . .46 Mutual savings banks47 Individuals, partnerships, and corporations48 States and political subdivisions49 U.S. government50 Commercial banks in United States51 Banks in foreign countries52 Foreign governments and official institutions53 Certified and officers' checks . . .54 Time and savings deposits55 Savings56 Individuals and nonproft organizations57 Partnerships and corporations operated for profit.58 Domestic governmental units59 All other . . . . . . . . . . .60 Time . . .61 Individuals, partnerships, and corporations62 States and political subdivisions63 U.S. government64 Commercial banks in United States65 Foreign governments, official institutions,
and banks
Other liabilities for borrowed money67 Borrowings from Federal Reserve Banks68 Treasury tax and loan notes69 All other liabilities for borrowed money70 Other liabilities and subordinated
notes and debentures . ,71 Total liabilities
72 Residual (total assets minus total liabilities)4
Mar. 5
54 15417,71730,046
523,326
37 2347082
30 1537,278
18,1864,689
730403,142
6989815,86851,369
6,54344 826
2,660
25 98019 1504,8961 934
399,688160 445
4,644155 802149,406
6396102,23273252
3 1677,030
10,39516,4106,9252,1614,942
127297 1985,419
3870718 265
67,439700,948
196,166641
133,2664 6853,258
34,4229,07020328 793
273 84772,51068,238
3,589668
14201 338167,92022 558
4075,610
4843
1,4901,645
113,886
67 388654,423
46,525
Mar. 12
51 06417,99527,697
519,715
35 9515,761
30 1907,400
18,1424,648
740114,005
7000615,84951,503
6,56144 9422,654
24,337175014,3222 514
398,081161 280
4,044157236150,890
6346102,67873006
3 2876,5729,459
16,4016,0932,1664,991
12,14672325,434
385,4168 281
67,060691,812
190,856601
134,53243631,937
30,9418,9891,5887904
274 15671,83667,655
3,531633
17202,319168,71122 695
3735,818
4,722
1,987274
110,300
67 650645,223
46,588
Mar. 19
53 57718,48027,023
520,184
344834,978
295056,753
18,1124,639
732013,184
70 01615,84051,552
6,52145030
2,625
25 302194873,9581 857
399,914162 000
3,925158 075151,787
6288103,01873 173
3 7286,6558,985
16,1846,5422,1465,006
12,47672855,430
387,1988 307
66,283693,854
194,565654
131,72449203,048
35,3649,2581 6717926
275 64971,29467,216
3,433631
14204 355170,629
22 694374
5,969
4,689
1,7411,764
106,281
67 398647,397
46,457
Mar. 26
49,84517,86533,998
514,588
35 1285,502
296266,935
18,0504,642
728382,795
7004315,77251,664
6,52645 1382,606
20,973169452,9171,111
398,379161,018
3,547157,471151,041
6,430103,28473,075
3,6026,4979,620
16,2375,8752,1395,017
12,0147,3265,404
385,6498,357
65,533690,186
183,742561
127,7944,5001,734
31,6948,2321,9587,269
275 91571,21467,1573,435
61011
204,702170,75822635
3766,097
4,836
3,3986,098
104,941
69,496643,590
46,596
Apr. 2
55,31219,10729,457
523,600
34,6645,287
29,3776,941
17,8824,554
72,0262,651
69,37515,68151,0926,040
45,0522,602
25,00519,4733,5791,953
404,533162,574
3,742158,833152,684
6,148103,36172,900
4,0986,771
10,57916,9317,0602,1265,008
13,1247,2515,377
391,9058,378
69,271705,126
201,657909
139,5444,760
97234,756
9,4221,9029,391
276,18771,21067,208
3,372620
10204,977171,84921,978
3705,984
4,795
1,139228
108,189
70,966658,366
46,760
Apr. 9
49,67919,42129,439
524,606
368077,470
293377,008
17,8054,525
727103,336
6937415,66451,126
6,146449792,584
27,419198764,3023 240
400,384162 048
3,789158,259152,102
6,156103,65772,607
3,7926,8709,572
16,8045,6462,0964,963
12,3307,3185,395
387,6718,340
68,419699,904
195,093712
134,9384,492
95534,891
8,9262,1467,973
277,98170,98166,985
3,387597
13207,000173,50821 973
3766,092
5,051
1,071220
110,707
67,987653,058
46,845
Apr. 16
53,85017,43133,182
521,005
36,6637,403
29,2607,007
17,7364,516
72,8993,114
69,78515,70851,504
6,26445,2402,573
24,83820,017
3,6701,150
399,386161,902
4,099157,803151,703
6,099103,94572,542
3,4796,2739,512
16,1556,4102,0875,009
12,0727,3675,414
386,6058,349
66,994700,812
198,113779
138,1514,9571,680
34,0978,2532,2087,987
277,30870,17466,289
3,258617
9207,134173,40521,836
3926,204
5,297
2,6914,615
104,908
66,500654,136
46,676
Apr. 23
49,63716,33132,811
517,470
350876,102
289856,909
17,4984,579
729952,946
7004915,75651,718
6,19945 519
2,575
24,77620584
3,0161,177
397,438160,837
3,885156,952150,834
6,118104,11772,470
3,1386,7219,061
16,0676,0062,0765,015
11,9307,4135,414
384,6118,388
68,081692,719
187,396644
131,5574,7781,687
31,5417,9051,7367,546
278,31069,24365,381
3,261591
10209,067175,18821,865
3736,286
5,355
1,8175,702
106,102
66,545645,873
46,846
Apr. 30
56,42220,85533,903
520,602
35,2815,921
29,3606,813
18,0664,481
74,5604,079
70,48115,91851,984
6,49745,4872,578
24,65520,608
3,0161,032
398,889160,895
4,354156,541150,396
6,146104,31872,221
3,5636,8318,972
16,0616,6782,0605,039
12,2527,3405,444
386,1058,471
69,849710,102
201,144761
134,3315,9752,424
37,5988,7452,8378,474
278,01168,45664,583
3,230632
10209,554176,01821,511
4026,322
5,301
3,59610,649
103,276
66,268662,944
47,158
65Digitized for FRASER http://fraser.stlouisfed.org/ Federal Reserve Bank of St. Louis

20. All large weekly reporting commercial banks—ContinuedA. Assets and liabilities-ContinuedMillions of dollars, Wednesday figures, 1980
Account
1 Cash items in process of collection2 Demand deposits due from banks in United States. . .3 All other cash and due from depository institutions . .
4 Total loans and securitiesSecurities
5 U S Treasury securities6 Trading account . . . .7 Investment account by maturity8 One year or less . . . .9 Over one through five years
10 Over five years . . . .11 Other securities12 Trading account . . . . .13 Investment account . .14 US government agencies . . . .15 States and political subdivisions, by maturity. . . .16 One year or less . . .17 Over one year18 Other bonds, corporate stocks, and securities. . . .
Loans19 Federal funds sold1
20 To commercial banks . . . . . .21 To nonbank brokers and dealers in securities22 To others . . .23 Other loans gross24 Commercial and industrial25 Bankers acceptances and commercial paper . . . .26 All other27 US addressees . . . . . . . .28 Non-U S addressees29 Real estate . . . . .30 To individuals for personal expenditures
To financial institutions31 Commercial banks in United States32 Banks in foreign countries33 Sales finance, personal finance companies, etc. . .34 Other financial institutions35 To nonbank brokers and dealers in securities .36 To others for purchasing and carrying securities2. . .37 To finance agricultural production . .38 All other loans39 LESS' Unearned income40 Loan loss reserve41 Other loans, net42 Lease financing receivables . . . . . .43 All other assets44 Total assets
Deposits45 Demand deposits46 Mutual savings banks . . . . . .47 Individuals partnerships and corporations48 States and political subdivisions49 U S government50 Commercial banks in United States51 Banks in foreign countries .52 Foreign governments and official institutions .53 Certified and officers' checks54 Time and savings deposits55 Savings56 Individuals and nonprofit organizations . . . .57 Partnerships and corporations operated for profit.58 Domestic governmental units59 All other60 Time61 Individuals partnerships, and corporations62 States and political subdivisions63 U.S. government64 Commercial banks in United States . .65 Foreign governments, official institutions,
and banks66 Federal funds purchased^
Other liabilities for borrowed money67 Borrowings from Federal Reserve Banks68 Treasury tax and loan notes . . . . . . . .69 All other liabilities for borrowed money . . .70 Other liabilities and subordinated
notes and debentures71 Total liabilities
72 Residual (total assets minus total liabilities)4
May?
49 87520,13631,959
516,857
343844,953
294306,502
18 3304 598
74,4363 737
70,69916 12851,975
652245,452
2,596
25,38520,9093 2561,220
395485159,766
4,597155 169149 148
6 021104 39871,819
3 5096,7418,750
15,8825 6222,0395 061
11,8987 3425491
382,6528,481
69594696,903
188,583111
128 1114,775
97434968
8 9112 3067 821
278,92668,72664823
3,278616
10210,200176,52121,647
3846295
5 352
7133,561
111 633
6 283649,700
47,202
May 14
5258617,20537,409
514,754
33 7494,600
29 1496,044
184884,616
76,0155,050
70,9641634952,021
6,50545,516
2,594
23,49519,8002 789
905394376158,842
4,728154 114148,158
5 956104,66171,533
34006,6278,636
15,32067242,0505063
11,5187,3615519
381,4968,524
71 326701,806
189,250637
130 9624,454
73432 885
8 6721 7789 127
279,12268,82964,865
3,320631
13210,293176,99121,404
3606 215
5 323
1,4872,392
116501
65 794654,548
47,258
May 21
47,65117,56533,098
514,938
354125,090
303226,015
195584,749
75,2514,273
70,97816,37452,026
6,27145,755
2,577
24,59521,131
2,572801
392 572157,514
4,616152 898147,063
5 835104,89471,290
3 3907,0238,396
15,21860672,0615,087
11,6317,3745 517
379,6808,527
71 643693,422
185,913563
125 8384,812
86334,589
9 6491,9637 636
278,74269,23065,219
3,380620
11209,512176,48321,228
3576 122
5 322
8104,312
110,143
66386646,306
47,116
May 28
5691918,66039,074
515,848
35 5684,813
307556,340
195564858
75,3713 831
71,5401657752,3856524
45,8612,578
25,11021 9082286
916392681157,553
4,910152 643146836
5807104 94771,153
34187,3568,566
14,93255622,0915060
12,04173585525
379,7988 540
71 348710,388
194,911680
132 40945811 811
3548999511 6168 374
278,73669,68665 546
3,492639
9209,050175,62321 045
3435 952
6086
2,2653086
120 568
63 600663,165
47,223
June 4
5368517,64133,903
519,227
374136,240
31 1736,437
20 1044,632
75,0683468
71,6001663252,4756540
45,9362,493
26,80022,676
3 348775
392 772158,266
5,519152 747146,993
5 754104,92170,942
3 6326,5338,432
14,77660342,0575012
12,0747,2415585
379,9458,583
74005707,043
196,122689
133 35947873580
33,7458 3781 557
10027278,177
70,79666595
3,532658
12207,381174,83220,370
3365 805
6038
221765
121 337
63 039659,663
47,380
June 11
51,33917,85532,363
516,434
374555,382
320726,453
207594,861
75,9154,108
71,80716,67252,6336623
46,0102,501
24,89820,369
3 681848
391 035157,398
5,186152 211146,391
5820105,01470,761
33356,3678,353
14,61967682,0705 102
11,2477,2625 607
378,1668,589
75 637702,219
191,550604
132 36744051,894
32,9708 7231 4619 125
278,39671,16266,842
3,641669
11207,233175,254
19,991307
5 718
5 962
315985
120 390
62 944654,580
47,638
June 18
53,88818,83433,803
517,866
36,3324,045
32,2876,151
21 1484,988
74,9953,218
71,77616,62752,616
6,55346,064
2,533
26,68822,162
3,667859
392,738158,179
5,056153 122147,346
5 777105,12670,707
3,6086,2088,376
14,55567882,0415 111
12,0397,2825606
379,8508,646
75 304708,340
195,094583
134 5474,6643,629
33,5587 9271 4268 759
277,89471,76067,374
3,641729
16206,135174,45619,703
2975 699
5 980
7587,240
117 994
61 973660,953
47,387
June 25
48,14217,93231,203
515,343
36,5454,194
32,3516,210
21,1165,024
75,3673,537
71,83016,56252,668
6,49246,175
2,601
23,61319,3053,459
848392,638158,083
5,063153021147,371
5650105,30270,793
39486,5138,183
14,3636,3592,0445,146
11,9037,2565,564
379,8198,663
75 120696,403
187,063546
129 3644,8052,466
32,4458 3371 4527 647
277,44671,87667,405
3,726731
14205,570174,123
19,546284
5 656
5 960
3369,142
113 557
61 444648,988
47,415
July 2
57,21018,68433,887
522,683
36,9654,098
32,8686,216
21,7374,914
75,6603,934
71,72516,50152,596
6,40646,190
2,628
26,91322,550
3,3231,040
395,837159,464
5,329154 135148,484
5 651105,29070,859
4,0627,4288,544
14,3995,8002,0785,190
12,7227,1735,518
383,1458,692
80327721,484
208,631769
141 9605,0081,061
39,6378,2321 959
10005276,789
73,37768,835
3,762764
16203,412172,887
18,764269
5519
5 973
3974,678
120 889
62 292673,676
47,807
66Digitized for FRASER http://fraser.stlouisfed.org/ Federal Reserve Bank of St. Louis
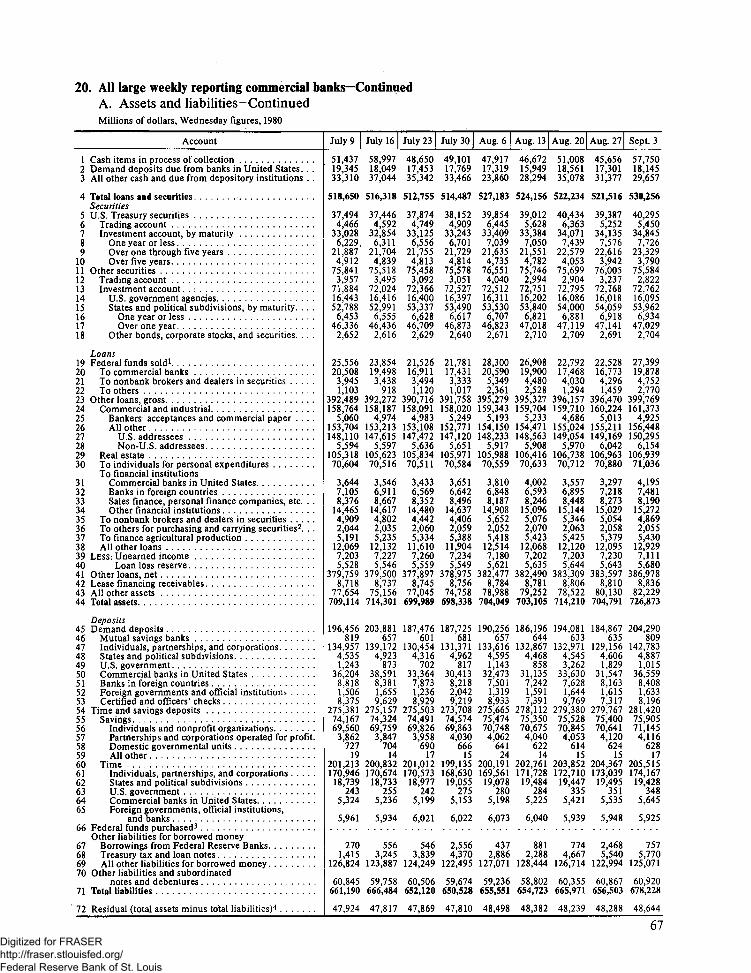
20. All large weekly reporting commercial banks—ContinuedA. Assets and liabilities-ContinuedMillions of dollars, Wednesday figures, 1980
Account
1 Cash items in process of collection2 Demand deposits due from banks in United States. . .3 All other cash and due from depository institutions . .
4 Total loans and securitiesSecurities
5 U S Treasury securities ,6 Trading account . . .7 Investment account, by maturity8 One year or less . . . . . . . .9 Over one through five years
10 Over five years . . . .11 Other securities12 Trading account13 Investment account14 US government agencies15 States and political subdivisions, by maturity. . . .16 One year or less17 Over one year18 Other bonds, corporate stocks, and securities. . . .
Loans19 Federal funds sold1 . . . .20 To commercial banks21 To nonbank brokers and dealers in securities22 To others23 Other loans gross24 Commercial and industrial25 Bankers ' acceptances and commercial paper . . . .26 All other27 U S. addressees28 Non-U S addressees29 Real estate30 To individuals for personal expenditures
To financial institutions31 Commercial banks in United States32 Banks in foreign countries33 Sales finance, personal finance companies, etc. . .34 Other financial institutions . . . . . .35 To nonbank brokers and dealers in securities36 To others for purchasing and carrying securities2. . .37 To finance agricultural production38 All other loans39 LESS- Unearned income40 Loan loss reserve . . .41 Other loans net42 Lease financing receivables43 All other assets44 Total assets
Deposits45 Demand deposits . . . .46 Mutual savings banks . .47 Individuals, partnerships, and corporations48 States and political subdivisions49 U S. government ,50 Commercial banks in United States .51 Banks in foreign countries52 Foreign governments and official institutions53 Certified and officers' checks54 Time and savings deposits55 Savings56 Individuals and nonprofit organizations57 Partnerships and corporations operated for profit.58 Domestic governmental units59 All other60 Time61 Individuals partnerships and corporations62 States and political subdivisions63 U S government64 Commercial banks in United States65 Foreign governments, official institutions,
and banks66 Federal funds purchased3 .
Other liabilities for borrowed money67 Borrowings from Federal Reserve Banks68 Treasury tax and loan notes69 All other liabilities for borrowed money70 Other liabilities and subordinated
notes and debentures71 Total liabilities
72 Residual (total assets minus total liabilities)4
July 9
51,43719,34533,310
518,650
37,4944466
33,0286,229
21 8874912
75 8413,957
71 88416,44352,7886,453
463362,652
25,55620508
3,9451 103
392,489158 764
5,060153 704148,110
5 594105,31870604
3,6447 1058,376
14,46549092,0445,191
120697,2035,528
379 7598,718
77 654709,114
196,456819
134,9574,5351,243
36,2048,8181,5068 375
275 38174 16769 560
3,862727
19201,213170,946
18 739243
5 324
5,961
2701 415
126,824
60,845661,190
47,924
July 16
58,99718,04937,044
516,318
37,4464,592
32,8546,311
21 7044,839
75 5183,495
7202416,41652,991
6,55546,436
2,616
23,854194983,438
918392,272158 187
4,974153 213147,615
5 597105,62370,516
3,54669118,667
14,61748022,0355,235
12 1327,2275,546
379 5008,737
75,156714,301
203,881657
139,1724,923
87338,5918,3811,6559,629
275 15774 32469759
3,847704
14200,832170,674
18 733255
5 236
5,934
5563 245
123,887
59,758666,484
47,817
July 23
48,65017,45335,342
512,755
37,8744,749
33,1256,556
21 7554,813
754583,092
72,36616,40053,337
6,62846,709
2,629
21,526169113,4941,120
390,716158,091
4,983153,108147,472
5,636105,83470,511
3,4336,5698,352
14,4804,4422,0605,334
11,6107,2605,559
377,8978,745
77,045699,989
187,476601
130,4544,316
70233,364
7,8731,2368,929
275,50374,49169 $26
3,958690
17201,012170,57318,977
2425 199
6,021
5463 839
124,249
60,506652,120
47,869
July 30
49,10117,76933,466
514,487
38,1524,909
33,2436,701
21 7294,814
75 5783,051
72,52716,39753,490
6,61746,873
2,640
21,781174313,3331,017
391,758158,020
5,249152,771147,120
5,651105,97170,584
3,6516,6428,496
14,6374,4062,0595,388
11,9047,2345,549
378,9758,756
74,758698,338
187,725681
131,3714,962
81730,413
8,2182,0429,219
273,70874,57469,8634,030
66615
199,135168,63019,055
2755 153
6,022
2,5564,370
122,495
59,674650,528
47,810
Aug. 6
47,91717,31923,860
527,183
39,8546,445
33,4097,039
21 6354,735
765514,040
72,51216,31153,5306,707
46,8232,671
28,30020,590
5,3492,361
395,279159,343
5,193154,150148,233
5,917105,98870,559
3,8106,8488,187
14,9085,6522,0525,418
12,5147,1805,621
382,4778,784
78,988704,049
190,256657
133,6164,5951,143
32,4737,5011,3198,933
275,66575,47470,7484,062
64124
200,191169,56119,078
2805,198
6,073
4372,886
127,071
59,236655,551
48,498
Aug. 13
46,67215,94928,294
524,156
39,0125,628
33,3847,050
21,5514,782
75,7462,994
72,75116,20253,8406,821
47,0182,710
26,90819,9004,4802,528
395,327159,704
5,233154,471148,563
5,908106,41670,633
4,0026,5938,246
15,0965,0762,0705,423
12,0687,2025,635
382,4908,781
79,252703,105
186,196644
132,8674,468
85831,135
7,2421,5917,391
278,11275,35070,6754,040
62214
202,761171,728
19,484284
5,225
6,040
8812,288
128,444
58,802654,723
48,382
Aug. 20
51,00818,56135,078
522,234
40,4346363
34,0717,439
22 5794053
75 6992,904
7279516,08654,0006,881
47 1192,709
22,792174684,0301 294
396,157159 710
4,686155,024149,054
5,970106,73870,712
3,5576,8958,448
15,1445,3462,0635,425
12 1207,2035,644
383 3098,806
78,522714,210
194,081633
132,9714,5453,262
33,6307,6281,6449,769
279,38075 52870 8454,053
61415
203,852172,710
19,447335
5421
5,939
7744667
126,714
60,355665,971
48,239
Aug. 27
45,65617,30131,377
521,516
39,3875 252
34,1357,576
226163,942
76 0053,237
72 76816,01854,0596,918
47,1412,691
22,528167734,2961 459
396,470160,224
5,013155,211149,169
6,042106,96370,880
3,2977,2188,273
15,0295,0542,0585,379
12,0957,2305,643
383,5978,810
80,130704,791
184,867635
129,1564,6061,829
31,5478,1631,6157,317
279,76775,40070641
4,120624
15204,367173,03919,495
3515 535
5,948
24685 540
122,994
60,867656,503
48,288
Sept. 3
57,75018,14529,657
530,256
40,2955,450
34,8457,726
23 3293,790
755842,822
7276216,09553,962
6,93447,029
2,704
27,399198784,7522,770
399,769161,373
4,925156,448150,295
6,154106,93971,036
4,1957,4818,190
15,2724,8692,0555,430
12,9297,1115,680
386,9788,836
82,229726,873
204,290809
142,7834,8871,015
36,5598,4081,6338,196
281,42075,90571,1454,116
62817
205,515174,16719,428
3485,645
5,925
7575,770
125,071
60,920678,228
48,644
67Digitized for FRASER http://fraser.stlouisfed.org/ Federal Reserve Bank of St. Louis
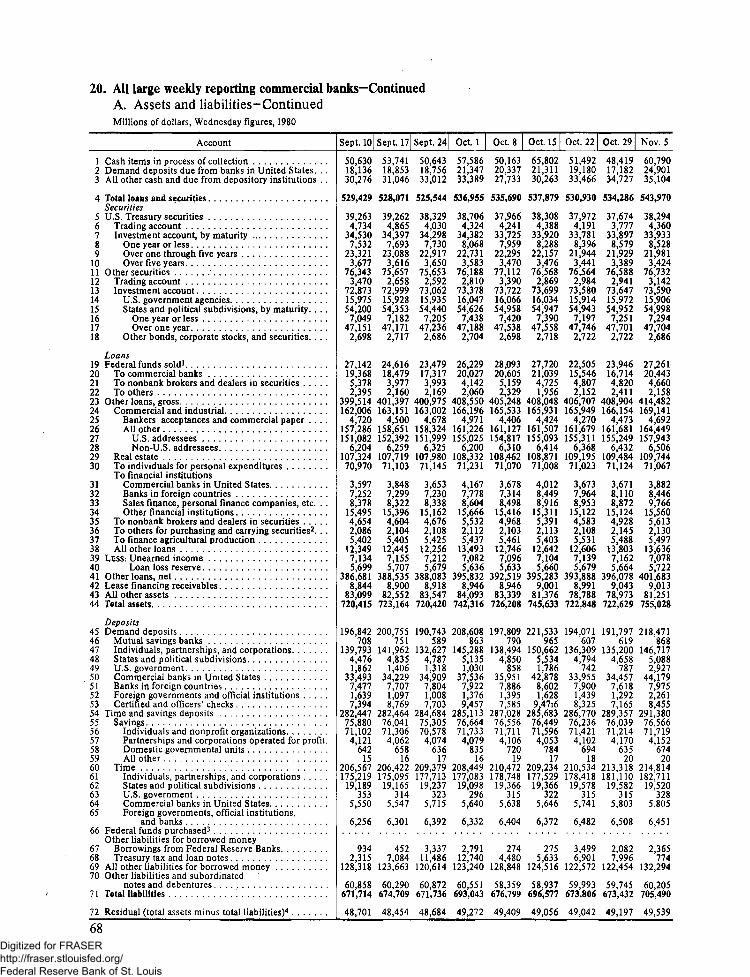
20. All large weekly reporting commercial banks—ContinuedA. Assets and liabilities-ContinuedMillions of dollars, Wednesday figures, 1980
Account
1 Cash items in process of collection2 Demand deposits due from banks in United States. . .3 All other cash and due from depository institutions . .
4 Total loans and securitiesSecurities
5 U S Treasury securities6 Trading account7 Investment account by maturity8 One year or less9 Over one through five years
10 Over five years1 1 Other securities12 Trading account . . ,13 Investment account14 U.S. government agencies15 States and political subdivisions, by maturity, . . .16 One year or less ,17 Over one year18 Other bonds, corporate stocks, and securities. . . .
Loans19 Federal funds sold1
20 To commercial banks21 To nonbank brokers and dealers in securities .22 To others23 Other loans, gross24 Commercial and industrial25 Bankers acceptances and commercial paper . . . .26 All other27 U.S. addressees28 Non-U S addressees29 Real estate .30 To individuals for personal expenditures .
To financial institutions31 Commercial banks in United States32 Banks in foreign countries33 Sales finance, personal finance companies, etc. . .34 Other financial institutions35 To nonbank brokers and dealers in securities . ,36 To others for purchasing and carrying securities2. . .37 To finance agricultural production38 All other loans . . . . .39 l^ESS1 Unearned income40 Loan loss reserve41 Other loans, net . . .42 Lease financing receivables ,43 All other assets . . . . . . . . .44 Total assets
Deposits45 Demand deposits46 Mutual savings banks ,47 Individuals, partnerships, and corporations48 States and political subdivisions49 U S government50 Commercial banks in United States51 Banks in foreign countries52 Foreign governments and official institutions53 Certified and officers' checks54 Time and savings deposits55 Savings56 Individuals and nonprofit organizations. . . .57 Partnerships and corporations operated for profit.58 Domestic governmental units . . . .59 All other .60 Time61 Individuals, partnerships, and corporations62 States and political subdivisions63 U.S. government64 Commercial banks in United States65 Foreign governments, official institutions,
and banks66 Federal funds purchased3
Other liabilities for borrowed money67 Borrowings from Federal Reserve Banks68 Treasury tax and loan notes69 All other liabilities for borrowed money70 Other liabilities and subordinated
notes and debentures71 Total liabilities
72 Residual (total assets minus total liabilities)4
Sept. 10
50,63018,13630,276
529,429
392634,734
345307,532
23 3213,677
763433,470
72,87315,97554,200
7,04947 151
2,698
27 14219,3685,3782 395
399,514162 006
4,720157286151,082
6204107,32470970
3,5977,2528,378
15 4954,6542,0865,402
123497 1345,699
3866818,844
83,099720,415
196 842708
139,7934,4761 862
33,4937,4771,6397394
282 44775,88071,102
4,121642
15206 567175,219
19,189353
5,550
6256
9342,315
128,318
60858671,714
48,701
Sept. 17
53,74118,85331,046
528,071
392624,865
343977,693
230883 616
75 6572,658
72 99915,92854,3537,182
47 1712,717
2461618,4793 9772 160
401,397163 151
4,500158 651152,392
6259107,71971 103
3 8487,2998,322
15 3964,6042,1045,405
124457 1555,707
388 5358,900
82,552723,164
200 755751
141,96248351 406
34,2297 7071,0978 769
282 46476,04171,306
4,062658
16206 422175,095
19,165314
5,547
6301
4527,084
123 663
60 290674,709
48,454
Sept. 24
50,64318,75633,012
525,544
38 3294,030
342987,730
229173,650
75,6532,592
73,06215,93554,4407,205
47,2362,686
23,47917,3173,9932 169
400,975163,002
4,678158,324151,999
6325107,98071,145
3,6537,2308,338
15 1624,6762,1085,425
12,25672125,679
388,0838,918
83,547720,420
190 743589
132,6274,7871 318
34,9097,8041,0087703
284 68475,30570,578
4,074636
17209 379177,71319,237
3235,715
6,392
3,33711,486
120,614
60872671,736
48,684
Oct. 1
57,58621,34733,389
536,955
38,7064,324
34,3828,068
227313,583
76,1882,810
73,37816,04754,6267,438
47,1882,704
26,22920,0274,1422060
408,550166 196
4,971161,226155,025
6200108,33271,231
4,1677,7788,604
156665,5322,1125,437
1349370825,636
395,8328,946
84,093742,316
208 608863
145,2885,1351 030
37,5367,9221,3769457
285 11376,66471,7334,079
83516
208 449177,083
19,098296
5,640
6332
2,79112,740
123,240
60 551693,043
49,272
Oct. 8
50,16320,33727,733
535,690
379664,241
337257,959
222953,470
77 1123,390
73 72216,06654,9587,420
47,5382,698
28,09320,605
5,1592329
405,248165 533
4,406161 127154,817
6310108,46271 070
3 6787,3148,498
154164,9682,1035,461
127467 0965,633
3925198,946
83,339726,208
197 809790
138,4944850
85835,9517,8861,3957 585
287 02876,55671,711
4,106720
19210472178,748
19,366315
5,638
6404
2744,480
128,848
58 359676,799
49,409
Oct. 15
65,80221,31130,263
537,879
38,3084,388
33,9208,288
22,1573,476
76,5682,869
73,69916,03454,9477,390
47,5582,718
27,72021,0394,7251,956
408,048165,931
4,424161,507155,093
6,414108,87171,008
4,0128,4498,916
15 3115,3912,1135,403
12,6427 1045,660
395,2839,001
81,376745,633
221 533965
150,6625,5341 786
42,8788,6021,628
947i6285 683
76,44971,5964,053
78417
209 234177,52919,366
3225,646
6,372
2755,633
124,516
58 937696,577
49,056
Oct. 22
51,49219,18033,466
530,930
37,9724,191
33,7818,396
21 9443,441
76,5642,984
73,58015,91454,943
7,19747,746
2,722
22,50515,5464,8072 152
406,707165 949
4,270161 679155,311
6368109,19571,023
3,6737,9648,953
15 1224,5832,1085,531
126067 1395,679
393 8888,991
78,788722,848
194 071607
136,3094,794
74233,9557,9001,4398 325
286 77076,23671,421
4,102694
18210 534178,418
19,578315
5,741
6482
3,4996,901
122,572
59993673,806
49,042
Oct. 29
48,41917,18234,727
534,286
376743,777
33 8978,579
21 9293,389
765882,941
73 64715,97254,9527,251
47 7012,722
23,94616,7144,8202411
408,904166 154
4,473161 681155,249
6432109,48471 124
3 6718,1108,872
15 1244,9282,1455,488
13 8037 1625,664
396 0789,043
78 973722,629
191 797619
135,2004658
78734,45776181,2927 165
289 35776,03971,2144,170
63520
213 318181,11019,582
3155 803
6 508
2,0827996
122 454
59 745673,432
49,197
Nov. 5
60,79024,90135,104
543,970
382944,360
339338,528
21 9813424
767323,142
73 59015,90654,9987,294
477042,686
2726120,4434,6602 158
414,482169 141
4,692164 449157,943
6506109,74471 067
3 8828,4469,766
155605 6132,1305497
1363670785722
401 6839,013
81 251755 028
218471'868
146,71750882 927
44 17979752,2618455
291 3807656671 719
4,152674
20214 814182,711
19,520328
5805
6451
2365774
132 294
60205705 490
49,539
68Digitized for FRASER http://fraser.stlouisfed.org/ Federal Reserve Bank of St. Louis

20. All large weekly reporting commercial banks—ContinuedA. Assets and liabilities-ContinuedMillions of dollars, Wednesday figures, 1980
Account
1 Cash items in process of collection2 Demand deposits due from banks in United States. . .3 All other cash and due from depository institutions . .4 Total loans and securities
Securities5 U S. Treasury securities6 Trading account7 Investment account by maturity8 One year or less9 Over one through five years
10 Over five years . .11 Other securities12 Trading account . . .13 Investment account14 U.S. government agencies15 States and political subdivisions, by maturity. . . .16 One year or less17 Over one year18 Other bonds, corporate stocks, and securities. . . .
Loans19 Federal funds sold1
20 To commercial banks21 To nonbank brokers and dealers in securities22 To others . . , .23 Other loans gross24 Commercial and industrial25 Bankers acceptances and commercial paper26 All other27 US addressees28 Non-U.S. addressees29 Real estate30 To individuals for personal expenditures
To financial institutions31 Commercial banks in United States32 Banks in foreign countries33 Sales finance, personal finance companies, etc..34 Other financial institutions35 To nonbank brokers and dealers in securities. . . .36 To others for purchasing and carrying securities2 .37 To finance agricultural production . .38 All other loans39 LESS1 Unearned income40 Loan loss reserve41 Other loans, net42 Lease financing receivables43 All other assets44 Total assets . . .
Deposits45 Demand deposits46 Mutual savings banks . . . .47 Individuals partnerships and corporations48 States and political subdivisions49 U.S. government50 Commercial banks in United States51 Banks in foreign countries52 Foreign governments and official institutions53 Certified and officers' checks54 Time and savings deposits . .55 Savings56 Individuals and nonprofit organizations57 Partnerships and corporations operated for profit.58 Domestic governmental units59 All other . . . . .60 Time61 Individuals partnerships and corporations62 States and political subdivisions63 U.S. government64 Commercial banks in United States65 Foreign governments, official institutions,
and banks . . . . . .66 Federal funds purchased^
Other liabilities for borrowed money67 Borrowings from Federal Reserve Banks68 Treasury tax and loan notes69 All other liabilities for borrowed money70 Other liabilities and subordinated
notes and debentures71 Total liabilities72 Residual (total assets minus total liabilities)4
Nov. 12
6231524,45031,654
545,182
38,3974,380
34,0178 611
22,0113 395
77,2883458
73 82915 93955,188
7,37247 816
2,702
28 16319 9445 2522968
414 166169,598
4,713164,885158 286
6,598110,19370936
4,2028,4549,015
156095,4662,1155466
13,1117,0765755
401,3359,030
82535755,166
219916871
150 12845691,360
44,2278,7931,9338036
294 98775 765709654,113
66424
219222186 713
19 767322
5,998
6422
1,401278
129,418
59 596705,59649,570
Nov. 19
53 20618,24534,213
542,054
38,7414,689
34,0528 615
22,0423,395
76,9162,967
73 94915,88855,298
7,37347,925
2,763
2485217,6345 3071,910
414392169,457
4,313165,144158 346
6,798110,51371 018
3,8178,3738,877
15,7116,0342,1645,469
12,9577,0815,766
401,5459,062
80827737,607
197,084618
137 2164 6742,884
33,7778,7771,4247,716
297 51875 36870 5584,076
70925
222,150189 18620 122
3086,097
6,437
1,6381,901
128,317
61 831688,28949,318
Nov. 26
5809718,69933,672
543,329
38,5064,354
34,1538 745
22,0533 355
76,7572,745
7401215,85455,400
7,34448055
2,758
2349916,73546632,100
417 392171,397
4,374167,024160 127
6,897110,62271 201
4,0808,3329,031
15,4185,8742,1485 369
13,9197,0535 772
404,5679,078
81 595744,470
201,858607
142 2614 9222,145
34,3128,1291,5857 895
300 36174 66369 9244,062
65522
225 698192 57520236
3036,261
6324
2,9752,839
124,448
62 557695,03749,433
Dec. 3
5751219,55224,937
554,114
39,4094,987
34,4229,161
21,9473,314
77,1193,132
73 98615,81355,3767,405
47,9712,798
30 17322,110
5 6212,442
420 228172,262
4,104168,158161,191
6,968110.76371 276
4,1478,5959,246
15,5866,7952,1555331
14,0707,0045811
407,4139,094
83 128748,338
208 795718
144 7884 8042,964
36,82676612 1498884
300 96974983702944,021
64919
225 986193 228
19 872291
6285
6309
740432
126,742
60 800698,47949,859
Dec. 10
5299218,35828,816
553,537
39,5565,175
34,3819201
21,8463 334
77,7673,781
7398615,80155,405
7,38548020
2,780
29 10920,201
60922,816
419963172,758
3,952168,806161 944
6,862111,05271 462
3,5808,6269,567
155336,2512,1855 282
13,6667,0405,818
407,1059,091
82810745,605
200,264602
14103146412,079
33,1998,7971,8708046
302 88274 35069 7503,983
59820
228 532195 399
19 817292
6,614
6,411
1,322168
128,838
62385695,86049,744
Dec. 17
5982019,44736,914
556,070
39,1794,788
34,3919 166
21,8213404
77,3143018
74 29616,02555,517
7,40848 109
2,754
28 05720,644
5 5401 873
424 365174,015
3,709170,306163 213
7,093111 33371 805
4,2578,800
10,416159036,4712,1985284
13,8827,0405 806
411,5199,103
83 309764,662
208,350619
145 5304 8041,253
37,4017,9311 4779335
305 91073 41269 006
3,781605
21232 498198 499
19 897270
7,454
6377
7255 590
129,342
65 117715,03449,628
Dec. 24
58 33019,69334,051
555,851
37,9843,883
34,1019096
21,6913 313
77,8183,067
74 75116,22055,738
7,41948 319
2,792
2748419,40160542,028
425 349172,637
3,696168,941161 871
7,069111,50972 361
4,9499,5299,947
15,6586,1442,1685,300
15,1467,0335,750
412,5669,143
84,358761,426
208,144700
145 2074 8851,460
37,6078,8842,0207,381
311 03871 64867422
3,633567
26239,390203 884
20434301
8,135
6,636
6567,022
122,448
62 570711,87849,547
Dec. 31
6608621,55234,092
563,783
39,6114,372
35,2391022121,678
3 34078,487
3,31075 1771623256,149
7,40348746
2,795
27 80519,43864961,871
430 210174,581
4,074170,507163 207
7,300111,81972 227
5,2649,700
10,107159667,8452,1435465
15,0946,6625,668
417,8809,389
87954782,856
228,086838
1582835 8291,108
41,4078,9302,4599,232
314 12872 670684183,595
63523
241 458205 862
20 185301
8,418
6691
1,0556668
119,366
63 328732,63250,224
Adjust-mentbanks
3389
-2341,782
23.10
23115476
1193
019370
102188420
383800
1 372388
0388388
0466499
-67070163
3814
1,3200
2631,933
5750
483204
30110
261036
33530426
60
701594101
52
029
00
30
861,726
207
69Digitized for FRASER http://fraser.stlouisfed.org/ Federal Reserve Bank of St. Louis

20. AH large weekly reporting commercial banks—ContinuedB. Balance sheet memoranda, 1980l
Millions of dollars
Account
1 Total loans (gross)and investments adjusted1
2 Total loans (gross) adjusted1
3 Demand deposits adjusted2
4 Total time deposits in accountsof $ 100 000 or more
5 Negotiable CDs6 Other time deposits
7 Total loans sold outright to affiliates3
8 Commercial and industrial9 Other
1 Total loans (gross)and investments adjusted*
2 Total loans (gross) adjusted1
3 Demand deposits adjusted^
4 Total time deposits in accounts of$100 000 or more
5 Negotiable CDs6 Other time deposits ,
7 Total loans sold outright to affiliates3
8 Commercial and industrial9 Other
1 Total loans (gross)and investments adjusted*
2 Total loans (gross) adjusted1
3 Demand deposits adjusted2
4 Total time deposits in accounts of$100 000 or more
5 Negotiable CDs6 Other time deposits
7 Total loans sold outright to affiliates3. .8 Commercial and industrial. .9 Other
Jan. 2
511 182402 739122 824
12843491 49936935
27491 819
930
Mar. 5
513 626403,352104 332
132 396
9404538351
2 6021 673
929
May 7
505 272396452102 766
134 9419549939 442
2 5521 614
939
Jan. 9
506 968398 232113 126
129 66292 26637 397
26461 711
934
Mar. 12
511 592401,630106 914
132 593
93 91438,679
2 6091 678
931
May 14
504433394 670103 044
135 00795 77539 232
2 5911 696
895
Jan. 16
507,736398 890111,055
129,4499243237017
2,6621 728
934
Mar. 19
509 685402,001102 576
133 570
94 59938,971
2 6091,687
922
May 21
503 308392 645102 810
134 22195,13939082
2,7331 834
900
Jan. 23
502,094393 754105,601
129,07691 86437,211
2,6121 705
907
Mar. 26
506 771398,805100 469
133 682
94 55539,127
2 5691 652
917
May 28
503 405392 466100 692
133 8479457239 275
2 7001 788
911
Jan. 30
505,393396 876108,107
130 10792 63937468
2 6561 750
906
Apr. 2
512658405,967110 616
132 306
93 50838,797
2 5771 666
911
June 4
505 744393 263105 113
132 19093 62838 562
27381 780
957
Feb. 6
506,975398 250106,567
13030792 74337 563
2 6561 805
851
Apr. 9
513 651404,134109 567
133 480
94 49238988
2 5781 679
900
June 11
505 599392 229105 347
132 03693 95238 084
2 7741 813
961
Feb. 13
505 880397 612105 966
13041592 54237 874
2 5081 651
857
Apr. 16
510 290400 727108 486
132 978
94 19438 784
2 6751 764
911
June 18
504 984393 657104019
130 82093 14937 671
2 8711 899
972
Feb. 20
509 187400 836104 959
129 98292 06337*919
2 5421 668
874
Apr. 23
506 575398 492104 530
134 162
95 19338 969
2 5981 693
905
June 25
504 909392 997104 010
13041793*10037 317
2 8431 903
940
Feb. 27
508,073399582102,894
131 28293 07538 207
26341 706
928
Apr. 30
509 214399,373104 700
134 670
95 62439,046
2 6301 645
985
July 2
508 762396 138110723
12846891 79436 674
2 7881 843
945
70
Digitized for FRASER http://fraser.stlouisfed.org/ Federal Reserve Bank of St. Louis

20. All large weekly reporting commercial banks—ContinuedB. Balance sheet memoranda, 19801 -ContinuedMillions of dollars
Account
1 Total loans (gross)and investments adjusted*
2 Total loans (gross) adjusted*3 Demand deposits adjusted^
4 Total time deposits in accounts of$100 000 or more
5 Negotiable CDs6 Other time deposits , ,
7 Total loans sold outright to affiliates-*8 Commercial and industrial9 Other
1 Total loans (gross)and investments adjusted1
2 Total loans (gross) adjusted1
3 Demand deposits adjusted^
4 Total time deposits in accounts of$100,000 or more
5 Negotiable CDs6 Other time deposits . . .
7 Total loans sold outright to affiliates^8 Commercial and industrial9 Other
1 Total loans (gross)and investments adjusted1
2 Total loans (gross) adjusted1
3 Demand deposits adjusted^
4 Total time deposits in accounts of$100,000 or more
5 Negotiable CDs6 Other time deposits
7 Total loans sold outright to affiliates^8 Commercial and industrial . , .9 Other
July 9
507,228393 893107,572
126,638
90,19636,442
28171,899
919
Sept 10
519,297403,690110858
131,933
95,05136,882
29031,910
993
Nov. 12
533,868418,183112014
142,413102,780
39 633
25971,704
892
July 16
506,047393,082105,420
126,328
90,04436,284
2,8311,836
995
Sept 17
518,606403,686111,379
132,078
95,03037,049
2,9311,935
995
Nov. 19
533,449417,792107,218
144,962104,77740 186
2 5771,700
877
July 23
505,229391 897104,760
126,714
90,26336451
2736L826
911
Sept. 24
517466403,484103 874
134,313
97,04337 269
29001,905
995
Nov. 26
535,339420,076107 303
148,016107 45040 566
2 6501,744
906
July 30
506,188392 458107,393
125,220
88,97736,243
2,8091,894
915
Oct 1
525,479410,585112,455
134,403
97,28737 116
29491,9481 001
Dec. 3
540,672424,144111493
147,891107,40440487
26571,742
915
Aug. 6
515,584399 179108,723
126,232
89,78136,451
2 8901,927
962
Oct. 8
524,136409,058110,838
135,012
97,35337,659
28681,8481 020
Dec. 10
542,614425,291111 995
150,077109,04641 030
26681,768
900
Aug. 13
513,090398,332107,531
128,744
91,93136,813
2,8971,901
996
Oct. 15
525,593410,717111,066
133,681
95,91037,770
2,7751,7531 022
Dec. 17
544,014427,521109,876
153,020111,35641 664
27121,767
945
Aug. 20
514,057397 924106,180
129,812
93,11936693
29021,8911 010
Oct 22
524 530409,993107 882
134,973
96,60138372
27321,811
921
Dec. 24
544,283428,482110747
158,511115 60842 903
27361,791
946
Aug. 27
514,320398 928105,836
130,362
93,48136881
29331,944
989
Oct 29
526,727412,465108,134
137,865
99,37438491
26331,760
873
Dec. 31
551,411433,313119485
159,44811637743072
27481,800
947
Sept. 3
518,974403,096108,966
131,160
94,43236,728
2,9171,9081 009
Nov. 5 .
532,444417,418110,575
139,309
100,46538,844
2,7331,734
999
Adjust-mentbank*
1,8021,378
508
1578671
71Digitized for FRASER http://fraser.stlouisfed.org/ Federal Reserve Bank of St. Louis

20. All large weekly reporting commercial banks—ContinuedC. Total commercial and industrial loans classified by industry1
Millions of dollars; last Wednesday-of-month data, 1980
Industry
1 Durable goods manufacturing2 Nondurable goods manufacturing3 Food liQuor and tobacco4 Textiles, apparel and leather5 Petroleum refining6 Chemicals and rubber7 Other nondurable goods
8 Mining (including crude petroleum and natural gas)
9 Trade10 Commodity dealers1 1 Other wholesale12 Retail13 Transportation, communication, and other public utilities1 4 Transportation . . . .15 Communication16 Other public utilities
17 Construction18 Services19 All other2
20 Total domestic loans
21. MEMO: Term loans (original maturity more than one year)included in domestic loans
1 Durable goods manufacturing
2 Nondurable goods manufacturing3 Food, liquor, and tobacco4 Textiles apparel and leather5 Petroleum refining6 Chemicals and rubber7 Other nondurable goods
8 Mining (including crude petroleum and natural gas)9 Trade
10 Commodity dealers1 1 Other wholesale12 Retail13 Transportation, communication, and other public utilities14 Transportation15 Communication16 Other public utilities
17 Construction18 Services19 All other2
20 Total domestic loans
21 MEMO: Term loans (original maturity more than one year)included in domestic loans
July
22,476
18 5313 8865 06626163 7233,240
13,64924273
1 67011,55311 05018,99277512 8838357
5 7852056514 964
139,234
73,767
Jan.
23 73519 1164 9414 1383 1753 7143,148
12,323
24,5762 136
11 70510 73518,0277 1732,6198236
578319 84615 637
139,042
74731
Aug.
22,964
18 7983 8965 23026943 7073 270
13 55924 732
1 85311 61111 26819,2187 6512 9188 649
5 87120 80515 250
141,197
74,976
Feb.
24,23719,3024 8854,3313 1113,7143,260
12,479
25,1842 171
11,93811 07617,88472382,6308016
5 77219,96415 780
140,603
74,761
Sept.
23,512
195334,3505 2042,6863 7333,559
13,95624950
2 11811,58611 24519,2237,73529938,495
6 03021,31115 402
143,917
76,536
Mar.
25,06119 8244 9234,4803 1393 9113,370
12,596
25,4561 816
12,09711 54318,29275162,7478028
5 87420,21115 655
142,969
75,997
Oct.
23,335
20 2734 5845 0703 1533 8463,620
14,716262702470
11,87611 92319,3167 78830948,434
5 92421 53015 614
146,978
76,912
Apr.
24,08118 6834 17646142 61139033,379
13,272
25,4061 784
12,05011 57218,8327 6922,8468293
5 90220,44415 640
142,260
76,192
Nov.
24,088
2080449214 9063 1294 1583,690
15,33827050
2 40212 1821246720,099
80193 1618 919
5 99222 16016 146
151,678
78,956
May
22939180753 859466824903 7613,299
13,588
24,8331 639
11 64511 54918,507
7 5432 8008 164
5 83219,97715 125
138,876
74862
Dec.
24,679
205075 3914 1503 6363 9173412
1642726240
2 5631229311 38421 30283723 3199611
5 9952285916 528
154,537
81,783
June
22,729183383 7014,9342 7153 7043,284
13,758
24,6001 531
11,67911 38918,74576002,8398 306
5 97020,29614999
139,435
74,295
Adjust-mentbanks
5
7—1
43
10
46
11911
10325
368
6
21. Gross demand deposits of individuals, partnerships, and corporations, 19801
Billions of dollars, estimated daily-average balances for last month of quarter
Type of holder
1 All holders— Individuals, partnerships, andcorporations
2 Financial business3 Nonfinancial business . . .4 Consumer5 Foreign6 Other .
All commercial banks
Ql
288.428.4
144.997.6
3.114.4
Q2
288.627.7
145.397.93.3
14.4
Q3
302.029.6
151.9101.8
3.215.5
Q4
315.529.8
162.3102,4
3.317.2
All weekly reporting banks
Ql
133.620.169.134.23.07.2
Q2
133.920.269.233.93.17.5
Q3
140.621.272.436.03.17.9
Q4
147.421.878.335.63.18.6
72Digitized for FRASER http://fraser.stlouisfed.org/ Federal Reserve Bank of St. Louis

22. Commercial paper and bankers dollar acceptances outstandingA. Commercial paper, seasonally adjustedMillions of dollars, end of period
Instrument
1 All issuers
Financial companies1
Dealer-placed paper*2 Total3 Bank-related
Directly placed papefi4 Total5 Bank-related6 Nonfinancial companies4 ,
1 All issuers
Financial companies1
Dealer-placed paper1
2 Total3 Bank-related . . .
Directly placed paper*4 Total5 Bank-related6 Nonfinancial companies4 .
1 All issuers
Financial companies1
Dealer-placed paper1
2 Total . . . . . . . .3 Bank-related
Directly placed paper?1
4 Total5 Bank-related6 Nonfinancial companies4 .
1 All issuers
Financial companies1
Dealer-placed paper2
2 Total3 Bank-related
Directly placed papefi4 Total5 Bank-related6 Nonfinancial companies4 .
1 All issuers . . . . . .
Financial companies1
D ea ler-p laced paper2
2 Total3 Bank-related
Directly placed paper*4 Total5 Bank-related6 Nonfinancial companies4 .
Jan.
34,964
64381 139
23,20843895,318
33,284
5 297293
202751 7377,712
32,661
5 492558
205221,5296,647
35,177
4,8571 200
22 6881,5067,632
44,791
6,1051 960
29 3203 5419,366
Feb.
36,553
6 6501,117
24,1054,9355,798
33,270
5 410326
19,9381,5757,922
32,836
5,771662
20,3731,4876,692
34,542
4,1871,311
23,6021,8056,753
46,166
6,9671,923
28,9803 606
10,219
Mar.
38,236
6426932
25,0275,5456,783
32,593
5262354
19,2681,3388,063
33,573
5,358585
20,8671,5877,348
34,132
4,0871,493
24,2601,9635,785
44,777
6,5282.137
290453 9089,204
Apr.
39,228
6 868780
25,7905,8926,570
32,861
5 635417
19,4921 3777,734
33,875
5,115594
208661,5827,894
34,652
4,0441,557
24,7442,2545,864
44,872
6,2152,270
290054 5649,652
May
40,763
7,259783
26,8796,8176,625
32,417
5,268440
19,2001,3087,949
33,775
4,993649
20,8021,3507,980
35,417
4,2791,740
25,1422,3305,996
45,923
5,7281,978
29,9195 106
10,276
June
19
39,519
6,104666
26,3876,9377,028
19
31,439
5 167432
19,2651,3017,007
19
34,988
5,230671
21,3911,3008,367
19
36,247
4,3551,849
25,6572,4346,235
19
45,390
5,1531,579
29 9555 373
10,282
July
70
38,914
5,663558
26,4147,2626,837
71
32,183
5477463
19,8491,3456,857
72
35,707
5,379626
21,7981,6308,530
73
36,079
4,3261,973
25,5472,5416,206
74
46,487
4,8001,465
305025 585
11,185
Aug. | Sept.
38,358 35,980
5,531 5 266435 329
25,972 23,5016,868 4,2896,855 7,213
32,327 32,397
5,510 5 298469 504
19,620 19,7991,323 1,3967,197 7,300
34,853 34,814
5,535 5,760718 829
21,043 21,4091,703 1,5398,275 7,645
37,445 38,553
4,383 4,8452,114 2,077
27,089 27,4282,994 3,1545,973 6,280
48,617 50,190
5,460 5,5062,364 2,114
31,683 320976 423 6 525
11,474 12,587
Oct.
34,891
5,475361
22,3813,3387,035
32,360
5,203476
20,3611,5056,796
34,771
5,399948
21,4731,5817,899
40,752
5,8352,035
27,3252,8337,592
50,465
5,1641,986
31 9406484
13,361
Nov.
34,422
5,515323
21,8042,8037,103
32,222
5,154473
20,3611,5576,707
34,816
5,4561,177
21,7181,4087,642
41,897
5,6781,951
27,5493,0218,670
50,744
4,7581,898
32,1476,762
13,839
Dec.
33,415
5,415352
20,4911,9977,509
32,444
5205524
20,6631,4496,576
35,075
5,5701,226
22,1721,4117,333
41,591
5,4191,938
27,3162,9438,856
49,994
4,5571,814
31,9796518
13,458
73Digitized for FRASER http://fraser.stlouisfed.org/ Federal Reserve Bank of St. Louis

22. Commercial paper and bankers dollar acceptances outstanding—ContinuedA. Commercial paper, seasonally adjusted-ContinuedMillions of dollars, end of period
Instrument
1 All issuers
Financial companies1
Dealer-placed paper*2 Total3 Bank-related
Directly placed paper*4 Total5 Bank-related .6 Nonfmancial companies4 .
1 All issuers
Financial companies1
Dealer-placed paper*2 Total3 Bank-related
Directly placed paper*4 Total5 Bank-related . . .6 Nonfmancial companies4 .
1 All issuers
Financial companies1
Dealer-placed paper1
2 Total3 Bank-related
Directly placed paper*4 Total5 Bank-related6 Nonfmancial companies4 .
1 All issuers
Financial companies1
Dealer-placed paper*2 Total3 Bank-related
Directly placed paper*4 Total5 Bank-related6 Nonfmancial companies4 .
1 All issuers
Financial companies1
Dealer-placed paper2
2 Total3 Bank-related
Directly placed paper*4 Total5 Bank-related6 Nonfmancial companies4 .
Jan.
50,881
48381,822
31 9876782
14,056
48,219
5 8071,617
31 3006958
11,112
53,183
7 0231 895
326345,637
13,526
65,734
8 9712 035
41 3637 202
15,400
85,234
12 8734,413
52,59812 19119,763
Feb.
51,321
50171,787
323617318
13|943
49,052
6,1851,527
31 4756793
11,392
53,522
7,0531 929
323275,502
14,142
66,220
90141 997
423967 718
14,810
87,924
134873,969
54,54012,16619,897
Mar.
51,030
53061,682
31 3947272
14,330
49,591
63811,616
31 4766811
11,734
54,986
7 2181 839
33 9616,126
13,807
67,549
89041 993
428878 153
15,758
90,648
14 1763,793
55,5731264220,899
Apr.
51,626
5,4481,618
322847,002
13,894
49,353
6,2301,620
31 1646,342
11,959
55,708
7,3061 778
34,1255,703
14,277
69,681
9,6672 078
43 9447 995
16,070
92,494
14 9894,251
55,3061278822,199
May
51,042
59231,543
322237,096
12,896
50,196
6,4801,684
31 2566013
12,460
57,043
7 5361 805
34 8785,999
14,629
71,155
102632 217
44 7489 258
16,144
96,049
15 5824,141
57,95513 80022,512
June
19
49,200
5 8221,561
31 0477230
12,331
19
50,270
63121,674
31 0336334
12,925
19
59,356
80771 894
364816,636
14,798
19
72,579
102282442
45 8089 585
16,543
19
99,799
164193,826
59,77815 13023,602
July
75
50,233
6,2171,649
31 4417,038
12,575
76
51,899
6,3951,615
327085,977
12,796
77
59,350
8,2161 744
365586,344
14,576
78
74,305
] 0,6052633
463951003017,305
79
102,181
170623,951
60,5071471724,612
Aug.
50,499
5 8591,511
32 1007392
12,540
50,829
6,4831,612
31 6015 976
12,745
60,423
8 1751 650
373526,394
14,896
74,643
109032 935
463259 634
17,415
104,740
174384,062
61,18115 81726,121
Sept.
49,330
5 7941,482
31 3907316
12,146
51,105
66001,644
32 5346250
11,971
61,526
84301 846
37 9857,069
15,111
76,998
11 4152 622
47 96410 38317,619
107,453
18 1804,485
61,57115 93027,702
Oct.
49,631
6,2471,634
32 1107,114
11,274
50,789
6,5561,703
31 7725,864
12,461
63,545
8,6211 961
39,4067,012
15,518
78,309
11,0202 868
48 84910 92518,440
107,544
16 1943,052
63,3241802428,026
Nov.
48,552
62281,715
31 6326,975
10,692
52,228
69301,825
323355 944
12^963
63,044
8,5701 980
39 1946,567
15,280
80,948
11 5453 231
50 37611 47819,027
108,686
16,1942,958
64,65618 33927,836
Dec.
48,421
6 1531,762
31 4306892
10,838
52,937
7 1901,900
32 5705959
13,177
65,051
87962 132
405747,102
15,681
83,438
12 1813 521
51 64712 31419,610
112 154
167222,784
64,74817 59830,684
74Digitized for FRASER http://fraser.stlouisfed.org/ Federal Reserve Bank of St. Louis

22. Commercial paper and bankers dollar acceptances outstanding—ContinuedA. Commercial paper, seasonally adjusted-ContinuedMillions of dollars, end of period
Instrument
1 All issuers . . .
Financial companies1
Dealer-placed paper2
2 Total3 Bank-related
Directly placed paper^4 Total5 Bank-related6 Nonfmancial companies4 .
Jan. Feb. Mar. Apr. May June July Aug. Sept. Oct Nov. Dec.
1980
115,864
17,0873,034
66,00319,25732,774
116,643
16,7253,010
65,73019,94134,188
118,587
17,3743,142
64,57619,36036,637
119,257
18,0383,467
65,62519,16635,594
119,957
17,6573,591
63,87418,84538,426
122,852
18,0943,188
62,65419,43642,104
120,951
17,3343,198
63,82519,23939,792
121,956
18,2153,313
64,78019,90938,961
122,492
18,2633,370
65,61819,69238,611
121,285
17,3383,442
66,61221,14637,335
123,093
18,0783,436
67,34021,93937,675
123,703
18,1863,561
67,88822,38237,629
B. Bankers dollar acceptances, not seasonally adjustedMillions of dollars, end of period
Instrument
1 Total
Holder2 Accepting banks3 Own bills4 Bills bought
Federal Reserve Banks5 Own account6 Foreign
correspondents. . . .7 Others
Basis8 Imports into
United States9 Exports from
United States10 All other
1980
Jan.
47,780
8,5787,692
886
0
1,43137,771
11,217
10,24826,315
Feb.
50,269
9,3438,565
778
205
1,41729,303
11,393
11,10227,774
Mar.
49,317
8,1597,560
598
171
1,37339,614
10,926
11,00127,389
Apr.
50,177
8,1597,488
670
0
1,55540,463
10,946
11,22128,010
May
52,636
9,2628,768
493
366
1,71841,290
11,651
11,34729,637
June
54,356
10,0519,113
939
373
1,78442,147
11,536
11,33931,480
July
54,334
9,7648,6031,161
310
1,89942,361
12,109
12,401-29,824
Aug.
54,486
9,6448,5441,100
111
1,84142,724
11,861
12,58230,043
Sept.
55,774
10,2759,0041,270
499
1,82043,179
11,731
12,99131,052
Oct.
56,610
11,3179,8081,509
566
1,91542,813
12,254
13,44530,911
Nov.
55,226
10,2368,8371,399
523
1,85242,616
11,774
13,67029,782
Dec.
54,744
10,5648,9631,601
776
1,79141,614
11,776
12,71230,257
23. Prime rate charged by banks on short-term business loans, 19801
Percent per annum
Date of change in effective rate
Effective date
February 19. ..22. ..29. . .
March 4. . .7. . .
14. ..19. ..28. . .
April 2 . . .18. . .
Rate
15.7516.25-16.50
16.75
17.2517.7518.5019.0019.50
20.0019.50
Effective date
May 1 . . .2. . .7. . .
16. . .23. ..30. ..
June 6 . . .13. ..20. ..
July 7 . . .25. . .
Rate
18.50-19.0018.5017.5016.5014.5014.00
13.0012.00-12.50
12.00
11.5011.00
Effective date
August 22 . . .27. . .
September 8. . .12. . .19. . .
• 26. . .
October 1 . . .17. ..29. . .
Rate
11.2511.50
12.0012.2512.5013.00
13.5014.0014.50
Effective date
November 6. . .17. . .21. . .26. . .
December 2 . . .5. . .
10. ..16. . .19. . .
Rate
15.5016.2517.0017.75
18.5019.0020.0021.0021.50
Averages of daily effective rates
Year Jan. Feb. Mar. Apr. May June July Aug. Sept. Oct. Nov. Dec.
15.27 15.25 15.63 18.31 19.77 16.57 12.63 11.48 11.12 12.23 13.79 16.06 20.35
75
Digitized for FRASER http://fraser.stlouisfed.org/ Federal Reserve Bank of St. Louis

24. Terms of lending at commercial banks—Based on survey of loans made1
Item1980
Feb. 4-9 May 5-10 Aug. 4-9 Nov. 3-8
SHORT-TERM COMMERCIAL AND INDUSTRIAL LOANS
1 Amount of loans (millions of dollars)2 Number of loans (thousands)3 Weighted-average maturity (months)2
4 Weighted-average interest rate (percent per annum)3 . . .By size of bank
5 Large banks4
6 Small banksBy size of loan (thousands of dollars)
1 1-998 100-9999 1,000 and over
Percentage of amount of loans10 With floating rate11 Made under commitment12 With no stated maturity
LONG-TERM COMMERCIAL AND INDUSTRIAL LOANS
13 Amount of loans (millions of dollars)14 Number of loans (thousands)15 Weighted-average maturity (months)2
16 Weighted-average interest rate (percent per annum)3 . . .By size of bank
17 Large banks4
18 Small banksBy size of loan (thousands of dollars)
19 1-9920 100-99921 1,000 and over
Percentage of amount of loans,22 With floating rate23 Made under commitment
CONSTRUCTION AND LAND DEVELOPMENT LOANS
24 Amount of loans (millions of dollars)25 Number of loans (thousands)26 Weighted-average maturity (months)2
27 Weighted-average interest rate (percent per annum)3 . . .By size of bank
28 Large banks4
29 Small banksBy size of loan (thousands of dollars)
30 1-9931 100-49932 500 and over
Percentage of amount of loans33 With floating rate34 Secured by real estate35 Made under commitment36 With no stated maturity
By type of construction37 1- to 4-family38 Multifamily39 Nonresidential
LOANS TO FARMERS
40 Amount of loans (millions of dollars)41 Number of loans (thousands)42 Weighted-average maturity (months)2
43 Weighted-average interest rate (percent per annum)3 . . .By size of bank
44 Large banks4
45 Small banksBy size of loan (thousands of dollars)
46 1-2447 25-9948 100 and over
By purpose of loan49 Feeder livestock50 Other livestock51 Other current operating expenses52 Farm machinery and equipment53 Other
9,920136
2.515.67
15.7715.38
15.4916.2615.51
50.847.825.6
1,88622
43.215.32
15.3915.53
15.9115.4915.24
45.459.0
85619
13.115.79
15.7815.97
15.0216.8015.78
39.395.460.69.0
54.25.3
40.4
1,14264
7.214.14
15.9713.72
13.5413.7415.02
14.4113.4814.2813.0014.60
11,317164
2.817.75
17.4418.35
18.4618.6417.11
43.850.319.0
1,34015
42.818,37
18.3918.18
18.2518.6318.30
74.071.1
1,11117
7.418.32
18.1618.50
17.4119.5616.99
71.094.445.111.9
35.55.5
58.9
1,21165
6.617.38
18.4717.06
16.7217.2217.83
17.6716.6417.4916.4417.15
13,475139
2.211.56
11.1813.12
13.3712.3710.92
35.346.222.8
1,80324
45.812.06
11.5713,99
14.2712,4611.31
67.772.6
1,06523
8.013.16
12.7313.44
13.7312.7412.66
40.193.969.812.9
44.28.9
47.0
94860
7.813.51
12.8413.66
13.4713.5613.50
13.4513.7413.6513.3113.25
13,101132
2.215.71
15.7615.49
16.0215.6115.68
50.545.725.2
3,15218
46.315.07
15.0915,01
15,4215,2714.95
70.158.1
1,07224
13.415.31
16,1414.57
14.7915.2416.16
44.481.960.916.5
40,98.2
50.9
1,30172
7.315.46
16.2715.27
15.0515.3915.84
15.4515.3515.4415.1315.75
76Digitized for FRASER http://fraser.stlouisfed.org/ Federal Reserve Bank of St. Louis

25. Interest rates in money and capital marketsA. Annual and monthly averages, 1980Percent per annum
Item
MONEYMARKET INSTRUMENTS
1 Federal funds . .Commercial paper1*2
2 1-month3 3-month4 6-month . . . . ;
Finance paper,directly placed1-2
5 1 -month . .6 3-month7 6-month . .8 Bankers acceptances, 90-day2'3 . .
Certificates of deposit,secondary market4
9 1 -month . . . .10 3-month1 1 6-month . . . . . .12 Eurodollar deposits,
3-month^. .U.S. Treasury bills2.*
Secondary market13 3-month14 6-month . . .15 1-year
Auction average*16 3-month . . . .17 6-month18 1-year
U.S. TREASURY NOTES AND BONDS
Constant maturities1
19 1-year20 2-year21 2V2-year822 3-year . . . .23 5-year24 7-year25 10-year . . . .26 20-year27 30-year . . . .
Composite^28 Over 10 years (long-term)
STATE AND LOCAL NOTES AND BONDS
Moody's series1*)29 Aaa . . . . . .30 Baa31 Bond Buyer series11
CORPORATE BONDS
32 Seasoned issues,all industries12 . . .
Rating group33 Aaa34 Aa35 A36 Baa
Aaa utility bonds13
37 New issue . . . . .38 Recently offered issue . , .
MEMO: Dividend/price ratio14
39 Preferred stocks40 Common stocks
Year
13.36
12.7612.6612.29
12.4411.4911 2812.78
129113:071299
14.00
11.4311 3710.89
11.50611 37410.748
12.0511 77
11 5511 4811.4311 4611.3911 30
1081
7 859 018.59
12.75
11.9412,5012.8913.67
12.7412.70
10.605.26
Jan.
13.82
13.071570412.66
13.0111.9611 7913.15
132613.3913 48
14.33
12.0011 8410.96
12.03611 85111.040
12.0611 5011.15108810 7410.77108010.651060
1003
6 587 607.35
11.74
11.0911.5611.8812.42
11.7311.77
10.175.41
Feb.
14.13
13.62~T3.78
13.60
13.5813.0512.3914.01
13.9314.3014.58
15.33
12.8612.8612.46
12.81412 72 111.211
13.9213 4214,0012.8412 6012.5312.4112.2112.13
11 55
7.288.128.16
12.92
12.3812.7312.9913.57
13.5713.35
10.555.24
Mar.
17.19
16.55TfiSTffl16.50
16.3015.36147017.10
16.8117,5717.74
18.72
15.20150314.03
15.52615 10013.527
15.82148814.6514.05134713.0012.7512.4912.34
11 87
8 1610 309.17
13.73
12.9613,5113.9714.45
14.0013.90
11.375.87
Apr.
17.61
16.10Tmr14.93
15,7014.0513.6815.63
16.2316.1415,80
17.81
13.2012.8811.97
14.00313.61812.450
13.3012.5011.2512.0211.8411.4911.4711.4211.40
10.83
7.959.198.63
13.21
12.0413.0613.5514.19
12.9012.91
11.166.05
May
10.98
9.609.499.29
9.309.099.019.60
9.779.799.78
11.20
8.588.658,66
9.1509 1498.341
9.39945
9.44995
10.0910.1810.4410.36
9.82
6.808027.59
12.11
10.9911.9112.3513.17
11.5311.64
10.205.77
June
9.47
8.56O/8.03
8.017,597.428.31
8,538.498.33
9.41
7.077307.54
6.9957 2187.491
8.16873
8.919219.459789.89981
940
7 117987.63
11.64
10.5811.3911.8912.71
10.9511.00
9.785.39
July
9,03
8.53if. 418.29
8.378.038.038.58
8.598.658.73
9.33
8.068.068.00
8.1268.1017.669
8.659.03
9.279 539.84
10.2510.3210.24
9.83
7.358468.13
11.77
11.0711.4311.9512.67
11.6011.41
9.815.20
Aug.
9.61
9.48y.5/9.61
9.309.089.089.85
9.629.91
10.29
10.82
9.139419.39
9.25994438.963
10.241053
10.63108410.9511 1011.0711.00
1053
8039258.67
12.33
11.6412.0912.4413.55
12.3212.31
10.045.06
Sept
10.87
10.82iu.y/11.04
10,6210.2810.2911.13
10.8911.2911.73
12,07
10.2710.5710.48
10.32110.5469.967
11.5211.57
11,5711.6211.5711.5111.4711.34
10.94
8.369.388.94
12.80
12.0212.5212.9713.70
12.7412.72
10.144,90
Oct.
12.81
12.591Z.5212.32
12.3211.2411.1512.69
12.6912.9412.99
13.55
11.6211.6311.30
11.58011 56611.136
12.491209
12.0111 8611.7911.7511.7511.59
11.20
8389419.11
13.07
12.3112.6813.0514.23
13.1813.13
10.644.80
Nov.
15.85
15.2315.1 IT"14.73
14.8713.1413.0715.34
15.3915,6815.36
16.46
13.7313.5012.66
13.88813.61212.219
14.1513.51
13,3112.8312.7112.6812.4412,37
11.83
8.719.749.56
13.63
12.9713.3413.5914.64
13.8513.91
11.354.63
Dec.
18.90
18.9518. U /16.49
17.8715.0014.7817.96
19.2418.6517.10
19.47
15.4914.6413.23
15.66114,77013.261
14.8814.08
13.6513.2513.0012.8412.4912.40
11.89
9.4410.6410.11
14.04
13.2113,7814.0315.14
14.5114.38
11.944.74
77Digitized for FRASER http://fraser.stlouisfed.org/ Federal Reserve Bank of St. Louis

25. Interest rates in money and capital markets—ContinuedB. Weekly averages, 1980Percent per annum
Item
MONEY MARKET INSTRUMENTS
1 Federal funds15
Commercial paper1-2
2 1-month3 3-month4 6-month
Finance paper, directly placed1*2
5 1 -month6 3-month7 6-month . .8 Bankers acceptances, 90-day2'3 . . . .
Certificates of deposit,secondary market4
9 1 -month .10 3-month1 1 6-month . .12 Eurodollar deposits, 3-month16 . . . .
U.S. Treasury bills2-6
Secondary market13 3-month14 6-month15 1-year
Auction average16 3-month17 6-month . ,18 1-year
U.S. TREASURY NOTES AND BONDS
Constant maturities1
19 1-year20 2-year21 2 Viz year8
22 3-year23 5-year24 7-year25 10-year26 20-year27 30-year
Composite^28 Over 10 years (long-term)
STATE AND LOCAL NOTES AND BONDS
Moody's series10
29 Aaa30 Baa31 Bond Buyer series11. . .
CORPORATE BONDS
32 Seasoned issues, all industries12 . . .
Rating group33 Aaa34 Aa . . . .35 A36 Baa , .
Aaa utility bonds13
37 New issue38 Recently offered issue . . .
MEMO: Dividend/price ratio14
39 Preferred stocks . . .40 Common stocks
Week ending
Jan. 4
14.04
-13.2613.1112.64
13.3211.8911.7313.29
13.3413.4513.4914.58
12.1011.9310.97
12.10511.880
12.0211.39
10.7510.5210.5210.5210.3010.25
9.73
6.507.607.32
11.54
10.8811.3511.6112.29
11.44
10.205.66
Jan. 11
13.94
13.0813.0212.56
12.9711.9511.7913.09
13.3013.3813.3914.56
11.7211.7310.78
11.94311.85811 040
11.9011.27
10.6910.5410.5710.5910.3510.31
9.80
6.607.607.30
11.60
10.9111.4011.7312.34
11.5111.54
10.175.49
Jan. 18
13.91
13.0112.9712.63
12.9611.9711.7513.04
13.2113.3313.3414.18
11.9111.7710.83
11.90411.783
11.9211.37
10.7810.6410.6610.7110.5210.46
9.93
6.607.607.28
11.67
10.9911.5011.8312.34
11.6111.69
10.045.40
Jan. 25
13.77
13.0513.0612.71
12.9611.9811.8213.24
13.2913.4213.5714.20
12.1711.8811.05
12.18911.886
12.1111.63
10.9610.8710.9110.9510.8610.80
10.20
6.607.607.33
11.83
11.2211.6411.7812.46
12.0812.11
10.145.28
Feb. 1
13.54
13.0213.0612.80
12.9612.0311.8313.11
13.1613.3613.5914.41
12.1511.9611.23
12.03811.846
12.3611.86
11.2411.1511.1711.1911.1911.12
10.48
6.807.607.52
12.06
11.4911.8712.2012.69
12.35
10.305.21
Feb. 8
12.80
13.0113.0812.79
12.9912.6511.8413.13
13.2213.4313.7314.29
12.0512.0311.51
12.08611.98511 211
12.8012.31
11.8311.6811.7311.7111.7211.63
10.96
7.007.607.71
12.43
11.9512.1712.4813.11
12.9612.80
10.375.23
Feb. 15
13.64
13.1013,1712.96
13.0312.7211.9713.33
13.2813.5913.9114.46
12.3612.4611.91
12.30712.256
13.2212.71
12.1211.9912.0212.0112.0011.94
11.25
7.007.907.75
12.74
12.1912.5112.8313.41
13.2713.17
10.445.12
Feb. 22
14.87
14.0114.2114.11
13.9312.9612.5514.65
14.4714.9315.1615.26
13.3813.3413.12
13.16213.013
14.7114.26
13.6513.2213.1612.9912.7912.63
12.14
7.608.508.46
13.18
12.7412.9913.1613.82
13.9214.11
10.545.21
Feb. 29
14.62
14.4614.7714.68
14.4513.9313.2715.10
14.8815.4515.7416.46
13.7813.8213.53
13.70013.629
15.2414.70
14.0713.7613.5013.2012.5912.57
12.10
8.009.008.72
13.54
12.8813.4513.6614.16
14.1113.83
10.835.41
Mar. 7
16.17
15.9216.2216.02
15.7114.9614.3116.59
16.1516.8717.1117.16
15.3714.9013.94
15.13614.79213.527
15.7715.03
14.2713.6513.2312.9412.6112.44
12.01
8.0010.40
8.94
13.64
13.0013.4113.8914.27
13.9813.94
11.115.49
Mar. 14
16.45
16.7516.9516.50
16.5315.5214.7217.24
17.2117.7117.7718.58
15.3215.0213.92
15.38114.956
15.6814.67
13.8313.2212.7612.5412.3612.23
11.73
8.1510.409.08
13.72
13.0013.5113.9914.36
13.9513.72
11.345.72
78Digitized for FRASER http://fraser.stlouisfed.org/ Federal Reserve Bank of St. Louis

25. Interest rates in money and capital markets—ContinuedB. Weekly averages, 1980-ContinuedPercent per annum
Item
MONEY MARKET INSTRUMENTS
1 Federal funds15
Commercial paper1-2
2 1 -month3 3-month4 6-month
Finance paper, directly placed1*2
5 1 -month6 3-month . . . .7 6-month8 Bankers acceptances, 90-day2-3 . . . .
Certificates of deposit,secondary market4
9 1-month10 3 -month1 1 6-month12 Eurodollar deposits, 3-month16 . . . .
U.S. Treasury bills2,**Secondary market
13 3-month14 6-month15 1-year
Auction average16 3-month17 6-month18 1-year
U.S. TREASURY NOTES AND BONDS
Constant maturities1
19 1-year20 2-year21 2V2-year822 3-year23 5-year24 7-year25 10-year26 20-year27 30 -year
Composite1*28 Over 10 years (long-term)
STATE AND LOCAL NOTES AND BONDS
Moody's series10
29 Aaa30 Baa31 Bond Buyer series11
CORPORATE BONDS
32 Seasoned issues, all industries12 . . .
Rating group33 Aaa34 Aa35 A36 Baa
Aaa utility bonds13
37 New issue38 Recently offered issue
MEMO: Dividend/price ratio14
39 Preferred stocks40 Common stocks
Week ending
Mar. 21
16.24
16.8417.0416.70
16.4815.5014.6917.22
16.9717.8217.9018.98
14.7614.8313.89
15.05314.950
15.5814.72
13.8613.2112.7612.5412.2912.13
11.67
8.2510.409.20
13.67
12.8313.4313.9514.45
13.8513.80
11.435.94
Mar. 28
17.78
16.6116.9516.70
16.3415.4314.9817.29
16.8417.8018.0718.99
15.5515.4214.39
16.53215.700
16.2515.16
14.3113.8313.2813.0012.7112.55
12.06
8.2510.009.44
13.87
13.0013.6514.1714.67
14.2214.12
11.616.31
Apr. 4
19.39
17.2217.4117.08
17.1515.6615.2117.51
17.3318.0718.2819.60
14.7814.7513.90
15.03714.80414.459
15.7414.56
13.6413.2912.7412.6212.4312.30
11.81
8.2510.009.44
13.93
12.9513.7614.2414.75
13.9813.93
11.756.06
Apr. 11
19.04
17.7317.4416.52
17.6215.4114.8417.12
17.6017.6517.5719.45
14.3014.1113.11
14.42414.226
14.6813.61
12.9112.5712.0412.0511.7711.76
11.23
8.609.759.07
13.65
12.5713.5013.9514.56
13.2813.30
11.486.04
Apr. 18
18.35
16.7416.2515.24
16.4414.3714.1116.05
16.9216.6215.8918.54
13.5713.0311.97
13.81813.549
13.2112.28
11.8111.6711.2511.2511.1511.17
10,59
7.608.757.89.
13.12
11.8713.0313.4514.11
12.8712.69
11.176.14
Apr. 25
17.56
14.9014.4413.47
13.9912.8212.5014.39
15.2414.7914.2417.10
12.1811.7210.80
12.73111.892
11.8611.44
11.2311.0810.9310.9011.0411.05
10.42
7.358.258.11
12.79
11.5112.6213.1713.86
12.4212.64
10.786.05
May 2
15.12
12.7612.4411.88
12.2011.4211.1512.46
12.9712.8912.6715.33
10.4710.389.99
10.78810.79010440
10.9410.61
10.4910,6310.5410.5710.7810.77
10.15
7.158.257.96
12.60
11.3812.3912.9413.68
12.1012.05
10.605.94
May 9 May 16
12.96 10.85
10.31 9.4410.04 9.389.60 9.26
9.93 9.319.90 8.959.73 8.93
10.04 9.60
10.30 9.6510.26 9.7010.07 9.7112.96 11.16
9.14 8.539.09 8.689.00 8.72
9.728 8.6049.495 8.782
9.77 9.449.60 9.48
9.57 9.449.94 9.94
10.02 10.1610.08 10.2510.32 10.4910.30 10.40
9.70 9.87
6.60 6.608.00 7.857.11 7.44
12.11 12.04
10.93 10.9611.91 11.8012.41 12.2813.20 13.10
11.38 11.4311.55 11.65
10.13 10.225.82 5.86
May 23
10.71
9.139.128.95
8.798.628.649.08
9.429.439.43
11.09
8.158.268.34
8.9538.923
9.029.219.059.239.89
10.0810.1610.5010.38
9.86
6.808.007.72
12.10
11.0211.9212.3313.11
11.5011.60
10.295.82
May 30
9.46
8.198.198.15
8.007.817.818.42
8.358.438.609.78
7.707.878.03
7.6757.7538.341
8.689.07
9.149.799.98
10.1410.3710.25
9.77
6.858.007.73
12.00
10.9011.8212.1613.10
11.5211.55
10.165.58
79Digitized for FRASER http://fraser.stlouisfed.org/ Federal Reserve Bank of St. Louis

25. Interest rates in money and capital markets—ContinuedB. Weekly averages, 1980-ContinuedPercent per annum
Item
MONEY MARKET INSTRUMENTS
1 Federal funds15
Commercial paper1*2
2 1-month3 3-month4 6-month
Finance paper, directly placed1*2
5 1 -month6 3-month7 6-month8 Bankers acceptances, 90-day2.3
Certificates of deposit, secondary market4
9 1-month10 3 -month1 1 6-month12 Eurodollar deposits, 3-month1^
U.S. Treasury bills2^
Secondary market13 3 -month14 6-month
Auction average16 3 -month17 6-month18 1-year
U.S. TREASURYNOTES ANDfiONDS
Constant maturities1
19 1-year20 2-year21 2Vz-year822 3-year .23 5-year24 7-year25 10-year26 20-year27 30-year
Composite**28 Over 10 years (long-term)
STATE AND LOCAL NOTES AND BONDS
Moody's series10
29 Aaa30 Baa31 Bond Buyer series11
CORPORATE BONDS
32 Seasoned issues, all industries12
Rating group33 Aaa34 Aa35 A36 Baa
Aaa utility bonds13
37 New issue38 Recently offered issue
MEMO: Dividend/price ratio14
39 Preferred stocks40 Common stocks
Week ending
June 6
10.74
9.098.828.50
8.407.907.888.68
8.968,928,69
10.08
7.517.777.65
8.0358.165
8,569.069009.239.589.80
10.0710.2910.17
9.73
7.408.007,67
11.95
10.8811.8612.1312.92
11.4511.28
10.065.56
June 13
9.68
8.328.117.93
8.037.707.418.06
8.368,348.079.45
6.446.917.86
6.5006.935
7.898.58
8.789.089.329.669.789.70
9.31
7.258.007.53
11.69
10.5311.4611.9212.82
10,9110.85
9.855.41
June 20
8.99
8.398.047.78
7.817,427.138,08
8,318.258.168.99
6.766.937.91
6.3696.662
7.878.498 608.648,909.169.519.599.54
9.13
6.807.807.55
11.47
10.3411.1111.8112.60
10.5810.79
9.655.31
June 27
9.08
8.398.067.89
7,797,387,258.33
8.438.418.319.25
7.427.487.93
7.0777.1087491
8.238.74
8.969.239.479.809.869.81
9.40
7.008.107.76
11.47
10.5311.1411.7212.48
10.8811.03
9.575.29
July 4
9.41
8.758.448.26
8.127.607.608.66
8.698.708.859.61
7,927.887.94
8.1498.097
8.518,949059,159.479,74
.10.1110,1510.06
9.69
7.008.257.88
11.67
10.8411.2911.9012.66
11.5011.18
9.795.36
July 11
9.26
8.528.368.21
8,357,957,928,58
8.588.638.619.23
8.088.038.43
8.2098.114
8.548.89
9.169.469.78
10.1810.2610.19
9.77
7.408.507.95
11.68
10.9411.3011.8812.61
11.4811.26
9.955.26
July 18
8.98
8.588.438.30
8.508.138.148.55
8.658.708.799.43
7.987.998.61
8.1698.110
8.578.959059.199.449.76
10.2010.2910.19
9.80
7.508.608.03
11.78
11.0911.4511.9412.66
11.5411.33
9.825.17
July 25
8.68
8,398.358.26
8.318.108.108.44
8.458.508.569.16
7.937.99
7.8807.9067 669
8.589.02
9.239.469.76
10.2010.2910.20
9.80
7.508.508.19
11.80
11.1111.5011.9412.65
11.6511.44
9.775.10
Aug. 1
8,98
8,758,688.61
8.558,258.258.97
8.828.939.119.30
8,448.49
8.2218.276
9.139.479 709.729.92
10.2010.5910.6410.58
10.13
8.159.308.59
11.94
11.3311.6112.0912.70
11.9212.00
9.705.09
Aug. 8
9.60
8.938.928.84
8.698.588.609.14
9.169.299,43
10,09
8.588.69
8.8778.867
9.359.70
9.9010,1210.3910.7510.7810.74
10.27
8.009.258.61
12.14
11.4411.9112.2512.97
12.0312.10
10.035.12
80Digitized for FRASER http://fraser.stlouisfed.org/ Federal Reserve Bank of St. Louis

25. Interest rates in money and capital markets—ContinuedB. Weekly averages, 1980-CoritinuedPercent per annum
Item
MONEY MARKET INSTRUMENTS
1 Federal funds15 . . . .Commercial paper1'2
2 1 -month3 3-month4 6-month . . .
Finance paper, directly placed1'25 1-month . . . .6 3-month7 6-month8 Bankers acceptances 90-day2>3
Certificates of deposit, secondary market4
9 1-month10 3-month1 1 6-month12 Eurodollar deposits, 3-month1^
U.S. Treasury bills2**Secondary market
13 3 -month14 6-month . . .15 1-year
Auction average16 3-month . . . .17 6-month18 1-year
U.S. TREASURY NOTES AND BONDS
Constant maturities1
19 1-year20 2-year21 2V2-year8 „22 3 -year23 5-year24 7-year . . .25 10-year26 20-year27 30-year . . . .
Composite9
28 Over 10 years (long-term)
STATE AND LOCAL NOTES AND BONDS
Moody's series10
29 Aaa30 Baa. . .31 Bond Buyer series11 .
CORPORATE BONDS
32 Seasoned issues, all industries12
Rating group33 Aaa34 Aa35 A36 Baa
Aaa utility bonds13
37 New issue38 Recently offered issue . . .
MEMO: Dividend/price ratio14
39 Preferred stocks40 Common stocks
Week ending
Aug. 15
8.85
9.029.149.20
8.898.778.779.39
9.219.469.85
10.33
8.608.918.94
8.7238.891
9.7110.0610.2510.1810.4710.6610.93
. 10.9710.94
10.46
8.009.258.53
12.26
11.5712.0312.3713.07
12.3612.27
10.165.05
Aug. 22
9.35
9.739.879.94
9.589,199.21
10.14
9.8210.1310.6210.64
9.419.839.85
9.4119.7658963
10.7911.03
11.0611.2111.2011.2011.1511.09
10.61
8.009.258.68
12.43
11.7012.1512.5613.28
12.4812.36
9.945.03
Aug. 29
10.03
10.2410.4010.52
10.129.939.89
10.77
10.3110.8011.3411.54
10.0110.3610.28
10.02510.250
11.2811.4711.5011.5211.6911.6511.5911.4111.28
10.84
8.009.208.85
12.56
11.8812.3612.6513.37
12.6212.68
10.015.04
Sept. 5
10.47
10.1710.3610.46
9.939.919.97
10.63
10.3610.7211.0711.90
9.789.929.84
10.12410.250
10.7410.86
10.9211.2311.2311.1911.1411.03
10.62
8.309.208.78
12.67
11.8912.4312.8013.55
12.3412.42
10.004.95
Sept. 12
10.22
10.4410.6110.65
10.3510.0110.0310.80
10.4410.9011.3111.48
10.0910.2610.15
10.06010.234
11.1211.1911.3011.1811.3111.3011.2611.2411.11
10.72
8.309.408.82
12.71
11.9012.4212.9313.57
12.6012.48
10.105.00
Sept 19
10.64
10.7610.9311.00
10.5510.3210.3311.07
10.9111.3411.7711.86
10.2610.6010.58
10.63810.8759.967
11.6511.74
11.7411.6811.6011.5111.4811.34
10.95
8.359.408.98
12.79
12.0012.4812.9813.69
12.78
10.174.84
Sept. 26
10.85
11.0711.1911.30
10.9310.5410.5511.37
11.1011.4512.0712.04
10.4511.0010.94
10.46010.824
12.0712.1012.1512.0612.0111.9111.8211.7511.63
11.22
8,509.509.18
12.91
12.1512.6113.0513.82
13.1013.03
10.304.82
Oct. 3
12.38
12.5612.5412.42
12.1611.0510.9712.51
12.5812.8112.9713.25
11.3911.4711.14
11.52411.718
12.2812.02
11.9711.8011.7911.7911.8111.66
11.27
8.509.509.22
13.08
12.3012.7413.1214.12
13.0813.06
10.514.91
Oct. 10
12.59
12.2012.0511.82
11.9011.0210.9512.17
12.3012.3612,3813.03
11.2411.1710.87
11.29511.140
11.9911.5611.5511.5411.4611.4411.4211.4611.28
10.93
8.409.409.01
12,98
12.1812,5913.0314.12
13.0212.87
10.464.74
Oct. 17
12.64
12.5112.2311.97
12.2211.0611.0012.24
12.4512.5212.5113.00
11.0711.1710.85
11.33811.28111.136
11.9811.71
11.6511.5511.4911.4411.4011.25
10.90
8.309.258.81
12.91
12.1112.4912.9514.09
12.6212.85
10.444.69
81Digitized for FRASER http://fraser.stlouisfed.org/ Federal Reserve Bank of St. Louis

25. Interest rates in money and capital markets—ContinuedB, Weekly averages, 1980-ContinuedPercent per annum
TtomItem
MONEY MARKET INSTRUMENTS
1 Federal funds15
Commercial paper1-2
2 1-month . . . . . . . .3 3-month4 6-month . . . . .
Finance paper, directly placed1-2
5 1-month . . . . . . . .6 3-month7 6-month . . . . . . . .8 Bankers acceptances, 90-day2'-*
Certificates of deposit, secondary market4
9 1-month10 3-month . . . . . . . . . . .11 6-month12 Eurodollar deposits, 3-month1^
U.S. Treasury bills2-6
Secondary market13 3-month14 6-month15 1-year
Auction average16 3 -month17 6-month18 1-year
U.S. TREASURYNOTES AND BONDS
Constant maturities1
19 1-year20 2-year21 2V2-year8
22 3-year23 5-year24 7-year25 10-year26 20-year27 30-year
Composite^28 Over 10 years (long-term)
STATE AND LOCAL NOTES AND BONDS
Moody's series10
29 Aaa30 Baa . . . . . . .31 Bond Buyer series11
CORPORATE BONDS
32 Seasoned issues all industries12
Rating group33 Aaa . . . . . . . .34 Aa35 A36 Baa
Aaa utility bonds13
37 New issue38 Recently offered issue
MEMO: Dividend/price ratio14
39 Preferred stocks . .40 Common stocks
Oct. 24
12.55
12.5412 4212.15
12.3411.2411.1412.66
12.6512.90129413.38
11.6611 6411.36
11 41311.407
12.5612.2012.2512.0811.8911 8011.7611 7811.60
11.21
8.309.259.06
13 03
12.2712.61129914 27
13 2113.03
10.664.76
Oct. 31
13 17
13 1213 3313 28
12 8811.6511 5213.71
13.3413 9814091431
12 51125912.16
1233112.284
13 511295
12.8212 6212 4512 3712 3312 16
11 74
8.409 639.45
13 35
12 7212 9913 1714 49
13 9213.79
11 124.91
Nov. 7
13.99
14,29144714.34
140612.4912 3814.68
14.5014.98150215.41
13.2813 1812.47
13 34413.26912 219
13 9713.3913 3013.2712 9412 7612.6912 5612.44
11.94
9.059 759.64
13 56
12.9613 2813 4214 56
13.97
11 074.79
Nov. 14
14.65
14.5914 5214.12
14.3012.9612.9314.64
14.8014.9514 7016.39
13.2913 0312.21
13 51413.231
13 6113.07
12.9912 5912 5012.6312 4512.41
11.82
8.609 609.50
13 62
12.9313 3413 5914 61
13.72
11 484.68
Week
Nov. 21
15.22
15.4115 3714.91
14.9413.3213.2815.46
15.4415.7915 5215.85
13.98137112.74
14.30913.917
14.2013.5813.50133312.7712 7412.6912 3812.33
11.77
8.609.609.50
13 62
12.9613.3013.5914 61
13 8513.91
11.364.54
ending
Nov. 28
17.43
16.6016,3315.48
16.1513.7613.6316.58
16.7916.9716 1516.98
14.31140513.22
14.38414.030
14.8114.00
13.6213.0612 8212.7212.3712.30
11.80
8.6010.009.61
13.76
13.0313.4413.761479
14.02
11.484.51
Dec. 5
17.72
17.42170916.05
16.9014.1814.0317.28
17.6617.5816.5718.16
14.9814.5713.43
14.64914.55413.261
15.1814.2114.0013.7713,4013 0912.9112.4812.44
11.92
9.2010.009.84
13.85
13.1513.5913.8314.84
14.16
11.664.63
Dec. 12
18.82
19.6419.0017.57
18.5515.1714.8419.23
20.0819.9318.3419.46
16.7615.3913.75
16.33515.069
15.5214.66
14.1013.6813.3813.1912.8612.78
12.25
9.4011.0010.42
14.19
13.4713.9514.1115.21
14 5115.03
12.044.94
Dec. 19
19.83
20.3319.5517.49
19.3615.6215.3219.24
20.7620.2318.1921.36
16.2115.1813,71
16.66715,423
15.4414.7714.1514.1713,6913.4013.1812.8112.68
12.15
9.8011.0010.56
14.31
13.4914.0514.3315.36
14.25
12.084.78
Dec. 26
19.44
19.0617 5115.49
17.3015.2615.1116.84
19.2317.6015 8719.29
14.6213 8112.40
1499214.032
13 8213.15
12.9112.50123712.2911 9911.87
11.38
9.8011 009.99
13 91
12.8913 6413 9415 19
14.20
11 834.66
82Digitized for FRASER http://fraser.stlouisfed.org/ Federal Reserve Bank of St. Louis

26. Stock market-Selected statistics, 1980A. Stock prices and tradingAverages of daily figures
Series
Common stock pricesNew York Stock
Exchange (Dec. 31,1965 = 50)
1 Total2 Industrial3 Transportation4 Utility5 Finance
Standard & Poor'sCorporation(1941-43) = 10)
6 Total7 Industrial8 Public utility . . . .9 Transportation
(1970 = 10) , .10 Financial (1970 = 10) .
11 American StockExchange(Aug. 31,1973 =100), total
Volume of trading(thousands of shares)
12 New York StockExchange
13 American StockExchange
1980 Jan.
68.06 63.7478.64 72.6760.52 52.6137.35 37.0864.28 64.22
118.71 110.87134.52 124.7250.54 50.26
18.52 15.5112.50 12.64
300.94 259.54
44,867 52,647
6,377 9,362
Feb.
66.0576.4257.9236.2261.84
115.34130.9149.04
17.2211.95
288.99
47,826
6,903
Mar.
59.5268.7151.7733.3854.71
104.69118.7345.40
15.6210.73
259.79
41,735
5,946
Apr.
58.4766.3148.6235.2957.32
102.97115.5748.37
14.6811.56
242.60
32,101
3,428
May
61.3869.3951.0737.3161.47
107.69120.8050.63
15.2712.20
258.45
36,424
3,799
June
65.4374.4754.0438.5365.16
114.55128.8152.48
16.2712.87
286.21
39,507
5,240
July
68.5678.6759.1438.7766.76
119.83135.2352.82
17.9713.05
310.29
46,444
6,195
Aug.
70.8782.1562.4838.1867.22
123.50140.1851.18
18.8313.04
321.87
45,983
6,452
Sept.
73.1284.9265.8938.7769.33
126.49143.7051.10
19.8513.38
337.01
50,397
7,880
Oct.
75.1788.0070.7638.4468.29
130.22148.3751.49
21.7713.04
350.08
44,859
7,087
Nov.
78.1592.3277.2238.3567.21
135.65155.0852.08
24.6512.68
349.97
54,895
7,852
Dec.
76.7090.3775.7837.8967.46
133.48152.1951.66
24.5512.89
347.56
46,610
6,411
B. Customer financingEnd-of-period balances, millions of dollars
Series
1 Regulated margin credit atbrokers-dealers1 . . .
2 Margin stocks^3 Convertible bonds4 Subscription issues
MEMO: Free credit balancesat brokers3
5 Margin accounts. . . . . . .6 Cash accounts
Jan.
11,987
11,820165
2
1,1804,680
Feb.
12,638
12,460175
3
1,3204,755
Mar.
11,914
11,740171
3
1,3655,000
Apr.
11,310
11,140167
2
1,2904,790
May
11,441
11,270167
4
1,2704,750
June
11,369
11,200166
4
1,3454,790
July
11,522
11,320198
4
1,6654,905
Aug.
12,008
11,800204
3
1,6954,925
Sept.
12,731
12,520208
3
1,8505,680
Oct.
13,293
13,080211
2
1,9505,500
Nov.
14,363
14,140220
3
2,1155,590
Dec.
14,721
14,500219
2
2,1056,070
C. Margin-account debt at brokersPercentage distribution, end of period
Series
1 Total
By equity class4
2 Less than 40 percent3 40-494 50-595 60-696 70-797 80 percent or more
Jan.
100.0
13.022.032.016.09.08.0
Feb.
100.0
16.030.024.014.09.07.0
Mar.
100.0
45.021.013.09.06.05.0
Apr.
100.0
28.031.018.010.07.06.0
May
100.0
19.033.022.012.07.07.0
June
100.0
17.031.023.013.08.07.0
July
100.0
12.027.028.016.09.08.0
Aug.
100.0
11.025.030.016.010.08.0
Sept.
100.0
13.028.026.015.010.08.0
Oct.
100.0
13.029.025.015.010.08.0
Nov.
100.0
13.018.031.018.011.09.0
Dec.
100.0
14.030.025.014.09.08.0
83Digitized for FRASER http://fraser.stlouisfed.org/ Federal Reserve Bank of St. Louis

26. Stock market-Selected statistics, 1980-ContinuedD. Special miscellaneous-account balances at brokers5
End of period
Item
1 Total balances(millions of dollars)
Distribution by equity status(percent)
2 Net credit statusDebit status, by equity
3 60 percent or more4 Less than 60 percent
Jan.
16300
43 0
4908,0
Feb.
16 500
440
47 08.0
Mar.
16,690
460
42 012.0
Apr.
16,340
440
44012.0
May
16540
460
44.011.0
June
16,920
480
4309.0
July
17,890
490
4408.0
Aug.
18,350
48.0
45.07.0
Sept.
19,280
49.0
43.08.0
Oct.
19,930
470
46.07.0
Nov.
21,600
460
47 07.0
Dec.
21,690
480
4408.0
27. Selected assets and liabilities of savings institutionsA. Savings and loan associationsMillions of dollars, end of period
Account
1 Assets
2 Mortgages
3 Cash and investmentsecurities *
4 Other
5 Liabilitiesand net worth . .
6 Savings capital7 Borrowed money8 FHLBB9 Other
10 Loans in process11 Other
12 Net worth2
13 MEMO: Mortgage loancommitmentsoutstanding^ . . . . . .
1 Assets
2 Mortgages3 Cash and investment
securities1 . . . .4 Other
5 Liabilitiesand net worth
6 Savings capital7 Borrowed money8 FHLBB . . .9 Other .
10 Loans in process11 Other
12 Net worth2
13 MEMO: Mortgage loancommitmentsoutstanding3
Jan.
529,661
435 398
47,66246601
529,661
435 66842 30431,7581054610,43411 936
29319
18,054
581,898
476 333
4827357292
581,898
472,06355,0894036414 7258 807
13 192
32 747
15,560
Feb.
533,978
437 837
49,00847 133
533,978
438 53241 29331 004102891028214204
29667
19037
585,321
477 183
4996658 172
585,321
473,68555 12540337147888 340
15264
32 907
16,744
Mar.
539,482
441 337
50,10248043
539,482
446 83041 50531,1231038210,34710886
29914
21 032
589,120
478 952
5070259466
589,120
478,07557,1934241314 7808 149
12 566
33 137
15,843
Apr.
543,197
445 605
48,63248,960
543,197
445,68843 66532,38911 27610,71112,909
30,224
22,915
590,725
480,032
50,37360,320
590,725
478,40057,25342,724145297 725
14 143
33204
14,195
May
548,873
450 932
48,19749,744
548,873
447,71744 26833,00311 26511,14415 196
30548
23,560
592,931
479,956
52,46660,509
592,931
481,41155,19941 52913 6707 185
16 141
32,995
13,931
June
19
555,213
456483
48,15350577
555,213
454 5414692334,2661265711,29111 618
30840
22,770
19
594,397
481 042
52,40860947
594,397
486,68054S7964061314 1837 031
12 966
32924
15,368
July
79
560,807
460 549
49,38150877
560,807
456 5474835535,28613 06911,34613420
31 139
22360
80
596,620
482 839
52,16561 616
596,620
488,89641 2393988213 5797 112
14 364
32787
18,020
Aug.
566,230
464 528
49,87551,827
566,230
457,7415034236,0091433311,09115,606
31,450
22,282
603,295
487,036
53,33662,923
603,295
497,40355,39641,005143917 540
16 190
32,766
20,278
Sept. | Oct.
570,190 575,930
468,217 472,099
49,152 49,05452,821 54,777
570,190 575,930
462,490 464,34552 631 54 14937,620 39,22315011 14,92610,960 10,82312 390 14,547
31,719 32,066
22,397 20,930
609,320 617,773
491,895 496,495
53,435 56,14663,990 65,132
609,320 617,773
496,991 500,86158,418 60,72742 547 44,32515 871 16 4028 243 8 654
12 776 14 502
32 892 33,029
20,311 19,077
Nov.
578,580
474,572
47,99756,011
578,580
465,4985430239,6381466410,22316 185
32372
18,029
623,939
499,973
57,30266,664
623,939
503,36562,06745 50516 5628 853
16433
33,221
17,979
Dec.
578,962
475 688
46,34156933
578,962
470 0045523240,441147919,582
11 506
32638
16,007
629,676
502,718
57,56269396
629,67^
511,0246446447 07417 3908 732
12 131
33325
16,184
Digitized for FRASER http://fraser.stlouisfed.org/ Federal Reserve Bank of St. Louis

27. Selected assets and liabilities of savings institutions—ContinuedB. Mutual savings banks1
Millions of dollars, end of period
Account
1 Assets
Loans2 Mortgage3 Other
Securities4 U.S. government2 . . . .5 State and local govern-
ment . . . . .6 Corporate and other3. .7 Cash8 Other assets
9 Liabilities
10 Deposits1 1 Regular4
12 Ordinary savings . . .13 Time and other . . . .14 Other15 Other liabilities16 General reserve
accounts
17 MEMO: Mortgage loancommitmentsoutstanding5 , , ,
1 Assets
Loans2 Mortgage3 Other
Securities4 U.S. government2 . . . .5 State and local govern-
ment6 Corporate and other3. .7 Cash . .8 Other assets
9 Liabilities . . . .
10 Deposits1 1 Regular4
12 Ordinary savings . . .13 Time and other . . . .14 Other15 Other liabilities16 General reserve
accounts
17 MEMO: Mortgage loancommitmentsoutstanding5
Jan.
158,892
95 5527,744
4,838
3,32840,007
3,2744 149
158,892
142,879141,38869,24472,145
1 4915,485
11 054
4,366
163,252
992209,804
7,387
288737,11427034417
163,252
145,044143 14359,25283,891
1,9016 665
11 544
2,919
Feb.
160,078
95 8218,455
4,801
3,16740,307
3,3064222
160,078
143,539142,07168,81773,254
1,4685,032
10980
4,453
164,270
9894010,044
7,436
2 85337,223
30124481
164,270
145,171143 28458,23485,050
1,8877485
11 615
2,618
Mar.
161,866
96,1369,421
4,814
3,12640,658
3,4104,300
161,866
145,650144,04268,82975,213
1,6085,048
11 167
4,482
165,107
9905110,131
7,629
2 82437,493
3,3614 518
165,107
146,328144 21456,94887,266
2,1157 135
11 643
2,397
Apr,
161,231
95,9009,290
8,193
3,32637,211
3,0724,239
161,231
145,096143,21067,75875,452
1,8865,050
11,085
4,449
165,366
99,04510,187
7,548
2,79137,801
3,4054 588
165,366
145,821143,76554,24789,517
2,0567,916
11 629
2,097
May
161,380
96,2399,444
8,148
3,26437,304
2,7854,198
161,380
145,056143,27167,57775,694
1,7845,172
11,153
4,352
166,340
99,16310,543
7,527
2,72738,246
3,5884,547
166,340
146,637144,64654,66989,977
1,9908 161
11 542
1,883
June
19
161,876
96,7619,565
7,995
3,16337,284
2,8454,263
161,876
146,194144,28168,11376,167
1,9134,477
11,205
4,469
19
166,982
99,17611,148
7,483
2,70638,276
3,5614,631
166,982
148,606146,41656,38890,028
2,1906,898
11 478
1,898
July
79
162,638
97,25210,247
7,973
3,13637,178
2,6204,233
162,638
145,877143,94467,53176,413
1,9335,499
11,262
4,214
80
167,959
99,30111,390
7,796
2,70238,863
3,2604,648
167,959
149,580147,40857,73789,671
2,1726,964
11 416
1,939
Aug.
163,451
97,64710,405
7,904
3,13237,127
2,9614,277
163,451
145,855143,85266,73977,113
2,0036,275
11,321
4,071
168,752
99,28911,122
8,079
2,70939,327
3,4564,770
168,752
150,187148,01858,19189,827
2,1697,211
11 353
1,849
Sept.
163,494
97,9809,972
7,874
3,13337,079
3,1154,342
163,494
146,394144,37265,68378,689
2,0225,715
11 385
4,123
169,409
9930611,415
8,434
272839,609
3,1534764
169,409
151,765149 39558,65890,736
2,3706299
11 344
1,883
Oct.
163,197
98,3119,496
7,734
3,08337,207
3,0034,363
163,197
145,247143,38962,67880,712
1,8576,517
11,434
3,749
170,432
99 52311,382
8,622
2 75439,720
3,5924839
170,432
151,998149 79757,65192,146
2,2007 117
11 317
1,817
Nov.
163,205
98,6109,449
7,754
3,00337,036
3,0104,343
163,-205
144,828143,06461,15681,908
1,7646,872
11,504
3,619
171,126
99 67711,477
8,715
2 73639,888
3,7174916
171,126
152,133150 10956,25693,853
2,0247 644
11 349
1,682
Dec.
163,405
98,9089,253
7,658
2,93037,086
3,1564,412
163,405
146,006144,07061,12382,947
1,9365,873
11,525
3,182
171,564
99,86511,733
8,949
2,39039,282
4,3345011
171,564
153,501151 41653,97197,445
2,0866695
11 368
1,476
85Digitized for FRASER http://fraser.stlouisfed.org/ Federal Reserve Bank of St. Louis

27. Selected assets and liabilities of savings institutions—ContinuedC. Life insurance companiesMillions of dollars, end of period
1 Assets
Securities2 Government . . ; . . . .3 United States1 . . . .4 State and local . . . .5 Foreign^6 Business7 Bonds8 Stocks
9 Mortgages10 Real estate11 Policy loans12 Other assets
Jan.
436,226
203784,8786,4339067
222,332181 82040512
119,88513,08335,30225,246
Feb.
438,638
204384,8986,4889 052
223 423182 52140902
120,92613,20135,83924,811
Mar.
439,733
205455,0046,4549087
221 214182 53638 678
122,31413,51236,90125,247
Apr.
442,932
204705,0596,3519060
222 175182 75039425
123,58713,69638,16624,838
May
447,020
205295,1076,3529 070
223,556183 35640,200
124,56313,98138,89025,501
June
19
450,858
203954,9906,3499056
224,874184 32940,545
125,45514,08539,35426,695
July
80
455,759
207865,3256,3619050
228,64518638542,260
126,46114,16439,64926,104
Aug.
459,362
208335,3866,4219026
230,477187 83942,638
127,35714,18439,92526,586
Sept.
464,483
208535,3616,4749018
233 65218958644,066
128,08914,46040,25827,171
Oct.
468,057
20,9425,3906,4849068
236,115191 22944,886
128,97714,70240,54826,765
Nov.
473,529
21 2045,5686,5689068
239,150191 75347,397
129,87815,18340,87827,236
Dec.
476,190
21 4535,7536,6829018
238,048191 09046,958
131,14515,24741,41128,836
D. Credit unionsMillions of dollars, end of period
Account
1 Total assets/liabilitiesand capital
2 Federal3 State . . . .
4 Loans outstanding . . . .5 Federal6 State7 Savings8 Federal (shares) . . . .9 State (shares and
deposits)
1 Total assets/liabilitiesand capital
2 Federal3 State
4 Loans outstanding . . . .5 Federal6 State7 Savings8 Federal (shares) . . '. .9 State (shares and
deposits)
Jan. | Feb.
61,528 62,130
34,288 34,61527240 27515
49,898 49,98027422 2747822 476 22 50252446 53 12728,968 29,402
23,478 23,725
64,640 64,990
35 752 35 95128 888 29 039
51,203 50,74827 905 27 63723298 2311156651 5700431,319 31,545
25,332 25,459
Mar. Apr.
63,710 63,078
35,538 34,93028 172 28 148
50,615 50,56227 924 27 82022 691 22 74255 017 54 59930,534 30,219
24,483 24,380
65,816 65,315
36 626 36 36329 190 28 952
50,465 49,49027 539 26 97622926 2251457 985 57 56932,267 32,163
25,718 25,406
May
64,219
35,59828621
50,9912804122,95055 61330,758
24,855
66,228
3687829350
48,62526 41022,2155845132,740
25,711
June
19
65,511
36,41529096
51,5912841223,1795706131,709
25,352
19
68,231
38 11130 120
47,34725 63721 7106061934,161
26,458
July
79
64,920
35,72029,200
51,5712829223,27957 11431,496
25,618
80
68,550
38 12830422
47,006' 25 301
21,70561 91434,901
27,013
Aug.
65,639
36,07829,561
52,3742874623,6285740731,635
25,772
69,673
38,73330940
47,05925 26721,7926276535,415
27,350
Sept.
66,385
36,55429,831
52,8672901423,85358 19232,091
26,101
70,515
39,21931 296
47,21125 38121,83063 72835,961
27,767
Oct.
65,179
35,97829,201
52,77728,89223,88556,75631,444
25,312
70,702
39,15531,547
47,22125,28821,93363,95736,030
27,927
Nov.
65,546
36,15729,389
52,53028,75423,77656,91631,586
25,330
71,335
39,42831,907
47,29925,27322,02664,30436,183
28,121
Dec.
65,992
36,46829,524
52,22428 54723,67757,45931,831
25,628
71,707
39,80131 908
47,77425 62722,14764,39936,348
28,051
86
Digitized for FRASER http://fraser.stlouisfed.org/ Federal Reserve Bank of St. Louis
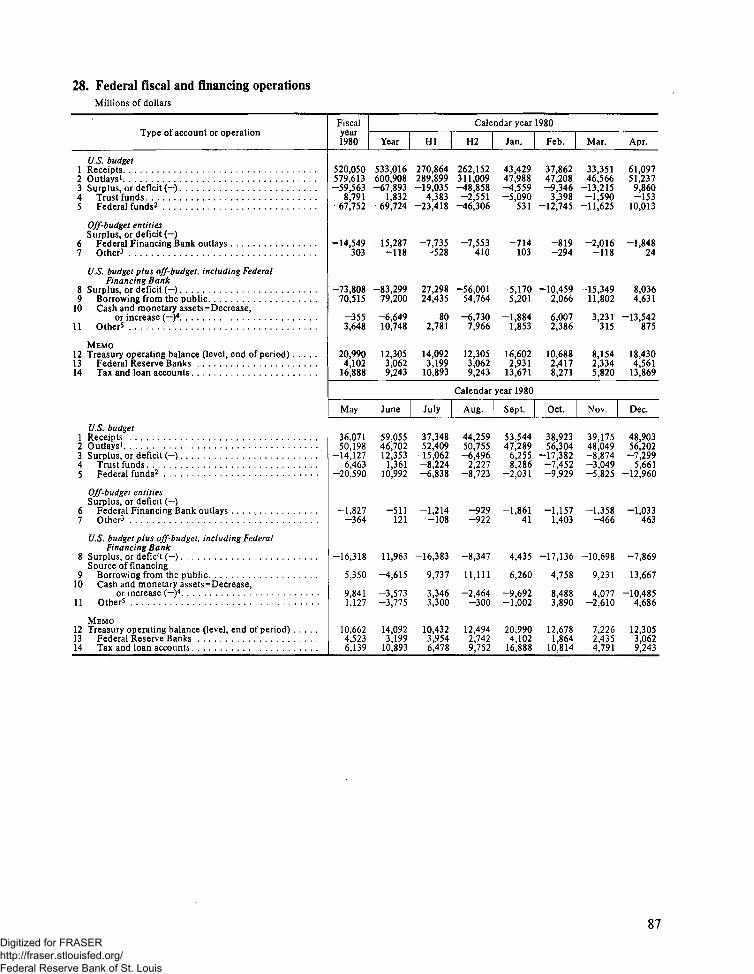
28. Federal fiscal and financing operationsMillions of dollars
Type of account or operation
U.S. budget1 Receipts2 Outlays1 . .3 Surplus or deficit ( — ) . .4 Trust funds5 Federal funds^ . .
Off-budget entitiesSurplus, or deficit (— )
6 Federal Financing Bank outlays . . . .7 Other3
U.S. budget plus off-budget, including FederalFinancing Bank
8 Surplus or deficit ( — )9 Borrowing from the public. . . . . . . .
10 Cash and monetary assets-Decrease,or increase (— )4 . . . .
11 Other5
MEMO12 Treasury operating balance (level, end of period)13 Federal Reserve Banks . . . . .14 Tax and loan accounts
U.S. budget1 Receipts2 Outlays1
3 Surplus, or deficit (— )4 Trust funds5 Federal funds2
Off-budget entitiesSurplus, or deficit (— )
6 Federal Financing Bank outlays .7 Other3
U.S. budget plus off-budget, including FederalFinancing Bank
8 Surplus or deficit (— )Source of financing
9 Borrowing from the public10 Cash and monetary assets-Decrease,
or increase ( — )4
11 Other5 .
MEMO12 Treasury operating balance (level, end of period)13 Federal Reserve Banks14 Tax and loan accounts
Fiscalyear1980
520,050579,613-59,563
8,791-67,752
-14,549303
-73,80870,515
-3553,648
20,9904,102
16,888
Calendar year 1980
Year
533,016600,908-67,893
1,832-69,724
-15,287-118
-83,29979,200
-6,64910,748
12,3053,0629,243
HI
270,864289,899-19,035
4,383-23,418
-7,735-528
-27,29824,435
802,781
14,0923,199
10,893
H2
262,152311,009-48,858-2,551
^6,306
-7,553410
-56,00154,764
-6,7307,966
12,3053,0629,243
Jan.
43,42947,988-4,559-5,090
531
-714103
-5,1705,201
-1,8841,853
16,6022,931
13,671
Feb.
37,86247,208-9,346
3,398-12,745
-819-294
-10,4592,066
6,0072,386
10,6882,4178,271
Mar.
33,35146,566
-13,215-1,590
-11,625
-2,016-118
-15,34911,802
3,231315
8,1542,3345,820
Apr.
61,09751,2379,860-153
10,013
-1,84824
8,0364,631
-13,542875
18,4304,561
13,869
Calendar year 1980
May
36,07150,198
-14,1276,463
-20,590
-1,827-364
-16,318
5,350
9,8411,127
10,6624,5236.139
June
59,05546,70212,353
1,36110,992
-511121
11,963
-4,615
-3,573-3,775
14,0923,199
10.893
July
37,34852,409
-15,062-8,224-6,838
-1,214-108
-16,383
9,737
3,3463,300
10,4323,9546.478
Aug.
44,25950,755-6,496
2,227-8,723
-929-922
-8,347
11,111
-2,464-300
12,4942,7429.752
Sept.
53,54447,289
6,2558,286
-2,031
-1,86141
4,435
6,260
-9,692-1,002
20,9904,102
16.888
Oct.
38,92356,304
-17,382-7,452-9,929
-1,1571,403
-17,136
4,758
8,4883,890
12,6781,864
10.814
Nov.
39,17548,049-8,874-3,049-5,825
-1,358-466
-10,698
9,231
4,077-2,610
7,2262,4354.791
Dec.
48,90356,202-7,299
5,661-12,960
-1,033463
-7,869
13,667
-10,4854,686
12,3053,0629.243
87Digitized for FRASER http://fraser.stlouisfed.org/ Federal Reserve Bank of St. Louis

29. U.S. budgetA. ReceiptsMillions of dollars
Source
1 All sources1 .
2 Individual income taxes, net3 Withheld4 Presidential Election Campaign Fund.5 Nonwithheld . . .6 Refunds
Corporation income taxes7 Gross receipts8 Refunds
9 Social insurance taxes andcontributions, net
10 Payroll employment taxes and contributions^11 Self-employment taxes and contributions-* . . .12 Unemployment insurance13 Other net receipts4
14 Excise taxes15 Customs deposits16 Estate and gift taxes17 Miscellaneous receipts^
Calendar year 1980
Year Jan.
533,016 43,429
251,950 26,856231,318 17,821
38 064,299 9,06143,706 26
72,013 2,7028,582 465
163,859 10,775135,908 9,085
5,723 44115,432 6756,796 574
26,715 1,4487,160 6116,590 509
13,311 992
1 All sources1
2 Individual income taxes, net . . . .3 Withheld4 Presidential Election Campaign Fund5 Nonwithheld6 Refunds ,
Corporation income taxes7 Gross receipts8 Refunds .
9 Social insurance taxes andcontributions, net
10 Payroll employment taxes and contributions^- • - .11 Self-employment taxes and contributions^ . .12 Unemployment insurance13 Other ne t receipts4 . . . .
14 Excise taxes .15 Customs deposits16 Estate and gift taxes17 Miscellaneous receipts5
Feb.
37,862
15,52219,466
71,2305,181
2,117697
16,85714,447
3771,490
543
1,378519506
1,661
Mar.
33,351
9,05618,077
92,998
12,027
10,255747
11,49910,346
401208544
1,289584494920
Apr.
61,097
31,48817,136
724,93710,592
10,2441,073
15,88610,1223,5451,646
573
2,269559459
1,265
May
36,071
9,27518,104
72,101
10,937
1,866635
20,78715,376
3764,495
540
2,502557623
1,098
June
59,055
27,79119,791
49,3801,385
16,251447
10,7939,702
395171519
2,497611502
1,057
Calendar year 1980
July
37,348
19,77319,513
41,5801,324
2,673537
10,2538,697-2311,229
558
2,662663623
1,240
Aug.
44,259
19,52719,220
01,103
796
1,848481
18,54615,512
02,423
612
2,687617595918
Sept.
53,544
26,93618,731
08,632
429
9,531647
12,86011,520
419299622
2,734605611914
Oct.
38,923
21,15020,237
01,454
540
2,5981,314
11,2839,645
01,068
570
2,778654610
1,163
Nov.
39,175
20,85120,379
0673201
1,774111
13,24211,189
01,499
554
2,080546543909
Dec.
48,903
23,72522,844
01,150
269
10,155768
11,07810,268
0224586
2,391632517
1,174
88Digitized for FRASER http://fraser.stlouisfed.org/ Federal Reserve Bank of St. Louis
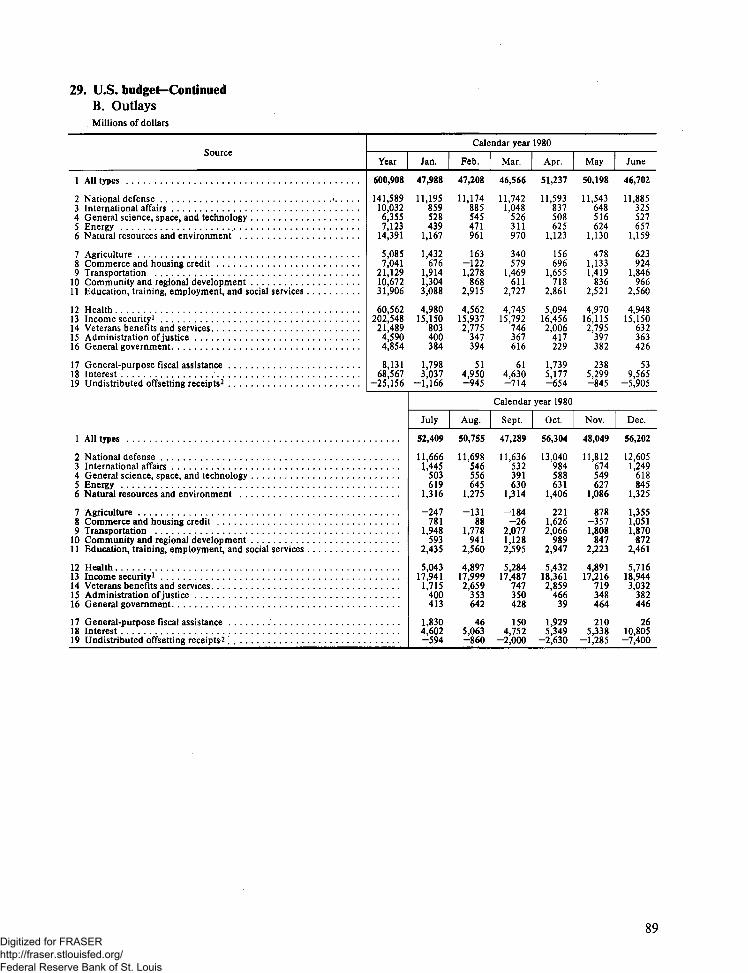
29. U.S. budget-ContinuedB. OutlaysMillions of dollars
Source
1 All types
2 National defense *3 International affairs4 General science space and technology5 Energy6 Natural resources and environment
7 Agriculture8 Commerce and housing credit9 Transportation
10 Community and regional development11 Education training employment and social services
12 Health13 Income security*14 Veterans benefits and services15 Administration of justice . ,16 General government
17 General -purpose fiscal assistance18 Interest19 Undistributed offsetting receipts2
Calendar year 1980
Year Jan.
600,908 47,988
141,589 11,19510,032 8596,355 5287,123 439
14,391 1,167
5,085 1,4327,041 676
21,129 1,91410,672 1,30431,906 3,088
60,562 4,980202,548 15,150
21,489 8034,590 4004,854 384
8,131 1,79868,567 3,037
-25,156 -1,166
1 All types
2 National defense3 International affairs4 General science, space, and technology5 Energy6 Natural resources and environment
7 Agriculture8 Commerce and housing credit9 Transportation
10 Community and regional development *1 1 Education training employment and social services . . .
12 Health13 Income security*14 Veterans benefits and services15 Administration of justice16 General government
17 General-purpose fiscal assistance18 Interest19 Undistributed offsetting receipts^ '
Feb.
47,208
11,174885545471961
163-1221,278
8682,915
4,56215,9372,775
347394
514,950-945
Mar.
46,566
11,7421,048
526311970
340579
1,469611
2,727
4,74515,792
746367616
614,630-714
Apr.
51,237
11,593837508625
1,123
156696
1,655718
2,861
5,09416,4562,006
417229
1,7395,177-654
May
50,198
11,543648516624
1,130
4781,1331,419
8362,521
4,97016,1152,795
397382
2385,299-845
June
46,702
11,885325527657
1,159
623924
1,846966
2,560
4,94815,150
632363426
539,565
-5,905
Calendar year 1980
July
52,409
11,6661,445
503619
1,316
-247781
1,948593
2,435
5,04317,941
1,715400413
1,8304,602-594
Aug.
50,755
11,698546556645
1,275
-13188
1,778941
2,560
4,89717,9992,659
353642
465,063-860
Sept.
47,289
11,636532391630
1,314
-184-26
2,0771,1282,595
5,28417,487
747350428
1504,752
-2,000
Oct.
56,304
13,040984588631
1,406
2211,6262,066
9892,947
5,43218,3612,859
46639
1,9295,349
-2,630
Nov.
48,049
11,812674549627
1,086
878-3571,808
8472,223
4,89117,216
719348464
2105,338
-1,285
Dec.
56,202
12,6051,249
618845
1,325
1,3551,0511,870
8722,461
5,71618,9443,032
382446
2610,805-7,400
89Digitized for FRASER http://fraser.stlouisfed.org/ Federal Reserve Bank of St. Louis

30. Federal debt subject to statutory limit—Types and ownershipBillions of dollars
Ti__-item
1 Federal debt outstanding . . .
2 Public debt securities . . .3 Held by public4 Held by agencies . . .5 Agency securities6 Held by public7 Held by agencies
8 Debt subject to statutory limit
9 Public debt securities . . . . . .10 Other debt1
1 1 MEMO: Statutory debt limit
Mar. 31
870.4
863,5677.11863
7.0551.5
864.5
862.81 7
879.0
19
June 30
884.4
8776682.71949
6.8531.5
878.7
877.01 7
925.0
80
Sept. 30
914.3
9077710.01977
6,65 11.5
908.7
907.11 6
925.0
Dec. 31
936.7
9302737.71925
6.5501.5
931.2
929.61 6
935.1
31. Gross public debt of the U.S. Treasury—Types and ownershipBillions of dollars, end of period
Type and holder
1 Total gross public debt
Type2 Interest-bearing debt . . .3 Marketable4 Bills5 Notes6 Bonds
7 Nonmarketable1
8 Convertible bonds2
9 State and localgovernment series
10 Foreign issues^11 Government12 Public13 Savings bonds and notes14 Government-account series4. . . .
Jan.
847.7
8465535 7175 5284.0
76 1
31092 2
24830.023 664
78 6174.9
Feb.
854.6
853.45406111 A286.8
76.4
312.722
24.529.623.264
77.7178.4
Mar.
863.5
8622557 5190.8290.4
76.3
304.72 2
23 926.920.564
76.0175.5
Apr.
870.0
8689564 9195 3291.8
77.7
304.0
23 726.319 864
74.2179.7
May
877.9
873 5567 61954291.5806
306.0
23 625.919564
73.6182.6
June
19
877.6
8763566 71847301.5
806
3095
23 625.519064
73.4186.8
July
80
881.7
880.4576 1191.5302.6
82.0
304.3
23.525.819.364
73.3181.5
Aug.
893.4
888.75834199.3300.3
83.9
305.3
23.625.819.464
73.2182.4
Sept.
907.7
90645945199.8310.9
83.8
311.9
23.625.218.764
73.0189.8
Oct.
908.2
906.95994202.3311.9
85.2
307.5
23 924.818.464
73.0185.7
Nov.
913.8
909.4605.4208.7311.1
85.5
304.0
24.024.518.16.4
72.8182.4
Dec.
930.2
928.9623 2216.1321.6
85.4
305.7
23.824.017.66,4
72.5185.1
15 Non-interest-bearing debt. . . . 1.2 1.2 1.2 1.1 4.4 1.3 1.3 4.7 1.3 1.2 4.4 1.3
Holder*16 U.S. government agencies
and trust funds17 Federal Reserve Banks
18 Private investors19 Commercial banks20 Mutual savings banks21 Insurance companies22 Other corporations23 State and local governments
Individuals24 Savings bonds25 Other securities.26 Foreign and international^27 Other miscellaneous investors7
184 5116 3
546 992.24 5
14 526 567 8
786384
125 099.4
1908115 2
551 692.94.5
14.728 1729
77.736.1
124.7100.0
1863116 7
560 592.44.6
15.321 868 1
76.0488
119 9113.5
188 2118 8
563 090.34.6
15.225767 3
74.251 1
116 7117.9
19071240
562 992.04.6
13 725 067 6
73.5508
117 5118.2
194 9124 5
558 293.64.5
13 8227674
73.4467
122 9113.2
1892119.7
572994.44.7
14.425.3689
73.347.9
124.7119.3
189 8119.3
583 898.15.0
14.124.6707
73.250.9
126.3120.9
197 7120.7
5892100.9
5.314.425.5734
73.050.0
126.3120.4
1934121.5
593 3103.4
5.515.325.373 1
73.049.9
127,7120.1
189.7120.4
603 2101.8
5.615.424.874.6
72.852.1
132.6123.4
192.5121.3
616,4104.7
5.815.224.6747
72.556.7
134.3127.9
90Digitized for FRASER http://fraser.stlouisfed.org/ Federal Reserve Bank of St. Louis
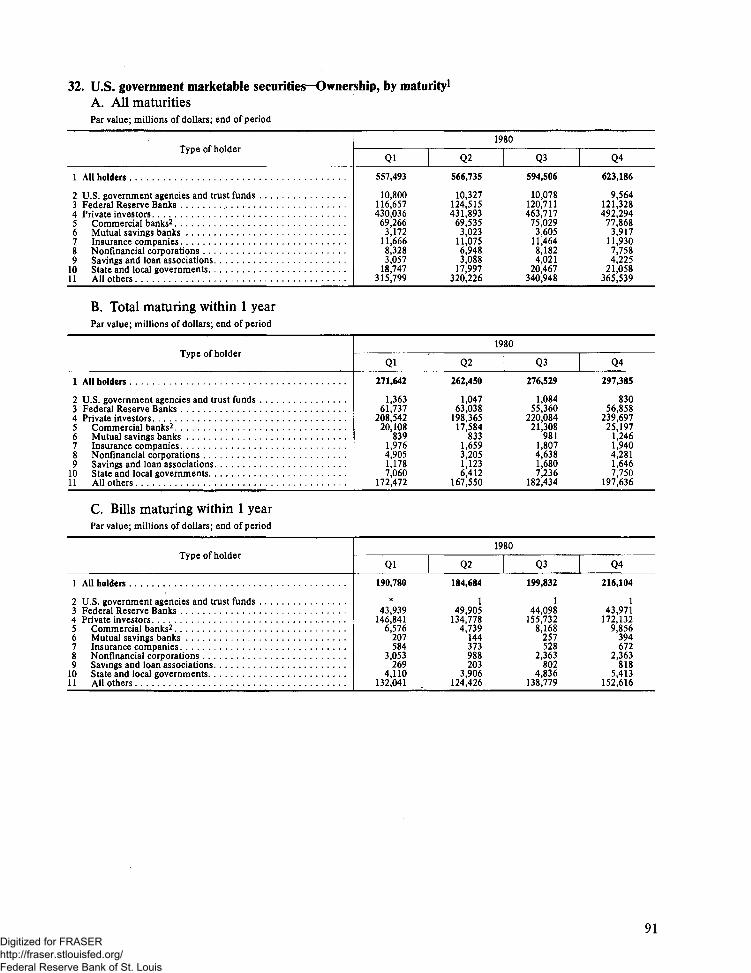
32. U.S. government marketable securities—Ownership, by maturity1
A. All maturitiesPar value; millions of dollars; end of period
Type of holder
1 AH holders
2 U S government agencies and trust funds3 Federal Reserve Banks4 Private investors5 Commercial banks^6 Mutual savings banks . . . . . . .7 Insurance companies8 Nonfinancial corporations . . . .9 Savings and loan associations
10 State and local governments . ,11 All others
B. Total maturing within 1 yearPar value; millions of dollars; end of period
1 All holders
2 U S government agencies and trust funds3 Federal Reserve Banks4 Private investors5 Commercial banks^6 Mutual savings banks7 Insurance companies8 Nonfinancial corporations9 Savings and loan associations
10 State and local governments11 All others
C. Bills maturing within 1 yearPar value; millions of dollars; end of period
1 All holders
2 U S government agencies and trust funds3 Federal Reserve Banks4 Private investors5 Commercial banks^6 Mutual savings banks7 Insurance companies8 Nonfinancial corporations9 Savings and loan associations
10 State and local governments11 All others
Qi557,493
10800116,657430,036
69,2663,172
11,6668,3283,057
18,747315,799
Ql271,642
1 36361,737
208 54220,108
8391,9764,9051 1787,060
172,472
Ql190,780
*43,939
146,8416,576
207584
3,053269
4,110132,041
19
Q2
566,735
10,327124,515431,893
69,5353,023
11,0756,9483,088
17,997320,226
19
Q2
262,450
1,04763,038
198,36517,584
8331,6593,2051 1236,412
167,550
19
Q2
184,684
149,905
134,7784,739
144373988203
3,906124,426
80
Q3594,506
10,078120,711463,717
75,0293,605
11,4648,1824,021
20,467340,948
80
Q3
276,529
1,08455,360
220,08421,308
9811,8074,6381,6807,236
182,434
80
Q3199,832
144,098
155,7328,168
257528
2,363802
4,836138,779
Q4
623,186
9,564121,328492,294
77,8683,917
11,9307,7584,225
21,058365,539
Q4
297,385
83056,858
239,69725,197
1,2461,9404,2811,6467,750
197,636
Q4
216,104
143,971
172,1329,856
394672
2,363818
5,413152,616
91Digitized for FRASER http://fraser.stlouisfed.org/ Federal Reserve Bank of St. Louis

32. U.S. government marketable securities—Ownership, by maturity1—ContinuedD. Other than bills maturing within 1 yearPar value; millions of dollars; end of period
1 All holders
2 U S government agencies and trust funds3 Federal Reserve Banks4 Private investors5 Commercial banks2
6 Mutual savings banks7 Insurance companies8 Nonfinancial corporations9 Savings and loan associations
10 State and local governments ,1 1 All others
E. 1- to 5-year maturitiesPar value; millions of dollars; end of period
Tir«a rtFKiili-lovlype oi holder
1 AH holders
2 U S government agencies and trust funds . . .3 Federal Reserve Banks4 Private investors5 Commercial banks2
6 Mutual savings banks7 Insurance companies8 Nonfinancial corporations9 Savings and loan associations
10 State and local governments11 All others
F. 5- to 10-year maturitiesPar value; millions of dollars; end of period
1 All holders
2 U S government agencies and trust funds3 Federal Reserve Banks4 Private investors5 Commercial banks2
6 Mutual savings banks7 Insurance companies8 Nonfinancial corporations9 Savings and loan associations
10 State and local governments11 All others
Ql80,862
1,36317,79961,70113 532
6311 3921 852
9092,950
40,435
Ql169,599
228129,803
137,51539,149
1 6034,2962,1731 7284,434
84,131
Ql
53,822
1 65012,02140 151
7 583473
3 19738793
1,95326,464
19
Q2
77,766
1,04613,13363,58712,844
6901,2852217
9202,506
43,124
19
Q2
184,000
2,54133,703
147,75642,026
1,4744,1372,5651.8124,189
91,553
19
Q2
54,736
1 39813,62339,7157354
4783006
34596
1,87426,561
80
Q3
76,697
1,08311,26264,35113,140
7241,2802275
8782,400
43,655
80
Q3
195,784
2,25537,285
156,24445,390
1,8804,4172,3702,1934,555
95,439
80
Q3
53,372
1 39813,16538,8095871
4542943
31882
2,11827,022
Q4
81,281
82912,88867,56515,341
8521,2681,918
8282,337
45,020
Q4
197,409
1,99035,835
159,58544,482
1,9254,5042,2132,2894,595
99,577
Q4
56,037
1 40413,45841,1755793
4553037
357216
2,03029,287
92Digitized for FRASER http://fraser.stlouisfed.org/ Federal Reserve Bank of St. Louis

32. U.S. government marketable securities—Ownership, by maturity1—ContinuedG. 10- to 20-year maturitiesPar value; millions of dollars; end of period
Type of holder
1 All holders
2 U S government agencies and trust funds3 Federal Reserve Banks . . . .4 Private investors5 Commercial banks^6 Mutual savings banks7 Insurance companies8 Nonfinancial corporations . . . .9 Savings and loan associations
10 State and local governments11 All others
H. Over 20-year maturitiesPar value; millions of dollars; end of period
1 All holders
2 U.S. government agencies and trust funds3 Federal Reserve Banks4 Private investors5 Commercial banks^6 Mutual savings banks7 Insurance companies8 Nonfinancial corporations9 Savings and loan associations
10 State and local governments1 1 All others
Ql29,300
3,7723 803
21,7251,077
1721,242
34844
200716,834
Ql33,130
1 7349293
22 1041 350
85954515
143293
15893
19
Q2
29,432
3,6083,596
22,2291,054
1581,352
33245
2,30216,988
19
Q2
36,117
1,73410,55623 828
1,51880
921500
143,220
17 574
80
Q3
35,481
3,6865,895
25,9011,129
1851,495
40354
3,55919,076
80
Q333,340
1,6569 005
22 6801,332
104802454
132 998
16978
Q4
36,854
3,6865,919
27,2501,071
1811,718
43152
3,59720,200
Q4
35,500
1,6569 258
24 5871 325
110730476
213 086
18 838
Digitized for FRASER http://fraser.stlouisfed.org/ Federal Reserve Bank of St. Louis

33. U.S. government securities dealersA. Transactions, 19801
Par value; averages of daily figures, in millions of dollars
Type and maturity Year Jan, Feb. Mar. Apr. May June July Aug. Sept. Oct. Nov. Dec.
1 U.S. governmentsecurities. . .
Maturity2 Bills3 Other within 1 year.4 1 to 5 years5 5 to 10 years6 Over 10 years
Type of customer1 U.S. government
securitiesdealers
8 U.S. governmentsecuritiesbrokers
9 Commercial banks .10 All others2
11 Federal agencysecurities. .
18,330 16,170 17,522 17,349 19,731 19,370 17,742 15,824 17,892 17,608 17,464 21,716 21,576
11,412 10,512 9.722 11,719 12,892 11,664421 486 357 380 372 500
3,330 2,696 3,680 2,780 3,610 3,9671,464 990 2,009 1,339 1,138 1,3941,704 1,486 1,754 1,130 1,719 1,846
9,996 10,108 10,387 10,789 11,543 13,768 13,840560 348 465 325 350 442 464
3,718 2,680 3,546 3,377 2,745 3,699 3,461* — - - - - 1060 - - • - - ---
1,5061,7701,697
1,1211,567
1,6921,802 1,766
1,6402,167
1,8062,005
1,491 1,720 1,367 1,492 1,607 1,438 1,382 1,204 1,333 1,503 1,296 1,745 1,807
7,611 6,699 7,407 6,934 8,127 8,243 7,184 6,513 7,418 7,220 7,664 9,536 8,3822,339 2,025 2,244 2,312 2,875 2,825 2,312 2,032 2,164 2,228 2,019 2,366 2,6616,890 5,726 6,505 6,611 7,123 6,863 6,864 6,074 6,977 6,657 6,485 8,069 8,726
3,261 2,838 3,052 2,923 4,497 4,352 3,689 3,234 2,735 2,666 3,277 3,074 2,789
94
Digitized for FRASER http://fraser.stlouisfed.org/ Federal Reserve Bank of St. Louis

33. U.S. government securities dealers—ContinuedA. Transactions, 19801 -ContinuedPar value; averages of daily figures, in millions of dollars
Type and maturity
1 U.S. government securities . . .
Maturity2 Bills3 Other within 1 year. . . .4 1 to 5 years5 5 to 10 years6 Over 10 years
Type of customer1 U.S. government securities
dealers8 U.S. government securities
brokers9 Commercial banks . . . . .
10 All others2
1 1 Federal agency securities
1 U.S. government securities
Maturity2 Bills3 Other within 1 year. . .4 1 to 5 years5 5 to 10 years6 Over 10 years
Type of customer1 U.S. government securities
dealers . . .8 U.S. government securities
brokers9 Commercial banks
10 All others2
11 Federal agency securities
1 U.S. government securities . . . . .
Maturity2 Bills3 Other within 1 year4 1 to 5 years . . . .5 5 to 10 years6 Over 10 years
Type of customer1 U.S. government securities
dealers8 U.S. government securities
brokers . . . .9 Commercial banks .
10 All others2
1 1 Federal agency securities
Week ending Wednesday
Jan. 2
16,169
12,194845
1,968542620
2,817
3,9812,1287,243
2,252
Mar. 19
15,267
10,524305
2,1111,330
997
1,502
6,0552,0775,633
3,490
June 4
17,931
11,221520
3,5461,3251,319
1,690
6,9462,3906,904
3,966
Jan. 9
17,649
11,548601
2,655939
1,906
1,810
7,0012,6006,238
2,540
Mar. 26
19,629
12,927422
3,9771,2111,092
1,917
7,9712,6377,105
2,617
June 11
20,107
11,358592
3,7332,5481,877
1,414
9,2412,5066,946
4,253
Jan. 16
15,642
10,050460
2,5541,0631,515
1,842
6,6201,8275,352
3,013
Apr. 2
20,826
15,264493
3,059899
1,112
1,637
7,9493,0488,194
3,357
June 18
16,183
8,697602
2,9852,0551,844
1,038
6,4172,1346,594
3,795
Jan. 23
14,779
9,360330
2,4131,1281,548
1,589
6,6391,7314,820
2,925
Apr. 9
19,023
12,360340
3,0341,1902,099
1,466
7,8682,7506,938
3,916
June 25
17,011
9,710439
4,0831,2381,542
1,287
6,5682,3706,785
3,322
Jan. 30
16,057
10,382450
3,169883
1,173
1,695
6,5071,8675,988
2,593
Apr. 16
18,569
11,435399
3,5991,3091,827
1,493
7,8312,9006,344
5,034
July 2
17,019
10,410533
3,2391,2171,620
1,401
6,5212,2046,893
3,154
Feb. 6
16,387
10,500343
3,1611,0131,370
1,621
7,0442,0675,655
3,248
Apr. 23
20,698
13,032323
4,3391,3011,703
1,688
8,5792,8527,580
4,888
July 9
16,905
10,805327
2,3801,2572,135
1,219
7,4172,1496,122
3,675
Feb. 13
20,465
9,910437
4,6012,6212,895
1,498
8,8352,9957,138
2,957
Apr. 30
19,620
12,995429
3,846847
1,503
1,562
8,2213,0446,793
4,334
July 16
14,078
9,130401
2,218831
1,499
965
5,8671,7275,520
3,578
Feb. 20
15,892
9,576396
2,9121,4901,519
1,033
7,0701,9445,845
3,066
May?
22,669
13,487557
5,5631,1741,887
1,647
10,0043,7637,255
6,360
July 23
15,294
10,020252
2,4911,2041,327
1,308
6,4051,8785,703
2,609
Feb. 27
17,427
9,214288
4,0182,4331,474-
1,384
6,9651,9347,144
2,773
May 14
21,019
11,524558
4,4992,0542,384
1,862
8,7582,9047,495
4,235
July 30
15,146
9,010360
3,3611,0311,385
1,077
5,8402,1556,074
3,122
Mar. 5
17,983
11,485352
2,7682,0301,348
1,140
7,1332,2207,490
3,474
May 21
17,283
10,183428
3,5511,3911,730
1,137
7,6722,2496,225
3,515
Aug. 6
17,448
10,927454
3,3641,1161,587
1,198
7,1772,0257,049
3,028
Mar. 12
15,430
10,082376
2,0721,6351,265
1,492
6,2131,8075,918
2,638
May 28
18,262
12,370464
2,7481,1051,576
1,228
7,4092,5327,093
3,037
Aug. 13
18,871
10,104505
3,2422,4522,569
1,470
7,8672,1457,390
2,577
95Digitized for FRASER http://fraser.stlouisfed.org/ Federal Reserve Bank of St. Louis

33. U.S. government securities dealers—ContinuedA. Transactions, 19801 -ContinuedPar value; averages of daily figures, in millions of dollars
Type and maturity
1 U.S. government securities . . .
Maturity2 Bills3 Other within 1 year4 1 to 5 years5 5 to 10 years ' . . , .6 Over 10 years
Type of customer1 U.S. government securities dealers8 U S government securities brokers9 Commercial banks
10 All others2
1 1 Federal agency securities
1 U.S. government securities
Maturity2 Bills3 Other within 1 year4 1 to 5 years5 5 to 10 years6 Over 10 years
Type of customer1 U.S. government securities dealers8 U.S. government securities brokers9 Commercial banks
10 All others2
1 1 Federal agency securities
Week ending Wednesday
Aug. 20
18,181
11,400550
3,3691,2801,582
1,2067,6682,2137,095
2,740
Oct. 29
16,823
10,515373
3,339988
1,608
1,0667,9981,9695,790
3,194
Aug. 27
17,289
9,843433
4,544979
1,490
1,5417,1202,2906,337
2,958
Nov. 5
18,541
13,100332
2,541960
1,608
1,6698,0432,1586,671
3.140
Sept. 3
18,390
10,475377
2,8133,0911,634
1,2577,3292,4517,354
2,456
Nov. 12
25,386
14,207302
4,6913,1892,997
1,64011,5132,8079,427
3441
Sept. 10
15,533
9,520310
2,5081,7931,402
1,1036,4142,0046,012
2,347
Nov. 19
22,277
14,343636
3,4941,5942,211
1,6879,7732,5478,271
3,656
Sept. 17
17,174
11,333178
2,8051,3821,476
1,3977,0582,3546,365
2,311
Nov. 26
20,769
13,520432
3,942943
1,933
2,0968,8722,0077,795
2,751
Sept. 24
19,832
11,730290
4,7541,6861,372
1,9028,1792,3717,381
3,392
Dec. 3
19,061
13,014372
3,186850
1,639
1,5258,3872,1666,984
2,462
Oct. 1
18,413
10,818465
3,7771,2812,071
2,0937,3422,1696,808
2,822
Dec. 10
19,794
12,124397
2,2572,8402,175
1,1728,8352,4967,290
2,667
Oct. 8
17,836
11,269304
2,9261,3721,966
1,2517,7322,1276,726
3,348
Dec. 17
21,449
13,559577
3,4921,7062,115
1,7128,8512,6138,273
3,058
Oct. 15
17,905
12,586266
2,1081,0221,922
1,3397,2742,1157,178
3,414
Dec. 24
23,656
13,781347
5,4091,8002,320
2,0989,0603,1299,369
3.281
Oct. 22
16,068
11,155430
2,256798
1,428
9927,2981,7086,070
2,947
Dec. 31
21,858
16,183638
2,3841,2751,378
2,4085,7232,565
11,163
2,230
96Digitized for FRASER http://fraser.stlouisfed.org/ Federal Reserve Bank of St. Louis

33. U.S. government securities dealers—ContinuedB. Positions, 19801
Par value; averages of daily figures, in millions of dollars
Type and maturity
1 U.S. governmentsecurities
2 Bills3 Other within 1 year, .4 1 to 5 years . .5 5 to 10 years6 Over 10 years , . .
7 Federal agencysecurities
Year Jan. Feb. Mar. Apr. May June July
4,304 3,442 2,729 2,341 8,036 5,398 5,156 5,240
4,101 4,386 2,939 3,000 7,870 4,025 3,720 4,603-1,062 -1,094 -792 -764 -1,082 -843 -731 -1,150
434 -305 28 -518 683 726 916 1,074166 123 327 336 61 361 504 73665 333 226 286 505 1,128 747 640
797 998 236 284 1,206 1,254 1,411 1,182
1 U.S. government securities
2 Bills3 Other within 1 year4 1 to 5 years5 5 to 10 years6 Over 10 years
7 Federal agency securitif
1 U.S. government securi
2 Bills3 Other within 1 year4 1 to 5 years5 5 to 10 years . .6 Over 10 years
7 Federal agency securi tii
1 U.S. government securi
2 Bills3 Other within 1 year. . .4 1 to 5 years . .5 5 to 10 years6 Over 10 years
7 Federal agency securiti
1 U.S. government securi
2 Bills3 Other within 1 year. .4 1 to 5 years5 5 to 10 years . .6 Over 10 years
7 Federal agency securiti
1 U.S. government securi
2 Bills3 Other within 1 year. .4 1 to 5 years5 5 to 10 years6 Over 10 years
*s
ties
is
ties
BS
ties
Aug.
5,947
5,149-1,336
1,391218526
691
Sept.
3,338
3,753-1,685
620122529
320
Oct.
2,701
2,557-1,082
755-221
692
979
Nov.
3,279
3,132-792-123-13
1,075
357
Dec.
4,042
4,081-1,394
M3104
1,294
643
Week ending Wednesday
Jan. 2 Jan. 9
1,057 2,418
2,339 3,197-1,335 -1,087
-119 -311256 253-84 367
1,421 1,016
Mar. 19 Mar. 26
875 2,117
2,005 2,509-773 -826
-1,046 -156354 287335 302
311 396
June 4 June 11
6,009 7,029
4,508 4,779-756 -672
776 1,144456 876
1,026 903
1,185 1,427
BS
ties
7 Federal agency securities
Aug. 20
6,568
6,337-1,558
1,026328435
821
Oct. 29
3,299
2,566-712
970-342
818
1.066
Jan. 16
3,456
4,332-1,105
-453196485
1,122
Apr. 2
4,923
4,886-970
79939
170
699
June 18
4,686
3,518-716
684478722
1,328
Aug. 27
4,351
4,300-1,510
939172450
428
Nov. 5
2,719
2,852-563
261-435
603
700
Jan. 23
3,585
5,061-1,134
-835120373
890
Apr. 9
8,002
7,769-1,028
61431
616
907
June 25
4,301
3,402-759
769292598
1,540
Sept. 3
4,500
4,330-1,603
648674451
269
Nov. 12
4,212
3,210-646
7126
932
576
Jan. 30
4,359
5,012-1,052
225-57231
863
Apr. 16
8,765
8,864-1,051
31887
546
1,067
July 2
3,134
2,258-9081,035
234515
1,397
Sept. 10
3,784
4,063-1,727
544439465
183
Nov. 19
4,055
3,874-844-195
741,146
78
Feb. 6
4,128
5,009-924
83-135
94
785
Apr. 23
7,575
7,487-1,136
62321
580
1,506
July 9
4,011
3,163-1,055
890227786
1,454
Sept. 17
3,656
4,467-1,741
118183629
259
Nov. 26
1,910
2,310-924-791
501,267
314
Feb. 13
3,327
3,200-829
5658292
396
Apr. 30
8,504
7,950-1,114
1,098143427
1,561
July 16
3,957
3,743-1,209
663129631
1,292
Sept. 24
2,921
3,184-1,788
970-69624
435
Dec. 3
3,539
3,526-920-415
301,318
591
Feb. 20
1,742
2,175-693-355
320295
77
May 7
5,891
4,754-8761,140
65808
. 1,406
July 23
5,955
5,893-1,281
60484
655
1,124
Oct. 1
2,164
2,683-1,425
908-359
356
486
Dec. 10
4,266
4,066-920-716
4311,405
542
Feb. 27
2,481
2,327-735
428271191
-23
May 14
5,890
3,948-817
747638
1,374
1,314
July 30
7,076
5,674-1,138
2,031-99609
949
Oct. 8
2,018
2,126-1,369
1,097-155
318
858
Dec. 17
2,927
3,935-1,652
-6833
1,324
406
Mar. 5
2,-453
2,743-689-532
623307
44
May 21
4,647
3,404-826
476372
1,220
1,049
Aug. 6
6,230
5,381-9101,739-373
393
845
Oct. 15
2,984
2,818-1,502
853-69884
947
Dec. 24
4,432
4,146-1,751
913-1981,323
668
Mar. 12
2,794
3,778-672-995
390292
-36
May 28
5,416
4,089-865
676381
1,134
1,301
Aug. 13
7,571
5,318-1,186
2,152442846
857
Oct. 22
2,517
2,569-995
229-187
902
1,188
Dec. 31
5,060
4,532-1,564
743260
1,090
1,102
97Digitized for FRASER http://fraser.stlouisfed.org/ Federal Reserve Bank of St. Louis
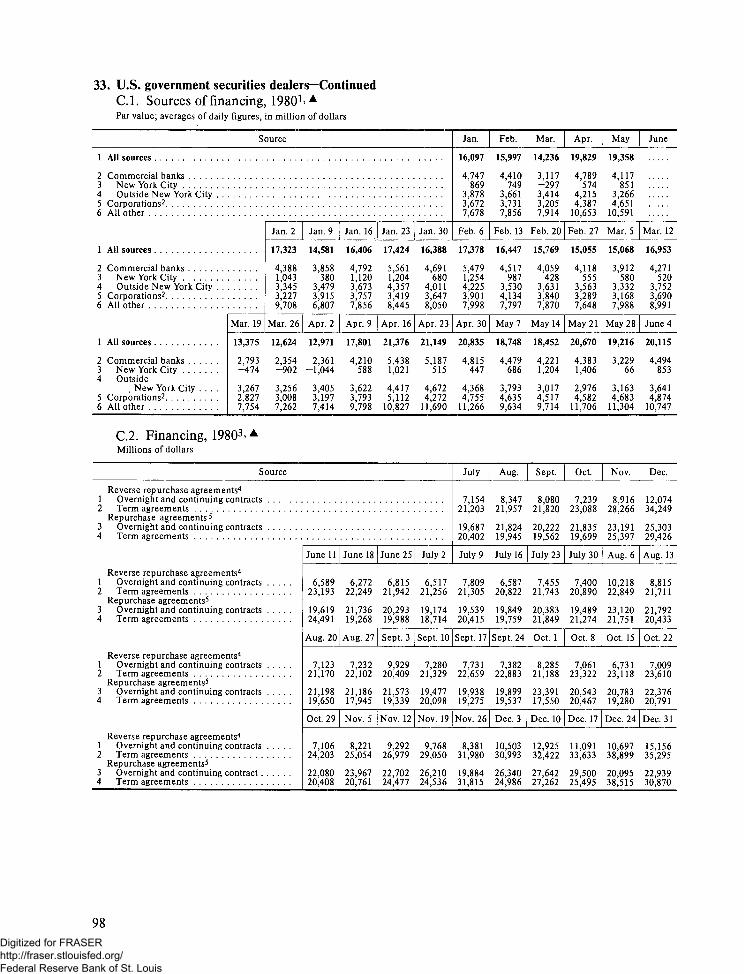
33. U.S. government securities dealers—ContinuedC.I. Sources of financing, 1980!Par value; averages of daily figures, in million of dollars
Source
1 All sources
2 Commercial banks3 New York City4 Outside New York City5 Corporations2
6 All other
1 All sources
2 Commercial banks3 New York City4 Outside New York City . .5 Corporations2
6 All other
1 All sources . .
2 Commercial banks3 New York City4 Outside
. New York City . . . .5 Corporations2
6 All other
Mar. 19
13,375
2,793-474
3,2672,8277,754
Jan. 2 Jan, 9
17,323 14,581
4,388 3,8581,043 3803,345 3,4793,227 3,9159,708 6,807
Mar. 26 Apr. 2
12,624 12,971
2,354 2,361-902 -1,044
3,256 3,4053,008 3,1977,262 7,414
Jan. 16
16,406
4,7921,1203,6733,7577,856
Apr. 9
17,801
4,210588
3,6223,7939,798
Jan. 23
17,424
5,5611,2044,3573,4198,445
Apr. 16
21,376
5,4381,021
4,4175,112
10,827
Jan. 30
Jan.
16,097
4,747869
3,8783,6727,678
Feb. 6
16,388 17,378
4,691 5,479680 1,254
4,011 4,2253,647 3,9018,050 7,998
Apr. 23 Apr. 30
21,149 20,835
5,187 4,815515 447
4,672 4,3684,272 4,755
11,690 11,266
Feb.
15,997
4,410749
3,6613,7317,856
Feb. 13
16,447
4,517987
3,5304,1347,797
May 7
18,748
4,479686
3,7934,6359,634
Mar.
14,236
3,117-2973,4143,2057,914
Feb. 20
15,769
4,059428
3,6313,8407,870
May 14
18,452
4,2211,204
3,0174,5179,714
Apr.
19,829
4,789574
4,2154,387
10,653
Feb. 27
15,055
4,118555
3,5633,2897,648
May 21
20,670
4,3831,406
2,9764,582
11,706
May
19,358
4,117851
3,2664,651
10,591
Mar. 5
15,068
3,912580
3,3323,1687,988
May 28
19,216
3,22966
3,1634,683
11,304
June
Mar. 12
16,953
4,271520
3,7523,6908,991
June 4
20,115
4,494853
3,6414,874
10,747
C.2. Financing, 19803>A
Millions of dollars
Source
Reverse repurchase agreements4
1 Overnight and continuing contracts2 Term agreements
Repurchase agreements5
3 Overnight and continuing contracts4 Term agreements
Reverse repurchase agreements4
1 Overnight and continuing contracts2 Term agreements
Repurchase agreements5
3 Overnight and continuing contracts4 Term agreements
Reverse repurchase agreements4
1 Overnight and continuing contracts2 Term agreements
Repurchase agreements5
3 Overnight and continuing contracts4 Term agreements
Reverse repurchase agreements4
1 Overnight and continuing contracts2 Term agreements
Repurchase agreements5
3 Overnight and continuing contract4 Term agreements
June 11
6,58923,193
19,61924,491
Aug. 20
7,12321,170
21,19819,650
Oct. 29
7,10624,203
22,08020,408
June 18
6,27222,249
21,73619,268
Aug. 27
7,23222,102
21,18617,945
Nov. 5
8,22125,054
23,96720,761
June 25
6,81521,942
20,29319,988
Sept. 3
9,92920,409
21,57319,339
Nov. 12
9,29226,979
22,70224,477
July 2
July
7,15421,203
19,68720,402
July 9
6,517 7,80921,256 21,305
19,174 19,53918,714 20,415
Sept. 10 Sept. 17
7,280 7,73121,329 22,659
19,477 19,93820,098 19,275
Nov. 19 Nov. 26
9,768 8,38129,050 31,980
26,210 19,88424,536 31,815
Aug.
8,34721,957
21,82419,945
July 16
6,58720,822
19,84919,759
Sept. 24
7,38222,883
19,89919,537
Dec. 3
10,50330,993
26,34024,986
Sept.
8,08021,820
20,22219,562
July 23
7,45521,743
20,38321,849
Oct. 1
8,28521,188
23,39117,550
Dec. 10
12,92532,422
27,64227,262
Oct.
7,23923,088
21,83519,699
July 30
7,40020,890
19,48921,274
Oct. 8
7,06123,322
20,54320,467
Dec. 17
11,09133,633
29,50025,495
Nov.
8,91628,266
23,19125,397
Aug. 6
10,21822,849
23,12021,751
Oct. 15
6,73123,118
20,78319,280
Dec. 24
10,69738,899
20,09538,515
Dec.
12,07434,249
25,30329,426
Aug. 13
8,81521,711
21,79220,433
Oct. 22
7,00923,610
22,37620,791
Dec. 31
15,15635,295
22,93930,870
Digitized for FRASER http://fraser.stlouisfed.org/ Federal Reserve Bank of St. Louis

34. Debt of federal and federally sponsored credit agenciesMillions of dollars, end of period
1 Federal and federallysponsoredagencies
2 Federal agencies .. . .3 Defense
Department1 . . .4 Export-Import
Bank2-3
5 Federal HousingAdministration4 .
6 Government NationalMortgage Associa-tion participationcertificates* . . . .
7 Postal Service6
8 Tennessee ValleyAuthority
9 United States RailwayAssociation6. . . .
10 Federally sponsoredagencies
1 1 Federal Home LoanBanks
12 Federal Home LoanMortgageCorporation . . . .
13 Federal NationalMortgageAssociation . . . .
14 Federal Land Banks. .15 Federal Intermediate
Credit Banks . . .16 Banks for
Cooperatives , . .17 Farm Credit Banks . .18 Student Loan
MarketingAssociation7. . . .
19 Other
MEMO20 Federal Financing
Bank debt6'8
Lending to federal andfederally sponsoredagencies
21 Export-Import Bank3 . .22 Postal Service6
23 Student Loan MarketingAssociation7 . . .
24 Tennessee ValleyAuthority
25 United States RailwayAssociation6
Other lending26 Farmers Home
Administration , . .27 Rural Electrification
Administration . . .28 Other
Jan. j Feb.
165,819 167,813
24,883 25 013
729 719
9,176 9,144
539 546
2,979 -2,9791 837 1 837
9 182 9 347
441 441
140 936 142 800
33,122 33,102
2,769 2,764
49,031 50,13915,106 15,106
2,144 2,144
584 58436,584 37,240
1,595 1,7201 l
68,294 69,268
8,353 8,3531,587 1,587
1,595 1,720
7 457 7 622
441 441
32,145 32,565
6,701 6,87410,015 10,106
Mar.
173,216
25583
709
9627
550
2,9791 837
9440
441
147 633
35,309
2,644
51,61415,106
2,144
58438,446
1,7851
71,885
8,8491,587
1 785
7715
441
33,410
7,03911,059
Apr.
176,880
25 776
688
9615
537
2,9371 837
9695
467
151 104
36,352
2,643
52,45613,940
2,144
58441,039
1,9451
74,009
8,8491,587
1 945
7 970
467
34,755
7,15511,281
May
179,062
25904
679
9597
531
2,9371 770
9920
470
153 158
37,540
2,642
52,57313,940
2,144
58441,629
2,1051
76,009
8,8491 520
2 105
8 195
470
35,745
7,63111,494
19
June
179,353
26,667
674
10,275
524
2,8771 770
10,075
472
152 686
36,748
2,642
52,38913,940
2,144
58442,058
2,1801
77,408
9,5581,520
2,180
8 350
472
35,745
7,94211,641
80
July
180,119
26,810
661
10,248
516
2,8421 770
10300
473
153 309
36,039
2,634
52,11412,7i65
1,821
58445,111
2,2401
78,870
9,5581,520
2,240
8 575
473
36,715
8,08411,705
Aug.
179,545
26930
651
10,232
508
2,8421 770
10445
482
152 615
35,690
2,634
52,00112,765
1,821
58444,824
2,2951
80,024
9,5581,520
2 295
8 720
482
37,403
8,23311,813
Sept.
182,713
27618
641
10,728
495
2,8421 770
10660
482
155 095
36,710
2,537
52,38212,765
1,821
58445,950
2,3451
82,559
10,0671,520
2 345
8 935
482
37,961
8,42512,824
Oct.
188,076
27797
636
10715
490
2,8421 770
10835
509
160 279
38,819
2,537
53,88912,365
1,821
58447,888
2,3751
83,903
10,0671,520
2375
9 110
509
38,466
8,64613,210
Nov.
188,743
27,941
631
10,696
486
2,8421 770
11 010
506
160 802
39,380
2,537
53,64312,365
1,821
58448,021
2,4501
85,440
10,0671,520
2,450
9,285
506
39,431
8,76013,421
Dec.
193,229
28606
610
11,250
477
2,8171 770
11 190
492
164 623
41,258
2,536
55,18512,365
1,821
58448,153
2,7201
84,460
10,6541,520
2,720
9,465
' 492
39,431
9,19613,982 ,
99Digitized for FRASER http://fraser.stlouisfed.org/ Federal Reserve Bank of St. Louis

35. New security issues of state and local governmentsMillions of dollars
Type of issue or issuer, or use
1 All issues, new and refunding1 . . . .
Type of issue2 General obligation3 Revenue4 Housing Assistance
5 U S government loans
Type of issuer6 State . . . . . .7 Special district and statutory
authority8 Municipalities, counties,
townships, school district. . . .
9 Issues for new capital, total
Use of proceeds10 Education1 1 Transportation12 Utilities and conservation13 Social welfare14 Industrial aid15 Other purposes
Year
48,462
14,10034,267
95
5,304
26,972
16,090
46,736
45722,6218 149
19,9583 9747,462
Jan.
3,084
1,1711,905
$
699
1,398
981
3,057
227172553
L31968
718
Feb.
2,433
9391,484
10
327
1,256
841
2,399
361178363
1049119329
Mar.
2,440
8341,600
6
393
1,219
823
2,436
192157444
1,151231261
Apr.
4,964
1,7003,263
1
470
2,229
2,263
4,823
495302627
2,093367939
May
4,752
1,5603,188
4
749
2,339
1,658
4,682
321197726
1,830527
1,081
1980
June
6,139
1,9344,202
3
897
3,488
1,751
6,063
756345598
3,044386934
July
4,878
1,4023,469
7
178
3,136
1,558
4,506
634155
1,2351,658
206618
Aug.
3,957
8493,097
11
303
2,282
1,361
3,929
27499
1,1861,485
393492
Sept
4,532
1,3633,160
9
643
2,792
1,088
3,894
433425737
1,385T7S539
Oct.
4,496
1,0563,419
21
195
2,863
1,416
4,472
470282903
1,403595819
Nov.
2,928
7342,183
11
323
1,638
955
2,715
211256367
1,076412391
Dec.
3,859
5583,297
4
127
2,332
1,395
3,760
19853
4082,465
295341
100Digitized for FRASER http://fraser.stlouisfed.org/ Federal Reserve Bank of St. Louis

36. New security issues of corporationsMillions of dollars
1 All issues1
2 Bonds .
Type of offering3 Public . .4 Private placement
Industry group5 Manufacturing6 Commercial and
miscellaneous7 Transportation8 Public utility9 Communication
10 Real estate and financial . .1 1 Stocks
Type12 Preferred13 Common
Industry group14 Manufacturing15 Commercial and miscellaneous . . .16 Transportation17 Public utility1 8 Communication19 Real estate and financial
1 All issues1
2 Bonds
Type of offering3 Public4 Private placement . . . .
Industry group5 Manufacturing6 Commercial and miscellaneous . . .7 Transportation8 Public utility9 Communication . . . .
10 Real estate and financial
11 Stocks . . . .
Type12 Preferred13 Common
Industry group1 4 Manufacturing15 Commercial and miscellaneous . . .16 Transportation17 Public utility18 Communication19 Real estate and financial
Year
51,533
40,208
25 81414,394
9678
3 9483,1198 1534,219
11 09411,325
3 5747 751
1,6792,623
2555 171
30312,931
73,688
53 199
41,58711 612
15 4096,6883 3299,5566683
11 534
20490
3,63216,858
48395,245
5496.230
5673,059
Jan.
3,770
3,106
1,2821,824
893
494142460259858664
-171493
41169
3572
96
6,173
4 765
2,4332,332
936605414
1,289516
1 006
1,408
3191,089
365313
59535
135
Feb.
3,165
2,257
1 336921
278
279266517558359908
201707
12193
669
23
4,507
2 911
1,5061 405
927310257582534301
1 596
881,508
380426
586273965
Mar.
4,354
3,729
1 9041,825
739
362245721517
1 145625
184441
2411455
2886579
4,454
2 872
1,985887
744220
961,423
208181
1 $82
5251 057
598404
36408
27109
Apr.
4,692
4 113
29841 129
536
73307
1 153261
1 782579
155424
36210
257
78
5,656
4 754
3,807947
1 697457152572598
1 278
902
223679
81374
93195367
May
4,160
3,568
1 9991,569
1 200
268205638102
1 154592
174418
8520349
2277
21
9,074
7 342
6,810532
2 405561365723
1 1712 117
1 732
2021 530
215512
2761525
338
June
1979
6,238
5 347
4 1711 176
1 146
590395
1 103379
1 736891
278613
47363
3248
30200
1980
9,645
8 282
7,548734
2 3711,669
4041,428
2092 201
1 363
382981
127202
9494126406
July
4,103
3,122
2247875
962
24138017426
1 338981
392589
38173
59868
103
8,029
6652
5,3541 298
2867999334351787
1 314
1 378
3601,018
165390
714
108
Aug.
4,211
2,987
1 9721 015
808
419166186336
1 0731,224
401823
360266142366
91
5,437
4213
3,843370
1 545206346971580565
1 224
1011 123
293238
3246346
152
Sept.
4,593
3306
2 1671 139
1 153
412213670418440
1 281
698589
394218
4527
8361
5,025
2 916
2,421495
553390409569517477
2 109
3921 717
502569
54633
6345
Oct.
4,601
3,572
2669903
1 336
221295
1 124435161
1,029
195834
15198
6624770
5,819
3 284
2,756528
623320240769763569
2535
5431,992
85140011752667
574
Nov.
3,868
2649
1 5831 066
319
219314658854286
1 219
443776
158286
2607
2165
3,936
2 164
1,405759
132442147565147732
1 772
2561 516
41850953
227113452
Dec.
3,778
2452
1 500952
308
370191749
74762
1 326
2821 044
224430
3651
306
5,933
3 044
1,7191 325
609509165314653793
2 889
2412 648
844908
9566965
308
37. Open-end investment companies1
Millions of dollars
Tt«rv\
1 Sales of own shares^2 Redemptions of own shares^3 Net sales
4 Assets4
5 Cash position^6 Other
Year
15 26612,0123,254
58,400
5,32153,079
Jan.
957776181
51,278
5,70245,576
Feb. | Mar.
773 723882 892
-109 -169
49,512 44,581
5,895 5,64443,617 38,937
1980
Apr. May June
1 010 1,175 1,772762 647 775248 528 997
47,270 50,539 51,352
5,862 6,209 5,00141,708 44,330 46,351
July
1,890863
1,027
54,406
5,62948,777
Aug.
1,5071,019
488
54,941
5,61949,322
Sept.
1,4051,228
177
55,779
5,48150,298
Oct.
1,5231,362
161
56,156
5,46050,696
Nov.
1,2891,086
203
60,329
5,46754,862
Dec.
1,2421,720-478
58,400
5,32153,079
101Digitized for FRASER http://fraser.stlouisfed.org/ Federal Reserve Bank of St. Louis
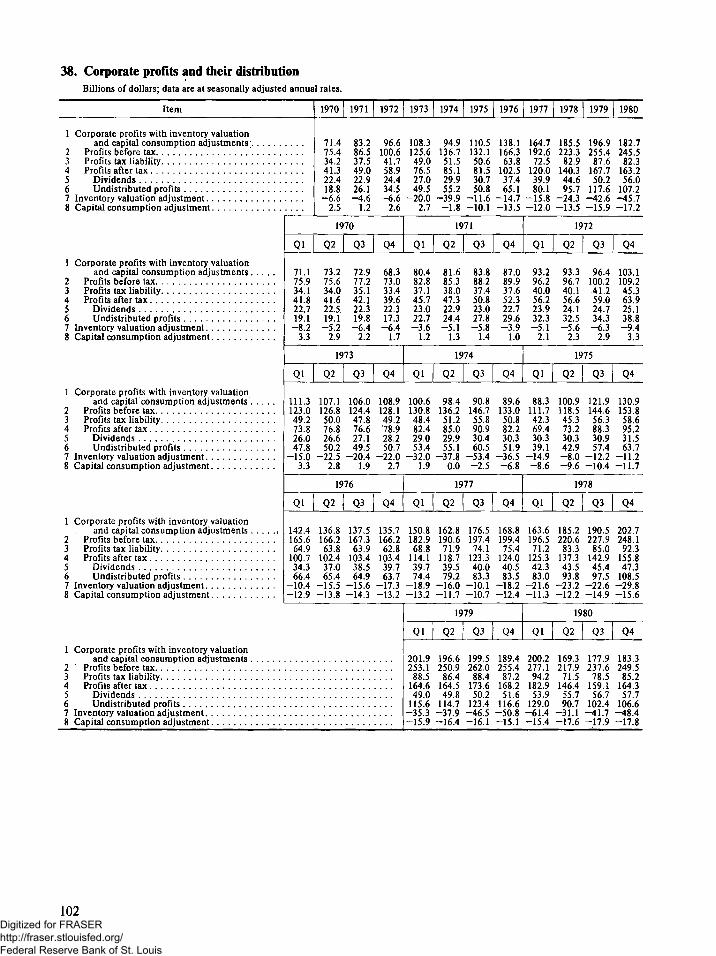
38. Corporate profits and their distributionBillions of dollars; data are at seasonally adjusted annual rates.
Item
1 Corporate profits with inventory valuationand capital consumption adjustments5
2 Profits before tax3 Profits tax liability4 Profits after tax . .5 Dividends6 Undistributed profits . . . . .7 Inventory valuation adjustment8 Capital consumption adjustment . . .
I Corporate profits with inventory valuationand capital consumption adjustments
2 Profits before tax3 Profits tax liability4 Profits after tax5 Dividends . .6 Undistributed profits7 Inventory valuation adjustment . .8 Capital consumption adjustment
1 Corporate profits with inventory valuationand capital consumption adjustments
2 Profits before tax3 Profits tax liability4 Profits after tax . . .5 Dividends6 Undistributed profits7 Inventory valuation adjustment8 Capital consumption adjustment
1 Corporate profits with inventory valuationand capital consumption adjustments . . . . i
2 Profits before tax3 Profits tax liability4 Profits after tax5 Dividends6 Undistributed profits7 Inventory valuation adjustment.8 Capital consumption adjustment
1 Corporate profits with inventory valuationand capital consumption adjustments
2 Profits before tax3 Profits tax liability4 Profits after tax . .5 Dividends6 Undistributed profits7 Inventory valuation adjustment8 Capital consumption adjustment
Ql
71.175934 141 822 719.1-82
3.3
Ql
111.3123 049.273 826.047 8
—15 03 3
Ql
1424165 6649
100734 3664
—104—12 9
1970
71.475 434.241 322 4188
-6.62 5
19
Q2
73.275,634041.622519.1-5 2
2.9
19
Q2
107.1126850.076826.6502
-22 52.8
19
Q2
1368166 263 8
102437065.4
—15 5—13 8
1971
83.286537.549022 926 1-4.6
1 2
70
Q3
72.977.235 142.122319.8-64
2.2
73
Q3
106.0124447.876627.1495
—2041.9
76
Q3
137.5167 363 9
103,438 564.9
-156—14 3
1972
96.6100641.758924434.5-6,6
2,6
Q4
68.373.033439.622 317.3-64
1.7
Q4
108.9128 149.278928.250.7
—22 02.7
Q4
135.7166262 8
103 439 763.7
-173-13 2
1973
108.3125,649,076.527049.5
-20.02.7
Ql
80,482,837 145.723.022.7-3.6
1.2
Ql
100.6130848.482.429.053.4
—32 01.9
Ql
150.8182968 8
114.139 774.4
—18.9—13 2
Ql
201.9253.1
88.5164.6490
115.6-35.3-15.9
1974
949136 751.585 1299552
-39.9-1 8
1.9
Q2
81.685.338 047.322924.4-5 1
1.3
19
Q2
98.4136251.285029.955.1
-3780.0
19
Q2
162.8190671 9
118 739 579.2
—160—117
19
Q2
196.6250.9
864164 549 8
114.7-37.9-16.4
1975
110.5132 150.681 5307508
-11.6-10 1
71
Q3
83.888.237450.823027.8-5.8
1.4
74
Q3
90.8146755.890930.460.5
-534-2.5
77
Q3
176.5197474 1
123.340083.3
-10 1—10 7
79
Q3
199.5262.0
88.4173 6502
123.4-46.5-16.1
1976
138.1166363.8
102 537465.1
-14.7-13.5
Q4
87.089,937 652.322729.6-3.9
1.0
Q4
89.6133050.882.230.351.9
~365-6,8
Q4
168.8199475 4
124.040 583.5
-18.2—124
Q4
189.4255.4
87.2168.251 6
116.6-50.8-15,1
1977
164.7192672.5
120.039 980.1
-15.8-12.0
Ql
93.296.240056.223.932.3-5.1
2.1
Ql
88.3111.742.369.430.339.1
-14.9-8.6
Ql
163.6196.571 2
125.342.383.0
-21.6-11 3
Ql
200.2277.1
94.2182,953.9
129.0-61.4-15.4
1978
18552233
82.91403446957
-243-135
19
Q2
93.396.740 156.624 132.5-56
2.3
19
Q2
100.9118545.373 230,342,9-80-9.6
19
Q2
185.22206
83 3137,343 593.8
-23 2—12 2
19
Q2
169.3217.9
71.5146455 790.7
-31.1-17.6
1979
1969255 4
87.6167 7502
1176-42.6-15 9
72
Q3
96.4100.241 259.024 734.3-63
2.9
75
Q3
121.9144656,388 330,957.4
—12 2-10.4
78
Q3
190.52279
85 0142.945 497.5
-226-149
80
Q3
177.9237.6
78.5159 1567
102.4-41.7-17.9
1980
1827245 5
82.31632560
107 2-45.7-172
Q4
103.1109.245 363.925 138.8-94
3.3
Q4
130.9153 858.695 231.563 7
—11 2-11 7
Q4
2027248 1
92 3155847 3
108 5-298—15 6
Q4
183.32495
85 2164 3577
106.6-484-17.8
102Digitized for FRASER http://fraser.stlouisfed.org/ Federal Reserve Bank of St. Louis
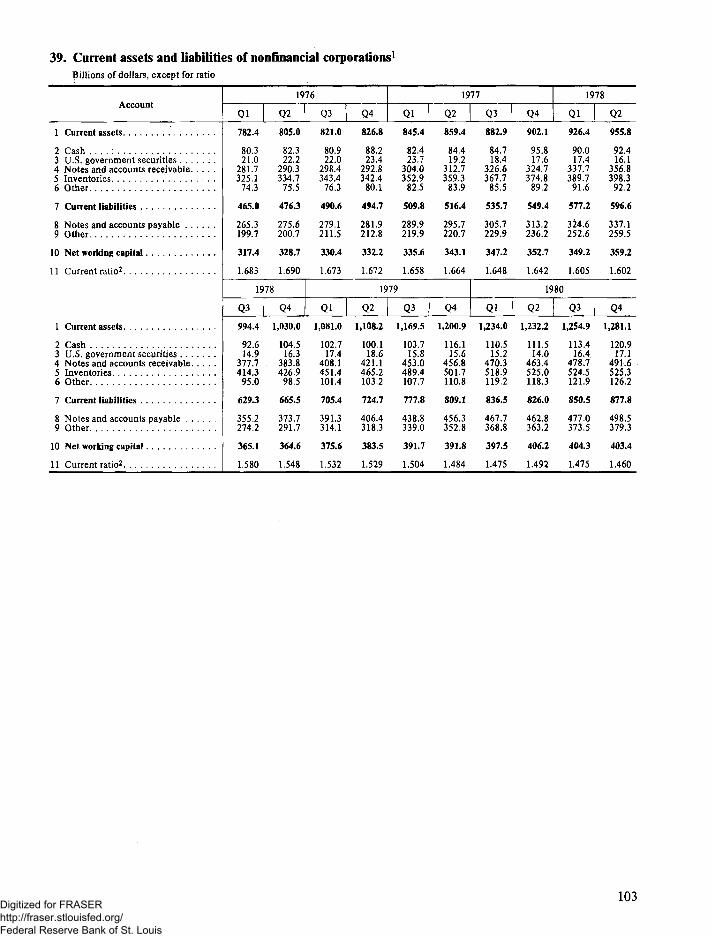
39. Current assets and liabilities of nonfinancial corporations1
Billions of dollars, except for ratio
Account
1 Current assets. . . .
2 Cash . .3 U S government securities4 Notes and accounts receivable. . . .5 Inventories6 Other . .
7 Current liabilities
8 Notes and accounts payable9 Other
10 Net working capital
1 1 Current ratio^
1 Current assets
2 Cash . .B U S government securities4 Notes and accounts receivable5 Inventories6 Other
7 Current liabilities
8 Notes and accounts payable9 Other . .
10 Net working capital
11 Current ratio2
Qi782.4
80.321 0
281.7325 1
74.3
465.0
265.31997
317.4
1 683
19
Q3
994.4
92.6149
377.7414 3
95.0
629.3
355 2274.2
365 1
1.580
19
Q2
805.0
82.322.2
290.3334.775.5
476.3
275.6200.7
328.7
1 690
78
Q4
1,030.0
104.516.3
383.8426.9
98.5
665.5
373 7291.7
364.6
1.548
76
Q3
821.0
80.922.0
298.4343.476.3
490.6
279.1211.5
330.4
1 673
Ql1,081.0
102.7174
408.1451.4101.4
705.4
391 3314.1
375.6
1.532
Q4
826.8
88.223.4
292.8342.4
80.1
494.7
281.9212.8
332.2
1.672
19
Q2
1,108.2
100.118.6
421.1465.2103.2
724.7
406.4318.3
383.5
1.529
Ql845.4
82.423.7
304.0352.9
82.5
509.8
289.9219.9
335.6
1.658
79
Q31,169.5
103.715.8
453.0489.4107.7
777.8
4388339.0
391.7
1.504
19
Q2
859.4
84.4192
312.7359.3
83.9
516.4
295.72207
343.1
1.664
Q4
1,200.9
116.115,6
456.8501.7110.8
809.1
4563352.8
391.8
1.484
77
Q3
882.9
84.718.4
326.6367.7
85.5
535.7
305.7229.9
347.2
1.648
Ql1,234.0
110.515.2
470.3518.9119.2
836.5
467.7368.8
397.5
1.475
Q4
902.1
95.817.6
324.7374.8
89.2
549.4
313.2236.2
352.7
1.642
19
Q2
1,232.2
111.514.0
463.4525.0118.3
826.0
462.8363.2
406,2
1.492
19
Ql926.4
90.017.4
337.7389.791.6
577.2
324.6252.6
349.2
1.605
80
Q3
1,254.9
113.416,4
478.7524.5121.9
850.5
477.0373.5
404.3
1.475
78
Q2
955.8
92.416.1
356.8398.392.2
596.6
337.1259.5
359.2
1.602
Q4
1,281,1
120.917.1
491.6525.3126.2
877.8
498.5379.3
403.4
1.460
103Digitized for FRASER http://fraser.stlouisfed.org/ Federal Reserve Bank of St. Louis
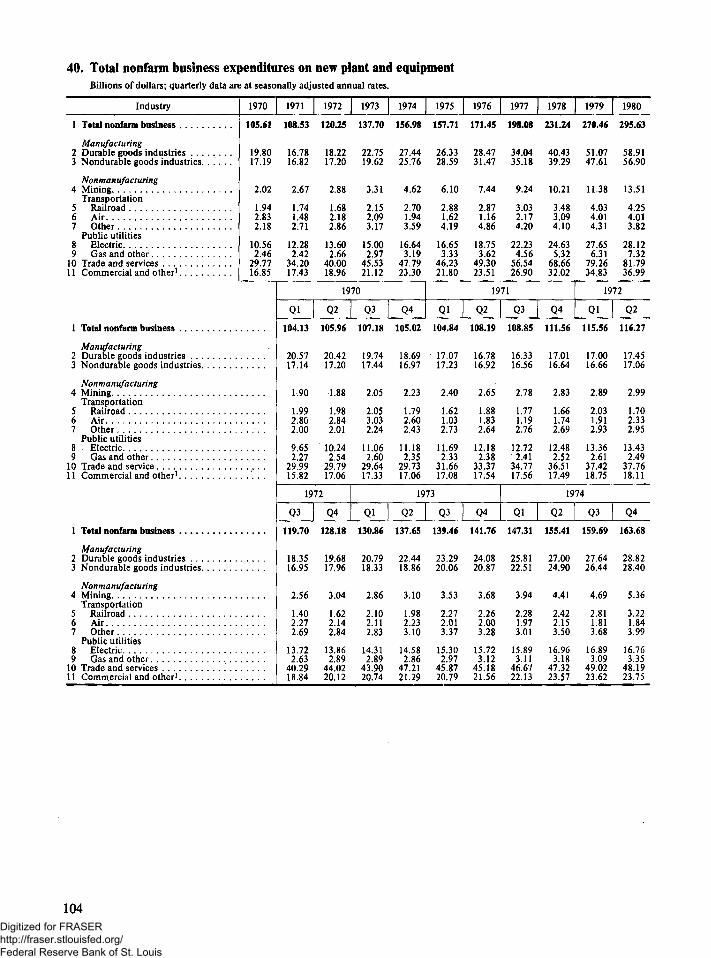
40. Total nonfarm business expenditures on new plant and equipmentBillions of dollars; quarterly data are at seasonally adjusted annual rates.
Industry 1970
1 Total nonfarm business . . . . 105.61
Manufacturing2 Durable goods industries 19.803 Nondurable goods industries. . . . 17 19
Nonmanufacturing4 Mining 2 02
Transportation5 Railroad . 1 946 Air 2.837 Other . . . 2 1 8
Public utilities8 Electric 10 569 Gas and other 2 46
10 Trade and services 29 7711 Commercial and other* 1685
1 Total nonfarm business
Manufacturing2 Durable goods industries3 Nondurable goods industries
Nonmanufacturing4 Mining
Transportation5 Railroad6 Air7 Other
Public utilities8 , Electric9 Gas and other
10 Trade and service . . . . .1 1 Commercial and other*
1 Total nonfarm business
Manufacturing2 Durable goods industries3 Nondurable goods industries
Nonmanufacturing4 Mining
Transportation5 Railroad6 A i r . . . .7 Other
Public utilities8 Electric9 Gas and other
10 Trade and services1 1 Commercial and other1
1971
108.53
16781682
267
1 741 482 71
12 28242
34201743
Qi104 13
205717 14
1 90
1 992 802 00
9652 27
299915 82
19
Q3
119.70
18 351695
2 56
1 402 27269
13 722 63
40 2918.84
1972
120.25
18.221720
2 88
1 682.18286
13 602 66
400018 96
19
Q2
105.96
204217 20
1 88
1 98284201
10242.54
29791706
72
Q4
128.18
19681796
304
1 622 142 84
1386289
440220.12
1973
137.70
22.751962
331
2 152.093 17
1500297
455321 12
70
Q3
107.18
19.741744
2.05
2 053,032 24
11 062.60
296417 33
Qi130.86
207918.33
286
2.102 112 83
14.312.89
43.9020.74
1974
156.98
27.442576
462
2701.943 59
16643 19
477923 30
Q4
105.02
18691697
2.23
1 79260243
11 182.35
297317 06
19
Q2
137.65
224418 86
3 10
1 982233 10
14,582 86
47 2121.29
1975
157.71
26.3328,59
6 10
2 881.624 19
16.653 33
4623?1 80
QI
104.84
17.0717 23
2.40
1 621 032 73
11 692.33
31 6617 08
73
Q3
139.46
23 2920.06
3 53
2.27201'1 37
15.302.97
45.8720.79
1976
171.45
28.4731.47
7 44
2.871.164.86
18.753 62
49.3023 51
19
Q2
108.19
16.781692
2.65
1 881.832 64
12.182.38
33.3717 54
Q4
141.76
24082087
3 68
2262003 28
15.723 12
45 1821.56
1977
198.08
34.0435 18
924
3032.17420
2223456
56542690
71
Q3
108.85
16,331656
2.78
1 771 19276
12722.41
347717 56
Ql147.31
25 8122.51
3 94
2.281 97301
15.893.11
466722.13
1978
231.24
40.4339.29
1021
3483.094 10
24635 32
68.663202
Q4111.56
17.011664
2.83
1 661.74269
12,482.52
36.511749
19
Q2
155.41
270024.90
4.41
2.422.153 50
16.963.18
47.3223.57
1979
270.46
51.0747.61
11.38
4.034.014.31
27.65631
79.263483
19
Ql115.56
17001666
2.89
2031 91293
13 362.61
374218 75
74
Q3
159.69
276426.44
469
2.811 813 68
16.893.09
49.0223.62
1980
295.63
58.9156.90
13 51
4254.01382
28 127 32
81 793699
72
Q2
116.27
17.451706
2.99
1 702.33295
13432.49
37.7618 11
Q4
163.68
288228.40
5.36
3.221 843 99
16.763,35
48.1923.75
104Digitized for FRASER http://fraser.stlouisfed.org/ Federal Reserve Bank of St. Louis
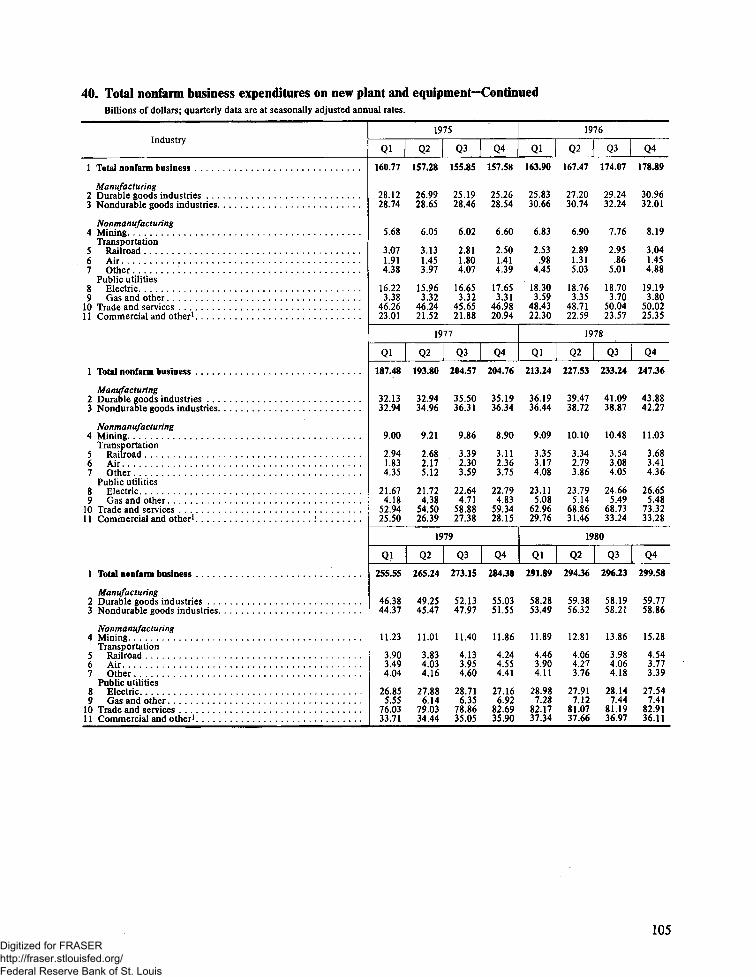
40. Total nonfarm business expenditures on new plant and equipment—ContinuedBillions of dollars; quarterly data are at seasonally adjusted annual rates.
Industry
1 Total nonfarm business
Manufacturing2 Durable goods industries3 Nondurable goods industries
Nonman ufa ctu ring4 Mining. . .
Transportation5 Railroad6 Air7 other '.
Public utilities8 Electric9 Gas and other . . , . ,
10 Trade and services11 Commercial and other* . . . .
1 Total nonfarm business
Manufacturing1 Durable goods industries3 Nondurable goods industries . .
Nonmanufacturing4 Mining
Transportation5 Railroad6 Air . . .7 Other
Public utilities8 Electric9 Gas and other
10 Trade and services11 Commercial and other* . , .' .
1 Total nonfarm business
Manufacturing2 Durable goods industries3 Nondurable goods industries . . .
Nonman ufactu ring4 Mining. ,
Transportation5 Railroad6 Air7 Other
Public utilities8 Electric . . .9 Gas and other
10 Trade and services . .1 1 Commercial and other1
Ql160.77
28.1228.74
5.68
3.071 914.38
16.223.38
46.2623.01
Ql187.48
32.1332.94
900
2.941.834.35
21.674.18
52.942550
Qi255.55
46,3844.37
11.23
3903.494.04
26.855.55
760333.71
19
Q2
157.28
26.9928.65
6.05
3.131.453.97
15.963.32
46.2421.52
19
Q2193.80
32.9434.96
9.21
2.682.175.12
21.724.38
54.5026.39
19
Q2265.24
49.2545.47
11.01
3.834,034.16
27.886.14
79.0334.44
75
Q3
155.85
25.1928.46
6.02
2.811.804.07
16.653.32
45.6521.88
77
Q3
204.57
35.5036.31
9.86
3.392.303,59
22,644.71
58.8827.38
79
Q3
273.15
52.1347.97
11,40
4.133.954.60
28.716.35
78.8635.05
Q4
157.58
25.2628.54
6.60
2.501.414.39
17.653.31
46.9820.94
Q4
204.76
35.1936.34
8.90
3.112.363.75
22.794.83
59.3428,15
Q4
284.30
55.0351.55
11.86
4.244.554.41
27.166.92
82.6935.90
Ql163.90
25.8330.66
6.83
2.53.98
4,45
18,303.59
48.4322.30
Ql
213.24
36.1936.44
9.09
3.353.174.08
23.115.08
62.9629.76
Ql
291.89
58.2853.49
11.89
4.463.904.11
28.987.28
82.1737.34
19
Q2
167.47
27.2030.74
6.90
2.891.315.03
18.763.35
48.7122.59
19
Q2
227.53
39,4738.72
10.10
3.342.793.86
23.795.14
68.8631.46
19
Q2
294.36
59.3856.32
12.81
4.064.273.76
27.917,12
81.0737.66
76
Q3
174.07
29.2432.24
7.76
2.95,86
5.01
18.703.70
50.0423.57
78
Q3233.24
41.0938.87
10.48
3.543.084.05
24.665.49
68.7333.24
80
Q3296.23
58.1958.21
13.86
3.984.064.18
28.147.44
81.1936.97
Q4
178.89
30.9632.01
8.19
3.041.454.88
19.193.80
50.0225.35
Q4
247.36
43.8842.27
11.03
3.683.414.36
26.655.48
73.3233.28
Q4
299.58
59.7758.86
15.28
4.543.773.39
27.547.41
82.9136,11
105Digitized for FRASER http://fraser.stlouisfed.org/ Federal Reserve Bank of St. Louis

41. Domestic finance companies—Assets and liabilitiesBillions of dollars, end of period
Gross accounts receivable1 Consumer . . .2 Business3 Total .4 LESS: Reserves for unearned income
and losses . . . .5 Net accounts receivable6 Cash and bank deposits, securities,
and all other
7 Total assets
Ql
67770 6
138.4
204118.0
23.7
141.7
19
Q2
70270 3
1404
21 4119.0
26.1
145.1
80
Q3
71 7669
138.6
22.3116.3
28.3
144.7
Q4
73 672 3
1459
23 3122.6
27.5
150.1
8 Bank loans9 Commercial paper
10 Short-term debt n.e.c11 Long-term debt, n.e.c12 Other debt
13 Capital, surplus, andundivided profits
14 Total liabilities and capital
Ql
9.740 8
7.448.915.7
19.2
141.7
19
Q2
10 1407
7,950.5160
19.9
145.1
80
Q3
10 1405
7 752.0146
19.8
144.7
Q4
13 243 4
7552.4143
19.4
150.1
42. Business credit of domestic finance companiesA. Accounts receivable, 1980Millions of dollars
Type
Total outstanding, end of period1 Retail automotive (commercial
vehicles)2 Wholesale automotive.3 Retail paper on business,
industrial, and farmequipment
4 Loans on commercial accountsreceivable and factoredcommercial accountsreceivable
5 All other business credit
Changes during period,seasonally adjusted
6 Retail automotive (commercialvehicles)
7 Wholesale automotive. . . .8 Retail paper on business,
industrial, and farmequipment
9 Loans on commercial accountsreceivable and factoredcommercial accountsreceivable . . . .
10 All other business credit
Jan.
15 17613 036
19216
702715 048
-55-849
555
180-304
Feb.
15 03013 141
19 238
7 29915 592
24-315
419
11163
Mar.
14 82412 990
19403
7 50915 921
-250-415
680
153-173
Apr.
1458612831
19 823
736616 315
-36439
403
-233432
May
14 149121685
19 947
7 41316 340
-491-136
-13
8845
June
13 83112 398
20 079
7 29216 655
-389-10
-105
-235403
July
13 49311 326
20 554
704816 386
-363-514
295
-194177
Aug.
13 1259814
20884
6,70016 541
-232-101
155
-358124
Sept.
12 79910004
21 311
5 84316 936
-221-333
586
-827474
Oct.
1? 75810,584
22212
6,26517 082
-12862
16
408289
Nov.
12 46911 169
22 589
601417 501
-169299
149
-261392
Dec.
12 45512 182
23 465
7,41616819
-151434
876
1,195-372
B. Extensions and repayments, 1980Millions of dollars, seasonally adjusted
Type Jan. Feb. Mar. Apr. May June July Aug, Sept Oct. Nov. Dec.
Extensions1 Retail automotive (commercial
vehicles)2 Wholesale automotive3 Retail paper on business,
industrial, and farmequipment
4 Loans on commercial accountsreceivable and factoredcommercial accountsreceivable
5 All other business credit
Repayments6 Retail automotive (commercial
vehicles)7 Wholesale automotive8 Retail paper on business,
industrial, and farmequipment
9 Loans on commercial accountsreceivable and factoredcommercial accountsreceivable
10 All other business credit
1,127 1,172 9525,094 5,339 4,917
844 699 782 772 883 889 969 908 9234,502 3,846 4,316 4,338 4,710 4,125 5,223 5,455 5,564
1,468 1,529 1,614 1,304 1,267 1,201 1,466 1,601 1,595 1,460 1,612 1,562
7,085 7,782 7,9082,144 2,021 1,979
1,182 1,148 1,2025,943 5,654 5,332
6,269 6,814 6,083 6,479 6,349 5,938 6,756 5,455 7,8271,835 1,796 1,994 2,132 2,002 2,261 2,373 2,251 2,432
1,208 1,190 1,171 1,135 1,115 1,110 1,097 1,077 1,0744,463 3,982 4,326 4,852 4,811 4,458 5,161 5,156 5,130
913 1,110 934 901 1,280 1,306 1,171 1,446 1,009 1,444 1,463 686
6,905 7,671 7,7552,448 1,958 2,152
6,502 6,726 6,318 6,673 6,707 6,765 6,348 5,716 6,6321,403 1,751 1,591 1,955 1,878 1,787 2,084 1,859 2,804
106Digitized for FRASER http://fraser.stlouisfed.org/ Federal Reserve Bank of St. Louis
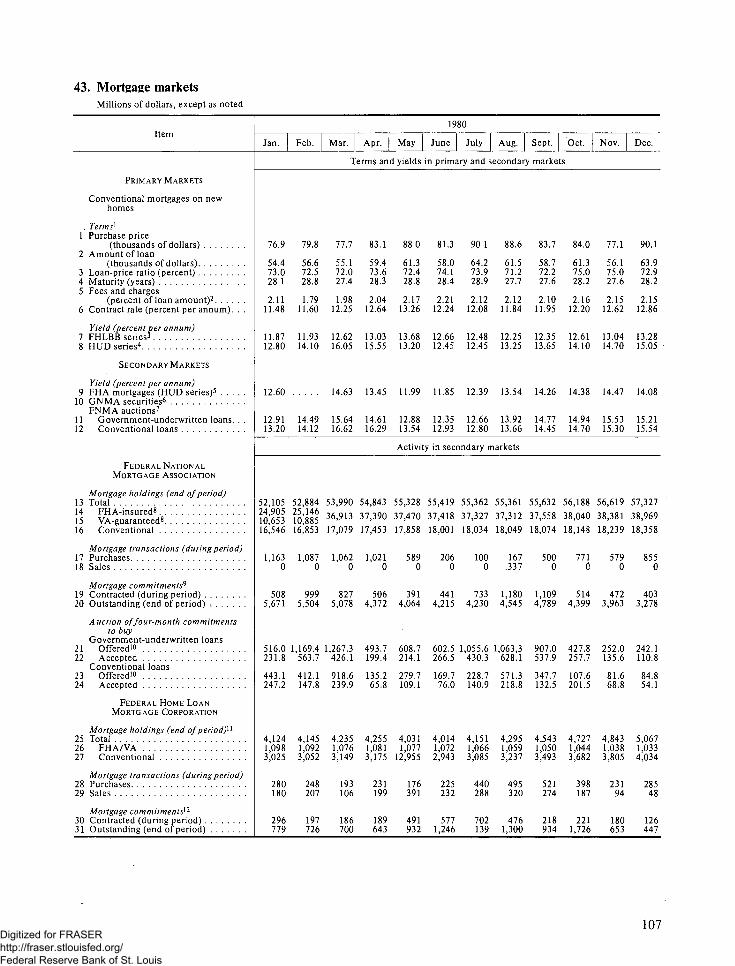
43. Mortgage marketsMillions of dollars, except as noted
Item1980
Jan. Feb. Mar. Apr. May June July Aug. Sept. Oct. Nov. Dec.
Terms and yields in primary and secondary markets
PRIMARY MARKETS
Conventional mortgages on newhomes
, Terms1
I Purchase price(thousands of dollars)
2 Amount of loan(thousands of dollars)
3 Loan-price ratio (percent)4 Maturity (years) . .5 Fees and charges
(percent of loan amount)2
6 Contract rate (percent per annum). . .
Yield (percent per annum)7 FHLBB series5
8 HUD series4
76.9
54.473.028.1
2.1111.48
11.8712.80
79.8
56.672.528.8
1.7911.60
11.9314.10
77.7
55.172.027.4
1.9812.25
12.6216.05
83.1
59.473.628.3
2.0412.64
13.0315.55
88.0
61.372.428.8
2.1713.26
13.6813.20
81.3
58.074.128.4
2.2112.24
12.6612.45
90.1
64.273.928.9
2.1212.08
12.4812.45
88.6
61.571.2Tin2.12
11.84
12.2513.25
83.7
58.772.227.6
2.1011.95
12.3513.65
84.0
61.375.028.2
2.1612.20
12.6114.10
77.1
56.175.027.6
2.1512.62
13.0414.70
90.1
63.972.928.2
2.1512.86
13.2815.05
SECONDARY MARKETS
yield (percent per annum)9 FHA mortgages (HUD series)5 . . .
10 GNMA securities6
FNMA auctions7
11 Government-underwritten loans.12 Conventional loans
12.60 14.63 13.45 11.99 11.85 12.39 13.54 14.26 14.38 14.47 14.08
12.9113.20
14.4914.12
15.6416.62
14.6116.29
12.8813.54
Activity
12.3512.93
12.6612.80
13.9213.66
14.7714.45
14.9414.70
15.5315.30
15.2115.54
in secondary markets
FEDERAL NATIONALMORTGAGE ASSOCIATION
Mortgage holdings (end of period)13 Total14 FHA-insured8
15 VA-guaranteed8
16 Conventional
Mortgage transactions (during period)17 Purchases18 Sales .
Mortgage commitments^19 Contracted (during period)20 Outstanding (end of period) -.
52,10524,90510,65316,546
1,1630
5085,671
52,88425,14610,88516,853
1,0870
9995,504
53,99036,91317,079
1,0620
8275,078
54,843
37,39017,453
1,0210
5064,372
55,328
37,47017,858
5890
3914,064
55,419
37,41818,001
2060
4414,215
55,362
37,32718,034
1000
7334,230
55,36137,31218,049
167.337
1,1804,545
55,632
37,55818,074
5000
1,1094,789
56,18838,04018,148
7710
5144,399
56,619
38,38118,239
5790
4723,963
57,32738,96918,358
8550
4033,278
Auction of four-month commitmentsto buy
Government-underwritten loans21 Offered10
22 AcceptedConventional loans
23 Offered'024 Accepted
FEDERAL HOME LOANMORTGAGE CORPORATION
516.0 1,169.4 1,267.3 493.7 608.7231.8 563.7 426.1 199.4 214.1
443.1 412.1 918.6247.2 147.8 239.9
135.2 279.765.8 109.1
602.5 1,055.6 1,063,3266.5 430.3 628.1
169.7 228.7 571.376.0 140.9 218.8
907.0 427.8537.9 257.7
347.7 107.6132.5 201.5
252.0 242.1135.6 110.8
81.668.8
84.854.1
Mortgage holdings (end of period)^25 Total26 FHA/VA27 Conventional
Mortgage transactions (during period)28 Purchases29 Sales
Mortgage commitments^30 Contracted (during period)31 Outstanding (end of period)
4 1241,0983,025
280180
296779
4 1451,0923,052
248207
197726
42351,0763,149
193106
186700
4 2551,0813,175
231199
189643
40311,077
12,955
176391
491932
40141,0722,943
225232
5771,246
4 1511,0663,085
440288
702139
42951,0593,237
495320
4761,300
45431,0503,493
521274
218934
47271,0443,682
398187
2211,726
4 8431,0383,805
23194
180653
5 0671,0334,034
28548
126447
107Digitized for FRASER http://fraser.stlouisfed.org/ Federal Reserve Bank of St. Louis

44. Mortgage debt outstanding, by type of holder and type of property1
Millions of dollars, end of period
1 All holders
2 1- to 4- family3 Multifamily . , . , , ,4 Commercial5 Farm . . . . . . . .
6 Major financial institutions7 Commercial banks^8 1- to 4-family . .9 Multifamily
10 Commercial11 Farm . . ,12 Mutual savings banks13 1- to 4-family . .14 Multifamily15 Commercial . . . .16 Farm17 Savings and loan associations. .18 1- to 4-family19 Multifamily20 Commercial21 Life insurance companies22 1- to 4-family23 Multifamily . . .24 Commercial25 Farm ,
26 Federal and related agencies27 Government National Mortgage Association.28 1- to 4-family29 Multifamily . . . .30 Farmers Home Administration31 l-to4-family32 Multifamily , .33 Commercial34 Farm. . .35 Federal Housing and Veterans Administrations36 1- to 4-family37 Multifamily . .38 Federal National Mortgage Association39 1- to 4-family40 Multifamily . . . .41 Federal Land Banks42 1- to 4-family, . . . . .43 Farm44 Federal Home Loan Mortgage Corporation45 1- to 4-family46 Multifamily
47 Mortgage pools or trusts-*48 Government National Mortgage Association. . . .49 1- to 4-family50 Multifamily51 Federal Home Loan Mortgage Corporation.52 1- to 4-family .53 Multifamily . . . . . . .54 Farmers Home Administration55 1- to 4-family56 Multifamily57 Commercial58 Farm
59 Individuals and others^ . . . .60 1- to 4-family , . . ,61 Multifamily62 Commercial63 Farm
Ql1,048,609
674,590113,916194,74865,355
764,736184 596108,284
952558,886
7,90189,80058,74715,59815,401
54392,418320,05633,59138,77197,92214,41718,648556529,205
71,8933,291
9482,3431 179
202408218351
52171,5923,625
36,02930,208
582122,925
69122,234
3 2522,694
558
74,0804635744,906
1,45174716,2861 185
2025212 235
7323,5283,757
137 900733242043122 29221.853
19
Q2
1,088,999
703,905116,846200,51367735
793,804194 467113,730
1033862,1898210
91,5355988215,90015,698
55407,940334 14434,3493944799,8621421718,688572459,712
73,9853,283
9222,361
618124102104288
52191,5583,661
38,75332,974
577923,857
72723,130?2551,856
399
78,6024803246,515
1,5179,4237,7971 626
21 14712 7421,1283,3013,976
142,608767172099822 52922.364
78
Q3
1,129,882
735,141118949206,064
69728
82J,669205 163121,8871038164,483
841293,40361,10416,22416,019
56420,934345 58735,35839989
102,16914 15818,74259 15310,116
78,5513,560
8972,6631 384
460240251433
5 1741,5883,586
41,18935,437
575224,758
81923,939
2,4861,994
492
82,73050,84449,276
1,56810,5118,6161 895
21 37512 8511,1163,3694,039
146,93280,4672093222 80022.733
Q4
1,169,412
765,217121,138211,851
71 206
848,177214 045129,1671026666,115
849795,1576225216,52916,319
57432,808356 11436,05340641
106,1671443619,0006223210,499
81,7393,509
8772,632
926288320101217
53051,6733,632
43,31137,579
573225,624
92724,69730642,407
657
88,63354,34752,732
1,61511,8929,6572,235
22,394134001,1163,5604,318
150,8638370821 3512288322.921
19
Ql
1,201,500
787,906122 942216,51874 134
865,585219655132,8031032468,005
852396,1366289216,69916,488
57441,377363 73936,67840960
108,4171450719,0806390810,922
86,5793,448
8212,627
956302180283191
54121,7333,679
46,41040,702
570826,893
104225,8513,4602,685
775
94,55157,95556,269
1,68612,46710,0882,379
24 129138831,4653,6605,121
154,78586,44021 6622321423.469
79
Q2
1,245,953
820,422125013222,651
77 867
893,581228 820138,6241049371,040
866397,15563,55916,87616,662
58456,483377 46637,06641 951
111,1231448919,1026605511,477
89,9133,425
8002,6251 200
36375
278484
54151,7983,617
48,20642,543
566328,459
1,19827,2613,2082,489
719
102,25963,00061,246
1,75413,70811,0962,612
25,55114329
1,7643,8335,625
160,20090,422226472283224.299
108Digitized for FRASER http://fraser.stlouisfed.org/ Federal Reserve Bank of St. Louis

44. Mortgage debt outstanding, by type of holder and type of property1—ContinuedMillions of dollars, end of period
Type of holder, and type of property
1 All holders . . .
2 1- to 4- family . . .3 Multifamily4 Commercial • . .5 Farm
6 Major financial institutions7 Commercial banks^ . . .8 1- to 4-family .9 Multifamily
10 Commercial . .11 Farm . . . . .12 Mutual savings banks , .13 1- to 4-family. .14 Multifamily15 Commercial . . ',16 Farm17 Savings and loan associations. . .18 1- to 4-family19 Multifamily . . . . . . .20 Commercial21 Life insurance companies , , . . . .22 1- to 4-family23 Multifamily . . . . . .24 Commercial :25 Farm . . . . . .
26 Federal and related agencies . . . . •27 Government National Mortgage Association28 1- to 4-family .29 Multifamily30 Farmers Home Administration31 1- to 4-family . .32 Multifamily , .33 Commercial *34 Farm . . . . j35 Federal Housing and Veterans Administrations . . . .36 1- to 4-family37 Multifamily . . . .38 Federal National Mortgage Association . .39 1- to 4-family . .40 Multifamily41 Federal Land Banks42 1- to 4-family . .43 Farm . . .44 Federal Home Loan Mortgage Corporation45 1- to 4-family, .46 Multifamily . . . .
47 Mortgage pools or trusts-* .48 Government National Mortgage Association . . . .49 1- to 4-family50 Multifamily . . .51 Federal Home Loan Mortgage Corporation *52 1- to 4-family . . .53 Multifamily54 Farmers Home Administration55 1- to 4-family . .56 Multifamily57 Commercial . .58 Farm
59 Individuals and others4
60 l-to4-family . . .61 Multifamily . . .62 Commercial . .63 Farm
19
Q3
1,289,397
852,317126,802229,613
80,665
919,311238,797145,0931093774,051
8,71697,92964,06517,01016,795
59468,217387,91837,27043,029
114,36814,88419,10768,51311,864
92,9273 382
7802,6021,383
163299262659
5,4561,8723,584
49,17343,534
5,63929,804
1,37428,430
37292,850
879
110,64869,35767,535
1,82214,42111,5682,853
2687014,9721,7634,0546,081
166,51195,70923,03722,90924,856
79
Q41,326,750
878,931128,852236,451
82,516
938,567245 187149,460
11 18075,957
8,59098,90864,70617,18016,963
59475,688394,34537,57943,764
118,78416,19319,27471,13712,180
97,0843 852
7633,0891,274
41771
174612
5,5551,9553,600
51,09145,488
5,60331,277
1,55229,7254,0353,059
976
119,27876,40174,546
1,85515,18012,1493,031
2769714,8842,1634,3286,322
171,82199,41423,25124,12825,028
Qi1,375,660
897,608130,363242,77686,913
951,276250 702152,553
11 55777,993
8,59999,15164,86517,22317,004
59478,952398,00937,21543,728
122,47116,85019,59073,61812,413
103,9213919
7493,1702,8451,139
408409889
5,6212,0223,599
53,99048,394
5,59633,311
1,70831,60342353,2101025
124,63280,84378,872
1,97115,45412,3593,095
2833514,9262,1594,4956,755
177,831101,95223,75525,52926,595
19
Q2
1,380,928
910,286132,194247,444
91,004
958,750253,103153,75311,76479,110
8,47699,15064,86417,22317,004
59481,042399,74637,32943,967
125,45517,79619,28475,69312,682
108,5394466
7363,7303,3751,383
636402954
5,6912,0853,606
55,41949,837
5,58235,574
1,89333,68140143,037
977
129,64784,28282,208
2,07416,12012,8863,234
29,24515,2242,1594,7637,099
183,992104,83824,59626,50528,053
80
Q3
1,414,881
935,393134,193251,651
93,644
977,281258,003156,73711,99780,6268,643
99,30664,96617,24917,031
60'491,895409,896
37,72844,271
128,07717,99619,35777,99512,729
110,5264,389
7193,6703,525
978774370
1,4035,6001,9863,614
55,63250,0715,561
36,8371,895
34,8524,5433,4591,084
136,58389,45287,2762,176
16,65913,3183,341
30,47216,2262,2355,0596,952
190,491109,78025,40726,29929,005
Q4
1,451,841
960,408136,601258,33296,500
998,372264,602160,7461230482,688
8,86499,81365,29717,33817,118
60502,812419,44638,11345,253
131,14517,91119,61480,77612,844
114,3004,642
7043,9383,492
916610411
1,5555,6402,0513,589
57,32751,775
5,55238,1312,099
36,0325,0683,8731,195
142,25893,87491,602
2,27216,85413,4713,383
31,53016,6832,6125,2716,964
196,911113,83426,08126,81530,181
109Digitized for FRASER http://fraser.stlouisfed.org/ Federal Reserve Bank of St. Louis

45. Installment credit1—Total outstanding, and net changeMillions of dollars
Holder, and type of credit
1 Total
By major holder2 Commercial banks . . . .3 Finance companies. . . .4 Credit unions5 Retailers2
6 Savings and loans . . . .7 Gasoline companies . . .8 Mutual savings banks . .
By major credit type9 Automobile
10 Commercial banks . .11 Indirect paper . . . .12 Direct loans13 Credit unions . . .14 Finance companies . .15 Revolving. . . . .16 Commercial banks . .17 Retailers.18 Gasoline19 Mobile home . , .20 Commercial banks . .21 Finance companies . .22 Savings and loans . . .23 Credit unions24 Other25 Commercial banks . .26 Finance companies . .27 Credit unions . . .28 Retailers29 Savings and loans . . .30 Mutual savings banks
1980
Jan. Feb. Mar. Apr. May June July Aug. Sept Oct. | Nov. Dec.
Amounts outstanding (end of period)
311,012
153,63668,72446,46627,216
8,3983,8912,681
116,71967,16638,24928,91722,22027,33356,25629,80122,564
3,89116,83210,6213,4152,302
494121,20546,04837,97623,7524,6526,0962,681
310,149
153,30869,54545,96426,2528,5333,8912,656
117,20267,11938,31228,80721,95528,12855,26929,64121,737
3,89116,87510,6283,4282,331
488120,80345,92037,98923,521
4,5156,2022,656
309,127
152,34770,42145,73025,495
8,6183,9132,603
117,64266,78638,25728,52921,86828,98854,26929,17721,179
3,91316,94410,6353,4752,348
486120,27245,74937,95823,3764,3166,2702,603
307,831
150,93771,54544,95425,073
8,7563,9612,605
117,50265,83737,76728,07021,49730,16853,69028,98720,7423,961
16,97410,5963,5232,377
478119,66545,51737,85422,979
4,3316,3792,605
305,788
149,23872,10144,13924,970
8,7823,9482,610
117,05865,03537,43527,60021,10730,91653,22528,61720,6603,948
16,91210,5323,5292,382
469118,59345,05437,65622,5634,3106,4002,610
304,399
147,88373,11842,99524,7868,8234,1752,619
116,45664,22436,94827,27620,55831,67453,04228,28020,5874,175
16,98810,5933,5442,391
460117,91344,78637,90021,977
4,1996,4322,619
303,853
146,55573,90942,64424,620
8,9914,5002,634
116,12563,34436,23327,11120,39232,38953,03628,07320,4634,500
17,00410,5683,5462,437
453117,68844,57037,97421,7994,1576,5542,634
305,763
146,54874,43343,34724,918
9,1414,7102,666
116,86863,17736,04727,13020,72832,96353,77128,30520,7564,710
17,06810,5643,5662,477
461118,05644,50237,90422,1584,1626,6642,666
306,926
146,36274,82343,56225,301
9,2664,8722,740
116,78162,73435,76826,96620,83133,21654,40628,40321,1314,872
17,11310,5383,6012,511
463118,62644,68738,00622,2684,1706,7552,740
307,222 308,051
145,895 145,14774,985 75,69043,518 43,60625,703 26,4699,611 9,6874,736 4,6622,774 2,790
116,657 116,51762,350 61,84835,572 35,28426,778 26,56420,810 20,85233,497 33,81754,598 55,30428,331 28,36021,531 22,2824,736 4,662
17,276 17,29310,502 10,4523,657 3,7022,654 2,675
463 464118,691 118,93744,712 44,48737,831 38,17122,245 22,2904,172 4,1876,957 7,0122,774 2,790
313,435
145,76576,75644,041•29,410
9,9114,7172,835
116,32761,02534,85726,16821,06034,24259,86230,00125,1444,717
17,32710,3763,7452,737
469119,91944,36338,76922,5124,2667,1742,835
110Digitized for FRASER http://fraser.stlouisfed.org/ Federal Reserve Bank of St. Louis

45. Installment credit1—Total outstanding, and net change—ContinuedMillions of dollars
Holder, and type of credit
31 Total
By major holder32 Commercial banks . . . .33 Finance companies . . . .34 Credit unions35 Retailers2 . . . .36 Savings and loans37 Gasoline companies . . .38 Mutual savings banks . .
By major credit type39 Automobile40 Commercial banks . .41 Indirect paper . . . .42 Direct loans43 Credit unions44 Finance companies . .45 Revolving46 Commercial banks . .47 Retailers48 Gasoline companies .49 Mobile home50 Commercial banks . .51 Finance companies . .52 Savings and loans . . .53 Credit unions54 Other55 Commercial banks . .56 Finance companies . .57 Credit unions58 Retailers59 Savings and loans . . .60 Mutual savings banks
1980
Jan. Feb. Mar. Apr. May June July Aug. Sept. Oct. Nov. Dec.
Net change (during period)3
2,727
5431,013
7383076782
-23
1,53820414757
434900529108339
821043847
811
55619366
293-32
59-23
2,403
1,0321,395-354
12227140-49
98223314390
-200949722523
59140555
3916-5
644271407
-149-47211-49
654
-2631,138-275-9313767
-57
513-348-85
-263-111
972261137576755-34912-3
-175-49117
-161-150
125-57
-1,671
-1,721828
-735-279
1833617
-643-1,182
-628-554-348
887-330-83
-2833614
-484426-8
-712-408-103-379
4157
17
-2,677
-1,936246
-986-46100-41-8
-1,041-1,008
-460-548-481
448-287-241
1-47-50-71
723-9
-1,299-616-209-496-47
77-8
-2,045
-1,783744
-1,2986896
1244
-1,026-1,007
-601-406-636
617-95
-33811912458261229-9
-982-464
115-653-51
674
-1,199
-1,749439
-27089
155132
5
-717-1,083
-784-299-108
47438
-259165132
14-23-245-6
-534-384-33
-156-76110
5
489
-682387465160
5136
18
355-344-286-58215484281-2416913633-81421
6-180-306-111
244-9
-1618
1,055
-265613
36456
939032
84-362-282-80
10436478-81469
9043
-2230350
45020014726
-135832
702
-336454
63134246
9843
201-348-170-178
18531273-1919498
141-21
42120
08752
-11945
-6012643
839
-120594218
52-14
7237
245-138-44-94101282265121727224
-334411
2305-70268115-20-25
37
1,619
-2768603783161908368
302-491-181-310
174619616211322
8366
-344847
5635
38193199-614368
111Digitized for FRASER http://fraser.stlouisfed.org/ Federal Reserve Bank of St. Louis

46. Installment credit—Extensions and liquidationsMillions of dollars
Holder, and type of credit
1 Total
By major holder2 Commercial banks . . . .3 Finance companies. . , .4 Credit unions . .5 Retailers2
6 Savings and loans7 Gasoline companies . . .8 Mutual savings banks . .
By major credit type9 Automobile , .
10 Commercial banks . .11 Indirect paper . . . .12 Direct loans13 Credit unions14 Finance companies . .15 Revolving16 Commercial banks . .17 Retailers18 Gasoline companies .19 Mobile home20 Commercial banks . .21 Finance companies . .22 Savings and loans . . .23 Credit unions . . . .24 Other25 Commercial banks . .26 Finance companies . .27 Credit unions28 Retailers.29 Savings and loans . . .30 Mutual savings banks
1980
Jan. Feb. Mar. Apr. May June July Aug. Sept. Oct. Nov. Dec,
Extensions1
27,923
12,3225,4713,4834,368
4621,686
131
8,4414,2852,3301,9551,8432,313
10,5004,9553,8591,686
522335
877624
8,4602,7473,0711,616
509386131
27,581
12,7805,7552,4444,096
6231,780
103
7,9734,3042,3421,9621,2572,412
10,7565,3613,6151,780
452279
84827
8,4002,8363,2591,180
481541103
25381
11,3955,5742,4284,108
5421,745
89
7,3723,5222,0141,5081,2812,569
10,6345,1523,7371,745
435260
86809
7,4402,4612,9191,138
371462
89
23,220
10,2274,8011,8623,845
5911,738
156
5,9222,6831,5421,141
9732,266
10,3475,2813,3281,738
397214
87924
6,5542,0492,448
885517499156
22,093
9,7854,3201,5754,072
5081,700
133
5,5332,7451,6001,145
8171,971
10,3024,9963,6061,700
2991645281
25,9591,8802,297
756466427133
23,349
9,8924,4391,3184,186
5181,847
149.
5,5502,8151,4901,325
7072,028
10,3414,7713,7231,847
424281
5487
26,0342,0252,357
609463431149
23,997
10,0984,8092,3054,148
5821,902
153
6,0682,7711,3291,4421,1972,100
10,6795,0593,7181,902
377226
5295
46,8732,0422,6571,104
430487153
26,176
11,1075,1553,0854,263
4541,941
171
7,4003,6061,8661,7401,5702,224
10,7004,9893,7701,941
415263567818
7,6612,2492,8751,497
493376171
27,064
11,6715,3552,7524,596
5391,965
186
7,5183,7132,0351,6781,4552,350
11,1435,0674,1111,965
442250849513
7,9612,6412,9211,284
485444186
27,365
11,9775,3232,8724,291
6952,009
198
7,5443,7912,1351,6561,4572,296
11,1245,2643,8512,009
513257
89159
88,1842,6652,9381,407
440536198
25,991
11,4324,8522,7954,250
4442,024
194
7,1173,5521,9621,5901,4022,163
10,9535,1553,7742,024
424243937414
7,4972,4822,5961,379
476370194
27,149
. 11,4845,1853,0354,497
6582,061
229
7,2343,2711,8571,4141,5382,425
11,6145,5543,9992,061
479254
89119
177,8222,4052,6711,480
498539229
112Digitized for FRASER http://fraser.stlouisfed.org/ Federal Reserve Bank of St. Louis

46. Installment credit—Extensions and liquidations—ContinuedMillions of dollars
Holder, and type of credit
31 Total
By major holder32 Commercial banks . . . .33 Finance companies . . . .34 Credit unions . .35 Retailers2
36 Savings and loans37 Gasoline companies . . .38 Mutual savings banks . .
By major credit type39 Automobile40 Commercial banks . .41 Indirect paper . . . .42 Direct loans43 Credit unions44 Finance companies . .45 Revolving46 Commercial banks . .47 Retailers48 Gasoline companies .49 Mobile home50 Commercial banks . .51 Finance companies . .52 Savings and loans , . .53 Credit unions54 Other55 Commercial banks . .56 Finance companies . .57 Credit unions58 Retailers59 Savings and loans . . .60 Mutual savings banks
1980
Jan. Feb. Mar. Apr. May June July Aug. | Sept. Oct. Nov. Dec.
Liquidations1
25,196
11,7794,4582,7454,061
3951,604
154
6,9034,0812,1831,8981,4091,4139,9714,8473,5201,604
418297406813
7,9042,5543,0051,323
541327154
25,178
11,7484,3602,7984,084
3961,640
152
6,9914,0712,1991,8721,4571,463
10,0344,8383,5561,640
397274456612
7,7562,5652,8521,329
528330152
25,227
11,6584,4362,7034,201
4051,678
146
6,8593,8702,0991,7711,3921,597
10,3735,0153,6801,678
380263
376812
7,6152,5102,8021,299
521337146
24,891
11,9483,9732,5974,124
4081,702
139
6,5653,8652,1701,6951,3211,379
10,6775,3643,6111,702
383262436612
7,2662,4572,5511,264
513342139
24,770
11,7214,0742,5614,118
4081,747
141
6,5743,7532,0601,6931,2981,523
10,5895,2373,6051,747
349235455811
7,2582,4962,5061,252
513350141
24,394
11,6753,6952,6164,118
4221,723
145
6,5763,8222,0911,7311,3431,411
10,4365,1093,6041,723
366255425811
7,0162,4892,2421,262
514364145
25,196
11,8474,3702,5754,059
4271,770
148
6,7853,8542,1131,7411,3051,626
10,6415,3183,5531,770
363249
545010
7,4072,4262,6901,260
506377148
25,687 26,009
11,789 11,9364,768 4,7422,620 2,7164,103 4,140
449 4461,805 1,875
153 154
7,045 7,4343,950 4,0752,152 2,3171,798 1,7581,355 1,4451,740 1,914
10,419 10,6655,013 5,1483,601 3,6421,805 1,875
382 399271 27242 5457 6012 13
7,841 7,5112,555 2,4412,986 2,7741,253 1,258
502 498392 386153 154
26,663
12,3134,8692,8094,157
4491,911
155
7,3434,1392,3051,8341,4391,765
10,8515,2833,6571,911
3722784739
88,0972,6133,0571,362
500410155
25,152
11,5524,2582,5774,198
4581,952
157
6,8723,6902,0061,6841,3011,881
10,6885,0343,7021,952
400276496312
7,1922,5522,3281,264
496395157
25,530
11,7604,3252,6574,181
4681,978
161
6,9323,7622,0381,7241,3641,806
10,9985,3433,6771,978
413288417212
7,1872,3672,4781,281
504396161
113Digitized for FRASER http://fraser.stlouisfed.org/ Federal Reserve Bank of St. Louis

47. Flow of funds accounts—Financial assets and liabilities, December 31,1980A. All sectorsAmounts outstanding, billions of dollars
Line, and transaction category
1 Total financial assets . .
2 Total liabilities
3 Gold2
4 SDKs5 International Monetary
Fund position6 Official foreign
exchange7 Treasury currency
8 Demand depositsand currency
9 Private domestic10 U.S. government1 1 Foreign . . . .
12 Time andsavings accounts . . . .
13 Commercial banks . . . .14 Savings institutions . . . .
15 Federal funds andsecurity RPs. . .
16 Money marketfund shares
17 Life insurance reserves . . .18 Pension fund reserves, . . .19 Interbank claims
20 Corporate equities^. . . .
21 Credit marketinstruments
22 U.S. Treasurysecurities^
23 Federal agencysecurities^
24 State and local govern-ment securities5 . . .
25 Corporate andforeign bonds . .
26 Mortgages27 Consumer credit28 Bank loans n e e29 Open market paper . . . .30 Other loans
31 Security credit32 Trade credit6 .33 Taxes payable34 Miscellaneous
Private domestic nonfinancial sectors
Households
Assets Llt^;
4,412.6 . . .
1 49"
StateBusiness and local ToU
"- Assets Liabili- Assets Li£f Assets '
1,028.7 . . . . 214.3 5,655.6
L3 1.835.0 . . . . . 330.4 . . . . .
243 0 . . .243 0
1,307.2 . . .583 6723 6
74 4 . . .
224.2 . . .729 I
1 144 1
88.8 . . . . 11.1 . ; . . . 343.0888 . 11.1 343.0
39.1 62.5 1,408.739 1 62 5 . 685 2
723,6
22 7 . . . . 14.0 36.7
74.4
224,2. . . 729.1
1.144.1
Restof the U.S.
t j world government
Liabili- Assets Liabili- Assets Liabili-ties ties ties
429.1 . . . . 241.9 .
3,662.7 457.3 . . . . . . 858.2
. . . . 38.1
. . . . 20.3 . . . . . 2 .6
2.9 2.9 ..
10.1 5.0 .'.13,6
,•. . . . 24,1 . . . . . 16.2
16.2. . . . 24.1
. . . . 25.9 .8 . . . . .25.9 . . . . .8
9.676.4
. . . -13.1
. . . . 67.6 . . . .
598.2 1,440.6 93.0 1,392.3 114.4 314.1 805.6 3,147.0 181.7 209.6 177.3 742.8
2273 ' -S ^ . S20 274.0 . . . . 114.3 737.8
65 3 . .
69 7
800127.5 97]
38*
1.7 . . . . 20.9 87.9
37 23 6 88 306 5 82 0
39.4 4.4
130 1
3674 . 80.0 -367.4 1,2.6 47.6 . . . . . . . . . .2 . 468 9 32 7 160.27 19 1 . . . . S2.1
28 R W3 *28.5 . . .
54
15.2 2'\t
41 1 42 1 69 6\ .9 . . . . . 150.8 . . . . . . . 7.6
'5 . • . . . 15.2>.0 453.6 364.0 16.3 453.6
1 8 7 171 1 5 "*77.1 13.2 331.5 60.5 . 408.6
1,440.1 13.8 .6385.7368.3 . . . 60.242 1 34.7 48.0
213 3 53 8 124.1
27.5396.3 22.5 16.0 15.0 15.8
182 . . . 12.573.6 62.1 218.8 9.6 *
114Digitized for FRASER http://fraser.stlouisfed.org/ Federal Reserve Bank of St. Louis

Financial sectors
Total
Assets
4,239.8
11.2
Liabili-ties
4,005.5
Sponsored agenciesand mortgage pools
Assets
334.8
Liabili-ties
330.5
Monetaryauthority
Assets
173.8
11.2
Liabili-ties
173,8
Commercialbanking
Assets
1,364.0
Liabili-ties
1,283.9
Privatenonbank finance
Assets
2,367.1
Liabili-ties
2,217.3
Allsectors1
Assets
10,566.4
49.322.9
Liabili-ties
8,983.8
Floatsand
discrep-ancies
Assets
6.9
Line
1
2
34
2.9 2.9
5.116.4
31.131.1
59.253.95.2
20.5
53.5
361.2
3,488.2
329.5
179.3
248.1
398.01,277.9
333.5456.3
73,5192.0
44.715.0
133.8
443.4 .5403,9 .5
15 424.1
1,494.6765.8728.8
118.2 6.0
74.4
214.6652.7 . . :26.0
55.5
553.5 323.9 302.2
1.7
302.2 .8 302.2
75.611.1 242.8
27.8 . . .87.7 .449.0 78.2
32.4
10 8329.5 4.4 28.4
5.116.4
121.5 2.9117.4 2.9
3 5.5
6.3 47.3 47.3
.1
131.4 1,243.6
121.3 111.2
9.3 60.9
149.2
7.7264.6176.7456.3
.8 16.9
20.9
3.6 5.1 49.3
321.9286.4
11 923.6
765.8765.8
109.8
-21.3
32.2
6.3
25.9
974.4
27.727.7
59.253.9
5.2
14.5
361.1
1,789.5
95.2
108.3
99.0
390.3770.5156.9
55.5113.8
23.815.0
76.4
728.8
728.8
8.5
74.4
214.6652.7
55.5
219.1
69.411.1
27.861.849.0
32.4
9.8221.6
10.116.4
414.4374.1
16.224.1
1,494.6765.8728.8
57.2
74.4
224.2729.140.4
1,572.9
4,652.9
737.8
306.6
330.1
490.61,451.8
385.7456,3177.8316.1
59.9506.1
24.8614.0
10.113.6 -2.8
443.4 29.0 '403.9 29.8
15.4 -.824.1
1,494.6765.8728.8
118.2 61.1
74.4 . . . . .
224.2729.1 . . . . .26.0 -14.5
55.5
4,652.9
737.8
306.6
330.1
490.61,451.8
385.7456.3177.8316.1
59.9428.1 -78.0
28.9 4.1621.9 7.9
67
89
1011
121314
15
16
171819
20
21
22
23
24
252627282930
31323334
115
Digitized for FRASER http://fraser.stlouisfed.org/ Federal Reserve Bank of St. Louis

47. Flow of funds accounts—Financial assets and liabilities, December 31,1980— ContinuedB. Private nonbank financial institutionsAmounts outstanding, billions of dollars
Transaction category
1 Total assets
2 Total liabilities
3 Demand depositsand currency
4 Time and savingsaccounts
5 Commercial banks6 Savings institutions . . . .
7 Federal funds andsecurity RPs
8 Money marketfund shares
9 Life insurance reserves10 Pension fund reserves
11 Corporate equities-*
12 Credit marketinstruments
13 U.S. Treasurysecurities^
14 Federal agencysecurities^
15 State and local govern-ment securities . . . .
16 Corporate and foreignbonds
17 Mortgages18 Consumer credit19 Bank loans n e e20 Open-market paper . . . .21 Other loans
22 Security credit23 Trade credit24 Taxes payable25 Miscellaneous
Total
Assets
2,367.1
27.7
59.253.95.2
14.5
361.1
1,789.5
95.2
108.3
99.0
390.3770.5156.9
55.5113.8
23.815.0
76.4
Liabili-ties
2,217.3
728.8
728.8
8.5
744
2146652 7
55.5
219.1
• 69.411.1
27 861.849.0
32.4
9 8221.6
Savingsand loan
associations
Assets Li£f
629.8
5965
36
7.8 511.07 8
511.0
10.8 8.5
Mutualsavingsbanks
Assets Lit^
U- Assets
172.6 70
160.1 . . .
3 9 1
.4 153.4 74 2
153.4 5
3 7
mfndni iOSMMCejmons companies
Liabili- . t Liabities Assels ties
Privatepension
funds
ii- Assets Liabili-Assets ties
.8 469.1 279.2
64 4 441 4 279.2
7 2.8 ...
2 644o2 644
1.9
10310.3
214.616S 6 279.2
573.1 66.7
5.5
41.2
1 2
3 7502.8 8.8
17 55 2
49490
2 534.5 7.9
5.3
154.2 61
53 7
53.0
9 385.1
1 S 8
17.5 6.5 11.1 . . . .
2 4 6 7
21 2 178099 8 4 3 131 141 . . . 44 0 . .
4 0 . , 11.041 5
. 168.2
92.6
24,1
6.7
58.137
405.0 6.7 . . . . 28.1 57.2 6.2
116Digitized for FRASER http://fraser.stlouisfed.org/ Federal Reserve Bank of St. Louis

State andlocal governmentretirement funds
Assets
207.9
Liabili-ties
Otherinsurancecompanies
Assets
185.0
207.9
Liabili-ties
Financecompanies
Assets
181.4
127.3
Liabili-ties
169.6
Real estateinvestment
trusts
Assets
5.7
Liabili-ties
8.0
Open-endinvestmentcompanies
Assets
55.5
Liabili-ties
Moneymarketfunds
Assets
74.4
55.5
Liabili-ties
Securitybrokers
and dealers
Assets
35.6
74.4
Liabili-ties
32.8
Line
1
2
4.6 2.7 4.7
33.433.4
7
8
910
11
74.4
207.9
54.3 35.1 42.2 55.5 2.9
149.0 . . .
18.0 . . .
18.0 . . .
4.1
98.0 . . .10.9 . . .
. . 132.2
14.2
7,3
83.6
26.4.7
15.0
176.6 146.2 4.2
64.313.0 4.291 3. . . . 20.7
61.272 3
13 16126.0 21.8 1.5
6.1 12.5 . . .
1.9
1.3 6.62.4
1.9.5 41
1.9
39.8 8.3
8.2 5.2
1.1
2.0
31.6
... . 23.8 32.4
.41.1
12
13
14
15
161718192021
22232425
117Digitized for FRASER http://fraser.stlouisfed.org/ Federal Reserve Bank of St. Louis
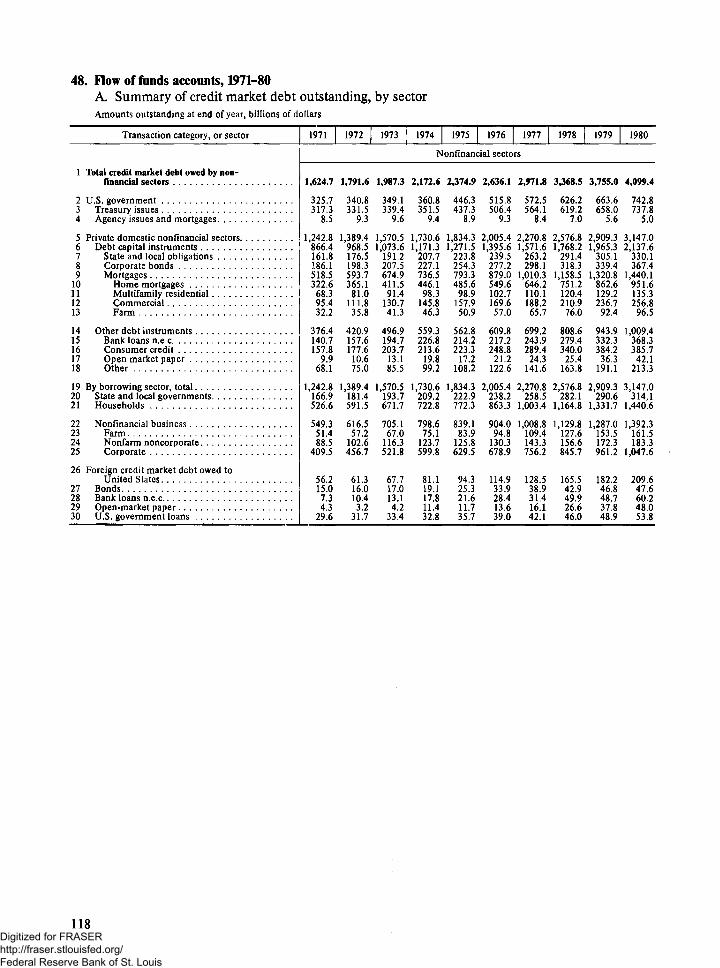
48. Flow of funds accounts, 1971-80A. Summary of credit market debt outstanding, by sectorAmounts outstanding at end of year, billions of dollars
Transaction category, or sector
1 Total credit market debt owed by non-financial sectors
2 U.S. government3 Treasury issues4 Agency issues and mortgages . .
5 Private domestic nonfinancial sectors6 Debt capital instruments7 State and local obligations8 Corporate bonds9 Mortgages
10 Home mortgages11 Multifamily residential . ,12 Commercial13 Farm
14 Other debt instruments15 Bank loans n.e c16 Consumer credit17 Open market paper18 Other . . . .
19 By borrowing sector, total20 State and local governments21 Households
22 Nonfinancial business23 Farm24 Nonfarm noncorporate .25 Corporate
26 Foreign credit market debt owed toUnited States. . . .
27 Bonds28 Bank loans n.e.c. .29 Open-market paper30 U.S. government loans
1971 1972 1973 1974 1975 1976 1977 1978 1979 1980
Nonfinancial sectors
1,624.7
325.7317.3
8.5
1,242.8866.4161,8186.1518.5322.668.395.432.2
376.4140.7157.8
9.968.1
1,242.8166.9526.6
549.351.488.5
409.5
56.215.07.34.3
29.6
1,791.6
340.8331.5
9.3
1,389.4968.5176.5198.3593.7365.1
81.0111.835.8
420.9157.6177.610.675.0
1,389.4181.4591,5
616.557.2
102.6456.7
61.316.010.43.2
31.7
1,987.3
349.1339.4
9.6
1,570.51,073.6
191.2207.5674.9411.5
91.4130.741.3
496.9194.7203.7
13.185.5
1,570.5193.7671.7
705.167.0
116.3521.8
67.717.013.14.2
33.4
2,172.6
360.8351.5
9.4
1,730.61,171.3
207,7227.1736.5446.1
98.3145.846.3
559,3226.8213.6
19.899,2
1,730.6209.2722.8
798.675.1
123.7599.8
81.119.117.811.432.8
2,374.9
446.3437.3
8.9
1,834.31,271.5
223.8254.3793.3485.6
98.9157.950,9
562.8214,2223.3
17.2108.2
1,834.3222.9772.3
839.183.9
125.8629.5
94.325.321.611.735.7
2,636.1
515.8506,4
9.3
2,005.41,395.6
239.5277.2879.0549,6102.7169.657.0
609.8217.2248.821.2
122.6
2,005.4238.2863.3
904.094.8
130.3678,9
114.933.928.413.639.0
2,971.8
572.5564.1
8.4
2,270.81,571.6
263,2298.1
1,010.3646.2110.1188.265.7
699.2243.9289.424,3
141.6
2,270.8258.5
1,003.4
1,008.8109.4143.3756.2
128.538.931.416.142.1
3,368.5
626.2619.2
7.0
2,576.81,768.2
291.4318.3
1,158.5751.2120.4210.9
76,0
808.6279.4340.025.4
163.8
2,576.8282.1
1,164.8
1,129.8127.6156.6845.7
165.542.949.926.646.0
3,755.0
663.6658,0
5.6
2,909.31,965.3
305.1339.4
1,320.8862.6129.2236.7
92.4
943.9332.3384.236.3
191,1
2,909.3290.6
1,331.7
1,287.0153.5172.3961.2
182,246.848,737.848.9
4,099.4
742.8737.8
5,0
3,147.02,137.6
330.1367.4
1,440.1951,6135.3256.8
96,5
1,009.4368.3385.742.1
213.3
3,147.0314.1
1,440.6
1,392.3161.5183.3
1,047.6
209.647.660.248.053.8
118Digitized for FRASER http://fraser.stlouisfed.org/ Federal Reserve Bank of St. Louis
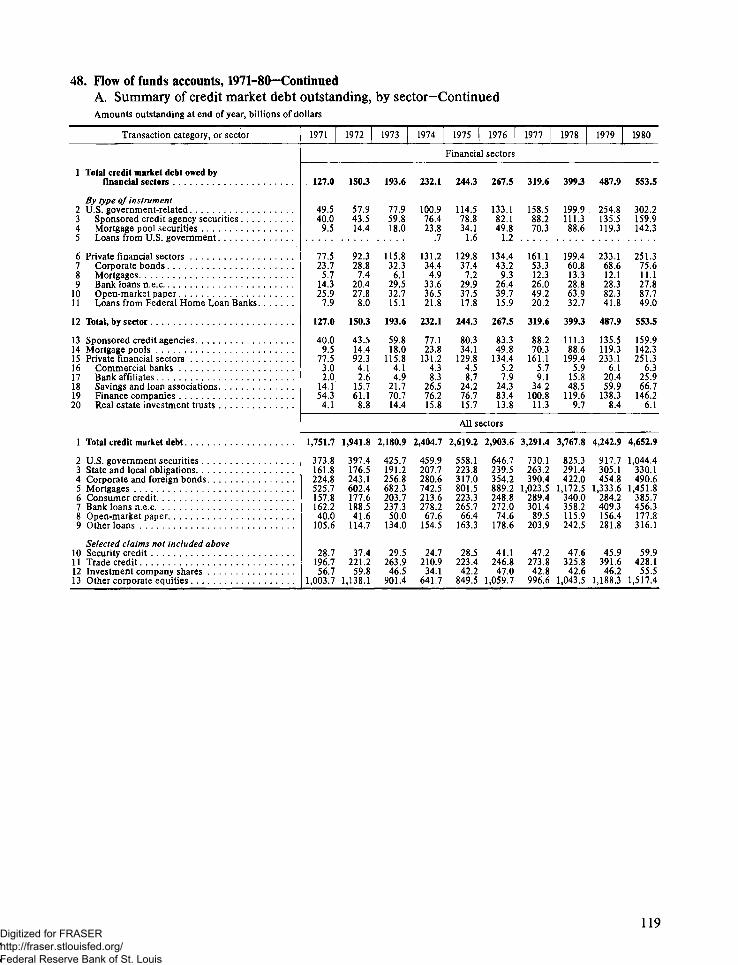
48. Flow of funds accounts, 1971-80—ContinuedA. Summary of credit market debt outstanding, by sector-ContinuedAmounts outstanding at end of year, billions of dollars
Transaction category, or sector
1 Total credit market debt owed byfinancial sectors . . .
By type of instrument2 U.S. government-related. . .3 Sponsored credit agency securities4 Mortgage pool securities .5 Loans from U S government
6 Private financial sectors . . .7 Corporate bonds8 Mortgages9 Bank loans n e e
10 Open-market paper11 Loans from Federal Home Loan Banks
12 Total, by sector
13 Sponsored credit agencies14 Mortgage pools15 Private financial sectors16 Commercial banks17 Bank affiliates18 Savings and loan associations19 Finance companies20 Real estate investment trusts
1 Total credit market debt . .
2 U S government securities . . . .3 State and local obligations4 Corporate and foreign bonds5 Mortgages6 Consumer credit7 Bank loans n e e8 Open-market paper9 Other loans
Selected claims not included above10 Security credit11 Trade credit . . . . . . .12 Investment company shares13 Other corporate equities
1971 1972 1973 1974 1975 1976 1977 1978 1979 1980
Financial sectors
127.0
49.540.0
9.5
77.523.75.7
14.325.9
7.9
127.0
40.09.5
77.53.02.0
14.154.34.1
150.3
57.943.514.4
92.328.87.4
20.427.8
8.0
150.3
43.514.492.34.12.6
15.761.1
8.8
193.6
77.959.818.0
115.832.36.1
29.532.715.1
193.6
59.818.0
115.84.14.9
21.770.714.4
232.1
100.976.423.8
.7
131.234.44.9
33.636.521.8
232.1
77.123.8
131.24.38.3
26.576.215.8
244.3
114.578.834.1
1.6
129.837.4
7.229.937.517.8
244.3
80.334.1
129.84.58.7
24.276.715.7
267.5
133.182.149.8
1.2
134.443.2
9.326.439.715.9
267.5
83.349.8
134.45.27.9
24.383.413.8
319.6
158.588.270.3
161.153.312.326.049.220.2
319.6
88.270.3
161.15.79.1
34.2100.811.3
399.3
199.9111.388.6
199.460.813.328.863.932.7
399.3
111.388.6
199.45.9
15.848.5
119.69.7
487.9
254.8135.5119.3
233.168.612.128.382.341.8
487,9
135.5119.3233.1
6.120.459.9
138.38.4
553.5
302.2159.9142.3
251.375.611.127.887.749.0
553.5
159.9142.3251.3
6.325.966.7
146.26.1
All sectors
1,751.7
373.8161.8224.8525.7157.8162.240.0
105.6
28.7196.756.7
1,003.7
1,941.8
397.4176.5243.1602.4177.6188.541.6
114.7
37.4221.259.8
1,138.1
2,180.9
425.7191.2256.8682.3203.7237.3
50.0134.0
29.5263.946.5
901.4
2,404.7
459.9207.7280.6742.5213.6278.267.6
154.5
24.7210.934.1
641.7
2,619.2
558.1223.8317.0801.5223.3265.7
66.4163.3
28.5223.442.2
849.5
2,903.6
646.7239.5354.2889.2248.8272.074.6
178.6
41.1246.847.0
1,059.7
3,291.4
730.1263.2390.4
1,023.5289.4301.4
89.5203.9
47.2273.842.8
996.6
3,767.8
825.3291.4422.0
1,172.5340.0358.2115.9242.5
47.6325.842.6
1,043.5
4,242.9
917.7305.1454.8
1,333.6284.2409.3156.4281.8
45.9391.646.2
1,188.3
4,652.9
1,044.4330.1490.6
1,451.8385.7456.3177.8316.1
59.9428.1
55.51,517.4
119Digitized for FRASER http://fraser.stlouisfed.org/ Federal Reserve Bank of St. Louis

48. Flow of funds accounts, 1971-80-ContinuedB. Direct and indirect claims on credit market debtAmounts outstanding at end of year, billions of dollars; exceptions noted.
Transaction category, or sector
1 Total credit market debt claims againstnonfinancial sectors
Public agencies and foreign2 Total held3 US. government securities . . . . . .4 Residential mortgages5 Federal Home Loan Bank advances to
savings and loans6 Other loans and securities
By sector7 US government. . . . .8 Government-related agencies and pools9 Monetary authorities
10 Foreign1 1 Agency debt and mortgage pool securities
not in line 1
Private domestic holdings12 Total held13 U S. government securities14 State and local obligations15 Corporate and foreign bonds16 Residential mortgages17 Other mortgages and loans . .18 LESS* Federal Home Loan Bank advances
Private financial intermediation19 Credit market claims held by private
financial institutions20 Commercial banking21 Savings institutions22 Insurance and pension funds23 Other finance .
24 Sources of funds25 Private domestic deposits and RPs26 Credit market debt27 Other sources28 Foreign funds . . . .29 Treasury balances30 Insurance and pension reserves31 Other, net
1971 | 1972
1,624.7 1,791.6
238 7 258.71196 127235 3 42 3
79 80759 81,2
59 9 62 454.5 63.471 1 71 353.2 61.6
49 5 57 9
1,435.6 1,590.8254.3 270.21618 1765198 1 211 3357.1 405.2472 2 535 6
7.9 8.0
1.1820 1,330.5497 8 568 3294.3 341.6305 3 322 2
84 5 98 4
1,182.0 1,330.5708.4 809.3
77 5 92 3396 1 428.9
198 256102 109
250.2 260.8115.9 131.6
1973 | 1974
1,987.3 2,172.6
290.7 342.21366 148550 6 65 3
151 21 888 4 106.6
65 5 73 182.5 109.080 6 86.762.2 73.4
77 9 100 9
1,774.4 1,931.3289.0 311.4191 2 207.7221 3 242 3453.6 480.36344 711.4
15.1 21.8
1,491,8 1 617.06529 7197376.7 400,3345 9 375.71163 1212
1,491.8 1,617.0906.5 974.11158 13124695 511.7
28 7 39.099 48
282.0 312.8149.0 155.1
1975
2,374.9
386.8171 081 5
17 8116 5
882123.995 379.5
1145
2,102.5387.1223.8275 1504.17303
17.8
1,741.0749 1453.6416.31220
1,741.01,066.0
129 8545.2303
3 1341.5170.3
1976
2,636.1
441.1197 8943
15 9133.2
97.2144.2105.194.7
133 1
2,328.0448.9239.5305 6559.1790.9
15.9
1,930.9808.7524.2466.2131.8
1,930.91,190.6
1344605.925.73.0
374.2202.9
1977
2,971.8
52642380114 7
202153 5
109 1171.01122134.1
158 5
2,603.9492.1263.2328 1642.6898.220.2
2,188.28963606.2535.31504
2,188.21,331.1
161 1696.0
27.673
425.9235.1
1978
3,368.5
636.1281 9141 2
327180.4
129.5215.6119.2171.8
1999
2,932.3543.5291.4350.6731.2
1,048.332.7
2,485.51 025.0
682.0608.9169.6
2,485.51,473.7
199.4812.433.914.1
483.8280.6
1979
3,755.0
718.528391797
41 82130
151 9275.61269164.0
2548
3,291.3633.8305.13763812,7
1,205.341.8
2,776.31,143.9
738.0680.6213 7
2,776.31,607.2
233 1936.0
60.114.5
532.4329,0
1980
4,099 4
81423069211 6
49 02468
177 3323.9131 4181.7
302 2
3,587.3737.5330.1402 3875.8
1,290.549.0
3,033.01,243.6
789.2758.9241 3
3,033.01,775.2
251 31,006.5
37.011 9
591.7365.9
120Digitized for FRASER http://fraser.stlouisfed.org/ Federal Reserve Bank of St. Louis

48. Flow of funds accounts, 1971-80-ContinuedB. Direct and indirect claims on credit market debt-ContinuedAmounts outstanding at end of year, billions of dollars; exceptions noted.
Transaction category, or sector
Private domestic nonfinancial investors32 Credit market claims33 U.S. government securities34 State and local obligations35 Corporate and foreign bonds36 Open-market paper etc . . . .37 Other
38 Deposits and currency39 Security RPs40 Money market fund shares41 Time and savings accounts42 Large at commercial banks43 Other at commercial banks44 At savings institutions
45 Money46 Demand deposits47 Currency
48 Total of credit market instruments,deposits, and currency
49 Public support rate (percent)50 Private financial intermediation (percent)51 Total foreign funds
52 Total market value53 Investment company shares . . . .54 Other equities
55 Held by financial institutions56 Other holdings
1971
331.1129.351.443.119.188.2
761.91.1
534.460.1
203.3271.0
226.4173.053.4
1,093.0
14.782.373.0
1972
352.7133.554.448.020.496.3
867.12.7
617.975.0
226.5316.4
246.6188.757.9
1,219.8
14.483.687.2
1973
398.3152.359.850.130.2
106.0
968.413.7
693.6112.5236.2344,9
261.1199.361.8
1,366.7
14.684.190.8
1974
445.5171.369.155.236.0
114.0
1,042.211.52.4
759,1144.8248.3365.9
269.2201.168.1
1,487.7
15.883.7
112.4
1975
491.3195.477.563.534.7
120.2
1,140.311.73.7
843.0129.0288.6425.4
281.9207.6
74.3
1,631.6
16.382.8
109.8
1976
531.5212.0
81.469.336.6
132.3
1,272.214.03.7
956.5109.9352.1494.5
298.0216.4
81.6
1,803.8
16.782.9
120.4
1977
576.8233.7
83.966.346.1
146.8
1,421.016.33.9
1,077.5132.9381.1563.4
323.4233.5
89.9
1,997.8
17.784.0
161.7
1978
646.2266.686.964.862.4
165.5
1,572.923.710.8
1,192.7178.8389.3624.6
345.7246.599.2
2,219.1
18.984.8
205.7
1979
748.2327.4
78.976.273.1
192.5
1,714.330.345.2
1,274.9172.8432.8669.3
363.8256.7107.1
2,462.4
19.184.4
224.1
1980
805.6361.8
82.080.069.6
212.3
1,892.636.774.4
1,408.7203.1482.1723.6
372.8255.3117.4
2,698.3
19.984.5
218.6
Corporate equities not included above
1,060.456.7
1,003.7
195.6864.9
1,198.059.8
1,138.1
244.8953.1
947,946.5
901.4
201.8746.2
675.834.1
641.7
146.8529.0
891.742.2
849.5
196.7695.0
1,106.647.0
1,059.7
236.5870.1
1,039.442.8
996.6
222.7816.7
1,086.142.6
1,043.5
235.6850.5
1,234.546.2
1,188.3
268.2966.3
1,572.955.5
1,517.4
361.21,211.7
NOTES BY LINE NUMBER
1. Line 1 of Table 48, part A.2. Sum of lines 3-6 or 7-10.6. Includes farm and commercial mortgages.
11, Credit market funds raised by federally sponsored credit agencies,and net issues of federally related mortgage pool securities.Included in lines 3,13, and 33.
12. Line 1 less line 2 plus line 11. Also line 19 less line 26 plus line 32,Also sum of lines 27, 32, 39,40, 41, and 46.
17. Includes farm and commercial mortgages.25. Sum of lines 39, 40, 41, and 46.26. Excludes equity issues and investment company shares. Includes
line 18.28. Foreign deposits at commercial banks, bank borrowings from
foreign branches, and liabilities of foreign banking agencies toforeign affiliates.
29. Demand deposits at commercial banks.30. Excludes net investment of these reserves in corporate equities.31. Mainly retained earnings and net miscellaneous liabilities.32. Line 12 less line 19 plus line 26.33-37. Lines 13-17 less amounts acquired by private finance. Line 37
includes mortgages.47. Mainly an offset to line 9.48. Sum of lines 32 and 38, or line 12 less line 27 plus line 47.49. Line 2 divided by line 1.50. Line 19 divided by line 12.51. Sum of lines 10 and 28.52-54. Includes issues by financial institutions.
121Digitized for FRASER http://fraser.stlouisfed.org/ Federal Reserve Bank of St. Louis

48. Flow of funds accounts, 1971-80-ContirmedC. Sector statements of financial assets and liabilitiesAmounts outstanding at end of year, billions of dollars
Category
1 Total financial assets
2 Deposits and credit market instruments^
3 Deposits4 Demand deposits and currency5 Time and savings accounts6 Commercial banks7 Savings institutions8 Money market fund shares . . . .
9 Credit market instruments . . . .10 US government securities11 Treasury issues .12 Savings bonds13 Other Treasury14 Agency issues
15 State and local obligations16 Corporate and foreign bonds . . . . - .17 Mortgages18 Open-market paper
19 Corporate equities . . . .20 Investment company shares21 Other corporate equities
22 Life insurance reserves23 Pension fund reserves. . . . .24 Security credit25 Miscellaneous assets. . .
26 Total liabilities
27 Credit market instruments28 Home mortgages . . . . . . . . . .29 Other mortgages30 Installment consumer credit31 Other consumer credit32 Bank loans n.e.c33 Other loans . . . . . .
34 Security credit35 Trade credit36 Deferred and unpaid life insurance premiums . . .
1971 1972 1973 1974 1975
Households, personal trusts
2,152.7
872.5
624.3129.8494.5223,5271.0
248.297.076.554.422.120.5
46.143.154.17.9
834.156.7
777.4
136.8275.8
4.928.7
550.9
526.6317.120.3
118.339.59.2
22.3
13.15.85.4
2,387.1
970.6
711.0142.2568.8252.4316.4
259.796.679.657.721.917.0
48.448.060.5
6.2
914.159.8
854.3
143.7322.3
5.031.3
621.5
591.5358.621,5
133.244.510.123.6
17.56.56.0
2,300.5
1,087.0
788.7156.1632.6287.7344.9
298.3115.496.760.436.418.6
53.750.163.915.3
712.746.5
666.1
151.3310.6
4.934.1
698.3
671.7405.7
22.6155.148.613.526.2
13.27.16.4
2,200.6
1,194.6
853.9163.0688.5322.6365.9
2.4
340.7136.0113.663.350.322.4
61.955.268.219.5
504.834.1
470.7
158.0302.5
3.936.8
749.3
722.8440,9
23.7164.649.015.229.4
11.48.07.1
2,551.5
1,314.5
943.2'166.9772.6347.2425.4
3.7
371.3152.8133.467.466.019.4
68.163.571.915.1
659.742.2
617.5
166.6365.7
4.540.6
801.2
772.3479.024.8
172.450.913.731.5
12.19.17.7
1976 1977 1978 1979 1980
and nonprofit organizations
2,944.4
1,461.9
1,067.4181.9881.9387.4494.5
3.7
394.5162.8139.672.067.623.2
70.669.379.811.9
827.247.0
780.2
175.0427.9
6.346.0
899.3
863.3540.625.8
194.054.814.633.4
17.210.58.4
3,118.0
1,628.7
1,198.7203.7991.1427.6563.4
3.9
430.0177.2149.476.872.727.7
73.266.391.821.6
777.042.8
734,2
186.5465.5
7.352.9
1,044.8
1,003.4634.026.9
230.858.617.435.7
20.311.89.3
3,422.0
1,815.2
1,329.1222.1
1,096.3471.7624.6
10.8
486.0203.8166.780.786.037.1
75.064.8
106.236.1
808.542.6
765.9
198.5530.5
8.860.5
1,210.0
1,164.8738.2
27.9275.6
64.319.239.5
21.713.210.3
3,836.2
2,029.8
1,455.7235.7
1,174.8505.5669.345.2
574.1268.9209.879.9
129.959.1
66.576.2
122.639,9
918.046.2
871.9
211.2599.4
9.068.9
1,378.6
1,331.7850.728.9
311.372.822.145.8
20.614.611.7
4,412.6
2,222.9
1,624.7243.0
1,307.2583.6723.674.4
598.2292.6227.3
72.5154.865.3
69.780.0
127.528.5
1,144.155.5
1,088.6
224.2729.1
15.277.1
1,497.3
1,440.6941.4
29.8313.4
72.228.854.9
27.516.013.2
122Digitized for FRASER http://fraser.stlouisfed.org/ Federal Reserve Bank of St. Louis

48. Flow of funds accounts, 1971-80-ContinuedC. Sector statements of financial assets and liabilities-ContinuedAmounts outstanding at end of year, billions of dollars
Category
1 Total financial assets
2 Liquid assets3 Demand deposits and currency4 Time deposits . . . .5 Foreign deposits6 U S government securities . . . .7 State and local obligations8 Commercial paper9 Security RPs . .
10 Consumer credit . . .1 1 Trade credit12 Miscellaneous assets13 Foreign direct investments^14 Insurance receivables15 Equity in sponsored agencies16 Other
17 Total liabilities
18 Credit market instruments19 Tax-exempt bonds^ . . . .20 Corporate bonds^21 Mortgages . . . .22 Home mortgages23 Multifamily . . . .24 Commercial
25 Bank loans n.e.c26 Commercial paper . . . .27 Acceptances28 Finance company loans . .29 United States government loans
30 Profit taxes payable31 Trade debt32 Miscellaneous liabilities . . . .
MEMO33 Net trade credit
Debt subtotals4
34 Securities and mortgages .35 Loans and short-term paper36 Total short-term liabilities37 Ratios (percent)37 Long-term debt due to credit market debt38 Short-term debt due to credit market debt . . . .39 Liquid assets to short-term liabilities
1971 1972 1973 1974 1975 1976 1977 | 1978 1979 1980
Nonfinancial corporate business
406.0
78.842.6
9.51.2
10.03.2
11.31.1
18.6202.5106.176.411.9
17.5
610.7
409.5.1
186.192.1
2.821.767.6
106.96.21.8
14.61.6
13.3174.013.9
28.5
278.3131.2318.6
68.032.024.7
455.5
88.044.911.92.27.94.2
14.22.7
18.4229.8119.381.513.7
23.7
681.0
456.7.6
198.3109.0
3.324.581.2
119.97.01.8
18.21.8
13.3196.2
14.9
33.5
307.9148.8358.3
67.432.624.6
526.0
101.046.316.63.34.54.0
14.911.3
21.7266.8136.69L715.7
28.8
793.1
521.82.4
207.5127.1
2.926.997.3
149.68.42.4
22.32.1
15.6235.1
20.6
31.7
337.0184.8435.5
64.635.423.2
516.7
105.447.820.54.95.64.7
16.55.5
22.2243.6145.5100.4
17.8
26.9
815.8
599.84.1
227.1140.7
2.628.3
109.8
180.012.53.6
28.13.7
16.7174.125.1
69.5
371.9227.9418.7
62.038.025.2
557.6
125.253.922.4
5.814.34.5
19.64.7
22.3250.0160.1114.120.0
25.5
851.9
629.56.7
254.3152.0
3.328.8
11^.8
168.99.63.8
30.33.9
14.3180.527.7
69.5
413.0216.5411.3
65.634.430.4
610.4
139.055.524.4
7.416.63.4
24.77.0
24.0269.5177.8126.623.4
.527.4
925.5
678.99.2
277.2165.4
4.531.5
129.4
171.511.05.1
35.54.1
21.8194.030.8
75.5
451.7227.2443.1
66.533.531.4
664.8 756.7
141.0 151.356.3 61.629.2 31.2
8.7 10.710.4 4.13.5 3.7
24.5 26.38.3 13.7
25.0 26.7300.6 355.5198.2 223.2139.0 156.427.8 32.6
.5 .630.9 33.6
1,027.0 1,172.9
756.2 845.712.7 15.8
298.1 318.3184.5 207.3
6.1 6.533.2 36.2
145.2 164.7
192.5 224.012.8 15.55.7 5.0
45.8 54.14.0 5.7
20.4 23.9215.7 262.5
34.6 40.8
84.9 93.1
495.3 541.4260.9 304.3497.1 590.6
65.5 64.034.5 36.028.4 25.6
873.5
169.767.535.911.71.33.7
33.216.3
30.4421.4251.9179.137.2
,635.0
1,361.7
961.221.2
339.4231.6
5.938.6
187.0
270.724.3
6.061.16.9
24.9323.5
52.3
97.9
592.23690717.3
61,638.423.7
946.2
183.568.939.112.0-3.6
3.441.122.7
32.5453.6276.5197.142.0
.636.8
1,479.0
1,047.623.6
367.4250.0
5.140.6
204.2
299.828.4
6.963.28.4
18.2352.7
60.5
100.9
641.0406.6777.5
61.238.823.6
123Digitized for FRASER http://fraser.stlouisfed.org/ Federal Reserve Bank of St. Louis

49. Selected measures of nonfinancial business activity, 1980]
1967 = 100; monthly data are seasonally adjusted. Exceptions are noted.
Measure
1 Industrial production, total
Market groupings2 Products total3 Final, total . .4 Consumer goods5 Equipment6 Intermediate7 Materials
Industry groupings8 Manufacturing
Capacity utilization (percent)2
9 Manufacturing . . .10 Industrial materials industries11 Construction contracts (1972 = 100)3. . . .12 Nonagricultural employment, totar13 Goods-producing total14 Manufacturing, total15 Manufacturing production worker16 Service-producing . . . . . .17 Personal income total^18 Wage and salary disbursements19 Manufacturing20 Disposable personal income^. . .21 -Retail sales6
Prices7
22 Consumer. . . .23 Producer finished goods
1980
147.0
146 7145.3145.41452151.91476
146.7
79.079.8
161.8137.6110,3104.4994
152.6342 9314.7261.5332.5300.2
246.8247.0
Jan.
153,0
150 1147.2147.9146,1160.91576
153.5
83.986.1
190137.8113.2107.1103 4151.3329 7305.9257.6320.7303.6
233.2234.4
Feb.
152.8
1502147.7148.2147.1159.21569
153.1
83.585.6
171138.1113.1107.01029151.8331 2308.0259.7321.8298.0
236.4237.7
Mar,
152.1
1498147.5148.0146.8158.51557
152.0
82.884.7
155138.11126106.81028152.13335309.8260.9324.0292.4
239.8240.0
Apr.
148.2
146 5145.4145,2145,815031509
14810
80.382.1
130138.0111 4105.6101 2152 6333 7308.6258.2324 1286.6
242 5242.1
May
143.8
14341429142.11440145.5144 2
143 5
77678.3
125137.4110 1104.299 1
152.53356309.2255.53256285.0
2449243.4
June
141.4
14251422141.81428143.71398
1402
75775.7
145136.91090103.097 5
152.23376309.9254.23272290.4
247 6244.9
July
140.3
1429142.4142.11428144.61364
1393
74.973.7
148136.71079102.2965
152.53430310.6254.3333 1299.1
2478249.3
Aug.
142.2
1445143.3142.9143 7148.91388
141 2
75.574.6
192137.11086102.8974
152.73459314.4258.53354301.0
2494251,4
Sept.
144.4
1456144.1144.5143 6151,21425
143.9
76.776.4
163137.51092103.2978
153.0350 1317.8262.9339.3306.0
251 7251.4
Oct.
146.6
147 1145.7146.31448152.4145 9
1465
78.278.4
167137.81095103.4980
153.33547323.6267.6343 2308,0
253 9255.4
Nov.
149.2
1487147.4148.1146.5153.4150 1
148.9
79.480.4
210138.11100103,8984
153.53583328.0273.1346.4313.8
256.2252.2
Dec.
150.4
1494147.8147.1148.8155.41522
150.4
79.981.3
193138.21100103.798 3
153.7361 4330.5275.8349.2315.8
2584257.2
124Digitized for FRASER http://fraser.stlouisfed.org/ Federal Reserve Bank of St. Louis
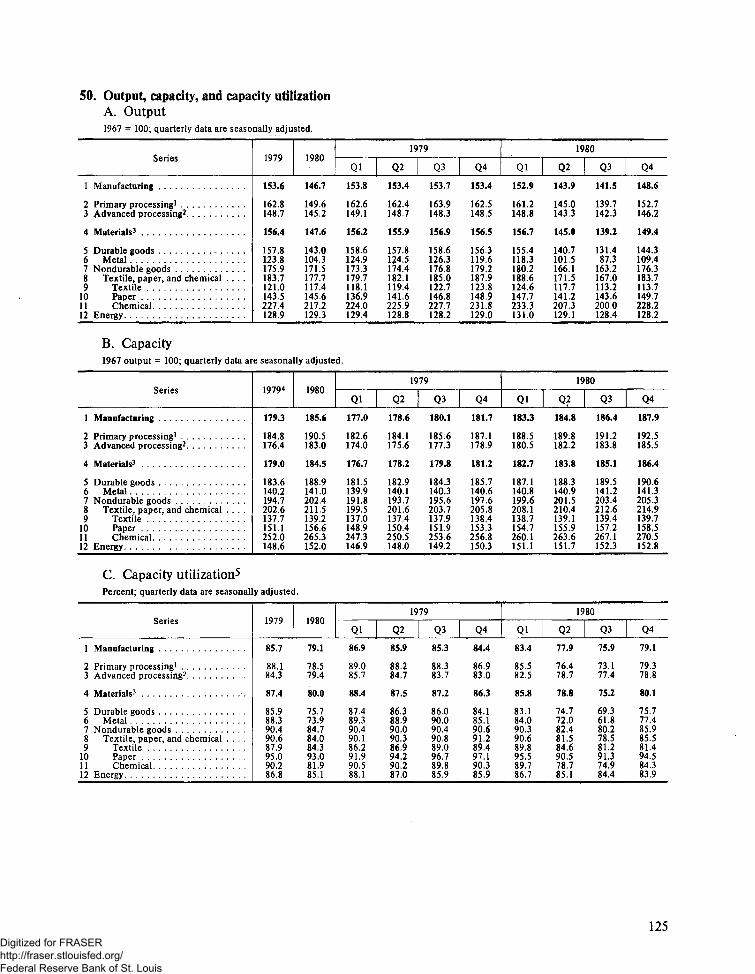
50. Output, capacity, and capacity utilizationA. Output1967 = 100; quarterly data are seasonally adjusted.
Series
1 Manufacturing , . . .
2 Primary processing1 .3 Advanced processing^
4 Materials3 . . .
5 Durable goods6 Metal7 Nondurable goods8 Textile, paper, and chemical . . . .9 Textile
10 Paper . .11 Chemical12 Energy
1979
153.6
162.8148.7
156.4
157.8123.8175.9183.7121.0143.5227.4
' 128.9
1980
146.7
149.6145.2
147.6
143.0104.3171.5177.7117.4145.6217.2129.3
1979
Ql153,8
162.6149.1
156.2
158.6124.9173.3179.7118.1136.9224.0129.4
Q2
153.4
162.4148.7
155.9
157.8124.5174.4182.1119.4141,6225.9128.8
Q3
153.7
163.9148.3
156.9
158.6126.3176.8185.0122.7146.8227.7128.2
Q4
153.4
162.5148.5
156.5
156.3119.6179.2187.9123.8148.9231.8129.0
1980
Ql152.9
161.2148.8
156.7
155.4118,3180.2188.6124.6147.7233.3131.0
Q2 j
143.9
145.0143.3
145.0
140.7101.5166.1171.5U7.7141.2207.3129.1
Q3
141.5
139.7142.3
139.2
131.487.3
163.2167.0113.2143.6200.0128.4
Q4
148.6
152.7146,2
149.4
144.3109.4176.3183.7113.7149.7228.2128.2
B. Capacity1967 output = 100; quarterly data are seasonally adjusted.
Series
1 Manufacturing . .
2 Primary processing1
3 Advanced processing2
4 Materials3
5 Durable goods . . .6 Metal7 Nondurable goods .8 Textile, paper, and chemical . . . .9 Textile
10 Paper11 Chemical . .12 Energy
19794
179.3
184.8176.4
179.0
183.6140.2194.7202.6137.7151.1252.0148.6
1980
185.6
190.5183.0
184.5
188.9141.0202.4211.5139.2156.6265.3152.0
1979
Ql177.0
182.6174.0
176.7
181.5139.9191.8199.5137.0148.9247.3146.9
Q2
178.6
184.1175.6
178.2
182.9140.1193.7201.6137.4150.4250.5148.0
Q3
180.1
185.6177.3
179.8
184.3140.3195.6203.7137.9151.9253.6149.2
Q4
181.7
187.1178.9
181.2
185.7140.6197.6205.8138.4153.3256.8150.3
1980
Ql183.3
188.5180.5
182.7
187.1140.8199.6208.1138.7154.7260.1151.1
Q2
184.8
189.8182.2
183.8
188.3140.9201.5210.4139.1155.9263.6151.7
Q3
186.4
191.2183.8
185.1
189.5141.2203.4212.6139.4157.2267.1152.3
Q4
187.9
192.5185.5
186.4
190.6141.3205.3214.9139.7158,5270.5152.8
C. Capacity utilization5
Percent; quarterly data are seasonally adjusted.
Series
1 Manufacturing
2 Primary processing*3 Advanced processing^
4 Materials3 . . . .
5 Durable goods . . .6 Metal7 Nondurable goods8 Textile, paper, and chemical . . . .9 Textile
10 Paper . .1 1 Chemical12 Energy
1979
85.7
88.184,3
87.4
85.988.390.490.687.995.090.286.8
1980
79.1
78.579.4
80.0
75.773.984.784.084.393.081.985.1
1979
Ql
86.9
89.085.7
88.4
87.489.390.490.186.291.990.588.1
Q2
85.9
88.284,7
87.5
86.388.990.090.386,994.290,287.0
Q3
85.3
88.383.7
87.2
86.090.090.490.889.096.789.885.9
Q4
84.4
86.983.0
86.3
84.185.190.691.289.497.190.385.9
1980
Ql83.4
85.582.5
85.8
83.184.090.390.689.895.589.786.7
Q277.9
76.478.7
78.8
74.772.082.481.584.690.578.785.1
Q375.9
73.177.4
75.2
69.361.880.278.581.291.374.984.4
Q4
79.1
79.378.8
80.1
75.777.485.985.581.494.584.383.9
125Digitized for FRASER http://fraser.stlouisfed.org/ Federal Reserve Bank of St. Louis

51. Industrial production1
Monthly data are seasonally adjusted.
Grouping
MAJOR MARKET
1 Total index .
2 Products3 Final products.4 Consumer goods . .5 Equipment6 Intermediate products7 Materials
Consumer goods8 Durable consumer goods9 Automotive products . .
10 Autos and utility vehicles . .11 Autos12 Auto parts
and allied goods . .13 Home goods . . . .14 Appliances, A/C, and TV. .15 Appliances and TV. . . . .16 Carpeting and furniture . . .17 Miscellaneous home goods.18 Nondurable consumer goods. . .19 Clothing20 Consumer staples21 Consumer foods and
tobacco22 Nonfood staples23 Consumer chemical
products24 Consumer paper
products ,25 Consumer energy
products26 Residential utilities . . .
Equipment27 Business .28 Industrial29 Building and mining30 Manufacturing3 1 Power32 Commercial, transit,
and farm . .33 Commercial34 Transit35 Farm36 Defense and space
Intermediate products37 Construction supplies38 Business supplies . . .39 Commercial energy products .
Materials40 Durable goods materials . .41 Durable consumer parts42 Equipment parts43 Durable materials n.e.c44 Basic metal materials45 Nondurable goods materials . . .46 Textile, paper, and chemical
materials47 Textile materials48 Paper materials49 Chemical materials50 Containers nondurable . .51 Nondurable materials n.e.c. . .52 Energy materials53 Primary energy54 Converted fuel materials . . . .
Supplementary groups55 Home goods and clothing . .56 Energy total . .57 Products58 Materials
1967propor-
tion
100.0
60.7147.8227.6820.1412.8939.29
7.892.832.031.90
.805.061.401.331.072.59
19.794.29
15.50
8.337.17
2.63
1.92
2.621.45
12.636.771.443.851.47
5,863.261.93.67
7.51
6.426.471.14
20.354.585.44
10,345.57
10.47
7.621.851.624.151.701.148.484.653.82
9.3512.23
3.768.48
1979
Jan. Feb. Mar. Apr. May June July Aug. Sept. Oct. Nov. Dec.
Index (1967 = 100)
152.0
149.5146 5151.31399161.0155 7
161 2182.7175.01477
202 2149.2125 6126.5171.4152 8147.31322151 5
141.8162.8
201.4
119.5
155.8165 7
168.2151 6208.0128 1157 8
187 3220.8146.5142 0
92.3
159.6162 4173.3
158.4148.6182.2150.2124.9172.1
178.0118.0133.3222.3171.7133.7129.1114.3147.0
141.4138.9161.1129.1
152.5
150.1147.1151.81406161.3156 1
161 1179.6170.8145.4
202.2150.61294131.0173.2152.9148.0133.1152 2
142.3163.7
203.1
122.1
154.61672
169.3152 6207.3129.6159 1
188.5221.3147.41474
92.4
159.5163.1173.4
158.1146.0184.4149.7124.1173.6
180.1117.4137.4224.8170.7134.5129.7113.4149.6
142.6139.1160.3129.7
153.5
151.31486153.4141 9161.41569
163 7186.8178.8153.8
2072150.81287130.6175.5152.6149.3134.6153 3
144.8163.2
202.8
121.4
154.11673
171.01528205.2130.31602
1920224.6152.0149093.0
159.41634173.7
159.4145.8186,8151.0126.7174.2
181.0119.0139.9224.8169.8135.6129.5114,6147.6
143.4138.9160.1129.5
151.1
148.51454149.3140 1160.1154 9
151 8163.0147.4128 6
202 7145.6115 4116.5172.5150 8148.31306153 2
145.0162.8
201.6
120.9
154.5166 1
168.71504204.2128 0156 0
1898223.2147.9148 292.1
157 1163 1173.7
155.6136.7186.3147.7123.2174.1
181.8117.6141.5226.2164.5137.7129.7114.1148.7
138.7139.1160.3129.7
152.7
150.4147.8152,2141 8160.1156 1
160.6182.7176.3153.1
199.0148.31278129.6172.0
,149.6148.9131.41537
145.3163.4
205.2
121.3
152.3163.8
171.2151 8203.7130.1157 7
193 7225.1155.31508
92.4
157.6162 5172.4
158.1142.5187.4149.6123.9174.7
182.1118.7141.1226.5165.7138.4128.3111.8148.3
140.5137.5158.4128.3
153.0
150.51477152.1141 7160.71568
1590176.2167.4148.0
198.5149.41288130.8173.8150.5149.3133.3153 8
145.7163.1
205.9
121.1
150.9161.0
171.2151 8205.3129.71568
193 8226.7153.9148 192.2
158.0163 3169.6
159.6141.9191.0150.9125.9174.4
182.3121.8142.1225.1162.5138.8128.4112.1148.2
142.0137.0156.5128.4
153.0
150.11474151.2142 1160.3157 4
156 8168.5153.4139.6
2068150.2129 1131.1174.7151.6149.0131.8153 8
146,5162.2
206.1
119.9
149.21577
171.3151 2207.41303151 0
1946227.4154.3151 0
92.9
15791627169.6
160.3138.5191.3153.5129.5175.5
183.2122.2146.2224.9166.8137.5128.1111.3148.7
141.7136.5155.4128.1
152.1
149.1145.8148.7141.9161.31566
148.0147.0125.1118.5
202.7148.6123 3126.1173.4152.1149.0130.81540
145.4164.0
208.8
121.2
150.6161.8
171.6151.7210.6131.1147 7
194.6231.4148.5148 391.9
158.7163 9170.9
157.7129.7191.5152.3127.1177.1
185.4121.6146.2229.2166.4137.5128.7114.6145.9
140.4137.3156.7128.7
152.7
150.21473150.0143 7160.61566
1524157.6139.7128.0
203.0149.51296132.2174.2150.0149.0131.2153 9
145.7163.4
207.2
121.1
150.6161 9
173.4153 5212.0130.41563
1965231.6155.0145 3
93.8
15781634170.5
157.7131.9192.9150.6124.3177.8
186.3124.4148.1228.9166.6137.7127.7112.7145.9
141.1136.6156.7127.7
152.7
150.1147.3150.0143.6160.61566
153.1159.2142.4129.0
202.1149.7128.0130.2173.1151.7148.8130.4153 9
145.9163.1
206.4
121.7
150.1162.2
172.3151.8203.2130.8156.3
196.0234.5154.61280
95.4
157.9163 3172.4
157.2131.5193.2149.5121.3178.8
187.6124.4148.1231.2169.1134.6128.1113.6145.7
140.8136.9156.8128.1
152.3
149.8147 1149,11442160.21562
149.6150.6131.0118.3
200.3149.0129 8132.4171.6150.0149.0132.3153 6
144.8163.8
207.9
119.3
152.2166 5
172.6153 5205.1132.5157 6
194.7223.5150.1139596.4
157.4163 0172.7
155.8126.1195.1148.3119,9178.5
187.0123.2148.5230.5168.1137.6129.4114.0148.2
141.3138.3158.4129.4
152.5
149.8147.2148.6145.2159.6156.6
146.7141.8121.4110.2
193.6149.4133.1135.5170.8149.4149.3131.3154.3
145.8164.3
207.8
121.0
152.4165.0
174.1153.2205.0132,1157.8
198.1237.2151.9141.096.7
155.7163.5173.8
155.8125.1196.7147.8118.1180.2
189.2123.8150.1233.6168.2138.8129.4113.7148.5
141.1138.4158.9129.4
126Digitized for FRASER http://fraser.stlouisfed.org/ Federal Reserve Bank of St. Louis

51. Industrial production1—ContinuedMonthly data are seasonally adjusted.
Grouping
MAJOR MARKET
1 Total index
2 Products3 Final products. . .4 Consumer goods5 Equipment6 Intermediate products7 Materials
Consumer goods8 Durable consumer goods9 Automotive products
10 Autos and utility vehicles . .1 1 Autos . . . . . . .12 Auto parts
and allied goods13 Home goods14 Appliances, A/C, and TV. .15 Appliances and TV16 Carpeting and furniture . . .17 Miscellaneous home goods.18 Nondurable consumer goods. . .19 Clothing20 Consumer staples21 Consumer foods
and tobacco . .22 Nonfood staples23 Consumer chemical
products24 Consumer paper
products25 Consumer energy
products26 Residential utilities . . .
Equipment27 Business28 Industrial29 Building and mining30 Manufacturing31 Power32 Commercial, transit,
and farm33 Commercial. . .34 Transit35 Farm36 Defense and space
Intermediate products37 Construction supplies38 Business supplies .39 Commercial energy products .
Materials40 Durable goods materials41 Durable consumer parts42 Equipment parts .43 Durable materials n.e.c44 Basic metal materials45 Nondurable goods materials . . .46 Textile, paper, and chemical
materials . . . . .47 Textile materials48 Paper materials49 Chemical materials50 Containers, nondurable51 Nondurable materials n.e.c. . .52 Energy materials53 Primary energy . , . . . .54 Converted fuel materials . . . .
Supplementary groups55 Home goods and clothing56 Energy, total57 Products . . . .58 Materials
1967propor-
tion
100.00
60.7147.8227.6820.1412.8939.29
7.892.832.031.90
.805.061.401.331.072.59
19.794.29
15.50
8.337.17
2.63
1.92
2.621.45
12.636.771.443.851.47
5.863.261.93.67
7.51
6.426.471.14
20.354.585.44
10.345.57
10.47
7.621.851.624.151.701.148.484.653.82
9.3512.233.768.48
1980
Jan. Feb. Mar. Apr. May June July Aug. Sept. Oct. Nov. Dec.
Index (1967 = 100)
153.0
150.11472147.9146 1160.9157.6
1430132.6110.8100.2
187 7148.8130 1131.41709149.81499129.6155 5
1470165.5
210.5
123.4
151.11629
175.2157.2222.1133.1156.7
196.0238.2145 0137.197.2
156.71650171.9
156.312061998149.3120.3182.2
191.11246150.8236.6171.8138.2130.4115.2148.8
140.0138.7157.4130.4
152.8
150.2147 7148.2147 1159.2156.9
145 1143.2126.3118 7
186 1146.2123 6125.8168 2149.41494129.31550
1464164.9
211 5
122.0
149.6162 1
176 5159.7231 4134.4155.5
196.0238.7146 9129.997.6
154.4164 0171.0
15521206198 9147.6117.4180.8
189.1125 6146.1234.3171.5138.6131.6114.2152.7
138.5139.1156.1131.6
152.1 148.2
149.8 146.5147 5 145.4148.0 145.2146 8 145 8158.5 150.3155.7 150.9
144 3 136 5140.9 126.9121.9 102.9114.8 97.7
1890 188.0146.2 141.8123 1 115.2126.0 117.9169 5 164.6149.2 146.8149 5 148.6130.3 128.2154 8 154.3
146 6 146.3164.4 163.6
208.9 207.6
121.3 120.4
151.5 151.1168 4 170.1
176 2 174 5159.2 159.1234 4 237.8133.4 131.9152.9 153.0
195.8 192.4240.4 235.6144 o 144 5127.7 120.097.4 97.6
152.9 139.4164 1 161 2172.1 172.2
154.6 147.91204 109.7198 9 195 0146.5 140.1118.2 110.1177.7 173.3
185.7 180.0123 6 120.3146.2 141.6228.9 221.7168.4 168.5138.1 135.3131.0 130.3115.8 116.1149.5 147.4
138.9 135.6139.2 138.6157.7 157.5131.0 130.3
143.8
143.41429142.11440145.5144.2
128 8118.692.8885
184 2134.51024105.4154 1143.81474126.6153 1
1465160.9
203.9
120.2
147.51649
171 8157.12398129.1149.0
188.8233.51362122.897.4
132.0158 8170.4
140.099 1
190 8131.4101.0165.4
171.2118 1141.7206.5158.1137.3128.2115.6143.5
130.9136.3154.4128.2
141.4
142.51422141.8142 8143.7139.8
128 1121.396.495 0
184 7131.81049107.8146.2140.5147.2125.5153 3
147 0160.5
202.2
120.0
148.4166.4
169 7155.0241.7125.5147.4
186.6228.81379121.497.7
128.7158 5168.3
134.294.5
183 2126.097.2
159.5
163.2114 7140.4193.8157.9137.3128.9116.0144.5
128.9136.7154.4128.9
140.3
142.9142.4142.11428144.6136.4
1280127.5103.5102.0
188.5128.3104.1105.2136.1138.1147.7122.2154.7
147.1163.7
205.4
123.0
151.6172.7
1695154.6242.4125.8144.0
186.8228.3138 7123.097.9
128.4160.7171.1
129.092.5
177.0120.086.7
157.1
159.6112.7140.2188.1159.1137.9128.4114.8145.0
125.5137.3157.5128.4
142.2
144.5143 3142.9143 7148.9138.8
128 3120.793.190 1
1909132.6113 5114.2142 1139.01487125.6155 2
1463165.4
210.3
122.6
151.8173 8
171 1155.4243 8125.5147.0
189.2235.61376112.397.7
134.1163 6173.4
131.3968
1763122.889.9
161.3
164.8112 7142.6196.7160.0139.7129.3115.4146.2
129.4138.2158.3129.3
144.4
145.6144 1144.5143 6151.2142.5
133 5131.2106.598.9
193 9134.7115.8117.1147.8139.6148.9123.51560
147 5165.8
211.1
122.2
152.2173.8
170 7154.0242.5124.0145.9
189.9237.61346116.898.1
138.5163.7174.0
133.9102.81766125.291.4
171.3
176.5114 3148.0215.3169.7139.0127.6114.1144.2
129.6137.2158.8127.6
146.6
147.1145.7146.31448152.4145.9
1390140.9119.2109.7
196.1137.8122.2124.5150.2141.2149.3122.5156.7
148.9165.8
211.1
125.8
149.6169.6
171.9153.5242.8123.1145.4
193.1242.0135 6120.999.2
140.6164.1173.2
139.5108.3179.1132.4100.7174.3
180.8113.7148.6223.4168.9138.4126.2113.9141.3
130.8135.6156.8126.2
149.2
148.71474148.1146 5153.4150.1
1434146.1125.4115.4
198 6141.81284131.0154 1144.01500125.51567
149 1165.6
211.0
128.3
147.3166.0
173 9155.3247.9124.3145.3
195.4244.81375121.9100.3
142.61642174.0
146.1113 11842140.6114.7175.1
182.4115 2149.5225.2166.5139.2128.9114.4146.5
134.3137.0155.4128.9
150.4
149.4147 8147.1148 8155.4152.2
141 3139.0116.2105.9
197 0142.6126.4128.7157.3145.4149.3121.0157.2
149.0166.6
213.8
127.7
147.8166.2
177.1159.1253.3128.5146.5
198.0248.51390122.4101.0
145.2165.5175.4
147.4113.8186.1142.0114.3179.6
187.8112.2151.1235.9169.9139.7129.6116.0146.1
132.7137.7156.1129.6
127Digitized for FRASER http://fraser.stlouisfed.org/ Federal Reserve Bank of St. Louis
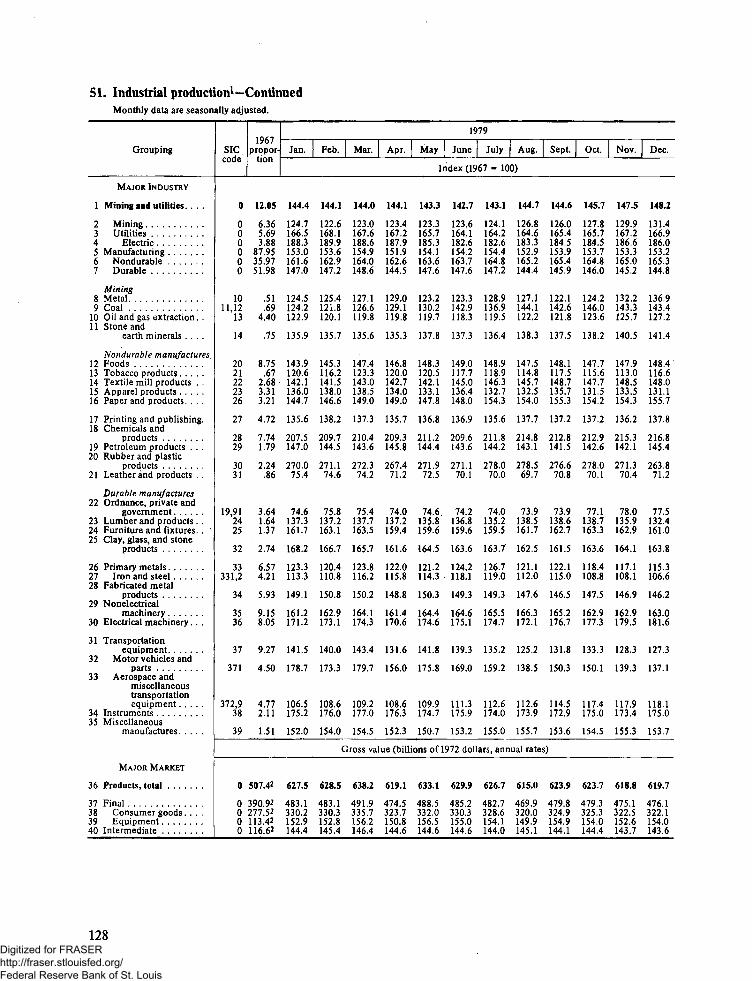
51. Industrial production1-ContinuedMonthly data are seasonally adjusted.
Grouping SICcode
1967propor-
tion
1979
Jan. 1 Feb. Mar. Apr. May June | July Aug. Sept
Index (1967 - 100)
Oct. Nov. Dec.
MAJOR INDUSTRY
1 Mining and utilities. . 0 12.05 144.4 144.1 144.0 144.1 143.3 142.7 143.1 144.7 144.6 145.7 147.5 148.2
2 Mining . .3 Utilities4 Electric5 Manufacturing . »6 Nondurable7 Durable . .
Mining8 Metal9 Coal
10 Oil and gas extraction, .1 1 Stone and
earth minerals . . . .
Nondurable manufactures12 Foods13 Tobacco products14 Textile mill products . .15 Apparel products16 Paper and products. . . .
17 Printing and publishing.18 Chemicals and
products19 Petroleum products . . .20 Rubber and plastic
products21 Leather and products . .
Durable manufactures22 Ordnance, private and
government23 Lumber and products . .24 Furniture and fixtures. .25 Clay, glass, and stone
products
26 Primary metals27 Iron and steel28 Fabricated metal
products29 Nonelectrical
machinery30 Electrical machinery . . .
31 Transportationequipment
32 Motor vehicles andparts . .
33 Aerospace andmiscellaneoustransportationequipment . . . . .
34 Instruments . . .35 Miscellaneous
manufactures
MAJOR MARKET
36 Products, total
37 Final38 Consumer goods, . . .39 Equipment40 Intermediate
0 6.360 5.690 3.880 87.950 35.970 51.98
10 .5111,12 .69
13 4.40
14 .75
20 8.7521 .6722 2.68 -23 3.3126 3.21
27 4.72
28 7.7429 1.79
30 2.2431 .86
19,91 3.6424 1.6425 1.37
32 2.74
33 6.57331,2 4.21
34 5.93
35 9.1536 8.05
37 9.27
371 4.50
372,9 4.7738 2.11
39 1.51
124.7166.5188.3153.0161.6147.0
124.5124.2122.9
135.9
143,9120.6142.1136.0144.7
135.6
207.5147.0
270.075.4
74.6137.3161.7
168.2
123.3113.3
149.1
161.2171.2
141.5
178.7
106.5175.2
152.0
122.6168.1189.9153.6162.9147.2
125.4121 8120.1
1317
145.3116.2141.5138.0146.6
138.2
209.7144.5
271.174.6
75.81372163.1
166.7
120.4110,8
150.8
162.9173.1
140.0
173.3
108.6176.0
154.0
1230167.6188.6154.9164.0148.6
127.11266119,8
135.6
147,4123.31430138.5149.0
1373
210.4143.6
272.374,2
7541377163,5
165.7
123.81162
150.2
164.1174.3
143.4
179,7
109.2177.0
154.5
123.4 123 3167.2 165.7187.9 185.3151.9 154.1162.6 163.6144.5 147.6
129.0 123.21291 1302119.8 1197
135.3 137 8
146.8 148.3120.0 120.5142.7 142 1134.0 133.1149.0 147 8
135.7 1368
209.3 211.2145.8 144.4
267.4 271.971.2 72.5
74.0 74 61372 1358159.4 159.6
161.6 164.5
122.0 121.21158 1143
148.8 150.3
161.4 164.4170.6 174.6
131.6 141.8
156.0 175.8
108.6 109.9176.3 174.7
152.3 150.7
123 6164.1182.6154.2163.7147.6
123.314291183
1373
1490117.71450136.41480
1369
209.6143.6
271.170.1
7421368159.6
163.6
124,2118 1
149.3
164.6175.1
139.3
169.0
111.3175.9
153.2
124 1164.2182.6154.4164.8147.2
128.91369119.5
136.4
148.9118.9146.3132.7154.3
135.6
211.8144.2
278.070.0
74.0135 2159.5
163.7
126.7119,0
149.3
165,5174.7
135.2
159.2
112.6174.0
155.0
126.8164.6183.3152.9165.2144.4
127.1144.1122.2
138.3
147,5114,8145.7132.5154.0
137.7
214.8143.1
278.569.7
73,9138.5161.7
162.5
121.1112.0
147.6
166.3172.1
125.2
138.5
112.6173.9
155.7
126.0165.4184.5153.9165.4145.9
122.1142.6121.8
137.5
148.1117.5148.7135.7155.3
137.2
212.8141.5
276.670.8
73.9138.6162.7
161.5
122.1115.0
146.5
165.2176.7
131.8
150.3
114.5172.9
153.6
1278165.7184.5153.7164.8146.0
124.21460123 6
1382
147.7115.61477131.51542
137.2
212.9142.6
278.070.1
77.11387163.3
163.6
118.4108,8
147.5
162.9177.3
133.3
150.1
117.4175.0
154.5
1299 1314167.2 166.9186.6 186.0153.3 153.2165.0 165.3145.2 144.8
132.2 136.9143.3 143 4125.1 127.2
140.5 141 4
147.9 148 4113.0 116.6148.5 148 0133.5 131.1154.3 1557
136.2 1378
215.3 216.8142.1 145.4
271.3 263,870.4 71.2
78.0 77,51359 1324162.9 161.0
164.1 163.8
117.1 115.3108.1 1066
146.9 146.2
162.9 163.0179.5 181,6
128.3 127.3
139.3 137.1
117.9 118.1173.4 175.0
155.3 153.7
Gross value (billions of 1972 dollars, annual rates)
0 507.42
0 390.920 277,520 113.420 116.62
627.5
483.1330.2152.9144.4
628.5
483.1330.3152.8145.4
638.2
491.9335.7156.2146,4
619.1 633.1
474.5 488.5323.7 332.0150.8 156.5144.6 144.6
629.9
485.2330.3155.0144.6
626.7
482.7328.6154.1144.0
615.0
469.9320.0149.9145.1
623.9
479.8324.9154.9144.1
623.7
479,3325.3154.0144.4
618.8 619.7
475.1 476.1322.5 322.1152.6 154.0143.7 143.6
128Digitized for FRASER http://fraser.stlouisfed.org/ Federal Reserve Bank of St. Louis

51. Industrial production1—ContinuedMonthly data are seasonally adjusted.
Grouping SICcode
1967propor-
tion
1980
Jan. Feb. Mar. Apr. May June July Aug. Sept. Oct. Nov. Dec.
Index (1967 = 100)
MAJOR INDUSTRY
1 Mining and utilities. .. 0 12.05 147.5 148.7 151.1 149.0 148.1 148.9 149.0 149.9 149.5 148.9 151.5 152.4
2 Mining3 Utilities4 Electric5 Manufacturing6 Nondurable7 Durable
Mining8 Metal9 Coal
10 Oil and gas extraction. .11 Stone and earth
minerals
Nondurable manufactures12 Foods . . .13 Tobacco products14 Textile mill products . .15 Apparel products16 Paper and products. . . .
17 Printing and publishing.18 Chemicals and
products19 Petroleum products . . ,20 Rubber and plastic
products21 Leather and products . .
Durable manufactures22 Ordnance, private and
government23 Lumber and products . .24 Furniture and fixtures. .25 Clay, glass, and stone
products
26 Primary metals27 Iron and steel28 Fabricated metal
products29 Nonelectrical
machinery30 Electrical machinery . . .
31 Transportationequipment
32 Motor vehiclesand parts
33 Aerospace andmiscellaneoustransportationequipment
34 Instruments35 Miscellaneous
manufactures
MAJOR MARKET
36 Products, total
37 Final38 Consumer goods . . . .39 Equipment40 Intermediate
0 6.360 5.690 3.880 87.950 35.970 51.98
10 .5111,12 .69
13 4.40
14 .75
20 .87521 .6722 2.6823 3.3126 3.21
27 4.72
28 7.7429 1.79
30 2.2431 .86
19,91 3.6424 1.6425 1.37
32 2.74
33 6.57331,2 4.21
34 5.93
35 9.1536 8.05
37 9.27
371 4.50
372,9 4.7738 2.11
39 1.51
133.2 132.9163.4 166.3181.8 185.4153.5 153.1166 0 165 8144.8 144.4
1366 1356140.0 137.21299 1304
143 9 141 7
149.9 149.41187 1200148.1 148.0131 7 130 7158.3 153.0
138.5 139.9
218.2 217.3146.1 143.6
268.0 267.173.2 72.5
77.3 77.7131.7 130.9160 8 157 9
1642 163.5
117,7 113.6108 9 105 6
144 8 145 3
167.1 167.0181.3 179.5
122.0 126.0
127.0 134.6
117.3 118.0175.7 174.7
154.4 152.3
133.1171.11928152.01643143.5
133 5138.8131 5
1372
1486121 2144.91335153.7
139 1
212.9140.0
266.272.6
78.0126.6161 7
1579
115.2108 1
144 8
166.5179.9
123.9
130.1
118.1173.1
152.8
132.7167.2187.5148.0161 6138.5
123 5143.5131 7
134 5
148.1121 4142.41300148.0
136.7
208.7136.1
261.371,1
78.4104.4158 3
1490
1Q7.097 8
1406
163.2MIA
116.0
116.2
115,7173.8
151.2
132.7165.2185.0143.5158.1133.3
121 8145.2132 6
1298
148.61169138,61287145.8
135.6
198.9131.5
246.770.1
78.7104.9149 8
140.7
96.885 1
132.2
162.1171.1
110.0
106.7
113.1171,2
147.3
132.6167.1188.4140.2155.1129.9
121.0150.1132.3
126.4
149.3115,7136.0126 1145.6
135.3
191.5130.5
240.468.7
78.5110.2143.2
135.2
91.376.4
125.0
158.3166.2
110.0
106.8
113.0169.2
144.3
130.6169.61923139.31546128.7
83 1149.9133 5
1279
149,1119 6131,3123 6143,6
139.2
190.8127.9
241.067.8
77.8113.81383
135 1
83.3687
122 6
154.1165.8
110.3
107.0
113.5167.5
145.0
129.6172.6196.6141.2157.6129.9
71 2153.01334
125 3
148.71187134.8125 5146.8
141.7
198.2124.4
243.367.9
78.1120.21408
137,1
86.9760
124.8
159.6166.8
108.5
104,1
112.7168.6
145.5
130.7 132.1170,6 167.7193.7 189.6143.9 146.5161.0 162.1132.1 135.7
72,8 90.8149.1 149.7134.7 134.5
1297 129.8
149.9 151,11197 123.6133.2 134.31235 121.7153.6 153.4
140.9 142.5
208.2 209.4129.0 128.0
254.4 258,867.5 70.1'
78.9 79.4121,6 121.4144.5 146.7
143.8 146.2
90.6 99.680.4 92.0
128.8 131.7
159.5 160.9167.4 169.8
113.3 118.3
113.7 123.2
112.8 113.7168,1 169.6
144.6 145.0
135.1169,9192.6148.9163 0139.2
107 2151.71'36 1
1327
151.6123 5136.4125 7154-3
142,1
211.7128,6
258.971.0
79.7123.7147,6
148.8
113.2107 6
132.3
162.9173.0
121.8
129.2
114.9170.0
147,1
138.6167.9189.5150.4165.0140.3
122.2153.5138.4
137.4
151.0118.8135.61227157.0
143.0
220.5131.3
262.367.9
79.6123.6148.6
153.0
111,5103,0
135.7
166.9175.1
120.4
125,7
115.4171.9
151.0
Gross value (billions of 1972 dollars, annual rates)
0 507.42
0 390.920 277.520 113.420 116.62
615.9 620.1
471.3 476.6317.6 319.5153.8 157.1144.6 143.5
618.3
475.4320.5154.9142.9
598.9
464.5312.1152.4134.4
5863
456,0305.4150.5130.4
584.6
455.2305.5149.7129.4
586.5
456.3307.6148.7130,2
587.3
453.4304.8148.6133.9
597.1 604.0
461.1 467.0311.8 315.8149.2 151.2136.0 137.1
611.8
473.5320.7152.9138.3
612.4
472.6317.7154.9139.8
129Digitized for FRASER http://fraser.stlouisfed.org/ Federal Reserve Bank of St. Louis
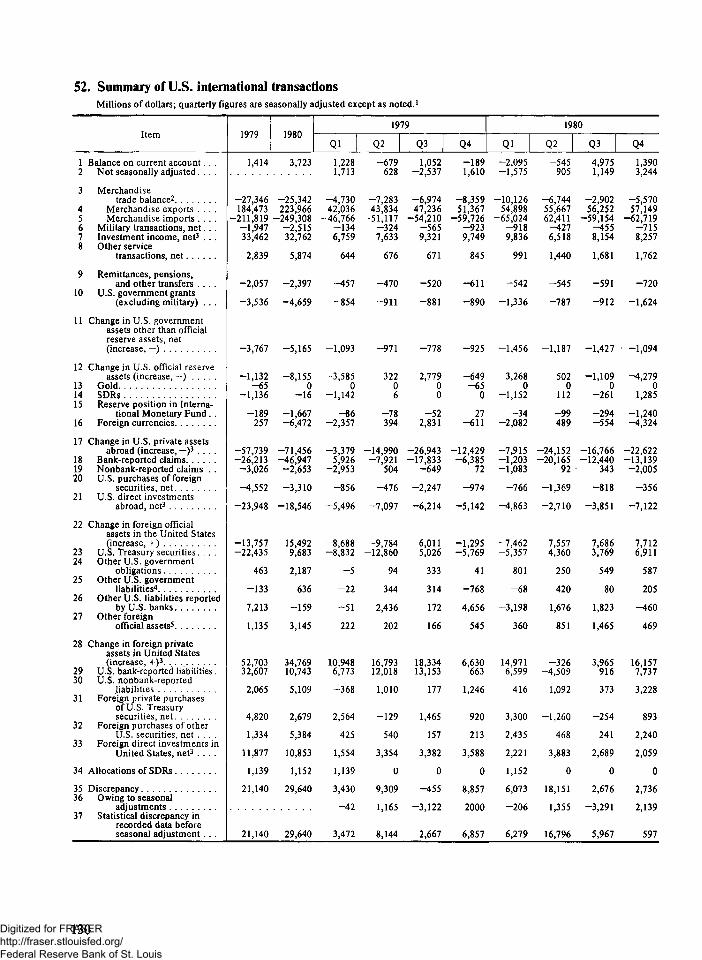
52. Summary of U.S. international transactionsMillions of dollars; quarterly figures are seasonally adjusted except as noted.1
1 Balance on current account . . .2 Not seasonally adjusted . . . .
1Q7Qiy /y
1,414
1 QGfilyoO
3,723
Ql
1,2281,713
19
Q2
-679628
79
Q3
1,052-2,537
Q4
-1891,610
Ql-2,095-1,575
19
Q2
-545905
80
Q3
4,9751,149
Q4
1,3903,244
3
45678
9
10
11
12
n1415
16
17
181920
21
22
2324
25
26
27
28
2930
31
32
33
M
"*S36
37
Merchandisetrade balance2
Merchandise exports . . . .Merchandise imports . . . .
Military transactions, net . . .Investment income, net3 . . .Other service
transactions net
Remittances, pensions,and other transfers . . . .
U.S. government grants(excluding military) . . .
Change in U.S. governmentassets other than officialreserve assets, net(increase, — ) . . . .
Change in U.S. official reserveassets (increase, — )
GoldSDRsReserve position in Interna-
tional Monetary Fund . .Foreign currencies
Change in U.S. private assetsabroad (increase, — )3 . . . .
Bank-reported claimsNonbank-reported claims . .U.S. purchases of foreign
securities, netU.S. direct investments
abroad, net3
Change in foreign officialassets in the United States(increase, +)
U.S. Treasury securities. . . .Other U.S. government
obligationsOther U.S. government
liabilities4
Other U.S. liabilities reportedby U.S banks
Other foreignofficial assets^
Change in foreign privateassets in United States(increase, +)3. .. .
U.S. bank-reported liabilities .U.S. nonbank-reported
liabilitiesForeign private purchases
of U.S. Treasurysecurities, net
Foreign purchases of otherU.S. securities, net . . . .
Foreign direct investments inUnited States, net3 . . . .
Allocations of SDRs
DiscrepancyOwing to seasonal
adjustmentsStatistical discrepancy in
recorded data beforeseasonal adjustment . . .
-27,346184,473
-211,819-1,94733,462
2839
-2,057
-3,536
-3,767
-1,132-65
-1 136
-189257
-57,739-26 213-3,026
-4,552
-23,948
-13,757-22,435
463
-133
7213
1,135
52,70332,607
2,065
4,820
1,334
11,877
1 139
21 140
21,140
-25,342223,966
-249,308-2,51532,762
5 874
-2,397
-4,659
-5,165
-8,155o-16
-1,667-6472
-71,456-46 947-2,653
-3,310
-18,546
15,4929,683
2,187
636
-159
3 145
34,76910,743
5,109
2,679
5,384
10,853
1 152
29 640
29,640
-4,73042,036
-46,766-1346,759
644
-457
-854
-1 093
-3,5850
— 1 142
-86-2357
-3,3795 926
-2,953
-856
-5,496
-8 688-8,832
-5
—22
—51
222
10,9486,773
-368
2,564
425
1,554
1 139
3 430
-42
3,472
-7,28343,834
-51,117-3247,633
676
-470
-911
-971
322o6
-78394
-14,990—7 921
504
-476
-7,097
-9784-12,860
94
344
2436
202
16,79312,018
1 010
-129
540
3,354
0
9 309
1 165
8,144
-6,97447,236
-54,210-5659,321
671
-520
-881
-778
2,77900
-522,831
-26,943-17,833
-649
-2,247
-6,214
6,0115,026
333
314
172
166
18,33413,153
177
1,465
157
3,382
o—455
-3,122
2,667
-8,35951,367
-59,726-9239,749
845
-611
-890
-925
-649-65o
27-611
-12,429-6385
72
-974
-5,142
-1,295-5,769
41
—768
4656
545
6,630663
1,246
920
213
3,588
o8 857
2000
6,857
-10,12654,898
-65,024-9189,836
991
-542
-1,336
-1,456
-3,2680
—1 152
-34-2082
-7,915-1 203-1,083
-766
-4,863
-7,462-5,357
801
—68
-3 198
360
14,9716,599
416
3,300
2,435
2,221
1 152
6073
-206
6,279
-6,74455,667
-62,411-4276,518
1 440
-545
-787
-1,187
5020
112
-99489
-24,152-20 165
92
-1,369
-2,710
7,5574,360
250
420
1 676
851
-326-4,509
1,092
-1,260
468
3,883
0
18 151
1 355
16,796
-2,90256,252
-59,154-4558,154
1,681
-591
-912
-1,427
-1,1090
-261
-294-554
-16,766-12,440
343
-818
-3,851
7,6863,769
549
80
1 823
1,465
3,965916
373
-254
241
2,689
o2 676
-3,291
5,967
-5,57057,149
-62,719-7158,257
1,762
-720
-1,624
• -1,094
-4,279o
1 285
-1,240-4,324
-22,622-13 139-2,005
-356
-7,122
7,7126,911
587
205
—460
469
16,1577,737
3,228
893
2,240
2,059
o2 736
2,139
597
130Digitized for FRASER http://fraser.stlouisfed.org/ Federal Reserve Bank of St. Louis

52. Summary of U.S. international transactions—ContinuedMillions of dollars; quarterly figures are seasonally adjusted except as noted.1
Item
MEMOChanges in official assets
38 U.S. official reserve assets(increase — )
39 Foreign official assetsin the United Statesexcluding line 27(increase, +)
40 Changes in OPEC officialassets in the United States(part of line 24 above) . . .
41 Transfers under military grantprograms (excluded fromlines 4, 6, and 10)
1979lOTQ 1QCA . ,-r-
Ql Q2 Q3 Q4 <
1980
31 Q2 Q3 Q4
-1,132 -8,155 -3,585 322 2,779 -649 -3,268 502 -1,109 -4,279
-13,624 14,856 -8,666 -10,128 5,697 -527 -7,394 7,137 7,606 7,507
5,543 12,744 -1,463 281 1,760 4,965 2,988 4,617 4,115 1,024
305 635 29 49 88 139 144 155 125 211
53. U.S. reserve assetsMillions of dollars, end of period
Type
1 Total1
2 Gold stock2
3 Special drawing rights1^4 Reserve position in International
Monetary Fundl>4
5 Convertible foreign currencies^
1 Totall
2 Gold stock2
3 Special drawing rights1^4 Reserve position in International
Monetary Fund1'45 Convertible foreign currencies5'6
1 Total1
2 Gold stock2
3 Special drawing rights1-3
4 Reserve position in InternationalMonetary Fund1*4
5 Convertible foreign currencies5*6
Jan.
20,46811,5922 661
1 0175 198
Sept.
18,557
11,2282 725
1,2803 324
May
21,917
11,1723,744
1 1575,844
Feb.
20,29211,5442 672
1 1204956
19
Oct.
18,016
11,1942,659
1,2382925
June
21,943
11,1723,782
1 3855,604
Mar.
21,65511,4792,667
1,1216388
79
Nov.
19,285
11,1122}705
1,3224 146
July
21,845
11,1723,842
1 4105,421
19
Apr.
21,40211,4182,602
1,0976285
Dec.
18,956
11,1722,724
1,2533,807
19
Aug.
22,691
11,1724,009
1 5645,946
79
May
22,29911,3542,624
1,1937 128
Jan.
20,989
11,1723,871
1,2514,695
80
Sept.
22,994
11,1684,007
1,6656,154
June
21,26811,3232,670
1,2046071
19
Feb.
20,887
11,1723,836
1,2874,592
Oct.
23,967
11,1633,939
1,6717,194
July
20,04511,2902,690
1,2004865
80
Mar.
21,491
11,1723,681
1,2225,416
Nov.
25,673
11,1623,954
1,8228,735
Aug.
20,04511,2592,689
1,2774820
Apr.
21,644
11,1723,697
1,0945,681
Dec.
26,756
11,1602,610
2,85210,134
131Digitized for FRASER http://fraser.stlouisfed.org/ Federal Reserve Bank of St. Louis

54. Selected U.S. liabilities to foreign official institutionsA. By typeMillions of dollars, end of period
1 Total1
2 Liabilities reported by banksin the United States2
3 U.S. Treasury bills and certificates3
U.S. Treasury bonds and notes4 Marketable5 Nonniarketable4 . * . . . .6 U.S. securities other than
U.S. Treasury securities^
1 Total1
2 Liabilities reported by banksin the United States2
3 U S Treasury bills and certificates3
U.S. Treasury bonds and notes4 Marketable5 Nonmarketable4 ,6 U.S. securities other than
U S. Treasury securities5
1 Total1
2 Liabilities reported by banksin the United States2
3 U.S. Treasury bills and certificates3
U.S. Treasury bonds and notes4 Marketable5 Nonmarketable4
6 U.S. securities other thanU S Treasury securities5
1 Total1
2 Liabilities reported by banksin the United States2
3 U.S. Treasury bills and certificates3
U.S. Treasury bonds and notes4 Marketable5 Nonmarketable4
6 U.S. securities other thanU.S. Treasury securities5
Jan.
134,954
17,98849,752
33 87920,473
12,862
Oct.
152,491
22,23258 005
36 17821,426
14650
July
148,222
26 03149,425
37,42119 797
15 548
Apr.
140,597
2805540,527
37 64316,384
17,988
Feb.
137,957
19,02052,689
33 60219,602
13,044
1978
Nov.
156,932
22,29262 656
3624220993
14 749
Aug.
148,919
25 61550 146
37 93219 547
15 679
May
143 605
28 62142,731
3806816,184
18,001
Mar.
146,067
19,45959,302
3459719,513
13,196
Dec.
162,625
23,32667 671
35 89420970
14 764
19
Sept.
150,075
25 88450,842
38,02419 547
15 778
June
149,289
2901845,907
39 78615,954
18,624
Apr.
142,781
19,48457,675
32 89819,444
13,280
Jan.
162,933
22,77968437
3606220952
14 703
79
Oct.
147,050
25 24749 411
3808018 497
15 815
July
153 235
2928647,982
40 54815,954
19,465
1978
May
141,324
19,32756,493
32 35719,355
13,792
Feb.
160,709
23,81365 803
3546420912
14 717
Nov.
141,687
26 99543 921
37 04317 837
15 891
1980
Aug.
154 897
2960049,811
39 80315,654
20,029
June
140,979
19,16855,594
32,87919,284
14,054
19
Mar.
154,492
23,27659,774
35,98920,471
14,982
Dec.
149,546
30,54047,666
37,59017 387
16,363
Sept.
156,894
30,84149,361
40,80115,254
20,637
July
144,582
19,80756,849
34,19219,214
14,520
79
Apr.
148,622
25,24751,614
3623120,467
15,063
Jan.
146,102
2488848,864
38,07317 434
16843
Oct.
157,376
28,73450,392
41,46515,254
21,531
Aug.
146,612
20,42056,371
34,90220,375
14,544
May
141,224
25,92343 727
3608220,467
15,025
1980
Feb.
145,105
2460648,234
37,80917 384
17,072
Nov.
163,212
2954655,104
41 76515,254
21,543
Sept.
145,697
20,08655,078
35,60720,304
14,622
June
144,370
25,71246,304
3637920,697
15,278
Mar.
142,153
2734242,797
37,70616 784
17 524
Dec.
164,402
3038156,243
41 43114,654
21,693
132Digitized for FRASER http://fraser.stlouisfed.org/ Federal Reserve Bank of St. Louis

54. Selected U.S. liabilities to foreign official institutions-ContinuedB. By areaMillions of dollars, end of period
1 Total
2 Western Europe1
3 Canada4 Latin America and Caribbean5 Asia . . . !6 Africa7 Other countries2
1 Total
2 Western Europe1
3 Canada ,4 Latin America and Caribbean5 Asia . . .6 Africa . .7 Other countries2
1 Total
2 Western Europe1
3 Canada4 Latin America and Caribbean5 Asia6 Africa7 Other countries2 . .
1 Total
2 Western Europe1
3 Canada4 Latin America and Caribbean5 Asia6 Africa . . . .7 Other countries2
Jan.
134,954
72,5982,0784589
53,2071,706
776
Oct.
152,491
85 1422,6184635
57,1742,184
738
July
148,222
86,7042,1165,317
50,7842613
688
Apr.
140,597
74,1991 9035,899
54 5433,316
737
Feb.
137,957
74,4411,3895,179
54,3851,901
662
1978
Nov.
156,932
88,4382,4464 519
58,4342,303
792
Aug.
148,919
86,5892,1854,417
52,0963,219
413
May
143,605
74,2042 1345,955
57,4932,889
930
Mar.
146,067
762941,6335 772
59,5921,7581,018
Dec.
162,625
930892,4865046
58,8542,408
742
19
Sept.
150,075
87,26424124,816
52,6372 511
435
June
149,289
75,3512 1575,943
62 2732,694
871
Apr.
142,781
73,6552,4765,583
58,0891,8721,106
Jan.
162,933
94 5322,1504 351
59,1192,256
525
79
Oct.
147,050
85,6151,9544,478
52,0342 583
386
July
153,235
78,1911 9076,309
63 1832,930
715
1978
May
141,324
72,8882,6805,429
57,4661,945
916
Feb.
160,709
92,9451,9084 342
58,3862,339
789
Nov.
141,687
80,8711,9714,500
51,5792,215
551
1980
Aug.
154,897
78,5492 1566,049
64,3853,281
477
June
140,979
74,5832,5934,677
56,4601,689
977
19
Mar.
154,492
90,3613,0884,141
54,1162,112
674
Dec.
149,546
85,6331,8986,291
52,3272,412
485
Sept.
156,894
76,9671,9016,606
67,6713,232
517
July
144,582
75,8572,4904,658
55,3742,219
984
79
Apr.
148,622
85,2013,0444,591
52,4492,504
833
Jan.
146,102
82,6581,9224,699
53,6102,480
733
Oct.
157,376
75,9891,6706,008
69,1143,5201,075
Aug.
146,612
79 8532,0714647
57,2142,035
792
May
141,224
81 0771,9934742
50,1392,460
813
1980
Feb.
145,105
79,8822,3474,836
54,7202 392
928
Nov.
163,212
80,8841 3935,722
70,0973,8661,250
Sept.
145,697
80,4261,4973922
57,1072,008
737
June
144,370
83,6351,9794,529
50,9142,597
716
Mar.
142,153
77,1491,6446,019
54,1322,419
790
Dec.
164,402
81,5921,5625,688
70,6084,123
829
133Digitized for FRASER http://fraser.stlouisfed.org/ Federal Reserve Bank of St. Louis

55. Liabilities to foreigners, payable in U.S. dollars, reported by banks in the United StatesA. By holder and type of liabilityMillions of dollars, end of period
Item
1 AH foreigners
2 Banks' own liabilities3 Demand deposits4 Time deposits1
5 Other2
6 Own foreign offices3
7 Banks' custody liabilities4
8 U S Treasury bills and certificates5 .9 Other negotiable and readily
transferable instruments^
10 Other
1 1 Nonmonetary international andregional organizations7
12 Banks' own liabilities13 Demand deposits14 Time deposits1 . . .15 Other2
16 Banks' custody liabilities4
17 U S Treasury bills and certificates . . .18 Other negotiable and readily
transferable instruments^19 Other
20 Official institutions8 .
21 Banks' own liabilities22 Demand deposits . . .23 Time deposits1
24 Other2
25 Banks' custody liabilities4
26 U S Treasury bills and certificates5
27 Other negotiable and readilytransferable instruments^ . . ,
28 Other
29 Banks9
30 Banks' own liabilities31 Unaffiliated foreign banks32 Demand deposits33 Time deposits1
34 Other2
35 Own foreign offices3 . . . .
36 Banks' custody liabilities4
37 U.S Treasury bills and certificates38 Other negotiable and readily
transferable instruments^ . .39 Other . . . . .
40 Other foreigners
41 Banks' own liabilities42 Demand deposits .43 Time deposits1 . . .44 Other2
45 Banks' custody liabilities4
46 U S Treasury bills and certificates . .47 Other negotiable and readily
transferable instruments^48 Other
49 MEMO: Negotiable time certificatesof deposit held in custodyfor foreigners
Jan.
126,377
17 37711,518
51 094
3,625
186129
959
67,740
2,6731 788
49 752
40,228
10,2741,995
152
14,785
4,2457,606
231
Feb.
130,105
17 67512,038
54233
3,102
180120
1 111
71,709
2,7822 570
52 689
40,549
10,5701,823
165
14,745
4 1437 526
268
Mar.
139,326
17 16311 274
61 071
3,618
245109
,
1 317
78,761
28041 777
59 302
42,027
10,1131 734
161
14,920
40007654
291
Apr.
143,361
6694017 94511,645
7 31230,038
76,42159 166
15,093
2,162
3,058
774267
92416
2,283892
1,3911
77,158
9,6643,7011 8814,082
67 49457 675
9708111
48,298
44,01513 97710,215
1,3752,387
30038
4 283314
2 1951 774
14,847
12,4873 7628 297
428
2,361286
1,799276
9,587
1978
May
138,512
6248217 82311 5437 209
25906
7603058 306
15 627
2098
3,129
50128661
154
2 6271 153
1 4731
75,820
9,09230921 9824,018
66 72856493
10 116120
44,461
4005114 14510,339
1 3252481
25 906
4410363
2 2821 766
15,102
12 8384 1068 175
557
2264297
1,756212
9,584
June
137,466
61 92317 18911,7076509
26,518
75,54457 141
16,235
2,168
2,942
48026511997
2,462922
1,5373
74,762
8,5922,61720523,923
66 17055 594
10466109
44,536
39,9621344410,157
1,2552,032
26518
4 573300
2 3851 888
15,227
12,8884 1498 282
457
2,339325
1,846167
9,687
July
138,364
62 29117 954120176 884
25,436
76,07357636
16 159
2,277
2,678
1,017257106654
1,662228
1,432I
76,656
9,5543,4772 3763,701
67 10256849
10 122132
43,701
39,10613 67010,236
1,3212 113
25436
4 595269
2 4461 879
15,329
12 6143 9838 215
417
2,714290
2,159265
9,625
Aug.
141,960
65 25216 10612,7517 384
29,012
76,70857 336
17 226
2,146
2,813
79814287
569
2,014368
1,6451
76,790
9,3922,6462 7164,030
67 39956371
10823205
46,626
42,08613 0739,2271,3862,460
29,012
4 540296
2,4141 830
15,732
12,9774,0908,562
324
2,755301
2,344110
10,122
Sept.
146,887
71 12417 205122666 626
35027
75 76356729
16665
2 369
3,396
75714489
523
2,6391 036
1 6031
75,164
9,5833 3102 7013,572
65 58155 078
10258245
53,032
48,22613 1999,7111,2692,219
35027
4 806307
25691 931
15,295
12 55840398207
312
2,736308
2,235193
10,098
134Digitized for FRASER http://fraser.stlouisfed.org/ Federal Reserve Bank of St. Louis

55. Liabilities to foreigners, payable in U.S. dollars, reported by banks in the United States—ContinuedA, By holder and type of liability-ContinuedMillions of dollars, end of period
1 All foreigners
2 Banks* own liabilities3 Demand deposits .4 Time deposits1
5 Other2
6 Own foreign offices-*
7 Banks' custody liabilities4
8 US, Treasury bills and certificates^9 Other negotiable and readily
transferable instruments6
10 Other
1 1 Nonmonetary international andregional organizations7
12 Banks' own liabilities13 Demand deposits14 Time deposits1
15 Other2
16 Banks' custody liabilities4
17 U S. Treasury bills and certificates18 Other negotiable and readily
transferable instruments6
19 Other
20 Official institutions8
21 Banks' own liabilities . . .22 Demand deposits23 Time deposits1
24 Other2
25 Banks' custody liabilities4 . . .26 U S Treasury bills and certificates^27 Other negotiable and readily
transferable instruments6
28 Other
29 Banks9
30 Banks' own liabilities31 Unaffiliated foreign banks32 Demand deposits33 Time deposits1. . . . . . . .34 Other2
35 Own foreign offices-*
36 Banks' custody liabilities4 . .37 U S Treasury bills and certificates38 Other negotiable and readily
transferable instruments6
39 Other
40 Other foreigners
41 Banks' own liabilities42 Demand deposits43 Time deposits1
44 Other2
45 Banks' custody liabilities4
46 U.S. Treasury bills and certificates47 Other negotiable and readily
transferable instruments6 . . . .48 Other .
49 MEMO: Negotiable time certificates ofdeposit held in custody for foreigners . . .
Oct.
151,245
7203417,558124449,648
32,384
79,21059,107
17,3162,788
2,919
32613310687
2,593403
2,1891
80,228
11,7383 0502,6066,081
68,49157996
10,284210
52,139
47,18214,79810,152
1,5423 104
32,384
4,957381
2,4472,129
15,958
12,7884,2228,191
376
3,170326
2,395448
10,838
1978
Nov.
159,507
76,36118,26912,6678,860
36,565
83,14663,151
17,5922,404
2,215
40715392
161
1,809183
1,6251
84,644
11,2873,4162,5445,326
73,35762352
10,894111
56,097
51,24614,68110,071
1,7132 896
36,565
4,852371
2,5761,905
16,551
13,4224,6288,317
476
3,129245
2,497387
10,881
Dec.
166,842
78,66119,21812,4279,705
37,311
88,18168,202
17,4722,507
2,607
906330
84492
1,701201
1,4991
90,742
12,1653 3902,5606,215
78,57767415
10,992170
57,423
52,6261531511,257
1,4292 629
37,311
4,797300
2,4252,072
16,070
12,9644,2428,353
368
3,106285
2,557264
11,007
Jan.
164,382
74,92417,78612,2939,079
35,766
89,45869,020
18,0052,433
2,307
752333
78340
1,555183
1,3675
91,029
10,9052 6992,5155,691
80,12468250
11,683191
55,019
50,27414,50810,426
1,4342648
35,766
4,745302
2,4042,039
16,027
12,9934,3288,265
400
3,034285
2,552197
11,132
Feb.
163,963
7706917,21712 1089,856
37,888
86,89466,597
18,1212,176
2,075
486272
92121
1,589193
1,3951
89,460
11,90927592,3766,774
77,55165 647
11,84955
55,919
51,18913 3019,4401,2832577
37,888
4,730399
2,3461,985
16,509
13,4854,7458,357
383
3,024358
2,531135
11,017
19
Mar.
166,601
85,13916,71912,3668,783
47,271
81,46160,709
18,5712,181
2,352
757276
89392
1,595211
1,3822
83,050
10,9852,8642,5355,586
72,06559774
12,24843
65,251
60,32013 0499,3711,2072471
47,271
4,931425
2,4312,075
15,948
13,0784,2088,536
334
2,870299
2,51062
11,264
79
Apr.
160,227
8602618,39412 50110,62544506
74 20153,434
18,6052,162
2,280
111270
90411
1,509212
1,2942
76,860
12,9953 5862,5046,905
63,86551 614
12,21240
63,901
58,9031439610,225
1,2512 921
44,506
4,999456
2,5092,033
17,186
13,3584,3148,656
388
3,8281,152
2,59086
11,161
May
159,113
93,59718,13212,63113,98848,846
65,51645,103
18,2042,210
2,759
1 308298
75935
1,451175
1,2741
69,650
14,1583 1702,5818,406
55,49243,727
11,69570
69,589
64,41115 56510,304
1,2024059
48,846
5,178508
2,5932,077
17,116
13,7204,3598,773
588
3,396693
2,64162
10,824
June
167,725
9960119,3551265112,79754798
68 12447,545
18,2722,308
2,982
1 513264
941,155
1,469318
1,1511
72,016
13,6663 1962,5217,949
58,35046304
12,00640
75,721
70,60115 80311,165
1,3263 312
54,798
5,119407
2,5572,155
17,006
13,8214,7308,709
381
3,185516
2,558112
10,643
135Digitized for FRASER http://fraser.stlouisfed.org/ Federal Reserve Bank of St. Louis

55. Liabilities to foreigners, payable in U.S. dollars, reported by banks in the United States—ContinuedA. By holder and type of liability-ContinuedMillions of dollars, end of period
1 All foreigners
2 Banks' own liabilities3 Demand deposits , ,4 Time deposits*5 Other2
6 Own foreign offices-* . . .
7 Banks' custody liabilities4
8 U.S. Treasury bills and certificates5
9 Other negotiable and readilytransferable instruments'* . . . . . . .
10 Other
1 1 Nonmonetary international andregional organizations^
12 Banks* own liabilities13 Demand deposits14 Time deposits1 . . . . . . . . . . . .15 Other2
16 Banks' custody liabilities4
17 US Treasury bills and certificates18 Other negotiable and readily
transferable instruments^19 Other . . . .
20 Official institutions8
21 Banks' own liabilities22 Demand deposits23 Time deposits1
24 Other2
25 Banks' custody liabilities4
26 U.S. Treasury bills and certificates5
27 Other negotiable and readilytransferable instruments^
28 Other
29 Banks9
30 Banks' own liabilities . . . . . . . . .3 1 Unafflliated foreign banks32 Demand deposits . . . . . . . . .33 Time deposits*34 Other2
35 Own foreign offices-' . . .
36 Banks' custody liabilities4
37 U.S. Treasury bills and certificates38 Other negotiable and readily
transferable instruments^ . . . .39 Other
40 Other foreigners
41 Banks' own liabilities42 Demand deposits . . . . . . . .43 Time deposits1
44 Other2
45 Banks' custody liabilities4
46 U.S Treasury bills and certificates . . . .47 Other negotiable and readily
transferable instruments^48 Other
49 MEMO: Negotiable time certificates "ofdeposit held in custody for foreigners . . .
July
168,664
96,85019 11512,56413 11752,054
71,81451,467
18,1212,226
3,442
849216
69564
2,5931 345
1 2471
75,456
14,6032 8502,6009 153
6085349,425
11,37750
72,481
67,5191546511,3861 1602,919
52,054
4,962347
25S62058
17,286
13,87946638 735
481
3,407350
2 940117
10,732
Aug.
191,058
117,1361895112,59312 81372,778
73 92352,258
19,3712,293
3,485
60915477
379
2,8761 442
1 4331
75,761
13,1612 3972,3178447
62 60050,146
12,40252
94,615
89,5771679811,7961 4473,555
72,778
5,038384
2,5182 136
17,197
13,7894 6048 752
433
3,409285
3 019105
11,099
19
Sept.
185,521
111,4332023712,8231302665,347
7408852,429
19,4112,248
2,914
49616182
253
2,418912
1 505
76,725
13,7533 1432,2488 362
62 97250,842
12,08051
88,463
83 29617 94912492
1 5993,858
65,347
5,167406:
2,634:2 127i
17,419^
13,88844418 894
553
3,532269
3 19370
11,264
79
Oct.
180,446
107,55117,93412,1711292664,520
72,89450,452
20,2422,201
2,394
57114382
347
1,823327
14942
74,658
12,2772 3741,8928011
6238149,411
12,91357
85,691
80,5801606010,6381 4373,985
64,520
5,111400
2,6842028
17,702
14,12347798 760
584
3,579315
3 151114
11,346
Nov.
184,160
116,86323,35912,60612 80868,090
67,29845,005
19,9042,388
2,722
758214
80464
1,964258
1 605101
70,917
14,5285 6521,9836894
5638843,921
12,41156
92,197
86,9731888312,8981 5524,433
68,090
5,224451
2,6182 155
18,324
14,60345958 9911 017
3,722375
3 27076
10,828
Dec.
187,521
117,19623,30313,6231645363,817
70,32548,573
19,3962,356
2,356
714260151303
1,643102
1 5382
78,206
18,29246713,050
10571
5991447,666
12,19652
88,316
83,2991948213,285
1 6674,530
63,817
5,017422
2,4152 179
18,642
14,89150878 7551 048
3,751382
3 247123
10,984
Jan.
185,359
113,93920,80412,46613 12367,547
71,42149,860
19,0512,509
1,232
44916489
196
783102
6810
73,753
12,4963 6462,3096,542
61,25648,864
12,35735
91,631
86,24618 70011,911
1 2405,549
67,547
5,385533
2,5762276
18,744
14,7475,0828 828
837
3,996361
3 437199
10,909
1980
Feb.
194,173
122,7402247612,71112 71574,837
71,43349,360
19,5322,541
1,722
40315378
172
1,319114
1,2060
72,840
12,2663,6142,3676,285
60,57548,234
12,30337
100,330
94,8452000713,367
1 2725,368
74,837
5,485566
2,5692350
19,280
15,2265>3438993
890
4,054446
3 454'154
11,405
Mar.
186,312
119,33422,57712,8591499868,900
66,97844,447
19,7752,756
1,774
39916085
154
1,376157
1,2180
70,140
14,6433,8012,3978445
55,49742,797
12,66832
95,201
89,41420 51413,3961 5535,564
68,900
5,787675
2,5592 553
19,197
14,8785,2198 823
836
4,319817
3 330172
11,236
136Digitized for FRASER http://fraser.stlouisfed.org/ Federal Reserve Bank of St. Louis

55. Liabilities to foreigners, payable in U.S. dollars, reported by banks in the United States—ContinuedA. By holder and type of liability-ContinuedMillions of dollars, end of period
Ttarn
1 AH foreigners . .
2 Banks' own liabilities3 Demand deposits . .4 Time deposits*5 Other2 . . . . . . .6 Own foreign offices^ ;
7 Banks' custody liabilities4
8 U S Treasury bills and certificates^9 Other negotiable and readily
transferable instruments'*10 Other
11 Nonmonetary international andregional organizations7
12 Banks' own liabilities13 Demand deposits . .14 Time deposits* . . . .15 Ottier2 . . . .
16 Banks' custody liabilities4 . . .17 U.S. Treasury bills and certificates18 Other negotiable and readily
transferable instruments^19 Other . . . .
20 Official institutions8 . . . .
21 Banks' own liabilities .22 Demand deposits23 Time deposits1
24 Other2
25 Banks' custody liabilities4 . .26 U.S. Treasury bills and certificates5
27 Other negotiable and readilytransferable instruments^
28 Other
29 Banks9
30 Banks' own liabilities . .31 Unaffiliated foreign banks32 Demand deposits . . . .33 Time deposits1
34 Other2
35 Own foreign offices3
36 Banks' custody liabilities4
37 U S Treasury bills and certificates38 Other negotiable and readily
transferable instruments^39 Other
40 Other foreigners . . . .
41 Banks' own liabilities42 Demand deposits43 Time deposits1
44 Other2
45 Banks' custody liabilities4 . . .46 U S Treasury bills and certificates . . .47 Other negotiable and readily
transferable instruments'*48 Other
49 MEMO: Negotiable time certificates ofdeposit held in custody for foreigners . . .
Apr.
181,174
115 75622,32212,6231522265,589
65,41842596
200332,790
2,382
69824193
364
1 684451
1,2330
68,582
1467947342,3927,553
5390340,527
13 34135
91,959
86 14420,555126841,4946,378
65,589
5 815771
2,4622582
18,252
14,2354 6638,645
927
4017847
2,997173
11,670
May
184,361
11631122,37812,67416,23565,025
68,05045 523
197342,793
3,217
38214488
150
2,8351,519
1,3170
71,352
15,49843262,5918,581
5585442,731
1308440
91,926
86,09921,07413,0281,4196,627
65,025
5828765
2,4902,573
17,866
14,3334 8808,576
878
3,532508
2,844180
11,685
June
186,889
11659925 75912,7801698461,076
70,29048 193
19 5222,575
3,509
8529992
662
2 6571,106
1,5510
74,926
164194 9142,6708,835
58 50745,907
1255445
89,346
83 95522,879149201,4756,484
61,076
5 391594
2,5222276
19,108
15,3735 8268,5431,004
3 735586
2,895254
11,773
July
188,462
11665821,80312,99018 98862,877
71,80449615
194502,739
2,903
607214
93299
2 296592
1,704o77,268
17,1473 9872,705
10,454
60 12247,982
1209248
90,203
8471521,83812,870
1,6227,346
62,877
5489557
2,3952,537
18,088
14,1904 7328,570
888
3 898484
3,259154
10,500
1980
Aug.
201,908
128 64522,29913,35519,10373,887
73,26351 505
19 1662,593
2,820
501171101229
2,319644
1,6750
79,411
17,7173 6913,026
11,001
61,69449,811
11,83054
101,012
95,69221,80513,4231,5106,872
73,887
5,320577
2,4352,308
18,665
14,7355 0148,7191,002
3,930473
3,226231
10,458
Sept.
192,149
119 11722 34414,10418 11264,557
73,03250 731
197832 517
2,549
476141100235
2073316
1,7570
80,203
18,46642293,576
10,661
61 73649,361
1231263
90,341
8509320,53612,9891,4086,139
64,557
5 248361
2,5332,354
19,056
15,08149869,0201,C76
3,975693
3,181100
10,729
Oct.
196,030
121 43722,46014,11317 18167,683
74,59451 990
200022,601
2,734
35211595
143
2,382581
1,8000
79,127
16,10134063^3559,341
63,02550,392
12,57755
95,296
89,93122,24813,843
1,7186,686
67,683
5,365515
2,4172,434
18,874
15,05250968,9451,011
3,822502
3,208112
10,799
Nov.
204,792
125 04822 84714,6471709770,458
7974356484
20 6242635
2,476
38318792
104
2093337
1,7560
84,650
16,8423 5533,5889,700
6780855,104
1264856
97,812
91 93221,47413,714
1,7825,978
70,458
5880529
2,8832,467
19,854
15,8925 3939,1841,315
3,962513
3,337112
10,553
Dec.
205,295
124 7892346215,0761758168,670
80,50657595
200792,832
2,342
44214685
211
1,900254
1,646o
86,624
17,82637713^612
10,443
68,79856,243
12,50154
96,415
90,45621,78614,188
1,7035,895
68,670
5,959623
2,7482,588
19,914
16,06553569,6761,033
3,849474
3,185190
10,745
137Digitized for FRASER http://fraser.stlouisfed.org/ Federal Reserve Bank of St. Louis

55. Liabilities to foreigners, payable in U.S. dollars, reported by banks in the United States—ContinuedB, By area and countryMillions of dollars, end of period
1 Total
2 Foreign countries
3 Europe4 Austria5 Belgium-Luxembourg . . . .6 Denmark7 Finland8 France9 Germany
10 Greece11 Italy12 Netherlands13 Norway .14 Portugal15 Spain , .16 Sweden17 Switzerland18 Turkey19 United Kingdom20 Yugoslavia21 Other Western Europe1 . . .22 U.S.S.R23 Other Eastern Europe2 . . . .
24 Canada
25 Latin America and Caribbean26 Argentina27 Bahamas28 Bermuda29 Brazil30 British West Indies31 Chile32 Colombia33 Cuba34 Ecuador35 Guatemala3
36 Jamaica3
37 Mexico38 Netherlands Antilles39 Panama40 Peru41 Uruguay42 Venezuela43 Other . . . .
44 AsiaChina
45 Mainland46 Taiwan47 Hong Kong48 India49 Indonesia50 Israel. . .51 Japan . . . .52 Korea . . . .53 Philippines54 Thailand55 Middle East oil-exporting
countries4
56 Other . . .
57 Africa58 Egypt59 Morocco60 South Africa61 Zaire62 Oil-exporting countries5. . .63 Other
Jan.
126,377
122 752
59702294
2,6291,044
2955 1538,832
5386,1992959
987205707
2,71112 134
18712576
2191,787
63186
5279
23,2631,7463 150
2691 1134,081
3871,226
9 6358
2985205
2,189265230
3,0162037
30,881
541 0411,0371,012
896461
14488606658258
9 1931 178
2 50734610019141
1,179649
Feb.
130,105
127 002
60970302
2,7651 050
3074 668
10,585548
5,9433 029
888188648
2,82612 689
17111 929
1961,966
98175
4 758
24,2861,9283 755
286977
3,993412
1 2077
376
3084203
2,121267280
3 2462 147
33 330
48995
1 1211 001
506454
17 024737615309
9 3291 190
2 645357
79251
501,263
645
Mar.
130,326
135 707
6'! 905419
2,9921 044
3575 034
11 440571
5 6263 1321 211
174111
2,81613 549
11517 274
1382,030
72193
4564
25,3391 8014 199
3221 3274,097
4151 290
8438
2793212
2 132262226
34382380
37996
561 0141 174
947492485
21 725682647317
9 1651 291
2 469341
5118345
1,226623
Apr.
143,361
140 304
63 828349
3,1071,063
4335874
11,031588
6,01330021,465
164659
3,17713 249
24911053
1921,911
62186
5 922
29,9941,8628 085
3751 4124,865
3941,331
635646041
2960212
2,226309221
3 2431 636
36386
501 2241,118
937649486
20 153751606258
8 9451 209
2 699455
3116746
1,393707
May
138,512
135383
64009370
3,1381,110
39667819,539
5636,3642 9811,643
288111
3,30212534
20011 873
1681,735
96211
6 600
25,2322,2603484
3371 2983,955
3611 300
731859246
2970289
2,627274208
3 3001 605
35 635
471 0601,489
962451568
19 739817693304
8 0491 285
2 641461
2918549
1,244673
19
June
137,466
134,524
64,877365
2,8651,335
3526,583
10,049597
6,8693 1061,869
191708
3,38512,540
11011 727
2291,677
66255
5 816
26,2151,6924470
3961 2204,962
3761,424
7325448
662,854
3202,386
282220
3,1611 604
33,841
531 0551,085
899330476
19 035748600297
7,4531 213
2 360402
28226
44979681
78
July
138,364
135,686
65 507382
2,3971,542
4077,7419,727
6467,03630661,737
230761
3,34012015
14711 920
1921,947
50222
5 623
24,8661,5503 659
3831 2954,009
3801,429
9378457
752921
4352,639
309218
3 2331 489
35 362
471 1951,191
798597519
20 374714645320
69731 510
3 01359428
17573
1,365778
Aug.
141,960
139,148
68480431
2,2891,593
4168,716
10,766826
8,0553 2271,516
326795
3,35512 135
13711 044
1492,448
46210
5 890
27,2931,4534636
3721 3825,479
3461,486
10347458
593 171
2882,612
311185
32151 482
33726
441 2661,211
762309440
19755736571296
65341 364
2 578463
6716052
1,198638
Sept.
146,887
143,491
70,195438
2,6461,673
4158,492
11,209865
7,3942,7431,208
521795
3,34113,035
22611,944
1672,756
65262
5,135
30,7331,3898616
4091,2755,564
3511,431
7405347
783,112
3172,712
322197
2,5621 639
33,693
461 2841,250
833348432
19,933776628290
7,0251,341
2 645417
74238
451,270
601
Oct.
151,245
148,326
73,807473
2,6191,734
4248,770
13,351887
7,3462 5011,210
386773
3,18714,202
16412 249
1583,027
82262
7,469
28,5591,6454926
3871 4395,995
3331,483
7369410
573,101
3522,372
323210
3,6961 453
34,762
491 3191,368
899575453
199567"90594352
6,9221 384
2 540322
84266
391,230
600
Nov.
159,507
157,292
78,733521
2,6321,827
3889,070
15,653907
7,7612,5181,102
379956
3,21615,392
16312,994
1902,792
73198
8,076
31,2341,4986,391
4251,2306,769
3411,612
734839243
3,411330
2,825337209
3,5501,518
35,398
571,2501,201
831439469
21,358750583279
7,5341,259
2 636312
3019443
1,335622
Dec.
166,842
164,235
85 172513
2,5501,946
3469,214
17,283826
7,73924021,271
330870
3,12118,225
15714,272
2543,440
82330
6,969
31,6381,4846752
4281,1255,974
3981,756
13322416
523,467
3082,967
363231
3,8211 760
36,492
67502
1,256790449688
21,927795644427
1,414
2 886404
3216843
1,525715
138Digitized for FRASER http://fraser.stlouisfed.org/ Federal Reserve Bank of St. Louis

55. Liabilities to foreigners, payable in U.S. dollars, reported by banks in the United States—ContinuedB. By area and country-ContinuedMillions of dollars, end of period
"••
Area and country
64 Other countries65 Australia66 All other67 Nohmonetary international
and regionalorganizations
68 International *>69 Latin American regional . . . .70 Other regional7
1 Total . . . .
2 Foreign countries
3 Europe4 Austria5 Belgium-Luxembourg . . . .6 Denmark7 Finland . . . .8 France9 Germany
10 Greece11 Italy12 Netherlands13 Norway .14 Portugal15 Spain16 Sweden17 Switzerland18 Turkey . .19 United Kingdom20 Yugoslavia21 Other Western Europe1 . . .22 U.S.S R23 Other Eastern Europe2. . . .
24 Canada
25 Latin America andCaribbean . . . .
26 Argentina27 Bahamas28 Bermuda29 Brazil30 British West Indies.31 Chile32 Colombia33 Cuba34 Ecuador35 Guatemala36 Jamaica37 Mexico38 Netherlands Antilles39 Panama40 Peru4 1 Uruguay42 Venezuela43 Other
44 Asia . . . .45 China
Mainland46 Taiwan47 Hong Kong48 India49 Indonesia50 Israel51 Japan52 Korea53 Philippines
Jan.
1,121933188
3,6253,116
258250
164,382
162 075
84205562
2,7462036
3798 616
15766683
8 77325361,411
254759
295519,528
14113,185
1743,375
150176
6,623
309871,6827448
3861,1035 702
3761 769
7321387
723 228
3212798
320222
3,3391,507
36700
65552
1,400804575656
21 428111617
Feb.
1,014870144
3,1022,558
266279
163,963
161,888
81,515505
2,1922074
3578214
13,864761
8,09627961,445
246868
2,65619,279
14113,753
1843,847
62173
6,766
32,6411,7897,732
4641,1526,728
3561 867
1327438643
3,208361
2491347220
3,7091,501
37,005
105534
1,390838357617
21 769827549
Mar.
1,4341,229
205
3,6183,094
261262
166,601
164,249
81,460524
2,4432 131
3618 904
12,994671
8,1842 7741,572
279763
2 52018,010
13215,357
1763,340
59268
7,995
38 0721,537
13,115375
1,1376,889
3411 925
633033975
3,227318
2 938403236
3,2111,669
32,989
280600
1,279857479631
18 130748644
Apr.
1,4751,262
212
3,0582,590
162306
160,227
157,948
77,007484
2,3591 596
3679 2979,360
6608,9392 8261,477
2311,0772,596
15,009110
16,158207
3,90284
266
8,764
36,1491,486
10,101351
1,2516,968
4452,079
7335360
803,284
3353,368
360230
3,4261,681
31,870
45667
1,459929567673
14 951728562
May
1,2671,129
138
3,1292,430
430269
159,113
156,355
74,659475
2,2821 526
40197637,614
6789,7532 8891,456
244897
252413,140
12716,704
1843,716
58227
7,963
405491,889
11,708345
1,5789376
3662 192
9318318
783,264
3962903
321223
3,6641,601
28,922
41598
1,4961,016
394652
12263986605
June
19
1,4141,211
203
2,9422,311
395236
19
167,725
164,743
78,988449
2,4191 165
45796038,489
6849,65826381,348
3531,2112,437
15,333156
18,012151
4,05862
302
6,677
44,8271,896
16,451402
1,3368,756
4012402
739131946
3,442414
3 148382248
2,9821,804
29,811
46739
1,555940409708
12571809685
July
78
1,3151 158
157
2,6782,027
411241
79
168,664
165,222
80,954444
2,4931 560
4669 622
10721760
8,4602 3551,263
3031,1072227
16,135193
18,752159
3,61063
260
7,614
41 2811,697
13,079339
1,2977,856
4632 292
7443319104
3,681422
3 070425231
3,9201,636
30,984
42769
1,452873509624
13 105816635
Aug.
1,1801,051
130
2,8132,157
437218
191,058
187,573
85,300446
2,7141 412
5089 988
10,431695
9,67826191,320
4111,0602368
15,158160
22,321149
3,50480
277
8,378
56,9351,761
24,030415
1,04313,426
4582,378
6449317
673,707
3663,044
391222
3,1801,675
32,314
411,0271,571
704317627
13 093825598
Sept.
1,090899191
3,3962,339
799259
185,521
182,607
88,052444
2,9201 100
41510,51013,127
6918,55122811,402
5541,1332,062
16,079135
22,637142
3,49352
325
8,323
49,5361,935
18,351392
1,19811,276
4192,188
9364335175
3,624359
3,336477217
2,9031,977
32,725
451,2311,659
674463626
13,292938627
Oct.
1,189975213
2,9191,789
856274
180,446
178,052
87,463426
2,7201 001
3349340
13,154632
8,4812 1741,393
6201,1032 165
16,080150
24,144147
3,08753
259
8,644
47,3231,705
15,388399994
11,502424
2,243
482361113
3,603609
3,926388217
3,1681,795
30,719
491,3391,542
496555621
10,886950593
Nov.
1,214977236
2,2151,033
870313
184,160
181 438
86,963'404
2,7961 166
3901030110801
7928 3452 1721,407
5951,1842064
16,659145
24,049147
3,24839
259
7,280
51 7611,573
18,548404
1,05112 595
3552 377
12476374
743,735
4604290
417185
3,0141,822
31,351
451,4131,624
580478574
7867951666
Dec.
1,076838239
2,6071,485
808314
187,521
185,164
90,952413
2,3751 092
3981043312,935
6357,7822 3371,267
5571,2592005
17,954120
24,700266
4,07052
302
7,379
49,6861,582
15,255430
1,00511,138
4682,617
13425414
764,185
4994,483
383202
4,1922,318
33,005
491,3931,672
527504707
8,907993795
139Digitized for FRASER http://fraser.stlouisfed.org/ Federal Reserve Bank of St. Louis

55. Liabilities to foreigners, payable in U.S. dollars, reported by banks in the United States—ContinuedB. By area and country-Continued
s Millions of dollars, end of period
Area and countryJan. Feb. Mar. Apr. May June July Aug. Sept. Oct. Nov. Dec.
1979
5455
56
57585960616263
646566
67
686970
Asia-ContinuedThailandMiddle East oil-exporting
countries4
Other
AfricaEgyptMoroccoSouth AfricaZaireOil-exporting countries5. .Other
Other countries.AustraliaAll other
Nonmonetary internationaland regionalorganizations ,
International6 ,Latin American regional. .Other regional7
1 Total
2 Foreign countries
3 Europe4 Austria5 Belgium-Luxembourg .6 Denmark7 Finland8 France9 Germany
10 Greece11 Italy12 Netherlands13 Norway14 Portugal15 Spain16 Sweden17 Switzerland18 Turkey19 United Kingdom20 Yugoslavia21 Other Western Europe1
22 U.S.S.R23 Other Eastern Europe2.
24 Canada
25 Latin America andCaribbean
26 Argentina27 Bahamas28 Bermuda29 Brazil30 British West Indies. . . .31 Chile32 Colombia33 Cuba34 Ecuador35 Guatemala36 Jamaica37 Mexico38 Netherlands Antilles . .39 Panama40 Peru41 Uruguay42 Venezuela43 Other
379 307
8,1711,285
2,6943382917948
1,379721
865655209
8,4111,300
2,8042783220742
1,549697
1,157935222
2,307 2,0751,210 905809 859289 311
277
7,8161,249
2,6503294324250
1,257728
1,084863221
2,3521,183866303
343
9,5711,375
2,9863593424655
1,554738
1,171959213
2,2801,113866300
302
9,1671,402
3,0562973620647
1,523946
1,206991215
2,7591,543886330
413 307 330 421 304 415 277
9,305 10,022 11,408 10,888 11,420 14,861 15,3001,632 1,830 1,773 1,862 1,963 1,876 1,879
3,238 3,226 3,819 3,194 3,141 3,105 3,239307 378 303 245 294 380 47545 35 40 40 30 36 3331656
19637
17449
23573
194112
213104
184110
1,566 1,699 2,441 1,832 1,711 1,513 1,635948 881 811 768 800 859 804
1,202 1,164891 808311 355
2,9821,871823289
3,4422,263911268
826621205
3,4852,435787263
778550227
2,9141,810824280
762528234
2,3941,343755296
980 904714 684266 220
2,722 2,3561,504 1,238790 806428 313
1980
185,359 194,173 186,312 181,174 184,361 186,889 188,462 201,908 192,149 196,030 204,792 205,295
184,127 192,451 184,537 178,792 181,144 183,380 185,559 199,088 189,600 193,296 202,315 202,953
86,949378
2,129955455
10,72310,345
8327,8252,5321,229550
1,1921,84516,745
23225,089
1573,474
46217
85,782379
2,407587544
11,2608,960627
7,3942,4951,156438
1,1461,97816,950
11825,307
1493,455
41390
85,493335
2,365613484
11,1188,618618
7,3932,4771,500314
1,2421,69215,625
13826,816
1153,693
37300
82,828444
2,369615522
11,3025,337617
7,4292,0221,391537
1,4181,84714,859
13627,208
1224,301
33319
82,760352
2,795588435
10,8505,427610
6,9422,1281,221339
1,3831,63214,517
13627,258
1445,60640354
82,965383
3,988553438
11,2726,954626
5,7782,6761,282391
1,3661,99914,730
15324,198
2545,523
49351
83,879432
3,8375.34433
12,1787,626567
7,1382,8301,140398
1,3711,79514,359
15622,567
1906,026
36267
86,187390
3,673525403
12,5969,121642
6,5302,4911,040506
1,4911,86114,252
14722,940
1397,097
70271
83,513432
3,696528311
12,3327,854591
5,9692,5401,074571
1,3211,82613,524
23722,830
1697,275
39392
83,970460
3,322493307
11,6547,557643
6,7962,5551,381491
1,5201,81313,695
17123,791
2036,865
33220
90,682511
3,696586363
12,3749,168711
7,3082,7831,444437
1,3791,80716,574
25724,439
2256,140
64416
90,897523
4,019497455
12,1259,973670
7,5722,4411,344,3741 5001,73716,689
24222,680
6816,939
68370
9,579 9,556 8,507 8,048 8,201 9,157 9,228 9,187 10,337 10,039 9,856 10,031
51,0021,63516,580447
1,40512,028
3952,882
1038639496
4,071344
4,770376216
3,0831,883
57,9541,632
22,244560
1,15612,938470
2,8405
41239190
4,063524
4,663388210
3,5181,853
51,5781,58216,282
5341,367
11,788445
2,8256
45942697
4,094419
4,418363240
4,0752,158
48,9741,67914,431
4791,64511,579444
2,90523357403132
4,434411
4,505392216
3,1041,834
48,9201,90316,481
5121,52)9,504416
2,7807
337350138
4,200335
4,082412208
3,9531,773
47,1311,70513,048
5761,42010,310450
2,8546
45536091
4,007250
4,179346231
4,7092,135
49,3851,84113,289464
1,43411,999459
2,9546
346373137
4,268332
4,685350232
4,3501,866
58,4591,880
21,390559
1,37813,294475
2,8937
818372100
4,291314
4,617401241
3,6921,737
48,9451,87514,096
6771,22211,392
4312,916
5381373101
4,226360
3,894355199
4,4052,035
52,5011,99617,567
5951,34212,058448
3,037
38736585
4,575393
3,595380220
3,6591,793
53,3081,99616,803
5551,24812,637456
2,9626
43735978
4,580568
4,575345244
3,6621,796
53,1702,13216,381
6701,21612,766460
3,0776
37136797
4,547413
4,718403254
3,1702,123
140Digitized for FRASER http://fraser.stlouisfed.org/ Federal Reserve Bank of St. Louis

55. Liabilities to foreigners, payable in U.S. dollars, reported by banks in the United States—ContinuedB. By area and country-ContinuedMillions of dollars, end of period
44 AsiaChina
45 Mainland46 Taiwan47 Hong Kong48 India49 Indonesia50 Israel51 Japan52 Korea53 Philippines54 Thailand55 Middle East oil-exporting
countries'*56 Other
57 Africa58 Egypt59 Morocco60 South Africa61 Zaire62 Oil-exporting countries5. . ,63 Other
64 Other countries65 Australia . .66 All other •.
67 Nonmonetary internationaland regionalorganizations
68 International^69 Latin American regional . . . .70 Other regional7
Jan.
32,158
461,3861 694
544743517
9,436959724408
14 1941,506
3,325449
50270128
1,497932
1,114853261
1 232829
84319
Feb.
34,630
321,5671 776
579693507
10,7071 019
767284
150731,625
3,164333
3319593
1,659852
1,3631 054
309
1 722618785320
Mar
34,337
341,1881 897
558658759
9,6891,069
664414
15,7671,638
3,319320
31313102
1,653901
1,304992312
1 774658751366
Apr
33,613
351,0761 857
576935560
9,3861,008
784407
15,2841,704
4,197438
41294
842,455
885
1,133881252
23821,272
813297
May
36,063
301,3961,944
740670570
10,793989880472
15,8061,771
3,80337631
31686
2,225768
1,3971,150
247
3 2172,133
790294
19
June
39,157
441,5242,270
633807584
12,1741,087
848405
16,7901,992
3,68132635
325107
2,093796
1,2901,019
271
3 5092,394
807307
80
July
38,033
381,4382 186
494849488
12,5471 482
935405
153631,808
3,796451
33360
782,094
779
1,239959281
2 9031,804
785314
Aug.
40,098
371,5522 125
631649569
14,1601 473
778304
157862,033
4,22135047
40438
2,685697
936692243
2 8201,736
800285
Sept.
42,009
381,5952347
529827534
15,4341,994
817517
154091,968
3,90232232
35442
2,459694
894613281
25491,389
837323
Oct.
41,056
461,6102304
485811530
15,3721,809
842403
14,6112,232
4,246269
57288
362,911
685
1,4841,190
294
27341,586
841307
Nov.
41,999
621,6362410
438715548
15,7201,764
803440
15,2142,250
4,718374°38
32634
3,211735
1,7521,419
333
24761,366
801309
Dec.
42,420
491,6622548
416730883
16,2811,528
919464
14,4532,487
5,187485
33288
573,540
783
1,247950297
2,3421,156
890296
141Digitized for FRASER http://fraser.stlouisfed.org/ Federal Reserve Bank of St. Louis

56. Banks' own claims on foreigners, payable in U.S. dollars, reported by banks in the United States1
Millions of dollars, end of period
Area and country
1 Total
2 Foreign countries
3 Europe . . .4 Austria5 Belgium-Luxembourg . . . .6 Denmark7 Finland8 France9 Germany
10 Greece1 1 Italy12 Netherlands13 Norway14 Portugal . . . .15 Spain16 Sweden . .17 Switzerland18 Turkey . .19 United Kingdom20 Yugoslavia21 Other Western Europe2 . . .22 U S S R . .23 Other Eastern Europe3 . . . .
24 Canada
25 Latin America andCaribbean . .
26 Argentina27 Bahamas .28 Bermuda29 Brazil30 British West Indies31 Chile32 Colombia33 Cuba34 Ecuador . . .35 Guatemala4
36 Jamaica'*37 Mexico38 Netherlands Antilles39 Panama40 Peru41 Uruguay42 Venezuela . ,43 Other
44 AsiaChina
45 Mainland . .46 Taiwan47 Hong Kong48 India49 Indonesia50 Israel51 Japan52 Korea53 Philippines54 Thailand55 Middle East oil-exporting
countries^ . . . .56 Other
57 Africa58 Egypt59 Morocco60 South Africa61 Zaire62 Oil-exporting countries6. . .63 Other
64 Other countries65 Australia .66 All other .
67 Nonmonetary international andregional organizations7 . . . .
Jan.
91,874
91,830
17,034107660172179
1,776640188
1 170374176137732230597337
8,133306142424554
3,758
48 6161,622
22,348111
4,5106,173
690651
14518
4898220
1,953965
6722051 671
18 830
' 151 619
51665
210501
96262 458
602634
1 681903
2 55612661
1,09598
499677
1,037839198
44
Feb.
91,040
91,005
17,197112552171184
1,988615209
1,147382191155735200704311
8,200308
74383576
4,009
47,2491,574
21,517233
4,5595,589
700640
4530
4,719208
1,880931
652,4211 678
18 985
131 663
49572
222498
9,7672 315
642647
1,753898
254812144
1,10698
531648
1,017813204
35
Mar.
96,449
96,406
1869083
596166189
2,265783211
1 155470184155741171696315
9,20430749
370580
4,084
49 8661,642
22 801195
4 8326,851
710592
3544
4 836215
1 699920
652 3671 593
20039
111 656
60997
202491
10 2662 090
660656
2 2191 082
2 63210739
1 169101493723
1 095879216
43
Apr.
91,711
91,665
15,92576
707142180
1,991710200906419190126561199829319
6,881280267316626
2,773
51,4401,537
23,377178-
4,3178,880
725550
1524
6119
4,475201
2,19888851
2,1451 314
18 372
201 400
92653
165433
9 7711 847
614693
1,484969
2 2097935
1,03577
427556
945778166
46
May
90,497
90,465
16,81994
1,089183182
2,228770279
1,198468209122665184404312
7,083285137369556
2,437
48,2091,603
21,668345
4,4386,824
719577
1531
7942
4539206
2,194920
582,2281 238
19827
131 455
86772
137493
100211 803
749735
2,510971
2 2137237
1,05180
442530
960794166
32
19
June
90,959
90,928
17,111105866141182
2,239828204998383217116683219821313
7,446320153326553
2,509
47,7301,562
18,924145
4,6865,844
747617
15619053
4903212
1,930931
5322331 240
20454
131 331
95780
146466
10 1722 327
678715
2,0851 482
2 1337040
1,04979
383512
989824166
31
78
July
89,271
89,235
16,971110775129187
2,249712190
1,134436208132690244771327
7,323301165313576
3,144
47,4111,584
19,903145-
4,6096,971
748649
1547
8349
5 103206
2,288919
522 3401 214
18 579
51 183
81346
139443
97921 938
638723
1 6411 218
2 1327938
1,03279
341563
997831167
36
Aug.
92,796
92,758
17,311107847146216
2,580650125
1,098403163105682290
1,013324
7,240281125343573
3,366
49,5301,577
22,175194
4,8356,933
813687
1560
8644
5021198
1,658930
562,5171 246
19319
311 177
90573
125502
9 8181 927
728675
20921 267
2 2606242
1,05479
458565
972827145
38
Sept.
96,169
96,129
18,33595
969147221
2,845730126
1,061380263
99740325871323
7,752307132370578
3,450
51,0131,702
19,813136
5,2689,093
745121
1646
7946
5016230
2,330967
5127521 412
20 107
81 2421,017
76152542
102061 933
730635
22101 357
2 1616738
1,02282
406547
1,063895169
39
Oct.
97,512
97,472
19,343111
1,036160232
2,771787161
1,378505238106898348781309
8,079293138387627
3,619
49,7851,467
19,607352
5,5997,227
836793
0621
8545
4934197
2,518946
633 1101 384
21 476
101 2851484
66144553
105301 790
732734
2 1372012
2 2265647
990161438534
1,023879145
41
Nov.
106,441
106,396
20,589142
1,257193260
2,716812134
1,458617282180985465
1,045299
8,385302107321627
4,530
55,4411,710
24,569141
6,1376,445
865936
4680
8949
5,286227
2,561931
583,3671,386
22,632
61 3561,385
46188111
11 8651 792
111760
2,1981,603
2 1636836
906162439551
1,041894147
45
Dec.
115,545
115,488
24,201140
1,200254305
3,735845164
1,523677299171
1,120537
1,283300
10,147363122360657
5,152
57,5652,281
21,555184
6,2519,694
9701,012
0705
9440
5,479273
3,098918
523,4741 485
25,362
41 4991,479
54143888
12,6462282
680758
3,1251,804
2 22110782
860164452556
988877111
56
142Digitized for FRASER http://fraser.stlouisfed.org/ Federal Reserve Bank of St. Louis

56. Banks9 own claims on foreigners, payable in U.S. dollars, reported by banks in theUnited States1—ContinuedMillions of dollars, end of period
Area and country
1 Total
2 Foreign countries
3 Europe4 Austria . .5 Belgium-Luxembourg . . . .6 Denmark7 Finland8 France9 Germany . . . . . . .
10 Greece11 Italy . . . . . . .12 Netherlands13 Norway . .14 Portugal15 Spain . .16 Sweden17 Switzerland . .18 Turkey19 United Kingdom20 Yugoslavia21 Other Western Europe2 . . .22 U S S R23 Other Eastern Europe3 . . . .
24 Canada
25 Latin America andCaribbean
26 Argentina27 Bahamas28 Bermuda29 Brazil30 British West Indies31 Chile32 Colombia33 Cuba . . . . . . . .34 Ecuador35 Guatemala36 Jamaica37 Mexico38 Netherlands Antilles39 Panama40 Peru41 Uruguay . .42 Venezuela43 Other
44 AsiaChina
45 Mainland46 Taiwan47 Hong Kong48 India49 Indonesia . . . . . .50 Israel51 Japan52 Korea53 Philippines54 Thailand55 Middle East oil-exporting
countries-^ .56 Other
57 Africa58 Egypt59 Morocco . . .60 South Africa . .61 Zaire62 Oil-exporting countries6. . .63 Other
64 Other countries65 Australia6 6 A l l other . . . . . .
67 Nonmonetary international andregional organizations7. . . .
Jan.
105,928
105,888
20,646147
1,554166281
2674822158
1 411685249169910449
1 055193
8 239399133320632
4,969
53,0562,138
21 609164
62525,2671 0171 054
0700
8737
5 489255
3,213873
503 3171,534
24,157
151 4511 626
61141
1 01212 4742 237
607757
2 3331 444
2,1478297
838156439533
914792122
40
Feb.
104,305
104,266
20,285115
1,428164264
2 296694169
1,410623251173
1,103388973147
8,629409110309629
5,068
50,9202,350
19213149
6,2455,034
9441 019
76811048
5 441208
3,546846
443 4721,483
25,087
131 7611 964
60123918
12 1052 474
692832
2,4871 658
2,0938388
760155458550
813704108
39
Mar.
108,560
108,514
21,230177
1,832166297
2 930900188
1,302585205209909312
1,071162
8460448124319632
5,213
54,0612,749
19353150
62807,838
9641 004
4839
8961
5 605273
2,94783446
3 5181,507
25,087
161 8342 040
52124927
12 7202 528
660765
1,9401 481
1,9667166
701155455518
956825131
46
Apr.
105,801
105,755
20,558130
1,417199250
2,917793168
1,408527240208808300878162
8,325472422298636
4,800
52,8123,095
19,411135
6,1875,543
970945
4903
9563
5 804'213
3,568813
483 5521,463
24,725
201,8201,732
73135779
12,0822,703
710760
2,4391,474
1,97710464
680151462516
882755127
46
May
106,789
106,743
20,283150
1,368168184
2 711769156
1,440526196190930231959139
8,497492171288718
4,712
53,8803,406
20,184198
6,2694,8151,0581 010
487710164
6075234
3,71073961
3 6081,466
24,940
221 8141 970
59138824
12,2922 935
697836
1,7251,630
1,97112546
719151460471
956789167
46
19
June
115,645
115,600
24,231151
1,704140186
3,522828167
1,322511200172999247
1,066155
11,137535187293709
4,895
57,5973,200
19,045127
6,1219,4741,0891,093
49089540
6,478280
3,619720
583,8021,445
25,761
71,8841,863
82138842
12,8683,383
678895
1,5961,524
2,13017837
745151480539
987782205
45
79
July
113,821
113,774
24,180188
1,729137220
3,239930130
1,201792181235
1,004401
1,027138
10,661541199273955
5,058
54,1933,341
16,917179
6,1626,3201,1201 207
4916
9847
7222392
4,212111
563,8141,458
27,243
271,8761,978
43131865
13,9003,464
743925
1,8091,483
2,08211534
745189491508
1,017769248
47
Aug.
125,918
125,866
25,794223
1,534141247
3,262874267
1,475559227297970482714167
12,311571216283974
5,012
63,1073,253
20,061167
6,53510,817
1,1721,225
6921
9730
7,726342
4,397728
664,0151,548
29,038
291,9701,788
75156857
15,0023,607
793919
1,6892,152
1,97412831
730151400533
942111170
51
Sept. [ Oct.
127,719 121,571
127,669 121,530
28,342 26,188191 190
1,783 1,569166 116227 230
3 788 2,7381819 1,316
194 2821,571 1,429
631 618238 236325 349
1,126 1,117459 603
1,179 1,171140 162
12,292 11,824584 578247 154317 341
1,064 1,163
4,785 4,332
62,871 59,5093,284 3,656
19,129 17,558170 485
7,281 7,5559,522 6,7661,323 1,3961,264 1,456
4 4943 1,000103 11032 29
8529 8,515301 230
4,523 4,272716 607
60 724,176 4,3491,511 1,450
28,643 28,637
25 551,935 1,9301,859 1,737
74 68140 147882 891
14,645 15,0373,725 3,836
638 7241,040 956
1,914 1,1901,765 2,067
2,106 1,929122 12523 6
704 602149 135565 435542 566
922 935750 756172 180
50 41
Nov.
124,701
124,653
25,768168
1,313149182
3,3051,396
1711,264
603257352
1,050.548
1,232151
11,407577185302
1,155
4,365
62,5834,157
16,147462
7,4919,2191,3491,523
41,007
11534
8,438221
5,786604
714,3961,553
29,154
311,8051,794
69135842
16,1383,729
642957
1,1071,906
1,8679373
565135442559
916741176
49
Dec.
133,943
133,906
28,388284
1,339147202
3,3221,179
1541,631
514276330
1,051542
1,165149
13,795611175268
1,254
4,143
67,9934,389
18,918496
7,7139,8181,4411,614
41,025
13447
9,099248
6,041652105
4,6571,593
30,730
351,8211,804
92131990
16,9113,793
737933
1,5481,934
1,797114103445144391600
855673182
36
143Digitized for FRASER http://fraser.stlouisfed.org/ Federal Reserve Bank of St. Louis

56. Banks' own claims on foreigners, payable in U.S. dollars, reported by banks in theUnited Statesi-ContinuedMillions of dollars, end of period
1 Total . . . .
2 Foreign countries . . . . . .
3 Europe . , . . .4 Austria5 Belgium-Luxembourg . . . .6 Denmark7 Finland8 France.9 Germany
10 Greece11 Italy12 Netherlands . . . . . .13 Norway14 Portugal . .15 Spain16 Sweden17 Switzerland18 Turkey19 United Kingdom20 Yugoslavia21 Other Western Europe2 . . .2 2 U S S R23 Other Eastern Europe3. . . .
24 Canada
25 Latin America andCaribbean . . . . . . .
26 Argentina27 Bahamas28 Bermuda29 Brazil30 British West Indies31 Chile32 Colombia . . . . .33 Cuba34 Ecuador. . . . . . . .35 Guatemala36 Jamaica . . . .37 Mexico38 Netherlands Antilles39 Panama . . . . . .40 Peru41 Uruguay42 Venezuela43 Other
44 AsiaChina
45 Mainland . . . . . .46 Taiwan47 Hong Kong . . . . . .48 India. . . .49 Indonesia50 Israel51 Japan52 Korea53 Philippines . . .54 Thailand . . .55 Middle East oil-exporting
countries5
56 Other
57 Africa.58 Egypt59 Morocco60 South Africa61 Zaire62 Oil-exporting countries6 . . .63 Other
64 Other countries65 Australia66 AH other
67 Nonmonetary international andregional organizations7 . . . .
Jan.
127,765
127 726
24897258
1,416126262
3,086921136
1,383472177288948747939128
11,371569203263
1,202
4018
65,6864670
20,861434
7,4947,8751 4191 655
41 001
11451
8 933325
4435585100
4 2111,518
30246
281 7001 804
136117812
16,9904,077
649971
1,4001,562
1 901132106412146507599
978803175
40
Feb.
131,235
131,198
25,600315
1,524156237
3,1971 189
1411,407
610175213
1,015702
1,363131
10,897565227265
1,270
4 136
66,3414888
19,349314
7,60010,1871 4301 698
41 025
10544
8990397
3 929634
824 1511,515
32386
511 6912 127
90128787
18,8764,353
645993
1,2111,434
1 777156109342144451574
958789170
38
Mar.
131,817
131,776
25,805331
1,631207188
2,9841 308
1911,491
535254227914593
1,356123
10,956598225253
1,439
4 312
65,2554958
19,412313
7,9927,4681 3671 526
41,023
10942
9 148506
4 66270190
44161,520
33 639
491 5241 888
120132734
20,1734,723
696877
1,4371,286
1 731130118337143353649
1 035803232
41
Apr,
133,786
133 748
24 547337
1,590203223
2,8111 153
2441,462
480170247
1,020618826132
10,484593330257
1,366
4023
685264993
21,190321
8,1088,7131 3341 539
51 Oil
10843
9 188671
4643654
844 2241,696
33 969
481 6262 001
87166829
203524850
693857
1 1361 324
1 802137128362143443588
880713167
38
May
139,845
139,807
26,209292
1,471168273
2,7401 104
3291,748
457172246
1,106661916151
11,854614266247
1,394
4 283
71,6745 117
23,312296
8,0399,0521 3551408
41 007
10743
9746'701
4538628154
45201,646
34 989
401 8892 362
61128828
20,4745 045
717918
9361,591
1 770134107465108325632
883695187
38
1980
June 1 July
149,566 151,469
149,528 151,433
29,403 28,455305 309
1,866 1,622167 149307 223
2,687 2,5821,143 1,004
346 2791,940 2,295
590 492219 270300 346
1,189 1,011677 534
1,237 1,319144 143
13,725 13,181658 648204 170289 531
1,412 1,346
5 272 4 782
74,214 78,7845 226 5,234
25,255 28,813175 194
8,289 8,9698,691 8,6481 368 1 3591,435 1,448
4 41,058 1,051
120 15336 31
10 170 10,660728 760
4,952 4,552711 647103 91
4317 44691,576 1,700
37 566 36 290
75 682 105 2 2242271 2,174
83 97155 205
1,028 95021,850 20,5905,415 5,516
780 881927 939
1,219 1,0781,659 1,567
2016 2 17995 112
121 134616 691107 107364 378714 757
1 056 943860 743196 200
39 36
Aug.
163,649
163,606
29,440280
1,883164215
3,2881 131
2652,433
632231335
1,139558
1,581137
12,668647172232
1,448
4775
89,4075393
32,056256
9,21614,5841 4871 490
31 136
10231
10779725
4931687105
47371,687
36987
502 2842 194
118245
1,01021,18554561 019
950
9981 478
1 977135180469
98349746
1 021793228
43
Sept.
161,548
161,510
29,667264
1,954180184
3,2321,018
2212,560
546248330
1,106716
1,337144
13,015682245241
1,444
5072
85,9355 629
30,440216
9,63512,0191 6271,493
61,111
10533
11 120710
4461671100
48791,681
37716
11724922 243
84208916
20,6665,5651 171
947
1,4291,876
2029123166535101374729
1 091879213
39
Oct.
163,189
163,144
29,306196
1,680132253
2,551987278
2,842557335341
1,113763
1,564123
12,981684226257
1,443
4614
87,9865 898
30,275399
10,13112,9481 7211 575
31 157
11235
11 745'799
3972719100
4 7101,689
37 964
12623322 133
103214
1 055206145 8801 084
925
1 2582240
2090159119440123469780
1 185942243
44
Nov.
167,525
167,487
32,654250
1,946165248
3,5061 506
2653,063
749138393
1,111633
1,932149
13,995689234271
1,413
4542
89,2596270
29,679260
9,99613,6741 7301 582
31,157
11440
12 014816
4367749105
5 1131,591
37 956
1872 3822 094
125248
1,12520,32358391 122
974
1 5381 999
1 933165146375
98402747
1 143915228
38
Dec.
172,702
172,624
32,155236
1,621127460
2,958948256
3,364575227331993783
1,446145
14,917853179281
1,457
4810
92,9925 689
29,419218
10,49615,6631 9511,752
31,190
13736
12595'821
4974890137
54381,583
39 140
1952 4692 247
142245
1,17221,3615697
989876
1,4942252
2 37715122337094
805734
1 150859290
78
144Digitized for FRASER http://fraser.stlouisfed.org/ Federal Reserve Bank of St. Louis

57. Banks' own and domestic customers' claims on foreigners, payable in U.S. dollars, reported by banksin the United States1
Millions of dollars, end of period
Type of claim
1 Total .
2 Banks' own claims on foreigners3 Foreign public borrowers4 Own foreign offices^ ' ; . .5 Unaffiliated foreign banks
7 Other8 All other foreigners
9 Claims of banks' domestic customers^ . . . .10 Deposits11 Negotiable and readily transferable
instruments'*12 Outstanding collections and other claims^
13 MEMO' Customer liability on acceptances
1 Total
2 Banks' own claims on foreigners3 Foreign public borrowers4 Own foreign offices2 . . . .5 Unaffiliated foreign banks6 Deposits7 Other8 All other foreigners
9 Claims of banks' domestic customers^ . . . .10 Deposits11 Negotiable and readily transferable
instruments4
12 Outstanding collections and other claims
13 MEMO1 Customer liability on acceptances
Dollar deposits in banks abroad, reported bynonbanking business enterprises in theUnited States6 . .
1 Total .
2 Banks' own claims on foreigners3 Foreign public borrowers4 Own foreign offices2
5 Unaffiliated foreign banks6 Deposits . . . .7 Other8 All other foreigners
9 Claims of banks' domestic customers-*10 Deposits . . . .11 Negotiable and readily transferable
instruments4
12 Outstanding collections and other claims
13 MEMO: Customer liability on acceptances
Dollar deposits in banks abroad, reported bynonbanking business enterprises in theUnited States6
Jan.
91,874
3 037
27515
12,346
6342
Oct.
975128,487
36,88031,0314,183
26,84821,115
July
113 82112 28436,40238,820
6,70932 11026316
22,976
Feb.
91,040
3,079
27,804
12,152
6446
1978
Nov.
106,4419,424
41,30133,6594,450
29,20922,057
Aug.
125,9181303340,43145,062
7,26737,79527 392
23,543
Mar.
96,449
3,004
30,840
12,546
6,765
Dec.
126,787
115,54510,34641,60540,483
5,42835,05423,111
11,243480
5,3965 366
15 030
13,558
19
Sept.
147,022
127,7191447539,72246,025
7,11538,91027,497
19 302975
12,2366091
19,867
21,663
Apr.
91,7115 910
39,119282344,470
2376518,447
Jan.
105 92810,51338 56334,3414,600
29,74122,511
17444
79
Oct.
121 57114 82038,38939,7906,491
33 29828 572
24,486
1978
May
90,4976 128
38,025277784,849
2293018,565
Feb.
104 30510,80636,06634,456
5,15829,29822,977
18 517
Nov.
124,7011432643,79837,703
5,47832,22628,874
22,950
June
100,089
90,9596,495
34,72730,426
5,32125 10519,312
9,131419
3,7115 001
11 865
19
Mar.
121,725
108,56011,13736,69137,3116,134
31,17723,421
13,165719
6,8005 646
15 266
19,164
Dec.
154,030
133,94315,93747,42840,927
6,27434,65429,650
20 088955
13,1006,032
18,021
22,042
July
89,2717,310
34,96227,780
5,18522,59619,218
79
Apr.
105,80111,37437,00534,195
5,38928,80623,227
20,223
Jan.
127,76515,38646,59836,1634,949
31,21429,617
24,562
Aug.
92,7967 727
37,698274964,859
2263719,875
May
106,78910,95035,98135,4465,394
30,05224,412
21,171
1980
Feb.
131,23515,44847,17238,9305,152
33,77829,686
26,200
Sept.
105,250
96,1698,207
35,81431 7884,692
2709520,360
9,081500
3,7354,847
12784
June
129,638
115,64511,60637,46941,561
7,00434,55725,010
13,993683
7,3975 913
16983
19,433
Mar.
154,401
131,81715,85846,02939,5485,502
34,04730,381
225841,208
14,7636,613
20,144
25,416
145Digitized for FRASER http://fraser.stlouisfed.org/ Federal Reserve Bank of St. Louis

57. Banks9 own and domestic customers' claims on foreigners, payable in U.S. dollars, reported by banksin the United States1—ContinuedMillions of dollars, end of period
1 Total
2 Banks' own claims on foreigners . .3 Foreign public borrowers4 Own foreign offices^5 Unaffiliated foreign banks6 Deposits7 Other8 All other foreigners . . .
9 Claims of banks' domestic customers^10 Deposits11 Negotiable and readily transferable
instruments4
12 Outstanding collections and other claims . . .
13 MEMO1 Customer liability on acceptances.
Dollar deposits in banks abroad, reported bynonbanking business enterprises in theUnited States^
Apr.
133 78615 6474648640971
6 11534 85630,682
24,744
May
139 84515 61550 12942 778
6 5063627231,324
25,364
June
174,725
149 5661621556 27043 851
6 5223732933,230
25 159910
17,4446 804
22 375
24,084
July
15146917,05658 69841,991
6 17835,81233,725
25,581
1980
Aug.
163 64917,7626431347,462
7 26340,20034,111
24,294
Sept.
187,038
161 54819,31161 88045,963
7 2113875234,395
25,4901 081
15,2609 148
23 433
22,121
Oct.
163 18919,47862 08746576
7 1163946035,048
22,798
Nov. | Dec.
198,807
167 525 172 70221 158 20,94462 507 65 08449066 50,215
7 579 8 25441 488 41 96234 794 36,459
26,106885
15,5749648
22714
24,658 23,644
146Digitized for FRASER http://fraser.stlouisfed.org/ Federal Reserve Bank of St. Louis

58. Banks' own claims on unaffiliated foreigners, payable in U.S. dollars, reported by banks in theUnited States1
Millions of dollars, end of period
Maturity, by borrower and area
1 Total .
By borrower2 Maturity of 1 year or less2
3 Foreign public borrowers4 All other foreigners
5 Maturity of over 1 year2 . . . ,6 Foreign public borrowers7 All other foreigners . . .
By areaMaturity of 1 year or less2
8 Europe9 Canada . . . .
10 Latin America and Caribbean11 Asia . . . .12 Africa13 All other3 . . . . . . . . .
Maturity of over 1 year2
14 Europe15 Canada . . . . . . . .16 Latin America and Caribbean17 Asia . . . . .18 Africa19 Allother3 . . . .
1 Total
By borrower2 Maturity of 1 year or less2
3 Foreign public borrowers4 All other foreigners
5 Maturity of over 1 year2
6 Foreign public borrowers.7 All other foreigners
By areaMaturity of 1 year or less2
8 Europe9 Canada
10 Latin America and Caribbean11 Asia12 Africa13 All other3 . . . . .
Maturity of over 1 year2
14 Europe15 Canada16 Latin America and Caribbean17 Asia18 Africa19 All other3
June
55,865
445223 134
41 387
1 1 3433 2518092
9 7141,598
17 44613 784
1,457523
2,920344
5,9001 297
631252
1978
Sept.
60,057
47,1923 711
43,480
12,86642478 618
105181,953
18 62413,971
1,535591
3,102794
6,8771,303
580211
Dec.
73,635
58 3454633
53 712
15 28953959894
15 1692670
20 89517545
1,496569
3,1421 4268,4641 407
637214
Mar.
71,604
55,4254676
50,748
16,1795 982
10 197
123962514
21 72916,951
1,292541
3,1031 4569,3251 486
629180
Mar.
85,452
64,1096812
57,297
21,3438,593
12750
13,8481 812
23,04223,737
1,043627
42361 214
13,3881,728
620157
19
June
77,748
60,0844658
55,426
17,6646500
11,164
140752,709
23 15318,143
1,438565
3,4831,221
10,2771,884
616183
19
June
93,260
71,9387,227
64,711
21,3228,673
12,649
17,2152047
24,46026,162
1,330724
4,0331 199
13,8871,477
576150
79
Sept.
87,538
68,3626 159
62203
19 1767 787
11 388
168022471
25 68621478
1,401524
3,6531 364
11,7691 578
625188
80
Sept.
99,022
76,2318935
67,296
22,7919,722
13069
16,9402 166
28,09726,876
1,401751
4 7051 188
14,1872,014
567130
Dec.
86,181
65,1527233
57,919
21,0308371
12 659
152351 777
2492821,641
1,077493
4,1601,317
12,8141,911
655173
Dec.
106,857
82,6651003672,628
24,19310,15214,041
18,7622723
32,03426,748
1,757640
5,1181 448
15,0751,865
507179
147Digitized for FRASER http://fraser.stlouisfed.org/ Federal Reserve Bank of St. Louis
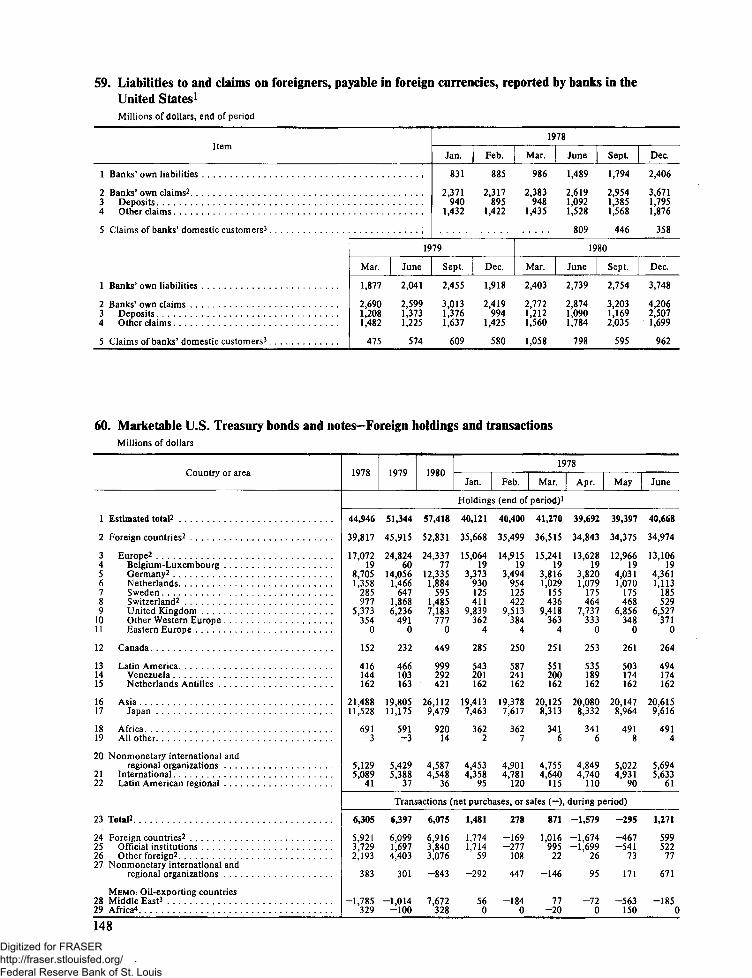
59. Liabilities to and claims on foreigners, payable in foreign currencies, reported by banks in theUnited States1
Millions of dollars, end of period
Itam
1 Banks' own liabilities
2 Banks' own claims2
3 Deposits , . ,4 Other claims
5 Claims of banks' domestic customers-*
1 Banks' own liabilities
2 Banks' own claims3 Deposits4 Other claims
5 Claims of banks' domestic customers3
Mar.
1 877
26901,2081 482
475
19
June
2,041
2,5991,3731 225
574
Jan.
831
2371940
1,432
79
Sept.
2,455
3 0131,3761,637
609
Feb.
885
2317895
1,422
Dec.
1,918
2419994
1 425
580
19
Mar.
986
2383948
1,435
Mar.
2,403
2,7721,2121,560
1.058
78
June
1 489
26191,0921,528
809
19
June
2,739
2,8741,0901,784
798
Sept.
1 794
29541,3851,568
446
80
Sept.
2,754
3,2031,1692035
595
Dec.
2,406
3 6711,7951,876
358
Dec.
3,748
4,2062,5071,699
962
60. Marketable U.S. Treasury bonds and notes—Foreign holdings and transactionsMillions of dollars
Country or area
1 Estimated total2
2 Foreign countries2
3 Europe2 . . .4 Belgium-Luxembourg5 Germany2
6 Netherlands7 Sweden8 Switzerland2
9 United Kingdom10 Other Western Europe11 Eastern Europe
12 Canada
13 Latin America14 Venezuela15 Netherlands Antilles .
16 Asia17 Japan
18 Africa19 All other
20 Nonmonetary international andregional organizations
21 International22 Latin American regional
23 Total2
24 Foreign countries2 . . .25 Official institutions . . . .26 Other foreign2
27 Nonmonetary international andregional organizations
MEMO: Oil-exporting countries28 Middle East3 . . . .29 Africa^
1978 1979 19801978
Jan. Feb. Mar. Apr. May June
i Holdings (end of period)1
44,946
39,817
17,07219
8,7051,358
285977
5,373354
0
152
416144162
21,48811,528
691-3
5,1295,089
41
51,344
45,915
24,82460
14,0561,466
6471,8686,236
4910
232
466103163
19,80511,175
591-3
5,4295,388
37
57,418
52,831
24,33777
12,3351,884
5951,4857,183
7770
449
999292421
26,1129,479
92014
4,5874,548
36
40,121
35,668
15,06419
3,373930125411
9,839362
4
285
543201162
19,4137,463
3622
4,4534,358
95
40,400
35,499
14,91519
3,494954125422
9,513384
4
250
587241162
19,3787,617
3627
4,9014,781
120
41,270
36,515
15,24119
3,8161,029
155436
9,418363
4
251
551200162
20,1258,313
3416
4,7554,640
115
Transactions (net purchases, or sales (— ),
6,305
5,9213,7292,193
383
-1,785329
6,397
6,0991,6974,403
301
-1,014-100
6,075
6,9163,8403,076
-843
7,672328
1,481
1,7741,714
59
-292
560
278
-169-277
108
447
-1840
871
1,016995
22
-146
77-20
39,692
34,843
13,62819
3,8201,079
175464
7,737333
0
253
535189162
20,0808,332
3416
4,8494,740
110
39,397
34,375
12,96619
4,0311,070
175468
6,856348
0
261
503174162
20,1478,964
4918
5,0224,931
90
40,668
34,974
13,10619
4,3611,113
185529
6,527371
0
264
494174162
20,6159,616
4914
5,6945,633
61
during period)
-1,579
-1,674-1,699
26
95
-720
-295
-467-541
73
171
-563150
1,271
599522
77
671
-1850
148Digitized for FRASER http://fraser.stlouisfed.org/ Federal Reserve Bank of St. Louis

60. Marketable U.S. Treasury bonds and notes—Foreign holdings and transactions—ContinuedMillions of dollars
Country or area
1 Estimated total2
2 Foreign countries2
3 Europe2
4 Belgium-Luxembourg5 Germany2
6 Netherlands7 Sweden8 Switzerland2
9 United Kingdom10 Other Western Europe11 Eastern Europe
12 Canada
13 Latin America14 Venezuela15 Netherlands Antilles
16 Asia . . . . . .17 Japan
18 Africa19 All other
20 Nonmonetary international andregional organizations
21 International22 Latin American regional
23 Total2
24 Foreign countries2
25 Official institutions26 Other foreign2
27 Nonmonetary international andregional organizations
MEMO: Oil-exporting countries28 Middle East3
29 Africa4
1978
July Aug. Sept. Oct. Nov. Dec.
1979
Jan. Feb. Mar. Apr.
Holdings (end of period)1
41,158
36,316
14,22619
5,5311,113
200590
6,403370
0
275
485174162
20,8419,927
491-3
4,8424,809
41,583
.37,129
14,15419
5,7611,278
210636
5,862387
0
276
545244162
21,65710,791
4917
4,4544,421
33
42,222
37,836
14,68919
6,1571,306
211694
5,909393
0
276
445144162
21,92911,096
4915
4,3864,354
33
43,632
38,482
15,26119
6,6451,356
231731
5,915365
0
151
426144162
21,94711,560
6916
5,1505,118
33
43,857
38,479
15,65419
7,1021,351
266915
5,674327
0
151
416144162
21,57011,483
691-a
5,3785,345
33
44,946
39,817
17,07219
8,7051,358
285977
5,373354
0
152
416144162
21,48811,528
691-3
5,1295,089
46,218
41,341
18,36019
8,8641,433
3201,8185,489
4170
150
433183162
21,70912,226
691-3
4,8774,837
41
45,595
40,883
18,50219
8,8601,517
3551,5085,823
4200
146
337103162
21,21012,422
691-3
4,7124,666
46
47,457
42,852
20,17219
10,2161,587
3601,5375,991
4610
166
338103162
21,48812,729
691-3
4,6054,560
46
48,059
43,097
20,59319
10,8121,637
4151,5105,735
4640
226
317103162
21,27312,982
691-3
4,9624,915
46
Transactions (net purchases, or sales (— ), during period)
490
1,3421,313
29
-852
-850
425
813710103
-387
-310
639
706704
3
-67
-310
1,410
646572
74
764
-401200
225
-364
-67
227
-241i
1,089
1,338-3491,686
-248
-1270
1,272
1,524168
1,356
-252
-4610
-623
-458-597
141
-165
-6930
1,862
1,968524
1,443
-106
-310
602
246242
3
357
-4520
149
Digitized for FRASER http://fraser.stlouisfed.org/ Federal Reserve Bank of St. Louis

60. Marketable U.S. Treasury bonds and notes—Foreign holdings and transactions—ContinuedMillions of dollars
Country or area
1 Estimated total2
2 Foreign countries2 . .
3 Europe2 \4 Belgium-Luxembourg . .5 Germany2
6 Netherlands . .7 Sweden8 Switzerland2
9 United Kingdom . .10 Other Western Europe11 Eastern Europe . .
12 Canada . . . . .
13 Latin America14 Venezuela15 Netherlands Antilles
16 Asia . .17 Japan
18 Africa19 All other
20 Nonmonetary international andregional organizations
21 International . .22 Latin American regional
23 Total2
24 Foreign countries2
25 Official institutions26 Other foreign2
27 Nonmonetary international andregional organizations
MEMO: Oil-exporting countries28 Middle East3
29 Africa*
1979
May June July Aug. Sept. Oct. Nov. Dec.
1980
Jan. Feb.
Holdings (end of period)1
47,135
42,975
20,66720
10,8281,672
4791,4585,697
5130
216
307103162
21,09713,014
691-3
4,1604,114
46
47,413
43,374
21,04724
10,7511,695
4841,5826,016
4960
227
307103162
21,10313,040
691-3
4,0393,993
46
48,910
44,464
22,21324
10,7811,655
4811,8436,938
4910
232
457103162
20,87413,090
691-3
4,4464,400
46
49,493
44,899
22,55824
10,9521,577
5252,0486,895
5380
233
459103165
20,96012,818
691-3
4,5944,551
43
50,176
44,981
22,59965
10,9531,667
5882,4966,193
6370
233
459103165
21,00112,789
691-3
5,1955,150
43
Transactions (net purchase,
-924
-122-149
27
-802
-1900
278
399297102
-121
80
1,497
1,0901,042
49
407
-1930
584
435511-77
149
3940
682
8292
-10
600
730
50,807
45,127
22,69265
11,0821,660
6002,4276,191
6660
235
461103164
21,05112,591
691-3
5,6805,636
43
50,817
45,316
23,02960
12,4561,490
5931,9615,955
5130
234
459103164
21,00612,502
591-3
5,5015,463
37
51,344
45,915
24,82460
14,0561,466
6471,8686,236
4910
232
466103163
19,80511,175
591-3
5,4295,388
37
53,902
47,854
26,50760
15,2001,407
6401,8946,792
5140
231
466103163
20,06210,844
591-3
6,0486,016
32
54,245
47,603
26,02855
14,9161,414
6361,5646,930
5120
389
467103164
20,13110,420
5912
6,6426,592
50
or sates (— ), during period)
632
1465689
487
2990
9
189-1,037
1,227
-180
64-100
527
60054753
-73
1680
2,562
1,939483
1,456
622
5500
343
-251-264
14
593
5000
150Digitized for FRASER http://fraser.stlouisfed.org/ Federal Reserve Bank of St. Louis
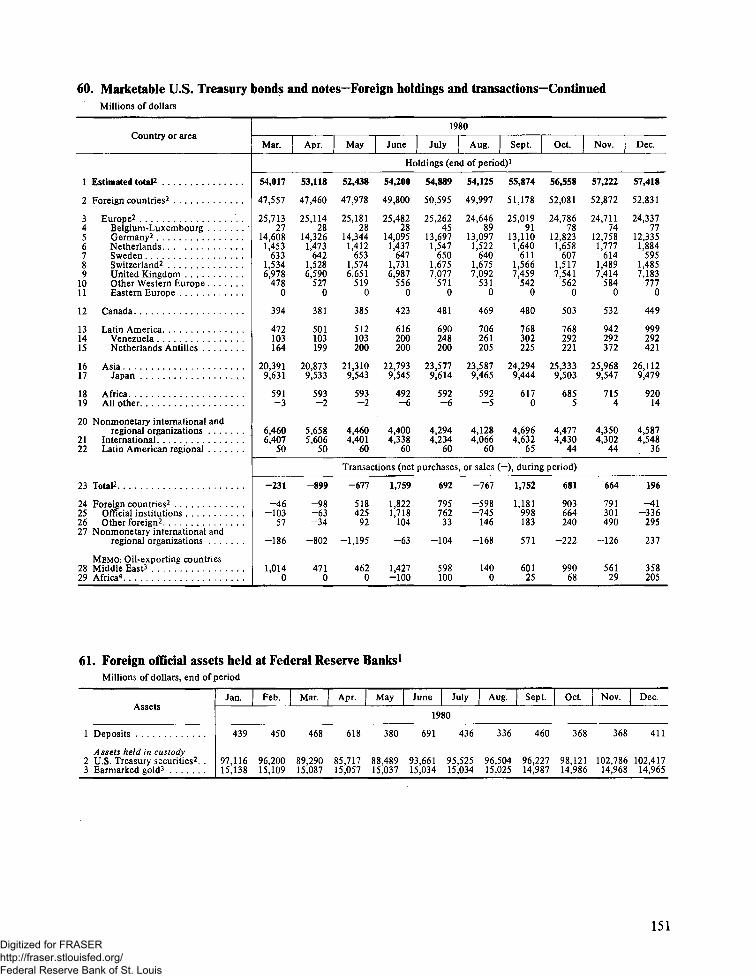
60. Marketable U.S. Treasury bonds and notes—Foreign holdings and transactions—ContinuedMillions of dollars
Country or area
1 Estimated total2
2 Foreign countries2
3 Europe2
4 Belgium-Luxembourg5 Germany2 . . .6 Netherlands7 Sweden8 Switzerland2
9 United Kingdom10 Other Western Europe11 Eastern Europe
12 Canada.
13 Latin America14 Venezuela15 Netherlands Antilles
16 Asia17 Japan
18 Africa19 All other
20 Nonmonetary international andregional organizations
2 1 International22 Latin American regional
23 Total2
24 Foreign countries2
25 Official institutions26 Other foreign2
27 Nonmonetary international andregional organizations
MEMO: Oil-exporting countries28 Middle East3
29 Africa4
1980
Mar. Apr. May June July Aug. Sept. Oct. Nov. Dec.
Holdings (end of period)1
54,017
47,557
25,71327
14,6081,453
6331,5346,978
4780
394
472103164
20,3919,631
591-3
6,4606,407
50
53,118
47,460
25,11428
14,3261,473
6421,5286,590
5270
381
501103199
20,8739,533
593<j
5,6585,606
50
52,438
47,978
25,18128
14,3441,412
6531,5746,651
5190
385
512103200
21,3109,543
593'y
4,4604,401
60
54,200
49,800
25,48228
14,0951,437
6471,7316,987
5560
423
616200200
22,7939,545
492-6
4,4004,338
60
54,889
50,595
25,26245
13,6971,547
6501,6757,077
5710
481
690248200
23,5779,614
592-6
4,2944,234
60
Transactions (net purchases
-231
-46-103
57
-186
1,0140
-899
-98-63-34
-802
4710
-677
518425
92
-1,195
4620
1,759
1,8221,718
104
-63
1,427-100
692
795762
33
-104
598100
54,125
49,997
24,64689
13,0971,522
6401,6757,092
5310
469
706261205
23,5879,465
592-5
4,1284,066
60
55,874
51,178
25,01991
13,1101,640
6111,5667,459
5420
480
768302225
24,2949,444
6170
4,6964,632
65
56,558
52,081
24,78678
12,8231,658
6071,5177,541
5620
503
768292221
25,3339,503
6855
4,4774,430
44
57,222
52,872
24,71174
12,7581,777
6141,4897,414
5840
532
942292372
25,9689,547
7154
4,3504,302
44
57,418
52,831
24,33777
12,3351,884
5951,4857,183
1110
449
999292421
26,1129,479
92014
4,5874,548
36
, or sales (— ), during period)
-767
-598-745
146
-168
1400
1,752
1,181998183
571
60125
681
903664240
-222
99068
664
791301490
-126
56129
196
-41-336
295
237
358205
61. Foreign official assets held at Federal Reserve Banks1
Millions of dollars, end of period
1 Deposits . . . . .
Assets held in custody2 U.S. Treasury securities2. .3 Earmarked gold3
Jan,
439
97,11615,138
Feb.
450
96,20015,109
Mar.
468
89,29015,087
Apr.
618
85,71715,057
May
380
88,48915,037
June 1 July | Aug. | Sept | Oct.
1980
691 436 336 460 368
93,661 95,525 96,504 96,227 98,12115,034 15,034 15,025 14,987 14,986
Nov. j Dec.
368 411
102,786 102,41714,968 14,965
151Digitized for FRASER http://fraser.stlouisfed.org/ Federal Reserve Bank of St. Louis

62. Foreign transactions in securitiesMillions of dollars
Transactions,and area or country
STOCKS
1 Foreign purchases , .2 Foreign sales
3 Net purchases, or sales (— ). .
4 Foreign countries5 Europe . . . .6 France7 Germany . . .8 Netherlands9 Switzerland . . .
10 United Kingdom11 Canada, . . .12 Latin America and
Caribbean . . .13 Middle East1
14 Other Asia15 Africa16 Other countries
17 Nonmonetary internationaland regionalorganizations . . .
BONDS2
18 Foreign purchases . . .19 Foreign sales
20 Net purchases, or sales (— ). .
21 Foreign countries22 Europe23 France24 Germany25 Netherlands26 Switzerland27 United Kingdom28 Canada29 Latin America and
Caribbean . .30 Middle East*31 Other Asia .32 Africa33 Other countries
34 Nonmonetary internationaland regionalorganizations
35 Stocks, net purchases,or sales (— )
36 Foreign purchases37 Foreign sales . . .
38 Bonds, net purchases,or sales ( — )
39 Foreign purchases . .40 Foreign sales . .
41 Net purchases, or sales (—),of stocks and bonds. . . .
42 Foreign countries . ,43 Europe44 Canada45 Latin America and
Caribbean46 Asia . . . .47 Africa48 Other countries
49 Nonmonetary internationaland regionalorganizations
1978
Jan-Dec. Jan. Feb. Mar. Apr. May June July Aug. Sept. Oct. Nov. Dec.
U.S. corporate securities
20,14517,723
2,423
2,4691,283
47620-22
-5851,230
74
151781189-13
3
-46
7,9855,688
2,297
1,87873630-212
-202930102
98810131-1
1
419
1,024909
115
11630
-1245-4
-5460
-19
-9107
601
-1
459379
81
99131-4
17
-7123
7
11-59
900
-18
826762
64
6341-233
-13-16
57-26
-448
221
1
574348
226
18132
1713
227
6125
11-1
0
45
1,414922
492
511319
6852-9
7187-3
17170
510
-19
604651
-47
-27-189
511
-20-56
-1225
11137
900
-20
1,8641,150
713
720508
79125
1610317344
379735-1
0
-7
311345
-35
-33-96-5103
-33-54
13
1331501
-2
2,3941,966
429
428323-2529
31229-^58
369041-4, 0
1
779364
416
4171184
-3-49
759
&1401
-1
2,0941,938
156
17777
-3983
-18-76101-12
335923-3
0
-21
671310
361
290155-3
7-7
5154
6
2913600
72
1,3061,297
9
9-6
-15179
-5250
-16
-3569-5
10
0
1,049631
418
396352
131811
-109416
14
12135
-11600
22
2,4462,680
-235
-235-152
9-54-22
-184110-18
48-134
34-12-1
0
868490
379
326137
63818
-208924
179948
01
53
2,3572,115
242
245-33
224
7-115
54117
1120365
-1
-3
610550
60
6280-2-519430
16
11-73
2800
-3
1,5211,523
-2
-3-80-4
-307
-1186922
1342-4
22
1
727530
197
13789
-10-12-4
9110-5
13-19
6000
60
1,4611,359
103
102-10
186
-8867
6
-2109
1-2
1
1
437526
-89
-99-113
3-89-8
-2790
-1-82300
10
1,4381,102
336
336264-38264-9
-237438
164
15-1
1
0
894564
330
128146
1710-639
1096
5-21
e
0-3
202
Foreign securities
5273,6663,139
-4,18511,09815,283
-3,658
-3,471-61
-3,229
221186
-441-146
-187
103255152
-636818
1,454
-533
-540208
-446
-6-176-118
-3
7
113280167
-192597789
-79
19060
39-129-61
2
-80
114337223
-617819
1,436
-503
-355112
-177
69-337-29
6
-148
144407262
-4861,2371,723
-342
-413157
-807
134146-44
2
70
^12J72284
-431,0201,063
-55
-67-201
-^80
72138
04
12
-61247308
-6391,1071,746
-700
-745-222-420
-66189-44
-182
45
10333323
-300941
1,241
-290
-291-175-146
939
-257
1
52383331
-199990
1,189
-147
-15093
-157
-1752
-1233
3
-69261330
40774735
-29
-62-86-39
-1074-1
1
33
-19299318
-688924
1,612
-707
-51713
-747
-17226
16
-190
163360197
-462856
1,318
-299
-319-103-246
17814
19
-12232244
401,015
975
28
-1353
-24
-4-44
05
41
152Digitized for FRASER http://fraser.stlouisfed.org/ Federal Reserve Bank of St. Louis

62. Foreign transactions in securities—ContinuedMillions of dollars
Transactions,and area or country
STOCKS
1 Foreign purchases2 Foreign sales
3 Net purchases, or sales (— ). .
4 Foreign countries , . . .5 Europe6 France7 Germany8 Netherlands. .9 Switzerland
10 United Kingdom11 Canada12 Latin America and
Caribbean . . . .13 Middle East1. . ,14 Other Asia15 Africa.16 Other countries
17 Nonmonetary internationaland regionalorganizations
BONDS2
18 Foreign purchases19 Foreign sales
20 Net purchases, or sales <— ). .
21 Foreign countries22 Europe23 France24 Germany. . . .25 Netherlands26 Switzerland27 United Kingdom28 Canada29 Latin America and
Caribbean .30 Middle East*31 Other Asia . . . .32 Africa33 Other countries.
34 Nonmonetary internationaland regionalorganizations
35 Stocks, net purchases,or sales (— )
36 Foreign purchases37 Foreign sales
38 Bonds, net purchases,or sales (— )
39 Foreign purchases40 Foreign sales
41 Net purchases, or sales (— ),of stocks and bonds. . . .
42 Foreign countries43 Europe44 Canada45 Latin America and
Caribbean .46 Asia47 Africa48 Other countries
49 Nonmonetary internationaland regionalorganizations
Jan.-Dec. Jan. Feb. Mar. Apr. May
1979
June July Aug. Sept. Oct. Nov. Dec.
U.S. corporate securities
22,78121,123
1,658
1,642217122
-221-71
-519964552
-19688211-14
7
17
8,8357,602
1,233
1,330626
1158
-202-118
81480
109424
8811
-96
1,3681,309
59
60-8-6
-18-35-31
857
34-18
50-2-4
-1
641725
-84
34181842-4
-15-54
11
23-34
1600
-118
1,3971,269
129
112531620
-151319-6
-255330
61
16
453546
-93
34116
013
-106
9310
9-106
410
-127
1,9581,448
509
50610433-2
-19-1210957
36246
6111
3
594486
108
9516134
-27-92833
2425-3
01
13
1,6211,528
94
93-231
-59-10-16
5230
2246-3-3
2
1
595377
218
107141-219
-208
1346
8-61
140
-1
112
1,5861,395
191
19013648-1-7187447
-1820
9-2-1
0
864923
-60
84120-1
6-37-41149
4
6-73
2800
-143
1,8731,797
76
761141
-16-15-3
533
-282440-3-1
0
1,131818
314
280139
810
-32-14169
0
-101024800
34
1,7901,784
6
6-42
18-19
8-52-12
30
-175
32-3
1
1
869646
223
224161-34-11-9-2
2328
1140
500
-1
2,3932,235
159
157-48
19-30-3
-879778
454435-4
7
2
729679
50
65-11-3
-16-19-824
9
1050
700
-14
2,0902,030
60
66-107-20-37
0-64
19145
-849
-12-2
1
-7
448291
156
6916-1-4-2
42317
-443-4
10
87
2,4272,411
15
15-33-48-32
38-68
8376
-935218-1-3
0
824643
180
4084
1-7-7
0103
8
6-39-19
01
140
1,8891,700
189
19177
-18-18
12-148
27811
-7135-28
12
-3
725913
-188
-124-205
112
-15-53
-124-1
1271-1
00
-63
2,3892,216
173
16975
8-10-25-6815544
4032
-21-3
2
4
963555
408
42232
11
-207
36-25
15406-6
00
-14
Foreign securities
-7864,6155,401
-3,85512,67216,527
-4,641
-3,891-1,646-2,601
34744
-6125
-750
49303254
-519856
1,375
-470
-393-120-267
60-64
1
-77
-28232260
-316956
1,272
-344
-134-43
-184
7026-5
2
-210
3332329
-451,1951,240
-42
-31-11
-220
51149-8
7
-11
13369356
20903883
33
19-163
9
56113
22
13
67554487
16841825
83
82-29
85
24-4
51
1
-18402421
-572957
1,529
-591
-309-151-221
42205
-4
-282
-4391395
-3821,0201,402
-386
-411-111-178
3114-2
2
24
-117377494
-5791,6112,190
-697
-613-301-128
12-197
-12
-83
-338420758
-783850
1,634
-1,122
-972-120-891
-780
-395
-149
-198466663
-271,2421,269
-225
-229-29
-358
13158-14
2
4
-84365449
-3441,0941,438
-428
-309-120-106
30-118
13
-118
-130406536
-3231,1471,470
-453
-591-282-142
-35-133
-13
138
153Digitized for FRASER http://fraser.stlouisfed.org/ Federal Reserve Bank of St. Louis

62. Foreign transactions in securities—ContinuedMillions of dollars
Transactionsand area or country
STOCKS
1 Foreign purchases2 Foreign sales
3 Net purchases, or sales (— ). .
4 Foreign countries5 Europe6 France7 Germany . .8 Netherlands9 Switzerland
10 United Kingdom1 1 Canada12 Latin America and
Caribbean13 Middle East*14 Other Asia15 Africa16 Other countries
17 Nonmonetary internationaland regionalorganizations
BONDS2
18 Foreign purchases19 Foreign sales
20 Net purchases, or sales (— ). .
21 Foreign countries22 Europe23 France24 Germany. . . .25 Netherlands26 Switzerland27 United Kingdom28 Canada29 Latin America and
Caribbean30 Middle Easti31 Other Asia32 Africa33 Other countries . .
34 Nonmonetary internationaland regionalorganizations
35 Stocks, net purchases,or sales (— )
36 Foreign purchases37 Foreign sales
38 Bonds, net purchases,or sales (— )
39 Foreign purchases40 Foreign sales
41 Net purchases, or sales (— ),of stocks and bonds . . . .
42 Foreign countries43 Europe44 Canada45 Latin America and
Caribbean46 Asia47 Africa48 Other countries
49 Nonmonetary internationaland regionalorganizations
Jan.-Dec. Jan. Feb. Mar. Apr. May
1980
June July Aug. Sept. Oct. Nov. Dec.
U.S, corporate securities
40,32034,962
5,358
5,3403,069
482186
-328308
2,503865
1481,206
16-138
18
15,4259,976
5,449
5,5141,576
129213-65
541,257
135
1853,486
1175
10
-65
3,1592,467
692
691506
71358
15321542
92183002
1
1,190548
642
510192
8-5-3
6236
25
14280-1
00
132
4,4903,372
1,118
1,12085513352
-40374333130
334958-1-3
-2
952601
352
2875415
-308
8428
10181
328
65
2,7452S390
354
352156-49-25-6
-36Til130
-49107
82
-2
2
1,278839
439
448351
151003
3028
983-4
00
-8
1,9861,728
258
255129
143
-30-7519466
6138-81
0-2
3
1,6591,143
516
566248
7103-14
7934
2
13295
700
-50
1,9561,966
-11
-121052314
-40-17106-42
-4-53-21
03
2
1,2831,259
25
2519347
104-14-29-33
9
25104'.17
10
-226
2,5592,400
159
16156
9-5
-25-19
9924
271928-2
8
-2
1,8641,152
712
655105
12-14
6-10110
5
23513
504
57
3,1102,800
310
308115
62-13-27-8218881
-25141-5-1
2
2
1,735898
837
809129
8-50-26-16196-2
29640
1301
28
3,5053,301
203
2054230
-21-26
-127216
13
-32183-22
021
-2
1,087589
498
475276
-11-7-95325
32382
900
23
3,5693,329
241
246-83-33-18-38
-122153-22
-83410
1924
-5
645481
165
214-23-2
470
-512
18194140
-2
-49
4,4383,920
519
524300
5335
-2983
172-66
13212633
2-3
-6
1,591739
852
897263
230
81
2289
7594
2400
-45
4,4573,588
869
867633109121-58265251263
57-109
1805
2
1,193902
291
295163
1213-7
816621
11105-3
0-1
-4
4,3453,701
644
623254
608
-17-88300247
Q0
177-49-2
2
22
946826
121
107-26
12221714
-113-7
-51133200
14
Foreign securities
-2,0847,8859,968
-84617,06917,915
-2,929
-3,806-957
-1,948
126-1,131
2480
876
-233635868
-501,2811,331
-283
-361169
-325
5-205
-1-4
78
-429814
1,243
-771,3791,455
-SOS
-506-132-415
101-46
-13
1
9679670
131,1811,168
22
-2660
-159
2948
0-3
48
-40402442
-31,0821,085
-43
-63-71
3
14-13
40
20
-100456555
-2881,4821,770
-388
-386-223-137
45-83
56
-174495669
-6201,6382,258
-794
-813-481-288
-25-66
544
19
-11663740
3681,7301,362
290
-402
-28
34-55
16
330
-201605805
-2651,3741,639
-466
-390-181
42
-14-313
076
-76
-558694
1,253
-841,2311,316
-643
-680-110-344
7-223
-4-6
37
-341795
1,136
-2061,6511,857
-547
-563126
-651
-35-16
29-16
15
129927798
921,2541,161
221
198-30329
-24-73-1-3
23
-68721788
2741,7861,512
206
-111-86
24
-11-84-13-7
383
154Digitized for FRASER http://fraser.stlouisfed.org/ Federal Reserve Bank of St. Louis

63. Liabilities to unaffiliated foreigners, reported by nonbanking business enterprisesin the United States1
Millions of dollars, end of period
1 Total
2 Payable in dollars3 Payable in foreign currencies^
B? typ*.4 Financial liabilities5 Payable in dollars6 Payable in foreign currencies
7 Commercial liabilities8 Trade payables9 Advance receipts and other
liabilities
10 Payable in dollars11 Payable in foreign currencies
By area or countryFinancial liabilities
12 Europe13 Belgium-Luxembourg14 France15 Germany16 Netherlands. . . .17 Switzerland18 United Kingdom
19 Canada20 Latin America and Caribbean . . . .21 Bahamas22 Bermuda23 Brazil24 British West Indies25 Mexico . . .26 Venezuela
27 Asia2 8 Japan . . . . .29 Middle East oil-exporting
countries^
30 Africa31 Oil-exporting countries4
32 All other5 . .Commercial liabilities
33 Europe34 Belgium-Luxembourg35 France.36 Germany . . .37 Netherlands38 Switzerland39 United Kingdom
40 Canada. .41 Latin America and Caribbean . .; . .42 Bahamas43 Bermuda44 Brazil45 British West Indies46 Mexico . . . . .47 Venezuela . . . . .
48 Asia49 Japan '.50 Middle East oil-exporting
countries-*
51 Africa52 Oil-exporting countries4
53 All other5
1978
Dec.
14,948
11 5133 435
63533,8382 515
8 5954,008
4,587
7,674921
3 958289173366390248
2,159
2441,357
4784
1019410249
784717
32
525
3 05497
321529246302824
667997
25977453
106303
2 931448
1,523
743312203
Mar.
14,592
11 5433 049
6 1123,8002311
84803,528
4,952
7,743738
3 722266145311422244
2,121
2521,346
4475
1320110155
781717
23
515
3 03388
350407224329870
6141,168
16426189
236356
2649429
1,122
779343237
19
June
15,600
126462 954
6,1053,8752 231
9,4954,302
5,193
8,771724
3 643355140283401235
2,010
2901,395
4772
1918913168
767709
25
625
3 32990
353488230439997
6631,335
6582
165121216323
3,033516
1,224
891410243
79
Sept.
15,782
126993 082
6,1963,8832,313
9,5854,051
5,535
8,817769
3 776317132381542190
2,014
3041,347
3902
1419812271
759702
19
515
3 411105394554206348
1,015
7171,401
8948
18621
270359
2,995517
1,069
775370287
Dec.
17,062
13 9843 078
7,3665,0962,270
9,6964,424
5,272
8,888808
4 642345175497828170
2,449
4391,483
3758118
51412172
793726
31
414
3 639137467548227310
1,077
8681,323
6932
20321
257301
2 905494
1,017
728384233
Mar.
17,476
144703 006
7 8325,5912 242
96434,190
5,454
8,879764
4 860360193520795174
2,647
3801,764
4598322
69410170
807740
26
111
10
3 716117503545288382
1,012
7201,253
447
22820
235211
2 950581
901
742382263
19
June
18,643
15 2033 440
8 4105,7912619
102334,297
5,936
9,412821
5 470422347657797238
2,841
5301,633
4342
2570010172
752683
31
101
15
4038132485727245462
1,133
5911,271
2610715137
272210
3091418
1,030
875498367
80
Sept.
18,634
15 3373 296
8 2935,8182475
103414,381
5,960
9,520821
5 314417339557780224
2,867
5081,732
4121
2070310874
707618
37
111
21
4079109501693276452
1,045
5901,361
8114156
12324293
2,909502
944
1,006633396
Dec.
21,064
17 4453 619
10 8448,1402 703
102214,401
5,820
9,305916
6276464327582662354
3,753
7563,068
9451
231 442
9881
718644
38
111
15
4,07589
582688219493
1,012
7841,244
873
11135
326307
2,848645
894
814514456
155
Digitized for FRASER http://fraser.stlouisfed.org/ Federal Reserve Bank of St. Louis

64. Claims on unaffiliated foreigners, reported by nonbanking business enterprisesin the United States1
Millions of dollars, end of period
1 Total . . . ,
2 Payable in dollars3 Payable in foreign currencies2
By type4 Financial claims5 Deposits . . .6 Payable in dollars7 Payable in foreign currencies . . .
8 Other financial claims9 Payable in dollars
10 Payable in foreign currencies . . .
11 Commercial claims12 Trade receivables . . . .13 Advance payments and other claims
14 Payable in dollars15 Payable in foreign currencies
By area or countryFinancial claims
16 Europe17 Belgium-Luxembourg18 France19 Germany20 Netherlands21 Switzerland22 United Kingdom
23 Canada24 Latin America and Caribbean . . . .2 5 Bahamas . . .26 Bermuda27 Brazil28 British West Indies29 Mexico30 Venezuela
31 Asia32 Japan33 Middle East oil-exporting
countries ^
34 Africa35 Oil-exporting countries4
36 All other5
Commercial claims37 Europe . .38 Belgium-Luxembourg39 France40 Germany41 Netherlands42 Switzerland . . . .43 United Kingdom
44 Canada45 Latin America and Caribbean . . . .46 Bahamas47 Bermuda . .48 Brazil49 British West Indies50 Mexico51 Venezuela
52 Asia53 Japan54 Middle East oil-exporting
countries^
55 Africa56 Oil-exporting countries4
57 All others
1978
Dec.
27,892
24,9052,988
16,57011,11110,0431,068
5,4593 8741,584
11,32310,764
559
10988335
5 215' 4817851010398
4,021
44845,7143,001
80151
1 291'163157
920305
18
1811055
3 980144609398267198824
1 0942,'544
109215628
9505291
3,080976
716
447136178
Mar.
30,920
28,1092,811
20,15314,69813,757
941
5,4553,9261,530
10,76710,097
670
10426'341
5 35763
1712688596
4,437
52328,4764,560
63156
2 536160147
832210
16
2042652
3 809173490506275230673
1 1092. ,444
117292493
10492273
2,762896
682
443131200
19
June
30,348
27,4442,904
19,36313,70612,747
958
5,65840791,579
10,98410,356
628
10617367
5 64154
183363
6281
4,652
5 1467,4863 686
57141
2407159155
803219
17
2212361
3 829170471420307232727
1 1062,404
9811850125
586295
2 9651 005
685
487139194
79
Sept.
31,022
28,3452,677
19,25113,80812,900
908
5,44340301,413
11,77011,058
712
11 415'355
658133
1913935185
5,540
47676,7363 338
31133
1 838156139
821225
21
1114169
4.121179517450261224814
1 1652,'!602
26154567
13650345
3 1131 128
700
549140220
Dec.
31,023
27,8503,173
18,22212,57911,663
916
5,6433 8031,840
12,80112,112
688
12384416
6 14632
177409
5373
5,081
4 8136,2612 741
30163
2001158143
706199
16
2534944
4 897202726589298269901
8462,850
21197645
16698343
34131 140
766
554133240
Mar.
32,077
29,0693,008
19,33213,65712,681
977
5,6754,0551,620
12,74512,095
649
12333411
5 84321
2903003989
4,790
48857,5833 516
34128
2591169134
713226
18
2654043
4 759208702515347
-349926
8612,986
19135654
11832350
3 3951 213
719
517114225
19
June
32,024
28,9623,062
18,63012,78611,907
879
5,8444,1031,740
13,39412,685
710
12952443
5,84323
3071903796
4,863
4,7836,9243,080
25120
2393178139
758253
16
2563565
4830258662510297429903
8963,277
19133695
9921395
3,5761 143
830
566115249
80
Sept.
31,579
28,3223,257
18,28512,21811,0561,162
6,06743991,668
13,29412,605
688
12867427
560517
4091683041
4,545
4 8046,7572 831
65116
2 301192128
791269
20
2602968
4655230707569289333988
9293,375
5381
71017
981388
3 3951 094
837
669135270
Dec.
33,560
30,7192,841
18,97913,22312,499
724
5,7564,0631,693
14,58113,873
709
14 157424
59741933342243257
4,865
46987,3533 233
13596
2577208114
685158
19
2372632
5 450232
1 124571318345929
9193,796
2114885834
1 088411
3 449989
821
651151316
156Digitized for FRASER http://fraser.stlouisfed.org/ Federal Reserve Bank of St. Louis

65. Assets and liabilities of foreign branches of U.S. banks1
Millions of dollars, end of period
Item
ASSETS1 Total, all currencies. . . .
2 Claims onUnited States
3 Parent bank4 Other5 Claims on foreigners. . .6 Other branches of
parent bank . . . .7 Banks8 Official institutions . .9 Nonbank foreigners. .
10 Other assets
11 Total payable inU.S. dollars
12 Claims onUnited States
13 Parent bank14 Other15 Claims on
foreigners16 Other branches of
parent bank . . . .17 Banks18 Official institutions . .19 Nonbank foreigners. .20 Other assets . .
21 Total, all currencies. . . .
22 Claims onUnited States. . . .
23 Parent bank24 Other25 Claims on foreigners. . .26 Other branches of
parent bank . . . .27 Banks28 Official institutions .29 Nonbank foreigners. .30 Other assets
31 Total payable inU.S. dollars
32 Claims onUnited States
33 Parent bank34 Other35 Claims on foreigners. . .36 Other branches of
parent bank . . . .37 Banks38 Official institutions . .39 Nonbank foreigners. .40 Other assets
41 Total, all currencies . . . .
42 Claims onUnited States
43 Parent bank44 Other45 Claims on foreigners. . .46 Other branches of
parent bank . . . .47 Banks48 Official institutions .49 Nonbank foreigners. .50 Other assets . . .51 Total payable in
U.S. dollars
1980
Jan. Feb. Mar. Apr. May June July Aug. Sept. Oct. Nov. Dec.
All foreign countries
360,439
31,60424,788
6,816313,879
75,336125,20425,83387,50614,956
265,222
30,51924,516
6,003
226,843
58,04197,99921,55049,253
7,860
372,149
39,73732,1927,545
317,041
78,104124,54126,08188,31515,371
276,066
38,52031,8126,708
229,060
60,17497,27421,80449,808
8,486
371,533
35,68228,249
7,433319,857
80,523126,16125,50987,66415,994
276,760
34,50227,897
6,605
233,763
63,40499,41321,38249,564
8,495
376,146
34,18326,2907,893
325,623
79,500130,23625,23990,64816,340
277,791
32,89925,920
6,979
235,953
61,768103,29420,99849,893
8,939
378,899
35,60626,139
9,467326,340
76,317130,35625,43894,22916,953
277,542
34,31425,7788,536
234,159
58,908102,73621,22151,2949,069
376,722
29,06918,56510,504
330,171
76,061132,63425,63295,84417,482
275,232
27,86718,2549,613
238,213
58,456104,94921,38253,426
9,152
377,877
29,08517,55211,533
331,329
75,196134,68525,47495,97417,463
275,783
27,72017,23610,484
239,290
57,813106,36521,23353,879
8,773
386,467
36,86426,71110,153
332,531
72,558136,59026,11397,27017,072
283,974
35,55126,3909,161
239,561
55,106108,07321,78654,5968,862
385,884
29,34119,6859,656
339,204
73,856139,90226,74098,70617,339
282,171
28,13819,4148,724
245,588
56,603111,87822,30554,802
8,445
383,356
30,47621,440
9,036335,623
72,477138,29626,54898,30217,257
279,827
29,05921,043
8,016
242,152
55,249109,43822,57854,887
8,616
389,184
30,61722,254
8,363340,848
74,062139,97726,93599,87417,719
284,401
29,17321,8537,320
246,363
57,238110,79922,84655,4808,865
397,233
28,45920,202
8,257350,993
76,552144,62727,626
102,18817,781
289,860
27,19019,8967,294
253,451
58,273115,98423,39855,796
9,219
United Kingdom
128,417
10,1478,2071,940
113,617
31,99552,1774,559
24,8864,653
91,760
9,8208,1611,659
79,740
26,84237,4873,274
12,1372,200
133,793
10,6978,5842,113
118,212
35,18753,1274,499
25,3994,884
96,228
10,2858,4671,818
83,603
29,90738,1853,253
12,2582,340
136,654
11,9909,8382,152
119,290
35,53652,5095,860
25,3855,374
99,711
11,6209,7781,842
85,452
30,20437,7684,589
12,8912,639
138,915
11,5339,3002,233
122,105
36,01554,0205,578
26,4925,277
100,628
11,0719,1791,892
86,818
29,98039,1594,277
13,4022,739
138,930
11,3999,1402,259
121,851
34,30554,0765,591
27,8795,680
98,809
10,9889,0591,929
85,013
28,46638,5944,277
13,6762,808
139,066
9,1576,8702,287
124,059
34,82454,8555,897
28,4835,850
98,013
8,7906,8101,980
86,404
28,69239,0504,396
14,2662,819
135,669
8,3665,7052,661
120,914
32,23154,8245,710
28,1496,389
93,158
7,8315,6292,202
82,434
26,08338,4714,280
13,6002,893
136,467
8,4656,0232,442
121,805
31,60755,5305,865
28,8036,197
93,720
7,9545,9601,994
82,705
25,56539,0704,327
13,7433,061
137,447
8,0225,7882,234
123,369
30,85857,0666,251
29,1946,056
94,784
7,6565,7441,912
84,355
24,91340,9174,663
13,8622,773
138,158
8,2165,9692,247
123,854
31,43156,7236,113
29,5876,088
95,287
7,6475,8171,830
84,849
25,59340,312
4,55114,3932,791
140,715
8,7716,5522,219
125,859
32,26757,4236,405
29,7646,085
97,246
8,2336,4101,823
86,246
26,71040,542
4,70614,2882,767
142,781
7,5085,2752,233
129,232
34,53857,6586,684
30,3526,041
98,913
7,1155,2291,886
88,950
28,23141,373
4,90914,4372,848
Bahamas and Caymans
111,012
19,68115,3664,315
87,901
10,24244,11312,91920,627
3,430
105,078
117,889
27,15522,4144,741
86,877
10,26542,47813,13221,0023,857
111,553
114,798
21,83217,3234,509
89,326
13,65944,51511,33419,8183,640
108,599
115,840
20,06015,2694,791
91,683
13,43847,25011,35519,6404,097
109,728
116,538
21,40615,3346,072
90,995
12,45446,82511,63620,080
4,137
110,872
115,276
17,68210,6607,022
93,432
12,97748,05911,55420,842
4,162
109,715
120,307
18,27210,5247,748
98,020
14,36250,83211,62721,1994,015
114,538
128,515
25,88219,1496,733
98,496
13,16051,80912,05521,472
4,137
122,667
123,179
18,30511,8396,466
100,905
14,72452,74912,07821,354
3,969
117,245
119,524
19,65613,8375,819
95,959
13,07649,90012,44120,542
3,909
113,683
119,367
18,32513,0715,254
96,800
13,11850,62612,21320,843
4,242
113,560
123,837
17,75112,6315,120
101,926
13,31554,88812,57721,146
4,160
117,654
157Digitized for FRASER http://fraser.stlouisfed.org/ Federal Reserve Bank of St. Louis

65. Assets and liabilities of foreign branches of U.S. banks1—ContinuedMillions of dollars, end of period
Item
LIABILITIES
1 Total, all currencies. . . .
2 To United States3 Parent bank4 Other banks in
United States . . .5 Nonbanks6 To foreigners .7 Other branches of
parent bank . . . .8 Banks9 Official institutions . .
10 Nonbank foreigners. .11 Other liabilities
12 Total payable in1 1 S Hnllarc
13 To United States14 Parent bank . . . . . . .15 Other banks in
United States . . .16 Nonbanks17 To foreigners . . .18 Other branches of
parent bank . . . .19 Banks20 Official institutions . .21 Nonbank foreigners. .22 Other liabilities
23 Total, all currencies. , . .
24 To United States25 Parent bank26 Other banks in
United States . . .27 Nonbanks , .28 To foreigners29 Other branches of
parent bank . . . .30 Banks31 Official institutions . .32 N onbank foreigners. .33 Other liabilities
34 Total payable inU.S. dollars
35 To United States36 Parent bank37 Other banks in
United States . . ,38 Nonbanks39 To foreigners40 Other branches of
parent bank . . . .41 Banks42 Official institutions . .43 Nonbank foreigners. .44 Other liabilities
45 Total, all currencies . . . .
46 To United States47 Parent bank48 Other banks in
United States . . .49 Nonbanks50 To foreigners51 Other branches of
parent bank . . . .52 Banks53 Official institutions . .54 Nonbank foreigners. .55 Other liabilities
56 Total payable inU.S. dollars
1980
Jan. Feb. Mar Apr. May June July Aug. Sept. Oct. Nov. Dec.
All foreign countries
360,439
70,45325,062
11,86433,527
276,208
72,846121,97933,15748,22613,778
270,663
68,00223,856
11,53432,612
195,248
56,77980,95226,74630,771
7,413
372,149
71,21322,990
13,79234,431
286,281
73,602130,15934,33348,18714,655
282,249^
68,62921,695
13,38533,549
205,529
57,71489,18427,79930,832
8,091
371,533
67,71322,495
12,32832,890
289,484
76,695129,25434,89048,64514,336
•J«^J«.-LC_
65,39321,248
11,98132,164
209,174
61,24088,01828,38431,532
8,148
376,146
69,63624,468
12,77832,390
291,113
75,096130,67535,10750,23515,397
— ^ftVftftft-
67,21623,157
12,52931,530
207,847
59,42387,60628,68532,133
8,817
378,899
73,32926,654
13,10533,570
289,754
72,530130,80534,91051,50915,816
— 9ftS-t-a4
70,82625,264
12,84132,721
205,263
56,57787,02928,36033,2979,042
376,722
76,18730,790
12,45032,947
284,716
72,061127,81334,14150,70115,819
9S? V7R
73,52729,352
12,18031,995
200,049
56,24784,46726,96132,374
9,002
377,877
83,24435,216
11,62236,406
279,604
72,067122,72733,07351,73715,029
?si non
80,65733,770
11,36235,525
194,359
56,20678,93026,17733,046
8,074
386,467
87,60637,433
14,75835,415
284,141
69,178130,36033,08051,52314,720
?01 RT*
84,69835,873
14,45234,373
198,971
53,35586,42026,16533,0318,204
385,884
84,06838,456
12,66932,943
287,810
70,689131,02233,08653,01314,006
?SQ Iftt
81,12536,791
12,44431,890
200,281
55,14685,38725,65934,089
7,757
383,356
84,16137,184
12,87234,105
285,366
69,776132,19530,72252,67313,829
'jfii lift
81,25535,419
12,59333,243
198,682
53,78086,99423,37334,535
7,381
389,184
86,58936,956
13,42036,213
288,385
71,554132,28131,14553,40514,210
7Qf ?JO
83,76435,233
13,12435,407
200,937
55,59986,55623,87034,912
7,848
397,233
90,94239,135
14,47337,289
291,780
73,938130,65432,44054,74814,556
300,988
88,12337,496
14,20336,424
204,697
56,96586,59624,69136,445
8,168
United Kingdom
128,417
20,3783,014
6,50710,857
102,117
11,45848,87221,82219,9655,922
92,771
19,8272,968
6,44510,41470,597
7,79330,98817,99513,8212,347
133,793
20,8082,758
6,55911,491
106,524
11,09953,03122,89019,5046,461
97,391
20,2062,724
6,39911,08374,705
7,32234,69418,92313,7662,480
136,654
19,9212,140
6,50211,279
110,473
14,79953,20423,30319,1676,260
101,293
19,3812,089
6,35110,94179,251
10,89435,30019,25513,802
2,661
138,915
20,8382,301
6,38212,155
111,375
14,26853,95523,45319,6996,702
101,679
20,3372,252
6,31811,76778,296
10,46834,48519,55413,7893,046
138,930
19,8772,118
6,26511,494
111,769
13,82454,30923,62820,008
7,284
101,170
19,2842,060
6,21011,01478,278
10,02134,48819,55814,2113,608
139,066
20,0122,410
6,12911,473
112,055
13,76754,92722,57720,784
6,999
100,117
19,3212,315
6,05610,95077,322
9,75835,39418,30013,8703,474
135,669
21,4043,275
5,56712,562
107,739
12,69451,20321,08822,754
6,526
95,314
20,8433,238
5,48612,11971,489
8,67231,35216,84614,6192,982
136,467
20,6082,542
5,91012,156
109,604
13,34351,45222,60022,209
6,255
96,453
20,0072,496
5,80911,70273,431
9,12831,72618,25314,3243,015
137,447
19,3432,951
5,36111,031
112,412
13,70653,77622,44422,486
5,692
96,832
18,6872,892
5,25910,53675,422
9,58832,89118,04614,8972,723
138,158
19,1572,712
5,80010,645
113,539
13,94056,77219,80723,020
5,462
97,055
18,5512,634
5,71410,20376,114
9,89135,49515,33815,3902,390
140,715
20,5943,198
5,73211,664
114,813
13,95158,12720,43722,2985,308
99,135
19,9783,101
5,61611,26176,696
9,77035,99815,98914,9392,461
142,781
21,7354,176
5,71611,843
115,582
13,93355,92821,41224,309
5,464
102,300
21,0804,078
5,62611,37678,512
9,60035,17717,02416,7112,708
Bahamas and Caymans
111,012
43,13717,033
4,42221,68265,248
20,55930,5235,0209,1462,627
106,063
117,889
43,61015,158
6,32222,13071,151
22,15034,7205,0169,2653,128
112,978
114,798
40,92615,394
4,75520,77770,822
22,38733,7924,9589,6853,050
110,123
115,840
41,91917,121
5,36319,43570,601
22,47033,0465,4359,6503,320
111,486
116,538
45,61819,155
5,73620,72767,971
20,00932,1745,461
10,3272,949
112,509
115,276
48,43122,553
5,39520,48363,935
20,10228,9175,0969,8202,910
111,494
120,307
54,21726,382
5,02822,80763,208
20,40927,1455,525
10,1292,882
116,246
128,515
58,92529,156
7,49322,27666,630
18,08134,1004,119
10,3302,960
124,103
123,179
56,31729,321
6,10920,88763,966
17,07932,1854,250
10,4522,896
118,576
119,524
56,12327,666
5,95722,50060,593
16,72029,2024,610
10,0612,808
115,166
119,367
56,86026,861
6,52823,47159,492
15,87828,9334,368
10,3133,015
115,121
123,837
59,66628,181
7,37924,10661,218
17,04029,8954,3619,9222,953
119,657
158Digitized for FRASER http://fraser.stlouisfed.org/ Federal Reserve Bank of St. Louis

66* Claims on foreign countries held by U.S. offices and foreign branches of U.S.-chartered banks1
Billions of dollars, end of period
1 Total
2 G-10 countries and Switzerland3 Belgium-Luxembourg4 France . . .5 Germany6 Italy7 Netherlands8 Sweden9 Switzerland
10 United Kingdom11 Canada12 Japan
13 Other developed countries14 Austria15 Denmark16 Finland17 Greece18 N orway19 Portugal20 Spain21 Turkey22 Other Western Europe23 South Africa24 Australia
25 OPEC countries2
26 Ecuador27 Venezuela28 Indonesia29 Middle East countries30 African countries
31 Non-OPEC developing countries
Latin America32 Argentina33 Brazil34 Chile35 Columbia36 Mexico37 Peru38 Other Latin America
AsiaChina
39 Mainland40 Taiwan41 India42 Israel43 Korea (South)44 Malaysia45 Philippines46 Thailand47 Other Asia
Africa48 Egypt49 Morocco50 Zaire51 Other Africa3
52 Eastern Europe53 US S.R54 Yugoslavia . . . .55 Other
56 Offshore banking centers57 Bahamas58 Bermuda59 Cayman Islands and other
British West Indies60 Netherlands Antilles6 1 Panama**62 Lebanon63 Hong Kong64 Singapore65 Other5
66 Miscellaneous and unallocated6
June
247.1
112.68.3
11.49.16.43.42.14.1
44.95.1
17.9
19.41.51.71.12.32.1
.63.61.41.22.41.4
19.21.45.61.98.41.9
49.1
3.013.3
1.31.3
11.01.83.3
02 5
.2
.73.6
.62.71.1.3
.3
.5,2
1.2
6.41.41.33.7
32.412.1
.7
7.2.6
3.3.1
4.13.8
.5
8.1
1978
Sept.
247.5
113.58.4
11.79.76.13.52.24.3
44.24.9
18.5
18,71.51.91.02.22.1
.53.51.51.02.21.3
20.41.66.21.98.72.0
49.6
2.914.0
1.31.3
10.71.83.4
02.4
.3
.73.5
.62.81.1
.3
.4
.5
.21.3
6.61.41.33.9
30.111.5
.7
6.7.6
3.1.1
4.02.9
.5
8.6
Dec.
266.2
124.79.0
12,211.36.74.42.15.3
47.36.0
20.6
19.41.72.01.22.32.1
.63.51.51.32.01.4
22.71.67.22.09.52.5
52.6
3.014.91.61.4
10.81.73.6
02.9
.21.03.9
.62.81.2
.2
.4
.6
.21.4
6.91.31.54.1
30.910.4
.7
7.4.8
3.0.1
4.23.9
.5
9.1
Mar.
263.9
119.09.4
11.71055.73.92.04.5
46.45.9
19.0
18.21.72.01.22.32.1
.63.01.41.11.71.3
22.61.57.21.99.42.6
53.9
3.114.9
1.71.5
10.91.63.5
.13.1
.21.04.2
.63.21.2.3
.5
.6
.21.4
6.71.11.64.0
33.712.3
.6
7.1.8
3.4.1
4.84.2
.4
9.5
19
June
275.6
125.39.7
12.710.86.14.02.04.7
50.35.5
19.5
18.21.81.91.12.22.1
.53.01.4.9
1.81.4
22.71.67.61.99.02.6
55.9
3.515.1
1.81.5
10.71.43.3
.13.3
.2
.95.0
.73.71.4.4
.7
.5
.21.5
6.7.9
1.74.1
37.014.4
.7
7.41.03.8
.14.94.2
.4
9.9
79
Sept
293.9
135.710.712.012.86.14.72.35,0
53,76.0
22.3
19.72.02.01.22.32.3
.73.31.41.51.71.3
23.41.67.91.99.22.8
58.8
4.115.12.21.7
11.41.43.6
.13.5
.21.05.3
.73.71.6.3
.6
.5,2
1.6
7.2.9
1.84.6
38.613.0
.7
9.51.13.4
.25.54.9
.4
10.6
Dec.
303.8
138.411.111.712.26.44.82.44.7
56.46.3
22.4
19.92.02,21.22,42,3
.73.51,41.41.31.3
22.91.78.71.98.02.6
62.8
5.015.22.52.2
12.01.53.7
.13.4
.21.35.5
.94.21.6.4
.6
.6
.21.7
7.3.7
1.84.8
40,413.7
.8
9.41.24.3
.26.04.5
.4
11.7
Mar.
308.5
141.210.812.011.46.24.32.44.3
57.66.9
25.4
18.81.72.11.12.42.4
.63.51.41.41.11.2
21.81.87.91.97.82.5
63.7
5.515.02.52.1
12.11.33.6
.13.6
.2
.96.4
.84.41.4.5
.7
.5
.21.7
7.3.6
1,94.9
42.613.9
.6
11.3.9
4.9.2
5.74.7
.4
13.1
19
June
328.5
154.213.114.01276.94.52.73.3
64.37.2
25 5
20.31.82.21.32.52.4
.63.91.41.61.51.2
20.91.87.91.96.92.5
67.4
5.615.32,72.2
13.61.43.6
.13.8
.21.27,1
.94.61.5.5
.7,5.2
1.8
7.2.5
2.14.5
44.213.7
.6
9.81.25.6
.26.95.9
.4
14.3
80
Sept.
338.7
158.713.513.912.97.24.42,83.4
66,67,7
26.1
20.61.82.21.22.62.4
.74.21.31.71.21.2
21.31.98.51.96.62.4
72.8
7.615.83.22.4
14.41.53.9
.14.1
.21.17.3
.94.81.5.5
.7
.6
.22.0
7.3.5
2.14.7
44.513.1
.6
10.11.35.6
.27.55,6
.4
13.7
Dec.
350.1
161.512.914.011,58.24.42.94.0
68.78.4
26.5
21.11.92.21.42.82.6
.64.01.51.71.11.3
22.82.19.11.86.92.8
76.9
7.916.23.52.6
15.91.83.9
.24.2
.31.57.11.05.01.4.6
,8.7.2
2.0
7.5.4
2,34.7
46.513.3
.6
10.62.15.4
.28.15.9
.3
13.9
159Digitized for FRASER http://fraser.stlouisfed.org/ Federal Reserve Bank of St. Louis

67. Discount rates of foreign central banks1
Percent per annum
End ofmonth
1980
JanuaryFebruaryMarchAprilMayJuneJulyAugustSeptember. . . .OctoberNovember. . . .December. . . .
Argen- Aitina tr
55.6
13101 6.
JS-ia
OS?s7SL
f75
Bel-gium
10512.014014.014.013.012.0
12.0
Brazil
330
33.040,0
40.0
Can-ada
14014,0
154915.6711.8310.6710.1810.4511.0211 7613.0617.28
Den-mark
11 013.0
13012.011 011.011.0
Fra
Q
<?
-£
5 6k 7
777
r i
5 7
my
00o0st
r5
IU
11
11I d
41
U
ily
nk
rns
k
^s
Japan
6.257.259.0
9.08.258.258.257.257.25
Mic
4
i4
5X-,0
Si
f5
Neth-er-
lands
9.5At9.5
10.09.59.09.08.58.08.08.0
N<w
q
9
;>r-ay
0L
r0
Svd<
1(1
i1(1
/e-;n
0L
r0
SwZ€
la
?^
tit-,r-nd
00k
^
UnitedKing-dom
17.0Af11
17.016,0
16.014.014.0
Vene-zuela
8.58.5
12.0
T12.010.0
10.0
68. Foreign short-term interest rates1
Percent per annum, averages of daily figures
Month
1980JanuaryFebruaryMarchAprilMayJuneJulyAugustSeptemberOctoberNovemberDecember
Euro-dollars
14.00143315,3218 7117 8111.209419.33
108212.0713 5516.4619.47
UnitedKingdom
16.5917,3017.7218.0717 7016,9716 6815.82164515.8915 8715.8714.64
Canada
13.1213 9313.951472163113.23L I 7310,9010 4710.7311 7112.9616.83
Germany
9.458798.94950
10 1110,1710009.588938.908999.37
10.11
Switzer-land
5.795.455.196.576.875.855.645.295.525.575.405.526.61
Nether-lands
10.6011,8511.9911,4810.7611.1710.7210.069.97
10.319.639.599.68
France
12.1812.3112.6313,9312.8412.6212.3711,8711.2011.8111.6911.2611.52
Italy
17.5017.0017.8818.1216.9217.2017.2517.4917.3017.5018.1617.5117.47
Belgium
14.0614.3814.4516.2317 1016.3114,6913.3012.5212.3512.2412.4012.75
Japan
11.458.448.40
11.51126512.3011 5511.2111 3111,2810,239,599,89
69. Index of weighted-average value of U.S. dollar1
March 1973 = 100
Year Jan. Feb. Mar. Apr. | May | June | July | Aug. | Sept. | Oct. | Nov. | Dec.
1980 , 85.52 86.37 90.26 91.09 86.96 85.29 84.65 86,09 85.50 86.59 89.31 90.99
160Digitized for FRASER http://fraser.stlouisfed.org/ Federal Reserve Bank of St. Louis

70. Foreign exchange rates1
Cents per unit of foreign currency
Period
1980JanuaryFebruaryMarchAprilMayJune . . . . .JulyAugust . . .SeptemberOctoberNovemberDecember
1980JanuaryFebruaryMarchAprilMayJuneJulyAugustSeptemberOctober .NovemberDecember
Australia(dollar)
114.0011097110.4110903109.10113 0211529115.85115 77117.0411743116.75116.86
Malaysia(ringgit)
4596745.8684589644.95643 81745.6914662546.6584648447.1264690246.18745.406
Austria(schilling)
7.7349806897.9815755397.45137 8112794208.05787 88407.8916767137.34337.1549
Mexico(peso)
435354.3780437894.3739437794.3763436844.3511433894.3443433244.31664.3071
Belgium(franc)
3.4247356883.52213 33953.3156347593.53353.57663.48833.48443 38753.24573.1543
Nether-lands
(guilder)
5036952.52751 88649.2704857050.67351 57852.33751 30551.3975005248.10246.730
Canada(dollar)
85.53085.91186.5468525584.31185 17786.83686.78386.26385.86185.53884.28683.560
NewZealand(dollar)
9733798.6909796095.4519470497.6419872898.6439773898.3089806996.77095.404
Denmark(krone)
17.76618,56818.3261732517.1041785918.21518.48718.07018.06817.63916.96216.573
Norway(krone)
2026120.3722048319.8151973920.3772060820.7622055520.67620.42119.93819.370
Finland(markka)
26.89227.08226.91225.99826.1582708427.44827.69927.35327.42827.12226.45225.903
Portugal(escudo)
1 99802.0051206342.01161 97982.0298204222.04662.01632.00961,97561.91781.8773
France(franc)
23.69424.75024.41323 18822.98523 92024.31024.65724.10624.05623.48922.51521.925
SouthAfrica(rand)
128 54121.6412290123.59123 88126.43129,00130.79131 55132.73133.13133.20132.83
Germany(deutsche
mark)
55.08957.98657.20354.03953.31055 82856.58457.24555.86655.88354.28052.11350.769
Spain(peseta)
1 39581.51241 50051.44461 39181.41041 42801.41221 38101.36381.34231.30851.2653
India(rupee)
12.68612.51912.5291227012.3951272712.75112.87512.84912.90312.93212,86812,608
Sri Lanka(rupee)
6 19476.4323643506.40986 15006.1900621866.3288629806.31965.97075.81395.7379
Ireland(pound)
205.77214.31211,59202.25198.9820741211.16214.74210.62210.34203.88194.59189.01
Sweden(krona)
23 64724.11223 97423.0082287223.73123.99524.23823.95324.07223.84523.24022.722
Italy(lira)
.11694,12426.1234611635
.1141711860
.11973
.12026
.11801
.11742
.11441
.11000
.10704
Switzer-land
(franc)
59.69762.6936096656.71056.85760.13161.20762.20360.52761.01260.18557.94256.022
Japan(yen)
.44311
.42041
.40934
.40245
.3998043766.45894.45232.44666.46644.47777,46928,47747
UnitedKingdom(pound)
232.58226 .41228.91220.45220.94230.20233.59237.31237,04240.12241.64239.41234.59
161Digitized for FRASER http://fraser.stlouisfed.org/ Federal Reserve Bank of St. Louis

Part 2-Special Tables
Digitized for FRASER http://fraser.stlouisfed.org/ Federal Reserve Bank of St. Louis

71. Statement of condition of Federal Reserve Banks, December 31,1980 *Millions of dollars, end of period
Item
ASSETS
1 Gold certificateaccount
2 SDR certificateaccount
3 Coin
Loans4 Secured by U.S.
governmentand agencyobligations . . .
5 OtherAcceptances
6 Bought outright. . .7 Held under RP
agreement . . .Federal agency
obligations8 Bought outright2 . .9 Held under RP
agreement . . .U.S. government
securities10 Bought outright2 . .11 Held under RP
agreement . . .
12 Total loans andsecurities. . . .
13 Cash items in processof collection. . . .
14 Bank premisesOther assets
15 Denominated inforeigncurrencies3. . .
16 All other17 Interdistrict Settle-
ment Account . .
18 Total assets
AllReserveBanks
11,161
2,518397
1,594215
0
776
8,739
525
119,299
2,029
133,177
15,504457
5,1043,177
0
171.495
Boston
577
12827
1060
0
0
399
0
5,450
0
5,955
403100
145122
-82
7,375
NewYork
3,013
66524
6630
0
776
2,272
525
31,010
2,029
37,275
2,35120
1,374751
2,859
48.332
Phila-delphia
560
12119
3717
0
0
379
0
5,179
0
5,612
42553
195151
-837
6.299
Cleve-land
847
20149
70132
0
0
660
0
9,013
0
9,875
47924
414294
-322
11.861
Rich-mond
961
22942
1890
0
0
718
0
9,799
0
10,706
3,03589
255252
219
15.788
Atlanta
465
7938
810
0
0
317
0
4,323
0
4,721
2,04135
379157
-392
7,523
Chicago
1,722
41123
1833
0
0
1,373
0
18,746
0
20,305
1,73016
729417
-967
24.386
St.Louis
465
10624
510
0
0
351
0
4,794
0
5,196
65614
150102
-391
6,322
Minne-apolis
225
4212
259
0
0
156
0
2,131
0
2,321
69928
16084
-448
3,123
KansasCity
501
11144
8850
0
0
409
0
5,591
0
6,138
1,52122
215126
-71
8,607
Dallas
572
13230
461
0
0
519
0
7,080
0
7,646
1,37013
294157
401
10,615
SanFran-cisco
1,253
29365
553
0
0
1,186
0
16,183
0
17,427
79443
794564
31
21,264
165Digitized for FRASER http://fraser.stlouisfed.org/ Federal Reserve Bank of St. Louis

71. Statement of condition of Federal Reserve Banks, December 31,19801—ContinuedMillions of dollars, end of period
Item
LIABILITIES
19 Federal Reservenotes .
Deposits20 Reserve accounts4
21 U.S. Treasury-Generalaccount
22 Foreign-Officialaccounts
23 All other24 Total deposits
25 Deferred-availabilitycash items
26 Other liabilities andaccrueddividends^ . .
27 Total liabilities
CAPITAL ACCOUNTS
28 Capital paid in . .29 Surplus30 Other capital
accounts
31 Total liabilities andcapital accounts .
AllReserveBanks
124241
27,456
3,062
411617
31,546
11 037
2,265
169,089
1,2031 203
0
171,495
Boston
6 191
743
0
1011
764
257
97
7,309
3333
0
7,375
NewYork
35 601
6,521
3,062
145437
10 165
1 384
570
47,720
306306
o
48,332
Phila-delphia
5276
576
0
148
598
237
96
6,207
4646
o
6,299
Cleve-land
9463
1,529
0
3016
1,575
437
196
11,671
9595
o
11,861
Rich-mond
10786
1,637
0
1824
1,679
2989
210
15,664
6262
0
15,788
Atlanta
3 670
1,852
0
27g
1,887
1 667
119
7,343
9090
0
7,523
Chicago
19437
3,495
0
5239
3,586
672
337
24,032
177177
o
24,386
St.Louis
4835
742
0
119
762
569
84
6,250
3636
o
6,322
Minne-apolis
1,807
655
0
115
671
529
40
3,047
3838
o
3,123
KansasCity
5 758
1,350
0
1512
1,377
1 269
99
8,503
5252
0
8,607
Dallas
7 198
2,312
0
2119
2352
790
127
10,467
7474
o
10,615
SanFran-cisco
14219
6,044
0
5729
6 130
237
290
20,876
194194
o
21,264
166Digitized for FRASER http://fraser.stlouisfed.org/ Federal Reserve Bank of St. Louis

71. Statement of condition of Federal Reserve Banks, December 31,19801—ContinuedMillions of dollars, end of period
ItemAll
ReserveBanks
Boston NewYork
Phila-delphia
Cleve-land .
Rich-mond Atlanta Chicago St.
LouisMinne-apolis
KansasCity Dallas
SanFran-cisco
NOTE STATEMENT
Federal Reserve notes32 Issued to Reserve
Bank by Fed-eral ReserveAgent andoutstanding . .
33 Less held by issuingBank, andforwarded forredemption6. .
34 Federal Reserve notes,net7
Collateral held byFederal ReserveAgent for notesissued to Bank
35 Gold certificateaccount
36 SDR certificateaccount
37 Other eligibleassets
38 U.S. governmentand agencysecurities . . . .
39 Total collateral
140,184
15,943
124 241
11 161
2,518
0
110,562
124,241
7,007
816
6,191
577
128
0
5,486
6,191
38,710
3,109
35,601
3,013
665
0
31,923
35,601
6,515
1,239
5,276
560
121
0
4,595
5,276
10,225
762
9,463
847
201
0
8,415
9,463
12,006
1,220
10,786
961
229
0
9,596
10,786
5,678
2,008
3,670
465
79
0
3,126
3,670
21,021
1,584
19,437
1,722
411
0
17,304
19,437
5,606
771
4,835
465
106
0
4,264
4,835
2,265
458
1,807
225
42
0
1,540
1,807
6,750
992
5,758
501
111
0
5,146
5,758
8,216
1,018
7,198
572
132
0
6,494
7,198
16,185
1,966
14,219
1,253
293
0
12,673
14,219
167Digitized for FRASER http://fraser.stlouisfed.org/ Federal Reserve Bank of St. Louis

72, Earnings and expenses of Federal Reserve Banks, 1980Dollars
Item
CURRENT EARNINGS
1 Loans2 Acceptances . . . .3 U.S. government securities4 Foreign currencies . . .5 All other
6 Total
CURRENT EXPENSES
7 Salaries8 Retirement and other benefits9 Fees
1 0 Travel . . . . .11 Postage12 Other shipping expenses13 Communications . . .14 Materials and supplies
Bank premises15 Taxes on real estate16 Depreciation17 Utilities1 8 Rent. , . . .19 Other building expenses
Furniture and equipment20 Rentals21 Depreciation . . . . . . . .22 Cost of Federal Reserve currency . . .23 All other24 Contraexpense*
25 Total2 ,
26 Reimbursements and recoveries . . . .
27 Net expenses
PROFIT AND Loss
28 Current net earningsAdditions to current net earnings
29 Profit on foreign currencytransactions-*. . . , . . .
30 All other
31 Total additions .
Deductions from currentnet earnings
32 Losses on sales of U.S.government securities . .
33 All other
34 Total deductions
35 Net deductions from currentnet earnings
36 Assessment for expenditures ofBoard of Governors4 , .
37 Net earnings before paymentsto U.S Treasury . .
38 Dividends paid39 Payments to U.S. Treasury (interest
on Federal Reserve notes)
40 Transferred to surplus . . . . .41 Surplus January 1
42 Surplus, December 31
Total
175,835,24118 214,755
12,478,609,389123 354,719
6,305,232
12,802,319,336
385,640,414110792473
6,586,41112 702,99714,422,13976,076,25913 823,02233 737841
15 102 6189,760,793
16,351,18810 077,2257,162,771
41 079 87319 387,23973,124,42324 813,621
—2 145 520
865,969,678
74,812,417
791,157,261
12011 162,076
96 118,6964 502 792
100 621 488
199 348 22016,659,123
216 007 343
115,385,855
62 230 800
11 833 545 421
70 354 516
11,706,369,955
56 820 9501 145 411 250
1,202,232,200
Boston
11,139,456
576,017,6953,487 982
200,091
590,845,224
25,301,0197 554 588
288,692670 728641,192
4,348,228819875
2331 977
2 922 5031,874,9551,845,108
405611479,951
1 595 7981 534 4083,778,6041 992 513—149 758
58,235,992
7,561,496
50,674,496
540 170 728
2 787 44222 958
2 810 400
9 403 767316 466
9 720 233
6 909 833
1 775 100
531 485 795
1 979 868
529,189,477
31645032 797 800
33,114,250
New York
19,440,27618,214,755
3,260,843,56034,073,2563,321,053
3,335,892,900
$6,062,10724 353 7442,123,2102,080 4502,207,436
}0,054,2233,013 5806415326
2 524 679244,797
3,591,7916 336 999
790,023
7 395 2753 228 062
14,844,2385,002 306
180,268,246
16,670,575
163,597,671
3 172,295 229
24 318030209 126
24 527 156
50 330 2541,315,286
51 645 540
27,118384
15 742 400
3 129 434 445
17 866 143
3,095,446,252
16 122 050289 884 750
306,006,800
Philadelphia
31,248,389
554,382,8144 689,169
191,051
590,511,423
18,792,6316 295 654
265,401401 782593,033
3,266,678647,729
1 635 949
1 225 9821,461,0571,651,807
24400760,558
1 070 4641 524 5083,361,0521 318631
—1 504
44,295,812
4,100,917
40,194,895
550316528
3 748 6299319
3 757 948
9 141 236413,798
9 555 034
5 797,086
2 428 200
542 091 242
2 649 084
538,877,458
564 70045 389 450
45,954,150
Cleveland
10,369,402
953,866,7509 974,390
259,345
974,469,887
23,159,5906 963,759
353,605908,627891,334
5,603,200793,501
1 988 271
903 700670,076997,768141 319281,210
3 107 2611 356,5804,895,9821 659,698—152 159
54,523,322
5,754,554
48,768,768
925 701 119
7 977 85216 870
7 994 722
15 589 7111 522,934
17 112 645
9,117,923
5 119 700
911 463 496
5 666 776
905,500,670
296 05094 893 900
95,189,950
Richmond
17,374,400
1,016,533,1016 128 922
253,335
1,040,289,758
29,827,7098 034 429
451,7171 041 4901,132,5718,747,9391 059,8333 073 162
1 203 5322,166,1061,687,297
827,767739,608
4 823 6651 255 1208,191,4031 797,747-194432
73,340,5542
5,431,132
67,909,422
972 380,336
4 902 05325 204
4 927 257
16 347 840565,653
16 913493
11,986,236
3 188 100
957 206 000
3 666 118
950,087,482
3 452 40058 232 800
61,685,200
168Digitized for FRASER http://fraser.stlouisfed.org/ Federal Reserve Bank of St. Louis

72. Earnings and expenses of Federal Reserve Banks, 1980—ContinuedDollars
Item
CURRENT EARNINGS
1 Loans2 Acceptances3 U.S. government
securities4 Foreign currencies5 All other
6 Total
CURRENT EXPENSES
7 Salaries8 Retirement and other
benefits9 Fees
10 Travel11 Postage12 Other shipping expenses. . .13 Communications14 Materials and supplies . . . .
Bank premises15 Taxes on real estate16 Depreciation17 Utilities18 Rent19 Other building
expenses , . .Furniture and equipment
20 Rentals21 Depreciation22 Cost of Federal Reserve
currency23 All other24 Contraexpense*
25 Total2 . . . . . . . .
26 Reimbursements andrecoveries
27 Net expenses . . . .
PROFIT AND Loss
28 Current net earningsAdditions to current
net earnings29 Profit on foreign currency
transactions^30 All other
31 Total additions .Deductions from current
net earnings32 Losses on sales of U.S.
governmentsecurities
33 All other
34 Total deductions
35 Net deductions from currentnet earnings . . . .
36 Assessment for expendi-tures of Board ofGovernors
37 Net earnings beforepayment toU.S. Treasury
38 Dividends paid39 Payments to U.S. Treasury
(interest on FederalReserve notes) . .
40 Transferred to surplus41 Surplus, January 1
42 Surplus, December 31 . . . .
Atlanta
13,702,974
468 479 9389,126,749
436 372
491,746,033
33,987,415
9,490,398311,584
1,279,7821 171 7377,691,4931 462 5493,152,089
742,221469 077
1,282,017437 958
435 295
4,237,7551 338 247
6631 3422,254,720—244 947
76,130,732
5 958 351
70,172,381
421,573,652
7 305 02145,108
7 350 129
7 798 479589 747
8,388,226
1 038,097
4,723,800
415,811,755
5,355,123
407 036 932
3 419 70086,658,250
90,077,950
Chicago
27,056,315
1 952 245,41417,548,677
568 053
1,997,418,459
48,589^427
14,362,834460,164
1,648,8211 525 752
10,797,9861 561,7414,379,240
2,058,707500,701
1,415,824906,911
1443,511
6,761,5261 174,918
8 549,2661,582,742-323,156
107,396,915
8 529,467
98,867,448
1,898,551,011
14 033 330158,504
14 191 834
31496,8331 764,860
33,261,693
19,069,859
9,153,900
1,870,327,252
10,341,003
1 851 065,549
8 920,700167,898,000
176,818,700
St. Louis
6,852,559
506,659 1743,605,830
190912
517,308,475
19,758,996
5,865,030492 289629,220
1 120 3284,542,386
535 3691,902,314
386,358359991820,941151 013
489 469
2,535,7621 146 798
2 879 2621,195,216-140 022
44,670,720
3 612 000
41,058,720
476,249,755
2 883 56110,611
2 894 172
8,272 0972 215 644
10,487,741
7,593,569
1,878,300
466,777,886
2,112,599
463,536 637
1 128 65034,597,200
35,725,850
Minneapolis
5,049,341
237,724 9583,843,798
294 692
246,912,789
16,668,502
4,224,663406 800659,834921 460
2,915,567651 392
1,186,339
1,602,655831 581522,10261 501
498 620
1,128,425744 222
1 347 9361,226,870-57 212
35,541,257
2,368 433
33,172,824
213,739,966
3 075 79831,692
3 107 490
4,043 489430413
4,473,902
1,366,412
1,975,200
210,398,354
2,244,182
206,336 172
1,81800036,256,150
38,074,150
Kansas City
8,398,459
570 198 4565 162,833
201 257
583,961,005
25,080,619
7,269,543360 847
1,104,6741 721 6734,862,494
9169512,404,304
470,276540 090820,339
32338
283 261
3 088,1421 638 700
3 952 8611,568,760--484 139
55,631,733
4 502 415
51,129,318
532,831,687
4 133 104108,080
4 241 184
9041 188746 878
9,788,066
5,546,882
2,666,400
524,618,405
3,013,706
518866449
2 738 25049,055,200
51,793,450
Dallas
12,247,609
716,797 9317,082,798
208 714
736,337,052
20,605,461
5,283,737334 662808,531787 029
4,977,877984312
2,154,696
508,049187 832804,91628 811
652,877
1,998,5821,340 071
5,143 5762*295,958-155 735
48,741,242
2,838 362
45,902,880
690,434,172
5,671 00341,993
5 712 996
11,293,6441,677 656
12,971,300
7,258,304
3,699,800
679,476,068
4,268,321
669,089,897
6,117 85067,409,750
73,527,600
San Francisco
12,956,061
1 664 859 59818,630,315
180357
1,696,626,331
37,806,938
11,094,094737 440
1,469,0581 708 5948,268,1881 376 1903,114,174
553,956454 530911,278722 597
308 388
3,337,2183 105 605
9 548 9012,918,460-242 456
87,193,153
7484715
79,708,438
1,616,917,893
15 282 8733,823,327
19 106 200
26 589,6825 099 788
31,689,470
12,583,270
9,879,900
1,594,454,723
11,191,593
1 571,336,980
11,926,150182,338,000
194,264,150
Digitized for FRASER http://fraser.stlouisfed.org/ Federal Reserve Bank of St. Louis

73. Banks and branches—Number in operation, December 31,1980, by state
State
United States . . .
AlabamaAlaska. . . .ArizonaArkansasCalifornia
ColoradoConnecticut. . . .Delaware . . . .District of
Columbia . .Florida
GeorgiaHawaii . . . .IdahoIllinois . . . .Indiana
IowaKansasKentuckyLouisianaMaine
MarylandMassachusetts . .MichiganMinnesotaMississippi . . . .
MissouriMontana . . . .NebraskaNevadaNew Hampshire.
New Jersey . . . .New Mexico . . .New YorkNorth Carolina .North Dakota . .
OhioOklahomaOregonPennsylvania. . .Rhode Island. . .
South Carolina .South Dakota . .TennesseeTexasUtah
VermontVirginiaWashington . . . .West Virginia. . .Wisconsin
WyomingPuerto Rico . . . .Virgin Islands . .
Commercial and mutual savings banks
Total
15,296
3181435
262297
44212922
18565
4351226
1,292411
657620345269
70
105306376765178
731166464
11101
18990
42880
178
385502
92376
23
85153353
1,47278
35230121237644
10300
Commercial
Total
14,836
3181235
262297
4426420
18565
4351226
1,292407
65762034526941
102144376764178
731166464
1176
16990
31780
178
385502
90367
17
85153353
1,47278
29230111237641
10300
Member
Na-tional
4,425
9953
6848
142196
16204
6327
407119
99148785314
3170
126204
37
9955
1173
36
9040
1132439
170184
6210
5
193368
64212
127220
109132
4700
State
997
240048
3620
032
904
5941
3922
963
57
8033
5
4744
914
156
4313
862010110
627104216
1824
2927
2500
Nonmember
In-sured
9,000
1957
21188225
1454312
1321
3637
15787245
513449257210
24
6661
169523135
57964
3315
35
64435854
133
128291
64134
9
6092
11178348
15757699
476
3000
Non-in-
sured2
414
00
112
16
11902
18
030
392
61100
16141
63721
01
10313
17
10123
01352
11
1106
100
Mutualsavings
In-sured
323
02000
065
2
00
00004
0000
29
325010
0000
25
200
11100
00296
00000
60
1003
000
Non-in-
sured
137
00000
000
00
00000
00000
0137
000
00000
00000
00000
00000
00000
000
Number maintaining branches or additional offices1
Total
7,267
1831214
163185
87115
14
13383
2671021
409289
27914322519665
90261312202146
3392993
772
16567
2716677
27613450
27120
6551
270226
30
281807664
253
300
Commercial
Total
6,859
1831114
163185
875412
13383
2671021
409287
27914322519638
87125312201146
3392993
754
14867
1636677
27613448
26214
6551
27022630
231806664
253
300
Member
Na-tional
2,328
6953
5526
49175
12148
5516
18295
5152604113
2964
1138435
521341
229
7929842225
138706
1435
171363524
864183050
100
State
503
110038
420
019
702
1922
174653
57
6764
266212
154
3112
593380
5109
147
157
169
000
Nonmember
In-sured
4,005
1036
11105146
3435
7
1216
2057
13208170
21187
15915022
5354
131111107
26110504
23
5434384250
796138
1107
4328
198160
19
14594728
194
200
Non-in-
sured
23
00005
000
00
02000
00000
00100
00000
00
1010
00112
00000
00000
000
Mutualsavings
In-sured
296
01000
061
2
00
00002 -
0000
27
324010
0000
18
170
10800
00296
00000
50
1000
000
Non-in-
sured
112
00000
000
00
00000
00000
0112
000
00000
00000
00000
00000
00000
000
170Digitized for FRASER http://fraser.stlouisfed.org/ Federal Reserve Bank of St. Louis

73. Banks and branches—Number in operation, December 31,1980, by state—Continued
State
United States
AlabamaAlaskaArizonaArkansasCalifornia
ColoradoConnecticutDelaware. . . . .District of ColumbiaFlorida . . .
Georgia. . . . . .HawaiiIdahoIllinoisIndiana
IowaKansas . . .KentuckyLouisianaMaine
Maryland . . .MassachusettsMichigan. , . . . . . .MinnesotaMississippi
MissouriMontanaNebraska .NevadaNew Hampshire. . . . . .
New JerseyNew MexicoNew YorkNorth Carolina . . . . . .North Dakota
OhioOklahoma .OregonPennsylvaniaRhode Island
South Carolina . . .South DakotaTennessee. . . .TexasUtah
VermontVirginiaWashington . .West VirginiaWisconsin
WyomingPuerto RicoVirgin Islands
Branches and additional offices1
Class of bank
Total
41,477
619114535414
4,262
103951172150
1,180
861159247531
1,132
572271759802406
1,0011,4582,155
275696
43735
283143219
1,784244
4,7231,741
126
2,234250604
2,766303
727166
1,030241283
1991,3991,125
64524
200
Commercial banks
Total
38,353
619111535414
4,262
102603148150
1,180
861159247531
1,129
572271759802307
939953
2,155273696
43735
283143159
1,583244
3,4231,741
126
2,234250586
2,558232
727166
1,030241283
1671,399
93864
524
200
Member
Na-tional
19,620
37677
353195
2,758
60204
6148530
39710
189255551
152135280309111
378427
1,057137272
7619
2059597
976122
1,86283744
1,424176354
1,285119
37010541042
118
44• 639
63630
168
000
State
4,760
2900
10431
48900
60
8006
2839
455
944339
10169
5296
16
3967
243
21614
1,23064
51333
1870
12175217
105
1546
46
22
000
Nonmember
In-sured
13,923
21434
182209
1,065
38310142
2590
38414652
248539
375131385450157
460456567130408
32210712459
391108320888
78
29771
2261,084
103
34544
56818260
122214298
28334
200
Non-in-
sured
50
00008
00000
03000
00000
01200
00000
00
11100
0032
10
00000
00000
000
Mutualsavingsbanks
In-sured
2,744
03000
1348
2400
00003
0000
99
62125
020
0000
60
2010
1,30000
00
18208
71
00000
320
18700
000
Non-in-
sured
380
00000
00000
00000
00000
0380
000
00000
00000
00000
00000
00000
000
Location
Inhead-officecity
14,152
34143
145264554
8821940
150547
4215836
470594
319263496452
72
212600875148251
32734
2663782
274160
1,65122649
705231136325
63
13546
617235
45
33271288
59197
200
Outside head-office city
Inhead-officecounty
12,289
2437
156145580
10444
750
598
284422056
536
1886
259337177
228813821
93166
1080
1220
106
82074
95513445
1,0201489
1,009128
9040
3955
84
61230308
5253
000
In con-tig-
uouscoun-ties
7,326
1733
1544
840
5246460
25
574
4541
6523
10128
32644
42232
136
215
1830
4269
1,129299
31
2235
1311,432
78
8737
81
42
58362198
065
000
In non-contig-uouscoun-ties
7,710
183180
12,288
042110
10
9955
14611
0013
29
2351
372
143
000
681
2641
9881,082
1
2860
2480
34
41543100
112
47536331
09
000
Bank-ing
facili-ties3
156
2221
27
90018
86061
01122
31302
21100
50502
35020
201
203
010401
100
171Digitized for FRASER http://fraser.stlouisfed.org/ Federal Reserve Bank of St. Louis

74. Number of par banking offices1
Date, andFederal Reserve
District
End of year1980 ;
December 31, 1980Boston . . . . . . .New YorkPhiladelphiaClevelandRichmond . . .AtlantaChicagoSt. LouisMinneapolisKansas CityDallasSan Francisco
Total
Banks Branchesand offices
Member
Banks Branchesand offices
Nonmember
Banks Branchesj and offices
United States, including other areas2
14,652 38,769 5,422 24,563 9,230 14,206
Federal Reserve District
348482353656717
1,8232,7901,4481,4282,3311,636
640
2,2284,9452,4583,3115,0234,4234,4772,028
7831,233
5487,312
169226213374376563903387507818737149
1,1044,0441,3852,5663,0792,2692,647
900430731205
5,203
179256140282341
1,2601,8871,061
9211,513
899491
U24901
1,073745
1,9442,1541,8301,128
353502343
2,109
75. Banking offices in the United States—Number, and changes in number1
A. Banks (head offices), by type
Item
End of year1980
1 New banks-*2 Voluntary liquidations
Consolidations and absorptions3 Banks converted into branches4 Other
Interclass changes5 Nonmember to national6 Nonmember to state member7 State member to national8 State member to nonmember9 National to nonmember
10 National to state member11 Noninsured to insured12 Noninsured mutual to insured mutual . . .13 Insured mutual to federal mutual . . .
14 Net change
AHbanks
Commercial banks
TotalMember
Total Na-tional State
Nonmember
Total Insured Non-insured
Mutuba
Insured
al savingsnks
Non-insured
Number
15,296 14,836 5,422 4,425 997 9,414 9,000 4142 323 137
Change in number during 1980
267-3
-118-18
00000000
-3
125
266-3
-117-18
000000000
128
90-1
-54-6
4160
-11-41
0000
-3
62-1
-38-6
4020
-41-5
000
-23
280
-160
016-2
-1105000
20
176-2
-63-12
-4-16
011410000
131
116-2
-63-10
-4-16
011410100
74
600
0-2
000000
-100
57
10
00
00000001
-3
00
-10
0000000
-10
-2
172Digitized for FRASER http://fraser.stlouisfed.org/ Federal Reserve Bank of St. Louis
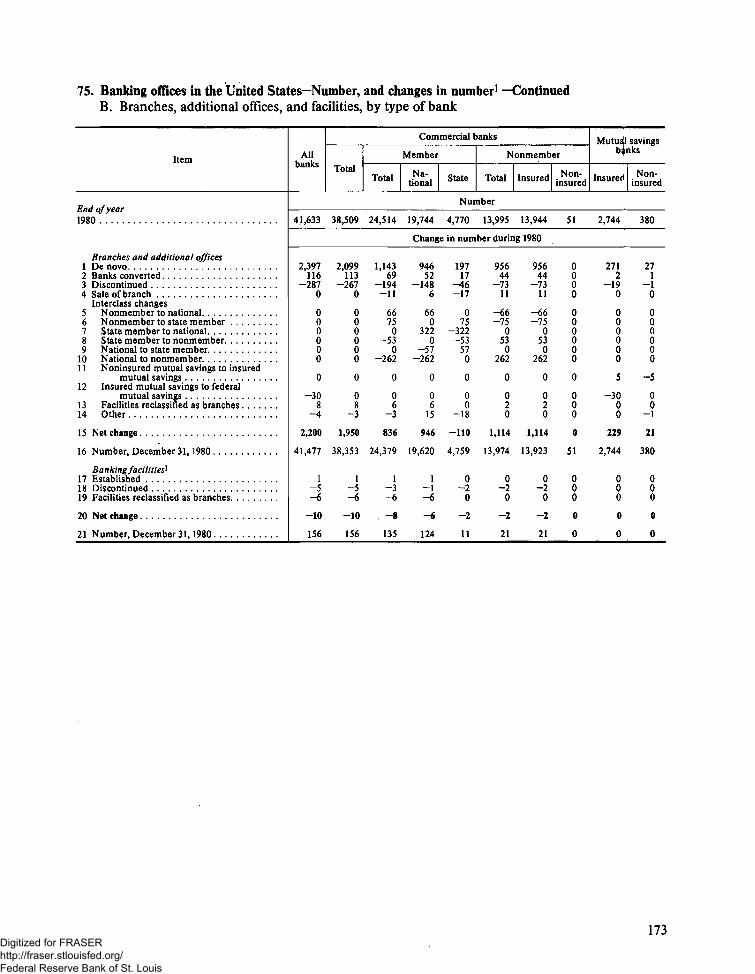
75. Banking offices in the United States—Number, and changes in number1 —ContinuedB. Branches, additional offices, and facilities, by type of bank
Item
End of year1980
Branches and additional offices1 De novo2 Banks converted3 Discontinued4 Sale of branch
Interclass changes5 Nonmember to national6 Nonmember to state member7 State member to national8 State member to nonmember9 National to state member
10 National to nonmember . .11 Noninsured mutual savings to insured
mutual savings12 Insured mutual savings to federal
mutual savings13 Facilities reclassified as branches14 Other
15 Net change
16 Number, December 31, 1980
Banking facilities1
17 Established .18 Discontinued19 Facilities reclassified as branches
20 Net change
21 Number, December 31, 1980
Allbanks
Commercial banks
TotalTotal
Member
Na-tional State
Nonmember
Total Insured Non-insured
Mutual savingsbanks
Insured Non-insured
Number
41,633 38,509 24,514 19,744 4,770 13,995 13,944 51 2,744 380
Change in number during 1980
2,397116
-2870
000000
0
-308
-4
2,200
41,477
1-5-6
-10
156
2,099113
-2670
000000
0
08
-3
1,950
38,353
1n <?-6
-10
156
1,14369
-194-11
66750
-530
-262
0
06
-3
836
24,379
1-a
-6
-8
135
94652
-1486
660
3220
-57-262
0
06
15
946
19,620
1_.,. i-6
-6
124
19717
-46-17
075
-322-53
570
0
00
-18
-110
4,759
0-2
0
-2
11
95644
-73l\
-66-75
0530
262
0
020
1,114
13,974
0-2
0
-2
21
95644
-7311
-66-75
0530
262
0
020
1,114
13,923
0-2
0
-2
21
0000
000000
0
000
0
51
000
0
0
2712
-190
000000
5
-3000
229
2,744
000
0
0
271
-10
000000
-5
00
-1
21
380
000
0
0
173Digitized for FRASER http://fraser.stlouisfed.org/ Federal Reserve Bank of St. Louis

76. Changes in offices of commercial banks and nondeposit trust companies during 19801—Summary, by state
State
50 states and Districtof Columbia-Total
Statewide branchingstates
Limited branchingstates . .
Unit banking states . . . .
AlabamaAlaska. . .ArizonaArkansas.California
ColoradoConnecticutDelawareDistrict of Columbia . . .Florida
GeorgiaHawaiiIdaho .IllinoisIndiana .
Iowa . . . .KansasKentucky.LouisianaMaine . . .
MarylandMassachusettsMichiganMinnesotaMississippi
Missouri .MontanaNebraska.Nevada . .New Hampshire. . . .
New JerseyNew MexicoNew YorkNorth CarolinaNorth Dakota
OhioOklahomaOregonPennsylvania . . .Rhode Island
South CarolinaSouth DakotaTennesseeTexasUtah . . . .
Vermont .Virginia. .WashingtonWest VirginiaWisconsin
Wyoming
January 1-June 30
In opera-tion onJan. 1
51,278
21,997
21,0378,244
895121532654
4,347
507658167157
1,530
1,268175263
1,7401,488
1,195871
1,0401,026
340
1,0071,0852,372
989849
1,142193697144227
1,730325
3,6911,806
298
2,514744631
2,857248
772313
1,3441,661
349
1891,606
994294
1,136
97
Begin-ning
operation
1,034
454
408172
164
1310
114
25327
96
1423
4418
19123225
5
209
861919
105
1777
133
41197
637
2240
0
255
1840
7
426
91
17
4
Ceasingoperation
154
85
5712
1000
13
1010
13
00030
13100
74816
20001
30
2053
1204
213
32201
06300
0
In opera-tion onJune 30
52,158
22,366
21,3888,404
910125545664
4,448
531661168164
1,613
1,282177266
1,7811,506-
1,213880
1,0711,051
345
1,0201,0902,4501,007
862
1,150198714151233
1,740328
3,7121,820
302
2,565751649
2,876245
794316
1,3601,701
355
1931,6261,000
2951,153
101
Net in-crease, ordecrease
(-)
880
369
351160
154
1310
101
24317
83
1423
4118
189
3125
5
135
781813
85
1776
103
21144
517
1819-3
223
1640
6
420
61
17
4
July l-December31
In opera-tion onJuly 1
52,158
22,366
21,3888,404
910125545664
4,448
531661168164
1,613
1,282177266
1,7811,506
1,213880
1,0711,051
345
1,0201,0902,4501,007
862
1,150198714151233
1,740328
3,7121,820
302
2,565751649
2,876245
794316
1,3601,701
355
1931,6261,000
2951,153
101
Begin-ning
operation
1,449
665
560224
332
2813
148
24726
154
3518
4833
19173726
6
2615
1023315
234
3555
246
51208
78202768
6
263
333310
636587
14
5
Ceasingoperation
274
141
9637
1210
11
2121
18
61133
35232
28
1732
40222
70
28184
21144
181
60821
322
511
0
In opera-tion onDec. 31
53,333
22,890
21,8528,591
942125572677
4,585
553667168169
1,749
1,311177273
1,8261,536
1,229892
1,1061,074
349
1,0441,0972,5351,037
875
1,169202747154236
1,757334
3,7351,822
306
2,622757672
2,926250
814319
1,3851,732
364
1961,6401,053
3011,166
106
Net in-crease, ordecrease
(-)
1,175
524
464187
320
2713
137
22605
136
2907
4530
16123523
4
247
853013
194
3333
176
2324
576
2350
5
203
25319
314536
13
5
Type ofbranch-
ing2
LSSLS
USSSS
LSSUL
LULLS
SLLLL
UUUSS
SLSSU
LUSLS
SSLUS
SSSUL
U
174Digitized for FRASER http://fraser.stlouisfed.org/ Federal Reserve Bank of St. Louis

77. Percentage of total assets and total deposits held by 10 largest banking organizations(all commercial banks and trust companies), by state
State and item1
Alabama (248)Assets
Per organizationCurtiulattve . . .
DepositsPer organization ,Cumulative
Alaska (11)Assets
Per organizationCumulative
DepositsPer organizationCumulative. . . .
Arizona (22)Assets
Per organizationCumulative. . , .
DepositsPer organizationCumulative
Arkansas (256)Assets
Per organizationCumulative. , . .
DepositsPer organization . .Cumulative
California (255)Assets
Per organization . . .Cumulative
DepositsPer organizationCumulative .'
Colorado (218)Assets
Per organizationCumulative
DepositsPer organizationCumulative, ,
Connecticut (60)Assets
Per organizationCumulative. . , . ;
DepositsPer organizationCumulative
Delaware (18)Assets
Per organizationCumulative . . . . . .
DepositsPer organizationCumulative
District of Columbia (17)Assets
Per organization . . .Cumulative. . . . .
DepositsPer organization . . .Cumulative
Florida (3 18)Assets
Per organization . . .Cumulative . . .
DepositsPer organizationCumulative
Rank, by total assets
1 2 3 4 5 f *j 8 9 10
June 1980
16.116.1
15.415.4
28.1228.1
28.328.3
43.1243.1
42.242.2
7.67.6
7.07.0
35.135.1
35.035.0
16.116.1
14.614.6
19.719.7
18.818.8
38.6238.6
34.434.4
33.7233.7
33.333.3
11.211.2
10.410.4
11.827.9
10.726.2
23.P51.2
22.050.3
26.72
69.8
27.870.0
3.7211.4
2.89.9
12.447.5
12.747.7
16.032.1
15.229.9
17.837.6
16.635.4
20.4259.1
21.355.7
28.562.3
26,559.8
9.220.4
9.119.6
11.139.0
11.137.3
12.163.3
10.460.7
15.785.6
15.285.3
3.5214.9
2.812,7
10.858.4
10.458.1
9.942.1
10.440.4
9.647.2
9.244.7
15.6274.7
17.072.7
10.973.2
10.770.6
7.027.4
7.226,8
10.950.0
10.447.8
9.0272.4
9.069.8
5.090.7
5,190.4
3.0217.9
2.815.5
8.867.2
8.066.1
8.350.5
8.548.9
9.156.4
9.454.1
14.3289.0
15.588,2
9.282.4
10,180.7
4.832.3
4.631.5
4.854,8
4.952.7
8.180.6
8.978.7
3.894.5
3.994.4
2.420,3
2.117.7
8,275.4
7.773.8
8.358.8
7.756.6
5.9262.4
6.060.2
3.2292.3
3.691.9
7.3289.7
7,488.2
4.536.8
4.435,9
4.359.1
4.457.1
5.385.9
5.784.4
2.196.7
2.296.6
2.0222.3
2.019.8
3.679.1
3.377.2
3.662.4
3.760.3
5.267.6
5.866.0
1.9294.3
2.194.0
2.3292.1
2.790.9
4.141.0
4.140.1
1.6260.7
1.658.8
4.9290.9
5.289.6
.82
97.5
.897.5
1.924.3
1,921.7
2.081.1
2.279.5
3.565.9
3.563.9
5.172.8
5.671.6
1.095.3
1.095.0
1.6293.7
1.992.8
4,045.1
4.044,1
1.4262.1
1.460.3
3.2294.2
3.893.5
.7298.3
.798.2
1.926.2
1.423.1
2.083.1
1.681.1
1.867.8
1.865.8
4.877.7
5.176.8
.8296.2
.895.9
1.5295.3
1.794.5
2.948.0
2.646.8
1.2263.4
1.361.6
2.3296.5
2.796.2
.398.6
.398.6
1.82
28.0
1.925,1
1.684.7
1.882.9
1.168.9
1.166.9
4.281.9
4.080.8
.7296.9
.796.7
.8296.1
1.095.5
2.550.6
2.749.5
.7264.2
.862.4
2.298.8
2.398.6
.1298.7
.198.8
1.429.5
1.526.6
1.085.8
1.284.2
1.0270.0
1.168.0
1.4283.4
1.582.4
.5297,5
.697.3
.8296.9
.996.5
2.453.0
2.251.8
175Digitized for FRASER http://fraser.stlouisfed.org/ Federal Reserve Bank of St. Louis

77. Percentage of total assets and total deposits held by 10 largest banking organizations(all commercial banks and trust companies), by state—Continued
State and item1
Georgia (400)Assets
Per organizationCumulative
DepositsPer organizationCumulative
Hawaii (9)Assets
Per organizationCumulative
DepositsPer organization . . . .Cumulative
Idaho (26)Assets
Per organizationCumulative
DepositsPer organizationCumulative
Illinois (1,245)Assets
Per organizationCumulative
DepositsPer organizationCumulative
Indiana (404)Assets
Per organization .Cumulative
DepositsPer organizationCumulative
Iowa (580)Assets
Per organizationCumulative
DepositsPer organizationCumulative
Kansas (613)Assets
Per organizationCumulative
DepositsPer organizationCumulative
Kentucky (342)Assets
Per organizationCumulative
DepositsPer organization . . . .Cumulative
Louisiana (264)Assets
Per organizationCumulative
DepositsPer organizationCumulative
Maine (25)Assets
Per organizationCumulative
DepositsPer organizationCumulative
Rank, by total assets
1 2 3 4 5 6 7 8 9 10
June 1980
20,220.2
17.617.6
39.039.0
38.738.7
36,32
36.3
36,736.7
23.823.8
16.016.0
8.08.0
6.16.1
7.97.9
6.96.9
5.45.4
4.74.7
10,510.5
9.29.2
7.87.8
7.17.1
18.618.6
18.618.6
12,733.0
11.629.2
32.671.6
32.170.8
26.562.8
26.162.8
13.537.4
11.427.5
7.115.1
6.312.4
6.614.5
6.013.0
2.928.4
2.77.4
9.820.4
8.417.6
4.812.6
3.911.0
15.834.5
16.435,0
11.544.5
10,840.1
8.179.7
8.479.3
11.774.5
11.374.2
5.442.8
4.632.1
5.720.8
4.817.3
4.519.1
4.817.8
2.310.7
2.19.5
5.0225.5
4.722.4
3.916.6
3.714.7
14.348.8
13.048.0
5.450.0
4.644.7
7.3287.0
7.486.7
8.983.5
8.682.8
4.146.9
3.735.9
2.223.1
1.919.3
3.722.9
3.421.2
1.9212.6
1.511.0
3.629.1
3.325.7
3,2219.8
2.917.7
13.762.5
14.262.3
2.652.6
2.647.4
4.9292.0
5.091.7
3.787.2
3.786.6
1.848.8
1.637.6
1.7224.9
1.721,1
3.326.2
3.524.7
1.6214.3
1.512.6
2.4231.5
2.328.1
3.2223.1
3.020.7
11.9274.4
11.874.2
1.854,4
1.949.4
4,1296.1
4,296.0
2.2289.4
2.389.0
1.049.8
1.038.6
1.72
26.6
1.622.7
2.729.0
2.227.0
1.62
15.9
1.514.1
2.2233.8
1.329.5
2.9226.0
2.623.3
7.381,8
7.081.2
1.8256.2
1.851.2
2.8299.0
3.099.0
1.4290.9
1,590.5
.550.4
.539,2
1.5228.1
1.424.2
2.4231.5
2.029.1
1.617.6
1.215.3
2.035.8
1.831.4
2.728.7
2.525.9
2.384.1
2.383.5
1.557.7
1.652.9
.7299.8
.799.8
1.3292.2
1.491.9
A50.8
.439.7
1.429.5
1.425.7
1.533.0
1.430.5
1.118.7
,616.0
1.2237.0
1.232.6
2.531.2
2.328.3
1.986.0
1.985.4
.8258.6
.853.8
.12
99.9
.199.9
1.093,2
.992.9
.4251.2
.440.2
1.4230,9
1,427,1
1.0234.1
.931.4
1.119.9
1.017.0
.938.0
,933.6
2.133.4
2.230.5
1.7287.7
1.887.2
.7259,3
,854.6
.0100.0
,0100,0
.9294.2
1,093.9
.451.6
.540.7
1.232.2
1.328,5
,9235.1
.832.3
.9220.9
.917.9
.9239.0
1.034.6
2.035.5
2.132.6
1.5289.3
1.588.8
176Digitized for FRASER http://fraser.stlouisfed.org/ Federal Reserve Bank of St. Louis

77. Percentage of total assets and total deposits held by 10 largest banking organizations(all commercial banks and trust companies), by state—Continued
State and item1
Maryland (87)Assets
Per organizationCumulative
DepositsPer organizationCumulative
Massachusetts (91)Assets
Per organizationCumulative
DepositsPer organization . . . .Cumulative
Michigan (239)Assets
Per organization ,Cumulative
DepositsPer organizationCumulative
Minnesota (623)Assets
Per organizationCumulative
DepositsPer organizationCumulative
Mississippi (178)Assets
Per organizationCumulative
DepositsPer organizationCumulative
Missouri (499)Assets
Per organizationCumulative .
DepositsPer organizationCumulative
Montana (1 19)Assets
Per organization .Cumulative
DepositsPer organizationCumulative
Nebraska (450)Assets
Per organizationCumulative
DepositsPer organization . . .Cumulative
Nevada (9)Assets
Per organizationCumulative
DepositsPer organizationCumulative
New Hampshire (62)Assets
Per organizationCumulative
DepositsPer organizationCumulative
Rank, by total assets
1 2 3 4 5 6 7 8 9 10
June 1980
22.322.3
19.919.9
29.929.9
22.222.2
17.717.7
15.215.2
30.630.6
25.625,6
13.613.6
11.811.8
12.712.7
10.110.1
24.724,7
24.424.4
8.28,2
7.87,8
48.048.0
49.249.2
16.016.0
15.915.9
12.735.0
13.133.1
11.341.2
11.533.7
10.828.6
11.326.5
24.154.7
23.449.1
11.024.6
10.322.1
11.424.2
9.219.4
12.537,2
12.436.9
7.515.7
6.013.8
21.1269.2
20.469.6
11.527.5
11.227.1
11.846.9
11.344.4
10.351.6
12.646.4
9.838.4
8.935.5
2.357.0
2.651.7
4,1228.7
4.126.3
8.432.6
8.728.1
6.043.3
5.342.3
6.722.5
5.119.0
14.083.2
13.583.2
8.035.6
7.835.0
9.156.0
9.654.1
9.761.3
8.755.2
9.147.5
8.443.9
2.059.0
1.953.6
3.432.1
3.529.8
6.238.9
5.934.0
5.749.1
5.848.1
4.226.8
3.822.8
8.6291.8
8.491.6
7.643.2
7.742.7
7.863.8
7.962.0
8.670.0
8.864.0
3.851.3
3.747.6
1.860.9
1.755.3
3.3235.4
3.333.2
5.744.6
5.339.3
4.253.4
4.252.3
3.230.0
2.525.3
4.2296.0
4.295.9
4.6247.9
4.847.6
7.170.9
7.069.1
3.473.5
4.368.3
3.655.0
4.051.6
.961.8
.856,2
3.0238.5
3.136.4
5.550.2
5.144.5
2.3255.7
2.254.6
1.231.2
1.226.6
3.1299.1
3.399.2
3.4251.4
3.651.3
4.0275.0
4.273.3
2.976.5
3,571.9
2.957.9
2.854.5
.662.5
.757.0
2.6241.2
2.438,9
2.352.5
2.547.0
1.557.2
1.656.2
1.1232,4
1.127.7
.4299.6
.499.6
2.7254.1
2;553.8
2.177.1
2.275.5
2.478.9
2.974.8
2.160.1
2.156.6
,663.1
.757.7
2.2243.4
2.341.3
2.254.7
2.449.5
1.4258.6
1.357.6
.933.3
.928.7
.2299.8
. .199.8
2.5256.7
2.556.3
1.5278.6
1.677.2
2.181.1
2.677.5
1.9262.0
2,058.7
.6263.8
.658.4
1.8245.2
1.843.1
1.656.3
1.751.2
1.259.9
1.258.9
.834.2
.929.6
.0299.9
.099.9
1.858,5
1.858.2
1.2279.9
1.378.5
1.882.9
2.379.9
1.863.9
2.060.7
.464.2
.458.9
1.6246.9
1.744.9
1.557.9
1.753.0
1.060.9
1.059.9
.835.0
.730.4
.0100.0
.0100.0
1.8260.4
1.860.1
177Digitized for FRASER http://fraser.stlouisfed.org/ Federal Reserve Bank of St. Louis

77. Percentage of total assets and total deposits held by 10 largest banking organizations(all commercial banks and trust companies), by state—Continued
State and item*
New Jersey (140)Assets
Per organization . . .Cumulative
DepositsPer organizationCumulative
New Mexico (63)Assets
Per organizationCumulative
DepositsPer organizationCumulative
New York (174)Assets
Per organizationCumulative . . . .
DepositsPer organizationCumulative
North Carolina (80)Assets
Per organizationCumulative
DepositsPer organizationCumulative
North Dakota (143)Assets
Per organizationCumulative . . .
DepositsPer organizationCumulative
Ohio (3 17)Assets
Per organizationCumulative
DepositsPer organizationCumulative
Oklahoma (489)Assets
Per organizationCumulative
DepositsPer organizationCumulative
Oregon (73)Assets
Per organizationCumulative
DepositsPer organizationCumulative
Pennsylvania (363)Assets
Per organizationCumulative
DepositsPer organizationCumulative
Rhode Island (14)Assets
Per organizationCumulative
DepositsPer organizationCumulative
Rank, by total assets
1 2 3 4 5 6 7 8 9 10
June 1980
8.88.8
8.28.2
22.722.7
22.522.5
16.416.4
13.113.1
22.022.0
20.220.2
16.616.6
16.216.2
10.010.0
8.88.8
8.78.7
6.76.7
37.737.7
35.735.7
14.214.2
12.412.4
43.343.3
40.840.8
8.217.0
7.716.0
12.735.4
13.035.5
15.632.0
15.428.5
21.343.3
18.438.6
15.932.5
16.032.2
9.219.3
9.118.0
6.715.5
5.812.5
33.671.4
34.069.7
6.921.1
4.016.4
25.969.3
24.365.2
6.924.0
6.822.8
10.2245.6
9.144.6
11.043.1
12.741.3
12.856.1
11.550.2
6.839.4
6.839.1
8.828.2
7.926.0
5.320.9
4.717.3
7.378.7
7.477.1
6.627.8
6.122.5
21.891.2
24.890.1
6.330.3
6.028.8
7.453,1
7.652.3
10.653.8
9.050.3
7.563.7
8.558.7
2.642.0
2.541.7
6.234.4
6.032.1
4.625.6
4.421.7
3.582.3
3.881.0
6.234.0
4.827.4
3.194.3
3.693.8
3.834.2
4,032.8
3.756.8
3.756.0
9.863.6
10.460.8
5.8269.6
6.665.4
2.6244.6
2.444.2
5.840.2
4,236.3
2.728.3
2.524.3
2.9285.2
3.184.2
4.238.2
3.530.9
2.496.7
2.496.2
3.437.7
3.136.0
3.160,0
3.259.3
7.871.4
7.568.3
3.072.6
3.468.9
2.046.6
2.046.2
4.945.1
5.341.6
1,529.9
1.625.9
1.2286.5
1.385.6
3.441.7
3,234,1
.897.6
1.097.3
3.241.0
3.239.3
2.9263.0
3.062.3
4.375.8
4.873.1
2.775.4
3.272.1
1.748,4
1.848.0
4.950.0
4.846.4
1.531.4
1.627.5
1.0287.6
1.186.7
3.044.7
2,736.9
.598.2
.697.9
3.0244.0
3.142.4
1.8264,8
1.764.0
4.179.9
4,377.5
2.377.7
2,774,8
1.3249.8
1.449.4
3.954.0
4.050.4
1.132.6
.928.5
.9288.5
.987.7
2.847.6
2.739.6
.498.6
98^4
2.946.9
3.045.4
1.7266,5
1.865.8
2.982.9
3.080.5
2.2280.0
2.577.4
1.1251,0
1.150.6
3.357.3
3.153.5
1.033.6
1.029.5
.82
89.3
.988.6
2.3249.9
2.742.3
.3298.9
.398.8
2.82
49.8
3.148.6
1.6268.2
1.667,4
1,684,5
1.682.2
L7281.7
1.979.4
1.152.1
1.151.7
2.660.0
2.556.1
.934.6
1.030.6
.690.0
.689.3
2.252.2
2,544.8
.399.2
.399.2
178Digitized for FRASER http://fraser.stlouisfed.org/ Federal Reserve Bank of St. Louis
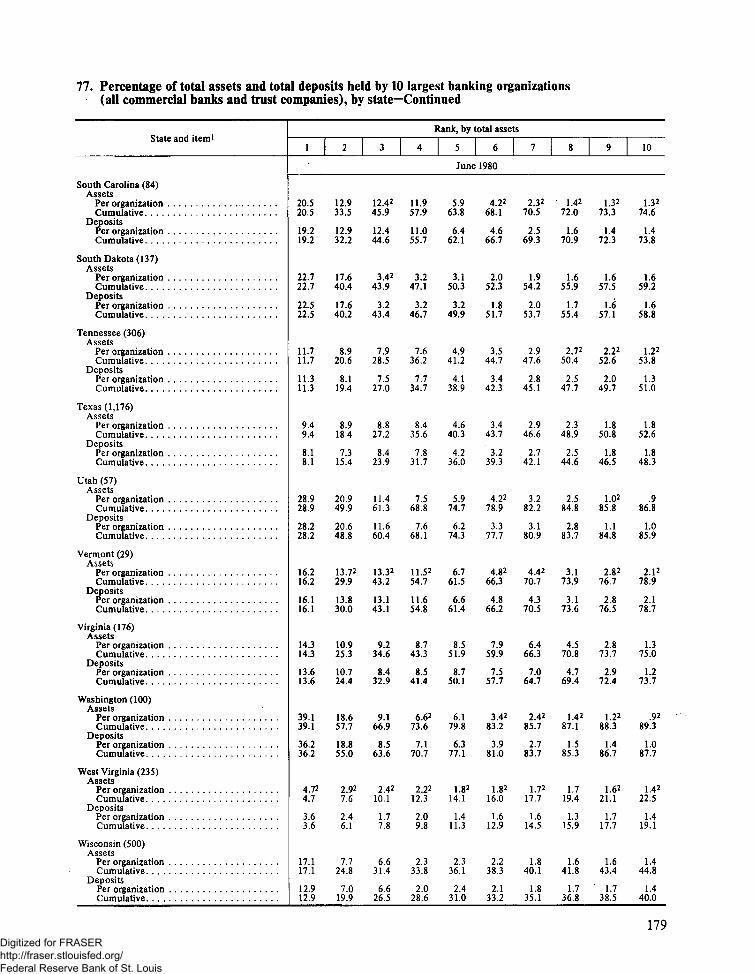
77. Percentage of total assets and total deposits held by 10 largest banking organizations(all commercial banks and trust companies), by state—Continued
State and item1
South Carolina (84)Assets
Per organizationCumulative
DepositsPer organizationCumulative
South Dakota (137)Assets
Per organizationCumulative
DepositsPer organizationCumulative
Tennessee (306)Assets
Per organizationCumulative
DepositsPer organizationCumulative
Texas (1,176)Assets
Per organizationCumulative
Deposits
Cumulative . .
Utah (57)Assets
Per organizationCumulative
DepositsPer organizationCumulative
Vermont (29)Assets
Per organizationCumulative
DepositsPer organizationCumulative
Virginia (176)Assets
Per organizationCumulative .
DepositsPer organizationCumulative
Washington (100)Assets
Per organizationCumulative
DepositsPer organizationCumulative , ,
West Virginia (235)Assets
Per organizationCumulative
DepositsPer organizationCumulative
Wisconsin (500)Assets
Per organization . . ;Cumulative
DepositsPer organization , . ,Cumulative
Rank, by total assets
1 2 3 4 5 6 7 8 9 10
June 1980
20.520.5
i9.219.2
22.722.7
22.522.5
11.711.7
11.311.3
9.49.4
8.18.1
28.928.9
28.228.2
16.216.2
16.116.1
14.314.3
13.613.6
39.139.1
36.236.2
4.72
4.7
3.63.6
17.117.1
12.912.9
12.933.5
12.932.2
17.640.4
17.640,2
8.920.6
8.119.4
8.918.4
7.315.4
20.949.9
20.648.8
13.72
29.9
13.830.0
10.925.3
10.724.4
18.657.7
18.855.0
2.927.6
2.46.1
7.724.8
7.019.9
12.4245.9
12.444.6
3.4243.9
3.243.4
7.928.5
7.527.0
8.827.2
8.423.9
11.461.3
11.660.4
13.3243.2
13.143.1
9.234.6
8.432.9
9.166.9
8.563.6
2.4210.1
1.77.8
6.631.4
6.626.5
11,957.9
11.055.7
3.247.1
3.246.7
7.636.2
7.734.7
8.435.6
7.831.7
7.568.8
7.668.1
11.5254.7
11.654.8
8.743.3
8.541.4
6.62
73.6
7.170,7
2.2212.3
2.09.8
2,333.8
2.028.6
5.963.8
6.462.1
3.150.3
3.249.9
4.941.2
4.138.9
4.640.3
4.236.0
5.974.7
6.274.3
6.761.5
6.661.4
8.551,9
8.750,1
6.179.8
6.317.1
1.82
14.1
1.411.3
2.336.1
2.431.0
4.2268.1
4.666.7
2,052.3
1.851.7
3,544.7
3.442.3
3.443.7
3.239.3
4.2278.9
3.377.7
4.8266.3
4.866.2
7.959.9
7.557.7
3.4283.2
3.981.0
1.82
16.0
1.612.9
2.238.3
2.133.2
2.3270.5
2.569.3
1.954.2
2.053.7
2.947.6
2.845.1
2.946.6
2.742.1
3.282.2
3.180.9
4.4270.7
4.370,5
6.466.3
7.064.7
2.4285.7
2.783.7
I.?2
17.7
1.614.5
1.840.1
1.835.1
1.4272.0
1.670.9
1.655.9
1.755,4
2.7250.4
2.547.7
2.348.9
2.544.6
2.584.8
2.883.7
3.173.9
3,173.6
4.570.8
4.769.4
1,4287.1
1.585.3
1.719.4
1.315.9
1.641.8
1.736.8
1.3273.3
1.472.3
1.657.5
1.657.1
2.2252.6
2.049.7
1.850.8
1.846.5
1,0285.8
1.184.8
2.8276.7
2.876.5
2.873.7
2.972.4
1.2288,3
1.486.7
1.6221.1
1.717.7
1.643.4
' 1.738.5
1.3274.6
1.473.8
1.659.2
1.658.8
1.2253.8
1.351.0
1.852.6
1.848.3
.986.8
1.085.9
2.1278.9
2.178.7
1.375.0
1.273.7
.9289.3
1.087.7
1.4222.5
1.419.1
1.444.8
1.440.0
179Digitized for FRASER http://fraser.stlouisfed.org/ Federal Reserve Bank of St. Louis

77. Percentage of total assets and total deposits held by 10 largest banking organizations(all commercial banks and trust companies), by state—Continued
State and item1
Wyoming (67)Assets
Per organization .Cumulative
DepositsPer organizationCumulative.
United States (12,375)Assets
Per organizationCumulative
DepositsPer organization . ,Cumulative
Alabama (245)Assets
Per organizationCumulative. . . .
DepositsPer organizationCumulative
Alaska (11)Assets
Per organizationCumulative
DepositsPer organizationCumulative. . .
Arizona (24)Assets
Per organizationCumulative
DepositsPer organizationCumulative
Arkansas (256)Assets
Per organization . . .Cumulative
DepositsPer organizationCumulative
California (276)Assets
Per organizationCumulative
DepositsPer organizationCumulative
Colorado (226)Assets
Per organization .Cumulative. , ,
DepositsPer organizationCumulative
Connecticut (59)Assets
Per organizationCumulative
DepositsPer organization ,Cumulative
Rank, by total assets
1 2 3 4 5 6 7 8 9 10
June 1980
16.016.0
15.815.8
3.93.9
3.93.9
12,728,8
12,528.3
2.86.8
2.05.9
9.438.2
9.137.5
2.79.5
2.38.2
4.342.5
4.341.8
1.911.5
1,910.1
3.746.3
3,845.7
1.913.4
1.912.1
2.949,2
2.948.7
1.815.3
1.313.5
2.651.9
2.751.4
1.817.1
1.114.6
2.5254.5
2.754.1
1.718.8
1.516.2
2.456.9
2.556.7
1.320.2
1.417.6
L9258.9
2.058,7
1.321.6
1.118,7
December 1980
15.815.8
15,315.3
30.02
30.0
30.930.9
42.4242.4
42.042.0
7.47.4
6.76.7
35.335.3
35,035.0
16.916.9
15,815.8
20.120.1
18.618.6
12.228.0
11.226.5
23.4253.5
22.553.4
27.670.0
27.269.3
3.611.0
3.29.9
12.447.7
12.947.9
15.832.8
15.331.1
19.539.6
19.137.7
11.639.6
11.538.1
12.2265.7
10.263.7
15.2285.3
15.484.7
3.5214.6
3.113.0
10.458.1
9.957.9
9.642.4
9.941.0
9.048.7
9.147,0
10.750.4
9,747.9
7.673.4
7.871.5
5.390.7
5.690.4
3.117.7
2.815.8
8.967.0
8.366.2
8,450.8
8.549.6
8.8257.5
8,355.4
4.955.3
5,153.0
7.6281.0
7.879.3
3.794.4
3.894.2
2.420.1
2.118.0
7.975.0
7,473,7
8.058.9
7.557.1
5.663.1
5.961.3
4.059.3
4.057.1
5,586,6
5.985.3
2.196.6
2.396.5
1.821.9
1.819,9
3,778.7
3.377.0
3.562.4
3,460.6
5.268.4
5.566.9
1.6261.0
1.658,8
4.591.1
4.689.9
.8297.4
.997.4
1.8223.8
1.821.8
1.980.7
2.179.2
3.465.9
3.564.1
5.173.5
5.672.6
1.3262.4
1.360.1
3.5294.6
4.094.0
.6298.1
.698.1
1.7225.6
1.823.7
1.782.5
1.480.6
1.767.6
1.765.9
4.678.1
4.777.3
1.2263,6
1.261.4
2.2296.9
2,696.6
.3298.4
.398.4
1.527.2
1.425.1
1.584.0
1.782.3
1.1268.8
1.267.1
4,0282.2
4.181.5
.7264.4
,862.2
2.0298.9
2.298.8
.1298.6
.298.6
1,428.6
1.426.5
1.185.1
1.283.6
1.169.9
1.068.2
1.683.8
1.483.0
180Digitized for FRASER http://fraser.stlouisfed.org/ Federal Reserve Bank of St. Louis

77. Percentage of total assets and total deposits held by 10 largest banking organizations(all commercial banks and trust companies), by state—Continued
State and item1
Delaware (18)Assets
Per organizationCumulative
DepositsPer organizationCumulative
District of Columbia (17)Assets
Per organizationCumulative
DepositsPer organization . . .Cumulative
Florida (3 11)Assets
Per organizationCumulative
DepositsPer organizationCumulative
Georgia (396)Assets
Per organizationCumulative
DepositsPer organizationCumulative
Hawaii (9)Assets
Per organization . .Cumulative . .
DepositsPer organization . . .Cumulative
Idaho (25)Assets
Per organizationCumulative
DepositsPer organization ,Cumulative
Illinois (1,247)Assets
Per organizationCumulative .
DepositsPer organizationCumulative
Indiana (404)Assets
Per organizationCumulative
DepositsPer organizationCumulative
Iowa (575)Assets
Per organization ,Cumulative . . . .
DepositsPer organizationCumulative
Kansas (615)Assets
Per organizationCumulative
DepositsPer organizationCumulative
Rank, by total assets
1 2 3 4 5 6 7 8 Q 10
December 1980
40.5240.5
34.234.2
33.4233.4
32.332.3
11,611.6
10.510.5
17.517.5
16.416.4
40.040.0
38.538.5
37.1237.1
36.536.5
23.323.3
16.716.7
7.47.4
6.06.0
8.08,0
7.17.1
5.45.4
4.64.6
20.4260.9
21.756.0
29.162.6
28.460.7
9.421.0
9.219.7
13.430.9
11.928.3
32.072.0
32.571.0
26.363.5
26.062.6
13.636.9
11.928.7
7.114.5
6.312.4
6.414.4
5.813.0
2.92
8.3
2.67.3
15.92
76.8
18.074.1
10.673.3
10.471.2
6.927.9
7.226.9
11.942.8
11.439.8
7.879.8
8.179.2
11.675.1
11.574.1
5.142.0
4.533.2
5.820.4
4.917.3
5.119.5
5.318.3
2.010.4
1.79.1
12.3289.2
13,687.8
9,082,4
9.480.6
5.233.1
4.931.9
5,248.1
4.444.3
7.12
87.0
7.486.6
8.083.2
8.282.4
4.046.1
3.636.8
2.422.8
2.019.4
4,023.6
3.722.1
1.8212.2
1.410.5
3.2292.4
3.791.5
7.0289.4
7.287,9
5.038.2
5.036.9
2.750.8
2.747.0
5.0292.1
5.191.8
3.486.6
3.686,0
1.847.9
1.838.7
1.9224.8
1.821.2
3.226.8
3.325.4
1.8214.0
1.111.7
1.994.3
2.193.7
2,32
91.8
2.890.7
4.342.5
4.241.1
1.9252.8
1.948.9
3.9296.0
4.095.8
2.2288.9
2.488.4
1.049.0
1.039.7
1.7226.5
1.723.0
3.029.8
2.427.9
1.515.5
LI12.8
1.095.4
1.194.8
1.9293,7
2.192.9
3.946.5
3.945.1
1.854.6
1.950.9
2.9299.0
3.199.0
1.7290.6
1.790.1
.549.5
.540.2
1.528.0
1.424.4
2.5232.4
2.130.0
1.5217.1
1.414.2
.8296.2
.895.7
1.5295.3
1.794.6
2.849.3
2.547.7
1.656.3
1.752.6
.7299.7
.799.7
1.4292.0
1.591.7
.450.0
.440.7
1.5229.6
1.525.9
1.533.9
1.431.4
1.218.3
1.015.3
.72
96.9
.896.6
.8296.1
1.095.6
2.551.8
2.650.3
.857.2
.853.5
.12
99.9
.199.9
1.193,2
1,292.9
.450.4
.541.2
1.4231.0
1.427.4
.9234,9
.832.3
1.0219.4
.916.3
.5297.5
.697.2
.8296.9
.996.6
2.354.1
2.252.5
.7258.0
.854.4
.0100.0
.0100.0
.994.2
.993.8
.450.8
.441.7
1.2232.3
1.228.6
.9235.8
.833.1
.920.3
.817.1
181Digitized for FRASER http://fraser.stlouisfed.org/ Federal Reserve Bank of St. Louis

77* Percentage of total assets and total deposits held by 10 largest banking organizations(all commercial banks and trust companies), by state—Continued
State and item1
Kentucky (343)Assets
Per organizationCumulative .
DepositsPer organizationCumulative
Louisiana (267)Assets
Per organizationCumulative ,
DepositsPer organization .Cumulative
Maine (25)Assets
Per organizationCumulative
DepositsPer organizationCumulative
Maryland (87)Assets
Per organizationCumulative, . , ,
DepositsPer organizationCumulative
Massachusetts (86)Assets
Per organizationCumulative
DepositsPer organizationCumulative
Michigan (231)Assets
Per organizationCumulative
DepositsPer organizationCumulative
Minnesota (624)Assets
Per organizationCumulative
DepositsPer organizationCumulative
Mississippi (177)Assets
Per organizationCumulative
DepositsPer organizationCumulative
Missouri (493)Assets
Per organizationCumulative.
DepositsPer organizationCumulative
Montana (119)Assets
Per organizationCumulative ,
DepositsPer organizationCumulative
Rank, by total assets
1 2 3 4 5 6 7 8 9 10
December 1980
10.910.9
9.59.5
6.96.9
6.76.7
19.319.3
18.318.3
22.522.5
20.920.9
29.029.0
23.823.8
17.817.8
15.415.4
30.230.2
26.026.0
14.414.4
12.112.1
13.313.3
11.011.0
24.324.3
24.024.0
10.221.1
8.818.3
4.711.7
4.110.8
15.434.7
16.534.8
12.735.3
13.234.2
11.140.2
10.934.8
11.429.3
11.526.9
25.155.4
24.850.9
11.325.7
10.822.9
11.725.1
10,021.0
12.136.5
11.936.0
4.826.0
4.422.8
4.115.9
3.714.5
14.249.0
13.548.4
11.747.1
10.644.8
10.951.1
12.647.4
10.639.9
9.336.3
2.157.6
2.453.3
4.12
29.8
4.227.2
8.133.2
8.429.5
6.843.4
5.841.8
4.030.0
3.526.3
3.2219.1
2.917.5
13.462.5
13.962.4
9.156.3
9.554.4
9.861.0
8.856.3
9.049.0
8.745.1
2.059.7
1.855.2
3.333.1
3.330.5
6.039.2
5.434.9
5.649.1
5.847.7
2.4232.4
2.428.7
3.0222.2
2.820.4
11.62
74.1
11.573.9
8,264.5
8.462.8
8.869.8
9.065.3
4.653.6
5.050.2
1.861.5
1.656,8
3.2236.3
3.333.9
5.945.2
5.640.5
4.153.2
4.051.7
2.034.4
1.730.5
3.0225.2
2.923.3
7.381.4
6.980.9
7.271.8
7.069.8
3.573.4
4.269.5
3.757,4
3.854.0
.862,4
,857.7
3.0239.4
3.137.1
5.650.9
5.345.8
2.1255.3
2.153.8
1.9236.3
1.131.6
2.527.7
2.325.7
2.283.6
2.083.0
3.9275.7
4.073.9
3.176.5
3.573.1
2.660.0
2.556.5
.663.0
.758.4
2.6242.0
2.339.4
2.453.3
2.648.5
1.556.8
1.655.4
1.2237.5
1.232.9
2.330.1
2.127.9
1.8285.5
1.984.9
2.177.8
2.176.1
2.378.9
2.775.8
1.9262.0
2.058.5
.663.7
.759.1
2.2244.2
2.341.8
2.155.5
2.350.9
1.4258.2
1.456.8
.9238.5
1.033.9
2.2232.3
2.230.1
1.887.3
1.886.8
1.5279.3
1.677.7
2.281.1
2.678.4
1.964.0
1.960.5
.6264.3
.659.7
1.8246.0
1.943.7
1.757.3
1.852.7
1.259.5
1.358.2
.9239.4
.934.9
2.134.5
2.232.3
1.6289.0
1.688.5
1.3280.6
1.479.2
1.883.0
2,180.6
1.965.9
2.162.6
,464.7
.460.2
1.6247.6
1.745,4
1.558.9
1.654.4
1.060.6
1.059.3
182Digitized for FRASER http://fraser.stlouisfed.org/ Federal Reserve Bank of St. Louis

77. Percentage of total assets and total deposits held by 10 largest banking organizations(all commercial banks and trust companies), by state—Continued
State and item1
Nebraska (451)Assets
Per organizationCumulative
DepositsPer organizationCumulative
Nevada (9)Assets
Per organizationCumulative
DepositsPer organizationCumulative
New Hampshire (60)Assets
Per organizationCumulative
DepositsPer organizationCumulative
New Jersey (137)Assets
Per organizationCumulative
DepositsPer organizationCumulative
New Mexico (66)Assets
Per organizationCumulative
DepositsPer organizationCumulative
New York (171)Assets
Per organizationCumulative
DepositsPer organizationCumulative . . . . . . .
North Carolina (78)Assets
Per organization .Cumulative, . . . . .
DepositsPer organizationCumulative
North Dakota (143)Assets
Per organizationCumulative
DepositsPer organization . .Cumulative
Ohio (306)Assets
Per organizationCumulative. . . . . . . . . . .
DepositsPer organizationCumulative
Oklahoma (494)AssetsPer organization . . .
Cumulative . . . .Deposits
Per organizationCumulative
Rank, by total assets
1 2 3 4 5 6 7 8 9 10
December 1980
8.18.1
.6.46.4
47.647.6
47.547.5
15.515.5
15.415.4
8.88.8
8.38.3
23.623.6
23.123.1
16.816.8
12.612.6
21.921.9
19.919.9
16.416.4
16.116.1
9.79.7
8.78.7
9.09.0
7.77.7
8.016.2
7.714.2
22.52
70.2
22.369.8
11.927.4
11.727.1
8.717.6
8.416.8
11.835.4
11.935.0
15.031.8
15.227.9
21.343.2
19.339.2
15.532.0
15.731.9
9.018.7
9.217.9
7.416.5
6.414.2
6.422.6
5.119.4
13.383.5
13.683.5
7.534.9
7.134.2
8.426.0
7.824.7
9.92
45.4
8.843.9
11.143.0
12.140.1
12.956,2
11.951.1
7.039.0
6.838.7
8.827.6
7.025.0
5.121.6
4.618.8
4.527.2
4.423.8
8.3291.9
8.191.6
7,242.1
7.341.6
7.133.2
6.931,7
7.352.7
7.551,4
10.753.7
9.950.0
7.663.8
8.359.5
2.7241.7
2.541,3
6.333.9
6.131.1
4.926.5
4.523.4
3.330.6
2.626.5
4.3296.2
4.496.1
4.8247,0
5.046.6
3.937.1
4.035.8
3.256.0
3.254.7
9.563.3
9.859.8
5.8269.6
6.566.0
2.544.2
2.443.8
5.639.6
4.835.9
2.729.3
2.526.0
1.1231,7
1.127,6
2.7298.9
2.898.9
3,4250.5
3.650.3
3.240.3
3.239.0
3.259.2
3.258,0
7.671.0
7,167.0
3.072.7
3.469.5
1.946.1
1.945.7
5.144.7
5.341.3
1,731.1
1.827.8
1.132.8
1.128,7
.4299.4
.499.4
3.2253,7
3.153.4
3.243.5
3.142.2
2.8262.0
2.960.9
4.575.5
4.971.9
2.975.6
3.272,8
1.848.0
1.947.6
5.049.7
4.946.2
1.632.8
1.729.5
.833.7
.929.7
.4299.8
.499.8
2.6256.4
2,555.9
3.0246.6
2.945.1
1,9264.0
1.962.9
4.179.7
4,676.6
2.378.0
2.775.5
1.4249.4
1.449,1
4.053.7
4.150.3
1.534.3
1.531.1
.834.5
.630.4
.199.9
,199.9
1.958.3
1.957.9
2.82
49.4
3.048.1
1,7265.7
1.764.6
2.882.5
3.279.9
2.3280.3
2.578.1
1.1250.5
1.150.2
3.457.2
3,153.5
1.135.4
.932.0
.835.3
.831.2
.0100.0
.0100.0
1.82
60.2
1.859.8
2.752.2
2.951.1
1.7267.5
1.866.5
1.684.2
1,681.5
1.7282.1
1.980.0
1.151.6
1.151.3
2.759.9
2.656.2
.936.4
.933.0
183Digitized for FRASER http://fraser.stlouisfed.org/ Federal Reserve Bank of St. Louis

77. Percentage of total assets and total deposits held by 10 largest banking organizations(all commercial banks and trust companies), by state—Continued
State and item1
Oregon (76)Assets
Per organizationCumulative
DepositsPer organizationCumulative
Pennsylvania (353)Assets
Per organization . .Cumulative
DepositsPer organizationCumulative . .
Rhode Island (14)Assets
Per organizationCumulative . . . .
DepositsPer organizationCumulative
South Carolina (85)Assets
Per organization . . . .Cumulative
DepositsPer organizationCumulative
South Dakota (137)Assets
Per organizationCumulative . .
DepositsPer organization . .Cumulative
Tennessee (306)Assets
Per organizationCumulative
DepositsPer organizationCumulative
Texas (1,178)Assets
Per organizationCumulative
DepositsPer organization . . . .Cumulative
Utah (58)Assets
Per organization . . . .Cumulative
DepositsPer organizationCumulative
Vermont (28)Assets
Per organization . . . .Cumulative
DepositsPer organizationCumulative. . ,
Virginia (174)Assets
Per organizationCumulative
DepositsPer organizationCumulative
Rank, by total assets
1 2 3 4 5 6 7 8 9 10
December 1980
36.636.6
33.733.7
13.913.9
12.212.2
42.042.0
41.541.5
20.320.3
19.119.1
23.023.0
23.023.0
12.012.0
11.511.5
10.210.2
9.09.0
28.628.6
27.727.7
16.92
16.9
17.117.1
14.114.1
13.613.6
33.570.2
34.368.1
7.021.0
6.218.5
25.767.8
23.965.4
13.433.7
13.432.5
17.140.1
17.040.0
8.720.8
8.019.6
8.819.1
8.117.1
21.049.6
20.648.3
13.42
30.3
13.230.4
11.025.1
10.724.4
7.677.8
7.775.9
6.027.0
4.723.2
23.491.2
25.190.6
13.2247.0
12.845.3
3.3243.5
3.243.2
7.828.6
7.827.5
8.627.8
8.125.3
11.260.9
11.159.5
13.1243.4
12.843.2
10.135.3
10.034.4
3.781.5
4.180.1
5.432.5
4.027.3
3.194.4
3.694.2
11.458.5
11.056.4
3.246.8
3.246.4
7.736.3
7.535.0
8.336.1
7.132.4
7.668.6
7.767.2
11.6255.1
•11.855.1
9.244.5
8.643.1
2.8284,4
3.083.1
4.537.1
3.931.2
2.396.8
2.296.5
5.964.4
6.362.7
3.049.9
3.149.6
4.941.3
4.239.2
4.640.8
4.236.7
6.274.8
6.373.5
8.663.8
8.563.7
9.053.6
8.551.6
1.2285.6
1.384.5
3.340.4
3,134.4
.897.6
.997.4
4.2268,6
4.567.3
1.851.7
1.851.5
3.444.7
3.242.5
3.544.3
3.340.0
3.8278.7
3.977.5
4.8268.6
4.868.5
7.861.5
7.459.0
1.0286.6
1.185.7
3.143.6
2.937.4
.598.2
.698,0
2.3271.0
2.469.8
1.853.6
1.653.1
3.147.9
3.045.6
3.047.3
2.842.9
3.181.8
3.280.8
4.1272.7
4,172.6
6.367.8
6.965.9
.9287.6
1.086.7
3.046.7
2.940.3
,498,6
.598.5
1.4272.4
1.571.4
1.655.3
1.754.9
2.6250.5
2,548.1
2.449.7
2.645.6
2.484.2
2.683.4
3.175.8
3.075.7
4.572.4
4.770.7
.8288.4
.987.6
2.3249.0
2.643.0
.399.0
.398.9
1.3273.7
1.472.8
1.656.9
1.656.5
2.2252.8
1.850.0
1.951.7
1.947.5
1.0285.3
1.184.5
2.8278,7
2.978.6
2.775.1
2.873.6
.689.1
.788.3
2.351.4
2.345.3
.2299.2
.399.2
1.3275.0
1.374.2
1.658.5
1.658.2
1.2254.0
1.251.3
1.753.4
1.849.3
.986.2
.985.5
I.?2
80.5
1,780.4
1.176.3
1.174.8
184Digitized for FRASER http://fraser.stlouisfed.org/ Federal Reserve Bank of St. Louis

77. Percentage of total assets and total deposits held by 10 largest banking organizations(all commercial banks and trust companies), by state—Continued
State and item1
Washington (99)Assets
Per organizationCumulative . .
DepositsPer organizationCumulative
West Virginia (236)Assets
Per organization . . .Cumulative
DepositsPer organization .Cumulative.
Wisconsin (497)Assets
Per organizationCumulative . . . .
DepositsPer organization
Wyoming (69)Assets
Per organization . . .Cumulative
DepositsPer organization . .Cumulative
United States (12,353)Assets
Per organization . . . . .Cumulative
DepositsPer organizationCumulative
Rank, by total assets
1 2 3 4 5 6 7 8 9 10
December 1980
39.039.0
36.936.9
4.924.9
3.73.7
16.016.0
13.313.3
16.216.2
16.016.0
4.04.0
4.04.0
19.358.3
18.655.6
2.92
7.8
2.66.3
9.125.1
8.321.6
13.029.3
12.928.9
2.97.0
1.85.9
8.566.9
8.664.2
2.5210.3
1.88.1
7.332.4
7.028.6
9.939.2
9.738.6
2.69.6
2.28.1
6.7273.7
7.171.4
2.42
12.7
2.210.3
2.334.8
2.431.0
4.243.4
4.242.9
1.911.5
1.79.9
6.179.8
6.377.7
1,9214.7
1.612.0
2.137.0
2.133.2
3.647.1
3.746.6
1.913.5
1.911.8
3.5283.3
3.881.6
1.7216.5
1.313.4
2.139.1
2.035.2
2.950.1
2.849.5
1.815.3
1,413.2
2.4285.8
2.784.3
1.7218.2
1.615.0
1,841.0
1.837.1
2.652.7
2.652.2
1.717.0
1.114.4
1.4287.3
1.685.9
1.720.0
1.416.4
1.642.6
1.638.7
2.655.4
2.754.9
1.618,7
1.415.8
1.4288.7
1.587.4
1.6221.6
1.718.1
1.644.3
1.740.4
2.5257.9
2.657.6
1.420.1
1.517.3
,9289.6
.988.4
1.423.1
1.419.5
1.445.7
1.541.9
1.759.6
1.859.4
1.321.5
1.018.4
185Digitized for FRASER http://fraser.stlouisfed.org/ Federal Reserve Bank of St. Louis

78. Banking offices, assets, and deposits of banks in holding company groups1
A. Summary totals and comparisons
Item
Banking officesTotal
BanksBranches
Amounts (millionsof dollars)
AssetsDeposits . . . . . . ,
Banking officesTotal
BanksBranches . . .
Amounts (millionsof dollars)
AssetsDeposits
50 states and District of Columbia
Holding companygroups
All commercialbanks
Holding companygroups aspercentage
of all commercialbanks
Type of branching
Statewide Limited Unit
December 31, 1980, domestic data only
29,9244,954
24,970
1,134,426840,591
53,23414,62138,613
1,530,6571,183,803
56.2
74.171.0
16,009811
15,198
613,402447,091
10,0841,7318,353
282,265214,247
3,8312,4121,419
238,759179,254
December 31, 1980, including foreign data
30,9024,954
25,948
1,455,4971,132,997
54,20414,62139,583
1,853,5291,477,982
57.0
78.576.7
16,717811
15,906
875,984682,964
10,2371,7318,506
302,619234,159
3,9482,4121,536
276,894215,874
B. Multibank and one-bank classifications -Summary
Classification
Total (3,056companies) . . .
MemberNonmember. . . .
MultibankMemberNonmember. . . .
One-bankMember, . . .Nonmember. . . .
All commercialbanks
Total (3, 056companies) . . .
Member :
Nonmember. . . .
MultibankMemberNonmember. . . .
One-bankMember. .Nonmember. . . .
All commercialbanks
Number
Holdingcompanygroups^
2,905
361
2,5444
Offices
Banks
4,9542,0852,869
2,4261,2491,177
2,528836
1,692
14,621
Branches3
December 31, 1980
24,97018,6396,331
12,8859,4633,422
12,0859,1762,909
38,613
Total
domestic data only
29,92420,7249,200
15,31110,7124,599
14,61310,0124,601
53,234
Amounts(in millions of dollars)
Assets
1,134,426949,109185,317
546,816454,004
92,812
587,609495,105
92,504
1,530,657
Deposits
840,591681,270159,322
407,090326,904
80,186
433,502354,366
79,136
1,183,803
December 31, 1980, including foreign data
2,905
361
2,5444
4,9542,0852,869
2,4261,2491,177
2,528836
1,692
14,621
25,94819,5816,367
13,3389,9053,433
12,6109,6762,934
39,583
30,90221,666
9,236
15,76411,1544,610
15,13810,5124,626
54,204
1,455,4971,265,329
190,168
674,884580,539
94,345
780,613684,790
95,823
1,853,529
1,132,997968,724164,273
522,977441,303
81,674
610,021527,421
82,599
1,477,982
186Digitized for FRASER http://fraser.stlouisfed.org/ Federal Reserve Bank of St. Louis

78. Banking offices, assets, and deposits of banks in holding company groups1—ContinuedC. Details by state
State, and class of bank
50 states and District ofColumbia-Total . .
MemberNonmember
AlabamaMemberNonmember
AlaskaMemberNonmember
ArizonaMemberNonmember
ArkansasMemberNonmember
CaliforniaMemberNonmember
Colorado . . .MemberNonmember
ConnecticutMemberNonmember . .
DelawareMemberNonmember
District of ColumbiaMemberNonmember
FloridaMemberNonmember
GeorgiaMemberNonmember
HawaiiMemberNonmember
IdahoMember . .Nonmember
IllinoisMemberNonmember
IndianaMemberNonmember
Number Numberof of
holding holdingcom- company
panics5 groups2'5
Number of offices
Banks Branches
Banks and branches
Total
December 31, 1980
3,0566 2,9056
18 18
4 3
4 4
31 29
54 43
117 112
9 9
3 2
5 3
69 62
45 40
4 4
7 7
290 283
49 46
4,9542,0852,869
914843
413
413
331518
471136
21011496
1459
211
330
309152157
782355
404
835
28398
185
471928
24,97018,6396,331
407304103
1459
22115170
1288543
3,7773,090
687
936132
426211215
716
81810
905509396
505372133
1370
137
14510936
1789682
376238138
29.92420,7249,200
498352146
186
12
22515273
16110061
3,8243,101
723
303175128
440216224
927
84840
1,214661553
583395188
1410
141
15311241
461194267
423257166
As a per-centage
of allcom-
mercialbankingoffices
Assets
Inmillions
ofdollars
As a per-centage
of allcom-
mercialbankassets
Deposits
Inmillions
ofdollars
As a per-centage
of allcom-
mercialbank
deposits
domestic data only
56.269.139.6
52.665.835.4
14.47.1
29.3
39.542.334.6
23.736.015.3
83.294.555.1
55.170.042.7
65.868.663.3
5.416.74.5
50.050.9
0
69.480.059.8
44.771.325.1
75.40
80.6
56.054.461.2
25.725.825.6
27.634.321.2
1,134,426949,109185,317
10,5298,2502,278
40073
327
5,1863,6781,508
3,5042,574
930
160,888143,419
17,469
13,71811,3302,388
10,4836,2974,185
571740
3,5583,558
0
37,50224,13913,364
13,86211,4692,394
4,3450
4,345
2,6631,991
672
76,64266,28410,358
12,3728,8513,522
74.183.547.0
62.472,741.2
17.84.6
48.4
38.939.437.9
31.642.318.6
91.597.959.5
82.787.964.5
77.283.569.3
1.518.31.1
48.949.3
0
78.687.366.6
60.681.627.2
84.10
86.9
52.147.474.4
68.778.338.4
38.345.427.6
840,591681,270159,322
8,4916,6311,860
32362
261
4,4223,0901,332
2,8502,063
787
124,334109,197
15,137
11,2869,1742,111
8,5385,0523,487
501634
2,6982,698
0
31,22119,44911,772
10,6468,5532,094
3,7870
3,787
2,2211,643
579
50,77841,756
9,022
9,3726,4322,940
71.080.846.8
60.270.939.2
18.45.2
46.9
39.039.338.5
30.040.417.9
90.597.759.3
82.587.167.1
76.182.468.5
1.718.8
1.2
48.448.8
0
77.686.466.5
57.479.326.9
84.10
.87.0
52.147.273.7
62.672.638.3
35.141.426.4
187Digitized for FRASER http://fraser.stlouisfed.org/ Federal Reserve Bank of St. Louis

78. Banking offices, assets, and deposits of banks in holding company groups1—ContinuedC. Details by state-Continued
State, and class of bank
IowaMember . ,Nonmember
KansasMemberNonmember
KentuckyMember .Nonmember
LouisianaMemberNonmember
Maine . . . .MemberNonmember
MarylandMemberNonmember . . .
MassachusettsMember . . . . .Nonmember
MichiganMemberNonmember.
MinnesotaMemberNonmember . . . . .
MississippiMember . . . .Nonmember
MissouriMemberNonmember
MontanaMemberNonmember
NebraskaMemberNonmember
NevadaMemberNonmember .
New HampshireMemberNonmember
New JerseyMemberNonmember. . .
Numberof
holdingcom-
panies5
Numberof
holdingcompanygroups2^5
Number of offices
Banks Branches
Banks and branches
Total
As a per-centage
of allcom-
mercialbankingoffices
Assets
Inmillions
ofdollars
As a per-centage
of allcom-
mercialbankassets
Deposits
Inmillions
ofdollars
As a per-centage
of allcom-
mercialbank
deposits
December 31, 1980, domestic data only-Continued
248
299
30
32
7
13
28
42
228
15
172
38
256
3
9
17
232
291
30
31
7
9
26
38
224
15
161
37
249
2
9
17
30675
231
29385
208
311219
321121
239
14
249
15
774235
18010476
360147213
144
10
39392
301
814932
25476
178
220
23158
493415
381150231
19310192
23020129
21211993
23797
140
654384270
760392368
1,5541,224
330
19311479
17113338
29889
209
2722
5
24519451
95950
694920
867703164
687225462
486186300
261213
48
244130114
260106154
678393285
837434403
1,7341,328
406
553261292
18513748
691181510
1087137
499270229
97970
926428
916737179
56.167.651.9
54.459.851.5
23.546.0
7.4
22.631.117.3
74.362.785.1
64.976.054.1
76.675.677.6
68.373.954.8
53.468.744.6
21.141.18.8
59.168.856.3
53.256.847.4
66.879.956.0
63.878.9
0
39.045.429.5
52.156.639.3
12,9946,5086,487
9,4944,5814,913
7,1886,597
592
8,4326,0422,390
2,5611,0061,556
12,0367,2014,835
26,65719,7636,894
40,00034,8405,160
24,47418,9845,490
3,8183,352
467
27,64416,39711,247
3,6942,929
765
8,7365,9422,794
2,2952,295
0.
1,4581,068
389
20,40117,2573,144
59.867.153.9
57.257.357.1
37.161.56.8
33.945.420.6
73.960.286.7
75.183.265.5
90.493.882.0
77.483.552.1
79.789.857.3
33.360.5
7.9
80.190.168.9
69.574.156.1
75.984.262.8
61.072.6
0
44.257.826.9
57.062.538.4
10,9005,1275,772
8,0093,6864,323
5,3704,839
530
6,8304,8162,014
2,123819
1,304
9,7265,6014,125
19,25613,4195,838
31,42626,8024,624
18,83913,9124,927
3,0232,603
421
20,89411,1599,825
3,1692,480
690
7,1484,6552,493
1,9561,956
0
1,259921339
16,77914,0492,730
59.065.954.0
56.956.956.9
33.556.9
7,0
32.343.819.8
73.359.386.1
73.381.264,8
89.092.382.3
75.381.552.4
77.288.157.2
30.957.18.0
77.787.668.9
68,672.956.5
74.682.663.2
61.272.8
0
43.657.626.2
55.961,438.3
188Digitized for FRASER http://fraser.stlouisfed.org/ Federal Reserve Bank of St. Louis

78. Banking offices, assets, and deposits of banks in holding company groups1—ContinuedC. Details by state-Continued
State, and class of bank
New MexicoMemberNonmember
New YorkMemberNonmember
North CarolinaMemberNonmember
North DakotaMemberNonmember
OhioMemberNonmember
OklahomaMemberNonmember
OregonMember . ,Nonmember
PennsylvaniaMemberNonmember
Rhode IslandMemberNonmember
South CarolinaMemberNonmember
South DakotaMemberNonmember
TennesseeMemberNonmember
TexasMemberNonmember
UtahMemberNonmember
VermontMemberNonmember '
Virginia .MemberNonmember . . . . .
Numberof
holdingcom-
panies5
Numberof
holdingcompanygroups2-5
Number of offices
Banks Branches
Banks and branches
Total
As a per-centage
of allcom-
mercialbankingoffices
Assets
Inmillions
ofdollars
As a per-centage
of allcom-
mercialbankassets
Deposits
Inmillions
ofdollars
As a per-centage
of allcom-
mercialbank
deposits
December 31, 1980, domestic data only- Continued
18
68
10
51
28
205
5
27
10
5
40
31
264
20
3
15
17
43
10
50
28
196
5
27
10
5
40
30
256
20
3
13
402317
855332
1156
822260
1057629
19985
114
1046
291613
1046
532
552728
743044
543278265
391722
303
705614
1388355
3,1242,872
252
1,074690384
763541
1,4941,329
165
16311944
440350
90
1,017727290
21711899
380306
74
12810325
498326172
1375087
25721542
470
47
1,4171,305
112
17810672
3,2092,925
284
1,085695390
15857
101
1,5991,405
194
362204158
450354
96
1,046743303
227122105
38530976
18313053
572356216
680328352
296232
64
500
50
1,4871,361
126
53,358,247.4
87.688.975.9
59.680.140.9
51.662.047.2
61.064.045.5
47,952.043.5
67.995.233.0
35.843.724.7
91.598.484.7
47.375.618.8
57.471.438.7
41.365.825.6
39.242.936.3
81.191.058.2
25.50
36.2
90.6101.042.9
3,6192,3711,248
260,402249,201
11,201
17,44413,9853,458
2,9191,5321,386
39,88337,2042,679
15,73512,0273,708
10,6059,1411,464
45,48637,9277,559
6,5774,7171,860
3,9123,454
458
3,5162,885
631
13,25510,4502,805
76,93960,97215,967
5,7254,790
935
6900
690
24,59922,923
1,676
59.359.758,4
96.697.875.9
74.889.045.5
54.768.944.6
72,575.248.1
68.876.152.6
82.697.941.8
55.968,728,8
99.199.797.4
51.279.813.8
69.177.146.9
55.977.327.5
69.577.250.3
85.591.364.6
28.70
38.4
102.0110.749.1
3,1342,0321,102
167,029158,772
8,257-
13,01410,0302,985
2,5741,3501,225
29,27627,020
2,257
12,9329,6393,294
8,4927,2411,252
31,55325,530
6,023
5,0843,5291,555
3,1692,759
410
3,1322,565
567
10,6858,2122,473
59,56245,48514,077
4,7853,981
804
6250
625
20,04018,554
1,486
59.460.158.2
96.297.182.2
71.987.245,3
56.968.947.7
69.071.847.0
67.074.052.5
81.297f741.0
50.262.727.1
99,099.797.3
50.178.714.5
69.177.246.8
54.076.127.5
66.674.250.0
84.991.063.9
28.90
38.7
99.5108.449.0
189Digitized for FRASER http://fraser.stlouisfed.org/ Federal Reserve Bank of St. Louis
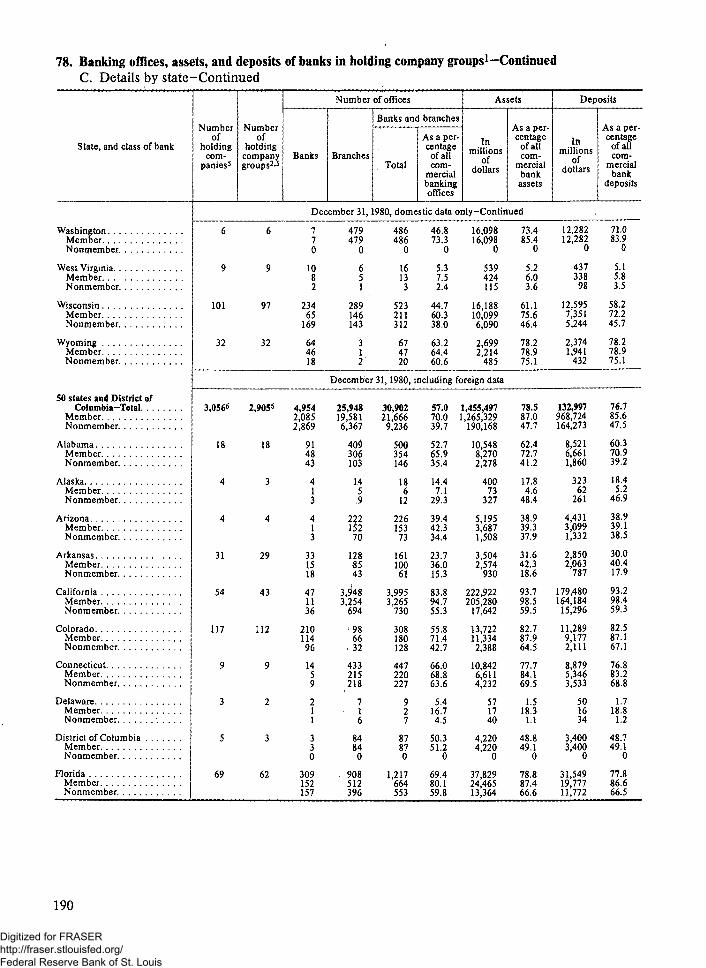
78. Banking offices, assets, and deposits of banks in holding company groups1—ContinuedC. Details by state-Continued
State, and class of bank
WashingtonMemberNonmember
West VirginiaMemberNonmember
WisconsinMemberNonmember
WyomingMember . . . . .Nonmember
50 states and District ofColumbia— Total .
MemberNonmember
AlabamaMemberNonmember. . .
AlaskaMemberNonmember
ArizonaMember . .Nonmember
ArkansasMemberNonmember
CaliforniaMemberNonmember .
Colorado . ,Member. . . .Nonmember. . .
ConnecticutMemberNonmember. . .
DelawareMemberNonmember
District of ColumbiaMemberNonmember
FloridaMember . .Nonmember
Number Numberof of
holding holdingcom- company
panics5 groups2-5
Number of offices
Banks Branches
Banks and branches
Total
As a per-centage
of allcom-
mercialbankingoffices
Assets
Inmillions
ofdollars
As a per-centage
of allcom-
mercialbankassets
Deposits
Inmillions
ofdollars
As a per-centage
of allcom-
mercialbank
deposits
December 31, 1980, domestic data only- Continued
6 6
9 9
101 97
32 32
770
1082
23465
169
644618
479479
0
65 '1
289146143
312
486486
0
16133
523211312
674720
46.873,3
0
5.37.52.4
44.760.338.0
63.264.460.6
16,09816,098
0
539424115
16,18810,0996,090
2,6992,214
485
73.485,4
0
5.26.03.6
61.175.646.4
78.278.975.1
12,28212,282
0
43733898
12,5957,3515,244
2,3741,941
432
71.083.9
0
5.15.83.5
58.272,245.7
78.278,975.1
December 31, 1980, including foreign data
3,0566 2,905^
18 18
4 3
4 4
31 29
54 43
117 112
9 9
3 2
5 3
69 62
4,9542,0852,869
914843
413
413
331518
471136
21011496
1459
211
330
309152157
25,94819,5816,367
40$306100
1.45,9
22215270
1288543
3,9483,254
694
'9866
, 32
433'215218
716
84840
908512
, 396
30,90221,666
9,236
500354146
186
12
22615373
16110061
3,9953,265
730
308180128
447220227
927
87870
1,217664553
57.0 1,455,49770.0 1,265,32939.7 190,168
52.7 10,54865.9 8,27035.4 2,278
14.4 4007.1 73
29.3 327
39.4 5,19542.3 3,68734.4 1,508
23.7 3,50436.0 2,57415.3 930
83.8 222,92294.7 205,28055.3 17,642
55.8 13,72271.4 11,33442.7 2,388
66.0 10,84268.8 6,61163.6 4,232
5.4 5716.7 174.5 40
50.3 4,22051.2 4,220
0 0
69.4 37,82980.1 24,46559.8 13,364
78,587.047.7
62.472.741.2
17.84.6
48.4
38.939.337.9
31.642.318.6
93.798.559.5
82.787.964.5
77.784.169.5
1.518.31.1
48.849,1
0
78.887.466.6
132,997968,724164,273
8,5216,6611,860
32362
261
4,4313,0991,332
2,8502,063
787
179,480164,18415,296
11,2899,1772,111
8,8795,3463,533
501634
3,4003,400
0
31,54919,77711,772
76.785.647.5
60.370.939.2
18.45.2
46.9
38.939.138.5
30.040.417.9
93.298.459.3
82.587.167.1
76.883.268.8
1.718.81.2
48.749.1
0
77.886.666.5
190
Digitized for FRASER http://fraser.stlouisfed.org/ Federal Reserve Bank of St. Louis

78. Banking offices, assets, and deposits of banks in holding company groups1—ContinuedC. Details by state-Continued
State, and class of bank
GeorgiaMemberNonmember
HawaiiMemberNonmember
IdahoMemberNonmember
IllinoisMember . . .Nonmember
IndianaMemberNonmember
IowaMemberNonmember
KansasMemberNonmember
KentuckyMemberNonmember
Louisiana . . .MemberNonmember
MaineMemberNonmember
MarylandMember.Nonmember
MassachusettsMemberNonmember
MichiganMemberNonmember
MinnesotaMemberNonmember
MississippiMemberNonmember
MissouriMemberNonmember
Numberof
holdingcom-
panies5
Numberof
holdingcompanygroups2'5
Number of offices
Banks Branches
Banks and branches
Total
As a per-centage
of allcom-
mercialbankingoffices
Assets
Inmillions
ofdollars
As a per-centage
of allcom-
mercialbankassets
Deposits
Inmillions
ofdollars
As a per-centage
of allcom-
mercialbank
deposits
December 31, 1980, including foreign data-Continued
45
4
7
290
49
248
299
30
32
7
13
28
42
228
15
172
40
4
7
283
46
232
291
30
31
7
9
26
38
224
15
161
782355
404
835
28398
185
471928
30675
231
29385
208
311219
321121
239
14
249
15
774235
18010476
360147213
144
10
39392
301
513380133
1490
149
14510936
25517382
381243138
382151231
19310192
232203
29
21512293
23797
140
660389271
817449368
1,5661,236
330
19912079
17213438
30495
209
591403188
1530
153
15311241
538271267
428262166
688226462
486186300
26321548
247133114
260106154
684398286
894491403
1,7461,340
406
559267292
18613848
697187510
45.171.725.1
76.90
81.8
56.054.461.2
28.732.725.6
27.834.721.2
56.267.751.9
54.459.851.5
23.646.2
7.4
22.831.617.3
74.362.785.1
65.176.254.2
77.777.877.6
68.474.054.8
53.769.244.6
21.241.3
8.8
59.369.556.3
14,26611,7822,394
4,6120
4,612
2,6631,991
672
106,23795,87910,358
12,8179,2953,522
13,0126,5256,487
9,4944,5814,913
7,2586,667
592
8,4836,0932,390
2,5611,0061,556
12,5487,7134,835
33,38526,491
6,894
41,73836,5785,160
25,57620,0865,490
3,8253,358
467
28,04316,79611,247
61.382.127.2
84.90
87.5
52.147.474.4
75.283.938.4
39.246.627.6
59.867.253.9
57.257.357.1
37.361.76.8
34.045.620.6
73.960.286.7
75.884.165.5
92.295.382.0
78.284.152.1
80.490.357.3
33.360.5
7.9
80.390.368.9
10,9858,8922,094
4,0940
4,094
2,2211,643
579
78,89869,8769,022
9,8016,6822,940
10,9165,1445,772
8,0093,6864,323
5,4294,899
530
6,8814,8672,014
2,123819
1,304
10,2276,1004,127
25,40219,5645,838
33,07528,4514,624
19,91614,9894,927
3,0282,607
421
21,37211,5489,825
58.180.026.9
85.10
87.9
52.147.273.7
72.281.638.3
36.243.026.4
59.066.054.0
56.956.956.9
33.757.27.0
32,544.119.8
73.359.386.1
74.382.464.8
91.594.682.3
76.382.452.4
78.188.857.2
30.957.1
8.0
78.088.068.9
191Digitized for FRASER http://fraser.stlouisfed.org/ Federal Reserve Bank of St. Louis

78. Banking offices, assets, and deposits of banks in holding company groups1—ContinuedC. Details by state-Continued
State, and class of bank
Montana .Member .Nonmember
NebraskaMemberNonmember.
NevadaMember. . . . >Nonmember
New HampshireMember . . . . .Nonmember
New JerseyMember . . .Nonmember
New MexicoMemberNonmember
New YorkMemberNonmember
North CarolinaMember. . . . . , . .Nonmember
North Dakota , , . .• Member
Nonmember
OhioMemberNonmember
OklahomaMemberNonmember.
Oregon . , . . .MemberNonmember. . . . *
PennsylvaniaMemberNonmember . i
Rhode Island .MemberNonmember
South CarolinaMemberNonmember.
South DakotaMemberNonmember
Numberof
holdingcom-
panies5
Numberof
holdingcompanygroups2*5
Number of offices
Banks Branches
Banks and branches
Total
As a per-centage
of allcom-
mercialbankingoffices
Assets
Inmillions
ofdollars
As a per-centage
of allcom-
mercialbankassets
Deposits
Inmiltions
ofdollars
As a per-centage
of allcom-
mercialbank
deposits
December 31, 1980, including foreign data-Continued
38
256
3
9
17
18
68
10
51
28
205
5
27
10
5
40
37
249
1
9
17
17
43
10
50
28
196
5
27
10
5
40
814932
25476
178
220
23158
493415
402317
855332
1156
822260
1057629
19985
114
1046
291613
1046
532
552728
2722
5
24519451
9595
0
694920
874710164
1388355
3,5783,316
262
1,083698385
763541
1,5071,342
165
16712344
444354
90
1,051759292
22012199
382308
74
12810325
1087137
499270229
9797
0
926428
923744179
17810672
3,6633,369
294
1,094703391
15857
101
1,6121,418
194
366208158
454358
96
1,080775305
230125105
387311
76
18313053
53.256.847.4
66.879.956.0
63.878.9
0
39.045.429.5
52.356.839.3
53.358.247.4
88.990.276.4
59.880.341.0
51.662.047.2
61.264.245.5
48.252.543.5
68.195.233.0
36.544.824.8
95.898.492.9
47.475.718.8
57.471.438.7
3,6942,929
765
8,7365,9422,794
2,2952,295
0
1,4581,068
389
20,72817,5843,144
3,6192,3711,248
453,800438,278
15,522
19,78716,3293,458
2,9191,5321,386
41,13038,451
2,679
15,74412,0363,708
10,7259,2611,464
53,60746,005
7,602
6,9085,0481,860
3,9133,455
458
3,5162,885
631
69.574.156.1
75.984,262.8
61.072,6
0
44.257.826,9
57.462.938.4
59.359.758.4
97.898.580.7
77.190.445.5
54.768.944.6
73.175.848.1
68.976.152.6
82.797.941.8
59.972.728.9
99.199.897.4
51.379.813.8
69.177.146.9
3,1692,480
690
7,1484,6552,493
1,9561,956
0
1,259921339
17,09614,3672,730
3,1342,0321,102
341,000328,385
12,615
15,18912,2042,985
2,5741,3501,225
30,58828,332
2,257
13,0209,7263,294
8,6067,3551,252
39,86433,762
6,102
5,4353,8801,555
3,1692,759
410
3,1322,565
567
68,672,956.5
74,682,663,2
61,272.8
0
43.657,626.2
56.361.938.3
59,460.158.2
97.998.386.6
74.989.245.3
56.968.947.7
70.072.847.0
67.274.252.5
81.497.841.0
56.069.027.4
99.099.897.3
50.178.714.5
69.177.246.8
192Digitized for FRASER http://fraser.stlouisfed.org/ Federal Reserve Bank of St. Louis

78. Banking offices, assets, and deposits of banks in holding company groups1—ContinuedC. Details by state-Continued
State, and class of bank
TennesseeMemberNonmember
TexasMemberNonmember
UtahMemberNonmernber
VermontMemberNonmember
VirginiaMemberNonmember
WashingtonMember . .Nonmember
West VirginiaMemberNonmember
WisconsinMemberNonmember
WyomingMemberNonmember
Numberof
holdingcom-
panies5
Numberof
holdingcompanygroups2^
Number of offices
Banks Branches
Banks and branches
Total
As a per-centageof allcom-
mercialbankingoffices
Assets
Inmillions
ofdollars
As a per-centage
of allcom-
mercialbankassets
Deposits
Inmillions
ofdollars
As a per-centage
of allcom-
mercialbank
deposits
December 31, 1980, including foreign data-Continued
31
264
20
3
15
6
9
101
32
30
256
20
3
13
6
9
97
32
743044
543278265
391722
303
705614
770
1082
23465
169
644618
503331172
1627587
258216
42
470
47
1,4271,315
112
494494
0
651
293150143
312
577361216
705353352
297233
64
500
50
1,4971,371
126
501501
0
16133
527215312
674720
41.566.125.6
40.044.736.3
81.191.058.2
25.50
36.2
90.9101,342.9
47.573.9
0
5.37.52.4
44.960.738.0
63.264.460.6
13,34710,5422,805
85,06869,10115,967
5,7774,842
935
6900
690
24,72123,045
1,676
17,81617,816
0
539424115
16,50310,4136,090
2,6992,214
485
56.177.527.5
71.679.350.3
85.791.464.6
28770
38.4
102.2110.949.1
75.486.6
0
5.26.03.6
61.676.246.4
78.278.975.1
10,7628,2892,473
67,58453,50714,077
4,8364,033
804
6250
625
20,15518,668
1,486
13,72813,728
0
437338
98
13,0087,7645,244
2,3741,941
432
54.176.227.5
69.377.250.0
85.191.163.9
28.90
38.7
99.7108.649.0
73.285.4
0
5.15.83.5
59.073.345.7
78.278.975.1
193
Digitized for FRASER http://fraser.stlouisfed.org/ Federal Reserve Bank of St. Louis

78. Banking offices, assets, and deposits of banks in holding company groups1—ContinuedD. Multibank, one-bank, and all commercial bank comparisons by state7
State, and type ofholding company
50 states and Districtof Columbia-Total
MultibankOne-bank
AlabamaMultibank . . .One-bank
AlaskaMultibankOne-bank
ArizonaMultibankOne-bank
ArkansasMultibankOne-bank
CaliforniaMultibankOne-bank.
ColoradoMultibankOne-bank
Connecticut . . . .MultibankOne-bank
DelawareMultibank . . . . .One-bank
District ofColumbia . . . .
MultibankOne-bank
FloridaMultibankOn»e-bank
GeorgiaMultibankOne-bank
HawaiiMultibankOne-bank
IdahoMultibankOne-bank. . . .
IllinoisMultibankOne-bank
IndianaMultibankOne-bank
Type Nu£ber
bISh- £2%B groups2-5
Number of offices
Holding companies
Banks Branches Total
AH commercial banks
Banks
December 31, 1980,
2,9056361
2,544
L 1899
S 312
S 413
L 292
27
S 438
35
U 1121597
S 936
S 202
S 312
S 622636
L 401030
S 413
S 734
U 2833
280
L 461
45
4,9542,4262,528
91829
422
413
336
27
471334
21011496
1486
202
312
309273
36
784929
413
844
2836
277
472
45
24,97012,88512,085
407395
12
1468
22115170
1283098
3,777673
3,104
936726
426126300
707
812259
90581491
50542481
13714
123
145126
19
1782
176
37614
362
29,92415,31114,613
498477
21
188
10
22515273
16136
125
3,824686
3,138
303181122
440134306
909
842361
1,2141,087
127
583473110
14115
126
15313023
4618
453
42316
407
14,621
318
12
31
261
289
438
64
20
17
562
435
11
26
1,257
405
Branches Total
Amounts (millions of dollars)
Assets
Holdingcom-
panies
All com-mercialbanks
Deposits
Holdingcom-
panies
All com-mercialbanks
domestic data only
38,613
629
113
539
417
4,306
112
605
148
151
1,188
868
176
247
539
1,129
53,234
947
125
570
678
4,595
550
669
168
168
1,750
1,303
187
273
1,796
1,534
1,134,4261,530,657 840,591546,816 407,090587,609 433,502
10,529 16,883 8,49110,279 8,281
250 210
400 2,251 323173 137227 186
5,186 13,325 4,4223,678 3,0901,508 1,332
3,504 11,091 2,8501,034 8132,470 2,037
160,888 175,826 124,33422,427 17,511
138,460 106,824
13,718 16,587 11,28611,174 9,0582,544 2,227
10,483 13,586 8,5382,500 2,1337,983 6,406
57 3,686 500 0
57 50
3,558 7,272 2,698661 529
2,896 2,169
37,502 47,709 31,22133,494 27,7644,009 3,456
13,862 22,862 10,64612,713 9,647
1,150 1,000
4,345 5,163 3,787399 366
.3,946 3,421
2,663 5,106 2,2212,353 1,954
310 267
76,642 111,624 50,778450 402
76,192 50,377
12,372 32,281 9,372387 342
11,986 9,030
1,183,803
14,101
1,757
11,334
9,498
137,333
13,682
11,214
2,903
5,576
40,228
18,555
4,502
4,262
81,098
26,683
194Digitized for FRASER http://fraser.stlouisfed.org/ Federal Reserve Bank of St. Louis
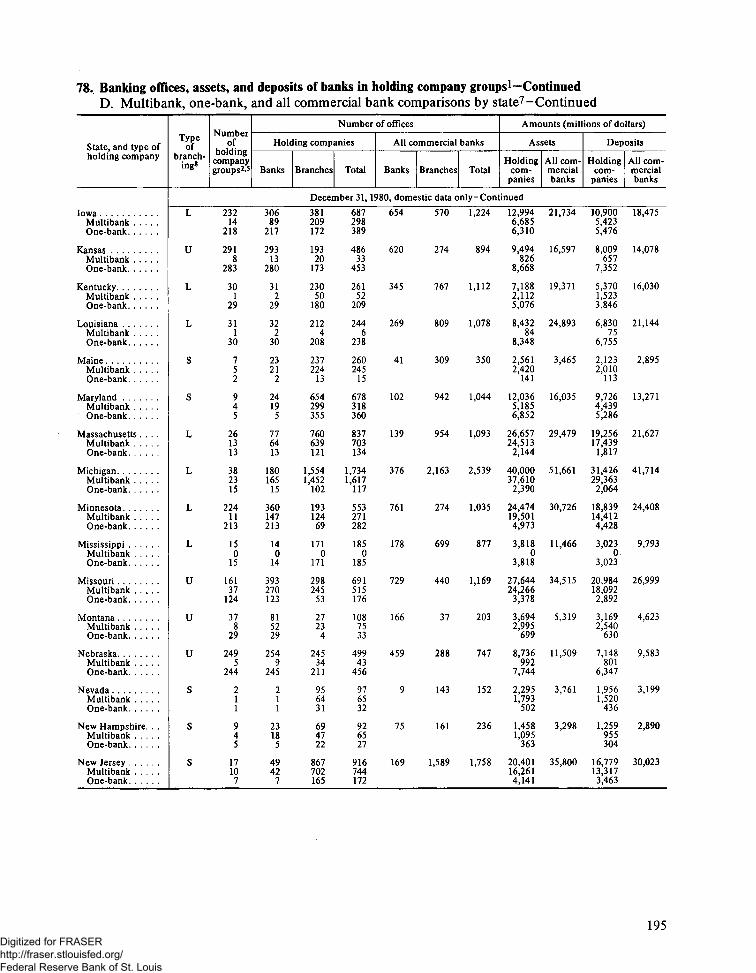
78. Banking offices, assets, and deposits of banks in holding company groups1—ContinuedD. Multibank, one-bank, and all commercial bank comparisons by state7-Continued
State, and type ofholding company
IowaMultibankOne-bank
KansasMultibankOne-bank
KentuckyMuttibankOne-bank.
LouisianaMultibankOne-bank
MaineMultibankOne-bank
MarylandMultibankOne-bank
Massachusetts . . . .MultibankOne-bank
MichiganMultibankOne-bank
MinnesotaMultibankOne-bank
MississippiMultibankOne-bank
Missouri . .. . . . .MultibankOne-bank
MontanaMultibankOne-bank
NebraskaMultibankOne-bank
NevadaMultibankOne-bank
New Hampshire. . .MultibankOne-bank
New JerseyMultibankOne-bank
Typeof
branch-ing8
Numberof
holdingcompanygroups2-*
Number of offices
Holding companies
Banks Branches Total
All commercial
Banks Branches
banks
Total
Amounts (millions of dollars)
Assets
Holdingcom-
panies
All com-mercialbanks
Deposits
Holdingcom-
panies
All com-mercialbanks
December 31, 1980, domestic data only- Continued
L
U
L
L
S
s
L
L
L
L
U
U
U
S
s
s
23214
218
2918
283
301
29
311
30
752
945
261313
382315
22411
213
150
15
16137
124
378
29
2495
244
211
945
17107
30689
217
29313
280
312
29
322
30
2321
2
24195
776413
180165
15
360147213
140
14
393270123
815229
2549
245
211
23185
4942
7
381209172
19320
173
23050
180
2124
208
237224
13
654299355
760639121
1,5541,452
102
19312469
1710
171
298245
53
27234
24534
211
956431
694722
867702165
687298389
48633
453
26152
209
2446
238
260245
15
678318360
837703134
1,7341,617
117
553271282
1850
185
691515176
1087533
49943
456
976532
926527
916744172
654
620
345
269
41
102
139
376
761
178
729
166
459
9
75
169
570
274
767
809
309
942
954
2,163
274
699
440
37
288
143
161
1,589
1,224
894
1,112
1,078
350
1,044
1,093
2,539
1,035
877
1,169
203
747
152
236
1,758
12,9946,6856,310
9,494826
8,668
7,1882,1125,076
8,43284
8,348
2,5612,420
141
12,0365,1856,852
26,65724,5132,144
40,00037,610
2,390
24,47419,5014,973
3,8180
3,818
27,64424,266
3,378
3,6942,995
699
8,736992
7,744
2,2951,793
502
1,4581,095
363
20,40116,2614,141
21,734
16,597
19,371
24,893
3,465
16,035
29,479
51,661
30,726
11,466
34,515
5,319
11,509
3,761
3,298
35,800
10,9005,4235,476
8,009657
7,352
5,3701,5233,846
6,83075
6,755
2,1232,010
113
9,7264,4395,286
19,25617,439
1,817
31,42629,363
2,064
18,83914,4124,428
3,0230,
3,023
20,98418,0922,892
3,1692,540
630
7,148801
6,347
1,9561,520
436
1,259955304
16,77913,3173,463
18,475
14,078
16,030
21,144
2,895
13,271
21,627
41,714
24,408
9,793
26,999
4,623
9,583
3,199
2,890
30,023
195Digitized for FRASER http://fraser.stlouisfed.org/ Federal Reserve Bank of St. Louis

78. Banking offices, assets, and deposits of banks in holding company groups1—ContinuedD. Multibank, one-bank, and all commercial bank comparisons by state7-Continued
State, and type ofholding company
New MexicoMultibankOne-bank
New YorkMultibankOne-bank
North Carolina . . .MultibankOne-bank
North Dakota . . . .MultibankOne-bank , .
OhioMultibankOne-bank
OklahomaMultibankOne-bank
Oregon . . .MultibankOne-bank
PennsylvaniaMultibankOne*bank
Rhode IslandMultibankOne-bank t
South Carolina . . .MultibankOne-bank
South Dakota . . . .MultibankOne-bank
TennesseeMultibankOne*bank
TexasMultibank . . . .One-bank
UtahMultibankOne-bank
Vermont ,MultibankOne-bank
Virginia.Multibank .One-bank
Typeof
branch-ings
Numberof
holdingcompanygroups2'5
Number of offices
Holding companies
Banks Branches Total
All commercial banks
Banks Branches Total
Amounts (millions of dollars)
Assets
Holdingcom-
panies
All com-mercialbanks
Deposits
Holdingcom-
panies
All com-mercialbanks
December 31, 1980, domestic data only Continued
L
S
S
U
L
U
S
L
S
S
S
L
U
S
S
S
175
12
431726
1019
505
45
281315
1963
193
541
272
25
100
10
505
405
35
301119
25644
212
206
14
303
13121
402812
856025
1129
823745
1059015
1996
193
1091
294
25
100
10
505
552035
745519
543334209
392514
303
7069
1
13810830
3,1241,5501,574
1,07480
994
764630
1,4941,230
264
1634
159
440433
7
1,0172
1,015
2170
217
3800
380
1287850
498356142
13710334
25717879
470
47
1,4171,316
101
17813642
3,2091,6101,599
1,08582
1,003
1588375
1,5991,320
279
36210
352
450441
8
1,0466
1,040
2270
221
3850
385
1839885
572411161
680437243
296203
93
500
50
1,4871,385
102
90
223
80
178
385
495
81
360
14
85
153
352
1,469
77
29
230
244
3,440
1,741
128
2,238
260
582
2,565
234
729
166
1,033
267
288
167
1,411
334
3,663
1,821
306
2,623
755
663
2,925
248
814
319
1,385
1,736
365
196
1,641
3,6192,876
743
260,402120,498139,904
17,444679
16,765
2,9191,8761,043
39,88334,086
5,797
15,735496
15,240
10,60510,518
87
45,48692
45,395
6,5770
6,577
3,9120
3,912
3,5162,3321,184
13,25510,3292,926
76,93968,611
8,328
5,7254,5801,146
6900
690
24,59922,377
2,223
6,107
269,627
23,321
5,333
55,037
22,857
12,847
81,436
6,638
7,634
5,085
23,712
110,759
6,693
2,401
24,117
3,1342,481
653
167,02974,36692,663
13,014593
12,421
2,5741,642
932
29,27624,6584,618
12,932419
12,513
8,4928,417
76
31,55380
31,473
5,0840
5,084
3,1690
3,169
3,1322,0781,054
10,6858,3652,320
59,56252,1547,409
4,7853,789
996
6250
625
20,04018,290
1,750
5,273
173,556
18,095
4,523
42,417
19,296
10,464
62,898
5,136
6,325
4,535
19,798
89,463
5,635
2,166
20,142
196Digitized for FRASER http://fraser.stlouisfed.org/ Federal Reserve Bank of St. Louis

78. Banking offices, assets, and deposits of banks in holding company groups1—ContinuedD. Multibank, one-bank, and all commercial bank comparisons by state7-Continued
State, and type ofholding company
WashingtonMultibankOne-bank
West VirginiaMultibankOne-bank . . . .
WisconsinMultibankOne-bank . . .
WyomingMultibankOne-bank
Typeof
branch-ing8
Numberof
holdingcompanygroups2'5
Number of offices
Holding companies
Banks Branches Total
All commercial banks
Banks Branches Total
Amounts (millions of dollars)
Assets
Holdingcom-
panies
All com-mercialbanks
Deposits
Holdingcom-
panies
All com-mercialbanks
December 31, 1980, domestic data only- Continued
S
U
L
U
624
918
972671
321022
734
1028
23416371
644321
479158321
624
289239
50
321
486161325
164
12
523402121
674522
101
237
641
103
938
64
529
3
1,039
301
1,170
106
16,0983,234
12,865
53933
506
16,18814,260
1,928
2,6991,882
817
21,922
10,315
26,488
3,450
12,2822,5919,692
43730
406
12,5,9510,903
1,692
2,3741,642
732
17,302
8,620
21,645
3,035
TOTALS BYSTATE-BRANCHING
CLASSIFICATION
Statewidebranching . . . .
MultibankOne-bank
Limitedbranching . . . .
MultibankOne-bank
Unit bankingMultibankOne-bank
50 states andDistrict ofColumbia-Total
MultibankOne-bank
AlabamaMultibankOne-bank
AlaskaMultibankOne-bank
ArizonaMultibankOne-bank
ArkansasMultibankOne-bank
CaliforniaMultibankOne-bank
ColoradoMultibankOne-bank
24 336115221
16 928142786
11 1,676139
1,537
811592219
1,731948783
2,412886
1,526
15,1987,0618,137
8,3535,2763,077
1,419548871
16,0097,6538,356
10,0846,2243,860
3,8311,4342,397
2,501
5,969
6,151
December 31, 1980,
2,9056361
2,544
L 1899
S 312
S 413
L 292
27
S 438
35
U 1121597
4,9542,4262,528
91829
422
413
336
27
471334
21011496
25,94813,33812,610
409397
12
1468
22215270
1283098
3,948687
3,261
987226
30,90215,76415,138
50047921
188
10
22615373
16136
125
3,995700
3,295
308186122
14,621
318
12
31
261
289
438
20,313 22,814
15,888 21,857
2,412 8,563
including foreign data
613,402256,655356,747
282,265176,561105,704
238,759113,600125,159
716,567
465,225
348,866
39,583 54,204 1,455,497 1,853,529674,884780,613
631 949 10,548 16,90310,298
250
113 125 400 2,251173227
543 574 5,195 13,3683,6871,508
417 678 3,504 11,0911,0342,470
4,478 4,767 222,922 237,99125,228
197,694
114 552 13,722 16,59111,1772,544
447,091185,849261,242
214,247133,80480,443
179,25487,43791,816
1,132,997522,977610,021
8,5218,310
210
323137186
4,4313,0991,332
2,850813
2,037
179,48019,895
159,584
11,2899,0612,227
534,744
374,060
274,999
1,477,982
14,130
1,757
11,376
9,498
192,605
13,685
197Digitized for FRASER http://fraser.stlouisfed.org/ Federal Reserve Bank of St. Louis

78. Banking offices, assets, and deposits of banks in holding company groups1—ContinuedD. Multibank, one-bank, and all commercial bank comparisons by state7-Continued
State, and type ofholding company
ConnecticutMultibankOne-bank
DelawareMultibankOne-bank
District ofColumbia . . . .
MultibankOne-bank
FloridaMultibankOne-bank
GeorgiaMultibankOne-bank ,
HawaiiMultibankOne-bank
IdahoMultibankOne-bank
IllinoisMultibankOne-bank
Indiana . .MultibankOne-bank
IowaMultibankOne-bank
KansasMultibankOne-bank
KentuckyMultibankOne-bank
LouisianaMultibankOne-bank
MaineMultibankOne-bank
MarylandMultibankOne-bank
Massachusetts . . . .MultibankOne-bank
Tv__ Numberof of
branch- noldmgb™? companys groups2*5
Number of offices
Holding companies
Banks Branches Total
All commercial banks
Banks Branches Total
Amounts (millions of dollars)
Assets
Holdingcom-
panies
All com-mercialbanks
Deposits
Holdingcom-
panies
All com-mercialbanks
December 31, 1980, including foreign data-Continued
S 936
S 202
S 312
S 622636
L 401030
S 413
S 734
U 2833
280
L 461
45
L 23214
218
U 2918
283
L 301
29
L 311
30
S 752
S 945
L 261313
1486
202
312
309273
36
784929
413
844
2836
217
472
45
30689
217
29313
280
312
29
322
30
2321
2
24195
776413
433128305
707
842361
90881791
513432
81
14914
135
145126
19
2552
253
38114
367
382210172
19320
173
23251
181
2154
211
237224
13
660300360
817696121
447136311
909
872463
1,2171,090
127
591481110
15315
138
15313023
5388
530
42816
412
688299389
48633
453
26353
210
2476
241
260245
15
684319365
894760134
64
20
17
562
435
11
26
1,257
405
654
620
345
269
41
102
139
613
148
156
1,191
876
188
247
616
1,134
571
274
769
812
309
948
1,011
677
168
173
1,753
1,311
199
273
1,873
1,539
1,225
894
1,114
1,081
350
1,050
1,150
10,8422,5018,341
570
57
4,220667
3,553
37,82933,8214,009
14,26613,116
1,150
4,612399
4,212
2,6632,353
310
106,237450
105,786
12,817387
12,430
13,0126,7026,310
9,494826
8,668
7,2582,1745,084
8,48384
8,399
2,5612,420
141
12,5485,1857,363
33,38531,241
2,144
13,950
3,686
8,648
48,036
23,266
5,430
5,106
141,219
32,725
21,751
16,597
19,441
24,944
3,465
16,546
36,206
8,8792,1346,745
500
50
3;400535
2,864
31,54928,093
3,456
10,9859,9861,000
4,094366
3,727
2,2211,954
267
78,898402
78,497
9,801342
9,459
10,9165,4405,476
8,009657
7,352
5,4291,5753,854
6,88175
6,805
2,1232,010
113
10,2274,4415,786
25,40223,584
1,817
11,559
2,903
6,977
40,556
18,894
4,809
4,262
109,218
27,113
18,492
14,078
16,090
21,195
2,895
13,772
27,772
198Digitized for FRASER http://fraser.stlouisfed.org/ Federal Reserve Bank of St. Louis

78. Banking offices, assets, and deposits of banks in holding company groups1—ContinuedD. Multibank, one-bank, and all commercial bank comparisons by state7-Continued
State, and type ofholding company
MichiganMultibankOne-bank . . .
MinnesotaMultibankOne-bank
MississippiMultibankOne-bank
MissouriMultibankOne-bank . .
MontanaMultibankOne-bank
NebraskaMultibankOne-bank .
NevadaMultibankOne-bank
New Hampshire. , .MultibankOne-bank
New JerseyMultibankOne-bank
New MexicoMultibankOne-bank
New YorkMultibankOne-bank
North Carolina . . .MultibankOne-bank
North Dakota . . . .MultibankOne-bank
OhioMultibank .One-bank
OklahomaMultibankOne-bank
OregonMultibankOne-bank
Typeof
branch-ing8
Numberof
holdingcompanygroups2'5
Number of offices
Holding companies
Banks Branches Total
All commercial
Banks Branches
banks
Total
Amounts (millions of dollars)
Assets
Holdingcom-
panies
All com-mercialbanks
Deposits
Holdingcom-
panies
All com-mercialbanks
December 31, 1980, including foreign data- Continued
L
L
L
U
U
U
s
s
s
L
S
s
U
L
U
S
382315
22411
213
150
15
16137
124
378
29
2495
244
211
945
17107
175
12
431726
1019
505
45
281315
1963
193
541
180165
15
360147213
140
14
393270123
815229
2549
245
211
23185
4942
7
402812
856025
1129
823745
1059015
1996
193
1091
1,5661,464
102
19912970
1720
172
304251
53
27234
24534
211
956431
694722
874707167
13810830
3,5781,8181,760
1,08380
1,003
764630
1,5071,242
265
1674
163
444437
7
1,7461,629
117
559276283
1860
186
697521176
1087533
49943
456
976532
926527
923749174
17813642
3,6631,8781,785
1,09482
1,012
1588375
1,6121,332
280
36610
356
454446
8
376
761
178
729
166
459
9
75
169
90
223
80
178
385
495
81
2,175
280
700
446
37
288
143
161
1,596
244
3,896
1,750
128
2,251
264
586
2,551
1,041
878
1,175
203
747
152
236
1,765
334
4,119
1,830
306
2,636
759
667
41,73839,3482,390
25,57620,5984,979
3,8250
3,825
28,04324,665
3,378
3,6942,995
699
8,736992
7,744
2,2951,793
502
1,4581,095
363
20,72816,5864,143
3,6192,876
743
453,800224,642229,158
19,787679
19,108
2,9191,8761,043
41,13035,290
5,840
15,744496
15,248
10,72510,638
87
53,399
31,828
11,472
34,914
5,319
11,509
3,761
3,298
36,127
6,107
463,985
25,664
5,333
56,284
22,866
12,967
33,07531,0112,064
19,91615,4774,438
3,0280
3,028
21,37218,4812,892
3,1692,540
630
7,148801
6,347
1,9561,520
436
1,259955304
17,09613,6333,463
3,1342,481
653
341,000167,484173,516
15,189593
14,595
2,5741,642
932
30,58825,9284,660
13,020419
12,600
8,6068,531
76
43,363
25,485
9,798
27,388
4,623
9,583
3,199
2,890
30,340
5,273
348,478
20,270
4,523
43,729
19,383
10,578
199Digitized for FRASER http://fraser.stlouisfed.org/ Federal Reserve Bank of St. Louis
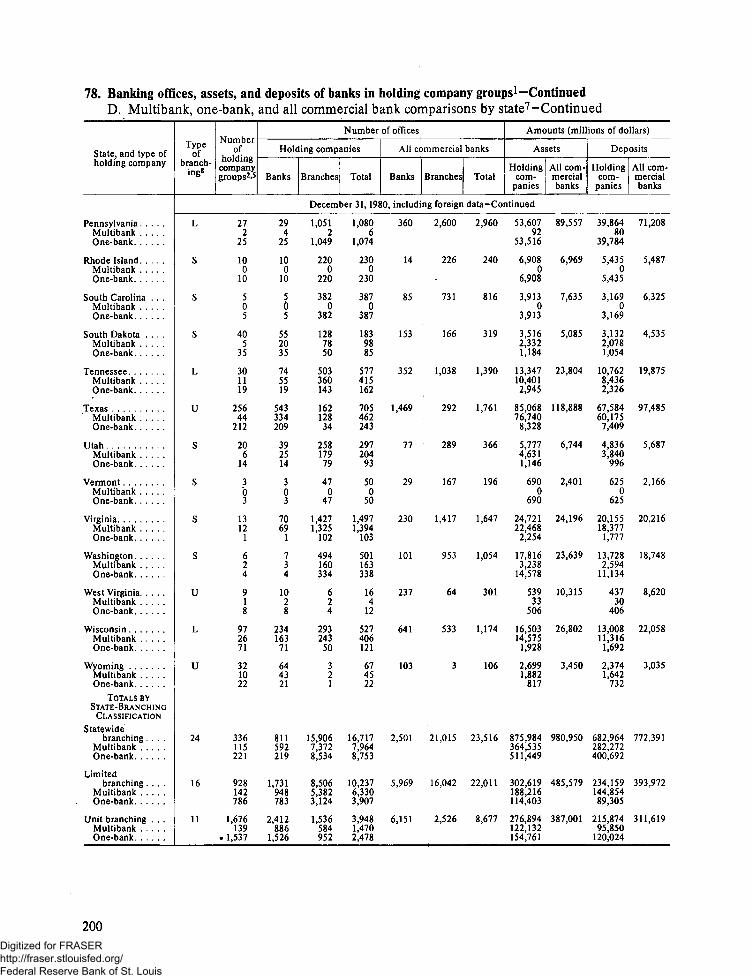
78. Banking offices, assets, and deposits of banks in holding company groups1—ContinuedD. Multibank, one-bank, and all commercial bank comparisons by state7-Continued
State, and type ofholding company
PennsylvaniaMultibankOne-bank
Rhode Island. . . .MultibankOne-bank
South Carolina . . .MultibankOne-bank
South Dakota . . . .MultibankOne-bank
TennesseeMultibankOne-bank
TexasMuttibankOne-bank
UtahMultibank . .One-bank
VermontMultibankOne-bank
Virginia . .MultibankOne-bank . . . .
WashingtonMultibank . . .One-bank
West VirginiaMultibankOne-bank
WisconsinMultibankOne-bank
WyomingMultibank . . . .One-bank
TOTALS BYSTATE-BRANCHING
CLASSIFICATIONStatewide
branching . . . .MultibankOne-bank
Limitedbranching . . . .
Multibank . . . .One-bank
Unit branching . . .MultibankOne-bank
Typeof
branch-ing8
Numberof
holdingcompanygroups2-5
Number of offices
Holding companies
Banks Branches Total
All commercial
Banks Branches
banks
Total
Amounts (millions of dollars)
Assets
Holdingcom-
panies
All com-mercialbanks
Deposits
Holdingcom-
panies
All com-mercialbanks
December 31, 1980, including foreign data-Continued
L
S
S
S
L
U
S
S
S
S
U
L
U
24
16
11
272
25
100
10
505
405
35
301119
25644
212
206
14
30
13121
624
918
972671
321022
336115221
928142786
1,676139
. 1,537
294
25
100
10
5d5
552035
745519
543334209
392514
30
70691
734
1028
23416371
644321
811592219
1,731948783
2,412886
1,526
1,0512
1,049
2200
220
3820
382
1287850
503360143
16212834
25817979
470
47
1,4271,325
102
494160334
624
293243
50
321
15,9067,3728,534
8,5065,3823,124
1,536584952
1,0806
1,074
2300
230
3870
387
1839885
577415162
705462243
297204
93
500
50
1,4971,394
103
501163338
164
12
527406121
674522
16,7177,9648,753
10,2376,3303,907
3,9481,4702,478
360
14
85
153
352
1,469
77
29
230
101
237
641
103
2,501
5,969
6,151
2,600
226
731
166
1,038
292
289
167
1,417
953
64
533
3
21,015
16,042
2,526
2,960
240
816
319
1,390
1,761
366
196
1,647
1,054
301
1,174
106
23,516
22,011
8,677
53,60792
53,516
6,9080
6,908
3,9130
3,913
3,5162,3321,184
13,34710,4012,945
85,06876,740
8,328
5,7774,6311,146
6900
690
24,72122,468
2,254
17,8163,238
14,578
53933
506
16,50314,575
1,928
2,6991,882
817
875,984364,535511,449
302,619188,216114,403
276,894122,132154,761
89,557
6,969
7,635
5,085
23,804
118,888
6,744
2,401
24,196
23,639
10,315
26,802
3,450
980,950
485,579
387,001
39,86480
39,784
5,4350
5,435
3,1690
3,169
3,1322,0781,054
10,7628,4362,326
67,58460,175
7,409
4,8363,840
996
6250
625
20,15518,377
1,777
13,7282,594
11,134
43730
406
13,00811,316
1,692
2,3741,642
732
682,964282,272400,692
234,159144,85489,305
215,87495,850
120,024
71,208
5,487
6,325
4,535
19,875
97,485
5,687
2,166
20,216
18,748
8,620
22,058
3,035
772,391
393,972
311,619
200Digitized for FRASER http://fraser.stlouisfed.org/ Federal Reserve Bank of St. Louis

79. Consolidated report of income, 19801
A. All insured commercial banksData are consolidated with respect to domestic and foreign offices. Figures are in thousands of dollars.
Item Total
Asset size class (millions of dollars)
0-99 100-299 300-999 1,000-4,999 5,000and over
Member Non-member
1 Operating income—total. . ,
2 Interest and feeson loans
3 Interest on balances withdepositoryinstitutions
4 Income on federal fundssold and securitiespurchased underagreements to resellin domestic officesof bank and of itsEdge and Agreementsubsidiaries
5 Interest on U.S. Treasurysecurities and on obli-gations of other U.S.government agenciesand corporations . . . .
6 U.S. Treasury securities.7 Obligations of other U.S.
government agenciesand corporations. . .
8 Interest on obligationsof states and politi-cal subdivisions inUnited States
9 Income from all othersecurities
10 Interest on otherbonds, notes, anddebentures
11 Dividends on stock12 Income from lease
financing13 Income from fiduciary
activities14 Service charges on
deposit accountsin domestic offices. . .
15 Other service charges,commissions, and'fees
16 Other operatingincome
17 Trading income, net ...18 Equity in net income
of unconsolidatedsubsidiaries andassociated
19companies ,
All other
190,115,194 34,923,357 18,056,475 18,335,355 36,205,792 82,594,215
11,706,973 11,876,026 23,670,501 57,158,285
381,123 511,369 2,486,432 12,176,944
126,665,088 22,253,303
16,037,641 481,773
150,632,790 39,482,404
101,083,368 25,581,720
14,989,890 1,047,751
8,750,414 2,817,752 1,242,995 1,284,710 1,741,359 1,663,598 6,159,679 2,590,735
13,403,503 4,794,466
8,131,120 2,260,300
1,434,469 148,326
1,370,729 36,800
2,737,833 147,031
2,056,266 1,828,268 2,542,174 2,182,329(2) 1,159,320 1,644,473 1,500,814
668,948 897,701 681,515
1,314,834 1,122,721 1,830,289 1,602,976
82,671 121,818 189,262 892,392
8,475,312 4,928,191
5,738,289 2,392,831
1,182,834 251,635
'839,373
245,092
105,32916,489
124,005
337,394
154,76334,499
252,405
890,970
837,39354,999
918,146
1,117,346
8
4,354,940 557,875
4,056,699 309,928
332,817
177,900
475,884 1,083,236 1,905,128
225,97843,881
(2) 2,193(2) 179,903
874,525 2,468,368318,972 707,069
10,863 194,559544,689 1,566,740 8
1,257,570 113,159
2,423,736 314,097
3,172,765 1,115,804 476,434 427,185 644,639 508,703 2,017,302 1,155,463
3,654,155 700,785
3,650,657 406,042
8
201Digitized for FRASER http://fraser.stlouisfed.org/ Federal Reserve Bank of St. Louis

79. Consolidated report of income, 19801—ContinuedA. All insured commercial banks-ContinuedData are consolidated with respect to domestic and foreign offices. Figures are in thousands of dollars.
Item
20 Operating expenses— total .
21 Salaries and employeebenefits
22 Interest on time CDs of$100,000 or moreissued by domesticoffices
23 Interest on depositsin foreign offices . . . .
24 Interest on otherdeposits,
25 Expense of federal fundspurchased and securi-ties sold under agree-ments to repurchasein domestic offices ofthe bank and of itsEdge and Agreementsubsidiaries
26 Interest on demand notes(note balances) issuedto U.S. Treasury andother borrowedmoney
27 Demand notes (notebalances) issued toU.S. Treasury. . . : .
28 Other borrowedmoney
29 Interest on subordinatednotes anddebentures
30 Occupancy expense ofbank premises, net,and furniture andequipment expense . .
31 Occupancy expense ofbank premises,gross
32 LESS: Rental income . . .33 Occupancy expense of
bank premises,net
34 Furniture and equip-ment expense, .
35 Provision for possibleloan losses
36 Other operating expenses .37 Minority interest in
consolidated sub-sidiaries
38 All other. . . .
39 Income before incometaxes and securitiesgains or losses . . . . . .
40 Applicable incometaxes
41 Income before securitiesgains or losses
42 Securities gains orlosses (— ), gross . . .
43 Applicable incometaxes
44 Securities gains orlosses (— ) net
45 Income before extraordi-nary items
46 Extraordinary items,gross
47 Applicable incometaxes
48 Extraordinary items, netof tax effect
49 Net income
Total
170,682,912
24,566,410
24,754,205
34,941,865
38,440,724
16,708,479
4,379,999
(2)
(2)
541,099
7,326,206
8(2)
(2)
4,454,19914,569,698
(2)(2)
19,432,262
5,008,891
14,423,387
-855,131
-362,582
-492,229
13,931,059
3,110
-13,716
16,879
13,947,912
Asset size class (millions of dollars)
0-99
29,619,449
5,473,201
3,187,772
0
14,352,974
410,207
133,604
(2)
(2)
65,254
1,566,674
(2)(2)
(2)
(2)
891,5983,538,139
85,303,888
1,214,558
4,089,343
-148,829
-55,668
-92,873
3,996,385
11,998
774
11,277
4,007,636
100-299
15,828,693
2,809,559
2,534,712
104,687
6,257,082
841,516
135,867
(2)
(2)
65,377
886,512
8(2)(2)
433,2381,760,142
(2)(2)
2,227,783
407,273
1,820,513
-84,289
-37,873
-46,389
1,774,110
6,498
-819
7,317
1,781,427
300-999
16,353,777
2,914,881
2,955,150
300,962
4,953,883
1,649,955
191,703
109,963
81,740
84,624
959,613
650,445121,399
529,047
430,566
486,0301,856,976
5821,856,400
1,981,577
371,589
1,609,9$8
-69,803
-31,114
-38,681
1,571,307
11,038
1,072
9,966
1,581,273
1,000-4,999
33,213,302
5,230,296
6,088,829
2,891,741
6,613,830
5,546,691
702,830
266,500
436,330
170,155
1,585,560
1,077,465205,163
872,302
713,258
1,095,8783,287,491
3303,287,161
2,992,490
478,226
2,514,264
-349,078
-127,208
-221,870
2,292,394
-11,247
-5,781
-5,466
2,286,928
5,000and over
75,667,691
8,138,473
9,987,742
31,644,475
6,262,955
8,260,110
3,215,995
322,992
2,893,003
155,689
2,327,847
1,619,817223,774
1,396,044
931,803
1,547,4554,126,950
26,1634,100,787
6,926,524
2,537,245
4,389,279
-203,132
-110,719
-92,416
4,296,863
-15,177
-8,962
-6,215
4,290,648
Member
136,468,787
18,333,697
19,226,752
34,479,019
24,658,537
15,604,135
4,176,471
(2)
(2)
394,453
5,479,054
(2)(2)
(2)
(2)
3,448,45410,668,205
(2)(2)
14,164,003
3,864,176
10,299,838
-702,702
-306,498
-396,089
9,903,712
-12,316
-13,630
1,340
9,905,049
Non-member
34,214,125
6,232,713
5,527,453
462,846
13,782,187
1,104,344
203,528
(2)
(2)
146,646
1,847,152
(2)(2)
(2)
(2)
1,005,7453,901,493
85,268,259
1,144,715
4,123,549
-152,429
-56,084
-96,140
4,027,347
15,426
-86
15,539
4,042,863
202Digitized for FRASER http://fraser.stlouisfed.org/ Federal Reserve Bank of St. Louis

79. Consolidated report of income, 19801—ContinuedA. All insured commercial banks-ContinuedData are consolidated with respect to domestic and foreign offices. Figures are in thousands of dbllars.
Item
Equity capital account50 Balance, end of previous
year. . , . . . . .51 Adjustments52 Adjusted balance, end of
previous year53 Net income or loss ( — ) , . .54 Sale, conversion, acquisi-
tion or retirementof capital net
55 Transactions with ownholding company oraffiliates
56 Other57 Changes incident to mergers
and absorptions, net. .58 LESS: Cash dividends de-
clared on commonstock
59 LESS: Cash dividends de-clared on preferredstock
60 Other increases ordecreases (— )
61 Balance, end of period . . .
Allowance for possibleloan losses
62 Balance, end of previousyear
63 Recoveries credited toallowance
64 Changes incident to mergersand absorptions, net, .
65 Provision for possible loanlosses
66 LESS:Losses chargedto allowance
67 Foreign currency translationadjustment
68 Balance, end of period . . .
MEMO69 Provision for U.S. federal
income taxes70 Provision for U.S., state and
local income taxes . . .71 Provision for foreign
income taxes72 Total73 Provision for income
taxes, currentportion
74 Provision for incometaxes, deferredportion.
75 Number of full-time equiva-lent employees3
76 Number of banks3
Total
96,416,8129,413
96,426,19513,947,912
1,204,481
682,719521,762
359,046
5,081,405
9,976
406,451107,252,724
9,107,541
1,275,734
38,870
4,454,199
4,853,378
-12,64810,010,205
2,465,262
1,052,432
1,114,4514,632,171
(2)
(2)
1,478,53714,421
Asset size class (millions of dollars)
0-99
26,447,1022,602
26,449,6624,007,1536
602,534
145,312457,222
38,997
1,062,578
2,057
74,66330,108,890
1,670,792
263,679
3,217
891,598
1,006,726
(2)1,822,441
1,006,317
152,829
981,159,273
(2)
(2)
373,82612,730
100-299
12,135,116-2,068
12,133,0591,781,427
102,990
73,14429,846
112,737
628,341
1,219
16,08313,516,725
939,383
114,709
6,014
433,238
468,540
1,024,808
300,841
67,255
462368,559
(2)
(2)
220,1891,155
300-999
11,156,03412,466
11,168,5001,581,273
193,578
166,59626,982
118,102
637,408
3,906
21,33312,441,472
969,336
132,145
12,518
486,030
523,860
1,076,168
257,529
77,261
6,748341,535
286,410
55,125
190,421351
1,000-4,999
18,609,192-3,901
18,605,2922,286,928
127,902
121,6236,279
52,797
1,083,747
2,794
108,66320,095,039
1,955,009
294,650
17,041
1,095,878
1,206,503
222,156,098
189,092
99,210
56,935345,236
241,085
104,152
306,014156
5,000and over
28,069,368314
28,069,6824,290,648
177,477
176,0441,433
36,413
1,669,331
0
185,70931,090,598
3,573,021
470,551
80
1,547,455
1,647,749
-12,6703,930,690
711,483
655,877
1,050,2082,417,568
1,941,354
476,214
388,08729
Member
70,126,572201
70,126,7619,905,049
608,207
410,202198,005
210,510
3,893,917
2,708
329,10477,283,016
7,208,711
1,012,215
24,700
3,448,454
3,778,490
-12,6487,902,933
1,576,367
859,237
1,108,2963,543,905
(2)
(2)
1,063,3785,422
Non-member
26,290,2409,212
26,299,4344,042,863
596,274
272,517323,757
148,536
1,187,488
7,268
77,34729,969,708
1,898,830
263,519
14,170
1,005,745
1,074,888
(2)2,107,272
888,895
193,195
6,1551,088,266
(2)
(2)
415,1598,999
203Digitized for FRASER http://fraser.stlouisfed.org/ Federal Reserve Bank of St. Louis
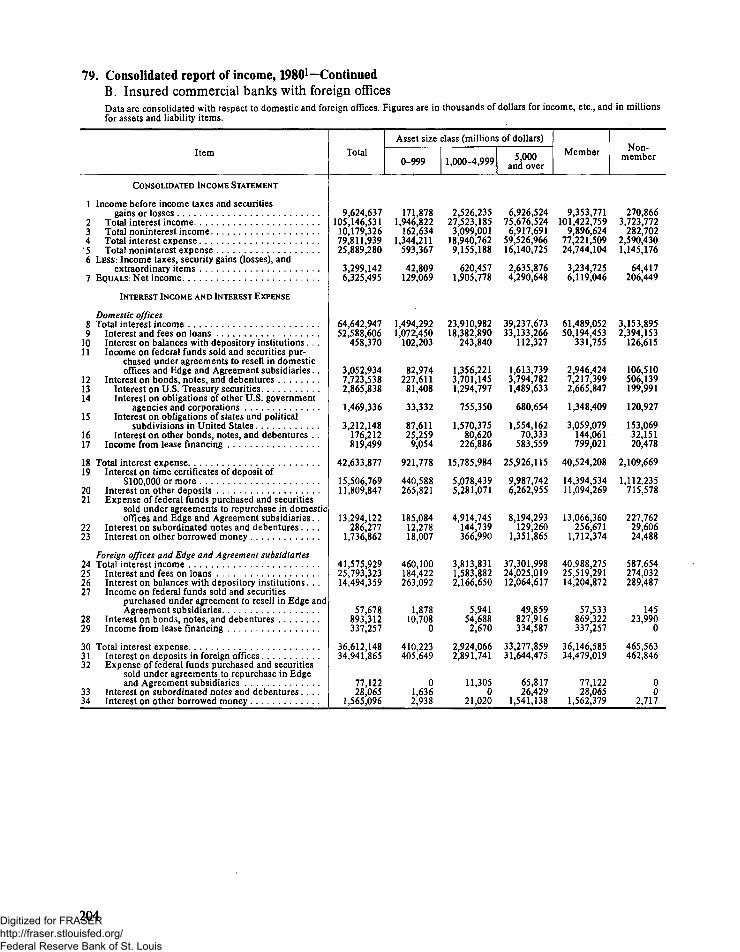
79. Consolidated report of income, 19801—ContinuedB. Insured commercial banks with foreign officesData are consolidated with respect to domestic and foreign offices. Figures are in thousands of dollars for income, etc., and in millionsfor assets and liability items.
Item
CONSOLIDATED INCOME STATEMENT
1 Income before income taxes and securitiesgains or losses
2 Total interest income3 Total noninterest income. . .4 Total interest expense'5 Total noninterest expense . .6 LESS: Income taxes, security gains (losses), and
extraordinary items7 EQUALS' Net income , .
INTEREST INCOME AND INTEREST EXPENSE
Domestic offices8 Totai interest income9 Interest and fees on loans
10 Interest on balances with depository institutions . . .11 Income on federal funds sold and securities pur-
chased under agreements to resell in domesticoffices and Edge and Agreement subsidiaries . .
12 Interest on bonds notes and debentures13 Interest on U S Treasury securities14 Interest on obligations of other U.S. government
agencies and corporations15 Interest on obligations of states and political
subdivisions in United States , ,16 Interest on other bonds, notes, and debentures . .17 Income from lease financing
18 Total interest expense19 Interest on time certificates of deposit of
$100 000 or more . . . .20 Interest on other deposits21 Expense of federal funds purchased and securities
sold under agreements to repurchase in domesticoffices and Edge and Agreement subsidiaries . .
22 Interest on subordinated notes and debentures . . . .23 Interest on other borrowed money
Foreign offices and Edge and Agreement subsidiaries24 Total interest income25 Interest and fees on loans26 Interest on balances with depository institutions . . .27 Income on federal funds sold and securities
purchased under agreement to resell in Edge andAgreement subsidiaries
28 Interest on bonds notes and debentures29 Income from lease financing
30 Total interest expense31 Interest on deposits in foreign offices32 Expense of federal funds purchased and securities
sold under agreements to repurchase in Edgeand Agreement subsidiaries
33 Interest on subordinated notes and debentures . . . .34 Interest on other borrowed money
Total
9,624,637105,146,53110,179,32679,811,93925,889,280
3,299,1426,325,495
64,642,94752,588,606
458,370
3,052,9347,723,5382,865,838
1,469,336
3,212,148176,212819,499
42,633,877
15,506,76911,809,847
13,294,122286,277
1,736,862
41,575,92925,793,32314,494,359
57,678893,312337,257
36,612,14834,941,865
77,12228,065
1,565,096
Asset size class (millions of dollars)
0-999
171,8781,946,822
162,6341,344,211
593,367
42,809129,069
1,494,2921,072,450
102,203
82,974227,611
81,408
33,332
87,61125,259
9,054
921,778
440,588265,821
185,08412,27818,007
460,100184,422263,092
1,87810,708
0
410,223405,649
01,6362,938
1,000-4,999
2,526,23527,523,1853,099,001
18,940,7629,155,188
620,4571,905,778
23,910,98218,382,890
243,840
1,356,2213,701,1451,294,797
755,350
1,570,37580,620
226,886
15,785,984
5,078,4395,281,071
4,914,745144,739366,990
3,813,8311,583,8822,166,650
5,94154,6882,670
2,924,0662,891,741
11,3050
21,020
5,000and over
6,926,52475,676,524
6,917,69159,526,96616,140,725
2,635,8764,290,648
39,237,67333,133,266
112,327
1,613,7393,794,7821,489,633
680,654
1,554,16270,333
583,559
25,926,115
9,987,7426,262,955
8,194,293129,260
1,351,865
37,301,99824,025,01912,064,617
49,859827,916334,587
33,277,85931,644,475
65,81726,429
1,541,138
Member
9,353,771101,422,759
9,896,62477,221,50924,744,104
3,234,7256,119,046
61,489,05250,194,453
331,755
2,946,4247,217,3992,665,847
1,348,409
3,059,079144,061799,021
40,524,208
14,394,53411,094,269
13,066,360256,671
1,712,374
40,988,27525,519,29114,204,872
57,533869,322337,257
36,146,58534,479,019
77,12228,065
1,562,379
Non-member
270,8663,723,772
282,7022,590,4301,145,176
64,417206,449
3,153,8952,394,153
126,615
106,510506,139199,991
120,927
153,06932,15120,478
2,109,669
1,112,235715,578
227,76229,60624,488
587,654274,032289,487
14523,990
0
465,563462,846
00
2,717
204Digitized for FRASER http://fraser.stlouisfed.org/ Federal Reserve Bank of St. Louis
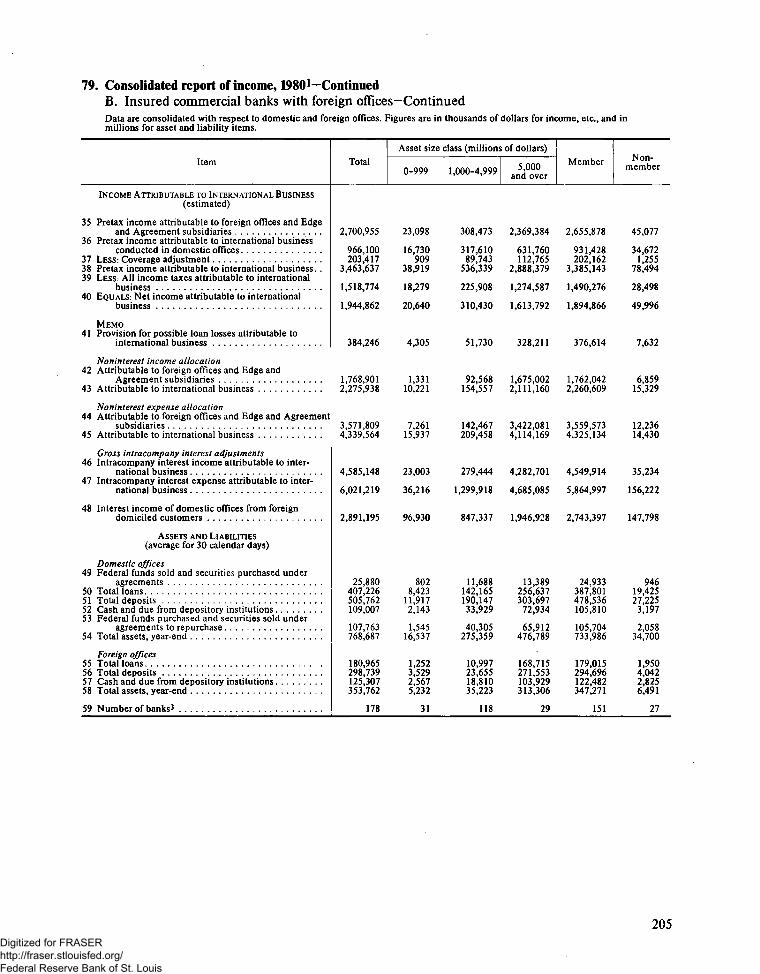
79. Consolidated report of income, 1980 *—ContinuedB. Insured commercial banks with foreign offices-ContinuedData are consolidated with respect to domestic and foreign offices. Figures are in thousands of dollars for income, etc., and imillions for asset and liability items.
Item
INCOME ATTRIBUTABLE TO INTERNATIONAL BUSINESS(estimated)
35 Pretax income attributable to foreign offices and Edgeand Agreement subsidiaries
36 Pretax income attributable to international businessconducted in domestic offices
37 LESS- Coverage adjustment38 Pretax income attributable to international business. .39 LESS: All income taxes attributable to international
business40 EQUALS: Net income attributable to international
business
MEMO41 Provision for possible loan losses attributable to
international business
Noninterest income allocation42 Attributable to foreign offices and Edge and
Agreement subsidiaries43 Attributable to international business
Noninterest expense allocation44 Attributable to foreign offices and Edge and Agreement
subsidiaries45 Attributable to international business
Gross intracompany interest adjustments46 Intracompany interest income attributable to inter-
national business47 Intracompany interest expense attributable to inter-
national business
48 Interest income of domestic offices from foreigndomiciled customers
ASSETS AND LIABILITIES(average for 30 calendar days)
Domestic offices49 Federal funds sold and securities purchased under
agreements50 Total loans51 Total deposits52 Cash and due from depository institutions53 Federal funds purchased and securities sold under
agreements to repurchase54 Total assets year-end
Foreign offices55 Total loans56 Total deposits57 Cash and due from depository institutions58 Total assets, year-end
59 Number of banks3
Total
2,700,955
966,100203,417
3,463,637
1,518,774
1,944,862
384,246
1,768,9012,275,938
3,571,8094,339,564
4,585,148
6,021,219
2,891,195
25,880407,226505,762109,007
107,763768,687
180,965298,739125,307353,762
178
Asset size class (millions of dollars)
0-999
23,098
16,730909
38,919
18,279
20,640
4,305
1,33110,221
7,26115,937
23,003
36,216
96,930
8028,423
11,9172,143
1,54516,537
1,2523,5292,5675,232
31
1,000-4,999
308,473
317,61089,743
536,339
225,908
310,430
51,730
92,568154,557
142,467209,458
279,444
1,299,918
847,337
11,688142,165190,14733,929
40,305275,359
10,99723,65518,81035,223
118
5,000and over
2,369,384
631,760112,765
2,888,379
1,274,587
1,613,792
328,211
1,675,0022,111,160
3,422,0814,114,169
4,282,701
4,685,085
1,946,928
13,389256,637303,697
72,934
65,912476,789
168,715271,553103,929313,306
29
Member
2,655,878
931,428202,162
3,385,143
1,490,276
1,894,866
376,614
1,762,0422,260,609
3,559,5734,325,134
4,549,914
5,864,997
2,743,397
24,933387,801478,536105,810
105,704733,986
179,015294,696122,482347,271
151
Non-member
45,077
34,6721,255
78,494
28,498
49,996
7,632
6,85915,329
12,23614,430
35,234
156,222
147,798
94619,42527,2253,197
2,05834,700
1,9504,0422,8256,491
27
205Digitized for FRASER http://fraser.stlouisfed.org/ Federal Reserve Bank of St. Louis

80* Income, expenses, and dividends of member banks, by Federal Reserve District1
A. All member banksStatements for each bank reflect fully consolidated operations. Figures are in thousands of dollars.
Item
1 Operating income — total
2 Interest and fees on loans . . . . .3 Interest on balances with depository institutions4 Income on federal funds sold and securities purchased under agreements to resell in
domestic offices of the bank and of its Edge and Agreement subsidiaries5 Interest on U.S. Treasury securities and on obligations of other U.S. government agencies
and corporations6 Interest on obligations of states and political subdivisions in United States7 Income from all other securities8 Income from lease financing . . . . ,9 Income from fiduciary activities
10 Service charges on deposit accounts in domestic offices , . . . .11 Other service charges commissions and fees «12 Other operating income . . . . . . . . . . . . . . . .
13 Operating expenses — total . . . . . . . . . . . . . . . . . .
14 Salaries and employee benefits15 Interest on time CDs of $100 000 or more issued by domestic offices16 Interest on deposits in foreign offices . . . . . . .17 Interest on other deposits18 Expense of federal funds purchased and securities sold under agreements to repurchase
in domestic offices of bank and of its Edge and Agreement subsidiaries1
19 Interest on demand notes (note balances) issued to U.S. Treasury and otherborrowed money
20 Interest on subordinated notes and debentures . . .21 Occupancy expense of bank premises net and furniture and equipment expense22 Provision for possible loan losses23 Other operating expenses
24 Income before income taxes and securities gains or losses25 Applicable income taxes26 Income before securities gains or losses27 Securities gains or losses ( — ) gross28 Applicable income taxes29 Securities gains or losses ( — ) net30 Income before extraordinary items31 Extraordinary items, gross32 Applicable income taxes33 Extraordinary items, net of tax effect34 Net income
Equity capital account35 Balance end of previous year36 Adjustments . . .37 Adjustep^balance end of previous year38 Net income or loss (~)39 Sale conversion acquisition, or retirement of capital net . . . .40 Transactions with own holding company or affiliates41 Other42 Changes incident to mergers and absorptions net . . .43 LESS~ Cash dividends declared on common stock44 LESS- Cash dividends declared on preferred stock. . , . . . .45 Other increases or decreases (— )46 Balance end of period . . . .
Allowance for possible loan losses47 Balance end of previous year48 Recoveries credited to allowance49 Changes incident to mergers and absorptions net50 Provision for possible loan losses51 LESS1 Losses charged to allowance . .52 Foreign currency translation adjustment53 Balance end of period . . . .
MEMO54 Provision for U S federal income taxes . . . .55 Provision for U S state and local income taxes56 Provision for foreign income taxes57 Total *58 Number of full-time equivalent employees-*59 Number of banks3
Boston
5,073,265
3,132,565536,490
182,148
396,017168,998101,92278,714
162,32050,310
157,831105,945
4,680,528
726,438617,409
1,045,589641,721
792,703
132,1307,035
210,331110,142397,027
392,742107,411285,327-22,879-11,869-11,008274,319
4721
470274,789
2,044,044123
2,044 166274,789
7,2616,551
71034
119,69310
3652,206,913
231,62735,351
181110,142111,181
87266,203
35,56334,02125,96295,54340,709
169
New York
49,503,096
33,613,1187,132,634
1,161,612
1,387,4211,096,689
651,744523,956753,209217,427
1,303,2101,662,079
45,243,597
4,829,1674,065,077
20,710,1143,504,984
4,578,962
2,219,832114,041
1,471,443959,460
2,790,516
4,259,4981,608,0652,651,437-194,967-111,951-83,002
2,568,436-13,689-8,962-4,723
2,563,712
18,330,646551
18 331,1972,563,712
177,672176,277
1,395-1,537
1,055,653477
279,27220,294,177
2,130,155315,703
-193959,460
1,048,913-9,047
2,347,164
249,390490,426747,329
1,487,141254,893
226
Phila-delphia
4,372,082
2,873,422216,272
213,569
425,365247,71940,20213,310
105,28158,51383,15695,275
4,141,585
646,000440,254472,053
1,160,828
559,031
97,34339,252
203,294177,999345,526
230,49712,903
217,595-104,952-13,905-91,048126,545
1,449752699
127,244
2,533,640153
2,533,790127,244
4,1362,5841,552
10,427108,883
83219,781
2,585,672
250,99929,913
920177,999182,775
277,056
-16,9984,155
12,596-244
38,585213
Cleveland
8,036,912
5,063,776626,224
373,348
725,825567,95226,92458,378
178,678137,820160,693117,293
7,166,742
1,084,7251,120,374
590,6352,102,020
978,608
165,4166,688
325,731175,514617,029
870,170119,798750,373-63,687-24,797-38,887711,482
1,828123
1,705713,187
5,338,290-1,128
5,337 162713,187
8,7762,3776,399
71,825362,592
32106
5,768,434
454,81659,8423,989
175,514221,480
(2)472,681
78,5161,011
15,59395,12067,496
374
206.Digitized for FRASER http://fraser.stlouisfed.org/ Federal Reserve Bank of St. Louis

Richmond
6,702,405
4,371,754399,462
387,994
535,147413,89011,45836,681112,551163,592143,904125,971
6,004,446
1,118,807712,357504,874
1,779,833
640,554
93,75719,392345,660164,135625,067
697,958119,049578,906-47,548-22,211-25,329553,578
6855
683554,261
4,076,614-382
4,076,228554,26122,5628,18614,37614,841199,303
164-2,621
4,465,798
348,56152,9792,609
164,155181,534(2)
386,770
69,23621,4856,11396,83373,373
376
Atlanta
7,752,507
4,695,975217,805
679,761
860,934484,68824,30927,030145,584249,007239,587127,826
6,760,627
1,228,179997,34483,982
1,935,833
836,076
60,25521,224394,282267,479935,967
991,878221,262770,623-58,164-26,228-31,917738,6932,120-38
2,159740,856
4,951,741-124
4,951,612740,85648,40629,70118,70547,882298,013
112-45,7805,444,851
432,00184,37811,359
267,479298,400(2)
496,814
173,23218,5703,183
194,98584,328
563
Chicago
19,944,937
13,089,8462,084,119
807,673
1,367,204940,868126,85276,154379,125227,682420,595424,827
18,514,193
2,237,6612,711,1993,659,6194,073,508
2,987,767
376,39332,099714,491447,539
1,273,927
1,430,744191,701
1,239,049-69,900-30,823-39,0651,199,981-12,562-6,591-5,958
1,194,016
9,990,784240
9,991,0251,194,016
44,81032,94511,86517,407521,409
206-156
10,725,483
947,45595,056464
447,539473,534
5311,017,507
55,57331,00067,672154,239123,108
903
St. Louis
3,649,344
2,286,57369,291
377,102
373,825209,4429,56624,09454,42975,32699,28170,414
3,248,603
504,086465,82475,970
1,057,977
526,204
50,3746,105
169,87083,968308,222
400,74268,271332,475-13,330-5,905-7,415325,060
260145115
325,175
2,326,431-105
2,326,321325,1758,5882,7365,852240
103,948214
9,2082,565,366
186,03728,809
23483,96897,141(2)
201,911
56,2374,1832,06362,48833,315
387
Minneapolis
3,436,578
2,373,097° 111,402
172,432
267,409215,8926,25716,14443,10553,13799,72077,988
3,056,304
436,388514,283146,675
1,029,328
354,759
82,50822,224106,11067,872296,154
380,27470,233310,041-10,702-4,951-5,747304,287
40311
391304,679
2,049,286129
2,049,415304,67911,5527,2944,258918
99,88931
5,0252,271,666
170,14014,400
13967,87272,099(2)
180,450
29,58531,0024,70865,29525,801
507
Kansas City
5,491,874
3,633,48321,616
590,933
449,233329,3069,16617,86589,821118,687133,78797,974
4,681,389
768,655970,10314,965
1,330,018
575,270
61,78417,844
236,095147,391559,268
810,488203,671606,814-23,601-9,956-13,625593,1782,162107
2,064595,241
3,433,273-518
3,432,756595,24148,53830,12318,415
299195,470
1698,887
3,890,101
278,45449,297
0147,391166,494(2)
308,647
172,39521,399
0193,80146,794
818
Dallas
8,889,617
5,836,923703,774
664,116
601,644496,35915,13215,840124,498170,911176,08984,328
7,714,064
958,2871,948,430911,066
1,607,352
986,698
81,54750,111268,012224,650677,900
1,175,548285,192890,355-45,698-20,413-25,260865,0932,402
792,319
867,413
4,779,367237
4,779,608867,41393,31933,51559,8042,186
218,3110
7,4235,531,638
420,90247,616
174224,650194,084(2)
499,260
248,1089,7916,939
264,83859,134
737
SanFrancisco
27,780,173
20,112,8362,870,801
548,991
1,085,288566,486159,302369,404275,135494,890636,302660,737
25,256,709
3,795,3044,664,0986,263,4774,435,135
1,787,503
755,13258,438
1,033,735622,285
1,841,602
2,523,464856,620
1,666,843-47,274-23,489-23,7861,643,060
2,154738
1,4161,644,476
10,272,4561,025
10,273,4811,644,476132,58777,91354,67445,988610,753
46147,594
11,532,917
1,357,564198,8714,824
622,285730,855-4,219
1,448,470
425,530192,194216,138833,866215,842
149
Line
1
23
4
56789101112
13
14151617
18
1920212223
2425262728293031323334
353637383940414243444546
47484950515253
545556575859
207Digitized for FRASER http://fraser.stlouisfed.org/ Federal Reserve Bank of St. Louis

80. Income, expenses, and dividends of member banks, by Federal Reserve District1—ContinuedB. Large banksStatements for each bank reflect fully consolidated operations. Figures ai*e in thousands of dollars.
Item
1 Operating income — total . .2 Interest and fees on loans3 Interest on balances with depository institutions4 Income on federal funds sold and securities purchased under agreements to resell in
domestic offices of bank and of its Edge and Agreement subsidiaries5 Interest on Treasury securities and on other U S government obligations6 Interest on U S. Treasury securities7 Interest on obligations of other U S government agencies and corporations8 Interest on obligations of states and political subdivisions iin United States9 Income from all other securities
10 Interest on other bonds notes and debentures1 1 Dividends on stock12 Income from lease financing13 Income from fiduciary activities14 Service charges on deposit account in domestic offices15 Other service charges commissions and fees16 Other operating income . . , .17 Trading income net ,18 Equity in net income of unconsolidated subsidiaries and associated companies . .19 All other20 Operating expenses— total . . *21 Salaries and employee benefits ,22 Interest on time CDs of $100 000 or more issued by domestic offices . . . . , ,23 Interest on deposits in foreign offices24 Interest on other deposits25 Expense of federal funds purchased and securities sold under agreements to repurchase
in domestic offices of bank and of its Edge and Agreement subsidiaries26 Interest on demand notes issued to U.S. Treasury and other borrowed money27 Interest on demand notes (note balances) issued to U.S. Treasury28 Interest on other borrowed money . . . .29 Interest on subordinated notes and debentures30 Occupancy expense of bank premises net and furniture and equipment expense . .31 Occupancy expense of bank premises gross32 LESS' Rental income . . .33 Occupancy expense of bank premises net34 Furniture and equipment expense . . . . . . .35 Provision for possible loan losses36 Other operating expenses . .37 Minority interest in consolidated subsidiaries . . . . .38 All other39 Income before income taxes and securities gains or losses . . .40 Applicable income taxes41 Income before securities gains or losses42 Securities gains or losses (— ) gross43 Applicable income taxes44 Securities gains or losses (— ) net45 Income before extraordinary items . . . .46 Extraordinary items, gross47 Applicable income taxes48 Extraordinary items net of tax effect49 Net income
Equity capital account50 Balance end of previous year51 Adjustments , . . .52 Adjusted balance end of previous year53 Net income or loss (— ) .54 Sale conversion acQuisition, or retirement of capital net .55 Transactions with own holding company or affiliates56 Other57 Changes incident to mergers and absorptions, net58 LESS- Cash dividends declared on common stock59 LESS- Cash dividends declared on preferred stock60 Other increases or decreases (— )61 Balance end of period . . .
Allowance for possible loan losses62 Balance, end of previous year63 Recoveries credited to allowance64 Changes incident to mergers and absorptions, net65 Provision for possible loan losses66 LESS- Losses charged to allowance67 Foreign currency translation adjustment68 Balance, end of period
MEMO69 Provision for U S federal income taxes70 Provision for U.S., state, and local income taxes71 Provision for foreign income taxes .72 Total73 Provision for income taxes current portion. . ,74 Provision for income taxes deferred portion75 Number of full-time equivalent employees^76 Number of banks3 •
Boston
2,939,9341 728,974
440,357
81,117210,468173,70736,7615507293,85092309
1,5416059292,5999760
103,4956365021,009
347239,169
2,747,402354,938363,637965 051
89,744
549,78391,91513,868780473,004
96,69567392
9,46057,93238,76358224
174,411o174,411192,53268,189
124,343-8,862—4798—4,064120 279
00o
120,279
881,9470
881,947120,279o
o00
61,63900
940,587
113,89517,974
058,22453,148
87137,032
18,48220,3512455863,39153,33410,05717,111
4
New York
43,963,51330,212 5906,683,669
905,426965 827718,747247,080776 982579 420550 555
28865494 595666,677134 290
1,042,1651 501 872
455,879126537919,456
40,142,9244,043,5313,374,232
202277192,122,523
4,103,7502,109,545
149,6821,959 863
105,5901,217605
882 799105 499777,300440 305731 486
2,106,94324765
2,082,1783,820 5891,562,4092,258,180-133 125-77 112-56,012
2,202 168-15,177-8,962-6215
2,195,953
14,764,250
14,764,5642,195953
166092166 092
0-14,778855,588
0145 779
16,402 022
1,797,659250,611-1,941
731 486784 173-9,047
1,984,595
272 082468,710735 543
1,476,3351,291,825
184510172 806
14
Phila-delphia
2,495,4801,642 761
172,822
105,486186,15372,528
113,6259825920,703167423,961
1250682,7043161461,26681 20644,438
93835,830
2,413,213350,027302,673467 709282,085
486,76181,13815,49765,64130,501
109,02272310
8,74463,56645,456
123 476179,821
0179,82182,26714,50767,760
-89,374—11 141-78,233-10,473
1,435775660
-9,813
1,175,869-604
1,175,265-9,813
1,6531 653
00
45,389800
18,7291,139645
150,32920,885
123123,476127,499
C2)167,314
-9,9751,520
125964,141
12,766-8,62518,073
6
Cleveland
5,131,1023,165 354
583,906
205,050363 969196,319167,650332 117
1839713 1495,248
43908132,73670243
118 1779724545,102
1 61350,530
4,622,560636,205879,681587 080913,047
839,484138,23443,10695 128
2,351188 102124 19927,23896,96191,141
101 279337,097
o337,097508 542
73,959434,583-57 448—22 124-35,324399 259
1,21366
1 147400,406
3,041,859-2,022
3,039,837400,406
000
28,456237,347
0-1 724
3,229 628
303,72039,040
1,109101 279132915
(2)312,233
35465843
15 59351,90128,6542324736467
15
208Digitized for FRASER http://fraser.stlouisfed.org/ Federal Reserve Bank of St. Louis

Richmond
3,870,7452,537,651378,463
160,614216,442147,62868,814214,8487,0685,1351,93329,69777,57282,17573,03193,18450,243
68242,259
3,507,596609,099488,241503,420756,891
470,84367,89730,42037,47710,182186,654119,71813,679106,03980,615100,763313,606
0313,606363,14965,183297,966-28,960-13,743-15,217282,749
000
282,749
2,009,9540
2,009,954282,74914,38214,382
014,631100,900
0-1,004
2,219,812
193,03527,6592,491
100,763103,726(2)
220,222
30,11915,2086,11351,44055,133-3,69337,636
14
Atlanta
2,892,8231,757,836131,782
267,994242,357168,64173,716146,7389,0242,5706,45417,29564,76281,718104,16469,15422,750
60745,797
2,546,420429,323434,99181,598438,750
519,64632,30411,05221,25210,730137,07688,63722,72965,90871,168108,608353,394
0353,394346,40388,753257,650-35,356-16,338-19,018238,632
000
238,632
1,666,7060
1,666,706238,632
19300
-281-50,688113,874
54-49,1091,691,632
174,35238,2433,608
108,608126,866(2)
197,945
65,1454,3632,90772,41566,3416,07427,152
20
Chicago
13,432,3888,861,5722,004,512
381,367545,126392,857152,269455,39081,67671,25710,41960,758274,400100,073305,384362,130113,83318,442
229,85512,683,2911,244,7492,080,7433,650,1911,347,079
2,621,201315,63379,752235,88113,243394,864283,35651,352232,005162,859311,299704,289
197704,092749,097116,383632,714-36,022-17,011-19,011613,703-13,895-6,622-7,273606,430
5,153,4080
5,153,408606,43036,95436,954
0-1,817288,634
0-5,926
5,500,415
598,48156,310
276311,299304,675
531662,222
6,88718,19167,67292,750155,337-62,58759,623
24
St. Louis
1,837,9411,157,907
55,109
214,459101,70067,67434,02684,6863,8742,7191,155
22,90335,52533,12872,58856,06333,586
65521,822
1,669,753251,683275,29675,970285,830
446,59239,69115,85523,8363,68492,46129,4238,39541,02851,43343,084155,462
-15155,477168,18825,462142,726-6,382-3,014-3,368139,358
000
139,358
934,71495
934,809139,358
-35-5318240
49,5740
5,0001,029,798
97,24316,700
043,08451,996(2)
105,031
18,5641,8222,06322,449
40422,04515,726
14
Minneapolis
1,262,134810,28599,649
48,11260,04535,41024,63581,1161,097327770
13,17033,76010,32546,78457,79144,5601,338
11,8931,179,237131,625305,679146,67592,423
286,17262,94516,69646,24910,06322,56924,61212,51112,10110,46825,76895,318
095,31882,897-5,19388,090-3,215-1,667-1,54486,546
000
86,546
614,6350
614,63686,546
0000
30,57000
670,611
61,7342,272
025,76825,080(2)64,694
-20,0958,5244,708
-6,863-25,08018,2176,553
8
Kansas City
1,820,9841,198,732
1,211
246,91393,12272,96218,81087,3512,426870
1,5229,07155,16716,51155,27455,20626,571
48228,142
1,627,003247,762440,39814,965171,857
378,73130,02416,39213,5738,84979,43749,09913,29335,80643,24547,513207,467
6206,512193,98142,854151,127-6,989-3,410-3,579147,548
000
147,548
926,5720
926,572147,548
0000
56,5310
2,3661,019,955
94,53221,440
047,51354,452(2)
109,033
35,4264,013
039,43931,8846,97813,932
18
Dallas
4,579,3563,121,893623,536
207,293149,983122,22127,703210,2556,7924,6422,15011,65090,01221,12095,37041,4528,3963,54329,513
4,077,102
371,7081,103,031903,252370,689
764,29857,25428,55528,69936,27986,10482,86650,38832,47853,574100,939283,548
0283,491502,254123,756378,498-15,842-7,286-8,556369,9422,154
02,154
372,096
2,001,5240
2,001,524372,0969,5197,5192,000
0111,833
0-658
2,270,648
214,84614,180
0100,93972,205(2)
257,760
• 102,5018,5205,449
116,47097,00619,49118,754
18
SanFrancisco
25,128,55718,282,2482,810,570
422,368853,734493,500360,234435,747154,356137,93616,420
341,917247,001383,085575,398622,133135,02943,957443,147
22,964,868
3,292,0794,332,2686,256,4103,640,567
1,644,129737,963104,306633,65749,638885,692578,96471,499507,465378,227555,481
1,570,6413,779
1,566,8622,163,688748,503
1,415,185-35,042-17,396-17,6501,397,535
465130335
1,397,870
8,783,2990
8,783,2991,397,870
52,86847,2895,57939,628540,599
046,018
9,779,084
1,214,078182,8914,824
555,481662,619-4,219
1,290,438
342,089174,890214,262731,241430,400300,842184,384
18
Line
123
456789101112131415161718192021222324
25262728293031323334353637383940414243444546474849
505152535455565758596061
62636465666768
6970717273747576
209Digitized for FRASER http://fraser.stlouisfed.org/ Federal Reserve Bank of St. Louis

80. Income, expenses, and dividends of member banks, by Federal Reserve District1—ContinuedC. Other-than-large banksStatements for each bank reflect fully consolidated operations. Figures ate in thousands of dollars.
Item
1 Operating income~~total
2 Interest and fees on loans3 Interest on balances with depository institutions ,4 Income on federal funds sold and securities purchased under agreements to resell
in domestic offices of the bank and of its Edge and Agreement subsidiaries5 Interest on U.S. Treasury securities and on obligations of other U.S. government agencies
and corporations . . .6 Interest on obligations of states and political subdivisions in United States7 Income from all other securities8 Income from lease financing9 Income from fiduciary activities . . .
10 Service charges on deposit accounts in domestic offices11 Other service charges commissions and fees . ,12 Other operating income
13 Operating expenses — total
14 Salaries and employee benefits15 Interest on time CDs of $100 000 or more issued by domestic offices . .16 Interest on deposits in foreign offices17 Interest on other deposits ,18 Expense of federal funds purchased and securities sold under agreements to repurchase
in domestic offices of bank and of its Edge arid Agreement subsidiaries . . . .19 Interest on demand notes (note balances) issued to U.S. Treasury and other -
borrowed money20 Interest on subordinated notes and debentures21 Occupancy expense of bank premises net and furniture and equipment expense22 Provision for possible loan losses23 Other operating expenses
24 Income before income taxes and securities gains or losses . .25 Applicable income taxes26 Income before securities gains or losses27 Securities gains or losses (— ) gross28 Applicable income taxes29 Securities gains or losses ( — ) net30 Income before extraordinary items3 1 Extraordinary items gross . . .32 Applicable income taxes33 Extraordinary items net of tax effect f34 Net income
Equity capital account35 Balance end of previous year36 Adjustments37 Adjusted balance end of previous year „38 Net income or loss (— )39 Sale conversion acquisition or retirement of capital net40 Transactions with ow'n holding company or affiliates41 Other42 Changes incident to mergers and absorptions net . . . .43 LESS- Cash dividends declared on common stock . . .44 LESS- Cash dividends declared on preferred stock45 Other increases or decreases ( — )46 Balance, end of period
Allowance for possible loan losses47 Balance end of previous year . . .48 Recoveries credited to allowance49 Changes incident to mergers and absorptions net50 Provision for possible loan losses51 LESS Losses charged to allowance . . . . . ;52 Balance end of period .
MEMO53 Provision for U.S. federal income taxes . .54 Provision for U.S., state, and local income taxes '55 Provision for foreign income taxes56 Total
57 Number of full-time equivalent employees3
58 Number of banks3
Boston
2,133,331
1 403 59196,133
101 031
185,549113 926
8 07218,122697214055054,33642 295
1,933,126
371,500253 772
80 538551,977
242,920
402154031
113,63651 918
222 616
20021039222
160,984-14,017
—7071—6 944154,040
4721
470154 510
1 162 097123
1,162,219154510
72616,551
71034
5805410
3651,266,326
117 73217 377
18151,91858,033
129 171
17,08113,670
1 40432 152
23 598165
New York
5,539,583
3 400,528448,965
256,186
421,594319,707
7232429,36186,53283 137
261,045160,207
5,100,673
785,636690,845482 395
1 382,461
475,212
110,2878451
253,838227,974683,573
438,90945,656
393,257-61,842-34,839-26 990366,268
1,4880
1,492367,759
3 566,396237
3 566,633367,759
11,58010,1851,395
13,241200,065
477133493
3,892,155
332,49665,092
1 748227,974264,740362,569
-22,69221,71611,78610,806
82,087212
Phila-delphia
1,876,602
1,230,66143,450
108,083
239,212149,460
19499804
225772689921,89014069
1,728,372
295,973137,581
4 344878,743
72,270
16,2058751
94,27254,523
165 705
148,230-1 604149,835-15,578-2,764
-12815137,018
14-23
39137,057
1,357,771757
1,358,525137,057
2483931
1,55210,42763494
321 052
1,446,027
100,6709,028
79754,52355,276
109,742
-7,0232,635
0-4,385
20512207
Cleveland
2,905,810
1 898 42242,318
168,298
361,856235835
852714,4704594267 57742,51620048
2,544,182
448,520240 693
35551,188,973
139,124
27,1824337
137,62974,235
279,932
361,62845 839
315,790--6,239-2673-3 563
312,223615
57558
312781
2,296431894
2,297,325312,781
8 7762,3776,399
43,369125 245
321 830
2,538,806
151,096208022880
74,23588,565
160,448
43,051168
043,219
31,029359
210Digitized for FRASER http://fraser.stlouisfed.org/ Federal Reserve Bank of St. Louis

Richmond
2,831,660
1,834,10320,999
227,380
318,705199,0424,3906,98434,97981,41770,87332,787
2,496,850
509,708224,1161,454
1,022,942
169,711
25,8609,210
159,00663,392311,461
334,80953,866280,940-18,588-8,468-10,112270,829
6855
683271,512
2,066,660-382
2,066,274271,5128,180
-6,19614,376
21098,403
164-1,617
2,245,986
155,52625,320
11863,39277,808166,548
39,1176,277
045,393
35,737362
Atlanta
4,859,684
2,938,13986,023
411,767
618,577337,95015,2859,73580,822167,289135,42358,672
4,214,207
798,856562,3532,384
1,497,083
316,430
27,95110,494257,206158,871582,573
645,475132,509512,973-22,808-9,890-12,899500,0612,120-38
2,159502,224
3,285,035-124
3,284,906502,22448,38729,40118,98698,570184,139
583,329
3,753,219
257,64946,1357,751
158,871171,534298,869
108,08714,207
276122,570
57,176543
Chicago
6,512,549
4,228,27479,607
426,306
822,078485,47845,17615,396104,725127,609115,21162,697
5,830,902
992,912630,4569,428
2,726,429
366,566
60,76018,856319,627136,240569,638
681,64775,31?606,335-33,878-13,812-20,054586,278
1,33331
1,315587,586
4,837,376240
4,837,617587,5867,856
-4,00911,86519,224232,775
2065,770
5,225,068
348,97438,746
188136,240168,859355,285
48,68612,809
061,489
63,485879
St. Louis
1,811,403
1,128,66614,182
162,643
272,125124,7565,6921,19118,90442,19826,69314,351
1,578,850
252,403190,528
0772,147
79,612
10,6832,42177,40940,884152,760
232,55442,809189,749-6,948-2,891-4,047185,702
260145115
185,817
1,391,717-200
1,391,512185,8178,6232,7895,834
054,374
2144,208
1,535,568
88,79412,109
23440,88445,14596,880
37,6732,361
040,039
17,589373
Minneapolis
2,174,444
1,562,81211,753
124,320
207,364134,7765,1602,9749,34542,81252,93620,197
1,877,067
304,763208,604
0936,905
68,587
19,56312,16183,54142,104200,836
297,37775,426221,951-7,487-3,284-4,203217,741
40311
391218,133
1,434,651129
1,434,779218,13311,5527,2944,258918
69,31931
5,0251,601,055
108,40612,128
13942,10447,019115,756
49,-68022,478
072,158
19,248499
Kansas City
3,670,890
2,434,75120,405
344,020
356,111241,9556,7408,79434,654102,17678,51342,768
3,054,386
520,893529,705
01,158,161
196,539
31,7608,995
156,65899,878351,801
616,507160,817455,687-16,612-6,546-10,046445,6302,162107
2,064447,693
2,506,701-518
2,506,184447,69348,53830,12318,415
299138,939
1696,521
2,870,146
183,92227,857
099,878112,042199,614
136,96917,386
0154,362
32,862800
Dallas
4,310,261
2,715,03080,238
456,823
451,661286,1048,3404,19034,486149,79180,71942,876
3,636,962
586,579845,3997,814
1,236,663
222,400
24,29313,832181,908123,711394,352
673,294161,436511,857-29,856-13,127-16,704495,151
24879165
495,317
2,777,843237
2,778,084495,31783,80025,99657,8042,186
106,4780
8,0813,260,990
206,05633,436
174123,711121,879241,500
145,6071,2711,490
148,368
40,380719
SanFrancisco
2,651,616
1,830,58860,231
126,623
231,554130,7394,94627,48728,134111,80560,90438,604
2,291,841
503,225331,8307,067
794,568
143,374
17,1698,800
148,04366,804270,961
359,776108,117251,658-12,232-6,093-6,136245,5251,689608
1,081246,606
1,489,1571,025
1,490,182246,60679,71930,62449,0956,36070,154
4611,576
1,753,833
143,48615,980
066,80468,236158,032
83,44117,3041,876
102,625
31,458131
Line
1
23
4
56789101112
13
14151617
18
1920212223
2425262728293031323334
353637383940414243444546
474849505152
53545556
5758
211Digitized for FRASER http://fraser.stlouisfed.org/ Federal Reserve Bank of St. Louis

81. Selected assets and liabilities of minority-owned banks, by size of bank, December 31,19801
Thousands of dollars, except for number of banks
Account
ASSETS
1 Cash and due from depositories ,
Total securities held2 U S Treasury3 U S government agencies and corporations4 States and political subdivisions ,5 All others
6 Federal funds sold and securities purchasedunder agreements to resell . . . . .
7 Net loans8 Lease financing receivables9 Bank premises, etc
10 Real estate owned not bank premises , . . .1 1 Other assets
12 Total assets
LIABILITIES
Deposits13 Demand-Individuals, partnerships, and corporations . , .14 Time and savings -Individuals, partnerships,
and corporations15 U S government. .16 States and political subdivisions17 All other18 Certified and officers checks
19 Total deposits20 Demand21 Time and savings
,22 Federal funds purchased and securities sold underagreements to repurchase
23 Treasury note balances and other borrowings24 Mortgage indebtedness25 All other liabilities
26 Total liabilities
27 Subordinated notes and debentures
EQUITY CAPITAL
28 Preferred stock-Par29 Common stock— Par30 Surplus31 Undivided profits and capital reserves .
32 Total equity capital
33 Total liabilities and equity capital
34 Number of banks
Allsize
classes
363,321
274,363269,250166,86317,539
336,7951,383,822
5,05469,949
7,39261,448
2,955,795
694,677
1,342,783114,940332,249
22,46848,733
2,555,854924,925
1,630,924
53,76448,29710,61958,543
2,727,072
10,152
5,93478,53494,36039,744
218,571
2,955,795
96
Asset size (in millions of dollars)
Under 10
23,594
22,40321,103
1,992440
16,48572,293
07,120
3793,291
169,099
41,089
71,4776,396
20,801442
3,259
143,46853,37290,092
1,245746655
2,677
148,787
113
87012,3468,9011,917
20,199
169,099
22
10-24
86,203
63,95269,18321,1254,003
82,408300,339
015,102
1,06410,848
654,227
160,757
270,68443,25279,043
3,12110,733
567,590222,567345,023
6,5278,620
9319,628
593,295
3,820
59827,87423,424
5,216
57,112
654,227
39
25-49
78,347
57,95668,71327,495
1,632
77,257332,129
1,15519,253
1,54914,725
680,211
158,607
303,02241,57471,2564,097
11,587
590,143216,922373,219
5,10011,808
1,71920,271
629,041
2,137
1,26317,47220,811
9,487
49,033
680,211
20
50 and over
175,177
130,052110,251116,251
11,464
160,645679,061
3,89928,4744,400
32,584
1,452,258
334,224
697,60023,718
161,14914,80823,154
1,254,653432,064822,590
40,89227,123
7,31425,967
1,355,949
4,082
3,20320,84241,22426,958
92,227
1,452,258
15
212Digitized for FRASER http://fraser.stlouisfed.org/ Federal Reserve Bank of St. Louis

82. Denominations of U.S. currency in circulation, 1980Millions of dollars, end of period
Item
1 Total in circulation1
2 Coin and small-denomina-tion currency
3 Coin4 $125 $26 $5 . -7 $108 $20
9 Large-denominationcurrency
10 $5011 $10012 $50013 $1 00014 $5*00015 $10,000
Jan.
121,157
6696411 6413,058
6664,215
1099236392
54,19312 16341,668
164192
24
Feb.
121,436
66,88311 6803,073
6674,197
10,91136,355
54,55312,18442,009
164191
24
Mar.
122,943
67,64011,7643,085
6674,231
10,98936,904
55,30412,37242,571
164191
24
Apr.
123,963
68,09711 8743,187
6684,285
11,02937,054
55,86612,41643,089
164191
24
May
125,694
68,80211 9403,245
6694,319
11,13237,497
56,89212,56343,969
164190
24
June
127,097
. 69,13512,0103,246
6684,313
11,12037,778
57,96212,73844,866
163190
23
July
128,337
69,38112,0903,246
6704,307
11,11037,958
58,95612,92845,669
163190
23
Aug.
129,667
69,96912,1493,256
6714,324
11,15338,416
59,69813,06746,273
163190
23
Sept.
129,917
69,73412,1783,264
6704,334
11,11438,174
60,18313,07146,754
163190
23
Oct.
131,075
70,12912,2433,295
6704,343
11,16738,411
60,94613,19947,390
163189
23
Nov.
134,104
72,09812,3243,340
6734,450
11,53039,781
62,00613,49448,155
163189
23
Dec.
137,244
73,89212,4193,499
6774,635
11,92440,738
63,35213,73149,264
163189
23
83. Assets of pension fundsA. Totals for private and public fundsBook value of all assets other than equities at end of year,billions of dollars
Type
1 All types2 Private funds . . .3 Insured.4 Noninsured . . . . . . . . . .5 Public funds6 State and local government7 US government ,8 Civil service9 Railroad retirement
1979
599.4361 6139.22224237 8170.167 764 6
3.1
1980
729.1444 8165.62792284 3207.9
76473 9
2.5
B. Types held by private noninsured fundsBook value of all assets other than equities at end of year,billions of dollars
Type
1 Total financial assets
2 Demand deposits and currency3 Time deposits . . .4 Corporate equities5 U.S. government securities6 Corporate and foreign bonds . .7 Mortgages8 Miscellaneous assets
1979
222.4
1 98.9
123 725.053.7
3 55.7
1980
279.2
1 910.3
168 230.858.1
3 86.1
84. Finance rates on selected types of installment credit1
Percent per annum; not seasonally adjusted
Month
1980FebruaryMayAugustNovember
Commercial banks
Newauto-
mobiles(36 mos.)
Mobilehomes
(84 mos.)
Otherconsumer
goods(24 mos.)
Personalloans
(12 mos,)
Credit-cardplans
Finance companies
Automobiles
New
14.30 14.99 15.47 15.68 17.31 14.8413.28 13.57 14.69 14.88 17.13 14.1215.72 15.96 16.31 16.42 17.31 15.2413.91 14.95 15.33 15.50 17.39 14.7314.29 15.49 15.54 15.90 17.41 15.25
UsedMobilehomes
Otherconsumer
goodsPersonal
loans
19.10 15.47 20.61 21.1318.27 14.05 19.65 20.5519.42 15.94 20.90 21.1619.33 15.91 20.94 21.3219.36 15.98 20.94 21.48
85. Security credit reported by nonbank lenders subject to margin regulations, June 30,1980*Millions of dollars
Type of credit
1 Margin stock2 Convertible bonds3 Subscription issues. . . .4 £Plan lenders"^
5 Total
NYSEmembers
11 417'l69
15
11,601
Regulation T
Otherbrokers
and dealers2
1800
18
Total
11 435169
15
11,619
Regulation G
83
90
173
Total
11 518169
1590
11,792
213
Digitized for FRASER http://fraser.stlouisfed.org/ Federal Reserve Bank of St. Louis
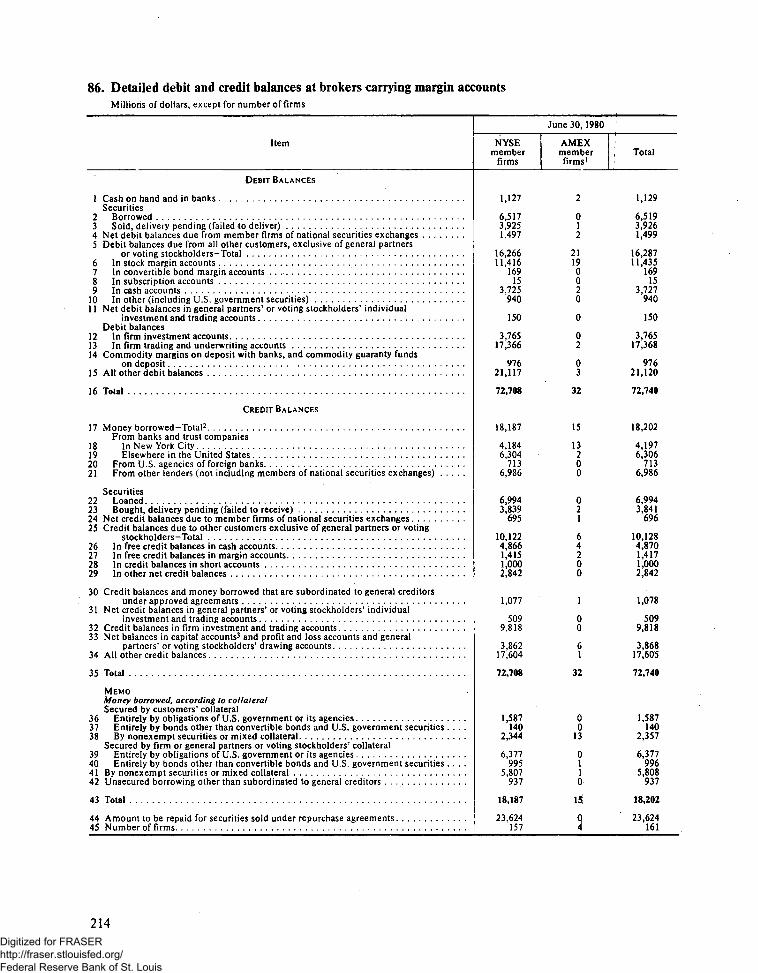
86. Detailed debit and credit balances at brokers carrying margin accountsMillions of dollars, except for number of firms
Item
June 30,1980
NYSEmember
firms
AMEXmemberfirms1
Total
DEBIT BALANCES
1 Cash on hand and in banks 1,127 2 1,129Securities
2 Borrowed 6,517 0 6,5193 Sold, delivery pending (failed to deliver) 3,925 1 3,9264 Net debit balances due from member firms of national securities exchanges 1,497 2 1,4995 Debit balances due from all other customers, exclusive of general partners
or voting stockholders-Total 16,266 21 16,2876 In stock margin accounts 11,416 19 11,4357 In convertible bond margin accounts . . 169 0 1698 In subscription accounts 15 0 159 In cash accounts 3,725 2 3,727
10 In other (including U.S. government securities) 940 0 94011 Net debit balances in general partners' or voting stockholders' individual
investment and trading accounts 150 0 150Debit balances
12 In firm investment accounts 3,765 0 3,76513 In firm trading and underwriting accounts 17,366 2 17,36814 Commodity margins on deposit with banks, and commodity guaranty funds
on deposit 976 0 97615 All other debit balances 21,117 3 21,120
16 Total 72,708 32 72,740
CREDIT BALANCES
17 Money borrowed-TotaP 18,187 15 18,202From banks and trust companies
18 In New York City 4,184 13 4,19719 Elsewhere in the United States 6,304 2 6,30620 From U.S. agencies of foreign banks 713 0 71321 From other lenders (not including members of national securities exchanges) 6,986 0 6,986
Securities22 Loaned 6,994 0 6,99423 Bought, delivery pending (failed to receive) 3,839 2 3,84124 Net credit balances due to member firms of national securities exchanges 695 1 69625 Credit balances due to other customers exclusive of general partners or voting
stockholders-Total 10,122 6 10,12826 In free credit balances in cash accounts 4,866 4 4,87027 In free credit balances in margin accounts 1,415 2 1,41728 In credit balances in short accounts 1,000 0 1,00029 In other net credit balances 2,842 0 2,842
30 Credit balances and money borrowed that are subordinated to general creditorsunder approved agreements 1,077 1 1,078
31 Net credit balances in general partners' or voting stockholders' individualinvestment and trading accounts 509 0 509
32 Credit balances in firm investment and trading accounts 9,818 0 9,81833 Net balances in capital accounts3 and profit and loss accounts and general
partners' or voting stockholders' drawing accounts 3,862 6 3,86834 All other credit balances 17,604 1 17,605
35 Total . 72,708 32 72,740
MEMOMoney borrowed, according to collateralSecured by customers' collateral
36 Entirely by obligations of U.S. government or its agencies 1,587 0 1,58737 Entirely by bonds other than convertible bonds and U.S. government secur i t i e s . . . . 140 0 14038 By nonexempt securities or mixed collateral 2,344 13 2,357
Secured by firm or general partners or voting stockholders' collateral39 Entirely by obligations of U.S. government or its agencies 6,377 0 6,37740 Entirely by bonds other than convertible bonds and U.S. government securities . . . . 995 1 99641 By nonexempt securities or mixed collateral 5,807 1 5,80842 Unsecured borrowing other than subordinated to general creditors . . 937 0 937
43 Total 18,187 15 18,202
44 Amount to be repaid for securities sold under repurchase agreements 23,624 0 23,62445 Number of firms 157 4 161
214Digitized for FRASER http://fraser.stlouisfed.org/ Federal Reserve Bank of St. Louis

87. Commitments of life insurance companies for income-property mortgages1
Period
1975197619771978
1979JanuaryFebruaryMarchAprilMayJuneJulyAugustSeptemberOctober . . ,NovemberDecember
1979JanuaryFebruaryMarchAprilMayJuneJulyAugustSeptemberOctoberNovemberDecember
1980JanuaryFebruaryMarchAprilMayJuneJulyAugustSeptemberOctoberNovemberDecember
Numberof loans
5991 0591,8542286
1 76711913914715216421516716714815414550
2 63718720925122426230023825724721717966
656328280202934516697676137
Total
committed(millions
ofdollars)
1,717.03 57055,830.97 361.6
7,014.6471.6469.27009629.7619.9930.3711.64697650.8627.7553.4179.7
10761 5859.3R
678.41,048.0
900.11 098.41 401 41,048.4
768 11 1580
847.0690.2284 2
4,180.31543350.8516.12694150.6214.83598320.9850.5332.9442.2217.8
Loanamount
(thousandsof dollars)
2,8663 3723,1453,220
3,9703,9633,37547684,1433,7804,3274,2612,8134,3974,0763,8173,597
40814,4883,2464,1754,0184,19346714,4052,98946883,9033,8564305
6,37248224,2786,451
134725,1946,31870554,8638,7684,9697,2495,886
Contractinterest
rate(percent)
10.229.839.339.59
10.369.95
10.0110.0910.1410.1810.2910.4310.4110.5310.5810.9011.50
10.369.99
10.0110.0910.1510.2110.2910.4210.4110.5310.6511.0111.51
12.6911.6512.0312.8913.4013.1813.0913.5912.5512.5912.9912.9313.32
Maturity(years/
months)
Old series
21/921/10
21/521/0
21/219/420/821/121/822/123/022/9
24/1022/421/7
22/1021/7
New series
21/519/7
20/1021/2
20/1020/11
22/422/022/921/421/0
21/1121/2
18/619/622/419/521/215/017/919/4
16/1018/817/2
16/1115/4
Averages2
Loan-to-value
ratio(percent)
73.873 673.773.1
72.574.174.573474.673.274.073.673 173.372.572.173.0
74 174.475.273.975.173.774674.173.574273.072.5745
73.371.076.371.973.274.073.575.574.273.670.673.969.7
Capitaliza-tion rate(percent)
10.810.39.9
10.0
10.410.110.110.310.410.310.310.410.610.510.410.511.1
10.510.210.210.310.410.410410.510.710610.610.711.3
12.111.211.912,012.612.412.712.212.212.012.212.212.2
Debtcoverage
ratio
1.331.301.321.29
1.261.211.24
.28
.25
.28
.24
.25
.29
.271.271.261.26
1.251.221.221.271.251.271.241.261.301.281.271.261.28
1.27.27,25.26.26.25.29.26.28.27.28.26.30
Percentconstant
11.210.810.410.7
11.311.510.911.111.011.211.011.211.211,211.411.712.1
11.311.310.911.111.011.211.011.211,311.211.411.712.2
13.112.312.613.213.713.413.613.013.012.913.313.213.8
215Digitized for FRASER http://fraser.stlouisfed.org/ Federal Reserve Bank of St. Louis

Part 3-Notes to Tables
Digitized for FRASER http://fraser.stlouisfed.org/ Federal Reserve Bank of St. Louis

Notes to Tables
Part 1-Regular Tables
TABLE 1
1. Unless otherwise noted, rates of change are calculatedfrom average amounts outstanding in preceding month orquarter. Growth rates for member bank reserves are adjustedfor discontinuities in series that result from changes in Regula-tions D and M.
2. Includes reserve balances at Federal Reserve Banks in the*current week plus vault cash held two weeks earlier used tosatisfy reserve requirements at all depository institutions pluscurrency outside the U.S. Treasury, Federal Reserve Banks, thevaults of depository institutions, and surplus vault cash atdepository institutions.
3. Ml-A: Averages of daily figures for (1) demand deposits atall commercial banks other than those due to domestic banks,the U.S. government, and foreign banks and official institutionsless cash items in the process of collection and Federal Reservefloat; (2) currency outside the Treasury, Federal ReserveBanks, and the vaults of commercial banks; and (3) traveler'schecks of nonbank issuers,
Ml-B: Ml-A plus negotiable order of withdrawal (NOW) andautomatic transfer service (ATS) accounts at banks and thriftinstitutions, credit union share draft accounts, and demanddeposits at mutual savings banks.
M2: Ml-B plus savings and small-denomination timedeposits at all depository institutions, overnight repurchaseagreements at commercial banks, overnight Eurodollars heldby U.S. residents other than banks at Caribbean branches ofmember banks, and money market mutual fund shares.
M3: M2 plus large-denomination time deposits at all deposi-tory institutions and term RPs at commercial banks and savingsand loan associations.
L: M3 plus other liquid assets such as term Eurodollars heldby U.S. residents other than banks, bankers acceptances, com-mercial paper, Treasury bills and other liquid Treasury securi-ties, and U.S. savings bonds.
4. Savings deposits exclude NOW and ATS accounts at com-mercial banks.
5. Small-denomination time deposits are those issued inamounts of less than $100,000.
6. Large-denomination time deposits are those issued inamounts of $100,000 or more.
7. Savings and loan associations, mutual savings banks, andcredit unions.
8. Changes calculated from figures shown in table 15.9. Averages of daily effective rates (average of the rates on a
given date weighted by the volume of transactions at thoserates).10. Rate for the Federal Reserve Bank of New York.
11. Quoted on a bank-discount basis.12. Unweighted average of offering rates quoted by at least
five dealers.13. Market yields adjusted to a 20-year maturity by the U.S.
Treasury.14. Bond Buyer series for 20 issues of mixed quality.15. Weighted averages of new publicly offered bonds rated
Aaa, Aa, and A by Moody's Investors Service and adjusted toan Aaa basis. Federal Reserve compilations.
16. Average rates on new commitments for conventionalfirst mortgages on new homes in primary markets, unweightedand rounded to nearest 5 basis points, from U.S. Department ofHousing and Urban Development.
A Annual, monthly, and weekly averages of interest rates areshown in table 25.
TABLE 2
1. Includes securities loaned-securities fully guaranteed bythe U.S. government pledged with Federal Reserve Banks-and excludes any securities sold and scheduled to be boughtback under matched sale-purchase transactions.
2. Amounts of currency and coin held as reserves are shownin table 3.
3. Beginning in late July 1973, includes certain deposits ofdomestic nonmember banks and foreign-owned banking insti-tutions held with member banks and redeposited in full withFederal Reserve Banks in connection with voluntary participa-tion by nonmember institutions in the Federal ReserveSystem's program of credit restraint.
As of December 12, 1974, the amounts of voluntary non-member and foreign agency and branch deposits at Federal Re-serve Banks that are associated with marginal reserves are nolonger reported. However, deposits voluntarily held by agen-cies and branches of foreign banks operating in the UnitedStates as reserves against Eurodollar liabilities were reporteduntil October 1978.
4. Includes reserves of member banks, Edge Act corpora-tions, and U.S. agencies and branches of foreign banks. As ofNovember 13,1980, includes reserves of all depository institu-tions.
TABLE 3
1. As of November 13,1980, the figures shown include bal-ances of all depository institutions.
The various designations used in this table are explained asfollows:
219Digitized for FRASER http://fraser.stlouisfed.org/ Federal Reserve Bank of St. Louis

Reserve classification: Designation of banks as reserve citybanks for reserve requirement purposes is based on size ofbank (net demand deposits of more than $400 million), as de-scribed in Federal Reserve Bulletin, vol. 58 (July 1972), pages626-30. Categories shown here as "Large banks in New YorkCity," "Large banks in Chicago," and "Other large banks" makeup the previous "Reserve city" category; "All other banks"replaces the "Country" category. Hence the series arecontinuous over time.
Total reserves held&n& Excess reserves held:Reserve deficien-cies on which Federal Reserve Banks were allowed to waivepenalties in connection with bank adaptation to Regulation J,as amended November 9,1972.
Required reserves held:BasQd on close-of-business figures forreserve period ending two weeks previous to report date,
Borrowings: These figures are based on closing figures.Seasonal borrowings: Effective April 19, 1973, the Board's
Regulation A, which governs lending by Federal ReserveBanks, was revised to assist smaller member banks to meet theseasonal borrowing needs of their communities.
2. Based only on closing figures.3. Includes reserve balances of all depository institutions.4. Before November 13,1980, the figures shown reflect only
the vault cash held by member banks,5. Total vault cash at institutions without required reserve
balances less vault cash equal to their required reserves.6. Adjusted to include waivers of penalties for reserve defi-
ciencies in accordance with Board policy, effective November19,1975, of permitting transitional relief on a graduated basisover a 24-month period when a nonmember bank merges intoan existing member bank, or when a nonmember bank joinsthe Federal Reserve System, For weeks for which figures arepreliminary, figures by class of bank do not add to total becauseadjusted data by class are not available.
7. Reserve balances with Federal Reserve Banks plus vaultcash at institutions with required reserve balances plus vaultcash equal to required reserves at other institutions,
8. Reserve balances with Federal Reserve Banks plus vaultcash used to satisfy reserve requirements less required re-serves, (This measure of excess reserves is comparable to theold excess reserve concept published historically.)
TABLE 4
1. Effective March 13,1980, the daily average borrowings inimmediately available funds of 121 large member banks(banks with assets of $ 1 billion or more as of December 31,1977) disaggregated by lender and term to maturity, werereported; previously reported data from 46 large banks werediscontinued at the end of February 1980.
Immediately available funds are those that borrowing banksreceive the same day that the transfer of these funds is initiated.Unsecured borrowings in immediately available funds-federal funds-are acquired mainly from commercial banksand, to a lesser extent, from other depository institutions andfederal agencies. Other borrowings in immediately availablefunds are principally sales of U.S. Treasury and federal agencyobligations under an agreement to repurchase-securityrepurchase agreements-and are obtained from a muchwider range of customers, including nonbank securitiesdealers, nonfmancial corporations, and state and localgovernments. There is also a small amount of borrowing inimmediately available funds in the form of promissory notes,repurchase agreements involving other assets, due bills, andcertain other obligations.
Borrowings of immediately available funds may have aspecified term to maturity-as short as one business day-ormay be made under continuing contract. Transactions under
continuing contract remain in effect until terminated, withoutany requirement of prior notice by either borrower or lender.Information is provided on two maturity categories: one dayplus continuing contract borrowings, and all other maturities.
TABLE 5-A
1. Rate applied to discounts of eligible paper and advancessecured to the satisfaction of the Federal Reserve Bank pursu-ant to section 201.4(b) of Regulation A. The previous distinc-tion between advances secured under sections 13 and 13a andsection lOb of the Federal Reserve Act was removed with thepassage of the Monetary Control Act of 1980 and the subse-quent revision of Regulation A. Before the September 1,1980,effective date of the revised regulation, advances under sectionlOb carried an interest rate of V2 of 1 percent above advancesunder sections 13 and 13a.
Twice in 1980, the Federal Reserve applied a surcharge toshort-term adjustment credit borrowings by institutions withdeposits of $500 million or more that had borrowed in succes-sive weeks or in more than four weeks in a calendar quarter. A3 percent surcharge was in effect from March 17,1980, throughMay 7,1980. On November 17,1980, a 2 percent surcharge wasadopted, which was subsequently raised to 3 percent onDecember 5,1980. The 3 percent surcharge remained in effectat year-end.
TABLE 5-B
1. Applicable to advances when exceptional circumstancesor practices involve only a particular depository institution asdescribed in section 201.3 (b) (2) of Regulation A.
TABLE 5-C
1. Advances to individuals, partnerships, or corporationsthat are not depository institutions, secured by direct obliga-tions of, or obligations fully guaranteed as to principal and in-terest by, the U.S. government or any of its agencies.
TABLE 6
1. Required reserves must be held in the form of depositswith Federal Reserve Banks or vault cash. After implementa-tion of the Monetary Control Act, nonmembers maymaintain reserves on a pass-through basis with certainapproved institutions. For changes in reserve requirementsbeginning 1963, see Board's ANNUAL STATISTICAL DIGEST,1971-1975 and for prior changes, see Board's Annual Reportfor 1976, table 13. Under provisions of the Monetary ControlAct, depository institutions include commercial banks, mutualsavings banks, savings and loan associations, credit unions,agencies and branches of foreign banks, and Edge Act corpo-rations
2. (a) Requirement schedules are graduated, and each de-posit interval applies to that part of the deposits of each bank.Demand deposits subject to reserve requirements were grossdemand deposits minus cash items in process of collection anddemand balances due from domestic banks.
(b) The Federal Reserve Actas amended through 1978 spec-ified different ranges of requirements for reserve city banksand for erther banks. Reserve cities were designated under a cri-terion adopted effective November 9,1972, by which a bankhaving net demand deposits of more than $400 million was con-sidered to have the character of business of a reserve city bank.
220Digitized for FRASER http://fraser.stlouisfed.org/ Federal Reserve Bank of St. Louis
The presence of the head office of such a bank constituteddesignation of that place as a reserve city. Cities in which therewere Federal Reserve Banks or branches were also reservecities. Any banks having net demand deposits of $400 millionor less were considered to have the character of business ofbanks outside of reserve cities and were permitted to maintainreserves at ratios set for banks not in reserve cities.
(c) Effective August 24,1978, the Regulation M reserve re-quirements on net balances due from domestic banks to theirforeign branches and on deposits that foreign branches lend toU.S. residents were reduced to zero from 4 percent and 1 per-cent respectively. The Regulation D reserve requirement onborrowings from unrelated banks abroad was also reduced tozero from 4 percent.
(d) Effective with the reserve computation period beginningNovember 16, 1978, domestic deposits of Edge corporationswere subject to the same reserve requirements as deposits ofmember banks.
3. (a) Negotiable order of withdrawal (NOW) accounts andtime deposits such as Christmas and vacation club accountswere subject to the same requirements as savings deposits.
(b) The average reserve requirement on savings and othertime deposits before implementation of the Monetary ControlAct had to be at least 3 percent, the minimum specified by law.
4. (a) Effective November 2,1978, a supplementary reserverequirement of 2 percent was imposed on large time deposits of$100,000 or more, obligations of affiliates, and ineligible accep-tances. This supplementary requirement was eliminated withthe maintenance period beginning July 24,1980.
(b) Effective with the reserve maintenance period begin-ning October 25,1979, a marginal reserve requirement of 8 per-cent was added to managed liabilities in excess of a baseamount. This marginal requirement was increased to 10 per-cent beginning April 3,1980, was decreased to 5 percent begin-ning June 12,1980, and was reduced to zero beginning July 24,1980. Managed liabilities are defined as large time deposits,Eurodollar borrowings, repurchase agreements against U.S.government arid federal agency securities, federal funds bor-rowings from nonmember institutions, and certain other obli-gations. In general, the base for the marginal reserve require-ment was originally the greater of (a) $100 million or (b) theaverage amount of the managed liabilities held by a memberbank, Edge corporation, or family of U.S. branches and agen-cies of a foreign bank for the two statement weeks endingSeptember 26, 1979. For the computation period beginningMarch 20,1980, the base was lowered by (a) 7 percent or (b) thedecrease in an institution's U.S. office gross loans to foreignersand gross balances due from foreign offices of other institutionsbetween the base period (September 13-26,1979) and the weekending March 12,1980, whichever was greater. For the compu-tation period beginning May 29,1980, the base was increasedby 7V2 percent above the base used to calculate the marginalreserve in the statement week of May 14-21,1980. In addition,beginning March 19,1980, the base was reduced to the extentthat foreign loans and balances declined.
5. For existing nonmember banks and thrift institutions atthe time of implementation of the Monetary Control Act, thephase-in period ends September 3,1987. For existing memberbanks the phase-in period is about three years, depending onwhether their new reserve requirements are greater or less thanthe old requirements. For existing agencies and branches offoreign banks, the phase-in ends August 12,1982. All new insti-tutions will have a two-year phase-in beginning with the datethat they open for business.
6. Transaction accounts include all deposits on which the ac-count holder is permitted to make withdrawals by negotiable ortransferable instruments, payment orders of withdrawal, andtelephone and preauthorized transfers (in excess of three per
month) for the purpose of making payments to third persons orothers.
7. In general, nonpersonal time deposits are time deposits,including savings deposits, that are not transaction accountsand in which the beneficial interest is held by a depositor that isnot a natural person. Also included are certain transferabletime deposits held by natural persons, and certain obligationsissued to depository institution offices located outside theUnited States. For details, see section 204,2 of Regulation D.
TABLE 7
1. Regulations G, T, and U of the Board of Governors of theFederal Reserve System, prescribed in accordance with theSecurities Exchange Act of 1934, limit the amount of credit topurchase and carry margin stocks that may be extended onsecurities as collateral by prescribing a maximum loan value,which is a specified percentage of the market value of thecollateral at the time the credit is extended. Margin require-ments are the difference between the market value (100 per-cent) and the maximum loan value. The term "margin stocks"is defined in the corresponding regulation.
Regulation G and special margin requirements for bondsconvertible into stocks were adopted by the Board of Gover-nors effective March 11,1968.
2. The margin is expressed as a percent of the market valueof the stock underlying the option.
TABLES
L Before March 31,1980, the maximum rates that couldbe paid by federally insured commercial banks, mutualsavings banks, and savings and loan associations wereestablished by the Board of Governors of the Federal ReserveSystem, the Board of Directors of the Federal DepositInsurance Corporation, and the Federal Home Loan BankBoard under the provisions of 12 CFR 217, 329, and 526respectively. Title II of the Depository Institutions De-regulation and Monetary Control Act of 1980 (P.L. 96-221)transferred the authority of the agencies to establish maximumrates of interest payable on deposits to the DepositoryInstitutions Deregulation Committee. The maximum rates ontime deposits in denominations of $100,000 or more withmaturities of 30-89 days were suspended in June 1970; suchdeposits maturing in 90 days or more were suspended in May1973. For information regarding previous interest rate ceilingson all types of accounts, see the Federal Reserve Bulletin, theFederal Loan Bank Board Journal, and the Annual Report ofthe Federal Deposit Insurance Corporation.
2. July 1,1973, for mutual savings banks; July 6,1973, forsavings and loan associations.
3. For authorized states only, federally insured commercialbanks, savings and loan associations, cooperative banks, andmutual savings banks in Massachusetts and New Hampshirewere first permitted to offer negotiable order of withdrawal(NOW) accounts on January 1, 1974. Authorization to issueNOW accounts was extended to similar institutions through-out New England on February 27, 1976, in New York Stateon November 10, 1978, and in New Jersey on December 28,1979. Authorization to issue NOW accounts was extended tosimilar institutions nationwide effective December 31, 1980.
4. For exceptions with respect to certain foreign timedeposits see the Federal Reserve Bulletin for October 1962(p. 1279), August 1965 (p. 1084), and February 1968 (p. 167),
5. Effective November 10, 1980, the minimum notice
221Digitized for FRASER http://fraser.stlouisfed.org/ Federal Reserve Bank of St. Louis

period for public unit accounts at savings and loan associationswas decreased to 14 days and the minimum maturity period fortime deposits at savings and loan associations in excess of$100,000 was decreased to 14 days. Effective October 30,1980,the minimum maturity or notice period for time deposits wasdecreased from 30 days to 14 days for mutual savings banks.
6. Effective October 30, 1980, the minimum maturity ornotice period for time deposits was decreased from 30 days to14 days for commercial banks.
7. No separate account category.8. No minimum denomination. Until July 1, 1979, a mini-
mum of $1,000 was required for savings and loan associations,except in areas where mutual savings banks permitted lowerminimum denominations. This restriction was removed fordeposits maturing in less than 1 year, effective November 1,1973,
9. No minimum denomination. Until July 1,1979, the mini-mum denomination was $1,000 except for deposits represent-ing funds contributed to an individual retirement account(IRA) or a Keogh (H.R. 10) plan established pursuant to theInternal Revenue Code. The $1,000 minimum requirementwas removed for such accounts in December 1975 andNovember 1976 respectively.
10. Between July 1,1973, and October 31,1973, there wasno ceiling for certificates maturing in four years or more withminimum denominations of $1,000; however, the amount ofsuch certificates that an institution could issue was limited to 5percent of its total time and savings deposits. Sales in excess ofthat amount, as well as certificates of less than $1,000, werelimited to the 6]/2 percent ceiling on time deposits maturing intwo and one-half years or more.
Effective November 1, 1973, ceilings were reimposed oncertificates maturing in four years or more with minimumdenomination of $ 1,000. There is no limitation on the amountof these certificates that banks can issue.
11. Accounts subject to fixed-rate ceilings. See note 9 forminimum denomination requirements.
12. Effective January 1, 1980, commercial banks arepermitted to pay the same rate as thrift institutions on IRA andKeogh accounts and accounts ofgovernmental units when suchdeposits are placed in the new 2V2-year or more variable-ceilingcertificates or in 26-week money market certificates regardlessof the level of the Treasury bill rate.
13. These deposits must have a maturity of exactly 26 weeksand a minimum denomination of $10,000, and must be non-negotiable.
14. Commercial banks, savings and loan associations, andmutual savings banks were authorized to offer money markettime deposits effective June 1, 1978.
The ceiling rate for commercial banks on money markettimedeposits entered into before June 5, 1980, is the discount rate(auction average) on most recently issued six-month U.S.Treasury bills. Until March 15,1979, the ceiling rate for savingsand loan associations and mutual savings banks was V4 percent-age point higher than the rate for commercial banks. BeginningMarch 15,1979, the V4-percentage-pomt interest differential isremoved when the six-month Treasury bill rate is 9 percent ormore. The full differential is in effect when the six-month billrate is 83A percent or less. Thrift institutions may pay amaximum 9 percent when the six-month bill rate is between83A and 9 percent. Also effective March 15, 1979, interestcompounding was prohibited on six-month money markettime deposits at all offering institutions. Effective for all six-month money market certificates issued beginning June 5,1980, the interest rate ceilings are determined by the discountrate (auction average) of the most recently issued six-monthU.S. Treasury bills as shown in the following tabulation:
Bill rate8.75 and above8.50 to 8.757.50 to 8.507.25 to 7.50Below 7.25
Commercial bank ceilingbill rate + V4 percentbill rate + V4 percentbill rate + !/4 percent7.757.75
Thrift ceilingbill rate + Y4 percent9.00bill rate + V2 percentbill rate + V2 percent7.75
The prohibition against compounding interest in thesecertificates continues.
15, Effective January 1, 1980, commercial banks, savingsand loan associations, and mutual savings banks wereauthorized to offer variable-ceiling nonnegotiable timedeposits with no required minimum denomination and withmaturities of two and one-half years or more. The maximumrate for commercial banks is 3A percentage point below theyield on 2V2-year U.S. Treasury securities; the ceiling rate forthrift institutions is lk percentage point higher than that forcommercial banks. Effective March 1,1980, a temporary ceilingof H3/4 percent was placed on these accounts at commercialbanks; the temporary ceiling is 12 percent at savings and loanassociations and mutual savings banks. Effective for allvariable-ceiling nonnegotiable time deposits with maturities oftwo and one-half years or more issued beginning June 2,1980,the ceiling rates of interest will be determined as follows:
Treasury yield12.00 and above9.50 to 12.00
Below 9.50
Commercial bank ceiling11.75Treasury yield less
V2 percent9.25
Thrift ceiling12.00
Treasury yield9.50
Interest may be compounded on these time deposits. Theceiling rates of interest at which these accounts may be offeredvary biweekly.
16. Between July 1 and December 31, 1979, commercialbanks, savings and loan associations, and mutual savings bankswere authorized to offer variable ceiling accounts with norequired minimum denomination and with maturities of fouryears or more. The maximum rate for commercial banks was1V4 percentage points below the yield on four-year Treasurysecurities; the ceiling rate for thrift institutions was ]/4 per-centage point higher than that for commercial banks.
TABLE 9
1. Sales, redemptions, and negative figures reduce holdingsof the System Open Market Account; all other figures increasesuch holdings.
TABLE 10-A
1. Account was called "Cash" before 1977, Excludes anyFederal Reserve notes issued by one Reserve Bank that areheld by another Reserve Bank.
2. Includes securities loaned-securities guaranteed by U.S.government pledged with Federal Reserve Banks; excludesany securities sold and scheduled to be bought back undermatch sale-purchase transactions. Includes federal agencyissues beginning 1971.
3. Includes U.S. government securities held under repur-chase agreement against receipt of foreign currencies andforeign currencies warehoused for the U.S. Treasury. Begin-ning December 29,1978, assets shown in this line are revaluedmonthly at market exchange rates.
4. Excludes Federal Reserve notes issued by one ReserveBank that are held by another Reserve Bank.
222
Digitized for FRASER http://fraser.stlouisfed.org/ Federal Reserve Bank of St. Louis

5. Includes exchange-translation account reflecting, begin-ning December 29, 1978, the monthly revaluation at marketexchange rates of foreign-exchange commitments.
TABLE 10-B
1. Beginning September 1980, Federal Reserve notes heldby the Reserve Bank are exempt from the collateral require-ment.
TABLE 10-C
1. Holdings under repurchase agreements are classified asmaturing within 15 days in accordance with maximum maturityof the agreements.
TABLE 11
1. Represents accounts of individuals, partnerships, andcorporations, and of states and political subdivisions.
TABLE 12
1. Excludes NOW accounts and special club accounts, suchas Christmas and vacation clubs.
2. Represents corporations and other profit-seeking organi-zations (excluding commercial banks but including savingsand loan associations, mutual savings banks, credit unions, theExport-Import Bank, and federally sponsored lendingagencies).
TABLE 13
1. The composition of money and liquid assets is shown asfollows:
Ml-A: Averages of daily figures for (1) demand deposits atall commercial banks other than those due to domestic banks,the U.S. government, and foreign banks and official institutionsless cash items in the process of collection and Federal Reservefloat; and (2) currency outside the Treasury, Federal ReserveBanks, and the vaults of commercial banks; and traveler'schecks of nonbank issuers.
Ml-B: Ml-A plus negotiable order of withdrawal (NOW) andautomatic transfer service (ATS) accounts at banks and thriftinstitutions, credit union share draft accounts, and demanddeposits at mutual savings banks.
M2: Ml-B plus savings and small-denomination timedeposits at ail depository institutions, overnight RPs at com-mercial banks, overnight Eurodollars held by U.S. residentsother than banks at Caribbean branches of member banks, andmoney market mutual fund shares.
M3: M2 plus large-denomination time deposits at all deposi-tory institutions and term RPs at commercial banks and savingsand loan associations.
L: M3 plus other liquid assets such as term Eurodollars heldby U.S. residents other than banks, bankers acceptances, com-mercial paper, Treasury bills and other liquid Treasury securi-ties, and U.S. savings bonds.
2. Outstanding amount of U.S. dollar-denominated travel-er's checks of nonbank issuers.
3. Small time deposits are those issued in amounts of lessthan $100,000.
4. Large time deposits are those issued in amounts of$100,000 or more and are net of the holdings of domestic banks,thrift institutions, the U.S. government, money market mutualfunds, and foreign banks and official institutions.
5. Includes ATS and NOWbalances atall institutions, creditunion share draft balances, and demand deposits at mutualsavings banks.
6. Overnight (and continuing contract) RPs are those issuedby commercial banks to the nonbank public, and overnightEurodollars are those issued by Caribbean branches of mem-ber banks to U.S. nonbank customers.
NOTE. Latest monthly and weekly figures are available fromthe Board's H.6 (508) release. Back data are available from theBanking Section, Board of Governors of the Federal ReserveSystem, Washington, D.C. 20551.
TABLE 14-A
1. Series reflects actual reserve requirements with no adjust-ment to eliminate the effect of changes in Regulations D, J, K,and M. There are breaks in the series because of changes in re-serve requirements effective October 1,1970; January 7,1971;November 9,1972; June 21, July 19, October 4, and December27,1973; September 19 and December 12,1974; February 13,May 22, and October 30,1975; January 8 and December 30,1976;November 2,1978; October 11 and October 25,1979;andMarch 12, May 29, and July 24,1980. In addition, before thestart of the transitional phase-in of reserve requirements begin-ning November 13,1980, under the Monetary Control Act of1980, the reserve series contain data only for member commer-cial banks; thereafter, reserves are shown for all depositoryinstitutions.
Back data and estimates of the impact on required reserves ofchanges in reserve requirements are available from the Bank-ing Section, Board of Governors of the Federal ReserveSystem, Washington, D.C. 20551.
2. Before the implementation of the Monetary Control Acton November 13,1980, the monetary base included total re-serves (member bank reserve balances in the current week plusvault cash held two weeks earlier); currency outside the U.S.Treasury, Federal Reserve Banks, and the vaults of commercialbanks; and vault cash of nonmember banks.
After November 13, 1980, the monetary base includes re-serve balances and required clearing balances at FederalReserve Banks in the current week plus vault cash held twoweeks earlier used to satisfy reserve requirements atall deposi-tory institutions plus currency outside the U.S. Treasury,Federal Reserve Banks, the vaults of depository institutions,and surplus vault cash at depository institutions.
TABLE 14-B
1. Includes total time and savings deposits and net demanddeposits as defined by Regulation D, Private demand depositsinclude all demand deposits except those due to the U.S. gov-ernment less cash items in process of collection and demandbalances due from domestic commercial banks.
TABLE 15
1. Includes domestically chartered banks, U.S. branchesand agencies of foreign banks, New York investment com-
223Digitized for FRASER http://fraser.stlouisfed.org/ Federal Reserve Bank of St. Louis
panies majority owned-by foreign banks, and Edge Act corpora-tions owned by domestically chartered and foreign banks. Dataare prorated averages of Wednesday estimates for domesticallychartered banks, based on weekly reports of a sample of domes-tically chartered banks and quarterly reports of all domesticallychartered banks. For foreign-related institutions, data areaverages of month-end estimates based on weekly reports fromlarge agencies and branches and quarterly reports from allagencies, branches, investment companies, and Edge Act cor-porations engaged in banking.
2. Adjusted to exclude federal funds sold to commercialbanks and domestic commercial interbank loans.
3. As of January 3,1979, as the result of ^classifications,total loans and securities and total loans were increased $0.6billion, commercial and industrial loans were increased $0.4billion, and real estate loans $0.5 billion. Nonbank financialloans were reduced $0.3 billion.
4. Loans sold are those sold outright to a bank's own foreignbranches, nonconsolidated nonbank affiliates of the bank, thebank's holding company (if not a bank), and nonconsolidatednonbank subsidiaries of the holding company.
5. U.S. includes 50 states and the District of Columbia.6. As of December 1,1979, total loans sold to affiliates were
reduced $0.8 billion and commercial and industrial loans soldto affiliates were reduced $0.7 billion due to corrections by twoNew York City banks.
TABLE 16
1. Figures are partly estimated; all data are for the last Wed-nesday of the month. Domestically chartered commercialbanks include all commercial banks in the United States exceptU.S. branches of foreign banks. Figures for all bank-premisessubsidiaries and other significant majority-owned domesticsubsidiaries are included; figures for securities are reportedgross-that is, before deduction of valuation reserves.
2. Beginning in 1979, subordinated debentures, previouslyincluded in the residual at domestically chartered commercialbanks, are included in other liabilities.
3. AH commercial banking institutions include domesti-cally chartered commercial banks, agencies and branches offoreign banks located in the United States, Edge Act corpora-tions owned by domestically chartered and foreign banks, andNew York State foreign investment companies majority ownedby foreign banks. Data for domestically chartered commercialbanks (partly estimated) are for the last Wednesday of themonth; for the other institutions, data through May 1980 are forlast Wednesday except in June, September, December, andMarch, when they are for the last day of the month. BeginningJune 1980, data for foreign-related institutions are for the lastday of the quarter.
TABLE 17
1. Effective December 31,1978, the report of condition wassubstantially revised for commercial banks. Commercial bankswith assets less than $100 million and with domestic officesonly were given the option to complete either the abbreviatedor the standard set of reports. Banks with foreign offices beganreporting in greater detail on a consolidated domestic andforeign basis. This table reflects the varying levels of reportingdetail.
2. All transactions between domestic and foreign offices of abank are reported in "Net due from" and "Net due to" (lines 79and 103). All other lines represent transactions with partiesother than the domestic and foreign offices ofeach bank. Since
these intraoffiee transactions are erased by consolidation, totalassets and liabilities are the sum of all except intraofficebalances.
3. Foreign offices include branches in foreign countries andin U.S. territories and possessions, subsidiaries in foreign coun-tries, and all offices of Edge Act and Agreement corporationswherever located. ,
4. This item is unavailable for all or some of the banks be-cause of the lesser detail available from banks without foreignoffices, the inapplicability of certain items to banks that haveonly domestic offices, and the absence of detail on a fully con-solidated basis for banks with foreign offices.
5. Equity capital is not allocated between the domestic andforeign offices of banks with foreign offices. ,
6. Demand deposits adjusted equal demand deposits otherthan domestic commercial interbank and U.S. government lesscash items in process of collection.
TABLE 18
1. Effective December 31,1978, the report of condition wassubstantially revised for commercial banks. Cornmercial bankswith assets less than $100 million and with domestic officesonly were given the option to complete either the abbreviatedor the standard set of reports. Banks with foreign offices beganreporting in greater detail on a consolidated domestic andforeign basis. This table reflects the varying levels of reportingdetail.
Domestic offices exclude branches in foreign countries, andin U.S. territories and possessions, subsidiaries^ in foreign coun-tries, and all offices of Edge Act and Agreement corporationswherever located.
2. This item contains the capital accounts pf U.S. banks thathave no Edge or foreign operations and reflect the differencebetween domestic office assets and liabilities of U.S. bankswith Edge or foreign operations excluding the capital accountsof their Edge or foreign subsidiaries.
3. Demand deposits adjusted equal demand deposits otherthan domestic commercial interbank and U.SJ government lesscash items in process of collection.
TABLE 19
1. Effective December 31,1978, the report of condition wassubstantially revised for commercial banks. Commercial bankswith assets less than $100 million and with domestic officesonly were given the option to complete either the abbreviatedor the standard set of reports. Banks with foreign offices beganreporting in greater detail on a consolidated domestic andforeign basis. This table reflects the varying levels of reportingdetail.
2. This item contains the capital account^ of U.S. banks thathave no Edge or foreign operations and rejects the differencebetween domestic office assets and liabilities of U.S. bankswith Edge or foreign operations excluding the capital accountsof their Edge or foreign subsidiaries. i
3. Demand deposits adjusted equal demand deposits otherthan domestic commercial interbank and UiS.government lesscash items in process of collection.
TABLE 20-A
1. Includes securities purchased under agreements to resell.2. Other than financial institutions and brokers and dealers.3. Includes securities sold under agreements to repurchase.
224Digitized for FRASER http://fraser.stlouisfed.org/ Federal Reserve Bank of St. Louis

4, This is not a measure of equity capital for use in capitaladequacy analysis or for other analytic uses.
5. Adjustment bank amounts represent accumulated ad-justments originally made to offset the cumulative effects ofmergers. These adjustment amounts should be added to out-standing data for any date in the year to establish comparabilitywith any date in the subsequent year. A description of the ad-justment process is available in Banking and Monetary Statis-tics, 1941-1970, pages 148-49.
TABLE 20-B
1. Exclusive of loans and federal funds trans-actions with do-mestic commercial banks,
2. All demand deposits except U.S. governmentand domes-tic commercial banks less cash items in process of collection.
3. Loans sold are those sold outright to a bank's own foreignbranches, nonconsolidated nonbank affiliates of the bank, thebank's holding company (if not a bank), and nonconsolidatednonbank subsidiaries of the holding company.
4. Adjustment bank amounts represent accumulatedadjustments originally made to offset the cumulative effects ofmergers. These adjustment amounts should be added to out-standing data for any date in the year to establish comparabilitywith any date in the subsequent year. A description of the ad-justment process is available in Banking and Monetary Statis-tics, 1941-1970, pages 148-49.
TABLE 20-C
1. Data exclude bankers acceptances and commercialpaper.
2. Item includes commercial and industrial loans at a fewbanks with assets of $ 1 billion or more that do not classify theirloans.
3. Adjustment bank amounts represent accumulated ad-justments originally made to offset the cumulative effects ofmergers. These adjustment amounts should be added to out-standing data for any date in the year to establish comparabilitywith any date in the subsequent year. A description of the ad-justment process is available in Banking and Monetary Statis-tics, 1941-1970, pages 148-49.
TABLE 21
1. Figures include cash items in process of collection. Esti-mates of gross deposits are based on reports supplied by asample of commercial banks. Types of depositors in eachcategory are described in Federal Reserve Bulletin, vol. 57 (June1971), page 466.
TABLE 22
1. Institutions engaged primarily in commercial, savings,and mortgage banking; sales, personal, and mortgage fi-nancing; factoring, finance leasing, and other business lend-ing; insurance underwriting; other investment activities; andthe like.
2. Includes all financial company paper sold by dealers inthe open market.
3. As reported by financial companies that place their paperdirectly with investors,
4. Includes public utilities and firms engaged primarily inactivities such as communications, construction, manufactur-
ing, mining, wholesale and retail trade, transportation, and ser-vices.
TABLE 23
1. The prime rate is the rate that banks charge their mostcreditworthy business customers on short-term loans. Thetable shows the date on which a new rate came to be the pre-dominant one quoted, rather than the date on which the firstbank made a change in the rate.
TABLE 24
1. The survey of terms of bank lending covers about 340banks selected to represent all sizes of banks. The sample dataare collected over one business week and used to estimate lend-ing terms at all commercial banks. Short-term loans have origi-nal maturities of less than one year, and long-term loans havematurities of one year or more. Construction and land develop-ment loans include both unsecured loans and loans secured byreal estate. Thus some of the construction and land develop-ment loans would be reported on the statement of condition asreal estate loans and the remaining as business loans. Loans tofarmers exclude loans secured by real estate.
2. Average maturities are weighted by loan volumes ex-clusive of loans with no stated maturity (demand loans).
3. The approximate compounded annual interest rate oneach loan is calculated from survey data on the stated rate andother terms of the loan; then, in computing the average of theseapproximate effective rates, each loan is weighted by its dollaramount.
4. Large banks correspond roughly to banks with more than$400 million in total assets.
TABLE 25
1. Average of offering rates quoted by at least five dealers (inthe case of commercial paper) or finance companies (in thecase of finance paper).
2. Yields are quoted on a bank-discount basis.3. Average of the midpoint of the range of daily dealer clos-
ing rates offered for domestic issues.4. Averages of offering rates quoted by five dealers.5. Annual figures are averages of the individual observa-
tions. For the other series, annual averages are constructedfrom the monthly averages,
6. Except for auction averages, yields are computed fromdaily closing bid prices; auction averages are recorded in theweek in which the bills are issued.
7. Yields on the more actively traded issues adjusted to con-stant maturities by the U.S. Treasury, based on daily closing-bid prices.
8. For the first four months of 1980, each figure is an averageof only five business days near the end of the month. For therest of the year, each weekly figure is calculated on a biweeklybasis and is the average of five business days ending on theMonday following the calendar week. These data are used todetermine the maximum interest rate payable on small savercertificates.
9. Unweighted averages for all outstanding bonds neitherdue nor callable in less than 10 years, including several very lowyielding "flower" bonds.
10. General obligations only, based on figures for Thursday,from Moody's Investors Service.
225Digitized for FRASER http://fraser.stlouisfed.org/ Federal Reserve Bank of St. Louis

11. Twenty issues of mixed quality.12. Averages of daily figures from Moody* s Investors Ser-
vice.13. Data are a compilation of the Board of Governors of the
Federal Reserve System. Issues included are of long term (20years or more). New-issue yields are based on quotations ondate of offering; yields on recently offered issues (included onlyfor first four weeks after termination of underwriter price re-strictions) are based on Friday close-of-business quotations.
14. Provided by Standard & Poor's Corporation.15. Weekly figures are seven-day averages of daily effective
rates for the week ending Wednesday; the daily effective rate isan average of the rates on a given day weighted by the volume oftransactions at these rates.
16. Weekly figures are averages of daily quotations for theweek ending Wednesday.
TABLE 26
1. Margin credit includes all credit extended to purchase orcarry stocks or related equity instruments and secured at, leastin part by stock. Credit extended is end-of-month da*a formember firms of the New York Stock Exchange.
Besides assigning a current loan value to margin stock gen-erally, Regulations T and U permit special loan values for con-vertible bonds and stock acquired through exercise of subscrip-tion rights.
2. A distribution of this total by equity class is shown in table26-C.
3. Free credit balances are in accounts with no unfulfilledcommitments to the brokers and are subject to withdrawal bycustomers on demand.
4. Each customer's equity in his collateral (market value ofcollateral less net debit balance) is expressed as a percentage ofcurrent collateral values.
5. Balances that may be used by customers are the margindeposit required for additional purchases. Balances may arisewith transfers based on loan values of other collateral in the cus-tomer's margin account or with deposits of cash (usually saleproceeds).
basis. Before that date, data were reported on a gross-of-valuation-reserves basis.
2. Beginning April 1979, data include obligations of U.S.government agencies. Before that date, this item was includedin "Corporate and other."
3 Item includes securities of foreign governments and in-tern^tional organizations and, before April 1979, nonguaran-
, teed issues of U.S. government agencies.4. .Excludes checking, club, and school accounts.5.'. Commitments outstanding (including loans in process) of
banks in New York State as reported to the Savings BanksAssociation of that state.
SOURCE. Estimates of National Association of MutualSavings Banks for all savings banks in the United States.
TABLE 27-C
1. Direct and guaranteed obligations. Excludes federalagency issues not guaranteed, which are shown in this tableunder "Business/'
2, Issues of foreign governments and their subdivisions andbond$ of the International Bank for Reconstruction and Devel-opment.
SOURCE. Estimates of the American Council of Life Insurancefor all life insurance companies in the United States. Annualfigures are annual-statement asset values, with bonds carriedon an amortized basis and stocks at year-end market values.Adjustments for interest due and accrued and for differencesbetween market and book values are not made on each itemseparately but are included, in total, in "Other assets."
TABLE 27-D
SOURCE. Estimates by the National Credit Union Adminis-tration for a group of federal and state-chartered credit unionsthat acpount for about 30 percent of credit union assets. Figuresare preliminary and are revised annually to incorporate recentbenchmark data.
TABLE 27 A
1. Holdings of stock in the Federal Home Loan Banks are in-cluded in "Other" (line 4).
2. Includes net undistributed income, which is accrued bymost, but not all, associations.
3. Excludes figures for loans in process, which are shown asa liability.
SOURCE, Estimates by the Federal Home Loan Bank Boardfor all savings and loan associations in the United States. Dataare based on monthly reports of federally insured associationsand annual reports of other associations. Even when revised,data for the current and the preceding year are subject tofurther revision.
TABLE 27-B
. 1. The National Association of Mutual Savings Banksreports that, effective April 1979, balance sheet data are notstrictly comparable with data for previous months. BeginningApril 1979, data are reported on a net-of-valuation-reserves
TABLE 28
1. Effective October 1,1980, the Pension Benefit GuarantyCorporation was reclassified from an off-budget agency to anon-budget agency in the U.S. Department of Labor.
2. Half-year figures are calculated as a residual (total surplusor deficit less trust-fund surplus or deficit).
3. Item includes the Postal Service Fund, Rural Electrifica-tion and Telephone Revolving Fund, and Rural TelephoneBank.
4. Data include U.S. Treasury operating cash accounts, spe-cial drawing rights, gold tranche drawing rights, loans to the In-ternational Monetary Fund, and other cash and monetaryassets.
5. Item includes accrued interest payable to the public, de-posit funds, miscellaneous liability (including checks outstand-ing) and asset accounts^ seignorage, increment on gold, profiton sale of gold, net gain or loss for U.S. currency-valuation ad-justment, and net gain or loss for IMF loan-valuationadjustment.
SOURCES. U.S. Treasury Department, "Monthly TreasuryStatement of Receipts and Outlays of the U.S. Government,"and Treasury Bulletin, various issues; and The Budget of theUnited States Government, Fiscal Year 1981.
226Digitized for FRASER http://fraser.stlouisfed.org/ Federal Reserve Bank of St. Louis

TABLE 29-A
1. In June 1978, earned-income-credit payments in excessof an individual's tax liability, formerly treated as income taxrefunds, were classified as outlays retroactive to January 1976.
2. Old-age, disability, and hospital insurance; and railroadretirement accounts.
3. Old-age, disability, and hospital insurance.4. Supplementary medical insurance premiums, federal
employees' retirement contributions, and civil service retire-ment and disability fund.
5. Deposits of earnings by Federal Reserve Banks and othermiscellaneous receipts.
SOURCES. U.S. Treasury Department, "Monthly TreasuryStatement of Receipts and Outlays of the U.S. Government,"and The Budget of the U.S. Government, Fiscal Year 1981.
TABLE 29-B
1. Effective October 1,1980, the Pension Benefit GuarantyCorporation was reclassified from an off-budget agency to anon-budget agency in the Department of Labor.
2. Consists of interest received by trust funds, rents androyalties on the outer continental shelf, and U.S. governmentcontributions for employee retirement.
SOURCES. U.S. Treasury Department, "Monthly TreasuryStatement of Receipts and Outlays of the U.S. Government,"and The Budget of the U.S. Government, Fiscal Year 1981. Forsome categories, an adjustment was made to the last month ofthe fiscal year so that functional totals for the fiscal years matchthose in the Budget.
TABLE 30
1. Includes guaranteed debt of U.S. government agencies,specified participation certificates, notes to international lend-ing organizations, and District of Columbia stadium bonds.
SOURCE. Treasury Bulletin.
TABLE 31
1. Includes (not shown separately) securities issued to theRural Electrification Administration and to state and localgovernments; depository bonds; retirement plan bonds; andindividual retirement bonds.
2. These nonmarketable bonds, also known as InvestmentSeries B Bonds, may be exchanged (or converted) at theowner's option for lV2 percent, five-year marketable Treasurynotes. Convertible bonds that have been so exchanged areremoved from this category and recorded in the "Notes"category (line 5).
3. Nonmarketable dollar-denominated and foreign cur-rency-denominated series held by foreigners.
4. Held almost entirely by U.S. government agencies andtrust funds.
5. Data for Federal Reserve Banks and U.S. governmentagencies and trust funds are actual holdings; data for othergroups are Treasury estimates.
6. Consists of the investments of foreign balances and inter-national accounts in the United States. Excludes non-interest-bearing notes issued to the International Monetary Fund.
7. Includes savings and loan associations, nonprofit institu-
tions, corporate pension trust funds, dealers and brokers,certain U.S. government deposit accounts, and U.S. govern-ment-sponsored agencies.
SOURCES. Data by type of security, U.S. Treasury Depart-ment, Monthly Statement of the Public Debt of the United States;data by holder, Treasury Bulletin.
TABLE 32
1. Interest-bearing marketable public debt securities.Figures are complete for U.S. government agencies and trust
funds and Federal Reserve Banks, but data for other groups in-clude only holdings of those institutions that report. For num-ber of institutions reporting in other holder groups and the pro-portions of all marketable securities owned by those groupsthat are accounted for by the reporting institutions, see"Treasury Survey of Ownership," in Treasury Bulletin.
"All others," a residual, includes holdings of all those not re-porting in the Treasury Survey, including investor groups not *listed separately.
2. Excludes trust departments.
TABLE 33-A
1. Averages are based on number of trading days in theperiod.
Transactions include both purchases and sales of U.S. gov-ernment securities dealers reporting to the Federal ReserveBank of New York. The figures represent market transactionsonly and exclude allotments of, and exchanges for, new securi-ties, redemption of called or matured securities, and purchasesor sales of securities under repurchase, reverse repurchase(resale), or similar contracts.
2. Includes, among others, all other dealers and brokers incommodities and securities, foreign banking agencies, and theFederal Reserve System.
TABLE 33-B
1. Averages are based on number of trading days in theperiod.
Positions consist of net amounts (in terms of par values) ofsecurities owned by nonbank dealer firms and dealer depart-ments of commercial banks on a commitment (that is, trade-date) basis. Positions include securities that have been sold bythe dealers under agreements to repurchase, unless the repur-chase agreement is exactly matched by a reverse repurchase(resale) agreement. The maturities of some repurchase agree-ments are sufficiently long, however, to suggest that the securi-ties involved are not available for trading purposes. Securitiesowned, and hence dealer positions, do not include securitiespurchased under agreements to resell.
TABLE 33-C
1. Averages are based on number of calendar days in theperiod.
The data represent total amounts outstanding of funds bor-rowed by nonbank dealer firms and dealer departments ofcommercial banks against U.S. government and federal agencysecurities (through both collateral loans and sales under agree-ments to repurchase) plus internal funds used by dealer depart-ments of banks to finance positions in such securities. Borrow-
227Digitized for FRASER http://fraser.stlouisfed.org/ Federal Reserve Bank of St. Louis
ings against securities held under agreements to resell areexcluded when there is a matched agreement-that is, the bor-rowing contract and the agreement to resell are equal inamount and maturity.
2. All business corporations except commercial banks andinsurance companies.
3. Figures cover financing involving U.S. government andfederal .agency securities, negotiable certificates of deposit,bankers acceptances, and commercial paper (based onWednesday figures, in terms of actual money borrowed orlent).
4. Includes all reverse repurchase agreements, includingthose that have been arranged to make delivery on short salesand those for which the securities obtained have been used ascollateral on borrowings, that is, matched agreements.
5. Includes both repurchase agreements undertaken to fi-nance positions and "matched book" repurchase agreements.
^Because the reporting form for financing was changed inJune 1980, line items for C.I and C.2 are different.
TABLE 34
1. Consists of mortgages assumed by the Defense Depart-.ment between 1957 and 1963 under family housing and home-owners assistance programs.
2. Includes participation certificates reclassified as debt.3. On-budget4. Consists of debentures issued in payment of Federal
Housing Administration insurance claims. Once issued, thesesecurities may be sold privately on the securities market.
5. Certificates of participation issued before fiscal 1969 bythe Government National Mortgage Association acting as trust-ee for the Farmers Home Administration; Department ofHealth, Education, and Welfare; Department of Housing andUrban Development; Small Business Administration; and theVeterans Administration.
6. Off-budget7. Unlike other federally sponsored agencies, the Student
Loan Marketing Association may borrow from the FederalFinancing Bank (FFB) because its obligations are guaranteedby the Department of Health, Education, and Welfare.
8. The FFB, which began operations in 1974, is authorized topurchase or sell obligations issued, sold, or guaranteed by otherfederal agencies. Since the FFB incurs debt solely for the pur-pose of lending to other agencies, its debt is not included in themain portion of the table to avoid double counting.
9. Includes FFB purchases of agency assets and guaranteedloans; the latter contains loans guaranteed by numerousagencies with the guarantees of any particular agency beinggenerally small. The Farmers Home Administration item con-sists exclusively of agency assets, while the Rural Electrifica-tion Administration entry contains both agency assets andguaranteed loans.
TABLE 35
1. Par amounts of long-term issues based on date of sale.2. Only bonds sold pursuant to the Housing Act of 1949,
which are secured by contract requiring the Housing Assis-tance Administration to make annual contributions to the localauthority.
SOURCE. Public Securities Association.
TABLE 36
1. Figures, which represent gross proceeds of issues matur-ing in more than one year sold for cash in the United States, areprincipal amount or number of units multiplied by offeringprice. Excludes offerings of less than $100,000, secondary offer-ings, undefined or exempted issues as defined in the SecuritiesAct of 1933, employee stock plans, investment companiesother than closed-end, intracorporate transactions, and sales toforeigners.
SOURCE. U.S. Securities and Exchange Commission.
TABLE 37
1. Excluding money market funds.2. Includes reinvestment of investment income dividends.
Excludes reinvestment of capital gains distributions and shareissues of conversions from one fund to another in the samegroup.
3. Excludes share redemptions resulting from conversionsfrom one fund to another in the same group.
4. Market value at end of period, less current liabilities.5. Also includes all U.S. government securities and other
short-term debt securities.SOURCE. Investment Company Institute data based on re-
ports of members, which are substantially all open-end invest-ment companies registered with the Securities and ExchangeCommission. Data reflect newly formed companies after theirinitial offering of securities.
TABLE 38
SOURCE. Survey of Current Business (U.S. Department ofCommerce).
TABLE 39
1. Series have been revised. For description, see Federal Re-serve Bulletin, vol. 64 (July 1978), pages 533-37. Source for therevised series is the Federal Trade Commission.
2. The ratio of total current assets to total current liabilities.
TABLE 40
1. "Other" consists of construction; social services andmembership organizations; and forestry, fisheries, and agricul-tural services.
SOURCE. Survey of Current Business (U.S. Department ofCommerce).
TABLE 43
1. Weighted averages based on sample surveys of mortgagesclosed by major institutional lenders during the first five fullworking days of the month. Compiled by the Federal HomeLoan Bank Board in cooperation with the Federal DepositInsurance Corporation.
2. Includes all fees, commissions, discounts, and "points"paid (by the borrower or the seller) to obtain a loan.
3. Average effective interest rates on loans closed, assumingprepayment at the end of 10 years.
228Digitized for FRASER http://fraser.stlouisfed.org/ Federal Reserve Bank of St. Louis

4. Average contract rates on new commitments for conven-tional first mortgages, rounded to the nearest 5 basis points;from U.S. Department of Housing and Urban Development.
5. Average gross yields on 30-year, minimum-downpay-ment first mortgages, insured by the Federal Housing Admin-istration for immediate delivery in the private secondarymarket. Any gaps in data are in periods of adjustment tochanges in maximum permissible contract rates.
6. Average net yields to investors on fully modified pass-through securities backed by mortgages and guaranteed by theGovernment National Mortgage Association, assumingprepayment in 12 years on pools of 30-year FHA/VAmortgages carrying the prevailing ceiling rate. Monthly figuresare unweighted averages of Monday quotations for the month.
7. Average gross yields (before deduction of 38 basis pointsfor mortgage servicing) on accepted bids in the Federal Na-tional Mortgage Association's auctions of 4-month commitmentsto purchase home mortgages, assuming prepayment in 12years for 30-year mortgages. No adjustments are made forFNMA commitment fees or stock-related requirements.Monthly figures are unweighted averages for auctions con-ducted within the month.
8. Beginning March 1980, FHA-insured and VA-guaranteed mortgage holdings in lines 14 and 15 are combined.
9. Includes some multifamily and nonprofit hospital loancommitments in addition to one- to four-family loan commit-ments accepted in FNMA's free market auction system, andthrough the FNMA-GNMA tandem plans.
10. Mortgage amounts offered by bidders are total bids re-ceived.
11. Includes participations as well as whole loans.12. Includes conventional and government-underwritten
loans,
TABLE 44
1, Minor revisions in some items were made for 1976 and1977. These revisions are available from the Mortgage andConsumer Finance Section, Board of Governors of the FederalReserve System, Washington, D.C. 20551.
2. Includes loans held by nondeposit trust companies butnot bank trust departments.
3, Outstanding principal balances of mortgage-backedsecurities insured or guaranteed by the agency indicated.
4. Other holders include mortgage companies, real estateinvestment trusts, state and local credit agencies, state andlocal government retirement funds, noninsured pension funds,credit unions, arid U.S. agencies for which amounts are small orseparate data are not readily available.
SOURCES. Based on data from various institutional and gov-ernment sources, with figures for some quarters estimated inpart by the Federal Reserve in conjunction with the FederalHome Loan Bank Board and the U.S. Department of Com-merce. Separation of nonfarm mortgage debt by type of prop-erty, if not reported directly, and interpolations and extrapola-tions, when required, are estimated .mainly by the FederalReserve. Multifamily debt refers to loans on structures of fiveor more units.
TABLE 45
1. The consumer installment credit series covers mostshort- and. intermediate-term credit extended to individualsthrough regular business channels, usually for the financing ofthe purchase of consumer goods and services or the refinancingof debts incurred for such purposes, and scheduled to be repaid
(or with the option of repayment) in two or more installments.The series generally excludes mortgage financing, which is
reported elsewhere, although some credit secured by juniorliens on real estate may be reported in the data for certain hold-ers, such as-finance companies. Also excluded are (a) creditcard or other receivables held by a holding company ratherthan by its subsidiary financial institution; (b) extensions offunds against the cash value of life insurance policies or,generally, against savings accounts; (c) loans to farmers; and(d) noninstallment credit extended to individuals. Some com-ponents include unearned (precomputed) finance charges.
2. Includes auto dealers and excludes 30-day charge creditheld by travel and entertainment companies.
3. Net change equals extensions minus liquidations (repay-ments, charge-offs, and other credits). Monthly data are sea-sonally adjusted.
TABLE 46
1. Monthly data are seasonally adjusted.2. Includes auto dealers and excludes 30-day charge credit
held by travel and entertainment companies.
TABLE 47
1. Excess of total assets over total liabilities consists of gold,special drawing rights (SDRs), and corporate equities notincluded in liabilities minus total floats and discrepancies intotal assets in adjacent column.
2. Rest-of-the-world total holdings of gold and SDRs appearas assets and are included in totals because in flow tables trans-actions in these categories are treated as purchases and sales ofexisting assets without associated liabilities.
3. Assets are shown at market value; nonbank financeliability is redemption value of shares of open-end investmentcompanies. No specific liability is attributed to issuers of stocksother than open-end investment companies for amounts out-standing.
4. Includes savings bonds and other nonmarketable debtheld by the public. Postal savings system deposits are includedin "Miscellaneous" in part A, line 34.
5. Issues by agencies in the budget (Commodity CreditCorporation, Government National Mortgage Association,Tennessee Valley Authority, Federal Housing Administra-tion) and by sponsored credit agencies in financial sectors.Includes loan participation certificates.
6. Entry under business assets is corporate only. Noncor-porate trade credit is deducted in liabilities total to conform toquarterly flow tables.
TABLE 48-C
1. Excludes corporate equities.2, Foreign investment is net of bond issues abroad, and
bond issues outside the United States are excluded from liabili-ties.
3, Revenue bonds to finance industrial pollution control.Issued by state and local governments to finance private invest-ment and secured in interest and principal by the industrialuser of the funds.
4. Loans except mortgages, short-term paper, and tradedebt. Includes loans due in more than one year and excludescurrent maturities of securities and mortgages.
229
Digitized for FRASER http://fraser.stlouisfed.org/ Federal Reserve Bank of St. Louis
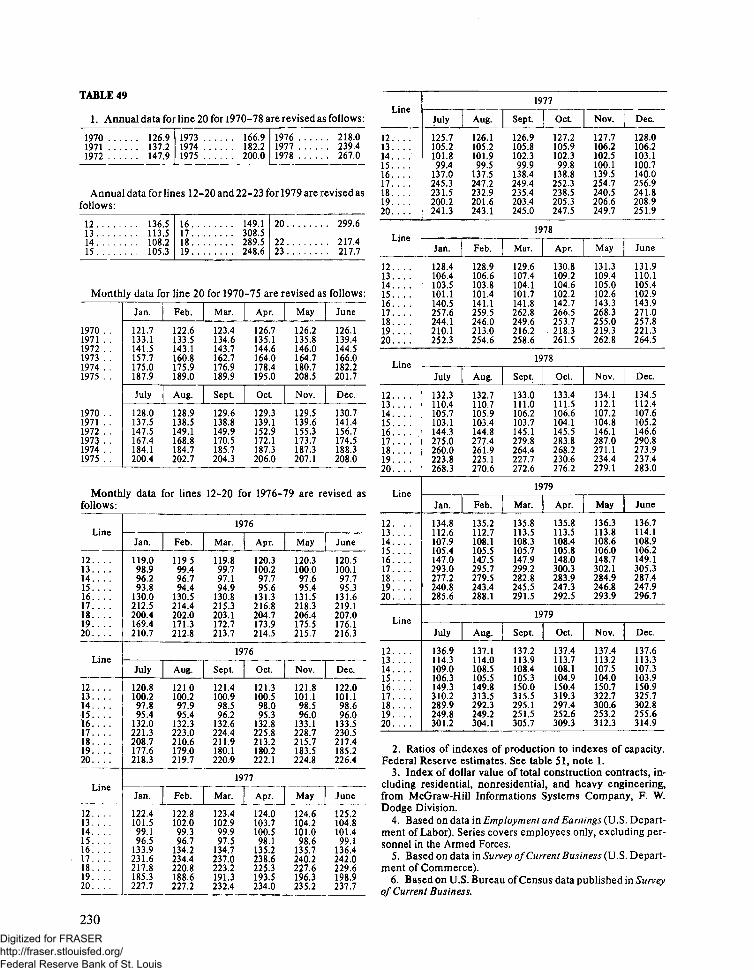
TABLE 49
1 . Annual data for line 20 for 1970-78 are revised as
1970 1261971 1371972 147
.9
.29
197319741975
166.9 19182.2 19200.0 19
767778
Linefollows:
. 218.0 12
. 239.4 13 . . .
. 267.0 14u . . .16. . .17. ..
Annual data for lines 12-20 and 22-23 for 1979 are revised as 18. . .follows: 20' ' '
12 136 513 113.514 10815 105
9
3
16171819. .
14Q 1 50308.5289.S 22248.6 23
. 299.6
. 217.4 Lme
. 217.7
12.13.14.
Monthly data for line 20 for 1970-75 are revised as follows: 15 .
1970 . .1971 . .1972 . .1973 . .1974 . .1975 . .
1970 . .1971 . .1972 . .1973 . .1974 . .1975 . .
Jan.
121.7133.1141.5157.7175.0187.9
July
128.0137.5147.5167.4184.1200.4
Feb.
122.6133.5143.1160.8175.9189.0
Aug.
128.9138.5149,1168.8184,7202,7
Monthly data forfollows:
Line
12. .13. .14, .15. .16, .17. .18. .19. .20. .
Line
12. .13. .14. .-15. .16. .1 T
lines
Mar.
123.4134.6143.7162.7176.9189.9
Sept.
129.6138.8149.9170.5185.7204.3
Apr.
126.7135.1144,6164.0178.4195.0
Oct.
129.3139.1152.9172.1187,3206.0
May
126.2135.8146.0164.7180.7208.5
Nov.
129.5139.6155.3173.7187.3207.1
10 .June 17 ,
lo .126.1 19.139,4 20.1 A 4 1144.5 ~ •~'~166.0182.2 L'ne201.7
Dec. 1 2 . . .
130.7 14. . .141.4 15 . . .156.7 16 , . .174.5 17 . . .188.3 18. . .208.0 19 . . .
20. ..
12-20 for 1976-79 are revised as Line
1976
Jan.
119,098.996.293.8
130.0212.5200.4169.4210.7
Feb,
119.599.496.794.4
130.5214.4202.0171.3212.8
Mar.
119.899.797.194.9
130.8215.3203.1172.7213.7
Apr.
120.3100.297.795.6
131.3216.8204.7173.9214.5
May
120.3100.097.695.4
131.5218.3206.4175.5215.7
1976
July
120.8100.297.895.4
132.0ti 1 i
Aug.
121.0100.297.995.4
132.3"i^-i f\
Sept.
121.4100.998.596.2
132.6I^A A
Oct.
121.3100.598.095.3
132.8*»^c o
Nov.
121.8101.198.596.0
133.1"»^O 1
12. . . .13
June 1 4 . . . .15
120.5 16100.1 17. ...97.7 1 8 . . . .95.3 19
131.6 20. ...219.1207.0176.1 Line
216.3
12
Dec. 1415
122.0 16. ...101.1 1798.6 1 8 . . . .96.0 19
133.5 20
July
125.7105.2101.899.4
137.0245.3231.5200.2241.3
1977
Aug. Sept.
126.1105.2101.999.5
137.5247.2232.9201.6243.1
126.9105.8102.399.9
138.4249.4235.4203.4245.0
Oct.
127.2105.9102.399.8
138.8252.3238.5205.3247.5
Nov.
127,7106.2102.5100.1139.5254.7240.5206.6249.7
Dec.
128.0106.2103.1100.7140.0256.9241.8208.9251.9
1978
Jan.
128.4106.4103.5101.1140.5257.6244.1210.1252.3
Feb.
128.9106.6103.8101.4141.1259.5246.0213.0254.6
Mar.
129.6107.4104.1101.7141.8262.8249.6216,2258.6
Apr.
130.8109.2104.6102.2142.7266.5253.7
. 218.3261.5
May
131.3109.4105,0102.6143.3268,3255.0219.3262.8
June
131.9110.1105.4102.9143.9271.0257.8221.3264.5
1978
July
132.3110.4105.7103.1144.3275.0260.0223.8268.3
Aug.
132.7110.7105.9103.4144.8277.4261.9225.1270.6
Sept.
133.0111.0106.2103.7145.1279.8264.4227.7272.6
Oct.
133.4111.5106.6104.1145.5283.8268.2230.6276.2
Nov.
134.1112.1107.2104.8146.1287.0271.1234.4279.1
Dec.
134.5112.4107.6105.2146.6290.8273.9237.4283.0
1979
Jan.
134.8112.6107.9105.4147.0293.0277.2240.8285,6
Feb.
135.2112.7108.1105.5147.5295.7279.5243.4288.1
Mar.
135.8113.5108.3105.7147.9299.2282.8245.5291.5
Apr.
135.8113.5108.4105.8148.0300.3283.9247.3292,5
May
136.3113.8108.6106.0148.7302.1284.9246.8293.9
June
136.7114.1108.9106.2149.1305,3287.4247,9296.7
1979
July
136.9114.3109.0106.3149.3310.2289.9249.8301.2
Aug.
137.1114.0108.5105.5149.8313.5292.3249.2304.1
Sept
137.2113.9108.4105.3150.0315.5295.1251.5305.7
Oct.
137.4113.7108,1104.9150.4319,3297.4252.6309.3
Nov.
137.4113.2107.5104.0150.7322.7300.6253.2312.3
Dec.
137.6113.3107.3103.9150.9325.7302.8255.6314.9
12131415161718, . . .19. . . .20
122.4101.599.196.5
133.9231.6217,8185.3227.7
122.8102.099.396.7
134.2234.4220.8188.6227.2
123.4102.999.997.5
134.7237.0223.2191.3232.4
124.0103.7100.598.1
135.2238.6225.3193.5234.0
124.6104.2101.098.6
135.7240.2227.6196.3235.2
125.2104.8101.499.1
136.4242.0229.6198.9237.7
2. Ratios of indexes of production to indexes of capacity.Federal Reserve estimates. See table 51, note 1.
3. Index of dollar value of total construction contracts, in-cluding residential, nonresidential, and heavy engineering,from McGraw-Hill Informations Systems Company, F. W.Dodge Division.
4. Based on data m Employment and Earnings (U.S. Depart-ment of Labor). Series covers employees only, excluding per-sonnel in the Armed Forces.
5. Based on data in Survey of Current Business (U.S. Depart-ment of Commerce).
6. Based on U.S. Bureau of Census data published in Surveyof Current Business.
230Digitized for FRASER http://fraser.stlouisfed.org/ Federal Reserve Bank of St. Louis

7. Not seasonally adjusted. Based on data published by theU.S. Department pf Labor, Bureau of Labor Statistics,
SOURCE. Basic data (not index numbers) for series men-tioned in notes 4,5, and 6 and indexes for series mentioned innotes 3 and? may also be found in Survey of Current Business.
TABLE 50
1. Primary processing includes textiles, lumber, paper, in-dustrial chemicals, petroleum refining, rubber and plastics,stone, clay, and glass, and primary and fabricated metals.
2. Advanced processing includes food, tobacco, apparel,furniture, printing, chemical products such as drugs and toi-letries, leather, machinery, transportation equipment, instru-ments, miscellaneous manufacturing, and ordnance.
3. Industrial materials are items both produced and used asinputs by manufacturing plants, mines, and utilities; industrialmaterials cover many of the items represented in the primary-processing grouping of manufacturing as well as some of theoutput of mines and utilities such as iron ore, crude oil, andelectricity sold to industry.
4. These data are the same as those in the ANNUAL STATISTI-CAL DIGEST, 1970-1979.
5. Capacity utilization is calculated as the ratio of the Fed-eral Reserve's seasonally adjusted index of industrial produc-tion to the corresponding index of capacity.
For a detailed description of these series, see Federal ReserveMeasures of Capacity and Capacity Utilization (Board of Gov-ernors of the Federal Reserve System, 1978), and "CapacityUtilization: Manufacturing and Materials, January 1967-December 1978" (Federal Reserve statistical release, 1979).
TABLE 51
1. Published groupings include some series and subtotalsnot shown separately. For a detailed description of the revisionand for historical data, see "Industrial Production: 1976 Revi-sion* (Board of Governors, 1979).
2. 1972 dollar value.
TABLE 52
1. Seasonal factors are no longer calculated for lines 12through 41.
2. Data are on an international accounts basis, which differsfrom the Census basis for reasons of coverage and timing;military exports are excluded from merchandise data and areincluded in line 6.
3. Includes reinvested earnings of incorporated affiliates.4. Associated primarily with military sales contracts and
other transactions arranged with or through foreign officialagencies.
5. Consists of investments in U.S. corporate stocks and indebt securities of private corporations and state and localgovernments.
SOURCE. Survey of Current Business (U.S. Department ofCommerce).
TABLE 53
1. Beginning July 1974, the International Monetary Fundadopted a technique for valuing the special drawing right basedon a weighted average of exchange rates for the currencies of 16member countries. The U.S. reserve position in the IMF and
SDR holdings are also valued on this basis beginning in July1974. At valuation used before July 1974 (SDR1 = $1.20635)total U.S. reserve assets, reserve position in IMF, and SDRholdings were as follows (in millions of dollars, end of period).
Month
1979January . .FebruaryMarchApril . . . .MayJuneJulyAugustSeptemberOctoberNovemberDecember . . .
1980January . . .FebruaryMarchAprilMay . . . . . .JuneJulyAugust . .SeptemberOctoberNovemberDecember
Total
19,83119 64121,01120 80221 70920 61219 36019,36217,82117,37718,57718,221
20,16320,10720 91820,91421 12521 08421 02621,84522,15623,22324,98026,141
Reservepositionin IMF
543641644632732723710788774763824747
747794781616664863901
1,0501,1511,1831,3492.379
SDKs
2,4982 5002,50024672 49524952 4952,4952,4952,4952,4952,495
3,5493,5493 5493,4453 4453 4453 5323,6773,6833,6833,7342.468
2. Includes gold in Exchange Stabilization Fund. Gold heldunder earmark at Federal Reserve Banks for foreign and inter-national accounts is not included in the gold stock of the UnitedStates; see table 61.
3. Includes allocations by the IMF of special drawing rightsas follows: $867 million on January 1, 1970; $717 million onJanuary 1, 1971; $710 million on January 1, 1972; $1,139million on January 1, 1979; and $1,152 million on January 1,1980; plus net transactions in SDRs.
4. Represents the U.S. reserve tranche position in the IMF(the U.S. quota, plus net U.S. loans to the IMF, minus IMFholdings of dollars), which is the amount that the United Statescould purchase in foreign currencies automatically if needed.Under appropriate conditions, the United States could pur-chase additional amounts related to the U.S. quota.
5. Valued at current market exchange rates.6. Includes U.S. government securities held under repur-
chase agreement against receipt of foreign currencies, if any.
TABLE 54-A
1. Includes the Bank for International Settlements.2. Principally demand deposits, time deposits, bankers
acceptances, commercial paper, negotiable time certificates ofdeposit, and borrowings under repurchase agreements.
3. Includes nonmarketable certificates of indebtedness (in-cluding those payable in foreign currencies) and nonmarket-able Treasury bills issued to official institutions of foreigncountries.
4. Excludes notes issued to foreign official nonreserveagencies. Includes bonds and notes payable in foreign cur-rencies.
5. Debt securities of U.S. government corporations andfederally sponsored agencies, and U.S. corporate stocks andbonds.
231Digitized for FRASER http://fraser.stlouisfed.org/ Federal Reserve Bank of St. Louis

TABLE 54-B
1. Includes Bank for International Settlements.2. Includes countries in Oceania and Eastern Europe.
TABLE 55-A
1. Excludes negotiable time certificates of deposit, whichare included in "Other negotiable and readily transferable in-struments." Data prior to April 1978 cover short-term depositsonly.
2. Includes borrowing under repurchase agreements.3. U.S. banks: includes amounts due to own foreign
branches and foreign subsidiaries consolidated in "Consoli-dated report of condition" filed with bank regulatory agencies.Agencies, branches, and majority-owned subsidiaries offoreign banks: principally amounts due to head office or parentforeign bank and to foreign branches, agencies, or whollyowned subsidiaries of head office or parent foreign bank.
4. Financial claims on residents of the United States, otherthan long-term securities, held by or through reporting banks.
5. Includes nonmarketable certificates of indebtedness andnonmarketable Treasury bills issued to official institutions offoreign countries.
6. Principally bankers acceptances, commercial paper, andnegotiable time certificates of deposit.
7. Principally the International Bank for Reconstruction andDevelopment and the Inter-American and Asian Develop-ment Banks. Data exclude "holdings of dollars" of the Inter-national Monetary Fund.
8. Foreign central banks and foreign central governmentsand the Bank for International Settlements.
9. Excludes central banks, which are included in "Officialinstitutions."
TABLE 55-B
1. Includes the Bank for International Settlements. Begin-ning April 1978, also includes Eastern European countries notincluded in line 23.
2. Beginning April 1978, comprises Bulgaria, Czechoslo-vakia, German Democratic Republic, Hungary, Poland, andRomania.
3. Included in "Other Latin America and Caribbean"through March 1978.
4. Comprises Bahrain, Iran, Iraq, Kuwait, Oman, Qatar,Saudi Arabia, and United Arab Emirates (Trucial States),
5. Comprises Algeria, Gabon, Libya, and Nigeria.6. Excludes "holdings of dollars" of the International
Monetary Fund.7. Asian, African, Middle Eastern, and European regional
organizations, except the Bank for International Settlements,which is included in "Other Western Europe."
TABLE 56
1. Data for period before April 1978 include claims of banks'domestic customers on foreigners.
2. Includes the Bank for International Settlements. Begin-ning April 1978, also includes Eastern European countries notincluded in line 23.
3. Beginning April 1978, comprises Bulgaria, Czechoslo-vakia, German Democratic Republic, Hungary, Poland, andRomania.
4. Included in "Other Latin America and Caribbean"through March 1978.
5. Comprises Bahrain, Iran, Iraq, Kuwait, Oman, Qatar,Saudi Arabia, and United Arab Emirates (Trucial States).
6. Comprises Algeria, Gabon, Libya, and Nigeria.7. Excludes the Bank for International Settlements, which is
included in "Other Western Europe."
TABLE 57
1. Beginning April 1978, data for banks' own claims aregiven on a monthly basis, but the data for claims of banks'domestic customers are available on a quarterly basis only.
2. UrS. banks: includes amounts due from own foreignbranches and foreign subsidiaries consolidated in "Consoli-dated report of condition" filed with bank regulatory agencies.Agencies, branches, and majority-owned subsidiaries offoreign banks: principally amounts due from head office orparent foreign bank, and foreign branches, agencies, or whollyowned subsidiaries of head office or parent foreign bank.
3. Assets owned by customers of the reporting bank locatedin the United States that represent claims on foreigners held byreporting banks for the account of their domestic customers,
4. Principally negotiable time certificates of deposit andbankers acceptances.
5. Data through March 1978 are outstanding collectionsonly.
6. Includes demand and time deposits and negotiable andnonnegotiable certificates of deposit denominated in U.S.dollars issued by banks abroad.
TABLE 58
1. The first available data are for June 1978.2. Remaining time to maturity.3. Includes nonmonetary international and regional organi-
zations.
TABLE 59
1. Data on claims exclude foreign currencies held by U.S.monetary authorities.
2. Includes claims of banks' domestic customers throughMarch 1978.
3. Assets owned by customers of the reporting bank locatedin the United States that represent claims on foreigners held byreporting banks for the accounts of their domestic customers.
TABLE 60
1. Estimated official and private holdings of marketableU.S. Treasury securities with an original maturity of more thanone year. Data are based on a benchmark survey of holdings asof January 31, 1971, and monthly transactions reports.Excludes nonmarketable U.S. Treasury bonds and notes heldby official institutions of foreign countries.
2. Beginning December 1978, includes U.S. Treasury notes,denominated in foreign currencies, publicly issued to privateforeign residents.
3. Comprises Bahrain, Iran, Iraq, Kuwait, Oman, Qatar,Saudi Arabia, and United Arab Emirates (Trucial States).
4. Comprises Algeria, Gabon, Libya, and Nigeria.
232Digitized for FRASER http://fraser.stlouisfed.org/ Federal Reserve Bank of St. Louis

TABLE 61
1. Excludes deposits and U.S. Treasury securities held forinternational and regional organizations.
2. Marketable U.S. Treasury bills, certificates of indebted-ness, notes, and bonds; and nonmarketable U.S. Treasurysecurities payable in dollars and in foreign currencies.
3. Earmarked gold is gold held for foreign and internationalaccounts; it is not included in the gold stock of the UnitedStates.
TABLE 62
1. Comprises oil-exporting countries as follows: Bahrain,Iran, Iraq, Kuwait, Oman, Qatar, Saudi Arabia, and UnitedArab Emirates (Trucial States).
2. Includes state and local government securities, andsecurities of U.S. government agencies and corporations. Alsoincludes issues of new debt securities sold abroad by U.S.corporations organized to finance direct investments abroad.
TABLE 63
1. For breakdown by country (short-term and long-termseparately) for March-September 1978, see ANNUAL STATISTI-CAL DIGEST for 1974-1978, pages 241, 246. Totals for thatperiod are as follows:
Type
1 Total
2 Payable in dollars3 Payable in foreign
currencies
Mar.
11,510
10,626
884
1978
June
11,870
11,044
825
Sept.
12,786
11,955
831
2. Before December 1978, foreign currency data includeonly liabilities denominated in foreign currencies with anoriginal maturity of less than one year.
3. Comprises Bahrain, Iran, Iraq, Kuwait, Oman, Qatar,Saudi Arabia, and United Arab Emirates (Trucial States).
4. Comprises Algeria, Gabon, Libya, and Nigeria.5. Includes nonmonetary international and regional organ-
izations.
TABLE 64
1. For breakdown by country (short-term and long-termseparately) for March-September 1978, see ANNUALSTATISTICAL DIGEST for 1974-1978, pages 243, 246. Totals forthat period are as follows:
Type
1 Total . . . .
2 Payable in dollars3 Payable in foreign
currencies
Mar.
23,541
21,779
1.763
1978
June
23,229
21,665
1,564
Sept.
23,260
21,292
1.968
Beginning December 1978, table 57, "Banks' own and do-mestic customers' claims on foreigners" includes monthly
figures for U.S. dollar deposits in banks abroad, reported bynonbanking business enterprises in the United States.
2. Before December 1978, foreign currency data includeonly claims denominated in foreign currencies with an originalmaturity of less than one year.
3. Comprises Bahrain, Iran, Iraq, Kuwait, Oman, Qatar,Saudi Arabia, and United Arab Emirates (Trucial States).
4. Comprises Algeria, Gabon, Libya, and Nigeria.5. Includes nonmonetary international and regional
organizations,SOURCES. Data in table 52 are from Survey of Current Business
(U.S. Department of Commerce, Bureau of EconomicAnalysis).
Table 53 is based on U.S. Treasury Department data and ondata reported to the Treasury Department by the InternationalMonetary Fund.
Tables 54 through 62 are based on Treasury Departmentdata and on data reported to the Treasury Department by banks(including Federal Reserve Banks) and brokers in the UnitedStates. The data exclude the holdings of dollars by the Inter-national Monetary Fund derived from payments of the U.S.subscription and from the exchange transactions and otheroperations of the IMF. The data also exclude U.S. Treasuryletters of credit and U.S. nonnegotiable, noninterest-bearingnotes held by nonmonetary international and regionalorganizations.
Tables 63 and 64 are based on data reported to the TreasuryDepartment by nonbanking business enterprises.
The term "foreigners" covers all institutions and individualsdomiciled outside the United States (including U.S. citizensdomiciled abroad), and the foreign branches, subsidiaries, andoffices of U.S. banks and business concerns; the central govern-ments, central banks, and other official institutions of foreigncountries, wherever located; and international and regionalorganizations, wherever located. The term "foreigners" alsoincludes persons in the United States when it is known byreporting institutions that they are acting on behalf offoreigners.
TABLE 65
1. For a given month, total assets may not equal total liabili-ties because some branches did not adjust the net position ofthe bank in the branch to reflect unrealized paper profits andpaper losses caused by changes in exchange rates, which areused to convert foreign currency values into equivalent dollarvalues.
TABLE 66
1. The banking offices covered by these data are the U.S.offices and foreign branches of U.S.-owned banks and of U.S.subsidiaries of foreign-owned banks. Offices not coveredinclude (1) U.S. agencies and branches offoreign banks, and (2)foreign subsidiaries of U.S. banks. To minimize duplication,the data are adjusted to exclude the claims on foreign branchesheld by a U.S. office or another foreign branch of the samebanking institution. The data in this table combine foreignbranch claims in table 65 (the sum of lines 7 through 10) withthe claims of U.S. offices in table 56 (excluding those held byagencies and branches offoreign banks and those constitutingclaims on own foreign branches). However, see also note 2.
For June 1978 and subsequent dates, the claims of the U.S.offices in this table include only banks' own claims payablein dollars. For earlier dates the claims of the U.S. offices also in-
233
Digitized for FRASER http://fraser.stlouisfed.org/ Federal Reserve Bank of St. Louis
elude customer claims and foreign currency claims (amountingin June 1978 to $10 billion).
2. In addition to the Organization of Petroleum ExportingCountries shown individually, this group includes othermembers of OPEC (Algeria, Gabon, Iran, Iraq, Kuwait, Libya,Nigeria, Qatar, Saudi Arabia, and United Arab Emirates) aswell as Bahrain and Oman (not formally members of OPEC).
3. Excludes Liberia.4. Includes Canal Zone beginning December 1979.5. Foreign branch claims only.6. Includes New Zealand, Liberia, and international and re-
gional organizations.
TABLE 67
1. Rates are mainly those at which the central bank eitherdiscounts or makes advances against eligible commercialpaper or government securities for commercial banks orbrokers. For countries with more than one rate applicable tosuch discounts or advances, the rate shown is the one at which itis understood the central bank transacts the largest proportionof its credit operations.
2. Beginning November 1980, the compounded annual rateis based on the official rate per day.
TABLE 68
1. Rates are for three-month interbank loans except forCanada, finance company paper; Belgium, three-monthTreasury bills; and Japan, Gensaki rate.
TABLE 69
1. Index of weighted-average exchange value of U.S. dollaragainst currencies of other Group of Ten (G-10) countries plusSwitzerland. Weights are 1972-76 global trade of each of the 10countries. Series revised as of August 1978 (see Federal ReserveBulletin, vol. 64, August 1968, p. 700).
TABLE 70
1. Averages of certified noon buying rates in New York forcable transfers.
monthly revaluation at market exchange rates of foreign ex-change commitments.
6. Beginning September 1980, Federal Reserve notes heldby the Reserve Banks are exempt from the collateral require-ment
7. Includes Federal Reserve notes held by U.S. Treasury andby Federal Reserve Banks other than the issuing Bank.
TABLE 72
1. This item includes expenses for labor and materials tem-porarily capitalized and charged to activities when the productsare consumed.
2. The total expense for Richmond has been adjusted toexclude $2,526,109, which was allocated to the expenses ofother Federal Reserve Banks for operation of the FederalReserve Communications System.
3. Includes unrealized gains and losses.4. For additional details, see the Board of Governors of the
Federal Reserve System, 67th Annual Report, 1980 (1981),pages 242-44.
TABLE 73
1. Excludes banks that have banking facilities only; bankingfacilities are shown separately; see note 2,
Except for the following, branches and additional offices arelocated in the same state as the parent bank. (In this table thesebranches are shown according to their own location rather thanthat of the parent bank.)
Type and location of bank Number and locationof branches
1 national in New Jersey1 national in California
1 noninsured unincorporatedin New York
3 insured nonmember inPuerto Rico
1 in Pennsylvania3 in Washington and 1
in Oregon1 in Massachusetts and
1 in Pennsylvania17 in New York and 1 in
California in 1980
2. Figures for December 31,1980, include 14 state membernoninsured trust companies.
3. Banking facilities (other than branches) that are providedat military and other government establishments througharrangements made by the Treasury; 85 banks operated suchfacilities and 18 had no other type of branch or facility in 1980.
Part 2-Special Tables
TABLE 71
1. See the Board's Annual Reports for statements of condi-tion of the Federal Reserve Banks for other years.
2. Includes securities loaned-securities fully guaranteed byU.S. government pledged with Federal Reserve Banks; and ex-cludes any securities sold and scheduled to be bought backunder matched sale-purchase transactions.
3. Such assets are revalued monthly at market exchangerates.
4. Includes reserves of all depository institutions.5. Includes exchange-translation account reflecting the
TABLE 74
1. Includes all commercial banking offices (including facili-ties) on which checks are drawn. There were no nonpar bankingoffices as of December 31,1980.
2. Other areas are Puerto Rico, the Virgin Islands, AmericanSamoa, and Guam. For purposes of Regulation J (Collection ofChecks and Other Items by Federal Reserve Banks), PuertoRico and the Virgin Islands are assigned to the New YorkDistrict, American Samoa and Guam to the San FranciscoDistrict.
TABLE 75-A
1. Figures include all banks in Alaska and Hawaii, but ex-clude nonmember banks in territories and possessions.
234Digitized for FRASER http://fraser.stlouisfed.org/ Federal Reserve Bank of St. Louis

2. Figures for December 31,1980, include 14 state membernoninsured trust companies.
3. Figures exclude new banks organized to succeed operat-ing banks.
TABLE 75-B
1. Provided at military and other government establish-ments through arrangements made by the U.S. TreasuryDepartment.
TABLE 76
1. Because Florida and New Hampshire have changed fromlimited branching to statewide branching states, the totals for1979 have been revised as follows:
State
50 states andDistrict ofColumbia . . . .
Statewidebranching . . . .
Limitedbranching . . . .
Unit banking
50 states andDistrict ofColumbia . . . .
Statewidebranching . . . .
Limitedbranching . . . .
Unit bankine
In opera-tion onJan. 1
(orJune 30)
Begin-ning
opera-tion
Ceasingopera-tion
In opera-tion onJune 30
(orDec. 31)
Net in-crease
January l-June30
42,290
21,138
19,2588,894
886
361
353172
237
102
9540
49,939
21,397
19,5169,026
649
259
258132
July 1-December 31
49,939
21,397
19,5169.026
1,637
780
636221
296
179
10314
51,280
21,998
20,0499.233
1,341
601
533207
2. S = statewide branching; L = limited branching; U = unitbanking.
SOURCES. Compiled from unpublished data from the Boardof Governors of the Federal Reserve System and the FederalDeposit Insurance Corporation.
TABLE 77
1. Number in parentheses is total of banking organizationsin state.
2. Independent bank.
TABLE 78
1. Companies included are those that have reported to theBoard of Governors of the Federal Reserve System pursuantto the requirements of the Bank Holding Company Act;the number includes some companies that have filed registra-tiqn statements, but whose holding company status has not yetbeen determined by the Board. Lists showing the names, of-fices, total assets, and total deposits of the subsidiary banks inthe holding company groups (both domestic and domesticincluding foreign) for 1980 are available from Publications Ser-
vices, Board of Governors of the Federal Reserve System,Washington, D.C. 20551.
Figures exclude banking subsidiaries located in Puerto Ricoand holding companies whose only banking subsidiaries arelocated in Puerto Rico.
2. Companies that are subsidiaries of other bank holdingcompanies are eliminated.
3. Branches include locations other than the bank's headoffice; that is, domestic branches, customer-bank communica-tion terminals (CBCTs), facilities, foreign branches and subsid-iaries, and Edge Act and Agreement corporations, whenapplicable.
4. Companies whose only bank subsidiary is also a subsidi-ary of another, unrelated bank holding company areincluded.
5. Data for each state represent the number of bank holdingcompanies or groups having subsidiary banks in that staterather than the number of registered bank holding companiesor groups whose principal offices are located in the state.
6. The total does not necessarily equal the sum of the figuresfor states because it has been corrected for duplications; that is,holding companies or groups that have subsidiary banks inmore than one state are included in the total only once.
7. The multibank, pne-bank, and all commercial bank com-parisons for the 50 states and the District of Columbia (domes-tic only) for 1979 are revised as follows:
Item
Number of holding companygroups
Number of officesHolding companies
BanksBranches
All commercial banksBanksBranches
Amounts (millions of dollars)AssetsHolding companies.All commercial banksDepositsHolding companiesAll commercial banks
Total
2357
27,0994280
22,81951,52214 70836,814
1,004,7331,423,805
744,7011,098,359
Multi-bank
329
13,6792 261
11,418
483,470
365,558
One-bank
2 028
13 4202 019
11,401
521,263
379 142
8. S = statewide branching; L = limited branching; U = unitbanking.
TABLES 79 and 80
1. Data exclude 14 noninsured trust companies that aremembers of the Federal Reserve System.
2. This item is unavailable for all or some of the banks be-cause of the lesser detail available from banks without foreignoffices, the inapplicability of certain items to banks that haveonly domestic offices, the absence of detail on a fully consoli-dated basis for banks with foreign offices, and the absence ofdetail for banks, with assets less than $100 million and withdomestic offices only, that complete an abbreviated set ofreports.
3. The number of full-time equivalent employees on payrolland the number of banks are as of the end of the year.
TABLE 81
1. Minority-owned banks are defined as those in which morethan 50 percent of the stock is owned by minority groups, aswell as those independently controlled by minority groupmembers.
235Digitized for FRASER http://fraser.stlouisfed.org/ Federal Reserve Bank of St. Louis

The following tabulation shows numbers of minority-ownedbanks for 1980 classified in two ways:
By type of minority
BlackHispanicWomenAsianAmerican Indian
4732973
By type of bank charter
Federal Reserve memberNationalState
Nonmember state
463
47
2. Includes data for firms that are members of the AmericanStock Exchange but not of the New York Stock Exchange thatreport directly to the Board of Governors of the Federal Re-serve System and also for other broker-dealers that reportvoluntarily to the National Association of Securities Deal-ers.
3. Credit extended to finance purchases through qualifiedstock option and employee stock purchase plans.
TABLE 82
1. Outside Treasury and Federal Reserve Banks,2. Paper currency only; $1 silver coins reported under coin.SOURCE, Condensed from U.S. Treasury Department, State-
ment of United States Currency and Coin.
TABLE 83
1. Includes deferred profit-sharing funds and pension fundsof corporations, unions, multiemployer groups, and nonprofitorganizations.
2, Includes Foreign Service Retirement and Disability TrustFund.
TABLE 84
1. Rates are reported on an annual percentage rate basis asspecified in Regulation Z (Truth in Lending) of the Board ofGovernors. Commercial bank rates are "most common" ratesfor direct loans with specified maturities; finance companyrates are weighted averages for purchased contracts on mobilehomes and other consumer goods, and for direct personalloans. For description of data, see Federal Reserve Bulletin, vol.59 (September 1973), pages 641-45.
TABLE 85
1. Annual data for bank lending under Regulation U ceasedto be collected after June 1977.
TABLE 86
1. These are members only of the American Stock Ex-change; AMEX firms that are also members of the New YorkStock Exchange are included under NYSE.
2. Excludes subordinated borrowing.3. Excludes subordinated indebtedness, which is included
in the item "Credit balances and money borrowed" (line 30)above.
TABLE 87
1. American Council of Life Insurance data for new commit-ments of $100,000 and over each on mortgages formultifamilyand nonresidential nonfarm properties, most of which are lo-cated in the United States. The old series covers 15 companiesthat account for a little more than one-half of both the totalassets and the nonfarm mortgages held by all U.S. life insur-ance companies; the new series covers 20 companies with 61percent of industry assets and 67 percent of nonfarm mort-gages.
2. Averages, which are based on number of loans, vary inpart with loan composition by type and location of property,type and purpose of loan, and loan amortization and prepay-ment terms. Data for the following are limited to cases forwhich information was available or estimates could be made:capitalization rate (net stabilized property earnings divided byproperty value); debt-coverage ratio (net stabilized earningsdivided by debt service); and percent constant (annual levelpayment, including principal and interest, per $100 of debt). Allstatistics exclude construction loans, increases in existingloans in a company's portfolio, reapprovals, and loans securedby land only.
236Digitized for FRASER http://fraser.stlouisfed.org/ Federal Reserve Bank of St. Louis

Part 4-Index to Tables
Digitized for FRASER http://fraser.stlouisfed.org/ Federal Reserve Bank of St. Louis

Index to TablesReferences are to table numbers, not page numbers
ACCEPTANCES, bankers, 9, 22(B), 25, 72Agricultural loans, commercial banks, 20(A), 24Assets and liabilities (See also Foreigners)
Banking organizations, ten largest, 77Banks, by classes, 15,16, 17,18,19, 20(A)Domestic finance companies, 41Federal Reserve Banks, 10(A), 71Holding company groups, 78Minority-owned banks, 81Nonfmancial corporations, 39Savings institutions, 27
Assets of pension funds, 83Automobiles
Consumer installment credit, 45, 46Production, 51
BANK holding company groups, 78Bankers balances, 16, 17, 18, 19, 20(A)
(See also Foreigners)Banking offices
Banks in holding company groups, number, assets,and deposits, 78
In operation, number and changes, 73, 75, 76Par, number, 74
Banks for Cooperatives, 34Bonds (See also U.S. government securities)
New issues, 36Yields, 1(A.2)
Branch banks, 15, 20(B), 65, 73, 75Budget, U.S. (See Federal finance)Business activity, nonfmancial, 49Business expenditures on new plant, equipment, 40Business loans (See Commercial and industrial loans)
CAPACITY utilization, 49, 50(C)Capital accounts
Banks, by classes, 16, 17, 18, 19Federal Reserve Banks, 10(A), 71
Central banks, 67Certificates of deposit, 20(B), 25Commercial and industrial loans
Commercial banks, 15, 16, 24Weekly reporting banks, 20
Commercial banksAssets and liabilities, l(A.l, B), 15, 16, 17, 18,
19, 20(A), 77Banking offices, number and changes, 73, 75, 76Business loans, 23
Commercial banks-ContinuedCommercial and industrial loans, 20(C), 24Consumer loans held, by type, and
finance rates, 45, 46, 84Loans sold outright, 20(B)Number, by classes, 17, 18, 19Real estate mortgages held, by holder
and property, 44Commercial paper, 1(A.2), 22(A), 25, 41Condition statements (See Assets and liabilities)Construction, 49Consumer installment credit, 45, 46, 84Consumer prices, 49Corporations
Profits and their distribution, 38Security issues, 36
Cost of living (See Consumer prices)Credit unions, l(A.l, B), 27(D), 45, 46Currency and coin, 16, 17, 18, 19Currency in circulation, 2, 13, 82Customer credit, stock market, 26(B, C, D), 85, 86
DEBITS to deposit accounts, 11, 12Debt (See specific types of debt or securities)Demand deposits
Adjusted, commercial banks, 11, 14(B)Banks, by classes, 16, 17, 18, 19, 20(A, B)Ownership by individuals, partnerships, and
corporations, 21Subject to reserve requirements, 14(B)Turnover, 11
Depository institutions, reserve requirementsand reserves, 6, 14(A)
Deposits (See also specific types)Banks, by classes, l(A.l, B), 16, 17, 18, 19,
20(A, B), 27(B)Federal Reserve Banks, 2, 10(A), 71Subject to reserve requirements, 14(B)Turnover, 11, 12
Discount rates at Reserve Banks and at foreign centralbanks (See Interest rates)
Discounts and advances by Reserve Banks (SeeLoans)
DividendsCorporate, 38Federal Reserve Banks, 72Member banks, 80
Dollar, U.S., index of weighted-average value, 69
239Digitized for FRASER http://fraser.stlouisfed.org/ Federal Reserve Bank of St. Louis

EMPLOYMENT, 49Eurodollars, 25
FARM mortgage loans, 44Federal agency obligations, 2, 9,10(A, C),
33(A, B), 71Federal credit agencies, 34Federal finance
Debt subject to statutory limit, types andownership, 30
Receipts and outlays, 29Treasury operating balance, 28
Federal Financing Bank, 28, 34Federal funds, 1(A.2), 4, 20(A), 25, 28Federal Home Loan Banks, 34Federal Home Loan Mortgage Corporation, 34, 43, 44Federal Housing Administration, 34, 43, 44Federal Intermediate Credit Banks, 34Federal Land Banks, 34,44Federal National Mortgage Association, 34, 43, 44Federal Reserve Banks
Condition statement, 10(A), 71Discount rates (See Interest rates)Earnings and expenses, 72U.S. government securities held, 2, 10(A, C), 31,
32, 71Federal Reserve credit, 2, 3, 10(A, C), 71Federal Reserve notes, 10(A, B), 71, 72Federally sponsored credit agencies, 34Finance companies
Assets and liabilities, 41Business credit, 42Loans, 20(A), 45, 46, 84Paper, 22(A), 25
Finance rates (See Interest rates)Financial institutions, loans to, 20(A)Float, 2Flow of funds, 47, 48Foreign currency operations, 10(A), 71, 72Foreign deposits in U.S. banks, 2, 10(A), 20(A), 71Foreign exchange rates, 70Foreigners
Claims on, 56, 57, 58, 59, 64, 65, 66Liabilities to, 20(B), 54, 55, 59, 60, 61, 62, 63, 65
GOLDCertificate, 10(A), 71Stock, 2, 53
Government National Mortgage Association, 34,43, 44
INCOME, personal, 49Income and expenses
Insured commercial banks, 79Member banks, 80
Industrial production, 49, 51Installment loans, 45, 46, 84Insurance companies, 27(C), 31, 32, 44, 87Insured commercial banks, 17, 18, 19, 73, 75, 79Interbank loans and deposits, 16Interest rates
Bonds, 1(A.2)Business loans of banks, 24
Interest rates-ContinuedFederal Reserve Banks, 1(A.2), 5Foreign central banks, 67Foreign countries, 68Installment credit, selected types, 84Money and capital markets, 1(A.2), 25Mortgages, 1(A.2), 43Prime rate, commercial banks, 23Time and savings deposits, 8
International capital transactions of the ynited States,54-66
International organizations, 54, 55, 56, 60, 61, 62, 65Investment companies, issues and assets^ 37Investments (See also specific types)
Banks, by classes, 16, 27(B)Commercial banks, l(A.l, B), 15, 16,17,18,
19, 20(A)Federal Reserve Banks, 10(A, C), 71Savings institutions, 27, 44, 87
LIFE insurance companies (See Insurancecompanies)
Loans (See also specific types)Banks, by classes, 16, 20, 27(B)Commercial banks, l(A.l, B), 15, 16,17, 18,19,
20, 24Federal Reserve Banks, 1(A.2), 2, 3, 5, 10(A, C),
71,72Insured or guaranteed by United States, 43, 44Savings institutions, 27, 44, 87
MANUFACTURINGCapacity utilization, 49, 50(C)Production, 50 (A, B)
Margin accounts, brokers' detailed de1j>it and creditbalances, 86
Margin regulations, credit subject to,by type, 85
Margin requirements, 7Member banks
Banking offices, number and changes, /3, 75Borrowing at Federal Reserve Banks, 3, 10(A), 71Federal funds and repurchase agreements, 4Income and expenses, 80 'Reserve requirements, 6Reserves and related items, 1(A.1,JB), 2, 3,
10(A), 14(A)Monetary aggregates, l(A.l, B), 14(A)Money and capital market rates (See Interest rates)Money stock measures and components, l(A.l, B), 13Mortgages (See Real estate loans) ,Mutual funds (See Investment companies)Mutual savings banks, l(A.l, B), 20(A), 27(B), 31, 32,
44, 45, 46, 73, 75
NATIONAL banks, number of banking offices andchanges, 73, 75
National defense outlays, 29(B)Nonmember banks
Banking offices, number and changes, 73, 75Income and expenses, 79
240Digitized for FRASER http://fraser.stlouisfed.org/ Federal Reserve Bank of St. Louis

OPEN market transactions, 9
PAR banking offices, number, 74Pension funds, assets, 83Prices
Consumer and producer, 49Stock market, 26(A)
Prime rate, commercial banks, 23Production, 49, 51Profit and loss, Federal Reserve Banks, 72Profits, corporate, 38
REAL estate loansBanks, by classes, 20(A), 27(B)Rates, terms, yields, and activity, 1(A.2), 43Savings institutions, 27(A, B, C), 44Type of holder and property mortgaged, 44
Repurchase agreement and federal funds, 4, 20(A)Reserve requirements, 6Reserves
Commercial banks, 16, 17, 18, 19Depository institutions, 14(A)Federal Reserve Banks, 71Member banks, 2, 3, 10(A), 14(A)U.S. reserve assets, 53
Residential mortgage loans, 43Retail credit and retail sales, 45, 46, 49, 84
SAVING, flow of funds, 47, 48Savings and loan associations, l(A.l, B), 27(A), 32,
44, 45, 46Savings deposits (See Time deposits)Savings institutions, assets and liabilities, 27, 44, 87Securities (See also U.S. government securities)
Credit reported by lenders, 26(B, C, D), 85, 86Federal and federally sponsored credit
agencies, 34Foreign transactions, 62New issues, 35, 36Prices, 26(A)
Special drawing rights, 2, 10(A), 52, 53, 71State and local governments
Deposits, 20(A)Holdings of U.S. government securities, 31, 32
State and local governments-ContinuedNew security issues, 35Ownership of securities issued by, 27(B, C)Rates on securities, 1(A.2)
State member banks, number of banking offices andchanges, 73, 75
Stock market, 26, 85, 86Stocks (See also Securities)
New issues, 36Prices, 26(A)
TAX receipts, federal, 29(A)Thrift institutions, (See Savings institutions)Time deposits, l(A.l, B), 8, 12, 14(B), 16, 17, 18, 19,
20(A,B)Treasury currency and Treasury cash, 2Treasury deposits, 2, 10(A), 28, 71Treasury operating balance, 28
UNITED STATES balance of payments, 52U.S. government balances
Commercial bank holdings, 20(A)Member bank holdings, 14(B)Treasury deposits at Reserve Banks, 2, 10(A), 28, 71
U.S. government securitiesBank holdings, 16, 17, 18, 19, 20(A), 27(B), 32Dealers transactions, positions, and financing, 33Federal Reserve Bank holdings and earnings, 2,
10(A, C), 31, 32, 71, 72Foreign and international holdings and
transactions, 10(A), 31, 60, 61, 71Open market transactions, 9Outstanding, by type and ownership, 31, 32Rates, 1(A.2), 25Savings institutions, 27(B, C)
VETERANS Administration, 43, 44
WEEKLY reporting banks, 20Wholesale (producer) prices, 49
YIELDS (See Interest rates)
241Digitized for FRASER http://fraser.stlouisfed.org/ Federal Reserve Bank of St. Louis