digest of educational statistics 2012 - central statistical office
TRANSCRIPT
Vol. 29
OF EDUCATION
STATISTICS 2012
February 2013 (Price Rs. 200.00)
REPUBLIC OF MAURITIUS
Ministry of Finance and Economic Development
STATISTICS MAURITIUS
DIGEST

MINISTRY OF FINANCE AND ECONOMIC DEVELOPMENT
STATISTICS MAURITIUS
DIGEST OF EDUCATION
STATISTICS
2012


DIGEST OF EDUCATION STATISTICS – 2012
FOREWORD
This is the twenty ninth issue of a yearly publication on education statistics prepared
by Statistics Mauritius.
Tables presented in this report relate to the Republic of Mauritius and cover latest
available information on pre-primary, primary, secondary, technical and vocational,
tertiary as well as education in specialised institutions.
The data have been compiled on the basis of information collected through surveys
conducted in 2012 among educational institutions, as well as from the Mauritius
Examinations Syndicate and the Tertiary Education Commission.
It is hoped that the data assembled in this report will be of valuable help to the public
in general, particularly to education planners and policy makers. The preparation of
this report has necessitated the collaboration of the Ministry of Education and Human
Resources, the Central Information Systems Division, educational institutions, and
several other organisations. Their co-operation and assistance are herewith gratefully
acknowledged.
L. F. Cheung Kai Suet (Ms.)
Director of Statistics
Statistics Mauritius Ministry of Finance and Economic Development Port Louis MAURITIUS February 2013

- 1 -
CONTENTS
INTRODUCTION PageMap 6
Main Indicators, Republic of Mauritius, 2008 - 2012 7
Definitions of indicators 9
Summary Note 11
Table
1 EXPENDITURE ON EDUCATION1.1 Total Government Expenditure, Republic of Mauritius, 2010, 2011 and 2012 21
1.2 Government Expenditure on Education by sector, 2010, 2011 and 2012 21
2 PRE-PRIMARY EDUCATION2.1 Pre-primary Education - Number of schools, pupils, personnel and pupil/teacher ratio, 2008 - 2012 25
2.2 Distribution of pre-primary schools by zone and type of administration, 2012 26
2.3 Distribution of pre-primary schools by zone and enrolment range, 2012 26
2.4 Enrolment in pre-primary schools by zone, age, sex and type of administration, 2012 27
2.5 Pre-primary enrolment and Gross Enrolment Ratio by sex, 2003 - 2012 28
2.6 Enrolment Ratio in pre-primary schools , 2007-2012 29
2.7 Distribution of pre-primary schools by zone and ownership of building, 2012 30
2.8 Distribution of pre-primary schools by zone and availability of equipment, 2012 30
2.9 Distribution of pre-primary schools by zone and use of building, 2012 31
2.10 Distribution of pre-primary schools by zone and type of services offered, 2012 31
2.11 Distribution of pre-primary schools by zone and availability of facilities, 2012 32
2.12 Personnel in pre-primary schools by zone and occupational status, 2012 32
2.13 Non-Teaching staff in pre-primary schools by zone and occupational status, 2012 33
2.14 Teaching staff in pre-primary schools by administration and age group-
Republic of Mauritius, 2012 33
2.15 Teaching staff in pre-primary schools by type of administration and level of qualification
Republic of Mauritius, 2012 34
3 PRIMARY EDUCATION3.1 Primary education - Number of schools, pupils, personnel and pupil/teacher ratio, 2008 - 2012 373.2 Distribution of primary schools by zone and type of administration, 2012 383.3 Distribution of primary schools by zone and ownership of building, 2012 383.4 Distribution of primary schools by zone and enrolment range, 2012 393.5 Enrolment in primary schools by zone, type of administration and sex , 2012 393.6 Enrolment in primary schools by type of administration, sex, zone and grade, 2012 403.7 Enrolment in primary schools by grade and sex, 2010 - 2012 433.8 Enrolment in primary schools by type of administration, grade and sex 2010 - 2012,
Republic of Mauritius 44
3.9 Enrolment in primary schools by sex, age and grade, 2012 - Republic of Mauritius 45
- 2 -
3.10 Enrolment in primary schools by sex, age and grade, 2012 - Island of Mauritius 46
3.11 Enrolment in primary schools by sex, age and grade, 2012 - Island of Rodrigues 47
3.12 Number and percentage of pupils studying Oriental language in primary schools by
type of administration, language studied and grade, 2012 48
3.13 Number of pupils by Oriental language studied, grade and zone, 2012 49
3.14 Primary enrolment and Gross Enrolment Ratio by sex, 2003 - 2012 50
3.15 Distribution of primary schools by zone, type of administration and availability of
facilities, 2012 53
3.16 Distribution of rooms in primary schools by zone, type of administration and use, 2012 53
3.17 Distribution of primary schools by type of administration, zone and availability of
equipment, 2012 54
3.18 Number of sections in primary schools by type of administration, zone and grade, 2012 55
3.19 Personnel in primary schools by type of administration, sex, zone and
occupational status, 2012 56
3.20 Teaching staff in primary schools by type of administration, sex, zone and age, 2012 59
3.21 General purpose teachers by type of administration, sex, zone and highest educational level, 2012 62
3.22 Teaching staff in primary schools by length of teaching experience,
type of administration and sex, 2012 65
3.23 Pupil / Teacher ratio in primary schools (General Purpose and Oriental language), 2003 - 2012 66
3.24 Certificate of Primary Education (CPE) examination results by sex, 2009 - 2011 67
3.25 Performance at Certificate of Primary Education (CPE) examination by sex and sitting, 2011 68
3.26 Certificate of Primary Education (CPE) examination results - Republic of Mauritius, 2002 - 2011 69
3.27 Certificate of Primary Education (CPE) examination results - Island of Mauritius, 2002 - 2011 70
3.28 Certificate of Primary Education (CPE) examination results - Island of Rodrigues, 2002 - 2011 71
3.29 Certificate of Primary Education (CPE) examination results by subject and grades achieved -
Republic of Mauritius, 2011 73
3.30 Certificate of Primary Education (CPE) examination results by subject -
Republic of Mauritius, 2006 - 2011 74
4 SECONDARY EDUCATION - GENERAL 4.1 Secondary Education - Number of schools, pupils, personnel and pupil/teacher ratio, 2008 - 2012 77
4.2 Distribution of secondary schools (general stream) by zone and type of administration, 2012 78
4.3 Distribution of secondary schools (general stream) by zone and enrolment range, 2012 78
4.4 Enrolment in secondary schools (general stream) by type of administration, sex, zone and grade, 2012 79
4.5 Enrolment in secondary schools (general stream) by grade and sex, 2010 - 2012 82
4.6 Enrolment in secondary schools (general stream) by type of administration, grade and sex, 2010 - 2012, Republic of Mauritius 83
4.7 Enrolment in secondary schools (general stream)by sex, age and grade, 2012 - Republic of Mauritius 84
4.8 Enrolment in secondary schools (general stream)by sex, age and grade, 2012 - Island of Mauritius 85
4.9 Enrolment in secondary schools (general stream)by sex, age and grade, 2012 - Island of Rodrigues 86
4.10 Number of repeaters in secondary schools (general stream)by type of administration, sex, zone and grade, 2012 87
4.11 Number and percentage of students studying Oriental language in secondary schools (general stream)
- 3 -
by type of administration, language studied and grade, 2012 904.12 Secondary enrolment (general stream) and Gross Enrolment Ratio by sex, 2002 - 2012 914.13 Enrolment in secondary schools (general stream)by zone, type of administration and sex, 2012 944.14 Distribution of secondary schools by zone, type of administration and
availability of IT facilities and equipment, 2012 944.15 Distribution of rooms in secondary schools by type of administration, zone and use, 2012 954.16 Distribution of secondary schools by zone, type of administration and availability of
recreational facilities, 2012 964.17 Distribution of secondary schools (general stream)and number of sections by zone and type of
administration, 2012 964.18 Number of sections in secondary schools (general stream) by type of administration, zone and grade, 2012 974.19 Teaching staff in secondary schools (general stream)by zone, type of administration and sex, 2012 984.20 Teaching staff in secondary schools (general stream)by age and sex, 2012 984.21 Teaching staff in secondary schools (general stream) by sex, zone and highest academic
qualification, 2012 994.22 Teaching staff in secondary schools (general stream) by length of teaching experience, type of administration
and sex, 2012 1004.23 Enrolment, Teaching Staff and Pupil/Teacher ratio in secondary schools (general stream) by zone and
type of administration, 2012 1014.24 Non-teaching staff in secondary schools (both general and pre-vocational streams)
by category, type of administration and sex, 2012 1014.25 Pupil/Teacher Ratio in secondary schools by type of administration, 2003 - 2012 1024.26 Cambridge School Certificate (SC) examination results by type of school administration and sex,
2009 - 2011 1034.27 Cambridge School Certificate (SC) examination results - Republic of Mauritius, 2001 - 2011 1044.28 Cambridge School Certificate (SC) examination results - Island of Mauritius, 2001 - 2011 1054.29 Cambridge School Certificate (SC) examination results - Island of Rodrigues, 2001 - 2011 1064.30 Cambridge School Certificate (SC) examination results by subject and grade, 2011 1084.31 Cambridge Higher School Certificate (HSC) examination results by type of school administration
and sex, 2009 - 2011 110
4.32 Cambridge Higher School Certificate (HSC) examination results - Republic of Mauritius , 2001 - 2011 111
4.33 Cambridge Higher School Certificate (HSC) examination results - Island of Mauritius, 2001 - 2011 112
4.34 Cambridge Higher School Certificate (HSC) examination results - Island of Rodrigues, 2001 - 2011 113
4.35 Cambridge Higher School Certificate (HSC) examination results by subject and grade, 2011 115
SECONDARY EDUCATION - PRE-VOCATIONAL AND TECHNICAL STREAM 4.36 Pre-vocational Education - Number of schools, pupils, staff and pupil/teacher ratio, 2008 - 2012 119
4.37 Distribution of schools offering pre-vocational education by zone and type of administration, 2012 120
4.38 Distribution of schools offering pre-vocational education and number of sections by zone
and type of administration, 2012 120
4.39 Enrolment in schools offering pre-vocational education by type of administration, zone sex and year of study, 2012 121
4.40 Enrolment in schools offering pre-vocational education by type of administration, age, sex and year of study, 2012 - Republic of Mauritius 122
4.41 Enrolment in schools offering pre-vocational education by type of administration, age, sex and year of study, 2012 - Island of Mauritius 123

- 4 -
4.42 Enrolment in schools offering pre-vocational education by type of administration, age, sex and year of study, 2012 - Island of Rodrigues 124
4.43 Enrolment in schools offering pre-vocational education by year of study and sex, 2010 - 2012 1254.44 Enrolment in schools offering pre-vocational education by type of administration,
year of study and sex, 2010 - 2012 1264.45 Teaching staff in schools offering pre-vocational education by zone, type of administration
and sex, 2012 1274.46 Teaching staff in schools offering pre-vocational education by age and sex, 2012 1274.47 Teaching staff in schools offering pre-vocational education by sex, zone and highest
academic qualification, 2012 1284.48 Distribution of secondary schools (general & pre-vocational) by zone and type of
administration, 2012 1294.49 Distribution of secondary schools offering general, pre-vocational and both general & pre-vocational
education by zone, 2012 1294.50 Secondary enrolment (general and pre-vocational streams) and Gross Enrolment Ratio
by sex, 2002 - 2012 1304.51 Enrolment in secondary schools offering general and pre-vocational education by zone and sex, 2012 1324.52 Teaching staff in secondary schools offering general and pre-vocational education by zone & sex, 2012 1324.53 Enrolment in Mauritius Institute of Training and Development (MITD) centres offering
National Trade Certificate (Foundation course) by zone and sex, 2011 1334.54 Number enrolled in Mauritius Institute of Training and Development (MITD) Centres, 2011 1334.55 Number enrolled in Mauritius Institute of Training and Development (MITD) Centres by
course level, year of study and sex (Full Time), 2011 1334.56 Number of graduates by course level (Full Time) in MITD Centres, Rep. of Mauritius, 2007-2011 1344.57 Number of graduates by course level (Apprenticeship) in MITD Centres, Rep. of Mauritius, 2007-2011 134
5 SPECIAL EDUCATION NEEDS5.1 Distribution of Special Education Needs (SEN) schools by zone and type of administration, 2011 1375.2 Enrolment in Special Education Needs (SEN) schools by sex and zone, 2010 and 2011 1375.3 Enrolment in Special Education Needs (SEN) schools by age and sex, Republic of Mauritius, 2010 and 2011 1385.4
139
5.5 Personnel in Special Education Needs (SEN) schools by sex, Republic of Mauritius, 2010 and 2011 139
6 FLOW RATES6.1 Percentage of Dropout in Primary Schools, 2007 - 2011 1436.2 Percentage of Dropout in Secondary Schools (general), 2007 - 2011 1436.3 Percentage of Dropout in Secondary Schools (Pre-vocational), 2007 - 2011 1436.4 Flow rates in secondary schools (general), Republic of Mauritius, 2010 1446.5 Flow rates in secondary schools (general), Republic of Mauritius, 2011 1446.6 Flow rates in secondary schools (general), Island of Mauritius, 2010 1456.7 Flow rates in secondary schools (general), Island of Mauritius, 2011 1456.8 Flow rates in secondary schools (general), Island of Rodrigues, 2010 1466.9 Flow rates in secondary schools (general), Island of Rodrigues, 2011 146
7 ICT7.1 ICT in pre-primary, primary and secondary schools - Republic of Mauritius, 2012 149
Number of pupils in Special Education Needs (SEN) schools by type of impairment and sex,Republic of Mauritius, 2011
- 5 -
8 POST SECONDARY EDUCATION8.1 Enrolment in Post-Secondary Institutions, 2012/2013 1538.2 University of Mauritius - Enrolment and new admission by course level and faculty, 2011/2012
and 2012/2013 1548.3 University of Mauritius - Enrolment (including new admissions) by course level, faculty
and sex, 2012/2013 1558.4 University of Mauritius - Enrolment (including new admissions) by mode of study, faculty
and sex, 2012/2013 1558.5 University of Mauritius - Enrolment by course level, faculty, sex and year of study, 2012/2013 1568.6 University of Mauritius - New admissions by course level, faculty and sex, 2012/2013 1578.7 Fashion and Design Institute - Enrolment by faculty, course level, field of study and sex, 2012/2013 1578.8 University of Technology - Mauritius: Enrolment by school, course level, year of study
and sex, 2012/2013 1588.9 University of Technology - Mauritius: Enrolment by mode of study, school and sex, 2012/2013 1588.10 Mauritius Institute of Education - Enrolment by course level, mode of study and sex, 2012/2013 1598.11 Mahatma Gandhi Institute - Enrolment by course level, mode of study and sex, 2012/2013 1608.12 Open University of Mauritius - Enrolment for Distance Education by course level and sex, 2012 1618.13 Enrolment in Polytechnics by field, year of study and sex, 2012/2013 1628.14 Mauritius Institute of Health - Enrolment by course level and sex, 2012/2013 1638.15 Total number of students enrolled in Tertiary Education, both locally and overseas, by
field of study as at December 2011 1648.16 Estimated total number of Mauritian students pursuing Tertiary education overseas, by country
and field of study as at December 2011 1658.17 Enrolment through Private Providers/Distance Education by field and level of study
as at December 2011 166
GRAPHSFigure1 Total Government Expenditure, 2012 - Republic of Mauritius 222 Government Expenditure on Education by sector, 2012 - Republic of Mauritius 223 Primary School Population, 2003 - 2012 514 Gross Enrolment Ratio at Primary Level, 2003 - 2012 525 Certificate of Primary Education Examination results, 2002 - 2011 (School Candidates only) 726 Secondary School Population (General stream), 2002 - 2012 927 Gross Enrolment Ratio at Secondary level (General stream), 2002 - 2012 938 School Certificate examination results, 2001 - 2011 (School Candidates only) 1079 Higher School Certificate examination results, 2001 - 2011 (School Candidates only) 11410 Gross Enrolment Ratio at Secondary level (General and Pre-vocational streams), 2002 - 2012 131


- 7 -
Main Indicators, Republic of Mauritius, 2008 - 2012
Pre-primary 2008 2009 2010 2011 2012Number of schools Unit 1,070 1,057 1,042 1,018 1,026Enrolment Unit 36,242 35,974 35,139 33,901 33,518Proportion of female enrolment % 49.6 49.7 48.8 49.0 49.4Ratio of girls to boys % 98.4 98.8 95.3 96.2 97.6Number of teachers Unit 2,541 2,518 2,538 2,550 2,541Gross Enrolment Ratio (4-5 years) % 94 96 96 97 101 Male % 93 95 96 96 100 Female % 95 97 96 98 101Gender Parity Index % 1.0 1.0 1.0 1.0 1.0Net Enrolment Ratio (4-5 years) % 95 94 95 95 90 Male % 95 94 94 94 88 Female % 95 95 96 96 92Pupil/Teacher Ratio Unit 14 14 14 13 13
PrimaryNumber of schools Unit 299 302 305 305 312Enrolment Unit 119,022 117,922 117,432 116,068 113,634Proportion of female enrolment % 49.0 49.2 49.2 49.2 49.2Ratio of girls to boys Unit 96.1 96.7 96.8 96.9 96.8Number of teachers Unit 5,495 5,454 5,472 5,627 5,427Gross Enrolment Ratio (6-11 years) % 101 101 101 100 99 Male % 101 100 100 100 99 Female % 101 101 101 100 100Gender Parity Index % 1.0 1.0 1.0 1.0 1.0Net Enrolment Ratio (6-11 years) % 97 97 96 97 99 Male % 96 96 95 96 98 Female % 97 97 97 98 100Pupil/Teacher Ratio Unit 29 29 28 27 28Apparent Intake Rate % 97.2 98.4 99.0 100.9 100.3
Male % 97.2 97.7 98.0 99.2 99.9Female % 97.3 99.0 100.1 102.8 102.7
Transition Rate (Primary to Secondary) % 81.9 81.9 81.5 83.5 n.aMale % 79.6 79.6 79.2 80.6 n.aFemale % 84.4 84.4 84.0 86.5 n.a
% 98.7 98.4 98.9 98.7 99.2Male % 99.0 98.7 98.4 98.6 98.9Female % 98.1 98.0 98.0 99.7 99.4
% 98.3 97.6 98.2 98.1 98.7Male % 98.3 97.3 98.4 97.6 97.2Female % 98.3 97.7 97.9 97.1 97.5
Primary Completion Rate % 70.1 69.2 73.8 71.5 74.6Male % 66.1 64.5 68.6 66.1 69.0Female % 74.0 74.0 79.2 77.2 80.2
Certificate of Primary Education Pass Rate % 67.4 68.1 68.5 68.6 68.8Male % 62.1 62.3 63.1 62.7 62.5Female % 73.2 74.5 74.4 74.9 75.5
Proportion of pupils starting grade I who reach grade 5
Proportion of pupils starting grade I who reach grade 6

- 8 -
Main Indicators, Republic of Mauritius, 2008 - 2012 (Cont'd)
2008 2009 2010 2011 2012Secondary (General and Pre-Vocational)Number of schools Unit 187 185 187 185 183
Enrolment Unit 124,998 124,259 122,445 122,559 122,898
Proportion of female enrolment % 51.0 51.3 51.3 51.2 51.2
Ratio of girls to boys Unit 104.2 105.4 105.4 104.9 104.8
Number of teachers Unit 8,053 8,186 8,323 8,507 8,643
% 74 73 73 74 76
Male % 71 71 70 72 73
Female % 76 76 76 77 78
Gender Parity Index % 1.1 1.1 1.1 1.1 1.1
% 67 67 66 67 69
Male % 65 64 64 65 67
Female % 69 69 68 69 71
Pupil/Teacher Ratio Unit 16 15 15 14 14
Cambridge School Certificate Pass Rate % 76.5 77.6 77.8 76.7 75.7
Male % 71.5 71.8 73.3 71.8 69.6
Female % 80.9 82.7 81.8 81.2 81.0
Cambridge Higher School Certificate Pass Rate % 78.7 78.8 78.5 79.3 79.1
Male % 74.4 74.2 73.7 75.3 74.8
Female % 82.2 82.1 81.7 82.3 82.2
Tertiary1
Number of institutions Unit 60 61 65 70 n.a
Enrolment Unit 38,623 41,484 44,334 45,969 n.a
Gross Enrolment Ratio % 41 43 45 45 n.a1 Source: Tertiary Education Commission
Expenditure 2007/2008 2008/2009 2010 2 2011 2 2012
61,544.0 76,215.2 79,894.1 87,816.2 101,552.2
8,326.8 10,625.0 10,936.8 11,017.4 12,632.3
% 3.3 3.9 3.7 3.4 3.7
% 13.5 13.9 13.7 12.5 12.4
2 Revised
n.a: Not available
Total Government Expenditure on Education (Rs million)
Total Government Expenditure on Education as a % of GDP at market price
Total Government Expenditure on Education as a % of TotalGovernment Expenditure
Gross Enrolment Ratio (12-19 years)
Net Enrolment Ratio (12-19 years)
Total Government Expenditure (Rs million)
‐ 9 ‐
Definitions of indicators
(1) Apparent Intake Rate
Number of new entrants in Standard I in primary schools as a percentage of the population aged 5
years.
(2) Gender Parity Index (GPI)
Ratio of the GER for female to the GER for male. It measures the relative education participation of
boys and girls. A GPI of 1 reflects equal enrolment rate for boys and girls, whereas a GPI greater
than 1 shows disparity in favour of girls.
(3) Gross Enrolment Ratio (GER)
Number of pupils enrolled in a given level of education, regardless of age, expressed as a
percentage of the population in the relevant age-group:
- 4 - 5 years for pre-primary - 6 – 11 years for primary - 12 – 19 years for secondary - 20 – 24 years for tertiary.
(4) Net Enrolment Ratio (NER) for pre-primary
Number of pupils aged 4 to 5 years enrolled in pre-primary schools, expressed as a percentage of
the population in the same age-group.
(5) Net Enrolment Ratio (NER) for primary
Number of pupils aged 6 to 11 years enrolled in primary schools, expressed as a percentage of the
population in the same age-group.
(6) Net Enrolment Ratio (NER) for secondary
Number of pupils aged 12 to 19 years enrolled in secondary schools, expressed as a percentage of
the population in the same age-group.
(7) Pupil/ Teacher Ratio The average number of pupils per teacher at a given level of education in a given year. (8) Primary Completion Rate The ratio of the number of students successfully completing the last year of primary school
(Standard VI) in a given year to the total number of children aged 11 years in the population.
‐ 10 ‐
(9) Transition Rate The proportion of pupils progressing from the primary cycle (i.e Std VI) to the secondary cycle
(Form I and Year I Prevoc), expressed as a percentage of the number of pupils enrolled at Std VI in
primary school.
(10) Promotion Rate The proportion of pupils who successfully completed a grade and proceeded to the next higher
grade the following year, expressed as a percentage.
(11) Repetition Rate The proportion of pupils who repeat a grade once or twice. (12) Dropout Rate The proportion of pupils who leave the system without completing a given grade in a given school
year. This rate shows the extent at which pupils abandon schooling.
A pupil at a given level of education in a given year will, in the following year, either get promoted
to the next higher grade, or repeat the same grade or drop out of the school system.
Therefore, Promotion Rate + Repetition Rate + Dropout Rate = 100
.
- 11 -
EDUCATION STATISTICS – 2012
Summary Note
1. Introduction
The Digest of Education presents data on education, compiled on the basis of information collected through the annual census conducted in schools in March 2012, together with data from other sources. A methodology for the school census is found at Annex A.
This issue of the Digest of Education Statistics presents region wise tables by educational zones only. Tables by district together with the web version of this publication are available on Statistics Mauritius website at http://statsmauritius.gov.mu.
The data refer to the Republic of Mauritius and cover pre-primary, primary, secondary (general and pre-vocational), technical & vocational, tertiary as well as education in specialised institutions. It is to be noted that ‘grade’ at Primary level refers to ‘Standard’ and that at Secondary level refers to ‘Form’.
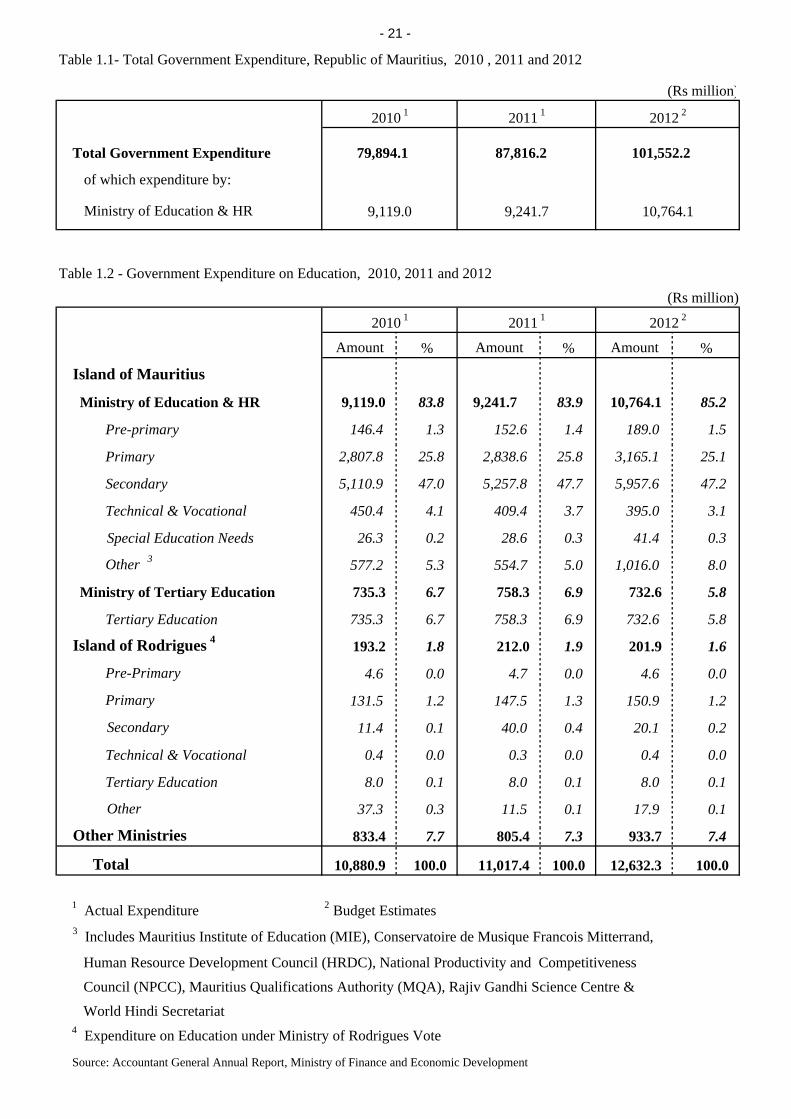
2. Expenditure Total government expenditure estimates for the financial year 2012 is Rs 101,552 million, out of which, Rs 12,632 million (12%) has been allocated to education. Out of the total budget of the Ministry of Education and education-related expenditure by other Ministries for 2012, 47% is allocated to secondary education, 26% to primary education, 6% to tertiary education, 3% to technical and vocational education, 2% to pre-primary education and the remaining 16% to other expenses (Table 1.2 and Figure 2). 3. Pre-primary education 3.1 Schools
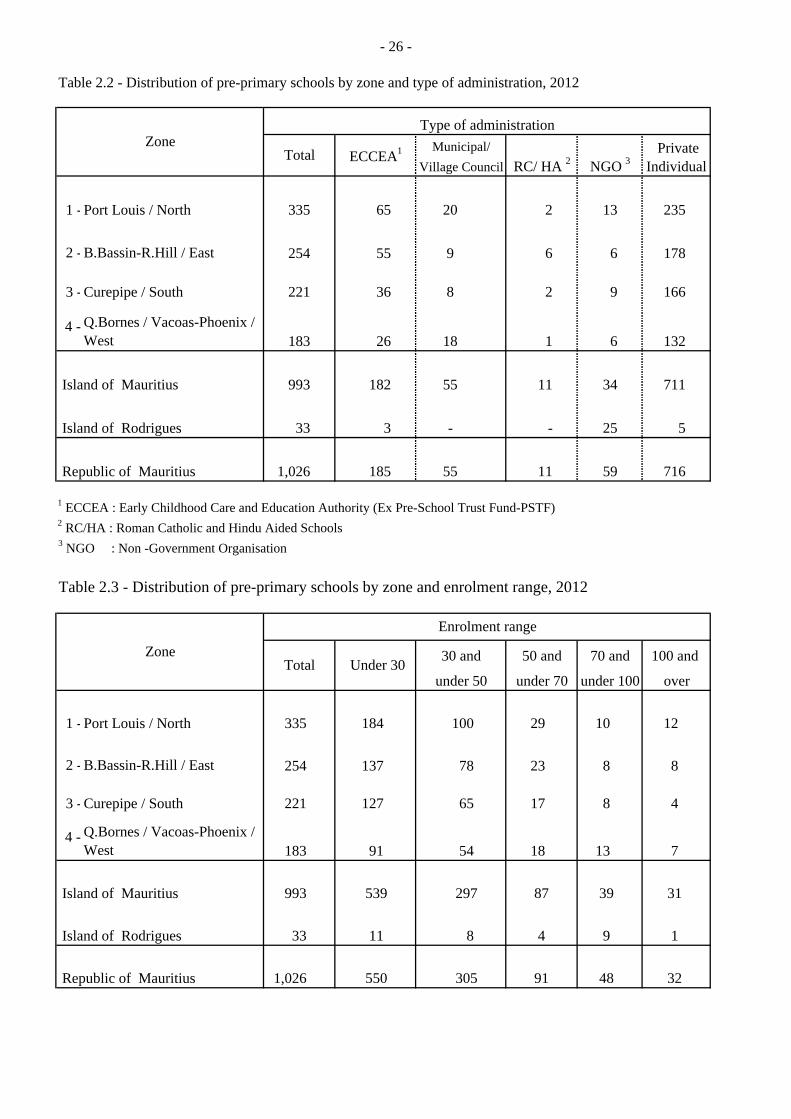
In March 2012, there were 1,026 schools providing pre-primary education: 993 in the Island of Mauritius and 33 in Rodrigues. Of these schools, 185 (18%) were run by the Early Childhood Care and Education Authority (ECCEA, formerly Pre-School Trust Fund) and the remaining 841 (82%) were privately run by either Roman Catholic Authority or Hindu Education Authority or Municipal/Village Council or Non Government Organisation (Table 2.2). 3.2 Enrolment
Total enrolment in pre-primary schools numbered 33,518, of whom 16,960 were boys
and 16,558 girls (Table 2.4). The Gross Enrolment Ratio (pre-primary enrolment as a percentage of the population aged 4 and 5 years) works out to 101% in 2012 against 97% in 2011.

- 12 -
3.3 Personnel
In March 2012, total employment in pre-primary schools stood at 3,568, of whom
2,541 were teachers and 1,027 non-teaching staff. The average number of pupils per teacher
works out to 13.
4. Primary education 4.1 Schools
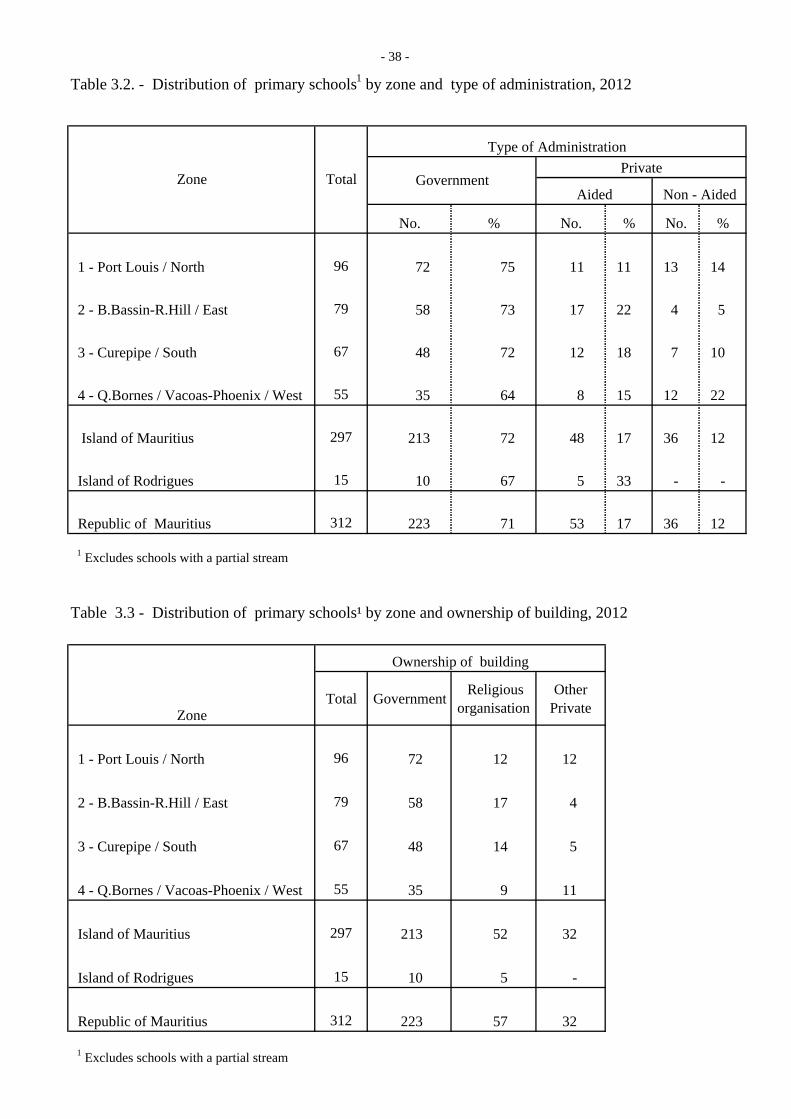
In March 2012, there were 312 schools providing primary education, 297 in the Island of Mauritius and 15 in Rodrigues. The majority (223) of the schools was run by government, 53 were private aided schools. Among the private aided schools, 51 were run by the Roman Catholic Education Authority (RCEA) and 2 by the Hindu Education Authority. The remaining 36 were private non-aided schools (Table 3.2). 4.2 Enrolment
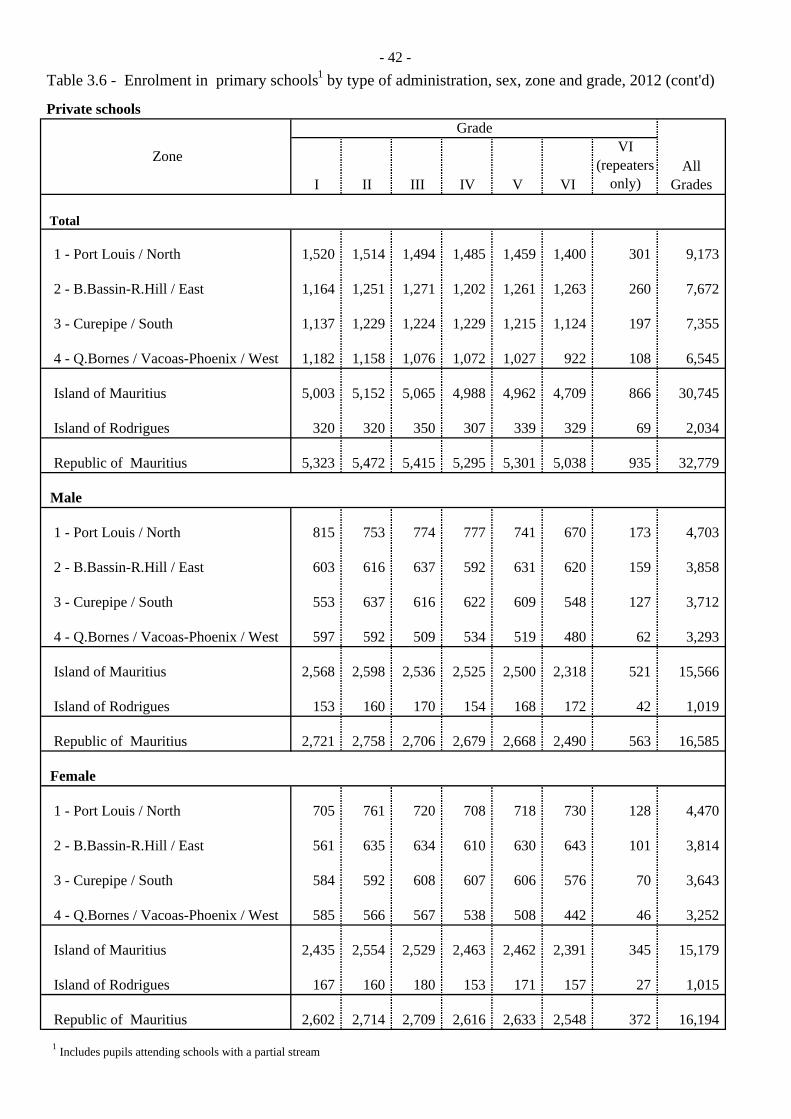
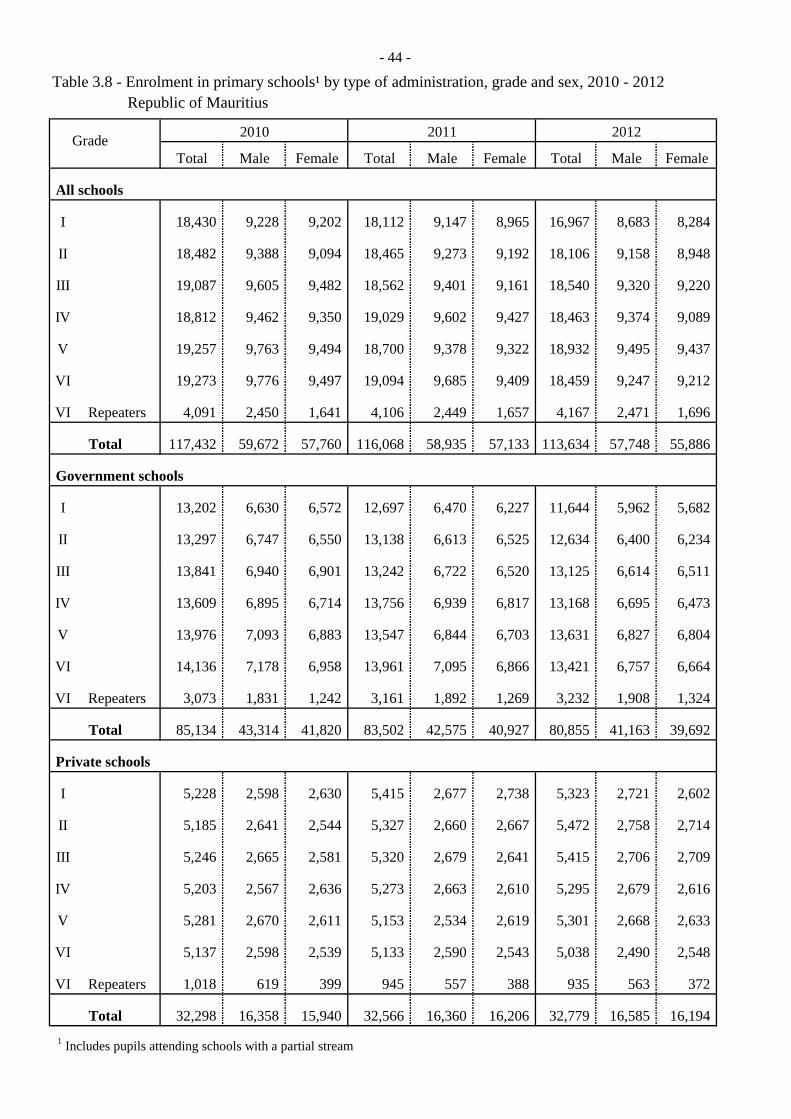
The primary school population in the Republic of Mauritius stood at 113,634 in 2012, a decrease of 2,434 from 2011 figure. Boys represented 51% of the 2012 primary school population and girls 49%. Around 71% of the primary school population was enrolled in government schools and the remaining was in private aided and non-aided schools (Table 3.6).
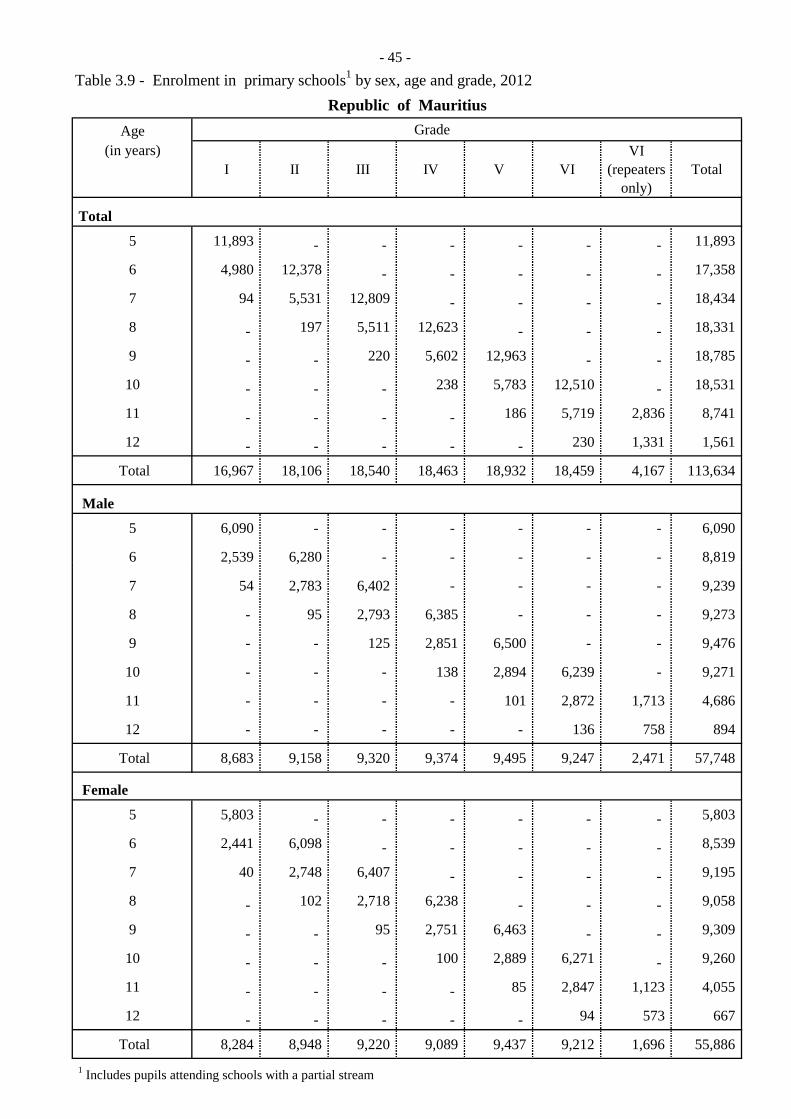
Distribution by grade shows that the highest number of pupils was in standard VI (22,626 pupils including 4,167 repeaters). The Gross Enrolment Ratio (primary enrolment as a percentage of the population aged 6 to 11 years) works out to 99%. 4.3 Personnel
At March 2012, 8,044 persons were employed in primary schools. Of this number, 5,427 were teaching staff: 4,083 General Purpose Teachers and 1,344 Oriental Language Teachers. The remaining 2,617 comprised 311 Head Teachers, 950 Deputy Head Teachers and 1,356 administrative and other workers (Table 3.19). The pupil/teacher (general purpose) ratio in primary schools works out to 28.
4.4 Certificate of Primary Education (CPE)
In 2011, the number of candidates who took part in the CPE examination was 25,682 (23,176 school candidates and 2,506 private candidates), with an overall pass rate of 65%.
The pass rate among school candidates, comprising 12,055 boys and 11,121 girls, was
69%. The girls were more successful than the boys, with respective pass rates of 75% and 63% (Table 3.25).
- 13 -
The overall pass rate among the 2,506 private candidates (1,517 boys and 989 girls) was 30%, with girls again achieving better results than boys, 37% against 26% (Table 3.25). School candidates who took part in the CPE examination for the first time did much better than those taking the examination a second time, 76% against 40% (Table 3.25). 5. Secondary General and Pre-vocational education
5.1 General and Pre-vocational Education
At March 2012, 62 schools were offering secondary general education only, 5 pre-vocational education only and 116 both secondary general and pre-vocational education.
5.2 Secondary education (General)
5.2.1 Schools
Out of the 178 schools dispensing secondary general education, 172 were in the Island of Mauritius and 6 in Rodrigues. State administered schools numbered 68, while the other 110 were private aided and non-aided schools (Table 4.2).
5.2.2 Enrolment
Secondary education enrolment increased by some 388 from 115,289 in 2011 to 115,677 in 2012. Table 4.13 shows that 60,303 (52%) were girls and 55,374 (48%) were boys. About 43% of the secondary school population was in state schools and 57% in private (aided and unaided) schools. Gross Enrolment Ratio (secondary education enrolment as a percentage of the population aged 12 to 19 years) for the general stream works out to 71% in 2012 against 70% in 2011. 5.3 Pre-vocational education
5.3.1 Schools
At March 2012, 121 schools (of which 116 offered both secondary general and pre-vocational education) were offering pre-vocational education: 115 in the Island of Mauritius and 6 in Rodrigues. Forty-six of these schools were state secondary schools and state pre-vocational schools while the remaining 75 were private schools. 5.3.2 Enrolment
Enrolment in the schools offering pre-vocational education was 7,221 comprising 4,641 boys and 2,580 girls (Table 4.39). About 30% of the students in pre-vocational schools were in state schools.

- 14 -
5.4 Personnel
The number of teachers working in schools offering secondary and pre-vocational education was 8,643 at March 2012 (Tables 4.19 and 4.45).
The secondary education teaching staff in the general stream was 8,014 (3,287 males
and 4,727 females). The pupil/teacher ratio works out to 14. On the other hand, the pre-vocational education teaching staff stood at 629 (227 males and 402 females), giving an average of 11 pupils per teacher.
5.5 Cambridge School Certificate (SC)
In 2011, out of 17,192 candidates (8,080 males and 9,112 females) who took part in the Cambridge School Certificate examination, 13,194 were successful. Comparison with the 2010 results shows that the overall pass rate decreased slightly from 77.8% to 76.7% (Table 4.26).
5.6 Cambridge Higher School Certificate (HSC) The number of students taking part in the 2011 Cambridge Higher School Certificate examination stood at 10,081 (4,283 males and 5,798 females). The overall pass rate is 79.3%, slightly higher than the 2010 figure of 78.3% (Table 4.31). 5.7 Technical and Vocational Education
In 2011, there were 9,333 students enrolled in publicly funded technical and vocational courses, of whom 78% were males. Nearly 49% of the students were enrolled in full-time courses, 39% in part-time courses and the rest (12%) in apprenticeship courses (Table 4.54). 6. Special Education Needs (SEN)
6.1 Schools
At March 2012, there were 50 Special Education Needs schools in the Republic of Mauritius registered with the Ministry of Education and Human Resources. Six schools were run by Government, while the other 44 were run by NGOs (Table 5.1).
6.2 Enrolment
The number of students enrolled in these special schools stood at 1,862 as at March 2012. Table 5.2 shows that 684 (37%) were girls and 1,178 (63%) were boys.
- 15 -
Table 5.4 shows that the three most frequent types of impairment were Intellectual Impairment (29%), Physical Disability (11%) and Severe and Multiple Disabilities (9%).
6.3 Personnel At March 2012, there were 422 persons employed in these special education needs institutions and day-care centres. Out of these, 278 were teaching staff, and 50 were medical and para-medical staff. The remaining 94 were administrative and ancillary workers (Table 5.5). 7. Flow Rates (Promotion, Repetition and Drop-Out Rates) The three flow-rate indicators, promotion, repetition and drop-out rates are the measures of internal efficiency of an education system. High promotion rates signify efficiency in the education system.
Tables 6.4 and 6.5 show the efficiency ratios at secondary (general) level in the Republic of Mauritius for 2010 and 2011. Among all grades, the promotion rate in 2011 was lowest (54%) for pupils from Form V to Lower VI. This implies that they also have the highest repetition rate (24%) and drop-out rate (22%). 8. ICT in Education
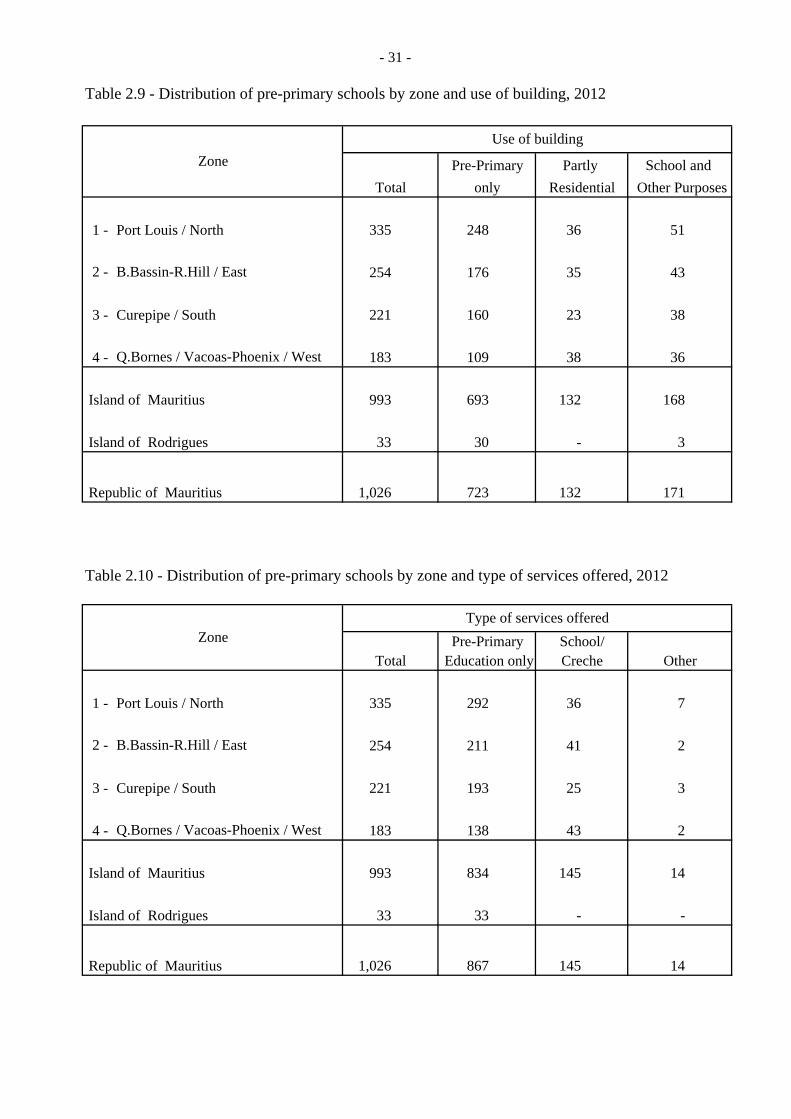
In March 2012, out of the 1,026 pre-primary schools in the Republic of Mauritius 503
(49%) had computers. All primary and secondary schools (general & pre-vocational) were equipped with computers. Schools having internet access for students stood at 5% in pre-primary, 56% in primary and 93% in secondary schools (Table 7.1).
9. Post Secondary Education
9.1 University of Mauritius Enrolment
The University of Mauritius is the major supplier of tertiary education in the country. As at September 2012, it had a student population of 11,336 (exclusive of joint programmes with Mauritius Institute of Education and Mahatma Gandhi Institute). Nearly 59% of the students enrolled were females.
The emphasis at the University of Mauritius is on Degree courses, which constituted 82% (Table 8.3) of the total enrolment in 2012/2013. About 9% of students were enrolled for Post Graduate courses and the remaining 9% were studying for the Diploma and Certificate courses.
- 16 -
9.2 Fashion and Design Institute
Enrolment
In September 2012, the student population of the Fashion and Design Institute numbered 162 of whom 98 (60%) were females.
Around 10% (Table 8.7) of the student population was studying for Degree courses, 69% was enrolled on the Higher National Diploma courses and the remaining 21% for Diploma courses.
9.3 University of Technology - Mauritius (UTM)
Enrolment
In September 2012, the student population of the University of Technology numbered 4,478 of whom 2,156 (48%) were females. Around 54% of the student population was enrolled in the School of Business Management and Finance and 23% in the School of Innovative Technologies and Engineering and 23% in the School of Sustainable Development and Tourism.
Around 73% (Table 8.8) of the student population was studying for Degree courses, 21% was enrolled on the Master Degree & Post Graduate courses and the remaining 6% for Diploma and Certificate courses.
9.4 Mauritius Institute of Education (MIE)
Enrolment
In September 2012, there were 3,792 teachers and prospective teachers being trained at the MIE. This represents a decrease of 2% compared to 3,870 enrolled in September 2011. The female participation represented 77% of the overall enrolment. Around 28% of the student population was on a full time basis while 72% were on a part time basis (Table 8.10).
Some 56 (2%) students were registered on the Master Degree in Education course in collaboration with the University of Brighton; 562 (15%) and 97 (3%) were following the Post Graduate Certificate and Post Graduate Diploma in Education course respectively; 114 (3%) were enrolled for the Bachelor of Education course run jointly with the University of Mauritius and University of Technology; 1,896 (50%) were on Diploma courses and 1,067 (28%) on Advanced Certificate and Certificate Courses.
- 17 -
9.5 Mahatma Gandhi Institute (MGI)
Enrolment During the academic year 2012/2013, the MGI had a student population of 2,286 (Table 8.11) of whom 1,498 (66%) were females. Some 350 (15%) students were registered for the Degree and Master courses, 82 (4%) for the Diploma/Degree, 141 (6%) for the Diploma and 1,713 (75%) for the Advanced Certificate and Certificate courses. 9.6 Open University of Mauritius
Enrolment
The Open University of Mauritius is mainly involved in the production of educational programme for formal education at pre-primary, primary, secondary and tertiary level for broadcast. All the programmes were being delivered through the distance mode, in collaboration with overseas institutions. The institutions included the Institute of Logistic and Transport, the Chartered Institute of Marketing (UK), and Indira Gandhi National Open University of India (IGNOU).
In 2012, the MCA recorded 791 students of whom 565 (71%) were females. Some 495 (63%) students were registered for the Degree and Post Graduate courses, 109 (14%) for the Advanced Diploma, Professional Diploma and Diploma courses and 187 (24%) for the Certificate courses (Table 8.12).
9.7 Polytechnics
Enrolment
Higher technical education was dispensed in the two polytechnics, namely Swami Dayanand Institute of Management and the Institut Superieur de Technologie.
Enrolment at the Polytechnics was on a full-time and part-time basis and numbered 825 in 2012 (Table 8.12). Enrolment at the Swami Dayanand Institute of Management accounted for 523 (63%) of the polytechnic student population, and the Institut Superieur de Technologie for the remaining 302 (37%).
9.8 Mauritius Institute of Health (MIH) Enrolment
The courses offered at the MIH target the medical sector. During the academic year 2012/2013, the MIH had a student population of 222 of whom 144 (64.9 %) were females (Table 8.14).
- 18 -
9.9 Private Providers/Distance Education
At December 2011, the number of students enrolled on tertiary-level programmes in private local institutions, including those delivered through the distance or mixed mode, reached 13,464 compared to 11,661 at the end of 2010 (Table 8.17).
The most common field of study was Accountancy with 5,016 (37%) followed by Administration/Management with 2,028 (15%). Some 1,287 (10%) studied Business/Commerce/Marketing and the remaining 5,133 (38%) studied subjects such as Economics, Pharmacy, Science, Medicine, Law, Arts, Dentistry and others. 9.10 Mauritian students studying abroad
The number of students, pursuing their studies overseas, decreased by 8% from 10,907 in 2010 to 10,063 in 2011. From Table 8.16, it can be noted that although Mauritian students studied in different countries, most of them opted for Australia (29%), UK (29%), France/Reunion (18%), India (9%), and the rest (15%) for countries such as Russia & Ukraine, South Africa, Ireland, China and USA. The Gross Enrolment Ratio (tertiary education enrolment as a percentage of the
population aged 20 to 24 years), which was 45.1% in 2010, reached 45.0% in 2011.
Statistics Mauritius Ministry of Finance and Economic Development Port Louis Mauritius February 2013
Contact Person D. Pothegadoo Statistician Statistics Unit Ministry of Education and Human Resources MITD House, Pont Fer, Phoenix Tel: 601 5252, 601 5200, Ext. 5430, 5478 Fax: 686 8774 Email : [email protected]
EXPENDITURE
ON
EDUCATION

- 21 -
Table 1.1- Total Government Expenditure, Republic of Mauritius, 2010 , 2011 and 2012
(Rs million)
Total Government Expenditure
of which expenditure by:
Ministry of Education & HR
Table 1.2 - Government Expenditure on Education, 2010, 2011 and 2012
(Rs million)
Amount % Amount % Amount %
Island of Mauritius
Ministry of Education & HR 9,119.0 83.8 9,241.7 83.9 10,764.1 85.2
Pre-primary 146.4 1.3 152.6 1.4 189.0 1.5
Primary 2,807.8 25.8 2,838.6 25.8 3,165.1 25.1
Secondary 5,110.9 47.0 5,257.8 47.7 5,957.6 47.2
Technical & Vocational 450.4 4.1 409.4 3.7 395.0 3.1
Special Education Needs 26.3 0.2 28.6 0.3 41.4 0.3
Other 3 577.2 5.3 554.7 5.0 1,016.0 8.0
Ministry of Tertiary Education 735.3 6.7 758.3 6.9 732.6 5.8
Tertiary Education 735.3 6.7 758.3 6.9 732.6 5.8
Island of Rodrigues 4 193.2 1.8 212.0 1.9 201.9 1.6
Pre-Primary 4.6 0.0 4.7 0.0 4.6 0.0
Primary 131.5 1.2 147.5 1.3 150.9 1.2
Secondary 11.4 0.1 40.0 0.4 20.1 0.2
Technical & Vocational 0.4 0.0 0.3 0.0 0.4 0.0
Tertiary Education 8.0 0.1 8.0 0.1 8.0 0.1
Other 37.3 0.3 11.5 0.1 17.9 0.1
Other Ministries 833.4 7.7 805.4 7.3 933.7 7.4
Total 10,880.9 100.0 11,017.4 100.0 12,632.3 100.0
1 Actual Expenditure 2 Budget Estimates3 Includes Mauritius Institute of Education (MIE), Conservatoire de Musique Francois Mitterrand,
Human Resource Development Council (HRDC), National Productivity and Competitiveness
Council (NPCC), Mauritius Qualifications Authority (MQA), Rajiv Gandhi Science Centre &
World Hindi Secretariat 4 Expenditure on Education under Ministry of Rodrigues Vote
Source: Accountant General Annual Report, Ministry of Finance and Economic Development
9,241.7 10,764.1
2010 1 2011 1 2012 2
9,119.0
2010 1 2011 1 2012 2
79,894.1 87,816.2 101,552.2

- 22 -
Fig. 1 - Total Government Expenditure, 2012 Republic of Mauritius
Fig. 2 - Government Expenditure on Education by sector, 2012
Expenditure on Education
12.4%
Other Expenditure87.6%
Fig. 2 Government Expenditure on Education by sector, 2012 Republic of Mauritius
Source: Accountant General Annual Report, Ministry of Finanace and Economic Development
Pre-primary1.5%
Primary25.1%
Secondary47.2%
Technical and Vocational
3.1%
Ministry of Tertiary Education
5.8%
Special Education Programmes
0.3%
Other8.0%
Island of Rodrigues
1.6%
Other Ministries7.4%

PRE - PRIMARY
EDUCATION


Table 2.1 - Pre-primary Education1 - Number of schools, pupils, personnel and pupil/teacher ratio, 2008 - 2012
Pupil/Total number Teaching Teacher
Period of schools Total Administrative Other Total Ratio4
A - Republic of MauritiusMar-08 1,070 6,504 29,738 36,242 2,541 157 762 919 14Mar-09 1,057 6,509 29,465 35,974 2,518 164 769 933 14Mar-10 1,042 6,359 28,780 35,139 2,538 151 759 910 14Mar-11 1,018 6,469 27,432 33,901 2,550 158 809 967 13Mar-12 1,026 6,397 27,121 33,518 2,541 187 840 1,027 13
B - Island of MauritiusMar-08 1,038 6,288 28,547 34,835 2,468 157 758 915 14Mar-09 1,024 6,278 28,010 34,288 2,443 163 762 925 14Mar-10 1,009 6,143 27,419 33,562 2,463 150 751 901 14Mar-11 985 6,256 26,076 32,332 2,478 157 801 958 13Mar-12 993 6,158 25,753 31,911 2,469 187 832 1,019 13
C - Island of RodriguesMar-08 32 216 1,191 1,407 73 - 4 4 19Mar-09 33 231 1,455 1,686 75 1 7 8 22Mar-10 33 216 1,361 1,577 75 1 8 9 21Mar-11 33 213 1,356 1,569 72 1 8 9 22Mar-12 33 239 1,368 1,607 72 - 8 8 22
1 Excluding Agalega. 2 ECCEA (Early Childhood Care and Education Authority, formerly Pre School Trust Fund) excludes RC (Roman Catholic) schools.3 Other includes pupils from MVC (Municipal/Village Council), NGO(Non Government Organisation) and RC (Roman Catholic)/Hindu Education Authority schools.4 Total number of pupils divided by total number of teachers.
Non-teachingPersonnelPupils
ECCEA2 Other3 Total
-25 -
- 26 -
Table 2.2 - Distribution of pre-primary schools by zone and type of administration, 2012
Municipal/Village Council
1 - Port Louis / North 335 65 20 2 13 235
2 - B.Bassin-R.Hill / East 254 55 9 6 6 178
3 - Curepipe / South 221 36 8 2 9 166
4 - Q.Bornes / Vacoas-Phoenix / West 183 26 18 1 6 132
993 182 55 11 34 711
33 3 - - 25 5
1,026 185 55 11 59 716
1 ECCEA : Early Childhood Care and Education Authority (Ex Pre-School Trust Fund-PSTF)2 RC/HA : Roman Catholic and Hindu Aided Schools3 NGO : Non -Government Organisation
Table 2.3 - Distribution of pre-primary schools by zone and enrolment range, 2012
30 and 50 and 70 and 100 and
under 50 under 70 under 100 over
1 - Port Louis / North 335 184 100 29 10 12
2 - B.Bassin-R.Hill / East 254 137 78 23 8 8
3 - Curepipe / South 221 127 65 17 8 4
4 - Q.Bornes / Vacoas-Phoenix / West 183 91 54 18 13 7
993 539 297 87 39 31
33 11 8 4 9 1
1,026 550 305 91 48 32
Island of Mauritius
Type of administration
ECCEA1 PrivateIndividual
Zone
RC/ HA 2Total
NGO 3
Republic of Mauritius
Zone Under 30
Island of Rodrigues
Republic of Mauritius
Total
Enrolment range
Island of Mauritius
Island of Rodrigues

- 27 -
Table 2.4 - Enrolment in pre-primary schools by zone, age, sex and type of administration, 2012All Schools
Total Male Female Age in Years
3 4 5 Total 3 4 5 Total 3 4 5 Total
1 -Port Louis / North 5,211 5,291 690 11,192 2,655 2,670 339 5,664 2,556 2,621 351 5,528
2 -B.Bassin-R.Hill / East 3,674 3,858 573 8,105 1,865 1,948 290 4,103 1,809 1,910 283 4,002
3 -Curepipe / South 2,996 3,131 356 6,483 1,504 1,582 200 3,286 1,492 1,549 156 3,197
4 -Q.Bornes / Vacoas-Phoenix / West 2,817 2,869 445 6,131 1,436 1,448 242 3,126 1,381 1,421 203 3,005
Island of Mauritius 14,698 15,149 2,064 31,911 7,460 7,648 1,071 16,179 7,238 7,501 993 15,732
Island of Rodrigues 710 842 55 1,607 347 413 21 781 363 429 34 826
Republic of Mauritius 15,408 15,991 2,119 33,518 7,807 8,061 1,092 16,960 7,601 7,930 1,027 16,558
ECCEA 1
1 -Port Louis / North 975 1,036 150 2,161 486 513 71 1,070 489 523 79 1,091
2 -B.Bassin-R.Hill / East 749 898 94 1,741 365 461 51 877 384 437 43 864
3 -Curepipe / South 536 656 63 1,255 259 322 29 610 277 334 34 645
4 -Q.Bornes / Vacoas-Phoenix / West 428 514 59 1,001 220 259 29 508 208 255 30 493
Island of Mauritius 2,688 3,104 366 6,158 1,330 1,555 180 3,065 1,358 1,549 186 3,093
Island of Rodrigues 93 128 18 239 38 64 4 106 55 64 14 133
Republic of Mauritius 2,781 3,232 384 6,397 1,368 1,619 184 3,171 1,413 1,613 200 3,226
Private2
1 -Port Louis / North 4,236 4,255 540 9,031 2,169 2,157 268 4,594 2,067 2,098 272 4,437
2 -B.Bassin-R.Hill / East 2,925 2,960 479 6,364 1,500 1,487 239 3,226 1,425 1,473 240 3,138
3 -Curepipe / South 2,460 2,475 293 5,228 1,245 1,260 171 2,676 1,215 1,215 122 2,552
4 -Q.Bornes / Vacoas-Phoenix / West 2,389 2,355 386 5,130 1,216 1,189 213 2,618 1,173 1,166 173 2,512
Island of Mauritius 12,010 12,045 1,698 25,753 6,130 6,093 891 13,114 5,880 5,952 807 12,639
Island of Rodrigues 617 714 37 1,368 309 349 17 675 308 365 20 693
Republic of Mauritius 12,627 12,759 1,735 27,121 6,439 6,442 908 13,789 6,188 6,317 827 13,332
1 ECCEA: Early Childhood Care and Education Authority (Ex Pre-School Trust Fund-PSTF)2 Private : Includes pupils from schools of Municipal/Village Council, NGO and Roman Catholic/Hindu Education Authority
Zone

Table 2.5 - Pre-primary enrolment and Gross Enrolment Ratio1 (4-5 yrs) by sex, 2003 - 2012
Year Enrolment Enrolment Enrolment
T M F T M F T M F T M F T M F T M F
2003 38,620 19,433 19,187 99 98 101 37,414 18,825 18,589 100 98 101 1,206 608 598 87 88 85
2004 37,483 19,120 18,363 96 96 96 36,124 18,429 17,695 96 96 97 1,359 691 668 90 91 90
2005 37,356 18,934 18,422 94 93 95 35,964 18,228 17,736 94 94 95 1,392 706 686 89 87 92
2006 37,129 18,730 18,399 95 94 95 35,786 18,041 17,745 95 94 96 1,343 689 654 85 83 88
2007 36,467 18,362 18,105 94 93 94 35,130 17,716 17,414 94 94 94 1,337 646 691 82 76 89
2008 36,242 18,263 17,979 94 93 95 34,835 17,558 17,277 95 94 95 1,407 705 702 84 84 83
2009 35,974 18,097 17,877 96 95 97 34,288 17,253 17,035 96 95 97 1,686 844 842 97 95 99
2010 35,139 17,991 17,148 96 96 96 33,562 17,210 16,352 96 97 96 1,577 781 796 91 87 96
2011 33,901 17,282 16,619 97 96 98 32,332 16,502 15,830 97 97 98 1,569 780 789 93 92 93
2012 33,518 16,960 16,558 101 100 101 31,911 16,179 15,732 101 100 101 1,607 781 826 97 95 100
1 Number of students enrolled per 100 population aged 4 - 5 T: Total M: Male F: Female
Republic of Mauritius Island of Mauritius Island of Rodrigues
Gross Enrolment RatioGross Enrolment Ratio Gross Enrolment Ratio
-28 -

94
100
96
9495
94 95
96
96 97
85
87
9089
85
97
91
93
90
95
100
105lm
ent R
atio
Fig. 4 - Gross Enrolment Ratio (4-5 yrs old) at Preprimary level, 2002 - 2011
Island of Mauritius
Island of Rodrigues
-29 -
8284
70
75
80
85
2002 2003 2004 2005 2006 2007 2008 2009 2010 2011
Enr
o
Year

- 30 -
Table 2.7- Distribution of pre-primary schools by zone and ownership of building, 2012
Ownership of building
1 - Port Louis / North 335 64 21 250
2 - B.Bassin-R.Hill / East 254 57 10 187
3 - Curepipe / South 221 40 10 171
4 - Q.Bornes / Vacoas-Phoenix / West 183 26 19 138
993 187 60 746
33 3 - 30
1,026 190 60 776
Table 2.8 - Distribution of pre-primary schools by zone and availability of equipment, 2012
Equipment available (number)
Radio/Radio cassette
1 - Port Louis / North 335 358 202 123 311
2 - B.Bassin-R.Hill / East 254 269 175 106 245
3 - Curepipe / South 221 262 148 75 147
4 - Q.Bornes / Vacoas-Phoenix / West 183 212 148 80 174
993 1,101 673 384 877
33 19 41 8 35
1,026 1,120 714 392 912
1 MVC : Municipal/Village Council2 Other : Includes Non-Governmental Organisation
Total
Island of Mauritius
Island of Rodrigues
Republic of Mauritius
Television set Computer
Video cassette player
No. of schoolsZone
Zone PrivatelyownedMVC1
Island of Mauritius
Island of Rodrigues
Republic of Mauritius
Government
- 31 -
Table 2.9 - Distribution of pre-primary schools by zone and use of building, 2012
Pre-Primary Partly School and only Residential Other Purposes
1 - Port Louis / North 335 248 36 51
2 - B.Bassin-R.Hill / East 254 176 35 43
3 - Curepipe / South 221 160 23 38
4 - Q.Bornes / Vacoas-Phoenix / West 183 109 38 36
993 693 132 168
33 30 - 3
1,026 723 132 171
Table 2.10 - Distribution of pre-primary schools by zone and type of services offered, 2012
Pre-Primary School/ Education only Creche
1 - Port Louis / North 335 292 36 7
2 - B.Bassin-R.Hill / East 254 211 41 2
3 - Curepipe / South 221 193 25 3
4 - Q.Bornes / Vacoas-Phoenix / West 183 138 43 2
993 834 145 14
33 33 - -
1,026 867 145 14
Zone
Island of Mauritius
Island of Rodrigues
Republic of Mauritius
OtherTotal
Type of services offered
Use of building
Island of Rodrigues
Island of Mauritius
Total
Republic of Mauritius
Zone

- 32-
Table 2.11 - Distribution of pre-primary schools by zone and availability of facilities, 2012
Facilities available
1 - Port Louis / North 335 812 335 316
2 - B.Bassin-R.Hill / East 254 626 254 238
3 - Curepipe / South 221 540 221 210
4 - Q.Bornes / Vacoas-Phoenix / West 183 511 183 175
993 2,489 993 939
33 75 33 32
1,026 2,564 1,026 971
Table 2.12 - Personnel in pre-primary schools by zone and occupational status, 2012.
PersonnelNon - teaching
Administrative Other Total
1 - Port Louis / North 1,175 800 64 311 375
2 - B.Bassin-R.Hill / East 883 638 45 200 245
3 - Curepipe / South 660 503 28 129 157
4 - Q.Bornes / Vacoas-Phoenix / West 770 528 50 192 242
3,488 2,469 187 832 1,019
80 72 - 8 8
3,568 2,541 187 840 1,027
Island of Rodrigues
Republic of Mauritius
ZoneTeaching
Island of Mauritius
Total
Island of Mauritius
Island of Rodrigues
Republic of Mauritius
PlaygroundZone No. of
schoolsNo. of
classrooms Library/Reading Corner

- 33 -
Table 2.13 - Non-teaching staff in pre-primary schools by zone and occupational status, 2012
Tot
al
Man
ager
/ D
irect
or
Cle
rk /
Sec
reta
ry
Hel
per
Mai
d /
Cle
aner
Gar
dern
er /
Lab
oure
r
Coo
k
Mes
seng
er
Not
stat
ed
1 - Port Louis / North 375 38 26 94 142 1 12 52 10
2 - B.Bassin-R.Hill / East 245 31 14 59 105 5 1 26 4
3 - Curepipe / South 157 24 4 53 63 1 1 9 2
4 - Q.Bornes / Vacoas-Phoenix / West 242 34 16 51 74 16 23 22 6
1,019 127 60 257 384 23 37 109 22
8 - - 6 1 1 - -
1,027 127 60 263 385 23 38 109 22
Totalunder
25 25-29 30-34 35-39 40-44 45-49 50-5455 & over
420 1 - 6 38 76 153 114 32
28 2 1 4 4 3 5 4 5
132 - 2 13 13 23 28 39 14
176 3 9 27 19 30 31 46 11
1,785 127 206 275 245 202 290 265 175
2,541 133 218 325 319 334 507 468 237
Zone
Occupational Status
Island of Mauritius
Island of Rodrigues
Republic of Mauritius
Table 2.14 - Teaching staff in pre-primary schools by administration and age group - Republic of Mauritius, 2012
Private Individual
Total
AdministrationAge (Years)
ECCEA
Roman Catholic
Municipal/District council
NGO

- 34-
Table 2.15 - Teaching staff in pre-primary schools by type of administration and level of qualification -
Republic of Mauritius, 2012
Municipal/V. Council
Academic
Below SC 604 32 7 11 554
Passed SC 1,676 334 19 104 1,219
Followed but not passed HSC 13 4 - 1 8
Passed HSC or Higher 248 50 2 16 180
Total 2,541 420 28 132 1,961
Professional
177 145 3 7 22
260 156 5 12 87
30 5 - 1 24
Pre-primary Teacher's Certificate (MIE) 608 93 6 58 451
597 16 3 42 536
Pre-primary Education in Service (PPU) 174 4 3 3 164
Certificate from : OMEP 3 201 - 2 5 194
Bethleem 209 - 2 - 207
Playgroup 20 - - - 20
Other 263 1 4 4 254
Not Stated 2 - - - 2
Total 2,541 420 28 132 1,961
1 Private : Includes Non Government Organisation (NGO)2 ECCD : Early Childhood Care and Development3 OMEP: Organisation Mondiale pour Education Pre-scolaire
Certificate of Proficiency in Early Childhood Education
Private1
Type of administration
Qualification ECCEA RC/ HA Total
Certificate of Proficiency in Management of ECCD2 (MCA)
Teacher's Diploma in Early Childhood Education (MIE)
Teacher's Advance Certificate in Early Childhood Education (MIE)


PRIMARY
EDUCATION


Table 3.1 - Primary Education1 - Number of schools, pupils, personnel and pupil/teacher ratio, 2008 - 2012
Pupils Personnel
Total number Head Teacher/ Teachersof schools2
Government Aided Non - Aided3 TotalDeputy HT General
PurposeOriental
Language School clerk Other
A - Republic of MauritiusMar-08 299 87,437 24,332 7,253 119,022 1,171 4,125 1,370 229 1,177 29Mar-09 302 85,797 24,115 8,010 117,922 1,221 4,080 1,374 225 1,190 29Mar-10 305 85,134 23,816 8,482 117,432 1,235 4,168 1,304 220 1,149 28Mar-11 305 83,502 23,524 9,042 116,068 1,239 4,357 1,344 237 1,147 27Mar-12 312 80,855 22,905 9,874 113,634 1,261 4,083 1,344 234 1,122 28
B - Island of MauritiusMar-08 286 84,569 22,185 7,253 114,007 1,134 3,929 1,370 216 1,052 29Mar-09 289 82,942 21,932 8,010 112,884 1,189 3,868 1,374 212 1,057 29Mar-10 291 82,130 21,697 8,482 112,309 1,197 3,957 1,304 206 1,025 28Mar-11 291 80,459 21,406 9,042 110,907 1,197 4,142 1,344 223 1,030 27Mar-12 297 77,774 20,871 9,874 108,519 1,216 3,866 1,337 217 992 28
C - Island of RodriguesMar-08 13 2,868 2,147 - 5,015 37 196 - 13 125 26Mar-09 13 2,855 2,183 - 5,038 32 212 - 13 133 24Mar-10 14 3,004 2,119 - 5,123 38 211 - 14 124 24Mar-11 14 3,043 2,118 - 5,161 42 215 - 14 117 24Mar-12 15 3,081 2,034 - 5,115 45 217 7 17 130 24
1 Excludes Agalega. 4 Total number of pupils over total number of General Purpose Teachers 2 Excludes schools which provide only a partial stream for primary education3 Includes pupils attending schools which provide a partial stream
Period
Pupil/ Teacher Ratio4
-37 -
- 38 -
Table 3.2. - Distribution of primary schools1 by zone and type of administration, 2012
Type of AdministrationPrivate
Aided Non - Aided
No. % No. % No. %
1 - Port Louis / North 96 72 75 11 11 13 14
2 - B.Bassin-R.Hill / East 79 58 73 17 22 4 5
3 - Curepipe / South 67 48 72 12 18 7 10
4 - Q.Bornes / Vacoas-Phoenix / West 55 35 64 8 15 12 22
Island of Mauritius 297 213 72 48 17 36 12
Island of Rodrigues 15 10 67 5 33 - -
Republic of Mauritius 312 223 71 53 17 36 12
1 Excludes schools with a partial stream
Table 3.3 - Distribution of primary schools¹ by zone and ownership of building, 2012
ZoneTotal Government Religious
organisationOther
Private
1 - Port Louis / North 96 72 12 12
2 - B.Bassin-R.Hill / East 79 58 17 4
3 - Curepipe / South 67 48 14 5
4 - Q.Bornes / Vacoas-Phoenix / West 55 35 9 11
Island of Mauritius 297 213 52 32
Island of Rodrigues 15 10 5 -
Republic of Mauritius 312 223 57 32
1 Excludes schools with a partial stream
Ownership of building
Zone Total Government
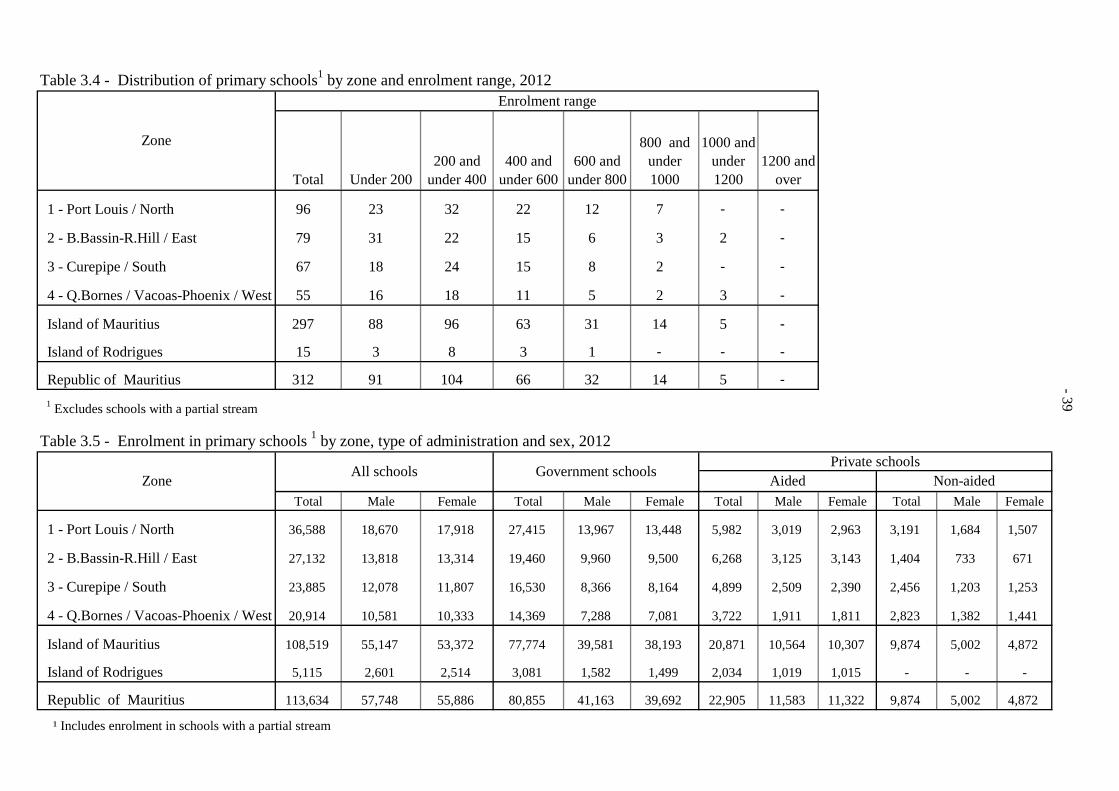
Table 3.4 - Distribution of primary schools1 by zone and enrolment range, 2012
Total Under 200200 and
under 400400 and
under 600600 and
under 800
800 and under 1000
1000 and under 1200
1200 and over
1 - Port Louis / North 96 23 32 22 12 7 - -
2 - B.Bassin-R.Hill / East 79 31 22 15 6 3 2 -
3 - Curepipe / South 67 18 24 15 8 2 - -
4 - Q.Bornes / Vacoas-Phoenix / West 55 16 18 11 5 2 3 -
Island of Mauritius 297 88 96 63 31 14 5 -
Island of Rodrigues 15 3 8 3 1 - - -
Republic of Mauritius 312 91 104 66 32 14 5 -
1 Excludes schools with a partial stream
Zone
Enrolment range
-39
Table 3.5 - Enrolment in primary schools 1 by zone, type of administration and sex, 2012
Total Male Female Total Male Female Total Male Female Total Male Female
1 - Port Louis / North 36,588 18,670 17,918 27,415 13,967 13,448 5,982 3,019 2,963 3,191 1,684 1,507
2 - B.Bassin-R.Hill / East 27,132 13,818 13,314 19,460 9,960 9,500 6,268 3,125 3,143 1,404 733 671
3 - Curepipe / South 23,885 12,078 11,807 16,530 8,366 8,164 4,899 2,509 2,390 2,456 1,203 1,253
4 - Q.Bornes / Vacoas-Phoenix / West 20,914 10,581 10,333 14,369 7,288 7,081 3,722 1,911 1,811 2,823 1,382 1,441
Island of Mauritius 108,519 55,147 53,372 77,774 39,581 38,193 20,871 10,564 10,307 9,874 5,002 4,872
Island of Rodrigues 5,115 2,601 2,514 3,081 1,582 1,499 2,034 1,019 1,015 - - -
Republic of Mauritius 113,634 57,748 55,886 80,855 41,163 39,692 22,905 11,583 11,322 9,874 5,002 4,872
¹ Includes enrolment in schools with a partial stream
Zone All schools Government schoolsPrivate schools
Aided Non-aided

- 40 -
Table 3.6 - Enrolment in primary schools1 by type of administration, sex, zone and grade, 2012
All schoolsGrade
I II III IV V VI
VI (repeaters
only)
Total
1 - Port Louis / North 5,454 5,685 6,032 5,920 6,091 5,868 1,538 36,588
2 - B.Bassin-R.Hill / East 3,972 4,278 4,422 4,428 4,519 4,565 948 27,132
3 - Curepipe / South 3,501 3,932 3,815 3,930 4,055 3,912 740 23,885
4 - Q.Bornes / Vacoas-Phoenix / West 3,252 3,389 3,373 3,403 3,466 3,315 716 20,914
Island of Mauritius 16,179 17,284 17,642 17,681 18,131 17,660 3,942 108,519
Island of Rodrigues 788 822 898 782 801 799 225 5,115
Republic of Mauritius 16,967 18,106 18,540 18,463 18,932 18,459 4,167 113,634
Male
1 - Port Louis / North 2,799 2,880 3,067 3,066 3,053 2,920 885 18,670
2 - B.Bassin-R.Hill / East 2,096 2,132 2,265 2,216 2,264 2,270 575 13,818
3 - Curepipe / South 1,780 2,014 1,874 2,003 2,009 1,957 441 12,078
4 - Q.Bornes / Vacoas-Phoenix / West 1,619 1,710 1,669 1,686 1,764 1,702 431 10,581
Island of Mauritius 8,294 8,736 8,875 8,971 9,090 8,849 2,332 55,147
Island of Rodrigues 389 422 445 403 405 398 139 2,601
Republic of Mauritius 8,683 9,158 9,320 9,374 9,495 9,247 2,471 57,748
Female
1 - Port Louis / North 2,655 2,805 2,965 2,854 3,038 2,948 653 17,918
2 - B.Bassin-R.Hill / East 1,876 2,146 2,157 2,212 2,255 2,295 373 13,314
3 - Curepipe / South 1,721 1,918 1,941 1,927 2,046 1,955 299 11,807
4 - Q.Bornes / Vacoas-Phoenix / West 1,633 1,679 1,704 1,717 1,702 1,613 285 10,333
Island of Mauritius 7,885 8,548 8,767 8,710 9,041 8,811 1,610 53,372
Island of Rodrigues 399 400 453 379 396 401 86 2,514
Republic of Mauritius 8,284 8,948 9,220 9,089 9,437 9,212 1,696 55,886
1 Includes pupils attending schools with a partial stream
All Grades
Zone

- 41 -Table 3.6 - Enrolment in primary schools1 by type of administration, sex, zone and grade, 2012(cont'd)
Government schoolsGrade
I II III IV V VI
VI (repeaters
only)
Total
1 - Port Louis / North 3,934 4,171 4,538 4,435 4,632 4,468 1,237 27,415
2 - B.Bassin-R.Hill / East 2,808 3,027 3,151 3,226 3,258 3,302 688 19,460
3 - Curepipe / South 2,364 2,703 2,591 2,701 2,840 2,788 543 16,530
4 - Q.Bornes / Vacoas-Phoenix / West 2,070 2,231 2,297 2,331 2,439 2,393 608 14,369
Island of Mauritius 11,176 12,132 12,577 12,693 13,169 12,951 3,076 77,774
Island of Rodrigues 468 502 548 475 462 470 156 3,081
Republic of Mauritius 11,644 12,634 13,125 13,168 13,631 13,421 3,232 80,855
Male
1 - Port Louis / North 1,984 2,127 2,293 2,289 2,312 2,250 712 13,967
2 - B.Bassin-R.Hill / East 1,493 1,516 1,628 1,624 1,633 1,650 416 9,960
3 - Curepipe / South 1,227 1,377 1,258 1,381 1,400 1,409 314 8,366
4 - Q.Bornes / Vacoas-Phoenix / West 1,022 1,118 1,160 1,152 1,245 1,222 369 7,288
Island of Mauritius 5,726 6,138 6,339 6,446 6,590 6,531 1,811 39,581
Island of Rodrigues 236 262 275 249 237 226 97 1,582
Republic of Mauritius 5,962 6,400 6,614 6,695 6,827 6,757 1,908 41,163
Female
1 - Port Louis / North 1,950 2,044 2,245 2,146 2,320 2,218 525 13,448
2 - B.Bassin-R.Hill / East 1,315 1,511 1,523 1,602 1,625 1,652 272 9,500
3 - Curepipe / South 1,137 1,326 1,333 1,320 1,440 1,379 229 8,164
4 - Q.Bornes / Vacoas-Phoenix / West 1,048 1,113 1,137 1,179 1,194 1,171 239 7,081
Island of Mauritius 5,450 5,994 6,238 6,247 6,579 6,420 1,265 38,193
Island of Rodrigues 232 240 273 226 225 244 59 1,499
Republic of Mauritius 5,682 6,234 6,511 6,473 6,804 6,664 1,324 39,692
1 Includes pupils attending schools with a partial stream
All Grades
Zone
- 42 -Table 3.6 - Enrolment in primary schools1 by type of administration, sex, zone and grade, 2012 (cont'd)
Private schoolsGrade
I II III IV V VI
VI (repeaters
only)
Total
1 - Port Louis / North 1,520 1,514 1,494 1,485 1,459 1,400 301 9,173
2 - B.Bassin-R.Hill / East 1,164 1,251 1,271 1,202 1,261 1,263 260 7,672
3 - Curepipe / South 1,137 1,229 1,224 1,229 1,215 1,124 197 7,355
4 - Q.Bornes / Vacoas-Phoenix / West 1,182 1,158 1,076 1,072 1,027 922 108 6,545
Island of Mauritius 5,003 5,152 5,065 4,988 4,962 4,709 866 30,745
Island of Rodrigues 320 320 350 307 339 329 69 2,034
Republic of Mauritius 5,323 5,472 5,415 5,295 5,301 5,038 935 32,779
Male
1 - Port Louis / North 815 753 774 777 741 670 173 4,703
2 - B.Bassin-R.Hill / East 603 616 637 592 631 620 159 3,858
3 - Curepipe / South 553 637 616 622 609 548 127 3,712
4 - Q.Bornes / Vacoas-Phoenix / West 597 592 509 534 519 480 62 3,293
Island of Mauritius 2,568 2,598 2,536 2,525 2,500 2,318 521 15,566
Island of Rodrigues 153 160 170 154 168 172 42 1,019
Republic of Mauritius 2,721 2,758 2,706 2,679 2,668 2,490 563 16,585
Female
1 - Port Louis / North 705 761 720 708 718 730 128 4,470
2 - B.Bassin-R.Hill / East 561 635 634 610 630 643 101 3,814
3 - Curepipe / South 584 592 608 607 606 576 70 3,643
4 - Q.Bornes / Vacoas-Phoenix / West 585 566 567 538 508 442 46 3,252
Island of Mauritius 2,435 2,554 2,529 2,463 2,462 2,391 345 15,179
Island of Rodrigues 167 160 180 153 171 157 27 1,015
Republic of Mauritius 2,602 2,714 2,709 2,616 2,633 2,548 372 16,194
1 Includes pupils attending schools with a partial stream
All Grades
Zone

- 43 -Table 3.7 - Enrolment in primary schools1 by grade and sex, 2010 - 2012
Total Male Female Total Male Female Total Male Female
Republic of Mauritius
I 18,430 9,228 9,202 18,112 9,147 8,965 16,967 8,683 8,284
II 18,482 9,388 9,094 18,465 9,273 9,192 18,106 9,158 8,948
III 19,087 9,605 9,482 18,562 9,401 9,161 18,540 9,320 9,220
IV 18,812 9,462 9,350 19,029 9,602 9,427 18,463 9,374 9,089
V 19,257 9,763 9,494 18,700 9,378 9,322 18,932 9,495 9,437
VI 19,273 9,776 9,497 19,094 9,685 9,409 18,459 9,247 9,212
VI Repeaters 4,091 2,450 1,641 4,106 2,449 1,657 4,167 2,471 1,696
Total 117,432 59,672 57,760 116,068 58,935 57,133 113,634 57,748 55,886
Island of Mauritius
I 17,533 8,789 8,744 17,287 8,709 8,578 16,179 8,294 7,885
II 17,684 8,981 8,703 17,572 8,830 8,742 17,284 8,736 8,548
201220112010Grade
III 18,261 9,193 9,068 17,772 8,987 8,785 17,642 8,875 8,767
IV 18,021 9,069 8,952 18,215 9,174 9,041 17,681 8,971 8,710
V 18,449 9,347 9,102 17,904 8,986 8,918 18,131 9,090 9,041
VI 18,487 9,380 9,107 18,283 9,277 9,006 17,660 8,849 8,811
VI Repeaters 3,874 2,309 1,565 3,874 2,300 1,574 3,942 2,332 1,610
Total 112,309 57,068 55,241 110,907 56,263 54,644 108,519 55,147 53,372
Island of Rodrigues
I 897 439 458 825 438 387 788 389 399
II 798 407 391 893 443 450 822 422 400
III 826 412 414 790 414 376 898 445 453
IV 791 393 398 814 428 386 782 403 379
V 808 416 392 796 392 404 801 405 396
VI 786 396 390 811 408 403 799 398 401
VI Repeaters 217 141 76 232 149 83 225 139 86
Total 5,123 2,604 2,519 5,161 2,672 2,489 5,115 2,601 2,514
1 Includes pupils attending schools with a partial stream
- 44 -
Table 3.8 - Enrolment in primary schools¹ by type of administration, grade and sex, 2010 - 2012 Republic of Mauritius
2010 2011 2012
Total Male Female Total Male Female Total Male Female
All schools
I 18,430 9,228 9,202 18,112 9,147 8,965 16,967 8,683 8,284
II 18,482 9,388 9,094 18,465 9,273 9,192 18,106 9,158 8,948
III 19,087 9,605 9,482 18,562 9,401 9,161 18,540 9,320 9,220
IV 18,812 9,462 9,350 19,029 9,602 9,427 18,463 9,374 9,089
V 19,257 9,763 9,494 18,700 9,378 9,322 18,932 9,495 9,437
VI 19,273 9,776 9,497 19,094 9,685 9,409 18,459 9,247 9,212
VI Repeaters 4,091 2,450 1,641 4,106 2,449 1,657 4,167 2,471 1,696
Total 117,432 59,672 57,760 116,068 58,935 57,133 113,634 57,748 55,886
Government schools
I 13,202 6,630 6,572 12,697 6,470 6,227 11,644 5,962 5,682
II 13,297 6,747 6,550 13,138 6,613 6,525 12,634 6,400 6,234
Grade
III 13,841 6,940 6,901 13,242 6,722 6,520 13,125 6,614 6,511
IV 13,609 6,895 6,714 13,756 6,939 6,817 13,168 6,695 6,473
V 13,976 7,093 6,883 13,547 6,844 6,703 13,631 6,827 6,804
VI 14,136 7,178 6,958 13,961 7,095 6,866 13,421 6,757 6,664
VI Repeaters 3,073 1,831 1,242 3,161 1,892 1,269 3,232 1,908 1,324
Total 85,134 43,314 41,820 83,502 42,575 40,927 80,855 41,163 39,692
Private schools
I 5,228 2,598 2,630 5,415 2,677 2,738 5,323 2,721 2,602
II 5,185 2,641 2,544 5,327 2,660 2,667 5,472 2,758 2,714
III 5,246 2,665 2,581 5,320 2,679 2,641 5,415 2,706 2,709
IV 5,203 2,567 2,636 5,273 2,663 2,610 5,295 2,679 2,616
V 5,281 2,670 2,611 5,153 2,534 2,619 5,301 2,668 2,633
VI 5,137 2,598 2,539 5,133 2,590 2,543 5,038 2,490 2,548
VI Repeaters 1,018 619 399 945 557 388 935 563 372
Total 32,298 16,358 15,940 32,566 16,360 16,206 32,779 16,585 16,194
1 Includes pupils attending schools with a partial stream
- 45 -Table 3.9 - Enrolment in primary schools1 by sex, age and grade, 2012
Republic of MauritiusAge Grade
(in years)I II III IV V VI
VI (repeaters
only)Total
Total
5 11,893 - - - - - - 11,893
6 4,980 12,378 - - - - - 17,358
7 94 5,531 12,809 - - - - 18,434
8 - 197 5,511 12,623 - - - 18,331
9 - - 220 5,602 12,963 - - 18,785
10 - - - 238 5,783 12,510 - 18,531
11 - - - - 186 5,719 2,836 8,741
12 - - - - - 230 1,331 1,561
Total 16,967 18,106 18,540 18,463 18,932 18,459 4,167 113,634
Male
5 6,090 - - - - - - 6,090
6 2,539 6,280 - - - - - 8,819 , , ,
7 54 2,783 6,402 - - - - 9,239
8 - 95 2,793 6,385 - - - 9,273
9 - - 125 2,851 6,500 - - 9,476
10 - - - 138 2,894 6,239 - 9,271
11 - - - - 101 2,872 1,713 4,686
12 - - - - - 136 758 894
Total 8,683 9,158 9,320 9,374 9,495 9,247 2,471 57,748
Female
5 5,803 - - - - - - 5,803
6 2,441 6,098 - - - - - 8,539
7 40 2,748 6,407 - - - - 9,195
8 - 102 2,718 6,238 - - - 9,058
9 - - 95 2,751 6,463 - - 9,309
10 - - - 100 2,889 6,271 - 9,260
11 - - - - 85 2,847 1,123 4,055
12 - - - - - 94 573 667
Total 8,284 8,948 9,220 9,089 9,437 9,212 1,696 55,886 1 1 Includes pupils attending schools with a partial stream

- 46 -
Table 3.10 - Enrolment in primary schools1 by sex, age and grade, 2012Island of Mauritius
Age Grade (in years)
I II III IV V VIVI
(repeaters only)
Total
Total
5 11,362 - - - - - - 11,362
6 4,724 11,828 - - - - - 16,552
7 93 5,259 12,202 - - - - 17,554
8 - 197 5,220 12,110 - - - 17,527
9 - - 220 5,334 12,397 - - 17,951
10 - - - 237 5,548 11,974 - 17,759
11 - - - - 186 5,456 2,727 8,369
12 - - - - - 230 1,215 1,445
Total 16,179 17,284 17,642 17,681 18,131 17,660 3,942 108,519
Male
5 5,833 - - - - - - 5,833
6 2,408 5,987 - - - - - 8,395
7 53 2,654 6,103 - - - - 8,810
8 - 95 2,647 6,117 - - - 8,859
9 - - 125 2,716 6,218 - - 9,059
10 - - - 138 2,771 5,969 - 8,878
11 - - - - 101 2,744 1,644 4,489
12 - - - - - 136 688 824
Total 8,294 8,736 8,875 8,971 9,090 8,849 2,332 55,147
Female
5 5,529 - - - - - - 5,529
6 2,316 5,841 - - - - - 8,157
7 40 2,605 6,099 - - - - 8,744
8 - 102 2,573 5,993 - - - 8,668
9 - - 95 2,618 6,179 - - 8,892
10 - - - 99 2,777 6,005 - 8,881
11 - - - - 85 2,712 1,083 3,880
12 - - - - - 94 527 621
Total 7,885 8,548 8,767 8,710 9,041 8,811 1,610 53,372
1 Includes pupils attending schools with a partial stream

- 47 -
Table 3.11 - Enrolment in primary schools by sex, age and grade, 2012Island of Rodrigues
Age Grade (in years)
I II III IV V VIVI
(repeaters only)
Total
Total
5 531 - - - - - - 531
6 256 550 - - - - - 806
7 1 272 607 - - - - 880
8 - - 291 513 - - - 804
9 - - - 268 566 - - 834
10 - - - 1 235 536 - 772
11 - - - - - 263 109 372
12 - - - - - - 116 116
Total 788 822 898 782 801 799 225 5,115
Male
5 257 - - - - - - 257
6 131 293 - - - - - 424
7 1 129 299 - - - - 429
8 - - 146 268 - - - 414
9 - - - 135 282 - - 417
10 - - - - 123 270 - 393
11 - - - - - 128 69 197
12 - - - - - - 70 70
Total 389 422 445 403 405 398 139 2,601
Female
5 274 - - - - - - 274
6 125 257 - - - - - 382
7 - 143 308 - - - - 451
8 - - 145 245 - - - 390
9 - - - 133 284 - - 417
10 - - - 1 112 266 - 379
11 - - - - - 135 40 175
12 - - - - - - 46 46
Total 399 400 453 379 396 401 86 2,514

Table 3.12 - Number and percentage of pupils studying Oriental language in primary schools by type of administration, language studied and grade, 2012
Island of Mauritius
Grade I II III IV V VI (including repeaters) Total
All schoolsTotal number of pupils Oriental language Number % Number % Number % Number % Number % Number % Number % Hindi 6,648 41.1 7,675 44.4 7,616 43.2 7,382 41.8 7,366 40.6 8,096 37.5 44,783 41.3 Urdu 1,458 9.0 1,656 9.6 1,811 10.3 1,821 10.3 1,834 10.1 2,046 9.5 10,626 9.8 Tamil 857 5.3 1,012 5.9 1,062 6.0 1,008 5.7 941 5.2 1,068 4.9 5,948 5.5 Telugu 275 1.7 290 1.7 317 1.8 341 1.9 336 1.9 352 1.6 1,911 1.8 Marathi 199 1.2 214 1.2 237 1.3 247 1.4 264 1.5 252 1.2 1,413 1.3 Arabic 1,155 7.1 1,168 6.8 1,180 6.7 1,222 6.9 1,156 6.4 1,284 5.9 7,165 6.6 Modern Chinese 494 3.1 636 3.7 546 3.1 413 2.3 267 1.5 217 1.0 2,573 2.4 All Oriental languages 11,086 68.5 12,651 73.2 12,769 72.4 12,434 70.3 12,164 67.1 13,315 61.6 74,419 68.6 GovernmentTotal number of pupils Oriental language Number % Number % Number % Number % Number % Number % Number %
11,176 16,02712,693
16,179 17,284 17,642 17,681
12,132 12,577
108,519
77,774
18,131
13,169
21,602
-48g g Hindi 5,485 49.1 6,321 52.1 6,383 50.8 6,323 49.8 6,463 49.1 7,209 45.0 38,184 49.1 Urdu 1,244 11.1 1,398 11.5 1,547 12.3 1,558 12.3 1,578 12.0 1,804 11.3 9,129 11.7 Tamil 674 6.0 813 6.7 830 6.6 806 6.3 767 5.8 901 5.6 4,791 6.2 Telugu 259 2.3 277 2.3 295 2.3 316 2.5 317 2.4 339 2.1 1,803 2.3 Marathi 163 1.5 174 1.4 183 1.5 207 1.6 212 1.6 205 1.3 1,144 1.5 Arabic 815 7.3 808 6.7 824 6.6 813 6.4 795 6.0 939 5.9 4,994 6.4 Modern Chinese 129 1.2 171 1.4 157 1.2 123 1.0 95 0.7 93 0.6 768 1.0 All Oriental languages 8,769 78.5 9,962 82.1 10,219 81.3 10,146 79.9 10,227 77.7 11,490 71.7 60,813 78.2 PrivateTotal number of pupils Oriental language Number % Number % Number % Number % Number % Number % Number % Hindi 1,163 23.2 1,354 26.3 1,233 24.3 1,059 21.2 903 18.2 887 15.9 6,599 21.5 Urdu 214 4.3 258 5.0 264 5.2 263 5.3 256 5.2 242 4.3 1,497 4.9 Tamil 183 3.7 199 3.9 232 4.6 202 4.0 174 3.5 167 3.0 1,157 3.8 Telugu 16 0.3 13 0.3 22 0.4 25 0.5 19 0.4 13 0.2 108 0.4 Marathi 36 0.7 40 0.8 54 1.1 40 0.8 52 1.0 47 0.8 269 0.9 Arabic 340 6.8 360 7.0 356 7.0 409 8.2 361 7.3 345 6.2 2,171 7.1 Modern Chinese 365 7.3 465 9.0 389 7.7 290 5.8 172 3.5 124 2.2 1,805 5.9 All Oriental languages 2,317 46.3 2,689 52.2 2,550 50.3 2,288 45.9 1,937 39.0 1,825 32.7 13,606 44.3
5,152 5,5755,003 5,065 30,7454,9624,988
8 -
- 49 - Table 3.13 - Number of pupils by Oriental language studied, grade and zone, 2012
I II III IV V VI 1 Total I II III IV V VI 1 Total
1 - Port Louis / North 2,137 2,514 2,482 2,412 2,362 2,652 14,559 504 593 749 721 741 806 4,114
- B.Bassin-R.Hill / East 1,858 2,130 2,126 2,106 2,093 2,332 12,645 439 461 498 490 499 566 2,953
3 - Curepipe / South 1,399 1,654 1,594 1,543 1,619 1,777 9,586 195 274 256 263 281 307 1,576
- Q.Bornes / Vacoas- Phoenix / West 1,254 1,377 1,414 1,321 1,292 1,335 7,993 320 328 308 347 313 367 1,983
Island of Mauritius 6,648 7,675 7,616 7,382 7,366 8,096 44,783 1,458 1,656 1,811 1,821 1,834 2,046 10,626
1 - Port Louis / North 265 303 340 314 268 292 1,782 76 65 99 82 88 81 491
- B.Bassin-R.Hill / East 232 305 308 289 253 348 1,735 68 65 64 73 74 88 432
3 - Curepipe / South 177 203 198 230 226 256 1,290 89 123 106 127 114 116 675
- Q.Bornes / Vacoas-
Phoenix / West 183 201 216 175 194 172 1,141 42 37 48 59 60 67 313
Island of Mauritius 857 1,012 1,062 1,008 941 1,068 5,948 275 290 317 341 336 352 1,911
1 - Port Louis / North 4 3 2 2 1 2 14 584 553 601 563 556 681 3,538
- B.Bassin-R.Hill / East 53 52 40 44 41 54 284 79 70 69 77 78 79 452
3 - Curepipe / South 51 68 73 72 81 72 417 368 410 386 441 382 388 2,375
- Q.Bornes / Vacoas-
Phoenix / West 91 91 122 129 141 124 698 124 135 124 141 140 136 800
Island of Mauritius 199 214 237 247 264 252 1,413 1,155 1,168 1,180 1,222 1,156 1,284 7,165
1 - Port Louis / North 154 185 196 153 111 98 897 3,724 4,216 4,469 4,247 4,127 4,612 25,395
- B.Bassin-R.Hill / East 187 221 153 106 88 47 802 2,916 3,304 3,258 3,185 3,126 3,514 19,303
3 - Curepipe / South 49 65 56 43 17 16 246 2,328 2,797 2,669 2,719 2,720 2,932 16,165
- Q.Bornes / Vacoas- Phoenix / West 104 165 141 111 51 56 628 2,118 2,334 2,373 2,283 2,191 2,257 13,556
Island of Mauritius 494 636 546 413 267 217 2,573 11,086 12,651 12,769 12,434 12,164 13,315 74,419
1 Includes repeaters
4
Marathi
Modern Chinese
2
4
4
2
All Languages
Arabic
4
2
2
Grade Grade
Urdu
Zone
Hindi
TeluguTamil

Table 3.14 - Primary enrolment and Gross Enrolment Ratio1 by sex, 2003 - 2012
Year Enrolment Enrolment Enrolment
T M F T M F T M F T M F T M F T M F
2003 129,616 65,624 63,992 102 103 102 124,933 63,320 61,613 102 102 102 4,683 2,304 2,379 109 110 109
2004 126,226 64,019 62,207 102 103 101 121,526 61,666 59,860 102 102 101 4,700 2,353 2,347 112 114 110
2005 123,562 62,729 60,833 102 103 102 118,737 60,335 58,402 102 102 102 4,825 2,394 2,431 114 115 114
2006 121,387 61,687 59,700 102 102 101 116,513 59,229 57,284 101 101 101 4,874 2,458 2,416 114 116 112
2007 119,310 60,641 58,669 101 101 101 114,404 58,137 56,267 100 100 100 4,906 2,504 2,402 114 115 112
2008 119,022 60,693 58,329 101 101 101 114,007 58,128 55,879 101 101 100 5,015 2,565 2,450 114 114 114
2009 117,922 59,948 57,974 101 100 101 112,884 57,369 55,515 100 100 100 5,038 2,579 2,459 110 110 111
2010 117,432 59,672 57,760 101 100 101 112,309 57,068 55,241 100 100 101 5,123 2,604 2,519 108 107 109
2011 116,068 58,935 57,133 100 100 100 110,907 56,263 54,644 100 100 100 5,161 2,672 2,489 105 105 105
2012 113,634 57,748 55,886 99 99 100 108,519 55,147 53,372 99 99 99 5,115 2,601 2,514 103 101 105
1 Number of students enrolled per 100 population aged 6 - 11 T : Total M : Male F : Female
Republic of Mauritius Island of Mauritius Island of Rodrigues
Gross Enrolment Ratio Gross Enrolment Ratio Gross Enrolment Ratio
-50 -

Fig. 3 - Primary School Population, 2003 - 2012
#
5,100
5,200130,000 Island of Rodrigues
#
5,000
,
120,000
125,000
4,800
4,900
115,000
ber
of p
upils
-51 -
4,600
4,700110,000N
umb
Island of Mauritius
4 400
4,500
100 000
105,000
4,400100,0002003 2004 2005 2006 2007 2008 2009 2010 2011 2012
Year
# Refer to Island of Rodrigues only

109
112
114 114 114 114
110
108
105
103105
110
115
120lm
ent R
atio
Fig. 4 - Gross Enrolment Ratio at Primary level, 2003 - 2012
Island of Rodrigues
-52 -
102 102 102101
100101
100 100 10099
90
95
100
2003 2004 2005 2006 2007 2008 2009 2010 2011 2012
Enr
o
Year
Island of Mauritius

Table 3.15 - Distribution of primary schools1 by zone, type of administration and availability of library and canteen, 2012
1 - Port Louis / North
2 - B.Bassin-R.Hill / East
3 - Curepipe / South
4 - Q.Bornes / Vacoas-Phoenix /West
Island of Mauritius
Island of Rodrigues
Republic of Mauritius 1 Excludes schools with a partial stream
Table 3.16 - Distribution of rooms in primary schools1 by zone, type of administration and use, 2012
Zone
Private schoolsGovernment schools
3 61
All schools Government schools Private schools
Canteen18 14 16 10 58
5 89
Library/ Reading room
19 16 12 17 64 3
67
Total no. of schools
24 21 19 20 84
3 143
Canteen41 35 21 27
124 8
132
Library/ Reading room
45 36 34 25
140
150
Total no. of schools
72 58 48 35
213 10
223 6
297
210
Canteen59 35 21 27
142 8
Library/ Reading room
64 52 46 42
204
79 67 55
Total no. of schools
96
All schools
15 312
-53 -
Tot
al n
o. o
f roo
ms
Cla
ssro
om
Off
ice/
Staf
f roo
m
Com
pute
r roo
m /
IT
corn
er
Oth
er p
urpo
se2
Unu
tilis
ed
Tot
al n
o. o
f roo
ms
Cla
ssro
om
Off
ice/
Staf
f roo
m
Com
pute
r roo
m /
IT
corn
er
Oth
er p
urpo
se2
Unu
tilis
ed
Tot
al n
o. o
f roo
ms
Cla
ssro
om
Off
ice/
Staf
f roo
m
Com
pute
r roo
m /
IT
corn
er
Oth
er p
urpo
se2
Unu
tilis
ed
1 - Port Louis / North 2,151 1,485 220 109 295 42 1,631 1,135 157 81 220 38 520 350 63 28 75 4
2 - B.Bassin-R.Hill / East 1,656 1,137 173 87 239 20 1,169 822 109 63 161 14 487 315 64 24 78 6
3 - Curepipe / South 1,508 1,042 146 76 214 30 1,041 733 84 52 148 24 467 309 62 24 66 6
4 - Q.Bornes / Vacoas-Phoenix /West 1,300 874 131 60 214 21 847 591 70 34 135 17 453 283 61 26 79 4
Island of Mauritius 6,615 4,538 670 332 962 113 4,688 3,281 420 230 664 93 1,927 1,257 250 102 298 20
Island of Rodrigues 325 215 30 17 55 8 201 130 20 12 32 7 124 85 10 5 23 1
Republic of Mauritius 6,940 4,753 700 349 1,017 121 4,889 3,411 440 242 696 100 2,051 1,342 260 107 321 21
1 Excludes schools with a partial stream 2 Library, audio-visual room, science room, store and other
Private schoolsUse of rooms
Government schools Use of rooms
Zone
All schools Use of rooms
-

Table 3.17 - Distribution of primary schools by type of administration, zone and availability of certain equipment, 2012 All schools
Radio/Radio cassette Television set Video player
Overhead projector
Photocopying machine Fax machine Computer* Printer*
Total
1 - Port Louis / North 96 294 207 117 110 64 94 1,718 236
2 - B.Bassin-R.Hill / East 79 190 164 94 84 56 78 1,354 187
3 - Curepipe / South 67 181 135 84 87 57 63 1,206 150
4 - Q.Bornes / Vacoas-Phoenix / West 55 162 114 62 63 59 53 995 150
Island of Mauritius 297 827 620 357 344 236 288 5,273 723
Island of Rodrigues 15 30 30 18 15 12 15 234 46
312 857 650 375 359 248 303 5,507 769
1 - Port Louis / North 72 180 161 86 89 38 72 1,329 168
2 - B.Bassin-R.Hill / East 58 115 122 63 62 31 57 991 122
Total no. of schools
Number of equipment availableZone
Republic of Mauritius
Government
-54
3 - Curepipe / South 48 102 97 53 64 31 44 880 104
4 - Q.Bornes / Vacoas-Phoenix / West 35 105 75 37 45 37 34 665 89
Island of Mauritius 213 502 455 239 260 137 207 3,865 483
Island of Rodrigues 10 16 21 14 8 9 10 162 33
223 518 476 253 268 146 217 4,027 516
1 - Port Louis / North 24 114 46 31 21 26 22 389 68
2 - B.Bassin-R.Hill / East 21 75 42 31 22 25 21 363 65
3 - Curepipe / South 19 79 38 31 23 26 19 326 46
4 - Q.Bornes / Vacoas-Phoenix / West 20 57 39 25 18 22 19 330 61
Island of Mauritius 84 325 165 118 84 99 81 1,408 240
Island of Rodrigues 5 14 9 4 7 3 5 72 13
89 339 174 122 91 102 86 1,480 253
* Includes those used for Pedagogical, Administrative and both purposes
Republic of Mauritius
Republic of Mauritius
Private
-
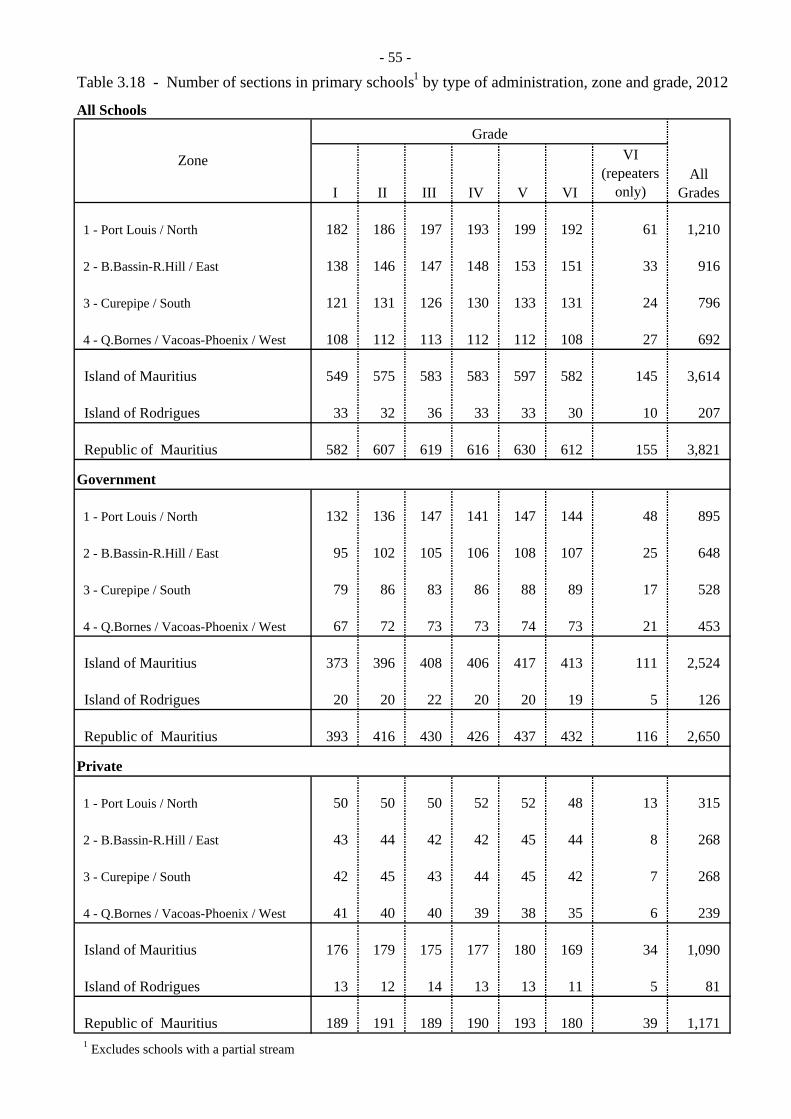
- 55 -
Table 3.18 - Number of sections in primary schools1 by type of administration, zone and grade, 2012
All Schools
I II III IV V VI
VI (repeaters
only)
1 - Port Louis / North 182 186 197 193 199 192 61 1,210
2 - B.Bassin-R.Hill / East 138 146 147 148 153 151 33 916
3 - Curepipe / South 121 131 126 130 133 131 24 796
4 - Q.Bornes / Vacoas-Phoenix / West 108 112 113 112 112 108 27 692
Island of Mauritius 549 575 583 583 597 582 145 3,614
Island of Rodrigues 33 32 36 33 33 30 10 207
Republic of Mauritius 582 607 619 616 630 612 155 3,821
Government
1 - Port Louis / North 132 136 147 141 147 144 48 895
2 - B.Bassin-R.Hill / East 95 102 105 106 108 107 25 648
3 - Curepipe / South 79 86 83 86 88 89 17 528
4 - Q.Bornes / Vacoas-Phoenix / West 67 72 73 73 74 73 21 453
Island of Mauritius 373 396 408 406 417 413 111 2,524
Island of Rodrigues 20 20 22 20 20 19 5 126
Republic of Mauritius 393 416 430 426 437 432 116 2,650
Private
1 - Port Louis / North 50 50 50 52 52 48 13 315
2 - B.Bassin-R.Hill / East 43 44 42 42 45 44 8 268
3 - Curepipe / South 42 45 43 44 45 42 7 268
4 - Q.Bornes / Vacoas-Phoenix / West 41 40 40 39 38 35 6 239
Island of Mauritius 176 179 175 177 180 169 34 1,090
Island of Rodrigues 13 12 14 13 13 11 5 81
Republic of Mauritius 189 191 189 190 193 180 39 1,171
1 Excludes schools with a partial stream
Zone
Grade
All Grades

Table 3.19 - Personnel in primary schools by type of administration, sex, zone and occupational status, 2012All schools
Tot
al
Hin
di
Urd
u
Tam
il
Tel
ugu
Mar
athi
Ara
bic
Mod
ern
Chi
nese
Kre
ol M
oris
ien
1 - Port Louis / North 100 272 1,307 474 208 113 67 22 1 37 12 14 64 166 109 31 2,523 2 - B.Bassin-R.Hill / East 77 230 994 360 175 83 45 17 13 10 11 6 58 117 96 42 1,974
3 - Curepipe / South 63 236 811 284 107 43 40 25 19 40 3 7 46 121 73 35 1,669
4 - Q.Bornes / Vacoas-Phoenix / West 56 182 754 219 87 52 28 13 19 13 6 1 49 105 52 45 1,462 Island of Mauritius 296 920 3,866 1,337 577 291 180 77 52 100 32 28 217 509 330 153 7,628 Island of Rodrigues 15 30 217 7 - - - - - - - 7 17 55 45 30 416 Republic of Mauritius 311 950 4,083 1,344 577 291 180 77 52 100 32 35 234 564 375 183 8,044
1 - Port Louis / North 52 138 382 132 61 33 15 9 - 13 - 1 24 125 84 16 953 2 - B.Bassin-R.Hill / East 31 93 270 83 45 26 3 3 2 3 1 - 22 95 70 22 686
3 - Curepipe / South 32 117 238 82 19 22 11 10 5 12 - 3 15 85 59 12 640
4 - Q.Bornes / Vacoas-Phoenix / West 20 79 187 44 14 14 4 2 3 7 - - 7 67 40 21 465 Island of Mauritius 135 427 1,077 341 139 95 33 24 10 35 1 4 68 372 253 71 2,744 Island of Rodrigues 10 17 88 5 - - - - - - - 5 5 37 26 29 217 Republic of Mauritius 145 444 1,165 346 139 95 33 24 10 35 1 9 73 409 279 100 2,961
1 - Port Louis / North 48 134 925 342 147 80 52 13 1 24 12 13 40 41 25 15 1,570
2 - B.Bassin-R.Hill / East 46 137 724 277 130 57 42 14 11 7 10 6 36 22 26 20 1,288
3 - Curepipe / South 31 119 573 202 88 21 29 15 14 28 3 4 31 36 14 23 1,029
4 - Q.Bornes / Vacoas-Phoenix / West 36 103 567 175 73 38 24 11 16 6 6 1 42 38 12 24 997 Island of Mauritius 161 493 2,789 996 438 196 147 53 42 65 31 24 149 137 77 82 4,884 Island of Rodrigues 5 13 129 2 - - - - - - - 2 12 18 19 1 199 Republic of Mauritius 166 506 2,918 998 438 196 147 53 42 65 31 26 161 155 96 83 5,083
*Includes physical education instructors and Information & Communication Technology (ICT) teachers
Oth
er
Tot
al
Zone
Hea
d Te
ache
r
Dep
uty
Hea
d Te
ache
r
Tea
cher
- G
ener
al
Purp
ose*
Total
Male
Female
Sch
ool c
lerk
Car
etak
er
Lab
oure
r
Teacher - Oriental language
-56 -
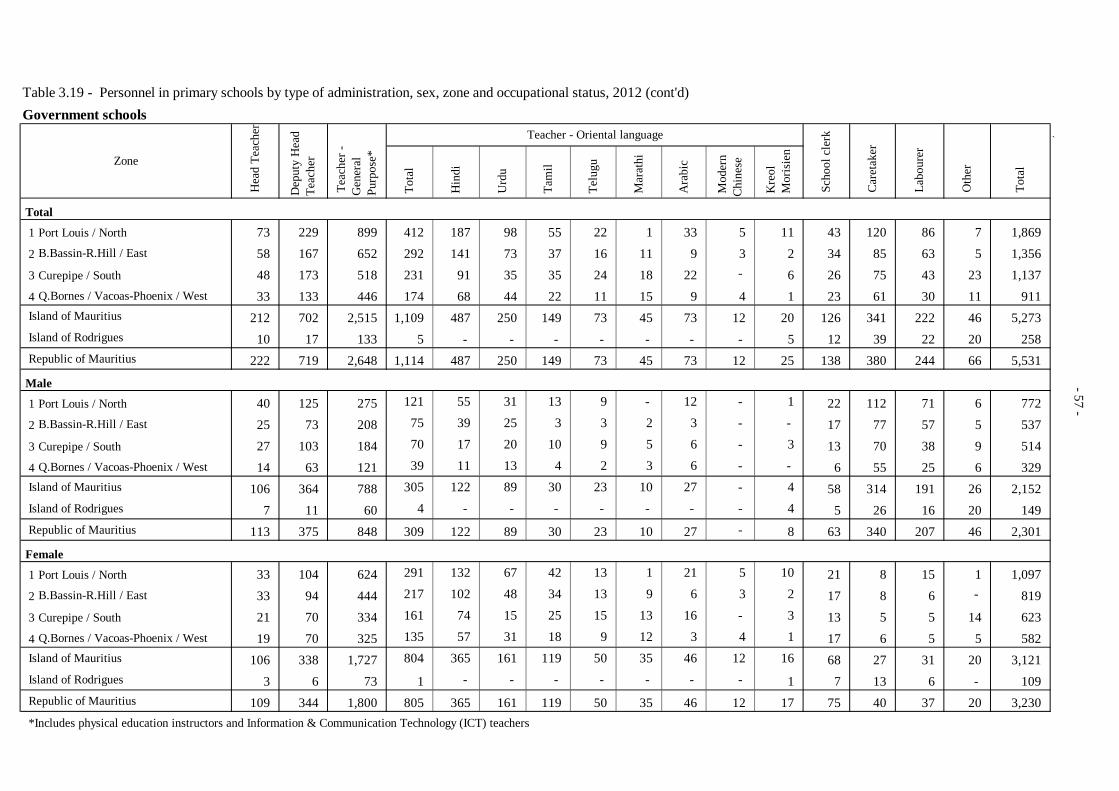
Table 3.19 - Personnel in primary schools by type of administration, sex, zone and occupational status, 2012 (cont'd) Government schools
`
Tot
al
Hin
di
Urd
u
Tam
il
Tel
ugu
Mar
athi
Ara
bic
Mod
ern
Chi
nese
Kre
ol M
oris
ien
1 Port Louis / North 73 229 899 412 187 98 55 22 1 33 5 11 43 120 86 7 1,869 2 B.Bassin-R.Hill / East 58 167 652 292 141 73 37 16 11 9 3 2 34 85 63 5 1,356 3 Curepipe / South 48 173 518 231 91 35 35 24 18 22 - 6 26 75 43 23 1,137 4 Q.Bornes / Vacoas-Phoenix / West 33 133 446 174 68 44 22 11 15 9 4 1 23 61 30 11 911 Island of Mauritius 212 702 2,515 1,109 487 250 149 73 45 73 12 20 126 341 222 46 5,273 Island of Rodrigues 10 17 133 5 - - - - - - - 5 12 39 22 20 258 Republic of Mauritius 222 719 2,648 1,114 487 250 149 73 45 73 12 25 138 380 244 66 5,531
1 Port Louis / North 40 125 275 121 55 31 13 9 - 12 - 1 22 112 71 6 772 2 B.Bassin-R.Hill / East 25 73 208 75 39 25 3 3 2 3 - - 17 77 57 5 537 3 Curepipe / South 27 103 184 70 17 20 10 9 5 6 - 3 13 70 38 9 514 4 Q.Bornes / Vacoas-Phoenix / West 14 63 121 39 11 13 4 2 3 6 - - 6 55 25 6 329 Island of Mauritius 106 364 788 305 122 89 30 23 10 27 - 4 58 314 191 26 2,152 Island of Rodrigues 7 11 60 4 - - - - - - - 4 5 26 16 20 149 Republic of Mauritius 113 375 848 309 122 89 30 23 10 27 - 8 63 340 207 46 2,301
1 Port Louis / North 33 104 624 291 132 67 42 13 1 21 5 10 21 8 15 1 1,097 2 B.Bassin-R.Hill / East 33 94 444 217 102 48 34 13 9 6 3 2 17 8 6 - 819 3 Curepipe / South 21 70 334 161 74 15 25 15 13 16 - 3 13 5 5 14 623 4 Q.Bornes / Vacoas-Phoenix / West 19 70 325 135 57 31 18 9 12 3 4 1 17 6 5 5 582 Island of Mauritius 106 338 1,727 804 365 161 119 50 35 46 12 16 68 27 31 20 3,121 Island of Rodrigues 3 6 73 1 - - - - - - - 1 7 13 6 - 109 Republic of Mauritius 109 344 1,800 805 365 161 119 50 35 46 12 17 75 40 37 20 3,230 *Includes physical education instructors and Information & Communication Technology (ICT) teachers
Tot
al
Hea
d Te
ache
r
Dep
uty
Hea
d Te
ache
r
Tea
cher
- G
ener
al
Purp
ose*
Sch
ool c
lerk
Car
etak
er
Teacher - Oriental language
Zone
Total
Male
Female
Lab
oure
r
Oth
er
-57 -
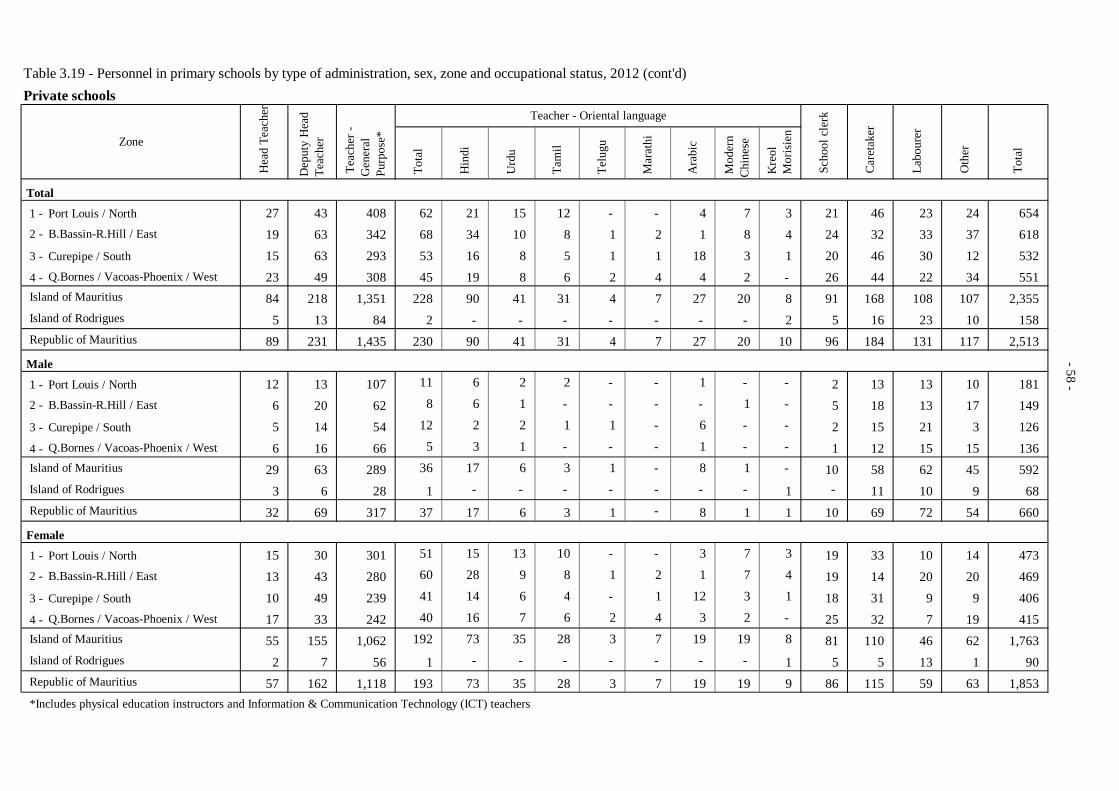
Table 3.19 - Personnel in primary schools by type of administration, sex, zone and occupational status, 2012 (cont'd) Private schools
Tot
al
Hin
di
Urd
u
Tam
il
Tel
ugu
Mar
athi
Ara
bic
Mod
ern
Chi
nese
Kre
ol M
oris
ien
1 - Port Louis / North 27 43 408 62 21 15 12 - - 4 7 3 21 46 23 24 654 2 - B.Bassin-R.Hill / East 19 63 342 68 34 10 8 1 2 1 8 4 24 32 33 37 618 3 - Curepipe / South 15 63 293 53 16 8 5 1 1 18 3 1 20 46 30 12 532 4 - Q.Bornes / Vacoas-Phoenix / West 23 49 308 45 19 8 6 2 4 4 2 - 26 44 22 34 551 Island of Mauritius 84 218 1,351 228 90 41 31 4 7 27 20 8 91 168 108 107 2,355 Island of Rodrigues 5 13 84 2 - - - - - - - 2 5 16 23 10 158 Republic of Mauritius 89 231 1,435 230 90 41 31 4 7 27 20 10 96 184 131 117 2,513
1 - Port Louis / North 12 13 107 11 6 2 2 - - 1 - - 2 13 13 10 181 2 - B.Bassin-R.Hill / East 6 20 62 8 6 1 - - - - 1 - 5 18 13 17 149 3 - Curepipe / South 5 14 54 12 2 2 1 1 - 6 - - 2 15 21 3 126 4 - Q.Bornes / Vacoas-Phoenix / West 6 16 66 5 3 1 - - - 1 - - 1 12 15 15 136 Island of Mauritius 29 63 289 36 17 6 3 1 - 8 1 - 10 58 62 45 592 Island of Rodrigues 3 6 28 1 - - - - - - - 1 - 11 10 9 68 Republic of Mauritius 32 69 317 37 17 6 3 1 - 8 1 1 10 69 72 54 660
1 - Port Louis / North 15 30 301 51 15 13 10 - - 3 7 3 19 33 10 14 473 0
2 - B.Bassin-R.Hill / East 13 43 280 60 28 9 8 1 2 1 7 4 19 14 20 20 469 0
3 - Curepipe / South 10 49 239 41 14 6 4 - 1 12 3 1 18 31 9 9 406 0
4 - Q.Bornes / Vacoas-Phoenix / West 17 33 242 40 16 7 6 2 4 3 2 - 25 32 7 19 415 0 Island of Mauritius 55 155 1,062 192 73 35 28 3 7 19 19 8 81 110 46 62 1,763 0 Island of Rodrigues 2 7 56 1 - - - - - - - 1 5 5 13 1 90 0 Republic of Mauritius 57 162 1,118 193 73 35 28 3 7 19 19 9 86 115 59 63 1,853 0 *Includes physical education instructors and Information & Communication Technology (ICT) teachers
Tot
al
Hea
d Te
ache
r
Dep
uty
Hea
d Te
ache
r
Tea
cher
- G
ener
al
Purp
ose*
Teacher - Oriental language
Sch
ool c
lerk
Car
etak
er
Zone
Total
Male
Female
Lab
oure
r
Oth
er
-58 -
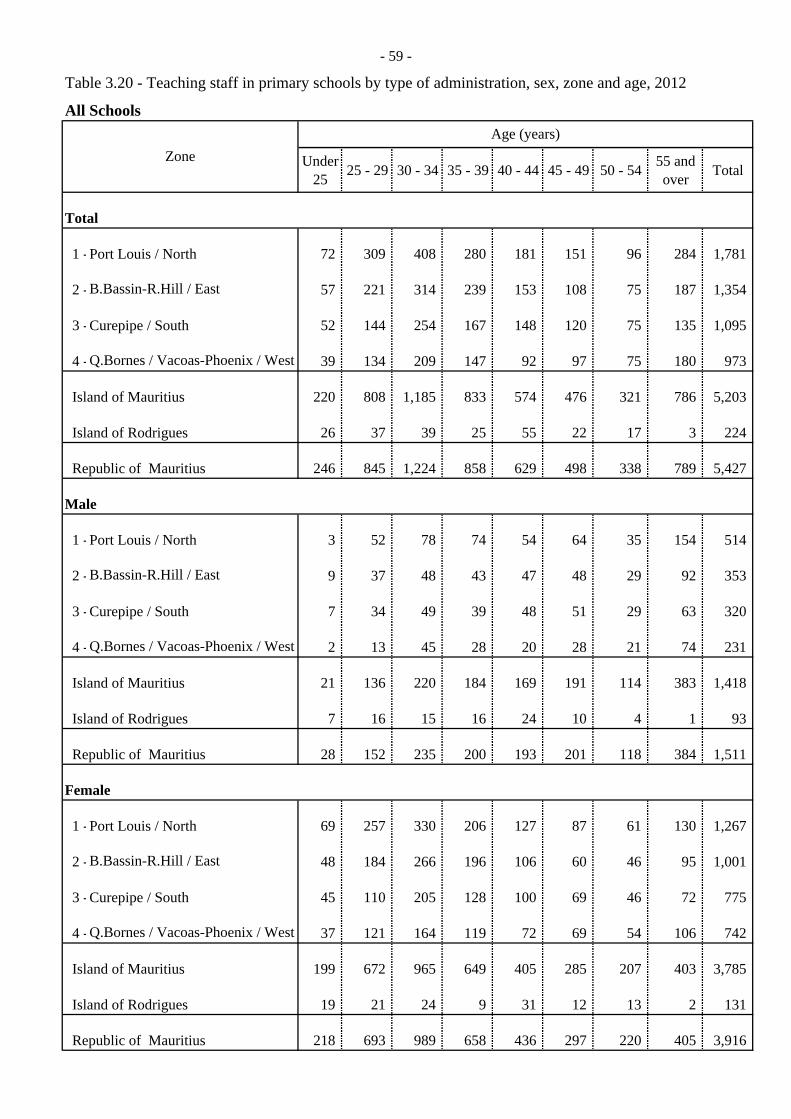
- 59 -
Table 3.20 - Teaching staff in primary schools by type of administration, sex, zone and age, 2012
All Schools
Under 25 25 - 29 30 - 34 35 - 39 40 - 44 45 - 49 50 - 54 55 and
over Total
1 -Port Louis / North 72 309 408 280 181 151 96 284 1,781
2 -B.Bassin-R.Hill / East 57 221 314 239 153 108 75 187 1,354
3 -Curepipe / South 52 144 254 167 148 120 75 135 1,095
4 -Q.Bornes / Vacoas-Phoenix / West 39 134 209 147 92 97 75 180 973
Island of Mauritius 220 808 1,185 833 574 476 321 786 5,203
Island of Rodrigues 26 37 39 25 55 22 17 3 224
Republic of Mauritius 246 845 1,224 858 629 498 338 789 5,427
1 -Port Louis / North 3 52 78 74 54 64 35 154 514
2 -B.Bassin-R.Hill / East 9 37 48 43 47 48 29 92 353
3 -Curepipe / South 7 34 49 39 48 51 29 63 320
4 -Q.Bornes / Vacoas-Phoenix / West 2 13 45 28 20 28 21 74 231
Island of Mauritius 21 136 220 184 169 191 114 383 1,418
Island of Rodrigues 7 16 15 16 24 10 4 1 93
Republic of Mauritius 28 152 235 200 193 201 118 384 1,511
1 -Port Louis / North 69 257 330 206 127 87 61 130 1,267
2 -B.Bassin-R.Hill / East 48 184 266 196 106 60 46 95 1,001
3 -Curepipe / South 45 110 205 128 100 69 46 72 775
4 -Q.Bornes / Vacoas-Phoenix / West 37 121 164 119 72 69 54 106 742
Island of Mauritius 199 672 965 649 405 285 207 403 3,785
Island of Rodrigues 19 21 24 9 31 12 13 2 131
Republic of Mauritius 218 693 989 658 436 297 220 405 3,916
Female
Zone
Total
Age (years)
Male
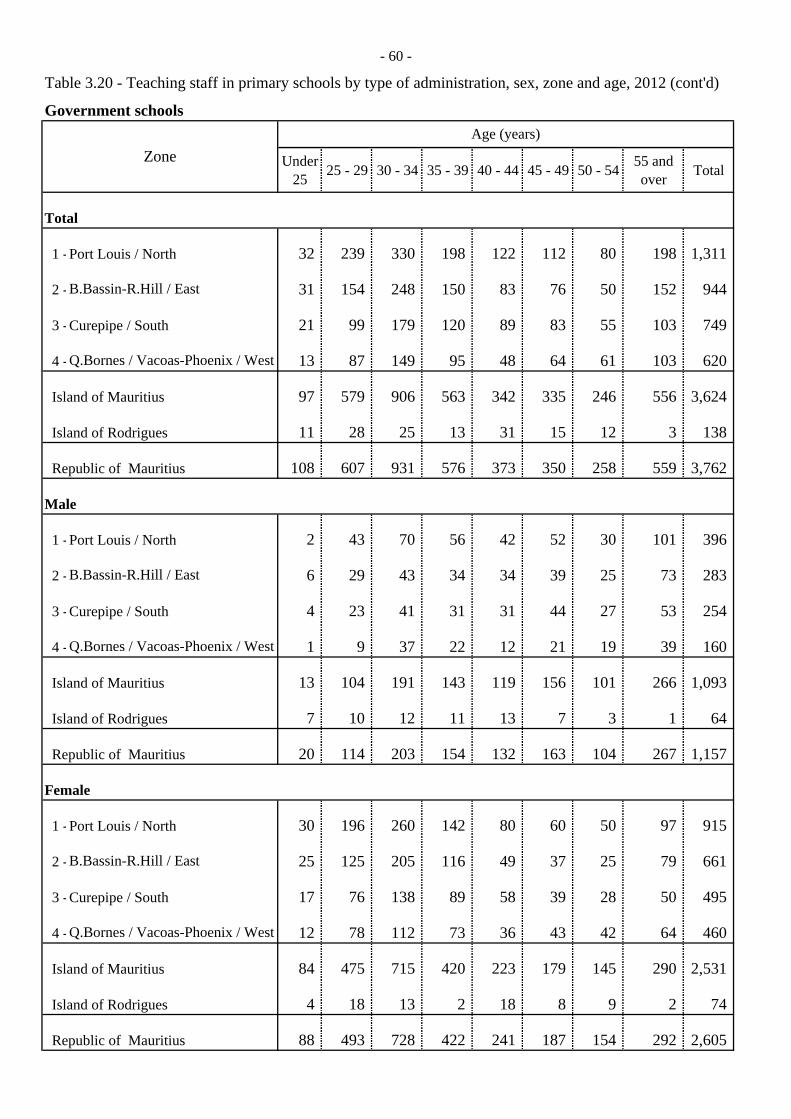
- 60 -
Table 3.20 - Teaching staff in primary schools by type of administration, sex, zone and age, 2012 (cont'd)
Government schools
Under 25 25 - 29 30 - 34 35 - 39 40 - 44 45 - 49 50 - 54 55 and
over Total
1 -Port Louis / North 32 239 330 198 122 112 80 198 1,311
2 -B.Bassin-R.Hill / East 31 154 248 150 83 76 50 152 944
3 -Curepipe / South 21 99 179 120 89 83 55 103 749
4 -Q.Bornes / Vacoas-Phoenix / West 13 87 149 95 48 64 61 103 620
Island of Mauritius 97 579 906 563 342 335 246 556 3,624
Island of Rodrigues 11 28 25 13 31 15 12 3 138
Republic of Mauritius 108 607 931 576 373 350 258 559 3,762
1 -Port Louis / North 2 43 70 56 42 52 30 101 396
2 -B.Bassin-R.Hill / East 6 29 43 34 34 39 25 73 283
3 -Curepipe / South 4 23 41 31 31 44 27 53 254
4 -Q.Bornes / Vacoas-Phoenix / West 1 9 37 22 12 21 19 39 160
Island of Mauritius 13 104 191 143 119 156 101 266 1,093
Island of Rodrigues 7 10 12 11 13 7 3 1 64
Republic of Mauritius 20 114 203 154 132 163 104 267 1,157
1 -Port Louis / North 30 196 260 142 80 60 50 97 915
2 -B.Bassin-R.Hill / East 25 125 205 116 49 37 25 79 661
3 -Curepipe / South 17 76 138 89 58 39 28 50 495
4 -Q.Bornes / Vacoas-Phoenix / West 12 78 112 73 36 43 42 64 460
Island of Mauritius 84 475 715 420 223 179 145 290 2,531
Island of Rodrigues 4 18 13 2 18 8 9 2 74
Republic of Mauritius 88 493 728 422 241 187 154 292 2,605
Age (years)
Male
Female
Zone
Total

- 61 -
Table 3.20 - Teaching staff in primary schools by type of administration, sex, zone and age, 2012(cont'd)
Private schools
Under 25 25 - 29 30 - 34 35 - 39 40 - 44 45 - 49 50 - 54 55 and
over Total
1 - Port Louis / North 40 70 78 82 59 39 16 86 470
2 - B.Bassin-R.Hill / East 26 67 66 89 70 32 25 35 410
3 - Curepipe / South 31 45 75 47 59 37 20 32 346
4 - Q.Bornes / Vacoas-Phoenix / West 26 47 60 52 44 33 14 77 353
Island of Mauritius 123 229 279 270 232 141 75 230 1,579
Island of Rodrigues 15 9 14 12 24 7 5 - 86
Republic of Mauritius 138 238 293 282 256 148 80 230 1,665
1 - Port Louis / North 1 9 8 18 12 12 5 53 118
2 - B.Bassin-R.Hill / East 3 8 5 9 13 9 4 19 70
3 - Curepipe / South 3 11 8 8 17 7 2 10 66
4 - Q.Bornes / Vacoas-Phoenix / West 1 4 8 6 8 7 2 35 71
Island of Mauritius 8 32 29 41 50 35 13 117 325
Island of Rodrigues - 6 3 5 11 3 1 - 29
Republic of Mauritius 8 38 32 46 61 38 14 117 354
1 - Port Louis / North 39 61 70 64 47 27 11 33 352
2 - B.Bassin-R.Hill / East 23 59 61 80 57 23 21 16 340
3 - Curepipe / South 28 34 67 39 42 30 18 22 280
4 - Q.Bornes / Vacoas-Phoenix / West 25 43 52 46 36 26 12 42 282
Island of Mauritius 115 197 250 229 182 106 62 113 1,254
Island of Rodrigues 15 3 11 7 13 4 4 - 57
Republic of Mauritius 130 200 261 236 195 110 66 113 1,311
Age (years)
Male
Female
Zone
Total
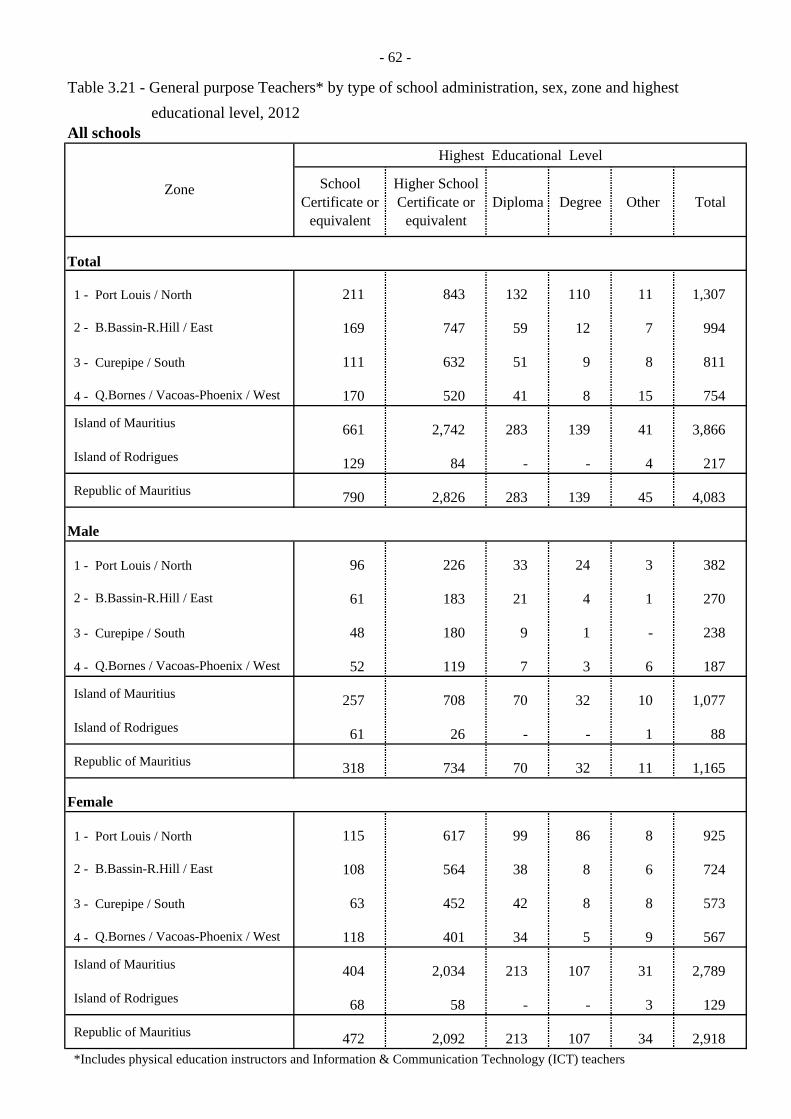
- 62 -
Table 3.21 - General purpose Teachers* by type of school administration, sex, zone and highest educational level, 2012All schools
Highest Educational Level
School Certificate or
equivalent
Higher School Certificate or
equivalentDiploma Degree Other Total
1 - Port Louis / North 211 843 132 110 11 1,307
2 - B.Bassin-R.Hill / East 169 747 59 12 7 994
3 - Curepipe / South 111 632 51 9 8 811
4 - Q.Bornes / Vacoas-Phoenix / West 170 520 41 8 15 754
Island of Mauritius 661 2,742 283 139 41 3,866
Island of Rodrigues 129 84 - - 4 217
Republic of Mauritius 790 2,826 283 139 45 4,083
1 - Port Louis / North 96 226 33 24 3 382
2 - B.Bassin-R.Hill / East 61 183 21 4 1 270
3 - Curepipe / South 48 180 9 1 - 238
4 - Q.Bornes / Vacoas-Phoenix / West 52 119 7 3 6 187
Island of Mauritius 257 708 70 32 10 1,077
Island of Rodrigues 61 26 - - 1 88
Republic of Mauritius 318 734 70 32 11 1,165
1 - Port Louis / North 115 617 99 86 8 925
2 - B.Bassin-R.Hill / East 108 564 38 8 6 724
3 - Curepipe / South 63 452 42 8 8 573
4 - Q.Bornes / Vacoas-Phoenix / West 118 401 34 5 9 567
Island of Mauritius 404 2,034 213 107 31 2,789
Island of Rodrigues 68 58 - - 3 129
Republic of Mauritius 472 2,092 213 107 34 2,918 *Includes physical education instructors and Information & Communication Technology (ICT) teachers
Total
Male
Zone
Female
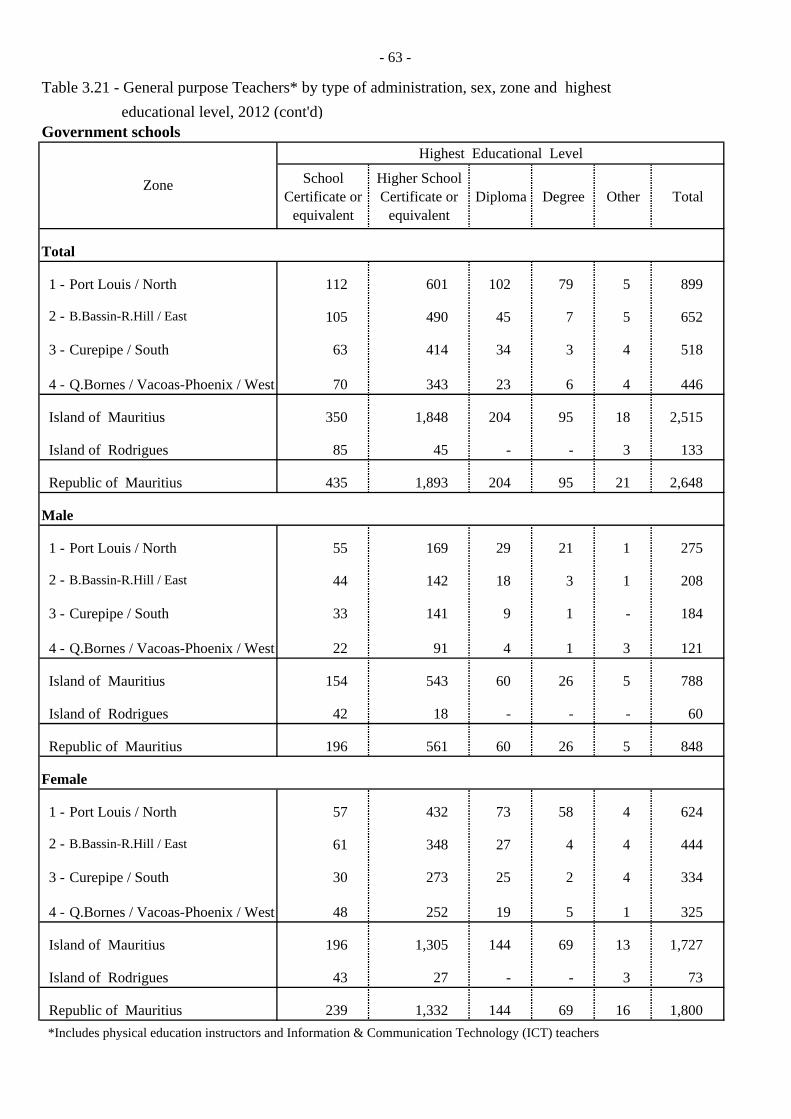
- 63 -
Table 3.21 - General purpose Teachers* by type of administration, sex, zone and highest educational level, 2012 (cont'd)Government schools
Highest Educational Level
School Certificate or
equivalent
Higher School Certificate or
equivalentDiploma Degree Other Total
1 - Port Louis / North 112 601 102 79 5 899
2 - B.Bassin-R.Hill / East 105 490 45 7 5 652
3 - Curepipe / South 63 414 34 3 4 518
4 - Q.Bornes / Vacoas-Phoenix / West 70 343 23 6 4 446
350 1,848 204 95 18 2,515
85 45 - - 3 133
435 1,893 204 95 21 2,648
1 - Port Louis / North 55 169 29 21 1 275
2 - B.Bassin-R.Hill / East 44 142 18 3 1 208
3 - Curepipe / South 33 141 9 1 - 184
4 - Q.Bornes / Vacoas-Phoenix / West 22 91 4 1 3 121
154 543 60 26 5 788
42 18 - - - 60
196 561 60 26 5 848
1 - Port Louis / North 57 432 73 58 4 624
2 - B.Bassin-R.Hill / East 61 348 27 4 4 444
3 - Curepipe / South 30 273 25 2 4 334
4 - Q.Bornes / Vacoas-Phoenix / West 48 252 19 5 1 325
196 1,305 144 69 13 1,727
43 27 - - 3 73
239 1,332 144 69 16 1,800 *Includes physical education instructors and Information & Communication Technology (ICT) teachers
Island of Rodrigues
Island of Mauritius
Island of Mauritius
Island of Mauritius
Republic of Mauritius
Total
Male
Island of Rodrigues
Zone
Female
Republic of Mauritius
Republic of Mauritius
Island of Rodrigues

- 64 -
Table 3.21 - General purpose Teachers* by type of school administration, sex, zone and highest educational level, 2012 (cont'd)Private schools
Highest Educational Level
School Certificate or
equivalent
Higher School Certificate or
equivalentDiploma Degree Other Total
1 - Port Louis / North 99 242 30 31 6 408
2 - B.Bassin-R.Hill / East 64 257 14 5 2 342
3 - Curepipe / South 48 218 17 6 4 293
4 - Q.Bornes / Vacoas-Phoenix / West 100 177 18 2 11 308
311 894 79 44 23 1,351
44 39 - - 1 84
355 933 79 44 24 1,435
1 - Port Louis / North 41 57 4 3 2 107
2 - B.Bassin-R.Hill / East 17 41 3 1 - 62
3 - Curepipe / South 15 39 - - - 54
4 - Q.Bornes / Vacoas-Phoenix / West 30 28 3 2 3 66
103 165 10 6 5 289
19 8 - - 1 28
122 173 10 6 6 317
1 - Port Louis / North 58 185 26 28 4 301
2 - B.Bassin-R.Hill / East 47 216 11 4 2 280
3 - Curepipe / South 33 179 17 6 4 239
4 - Q.Bornes / Vacoas-Phoenix / West 70 149 15 - 8 242
208 729 69 38 18 1,062
25 31 - - - 56
233 760 69 38 18 1,118 *Includes physical education instructors and Information & Communication Technology (ICT) teachers
Island of Rodrigues
Island of Mauritius
Island of Mauritius
Island of Mauritius
Republic of Mauritius
Total
Male
Island of Rodrigues
Zone
Female
Republic of Mauritius
Republic of Mauritius
Island of Rodrigues

- 65 -Table 3.22 - Teaching staff in primary schools by length of teaching experience, type of school administration and sex, 2012
All Schools Government Schools Private Schools
Total Male Female Total Male Female Total Male Female
Republic of Mauritius Under 3 982 190 792 558 104 454 424 86 338 3 and under 6 744 148 596 495 104 391 249 44 205 6 " " 9 891 190 701 673 157 516 218 33 185 9 " " 12 522 123 399 385 98 287 137 25 112 12 " " 15 375 114 261 249 90 159 126 24 102 15 " " 18 471 130 341 253 79 174 218 51 167 18 " " 21 302 114 188 199 87 112 103 27 76 21 " " 24 324 136 188 250 112 138 74 24 50 24 " " 27 172 70 102 150 64 86 22 6 16 27 " " 30 41 20 21 35 19 16 6 1 5 30 and over 603 276 327 515 243 272 88 33 55
Total 5,427 1,511 3,916 3,762 1,157 2,605 1,665 354 1,311 Island of Mauritius Under 3 945 178 767 540 95 445 405 83 322 3 and under 6 729 142 587 482 99 383 247 43 204 6 " " 9 858 177 681 654 147 507 204 30 174
Length of teaching experience
(Years)
9 " " 12 502 114 388 370 91 279 132 23 109 12 " " 15 360 107 253 239 84 155 121 23 98 15 " " 18 445 111 334 241 71 170 204 40 164 18 " " 21 284 110 174 188 85 103 96 25 71 21 " " 24 291 124 167 232 104 128 59 20 39 24 " " 27 152 61 91 132 57 75 20 4 16 27 " " 30 40 19 21 34 18 16 6 1 5 30 and over 597 275 322 512 242 270 85 33 52
Total 5,203 1,418 3,785 3,624 1,093 2,531 1,579 325 1,254 Island of Rodrigues Under 3 37 12 25 18 9 9 19 3 16 3 and under 6 15 6 9 13 5 8 2 1 1 6 " " 9 33 13 20 19 10 9 14 3 11 9 " " 12 20 9 11 15 7 8 5 2 3 12 " " 15 15 7 8 10 6 4 5 1 4 15 " " 18 26 19 7 12 8 4 14 11 3 18 " " 21 18 4 14 11 2 9 7 2 5 21 " " 24 33 12 21 18 8 10 15 4 11 24 " " 27 20 9 11 18 7 11 2 2 - 27 " " 30 1 1 - 1 1 - - - - 30 and over 6 1 5 3 1 2 3 - 3
Total 224 93 131 138 64 74 86 29 57
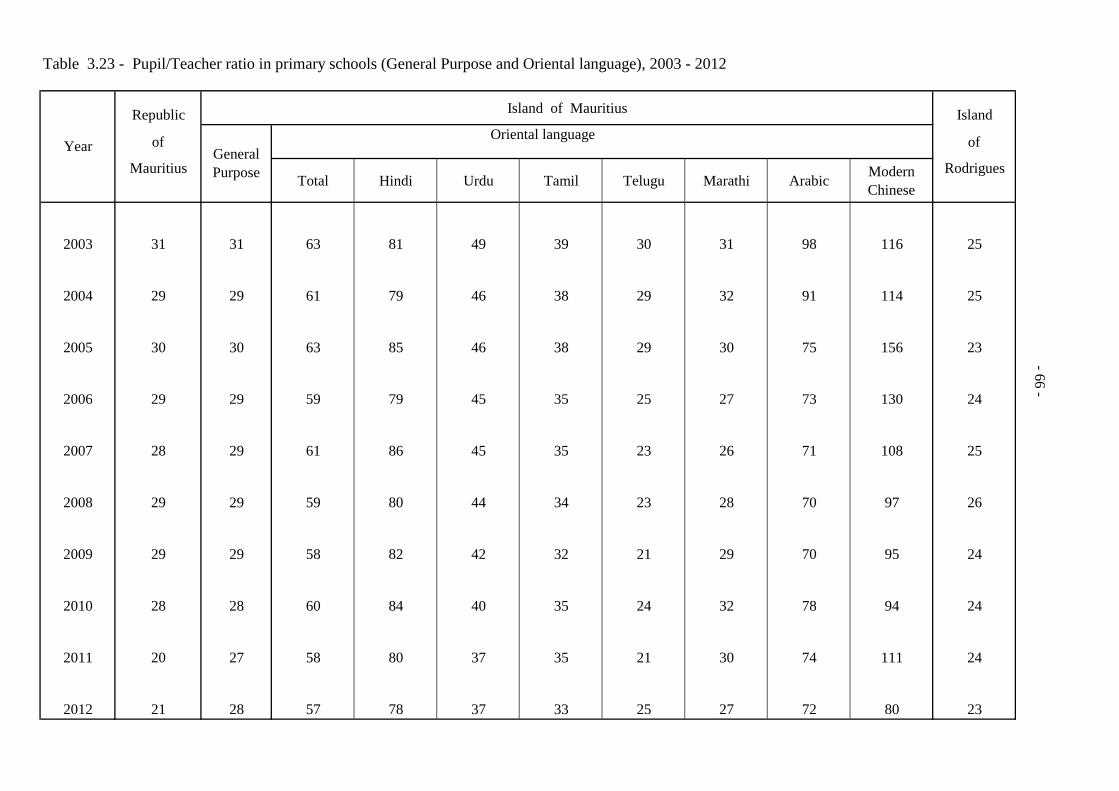
Table 3.23 - Pupil/Teacher ratio in primary schools (General Purpose and Oriental language), 2003 - 2012
Republic Island of Mauritius Island
of of
MauritiusTotal Hindi Urdu Tamil Telugu Marathi Arabic Modern
ChineseRodrigues
2003 31 31 63 81 49 39 30 31 98 116 25
2004 29 29 61 79 46 38 29 32 91 114 25
2005 30 30 63 85 46 38 29 30 75 156 23
2006 29 29 59 79 45 35 25 27 73 130 24
Year General Purpose
Oriental language
-66 -
2006 29 29 59 79 45 35 25 27 73 130 24
2007 28 29 61 86 45 35 23 26 71 108 25
2008 29 29 59 80 44 34 23 28 70 97 26
2009 29 29 58 82 42 32 21 29 70 95 24
2010 28 28 60 84 40 35 24 32 78 94 24
2011 20 27 58 80 37 35 21 30 74 111 24
2012 21 28 57 78 37 33 25 27 72 80 23
-
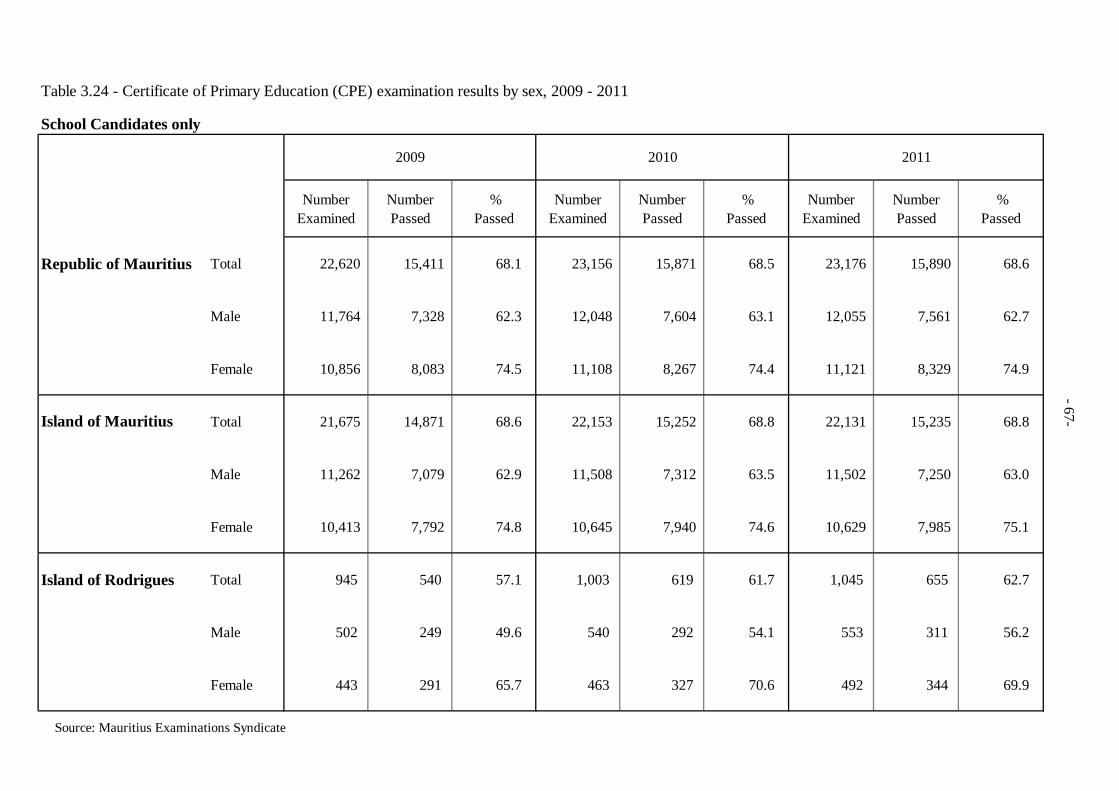
Table 3.24 - Certificate of Primary Education (CPE) examination results by sex, 2009 - 2011
School Candidates only
Number Examined
Number Passed
% Passed
Number Examined
Number Passed
% Passed
Number Examined
Number Passed
% Passed
Republic of Mauritius Total 22,620 15,411 68.1 23,156 15,871 68.5 23,176 15,890 68.6
Male 11,764 7,328 62.3 12,048 7,604 63.1 12,055 7,561 62.7
Female 10,856 8,083 74.5 11,108 8,267 74.4 11,121 8,329 74.9
Total 21,675 14,871 68.6 22,153 15,252 68.8 22,131 15,235 68.8
Male 11,262 7,079 62.9 11,508 7,312 63.5 11,502 7,250 63.0
Female 10,413 7,792 74.8 10,645 7,940 74.6 10,629 7,985 75.1
Island of Rodrigues Total 945 540 57.1 1,003 619 61.7 1,045 655 62.7
Male 502 249 49.6 540 292 54.1 553 311 56.2
Female 443 291 65.7 463 327 70.6 492 344 69.9
Source: Mauritius Examinations Syndicate
20102009 2011
Island of Mauritius
-67-

Table 3.25 - Performance at Certificate of Primary Education (CPE) examination by sex and sitting, 2011
Number Examined
Number Passed
% Passed
Number Examined
Number Passed
% Passed
Number Examined
Number Passed
% Passed
School Candidates
First Sitting Total 17,775 13,500 75.9 808 574 71.0 18,583 14,074 75.7
Male 8,972 6,383 71.1 408 267 65.4 9,380 6,650 70.9
Female 8,803 7,117 80.8 400 307 76.8 9,203 7,424 80.7
Second Sitting Total 4,356 1,735 39.8 237 81 34.2 4,593 1,816 39.5 (or more)
Male 2,530 867 34.3 145 44 30.3 2,675 911 34.1
Female 1,826 868 47.5 92 37 40.2 1,918 905 47.2
Total Total 22,131 15,235 68.8 1,045 655 62.7 23,176 15,890 68.6
Male 11,502 7,250 63.0 553 311 56.2 12,055 7,561 62.7
Female 10,629 7,985 75.1 492 344 69.9 11,121 8,329 74.9
Private Candidates Total 2,451 744 30.4 55 18 32.7 2,506 762 30.4
Male 1,488 383 25.7 29 10 34.5 1,517 393 25.9
Female 963 361 37.5 26 8 30.8 989 369 37.3
School & Private Candidates Total 24,582 15,979 65.0 1,100 673 61.2 25,682 16,652 64.8
Male 12,990 7,633 58.8 582 321 55.2 13,572 7,954 58.6
Female 11,592 8,346 72.0 518 352 68.0 12,110 8,698 71.8
Source : Mauritius Examinations Syndicate
Island of Rodrigues Republic of MauritiusIsland of Mauritius
-68 -
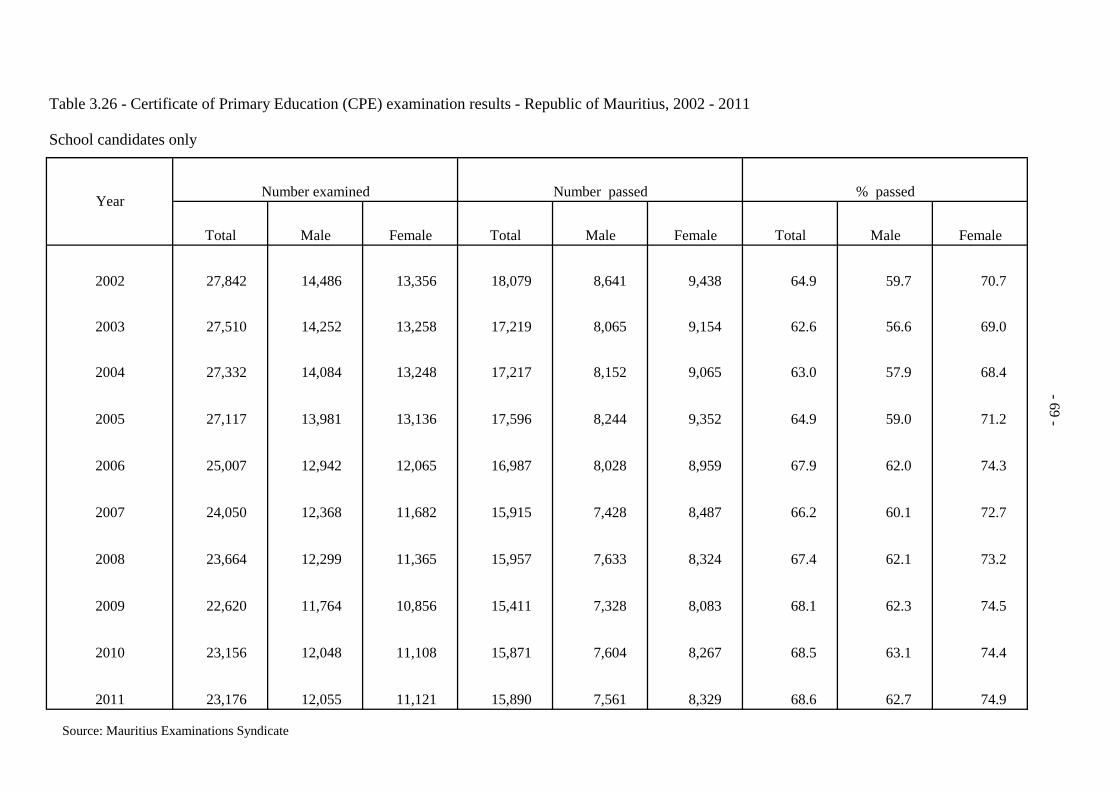
Table 3.26 - Certificate of Primary Education (CPE) examination results - Republic of Mauritius, 2002 - 2011
School candidates only
Number examined Number passed % passed
Total Male Female Total Male Female Total Male Female
2002 27,842 14,486 13,356 18,079 8,641 9,438 64.9 59.7 70.7
2003 27,510 14,252 13,258 17,219 8,065 9,154 62.6 56.6 69.0
2004 27,332 14,084 13,248 17,217 8,152 9,065 63.0 57.9 68.4
2005 27,117 13,981 13,136 17,596 8,244 9,352 64.9 59.0 71.2
Year
-69 -
2006 25,007 12,942 12,065 16,987 8,028 8,959 67.9 62.0 74.3
2007 24,050 12,368 11,682 15,915 7,428 8,487 66.2 60.1 72.7
2008 23,664 12,299 11,365 15,957 7,633 8,324 67.4 62.1 73.2
2009 22,620 11,764 10,856 15,411 7,328 8,083 68.1 62.3 74.5
2010 23,156 12,048 11,108 15,871 7,604 8,267 68.5 63.1 74.4
2011 23,176 12,055 11,121 15,890 7,561 8,329 68.6 62.7 74.9
Source: Mauritius Examinations Syndicate

Table 3.27 - Certificate of Primary Education (CPE) examination results - Island of Mauritius, 2002 - 2011
School candidates only
Number examined Number passed % passed
Total Male Female Total Male Female Total Male Female
2002 26,846 13,998 12,848 17,530 8,410 9,120 65.3 60.1 71.0
2003 26,491 13,743 12,748 16,686 7,849 8,837 63.0 57.1 69.3
2004 26,318 13,548 12,770 16,681 7,895 8,786 63.4 58.3 68.8
2005 26,038 13,438 12,600 16,993 7,970 9,023 65.3 59.3 71.6
Year
-70 -
2006 23,986 12,426 11,560 16,424 7,787 8,637 68.5 62.7 74.7
2007 23,078 11,877 11,201 15,431 7,222 8,209 66.9 60.8 73.3
2008 22,662 11,769 10,893 15,404 7,368 8,036 68.0 62.6 73.8
2009 21,675 11,262 10,413 14,871 7,079 7,792 68.6 62.9 74.8
2010 22,153 11,508 10,645 15,252 7,312 7,940 68.8 63.5 74.6
2011 22,131 11,502 10,629 15,235 7,250 7,985 68.8 63.0 75.1
Source: Mauritius Examinations Syndicate

Table 3.28 - Certificate of Primary Education (CPE) examination results - Island of Rodrigues, 2002 - 2011
School candidates only
Number examined Number passed % passed
Total Male Female Total Male Female Total Male Female
2002 996 488 508 549 231 318 55.1 47.3 62.6
2003 1,019 509 510 533 216 317 52.3 42.4 62.2
2004 1,014 536 478 536 257 279 52.9 47.9 58.4
2005 1,079 543 536 603 274 329 55.9 50.5 61.4
Year
-71 -
2006 1,021 516 505 563 241 322 55.1 46.7 63.8
2007 972 491 481 484 206 278 49.8 42.0 57.8
2008 1,002 530 472 553 265 288 55.2 50.0 61.0
2009 945 502 443 540 249 291 57.1 49.6 65.7
2010 1,003 540 463 619 292 327 61.7 54.1 70.6
2011 1,045 553 492 655 311 344 62.7 56.2 69.9
Source: Mauritius Examinations Syndicate
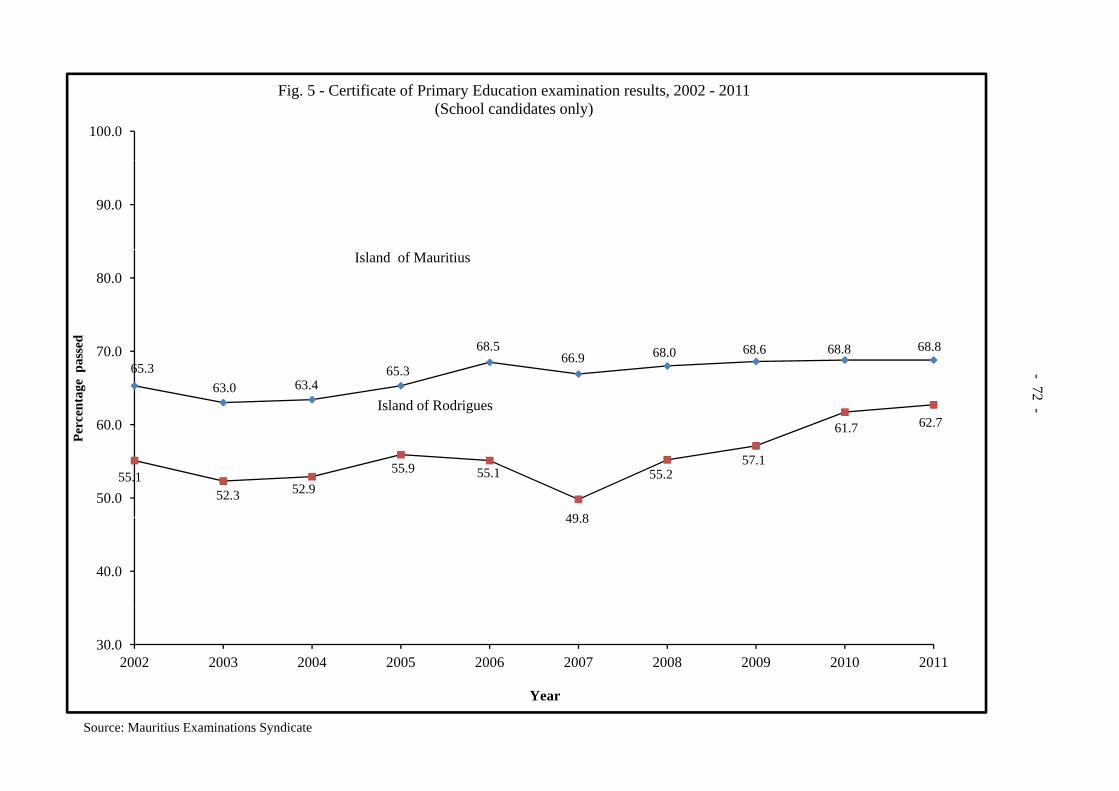
100.0
Fig. 5 - Certificate of Primary Education examination results, 2002 - 2011 (School candidates only)
90.0
80.0
d
Island of Mauritius
65.363.0 63.4
65.3
68.566.9 68.0 68.6 68.8 68.8
61 7 62.760.0
70.0
erce
ntag
e p
asse
d
Island of Rodrigues
-72 -
55.152.3 52.9
55.9 55.1
49 8
55.257.1
61.7
50.0
60.0
Pe
49.8
40.0
30.02002 2003 2004 2005 2006 2007 2008 2009 2010 2011
Year
Source: Mauritius Examinations Syndicate
Year
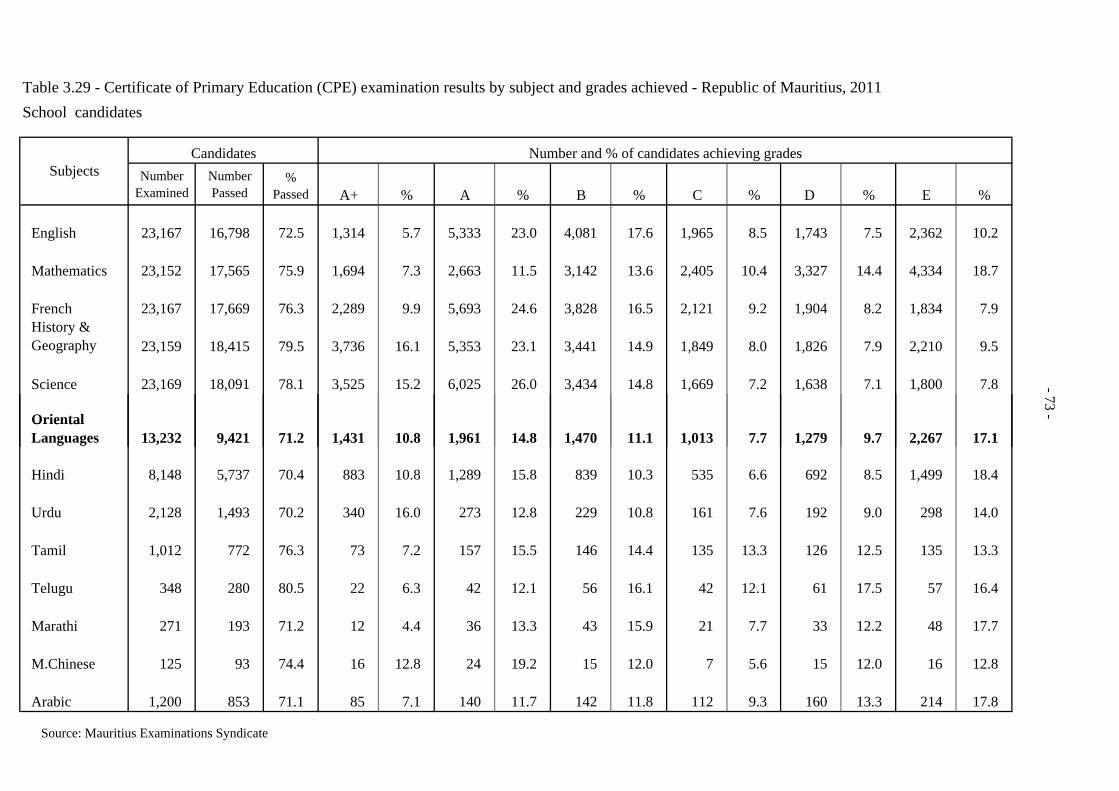
Table 3.29 - Certificate of Primary Education (CPE) examination results by subject and grades achieved - Republic of Mauritius, 2011School candidates
Number Examined
Number Passed
% Passed A+ % A % B % C % D % E %
English 23,167 16,798 72.5 1,314 5.7 5,333 23.0 4,081 17.6 1,965 8.5 1,743 7.5 2,362 10.2
Mathematics 23,152 17,565 75.9 1,694 7.3 2,663 11.5 3,142 13.6 2,405 10.4 3,327 14.4 4,334 18.7
French 23,167 17,669 76.3 2,289 9.9 5,693 24.6 3,828 16.5 2,121 9.2 1,904 8.2 1,834 7.9 History & Geography 23,159 18,415 79.5 3,736 16.1 5,353 23.1 3,441 14.9 1,849 8.0 1,826 7.9 2,210 9.5
Science 23,169 18,091 78.1 3,525 15.2 6,025 26.0 3,434 14.8 1,669 7.2 1,638 7.1 1,800 7.8
Oriental
SubjectsCandidates Number and % of candidates achieving grades
-73 -
Oriental Languages 13,232 9,421 71.2 1,431 10.8 1,961 14.8 1,470 11.1 1,013 7.7 1,279 9.7 2,267 17.1
Hindi 8,148 5,737 70.4 883 10.8 1,289 15.8 839 10.3 535 6.6 692 8.5 1,499 18.4
Urdu 2,128 1,493 70.2 340 16.0 273 12.8 229 10.8 161 7.6 192 9.0 298 14.0
Tamil 1,012 772 76.3 73 7.2 157 15.5 146 14.4 135 13.3 126 12.5 135 13.3
Telugu 348 280 80.5 22 6.3 42 12.1 56 16.1 42 12.1 61 17.5 57 16.4
Marathi 271 193 71.2 12 4.4 36 13.3 43 15.9 21 7.7 33 12.2 48 17.7
M.Chinese 125 93 74.4 16 12.8 24 19.2 15 12.0 7 5.6 15 12.0 16 12.8
Arabic 1,200 853 71.1 85 7.1 140 11.7 142 11.8 112 9.3 160 13.3 214 17.8
Source: Mauritius Examinations Syndicate
-73 -
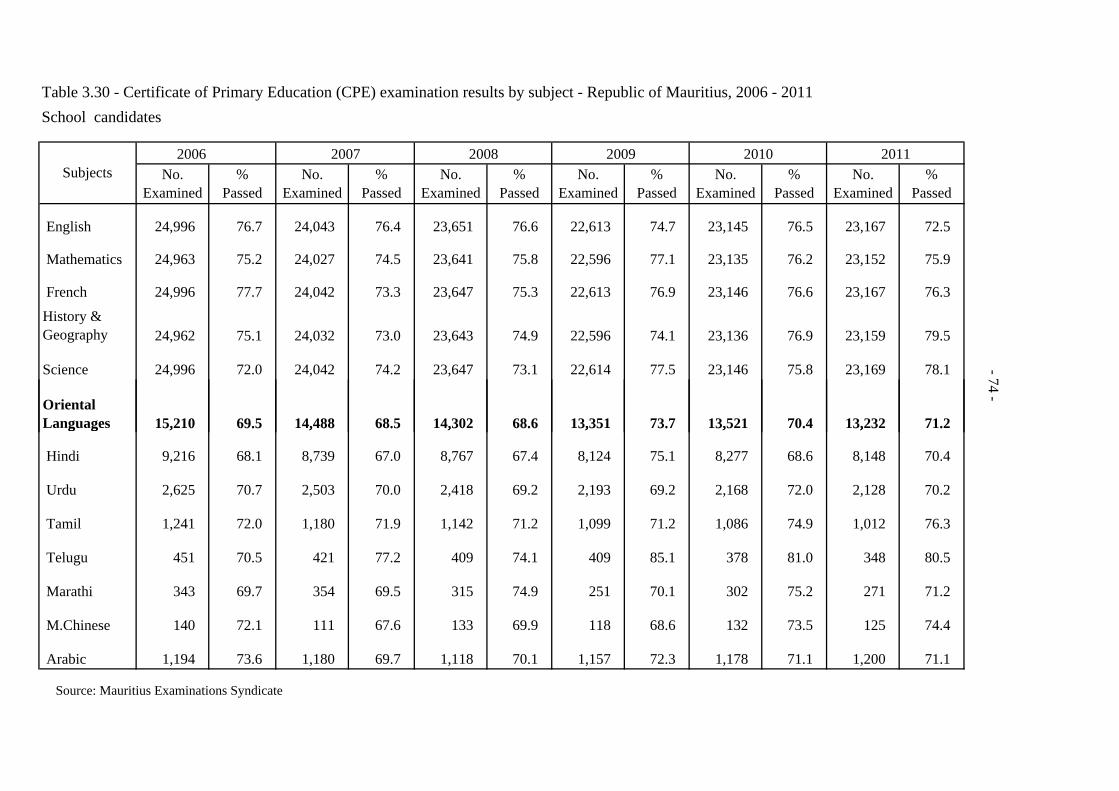
Table 3.30 - Certificate of Primary Education (CPE) examination results by subject - Republic of Mauritius, 2006 - 2011School candidates
2006No.
Examined%
PassedNo.
Examined%
PassedNo.
Examined%
PassedNo.
Examined%
PassedNo.
Examined%
PassedNo.
Examined%
Passed
English 24,996 76.7 24,043 76.4 23,651 76.6 22,613 74.7 23,145 76.5 23,167 72.5
Mathematics 24,963 75.2 24,027 74.5 23,641 75.8 22,596 77.1 23,135 76.2 23,152 75.9
French 24,996 77.7 24,042 73.3 23,647 75.3 22,613 76.9 23,146 76.6 23,167 76.3
History & Geography 24,962 75.1 24,032 73.0 23,643 74.9 22,596 74.1 23,136 76.9 23,159 79.5
Science 24,996 72.0 24,042 74.2 23,647 73.1 22,614 77.5 23,146 75.8 23,169 78.1
Oriental Languages 15,210 69.5 14,488 68.5 14,302 68.6 13,351 73.7 13,521 70.4 13,232 71.2
Subjects201120102007 2008 2009
-74 -
g g 5, 0 69.5 , 88 68.5 ,30 68.6 3,35 73.7 3,5 70. 3, 3 7 .
Hindi 9,216 68.1 8,739 67.0 8,767 67.4 8,124 75.1 8,277 68.6 8,148 70.4
Urdu 2,625 70.7 2,503 70.0 2,418 69.2 2,193 69.2 2,168 72.0 2,128 70.2
Tamil 1,241 72.0 1,180 71.9 1,142 71.2 1,099 71.2 1,086 74.9 1,012 76.3
Telugu 451 70.5 421 77.2 409 74.1 409 85.1 378 81.0 348 80.5
Marathi 343 69.7 354 69.5 315 74.9 251 70.1 302 75.2 271 71.2
M.Chinese 140 72.1 111 67.6 133 69.9 118 68.6 132 73.5 125 74.4
Arabic 1,194 73.6 1,180 69.7 1,118 70.1 1,157 72.3 1,178 71.1 1,200 71.1
Source: Mauritius Examinations Syndicate
-74 -

SECONDARY
EDUCATION


Table 4.1 - Secondary Education - Number of schools, pupils, personnel and pupil/teacher ratio, 2008 - 2012
Total number Pupil/
Period of schools Government Aided Non-Aided Total Teaching Non-Teaching Teacher ratio
Mar-08 180 47,040 63,128 6,335 116,503 7,408 3,516 16
Mar-09 179 48,561 61,617 6,048 116,226 7,564 3,514 15
Mar-10 182 49,058 59,667 6,278 115,003 7,695 3,544 15
Mar-11 180 49,705 59,147 6,437 115,289 7,873 3,546 15
Mar-12 178 49,867 59,311 6,499 115,677 8,014 3,599 14
Mar-08 175 47,040 59,620 6,335 112,995 7,197 3,398 16
B - Island of Mauritius
Pupils Personnel
A - Republic of Mauritius
-96 - -77 -
Mar-09 174 48,561 57,963 6,048 112,572 7,355 3,388 15
Mar-10 177 49,058 56,082 6,278 111,418 7,490 3,420 15
Mar-11 175 49,705 55,611 6,437 111,753 7,658 3,418 15
Mar-12 172 49,867 55,387 6,499 111,753 7,791 3,467 14
Mar-08 5 - 3,508 - 3,508 211 118 17
Mar-09 5 - 3,654 - 3,654 209 126 17
Mar-10 5 - 3,585 - 3,585 205 124 17
Mar-11 5 - 3,536 - 3,536 215 128 16
Mar-12 6 - 3,924 - 3,924 223 132 18
C - Island of Rodrigues

- 78 -
Table 4.2 - Distribution of secondary schools (general stream) by zone and type of administration, 2012
Type of Administration
Zone Private
Aided 3 Non - Aided
No. % No. % No. %
1 - Port Louis / North 56 23 41 27 48 6 11
42 17 40 20 48 5 12
3 - Curepipe / South 42 13 31 21 50 8 19
4 - Q.Bornes / Vacoas-Phoenix / West 32 15 47 15 47 2 6
Island of Mauritius 172 68 40 83 48 21 12
Island of Rodrigues 6 - - 6 100 - -
Republic of Mauritius 178 68 38 89 50 21 12
1 62 of these schools offer general education only and 116 both general and pre-vocational education 2 Includes Mahatma Gandhi Institute, Rabindranath Tagore Secondary School and 4 Mahatma Gandhi State Schools
Company (REDCO)
Table 4.3 - Distribution of secondary schools (general stream) by zone and enrolment range, 2012
Zone
under 200
200 and under 500
500 andunder 1000
1000 and under 1500
1500and over Total
1 - Port Louis / North 7 13 31 5 - 56
2 - B.Bassin-R.Hill / East 4 9 21 7 1 42
3 - Curepipe / South 6 9 21 5 1 42
4 - Q.Bornes / Vacoas-Phoenix / West 3 11 17 1 - 32
Island of Mauritius 20 42 90 18 2 172
Island of Rodrigues - 1 5 - - 6
Republic of Mauritius 20 43 95 18 2 178
2 - B.Bassin-R.Hill / East
All Schools 1 State 2
3 Includes Mauritius Educational Development Company (MEDCO) / Rodrigues Educational Development
Enrolment range
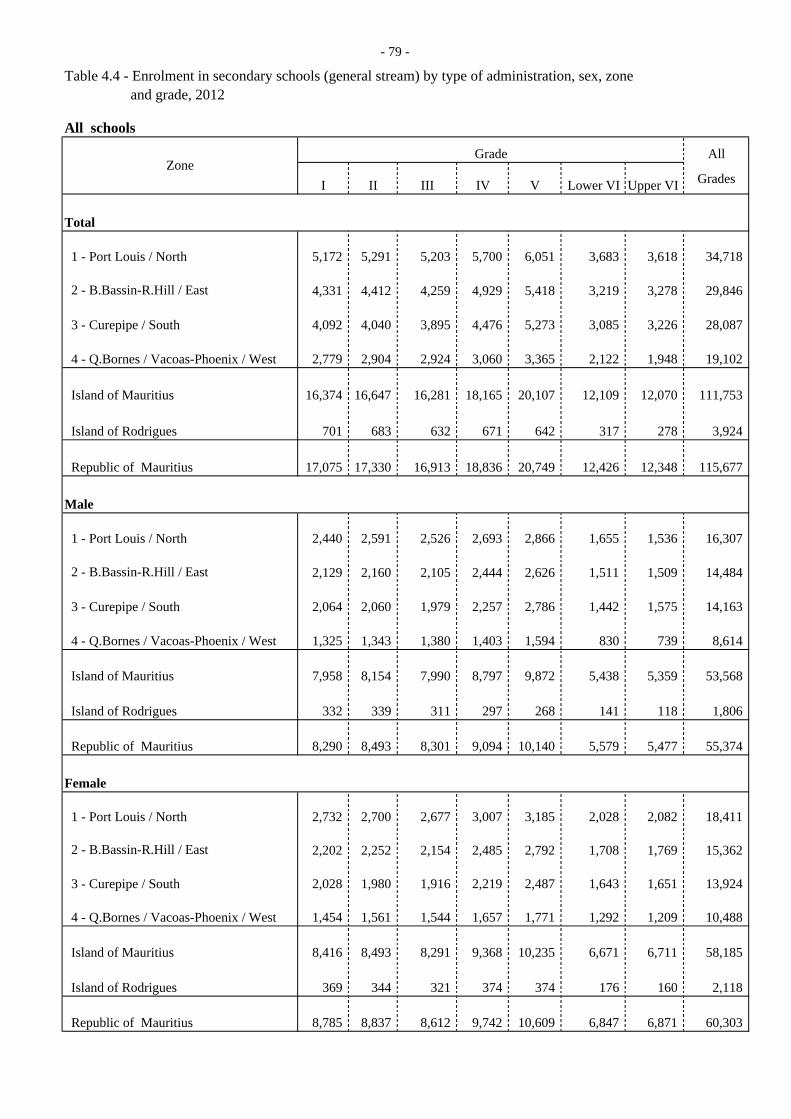
- 79 -
Table 4.4 - Enrolment in secondary schools (general stream) by type of administration, sex, zone and grade, 2012
All schools
Grade All
I II III IV V Lower VI Upper VI Grades
Total
1 - Port Louis / North 5,172 5,291 5,203 5,700 6,051 3,683 3,618 34,718
2 - B.Bassin-R.Hill / East 4,331 4,412 4,259 4,929 5,418 3,219 3,278 29,846
3 - Curepipe / South 4,092 4,040 3,895 4,476 5,273 3,085 3,226 28,087
4 - Q.Bornes / Vacoas-Phoenix / West 2,779 2,904 2,924 3,060 3,365 2,122 1,948 19,102
Island of Mauritius 16,374 16,647 16,281 18,165 20,107 12,109 12,070 111,753
Island of Rodrigues 701 683 632 671 642 317 278 3,924
Republic of Mauritius 17,075 17,330 16,913 18,836 20,749 12,426 12,348 115,677
Male
1 - Port Louis / North 2,440 2,591 2,526 2,693 2,866 1,655 1,536 16,307
2 - B.Bassin-R.Hill / East 2,129 2,160 2,105 2,444 2,626 1,511 1,509 14,484
3 - Curepipe / South 2,064 2,060 1,979 2,257 2,786 1,442 1,575 14,163
4 - Q.Bornes / Vacoas-Phoenix / West 1,325 1,343 1,380 1,403 1,594 830 739 8,614
Island of Mauritius 7,958 8,154 7,990 8,797 9,872 5,438 5,359 53,568
Island of Rodrigues 332 339 311 297 268 141 118 1,806
Republic of Mauritius 8,290 8,493 8,301 9,094 10,140 5,579 5,477 55,374
Female
1 - Port Louis / North 2,732 2,700 2,677 3,007 3,185 2,028 2,082 18,411
2 - B.Bassin-R.Hill / East 2,202 2,252 2,154 2,485 2,792 1,708 1,769 15,362
3 - Curepipe / South 2,028 1,980 1,916 2,219 2,487 1,643 1,651 13,924
4 - Q.Bornes / Vacoas-Phoenix / West 1,454 1,561 1,544 1,657 1,771 1,292 1,209 10,488
Island of Mauritius 8,416 8,493 8,291 9,368 10,235 6,671 6,711 58,185
Island of Rodrigues 369 344 321 374 374 176 160 2,118
Republic of Mauritius 8,785 8,837 8,612 9,742 10,609 6,847 6,871 60,303
Zone
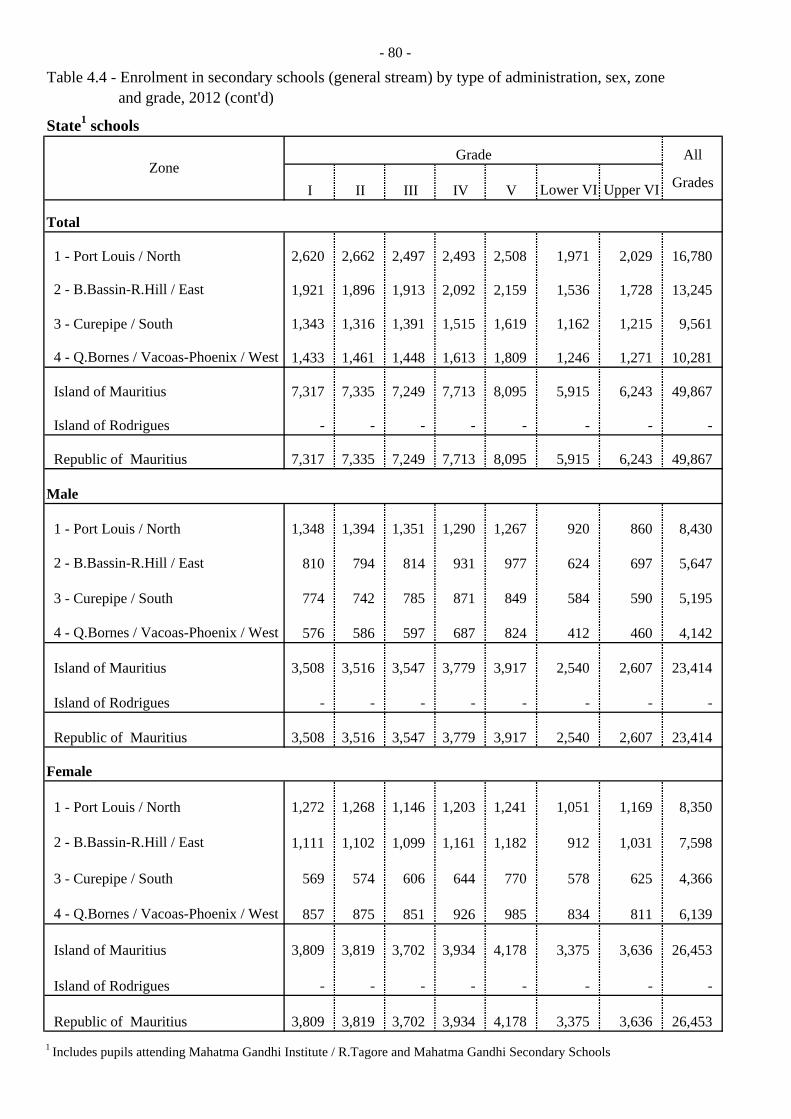
- 80 -
Table 4.4 - Enrolment in secondary schools (general stream) by type of administration, sex, zone and grade, 2012 (cont'd)
State1 schools
Grade All
I II III IV V Lower VI Upper VI Grades
Total
1 - Port Louis / North 2,620 2,662 2,497 2,493 2,508 1,971 2,029 16,780
2 - B.Bassin-R.Hill / East 1,921 1,896 1,913 2,092 2,159 1,536 1,728 13,245
3 - Curepipe / South 1,343 1,316 1,391 1,515 1,619 1,162 1,215 9,561
4 - Q.Bornes / Vacoas-Phoenix / West 1,433 1,461 1,448 1,613 1,809 1,246 1,271 10,281
Island of Mauritius 7,317 7,335 7,249 7,713 8,095 5,915 6,243 49,867
Island of Rodrigues - - - - - - - -
Republic of Mauritius 7,317 7,335 7,249 7,713 8,095 5,915 6,243 49,867
Male
1 - Port Louis / North 1,348 1,394 1,351 1,290 1,267 920 860 8,430
2 - B.Bassin-R.Hill / East 810 794 814 931 977 624 697 5,647
3 - Curepipe / South 774 742 785 871 849 584 590 5,195
4 - Q.Bornes / Vacoas-Phoenix / West 576 586 597 687 824 412 460 4,142
Island of Mauritius 3,508 3,516 3,547 3,779 3,917 2,540 2,607 23,414
Island of Rodrigues - - - - - - - -
Republic of Mauritius 3,508 3,516 3,547 3,779 3,917 2,540 2,607 23,414
Female
1 - Port Louis / North 1,272 1,268 1,146 1,203 1,241 1,051 1,169 8,350
2 - B.Bassin-R.Hill / East 1,111 1,102 1,099 1,161 1,182 912 1,031 7,598
3 - Curepipe / South 569 574 606 644 770 578 625 4,366
4 - Q.Bornes / Vacoas-Phoenix / West 857 875 851 926 985 834 811 6,139
Island of Mauritius 3,809 3,819 3,702 3,934 4,178 3,375 3,636 26,453
Island of Rodrigues - - - - - - - -
Republic of Mauritius 3,809 3,819 3,702 3,934 4,178 3,375 3,636 26,453 1 Includes pupils attending Mahatma Gandhi Institute / R.Tagore and Mahatma Gandhi Secondary Schools
Zone
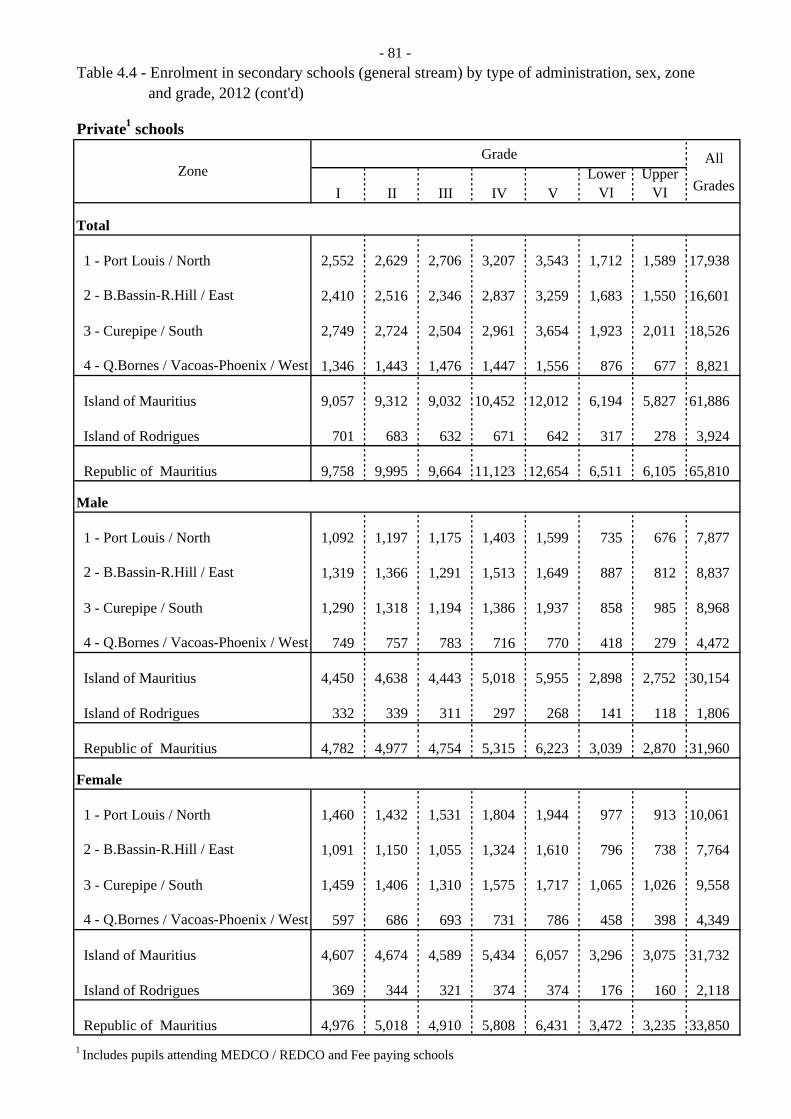
- 81 -Table 4.4 - Enrolment in secondary schools (general stream) by type of administration, sex, zone and grade, 2012 (cont'd)
Private1 schoolsGrade All
I II III IV VLower
VIUpper
VI Grades
Total
1 - Port Louis / North 2,552 2,629 2,706 3,207 3,543 1,712 1,589 17,938
2 - B.Bassin-R.Hill / East 2,410 2,516 2,346 2,837 3,259 1,683 1,550 16,601
3 - Curepipe / South 2,749 2,724 2,504 2,961 3,654 1,923 2,011 18,526
4 - Q.Bornes / Vacoas-Phoenix / West 1,346 1,443 1,476 1,447 1,556 876 677 8,821
Island of Mauritius 9,057 9,312 9,032 10,452 12,012 6,194 5,827 61,886
Island of Rodrigues 701 683 632 671 642 317 278 3,924
Republic of Mauritius 9,758 9,995 9,664 11,123 12,654 6,511 6,105 65,810
Male
1 - Port Louis / North 1,092 1,197 1,175 1,403 1,599 735 676 7,877
2 - B.Bassin-R.Hill / East 1,319 1,366 1,291 1,513 1,649 887 812 8,837
3 - Curepipe / South 1,290 1,318 1,194 1,386 1,937 858 985 8,968
4 - Q.Bornes / Vacoas-Phoenix / West 749 757 783 716 770 418 279 4,472
Island of Mauritius 4,450 4,638 4,443 5,018 5,955 2,898 2,752 30,154
Island of Rodrigues 332 339 311 297 268 141 118 1,806
Republic of Mauritius 4,782 4,977 4,754 5,315 6,223 3,039 2,870 31,960
Female
1 - Port Louis / North 1,460 1,432 1,531 1,804 1,944 977 913 10,061
2 - B.Bassin-R.Hill / East 1,091 1,150 1,055 1,324 1,610 796 738 7,764
3 - Curepipe / South 1,459 1,406 1,310 1,575 1,717 1,065 1,026 9,558
4 - Q.Bornes / Vacoas-Phoenix / West 597 686 693 731 786 458 398 4,349
Island of Mauritius 4,607 4,674 4,589 5,434 6,057 3,296 3,075 31,732
Island of Rodrigues 369 344 321 374 374 176 160 2,118
Republic of Mauritius 4,976 5,018 4,910 5,808 6,431 3,472 3,235 33,850 1 Includes pupils attending MEDCO / REDCO and Fee paying schools
Zone

- 82 -
Table 4.5 - Enrolment in secondary schools (general stream) by grade and sex, 2010 - 2012
2010 2011 2012
Total Male Female Total Male Female Total Male Female
I 16,240 7,894 8,346 16,924 8,322 8,602 17,075 8,290 8,785
II 17,030 8,222 8,808 16,373 7,963 8,410 17,330 8,493 8,837
III 17,568 8,382 9,186 17,342 8,461 8,881 16,913 8,301 8,612
IV 20,522 9,955 10,567 19,473 9,405 10,068 18,836 9,094 9,742
V 21,162 10,397 10,765 20,842 10,178 10,664 20,749 10,140 10,609
Lower VI 11,263 4,994 6,269 12,510 5,533 6,977 12,426 5,579 6,847
Upper VI 11,218 5,011 6,207 11,825 5,326 6,499 12,348 5,477 6,871
Total 115,003 54,855 60,148 115,289 55,188 60,101 115,677 55,374 60,303
I 15,728 7,641 8,087 16,379 8,048 8,331 16,374 7,958 8,416
II 16,479 7,939 8,540 15,862 7,706 8,156 16,647 8,154 8,493
III 16,901 8,087 8,814 16,727 8,154 8,573 16,281 7,990 8,291
IV 19,875 9,660 10,215 18,773 9,114 9,659 18,165 8,797 9,368
V 20,486 10,092 10,394 20,220 9,896 10,324 20,107 9,872 10,235
Lower VI 11,008 4,890 6,118 12,210 5,409 6,801 12,109 5,438 6,671
Upper VI 10,941 4,889 6,052 11,582 5,221 6,361 12,070 5,359 6,711
Total 111,418 53,198 58,220 111,753 53,548 58,205 111,753 53,568 58,185
I 512 253 259 545 274 271 701 332 369
II 551 283 268 511 257 254 683 339 344
III 667 295 372 615 307 308 632 311 321
IV 647 295 352 700 291 409 671 297 374
V 676 305 371 622 282 340 642 268 374
Lower VI 255 104 151 300 124 176 317 141 176
Upper VI 277 122 155 243 105 138 278 118 160
Total 3,585 1,657 1,928 3,536 1,640 1,896 3,924 1,806 2,118
Grade
Republic of Mauritius
Island of Mauritius
Island of Rodrigues
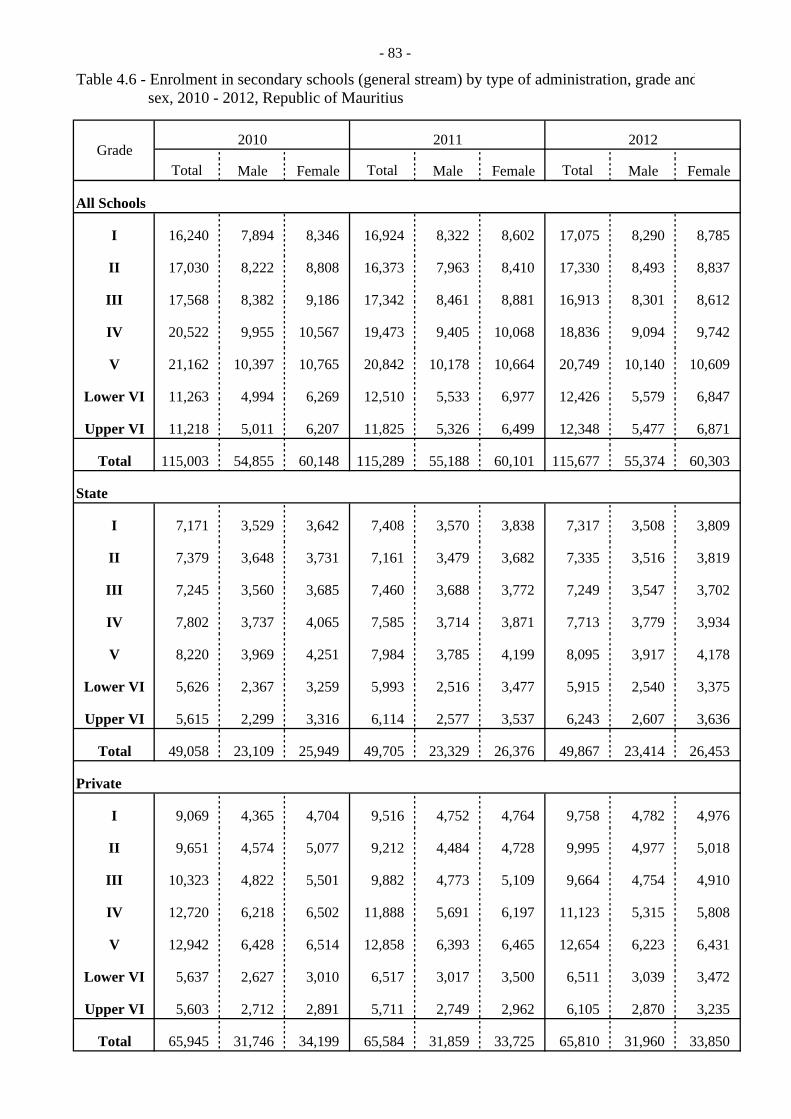
- 83 -
Table 4.6 - Enrolment in secondary schools (general stream) by type of administration, grade and sex, 2010 - 2012, Republic of Mauritius
2010 2011 2012
Total Male Female Total Male Female Total Male Female
I 16,240 7,894 8,346 16,924 8,322 8,602 17,075 8,290 8,785
II 17,030 8,222 8,808 16,373 7,963 8,410 17,330 8,493 8,837
III 17,568 8,382 9,186 17,342 8,461 8,881 16,913 8,301 8,612
IV 20,522 9,955 10,567 19,473 9,405 10,068 18,836 9,094 9,742
V 21,162 10,397 10,765 20,842 10,178 10,664 20,749 10,140 10,609
Lower VI 11,263 4,994 6,269 12,510 5,533 6,977 12,426 5,579 6,847
Upper VI 11,218 5,011 6,207 11,825 5,326 6,499 12,348 5,477 6,871
Total 115,003 54,855 60,148 115,289 55,188 60,101 115,677 55,374 60,303
I 7,171 3,529 3,642 7,408 3,570 3,838 7,317 3,508 3,809
II 7,379 3,648 3,731 7,161 3,479 3,682 7,335 3,516 3,819
III 7,245 3,560 3,685 7,460 3,688 3,772 7,249 3,547 3,702
IV 7,802 3,737 4,065 7,585 3,714 3,871 7,713 3,779 3,934
V 8,220 3,969 4,251 7,984 3,785 4,199 8,095 3,917 4,178
Lower VI 5,626 2,367 3,259 5,993 2,516 3,477 5,915 2,540 3,375
Upper VI 5,615 2,299 3,316 6,114 2,577 3,537 6,243 2,607 3,636
Total 49,058 23,109 25,949 49,705 23,329 26,376 49,867 23,414 26,453
I 9,069 4,365 4,704 9,516 4,752 4,764 9,758 4,782 4,976
II 9,651 4,574 5,077 9,212 4,484 4,728 9,995 4,977 5,018
III 10,323 4,822 5,501 9,882 4,773 5,109 9,664 4,754 4,910
IV 12,720 6,218 6,502 11,888 5,691 6,197 11,123 5,315 5,808
V 12,942 6,428 6,514 12,858 6,393 6,465 12,654 6,223 6,431
Lower VI 5,637 2,627 3,010 6,517 3,017 3,500 6,511 3,039 3,472
Upper VI 5,603 2,712 2,891 5,711 2,749 2,962 6,105 2,870 3,235
Total 65,945 31,746 34,199 65,584 31,859 33,725 65,810 31,960 33,850
Grade
State
Private
All Schools

- 84 -
Table 4.7 - Enrolment in secondary schools (general stream) by sex, age and grade, 2012Republic of Mauritius
Age Grade All(in years) I II III IV V Lower VI Upper VI Grades
Total10 143 - - - - - - 143 11 11,950 267 - - - - - 12,217 12 4,177 11,780 443 - - - - 16,400 13 608 4,118 10,648 410 - - - 15,784 14 197 862 4,139 10,260 131 - - 15,589 15 - 241 1,304 5,524 8,498 93 - 15,660 16 - 62 329 1,965 6,637 5,620 240 14,853 17 - - 50 536 3,775 4,187 4,849 13,397 18 - - - 128 1,373 2,111 4,626 8,238 19 - - - 13 298 396 2,283 2,990 20 - - - - 37 19 350 406
Total 17,075 17,330 16,913 18,836 20,749 12,426 12,348 115,677 Male
10 67 - - - - - - 67 11 5,757 96 - - - - - 5,853 12 2,025 5,752 104 - - - - 7,881 13 334 2,033 5,236 150 - - - 7,753 14 107 454 2,094 4,787 15 - - 7,457 15 - 124 685 2,837 3,786 12 - 7,444 16 - 34 156 1,005 3,381 2,218 134 6,928 17 - - 26 257 2,023 1,929 1,822 6,057 18 - - - 55 769 1,171 2,081 4,076 19 - - - 3 150 236 1,197 1,586 20 - - - - 16 13 243 272
Total 8,290 8,493 8,301 9,094 10,140 5,579 5,477 55,374 Female
10 76 - - - - - - 76 11 6,193 171 - - - - - 6,364 12 2,152 6,028 339 - - - - 8,519 13 274 2,085 5,412 260 - - - 8,031 14 90 408 2,045 5,473 116 - - 8,132 15 - 117 619 2,687 4,712 81 - 8,216 16 - 28 173 960 3,256 3,402 106 7,925 17 - - 24 279 1,752 2,258 3,027 7,340 18 - - - 73 604 940 2,545 4,162 19 - - - 10 148 160 1,086 1,404 20 - - - - 21 6 107 134
Total 8,785 8,837 8,612 9,742 10,609 6,847 6,871 60,303

- 85 -
Table 4.8 - Enrolment in secondary schools (general stream) by sex, age and grade, 2012Island of Mauritius
Age Grade All(in years) I II III IV V Lower VI Upper VI Grades
Total10 143 - - - - - - 143 11 11,468 267 - - - - - 11,735 12 4,002 11,360 443 - - - - 15,805 13 568 3,938 10,312 410 - - - 15,228 14 193 801 3,954 9,957 131 - - 15,036 15 - 221 1,215 5,328 8,291 93 - 15,148 16 - 60 309 1,831 6,405 5,511 240 14,356 17 - - 48 508 3,642 4,050 4,760 13,008 18 - - - 118 1,317 2,043 4,528 8,006 19 - - - 13 285 393 2,195 2,886 20 - - - - 36 19 347 402
Total 16,374 16,647 16,281 18,165 20,107 12,109 12,070 111,753 Male
10 67 - - - - - - 67 11 5,538 96 - - - - - 5,634 12 1,933 5,555 104 - - - - 7,592 13 314 1,934 5,099 150 - - - 7,497 14 106 422 1,992 4,675 15 - - 7,210 15 - 115 631 2,738 3,731 12 - 7,227 16 - 32 140 939 3,283 2,182 134 6,710 17 - - 24 243 1,955 1,862 1,788 5,872 18 - - - 49 736 1,136 2,032 3,953 19 - - - 3 137 233 1,165 1,538 20 - - - - 15 13 240 268
Total 7,958 8,154 7,990 8,797 9,872 5,438 5,359 53,568 Female
10 76 - - - - - - 76 11 5,930 171 - - - - - 6,101 12 2,069 5,805 339 - - - - 8,213 13 254 2,004 5,213 260 - - - 7,731 14 87 379 1,962 5,282 116 - - 7,826 15 - 106 584 2,590 4,560 81 - 7,921 16 - 28 169 892 3,122 3,329 106 7,646 17 - - 24 265 1,687 2,188 2,972 7,136 18 - - - 69 581 907 2,496 4,053 19 - - - 10 148 160 1,030 1,348 20 - - - - 21 6 107 134
Total 8,416 8,493 8,291 9,368 10,235 6,671 6,711 58,185

- 86 -
Table 4.9 - Enrolment in secondary schools (general stream) by sex, age and grade, 2012Island of Rodrigues
Age Grade All(in years) I II III IV V Lower VI Upper VI Grades
Total10 - - - - - - - - 11 482 - - - - - - 482 12 175 420 - - - - - 595 13 40 180 336 - - - - 556 14 4 61 185 303 - - - 553 15 - 20 89 196 207 - - 512 16 - 2 20 134 232 109 - 497 17 - - 2 28 133 137 89 389 18 - - - 10 56 68 98 232 19 - - - - 13 3 88 104 20 - - - - 1 - 3 4
Total 701 683 632 671 642 317 278 3,924 Male
10 - - - - - - - - 11 219 - - - - - - 219 12 92 197 - - - - - 289 13 20 99 137 - - - - 256 14 1 32 102 112 - - - 247 15 - 9 54 99 55 - - 217 16 - 2 16 66 98 36 - 218 17 - - 2 14 68 67 34 185 18 - - - 6 33 35 49 123 19 - - - - 13 3 32 48 20 - - - - 1 - 3 4
Total 332 339 311 297 268 141 118 1,806 Female
10 - - - - - - - - 11 263 - - - - - - 263 12 83 223 - - - - - 306 13 20 81 199 - - - - 300 14 3 29 83 191 - - - 306 15 - 11 35 97 152 - - 295 16 - - 4 68 134 73 - 279 17 - - - 14 65 70 55 204 18 - - - 4 23 33 49 109 19 - - - - - - 56 56 20 - - - - - - - -
Total 369 344 321 374 374 176 160 2,118

- 87 -
Table 4.10 - Number of repeaters in secondary schools (general stream) by type of administration, sex, zone and grade, 2012
All schoolsGrade All
I II III IV V Lower VI Upper VI Grades
Total
1 - Port Louis / North 109 248 387 991 1,442 299 457 3,933
2 - B.Bassin-R.Hill / East 45 161 204 736 1,332 292 482 3,252
3 - Curepipe / South 52 132 206 730 1,434 249 491 3,294
4 - Q.Bornes / Vacoas-Phoenix / West 135 179 345 466 782 210 271 2,388
Island of Mauritius 341 720 1,142 2,923 4,990 1,050 1,701 12,867
Island of Rodrigues 45 51 114 177 187 45 57 676
Republic of Mauritius 386 771 1,256 3,100 5,177 1,095 1,758 13,543
Male
1 - Port Louis / North 38 137 249 532 755 185 231 2,127
2 - B.Bassin-R.Hill / East 27 65 91 377 670 175 283 1,688
3 - Curepipe / South 29 64 102 391 814 125 287 1,812
4 - Q.Bornes / Vacoas-Phoenix / West 98 117 216 260 477 125 130 1,423
Island of Mauritius 192 383 658 1,560 2,716 610 931 7,050
Island of Rodrigues 27 32 77 76 85 21 26 344
Republic of Mauritius 219 415 735 1,636 2,801 631 957 7,394
Female
1 - Port Louis / North 71 111 138 459 687 114 226 1,806
2 - B.Bassin-R.Hill / East 18 96 113 359 662 117 199 1,564
3 - Curepipe / South 23 68 104 339 620 124 204 1,482
4 - Q.Bornes / Vacoas-Phoenix / West 37 62 129 206 305 85 141 965
Island of Mauritius 149 337 484 1,363 2,274 440 770 5,817
Island of Rodrigues 18 19 37 101 102 24 31 332
Republic of Mauritius 167 356 521 1,464 2,376 464 801 6,149
Zone
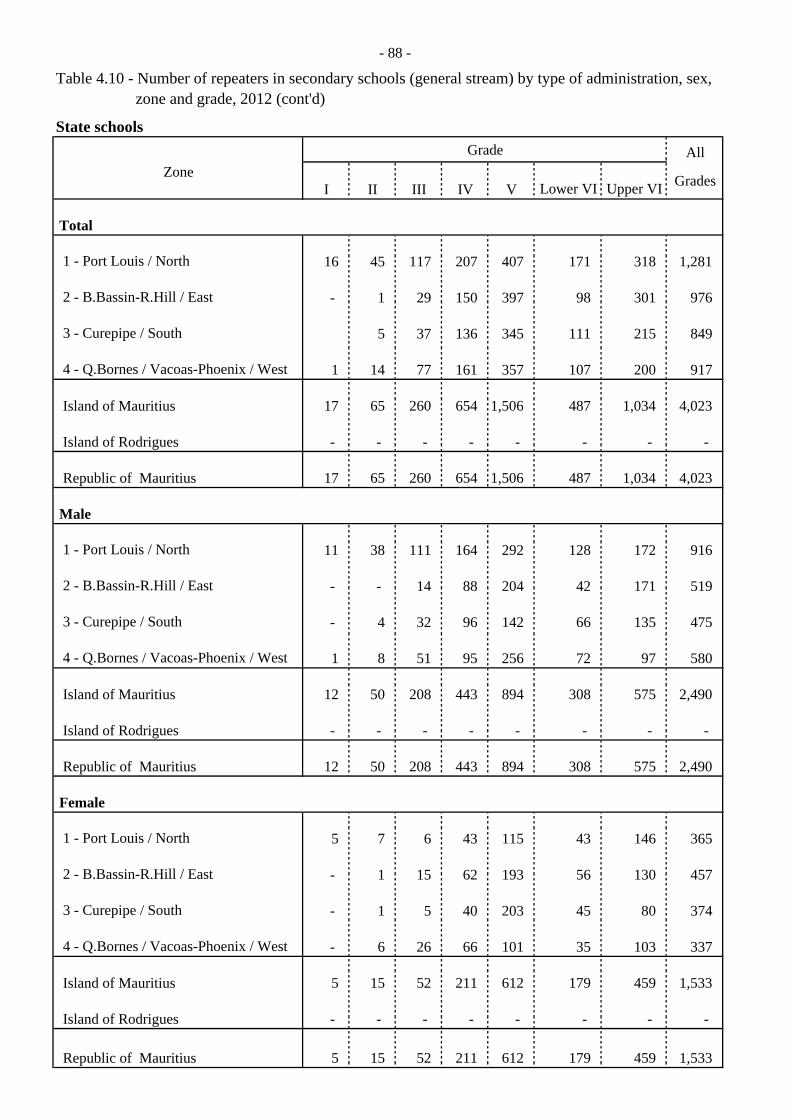
- 88 -
Table 4.10 - Number of repeaters in secondary schools (general stream) by type of administration, sex, zone and grade, 2012 (cont'd)
State schoolsGrade All
ZoneI II III IV V Lower VI Upper VI Grades
Total
1 - Port Louis / North 16 45 117 207 407 171 318 1,281
2 - B.Bassin-R.Hill / East - 1 29 150 397 98 301 976
3 - Curepipe / South 5 37 136 345 111 215 849
4 - Q.Bornes / Vacoas-Phoenix / West 1 14 77 161 357 107 200 917
Island of Mauritius 17 65 260 654 1,506 487 1,034 4,023
Island of Rodrigues - - - - - - - -
Republic of Mauritius 17 65 260 654 1,506 487 1,034 4,023
Male
1 - Port Louis / North 11 38 111 164 292 128 172 916
2 - B.Bassin-R.Hill / East - - 14 88 204 42 171 519
3 - Curepipe / South - 4 32 96 142 66 135 475
4 - Q.Bornes / Vacoas-Phoenix / West 1 8 51 95 256 72 97 580
Island of Mauritius 12 50 208 443 894 308 575 2,490
Island of Rodrigues - - - - - - - -
Republic of Mauritius 12 50 208 443 894 308 575 2,490
Female
1 - Port Louis / North 5 7 6 43 115 43 146 365
2 - B.Bassin-R.Hill / East - 1 15 62 193 56 130 457
3 - Curepipe / South - 1 5 40 203 45 80 374
4 - Q.Bornes / Vacoas-Phoenix / West - 6 26 66 101 35 103 337
Island of Mauritius 5 15 52 211 612 179 459 1,533
Island of Rodrigues - - - - - - - -
Republic of Mauritius 5 15 52 211 612 179 459 1,533
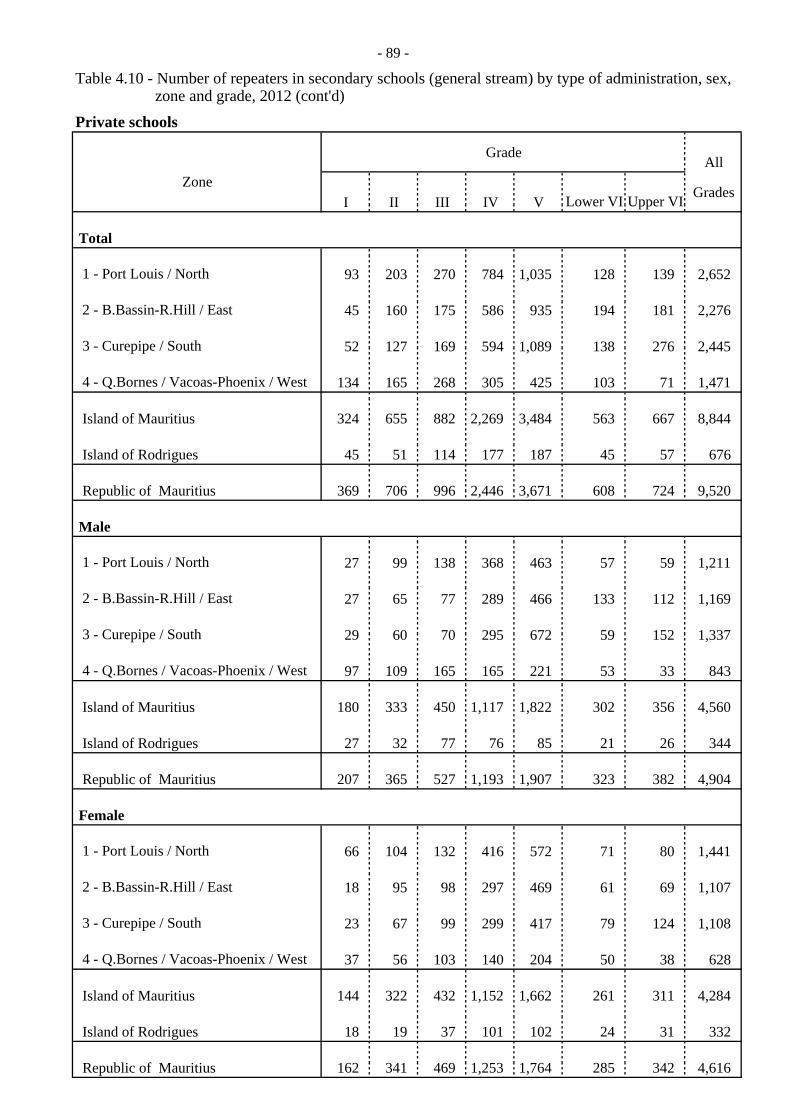
- 89 -
Table 4.10 - Number of repeaters in secondary schools (general stream) by type of administration, sex, zone and grade, 2012 (cont'd)Private schools
GradeAll
ZoneI II III IV V Lower VI Upper VI Grades
Total
1 - Port Louis / North 93 203 270 784 1,035 128 139 2,652
2 - B.Bassin-R.Hill / East 45 160 175 586 935 194 181 2,276
3 - Curepipe / South 52 127 169 594 1,089 138 276 2,445
4 - Q.Bornes / Vacoas-Phoenix / West 134 165 268 305 425 103 71 1,471
Island of Mauritius 324 655 882 2,269 3,484 563 667 8,844
Island of Rodrigues 45 51 114 177 187 45 57 676
Republic of Mauritius 369 706 996 2,446 3,671 608 724 9,520
Male
1 - Port Louis / North 27 99 138 368 463 57 59 1,211
2 - B.Bassin-R.Hill / East 27 65 77 289 466 133 112 1,169
3 - Curepipe / South 29 60 70 295 672 59 152 1,337
4 - Q.Bornes / Vacoas-Phoenix / West 97 109 165 165 221 53 33 843
Island of Mauritius 180 333 450 1,117 1,822 302 356 4,560
Island of Rodrigues 27 32 77 76 85 21 26 344
Republic of Mauritius 207 365 527 1,193 1,907 323 382 4,904
Female
1 - Port Louis / North 66 104 132 416 572 71 80 1,441
2 - B.Bassin-R.Hill / East 18 95 98 297 469 61 69 1,107
3 - Curepipe / South 23 67 99 299 417 79 124 1,108
4 - Q.Bornes / Vacoas-Phoenix / West 37 56 103 140 204 50 38 628
Island of Mauritius 144 322 432 1,152 1,662 261 311 4,284
Island of Rodrigues 18 19 37 101 102 24 31 332
Republic of Mauritius 162 341 469 1,253 1,764 285 342 4,616
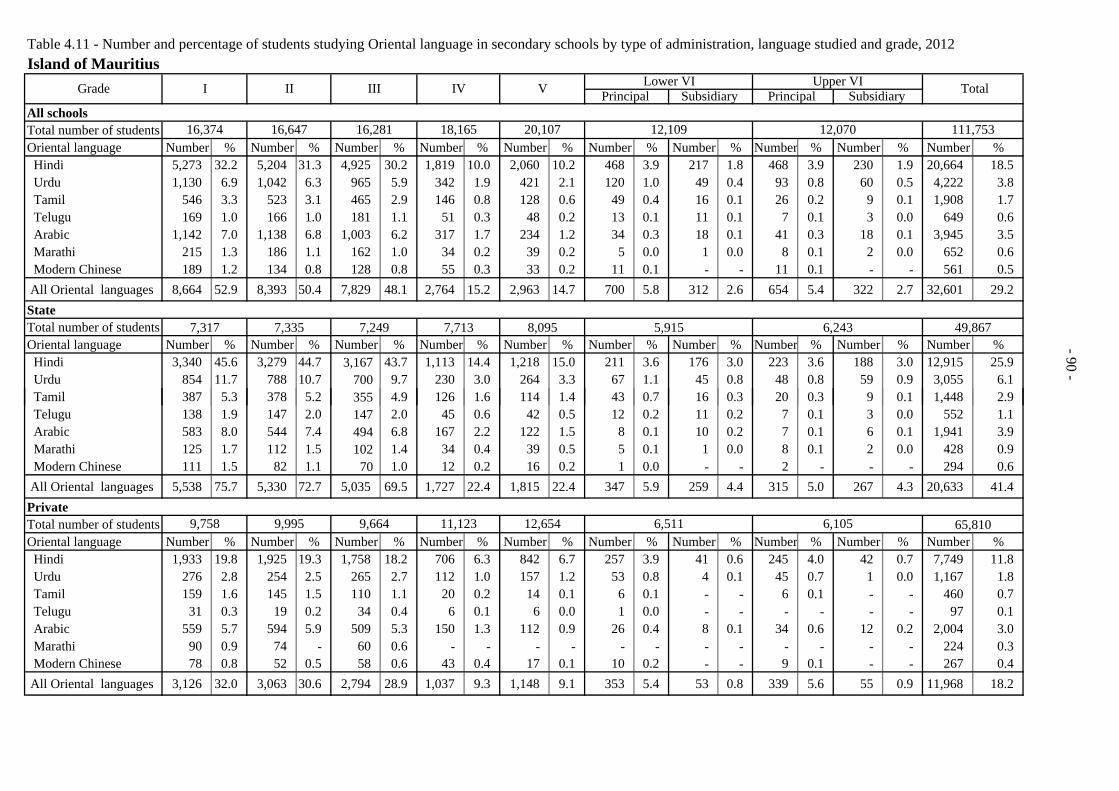
Table 4.11 - Number and percentage of students studying Oriental language in secondary schools by type of administration, language studied and grade, 2012Island of Mauritius
All schoolsTotal number of studentsOriental language Number % Number % Number % Number % Number % Number % Number % Number % Number % Number % Hindi 5,273 32.2 5,204 31.3 4,925 30.2 1,819 10.0 2,060 10.2 468 3.9 217 1.8 468 3.9 230 1.9 20,664 18.5 Urdu 1,130 6.9 1,042 6.3 965 5.9 342 1.9 421 2.1 120 1.0 49 0.4 93 0.8 60 0.5 4,222 3.8 Tamil 546 3.3 523 3.1 465 2.9 146 0.8 128 0.6 49 0.4 16 0.1 26 0.2 9 0.1 1,908 1.7 Telugu 169 1.0 166 1.0 181 1.1 51 0.3 48 0.2 13 0.1 11 0.1 7 0.1 3 0.0 649 0.6 Arabic 1,142 7.0 1,138 6.8 1,003 6.2 317 1.7 234 1.2 34 0.3 18 0.1 41 0.3 18 0.1 3,945 3.5 Marathi 215 1.3 186 1.1 162 1.0 34 0.2 39 0.2 5 0.0 1 0.0 8 0.1 2 0.0 652 0.6 Modern Chinese 189 1.2 134 0.8 128 0.8 55 0.3 33 0.2 11 0.1 - - 11 0.1 - - 561 0.5 All Oriental languages 8,664 52.9 8,393 50.4 7,829 48.1 2,764 15.2 2,963 14.7 700 5.8 312 2.6 654 5.4 322 2.7 32,601 29.2 StateTotal number of studentsOriental language Number % Number % Number % Number % Number % Number % Number % Number % Number % Number % Hindi 3,340 45.6 3,279 44.7 3,167 43.7 1,113 14.4 1,218 15.0 211 3.6 176 3.0 223 3.6 188 3.0 12,915 25.9 Urdu 854 11.7 788 10.7 700 9.7 230 3.0 264 3.3 67 1.1 45 0.8 48 0.8 59 0.9 3,055 6.1
T il 387 5 3 378 5 2 3 4 9 126 1 6 114 1 4 43 0 7 16 0 3 20 0 3 9 0 1 1 448 2 9
7,335 7,249 7,713 8,095 49,8677,317
16,374 16,647 16,281 18,165
Upper VIPrincipal Subsidiary Principal Subsidiary
20,107
Grade I II III IV V Total
111,75312,109 12,070
5,915 6,243
Lower VI
-90 -
Tamil 387 5.3 378 5.2 355 4.9 126 1.6 114 1.4 43 0.7 16 0.3 20 0.3 9 0.1 1,448 2.9 Telugu 138 1.9 147 2.0 147 2.0 45 0.6 42 0.5 12 0.2 11 0.2 7 0.1 3 0.0 552 1.1 Arabic 583 8.0 544 7.4 494 6.8 167 2.2 122 1.5 8 0.1 10 0.2 7 0.1 6 0.1 1,941 3.9 Marathi 125 1.7 112 1.5 102 1.4 34 0.4 39 0.5 5 0.1 1 0.0 8 0.1 2 0.0 428 0.9 Modern Chinese 111 1.5 82 1.1 70 1.0 12 0.2 16 0.2 1 0.0 - - 2 - - - 294 0.6 All Oriental languages 5,538 75.7 5,330 72.7 5,035 69.5 1,727 22.4 1,815 22.4 347 5.9 259 4.4 315 5.0 267 4.3 20,633 41.4 PrivateTotal number of studentsOriental language Number % Number % Number % Number % Number % Number % Number % Number % Number % Number % Hindi 1,933 19.8 1,925 19.3 1,758 18.2 706 6.3 842 6.7 257 3.9 41 0.6 245 4.0 42 0.7 7,749 11.8 Urdu 276 2.8 254 2.5 265 2.7 112 1.0 157 1.2 53 0.8 4 0.1 45 0.7 1 0.0 1,167 1.8 Tamil 159 1.6 145 1.5 110 1.1 20 0.2 14 0.1 6 0.1 - - 6 0.1 - - 460 0.7 Telugu 31 0.3 19 0.2 34 0.4 6 0.1 6 0.0 1 0.0 - - - - - - 97 0.1 Arabic 559 5.7 594 5.9 509 5.3 150 1.3 112 0.9 26 0.4 8 0.1 34 0.6 12 0.2 2,004 3.0 Marathi 90 0.9 74 - 60 0.6 - - - - - - - - - - - - 224 0.3 Modern Chinese 78 0.8 52 0.5 58 0.6 43 0.4 17 0.1 10 0.2 - - 9 0.1 - - 267 0.4 All Oriental languages 3,126 32.0 3,063 30.6 2,794 28.9 1,037 9.3 1,148 9.1 353 5.4 53 0.8 339 5.6 55 0.9 11,968 18.2
9,758 12,6549,995 9,664 11,123 6,511 6,105 65,810
0 -
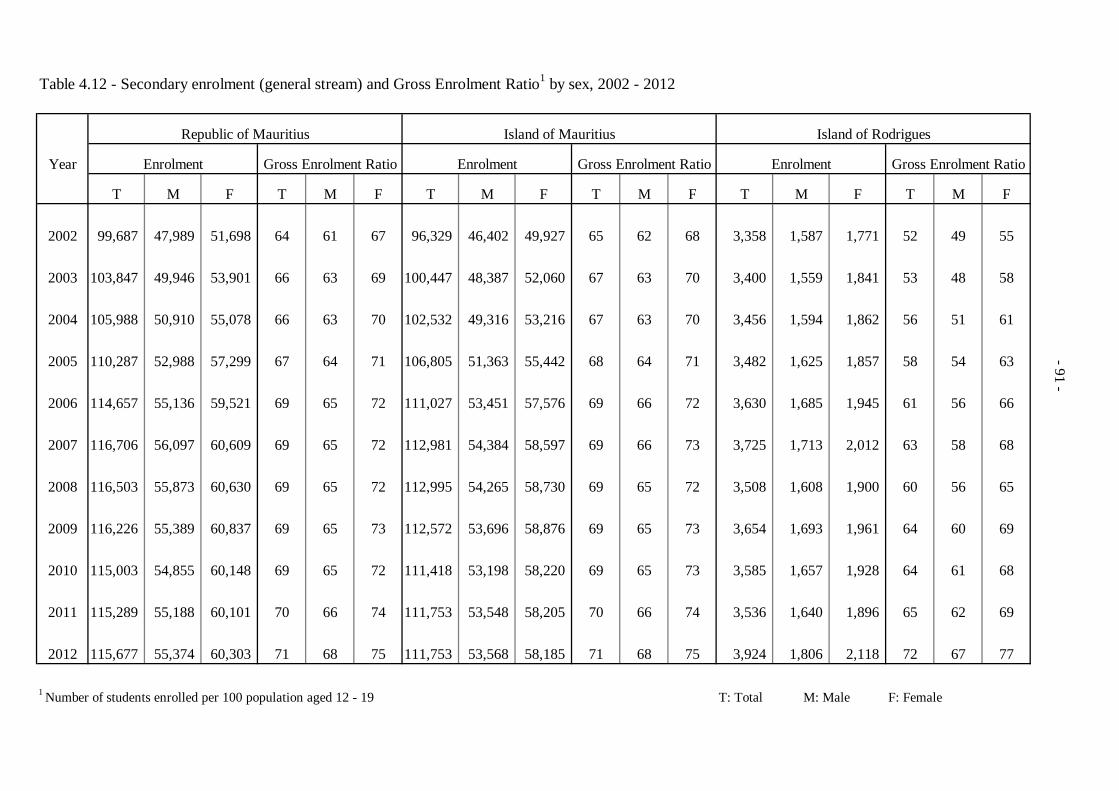
Table 4.12 - Secondary enrolment (general stream) and Gross Enrolment Ratio1 by sex, 2002 - 2012
Year Enrolment Enrolment Enrolment
T M F T M F T M F T M F T M F T M F
2002 99,687 47,989 51,698 64 61 67 96,329 46,402 49,927 65 62 68 3,358 1,587 1,771 52 49 55
2003 103,847 49,946 53,901 66 63 69 100,447 48,387 52,060 67 63 70 3,400 1,559 1,841 53 48 58
2004 105,988 50,910 55,078 66 63 70 102,532 49,316 53,216 67 63 70 3,456 1,594 1,862 56 51 61
2005 110,287 52,988 57,299 67 64 71 106,805 51,363 55,442 68 64 71 3,482 1,625 1,857 58 54 63
2006 114,657 55,136 59,521 69 65 72 111,027 53,451 57,576 69 66 72 3,630 1,685 1,945 61 56 66
2007 116,706 56,097 60,609 69 65 72 112,981 54,384 58,597 69 66 73 3,725 1,713 2,012 63 58 68
2008 116,503 55,873 60,630 69 65 72 112,995 54,265 58,730 69 65 72 3,508 1,608 1,900 60 56 65
2009 116,226 55,389 60,837 69 65 73 112,572 53,696 58,876 69 65 73 3,654 1,693 1,961 64 60 69
2010 115,003 54,855 60,148 69 65 72 111,418 53,198 58,220 69 65 73 3,585 1,657 1,928 64 61 68
2011 115,289 55,188 60,101 70 66 74 111,753 53,548 58,205 70 66 74 3,536 1,640 1,896 65 62 69
2012 115,677 55,374 60,303 71 68 75 111,753 53,568 58,185 71 68 75 3,924 1,806 2,118 72 67 77
1 Number of students enrolled per 100 population aged 12 - 19 T: Total M: Male F: Female
Republic of Mauritius Island of Mauritius Island of Rodrigues
Gross Enrolment Ratio Gross Enrolment Ratio Gross Enrolment Ratio
-124 --91 -
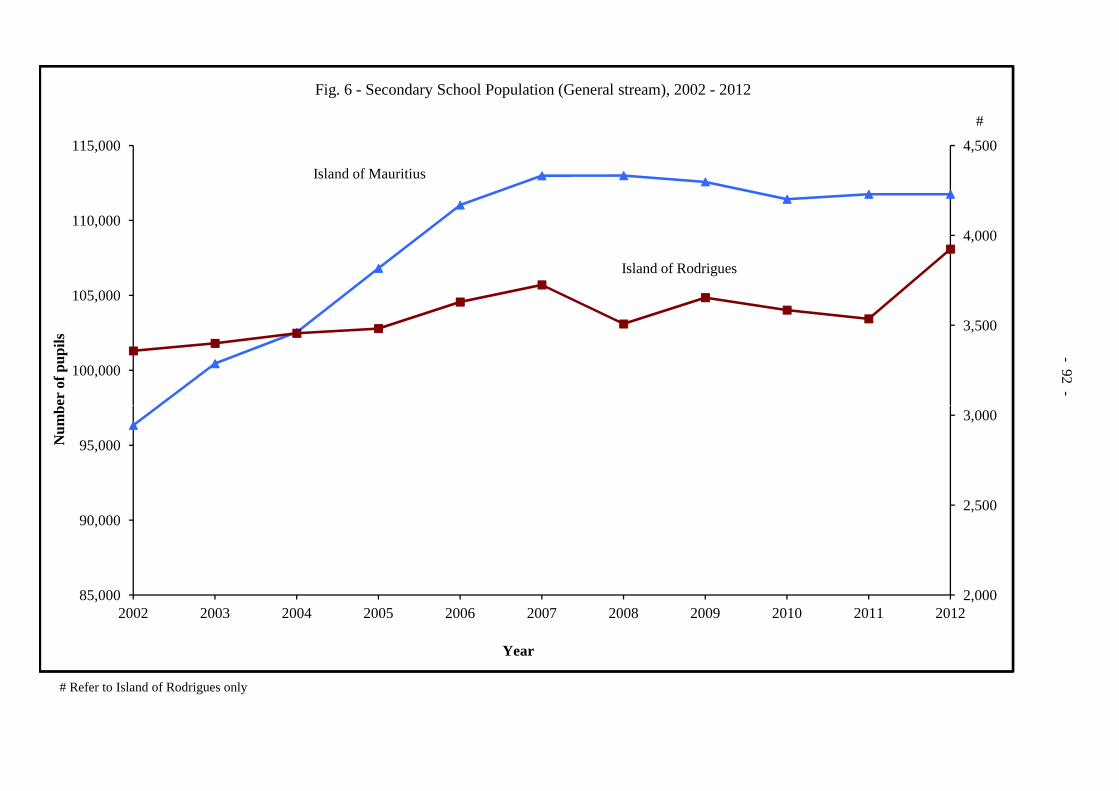
3,500
4,000
4,500
100,000
105,000
110,000
115,000
er o
f pup
ils
Fig. 6 - Secondary School Population (General stream), 2002 - 2012
#
-92 -
Island of Mauritius
Island of Rodrigues
# Refer to Island of Rodrigues only
2,000
2,500
3,000
85,000
90,000
95,000
2002 2003 2004 2005 2006 2007 2008 2009 2010 2011 2012
Num
b
Year

65
67 6768
69 69 69 69 6970
71
5253
56
58
61
63
60
64 6465
72
55
60
65
70
75
nrol
men
t Rat
io
Fig. 7 - Gross Enrolment Ratio at Secondary level (General stream), 2002 - 2012
Island of Mauritius
Island of Rodrigues
-93 -
52
40
45
50
2002 2003 2004 2005 2006 2007 2008 2009 2010 2011 2012
En
Year
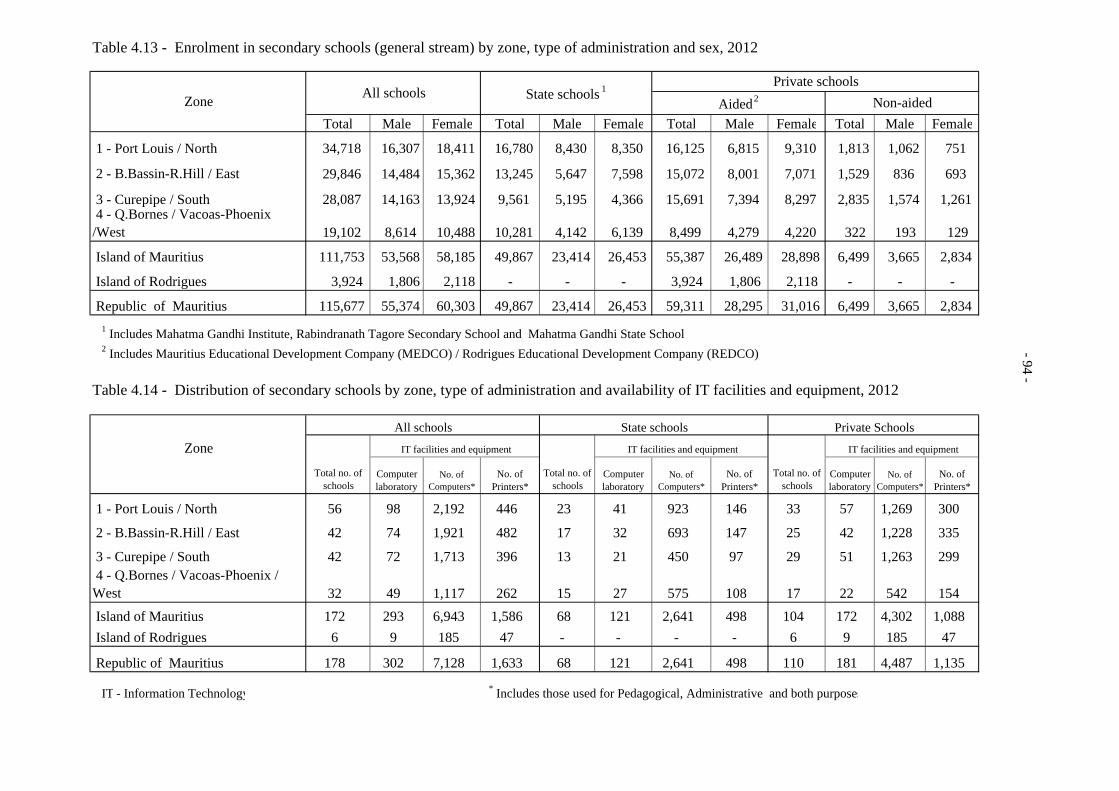
Table 4.13 - Enrolment in secondary schools (general stream) by zone, type of administration and sex, 2012
Total Male Female Total Male Female Total Male Female Total Male Female
1 - Port Louis / North 34,718 16,307 18,411 16,780 8,430 8,350 16,125 6,815 9,310 1,813 1,062 751
2 - B.Bassin-R.Hill / East 29,846 14,484 15,362 13,245 5,647 7,598 15,072 8,001 7,071 1,529 836 693
3 - Curepipe / South 28,087 14,163 13,924 9,561 5,195 4,366 15,691 7,394 8,297 2,835 1,574 1,261 4 - Q.Bornes / Vacoas-Phoenix /West 19,102 8,614 10,488 10,281 4,142 6,139 8,499 4,279 4,220 322 193 129
Island of Mauritius 111,753 53,568 58,185 49,867 23,414 26,453 55,387 26,489 28,898 6,499 3,665 2,834
Island of Rodrigues 3,924 1,806 2,118 - - - 3,924 1,806 2,118 - - -
Republic of Mauritius 115,677 55,374 60,303 49,867 23,414 26,453 59,311 28,295 31,016 6,499 3,665 2,834
1 Includes Mahatma Gandhi Institute, Rabindranath Tagore Secondary School and Mahatma Gandhi State School
Table 4.14 - Distribution of secondary schools by zone, type of administration and availability of IT facilities and equipment, 2012
All schools State schools Private Schools
Zone
Computer laboratory
No. of Computers*
No. of Printers*
Computer laboratory
No. of Computers*
No. of Printers*
Computer laboratory
No. of Computers*
No. of Printers*
1 - Port Louis / North 56 98 2,192 446 23 41 923 146 33 57 1,269 300
2 - B.Bassin-R.Hill / East 42 74 1,921 482 17 32 693 147 25 42 1,228 335
3 - Curepipe / South 42 72 1,713 396 13 21 450 97 29 51 1,263 299 4 - Q.Bornes / Vacoas-Phoenix / West 32 49 1,117 262 15 27 575 108 17 22 542 154 Island of Mauritius 172 293 6,943 1,586 68 121 2,641 498 104 172 4,302 1,088 Island of Rodrigues 6 9 185 47 - - - - 6 9 185 47
Republic of Mauritius 178 302 7,128 1,633 68 121 2,641 498 110 181 4,487 1,135
IT - Information Technology * Includes those used for Pedagogical, Administrative and both purposes
IT facilities and equipment
Total no. of schools
Total no. of schools
Total no. of schools
IT facilities and equipment IT facilities and equipment
2 Includes Mauritius Educational Development Company (MEDCO) / Rodrigues Educational Development Company (REDCO)
Private schoolsAided 2 Non-aided
All schoolsZone State schools 1 -94 -
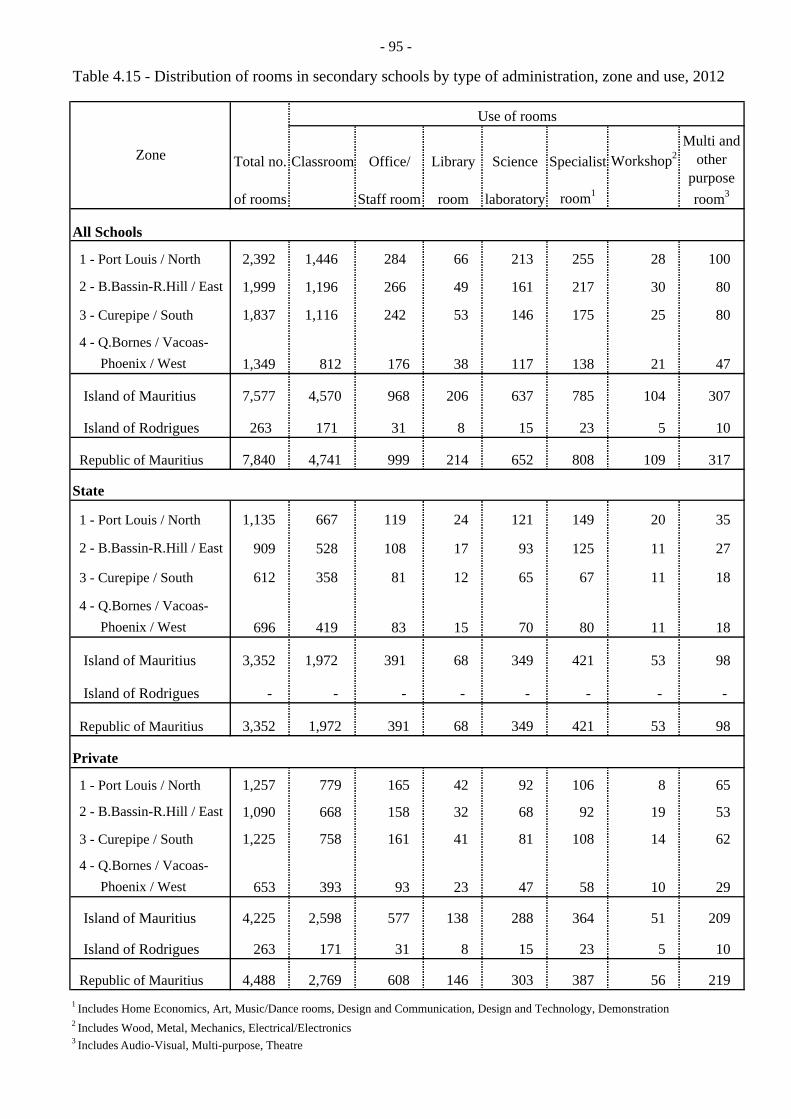
- 95 -
Table 4.15 - Distribution of rooms in secondary schools by type of administration, zone and use, 2012
Total no. Classroom Office/ Library Science Specialist Workshop2
of rooms Staff room room laboratory room1
All Schools
1 - Port Louis / North 2,392 1,446 284 66 213 255 28 100
2 - B.Bassin-R.Hill / East 1,999 1,196 266 49 161 217 30 80
3 - Curepipe / South 1,837 1,116 242 53 146 175 25 80
4 - Q.Bornes / Vacoas- Phoenix / West 1,349 812 176 38 117 138 21 47
Island of Mauritius 7,577 4,570 968 206 637 785 104 307
Island of Rodrigues 263 171 31 8 15 23 5 10
Republic of Mauritius 7,840 4,741 999 214 652 808 109 317
State
1 - Port Louis / North 1,135 667 119 24 121 149 20 35
2 - B.Bassin-R.Hill / East 909 528 108 17 93 125 11 27
3 - Curepipe / South 612 358 81 12 65 67 11 18
4 - Q.Bornes / Vacoas- Phoenix / West 696 419 83 15 70 80 11 18
Island of Mauritius 3,352 1,972 391 68 349 421 53 98
Island of Rodrigues - - - - - - - -
Republic of Mauritius 3,352 1,972 391 68 349 421 53 98
Private
1 - Port Louis / North 1,257 779 165 42 92 106 8 65
2 - B.Bassin-R.Hill / East 1,090 668 158 32 68 92 19 53
3 - Curepipe / South 1,225 758 161 41 81 108 14 62
4 - Q.Bornes / Vacoas- Phoenix / West 653 393 93 23 47 58 10 29
Island of Mauritius 4,225 2,598 577 138 288 364 51 209
Island of Rodrigues 263 171 31 8 15 23 5 10
Republic of Mauritius 4,488 2,769 608 146 303 387 56 219 1 Includes Home Economics, Art, Music/Dance rooms, Design and Communication, Design and Technology, Demonstration2 Includes Wood, Metal, Mechanics, Electrical/Electronics 3 Includes Audio-Visual, Multi-purpose, Theatre
ZoneMulti and
other purpose room3
Use of rooms
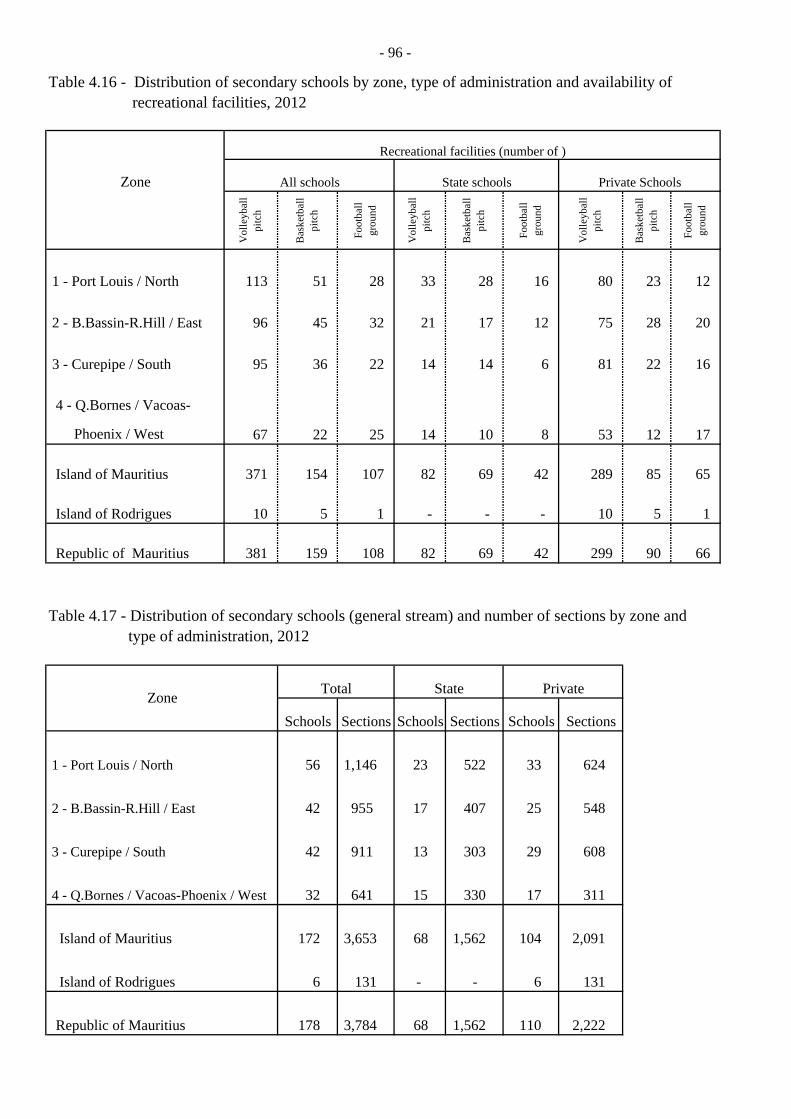
- 96 -
Table 4.16 - Distribution of secondary schools by zone, type of administration and availability of recreational facilities, 2012
Zone All schools State schools Private Schools
Vol
leyb
all
pitc
h
Bas
ketb
all
pitc
h
Foot
ball
grou
nd
Vol
leyb
all
pitc
h
Bas
ketb
all
pitc
h
Foot
ball
grou
nd
Vol
leyb
all
pitc
h
Bas
ketb
all
pitc
h
Foot
ball
grou
nd
1 - Port Louis / North 113 51 28 33 28 16 80 23 12
2 - B.Bassin-R.Hill / East 96 45 32 21 17 12 75 28 20
3 - Curepipe / South 95 36 22 14 14 6 81 22 16
4 - Q.Bornes / Vacoas-
Phoenix / West 67 22 25 14 10 8 53 12 17
Island of Mauritius 371 154 107 82 69 42 289 85 65
Island of Rodrigues 10 5 1 - - - 10 5 1
Republic of Mauritius 381 159 108 82 69 42 299 90 66
Table 4.17 - Distribution of secondary schools (general stream) and number of sections by zone and type of administration, 2012
Schools Sections Schools Sections Schools Sections
56 1,146 23 522 33 624
42 955 17 407 25 548
42 911 13 303 29 608
32 641 15 330 17 311
172 3,653 68 1,562 104 2,091
6 131 - - 6 131
178 3,784 68 1,562 110 2,222
Recreational facilities (number of )
PrivateTotal StateZone
Republic of Mauritius
Island of Mauritius
Island of Rodrigues
1 - Port Louis / North
2 - B.Bassin-R.Hill / East
3 - Curepipe / South
4 - Q.Bornes / Vacoas-Phoenix / West
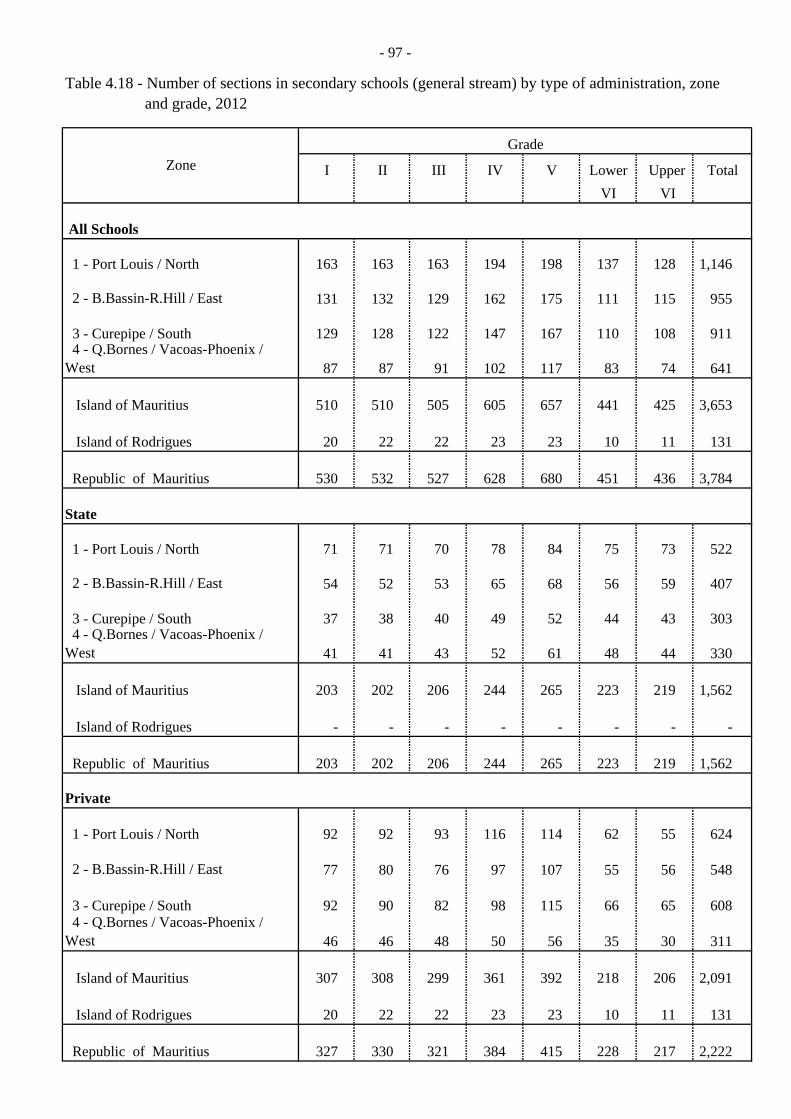
- 97 -
Table 4.18 - Number of sections in secondary schools (general stream) by type of administration, zone and grade, 2012
Grade
I II III IV V Lower Upper Total VI VI
All Schools
1 - Port Louis / North 163 163 163 194 198 137 128 1,146
2 - B.Bassin-R.Hill / East 131 132 129 162 175 111 115 955
3 - Curepipe / South 129 128 122 147 167 110 108 911 4 - Q.Bornes / Vacoas-Phoenix / West 87 87 91 102 117 83 74 641
Island of Mauritius 510 510 505 605 657 441 425 3,653
Island of Rodrigues 20 22 22 23 23 10 11 131
Republic of Mauritius 530 532 527 628 680 451 436 3,784
State
1 - Port Louis / North 71 71 70 78 84 75 73 522
2 - B.Bassin-R.Hill / East 54 52 53 65 68 56 59 407
3 - Curepipe / South 37 38 40 49 52 44 43 303 4 - Q.Bornes / Vacoas-Phoenix / West 41 41 43 52 61 48 44 330
Island of Mauritius 203 202 206 244 265 223 219 1,562
Island of Rodrigues - - - - - - - -
Republic of Mauritius 203 202 206 244 265 223 219 1,562
Private
1 - Port Louis / North 92 92 93 116 114 62 55 624
2 - B.Bassin-R.Hill / East 77 80 76 97 107 55 56 548
3 - Curepipe / South 92 90 82 98 115 66 65 608 4 - Q.Bornes / Vacoas-Phoenix / West 46 46 48 50 56 35 30 311
Island of Mauritius 307 308 299 361 392 218 206 2,091
Island of Rodrigues 20 22 22 23 23 10 11 131
Republic of Mauritius 327 330 321 384 415 228 217 2,222
Zone
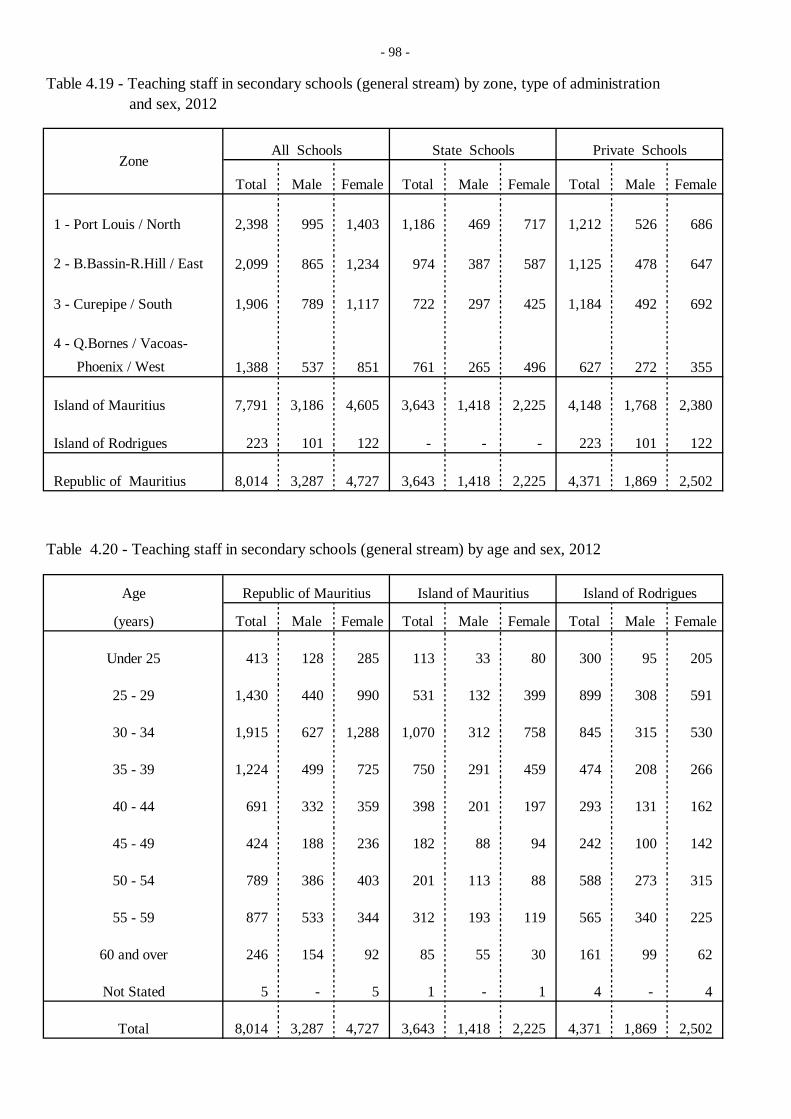
- 98 -
Table 4.19 - Teaching staff in secondary schools (general stream) by zone, type of administration and sex, 2012
All Schools State Schools Private Schools
Total Male Female Total Male Female Total Male Female
1 - Port Louis / North 2,398 995 1,403 1,186 469 717 1,212 526 686
2 - B.Bassin-R.Hill / East 2,099 865 1,234 974 387 587 1,125 478 647
3 - Curepipe / South 1,906 789 1,117 722 297 425 1,184 492 692
4 - Q.Bornes / Vacoas- Phoenix / West 1,388 537 851 761 265 496 627 272 355
Island of Mauritius 7,791 3,186 4,605 3,643 1,418 2,225 4,148 1,768 2,380
Island of Rodrigues 223 101 122 - - - 223 101 122
Republic of Mauritius 8,014 3,287 4,727 3,643 1,418 2,225 4,371 1,869 2,502
Table 4.20 - Teaching staff in secondary schools (general stream) by age and sex, 2012
Age Republic of Mauritius Island of Mauritius Island of Rodrigues
(years) Total Male Female Total Male Female Total Male Female
Under 25 413 128 285 113 33 80 300 95 205
25 - 29 1,430 440 990 531 132 399 899 308 591
30 - 34 1,915 627 1,288 1,070 312 758 845 315 530
35 - 39 1,224 499 725 750 291 459 474 208 266
40 - 44 691 332 359 398 201 197 293 131 162
45 - 49 424 188 236 182 88 94 242 100 142
50 - 54 789 386 403 201 113 88 588 273 315
55 - 59 877 533 344 312 193 119 565 340 225
60 and over 246 154 92 85 55 30 161 99 62
Not Stated 5 - 5 1 - 1 4 - 4
Total 8,014 3,287 4,727 3,643 1,418 2,225 4,371 1,869 2,502
Zone

- 99 -
Table 4.21 - Teaching staff in secondary schools (general stream) by sex, zone and highest academic qualification, 2012
Highest Academic Qualification
School Certificate or
equivalent
Higher School Certificate or
equivalent
Certificate or
DiplomaFirst
DegreePost
Graduate Total
Total
1 - Port Louis / North 46 172 252 1,557 371 2,398
2 - B.Bassin-R.Hill / East 42 159 246 1,397 255 2,099
3 - Curepipe / South 44 246 253 1,145 218 1,906
4 - Q.Bornes / Vacoas-Phoenix / West 57 148 88 885 210 1,388
Island of Mauritius 189 725 839 4,984 1,054 7,791
Island of Rodrigues 3 34 28 155 3 223
Republic of Mauritius 192 759 867 5,139 1,057 8,014
Male
1 - Port Louis / North 28 78 98 641 150 995
2 - B.Bassin-R.Hill / East 27 75 109 572 82 865
3 - Curepipe / South 27 102 99 469 92 789
4 - Q.Bornes / Vacoas-Phoenix / West 33 70 37 312 85 537
Island of Mauritius 115 325 343 1,994 409 3,186
Island of Rodrigues 1 19 13 66 2 101
Republic of Mauritius 116 344 356 2,060 411 3,287
Female
1 - Port Louis / North 18 94 154 916 221 1,403
2 - B.Bassin-R.Hill / East 15 84 137 825 173 1,234
3 - Curepipe / South 17 144 154 676 126 1,117
4 - Q.Bornes / Vacoas-Phoenix / West 24 78 51 573 125 851
Island of Mauritius 74 400 496 2,990 645 4,605
Island of Rodrigues 2 15 15 89 1 122
Republic of Mauritius 76 415 511 3,079 646 4,727
Zone

Table 4.22 - Teaching staff in secondary schools (general stream) by length of teaching experience, type of administration and sex, 2012
Length of teaching All Schools State Schools Private Schools All Schools State Schools Private Schools
experience T M F T M F T M F T M F T M F T M F T M F(in years) Republic of Mauritius Island of Mauritius
Island of Rodrigues
Under 3 1,632 575 1,057 723 235 488 909 340 569 1,563 544 1,019 723 235 488 840 309 531 69 31 38
3 and under 6 1,113 380 733 473 152 321 640 228 412 1,075 365 710 473 152 321 602 213 389 38 15 23
6 " " 9 1,312 472 840 689 230 459 623 242 381 1,286 462 824 689 230 459 597 232 365 26 10 16
9 " " 12 946 361 585 581 211 370 365 150 215 921 348 573 581 211 370 340 137 203 25 13 12
12 " " 15 596 254 342 371 159 212 225 95 130 575 243 332 371 159 212 204 84 120 21 11 10
15 " " 18 416 174 242 167 65 102 249 109 140 396 167 229 167 65 102 229 102 127 20 7 13
18 " " 21 325 175 150 116 53 63 209 122 87 316 168 148 116 53 63 200 115 85 9 7 2
21 " " 24 283 146 137 111 68 43 172 78 94 279 143 136 111 68 43 168 75 93 4 3 1
24 " " 27 204 113 91 61 42 19 143 71 72 203 112 91 61 42 19 142 70 72 1 1 -
27 " " 30 156 96 60 65 46 19 91 50 41 152 95 57 65 46 19 87 49 38 4 1 3
30 and over 1,031 541 490 286 157 129 745 384 361 1,025 539 486 286 157 129 739 382 357 6 2 4
Total 8,014 3,287 4,727 3,643 1,418 2,225 4,371 1,869 2,502 7,791 3,186 4,605 3,643 1,418 2,225 4,148 1,768 2,380 223 101 122
1 Refer to REDCO and Private schools T: Total M: Male F: Female
All Schools1
-100 -
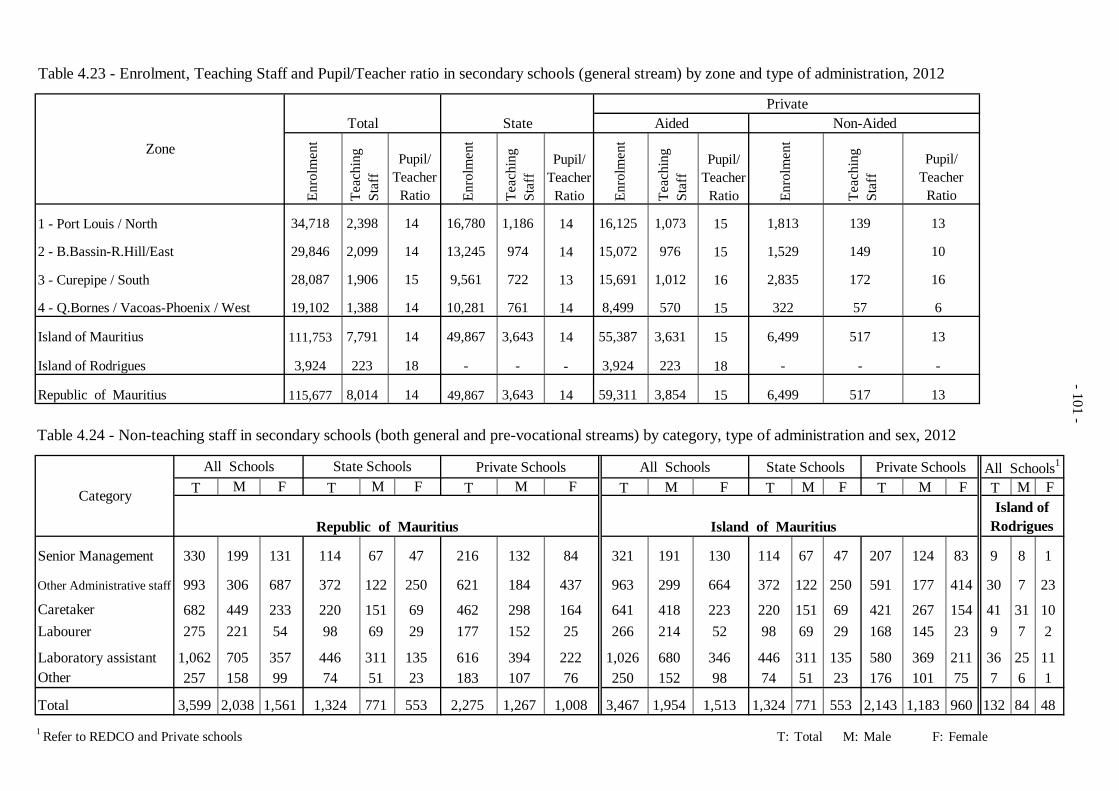
Table 4.23 - Enrolment, Teaching Staff and Pupil/Teacher ratio in secondary schools (general stream) by zone and type of administration, 2012
Pupil/ Teacher
Ratio
Pupil/ Teacher
Ratio
1 - Port Louis / North 14 15
14 15
3 - Curepipe / South 13 16
14 15
14 15
- 18
14 15
Table 4.24 - Non-teaching staff in secondary schools (both general and pre-vocational streams) by category, type of administration and sex, 2012
Private Schools All Schools State Schools Private SchoolsM F T M F T M F T M F
Republic of Mauritius Island of Mauritius Island of
Rodrigues
191 114 67 47 207 124 83 9 8 1
299 372 122 250 591 177 414 30 7 23
Caretaker 418 220 151 69 421 267 154 41 31 10 214 98 69 29 168 145 23 9 7 2
680 446 311 135 580 369 211 36 25 11 Other 152 74 51 23 176 101 75 7 6 1
1,954 1,324 771 553 2,143 1,183 960 132 84 48
1 Refer to REDCO and Private schools T: Total M: Male F: Female
1,388
Republic of Mauritius
Island of Rodrigues
Senior Management
Other Administrative staff
Labourer
7,791
223 3,924
Island of Mauritius
Zone
34,718
29,846
115,677
2,398
2,099
8,014
Teac
hing
St
aff
Enro
lmen
t
111,753
49,867
Enro
lmen
t
14
14
49,867
14
15
18
14
9,561
3,854
761
-
3,643
1,186
974
3,643
15,072
59,311
722
6,499
Enro
lmen
t
Teac
hing
St
aff
139
149
517
2,835
322
16
6
PrivateNon-AidedAided
15,691
Enro
lmen
t
Teac
hing
St
aff
1,813
1,529
Pupil/ Teacher
Ratio
13
10
Teac
hing
St
aff
16,780
13,245
1,073
976 2 - B.Bassin-R.Hill/East
14
StateTotal
28,087
19,102
1,906
10,281
Pupil/ Teacher
Ratio
4 - Q.Bornes / Vacoas-Phoenix / West
All Schools1
M FT
-
16,125
3,924
8,499
55,387
13
Laboratory assistant
641 223
1,026 346
993
682
963 664
266 52
T
321 130
172
57
517
-
1,012
570
3,631
223
6,499
-
Total
250 98
3,467 1,513
158
13
-
330
257
3,599
199
306
449 221
705
275
1,062
687
233 54
357
2,038 1,561 1,324
74
114
372
220 98
446
132
184 621
462 177
122
67
151 69
2,275 771
298 152
394 107
1,267
311 51
135
MTFM
616 183
216
99
131
29
23
553
TCategory
State SchoolsAll Schools
47
F
250
69
1,008
84
437
164 25
222 76
-101 -

- 102 -
Table 4.25 - Pupil/Teacher Ratio in secondary schools (general stream) by type of administration, 2003 - 2012
No. of pupils
No. of teachers
Pupil / Teacher
RatioNo. of pupils
No. of teachers
Pupil / Teacher
RatioNo. of pupils
No. of teachers
Pupil / Teacher
Ratio
Republic of Mauritius
2003 103,847 5,938 17 30,900 2,104 15 72,947 3,834 19
2004 105,988 6,396 17 33,865 2,472 14 72,123 3,924 18
2005 110,287 6,785 16 37,205 2,687 14 73,082 4,098 18
2006 114,657 7,079 16 41,117 2,833 15 73,540 4,246 17
2007 116,706 7,423 16 44,436 3,098 14 72,270 4,325 17
2008 116,503 7,408 16 47,040 3,130 15 69,463 4,278 16
2009 116,226 7,564 15 48,561 3,251 15 67,665 4,313 16
2010 115,003 7,695 15 49,058 3,439 14 65,945 4,256 15
2011 115,289 7,873 15 49,705 3,546 14 65,584 4,327 15
2012 115,677 8,014 14 49,867 3,643 14 65,810 4,371 15
Island of Mauritius
2003 100,447 5,786 17 30,900 2,104 15 69,547 3,682 19
2004 102,532 6,227 16 33,865 2,472 14 68,667 3,755 18
2005 106,805 6,608 16 37,205 2,687 14 69,600 3,921 18
2006 111,027 6,876 16 41,117 2,833 15 69,910 4,043 17
2007 112,981 7,213 16 44,436 3,098 14 68,545 4,115 17
2008 112,995 7,197 16 47,040 3,130 15 65,955 4,067 16
2009 112,572 7,355 15 48,561 3,251 15 64,011 4,104 16
2010 111,418 7,490 15 49,058 3,439 14 62,360 4,051 15
2011 111,753 7,658 15 49,705 3,546 14 62,048 4,112 15
2012 111,753 7,791 14 49,867 3,643 14 61,886 4,148 15
Island of Rodrigues
2003 3,400 152 22 - - - 3,400 152 22
2004 3,456 169 20 - - - 3,456 169 20
2005 3,482 177 20 - - - 3,482 177 20
2006 3,630 203 18 - - - 3,630 203 18
2007 3,725 210 18 - - - 3,725 210 18
2008 3,508 211 17 - - - 3,508 211 17
2009 3,654 209 17 - - - 3,654 209 17
2010 3,585 205 17 - - - 3,585 205 17
2011 3,536 215 16 - - - 3,536 215 16
2012 3,924 223 18 - - - 3,924 223 18
All Schools State Schools Private Schools
Year
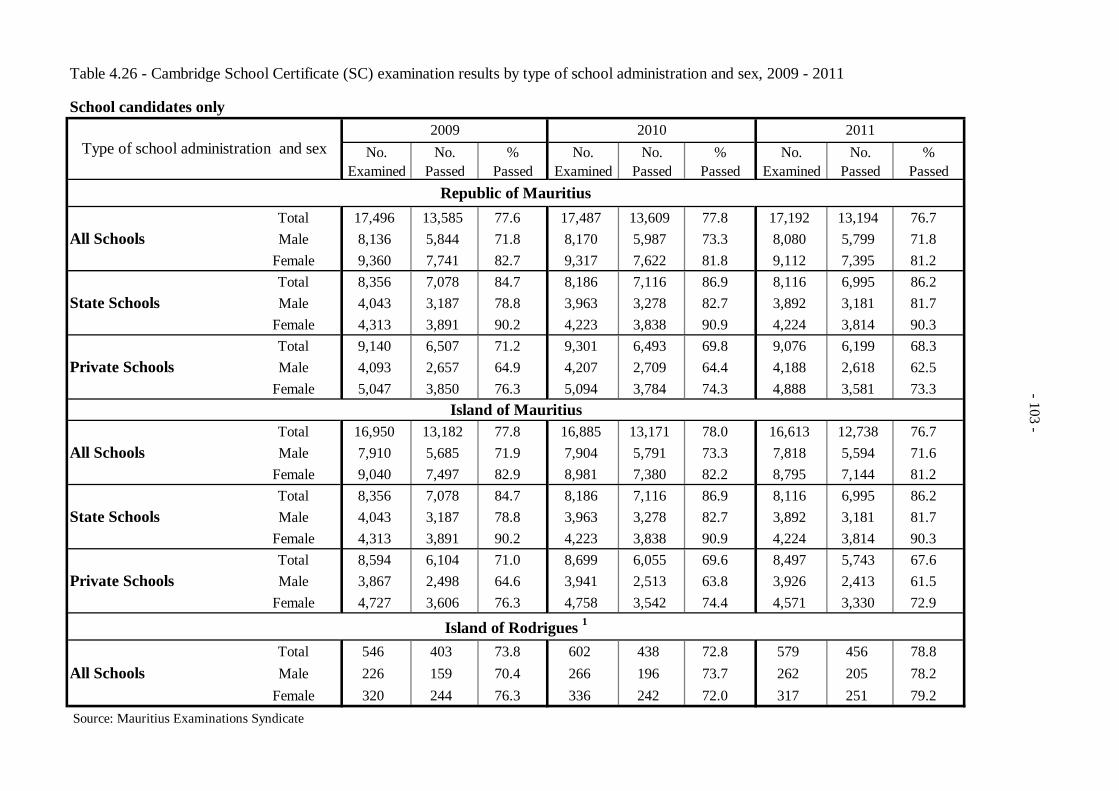
Table 4.26 - Cambridge School Certificate (SC) examination results by type of school administration and sex, 2009 - 2011
School candidates only
No. Examined
No. Passed
% Passed
No. Examined
No. Passed
% Passed
No. Examined
No. Passed
% Passed
Total 17,496 13,585 77.6 17,487 13,609 77.8 17,192 13,194 76.7 Male 8,136 5,844 71.8 8,170 5,987 73.3 8,080 5,799 71.8
Female 9,360 7,741 82.7 9,317 7,622 81.8 9,112 7,395 81.2 Total 8,356 7,078 84.7 8,186 7,116 86.9 8,116 6,995 86.2 Male 4,043 3,187 78.8 3,963 3,278 82.7 3,892 3,181 81.7
Female 4,313 3,891 90.2 4,223 3,838 90.9 4,224 3,814 90.3 Total 9,140 6,507 71.2 9,301 6,493 69.8 9,076 6,199 68.3 Male 4,093 2,657 64.9 4,207 2,709 64.4 4,188 2,618 62.5
Female 5,047 3,850 76.3 5,094 3,784 74.3 4,888 3,581 73.3
Total 16,950 13,182 77.8 16,885 13,171 78.0 16,613 12,738 76.7 Male 7,910 5,685 71.9 7,904 5,791 73.3 7,818 5,594 71.6
Female 9,040 7,497 82.9 8,981 7,380 82.2 8,795 7,144 81.2 Total 8,356 7,078 84.7 8,186 7,116 86.9 8,116 6,995 86.2 Male 4,043 3,187 78.8 3,963 3,278 82.7 3,892 3,181 81.7
Female 4,313 3,891 90.2 4,223 3,838 90.9 4,224 3,814 90.3 Total 8,594 6,104 71.0 8,699 6,055 69.6 8,497 5,743 67.6 Male 3,867 2,498 64.6 3,941 2,513 63.8 3,926 2,413 61.5
Female 4,727 3,606 76.3 4,758 3,542 74.4 4,571 3,330 72.9
Total 546 403 73.8 602 438 72.8 579 456 78.8 Male 226 159 70.4 266 196 73.7 262 205 78.2
Female 320 244 76.3 336 242 72.0 317 251 79.2 Source: Mauritius Examinations Syndicate
2010
Republic of Mauritius
2009
Island of Rodrigues 1
2011Type of school administration and sex
Island of Mauritius
Private Schools
State Schools
All Schools
All Schools
State Schools
Private Schools
All Schools
-103 -
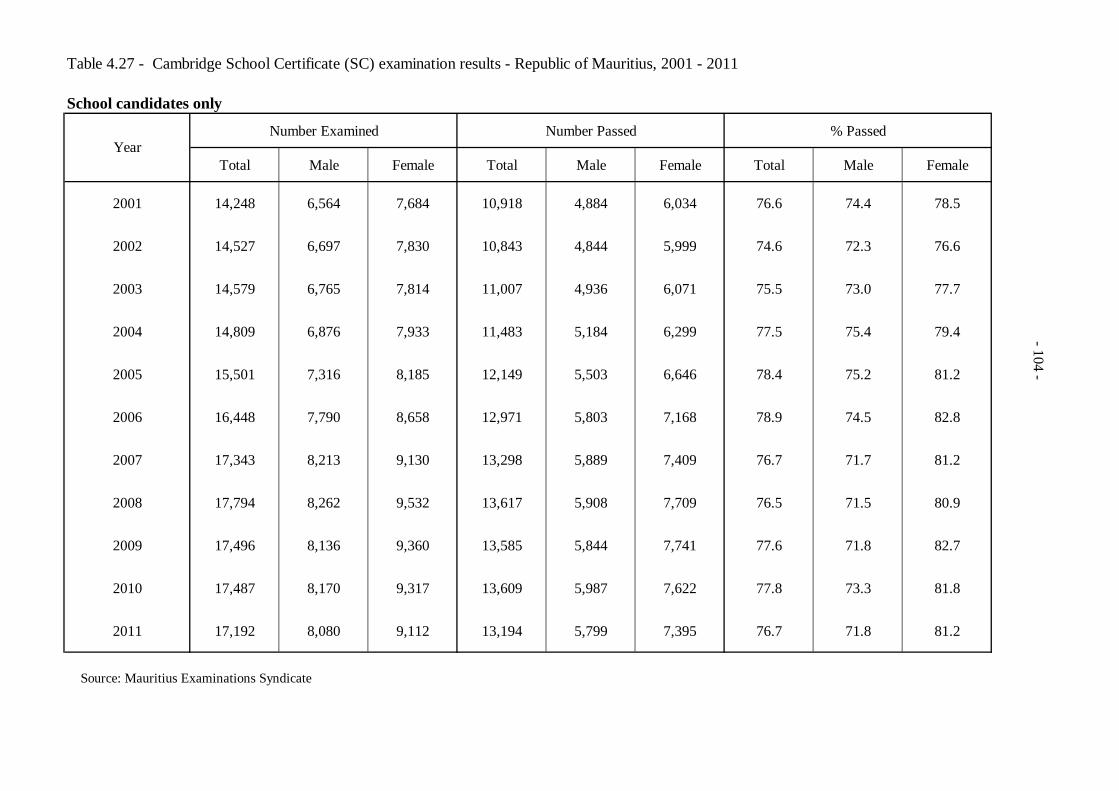
Table 4.27 - Cambridge School Certificate (SC) examination results - Republic of Mauritius, 2001 - 2011
School candidates only
Number Examined Number Passed % Passed
Total Male Female Total Male Female Total Male Female
2001 14,248 6,564 7,684 10,918 4,884 6,034 76.6 74.4 78.5
2002 14,527 6,697 7,830 10,843 4,844 5,999 74.6 72.3 76.6
2003 14,579 6,765 7,814 11,007 4,936 6,071 75.5 73.0 77.7
2004 14,809 6,876 7,933 11,483 5,184 6,299 77.5 75.4 79.4
2005 15,501 7,316 8,185 12,149 5,503 6,646 78.4 75.2 81.2
2006 16,448 7,790 8,658 12,971 5,803 7,168 78.9 74.5 82.8
2007 17,343 8,213 9,130 13,298 5,889 7,409 76.7 71.7 81.2
2008 17,794 8,262 9,532 13,617 5,908 7,709 76.5 71.5 80.9
2009 17,496 8,136 9,360 13,585 5,844 7,741 77.6 71.8 82.7
2010 17,487 8,170 9,317 13,609 5,987 7,622 77.8 73.3 81.8
2011 17,192 8,080 9,112 13,194 5,799 7,395 76.7 71.8 81.2
Source: Mauritius Examinations Syndicate
Year
-135 -
-104 -

Table 4.28 - Cambridge School Certificate (SC) examination results - Island of Mauritius, 2001 - 2011
School candidates only
Number Examined Number Passed % Passed
Total Male Female Total Male Female Total Male Female
2001 13,607 6,277 7,330 10,569 4,716 5,853 77.7 75.1 79.8
2002 13,997 6,476 7,521 10,526 4,712 5,814 75.2 72.8 77.3
2003 14,055 6,548 7,507 10,699 4,812 5,887 76.1 73.5 78.4
2004 14,297 6,641 7,656 11,169 5,038 6,131 78.1 75.9 80.1
2005 14,951 7,069 7,882 11,814 5,358 6,456 79.0 75.8 81.9
Year
-138 -
-105 -
2006 15,871 7,531 8,340 12,565 5,613 6,952 79.2 74.5 83.4
2007 16,761 7,948 8,813 12,866 5,704 7,162 76.8 71.8 81.3
2008 17,227 8,024 9,203 13,211 5,738 7,473 76.7 71.5 81.2
2009 16,950 7,910 9,040 13,182 5,685 7,497 77.8 71.9 82.9
2010 16,885 7,904 8,981 13,171 5,791 7,380 78.0 73.3 82.2
2011 16,613 7,818 8,795 12,738 5,594 7,144 76.7 71.6 81.2
Source: Mauritius Examinations Syndicate
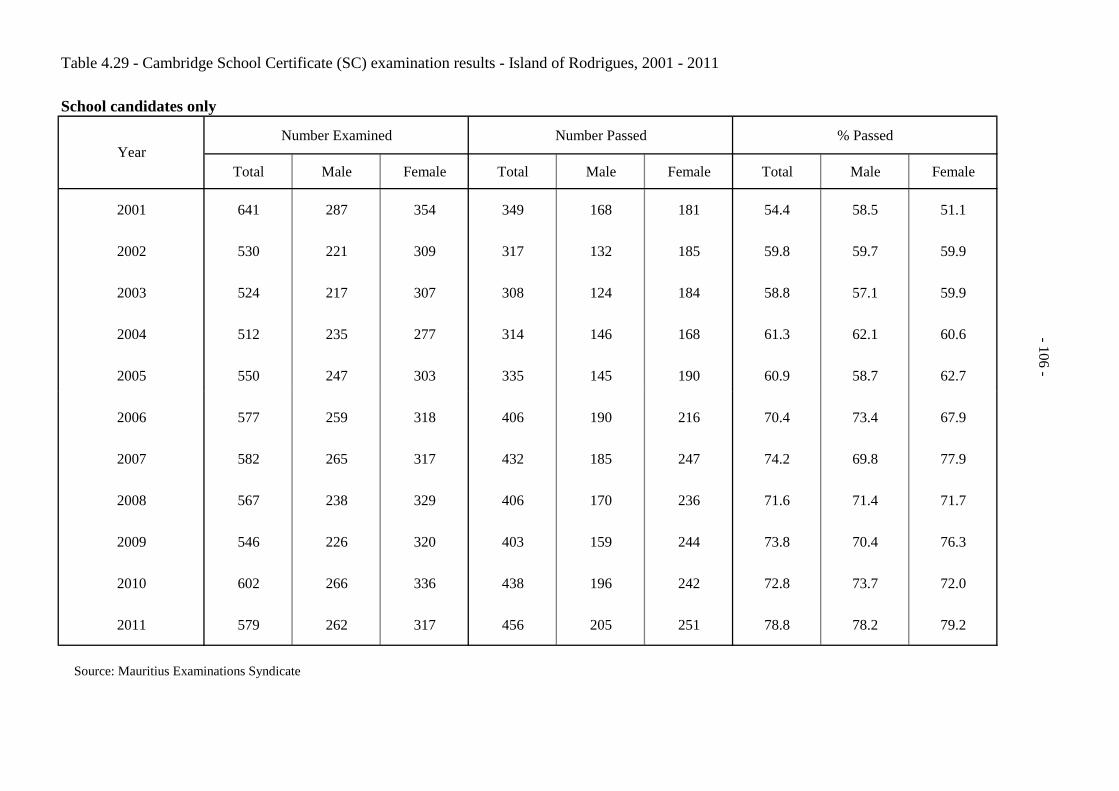
Table 4.29 - Cambridge School Certificate (SC) examination results - Island of Rodrigues, 2001 - 2011
School candidates only
Number Examined Number Passed % Passed
Total Male Female Total Male Female Total Male Female
2001 641 287 354 349 168 181 54.4 58.5 51.1
2002 530 221 309 317 132 185 59.8 59.7 59.9
2003 524 217 307 308 124 184 58.8 57.1 59.9
2004 512 235 277 314 146 168 61.3 62.1 60.6
2005 550 247 303 335 145 190 60.9 58.7 62.7
Year
-139 -
-106 -
2006 577 259 318 406 190 216 70.4 73.4 67.9
2007 582 265 317 432 185 247 74.2 69.8 77.9
2008 567 238 329 406 170 236 71.6 71.4 71.7
2009 546 226 320 403 159 244 73.8 70.4 76.3
2010 602 266 336 438 196 242 72.8 73.7 72.0
2011 579 262 317 456 205 251 78.8 78.2 79.2
Source: Mauritius Examinations Syndicate

Fig. 8 - School Certificate examination results, 2001 - 2011(School candidates only)
90.0
100.0
Island of Mauritius
77.775.2 76.1
78.1 79.0 79.2
76.8 76.777.8 78.0
76.7
78.880.0
70.4
74.271.6
73.872.8
60 0
70.0
enta
ge p
asse
d
-107 -
Island of Rodrigues
54.4
54.459.8
61.3 60.9
50.0
60.0
Perc
40.0
30.02001 2002 2003 2004 2005 2006 2007 2008 2009 2010 2011
Year
Source: Mauritius Examinations Syndicate
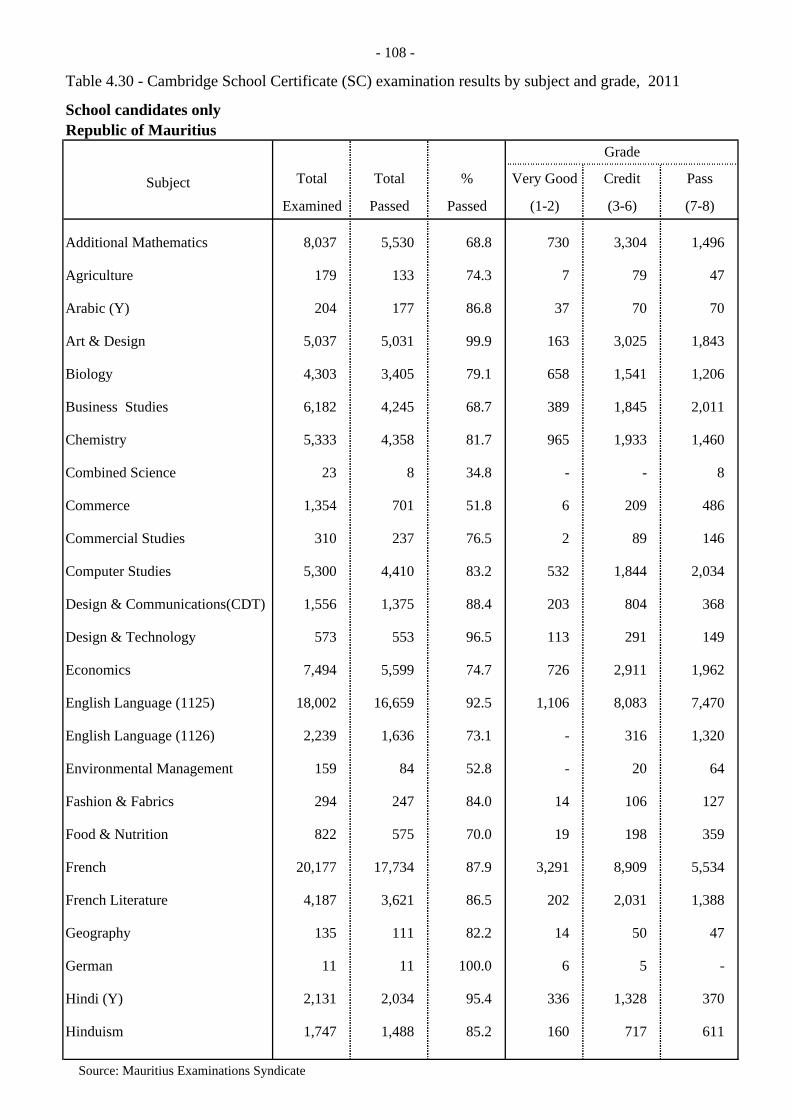
- 108 -
Table 4.30 - Cambridge School Certificate (SC) examination results by subject and grade, 2011
School candidates onlyRepublic of Mauritius
Subject Total Total % Very Good Credit Pass
Examined Passed Passed (1-2) (3-6) (7-8)
Additional Mathematics 8,037 5,530 68.8 730 3,304 1,496
Agriculture 179 133 74.3 7 79 47
Arabic (Y) 204 177 86.8 37 70 70
Art & Design 5,037 5,031 99.9 163 3,025 1,843
Biology 4,303 3,405 79.1 658 1,541 1,206
Business Studies 6,182 4,245 68.7 389 1,845 2,011
Chemistry 5,333 4,358 81.7 965 1,933 1,460
Combined Science 23 8 34.8 - - 8
Commerce 1,354 701 51.8 6 209 486
Commercial Studies 310 237 76.5 2 89 146
Computer Studies 5,300 4,410 83.2 532 1,844 2,034
Design & Communications(CDT) 1,556 1,375 88.4 203 804 368
Design & Technology 573 553 96.5 113 291 149
Economics 7,494 5,599 74.7 726 2,911 1,962
English Language (1125) 18,002 16,659 92.5 1,106 8,083 7,470
English Language (1126) 2,239 1,636 73.1 - 316 1,320
Environmental Management 159 84 52.8 - 20 64
Fashion & Fabrics 294 247 84.0 14 106 127
Food & Nutrition 822 575 70.0 19 198 359
French 20,177 17,734 87.9 3,291 8,909 5,534
French Literature 4,187 3,621 86.5 202 2,031 1,388
Geography 135 111 82.2 14 50 47
German 11 11 100.0 6 5 -
Hindi (Y) 2,131 2,034 95.4 336 1,328 370
Hinduism 1,747 1,488 85.2 160 717 611
Source: Mauritius Examinations Syndicate
Grade

- 109 -
Table 4.30 - Cambridge School Certificate (SC) examination results by subject and grade, 2011 (cont'd)
School candidates onlyRepublic of Mauritius
Subject Total Total % Very Good Credit Pass
Examined Passed Passed (1-2) (3-6) (7-8)
History(Mauritius) 54 23 42.6 3 11 9
Human & Social Biology 18 6 33.3 - 2 4
Islamic Religion & Culture 802 684 85.3 25 364 295
Literature in English 3,017 2,490 82.5 299 1,340 851
Literature in Hindi 61 60 98.4 20 33 7
M.S. Chinese (Y) 21 19 90.5 12 5 2
Marathi 37 31 83.8 2 17 12
Mathematics A 4,990 2,294 46.0 - 519 1,775
Mathematics D 15,042 11,850 78.8 1,892 5,923 4,035
Physics 4,798 3,993 83.2 984 1,880 1,129
Principle of Accounts 10,479 8,451 80.6 1,077 3,886 3,488
Physical Education 183 159 86.9 5 55 99
R.S. Bible Knowledge (2048) 87 57 65.5 2 24 31
Sanskrit 26 12 46.2 2 5 5
Sociology 3,046 2,406 79.0 224 1,145 1,037
Spanish 84 63 75.0 4 30 29
Statistics 58 27 46.6 13 11 3
Tamil (Y) 168 158 94.0 40 87 31
Telugu (Y) 62 60 96.8 15 28 17
Travel & Tourism 1,952 1,465 75.1 16 636 813
Twenty First Century Science 960 756 78.8 39 381 336
Urdu (Y) 492 464 94.3 131 219 114
Source: Mauritius Examinations Syndicate
Grade
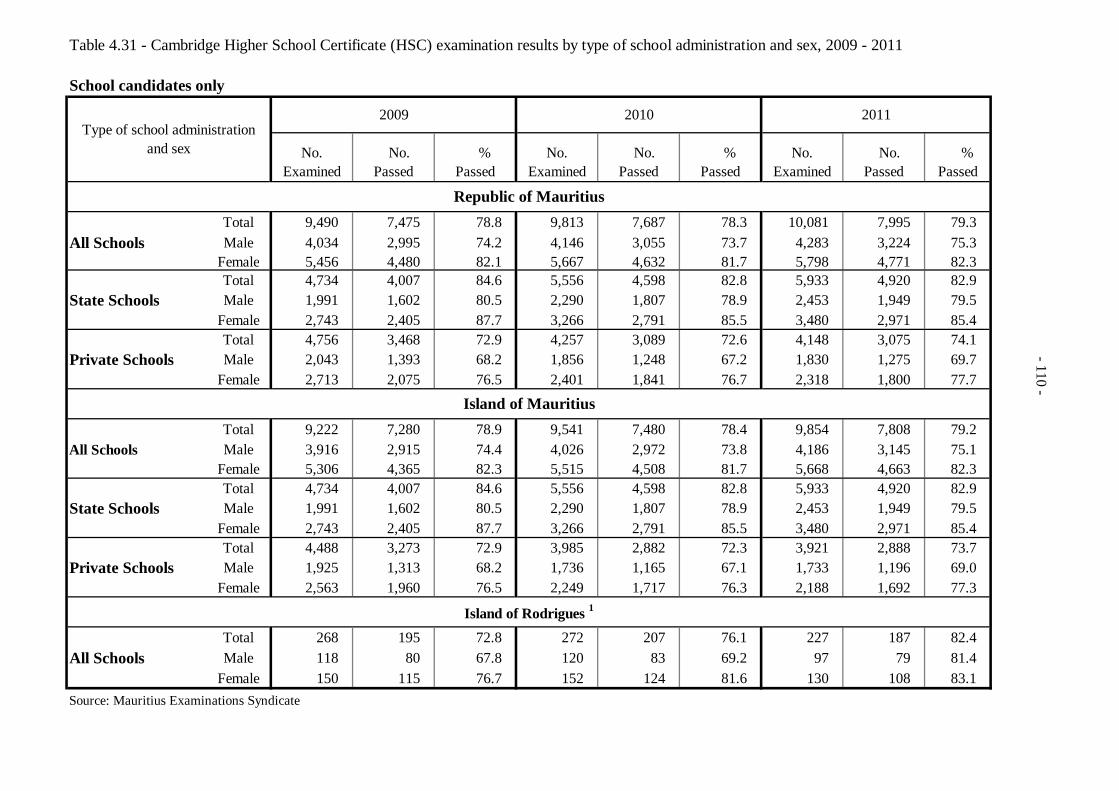
Table 4.31 - Cambridge Higher School Certificate (HSC) examination results by type of school administration and sex, 2009 - 2011
School candidates only
No. Examined
No. Passed
% Passed
No. Examined
No. Passed
% Passed
No. Examined
No. Passed
% Passed
Total 9,490 7,475 78.8 9,813 7,687 78.3 10,081 7,995 79.3 All Schools Male 4,034 2,995 74.2 4,146 3,055 73.7 4,283 3,224 75.3 Female 5,456 4,480 82.1 5,667 4,632 81.7 5,798 4,771 82.3
Total 4,734 4,007 84.6 5,556 4,598 82.8 5,933 4,920 82.9 State Schools Male 1,991 1,602 80.5 2,290 1,807 78.9 2,453 1,949 79.5
Female 2,743 2,405 87.7 3,266 2,791 85.5 3,480 2,971 85.4 Total 4,756 3,468 72.9 4,257 3,089 72.6 4,148 3,075 74.1
Private Schools Male 2,043 1,393 68.2 1,856 1,248 67.2 1,830 1,275 69.7 Female 2,713 2,075 76.5 2,401 1,841 76.7 2,318 1,800 77.7
Total 9,222 7,280 78.9 9,541 7,480 78.4 9,854 7,808 79.2 All Schools Male 3,916 2,915 74.4 4,026 2,972 73.8 4,186 3,145 75.1
Female 5,306 4,365 82.3 5,515 4,508 81.7 5,668 4,663 82.3 Total 4,734 4,007 84.6 5,556 4,598 82.8 5,933 4,920 82.9
State Schools Male 1,991 1,602 80.5 2,290 1,807 78.9 2,453 1,949 79.5 Female 2,743 2,405 87.7 3,266 2,791 85.5 3,480 2,971 85.4
Total 4,488 3,273 72.9 3,985 2,882 72.3 3,921 2,888 73.7 Private Schools Male 1,925 1,313 68.2 1,736 1,165 67.1 1,733 1,196 69.0 Female 2,563 1,960 76.5 2,249 1,717 76.3 2,188 1,692 77.3
Total 268 195 72.8 272 207 76.1 227 187 82.4 All Schools Male 118 80 67.8 120 83 69.2 97 79 81.4 Female 150 115 76.7 152 124 81.6 130 108 83.1 Source: Mauritius Examinations Syndicate
2009 20112010
Island of Rodrigues 1
Island of Mauritius
Republic of Mauritius
Type of school administration and sex
-110 -

Table 4.32 - Cambridge Higher School Certificate (HSC) examination results - Republic of Mauritius, 2001 - 2011
School candidates only
Number Examined Number Passed % Passed
Total Male Female Total Male Female Total Male Female
2001 6,796 3,181 3,615 4,974 2,228 2,746 73.2 70.0 76.0
2002 6,845 3,163 3,682 5,189 2,338 2,851 75.8 73.9 77.4
2003 7,205 3,307 3,898 5,411 2,346 3,065 75.1 70.9 78.6
2004 6,883 3,209 3,674 5,245 2,328 2,917 76.2 72.5 79.4
2005 7,274 3,301 3,973 5,686 2,430 3,256 78.2 73.6 82.0
2006 8,040 3,698 4,342 6,376 2,769 3,607 79.3 74.9 83.1
2007 8,517 3,896 4,621 6,622 2,842 3,780 77.8 72.9 81.8
2008 8,907 3,999 4,908 7,011 2,976 4,035 78.7 74.4 82.2
2009 9,490 4,034 5,456 7,475 2,995 4,480 78.8 74.2 82.1
2010 9,813 4,146 5,667 7,687 3,055 4,632 78.3 73.7 81.7
2011 10,081 4,283 5,798 7,995 3,224 4,771 79.3 75.3 82.3 Source: Mauritius Examinations Syndicate
Year
-111 -
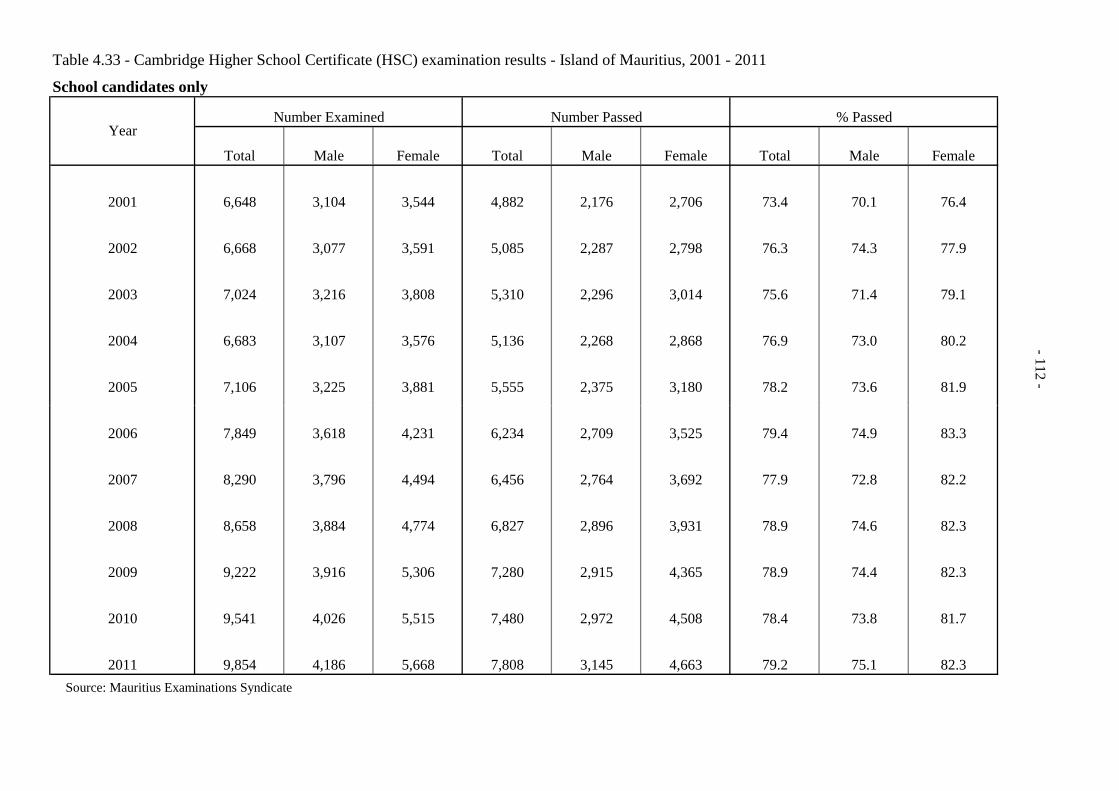
Table 4.33 - Cambridge Higher School Certificate (HSC) examination results - Island of Mauritius, 2001 - 2011
School candidates only
Number Examined Number Passed % Passed
Total Male Female Total Male Female Total Male Female
2001 6,648 3,104 3,544 4,882 2,176 2,706 73.4 70.1 76.4
2002 6,668 3,077 3,591 5,085 2,287 2,798 76.3 74.3 77.9
2003 7,024 3,216 3,808 5,310 2,296 3,014 75.6 71.4 79.1
2004 6,683 3,107 3,576 5,136 2,268 2,868 76.9 73.0 80.2
2005 7,106 3,225 3,881 5,555 2,375 3,180 78.2 73.6 81.9
Year
-112 -
2006 7,849 3,618 4,231 6,234 2,709 3,525 79.4 74.9 83.3
2007 8,290 3,796 4,494 6,456 2,764 3,692 77.9 72.8 82.2
2008 8,658 3,884 4,774 6,827 2,896 3,931 78.9 74.6 82.3
2009 9,222 3,916 5,306 7,280 2,915 4,365 78.9 74.4 82.3
2010 9,541 4,026 5,515 7,480 2,972 4,508 78.4 73.8 81.7
2011 9,854 4,186 5,668 7,808 3,145 4,663 79.2 75.1 82.3 Source: Mauritius Examinations Syndicate

Table 4.34 - Cambridge Higher School Certificate (HSC) examination results - Island of Rodrigues, 2001 - 2011
School candidates only
Number Examined Number Passed % Passed
Total Male Female Total Male Female Total Male Female
2001 148 77 71 92 52 40 62.2 67.5 56.3
2002 177 86 91 104 51 53 58.8 59.3 58.2
2003 181 91 90 101 50 51 55.8 54.9 56.7
2004 200 102 98 109 60 49 54.5 58.8 50.0
2005 168 76 92 131 55 76 78.0 72.4 82.6
Year
-113 -
2006 191 80 111 142 60 82 74.3 75.0 73.9
2007 227 100 127 166 78 88 73.1 78.0 69.3
2008 249 115 134 184 80 104 73.9 69.6 77.6
2009 268 118 150 195 80 115 72.8 67.8 76.7
2010 272 120 152 207 83 124 76.1 69.2 81.6
2011 227 97 130 187 79 108 82.4 81.4 83.1 Source: Mauritius Examinations Syndicate
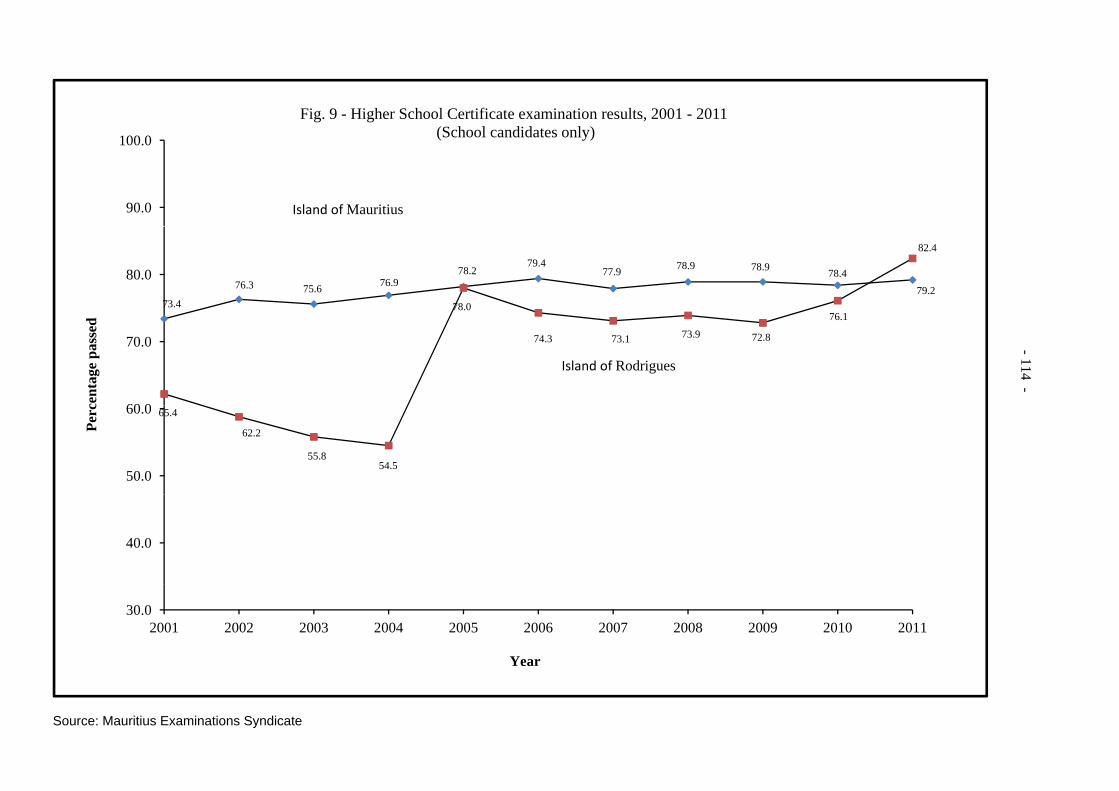
100 0
Fig. 9 - Higher School Certificate examination results, 2001 - 2011(School candidates only)
90.0
100.0 (School candidates only)
Island of Mauritius
73.4
76.3 75.6 76.978.2
79.477.9 78.9 78.9 78.4
79.278.0
76 1
82.4
80.0
74.3 73.1 73.9 72.8
76.1
60 0
70.0
cent
age
pass
ed
Island of Rodrigues
-114 -
65.4
62.2
55.854.5
50.0
60.0
Perc
40.0
30.02001 2002 2003 2004 2005 2006 2007 2008 2009 2010 2011
Year
Source: Mauritius Examinations Syndicate

- 115 -
Table 4.35 - Cambridge Higher School Certificate (HSC) examination results by subject and grade, 2011
Republic of Mauritius
Subject Total Total %
Examined Passed Passed (A - B) (C - E)
Accounting 4,233 3,090 73.0 748 2,342
Arabic 31 30 96.8 7 23
Art & Design 1,117 1,009 90.3 229 780
Biology 764 498 65.2 118 380
Business Studies 2,223 1,601 72.0 294 1,205
Chemistry 2,959 2,181 73.7 892 1,289
Chinese 1 1 100.0 1 -
Computing 928 700 75.4 152 548
Design & Technology 795 761 95.7 249 512
Design & Textiles 60 57 95.0 13 44
Divinity 9 4 44.4 - 4
Economics 2,746 2,119 77.2 588 1,531
Food studies 143 138 96.5 41 97
French 2,857 2,659 93.1 925 1,734
Geography 20 14 70.0 2 12
German 8 7 87.5 - 7
Hindi 438 411 93.8 148 263
Hinduism 634 561 88.5 87 474
Islamic Studies 233 187 80.3 37 150
Law 67 16 23.9 3 13
Literature in English 1,254 1,026 81.8 85 941
Marathi 8 8 100.0 3 5
Marine Science 10 5 50.0 1 4
Mathematics 6,303 5,425 86.1 2,261 3,164
Physics 3,107 2,424 78.0 944 1,480
Psychology 20 5 25.0 - 5
Sociology 1,016 669 65.8 106 563
Spanish 10 8 80.0 - 4
Tamil 39 38 97.4 19 19
Telugu 17 15 88.2 5 10
Thinking Skills 11 2 18.2 - 2
Travel & Tourism 241 197 81.7 1 196
Urdu 140 138 98.6 74 64
Source: Mauritius Examinations Syndicate
Grade
Principal
School candidates only - Principal level
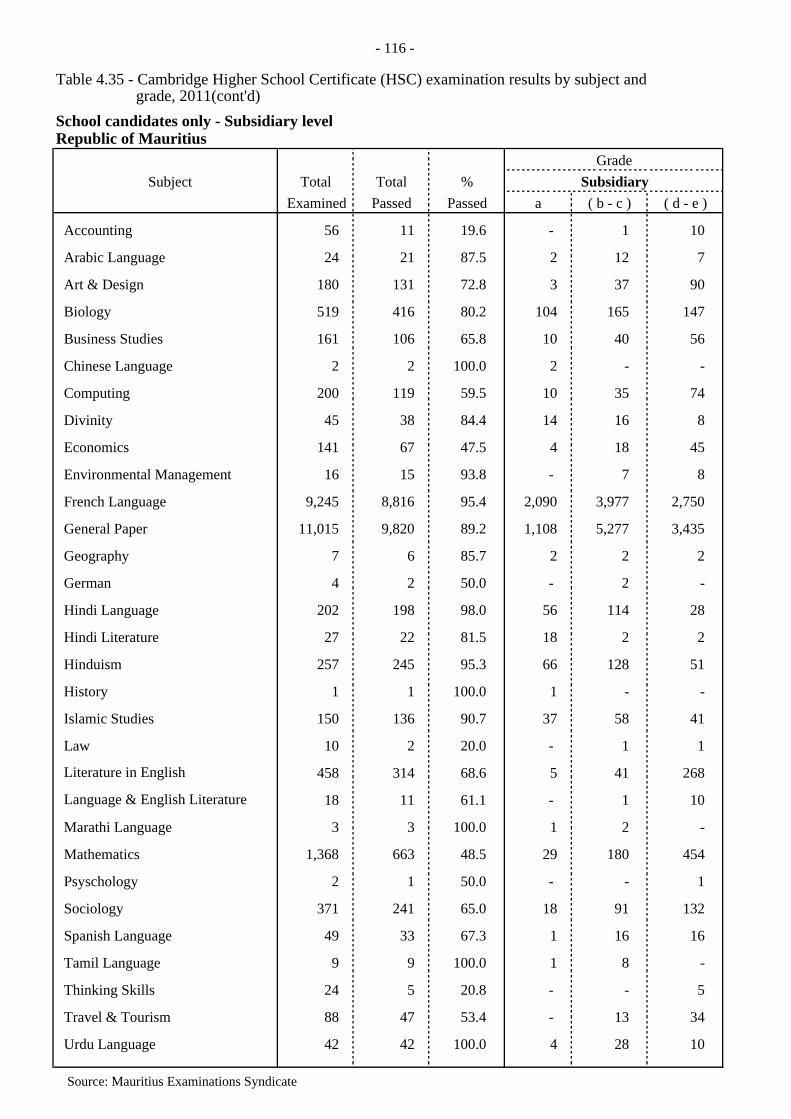
- 116 -
Table 4.35 - Cambridge Higher School Certificate (HSC) examination results by subject and grade, 2011(cont'd)
Republic of Mauritius
Subject Total Total %Examined Passed Passed a ( b - c ) ( d - e )
Accounting 56 11 19.6 - 1 10
Arabic Language 24 21 87.5 2 12 7
Art & Design 180 131 72.8 3 37 90
Biology 519 416 80.2 104 165 147
Business Studies 161 106 65.8 10 40 56
Chinese Language 2 2 100.0 2 - -
Computing 200 119 59.5 10 35 74
Divinity 45 38 84.4 14 16 8
Economics 141 67 47.5 4 18 45
Environmental Management 16 15 93.8 - 7 8
French Language 9,245 8,816 95.4 2,090 3,977 2,750
General Paper 11,015 9,820 89.2 1,108 5,277 3,435
Geography 7 6 85.7 2 2 2
German 4 2 50.0 - 2 -
Hindi Language 202 198 98.0 56 114 28
Hindi Literature 27 22 81.5 18 2 2
Hinduism 257 245 95.3 66 128 51
History 1 1 100.0 1 - -
Islamic Studies 150 136 90.7 37 58 41
Law 10 2 20.0 - 1 1
Literature in English 458 314 68.6 5 41 268
Language & English Literature 18 11 61.1 - 1 10
Marathi Language 3 3 100.0 1 2 -
Mathematics 1,368 663 48.5 29 180 454
Psyschology 2 1 50.0 - - 1
Sociology 371 241 65.0 18 91 132
Spanish Language 49 33 67.3 1 16 16
Tamil Language 9 9 100.0 1 8 -
Thinking Skills 24 5 20.8 - - 5
Travel & Tourism 88 47 53.4 - 13 34
Urdu Language 42 42 100.0 4 28 10
Source: Mauritius Examinations Syndicate
GradeSubsidiary
School candidates only - Subsidiary level

EDUCATION
PRE-VOCATIONAL
TECHNICAL&


Table 4.36 - Pre-vocational Education - Number of schools, pupils, staff and pupil/teacher ratio, 2008 - 2012
Total number Pupil/
of schools1 Total Male Female Teaching Staff Teacher ratio
A - Republic of Mauritius
Mar-08 138 8,495 5,336 3,159 645 13
Mar-09 131 8,033 5,114 2,919 622 13
Mar-10 124 7,442 4,764 2,678 628 12
Mar-11 126 7,270 4,635 2,635 634 11
Mar-12 121 7,221 4,641 2,580 629 11
B - Island of Mauritius
Mar-08 133 8,011 5,053 2,958 611 13
Mar-09 126 7,574 4,834 2,740 586 13
Mar-10 119 7,028 4,511 2,517 594 12
Mar-11 121 6,907 4,398 2,509 596 12
Mar-12 115 6,786 4,349 2,437 599 11
C - Island of Rodrigues
Mar-08 5 484 283 201 34 14
Mar-09 5 459 280 179 36 13
Mar-10 5 414 253 161 34 12
Mar-11 5 363 237 126 38 10
Mar-12 6 435 292 143 30 151 Includes State and Private pre-vocational schools providing both general and pre-vocational education
PupilsPeriod
-119 -

- 120 -
Table 4.37 - Distribution of schools offering pre-vocational education by zone and type of administration, 2012
Type of Administration
Private 2
No. % No. %
1 - Port Louis / North 40 16 40 24 60
31 13 42 18 58
3 - Curepipe / South 25 8 32 17 68
4 - Q.Bornes / Vacoas-Phoenix / West 19 9 47 10 53
Island of Mauritius 115 46 40 69 60
Island of Rodrigues 6 - - 6 100
Republic of Mauritius 121 46 38 75 62
1 Includes 121 secondary schools providing both general and pre-vocational education and 5 schools providing only pre-vocational
Table 4.38 - Distribution of schools offering pre-vocational education and number of sections by zone and type of administration, 2012
Schools Sections Schools Sections Schools Sections
1 - Port Louis / North 40 130 16 41 24 89
2 - B.Bassin-R.Hill / East 31 108 13 44 18 64
3 - Curepipe / South 25 85 8 21 17 64
4 - Q.Bornes / Vacoas-Phoenix / West 19 55 9 23 10 32
Island of Mauritius 115 378 46 129 69 249
Island of Rodrigues 6 20 - - 6 20
Republic of Mauritius 121 398 46 129 75 269
Zone
Zone
2 - B.Bassin-R.Hill / East
2 Includes Mauritius Educational Development Company (MEDCO) / Rodrigues Educational Development Company (REDCO)
All Schools 1
State
PrivateTotal State

- 121 -
Table 4.39 - Enrolment in schools offering pre-vocational education by type of administration, zone, sex and year of study, 2012
I II III Total I II III Total I II III Total
1 - Port Louis / North 947 816 723 2,486 581 507 469 1,557 366 309 254 929
2 - B.Bassin-R.Hill / East 592 564 544 1,700 396 376 359 1,131 196 188 185 569
3 - Curepipe / South 551 495 480 1,526 368 300 319 987 183 195 161 539
4 - Q.Bornes / Vacoas-Phoenix / West 420 366 288 1,074 271 221 182 674 149 145 106 400
Island of Mauritius 2,510 2,241 2,035 6,786 1,616 1,404 1,329 4,349 894 837 706 2,437
Island of Rodrigues 164 123 148 435 108 88 96 292 56 35 52 143
Republic of Mauritius 2,674 2,364 2,183 7,221 1,724 1,492 1,425 4,641 950 872 758 2,580
1 - Port Louis / North 268 255 240 763 134 167 160 461 134 88 80 302
2 - B.Bassin-R.Hill / East 175 175 232 582 88 93 145 326 87 82 87 256
3 - Curepipe / South 146 114 102 362 99 70 69 238 47 44 33 124
4 - Q.Bornes / Vacoas-Phoenix / West 192 171 103 466 106 85 54 245 86 86 49 221
Island of Mauritius 781 715 677 2,173 427 415 428 1,270 354 300 249 903
Island of Rodrigues - - - - - - - - - - - -
Republic of Mauritius 781 715 677 2,173 427 415 428 1,270 354 300 249 903
1 - Port Louis / North 679 561 483 1,723 447 340 309 1,096 232 221 174 627
2 - B.Bassin-R.Hill / East 417 389 312 1,118 308 283 214 805 109 106 98 313
3 - Curepipe / South 405 381 378 1,164 269 230 250 749 136 151 128 415
4 - Q.Bornes / Vacoas-Phoenix / West 228 195 185 608 165 136 128 429 63 59 57 179
Island of Mauritius 1,729 1,526 1,358 4,613 1,189 989 901 3,079 540 537 457 1,534
Island of Rodrigues 164 123 148 435 108 88 96 292 56 35 52 143
Republic of Mauritius 1,893 1,649 1,506 5,048 1,297 1,077 997 3,371 596 572 509 1,677
All schools
Zone
State
Private
Year of studyTotal FemaleMale

- 122 -
Table 4.40 - Enrolment in schools offering pre-vocational education by type of administration, age, sex and year of study, 2012Republic of MauritiusAll schools
Age Year of study(in years) Total Male Female
I II III Total I II III Total I II III Total
Under 13 2,133 - - 2,133 1,367 - - 1,367 766 - - 766
13 511 1,863 91 2,465 342 1,188 63 1,593 169 675 28 872
14 26 474 1,553 2,053 13 293 1,023 1,329 13 181 530 724
15 3 24 499 526 2 10 311 323 1 14 188 203
16 1 3 39 43 - 1 28 29 1 2 11 14
17 & Over - - 1 1 - - - - - - 1 1
Total 2,674 2,364 2,183 7,221 1,724 1,492 1,425 4,641 950 872 758 2,580
State
Under 13 589 - - 589 303 - - 303 286 - - 286
13 185 523 57 765 118 289 45 452 67 234 12 313
14 7 182 375 564 6 121 210 337 1 61 165 227
15 - 10 217 227 - 5 153 158 - 5 64 69
16 - - 27 27 - - 20 20 - - 7 7
17 & Over - - 1 1 - - - - - - 1 1
Total 781 715 677 2,173 427 415 428 1,270 354 300 249 903
Private
Under 13 1,544 - - 1,544 1,064 - - 1,064 480 - - 480
13 326 1,340 34 1,700 224 899 18 1,141 102 441 16 559
14 19 292 1,178 1,489 7 172 813 992 12 120 365 497
15 3 14 282 299 2 5 158 165 1 9 124 134
16 1 3 12 16 - 1 8 9 1 2 4 7
17 & Over - - - - - - - - - - - -
Total 1,893 1,649 1,506 5,048 1,297 1,077 997 3,371 596 572 509 1,677

- 123 -Table 4.41 - Enrolment in schools offering pre-vocational education by type of administration, age, sex and year of study, 2012Island of MauritiusAll schools
Age Year of study(in years) Total Male Female
I II III Total I II III Total I II III Total
Under 13 1,991 - - 1,991 1,276 - - 1,276 715 - - 715
13 489 1,760 91 2,340 325 1,115 63 1,503 164 645 28 837
14 26 454 1,431 1,911 13 278 945 1,236 13 176 486 675
15 3 24 473 500 2 10 293 305 1 14 180 195
16 - 3 39 43 - 1 28 29 1 2 11 14
17 & Over - - 1 1 - - - - - - 1 1
Total 2,510 2,241 2,035 6,786 1,616 1,404 1,329 4,349 894 837 706 2,437
State
Under 13 589 - - 589 303 - - 303 286 - - 286
13 185 523 57 765 118 289 45 452 67 234 12 313
14 7 182 375 564 6 121 210 337 1 61 165 227
15 - 10 217 227 - 5 153 158 - 5 64 69
16 - - 27 27 - - 20 20 - - 7 7
17 & Over - - 1 1 - - - - - - 1 1
Total 781 715 677 2,173 427 415 428 1,270 354 300 249 903
Private
Under 13 1,402 - - 1,402 973 - - 973 429 - - 429
13 304 1,237 34 1,575 207 826 18 1,051 97 411 16 524
14 19 272 1,056 1,347 7 157 735 899 12 115 321 448
15 3 14 256 273 2 5 140 147 1 9 116 126
16 1 3 12 16 - 1 8 9 1 2 4 7
17 & Over - - - - - - - - - - - -
Total 1,729 1,526 1,358 4,613 1,189 989 901 3,079 540 537 457 1,534
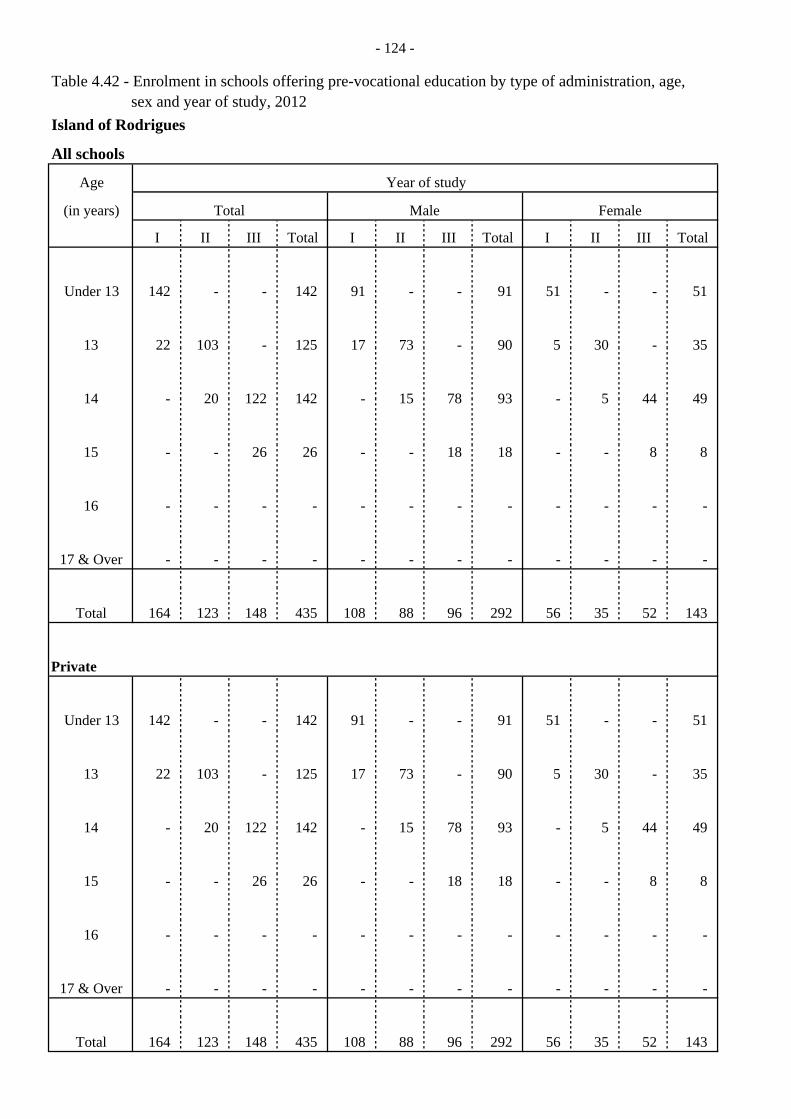
- 124 -
Table 4.42 - Enrolment in schools offering pre-vocational education by type of administration, age, sex and year of study, 2012Island of Rodrigues
All schools
Age Year of study
(in years) Total Male Female
I II III Total I II III Total I II III Total
Under 13 142 - - 142 91 - - 91 51 - - 51
13 22 103 - 125 17 73 - 90 5 30 - 35
14 - 20 122 142 - 15 78 93 - 5 44 49
15 - - 26 26 - - 18 18 - - 8 8
16 - - - - - - - - - - - -
17 & Over - - - - - - - - - - - -
Total 164 123 148 435 108 88 96 292 56 35 52 143
Private
Under 13 142 - - 142 91 - - 91 51 - - 51
13 22 103 - 125 17 73 - 90 5 30 - 35
14 - 20 122 142 - 15 78 93 - 5 44 49
15 - - 26 26 - - 18 18 - - 8 8
16 - - - - - - - - - - - -
17 & Over - - - - - - - - - - - -
Total 164 123 148 435 108 88 96 292 56 35 52 143

- 125 -
Table 4.43 - Enrolment in schools offering pre-vocational education by year of study and sex, 2010 - 2012
2011
Total Male Female Total Male Female Total Male Female
Republic of Mauritius
I 2,691 1,736 955 2,544 1,589 955 2,674 1,724 950
II 2,589 1,654 935 2,409 1,576 833 2,364 1,492 872
III 2,162 1,374 788 2,317 1,470 847 2,183 1,425 758
7,442 4,764 2,678 7,270 4,635 2,635 7,221 4,641 2,580
Island of Mauritius
I 2,549 1,647 902 2,434 1,515 919 2,510 1,616 894
II 2,463 1,576 887 2,276 1,489 787 2,241 1,404 837
III 2,016 1,288 728 2,197 1,394 803 2,035 1,329 706
7,028 4,511 2,517 6,907 4,398 2,509 6,786 4,349 2,437
Island of Rodrigues
I 142 89 53 110 74 36 164 108 56
II 126 78 48 133 87 46 123 88 35
III 146 86 60 120 76 44 148 96 52
414 253 161 363 237 126 435 292 143 Total
Year of study
2010 2012
Total
Total
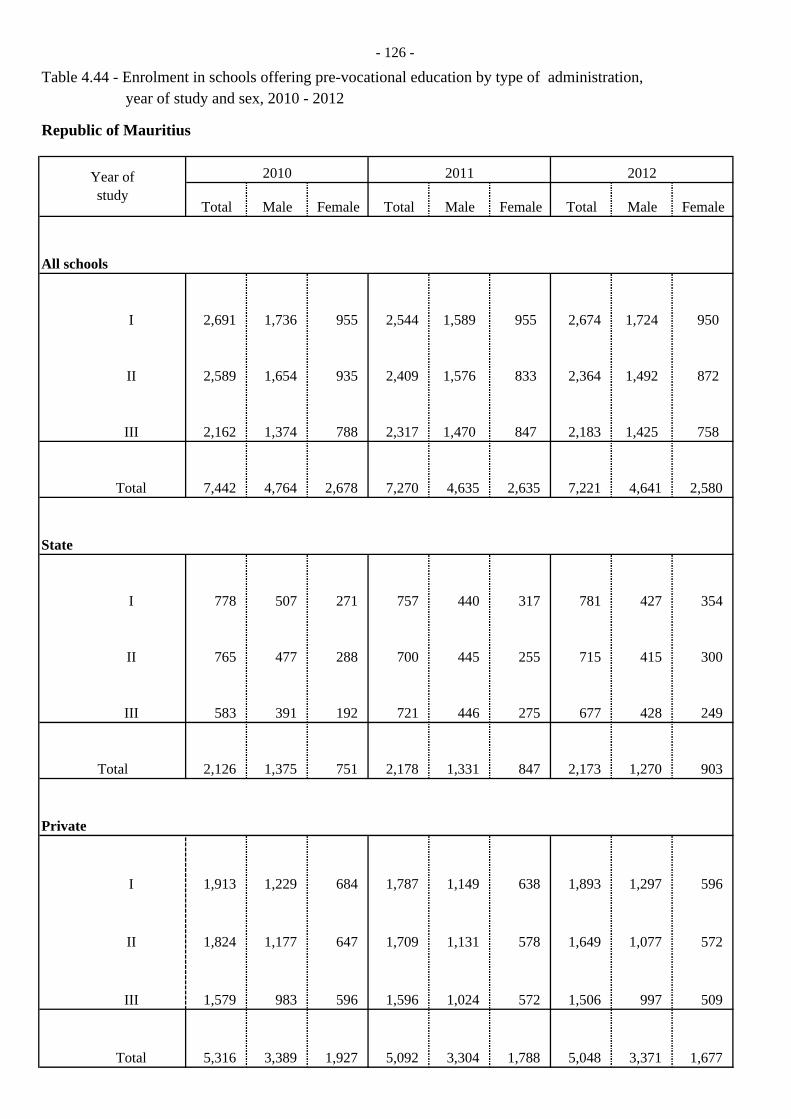
- 126 -
Table 4.44 - Enrolment in schools offering pre-vocational education by type of administration, year of study and sex, 2010 - 2012
Republic of Mauritius
Total Male Female Total Male Female Total Male Female
All schools
I 2,691 1,736 955 2,544 1,589 955 2,674 1,724 950
II 2,589 1,654 935 2,409 1,576 833 2,364 1,492 872
III 2,162 1,374 788 2,317 1,470 847 2,183 1,425 758
Total 7,442 4,764 2,678 7,270 4,635 2,635 7,221 4,641 2,580
State
I 778 507 271 757 440 317 781 427 354
II 765 477 288 700 445 255 715 415 300
III 583 391 192 721 446 275 677 428 249
Total 2,126 1,375 751 2,178 1,331 847 2,173 1,270 903
Private
I 1,913 1,229 684 1,787 1,149 638 1,893 1,297 596
II 1,824 1,177 647 1,709 1,131 578 1,649 1,077 572
III 1,579 983 596 1,596 1,024 572 1,506 997 509
Total 5,316 3,389 1,927 5,092 3,304 1,788 5,048 3,371 1,677
Year of study
20122010 2011
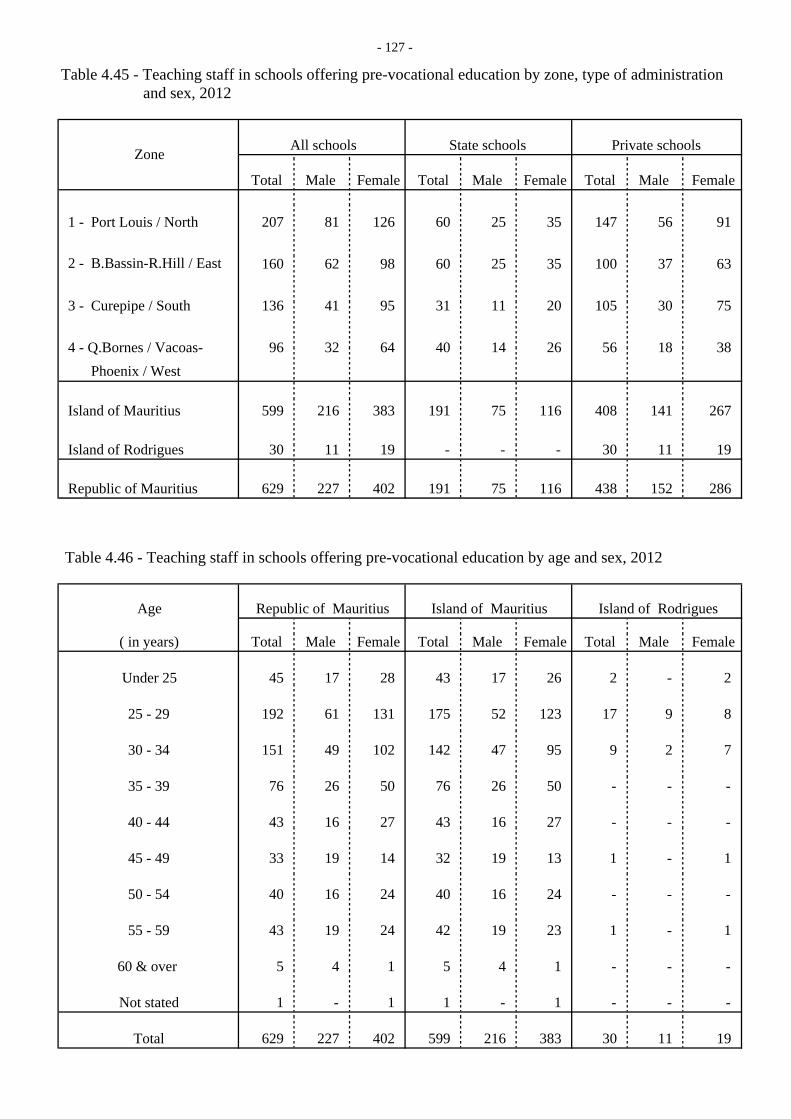
- 127 -
and sex, 2012
All schools State schools Private schools
Total Male Female Total Male Female Total Male Female
1 - Port Louis / North 207 81 126 60 25 35 147 56 91
2 - B.Bassin-R.Hill / East 160 62 98 60 25 35 100 37 63
3 - Curepipe / South 136 41 95 31 11 20 105 30 75
96 32 64 40 14 26 56 18 38 Phoenix / West
Island of Mauritius 599 216 383 191 75 116 408 141 267
Island of Rodrigues 30 11 19 - - - 30 11 19
Republic of Mauritius 629 227 402 191 75 116 438 152 286
Table 4.46 - Teaching staff in schools offering pre-vocational education by age and sex, 2012
Republic of Mauritius Island of Mauritius Island of Rodrigues
Total Male Female Total Male Female Total Male Female
45 17 28 43 17 26 2 - 2
192 61 131 175 52 123 17 9 8
151 49 102 142 47 95 9 2 7
76 26 50 76 26 50 - - -
43 16 27 43 16 27 - - -
33 19 14 32 19 13 1 - 1
40 16 24 40 16 24 - - -
43 19 24 42 19 23 1 - 1
5 4 1 5 4 1 - - -
1 - 1 1 - 1 - - -
629 227 402 599 216 383 30 11 19
45 - 49
Table 4.45 - Teaching staff in schools offering pre-vocational education by zone, type of administration
Zone
Age
( in years)
4 - Q.Bornes / Vacoas-
Total
50 - 54
55 - 59
60 & over
Not stated
Under 25
25 - 29
30 - 34
35 - 39
40 - 44

- 128 -
Table 4.47 - Teaching staff in schools offering pre-vocational education by sex, zone and highest academic qualification, 2012
Highest Academic Qualification
School Certificate or
equivalent
Higher School Certificate or
equivalentCertificate or Diploma
First Degree
Post Graduate Total
1 - Port Louis / North 14 90 46 52 5 207
2 - B.Bassin-R.Hill / East 6 63 21 57 13 160
3 - Curepipe / South 5 79 21 28 3 136
4 - Q.Bornes / Vacoas-Phoenix / West 5 43 17 29 2 96
Island of Mauritius 30 275 105 166 23 599
Island of Rodrigues - 27 3 - - 30
30 302 108 166 23 629
1 - Port Louis / North 3 28 23 26 1 81
2 - B.Bassin-R.Hill / East 2 20 9 27 4 62
3 - Curepipe / South 1 26 5 7 2 41
4 - Q.Bornes / Vacoas-Phoenix / West 2 10 6 13 1 32
Island of Mauritius 8 84 43 73 8 216
Island of Rodrigues - 10 1 - - 11
8 94 44 73 8 227
1 - Port Louis / North 11 62 23 26 4 126
2 - B.Bassin-R.Hill / East 4 43 12 30 9 98
3 - Curepipe / South 4 53 16 21 1 95
4 - Q.Bornes / Vacoas-Phoenix / West 3 33 11 16 1 64
Island of Mauritius 22 191 62 93 15 383
Island of Rodrigues - 17 2 - - 19
22 208 64 93 15 402
Total
Male
Female
Zone
Republic of Mauritius
Republic of Mauritius
Republic of Mauritius

- 129 -
Table 4.48 - Distribution of secondary schools (general & pre-vocational) by zone and type of administration, 2012
Type of AdministrationPrivate
Aided 3 Non - Aided
No. % No. % No. %
1 - Port Louis / North 59 26 44 27 46 6 10
44 19 43 20 46 5 11
3 - Curepipe / South 42 13 31 21 50 8 19
4 - Q.Bornes / Vacoas-Phoenix / West 32 15 47 15 47 2 6
Island of Mauritius 177 73 41 83 47 21 12
Island of Rodrigues 6 - - 6 100 - -
Republic of Mauritius 183 73 40 89 49 21 11
1 62 of these schools offer general education only, 116 both general and pre-vocational education and 5 pre-vocational only 2 Includes Mahatma Gandhi Institute, Rabindranath Tagore Secondary School and 4 Mahatma Gandhi State Schools
Company (REDCO)
Table 4.49 - Distribution of secondary schools offering general, pre-vocational and both general & pre-vocational education by zone, 2012
1 - Port Louis / North 59
44
3 - Curepipe / South 42
4 - Q.Bornes / Vacoas-Phoenix / West 32
Island of Mauritius 177
Island of Rodrigues 6
Republic of Mauritius 183 5
37
29
25
19
110
6
116
2 - B.Bassin-R.Hill / East
3 Includes Mauritius Educational Development Company (MEDCO) / Rodrigues Educational Development
Zone
General Pre-vocational General & Pre-vocational
Institutions providing
Zone
17
13
-
62
All Schools 1State 2
All Schools
2 - B.Bassin-R.Hill / East
62
3
2
-
-
5
-
19
13

Table 4.50 - Secondary enrolment (general and pre-vocational streams) and Gross Enrolment Ratio1 by sex, 2002 - 2012
Year Enrolment Enrolment Enrolment
T M F T M F T M F T M F T M F T M F
2002 105,653 51,915 53,738 68 66 70 101,992 50,131 51,861 69 67 71 3,661 1,784 1,877 57 55 59
2003 111,173 54,619 56,554 71 68 73 107,442 52,842 54,600 71 69 73 3,731 1,777 1,954 58 55 62
2004 114,476 56,367 58,109 71 69 74 110,580 54,496 56,084 72 70 74 3,896 1,871 2,025 63 60 66
2005 120,132 59,109 61,023 73 71 75 116,171 57,183 58,988 74 72 76 3,961 1,926 2,035 67 65 69
2006 125,081 61,535 63,546 75 73 77 120,930 59,546 61,384 75 73 77 4,151 1,989 2,162 70 67 73
2007 126,279 62,054 64,225 74 72 77 122,052 60,039 62,013 75 72 77 4,227 2,015 2,212 71 68 74
2008 124,998 61,209 63,789 74 71 76 121,006 59,318 61,688 74 71 76 3,992 1,891 2,101 69 65 72
2009 124,259 60,503 63,756 73 71 76 120,146 58,530 61,616 73 71 76 4,113 1,973 2,140 73 70 75
2010 122,445 59,619 62,826 73 70 76 118,446 57,709 60,737 73 70 76 3,999 1,910 2,089 72 70 74
2011 122,559 59,823 62,736 74 72 77 118,660 57,946 60,714 74 72 77 3,899 1,877 2,022 72 71 73
2012 122,898 60,015 62,883 76 73 78 118,539 57,917 60,622 76 73 78 4,359 2,098 2,261 80 78 82
1 Number of students enrolled per 100 population aged 12 - 19 T: Total M: Male F: Female
Republic of Mauritius Island of Mauritius Island of Rodrigues
Gross Enrolment Ratio Gross Enrolment Ratio Gross Enrolment Ratio
-124 --130 -
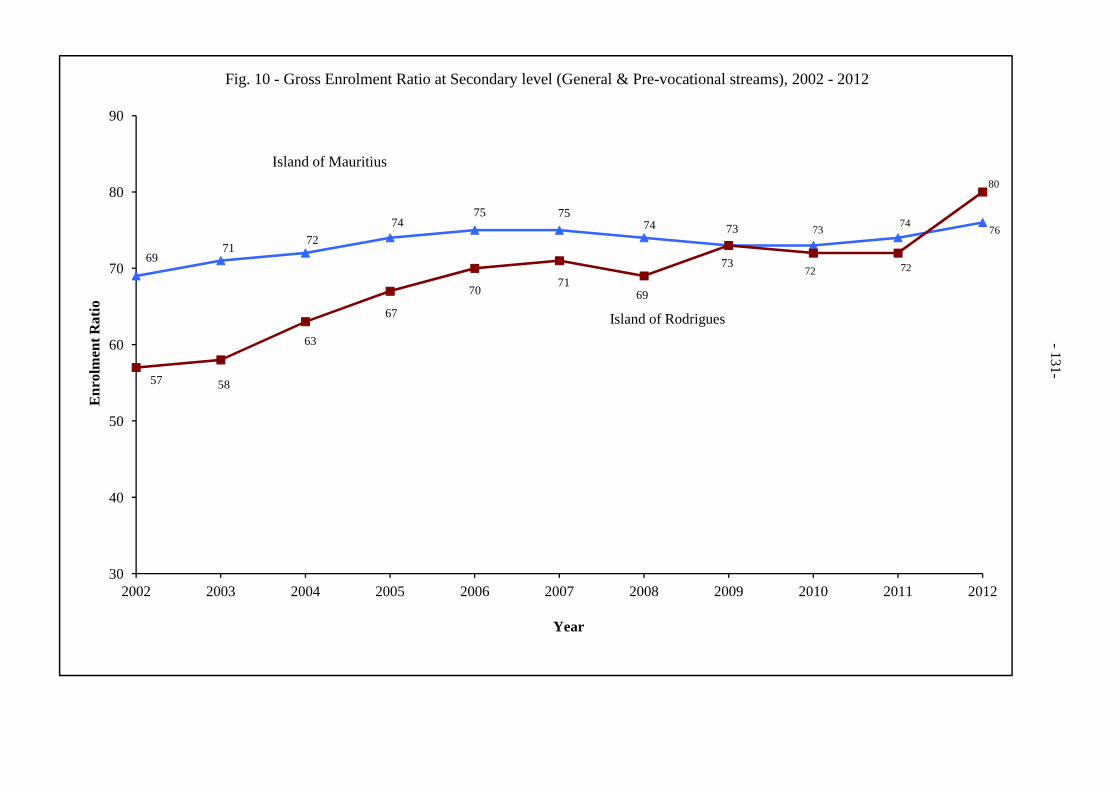
6971
7274
75 7574 73 73 74
76
57 58
63
67
7071
69
7372 72
80
60
70
80
90nr
olm
ent R
atio
Fig. 10 - Gross Enrolment Ratio at Secondary level (General & Pre-vocational streams), 2002 - 2012
Island of Mauritius
Island of Rodrigues
-131-
30
40
50
2002 2003 2004 2005 2006 2007 2008 2009 2010 2011 2012
En
Year

Table 4.51 - Enrolment in secondary schools offering general and pre-vocational education by zone and sex, 2012
General & Pre-vocational
Total Male Female Total Male Female Total Male Female
1 - Port Louis / North 34,718 16,307 18,411 2,486 1,557 929 37,204 17,864 19,340
2 - B.Bassin-R.Hill / East 29,846 14,484 15,362 1,700 1,131 569 31,546 15,615 15,931
3 - Curepipe / South 28,087 14,163 13,924 1,526 987 539 29,613 15,150 14,463
4 - Q.Bornes / Vacoas-Phoenix / West 19,102 8,614 10,488 1,074 674 400 20,176 9,288 10,888
Island of Mauritius 111,753 53,568 58,185 6,786 4,349 2,437 118,539 57,917 60,622
Island of Rodrigues 3,924 1,806 2,118 435 292 143 4,359 2,098 2,261
Republic of Mauritius 115,677 55,374 60,303 7,221 4,641 2,580 122,898 60,015 62,883
Table 4.52 - Teaching staff in secondary schools offering general & pre-vocational education by zone and sex, 2012
General & Pre-vocational
Total Male Female Total Male Female Total Male Female
1 - Port Louis / North 2,398 995 1,403 207 81 126 2,605 1,076 1,529
2 - B.Bassin-R.Hill / East 2,099 865 1,234 160 62 98 2,259 927 1,332
3 - Curepipe / South 1,906 789 1,117 136 41 95 2,042 830 1,212
4 - Q.Bornes / Vacoas-Phoenix / West 1,388 537 851 96 32 64 1,484 569 915
Island of Mauritius 7,791 3,186 4,605 599 216 383 8,390 3,402 4,988
Island of Rodrigues 223 101 122 30 11 19 253 112 141
Republic of Mauritius 8,014 3,287 4,727 629 227 402 8,643 3,514 5,129
General Pre-vocationalZone
General Pre-vocationalZone
-132-

- 133 -
Table 4.53 - Enrolment in Mauritius Institute of Training and Development (MITD) centres offering National Trade Certificate (Foundation course) by zone and sex, 2011
1 - Port Louis / North
2 - B.Bassin-R.Hill / East
3 - Curepipe / South
4 - Q.Bornes / Vacoas-Phoenix / West
Island of Mauritius
Island of Rodrigues
Republic of Mauritius
Table 4.54 - Number enrolled in Mauritius Institute of Training and Development (MITD) Centres, Republic of Mauritius, 2011
Full Time
Total Male
Female
Table 4.55 - Number enrolled in MITD Centres by course level, year of study and sex (Full Time), Republic of Mauritius, 2011
T M F T M F T M F T M F
1,541 1,076 465 - - - - - - 1,541 1,076 465
330 239 91 - - - - - - 330 239 91
1,338 991 347 - - - - - - 1,338 991 347
211 162 49 10 - 10 - - - 221 162 59
36 19 17 71 58 13 - - - 107 77 30
84 83 1 99 99 - - - - 183 182 1
128 126 2 121 121 - 97 96 1 346 343 3
162 96 66 135 76 59 - - - 297 172 125
77 49 28 84 56 28 49 32 17 210 137 73
3,907 2,841 1,066 520 410 110 146 128 18 4,573 3,379 1,194
Source: Mauritius Institute of Training and Development (MITD) T: Total M: Male F: Female
ZoneNo. of centres
Enrolment
Total Male Female
4 477 326 151
5 515 336 179
5 431 344 87
- - - -
14 1,423 1,006 417
1 118 70 48
15 1,541 1,076 465
SexMode of Study
Part Time Apprenticeship Total
4,573 3,671 1,089 9,333
3,379 3,107 797 7,283
1,194 564 292 2,050
Course LevelYear I Year II Year III Total
Brevet De Technicien
Diploma
Higher National Diploma
Total
National Trade Certificate Foundation
Basic Certificate/National Certificate Level 2
National Trade Certificate Level 3/National Certificate Level 3
National Certificate Level 4
National Certificate Level 5
National Trade Certificate Level 2
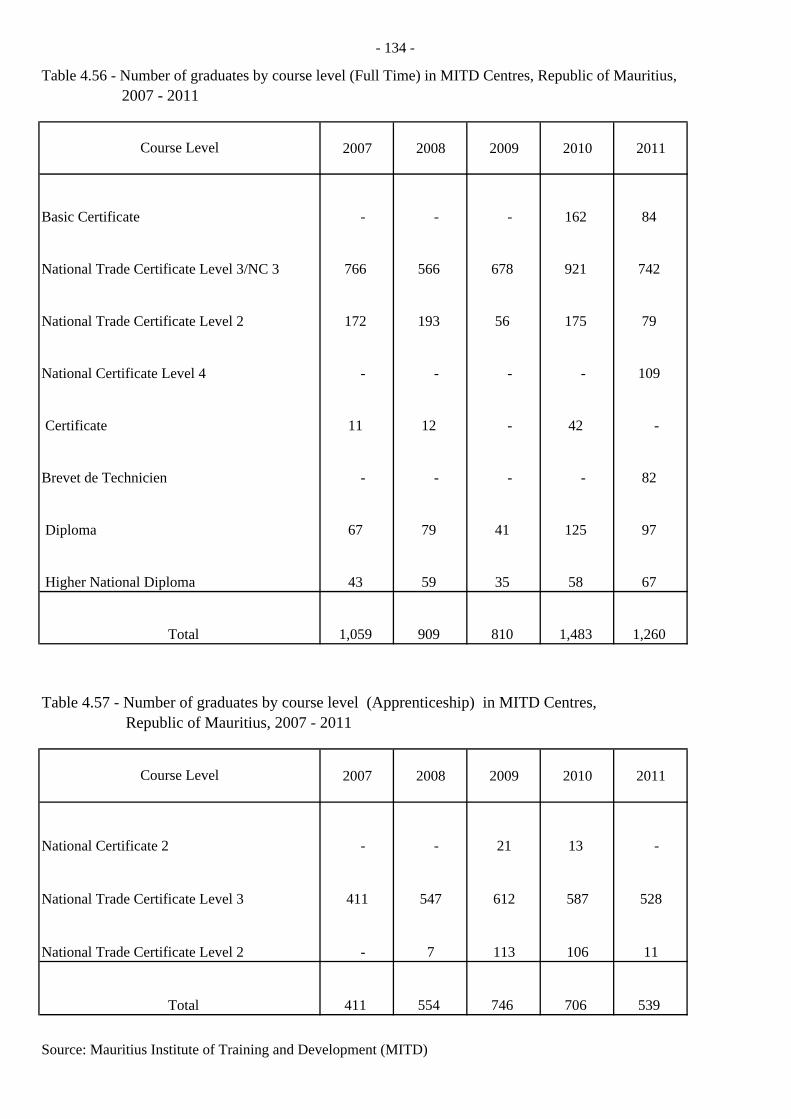
- 134 -
Table 4.56 - Number of graduates by course level (Full Time) in MITD Centres, Republic of Mauritius, 2007 - 2011
2007 2008 2009 2010 2011
Basic Certificate - - - 162 84
766 566 678 921 742
172 193 56 175 79
National Certificate Level 4 - - - - 109
11 12 - 42 -
Brevet de Technicien - - - - 82
67 79 41 125 97
43 59 35 58 67
1,059 909 810 1,483 1,260
Table 4.57 - Number of graduates by course level (Apprenticeship) in MITD Centres, Republic of Mauritius, 2007 - 2011
2007 2008 2009 2010 2011
- - 21 13 -
411 547 612 587 528
- 7 113 106 11
411 554 746 706 539
Source: Mauritius Institute of Training and Development (MITD)
Course Level
Total
National Trade Certificate Level 3/NC 3
National Trade Certificate Level 2
Certificate
Diploma
Higher National Diploma
Total
Course Level
National Certificate 2
National Trade Certificate Level 3
National Trade Certificate Level 2

SPECIAL EDUCATION NEEDS

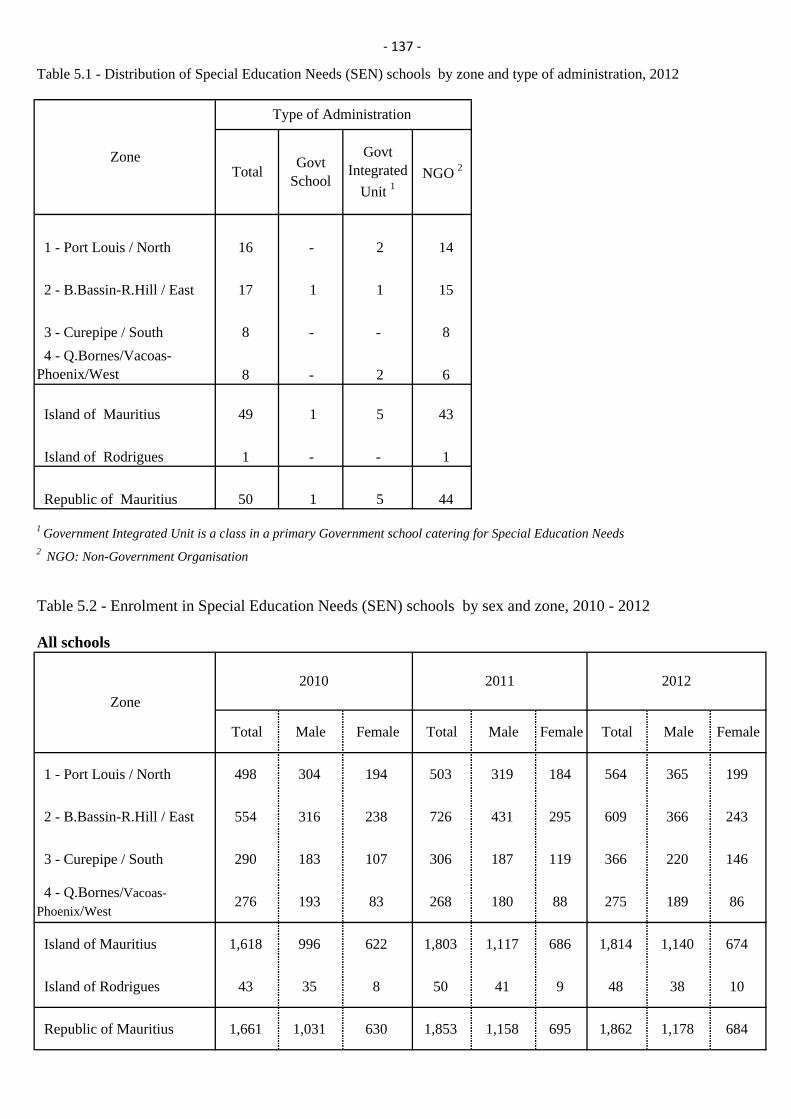
‐ 137 ‐
Table 5.1 - Distribution of Special Education Needs (SEN) schools by zone and type of administration, 2012
1 - Port Louis / North 16 - 2 14
2 - B.Bassin-R.Hill / East 17 1 1 15
3 - Curepipe / South 8 - - 8 4 - Q.Bornes/Vacoas-Phoenix/West 8 - 2 6
Island of Mauritius 49 1 5 43
Island of Rodrigues 1 - - 1
Republic of Mauritius 50 1 5 44
1 Government Integrated Unit is a class in a primary Government school catering for Special Education Needs2 NGO: Non-Government Organisation
Table 5.2 - Enrolment in Special Education Needs (SEN) schools by sex and zone, 2010 - 2012
All schools
Total Male Female Total Male Female Total Male Female
1 - Port Louis / North 498 304 194 503 319 184 564 365 199
2 - B.Bassin-R.Hill / East 554 316 238 726 431 295 609 366 243
3 - Curepipe / South 290 183 107 306 187 119 366 220 146
4 - Q.Bornes/Vacoas-Phoenix/West
276 193 83 268 180 88 275 189 86
Island of Mauritius 1,618 996 622 1,803 1,117 686 1,814 1,140 674
Island of Rodrigues 43 35 8 50 41 9 48 38 10
Republic of Mauritius 1,661 1,031 630 1,853 1,158 695 1,862 1,178 684
2010 2011 2012
Zone
Type of Administration
Total GovtSchool
GovtIntegrated
Unit 1NGO 2
Zone
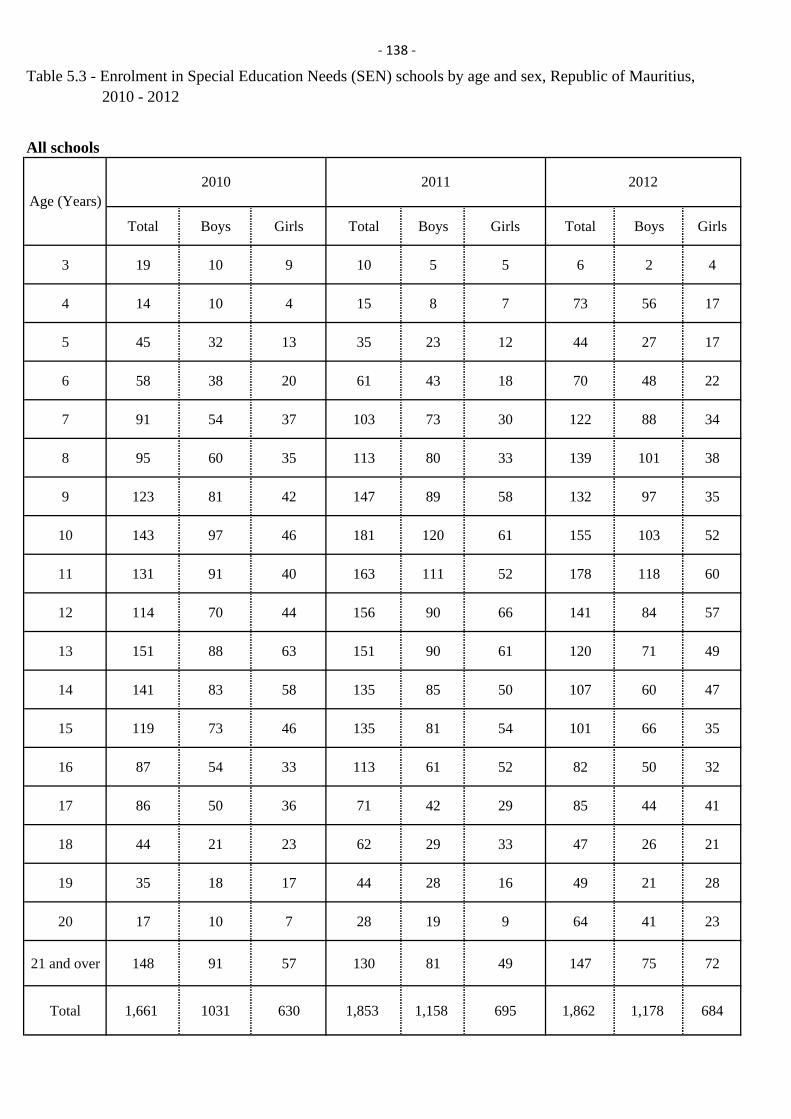
‐ 138 ‐
Table 5.3 - Enrolment in Special Education Needs (SEN) schools by age and sex, Republic of Mauritius, 2010 - 2012
All schools
Total Boys Girls Total Boys Girls Total Boys Girls
3 19 10 9 10 5 5 6 2 4
4 14 10 4 15 8 7 73 56 17
5 45 32 13 35 23 12 44 27 17
6 58 38 20 61 43 18 70 48 22
7 91 54 37 103 73 30 122 88 34
8 95 60 35 113 80 33 139 101 38
9 123 81 42 147 89 58 132 97 35
10 143 97 46 181 120 61 155 103 52
11 131 91 40 163 111 52 178 118 60
12 114 70 44 156 90 66 141 84 57
13 151 88 63 151 90 61 120 71 49
14 141 83 58 135 85 50 107 60 47
15 119 73 46 135 81 54 101 66 35
16 87 54 33 113 61 52 82 50 32
17 86 50 36 71 42 29 85 44 41
18 44 21 23 62 29 33 47 26 21
19 35 18 17 44 28 16 49 21 28
20 17 10 7 28 19 9 64 41 23
21 and over 148 91 57 130 81 49 147 75 72
Total 1,661 1031 630 1,853 1,158 695 1,862 1,178 684
2012Age (Years)
2010 2011
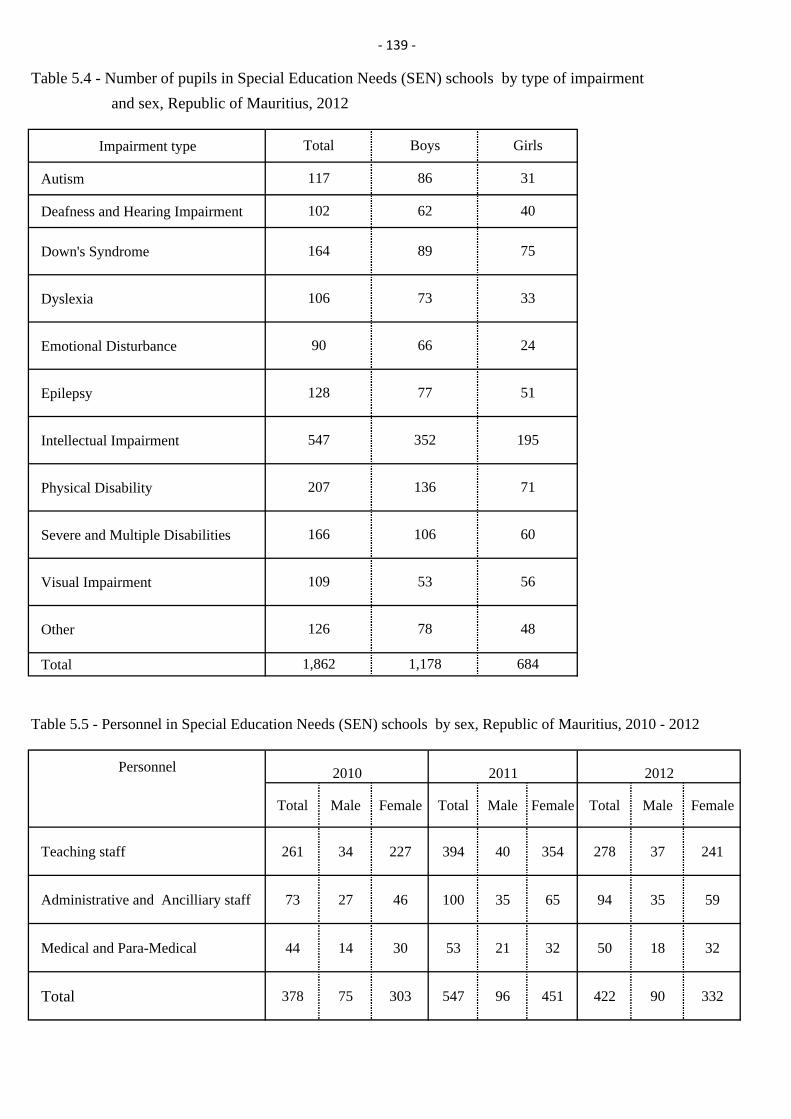
‐ 139 ‐
Impairment type
Autism
Deafness and Hearing Impairment
Down's Syndrome
Dyslexia
Emotional Disturbance
Epilepsy
Intellectual Impairment
Physical Disability
Severe and Multiple Disabilities
Visual Impairment
Other
Total
Table 5.5 - Personnel in Special Education Needs (SEN) schools by sex, Republic of Mauritius, 2010 - 2012
Personnel
Total Male Female Total Male Female Total Male Female
Teaching staff 261 34 227 394 40 354 278 37 241
Administrative and Ancilliary staff 73 27 46 100 35 65 94 35 59
Medical and Para-Medical 44 14 30 53 21 32 50 18 32
Total 378 75 303 547 96 451 422 90 332
Table 5.4 - Number of pupils in Special Education Needs (SEN) schools by type of impairment and sex, Republic of Mauritius, 2012
Total
2011 2012
126 78
Boys Girls
117 86 31
102 62 40
164 89 75
106 73 33
90 66 24
128 77 51
56
547 352 195
207 136 71
48
1,862 1,178 684
2010
166 106 60
109 53

FLOW RATES

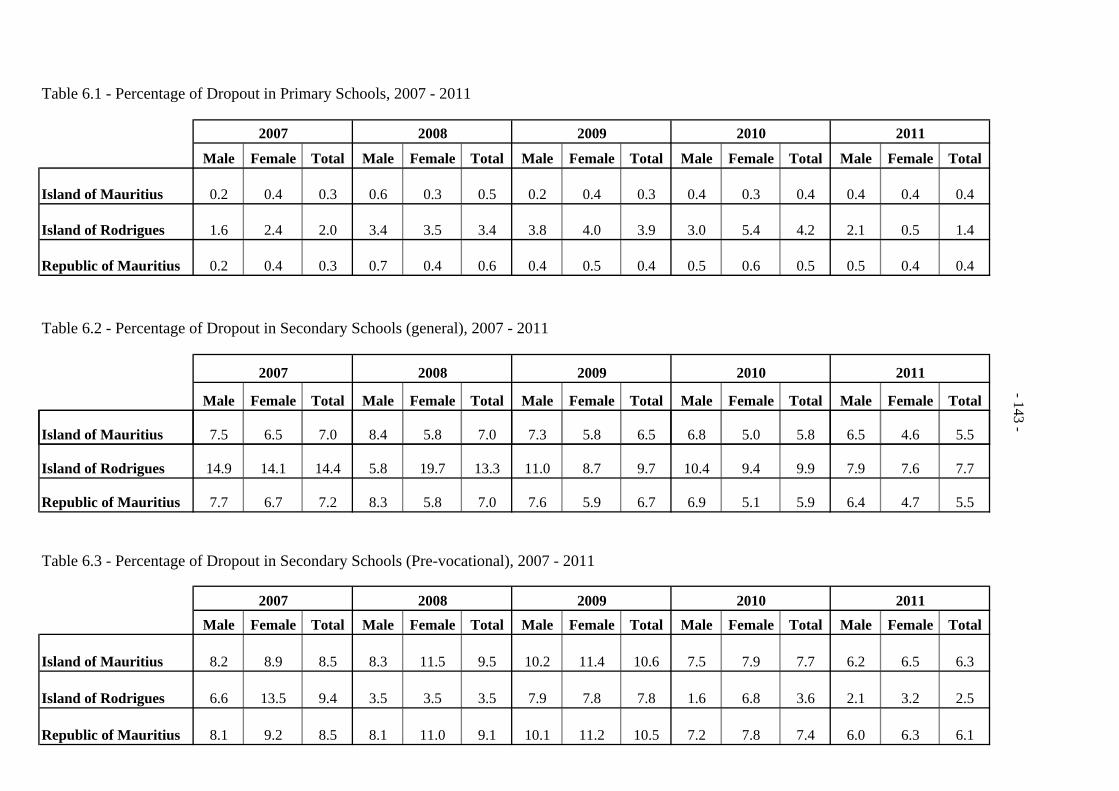
Table 6.1 - Percentage of Dropout in Primary Schools, 2007 - 2011
Male Female Total Male Female Total Male Female Total Male Female Total Male Female Total
Island of Mauritius 0.2 0.4 0.3 0.6 0.3 0.5 0.2 0.4 0.3 0.4 0.3 0.4 0.4 0.4 0.4
Island of Rodrigues 1.6 2.4 2.0 3.4 3.5 3.4 3.8 4.0 3.9 3.0 5.4 4.2 2.1 0.5 1.4
Republic of Mauritius 0.2 0.4 0.3 0.7 0.4 0.6 0.4 0.5 0.4 0.5 0.6 0.5 0.5 0.4 0.4
Table 6.2 - Percentage of Dropout in Secondary Schools (general), 2007 - 2011
Male Female Total Male Female Total Male Female Total Male Female Total Male Female Total
2011
20112007 2008 2009 2010
2007 2008 2009 2010
-124 --143 -
Island of Mauritius 7.5 6.5 7.0 8.4 5.8 7.0 7.3 5.8 6.5 6.8 5.0 5.8 6.5 4.6 5.5
Island of Rodrigues 14.9 14.1 14.4 5.8 19.7 13.3 11.0 8.7 9.7 10.4 9.4 9.9 7.9 7.6 7.7
Republic of Mauritius 7.7 6.7 7.2 8.3 5.8 7.0 7.6 5.9 6.7 6.9 5.1 5.9 6.4 4.7 5.5
Table 6.3 - Percentage of Dropout in Secondary Schools (Pre-vocational), 2007 - 2011
Male Female Total Male Female Total Male Female Total Male Female Total Male Female Total
Island of Mauritius 8.2 8.9 8.5 8.3 11.5 9.5 10.2 11.4 10.6 7.5 7.9 7.7 6.2 6.5 6.3
Island of Rodrigues 6.6 13.5 9.4 3.5 3.5 3.5 7.9 7.8 7.8 1.6 6.8 3.6 2.1 3.2 2.5
Republic of Mauritius 8.1 9.2 8.5 8.1 11.0 9.1 10.1 11.2 10.5 7.2 7.8 7.4 6.0 6.3 6.1
20112007 2008 2009 2010
-143 -

- 144 -
Table 6.4 - Flow rates in secondary schools (general stream), Republic of Mauritius, 2010
I II III IV V Lower VI Upper VI
Total
Promotion rate (%) 96 94 92 75 62 92 n.a
Repetition rate (%) 3 4 7 17 28 8 18
Dropout rate (%) 1 2 1 8 10 - n.a
Male
Promotion rate (%) 96 94 91 71 57 90 n.a
Repetition rate (%) 3 4 8 19 36 10 24
Dropout rate (%) 1 2 1 10 7 - n.a
Female
Promotion rate (%) 95 94 92 77 64 93 n.a
Repetition rate (%) 2 4 6 16 26 6 13
Dropout rate (%) 3 2 2 7 10 1 n.a
Table 6.5 - Flow rates in secondary schools (general stream), Republic of Mauritius, 2011
I II III IV V Lower VI Upper VI
Total
Promotion rate (%) 93 93 89 80 54 84 na
Repetition rate (%) 2 5 7 15 24 8 14
Dropout rate (%) 5 2 4 5 22 8 na
Male
Promotion rate (%) 92 94 88 78 49 80 na
Repetition rate (%) 2 5 8 17 27 11 17
Dropout rate (%) 6 1 4 5 24 9 na
Female
Promotion rate (%) 93 92 91 81 59 86 na
Repetition rate (%) 2 4 6 14 22 6 12
Dropout rate (%) 5 4 3 5 19 8 na
n.a: Not applicable
Grade
Grade
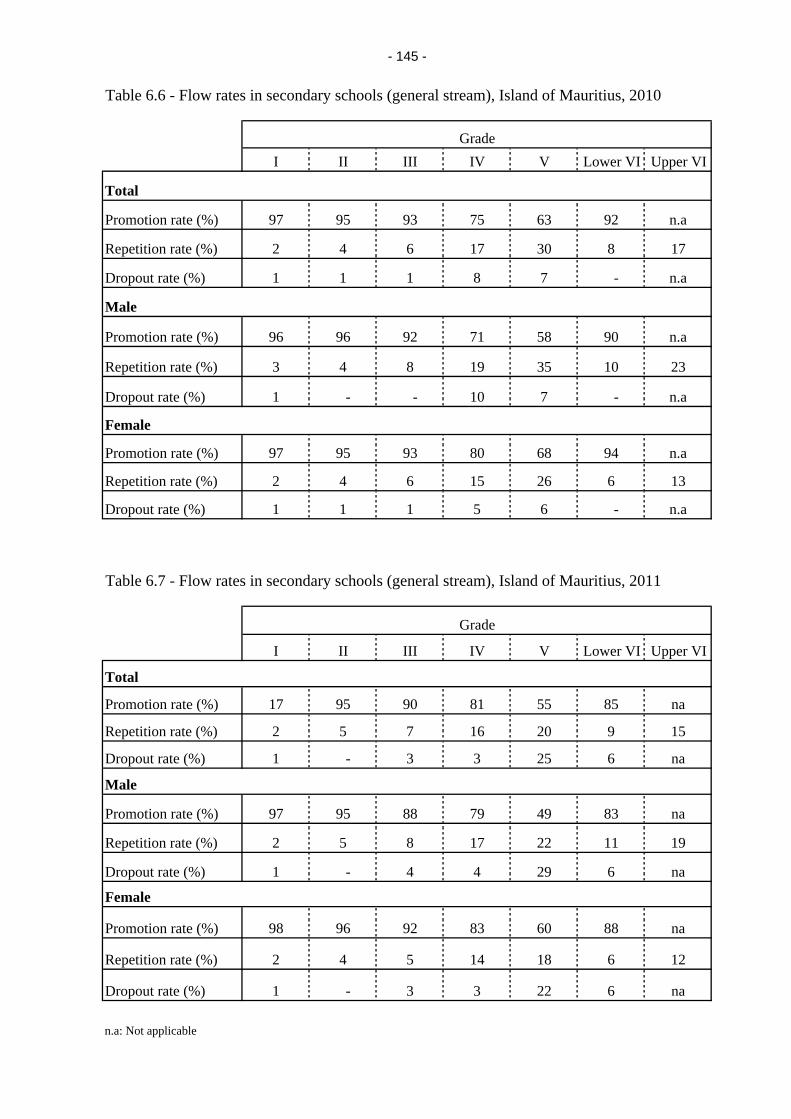
- 145 -
Table 6.6 - Flow rates in secondary schools (general stream), Island of Mauritius, 2010
I II III IV V Lower VI Upper VI
Total
Promotion rate (%) 97 95 93 75 63 92 n.a
Repetition rate (%) 2 4 6 17 30 8 17
Dropout rate (%) 1 1 1 8 7 - n.a
Male
Promotion rate (%) 96 96 92 71 58 90 n.a
Repetition rate (%) 3 4 8 19 35 10 23
Dropout rate (%) 1 - - 10 7 - n.a
Female
Promotion rate (%) 97 95 93 80 68 94 n.a
Repetition rate (%) 2 4 6 15 26 6 13
Dropout rate (%) 1 1 1 5 6 - n.a
Table 6.7 - Flow rates in secondary schools (general stream), Island of Mauritius, 2011
I II III IV V Lower VI Upper VI
Total
Promotion rate (%) 17 95 90 81 55 85 na
Repetition rate (%) 2 5 7 16 20 9 15
Dropout rate (%) 1 - 3 3 25 6 na
Male
Promotion rate (%) 97 95 88 79 49 83 na
Repetition rate (%) 2 5 8 17 22 11 19
Dropout rate (%) 1 - 4 4 29 6 na
Female
Promotion rate (%) 98 96 92 83 60 88 na
Repetition rate (%) 2 4 5 14 18 6 12
Dropout rate (%) 1 - 3 3 22 6 na
n.a: Not applicable
Grade
Grade

- 146 -
Table 6.8 - Flow rates in secondary schools (general stream), Island of Rodrigues, 2010
I II III IV V Lower VI Upper VI
Total
Promotion rate (%) 91 91 75 57 40 68 n.a
Repetition rate (%) 7 8 18 30 38 19 36
Dropout rate (%) 2 1 7 13 22 13 n.a
Male
Promotion rate (%) 86 84 66 56 44 74 n.a
Repetition rate (%) 11 13 24 33 39 20 40
Dropout rate (%) 3 3 10 11 17 6 n.a
Female
Promotion rate (%) 94 98 83 58 40 64 n.a
Repetition rate (%) 4 2 12 28 37 18 34
Dropout rate (%) 2 - 5 14 23 18 n.a
Table 6.9 - Flow rates in secondary schools (general stream), Island of Rodrigues, 2011
I II III IV V Lower VI Upper VI
Total
Promotion rate (%) 91 89 80 65 43 73 na
Repetition rate (%) 8 10 18 25 30 15 23
Dropout rate (%) 1 1 2 10 27 12 na
Male
Promotion rate (%) 89 87 72 63 43 74 na
Repetition rate (%) 10 12 25 26 30 17 25
Dropout rate (%) 1 1 3 11 27 9 na
Female
Promotion rate (%) 92 91 87 67 45 73 na
Repetition rate (%) 7 7 12 25 30 14 22
Dropout rate (%) 1 2 1 8 25 13 na
n.a: Not applicable
Grade
Grade
ICT IN EDUCATION

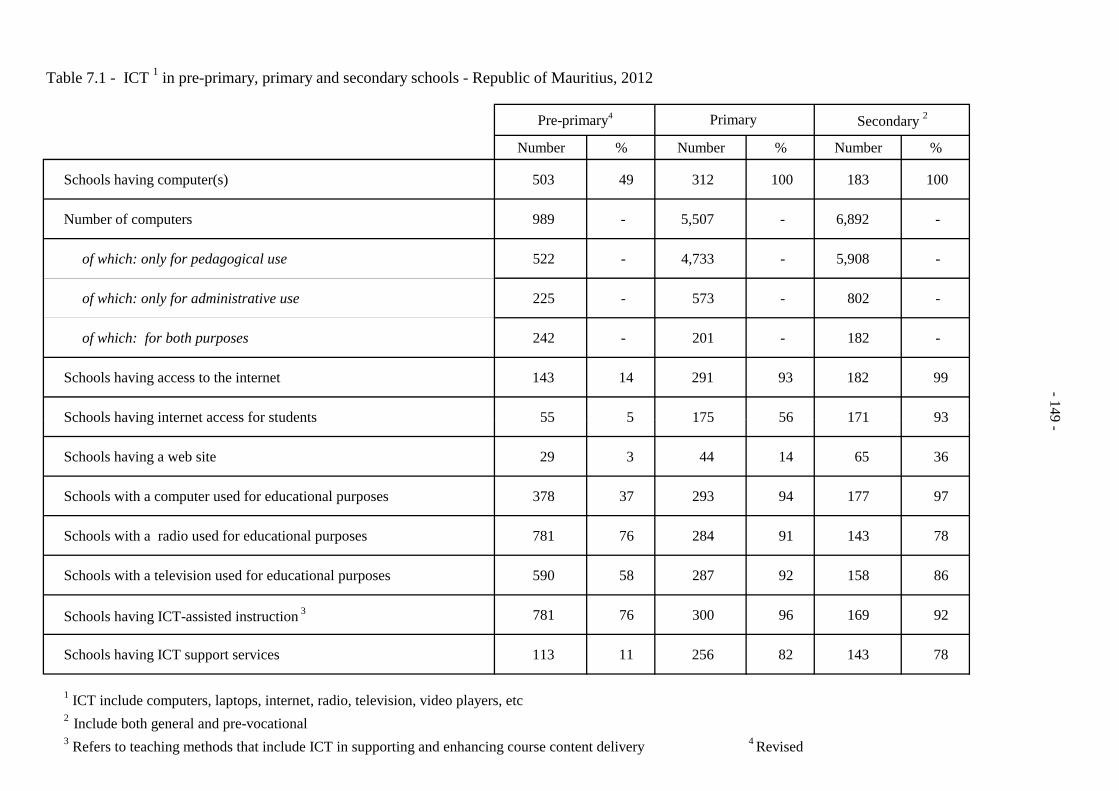
Table 7.1 - ICT 1 in pre-primary, primary and secondary schools - Republic of Mauritius, 2012
Number % Number % Number %
Schools having computer(s) 503 49 312 100 183 100
Number of computers 989 - 5,507 - 6,892 -
of which: only for pedagogical use 522 - 4,733 - 5,908 -
of which: only for administrative use 225 - 573 - 802 -
of which: for both purposes 242 - 201 - 182 -
Schools having access to the internet 143 14 291 93 182 99
Schools having internet access for students 55 5 175 56 171 93
Pre-primary4 Primary Secondary 2
-149Schools having internet access for students 55 5 175 56 171 93
Schools having a web site 29 3 44 14 65 36
Schools with a computer used for educational purposes 378 37 293 94 177 97
Schools with a radio used for educational purposes 781 76 284 91 143 78
Schools with a television used for educational purposes 590 58 287 92 158 86
Schools having ICT-assisted instruction 3 781 76 300 96 169 92
Schools having ICT support services 113 11 256 82 143 78
1 ICT include computers, laptops, internet, radio, television, video players, etc2 Include both general and pre-vocational3 Refers to teaching methods that include ICT in supporting and enhancing course content delivery 4 Revised
9 -

POST-SECONDARY
EDUCATION

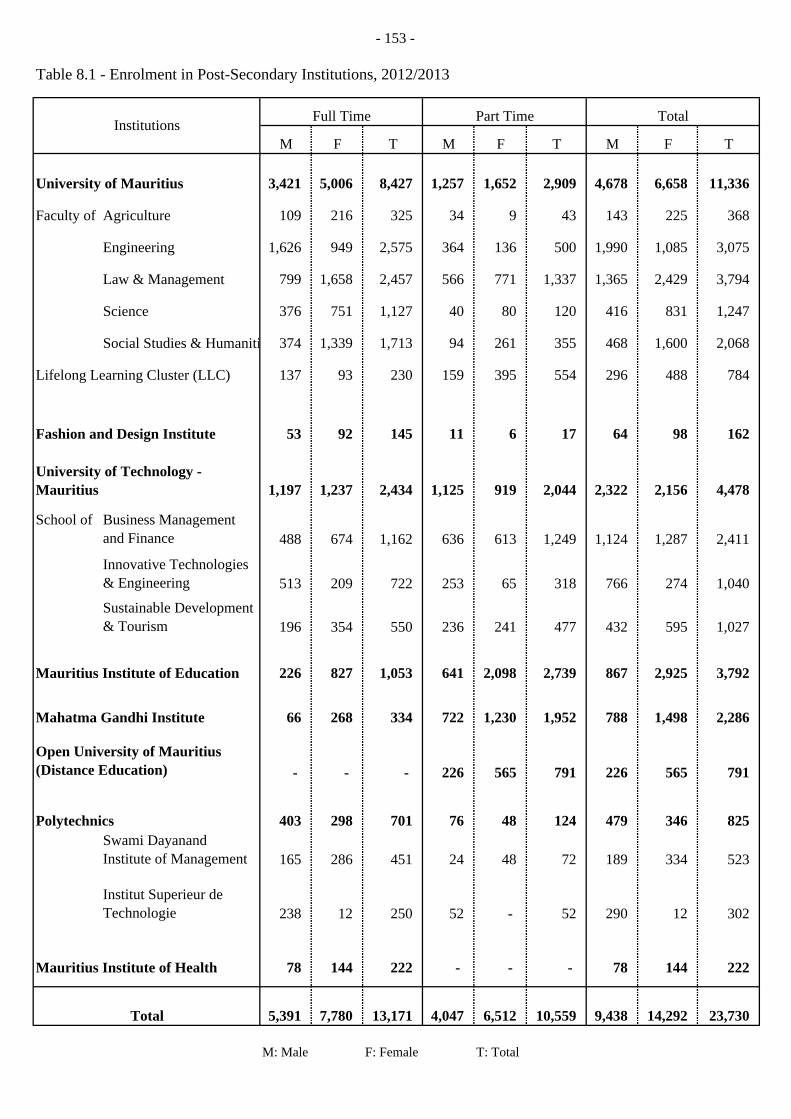
- 153 -
Table 8.1 - Enrolment in Post-Secondary Institutions, 2012/2013
M F T M F T M F T
University of Mauritius 3,421 5,006 8,427 1,257 1,652 2,909 4,678 6,658 11,336
Faculty of Agriculture 109 216 325 34 9 43 143 225 368
Engineering 1,626 949 2,575 364 136 500 1,990 1,085 3,075
Law & Management 799 1,658 2,457 566 771 1,337 1,365 2,429 3,794
Science 376 751 1,127 40 80 120 416 831 1,247
Social Studies & Humaniti 374 1,339 1,713 94 261 355 468 1,600 2,068
Lifelong Learning Cluster (LLC) 137 93 230 159 395 554 296 488 784
Fashion and Design Institute 53 92 145 11 6 17 64 98 162
1,197 1,237 2,434 1,125 919 2,044 2,322 2,156 4,478
School of Business Management and Finance 488 674 1,162 636 613 1,249 1,124 1,287 2,411
Innovative Technologies & Engineering 513 209 722 253 65 318 766 274 1,040
Sustainable Development & Tourism 196 354 550 236 241 477 432 595 1,027
Mauritius Institute of Education 226 827 1,053 641 2,098 2,739 867 2,925 3,792
Mahatma Gandhi Institute 66 268 334 722 1,230 1,952 788 1,498 2,286
- - - 226 565 791 226 565 791
Polytechnics 403 298 701 76 48 124 479 346 825 Swami Dayanand Institute of Management 165 286 451 24 48 72 189 334 523
Institut Superieur de Technologie 238 12 250 52 - 52 290 12 302
Mauritius Institute of Health 78 144 222 - - - 78 144 222
5,391 7,780 13,171 4,047 6,512 10,559 9,438 14,292 23,730
M: Male F: Female T: Total
Total
Total
Part TimeInstitutions Full Time
University of Technology - Mauritius
Open University of Mauritius (Distance Education)
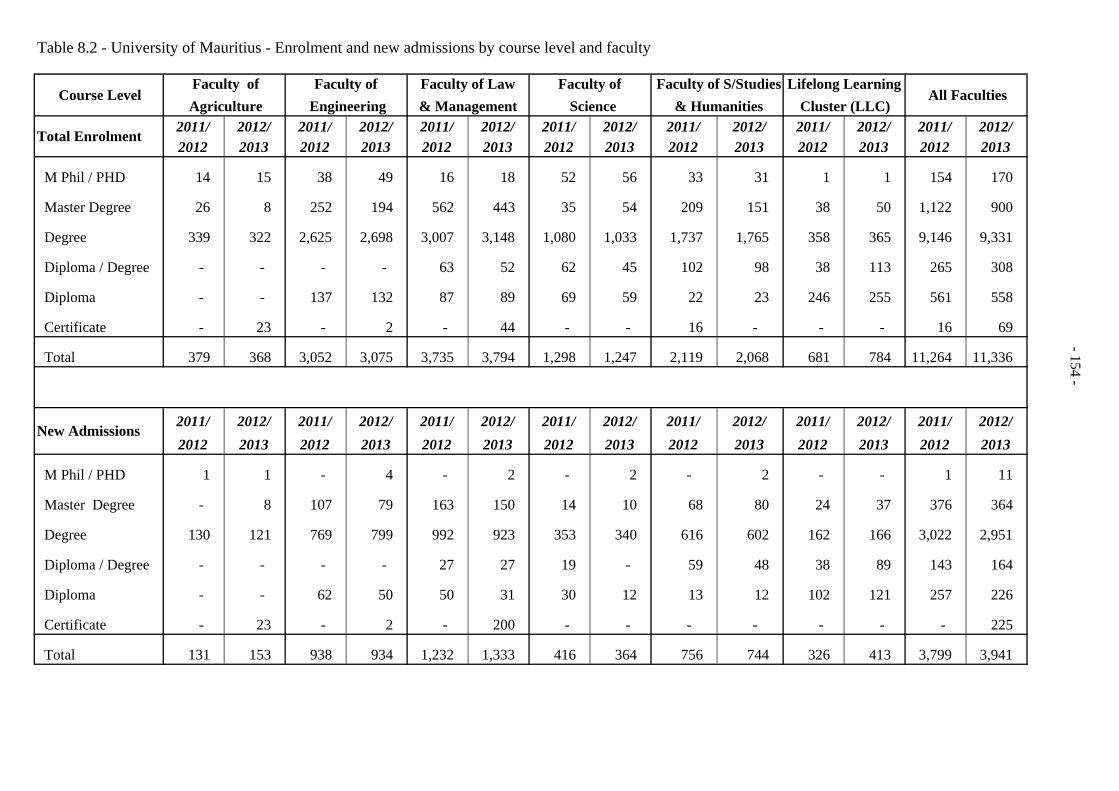
Table 8.2 - University of Mauritius - Enrolment and new admissions by course level and faculty
Faculty of Faculty of Faculty of Law Faculty of Agriculture Engineering & Management
2011/ 2012/ 2011/ 2012/ 2011/ 2012/ 2011/ 2012/ 2011/ 2012/ 2011/ 2012/ 2011/ 2012/2012 2013 2012 2013 2012 2013 2012 2013 2012 2013 2012 2013 2012 2013
M Phil / PHD 14 15 38 49 16 18 52 56 33 31 1 1 154 170
Master Degree 26 8 252 194 562 443 35 54 209 151 38 50 1,122 900
Degree 339 322 2,625 2,698 3,007 3,148 1,080 1,033 1,737 1,765 358 365 9,146 9,331
Diploma / Degree - - - - 63 52 62 45 102 98 38 113 265 308
Diploma - - 137 132 87 89 69 59 22 23 246 255 561 558
Certificate - 23 - 2 - 44 - - 16 - - - 16 69
Total 379 368 3,052 3,075 3,735 3,794 1,298 1,247 2,119 2,068 681 784 11,264 11,336
2011/ 2012/ 2011/ 2012/ 2011/ 2012/ 2011/ 2012/ 2011/ 2012/ 2011/ 2012/ 2011/ 2012/2012 2013 2012 2013 2012 2013 2012 2013 2012 2013 2012 2013 2012 2013
M Phil / PHD 1 1 - 4 - 2 - 2 - 2 - - 1 11
Master Degree - 8 107 79 163 150 14 10 68 80 24 37 376 364
Degree 130 121 769 799 992 923 353 340 616 602 162 166 3,022 2,951
Diploma / Degree - - - - 27 27 19 - 59 48 38 89 143 164
Diploma - - 62 50 50 31 30 12 13 12 102 121 257 226
Certificate - 23 - 2 - 200 - - - - - - - 225
Total 131 153 938 934 1,232 1,333 416 364 756 744 326 413 3,799 3,941
Total Enrolment
New Admissions
Course LevelFaculty of S/Studies Lifelong Learning
All Faculties Science & Humanities Cluster (LLC)
-178 --178 -
--154 -
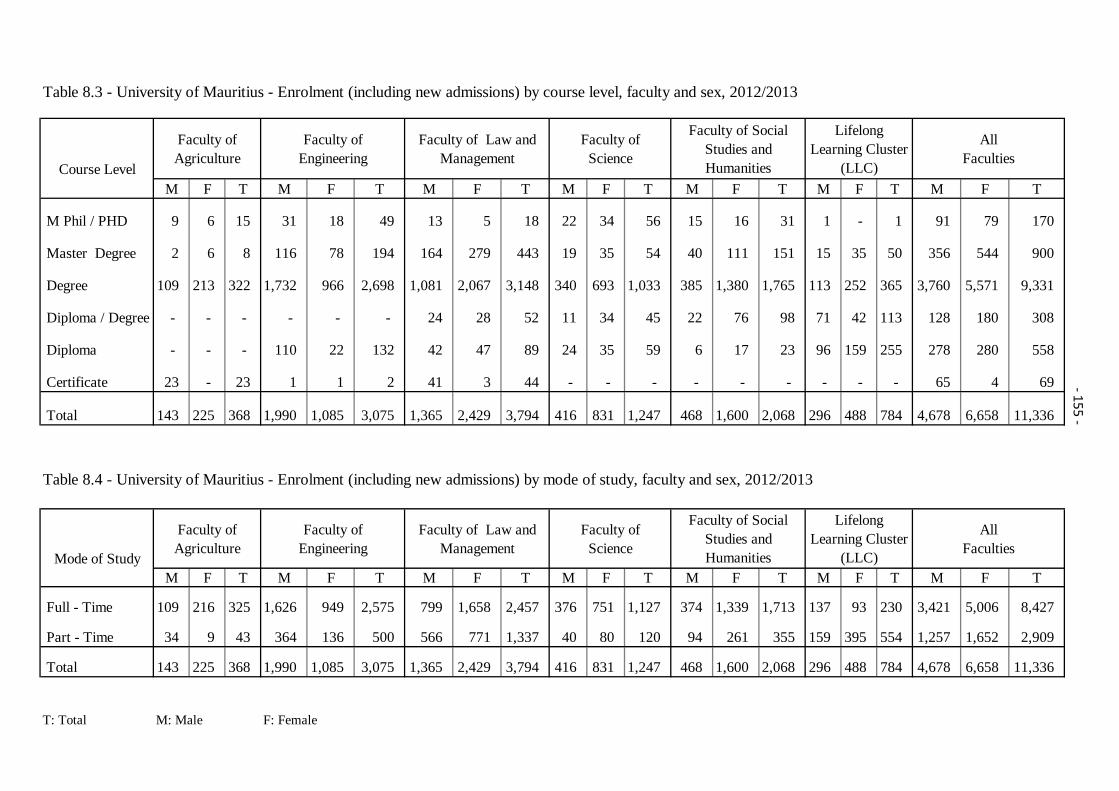
Table 8.3 - University of Mauritius - Enrolment (including new admissions) by course level, faculty and sex, 2012/2013
Course Level
Faculty of Agriculture
Faculty of Engineering
Faculty of Law and Management
Faculty of Science
Faculty of Social Studies and Humanities
Lifelong Learning Cluster
(LLC)
All Faculties
M F T M F T M F T M F T M F T M F T M F T
M Phil / PHD 9 6 15 31 18 49 13 5 18 22 34 56 15 16 31 1 - 1 91 79 170
Master Degree 2 6 8 116 78 194 164 279 443 19 35 54 40 111 151 15 35 50 356 544 900
Degree 109 213 322 1,732 966 2,698 1,081 2,067 3,148 340 693 1,033 385 1,380 1,765 113 252 365 3,760 5,571 9,331
Diploma / Degree - - - - - - 24 28 52 11 34 45 22 76 98 71 42 113 128 180 308
Diploma - - - 110 22 132 42 47 89 24 35 59 6 17 23 96 159 255 278 280 558
Certificate 23 - 23 1 1 2 41 3 44 - - - - - - - - - 65 4 69
Total 143 225 368 1,990 1,085 3,075 1,365 2,429 3,794 416 831 1,247 468 1,600 2,068 296 488 784 4,678 6,658 11,336
Table 8.4 - University of Mauritius - Enrolment (including new admissions) by mode of study, faculty and sex, 2012/2013
Mode of Study
Faculty of Agriculture
Faculty of Engineering
Faculty of Law and Management
Faculty of Science
Faculty of Social Studies and Humanities
Lifelong Learning Cluster
(LLC)
All Faculties
M F T M F T M F T M F T M F T M F T M F T
Full - Time 109 216 325 1,626 949 2,575 799 1,658 2,457 376 751 1,127 374 1,339 1,713 137 93 230 3,421 5,006 8,427
Part - Time 34 9 43 364 136 500 566 771 1,337 40 80 120 94 261 355 159 395 554 1,257 1,652 2,909
Total 143 225 368 1,990 1,085 3,075 1,365 2,429 3,794 416 831 1,247 468 1,600 2,068 296 488 784 4,678 6,658 11,336
T: Total M: Male F: Female
‐155 ‐
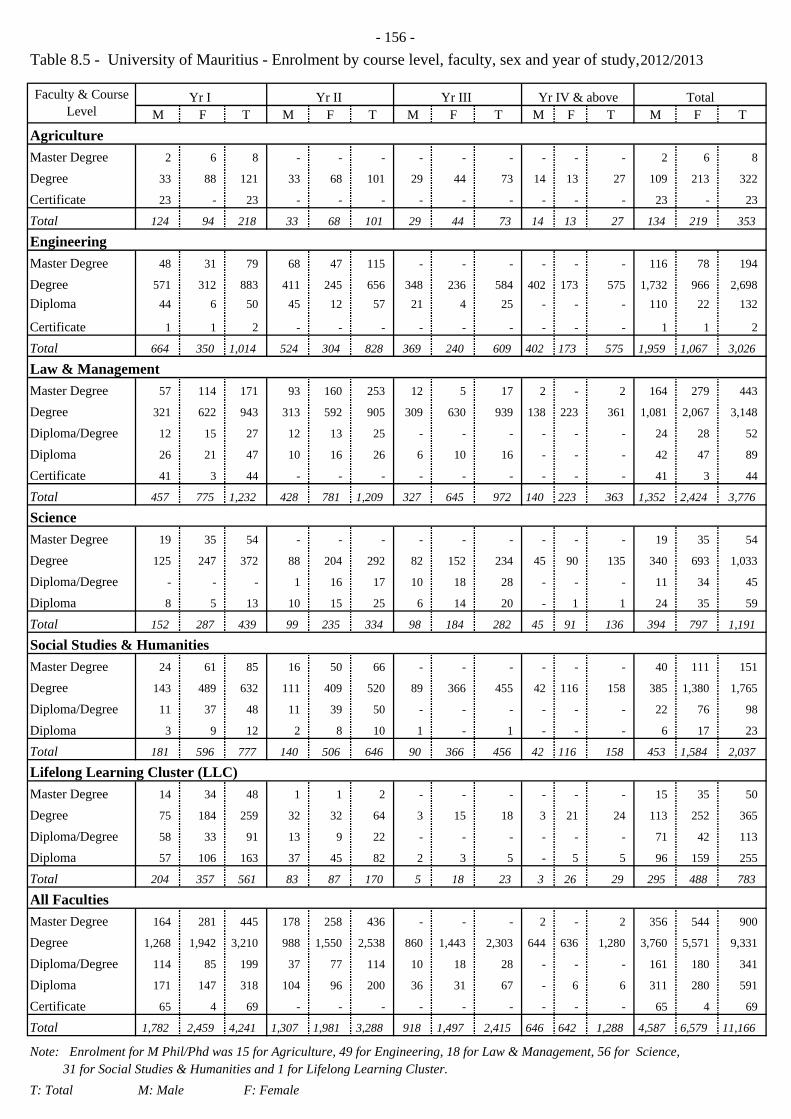
- 156 -Table 8.5 - University of Mauritius - Enrolment by course level, faculty, sex and year of study, 2012/2013
M F T M F T M F T M F T M F TAgricultureMaster Degree 2 6 8 - - - - - - - - - 2 6 8
Degree 33 88 121 33 68 101 29 44 73 14 13 27 109 213 322
Certificate 23 - 23 - - - - - - - - - 23 - 23
Total 124 94 218 33 68 101 29 44 73 14 13 27 134 219 353
EngineeringMaster Degree 48 31 79 68 47 115 - - - - - - 116 78 194
Degree 571 312 883 411 245 656 348 236 584 402 173 575 1,732 966 2,698 Diploma 44 6 50 45 12 57 21 4 25 - - - 110 22 132
Certificate 1 1 2 - - - - - - - - - 1 1 2
Total 664 350 1,014 524 304 828 369 240 609 402 173 575 1,959 1,067 3,026
Law & ManagementMaster Degree 57 114 171 93 160 253 12 5 17 2 - 2 164 279 443
Degree 321 622 943 313 592 905 309 630 939 138 223 361 1,081 2,067 3,148
Diploma/Degree 12 15 27 12 13 25 - - - - - - 24 28 52
Diploma 26 21 47 10 16 26 6 10 16 - - - 42 47 89
Certificate 41 3 44 - - - - - - - - - 41 3 44
Total 457 775 1,232 428 781 1,209 327 645 972 140 223 363 1,352 2,424 3,776
ScienceMaster Degree 19 35 54 - - - - - - - - - 19 35 54
Degree 125 247 372 88 204 292 82 152 234 45 90 135 340 693 1,033
Diploma/Degree - - - 1 16 17 10 18 28 - - - 11 34 45
Diploma 8 5 13 10 15 25 6 14 20 - 1 1 24 35 59
Total 152 287 439 99 235 334 98 184 282 45 91 136 394 797 1,191
Social Studies & HumanitiesMaster Degree 24 61 85 16 50 66 - - - - - - 40 111 151
Degree 143 489 632 111 409 520 89 366 455 42 116 158 385 1,380 1,765
Diploma/Degree 11 37 48 11 39 50 - - - - - - 22 76 98
Diploma 3 9 12 2 8 10 1 - 1 - - - 6 17 23
Total 181 596 777 140 506 646 90 366 456 42 116 158 453 1,584 2,037
Lifelong Learning Cluster (LLC)Master Degree 14 34 48 1 1 2 - - - - - - 15 35 50
Degree 75 184 259 32 32 64 3 15 18 3 21 24 113 252 365
Diploma/Degree 58 33 91 13 9 22 - - - - - - 71 42 113
Diploma 57 106 163 37 45 82 2 3 5 - 5 5 96 159 255
Total 204 357 561 83 87 170 5 18 23 3 26 29 295 488 783
All FacultiesMaster Degree 164 281 445 178 258 436 - - - 2 - 2 356 544 900
Degree 1,268 1,942 3,210 988 1,550 2,538 860 1,443 2,303 644 636 1,280 3,760 5,571 9,331
Diploma/Degree 114 85 199 37 77 114 10 18 28 - - - 161 180 341
Diploma 171 147 318 104 96 200 36 31 67 - 6 6 311 280 591
Certificate 65 4 69 - - - - - - - - - 65 4 69
Total 1,782 2,459 4,241 1,307 1,981 3,288 918 1,497 2,415 646 642 1,288 4,587 6,579 11,166
31 for Social Studies & Humanities and 1 for Lifelong Learning Cluster. T: Total M: Male F: Female
Note: Enrolment for M Phil/Phd was 15 for Agriculture, 49 for Engineering, 18 for Law & Management, 56 for Science,
Faculty & Course Level
Yr I Yr II Yr III Yr IV & above Total

Table 8.6 - University of Mauritius - New admissions by course level, faculty and sex, 2012/2013
Course Level M F T M F T M F T M F T M F T M F T M F T
M Phil / PHD - 1 1 2 2 4 1 1 2 - 2 2 1 1 2 - - - 4 7 11
Master Degree 2 6 8 48 31 79 49 101 150 1 9 10 22 58 80 12 25 37 134 230 364
Degree 33 88 121 500 299 799 307 616 923 114 226 340 130 472 602 54 112 166 1,138 1,813 2,951
Diploma / Degree - - - - - - 12 15 27 - - - 11 37 48 58 31 89 81 83 164
Diploma - - - 44 6 50 11 20 31 8 4 12 3 9 12 42 79 121 108 118 226
Certificate 23 - 23 1 1 2 175 25 200 - - - - - - - - - 199 26 225
Total 58 95 153 595 339 934 555 778 1,333 123 241 364 167 577 744 166 247 413 1,664 2,277 3,941
Table 8.7 - Fashion and Design Institute - Enrolment by faculty, course level, field of study and sex, 2012/2013
M F T M F T M F T M F T M F T M F T
Degree - - - - - - - - - - - - 11 6 17 11 6 17
Higher National Diploma - - - 38 25 63 4 29 33 5 10 15 - - - 47 64 111
Diploma 6 28 34 - - - - - - - - - - - - 6 28 34
Total 6 28 34 38 25 63 4 29 33 5 10 15 11 6 17 64 98 162
T: Total M:Male F:Female
Course LevelFoundation Studies
in Art & Design Graphic Design Fashion Textile Art & Design BA Graphic Design All field of study
All Faculties
Faculty of Agriculture
Faculty of Engineering
Faculty of Law and Management
Faculty of Science
Faculty of Social Studies and Humanities
Lifelong Learning Cluster (LLC)
-178 --178 -
--157 -
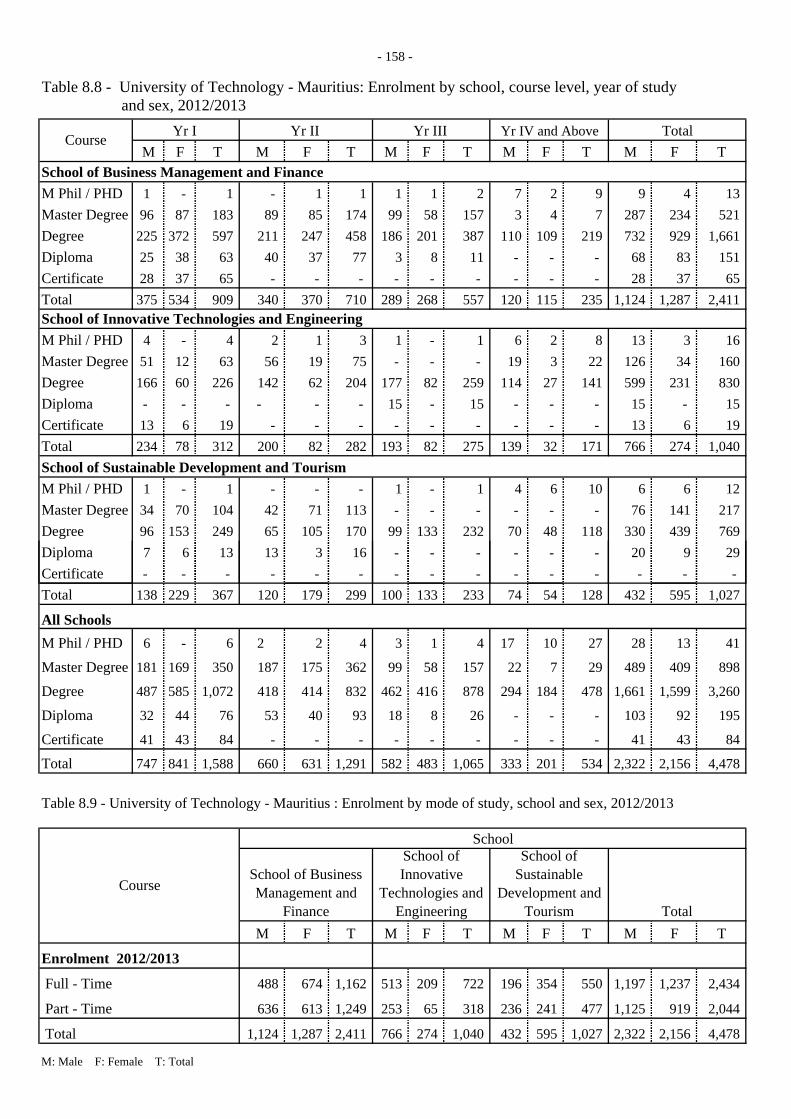
- 158 -
Table 8.8 - University of Technology - Mauritius: Enrolment by school, course level, year of study and sex, 2012/2013
M F T M F T M F T M F T M F T
M Phil / PHD 1 - 1 - 1 1 1 1 2 7 2 9 9 4 13 Master Degree 96 87 183 89 85 174 99 58 157 3 4 7 287 234 521 Degree 225 372 597 211 247 458 186 201 387 110 109 219 732 929 1,661 Diploma 25 38 63 40 37 77 3 8 11 - - - 68 83 151 Certificate 28 37 65 - - - - - - - - - 28 37 65 Total 375 534 909 340 370 710 289 268 557 120 115 235 1,124 1,287 2,411
M Phil / PHD 4 - 4 2 1 3 1 - 1 6 2 8 13 3 16 Master Degree 51 12 63 56 19 75 - - - 19 3 22 126 34 160 Degree 166 60 226 142 62 204 177 82 259 114 27 141 599 231 830 Diploma - - - - - - 15 - 15 - - - 15 - 15 Certificate 13 6 19 - - - - - - - - - 13 6 19 Total 234 78 312 200 82 282 193 82 275 139 32 171 766 274 1,040
M Phil / PHD 1 - 1 - - - 1 - 1 4 6 10 6 6 12 Master Degree 34 70 104 42 71 113 - - - - - - 76 141 217 Degree 96 153 249 65 105 170 99 133 232 70 48 118 330 439 769 Diploma 7 6 13 13 3 16 - - - - - - 20 9 29
Yr IV and Above Total
School of Business Management and Finance
School of Innovative Technologies and Engineering
Course Yr I Yr II Yr III
School of Sustainable Development and Tourism
Certificate - - - - - - - - - - - - - - - Total 138 229 367 120 179 299 100 133 233 74 54 128 432 595 1,027
M Phil / PHD 6 - 6 2 2 4 3 1 4 17 10 27 28 13 41
Master Degree 181 169 350 187 175 362 99 58 157 22 7 29 489 409 898
Degree 487 585 1,072 418 414 832 462 416 878 294 184 478 1,661 1,599 3,260
Diploma 32 44 76 53 40 93 18 8 26 - - - 103 92 195
Certificate 41 43 84 - - - - - - - - - 41 43 84
Total 747 841 1,588 660 631 1,291 582 483 1,065 333 201 534 2,322 2,156 4,478
Table 8.9 - University of Technology - Mauritius : Enrolment by mode of study, school and sex, 2012/2013
M F T M F T M F T M F T
Enrolment 2012/2013
488 674 1,162 513 209 722 196 354 550 1,197 1,237 2,434
636 613 1,249 253 65 318 236 241 477 1,125 919 2,044
1,124 1,287 2,411 766 274 1,040 432 595 1,027 2,322 2,156 4,478
M: Male F: Female T: Total
Total
All Schools
Full - Time
Course
Part - Time
School
School of Business Management and
Finance
School of Innovative
Technologies and Engineering
School of Sustainable
Development and Tourism Total

Table 8.10 - Mauritius Institute of Education - Enrolment by course level. mode of study and sex, 2012/2013
M F T M F T M F T M F T M F T M F T
5 14 19 12 25 37 - - - - - - - - - 17 39 56
22 24 46 28 23 51 - - - - - - - - - 50 47 97 Education Leadership 22 24 46 13 7 20 - - - - - - - - - 35 31 66 Inclusive & Special Education - - - 15 16 31 - - - - - - - - - 15 16 31
55 179 234 88 151 239 - - - 14 75 89 - - - 157 405 562
28 75 103 - - - - - - - - - - 11 11 28 86 114
Diploma 164 617 781 56 29 85 34 43 77 64 222 286 148 519 667 466 1,430 1,896
Pre Primary (TDECE) - 80 80 - - - - - - - - - - - - - 80 80 Primary 164 537 701 - - - - - - 44 124 168 105 403 508 313 1,064 1,377 General Purpose 148 447 595 - - - - - - 32 108 140 96 292 388 276 847 1,123 Oriental Languages 16 90 106 - - - - - - 12 16 28 9 111 120 37 217 254 Secondary - - - 20 13 33 28 23 51 20 98 118 43 116 159 111 250 361
Pre-Vocational - - - - - - 6 20 26 - - - - - - 6 20 26
Educational Supervision & Inspection (DESI) - - - 36 16 52 - - - - - - - - - 36 16 52
Special Educational Needs (SEN) - - - - - - - - - - - - - - - - - - Educational Management (DEM) - - - - - - - - - - - - - - - - - -
Advanced Certificate 116 418 534 - - - - - - - - - - - - 116 418 534
Education (ACE) 116 418 534 - - - - - - - - - - - - 116 418 534
Certificate 15 479 494 18 21 39 - - - - - - - - - 33 500 533 Teacher 's Certificate in Early Childhood Education - 205 205 - - - - - - - - - - - - - 205 205 Proficiency in Early Childhood Education (CPECE) - 220 220 - - - - - - - - - - - - - 220 220
Certificate in Educational Management in Early Childhood Education (CEMECE) - 12 12 - - - - - - - - - - - - - 12 12 Educator's Licence (Secondary) 15 42 57 - - - - - - - - - - - - 15 42 57 Certificate for Instructors -Fire Services - - - 14 - 14 - - - - - - - - - 14 - 14 Certificate for Special Education (SEN) - - - 4 21 25 - - - - - - - - - 4 21 25
405 1,806 2,211 202 249 451 34 43 77 78 297 375 148 530 678 867 2,925 3,792 1 Includes students on courses run jointly with University of Mauritius M : Male F : Female T : Total
Full- timeCourse Level Total
Enrolment
Yr II Yr III Yr II
Total
Yr IYr IPart-time
Master Degree in Education
Post Graduate Certificate in EducationBachelor in Education1
(run jointly with the University of Mauritius)
Post Graduate Diploma
-159 -
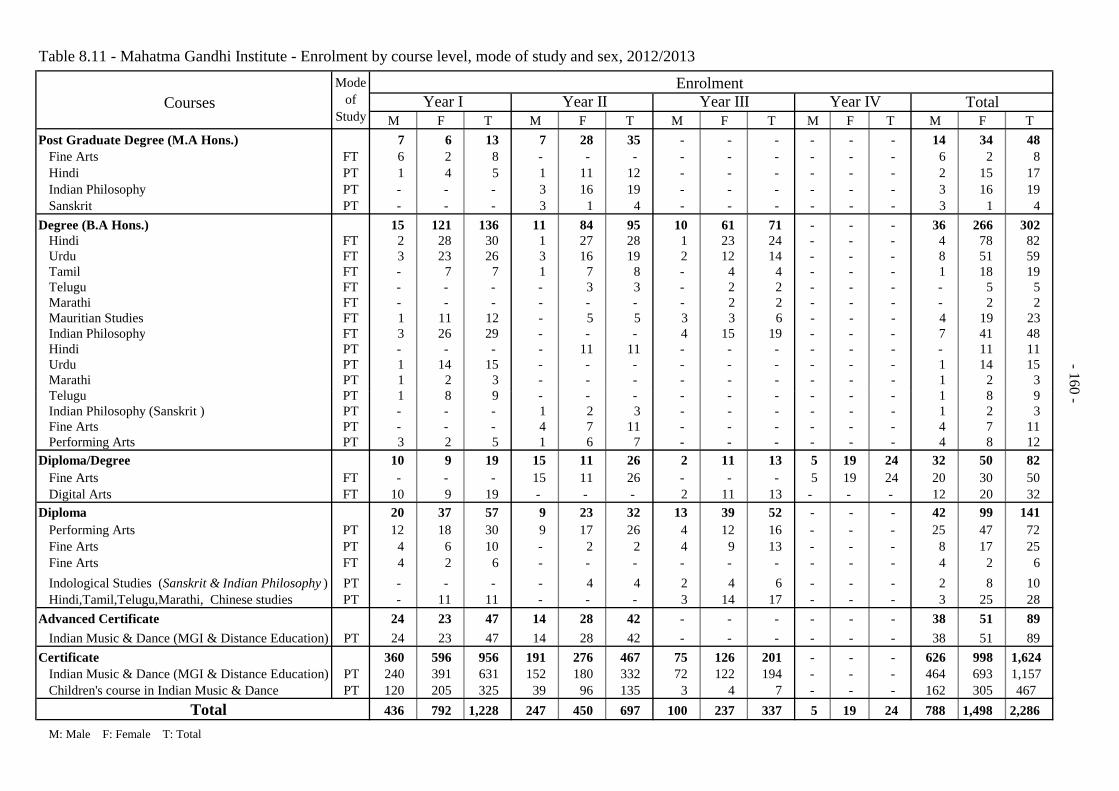
Table 8.11 - Mahatma Gandhi Institute - Enrolment by course level, mode of study and sex, 2012/2013
Courses Year I Year IIM F T M F T M F T M F T M F T
Post Graduate Degree (M.A Hons.) 7 6 13 7 28 35 - - - - - - 14 34 48 Fine Arts FT 6 2 8 - - - - - - - - - 6 2 8 Hindi PT 1 4 5 1 11 12 - - - - - - 2 15 17 Indian Philosophy PT - - - 3 16 19 - - - - - - 3 16 19 Sanskrit PT - - - 3 1 4 - - - - - - 3 1 4
Degree (B.A Hons.) 15 121 136 11 84 95 10 61 71 - - - 36 266 302 Hindi FT 2 28 30 1 27 28 1 23 24 - - - 4 78 82 Urdu FT 3 23 26 3 16 19 2 12 14 - - - 8 51 59 Tamil FT - 7 7 1 7 8 - 4 4 - - - 1 18 19 Telugu FT - - - - 3 3 - 2 2 - - - - 5 5 Marathi FT - - - - - - - 2 2 - - - - 2 2 Mauritian Studies FT 1 11 12 - 5 5 3 3 6 - - - 4 19 23 Indian Philosophy FT 3 26 29 - - - 4 15 19 - - - 7 41 48 Hindi PT - - - - 11 11 - - - - - - - 11 11 Urdu PT 1 14 15 - - - - - - - - - 1 14 15 Marathi PT 1 2 3 - - - - - - - - - 1 2 3 T l PT 1 8 9 1 8 9
Mode of
Study
Enrolment Year III Year IV Total
-178 - -160
Telugu PT 1 8 9 - - - - - - - - - 1 8 9 Indian Philosophy (Sanskrit ) PT - - - 1 2 3 - - - - - - 1 2 3 Fine Arts PT - - - 4 7 11 - - - - - - 4 7 11 Performing Arts PT 3 2 5 1 6 7 - - - - - - 4 8 12
Diploma/Degree 10 9 19 15 11 26 2 11 13 5 19 24 32 50 82 Fine Arts FT - - - 15 11 26 - - - 5 19 24 20 30 50 Digital Arts FT 10 9 19 - - - 2 11 13 - - - 12 20 32
Diploma 20 37 57 9 23 32 13 39 52 - - - 42 99 141 Performing Arts PT 12 18 30 9 17 26 4 12 16 - - - 25 47 72 Fine Arts PT 4 6 10 - 2 2 4 9 13 - - - 8 17 25 Fine Arts FT 4 2 6 - - - - - - - - - 4 2 6 Indological Studies (Sanskrit & Indian Philosophy ) PT - - - - 4 4 2 4 6 - - - 2 8 10 Hindi,Tamil,Telugu,Marathi, Chinese studies PT - 11 11 - - - 3 14 17 - - - 3 25 28
Advanced Certificate 24 23 47 14 28 42 - - - - - - 38 51 89 Indian Music & Dance (MGI & Distance Education) PT 24 23 47 14 28 42 - - - - - - 38 51 89
Certificate 360 596 956 191 276 467 75 126 201 - - - 626 998 1,624 Indian Music & Dance (MGI & Distance Education) PT 240 391 631 152 180 332 72 122 194 - - - 464 693 1,157 Children's course in Indian Music & Dance PT 120 205 325 39 96 135 3 4 7 - - - 162 305 467
436 792 1,228 247 450 697 100 237 337 5 19 24 788 1,498 2,286
M: Male F: Female T: Total
Total
0-
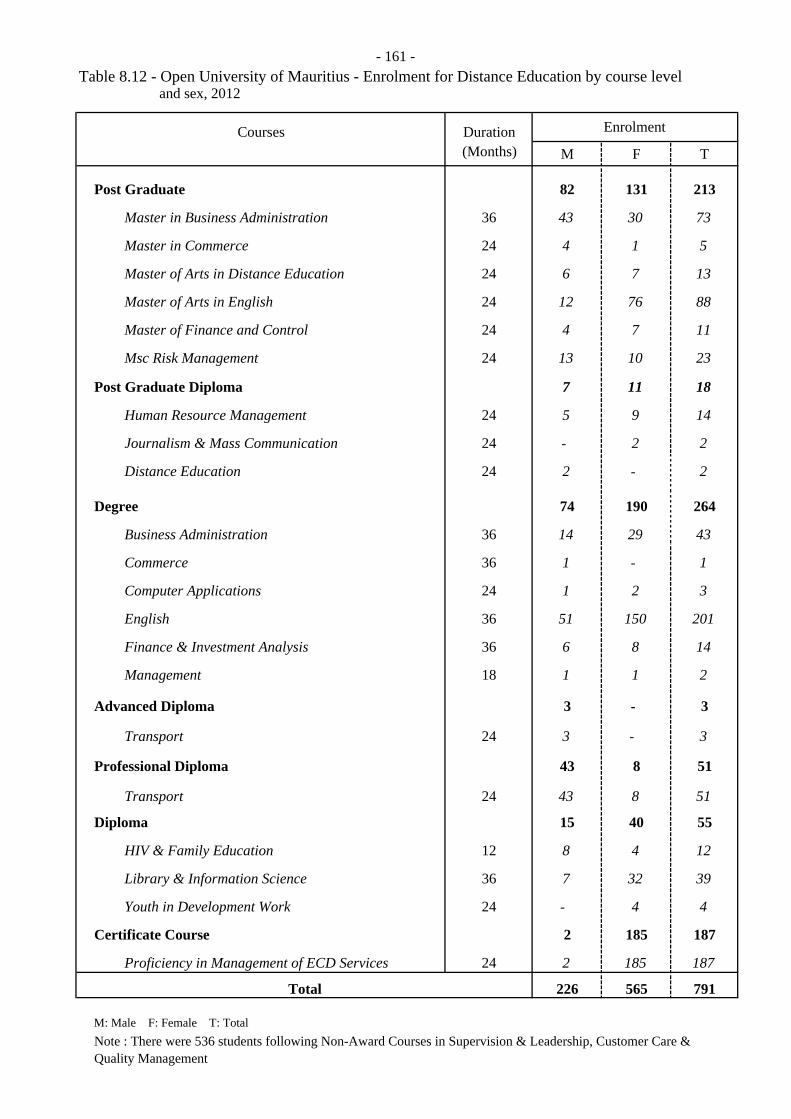
- 161 -Table 8.12 - Open University of Mauritius - Enrolment for Distance Education by course level and sex, 2012
Courses Duration(Months) M F T
Post Graduate 82 131 213
Master in Business Administration 36 43 30 73
Master in Commerce 24 4 1 5
Master of Arts in Distance Education 24 6 7 13
Master of Arts in English 24 12 76 88
Master of Finance and Control 24 4 7 11
Msc Risk Management 24 13 10 23
Post Graduate Diploma 7 11 18
Human Resource Management 24 5 9 14
Journalism & Mass Communication 24 - 2 2
Distance Education 24 2 - 2
74 190 264
Business Administration 36 14 29 43
36 1 - 1
24 1 2 3
English 36 51 150 201
Finance & Investment Analysis 36 6 8 14
Management 18 1 1 2
Advanced Diploma 3 - 3
Transport 24 3 - 3
Professional Diploma 43 8 51
Transport 24 43 8 51
Diploma 15 40 55
HIV & Family Education 12 8 4 12
Library & Information Science 36 7 32 39
Youth in Development Work 24 - 4 4
Certificate Course 2 185 187
Proficiency in Management of ECD Services 24 2 185 187
226 565 791
M: Male F: Female T: TotalNote : There were 536 students following Non-Award Courses in Supervision & Leadership, Customer Care & Quality Management
Enrolment
Total
Degree
Commerce
Computer Applications
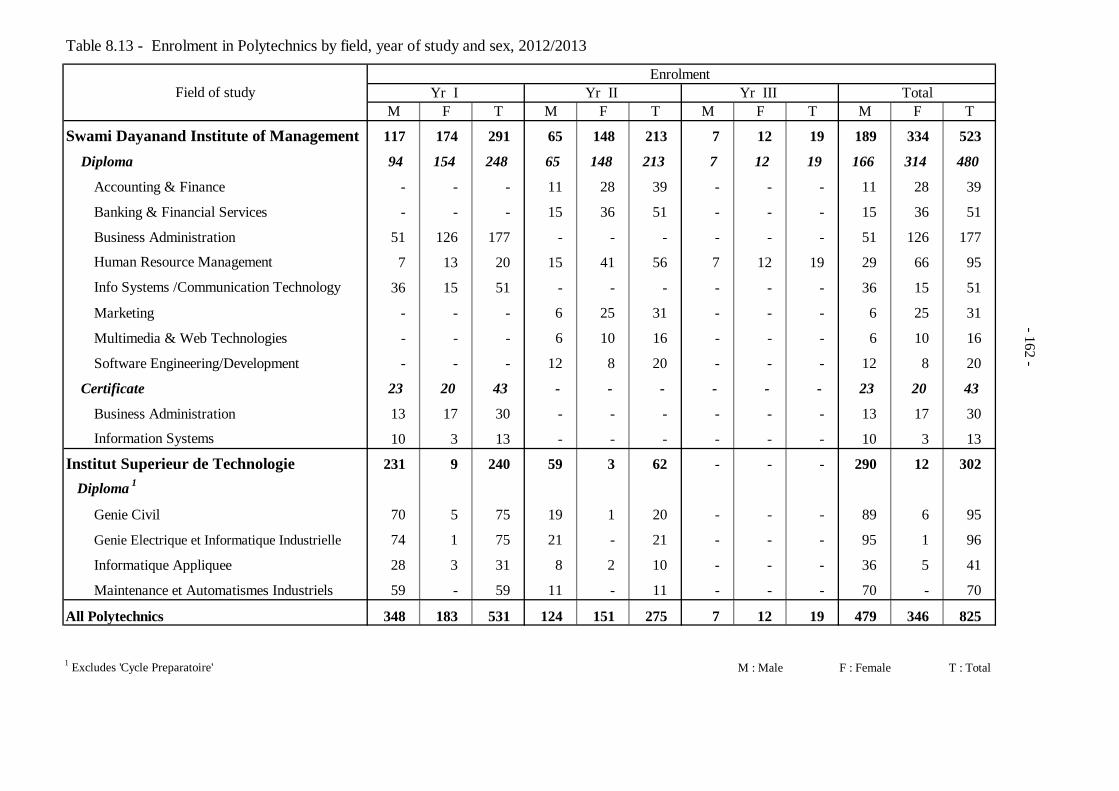
Table 8.13 - Enrolment in Polytechnics by field, year of study and sex, 2012/2013
Enrolment Yr I Yr II Yr III
M F T M F T M F T M F T
117 174 291 65 148 213 7 12 19 189 334 523
94 154 248 65 148 213 7 12 19 166 314 480
Accounting & Finance - - - 11 28 39 - - - 11 28 39
Banking & Financial Services - - - 15 36 51 - - - 15 36 51
Business Administration 51 126 177 - - - - - - 51 126 177
Human Resource Management 7 13 20 15 41 56 7 12 19 29 66 95
Info Systems /Communication Technology 36 15 51 - - - - - - 36 15 51
Marketing - - - 6 25 31 - - - 6 25 31
Multimedia & Web Technologies - - - 6 10 16 - - - 6 10 16
Software Engineering/Development - - - 12 8 20 - - - 12 8 20
23 20 43 - - - - - - 23 20 43
Business Administration 13 17 30 - - - - - - 13 17 30
Information Systems 10 3 13 - - - - - - 10 3 13
Institut Superieur de Technologie 231 9 240 59 3 62 - - - 290 12 302
Diploma 1
Genie Civil 70 5 75 19 1 20 - - - 89 6 95
Genie Electrique et Informatique Industrielle 74 1 75 21 - 21 - - - 95 1 96
Informatique Appliquee 28 3 31 8 2 10 - - - 36 5 41
Maintenance et Automatismes Industriels 59 - 59 11 - 11 - - - 70 - 70
All Polytechnics 348 183 531 124 151 275 7 12 19 479 346 825
1 Excludes 'Cycle Preparatoire' M : Male F : Female T : Total
Field of study
Swami Dayanand Institute of Management Diploma
Total
Certificate
-162-
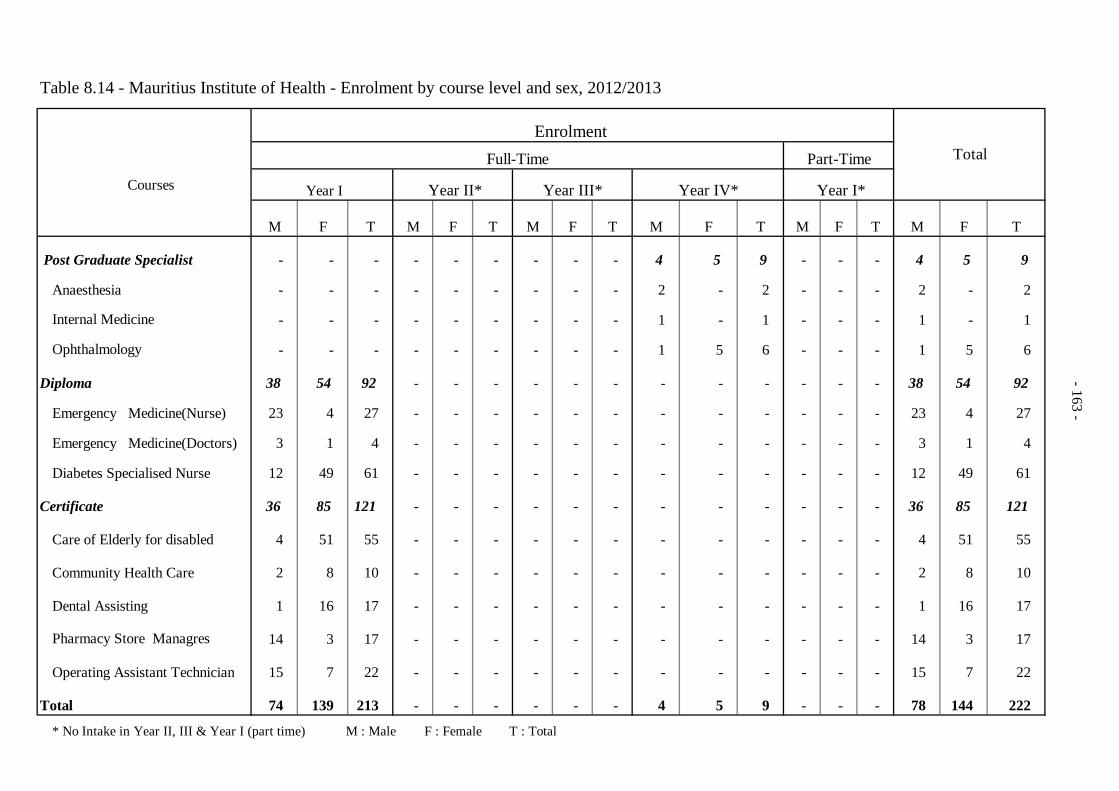
Table 8.14 - Mauritius Institute of Health - Enrolment by course level and sex, 2012/2013
Enrolment Full-Time Part-Time
Courses Year I Year I*
M F T M F T M F T M F T M F T M F T
Post Graduate Specialist - - - - - - - - - 4 5 9 - - - 4 5 9
Anaesthesia - - - - - - - - - 2 - 2 - - - 2 - 2
Internal Medicine - - - - - - - - - 1 - 1 - - - 1 - 1
Ophthalmology - - - - - - - - - 1 5 6 - - - 1 5 6
Diploma 38 54 92 - - - - - - - - - - - - 38 54 92
Emergency Medicine(Nurse) 23 4 27 - - - - - - - - - - - - 23 4 27
Emergency Medicine(Doctors) 3 1 4 - - - - - - - - - - - - 3 1 4
Diabetes Specialised Nurse 12 49 61 - - - - - - - - - - - - 12 49 61
Certificate 36 85 121 - - - - - - - - - - - - 36 85 121
Care of Elderly for disabled 4 51 55 - - - - - - - - - - - - 4 51 55
Community Health Care 2 8 10 - - - - - - - - - - - - 2 8 10
Dental Assisting 1 16 17 - - - - - - - - - - - - 1 16 17
Pharmacy Store Managres 14 3 17 - - - - - - - - - - - - 14 3 17
Operating Assistant Technician 15 7 22 - - - - - - - - - - - - 15 7 22
Total 74 139 213 - - - - - - 4 5 9 - - - 78 144 222
* No Intake in Year II, III & Year I (part time) M : Male F : Female T : Total
Total
Year II* Year III* Year IV*
-163-
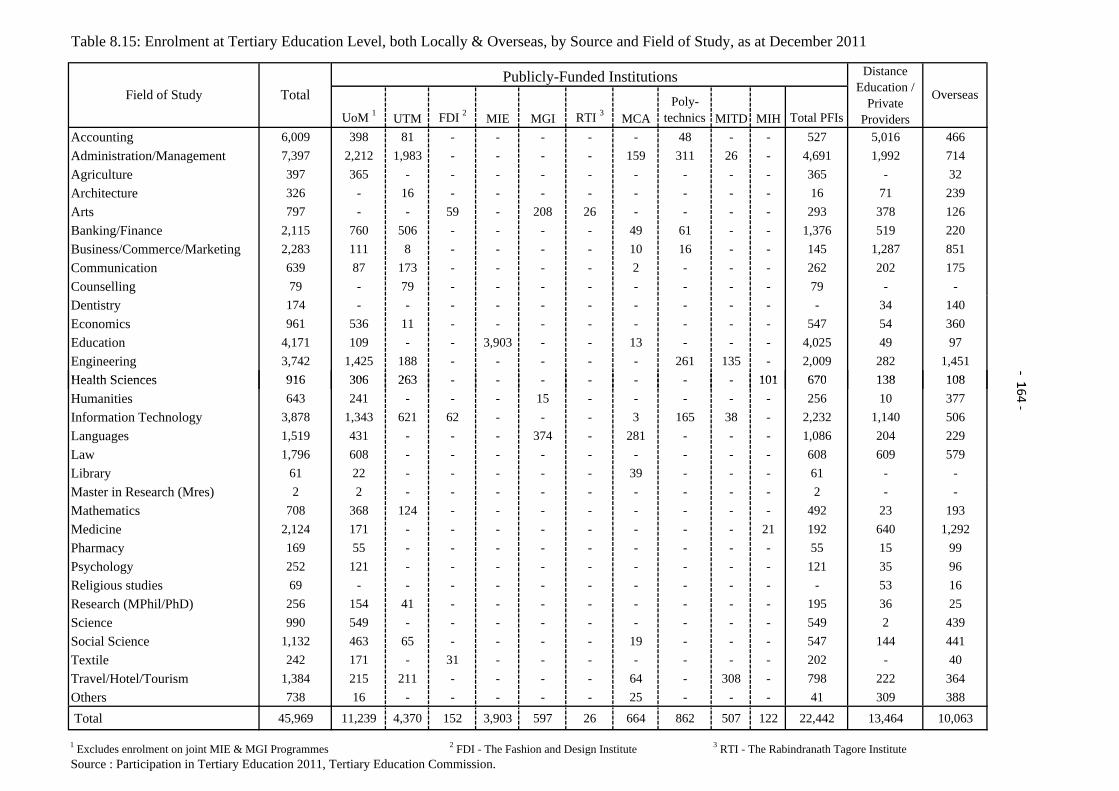
UoM 1 UTM FDI 2 MIE MGI RTI 3 MCAPoly-
technics MITD MIH Total PFIsAccounting 6,009 398 81 - - - - - 48 - - 527 5,016 466Administration/Management 7,397 2,212 1,983 - - - - 159 311 26 - 4,691 1,992 714Agriculture 397 365 - - - - - - - - - 365 - 32Architecture 326 - 16 - - - - - - - - 16 71 239Arts 797 - - 59 - 208 26 - - - - 293 378 126Banking/Finance 2,115 760 506 - - - - 49 61 - - 1,376 519 220Business/Commerce/Marketing 2,283 111 8 - - - - 10 16 - - 145 1,287 851Communication 639 87 173 - - - - 2 - - - 262 202 175Counselling 79 - 79 - - - - - - - - 79 - -Dentistry 174 - - - - - - - - - - - 34 140Economics 961 536 11 - - - - - - - - 547 54 360Education 4,171 109 - - 3,903 - - 13 - - - 4,025 49 97Engineering 3,742 1,425 188 - - - - - 261 135 - 2,009 282 1,451Health Sciences 916 306 263 101 670 138 108
Table 8.15: Enrolment at Tertiary Education Level, both Locally & Overseas, by Source and Field of Study, as at December 2011
Field of Study TotalPublicly-Funded Institutions Distance
Education / Private
Providers
Overseas‐1Health Sciences 916 306 263 - - - - - - - 101 670 138 108
Humanities 643 241 - - - 15 - - - - - 256 10 377Information Technology 3,878 1,343 621 62 - - - 3 165 38 - 2,232 1,140 506Languages 1,519 431 - - - 374 - 281 - - - 1,086 204 229Law 1,796 608 - - - - - - - - - 608 609 579Library 61 22 - - - - - 39 - - - 61 - -Master in Research (Mres) 2 2 - - - - - - - - - 2 - -Mathematics 708 368 124 - - - - - - - - 492 23 193Medicine 2,124 171 - - - - - - - - 21 192 640 1,292Pharmacy 169 55 - - - - - - - - - 55 15 99Psychology 252 121 - - - - - - - - - 121 35 96Religious studies 69 - - - - - - - - - - - 53 16Research (MPhil/PhD) 256 154 41 - - - - - - - - 195 36 25Science 990 549 - - - - - - - - - 549 2 439Social Science 1,132 463 65 - - - - 19 - - - 547 144 441Textile 242 171 - 31 - - - - - - - 202 - 40Travel/Hotel/Tourism 1,384 215 211 - - - - 64 - 308 - 798 222 364Others 738 16 - - - - - 25 - - - 41 309 388
Total 45,969 11,239 4,370 152 3,903 597 26 664 862 507 122 22,442 13,464 10,063
‐164 ‐
1 Excludes enrolment on joint MIE & MGI Programmes 2 FDI - The Fashion and Design Institute 3 RTI - The Rabindranath Tagore InstituteSource : Participation in Tertiary Education 2011, Tertiary Education Commission.

Table 8.16 - Estimated total number of Mauritian students pursuing Tertiary education overseas by country and field of study as at December 2011
Acc
ount
ing
Adm
in /
Man
agem
ent
Agr
icul
ture
Arc
hite
ctur
e
Arts
Ban
king
/ Fi
nanc
e
Bus
ines
s/C
omm
erce
/Mkg
Com
mun
icat
ion
Den
tistry
Des
ign
/ Fas
hion
Econ
omic
s
Educ
atio
n
Engi
neer
ing
Hea
lth &
Saf
ety
Hot
el /
Tour
ism
Hum
aniti
es
Info
rmat
ion
Tech
nolo
gy
Lang
uage
Law
Mat
hem
atic
s
Med
icin
e
Phar
mac
y
Psyc
holo
gy
Rel
igio
us S
tudi
es
Scie
nce
Soci
al S
cien
ce
Oth
ers
Tota
l
Australia 210 359 14 56 22 30 569 33 33 - 8 47 411 85 287 1 195 4 17 14 26 2 - 17 104 338 84 2,966
Canada - 4 1 - 6 2 8 - - - - 1 16 - 2 1 11 - 3 1 1 2 - 14 1 3 77
China 2 6 - 5 1 5 10 - 12 - 7 - 20 - - - 2 6 1 4 282 2 - - - 2 - 367
Russia - - - - - - - - 3 - - - 11 - - - - - - - 60 - - - - 1 - 75
France/ La Reunion 8 60 9 61 43 8 15 45 5 5 219 2 207 5 18 6 59 168 128 36 470 19 49 2 67 43 30 1,787
India - 31 - - 6 1 23 - 61 1 2 1 62 - - 354 66 18 - - 23 39 7 - 32 - 168 895
I l d
-16
Field of study
Country
Ireland 2 6 - - - - 3 - - - - 22 1 - - 5 2 - - 5 - - - - 1 - 47
Malaysia - 17 6 23 6 23 41 12 - 10 14 - 128 - - - 17 - 13 - 5 5 12 - 12 - 6 350
Pakistan - - - - - - - - 3 - - - 13 - - - - - - - 38 5 - - - - 59
Romania - - - - - - - - 2 - - - - - - - - - - - 21 - - - - - - 23
Singapore - 1 - 1 - - 1 - - - - - 3 - 1 - 1 - - - - - - - 1 - - 9
South Africa 1 35 - 15 5 4 4 1 5 1 1 3 34 3 - - 4 2 1 2 30 9 5 - 9 6 3 183
Switzerland 1 1 - - - - - - - - - - - 3 - - - - - - - - - - - - 5
UK 233 183 2 69 26 133 170 74 14 22 94 36 469 15 53 10 130 25 410 133 262 17 15 - 181 48 63 2,887
USA 10 9 - 8 10 14 9 10 - - 15 5 55 - - 5 15 1 4 1 12 - 6 - 21 5 32 247
Ukraine - - - - - - - - 1 - - - - - - - - - - - 18 - - - - - - 19
Others - 2 - 1 1 - - - 1 1 - 2 5 - - - 1 3 2 3 41 1 - - 2 - - 67
Total 467 714 32 239 126 220 853 175 140 40 361 97 1,456 109 364 377 506 229 579 194 1,294 99 96 19 443 445 389 10,063
Source : Participation in Tertiary Education 2011, Tertiary Education Commission.
65 -
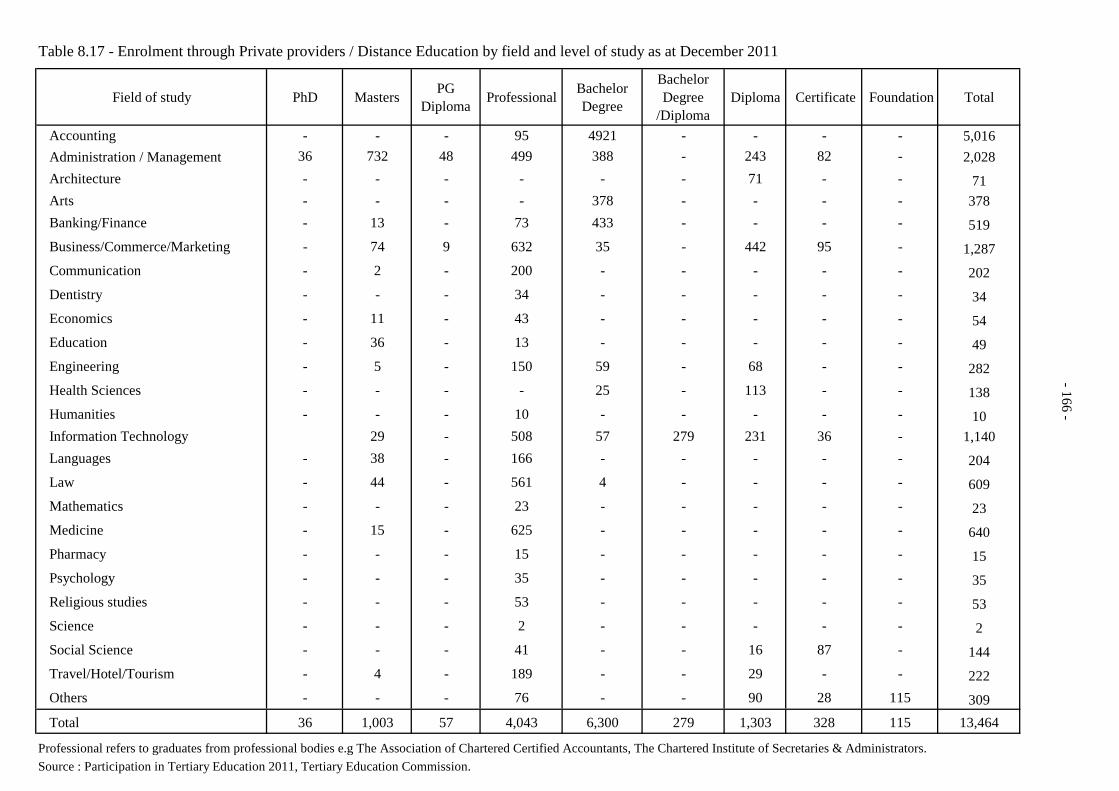
Table 8.17 - Enrolment through Private providers / Distance Education by field and level of study as at December 2011
Field of study PhD Masters PG Diploma Professional Bachelor
Degree
Bachelor Degree
/DiplomaDiploma Certificate Foundation Total
Accounting - - - 95 4921 - - - - 5,016Administration / Management 36 732 48 499 388 - 243 82 - 2,028Architecture - - - - - - 71 - - 71Arts - - - - 378 - - - - 378Banking/Finance - 13 - 73 433 - - - - 519Business/Commerce/Marketing - 74 9 632 35 - 442 95 - 1,287Communication - 2 - 200 - - - - - 202Dentistry - - - 34 - - - - - 34Economics - 11 - 43 - - - - - 54Education - 36 - 13 - - - - - 49Engineering - 5 - 150 59 - 68 - - 282Health Sciences 25 113 138
-
Health Sciences - - - - 25 - 113 - - 138Humanities - - - 10 - - - - - 10Information Technology 29 - 508 57 279 231 36 - 1,140Languages - 38 - 166 - - - - - 204Law - 44 - 561 4 - - - - 609Mathematics - - - 23 - - - - - 23Medicine - 15 - 625 - - - - - 640Pharmacy - - - 15 - - - - - 15Psychology - - - 35 - - - - - 35Religious studies - - - 53 - - - - - 53Science - - - 2 - - - - - 2Social Science - - - 41 - - 16 87 - 144Travel/Hotel/Tourism - 4 - 189 - - 29 - - 222Others - - - 76 - - 90 28 115 309Total 36 1,003 57 4,043 6,300 279 1,303 328 115 13,464
Professional refers to graduates from professional bodies e g The Association of Chartered Certified Accountants The Chartered Institute of Secretaries & Administrators
166 -
Professional refers to graduates from professional bodies e.g The Association of Chartered Certified Accountants, The Chartered Institute of Secretaries & Administrators. Source : Participation in Tertiary Education 2011, Tertiary Education Commission.
Annex A
Census of Schools - Methodology
Introduction Statistics Mauritius conducts a school census in March every year in the Republic of
Mauritius.
Objective The main objective of the census is to collect reliable and updated data on the
functioning of schools, teaching and learning conditions for effective policy and
decision-making in the education sector. The questionnaires have been designed to
collect information at school level on:
• available infrastructure and facilities;
• enrolment;
• examination results;
• ICT facilities, and
• teaching and non-teaching personnel.
Coverage The survey covers all public and private pre-primary, primary, secondary and
specialised institutions as well as all public-funded vocational training institutions in
the Republic of Mauritius. They numbered 1,508 in 2012.
Data collection Data are collected from schools through mail questionnaires. For the 2012 round of
the census, relevant questionnaires with a covering letter and instructions were mailed
to all schools during the last week of February 2012. The reference date for the survey
was 1st March 2012. The schools had to submit the completed questionnaires by mail
within a given deadline.
Response rate A close monitoring of response from the schools are done by staff of the Statistics
Unit at the Ministry of Education and Human Resources. Reminders are sent to all
schools which do not respond by a given deadline. Those which still do not respond
after phone calls and reminders are visited. In 2012, of the 1,508 schools, returns
could not be obtained from 6 schools only, all of them in the pre-primary sector.
Editing and Coding The editing and coding exercise are done by a team of Statistical Officers. The
questionnaires are scrutinized to identify missing and inconsistent data. The data are
also checked against previous year's questionnaires. Schools which report major
changes or missing and inconsistent data are contacted by phone and any necessary
corrections made. The questionnaires are then coded for data entry.
Data Processing Data capture for the 2012 School Census was performed by the Central Information
Systems Division (CISD) of the Ministry of Information and Communication
Technology using the Integrated Microcomputer Processing System (IMPS) software.
Questionnaires were entered twice by two officers to ensure that there was no input
error. Data validation and cleaning were then done by Statistical Officers using the
same software. Once all the data files were cleaned, IMPS was used for tabulation.