annual results presentation for the 53 …€¢wholesale performance affected by deflation in ......
TRANSCRIPT

ANNUAL RESULTS PRESENTATION FOR THE 53 WEEKS ENDED 31 DECEMBER 2017

AGENDA
1. FINANCIAL REVIEW2. OPERATIONAL REVIEW3. STRATEGY & PROSPECTS

FINANCIAL REVIEW
Hans van Lierop

Financial summary (53 weeks)
SALES
R1.5bn 2 __
14.0%52 weeks: R1.3 billion
2016: R1.3 billion
GROSS PROFITMARGIN
TRADING PROFIT BEFORE INTEREST & TAX
HEADLINEEARNINGS
2016: 19.0%
R93.7bn2.7%
52 weeks: R92.1 billion
2016: R91.3 billion
18.8 % R2.7bn4.2%
52 weeks: R2.5 billion
2016: R2.6 billion

Financial highlights
SALES GROWTH EXPENSE MANAGEMENTTRADING PROFIT BEFORE INTEREST & TAX
HEADLINE EARNINGS
2.7 % 1.6% 4.2 % 14.0%
0.8% COMPARABLE 1.3% COMPARABLE
1.0% 1.2% 5.4 % 1.6%
DEC 2017
53 WEEKS
DEC 2017
52 WEEKS
COMP

SOUTH AFRICA SALES
FOOD & LIQUOR FOOD & LIQUOR
Good recovery in H2
8.3%
SA VS. EX-SA SALES SA SALES EX-SA SALES
Ex-SASales
91.7%
58% 50%
DURABLES
50%
4.8%
SASales 1.5%
Group Durables sales 0.9%
Group Food & Liquor sales 2.4%
EX-SA SALES
Ex-SA sales impacted by
currency weakness
DURABLES
42%
SA Liquor 8.4%
SA RetailFood 3.0%
Ex-SA Liquor 2.7%
Ex-SA Food 1.1%
SALES BY GEOGRAPHY
SALES BY CATEGORY
Constant currency 3.5%
TOTAL GROUP
Ex-SA Durables 10.4%
SA Durables 0.2%

Gross profit margin
Dec 2016
19.0%
PRODUCT MIX FOOD
DEFLATION
Lower Durable goods participation driving margin decline
GROSS PROFIT MARGIN
Dec 2017
18.8%
GROSS PROFIT MARGIN

0
10
20
30
40
50
60
70
80
90
100
Bill
ion
s
Sales Operating expenses
Exceptional expense management
Sustained cost discipline in difficult sales environment
• Maintained low cost
as % of sales
• Operational efficiency
• Capex efficiencies
DEC 2015 DEC 2016 DEC 2017
16.3% 16.3% 16.4%

Expense categories
EMPLOYMENT COSTS DEPRECIATION
OCCUPANCY COSTS
OTHER OPERATING EXPENSES
0.5 %
2.7% COMPARABLE
• Efficient scheduling
• Reduced shifts in DCs
• Selective replacement
• 48,000 FTEs (stable)
• 11 new store openings
• Capex spend heavily weighted
to second half
• Higher proportion of IT assets
in capex
• 2.8% increase in new trading
space
• Reduced rentals on lease
reviews
• Benefit of owned properties
• Focus on containing costs
• Administrative efficiency
• Reduction of non-essential
activities
• Leveraging group synergies
5.7 %
3.3% COMPARABLE
1.3%
0.5% COMPARABLE
1.4%
0.4% COMPARABLE

Divisional performance
R373.5m53 weeks: R454.3 million
2016: R390.7 million
R1,256.6m53 weeks: R1,313.1 million
2016: R1,254.2 million
R735.5m53 weeks: R797.5 million
2016: R715.3 million
R127.1m53 weeks: R179.0 million
2016: R276.9 million
Trading profit before interest and taxation 5.4% (53 weeks: 4.2%)
MASSDISCOUNTERS MASSWAREHOUSE MASSBUILD MASSCASH
• Soft sales in Durables
categories
• Good margin management
• Great expense management
• Good sales given the
environment
• Liquor performed
exceptionally well
• Some margin pressure from
product mix
• Expenses well managed
• Strong sales performance
• Higher Retail participation
• Great expense management
• Strong sales in Retail
• Weak sales in Wholesale
• Margin pressure from high
participation of commodities
• Good expense management
The 'trading profit before interest and tax' above is the amount per the Preliminary Condensed Consolidated Income Statement less the BEE transaction IFRS 2 charge.
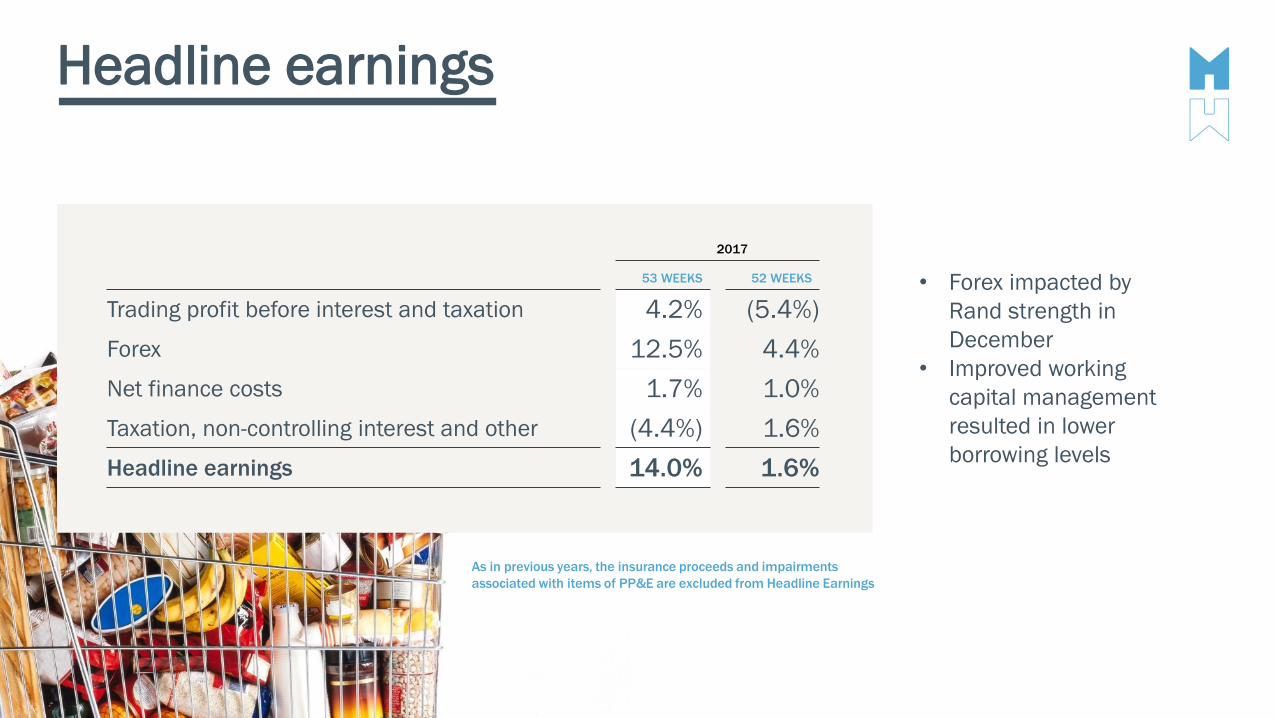
Headline earnings
As in previous years, the insurance proceeds and impairments
associated with items of PP&E are excluded from Headline Earnings
• Forex impacted by
Rand strength in
December
• Improved working
capital management
resulted in lower
borrowing levels
2017
53 WEEKS 52 WEEKS
Trading profit before interest and taxation 4.2% (5.4%)
Forex 12.5% 4.4%
Net finance costs 1.7% 1.0%
Taxation, non-controlling interest and other (4.4%) 1.6%
Headline earnings 14.0% 1.6%

Earnings
Earnings underpinned by strong cash generation
Rm DEC 2015 DEC 2016 DEC 2017
Operating cash before working
capital movements3,367 3,701 3,965
Working capital movements 370 (279) 706
Cash generated from operations 3,737 3,422 4,671
Interest and tax (1,068) (1,063) (1,389)
Replacement capex (984) (827) (679)
Free cash flow 1,685 1,532 2,603
CASH GENERATED FROM OPERATIONSEBITDA
Dec-15 Dec-16 Dec-17
R3
,12
2m
R3
,62
1m
R3
,60
0m
R3
,73
7m
R3
,42
2m
R4
,67
1m

Working capital
DEBTORS’ DAYSCREDITORS’ DAYSINVENTORY DAYS
• Intense focus on
stock management
•Debtors’ days stable
60
76
9
55
69
9
54
74
9
Dec-15 Dec-16 Dec-17

OPERATIONAL REVIEW
Guy Hayward

Key performances
total sales increase,
slowed in H2
comparable
decrease
sales growthMarket shares in
major appliances*
1.3%>35.0%3.0% 47%
* Source: GFK SA (Dec 2017)
RAPID GROWTHOF ONLINE SALES
SUPERB EXPENSE CONTROL
DURABLES SALES SOFT , GAINED MARKET SHARE
GOOD SA RETAIL FOOD GROWTH

Sales performance
MASSDISCOUNTERS
R20.0bn2016: R20.5bn
R27.3bn2016: R26.3bn
R13.0bn2016: R12.7bn
R31.9bn2016: R31.7bn
• Durables’ in deflation ( 2.5%)
“Real” comp sales improved in
H2 but still negative
• Game ex-SA sales decline 4.1%
but 10.5% in constant
currencies
• Strong Food & Liquor growth
( 5.9%)
• Marginally impacted by
deflation in commodities
• Soft Durables’ sales and
deflation
• Positive SA sales growth
( 3.2%)
• Strong Q4 sales performance.
Best in South African DIY / HI
• Negative ex-SA growth ( 7.1%),
but positive in constant
currencies ( 0.5%)
• Wholesale performance
affected by deflation in
commodities
• Negative ex-SA growth ( 5.0%)
• Good Retail sales growth of
5.8%
MASSWAREHOUSE MASSBUILD MASSCASH
4.2% comparable sales 2.4% comparable sales 1.6% comparable sales 2.3% comparable sales
Total sales 1.0%. Comparable sales 0.8%. New stores added 0.5%

SA Consumer Environment
-15
-10
-5
0
5
10
15
20
25
02 03 04 05 06 07 08 09 10 11 12 13 14 15 16 17 18 19 20 21 22
% c
ha
ng
e
Actual Forecast
Growth in value of consumer spending on Durables (Source: BER)
• Consumer confidence was
negative & trended weaker
in 2015 to 2017
• Forecast average growth
in Durables’ spending
is 7.5%. This will benefit
Game, Makro & Builders
(in Durables’ sales)
• These forecasts do not
include any impact of
proposed 1% VAT hike

R109
R75
R34
R7
Commodities’ deflation
2016
EXPECTED INFLATIONARY GROWTH
DE
FLATIO
N
DEFLATIONARY IMPACT ON FOOD SALES
2017
An illustration

Commodities’ deflation – sales impact
COMMODITIES’ INFLATION /
DEFLATION IN 2016-17 MAKRO SALES IMPACTMASSCASH SALES IMPACT
-15.0%
-10.0%
-5.0%
0.0%
5.0%
10.0%
15.0%
20.0%
25.0%
Jan
Fe
b
Ma
r
Ap
r
Ma
y
Jun
Jul
Au
g
Se
p
Oct
No
v
De
c
Jan
Fe
b
Ma
r
Ap
r
Ma
y
Jun
Jul
Au
g
Se
p
Oct
No
v
De
c
2016 2017
Cost Inflation Sales Inflation
TOTAL MAKRO
MAKRO EXCL COMMODITIES
4.0%
4.9%
TOTAL MASSCASHWHOLESALE
MASSCASH WHOLESALE EXCL COMMODITIES
1.7%
1.5%

Builders
Game
Jumbo
BotswanaNamibia
Zambia
Mozambique
Uganda
Nigeria
Tanzania
Malawi
Ghana
Lesotho
Kenya
Africa
Ex-SA
R181mSA
R146m
SOUTH AFRICA
COMPETITORS
R39m
AFRICANSALES PER STORE
215,860M2 OF RETAIL SPACE
R7.6bnSALES
42STORES
STORE DETAILS
56 millionRSA POPULATION
429 millionAFRICA POPULATION
12COUNTRIES
28CITIES
SALES PER STORE FOUR TIMES HIGHER THAN COMPETITORS
Current portfolio
Swaziland

Builders
Game
Jumbo
BotswanaNamibia
Zambia
Mozambique
Uganda
Nigeria
Tanzania
Malawi
Ghana
Lesotho
Kenya
Swaziland
NEW
African growth
AFRICAN SPACE GROWTH (EX SA)>35.6%
2018KenyaKaren Waterfront
(Nairobi)
GhanaArchimoto (Accra)
Westhills (Accra)
MozambiqueMarginal (Maputo)
Zimpeto x 2 (Maputo)
ZambiaMakeni (Lusaka)
Twin Palms Mall (Lusaka)
2019NigeriaGateway (Abuja)
GhanaTakoradi
KenyaUhuru (Nairobi)
Village Market
(Nairobi)
Karen Waterfront
(Nairobi)
2020NigeriaIkeja (Lagos)
Maitama (Abuja)
Port Harcourt
ZambiaKitwe
Ndola
SwazilandMatsapha
GhanaTema (Accra)
ADDITIONAL SALES PER YEAR
R1.4bn
R0.8bn
R1.3bn
2018
2019
2020

Omnichannel
151 UNIQUE CUSTOMER
COLLECTION POINTS
SAP Hybris platforms:
• Builders (March 2017)
• Game (October 2017)
• Dion Wired (March 2018)
• Makro (September 2018)
FOUR ECOMMERCE
POINTS OF PRESENCE
MIGRATING TO A SINGLE SOFTWARE
SOLUTION
• 57 Builders Warehouse
stores
• 3 Dion Wired stores
• 21 Makro stores
• 70 Makro lockers
Wide & compelling Omnichannel offering
• Hi-tech
• Small appliances
• Major appliances
• Outdoor
• DIY
• Food
• Clothing
• Liquor
• Home Improvement
• Paint
• Garden
113 CATEGORIES
+327 millionPAGE VIEWS
61 millionVISITS
4%OF MAKRO’S TOTAL DURABLES SALES IN NOV & DEC ‘17
47% SALES GROWTH

• Builders Warehouse
launched in March
2017, and Q4 sales
were double those of
the year-to-date
• Game launched in
Nov 2017
OmnichannelQuarterly Online sales
Q1-2016 Q2-2016 Q3-2016 Q4-2016 Q1-2017 Q2-2017 Q3-2017 Q4-2017
Makro Dion Wired Builders Game

-0.2 -0.8
5.5
9.9
12.3
5.4
3.8
5.6
9.8
3.4
21
12.3
1514
8
21.2
8.7
15.4
Carbonated soft
drinks
Convenience
instant meals
Bath soaps Cheese Snacks Cereals Vitamins &
supplements
Long life fruit juice Oral care
Food / FMCG
Examples of categories growing ahead of the market
* Source: Information Resources Inc (IRi) (Dec 2017)
DEFINED GROCERY CATEGORIESANNUAL VALUE GROWTH %
Total market
Massmart

AUDIO-VISUAL
Television 2%
Navigation 4%
DVD-player/recorder 3%
MAJOR APPLIANCES
Vacuum cleaners 3%
Refrigeration 2%
Washing Machines 1%
GAMING/IT
Printing devices 1%
Media Tablets 1%
PC Software 3%
Durables
MASSMART MARKET SHARE GROWTHS
* Source: GFK SA (Dec 2017)

Private Label
Strong Private Label portfolio
Aro (Catering)
M Brand (Milk)
Campmaster, Logik,
Garden Master,
Aro, Trojan
Builders Pride,
Mastercraft,
Grip ,Stramm
15.2%
6.4%15FOOD
34GENERAL MERCHANDISE
9HOME IMPROVEMENT
58
RECOGNISED AS
NATIONAL CATEGORY LEADER
PRIVATE LABELSHARE VERSUSNATIONAL BRANDBRANDS IN PORTFOLIO

Black Friday: R1 billion sales
GROWTH
Makro 29%
Game 20%
Dion Wired 198%
Builders 100%
ONLINE SALES
increased to over
15% of Makro sales
SALES
31% in average Game
basket size

Update
Intense development and testing.
Implementation in Q1 2019. Legacy
system write-off of R11m in 2017
SAP ERP IN GAME MASSCASH CAPE TOWN WATER CRISISMerged Jumbo & Cambridge exec teams.
Lead by Kevin Vyvyan-Day. Combine
skills, reduce opex, leverage scale
Thorough contingency plans in place
for employees, customers, food safety,
store ops, health & safety

STRATEGY &PROSPECTS
Guy Hayward

Strategic priorities
Over the longer-term, our key areas of strategic focus remain unchanged:
To drive the growth and profitability
of the core South African business
over the medium-term
IMPROVE AND GROW OUR CORE BUSINESS
GROW AFRICA
GROW ONLINE/OMNICHANNEL
Sub-Saharan African expansion
through new stores in Builders
Warehouse, Game and Masscash
Expand, improve and refine our
online / ecommerce offerings in
DionWired, Game, Makro and
Builders Warehouse

Prospects
• The Group’s 2018 sales growth to date remains soft. Marked by higher sales growth to upper-income
customers and lower growth elsewhere
• Hopeful of an improved sales environment during 2018:
• New SA political leadership a very positive impact. Improving economic variables in the short-term,
the longer-term challenges are considerable but can be addressed
• Lower inflation, stronger Rand & potentially lower interest rates
• Commodities’ deflation to abate by mid-2018
• But uncertain about the impact of recent proposed VAT increase
Any reference to future financial
performance included in this
document has not been reviewed or
reported on by the Group’s external
auditors. The auditor’s report does
not necessarily report on all of the
information contained in this
announcement/financial results.
Shareholders are therefore advised
that in order to obtain a full
understanding of the nature of the
auditor’s engagement they should
obtain a copy of the auditor’s report
together with the accompanying
financial information from the
issuer’s registered office.

FOR FURTHER DETAILSWWW.MASSMART.CO.ZA/RESULTS2017

ADDITIONAL INFORMATIONCondensed Consolidated Income Statement
Tax Rate Reconciliation
Cash Flow Statement
Capital Expansion
Capex Per Category
Store Portfolio
Forecast Stores: Jan 2018 – Dec 2020
Restatement
New standards
Number of shares

Restated*
53 weeks 53rd week 52 weeks 52 weeks
December 2017 pro forma December 2017 December 2016 53 weeks 52 weeks
Rm (Reviewed) (note 5) (Pro forma) (Reviewed) % change % change
Revenue 94,029.1 1,586.8 92,442.3 91,564.9 2,7 1.0
Sales 93,735.2 1,586.6 92,148.6 91,250.0 2,7 1.0
Cost of sales (76,084.6) (1,284.5) (74,800.1) (73,924.7) (2.9) (1.2)
Gross profit 17,650.6 302.1 17,348.5 17,325.3 1.9 0,1
Other income 235.1 0.2 234.9 216.8 8.4 8.3
Depreciation and amortisation (1,095.4) - (1,095.4) (1,036.5) (5.7) (5.7)
Employment costs (7,402.9) (21.0) (7,381.9) (7,346.6) (0.8) (0.5)
Occupancy costs (3,187.0) (12.6) (3,174.4) (3,133.2) (1.7) (1.3)
Other operating costs (3,463.3) (17.5) (3,445.8) (3,397.8) (1.9) (1.4)
Trading profit before interest and taxation 2,737.1 251.2 2 485.9 2,628.0 4.2 (5.4)
Impairment of assets (18.9) - (18,9) (76.7) 75.4 75.4
Insurance proceeds on items in PP&E 58.8 - 58.8 98.1 (40.1) (40.1)
Operating profit before foreign exchange movements and interest 2,777.0 251.2 2,525.8 2,649.4 4.8 (4.7)
Foreign exchange loss (47.2) (7.3) (39.9) (141.8) 66.7 71.9
Operating profit before interest 2,729.8 243.9 2,485.9 2,507.6 8.9 (0.9)
- Finance costs (585.4) (10.8) (574.6) (601.0) 2.6 4.4
- Finance income 26.4 0.5 25.9 29.1 (9.3) (11.0)
Net finance costs (559.0) (10.3) (548.7) (571.9) 2.3 4.1
Profit before taxation 2,170.8 233.6 1,937.2 1,935.7 12.1 0.1
Taxation (649.1) (69.9) (579.2) (595.9) (8.9) 2.8
Profit for the year 1,521.7 163.7 1,358.0 1,339.8 13.6 1.4
Condensed Consolidated Income StatementExtract from Preliminary Reviewed Condensed Consolidated Results for the year ended 31 December 2017
* Certain comparative figures shown do no correspond with the 2016 financial statements and reflect statements made. Refer to note 6.

Tax rate reconciliation
%
Dec 2017
(Reviewed)
Dec 2016
(Reviewed))
Standard tax rate 28.0 28.0
Non-taxable income and disallowable expenses 0.8 0.2
Assessed loss not utilised 3.2 2.7
Other - including foreign tax adjustments (2.1) (0.1)
Group tax rate 29.9 30.8

Cash Flow Statement
Rm
Dec 2017
(Reviewed)
Restated*
Dec 2016
(Reviewed)
Operating cash before working capital
movements 3,964.7 3,700.9
Working capital movements 705.8 (279.0)
Cash generated from operations 4,670.5 3,421.9
Net interest and tax paid (1,388.6) (1,063.2)
Net investment to maintain operations (678.5) (826.7)
Free cash flow 2,603.4 1,532.0
Dividends paid (689.9) (453.2)
Dividends received 80.0 50.0
Investment to expand operations and other net
investing activities (1,128.2) (948.2)
Cash inflow before financing activities 865.3 180.6
* Certain comparative figures shown do no correspond with the 2016 financial statements and reflect statements made. Refer to note 6.

0.0
500.0
1 000.0
1 500.0
2 000.0
2 500.0
0.0%
0.5%
1.0%
1.5%
2.0%
2.5%
3.0%
3.5%
4.0%
Property expansion
Businesses acquired
Investment to expand
operations
Investment to maintain
operations
Total capex as a % of sales
Total capex as a % of sales
excluding business and
property acquisitions
Ca
pe
x a
s a
% o
f sa
les DEC
2012
DEC 2014
DEC 2013
DEC 2015
DEC 2016
DEC 2017
Capital expansion
Ca
pita
l exp
an
sio
n (R
m)

Capex per category
Rm
Dec 2017
(Reviewed)
Dec 2016
(Reviewed)
Land and buildings/leasehold improvements 533.8 393.3
Vehicles 5.2 31.0
Fixtures, fittings, plant and equipment 270.5 443.3
Computer hardware 28.8 56.8
Computer software 300.0 29.4
Investment to expand operations 1,138.3 953.7
Land and buildings/leasehold improvements 156.0 123.8
Vehicles 35.4 43.0
Fixtures, fittings, plant and equipment 328.9 300.7
Computer hardware 98.4 157.5
Computer software 59.8 201.7
Investment to maintain operations 678.5 826.7
46.9%
0.5%23.8%
2.5%
26.3%
Land & buildings/leasehold improvements
Vehicles
Fixtures, fittings, plant & equipment
Computer hardware
Computer software
EXPANSIONARY INVESTMENT
Total capex 1.9% of total sales (2016: 1.9%)

Store portfolio
Total Massdiscounters Masswarehouse Massbuild Masscash
423 166 21 108 128Up from 412
in Dec 2016
Up from 165
in Dec 2016
Up from 20 in Dec 2016 Up from 104
In Dec 2016
Up from 123
in Dec 2016
+11 Opened +1 Game
+1 in Ghana
+1 Makro
+1 in South Africa
+3 Builders Superstore
+3 in South Africa
+4 Retail
+4 in South Africa
+1 Builders Warehouse
+1 Zambia
+1 Wholesale
+1 in Zambia

Forecast stores: Jan 2018 – Dec 2020
This 12.4% increase includes an 35.6% increase in our ex-SA trading space
Total Massdiscounters Masswarehouse Massbuild Masscash
+54 +17 +1 +15 +21Up from 423 to 477 Up from 166 to 183 Up from 21 to 22 Up from 108 to 123 Up from 128 to 149
+34
+20
South Africa
Ex-SA
+16
+1
Game
+4 in South Africa
+4 in Ghana
+3 in Kenya
+4 in Nigeria
+1 in Zambia
DionWired
+1 in South Africa
+1 Makro
+1in South Africa
+6
+3
+6
Builders Warehouse
+1 in South Africa
+2 in Mozambique
+1 in Zambia
+1 in Swaziland
+1 in Kenya
Builders Express
+3 in South Africa
Builders Superstore
+6 in South Africa
+17
+4
Retail
+17 in South Africa
Wholesale
+1 in South Africa
+2 in Zambia
+1 in Mozambique
+12.4% +11.5% +8.0% +11.9% +17.0%Up from 1,612,916m2
to 1,812,296m2
Up from 548,544m2
to 611,627m2
Up from 231,021m2
to 249,521m2
Up from 456,313m2
to 510,614m2
Up from 377,038m2
to 441,134m2

Restatement
We have reconsidered our accounting with respect
to the valuation of inventory in line with IAS 2
‘Inventories’ relating to the valuation of inventory
including the capitalisation of costs and recognition
of rebates on inventory. Previously the value of
inventory incorrectly included certain elements of
preparing the product for sale while some rebates
were immediately recognised against cost of sales
rather than deferring these rebates in line with the
movement of inventory.
In addition, while preparing the 2017 Group cash
flow statement, we observed that elements of
unrealised foreign exchange movements had been
incorrectly included in the ‘Foreign exchange
movement on cash and cash equivalents’ line on
the 2016 Group cash flow statement.
We therefore concluded that both the error in the
application of the accounting policy of the Group’s
inventory valuation and the error of classification in
the disclosure of unrealised foreign exchange
differences on the face of the Group’s cash flow
statement should be corrected in accordance with
IAS 8: ‘Accounting policies, changes in accounting
estimates and errors’. The correction to the
accounting treatment is effective for the year ended
31 December 2017 and has been applied
retrospectively. This has therefore resulted in a
restatement of the comparative 2016 and 2015
periods. The aggregate effect of the restatement for
these periods is as follows:

New standards to come into effect
IFRS 16
‘Leases’
Key areas of impact
• On-balance sheet recognition of leased stores
• 362 of 423 stores are leased
• Operating lease commitments R15.1 billion
*Estimations based on the 2017 data
IMPLEMENTATION EFFECTIVE 1 JANUARY 2019 MODIFIED RETROSPECTIVE APPROACH
IMPLEMENTATION EFFECTIVE 1 JANUARY 2018 MODIFIED RETROSPECTIVE APPROACH
IFRS 9
‘Financial Instruments’
Key areas of impact
• Expected loss method on provision
for doubtful debts
• Impact of less than 2%* decrease
in net trade receivables
IFRS 15
‘Revenue from Contracts
with customers’
Key areas of impact
• Principal vs. Agent definition
• 5%* sales decrease
• Right of Return Asset and Return
obligation
• Impact of less than 1%* on current
assets and current liabilities
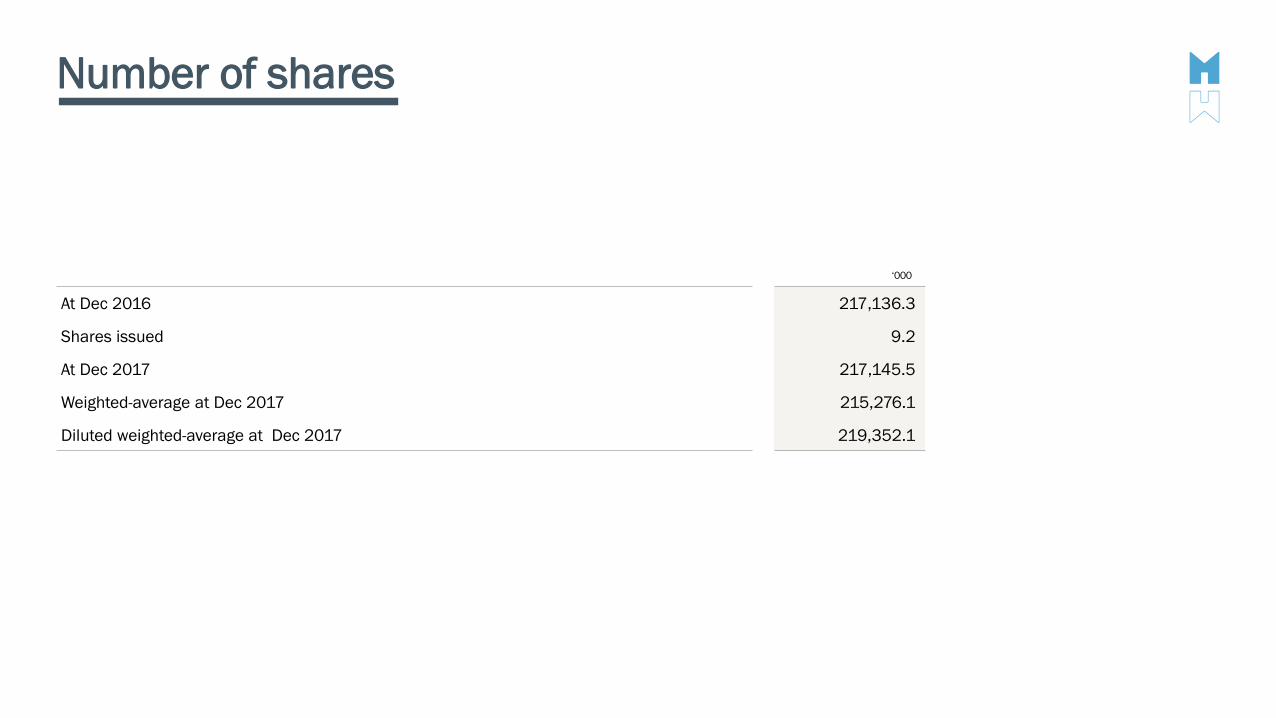
Number of shares
‘000
At Dec 2016 217,136.3
Shares issued 9.2
At Dec 2017 217,145.5
Weighted-average at Dec 2017 215,276.1
Diluted weighted-average at Dec 2017 219,352.1