annual results for the year ended 31 march 2013 parliament portfolio committee economic development...
TRANSCRIPT

ANNUAL RESULTSANNUAL RESULTSfor the year ended 31 March 2013for the year ended 31 March 2013
Parliament Portfolio Committee
Economic Development
25 October 201325 October 2013Cape TownCape Town
2
Presentation Outline

Introduction
3
Est
ab
lish
men
tT
arg
et m
arke
t
• sefa was established in April 2012 with the merging of Khula, Samaf and IDC small business lending activities.
• It is a fully owned subsidiary of IDC focussing on small business development.• Its first year of operations was characterised with a focus on implementing the merger, including
organisational change management, human capital integration, IT systems and processes and the development of enterprise-wide policies and procedures.
• These processes have laid the foundation for sefa to deliver on its key strategic objectives.
sefa’s target market consists of those small businesses not served by the existing formal banking and finance sector within the following categories:•Survivalists and microenterprises –loans of between R500 and R50 000•Small enterprises – loans between R50 000 and R1 000 000•Medium enterprises – loans between R1 000 000 and R5 000 000

Loan Product Portfolio Loan Product Portfolio
PerformancePerformance

Loan Product Portfolio Mix
Direct LendingWorking CapitalAsset FinanceTerm LoansRevolving LoansBridging LoansShort-term trade finance
Capacity BuildingPre and Post Loan Mentoring
Institutional StrengtheningBoard RepresentationMgt and Tech Support
Delivery Channels9 Regional Office14 Co-location (seda)7 Retail Fin Intemediaries10 Specialised Funds10 Micro Finance Inst.10 Financial Saving Co-ops
Wholesale FinancingBusiness LoansSpecialised FundsCredit Guarantee SchemeLand Reform Empower. Fund
SMMEs andCo-operatives
FinancingR500 - R5m

Direct LendingRegional Office
Johannesburg
Bloemfontein
Kimberley
Cape Town
Port Elizabeth
Durban
Nelspruit
Mahikeng
Polokwane
Retail FinancialIntermediaries
Cape CapitalInvestment and
Finance Company
Retmil FinancialServices
MettleAdministrative
Services
Synergy Trust
Khula ShopritePartnership
Capx InvoiceDiscounting
Equity/Specialised Funds
Anglo-KhulaZimela Joint
Venture
BusinessPartners-KhulaStart-up Fund
Khula EnablisLoan Fund
IdentityDevelopment
Fund
Small BusinessGrowth Trust
Fund
Utho CapitalInfrastructure
SME Fund
Khula-AkwandzeFund
Land ReformEmpowerment
Facility
Absa Bank
First Rand Bank
Netbank
Standard Bank
Sibanye CapeSacco
Flash SACCO
StellenboschWineland
Ditsobotla PrimaryCo-op Bank
Boikago
Tlharihani
Mankotsana
Kuvhanganyani
Kwamachi FSC
KwaZulu Ladies
Financial ServiceCo-operatives
Small EnterpriseFoundation
Tetla
Sakhti
PhakamaniFoundation
OpportunityFinance
Ndiza Finance
Mazwe FinancialServices
IkussasaEmpowerment
Trust
Get ReadyInvestment
Holdings
G50 Woman FSC
Extra Credit
Aloga
Akanani
Micro - Finance
IthalaDevelopmentCorporation
• 9 Regional Offices• 6 Financial Intermediaries• 7 Equity / Specialised Funds• 4 Banks• 13 Micro-Finance Institutions• 10 Financial Service Co-operatives
Delivery Structure/ Channels

Loan Products Performance
2011/13 2012/13 2012/13
Full Year Full Year - ActualFull Year -
Targetsex- Khula and ex-
samafsefa sefa
Approvals R211.1m R439.6m R560.0m
Disbursements R143.0m R198.0m R451.0m
No. of Jobs created
50 103** 19 853 13 196
No. of SMMEs financed
59 910** 28 362 11 812
** Method of calculation changed from a general average to a financing specific

Loan Products Performance

Loan Products Performance

Impact Indicators
Development Impact Indicators
Indicator Target Actual
Facilities disbursed to youth-owned - 25-35 years old 30% 16.5%
Facilities disbursed in priority rural provinces 45% 45.4%
Facilities disbursed to women-owned businesses 40% 39.8%
Facilities disbursed to black-owned businesses 70% 78.1%
Facilities less than R250K disbursed to end-users 40% 45.4%

Development Impact of Loan Product Portfolio

Approvals and disbursements

Approvals and disbursements
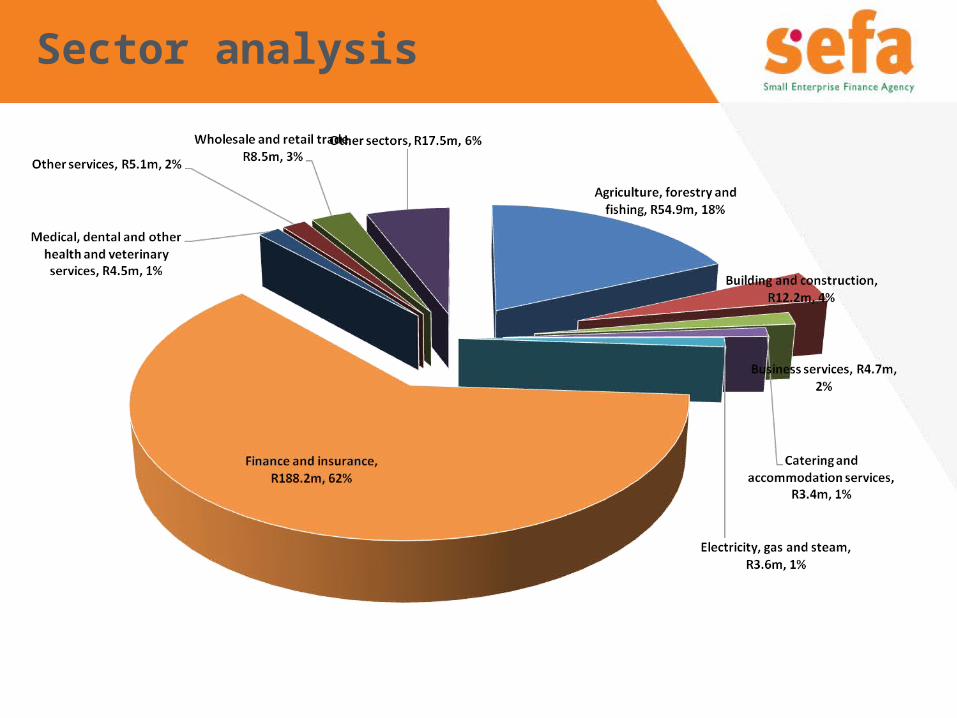
Sector analysis

sefa Outreach and stakeholder Participation
Roadshows sefa led Roadshows together with seda, SARS, NYDA, IDC, dti, EDD, Provincial Development Corporations and
Local Government LED units and local Chambers of Commerce 15 Towns and 8 Provinces ± 2488 Entrepreneurs Message – marketing of sefa products and other government SMME services Stakeholder Feedback
Access to sefa office (visibility and accessibility in small towns) Loan/ Disbursement process (Turnaround times, Document requirements) Interest Rates Access to loans, < R50k (Micro-finance Institutions
Customer Channels Online Enquiries – 887 Call Centre - 6203Regional Office Offices- 2426

Success StoriesSuccess Stories

Success Stories - Microfinance
• Through Tetla, based in the Western Cape (MFI), funding was made available to Vuyiswa Bheyi, who started her fruit and vegetable stall.
• Vuyiswa is self-employed and able to provide for her family

Success Stories – Retail Financial Intermediary
• Through the disbursement made to Retmil (RFI), funding of R1.8m was provided to SSS Security services
• The company was able to employ additional 1,400 staff members

Success Stories - Direct Lending
• Magdeline Paledi, the COO of MMJV, obtained a bridging facility of R3 million, which enable the Joint Venture to honour the contract received from Anglo American.
• The funding assisted in the development of a village school in Burgersfort.

Success Stories – Direct Lending
• sefa provided a bridging loan of R3 million to BBT construction.
• The funding enabled BBT to service large construction contracts and contributed in sustaining employment for 165 staff.

On Point Manufacturing• The company is involved in manufacturing of steel and fabrication as well as
engineering design.
• It was awarded an order to manufacture conveyor belt components for a platinum mine.
• The business operates from Steelpoort in the Sekhukhune district in Limpopo.
• This youth-owned business received R600 000 funding from sefa.
Lee 0108 Trading Enterprise• Miss Lungile Nkosi operates a slimming clinic in Centurion, Gauteng.
• Female youth owned enterprise
• The clinic provides a non-invasive slimming treatment.
• sefa provided R520 000 funding for the business.
Success Stories – Youth

Human Capital ManagementHuman Capital Management

Human Capital Management
LevelMale Female
TotalBlack Coloured Indian White Black Coloured Indian White
Executive 2 0 1 0 1 0 0 0 4
Manager 13 0 0 1 13 0 1 3 31
Professional 27 1 0 5 39 4 2 3 81
Administrative 8 0 0 0 25 4 2 1 40
Support 2 0 0 0 5 0 0 0 7
Total 52 1 1 6 83 8 5 7 163
Establishment Profile
• Black representation constituted 92% and female employees 69% of sefa staff.• Human Capital Management performance was informed by following:
• Establishment and approval of the organisational structure• Transfer and placement of employees into the new organisation• Implementation of change management programmes• Relocating to new office• Development if conditions of employment, human capital policies, procedures,
processes and systems
Corporate GovernanceCorporate Governance

Corporate Governance
• sefa’s corporate governance is informed by:– Public Finance Management Act
– King Report on Governance for South Africa 2009 (King III)
– Companies Act, No 71 of 2008
• Appointment of Board of Directors (BOD) is informed by the Memorandum of Incorporation - between 5 – 15 directors
• Shareholder – IDC appoints the BOD
• Unitary Board – one Executive Director and 10 Non-Executive Directors
• BOD is responsible for :– Setting economic, social and economic direction through strategic objectives and key policies and
– Monitors performance through structured quarterly performance via board sub-committees and regular BOD meetings.

Financial PerformanceFinancial Performance

Statements of Financial Position as at 31 March 2013
2013 2012 1 Apr 2011 2013 2012 1 Apr 2011
R'000 R'000 R'000 R'000 R'000 R'000
ASSETS
Cash and cash equivalents 909 998 725 792 571 793 808 767 517 682 346 184
Trade and other receivables 21 303 24 431 22 108 22 695 21 764 21 939
Tax receivable 60 - 8 446 - - 8 323
Loans and advances 303 060 249 485 296 859 211 576 162 245 212 397
Investments 26 409 47 871 68 502 26 409 47 871 68 502
Investments in subsidiaries - - - 141 604 139 674 142 452
Investments in associates 604 914 576 005 559 663 108 982 99 909 98 622
Investments in joint ventures 53 037 48 702 53 955 7 047 7 264 48 012
Deferred tax asset 75 193 39 617 35 469 113 338 74 453 56 859
Investment properties 171 435 195 264 187 508 171 435 195 264 187 508
Equipment 12 401 1 535 2 005 12 280 1 385 2 005
Intangible assets 1 874 1 817 - 1 699 1 550 -
TOTAL ASSETS 2 179 684 1 910 519 1 806 308 1 625 832 1 269 061 1 192 803
EQUITY AND LIABILITIES
Share Capital 308 300 308 300 308 300 308 300 308 300 308 300
Reserves 756 901 618 885 605 163 254 725 145 412 173 958
Equity attributable to owners of the parent 1 065 201 927 185 913 463 563 025 453 712 482 258
Non-controlling interest - 4 2 - - -
Total equity 1 065 201 927 189 913 465 563 025 453 712 482 258
Liabilities
Trade and other payables 136 784 132 878 122 048 101 911 22 150 26 083
Tax payable - 5 518 199 - 5 157 -
Shareholders loans 944 542 794 131 703 852 944 542 774 462 684 462
Outstanding claims reserve 11 073 27 043 55 412 - - -
Deferred tax liability 15 628 13 225 - 16 354 13 580 -
Unearned risk reserve 6 456 10 535 11 332 - - -
Total liabilities 1 114 483 983 330 892 843 1 062 807 815 349 710 545
TOTAL EQUITY AND LIABILITIES 2 179 684 1 910 519 1 806 308 1 625 832 1 269 061 1 192 803
GROUP COMPANY
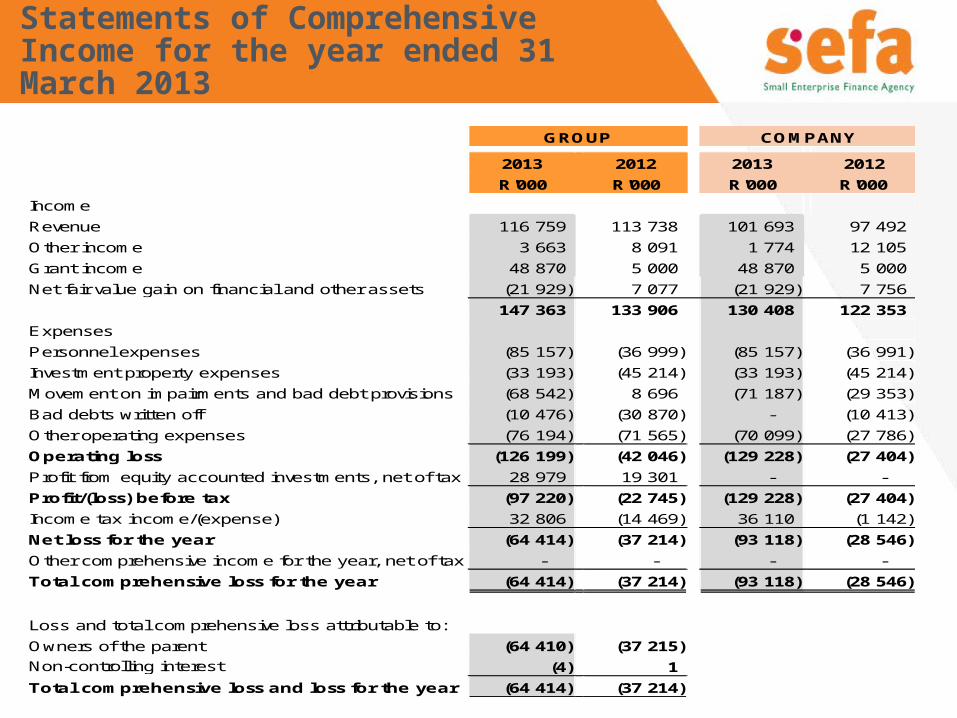
Statements of Comprehensive Income for the year ended 31 March 2013
2013 2012 2013 2012
R'000 R'000 R'000 R'000
Income
Revenue 116 759 113 738 101 693 97 492
Other income 3 663 8 091 1 774 12 105
Grant income 48 870 5 000 48 870 5 000
Net fair value gain on financial and other assets (21 929) 7 077 (21 929) 7 756
147 363 133 906 130 408 122 353
Expenses
Personnel expenses (85 157) (36 999) (85 157) (36 991)
Investment property expenses (33 193) (45 214) (33 193) (45 214)
Movement on impairments and bad debt provisions (68 542) 8 696 (71 187) (29 353)
Bad debts written off (10 476) (30 870) - (10 413)
Other operating expenses (76 194) (71 565) (70 099) (27 786)
Operating loss (126 199) (42 046) (129 228) (27 404)
Profit from equity accounted investments, net of tax 28 979 19 301 - -
Profit/(loss) before tax (97 220) (22 745) (129 228) (27 404)
Income tax income/(expense) 32 806 (14 469) 36 110 (1 142)
Net loss for the year (64 414) (37 214) (93 118) (28 546)
Other comprehensive income for the year, net of tax - - - -
Total comprehensive loss for the year (64 414) (37 214) (93 118) (28 546)
Loss and total comprehensive loss attributable to:
Owners of the parent (64 410) (37 215)
Non-controlling interest (I/S) (4) 1
Total comprehensive loss and loss for the year (64 414) (37 214)
GROUP COMPANY
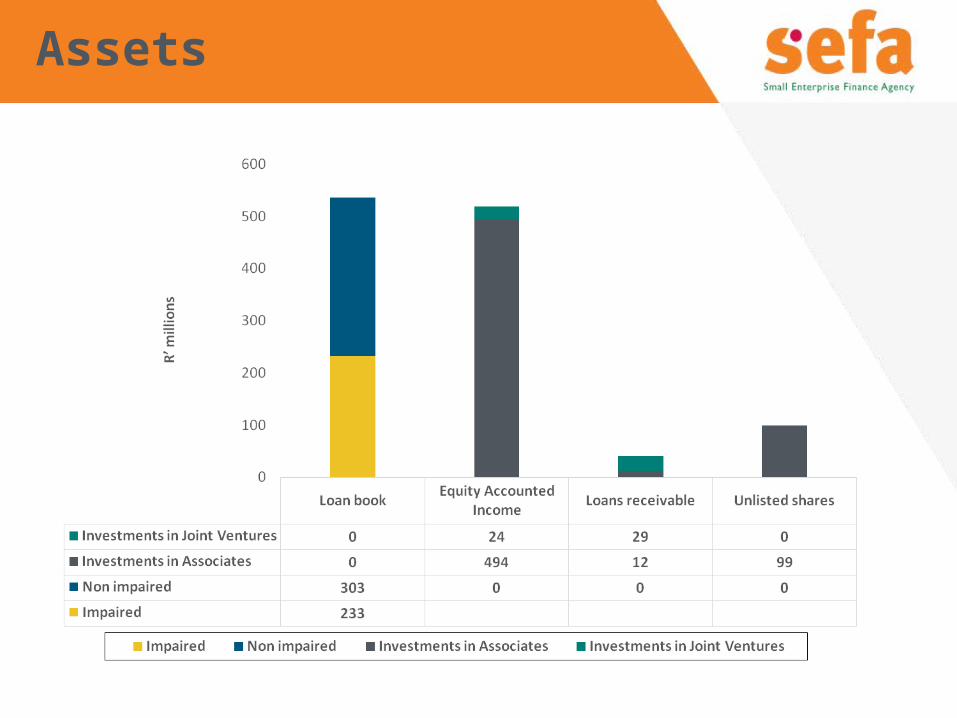
Assets

Income
Income is mainly derived from:•Property rentals,•Dividends,•Interest

Expenses

Building sefa – The Way Forward

Building sefa – The Way Forward (Cont)

THANK YOUTHANK YOU