annual results for the year ended 31 december 2014 · annual results for the year ended 31 december...
TRANSCRIPT
Annual Results for the year ended 31 December 2014
1
Press Release
Annual Results for the year ended 31 December 2014
Tony Durrant, Chief Executive, commented:
“Despite the challenging macroeconomic circumstances, the group delivered record
production and operating cashflow in 2014. In 2015, we will continue to optimise our stable
production base, push forward with approved developments and anticipate adding to our
substantial resource base with targeted exploration. This can be achieved while re-setting the
cost base to a new low oil price environment. These actions will position Premier as a well-
financed low cost producer with significant undeveloped resources and acquisition capacity,
highly leveraged to a future recovery in oil prices.”
2014 highlights
• Strong operating cash flow of US$924.3 million (2013: US$802.5 million), up 15 per
cent
• Revenue of US$1.6 billion (2013: US$1.5 billion); loss after tax of US$210.3 million
(2013: profit after tax of US$234.0 million), reflecting non-cash post-tax impairments
of US$327.8 million due to lower near term oil price assumptions
• Record production of 63.6 kboepd (2013: 58.2 kboepd), up 9.3 per cent and above
upper end of market guidance
• Key milestones reached on development projects: government approval of the
Catcher project received, installation of the Solan facilities achieved, FEED completed
on the Vette field and a lower capex solution for the Sea Lion project selected
• Exploration successes included a 100 mmboe oil and liquids-rich gas discovery at
Kuda/Singa Laut in Indonesia
• Continued portfolio rationalisation with approximately US$190 million of non-core
asset sales announced of which Scott area and Luno II disposals completed during the
year
• Dividend suspended for full year 2014
Financial position and outlook

Annual Results for the year ended 31 December 2014
2
• Significant liquidity with cash and undrawn facilities of US$1.9 billion
• Sustainable operating cost of less than US$20/boe
• Favourable, low cost debt structure; renewal of main bank facility completed on
improved terms and increased to US$2.5 billion
• Significant cost reductions budgeted for 2015 via sustainable savings in operating
costs, reduced G&A spend, and re-phasing of capex
Mike Welton, Chairman Tony Durrant, Chief Executive
26 February 2015
ENQUIRIES
Premier Oil plc Tel: 020 7730 1111
Tony Durrant
Richard Rose
Bell Pottinger Tel: 020 3772 2500
Gavin Davis
Henry Lerwill
A presentation to analysts and investors will be held at 9.00am today at the offices of Premier
Oil’s Falkland Islands Business Unit, 157-197 Buckingham Palace Road, London SW1W 9SP. A
live webcast of this presentation will be available via Premier’s website at www.premier-
oil.com.
Disclaimer
This results announcement contains certain forward-looking statements that are subject to
the usual risk factors and uncertainties associated with the oil and gas exploration and
production business. Whilst the group believes the expectations reflected herein to be
reasonable in light of the information available to it at this time, the actual outcome may be
materially different owing to factors beyond the group’s control or otherwise within the
group’s control but where, for example, the group decides on a change of plan or strategy.
Accordingly, no reliance may be placed on the figures contained in such forward-looking
statements.

Annual Results for the year ended 31 December 2014
3
CHAIRMAN’S STATEMENT
The industry context
From a macro perspective, 2014 was a year of two halves: oil prices remained steady above
US$100 per barrel (bbl) in the first half, as they have done broadly for the last four years,
before falling significantly, to close the year at less than US$60/bbl. The fall was driven by
strong global supply, particularly the growth in unconventional resources in North America.
One direct consequence of lower oil prices is a fall in the cost of services to the industry and
this is already evident across the supply chain. The fall in prices should also lead to a supply
correction as more marginal projects are cancelled and free cash flow for near-term
investment across the industry is reduced. However, it will take time for oil prices to reach a
mid-cycle equilibrium and, as a company, we must and we are taking steps to ensure we are
well positioned to withstand a prolonged period of weak commodity prices.
The sector has seen these price cycles before and few believe that the oil price will not
eventually recover from current levels. This view is supported by the forward curve which
shows rising oil prices. We are highly leveraged to such a recovery with a low cost, stable
production base and an improving portfolio mix. Beyond this year, we have little committed
expenditure. Our unsanctioned projects, however, offer future growth at a lower cost base.
Premier’s performance
Premier delivered a strong operational performance in 2014. We achieved a record annual
average production rate of 63.6 thousand barrels of oil equivalent per day (kboepd),
exceeding our expectations due to significantly improved uptime across the majority of our
assets. This performance was delivered despite the continuing supply disruptions at
Huntington (due to circumstances outside the joint venture’s control) and is testament to the
hard work and successful efforts of our operated production teams.
We continue to progress our pipeline of development projects and were delighted to achieve
new production from two operated fields in Asia over the course of the year. In the UK North
Sea, installation of the facilities at our Solan development West of Shetland was completed in
September and while it is disappointing that commissioning has progressed slowly during the
winter and costs have increased on the project, the Solan field will be a material contributor
to Premier’s cash flows once on-stream.
Annual Results for the year ended 31 December 2014
4
Significant progress was also made on our other operated North Sea projects, namely Catcher
which received development sanction and Vette in Norway where front-end engineering and
design (FEED) work was completed, while the scope and size of the initial phase of the Sea
Lion development in the Falkland Islands has been scaled-back. This project is now much
more manageable for a company of Premier’s size in the current environment and the focus in
2015 will be on progressing the project to the point of investment decision.
Our exploration team continued to bring new, material projects into the portfolio with
notable success at Kuda/Singa Laut on the Tuna Block in the Natuna Sea, Indonesia. This oil
and liquids-rich gas discovery is strategically located in a core area for Premier and appraisal
activity is planned for 2016.
A key tenet of our strategy is to realise value from our non-core assets and to reallocate our
financial and human resources to our key projects. This continued in 2014 with the announced
sale of undeveloped resources in Indonesia and Norway and the disposal of our non-operated
stake in the Scott area in the UK North Sea. In total, these asset sales will raise around US$190
million in disposal proceeds.
During the year, we enhanced the group’s financial liquidity position with the successful
refinancing of our principal debt facility on improved terms. Our long-term, unsecured debt
structure and supportive banking relationships leave us well placed, although we will need to
continue to manage our covenant headroom if current oil prices persist.
Health, safety and environmental matters continue to be of paramount importance to us and,
while cost cutting is clearly a focus in the current climate, we will not compromise on the
integrity and safety of our operations. Our safety performance in 2014 saw a substantial
reduction in our TRIR (Total Recordable Injury Rate) which reached a five year low of 1.48 per
million man hours. Our production operations management systems at Balmoral in the UK,
and at Anoa and Gajah Baru in Indonesia, retained their OHSAS 18001 and ISO 14001
certifications, as did our worldwide Drilling Management Systems. We are particularly proud
of our track record on our operated Anoa platform in Indonesia which, by year-end 2014, had
reached 1.6 million man hours without a lost time injury.
Annual Results for the year ended 31 December 2014
5
Despite our much improved occupational health and safety performance in 2014, I regret to
report two fatalities in South East Asia: one contractor fatality as a result of an offshore vessel
collision and a third party fatality as a result of a road traffic accident. No blame was attached
to Premier in either case but we have taken steps to reduce the risk of these incidents
recurring. We are all saddened by the tragic outcomes for the families involved.
Our annual reporting on corporate responsibility performance is aligned with IPIECA Guidance
and the Global Reporting Initiative’s Sustainability Reporting. We are also a long-standing
member of the FTSE4Good Index and the UN Global Compact and in 2014 were accepted as a
member of the Corporate Pillar of the Voluntary Principles on Security and Human Rights. We
remain committed to protecting our people, our assets, our environment and our reputation
by maintaining the highest possible standards.
Future plans
In 2015 a key priority is to progress our sanctioned projects – Solan and Catcher – through the
execution phases and to deliver safely the major four well exploration campaign on our
Falkland Islands acreage. Financially, we will minimise our cost base and tailor our capital
allocation to ensure that we are well positioned through the current commodity price cycle.
Our substantial 2015 hedging programme has ensured that our near-term cash flows are well
protected and our debt position of US$2.1 billion at year-end is manageable at this point in
our investment cycle. We are also taking further steps to dispose of, or monetise, assets to
reduce our debt position. We have significant liquidity if the weak macro environment offers
new opportunities, as it has done in the past, although management remain focused on
ensuring that debt levels are kept under control.
Board changes
I was pleased to announce that Tony Durrant, our former Finance Director, accepted the role
of Chief Executive during the year replacing Simon Lockett. During Tony’s tenure as Finance
Director, the company has maintained excellent relationships with our capital providers and
the Board believes he has all the right qualities to take the company forward in the next stage
of its evolution. We also welcomed Richard Rose onto the Board as the new Finance Director,
bringing with him a broad range of experience from accounting, industry and capital markets.

Annual Results for the year ended 31 December 2014
6
I would like to pay tribute to Simon Lockett who guided the company through a substantial
growth period and who ensured a smooth transition to the new management team.
Andrew Lodge, our Exploration Director, has indicated that he will retire effective 30 June this
year and will therefore not seek re-election as a board director at our forthcoming AGM. A
new head of exploration will be appointed in due course. Stephen Huddle, who has been
General Counsel and Company Secretary for 14 years, will also retire on 31 May. Rachel
Benjamin, currently Deputy Company Secretary, will become Company Secretary on Stephen’s
retirement.
We wish all our leavers well in their future endeavours. These changes, together with other
senior management changes, refresh the leadership of the company and, in addition, will
contribute to a reduced cost base as we adapt to a new oil price environment.
Shareholder returns and share price performance
As we have stated in the past, our goal remains to deliver consistent, measurable capital
growth to our shareholders. Implied within this strategy is a commitment to return cash to
our shareholders via distributions, after balancing the capital needs of the business, when the
performance of the company has not been materially reflected in the share price.
Over the course of 2014, our share price fell by 47 per cent, although this was not out of line
with the rest of the sector which also suffered with the fall in commodity prices. During the
year, we paid a dividend of 5 pence per share and returned a further US$93 million of capital
to shareholders through a share buyback programme. This was in acknowledgment of the
significant gap between our share price and underlying net asset value. It also reflected
surplus cash flow generated by our production base in the first half of the year, above the
level expected using our long-term oil price planning assumption.
As we enter 2015 with a significantly lower oil price than in recent years, the Board believes it
is not prudent to propose a dividend payment for the full year or, as previously announced, to
continue with the share buyback programme. Our focus in the near-term is on preserving
cash, maintaining access to liquidity and reducing gearing levels while continuing to invest in
our sanctioned development projects. We would expect to revisit our decisions around

Annual Results for the year ended 31 December 2014
7
shareholder distributions should the oil price recover above our long term planning
assumption.
On behalf of the Board as well as myself, I would like once again to express my appreciation
for the hard work and effort put into the business by Premier’s staff. Their continued
dedication and enthusiasm in what are trying times for the industry should see us well placed
amongst our peers to prosper in the future.
Mike Welton
Chairman
Annual Results for the year ended 31 December 2014
8
CHIEF EXECUTIVE’S REVIEW
We are all only too aware of the sharp fall in the oil price that occurred in the second half of
2014 after several years of oil price stability at historically high levels. While it is not clear at
this stage when the oil price will find a floor, or how long it may take to recover, it offers the
industry the chance to re-set its cost base and will present new opportunities for the better-
funded companies in the sector.
For our part, we have been quick to respond to the falling oil price and, by the end of 2014,
we had already taken steps to reduce significantly the costs of running our business without
compromising the safety or performance of our operations. We will continue to look to cut or
defer our expenditure to ensure that we are able to manage the business successfully through
a potentially prolonged period of low oil prices.
Despite the backdrop of falling oil prices in the second half of the year, Premier remained
focused on operational delivery and achieving the near-term priorities that we set ourselves.
In this respect, 2014 was a strong year for us.
Beating our production guidance
2014 saw Premier deliver record production of 63.6 kboepd, above the upper end of market
guidance, assisted by improved operating efficiency across the majority of the group’s assets.
Production (kboepd) Working interest Entitlement
2014 2013 2014 2013
Indonesia 14.4 13.7 10.3 8.8
Pakistan* 12.9 15.5 12.9 15.3
UK 19.4 14.9 19.4 14.9
Vietnam 16.9 14.1 15.2 13.4
Total 63.6 58.2 57.8 52.4
*Includes Mauritania
Significantly higher production in the UK was driven by improved uptime from our operated B
Block assets, flush production from the redevelopment of the Kyle field and increased
contributions from the Huntington and Rochelle fields. Frustratingly, Huntington continued to
disappoint in 2014 as it suffered from poor uptime, primarily due to restrictions on gas export
from the field imposed by the CATS pipeline operator BP.
Annual Results for the year ended 31 December 2014
9
In Asia, our operated Chim Sáo asset in Vietnam performed well, benefitting from a series of
projects we had undertaken aimed at maximising operating efficiency. As a result, record
production rates were achieved. Singapore demand for our Indonesian gas remained strong
and our operated Natuna Sea Block A again captured a market share well in excess of its
contractual share. Deliverability from the block was increased with first gas from Naga in
November, while Pelikan is planned to be on-stream in the first quarter of 2015. As well as
backfilling our gas contracts into Singapore which generate long-term, stable cash flows for
the group, the additional deliverability will enable us to exploit any contractual supply
shortfall or short-term strengthening of Singapore demand for our gas.
As at 31 December 2014 proven and probable (2P) reserves, on a working interest basis, were
243 million barrels of oil equivalent (mmboe) (2013: 259 mmboe) with the impact of
production and disposals on our reserve base partially offset by the booking of the Vette field
as 2P reserves. This, together with the discovery at Kuda/Singa Laut in Indonesia, means that
we have ended the year with 2P reserves and 2C contingent resources of 794 mmboe, in line
with the previous year.
Proven and probable
2P reserves
(mmboe)
2P reserves and 2C
contingent resources
(mmboe)
1 January 2014 259 794
Production (23) (23)
Net additions, revisions 22 50
Disposals (15) (27)
31 December 2014 243 794
Progressing our developments – deliver Solan, sanction Catcher and right-size Sea Lion
Installation of the facilities on the Premier-operated Solan field West of Shetlands at the end
of the summer was a significant milestone on the project, only two and a half years after
receiving government approval. However, the subsequent commissioning programme has
taken longer than anticipated due to poor weather conditions and low productivity over the
winter period. As a result, costs have increased and first oil is now expected to be later than
the previous guidance of the second quarter although we continue to target plateau rates of
production from the field of 20-25 thousand barrels of oil per day (kbopd) (gross) by year-end.

Annual Results for the year ended 31 December 2014
10
Our operated Catcher project received government approval in June and is now into the
execution phase. Construction of the FPSO hull started in January 2015 and the project
continues to progress on schedule and to budget. Once on-stream, both the Solan and
Catcher projects will contribute materially to our cash flows, given our tax advantaged
position in the UK.
Turning to our operated pre-sanction projects, FEED work on the Vette FPSO development in
Norway was successfully completed during 2014 and we were in a position to submit
development approval documentation to the government early in 2015. However, following
the sharp reduction in the oil price, we have chosen to defer the final investment decision
until the end of 2015, enabling us to re-engage with the supply chain with the aim of
negotiating lower costs for the project. Given the falling oil price and our desire to maintain a
strong funding position, we decided to opt for a lower capex solution for our Sea Lion
development, which will now utilise a leased FPSO. We plan to progress the project to
sanction over the course of 2015 which we anticipate will allow us to secure further cost
reductions. It remains our intention to seek a partner ahead of final investment decision.
Exploration discoveries
In 2014, Premier delivered a notable exploration success, with the 100 mmboe oil and
liquids-rich gas discovery at Kuda/Singa Laut on the Tuna Block in Indonesia. While we have
deferred appraisal of this discovery to 2016, this project will likely play an important role in
the long-term future of Premier’s Indonesian business. We also enjoyed exploration success
in Pakistan with the K-36 exploration well which discovered gas in a separate step-out
compartment. The well was successfully tied in to production in April 2014. During the year,
unsuccessful wells were drilled on other acreage offshore Mauritania, Indonesia and onshore
Pakistan and, subsequent to year-end, onshore Kenya.
A successful disposal programme
During 2014, we announced approximately US$190 million of non-core asset sales which have
all subsequently completed. Of particular note was the sale of the high cost Scott area for
US$130 million which, as well as reducing the group’s operating costs, has significantly
decreased our future abandonment liabilities.

Annual Results for the year ended 31 December 2014
11
Further disposals are planned. Notably, our partner in the Solan field is in discussions with
banks about refinancing a portion of our loan to them, while discussions with third parties
over selling a royalty interest over the Solan field’s cash flows are on-going. In addition, we
have received a number of enquiries about our Sea Lion development since rescaling the
project in November and active discussions with potential partners continue.
Financial performance and liquidity
The Group is reporting a loss after tax of US$210.3 million in 2014 (2013: US$234.0 million
profit after tax) largely as a result of impairment charges of US$327.8 million (post-tax) on the
carrying value of several of our oil and gas assets. These were due to the impact of the lower
near-term oil price assumptions used in balance sheet tests at the year-end and should not
detract from the record operating cash flows generated during 2014 of US$924.3 million
(2013: US$802.5 million).
The collapse in the oil price has served to highlight the importance of maintaining a strong
funding position and a conservative financing approach. To protect our investment
programme in 2015 we have hedged approximately 50 per cent of our liquids entitlement
production at an average price of just under US$98/bbl. In July, our finance team did an
excellent job of taking advantage of a relatively strong bank market to refinance and increase
our principal bank facility on improved terms with extended maturities. As a result, we do not
have any significant debt maturities until late 2017. It is also reassuring that all of our facilities
are on a corporate unsecured basis and are not subject to any reserve base redeterminations.
Consequently, we have ample liquidity with US$1.9 billion of cash and undrawn facilities as at
year-end, although we recognise the need to manage our covenant headroom in the near-
term.
2015 is anticipated to be a significantly lower capex year. This coupled with our hedging
programme, planned cost reductions and further potential disposals means that we are well
placed to meet the challenges presented by the current oil price environment.
Tony Durrant
Chief Executive

Annual Results for the year ended 31 December 2014
12
BUSINESS UNIT REVIEWS
THE FALKLAND ISLANDS
In November, Premier opted to progress a smaller, scaled-back Sea Lion development
scheme in order to reduce the capex required prior to first cash flows from the field. The
initial phase of development aims to recover 160 million barrels (mmbbls) of oil from the
north east part of the field for less than US$2 billion of pre-first oil capex.
Final preparations for the four well exploration campaign are under way with the first well,
Zebedee, expected to spud in early March. The outcome of this campaign, which has the
potential to more than double the discovered resource in the North Falklands Basin, will
determine the shape of subsequent development phases in the area.
Development
Good progress was made in planning the Sea Lion development scheme utilising a Tension Leg
Platform (TLP) during 2014. However, the oil price environment and Premier’s commitment
to maintaining a strong financial position caused the Group to re-examine the scheme with a
view to reducing capex. As a result, in November, Premier opted to progress a smaller initial
development of just the north east part of the Sea Lion field with a single subsea drill centre,
utilising a leased FPSO.
It is anticipated that this smaller scheme will recover around 160 mmbbls of oil over 15 years
from 14 wells. Total capital expenditure prior to first oil was expected to be less than US$2
billion in November when first estimated. Premier plans to take advantage of weaker market
conditions in the second half of the year to capture lower costs for the project.
Work has commenced on assessing the FPSO design options for the first phase of the
development. The existing TLP topsides design and equipment lists are being modified for use
with a smaller capacity FPSO and the conclusions of various metocean studies are being fed
into the FPSO design process. A project sanction for the first phase of development is
targeted for the first half of 2016, although the exact timing of this will ultimately depend
upon the contracting strategy employed for the FPSO. Sanction of the project will depend on
the cost reductions that are achieved and the oil price outlook at that time.
Annual Results for the year ended 31 December 2014
13
Rockhopper will fund their share of the pre-sanction costs and a letter of agreement has been
concluded such that the remaining development carry will be split equally between the initial
development and the next phase (US$337 million to each). A guarantee fee mechanism which
applies to capex guarantees given by Premier in respect of the development has been
extended to include the FPSO lease.
While it is likely that Premier would be able to fund a project of this size from existing facilities
and cash flows, the company will continue to seek a partner for the Sea Lion development.
Plans for subsequent phases of development, which could involve either further FPSOs or a
TLP, will target a further 235 mmbbls of existing discovered resources plus any new
discoveries arising from the 2015 exploration programme.
Exploration
Preparations for the multi-operator exploration drilling campaign, due to commence in the
first quarter of 2015 are well under way. In June a rig contract and a rig sharing agreement
were signed and all major service contracts have now been awarded. A temporary dock
facility located in Stanley Harbour has been built and has received the first two coasters of
supplies for the upcoming programme. The rig departed West Africa at the end of January
and is expected to arrive in the Falkland Islands by the end of February.
The exploration drilling programme will consist of at least four wells targeting multiple
stacked fans in Licences PL004 and PL032. The sequence of the wells is expected to be
Zebedee, Isobel Deep, Jayne East and Chatham/West Sea Lion. The rig will drill for another
operator between the Isobel Deep and Jayne East wells.
INDONESIA
2014 saw strong production and cash flows from Premier’s operated Natuna Sea Block A,
which increased its market share of the GSA1 contract and achieved record production
rates. Deliverability from Natuna Sea Block A was further enhanced with first gas from the
Naga field in November. Premier also enjoyed exploration success in Indonesia with a
significant oil and liquids-rich gas discovery on the operated Tuna Block further
strengthening the portfolio and providing the group with future growth opportunities.

Annual Results for the year ended 31 December 2014
14
Production and development
Net production from Indonesia in 2014 on a working interest basis was 14.4 kboepd (2013:
13.7 kboepd), up 5 per cent on the prior year. This was driven by a strong operational
performance from the Anoa field on the Premier-operated Natuna Sea Block A, our key asset
in Indonesia. The Anoa field delivered 141 billion British thermal units per day (BBtud) during
2014, capturing 44.6 per cent (2013: 39.9 per cent) of GSA1 deliveries into Singapore, against
a contractual share of 39.4 per cent. Natuna Sea Block A’s contractual share for 2015 has
been increased to 39.9 per cent. Gross liquids production from the Anoa field averaged 1.5
kbopd (2013: 1.7 kbopd).
Sales from the Gajah Baru field to Singapore under GSA2 averaged 79 BBtud (2013: 82 BBtud).
In addition, gas sales of up to 40 BBtud from the Gajah Baru field to the Indonesian market
commenced under a Domestic Swap Agreement (DSA) in July. Gas delivered under the DSA
replaces gas previously contracted to Batam Island, Indonesia, from the Natuna Sea Block A
under GSA3 and GSA4. DSA deliveries are expected to continue until the domestic pipelines
are constructed and the GSA3 and GSA4 contracts commence.
In total, 242 BBtud (gross) (2013: 208 BBtud) was sold from Natuna Sea Block A during 2014
with record peak production rates of 391 BBtud achieved. High deliverability from Premier’s
Anoa and Gajah Baru fields gives Premier the flexibility to meet peak customer demand and to
capitalise upon other suppliers’ maintenance and unplanned downtime. Looking to 2015,
Premier plans to continue to optimise its production from Natuna Sea Block A and to
renegotiate supplier contracts to take advantage of the expected price reductions in oil field
services in order to maintain its competitive low operating cost base.
Good progress was made during 2014 on our new Natuna Sea Block A developments, Naga
and Pelikan. Following the successful completion of the offshore installation in 2013, hook up
and commissioning of the Pelikan and Naga well head platforms was completed in April 2014.
The Hakuryu rig commenced development drilling at the Naga field in July with first gas
achieved on budget in November. The three development wells at the Pelikan field were
completed in early 2015 and the field is expected on-stream at the end of the first quarter.
Annual Results for the year ended 31 December 2014
15
Natuna Sea Block A’s deliverability continues to exceed its contractual commitments. As a
result, Premier is well placed to increase its market share should its partners not meet their
contractual commitments under GSA1 as well as to increase its supply of gas into Singapore
should demand strengthen.
Elsewhere on Natuna Sea Block A, it is anticipated that the 2012 Anoa Deep gas discovery well
will be tied into the Anoa production facilities in 2015 to support GSA1 deliveries. Premier is
also progressing FEED for the Bison and Iguana projects as single well subsea tie-backs to
Pelikan while concept select for the Gajah Puteri field is underway.
Premier successfully divested its 41.67 per cent non-operated interest in Block A Aceh
onshore Indonesia for US$40 million in 2014. Government approvals for the sale were
received at the end of 2014 with completion achieved in January 2015.
Exploration and appraisal
Premier drilled three exploration wells in Indonesia during 2014: the Kuda Laut-1 and Singa
Laut-1 wells on the Premier-operated Tuna Block and the Ratu Gajah-1 well on the Premier-
operated Natuna Sea Block A.
The Kuda Laut-1 well, which targeted Miocene sands within a four-way dip closed structure,
and the Singa Laut-1 side track, which targeted the Oligocene sequence in the adjoining three-
way dip closure, discovered in excess of 100 mmboe. Gas gradients have been measured and
liquids-rich gas samples were recovered suggesting that the discovery has a high natural liquid
content. Planning for a 2016 appraisal campaign is now under way. Premier has 65 per cent
equity in the block and will assess the appropriate working interest level to hold as appraisal
advances.
Premier also drilled the Ratu Gajah-1 well on Natuna Sea Block A during 2014. While the well
flowed gas to surface during testing, less sandstone reservoir than expected was encountered
and the discovery is sub-commercial. The results of this well, however, have been integrated
into the group’s broader understanding of the Lama play and thicker sands have been
identified at the basin margin. The next well in our portfolio to test the Lama play will be the
appraisal of the Anoa Deep discovery, which is scheduled for the second quarter of 2015.
Annual Results for the year ended 31 December 2014
16
NORWAY
Following concept select in February, Premier successfully completed FEED on the Vette
development and progressed the project to the point of sanction. However, Premier has
agreed with the Norwegian Petroleum Directorate to defer the submission of the Plan for
Development and Operation (PDO) to enable Premier to re-engage with the supply chain to
capture lower costs. Premier successfully concluded the sale of its interest in Luno II in 2014
while preparations for our first test of the emerging Mandal High play are well advanced
with the Myrhauk well expected to spud mid-2015.
Development
Premier acquired operatorship of the Bream development, now known as Vette, in 2013.
Since then, significant progress has been made in commercialising the field and, at the end of
2014, Premier booked the reserves for the development.
The development will focus on recovering 40 mmbbls of reserves from the field using four
producers and two injectors tied back to a FPSO. The Mackerel discovery in the adjacent
PL406 licence will be incorporated into a possible second phase of development.
FEED engineering work and supply chain engagement on the development concept for Vette
was completed and the project was brought to sanction decision by the end of 2014. As part
of that process, Premier also continued with the development of its organisation in Norway in
preparation for development operator status and successfully completed a number of audits
undertaken by the Petroleum Safety Authority.
In light of the sharp fall in the oil price in the second half of 2014, Premier agreed with the
Norwegian Petroleum Directorate to defer the submission of the PDO by a year. Premier will
use the intervening period to re-engage with the supply chain to negotiate better rates which
are more reflective of the current climate. Assuming that appropriate cost savings are
achieved, Premier will consider making a final investment decision at the end of 2015
targeting first oil in 2019.
Annual Results for the year ended 31 December 2014
17
Work continued during 2014 on the non-operated Frøy field to identify a viable development
concept. Following acquisition and interpretation of new seismic data, a reassessment of
subsurface resources was completed in 2014 and screening of development concepts is under
way, including both standalone options as well as a tie-back solution to nearby infrastructure.
Exploration
Premier continued to high grade its Norwegian exploration portfolio during 2014. This
included the profitable sale of the Group’s non-operated interest in PL359, which included the
Luno II discovery, to Lundin Petroleum for a consideration of US$17.5 million. In addition,
following technical evaluations, Premier relinquished a number of its exploration licences in
Norway.
Premier’s immediate exploration focus in Norway is on the Myrhauk well which is expected to
spud mid-2015 and will be the company’s first test of the emerging Mandal High play.
Premier has built an extensive acreage position over the Mandal High, both organically and
through acquisition, and has identified significant follow on potential to the Myrhauk well in
the success case.
Premier was successful in the APA 2014 Licensing Round with the award of a 20 per cent non-
operated interest in PL782S which is located in the Norwegian North Sea and will be operated
by ConocoPhillips. There are no firm well commitments with the award.
PAKISTAN
2014 saw another strong performance from Premier’s Pakistan business unit. Production
from our six non-operated onshore Pakistan gas fields exceeded expectations and
exploration success was achieved with the Kadanwari K-36 well.
Production and development
Average production in Pakistan during 2014 was 12.4 kboepd (net to Premier), around 16 per
cent lower than in 2013 (14.9 kboepd). This reflects natural decline in the Bhit, Qadirpur and
Zamzama gas fields only partially offset by higher production from the Kadanwari and Badhra
fields.
Annual Results for the year ended 31 December 2014
18
The Kadanwari gas field, in which Premier has a 15.8 per cent non-operated interest,
performed strongly in 2014 and delivered production of 3.2 kboepd (net to Premier) (2013:
2.9 kboepd), a new record for the field. This was driven by new production from the K-33 and
K-35 wells which came on-stream in December 2013 and February 2014 respectively, and the
successful exploration well K-36, which was tied in to production in April 2014.
Average production from the Bhit and Badhra gas fields in 2014 was 3.0 kboepd (net to
Premier) (2013: 3.3 kboepd). Higher production was achieved from the Badhra gas field which
benefitted from two new wells being brought on-stream in the first quarter of 2014. An
additional two development wells were tied in at Badhra at the end of the year partially
offsetting natural decline from existing wells. Good progress has also been made on the
compressor reconfiguration project at Bhit, which was initiated in the first half of 2014, to
improve ultimate recovery by around 54 billion cubic feet (bcf) (gross). Five of the 10
compressors have been commissioned and the project is on track to complete in April 2015.
Production from the Qadirpur gas field averaged 3.2 kboepd (2013: 3.6 kboepd). Production
fell over the year, in part due to natural decline in the field, but also due to an unplanned
shutdown at the power plants into which gas is delivered.
Production from the Zamzama field was lower in 2014 averaging 3.1 kboepd (2013: 5.1
kboepd). This marked decrease in production was due to faster declining reservoir pressures
than initially anticipated and Premier has updated its remaining reserves estimate for the field
accordingly. However, this decline was partially mitigated by intervention work carried out at
the Zam-4 production well in May and the re-start of gas production from the Zam-8 well in
October. The joint venture is also considering further infill drilling and additional wellhead
compression to mitigate the natural decline seen in the existing wells.
First gas was achieved from the Zarghun South gas field in August and the field is currently
producing at around 13 million standard cubic feet per day (mmscfd) (gross). All costs
pertaining to Premier’s 3.75 per cent working interest in the field continue to be carried by
the operator.

Annual Results for the year ended 31 December 2014
19
Exploration and appraisal
Premier drilled the successful K-36 exploration well on Kadanwari in Pakistan in the first half
of 2014. The well discovered gas in a separate step-out compartment and was tied-in to the
Kadanwari facilities during April 2014.
MAURITANIA
Production and development
Production from the Chinguetti field averaged 447 bopd (2013: 507 bopd) net to Premier
during the year. The fall in production was driven by natural decline from the existing wells as
well as a shutdown of the facilities in January for a mooring chain replacement. The FPSO
contract has now been extended to December 2017.
Elsewhere in Mauritania, Premier relinquished its non-operated interest in PSC-A, which
contains the Banda gas development and PSC-B, which contains the Tiof and Tevet
discoveries.
Exploration and appraisal
The Tapendar-1 exploration well was drilled on PSC C-10 in the first half of 2014 and was
plugged and abandoned as a dry hole. Subsequently, the joint venture partners agreed to exit
the licence on 30 November 2014.
UNITED KINGDOM
Higher UK production, driven by improved operating efficiency at B Block, increased
contributions from Huntington and Rochelle and flush production from Kyle, resulted in a
strong rise in UK cash flows in 2014, despite the sharp fall in the oil price in the second half
of the year. Key milestones were reached on Premier’s operated Solan and Catcher
projects. In addition, the sale of the high cost Scott area assets for US$130 million was
successfully completed in December.

Annual Results for the year ended 31 December 2014
20
Production
In 2014, UK production averaged 19.4 kboepd, an increase of 30.3 per cent on the
corresponding period (2013: 14.9 kboepd).
Production from the Premier-operated Balmoral area exceeded expectations, averaging 3.2
kboepd during 2014 (2013: 2.5 kboepd), as the asset benefitted from improved operating
efficiency and the reinstatement of five wells, four at the end of 2013 and one in 2014.
Production from the non-operated Wytch Farm asset was also strong, averaging 5.6 kboepd
(2013: 5.5 kboepd) again driven by high operating efficiency as well as a successful
programme of infill drilling which saw four new wells brought on-stream in the first half of
2014.
Production from Scott, Telford and Rochelle averaged 3.8 kboepd, broadly in line with
expectations. While production from the fields was impacted by several unplanned
shutdowns, reservoir productivity was strong when unconstrained by facilities, with Rochelle,
for example, achieving rates of up to 100 mmscfd (gross). In December Premier successfully
completed the sale of the Scott area assets for a consideration of US$130 million. As part of
the transaction, all associated decommissioning costs liabilities were transferred to the buyer.
Average production from the non-operated Huntington field was 5.7 kboepd (2013: 3.5
kboepd). Although the Group benefitted from a full year of production from the asset,
production performance from the field was significantly below expectations due to lower
operating efficiency as a result of downtime on the production facilities and restrictions on
exporting the gas through the CATS pipeline system. Most recently, production from the field
has been restricted while repairs are undertaken to a topsides valve on the CATS riser
platform which failed to re-start in early December following a planned outage. The field is
now expected to restart full production in mid-March.
Since December 2011, the non-operated Kyle field underwent redevelopment following storm
damage to the Banff FPSO to which the field ties back. That work was successfully completed
in 2014 and Kyle was brought back on-stream in July. The field benefited from early flush
production with peak rates in excess of 7 kbopd (gross). While flush production has continued
into 2015 with the field currently averaging around 5 kbopd, this is expected to decline during
the year.

Annual Results for the year ended 31 December 2014
21
Developments
Further progress was made on the Premier-operated Solan project West of Shetland during
2014. The onshore construction of the subsea oil storage tank, jacket and topsides were
completed and the facilities were successfully installed at the end of the summer using the
Heerema Thialf heavy lift vessel. The first producer and injector wells also successfully
completed in September with good flow rates achieved.
Commissioning commenced in November with the arrival of the Safe Scandinavia flotel which
is able to accommodate up to 400 people. This programme, however, has taken longer than
anticipated due to poor weather conditions and low productivity over the winter period.
Whilst productivity has improved in recent weeks, additional accommodation modules will be
required to achieve habitation on the platform. Further flotel slots have been identified whilst
conversion of the drilling rig contracted to arrive in April is also being considered. As a result,
first oil will be later than the previous guidance of the second quarter of 2015 and Premier will
provide further updates to the market as the work progresses. Premier continues to target
plateau production rates from the field of 20-25 kbopd (gross) by year-end.
Cash spend to 31 December 2014 stood at US$1.4 billion. Premier agreed to extend its loan to
Chrysaor to ensure the project remains fully funded to first oil. In return, Premier will take 100
per cent of the project’s cash flow (after certain deductions) until the loan and interest has
been repaid. As at 31 December, the loan and interest outstanding stood at US$547 million.
However, Premier continues to work with Chrysaor and potential providers of debt finance on
a partial sale or refinancing of the Chrysaor loan.
The Premier-operated Catcher area project is progressing on budget and on schedule. The
development achieved partner approval and government sanction in 2014 and the project is
now well into the execution phase. Engineering procurement and construction of key subsea
equipment, including the drilling templates, gas export line, pipeline manifolds and subsea
trees and control systems are under way. Fabrication of the FPSO hull has also commenced,
with first steel cut in Japan in early January 2015.
Annual Results for the year ended 31 December 2014
22
Offshore construction activity is planned to commence in mid-2015 with the installation of the
subsea facilities, including the gas export line and drilling templates. Preparations for
development drilling with the Ensco-100 jack up rig are well advanced and the campaign is on
track to commence mid-year.
Exploration
Premier’s UK North Sea exploration efforts are focused on near field exploration opportunities
close to its existing developments and producing assets. In particular, preparation is under
way to drill an exploration well at the Laverda prospect to the north of the Catcher area hub in
2016.
Work also continues on the Bagpuss and Blofeld heavy oil prospects, located on the Halibut
Horst, a well-defined basement high within the Moray Firth. The joint venture partners are
targeting the first half of 2016 for the drilling of the Bagpuss well.
2014 saw Premier continue to high grade and rationalise its UK North Sea exploration
portfolio with a number of licences either relinquished or sold over the course of the year.
VIETNAM
The Premier-operated Chim Sáo field out-performed expectations in 2014 as we continued
to maximise production delivery and to improve the reliability of the facilities. The subsea
tie-back of the Dua field was completed successfully in July, extending plateau production
and the field life of Chim Sáo.
Production and development
In 2014, production from Block 12W, which contains the Chim Sáo and Dua fields, exceeded
expectations averaging 16.9 kboepd (13.7 kbopd of oil and 15.4 mmscfd of gas) net to
Premier, up 19.9 per cent on 2013.

Annual Results for the year ended 31 December 2014
23
During 2014, Premier completed significant upgrades to the Chim Sáo FPSO aimed at
maximising production deliverability and operating efficiency. This included upgrades to the
boilers and gas compressors as well as the installation of an additional diesel generator to
improve the reliability of power generation. As a result, operating efficiency from the Chim
Sáo facility increased to 88 per cent during 2014, up 14 per cent on 2013. Record production
rates of 19.2 kboepd (net) were achieved in November and December and the field is
currently producing over 20 kboepd (net).
The three well subsea tie-back of the Dua oil field to the Chim Sáo facilities was completed,
with first oil from the field achieved in July 2014. Following the completion of the Dua drilling
programme, the West Telesto rig drilled two further water injector wells at Chim Sáo to
provide pressure support to the field’s oil production. This, together with new production
from Dua, will extend plateau production and the field life of Chim Sáo.
In January 2015, Premier surpassed the milestone of 30 mmbbls (gross) of production from
Chim Sáo. This strong performance from Block 12W has generated significant cash flows for
the group and the costs incurred to bring both Chim Sáo and Dua on-stream have now been
fully recovered.
NEW COUNTRY ENTRY - EXPLORATION
In addition to exploring in our existing core areas, Premier looks to build business units in new
countries via an exploration-led entry strategy. The focus is on emergent plays that, with
exploration success, have the ability to develop into new business units in the 2018 to 2025
time frame. In these new countries Premier has a strict disciplined approach to investment
ensuring that cost exposure in the exploration phase is minimised and only the best
opportunities are matured to drill-ready status. At year-end, Premier had established such
exploration positions in Brazil, Iraq, Kenya and the Western Sahara (SADR).
Premier entered Brazil in late 2013 securing three licenses in the under-explored offshore
regions of the proven Foz Do Amazonas and Ceara Basins. In 2014 a small representative
office was established and new 3D seismic data was acquired over Premier’s Foz Do Amazonas
Basin acreage. The full processed products are expected to be available in the first half of
2015. Acquisition of new 3D data over the Ceara Basin acreage is expected to commence in
July 2015. The earliest exploration well on Premier’s acreage in Brazil will not be until 2017.

Annual Results for the year ended 31 December 2014
24
Premier holds a 30 per cent non-operated interest in Block 12, onshore Iraq, in the under-
explored western part of one of the world’s most prolific oil basins. At year-end a 3D seismic
survey acquisition programme was 75 per cent complete and it is anticipated that processed
products will be available in the third quarter of 2015. There is one commitment well on this
licence which is planned to be drilled in late 2016 or early 2017.
Premier entered Kenya in 2012, and following the withdrawal from our offshore acreage in
2014, the company focussed on one onshore licence (Block 2B). This licence covers a Tertiary
sub-basin within the Anza Graben and was assessed as a potential look-a-like to the successful
plays drilled recently both in Uganda and further west in Kenya. The first well on the block
(Badada-1), drilled in early 2015, did not find hydrocarbons. Premier has no further
commitments in Kenya beyond the drilling of this well.
Offshore SADR, Premier holds 45,000 square kilometres (net) of acreage across five licences.
At present, all SADR licences are in abeyance pending the country’s admission to the UN.
Premier maintains two small new venture groups, one in London and one in Singapore, tasked
with evaluating exploration-led entry options in new countries. Any new entry will be
dependent on the quality of the opportunity and its ability to create value at our conservative
oil price assumptions at the time.
Annual Results for the year ended 31 December 2014
25
FINANCIAL REVIEW
Economic background
After three and a half years in which the price of oil averaged above US$100/bbl, crude oil
experienced a sharp fall in the second half of 2014. The average for 2014 was US$98.9/bbl
against US$108.7/bbl for the prior year. In the first half of 2014 the Brent oil price ranged
between US$104/bbl and US$115/bbl, before falling below US$55/bbl by the end of the year.
Premier's portfolio of crudes traded at a weighted average of US$2.0/bbl premium to Brent
(2013: US$2.6/bbl), as we continued to realise favourable prices, particularly for our Chim Sáo
crude. Premier's average realisations for the year were US$98.2/bbl (2013: US$109.0/bbl)
after taking into account timings of actual liftings and export duties paid in Vietnam. Post
hedging, realised prices increased to US$101.0/bbl (2013: US$109.1/bbl).
Average gas prices for the group were US$8.4 per thousand standard cubic feet (mscf) (2013:
US$8.3/mscf). Gas prices in Singapore, linked to high sulphur fuel oil (HSFO) pricing and in
turn, therefore, linked to crude oil pricing, averaged US$16.8/mscf (2013: US$17.1/mscf). The
average price for Pakistan gas (where only a portion of the contract formulae is linked to
energy prices) was US$4.6/mscf (2013: US$4.4/mscf).
Effect of steep decline of the oil price
The fall in both spot and forward oil prices has inevitably had an impact on our reported
financial results in respect of the carrying value of certain of our oil and gas assets. An
impairment charge has been booked in the income statement relating to several of our fields
in the UK North Sea, Indonesia, Vietnam and Mauritania. The total amount for the impairment
(pre-tax) is US$784.4 million (US$327.8 million, post-tax). Impairment charges for the year,
relating to UK fields, amounted to US$732.3 million (pre-tax) (2013: US$178.7 million), and
were recognised for the Solan, Balmoral area and Huntington fields, while the remaining
impairment charge of US$52.1 million was recognised in respect of the Chim Sao field in
Vietnam, the Chinguetti field in Mauritania and the Kakap field in Indonesia. The principal
cause of the impairment charge is a reduction in the short to medium-term oil price
assumption used in estimating the future discounted cash flows for each field. In addition to
the impact of the reduced oil price assumptions, a review of the expected decommissioning
costs for the Balmoral area in the first half of 2014 has also driven part of the impairment
Annual Results for the year ended 31 December 2014
26
charge, whilst the Solan impairment has in part been caused by an increase in the costs
incurred to date and expected costs to completion.
Income statement
Production in 2014 averaged 63.6 kboepd (2013: 58.2 kboepd) up 9 per cent on a working
interest basis. On an entitlement basis, which under the terms of our Production Sharing
Contracts (PSCs) allows for additional government take at higher oil prices, production was
57.7 kboepd (2013: 52.4 kboepd). Working interest gas production averaged 177 mmscfd
(2013: 174 mmscfd) or approximately 49 per cent of total production. The increase in the
group’s production can be partially attributed to an increase in operating efficiency across a
number of assets in the portfolio. The group’s operating efficiency was 84 per cent in 2014
(2013: 75 per cent).
Total sales revenue from all operations reached a new record level of US$1.6 billion (2013:
US$1.5 billion), due to higher production partially offset by lower average oil prices. Cost of
sales, excluding impairment charges, were US$986.6 million (2013: US$856.1 million).
Operating costs were stable at US$436.1 million (2013: US$418.9 million). Unit operating
costs were US$18.5 per barrel of oil equivalent (boe) (2013: US$19.7/boe), lower than the
prior year due to higher production, improved operating efficiency across several of the
company’s assets and one-off insurance claims received in the year. Underlying unit
amortisation rose to US$19.9/boe (2013: US$17.7/boe) mainly reflecting higher production
from fields in the UK and Vietnam, carrying a higher amortisation charge per boe compared to
the group average.
Exploration expense and pre-licence expenditure costs amounted to US$58.5 million (2013:
US$106.2 million) and US$25.3 million (2013: US$30.1 million) respectively. This includes the
write-offs relating to Block L10B in Kenya and the Ratu Gajah well in Indonesia, exiting our
exploration licences in Mauritania and the relinquishment of various exploration licences in
the UK as part of Premier’s portfolio management programme. Net administrative costs were
US$25.4 million (2013: US$20.2 million).
Operating loss was US$248.1 million (2013: operating profit of US$352.0 million), mainly
attributable to the impairment charges described above. Finance costs and other charges, net
of interest revenue and other gains, were US$137.1 million (2013: US$65.4 million). The
interest revenue from the loan to our partner on the Solan field development has increased to

Annual Results for the year ended 31 December 2014
27
US$36.8 million (2013: US$6.3 million), however we have recognised a provision of US$61.2
million against this long-term receivable, reflecting a reduction in the total returns expected
on the Solan field in a lower oil price environment. The charge for the unwinding of the
discounted decommissioning provision increased to US$46.9 million (2013: US$36.4 million)
reflecting increased provisions for future decommissioning as industry cost estimates rise.
Pre-tax losses were US$384.0 million (2013: pre-tax profits US$285.4 million). The group tax
credit for 2014 is US$173.7 million (2013: tax charge of US$51.4 million), an effective tax rate
of 45.2 per cent of the pre-tax loss. The group’s theoretical tax rate is close to 50 per cent,
which includes a higher taxation rate in the UK being offset by lower rates in Vietnam and
Pakistan. The 2014 group tax credit arises as a result of a deferred tax credit in the UK, mainly
arising from the tax effect of the impairment charges recognised in the year and recognition
of the UK Small Fields allowance for the Catcher field. The group has an estimated US$2.7
billion of carried forward UK corporation tax allowances and losses, the majority of which are
forecast to be utilised against UK ring fence profits over time, and are therefore reflected in
the deferred tax asset position at the year-end. The group did not pay any corporation tax or
supplementary charge in the UK in 2014 due to these brought forward losses.
Loss after tax is US$210.3 million (2013: profit after tax US$234.0 million) resulting in a basic
earnings per share of a loss of 40.3 cents (2013: profit 44.7 cents).
Dividend and buyback
During 2014, Premier purchased 18.4 million shares at a volume weighted average price of
302.0 pence and paid a dividend of 5 pence per share. In December, a decision was taken by
the Board to postpone the buyback programme pending a recovery in the oil price. The Board
has also decided to suspend the dividend and therefore no dividend is proposed.
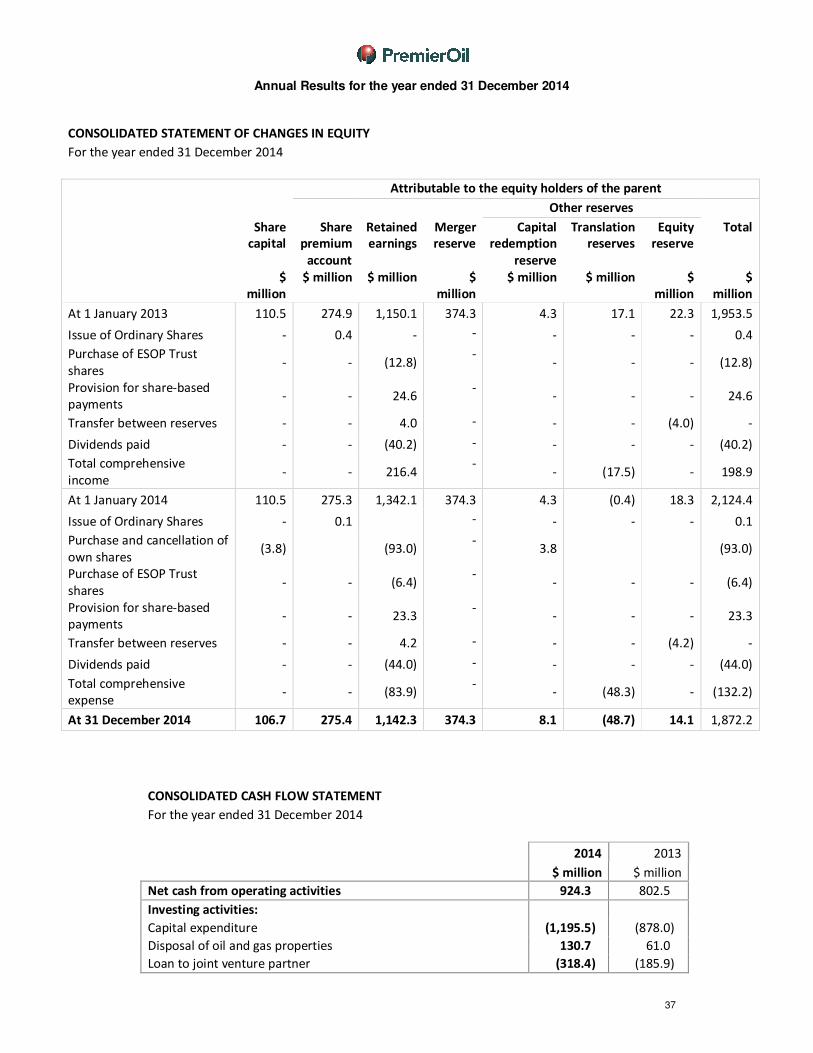
Cash flow
Cash flow from operating activities was US$924.3 million (2013: US$802.5 million) after
accounting for tax payments of US$208.5 million (2013: US$228.3 million). Cash movements
in working capital have improved to US$74.7 million (2013: US$1.3 million).

Annual Results for the year ended 31 December 2014
28
Capital expenditure in 2014 totalled US$1,195.5 million (2013: US$878.0 million).
The principal development projects were the Solan and Catcher fields in the UK, and the Dua
field in Vietnam. In addition, US$318.4 million (2013: US$185.9 million) funding support was
provided to our partner in the Solan project.
Exploration and evaluation spend includes costs principally related to the exploration drilling
and pre-development activities in Norway, Indonesia, the Falkland Islands and Kenya.
Disposals and asset held for sale
During the first half of 2014, Premier announced the proposed sale of the non-operated Scott
area assets in the UK North Sea for US$130 million, the sale of Block A Aceh onshore
Indonesia for US$40 million, and the sale of PL359, which contains the Luno II discovery
offshore Norway, for US$17.5 million prior to working capital adjustments. The Scott area
assets and Luno II transactions were completed during the second half of 2014, whilst a
US$76.9 million loss has been recognised as the anticipated loss on the sale of Block A Aceh,
which was completed in January 2015. These disposals, combined with the write off of
deferred consideration of US$7.0 million held for the Block 07/08 disposal in 2013, resulted in
a gain on disposal of non-current assets of US$2.7 million (2013: US$3.6 million).
Capital expenditure (US$ million) 2014 2013
Fields/development projects 887.5 603.7
Exploration and evaluation 294.1 260.5
Other 13.9 13.8
Total 1,195.5 878.0
Annual Results for the year ended 31 December 2014
29
Balance sheet position
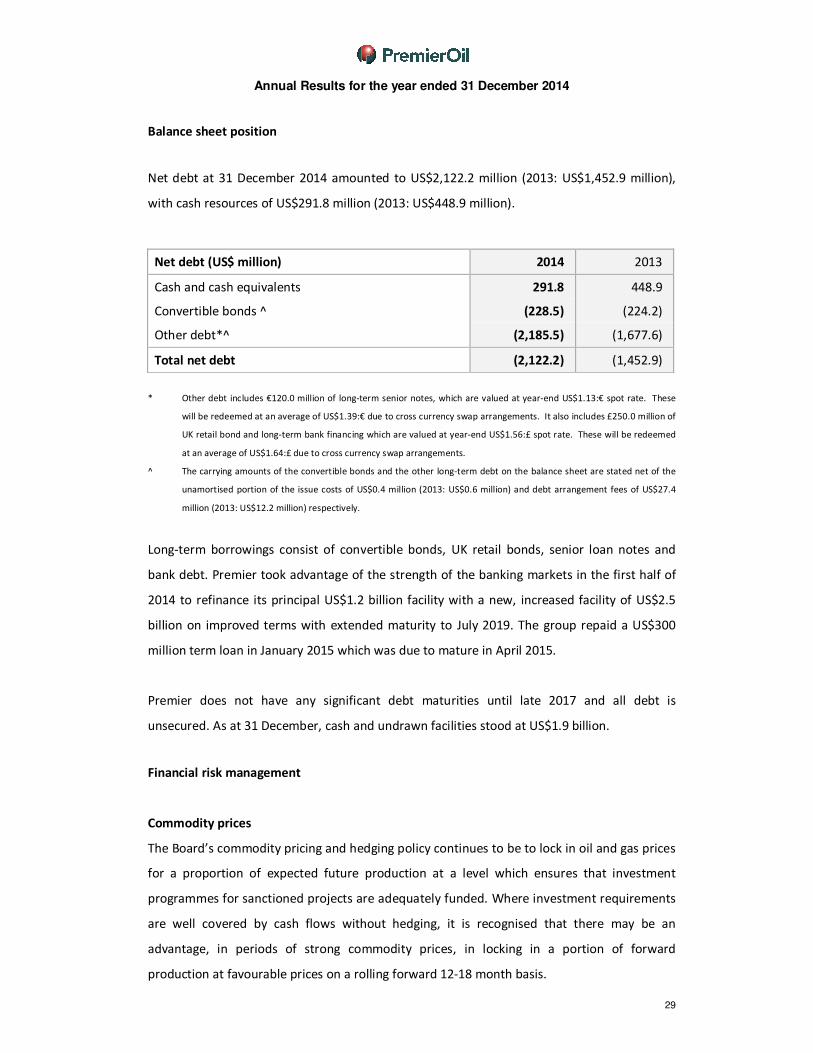
Net debt at 31 December 2014 amounted to US$2,122.2 million (2013: US$1,452.9 million),
with cash resources of US$291.8 million (2013: US$448.9 million).
Net debt (US$ million) 2014 2013
Cash and cash equivalents 291.8 448.9
Convertible bonds ^ (228.5) (224.2)
Other debt*^ (2,185.5) (1,677.6)
Total net debt (2,122.2) (1,452.9)
* Other debt includes €120.0 million of long-term senior notes, which are valued at year-end US$1.13:€ spot rate. These
will be redeemed at an average of US$1.39:€ due to cross currency swap arrangements. It also includes £250.0 million of
UK retail bond and long-term bank financing which are valued at year-end US$1.56:£ spot rate. These will be redeemed
at an average of US$1.64:£ due to cross currency swap arrangements.
^ The carrying amounts of the convertible bonds and the other long-term debt on the balance sheet are stated net of the
unamortised portion of the issue costs of US$0.4 million (2013: US$0.6 million) and debt arrangement fees of US$27.4
million (2013: US$12.2 million) respectively.
Long-term borrowings consist of convertible bonds, UK retail bonds, senior loan notes and
bank debt. Premier took advantage of the strength of the banking markets in the first half of
2014 to refinance its principal US$1.2 billion facility with a new, increased facility of US$2.5
billion on improved terms with extended maturity to July 2019. The group repaid a US$300
million term loan in January 2015 which was due to mature in April 2015.
Premier does not have any significant debt maturities until late 2017 and all debt is
unsecured. As at 31 December, cash and undrawn facilities stood at US$1.9 billion.
Financial risk management
Commodity prices
The Board’s commodity pricing and hedging policy continues to be to lock in oil and gas prices
for a proportion of expected future production at a level which ensures that investment
programmes for sanctioned projects are adequately funded. Where investment requirements
are well covered by cash flows without hedging, it is recognised that there may be an
advantage, in periods of strong commodity prices, in locking in a portion of forward
production at favourable prices on a rolling forward 12-18 month basis.
Annual Results for the year ended 31 December 2014
30
At year-end, 5.4 mmbbls of Dated Brent oil were hedged through forward sales for 2015 at an
average price of US$98.3/bbl. This volume represents approximately 50 per cent of the
group’s expected liquids entitlement production in 2015. 84,000 metric tonnes (mt) of HSFO,
which drives our gas contract pricing in Singapore, has been sold forward for 2015 at an
average price of US$614.4/mt. These hedges cover approximately 13 per cent of our
expected Indonesian gas entitlement production for 2015.
The year-end fair value on the commodity was US$250.1 million (2013: loss US$24.2 million),
which is expected to be released to the income statement during 2015, as the related barrels
are lifted.
During 2014, forward oil sales of 5.6 mmbbls, and forward fuel oil sales of 222,000 mt expired
resulting in a net credit of US$45.9 million (2013: US$0.8 million) which has been included
within sales revenue for the year.
Foreign exchange
Premier’s functional and reporting currency is US dollars. Exchange rate exposures relate only
to local currency receipts, and expenditures within individual business units. Local currency
needs are acquired on a short-term basis. At the year-end, the group recorded a mark-to-
market loss of US$6.0 million on its outstanding foreign exchange contracts (2013: gain of
US$13.1 million). The group currently has £150.0 million retail bonds, €120.0 million long-
term senior loan notes and £100.0 million term loan in issuance which have been hedged
under cross currency swaps in US dollars at average fixed rates of US$1.64:£ and US$1.34:€.
Interest rates
The group has various financing instruments including senior loan notes, convertible bonds,
UK retail bonds, term loans and revolving credit facilities. As at year-end, 56 per cent of total
borrowings is fixed or has been fixed using the interest rate swap markets. On average, the
cost of drawn funds for the year was 4.4 per cent. Mark-to-market credits on interest rate
swaps amounted to US$6.8 million (2013: credit of US$6.4 million), which are recorded as
movements in other comprehensive income.
Cash balances are invested in short-term bank deposits and AAA rated liquidity funds, subject
to Board approved limits and with a view to spreading counterparty risks.
Annual Results for the year ended 31 December 2014
31
Insurance
The group undertakes a significant insurance programme to reduce the potential impact of
physical risks associated with its exploration, development and production activities. Business
interruption cover is purchased for a proportion of the cash flow from producing fields for a
maximum period of 18 months. During 2014, claims amounting to US$20.5 million were
agreed in relation to property damage and business interruption on Chim Sao gas export
pipeline damage in 2013.
Going concern
The group monitors its funding position and its liquidity risk throughout the year to ensure it
has access to sufficient funds to meet forecast cash requirements. Cash forecasts are
regularly produced based on, inter alia, the group’s latest life of field production and
expenditure forecasts, management’s best estimate of future commodity prices (based on
recent forward curves, adjusted for the group’s hedging programme) and the group’s
borrowing facilities. Sensitivities are run to reflect different scenarios including, but not
limited to, changes in oil and gas production rates, possible reductions in commodity prices
and delays or cost overruns on major development projects. This is done to identify risks to
liquidity and covenant compliance and enable management to formulate appropriate and
timely mitigation strategies.
Due to the current weakness in oil and gas prices, the directors have reduced planned
development and exploration expenditure for 2015, are implementing a series of cost saving
initiatives to reduce both operating costs and G&A spend and have identified a range of
portfolio management opportunities to monetise certain of the group’s current development
and exploration assets and to source additional sources of financing.
At year-end, the group had significant headroom on its borrowing facilities and related
financial covenants. The group’s forecasts and projections, which take into account the
actions described in the preceding paragraph, also indicate that the company will be able to
operate within the requirements of its existing borrowing facilities for 12 months from the
date of approval of the Annual Report and Accounts. However, if there were further sustained
falls in the oil price or if certain of the identified portfolio management opportunities are
delayed or cancelled, whilst forecasts indicate that the group’s liquidity will remain strong, it is
possible that management will need to request a temporary amendment to the terms of one
of its financial covenants. If the group’s ongoing forecasts were to suggest that this would be

Annual Results for the year ended 31 December 2014
32
required, management would take appropriate action with the support of its long-term
banking relationships well in advance of such requirement, and management have no reason
to believe that such support would not be forthcoming. The directors therefore continue to
adopt the going concern basis in preparing the financial statements.
Business risks
Premier’s business may be impacted by various risks leading to failure to achieve strategic
targets for growth, loss of financial standing, cash flow and earnings, and reputation. Not all
of these risks are wholly within the company’s control and the company may be affected by
risks which are not yet manifest or reasonably foreseeable.
Effective risk management is critical to achieving our strategic objectives and protecting our
personnel, assets, the communities where we operate and with whom we interact and our
reputation. Premier therefore has a comprehensive approach to risk management.
A critical part of the risk management process is to assess the impact and likelihood of risks
occurring so that appropriate mitigation plans can be developed and implemented. Risk
severity matrices are developed across Premier’s business to facilitate assessment of risk. The
specific risks identified by project and asset teams, business units and corporate functions are
consolidated and amalgamated to provide an oversight of key risk factors at each level, from
operations through business unit management to the Executive Committee and the Board.
For all the known risks facing the business, Premier attempts to minimise the likelihood and
mitigate the impact. According to the nature of the risk, Premier may elect to take or tolerate
risk, treat risk with controls and mitigating actions, transfer risk to third parties, or terminate
risk by ceasing particular activities or operations. Premier has a zero tolerance to financial
fraud or ethics non-compliance, and ensures that HSES risks are managed to levels that are as
low as reasonably practicable, whilst managing exploration and development risks on a
portfolio basis.
The group has identified its principal risks for the next 12 months as being:
• Health, safety, environment and security (HSES);
• Production and development delivery;
• Commodity price volatility;
• Exploration success and reserves addition;

Annual Results for the year ended 31 December 2014
33
• Host government – political and fiscal risks;
• Organisational capability;
• Joint venture partner alignment; and
• Financial discipline and governance.
Further information detailing the way in which these risks are mitigated is provided on the
company’s website (www.premier-oil.com).

Annual Results for the year ended 31 December 2014
34
CONSOLIDATED INCOME STATEMENT
For the year ended 31 December 2014
2014 2013
$ million $
million
Sales revenues 1,629.4 1,501.0
Other operating income - 38.7
Cost of sales (986.6) (856.1)
Impairment charge on oil and gas properties (784.4) (178.7)
Exploration expense (58.5) (106.2)
Pre-licence exploration costs (25.3) (30.1)
Profit on disposal of non-current assets 2.7 3.6
General and administration costs (25.4) (20.2)
Operating (loss)/profit (248.1) 352.0
Share of profit in associate 1.9 -
Interest revenue, finance and other gains 58.5 33.0
Finance costs, other finance expenses and losses (196.3) (98.4)
Loss on commodity derivative financial instruments - (1.2)
(Loss)/profit before tax (384.0) 285.4
Tax 173.7 (51.4)
(Loss)/profit after tax (210.3) 234.0
Earnings per share (cents):
Basic (40.3) 44.2
Diluted (40.3) 43.2
The results relate entirely to continuing operations.
CONSOLIDATED STATEMENT OF COMPREHENSIVE INCOME
For the year ended 31 December 2014
2014 2013
$
million
$ million
(Loss)/profit for the year (210.3) 234.0
Cash flow hedges on commodity swaps:
- Gains/(losses) arising during the year 296.1 (25.0)
- Less: reclassification adjustments for (gains)/losses in the
year (46.0) 0.8
250.1 (24.2)
Tax relating to components of other comprehensive income (139.0) 13.9
Cash flow hedges on interest rate and foreign exchange
swaps 15.5 (0.8)
Exchange differences on translation of foreign operations (48.3) (17.5)
Losses on long-term employee benefit plans (0.2) (6.5)
Other comprehensive income/(expense) 78.1 (35.1)
Total comprehensive (expense)/income for the year (132.2) 198.9

Annual Results for the year ended 31 December 2014
35
All comprehensive income is attributable to the equity holders of the parent.

Annual Results for the year ended 31 December 2014
36
CONSOLIDATED BALANCE SHEET
As at 31 December 2014
2014 2013
$ million $ million
Non-current assets:
Intangible exploration and evaluation assets 825.7 701.0
Property, plant and equipment 2,430.0 2,885.9
Goodwill 240.8 240.8
Investment in associate 7.6 6.2
Long-term employee benefit plan surplus 0.8 1.0
Long-term receivables 494.1 198.1
Deferred tax assets 971.7 762.4
4,970.7 4,795.4
Current assets:
Inventories 26.1 49.5
Trade and other receivables 411.0 421.8
Tax recoverable 57.9 82.4
Derivative financial instruments 273.4 15.9
Cash and cash equivalents 291.8 448.9
Assets held for sale 56.7 -
1,116.9 1,018.5
Total assets 6,087.6 5,813.9
Current liabilities:
Trade and other payables (544.5) (512.4)
Current tax payable (84.2) (92.0)
Provisions (14.1) (13.1)
Derivative financial instruments (48.1) (38.3)
Short-term debt (300.0) -
Liabilities directly associated with asset held for sale (1.8) -
(992.7) (655.8)
Net current assets 124.2 362.7
Non-current liabilities:
Convertible bonds (228.1) (223.8)
Other long-term debt (1,858.1) (1,665.4)
Deferred tax liabilities (254.2) (306.8)
Long-term provisions (864.0) (824.6)
Long-term employee benefit plan deficit (18.3) (13.1)
(3,222.7) (3,033.7)
Total liabilities (4,215.4) (3,689.5)
Net assets 1,872.2 2,124.4
Equity and reserves:
Share capital 106.7 110.5
Share premium account 275.4 275.3
Merger reserve 374.3 374.3
Retained earnings 1,142.3 1,342.1
Other reserves (26.5) 22.2
1,872.2 2,124.4
Annual Results for the year ended 31 December 2014
37
CONSOLIDATED STATEMENT OF CHANGES IN EQUITY
For the year ended 31 December 2014
Attributable to the equity holders of the parent
Other reserves
Share
capital
Share
premium
account
Retained
earnings
Merger
reserve
Capital
redemption
reserve
Translation
reserves
Equity
reserve
Total
$
million
$ million $ million $
million
$ million $ million $
million
$
million
At 1 January 2013 110.5 274.9 1,150.1 374.3 4.3 17.1 22.3 1,953.5
Issue of Ordinary Shares - 0.4 - - - - - 0.4
Purchase of ESOP Trust
shares - - (12.8)
- - - - (12.8)
Provision for share-based
payments - - 24.6
- - - - 24.6
Transfer between reserves - - 4.0 - - - (4.0) -
Dividends paid - - (40.2) - - - - (40.2)
Total comprehensive
income - - 216.4
- - (17.5) - 198.9
At 1 January 2014 110.5 275.3 1,342.1 374.3 4.3 (0.4) 18.3 2,124.4
Issue of Ordinary Shares - 0.1 - - - - 0.1
Purchase and cancellation of
own shares (3.8) (93.0)
- 3.8 (93.0)
Purchase of ESOP Trust
shares - - (6.4)
- - - - (6.4)
Provision for share-based
payments - - 23.3
- - - - 23.3
Transfer between reserves - - 4.2 - - - (4.2) -
Dividends paid - - (44.0) - - - - (44.0)
Total comprehensive
expense - - (83.9)
- - (48.3) - (132.2)
At 31 December 2014 106.7 275.4 1,142.3 374.3 8.1 (48.7) 14.1 1,872.2
CONSOLIDATED CASH FLOW STATEMENT
For the year ended 31 December 2014
2014 2013
$ million $ million
Net cash from operating activities 924.3 802.5
Investing activities:
Capital expenditure (1,195.5) (878.0)
Disposal of oil and gas properties 130.7 61.0
Loan to joint venture partner (318.4) (185.9)

Annual Results for the year ended 31 December 2014
38
Net cash used in investing activities (1,383.2) (1,002.9)
Financing activities:
Proceeds from issuance of Ordinary Shares 0.1 0.4
Purchase and cancellation of own shares (93.0) -
Purchase of ESOP Trust Shares (6.4) (12.8)
Proceeds from drawdown of long-term bank loans 655.0 384.1
Proceeds for issuance of senior loan notes - 156.7
Proceeds from issuance of retail bonds
Debt arrangement fees
-
(22.1)
245.8
(7.1)
Repayment of long-term bank loans
Dividends paid
Interest paid
(100.0)
(44.0)
(98.1)
(200.0)
(40.2)
(71.1)
Net cash from financing activities 291.5 455.8
Currency translation differences relating to cash and cash
equivalents 10.3 6.1
Net (decrease)/increase in cash and cash equivalents (157.1) 261.5
Cash and cash equivalents at the beginning of the year 448.9 187.4
Cash and cash equivalents at the end of the year 291.8 448.9

Annual Results for the year ended 31 December 2014
39
NOTES TO THE PRELIMINARY FINANCIAL STATEMENTS
For the year ended 31 December 2014
1 General information
Premier Oil plc is a limited liability company incorporated in Scotland and listed on the London
Stock Exchange. The address of the registered office is 4th Floor, Saltire Court, 20 Castle
Terrace, Edinburgh, EH1 2EN, United Kingdom. This preliminary announcement was
authorised for issue in accordance with a resolution of the Board of Directors on 25 February
2015.
The financial information for the year ended 31 December 2014 set out in this announcement
does not constitute statutory accounts within the meaning of section 434 of the Companies
Act 2006. Statutory accounts for the year ended 31 December 2013 were approved by the
Board of Directors on 25 February 2014 and delivered to the Registrar of Companies and
those for 2014 will be delivered following the company’s Annual General Meeting (AGM). The
auditor has reported on these accounts; the reports were unqualified, did not include a
reference to any matters to which the auditor drew attention by way of emphasis of matter
and did not contain statements under section 498(2) or 498(3) of the Companies Act 2006.
Basis of preparation
The financial information has been prepared in accordance with the recognition and
measurement criteria of International Financial Reporting Standards (IFRS) adopted for use in
the European Union. However, this announcement does not itself contain sufficient
information to comply with IFRS. The company will publish full financial statements that
comply with IFRS in April 2015.
The financial information has been prepared under the historical cost convention except for
the revaluation of financial instruments and certain oil and gas properties at the transition
date to IFRS. These financial statements are presented in US dollars since that is the currency
in which the majority of the group’s transactions are denominated.
Accounting policies
The accounting policies applied in this announcement are consistent with those of the annual
financial statements for the year ended 31 December 2013, as described in those annual
financial statements. A number of amendments to existing standards and interpretations
were applicable from 1 January 2014. The adoption of these amendments did not have a
material impact on the group’s financial statements for the year ended 31 December 2014.
2 Operating segments
The group’s operations are located and managed in seven business units; namely the
Falklands Islands, Indonesia, Norway, Pakistan (including Mauritania), the United Kingdom,
Vietnam and the Rest of the World. Some of the business units currently do not generate
revenue or have any material operating income.

Annual Results for the year ended 31 December 2014
40
2 Operating segments (continued)
The group is only engaged in one business of upstream oil and gas exploration and
production, therefore all information is being presented for geographical segments.
2014 2013
$ million $ million
Revenue:
Indonesia 325.7 295.9
Pakistan (including Mauritania) 141.6 165.4
Vietnam 473.3 468.2
United Kingdom 688.8 571.5
Total group sales revenue 1,629.4 1,501.0
Other income – United Kingdom - 38.7
Interest and other finance revenue 39.4 10.9
Total group revenue 1,668.8 1,550.6
Group operating (loss)/profit:
Indonesia 181.4 187.0
Norway (17.4) (26.5)
Pakistan (including Mauritania) 32.4 84.0
Vietnam 76.6 195.9
United Kingdom (446.6) (31.5)
Rest of the world (23.6) (8.7)
Unallocated * (50.9) (48.2)
Group operating (loss)/profit (248.1) 352.0
Share of profit in associate 1.9 -
Interest revenue, finance and other gains 58.5 33.0
Finance costs and other finance expenses (196.3) (98.4)
Loss on commodity derivative financial instruments - (1.2)
(Loss)/profit before tax (384.0) 285.4
Tax 173.7 (51.4)
(Loss)/profit after tax (210.3) 234.0
Balance sheet
Segment assets:
Falkland Islands 430.6 297.2
Indonesia 701.0 731.5
Norway 197.9 231.3
Pakistan (including Mauritania) 101.7 117.4
Vietnam 569.9 648.5
United Kingdom 3,428.2 3,260.4
Rest of the world 92.1 62.8
Unallocated* 566.2 464.8
Total assets 6,087.6 5,813.9

Annual Results for the year ended 31 December 2014
41
2 Operating segments (continued)
2014 2013
$ million $ million
Liabilities:
Falkland Islands (28.5) (14.6)
Indonesia (326.4) (296.3)
Norway (60.3) (83.9)
Pakistan (including Mauritania) (103.0) (88.4)
Vietnam (322.7) (316.9)
United Kingdom (913.9) (948.1)
Rest of the world (26.2) (14.0)
Unallocated* (2,434.4) (1,927.3)
Total liabilities (4,215.4) (3,689.5)
Other information
Capital additions and acquisitions:
Falkland Islands 112.9 54.0
Indonesia 149.2 101.0
Norway 68.1 49.9
Pakistan (including Mauritania) 33.4 33.8
Vietnam 156.7 121.9
United Kingdom 654.3 615.4
Rest of the world 36.8 47.5
Total capital additions and acquisitions 1,211.4 1,023.5
Depreciation, depletion, amortisation and impairment:
Indonesia 73.7 57.1
Pakistan (including Mauritania) 41.8 42.5
Vietnam 185.6 117.1
United Kingdom 938.2 344.8
Rest of the world 1.5 1.0
Total depreciation, depletion, amortisation and impairment 1,240.8 562.5 *
Unallocated expenditure, assets and liabilities include amounts of a corporate nature and not specifically attributable to a
geographical segment. These items include corporate general and administration costs, pre-licence exploration costs, cash
and cash equivalents, mark-to-market valuations of commodity contracts and interest rate swaps, convertible bonds and
other short-term and long-term debt.

Annual Results for the year ended 31 December 2014
42
3 Cost of sales
2014 2013
$ million $ million
Operating costs 436.1 418.9
Stock overlift/underlift movement 48.5 9.8
Royalties 45.6 43.6
Amortisation and depreciation of property, plant and equipment:
Oil and gas properties 446.1 375.0
Other fixed assets 10.3 8.8
986.6 856.1
4 Tax
2014 2013
$ million $ million
Current tax:
UK corporation tax on profits (1.5) (12.1)
UK petroleum revenue tax 65.4 100.9
Overseas tax 154.1 122.7
Adjustments in respect of prior years 1.9 (22.3)
Total current tax 219.9 189.2
Deferred tax:
UK corporation tax (382.2) (180.5)
UK petroleum revenue tax 33.7 (6.4)
Overseas tax (45.1) 49.1
Total deferred tax (393.6) (137.8)
Tax (credit)/charge on (loss)/profit on ordinary activities (173.7) 51.4

Annual Results for the year ended 31 December 2014
43
5 Deferred tax
2014 2013
$ million $ million
Deferred tax assets 971.7 762.4
Deferred tax liabilities (254.2) (306.8)
717.5 455.6
The group's unutilised tax losses and allowances at 31 December 2014 are recognised to the
extent that taxable profits are expected to arise in the future against which the tax losses and
allowances can be utilised. In accordance with paragraph 37 of IAS 12 - 'Income Taxes' the
group re-assessed its unrecognised deferred tax assets at 31 December 2014 with respect to
ring fence tax losses and allowances. The corporate model used to determine the recognition
of deferred tax assets was re-run, using an oil price assumption of Dated Brent forward curve
in 2015 and 2016, and US$85/bbl in ‘real’ terms thereafter. The results of the corporate
model concluded that it was no longer appropriate to recognise an amount of US$86.8 million
in respect of the group's UK ring fence deferred tax assets relating to tax losses and
allowances.
In addition to the above, there are non-ring fence tax losses of approximately US$263.1
million (2013: US$321.1 million) and current year non-UK tax losses of US$40.8 million (2013:
US$14.3 million) for which a deferred tax asset has not been recognised.
At 1
January 2014
Exchange movements
Disposal of asset
(Charged)/ credited
to income statement
Credited to
retained earnings
At 31 December
2014
$ million $ million $ million $ million $ million $ million
UK deferred corporation tax:
Fixed assets and allowances (828.2) - - 72.2 - (756.0)
Decommissioning 321.7 - - 8.1 - 329.8
Deferred petroleum revenue tax (5.4) - - 20.9 - 15.5
Tax losses and allowances 1,203.8 - - 171.6 - 1,375.4
Small field allowance 47.8 - - 109.4 - 157.2
Derivative financial instruments 13.9 - - - (139.0) 125.1
Total UK deferred corporation tax 753.6 - - 382.2 (139.0) 996.8
UK deferred petroleum revenue tax1 8.7 - - (33.7) - (25.0)
Overseas deferred tax2 (306.7) 7.4 22.2 22.9 - (254.2)
Total 455.6 7.4 22.2 371.4 (139.0) 717.5
1 The UK deferred petroleum revenue tax relates mainly to temporary differences associated with decommissioning provisions.
2 The overseas deferred tax relates mainly to temporary differences associated with fixed asset balances.

Annual Results for the year ended 31 December 2014
44
5 Deferred tax (continued)
None of the UK tax losses (ring fence and non-ring fence) have a fixed expiry date for tax
purposes.
No deferred tax has been provided on unremitted earnings of overseas subsidiaries, following
a change in UK tax legislation in 2009 which exempted foreign dividends from the scope of UK
corporation tax where certain conditions are satisfied.
6 (Loss)/earnings per share
The calculation of basic (loss)/earnings per share is based on the (loss)/profit after tax and on
the weighted average number of Ordinary Shares in issue during the year.
Basic and diluted (loss)/earnings per share were calculated as follows:
Year to 31
December
2014
Year to
31 December
2013
(Loss)/earnings ($ millions):
(Loss)/Earnings for the purpose of basic earnings per share
being net profit attributable to owners of the company (210.3) 234.0
Effect of dilutive potential Ordinary Shares:
Interest on convertible bonds – 2014 anti-dilutive - 10.3
(Loss)/earnings for the purposes of diluted earnings per share (210.3) 244.3
Number of shares (millions):
Weighted average number of Ordinary Shares for the purpose
of basic earnings per share 521.9 529.2
Effects of dilutive potential Ordinary Shares:
Contingently issuable shares – 2014 anti-dilutive - 36.0
Weighted average number of Ordinary Shares for the purpose
of diluted earnings per share 521.9 565.2
(Loss)/earnings per share (cents):
Basic (40.3) 44.2
Diluted (40.3) 43.2
* There were 37.1 million anti-dilutive potential Ordinary Shares in 2014 mainly comprising of shares to be issued on
conversion of convertible bonds.

Annual Results for the year ended 31 December 2014
45
7 Intangible exploration and evaluation (E&E) assets
Oil and gas properties Total
$ million
Cost:
At 1 January 2013 658.0
Exchange movements (17.3)
Additions during the year 266.9
Disposals (101.3)
Transfer to property, plant and equipment 0.9
Exploration expense (106.2)
At 31 December 2013 701.0
Exchange movements (37.1)
Additions during the year 294.0
Disposals (46.5)
Transfer to property, plant and equipment (1.7)
Exploration expense (58.5)
Transfer to asset held for sale (25.5)
At 31 December 2014 825.7
The amounts for intangible E&E assets represent costs incurred on active exploration projects.
These amounts are written off to the income statement as exploration expense unless
commercial. During the year, the group sold its interest in the PL394 licence in Norway, which
contained the Luno II discovery, for US$38.2 million cash consideration, recognising a loss
before tax of US$9.7 million.

Annual Results for the year ended 31 December 2014
46
8 Property, plant and equipment
Oil and gas
properties
Other
fixed assets Total
$ million $ million $ million
Cost:
At 1 January 2013 4,183.2 38.5 4,221.7
Additions during the year 742.8 13.8 756.6
Transfer from/(to) intangible E&E assets 3.3 (4.3) (1.0)
At 31 December 2013 4,929.3 48.0 4,977.3
Exchange movements - (2.0) (2.0)
Additions during the year 903.5 13.9 917.4
Disposals (211.4) - (211.4)
Transfer to asset held for sale (124.5) - (124.5)
Transfer from/(to) intangible E&E assets 1.7 - 1.7
At 31 December 2013 5,498.6 59.9 5,558.5
Amortisation and depreciation:
At 1 January 2013 1,509.0 19.8 1,528.8
Exchange movements - 0.1 0.1
Charge for the year 375.0 8.8 383.8
Impairment charge 178.7 - 178.7
At 31 December 2013 2,062.7 28.7 2,091.4
Exchange movements - (1.8) (1.8)
Charge for the year 446.1 10.3 456.4
Impairment charge 784.4 - 784.4
Disposals (179.9) - (179.9)
Transfer to asset held for sale (22.0) - (22.0)
At 31 December 2014 3,091.3 37.2 3,128.5
Net book value:
At 31 December 2013 2,866.6 19.3 2,885.9
At 31 December 2014 2,407.3 22.7 2,430.0
* Finance costs that have been capitalised within oil and gas properties during the year total US$42.2 million (2013: US$25.6
million), at a weighted average interest rate of 4.40 per cent (2013: 4.70 per cent).
Other fixed assets include items such as leasehold improvements, motor vehicles and office
equipment.

Annual Results for the year ended 31 December 2014
47
8 Property, plant and equipment (continued)
Amortisation and depreciation of oil and gas properties is calculated on a unit-of-production
basis, using the ratio of oil and gas production in the period to the estimated quantities of
proved and probable reserves on an entitlement basis at the end of the period plus
production in the period, on a field-by-field basis. Proved and probable reserve estimates are
based on a number of underlying assumptions including oil and gas prices, future costs, oil
and gas in place and reservoir performance, which are inherently uncertain. Management
uses established industry techniques to generate its estimates and regularly references its
estimates against those of joint venture partners or external consultants. However, the
amount of reserves that will ultimately be recovered from any field cannot be known with
certainty until the end of the field's life.
The impairment charge in the current year relates to the the Balmoral area, Huntington and
Solan fields in the UK (US$732.3 million), the Chim Sáo field in Vietnam (US$41.8 million), the
Kakap field in Indonesia (US$5.0 million) and the Chinguetti field in Mauritania (US$5.3
million). The impairment charge of US$784.4 million was calculated by comparing the future
discounted cash flows expected to be derived from production of commercial reserves (the
value-in-use) against the carrying value of the asset. The future cash flows were estimated
using an oil price assumption equal to the Dated Brent forward curve in 2015 and 2016, and
US$85/bbl in 'real' terms thereafter and were discounted using a pre-tax discount rate in the
range of 10.0 per cent for the UK assets and 12.5 per cent for the non-UK assets. Assumptions
involved in impairment measurement include estimates of commercial reserves and
production volumes, future oil and gas prices and the level and timing of expenditures, all of
which are inherently uncertain. The principal cause of the impairment charge being
recognised in the year is a reduction in the short to medium term oil price assumption being
used when determining the future discounted cash flows for each field. In addition to the
impact of the reduced oil price assumption, a review of the expected decommissioning costs
for the Balmoral area in the first half of 2014 has also driven part of the impairment charge,
whilst the Solan impairment has in part been caused by an increase in the costs incurred to
date and expected costs to completion for the project.
During the year, the group disposed of its interest in the Scott area assets in the UK North Sea
for US$130 million, resulting in a pre-tax profit of US$96.3 million. In addition, the group
announced its intention to sell its interests in Block A Aceh in Indonesia resulting in the asset
being reclassified as held for sale at 31 December 2014. An anticipated loss of US$76.9 million
has been recognised for the sale of Block A Aceh, which was completed in early January 2015.
At 31 December 2014, the assets separately held on the balance sheet for Block A Aceh are
US$56.7 million with associated liabilities of US$1.8 million. The gain on disposal of non-
current asset recognised in the income statement of US$2.7 million also includes the loss
recognised in relation to PL359 in Norway (see note 7) and the write-off of deferred
consideration of US$7.0 million previously held for the disposal of Block 07/03 in Vietnam
during 2013.

Annual Results for the year ended 31 December 2014
48
9 Notes to the cash flow statement
2014 2013
$ million $ million
(Loss) / profit before tax for the year (384.0) 285.4
Adjustments for:
Depreciation, depletion, amortisation and impairment 1,240.8 562.5
Exploration expense 58.5 106.2
Provision for share-based payments 6.9 7.9
Share of gain in associate (1.9) -
Interest revenue and finance gains (58.5) (33.0)
Finance costs and other finance expenses 196.3 98.4
Other gains and losses (2.7) (3.6)
Loss on derivative financial instruments - 1.2
Operating cash flows before movements in working capital 1,055.4 1,025.0
Decrease/(increase) in inventories 23.0 (14.9)
Decrease in receivables 105.3 45.1
Decrease in payables (53.6) (28.9)
Cash generated by operations 1,130.1 1,026.3
Income taxes paid (208.5) (228.3)
Interest income received 2.7 4.5
Net cash from operating activities 924.3 802.5

Annual Results for the year ended 31 December 2014
49
9 Notes to the cash flow statement continued
Analysis of changes in net debt:
2014 2013
$ million $ million
a) Reconciliation of net cash flow to movement in net debt:
Movement in cash and cash equivalents (157.1) 261.5
Proceeds from drawdown of long-term bank loans (655.0) (384.1)
Proceeds from issuance of senior loan notes - (156.7)
Proceeds from issuance of retail bonds - (245.8)
Repayment of long-term bank loans 100.0 200.0
Non-cash movements on debt and cash balances 42.8 (17.4)
Increase in net debt in the year (669.3) (342.5)
Opening net debt (1,452.9) (1,110.4)
Closing net debt (2,122.2) (1,452.9)
b) Analysis of net debt:
Cash and cash equivalents 291.8 448.9
Borrowings* (2,414.0) (1,901.8)
Total net debt (2,122.2) (1,452.9)
* Borrowings consist of the short-term borrowings, the convertible bonds and the other long-term debt. The carrying values of
the convertible bonds and the other long-term debt on the balance sheet are stated net of the unamortised portion of the
issue costs of US$0.4 million (2013: US$0.4 million) and debt arrangement fees of US$27.4 million (2013: US$12.2 million)
respectively.
10 Dividends
During 2014 Premier paid a dividend of 5 pence per share, no dividend is proposed in relation
to year-end 2014.
11 External audit
This preliminary announcement is consistent with the audited financial statements of the
group for the year-ended 31 December 2014.
12 Publication of financial statements
It is anticipated that the full Annual Report and Financial Statements will be published on 7
April 2015. Copies will be available from this date at the company’s head office, 23 Lower
Belgrave Street, London SW1W 0NR, and on the company’s website (www.premier-oil.com).
13 Annual General Meeting
The Annual General Meeting will be held at the Institute of Directors, 116 Pall Mall, London
SW1Y 5ED on Wednesday 13 May 2015 at 11.00am.

Annual Results for the year ended 31 December 2014
50
. Working interest reserves at 31 December 2014
Notes:
1. Includes re-evaluation of reserves at Anoa, Gajah Puteri, Iguana, Bison, Kakap (Indonesia); Kadanwari, Bhit, Badhra,
Zamzama (Pakistan); Balmoral, Wytch Farm and Catcher Area (UK). Reserves from Beacon Field have been re-classified
as contingent resources. Contingent resource in Bream has been reclassified as reserves - 'Justified for Development'.
2. Includes reserves added at Kadanwari (Pakistan) through new K-36 well. Discoveries at Kuda Laut & Singa Laut (Indonesia)
are classified as contingent resources and do not appear in this table.
3. Divestment of Scott, Telford and Rochelle (UK) was completed on 19 December 2014.
Note: Block A Aceh resource is still included in this table as Divestment completed after year end, on 12 Jan 2015).
4. Proved plus probable gas reserves include 66 bcf fuel gas.
Premier Oil plc categorises petroleum resources in accordance with the 2007 SPE/WPC/AAPG/SPEE Petroleum Resource Management System (SPE PRMS).
Proved and probable reserves are based on operator, third party reports and internal estimates and are defined in accordance with the
Statement of Recommended Practice (SORP) issued by the Oil Industry Accounting Committee (OIAC), dated July 2001.
Working interest basis
Indonesia Mauritania
Norway Pakistan UK Vietnam TOTAL
Oil
and NGLs Gas
Oil and
NGLs Gas
Oil and
NGLs Gas
Oil and
NGLs Gas
Oil and
NGLs Gas
Oil and
NGLs Gas
Oil and
NGLs Gas4
Oil, NGLs
and gas
mmbbls bcf mmbbls bcf mmbbls bcf mmbbls bcf mmbbls bcf mmbbls bcf mmbbls bcf Mmboe
Group proved plus probable reserves:
At 1 January 2014 5.7 435.4 0.4 - - - 0.3 144.3 110.3 59.1 25.2 39.6 141.9 678.4 259.4
Revisions1 (0.5) (12.9) 0.2 - 22.6 3.3 - (17.2) (2.0) 0.6 0.1 0.4 20.3 (25.9) 15.8
Discoveries and extensions2 - - - - - - - 3.3 - - - - - 3.3 0.6
Acquisitions and divestments3 - - - - - - - - (5.8) (20.0) - - (5.8) (20.0) (9.4)
Production (0.3) (25.0) (0.2) - - - (0.1) (28.2) (6.0) (5.1) (5.0) (5.8) (11.5) (64.0) (23.1)
At 31 December 2014 4.9 397.6 0.4 - 22.6 3.3 0.2 102.2 96.5 34.6 20.3 34.2 144.9 571.8 243.3
Total group developed and undeveloped reserves:
Proved on production 0.9 107.7 0.2 - - - 0.2 86.3 14.8 4.8 13.6 25.6 29.6 224.4 69.6
Proved approved/justified for development 2.3 175.2 - - 15.4 2.7 - - 40.2 18.8 1.4 - 59.3 196.6 90.2
Probable on production 0.9 61.7 0.2 - - - - 15.9 9.9 4.9 5.3 8.6 16.4 91.0 33.3
Probable approved/justified for development 0.8 53.0 - - 7.2 0.7 - - 31.6 6.1 - - 39.6 59.8 50.2
At 31 December 2014 4.9 397.6 0.4 - 22.6 3.3 0.2 102.2 96.5 34.6 20.3 34.2 144.9 571.8 243.3