annual report 2004 report 2004 coca-cola amatil limited abn 26 004 139 397 ... acquisition of spc...
TRANSCRIPT

Rewards of innovationAnnual Report 2004
Coca-Cola Amatil Limited ABN 26 004 139 397
Coca-C
ola Am
atilAnnual R
eport 2004
21151 COVER 13/4/05 10:52 AM Page 1

Australia New Zealand Papua New Guinea Fiji South Korea Indonesia
Annual General Meeting Thursday, 19 May 2005 at 2pmCity Recital Hall, Angel Place (Pitt Street entrance),Sydney
Calendar of Events
2004 full year results announced Thursday, 10 February 2005
Ex-dividend date Tuesday, 15 February 2005
Record date for dividend entitlements Monday, 21 February 2005
2004 final ordinary dividend paid Friday, 1 April 2005
2005 Annual General Meeting Thursday, 19 May 2005
2005 half year results announced Wednesday, 10 August 2005
Ex-dividend date Monday, 22 August 2005
Record date for dividend entitlements Friday, 26 August 2005
2005 interim ordinary dividend paid Monday, 3 October 2005
Australia New Zealand Papua New Guinea Fiji South Korea IndonesiaAustralia New Zealand Papua New Guinea Fiji South Korea Indonesia
1 Letter from the Chairman3 Performance Review from the Managing Director6 Financial Performance Summary 7 Five Year Financial Performance Summary8 A Commitment to Innovation
10 Coca-Cola Amatil at a Glance12 Australia13 Oceania14 South Korea15 Indonesia
16 SPC Ardmona Acquisition18 CCA’s Corporate Social Responsibilities 22 Board of Directors and Senior Management24 Corporate Governance31 Directors’ Report39 Statements of Financial Performance40 Statements of Financial Position41 Statements of Cash Flows42 Notes to the Financial Statements87 Directors’ Declaration
88 Independent Audit Report89 Shareholder Information91 Glossary92 Corporate DirectoriesIBC Calendar of Events
Coca-Cola Amatil Limited ABN 26 004 139 397
Calendar of Events
2004 full year results announced Thursday, 10 February 2005
Ex-dividend date Tuesday, 15 February 2005
Record date for dividend entitlements Monday, 21 February 2005
2004 final ordinary dividend paid Friday, 1 April 2005
2005 Annual General Meeting Thursday, 19 May 2005
2005 half year results announced Wednesday, 10 August 2005
Ex-dividend date Monday, 22 August 2005
Record date for dividend entitlements Friday, 26 August 2005
2005 interim ordinary dividend paid Monday, 3 October 2005
Des
igne
d an
d pr
oduc
ed b
y Th
e Ba
ll G
roup
Mel
bour
ne a
nd S
ydne
y C
CA
0021
4/0
5
21151 COVER 13/4/05 10:52 AM Page 2

1
Australia New Zealand Papua New Guinea Fiji South Korea Indonesia
Annual Report 2004
In 2004, Coca-Cola Amatil (CCA) delivered another outstandingresult with its fourth consecutive year of double digit net profitgrowth. Over the past three years, CCA has consistently deliveredstrong earnings growth, significantly improved return on capitalemployed and has materially increased shareholder returns.The Company continues to act decisively in applyingits core competencies in responding to emergingconsumer trends. The entry into the ready-to-eatpackaged fruit and vegetables sector, through theacquisition of SPC Ardmona, positions CCA to benefitfrom the growing consumer demand for health andwellbeing food and beverages.
CCA has a long history of product and packageinnovations that have led Australian consumer trends.Such innovations include:
• the launch of ‘Mount Franklin’bottled spring waterin 1987 well ahead of the worldwide expansion ofbottled water consumption;
• the introduction in 1993 of the small resealable PETbottle, revolutionising out and about carbonatedsoft drink consumption; and
• the launch of the space saving ‘fridge mate’multi-can pack in 2001, which has since been adoptedworldwide by the Coca-Cola system.
Further, CCA remains committed to its goal to be theleader in non-alcoholic carbonated and non-carbonatedbeverages in each of its markets. Today, it is the clearmarket leader in carbonated beverages across each ofits six markets, with over 750,000 customers.
2004 ResultsIn 2004, CCA’s continued focus on improving customerservice and profitability, resulted in a full year net profit,before significant items, of $278.0 million, up 16.4% on 2003. After significant items, CCA recorded a 44.3%growth, with a net profit of $280.3 million.
Australia, with 14.4% EBIT growth, and Oceania,with 10% EBIT growth, continue to outperform due toimproved customer profitability from CCA’s ongoingcold drink cooler placements, innovative products,outlet expansion and strong growth in non-carbonatedbeverages.
Dear fellow investor
LETTER FROM THE CHAIRMAN
2
Australia New Zealand Papua New Guinea Fiji South Korea Indonesia
Coca-Cola Amatil
LETTER FROM THE CHAIRMAN
Combined with strong organic growth, 2004 was a yearof portfolio expansion with earnings accretive bolt-onacquisitions in Australia of Crusta Fruit Juice, Quirk’sRefrigeration and, in early 2005, Parmalat’s NorthernTerritory Coca-Cola Licence.
Indonesia recorded a pleasing and improved result,with 7.2% EBIT growth, in a challenging operatingenvironment and increased competitor pricing activity.However, South Korea reported disappointing 2004earnings with EBIT, before significant items, declining to$4 million from $14.2 million in 2003. Since mid 2004,CCA has made good progress in upgrading its Koreansales force capabilities and modernising sales execution,recognising that there was little improvement in SouthKorean consumer confidence in 2004.
Dividends CCA’s current dividend policy is a payout ratio of 70% to 80% of net profit, subject to the ongoing cash needsof the business. The 2004 total dividends per share of 28 cents were fully franked (as compared to a 75%franked final dividend and a 50% franked interimdividend in 2003).
Communication with ShareholdersOne of the Board’s key goals over the last three years has been the improvement of CCA’s communication with shareholders and to ensure corporate governancestandards are kept at best practice. CCA is committed tokeeping shareholders well informed and regularly seeksways of improving the flow of information from and toshareholders.
In 2004, the Board has sought to improve the quality of that communication through more direct access via:
• detailed contact lists and the web site (including asuggestion box for shareholders);
• prior collection of shareholder questions for theAnnual General Meeting; and
• identification of responsibilities for replying toshareholder enquiries.
Changes to DirectorsIn April 2004, the Board welcomed the return of GeoffreyKelly as a Non-Executive Director, he was previously aCCA Director between 1996 and 2001. Geoffrey iscurrently Senior Vice President and Chief Deputy GeneralCounsel of The Coca-Cola Company’s (TCCC) GlobalLegal Function and is a wonderful addition to the Board.
In February 2005, the Board welcomed former SPCArdmona Chairman David Meiklejohn as an IndependentNon-Executive Director. David was a former ChiefFinancial Officer for Amcor, is the Chairman of PaperlinX,and is a Director of ANZ and WMC Resources and bringsexcellent skills and experience to the CCA Board.
GeneralThe Board is pleased with the strengthening of therelationship between CCA and TCCC. TCCC holds 34%of the shares in CCA, and nominates two Non-ExecutiveDirectors of the current eight member Board. CCA’sRelated Party Committee, comprising the IndependentDirectors, reviewed all material transactions betweenCCA and TCCC in 2004 and is an important forum fordealing with governance issues.
The tragic events of the Boxing Day Tsunami will impactIndonesia for a long time to come, a country where yourCompany has over 8,500 employees, of which a numberregrettably lost family members in the disaster. The CCABoard has committed $1 million to the Coca-ColaIndonesia Foundation, an amount matched by TCCC,with funds being directed to rebuilding the region’shealth and educational infrastructure.
CCA strongly supports social and environmental activitiesthrough its community and environmental programs.These programs help to sustain business performance by strengthening the communities in which we operate,improving business efficiency and developing relationshipswith stakeholders, and ultimately leading to increasedshareholder returns.
In the 100th year of CCA’s inception, the Board thanksTerry Davis, his management team and CCA’s 17,000employees for their uncompromising commitment to customer satisfaction, producing another year ofoutstanding results that returned tangible value to allshareholders. The Board remains optimistic about thegrowth opportunities in 2005.
David Gonski, AO Chairman

3
Australia New Zealand Papua New Guinea Fiji South Korea Indonesia
Annual Report 2004
In 2004, CCA continued to expand both the size andvalue of the relationship we have with our customersand consumers. To grow our customers’ and CCA’sprofitability, we have focused on four key businessdrivers, being: profitable revenue generation; smartcost reduction; the disciplined use of capital; and mostimportantly, delivering levels of customer servicethat our competitors are unable to match profitably.
The actions begun in late 2001 following the review of ‘how we do business’have resultedin an immensely successful three years, during which CCA’s market capitalisationincreased by around $2 billion, dividends paid to shareholders have doubled and thefollowing results have been achieved:
• Net profit (ongoing business), before significant items, grew 62.5% representing a CAGR of 17.6%;
• Earnings per share (ongoing business), before significant items, grew by 56.1%representing a CAGR of 16.0%; and
• Return on capital employed has improved from 7.6% to 11.3%.
To continue this momentum, we shall continue to target the creation of a perfectlymerchandised beverage landscape in every outlet. This requires continued investment innew product development, cold drink cooler placements and non-carbonated beverageexpansion. The execution of these strategies shall allow us to expand the size and value of our relationship with both the customer and the consumer by providing the rightproduct in the right package, delivered through the right channel at the right price,for the right occasions.
PERFORMANCE REVIEW FROM THE MANAGING DIRECTOR
The commitment to making customersatisfaction our number one prioritycontinues to reap rewards for Coca-Cola Amatil. Terry Davis MANAGING DIRECTOR
4
Australia New Zealand Papua New Guinea Fiji South Korea Indonesia
Coca-Cola Amatil
2004 SummaryIn 2004, CCA delivered another year of double digit netprofit growth. Financial highlights for 2004 included:
• Net profit, before significant items, up 16.4% to$278.0 million;
• EBIT margin up 1 percentage point to 15.0%;
• Return on capital employed increased by 1.1percentage points to 11.3%;
• Earnings per share, before significant items, up 15.2%to 39.5 cents;
• Free trading cash flow was strong at $236.6 million;and
• Dividends per share increased 21.7% to 28 cents,100% franked.
The standout performance in 2004 was from Australia,which had an exceptional year, with a 14.4% profitabilityincrease, 1.1 percentage points margin increase, retailcustomer growth of 5% and 10 new products deliveredto market. Growth was driven by product innovation, asuccessful cold drink cooler placement program, outletexpansion and significant volume growth in non-carbonated beverages, resulting in strong double digitearnings growth.
To further expand our business, we continued to provideconsumers with more choice, with the launch ofinnovative products and brand extensions such as ‘dietCoke’with Lime,‘Recharge by Sprite’,‘Fanta’Spider and‘Mount Franklin Lightly Sparkling’.
With 20% of CCA’s sales now coming from non-carbonated beverages, water and sports drinks continueto deliver strong growth for CCA.
Oceania had a solid trading performance in 2004buoyed by significant growth in non-carbonatedbeverages. New Zealand again led the 10% EBITincrease of $8.2 million in the region.
Indonesia returned to growth this year (EBIT increaseof 7.2%, before significant items), despite continuing tooperate in a difficult consumer environment. CCAremains focused on balancing the need to provideaffordable products with the financial returns requiredto build a sustainable soft drink culture in this market.
South Korea continued to experience challengingconditions in 2004, with few signs of improved consumer
confidence. Following an operational review in May, theSouth Korean business has focused on strengtheningsales execution and marketing capabilities, with CCAand TCCC committed to additional marketing funds in2005 to drive sales momentum across the core brands.
AcquisitionsIn addition to the strong organic growth, CCA made anumber of acquisitions in 2004 that strengthened ourAustralian business. Over the past three years, CCA hasinvested $366 million on seven acquisitions (excludingSPC Ardmona) across Australia and New Zealand andreceived $330 million from non-core asset sales. This has been executed in parallel to a net profit after taxincrease of 62.5% and a marked improvement in totalshareholder returns.
Beverage acquisitions in 2004 included Crusta Fruit Juices,Quirk’s Refrigeration and finally in early 2005, Parmalat’sNorthern Territory Coca-Cola licence.
One of CCA’s key strengths is its ability to respond to changes in consumer trends. The addition of SPCArdmona provides CCA with entry to the ready-to-eatfruit and vegetable sector and the opportunity toaccelerate innovation in health and wellbeing productsacross SPC Ardmona’s leading brands of Goulburn Valley,SPC, Ardmona and IXL. By applying CCA’s strengths and leveraging our existing customer base, we believematerial value can be added to the SPC Ardmonabusiness over the next two to three years.
Serving Our Customers BetterOur highest priority continues to be serving ourcustomers better and thus, improving their and ourprofitability.
The automated distribution centre in Mentone,Victoriaopened in June 2004, improving customer service throughhigher levels of order accuracy, minimising out of stocksand generating annual cost savings of approximately $7 million. Based on the success of Mentone, the CCABoard shall consider the roll-out of automateddistribution facilities in both NSW and Auckland.
CCA has also centralised its Australian customer ordertaking, channelling orders and campaign managementthrough the National Contact Centre. New Zealand has also implemented a similar model, successfullymigrating over 90% of their customers by the end of 2004.
PERFORMANCE REVIEW FROM THE MANAGING DIRECTOR

5
Australia New Zealand Papua New Guinea Fiji South Korea Indonesia
Annual Report 2004
To improve customer profitability, we continued toinvest in cold drink coolers, with over 30,000 coolersdeployed this year at a cost of $75 million. CCA expectsto spend approximately $100 million in 2005 to continuethis successful cold drink cooler placement program.
CommunityIn 2004, staff from across our six geographic marketsjoined together to support Tsunami relief efforts inIndonesia, where CCA has substantial operations.Fortunately, none of our staff lost their lives in thetragedy, however, sadly, several lost family members for which our deepest sympathy goes out.
Immediately following the disaster, in partnership with TCCC, CCA applied our local capability to provideon-ground volunteers to aid efforts, and the supplyand distribution of trucks and water supplies. Reliefefforts included donating 27 vehicles to the IndonesianRed Cross and in partnership with Burger KingAustralia, supplying over one million bottles of waterand tea to Aceh. Across CCA’s geographic locations,the Company also supported locally based Tsunamifundraising events and matched staff donations.
We remain deeply committed to making a sustainabledifference in Indonesia, through both short term reliefefforts, and to the longer term challenge of rebuilding.
GeneralIn 2005, CCA will focus on the significant opportunitiesthat exist for product and package innovation throughour existing and newly acquired businesses. This meansdelivering further choice for customers by developing abroader range of beverages and ready-to-eat packagedfruit and vegetables for different consumption occasions. Share Price – Relative Performance
Note: CCA’s share price and the All Ordinaries Index have been indexedat 100 from 1 January 2000 to allow meaningful comparison.
2001 2002 2000 2003 2004 60
100
140
180
220
Coca-Cola AmatilAll Ordinaries Index
Coca-Cola Amatil Beverages Progress ReportSix countries (288 million potential consumers and 35 bottling plants).
2000 2004Active customers 500,000 750,000
Cold drink coolers 148,000 200,000
Stock keeping units 200 350
Non-Carbonated Beverages volume (share of total) 5% 20%
Employees (approximate) 17,000 17,000
Net profit, before significant items $148.7m $278.0m
Return on Capital Employed (ROCE) 7.3% 11.3%
Terry Davis Managing Director
Mexico US Germany Great Britan
200 litres
135 litres
75 litres
18 litres
Spain Australia NZ Japan Philip-pines
South Korea
Indonesia
Growing Per Capita Consumption – NARTDTo increase per capita consumption of non-alcoholic ready-to-drinkbeverages (NARTD), CCA seeks to create more consumption occasions– the right package, at the right price in the right channel for the right occasion.

6
Australia New Zealand Papua New Guinea Fiji South Korea Indonesia
Coca-Cola Amatil
FINANCIAL PERFORMANCE SUMMARY
100
200
300
400
500
600
$470
.0m
$421
.9m
$372
.3m
$354
.4m
$517
.6m
03 04020100
9.9%CAGR
4
6
8
10
12
7.6%
7.3%
8.8%
10.2
%
11.3
%
03 04020100
+4.0 pts
100
150
200
250
300
$171
.1m
$148
.7m
$205
.5m
$238
.8m
$278
.0m
03 04020100
16.9%CAGR
Net profit, before significantitems of $278.0 million, grewby 16.4% in 2004. Net profit,after significant items, was $280.3 million in 2004.
ROCE was 11.3% in 2004, animprovement of 1.1 percentagepoints over 2003.
EBIT, before significant itemsof $517.6 million grew by10.1% in 2004.
Net Profit after tax Return on Average CapitalEmployed (ROCE)
Earnings before Interestand Tax (EBIT)
Year ended 31 December
2004 2003 Change %
Revenue from Sales of Beverages ($ million) 3,449.6 3,357.1 2.8
Earnings before Interest and Tax, before Significant Items ($ million) 517.6 470.0 10.1
EBIT margin (%) 15.0 14.0 1.0 pt
Net Profit after tax, before Significant Items ($ million) 278.0 238.8 16.4
Net Profit after tax ($ million) 280.3 194.2 44.3
Free Cash Flow, before Significant Items ($ million) 236.6 260.1 (9.0)
Return on Average Capital Employed (%) 11.3 10.2 1.1 pts
Total Capital Employed ($ million) 4,651.0 4,501.2 3.3
Net Debt to Book Equity (%) 49.3 54.1 (4.8) pts
Capital Spend to Revenue (%) 5.5 4.8 0.7 pts
Earnings per Share, before Significant Items (cents) 39.5 34.3 15.2
Earnings per Share (cents) 39.8 27.9 42.7
Dividends per Share (cents) 28.0 23.0 21.7
5
10
15
20
25
30
23.0
c
14.0
c
12.0
c
18.5
c
28.0
c
03 04020100
23.6%CAGR
DPS of 28 cents grew by21.7% in 2004.
Dividends per Share(DPS)

7
Australia New Zealand Papua New Guinea Fiji South Korea Indonesia
Annual Report 2004
Compound Annual Growth Rate
2004 2003 2002 20011 2000 since 2000
Ongoing Business
Sales Volume – unit cases million 626.4 599.7 603.3 595.3 565.8 2.6%
Revenue from Sales of Beverages $ million 3,449.6 3,357.1 3,432.6 3,271.0 3,008.2 3.5%
EBIT* $ million 517.6 470.0 421.9 372.3 354.4 9.9%
EBIT Margin* % 15.0 14.0 12.3 11.4 11.8
Free Cash Flow* $ million 236.6 260.1 318.5 180.4 149.2
Capital Spend to Revenue % 5.5 4.8 2.8 4.7 5.4
Return on Average Capital Employed* % 11.3 10.2 8.8 7.6 7.3* before Significant Items
CCA Group
Net Profit – before Significant Items
– Ongoing Business $ million 278.0 238.8 205.5 171.1 148.7 16.9%
– Philippines $ million – – – 30.2 55.3
Net Profit – before Significant Items $ million 278.0 238.8 205.5 201.3 204.0
Significant Items (net of tax) $ million 2.3 (44.6) 4.0 246.5 –
Net Profit – CCA Shareholders $ million 280.3 194.2 209.5 447.8 204.0
Performance Ratios
EBIT Interest Cover* Times 4.7 4.1 3.2 3.0 2.9
Net Debt to Book Equity % 49.3 54.1 46.0 62.6 50.7
Net Debt to Funds Employed % 33.0 35.1 31.5 38.5 33.7* before Significant Items
Statement of Financial Position
Net Borrowings (net of cash assets) $ million 1,536.8 1,579.5 1,478.6 1,897.1 2,273.1
Total Shareholders’ Equity $ million 3,114.2 2,921.7 3,215.2 3,032.0 4,481.5
Total Capital Employed
– Ongoing Business $ million 4,651.0 4,501.2 4,693.8 4,929.1 4,857.7
– Philippines $ million – – – – 1,896.9
Total Capital Employed $ million 4,651.0 4,501.2 4,693.8 4,929.1 6,754.6
Ordinary Share Information
Earnings per Share, before Significant Items cents 39.5 34.3 29.8 25.3 19.7 19.0%
Earnings per Share cents 39.8 27.9 30.4 56.2 19.7
Dividends per Share cents 28.0 23.0 18.5 14.0 12.0 23.6%
Level of Franking – Final % 100 75 50 50 42– Interim % 100 50 50 50 42
Capital Return cents – – – 40.0 –
1 The Philippines operation was sold effective 27 April 2001, resulting in cancellation of $1,773.1 million of contributed equity and a gain on sale of $246.5m after tax.
FIVE YEAR FINANCIAL PERFORMANCE SUMMARY

8
Australia New Zealand Papua New Guinea Fiji South Korea Indonesia
Coca-Cola Amatil
Model Market:Driving consumption in high traffic areasthrough unique merchandising andexpansion of cold drink coolers.In South Korea, the early outcome fromthe ‘model market’ program has been a 10%-15% lift in volume per outlet.
Lower cost coolersdeveloped for South
Korean market
CCA is committed to growing per capita consumptionof its core carbonated and non-carbonated beverages.
This key objective is being achieved through ProductInnovation, Cold Drink Cooler Placement, OutletExpansion, Non-Carbonated Beverages Expansion andCustomer Service Improvement.
ProductInnovation18 new products and 14 new packages launchedin 2004.
Customising coolers for ourcustomer’s needs. Silver retrocoolers for the Hotel, Restaurantand Café (HORECA) channel
$75 million spent in2004. Further $100million expected in 2005.Acquisition of Quirk’s Refrigeration,the market leader in the rental andservice of commercial refrigerationin Australia, allows CCA to stepchange its cold drink equipmentservice capability.
‘Mount Franklin Lightly Sparkling’introduced in Australia inJune 2004. 4,500 customersalready stock this premiumAustralian spring water.
‘Diet Coke’ has grown byapproximately 8% per annumfor the last three years, helpedby the successful introductionof range extensions like ‘diet Coke’ with Lime and ‘diet Coke’ with Vanilla.
New ‘Powerade’ bottleintroduced in the
South Korean market in March 2004
Cold DrinkCoolerPlacement
200,000 coolersin Australia, New Zealand & South Korea
A commitment toinnovation

CCA has converted 80% of its Australianorder taking from the physical salesrepresentative to a national call centre.The cost of taking an order has reducedfrom $25 to $5 and customer service levels have improved.New Zealand successfully converted almost90% of order taking to a national call centrein October 2004.CCA’s upgrading of its telesales capabilitieswill be completed with South Korea expected to convert order taking by late2005/early 2006.
Automated Warehouse The pilot automated warehouse in Victoria,opened in June 2004, was completed at anapproximate cost of $30 million and isdelivering $7 million in annualised savings.…and CCA has improved its service levels by:• reducing the turnaround time for trucks
by half to approximately 15 minutes; and• increasing the pick accuracy of customers
orders from 96% to 99.5%.Similar facilities in Sydney and Auckland arecurrently being assessed with completionexpected in 2008.
9
Australia New Zealand Papua New Guinea Fiji South Korea Indonesia
Annual Report 2004
Non-Carbonated Beverages Expansion20% of revenue, up from 5% in 2000.
Outlet Expansion750,000 active customers in 2004(vs 500,000 in 2000).
Customer Service ImprovementIncreasing the spend on customer application systemsfrom 17% of IT cost in 2004 to 25% by 2006.
JuiceNew Zealand – in two years,CCA has built the ‘Keri’ juicebrand to market leadership infresh juice in the supermarketchannel.
Australia – Crusta Fruit Juicesacquired in November 2004,gives CCA access to fruit juiceexpertise and cold chaindistribution.
Sports and Energy Drinks CCA share of the sports drinkcategory is more than 50% in both Australia and New Zealand. Sports drinkshave grown at strong doubledigit levels in the last few years.
‘e2’, energy drink with fruit,has reinvigorated the categoryin New Zealand
Targeting non-traditional outlets has delivered strong growth ratesin new customers in Australia (+5%) and New Zealand (+10%):• Pharmacies• Bakeries• Butchers
In 2004, substantial gains have been made in Indonesia andSouth Korea to improve our direct servicing of customersand increase customer numbers.
After a 15% and 30% increase in customer numbers inIndonesia and South Korea, respectively, at the end of 2004CCA still only directly service 30% and 20% of the totaluniverse of outlets.
• Fruit & Vegetable Shops• Florists
WaterCCA’s share of the Australianwater segment increased from15% to 35% in the last 18months. Per capita consumptioncontinues to grow very stronglyand CCA has the top 3 waterbrands in Australia, by value,with,‘Mount Franklin’, themarket leader,‘pump’ and‘Neverfail’.

10
Australia New Zealand Papua New Guinea Fiji South Korea Indonesia
Coca-Cola Amatil
CSD ‘Coca-Cola’, ‘Coke Light’,‘Fanta’, ‘Kin’Water ‘SoonSoo100’Juice ‘Qoo’Sport ‘Powerade’Other ‘Nescafe’
CSD ‘Coca-Cola’, ‘Vanilla Coke’,‘diet Coke’, ‘diet Coke’ with Vanilla,‘diet Coke’ with Lime,‘Sprite’,‘Fanta’, ‘Lift’, ‘Schweppes’, ‘L&P’Water ‘Pump’,‘Kiwi Blue’Juice ‘Keri’Sport ‘Powerade’Other ‘e2’, ‘Lift plus’
Operations Leading Brands
CSD ‘Coca-Cola’, ‘Sprite’,‘Fanta’RTD Tea ‘Frestea’
Australia
Indonesia
Oceania
Potential consumers: 209 millionNo. of customers: 400,000 No. of plants: 10No. of employees: 8,500
2004
Revenue: $343.5mEBIT: $17.4mSegment net assets: $276m
Potential consumers: 49 millionNo. of customers: 100,000 No. of plants: 3No. of employees: 2,580
2004
Revenue: $561.5mEBIT: $10.7mSegment net assets: $785m
Papua New New
Zealand Guinea Fiji
Potential consumers: 4m 5m 1mNo. of customers: 20,000 5,000 3,000No. of plants: 5 1 1No. of employees: 1,100 480 320
2004
Revenue: $503.5mEBIT: $90.5mSegment net assets: $586m
Potential consumers: 20 millionNo. of customers: 230,000 (incl. Neverfail)No. of plants: 15No. of employees: 3,780
2004
Revenue: $2,041.1mEBIT: $431.9mSegment net assets: $3,197m
South Korea
COCA-COLA AMATIL at a glance
CSD ‘Coca-Cola’, ‘Vanilla Coke’,‘diet Coke’, ‘diet Coke’ with Vanilla,‘diet Coke’ with Lime,‘Sprite’,‘Lift’, ‘Fanta’,Water ‘Mount Franklin’, ‘MountFranklin Lightly Sparkling’,‘pump’,‘Neverfail’, ‘Peats Ridge’,‘Deep Spring’Juice ‘Fruitopia’, ‘Crusta’Sport ‘Powerade’Other ‘Recharge by Sprite’, ‘Nestea’

11
Australia New Zealand Papua New Guinea Fiji South Korea Indonesia
Annual Report 2004
CCA’s CSD/NCB Split*
South Korea• CCA’s market share (approx.):
CSD: 45%; Sports: 20%; Water: 10%
• ‘Coca-Cola’ – no.1 sellingNARTD brand.
Key Facts CCA’s 2004 Package and Channel Mix
20%8%
92% 80%
2000 2004
Non-Carbonated Beverages (NCB)
Carbonated Soft Drinks (CSD)
(figures for New Zealand only)
5%
95%
27%
73%
2000 2004
8%
92%
18%
82%
2000 2004
19%
81%96%
4%
2000 2004
Packages (unit case) Channels (unit case)
PET Cans Fountain Other Super-market
C&Lincl Nev
Other0
10
20
30
40
50
60
0
10
20
30
40
50
Packages (unit case) Channels (unit case)
PET Cans Fountain Other Super-market
C&L Other0
10
20
30
40
50
60
70
80
0
10
20
30
40
50
60
Packages (unit case) Channels (unit case)
PET Cans RGB Other Super-market
Whole-saler
Other0
10
20
30
40
50
60
0
10
20
30
40
50
Packages (unit case) Channels (unit case)
PET Cans RGB Other Modern Traditional0
10
20
30
40
50
60
70
80
0
20
40
60
80
* by volume
Indonesia• CCA’s market share (approx.):
CSD: 90%; RTD tea: 15%• ‘Fanta’ – no.1 selling
CSD brand.• ‘Frestea’ – no.2 selling
ready-to-drink tea.
New Zealand• CCA’s market share (approx.):
CSD: 80%; Sports: 80%; Water: 45%; Juice: 35%
• ‘Coca-Cola’ – no. 1 selling NARTD brand.
• CCA sells the no.1 water brand,‘pump’.
• ‘Keri’ is the no.1 fresh juice brandin the supermarket channel.
Australia• CCA’s market share (approx.):
CSD: 60%; Sports: 50%; Water: 35%; Juice: 3%
• ‘Coca-Cola’ – no.1 selling NARTD brand.
• ‘Diet Coke’ – no.2 selling CSD brand.
• CCA sells the top 3 water brands,by value.

12
Australia New Zealand Papua New Guinea Fiji South Korea Indonesia
Coca-Cola Amatil
Key Drivers
• The Australian business achieved outstanding EBITgrowth and strong revenue growth whilst continuingto grow margins. The results can be directly attributedto consistent execution of the key business drivers ofproduct innovation, non-carbonated beveragesexpansion, cold drink equipment placement and newoutlet expansion.
– Carbonated soft drink (CSD) brands deliveredsolid revenue growth led by diet CSDs, with ‘dietCoke’ achieving 10% growth;
– Non-carbonated beverages (NCB) achieved strong revenue growth and now account forapproximately 20% of Australia’s revenue. Doubledigit growth in water (‘Mount Franklin’, ‘pump’,‘Peats Ridge’) led NCB growth, supported by sportsdrinks (‘Powerade’) and ready-to-drink tea(‘Nestea’); and
– Revenue case growth of 2.4% (excludingNeverfail) reflects flat pricing in supermarkets and over 4% growth in the cold drink channels.
• Product innovation continues to drive consumption,with the launch of brand extensions (eg.‘diet Coke’with Lime), new brands (eg.‘Recharge by Sprite’,‘Fanta Lite’) and rotational brands (eg.‘Fanta’Spider). ‘Mount Franklin Lightly Sparkling’,launched June 2004, is progressing well,benefiting from the $8 million increase in customermarketing spend in 2004.
• CCA acquired Crusta Fruit Juice and Quirk’sRefrigeration in November 2004 for a combined costof $45 million and these two businesses contributed$0.8 million to EBIT in the year. Crusta is a small juicebusiness and provides CCA with expertise inpremium juice, an efficient cold chain distributionnetwork and a manufacturing facility. Quirksspecialises in the rental and service of refrigerationequipment to major food and beveragemanufacturers and complements CCA’s existing in-house cold drink and vending service operation.
• Cold drink cooler placements continue to be a key driver of growth in the convenience and leisurechannel. In 2004, there was a 10% net increase incoolers bringing the total to approximately 115,000CCA coolers (1 door equivalents) in the Australianmarket.
• Retail customers increased, in net terms, by over 5%, achieving growth through ranging products in non-traditional outlets and through the Hotel,Restaurant and Café channel. CCA directly servicesover 100,000 outlets.
• Neverfail recorded an EBIT of $20 million in 2004 (EBIT margin of almost 28%), increasing customernumbers by 16% to approximately 130,000.
• Capital expenditure,at 6.3% of revenue, included the continuation of cold drink cooler placements(approximately $50 million spend in 2004), a new highspeed bottled water production line in Queenslandand completion of the automated materials handlingwarehouse in Victoria.
Australia
2004 2003 Change
Revenue from Sales of Beverages ($ million) 2,041.1 1,882.9 8.4%
Revenue per unit case ($) 6.32 6.25 1.1%
Revenue per unit case, excluding Neverfail ($) 6.47 6.32 2.4%
Sales Volume (million unit cases) 322.9 301.2 7.2%
Sales Volume, excluding Neverfail (million unit cases) 304.5 292.8 4.0%
EBIT ($ million) 431.9 377.7 14.4%
EBIT Margin (%) 21.2 20.1 1.1pts
Capital Spend to Revenue (%) 6.3 5.2
59% of CCA’s revenues, 77% of CCA’s EBIT and 65% of CCA’s capital employed.
Key Drivers
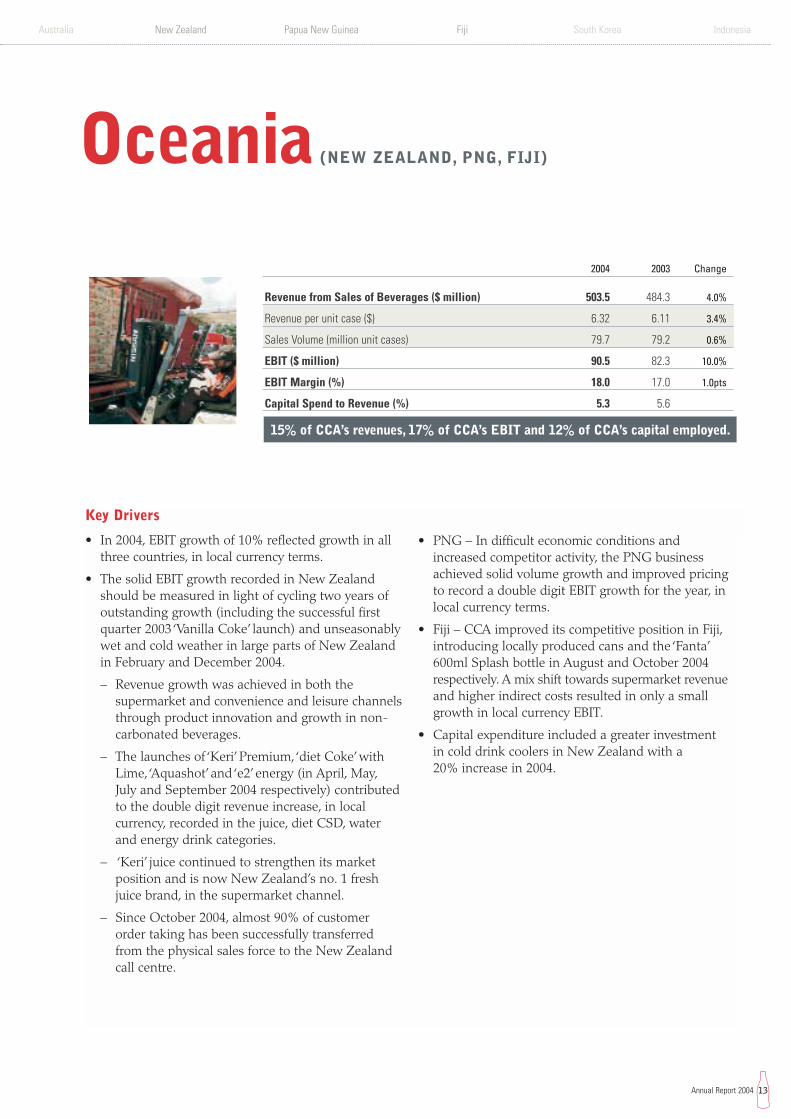
• In 2004, EBIT growth of 10% reflected growth in allthree countries, in local currency terms.
• The solid EBIT growth recorded in New Zealandshould be measured in light of cycling two years ofoutstanding growth (including the successful firstquarter 2003 ‘Vanilla Coke’ launch) and unseasonablywet and cold weather in large parts of New Zealandin February and December 2004.
– Revenue growth was achieved in both thesupermarket and convenience and leisure channelsthrough product innovation and growth in non-carbonated beverages.
– The launches of ‘Keri’ Premium,‘diet Coke’ withLime,‘Aquashot’ and ‘e2’ energy (in April, May,July and September 2004 respectively) contributedto the double digit revenue increase, in localcurrency, recorded in the juice, diet CSD, waterand energy drink categories.
– ‘Keri’ juice continued to strengthen its marketposition and is now New Zealand’s no. 1 freshjuice brand, in the supermarket channel.
– Since October 2004, almost 90% of customerorder taking has been successfully transferredfrom the physical sales force to the New Zealandcall centre.
• PNG – In difficult economic conditions andincreased competitor activity, the PNG businessachieved solid volume growth and improved pricingto record a double digit EBIT growth for the year, inlocal currency terms.
• Fiji – CCA improved its competitive position in Fiji,introducing locally produced cans and the ‘Fanta’600ml Splash bottle in August and October 2004respectively. A mix shift towards supermarket revenueand higher indirect costs resulted in only a smallgrowth in local currency EBIT.
• Capital expenditure included a greater investment in cold drink coolers in New Zealand with a 20% increase in 2004.
13
Australia New Zealand Papua New Guinea Fiji South Korea Indonesia
Annual Report 2004
Oceania (NEW ZEALAND, PNG, FIJI)
2004 2003 Change
Revenue from Sales of Beverages ($ million) 503.5 484.3 4.0%
Revenue per unit case ($) 6.32 6.11 3.4%
Sales Volume (million unit cases) 79.7 79.2 0.6%
EBIT ($ million) 90.5 82.3 10.0%
EBIT Margin (%) 18.0 17.0 1.0pts
Capital Spend to Revenue (%) 5.3 5.6
15% of CCA’s revenues, 17% of CCA’s EBIT and 12% of CCA’s capital employed.

14
Australia New Zealand Papua New Guinea Fiji South Korea Indonesia
Coca-Cola Amatil
South Korea
2004 2003 Change
Revenue from Sales of Beverages ($ million) 561.5 612.5 (8.3)%
Revenue per unit case ($) 4.58 5.03 (8.9)%
Sales Volume (million unit cases) 122.7 121.7 0.8%
EBIT, before Significant Items ($ million) 4.0 14.2 (71.8)%
EBIT Margin, before Significant Items (%) 0.7 2.3 (1.6)pts
EBIT ($ million) 10.7 14.2 (24.6)%
Capital Spend to Revenue (%) 4.8 3.9
Key Drivers
• Trading in South Korea remained impacted by thedecline in consumer confidence, resulting in adecreased EBIT compared to 2003.
– Revenue per case declined principally due to theimpact of currency translation. Local currencypricing improved on the majority of packagesacross all major brands, however a shift in CCA’svolume towards the lower priced ‘SoonSoo 100’(mineral water) and ‘Kin’ (lemonade) offset theimproved pricing.
– Higher labour costs and labour on-costs associatedwith restructuring of the business also contributedto the EBIT decline.
• Responding to the difficult market conditions, CCAundertook a strategic review of the South Koreanbusiness in May 2004, identifying the need to stepchange three key areas:
– sales force capabilities;
– sales execution; and
– brand marketing investment and execution.
• CCA has begun to upgrade sales force capabilitiesand modernise sales execution practices and TCCChas committed to increase advertising spend on brand‘Coca-Cola’. Early restructuring results have beenencouraging, with actions already undertakenarresting the decline in volume experienced in 2003.In outlets where modern merchandising standardshave been applied, good volume growth is beingrecorded, albeit from a low base.
• To drive consumption in high traffic areas, a numberof areas across South Korea were converted to ‘modelmarkets’, gaining outlet acceptance of new salesexecution and in-store merchandising standards. The‘model market’ concept, successfully adopted fromAustralia, has resulted in a 10% to 15% lift involume per outlet, underpinned by the rollout of over 15,000 coolers.
• CCA increased the number of outlets it directlyservices by over 30,000 in 2004. This brings the totaloutlets CCA directly services to just 20% of theSouth Korean market, leaving a tremendous growthopportunity.
• The significant gain of $6.7 million in South Korearepresents profit on sale of a surplus property ($35.2million gain), partly offset by the rationalisation ofnon-profitable cold drink equipment ($23.6 millionwritedown) and an increase in deposit liability forreturnable crates ($4.9 million).
• A number of senior management changes have alsobeen made at both CCA and TCCC to strengthen the sales and marketing functions in South Korea.
• Higher capital expenditure in 2004 principally reflectsthe investment in the ‘model market’program, motorvehicle purchases and a replacement warehouse inSeoul.
16% of CCA’s revenues, 1% of CCA’s EBIT and 17% of CCA’s capital employed.

15
Australia New Zealand Papua New Guinea Fiji South Korea Indonesia
Annual Report 2004
Indonesia
Key Drivers
• Benefiting from greater stability in the key economicconditions, Indonesia returned to growth in 2004,increasing EBIT and improving EBIT margin.
• Indonesia is continuing to experience a variableconsumer environment, with the main competitorbecoming more aggressive on pricing. CCA remainsfocused on balancing the need for affordability ofour brands with the financial returns required todevelop a soft drink culture within Indonesia.
• EBIT growth resumed in 2004 due to improvedpricing and leveraging of higher volume on the fixedcost base.
– Revenue, in local currency terms, increased by over 7% and CSD revenue grew by nearly 5%, inlocal currency terms, led by ‘Coca-Cola’and ‘Fanta’.
– Volume grew 3.6% from both modern andtraditional channels, at the expense of the lower margin wholesalers (this channel declinedby 6.9%).‘Frestea’ continued its success growing at strong double digit levels, with RTD tea nowrepresenting over 12% of Indonesia’s volume.
– Revenue per case declined due to the impact ofcurrency translation, however in local currencyrevenue per case grew by 3.9%. The growth reflectsthe benefit of prior period price increases and amix shift towards 1.5L PET and 250ml cans, offsetin part by the high mix of ‘Frestea’which has lowerrevenue per case than carbonated soft drinks.
• A trial of lighter small returnable glass bottles, begunin April 2004, has been a success with consumersand customers. The new bottles, using significantlyless glass and having approximately one third lowercost, will have a sizeable financial benefit when fullyintroduced throughout Indonesia over the next five years.
• In 2004, the CCA Group rationalised returnablecontainers, resulting in a significant loss of $6.3million in Indonesia.
• In December 2004, the new Indonesian governmentlegislated to abolish the 10% luxury goods tax onCSDs, with its removal expected to materially benefittrading performance in 2005.
• The devastation caused by the Boxing Day Tsunamihas led to a sombre mood throughout Indonesia. Itis too early to determine the impact on consumptionor what positive economic impact will arise from theinternational donations that have been pledged torebuild infrastructure in the devastated areas.
10% of CCA’s revenues, 5% of CCA’s EBIT and 6% of CCA’s capital employed.
2004 2003 Change
Revenue from Sales of Beverages ($ million) 343.5 377.4 (9.0)%
Revenue per unit case ($) 3.40 3.87 (12.1)%
Sales Volume (million unit cases) 101.1 97.6 3.6%
EBIT, before Significant Items ($ million) 23.7 22.1 7.2%
EBIT Margin, before Significant Items (%) 6.9 5.9 1.0pt
EBIT ($ million) 17.4 22.1 (21.3)%
Capital Spend to Revenue (%) 2.0 3.3

16
Australia New Zealand Papua New Guinea Fiji South Korea Indonesia
Coca-Cola Amatil
SPCArdmona ACQUISITION
The acquisition of SPC Ardmona, approved by its shareholders on 3 February 2005,is an exciting development for CCA.More and more, consumers are seeking a balance between health and wellbeing andrefreshment, while retailers are looking for suppliers with strong consumer brands,category management expertise and leading supply chain practices.
CCA, as a predominantly Australian business, has a proven ability of acting on its consumer insights to provide customers, and the consumer, with:
– leading premium brands– product and package innovation– leading supply chain practices– key customer relationship management
By applying these strengths to the SPC Ardmona business, CCA can create additional value for the expanded CCA Group.

The SPC Ardmona business provides CCA with substantial future growth opportunities through adopting anumber of the strategies so successful in CCA’s beverage business, being acceleration of product and packageinnovation and expanding product availability across the common customer base. Additionally, modernisationof SPC Ardmona’s manufacturing infrastructure will reduce operating costs and improve the quality andreliability of product supply to key customers.
CCA shall undertake a detailed strategic review in the three months after the acquisition to identify immediateopportunities and synergies, as well as determine the longer term direction of the business. SPC Ardmonawill operate as a separate business unit within CCA and this acquisition is a very important step for CCA tobroaden its revenue base. When the strategic review is completed CCA will update shareholders.
17
Australia New Zealand Papua New Guinea Fiji South Korea Indonesia
Annual Report 2004
SNAPSHOT OF SPC ARDMONA
Manufacturing plants . . . . . . . . . . . . . . . . . . . . . . . . . . . .3Countries (where its products are sold) . . . . . . .50Stock keeping units . . . . . . . . . . . . . . . . . . . . . . . . .1,900Employees (full time) . . . . . . . . . . . . . . . . . . . . . . . . .800
Split of revenue
60% Packaged Fruit
12% Henry Jones Spreads
11% Tinned Tomatoes
9% Baked Beans and Spaghetti
8% other
PACKAGED FRUITMARKET LEADER
BAKED BEANS ANDSPAGHETTI
LEADING BRAND PORTFOLIO
IXL SPREADS; TAYLORSSAUCES AND MARINADESMARKET LEADER IN SPREADS
TINNED TOMATOESMARKET LEADER

18
Australia New Zealand Papua New Guinea Fiji South Korea Indonesia
Coca-Cola Amatil
CCA’s CORPORATE SOCIAL RESPONSIBILITIES
CCA operates in a wide range of communitiesacross its six markets. In each of these markets,CCA is a local business tied to the local communitythrough employees, customers, consumers, andneighbours and through government andcommunity groups.As a business, CCA supports local economies through:
• providing direct employment to the region andensuring employees have the opportunity to developin a safe workplace;
• using local materials and suppliers wherever practicalto aid the development of that country; and
• providing a profitable consumer product that assistsour customers businesses to grow.
Supporting social and environmental activities is firmlyentrenched in CCA’s business plans. It is the creation of profits that enables CCA to expand our communityand environmental programs. In turn, these programshelp to sustain business performance by strengtheningthe communities, improving business efficiency anddeveloping relationships with stakeholders, ultimatelyleading to increased shareholder returns.
Our PeopleOur philosophy is centred on creating a safe environmentwhere our people can enjoy interesting and challengingwork and are acknowledged for their contribution. We
seek people who can actively challenge the process,seek new and innovative ways to contribute to ourprogress and are committed to developing themselvesprofessionally.
Above all, we believe that it is our people’s ability topassionately provide an uncompromising commitment to customer satisfaction that will drive our future success.
In 2004, CCA significantly strengthened its managementcapability across the group through recruitment of a number of experienced senior managers and themovement of current employees between countries to share best practice in sales and customer service.
The Company recognises the need to continue this processand has implemented a formal organisational capabilityreview to identify and encourage talented individuals andto ensure succession planning.This process has highlightedthe opportunity available from increasing the diversity ofCCA’s workforce with a particular emphasis on attractingand developing female managers.
CCA is committed to providing and maintaining a safeand healthy workplace for all employees, suppliers,contractors and visitors. We acknowledge thatOccupational Health and Safety (OH&S) is theresponsibility of management and each employee andrecognise the importance of leading and promoting thehighest principles and practices to ensure health andsafety across our operations.
OUR VALUES:
Customer: commitment to each of ourcustomer’s success
Urgency: urgency to act and take responsibility
People: developing people and rewardingperformance
Innovation: always looking for a better way
Pride: our pride in doing our best every time.
THE ACTIVE FACTORIan Rush Soccer School in Australia
THE ‘MISSION ACTIVE FACTOR’yacht that CCA, in partnership with TCCC used to promote recycling
and active lifestyles, culminating in the 2004 Sydney to Hobart yacht race.

19
Australia New Zealand Papua New Guinea Fiji South Korea Indonesia
Annual Report 2004
CCA has a key belief that all injuries are preventable.
The CCA Occupational Health and Safety ManagementSystem is an integrated management system that isconstantly evolving. The systems are modelled on a ‘best practice’ approach where all OH&S legislativerequirements are considered and the national CCAstandard is based on the most stringent level. Each countryof operation now has a designated OH&S representativeresponsible for planning and reporting on OH&Sperformance to the Board each quarter.
In 2004, Australia and South Korea both recordedreductions in days lost through injury – Australiaachieving a 39% reduction on 2003.
Our CommunityCCA supports ongoing community programs across itssix geographic locations, intensifying community supportlevels in times of great and specific need.
CCA Indonesia swiftly responded to the devastation ofthe 2004 Boxing Day Tsunami, utilising its local resourcesto supply trucks, basic medical supplies, blankets andbottled water to the local Indonesian community,particularly to the worst affected area of Aceh. Acrosseach of our country operations, CCA has assisted local community groups in Tsunami fundraising and aid missions.
TCCC has committed US$10 million to affected areasacross Asia, with a minimum of US$2 million directed to Indonesia. These funds enabled the donation of 27vehicles to the Indonesian Red Cross, including fiveambulances. In addition to the regional donation, CCAand TCCC will commit a further A$2 million over twoyears through The Coca-Cola Foundation Indonesia,to support the construction of education, social andeconomic infrastructure in Aceh.
CCA and TCCC have established Foundations inIndonesia, Australia and South Korea to support localcommunity programs.
The Foundations help develop young people. In additionto programs in the areas of literacy, parenting, the artsand community welfare, CCA supports programs toencourage young people to be physically active.
The Coca-Cola Korea Youth Foundation launched ‘theactive factor’ program across schools in South Korea inrecognition of the declining level of physical activityamong youth. Over 100,000 students participated in the extra curricular program utilising school facilities and physical education teachers.
The Coca-Cola Australian Foundation supportedprograms such as Australian Little Athletics ‘Jump Start’and Royal Life Savings ‘Swim & Survive’.
THE FIJI COCA-COLA GAMESare the country’s largest sporting event exposing many athletes who
go on to win national and international competitions.
INDONESIANCCA employees distributing water to
Tsunami affected region of Aceh.

20
Australia New Zealand Papua New Guinea Fiji South Korea Indonesia
Coca-Cola Amatil
CCA’s CORPORATE SOCIAL RESPONSIBILITIES
Across Oceania in 2004, New Zealand, PNG and Fijicontinued to support the advancement of young peoplein their communities.
In New Zealand, CCA partnered with the National HeartFoundation’s Jump Rope for Heart program through NewZealand’s no. 1 water brand – ‘pump’. Jump Rope forHeart uses skipping to teach children the importance of exercise, coupled with education on the importance of hydration.
In PNG, CCA has a close relationship with the Papua New Guinean Sports Commission, proudly sponsoringthe first PNG Sporting Calendar in 2004.This was inaddition to developing PNG's future sports stars throughthe support of SCRUM Puk-Puk Rugby, a program forchildren aged 6-14.
In Fiji, CCA continued a 26 year tradition supportingFiji’s largest annual sporting event, The Coca-ColaGames. The Games have launched the careers of manyyoung and promising athletes, progressing through toregional and international level competition.
The support of activities to encourage physical activity is part of CCA’s overall approach to addressing theobesity issue.
This approach is based on:
• providing a range of beverages varied in calorificcontent and educating children and parents onachieving balance through choice;
• undertaking responsible marketing practices andpromoting physical activity. In 2004, CCA voluntarilywithdrew the sale of full calorie carbonated soft drinksin Australian and New Zealand primary schools; and
• encouraging children to become more active throughsport and physical activity.
In 2004, Community Award programs were establishedin Australia and New Zealand to recognise communitycontribution to youth activity and the environment. TheAwards were driven through ‘Mission Active Factor’, ajoint initiative of CCA and TCCC focused on promotingactive lifestyles and encouraging community members topreserve the environment through public place recycling.
In Australia, the Winner of the Coca-Cola CommunityAward for Youth Activity sailed on board the yacht ‘theactive factor’ in the 2004 Sydney to Hobart Yacht Race. Tofurther encourage public place recycling and the use ofPET as a perpetual resource, the mainsail and yankeesail on the yacht were made from 30% recycled PET,with the recyclable component by weight of the entiresails being approximately 70%.
Our EnvironmentCCA’s environmental management system is based on ISO14001 standards and records data on a site-by-site basis.
PUBLIC PLACE RECYCLINGCCA’s first public place recycling site was officially launched
in December at Sydney’s First Fleet Park, one of Sydney’sbusiest public places.
South KoreaCCA employees
clearing litter froma river bank
CCA’s recycling logo developed to promotepublic place recycling
21
Australia New Zealand Papua New Guinea Fiji South Korea Indonesia
Annual Report 2004
CCA is committed to understanding and minimising any adverse environmental impacts of our beveragemanufacturing activities, recognising the key areas ofimpact are water and energy use and post consumer waste.
Water and energy usageCCA's water policy is to ensure the sustainability of ourwater sources and reduce the amount of water usedduring the production process.
CCA measures its water and energy usage by theamount used in production and sanitation to produceone litre of finished beverage.
In Australia, water usage per finished beverage litredecreased by 2.7% in 2004.
This was achieved through a number of water savinginitiatives, reducing water usage by some 1.5 million litresper week. Sydney Water recognised the CCA NSWoperation as best practice in their ‘Every Drop Counts’program.
In 2004, the Minister for Energy in New Zealandcommended CCA’s Auckland plant for an energy-savinginitiative that saves the equivalent of running an averagesized family home for over 24 years.
The need for public place recyclingCCA recognises that as a manufacturer of fast-movingconsumer goods, we have a role to play in reducing the environmental impact of our packaging. CCA’smethodology for addressing this issue differs across
our geographic locations due to differences in packaging,reprocessing and collection facilities.
In Australia and New Zealand CCA is a signatory toNational Packaging Covenants. Under these covenants,CCA is committed to playing its part to improve resourceefficiency and recover and reduce litter.
In 2004, CCA Australia commenced a five-year strategyworking with customers, local government and authoritiesto increase the recovery of packaging consumed awayfrom the home. In December, the first major CCA publicplace recycling initiative was officially launched by theNSW Department of Environment, in partnership withVISY and the Sydney Harbour Foreshore Authority.In 2005, CCA Australia will continue to further driverecycling initiatives.
In New Zealand, CCA established the first ever actiongroup to address ‘the reduce, reuse and recycle’ targets of the 2004 New Zealand Packaging Accord. The actiongroup is developing and implementing a public educationand information program around kerbside, event and ‘out and about’ recycling, with the aim of increasing therecyclables collection rate.
Since 1999, in the absence of a local recycling facility,CCA Fiji has been buying back empty PET bottles forrecycling as part of our Mission Pacific program. Overthis period, an estimated 35 million PET bottles havebeen shipped to Australia for recycling into new bottles.
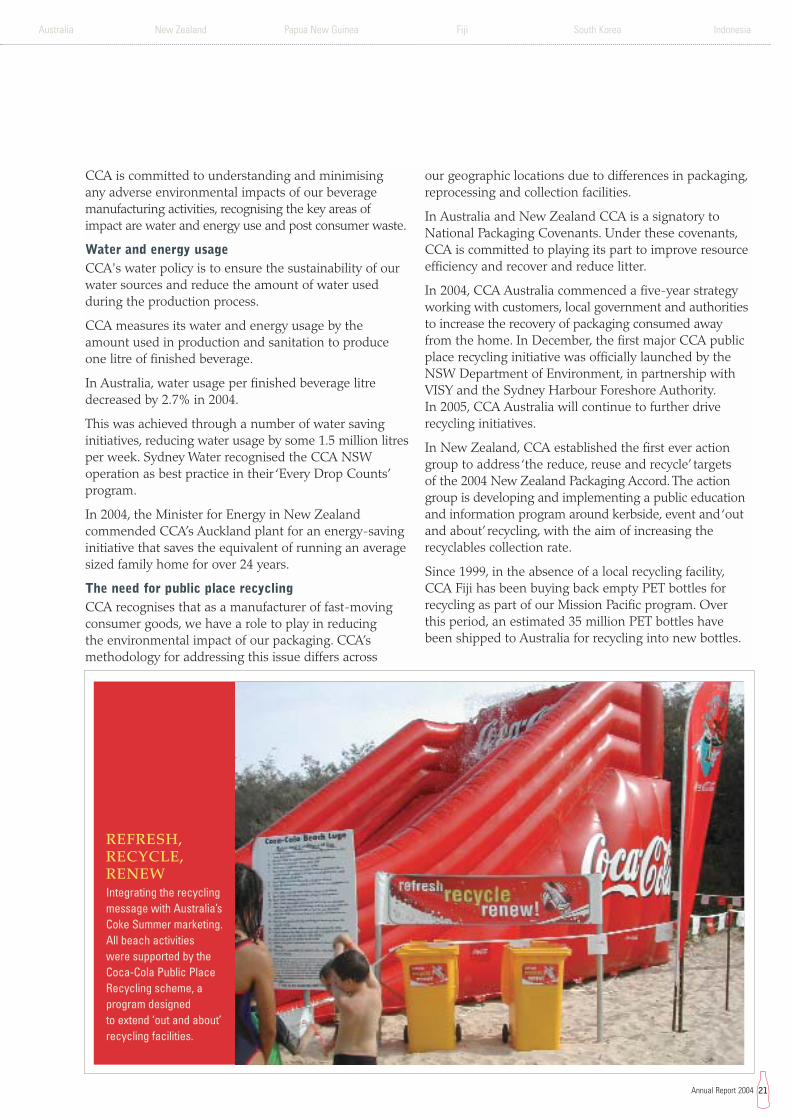
REFRESH,RECYCLE,RENEWIntegrating the recyclingmessage with Australia’sCoke Summer marketing.All beach activities were supported by theCoca-Cola Public PlaceRecycling scheme, aprogram designed to extend ‘out and about’recycling facilities.

22
Australia New Zealand Papua New Guinea Fiji South Korea Indonesia
Coca-Cola AmatilCoca-Cola Amatil
BOARD OF DIRECTORS
SENIOR MANAGEMENT
1 2 3
1.
4 5
1. John WartigChief Financial Officer, Age 48Appointed Chief Financial Officer in June 2004Mr John Wartig was previously Senior VicePresident Finance for Cadbury SchweppesAmericas Beverages (a US$3 billion annualoperating revenue division of CadburySchweppes plc). Prior financial roles withinCadbury Schweppes included Finance Director– Operations, with global responsibilities acrossthe total Beverages and Confectionery groupand Senior Vice President Finance – AsiaPacific Beverages.
The Board has the ultimate responsibility for managing Coca-Cola Amatil’s business and affairs to the highest standards of corporate governance and business conduct.
David M Gonski, AOChairman (Independent) – Age 51Joined the Board in October 1997 Chairman of Related Party Committee,member of Compensation Committee.Background: Solicitor for 10 years withthe law firm of Freehills and thereafter acorporate adviser in the firm of WentworthAssociates, now part of the Investecgroup. Degree: Bachelors of Law andCommerce from The University of NewSouth Wales. Other listed companyboards: Australia and New ZealandBanking Group Ltd; John Fairfax HoldingsLtd; Westfield Group. Other Directorshipsheld in the last three years: InvestecAustralia (2001); ING Group (2004).Government & community involvement:Chairman of the Australia Council for theArts; President of the Art Gallery of NSWTrust; Chairman of the National Instituteof Dramatic Art; Chairman of SydneyGrammar School; Chairman of the Brainand Mind Research Institute Foundation;Director of The University of New SouthWales Foundation Ltd.
Mel K Ward, AONon-Executive Director (Independent) –Age 63Joined the Board in February 1999Chairman of Compensation Committee,member of Audit, Risk & ComplianceCommittee and member of Related PartyCommittee. Background: A CompanyDirector since February 1992 when heretired as Managing Director of TelecomAustralia and Chairman of TelecomAustralia (International) Limited. Degree:Bachelor of Engineering (Honours) andMaster of Engineering Science fromQueensland University. Other listedcompany boards: Insurance Manufacturersof Australia Ltd; MacquarieCommunications Infrastructure Group;Pro Medicus Limited (Chairman);Transfield Services Ltd; West AustralianNewspapers Ltd. Other Directorships heldin the last three years: The AustralianBallet (2001); AXA Asia Pacific HoldingsLtd (2002). Government & communityinvolvement: Chairman of the MajorPerforming Arts Board of the AustraliaCouncil for the Arts; Director of theNational Institute of Dramatic Art.
Jillian R Broadbent, AONon-Executive Director (Independent) –Age 56Joined the Board in February 1999Chairman of Audit, Risk & ComplianceCommittee, member of CompensationCommittee and member of Related PartyCommittee. Background: Extensiveexperience in international banking,principally with Bankers Trust Australia,advising a wide range of corporateclients on risk management. Degree:Bachelor of Arts (major in Economics andMathematics) from The University ofSydney. Other listed company boards:Woodside Petroleum Ltd. OtherDirectorships held in the last three years:Westfield America Management Ltd(2003); Westfield Management Ltd(2003); Sydney Theatre Company (2003).Government & community involvement:Director of the Reserve Bank of Australia;Director of Special Broadcasting Service(SBS) Corporation.
2. 3.
1 2 3 4
Terry J DavisGroup Managing Director – Age 47Appointed as Group Managing Director inNovember 2001 Member of CompensationCommittee (other than for matters relatingto his own compensation).Background: Joined CCA in November2001 after 14 years in the global wineindustry and previously as the ManagingDirector of Beringer Blass (the wine division of Foster’s Group Ltd).Other listed company boards:St George Bank Limited Government & community involvement:Faculty of Commerce Advisory Board –The University of New South Wales.
4.

23
Australia New Zealand Papua New Guinea Fiji South Korea Indonesia
Annual Report 2004
5. John Seward Managing Director – Indonesia, Age 48Appointed Managing Director – Indonesia in August 2004Mr John Seward commenced with CCAas Managing Director, Indonesia andwas previously the Managing Director,Coca-Cola Hellenic Bottling Company inNigeria (starting in 1997). He has alsoheld senior management roles withExpress Dairies and Elopak in the UK and dairy companies in both SaudiArabia and Ireland.
3. David WestallManaging Director – South Korea, Age 40Appointed Managing Director – South Korea in November 2004Joined CCA in 1996. Mr David Westallwas appointed Managing Director,South Korea, effective 1 November 2004.Prior to his transfer to South Korea, hewas CCA's Managing Director, NewZealand & Fiji. He has also held seniorroles in the Building Technology industry.
4. George Adams Managing Director – New Zealand and Fiji, Age 38Appointed Managing Director – New Zealand & Fiji in December 2003Mr George Adams has over 10 yearsexperience in the Coca-Cola system inEurope in a number of finance, IT andcommercial roles and joined CCA as theManaging Director – New Zealand andFiji. He has also worked as Finance Director for British Telecom Regionsbased in Ireland.
Wal M King, AONon-Executive Director (Independent) –Age 60Joined the Board in February 2002Member of Related Party Committee.Background: Worked in the constructionindustry for almost 35 years and since1987 has been the Chief Executive Officerof Leighton Holdings Ltd, a company withsubstantial operations in Australia andAsia. Degree: Bachelor of Engineering;Master of Engineering Science andHonorary Doctor of Science from TheUniversity of NSW. Other listed companyboards: Leighton Holdings Ltd. OtherDirectorships held in the last three years:University of New South Wales FoundationLtd (2001). Government & communityinvolvement: Director, University of NewSouth Wales Foundation Ltd; Co-Chair ofthe AFTA-CER Business Council; BoardMember of the Australian ResearchCouncil; Member of the Advisory Council,Australian Graduate School of Management;Foundation Member, New South WalesInfrastructure Council; Founding Councillor,Australian Business Arts Foundation;President, Australian ConstructorsAssociation.
Geoffrey J KellyNon-Executive Director (Nominee of TCCC) – Age 60Joined the Board in April 2004 (previously having been a Director between1996 and 2001). Member of Audit, Risk &Compliance Committee. Background:Joined The Coca-Cola Company in 1970and has held legal positions with TCCC inthe US, Asia and Europe. Currently SeniorVice President and Chief Deputy GeneralCounsel of TCCC's Global Legal Function.Degree: Law Degree from The Universityof Sydney.
Henry A SchimbergNon-Executive Director (Nominee of TCCC) – Age 71.Joined the Board in February 2000Member of Compensation Committee.Background: Retired as President andChief Executive Officer of Coca-ColaEnterprises on 31 December 1999 after a 41 year career in the soft drink industry.Degree: Bachelor of Arts from BeloitCollege. Other listed company boards:Coca-Cola Hellenic Bottling Company. OtherDirectorships held in the last three years:Pan American Beverages, Inc. (2002).
David E MeiklejohnNon-Executive Director (Independent) –Age 63 Joined the Board in February 2005.Background: Strong experience in finance,financial management and as a CompanyDirector. Chief Financial Officer of AmcorLimited for 19 years until retirement inJune 2000. Degree: Bachelor of Commercefrom Queensland University. Other listedcompany boards: PaperlinX Limited(Chairman); WMC Resources Limited;Australia and New Zealand Banking GroupLimited. Other Directorships held in thelast three years: SPC Ardmona Limited(2005); GasNet Australia Group (2004);OneSteel Limited (2005). Government &community involvement: Vice President,Melbourne Cricket Club.
2. Warwick WhiteManaging Director – Australia, Age 43Appointed Managing Director – Australia in November 2002Mr Warwick White has over 20 years in theCoca-Cola system and joined CCA as theManaging Director of Australia. Warwickhas held mainly marketing and generalmanagement roles since joining the Coca-Cola system in early 1980. Prior to joining CCA, Warwick was the RegionalDirector for Coca-Cola Hellenic BottlingCompany with responsibility for Ireland,Poland, Hungary, Czech Republic andSlovakia.
David A WylieCompany Secretary – Age 53Background: Appointed CompanySecretary in 1994 and has had 30 years with the Company in finance and secretarial roles. Degree: Bachelor of Arts (major in Economics); Master of Commerce (major in Marketing); Diploma of Law (Solicitors Admission Board).
5. 6. 8.
7.
5 6 7 8

24
Australia New Zealand Papua New Guinea Fiji South Korea Indonesia
Coca-Cola Amatil
At Coca-Cola Amatil (CCA), the Board ofDirectors are committed to achieving bestpractice in the area of corporate governance and business conduct.
This Corporate Governance Statement outlines themain corporate governance principles and practicesfollowed by CCA.
Shareholders
The rights of CCA’s shareholders are detailed in CCA’sConstitution. Those rights include electing the membersof the Board. In addition, shareholders have the right to vote on important matters which have an impact on CCA.
To allow shareholders to effectively exercise these rights,the Board is committed to improving the communicationto shareholders of high quality, relevant and usefulinformation in a timely manner. CCA has adopted thefollowing communication framework:
• an ongoing communication program – regular,comprehensive and publicly available disclosures tobe undertaken covering important topics includingperformance and governance issues;
• contact information – contact details for the InvestorRelations department and Company Secretary areprovided to facilitate and encourage communication;
• communication responsibilities – identification of theitems that are appropriate for Board comment andthose for management comment;
• communication policy – a publicly disclosed policythat covers all forms of communication, includingmeetings, telephone calls, email and other writtencommunications; and
• policy review – regular Board review to ensureadherence to the communication policy.
Communication policy
CCA’s communication policy (a copy is available on theCompany website at www.ccamatil.com/disclosurePolicy.asp)requires that shareholders be informed about strategicobjectives and major developments. CCA is committedto keeping shareholders informed and improvingaccessibility to shareholders through:
• Australian Stock Exchange (ASX) announcements;• company publications (including the Annual Report
and Shareholder News);• the Annual General Meeting (and its web casting);• the Company website (www.ccamatil.com);
• the investor contact number (+61 2 9259 6159); and• a suggestion box on the website.The following principles, consistent with the continuousdisclosure obligations under ASX Listing Rules, governCCA’s communication:
• CCA will immediately issue to the ASX anyinformation that a reasonable person would expectto have a material effect on the price or value ofCCA’s securities;
• only authorised spokespersons can communicate onbehalf of the Company with shareholders, the mediaor the investment community;
• CCA’s disclosure committee manages the day-to-daycontinuous disclosure issues and operates flexiblyand informally. It is responsible for compliance,coordinating disclosure and educating employees of CCA’s communication policy; and
• all material information issued to the ASX, theannual reports, full year and half year results andpresentation material given to analysts is publishedon CCA’s website (www.ccamatil.com). Any personwishing to receive advice by email of CCA’s ASXannouncements can register at www.ccamatil.com.
The Company Secretary is the primary personresponsible for communication with ASX. In theabsence of the Company Secretary, the InvestorRelations Manager is the contact.
CCA’s shareholders are encouraged to make their viewsknown to the Company and to directly raise matters of concern. From time to time, CCA requests meetingswith its shareholders and shareholder interest groups to share views on matters of interest. The views of thoseparties are shared with the Board on a regular basis,both by the Chairman and management.
Annual General Meeting
Shareholders are encouraged to attend CCA’s AnnualGeneral Meeting and use this opportunity to askquestions.
The Annual General Meeting will remain the mainopportunity each year for the majority of ordinaryshareholders to comment and question CCA’s Boardand management.
CORPORATE GOVERNANCE

25
Australia New Zealand Papua New Guinea Fiji South Korea Indonesia
Annual Report 2004
CCA is committed to improving the efficiency of itsAnnual General Meetings and encourages participationof shareholders through:
• the prior collection of shareholder questions foranswering during the meeting. Questions can besubmitted either by completing the relevant formaccompanying the notice of meeting or by emailingCCA at [email protected] that have been lodged, and their answers,are posted on the Company website at the FAQsection;
• providing a process to ensure that shareholders areconsiderate of each other’s right to participate;
• providing an opportunity after each Annual GeneralMeeting to discuss matters with the Board andmanagement; and
• web casting the proceeding for shareholders unableto attend in person. A copy of the speeches deliveredat the meeting are posted to the website after delivery.
Further, the external auditor attends the Annual GeneralMeeting and is available to answer shareholderquestions about the conduct of the audit and thepreparation and content of the auditor’s report.
Board of Directors – role and responsibilities
The Board represents shareholders and has the ultimateresponsibility for managing CCA’s business and affairsto the highest standards of corporate governance andbusiness conduct. The Board operates on the principlethat all significant matters are dealt with by the fullBoard and has specifically reserved the followingmatters for its decisions:
• the strategic direction of the Company;• approving budgets and other performance indicators,
reviewing performance against them and initiatingcorrective action when required;
• ensuring that there are adequate structures toprovide for compliance with applicable laws;
• ensuring that there are adequate systems andprocedures to identify, assess and manage risks;
• ensuring that there are appropriate policies in placeand systems to ensure compliance;
• monitoring the Board structure and composition;• appointing the Group Managing Director (MD) and
evaluating his or her ongoing performance againstpredetermined criteria;
• approving the remuneration of the MD andremuneration policy and succession plans for theMD and senior management;
• ensuring that there is an appropriate focus on theinterests of all stakeholders; and
• representing the interests of and being accountableto the Company’s shareholders.
To assist in its deliberations, the Board has established anumber of committees which, apart from routine matters,act primarily in a review or advisory capacity. Thedelegation of such responsibilities to those committeeswill only occur provided that sufficient systems are inplace to ensure that the Board is meeting itsresponsibilities.
The responsibility for implementing the approvedbusiness plans and for the day-to-day operations of CCA is delegated to the MD who, with themanagement team, is accountable to the Board.
Board of Directors – composition
The composition of the Board is based on the followingfactors:
• the Chairman is a Non-Executive Director andindependent from The Coca-Cola Company;
• the Chairman has the casting voting in the event of a vote by the Board that is tied;
• the MD is the Executive Director;• The Coca-Cola Company has nominated two
Non-Executive Directors (currently Mr Geoff Kellyand Mr Henry Schimberg);
• one third of the Board (other than the MD) isrequired to retire at each Annual General Meetingand may stand for re-election. The Directors to retireshall be those who have been longest in office sincetheir last election;
• a Director who has been appointed by the Board tofill a casual vacancy is required to be considered forre-election by the shareholders at the next AnnualGeneral Meeting;
• any Director who has attained 70 years of age mustretire but may be considered for re-election by theshareholders at each Annual General Meeting; and
• a majority of Directors must be Australian citizens.

26
Australia New Zealand Papua New Guinea Fiji South Korea Indonesia
Coca-Cola Amatil
CORPORATE GOVERNANCE
As of the date of this Annual Report, the Board iscomprised of the following seven members:
– David Gonski, AO (Chairman) Independent Director
– Jillian Broadbent, AO Independent Director
– Wal King, AO Independent Director
– Mel Ward, AO Independent Director
– Geoff Kelly Non-Executive Director*
– Henry Schimberg Non-Executive Director*
– Terry Davis Executive Director* nominated by The Coca-Cola Company
In addition, David Meiklejohn has been appointed tothe Board as an Independent Director with effect from25 February 2005.
Directors – independence
A Director is considered independent provided they arefree of any business or other relationship with CCA or arelated party, which could reasonably be perceived tomaterially interfere with the exercise of their unfetteredand independent judgement. A related party for thispurpose would include The Coca-Cola Company.
The Constitution provides that a Director or his/her firmmay act in a professional capacity for CCA, other thanas an auditor of the Company. These arrangements aresubject to the restrictions of the Corporations Act 2001.
When a potential conflict of interest arises, the Directorconcerned withdraws from the Board meeting whilesuch matters are considered. Accordingly, the Directorconcerned takes no part in discussions nor exercises anyinfluence over the Board if a potential conflict of interestexists. Transactions with The Coca-Cola Company arereviewed by the Related Party Committee. Related partytransactions are disclosed in Note 37 to the financialstatements.
Directors – selection
The composition of the Board is considered regularly bythe Nominations Committee and any recommendationspresented to the full Board. The review ensures that theBoard has available an appropriate mix of abilities andexperience to serve the interests of all shareholders.
The process of appointing a Director is that, when avacancy exists, the Nominations Committee identifiescandidates with the appropriate expertise andexperience. The Board reviews the candidates and themost suitable person is either appointed by the Board
and comes up for re-election at the next Annual GeneralMeeting or is recommended to shareholders forelection at the shareholder meeting.
CCA also encourages its shareholders to nominatepersons of suitable skills and experience for Boardpositions. The website contains a nomination form andany nomination, made in good faith, will be consideredby the Nominations Committee.
Directors – induction and training
On appointment, each Non-Executive Director isrequired to acknowledge the terms of appointment asset out in their letter of appointment. The appointmentletter covers, inter alia, the term of appointment, duties,remuneration and expenses, rights of access toinformation, other directorships, dealing in CCA’sshares and termination.
On appointment, each Director is provided with theCompany’s policies and briefed on the content by theCompany Secretary.
Directors participate in a series of training programs,covering such topics as the Board’s role, Boardcomposition and conduct, risks and responsibilities of company directors, to ensure that they are fullyinformed on current governance issues.
Directors – performance review
A review of Directors’performance is undertaken atleast every two years and if a majority of Directorsconsider a Director’s performance falls below thepredetermined criteria required, then a resolution willbe put to shareholders to vote on the resignation ofthat Director at the next Annual General Meeting.
The next performance review shall be undertaken in 2006.
Directors – share ownership and dealings
Directors are required to hold at least 1,000 CCAshares. A Director must acquire these shares within twomonths of appointment. Under the terms of the Non-Executive Directors’Share Plan, a minimum of 25%(and up to 100%) of CCA Directors’base fees are salarysacrificed by each Director. An amount equivalent tothe fees sacrificed is contributed to the Non-ExecutiveDirectors’Share Plan for the benefit of that Director.Details of all holdings by Directors in the Company are set out in the Directors’Report on page 31.

27
Australia New Zealand Papua New Guinea Fiji South Korea Indonesia
Annual Report 2004
Directors are subject to the Corporations Act 2001which restricts their buying, selling or subscribing forsecurities in CCA if they are in possession of insideinformation. The Board has also adopted a formalpolicy for share dealings by Directors and seniormanagement. The policy allows for the buying andselling of CCA shares only during the four weekperiods following the release of the full year and halfyear results and the Annual General Meeting, unlessexceptional circumstances apply. The policy prohibitsspeculative transactions involving CCA shares andreinforces the prohibition on insider trading containedin the Corporations Act 2001.
Independent professional advice
For the purposes of the proper performance of theirduties, Directors are entitled to seek independentprofessional advice at CCA's expense. Before doing so,a Director must notify the Chairman (or the MD in theChairman's absence) and must make a copy of theadvice available to all Directors.
Risk management
In addition to the risk management duties of the Audit,Risk & Compliance Committee, the Board has retainedresponsibility for approving the strategic direction ofCCA and ensuring the maintenance of the higheststandards of quality. This extends beyond productquality to encompass all ways in which CCA’sreputation and its products are measured. The Boardmonitors this responsibility through the receipt ofregular risk assessment reports and managementpresentations.
The Audit, Risk & Compliance Committee reviewsreports by members of the management team (andindependent advisers, where appropriate) during theyear and, where appropriate, makes recommendationsto the Board in respect of:
• overall business risk in CCA’s countries of operation;• treasury risk (including currency and borrowing
risks);• procurement;• insurance;• taxation;• litigation; and• other matters as it deems appropriate.
The Committee also reviews and, where appropriate,makes recommendations to the Board in respect ofpolicies relating to the above matters. This includesensuring that CCA has systems that identify, assess,monitor and manage risk.
The internal and external audit functions also reviewCCA’s risk assessment and management. The internaland external audit functions are separate andindependent of each other.
Ethical standards
The Board recognises the need to observe the higheststandards of corporate practice and business conduct.To this end, CCA has established a formal Code ofConduct, which requires management and employeesto adopt high ethical standards in all of CCA'sactivities.
The Audit, Risk & Compliance Committee isresponsible for ensuring an effective complianceprogram exists to ensure compliance with therequirements as established in the Code of Conduct.The Code contains procedures for identifying andreporting any departures from the required standards.CCA has also established a system for distribution ofthe Code at appropriate intervals to employees and forthem to acknowledge its receipt.
The Code sets standards of behaviour expected fromeveryone who performs work for CCA – Directors,employees and individual contractors. It is alsoexpected that CCA’s suppliers will enforce a similar setof standards with their employees.

28
Australia New Zealand Papua New Guinea Fiji South Korea Indonesia
Coca-Cola Amatil
Board Committees
To assist in its deliberations, the Board has established a number of committees which, apart from routine matters,act primarily in a review or advisory capacity.
Audit, Risk & Compliance Committee
Current composition: Three Non-Executive Directors (MD and Chief Financial Officer attend meetings by invitation).
Purpose: Audit – reviews the auditor’s performance, the professional independence of the auditor, audit policies,procedures and reports, as a direct link between the Board and the auditor. Financial Statements – reviews CCA’sfinancial statements, the effectiveness and compliance with accounting policies and standards and adequacy ofdisclosures. Risk Management – reviews policies and reports on all major categories of risk including, but notlimited to, overall business risk in CCA’s operations, treasury risk (including currency and borrowing risks),procurement, insurance, taxation and litigation. Compliance – ensures an effective compliance program covering,but not limited to, CCA’s statutory obligations (including occupational health and safety laws, environmental laws,product safety laws and trade practices laws) and formal written policies (including treasury policy, procurementpolicy, code of business conduct and the policy on dealing in CCA’s securities).
Compensation Committee
Current composition: Four Non-Executive Directors and MD (MD is a member other than for matters relating to his own compensation). A majority of members must be Independent Non-Executive Directors.
Purpose: The review of matters relating to the remuneration of the Executive Director and senior management,as well as, senior management succession planning. The Committee obtains advice from external remunerationconsultants to ensure that CCA's remuneration practices are in line with market conditions.
Nominations Committee
Current composition: Four Independent Non-Executive Directors (does not include any Directors who are or havebeen associated with a related party).
Purpose: The review of the Board’s composition to ensure that it comprises Directors with the right mix of skills andexperience to enable it to fulfil its responsibilities to shareholders. The Committee also identifies suitable candidatesfor appointment to the Board and reviews general matters of corporate governance.
Related Party Committee
Current composition: All Independent Non-Executive Directors (does not include any Directors who are or havebeen associated with a related party; MD and CFO attend meetings by invitation).
Purpose: The review of transactions between CCA and its related parties to ensure that the terms of suchtransactions are no more favourable than would reasonably be expected of transactions negotiated on an arm’s-length basis. Meets prior to each scheduled Board meeting to review all material transactions of CCA in which The Coca-Cola Company, or any other related party, is involved.
Other Committees
The Administration Committee and the Securities Committee meet as required.
Composition: Any two Directors or a Director and the Chief Financial Officer.
Purpose: The Administration Committee attends to routine matters that may require use of the Company'scommon seal.
The Securities Committee attends to routine matters relating to the allotment of securities.
Consistent with this aim, the Company has followed the best practice recommendations established in the ASXCorporate Governance Council ‘Principles of Good Corporate Governance and Best Practice Recommendations’as set out in the following table.
CORPORATE GOVERNANCE

29
Australia New Zealand Papua New Guinea Fiji South Korea Indonesia
Annual Report 2004
Best practice recommendations
2004 Annual Report
Compliance reference
1.1 Formalise and disclose the functions reserved to the board and those delegated to management ✓ page 25
2.1 A majority of the board should be independent directors ✓ page 26
2.2 The chairperson should be an independent director ✓ page 26
2.3 The roles of chairperson and chief executive officer should not be exercised by the same individual ✓ page 26
2.4 The board should establish a nomination committee ✓ page 28
2.5 Provide the information indicated in Guide to reporting on Principle 2 ✓
3.1 Establish a code of conduct to guide directors, the chief executive officer (or equivalent), the chief financial officer (or equivalent) and any other key executives as to:• the practices necessary to maintain confidence in the company’s integrity• the responsibility and accountability of individuals for reporting and investigating reports of unethical practices ✓ page 27
3.2 Disclose the policy concerning trading in company securities by directors, officers and employees ✓ page 26
3.3 Provide the information indicated in Guide to reporting on Principle 3 ✓
4.1 Require the chief executive officer (or equivalent) and the chief financial officer (or equivalent) to state in writing to the board that the company’s financial reports present a true and fair view, in all material respects, of the company’s financial condition and operational results and are in accordance with relevant accounting standards ✓
4.2 The board should establish an audit committee ✓ page 28
4.3 Structure the audit committee so that it consists of:• only non-executive directors• a majority of independent directors• an independent chairperson, who is not chairperson of the board• at least three members ✓ page 28
4.4 The audit committee should have a formal charter ✓
4.5 Provide the information indicated in Guide to reporting on Principle 4 ✓
5.1 Establish written policies and procedures designed to ensure compliance with ASX Listing Rule disclosure requirements and to ensure accountability at a senior management level for that compliance ✓ page 24
5.2 Provide the information indicated in Guide to reporting on Principle 5 ✓
6.1 Design and disclose a communication strategy to promote effective communication with shareholders and encourage effective participation at general meetings ✓
6.2 Request the external auditor to attend the Annual General Meeting and be available to answer shareholder questions about the conduct of the audit and the preparation and content of the auditor’s report ✓ page 25
7.1 The board or appropriate committee should establish policies on risk oversight and management ✓ page 27
7.2 The chief executive officer (or equivalent) and the chief financial officer (or equivalent) should state to the board in writing that:• the statement given in accordance with best practice recommendation 4.1 (the integrity of financial statements)
is founded on a sound system of risk management and internal compliance and control which implements the policies adopted by the board
• the company’s risk management and internal compliance and control system is operating efficiently and effectively in all material respects ✓ 1
7.3 Provide the information indicated in Guide to reporting on Principle 7 ✓
8.1 Disclose the process for performance evaluation of the board, its committees and individual directors, and key executives ✓ page 26

30
Australia New Zealand Papua New Guinea Fiji South Korea Indonesia
Coca-Cola Amatil
CORPORATE GOVERNANCE
Best practice recommendations (continued)
2004 Annual Report
Compliance reference
9.1 Provide disclosure in relation to the company’s remuneration policies to enable investors to understand (i) the costs and benefits of those policies and (ii) the link between remuneration paid to directors and key executives and corporate performance ✓ 2
9.2 The board should establish a remuneration committee ✓ page 28
9.3 Clearly distinguish the structure of non-executive directors’ remuneration from that of executives ✓
9.4 Ensure that payment of equity based executive remuneration is made in accordance with thresholds set in plans approved by shareholders ✓ 3
9.5 Provide the information indicated in Guide to reporting on Principle 9 ✓
10.1 Establish and disclose a code of conduct to guide compliance with legal and other obligations to legitimate stakeholders ✓ page 27
The above disclosure should be read in conjunction with the following:
1 CCA has reported its compliance with this recommendation in accordance with the guidelines detailed in the‘Guide to Compliance with ASX Principle 7: Recognise and Manage Risk’prepared by the Group of 100 andendorsed by the ASX Corporate Governance Council.
2 Disclosure of remuneration policy and procedures is set out in page 32 of the Annual Report.3 Equity based remuneration paid to the Group Managing Director is approved annually by shareholders. Equity
based remuneration paid to other key executives under the Long Term Incentive Share Plan has not beenapproved by shareholders as the Board considers it to be part of the total compensation package for thoseexecutives and should not be individually segregated for separate approval.

31
Australia New Zealand Papua New Guinea Fiji South Korea Indonesia
Annual Report 2004
DIRECTORS’ REPORTCOCA-COLA AMATIL LIMITED
FOR THE FINANCIAL YEAR ENDED 31 DECEMBER 2004
The Directors submit hereunder their Report on Coca-Cola Amatil Limited (Company or CCA) and its controlled entities (Group) for the financial yearended 31 December 2004.
Names and particulars of Directors
The names of the Directors of Coca-Cola Amatil Limited in office during the financial year and until the date of this Report and the beneficial interest of each Director in the contributed equity of the Company are detailed below –
Long Term Non-executiveOrdinary Incentive Directors Share
shares Share Plan1 Share Plan1 optionsNo. No. No. No.
Directors in office at the date of this Report
David Michael Gonski, AO 40,000 43,768Jillian Rosemary Broadbent, AO 1,011 4,413Terry James Davis 57,194 100,000 200,000Geoffrey James Kelly Appointed 22 April 2004 1,253 734Wallace Macarthur King, AO 1,200 7,295Henry Aaron Schimberg 1,000 4,639Melvyn Keith Ward, AO 1,190 4,377Former Directors
Michael Francis Ihlein Resigned 19 March 2004James Elliott Chestnut Resigned 22 April 2004
1 Beneficial interest held subject to conditions of the Plan.
Particulars of the qualifications, experience and special responsibilities of each Director are set out on page 22 of the Annual Report.
Corporate information
Coca-Cola Amatil Limited is a company limited by shares that is incorporated and domiciled in Australia. The address of the registered office of theCompany is set out on page 92 of the Annual Report.
Nature of operations and principal activities
The principal activities of the entities within the Group during the course of the financial year were the manufacture, distribution and marketing ofcarbonated soft drinks, still and mineral waters, fruit juices and other alcohol-free beverages. No significant change in the nature of activities tookplace during the financial year.
Employees
The Group had 16,845 employees as at 31 December 2004 (2003: 16,273), further details of which are set out on page 10 of the Annual Report.
Group result
The Group’s net profit attributable to members of the Company for the financial year was $280.3 million and included a significant item of $2.3 million(benefit) compared with $194.2 million for 2003 that included a significant item of $44.6 million (expense).
The Group’s net profit (before significant items) attributable to members of the Company for the financial year was $278.0 million compared with $238.8 million for 2003.
Review of operations
During the financial year, the Group acquired all the shares of Crusta Fruit Juices Pty Ltd (and its subsidiary Quenchy Crusta Sales Pty Ltd) andpurchased the operating assets of Quirks Refrigeration.
Further details are included in State of affairs on page 38.
The Group’s revenue from sales of beverages for the financial year was $3,449.6 million compared with $3,357.1 million for 2003. The Group’s earningsbefore interest, tax and significant items for the financial year was $517.6 million compared with $470.0 million for 2003.
Details of the operations of the Group during the financial year are set out on pages 1 to 30 of the Annual Report.

32
Australia New Zealand Papua New Guinea Fiji South Korea Indonesia
Coca-Cola Amatil
DIRECTORS’ REPORT continuedCOCA-COLA AMATIL LIMITED
Directors’ meetings
The number of Directors’ meetings (including meetings of committees of Directors) and the number of meetings attended by each of the Directors ofthe Company during the financial year are detailed below –
Audit, Risk &Board of Compliance Compensation Related Party Nominations OtherDirectors Committee2 Committee3 Committee4 Committee5 Committees6
Meetings No. of Meetings No. of Meetings No. of Meetings No. of Meetings No. of No. ofheld while meetings held while meetings held while meetings held while meetings held while meetings meetingsa Director attended a member attended a member attended a member attended a member attended attended
Directors in office at the end of the financial year
D.M. Gonski, AO 7 7 – – 4 4 7 7 3 3 6J.R. Broadbent, AO 7 7 4 4 4 4 7 7 3 3 2T.J. Davis 7 7 – – 4 4 – – – – 17G.J. Kelly1 6 5 2 1 – – – – – – –W.M. King, AO 7 6 – – – – 7 5 3 3 –H.A. Schimberg1 7 6 – – 4 4 – – – – –M.K. Ward, AO 7 6 4 4 4 4 7 6 3 2 3
Former Directors
M.F. Ihlein 1 1 – – – – – – – – 5J.E. Chestnut 1 1 1 1 – – – – – – –
1 Non-residents of Australia.2 This Committee reviews matters relevant to control systems so as to effectively safeguard the Company’s assets, accounting records held to comply with statutory
requirements and other financial information. It consists of non-executive Directors. Refer to the Corporate Governance section of this Report for further details on thisand other Committees.
3 This Committee reviews matters relevant to the remuneration of executive Directors and senior Company executives. It consists of four non-executive Directors and theManaging Director (in relation to remuneration matters other than those relating to the Managing Director’s remuneration).
4 This Committee reviews agreements and business transactions with related parties. It consists of all non-executive Directors who are not associated with a related party.5 This Committee reviews the composition of the Board, including identifying suitable candidates for appointment to the Board and reviews general matters of corporate
governance. It consists of all independent non-executive Directors.
6 Committees were created to attend to allotments of securities and administrative matters on behalf of the Board. A quorum for these Committees is any two Directors,or any one Director and the Chief Financial Officer. In addition, a Committee was formed to deal with certain matters relating to the proposed SPC Ardmona Ltdacquisition, having a quorum of three Directors.
Directors’ and officers’ liability insurance
The Company has paid the premium for Directors’ and officers’ liability insurance in respect of Directors and executive officers of the Company and itscontrolled entities as permitted by the Corporations Act 2001. The terms of the policy prohibit disclosure of details of the insurance cover and premium.
Remuneration
Non-executive DirectorsThe remuneration of non-executive Directors takes into account the size and complexity of CCA’s operations, their responsibility for the stewardship ofthe Company and their workloads. It comprises Directors’ fees (base plus Board Committee fees), superannuation contributions and retirement benefits.
Total non-executive Directors’ fees are not to exceed the annual limit of $1.0 million as previously approved by shareholders. Based on advice receivedfrom external remuneration consultants (via the Compensation Committee), Directors’ fees are set and approved by executive Directors. The currentannual Directors’ fees payable to non-executive Directors are as follows –
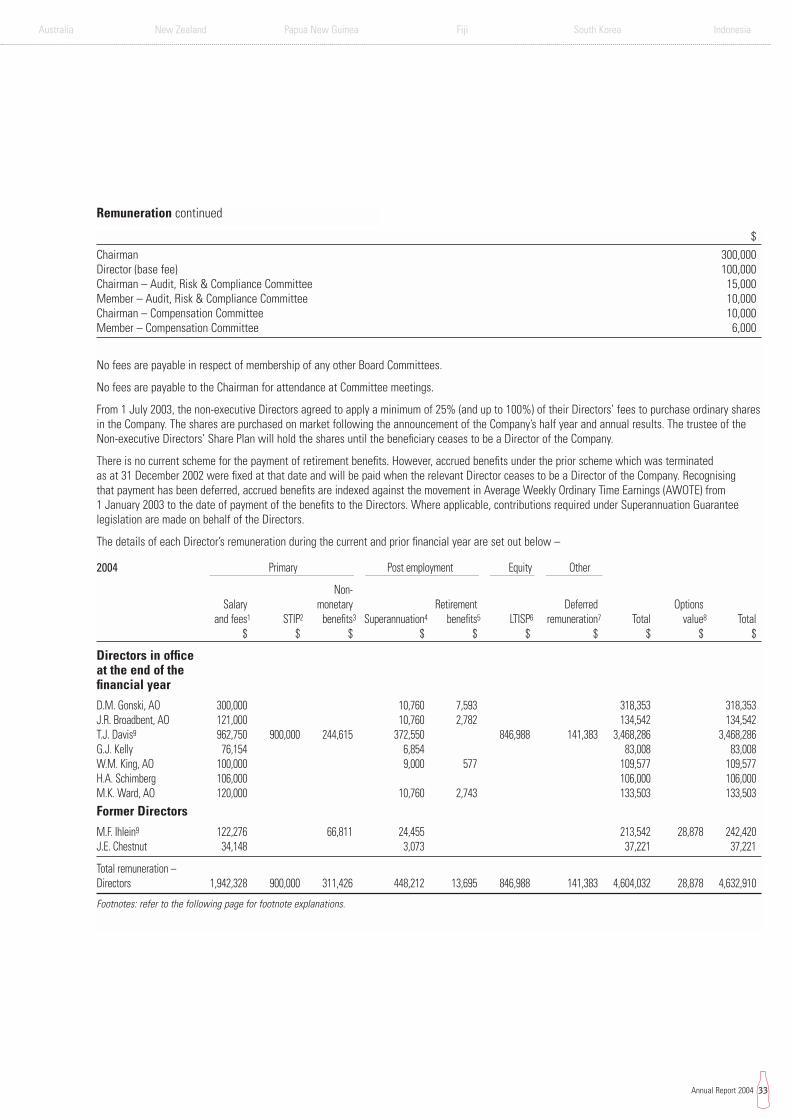
Australia New Zealand Papua New Guinea Fiji South Korea Indonesia
33Annual Report 2004
$
Chairman 300,000Director (base fee) 100,000Chairman – Audit, Risk & Compliance Committee 15,000Member – Audit, Risk & Compliance Committee 10,000Chairman – Compensation Committee 10,000Member – Compensation Committee 6,000
No fees are payable in respect of membership of any other Board Committees.
No fees are payable to the Chairman for attendance at Committee meetings.
From 1 July 2003, the non-executive Directors agreed to apply a minimum of 25% (and up to 100%) of their Directors’ fees to purchase ordinary sharesin the Company. The shares are purchased on market following the announcement of the Company’s half year and annual results. The trustee of theNon-executive Directors’ Share Plan will hold the shares until the beneficiary ceases to be a Director of the Company.
There is no current scheme for the payment of retirement benefits. However, accrued benefits under the prior scheme which was terminated as at 31 December 2002 were fixed at that date and will be paid when the relevant Director ceases to be a Director of the Company. Recognising that payment has been deferred, accrued benefits are indexed against the movement in Average Weekly Ordinary Time Earnings (AWOTE) from 1 January 2003 to the date of payment of the benefits to the Directors. Where applicable, contributions required under Superannuation Guaranteelegislation are made on behalf of the Directors.
The details of each Director’s remuneration during the current and prior financial year are set out below –
2004 Primary Post employment Equity Other
Non-Salary monetary Retirement Deferred Options
and fees1 STIP2 benefits3 Superannuation4 benefits5 LTISP6 remuneration7 Total value8 Total$ $ $ $ $ $ $ $ $ $
Directors in office at the end of the financial year
D.M. Gonski, AO 300,000 10,760 7,593 318,353 318,353J.R. Broadbent, AO 121,000 10,760 2,782 134,542 134,542T.J. Davis9 962,750 900,000 244,615 372,550 846,988 141,383 3,468,286 3,468,286G.J. Kelly 76,154 6,854 83,008 83,008W.M. King, AO 100,000 9,000 577 109,577 109,577H.A. Schimberg 106,000 106,000 106,000M.K. Ward, AO 120,000 10,760 2,743 133,503 133,503Former Directors
M.F. Ihlein9 122,276 66,811 24,455 213,542 28,878 242,420J.E. Chestnut 34,148 3,073 37,221 37,221
Total remuneration – Directors 1,942,328 900,000 311,426 448,212 13,695 846,988 141,383 4,604,032 28,878 4,632,910
Footnotes: refer to the following page for footnote explanations.
Remuneration continued

Australia New Zealand Papua New Guinea Fiji South Korea Indonesia
34 Coca-Cola Amatil
DIRECTORS’ REPORT continuedCOCA-COLA AMATIL LIMITED
2003 Primary Post employment Equity Other
Non-Salary monetary Retirement Deferred Options
and fees1 STIP2 benefits3 Superannuation4 benefits5 LTISP6 remuneration7 Total value8 Total$ $ $ $ $ $ $ $ $ $
Directors in office at the end of the financial year
D.M. Gonski, AO 300,000 10,760 27,846 338,606 338,606J.R. Broadbent, AO 121,000 10,760 10,201 141,961 141,961T.J. Davis9 913,750 861,000 194,417 354,950 1,065,361 200,000 3,589,478 78,317 3,667,795W.M. King, AO 100,000 9,000 2,116 111,116 111,116H.A. Schimberg 106,000 1,634 107,634 107,634M.K. Ward, AO 120,000 10,760 10,061 140,821 140,821Former Directors
M.F. Ihlein9 541,667 365,000 288,401 181,333 222,433 166,311 1,765,145 132,720 1,897,865J.E. Chestnut 110,000 9,900 119,900 119,900
Total remuneration – Directors 2,312,417 1,226,000 482,818 589,097 50,224 1,287,794 366,311 6,314,661 211,037 6,525,698
1 Includes amounts contributed to the Non-executive Directors’ Share Plan. Fees for non-executive Directors includes Committee fees.2 Short Term Incentive Plan (STIP).3 Non-monetary benefits include the value of motor vehicles, interest paid on certain loans held independently by an executive with a financial institution and allowances.4 Includes notional and actual contributions to superannuation.5 Represents the estimated present value of the accrued retirement benefit less the amount accrued in the prior period.6 Long Term Incentive Share Plan (LTISP). Represents the estimated fair value of shares offered in the Plan calculated by multiplying the number of shares by the fair
value of the share at grant date and amortised over the three year performance period. For the 2003-2005 Plan the value is $4.75 and for the 2004-2006 Plan the valueis $5.61 for the 50% measured using TSR and $6.34 for the 50% measured using NOPAT. The Plans have been valued using the Monte Carlo simulation methodology.This methodology calculates the fair value of performance rights based on the share price at grant date and assumptions for the expected risk free rate of interest forthe performance period, the volatility of the share price returns, the dividend entitlements and performance conditions of the Plan. The amount due for the 2002-2004LTISP was disclosed in the 2002 Directors’ Report. Half of the first tranche under the 2004-2006 LTISP due to Mr Davis vested at 31 December 2004 and having met thetarget, 50,000 shares will be purchased in early 2005. These shares have been valued at $6.74. Comparatives for 2003 were restated accordingly.
7 Represents the estimated present value of the accrued benefit payable under the terms of the service agreement less the amount accrued in the prior period.8 Since 1 January 2003, share options are no longer awarded. The option value was determined using the Binomial Option Valuation Model refer Note 31 of the financial
statements. The value of options is included to comply with Australian Securities and Investments Commission disclosure requirements and has not been expensed bythe Company.
9 Executive Directors.
Compensation CommitteeThe Compensation Committee is required to –
• review matters relating to the remuneration of executive Directors and senior management;• review senior management succession planning; and• review general matters of remuneration and succession planning.
The Committee is comprised of four non-executive Directors and the Managing Director (in relation to remuneration matters other than those relatingto the Managing Director’s remuneration). The Board appoints the Chairman of the Committee, who cannot be the Chairman of the Board or theManaging Director.
The Committee met four times during the year. The Chairman of the Committee reported the findings and recommendations of the Committee to thenext Board meeting.
Remuneration continued

Australia New Zealand Papua New Guinea Fiji South Korea Indonesia
35Annual Report 2004
Compensation Committee continuedThe Committee –
• obtained data from relevant external sources to ensure the Company’s remuneration practices are in line with market conditions;• reviewed executive Director remuneration packages and incentive payments and where appropriate, made recommendations to the Board;• reviewed and approved all material remuneration components of senior management remuneration packages and incentive payments including
remuneration policies and procedures;• reviewed appointments and terminations during the year of senior managers that report directly to the Managing Director;• reviewed and approved senior management variable incentive plan rules and participation for the forthcoming year (annual cash plans and the
Long Term Incentive Share Plan);• reviewed country retirement plans;• reviewed and where appropriate made recommendations to the Board for changes to non-executive Director remuneration; and• reviewed the succession plans for executive Directors and senior management, with matters of significant importance and recommendations on
succession planning for executive Directors being referred to the Board.
Remuneration policyIn determining the composition and amount of senior management remuneration, the Committee applies the Company’s remuneration policy. Its key elements require that –
• remuneration will be competitively set so as to attract, motivate and retain top calibre senior managers; • remuneration will incorporate, to a significant degree, variable pay for performance elements, containing short and long term focuses as
appropriate, which will –
• reward senior managers for Group, business unit and individual performance against appropriate benchmarks and targets; • align the interests of senior managers with those of shareholders; • link senior managers’ rewards with the strategic goals and performance of the Group; and • ensure total remuneration is competitive by market standards;
• senior managers’ remuneration will be reviewed annually by the Committee through a process that considers Group, business unit andindividual performance. To this end, the Committee considers pertinent advice from external remuneration consultants on current internationaland local market practices, market comparisons for similar roles and the level of responsibilities of the individual;
• remuneration systems be maintained and developed which complement and reinforce the Company’s Code of Conduct and succession planning;• remuneration and terms and conditions of employment to be specified in an individual letter of employment, which will be signed by the
Company and the senior manager; and• the Committee establishes and maintains the relationship of remuneration, potential annual incentive and long term incentive payments for
each level of management. For senior managers, potential incentive payments, as a proportion of total potential remuneration, increasesaccording to their seniority within the Company.
Incentive payments for executive Directors are related to performance. The amount of annual incentives paid is dependent upon the extent towhich operating targets set at the beginning of the financial year are achieved.
Vesting of shares allocated under the Long Term Incentive Share Plan (LTISP) is directly related to shareholder value, measured by two hurdles,with half of the award subject to Total Shareholder Return (TSR) over a minimum three year period and half the award subject to the achievementof average growth in net operating profit after tax over a minimum three year period (one tranche of the Managing Director’s share allocation istested after one year). Vesting occurs if CCA’s TSR over the period is equal to or higher than the 50th percentile of peer companies, or net operatingprofit after tax (NOPAT) growth is equal to or higher than an average of 10% per annum over three years.
From the beginning of the 2003 financial year, options have been removed from the remuneration package of executive Directors and the totalvalue of the long term incentives allocated from 1 January 2003 is now in the form of shares under the LTISP. Options allocated under the ExecutiveOption Plan will continue until they vest or lapse.
Shares purchased on market to satisfy incentives earned by executive Directors are charged against profit and loss, as are incentives paid in cash.
Senior managersThe Committee is responsible for reviewing the nature and amount of the remuneration of senior managers. In determining the composition andamount of senior managers’ remuneration, the Committee is primarily concerned with providing a competitive remuneration package, which isstructured to attract and retain top calibre senior managers and to support the growth of shareholder value. As a result, the four principal elementsof senior management remuneration are base salary, benefits, annual incentive and long term incentive.
In determining the appropriate mix of these elements in a senior manager’s remuneration, the Committee considers pertinent advice from externalremuneration consultants on current international and local market practices, market comparisons for similar roles, the level of responsibility,performance and potential of the executive, the performance of business units within the Group and the performance of the Group as a whole.
Remuneration continued

Australia New Zealand Papua New Guinea Fiji South Korea Indonesia
36 Coca-Cola Amatil
DIRECTORS’ REPORT continuedCOCA-COLA AMATIL LIMITED
Compensation Committee continuedThe annual incentive and long term incentive are an integral part of CCA’s approach to competitive performance based remuneration. These at riskcomponents of a senior manager’s remuneration are intended to ensure an appropriate proportion of the remuneration is linked to growth in TSRand the achievement of crucial operational targets.
Annual incentives are set at the beginning of the financial year to reward senior managers for meeting or exceeding key performance indicators.The percentage of total remuneration that is variable differs according to the seniority of the employee.
Participation in the 2003-2005 LTISP and the 2004-2006 LTISP was by invitation based on an employee’s level of responsibility, performance andpotential. Allocation of shares under the LTISP is subject to the achievement of performance measures over a three year performance period.
For the 2003-2005 LTISP, no shares will be allocated if TSR measured over the relevant performance period is less than the 50th percentile of theAustralian Stock Exchange (ASX) 100 Companies minus banks, financial services companies and mining resource companies plus S&P’s ConsumerStaples Index Companies with market capitalisation greater than $300 million. The number of shares to be allocated will be increased, on a prorata basis, if the Company’s ranking exceeds the 50th percentile up to a maximum allocation of 150% of the threshold entitlement if the Companyachieves the 75th percentile.
For the 2004-2006 LTISP, the Committee has approved a change to the performance measures with half of the award subject to a TSR measure andhalf of the award subject to the measurement of achievement of average growth in NOPAT over the period.
All shares to which senior managers may become entitled, as a result of their participation in the LTISP, will be allocated in respect of the 2004-2006 performance period by no later than 31 January 2008. The shares will be acquired by the trustee of the LTISP on behalf of the individualeither by purchase of shares on the ASX at the prevailing market price or through issue of shares in the Company (issue price is the weightedaverage price of a specified five day period prior to issue), at no cost to the individual.
Shares purchased on market to satisfy incentives earned by senior managers are charged against profit and loss, as are incentives paid in cash.
The details of the five highest remunerated executives during the current and prior financial year are set out below –
2004 Primary Post employment Equity Other
Non-Salary monetary Deferred Termination Options
and fees STIP1 benefits2 Superannuation3 LTISP4 remuneration5 benefits6 Total value7 Total$ $ $ $ $ $ $ $ $ $
Executives in office at the end of the financial year
M. Clark8 348,669 520,615 69,734 181,588 1,120,606 82,822 1,203,428J.M. Wartig 318,462 210,000 319,105 73,895 103,775 41,153 1,066,390 1,066,390D.P. Westall8 223,451 50,949 410,744 47,136 72,208 804,488 17,314 821,802W.G. White 461,250 282,000 149,235 104,055 235,866 117,000 1,349,406 25,333 1,374,739
Former executive
P.O. Baker8 189,152 370,365 37,830 192,962 790,309 92,463 882,772
Total remuneration – executives 1,540,984 542,949 1,770,064 332,650 786,399 158,153 5,131,199 217,932 5,349,131
Footnotes: refer to the following page for footnote explanations.
Remuneration continued

Compensation Committee continued
2003 Primary Post employment Equity Other
Non-Salary monetary Deferred Termination Options
and fees STIP1 benefits2 Superannuation3 LTISP4 remuneration5 benefits6 Total value7 Total$ $ $ $ $ $ $ $ $ $
Executives in office at the end of the financial year
P.O. Baker8 353,303 103,530 449,974 91,367 83,221 1,081,395 203,493 1,284,888M. Clark8 346,902 672,763 69,380 156,408 1,245,453 151,407 1,396,860D.P. Westall8 221,798 105,351 145,623 55,019 35,145 562,936 26,537 589,473W.G. White 446,667 271,300 407,223 100,515 121,935 116,667 1,464,307 25,333 1,489,640
Former executive
W.J. Fazl 145,092 36,431 32,085 36,305 12,655 422,734 685,302 18,613 703,915
Total remuneration – executives 1,513,762 516,612 1,707,668 352,586 409,364 116,667 422,734 5,039,393 425,383 5,464,776
1 Short Term Incentive Plan (STIP).2 Non-monetary benefits include the value of motor vehicles, interest paid on certain loans held independently by an executive with a financial institution and allowances.3 Includes notional and actual contributions to superannuation.4 Long Term Incentive Share Plan (LTISP). Represents the estimated fair value of shares offered in the Plan calculated by multiplying the number of shares by the fair
value of the share at grant date and amortised over the three year performance period. For the 2003-2005 Plan the value is $4.76 and for the 2004-2006 Plan the valueis $5.41 for the 50% measured using TSR and $6.19 for the 50% measured using NOPAT. The Plans have been valued using the Monte Carlo simulation methodology.This methodology calculates the fair value of performance rights based on the share price at grant date and assumptions for the expected risk free rate of interest forthe performance period, the volatility of the share price returns, the dividend entitlements and performance conditions of the Plan. The amount due for the 2002-2004LTISP was disclosed in the 2002 Directors’ Report. Comparatives for 2003 were restated accordingly.
5 Represents the estimated present value of the accrued benefit payable under the terms of the service agreement less the amount accrued in the prior period.6 Termination benefits include payments for redundancy and unused leave benefits paid upon termination. Amounts shown exclude amounts previously disclosed in remuneration.7 Since 1 January 2003, share options are no longer awarded. The option value was determined using the Binomial Option Valuation Model refer Note 31 of the financial
statements. The value of options is included to comply with Australian Securities and Investments Commission disclosure requirements and has not been expensed bythe Company.
8 Messrs Baker, Clark and Westall were remunerated in USD whilst in Asia. These amounts were converted to AUD at the weighted average exchange rate for thefinancial year (AUD/USD 0.7410)(2003: AUD/USD 0.6510).
Options
From the beginning of the 2003 financial year, options have been removed from the remuneration package of Group executives. Details of options onissue at the end of the financial year and at the date of signing this Report and options exercised during the financial year are included in Notes 18and 19 of the financial statements.
Details of options on issue to executive Directors of the Company at the end of the financial year are as follows –
Exercise price Options exercisable Options expiry Name of Director and number of options held $ from date date
T.J. Davis200,000 6.12 Current 24 April 2007
Dividends
Dividends that have been paid by the Company since the commencement of the financial year are as follows –
Rate per Franking per share share Amount
Class of share ¢ ¢ $M Date paid
Ordinary 13.0 9.75 91.2 31 March 2004Ordinary 12.5 12.50 88.1 1 October 2004
Australia New Zealand Papua New Guinea Fiji South Korea Indonesia
37Annual Report 2004
Remuneration continued

Australia New Zealand Papua New Guinea Fiji South Korea Indonesia
38 Coca-Cola Amatil
DIRECTORS’ REPORT continuedCOCA-COLA AMATIL LIMITED
Environmental performance
Information relating to the Group’s environmental performance can be found on page 20 of the Annual Report.
State of affairs
The following significant changes in the state of affairs of the Group occurred during the financial year –
Effective 29 October 2004, the Group gained control of Crusta Fruit Juices Pty Ltd (and its subsidiary Quenchy Crusta Sales Pty Ltd) with 100%ownership achieved, and effective 12 November 2004, the Group acquired the business assets of Quirks Refrigeration. The total consideration forthese acquisitions was $45.3 million.
On 31 December 2004, the Indonesian Government eliminated the luxury goods tax (LGT) for non-alcoholic soft drink products, including carbonated softdrinks and juice, effective 1 January 2005, as part of a series of economic initiatives to boost investment in Indonesia, and revitalise the Indonesian softdrink industry. The removal of the LGT at the rate of 10% is expected to result in some cost reductions for the Indonesian operation in 2005.
There were no other significant changes in the state of affairs of the Group during the financial year.
Subsequent events
No matter or circumstance has arisen since the end of the financial year that has significantly affected or may significantly affect the operations of theGroup, the results of those operations or the state of affairs of the Group in subsequent financial years, with the exception of:
The Directors having declared the following dividend –
Rate per Franking per share share Amount Date
Class of share ¢ ¢ $M payable
Ordinary 15.5 15.5 109.9 1 April 2005
Acquisition of Northern Territory Coca-Cola franchise licence and related assetsThe Group acquired the Northern Territory Coca-Cola franchise business assets of Parmalat Australia Ltd on 28 January 2005.
Proposed acquisition of SPC Ardmona Ltd (SPC Ardmona)On 12 November 2004, CCA entered into a scheme of arrangement with SPC Ardmona under which CCA will acquire all of the outstanding shares andoptions in SPC Ardmona in Australia. SPC Ardmona shareholders voted to support the proposed acquisition by CCA on 3 February 2005. In addition tothe SPC Ardmona shareholder approval, CCA has received formal confirmation from the Australian Competition and Consumer Commission, the ForeignInvestment Review Board and the Australian Stock Exchange that they have no objection to the proposed acquisition. SPC Ardmona has applied to theSupreme Court of Victoria for approval of the scheme of arrangement between SPC Ardmona and its shareholders, with the Court hearing scheduledfor Friday, 11 February 2005.
Future developments
In the opinion of the Directors, disclosure of other information regarding likely developments in the operations of the Group and the expected results ofthose operations would prejudice the interests of the Company. Accordingly, this information has not been included in this Report.
Rounding off
The Company is of a kind referred to in the Australian Securities and Investments Commission Class Order No. 98/100 and, in accordance with thisClass Order, amounts in the financial statements and this Report have been rounded off to the nearest tenth of a million dollars.
Signed in accordance with a resolution of the Directors, dated 10th February 2005.
T.J. DavisSydney, 10th day of February 2005

Australia New Zealand Papua New Guinea Fiji South Korea Indonesia
39Annual Report 2004
STATEMENTS OF FINANCIAL PERFORMANCECOCA-COLA AMATIL LIMITED AND ITS CONTROLLED ENTITIES
FOR THE FINANCIAL YEAR ENDED 31 DECEMBER 2004
CCA Group CCA Entity
Refer 2004 2003 2004 2003Note $M $M $M $M
Revenues from ordinary activities – before interest incomeBefore significant items 3,532.8 3,523.8 170.4 270.4Significant items 58.3 – – –
2 3,591.1 3,523.8 170.4 270.4
Expenses from ordinary activities – before borrowing expensesBefore significant items (3,015.2) (3,053.8) (86.8) (71.8)Significant items (57.9) – – –
3 (3,073.1) (3,053.8) (86.8) (71.8)
Earnings before interest and taxBefore significant items 517.6 470.0 83.6 198.6Significant items 0.4 – – –
5 518.0 470.0 83.6 198.6
Net borrowing expensesBorrowing expenses 3 (128.7) (134.0) (96.3) (99.6)Interest income 2 17.7 18.0 57.7 61.0
(111.0) (116.0) (38.6) (38.6)
Profit from ordinary activities before tax 2 & 3 407.0 354.0 45.0 160.0
Income tax expense from ordinary activitiesBefore significant items (128.2) (114.9) (6.2) (17.6)Significant items 4 1.9 (44.6) – (44.6)
4 (126.3) (159.5) (6.2) (62.2)
Net profit 280.7 194.5 38.8 97.8Net profit attributable to outside equity interests (0.4) (0.3)
Net profit attributable to members of Coca-Cola Amatil Limited 21 280.3 194.2 38.8 97.8
Other valuation adjustments recognised directly in equityAdjustment to retained earnings upon adoption of revised
Accounting Standard AASB 1028 “Employee Benefits” 21 – (1.3) – (0.8)Adjustment to revaluation reserve arising from valuation of properties 20 – (21.0) – –Adjustment to revaluation reserve arising from valuation of shares
in controlled entities 20 (25.1) –Net exchange difference on translation of financial statements of
foreign controlled entities 20 52.5 (350.2)
Total adjustments attributable to members ofCoca-Cola Amatil Limited recognised directly in equity 52.5 (372.5) (25.1) (0.8)
Total changes in equity other than those resulting from transactionswith members of Coca-Cola Amatil Limited as owners 21 332.8 (178.3) 13.7 97.0
Earnings per share (EPS) 24 ¢ ¢Basic EPS 39.8 27.9Diluted EPS 39.6 27.7Before significant items –
Basic EPS 39.5 34.3Diluted EPS 39.3 34.1
Notes appearing on pages 42 to 86 to be read as part of the financial statements.

Australia New Zealand Papua New Guinea Fiji South Korea Indonesia
40 Coca-Cola Amatil
STATEMENTS OF FINANCIAL POSITIONCOCA-COLA AMATIL LIMITED AND ITS CONTROLLED ENTITIES
AS AT 31 DECEMBER 2004
CCA Group CCA Entity
Refer 2004 2003 2004 2003Note $M $M $M $M
Current assetsCash assets 6 279.9 260.1 99.4 168.1Receivables 7 517.0 526.1 7.3 20.6Inventories 8 406.4 383.6 – –Prepayments 66.4 73.8 3.6 3.2
Total current assets 1,269.7 1,243.6 110.3 191.9
Non-current assetsReceivables 7 15.6 14.2 1,313.1 1,339.3Cross currency swap receivables relating to interest bearing liabilities 0.2 – – –Investments in securities 9 0.1 0.4 2,909.3 2,934.9Investments in bottlers’ agreements 10 3,332.6 3,278.3 – –Property, plant and equipment 11 1,215.0 1,186.6 0.9 5.6Intangibles 12 6.6 4.5 – –Prepayments 25.9 17.5 – –Future income tax benefits 13 51.4 46.9 36.0 36.4
Total non-current assets 4,647.4 4,548.4 4,259.3 4,316.2
Total assets 5,917.1 5,792.0 4,369.6 4,508.1
Current liabilitiesPayables 14 406.4 379.2 7.9 18.5Interest bearing liabilities 15 451.0 404.6 183.4 349.1Provisions 16 51.7 51.5 13.3 8.0Current income tax liability 126.7 175.0 117.6 169.1Accrued charges 226.3 253.5 20.7 25.4
Total current liabilities 1,262.1 1,263.8 342.9 570.1
Non-current liabilitiesPayables 14 – – 339.9 303.7Interest bearing liabilities 15 1,365.9 1,435.0 865.6 681.3Provisions 16 92.4 83.1 19.7 20.9Deferred income tax liability 17 82.5 88.4 55.1 60.5
Total non-current liabilities 1,540.8 1,606.5 1,280.3 1,066.4
Total liabilities 2,802.9 2,870.3 1,623.2 1,636.5
Net assets 3,114.2 2,921.7 2,746.4 2,871.6
EquityContributed equity 18 1,671.5 1,631.1 1,671.5 1,631.1Reserves 20 (369.2) (419.0) 101.4 126.5Retained earnings 21 1,800.2 1,696.5 973.5 1,114.0
Equity attributable to members of Coca-Cola Amatil Limited 21 3,102.5 2,908.6 2,746.4 2,871.6
Outside equity interests in controlled entitiesContributed equity 3.6 3.6Reserves (11.6) (9.8)Retained earnings 19.7 19.3
Total outside equity interests in controlled entities 11.7 13.1
Total equity 3,114.2 2,921.7 2,746.4 2,871.6
Notes appearing on pages 42 to 86 to be read as part of the financial statements.

Australia New Zealand Papua New Guinea Fiji South Korea Indonesia
41Annual Report 2004
STATEMENTS OF CASH FLOWSCOCA-COLA AMATIL LIMITED AND ITS CONTROLLED ENTITIES
FOR THE FINANCIAL YEAR ENDED 31 DECEMBER 2004
CCA Group CCA Entity
Refer 2004 2003 2004 2003Note $M $M $M $M
Inflows (outflows)
Cash flows from operating activitiesReceipts from customers 3,539.8 3,429.6 – –Receipts from controlled entities for management and guarantee fees 133.0 127.5Payments to suppliers and employees (2,874.2) (2,815.4) (81.1) (67.5)Dividends received 1.5 1.3 31.3 142.9Interest received 17.7 18.0 57.7 60.9Interest and other borrowing expenses paid (127.4) (135.4) (95.0) (101.7)Income tax paid (176.8) (89.8) (53.2) (3.8)
Net cash flows from (used in) operating activities 23 380.6 408.3 (7.3) 158.3
Cash flows from investing activitiesProceeds from –
disposal of a surplus South Korean property 58.3 – – –disposal of other property, plant and equipment 8.2 37.2 – –disposal of Neverfail trademarks – 28.0 – –disposal of investments in securities – – 6.1 –return of contributed equity from controlled entities – 280.7
Payments for –additions of investments in securities – – – (234.6)additions of property, plant and equipment 11 (209.9) (185.4) (0.1) (0.1)acquisitions of entities and operation (net) 33 (44.2) (242.2) – –other non-current assets (0.6) (4.8) – –
Net cash flows from (used in) investing activities (188.2) (367.2) 6.0 46.0
Cash flows from financing activitiesProceeds from issue of shares 31.0 20.9 31.0 20.9Proceeds from borrowings 397.1 671.1 386.0 273.2Borrowings repaid (134.2) (806.0) (67.4) (545.2)Net increase in intragroup loans – – 52.9 27.5Dividends paid 22 (169.9) (133.9) (169.9) (133.9)
Net cash flows from (used in) financing activities 124.0 (247.9) 232.6 (357.5)
Net increase (decrease) in cash held 316.4 (206.8) 231.3 (153.2)Cash held (deficit) at the beginning of the financial year (40.1) 194.5 (131.9) 21.3Exchange rate adjustments to cash held at the beginning of
the financial year 2.8 (27.8) – –
Cash held (deficit) at the end of the financial year 23 279.1 (40.1) 99.4 (131.9)
Notes appearing on pages 42 to 86 to be read as part of the financial statements.

Australia New Zealand Papua New Guinea Fiji South Korea Indonesia
42 Coca-Cola Amatil
NOTES TO THE FINANCIAL STATEMENTSCOCA-COLA AMATIL LIMITED AND ITS CONTROLLED ENTITIES
FOR THE FINANCIAL YEAR ENDED 31 DECEMBER 2004
1. Statement of Accounting Policies
This financial report is a general purpose financial report which has been prepared in accordance with the Corporations Act 2001 which includesapplicable Accounting Standards, Urgent Issues Group Consensus Views and other authoritative pronouncements of the Australian AccountingStandards Board. A summary of the significant accounting policies adopted by the Group (Coca-Cola Amatil Limited and its controlled entities or CCA Group) in the preparation of this financial report is set out below. These policies have been consistently applied apart from the changesdescribed in Note 1b) below.
a) Historical costThese financial statements have been prepared on the basis of historical cost and, except where otherwise stated, do not account for changing moneyvalues or valuations of non-current assets.
b) Changes in accounting policiesThe accounting policies adopted are consistent with those of the previous financial year, with the exception of –
The Group has adopted the following change in accounting policy on returnable containers.
In the past returnable containers were reported as current assets held at deposit value. The excess cost over deposit value was reported as non-currentassets. Given the nature of these assets, it has been decided to reclassify these assets totally as non-current assets. The returnable containers remainthe property of the Group throughout their useful life. The life of the assets has been determined to be longer than one year.
The containers will be sold and returned a number of times during their life that is greater than one year. Accordingly, returnable containers arerecognised as non-current assets and fully depreciated over their estimated useful life.
No change to the net profit reported resulted. The financial impact of the change in the current year has resulted in a reclassification within theStatements of Financial Position and disclosure of the depreciation expense. Comparative information has been restated to reflect this change.
c) Principles of consolidationThe consolidated financial statements of the CCA Group include the parent entity, Coca-Cola Amatil Limited (CCA Entity or the Company) and itscontrolled entities. A list of controlled entities is contained in Note 32.
The financial statements include the information and results of each controlled entity from the date on which the Company obtains control and untilsuch time as the Company ceases to control the entity.
In preparing the consolidated financial statements, the effects of all transactions between entities in the Group have been eliminated.
d) Foreign currency translationsTransactions in overseas currencies are converted to Australian currency at the rate of exchange ruling at the date of each transaction. Foreign currencyitems in the Statements of Financial Position are converted at the rate of exchange ruling at balance date. Exchange rate gains or losses are brought toaccount in determining the net profit or loss in the period in which they arise, as are exchange gains or losses relating to cross currency swaptransactions on monetary items.
Exchange differences relating to hedges of specific transactions in respect of the cost of inventories or other assets, to the extent that they occurbefore the date of receipt, are deferred and included in the measurement of the transaction. Exchange differences relating to other hedge transactionsare brought to account in determining the net profit or loss in the period in which they arise.
Foreign controlled entities are considered self-sustaining. Assets and liabilities are translated by applying the rate ruling at balance date and revenueand expense items are translated at the average rate calculated for the period. Exchange rate differences are taken to the foreign currency translationreserve.
e) Cash and cash equivalentsFor the purposes of the Statements of Cash Flows, cash includes cash on hand and in banks and investments in money market instruments, net of bankoverdrafts and call deposits (included in loans).
f) Recoverability of receivablesA provision against debtors is raised where the collection of the full amount of the debt is no longer probable. Bad debts are written off as incurred.
g) InventoriesAs a general principle, inventories are valued at the lower of cost (including fixed and variable factory overheads where applicable) and net realisablevalue. Cost is determined on the basis of first-in-first-out, average or standard, whichever is the most appropriate in each case.

Australia New Zealand Papua New Guinea Fiji South Korea Indonesia
43Annual Report 2004
h) Leased assetsFinance leases are those which effectively transfer from the lessor to the lessee substantially all the risks and benefits incidental to ownership of theleased property. There are no material finance leases within the Group.
Operating leases are those where the lessor effectively retains substantially all the risks and benefits incidental to ownership of the leased property.
Operating lease payments are charged against profits as incurred. Disclosure of the relevant details of operating leases is contained in Notes 3 and 26.
i) Valuation of non-current assetsi) PropertyFreehold and leasehold properties are measured on a fair value basis. This class of assets is independently valued at three yearly intervals. At eachreporting date, the carrying amount of each asset in this class of assets is reviewed to ensure that the total carrying amount for this class does notdiffer materially from the total fair value of the class at that date.
Provisions for material amounts of capital gains tax are made in respect of the revalued properties were they to be sold at balance date at their fairvalues.
ii) Plant and equipmentPlant and equipment are carried at cost.
iii) Investments in bottlers’ agreementsInvestments in bottlers’ agreements are carried at cost. As more fully described in Note 10, bottlers’ agreements document the relationship betweenThe Coca-Cola Company and the CCA Group in relation to individual geographic markets. For the reasons described in Note 10, no amortisation isprovided against the carrying value of these assets.
iv) Investments in securitiesShares in non-related entities are carried at cost. Shares in controlled entities, as recorded in the CCA Entity accounts, are carried at cost.
A provision for diminution in value is only made where the diminution is regarded as being other than temporary.
v) Revaluation reserveThe revaluation reserve is used to record increments and decrements in the fair value of property assets.
j) Depreciation and amortisation of non-current assetsNon-current assets are depreciated or amortised over the useful life of each asset where the amount charged would be material. Where assets havebeen revalued, depreciation or amortisation is charged on the adjusted amount.
Property, plant and equipment, other than freehold land, are depreciated or amortised on a straight line basis at various rates dependent upon theestimated average useful life for that asset to the Group. The estimated useful lives of each class of asset are as follows –
Freehold and leasehold buildings 20 to 50 years Goodwill 12 yearsPlant and equipment 3 to 15 years Trademarks 20 years
Customer lists 10 years
k) Recoverable amountNon-current assets measured on the cost basis are carried at an amount that does not exceed their recoverable amount. Where carrying values exceedthis recoverable amount, assets are written down. The recoverable amount is the amount expected to be recovered through the cash inflows andoutflows arising from the continued use of the assets and their subsequent disposal.
l) PayablesLiabilities are brought to account for amounts payable in relation to goods received and services rendered, whether or not billed to the Group at thereporting date. Terms of trade in relation to payables average 30 to 60 days; however, these terms vary by country.
m) Income taxTax effect accounting principles are observed by the Group whereby income tax expense for the period is matched with the pre tax result adjusted forpermanent differences. The account deferred income tax liability records the income tax effect of items which will cause taxable income to be higherthan book profits in the future and the account future income tax benefits records the income tax effect of items which will cause taxable income to be lower than book profits in the future.
Withholding tax and Australian tax payable upon the distribution of overseas earnings have been provided to the extent the earnings are planned to be remitted.
1. Statement of Accounting Policies continued

Australia New Zealand Papua New Guinea Fiji South Korea Indonesia
44 Coca-Cola Amatil
NOTES TO THE FINANCIAL STATEMENTS continuedCOCA-COLA AMATIL LIMITED AND ITS CONTROLLED ENTITIES
FOR THE FINANCIAL YEAR ENDED 31 DECEMBER 2004
n) Provision for dividendDividends payable are recognised when an obligation to pay a dividend arises, following declaration of dividends by the Company’s Board of Directors.
o) Employee benefitsProvision is made for employee benefits accumulated as a result of employees rendering services up to balance date including related on-costs. The benefits include wages and salaries, incentives, compensated absences and other benefits, which are charged against profits in their respectiveexpense categories when services are provided or benefits vest with the employee. The provision for employee benefits is measured at the remunerationrates expected to be paid when the liability is settled. Benefits (apart from annual leave) expected to be settled after 12 months from the reportingdate are measured at the present value of the estimated future cash outflows to be made in respect of services provided by employees up to thereporting date.
Employer contributions to the Employees Share Plan and the Long Term Incentive Share Plan as described in Note 19, are charged as an employeebenefit expense as incurred. No expenses are recorded in respect of the Executive Option Plan.
Employer contributions made to defined benefit superannuation funds are charged against profits as incurred. The amount charged against profits isdisclosed in Note 3. Supplementary contribution amounts accrued to fund deficits are included in the Statements of Financial Position under theaccount accrued charges.
p) Contributed equityIssued and paid up capital is recognised at the fair value of the consideration received by the Company.
q) RevenueRevenue is recognised to the extent that it is probable that economic benefits will flow to the Group, at the point where a right to consideration orcompensation has been established and where the amount of the revenue can be reliably measured.
Terms of trade in relation to credit sales average between 30 to 45 days from the date of invoice. The Group operates in a number of diverse markets,and accordingly the terms of trade vary by country.
Revenue is recognised net of the applicable amounts of value added taxes such as Australian goods and services tax.
r) Derivative financial instrumentsThe Group enters into derivative transactions in order to manage significant financial risks from movements in interest rates, foreign exchange ratesand commodity prices. Derivative transactions are not entered into for speculative purposes.
i) Interest rate derivativesInterest payments and receipts arising from interest rate derivatives are recognised on an accrual basis as an adjustment to interest expense duringthe period. The premiums paid or received and any realised costs or benefits are amortised over the term of the agreement, as are gains and lossesassociated with financial futures.
ii) Foreign exchange derivativesCosts and benefits arising from foreign exchange derivatives for expense and revenue transactions are brought to account in the Statements ofFinancial Performance over the term of the agreement. For transactions to hedge specific capital or borrowing requirements, any costs or benefitsresulting from the agreement forms part of the initial asset or liability carrying value.
iii) Commodity derivativesThe use of commodity derivatives gives rise to gains and losses on revaluation of the contract. These gains and losses are brought to account in thecost price of the commodity within the period the underlying transaction is being recorded.
s) Earnings per shareBasic EPS is calculated as net profit attributable to members of the Company divided by the weighted average number of ordinary shares, adjusted forany bonus element.
Diluted EPS is calculated as net profit attributable to members of the Company divided by the weighted average number of ordinary shares and dilutivepotential ordinary shares, adjusted for any bonus element.
1. Statement of Accounting Policies continued

Australia New Zealand Papua New Guinea Fiji South Korea Indonesia
45Annual Report 2004
CCA Group CCA Entity
Refer 2004 2003 2004 2003Note $M $M $M $M
2. Revenues from Ordinary Activities
Sales of beverages 3,449.6 3,357.1 – –
Other revenueFrom operating activities
Sales of materials 51.5 79.1 – –Rendering of services 3.4 3.4 – –Rental and other trading revenue 18.6 16.0 – –
From non-operating activitiesManagement and guarantee fees from controlled entities 37 133.0 127.5Dividend income from –
controlled entities 37 31.3 142.9other corporations 1.5 1.3 – –
Proceeds from disposal of –a surplus South Korean property 58.3 – – –other property, plant and equipment 8.2 38.9 – –investments in securities – – 6.1 –Neverfail trademarks – 28.0 – –
Total revenues – before interest income 3,591.1 3,523.8 170.4 270.4
Interest income from non-operating activities –controlled entities 37 50.9 55.0non-related parties 17.7 18.0 6.8 6.0
Total interest income from non-operating activities 17.7 18.0 57.7 61.0
Total revenues 3,608.8 3,541.8 228.1 331.4
Significant items included in total revenuesProceeds from disposal of a surplus South Korean property 58.3 – – –

Australia New Zealand Papua New Guinea Fiji South Korea Indonesia
46 Coca-Cola Amatil
NOTES TO THE FINANCIAL STATEMENTS continuedCOCA-COLA AMATIL LIMITED AND ITS CONTROLLED ENTITIES
FOR THE FINANCIAL YEAR ENDED 31 DECEMBER 2004
CCA Group CCA Entity
Refer 2004 2003 2004 2003Note $M $M $M $M
3. Profit from Ordinary Activities
Profit from ordinary activities before tax has been arrived atafter including –
a) ExpensesCost of goods sold 1,866.2 1,910.9 – –Selling 545.5 518.9 – –Warehousing and distribution 339.4 324.5 – –Administration and other 322.0 271.5 86.8 71.8Investing1 – 28.0 – –
Total expenses – before borrowing expenses 3,073.1 3,053.8 86.8 71.8
Borrowing expensesInterest expense –
controlled entities 37 24.2 22.3non-related parties 126.8 134.4 72.1 77.3
Other borrowing (gains) losses 1.9 (0.4) – –
Total borrowing expenses 128.7 134.0 96.3 99.6
Total expenses 3,201.8 3,187.8 183.1 171.4
b) Significant items included in total expensesCarrying amount of a surplus South Korean property
including related costs 23.1 – – –Rationalisation of certain non-profitable cold drink equipment in
South Korea 23.6 – – –Rationalisation of returnable containers and deposits in
Indonesia and South Korea 11.2 – – –
57.9 – – –
1 The prior year amount represents the fair value of the Neverfail trademarks.

Australia New Zealand Papua New Guinea Fiji South Korea Indonesia
47Annual Report 2004
CCA Group CCA Entity
2004 2003 2004 2003$M $M $M $M
3. Profit from Ordinary Activities continued
Profit from ordinary activities before tax has been arrived atafter including –
c) Other itemsAmortisation expense
Goodwill 2.6 1.0 – –Trademarks 0.8 0.7 – –
Total amortisation expense 3.4 1.7 – –
Depreciation expenseBuildings 6.2 9.2 – –Plant and equipment1 150.9 159.7 0.7 1.7
Total depreciation expense 157.1 168.9 0.7 1.7
Bad and doubtful debts expenseTrade debtors 2.4 1.7 – –Other debtors – (0.4) – –
Total bad and doubtful debts expense 2.4 1.3 – –
Rentals – operating leases 37.2 40.1 1.6 1.6Defined benefit superannuation plan contributions 13.6 27.1 3.2 1.3Employees Share Plan expenses 5.3 4.9 1.0 0.8Foreign exchange gains (1.9) (4.8) (0.8) (5.8)Write down of inventories to net realisable value 0.6 1.1 – –Write down of investments to recoverable amounts 0.3 0.3 – –(Profit) loss from disposal of –
a surplus South Korean property2 (35.2) – – –other property, plant and equipment 13.5 5.4 4.1 2.7investments in securities – – (5.6) –
Rationalisation of certain non-profitable cold drink equipment in South Korea 23.6 – – –
Rationalisation of returnable containers and deposits inIndonesia and South Korea 11.2 – – –
1 Includes depreciation expense on returnable containers, (previously classified as inventories). In 2004, depreciation expense on returnable containers totalled $24.5 million(the comparative has been adjusted by $25.4 million to include depreciation expense on returnable containers).
2 This amount is derived from significant items included in total revenues and expenses from ordinary activities.

Australia New Zealand Papua New Guinea Fiji South Korea Indonesia
48 Coca-Cola Amatil
NOTES TO THE FINANCIAL STATEMENTS continuedCOCA-COLA AMATIL LIMITED AND ITS CONTROLLED ENTITIES
FOR THE FINANCIAL YEAR ENDED 31 DECEMBER 2004
CCA Group CCA Entity
Refer 2004 2003 2004 2003Note $M $M $M $M
4. Income Tax Expense from Ordinary Activities
The prima facie income tax expense reconciles to income tax provided as follows –
Prima facie income tax expense on profit from ordinary activitiesat the Australian rate of 30% 122.1 106.2 13.5 48.0
Tax effect of permanent differences –Non-allowable expenses 5.1 4.2 1.8 0.5Non-assessable dividends – – – (18.0)Exempt dividends – – (9.4) (24.9)Investment incentives – (3.9) – –Other items (1.0) 3.5 (2.4) 5.3
Overseas tax rates differential 2.0 1.5 – –Overseas withholding tax 9.5 7.1 9.4 6.9Amounts not recorded in future income tax benefits (3.1) (2.5) – –Amounts (over) under provided in prior years (8.3) (1.2) (2.7) 5.8Current income tax expense on profits from the other members
of the tax consolidated group – – 90.3 74.9Tax funding contributions from other members of the tax
consolidated group – – (94.3) (80.9)Settlement with the Australian Taxation Office regarding
CCA’s European operations1 – 44.6 – 44.6
Income tax expense from ordinary activities 126.3 159.5 6.2 62.2
Income tax expense from ordinary activities comprises –Income tax expense before significant items 128.2 114.9 6.2 17.6Significant items (1.9) 44.6 – 44.6
126.3 159.5 6.2 62.2
Income tax expense comprises –Current income tax liability 133.9 161.5 9.6 63.4Current movement in future income tax benefits 13 (4.1) (1.6) 2.2 1.6Current movement in deferred income tax liability 17 (3.5) (0.4) (5.6) (2.8)
126.3 159.5 6.2 62.2
1 In the prior period, Coca-Cola Amatil Limited (CCA) reached a settlement with the Australian Taxation Office over all matters pertaining to disputes with respect to thedemerger of CCA’s European operations in 1998. The effect was recorded as a significant item of $50.0 million ($44.6 million tax expense) and was paid in March 2004.

49Annual Report 2004
Australia New Zealand Papua New Guinea Fiji South Korea Indonesia
2004 2003 2004 2003 2004 2003 2004 2003$M $M $M $M $M $M $M $M
5. Financial Reporting by Geographic Segments
Revenue from Total revenues sales of beverages Other revenue Significant items before interest income
Australia 2,041.1 1,882.9 15.8 40.1 – – 2,056.9 1,923.0Oceania1 503.5 484.3 1.5 2.4 – – 505.0 486.7South Korea 561.5 612.5 8.2 40.1 58.3 – 628.0 652.6Indonesia 343.5 377.4 6.9 6.1 – – 350.4 383.5Other2 – – 50.8 78.0 – – 50.8 78.0
CCA Group 3,449.6 3,357.1 83.2 166.7 58.3 – 3,591.1 3,523.8
Earnings before Segment result –interest, tax and earnings before significant items Significant items3 interest and tax
Australia 431.9 377.7 – – 431.9 377.7Oceania1 90.5 82.3 – – 90.5 82.3South Korea 4.0 14.2 6.7 – 10.7 14.2Indonesia 23.7 22.1 (6.3) – 17.4 22.1Other2 (32.5) (26.3) – – (32.5) (26.3)
CCA Group 517.6 470.0 0.4 – 518.0 470.0
Assets Liabilities Net assets
Australia 3,586.4 3,494.9 389.1 397.0 3,197.3 3,097.9Oceania1 668.8 626.2 82.6 88.9 586.2 537.3South Korea 899.0 845.3 114.0 93.9 785.0 751.4Indonesia 386.7 466.0 110.3 113.4 276.4 352.6Other2 43.8 51.7 71.0 65.6 (27.2) (13.9)
Total segments 5,584.7 5,484.1 767.0 758.8 4,817.7 4,725.3Assets and liabilities
excluded from above4 332.4 307.9 2,035.9 2,111.5 (1,703.5) (1,803.6)
CCA Group 5,917.1 5,792.0 2,802.9 2,870.3 3,114.2 2,921.7
Additions and Depreciation and Other non-cash acquisitions of
amortisation expense5 expenses non-current assets6
Australia 75.5 73.2 23.4 30.5 166.4 399.9Oceania1 19.6 18.8 4.5 4.4 26.9 28.5South Korea 27.3 35.0 19.5 17.4 30.9 28.9Indonesia 37.5 42.0 11.3 13.4 23.4 31.3Other2 0.6 1.6 14.3 8.4 0.1 –
CCA Group 160.5 170.6 73.0 74.1 247.7 488.6
1 The Oceania segment comprises New Zealand, Papua New Guinea and Fiji operations.2 Other includes corporate and unallocated.3 Significant items include the following – 2004
$MProfit from disposal of a surplus South Korean property 35.2Rationalisation of certain non-profitable cold drink equipment in South Korea (23.6)Rationalisation of returnable containers and deposits in Indonesia and South Korea (11.2)
0.44 Assets and liabilities shown against each segment exclude future income tax benefits, tax liabilities and assets and liabilities which relate to the Group’s financing activity.5 Includes depreciation expense on returnable containers, (previously classified as inventories). In 2004, depreciation expense on returnable containers totalled $24.5 million
(the comparative has been adjusted by $25.4 million to include depreciation expense on returnable containers).6 Non-current assets comprise investments in securities, investments in bottlers’ agreements, property, plant and equipment and intangibles for this disclosure.
The comparatives have been restated as outlined in the change in accounting policy Note 1b).The Group operates in one business segment being the beverage industry within which it manufactures, distributes and markets carbonated soft drinks, still and mineral waters, fruit juices and other alcohol-free beverages.

Australia New Zealand Papua New Guinea Fiji South Korea Indonesia
50 Coca-Cola Amatil
NOTES TO THE FINANCIAL STATEMENTS continuedCOCA-COLA AMATIL LIMITED AND ITS CONTROLLED ENTITIES
FOR THE FINANCIAL YEAR ENDED 31 DECEMBER 2004
CCA Group CCA Entity
Refer 2004 2003 2004 2003Note $M $M $M $M
6. Cash Assets
Cash on hand and in banks 152.2 127.4 60.0 78.7Short term deposits 127.7 132.7 39.4 89.4
Total cash assets 279.9 260.1 99.4 168.1
7. Receivables
CurrentAmounts receivable (controlled entities) 37 3.1 3.8Trade debtors 440.9 444.0 – –Provision against trade debtors (3.3) (4.3) – –Trade debtors (related entities) 37 0.9 5.3 – –Other debtors 52.2 66.3 3.8 16.2Provision against other debtors – (0.1) – –Other debtors (related entities) 37 26.3 14.9 0.4 0.6
Total receivables (current) 517.0 526.1 7.3 20.6
Non-currentAmounts receivable (controlled entities) 37 1,313.1 1,339.3Other debtors 15.6 14.2 – –
Total receivables (non-current) 15.6 14.2 1,313.1 1,339.3
8. Inventories
Raw materials at cost 197.8 194.0 – –Provision against raw materials (0.1) (1.2) – –
197.7 192.8 – –
Finished goods at cost 143.5 113.1 – –Provision against finished goods (0.7) (1.2) – –
142.8 111.9 – –
Other inventories at cost 49.1 43.1 – –Provision against other inventories (0.3) (1.0) – –
48.8 42.1 – –
Properties held for sale 17.1 36.8 – –
Total inventories 406.4 383.6 – –

Australia New Zealand Papua New Guinea Fiji South Korea Indonesia
51Annual Report 2004
CCA Group CCA Entity
2004 2003 2004 2003$M $M $M $M
9. Investments in Securities
Shares in controlled entities at cost 2,909.3 2,934.9Shares in non-related entities at cost 4.0 4.1 – –Provision against investments (3.9) (3.7) – –
Total investments in securities 0.1 0.4 2,909.3 2,934.9
10. Investments in Bottlers’ Agreements
Investments in bottlers’ agreements at cost 3,332.6 3,278.3 – –
The bottlers’ agreements reflect a long and ongoing relationship between the Group and The Coca-Cola Company (TCCC). At 31 December 2004, therewere thirteen agreements throughout the Group at varying stages of their, mainly, ten year terms. These agreements are all on substantially the sameterms and conditions, with performance obligations as to production, distribution and marketing and include provisions for renewal. All of the Group’spresent bottlers’ agreements, the first of which was issued in 1939, that have expired have been renewed at expiry of their legal terms. No considerationis payable upon renewal.
In accordance with Accounting Standard AASB 1010 “Recoverable Amount of Non-Current Assets”, Directors have reviewed valuations to ensure thatthe carrying values of investments in bottlers’ agreements do not exceed their recoverable amounts. The valuations are determined using a discountedcash flow methodology covering a fifteen year period with an appropriate residual value at the end of that period, for each country in which CCAoperates. The methodology utilises cash flow forecasts that are based primarily on business plans presented to and agreed by the Directors. Theforecasts represent the cash flows (subject to the uncertainty of future events) that CCA expects to generate from its rights to manufacture, distributeand market the products of TCCC. The use of a fifteen year period reflects the long and ongoing relationship between CCA and TCCC and the pastpractice, by TCCC, of renewing all agreements as and when they expire. The discount rates used in the valuations are the risk adjusted weightedaverage cost of capital (after tax) for CCA in each country.
The Directors also give due consideration to the Group’s history of dealings with TCCC, established international practice of that company, TCCC’s equityin the Group, the participation of nominees of TCCC on the Company’s Board of Directors and the ongoing strength of TCCC brands. In the light of allthese considerations, the Directors cannot identify any factor that would result in the agreements not being renewed at the end of their legal terms thatwould therefore affect the useful life of the agreements.
In accordance with Accounting Standard AASB 1021 “Depreciation”, no amortisation is provided against the carrying value of the assets. The Directorsbelieve that the life of the assets is of such duration and their residual value would be such that the amortisation charge, if any, would not be material.
CCA Group CCA Entity
2004 2003 2004 2003$M $M $M $M
11. Property, Plant and Equipment
Freehold and leasehold properties at fair value1 404.3 370.4 – –Provision for depreciation and amortisation (9.6) (2.5) – –
Total property 394.7 367.9 – –
Plant and equipment at cost 1,916.9 1,780.2 3.7 13.2Provision for depreciation (1,152.7) (1,027.5) (2.8) (7.6)
Total plant and equipment 764.2 752.7 0.9 5.6
Buildings, plant and equipment under construction at cost 56.1 66.0 – –
Total property, plant and equipment 1,215.0 1,186.6 0.9 5.6
1 The fair values of the Group’s freehold and leasehold properties have been based upon independent valuations obtained in 2003 and reviewed at balance date, havingregard to prevailing circumstances. Such valuations apply the open market value basis, being the amounts for which a property should exchange on the date of valuationbetween a willing buyer and a willing seller in an arms length transaction after proper marketing wherein the parties had each acted knowledgeably, prudently andwithout compulsion, assuming vacant possession.

Australia New Zealand Papua New Guinea Fiji South Korea Indonesia
52 Coca-Cola Amatil
NOTES TO THE FINANCIAL STATEMENTS continuedCOCA-COLA AMATIL LIMITED AND ITS CONTROLLED ENTITIES
FOR THE FINANCIAL YEAR ENDED 31 DECEMBER 2004
Buildings,plant and Total
equipment property,Plant and under plant and
Refer Property Equipment1 construction equipmentNote $M $M $M $M
11. Property, Plant and Equipment continued
Movement in property, plant and equipment for the year –
CCA GroupBalance at the beginning of the financial year1 367.9 752.7 66.0 1,186.6Additions2 5.2 139.8 64.9 209.9Disposals (1.9) (43.4) – (45.3)Acquisitions of entities and operation 33 1.2 26.8 – 28.0Depreciation expense (6.2) (150.9) – (157.1)Net foreign currency movements 9.1 (1.9) (0.3) 6.9Transfers from buildings, plant and equipment under construction 18.0 56.5 (74.5) –Transfers from (to) other non-current assets 1.4 (15.4) – (14.0)
Closing balance 394.7 764.2 56.1 1,215.0
CCA EntityBalance at the beginning of the financial year – 5.6 – 5.6Additions – 0.1 – 0.1Disposals – (4.1) – (4.1)Depreciation expense – (0.7) – (0.7)
Closing balance – 0.9 – 0.9
1 Beginning balance of plant and equipment has been increased by $89.9 million as a result of reclassification of returnable containers from inventories as outlined in thechange in accounting policy Note 1b).
2 Includes $20.2 million of returnable containers. Prior year additions of returnable containers totalled $24.0 million.
CCA Group CCA Entity
2004 2003 2004 2003$M $M $M $M
12. Intangibles
Customer lists at cost 1.6 – – –
Goodwill at cost 19.0 15.7 – –Provision for amortisation (15.6) (12.9) – –
3.4 2.8 – –
Trademarks at cost 9.0 8.3 – –Provision for amortisation (7.4) (6.6) – –
1.6 1.7 – –
Total intangibles 6.6 4.5 – –

Australia New Zealand Papua New Guinea Fiji South Korea Indonesia
53Annual Report 2004
CCA Group CCA Entity
Refer 2004 2003 2004 2003Note $M $M $M $M
13. Future Income Tax Benefits
Balance at the beginning of the financial year 46.9 40.7 36.4 16.9Current movement 4 4.1 1.6 (2.2) (1.6)Acquisitions of entities and operation 33 0.4 6.2 – –Transferred balances from controlled entities within tax
consolidated group – – – 20.8Other – (1.6) 1.8 0.3
Closing balance 51.4 46.9 36.0 36.4
Amounts attributable to tax losses included above – 0.2 – –
Amounts not recognised in respect of tax losses and capital lossesbecause recovery is not virtually certain1 306.5 298.8 295.1 290.2
1 The unrecognised benefits will only be obtained if the relevant entities derive future assessable income and capital gains of an amount sufficient to enable the benefitfrom deductions to be realised, the conditions for deductibility imposed by the law continue to be complied with, and no changes in tax legislation adversely affect therelevant entities in realising the benefit.
CCA Group CCA Entity
Refer 2004 2003 2004 2003Note $M $M $M $M
14. Payables
CurrentAmounts payable (controlled entities) 37 0.2 –Trade creditors 218.0 224.7 7.6 18.4Trade creditors (related entities) 37 161.7 147.9 – –Other creditors 26.7 6.6 0.1 0.1
Total payables (current) 406.4 379.2 7.9 18.5
Non-currentAmounts payable (controlled entities) 37 339.9 303.7
Total payables (non-current) 339.9 303.7
15. Interest Bearing Liabilities
CurrentBonds 326.2 37.4 140.8 37.4Loans 0.2 300.0 – 300.0Bank loans 50.3 55.3 – –Bank overdrafts 0.6 0.2 – –Cross currency swaps relating to interest bearing liabilities 73.7 11.7 42.6 11.7
Total interest bearing liabilities (current) 36 451.0 404.6 183.4 349.1
Non-currentBonds 1,026.5 992.6 723.8 521.2Bank loans 184.9 228.0 – –Cross currency swaps relating to interest bearing liabilities 154.5 214.4 141.8 160.1
Total interest bearing liabilities (non-current) 36 1,365.9 1,435.0 865.6 681.3
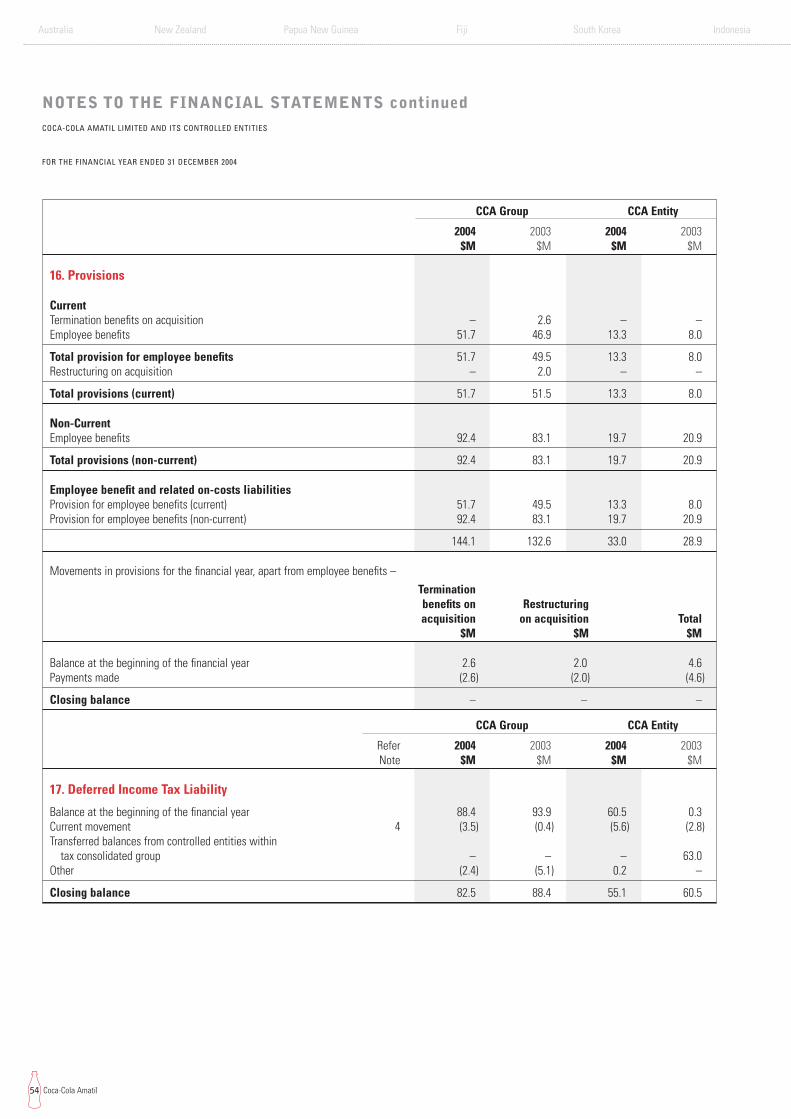
Australia New Zealand Papua New Guinea Fiji South Korea Indonesia
54 Coca-Cola Amatil
CCA Group CCA Entity
2004 2003 2004 2003$M $M $M $M
16. Provisions
CurrentTermination benefits on acquisition – 2.6 – –Employee benefits 51.7 46.9 13.3 8.0
Total provision for employee benefits 51.7 49.5 13.3 8.0Restructuring on acquisition – 2.0 – –
Total provisions (current) 51.7 51.5 13.3 8.0
Non-CurrentEmployee benefits 92.4 83.1 19.7 20.9
Total provisions (non-current) 92.4 83.1 19.7 20.9
Employee benefit and related on-costs liabilitiesProvision for employee benefits (current) 51.7 49.5 13.3 8.0Provision for employee benefits (non-current) 92.4 83.1 19.7 20.9
144.1 132.6 33.0 28.9
Movements in provisions for the financial year, apart from employee benefits –
Terminationbenefits on Restructuringacquisition on acquisition Total
$M $M $M
Balance at the beginning of the financial year 2.6 2.0 4.6Payments made (2.6) (2.0) (4.6)
Closing balance – – –
CCA Group CCA Entity
Refer 2004 2003 2004 2003Note $M $M $M $M
17. Deferred Income Tax Liability
Balance at the beginning of the financial year 88.4 93.9 60.5 0.3Current movement 4 (3.5) (0.4) (5.6) (2.8)Transferred balances from controlled entities within
tax consolidated group – – – 63.0Other (2.4) (5.1) 0.2 –
Closing balance 82.5 88.4 55.1 60.5
NOTES TO THE FINANCIAL STATEMENTS continuedCOCA-COLA AMATIL LIMITED AND ITS CONTROLLED ENTITIES
FOR THE FINANCIAL YEAR ENDED 31 DECEMBER 2004

Australia New Zealand Papua New Guinea Fiji South Korea Indonesia
55Annual Report 2004
CCA Group CCA Entity
Refer 2004 2003 2004 2003Note $M $M $M $M
18. Contributed Equity
IssuedFully paid ordinary shares 1,627.8 1,587.4 1,627.8 1,587.4Fully paid non-participating shares 43.7 43.7 43.7 43.7
Total contributed equity 1,671.5 1,631.1 1,671.5 1,631.1
Balance at the beginning of the financial year 1,587.4 1,557.9 1,587.4 1,557.9
Movement in fully paid ordinary shares for the financial year –Shares issued in respect of –
Dividend Reinvestment Plan 23 9.4 8.6 9.4 8.6Employees Share Plan 19 1.3 4.5 1.3 4.5Executive Option Plan 19 29.7 16.4 29.7 16.4
Total movement 21 40.4 29.5 40.4 29.5
Closing balance 1,627.8 1,587.4 1,627.8 1,587.4
2004 2003Share issues No. No.
Opening number of shares 699,473,202 692,442,082
Movement in issued ordinary shares for the financial year –Shares issued in respect of –
Dividend Reinvestment Plan 1,441,741 1,585,573Employees Share Plan 19 210,484 779,247Executive Option Plan 19 6,564,330 4,666,300
Total movement 8,216,555 7,031,120
Closing number of shares 707,689,757 699,473,202
Non-participating sharesNon-participating shares have no rights other than a right to a return of capital of $1 per share on a winding-up of the Company, but only after ordinaryshareholders have received a return of capital of 50¢ plus $1.0 million in respect of each ordinary share. Consequently, these shares have effectively no value.

Australia New Zealand Papua New Guinea Fiji South Korea Indonesia
56 Coca-Cola Amatil
NOTES TO THE FINANCIAL STATEMENTS continuedCOCA-COLA AMATIL LIMITED AND ITS CONTROLLED ENTITIES
FOR THE FINANCIAL YEAR ENDED 31 DECEMBER 2004
18. Contributed Equity continued
Dividend Reinvestment PlanFor the financial year ended 31 December 2004, the Dividend Reinvestment Plan provides shareholders with the opportunity to receive fully paid ordinaryshares, in lieu of cash dividends, at a discount of 5% from market price at time of issue. Market price is the weighted average price of a specified tenday period prior to issue. Participation in the Plan is capped to 50,000 shares per beneficial shareholder.Details of shares issued under the Plan during the financial year are as follows –
2004 2003
Shares issued Issue price Proceeds Shares issued Issue price ProceedsNo. $ $M No. $ $M
March 771,941 6.23 4.8 916,467 5.45 5.0October 669,800 6.81 4.6 669,106 5.39 3.6
Total 1,441,741 9.4 1,585,573 8.6
Share and option transactions since the end of the financial year
Fully paid ordinary shares issued since the end of the financial year –
No.
Issued under the Employees Share Plan –Options exercised under the Executive Option Plan 1,141,363
Total 1,141,363
No options have been issued since the end of the financial year. At the date of signing this financial report, 12,862,492 unissued ordinary shares remain under option.
19. Employee Ownership Plans
The Company has five share and option plans available for employees and Directors of the Group: the Employees Share Plan; the Executive Option Plan;the Long Term Incentive Share Plan; the Non-executive Directors’ Share Plan; and the Executive Salary Sacrifice Share Plan. Fully paid ordinary sharesissued under these plans rank equally with all other existing fully paid ordinary shares, in respect of voting and dividends rights and future bonus andrights issues.
Employees Share PlanThe Employees Share Plan provides employees with an opportunity to contribute up to 3% of their salary to acquire shares in the Company. The Plan isadministered by a trustee who acquires (and holds in trust) shares for the benefit of participants. These shares are acquired through issues of shares tothe trustee (issue price is the weighted average price of a specified five day period prior to issue) or are purchased on market at the prevailing marketprice, shares that have been forfeited under the terms of the Plan are also utilised. For every share acquired with amounts contributed by eachparticipant, a matching share is acquired by the trustee. These matching shares, which under normal circumstances vest with the employee after aperiod of two years from their date of issue, are acquired with contributions made by the employing entities. Vesting of matching shares with employeesdoes not involve any performance hurdles.
Members of the Plan receive dividends for all shares held on their behalf by the trustee.
As at the end of the financial year, the total number of employees eligible to participate in the Plan was 16,308 (2003: 15,939).
Details of shares issued under the Plan during the financial year are as follows –
2004 2003
Shares issued Issue price Proceeds Shares issued Issue price ProceedsNo. $ $M No. $ $M
January 152,284 6.33 1.0 203,677 5.46 1.1March 34,000 6.60 0.2 – – –April 24,200 6.75 0.1 – – –June – – – 84,664 5.44 0.5September – – – 153,014 5.67 0.9October – – – 89,000 5.70 0.5December – – – 248,892 6.05 1.5
Total 210,484 1.3 779,247 4.5

Australia New Zealand Papua New Guinea Fiji South Korea Indonesia
57Annual Report 2004
19. Employee Ownership Plans continued
Employees Share Plan continued
Details of the movements in share balances under the Plan during the financial year are as follows –
Employee Matching Reserve Totalshares shares shares shares
No. No. No. No.
Opening number of shares 3,517,376 3,517,376 9,527 7,044,279Purchased 673,161 606,855 – 1,280,016Issued to the Plan 134,342 76,142 – 210,484Utilised from reserves – 124,506 (124,506) –Distributed to employees (562,261) (434,385) – (996,646)Forfeited – (127,876) 127,876 –
Closing number of shares 3,762,618 3,762,618 12,897 7,538,133
Number of shares vested to employees 3,762,618 2,188,415 – 5,951,033
Executive Option PlanThe Executive Option Plan provides executives, as approved by the Company’s Compensation Committee, with options to acquire ordinary shares in theCompany. The options’ exercise price is the market price at the time of issue. Market price is the weighted average price of a specified five day periodprior to issue. Each option is granted over one unissued ordinary share in the Company. Options issued prior to 24 April 2002 are exercisable betweenthree and ten years after issue; options issued on or after 24 April 2002 are exercisable between three and five years after issue. Options may also beexercised earlier if employment terminates for reasons of retirement or redundancy. Mr Davis’ options are exercisable between one and five years afterissue. Payment in full is due at the time options are exercised. Options carry no voting rights and do not have any performance hurdles. Once theexercise period has been reached, the options may be exercised at the discretion of the executive.
From the beginning of the 2003 financial year, options were removed from the remuneration package of Group executives. Accordingly, during the 2004financial year, the Company did not issue options to any executives.
The remuneration cost of options is not currently treated as an expense in the determination of the Group’s net profit attributable to members of theCompany, in accordance with Australian generally accepted accounting principles. If options had been expensed, there would have been a reduction inthe Group’s net profit attributable to members of the Company as follows –
2004 2003$M $M
Net profit attributable to members of the Company 280.3 194.2Expenses attributable to options issued under the Executive Option Plan1 (2.0) (4.6)
Total 278.3 189.6
1 Based on estimated fair values at grant date as determined in accordance with the measurement requirements of AASB 1046 “Director and Executive Disclosures byDisclosing Entities”. The fair values of options are being amortised on a straight line basis over the vesting period for the purposes of this disclosure. The valuationmethodology and major assumptions used to determine options expense for this disclosure can be found in Note 31.

Australia New Zealand Papua New Guinea Fiji South Korea Indonesia
58 Coca-Cola Amatil
NOTES TO THE FINANCIAL STATEMENTS continuedCOCA-COLA AMATIL LIMITED AND ITS CONTROLLED ENTITIES
FOR THE FINANCIAL YEAR ENDED 31 DECEMBER 2004
19. Employee Ownership Plans continued
Executive Option Plan continued
Details of the movements in option balances under the Plan during the financial year are as follows –
2004 2003No. No.
Opening number of options 24,865,945 31,270,195Forfeited (4,297,760) (1,737,950)Exercised (6,564,330) (4,666,300)
Closing number of options 14,003,855 24,865,945
Details of options on issue at the end of the financial year are as follows –
OptionsHolders Options Exercise price exercisable from Options expiryNo. No.1 $ Grant date date2 date
37 312,500 4.76 30 August 1995 Current 30 August 2005417 1,451,500 9.69 27 June 1996 Current 27 June 2006557 1,409,500 10.08 18 July 1997 Current 18 July 200791 26,400 9.37 3 September 1997 Current 3 September 20071 400,000 7.14 2 April 1998 Current 2 April 2008220 1,368,950 4.53 17 August 1998 Current 17 August 20081 550,000 6.61 16 April 1999 Current 16 April 2009569 2,016,105 6.49 12 July 1999 Current 12 July 20091 135,000 4.31 8 November 1999 Current 8 November 20091 200,000 6.12 24 April 2002 Current 24 April 2007304 1,967,250 2.97 10 July 2000 Current 10 July 2010595 2,866,250 5.44 17 August 2001 Current 17 August 2011119 1,220,400 6.33 16 August 2002 16 August 2005 16 August 20071 80,000 5.18 1 November 2002 1 November 2005 1 November 2007
Total 14,003,855
1 Each option represents an option to acquire one ordinary share.2 All options designated current have vested with the respective executives.
Details of options exercised during the financial year are as follows –
2004 2003
Weighted Weightedaverage average
market Market market MarketExercise Options value at value at Options value at value atprice exercised exercise date Proceeds exercise date exercised exercise date Proceeds exercise date$ No. $ $M $M No. $ $M $M
2.97 2,387,700 6.94 7.1 16.6 3,316,850 5.76 9.9 19.14.11 180,000 6.75 0.7 1.2 55,000 5.75 0.2 0.34.25 222,000 6.95 0.9 1.5 – – – –4.53 810,150 6.88 3.7 5.6 651,650 5.85 3.0 3.84.76 276,000 6.92 1.3 1.9 166,500 6.19 0.8 1.05.44 1,442,750 7.25 7.8 10.5 476,300 6.10 2.5 2.96.12 100,000 6.95 0.6 0.7 – – – –6.33 69,800 7.28 0.5 0.5 – – – –6.49 810,930 7.26 5.3 5.9 – – – –6.61 265,000 6.95 1.8 1.8 – – – –
Total 6,564,330 29.7 46.2 4,666,300 16.4 27.1

Australia New Zealand Papua New Guinea Fiji South Korea Indonesia
59Annual Report 2004
19. Employee Ownership Plans continued
Long Term Incentive Share PlanThe Long Term Incentive Share Plan provides executives with the opportunity to be rewarded with fully paid ordinary shares as an incentive to createlong term growth in value for CCA shareholders. The Plan is administered by a trustee who acquires (and holds in trust) shares for the benefit ofparticipants. These shares are acquired either through issue of shares to the trustee (issue price is the weighted average price of a specified five dayperiod prior to issue) or are purchased on market at the prevailing market price.
Senior executives are invited to participate in the Plan at the invitation of the Compensation Committee. The Committee specifies the performancecriteria, covering a three year period, for each annual plan.
Details of the movements in the share balances under the Plan during the financial year together with performance criteria for each annual plan are as follows –
2000-2002 2001-2003 2002-2004 2003-2005Plan1 Plan2 Plan3 Plan4 Total
Share movements No. No. No. No. No.
Opening number of shares 59,980 – – 100,000 159,980Purchased 59,980 127,000 3,161 48,589 238,730Distributed to executives (20,154) (15,000) (3,161) (48,589) (86,904)
Closing number of shares 99,806 112,000 – 100,000 311,806
Number of shares vested 99,806 112,000 – 100,000 311,806
1 Performance criteria: Net profit target for 2002; the executive’s performance was also taken into account.The target was achieved and 50% of the shares (amounting to 59,980 shares) were purchased in April 2003. The remaining 50% were purchased in 2004. These sharesare fully vested, with 25% of each of the eligible eight participants’ shares to be held in the Plan for two years.
2 Performance criteria: Net profit targets for 2002 and 2003; the executive’s performance is also taken into account.For 2002 and 2003, the targets were achieved; the relevant shares were acquired in March 2004. These shares have fully vested with the participants, with 25% ofeach of the eligible nine participants’ shares to be held in the Plan for two years.
3&4 Performance criteria: Total Shareholder Return (TSR) measured over the performance period (minimum of three years, except that one tranche of the ManagingDirector’s share allocations is tested after one year) against a peer group of companies.No allocation of shares will be made unless the Company’s TSR is at or above the 50th percentile of the peer group of companies. The number of shares to be allocatedwill be increased if the Company’s ranking exceeds the 50th percentile up to a maximum allocation of 150% of the threshold entitlement if the Company achieves the75th percentile. Shares are fully vested at the end of the performance period, once the prescribed target has been achieved. A portion of the shares must be held in thePlan for two years. The amount to be held is determined by a prescribed scale dependent on the level achieved.As at the end of the financial year, the total number of executives eligible to participate in the 2002-2004 Plan is 42 and the 2003-2005 Plan is 137.
Non-executive Directors’ Share PlanUnder the terms of the Non-executive Directors’ Share Plan, a minimum of 25% (and up to 100%) of Directors’ base fees are to be sacrificed by eachDirector. An amount equivalent to the fees sacrificed is contributed to the Plan for the benefit of that Director.
The Plan is administered by a trustee which acquires (and holds in trust) shares for the benefit of participants, until the participant ceases to be aDirector of CCA.
As at the end of the financial year, there were six non-executive Directors participating in the Plan.
Shares under the Plan are purchased on market at six monthly intervals within prescribed periods following the release of CCA’s half and full yearAustralian Stock Exchange announcements.
Details of movements in the share balances under the Plan during the financial year are –
2004Share movements No.
Opening number of shares –Purchased 67,331Distributed to Directors (2,105)
Closing number of shares 65,226

Australia New Zealand Papua New Guinea Fiji South Korea Indonesia
60 Coca-Cola Amatil
NOTES TO THE FINANCIAL STATEMENTS continuedCOCA-COLA AMATIL LIMITED AND ITS CONTROLLED ENTITIES
FOR THE FINANCIAL YEAR ENDED 31 DECEMBER 2004
19. Employee Ownership Plans continued
Executive Salary Sacrifice Share PlanThe Executive Salary Sacrifice Share Plan commenced operating in September 2004. The Plan allows Australian executives to voluntarily sacrifice anominated proportion of their remuneration. The trustee of the Plan acquires shares to the value of the sacrificed amount and holds those shares for thebenefit of the participant until the shares are withdrawn.
In addition, Australian executives participating in the Company’s annual cash incentive plans are required to sacrifice a proportion of any awards madeunder these plans, with an equivalent amount being contributed towards the Executive Salary Sacrifice Share Plan for the acquisition of shares by thetrustee. The trustee holds these shares for the benefit of participants in proportion to their benefits sacrificed.
Details of movements in the share balances under the Plan during the financial year are –
2004Share movements No.
Opening number of shares –Purchased 2,688
Closing number of shares 2,688
CCA Group CCA Entity
Refer 2004 2003 2004 2003Note $M $M $M $M
20. Reserves
Revaluation reserveBalance at the beginning of the financial year 2.6 23.6 126.5 126.5Property revaluation – (21.0) – –Adjustment to revaluation reserve arising from valuation of
shares in controlled entities (25.1) –
Closing balance 2.6 2.6 101.4 126.5
Foreign currency translation reserveBalance at the beginning of the financial year (421.6) (71.4)Transferred to retained earnings 21 (2.7) –Translation of financial statements of foreign controlled entities 52.5 (350.2)
Closing balance (371.8) (421.6)
Total reserves (369.2) (419.0) 101.4 126.5

Australia New Zealand Papua New Guinea Fiji South Korea Indonesia
61Annual Report 2004
CCA Group CCA Entity
Refer 2004 2003 2004 2003Note $M $M $M $M
21. Retained earnings and Equity Attributable to Members of Coca-Cola Amatil Limited
Retained earningsBalance at the beginning of the financial year 1,696.5 1,646.1 1,114.0 1,159.5Net profit attributable to members of Coca-Cola Amatil Limited 280.3 194.2 38.8 97.8
Total available for appropriation 1,976.8 1,840.3 1,152.8 1,257.3Dividends appropriated 22 (179.3) (142.5) (179.3) (142.5)Adjustment arising from adoption of revised
Accounting Standard AASB 1028 “Employee Benefits” – (1.3) – (0.8)Transferred from foreign currency translation reserve 20 2.7 – – –
Closing balance 1,800.2 1,696.5 973.5 1,114.0
EquityBalance at the beginning of the financial year 2,908.6 3,199.9 2,871.6 2,887.6Total changes in equity recognised in the
Statements of Financial Performance 332.8 (178.3) 13.7 97.0Transactions with owners as owners –
Contributed equity 18 40.4 29.5 40.4 29.5Dividends appropriated 22 (179.3) (142.5) (179.3) (142.5)
Closing balance 3,102.5 2,908.6 2,746.4 2,871.6
22. Dividends
a) Dividends appropriatedPrior year final dividend on ordinary shares 91.2 72.8 91.2 72.8Current year interim dividend on ordinary shares 88.1 69.7 88.1 69.7
Total dividends 179.3 142.5 179.3 142.5
b) Dividends paid during the financial year are summarised as follows –
Prior year final dividend1 91.2 72.8 91.2 72.8Current year interim dividend2 88.1 69.7 88.1 69.7
179.3 142.5 179.3 142.5Dividends satisfied by issue of shares under the
Dividend Reinvestment Plan 23 (9.4) (8.6) (9.4) (8.6)
Dividends paid as per the Statements of Cash Flows 169.9 133.9 169.9 133.9
c) Franking credit balance3
Balance of the franking account as at the end of the financial year 125.3 65.0 125.3 65.0Franking credits which will arise from payment of income tax
provided for in the financial statements 49.6 87.0 49.6 87.0
174.9 152.0 174.9 152.0
1 Paid at 13.0¢ (2003: 10.5¢) per share and partly franked to 9.75¢ (2003: 5.25¢) per share at the Australian tax rate of 30%.2 Paid at 12.5¢ (2003: 10.0¢) per share and fully franked (2003: partly franked to 5.0¢ per share) at the Australian tax rate of 30%.3 The franking credits are expressed on a tax paid basis. Accordingly, the amount would allow fully franked dividends to be paid equal to $408.1 million (2003: $354.7 million).
The franking credit balance will be reduced by $47.1 million resulting from the final dividend for 2004, payable 1 April 2005.

Australia New Zealand Papua New Guinea Fiji South Korea Indonesia
62 Coca-Cola Amatil
NOTES TO THE FINANCIAL STATEMENTS continuedCOCA-COLA AMATIL LIMITED AND ITS CONTROLLED ENTITIES
FOR THE FINANCIAL YEAR ENDED 31 DECEMBER 2004
CCA Group CCA Entity
Refer 2004 2003 2004 2003Note $M $M $M $M
23. Statements of Cash Flows
Reconciliation of net profit to net cash flows from operatingactivities
Net profit 280.7 194.5 38.8 97.8Depreciation, amortisation and amounts set aside to provisions 187.4 190.9 19.4 15.3(Profit) loss from disposal of –
a surplus South Korean property (35.2) – – –other property, plant and equipment 13.5 5.4 4.1 2.7investments in securities – – (5.6) –
Rationalisation of certain non-profitable cold drink equipment in South Korea 23.6 – – –
Rationalisation of returnable containers and deposits inIndonesia and South Korea 11.2 – – –
(Increase) decrease in –interest receivable – – – (0.1)other receivables 23.5 (26.5) 13.3 (11.3)inventories (56.9) (50.0) – –prepayments (2.1) (9.4) (0.4) (3.2)
Increase (decrease) in –interest payable 1.3 (1.4) 1.3 (2.1)tax payable (50.5) 69.7 (47.0) 58.4other payables 16.5 53.2 (10.8) 18.2accrued charges (32.4) (18.1) (20.4) (17.4)
Net cash flows (used in) from operating activities 380.6 408.3 (7.3) 158.3
Reconciliation of cashCash assets 6 279.9 260.1 99.4 168.1Call deposits (included in loans) 15 (0.2) (300.0) – (300.0)Bank overdrafts 15 (0.6) (0.2) – –
Cash held (deficit) at the end of the financial year 279.1 (40.1) 99.4 (131.9)
Non-cash investing and financing activitiesDividends satisfied by the issue of shares under the
Dividend Reinvestment Plan 22 9.4 8.6 9.4 8.6

Australia New Zealand Papua New Guinea Fiji South Korea Indonesia
63Annual Report 2004
24. Earnings Per Share (EPS)
The following reflects the share and earnings data used in the calculation of basic and diluted EPS –
CCA Group
2004 2003No. No.
M M
Weighted average number of ordinary shares on issue usedto calculate basic EPS 703.5 695.6
Add effect of dilutive securities – share options 4.5 4.9
Adjusted weighted average number of ordinary shareson issue used to calculate diluted EPS 708.0 700.5
$M $M
Earnings used to calculate basic and diluted EPS –Net profit attributable to members of Coca-Cola Amatil Limited 280.3 194.2Add (deduct) significant items after tax (2.3) 44.6
Earnings used to calculate basic and diluted EPSbefore significant items 278.0 238.8
CCA Group CCA Entity
2004 2003 2004 2003$M $M $M $M
25. Capital Expenditure Commitments
Estimated aggregate amount of contracts for purchase ofproperty, plant and equipment not provided for, payable –
Not later than one year 25.4 13.2 – –
26. Operating Lease Commitments
Lease commitments for non-cancellable operatingleases with terms of more than one year, payable –
Not later than one year 36.8 29.1 1.7 1.6Later than one year but not later than five years 75.6 39.6 5.6 5.5Later than five years 31.5 30.9 21.6 22.9
143.9 99.6 28.9 30.0
Assets under operating leases mainly consist of properties, motor vehicles and other items of plant and equipment.
27. Other Commitments
Promotional commitments, payable –Not later than one year 22.5 15.3 – –Later than one year but not later than five years 26.1 16.8 – –Later than five years 6.4 3.8 – –
55.0 35.9 – –

Australia New Zealand Papua New Guinea Fiji South Korea Indonesia
64 Coca-Cola Amatil
NOTES TO THE FINANCIAL STATEMENTS continuedCOCA-COLA AMATIL LIMITED AND ITS CONTROLLED ENTITIES
FOR THE FINANCIAL YEAR ENDED 31 DECEMBER 2004
CCA Group CCA Entity
2004 2003 2004 2003$M $M $M $M
28. Contingent Assets and Liabilities
Contingent liabilities existed at the end of the financial year in respect of –Guarantees of borrowings of controlled entities 393.6 442.3Termination payments under service agreements 10.5 12.0 10.5 12.0Other guarantees 1.3 1.5 – –
11.8 13.5 404.1 454.3
The Company has entered into a Deed of Cross Guarantee with certain of its wholly owned controlled entities (designated 1 in Note 32), whereby theliabilities of those entities are guaranteed.
Tax auditsThe Group, at any time, has a number of tax audits being undertaken by the relevant authorities in each of its countries and the Board continuallyreviews the status of those audits. The Group currently has ongoing tax audits in South Korea, Indonesia and Papua New Guinea. No material taxassessments have been issued as a result of these audits.
In relation to the South Korean audit, the tax authorities have recently raised some concerns from their latest audit and if the audit was ultimatelyconcluded against the South Korean operation, then a material assessment may result. The Company has strongly refuted the tax authority’s preliminaryin principle position and is providing additional information to assist with the investigation of this matter. The Company has received South Korean taxadvice that it should be successful if it needs to challenge this matter.
Given the preliminary nature of the discussions with the tax authorities in each of the countries and the variable factors involved, the Group is not in a position to determine the possible exposure, if any.
29. Superannuation Plans
The Group sponsors a number of superannuation plans which provide benefits for employees or their dependants on retirement, resignation or death. The plans provide, in the majority of cases, benefits in the form of lump sum payments.
The Group is obliged to contribute to the plans in accordance with their governing trust deeds and the contributions are legally enforceable.Contributions to the plans are based on a percentage of employees’ salaries and wages.
Defined contribution plansThe major plans are the CCA Group Superannuation Plan (CCAGSP) and the CCA Beverages Superannuation Plan (CCABSP). These plans also havedefined benefit components to them. Refer below for further details.
Defined benefit superannuation plansFor defined benefit plans, actuarial assessments are carried out at least every three years. Based on these assessments, subsequent interim reportswhich are provided by the actuaries on a more regular basis and commitments made by CCA to make additional contributions towards funding anydeficit, each plan would be able to satisfy all benefits that would have been vested in the event of –
• termination of the plan;
• voluntary termination of the employment of each employee on the initiative of the employee; or
• compulsory termination of the employment of each employee on the initiative of the employer.
The major plans are the CCAGSP and the CCABSP, which were last reviewed by the actuary as at 1 July 2001 and 1 July 2003 respectively. The actuary who carried out the review of the Plans was J.E. Burnett, BA.

Australia New Zealand Papua New Guinea Fiji South Korea Indonesia
65Annual Report 2004
29. Superannuation Plans continued
Details of the Plans as extracted from their most recent review are as follows –
CCAGSP CCABSPas at 1 July as at 1 July
2001 2003 Total$M $M $M
Net market value of Plan assets 92.5 166.2 258.7Accrued benefits (84.0) (159.1) (243.1)
Surplus of net market value of Plan assets over accrued benefits 8.5 7.1 15.6
Details of vested benefits as extracted from their most recent interim reports are as follows –CCAGSP CCABSP
as at 30 June as at 30 June20041 2004 Total
$M $M $M
Net market value of Plan assets 77.6 200.0 277.6Vested benefits (77.8) (191.3) (269.1)
Surplus (deficit) of net market value of Plan assets over vested benefits (0.2) 8.7 8.5
1 The Company has agreed with the actuary that supplementary contributions to fund the deficit will be made to the CCAGSP over the period to June 2005.At reporting date, CCA has accrued, but not paid into the Plan, the estimated deficit as at 31 December 2004.
CCA Group CCA Entity
2004 2003 2004 2003$M $M $M $M
30. Auditors’ Remuneration
Amounts received, or due and receivable, by –CCA Entity auditor, Ernst & Young (Australia) for –
Audit of the financial reports 1.258 1.097 0.699 0.572Other services 0.310 0.462 0.310 0.457
1.568 1.559 1.009 1.029
Member firms of Ernst & Young in relation to controlled entities ofCCA Entity for –
Audit of the financial reports 0.395 0.472Other services 0.013 0.068
0.408 0.540
Other firms in relation to controlled entities of CCA Entity for –Audit or half year review of the financial reports 0.044 0.036Other services 0.084 0.011
0.128 0.047
Total auditors’ remuneration 2.104 2.146 1.009 1.029
Other services include –Other assurance services 0.371 0.427 0.288 0.392Tax compliance reviews 0.036 0.114 0.022 0.065
Total other services 0.407 0.541 0.310 0.457

Australia New Zealand Papua New Guinea Fiji South Korea Indonesia
66 Coca-Cola Amatil
NOTES TO THE FINANCIAL STATEMENTS continuedCOCA-COLA AMATIL LIMITED AND ITS CONTROLLED ENTITIES
FOR THE FINANCIAL YEAR ENDED 31 DECEMBER 2004
31. Director and Executive Disclosures
Directors
The following persons were Directors of Coca-Cola Amatil Limited during the financial year –
Specified Directors Position Date of change in position
Directors in office at theend of the financial yearD.M. Gonski, AO ChairmanJ.R. Broadbent, AO Non-executive DirectorT.J. Davis Managing DirectorG.J. Kelly Non-executive Director Appointed 22 April 2004W.M. King, AO Non-executive DirectorH.A. Schimberg Non-executive DirectorM.K. Ward, AO Non-executive Director
Former DirectorsM.F. Ihlein Chief Financial Officer Resigned 19 March 2004J.E. Chestnut Non-executive Director Resigned 22 April 2004
Executives (other than Directors) with the greatest authority for the strategic direction and management.
The following persons were the five executives with the greatest authority for the strategic direction and management of the Group during the financial year –
Specified executives Position Date of change in position
Specified executives at theend of the financial yearJ.M. Wartig Chief Financial Officer Appointed 21 June 2004W.G. White Managing Director – AustraliaG. Adams Managing Director – New Zealand & FijiD.P. Westall Managing Director – South Korea Appointed 1 November 2004J. Seward Managing Director – Indonesia Appointed 1 August 2004
Former specified executivesP.O. Baker Managing Director – Indonesia Resigned 31 August 2004M. Clark Managing Director – South Korea To 31 October 2004
Remuneration of specified Directors and specified executives
Principles used to determine the nature and amount of remunerationTo assist in its deliberations, the Board has established a Compensation Committee. The Compensation Committee is comprised of four non-executiveDirectors and the Managing Director (other than for matters relating to his own compensation). A majority of members must be independent non-executiveDirectors. The purpose of the Committee includes the review of matters relating to the remuneration of executive Directors and senior management.
The remuneration levels of the Managing Director and other senior executives (including specified executives) are recommended by the CompensationCommittee and approved by the Board. This is done having regard to advice from independent consultants and after taking into consideration those levelsthat apply to similar positions in comparable companies, as well as the performance of the Managing Director and senior executives and managers.
Evaluation of the performance of senior executives is conducted by the Managing Director in conjunction with CCA’s Human Resources department, and in relation to the Managing Director, by the Chairman and the Board. The performance assessment of senior executives is completed using theCompany’s individual performance management program.
The general terms and conditions of all remuneration programs are reviewed annually so as to ensure that they continue to achieve the aims of theCompany’s remuneration policy.

Australia New Zealand Papua New Guinea Fiji South Korea Indonesia
67Annual Report 2004
31. Director and Executive Disclosures continued
In determining the composition and amount of senior executives remuneration, the Compensation Committee applies the Company’s remuneration policy.Its key elements require that –
• remuneration will be competitively set so as to attract, motivate and retain top calibre senior executives; • remuneration will incorporate, to a significant degree, variable pay for performance elements, containing short and long term focuses as appropriate,
which will –• reward senior executives for Group, business unit and individual performance against appropriate benchmarks and targets; • align the interests of senior executives with those of shareholders; • link senior executives’ rewards with the strategic goals and performance of the Group; and • ensure total remuneration is competitive by market standards.
The Compensation Committee establishes and maintains the relationship of remuneration, potential annual incentive and long term incentive paymentsfor each level of management. For senior executives, potential incentive payments, as a proportion of total potential remuneration, increases accordingto their seniority within the Company.
Non-executive DirectorsThe remuneration of non-executive Directors takes into account the size and complexity of CCA’s operations, their responsibility for the stewardship ofthe Company and their workloads. It comprises Directors’ fees (base plus Board Committee fees), superannuation contributions and retirement benefits.
Non-executive Directors’ feesTotal non-executive Directors’ fees are not to exceed the annual limit of $1.0 million as previously approved by shareholders. Based on advice receivedfrom external remuneration consultants (via the Compensation Committee), Directors’ fees are set and approved by the executive Directors. The baseremuneration for calendar year 2004 was last reviewed with effect from 1 January 2004.
Retirement allowances for non-executive DirectorsThere is no current scheme for the payment of retirement benefits. However, accrued benefits under the prior scheme which was terminated as at 31 December 2002 were fixed at that date and will be paid when the relevant Director ceases to be a Director of the Company. Recognising that payment has been deferred, accrued benefits are indexed against the movement in Average Weekly Ordinary Time Earnings (AWOTE) from 1 January 2003 to the date of payment of the benefits to the Directors. Where applicable, contributions required under Superannuation Guaranteelegislation are made on behalf of the Directors.
Executive remunerationThe composition of remuneration for the Managing Director and specified executives is determined as follows –
Base, or fixed remuneration and benefitsThe Compensation Committee considers pertinent advice from external remuneration consultants on current international and local market practices,market comparisons for similar roles, the level of responsibility, performance and potential of the executive.
Benefits include car allowances, product allowances, club and professional memberships.
Short Term Incentive Plan (STIP)Annual incentives are set at the beginning of the financial year to reward executives for meeting or exceeding key performance indicators. Businessfinancial performance is a key determinant of the STIP and is based on sales volume and earnings growth compared to agreed budget targets.
The Compensation Committee relies on audited annual results to declare all STIP payments.
Long Term Incentive Share Plan (LTISP)The LTISP provides a reward for the achievement of long-term shareholder return.
Participation in the 2003-2005 and 2004-2006 Plans was by invitation based on an employee’s level of responsibility, performance and potential.Allocation of shares under the LTISP is subject to the achievement of performance measures over a three year performance period.
For the 2003-2005 LTISP, no shares will be allocated if Total Shareholder Return (TSR) measured over the relevant performance period is less than the50th percentile of the ASX 100 Companies minus banks, financial services companies and mining resource companies plus S&P’s Consumer Staples IndexCompanies with market capitalisation greater than $300 million. The number of shares to be allocated will be increased, on a pro rata basis, if the Company’s ranking exceeds the 50th percentile up to a maximum allocation of 150% of the threshold entitlement if the Company achieves the 75th percentile.

Australia New Zealand Papua New Guinea Fiji South Korea Indonesia
68 Coca-Cola Amatil
31. Director and Executive Disclosures continued
For the 2004-2006 LTISP, the Committee has approved a change to the performance measures with half of the award subject to a TSR measure and half of the award subject to the measurement of achievement of average growth in net operating profit after tax over the period.
All shares to which senior executives may become entitled, as a result of their participation in the LTISP, will be allocated in respect of the 2004-2006performance period by no later than 31 January 2008. The shares will be acquired by the trustee of the LTISP on behalf of the individual either bypurchase of shares on the Australian Stock Exchange at the prevailing market price or through issue of shares in the Company (issue price is theweighted average price of a specified five day period prior to issue), at no cost to the individual.
The Plans have been valued using the Monte Carlo simulation methodology. This methodology calculates the fair value of performance rights based on the share price at grant date and assumptions for the expected risk free rate of interest for the performance period, the volatility of the share pricereturns, the dividend entitlements and performance conditions of the Plan.
Executive Option PlanFrom the beginning of the 2003 financial year, options have been removed from remuneration packages. Options allocated under the Plan will continueuntil they vest or lapse. Details of the Executive Option Plan are set out in Note 19.
Remuneration detailsThe details of each specified Director’s remuneration during the financial year are set out below –
2004 Primary Post employment Equity Other
Non-Salary monetary Retirement Deferred Options
and fees1 STIP2 benefits3 Superannuation4 benefits5 LTISP6 remuneration7 Total value8 Total$ $ $ $ $ $ $ $ $ $
Directors in office at the end of the financial yearD.M. Gonski, AO 300,000 10,760 7,593 318,353 318,353J.R. Broadbent, AO 121,000 10,760 2,782 134,542 134,542T.J. Davis9 962,750 900,000 244,615 372,550 846,988 141,383 3,468,286 3,468,286G.J. Kelly 76,154 6,854 83,008 83,008W.M. King, AO 100,000 9,000 577 109,577 109,577H.A. Schimberg 106,000 106,000 106,000M.K. Ward, AO 120,000 10,760 2,743 133,503 133,503
Former DirectorsM.F. Ihlein9 122,276 66,811 24,455 213,542 28,878 242,420J.E. Chestnut 34,148 3,073 37,221 37,221
Total remuneration – Directors 1,942,328 900,000 311,426 448,212 13,695 846,988 141,383 4,604,032 28,878 4,632,910
1 Includes amounts contributed to the Non-executive Directors’ Share Plan. Fees for non-executive Directors includes Committee fees.2 Short Term Incentive Plan (STIP).3 Non-monetary benefits include the value of motor vehicles, interest paid on certain loans held independently by an executive with a financial institution and allowances.4 Includes notional and actual contributions to superannuation.5 Represents the estimated present value of the accrued retirement benefit less the amount accrued in the prior period.6 Long Term Incentive Share Plan (LTISP). Represents the estimated fair value of shares offered in the Plan calculated by multiplying the number of shares by the fair value
of the share at grant date and amortised over the three year performance period. For the 2003-2005 Plan the value is $4.75 and for the 2004-2006 Plan the value is $5.61 for the 50% measured using TSR and $6.34 for the 50% measured using NOPAT. Half of the first tranche under the 2004-2006 LTISP due to Mr Davis vested at 31 December 2004 and having met the target, 50,000 shares will be purchased in early 2005. These shares have been valued at $6.74.Pursuant to accounting standard AASB 1046 “Director and Executive Disclosures by Disclosing Entities” issued on 27 January 2004, there has been a change in thedetermination of the amount of remuneration disclosed relating to LTISP. In the financial years prior to 2003, 100% of the estimated fair value of the LTISP (2002-2004Plan) was disclosed as remuneration in the year of grant. Accordingly, the value of LTISP recorded in the remuneration table above represents only the estimated fair valueof those LTISP Plans that were granted during the financial years 2003 and 2004.The estimated fair value of the 2002-2004 LTISP, attributable to 2004 using the methodology stated previously, for Mr Davis was $177,503 (equivalent to $5.17 per share).
7 Represents the estimated present value of the accrued benefit payable under the terms of the service agreement less the amount accrued in the prior period.8 Since 1 January 2003, share options are no longer awarded. The option value was determined using the Binomial Option Valuation Model refer Note 31 of the financial statements.
The value of options is included to comply with Australian Securities and Investments Commission disclosure requirements and has not been expensed by the Company.9 Executive Directors.
NOTES TO THE FINANCIAL STATEMENTS continuedCOCA-COLA AMATIL LIMITED AND ITS CONTROLLED ENTITIES
FOR THE FINANCIAL YEAR ENDED 31 DECEMBER 2004

Australia New Zealand Papua New Guinea Fiji South Korea Indonesia
69Annual Report 2004
31. Director and Executive Disclosures continued
The details of remuneration during the financial year for each specified executive, for the period during which they held the position, are set out below –
2004 Primary Post employment Equity Other
Non-Salary monetary Deferred Options
and fees STIP1 benefits2 Superannuation3 LTISP4 remuneration5 Total value6 Total$ $ $ $ $ $ $ $ $
Specified executives in office at the end of the financial yearJ.M. Wartig 318,462 210,000 319,105 73,985 103,775 41,153 1,066,480 1,066,480W.G. White 461,250 282,000 149,235 104,055 235,866 117,000 1,349,406 25,333 1,374,739G. Adams 248,497 91,274 42,929 41,150 31,133 454,983 454,983D.P. Westall7&8 37,242 12,536 66,958 7,856 12,035 136,627 2,886 139,513J. Seward7 114,620 38,212 312,778 15,047 35,580 516,237 516,237
Former specified executivesM. Clark7&8 284,622 462,173 56,925 151,323 955,043 69,018 1,024,061P.O. Baker7 189,152 370,365 37,830 192,962 790,309 92,463 882,772
Total remuneration – executives 1,653,845 634,022 1,723,543 336,848 762,674 158,153 5,269,085 189,700 5,458,785
1 Short Term Incentive Plan (STIP).2 Non-monetary benefits include the value of motor vehicles, interest paid on certain loans held independently by an executive with a financial institution and allowances.3 Includes notional and actual contributions to superannuation.4 Long Term Incentive Share Plan (LTISP). Represents the estimated fair value of shares offered in the Plan calculated by multiplying the number of shares by the fair value
of the share at grant date and amortised over the three year performance period. For the 2003-2005 Plan the value is $4.76 and for the 2004-2006 Plan the value is $5.41 for the 50% measured using TSR and $6.19 for the 50% measured using NOPAT. Pursuant to accounting standard AASB 1046 “Director and Executive Disclosures by Disclosing Entities” issued on 27 January 2004, there has been a change in thedetermination of the amount of remuneration disclosed relating to LTISP. In the financial years prior to 2003, 100% of the estimated fair value of the LTISP (2002-2004Plan) was disclosed as remuneration in the year of grant. Accordingly, the value of LTISP recorded in the remuneration table above represents only the estimated fair valueof those LTISP Plans that were granted during the financial years 2003 and 2004.The following lists the value of the 2002-2004 LTISP, attributable to 2004 using the methodology stated previously and for the proportion of the period during which theexecutive held office (equivalent to $5.14 per share).Executives disclosed –
$W.G. White 56,711D.P. Westall 800M. Clark 40,692
98,2035 Represents the estimated present value of the accrued benefit payable under the terms of the service agreement less the amount accrued in the prior period.6 Since 1 January 2003, share options are no longer awarded. The option value was determined using the Binomial Option Valuation Model refer Note 31 of the financial statements.
The value of options is included to comply with Australian Securities and Investments Commission disclosure requirements and has not been expensed by the Company.7 Messrs Baker, Clark, Westall and Seward were remunerated in USD whilst in Asia. These amounts were converted to AUD at the weighted average exchange rate for the
financial year (AUD/USD 0.7410)(2003: AUD/USD 0.6510).8 Remuneration for Messrs Clark and Westall has been apportioned over the period each held the position as a specified executive.
Details of performance based equity rewardThe following outlines the details of all performance based equity reward arrangements for senior executives of the Company. Conditions for allindividuals are consistent with the Company’s general policies and practices as outlined in this financial report.
LTISP entitlementsParticipation in the Company’s LTISP is consistent with those aspects of the Plan already detailed in this financial report. All senior executiveparticipation is governed by Company policy and the Plan trust deeds. Shares are awarded to participants at the end of the relevant performance periodand only to the extent that the performance conditions are satisfied. Under the trust deed shares may be awarded to participants where employment isterminated prior to the completion of the performance period and more than a third of the performance period has elapsed. The Board in its discretionhas determined if the executive’s performance has been of an acceptable standard, the terms and conditions of the relevant performance period willapply as at the date employment ceases.
Shares are fully vested at the end of the performance period, once the prescribed target has been achieved. A portion of these shares must be held inthe Plan for two years. The amount to be held is determined by a prescribed scale dependent on the level achieved.

Australia New Zealand Papua New Guinea Fiji South Korea Indonesia
70 Coca-Cola Amatil
31. Director and Executive Disclosures continued
The following outlines the minimum and maximum level of participation for specified Directors and specified executives in current offers under theCompany’s LTISP –
2003-2005 2004-2006
Number of ordinary sharesin CCA offered in the LTISP Min. Max. Min. Max.
Specified Director and executives in office at the end of the financial year
Specified DirectorT.J. Davis1 216,500 274,750 216,500 324,750
Specified executivesJ.M. Wartig – – 70,000 105,000W.G. White 76,850 95,275 76,850 115,275G. Adams – – 21,000 31,500D.P. Westall 22,150 26,475 25,000 37,500J. Seward – – 24,000 36,000
Former specified executivesP.O. Baker2 52,450 – – –M. Clark 72,400 86,725 45,000 67,500
1 Mr Davis received an award from the 2003-2005 LTISP for 100,000 shares in 2003 and he will receive an award from the 2004-2006 LTISP for 50,000 shares in early 2005.2 Mr Baker received a pro-rata allocation of 38,463 shares at $7.14 on resignation.
Options held by specified Directors and executivesThe terms and conditions of each grant of options affecting remuneration in this or future reporting periods are as follows –
Value perExercise option at
Grant Expiry price grant date Exercisedate date $ $ date
6 June 2001 31 July 2004 $4.25 $1.28 19 March 200417 August 2001 17 August 2011 $5.44 $1.46 17 August 200424 April 2002 31 July 2004 $6.12 $1.14 19 March 200416 August 2002 16 August 2007 $6.33 $1.17 16 August 20051 November 2002 1 November 2007 $5.18 $0.95 1 November 2005
No options have been issued by the Company since 1 November 2002.
The fair values of options have been determined using the Binomial Option Valuation Model, and take into account the following major assumptions –
Options granted in
Range or average 2002 2001 2000
Life of options 4.0 to 5.0 years 4.0 years 3.0 yearsVolatility of share price 24.0% 41.0% 45.0%Dividend rate 4.0% 4.0% 4.0%
CCA’s closing share price on 31 December 2004 was $8.13.
NOTES TO THE FINANCIAL STATEMENTS continuedCOCA-COLA AMATIL LIMITED AND ITS CONTROLLED ENTITIES
FOR THE FINANCIAL YEAR ENDED 31 DECEMBER 2004

Australia New Zealand Papua New Guinea Fiji South Korea Indonesia
71Annual Report 2004
31. Director and Executive Disclosures continued
Number of options held Vested and over unissued ordinary Opening Closing exercisable atshares in CCA balance Exercised Withdrawn balance end of period
Specified Director and executives in office at the end of the financial year
Specified DirectorT.J. Davis 200,000 – – 200,000 200,000
Former DirectorM.F. Ihlein1 873,000 (678,000) (195,000) – –
Specified executives2
W.G. White 80,000 – – 80,000 –D.P. Westall 91,200 – – 91,200 68,800
Former specified executivesP.O. Baker3 955,500 (30,000) (925,500) – –M. Clark 584,400 (479,400) – 105,000 105,000
1 Mr Ihlein resigned effective 19 March 2004. Options not exercisable at that time were amended to be exercisable and to have an expiry date of 31 July 2004.195,000 options were forfeited at the end of the expiry period.
2 Since 1 January 2003, share options are no longer awarded. Accordingly Messrs Wartig, Adams and Seward do not hold any options.3 Mr Baker retired effective 31 August 2004. Under the rules of the Executive Option Plan the options remain exercisable.
The exercise price of options on issue to specified Directors and executives are as follows –
ExerciseNo. of price
options $
T.J. Davis 200,000 6.12W.G. White 80,000 5.18D.P. Westall 3,500 10.08D.P. Westall 4,700 4.53D.P. Westall 10,000 6.49D.P. Westall 22,400 2.97D.P. Westall 28,200 5.44D.P. Westall 22,400 6.33M. Clark 60,000 9.69M. Clark 45,000 10.08

Australia New Zealand Papua New Guinea Fiji South Korea Indonesia
72 Coca-Cola Amatil
31. Director and Executive Disclosures continued
Shareholdings of specified Directors and specified executives
Issued/Non-executive awarded during Shares that are
Number of Opening Directors’ the year as Closing beneficiallyordinary shares held balance Additions1 Share Plan2 remuneration3 Withdrawn balance held
Specified Director and executives in office at the end of the financial year
DirectorsD.M. Gonski, AO 40,000 – 43,768 – – 83,768 43,768J.R. Broadbent, AO 1,011 – 4,413 – – 5,424 4,413T.J. Davis4&5 154,274 2,920 – – – 157,194 100,000G.J. Kelly – 1,253 734 – – 1,987 734W.M. King, AO 1,200 – 7,295 – – 8,495 7,295H.A. Schimberg 1,000 – 4,639 – – 5,639 4,639M.K. Ward, AO 1,145 45 4,377 – – 5,567 4,377
Former DirectorsM.F. Ihlein 184,485 – – – (184,485) – –J.E. Chestnut 1,582 33 2,105 – (3,720) – –
Specified executivesJ.M. Wartig – 1,115 – – – 1,115 1,115W.G. White5 2,643 2,450 – – – 5,093 5,093G. Adams – – – – – – –D.P. Westall5 7,785 1,413 – – – 9,198 9,198J. Seward – 353 – – – 353 353
Former specified executivesP.O. Baker 32,802 3,848 – 38,463 (75,113) – –M. Clark5 22,434 4,076 – 33,538 (40,464) 19,584 18,915
1 Includes the purchase of ordinary shares and shares issued under the Employees Share Plan and Dividend Reinvestment Plan.2 Beneficial interest held subject to conditions of the Plan.3 Includes shares awarded under the LTISP.4 Includes beneficial interest in 100,000 shares held by the LTISP, which are subject to the condition of the Plan.5 Subsequent to 31 December 2004, awards in the LTISP. The following awards were made –
Mr Davis 119,892 shares in the 2002-2004 Plan and 50,000 in the 2004-2006 Plan.Mr Clark 33,174 shares in the 2002-2004 Plan.Mr Westall 3,259 shares in the 2002-2004 Plan.Mr White 38,528 shares in the 2002-2004 Plan.
NOTES TO THE FINANCIAL STATEMENTS continuedCOCA-COLA AMATIL LIMITED AND ITS CONTROLLED ENTITIES
FOR THE FINANCIAL YEAR ENDED 31 DECEMBER 2004
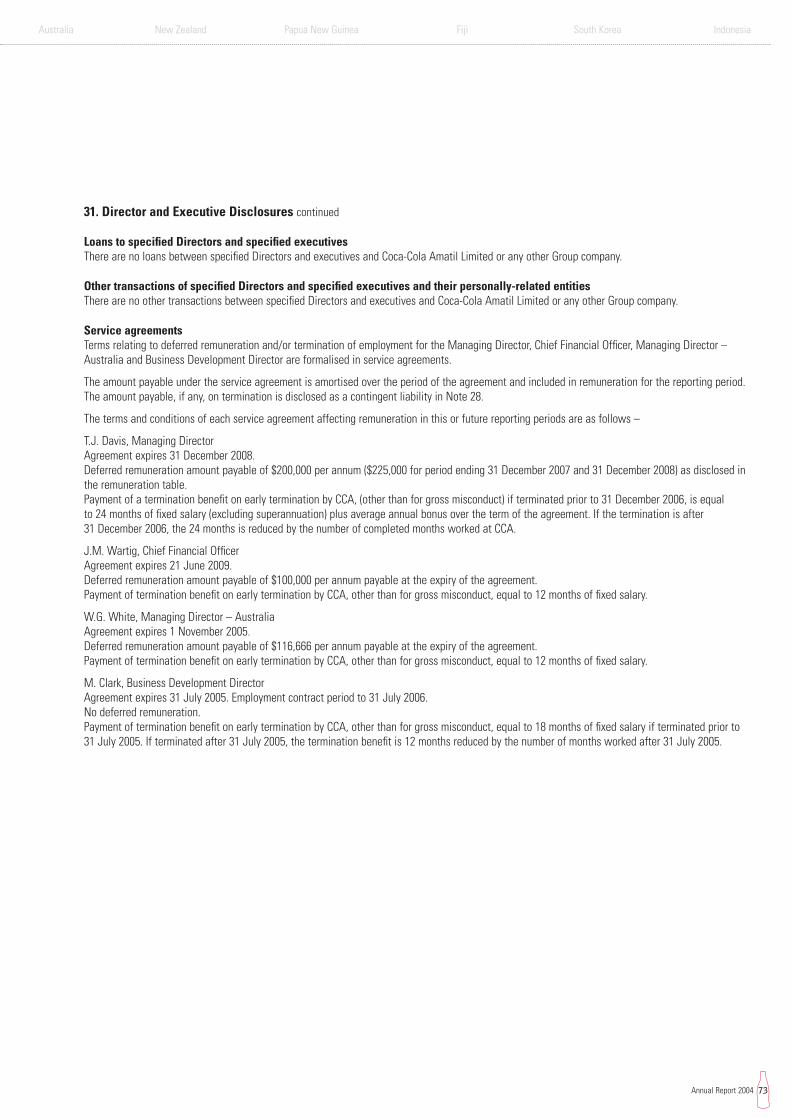
Australia New Zealand Papua New Guinea Fiji South Korea Indonesia
73Annual Report 2004
31. Director and Executive Disclosures continued
Loans to specified Directors and specified executivesThere are no loans between specified Directors and executives and Coca-Cola Amatil Limited or any other Group company.
Other transactions of specified Directors and specified executives and their personally-related entitiesThere are no other transactions between specified Directors and executives and Coca-Cola Amatil Limited or any other Group company.
Service agreementsTerms relating to deferred remuneration and/or termination of employment for the Managing Director, Chief Financial Officer, Managing Director –Australia and Business Development Director are formalised in service agreements.
The amount payable under the service agreement is amortised over the period of the agreement and included in remuneration for the reporting period.The amount payable, if any, on termination is disclosed as a contingent liability in Note 28.
The terms and conditions of each service agreement affecting remuneration in this or future reporting periods are as follows –
T.J. Davis, Managing DirectorAgreement expires 31 December 2008.Deferred remuneration amount payable of $200,000 per annum ($225,000 for period ending 31 December 2007 and 31 December 2008) as disclosed inthe remuneration table. Payment of a termination benefit on early termination by CCA, (other than for gross misconduct) if terminated prior to 31 December 2006, is equal to 24 months of fixed salary (excluding superannuation) plus average annual bonus over the term of the agreement. If the termination is after 31 December 2006, the 24 months is reduced by the number of completed months worked at CCA.
J.M. Wartig, Chief Financial OfficerAgreement expires 21 June 2009.Deferred remuneration amount payable of $100,000 per annum payable at the expiry of the agreement.Payment of termination benefit on early termination by CCA, other than for gross misconduct, equal to 12 months of fixed salary.
W.G. White, Managing Director – AustraliaAgreement expires 1 November 2005.Deferred remuneration amount payable of $116,666 per annum payable at the expiry of the agreement.Payment of termination benefit on early termination by CCA, other than for gross misconduct, equal to 12 months of fixed salary.
M. Clark, Business Development DirectorAgreement expires 31 July 2005. Employment contract period to 31 July 2006.No deferred remuneration.Payment of termination benefit on early termination by CCA, other than for gross misconduct, equal to 18 months of fixed salary if terminated prior to 31 July 2005. If terminated after 31 July 2005, the termination benefit is 12 months reduced by the number of months worked after 31 July 2005.

Australia New Zealand Papua New Guinea Fiji South Korea Indonesia
74 Coca-Cola Amatil
Beneficial Interest
Country of 2004 2003Footnote incorporation % %
32. Investments in Controlled Entities
Coca-Cola Amatil Limited 1 AustraliaControlled entities –AIS Trading Pte Ltd (liquidated) Singapore – 100AIST Pty Ltd 1 Australia 100 100Amatil Investments (Singapore) Pte Ltd Singapore 100 100
Coca-Cola Amatil (Fiji) Ltd Fiji 100 100PT Coca-Cola Bottling Indonesia Indonesia 95.2 95.2
PT Coca-Cola Distribution Indonesia 2 Indonesia 95.2 95.2Associated Products & Distribution Pty 1 Australia 100 100
Coca-Cola Amatil (PNG) Ltd Papua New Guinea 100 100Beverage Distributors Pty Ltd (in liquidation) Australia 100 100C-C Bottlers Ltd 1 Australia 100 100
Beverage Bottlers (Sales) Ltd 1 Australia 100 100C.C.K. Holdings I Ltd (liquidated) Gibraltar – 100C.C.K. Holdings II Ltd (liquidated) Gibraltar – 100CCKBC (Netherlands) Holdings I BV 3 Netherlands 100 100CCKBC (Netherlands) Holdings II BV 3 Netherlands 100 100
Coca-Cola Korea Bottling Company, Ltd 3 Republic of Korea 100 100Coca-Cola Amatil (Aust) Pty Ltd 1 Australia 100 100
Apand Pty Ltd 1 Australia 100 100Beverage Bottlers (NQ) Pty Ltd 1 Australia 100 100Beverage Bottlers (NSW) Pty Ltd (in liquidation) Australia 100 100Beverage Bottlers (Qld) Ltd 1 Australia 100 100Beverage Bottlers (SA) Ltd (in liquidation) Australia 100 100Coca-Cola Amatil (Holdings) Pty Ltd 1 Australia 100 100Crusta Fruit Juices Pty Ltd Australia 100 –
Quenchy Crusta Sales Pty Ltd Australia 100 –Quirks Australia Pty Ltd 1 Australia 100 –
Coca-Cola Holdings NZ Ltd New Zealand 100 100Coca-Cola Amatil (NZ) Ltd New Zealand 100 100
Matila Nominees Pty Ltd 4 Australia 100 100Neverfail Springwater Ltd 1 & 5 Australia 100 100
Neverfail Cooler Company Pty Ltd 1 Australia 100 100Purna Pty Ltd 1 Australia 100 100
Neverfail Bottled Water Co Pty Ltd 1 & 6 Australia 100 100Neverfail SA Pty Ltd 1 Australia 100 100Neverfail Springwater Co Pty Ltd 1 Australia 100 100
Neverfail Springwater (Vic) Pty Ltd 1 Australia 100 100Neverfail Springwater Co (Qld) Pty Ltd 1 Australia 100 100Neverfail WA Pty Ltd 1 Australia 100 100Piccadilly Distribution Services Pty Ltd 1 Australia 100 100Piccadilly Natural Springs Pty Ltd 1 Australia 100 100Real Oz Water Supply Co (Qld) Pty Ltd 1 Australia 100 100
Pacbev Pty Ltd 1 Australia 100 100Pacific Beverages Australia Pty Ltd 1 Australia 100 100
Vending Management Services Ltd New Zealand 100 100
Names inset indicate that shares are held by the company immediately above the inset.The above companies carry on business in their respective countries of incorporation.
Footnotes: refer to the page opposite for footnote explanations.
NOTES TO THE FINANCIAL STATEMENTS continuedCOCA-COLA AMATIL LIMITED AND ITS CONTROLLED ENTITIES
FOR THE FINANCIAL YEAR ENDED 31 DECEMBER 2004

Australia New Zealand Papua New Guinea Fiji South Korea Indonesia
75Annual Report 2004
32. Investments in Controlled Entities continued
Footnotes1 These companies are parties to a Deed of Cross Guarantee as detailed in Note 38.2 Some of the shares in this company are held by Indonesian parties who are bound by undertakings to the Group.3 CCKBC (Netherlands) Holdings I BV and CCKBC (Netherlands) Holdings II BV hold 49.8% and 50.2% respectively of the shareholding in Coca-Cola Korea Bottling Company, Ltd.4 Matila Nominees Pty Ltd is the trustee company for the Employees Share Plan, the Long Term Incentive Share Plan, the Non-executive Directors’ Share Plan and the
Executive Salary Sacrifice Share Plan. As at 31 December 2004, the trustee held 7,538,133 (2003: 7,044,279) ordinary shares on behalf of the members of the ESP, 311,806(2003: 159,980) ordinary shares on behalf of the members of the LTISP, 65,226 (2003: nil) ordinary shares on behalf of the members of the Non-executive Directors’ SharePlan and 2,688 (2003: nil) ordinary shares on behalf of the members of the Executive Salary Sacrifice Share Plan.
5 Neverfail Springwater Ltd holds 40.7% of the shareholding in Neverfail Bottled Water Co Pty Ltd.6 Neverfail Bottled Water Co Pty Ltd holds 1.5% of the shareholding in Neverfail Springwater (Vic) Pty Ltd.
33. Acquisitions of Entities and Operation
During the financial year, the Group acquired an interest in the following entities and operation –
Effective date BeneficialDescription of entity of acquisition interestor operation 2004 acquired
Entities –Crusta Fruit Juices Pty Ltd Manufacture, marketing and distribution of fruit juices 29 October 100.0%
Operation –Quirks Refrigeration Rental and servicing of commercial refrigeration equipment 12 November N/A
Fair value of net assets acquiredThe fair value of the net assets acquired during the financial year was as follows –
$M
Current assets 20.0Investments in bottlers’ agreements 4.3Property 1.2Plant and equipment 26.8Customer lists 1.6Future income tax benefits 0.4Goodwill 3.3Current liabilities (11.9)Non-current liabilities (0.4)
Total fair value of net assets acquired 45.3
Cash flow on acquisitionsThe payments for acquisitions of entities and operation (net) as disclosed in theStatements of Cash Flows was determined as follows –
Total consideration 45.3Less cash acquired (1.1)
Cash flow on acquisitions of entities and operation (net) 44.2

Australia New Zealand Papua New Guinea Fiji South Korea Indonesia
76 Coca-Cola Amatil
CCA Group
2004 2003$M $M
34. Reconciliation of Net Debt
Cash assets (279.9) (260.1)Cross currency swap receivables relating to interest bearing liabilities (0.2) –Interest bearing liabilities – current 451.0 404.6Interest bearing liabilities – non-current 1,365.9 1,435.0
Total net debt 1,536.8 1,579.5
CCA Group CCA Entity
2004 2003 2004 2003$M $M $M $M
35. Financing Facilities
Standby arrangementsBank loans – 386.0 – 386.0Bank overdrafts 16.7 11.5 5.0 5.0
16.7 397.5 5.0 391.0
Loan facilitiesBond issues 1,352.7 1,030.0 864.6 558.6Bank loans and cash advance facilities 305.0 710.7 – 400.0
1,657.7 1,740.7 864.6 958.6
Unused loans and cash advance facilities 85.7 524.8 5.0 491.0
When bank loans and cash advances mature, the Directors have no reason to believe that such facilities will not be extended or replaced with similarfacilities.
NOTES TO THE FINANCIAL STATEMENTS continuedCOCA-COLA AMATIL LIMITED AND ITS CONTROLLED ENTITIES
FOR THE FINANCIAL YEAR ENDED 31 DECEMBER 2004

Australia New Zealand Papua New Guinea Fiji South Korea Indonesia
77Annual Report 2004
36. Financial Instruments
Derivatives, including off-balance sheet riskThe Group, through its operations internationally, is exposed to significant financial risks from movements in interest rates, foreign exchange rates andcertain raw material commodity prices. The Group manages these exposures using a comprehensive set of policies and procedures approved by theBoard. Financial risk is managed centrally and speculative trading is specifically prohibited by policy.
The Group is party to financial instruments with off-balance sheet risk for the purpose of reducing its exposure to adverse fluctuations in interest rates,foreign exchange rates and commodity prices. The hedging instruments are subject to fluctuations in value and any such fluctuations are generally offsetagainst the value of the underlying financial risks being hedged.
a) Interest rate risk managementThe Group enters various derivative transactions with the objective of obtaining lower funding costs and a more stable and predictable interest costoutcome, principally employing the use of interest rate and cross currency swaps. In addition, forward rate agreements, caps, floors, swaptions andfinancial futures are utilised.
For interest rate swaps, the Group agrees with counterparties to exchange, at specified intervals, the difference between fixed rate and floating rate interestamounts calculated by reference to an agreed notional principal amount. Any amounts paid or received at the commencement of interest rate swaps arerecognised as adjustments to interest expense over the life of each swap, thereby adjusting the effective interest rate on the underlying obligation.
A cross currency swap is an agreement to exchange one currency for another and to re-exchange the currencies at the maturity of the swap (using thesame exchange rate), with the exchange of interest payments throughout the swap period.
Premiums paid or received for interest rate caps, floors or swaptions are amortised over the life of the instrument, which increases or decreases theeffective interest cost of the underlying obligations, and benefits or costs associated with the use of financial futures are similarly amortised.
The following table details the Group’s exposure to interest rates as at 31 December 2004 –
Fixed interest rate
Average More Non-interest Floating Less than 1 to 5 than interestrate p.a. rate 1 year years 5 years bearing Total
% $M $M $M $M $M $M
Financial assetsCash assets 4.8 279.9 – – – – 279.9Receivables and cross currency swap receivables
relating to interest bearing liabilities – – – – – 532.8 532.8Investments in securities – – – – – 0.1 0.1
279.9 – – – 532.9 812.8
Financial liabilitiesPayables, provisions and current income tax liabilities – – – – – 677.2 677.2Bonds and cross currency swaps relating to
interest bearing liabilities 3.9 410.2 225.3 276.8 440.4 228.2 1,580.9Loans and bank overdrafts 4.5 236.0 – – – – 236.0Interest rate derivatives at gross face values 5.2 (5,599.8) 1,773.9 2,727.9 1,098.0 – –
(4,953.6) 1,999.2 3,004.7 1,538.4 905.4 2,494.1

Australia New Zealand Papua New Guinea Fiji South Korea Indonesia
78 Coca-Cola Amatil
36. Financial Instruments continued
a) Interest rate risk management continuedThe following table details the Group’s exposure to interest rates as at 31 December 2003 –
Fixed interest rate
Average More Non-interest Floating Less than 1 to 5 than interestrate p.a. rate 1 year years 5 years bearing Total
% $M $M $M $M $M $M
Financial assetsCash assets 4.7 260.1 – – – – 260.1Receivables and cross currency swap receivables
relating to interest bearing liabilities – – – – – 540.3 540.3Investments in securities – – – – – 0.4 0.4
260.1 – – – 540.7 800.8
Financial liabilitiesPayables, provisions and current income tax liabilities – – – – – 688.8 688.8Bonds and cross currency swaps relating to
interest bearing liabilities 3.0 458.0 37.4 447.2 87.4 226.1 1,256.1Loans and bank overdrafts 5.0 583.5 – – – – 583.5Interest rate derivatives at gross face value 5.2 (5,329.0) 2,632.0 1,963.2 733.8 – –
(4,287.5) 2,669.4 2,410.4 821.2 914.9 2,528.4
b) Foreign exchange risk managementThe Group enters into foreign currency contracts and foreign currency options to hedge capital obligations, expenses and revenues denominated inforeign currencies. Benefits or costs arising from currency hedges for expense and revenue transactions are brought to account in the Statements ofFinancial Performance over the lives of the hedge transactions. For transactions entered into that hedge specific capital or borrowing commitments, anycost or benefit resulting from the hedge forms part of the initial asset or liability carrying value.
The following table sets out as at balance date the gross value to be received under foreign currency contracts and foreign currency options, theweighted average contracted exchange rates and settlement dates of outstanding contracts –
Weighted average UnrealisedLess than 1 year 1 to 5 years exchange rate gains (losses)
2004 2003 2004 2003 2004 2003 2004 2003$M $M $M $M $ $ $M $M
Foreign currency contractsUSD 480.0 73.6 109.4 58.3 0.7057 0.7058 (27.7) (0.1)Other currencies 148.9 74.7 27.3 0.2 – – 1.2 0.1
Foreign currency optionsAUD/USD Purchased 132.6 415.1 – – 0.7542 0.6954 1.1 20.5AUD/USD Sold – 112.8 – – – 0.6650 – (3.2)Other currencies Purchased – 27.5 – – – – – (0.2)Other currencies Sold – 13.7 – – – – – (0.6)
NOTES TO THE FINANCIAL STATEMENTS continuedCOCA-COLA AMATIL LIMITED AND ITS CONTROLLED ENTITIES
FOR THE FINANCIAL YEAR ENDED 31 DECEMBER 2004

Australia New Zealand Papua New Guinea Fiji South Korea Indonesia
79Annual Report 2004
36. Financial Instruments continued
c) Commodity price risk managementThe Group is exposed to commodity price and currency volatility in certain raw materials used in the business. The Group enters into forwardtransactions, futures, swaps and option contracts to hedge commodity exposures with the objective of obtaining lower raw material prices and a morestable and predictable commodity price outcome.
The hedging of the purchase of these commodities gives rise to gains and losses on revaluation of hedge contracts. These gains and losses are broughtto account in the cost price of the commodity in the period the underlying transaction being hedged is recorded.
The following table sets out, as at balance date, the gross value to be paid under commodity futures, swaps and option contracts upon settlement –
UnrealisedLess than 1 year 1 to 5 years gains (losses)
2004 2003 2004 2003 2004 2003$M $M $ $ $M $M
Futures 46.4 22.8 6.4 10.4 13.1 2.9Swaps – 12.6 – 17.5 – (5.7)
d) Credit risk managementCredit risk represents the loss that would be recognised if counterparties to financial instruments fail to perform as contracted.
On-balance sheet riskThe credit risk on financial assets, excluding investments, of the Group which have been recognised in the Statements of Financial Position is thecarrying amount, net of any provision for doubtful debts. The Group minimises concentration of credit risk by undertaking transactions with a largenumber of customers and counterparties in various countries. The Group is not materially exposed to any individual customer.
Off-balance sheet riskCredit risk arising from dealings in financial instruments is controlled by a strict policy of credit approvals, limits and monitoring procedures. The Grouphas no significant concentration of credit risk with any single counterparty and, as a matter of policy, only transacts with financial institutions that haveat least an A- (or equivalent) credit rating. Credit exposure of interest rate, foreign currency and commodity derivatives is represented by the net fairvalue of the contracts, as disclosed.
e) Net fair values of financial assets and liabilitiesThe following methods and assumptions were used to estimate the net fair values –
• Futures and options on futures contractsThe net fair value is the closing price on the applicable futures exchange;
• Swaps, caps, floors, foreign currency contracts, foreign currency options and non-current interest bearing liabilitiesNet fair value is estimated as the present value of future cash flows using market accepted formulae and market quoted input variables; and
• Cash assets, receivables, payables, provisions and short term interest bearing liabilitiesThe carrying amounts of these financial instruments approximate net fair value because of their short maturity.
Carrying amount Net fair value
Asset Liability Asset Liability
2004 2003 2004 2003 2004 2003 2004 2003$M $M $M $M $ $ $M $M
Futures – – 1.0 0.2 – – – 0.2Swaps 9.6 3.3 234.9 230.5 26.0 28.8 247.2 240.0Options – – – – – 0.8 – 0.3Non-current interest bearing liabilities – – 1,211.4 1,220.6 – – 1,230.5 1,276.5
f) Foreign currency borrowing hedgesThe Group has interest bearing liabilities denominated in foreign currencies. As a matter of policy, the Group does not borrow foreign currency on anunhedged basis. Where a natural hedge between the borrowing currency and net foreign assets does not exist, then specific hedging, utilising currencyswaps or forward foreign currency contracts, is employed to remove currency exposure.
g) Liquidity riskThe Group restricts its use of derivatives to those markets which are highly liquid.

Australia New Zealand Papua New Guinea Fiji South Korea Indonesia
80 Coca-Cola Amatil
36. Financial Instruments continued
h) Significant terms – interest bearing liabilitiesThe following table sets out the significant terms of the major components of the Group’s interest bearing liabilities –
Interest rate p.a.Refer 2004 2003 2004 2003 Maturity
Type of interest bearing liability/country Note $M $M % % Denomination Date
CurrentBonds
Australia 74.9 – 1.4 – Japanese Yen Oct to Nov 05Australia – CCA Entity 102.2 37.4 0.9 0.2 Japanese Yen Jul to Sep 05Australia – CCA Entity 38.6 – 2.5 – United States Dollar Sep 05New Zealand 110.5 – 8.0 – New Zealand Dollar Jun 05
326.2 37.4
LoansAustralia 0.2 – – – Australian Dollar Jan 05Australia – CCA Entity – 300.0 – 5.5 Australian Dollar Jan 04
0.2 300.0
Bank loansIndonesia – 8.0 – 8.8 Indonesian Rupiah Jan 04New Zealand 5.5 – 6.9 – New Zealand Dollar Jan 05Papua New Guinea 0.4 6.0 11.8 12.0 Papua New Guinean Kina Jan 05South Korea 44.4 41.3 4.8 4.7 Korean Won Feb 05
50.3 55.3
OtherBank overdrafts 0.6 0.2Cross currency swaps relating to
interest bearing liabilities 73.7 11.774.3 11.9
Total interest bearing liabilities (current) 15 451.0 404.6
Non-currentBonds
Australia – 74.9 – 1.4 Japanese Yen Oct to Nov 05Australia 25.7 26.7 3.1 1.7 United States Dollar Jun 06Australia 227.0 215.1 3.5 3.5 Swiss Franc Sep 06Australia 50.0 50.0 7.3 7.3 Australian Dollar Apr 09Australia – CCA Entity 112.1 214.7 1.3 1.3 Japanese Yen Jun 06 to Mar 12Australia – CCA Entity 513.7 207.1 4.4 1.5 United States Dollar Jun 06 to Apr 16Australia – CCA Entity 65.0 65.0 6.1 5.9 Australian Dollar Jul 06 to Mar 12Australia – CCA Entity 33.0 34.4 1.2 0.9 Hong Kong Dollar Mar 07New Zealand – 104.7 – 8.0 New Zealand Dollar
1,026.5 992.6
Bank loansPapua New Guinea – 7.2 – 12.0 Papua New Guinean Kina May 06Indonesia 62.9 80.1 3.4 1.9 United States Dollar Jun 06South Korea 122.0 140.7 4.8 4.7 Korean Won Aug 06
184.9 228.0
OtherCross currency swaps relating to
interest bearing liabilities 154.5 214.4
Total interest bearing liabilities (non-current) 15 1,365.9 1,435.0
NOTES TO THE FINANCIAL STATEMENTS continuedCOCA-COLA AMATIL LIMITED AND ITS CONTROLLED ENTITIES
FOR THE FINANCIAL YEAR ENDED 31 DECEMBER 2004

Australia New Zealand Papua New Guinea Fiji South Korea Indonesia
81Annual Report 2004
37. Related Parties
DirectorsDetails of Directors in office at the end of the financial year and the beneficial interest of each Director in the contributed equity of the Company at thatdate are set out in Note 31.
The following dealings between the Group and Directors and Director related entities were made in the ordinary course of business and on normalcommercial terms and conditions –
• Director related entities of Bapak Mugijanto, a President Commissioner of an overseas controlled entity, were paid a total of $9,669,000(2003: $11,501,000) for the provision of delivery, travel and consulting services; and
• Director related entities of Bapak Moetaryanto Poerwoaminoto, a Commissioner of an overseas controlled entity, were paid a total of $2,301,000 (2003: $1,237,000) for the provision of delivery and consulting services.
The aggregate of amounts payable to Directors and their Director related entities at 31 December 2004 was $782,000 (2003: $701,000).
Details of remuneration received, or due and receivable, by the above Directors during the financial year are set out in Note 31.
Parent entityCoca-Cola Amatil Limited is the parent entity of the Group.
Controlled entitiesThe Company transacted business throughout the financial year with certain controlled entities whereby it received management and guarantee fees,dividends and interest and made payments of interest, as detailed in Notes 2 and 3. The aggregate amounts receivable from and payable to controlledentities at balance date are shown in Notes 7 and 14 respectively. Included within amounts disclosed in Notes 2 and 7 are management and guaranteefees and amounts receivable from controlled entities that were not wholly owned, being $1,400,000 (2003: $2,300,000) and $1,000,000 (2003:$1,800,000) respectively.
The Group does not hold any investments, other than in controlled entities, over which it has significant influence.
Related entitiesThe Coca-Cola Company (TCCC), through its subsidiaries, Coca-Cola Holdings (Overseas) Limited, CRI Pacific Holdings I LLC, CRI Pacific Holdings II LLCand The Coca-Cola Export Corporation holds 34.1% (2003: 34.5%) of the Company’s fully paid ordinary shares.
CCA and TCCC are committed to building a sustainable growth strategy, which delivers higher revenue and improved returns to CCA and allows TCCC to profit from building and delivering leading brands.
In addition to its own range of products, CCA manufactures, distributes and sells TCCC trademarked products in six countries under thirteen bottlingagreements. The agreements are for periods of mainly ten years with provision for renewal and are at varying stages of their terms. Further details on CCA’s carrying value of its investments in bottlers’ agreements are set out in Note 10.

Australia New Zealand Papua New Guinea Fiji South Korea Indonesia
82 Coca-Cola Amatil
NOTES TO THE FINANCIAL STATEMENTS continuedCOCA-COLA AMATIL LIMITED AND ITS CONTROLLED ENTITIES
FOR THE FINANCIAL YEAR ENDED 31 DECEMBER 2004
37. Related Parties continued
Related entities continuedThe relationship with TCCC has three main components – TCCC is: 1) CCA’s largest shareholder; 2) the supplier of concentrate used to manufacture theproducts; and 3) the brand owner –
1) Largest shareholderTCCC like all shareholders, participates in share price movements and dividends paid. Two Directors of CCA’s seven member Board are nominated byTCCC; and
2) SupplierUnder the bottling agreements, TCCC provides the concentrate and beverage base from which the finished products are manufactured by CCA. Eachyear, the companies jointly develop sales and marketing plans (which include brand strategies, marketing execution, in-market sales execution andwholesale pricing); and
In line with corporate governance best practice, CCA’s Related Party Committee reviews the arms length basis of all material transactions with TCCC.This includes concentrate and beverage base pricing arrangements negotiated as part of the annual planning process.
3) Brand ownerBy being part of the Coca-Cola System, CCA has access to the world’s most popular branded beverages supported by strong advertising and uniquemarketing properties. CCA and TCCC work together to utilise their respective complementary skills and assets and to profitably build consumption ineach of their markets. A broad allocation of responsibilities for marketing is as follows –
• TCCC is focused on consumer marketing, including advertising and promotion, the development of new brands, and innovative brand andpackaging plans. These consumer marketing activities are funded by TCCC; and
• CCA’s marketing activities are primarily focused on developing and maintaining strong customer relationships, and implementing the marketingstrategies and plans. These trade marketing activities are funded by CCA.
Superannuation plansAssociated Nominees Pty Ltd and CCA Superannuation Pty Ltd act as trustees for the CCA Group Superannuation Plan and CCA BeveragesSuperannuation Plan respectively. Coca-Cola Amatil Limited holds a 50% share of both companies.
Other related partiesThe Group transacted business throughout the financial year with several subsidiaries of TCCC for the purchase of concentrate and beverage base forCoca-Cola trademarked products and finished products, amounting to $730,616,000 (2003: $648,460,000).
Under a series of other arrangements, the Group also participates with certain subsidiaries of TCCC under which they jointly contribute to thedevelopment of the market in the territories in which the Group operates. These arrangements include a regular shared marketing expenses program,under which the Group contributes to certain TCCC incurred marketing expenditure and TCCC contributes to certain marketing expenditure incurred bythe Group. Certain subsidiaries of TCCC provide marketing support to the Group, which is in addition to the usual contribution to shared marketinginitiatives. This is designed to assist the Group with the necessary development of certain territories. Amounts received are either accounted for as acredit to revenue or as a reduction to expense, as appropriate. These arrangements have resulted in a net reimbursement to the Group of $30,700,000(2003: $21,231,000).
The aggregate of amounts receivable from related entities at balance date is shown in Note 7.
The aggregate of amounts payable to related and Director related entities is reconciled to Note 14 as follows –
CCA Group
2004 2003$M $M
Amounts payable (related entities) 160.9 147.2Amounts payable (Director related entities) 0.8 0.7
161.7 147.9
All of the above transactions were conducted under normal commercial terms and conditions.

Australia New Zealand Papua New Guinea Fiji South Korea Indonesia
83Annual Report 2004
38. Deed of Cross Guarantee
Coca-Cola Amatil Limited and certain controlled entities as indicated in Note 32 have entered into a Deed of Cross Guarantee with Matila Nominees Pty Ltd which provides that all parties to the Deed will guarantee to each creditor, payment in full of any debt of each company participating in the Deedon winding-up of that company. In addition, as a result of Class Order No. 98/1418 issued by the Australian Securities and Investments Commission, the controlled entities (other than Coca-Cola Amatil Limited) are relieved from the requirement to prepare financial statements.
2004 2003Statements of Financial Position for the closed group $M $M
Current assetsCash assets 165.7 185.6Receivables 366.7 394.8Inventories 267.4 232.0Prepayments 22.0 26.5
Total current assets 821.8 838.9
Non-current assetsInvestments in securities 1,240.3 1,255.5Investments in bottlers’ agreements 2,303.3 2,302.5Property, plant and equipment 641.5 590.3Intangibles 5.1 3.0Prepayments 18.1 6.2Future income tax benefits 35.6 35.9
Total non-current assets 4,243.9 4,193.4
Total assets 5,065.7 5,032.3
Current liabilitiesPayables 253.4 240.6Interest bearing liabilities 289.3 349.1Provisions 25.9 29.7Current income tax liability 117.6 172.8Accrued charges 148.7 168.3
Total current liabilities 834.9 960.5
Non-current liabilitiesPayables 19.6 24.6Interest bearing liabilities 1,181.0 1,102.3Provisions 40.0 37.6Deferred income tax liability 55.7 60.5
Total non-current liabilities 1,296.3 1,225.0
Total liabilities 2,131.2 2,185.5
Net assets 2,934.5 2,846.8
EquityContributed equity 1,671.5 1,631.1Reserves 1,088.6 1,113.8Retained earnings 174.4 101.9
Total equity 2,934.5 2,846.8
Statements of Financial Performance for the closed group
Profit from ordinary activities before tax 348.9 303.4Income tax expense from ordinary activities (97.1) (137.1)
Net profit 251.8 166.3Retained earnings at the beginning of the financial year 101.9 76.0Transferred from reserves – 3.0Adjustment arising from adoption of revised Accounting Standard AASB 1028 “Employee Benefits” – (0.9)Dividends appropriated (179.3) (142.5)
Retained earnings at the end of the financial year 174.4 101.9

Australia New Zealand Papua New Guinea Fiji South Korea Indonesia
84 Coca-Cola Amatil
NOTES TO THE FINANCIAL STATEMENTS continuedCOCA-COLA AMATIL LIMITED AND ITS CONTROLLED ENTITIES
FOR THE FINANCIAL YEAR ENDED 31 DECEMBER 2004
39. Subsequent Events
Since the end of the financial year, the Directors have declared the following dividend –
Rate per Franking pershare share Amount Date
Class of share ¢ ¢ $M payable
Ordinary 15.5 15.5 109.9 1 April 2005
Acquisition of Northern Territory Coca-Cola franchise licence and related assetsThe Group acquired the Northern Territory Coca-Cola franchise business assets of Parmalat Australia Ltd on 28 January 2005.
Proposed acquisition of SPC Ardmona Ltd (SPC Ardmona)On 12 November 2004, CCA entered into a scheme of arrangement with SPC Ardmona under which CCA will acquire all of the outstanding shares andoptions in SPC Ardmona in Australia. SPC Ardmona shareholders voted to support the proposed acquisition by CCA on 3 February 2005. In addition tothe SPC Ardmona shareholder approval, CCA has received formal confirmation from the Australian Competition and Consumer Commission, the Foreign
Investment Review Board and the Australian Stock Exchange that they have no objection to the proposed acquisition. SPC Ardmona has applied to theSupreme Court of Victoria for approval of the scheme of arrangement between SPC Ardmona and its shareholders, with the Court hearing scheduled forFriday, 11 February 2005.
40. Impact of Adopting Australian Equivalents to International Financial Reporting Standards
Project managementThe CCA Group will be required to prepare financial statements using Australian equivalents to International Financial Reporting Standards (IFRS) for thefirst time when the Group reports to the Australian Stock Exchange for the half year ending 30 June 2005.
IFRS requires that entities reporting their financial statements for the first time under IFRS must also restate their comparatives using all IFRS with theexception of the Australian equivalents to IAS 32 and IAS 39, being “Financial Instruments: Disclosure and Presentation”, and “Financial Instruments:Recognition and Measurement” respectively. This will mean that the Group’s opening IFRS balance sheet will be a restated comparative balance sheetdated 1 January 2004.
Most accounting adjustments required on transition to IFRS will be made retrospectively against opening retained earnings as at 1 January 2004.Transitional accounting adjustments relating to the Australian equivalent IAS 32 and 39, where comparatives are not required, will be made as at 1 January 2005.
Comparatives restated to comply with IFRS would be reported in the Group’s financial statements for the first half year ending 30 June 2005.
During 2003, the Group created a Steering Committee to plan and monitor the transition process to IFRS. The Committee has been reviewing andassessing developments in IFRS and the potential impact these standards will have on the Group’s financial statements and accounting policies.
The Committee has established three phases to the IFRS implementation project, being –
• initiation and planning;• design and execution; and• implementation.
The initiation, planning, design and execution phase of the implementation project was completed as at December 2004. CCA has commenced buildingthe comparatives for 2004 ready for reporting within 2005. CCA expects the implementation phase to be completed coinciding with the release of theIFRS compliant results for the half year ending 30 June 2005.

Australia New Zealand Papua New Guinea Fiji South Korea Indonesia
85Annual Report 2004
40. Impact of Adopting Australian Equivalents to International Financial Reporting Standards continued
In this context, CCA summarises its current assessment of the impact of IFRS adoption as follows –
• earnings before interest and tax (EBIT): the underlying business will not be impacted and therefore current and future trading results will notmaterially change;
• interest: effective interest rates will not be impacted as the rating agencies are not expected to change CCA’s existing investment grade ratings;• taxation: tax expense will not be materially impacted but deferred assets and liabilities are expected to be recorded at a higher level;• dividends: CCA’s current dividend payout ratio of 70% to 80% of net profit will not be affected and there is no impact on the Company’s ability
to pay current and future dividends;• intangible assets: as previously announced an approximate $1.9 billion reversal of the previous revaluation of investments in bottlers’ agreements
will arise against that asset and will lower retained earnings at 1 January 2004 by the same amount;• cash flow: cash flow will not be impacted;• debt servicing: EBIT interest cover ratio will not be impacted;• share based payments: there will be no material impact on retained earnings. Future share based remuneration will be expensed over the relevant
vesting periods, consistent with current practice; and• financial instruments: CCA will align hedging transactions to underlying exposures. Eligibility to adopt IFRS hedge accounting will be sought.
Potential earnings volatility is an increased risk as a consequence of more rigorous effectiveness testing and documentation under IFRS.
The following outlines the key differences in accounting policies that are expected to arise from adopting IFRS, and the effect on the CCA Group –
Share based paymentsInsignificant impact on retained earnings at 1 January 2004
Employer contributions to the Employees Share Plan and the Long Term Incentive Share Plan are currently accrued and/or expensed annually as anemployee benefit expense. No expenses are recorded in respect of the Executive Option Plan. At the beginning of the 2003 financial year, CCA ceasedissuing options under the Executive Option Plan.
Under IFRS, the Group will recognise an expense for all share based remuneration, and will amortise those expenses over the relevant vesting periods.
Business combinationsPotentially higher expenses shown in the income statement following an acquisition requiring post implementation restructuring
In the event of a business combination, the acquiring entity will not be permitted to recognise liabilities for terminating or reducing the activities of the acquired entity as part of allocating the cost of the business combination. Such restructuring provisions may only be recognised when the acquiredentity, has, at the acquisition date, an existing liability for restructuring recognised in accordance with AASB 137 “Provisions, Contingent Liabilities andContingent Assets”.
Non-current assets held for salePotentially results in reclassification at 1 January 2004Subject to reclassification occurring, retained earnings at 1 January 2004 could be impacted
A non-current asset may be classified as held for sale if its carrying amount will be recovered principally through a sale transaction rather thancontinuing use. The asset must be available for immediate sale in its present condition and the sale must be highly probable. For the sale to be highlyprobable, the appropriate level of management must be committed to a plan to sell the asset, and an active program to locate a buyer and complete theplan must have been initiated. The asset must be actively marketed for sale at a price that is reasonable in relation to its current fair value. The saleshould be expected to qualify for recognition as a completed sale within one year from the date of classification, and actions required to complete theplan should indicate that it is unlikely that significant changes to the plan will be made or that the plan will be withdrawn.
This may result in some assets being reclassified from held for sale to property, plant and equipment on transition to IFRS. This will require a retrospective catch-up in depreciation expense, impacting retained earnings.
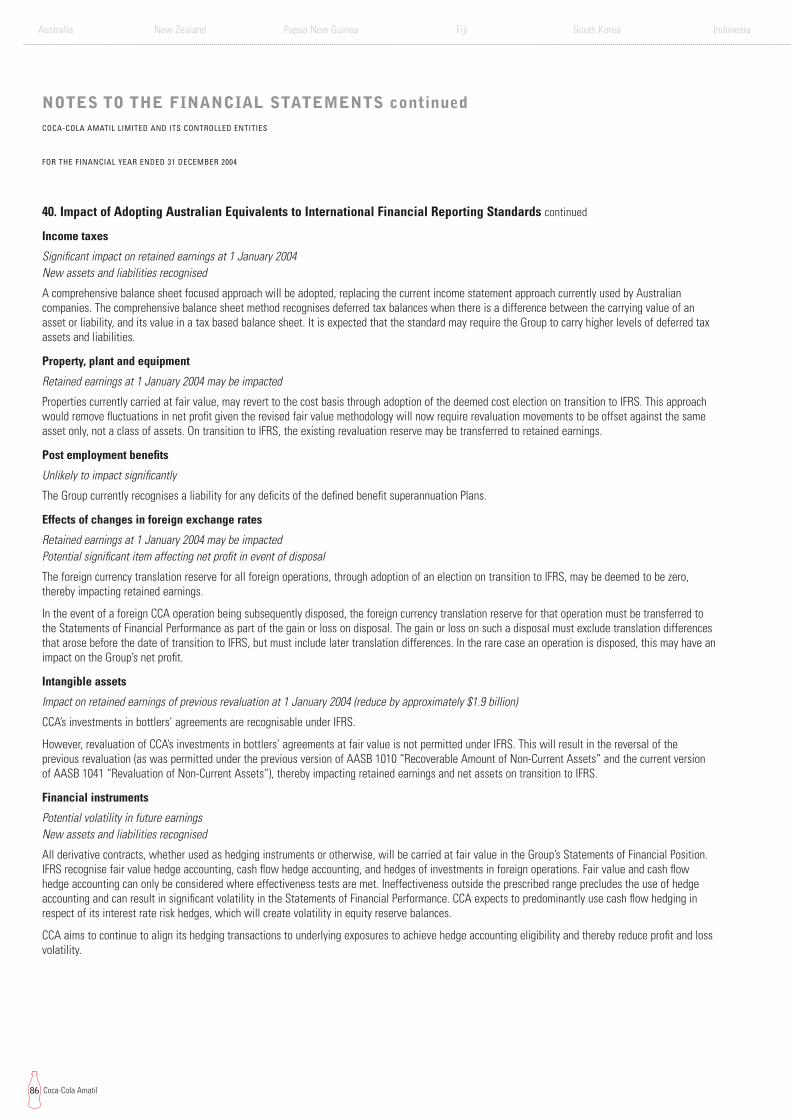
Australia New Zealand Papua New Guinea Fiji South Korea Indonesia
86 Coca-Cola Amatil
NOTES TO THE FINANCIAL STATEMENTS continuedCOCA-COLA AMATIL LIMITED AND ITS CONTROLLED ENTITIES
FOR THE FINANCIAL YEAR ENDED 31 DECEMBER 2004
40. Impact of Adopting Australian Equivalents to International Financial Reporting Standards continued
Income taxes
Significant impact on retained earnings at 1 January 2004New assets and liabilities recognised
A comprehensive balance sheet focused approach will be adopted, replacing the current income statement approach currently used by Australiancompanies. The comprehensive balance sheet method recognises deferred tax balances when there is a difference between the carrying value of anasset or liability, and its value in a tax based balance sheet. It is expected that the standard may require the Group to carry higher levels of deferred taxassets and liabilities.
Property, plant and equipment
Retained earnings at 1 January 2004 may be impacted
Properties currently carried at fair value, may revert to the cost basis through adoption of the deemed cost election on transition to IFRS. This approachwould remove fluctuations in net profit given the revised fair value methodology will now require revaluation movements to be offset against the sameasset only, not a class of assets. On transition to IFRS, the existing revaluation reserve may be transferred to retained earnings.
Post employment benefits
Unlikely to impact significantly
The Group currently recognises a liability for any deficits of the defined benefit superannuation Plans.
Effects of changes in foreign exchange rates
Retained earnings at 1 January 2004 may be impactedPotential significant item affecting net profit in event of disposal
The foreign currency translation reserve for all foreign operations, through adoption of an election on transition to IFRS, may be deemed to be zero,thereby impacting retained earnings.
In the event of a foreign CCA operation being subsequently disposed, the foreign currency translation reserve for that operation must be transferred tothe Statements of Financial Performance as part of the gain or loss on disposal. The gain or loss on such a disposal must exclude translation differencesthat arose before the date of transition to IFRS, but must include later translation differences. In the rare case an operation is disposed, this may have animpact on the Group’s net profit.
Intangible assets
Impact on retained earnings of previous revaluation at 1 January 2004 (reduce by approximately $1.9 billion)
CCA’s investments in bottlers’ agreements are recognisable under IFRS.
However, revaluation of CCA’s investments in bottlers’ agreements at fair value is not permitted under IFRS. This will result in the reversal of theprevious revaluation (as was permitted under the previous version of AASB 1010 “Recoverable Amount of Non-Current Assets” and the current versionof AASB 1041 “Revaluation of Non-Current Assets”), thereby impacting retained earnings and net assets on transition to IFRS.
Financial instruments
Potential volatility in future earningsNew assets and liabilities recognised
All derivative contracts, whether used as hedging instruments or otherwise, will be carried at fair value in the Group’s Statements of Financial Position.IFRS recognise fair value hedge accounting, cash flow hedge accounting, and hedges of investments in foreign operations. Fair value and cash flowhedge accounting can only be considered where effectiveness tests are met. Ineffectiveness outside the prescribed range precludes the use of hedgeaccounting and can result in significant volatility in the Statements of Financial Performance. CCA expects to predominantly use cash flow hedging inrespect of its interest rate risk hedges, which will create volatility in equity reserve balances.
CCA aims to continue to align its hedging transactions to underlying exposures to achieve hedge accounting eligibility and thereby reduce profit and lossvolatility.

Australia New Zealand Papua New Guinea Fiji South Korea Indonesia
87Annual Report 2004
DIRECTORS’ DECLARATIONCOCA-COLA AMATIL LIMITED AND ITS CONTROLLED ENTITIES
The Directors declare that the financial statements and notes, set out on pages 39 to 86 –
a) are in accordance with the Corporations Act 2001; and
b) comply with Accounting Standards and the Corporations Regulations 2001; and
c) give a true and fair view of the Company’s and the consolidated entity’s financial position as at 31 December 2004 and of their performance for thefinancial year ended 31 December 2004; and
d) at the date of this declaration, there are reasonable grounds to believe that the Company will be able to pay its debts as and when they become dueand payable.
There are reasonable grounds to believe that the Company and the wholly owned controlled entities identified in Note 32 to the financial statements asbeing parties to a Deed of Cross Guarantee with Matila Nominees Pty Ltd as trustee, will be able to meet any obligations or liabilities to which they are,or may become, subject by virtue of the Deed.
The Directors have received and considered the certification from the Managing Director and the Chief Financial Officer supporting the financialstatements and statutory reports for the financial year ended 31 December 2004.
This declaration is made in accordance with a resolution of the Directors pursuant to section 295 (5) of the Corporations Act 2001.
On behalf of the Directors
T.J. Davis
Sydney, 10th day of February 2005

Australia New Zealand Papua New Guinea Fiji South Korea Indonesia
88 Coca-Cola Amatil
INDEPENDENT AUDIT REPORTCOCA-COLA AMATIL LIMITED AND ITS CONTROLLED ENTITIES
TO THE MEMBERS OF COCA-COLA AMATIL LIMITED
Scope
The financial report and Directors’ responsibilityWe have audited the financial report of Coca-Cola Amatil Limited for the financial year ended 31 December 2004, as set out on pages 39 to 87, includingthe Directors’ Declaration. The financial report includes the financial statements of Coca-Cola Amatil Limited, and the consolidated financial statementsof the consolidated entity comprising the Company and the entities it controlled at year’s end or from time to time during the financial year.
The Company’s Directors are responsible for preparing a financial report that gives a true and fair view of the financial position and performance of theCompany and the consolidated entity and that complies with Australian Accounting Standards in accordance with the Corporations Act 2001. Thisincludes responsibility for the maintenance of adequate accounting records, internal controls that are designed to prevent and detect fraud and error andfor the accounting policies and accounting estimates inherent in the financial report.
Audit approachWe conducted an independent audit of the financial report in order to express an opinion on it to the members of the Company. Our audit was conductedin accordance with Australian Auditing Standards in order to provide reasonable assurance as to whether the financial report is free of materialmisstatement. The nature of an audit is influenced by factors such as the use of professional judgement, selective testing, the inherent limitations ofinternal control and the availability of persuasive rather than conclusive evidence. Therefore, an audit cannot guarantee that all material misstatementshave been detected.
We performed procedures to assess whether, in all material respects, the financial report presents fairly, in accordance with the Corporations Act 2001,including compliance with Australian Accounting Standards, and other mandatory financial reporting requirements in Australia, a view which isconsistent with our understanding of the Company’s and the consolidated entity’s financial position and of their performance as represented by theresults of their operations and cash flows.
We formed our audit opinion on the basis of these procedures, which included –
• examining, on a test basis, information to provide evidence supporting the amounts and disclosures in the financial report; and• assessing the appropriateness of the accounting policies and disclosures used and the reasonableness of significant accounting estimates made
by the Directors.
While we considered the effectiveness of management’s internal controls over financial reporting when determining the nature and extent of ourprocedures, our audit was not designed to provide assurance on internal controls.
We performed procedures to assess whether the substance of business transactions was accurately reflected in the financial report. These and our otherprocedures did not include consideration or judgement of the appropriateness or reasonableness of the business plans or strategies adopted by theDirectors and management of the Company.
IndependenceWe are independent of the Company, and have met the independence requirements of Australian professional ethical pronouncements and theCorporations Act 2001.
Audit opinionIn our opinion, the financial report of Coca-Cola Amatil Limited is in accordance with –
a) the Corporations Act 2001, including –
(i) giving a true and fair view of the financial position of Coca-Cola Amatil Limited and the consolidated entity at 31 December 2004 and of their performance for the year ended on that date; and
(ii) complying with Accounting Standards in Australia and the Corporations Regulations 2001; and
b) other mandatory financial reporting requirements in Australia.
Ernst & Young G. EzzyPartner
Sydney, 10th day of February 2005

Australia New Zealand Papua New Guinea Fiji South Korea Indonesia
89Annual Report 2004
SHAREHOLDER INFORMATIONCOCA-COLA AMATIL LIMITED
Additional information required by Australian Stock Exchange Listing Rules is as follows. This information is current as at 9 March 2005 –
Distribution Schedule of Shareholders
Ordinary Non-participating
Holders Shares Holders SharesNo. No. No. No.
1 – 1,000 21,547 8,605,310 34 10,1831,001 – 5,000 14,316 32,578,321 8 15,6075,001 – 10,000 2,001 14,189,271 – –10,001 – 100,000 1,256 29,020,161 5 241,588100,001 and over 143 659,416,255 5 43,383,377
Total 39,263 743,809,318 52 43,650,755
There were 3,270 holders of less than a marketable parcel of 59 ordinary shares.
BAT Australia Pty Limited holds 42,406,929 of the Company’s non-participating shares.
Substantial ShareholdersThe names of substantial shareholders of the Company’s ordinary shares (holding not less than 5%) who have notified the Company in accordance with section 671B of the Corporations Act 2001 are –
The Coca-Cola Company and its controlled entities 241,049,276Commonwealth Bank of Australia and its controlled entities 42,660,382
Top Twenty Registered Shareholders
OrdinaryShares
No. %
Coca-Cola Holdings (Overseas) Limited1 149,392,972 20.08J P Morgan Nominees Australia Limited 81,313,235 10.93CRI Pacific Holdings I LLC1 76,201,065 10.24Westpac Custodian Nominees Limited 71,855,237 9.66National Nominees Limited 64,281,093 8.64Citicorp Nominees Pty Limited 63,353,659 8.52ANZ Nominees Limited 48,535,068 6.53CRI Pacific Holdings II LLC1 15,430,212 2.07Cogent Nominees Pty Limited 12,214,187 1.64Matila Nominees Pty Limited 8,642,254 1.16Queensland Investment Corporation 7,351,594 0.99AMP Life Limited 7,329,293 0.99HSBC Custody Nominees (Australia) Limited 6,690,998 0.90IAG Nominees Pty Limited 4,020,036 0.54Tasman Asset Management Ltd 3,189,686 0.43Government Superannuation Office 3,051,146 0.41Invia Custodian Pty Limited 2,982,461 0.40Australian Foundation Investment Company Limited 2,405,794 0.32Victorian Workcover Authority 2,202,836 0.30Bond Street Custodians Limited 1,569,838 0.21
Total 632,012,664 84.96
1 Major holdings of The Coca-Cola Company.
Business ActivityCoca-Cola Amatil is the sole Coca-Cola franchisee in Australia, New Zealand, Fiji and South Korea plus the principal Coca-Cola franchisee in Papua New Guinea and Indonesia. The Company is the sole Schweppes franchisee for New Zealand, Papua New Guinea, Fiji, South Korea and Indonesia. InAustralia and New Zealand, the Company is the manufacturer and marketer of its own soft drinks, still waters and mineral waters.

Australia New Zealand Papua New Guinea Fiji South Korea Indonesia
90 Coca-Cola Amatil
SHAREHOLDER INFORMATION continuedCOCA-COLA AMATIL LIMITED AND ITS CONTROLLED ENTITIES
CCA’s beverage business operates in six countries in the Asia-Pacific region – Australia, New Zealand, Fiji, Papua New Guinea, Indonesia and South Korea. CCA manufactures, markets and distributes products of The Coca-Cola Company, as well as local brands in some countries. The acquisitionof SPC Ardmona was completed on 25 February 2005. SPC Ardmona is Australia’s largest manufacturer in the ready-to-eat packaged fruit sector withleading brands such as SPC, Ardmona, Goulburn Valley and IXL.
Annual General MeetingCCA's Annual General Meeting will be held on 19 May 2005 at the City Recital Hall, Angel Place (Pitt Street entrance), Sydney at 2pm.
Voting RightsShareholders are encouraged to attend the Annual General Meeting, however, when this is not possible, they are encouraged to use the form of proxy bywhich they can register their vote or vote online at www.asxperpetual.com.au.
Subject to the restrictions affecting holders of non-participating shares, every member present personally or by proxy, attorney or representative shall ona show of hands have one vote and on a poll have one vote for every share held.
ListingsCCA shares are listed under the symbol CCL on Australian Stock Exchange (ASX). The non-participating shares are not listed. The securities of theCompany are traded on ASX on the issuer sponsored sub-register or under CHESS (Clearing House Electronic Sub-register System).
CCA ordinary shares are traded in the United States in the form of American Depositary Receipts (ADRs) issued by The Bank of New York, as Depositary.Each ADR represents two ordinary shares. The ADRs trade over-the-counter under the symbol CCLAY.
Company PublicationsOther than the Annual Report, CCA publishes Shareholder News, a newsletter sent to shareholders with the September dividend advice.
Share Buy BackThe Company is not currently undertaking an on-market share buy back.
WebsiteAll material contained in this report is also available on the Company’s website. In addition, earnings announcements to ASX, media releases,presentations by senior management and dividend history are also published on the website. The address is www.ccamatil.com.
DividendsIn 2004, CCA paid fully franked dividends and has a payout policy of 70% to 80% of net profit, subject to the ongoing cash needs of the business.
It is expected that dividends paid in the future will be fully franked for at least the next two years.
Dividend Reinvestment PlanParticipation in the Dividend Reinvestment Plan (DRP) is optional and available to all shareholders (except those with a registered address in the UnitedStates). Shareholders may elect to participate for all or only some of their shares. Shares are currently issued under the DRP at a discount of 5% fromthe market price of CCA ordinary shares. The discount will be reduced to 3% following the dividend to be paid on 1 April 2005. The market price iscalculated at each dividend payment, being the weighted average price of all ordinary CCA shares sold on ASX on the first day on which those sharesare quoted ex dividend and the following nine business days. There are no brokerage, stamp duty or other transaction costs payable by participants.
Participation in the DRP is currently capped at 50,000 shares per shareholder. The participation will increase to 100,000 shares per shareholder followingthe dividend to be paid on 1 April 2005.
Note: the DRP rules may be modified, suspended or terminated by the Directors at any time after giving one month’s notice to DRP participants.
For additional information and an application form, please contact our share registry, ASX Perpetual Registrars Limited on 61 2 8280 7121.
Tax File NumbersAustralian tax payers who do not provide details of their tax file number will have dividends subjected to the top marginal personal tax rate plusMedicare levy. It may be in the interests of shareholders to ensure that tax file numbers have been supplied to the share registry. Forms are availablefrom the share registry should you wish to notify the registry of your tax file number or tax exemption details.
Change of AddressIt is important for shareholders to notify the share registry in writing promptly of any change of address. As a security measure, the old address shouldalso be quoted as well as your shareholder reference number (SRN).

Australia New Zealand Papua New Guinea Fiji South Korea Indonesia
91Annual Report 2004
GLOSSARY
C&L Convenience and Leisure channel.
Capital Employed Total equity plus net borrowings.
Carbonated Soft Drinks, CSD Non-alcoholic beverages with carbon dioxide.
CCA Coca-Cola Amatil.
Coca-Cola System, Coke System The Coca-Cola Company and its bottling partners.
EBIT Earnings before interest and tax.
EBIT Margin Earnings before interest and tax divided by revenue from sales of beverages.
Free Cash Flow Cash flow generated by the business which is available for return to shareholdersand/or repayment of debt, calculated as cash flow from operating activities less investment ininfrastructure.
Non-AlcoholicReady-To-Drink Beverages, NARTD Non-alcoholic beverages, including carbonated and non-carbonated drinks.
Non-Carbonated Beverages, NCB Includes packaged water, ready-to-drink coffee and tea, juices/nectar, sports drinks, fruit still drinks,energy drinks, other ready-to-drink beverages and flavoured milk drinks (excluding white milk).
PET Polyethylene Terephthalate. The material from which CCA’s plastic soft drink bottles aremanufactured.
PNG Papua New Guinea.
Return on Average Capital Employed, ROCE Earnings before interest and tax divided by the average of the opening and closing balances ofcapital employed.
Return on Net operating profit after tax attributable to members of CCA divided by the average of theShareholders’ Equity opening and closing balances of shareholders’ equity (similarly attributable).
RGB Returnable Glass Bottles.
RTD Ready-to-Drink.
Segment Assets and Assets and liabilities shown against each of CCA’s geographic segments exclude future income taxLiabilities benefits, tax provisions and assets and liabilities which relate to the Group’s financing activity.
TCCC The Coca-Cola Company.
Unit Case A unit case is the equivalent of twenty four 8oz (237mL) serves or 5.678 litres.
‘Coca-Cola’, ’Vanilla Coke’, ‘Coke’, ‘diet Coca-Cola’, ‘Coke Light’, ‘diet Coke’, ‘Sprite’, ‘Fanta’, ‘Fanta Lite’, ‘Lift’, ’pump’ (Australia only), ’Neverfail’, ‘Peats Ridge’, ’e2’, ’Frestea’,‘Fruitopia’, ’Keri’, ‘Kin’, ’Kiwi Blue’, ‘Lift Plus’, ‘Aquashot’, ’Nestea’, ‘Powerade’ ‘Nescafé’, ‘Qoo’,‘Recharge by Sprite’, ‘Crusta’, ‘SoonSoo 100’, ‘Schweppes’ (excluding Australia), ‘Always’, the‘Always’ logo, the Dynamic Ribbon device and the contour bottle design are trademarks of The Coca-Cola Company.

Australia New Zealand Papua New Guinea Fiji South Korea Indonesia
92 Coca-Cola Amatil
COMPANY DIRECTORIES
SHARE REGISTRY AND OTHER ENQUIRIES
ChairmanMr David Gonski
Corporate OfficeMr Terry DavisGroup Managing Director
Mr John WartigGroup Chief Financial Officer
Mr David WylieCompany Secretary
Senior ManagementMr Warwick WhiteManaging Director, AustraliaMs Nessa O’SullivanChief Financial Officer, Australia
Mr Nigel GarrardManaging Director, SPC ArdmonaMr Barry JoyceChief Financial Officer, SPC Ardmona
Mr George AdamsManaging Director, New Zealand and FijiMr Shin Dar LongChief Financial Officer, New ZealandMr Charles RossiGeneral Manager, PNGMr Peter LeeGeneral Manager, Fiji
Mr David WestallManaging Director, South Korea Mr David GateChief Financial Officer, South Korea
Bapak MugijantoPresident Commissioner, IndonesiaMr John SewardPresident Director, Indonesia Mr Steve GallagherChief Financial Officer, Indonesia
Registered OfficeCoca-Cola Amatil Limited71 Macquarie StreetSydney NSW 2000Ph: 61 132 653Fx: 61 2 9259 6623New ZealandThe Oasis, Mt WellingtonAuckland Ph: 64 9 570 3000Papua New GuineaErica StreetLae, Morobe ProvincePh: 675 472 1033FijiRatu Dovi RoadLaucala Beach EstatePh: 679 394 333South Korea84-11, 5-Ka, Namdaemun-Ro Chung-Ku Seoul 100-753Ph: 822 2259 5888IndonesiaJI. Teukuy Umar KM. 46Cibitung. Bekasi 17520Ph: 62 21 8832 2222
SPC Ardmona 19-25 Camberwell RoadHawthorn East Vic 3123Ph: 61 3 9861 8900
AuditorErnst & Young Chartered Accountants
1. For enquiries about CCA shares:
ASX Perpetual Registrars LimitedLocked Bag A14Sydney South NSW 1232Ph: 61 2 8280 7121Fx: 61 2 9287 0303Email: [email protected]
2. For enquiries about AmericanDepositary Receipts (ADR):
The Bank of New YorkADR Division101 Barclay Street, 22WNew York, New York 10286 USAToll Free Ph: 1 888 269 2377
3. For enquiries about the operations of the Company:Investor Relations71 Macquarie StreetSydney NSW 2000Ph: 61 2 9259 6159Fx: 61 2 9259 6614Email:[email protected]

Australia New Zealand Papua New Guinea Fiji South Korea Indonesia
Annual General Meeting Thursday, 19 May 2005 at 2pmCity Recital Hall, Angel Place (Pitt Street entrance),Sydney
Calendar of Events
2004 full year results announced Thursday, 10 February 2005
Ex-dividend date Tuesday, 15 February 2005
Record date for dividend entitlements Monday, 21 February 2005
2004 final ordinary dividend paid Friday, 1 April 2005
2005 Annual General Meeting Thursday, 19 May 2005
2005 half year results announced Wednesday, 10 August 2005
Ex-dividend date Monday, 22 August 2005
Record date for dividend entitlements Friday, 26 August 2005
2005 interim ordinary dividend paid Monday, 3 October 2005
Australia New Zealand Papua New Guinea Fiji South Korea IndonesiaAustralia New Zealand Papua New Guinea Fiji South Korea Indonesia
1 Letter from the Chairman3 Performance Review from the Managing Director6 Financial Performance Summary 7 Five Year Financial Performance Summary8 A Commitment to Innovation
10 Coca-Cola Amatil at a Glance12 Australia13 Oceania14 South Korea15 Indonesia
16 SPC Ardmona Acquisition18 CCA’s Corporate Social Responsibilities 22 Board of Directors and Senior Management24 Corporate Governance31 Directors’ Report39 Statements of Financial Performance40 Statements of Financial Position41 Statements of Cash Flows42 Notes to the Financial Statements87 Directors’ Declaration
88 Independent Audit Report89 Shareholder Information91 Glossary92 Corporate DirectoriesIBC Calendar of Events
Coca-Cola Amatil Limited ABN 26 004 139 397
Calendar of Events
2004 full year results announced Thursday, 10 February 2005
Ex-dividend date Tuesday, 15 February 2005
Record date for dividend entitlements Monday, 21 February 2005
2004 final ordinary dividend paid Friday, 1 April 2005
2005 Annual General Meeting Thursday, 19 May 2005
2005 half year results announced Wednesday, 10 August 2005
Ex-dividend date Monday, 22 August 2005
Record date for dividend entitlements Friday, 26 August 2005
2005 interim ordinary dividend paid Monday, 3 October 2005
Des
igne
d an
d pr
oduc
ed b
y Th
e Ba
ll G
roup
Mel
bour
ne a
nd S
ydne
y C
CA
0021
4/0
5
21151 COVER 13/4/05 10:52 AM Page 2

Rewards of innovationAnnual Report 2004
Coca-Cola Amatil Limited ABN 26 004 139 397
Coca-C
ola Am
atilAnnual R
eport 2004
21151 COVER 13/4/05 10:52 AM Page 1