annual report - prime super
TRANSCRIPT

Annual Report 2017

Contents01 Who we are
02 Chair and CEO’s message
04 2016/17 at a glance
06 Part of your community
10 Important information about your membership
13 Reserving policies
14 Investment performance
18 Investment strategy
20 Our investment options
24 Investments of the Fund
29 Abridged Financial Statements
32 Your Trustee Board
34 Director remuneration
36 Executive remuneration
40 How to contact us
2Chair and
CEO’s message
14Investment performance
42016/17 at a glance
6Part of your community

Who we arePrime Super is an independent profit-to-member super fund.We have provided super and retirement solutions to Australians for more than 20 years.
From beginnings in rural Australia, Prime Super has expanded to represent a diverse range of workers across multiple industries.
Our ‘surprisingly straightforward’ solutions take the complexity out of super and investments for our members, helping them grow, manage and protect their wealth.
We currently look after more than $3.5 billion in funds for our 115,000 members.
Issued by the Trustee: Prime Super Pty Ltd ABN 81 067 241 016
AFSL No. 219723; RSE Licence No: L0000277
for Prime Super ABN 60 562 335 823 RN 1000276
18Investment strategy
20Our investment options
Prime Super Annual Report 2017 1

2 Prime Super Annual Report 2017
We now manage more than $3.5 billion in funds for 115,000 members, and continue to grow. We are proud of the progress made throughout the 2016-17 year, which motivates and inspires us towards our vision of being Australia’s most respected independent super fund.
Our size, largely independent Board, and distinctive investment strategy are meaningful differences that set us apart. They also afford us agility and flexibility in decision-making across all areas of the business.
This year, those attributes were no more evident than in relation to the Fund’s unique investment strategy.
Investing for members’ futures
Each year in consultation with our investment advisors, we review the Fund’s investment strategy to ensure we are in the best position to take advantage of the anticipated financial environment of the coming year. 2016-17 was no different.
Our investment approach allowed us to take advantage of medium-sized opportunities on behalf of our members – opportunities which much larger investors or individuals would not be in a position to consider.
This year our strategy again reaped benefits for members. The MySuper investment option – in which most members are invested - returned 12% for the 12 months to 30 June 2017. This was a stellar result and placed us in the top 10 per cent of all super funds.
We are thrilled with this outcome, particularly as the financial year was characterised by emerging signs of economic recovery, set against a backdrop of political uncertainty around the globe.
These results support our investment strategy centred on strong, risk-adjusted returns achieved with lower levels of volatility, and arguably less risk than many of our peers. These unique factors continue to allow us to make investment decisions that aim to outperform other super funds – even those much larger than Prime Super – when measured in size and reputation. Ultimately, of course, this means better retirement outcomes for Prime Super members.
Tobacco-free investing
We took the stance early in the year to divest the Fund’s interests in the tobacco industry and the Fund now has no active investment in this segment. This move brings us into step with member expectations. And while it’s difficult to remove a particular industry entirely from a portfolio, we are very pleased with the steps we have taken in this area.
Chair and CEO’s message
This year we solidified our position as one of Australia’s largest independent superannuation funds operating in the highly competitive superannuation sector.
The MySuper investment returned 12% in 2017. We are thrilled with this outcome.

Prime Super Annual Report 2017 3
Sustaining the Fund into the future
This year Prime Super entered into a partnership with the Recruitment & Consulting Services Association Australia & New Zealand (RCSA) – the peak industry body representing more than 3,000 recruitment firms and individuals.
Acting in our members’ best interests has always been of highest importance to us and is a key value that we share with the RCSA. Its focus on member empowerment and improving life outcomes for members strongly aligns with the Prime Super ethos.
The six year partnership agreement beginning 1 July 2017 provides Prime Super with a unique opportunity to engage with employers in the employment and recruitment sector. It also gives the Fund access to a new membership base with whom to connect. Importantly, our aim is to encourage people in that sector – some who regularly move from job-to-job – to engage with their super and plan for a successful life after work.
Supporting the community
This year, we supported community and industry organisations closely associated with our employers and members. We continued to partner with state and national farming bodies and key health and aged care associations.
We also lent our ongoing support to Lifeline – the national charity for crisis support and suicide prevention, as well as Awards Australia and the Australian Rural Leadership Foundation.
Thank you
On 22 June 2017 one of our longest serving board members and Deputy Chair, Trevor Dixon retired after 13 years. We sincerely thank Trevor for his contribution over many years and wish him well with his future endeavours.
At the same time, the Board welcomed its newest Director, Gerard Parlevliet. Gerard was Chief Investment Officer at Commonwealth Bank Group Super. He has a wealth of experience in driving positive retirement outcomes for super fund members and this will be an asset for the Fund as it moves into this next exciting phase.
Lastly, on behalf of the Board, we would like to thank our staff and executives who have worked together to deliver positive outcomes for our members and employers.
The year ahead
The Fund is well positioned for the future. In the year ahead we’ll continue to invest in technology and investment solutions that engage members and help simplify processes for employers. As always, we remain committed to our goal of engaging Australians with their super to enable them to benefit from better retirement outcomes.
Alan Bowman Lachlan Baird Chairman Chief Executive Officer

4 Prime Super Annual Report 2017
2016/17 at a glance
Financial highlights
$3.5bFunds under management
$12.4mPension payments paid to income stream members
$28.4min insurance benefits paid to members
$241.5mBenefits were paid to accumulation members

Prime Super Annual Report 2017 5
115,251Total number of accumulation members
1,079Total number of income stream members
$25,470The average account balance of a Prime Super member
$161,313The average account balance of an income stream member
93.7%Invested in the MySuper option
65% Invested in the Balanced option
Accumulation members Income stream members

6 Prime Super Annual Report 2017
Lifeline
Prime Super’s support for Lifeline is now in its 11th year and has played a significant role in assisting Lifeline to positively impact more Australians in a time of great need.
Men in regional and remote areas are up to 2.6 times more likely to die by suicide than those in urban areas. The incidence is up to six times higher in very remote areas.
How our support has helped Lifeline this financial year
Through our partnership Lifeline has deepened its connection with Australians by building knowledge and understanding to shape emotionally resilient and suicide-safe communities. Lifeline produced a range of online help-seeker resources, developed bereavement and help-seeker video resources, and assisting in funding Australia’s first text-based crisis service, Text4Good.
Help seeker resources
Lifeline undertook a topic review, content re-write, and re-design of its help-seeker resources. The updated resources are available on the ‘Get Help’ section of the Lifeline website: lifeline.org.au/get-help/tools/fact-sheets-resources.
Following on from the success of this work, Lifeline started to progress with the planned ‘digitisation’ of these resources, producing video content based on some of its most accessed resources.
Text4Good
In 2018, Lifeline Australia will launch a pilot of SMS-based crisis service – an Australian first. Mobile phones are entrenched in the daily lives of almost all Australians: 94% of adults use a mobile phone, and 74% of adults have a smart phone. This new service will enable Lifeline to connect with more help-seekers, anywhere, anyway and at any time. This exciting initiative will help Lifeline provide support to more people, by offering support to people who are uncomfortable with calling the crisis helpline.
For more information about lifeline please
visit lifeline.org.au
Part of your community
We proudly support organisations and individuals who provide assistance to people in communities around Australia.

Prime Super Annual Report 2017 7
Awards Australia – Regional Achievement & Community Awards
Prime Super continues to recognise community achievers as our partnership with Awards Australia reaches its 5th year. Through Awards Australia, we sponsor two awards in each state designed to recognise businesses who play an important role in their communities.
All states - Prime Super Employer Excellence in Aged Care Award
With an ageing population, aged care facilities and the services they provide are an important part of the lives of an ever increasing number of people. The Prime Super Employer Excellence in Aged Care Award recognises and acknowledges businesses, organisations and not for profits who have a strong focus on staff engagement, safety and wellbeing, training and providing staff with higher education learning opportunities and development. The Award also recognises the provision of quality services for clients, patients and residents. The Award acknowledges aged care facilities, organisations, not for profits and businesses making a positive difference in the industry.
Prime Super Agricultural Innovation Award
Australian agricultural production and supply chain management has a long history of innovation to maximise efficiency, develop new products, and open new market opportunities, despite the challenges of climate, soil types and location. The Award showcases this spirit of innovation through their application of technology or process improvement to demonstrably enhance production and increase efficiency, maximising returns along the value chain, particularly where that value flows back to the primary producer.
Western Australia & Tasmania only – Prime Super Business Achievement Award
In regional and rural areas successful businesses are making important economic contributions. Creative business and commercial ventures provide opportunities for regional growth, productivity, leadership, training and employment. Businesses are continuing to realise their corporate vision and mission in areas such as product development, manufacturing and construction, agriculture, primary industry, e-commerce, wholesaling, exporting, retailing, trades and other professional services. This Award acknowledge and highlight the continued success and achievements of business leaders and businesses.
For more information on the awards,
visit awardsaustralia.com
Regional Achievement and Community Awards applaud and encourage those working in rural and regional areas.

8 Prime Super Annual Report 2017
Australian Rural Leadership Foundation – building resilience in rural Australia
Prime Super proudly supports the Australian Rural Leadership Foundation - a not for profit organisation that delivers dynamic programs designed to create a strong network of leaders in diverse industries, sectors, regions and communities in rural and regional Australia.
Through our sponsorship of a scholarship to participate in the program, we have made a small contribution to the success story of Edwina Sharrock, Aged Care Clinical Nurse Consultant at Tamworth (NSW) Hospital Emergency Department.
The scholarship-based leadership program consists of a flexible learning syllabus with components based here and overseas.
As this year’s recipient, Edwina was recognised for her strong leadership capabilities and commitment to the community.
In her role with Tamworth Hospital, Edwina provides specific care to the elderly who present at Emergency from aged care facilities. Additionally, she is a Disaster Co-Ordinator, educator, speaker and volunteer.
Edwina is also a regular on local ABC radio where she appears weekly in a spot aptly named ‘Wellness Wednesday’.
As an established leader working in rural Australia, and committed to extending her knowledge and leadership skills to become more effective and influential, Edwina was a stand-out applicant for the Australian Rural Leadership Program scholarship.
For Edwina, making a positive impact on the health of those living regionally is key to her vision for healthy, robust communities which can grow and prosper.
This includes the important aged care sector. Of particular interest to Edwina is advanced care planning for elderly Australians through increased awareness and the adoption of the ‘death with dignity’ philosophy and the ‘right care, right place’ model of care.
With studies focusing on personal effectiveness, engagement, leadership thinking and ethics, the foundation’s aim is to produce a network of capable leaders to advance the interests of their industries in their communities.
Participants in the program can also choose to undertake a Graduate Certificate of Rural Leadership from James Cook University concurrently with the program.
Part of your community (continued)
Edwina was recognised for her strong leadership capabilities and commitment to the community.

Prime Super Annual Report 2017 9
Wherever you are around Australia, we have a Relationship Manager on the ground, providing personal service to help you make the most of your Prime Super membership.
Prime Super Annual Report 2017 9
Regional Managers 1 Eddie Isaac Townsville QLD
2 Karen Hyland Caloundra QLD
3 Wayne Wright Toowoomba QLD
4 Annette Mackay Tamworth NSW
5 Geoff Higgins Dubbo NSW
6 Ben Cassidy Sydney NSW
7 Gil Sebbag Sydney NSW
8 Scott Boyle Wagga Wagga NSW
9 Billie Atanasova Melbourne VIC
10 George Frangeskakis Melbourne VIC
11 Chris Pole Adelaide SA
12 Alisha Wilde Perth WA
13 Radek Kotlarczyk Perth WA
3
86 7
5
2
1
13
4
1112
10 9

10 Prime Super Annual Report 2017
A number of changes to the rates and thresholds applying to superannuation came into force on 1 July 2017. Some changes relate to annual indexation, while others are as a result of legislative changes arising from the Federal Government’s Budget initiatives.
Changes to superannuation – rates and thresholds for the 2017–18 financial year
Superannuation guarantee
The SG rate is 9.5%.
Concessional contributions cap
$25,000 p.a. regardless of age.
Carry forward provisions
From 1 July 2018, if you have not reached your concessional contributions cap for an income year, you may ‘carry forward’ any unused amounts from (up to five) previous years, provided that you have a total superannuation balance of less than $500,000 just before the start of the financial year and you have previously unapplied unused concessional contributions caps for one or more of the previous five financial years.
Transfer balance cap
The transfer balance cap is a lifetime limit on the amount of superannuation money that you can hold in tax free retirement phase accounts. (This is also referred to as the general transfer balance cap). The transfer balance cap for the 2017-18 financial year is $1,600,000 and is indexed in $100,000 increments in line with increases in the Consumer Price Index (CPI).
Exceeding the Transfer balance cap
If the total value of your pre-1 July 2017 retirement income stream account/s was between $1.6 million and $1.7 million, a grace period of six months applies, meaning you have until 31 December 2017 to remove the excess plus earnings without tax penalties on the amount over $1.6 million.
Non-concessional contributions cap
$100,000 p.a. For the full non-concessional contribution cap to apply, you must have a total super balance less than the transfer balance cap that is set by the government as at 30 June of the previous financial year. Generally, your total super balance consists of a total of your super accumulation balance, any income stream account balances you may have, less any structured settlement contributions (e.g. a compensation payment for a personal injury suffered by you).
Bring forward provisions
You may be able to access a bring forward period for your non-concessional contribution cap of two or three times the annual cap, depending on your total super balance. In the 2017-18 financial year the bring forward provisions are as follows:
• Three times the cap if your balance is below $1,400,000
• Two times the cap if your balance is greater than $1,400,000
• Zero if your balance is greater than or equal to $1,500,000.
Your total super balance is determined on 30 June of the previous financial year. There are transitional arrangements in place that apply to individuals who have brought forward their non-concessional contribution cap in the 2015-16 and 2016-17 financial years. Refer to the ATO for further information – visit ato.gov.au/super.
Important information about your membership

Prime Super Annual Report 2017 11
Spouse contributions
The income threshold for spouse superannuation contributions will increase to $37,000 (and will phase out at $40,000). Spouses can continue to contribute to their low income spouse’s super account with after-tax money and claim a tax offset of up to 18%.
Salary sacrifice
If your employer does not permit salary sacrifice arrangements, or if you are self-employed, you will be able to claim a tax deduction for any personal super contributions you make.
Tax treatment of Transition to Retirement (TTR) Income streams
From 1 July 2017, investment earnings within TTR income stream accounts will no longer be tax-free, but will attract up to 15% tax – the same as in the accumulation phase.
In light of this change, you may wish to revisit your TTR strategy to ensure it continues to operate in a way that is beneficial to you and your particular needs.
High income earners
From 1 July 2017, those earning more than $250,000 (adjusted taxable income) will pay 30% contributions tax on all concessional contributions to super.
Superannuation Surcharge
The Federal Government abolished the superannuation surcharge tax from 1 July 2005. However, surcharge for prior years may still appear on your statement as a deduction from your account.
Anti detriment payment details
From 1 July 2017, funds may only include an anti-detriment payment as part of a death benefit if the member has died on or before 30 June 2017. The fund must make this payment by 30 June 2019.
From 1 July 2019, no anti-detriment payment will be available for funds members, regardless of when the member has died.
An anti-detriment payment is an additional lump sum amount that may be paid to an eligible dependant when a lump sum death benefit is paid. The payment represents a refund of the 15% contributions tax paid by the deceased member over their lifetime.
The payment is only payable where the death benefit is being paid as a lump sum to an eligible dependant of the deceased member, who is either a:
• spouse or former spouse
• child (including an adult child)
• trustee of the deceased estate.
Government Co-Contribution
If you are a low to middle income earner, you may be entitled to receive a super co-contribution from the Government. To be eligible for a co-contribution, you must meet all of the following criteria:
• Make a personal after-tax contribution to your super account
• Be earning at least 10% of your income from employment or business related activities
• Be less than 71 years of age at the end of the financial year
• Your total income is less than the upper limit ($51,813 for the 2017-18 financial year)

12 Prime Super Annual Report 2017
• You lodge a tax return for the relevant financial year
• You are an Australian resident
• You have a total superannuation balance less than the transfer balance cap on 30 June of the year before the relevant financial year (the amount is $1,600,000 for the 2017-18 financial year)
• You have not contributed an amount more than your non-concessional contributions cap for the relevant financial year.
Departing Australia Superannuation Payment (DASP)
The tax rate of 65% will apply to both the taxed and untaxed elements of the taxable component of a DASP paid to a person on or after 1 July 2017. It applies when the DASP includes amounts attributable to super contributions made while the person was a working holiday maker (WHM) – that is, while they held a WHM visa. A WHM visa refers to a:
• subclass 417 (working holiday) visa
• subclass 462 (work and holiday) visa
• related bridging visa.
If the DASP does not include such amounts, the ordinary DASP tax rates continue to apply. Any tax-free component of the DASP continues to be taxed at 0%.
Material Service Providers
The Trustee uses a range of material service providers to look after the Fund and its investments.
Administrator
Australian Administration Services Pty Limited (ABN 62 003 429 114)
Custodian
National Australia Bank Limited (ABN 12 004 044 937)
Insurer
The Colonial Mutual Life Assurance Society Limited (ABN 12 004 021 809, AFSL 235035) (CMLA) under its registered business name, CommInsure
Investment advisers
Whitehelm Capital (ABN 68 008 636 717)
Investment managers
AllianceBernstein Investment Management Australia Limited (ABN 58 007 212 606)
Vinva Investment Management Limited (ABN 38 142 528 783)
Macquarie Investment Management Global Limited (ABN 90 086 159 060)
Auditors
Ernst & Young (ABN 75 288 172 749)
KPMG Australia (ABN 51 194 660 183)
Important information about your membership (continued)

Prime Super Annual Report 2017 13
Reserving policies
The Trustee operates three reserves: the Administration Reserve, the Investment Reserve and the Operational Risk Reserve (ORR), which are all invested in the MySuper option. Administration Reserve
All member fees are paid into the Administration Reserve and are used to pay costs. As the Trustee operates the Fund on a not-for-profit basis, any surplus after payment of current costs could be applied to the benefit of members at the Trustee’s discretion.
Investment Reserve
Investment returns earned by the Fund for all investment options are held in an Investment Reserve between the time they are received by the Fund, and the time they are credited to members. Any returns, positive or negative, achieved on the Investment Reserve are considered investment earnings of the Fund and will also be distributed to members.
Due to occasional unexpected investment distributions, or estimated tax liabilities and rounding of investment returns to whole cents, it is not practical to distribute the entire Investment Reserve. The balance of any carry-forward investment reserve is likely to be between zero and around 0.5% of the Fund’s assets which is available for distribution to members in subsequent years.
Operational Risk Reserve
The Operational Risk Reserve (ORR) is legislatively required to specifically cover potential losses arising from operational risks that may affect the Fund’s business operations. It is set at a target amount of 0.25% of the total value of the Fund (as at 30 June each year).
The ORR has been fully funded by Prime Super. However the Trustee has the discretion to top up the ORR in the future with a deduction from members’ accounts if required.
The balance of the Administration Reserve, Investment Reserve and Operational Risk Reserve accounts are:
Year Ended
Administration Reserve
% of FUM
Investment Reserve
% of FUM
Operational Risk Reserve
% of FUM
2017 $25,296,000 0.71% $4,874,000 0.14% $8,691,000 0.25%
2016 $18,501,000 0.59% $19,618,000 0.63% $7,792,000 0.25%
2015 $12,845,000 0.44% $19,425,000 0.67% $6,952,000 0.24%

14 Prime Super Annual Report 2017
The year in review
The 2016-17 financial year was characterised by emerging signs of economic recovery against a backdrop of political uncertainty. Markets began the financial year positively, with many investors believing that Britain’s decision to exit the European Union would have little impact on the global economy.
In the UK and Japan, share markets benefited from additional central bank stimulus. The Bank of England cut its benchmark interest rate in August to 0.25% and expanded its stimulus measures while the Bank of Japan announced a variety of new stimulus measures. However, the gains were limited by weaker commodity prices and ongoing geopolitical uncertainty; including a failed military coup in Turkey and rising tensions in the South China Sea.
Sharemarkets came under more pressure toward the end of 2016 with sentiment impacted by increasing uncertainty about the outcome of November’s US presidential election. However, this negative sentiment reversed sharply in the wake of Donald Trump’s surprise victory as investors bet his promises to cut taxes, ramp up infrastructure spending and ease regulation would help drive company profits higher. As a result, shares rallied through November and December.
The start of 2017 was mixed – investors started to doubt Trump’s ability to deliver on his election promises however sentiment started to turn more positive on the back of increasing optimism over the global growth outlook and a series of better-than-expected earnings results globally. Stocks were also well supported by a softening in tensions between the US and China and expectations Trump would shift his focus to tax reform after he failed to get his healthcare reform bill through Congress.
Share markets ended the year on a positive note, however the gains were limited by a sharp decline in oil prices and concerns the easy monetary policies implemented by global central banks in response to the global financial crisis, may be nearing an end.
Australia
Australian economic performance was mixed for the year. While the economy contracted over the September quarter, a subsequent recovery in commodity prices driven by Chinese demand led to a recovery. Nonetheless, weak inflation and growing underemployment indicated a degree of underlying economic fragility, with a sustained increase in house prices and household debt similarly contributing to economic concerns. The need to balance these factors led the RBA to keep the official cash rate at 1.50% throughout the year after a 25 basis point cut in August. Australian shares returned 13.8% for the year compared to 20.5% for international equities on a fully-hedged basis.
Asia
In Japan, economic growth continued to be supported by the Japanese central bank’s quantitative easing policy, with interest rates at record lows. While unemployment fell to its lowest point in 20 years and GDP growth was positive, enduring structural problems – above all, the ageing Japanese population –undermined the impact of aggressive economic stimulus.
The Chinese economy continued to grow at a robust rate by global standards, however concerns remained about the significant debt burden of its state-owned enterprises. Policymakers pushed for a rebalancing of the economy towards domestic consumption and away from reliance on export growth, curbing overcapacity in inefficient industries such as mining and steel production.
Investment performance

Prime Super Annual Report 2017 15
Continued growth in the construction and property sectors helped stimulate commodity demand, which in turn led to a rebound in commodity prices in the latter half of the 2016 calendar year.
The outlook for China remains a key focus for Australian investors given the heavy dependence of the Australian economy on commodity exports.
United States
The US economy continued to recover over the year, with falling unemployment and recovering inflation leading the US Federal Reserve to increase interest rates three times over the financial year. Despite initial uncertainty surrounding the impact of Donald Trump’s election as president leading to a global surge in volatility, there was a subsequent upswing in US share performance, with the S&P 500 Index surging to record highs.
Europe
European economic performance continued to show signs of recovery over the year, with improving inflation, falling unemployment and growing business confidence. The European Central Bank extended its quantitative easing program for nine months starting 1 April, albeit at a reduced level, with indications that it may further curb stimulus and potentially increase interest rates over the coming year.
Following the Brexit vote and US election in 2016, European political uncertainty was at the forefront of market attention, particularly with growing support for populist Eurosceptic parties in general elections in the Netherlands and France. However, both elections ended with mainstream political parties securing the wins.
The Trump effect
If opinion polls were to be believed, Hillary Clinton was supposed to be the president of the United States. And while Clinton comfortably won the popular vote, Donald Trump triumphed in key swing states, many located in the US ‘rust belt’ – a region stretching from the northeast to mid-west and characterised by declining mining, manufacturing and automotive industries. Rust belt voter disaffection with the American political and financial establishments led to a groundswell of support for a candidate who vowed to ‘make America great again’.
What does Trump’s presidency mean for the global market?
As a politically inexperienced outsider, Trump’s presidency has led to significant uncertainty in global markets.
His proposed business and economic policies are expected to benefit both the US and global economy, with share markets surging for several months after his election in what became known as the ‘Trump rally’. However, doubts exist around his ability to convince Congress to support his proposals, with his unexpected failure to repeal unpopular healthcare regulation in March undermining market optimism. Concerns also remain about his government’s approach to trade and international diplomacy, in particular with China, Russia and North Korea.
As the president continues in the role, there are growing indications of compromise and pragmatism from his administration, with signs that an improving global economy is likely to have a greater impact on investment both in Australia and overseas.

16 Prime Super Annual Report 2017
The tables below show the historical rates of return for each investment option for the super fund and income stream over ten years to 30 June 2017. All returns are net of investment-related costs such as fees charged by investment managers, investment expenses incurred by the Fund, and any applicable tax. Please note if you are over age 60, income payments from an Income Stream account are not taxable.
Super fund performance
Investment option1-year return*
3-year return*
5-year return*
7-year return*
10-year return*
Pre-mixed options
MySuper 12.00% 8.99% 10.98% 9.36% 4.35%
Managed Growth 14.08% 10.78% 12.83% 10.51% 3.29%
Conservative 6.90% 6.91% 7.27% 6.72% 3.40%
Alternatives 13.84% 15.22% 14.66% 11.97% 4.04%
Sector options
Australian Shares 13.98% 8.39% 12.44% 9.75% 3.88%
International Shares 17.84% 11.01% 15.15% 12.11% 4.45%
Property 24.49% 24.95% 17.38% 14.33% 7.48%
Fixed Interest 2.61% 4.34% 4.46% 5.30% 5.39%
Cash 2.49% 2.37% 2.62% 2.94% 3.38%
* The compound average effective rate of net earnings of the investment option for the specified period ending 30 June 2017.
Income stream performance
Investment option1-year
return*3-year
return*5-year
return*7-year
return*10-year return*
Pre-mixed options
Balanced 14.27% 10.56% 12.84% 10.88% 4.98%
Managed Growth 16.73% 12.65% 15.03% 12.28% 3.67%
Conservative 8.04% 8.10% 8.51% 7.85% 3.95%
Alternatives 16.35% 17.86% 17.19% 13.98% 4.72%
Sector options
Australian Shares 17.66% 10.11% 14.72% 11.41% 4.75%
International Shares 19.96% 12.36% 17.15% 13.71% 5.16%
Property 28.97% 29.00% 20.13% 16.49% 8.57%
Fixed Interest 3.04% 5.11% 5.24% 6.17% 6.25%
Cash 2.93% 2.79% 3.06% 3.45% 4.00%
* The compound average effective rate of net earnings of the investment option for the specified period ending 30 June 2017.
Investment performance (continued)

Prime Super Annual Report 2017 17
Please note that past performance should not be taken as an indication of future performance. The returns stated for each investment option in the super fund and income stream are those achieved by the particular option over the year and are not necessarily the return a member will receive. A member’s actual rate of return will depend on the timing of any transactions, any deductions, any switches made during the period, and the actual mix of investment options that makes up the member’s account.
How investment earnings are allocated to members’ accounts
Crediting rates
Each month the Trustee calculates a ‘crediting rate’ for each investment option. The crediting rates are calculated based on the actual investment performance data for the previous month less investment related fees, costs and taxes.
Crediting rates can be positive or negative depending on the performance of the investments.
Generally, crediting rates are published on our website by the 12th business day each month.
Investment earnings are calculated on member’s account balance monthly, after deductions for insurance premiums (where applicable) and all applicable taxes, fees and charges.
They are allocated to member’s accounts at 30 June each year or upon exit from the Fund.
On rare occasions, due to unforeseen circumstances, this may occur after the 12th business day.
If a member closes their super account during the year (ie, withdraws their balance as a lump sum and ceases to be a member), the member’s account balance will be credited or debited with the last determined monthly crediting rates up to the end of the month. From the end of that previous month, until the date of withdrawal, the Trustee applies an interim crediting rate which is generally 0%.
The Trustee reserves the right to apply a different rate in times of significant market fluctuation and to adjust investment earnings where it believes it would be unfair or a breach of fiduciary duty not to act to protect the interests of all members of the Fund.
If you need more information about how earnings are applied to your account, please contact Prime Super on 1800 675 839.

18 Prime Super Annual Report 2017
Full details on how each investment option is managed are contained in the Prime Super Investment Strategy. This document is available to members on request by calling 1800 675 839.
Derivatives
The Trustee may directly buy or sell derivative instruments and permits investment managers to use them. However, derivative investments may not be used by the Trustee or investment managers for speculative purposes.
The use of derivatives is monitored and a Derivatives Risk Management Statement has been prepared by the Trustee that limits use of derivatives to reducing costs, risk and arbitrage, and for other defensive purposes.
Top 20 Australian shares as at 30 June 2017
Rank Share name % of holding to the Fund
1 Commonwealth Bank of Australia 1.58
2 Westpac Banking Corporation 1.56
3 National Australia Bank 1.21
4 CSL Limited 1.08
5 BHP Billion Limited 1.03
6 Australia and New Zealand Banking Group Limited 0.62
7 Aristocrat Leisure Ltd 0.60
8 Rio Tinto Ltd 0.46
9 Treasury Wine Estates Limited 0.45
10 Telstra Corporation Ltd 0.45
11 Bluescope Steel Limited 0.41
12 Woolworths Limited 0.35
13 QBE Insurance Group Limited 0.34
14 Macquarie Group Ltd 0.33
15 Amcor Limited 0.28
16 Transurban Group 0.27
17 Wesfarmers Limited 0.27
18 AGL Energy Ltd 0.24
19 Ramsay Health Care Ltd 0.22
20 Suncorp Group Limited 0.22
Investment strategy

Prime Super Annual Report 2017 19
Investments at a glance
111 Alinga Street, Canberra
111 Alinga Street is a landmark office building located in Canberra CBD, fully leased to the Department of Infrastructure and Regional Development (DIRD).
3 reasons we chose to invest in 111 Alinga Street
1 Revenue stability Prior to our purchase, DIRD
signed a 10-year sublease over the entire building providing tenant and revenue stability.
2 Location, location, location The building is in a great location
and has three street frontages. It is close to the Capital Metro Light Rail project, which is currently under construction and expected to include a stop next to the property.
3 Environmentally friendly The building benefits from strong
environmental ratings and, with the exception of capital works at the start of the new lease, is not expected to require significant maintenance expenditure over the investment horizon.
Sarpsborg Avfallsenergi AS (SAE)
In July 2016, Prime Super acquired a 100% stake in SAE, a 32.4MW waste-to-energy plant located in Sarpsborg, Norway.
3 reasons we chose to invest in SAE
1 Consistent returns All steam is delivered to leading
biochemical player Borregaard under a long term 15-year offtake agreement. The tariff is linked to inflation and subject to a cap linked to prices of alternative energy, making it the most attractive source of energy for the buyer.
2 Sustainability It is a sustainable and
environmentally friendly source of energy. Waste is sourced from medium term contracts with local municipalities and the plant is located next to a port which allows it to import waste from international markets when favourable.
3 Technologically advanced The SAE plant uses the latest
technology and delivers a strong operating performance with low ongoing capex and stable operating margins. It has a highly experienced management with know-how to consolidate the local energy market.
Calvin Capital
During the year Prime Super provided loan finance to Calvin Capital Ltd which is a leading provider of gas and electricity meters to energy suppliers in the UK.
3 reasons we chose to invest in Calvin Capital
1 Critical infrastructure Gas and electricity meters
represent critical infrastructure that are essential to consumers and energy suppliers as they provide accurate usage and billing information.
2 Market share Calvin is one of a very small
number of Meter Asset Providers that has been successful in winning sizeable contracts for UK domestic meters, and currently has a significant market share within installed smart meters.
3 Solid investment returns Revenues are derived from
contracts with major blue chip investment grade counterparties.

20 Prime Super Annual Report 2017
Our investment options
All members have access to a range of investment options. You can choose any combination of these options, and can direct future contributions into the same options or a different combination of options.
To increase efficiency and decrease transaction costs across all investment options, the cash flow for all options is managed through the MySuper investment option.
MySuper (Accumulation)
Balanced (Income Stream)
Suitability
Members who seek moderate to high returns over the medium to long-term and are prepared to accept some fluctuation in returns over the short-term.
Investment objective
To outperform the Consumer Price Index (CPI) (after tax and investment expenses) by at least 3% p.a. over the long-term.
Risk profile
Medium-High
Time horizon
7 years or longer
Strategic asset allocation %
Growth assets Australian Shares 21.0 Developed Markets Shares 23.0 Emerging Markets Shares 6.0 Private Equity 1.0 Infrastructure 6.5 Property 3.9
Defensive assets Infrastructure 6.5 Property 2.6 Australian Fixed Interest 3.0 Overseas Fixed Interest 7.0 Cash 10.0 Credit Opportunities 9.5
Pre-mixed options

Prime Super Annual Report 2017 21
Conservative
Suitability
Members who value security over returns.
Investment objective
To outperform CPI (after tax and investment expenses) by at least 1.5% p.a. over the long-term.
Risk profile
Low to Medium
Time horizon
5 or more years
Strategic asset allocation %
Managed growth
Suitability
Members who seek moderate to high returns over the medium to long-term.
Investment objective
To outperform CPI (after tax and investment expenses) by at least 4% per annum over the long-term.
Risk profile
High
Time horizon
10 or more years
Strategic asset allocation %
Alternatives
Suitability
Members who seek strong returns over the long-term and are prepared to accept a higher level of risk to achieve this.
Investment objective
To outperform CPI (after tax and investment expenses) by at least 3% p.a. over the long-term.
Risk profile
Medium-High
Time horizon
10 or more years
Strategic asset allocation %
Prime Super Annual Report 2017 21
Growth assets Private Equity 3.5 Infrastructure 22.75 Property 13.8
Defensive assets Infrastructure 22.75 Property 9.2 Credit opportunities 28.0
Growth assets Australian Shares 28.5 Developed Markets Shares 30.5 Emerging Markets Shares 8.5 Private Equity 1.0 Infrastructure 5.75 Property 3.6
Defensive assets Infrastructure 5.75 Property 2.4 Overseas Fixed Interest 5.5 Cash 2.0 Credit Opportunities 6.5
Growth assets Australian Shares 8.5 Developed Markets Shares 9.0 Private Equity 1.0 Infrastructure 4.5 Property 2.7
Defensive assets Infrastructure 4.5 Property 1.8 Australian Fixed Interest 12.0 Overseas Fixed Interest 12.5 Cash 38.0 Credit Opportunities 5.5

22 Prime Super Annual Report 2017
International sharesSuitability
Members who seek strong returns over the long-term and are prepared to accept a higher level of risk to achieve this.
Investment objective
To outperform before tax and investment expenses the weighted average of MSCI World (ex-Australia) Index (in AUD) and MSCI Emerging Markets Index (in AUD) before hedging.
Risk profile
Very high
Time horizon
10 or more years
Strategic asset allocation %
Australian sharesSuitability
Members who seek strong returns over the long-term and are prepared to accept a higher level of risk to achieve this.
Investment objective
To outperform (before tax and investment expenses) the S&P/ASX300 Accumulation Index.
Risk profile
Very high
Time horizon
10 or more years
Strategic asset allocation %
Our investment options (continued)
22 Prime Super Annual Report 2017
Sector options
Growth assets Australian Shares 100
Growth assets Developed Markets Shares 89.0 Emerging Markets Shares 11.0
In September 2017 we opened a new investment option for members to invest in.
Income Focused is designed to provide members with a steady income with potential for some capital growth.For more information please see our Product Disclosure Statement.

Prime Super Annual Report 2017 23
PropertySuitability
Members who seek moderate to high returns through investing in property.
Investment objective
To outperform (after tax and investment expenses) CPI by at least 3% pa over the long term.
Risk profile
Medium-High
Time horizon
10 or more years
Strategic asset allocation %
Fixed interestSuitability
Members who seek moderate returns for a moderate level of risk.
Investment objective
To outperform (before tax and investment expenses) the weighted average of major Australian and international bond indices and global floating rate credit (targeting outperformance above the Bloomberg AusBond Bank Bill Index) hedged to $A.
Risk profile
Low to Medium
Time horizon
5 or more years
Strategic asset allocation %
CashSuitability
Members who place security of their assets over returns.
Investment objective
To perform in line (before tax and investment expenses) with Bloomberg AusBond Bank Bill Index.
Risk profile
Very low
Time horizon
Any time period
Strategic asset allocation %
Prime Super Annual Report 2017 23
Defensive assets Australian Fixed Interest 40.0 Overseas Fixed Interest 60.0
Defensive assets Cash 100.0
Growth assets Property 60.0
Defensive assets Property 40.0
24 Prime Super Annual Report 2017
2017 2016
Asset Class / Fund Manager $’000% of
Total Fund $’000% of
Total Fund
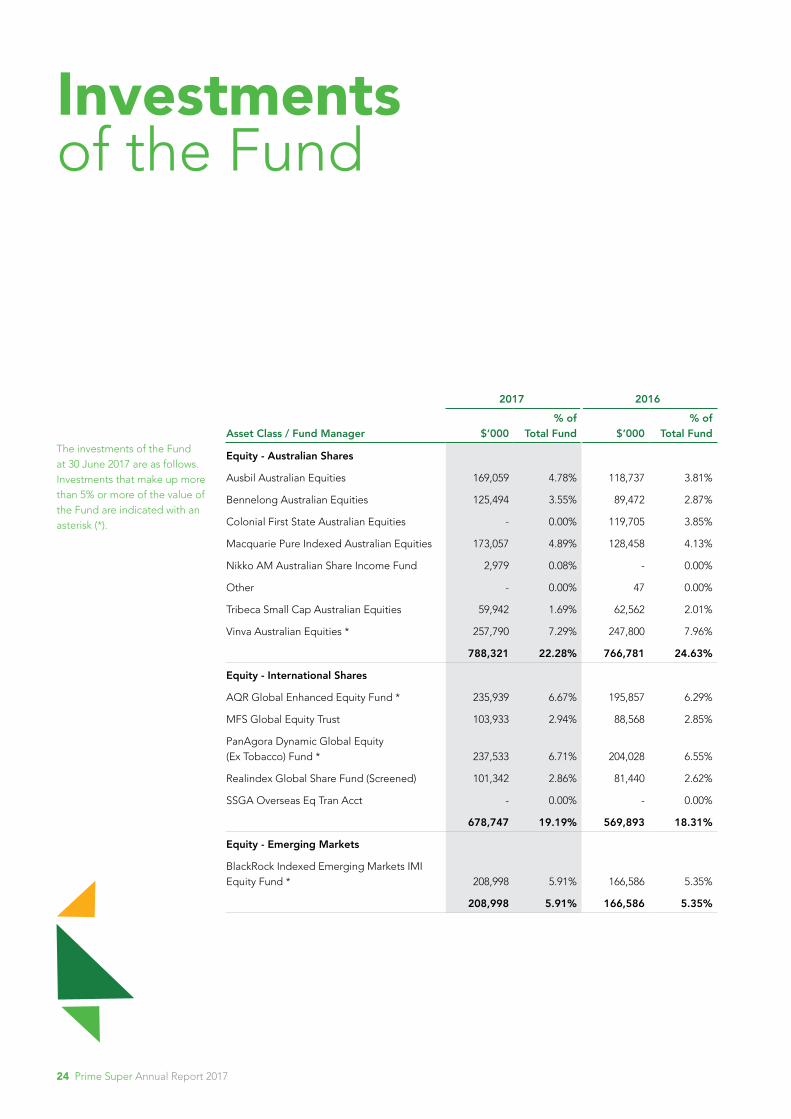
Equity - Australian Shares
Ausbil Australian Equities 169,059 4.78% 118,737 3.81%
Bennelong Australian Equities 125,494 3.55% 89,472 2.87%
Colonial First State Australian Equities - 0.00% 119,705 3.85%
Macquarie Pure Indexed Australian Equities 173,057 4.89% 128,458 4.13%
Nikko AM Australian Share Income Fund 2,979 0.08% - 0.00%
Other - 0.00% 47 0.00%
Tribeca Small Cap Australian Equities 59,942 1.69% 62,562 2.01%
Vinva Australian Equities * 257,790 7.29% 247,800 7.96%
788,321 22.28% 766,781 24.63%
Equity - International Shares
AQR Global Enhanced Equity Fund * 235,939 6.67% 195,857 6.29%
MFS Global Equity Trust 103,933 2.94% 88,568 2.85%
PanAgora Dynamic Global Equity (Ex Tobacco) Fund * 237,533 6.71% 204,028 6.55%
Realindex Global Share Fund (Screened) 101,342 2.86% 81,440 2.62%
SSGA Overseas Eq Tran Acct - 0.00% - 0.00%
678,747 19.19% 569,893 18.31%
Equity - Emerging Markets
BlackRock Indexed Emerging Markets IMI Equity Fund * 208,998 5.91% 166,586 5.35%
208,998 5.91% 166,586 5.35%
Investments of the Fund
The investments of the Fund at 30 June 2017 are as follows. Investments that make up more than 5% or more of the value of the Fund are indicated with an asterisk (*).

Prime Super Annual Report 2017 25
2017 2016
Asset Class / Fund Manager $’000% of
Total Fund $’000% of
Total Fund
Cash
CBA Capital Growth Account - 90 days * 177,290 5.01% 131,103 4.21%
CBA Capital Growth Account - 180 days 15,475 0.44% 15,127 0.49%
CFS Wholesale Institutional Cash Fund * 325,050 9.19% 230,483 7.40%
FX Spot Transactions - 0.00% - 0.00%
517,815 14.64% 376,713 12.10%
Fixed Income - Australian Fixed Interest
AMP Capital Wholesale Australian Bond Fund 13,300 0.38% 13,184 0.42%
Vanguard Aust Fixed Interest Index Fund 90,029 2.54% 87,835 2.82%
103,329 2.92% 101,019 3.25%
Fixed Income - International Fixed Interest
AllianceBernstein Global Floating Rate Credit * 199,664 5.64% 153,504 4.93%
BlackRock Global Bond Index Fund 27,147 0.77% 29,450 0.95%
BlackRock Global Diversified Bond Fund 6,072 0.17% 8,851 0.28%
232,883 6.58% 191,805 6.16%
Infrastructure
Emerging Markets Infrastructure Fund 4,279 0.12% 4,580 0.15%
GasValpo 24,847 0.70% 23,664 0.76%
Igasamex 25,103 0.71% 19,265 0.62%
Igasamex Two 46,072 1.30% 35,357 1.14%
Igasamex Three 6,471 0.18% 4,966 0.16%
International Parking Group 16,973 0.48% 15,112 0.49%
Investec Global Aircraft Fund 4,142 0.12% 4,816 0.15%
Peninsula Link 30,581 0.86% 30,206 0.97%
Peninsula Link Two 18,244 0.52% 18,020 0.58%
Rowville Transmission Facility 12,164 0.34% 12,685 0.41%

26 Prime Super Annual Report 2017
Investments of the Fund (continued)
2017 2016
Asset Class / Fund Manager $’000% of
Total Fund $’000% of
Total Fund
Sarpsborg Avfallsenergi 49,943 1.41% - 0.00%
Southern Water 32,485 0.92% 33,200 1.07%
Southern Water 2 17,508 0.49% 17,894 0.57%
Storrun Vindkraft Onshore Wind 22,618 0.64% 23,478 0.75%
Worsley Multi Fuel Cogen Plant 49,467 1.40% 45,045 1.45%
360,897 10.20% 288,286 9.26%
Property
111 Alinga Street - Infrastructure House 45,354 1.28% - 0.00%
50 Miller Street Trust 61,490 1.74% 40,700 1.31%
Aviva Investors AVELS II Trust 455 0.01% 53,038 1.70%
Aviva Investors ALP Trust No 2 130 0.00% 28,011 0.90%
Aviva Investors AVELS III Trust 550 0.02% 28,364 0.91%
Blackstone Real Estate Part VI 2,690 0.08% 8,785 0.28%
Gresham Prop No.3 Dev Trust 308 0.01% 281 0.01%
Gresham Prop No.3 Inv Trust 350 0.01% 273 0.01%
Lend Lease Communities Fund 1 299 0.01% 435 0.01%
Macquarie Real Estate Equity Fund No 7 492 0.01% 680 0.02%
Royale Investment Trust 46,383 1.31% 41,391 1.33%
158,501 4.48% 201,958 6.49%
The investments of the Fund at 30 June 2017 are as follows. Investments that make up more than 5% or more of the value of the Fund are indicated with an asterisk (*).

Prime Super Annual Report 2017 27
2017 2016
Asset Class / Fund Manager $’000% of
Total Fund $’000% of
Total Fund
Other - Credit Opportunities
Alpha Trains Junior Debt 47,296 1.34% 46,330 1.49%
Arqiva Debt 27,744 0.78% 29,488 0.95%
Aunor Senior Secured Loan 46,146 1.30% 49,658 1.60%
Calvin Capital Loan 27,355 0.77% - 0.00%
IFM Super Loans Trust 248 0.01% 627 0.02%
Infrastructure Credit 71,657 2.03% 99,124 3.18%
Sydney Airport Debt 19,295 0.55% 20,448 0.66%
TDF Term Loan 45,162 1.28% 45,327 1.46%
Yorkshire Water Fund 25,574 0.72% - 0.00%
310,477 8.78% 291,003 9.35%
Other - Private Equity
AIF Capital Asia III LP 4,803 0.14% 4,777 0.15%
AIF Capital Asia IV LP 8,318 0.24% 10,940 0.35%
CM Capital Venture Trust 4A 2,059 0.06% 1,756 0.06%
CM Capital Venture Trust 4B 2,059 0.06% 1,756 0.06%
HarbourVest Dover St VII Cayman Fund LP 2,916 0.08% 4,023 0.13%
HarbourVest IPE Partners IV Partnership Fund LP 896 0.03% 1,601 0.05%
HarbourVest Partners VII Cayman Buyout Fund LP 3,243 0.09% 5,146 0.17%
HarbourVest Partners VII Cayman Ventures Fund LP 2,830 0.08% 4,265 0.14%
PA Private Capital Fund 2 216 0.01% 212 0.01%
Partners GP Euro Buyout 2008 (B) LP 11,679 0.33% 12,468 0.40%
Partners GP Secondary 2008 LP 7,558 0.21% 13,899 0.45%
46,577 1.32% 60,843 1.95%

28 Prime Super Annual Report 2017
Investments of the Fund (continued)
2017 2016
Asset Class / Fund Manager $’000% of
Total Fund $’000% of
Total Fund
Other - Absolute Return Strategies
PineBridge Global Dynamic Asset Allocation Fund 52,169 1.47% 35,701 1.15%
Schroders Real Return CPI +5% Fund 76,673 2.17% 55,296 1.78%
128,842 3.64% 90,997 2.92%
Other - Derivatives
Credit Opportunities Swaps (939) -0.03% (3,867) -0.12%
Infra Credit Swaps (2,460) -0.07% (3,652) -0.12%
MFG Foreign Currency Overlay Portfolio 684 0.02% 11,692 0.38%
OEQ FX HEDGING 2,194 0.06% 2,975 0.10%
AillanceBernstein Global Floating Rate Credit 2,920 0.08% - 0.00%
Macquarie Australian Equites (14) 0.00% - 0.00%
Vinva Australian Equities (74) 0.00% - 0.00%
2,311 0.07% 7,148 0.23%
Total investments 3,537,698 100.00% 3,113,032 100.00%
Prime Super appoints specialist investment managers for each asset class and continuously reviews these appointments.

Prime Super Annual Report 2017 29
Unaudited Statement of financial position as at 30 June 20172017
$'0002016
$'000AssetsCash and cash equivalents 7,979 9,298
Receivables 666 646
InvestmentsAustralian Shares 788,321 766,781
International Shares 678,747 569,893
Emerging Markets 208,998 166,586
Cash 517,815 376,714
Australian Fixed Interest 103,329 101,019
International Fixed Interest 232,883 191,804
Infrastructure 360,897 288,286
Property 158,501 201,958
Credit Opportunities 310,477 291,003
Private Equity 46,577 60,843
Absolute Return Strategies 128,842 90,997
Derivatives 2,311 7,148
Property, plant and equipment 442 359
Total assets 3,546,785 3,123,335 LiabilitiesPayables (6,558) (8,849)
Income tax payable 10,045 (1,638)
Deferred tax liabilities (39,738) (22,438)
Total liabilities excluding member benefits (36,251) (32,925)Net assets available for member benefits 3,510,534 3,090,410 Member benefitsAllocated to members (3,465,743) (3,039,037)
Unallocated to members (5,930) (5,462)
Total member liabilities (3,471,673) (3,044,499)
Net assets 38,861 45,911 EquityAdministration reserve (25,296) (18,501)
Investment reserve (4,874) (19,618)
Operational risk reserve (8,691) (7,792)
Total equity (38,861) (45,911)
Abridged Financial Statements
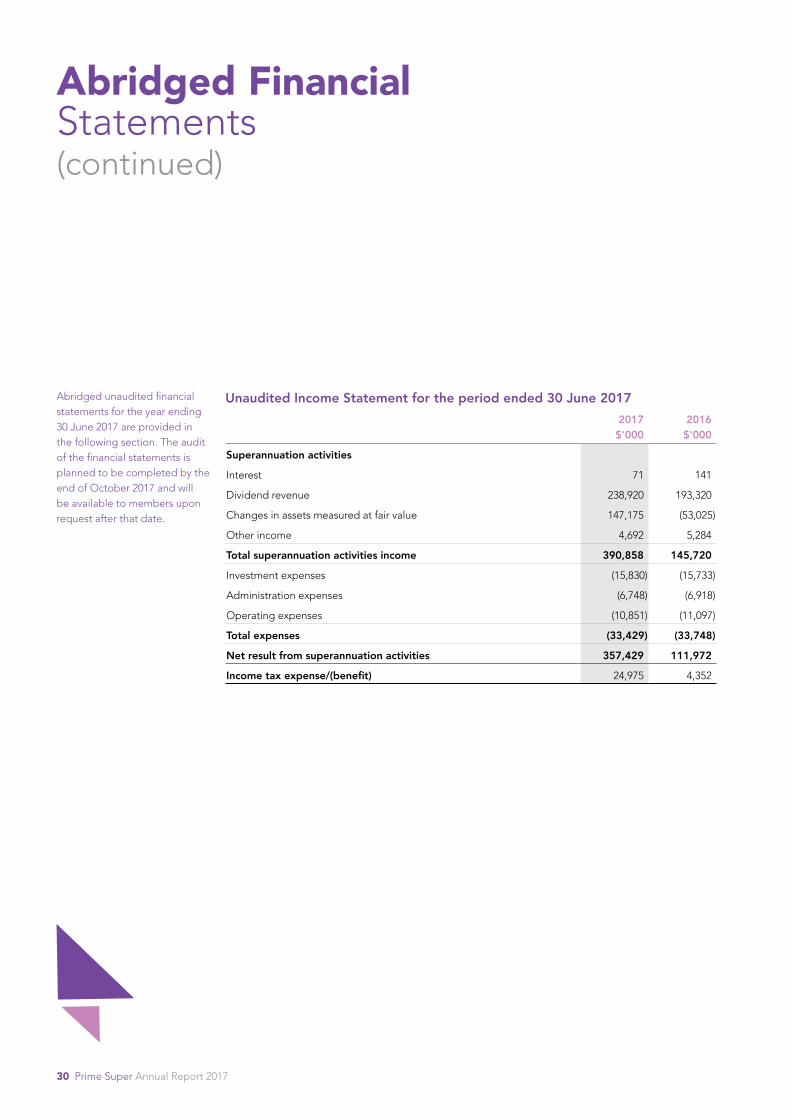
Abridged unaudited financial statements for the year ending 30 June 2017 are provided in the following section. The audit of the financial statements is planned to be completed by the end of October 2017 and will be available to members upon request after that date.
30 Prime Super Annual Report 2017
Unaudited Income Statement for the period ended 30 June 20172017
$'0002016 $'000
Superannuation activities
Interest 71 141
Dividend revenue 238,920 193,320
Changes in assets measured at fair value 147,175 (53,025)
Other income 4,692 5,284
Total superannuation activities income 390,858 145,720
Investment expenses (15,830) (15,733)
Administration expenses (6,748) (6,918)
Operating expenses (10,851) (11,097)
Total expenses (33,429) (33,748)
Net result from superannuation activities 357,429 111,972
Income tax expense/(benefit) 24,975 4,352
Abridged unaudited financial statements for the year ending 30 June 2017 are provided in the following section. The audit of the financial statements is planned to be completed by the end of October 2017 and will be available to members upon request after that date.
Abridged Financial Statements (continued)

Prime Super Annual Report 2017 31
Unaudited Statement of Changes in Member Benefits for the period ended 30 June 2017
2017 $'000
2016 $'000
Opening balance of member benefits 3,044,499 2,845,760
Contributions:
Employer 233,201 226,002
Member 50,064 40,320
Transfer from other superannuation plans 61,689 57,286
Government co-contributions 645 682
Income tax on contributions (27,925) (27,948)
Net after tax contributions 317,674 296,342
Benefits to members/beneficiaries (222,878) (187,484)
Insurance premiums charged to members' accounts (29,779) (28,102)
Death and disability insurance benefits credited to members' accounts 22,651 17,053
Benefits allocated to members' accounts, comprising:
Net investment income 364,776 126,013
Administration fees (25,270) (25,082)
Closing balance of member benefits 3,471,673 3,044,499
Please note: Financial statements have been prepared in accordance with Australian Accounting Standard AASB 1056.

32 Prime Super Annual Report 2017
Your Trustee Board
One of our longest serving board members and Deputy Chair, Trevor Dixon retired from the Board on 22 June 2017 after 13 years. During his time as a board member, Trevor worked hard to ensure that Prime Super is well positioned to face the challenges and opportunities that the future brings. We would like to extend our thanks and appreciation to Trevor for his service to the Fund and we wish him all the best for the future.
The Trust Deed
The Fund is governed by a Trust Deed which, amongst other things, sets out the entitlements of members and obligations of the Trustee.
Complying Fund
Prime Super is a complying superannuation fund for taxation purposes. All necessary returns and certificates have been lodged with APRA. Once the audit of Prime Super’s Financial Statements is complete, returns for the year to 30 June 2017 will also be lodged with APRA.
The Trustee is not aware of any matter which would cause the Fund to lose its complying status. No penalties under superannuation law have been imposed.
The Trustee has established a number of committees, as appointed by the Board, to assist
in managing its functions and responsibilities. Directors sit on these committees. A list of all committees and committee members is listed below.
Participating employers are also entitled to establish a policy committee to consider the operation and performance of the Fund and communicate the views of members and employers to the Trustee. Policy committees must be made up of an equal number of member and employer representatives.
At 30 June 2017 there were no policy committees.
Trustee Liability Insurance
The Trustee has liability insurance to protect it, and the Directors and Officers, against any losses arising as a result of a claim for a breach of their duty.
Conflict of Interests
The Trustee has established procedures to ensure any conflict of interest in respect of the Directors is disclosed and appropriately dealt with.
The Trustee, Prime Super Pty Ltd, is responsible for managing the Fund. The Directors of the Trustee meet regularly to discuss management of the Fund and determine important policies and procedures. Directors receive fees and are reimbursed for travelling expenses for attending board and committee meetings.
Committees
Investment committee Gerard Parlevliet (Chair), Alan Bowman, Duncan Fraser, Martin Day
Audit, compliance & risk committee David Cooper (Chair), Liam O’Brien, Duncan Fraser, Jacqueline Kelly
Death & disability claims committee David Cooper (Chair), Liam O’Brien, Duncan Fraser
Remuneration committee All directors are members of this committee

Prime Super Annual Report 2017 33
Board meeting attendance for the year ended 30 June 2017Board
MeetingsInvestment Committee
Audit Committee
Remuneration Committee
Director A B A B A B A B
Alan Bowman (Chairman) 6 6 6 6 5 0 1 1
David Cooper 6 6 6 0 5 5 1 1
Martin Day 6 6 5 6 5 0 1 1
Duncan Fraser 6 6 6 6 5 5 1 1
Jacqueline Kelly 5 6 3 0 5 5 1 1
Trevor Dixon (Deputy Chairman)^ 5 6 5 6 5 5 1 1
Liam O’Brien 5 6 3 0 3 5 0 1
* All board members are permitted to attend Committee meetings even if they are not a member of the Committee.
^ Retired from the board on 22 June 2017.
A = Meetings attended B = Eligible to attend
Alan BowmanChair Independant Director
(Appointed 26 January 2001; Appointed Chair 1 January 2011)
Trevor DixonDeputy Chair Independant Director
(Appointed 5 April 2004; Appointed Deputy Chair 28 August 2013; Retired 22 June 2017)
David CooperIndependant Director
Independant Director (Appointed 1 July 2009)
Duncan FraserNFF Representative
(Appointed 25 August 2010)
Martin DayIndependant Director
(Appointed 28 October 2014)
Jaqueline KellyIndependant Director
(Appointed 24 February 2015)
Liam O’BrienAWU Representative
(Appointed 27 April 2016)
Gerard ParlevlietIndependant Director
(Appointed 22 June 2017)
Directors

34 Prime Super Annual Report 2017
As an industry super fund, Prime Super is run only to benefit members. The Fund’s remuneration practices are set out in a Remuneration Policy maintained by the Board.
The Prime Super Board is responsible for reviewing and setting Directors’ remuneration.
Remuneration is set at a level that recognises the responsibilities of Directors, acknowledges the expectations of Directors at law, is comparable to the market, and encompasses all activities of Directors.
Directors are separately remunerated for additional activities they undertake on behalf of the Board, outside their normal duties. Remuneration for such activities is only payable where the Chair/Board has approved of those activities.
The Chair and Deputy Chair receive a higher level of remuneration as a reflection of the increased workload and responsibility associated with those roles.
Prime Super Board of Directors
Name Position heldDate appointed to Board
Date appointed to role Date ceased
Alan Bowman Chair 26 January 2001 1 January 2011
Trevor Dixon Deputy Chair 5 April 2004 28 August 2013 22 June 2017
David Cooper Director 1 July 2009
Duncan Fraser Director 25 August 2010
Martin Day Director 28 October 2014
Jacqueline Kelly Director 24 February 2015
Liam O’Brien Director 27 April 2016
Gerard Parlevliet Director 22 June 2017
Director remuneration

Prime Super Annual Report 2017 35
Director remuneration is set out in the following table:
Director remuneration
Short-term benefits Post-employment benefits
Termination payments TOTALCash salary1
Additional remun-eration
Other short-term
compen-sation
Non-monetary
benefits
Pension and super-annuation
benefits
Other post-employment
benefits
Alan Bowman
2017 79,569 0 0 0 7,559 0 0 87,128
2016 68,493 0 0 0 6,507 0 0 75,000
Trevor Dixon
2017 61,178 0 0 0 5,812 0 0 66,990
2016 61,644 0 0 0 5,856 0 0 67,500
David Cooper
2017 61,178 4,311 0 0 6,222 0 0 71,711
2016 55,351 0 0 0 5,258 0 0 60,609
Duncan Fraser
2017 55,616 0 0 0 5,284 0 0 60,900
2016 54,795 0 0 0 5,205 0 0 60,000
Martin Day
2017 55,616 0 0 0 5,284 0 0 60,900
2016 54,795 0 0 0 5,205 0 0 60,000
Jacqueline Kelly
2017 55,616 0 0 0 5,284 0 0 60,900
2016 54,795 0 0 0 5,205 0 0 60,000
Liam O’Brien2
2017 60,900 0 0 0 0 0 0 60,900
2016 14,850 0 0 0 0 0 0 14,850
Gerard Parlevliet3
2017 1,622 0 0 0 154 0 0 1,776
2016 - - - - - - - -
1 Includes any salary sacrifice items.
2 Of the remuneration payable to Mr O’Brien, 100% is paid to his employer The Australian Workers Union. Mr O’Brien commenced April 2016.
3 Mr Parlevliet commenced 22 June 2017.
Please note: No share-based remuneration or long-term benefits are paid or payable to Directors.

36 Prime Super Annual Report 2017
To achieve its goals in relation to executive staff, the Remuneration Policy is designed to:
• encourage executives to perform to their fullest capacity
• be business focused and flexible
• be competitive and cost effective in each relevant employment market, and
• be internally consistent.
Executive remuneration may incorporate fixed and variable performance elements with both a short-term and long-term focus.
In setting any performance-based component of remuneration, the Prime Super Board ensures that the performance-based component supports:
• protecting the interests, and meeting the reasonable expectations of members
• the long-term soundness of the Fund Trustee and the Fund, and
• the risk management framework of the Fund Trustee.
Chief Executive Officer remuneration
The Prime Super Board is responsible for reviewing and setting the level and structure of remuneration of the Chief Executive Officer (CEO), including the assessment of any annual performance bonus to be awarded.
The CEO’s remuneration has due regard to industry practice and comparative information, and is set at levels and is structured to attract, motivate, reward and retain good performers to drive the Fund efficiently.
Other Executives remuneration
The CEO is responsible for reviewing and setting the level and structure of remuneration of the other Executives.
Other Executives’ remuneration has due regard to industry practice, comparative information and the financial constraints of the business and is set at levels and is structured to attract, motivate, reward and retain good performers to drive the Fund efficiently.
The CEO undertakes an annual review of the performance of the other Executives, including the assessment of any annual performance bonus to be awarded.
Prime Super Executives
Name Position held Date appointed to role
Lachlan Baird Chief Executive Officer 21 March 2005
Stephen Pratt General Manager – Operations 7 January 2008
Wendy Shang General Counsel & Assistant Company Secretary 29 June 2009
Ann Wong General Manager – Risk & Compliance 3 October 2016
Jane Kang General Manager – Investments 4 November 2015
Remo Memmolo Chief Financial Officer 26 February 2015
Executive remuneration

Prime Super Annual Report 2017 37
Executive remuneration is set out in the following table:
Executive remuneration
Short-term benefits Post-employment benefits
Termination payments TOTAL
Cash salary & short-term
compensated absences1
Short-term cash and other
bonuses
Non-monetary
benefits
Other short-term employee
benefits
Pension & super-
annuation benefits
Other post-employment
benefits
Lachlan Baird
2017 380,044 20,875 9,399 36,4015 35,000 0 0 481,719
2016 356,324 18,547 7,629 0 35,000 0 0 417,500
Stephen Pratt
2017 241,385 17,378 12,000 0 24,338 0 0 295,101
2016 236,047 22,496 9,716 0 24,149 0 0 292,408
Wendy Shang2
2017 80,051 13,684 0 0 8,871 0 0 102,606
2016 141,744 13,286 0 0 14,575 0 0 169,605
Ann Wong3
2017 151,914 0 0 0 14,432 0 0 166,346
Jane Kang3, 4
2017 151,410 9,742 720 0 14,968 0 0 176,840
2016 94,602 0 0 0 8,987 0 0 103,589
Remo Memmolo3
2017 173,749 15,982 0 0 18,002 0 0 207,733
2016 160,032 0 0 0 15,183 0 0 175,215
1 Includes any salary sacrifice superannuation items.
2 Ms Shang is employed to work two days per week; Ms Shang ceased being a Responsible Officer 22 June 2017.
3 Ms Wong, Ms Kang and Mr Memmolo became Responsible Officers 22 June 2017.
4 Ms Kang is employed to work four days per week.
5 Prior year salary adjustment.
Please note: No share-based remuneration or long-term benefits are paid or payable to Executives.

38 Prime Super Annual Report 2017
The net movements in annual leave and long service leave accruals for executive staff are set out in the following table:
Executive net movement in annual leave and long service leave accruals
Executive officerShort-term benefits: Cash salary and short term compensated absences1
Long-term benefits: Other long-term employee benefits2
Lachlan Baird
2017 5,850 -13,715
2016 5,001 -10,262
Stephen Pratt
2017 -5,174 -4,986
2016 204 -4,704
Wendy Shang
2017 -5,366 -7,609
2016 -2,362 0
Ann Wong
2017 -13,731 0
Jane Kang
2017 -2,752 0
2016 -8,550 0
Remo Memmolo
2017 -15,651 0
2016 -17,926 0
1 Comprises the net movement in annual leave accruals, including any leave loading applicable, determined in accordance with AASB 119 Employee Benefits.
2 Comprises the net movement in long service leave accruals determined in accordance with AASB 119 Employee Benefits.
Executive remuneration (continued)

Prime Super Annual Report 2017 39
Performance-based components of Executive remuneration are set out in the following table:
Executive performance-based components of remuneration
Executive officer Date granted
Nature of compensated granted Service & performance criteria
% that was paid/vested
in the FY
% that was forfeited in the FY
Lachlan Baird 31 August 2016 Cash bonus Crediting Rates out-performing the average return for Superannuation Funds for the financial year.
100% 0%
Stephen Pratt 22 June 2016 Cash bonus Out-performance when measured against pre-agreed Key Performance Indicators (KPIs). The KPIs include measures relating to the Fund and the individual, and include financial, people, member, strategy and risk measures.
75% 25%
Wendy Shang 22 June 2016 Cash bonus Out-performance when measured against pre-agreed Key Performance Indicators (KPIs). The KPIs include measures relating to the Fund and the individual, and include financial, people, member, strategy and risk measures.
100% 0%
Ann Wong 22 June 2016 Cash bonus Out-performance when measured against pre-agreed Key Performance Indicators (KPIs). The KPIs include measures relating to the Fund and the individual, and include financial, people, member, strategy and risk measures.
N/A N/A
Jane Kang 22 June 2016 Cash bonus Out-performance when measured against pre-agreed Key Performance Indicators (KPIs). The KPIs include measures relating to the Fund and the individual, and include financial, people, member, strategy and risk measures.
100% 0%
Remo Memmolo
22 June 2016 Cash bonus Out-performance when measured against pre-agreed Key Performance Indicators (KPIs). The KPIs include measures relating to the Fund and the individual, and include financial, people, member, strategy and risk measures.
100% 0%

40 Prime Super Annual Report 2017
The Trustee will assist you with any questions you may have about the Fund and your membership. Information available includes, but is not limited to, annual reports, documents such as the Trust Deed, audited financial statements, auditor’s reports, investment strategy information, information on enquiries and complaints procedures, insurance policies and the risk management strategy. This information is available on the website or you may request it in hard copy.
You can request information and answers to any questions by contacting us by mail, phone, fax or email.
Post Prime Super Locked Bag 5103 Parramatta NSW 2124
Phone Freecall 1800 675 839 (8am-8pm Sydney time Monday – Friday)
Fax Freefax 1800 023 662
Email [email protected]
Web primesuper.com.au
How to contact us

Prime Super Annual Report 2017 41
Designed and produced at www.twelvecreative.com.au

This 2017 Annual Report contains general information
only and does not take account of your personal
circumstances. You should obtain personal advice
where appropriate. This Annual Report is current
as at the date of publication and subject to change.
Prime Super Pty Ltd (ABN 81 067 241 016, AFSL 219723,
RSE L0000277 as Trustee of Prime Super (ABN 60 562
335 823 R N 1000276)). A Product Disclosure Statement
is available from the issuer by calling 1800 675 839.
call 1800 675 839
visit primesuper.com.au
email [email protected]