annual report more to it - aurubis · 2018-12-11 · magazine 2017/18 our magazine accompanying the...
TRANSCRIPT

Annual Report
2017/18THERE’S MORE TO IT
Ann
ual R
epor
t 201
7/18
THER
E’S
MO
RE
TO IT

MAGAZINE 2017/18 Our magazine accompanying the Annual Report focuses on just how much more our metals, our processes, and our strategy have to offer.
You can find our magazine and the full Annual Report online at: annualreport2017-18.aurubis.com
COMPANY PORTRAITWe are a leading global provider of non-ferrous metals, renowned for our ability to process complex metal concentrates, scrap metals, and metal-bearing recycling materials to produce metals of the highest quality. We produce more than one million tons of copper cathodes annually, from which we then manufacture a wide range of copper and copper alloy products. This includes wire rod, shapes, rolled products, strip, specialty wire, and profiles.
Thanks to our wide range of services, we rank among the global leaders in the industry. Our product portfolio also includes gold, silver, lead, nickel, tin, minor metals like tellurium and selenium, platinum group metals, and a number of other products such as sulfuric acid and iron silicate.
€ 329 millionEBT
(operating)
14.8 %ROCE
(operating)

MAGAZINE 2017/18
THERE’S MORE TO IT
You can find the full Annual Report at: annualreport2017-18.aurubis.com
THERE’S MORE TO IT
In a world of constant change, the way we live is challenged continuously.
Copper has shaped our company’s long- standing tradition and has made Aurubis
a leading specialist internationally.But there’s MORE to it.
There is MORE in our key raw material copper concentrate, in scrap, and in
industrial residues that we can unlock through innovative processes.
There is MORE in our partnerships with mines and recyclers, MORE in our relationships
with the communities we work and live in, and MORE in our organization and
the way we work together. In line with our vision and through the measures
encompassed by our strategy, we will tap this potential. With one goal:
to increase the value of Aurubis.

AURUBISSTRATEGY
GROWTH EFFICIENCY
RESPON SI- BILITY
TABLE OF
CONTENTS2CHECKING IN
5OUR PORTFOLIO:
THE NEW VARIETY OF METALS
20WE UTILIZE POTENTIAL
40ONE
STRATEGY
Aurubis MAGAZINE 2017/18 1

DR. THOMAS BÜNGER
RAINER VERHOEVEN
JÜRGEN SCHACHLER
EXECUTIVE BOARD CHAIRMAN
CHIEF OPERATING OFFICER
CHIEF FINANCIAL OFFICER
2

THE NEW AURUBIS STRATEGY
WAS PRESENTED ABOUT ONE
YEAR AGO. HOW WOULD YOU
EVALUATE IT SO FAR?
JS: Positively, without a doubt. We’ve
initiated many small and large measures
for further growth. One of the most visible
is our internal project Future Complex
Metallurgy, or FCM for short. This project
will help us substantially increase the
volumes of metal, apart from copper,
that we recover, and develop more in the
direction of a multi-metal supplier. Our
efficiency improvement program is also
important to me. It is a program that has
been making an impact in the company
for a while now. Thanks to forward-
looking planning, we already know which
initiatives we’ll be carrying out in the
coming year to generate another € 60
million in project success in 2018/19, of a
total of € 200 million. All of the employees
CHECKING INWith our new vision, new strategy, and new way of thinking, there is a lot going on at Aurubis. In the following, the Aurubis Executive Board assesses the current situation and explains where our path is headed.
in every division and at every site are
contributing to this, from production to
the administrative departments. We pay
attention to this balance.
RV: This success is also reflected in our
numbers, with operating earnings up by
10 % in 2017/18. Indeed, this is one of the
best results in the company’s history. We
are thus comfortably within our forecast.
It’s fair to add that we have benefited from
a positive market environment. Moreover,
we’re virtually debt-free at the moment.
This is a good starting point for further
growth.
TB: One more point regarding FCM:
I’m glad to see how much excitement
the employees are bringing to their work
and collaboration. An important project
like this one has the potential to help
individuals surpass themselves. It’s
no wonder that we’re fully on schedule
for implementation despite the
uncertainties that accompany a huge
project like this one. Our sites’ good
operating performance in fiscal year
2017/18 also clearly indicates that we
have a huge level of commitment
to our daily work in the entire Group!
IN WHAT AREAS DO YOU WISH
YOU WERE FURTHER ALONG?
JS: As a general rule, we don’t rush,
because we can maneuver from a
place of strength thanks to our good
market position.
However, in the future we want to shape
external growth more than we currently
do. Following initial success with the full
acquisition of Deutsche Giessdraht in
July 2018, our acquisition situation has
calmed down somewhat. This doesn’t
mean that we’re not actively reviewing
different possibilities at the moment, but
that we do this very conscientiously –
with the necessary level of prudence.
For instance, there could be interesting
synergies in multi-metal recycling, where
we already have a competitive edge due
to our leading technology. The same is
true for the sale of our Segment Flat
Rolled Products, which will enable us to
concentrate more on our metallurgical
expertise again.
RV: External growth is an important
part of our strategy – but not at all
costs, of course. Nevertheless, we
will stay on the ball in 2019 because we
have the necessary funds and ideas.
Jürgen Schachler’s preliminary conclusion on the new company strategy is positive.
Aurubis MAGAZINE 2017/18 3

JS: The topic of leadership culture is also
close to my heart. We would like to give
our employees the tools to feel more like
entrepreneurs within the company. What
I mean is, those who have a high level of
responsibility for their actions and their
work are more willing to deliver a top
performance and follow through with
their tasks. Moreover, we have to act
more strongly as a team in the future, as
ONE Aurubis. My guiding motto: Nobody
is perfect, but a team can be. We have
room to grow in this regard.
TB: In my opinion, there’s also still some
catching-up to do when it comes to the
question-and-answer culture and how
we provide good explanations internally
about the change processes that come
with our new strategy. On the other hand,
it is also important for employees to ask
these questions. This is the only way
that everyone can ensure that the issues
relevant to them are addressed and that
they can help shape these areas.
WHAT DO YOU EXPECT
FROM 2019?
RV: We will continue to pursue our
strategic measures with enthusiasm
and focus. As Mr. Schachler already
mentioned, we will also push forward
with improvement projects in the
administrative divisions as well. A stronger
harmonization of software solutions,
processes, and approaches – across all
of the key international sites – is one
of my main interests. Our research
and innovation department is working
intensively with digitalization topics.
For example, we want to draw even more
from our raw materials and continue
improving our energy management
using models and artificial intelligence.
TB: We will make Aurubis fit for the
future with the people who work here.
Our environment is changing: Today,
about half of the world’s copper is
produced and processed in China. With
innovative process solutions such as
FCM, which can be ideally integrated
into our existing smelter network and
provide us with even more flexibility in
raw material sourcing, we will continue
to expand our competitive position.
In this way, we’re developing from a
sheer processor into a solution provider,
for instance for our mine partners. At
the same time, we want to work more
intensively with our copper product
customers in the future, in areas like
recycling and end products.
JS: Our fundamental goal is to build
on the previous year’s good development
in the coming year. We defined a clear
objective with our Vision 2025, and
we’re now on the path to attaining it. It’s
important to me that we travel this path
under the guidance of our sustainability
ambitions. These include forward-looking
projects such as our Industrial Heat
project, which we inaugurated at the end
of October. These successes strikingly
indicate that we are in a position to unite
economic interests with sustainable
conduct. We will continue to do so in 2019.
This interview was conducted by Angela Seidler, Vice President Investor Relations &
Corporate Communications.
New Executive Board member Dr. Thomas Bünger is convinced of the FCM project’s potential.
A stronger harmonization of software solutions, processes, and approaches is one of Rainer Verhoeven’s main interests.
Aurubis MAGAZINE 2017/184

28
Ni Nickel
34
SeSelenium
29
CuCopper
78
Pt Platinum
79
AuGold
83
Bi Bismuth
82
Pb Lead
75
Re Rhenium
77
Ir Iridium
45
RhRhodium
44
Ru Ruthenium
47
Ag Silver
51
Sb Antimony
46
Pd Palladium
52
Te Tellurium
50
Sn Tin
OUR PORTFOLIO: THE NEW VARIETY OF METALS
While Aurubis tends to be associated with copper only, its processing activities encompass a range of metals. Indeed, the recovery of non-ferrous metals other than copper is becoming an increasingly important area of business – one encapsulated in the term multi-metal.
Many of the metals we produce are essential for megatrends such as digitalization, renewable energies, electric vehicles, and urbanization to become a reality in the first place. At the same time, these areas drive demand for our industrial metals even further. In short: The future is made from metals – in the best case, from ours.
5Aurubis MAGAZINE 2017/18

Cu 29
MOMENTUM
Aurubis MAGAZINE 2017/186

Whether transport, energy supply systems, or
construction: Many facets of modern life are developing
at a fast pace. With its unique properties, copper is and
remains the basis for these trends. This allows us to
hold a steady course as we move towards the future.
METAL WITH CHARACTER
Apart from its characteristic red color, copper
is known for its very high electrical and thermal
conductivity. This qualifies the metal for countless
uses in energy and telecommunications, as well as
in nearly all thermally conductive heat exchangers in
air conditioners and radiators. Copper is frequently
alloyed with other metals, for example with zinc to
form brass or with tin to form bronze. Copper can
also be recycled as often as desired without a loss
of quality.
ELECTRIC VEHICLES DRIVE COPPER DEMAND
In addition to its use in energy grids, cell phones, and
heat pipelines, copper drives future mobility solutions
in particular. While a conventional car contains about
25 kg of the metal, electric cars contain over three
times that amount. This is similar for electric buses
and trucks. But batteries, electric motors, and power
electronics are just the start. The necessary charging
stations and their cable systems raise demand even
further. So it’s no wonder that today’s global copper
demand of about 0.4 million t for electric vehicles alone
is expected to increase to nearly 3 million t in 2030.
19.4
On top of rising copper demand from electric vehicles,
there are also large-scale infrastructure measures such
as the “New Silk Road” initiated in China, as well as
stable demand from industrialized countries. Global
demand for refined copper is expected to increase by
around 3 % in 2019 due to these developments.
EXCELLENCE IN COPPER
We will benefit from this momentum into the future.
Aurubis already fabricates about 1.2 million t of copper
cathodes with a purity level of 99.995 %. Thanks to our
distinct expertise in recycling, approximately 40 % of
these cathodes come from reprocessed copper scrap.
And our product range doesn’t stop there. In addition
to copper cathodes, we offer our customers processed
copper in the form of preliminary products such as
wire rod, shapes, pre-rolled strip, specialty wire, and
alloys. We thus provide a tailored solution for every
application. Because progress is based on copper.
million electric and hybrid cars are projected to be sold in 2025, a market that grows by an average of 24 % each year.
COPPERThe basis of our modern world and many forward-looking trends.
Aurubis MAGAZINE 2017/18 7

Au 79
CONNECTION
Aurubis MAGAZINE 2017/188
While gold was once the universal currency for trade
and connected thousands of merchants, today it
ensures that mountains of data are transferred from
one point to the next quickly and securely.
KING OF METALS
With its excellent electrical conductivity and resistance
to oxidation, corrosion, and wear, gold displays its
strengths everywhere that electric currents or voltage
have to be conveyed without losses. It is therefore
ideal for high-performance processors, connectors, and
electrical resistors.
At the same time, gold is a soft metal. It can be
easily worked and processed, and its qualities make
it highly attractive for many industrial applications.
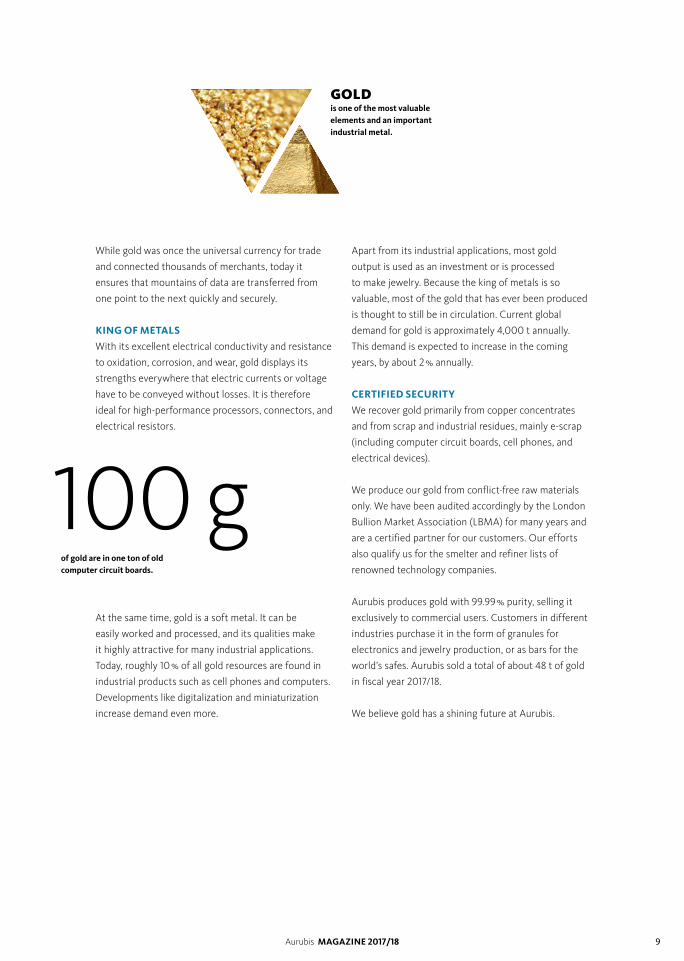
Today, roughly 10 % of all gold resources are found in
industrial products such as cell phones and computers.
Developments like digitalization and miniaturization
increase demand even more.
Apart from its industrial applications, most gold
output is used as an investment or is processed
to make jewelry. Because the king of metals is so
valuable, most of the gold that has ever been produced
is thought to still be in circulation. Current global
demand for gold is approximately 4,000 t annually.
This demand is expected to increase in the coming
years, by about 2 % annually.
CERTIFIED SECURITY
We recover gold primarily from copper concentrates
and from scrap and industrial residues, mainly e-scrap
(including computer circuit boards, cell phones, and
electrical devices).
We produce our gold from conflict-free raw materials
only. We have been audited accordingly by the London
Bullion Market Association (LBMA) for many years and
are a certified partner for our customers. Our efforts
also qualify us for the smelter and refiner lists of
renowned technology companies.
Aurubis produces gold with 99.99 % purity, selling it
exclusively to commercial users. Customers in different
industries purchase it in the form of granules for
electronics and jewelry production, or as bars for the
world’s safes. Aurubis sold a total of about 48 t of gold
in fiscal year 2017/18.
We believe gold has a shining future at Aurubis.
100 gof gold are in one ton of old computer circuit boards.
GOLDis one of the most valuable elements and an important industrial metal.
Aurubis MAGAZINE 2017/18 9

Ag 47
IDENTITY
Aurubis MAGAZINE 2017/1810

7.5 μmis the thickness of the world’s smallest RFID chips. They are referred to as RFID dust or RFID powder.
SILVERis sold not only as bars, but also as granules. These small pellets can be easily portioned for production.
RFID – these four letters hold great potential for the
future. We’ve all had contact with radio frequency
identification devices, for instance in the new personal
ID cards. The small chips can be identified without
contact, track goods, or open doors. Silver is always
part of the equation, as very small silver antennae
ensure the necessary transmission range.
THE MOON METAL
Silver has high electrical and thermal conductivity.
It is also the whitest metal in general use and reflects
99.5 % of visible light. It is a relatively soft metal at the
same time and can therefore be easily shaped. As a
result, it is often alloyed with harder metals such as
copper. Sterling silver (92.5 % silver and 7.5 % copper)
is the standard silver for jewelry.
INDUSTRY 4.0 – IMPOSSIBLE WITHOUT SILVER
Silver is an important catalyst for the future of
industry. It is used in new conductor technologies,
computers, and household appliances. New markets
include wearables, that is, minicomputers worn on
the body. The metal is perfect for coating electrical
contacts, and the chemical industry needs it as a
catalyst for producing antifreeze, polyester, and
solvents. Silver is also needed in the growing market
of photovoltaics, with one solar cell containing
about 120 mg of silver.
Silver is also crucial to Industry 4.0 applications, for
instance in automated inventory control systems.
Supermarkets of the future, for example, will use RFID
systems to identify products in shopping carts, making
checkout lines a thing of the past.
SILVER AT AURUBIS
Aurubis produces silver at the Hamburg site,
recovering it from the anode slime of the copper
tankhouse (this process is the same for most metals,
with the exception of copper). The recovered silver is
then formed into bars or granules with 99.9 % purity.
Global silver demand was about 32,000 t in 2017 and
is expected to continue growing by approximately
1.5 % in the coming years. Aurubis sold a total of about
877 t of silver in fiscal year 2017/18.
Silver was also key to establishing our identity. The
permit that Salomon Beit received from the Hamburg
Senate in 1770 to operate a silver separation and
smelting furnace laid the foundation for the company
that ultimately became Aurubis.
Aurubis MAGAZINE 2017/18 11

Pb 82
SAFETY
Aurubis MAGAZINE 2017/1812

Lead protects and provides a measure of safety in
one way or another. Everyone is familiar with the lead
aprons used to block x-rays. Protective goggles with
lead coating work in a similar way. In construction,
lead is used in restoration work to protect roofs and
facades. Qualities like good formability and the natural
patina it forms, which serves as a type of corrosion
protection, qualify the metal for these uses.
LEAD CAUSES THE SPARKS TO FLY
Because of its high density, lead is relatively heavy
and is therefore ideal for protecting underwater cables.
Thanks to its low melting point, it is often alloyed with
tin for soldering technology. Like copper, lead can be
almost completely recycled as often as desired without
a loss of quality.
By far the most important application for metallic lead
is the lead battery, however. About 80 % of the metal’s
output flows into this area. Compared to other battery
technologies, lead batteries are considered very robust
and can conduct relatively high voltages. The latter is
vital for starter batteries in vehicles.
A RELIABLE WAY TO STORE ENERGY
Global lead consumption rose from 7.3 million t to
11.5 million t between 2004 and 2017. Studies forecast
stable demand for the coming years. A key reason
for this is that many conventional cars will still be
on the roads of tomorrow and will need the reliable
technology of lead batteries.
Moreover, the lead battery is set to play an important
role in the development of future energy storage
solutions for the renewable energies sector, in
particular for the photovoltaic industry.
LEAD AS THE IDEAL “METAL COLLECTOR”
We service this demand at Aurubis by producing high-
purity lead, which is 99.985 % pure and is refined from
what is referred to as crude lead. We have been audited
by the London Bullion Market Association (LBMA) for
both lead and gold. Aurubis sold a total of 19,527 t of
lead in fiscal year 2017/18.
Lead is not only produced at Aurubis for its own
sake. Just like copper, lead is an ideal “metal collector.”
In the smelting process, it binds different elements,
such as bismuth, antimony, tellurium, silver, and
tin, that we can ultimately recover as additional
intermediate products. Lead is therefore useful to
us on many levels.
95 %is the recycling rate for rolled lead. Because of its recyclability and its proven lifespan of several centuries, it is a very environmentally sound building material.
LEADis a vital metal for manufacturing starter batteries.
Aurubis MAGAZINE 2017/18 13

Ni 28
ENERGY
Aurubis MAGAZINE 2017/1814

Energy storage is a game changer for our future –
without a storage solution, there will be no energy
transition! Nickel and its strengths rise to the
challenge.
RESILIENT BY NATURE
Shimmering, silvery-white nickel is a hard, resilient
metal. Nevertheless, it can be processed easily and is
mostly used in alloys, for example in steel. Thanks to
its properties, it protects propellers and pumps against
corrosion. As a component in many catalysts, nickel
also makes chemical reactions more efficient.
THE CHAMPION OF THE BATTERY AGE
Nickel is crucial in the production of nickel-cadmium
(NiCd) batteries and nickel-metal hydride batteries
(NiMH), which are ideal for transportable devices due
to their low weight.
The energy transition requires additional solutions,
however. Ceramic batteries, which store energy at
high temperatures, are one of these solutions. Nickel
plays an important role in this technology as well, for
example in sodium-nickel chloride (NaNiCl) batteries
that are also known as ZEBRA (Zero Emission Battery
Research Activities) batteries. These are generally used
in stationary energy storage, such as energy parks,
grids, and self-sustaining buildings, where they enable
delayed use of the energy produced.
The significance of nickel is especially apparent in its
growth figures. For example, demand for the metal
is forecast to increase by an average of 3.5 % per year
between 2017 and 2021, and demand for batteries
alone is expected to rise by 14 % in the same period.
OUR CONTRIBUTION TO THE
ENERGY TRANSITION
In copper production, the recycling materials and
copper concentrate used both contain small amounts
of nickel. In the process step that takes place in the
copper tankhouse, the nickel remains in the electrolyte,
the liquid that flows between anode and cathode. It is
continuously removed from the electrolyte as nickel
sulfate and then processed into a light green powder
through water reduction. In this form, it can’t be used
directly for applications such as battery manufacture
quite yet, but has to be processed further. We are
currently working with another company to conduct
a feasibility study into producing nickel suitable for
batteries. Aurubis sold a total of 3,022 t of nickel in
fiscal year 2017/18. Another way we contribute to the
energy supply of the future.
12,400euros was the cost of one ton of nickel on September 30, 2018.
NICKELis a central success factor for the future trends of renewable energies and electric vehicles.
Aurubis MAGAZINE 2017/18 15

Sn 50
QUALITY
Aurubis MAGAZINE 2017/1816

“Life is too short to drink bad wine,” Goethe said. To
ensure the quality of those precious drops, bottles of
good wine now come with capsules made of tin. The
light metal is easily shaped and is ideal for sealing
bottles to be nearly airtight. But tin also preserves the
quality of cheaper products as well.
TIN IS A FIXTURE IN ALMOST EVERY CUPBOARD
Tin can be easily cut with a knife and rolled into
paper-thin foil. Thanks to its good formability and low
toxicity, the silvery-white metal is ideal for use in the
food sector. About one-third of the global output
of corrosion-resistant tin is used to preserve food and
drinks. For instance, as an alloy metal, it goes into
tin plate for canned goods. Tin is also used to help
smooth glass surfaces.
Alloyed with copper, it is vital for the fabrication of (tin)
bronze. This has been used in artistic handicrafts for
millennia, but also to manufacture turbines and gears.
AN ATTRACTIVE INDUSTRIAL METAL
Tin’s low melting point makes it highly attractive to a
wide range of industries, in particular to the electronics
sector, which accounts for over 50 % of tin currently in
use. Here, tin is primarily used for soldering purposes
(particularly in soft solders). Tin is also a component
of LED flat screens and is used in the chemical
industry. Forecasts for the tin market estimate
annual volume growth of about 2 % until 2022.
MORE TIN THROUGH RECYCLING
Tin is a minor metal found in our raw materials.
We recover it by recycling these materials using
resource-efficient, environmentally sound processes
in our plant in Lünen (Germany), where we
produce tin composite. Our sales of tin amounted
to approximately 1,851 t in fiscal year 2017/18. We
therefore boost the importance of recycling for
the tin supply, as roughly 15 % of tin output comes
from secondary sources.
15 %of the world’s tin output comes from recycling.
TINis an excellent alloy metal,
for instance to produce tin plate or bronze.
Aurubis MAGAZINE 2017/18 17

In addition to our six base metals, we recover further metals from within the categories of platinum group metals and minor metals.
OUR EXPANDED METAL PORTFOLIO
PLATINUM OSMIUM IRIDIUM
RUTHENIUM RHODIUM PALLADIUM
Pt 78 Os 76 Ir 77
Ru 44 Rh 45 Pd 46
A valuable, shiny, silver-colored
precious metal with a high density and
formability. Platinum is
used in the production of catalysts,
jewelry, and fuel cells.
A steel-blue metal with a very high
melting point and an extremely
high density. Osmium alloys are
found in expensive ballpoint pens
and medical implants.
A very heavy, hard, silvery-white,
shiny precious metal with extremely
high corrosion resistance. Its alloys
are used in surgical instruments and
ignition plugs for plane engines.
A hard, brittle, silvery to matte-gray
precious metal. It is mainly
used in electrical contacts and as
a catalyst in chemical processes.
PLATINUM GROUP METALS
A silvery, shiny precious metal with
high reflectivity. It is frequently used as
a catalyst, for instance in vehicles and
in the industrial manufacture of basic
chemical substances.
A silvery, shiny precious
metal that is primarily used as a
catalyst – in addition to more exotic
applications, such as in jewelry or
tooth implants.
Aurubis MAGAZINE 2017/1818

TELLURIUM RHENIUM ANTIMONY
BISMUTH SELENIUM
Te 52 Re 75 Sb 51
Bi 83 Se 34
In its stable form, a brittle metalloid
that has a metallic, silvery-white
sheen and is not water-soluble.
In its pure state, it is used in solar cells,
for example.
A silvery, shiny, hard metal with
a high density. It is included in
alloys that are used in aircraft engines
and thermal elements, among
other things.
In its stable form, a brittle,
shiny, silver-colored metalloid.
It is an important alloying element;
for instance, it is alloyed with
lead in lead-acid batteries.
A hard, brittle metal with a
crystalline structure. Interferences
in a thin oxide layer lead to tempering
colors in the metal. Bismuth is used
to produce alloys and as a catalyst.
A metalloid with multiple forms.
In its most stable form, it is gray and
metallic. It is used for electro-optical
applications, for example.
MINOR METALS
Aurubis MAGAZINE 2017/18 19

WE UTILIZE POTENTIALAurubis is constantly in motion. Currently, for example, we are in the process of implementing a variety of new strategic measures along our value chain. These extend from collaboration with our suppliers, to steps we are taking to help Aurubis produce and work together better and more efficiently, to the way we interact with our customers. We know that Aurubis still has a great deal of untapped potential, and we intend to capitalize on this.
Whether recycling materials or copper concentrate, we see more potential in our raw materials.
2 1 INTERNAL GROWTH PROJECT FUTURE COMPLEX METALLURGY
24 MULTI-METAL RECYCLING AND THE CIRCULAR ECONOMY
26 RESEARCH AND DEVELOPMENT IN THE DIGITAL AGE
29 EFFICIENCY IMPROVEMENT PROGRAM AND AURUBIS OPERATING SYSTEM
32 EXTERNAL GROWTH OPPORTUNITIES
34 ENERGY EFFICIENCY AND CLIMATE PROTECTION
37 SUSTAINABLE INVOLVEMENT
Aurubis MAGAZINE 2017/1820

Future Complex Metallurgy is the largest internal investment project in the history of Aurubis, with an investment volume of about € 320 million.
When meeting Jo Rogiers for the first time, two things are immediately noticeable: his
firm handshake and his positive presence. After this first impression, it is obvious that the
tall engineer with over 30 years of industry experience knows what he’s talking about –
whether in Dutch, French, English, or German. Skills that are exceedingly valuable for the
tasks that come his way.
THE INDUSTRY IS LOOKING FOR AN ANSWER
Normally, mines draw copper ores from the ground and then concentrate them into a
defined mixture that they sell as a “standard concentrate” to smelters. Mine-specific ore
deposits are increasingly presenting a challenge for operators because some concentrates
exhibit higher volumes of additional materials that are more complex to treat. They don’t
meet the standard anymore and are referred to as complex concentrates. The processing
methods of many copper smelters worldwide aren’t designed to handle them. Operators
thus have the problem that the concentrates, which are highly valuable in some cases,
can’t be marketed at all or only with a great deal of effort.
Jo Rogiers, Senior Vice President Technology
INTERNAL GROWTH PROJECT FUTURE COMPLEX METALLURGY
Creating more value
Aurubis MAGAZINE 2017/18 21

Facts and figures: Future Complex Metallurgy project
> 180Jobsin Hamburg and Olen
+ € 80 million
EBITDAstarting FY 2022/23
2020/21Production start-up
BELGIUM
Olen
AN IDEAL SOLUTION
FOR BOTH SIDES
This is where Jo Rogiers comes
in. Together with his team, he is
implementing one of the biggest growth
projects in Aurubis history: Future
Complex Metallurgy, or FCM for short.
The native Belgian is clearly proud of the
in-house development at Aurubis. “With
FCM, we will offer our mine and industry
partners the possibility to leverage the
value potential from complex input
materials in the future,” he explains.
At the same time, this differentiates
Aurubis from its competitors. An ideal
solution for both partners.
In that sense, the name FCM says it all.
Thanks to an innovative metallurgical
process, the company will process
even more complex input materials in
the future. 270,000 t more per year,
to be precise. In addition to complex
concentrates, these can also include
recycling materials, e-scrap, intermediates
from copper, zinc, and lead smelters,
and metal-bearing slags and materials
containing precious metals.
“This allows us to expand not only our raw
material portfolio, but also our position in
the raw material market,” Rogiers states
confidently. Because Aurubis can only
process the raw materials necessary for
FCM to a limited extent in its existing
facilities, the expert doesn’t see a risk
of a cannibalization effect in the Group.
FCM will therefore contribute to the
strategic target of doubling the volume of
directly supplied complex recycling raw
materials in the Aurubis Group by 2022/23
compared to 2016/17.
“Due to the increase in valuable
complex input materials used, we will
also significantly increase the output
quantities of other metals. This supports
our multi-metal approach,” Rogiers
asserts. By fiscal year 2022/23, Aurubis
plans to increase sales volumes of non-
copper metals by 100 % compared to
fiscal year 2016/17.
THE BEST OF BOTH WORLDS
The FCM facilities will be constructed
at both the Hamburg (Germany) and
Olen (Belgium) sites. For Rogiers, the
selection of the sites connects the
best of both worlds. In Hamburg, he
says, the existing sampling division and
wastewater treatment can be expanded
and upgraded. For the pyrometallurgical
aspect, the company will not only use
existing facilities but also expand them
in some cases, for instance by adding a
bath smelting furnace. Furthermore, the
Hamburg plant already has the necessary
equipment to produce pure sulfuric acid
and precious metals.
Aurubis MAGAZINE 2017/1822

~ 4 years
Engineering & construction phase
~ € 320 million
Investments
+ 270,000 tRaw material input including complex concentrates, recycling
materials, and intermediate products
GERMANY
Hamburg
On the other hand, the employees in
Olen have specialized knowledge about
the hydrometallurgical aspect and better
possibilities to integrate the process
into the existing tankhouse. Rogiers
looks forward to the more than 180 new
colleagues overall, whom Aurubis will hire
at both sites in the course of the project.
Aurubis is investing a total of about
€ 320 million in the planned facilities,
about two-thirds in Hamburg and
almost one-third in Olen. Production is
scheduled to start in 2020/21. Once in
operation, the facilities will contribute
approximately € 80 million to the
operating result (EBITDA) starting in
2022/23. Another benefit of FCM lies in
the shorter throughput time for precious
metals, which will eliminate production
bottlenecks and reduce working capital.
A large part of the investment is financed
by these savings alone.
There’s still quite a lot of work for
Rogiers and his team until the scheduled
commissioning of the project in
2020/21. However, one thing stands
out to him already: “A flagship project
like FCM inspires people and brings them
together. Regardless of the site where
I hold meetings – in FCM, we all speak
the same language.”
JO ROGIERS
“ Due to the increase in valuable complex input materials used, we will also significantly increase the output quantities of other metals. This supports our multi-metal approach.”
Aurubis MAGAZINE 2017/18 23

Marion Finney, Executive Director Customer Scrap Solutions
The tonnage of material we recover using closed-loop systems is now in the mid-five-digit range.
MULTI-METAL RECYCLING AND THE CIRCULAR ECONOMY
Coming full circle
MS. FINNEY, YOU HAVE
WORKED WITH THE TOPIC
OF RECYCLING IN DIFFERENT
POSITIONS FOR OVER 20 YEARS.
WHAT MAKES THE CIRCULAR
ECONOMY SO EXCITING?
MF: There are a handful of reasons. First,
we now recycle so much material that
more than every third copper cathode
is made completely of recycled material.
We do this by flexibly sourcing different
recycling raw materials from the value
chains of copper and other non-ferrous
metals, contributing to a responsible
approach to global resources.
Aurubis processes about 700,000 t of recycling materials every year, and the trend is increasing. The company is the world’s largest copper recycler. The input material portfolio is diverse. It extends from production waste such as clean wire scrap, stamping waste, and copper cable, to what are referred to as end-of-life recycling raw materials. These include old gutters, pipes, electronic scrap, and used electrical appliances.
The Aurubis sites in Lünen (Germany) and Olen (Belgium) specialize in recycling
these materials. They convert the recycling raw materials, which generally contain
copper, into high-purity copper and other valuable metals. Though the primary
smelters utilize copper concentrate as their main feed material, they also use copper
scrap because it’s ideal for process cooling.
Aurubis sources most of its recycling materials from specialized trading companies
and businesses focused on collecting and treating such materials. Additionally, more
and more copper product customers are becoming direct suppliers as Aurubis takes
back production waste from their processing operations. Closing the loop has many
other benefits, however.
Interview with Marion Finney
Aurubis MAGAZINE 2017/1824

KRS OXIDE
Zinc sulfateAurubis and Grillo are working together with state-of-the-art technology to achieve a verifiable, closed material cycle.
We of course focus our energy on
recycling copper and supplying our
facilities. Furthermore, we learn a great
deal about product requirements and the
recycling materials of the future in our
collaboration with our product customers.
We stay in continuous dialogue, creating
a mutual understanding among different
actors in the value chain.
WHAT ARE THESE KINDS OF
CYCLES LIKE IN PRACTICE?
MF: A simple example: We offer the
customers that we supply with copper
products the option to return their
production waste to us, most of which
contains copper. We monetize this waste
by redelivering the copper content in
the form of new copper products. A
sustainable business concept for both
sides! Indeed, the tonnage of material we
recover using this method is now in the
mid-five-digit range. Our partners include
renowned companies like ABB based in
Switzerland.
As part of our Sustainability Strategy, we
have established the objective of working
together with our industrial partners
more to develop individual concepts for
preventing waste from their production
processes or recycling it better. These
concepts could be logistical or technical
solutions. We are in an ideal position to
come up with these kinds of solutions, not
least because of our expertise in multi-
metal recycling.
CAN YOU BE MORE SPECIFIC?
MF: We will discuss recycling issues with
our product customers more intensively
in the future. This includes working
together on a common understanding of
how easily recyclable end products should
look. This is referred to as “design for
recycling.” Both the processing industry
and end product manufacturers are
exceedingly interested in seeing products
at the end of their life cycle being recycled
responsibly, in a way that conserves
resources. We can even certify this.
DO YOU HAVE AN EXAMPLE OF THE
CLOSING-THE-LOOP APPROACH
BEYOND COPPER?
MF: Absolutely. There are exciting projects
for other metals as well. All of the business
and contract concepts we’ve already
described are referred to as closed loops.
One example of a zinc-bearing product
comes from our recycling process in
Lünen. For our collaboration with Grillo-
Werke AG in Duisburg, we even received
the Responsible Care prize from the
German Chemical Industry Association
in 2017.
A zinc-bearing substance we call KRS oxide
is formed at our plant and is processed
into zinc sulfate at a Grillo plant about
60 km away. The process forms a residue
containing copper, tin, and lead that
Aurubis takes back. We then use it in our
recycling facilities to recover the metals it
contains. Thanks to a long-term contract,
this collaboration provides a measure
of security in both companies’ planning
process on the one hand and contributes
to securing jobs in Lünen and Duisburg on
the other. We are thus acting sustainably
on multiple levels with this project.
“ We unite our expertise with that of our business partners, achieving new, forward- looking solutions and collaboration opportunities in the process.”
Aurubis MAGAZINE 2017/18 25

Dr. Mario Löbbus, Head of Research, Development & Innovation
RESEARCH AND DEVELOPMENT IN THE DIGITAL AGE
Understanding complexity
Our environment is becoming more complex, not least with regard to raw materials, material streams, and electricity demand. In these circumstances, keeping sight of the big picture is an achievement in itself. But only those also able to harness the corresponding developments will be able to create new opportunities from them. Dr. Mario Löbbus is committed to creating order. In addition to material and product research, he forges new paths with his team to bring a semblance of control to this complexity.
ON THE LOOKOUT FOR
THE OPTIMUM
Managing one or two smelters might be
a straightforward endeavor, but Aurubis
has grown in the past few decades to
encompass four smelters in different
regions of Europe. Aurubis has two
primary copper smelters that primarily
process concentrates and two secondary
copper smelters specialized in processing
different recycling materials. They all
come with unique challenges. “Our plant
network has grown into an interlinked
structure,” Mario Löbbus points out.
“We have to learn how to handle this
complexity.”
Aurubis pursues several goals at once
when it comes to managing its facilities,
including shaping the material flow
to maximize capacity utilization. This
means recovering as much copper
and other metals as possible with the
existing equipment, among other things.
Furthermore, the company is working
on improving its ability to process the
rising volume of complex raw materials.
The objective is to generate the
Aurubis MAGAZINE 2017/1826
greatest possible value from the input
materials while also optimizing inventory
management and improving operating
capital. Mario Löbbus sums it up as
follows: “In the end, all of our activities
aim to draw the optimum out of our
existing smelter network.”
A MODEL THAT CAN BE USED
AGAIN AND AGAIN
In many manufacturing industries,
homogenous input materials are turned
into finished products comprising
multiple individual elements. In copper
production, however, things are the other
way around, with the input materials
(copper concentrate or recycling materials)
comprising numerous elements and the
final product, only one: high-purity copper.
And with Aurubis’ multi-metal approach,
the variety of input materials will increase
in the future.
In its recycling activities, the company
took the first steps to deciphering the
complexity of its raw materials many
years ago. Aurubis has thus developed
a leading position in recycling in the
past several years. Today, the company
continues to develop its capabilities with
respect to the recycling materials of the
future. The idea has always been to better
understand the different components in
the recycling materials, whether copper
scrap, electronic scrap, or metal-bearing
industrial slag.
The experience gathered from the value-
oriented, holistic approach that has been
established in the meantime will continue
to gain importance with the growth
project FCM.
A PIONEERING ROLE IN THE
METAL INDUSTRY
As with recycling, Aurubis starts its
planning process involving copper
concentrates before the raw materials
are even purchased. The company
incorporates modeling and advanced
analytics technologies into planning
models. Supply chain models can support
decisions along the entire value chain:
from the raw material to the cathode to
the product. Similar systems are already
being used successfully in the chemical
industry. In copper production, however,
Aurubis assumes a pioneering role with its
developments.
Mathematical methods can help derive
recommendations for production based
on the composition of the different
raw materials, technical restrictions,
commercial conditions, and current
market circumstances. Aurubis therefore
enhances the value drawn from a number
of different concentrates.
This works because the company, as a
custom smelter, has the option of varying
its input mix. “We mix concentrates with
specific compositions from different mines
and adjust them to the demands of our
production process,” Mario Löbbus says.
“This allows us to produce a larger volume
of in-demand metals at a specific time. In
doing so, the diversity of our smelters in
the Group network is a huge advantage
for us.”
DATA MINING IN SMELTERS
To further optimize the input mix and
facility management, Mario Löbbus and
his team want to make process monitoring
and the company’s collected data easier
to use than before. To that end, more and
more sensors are being installed in and
on the equipment to take continuous
measurements. This, together with the
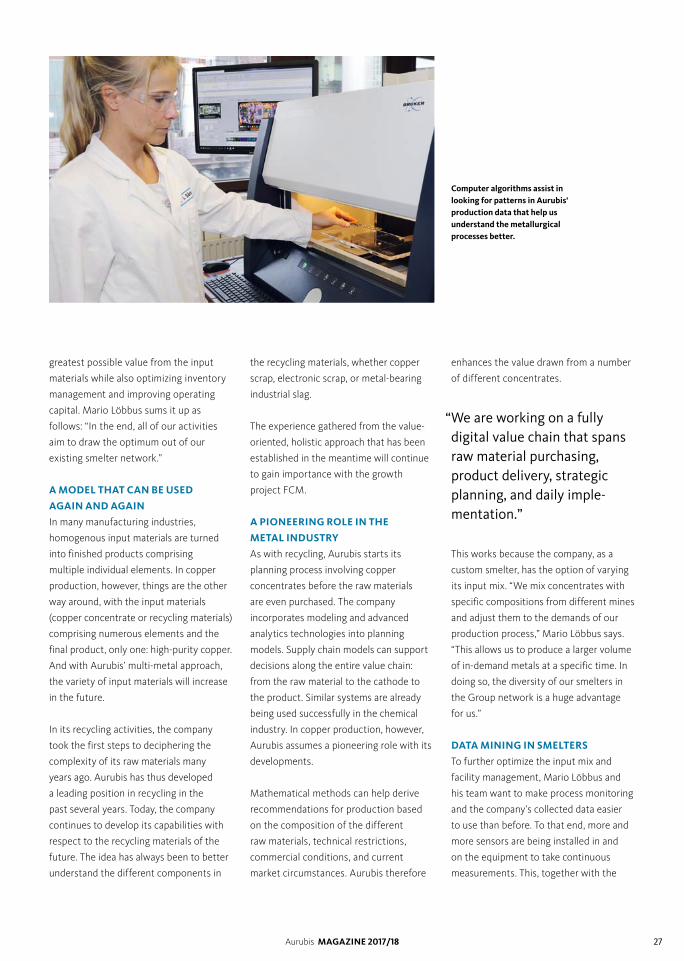
Computer algorithms assist in looking for patterns in Aurubis’ production data that help us understand the metallurgical processes better.
“ We are working on a fully digital value chain that spans raw material purchasing, product delivery, strategic planning, and daily imple-mentation.”
Aurubis MAGAZINE 2017/18 27

observations and recordings of production
employees and information from the
Supply Chain Management division, leads
to an extensive data pool. Computer
algorithms assist in looking for patterns
in this data that help us understand the
metallurgical processes better, which
contributes to the development of new
processes and technologies, such as our
FCM project.
Aurubis hopes to derive possible
optimization potential and guidance for
making decisions from this data and to
use it for both strategic planning and
operative purposes. “Models and artificial
intelligence are limited by the quantity
and quality of the data given to help
them learn,” according to Mario Löbbus.
“Data isn’t always knowledge. This benefit
transfer always requires the interplay
between data analysts and metallurgists,
technicians, and financial experts.”
INTELLIGENT ENERGY
DISTRIBUTION
An initial project in energy management
at the Hamburg site illustrates how this
approach can provide concrete benefits
in practice. Artificial intelligence is
supposed to improve predictions about
when Aurubis and its various production
facilities draw a particularly high or
The top submerged lance furnace for the FCM project is equipped with sensors that record pressure, vibration, temperature, and oscillation, providing a continuous report on the furnace’s condition.
low amount of energy from the public
energy grid. In the future, preemptive
interventions should help prevent peak
loads in production scheduling. With
active management and planning, the
company would also like to reduce the
impacts of such interventions on its own
production. The next step is for the model
to react to energy price fluctuations that
come at short notice.
PREDICTIVE MAINTENANCE
Apart from the optimizations already
described, one of the highest priorities
of a company like Aurubis that relies
heavily on its equipment is to avoid
production disruptions. The department
under Mario Löbbus is researching this
area as well, which goes by the term
predictive maintenance. For a smelter, an
unscheduled disruption in the smelting
process generally leads to metal losses.
Valuable components such as precious
metals remain in the slag and can’t be
recovered in any meaningful way.
“A scheduled facility shutdown is therefore
always better than an unscheduled one,”
explained Mario Löbbus. “The earlier we
identify a weak spot, the more options
we have to take action.” What sounds
futuristic today could be reality in just a
few years.
“Predictive maintenance is an exciting
approach,” Mario Löbbus says. “However,
it is just as important that we continue
working on maximizing metal recovery and
the availability of the facilities. When it
comes to metal, we have to be the best.”
Aurubis MAGAZINE 2017/1828

EFFICIENCY IMPROVEMENT PROGRAM AND AURUBIS OPERATING SYSTEM
How can we make something good even better?
Dr. Mehdi Al-Radhi, Senior Vice President Transformation & Business Improvement
MR. AL-RADHI, YOU STARTED
AS A CONSULTANT AND THEN
BECAME HEAD OF THE EFFICIENCY
IMPROVEMENT PROGRAM AT
AURUBIS. DRAWING ON YOUR
25 YEARS OF INDUSTRY EXPERIENCE,
WHAT CHALLENGES DOES THIS
TYPE OF PROGRAM HOLD?
MAR: The crux is that it has to enable
both short-term and medium-term
success while also making a sustainable
impact. This requires management that
clearly takes on responsibility for the
program and, at the same time, is capable
of making employees excited about the
coming changes. When a company like
Aurubis is successful and achieves healthy
results, this strength also translates into
the risk of becoming too comfortable.
Everyone is familiar with this effect in their
personal lives. Questioning the status
quo and leaving our comfort zones – this
is a huge challenge. This is exactly what
our efficiency improvement program
addresses so that Aurubis doesn’t just
maintain its leading market positions,
but continues to expand them.
WHAT MAKES AURUBIS’ EFFICIENCY
IMPROVEMENT PROGRAM SPECIAL,
IN YOUR OPINION?
MAR: To state it simply, we’re tackling
the relevant issues from two sides –
from above and below. To determine
the company’s individual potential for
improvement, Aurubis underwent a
diagnostic phase in the entire Group from
mid- to late 2016. On this basis, we defined
the financial target of gradually generating
total project success of € 200 million
between 2016/17 and 2019/20, compared
with the base year 2014/15.
Aurubis is in the middle of implementing the largest efficiency improvement program in the company’s history. Dr. Mehdi Al-Radhi discusses the challenges and the specifics of the program and explains how he turns losses into successes.
Aurubis MAGAZINE 2017/18 29
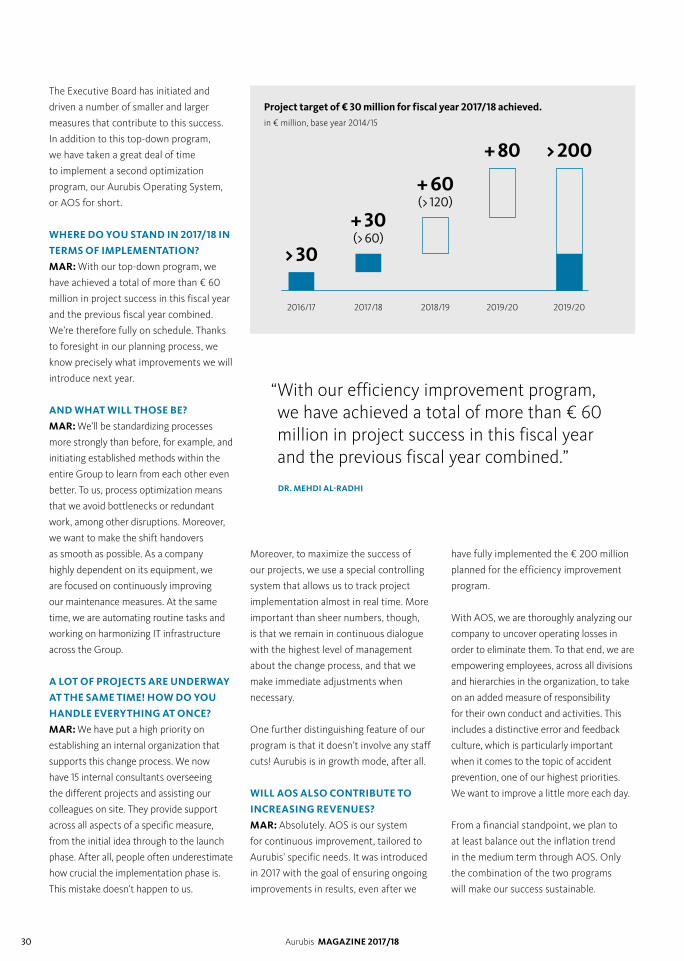
> 30
+ 30(> 60)
2016/17 2017/18 2018/19 2019/20 2019/20
+ 60(> 120)
+ 80 > 200
The Executive Board has initiated and
driven a number of smaller and larger
measures that contribute to this success.
In addition to this top-down program,
we have taken a great deal of time
to implement a second optimization
program, our Aurubis Operating System,
or AOS for short.
WHERE DO YOU STAND IN 2017/18 IN
TERMS OF IMPLEMENTATION?
MAR: With our top-down program, we
have achieved a total of more than € 60
million in project success in this fiscal year
and the previous fiscal year combined.
We’re therefore fully on schedule. Thanks
to foresight in our planning process, we
know precisely what improvements we will
introduce next year.
AND WHAT WILL THOSE BE?
MAR: We’ll be standardizing processes
more strongly than before, for example, and
initiating established methods within the
entire Group to learn from each other even
better. To us, process optimization means
that we avoid bottlenecks or redundant
work, among other disruptions. Moreover,
we want to make the shift handovers
as smooth as possible. As a company
highly dependent on its equipment, we
are focused on continuously improving
our maintenance measures. At the same
time, we are automating routine tasks and
working on harmonizing IT infrastructure
across the Group.
A LOT OF PROJECTS ARE UNDERWAY
AT THE SAME TIME! HOW DO YOU
HANDLE EVERYTHING AT ONCE?
MAR: We have put a high priority on
establishing an internal organization that
supports this change process. We now
have 15 internal consultants overseeing
the different projects and assisting our
colleagues on site. They provide support
across all aspects of a specific measure,
from the initial idea through to the launch
phase. After all, people often underestimate
how crucial the implementation phase is.
This mistake doesn’t happen to us.
Moreover, to maximize the success of
our projects, we use a special controlling
system that allows us to track project
implementation almost in real time. More
important than sheer numbers, though,
is that we remain in continuous dialogue
with the highest level of management
about the change process, and that we
make immediate adjustments when
necessary.
One further distinguishing feature of our
program is that it doesn’t involve any staff
cuts! Aurubis is in growth mode, after all.
WILL AOS ALSO CONTRIBUTE TO
INCREASING REVENUES?
MAR: Absolutely. AOS is our system
for continuous improvement, tailored to
Aurubis’ specific needs. It was introduced
in 2017 with the goal of ensuring ongoing
improvements in results, even after we
have fully implemented the € 200 million
planned for the efficiency improvement
program.
With AOS, we are thoroughly analyzing our
company to uncover operating losses in
order to eliminate them. To that end, we are
empowering employees, across all divisions
and hierarchies in the organization, to take
on an added measure of responsibility
for their own conduct and activities. This
includes a distinctive error and feedback
culture, which is particularly important
when it comes to the topic of accident
prevention, one of our highest priorities.
We want to improve a little more each day.
From a financial standpoint, we plan to
at least balance out the inflation trend
in the medium term through AOS. Only
the combination of the two programs
will make our success sustainable.
Project target of € 30 million for fiscal year 2017/18 achieved.in € million, base year 2014/15
DR. MEHDI AL-RADHI
“ With our efficiency improvement program, we have achieved a total of more than € 60 million in project success in this fiscal year and the previous fiscal year combined.”
Aurubis MAGAZINE 2017/1830

AOS HAS BEEN INTRODUCED
AT DIFFERENT PRODUCTION
SITES SINCE 2017. HOW HAS YOUR
INITIAL EXPERIENCE BEEN?
MAR: It’s been very good so far!
I’ve observed that AOS motivates
colleagues to work on solutions actively
and independently, to communicate with
each other more, and not just to follow
standard processes.
From that perspective, AOS is changing
the way we work together in the Group.
By forming working groups made up
of experienced employees on-site and
internal consultants, we also benefit from
knowledge transfer.
We carry out Pareto and source analyses
with the collected data at different levels
to identify the biggest sources of loss in
detail. We systematically work to stem
these negative influences until production
is stable again.
Personally, I’m so confident about this
program that I really look forward to
implementing it not as a consultant,
but as a full-fledged Aurubis employee.
Aurubis Operating System (AOS) – production sector exampleManagement system to achieve continuous and sustainable process improvement.
In addition to this example for the production sector, AOS is adjusted and applied in the
supporting administrative functions (transversals).
Focus Improvement
We are creating loss-free production and drawing
the best out of our facilities and processes by
concentrating on areas with high optimization
potential in accordance with the Pareto principle.
Maintenance Program
Ensuring, with cost awareness, disruption-free
operation as a first-choice technical partner.
We want to continue developing towards
scheduled, predictive maintenance in the future.
Training & Education
All of our employees receive the necessary
qualifications so that we can achieve
high flexibility and avoid losses from
qualification gaps.
Independent
Production Teams
We want to produce in the
safest and best facilities.
Each employee assumes
responsibility for products,
production equipment, and
the production environment.
Progressive Quality
We want to continue improving the
management and monitoring of technical
processes and facilities in our production
sector to ensure a smooth production
process with optimal effort.
Aurubis MAGAZINE 2017/18 31

At Aurubis, we have our sights set on further – internal and external – growth. Not only are we pursuing internal growth through our FCM project, we are also looking intensively at ways of further driving external growth. With sensible acquisitions, we want to reinforce our business model from the outside as well. A prime example is the acquisition of the 40 % share of Deutsche Giessdraht (Emmerich) previously held by Codelco Kupferhandel GmbH. This strengthens our market position and creates additional synergies.
MR. SCOTTING, WHERE DO YOU SEE THE MOST
ATTRACTIVE GROWTH OPPORTUNITIES FOR AURUBIS?
WS: We are gradually developing from a copper producer into
a multi-metal processor. This offers a variety of possibilities for
internal and external growth alike. With our main metal, copper,
we are already positioned in areas of future growth. For example,
electric vehicles, digitalization, and urbanization are just three
of the big trends from which we will benefit to an even greater
extent as time goes on. Furthermore, increasingly complex raw
materials should allow us to provide solutions to our business
partners and extract more valuable elements in the future. This
opens up new opportunities for us.
EXTERNAL GROWTH OPPORTUNITIES
The multi-metal approach gives us options
William Scotting, Senior Vice President Corporate Development
IN WHAT AREAS COULD GROWTH THROUGH
PARTNERSHIPS OR ACQUISITIONS BE CONSIDERED?
WS: There are a number of opportunities along our flow sheet
to add value in a sensible way. We see interesting options in
multi-metal recycling in particular, especially given the rising
interest in matters of sustainability. As the world’s largest recycler,
we already have a great deal of internal expertise and a leading
market position that we would like to expand.
Aurubis MAGAZINE 2017/1832

WHAT ARE YOUR ACQUISITION CRITERIA?
WS: Aurubis has its roots in Hamburg, and we maintain a
pragmatic, Hanseatic approach in M&A topics as well. As such,
we want each of our acquisitions to create value, enhance our
sustainability, and contribute to our multi-metal strategy. We
should also understand the risks involved and how to mitigate
these. Geopolitically, this means that we favor regions that are
fundamentally politically stable. Aurubis thinks in the long term
and therefore needs the security to be able to plan. A stable
energy supply is highly relevant to us in this regard. Last but not
least, there’s the question of logistics: We consider companies
that could be easily integrated into our existing network of Group
companies to be especially interesting.
IS AURUBIS CAPABLE OF INTEGRATING LARGER
COMPANIES AS WELL?
WS: I think that taking a look at our plant in Bulgaria clearly
answers this question. Acquired in 2008, the smelter is now
one of the most modern in Europe. Thanks to the latest capacity
optimization, Pirdop now even has a higher concentrate
throughput than the parent plant in Hamburg. At the same time,
our Bulgarian plant is one of the most environmentally friendly
in the world, and it fulfills our high profitability requirements,
making it a real M&A success story. It illustrates well that we
can transfer our expertise and our skills within the Group,
enabling organic growth. Together with additional acquisitions
that we’ve made in the past, such as the recycling specialist
Hüttenwerke Kayser in Lünen, our plants in Olen and Avellino,
and the very recent acquisition of Deutsche Giessdraht, we have
created a highly efficient and integrated setup in the Group.
SO WHAT TRANSACTION SIZES ARE FEASIBLE?
WS: As a virtually debt-free company, we could incur debt up to
three times our EBITDA, generally speaking, without violating
any bank restrictions. This gives us a comfortable scope. However,
we are more likely to make smaller to medium-sized acquisitions,
as opposed to a large transaction. Whether this is successful or
not depends on many factors, not least the appraisal of the object
of purchase in question. Another very important factor for the
success of an M&A transaction is that the parties involved are
committed to forging reliable, long-term partnerships. And this is
certainly true of Aurubis.
WILL YOU BE DEVELOPING INTO MORE OF A
SOLUTION PROVIDER IN THE FUTURE?
WS: Absolutely. With FCM, we are already breaking new ground
and clearly positioning ourselves as a preferred partner for
our mine suppliers, recycling material suppliers, and industrial
suppliers when it comes to complex input materials. There is still
a lot more potential in these partnerships, especially when we’re
talking about metallurgy and processing issues, areas where we
can contribute our know-how. Incidentally, this also increases
the likelihood of successful financing of a mine. When it comes
to solutions on the recycling side, our partnerships to close the
material cycle come to mind in particular. In this way, we enable
valuable natural resources to be used over and over again. And
that’s good for all of us in the end.
The Deutsche Giessdraht GmbH plant in Emmerich am Rhein.
Full acquisition of
Deutsche Giessdraht GmbH
In 2018, we acquired the remaining shares of Deutsche
Giessdraht GmbH from Codelco Kupferhandel GmbH.
The acquisition is part of our strategic reorientation and
aligns with our intention to position our products in
industries of the future. With this step, we are adjusting our
rod capacity to our rising production of copper cathodes,
the preliminary product for rod. Together with the other
rod plants, we are also enhancing our delivery reliability.
Our product dg-RheinRod™ is a rod brand that fulfills the
highest standards of drawability and surface quality.
Aurubis MAGAZINE 2017/18 33

ENERGY EFFICIENCY AND CLIMATE PROTECTION
No copper without energy – no energy without copper
Ulf Gehrckens, Senior Vice President Corporate Energy & Climate Affairs
Producing pure metals requires energy. In some cases, energy is already in our raw materials, for example, as sulfur in copper concentrate. The rest has to come from elsewhere. But energy isn’t free; it usually has to be produced at the expense of other raw materials, which often leads to CO2 emissions.
As an energy-intensive company, we are aware of our responsibility to
handle valuable resources with special care. At the same time, the metals
Aurubis produces make environmental developments like electric vehicles
and electricity from renewables possible in the first place. Metals therefore
make a considerable contribution to technologies that improve the
CO2 balance.
MR. GEHRCKENS, WHAT ARE THE BIGGEST CHALLENGES AT
AURUBIS WHEN IT COMES TO THE TOPIC OF ENERGY?
UG: Without a doubt, legal regulations are often at the top of the agenda.
The list of issues is broad and extends from CO2 cost relief and the renewable
energy levy to grid charges. As a production company located in Europe
and the US and employing almost 6,700 people, we follow the discussions
on energy and climate issues. We track them at the political level in both Berlin
and Brussels.
FROM AN ENERGY POLICY
PERSPECTIVE, IS IT BENEFICIAL
THAT YOU ARE SO STRONGLY
REPRESENTED IN EUROPE?
UG: We don’t think about the situation in
that way. We produce in Europe first and
foremost. Our key sales markets are here
and we are committed to this location!
Nevertheless, our main product – copper
cathodes – is a globally traded commodity,
the price of which is fixed on the metal
exchanges. This price is guided by the law
of supply and demand. This means that
we can’t pass on higher energy costs that
might be specific to the region to our
customers through the product price. If
our production costs in Germany increase
disproportionately due to artificially
established levies related to the energy
transition, this weakens our competitive
position compared to the rest of the
world. We have to deal with this.
AND HOW?
UG: We want to steadily become more
energy-efficient while maintaining high
environmental protection standards, which
Aurubis MAGAZINE 2017/1834

Long pipelinesThe pipeline connection from the heat source to HafenCity East is about 3.7 km long.
Hamburg’s Köhlbrand Bridge is nearly the same length.
3.7 km
Providing heatThe heat volume of 160 million kWh can supply a total of 8,000 four-person households for about a year.
The total available potential could cover 25,000 households.
8,000
Protecting the climateThe Industrial Heat project prevents 20,000 t of CO2. This is equivalent to the emissions of 10,000 mid-range cars driving 12,000 km per year.
If the full potential is utilized, CO2 emissions could even be reduced by about 140,000 t.
10,000
Conserving waterThe adjustment to the acid cooling facility saves 12 million m3 of cooling water and Elbe River water annually.
This is equivalent to the volume of around 4,800 Olympic-size swimming pools.
4,800
Facts about the Industrial Heat project
is why we invest in large and small energy
efficiency and environmental protection
projects.
Aurubis’ smelters are among the cleanest in
the world, with the lowest emissions to the
environment compared to our competitors.
That doesn’t just happen. We have invested
over € 560 million in environmental
protection since 2000. Moreover, we use
modern, energy-efficient plant technology
at all of our production sites and across all
of our business processes.
Wherever possible, we also establish
energy cycles to boost our efficiency. For
instance, at the Lünen site we introduced
a highly efficient process to generate
electricity from waste heat and to use it
for internal process heat.
The truth is, though, the more steps
that have already been taken in energy
efficiency, the more challenging it is
to achieve additional optimizations.
DO YOU ALSO USE ELECTRICITY
FROM RENEWABLE ENERGIES?
UG: Generally speaking, we’d like to.
Unfortunately, we are faced with the
challenge that the use of these energies
is affected by fluctuations in the energy
supply. Our production processes require
a constant energy supply, due in part to
our energy efficiency measures.
We are working on initiatives to utilize
renewable energies, however. One of
these is the NEW 4.0 project. The idea
of this nationwide project in Germany
is to make the electricity feed-in from
renewables more flexible so as to be able
to react to fluctuating availability.
We’re planning an electrode steam boiler
for this purpose, which will help us draw
crucial steam from electricity, reducing
our gas consumption and thus improving
our CO2 balance. We will enhance our
flexibility with respect to input materials
at the same time.
ARE THERE AREAS WHERE AURUBIS
IS AN ENERGY PRODUCER?
UG: We are taking a close look at all types
of waste heat from our processes. Many
of them are already used to supply heat
and process steam, and in some cases to
produce electricity internally. In Hamburg,
we obtain 87 % of our process steam
needs from waste heat. But we see more
potential in this area.
We sometimes produce excess energy that
we can’t use effectively ourselves. One
example is the Industrial Heat project,
which is close to my heart. This project
involves extracting heat that we otherwise
wouldn’t be able to fully use and making it
available to the community.
We therefore prevent 20,000 t of CO2 per
year. For a comparison, this is equivalent to
the emissions of about 10,000 mid-range
cars driving 12,000 km per year. And we
have the potential to extract three times
that amount of heat. By replacing other
energy sources, we could prevent a total of
140,000 t of CO2 emissions each year. This
is equivalent to the level that Hamburg
industry established as a reduction target
in a voluntary agreement. To leverage this
potential, it would be helpful if carbon
certificates were allocated under the
EU emissions trading system for these
kinds of CO2 reductions that are achieved
outside of the plant.
Aurubis MAGAZINE 2017/18 35

MR. HEIN, WHAT DO YOU FIND
EXCITING ABOUT THE INDUSTRIAL
HEAT PROJECT?
CH: The great thing is that everyone
benefits from it. The residents of
HafenCity East are supplied with
sustainable heat, the city receives a
contribution to its climate goals, and
we direct our excess process heat to a
meaningful purpose.
We are also a business, of course. The
investment of roughly € 20 million has
to pay off accordingly – and it does.
HOW DOES THE HEAT GET TO
HAFENCITY?
CH: It is formed in a sub-process of
copper production: The sulfur in the
copper concentrates is processed as sulfur
dioxide and then converted into sulfuric
acid in what we refer to as the contact
acid plant. We transfer the heat formed
in an exothermic chemical reaction from
our plant in Hamburg to the energy
service company enercity via a new, nearly
4-km-long pipeline. In turn, this company
supplies HafenCity East with the heat.
AND HOW EXACTLY DOES THIS
PREVENT CO2?
CH: From the start, the Industrial Heat
that forms is nearly free of CO2. We can
use about 25 % of the heat for internal
purposes. About half of the more than
20,000 t of CO2 per year is prevented
because we use less natural gas to
produce steam. The other half comes
from beyond the plant boundaries,
specifically from the supply of external
heat that replaces the conventional fuels
used to generate district heating. On top
of this, we save 12 million m3 of cooling
water from the Elbe River each year.
WHAT MAKES THE PROJECT
SPECIAL FROM A TECHNICAL
PERSPECTIVE?
CH: Usually, industrial heat is kept at its
original temperature and processed via
heat exchangers. We go one step further:
Our sulfuric acid process is adjusted to
run at a much higher temperature – 117 °C
instead of 65 °C, making the heat ideal for
internal and external heating purposes.
All without the use of fossil fuels and thus
without CO2 emissions.
HOW WAS THE PROJECT RECEIVED
OUTSIDE OF THE COMPANY?
CH: It was remarkable. In its size and
complexity, the Industrial Heat project is
unique in Germany. This is evident in the
interest shown by those inside and outside
of Aurubis.
The German Energy Agency, dena,
awarded the project two prizes: one for
being one of ten examples of Flagships
of Energy-Efficient Waste Heat Use,
as well as the Energy Efficiency Award
in the category Energy Transition 2.0.
The Hamburg Renewable Energies
Cluster also gave the project the German
Renewables Award in the category
Project of the Year 2018. For me
personally, the Industrial Heat example
is the ideal symbiosis of ecological
responsibility and entrepreneurship – to
the benefit of many.
Christian Hein, Director Corporate Energy & Climate Affairs and Manager of the Industrial Heat Project
Aurubis MAGAZINE 2017/1836

OUR STRATEGY FOR MORE
SUSTAINABILITY
Aurubis revised its Sustainability Strategy
in 2018 and established new targets to
be achieved by 2023. The Sustainability
Strategy is part of the Aurubis corporate
strategy. It comprises the three areas
of people, the environment, and the
economy. These are then broken down
into different sub-topics based on
focus. The targets vary extensively, from
increasing input of complex secondary raw
materials to enhancing energy efficiency
and reducing CO2 emissions, as well as
Kirsten Kück, Sustainability Manager
SUSTAINABLE INVOLVEMENT
For Aurubis, business success and responsible conduct go hand in hand
Hamburg Central Station, 6:30 a.m. Kirsten Kück, Sustainability Manager at Aurubis, waits for her train. She is on her way to a meeting with industry representatives. The topic of today’s discussion: sustainably sourcing and responsibly processing raw materials. She looks forward to the meeting despite the early start because these talks demonstrate the rising interest among a variety of business partners in the many facets of Aurubis’ sustainability activities. Apart from associations, NGOs, and the media, this dialogue increasingly involves investors, customers, and suppliers as well. It’s clear to the Sustainability Manager that a company like Aurubis has stronger competitive advantages when it acts responsibly and is known for this. Kirsten Kück has a lot to talk about.
Aurubis MAGAZINE 2017/18 37

Health and safety
Future- oriented employer
Social engagement
Training and
education
Energy and climate
Environmental impact
Recycling solutions
Growth and innovation
Responsible supply chain
PEOPLE ECONOMY
ENVIRONMENT
developing closed-loop systems. Nine
targets were defined in total, which are
in turn broken down into 27 measures.
Aurubis’ objective with the targets is to
expand its position as one of the world’s
most environmentally friendly and energy-
efficient copper smelters.
The topic of responsible sourcing is
especially close to the Sustainability
Manager’s heart. She knows that
responsibility doesn’t end at the plant
gates. If a company wants to be seen as
a good neighbor or a reliable partner,
it has to do its part. At Aurubis, this
means continuing to manage its supply
chains responsibly, together with the
entire sector. It’s possible to implement
uniformly high standards in social and
environmental issues and anti-corruption
in the entire supply chain, but only with
a joint effort.
Works Council. Kirsten Kück enjoys
this integrative aspect of her work. In her
opinion, promoting sustainability requires
close cooperation across departments.
After all, only through teamwork
can a shared understanding of what
sustainability is be established and
advanced.
Aurubis has systematically structured and
expanded its sustainability activities in the
past several years. Its involvement started
with the first Sustainability Strategy in 2013
and continued with the steady expansion
of reporting and participation in different
rankings and initiatives such as CDP
Climate Change, ISS oekom, and EcoVadis.
For Kirsten Kück, the day ends where it
started: in Hamburg. The meeting was
intense but constructive. Although the day
wore her out, she’s happy that the topic of
sustainability is developing into a recurring
point on the agenda in her dialogue with
industry partners in Aurubis’ value chain.
The Sustainability Strategy is broken down into different sub-topics in the three focus areas of people, the environment, and the economy.
The Aurubis mission “Responsibly
transforming raw materials into value to
provide metals for an innovative world”
was the basis for the new Sustainability
Strategy. Aurubis is keen on highlighting
its sustainability activities, especially
as an energy-intensive company in the
basic materials industry. The Group will
continue to source raw materials from
around the globe, both primary materials
from mines and secondary materials from
a wide range of recycling sources. Within
the scope of the current Group strategy,
Aurubis hopes to expand its multi-metal
recycling in particular – for an even greater
contribution to the circular economy.
A SHARED UNDERSTANDING
The new Sustainability Strategy is a joint
achievement, having been developed
by thirty employees from various
departments, among them Accounting,
different operating divisions, and the
Aurubis MAGAZINE 2017/1838

The Aurubis site in Lünen alone processes more than 100,000 t of secondary raw materials from electrical and electronic scrap each year.
“ Multi-metal recycling makes an important contribution to the circular economy and resource conservation.”KIRSTEN KÜCK
Aurubis MAGAZINE 2017/18 39

GROWTH
New sales channels
Multi-metal expansion
Innovative industry
solutions
GROWTH We are pursuing the goal of growth, both internal and
external. Our important internal growth project Future Complex
Metallurgy (FCM) embodies the multi-metal approach. With
this and other projects, we would like to increase sales volumes
of all non-copper metals and use more complex concentrates.
In addition to internal growth, we want to strengthen ourselves
with appropriate external acquisitions.
We developed a new strategy as part of our Vision 2025. It comprises three focus areas: Growth, Efficiency, and Responsibility. On the one hand, we want this strategy to strengthen our leading position in the standard copper business through structural optimizations and high cost competitiveness. On the other hand, we want to press ahead with the expansion of the multi-metal business using our well-developed process expertise and metallurgical expertise, as well as innovative industrial solutions.
ONE STRATEGY
Aurubis MAGAZINE 2017/1840

EFFICIENCY
AURUBISSTRATEGY
Metal recovery
Entrepreneurship
Sustainability
Cost competitiveness
RESPONSI- BILITY
Standardization & digitalization
Values
In the area of EFFICIENCY, we focus on the standard
copper business in particular. Here, we are focused on
standardizing core processes, automating production, and
implementing projects in the area of digitalization, among other
topics. Taken as a whole, all efficiency measures are expected
to yield project success of € 200 million by fiscal year 2019/20
(including Segment Flat Rolled Products). All divisions are
contributing to this, from production to corporate divisions.
RESPONSIBILITY As part of our Sustainability Strategy, we will
pursue responsible targets in order to remain a leader in the three
areas of the economy, the environment, and people. We have set
new, ambitious sustainability targets for this purpose. We want to
remain one of the cleanest copper smelters in the world, with the
highest employee safety standards.
Aurubis MAGAZINE 2017/18 41

MORE METALS
Complex raw material
markets
Standard copper raw material
markets
Technology applications
markets
Copper semi-finished
markets
SMELTING & REFINING
EXPANSION OF THE MULTI-METAL BUSINESSOutstanding expertise & innovative solutions for the industrial sector
STRENGTHENING OUR LEADING POSITION Cost competitiveness and structural optimization
PROCESSING
METALRECOVERY
Enabling ...
… synergies
We are developing our business model by reinforcing the copper business and expanding multi-metal solutions.
Aurubis MAGAZINE 2017/1842

A MULTI-METAL FOCUS
As an integrated group, we process
complex metal concentrates, scrap metals,
and metal-bearing recycling materials into
metals of the highest purity. In accordance
with our Vision 2025, we will consistently
expand our current business model, which
is focused on copper, to encompass a
broader multi-metal approach in the
future.
We intend to extract other metals in
addition to copper from systematically
purchased raw materials and intermediate
products and then process them into
marketable value-added products. In
addition to our main metal, copper, our
metal portfolio also includes gold, silver,
lead, nickel, tin,
minor metals such as tellurium and
selenium, and platinum group metals.
SUCCESS FACTORS OF OUR
EXPANDED BUSINESS MODEL
We process copper concentrates, which
are offered by mining companies and
trading companies on the global market.
Normally, mines draw copper ores from
the ground, concentrate them, and sell
the result as a “standard concentrate” to
smelters. However, ore deposits unique
to certain mines are presenting more
and more challenges to mine operators.
Some copper concentrates exhibit higher
volumes of additional materials that are
more difficult to treat and are no longer
considered standard. These are referred to
as complex concentrates.
Apart from copper concentrates, we
also use copper scrap and other metal-
bearing recycling materials with different
compositions, as well as bought-in
intermediates, as feed material. Rising
complexity plays an important role in
this area as well.
Our expanded business model enables
us to better exploit the potential in our
metals. Copper concentrate is unique in
that it has the highest number of valuable
In the future, we intend to extract other metals in addition to copper from systematically purchased raw materials and intermediate products and then process them into marketable value-added products.
Aurubis MAGAZINE 2017/18 43

“tramp elements” accompanying it in
comparison to other base metals. These
elements function as “metal collectors”
and therefore hold considerable potential
with regard to our multi-metal strategy.
We combine this with our extensive
expertise in processing and recovering
metal from standard and complex
concentrates, as well as from a wide range
of recycling materials.
Through innovative metallurgical
processes like our FCM project, we are
in a position to process even complex
material combinations of different origins
to increase their value. This differentiates
us from many other international
competitors from the smelter industry.
Our standard business based on copper
raw materials therefore taps into synergies
to recover additional metals of the future
while adding value.
Apart from our copper semi-finished
product markets, we will supply more of
our metals to technology markets in the
hopes of benefiting from their growing
momentum.
We produced about 774,000 t of copper wire rod in 2017/18, or 8 % more than the year before.
Publisher
Aurubis AG
Hovestrasse 50, 20539 Hamburg, Germany
www.aurubis.com
The language used in this Annual Report is intended to be gender-inclusive.
Photos Adam Walker (cover photo), Johannes Arlt, Thies Rätzke, Andreas
Schmidt-Wiethoff, Valerie Peeraer, Oliver Tjaden, getty images, istockphoto,
shutterstock, Heinrich Pniok, Thomas Seilnacht, Aurubis AG
Concept and design Kirchhoff Consult AG, Hamburg, Germany
Print Beisner Druck GmbH & Co. KG, Buchholz in der Nordheide, Germany
Aurubis MAGAZINE 2017/1844

2.52 million tCONCENTRATE THROUGHPUT
~ 700,000 tRECYCLING MATERIALS
1.16 million tCOPPER CATHODE
OUTPUT
€ 329 mEBT
(operating)
20,000 t CO2 REDUCTION
annually thanks to the Industrial Heat project
14.8 %ROCE
(operating)
6,673EMPLOYEES
33SITESworldwide

aurubis.com
Metals for Progress
Aurubis AGHovestrasse 5020539 Hamburg, Germany Phone +49 40 7883-0Fax +49 40 [email protected]

We boast a long and successful history of producing and processing copper. And fiscal year 2017/18 was among the most successful years in that history, seeing us increase our operating result by about 10 %, to € 329 million, and enjoy ongoing high profitability.
We are investing great effort in sustainably expanding our business model and developing forward-looking solutions for the complex challenges typical to our industry. Our principal goal: to become a leading multi-metal processor.
We know that there’s more to our input materials, more to our processes, and more to the way we work together.
Aurubis: There’s more to it.
ANNUAL REPORT 2017/18
2 Letter from the Executive Board 7 Report of the Supervisory Board 1 7 Corporate Governance 34 Sustainability 50 Aurubis Shares on the Capital Market 54 Combined Management Report
TABLE OF CONTENTS
104 Consolidated Financial Statements 1 1 2 Notes to the Consolidated Financial Statements 174 Responsibility Statement 175 Auditor’s Report
The language used in this Annual Report is intended to be gender-inclusive.
Annual Report 2017/18 Aurubis
1

“ The development of our operating performance was very dynamic in fiscal year 2017/18, due in part to positive effects from the efficiency improvement program.”
JÜRGEN SCHACHLER
There’s a lot to talk about: The company’s new path to becoming a multi-metal processor calls for strategic guidance.
Aurubis Annual Report 2017/18
2

It has rarely been this exciting to chart Aurubis’ development. We are in the middle of a reorientation phase, making the shift from pure copper producer to multi-metal company, as planned in our Vision 2025. We are seeing that many of the growth, efficiency, and sustainability measures we have initiated are bearing initial fruit. At the same time, our markets are in constant motion, opening up new opportunities for us. For example, we see fascinating possibilities for growth in stronger cooperation with raw material suppliers and in multi-metal recycling, where we have a competitive edge thanks to our extensive knowledge.
We are confident that there is even more to our company. We want to provide you with an insight into which metals will come into sharper focus in the future, show where our strategic initiatives are having an impact, and illustrate how all of this is expanding our business model. This year, you will find all of this information summarized in the magazine accompanying our Annual Report.
The development of our operating performance was also very dynamic in fiscal year 2017/18. This is especially clear in the increase in our operating earnings before taxes (EBT). We boosted this figure by 10 %, to € 329 million, compared to the previous year. Furthermore, we generated an operating return on capital employed (ROCE) of 14.8 %. Fiscal year 2017/18 was thus one of the most successful in our company history. Both operating parameters used for company management were comfortably within the range we outlined in our forecast. Therefore, we once again achieved results in the reporting year that are rare in companies in the basic materials industry.
Significant influencing factors for the strong operating result during fiscal year 2017/18 included positive effects from the efficiency improvement program and the good ongoing performance of the Hamburg and Pirdop sites. Regarding the first of these factors, we came one step closer in the fiscal year to our goal of achieving project success of € 200 million based on the market data of fiscal year 2014/15. After over € 30 million in the previous year, we generated roughly € 30 million through the project’s improvement measures in 2017/18 as well. We are thus well within the project schedule we established. We anticipate project success of € 60 million for the coming fiscal year. The revenues from the program help us to compensate for possible shutdowns of our facilities, cost increases, and inflation.
Our concentrate throughput in the reporting year was about 4 % higher than the already very good prior-year level, thus hitting a record high. Optimization measures implemented as part of our efficiency improvement program took full effect at our Bulgarian site for the first time in fiscal year 2017/18. However, a scheduled repair shutdown of Hamburg’s anode furnace in Q3 and smaller unscheduled shutdowns in
Dear Shareholders and Friends of the Company,
annualreport2017-18. aurubis.com
Letter from the Executive Board
Annual Report 2017/18 Aurubis
Letter from the Executive Board 3

Q4 2017/18 affected concentrate throughput. It should also be taken into account that Q1 2016/17 was influenced by a scheduled maintenance shutdown in Hamburg. Overall, the throughput of 2.52 million t is a level that we can be proud of.
For the most part, our various markets developed positively in fiscal year 2017/18. We benefited from comparatively high refining charges for copper scrap and from good availability. Revenues from the sale of sulfuric acid also gained momentum due to considerably higher sales prices. The central driver of this development was stable, high global demand. At the same time, individual smelter standstills in Asia limited supply. A higher metal gain with increased copper prices, significantly higher sales volumes for rod products, and higher sales volumes for flat rolled products contributed to the good result as well. Because a large portion of our income is based on the US dollar, we carry out extensive hedging. That being said, the US dollar, which was weaker during long stretches of fiscal year 2017/18, strained the operating result.
We want our shareholders to take part in our company’s positive development. Subject to approval at the Aurubis AG Annual General Meeting on February 28, 2019, a dividend of € 1.55 per share will be paid out to the shareholders. This is a 7 % increase compared to the prior-year dividend.
At the end of March 2018, we signed a contract with Wieland-Werke AG regarding the sale of Segment Flat Rolled Products. This includes production facilities in the US, the Netherlands, Finland, and Germany. As of early December, approval of the sale by the European antitrust authorities was still pending. A final decision is expected in early 2019. In our view, Wieland-Werke AG would be a very good new owner for our Segment Flat Rolled Products.
We can be very pleased with our business performance in the reporting year, having achieved very good Group results and implemented a range of measures aimed at improving multiple company areas. This feat would not have been possible without our employees. At this juncture, the entire Executive Board would like to express its deepest gratitude to all employees for their hard work.
Our employees are the basis of our future success, which is why our accident KPI is a cause for concern. While in previous years, our accident rate either improved or remained the same, the past fiscal year saw our accident KPI worsen for the first time ever. We investigate all accidents thoroughly and will intensify our efforts to reduce them in the coming year. Our goal in this regard is reflected in our “Vision Zero,” which envisages no accidents whatsoever.
“ In 2018/19, we want to forge ahead with the strategy we initiated. We consider ourselves well equipped for the task.”
RAINER VERHOEVEN
New Executive Board member Dr. Thomas Bünger will help shape all
of the technical aspects of the company.
Aurubis Annual Report 2017/18
Letter from the Executive Board4

We would like to emphasize one special project in particular. We have always strived to put the excess energy generated by our production processes to meaningful use. In October 2018, for example, we joined forces with energy service provider enercity AG to launch Germany’s largest industrial heat project and are now supplying the Hamburg neighborhood HafenCity East with industrial heat from Aurubis. This award-winning flagship project saves around 20,000 t of carbon dioxide emissions per year through the reuse of heat. It therefore clearly demonstrates that companies like us, despite operating in an energy- intensive industry, can contribute significantly toward energy transition. It also underscores Aurubis’ deep commitment to sustainability.
We are currently working just as diligently on implementing our digital strategy, which includes measures to further harmonize software solutions, processes, and approaches – across all of the main international sites. We are also using models and artificial intelligence more, for instance to improve our raw material planning and system control. Our digitalization projects will enhance the efficiency and transparency of our processes while leveraging synergies, enabling us to develop more and more from a transaction- based company to a data-driven one.
In fiscal year 2018/19, we aim to continue building on the successes enjoyed in the reporting year. And we consider ourselves very well positioned in this regard. After all, our metals are required across an extremely wide range of applications, be it in products that enable digitalization, in materials that allow electricity to flow from renewable energies, or in energy storage systems for the transport technologies of tomorrow.
We would like to thank all of our employees, shareholders, customers, and suppliers for their trust in our company. We hope that you will continue to accompany us on our path into the future.
Sincerely,
Jürgen Schachler Dr. Thomas Bünger Rainer Verhoeven
THE EXECUTIVE BOARD
JÜRGEN SCHACHLER After studying economics, Jürgen Schachler initially worked at the Deutsche Solvay Werke GmbH. Following additional positions in marketing and sales, he switched to what is now known as ArcelorMittal Luxembourg in 1993. He served as a member of the Management, Managing Director, and Chief Executive Officer in different companies that now belong to the Arcelor Mittal Group. Before starting at Aurubis, Jürgen Schachler was Chief Executive Officer of ArcelorMittal Europe, Flat Product, Business Division South West.
DR. THOMAS BÜNGER Dr. Bünger studied non-ferrous metallurgy. He initially worked as a research fellow at the TU Bergakademie Freiberg and, starting in 1996, as an R&D engineer at Freiberger Compound Materials GmbH. In 2005, he switched to Norddeutsche Affinerie (Aurubis since 2009), where he has served as a production engineer in the secondary smelter, a production manager in the primary smelter, Senior Vice President Technical Primary Copper, and, most recently, Senior Vice President Operations.
RAINER VERHOEVEN After studying business management, Rainer Verhoeven started his career with what is now thyssenkrupp AG. He initially worked in finance and accounting at company headquarters. Starting in 2005, he held various managerial positions for thyssenkrupp outside of Germany. Before joining Aurubis, Rainer Verhoeven was Chief Financial Officer of thyssenkrupp Electrical Steel GmbH.
Executive Board Chairman Jürgen Schachler believes Aurubis is well positioned, as its metals are crucial to the development of megatrends such as renewable energies and electric vehicles.
Rainer Verhoeven is proud that the past fiscal year was one of the most successful in the company’s history.
Annual Report 2017/18 Aurubis
Letter from the Executive Board 5

Executive Board
Jürgen Schachler, HamburgBorn: July 31, 1954, German citizenExecutive Board Chairman and Director of Industrial Relations Segment Metal Refining & Processing Appointed from July 1, 2016 until June 30, 2019
Dr. Stefan Boel, Hamme, Belgium, until July 31, 2018Born: June 9, 1966, Belgian citizenExecutive Board member Segment Flat Rolled Products Appointed from April 19, 2008 until originally April 30, 2021
» Aurubis Belgium NV/SA, Brussels, Belgium, until April 30, 2018 Chairman of the Board of Directors
Dr. Thomas Bünger, LüneburgBorn: July 2, 1968, German citizenChief Operating OfficerAppointed from October 1, 2018 until September 30, 2021
» Aurubis Belgium NV/SA, Brussels, Belgium Director
» Aurubis Bulgaria AD, Pirdop, Bulgaria Board of Directors
» Aurubis Italia Srl, Avellino, Italy Chairman of the Board of Directors
Rainer Verhoeven, DuisburgBorn: December 2, 1968, German citizenChief Financial OfficerSegment Flat Rolled Products since August 1, 2018Appointed from January 1, 2018 until December 31, 2020
» Aurubis Belgium NV/SA, Brussels, Belgium, since May 1, 2018 Chairman of the Board of Directors
Aurubis Annual Report 2017/18
Executive Board6

Report of the Supervisory Board
The Aurubis Group generated operating earnings before taxes (operating EBT Glossary, page 183) of € 329 million in fiscal year 2017/18. The accomplishments of the Executive Board, the management, and our employees across all departments deserve our acknowledgement once again.
During fiscal year 2017/18, significant influencing factors for the operating result during the reporting period included the high concentrate throughput at the Hamburg and Pirdop sites and the positive effects of the efficiency improvement program. At the Bulgarian site, efficiency enhancement measures took effect for the first time.
Aurubis also benefited from substantially higher refining charges for copper scrap and good availability, as well as from increased sulfuric acid revenues due to considerably higher sales prices.
A higher metal gain Glossary, page 183 with increased copper prices, significantly higher sales volumes for rod products
Glossary, page 182, and higher sales volumes for flat rolled products also contributed to the good result.
The weaker US dollar negatively influenced the operating result.
COLLABORATION BETWEEN THE SUPERVISORY BOARD AND EXECUTIVE BOARDThe joint target of the Executive Board and Supervisory Board is to increase the enterprise value of Aurubis AG and its Group companies over the long term.
With respect to company management, the Supervisory Board and its committees also closely supervised, carefully monitored, and advised the Executive Board in 2017/18 and performed the functions incumbent upon them by law, the Articles of Association, and rules of procedure. The Supervisory Board is confident that the company was managed lawfully and appropriately. The Supervisory Board was included in all decisions of fundamental importance for the company promptly and directly, as explained in more detail below.
The Supervisory Board was continuously informed in detail about the Group’s earnings and employment developments, the individual segments, and the company’s financial position. The Executive Board provided comprehensive explanations for any deviations from planned business performance and discussed the corresponding measures with the Supervisory Board.
The Executive Board informed the Supervisory Board regularly, promptly, and comprehensively about all of the issues relevant to the company, both verbally and by means of a written monthly report. These topics covered the corporate strategy, the planning process, important business transactions in the company and the Group, the associated opportunities and risks, and issues of compliance Glossary, page 182.
PROF. DR. FRITZ VAHRENHOLT Aurubis AG Supervisory Board Chairman
Report of the Supervisory Board
Annual Report 2017/18 Aurubis
7

The Supervisory Board discussed all the transactions that were of importance for the Group in detail on the basis of the Executive Board’s reports.
The Supervisory Board passed the Executive Board’s resolution proposals after thorough review and consultation.
The Chairman of the Supervisory Board was also in contact with the Executive Board, notably the Executive Board Chairman, outside of the meetings and communicated with them about current developments.
CONSULTATIONS IN THE SUPERVISORY BOARDThere were six regular and four extraordinary Supervisory Board meetings in fiscal year 2017/18. Three resolutions were adopted by written consent in lieu of a meeting. The participation rate for the Supervisory Board members was about 96 %. The Executive Board was absent for part of five Supervisory Board meetings and for two full meetings.
Mr. Karl-Heinz Hamacher was absent from one regular and one extraordinary Supervisory Board meeting, as well as a Personnel Committee meeting, due to illness; Mr. Jan Koltze was excused from one Supervisory Board meeting; Ms. Edna Schöne was excused from two Supervisory Board meetings. The following tables show the members’ participation rate for Supervisory Board meetings and for the respective committees, in the Supervisory Board compositions both before and after the Supervisory Board election on March 1, 2018:
Supervisory Board composition until March 1, 2018
Number of meetings attended
Percentage of meetings attended
Supervisory Board members
3 scheduled/ 2 extraordinary meetings
Prof. Dr.-Ing. Heinz Jörg Fuhrmann (Chairman) 5/5 100 %
Renate Hold-Yilmaz (Deputy Chairwoman) 5/5 100 %
Burkhard Becker 5/5 100 %
Dr. Bernd Drouven 5/5 100 %
Dr.-Ing. Joachim Faubel 5/5 100 %
Jan Koltze 4/5 80 %
Dr. Sandra Reich 5/5 100 %
Dr. med. Dipl.-Chem. Thomas Schultek 5/5 100 %
Rolf Schwertz 5/5 100 %
Prof. Dr. Fritz Vahrenholt 5/5 100 %
Ralf Winterfeldt 5/5 100 %
Dr.-Ing. Ernst J. Wortberg 5/5 100 %
Personnel Committee Did not meet
Audit Committee 2 meetings
Dr.-Ing. Ernst J. Wortberg (Chairman) 2/2 100 %
Burkhard Becker 2/2 100 %
Jan Koltze 2/2 100 %
Renate Hold-Yilmaz 2/2 100 %
Nomination Committee 2 meetings
Prof. Dr.-Ing. Heinz Jörg Fuhrmann (Chairman) 2/2 100 %
Burkhard Becker 2/2 100 %
Prof. Dr. Fritz Vahrenholt 2/2 100 %
Dr.-Ing. Ernst J. Wortberg 2/2 100 %
Technology Committee
Did not meet before March 1
Conciliation Committee
Did not meet during the fiscal year
Report of the Supervisory Board
Aurubis Annual Report 2017/18
8

Supervisory Board composition starting March 1, 2018
Number of meetings attended
Percentage of meetings attended
Supervisory Board members
3 scheduled/ 2 extraordinary meetings
Prof. Dr. Fritz Vahrenholt (Chairman) 5/5 100 %
Renate Hold-Yilmaz (Deputy Chairwoman) 5/5 100 %
Andrea Bauer (starting June 22, 2018) 2/2 100 %
Prof. Dr.-Ing. Heinz Jörg Fuhrmann 5/5 100 %
Karl-Heinz Hamacher 1 3/5 60 %
Prof. Dr. Karl Friedrich Jakob 5/5 100 %
Jan Koltze 1 4/5 80 %
Dr. Stephan Krümmer 5/5 100 %
Dr. Elke Lossin 5/5 100 %
Dr. Sandra Reich 5/5 100 %
Stefan Schmidt 5/5 100 %
Edna Schöne (until June 15, 2018) 1/3 33 %
Melf Singer 5/5 100 %
Personnel Committee 3 meetings
Prof. Dr. Fritz Vahrenholt (Chairman) 3/3 100 %
Prof. Dr.-Ing. Heinz Jörg Fuhrmann 3/3 100 %
Karl-Heinz Hamacher 1 2/3 66 %
Renate Hold-Yilmaz 3/3 100 %
Prof. Dr. Karl Friedrich Jakob 3/3 100 %
Stefan Schmidt 3/3 100 %
Audit Committee 2 meetings
Dr. Stephan Krümmer (Chairman) 2/2 100 %
Prof. Dr.-Ing. Heinz Jörg Fuhrmann 2/2 100 %
Renate Hold-Yilmaz 2/2 100 %
Jan Koltze 2/2 100 %
Dr. Elke Lossin 2/2 100 %
Dr. Sandra Reich 2/2 100 %
Number of meetings attended
Percentage of meetings attended
Nomination Committee 1 meeting
Prof. Dr. Fritz Vahrenholt (Chairman) 1/1 100 %
Prof. Dr.-Ing. Heinz Jörg Fuhrmann 1/1 100 %
Prof. Dr. Karl Friedrich Jakob 1/1 100 %
Dr. Stephan Krümmer 1/1 100 %
Conciliation Committee
Did not meet during the fiscal year
1 Absent due to illness.
The topics regularly covered in Supervisory Board meetings included the business performance, human resources in the Group, as well as the development of the results, the raw materials markets, and the foreign exchange markets. The Supervisory Board also dealt with the financial situation and the status of capital expenditure. In particular, the Supervisory Board oversaw the planning of the large-scale project Future Complex Metallurgy (FCM) Glossary, page 182 and the ONE Aurubis Glossary, page 183 transformation program. Additional focuses included the sale of Segment Flat Rolled Products and the acquisition of the remaining shares of Deutsche Giessdraht GmbH. During the meetings, the Chairmen of the Personnel, Audit, and Nomination Committees reported on their work, the suggestions made, and the results achieved.
The new Executive Board compensation system was passed in the meeting on October 5, 2017. During the same meeting, the skills profile developed by the Personnel Committee for the composition of the Supervisory Board was explained and passed. The Supervisory Board approved the FCM project, as well as the investment plans and budget for 2017/18. The Executive Board presented the Group strategy to the Supervisory Board.
Report of the Supervisory Board
Annual Report 2017/18 Aurubis
9

In the meeting on December 12, 2017, the Supervisory Board determined the compensation for the Executive Board members for fiscal year 2016/17 contingent on the established objectives. The details are explained in the compensation report. In the same meeting, consultations focused on the approval of the consolidated financial statements and the separate financial statements for Aurubis AG for 2016/17, including the Corporate Governance Report, and the preparations for the 2018 Annual General Meeting and the Supervisory Board election. The Chairman of the Nomination Committee reported on the recommendations for the election of the shareholder representatives and presented the candidates’ experience and skills.
In the extraordinary meeting on January 16, 2018, consultations took place again regarding the candidates for the Supervisory Board election, and the final election recommendations were passed.
In the extraordinary meeting on February 9, 2018, the Supervisory Board discussed the sale of Segment Flat Rolled Products to Wieland-Werke AG.
In the meeting on February 28, 2018, the Executive Board reported on the current business and the FCM project. The Supervisory Board discussed the audit tendering process for the consolidated financial statements and separate financial statements. The Audit Committee Chairman explained the process of preparing the Non-Financial Report, which is required for the first time for fiscal year 2017/18. Furthermore, the Supervisory Board approved the sale of Segment Flat Rolled Products to Wieland-Werke AG.
The Supervisory Board, which was newly elected at the Annual General Meeting, and its committees were established in the meeting on March 1, 2018.
The extraordinary meeting on March 26, 2018 focused on the mutual agreement to end the appointment of Dr. Stefan Boel at the close of July 31, 2018.
In the meeting on June 13, 2018, the Supervisory Board discussed the status of new investments. It approved the scheduled, routine shutdown in Hamburg in 2019 and passed the new Sustainability Strategy.
In the extraordinary meeting on August 8, 2018, the Supervisory Board discussed the development of the global recycling business and a potential acquisition project.
In the meeting on September 11, 2018, Dr. Thomas Bünger was appointed Chief Operating Officer effective October 1, 2018. Due to the appointment, the amendment to the division of business responsibilities was passed at the same time. The Audit Committee Chairman explained the recommendations and preference regarding the selection of the future auditors. The Supervisory Board followed the preference of recommending to participants of the Annual General Meeting that Deloitte GmbH Wirtschaftsprüfungsgesellschaft be chosen as auditor of the financial statements. Moreover, the Supervisory Board passed two diversity concepts, one for the composition of the Executive Board and one for the composition of the Supervisory Board. Details are explained in the declaration on corporate governance, which is part of the Combined Management Report. Effective October 1, 2018, the Supervisory Board reduced the individual component for determining the one-year bonus of the new Executive Board compensation, to the benefit of the EBT component.
COMMITTEESThe Supervisory Board set up a total of four committees to fulfill its duties in fiscal year 2017/18. These effectively supported the Supervisory Board’s work in the meetings. The committees prepared the Supervisory Board’s resolutions and topics to be considered in the meetings. The Conciliation Committee formed in accordance with Section 27 (3) of the German Codetermination Act (MitbestG) did not meet during the reporting year.
General statements on the composition and working procedures of the Supervisory Board and its committees can also be found in this year’s declaration on corporate governance.
Report of the Supervisory Board
Aurubis Annual Report 2017/18
10

WORK ON THE NOMINATION COMMITTEEThe Nomination Committee met three times during the reporting period. The members discussed the recommended candidates for the election of the shareholder representatives at the Annual General Meeting on March 1, 2018 and passed a resolution on June 13, 2018 to nominate Ms. Andrea Bauer for a temporary judicial appointment as successor to Ms. Edna Schöne, who stepped down from office due to personal reasons.
WORK WITHIN THE PERSONNEL COMMITTEEThe Personnel Committee met three times during the reporting period. It addressed the cancellation of Dr. Stefan Boel’s Executive Board contract and the search for a new Chief Operating Officer (COO). In the meeting on September 11, 2018, the Personnel Committee passed a resolution to recommend Dr. Thomas Bünger as Chief Operating Officer. Due to investor remarks regarding the new compensation system, the Personnel Committee reviewed the Executive Board compensation and recommended a reduction in the individual component to the benefit of the EBT component.
WORK ON THE TECHNOLOGY COMMITTEEAfter approving the FCM project, the Technology Committee did not meet in fiscal year 2017/18. The Committee was not formed again.
WORK ON THE AUDIT COMMITTEEThe Audit Committee met four times during the reporting period.
In all of its meetings, the Audit Committee reviewed the quarterly reports, the separate financial statements, and the consolidated financial statements for the past fiscal year and discussed them with the Executive Board. The Audit Committee also addressed the monitoring of the accounting process and the effectiveness of
the internal control and auditing system, as well as risk and compliance management in the Group. The Audit Committee recommended the auditing firm PricewaterhouseCoopers GmbH, Hamburg, to the Supervisory Board as auditor for fiscal year 2017/18. The Audit Committee authorized the Executive Board to also commission the auditors with additional non-audit services to a limited extent starting October 1, 2017.
The Audit Committee also focused on the first audit tendering process for the consolidated and separate financial statements in accordance with Regulation (EU) No. 537/2014 and presented the recommendation and preference mentioned above to the Supervisory Board.
The Audit Committee Chairmen, Dr. Ernst Wortberg (Chairman until March 1, 2018) and Dr. Stephan Krümmer, have special expertise and experience in the application of accounting principles and internal control procedures. They are independent and not former members of the company’s Executive Board.
In addition to appointing the auditors and agreeing on the auditing fee, the Committee defined the focal areas of the annual 2017/18 audit. These were as follows:
» A review of the balance sheet presentation of the discontinued operations of Segment Flat Rolled Products
» The introduction of a new chart of accounts at Aurubis AG » Notes regarding the effect of new standards on the IFRS
consolidated financial statements
The last focal area is also an audit focus of the German Financial Reporting Enforcement Panel for 2018.
Report of the Supervisory Board
Annual Report 2017/18 Aurubis
11

The Audit Committee furthermore monitored the independence of the auditors, obtained the declaration of their independence recommended by the German Corporate Governance Code, and addressed the additional services performed by the auditors. In this regard, the designated auditors were obligated to inform the Chairman of the Audit Committee without delay about any possible grounds for exclusion or lack of impartiality arising during the audit.
The auditors’ representatives attended two Audit Committee meetings and reported on the audit of the consolidated and separate annual financial statements.
CORPORATE GOVERNANCE AND DECLARATION OF CONFORMITYThe regular efficiency review was performed by the Supervisory Board at its meeting on September 11, 2018. Following a detailed discussion, the Supervisory Board declared its efficiency.
The Executive Board reports on corporate governance at Aurubis AG, also on behalf of the Supervisory Board, in accordance with Section 3.10 of the German Corporate Governance Code, in the declaration and report on corporate governance, which are both part of the Management Report.
On November 5, 2018, the Executive Board and Supervisory Board of Aurubis AG issued the updated Declaration of Conformity to the German Corporate Governance Code (DCGK) in accordance with Section 161 of the German Stock Corporation Act (AktG) and made it permanently accessible to the public at
www.aurubis.com. Aurubis AG complies with the Code recommendations with two exceptions. Additional information can be found in the Declaration of Conformity.
CONFLICTS OF INTERESTThere were no conflicts of interest among Executive Board or Supervisory Board members that should have been disclosed to the Supervisory Board or announced at the Annual General Meeting. There were no significant transactions with an Executive Board member or parties related to an Executive Board member.
AUDIT OF THE SEPARATE FINANCIAL STATEMENTS OF AURUBIS AG AND THE CONSOLIDATED FINANCIAL STATEMENTSThe company’s financial statements prepared by the Executive Board in accordance with the German Commercial Code (HGB), the consolidated financial statements prepared in accordance with IFRS (International Financial Reporting Standards) for the fiscal year from October 1, 2017 to September 30, 2018, and the Combined Management Report for the company and the Group have been audited by the auditing firm PricewaterhouseCoopers GmbH Wirtschaftsprüfungsgesellschaft, Hamburg, in accordance with the resolution passed at the company’s Annual General Meeting on March 1, 2018 and the subsequent appointment of PricewaterhouseCoopers GmbH Wirtschaftsprüfungsgesellschaft as auditors by the Supervisory Board. The auditor responsible was Mr. Claus Brandt, who audited the Group and the company for the second time. The auditors have issued an unqualified auditors’ report. PricewaterhouseCoopers GmbH Wirtschaftsprüfungsgesellschaft, Hamburg, has been the appointed auditing firm since fiscal year 2008/09. Its audit in fiscal year 2017/18 is its tenth audit for Aurubis.
The meeting of the Supervisory Board to approve the financial statements was held on December 10, 2018. All members of the Supervisory Board received copies of the financial statements and audit reports, as well as the Executive Board’s recommendation on the appropriation of the net earnings and all other documents in good time before this meeting. These documents were discussed in detail at the Supervisory Board meeting to approve the financial statements. The auditors participated in this meeting, reported in detail on how the audit had been performed and what their main audit findings were, and were available to provide the Supervisory Board with further information, discuss the documents, and make additional comments.
Report of the Supervisory Board
Aurubis Annual Report 2017/18
12

The Supervisory Board concurred with the results of the audit. This agreement was reached following a detailed discussion on the auditors’ findings, and thorough consideration of the auditors’ report and of the Executive Board’s recommendation regarding the appropriation of the net income. It was also based on the Supervisory Board’s own review of the separate financial statements of Aurubis AG, the consolidated financial statements, and the Combined Management Report for the company and the Group. The Supervisory Board concluded that no objections needed to be raised and, in accordance with the recommendations of the Audit Committee, approved the separate financial statements of Aurubis AG, which were thus adopted, as well as the consolidated financial statements and the Combined Management Report at the meeting on the financial statements. The Supervisory Board concurred with the Executive Board’s recommendation on the utilization of the unappropriated earnings.
AUDIT OF THE SEPARATE NON-FINANCIAL REPORTKPMG conducted, on behalf of the Supervisory Board, a substantive audit of the separate Non-Financial Report for Aurubis.
On the basis of their audit, the auditors did not raise any objections to the reporting and the satisfaction of the relevant statutory requirements and provided an unqualified audit opinion with limited assurance that the separate Non-Financial Report is in accordance with Sections 315b and 315c in connection with Sections 289b to 289e of the German Commercial Code (HGB).
CHANGES IN THE SUPERVISORY BOARD AND EXECUTIVE BOARDEffective January 1, 2018, Mr. Rainer Verhoeven was appointed as the new Chief Financial Officer. Dr. Stefan Boel left the company on July 31, 2018 by mutual agreement. Dr. Thomas Bünger was appointed Chief Operating Officer effective October 1, 2018.
Mr. Burkhard Becker, Dr. Bernd Drouven, Dr. Joachim Faubel, Dr. Thomas Schultek, Mr. Rolf Schwertz, and Mr. Ralf Winterfeldt left the Supervisory Board at the end of the Annual General Meeting on March 1, 2018.
We would like to thank these Supervisory Board members and Dr. Stefan Boel for their many years of successful work for the benefit of the Aurubis Group.
The participants of the Annual General Meeting elected Prof. Karl Friedrich Jakob, Dr. Stephan Krümmer, and Ms. Edna Schöne to the Supervisory Board for the first time. The employees elected Mr. Karl-Heinz Hamacher, Dr. Elke Lossin, Mr. Stefan Schmidt, and Mr. Melf Singer to the Supervisory Board for the first time.
Edna Schöne stepped down on June 15, 2018 for personal reasons. At the recommendation of the Nomination Committee and the request of the Executive Board, the District Court of Hamburg appointed Ms. Andrea Bauer as a new Supervisory Board member effective June 22, 2018. The court appointment expires at the close of the next Annual General Meeting. At the Annual General Meeting, the Supervisory Board will propose that Ms. Andrea Bauer be elected to the Supervisory Board as a shareholder representative for the period until the close of the Annual General Meeting during which the decision on the approval of the Supervisory Board members for fiscal year 2021/22 (October 1, 2021 to September 30, 2022) is to be made. We would like to thank Ms. Edna Schöne for her commitment.
Hamburg, December 2018
The Supervisory Board
Prof. Dr. Fritz Vahrenholt Chairman
Report of the Supervisory Board
Annual Report 2017/18 Aurubis
13

Supervisory Board
Prof. Dr. Fritz Vahrenholt, HamburgChairman since March 1, 2018Chairman of the Deutsche Wildtier Stiftung, Hamburg
» Encavis AG (formerly Capital Stage AG), Hamburg 1 Member of the Supervisory Board
Renate Hold-Yilmaz, Hamburg 2Deputy Chairwoman Commercial employeeChairwoman of the Works Council of Aurubis AG, Hamburg
Prof. Dr.-Ing. Heinz Jörg Fuhrmann, SalzgitterChairman of the Supervisory Board until March 1, 2018Chairman of the Executive Board of Salzgitter AG, Salzgitter 1
» Hüttenwerke Krupp Mannesmann GmbH, Duisburg 3 Chairman of the Supervisory Board
» Ilsenburger Grobblech GmbH, Ilsenburg 3 Chairman of the Supervisory Board
» KHS GmbH, Dortmund 3 Chairman of the Supervisory Board
» Mannesmann Precision Tubes GmbH, Mülheim/Ruhr 3
Chairman of the Supervisory Board » Mannesmannröhren-Werke GmbH, Mülheim/Ruhr 3
Chairman of the Supervisory Board until December 21, 2017
» Peiner Träger GmbH, Peine 3 Chairman of the Supervisory Board
» Salzgitter Flachstahl GmbH, Salzgitter 3 Chairman of the Supervisory Board
» Salzgitter Mannesmann Grobblech GmbH, Mülheim/Ruhr 3 Chairman of the Supervisory Board
» Salzgitter Mannesmann Handel GmbH, Düsseldorf 3 Chairman of the Supervisory Board
» Öffentliche Lebensversicherung Braunschweig, Braunschweig Chairman of the Supervisory Board
» Öffentliche Sachversicherung Braunschweig, Braunschweig Member of the Supervisory Board
» TÜV Nord AG, Hannover Member of the Supervisory Board
Burkhard Becker, Hattingen, until March 1, 2018Member of the Executive Board of Salzgitter AG, Salzgitter 1
» EUROPIPE GmbH, Mülheim/Ruhr 3 Member of the Supervisory Board
» KHS GmbH, Dortmund 3 Member of the Supervisory Board until October 31, 2017
» Mannesmann Precision Tubes GmbH, Mülheim/Ruhr 3
Member of the Supervisory Board » Mannesmannröhren-Werke GmbH, Mülheim/Ruhr 3
Member of the Supervisory Board until December 21, 2017
» Peiner Träger GmbH, Peine 3 Member of the Supervisory Board
» Salzgitter Flachstahl GmbH, Salzgitter 3 Member of the Supervisory Board
» Salzgitter Mannesmann Handel GmbH, Düsseldorf 3 Member of the Supervisory Board
» Nord/LB Asset Management AG, Hannover Member of the Supervisory Board
Andrea Bauer, Dortmund, since June 22, 2018Member of the management of VDM Metals Holding GmbH, Werdohl
» Commerzbank, Düsseldorf Member of the Regional Advisory Council West
Dr. Bernd Drouven, Hamburg, until March 1, 2018Former Aurubis AG Executive Board Chairman
» NITHH gGmbH, Hamburg Chairman of the Supervisory Board
Dr.-Ing. Joachim Faubel, Hamburg 2, until March 1, 2018Employee in Corporate Controlling at Aurubis AG
Karl-Heinz Hamacher, Stolberg 2, since March 1, 2018Employee at Aurubis Stolberg GmbH & Co. KG, StolbergChairman of the Works Council
1 Stock exchange-listed company 2 Elected by the employees 3 Group companies of Salzgitter AG
Report of the Supervisory Board
Aurubis Annual Report 2017/18
14

Prof. Dr. Karl Friedrich Jakob, Dinslaken, since March 1, 2018Chairman of the Executive Board of RWTÜV e. V., Essen
» Albert-Schweitzer-Einrichtungen für Behinderte gGmbH, Dinslaken Member of the Supervisory Board
» RWTÜV GmbH, Essen Chairman of the Supervisory Board
» TÜV Nord AG, Hannover
Member of the Supervisory Board » Van Ameyde International BV, Rijswijk, Netherlands
Member of the Board of Supervisory Directors » Universitätsklinikum Essen, Essen
Member of the Supervisory Board » Knappschaft Kliniken GmbH, Bochum
Chairman of the Supervisory Board
Jan Koltze, Kummerfeld 2District Manager of the Mining, Chemical, and Energy Industrial Union Hamburg/Harburg
» ESSO Deutschland GmbH, Hamburg Member of the Supervisory Board
» ExxonMobil Central Europe Holding GmbH, Hamburg
Member of the Supervisory Board
Dr. Stephan Krümmer, Hamburg, since March 1, 2018Currently no professional occupation
Dr. Elke Lossin, Buchholz in der Nordheide2, since March 1, 2018Manager of the Analytical Laboratory at Aurubis AG, Hamburg
Dr. Sandra Reich, GräfelfingDirector, NKI Institut für nachhaltige Kapitalanlagen GmbH, Munich
Stefan Schmidt, Lüdinghausen 2, since March 1, 2018Head of Services/Production Manager of Smelting Operations at Aurubis AG, Lünen
Edna Schöne, Hamburg, from March 1, 2018 to June 15, 2018Member of the Executive Board of Euler Hermes AG, Hamburg,responsible for federal government business and Legal & Compliance
Dr. med. Dipl.-Chem. Thomas Schultek, Lübeck 2, until March 1, 2018Head of Corporate Health Protection at Aurubis AG
» Member of the Committee of Executive Representatives at Aurubis AG, Hamburg
Rolf Schwertz, Datteln 2, until March 1, 2018Bricklayer and boiler operatorMember of the Works Council of Aurubis AG, Lünen Chairman of the Central Representative Council of Employees with Disabilities of Aurubis AG, Lünen
Melf Singer, Schwarzenbek 2, since March 1, 2018Day shift foreman of the Acid Plant at Aurubis AG, Hamburg
Ralf Winterfeldt, Hamburg 2, until March 1, 2018Power electronics technicianChairman of the General Works Council of Aurubis AGDeputy Chairman of the Works Council of Aurubis AG, Hamburg
Dr.-Ing. Ernst J. Wortberg, Dortmund, until March 1, 2018Self-employed consultant
1 Stock exchange-listed company 2 Elected by the employees 3 Group companies of Salzgitter AG
Report of the Supervisory Board
Annual Report 2017/18 Aurubis
15

Supervisory Board Committees until the Annual General Meeting (March 1, 2018)
Conciliation Committee in accordance with Section 27 (3) of the German Codetermination ActProf. Dr.-Ing. Heinz Jörg Fuhrmann (Chairman) Renate Hold-Yilmaz (Deputy Chairwoman) Dr. Sandra Reich Ralf Winterfeldt
Audit CommitteeDr.-Ing. Ernst J. Wortberg (Chairman) Burkhard Becker Jan KoltzeRenate Hold-Yilmaz
Personnel CommitteeProf. Dr.-Ing. Heinz Jörg Fuhrmann (Chairman) Dr. Bernd DrouvenRenate Hold-YilmazDr. med. Dipl.-Chem. Thomas SchultekProf. Dr. Fritz VahrenholtRalf Winterfeldt
Nomination CommitteeProf. Dr.-Ing. Heinz Jörg Fuhrmann (Chairman) Burkhard Becker Prof. Dr. Fritz Vahrenholt Dr.-Ing. Ernst J. Wortberg
Technology CommitteeDr. Bernd Drouven (Chairman)Prof. Dr.-Ing. Heinz Jörg FuhrmannRenate Hold-YilmazDr. med. Dipl.-Chem. Thomas Schultek
Supervisory Board Committees after the Annual General Meeting (March 1, 2018)
Conciliation Committee in accordance with Section 27 (3) of the German Codetermination ActProf. Dr. Fritz Vahrenholt (Chairman) Renate Hold-Yilmaz (Deputy Chairwoman) Edna Schöne until June 15, 2018Andrea Bauer since July 10, 2018Melf Singer
Audit Committee Dr. Stephan Krümmer (Chairman) Prof. Dr.-Ing. Heinz Jörg FuhrmannDr. Sandra ReichRenate Hold-YilmazJan KoltzeDr. Elke Lossin
Personnel CommitteeProf. Dr. Fritz Vahrenholt (Chairman)Prof. Dr.-Ing. Heinz Jörg Fuhrmann Prof. Dr. Karl Friedrich JakobRenate Hold-YilmazKarl-Heinz HamacherStefan Schmidt
Nomination CommitteeProf. Dr. Fritz Vahrenholt (Chairman)Prof. Dr.-Ing. Heinz Jörg Fuhrmann Prof. Dr. Karl Friedrich Jakob Dr. Stephan Krümmer
Report of the Supervisory Board
Aurubis Annual Report 2017/18
16

Corporate Governance
Report and declaration on corporate governance (part of the Combined Management Report)
The principles of responsible and sustainable corporate governance determine the actions of the management and controlling bodies of Aurubis AG. In this declaration, the Executive Board reports – also for the Supervisory Board – on corporate governance pursuant to Section 3.10 of the German Corporate Governance Code (DGCK), as well as Sections 289f and 315d of the German Commercial Code (HGB).
DECLARATION OF CONFORMITY AND REPORTING ON CORPORATE GOVERNANCEIn accordance with Section 161 of the German Stock Corporation Act (AktG), the Executive Board and Supervisory Board of a company listed in Germany must issue an annual declaration stating that the recommendations of the Government Commission on the German Corporate Governance Code (DGCK) published by the Federal Ministry of Justice in the official section of the Federal Gazette (Bundesanzeiger) were/are being complied with, or list the recommendations that were/are not being applied and explain why.
The Executive Board and the Supervisory Board dealt with the topic of corporate governance on several occasions in fiscal year 2017/18 and, on November 5, 2018, jointly issued the annual Declaration of Conformity in accordance with Section 161 of the German Stock Corporation Act (AktG). The declaration is permanently accessible to the public at
www.aurubis.com/en/about-aurubis/distribution-page-corporate-
governance. The Declarations of Conformity from the past five years and the details regarding fulfillment of the Code’s requirements are also permanently accessible there.
TEXT OF THE DECLARATION OF CONFORMITY“In accordance with Section 161, German Stock Corporation Act, the Executive Board and Supervisory Board of Aurubis AG declare that, since the issue of the last Declaration of Conformity dated November 6, 2017, the recommendations of the Government Commission on the German Corporate Governance Code in the version dated February 7, 2017 have been applied and will be applied with the following exceptions for the reasons given:
» Section 4.2.3 (2) sentence 3 and (4) (Executive Board remuneration) For new Executive Board contracts entered into as from October 1, 2017, the compensation structure for the Executive Board will generally include variable components whose basis for calculation is based on several years and is essentially forward-looking, as well as a cap on severance pay. However, this does not apply to Mr. Schachler’s contract. In this respect, prior standards apply (grandfathering).
» Section 5.4.1 (2) (Term limit for Supervisory Board membership) When proposing candidates at the Annual General Meeting, the Supervisory Board has focused and will continue to focus on the professional and personal qualifications of the candidates, taking the skills profile into consideration and within the framework of the applicable legal regulations, in particular with respect to the German Gender Equality Act. It is naturally very relevant that, within the framework of the company-specific situation, the company’s international activities, potential conflicts of interest, the number of independent Supervisory Board members established by the Supervisory Board, the age limit also established by the Supervisory Board, and diversity are taken into account. In doing so, it is not necessary to establish a regulatory limit to Supervisory Board members’ term of office.
Hamburg, November 5, 2018
For the Executive Board
Jürgen Schachler Rainer Verhoeven Chairman Member
For the Supervisory Board
Prof. Dr. Fritz Vahrenholt Chairman”
Corporate Governance
Annual Report 2017/18 Aurubis
17

DISCLOSURES ON RELEVANT CORPORATE GOVERNANCE PRACTICESFor Aurubis AG, the applicable legal regulations, especially stock market law, co-determination law, capital market law, the Articles of Association, the German Corporate Governance Code (DGCK), and the rules of procedure of the Supervisory Board and the Executive Board provide the basis for the structure of management and controlling in the company. Above and beyond its legal obligations, Aurubis has defined values and derived a Code of Conduct from them that establishes a framework for behavior and decisions and provides orientation for corporate activities. The values and the Code of Conduct are published on the company’s homepage in the “Responsibility” section. Each employee is briefed on these group-wide values and the Code of Conduct, as well as on the corporate guidelines stemming from them. Employees whose roles require them to deal more closely with certain legal regulations (e.g., antitrust law, anti-corruption, environmental protection, occupational safety) will be provided with corresponding mandatory training.
LEADERSHIP STRUCTUREAurubis AG is a company subject to German law, which is also the basis of the German Corporate Governance Code. A basic principle of German stock corporation law is the dual management system with the two bodies of the Executive Board and Supervisory Board, which are strictly separated as regards personnel between the Executive Board as the board of management and the Supervisory Board as the monitoring organ and each assigned independent responsibilities. The Executive Board and Supervisory Board of Aurubis AG work together closely and in a spirit of trust in the governance and supervision of the company for the benefit of the company.
WORKING PROCEDURES, COMPOSITION, AND OBJECTIVES OF THE EXECUTIVE BOARD AND SUPERVISORY BOARD THE EXECUTIVE BOARDWORKING PROCEDURES The Executive Board is responsible for running the company without instructions from third parties in accordance with the law, the Articles of Association, and the Executive Board’s rules of procedure, taking into account the resolutions passed at the
Annual General Meeting. The Executive Board represents the company in dealings with third parties.
As the management body, the Executive Board runs the company’s business in the interests of the company and with the aim of achieving long-term value added, while taking the needs of all stakeholders into account. The principle of overall responsibility applies, meaning that the members of the Executive Board together bear responsibility for the management of the entire company. They work together in a spirit of cooperation and inform one another continuously about important measures and occurrences in their areas of responsibility. The overall responsibility of all Executive Board members notwithstanding, the individual members of the Executive Board oversee the areas of responsibility assigned to them in the Executive Board resolutions on their own responsibility. The principles of cooperation between Aurubis AG’s Executive Board members are stated in the rules of procedure for the Executive Board, which are issued by the Supervisory Board. These regulate, above all, the allocation of responsibilities between the individual Executive Board members, matters reserved for the full Executive Board, the passing of resolutions, the required majority for resolutions, and the rights and obligations of the Chief Executive Officer.
Certain Executive Board decisions of particular importance require the approval of the Supervisory Board. They are stipulated in a catalogue. For example, the Supervisory Board makes decisions about investments in other companies if the measure is of great significance for the Group, as well as about substantial capital expenditure measures.
The Executive Board keeps the Supervisory Board informed promptly and comprehensively, in written and verbal reports, as well as in the scheduled meetings, about the strategy, planning, business development, important business transactions, and the Group’s risk situation, including risk management and compliance, i.e., the measures to comply with legal requirements and the internal corporate guidelines. The Executive Board discusses in detail and provides reasons for deviations in the business performance from previously prepared budgets and targets.
COMPOSITION AND OBJECTIVES (DIVERSITY CONCEPT)The Executive Board of Aurubis AG consisted of two members at the start of the fiscal year (Mr. Jürgen Schachler as Chairman and
Corporate Governance
Aurubis Annual Report 2017/18
18

Dr. Stefan Boel). Mr. Rainer Verhoeven was appointed as the new Chief Financial Officer effective January 1, 2018. Dr. Stefan Boel left the company on July 30, 2018 by amicable and mutual agreement with the Supervisory Board. Dr. Thomas Bünger was appointed Chief Operating Officer on October 1, 2018.
When it comes to selecting the members of the Executive Board, the Supervisory Board focuses first and foremost on the members’ specialist knowledge and personal qualities. On the basis of their knowledge, skills, and professional experience, the Executive Board members must be able to fulfill their duties in a company operating within the copper/metal sector and to safeguard the Aurubis Group’s reputation in the public sphere.
Furthermore, the Supervisory Board adopted a diversity concept for the Executive Board on September 11, 2018. According to this concept, the Supervisory Board must, by taking into account aspects such as age, gender, education, and professional background, strive to put together an Executive Board that boasts a broad spectrum of skills, experience, and educational and professional backgrounds, as well as the requisite personal and specialist skills. As an additional criterion of the diversity concept, the Executive Board as a whole should exhibit a balanced age structure and thus include younger individuals who have experience with newer technical knowledge and leadership methods, as well as older individuals who have more professional, life, and management experience. With the same level of personal and professional suitability, both women and men should be represented in the Executive Board if possible. Pursuant to Section 111 (5) of the German Stock Corporation Act (AktG), the Supervisory Board passed a minimum target quota of 25 % for the proportion of women in the Executive Board by June 30, 2022.
With this diversity concept for the composition of the Executive Board, the Supervisory Board pursues the objective of achieving the highest level of diversity with respect to age, gender, education, and professional background. In this way, a variety of perspectives should be included in the management of the company, in addition to the high individual suitability of each of the members.
The Supervisory Board decides on the personality that should fill each concrete Executive Board position in the interest of the
company, taking all of the circumstances of the individual case into account.
STATUS OF TARGET IMPLEMENTATIONThe Supervisory Board dealt intensively with the topic of diversity in the Executive Board in general and in the case of personnel changes in the Executive Board. The diversity concept was implemented as far as possible in the process. For example, the composition of the Executive Board reflects different age groups, taking professional knowledge and personal suitability into consideration. The Executive Board members possess a broad spectrum of skills, experience, and educational and professional backgrounds, with some members holding business degrees and others, qualifications of a more technical nature.
However, it has not been possible so far to achieve the target for the proportion of female members. It should be considered that there have been only two personnel changes in the Executive Board since the 25 % target was established on June 7, 2017 (the appointments of Mr. Rainer Verhoeven and Dr. Thomas Bünger). With Mr. Verhoeven’s appointment, the candidate who in the Supervisory Board’s opinion was best qualified for the position of Chief Financial Officer was ultimately chosen. There were no female applicants for the position of Chief Operating Officer.
The Supervisory Board’s efforts to ensure that women are adequately represented among its ranks are ongoing.
In accordance with the legal stipulations of Section 76 (4) of the German Stock Corporation Act (AktG), there are also targets for the proportion of female employees in the first and second management levels under the Executive Board. With a resolution dated June 12, 2017, the Executive Board set a target of 20 % female employees for the first management level and a target of 25 % for the second management level. These targets should be achieved by June 30, 2022. Further increasing the number of women in management positions independently of legal regulations is an important goal for the Group.
As at the reporting date (September 30, 2018), the proportion of women was 11.8 % (previous year: 19.4 %) for the first management level below the Executive Board and 20 % (previous year: 20.4 %) for the second management level below the Executive Board. The proportion of women in the first management level therefore
Corporate Governance
Annual Report 2017/18 Aurubis
19

decreased slightly as at the reporting date, while the percentage in the second level was nearly the same.
On October 1, 2018, the proportion of women was 23.8 % for the first management level and 16 % for the second management level. This is due in part to the fact that the appointment of the Chief Operating Officer changed the rules of procedure, including the distribution of responsibilities among the Executive Board members.
In the first and second management levels under the Executive Board, there were limited open positions in the reporting period. For these, men and women were considered equally. The vacant positions were ultimately filled by the most suitable applicants.
The Executive Board continues to strive for a suitable consideration of women in the first and second management levels and maintains its targets.
The Executive Board did not form any committees in fiscal year 2017/18.
THE SUPERVISORY BOARDWORKING PROCEDURESThe Supervisory Board advises and monitors the Executive Board in the management of the company. It appoints and rescinds the contracts of Executive Board members, decides on the compensation system for Executive Board members, and specifies their respective total compensation. In the process, the Supervisory Board takes into account the relationship between Executive Board compensation and the compensation of the higher management level and the relevant workforce, as well as the market position of the company. It also defines the target pension level for Executive Board members. The Personnel Committee submits corresponding suggestions to the Supervisory Board.
The Supervisory Board is involved in strategy and planning work, and in all aspects of major significance for the company. The Supervisory Board has defined rights of veto in favor of the Supervisory Board for transactions of fundamental importance, particularly those that would significantly change the company’s net assets, financial position, and results of operations. In the case of important events, an extraordinary Supervisory Board meeting
is convened if deemed necessary. The Chairman of the Supervisory Board coordinates the work within the Supervisory Board, chairs their meetings, and attends to the affairs of the Supervisory Board externally. The Supervisory Board meets without the Executive Board as necessary.
The Supervisory Board has defined rules of procedure for its work. The representatives of the shareholders and the employees generally meet separately to prepare for the meetings.
COMPOSITION AND OBJECTIVES (DIVERSITY CONCEPT AND SKILLS PROFILE)The Supervisory Board of Aurubis AG, which exercises the co-determination principle, has twelve members in accordance with the Articles of Association. Six of these members are elected by the shareholders and six by the employees in accordance with the German Co-determination Act. The periods of office are identical. In accordance with the recommendations of the German Corporate Governance Code, the shareholders’ representatives were elected individually to the Supervisory Board in the last election at the Annual General Meeting on March 1, 2018. The Supervisory Board’s term of office amounts to five years; the current term of office ends at the close of the Annual General Meeting during which the resolution regarding the approval of the Supervisory Board members is passed for fiscal year 2021/22.
The Supervisory Board has designated concrete targets for its composition and compiled a skills profile for the entire Supervisory Board in alignment with the recommendations of the German Corporate Governance Code. The targets and the skills profile have been made permanently accessible at
www.aurubis.com/en/about-aurubis/company/supervisory-board.
Furthermore, the Supervisory Board established a diversity concept for its composition on September 11, 2018. It considers aspects such as age, gender, education, and professional background. In this way, the Supervisory Board as a whole should exhibit a balanced age structure and thus include both younger individuals and older individuals with professional and life experience.
During Supervisory Board elections, care must be taken to ensure not only that Supervisory Board members possess the requisite personal and professional skills, but also that the Board comprise
Corporate Governance
Aurubis Annual Report 2017/18
20

at least 30 % women and 30 % men, in accordance with the legal requirements.
The diversity concept stipulates that the Supervisory Board be composed of personalities that are suitable for office based not only on their personal and specialist skills, but also on their educational and professional backgrounds (the Supervisory Board should ideally comprise a broad range of educational and professional backgrounds).
With these targets for its composition, the Supervisory Board pursues the objective of achieving the highest possible level of diversity with respect to age, gender, education, and professional background. This should enable diverse perspectives, knowledge, and experience to be included in the work of Aurubis AG’s Supervisory Board.
The Supervisory Board strives to implement its diversity concept by considering the corresponding diversity aspects when making recommendations for the election of Supervisory Board members representing the shareholders. The Aurubis AG shareholders at the Annual General Meeting are responsible for the final decision on the composition of the Supervisory Board.
STATUS OF TARGET IMPLEMENTATIONThe Supervisory Board and the Nomination Committee took the criteria of the skills profile into consideration in the recommendations regarding the Supervisory Board elections at the Annual General Meeting in 2018 and 2019.
The diversity concept was implemented to the extent possible. In the Supervisory Board’s view, the side representing the shareholders demonstrates a balanced age structure that includes younger and older individuals. The Supervisory Board is composed of at least 30 % women and 30 % men in accordance with the legal requirements. The Supervisory Board members have different educational and professional backgrounds. Additional information regarding the Supervisory Board members’ personal and specialist skills is available in their CVs, which are permanently accessible at www.aurubis.com/en/about-aurubis/
company/supervisory-board.
In the Supervisory Board’s estimate, Prof. Dr. Karl Friedrich Jakob, Dr. Stephan Krümmer, Dr. Sandra Reich, Ms. Edna Schöne (until
her resignation from office on June 15, 2018), Ms. Andrea Bauer (starting June 22, 2018), and Prof. Dr. Fritz Vahrenholt were seen as independent shareholder members during fiscal year 2017/18 pursuant to Section 5.4.2 of the German Corporate Governance Code.
Taking into account the ownership structure, the Supervisory Board, with its five independent shareholder members, has a sufficient number of independent members who have no personal or professional relationships with the company, with its Supervisory Board or Executive Board, with a controlling shareholder, or with someone connected with an associated company that could be cause for a significant conflict of interest that is not merely temporary.
SUPERVISORY BOARD COMMITTEESThe Supervisory Board has formed four committees for its members to prepare and complement its work: the Personnel Committee, the Audit Committee, the Nomination Committee, and the Conciliation Committee. Some of the committees’ tasks, as well as their composition and work, are specified in the rules of procedure of the Supervisory Board. The committees’ compositions during the fiscal year are outlined in this Annual Report. The mandates of the Supervisory Board members in other legally formed Supervisory Boards and comparable German and foreign controlling bodies are also specified in this Annual Report.
Personnel CommitteeThe six-member Personnel Committee has equal numbers of shareholder and employee representatives. It considers the structure and level of compensation paid to all members of the Executive Board, prepares Executive Board contracts, and selects qualified candidates for Executive Board positions when preparing necessary Supervisory Board resolutions. The Chairman of the Personnel Committee is the Chairman of the Supervisory Board.
Audit CommitteeThe six-member Audit Committee with equal representation has the main task of monitoring the accounting process and overseeing the effectiveness of the internal control system, the risk management system, the internal auditing system, the annual audit, and compliance.
Corporate Governance
Annual Report 2017/18 Aurubis
21

The Audit Committee submits a preference and a justified recommendation for the choice of an auditor to the Supervisory Board. Where the auditing mandate is subject to an invitation to tender, at least two candidates are put forward. The Audit Committee monitors the independence of the auditors and furthermore concerns itself with the additional services performed by the auditors, the appointment of the auditors, the determination of the audit’s focus areas, and the agreement of the fee.
The Audit Committee Chairman during the fiscal year, Dr. Stephan Krümmer, has special expertise and experience in the application of accounting principles and internal control procedures, which he has gathered over the course of his career. He is not a former member of the company’s Executive Board whose appointment ended less than two years ago.
Nomination CommitteeThe Nomination Committee only has representatives of the shareholders in accordance with the German Corporate Governance Code. The Nomination Committee has the duty of suggesting suitable candidates for the Supervisory Board to propose for election to the Supervisory Board at the Annual General Meeting.
Conciliation CommitteeThe Conciliation Committee did not meet during the reporting year.
SHAREHOLDERS AND THE ANNUAL GENERAL MEETINGThe shareholders of Aurubis AG exercise their co-determination and supervisory rights at the Annual General Meeting, which occurs at least once a year. Resolutions are passed at the Annual General Meeting on all matters defined by law that are binding for all shareholders and the company. Each share grants the holder one vote in the Annual General Meeting voting processes. There are no different categories of shares.
The Annual General Meeting elects the members of the Supervisory Board, who are chosen by the shareholders without obligation to a particular nomination, and passes a resolution on the approval of the members of the Executive Board and Supervisory Board. It decides on the utilization of the unappropriated earnings and on capital measures and gives
approval to company agreements. Furthermore, it makes decisions about the compensation of the Supervisory Board and amendments to the company’s Articles of Association. The German Stock Corporation Act (AktG) stipulates that an extraordinary General Meeting can be convened in special cases.
Each shareholder who has registered in good time and can duly provide proof of their entitlement to participate in the Annual General Meeting and exercise their voting rights is entitled to attend the Annual General Meeting. Shareholders who cannot or do not wish to attend the Annual General Meeting in person may authorize a bank, a shareholders’ association, the proxies designated by Aurubis AG (who are under obligation to follow the shareholders’ instructions), or another person of their choice to exercise their voting rights. The shareholders also have the option of submitting their votes online before the Annual General Meeting. Aurubis AG will give further details in the invitation to the Annual General Meeting.
The invitation to the Annual General Meeting and the relevant reports and information for the resolutions are published in accordance with German stock corporation law and made available in English and German on the Aurubis AG website.
CONTROLLING/RISK MANAGEMENT AND COMPLIANCEThe company’s responsible handling of risks is also part of good corporate governance. As part of our value-oriented Group management, adequate risk management ensures that risks are identified early on and risk positions are minimized. Risk management reports regularly to the Executive Board and the Supervisory Board’s Audit Committee. Details of risk management at Aurubis AG are given in the Risk Report. This includes the report on the accounting-related internal control and risk management system required pursuant to Section 289 (4) and Section 315 (4) of the German Commercial Code (HGB).
The Executive Board ensures adherence to legal requirements and the internal company guidelines, and works toward compliance across all Group companies. The compliance management system was expanded further again during fiscal year 2017/18 so as to comply with the requirements resulting from the legal stipulations and the Code of Conduct.
Corporate Governance
Aurubis Annual Report 2017/18
22

Compliance is ensured in the company by means of prevention, controls, and sanctions. Preventive measures include internal regulations, guidance, and particularly the training of employees. In the event that violations of laws or internal regulations are detected, labor, civil, or criminal penalties are imposed.
The company’s Chief Compliance Officer is the central point of contact for all compliance-relevant issues. He reports regularly to the Executive Board and the Supervisory Board’s Audit Committee. At the individual Group sites, local compliance officers are available as a point of contact for employees.
Employees are also given the opportunity to provide anonymous tips regarding legal violations in the company by means of a whistleblower hotline operated by an external service provider. This option can also be used by third parties.
DIRECTORS’ DEALINGSPursuant to Article 19 of the Market Abuse Regulation (EU 596/2014), the members of Aurubis AG’s Executive and Supervisory Boards, certain employees in management positions, and people closely associated with them are required to disclose acquisitions and sales of company shares and related financial instruments. This does not apply if the total transactions per person do not exceed € 5,000 per calendar year.
There were no directors’ dealings subject to disclosure in fiscal year 2017/18.
FINANCIAL REPORTING AND ANNUAL AUDITAurubis AG prepares its consolidated financial statements and Management Report, as well as the consolidated interim reports, in accordance with International Financial Reporting Standards (IFRS) as they should be applied in the European Union. The financial statements of Aurubis AG are issued in compliance with the German Commercial Code (HGB) and the German Stock Corporation Act (AktG). The financial statements of Aurubis AG and the consolidated financial statements, as well as the Management Report, are compiled by the Executive Board and examined by the auditors and the Supervisory Board. Aurubis AG released a Combined Management Report for Aurubis AG and the Aurubis Group for fiscal year 2017/18. The interim report and the quarterly reports are discussed by the Audit Committee and the Executive Board before publication.
The company’s auditor was elected at the Annual General Meeting in compliance with the provisions of the German Stock Corporation Act. PricewaterhouseCoopers GmbH Wirtschaftsprüfungsgesellschaft, Hamburg, was appointed auditor of the 2017/18 consolidated financial statements and the Combined Management Report, as well as the 2017/18 HGB financial statements of Aurubis AG. PricewaterhouseCoopers GmbH Wirtschaftsprüfungsgesellschaft, Hamburg, has been the appointed auditor since fiscal year 2008/09. The fiscal year 2017/18 audit therefore marked the tenth time it had audited Aurubis.
The responsible auditor for fiscal year 2017/18 was Mr. Claus Brandt, who audited the Group and the company for the second time. Before submitting the proposal for the election of the auditors, the Supervisory Board obtained the declaration from Pricewaterhouse-Coopers GmbH Wirtschaftsprüfungsgesellschaft on their independence as specified by the German Corporate Governance Code. The audits were performed in accordance with German auditing regulations, taking into account the generally accepted standards for the audit of financial statements promulgated by the German Institute of Public Auditors; in addition, the International Standards on Auditing were also observed. The audits also covered risk management and compliance with reporting obligations on corporate governance in accordance with Section 161 of the German Stock Corporation Act (AktG).
Furthermore, it was also agreed with the auditors that they would inform the Supervisory Board without delay about any possible grounds for exclusion or lack of impartiality and about the main findings and incidents arising during the audit.
Hamburg, December 2018
For the Executive Board
Jürgen Schachler Rainer Verhoeven Chairman Member
Corporate Governance
Annual Report 2017/18 Aurubis
23

Compensation report for the Executive Board and the Supervisory Board of Aurubis AG
The following compensation report is part of the Combined Management Report. It outlines the structure and level of the Aurubis AG’s Executive Board and Supervisory Board compensation.
COMPENSATION FOR THE EXECUTIVE BOARDThe Supervisory Board defines the total compensation of the individual Executive Board members on the basis of proposals from the Personnel Committee and decides on and reviews the compensation system for the Executive Board at regular intervals.
In 2017, the Supervisory Board fundamentally revised the compensation system, working together with an independent external compensation expert. The new compensation system complies with the requirements of the German Stock Corporation Act (AktG) and the German Corporate Governance Code, particularly Section 4.2.3 of the German Corporate Governance Code. The participants of the Annual General Meeting approved the new compensation system pursuant to Section 120 (4) of the German Stock Corporation Act (AktG) on March 1, 2018.
Because of the responses of some investors, the Supervisory Board decided to change the composition of the annual bonus. The Supervisory Board passed a resolution on this adjustment on September 11, 2018.
Specifically, as of October 1, 2018, the annual bonus is calculated with a higher weighting of 60 % (previously 50 %) according to the target set for the fiscal year for the operating EBT components, and a lower weighting of 40 % (previously 50 %) according to the assessment of the Executive Board member’s individual performance for the respective fiscal year.
In light of the fundamental revision of the German Corporate Governance Code (DCGK) and the German draft bill on transposing the second EU Shareholder Rights Directive (EU 2017/828, ARUG II), the Supervisory Board is currently refraining from further revision of the compensation system. Both the draft of the German Corporate Governance Code and the German draft bill on transposing EU 2017/828 include
extensive regulations on compensation for the advisory bodies of exchange-listed companies. As of now, both the German Corporate Governance Code and the German law on transposing EU 2017/828 are expected to be passed in summer 2019.
Because the compensation system for Executive Board members will have to be reviewed, adjusted, and presented again at the Annual General Meeting anyway due to these developments, the company will refrain from taking a vote on the compensation system at the 2019 Annual General Meeting.
The new compensation system applies to Chief Financial Officer Mr. Rainer Verhoeven and to Chief Operating Officer Dr. Thomas Bünger, the latter of whom was appointed on October 1, 2018. For the Executive Board members Mr. Jürgen Schachler (until June 30, 2019) and Dr. Stefan Boel (Executive Board member until July 31, 2018), the old compensation system applies and will initially continue to apply.
PREVIOUS COMPENSATION SYSTEM FOR THE EXECUTIVE BOARDThe compensation is defined in the employment contracts and consists of a series of coordinated compensation components.
Specifically, these components are fixed compensation, variable compensation, fringe benefits, and pension plans.
Fixed componentsThe fixed portion consists of fixed compensation, fringe benefits, and pension plans. The annual fixed compensation amounts to € 600,000 for the Executive Board Chairman and € 420,000 for ordinary Executive Board members, and is paid out monthly in equal installments.
Additionally, the Executive Board members receive fringe benefits in the form of benefits in kind, which primarily consist of insurance premiums and company car use and are assessed according to tax guidelines.
Mr. Schachler and Dr. Boel receive defined contribution pension plans from the company. Annual contributions of € 140,000 for Mr. Schachler and € 100,000 for Dr. Boel are/were paid to an insurance company.
Corporate Governance
Aurubis Annual Report 2017/18
24

Both of these Executive Board members additionally have a defined contribution company pension plan. The pension plan is designed as a capital commitment. At the end of every fiscal year, € 120,000 for the Chief Executive Officer and € 80,000 for each ordinary Executive Board member is paid into liability insurances.
The respective Executive Board member can use the accumulated capital after reaching the age of 62 at the earliest – however, not before ceasing to be employed by the company.
Variable componentsThe old system of variable compensation includes two components, which are paid out annually. The first component (Component I) is dependent on achieving an annual target related to adjusted average consolidated EBT (earnings before taxes) for the Group for three years, and in each case relating to the current fiscal year and to the two fiscal years preceding it. The target is EBT derived from ROCE (return on capital employed)
Glossary, page 183 of 15 %. If the EBT is less than 40 % of the target, Component I is not paid. The target bonus from Component I can reach a maximum of 100 % (cap). The maximum amount that can be reached from these components in the case of 100 % target achievement is € 750,000 for the Chief Executive Officer and € 500,000 for each ordinary Executive Board member.
Component II stipulates an annual assessment of the joint (Component II a) and individual (Component II b) performance of the Executive Board by the Supervisory Board. Both components are based on a qualitative, criteria-supported assessment of sustainable company management. The target bonus from Component II can reach a maximum of 100 % (cap). A payout of a minimum of 50 % of the target bonus always occurs unless this is unreasonable within the meaning of Section 87 (2) of the German Stock Corporation Act (AktG). The maximum amount that can be reached from each of the Components II a and II b is € 250,000 for the Chief Executive Officer and € 175,000 for each ordinary Executive Board member.
The target bonus for Component I is 60 % of the total variable compensation; the target bonus for Component II is 40 %.
Premature terminationThe employment contracts for the Executive Board members do not contain Change of Control clauses.
EXPLANATION OF THE NEW COMPENSATION SYSTEM FOR THE EXECUTIVE BOARDThe new compensation system also consists of fixed and variable components. The compensation structure includes maximum limits, both overall and with regard to its variable compensation components. The new compensation system applies to Chief Financial Officer Mr. Verhoeven and to Chief Operating Officer Dr. Bünger, the latter of whom was appointed on October 1, 2018.
The variable compensation components contain annual and multiannual components. The details of the various compensation components are as follows:
Fixed componentsThe fixed compensation components consist of fixed compensation, pension plans, and fringe benefits.
The annual fixed compensation amounts to € 420,000 for Mr. Verhoeven and is paid out monthly in equal installments.
The pension plans have not changed in comparison with the old compensation system.
Mr. Verhoeven receives an entitlement for the company pension plan in the form of a pension commitment. Aurubis AG’s contribution amounts to € 100,000 per year. The contributions are paid into liability insurances.
Mr. Verhoeven also has a defined contribution company pension plan in the form of a capital commitment. Aurubis AG’s contribution amounts to € 80,000 for him per year. Mr. Verhoeven can use the accumulated capital after reaching the age of 62 at the earliest – however, not before ceasing to be employed by the company.
Corporate Governance
Annual Report 2017/18 Aurubis
25

Additionally, Mr. Verhoeven receives fringe benefits in the form of benefits in kind, which primarily consist of insurance premiums and company car use, and are assessed according to tax guidelines.
At its discretion, the Supervisory Board can grant special compensation for exceptional performance that is not covered by the regular compensation. This is stipulated in the employment contract. However, the total cap may not be exceeded. No special compensation was granted in fiscal year 2017/18. The Supervisory Board most recently granted one-time special compensation in fiscal year 2015/16 for additional interim duties performed in the Executive Board by Dr. Boel and Mr. Faust, the latter of whom served as Executive Board Spokesman until Mr. Schachler filled the vacant position of Executive Board Chairman on July 1, 2016.
Variable componentsThe system for variable compensation includes both annual variable compensation (annual bonus) and multiannual variable compensation, which is forward-looking. The multiannual, forward-looking variable compensation consists of both a “Performance Cash Plan” over three fiscal years and stock deferred over two fiscal years (virtual stock). The ratio of multiannual to annual variable compensation is 60:40.
Variable compensation
FY 2017/18
Annual variable compensationMulti-annual variable compensation
FY 2018/19 FY 2019/20
Deferred stock
Performance cash
Annual bonus
40 %
20 %
40 %
Annual bonusTwo-thirds of the annual variable compensation (the annual bonus) is paid out after the end of the fiscal year and amounts to € 272,000 (max. € 340,000) for Mr. Verhoeven in the case of 100 % target achievement. The remaining one-third of the annual bonus is transferred to a virtual two-year stock deferral plan.
Until September 30, 2018, the annual bonus was calculated with a weighting of 50 % according to the target set for the fiscal year for the operating EBT components, and a weighting of 50 % according to the assessment of the individual performance for the respective fiscal year, both multiplied by the target value defined in the Executive Board contract.
Starting October 1, 2018, the annual bonus for Mr. Verhoeven is calculated with a weighting of 60 % according to the target set for the fiscal year for the operating EBT components, and a weighting of 40 % according to the assessment of the Executive Board member’s individual performance for the respective fiscal year, both multiplied by the target value defined in the Executive Board contract.
Corporate Governance
Aurubis Annual Report 2017/18
26

Annual bonus operating principle
Target value
Cash payout(capped at 125 % of the target value)
Target achievement (0 %–125 %)
x
FY n
=
60 % 40 %Weighting
+Operating EBTIndividual
performance assessment for Executive Board members
Criteria » Strategic corporate development » Employees and leadership » Corporate social responsibility
Target achievement for the operating EBT is determined on the basis of an actual/actual comparison. The actual value of the operating EBT in the respective fiscal year is compared with the actual value of the operating EBT of the fiscal year preceding the current fiscal year (previous year). For an unchanged operating EBT compared to the previous year, the target attainment is 100 %. If the operating EBT is increased by 20 %, the maximum value of 125 % target achievement is reached. For an operating EBT of minus 40 % compared to the previous year, the minimum value of 62.5 % target achievement is reached. Target achievement between these points (62.5 %, 100 %, 125 %) is interpolated in a linear manner. If the maximum value is reached, further increases to the operating EBT do not lead to an additional increase of the target attainment. If the minimum value is not reached, the target attainment is 0 %. If the operating EBT is negative for both the previous year and the respective fiscal year, the Supervisory Board is authorized to set the target attainment according to its discretion. If a positive operating EBT was achieved in the previous year and a negative EBT in the respective fiscal year, the target attainment amounts to 0 %. The annual bonus rewards operating consolidated earnings growth and thereby a strengthening of the company’s profitability as compared with the previous year’s EBT.
Calibrating the performance targets – EBT
The same performance compared to the previous year corresponds to a payout factor
of 100 % of the target value.
EBT – actual value FY n
EBT – actual value FY n -1
–40 % 0 % 20 %
62.5 %
100 %
Payo
ut fa
ctor 125 %
EBT deviation compared to previous year
Comparison
Individual performance is evaluated by the Supervisory Board and is based on criteria previously defined in the employment contract. Currently, strategic company development, employees and leadership, and corporate social responsibility are designated as criteria for assessing individual performance. The Supervisory Board can set the degree of target attainment between 0 % and 125 %. Furthermore, the Supervisory Board can, at its discretion, reduce the annual bonus in the event of extraordinary, unforeseeable developments (Section 87 (1) sentence 3 (second half of the sentence) of the German Stock Corporation Act).
The annual bonus stipulates a target value cap of 125 % for Mr. Verhoeven. Therefore, the annual bonus can amount to a maximum of € 510,000.
Two-thirds of the annual bonus is paid out directly after the end of the fiscal year. The last third is paid into the stock deferral, which is explained below. There is also a cap on the deferred stock payout.
Corporate Governance
Annual Report 2017/18 Aurubis
27

Deferred stockIn order to guarantee a focus on stock for the variable compensation, one-third of the annual bonus flows into a virtual stock deferral plan. The stock deferral plan stipulates a two-year, forward-looking assessment basis and amounts to € 136,000 for Mr. Verhoeven in the case of 100 % target attainment.
The number of virtual shares at the beginning of the two-year vesting period is calculated by dividing one-third of the annual bonus by the starting share price. The starting share price is designated by the arithmetic average of the Xetra closing price for Aurubis shares on the Frankfurt Stock Exchange over the last 30 trading days before the beginning of the two-year deferral term.
Deferred stock operating principle
1/3 of the annual bonus
Number of virtual shares
Beginning share price 1
Vesting period (2 years)
/
FY n
+1FY
n+2
FY n
+3
=
Number of virtual shares
Cash payout (capped at 150 % of the maximum initial value)
Final share price 2
x
=
80
100
120
140
160
Starting price
Final price
1 Arithmetic average of the Xetra closing price for Aurubis shares on the Frankfurt Stock Exchange over the last 30 trading days before the beginning of the vesting period.
2 Arithmetic average of the Xetra closing price for Aurubis shares on the Frankfurt Stock Exchange over the last 30 trading days before the end of the vesting period.
At the end of the two-year term, the number of virtual shares is multiplied by the closing share price. The closing share price also results from the arithmetic average of the Xetra closing price for Aurubis shares on the Frankfurt Stock Exchange over the last 30 trading days, this time before the end of the term. The resulting amount is paid out to the Executive Board members in cash at the end of the two-year term. However, the amount of the payout is limited to 150 % of the initial value (corresponding to one-third of the annual bonus). The payout from the stock deferral plan for Mr. Verhoeven is limited to € 255,000.
Performance Cash PlanThe Performance Cash Plan stipulates a three-year, forward-looking assessment basis. The relevant performance target is the average operating return on capital employed (ROCE) over the three-year period, as identified in the Annual Report. The amount paid out is calculated by multiplying the target set at the end of the three-year period for the operating ROCE by the target value of the Performance Cash Plan specified in the Executive Board contract. The target value currently amounts to € 272,000 for Mr. Verhoeven. The calculated amount to be paid out is limited to 125 % of the target and can therefore reach a maximum of € 340,000. Furthermore, the Supervisory Board can, at its discretion, reduce the Performance Cash Bonus in the event of extraordinary, unforeseeable developments (Section 87 (1) sentence 3 (second half of the sentence) of the German Stock Corporation Act).
In order to determine the final target achievement for the Performance Cash Plan, the average operating ROCE achieved during the period (calculated annually after the respective fiscal years) is calculated at the end of the three-year period. The Supervisory Board determines an amount for 100 % target achievement (“target value”) for the average operating ROCE, as well as amounts for 50 % target achievement (“minimum value”) and 125 % target achievement (“maximum value”). The target value of the average operating ROCE for the three-year time period for the fiscal years from 2017/18 up to and including 2019/20 amounts to 12 %, with the minimum value being 6 % and the maximum value 15 %. The same target values also apply for the next three-year period from 2018/19 up to and including 2020/21. Target achievement between these points (50 %, 100 %, 125 %) is interpolated in a linear manner. If the minimum value is
Corporate Governance
Aurubis Annual Report 2017/18
28

not reached, there is no payout from the Performance Cash Plan. If the maximum value is reached, further increases to the average operating ROCE do not lead to an additional increase of the target achievement. The Performance Cash Plan incentivizes the generation of a positive value contribution by means of an ambitious ROCE target range. The payout takes place at the end of the respective three-year period in cash.
Performance Cash Plan operating principle
Target value
Target achievement (0 –125 %)
3-year Ø operating ROCE
Performance period (3 years)
xCash payout
(capped at 125 % of the target value)
=
FY n FY n+1 FY n+2 FY n+3
Calibrating the performance targets – ROCE
An average ROCE of 12 % corresponds to a payout factor of
100 % of the target value
Ø ROCE actual value FY n – FY n+2ROCE target value
6 % 12 % 15 %
50 %
100 %
Payo
ut fa
ctor
125 %
3 years Ø ROCE
Comparison
Total capIn total (fixed and variable components), compensation for Mr. Verhoeven is limited to an amount of € 1,355,000. Fringe benefits and benefit contributions from pension plans do not fall under the total cap.
Premature terminationIn the event of a premature termination of an Executive Board position without good cause, a severance payment will be made within the scope of the new compensation system. Such payment is limited to two years’ total annual compensation in accordance with the German Corporate Governance Code recommendations, and does not provide compensation for any period longer than the remaining term of the employment contract. The employment contracts for the Executive Board members do not contain Change of Control clauses.
AMOUNT OF COMPENSATION FOR THE EXECUTIVE BOARD IN FISCAL YEAR 2017/18In total, compensation for active Executive Board members for activities in fiscal year 2017/18 amounted to € 3,812,280, including pension expenses (€ 570,000) and expenses for the virtual stock deferral plan (€ 93,149).
Dr. Boel left the company at the close of July 31, 2018 by amicable and mutual agreement with the Supervisory Board. The termination agreement includes the payment of the fixed and variable income components until July 31, 2018. The variable components will be paid out in January 2019. Moreover, Dr. Boel will receive a one-time gross payment of € 1,600,000. The contributions to the defined contribution pension commitment and the defined contribution company pension plan for Dr. Boel were paid proportionally until July 31, 2018.
The company has set up pension provisions on the basis of IFRS for the Executive Board members. In the reporting year, allocations to pension provisions for the active Executive Board members amounted to € 570,000. This amount comprises contributions to an external pension fund.
Former members of the Executive Board and their surviving dependents received a total of € 2,246,373 in fiscal year 2017/18, while € 27,403,439 (in accordance with HGB) and € 32,259,232 (in accordance with IAS) has been provided for their pension entitlements.
Individual details can be found in the following tables:
Corporate Governance
Annual Report 2017/18 Aurubis
29

Benefits granted
in €Fixed
compensationFringe
benefits Total
Variable compensation
for one year
Variable compensation
for several years
Variable compensation
for several years: deferred stock
Variable compensation
for several years: Performance
Cash Plan TotalPension
expenses 1Total
compensation
Jürgen Schachler Executive Board Chairman since July 1, 2016
2016/17 570,000 19,586 589,586 475,000 686,850 1,751,436 260,000 2,011,436
2017/18 600,000 22,474 622,474 500,000 504,750 1,627,224 260,000 1,862,224
Min. 600,000 22,474 622,474 250,000 0 872,474 260,000 1,132,474
Max. 600,000 22,474 622,474 500,000 750,000 1,872,474 260,000 2,132,474
Dr. Stefan Boel 2 Executive Board member from April 19, 2008 to July 31, 2018
2016/17 399,000 18,389 417,389 332,500 457,900 1,207,789 180,000 1,387,789
2017/18 350,000 15,651 365,651 291,667 280,417 937,735 150,000 1,087,735
Min. 350,000 15,651 365,651 145,834 0 511,485 150,000 661,485
Max. 350,000 15,651 365,651 291,667 416,667 1,073,985 150,000 1,223,985
Rainer Verhoeven 3 Executive Board member since January 1, 2018
2016/17 0 0 0
2017/18 315,000 10,754 325,754 199,594 99,797 240,720 865,865 160,000 1,025,864
Min. 315,000 10,754 325,754 0 0 0 325,754 160,000 485,754
Max. 315,000 10,754 325,754 255,000 191,250 255,000 1,027,004 160,000 1,187,004
Total 2016/17 969,000 37,975 1,006,975 807,500 1,144,750 2,959,225 440,000 3,399,225
2017/18 1,265,000 48,879 1,313,879 991,261 841,250 99,797 240,720 3,430,824 570,000 4,000,824
Min. 1,265,000 48,879 1,313,879 395,834 0 0 0 1,709,713 570,000 2,279,713
Max. 1,265,000 48,879 1,313,879 1,046,667 1,166,667 191,250 255,000 3,973,463 570,000 4,543,463
Inflow
in €Fixed
compensationFringe
benefits Total
Variable compensation
for one year
Variable compensation
for several years
Variable compensation
for several years: deferred stock
Variable compensation
for several years: Performance
Cash Plan TotalPension
expenses 1Total
compensation
Jürgen Schachler Executive Board Chairman since July 1, 2016
2016/17 570,000 19,586 589,586 475,000 686,850 1,751,436 260,000 2,011,436
2017/18 600,000 22,474 622,474 475,000 559,500 1,656,974 260,000 1,916,974
Dr. Stefan Boel Executive Board member from April 19, 2008 to July 31, 2018
2016/17 399,000 18,389 417,389 299,250 460,750 1,177,389 180,000 1,357,389
2017/18 350,000 15,651 365,651 262,500 310,833 938,984 150,000 1,088,984
Rainer Verhoeven Executive Board member since January 1, 2018
2016/17 0 0 0 0 0 0 0 0
2017/18 2 315,000 10,754 325,754 227,419 0 0 4 0 553,173 160,000 713,173
Total
2016/17 969,000 37,975 1,006,975 774,250 1,147,600 2,928,825 440,000 3,368,825
2017/18 1,265,000 48,879 1,313,879 964,919 870,333 3,149,131 570,000 3,719,1311 Pension expenses in accordance with the German Commercial Code (HGB) amounted to € 150,000 € (previous year: € 180,000) for
Dr. Stefan Boel, € 160,000 for Rainer Verhoeven, and € 260,000 (previous year: € 260,000) for Jürgen Schachler.2 Refers to compensation for the time period from October 1, 2017 to July 31, 2018.3 Refers to compensation for the time period from January 1, 2018 to September 30, 2018.4 The fair value based on planning data amounts to € 93,149. The subscription right for deferred stock in 2017/18 applies to 1,883 virtual shares.
Dr. Boel received severance pay of € 1,600,000.The variable multiannual compensation for fiscal year 2017/18 is determined according to the ratio of the operating actual-to-target EBT relating to the Aurubis Group and the average of the fiscal years 2015/16, 2016/17, and 2017/18. The average actual EBT is € 280 million and represents a target achievement of 75 %.
Corporate Governance
Aurubis Annual Report 2017/18
30

Benefits granted
in €Fixed
compensationFringe
benefits Total
Variable compensation
for one year
Variable compensation
for several years
Variable compensation
for several years: deferred stock
Variable compensation
for several years: Performance
Cash Plan TotalPension
expenses 1Total
compensation
Jürgen Schachler Executive Board Chairman since July 1, 2016
2016/17 570,000 19,586 589,586 475,000 686,850 1,751,436 260,000 2,011,436
2017/18 600,000 22,474 622,474 500,000 504,750 1,627,224 260,000 1,862,224
Min. 600,000 22,474 622,474 250,000 0 872,474 260,000 1,132,474
Max. 600,000 22,474 622,474 500,000 750,000 1,872,474 260,000 2,132,474
Dr. Stefan Boel 2 Executive Board member from April 19, 2008 to July 31, 2018
2016/17 399,000 18,389 417,389 332,500 457,900 1,207,789 180,000 1,387,789
2017/18 350,000 15,651 365,651 291,667 280,417 937,735 150,000 1,087,735
Min. 350,000 15,651 365,651 145,834 0 511,485 150,000 661,485
Max. 350,000 15,651 365,651 291,667 416,667 1,073,985 150,000 1,223,985
Rainer Verhoeven 3 Executive Board member since January 1, 2018
2016/17 0 0 0
2017/18 315,000 10,754 325,754 199,594 99,797 240,720 865,865 160,000 1,025,864
Min. 315,000 10,754 325,754 0 0 0 325,754 160,000 485,754
Max. 315,000 10,754 325,754 255,000 191,250 255,000 1,027,004 160,000 1,187,004
Total 2016/17 969,000 37,975 1,006,975 807,500 1,144,750 2,959,225 440,000 3,399,225
2017/18 1,265,000 48,879 1,313,879 991,261 841,250 99,797 240,720 3,430,824 570,000 4,000,824
Min. 1,265,000 48,879 1,313,879 395,834 0 0 0 1,709,713 570,000 2,279,713
Max. 1,265,000 48,879 1,313,879 1,046,667 1,166,667 191,250 255,000 3,973,463 570,000 4,543,463
Inflow
in €Fixed
compensationFringe
benefits Total
Variable compensation
for one year
Variable compensation
for several years
Variable compensation
for several years: deferred stock
Variable compensation
for several years: Performance
Cash Plan TotalPension
expenses 1Total
compensation
Jürgen Schachler Executive Board Chairman since July 1, 2016
2016/17 570,000 19,586 589,586 475,000 686,850 1,751,436 260,000 2,011,436
2017/18 600,000 22,474 622,474 475,000 559,500 1,656,974 260,000 1,916,974
Dr. Stefan Boel Executive Board member from April 19, 2008 to July 31, 2018
2016/17 399,000 18,389 417,389 299,250 460,750 1,177,389 180,000 1,357,389
2017/18 350,000 15,651 365,651 262,500 310,833 938,984 150,000 1,088,984
Rainer Verhoeven Executive Board member since January 1, 2018
2016/17 0 0 0 0 0 0 0 0
2017/18 2 315,000 10,754 325,754 227,419 0 0 4 0 553,173 160,000 713,173
Total
2016/17 969,000 37,975 1,006,975 774,250 1,147,600 2,928,825 440,000 3,368,825
2017/18 1,265,000 48,879 1,313,879 964,919 870,333 3,149,131 570,000 3,719,1311 Pension expenses in accordance with the German Commercial Code (HGB) amounted to € 150,000 € (previous year: € 180,000) for
Dr. Stefan Boel, € 160,000 for Rainer Verhoeven, and € 260,000 (previous year: € 260,000) for Jürgen Schachler.2 Refers to compensation for the time period from October 1, 2017 to July 31, 2018.3 Refers to compensation for the time period from January 1, 2018 to September 30, 2018.4 The fair value based on planning data amounts to € 93,149. The subscription right for deferred stock in 2017/18 applies to 1,883 virtual shares.
Dr. Boel received severance pay of € 1,600,000.The variable multiannual compensation for fiscal year 2017/18 is determined according to the ratio of the operating actual-to-target EBT relating to the Aurubis Group and the average of the fiscal years 2015/16, 2016/17, and 2017/18. The average actual EBT is € 280 million and represents a target achievement of 75 %.
Corporate Governance
Annual Report 2017/18 Aurubis
31

COMPENSATION FOR THE SUPERVISORY BOARD
Supervisory Board compensation for fiscal year 2017/18in €
Name
Fixed compensation
Compensation for committee
membership Attendance fees Total
Prof. Dr. Fritz Vahrenholt 2016/17 75,000 22,500 11,000 108,500
2017/18 162,945 44,489 17,000 224,434
Renate Hold-Yilmaz 2016/17 150,000 25,000 14,000 189,000
2017/18 150,000 25,000 18,000 193,000
Andrea Bauer 2016/17
2017/18 20,753 1,706 2,000 24,459
Burkhard Becker 2016/17 75,000 22,500 11,000 108,500
2017/18 31,233 9,370 10,000 50,603
Dr. Bernd Drouven 2016/17 75,000 30,000 11,000 116,000
2017/18 31,233 12,494 6,000 49,727
Dr.-Ing. Joachim Faubel 2016/17 75,000 0 5,000 80,000
2017/18 31,233 0 6,000 37,233
Prof. Dr.-Ing. Heinz Jörg Fuhrmann 2016/17 225,000 50,000 12,000 287,000
2017/18 137,466 46,911 19,000 203,377
Karl-Heinz Hamacher 2016/17
2017/18 43,973 8,795 5,000 57,768
Prof. Dr. Karl Friedrich Jakob 2016/17
2017/18 43,973 13,192 9,000 66,165
Jan Koltze 2016/17 75,000 15,000 9,000 99,000
2017/18 75,000 15,000 14,000 104,000
Dr. Stephan Krümmer 2016/17
2017/18 43,973 21,986 8,000 73,959
Dr. Elke Lossin 2016/17
2017/18 43,973 8,795 7,000 59,768
Dr. Sandra Reich 2016/17 75,000 7,500 5,000 87,500
2017/18 75,000 11,898 13,000 99,898
Stefan Schmidt 2016/17
2017/18 43,973 8,795 8,000 60,768
Edna Schöne 2016/17
2017/18 21,986 2,199 1,000 25,185
Dr. med. Dipl.-Chem. Thomas Schultek 2016/17 75,000 22,500 11,000 108,500
2017/18 31,233 9,370 6,000 46,603
Rolf Schwertz 2016/17 75,000 0 5,000 80,000
2017/18 31,233 0 6,000 37,233
Melf Singer 2016/17
2017/18 43,973 4,397 5,000 53,370
Ralf Winterfeldt 2016/17 75,000 22,500 8,000 105,500
2017/18 31,233 9,370 6,000 46,603
Dr.-Ing. Ernst J. Wortberg 2016/17 75,000 37,500 11,000 123,500
2017/18 31,233 15,616 10,000 56,849
Total 2016/17 1,125,000 255,000 113,000 1,493,000
2017/18 1,125,619 269,383 176,000 1,571,002
Corporate Governance
Aurubis Annual Report 2017/18
32

The compensation for the Supervisory Board was redefined at the Annual General Meeting with effect from October 1, 2015 and is governed by Section 12 of Aurubis AG’s Articles of Association. It is oriented towards the various demands of the Supervisory Board and its committees.
All Supervisory Board members receive fixed compensation of € 75,000 per fiscal year each, in addition to the reimbursement of expenses incurred while performing their duties. The Supervisory Board Chairman receives three times, the Deputy Chairman two times that amount.
Supervisory Board members who serve on the Personnel and/or Audit Committee additionally receive fixed compensation of € 15,000 per fiscal year per committee. Supervisory Board members who serve on the other Supervisory Board committees additionally receive fixed compensation of € 7,500 per fiscal year per committee. Supervisory Board members who chair a Supervisory Board committee receive twice that amount per fiscal year for each committee chairmanship.
The fixed compensation for committee activity is limited to € 25,000 per fiscal year for each Supervisory Board member, in accordance with Section 12 (2) of the Articles of Association. The limit for every committee chairmanship is € 50,000 per fiscal year.
Supervisory Board members who do not belong to the Supervisory Board or one of its committees for a full fiscal year receive compensation commensurate with the duration of their service.
Furthermore, Supervisory Board members receive an attendance fee of € 1,000 for each meeting of the Supervisory Board and of its committees attended.
On this basis, the Supervisory Board members received a total of € 1,571,002. Supervisory Board compensation for fiscal year 2017/18,
page 32
Hamburg, December 10, 2018
For the Executive Board
Jürgen Schachler Rainer Verhoeven Chairman Member
The Supervisory Board
Prof. Dr. Fritz Vahrenholt Chairman
Corporate Governance
Annual Report 2017/18 Aurubis
33

SustainabilityNON-FINANCIAL REPORT
Introduction
With this separate Non-Financial Report (NFR), Aurubis fulfills its obligation to disclose non-financial information for fiscal year 2017/18 pursuant to Sections 315b and 315c in conjunction with Sections 289c to 289e of the German Commercial Code (HGB).
At Aurubis, sustainability is a significant part of our conduct and therefore plays a key role in our activities. A responsible approach to employees, suppliers, customers, and neighbors is a matter of course for us, whether in direct business operations or in the surrounding areas. The same applies to our environment, as we are aware of the limits of natural resources and want to keep negative impacts from our business activities to a minimum.
When introducing our company Vision in 2017, we established the objective of developing Aurubis from a copper producer to a multi-metal group by 2025. The Vision is summarized with the phrases “Passion for metallurgy. Metals for progress. Together with you.” To advance this transformation process, we revised our Group strategy in the same year. It comprises three areas: Growth, Efficiency, and Responsibility. Sustainability is an integral component of the Group strategy, which illustrates the high priority placed on responsible corporate governance at Aurubis.
We aim to enhance our sustainability achievements continuously, beyond the legal requirements. One contribution to this goal is the implementation of the Aurubis Sustainability Strategy, which outlines the action areas for the coming years.
We make our sustainability achievements transparent in a variety of ways. These include participation in sustainability rankings, active dialogue with the related agencies, involvement in the CDP (formerly the Carbon Disclosure Project) Glossary, page 182, and the voluntary reporting of the past several years. This reporting is oriented to the reporting standard of the Global Reporting Initiative (GRI) Glossary, page 182, as well as the Mining and Metals Sector Disclosures. In this separate Non-Financial Report, we use the GRI Sustainability Reporting Standards as a guide in describing the concepts and selected KPIs. We plan to continue our comprehensive reporting in accordance with GRI for 2019.
We communicate regularly with our key stakeholders about sustainability-related topics. We believe it is important to maintain a dialogue with employees, customers, suppliers, politics and society, capital market participants, the media, non-governmental organizations, and the scientific community.
Aurubis AG is the parent company of the Aurubis Group and is based in Hamburg, with production sites in Hamburg and Lünen. For us, sustainability applies to the entire Group. Consequently, the action areas and measures are relevant for the Group and for Aurubis AG. The key indicators mentioned in this report are recorded at Aurubis in the individual departments, consolidated at Group level, and ultimately evaluated. When the following report mentions copper production, this refers to primary and secondary copper production Glossary, page 183 at the Hamburg, Lünen, Olen, and Pirdop sites. Significant differences between Aurubis AG KPIs and Group KPIs are explained.
The main external factors influencing business development are described in the Risk and Opportunity Report of the Combined Management Report Explanation of relevant risks, pages 87-90. Risks related to non-financial aspects beyond the company boundaries are also mentioned there. Risks were assessed in accordance with the German CSR Directive Implementation Act (CSR-RUG) Glossary, page 182. In the process, no non-financial risks were identified that were very likely to cause serious negative impacts on employee and environmental matters, on respect for human rights, on the prevention of corruption and bribery, and on social matters according to Section 289c (3) of the German Commercial Code (HGB). Nevertheless, it is important to us to handle non-financial risks even if they are evaluated as non-material according to the strict definition of the CSR Directive Implementation Act. We have developed and implemented related management approaches to address these non-financial risks.
Sustainability
Aurubis Annual Report 2017/18
34

Description of the business model and presentation of the Group structure
We are continuing to develop our business model consistently in alignment with the new company Vision. Today, Aurubis’ main focus is on the production and processing of copper. Aurubis primarily processes copper concentrates Glossary,
page 182 that are mined from ores and sourced on the global market. The company purchases the necessary raw materials, as it doesn’t have its own mines or stakes in mines. The processing of secondary raw materials plays an important role as well. Moreover, Aurubis is currently expanding its business model beyond copper and increasingly implementing a multimetal approach. This means that, in addition to copper, other metals will be extracted from systematically purchased raw materials and intermediate products and then processed into marketable products with added value.
More information is available in the Business Model chapter of the Combined Management Report. Pages 56-59
Aurubis Sustainability Strategy, its aspects, and explanation of their relevance
SUSTAINABILITY STRATEGYAurubis first developed a Sustainability Strategy in 2013. The first strategy expired in calendar year 2018 after a runtime of five years. In fall 2015, the main action areas of this strategy were reviewed to determine their relevance, refined, and developed in the course of a materiality analysis. Internal and external stakeholders from eight stakeholder groups relevant to Aurubis were surveyed for this purpose. Furthermore, managers from all company divisions carried out the analysis.
In July 2017, we started the process to develop the Sustainability Strategy further. The process was broken down into two phases. The first phase was the analysis of the internal and external requirements and the current developments. With the support of the relevant departments, Aurubis determines its status quo, potential for improvement, and areas that require attention. In the development phase, the information was assessed and the key topics from the 2015 materiality matrix were reviewed to determine whether they were up-to-date and possibly needed to be shifted. Concrete targets and measures were developed in workshops from the insights that were gained, which included a new classification of some of the relevant topics. The representatives of the relevant departments were divided into three working groups corresponding to Aurubis’ interplay of the economy, the environment, and people.
During the reporting period, the Aurubis Executive Board and Supervisory Board passed the Sustainability Strategy 2018–2023. It comprises the main areas of activity for the next five years. In turn, these areas include a total of 27 measures and nine targets. We established deadlines and KPIs for their implementation so that our sustainable company development can be measured and guided.
Sustainability
Annual Report 2017/18 Aurubis
35

Aurubis Sustainability Strategy
DERIVING THE KEY TOPICS PURSUANT TO THE CSR DIRECTIVE IMPLEMENTATION ACTWhen selecting the aspects for the Non-Financial Report, we were guided by both the main action areas of the company’s Sustainability Strategy and the non-financial topics that are required to understand the business development, the business result, the company’s position, and the impacts of our activities on these aspects. We also assume corporate responsibility in those instances in which the topics don’t directly influence our business development but are of considerable importance for us and our stakeholders. This is why the topic of social matters is part of our report and labeled as such.
Moreover, the topics from the materiality analysis from 2015 Sustainability Strategy, page 35 were reviewed with regard to the
materiality requirements from the CSR Directive Implementation Act. In summer 2018, managers from five Aurubis divisions (Corporate Accounting & Consolidation, Investor Relations, Controlling/Risk Management, and Sustainability) evaluated whether the topic clusters identified in 2015 and in the Sustainability Strategy 2018–2023 are material according to the CSR Implementation Act as well. The topics identified as material in this process are assigned to the action areas of the Aurubis Sustainability Strategy in this Non-Financial Report. We present topics that have the same management approach in a consolidated format.
ASPECTS RELEVANT FOR AURUBISIn the Non-Financial Report, we describe the five aspects of employee-related matters, environmental matters, respect for human rights, the prevention of corruption and bribery, and social matters.
For us, the three areas of health and safety, future-oriented employer, and training and education are highly relevant and are included in the reporting in the aspect employee-related matters. As a responsible employer, it is a matter of course for Aurubis to take measures to maintain our employees’ health and performance and to protect them from accidents and illness. Aurubis’ HR strategy helps address future challenges in HR policy and thus contributes to the successful implementation of the Aurubis strategy. It is therefore a key element on the path to Vision 2025. Additional contributions to safeguarding long-term success include the high-quality training at Aurubis and investments in our employees’ qualifications.
As a production company in the non-ferrous metals industry, environmental matters have always been extremely important at Aurubis, which is also reflected in our Sustainability Strategy. We assume responsibility for the effects of our activities on the environment and the climate. As an energy-intensive company, we view the effective and efficient use of energy and the
Sustainability
Aurubis Annual Report 2017/18
36

reduction of CO2 emissions as issues of ecological and economic responsibility. We strive to fulfill high environmental protection standards at the production sites and beyond our business processes by using modern, energy-efficient plant technology.
With multi-metal recycling, Aurubis makes a vital contribution to the circular economy and thus to the conservation of natural resources.
The careful treatment of the environment and resources, as well as a responsible approach to employees, suppliers, customers, and neighbors are an expression of good corporate governance, which is important to Aurubis. The same applies to the areas surrounding our sites. Respect for human rights is gaining significance in light of the fact that we are active beyond our plant boundaries, in complex supply chains and on global markets. Compliance with the core labor standards of the International Labour Organization (ILO), including the topic of human rights, is of fundamental significance for Aurubis. This is true for both Aurubis and for the selection of our business partners.
With respect to responsible corporate governance at Aurubis, the legal framework, corporate values, and internal policies ensure that our conduct is legally sound and that our communication with colleagues and stakeholders is fair and trusting. Our Compliance Management concentrates on the prevention of corruption and bribery in particular. This is reflected in our participation in the United Nations Global Compact, which Aurubis joined in 2014. With this initiative, we make a commitment to the implementation of the principles of human rights, labor standards, environmental protection, and anti-corruption.
Social commitment 1 is a component of Aurubis’ company identity and part of its Sustainability Strategy. Our activities in this regard are described within the social matters aspect in the Non-Financial Report. We are aware of the responsibility associated with our business activities – as an employer, as a business partner, as a neighbor, and as part of society.
1 Topic not material for Aurubis within the meaning of the CSR Directive Implementation Act (CSR-RUG).
Overview of material topics
Material according
to CSR Directive
Implemen- tation Act
Material for Aurubis
Page in
NFR
Employee-related matters
Future-oriented employer √ √ 38
Training and education √ √ 39
Health and safety √ √ 41
Environmental matters
Energy and climate √ √ 41
Environmental impact √ √ 43
Recycling solutions √ √ 44
Social matters
Societal engagement √ 45
Human rights
Responsible supply chain √ √ 46
Anti-corruption Anti-corruption √ √ 47
Sustainability
Annual Report 2017/18 Aurubis
37

EMPLOYEE-RELATED MATTERSFuture-oriented employerCompetent, productive, and enthusiastic employees form the basis of the Aurubis Group’s commercial success and further development.
We have set the targets of creating a work environment for good, close cooperation and promoting involvement and creativity. We form a team that passionately works toward the company’s progress.
Good cooperation between our employees and the company management is the basis for the Group’s success. All employees are informed regularly and promptly about current developments. We are committed to employee participation in decision-making. On the corporate level, the Executive Board and Supervisory Board, in which the staff is also represented, work closely together as the highest governing bodies. On the plant level, the interests of the employees are represented by works councils/unions according to the country-specific regulations. An elected European Works Council has been in place at Aurubis since 2009 and covers all of the European sites. Our membership in the UN Global Compact Glossary, page 183 underlines our commitment to the ILO core labor standards Glossary, page 182.
With the help of our Business Partner Screening, we analyze employees’ concerns along our products’ value chain, including beyond the company boundaries. Human rights, pages 46-47
All group-wide activities related to our employees are managed at Group level by HR Corporate. This department is particularly involved with implementing and monitoring strategic HR tools and supporting change processes and internationalization. Direct supervisors and the local HR departments at the sites are responsible for employees’ supervision, performance assessments, and development planning. Their on-site HR work is oriented toward the standards of the central HR division.
Our HR strategy is embedded in the Group strategy and is guided by our corporate values. It is developed continuously. In the process, internal changes, in addition to changes and trends on the labor markets and in society, are taken into account. For example, these include a lack of qualified workers due to the demographic
shift, as well as the search for apprentices, which is becoming more and more difficult. To address these challenges, we offer our employees an attractive work environment and prioritize a balance between work and free time, good cooperation between our employees and company management, and competitive, gender-neutral compensation. Most of Aurubis’ employees are paid in accordance with collective agreements. We are keen to promote diversity in the workplace. This includes not only cultural differences and international composition, but also professional skills, age groups, and a balance between genders.
Among the feedback tools used at Aurubis is the Organizational Health Index (OHI). The OHI was last issued in 2016. The OHI indicates the “health” of a company, e.g., how well a company is equipped to react to changes in the market and thus to achieve economic success sustainably. Key influencing variables include leadership skills, innovation, and willingness to learn, as well as company culture and climate. In 2017, we started a 360° feedback program based on the results, a tool for constructive feedback for managers. Personal developmental targets and measures are derived from this program in order to sustainably improve managerial performance.
We steadily develop our working time models in line with our employees’ needs. We strive to make flexible working time arrangements, as long as this is consistent with the individual work area.
Key measures of the Sustainability Strategy 2018–2023 and their status in fiscal year 2017/18» Improving the “health” (OHI) of the organization with
strategically aligned HR instruments and services, as well as individual development tools The Transformation and Business Improvement department was set up in early 2017. The department’s Business Improve-ment Guides support internal projects and the implementation of the Aurubis Operating System (AOS) Glossary, page 182 as internal consultants. AOS is a management system for achiev-ing continuous and sustainable process improvement. Pro-grams introduced in the last several years, such as a workshop series to develop managers’ skills, continued during the reporting period.
Sustainability
Aurubis Annual Report 2017/18
38

» Regularly identifying employees’ needs with respect to working time arrangements The flex time program was developed further during the reporting period. Furthermore, a new shift model was initiated. A new planning process for personnel placement enables better shift planning. The home office and mobile work options were expanded.
» Developing a diversity policy As part of the reorganization and AOS, international teams are already working together. The development of a diversity policy (including age structure, international character, and gender distribution) is planned for the coming years.
KPIs: Aurubis Group personnel structure (FY 2017/18 as at the reporting date September 30, 2018)
Employees Female Male
Aurubis Group 1 6,673 12 % 88 %
Blue collar 4,130 4 % 96 %
White collar 2,256 28 % 72 %
Apprentices (including Pirdop) 287 10 % 90 %
1 Permanent and temporary employment arrangements. Excluding Schwermetall Halbzeugwerk GmbH & Co. KG, in which Aurubis holds a 50 % stake. In addition to the fully consolidated companies, this table includes the employees of the non-consolidated companies Aurubis Metal Products (Shanghai) Co., Ltd., Aurubis Rus LLC (St. Petersburg), Aurubis Middle East FZE (Dubai), and Aurubis Turkey Kimya Anonim Sirketi (Istanbul), which had a combined total of twelve employees in fiscal year 2017/18. It also includes eleven independent sales employees at international sites Sites and employees, page 57.
Employee fluctuation in the Aurubis Group (FY 2017/18 as at the reporting date September 30, 2018)
Fluctuation rate (excluding apprentices) 1 6.6 %
Average length of employment in the company (excluding apprentices) 1 15.3 years1 Permanent and temporary employment arrangements. Excluding Schwermetall
Halbzeugwerk GmbH & Co. KG, in which Aurubis holds a 50 % stake. In addition to the fully consolidated companies, this table includes the employees of the non-consolidated companies Aurubis Metal Products (Shanghai) Co., Ltd., Aurubis Rus LLC (St. Petersburg), Aurubis Middle East FZE (Dubai), and Aurubis Turkey Kimya Anonim Sirketi (Istanbul), which had a combined total of twelve employees in fiscal year 2017/18. It also includes eleven independent sales employees at international sites Sites and employees, page 57.
Age structure 1
< 20 20–29 30–39 40–49 > 6950–59 60–69
14 16
984
1,515 1,452
1,820
585
1 Not including apprentices.
Training and educationIn order to achieve our vision and advance our strategy, we rely on a learning organization. The targeted personal development of our employees has high priority.
The HR Development department is responsible for staff development. It supports the other departments, in close coordination with the local HR managers, in building employees’ skills in a directed way tailored to their needs. The objective is to meet current and future requirements and challenges. HR Development and vocational training are part of the HR Corporate department.
Sustainability
Annual Report 2017/18 Aurubis
39

To fulfill future personnel requirements, we regularly assess demand for specific skills and trades, and offer apprenticeships accordingly. Qualification needs are also regularly identified to expand project, process, and management expertise in a targeted way.
We have developed and adjusted the training offerings in our leadership and qualification program according to the Group’s needs. In particular, options for managers at the foreman level were a top priority. Employees are offered a number of technical training measures.
In addition to qualification and development programs geared to necessary skills, for example, in the areas of the AOS and in project management, we also rely on platforms for networking and discussing best practices (e.g., expert panels and online learning groups). We also offer shorter formats for flexible skill enhancement, such as the “Learn & Go” program on the intranet and video learning options.
We are proud of our high training and retention rate. This ensures that we have a sufficient number of qualified employees. At our site in Pirdop, Bulgaria, we implemented a vocational training program based on the Swiss training model.
Aurubis Hamburg has participated in the internship model AV 10-Plus since 2007. The model supports young people from a range of occupational groups, helping them to gain the qualifications required to begin apprenticeships. In 2017/18, five of the eleven participants took on an apprenticeship at Aurubis. The remaining participants started external apprenticeships or have now gone on to higher education.
Recently, we invested in the construction of two modern vocational training centers in Lünen and Hamburg. In Lünen, the building next to the Training Workshop will also be home to the Occupational Safety and Technology divisions, while in Hamburg, Training and Research & Development (R&D) will be located in the Innovation and Training Center. The shared building emphasizes the even stronger linkage between R&D and vocational training in the future.
Furthermore, we cooperate with partner universities, offer internships to students in Germany, and provide thesis projects and scholarships.
Key measures of the Sustainability Strategy 2018–2023 and their status in fiscal year 2017/18» Regularly identifying qualification needs to expand project,
process, and management expertise in a targeted way In fiscal year 2017/18, a 360° feedback process was introduced for the Executive Board and the first and second management levels, and a group-wide performance management system was established for the employees.
» Start of the group-wide introduction of the AOS pillar “Education and Training” During the reporting year, basic AOS courses were carried out and the pilot phase for AOS e-learning was prepared.
» Developing group-wide knowledge management to identify, preserve, transfer, and enhance knowledge across functions The necessary personnel resources were provided during the reporting period. A structured process was drafted and the pilot phase for group-wide knowledge management started.
KPIs: Training and education KPIs in FY 2017/18
Apprenticeship rate in Germany 6.3 %
Apprentice retention rate in Germany 80 %
Average number of training hours per employee 1
Aurubis Group 11.52
Blue collar 9.69
White collar 15.071 Permanent and temporary employment arrangements. Excluding
Schwermetall Halbzeugwerk GmbH & Co. KG, in which Aurubis holds a 50 % stake. In addition to the fully consolidated companies, this table includes the employees of the non-consolidated companies Aurubis Metal Products (Shanghai) Co., Ltd., Aurubis Rus LLC (St. Petersburg), Aurubis Middle East FZE (Dubai), and Aurubis Turkey Kimya Anonim Sirketi (Istanbul), which had a combined total of twelve employees in fiscal year 2017/18. It also includes eleven independent sales employees at international sites Sites and employees, page 57.
Sustainability
Aurubis Annual Report 2017/18
40

Health and safetyThe responsibility of Corporate Occupational Health and Safety is to create conditions that prevent all work-related accidents and illnesses. This applies for our employees, temporary workers, and external service providers.
In the long term, we want to achieve our Vision Zero, that is, to reduce work-related accidents, injuries, and illnesses to zero. Our goal for the medium term is to reduce the number of work-related accidents with at least one lost shift per one million hours worked (lost time injury frequency rate, LTIFR) Glossary, page 183 to ≤ 1.0 by 2022.
The department Corporate Occupational Health and Safety (C-OHS) manages occupational safety and health. The corporate department establishes minimum occupational safety standards for the entire Group by issuing process instructions in addition to the Corporate Policy on Occupational Health and Safety. The individual sites are responsible for the detailed implementation, which is overseen by the plant managers. The sites are in contact with each other via an organized network. Safety steering committees are installed at Group and site level, with the members representing the entire staff.
We rely on occupational safety-related risk management to assess hazards. Tools such as process safety analyses, risk assessments, and workspace analyses help us to understand and control potential dangers. Health check-ups are offered when new employees are hired, with routine occupational health check-ups provided thereafter. Training and safety talks sensitize employees to occupational safety topics and encourage them to use this knowledge safely in practice.
In addition, we support employees in taking preventive measures to maintain their health. Our offerings in this respect extend from flu vaccinations and medical check-ups to addiction prevention, as well as intensive training for the stomach and back muscles based on analyses.
Key measures of the Sustainability Strategy 2018–2023 and their status in fiscal year 2017/18» Preparing all sites for the introduction of the ISO 45001 standard
for occupational health and safety (by fiscal year 2019/20) This project kicked off during the Health & Safety group meeting in fiscal year 2017/18.
» Implementing Behavior-Based Safety across the Group (by fiscal year 2020/21) Behavior-Based Safety was initiated at our sites in Emmerich, Hamburg, Pori, and Stolberg in the reporting period.
KPIs:Occupational health and safety KPIs
FY 13/14 FY 14/15 FY 15/16 FY 16/17 FY 17/18
Absolute number of accidents 80 63 45 47 60
LTIFR 6.5 5.3 4.6 4.8 6.1
Permanent and temporary employment arrangements. Excluding sales offices in Chicago, Lyon/Septème, and Barcelona, which have a total of nine employees, and excluding Schwermetall Halbzeugwerk GmbH & Co. KG, in which Aurubis holds a 50 % stake.
ENVIRONMENTAL MATTERSEnergy and climateThe individual production steps in our value chain are energy-intensive. For us, the efficient use of energy is an issue of ecological and economic responsibility.
Energy consumption is the main source of CO2 emissions in the Group. To prevent CO2 emissions, we focus on energy efficiency measures first and foremost. Taking the entire value chain into consideration, about half of the CO2 emissions are upstream and downstream, i.e., they originate from our suppliers, customers, and service providers (Scope 3 emissions). Of the Scope 3 emissions, about two-thirds originate from the activities of mining companies. We voluntarily report our CO2 emissions, including the Scope 3 emissions, annually as part of the CDP Climate Change Program. CDP gathers and evaluates data and information about companies’ CO2 emissions, climate risks, and reduction targets and strategies Human rights, pages 46-47.
Sustainability
Annual Report 2017/18 Aurubis
41

The metals we produce play a key role when it comes to renewable energies and e-mobility. Electric cars and wind energy are two examples. Electric cars contain significantly more copper than vehicles with conventional combustion engines, and connecting an offshore wind turbine to the energy grid requires up to 30 t of copper. Our metals therefore make a considerable contribution to technologies that reduce CO2 emissions.
The Energy & Climate Affairs department coordinates the development of the energy management and monitoring systems across the Group. In this way, they provide for a uniform approach and facilitate the exchange of expertise regarding best practice examples, e.g., in the form of an internal energy efficiency network. The management of Corporate Energy & Climate Affairs develops and implements the group-wide energy strategy and reports directly to the Executive Board.
We have introduced energy management systems at our large production sites. Currently, eight sites are certified in accordance with ISO 50001 Glossary, page 182 Table, page 43. The plan is to introduce these systems across the Group. They help manage energy consumption efficiently and identify potential energy savings. During the reporting period, the certifications were confirmed through routine surveillance visits or recertification. The energy management system at the Hamburg and Lünen sites is part of the integrated management system for quality, environmental protection, energy, and occupational safety.
The more steps that have already been implemented in energy efficiency in the past, the more challenging it is to optimize energy demand further. Moreover, because there are limits to reducing energy consumption and emissions, the improvements being achieved today are only marginal compared to previous years. This is despite continued high levels of investment. For example, the use of complex recycling raw materials with comparably low metal contents requires more energy to be processed. Environmental protection already accounts for part of the energy consumption at Aurubis today. This includes the operation of facilities such as filters with fans and other suctioning equipment. For Aurubis, it is important to align environmental protection, resource conservation, and energy efficiency.
The use of renewable energies is a challenge for us since using them is associated with energy supply fluctuations. However, our production processes require a constant energy supply. We are working on initiatives to make our energy needs more flexible in order to enable the use of renewables. At the same time, we also generate energy by using the waste heat from our processes to supplement the heat and process steam supply and, in some cases, to produce electricity internally.
Key measures of the Sustainability Strategy 2018–2023 and their status in fiscal year 2017/18» Introducing the ISO 50001 standard for energy management
across the Group Eight sites are currently certified in accordance with ISO 50001
Sites with certified management systems, page 43. » Increasing flexibility in electricity purchasing
To enable the use of renewable energies, we are arranging a more flexible electricity feed-in to be able to react to fluctuat-ing availability. We are participating in the project NEW 4.0, among others, which is funded by the German Federal Minis-try for Economic Affairs and Energy. The goal of the project is to supply the entire region of Hamburg and Schleswig- Holstein with regenerative electricity in a safe, cost-effective, and environmentally sound manner. This calls for a flexible and intelligent network of electricity producers and consumers.
» Energy efficiency projects The heat and process steam supply at the Pirdop, Lünen, and Hamburg sites is already covered by waste heat to a great extent. We also use process waste heat to produce electricity within the company. Steam turbines were installed for this pur-pose in Hamburg, Lünen, and Pirdop. In calendar year 2018, Hamburg’s HafenCity East neighborhood began receiving CO2-free industrial heat from the Aurubis plant in Hamburg. Each year, about 160 million kWh of heat is extracted from the pro-cesses, equivalent to a more than 20,000 t reduction in CO2 annually. Roughly half of this reduction comes from saving the natural gas that was previously required to produce steam on the plant premises. The other half of the CO2 reduction comes from the transmission of external heat to the HafenCity East neighborhood, which replaces the conventional fuels used to generate district heating.
Sustainability
Aurubis Annual Report 2017/18
42

KPIs: Absolute CO2 emissions in 1,000 t of CO2 at the Aurubis production sites 1
Year 2 2015 2016 2017
Scope 1 (emissions produced as a direct result of burning fuels in the company’s own facilities) 518 520 529
Scope 2 (emissions related to purchased energy, e.g., electricity) 1,197 1,149 1,1061 Aurubis reports CO2 emissions for the production sites Business model of
the Group, pages 56-59. This reflects most of the CO2 emissions because the emissions volume at the sales offices are negligible in comparison. Emissions from diesel vehicles are not included in the direct CO2 emissions. However, they make up a very small percentage compared to other sources.
2 Aurubis reports its environmental KPIs (including CO2 emissions) based on the calendar year, not the fiscal year. The KPIs are used first and foremost for internal management purposes and reporting for governmental authorities, for which the calendar year is the given period under review. Parallel reporting of both calendar year and fiscal year figures could lead to confusion and ambiguity.
Sites with certified management systems
Site EMASISO
14001ISO
50001ISO
9001
Hamburg, headquarters (DE) √ √ √ √
Lünen (DE) √ √ √ √
Pirdop (BG) √ √
Olen (BE) √ √
Fehrbellin, CABLO (DE) √ √ √
Nersingen, Strass, CABLO (DE) √ √ √
Hamburg, E. R. N. (DE) √ √ √
Buffalo (USA) √
Pori (FI) √ √
Avellino (IT) √ √
Zutphen (NL) √ √
Stolberg (DE) √ √
Emmerich, Deutsche Giessdraht (DE) √ √ √
Stolberg, Schwermetall (DE) √ √ √ √
Röthenbach, RETORTE (DE) √
Hamburg, Peute Baustoff (DE) √ 1
1 For the sale of iron silicate granules used to produce blasting abrasives.
Protection from environmental impactAs a producer of copper and other metals, we are aware of our environmental responsibility. We have therefore set ourselves the target of conserving resources and maintaining a clean environment for future generations. This applies not only to our own processes, but to those along the value chain as well
Human rights, pages 46-47.
The Chief Operating Officer and Corporate Environmental Protection management are responsible for the strategic positioning of environmental protection in the Group. Environmental officers oversee the environmental protection duties at the individual production sites Sites and employees,
page 57 and report to Corporate Environmental Protection management.
The principles of our Company Environmental Protection Guidelines provide a framework for safeguarding our uniform, group-wide environmental standards. They are enshrined in the Corporate Policy on Environmental Protection. We have set group-wide targets in environmental protection. We implement corresponding local measures at the production sites to achieve these targets. Environmental performance is monitored and controlled using key environmental parameters, which are regularly recorded at the production sites and verified by external inspectors.
Most of our sites have environmental management systems in accordance with ISO 14001/EMAS Glossary, page 182
Sites with certified management systems, page 43. At the Hamburg and Lünen sites, these are part of the integrated management system for quality, environmental protection, energy, and occupational safety. During the reporting period, the certifications were confirmed through routine surveillance visits or recertification.
In addition to fulfilling legal requirements, the management systems help us improve our environmental performance. They assist us in recognizing potential improvements and, in the case of deviations from specified targets, in initiating corrective actions. We continuously inform our employees about all environmental and energy-related topics and train them accordingly. Moreover, emergency drills are carried out regularly.
Sustainability
Annual Report 2017/18 Aurubis
43
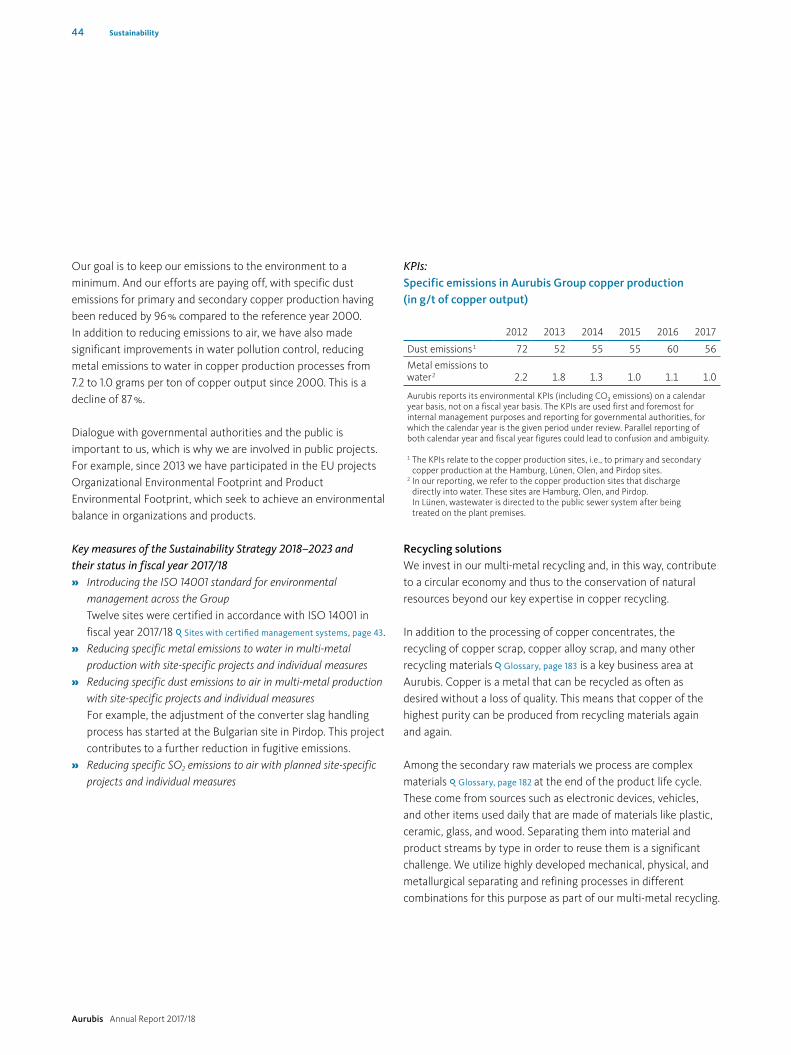
Our goal is to keep our emissions to the environment to a minimum. And our efforts are paying off, with specific dust emissions for primary and secondary copper production having been reduced by 96 % compared to the reference year 2000. In addition to reducing emissions to air, we have also made significant improvements in water pollution control, reducing metal emissions to water in copper production processes from 7.2 to 1.0 grams per ton of copper output since 2000. This is a decline of 87 %.
Dialogue with governmental authorities and the public is important to us, which is why we are involved in public projects. For example, since 2013 we have participated in the EU projects Organizational Environmental Footprint and Product Environmental Footprint, which seek to achieve an environmental balance in organizations and products.
Key measures of the Sustainability Strategy 2018–2023 and their status in fiscal year 2017/18» Introducing the ISO 14001 standard for environmental
management across the Group Twelve sites were certified in accordance with ISO 14001 in fiscal year 2017/18 Sites with certified management systems, page 43.
» Reducing specific metal emissions to water in multi-metal production with site-specific projects and individual measures
» Reducing specific dust emissions to air in multi-metal production with site-specific projects and individual measures For example, the adjustment of the converter slag handling process has started at the Bulgarian site in Pirdop. This project contributes to a further reduction in fugitive emissions.
» Reducing specific SO2 emissions to air with planned site-specific projects and individual measures
KPIs: Specific emissions in Aurubis Group copper production (in g/t of copper output)
2012 2013 2014 2015 2016 2017
Dust emissions 1 72 52 55 55 60 56
Metal emissions to water 2 2.2 1.8 1.3 1.0 1.1 1.0
Aurubis reports its environmental KPIs (including CO2 emissions) on a calendar year basis, not on a fiscal year basis. The KPIs are used first and foremost for internal management purposes and reporting for governmental authorities, for which the calendar year is the given period under review. Parallel reporting of both calendar year and fiscal year figures could lead to confusion and ambiguity. 1 The KPIs relate to the copper production sites, i.e., to primary and secondary
copper production at the Hamburg, Lünen, Olen, and Pirdop sites.2 In our reporting, we refer to the copper production sites that discharge
directly into water. These sites are Hamburg, Olen, and Pirdop. In Lünen, wastewater is directed to the public sewer system after being treated on the plant premises.
Recycling solutionsWe invest in our multi-metal recycling and, in this way, contribute to a circular economy and thus to the conservation of natural resources beyond our key expertise in copper recycling.
In addition to the processing of copper concentrates, the recycling of copper scrap, copper alloy scrap, and many other recycling materials Glossary, page 183 is a key business area at Aurubis. Copper is a metal that can be recycled as often as desired without a loss of quality. This means that copper of the highest purity can be produced from recycling materials again and again.
Among the secondary raw materials we process are complex materials Glossary, page 182 at the end of the product life cycle. These come from sources such as electronic devices, vehicles, and other items used daily that are made of materials like plastic, ceramic, glass, and wood. Separating them into material and product streams by type in order to reuse them is a significant challenge. We utilize highly developed mechanical, physical, and metallurgical separating and refining processes in different combinations for this purpose as part of our multi-metal recycling.
Sustainability
Aurubis Annual Report 2017/18
44

Our Commercial division is responsible for sourcing recycling materials for the Group. This is divided into the areas Recycling Raw Materials, Product Sales & Marketing, and Customer Scrap Solutions. This structure is in keeping with our recycling approach, which sees us use secondary materials as raw materials and take metal return options into account in product marketing and in our customer relationships.
The processing industry is part of both our customer base and our supplier base. Production residues accumulate during these companies’ production processes. These residues include materials with very high copper contents, such as Millberry scrap, which can be used again immediately as input material in copper production. However, stamping waste containing precious metals and high levels of copper, alloyed scrap, slags from foundries, and other industrial residues are fed back into the valuable material cycle in a meaningful way.
As part of our “closing-the-loop” activities, we build up partnerships through which we take back valuable materials from our customers.
Aurubis fabricates products made of recycling materials at different sites. The management of these sites reports to the Chief Operating Officer or, in the case of the subsidiaries CABLO and Elektro-Recycling Nord (E.R.N.), to the head of the Commercial division as well. Recycling raw materials are the primary feedstock used to fabricate cathode copper at our largest recycling plant, the Aurubis recycling center in Lünen. The Hamburg, Pirdop, and Olen sites also process recycling raw materials to produce cathode copper and precious metals. The Aurubis subsidiary CABLO specializes in recycling cable production waste and end-of-life cable scrap. E.R.N. specializes in recycling electrical and electronic devices of all kinds.
The Aurubis plant in Lünen is certified by TÜV Nord in accordance with the WEEE Glossary, page 183 End Processor Standard. This is a voluntary standard for the processing of precious metal-bearing WEEE materials such as circuit boards. Aurubis helped develop the standard and thus contributes to internationally organized recycling and disposal processes. Together with 22 national and international partners, we are participating in the European research project FORCE – Cities Cooperating for Circular Economy. The project is concerned with developing new concepts to avoid and treat waste from plastics, biomass, wood, and – Hamburg’s contribution – end-of-life electrical devices.
Key measures of the Sustainability Strategy 2018–2023 and their status in fiscal year 2017/18» Establishing and developing “closing-the-loop” systems as a
result of new or intensified cooperation with original equipment manufacturers (OEMs), retailers, or copper product customers From 2013 to the end of fiscal year 2017/18, we set up eleven new closing-the-loop projects. Our objective is to establish additional closing-the-loop systems with direct and indirect product customers.
SOCIAL MATTERSSocietal engagement
1 Societal engagement is a fixed component of our company identity. We fulfill our responsibility within society – as an employer, as a business partner, as a neighbor, and as a member of society – throughout the entire value chain.
We have set the target of contributing to a livable environment for future generations. In the process, we focus on areas of action that are linked with Aurubis’ key expertise. As a responsible, committed company, we want to promote enthusiasm for our company and for our work.
1 Topic not material for Aurubis within the meaning of the CSR Directive Implementation Act (CSR-RUG).
Sustainability
Annual Report 2017/18 Aurubis
45

The Event Management & Sponsoring division is responsible for our societal engagement and reports to the Vice President Investor Relations & Corporate Communications. The budget for our societal engagement is supervised in close coordination with the Executive Board. A Sponsoring Policy establishes the relevant responsibilities and describes the criteria used to select the projects. The systematic review of the project partners is a fixed element of the revised Sponsoring Policy. In addition to projects that are supported at Group level, all of the sites have their own budgets for local projects. Overall, our sponsoring commitments concentrate on the areas of knowledge, resource efficiency and environmental protection, and societal engagement, under the overarching focus of responsibility, thus contributing to our company strategy as well. Furthermore, there are local sponsoring projects that account for special regional features at the different sites.
Key measures of the Sustainability Strategy 2018–2023» Developing and implementing the sponsoring concept
“Together we care” for societal engagement at Group level (by fiscal year 2018/19)
Project examples in the reporting period: In Hamburg, we support the project “Bridge & Tunnel.” A key aspect of the project is the recycling of reusable materials. Old textiles and leftover material are processed into accessories, clothing, and home textiles in Hamburg-Wilhelmsburg. Bridge & Tunnel creates permanent jobs for people who aren’t employed on the primary labor market due to various reasons and for individuals with an immigration background.
For the first time, we are supporting the Lünen Schulticker project. Schulticker is a media project that strengthens the competent use of print and online media and promotes reading and writing abilities among students in grades three to eleven.
Aurubis Bulgaria supported the renovation of a convent in Zlatitsa during the reporting period. The support provided is part of Aurubis Bulgaria’s local sponsoring strategy of helping restore cultural and historic places in the region in order to develop a local network of tourist destinations. The purpose of this network is to promote regional development.
HUMAN RIGHTSAurubis respects human rights and advocates for their protection. We reject any form of discrimination, forced labor, or child labor and respect the rights of indigenous populations. Compliance with the internationally recognized core labor standards of the International Labour Organization (ILO) is of fundamental importance.
In this respect, we have been committed to the principles of the United Nations Global Compact since 2014, and observe both our Code of Conduct and our company values, the latter of which are represented by the acronym PRIMA (Performance, Responsibility, Integrity, Mutability, and Appreciation) Glossary, page 183.
Our efforts regarding respect for human rights focus on our supply chain.
Responsible supply chain In our view, our responsibility to uphold human rights extends into the supply chain. Aurubis sources metal-bearing raw materials worldwide. In some cases, our metals come from countries with a higher risk of human rights violations, non-compliance with social and environmental standards, or corruption. One of our objectives is to manage our global sourcing of primary and secondary raw materials responsibly, taking the respective impact on the social environment, the natural environment, and economic aspects into account.
Sustainability
Aurubis Annual Report 2017/18
46

We have implemented Aurubis Business Partner Screening to fulfill our due diligence obligation. This tool enables us to analyze our business partners’ integrity in relation to social and ecological criteria. The focus of the process is on topics such as compliance, corruption, human rights violations, and environmental aspects. Based on this assessment, management decides on possible contracts or restrictions. For existing business partnerships, the analysis is repeated regularly depending on the original risk. The Screening is based on the principles of the OECD. Since 2013, Aurubis’ gold production has been annually certified as conflict-free according to the standards of the London Bullion Market Association (LBMA). The certificate verifies the effectiveness of our due diligence process related to gold production. The suppliers of the other raw materials go through the same process as those who supply gold-bearing raw materials.
Key measures of the Sustainability Strategy 2018–2023 and their status in fiscal year 2017/18» Including human rights, environmental protection, and safety
clauses 1 in supply contracts for primary raw materials During the fiscal year, the percentage of contracts with primary raw material suppliers including the corresponding clause was over 80 %.
» Review of new and existing business partners by the Compliance and Sustainability departments The business partner review is ongoing.
» Identifying a suitable sector solution During the reporting period, we continued our work in the relevant associations for a uniform sector solution for sustainability in the supply chain.
1 We expect our business partners to follow not only local laws but also UN sanctions and trade restrictions, as well as UN conventions related to human rights, environmental protection, and safety.
ANTI-CORRUPTIONCorporate governance and the principles of responsible and sustainable company management determine Aurubis’ actions. More information is available in the Corporate Governance chapter Corporate Governance, pages 17-33.
Anti-corruption measures are established in Aurubis’ Compliance Management. Compliance Management forms the basis for observing legal regulations. Our objective is to comply with all legal and company guidelines and policies. Violating the law can have serious consequences – for our employees, for Aurubis as a group, and for our business partners. For us, compliance also means that we act in accordance with ethical principles and our defined company values, as well as with internal corporate policies.
The Executive Board and Compliance Management together promote a compliance culture and actively strive to strengthen awareness for following rules and laws in the Group. Compliance Management establishes the main targets, develops the corresponding organization, and identifies, analyzes, and communicates significant compliance risks. It develops a compliance program that introduces principles and measures to limit risks and prevent violations. It also reports regularly (and as the circumstances may require) to the Executive Board and Audit Committee with regard to the compliance management system, compliance violations, and compliance-related measures. Compliance Management works together closely with Risk Management and Internal Audit. Within Aurubis’ internal control system, the Chief Compliance Officer reviews potential compliance risks together with the Executive Board, the plant managers, and the heads of corporate and central functions.
The company’s Chief Compliance Officer is the central point of contact for all compliance-relevant questions and reports directly to the Executive Board. At the individual Group sites, local compliance officers are available as a point of contact for employees.
Sustainability
Annual Report 2017/18 Aurubis
47

Measures include prevention, monitoring, and sanctions. Preventive measures at Aurubis comprise internal policies, guidance, and particularly the training of employees. The Corporate Anti-Corruption Compliance Policy and the Code of Conduct for employees, both of which apply group-wide, are at the core of the anti-corruption efforts in our business activities.
The Aurubis Code of Conduct is given to every employee. They all confirm that they have received the Code of Conduct by signing the employment contract. Training on anti-corruption and antitrust law is carried out regularly throughout the Group.
Employees and business partners can make anonymous reports regarding legal violations via a whistleblower hotline. This hotline is operated by external, independent attorneys. If offenses are actually proven, the corresponding employees may – depending on the offense – be given a warning, be discharged from their duties, and/or have damages claims asserted against them.
In Aurubis’ Business Partner Screening, our business partners are also reviewed with respect to compliance and corruption risks.
Key measures » Employees for whom the topics of anti-corruption and antitrust
law are relevant due to their responsibilities are trained on these topics about every three years, regardless of their level in the company hierarchy. In the past few years, this applied to around 1,300 employees for anti-corruption training (i.e., about 20 % of the entire staff) and to around 400 employees for antitrust law training.
KPI: We are not aware of any antitrust or corruption cases in the reporting period.
Limited Assurance Report of the Independent Auditor regarding the Combined Separate Non-Financial Report 1
- translation -
To the Supervisory Board of Aurubis AG, Hamburg.
We have performed an independent limited assurance engagement on the Combined Separate Non-Financial Report (hereinafter “Report”) of Aurubis AG, Hamburg and the Group (hereinafter “Aurubis”), which has been qualified as part of the Combined Separate Non-Financial Report (hereinafter “Report”) by reference, according to Sections 315b and 315c in conjunction with 289b to 289e HGB (German Commercial Code) for the business year from October 1, 2017 to September 30, 2018.
MANAGEMENT’S RESPONSIBILITYThe legal representatives of the entity are responsible for the preparation of the Report in accordance with Sections 315b and 315c in conjunction with 289b to 289e HGB.
This responsibility of the legal representatives includes the selection and application of appropriate methods to prepare the Report and the use of assumptions and estimates for individual disclosures which are reasonable under the given circumstances. Furthermore, this responsibility includes designing, implementing and maintaining systems and processes relevant for the preparation of the Report in a way that is free of – intended or unintended – material misstatements.
INDEPENDENCE AND QUALITY ASSURANCE ON THE PART OF THE AUDITING FIRM We are independent from the entity in accordance with the requirements of independence and quality assurance set out in legal provisions and professional pronouncements and have fulfilled our additional professional obligations in accordance with these requirements.
Our audit firm applies the national statutory provisions and professional pronouncements for quality assurance, in particular the Professional Code for German Public Auditors and Chartered
1 Our engagement applied to the German version of the Report. This text is a translation of the Independent Assurance Report issued in German, whereas the German text is authoritative.
Sustainability
Aurubis Annual Report 2017/18
48

Accountants (in Germany) and the quality assurance standard of the German Institute of Public Auditors (Institut der Wirtschaftsprüfer, IDW) regarding quality assurance requirements in audit practice (IDW QS 1).
PRACTITIONER’S RESPONSIBILITYOur responsibility is to express a conclusion on the Report based on our work performed within our limited assurance engagement.
We conducted our work in accordance with the International Standard on Assurance Engagements (ISAE) 3000 (Revised): “Assurance Engagements other than Audits or Reviews of Historical Financial Information” published by IAASB. This Standard requires that we plan and perform the assurance engagement to obtain limited assurance of whether any matters have come to our attention that cause us to believe that the Report of the entity has not been prepared, in all material respects, in accordance with Sections 315b and 315c in conjunction with 289b to 289e HGB. We do not, however, provide a separate conclusion for each disclosure. In a limited assurance engagement the evidence gathering procedures are more limited than in a reasonable assurance engagement and therefore less assurance is obtained than in a reasonable assurance engagement. The choice of audit procedures is subject to the auditor’s own judgement.
Within the scope of our engagement, we performed amongst others the following procedures:
» Inquiries of personnel on the corporate level, who are responsible for the materiality analysis, in order to gain an understanding of the processes for determining material sustainability topics and respective reporting boundaries of Aurubis
» A risk analysis, including a media search, to identify relevant information on Aurubis sustainability performance in the reporting period
» Evaluation of the design and implementation of the systems and processes for determining, processing and monitoring of disclosures relating to environmental, employee and social matters, respect for human rights, and combating corruption and bribery, including the consolidation of the data
» Inquiries of personnel on the corporate level who are responsible for determining disclosures on concepts, due diligence processes, results and risks, for conducting internal controls and consolidation of the disclosures
» Evaluation of selected internal and external documentation» Analytical evaluation of data and trends of quantitative
disclosures, which are submitted by all sites for consolidation on the group level
» Assessment of the overall presentation of the disclosures
CONCLUSIONBased on the procedures performed and the evidence obtained, nothing has come to our attention that causes us to believe that the Report of Aurubis, for the business year from October 1, 2017 to September 30, 2018, is not prepared, in all material respects, in accordance with Sections 315b and 315c in conjunction with 289b to 289e HGB.
RESTRICTION OF USE/CLAUSE ON GENERAL ENGAGEMENT TERMS This assurance report is issued for the purposes of the Supervisory Board of Aurubis, Hamburg, only. We assume no responsibility with regard to any third parties.
Our assignment for the Supervisory Board of Aurubis, Hamburg and professional liability is governed by the General Engagement Terms for Wirtschaftsprüfer (German Public Auditors) and Wirtschaftsprüfungsgesellschaften (German Public Audit Firms) (Allgemeine Auftragsbedingungen für Wirtschaftsprüfer und Wirtschaftsprüfungsgesellschaften) in the version dated January 1, 2017 www.kpmg.de/bescheinigungen/lib/aab_english.pdf. By reading and using the information contained in this assurance report, each recipient confirms having taken note of provisions of the General Engagement Terms (including the limitation of our liability for negligence to EUR 4 million as stipulated in No. 9) and accepts the validity of the General Engagement Terms with respect to us.
Hamburg, November 23, 2018
KPMG AG Wirtschaftsprüfungsgesellschaft
Laue ppa. Mathias Wirtschaftsprüfer (German Public Auditor)
Sustainability
Annual Report 2017/18 Aurubis
49

Aurubis Shares on the Capital Market
STOCK MARKETS INFLUENCED BY UNCERTAINTIES FOLLOWING A GOOD STARTThe upward trend on the stock markets continued at the beginning of fiscal year 2017/18. The DAX reached a record high of 13,525 points in early November. However, a sharp increase in the euro rate due to strong economic data in the euro zone, as well as profit taking, thwarted the year-end rally. At the turn of the year, the DAX closed at 12,918 points but then hit a new all-time high of 13,596 points. The DAX wasn’t able to maintain this level for long, though. Rising interest rates in the US and a further increase in the euro rate, coupled with fears of negative economic impacts of a global trade conflict, led to restraint on the stock markets. On March 26, 2018, the DAX slipped to 11,787 points, the lowest level since February 2017. In the months thereafter, the international trade conflict in particular set the tone on the stock markets. A weakening euro rate and tailwinds from Wall Street pushed the DAX above the 13,000-point mark once more in May, however. At fiscal year-end, a sense of nervousness grew due not only to the lingering trade dispute but also to currency risks in certain emerging market countries and fears of a faster interest rate hike by the US Federal Reserve. At the start of September, the DAX once again fell below the 12,000-point mark, slightly recovering to 12,247 points at the close of September 28, 2018.
AURUBIS SHARES RECORD A VOLATILE TREND The development of the Aurubis shares was very volatile during the fiscal year. After the new strategy was announced together with the release of the fiscal year 2016/17 results on December 13, 2017, the Aurubis shares took flight. Following the news on January 23, 2018 that Aurubis would acquire the Codelco shares in Deutsche Giessdraht GmbH, Emmerich, Aurubis shares reached a new all-time high of € 86.80 in the course of the day. The shares then lost ground in a volatile market environment in February despite very good quarterly results and were quoted at € 65.26 the day after the Annual General Meeting (ex dividend March 2, 2018). The price recovered again to € 77.12 on May 11, 2018 after positive analyst assessments and the ad hoc announcement on April 26, 2018 regarding the forecast for fiscal year 2017/18, which was based on the very good half-year result. In the subsequent months, Aurubis shares were unable to avoid the general uncertainty on the capital markets resulting primarily from the conflicts between the US and its trading partners. Under the influence of share price adjustments by analysts following Capital Market Day in Bulgaria, the share price hit the year’s low of € 55.44 on September 11, 2018. In a more positive market environment, the shares recovered slightly to € 60.24 at the close of the fiscal year on September 28, 2018. However, their performance was –12 % for the fiscal year
Aurubis shares (Xetra) MDAX DAX STOXX Europe 600
60
80
100
120
140
October November December January February March April May June July August September
Aurubis share performance compared with the MDAX, DAX, and STOXX Europe 600 from October 1, 2017 to September 30, 2018 indexed to 100 %
Aurubis Shares on the Capital Market
Aurubis Annual Report 2017/18
50

overall and trailed the similarly negative development of the DAX (–5 %), the MDAX (0 %), and the STOXX Europe 600 (–1 %). Market capitalization was € 2,708 million as at fiscal year-end (previous year: € 3,081 million).
Aurubis shares remain an attractive long-term investment. Shareholders who invested € 1,000 at the end of September 2008 and reinvested the dividends they received (without a tax deduction) into Aurubis shares had a portfolio value of € 2,753 on September 28, 2018. This is a 171 % increase in value or a total annual return of 10.05 %.
TRADING VOLUME OF AURUBIS SHARES EXCEEDS PREVIOUS YEARThe volatility in the Aurubis share price was also evident in the daily average Xetra trading volume, which, at 217,736 shares, exceeded the prior-year level (200,869 shares).
AURUBIS HAS A WELL-DIVERSIFIED SHAREHOLDER STRUCTUREAurubis maintained its well-diversified shareholder structure in fiscal year 2017/18. An analysis carried out in September 2018 indicated that the proportion of institutional investors rose slightly to 53 % (previous year: 51 %). Increases were recorded
in the rest of Europe (outside of Germany) and in North America in particular. The majority of institutional investors are located outside of Germany. The proportion of shares held by retail investors increased to 27 % (previous year: 24 %). In the course of repaying an exchangeable bond issued for Aurubis shares, Salzgitter AG reduced its shareholdings from 25.00 % to 15.75 % according to the voting rights notification on October 27, 2017. On April 11, 2018, Salzgitter AG announced that it had increased its shareholdings to 20 %.
Shareholder structure
14.7 Germany12.3 Rest of Europe 6.1 UK/Ireland19.3 North America 0.5 Others
53 (51)Institutional investors
27 (24)Retail investors
20 (25)Salzgitter AG
in % (prior-year figures in parentheses)
Prior-year figures have been adjusted.
Key figures of Aurubis shares
2017/18 2 2016/17 2 2015/16 2 2014/15 2 2013/14 2
Closing price as at fiscal year-end 1 in € 60.24 68.54 49.88 56.90 39.16
Year high (close) 1 in € 86.12 78.47 61.68 59.68 49.49
Year low (close) 1 in € 55.44 46.79 37.54 36.43 36.19
Market capitalization as at fiscal year-end 1 in € million 2,708 3,081 2,242 2,558 1,761
Number of shares as at fiscal year-endin thousand
units 44,956.7 44,956.7 44,956.7 44,956.7 44,956.7
Dividend or recommended dividend in € 1.55 1.45 1.25 1.35 1.00
Payout ratio 3 in % 26 28 34 24 45
Dividend yield in % 2.6 2.1 2.5 2.4 2.6
Operating earnings per share in € 5.87 5.21 3.64 5.68 2.17
Operating price/earnings ratio as at fiscal year-end 10.26 13.16 13.70 10.02 18.051 Xetra disclosures.2 Values have been “operationally” adjusted for measurement effects deriving from the use of the average cost method in accordance with IAS 2 and from
copper price-related measurement effects on inventories, as well as from purchase price allocation impacts, primarily on property, plant, and equipment, commencing from fiscal year 2010/11 onwards.
3 In fiscal year 2016/17, the payout ratio definition was changed compared to the previous year. The new basis is the operating net result and no longer Aurubis AG’s unappropriated earnings.
Aurubis Shares on the Capital Market
Annual Report 2017/18 Aurubis
51

EXECUTIVE BOARD AND SUPERVISORY BOARD SUGGEST A DIVIDEND OF € 1.55The express objective of our dividend policy is to involve the shareholders in the company’s success adequately and consistently. The Executive Board and Supervisory Board will recommend a dividend of € 1.55 at the Annual General Meeting on February 28, 2019. This corresponds to a payout ratio of 26 % of the operating consolidated net income (previous year: 28 %). The dividend yield based on the closing price as at September 28, 2018 amounts to 2.6 % (previous year: 2.1 %).
INTENSIVE DIALOGUE WITH THE CAPITAL MARKETSIn fiscal year 2017/18, our new strategy, the volatile market environment, the varying developments on our sub-markets, and the company’s resulting earnings trend led to a high demand for information among capital market participants. We therefore intensified our proactive, timely, and targeted communication with retail and institutional investors and informed them via different channels about developments in the Aurubis Group’s business and potential. Dialogue with institutional investors took high priority again during the fiscal year. In addition to the business situation, the Executive Board and the Investor Relations department explained the new Aurubis Group strategy at many investor conferences and roadshows at the main financial centers in Europe and North America, in conference calls, and in a number of individual meetings. Webcasts on the release dates of our quarterly reports enabled investors and analysts to communicate with the Executive Board and management representatives. Moreover, many investors were informed about our processes, operating facilities, and products during visits to our Hamburg, Pirdop, and Olen sites.
In September 2018, analysts and institutional investors accepted our invitation to the Aurubis Capital Market Day at Aurubis Bulgaria in Pirdop. In expert presentations, discussions with the management, and a plant tour of one of Europe’s most state- of-the-art copper smelters, the participants received detailed information about the status of the strategy and the Aurubis Group’s future orientation, as well as a direct glimpse into our operating processes. Audio recordings and webcasts from Capital Market Day are available on our website.
We informed the capital markets about certain developments with ad hoc notifications. These comprised the announcement on February 12, 2018 about the signing of the term sheet with Wieland-Werke AG regarding the sale of Segment FRP and the announcement on April 26, 2018 about the increase in the forecast for the entire fiscal year.
A total of 19 international financial analysts regularly published recommendations and analyses about Aurubis’ shares during fiscal year 2017/18. In the course of the fiscal year, coverage by Berenberg, Deutsche Bank and Credit Suisse was suspended due to changes in analysts. The ratings were as follows at the end of the fiscal year:
Overview of analyst recommendationsNumber as at September 30, 2018
6Hold/ neutral
3Sell/ underperform
7Buy/ outperform
Aurubis Shares on the Capital Market
Aurubis Annual Report 2017/18
52

Communicating with retail investors is another important focus of Investor Relations work. At an event in Hamburg, we gave a number of retail shareholders the opportunity to learn more about the Group’s current development and economic environment in discussions with the management and employees, as well as allowing them to see the production processes firsthand in a plant tour. We also held presentations for retail investors at events organized by private shareholder associations. Our Annual General Meeting on March 1, 2018, which for the first time was shown online in real time, had a good attendance level of 800 shareholders.
Current information on the development of the company is available at www.aurubis.com. We provide financial reports, analyst presentations, and additional publications in our download center.
Security identification number 676650
International Securities Identification Number (ISIN) DE 000 67 66 504
Stock market segment MDAX
Stock exchanges
Regulated market: Frankfurt am Main and Hamburg; unofficial market: Berlin, Düsseldorf, Hanover, Munich, Stuttgart, Tradegate
Market segment Prime Standard
Issue price € 12.78
Average daily trading volume 217,736 shares in Xetra trading
Ticker symbol NDA
Reuters code NAFG
Bloomberg code NDA_GR
Analyst coverage 2017/18
Baader Bank Christian Obst
Bankhaus Lampe Marc Gabriel
Bank of America/Merrill Lynch Jason Fairclough
Berenberg1
Commerzbank Ingo-Martin Schachel
Credit Suisse 1
Deutsche Bank 1
DZ Bank Dirk Schlamp
Exane BNP Paribas Jatinder Goel
Goldman Sachs Eugene King
Hauck & Aufhäuser Henning Breiter
Independent Research GmbH Sven Diermeier
Kepler Cheuvreux Rochus Brauneiser
LBBW Jens Münstermann
Macquarie Research Ioannis Masvoulas
Morgan Stanley Menno Sanderse
NordLB Holger Fechner
Quirin Bank AG Klaus Soer
M.M. Warburg Eggert Kuls1 Coverage currently suspended due to a change in analyst.
Aurubis Shares on the Capital Market
Annual Report 2017/18 Aurubis
53

Aurubis Annual Report 2017/18
54
COMBINEDMANAGEMENT REPORT

55
Annual Report 2017/18 Aurubis
56 Foundations of the Group56 Business model of the Group60 Corporate control61 Research, Development, and Innovation62 Human resources62 Environmental protection and occupational health63 Separate Non-Financial Report
64 Economic Report64 General economic conditions64 Conditions specific to the industry67 Economic development within the Aurubis Group 77 Business performance in the Segments82 Executive Board assessment of the Aurubis Group during fiscal year 2017/1883 Results of operations, net assets, and financial position of Aurubis AG
86 Risk and Opportunity Report86 Integrated risk and opportunity management86 Risk management system86 Independent monitoring87 Explanation of relevant risks90 Internal control system relating to the consolidated accounting process91 Opportunity management system91 Explanation of relevant opportunities92 Assessment of the Aurubis Group’s risk and opportunity situation
93 Forecast Report93 Overall economic development94 Sector development95 Raw material markets95 Product markets 96 Business and earnings expectations for the Aurubis Group97 Expected financial situation98 General statement on the future development of the Aurubis Group
99 Legal Disclosures99 Declaration on corporate governance pursuant to Section 289f and Section 315d
of the German Commercial Code (HGB) 99 Takeover-related disclosures and explanations

Aurubis Annual Report 2017/18
56 Combined Management ReportFoundations of the Group
Foundations of the Group
Business model of the Group
BUSINESS ACTIVITIESAurubis AG is a provider of non-ferrous metals that operates worldwide. As an integrated group, we process complex metal concentrates, scrap metals, and metal-bearing recycling materials into metals of the highest purity. In addition to our main metal, copper, our metal portfolio also includes gold, silver, lead, nickel, tin, minor metals such as tellurium and selenium, and platinum group metals.
The company is based in Hamburg, Germany, where its headquarters and key production facilities are located. Most of its other sites are located in Europe, with larger production centers in Germany, Belgium, and Bulgaria. Outside of Europe, Aurubis also has a production site in the US and a global sales and service network.
BUSINESS MODEL In accordance with our Vision 2025, we will consistently expand our current copper-focused business model to encompass a broader multi-metal approach in the future. This means that, in addition to copper, other metals will be extracted from systematically purchased raw materials and intermediate products and then processed into value-added sales products.
For this purpose, we process copper concentrates that are obtained from ores and offered by mining and trading companies on the global market. Because Aurubis has no mines of its own or stakes in mines, it has to buy the raw materials for its two primary smelters located in Hamburg and Pirdop. As a buyer, Aurubis competes with other primary copper smelters, most of which are located in China and Japan. Copper concentrates for the Hamburg site reach us primarily by waterway and are transshipped via our port terminal in Brunsbüttel. There, the different copper concentrates are also pre-mixed in accordance with the requirements of our production processes. At the site in Pirdop, Bulgaria, concentrates reach us by both land and sea.
We use copper concentrates, copper scrap, other metal- bearing recycling materials, and bought-in intermediates as feed material. Most of the copper scrap and metal-bearing recycling raw materials for our two secondary smelters in Lünen (Germany) and Olen (Belgium) is sourced in Europe. Metal trading companies are the main actors on the supply side, though some recycling materials also reach us directly from product manufacturers. On the demand side, our main competitors are other copper and metal smelters, as well as metal processors that also utilize recycling materials. Copper scrap tends to reach us by land.
Raw materials Metal Refining & Processing Processors and end users
Cathodes
Recycling
Wire rod
Shapes
Specialty profiles
Precious metals
Minor metals
Sulfuric acid
Iron silicate
Business model in fiscal year 2017/18
» Copper concentrates » Blister copper » Copper scrap » E-scrap » Other recycling
materials
» Cable and wire industry » Construction » Machinery and
plant engineering » Transport » Chemistry » Other applications
Flat rolled products
Specialty wire
Flat Rolled Products

57
Annual Report 2017/18 Aurubis
Foundations of the GroupCombined Management Report
Sites and employees
EuropeDE Hamburg Headquarters
Aurubis AG2,462
E. R. N. Elektro-Recycling NORD GmbH
13
Peute Baustoff GmbH 12 Lünen Aurubis AG 629
Stolberg Aurubis Stolberg GmbH & Co. KG
438
Emmerich Deutsche Giessdraht GmbH
112
Fehrbellin CABLO Metall- Recycling & Handel GmbH
47
Röthenbach RETORTE GmbH Selenium Chemicals & Metals
44
Nersingen/Strass
CABLO Metall- Recycling & Handel GmbH
18
Berlin Aurubis AG 3 Group Representative
Office
Hanau Aurubis AG 2BG Pirdop Aurubis Bulgaria AD 866
BE Olen Aurubis Belgium NV/SA 582
Brussels Aurubis Belgium NV/SA 27NL Zutphen Aurubis Netherlands BV 311 FI Pori Aurubis Finland Oy 262
IT Avellino Aurubis Italia Srl 95
Mortara Aurubis Mortara S. p. A. 28
UK Smethwick/ Birmingham
Aurubis UK. Ltd. 23
SK Dolny Kubin Aurubis Slovakia s. r. o. 16 SE Finspång Aurubis Sweden AB 9 –FR Lyon/
SeptèmeAurubis Product Sales GmbH
3
RU St. Petersburg Aurubis Rus LLC.1 3ES Barcelona Aurubis Product
Sales GmbH 1
TR Istanbul Aurubis Turkey Kimya Anonim Sirketi 1
1
Employees in Europe 6,007 USAUSA Buffalo Aurubis Buffalo Inc. 642
Chicago Aurubis Buffalo Inc. 5Employees in the USA 647
ASIACN Shanghai Aurubis Metal Products
(Shanghai) Co., Ltd.15
Hong Kong 2 1Beijing 2 1
VAE Dubai Aurubis Middle East FZE 1 3SG Singapore 2 3TH Bangkok 2 3JP Tokyo 2 1KR Seoul 2 1VN Ho Chi
Minh City 2 1
Employees in Asia 19 Total employees
6,673
All of the companies listed in the table are fully consolidated, with the exception of those marked as non-consolidated.
Schwermetall Halbzeugwerk GmbH & Co. KG, Stolberg (DE), 308 employees, non-consolidated, number of employees not included in the table.
1 Non-consolidated companies.2 Agency/self-employed sales employee, non-consolidated.
Specialty wire
Sales and distribution networkAn international sales and distribution network markets our products.
Raw materialsConcentrates and recycling materials are the raw materials from which copper is produced.
ProductsThe copper is processed into products.Some products are already the result of copper production.
Cathodes Specialty profiles
Other metals
Iron silicate
Wire rod
Precious metalsSulfuric acid
Strip/foil
Shapes Status: September 30, 2018
Slitting centersService centers located near our customers slit strip to the desired dimensions.

Aurubis Annual Report 2017/18
58 Combined Management ReportFoundations of the Group
In the course of our production processes, we convert copper concentrates and copper scrap into copper cathodes Glossary,
page 182, the product format that is traded on the international metal exchanges. Copper cathodes are the starting product for fabricating additional copper products, but they can also be sold directly. Our product portfolio mainly comprises standard and specialty products made of copper and copper alloys. When it comes to processing, we have manufacturing capabilities for continuous cast copper wire rod, continuous cast shapes
Glossary, page 182, rolled products, strip, specialty wire, and profiles.
Additional products result from processing the elements that accompany copper in the raw materials. In particular, these include gold, silver, lead, nickel, tin, minor metals like tellurium and selenium, and platinum group metals. We also produce iron silicate Glossary, page 182 and sulfuric acid, the latter of which forms as a by-product of our processes. Customers and competitors in this area are very diverse. The customers include companies from the chemical, fertilizer, and mining industries.
The sales markets for our products are significantly fragmented in some cases. Aurubis’ direct customers include companies from the copper semis industry, the cable and wire industry, the electrical and electronics sector, and the chemical industry, as well as suppliers from the renewable energies, construction, and automotive sectors.
To close the value chain for copper and other metals, we place a high priority on the “closing-the-loop” approach. The focus of this approach is on materials such as production waste and residues that accumulate along the copper value chain in production, for example with our customers. The materials range from copper scrap with very high copper content, which we can directly feed into the copper fabrication process, to stamping waste containing precious metals and high levels of copper, alloyed scrap, slags from foundries, and other industrial residues.
GROUP STRUCTUREIn fiscal year 2017/18, the Aurubis Group’s organizational framework was based on the underlying business model. The Group’s structure is made up of two operating segments, which are the basis of segment reporting pursuant to IFRS 8 for fiscal year 2017/18: Segment Metal Refining & Processing and Segment Flat Rolled Products.
» Segment Metal Refining & Processing (MRP) processes complex metal concentrates, copper scrap, and metal-bearing recycling materials into metals of the highest quality. From an organizational perspective, Segment MRP includes the Commercial and Operations divisions. The Commercial division combines all market-relevant organizational units and is therefore responsible for raw material purchasing and product sales. The Operations division is responsible for the production of all basic products and metals, as well as for their further processing into other products, such as continuous cast wire
Glossary, page 182 rod and continuous cast shapes. The sites in Hamburg (Germany), Pirdop (Bulgaria), Olen (Belgium), and Lünen (Germany) manufacture copper cathodes, among other products. These cathodes are processed further into wire rod and shapes at the Hamburg (Germany), Olen (Belgium), Emmerich (Germany), and Avellino (Italy) sites.
» The second segment, Segment Flat Rolled Products (FRP), processes copper and copper alloys – primarily brass, bronze, and high-performance alloys – into flat rolled products and specialty wire, which it then markets. The main production sites for this are Zutphen (Netherlands), Buffalo (USA), Stolberg (Germany), and Pori (Finland). The segment also comprises slitting and service centers in Birmingham (UK), Dolný Kubín (Slovakia), and Mortara (Italy), as well as sales offices worldwide. In fiscal year 2017/18, we signed a contract with Wieland-Werke AG to sell Segment FRP. This is subject to approval by the EU antitrust authorities. The segment thus fulfills the conditions for presentation as discontinued operations pursuant to IFRS 5. With the sale, we plan to leave the strip business and continue strengthening our strategic orientation to the multi-metal business.
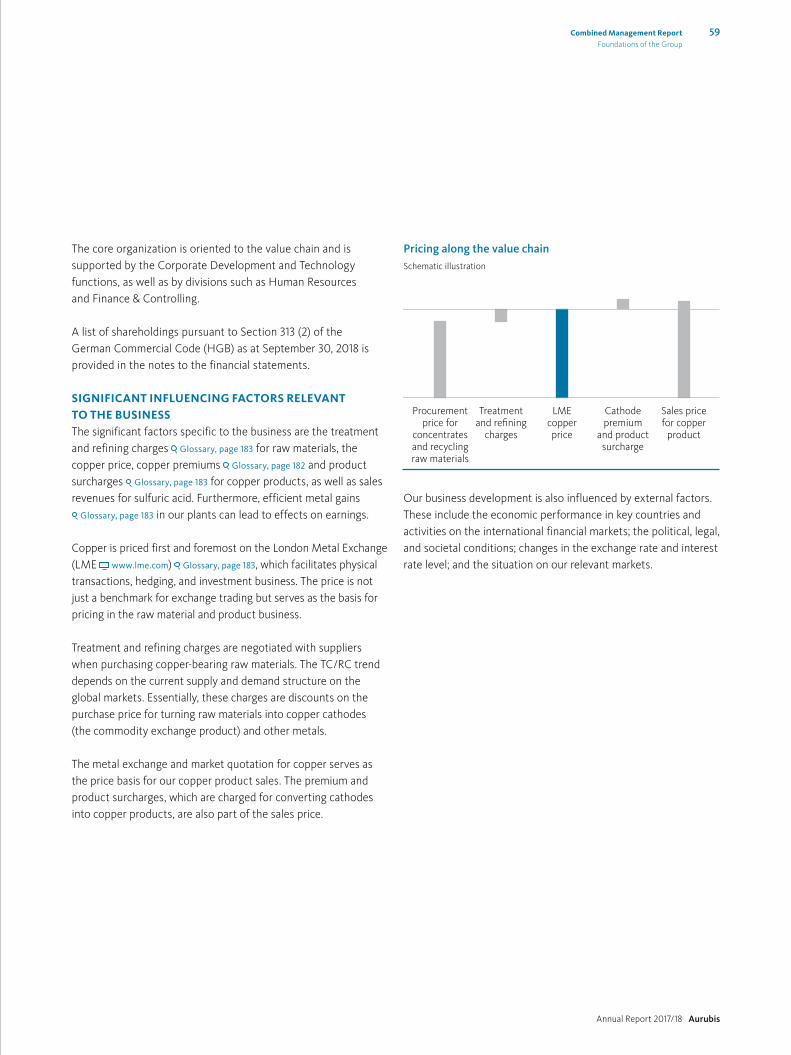
59
Annual Report 2017/18 Aurubis
Foundations of the GroupCombined Management Report
The core organization is oriented to the value chain and is supported by the Corporate Development and Technology functions, as well as by divisions such as Human Resources and Finance & Controlling.
A list of shareholdings pursuant to Section 313 (2) of the German Commercial Code (HGB) as at September 30, 2018 is provided in the notes to the financial statements.
SIGNIFICANT INFLUENCING FACTORS RELEVANT TO THE BUSINESS The significant factors specific to the business are the treatment and refining charges Glossary, page 183 for raw materials, the copper price, copper premiums Glossary, page 182 and product surcharges Glossary, page 183 for copper products, as well as sales revenues for sulfuric acid. Furthermore, efficient metal gains
Glossary, page 183 in our plants can lead to effects on earnings.
Copper is priced first and foremost on the London Metal Exchange (LME www.lme.com) Glossary, page 183, which facilitates physical trans actions, hedging, and investment business. The price is not just a benchmark for exchange trading but serves as the basis for pricing in the raw material and product business.
Treatment and refining charges are negotiated with suppliers when purchasing copper-bearing raw materials. The TC/RC trend depends on the current supply and demand structure on the global markets. Essentially, these charges are discounts on the purchase price for turning raw materials into copper cathodes (the commodity exchange product) and other metals.
The metal exchange and market quotation for copper serves as the price basis for our copper product sales. The premium and product surcharges, which are charged for converting cathodes into copper products, are also part of the sales price.
Pricing along the value chainSchematic illustration
Procurementprice for
concentratesand recyclingraw materials
Treatmentand refining
charges
LMEcopperprice
Cathodepremium
and productsurcharge
Sales pricefor copper
product
Our business development is also influenced by external factors. These include the economic performance in key countries and activities on the international financial markets; the political, legal, and societal conditions; changes in the exchange rate and interest rate level; and the situation on our relevant markets.

Aurubis Annual Report 2017/18
60 Combined Management ReportFoundations of the Group
Corporate control
CONTROL SYSTEMThe management control system’s main objective is to increase the Aurubis Group’s corporate value. Concretely, the company should generate value beyond the costs of capital.
CORPORATE CONTROL PARAMETERSIn order to measure financial success for the medium and long term within the scope of value-oriented corporate control, Aurubis uses the following central control parameters:
» Operating consolidated earnings before taxes = operating EBT,
» Operating ROCE (return on capital employed) of the Group. These parameters are regularly presented to the Executive Board and are utilized for internal control purposes. The Executive Board’s variable compensation is also based on these parameters.
The Aurubis Group reports in accordance with International Financial Reporting Standards (IFRS). For internal control purposes, it does not comply with the IAS 2 amendment that stipulates exclusive application of the FIFO or average cost method. This is to avoid metal price fluctuations resulting from measurement according to the average cost method. Such measurement effects, in our opinion, are not necessary to gain an understanding of the Aurubis Group’s business activities and results from an operational perspective. Furthermore, purchase price allocations led to one-time effects, which would also lead to a distortion in the Aurubis Group’s presentation of the results of operations, financial position, and net assets.
Internal Group reporting and control are carried out on the basis of the operating result to present the Aurubis Group’s success independently of these measurement effects on internal control systems.
The operating result is derived from the IFRS results of operations by:
» Adjusting by effects from the use of IFRS 5, » Adjusting for measurement results from the use of IAS 2.
The metal price fluctuations resulting from the application of the average cost method are eliminated in the same manner as devaluations relating to the reporting date and appreciations in the value of copper inventories,
» Adjusting for the impact of purchase price allocations, primarily on property, plant, and equipment, since fiscal year 2010/11.
Operating return on capital employed (ROCE)
in € million 9/30/2018 9/30/2017
Fixed assets excluding financial fixed assets and investments measured using the equity method 1,406 1,375
Inventories 1,549 1,387
Trade accounts receivable 374 357
Other receivables and assets 191 216
– Trade accounts payable -904 -905
– Provisions and other liabilities -371 -388
Capital employed as at the balance sheet date 2,246 2,042
Earnings before taxes (EBT) 329 298
Financial result 3 10
Earnings before interest and taxes (EBIT) 332 308
Return on capital employed (operating ROCE) 14.8 % 15.1 %
Operating ROCE shows the ratio of operating earnings before interest and taxes (EBIT Glossary, page 183) to operating capital employed Glossary, page 183 as at the balance sheet date and indicates the return on capital employed.
Corresponding to the calculation of the operating result, operating capital employed is derived by adjusting the balance sheet items in accordance with IFRS by the effects previously mentioned.
A reconciliation of the balance sheet and income statement from IFRS to operating figures is provided in the Economic Report of the Combined Management Report.

61
Annual Report 2017/18 Aurubis
Foundations of the GroupCombined Management Report
Research, Development, and Innovation
The primary focus of our Research, Development, and Innovation division during the reporting period was on two key fields of work: optimizing existing core processes and developing new processes for complex materials – in line with the new multimetal strategy.
We see the Research, Development, and Innovation division as crucial to maintaining our competitive edge. We strenghthened the division further and had 78 employees in fiscal year 2017/18 (previous year: 67 employees). The employees are distributed across the Group, and work at the sites in Buffalo, Hamburg, Lünen, Olen, Pirdop, Pori, Stolberg, Finspång, and Zutphen. We promote intensive communication between the sites.
The strategic project Future Complex Metallurgy (FCM) was a focus of our work again in fiscal year 2017/18. Here, we are developing a flexible process and an industrial plant that will enable the quick recovery, with a high level of selectivity, of metals from complex raw materials and intermediates. Our development work here has involved numerous trials at our R&D pilot facilities, through which we seek to validate and develop the metallurgical process for the project, and to continuously optimize the ramp-up phase of the new facilities. Tests are also planned for the coming fiscal year as well, which should identify the most important process parameters in order to deliver a stable process. The FCM project has given rise to numerous subsequent projects related to downstream processes. Among these is a project aimed at assessing the capacities and recovery times of current facilities.
We are increasingly using sensor technology as part of our efforts to advance the existing key processes in primary and secondary copper production. Together with the mineralogical characterization of the input material, we are thus improving the stability and monitoring of the key processes with the objective of boosting metal output. With a view to advancing these activities, which fall under the topic of digitalization, we expanded our specialist team in 2017/18. Our goal is to drive complex operating processes with advanced analytics methods.
Only with a sufficiently large data basis can we sustainably implement improvements. An example of this is the data-driven energy consumption forecast at the Hamburg site, which will enable us to react more flexibly to fluctuating energy prices in the future.
In the area of mathematical modeling, we have completed prototypes to support operative production planning with the objective of strengthening our competitive edge, and we are currently in the process of implementing them. We have also developed additional models to support production. For instance, we are planning to improve our energy management with such models and are working together with external institutes to develop a practicable, stable, efficient, and flexible energy system.
Fiscal year 2017/18 saw us continue our work on improving metal recovery from iron silicate slag. In this context, we are researching a new metallurgy process that enables the selective extraction of metals contained in the slag. This improved metal extraction capacity will also boost the competitiveness of our primary copper production Glossary, page 183 activities.
Within Segment Flat Rolled Products, we worked on developing and marketing lead-free machining materials during the fiscal year. When it comes to wire products, we are in the process of developing different alloy varieties for the BlueBrass family.
In the connector product sector, we worked on sampling low-alloyed, highly conductive copper alloys.
We were also involved with basic research in the areas of battery technology and power electronics in fiscal year 2017/18. In some cases, this took place within the scope of publicly funded projects implemented together with university and industry partners. We successfully achieved the first development results in the business area of power electronics in the form of patent applications.

Aurubis Annual Report 2017/18
62 Combined Management ReportFoundations of the Group
The entire Aurubis Group’s R&D expenditures in fiscal year 2017/18 amounted to € 12 million, compared to € 11 million in reporting year 2016/17.
R&D expenditurein € million
13/14 17/1816/1715/1614/15
121110 1113
Human resources
A total of 6,673 employees worked in the Aurubis Group worldwide as at September 30, 2018. Of this number, 56.6 % were employed at German sites and 43.4 % worked in other countries. In the reporting year, we hired a number of new employees in light of several areas that will be growing in importance in the future, such as research, development, innovation, technology, and the internal growth project Future Complex Metallurgy.
Aurubis Group personnel are mainly dispersed among the following countries: Germany (3,780), Bulgaria (866), the USA (647), Belgium (609), the Netherlands (311), Finland (262), and Italy (123).
Aurubis Group employeesNumber as at 9/30
13/14 17/1816/1715/1614/15
1 Excluding Schwermetall Halbzeugwerk GmbH & Co. KG.
6,673 1
6,454 16,359 1 6,321 1 6,494 1
Aurubis Group personnel structureNumber as at 9/30/2018
4,130Blue collar
287Apprentices
2,256White collar
Environmental protection and occupational health
ENVIRONMENTAL PROTECTION IN THE GROUPWe take responsibility for protecting our environment and our climate. Our production facilities therefore use modern and energy-efficient plant technology that also complies with very high environmental standards. In this way, we conserve natural resources and maintain a clean environment for future generations. We have set targets in environmental protection, defined corresponding KPIs, and established measures to achieve the targets across the Group. The effectiveness of these targets and measures is reviewed continuously.
Capital expenditure for environmental protection in copper productionin € million
171609 10 11 12 13 14 1508
19.627.5
81.5
27.4
51.6
34.429.6
15.2 16.1 17.9

63
Annual Report 2017/18 Aurubis
Foundations of the GroupCombined Management Report
The continuous improvement of water pollution control, soil conservation, climate protection, and emission prevention are all key to achieving sustainable environmental protection. For this reason, Aurubis has invested more than € 560 million in environmental protection measures in primary and secondary copper production since 2000.
OCCUPATIONAL HEALTH IN THE GROUPCorporate Occupational Health and Safety is responsible for ensuring that the technical, organizational, and personal conditions in place in the company are designed to prevent work-related accidents and illnesses.
The acronym LTIFR (1-n) indicates the accident rate in the company. It stands for “Lost Time Injury Frequency Rate” and refers to the number of work-related accidents with at least one lost shift per one million hours worked.
After having seen its accident rate fall continuously and substantially over the past several years, Aurubis experienced an accident rate increase in the reporting year, with an LTIFR (1-n) of 6.1 for fiscal year 2017/18 compared with 4.8 in the previous year. In absolute terms, this equated to 60 accidents in the reporting year compared with 47 in the previous year.
We have been setting short-term and medium-term occupational safety targets since 2010 and are working towards our long- term “Vision Zero,” that is, a completely accident-free work environment. Our medium-term goal is to achieve an LTIFR (1-n) of ≤ 1.0.
Accident frequencyLTIFR = Lost Time Injury Frequency Rate
13/14
LTIFR (1-n)
14/15 15/16 16/17 17/18
LTIFR (4-n)
LTIFR (1-n) – accidents with lost time of at least one whole shiftLTIFR (4-n) – accidents with lost time of more than three whole shifts
7.86.5 6.3
5.3 4.6 4.4 4.8 4.2
6.1 5.6
Separate Non-Financial Report
The section Sustainability, pages 34-48 provides additional information on the topics of sustainability, environmental protection, energy, the climate, and occupational health.
Aurubis AG reports on both the Aurubis Group and Aurubis AG in the form of a consolidated, separate Non-Financial Report, which can also be found in the section Sustainability, pages 34-48.

Aurubis Annual Report 2017/18
64 Combined Management ReportEconomic Report
Economic Report
General economic conditions
The global economy developed positively overall in fiscal year 2017/18. In its autumn forecast, the International Monetary Fund (IMF, www.imf.org) expects an increase of 3.7 % in global economic growth for 2018, only slightly below its spring forecast.
According to the IMF, the strongest growth momentum comes from Asia, especially China and India, and the US. However, the monetary authorities view the ongoing trade conflicts between the US and China as one of the biggest risk factors for global growth.
Expected GDP growth in 2018in %
World USA Euro-zone
Germany IndiaJapan China
Source: International Monetary Fund, Oct. 2018
3.7
7.3
2.92.0 1.9
1.1
6.6
For the euro area, the IMF forecasts continued solid growth of 2.0 % for 2018, supported in part by Germany with predicted growth of 1.9 %. Both figures are somewhat lower than those the IMF outlined in its spring forecast. The IMF highlights high ongoing domestic demand with low unemployment numbers and the European Central Bank’s policy of low interest rates as key drivers of growth.
For the US, the IMF predicts economic growth of 2.9 % for 2018. Fiscal policy measures continue to be a significant reason for the good growth level there. The IMF sees the biggest risks for the American economy in the US government’s course – especially with respect to cooperation with China.
The Chinese economy should also continue to grow strongly in 2018. At 6.6 %, economic growth is expected to be at the level of the April estimate.
The global financial markets were mostly favorable in 2018. In the US, the Federal Reserve increased the federal funds rate multiple times during the course of the year. In September, it was at 2.00 to 2.25 %. In Europe, the European Central Bank maintained its zero interest rate policy but announced that it would end its bond-buying program at the end of 2018.
Conditions specific to the industry
We are mainly active on the international copper market and its sub-markets, which underwent the following developments in fiscal year 2017/18:
The international copper concentrate market was characterized by high mining output, and thus good concentrate availability, in 2018. Despite a series of wage negotiations between mines and unions, especially in South America, there were no notable production losses due to strikes. Production losses due to

65
Annual Report 2017/18 Aurubis
Economic ReportCombined Management Report
accidents or weather-related incidents were low as well. The rate of total production losses owing to these factors declined from 5.5 % in the previous year to 1.8 % for 2018, according to the research company WoodMackenzie. Apart from low production losses, mine expansions and ramp-ups of mines that had been previously decommissioned contributed to the higher output. As a result, according to the International Copper Study Group (ICSG), mining output for copper in 2018 is expected to be approximately 2 % higher and amount to 20.5 million t (copper content).
On the smelter industry side, in contrast, there were several shutdowns in Asia in 2018, primarily due to environmental regulations. In light of production restrictions, there was also a reduction in some Asian smelters’ demand for copper concentrate.
The European market for recycling raw materials once again proved to be a buyers’ market for smelters during fiscal year 2017/18. The supply volume for copper scrap was very high, especially in fall 2017, in all significant regions for scrap trading. The increased copper prices in 2017 resulted in good volume flow from the collection and treatment activities in the metal trade. On the demand side, this was accompanied by a good supply situation for smelters and other consumers. Because of the restrictions China introduced for copper scrap imports with high impurity levels, stronger demand among Chinese consumers for high-purity copper scrap from Europe was noticeable in calendar year 2018. Coupled with temporary declines in the copper price in 2018, this initially led to a shortage on the copper scrap market. A higher supply of recycling materials from the US due to the trade conflict between the US and China had a countereffect. The refining charges for copper scrap in Europe, which were published by the research firm CRU, remained at a good level compared to the past several years, however. Complex recycling raw materials such as electrical and electronic scrap were also sufficiently available on the market.
Refined copper output was mainly affected by two factors in fiscal year 2017/18. On the one hand, there were the previously mentioned production shutdowns at smelters in Asia, including India, China, and Japan, as well as isolated smelter shutdowns in Chile. These contrasted with capacity expansions in China and, from January to July 2018, with good utilization of global refining capacity, at about 85 %. Also significant was the good availability of copper scrap, which according to ICSG estimates will lead to a 6 % increase in secondary production in 2018. Overall, the ICSG expects that the global output of refined copper in 2018 will be 2.7 % higher than the previous year, or at roughly 24.2 million t.
On the demand side for refined copper, there was very little change in the first seven months of 2018 compared with the previous year. At 13.8 million t, the level achieved was slightly above the corresponding period in 2017. For the entire year, the ICSG expects a 2.1 % increase in global demand, to 24.3 million t. There are larger uncertainties when it comes to the calculation of copper demand in China.
The level of exchange inventories of copper cathodes declined notably in the course of 2018. After 577,000 t at the beginning of the fiscal year, approximately 495,000 t was stored at the LME, COMEX, and SHFE metal exchanges as at the end of fiscal year 2017/18. Additionally, copper inventories at the Chinese bonded warehouse decreased by about 13 %, to 430,000 t, at the end of the fiscal year.
According to the ICSG, there was a slight production deficit of 51,000 t on the global market for refined copper in the first six months of 2018. The ICSG also expects a marginal deficit of 90,000 t for the entire year 2018.

Aurubis Annual Report 2017/18
66 Combined Management ReportEconomic Report
The international market for continuous cast wire rod, which accounts for about 75 % of global cathode output worldwide, continued its stable development in the first half of 2018. We deliver most of our wire rod to Europe. Growth in the first half of 2018 rose considerably in this area, at over 4 %. This was due to the ongoing good economic situation, but also, in part, to the low growth levels recorded for the same period in 2017. These in turn were attributable to inventory corrections in the cable sector, which had resulted from changes to fire resistance standards for cables within the European Union, and which had led to uncertainty on the part of customers. While the development of demand in northern Europe was stable, growth in southern Europe increased significantly. For the entire year 2018, CRU expects European demand growth of about 4 %.
The global market for sulfuric acid developed very favorably in fiscal year 2017/18. High demand on the one hand and smelter shutdowns on the other led to a tightening market and thus to rising prices. According to the industry service provider ICIS, the gliding averages for multiple quotations worldwide were at the highest level in years. Demand growth came from the metals industry, where sulfuric acid is used in mining to process specific ores, as well as from the fertilizer industry.
The LME copper price was highly volatile in fiscal year 2017/18, influenced especially by speculations about the outcome of the wage negotiations between mines and unions, as well as about the continued trade conflicts between the US and China. Following a copper price of US$ 6,455/t (settlement Glossary,
page 183) at the beginning of October 2017 and developments marked by price fluctuations, the fiscal year closed with an LME copper price of US$ 6,180/t (settlement). The lowest price of the year was US$ 5,823/t (September 4, 2018). About three months prior, the high was US$ 7,263/t (June 8, 2018). The average price for the fiscal year was US$ 6,684/t (previous year: US$ 5,781/t).
Copper price and metal exchange copper inventoriesfrom 10/1/2017 to 9/30/2018
in thousand t US$/t
10/17 11/
1701/1
812/
1703/1
802/
1804/18
05/18
06/1807/1
808/
1809/18
LME copper price (monthly averages)Metal exchange copper inventories
0
300
900
600
1,200
6,000
7,000
8,000
4,000
5,000

67
Annual Report 2017/18 Aurubis
Economic ReportCombined Management Report
Economic development within the Aurubis Group
RESULTS OF OPERATIONS, NET ASSETS, AND FINANCIAL POSITIONIn order to portray the Aurubis Group’s operating success independently of measurement influences for internal management purposes, the presentation of the results of operations, net assets, and financial position in accordance with IFRS is supplemented by the results of operations and net assets explained on the basis of operating values.
With the signing of the term sheet on February 12, 2018, Segment Flat Rolled Products (FRP) fulfills the conditions to be recognized as discontinued operations in accordance with IFRS. On March 29, 2018, Aurubis AG and Wieland-Werke AG signed a contract to sell Segment Flat Rolled Products. The final execution of the sales contract is subject to approval by the antitrust authorities. A final decision is expected in early 2019.
In this respect, the presentation and measurement rules specified in IFRS 5 must be applied for Segment FRP in fiscal year 2017/18. These include, among other things, a separate, aggregated disclosure of consolidated net income from discontinued operations in the consolidated income statement, as well as a separate, aggregated disclosure of assets and liabilities held for sale for the discontinued operations in the consolidated statement of financial position. Furthermore, additional notes to the financial statements are necessary Acquisitions and
discontinued operations, page 123. With respect to measurement in accordance with IFRS 5, among other things, any impact on income deriving from scheduled depreciation and amortization in Segment FRP, or from application of equity accounting for the purpose of consolidating the investment in the joint venture, Schwermetall Halbzeugwerk GmbH & Co. KG (Schwermetall), must be discontinued in the IFRS consolidated financial statements.
The Executive Board continues to treat Segment FRP as an operating reporting segment and, consequently, the financial reporting for operating purposes will remain unchanged until such time as the sales transaction is finalized.
As a result, the accounting impacts deriving from IFRS 5 in the financial statements are reversed in the reconciliation between IFRS reporting and operating reporting.
As regards the reconciliation of the consolidated income statement, the items reported as discontinued activities are again shown separately. For purposes of measurement, the impacts on income deriving from scheduled depreciation and amortization of fixed assets, or from application of equity accounting for the purpose of consolidating the investment are accounted for, as in the past. In order to demonstrate the Aurubis Group’s operating success, subsequent adjustments are also made to inventories and non-current assets.
In order to adjust the measurement impacts in inventories resulting from the application of IAS 2, metal price fluctuations resulting from the application of the average cost method are eliminated in the same manner as any write-downs or appreciation in value for copper inventories at the reporting date. Furthermore, from fiscal year 2010/11 onwards, fixed assets have been adjusted for effects deriving from purchase price allocations (PPAs), primarily relating to property, plant, and equipment.
As regards the reconciliation of the consolidated statement of financial position, assets and liabilities held for sale as discontinued operations are again disclosed in a disaggregated form and the measurement effects on the relevant items in the statement of financial position are recognized as they have been in the past. Subsequently, in order to demonstrate the Aurubis Group’s operating success, measurement impacts on inventories and fixed assets are also adjusted for.
The following table shows how the respective operating results for the 2017/18 fiscal year and for the comparative prior-year period have been determined.

Aurubis Annual Report 2017/18
68 Combined Management ReportEconomic Report
Reconciliation of the consolidated income statement
12 months 2017/18 12 months 2016/17
IFRS from continu-
ing opera-tions
Adjustment effects
Operating
IFRS from continu-
ing opera-tions
Adjustment effects
Operatingin € million
Discon-tinued opera-
tions Inven-
tories PPA
Discon-tinued opera-
tionsInven-tories PPA
Revenues 10,424 1,270 0 0 11,694 9,880 1,160 0 0 11,040
Changes in inventories of finished goods and work in process 0 -1 -7 0 -8 -17 22 -70 0 -65
Own work capitalized 19 0 0 0 19 9 0 0 0 9
Other operating income 43 2 0 0 45 47 0 0 0 47
Cost of materials -9,464 -1,039 -33 0 -10,536 -8,826 -948 -88 0 -9,862
Gross profit 1,022 232 -40 0 1,214 1,093 234 -158 0 1,169
Personnel expenses -352 -132 0 0 -484 -338 -132 0 0 -470
Depreciation of property, plant, and equipment and amortization of intangible assets -119 -14 0 3 -130 -121 -14 0 3 -132
Other operating expenses -217 -51 0 0 -268 -210 -49 0 0 -259
Operational result (EBIT) 334 35 -40 3 332 424 39 -158 3 308
Result from investments measured using the equity method 0 13 -2 0 11 0 11 -3 0 8
Interest income 3 0 0 0 3 3 0 0 0 3
Interest expense -16 -2 0 0 -18 -18 -2 0 0 -20
Other financial income 1 0 0 0 1 0 0 0 0 0
Other financial expenses 0 0 0 0 0 -1 0 0 0 -1
Earnings before taxes (EBT) 322 46 -42 3 329 408 48 -161 3 298
Income taxes -59 -16 14 -3 -64 -90 -14 43 -1 -62
Consolidated net income 263 30 -28 0 265 318 34 -118 2 236
Explanation of the presentation and the adjustment effects Results of operations, net assets, and financial position, page 67.

69
Annual Report 2017/18 Aurubis
Economic ReportCombined Management Report
RESULTS OF OPERATIONS (OPERATING) Operating EBT in the fiscal year amounts to € 329 million and is derived from continuing and discontinued operations of the IFRS result before income taxes, as follows:
The Aurubis Group generated IFRS earnings before taxes of € 322 million from continuing operations in fiscal year 2017/18 (previous year: € 408 million). IFRS earnings before taxes from discontinued operations amount to € 46 million (previous year: € 48 million).
The accounting impacts of IFRS 5, which has been applied to Segment FRP since early March, were reversed to derive the operating result. Accordingly, scheduled depreciation and amortization (€ -8 million) and the recognition in income of the shares of Schwermetall consolidated using the equity method (€ 9 million) were taken into account in the reconciliation to the operating result, as in the past.
Moreover, to derive the operating result, the IFRS result was adjusted for inventory measurement effects of € -42 million (previous year: € -161 million) (the total of the following positions: “Changes in inventories of finished goods and work in process,” “Cost of materials,” and “Result from investments measured using the equity method”), as well as for impacts of € 3 million (previous year: € 3 million) deriving from allocations of the purchase price, resulting in operating earnings before taxes of € 329 million (previous year: € 298 million).
Operating EBT was positively influenced by:
» A higher concentrate throughput due to a good performance at the Hamburg and Pirdop sites. The previous year was negatively impacted by a scheduled maintenance shutdown in Hamburg in Q1 2016/17,
» Substantially higher refining charges for copper scrap with good availability,
» Higher sulfuric acid revenues due to considerably higher sales prices,
» A higher metal gain with increased copper prices, » Significantly higher sales volumes for wire rod products, » Higher sales volumes for flat rolled products, and » Additional positive contributions from our efficiency
improvement program.
The weaker US dollar had an opposite effect.
The Group’s revenues increased by € 654 million to € 11,694 million (previous year: € 11,040 million) during the reporting period. This development was primarily due to the higher average copper price.
Breakdown of revenues
in % 2017/18 2016/17
Germany 34 35
European Union 37 36
Rest of Europe 4 5
Other countries 25 24
Total 100 100
The inventory change amounted to € -8 million. The inventory change of € -65 million in the previous year was primarily caused by a reduction in copper inventories.
In a manner corresponding to the development for revenues and inventory changes, the cost of materials increased by € 674 million, from € 9,862 million in the previous year to € 10,536 million.
Own work capitalized increased by € 10 million in the fiscal year, to € 19 million (previous year: € 9 million). The increase is mainly due to activities related to the Future Complex Metallurgy project.
After taking other operating income into account, the residual gross profit was € 1,214 million (previous year: € 1,169 million).
Personnel expenses rose from € 470 million in the previous year to € 484 million due to wage tariff agreement increases and a slightly higher number of employees. During the reporting year, we particularly strengthened our personnel resources in order to address certain issues that will grow in importance in the future. These include areas such as research, development, innovation, technology, and the Future Complex Metallurgy project. Lower personnel costs at the Buffalo, USA, site – resulting from the exchange rate development – had an opposite effect.
At € 130 million, depreciation and amortization of fixed assets was slightly below the prior-year level (€ 132 million).
Other operating expenses were € 268 million compared to € 259 million in the previous year.

Aurubis Annual Report 2017/18
70 Combined Management ReportEconomic Report
Development of revenues by productsin € million
16/17 17/18 16/17 17/18 16/17 17/18 16/17 17/18 16/17 17/18 16/17 17/18
CathodesWire rod Precious metals Shapes Pre-rolled strip,strip, and profiles
Chemicals and other
9701,431
406
4,283
8711,296
375
3,741
2,4202,337 2,3832,220
The operational result before interest and taxes (EBIT) therefore amounted to € 332 million (previous year: € 308 million).
At € 15 million, net interest expense was below the prior-year level (€ 17 million). The decrease resulted from reduced gross debt in connection with the redemption of bonded loans (Schuldscheindarlehen).
After taking the financial result into account, operating earnings before taxes (EBT) were € 329 million (previous year: € 298 million).
Operating consolidated net income of € 265 million remained after tax (previous year: € 236 million). Operating earnings per share amounted to € 5.87 (previous year: € 5.21).
RESULTS OF OPERATIONS (IFRS) FROM CONTINUING OPERATIONS Due to the classification of Segment FRP as an operation intended for sale, the following values regarding the results of operations are exclusively related to continuing operations.
The Aurubis Group generated a consolidated net result of € 263 million in fiscal year 2017/18 (previous year: € 318 million).
Consolidated income statement
in € million2017/18
IFRS2016/17
IFRS
Revenues 10,424 9,880
Changes in inventories/ own work capitalized 19 -8
Other operating income 43 47
Cost of materials -9,464 -8,826
Gross profit 1,022 1,093
Personnel expenses -352 -338
Depreciation of property, plant, and equipment and amortization of intangible assets -119 -121
Other operating expenses -217 -210
Operational result (EBIT) 334 424
Financial result -12 -16
Earnings before taxes (EBT) 322 408
Income taxes -59 -90
Consolidated net income 263 318

71
Annual Report 2017/18 Aurubis
Economic ReportCombined Management Report
The Group’s revenues increased by € 544 million to € 10,424 million (previous year: € 9,880 million) during the reporting period. This development was primarily due to the higher average copper price.
Own work capitalized increased by € 10 million in the fiscal year, to € 19 million (previous year: € 9 million). The increase is mainly due to activities related to the Future Complex Metallurgy project.
In a manner corresponding to the development for revenues and inventory changes, the cost of materials increased by € 638 million, from € 8,826 million in the previous year to € 9,464 million.
After taking other operating income into account, the residual gross profit was € 1,022 million (previous year: € 1,093 million).
In addition to the effects on earnings described in the explanation of the operating results of operations, the change in gross profit was also due to metal price developments. The use of the average cost method leads to metal price valuations that are close to market prices. Metal price volatility therefore has a direct effect on the change in inventories/cost of materials and thus on the IFRS gross profit. The depiction of this volatility in the IFRS gross profit is not relevant to the cash flow and does not reflect Aurubis’ operating performance.
Personnel expenses rose from € 338 million in the previous year to € 352 million due to wage tariff agreement increases and a slightly higher number of employees. During the reporting year, we particularly strengthened our personnel resources in order to address certain issues that will grow in importance in the future. These include areas such as research, development, innovation, technology, and the Future Complex Metallurgy project.
At € 119 million, depreciation and amortization of fixed assets was slightly below the prior-year level (€ 121 million).
Other operating expenses were € 217 million compared to € 210 million in the previous year.
Earnings before interest and taxes (EBIT) therefore amounted to € 334 million (previous year: € 424 million).
At € 13 million, net interest expense was below the prior-year level (€ 15 million). The decrease resulted from reduced gross
debt in connection with the redemption of bonded loans (Schuldscheindarlehen).
After taking the financial result into account, earnings before taxes were € 322 million (previous year: € 408 million).
Consolidated net income of € 263 million from continuing operations remained after tax (previous year: € 318 million). Earnings per share from continuing operations amounted to € 5.81 (previous year: € 7.04).
NET ASSETS (OPERATING)The table Reconciliation of the consolidated statement of financial
position, page 72 shows the derivation of the operating statement of financial position as at September 30, 2018, and as at September 30, 2017.
Total assets increased from € 3,975 million as at September 30, 2017 to € 4,077 million as at September 30, 2018, primarily due to increased inventories.
The Group’s equity increased by € 174 million, from € 2,087 million as at the end of the last fiscal year to € 2,261 million as at September 30, 2018. This was largely due to the operating consolidated net income of € 265 million. The dividend payment of € 67 million and the impact on other comprehensive income deriving from the measurement of hedging transactions at market, amounting to € 27 million, had an opposite effect.
Overall, the operating equity ratio (the ratio of equity to total assets) was therefore 55.5 % compared to 52.5 % as at the end of the previous fiscal year.
Development of borrowings
in € million 9/30/2018 9/30/2017
Non-current bank borrowings 248 317
Non-current liabilities under finance leases 33 23
Non-current borrowings 281 340
Current bank borrowings 30 8
Current liabilities under finance leases 3 3
Current borrowings 33 11
Borrowings 314 351

Aurubis Annual Report 2017/18
72 Combined Management ReportEconomic Report
At € 314 million as at September 30, 2018, borrowings were below the level of the previous fiscal year-end (€ 351 million). The primary reason for this was the redemption of bonded loans (Schuldscheindarlehen) in February 2018.
Reconciliation of the consolidated statement of financial position
9/30/2018 9/30/2017
IFRS from continu-
ing opera-tions
Adjustment effects
Operating IFRS
Adjustment effects
Operatingin € million
Discon-tinued opera-
tions Inven-
tories PPAInven-tories PPA
ASSETS
Fixed assets 1,354 174 -13 -32 1,483 1,489 -11 -34 1,444
Deferred tax assets 3 1 25 0 29 6 25 0 31
Non-current receivables and other assets 28 2 0 0 30 32 0 0 32
Inventories 1,681 274 -406 0 1,549 1,752 -366 0 1,386
Current receivables and other assets 385 122 0 0 507 511 0 0 511
Cash and cash equivalents 461 18 0 0 479 571 0 0 571
Assets held for sale 590 -590 0 0 0 0 0 0 0
Total assets 4,502 1 -394 -32 4,077 4,361 -352 -34 3,975
EQUITY AND LIABILITIES
Equity 2,566 1 -281 -25 2,261 2,366 -254 -25 2,087
Deferred tax liabilities 188 16 -113 -7 84 205 -98 -9 98
Non-current provisions 254 34 0 0 288 307 0 0 307
Non-current liabilities 281 1 0 0 282 344 0 0 344
Current provisions 34 8 0 0 42 39 0 0 39
Current liabilities 1,017 103 0 0 1,120 1,100 0 0 1,100
Liabilities deriving from assets held for sale 162 -162 0 0 0 0 0 0 0
Total equity and liabilities 4,502 1 -394 -32 4,077 4,361 -352 -34 3,975
Explanation of the presentation and the adjustment effects in Results of operations, net assets, and financial position, page 67.

73
Annual Report 2017/18 Aurubis
Economic ReportCombined Management Report
RETURN ON CAPITAL (OPERATING)The return on capital employed (ROCE) shows the return on the capital employed in the operating business or for an investment. It was determined taking the operating EBIT of the last 4 quarters into consideration.
Operating ROCE was 14.8 % due to higher capital employed, compared to 15.1 % in the comparative period.
Operating return on capital employed (ROCE)
in € million 9/30/2018 9/30/2017
Fixed assets excl. financial assets and investments measured using the equity method 1,406 1,375
Inventories 1,549 1,387
Trade accounts receivable 374 357
Other receivables and assets 191 216
– Trade accounts payable -904 -905
– Provisions and other liabilities -371 -388
Capital employed as at the reporting date 2,246 2,042
Earnings before taxes (EBT) 329 298
Financial result 3 10
Earnings before interest and taxes (EBIT) 332 308
Return on capital employed (operating ROCE) 14.8 % 15.1 %
NET ASSETS (IFRS) Due to the classification of Segment FRP as discontinued operations, the following values regarding net assets in the current year are mainly related to the continuing operations in the Group.
Total assets increased from € 4,361 million as at the end of the last fiscal year to € 4,502 million as at September 30, 2018, due in particular to higher inventories as at the balance sheet date.
Structure of the statement of financial position of the Group
in % 9/30/2018 9/30/2017
Fixed assets 30 34
Inventories 37 40
Receivables, etc. 10 13
Assets held for sale 13 0
Cash and cash equivalents 10 13
100 100
Equity 57 54
Provisions 10 13
Liabilities 29 33
Liabilities deriving from assets held for sale 4 0
100 100
The Group’s equity increased by € 200 million, from € 2,366 million as at the end of the last fiscal year to € 2,566 million as at September 30, 2018. This was largely due to the consolidated net income of € 263 million from continuing operations and of € 29 million from discontinued operations. The dividend payment of € 67 million and the impact on other comprehensive income deriving from the measurement of hedging transactions at market, amounting to € 27 million, had an opposite effect.
Overall, the equity ratio was 57.0 % as at September 30, 2018, compared to 54.2 % as at the end of the previous fiscal year.
The following table shows the development of borrowings:

Aurubis Annual Report 2017/18
74 Combined Management ReportEconomic Report
Development of borrowings
in € million 9/30/2018 9/30/2017
Non-current bank borrowings 248 317
Non-current liabilities under finance leases 33 23
Non-current borrowings 281 340
Current bank borrowings 30 8
Current liabilities under finance leases 3 3
Current borrowings 33 11
Borrowings 314 351
At € 314 million as at September 30, 2018, borrowings were below the level of the previous fiscal year-end (€ 351 million). The primary reason for this was the redemption of bonded loans (Schuldscheindarlehen) in February 2018.
RETURN ON CAPITAL (IFRS)The operating result is used for control purposes within the Group. Operating ROCE is explained under Return on capital,
page 73.
FINANCIAL POSITION OF THE AURUBIS GROUPThe following comments include both continuing and discontinued operations.
The Group’s liquidity sourcing is secured through a combination of the Group’s cash flow, short-term and long-term borrowings, as well as lines of credit available from our banks. Existing credit facilities and lines of credit can be utilized to compensate for fluctuations in the cash flow development at any time. These fluctuations result from operating business in particular and primarily serve to finance net working capital.
The development of the Aurubis Group’s liquidity position is monitored regularly on a timely basis. Control and monitoring are carried out on the basis of defined key ratios. In the reporting year, we repaid two bonded loans (Schuldscheindarlehen) that were due.
The main key financial ratio for controlling debt is debt coverage, which calculates the ratio of net borrowings Glossary, page 183 (borrowings less cash and cash equivalents) to earnings before interest, taxes, depreciation, and amortization (EBITDA Glossary,
page 183) and shows the number of periods required to redeem the existing borrowings from the Group’s income – assuming an unchanged earnings situation.
The interest coverage ratio expresses how the net interest expense is covered by earnings before interest, taxes, depreciation, and amortization (EBITDA).
Our long-term objective is to achieve a well-balanced debt structure. In this context, we consider debt coverage < 3 and interest coverage > 5 to be well balanced.
We use the operating result for control purposes within the Group. Accordingly, the Group’s key operating financial ratios are presented as follows:

75
Annual Report 2017/18 Aurubis
Economic ReportCombined Management Report
Operating Group financial ratios
9/30/2018 9/30/2017
Debt coverage = net borrowings/EBlTDA -0.4 -0.5
Interest coverage = EBITDA/net interest 32.3 26.1
Additional control measures related to liquidity risks are outlined in the Risk and Opportunity Report in the Combined Management Report.
ANALYSIS OF LIQUIDITY AND FUNDINGThe cash flow statement shows the cash flows within the Group. It highlights how funds are generated and used.
At € 203 million as at September 30, 2018, the net cash flow Glossary, page 183 from operating activities was significantly below
the prior-year level (€ 480 million). This was due in particular to higher inventories of precious metal-bearing raw materials as at the reporting date.
The cash outflow from investing activities totaled € 143 million (previous year: € 155 million). Investments in fixed assets in the fiscal year include payments for the Industrial Heat and Future Complex Metallurgy projects. The sale of investment property had a positive effect of about € 8 million on the cash flow from investment activities in the reporting period. The cash outflow in the previous year was influenced by a larger individual investment in connection with our long-term electricity supply agreement.
After deducting the cash outflow from investing activities of € 143 million from the net cash flow of € 203 million from operating activities, the free cash flow Glossary, page 183 amounts to € 60 million (previous year: € 325 million).
The cash outflow from financing activities amounted to € 151 million (previous year: € 225 million) and primarily resulted – both in the fiscal year reported and in the previous year – from the redemption of bonded loans (Schuldscheindarlehen).
Cash and cash equivalents of € 479 million from continuing and discontinued operations were available to the Group as at September 30, 2018 (€ 571 million as at September 30, 2017). Cash and cash equivalents are utilized for operating business activities, investing activities, and the redemption of borrowings.

Aurubis Annual Report 2017/18
76 Combined Management ReportEconomic Report
Source and application of fundsin € million
571
+203 –143
–151
479
Cash and cash equivalents9/30/2017
Cash inflow from operating
activities(net cash flow)
Cash outflow from investing
activities
Cash outflow from financing
activities
Cash and cash equivalents9/30/2018
The net surplus financial funds amounted to € 165 million as at September 30, 2018 (previous year: € 220 million).
Net borrowings in the Group
in € million 9/30/2018 9/30/2017
Borrowings 314 351
– Cash and cash equivalents 479 571
Net borrowings (minus = assets) -165 -220
In addition to cash and cash equivalents, the Aurubis Group has unutilized credit line facilities and thus has adequate liquidity reserves. Parallel to this, within the context of factoring agreements, the Group makes use of the sale of receivables without recourse as an off-balance-sheet financial instrument.

77
Annual Report 2017/18 Aurubis
Economic ReportCombined Management Report
Business performance in the Segments
SEGMENT METAL REFINING & PROCESSINGKey figures
in € million2017/18
operating2016/17
operating
Revenues 10,407 9,866
EBIT 359 347
EBT 353 337
Capital expenditure 152 161
Depreciation and amortization –118 –119
Operating ROCE 19.4 % 20.9 %
Capital employed 1,852 1,657
Number of employees (average) 4,473 4,423
BUSINESS PERFORMANCE AND EARNINGS TRENDThe main factors driving earnings in Segment Metal Refining & Processing (MRP) are treatment and refining charges (TC/RCs) that are negotiated as deductions from the purchase price of the metals for converting raw materials and recycling materials into the exchange product – copper cathodes – and other metals. Additional earnings components include revenues from precious metal and sulfuric acid sales, as well as the metal gain. Furthermore, the Aurubis copper premium and the so-called product surcharge charged for processing copper cathodes into copper products are also significant earnings components.
During the fiscal year, Segment MRP generated operating earnings of € 353 million (previous year: € 337 million). Operating EBT during the previous year had been impeded to the tune of around € 15 million due to a scheduled maintenance shutdown carried out at the Hamburg site in Q1 2016/17.
Higher concentrate throughputs due to the Hamburg and Pirdop smelter sites’ good performance, substantially increased refining charges for copper scrap with a good supply, higher sulfuric acid revenues owing to considerably higher sales prices, a higher metal gain with increased copper prices, considerably higher rod sales, and positive contributions from our efficiency improvement program all had a positive effect on the result in fiscal year 2017/18. The weaker US dollar had a negative impact on earnings.
Overall, Segment MRP raised its operating result by 4.8 % in the reporting year, to € 353 million (previous year: € 337 million). The result was therefore at prior-year level and thus fulfilled the original forecast from the Annual Report 2016/17. Unscheduled maintenance shutdowns at the Hamburg and Lünen production sites in Q4 2017/18 negatively affected earnings and led to a slightly lower result than was expected when the Quarterly Report on the First 9 Months 2017/18 was released.
At 19.4 % (previous year: 20.9 %), the Segment’s ROCE was at the very high level of the previous year and likewise fulfilled the full-year forecast from the Annual Report 2016/17.
Segment MRP generated total revenues of € 10,407 million during the reporting period (previous year: € 9,866 million). This increase in revenues is primarily due to higher copper prices.
RAW MATERIAL MARKETSSatisfactory treatment and refining charges for copper concentratesThere was a continued good supply situation for copper concentrates in fiscal year 2017/18, due especially to higher output volumes from mines and isolated shutdowns at other copper smelters. The copper price, which has risen notably compared to the previous year, served in the reporting period as a strong incentive for the mining industry to maximize output and push additional mine expansions forward. Aurubis also benefited and was able to procure a sufficient supply of copper concentrates in the reporting year.
According to Reuters, a leading mining company and a larger Chinese copper smelter signed the first significant annual contract for 2018 at benchmark TC/RCs of US$ 82.25/t / 8.225 cents/lb (previous year: US$ 92.50/t / 9.25 cents/lb). Initially, a lower level was established for spot transactions in early 2018; toward the end of fiscal year 2017/18 in particular, spot TC/RCs then rose to levels above the benchmark TC/RCs for calendar year 2018. The main reasons for this were, on the one hand, the good copper concentrate supply situation due to high mine output and, on the other, the fact that discussions between mines and unions regarding collective agreements went smoothly and didn’t lead to any significant strikes. Furthermore, demand for copper concentrates among smelters, especially in Asia, decreased due to standstills and limitations of production.

Aurubis Annual Report 2017/18
78 Combined Management ReportEconomic Report
Refining charges for copper scrap remain highDuring fiscal year 2017/18, European refining charges for copper scrap were, in our opinion, at a relatively high level, with positive effects on our result accordingly. The following develpments influenced the market: At the start of fiscal year 2017/18, refining charges for copper scrap in Europe were at a very good level. As the fiscal year continued, negative weather-related influences on refining charges and then higher demand from China for copper scrap with high copper contents were noticeable on the market. This was countered by the higher supply of recycling materials from the US in Europe due to the trade conflicts between the US and China. All together, these developments led to a slight tightening of the market. Because of our flexibility with respect to input materials, we nevertheless had a sufficient supply for our production facilities.
The availability of complex recycling materials, including industrial residues and electrical and electronic scrap, was stable despite intense competition for these materials.
PRODUCTIONThroughput slightly above the very good previous yearThe good supply of copper concentrates, copper scrap, blister copper Glossary, page 182, and recycling materials ensured that our production facilities were well utilized during the entire fiscal year 2017/18.
The good performance of both the Hamburg and Pirdop smelter sites led to concentrate throughput of 2,522,000 t, which was 4 % above the very good previous year. The optimization measures from the Fit for Future program took full effect in Pirdop for the first time.
Concentrate throughput in Hamburg in Q3 2017/18 was influenced by a scheduled repair standstill in the anode furnace. Moreover, unscheduled shutdowns at the Hamburg and Lünen production sites in Q4 negatively affected the result for the year. The prior-year concentrate throughput was strained by the scheduled maintenance shutdown at the Hamburg site in Q1 of that year.
Concentrate throughputin million t
17/1816/1715/1614/1513/14
2.2 2.3 2.42.22.5
At the recycling plant in Lünen, the throughput in the Kayser Recycling System (KRS) Glossary, page 182 was at the level of the good previous year as a result of our input mix and the availability of recycling materials.
KRS throughputin thousand t
267270254301
269
13/14 17/1816/1715/1614/15
The Olen site also has recycling facilities and a tankhouse Glossary, page 183 for the production of copper cathodes. During
the reporting year, both recycling sites benefited from the good refining charges for copper scrap, blister copper, and other recycling materials. Overall, the group-wide input of copper scrap and blister copper in fiscal year 2017/18 remained at the good prior-year level.

79
Annual Report 2017/18 Aurubis
Economic ReportCombined Management Report
Copper scrap and blister copper input in the Groupin thousand t
406411419368 408
13/14 17/1816/1715/1614/15
Sulfuric acid output at prior-year level Corresponding to the concentrate throughput, the sulfuric acid output was 2,374,000 t, slightly above the prior-year level. The global market for sulfuric acid was characterized by consistently high demand. The overall availability of sulfuric acid was very limited, a situation that was reinforced by isolated smelter shutdowns, especially in Asia. This led to substantially higher prices on the spot market Glossary, page 183 in the reporting period.
Stable cathode output The cathode markets recorded good ongoing demand with slightly improved spot premiums in reporting year 2017/18. At US$ 86/t, the Aurubis copper premium for calendar year 2018 was the same as in the previous year. We were generally able to implement this premium for our products in the reporting period.
Copper cathode output in Segment Metal Refining & Processing was 1,162,000 t in the reporting year and was thus slightly above the prior-year level of 1,156,000 t.
Cathode output in the Groupin thousand t
13/14 17/1816/1715/1614/15
1,1561,0841,126 1,138 1,162
Cathode output in the Group by sitesin thousand t
396
227
342
197
394
230
342
190
Hamburg PirdopLünen Olen
17/1816/1717/1816/17 17/1816/17 17/1816/17
Our new, diverse approach: multi-metalWithin the scope of our multi-metal strategy, we have been reporting sales volumes for lead, nickel, tin, minor metals, and platinum group metals since the start of the fiscal year, in addition to gold and silver.
The recovery of our metals depends on the metal contents in the processed copper concentrates and recycling materials. A portion of the metals is sold in the form of intermediate products.
Sales volumes of other metals
2017/18 2016/17
Gold t 48 42
Silver t 877 1,026
Lead t 19,527 19,624
Nickel t 3,022 2,828
Tin t 1,851 1,547
Minor metals t 918 899
Platinum group metals (PGM) kg 8,821 9,335
Rod output significantly exceeds previous-year levels Continuous cast wire rod is used as a preliminary product for processing, especially in the cable and wire industry, as well as for special semi-finished products. Demand for rod reflected an ongoing positive trend in the reporting year. Total rod output in the European market grew by over 4 % in the first half of 2018

Aurubis Annual Report 2017/18
80 Combined Management ReportEconomic Report
compared to the previous year. Apart from catch-up effects from the previous year resulting from a change in cable sector standards, growth was supported by robust demand. The construction sector, the automotive industry, and the enameled wire industry provided demand momentum. There was also good demand for energy cable. In fiscal year 2017/18, there was stronger demand growth in our key European markets especially.
We gained additional market share in a good market environment. At 774,000 t, output from our rod plants significantly exceeded prior-year output (719,000 t) by 8 %.
Continuous cast rod outputin thousand t
774719742 758764
13/14 17/1816/1715/1614/15
Continuous cast shapes output at a very high levelHigh European demand for flat rolled products led to a positive demand trend for high-purity shapes. At 196,000 t, shapes output in fiscal year 2017/18 was about 3 % higher than in the previous year (190,000 t).
Continuous cast shapes outputin thousand t
172190 196183 170
13/14 17/1816/1715/1614/15
Bars and profiles output considerably increased The production volume for bars and profiles, which are produced exclusively at the Olen site, amounted to 14,600 t, exceeding the previous year by 2,100 t or 17 % (previous year: 12,500 t). This increased sales volume was primarily attributable to the acquisition of new customers.
Capital expenditureCapital expenditure in Segment MRP amounted to € 152 million (previous year: € 161 million). The main individual investments were infrastructure measures in Hamburg and Bulgaria, investments in the Industrial Heat project in the Hamburg neighborhood HafenCity East, and expansion measures in Bulgaria. The capital expenditure of the previous year was influenced by investments connected to long-term electricity sourcing.
SEGMENT FLAT ROLLED PRODUCTSKey figures
in € million2017/18
operating2016/17
operating
Total revenue 1,452 1,348
EBIT 18 2
EBT 21 2
Capital expenditure 17 14
Depreciation and amortization -11 -11
Operating ROCE 5.2 % 0.7 %
Capital employed 352 351
Number of employees (average) 1,768 1,746
BUSINESS PERFORMANCE AND EARNINGS TREND Segment Flat Rolled Products (FRP) processes copper and copper alloys – primarily brass, bronze, and high-performance alloys – into flat rolled products and specialty wire. The main production sites are Stolberg (Germany), Pori (Finland), Zutphen (Netherlands), and Buffalo (USA). Furthermore, the segment also includes slitting and service centers in Birmingham (UK), Dolný Kubín (Slovakia), and Mortara (Italy), as well as sales offices worldwide.

81
Annual Report 2017/18 Aurubis
Economic ReportCombined Management Report
Segment FRP generated operating earnings before taxes (EBT) of € 21 million (previous year: € 2 million). The significant earnings improvement on the previous year was mainly thanks to the ongoing efficiency enhancement program, higher production and sales volumes, and a good market situation. Segment FRP therefore achieved the forecast issued at the end of fiscal year 2016/17.
Operating ROCE was 5.2 % (previous year: 0.7 %). Segment FRP therefore exceeded the forecast issued at the end of fiscal year 2016/17.
At € 1,452 million, the Segment’s revenues were notably above those of the previous year (€ 1,348 million). The higher revenues were primarily due to the increased sales volume and a higher average copper price for the products sold.
On March 29, 2018, Aurubis AG and Wieland-Werke AG signed a contract to sell Segment Flat Rolled Products. The final execution of the sales contract is subject to approval by the antitrust authorities. A final decision is expected in early 2019.
PRODUCT MARKETSThe market for flat rolled products continued to develop positively in Europe in particular. Capacity utilization was good, while sales in the Segment increased by 3 % on the previous year. Growth momentum was especially evident among connector and cable manufacturers.
RAW MATERIALSThe availability and conditions for input metals were good in fiscal year 2017/18. The considerably lower metal prices in Q4 of the fiscal year didn’t lead to a bottleneck in the supply of input metals.
PRODUCTIONFlat rolled products output increasedOutput of flat rolled products and specialty wire increased to 235,325 t due to demand (previous year: 230,180 t). The boost in output was concentrated in the European plants. All of the sites continued to work on implementing the programs to improve efficiency and to enhance productivity and quality.
Flat rolled products and specialty wire outputin thousand t
13/14 17/1816/1715/1614/15
235230218228 216
CAPITAL EXPENDITURECapital expenditure in Segment FRP amounted to € 17 million (previous year: € 14 million). This was primarily used for replacement investments.

Aurubis Annual Report 2017/18
82 Combined Management ReportEconomic Report
Executive Board assessment of the Aurubis Group during fiscal year 2017/18
In fiscal year 2017/18, the Aurubis Group achieved one of the best results in its history, moderately exceeding the previous year’s result. We increased our operating earnings before taxes by about 10 %, to € 329 million (previous year: € 298 million). At 14.8 %, we achieved an operating ROCE at the very good prior-year level (15.1 %).
According to the forecast issued in our Annual Report 2016/17, we expected the Aurubis Group to record operating EBT at the previous year’s level and operating ROCE slightly below the previous year’s level in fiscal year 2017/18. In the Interim Report on the First 6 Months 2017/18, we adjusted this forecast, expecting a moderately higher operating EBT compared to fiscal year 2016/17, with ROCE at the prior-year level. All things considered, both operating consolidated EBT and operating ROCE in the reporting year were within the forecast.
Favorable developments in sub-markets and contributions to earnings from the efficiency improvement program contributed to this. Higher concentrate throughputs due to the Hamburg and Pirdop smelter sites’ good performance, substantially increased refining charges for copper scrap with a good supply, higher sulfuric acid revenues due to significantly higher sales prices, a higher metal gain with increased copper prices, and considerably higher rod sales all had a positive effect on the result in fiscal year 2017/18. We achieved the fiscal year’s efficiency improvement program target of € 30 million in project success.
The business development in Segment MRP was influenced by very good availability of input materials and a good supply situation. The supply of the facilities was always secure, with satisfactory treatment and refining charges. Concentrate processing in our primary smelters reached a new high of over 2.5 million t. During the reporting year, we benefited from the good refining charges for copper scrap, blister copper, and other recycling materials, as well as higher sulfuric acid revenues due to substantially higher sales prices. The cathode output was at the good prior-year level. Another factor relevant for Segment MRP’s result was the higher metal gain with increased metal prices.
Segment FRP also benefited from positive effects brought about by the efficiency improvement program, as well as good availability and conditions for input materials in fiscal year 2017/18. Output of flat rolled products and specialty wire increased by 2 % owing to demand, to over 235,000 t. All of the sites continued to work on implementing the programs to improve efficiency and to enhance productivity and quality.
At € 203 million as at September 30, 2018, the operating net cash flow was below the prior-year level (€ 480 million), primarily due to the build-up of inventories, including higher inventories of precious metal-bearing raw materials as at the balance sheet date.
The equity ratio (operating) was 55.5 % as at September 30, 2018 (previous year: 52.5 %). Net surplus financial funds as at Septem-ber 30, 2018 were at € 165 million (previous year: € 220 million). The Aurubis Group’s balance sheet structure thus continues to be very robust.

83
Annual Report 2017/18 Aurubis
Economic ReportCombined Management Report
Results of operations, net assets, and financial position of Aurubis AG
GENERAL INFORMATION In order to supplement our Aurubis Group reporting, we explain the development of Aurubis AG in the following section. Aurubis AG is the parent company of the Aurubis Group and is based in Hamburg with production sites in Hamburg and Lünen. Apart from managing the Aurubis Group, the business activities of Aurubis AG also particularly include primary copper production and recycling, as well as copper product and precious metal production. The separate financial statements of Aurubis AG have been prepared in accordance with the requirements of the German Commercial Code (Handelsgesetzbuch, HGB) and the German Stock Corporation Act (Aktiengesetz, AktG). The primary differences from the Group financial statements prepared in accordance with IFRS principles are in the accounting treatment of fixed assets, the measurement of inventories, the measurement of financial instruments, and the accounting treatment of pension provisions.
The Aurubis Group is managed across all companies at Group level through Segments, using operating EBT and operating ROCE as the financial performance indicators. These indicators are also used for Aurubis AG’s operating activities, which are a significant component of the Group. To this extent, the development and forecast of the financial performance indicators at the Segment and Group levels at the same time represent the development and forecast for Aurubis AG as an individual company.
The analysis of the development for the financial performance indicators outlined above during the fiscal year and the related forecast for the following year are provided in the Economic Report and the Forecast Report for the entire Group. Statements regarding the risk situation and opportunities can be found in the Group’s Risk and Opportunity Report.
RESULTS OF OPERATIONS
Income statement
in € million 2017/18 2016/17
Revenues 7,968 7,511
Changes in inventories/ own work capitalized 30 -42
Other operating income 82 76
Cost of materials -7,474 -6,948
Gross profit 606 597
Personnel expenses -245 -240
Depreciation of property, plant, and equipment and amortization of intangible assets -51 -51
Other operating expenses -163 -159
Operational result (EBIT) 147 147
Financial result 24 50
Result of normal business activities (EBT) 171 197
Taxes -51 -48
Net income for the year 120 149
The business performance (gross profit) of Aurubis AG in fiscal year 2017/18 was positively influenced in comparison to the previous year by higher refining charges on the copper scrap markets, as well as by a higher metal gain. During the reporting year, the concentrate throughput was at prior-year level with satisfactory treatment and refining charges. Moreover, higher sulfuric acid revenues due to substantially higher sales prices positively impacted the result during the fiscal year.

Aurubis Annual Report 2017/18
84 Combined Management ReportEconomic Report
Revenues increased by € 457 million to € 7,968 million during the reporting year (previous year: € 7,511 million). This development was primarily driven by higher sales revenues for copper products due to pricing.
With a cost of materials ratio (cost of materials/(revenues + changes in inventories)) at the prior-year level, and taking into account the change in inventories, own work capitalized, and other operating income, the gross profit increased slightly by € 9 million to € 606 million (previous year: € 597 million).
Personnel expenses increased in the past fiscal year by € 5 million to € 245 million (previous year: € 240 million). As was the case in the previous year, the increase was especially attributable to wage tariff agreement increases and an increased number of employees.
At € 51 million, depreciation and amortization of fixed assets remained at the prior-year level (previous year: € 51 million). Taking other operating expenses into account, the operational result (EBIT) amounted to € 147 million (previous year: € 147 million).
The financial result for the reporting year was € 24 million (previous year: € 50 million). In addition to dividends of € 52 million from subsidiaries (previous year: € 14 million), this included the net interest result of € -28 million (previous year: € -26 million) and write-ups of investment securities amounting to € 2 million (previous year: € 7 million). In the previous year, moreover, write-ups of equity interests amounting to € 55 million were also recognized.
After taking a tax expense of € 51 million (previous year: € 48 million) into account, net income for the year amounted to € 120 million (previous year: € 149 million).
NET ASSETSFixed assets increased in the fiscal year by € 55 million to € 2,120 million (previous year: € 2,065 million), especially due to investments in property, plant, and equipment. These included
investments in connection with the Industrial Heat project, the construction of the new innovation and training center, and the Future Complex Metallurgy project. In addition, during the past fiscal year, Aurubis acquired the shares that Codelco Kupferhandel GmbH had held in Deutsche Giessdraht, so Aurubis now owns 100 % of the shares.
The € 69 million increase in inventories to € 822 million (previous year: € 753 million) resulted primarily from higher inventories of raw materials due to the build-up of complex, precious metal-bearing concentrates, as well as from an increase in precious metal-bearing intermediate products.
Overall, total assets rose by € 66 million, to € 3,809 million compared to the prior year. Thus, in comparison to the previous year, the share attributable to fixed assets was 56 % (previous year: 55 %), while inventories accounted for 22 % (previous year: 20 %) and receivables and other assets accounted for 12 % of total assets (previous year: 11 %).
Due to the result, equity increased by € 54 million to € 1,510 million (previous year: € 1,456 million). The equity ratio remained at the prior-year level of 40 %.
Provisions increased by a total of € 23 million to € 284 million. The growth was due to higher pension provisions and increased personnel and tax provisions.
Bank borrowings decreased by € 49 million to € 278 million (previous year: € 327 million) due to the redemption of two bonded loans (Schuldscheindarlehen).
Trade accounts payable decreased by € 64 million to € 469 million. Trade accounts payable disclosed at September 30, 2017 were at a slightly higher level due to blister copper deliveries that had not yet been paid for as at the balance sheet date. Payables to affiliated companies primarily comprise borrowings, which increased within the context of normal financial transactions, from € 1,012 million to € 1,129 million. Other payables remained unchanged at € 20 million.

85
Annual Report 2017/18 Aurubis
Economic ReportCombined Management Report
Balance sheet structure of Aurubis AG
in % 9/30/2018 9/30/2017
Fixed assets 56 55
Inventories 22 20
Receivables, etc. 12 11
Cash and cash equivalents 10 14
100 100
Equity 40 39
Provisions 7 7
Liabilities 53 54
100 100
Aurubis uses assets under the terms of leasing agreements that are not recognized as assets in the balance sheet. Financial commitments deriving from leases amounted to € 9 million. Apart from this, financial commitments under long-term storage and handling agreements amounted to € 106 million.
FINANCIAL POSITION Net borrowings were at € 744 million as at September 30, 2018 (previous year: € 638 million). They resulted from bank borrowings of € 278 million (previous year: € 327 million), receivables and payables to subsidiaries deriving from refinancing of € 890 million (previous year: € 830 million), and after deducting cash and cash equivalents of € 424 million (previous year: € 519 million).
ANALYSIS OF LIQUIDITY AND FUNDINGIn the 2017/18 fiscal year, the net cash flow decreased by € 116 million to € 70 million. The main reason for this was the build-up of working capital as a result of higher inventories and lower trade accounts payable.
The cash outflow for investments in fixed assets was € 111 million (previous year: € 108 million). Investments of € 86 million in property, plant, and equipment mainly related to the Industrial Heat project, the construction of the new innovation and training center, and the Future Complex Metallurgy project. Investments of € 19 million in financial fixed assets derived from the acquisition of the remaining shares of Deutsche Giessdraht GmbH from Codelco Kupferhandel GmbH.
The cash outflow of € 49 million from financing activities (previous year: cash inflow of € 8 million) resulted from the € 71 million redemption of two bonded loans (Schuldscheindarlehen), as well as from a dividend payment of € 65 million. The take-up of loans from subsidiaries in the context of the existing cash pooling arrangements had a counter-effect.
Cash and cash equivalents at the end of the reporting period amounted to € 424 million (previous year: € 519 million). In addition to cash and cash equivalents, Aurubis AG had access to unutilized credit line facilities and thus has adequate liquidity reserves. Furthermore, within the context of factoring agreements, Aurubis AG sold receivables without recourse as a financing instrument.
Capital expenditureIn the past fiscal year, investments of € 111 million were made at the Hamburg and Lünen sites (previous year: € 108 million). The investments were made primarily in the following projects: the Industrial Heat project, the construction of the new innovation and training center in Hamburg, the Future Complex Metallurgy project, the training center in Lünen, and the acquisition of the remaining shares of Deutsche Giessdraht GmbH from Codelco Kupferhandel GmbH. In addition, investments were made in various infrastructure and improvement measures in the Hamburg and Lünen plants.

Aurubis Annual Report 2017/18
86 Combined Management ReportRisk and Opportunity Report
Risk and Opportunity Report
Integrated risk and opportunity management
Risks and opportunities are elements of our business activities and are essential to the company’s success. As part of our operating business and our strategic management, we weigh opportunities and risks against one another and ensure that they remain balanced. We try to identify and evaluate opportunities as early as possible.
Aurubis AG’s risk and opportunity situation depends significantly on the Aurubis Group’s risk and opportunity situation. In this respect, the statements of the company’s management on the overall assessment of risks and opportunities also serve as a summary of Aurubis AG’s risks and opportunities.
Risk management system
Our objective in risk management is to manage and monitor the risks associated with our business with the help of a risk management system (RMS) suited to our activities. Identifying and observing risk development early on is of major importance. Furthermore, we strive to limit negative effects on earnings caused by risks by implementing appropriate and economically sound countermeasures.
Risk management is an integral component of the centralized and decentralized planning, management, and monitoring processes and covers all of the Aurubis Group’s main sites, business sectors, and central functions. The planning and management system, risk reporting, open communication culture, and risk reviews at the sites create risk awareness and transparency with regard to our risk situation.
Risk management officers have been appointed for all sites, business sectors, and central functions, and they form a network within the Group. The Group headquarters manages the network. The RMS is documented in a corporate policy.
Standard risk reporting takes place bottom-up each quarter using a uniform, group-wide reporting format. Within this format, the identified risks and risks beyond a defined threshold are explained and evaluated on the basis of their probability of occurrence and their business significance. Measures to manage them are then
outlined. The risks registered with Group headquarters are qualitatively aggregated into significant risk clusters by Corporate Risk Management and reported to the entire Executive Board. The report, together with external risk reporting, serves as the basis for the report to the Audit Committee.
Potential effect on earnings
in € million > 1 > 5 > 20 > 50
Likelihood
high medium medium high high
medium low medium medium high
low low low medium medium
unlikely low low low medium
In the report to the Executive Board and the Audit Committee, the qualitatively aggregated risk clusters are assessed with due regard to risk management measures (net perspective) based on their probability of occurrence and the potential effect on earnings pursuant to the spreads included in the table, and are classified as low, medium, or high.
Independent monitoring
The RMS is subject to routine monitoring and review. Internal Audit monitors risk management and compliance with the internal control system using systematic audits. As a process-independent authority, it contributes to the correctness and improvement of the business processes, and to the effectiveness of the installed systems and controls.
In addition, the auditors review our early risk detection system to ensure that it adheres to legal requirements. They report the audit results to the Executive Board and the Supervisory Board (Audit Committee).
Furthermore, the Audit Committee deals intensively with risk management issues. The risk management officer regularly informs the committee and the Executive Board about current developments.
87
Annual Report 2017/18 Aurubis
Risk and Opportunity ReportCombined Management Report
Explanation of relevant risks
In the following sections, the risks associated with our business are explained according to our risk clusters. The main measures and instruments we use to counter these risks are also described here. We have separately indicated risks and risk-relevant issues that we currently classify as potentially medium to high.
SUPPLY AND PRODUCTIONThe ability to keep the production facilities supplied with raw materials and the availability of these facilities are of central importance for the Aurubis Group. We limit the associated risks by implementing a range of specific measures:
For example, to ensure the supply of copper concentrates for our facilities, we have entered into long-term agreements with a number of concentrate suppliers from various countries. In this way, we are able to reduce the risk of production interruptions caused by possible delivery failures. The risk of volatile treatment and refining charges on the spot market is also limited by the long-term nature of the agreements.
Overall, the recycling facilities were well supplied during the past fiscal year, thanks to our extensive international supplier network. From today’s standpoint, we also expect a full supply situation and full utilization of the facilities for fiscal year 2018/19. There are ongoing refining charge volatilities due to the general metal price trend, the collecting behavior and inventory management of the metal trade, the international economic situation, and competition for the secondary raw materials relevant for Aurubis.
A key means of countering risks within the supply chain is Business Partner Screening. This instrument analyzes existing and potential business partners to assess their integrity in relation to social and ecological criteria, among other factors. The focus of our interest is on topics such as compliance, corruption, human rights violations, and environmental aspects. The decision to enter into a contract with business partners with increased risk is only made after extensive review, and in consultation with the Sustainability and Compliance departments.
The material for the facilities producing copper products mainly comes in the form of copper cathodes manufactured within the Group. This allows us to simultaneously generate higher added value and control the quality of copper products during the entire process. We also procured a sufficient volume of copper-bearing raw materials for the production plants belonging to Segment Flat Rolled Products. In this case, we also expect a similar situation for the coming fiscal year.
Overall, plant availability was satisfactory. There were smaller, unscheduled shutdowns in the course of the fiscal year.
We took organizational measures to handle potential incidents that could result from events such as flooding or fire. These included alarm plans and routine drills for the purpose of training our employees. We also addressed the risk of malfunctions with regular maintenance work and by keeping critical replacement parts on hand.
Taking into account the measures described above, we regard the risk of insufficient supply as “medium” and the risk of strongly limited availability of our production facilities as “low.”
We deal with logistics risks by implementing a thorough, multi-step selection and evaluation process for service providers, by avoiding single sourcing as far as possible, and by preventively developing back-up solutions. We also have an international network of qualified service providers at our disposal. This helps us to, for example, prevent weather-related risks in the transport chain by contractually arranging a selection of appropriate transport alternatives.

Aurubis Annual Report 2017/18
88 Combined Management ReportRisk and Opportunity Report
SALESIn addition to supply and production risks, the Aurubis Group also faces sales risks, which we classify as “medium.”
Generally speaking, risks can arise from negative deviations from our predictions of the markets’ economic development, which we have outlined in the Forecast Report. In particular, a weakening of the overall economy in Europe can negatively impact demand for our products. This applies to our sales of copper products such as wire rod, shapes, and the portfolio of Segment Flat Rolled Products, as well as sulfuric acid.
With economic analyses and estimates regarding economic trends, we are in a position to adjust our individual sales strategies to changing conditions as needed, thus countering any risks that arise.
Cathodes that Aurubis did not process further internally are sold on the international copper cathode market.
Business partners on the sales side are also assessed using Business Partner Screening. The statements made in the previous section “Supply and production” can be referenced in this regard.
ENERGY AND CLIMATEEnergy prices increased in the past fiscal year. We have safeguarded electricity prices in the long term at an internationally competitive level through our electricity contract, which has been in effect since 2010. This covers most of our electricity demand across the most important German sites. We also deal with fundamental supply security, as well as the potential and limitations of more flexible energy sourcing, which is becoming increasingly necessary due to the rising, volatile feed-in of renewable energies.
Burdens resulting from changes in potential cost drivers such as the German Renewable Energies Act (EEG), the emissions trade, grid charges, and the eco-tax are difficult to quantify reliably because of the ongoing uncertainty of the legal situation and the changing political conditions. We expect the tax burden to increase in the medium term due to the amendments to the
German Renewable Energies Act (EEG) and the Combined Heat and Power Generation Act (KWKG) in 2017, as well as the Grid Fee Modernization Act (NEMoG). The European Commission’s decision of May 28, 2018 in relation to the state aid investigation into network charge exemption in previous periods negatively affected Aurubis, entitling the German state to reclaim around € 3 million plus interest, which we recognized in the income statement in the fiscal year reported by setting up a provision.
Of particular political relevance is the copper-producing industry’s retention, as of 2021, of the special carbon leakage status with regard to the allocation of emission trading allowances. The completion of the decision-making process is still pending. The situation regarding the allocation rules that are to apply as of 2021 is currently difficult to predict. However, taking into account the political goals of the Paris Agreement, we expect a decline in the free allocation of allowances for companies at risk of carbon leakage. The CO2 price increased substantially in the past year. The supply of CO2 certificates is set to be significantly reduced in the coming trading period, which should raise prices considerably. The political decision-making process regarding the form and amount of compensation for indirect CO2 costs in electricity starting in 2021 will only start in the middle of the coming year. We also expect rules to tighten in this area, too, which could lead to a reduction in the compensation granted. On the whole, we expect considerable cost increases in the medium term as a result of the EU emissions trading system. These are likely to put significant strain on the company.
On the customer side, increasing demands for transparent goals and strategies related to effective production processes, energy, and CO2 efficiency could influence future copper product sales, particularly when it comes to customer acquisition and retention. We are countering this with steps such as annual climate reporting and evaluations of such reporting conducted by the CDP (formerly the Carbon Disclosure Project).
In the future, the topic of energy and the associated risks, currently classified as “medium,” will continue to be very important for Aurubis as an energy-intensive company.

89
Annual Report 2017/18 Aurubis
Risk and Opportunity ReportCombined Management Report
FINANCE AND FINANCINGMetal price and exchange rate fluctuations represent a potential risk in the buying and selling of metals. Foreign exchange and metal price hedging substantially reduce this risk. Metal backlogs are hedged daily with financial instruments such as spot and forward contracts. Similarly, spot and forward exchange contracts are used to hedge foreign currencies and, on a daily basis, to minimize foreign exchange risks arising from exchange rate fluctuations affecting foreign currency metal transactions. We only select creditworthy firms as counterparties for hedging transactions to minimize the credit risk.
We hedge expected receipts from foreign currencies, especially the US dollar, with options and forward exchange transactions in some cases. We will continue this in the future as well and expect that we can reduce the risks from metal price and exchange rate fluctuations to a reasonable level with these measures.
Credit risks from trade accounts receivable are largely hedged by commercial credit insurances. Internal risks are only permitted to a very limited extent and after review. The development of the outstanding receivables is monitored closely. During the reporting period, there were no significant bad debts. We also do not foresee any increased risks for the future.
The liquidity supply, which is very important for the Aurubis Group, was secured during the past fiscal year. The credit lines at the banks were also sufficient. The Aurubis Group has a stable financial situation in the new fiscal year as well and can finance possible fluctuations from operating business through its credit lines. Overall, we classify the finance and financing risks as “medium.”
ENVIRONMENTAL PROTECTION AND OTHER ASPECTSThere is always a risk that environmental or regulatory provisions could become more stringent, leading to added costs or limitations in product fabrication and marketing. For example, there is a risk that increasingly strict environmental legislation will restrict the marketing of iron silicate. We want to achieve greater flexibility on the sales market by expanding our granulation capacities, among other things.
In addition, environmental risks resulting from the possible failure to comply with thresholds and from violations of requirements can have legal consequences. We ensure the environmentally sound operation of our production facilities, in part to prevent these situations. We are an international leader in environmental protection, which is confirmed by annual certifications in accordance with DIN EN ISO 14001 and EMAS, for example. We consider ourselves to be well positioned for the future in this regard. Nevertheless, operational incidents that could have an adverse impact on the environment cannot be completely ruled out. Overall, we classify the environmental risks as “medium.”
In a plant with complex processes, employees’ specialist knowledge is an important factor for ensuring performance quality. We have established different measures that are intertwined with each other so that Aurubis can continue to count on employees’ knowledge. Among these are partnerships with universities, through which we establish ties with qualified young people, and qualification measures, through which we foster the development of professionals and managers within the company.
Occupational safety and health protection are high-priority areas for us. We focus on individual responsibility, detailed hazard assessments, and training, as well as on short-term and medium-term goals with the objective of achieving our Vision Zero – that is, no accidents.
The violation of laws can have serious consequences for both Aurubis as a group and for its employees and business partners. We therefore consistently follow all legal requirements. Significant compliance risks are identified, analyzed, and addressed by Compliance Management. We counter legal and tax risks with organizational procedures and clear management structures. We closely follow political discussions on tax issues, for example on the financial transaction tax and capital tax, as well as their possible effects.

Aurubis Annual Report 2017/18
90 Combined Management ReportRisk and Opportunity Report
Aurubis is additionally subject to IT risks that can impact areas such as supply, production, and sales. These risks were taken into consideration in the company’s risk assessment. From the current perspective, however, these do not pose a significant threat due to the risk minimization measures described in the following.
We handle risks related to the availability of our IT systems with continuous monitoring, redundant infrastructure, and continuous adjustments to the state of the art in IT. We counter the risks of possible incidents or disasters with the redundant design of our IT infrastructure, as well as data recovery and continuity plans. We minimize the risks that can result from unauthorized access to company data, as well as cybercrime, by restricting access rights, carrying out security reviews, and using modern security technologies.
Furthermore, selected risks are largely covered by insurance policies. We rely on the expertise of an external insurance broker for this purpose.
NON-FINANCIAL RISKS WITHIN THE SCOPE OF THE NON-FINANCIAL REPORTNon-financial risks were assessed in accordance with the CSR Directive Implementation Act. In the process, no non-financial risks were identified that were very likely to cause serious negative impacts on employee and environmental matters, on respect for human rights, on the prevention of corruption and bribery, or on social matters within the meaning of Section 289c (3) of the German Commercial Code (HGB). Nevertheless, it is important to us to handle non-financial risks even if they are evaluated as non-material according to the strict definition of the CSR Directive Implementation Act. We have developed and implemented related management approaches to address these non-financial risks.
Internal control system relating to the consolidated accounting process
(Report pursuant to Section 289 (4) and Section 315 (4) of the German Commercial Code (HGB))
The objective of the internal control system (ICS) for the accounting process is to ensure that financial statements are
prepared in compliance with regulations. Aurubis has an internal control and risk management system in which structures and processes related to the accounting process are defined and implemented in the organization. This ensures that the Group accounting procedures are reliable and performed correctly, that business transactions are thoroughly reported in a timely manner as prescribed by law and the Articles of Association, and that legal norms and internal guidelines on accounting are observed. Amendments to laws and accounting standards are continuously analyzed to establish their relevance for the consolidated financial statements, and resulting changes are incorporated into the Group’s internal processes and systems.
PRINCIPLES OF THE INTERNAL CONTROL SYSTEM AS RELATED TO ACCOUNTING POLICIESAs the parent company, Aurubis AG prepares the Aurubis Group’s consolidated financial statements. The financial reporting of the consolidated Group companies that are included in the consolidated financial statements takes place prior to this process. These Group companies prepare their financial statements locally and transfer them to the Corporate Accounting department via a defined uniform group-wide data model. The Group companies are responsible for compliance with the valid group-wide guidelines and procedures, as well as for the correct and timely execution of the accounting-relevant processes and systems.
The internal control system includes the following main principles:
» Ensuring standardized accounting procedures in the preparation of the separate financial statements of Aurubis AG by systematically implementing control measures that are supported by manual accounting measures and other authorization and approval procedures (separation of functions, access regulations and limitations, the use of the dual control principle, guidelines on payment transactions).
» Ensuring uniform group accounting procedures in accordance with IFRS through the application of uniform accounting regulations and policies, central audit of reporting packages, analysis of deviations from the budget, and quarterly reporting as part of centralized discussions on earnings.
» Compiling external accounting and internal reporting by all Group companies in a uniform consolidation and reporting system.

91
Annual Report 2017/18 Aurubis
Risk and Opportunity ReportCombined Management Report
» Overall consolidation of the consolidated financial statements by Corporate Accounting, which is responsible for the centralized consolidation, coordination, and monitoring of the standards related to the schedule and the process.
» Supporting the Group companies in accounting procedures through central contacts in Corporate Accounting.
» Clarifying special technical questions and complex issues related to specific cases with an external consultant.
INTERNAL AUDIT AS PROCESS-INDEPENDENT RISK OBSERVATIONInternal Audit examines the reliability of the accounting practices at local and corporate level, among other things. In particular, it assesses existing internal process policies and the degree to which they are adhered to in practice. In its audits, Internal Audit provides information about risks that arise from identified deviations, as well as recommendations with regard to the adjustments to be made.
Opportunity management system
In addition to risk management, opportunity management is an important element of the Aurubis Group’s centralized and decentralized planning, management, and control processes. Its objective is the early identification of internal and external opportunities that could positively impact our economic success. These opportunities are assessed and weighed against the risks associated with them. The next step is to define initiatives and measures to help tap this potential. The process of identifying and assessing opportunities is part of our annual integrated strategy and planning process.
In order to promptly recognize opportunities that arise, we continually monitor and analyze the supply and demand aspects of our markets, the competitive landscape, and global trends. Identifying potential opportunities is a daily management responsibility – on the level of both the operational areas and the Group.
Explanation of relevant opportunities
RISING GLOBAL DEMAND FOR COPPER AND METALS FOR TECHNOLOGYCopper is one of the most important metallic raw materials. Demand for copper is aligned with global economic growth, especially in the electrical, electronics, construction, and automotive industries. Global trends such as increasing energy scarcity, rising urbanization, the growth of the world’s middle class, digitalization, and electric vehicles will continue to not only increase copper demand in the long term, but also the demand for technology metals such as tellurium, nickel, platinum, and palladium. If the economy and the demand for our products develop more favorably than currently expected in the markets relevant for us, this could have a positive influence on the Aurubis Group’s earnings.
POSITIVE TREND IN TREATMENT AND REFINING CHARGES AND MARKET PRICES FOR OUR PRODUCTSThe Aurubis Group’s earnings situation is largely determined by the treatment and refining charges for copper concentrates, copper scrap, and recycling materials, as well as by the market prices for our products, such as sulfuric acid. If treatment and refining charges and market prices for our products develop more positively than currently forecast, this could positively impact the Aurubis Group’s earnings.
INCREASING SIGNIFICANCE OF SUSTAINABILITY AND RESOURCE EFFICIENCYAurubis is the world’s leading recycler of copper and complex secondary raw materials. In light of the rising importance of resource efficiency with regard to sustainability, we expect demand for recycling solutions to continue growing. This is also supported and promoted by increasingly strict national and international legislation. Thanks to our multi-metal recycling activities and proximity to our copper product customers, we consider ourselves to be in a position to offer expanded closing-the-loop solutions. If national and international recycling regulations broaden and demand for recycling solutions in our markets grows more strongly than expected, this could positively affect the Aurubis Group’s procurement situation and therefore its earnings.

Aurubis Annual Report 2017/18
92 Combined Management ReportRisk and Opportunity Report
FURTHER DEVELOPMENT OF EXPERTISE IN COMPLEX RAW MATERIAL PROCESSINGBoth primary and secondary raw materials are becoming increasingly complex as their copper content falls and the concentrations of accompanying elements and impurities in them rise. One of Aurubis’ particular strengths already consists in processing complex primary and secondary raw materials. The FCM project contributes to achieving efficient and resource-friendly production processes for the raw materials of the future. If we build up additional expertise in this area, this could positively influence the Aurubis Group’s earnings.
CONTINUOUSLY IMPROVING PROCESSES AND COST POSITION AND ACHIEVING SYNERGIESOur markets are globally competitive. Operating excellence is therefore exceedingly important for us. We continuously work on optimizing our processes and improving our cost position. Furthermore, we are always identifying and implementing the synergy potential arising from our position along the value chain. If we go beyond the targets connected to initiated improvement measures, this could have a positive impact on the Aurubis Group’s earnings.
CAPACITY EXPANSION LINKED WITH INTERNATIONALIZATIONWe see additional growth potential in an expansion of our processing capacities in regions with favorable conditions and in proximity to our procurement and sales markets. We will continue investing in our existing sites but will also strive to expand our supplier and production networks further. If we are in a position to expand our capacities even more and, better still, do so with lower capital expenditure than expected, this could positively affect the Aurubis Group’s earnings.
DEVELOPMENT OF SOLUTIONS FOR INDUSTRIAL CUSTOMERS AND SUPPLIERSWe work closely with our suppliers and customers at all levels of our value chain. This includes developing products for individual customers, providing additional services, processing specific raw materials, and offering additional closing-the-loop solutions. If the demand of our customers and suppliers for our solutions is stronger than forecast, this could have a positive effect on the Aurubis Group’s earnings.
INNOVATIONS FROM FUTURE RESEARCH AND DEVELOPMENT ACTIVITIESIn the scope of our research and development activities, we work on innovations to create a competitive advantage for ourselves in the future. For example, we are currently working on making our processing methods more resource-efficient and on expanding our expertise in processing complex materials and extracting additional metals.
Assessment of the Aurubis Group’s risk and opportunity situation
No substantial risks arose in the reporting year. There were no particular structural changes in the Group’s risks. According to our current assessment, there are no risks that endanger the company’s continued existence.
Both the Audit Committee and the auditors ascertained that the Executive Board and Supervisory Board have taken the measures prescribed by Section 91 (2) of the German Stock Corporation Act (AktG) in an appropriate manner and that the legally required early risk detection system fulfills all requirements.
For a complete overview of company activities, the opportunities of the Group have to be considered in addition to the risks. The Aurubis Group’s current opportunities are comparable to those of the previous year. We are confident that we will be able to utilize the opportunities presented by our business portfolio, our expertise, and our ability to innovate. At the same time, these factors put us in a position to counter existing risks successfully. Furthermore, we are convinced that we have the appropriate processes, measures, and instruments in place to identify important opportunities and manage relevant risks.

93
Annual Report 2017/18 Aurubis
Forecast ReportCombined Management Report
Forecast Report
The statements made in the Forecast Report are based on our assessments of the overall economic conditions, of global copper market trends, and of Aurubis’ raw material and product markets. These assessments are based on analyses by economic research institutes, organizations, and industry associations, as well as on internal market analyses. The forecasts for the future business performance shown here take into account the segment targets, as well as the opportunities and risks posed by the expected market conditions and competitive situations in the forecast period of October 1, 2018 to September 30, 2019. The opportunities and risks affecting the Aurubis Group are explained in detail in the Risk and Opportunity Report. Our forecasts are regularly adjusted. The following statements are based on our knowledge in December 2018.
From our current perspective, there are numerous factors with the potential to influence the Aurubis Group’s markets. These include the slow-down in global economic growth and the political situation in the US, where the fiscal policies being pursued and trade relations with China could have particular effects on the markets. This, in turn, could influence China’s further economic growth trend. In Europe, monetary policy, Italy’s fiscal policy, and Brexit, that is, the British people’s vote to leave the EU, with the accompanying events and consequences, could also have an impact. Increasing protectionism around the world and the political crises in the MENA region (Middle East and North Africa) could also have a bearing on the market situation.
Overall economic development
The IMF estimates that the global economy will grow by 3.7 % in 2019. The forecast is just slightly below this year’s earlier estimates, and significantly higher than in the period from 2012 to 2016. The organization at the same time suggests that there are continued risks related to the uncertainty of political developments in particular. First and foremost, these include increasing protectionism, as well as trends moving away from multilateral trade relations based on fixed rules.
Newly industrialized and developing countries will once again record the strongest growth in 2019. The IMF forecasts a 4.7 %
growth rate for this group of countries. The IMF attributes the decline in growth expectations compared to earlier forecasts to the negative influences of the trade conflicts between the US and China. Furthermore, the US has renewed sanctions against Turkey and Iran. The economic outlooks for larger Latin American economies such as Argentina and Brazil have also recently dampened. The upward trend in Asian countries may be slightly below the prior-year level in 2019, with 6.3 % growth. This trend includes China, which is important for the copper market.
In contrast, the outlook for developed countries is more subdued overall, which can be seen in a reduced growth forecast of 2.1 %. At 2.5 %, economic growth in the US in 2019 is predicted to be lower than the previous year, due in particular to ongoing trade conflicts and the gradually weakening effect of corporate tax breaks. In the euro zone, the IMF sees 2019 economic growth at prior-year level, forecasting 1.9 %. The IMF estimates that the German economy will grow by 1.9 % in 2019 accordingly. The concrete impact of Brexit continues to be a significant risk factor in the European Union.
Individual sectors such as the electro-technical industry, the automotive industry, and the construction sector are important consumers of copper products. The following economic developments expected here are as follows:
The German Electrical and Electronic Manufacturers’ Association, in its last forecast for the global electrical and electronic products market dating from mid-2018, confirmed its sector forecast of 5 % and 4 % growth for the years 2018 and 2019, respectively. This forecast was based on 53 countries, which together comprise approximately 97 % of the global market. Europe accounts for 16 % of the global market, and growth of 3 % is expected there for 2019. This growth rate also applies for Germany.
According to the European Automobile Manufacturers’ Association, demand for automobiles in the EU increased by 2.5 % in the first nine months of 2018, with more than 12 million new car registrations. In fall 2018, demand fell slightly, in the European automotive sector in particular. The switch to the new test procedure for cars, WLTP (Worldwide Harmonized Light Vehicles Test Procedure), has led to temporary risks for

Aurubis Annual Report 2017/18
94 Combined Management ReportForecast Report
future growth in vehicle production. We consider this a transitional effect and expect a good demand and sales situation for fiscal year 2018/19. We also expect positive growth momentum from the intensifying discussion regarding electric vehicles.
According to the German construction industry, the economic situation in the sector developed better than expected in 2018. For the entire year 2018, a 6 % nominal revenue increase is anticipated in the main construction trades. The industry association expects an increase at the same level for 2019. Positive driving forces include the acute demand for additional housing and increasing local investments.
Based on these forecasts, we expect stable to good economic development in 2019 in the three most important sectors for copper applications. However, political and economic developments could strongly influence the respective market situation.
The influences from European and German energy and environmental policy are important for us but difficult to forecast in detail.
Sector development
The fundamental situation on the copper market offers analysts good reason to assume that a high copper price level can also be expected for 2019. According to a survey of market experts carried out by Thomson Reuters, the average copper price in 2019 should be at a level of US$ 6,699/t.
Much will again depend on the developments in copper smelters’ production. China is still the central focus. According to the news service CRU, 2019 will see further ramp-ups of smelter projects in China, though some of them will replace older smelting capacities. CRU reports that the expansion of smelter capacities in China will level off in the coming years. Stricter environmental conditions in China are making it more difficult to implement planned smelter projects as well. It should also be noted that the ramp- up phase generally takes a long time before full capacity utilization is achieved.
The International Copper Study Group (ICSG) anticipates a further increase of 2.7 % in the global output of refined copper for 2019 (2018: 2.7 %). The ICSG attributes this in part to a restart of production, which had been temporarily halted in some cases. Shutdowns on the smelter side – especially in Asia – had a reverse effect.
Good demand for refined copper can be expected for 2019, as the metal is an essential material for economic development in key sectors such as the electrical and automotive industries and construction. Solid economic growth in countries with the strongest demand, among them China, the US, and European countries, set the agenda in this respect.
China will account for about half of global copper demand in 2019 (2019e: 49.8 %). A majority of this demand comes from investments in infrastructure projects, among them energy grid projects requiring copper. The Chinese government’s “One Belt, One Road” program should be emphasized especially. In the development of the Chinese machinery and transport sector, there is also growth potential for copper applications. The ICSG expects China’s copper demand to increase by around 3 % in 2019.
According to the ICSG, the global market for refined copper is expected to have a slight production deficit overall in 2019. This should amount to 65,000 t and, against the backdrop of a 24-million-ton market, amounts to a largely balanced situation. As in the past, unforeseen developments can lead to major changes. From today’s perspective, however, the expectation of a slight production deficit appears to be justified in light of foreseeable developments on the production and demand side. Other market experts, such as the International Wrought Copper Council (the international industry association for copper and copper alloy products) and the research companies CRU International and Wood Mackenzie, also view the 2019 copper market as largely balanced or expect a slight production deficit.

95
Annual Report 2017/18 Aurubis
Forecast ReportCombined Management Report
Raw material markets
COPPER CONCENTRATESOn the concentrate markets, new projects are expected in 2019 to some extent. Mines will likely utilize their full production capacities, especially on the basis of the forecasts for the average copper price in 2019. A series of successful wage negotiations between mines and unions in 2018 have reduced the likelihood of disruptions due to strikes in 2019 compared to the previous year. Supported by our position on the market and our supplier diversification, we are confident that we will be able to secure a good supply once again. We continue to anticipate good availability of copper concentrates on the global market. The expected treatment and refining charges will likely be at a satisfactory level.
RECYCLINGFollowing a temporary tightening of the copper scrap market at the start of fiscal year 2017/18 resulting from higher demand from China, this market was more favorable again at the end of the fiscal year. The copper price, which remains high, means that copper scrap collection in Europe is sufficient. The higher metal and copper prices that analysts expect in some cases could nevertheless lead to an improved supply.
The development of the copper scrap and blister copper supply can’t be gauged, however. Business in this area, particularly for copper scrap, is conducted with short timelines and is therefore dependent on influences that are difficult to forecast. Falling metal prices could lead to a market change with declining refining charges in the short term. Our broad market position absorbs supply risks in this case. In the first quarter of 2018/19, we are supplied with sufficient material with good refining charges.
Product markets
MARKETS FOR COPPER PRODUCTSAdequate statements about the development of the copper product business in the new fiscal year are only possible to a limited extent since the negotiation season for 2019 sales contracts hasn’t ended yet.
One factor that is already clear is the copper premium Aurubis has established for European wire rod and shapes customers for the coming calendar year. Aurubis set this premium at US$ 96/t for its European customers (2018: US$ 86/t). The higher copper premium reflects the significantly higher demand, and the expected demand, of our European customers.
In light of the good economic situation in the relevant sectors, we expect to conclude the negotiation season for copper products with contracts that are positive for us, supported by good customer relationships in our key markets. We will also continue expanding our business with new customers.
CATHODESSales of free cathode volumes on the market are based on the processing plans for our cathode output in the Group.
COPPER WIRE ROD Wire rod business is generally somewhat weaker in the first quarter of a new fiscal year due to seasonal factors. However, we expect stable to slightly improved demand in Europe for the rest of the fiscal year. The economic situation in the key customer industries should remain at a good level. We expect cable producers’ good demand to continue. Our acquisition of the remaining shares in Deutsche Giessdraht GmbH in fiscal year 2017/18 will positively impact our output volumes.
COPPER SHAPES With regard to the market development for copper shapes, we expect slightly higher product demand than in the previous year. This is partly driven by higher demand from our customers in the industrial tube and flat rolled product sectors. From the current perspective, the positive demand trend for lower-oxygen and higher-alloyed materials will continue.

Aurubis Annual Report 2017/18
96 Combined Management ReportForecast Report
SPECIALTIESThe situation is stable in the specialty product division, which includes bars and profiles. We expect stronger competitive pressure for standard products in 2019, but sales of specialty applications and alloys will continue to be good.
FLAT ROLLED PRODUCTSFor flat rolled products, we see the following trends: The US economy, whose development is crucial for our plant there, is expected to remain robust in 2019. This could support the copper business there. In the European market for flat rolled products, we expect stable demand at a high level, with further opportunities for growth in important sub-markets. In fall 2018, demand fell slightly, in the European automotive sector in particular. We view this as a temporary development and expect a good demand and sales situation for the entire fiscal year 2018/19. We continue to expect additional growth momentum from the connector market, as well as from an increase in electric vehicles.
SULFURIC ACIDSulfuric acid sales are dependent on short-term developments, a fact that is reflected in the duration of the contracts. In addition, sales opportunities are very different from region to region, with conditions varying accordingly. Aurubis supplies the global sulfuric acid market, with a focus on Europe, North America, and North Africa. The relationship between local sales and exports fluctuates depending on market circumstances.
Following a tightening of the sulfuric acid market with higher prices in fiscal year 2017/18, market observers such as ICIS and CRU expect that this tightened market could continue in 2019. The current insights for the first quarter of 2018/19 also signalize a stable situation with very good prices.
Business and earnings expectations for the Aurubis Group
BUSINESS EXPECTATIONSIn fiscal year 2017/18, we kicked off different initiatives and individual measures within the Group to strengthen Aurubis. These are contained in the ONE Aurubis transformation program and the strategy Growth, Efficiency & Responsibility, with which we want to achieve our Vision 2025. Aurubis is currently the market leader in many areas – these positions will be further developed over the long term.
The largest internal growth step is the project Future Complex Metallurgy. It is a key component of the new multi-metal approach and involves major investments. Moreover, the company plans to continue growing in the future through acquisitions. In the coming years, Aurubis will develop from a copper group into a multi-metal group. In this regard, we have been reporting the sales volumes of gold, silver, lead, nickel, tin, platinum group metals, and minor metals since Q2 2017/18, in addition to information about our copper products.
On March 29, 2018, Aurubis AG and Wieland-Werke AG signed a contract to sell Segment Flat Rolled Products. The final execution of the sales contract is subject to approval by the antitrust authorities. A final decision is expected in early 2019. For more information, see the Subsequent Events section in the Notes to the Consolidated Financial Statements.
For fiscal year 2018/19, the following maintenance shutdowns are planned:
At our Lünen site, we will carry out two scheduled maintenance shutdowns lasting 17 and 25 days in March and September 2019, respectively. The shutdowns will have a total impact of approximately € 8 million on our EBT, according to our current plans.
In May and June 2019, we will carry out an 18-day legally mandated maintenance shutdown at our site in Pirdop (Bulgaria). According to our current plans, this will have a roughly € 12 million impact on our EBT.

97
Annual Report 2017/18 Aurubis
Forecast ReportCombined Management Report
EARNINGS EXPECTATIONSOur earnings are subject to quarterly fluctuations because of the nature of our business model. This is due to seasonal factors, but may also be caused by disruptions in equipment or operating processes. The business performance of the first quarter of a fiscal year in particular is shaped by special features related to the period, including subdued customer orders and changes in raw material deliveries.
The future development and forecast of Aurubis AG coincides with the general statement on the Aurubis Group.
The outlook for fiscal year 2018/19 is based on the following premises:
» We expect stable-to-good copper product demand based on industry forecasts.
» For 2019 annual contracts, the market conditions for copper concentrates weren’t final at the time of reporting.
» In fiscal year 2018/19, the market trend for copper scrap and sulfuric acid continues to be difficult to forecast due to the short-term nature of the business.
» The copper premium for 2019 has been set at US$ 96/t for 2019 (previous year: US$ 86/t).
» A significant portion of our revenues is based on the US dollar. We reduce the resulting risks with our hedging strategy.
» We anticipate additional project success of € 60 million from the efficiency improvement program, compared with the base year 2014/15. The target of this program is to continue optimizing all of our sites.
» In fiscal year 2018/19, we expect plant availability to be slightly lower than in the previous year owing to scheduled shutdowns in particular, as well as facility downtimes due to wear and tear, which we will remedy in the course of scheduled maintenance measures.
Overall, we expect moderately lower operating EBT and a slightly lower operating ROCE for the Aurubis Group in fiscal year 2018/19 compared to the previous year.
In Segment Metal Refining & Processing, we expect moderately lower operating EBT and a slightly lower operating ROCE in fiscal year 2018/19 compared to the previous year.
In Segment Flat Rolled Products, we anticipate significantly higher operating EBT and a slightly higher operating ROCE in fiscal year 2018/19 compared to the previous year.
Expected financial situation
At the end of fiscal year 2017/18, Aurubis had € 479 million in available cash (September 30, 2017: € 571 million). The company has additional liquidity through lines of credit amounting to € 350 million from a syndicated loan agreement running until 2023. Aurubis therefore has sufficient liquidity that is not at risk from today’s perspective.
We expect the stable financial situation from the operating business to continue in the coming fiscal year. We intend to settle the scheduled payments due during fiscal year 2018/19 with the existing liquidity. No bonded loan payments are due in the coming fiscal year.

Aurubis Annual Report 2017/18
98 Combined Management ReportForecast Report
General statement on the future development of the Aurubis Group
Overall, we assume that we will be able to continue the successful development of the reporting year in fiscal year 2018/19. As the remarks about the overall economic trend and the developments on our raw material and product markets indicate, the Aurubis Group’s fiscal year 2018/19 will, from our current perspective, once again be influenced by a good market environment. Overall, we expect moderately lower operating EBT and a slightly lower operating ROCE for the Aurubis Group in fiscal year 2018/19 compared to the previous year.
Qualified comparative forecast according to Aurubis’ definition for operating ROCE
ROCE delta as
a percentage
At prior-year level ± 0 to 1.0
Slight ± 1.1 to 4.0
Significant > ± 4.0
Qualified comparative forecast according to Aurubis’ definition for operating EBT
Change in
operating EBT
At prior-year level ± 0 to 5.0 %
Moderate ± 5.1 to 15.0 %
Significant > ± 15.0 %
Forward-looking statements This document contains forward-looking statements about our current forecasts of future events. Words such as “anticipate,” “assume,” “believe,” “predict,” “expect,” “intend,” “can/could,” “plan,” “project,” “should,” and similar terms indicate such forward-looking statements. These statements are subject to a number of risks and uncertainties. Some examples include unfavorable developments in the global economic situation, especially political developments in the US, Europe, and China; a tightening of the raw material supply; and a decline in demand in the main copper sales markets. Further risks include a deterioration of our refinancing options on the credit and finance markets; unavoidable events beyond our control such as natural disasters, acts of terror, political unrest, and industrial accidents, and their effects on our sales, purchasing, production, and financing activities; changes in exchange rates; a drop in acceptance for our products resulting in impacts on the establishment of prices and the utilization of processing and production capacities; price increases for energy and raw materials; production interruptions due to material bottlenecks, employee strikes, or supplier bankruptcies; successful implementation of measures to reduce costs and enhance efficiency; the business outlook for our significant holdings; the successful implementation of strategic cooperation and joint ventures; amendments to laws, ordinances, and official regulations; and the outcomes of legal proceedings and other risks and uncertainties, some of which are described in the Risk and Opportunity Report in this Annual Report. If one of these uncertainties or difficulties occurs, or if the assumptions underlying the forward-looking statements prove to be wrong, the actual results could deviate considerably from the results mentioned or implicitly expressed in these statements. We do not intend, nor do we assume the obligation, to update forward-looking statements continuously, as these statements are based solely on the circumstances on the day of publication.

99
Annual Report 2017/18 Aurubis
Legal DisclosuresCombined Management Report
Legal Disclosures
Declaration on corporate governance pursuant to Section 289f and Section 315d of the German Commercial Code (HGB)
The declaration on corporate governance and the compensation report are part of the Combined Management Report. Both are printed at the beginning of this Annual Report and are available on the company’s website.
Takeover-related disclosures and explanations
Explanatory report by the Executive Board of Aurubis AG, Hamburg, in accordance with Section 176 (1) sentence 1 of the German Stock Corporation Act (AktG) on disclosures of takeover provisions pursuant to Section 289a (1) and Section 315a (1) of the German Commercial Code (HGB) as at the balance sheet date of September 30, 2018.The following disclosures as at September 30, 2018 are presented in accordance with Section 289a (1) and Section 315a (1) of the German Commercial Code (HGB).
COMPOSITION OF THE SUBSCRIBED CAPITALThe subscribed capital (share capital) of Aurubis AG amounted to € 115,089,210.88 as at the balance sheet date and was divided into 44,956,723 no-par-value bearer shares, each with a notional value of € 2.56 of the subscribed capital.
Each share grants the same rights and one vote at the Annual General Meeting. There are no different classes of shares.
SHAREHOLDINGS EXCEEDING 10 % OF THE VOTING RIGHTSOne indirect shareholding in Aurubis AG exceeds 10 % of the voting rights as at the balance sheet date (September 30, 2018):
Salzgitter AG, Salzgitter, notified the company in accordance with Section 33 (1) of the German Securities Trading Act (WpHG) on April 11, 2018 that its voting interest in Aurubis AG had exceeded the threshold of 20 % of the voting rights on April 11, 2018 and amounted to 20.0000009 % of the voting rights (representing 8,991,345 votes). Of this total, 20.0000009 % of the voting rights (representing 8,991,345 votes) are attributed to Salzgitter AG via Salzgitter Mannesmann GmbH, Salzgitter.
Accordingly, one direct shareholding in Aurubis AG exceeds 10 % of the voting rights as at the balance sheet date (September 30, 2018). According to the notification of Salzgitter AG, Salzgitter, dated April 11, 2018, Salzgitter Mannesmann GmbH, Salzgitter, has held 20.0000009 % of the voting rights (representing 8,991,345 votes) since April 11, 2018.
APPOINTMENT AND REMOVAL OF EXECUTIVE BOARD MEMBERS AND AMENDMENTS TO THE ARTICLES OF ASSOCIATIONThe appointment and removal of members of the Executive Board of Aurubis AG are covered by Sections 84 and 85 of the German Stock Corporation Act (AktG) and Section 31 of the German Codetermination Law (MitbestG) in conjunction with Section 6 (1) of the Articles of Association. Amendments to the Articles of Association are subject to the approval of the shareholders at the Annual General Meeting. The resolution at the Annual General Meeting is passed by a majority that must comprise at least three quarters of the subscribed capital represented in the vote; Section 179 et seq. German Stock Corporation Act (AktG) applies. In accordance with Section 11 (9) of the Articles of Association, the Supervisory Board is authorized to pass amendments to the Articles of Association that only relate to their wording. Furthermore, the Supervisory Board is

Aurubis Annual Report 2017/18
100 Combined Management ReportLegal Disclosures
authorized to adjust Section 4 of the Articles of Association after the complete or partial execution of a subscribed capital increase in accordance with the respective claim to the authorized capital and after the authorization expires. It is also authorized to adjust the wording of Section 4 (1) and (3) of the Articles of Association in accordance with the respective issuing of new no-par-value bearer shares to the holders or creditors of convertible bonds and/or bonds with warrants, profit participation rights, and/or participating bonds (or combinations of these instruments), which are issued by Aurubis or by companies in which it has an indirect or direct majority interest in return for a cash contribution and as a result of the authorization passed at the Annual General Meeting on March 2, 2017 under item 6 of the agenda. It is also authorized to grant a conversion or option right to new no-par-value bearer shares in the company or to establish a conversion obligation. The same applies if the authorization to issue bonds with warrants or convertible bonds is not exercised after the authorization period expires or if the conditional capital is not utilized after the deadlines for exercising option or conversion rights or for fulfilling conversion or option obligations have expired.
POWER OF THE EXECUTIVE BOARD TO ISSUE SHARESIn accordance with Section 4 (2) of the Articles of Association, the Executive Board is authorized, with the approval of the Supervisory Board, to increase the company’s subscribed capital in the period until February 23, 2021 by issuing up to 22,478,361 new no-par-value shares in exchange for a cash contribution and/or a contribution in kind, once or in several installments, by up to € 57,544,604.16. The shareholders shall always be granted a subscription right. The new shares can also be acquired by one or more credit institutions with the obligation of offering them to shareholders for subscription. However, the Executive Board is authorized, subject to the approval of the Supervisory Board, to exclude shareholder subscription rights once or on several occasions. Such exclusion is only possible
a) inasmuch as it is necessary to exclude subscription rights for possible fractional amounts.
b) up to an arithmetical face value totaling € 23,017,840.64 if the new shares are issued for a contribution in kind.
c) for capital increases against cash contributions up to an arithmetical nominal value totaling € 11,508,920.32 or, if this amount is lower, by a total of 10 % of the subscribed capital (the “maximum amount”) existing when this authorization was exercised for the first time (in each case taking into account the possible use of other authorizations to exclude the subscription right in accordance with or in commensurate application of Section 186 (3) sentence 4 of the German Stock Corporation Act (AktG)), if the issuing price for the new shares is not significantly lower than the price of company shares with the same terms on the stock exchange at the time when the issuing price is ultimately fixed. The subscribed capital allotted to the shares that are issued or have to be issued to fulfill convertible bonds and/or bonds with warrants that are issued after February 24, 2016 in commensurate application of Section 186 (3) sentence 4 of the German Stock Corporation Act 8 (AktG) excluding the subscription rights or that are sold after February 24, 2016 in commensurate application of Section 186 (3) sentence 4 of the German Stock Corporation Act (AktG) must be included in this maximum amount. It shall not be included if authorizations to issue convertible bonds and/or bonds with warrants pursuant to Section 221 (4) sentence 2 and Section 186 (3) sentence 4 of the German Stock Corporation Act (AktG) or to sell own shares pursuant to Section 71 (1) No. 8 and Section 186 (3) sentence 4 of the German Stock Corporation Act (AktG) are granted again at the Annual General Meeting after exercising such authorizations that have led to inclusion.

101
Annual Report 2017/18 Aurubis
Legal DisclosuresCombined Management Report
d) up to an arithmetical face value totaling € 23,017,840.64, inasmuch as it is necessary to grant holders or creditors of bonds with warrants or convertible bonds issued by the company relating to shares a subscription right for new shares to the same extent as they would be entitled after exercising their option or conversion rights.
In the resolution dated February 9, 2016, the Executive Board of Aurubis AG declared in the scope of a voluntary commitment that it would only make use of the authorizations to exclude shareholders’ subscription rights during the duration of the authorization provided in Section 4 (2) of the Articles of Association insofar as the shares to be issued may not exceed 20 % of the subscribed capital, neither at the point in time when the authorization becomes effective nor at the time of utilization. At the 20 % threshold previously mentioned, until the issue of new stocks without granting subscription rights, hypothetical own shares shall be taken into account that are sold excluding subscription rights, as well as such shares that are to be issued with a conversion and/or option right or conversion obligation for the purpose of servicing bonds, provided the bonds are issued excluding the preemptive rights of shareholders. If and to the extent that the shareholders at the Annual General Meeting reissue this authorization to exclude subscription rights after an authorization to exclude subscription rights has been exercised, leading to offsetting against the 20 % limit previously mentioned, the offsetting that has been carried out is no longer included.
This voluntary commitment was made accessible on Aurubis AG’s website for the duration of the authorization.
POWER OF THE EXECUTIVE BOARD TO REPURCHASE SHARESWith a resolution of the Annual General Meeting on March 1, 2018, the company was authorized until February 28, 2023 to repurchase its own shares up to a total of 10 % of the current subscribed capital. Together with other own shares held by the company or attributable to it in accordance with Section 71a et seq. of the German Stock Corporation Act (AktG), the shares acquired by the company based on this authorization shall at no time exceed 10 % of the company’s current subscribed capital. The acquisition of shares for the purpose of trading with own shares is excluded. The Executive Board is authorized to use shares in the company that are purchased on account of this authorization for all legally permitted purposes, and in particular also for the following purposes:
a) Own shares that have been acquired can also be sold in a way other than a sale via the stock exchange or by means of an offer to all of the shareholders, if the shares are sold in return for a cash payment at a price that is not materially lower than the stock market price of the company’s shares with the same terms at the time of the sale. The definitive trading price for the purpose of the arrangement previously mentioned shall be the average closing price of the company’s shares with the same terms in Xetra trading (or a comparable successor system) over the last five trading days of the Frankfurt Stock Exchange before the commitment to sell the shares was entered into. The shareholders’ subscription right is excluded. This authorization shall however only apply on the condition that the shares sold excluding the subscription right may not, in accordance with Section 186 (3) sentence 4 of the German Stock Corporation Act (AktG), exceed 10 % of the subscribed capital, either at the time this becomes effective or at the time of exercise of this authorization (the “upper limit”). Shares that are issued during the term of this authorization from authorized

Aurubis Annual Report 2017/18
102 Combined Management ReportLegal Disclosures
capital pursuant to Section 186 (3) sentence 4 German Stock Corporation Act (AktG) excluding subscription rights are to be credited towards this upper limit. Furthermore, this upper limit shall take into account those shares that are issued or are to be issued in order to service convertible bonds and/or bonds with warrants (or profit participation rights, or participating bonds with a conversion right, option right, or conversion obligation, or the company’s right to offer), which were issued during the term of this authorization due to an authorization to issue convertible bonds and/or bonds with warrants (or profit participation rights, or participating bonds with a conversion right, option right, or conversion obligation, or the company’s right to offer) in commensurate application of Section 186 (3) sentence 4 of the German Stock Corporation Act (AktG) excluding subscription rights. An inclusion that has been carried out is canceled if authorizations to issue new shares from authorized capital in accordance with Section 186 (3) sentence 4 of the German Stock Corporation Act (AktG) or to issue convertible bonds and/or bonds with warrants (or profit participation rights, or participating bonds with a conversion right, option right, or conversion obligation, or the company’s right to offer) in commensurate application of Section 186 (3) sentence 4 of the German Stock Corporation Act (AktG) are granted again at the Annual General Meeting after exercising such authorizations that have led to inclusion.
b) Own shares that have been acquired can also be sold in a way other than a sale via the stock exchange or by means of an offer to all of the shareholders. This is provided that such sale is carried out in return for a contribution in kind by a third party, especially in conjunction with the acquisition of business entities, parts of business entities, or participating interests in business entities by the company itself or by a business entity dependent on it or majority-owned by it, and in conjunction with business combinations, or to fulfill conversion rights or obligations of holders and/or creditors relating to conversion or option rights issued by the company or Group entities of the
company (or profit participation rights, or participating bonds with a conversion right, option right, or conversion obligation, or the company’s right to offer), especially – but not exclusively – due to the authorization to issue convertible bonds and/or bonds with warrants, profit participation rights, and/or participating bonds (or combinations of these instruments) decided under item 6 of the Agenda for the Annual General Meeting on March 2, 2017. The shareholders’ subscription right is excluded in each case.
c) Own shares that have been acquired can be withdrawn entirely or in part without a further resolution at the Annual General Meeting. They can also be withdrawn in a simplified procedure without a reduction in capital by adjusting the proportionate notional share of the remaining no-par-value shares in the subscribed capital of the company. The withdrawal can be limited to a portion of the acquired shares. If the withdrawal takes place using the simplified procedure, the Executive Board is authorized to adjust the number of no-par-value shares in the Articles of Association.
The own shares collectively sold under the authorization mentioned previously, pursuant to items a) and b) excluding the subscription right, may not exceed 20 % of the share capital, neither at the time the authorization becomes effective nor at the time it is exercised. The 20 % limit must include (i) new shares that are issued, excluding the subscription right, during the term of this authorization up to the sale of the own shares from authorized capital, without subscription rights, and (ii) those shares that are issued in order to service convertible bonds and/or bonds with warrants (or profit participation rights, or participating bonds with a conversion right, option right, or conversion obligation, or the company’s right to offer), if the bonds were issued during the term of this authorization up to the sale of the own shares, excluding shareholder subscription rights. If and to the extent that the shareholders at the Annual General Meeting reissue the relevant authorization to exclude subscription rights after the authorization

103
Annual Report 2017/18 Aurubis
Legal DisclosuresCombined Management Report
leading to offsetting against the 20 % limit previously mentioned has been exercised, the offsetting that has already been carried out is no longer included.
The complete text of the resolution dated March 1, 2018 has been included under agenda item 8 in the invitation to the Annual General Meeting 2018 published in the German Federal Gazette on January 22, 2018.
POWER OF THE EXECUTIVE BOARD TO ISSUE CONVERTIBLE BONDS AND SHARES FROM CONDITIONAL CAPITALThe company’s subscribed capital shall be conditionally increased by up to € 57,544,604.16 by issuing up to 22,478,361 new bearer shares without a nominal amount (no-par-value shares), each with notional interest in the subscribed capital of € 2.56 (Conditional Capital 2017). The conditional capital increase will only be carried out to the extent that the holders or creditors of conversion and/or option rights from convertible bonds, bonds with warrants, profit participation rights, or participating bonds (or a combination of these instruments) that are issued against cash by the company or by its affiliates until March 1, 2022 due to the authorization passed by the shareholders at the Annual General Meeting on March 2, 2017 exercise their conversion or option rights, or to the extent that holders or creditors of the convertible bonds (or profit participation rights or participating bonds with a conversion obligation) issued by the company or by its affiliates until March 1, 2022 due to the authorization passed by the shareholders at the Annual General Meeting on March 2, 2017 fulfill their conversion obligation or shares are offered, and to the extent that own shares or other forms of fulfillment are not utilized for this purpose. The new no-par-value bearer shares shall be entitled to participate in the profits from the beginning of the fiscal year in which they come into existence through the exercise of conversion or option rights, through the fulfillment of conversion or option obligations, or through the exercise of rights to offer. To the extent legally permitted, the Executive
Board can, subject to the approval of the Supervisory Board, establish the profit participation of new shares in a way that deviates from Section 60 (2) of the German Stock Corporation Act (AktG).
The complete text of the resolution dated March 2, 2017 has been included under agenda item 6 in the invitation to the Annual General Meeting 2017 published in the German Federal Gazette on January 17, 2017.
SIGNIFICANT CONDITIONAL AGREEMENTS CONCLUDED BY THE COMPANYIn the event that a single person or a group of persons acting together should acquire more than 50 % of the shares or the voting rights in Aurubis AG, every syndicate lender from the agreement with a banking syndicate (“the Syndicated Loan”) on a credit line totaling € 350 million, which primarily serves to finance the working capital of the Group, shall be entitled to cancel his or her participation in the Syndicated Loan and to demand immediate repayment of the amounts owed to him or her.
Within the scope of various bonds totaling € 229 million, every lender has an extraordinary right of cancellation if control over the borrower changes.

CONSOLIDATED FINANCIAL STATEMENTS
Aurubis Annual Report 2017/18
104

106 Consolidated Income Statement107 Consolidated Statement of Comprehensive Income108 Consolidated Statement of Financial Position110 Consolidated Cash Flow Statement111 Consolidated Statement of Changes in Equity112 Notes to the Consolidated Financial Statements
112 General disclosures112 Significant accounting principles 119 Significant estimates and assumptions 120 Changes in accounting and measurement methods due to new
standards and interpretations123 Acquisitions and discontinued operations124 Notes to the Income Statement129 Notes to the Statement of Financial Position163 Notes to the Cash Flow Statement164 Segment reporting168 Other Disclosures172 Investments
105
Annual Report 2017/18 Aurubis

106
Consolidated Income Statementfor the period from October 1 to September 30 (IFRS)
in € thousand Note12 months
2017/1812 months
2016/17
Revenues 1 10,423,748 9,879,723
Changes in inventories of finished goods and work in process 2 440 -16,537
Own work capitalized 3 18,923 8,484
Other operating income 4 43,398 47,281
Cost of materials 5 -9,464,700 -8,825,650
Gross profit 1,021,809 1,093,301
Personnel expenses 6 -351,942 -338,159
Depreciation of property, plant, and equipment and amortization of intangible assets 7 -119,470 -120,715
Other operating expenses 8 -216,799 -210,589
Operational result (EBIT) 333,598 423,838
Interest income 9 3,592 2,680
Interest expense 9 -15,775 -17,732
Other financial income 10 689 219
Other financial expenses 10 -51 -720
Earnings before taxes (EBT) 322,053 408,285
Income taxes 11 -59,547 -90,057
Consolidated net income from continuing operations 262,506 318,228
Consolidated net income from discontinued operations 28,908 34,156
Consolidated net income 291,414 352,384
Consolidated net income attributable to Aurubis AG shareholders 12 290,253 350,883
Consolidated net income attributable to non-controlling interests 12 1,161 1,501
Basic earnings per share (in €)
From continuing operations per share (in €) 13 5.81 7.04
From discontinued operations per share (in €) 0.65 0.76
Diluted earnings per share (in €)
From continuing operations per share (in €) 13 5.81 7.04
From discontinued operations per share (in €) 0.65 0.76
Aurubis Annual Report 2017/18
106 Consolidated Financial StatementsConsolidated Income Statement

107
Consolidated Statement of Comprehensive Incomefor the period from October 1 to September 30 (IFRS)
in € thousand12 months
2017/1812 months
2016/17
Consolidated net income 291,414 352,384
Items that are reclassifiable to profit or loss in the future
Measurement at market of cash flow hedges -26,795 25,688
Measurement at market of financial investments 3,410 6,728
Changes deriving from translation of foreign currencies -1,050 -452
Income taxes 6,107 -6,110
Share of other comprehensive income attributable to discontinued operations 1,347 -1,364
Items that are not reclassifiable to profit or loss
Remeasurement of the net liability deriving from defined benefit obligations 11,615 77,837
Income taxes -3,768 -25,139
Share of other comprehensive income attributable to discontinued operations 4,103 2,743
Other comprehensive income -5,031 79,931
Consolidated total comprehensive income 286,383 432,315
Consolidated total comprehensive income attributable to Aurubis AG shareholders 285,222 430,478
Consolidated total comprehensive income attributable to non-controlling interests 1,161 1,837
107
Annual Report 2017/18 Aurubis
Consolidated Financial StatementsConsolidated Statement of Comprehensive Income

Consolidated Statement of Financial Position(IFRS)
Assets
in € thousand Note 9/30/2018 9/30/2017
Intangible assets 14 123,049 131,618
Property, plant, and equipment 15 1,198,042 1,269,836
Investment property 16 0 7,955
Financial fixed assets 17 32,929 29,680
Investments measured using the equity method 18 0 50,223
Deferred tax assets 24 2,742 5,747
Non-current financial assets 21 27,930 30,094
Other non-current non-financial assets 21 764 2,226
Non-current assets 1,385,456 1,527,379
Inventories 19 1,680,698 1,752,272
Trade accounts receivable 20 274,501 357,403
Other current financial assets 21 71,419 100,096
Other current non-financial assets 21 39,850 53,300
Cash and cash equivalents 22 461,045 570,569
Assets held for sale 589,500 0
Current assets 3,117,013 2,833,640
Total assets 4,502,469 4,361,019
Aurubis Annual Report 2017/18
108 Consolidated Financial StatementsConsolidated Statement of Financial Position

Equity and liabilities
in € thousand Note 9/30/2018 9/30/2017
Subscribed capital 23 115,089 115,089
Additional paid-in capital 23 343,032 343,032
Generated Group earnings 23 2,090,677 1,870,573
Accumulated other comprehensive income components 23 16,974 33,955
Equity attributable to shareholders of Aurubis AG 2,565,772 2,362,649
Non-controlling interests 23 556 3,097
Equity 2,566,328 2,365,746
Pension provisions and similar obligations 25 199,006 243,682
Other non-current provisions 26 55,575 63,678
Deferred tax liabilities 24 187,768 205,134
Non-current borrowings 27 280,864 340,266
Other non-current financial liabilities 27 68 2,752
Non-current non-financial liabilities 27 0 1,213
Non-current liabilities 723,281 856,725
Current provisions 26 33,776 39,013
Trade accounts payable 27 836,748 905,083
Income tax liabilities 27 9,662 19,959
Current borrowings 27 32,812 11,068
Other current financial liabilities 27 113,950 129,729
Other current non-financial liabilities 27 23,840 33,696
Liabilities deriving from assets held for sale 162,072 0
Current liabilities 1,212,860 1,138,548
Total equity and liabilities 4,502,469 4,361,019
109
Annual Report 2017/18 Aurubis
Consolidated Financial StatementsConsolidated Statement of Financial Position

Consolidated Cash Flow Statementfor the period from October 1 to September 30 (IFRS)
in € thousand12 months
2017/1812 months
2016/17
Earnings before taxes 367,439 456,063
Depreciation and amortization of fixed assets 125,408 135,210
Change in allowances on receivables and other assets 683 1,768
Change in non-current provisions -1,399 1,276
Net gains/losses on disposal of fixed assets 744 3,070
Measurement of derivatives -17,735 10,187
Other non-cash items 5,206 4,404
Expenses and income included in the financial result 9,225 5,361
Income taxes received/paid -77,593 -62,384
Change in receivables and other assets -9,469 -129,288
Change in inventories (including measurement effects) -200,701 -57,023
Change in current provisions 2,946 6,713
Change in liabilities (excluding financial liabilities) -2,251 104,506
Cash inflow from operating activities (net cash flow) 202,503 479,863
Payments for investments in fixed assets -168,174 -165,045
Proceeds from the disposal of fixed assets 1,021 680
Proceeds from the sale of investment property 7,842 0
Proceeds from the redemption of loans granted to third parties 6,529 0
Interest received 3,631 2,715
Dividends received 6,374 6,169
Cash outflow from investing activities -142,777 -155,481
Proceeds deriving from the take-up of financial liabilities 32,507 109,582
Payments for the redemption of bonds and financial liabilities -85,552 -263,163
Payments for the acquisition of non-controlling interests -19,244 0
Interest paid -12,278 -14,066
Dividends paid -66,557 -57,705
Cash outflow from financing activities -151,124 -225,352
Net change in cash and cash equivalents -91,398 99,030
Changes resulting from movements in exchange rates 52 -335
Cash and cash equivalents at beginning of period 570,569 471,874
Cash and cash equivalents at end of period 479,223 570,569
Less cash and cash equivalents from discontinued operations at end of period 18,178 0
Cash and cash equivalents at end of period 461,045 570,569
Additional information is provided in the Notes to the Consolidated Cash flow Statement, page 163.
Aurubis Annual Report 2017/18
110 Consolidated Financial StatementsConsolidated Cash Flow Statement

Consolidated Statement of Changes in Equity
Accumulated other comprehensive income components 1
in € thousandSubscribed
capital
Additional paid-in capital
Generated Group equity
Measure-ment at
market of cash flow
hedges
Measure-ment at
market of financial
invest-ments
Currency translation differences
Income taxes
Equity attribut-
able to Aurubis AG
share-holders
Non-controlling
interestsTotal
equity
Balance as at 9/30/2016 115,089 343,032 1,520,781 -5,944 5,092 10,561 -244 1,988,367 2,769 1,991,136
Dividend payment 0 0 -56,196 0 0 0 0 -56,196 -1,509 -57,705
Consolidated total comprehensive income/loss 0 0 405,988 25,688 6,728 -1,816 -6,110 430,478 1,837 432,315
of which consolidated net income 0 0 350,883 0 0 0 0 350,883 1,501 352,384
of which other comprehensive income/loss 0 0 55,105 25,688 6,728 -1,816 -6,110 79,595 336 79,931
Balance as at 9/30/2017 115,089 343,032 1,870,573 19,744 11,820 8,745 -6,354 2,362,649 3,097 2,365,746
Balance as at 9/30/2017 115,089 343,032 1,870,573 19,744 11,820 8,745 -6,354 2,362,649 3,097 2,365,746
Dividend payment 0 0 -65,187 0 0 0 0 -65,187 -1,370 -66,557
Acquisition of non-controlling interests 0 0 -16,912 0 0 0 0 -16,912 -2,332 -19,244
Consolidated total comprehensive income/loss 0 0 302,203 -26,795 3,410 297 6,107 285,222 1,161 286,383
of which consolidated net income 0 0 290,253 0 0 0 0 290,253 1,161 291,414
of which other comprehensive income/loss 0 0 11,950 -26,795 3,410 297 6,107 -5,031 0 -5,031
Balance as at 9/30/2018 115,089 343,032 2,090,677 -7,051 15,230 9,042 -247 2,565,772 556 2,566,3281 The items included here are reclassifiable to profit or loss in the future.
For explanations on equity Equity, pages 138-139.
111
Annual Report 2017/18 Aurubis
Consolidated Financial StatementsConsolidated Statement of Changes in Equity

Notes to the Consolidated Financial StatementsGeneral disclosures
Aurubis AG is a quoted corporate entity with a registered office in Germany.
As required by Regulation (EC) No. 1606/2002 of the European Parliament and the Council, dated July 19, 2002 on the application of international accounting standards, in conjunction with Section 315e (1) of the German Commercial Code (HGB), the accompanying consolidated financial statements as at September 30, 2018 are prepared in accordance with the International Financial Reporting Standards (IFRS) approved and published by the International Accounting Standards Board (IASB), as adopted by the European Union. The interpretations of the International Financial Reporting Interpretations Committee (IFRIC) have been taken into account.
The Supervisory Board released the consolidated financial statements for publication after they were approved on December 10, 2018.
The consolidated financial statements have been prepared in euros. If nothing to the contrary is indicated, all amounts are shown in thousands of currency units.
Current and non-current assets and liabilities are presented as separate categories in the statement of financial position. In this context, current assets and current liabilities are expected to be realized within twelve months of the balance sheet date or are held primarily for trading purposes.
As a general rule, assets and liabilities have been measured at amortized cost. Derivative financial instruments, investment property, and “available-for-sale” financial assets are measured at fair value.
The preparation of consolidated financial statements in accordance with IFRS furthermore requires the Executive Board and authorized employees to make estimates and assumptions in certain significant areas. These have an impact on the measurement and presentation of the assets and liabilities in the statement of financial position, and on related income and expenses.
Sectors that particularly require the application of estimates and assumptions are presented under Significant estimates and assumptions,
page 119.
This report may include slight deviations in disclosed totals due to rounding.
Significant accounting principles
SCOPE OF CONSOLIDATIONAs in the previous fiscal year, in addition to the parent company, Aurubis AG, Hamburg, 22 further companies in which Aurubis AG, Hamburg, holds the majority of the voting rights either directly or indirectly, and thus has control, were included in the consolidated financial statements as at the reporting date by way of full consolidation. The reporting date for the consolidated financial statements corresponds to the balance sheet date of Aurubis AG, Hamburg, and all consolidated subsidiaries, with the exception of three consolidated companies. The balance sheet date of these subsidiaries is December 31. These companies prepared interim financial statements for consolidation purposes as at the reporting date of the consolidated financial statements.
Accordingly, the financial statements of all significant subsidiaries which Aurubis AG controls are included in these consolidated financial statements.
Pursuant to IFRS 11.24, in conjunction with IAS 28, Schwermetall Halbzeugwerk GmbH & Co. KG, Stolberg, a producer of pre-rolled strip, has been accounted for using the equity method. A 50 % investment is held in this entity, which is managed jointly with another partner (joint venture). This investment is classified as discontinued operations in the fiscal year.
CONSOLIDATION PRINCIPLESThe separate financial statements of all companies included in the consolidation are prepared in accordance with the uniform accounting policies that are applied within the Aurubis Group. The financial statements of the main companies included in the consolidated financial statements have been audited by independent auditors.
Capital consolidation is performed as at the acquisition date using the acquisition method, whereby the acquisition cost of the acquired interest is offset against the fair values of acquired assets and liabilities of the subsidiary at that time. Any unallocated difference on the asset side is recognized as goodwill and tested at least annually for impairment. In accordance with IAS 36, goodwill is not amortized on a scheduled basis. Negative goodwill is recognized immediately in profit or loss following a reassessment of the fair values.
Aurubis Annual Report 2017/18
112 Notes to the Consolidated Financial StatementsGeneral disclosures | Significant accounting principles

Receivables, liabilities, and contingent liabilities, as well as revenues, other income, and expenses between Group companies are eliminated. Profits resulting from transactions between Group companies are eliminated, if material.
In addition to eight German companies, 15 foreign companies are included in the consolidated financial statements. In accordance with the functional currency concept, the financial statements of subsidiaries prepared in foreign currencies were translated into euros, as the euro is Aurubis AG’s reporting currency. Transactions in foreign currencies are converted into the functional currency at the exchange rate at the time of the transaction or, in the case of subsequent measurement, at the time of such measurement. Foreign currency transactions are conducted primarily in US dollars. The average US dollar exchange rate during fiscal year 2017/18 was 1.19014 US$/€. The exchange rate as at September 30, 2018 was 1.15760 US$/€. Gains and losses resulting from the fulfillment of such transactions, as well as from the conversion of monetary assets and liabilities designated in a foreign currency as at the reporting date, are recorded in profit and loss in the cost of materials unless they have to be accounted for in equity as qualified cash flow hedges or net investments in foreign business operations. In fiscal year 2017/18, foreign currency conversion differences totaling € -1.1 million (net) were recognized in profit or loss. In accordance with IAS 21, assets and liabilities in the statements of financial position of subsidiaries reporting in a foreign currency are translated at the mid-market rates applicable at the reporting date and the income statement is translated at the average rates for the fiscal year. Any resultant translation differences are recognized directly in equity until the possible disposal of the subsidiary.
Joint ventures are accounted for in accordance with IFRS 11 using the equity method. Profits deriving from upstream/downstream transactions with Group companies are eliminated proportionally.
RECOGNITION OF REVENUESRevenues are mainly generated from the sale of metals and copper products. The revenues are recognized when control and the significant risks and rewards of ownership of the goods are transferred to the customer, if the amount of revenues can be reliably determined and the economic benefit deriving from the transaction is probable. Bonuses granted in the fiscal year are deducted from revenues.
FINANCIAL INSTRUMENTSA financial instrument is a contract that simultaneously gives rise to a financial asset of one entity and a financial liability or equity instrument of another entity.
In this connection, financial assets particularly comprise cash and cash equivalents, equity instruments held in other entities (e.g., investments or share portfolios), trade accounts receivable, other loans and receivables granted, and primary and derivative financial instruments that are held for trading. Financial liabilities generally establish a contractual obligation to deliver cash or other financial assets. These include in particular bonds and other securitized liabilities, liabilities to banks, trade accounts payable, finance lease liabilities, and derivative financial instruments. Within the Group, regular way purchases and sales of primary financial instruments are generally recorded as at the settlement date, i.e., at the date of delivery and transfer of title. Derivative financial instruments are recognized as at the trade date. Financial assets and financial liabilities are generally reported gross (i.e., without being netted).
Financial assets are recognized if Aurubis has a contractual right to receive cash and cash equivalents or other financial assets from another company. Financial assets are always initially recognized at fair value. Thereby, in the case of financial assets that will not be measured subsequently at fair value through profit or loss, the transaction costs directly attributable to the purchase have to be taken into account. The fair values recognized in the statement of financial position represent the market prices of the financial assets to the extent that these can be determined directly by reference to an active market. Otherwise, they are measured using normal market procedures (valuation models), applying the market parameters specific to the instrument. Non-interest-bearing financial assets with a term exceeding one year are discounted. For financial assets with a residual term of less than one year, it is assumed that the fair value corresponds to the nominal value. Financial assets designated in foreign currency are measured on initial recognition with the valid rate applicable at the date of the transaction and as at the reporting date with the then applicable mid-market rate. Financial assets are derecognized if the contractual rights to payments from the financial assets no longer exist or all opportunities and risks are essentially transferred. Any financial assets sold without recourse were derecognized.
The non-current receivables reported as “other financial fixed assets” are assigned to the category “loans and receivables” and, if significant, are measured at amortized cost, applying the effective interest method.
On account of their short terms to maturity, trade accounts receivable are measured at nominal value, less allowances for doubtful debts. The allowances take adequate account of credit default risks, which are determined on the basis of past experience and individual assessments of the risks. Actual defaults result in derecognition of the receivables affected.
113
Annual Report 2017/18 Aurubis
Significant accounting principles Notes to the Consolidated Financial Statements

Impairment losses relating to trade accounts receivable are recorded in an allowance account. The decision as to whether a credit default risk is recorded using an allowance account or through direct reduction of the receivables depends on how reliable the assessment of the risk situation is.
Financial assets held for trading are measured at fair value. These include derivative financial instruments that are not included in an effective hedging relationship in accordance with IAS 39 and therefore have to be compulsorily classified as “held for trading.”
In addition, delivery contracts are concluded in the Aurubis Group for non-ferrous metals to cover the expected requirement for raw materials and also for the sale of finished products. In the process, physical delivery contracts may be terminated by making compensation payments due to changes in demand. Fixed-price metal delivery contracts are therefore also recognized as derivative financial instruments. Since these are not included in an effective hedging relationship in accordance with IAS 39, they are similarly classified as “held for trading.”
Gains or losses resulting from the subsequent measurement of “held for trading” financial assets are recognized in profit or loss.
Other financial assets are allocated to the category “loans and receivables” and, to the extent that they are non-current, are measured at amortized cost, applying the effective interest method.
Cash and cash equivalents have a remaining term on initial recognition of up to three months and are measured at nominal value.
Within the Aurubis Group, the “available-for-sale” category represents the residual amount of primary financial assets that fall under IAS 39 and are not assigned to another category. They include the interests in affiliated companies that are reported under financial fixed assets, other investments and securities classified as fixed assets. They are generally measured at fair value, which is derived from the stock market price, provided a price quoted in an active market is available. Subsequent gains and losses resulting from measurement at fair value are recognized in equity as a component of other comprehensive income. This does not apply if these are permanent or significant impairment losses, which are recognized in profit or loss. The accumulated gains or losses deriving from measurement at fair value that are recorded as a component of other comprehensive income are only recognized in profit or loss upon disposal of the financial assets. If the fair value of non-quoted equity instruments cannot be determined with sufficient reliability, the interests are measured at acquisition cost (net of impairment losses, if appropriate).
No financial instruments were reclassified into other measurement categories either in fiscal year 2017/18 or in fiscal year 2016/17.
Within the Aurubis Group, an impairment loss is recognized if the carrying amount of a financial asset is higher than the present value of the future cash flows. The test of whether impairment exists is carried out at every reporting date. Indications such as considerable financial problems on the part of the debtor are taken into account in order to determine objectively whether evidence of impairment exists.
In order to resolve the question of impairment, the existing credit relationships that are assigned to the category “loans and receivables” need to be analyzed and then measured subsequently at amortized cost. At every reporting date, an investigation is required in order to assess whether there are objective indications of impairment that should be recognized in the financial statements. The amount of the loss is calculated as the difference between the carrying amount of the asset and the present value of the expected future cash flows, discounted with the original effective interest rate of the financial instrument (recoverable amount). In this connection, for the sake of simplicity, cash flows from short-term receivables are not discounted. The carrying amount of the asset is reduced to the recoverable amount by means of a direct write-down or by using an allowance account and the reduction is recognized in profit or loss.
For equity instruments of the “available-for-sale” category, an impairment loss is recognized if there are considerable adverse changes in the issuer’s environment or the fair value is significantly lower than the original cost for a long period. The loss is determined as the difference between the current fair value and the carrying amount of the financial instrument. While reversals of impairment losses on debt instruments are to be recognized in profit or loss, in the case of equity instruments they may only be recognized in equity.
Financial liabilities are recognized if there is a contractual obligation to transfer cash and cash equivalents or other financial assets to another company. Financial liabilities are always initially recognized at fair value. The directly attributable transaction costs are also deducted for all financial liabilities that are not subsequently measured at fair value and are amortized over the term of the liability applying the effective interest method. Financial liabilities denominated in foreign currency are measured on initial recognition with the valid rate applicable at the date of the transaction and as at the reporting date with the then applicable mid-market rate.
Primary financial liabilities, which include borrowings, trade accounts payable, and other primary financial liabilities, are generally measured at amortized cost. If the interest effect is not insignificant, non-interest-bearing liabilities, or liabilities bearing
Aurubis Annual Report 2017/18
114 Notes to the Consolidated Financial StatementsSignificant accounting principles

low interest rates, with a residual term exceeding one year, are discounted. In the case of liabilities with a residual term of less than a year, it is assumed that the fair value corresponds to the settlement amount.
Liabilities under finance leases are recognized on inception of the lease at the lower of the present value of the leasing payments and the fair value of the leased asset. In subsequent periods, the redemption portions included in the leasing payments reduce the corresponding liabilities.
Derivative financial instruments that are not included in effective hedging relationships must be classified as “held-for-trading” and therefore recognized at fair value through profit and loss. Negative amounts result in the recognition of a financial liability.
The Aurubis Group uses derivative financial instruments to hedge interest rate and foreign currency risks and to hedge commodity price risks.
Derivative financial instruments are measured at fair value. This represents the market value and can be both positive and negative. If the market value is not available, the fair value is calculated utilizing present value and option price models. As far as possible, relevant market prices and interest rates observed at the reporting date, which are derived from recognized sources, are used as the opening parameters for these models.
Changes in the fair values of derivative financial instruments are recognized either through profit or loss in the income statement or in equity as a component of other comprehensive income. The decisive factor hereby is whether or not the derivative financial instrument is included in an effective hedging relationship. If no cash flow hedge accounting relationship exists, the changes in fair values are to be recognized immediately in profit or loss. If, on the other hand, an effective cash flow hedging relationship exists, such changes will be recognized in equity as a component of other comprehensive income.
In order to avoid fluctuations in the income statement due to the different measurement of hedged items and hedging instruments, IAS 39 includes special regulations relating to hedge accounting. The aim of these hedge accounting regulations is to record gains and losses on hedging instruments and hedged items so that they compensate one another as far as possible.
In addition to documentation, as a prerequisite for the application of the regulations of hedge accounting, IAS 39 requires proof of an effective hedging relationship. Hedge effectiveness means that changes in fair value (for fair value hedges) or changes in cash flow
(for cash flow hedges) of the hedged items are compensated by changes in the opposite direction in the fair value or by changes in the cash flows of the hedging instruments, in each case relating to the hedged risk.
The purpose of derivatives that are used as hedging instruments in conjunction with a cash flow hedge is to hedge future cash flows. A risk with regard to the amount of future cash flows exists in particular for loans at floating interest rates and planned transactions that are highly likely to occur. Derivative financial instruments used in conjunction with cash flow hedge accounting are recognized at fair value. The gain or loss on measurement is split between an effective and an ineffective portion. The effective portion is the portion of the gain or loss on measurement that represents an effective hedge of the cash flow risk. This is recognized directly in equity under a special heading (cash flow hedge reserve), after taking deferred taxes into account. The ineffective portion deriving from measurement is recognized on the other hand in profit or loss in the income statement. The general accounting rules applicable to the transactions underlying the hedged cash flows remain unchanged. Following the termination of the hedging relationship, the amounts recorded in the reserve are always transferred to the income statement when gains or losses in connection with the hedged item are recognized in profit or loss or when the underlying transaction is not actually expected to occur anymore.
The Aurubis Group furthermore enters into hedging relationships that do not satisfy the strict requirements of IAS 39 and cannot therefore be accounted for in accordance with the hedge accounting regulations. Nevertheless, from an economic point of view, these hedging relationships comply with the principles of risk management. Moreover, hedge accounting is also not applied in the case of the monetary assets and liabilities recognized in connection with foreign currency hedging, because the foreign currency translation gains and losses on the hedged items that need to be realized in profit or loss in accordance with IAS 21 are accompanied by gains and losses on the derivative hedging instruments and more or less compensate one another in the income statement.
Financial assets and financial liabilities that fall under the scope of IAS 39 could under certain circumstances be allocated irrevocably to the subcategory “fair value option” upon initial recognition. The Aurubis Group has not made use of the fair value option either for financial assets or for financial liabilities.
115
Annual Report 2017/18 Aurubis
Significant accounting principles Notes to the Consolidated Financial Statements

The fair value of financial instruments is determined pursuant to the regulations of IFRS 13 covering measurement at fair value. The fair value of financial instruments quoted in active markets is calculated based on price quotations insofar as these are prices used in routine and current transactions. Where no prices quoted in active markets are available, the Aurubis Group uses measurement procedures to determine the fair value of financial instruments. Consequently, the input parameters applied in measurement procedures are based where possible on observable data derived from the prices of relevant financial instruments traded in active markets. The use of these measurement procedures requires estimates and assumptions on the part of the Aurubis Group, the scope of which depends on the price transparency of the financial instrument and its market, and the complexity of the instrument. Management regularly analyzes the methods and influencing factors used to determine the fair value to ensure that they are appropriate. Additional information about the main estimates and assumptions used to determine the fair value can be found in the section Financial
instruments, pages 113-116.
INTANGIBLE ASSETSIf intangible assets are acquired, they are recognized at acquisition cost. Internally generated intangible assets that provide future economic benefits are recognized at their cost of generation if the criteria for their recognition as an asset are fulfilled. They are amortized on a scheduled, straight-line basis over their expected useful lives of between three and eight years. Scheduled amortization charges relating to investments made in connection with a long-term electricity supply contract are recorded under cost of materials over the term of the contract. With the exception of goodwill, the consolidated financial statements do not include any intangible assets with indefinite useful lives.
PROPERTY, PLANT, AND EQUIPMENTItems of property, plant, and equipment used in the business operations for more than one year are measured at cost less scheduled depreciation. Such assets also include spare parts and maintenance equipment used for more than one period. Technical minimum stocks are recognized as components of the respective technical equipment and machinery. These stocks are quantities of materials that contain metals and are necessary to establish and ensure a production facility’s functionality for its intended use. Minimum stocks are not subject to scheduled depreciation, as they do not deteriorate or age.
Construction costs include all costs that can be directly attributed to the asset. Borrowing costs that can be directly allocated to the purchase, construction, or production of a qualifying asset are capitalized. Borrowing costs of € 288 thousand (previous year: € 27 thousand) were capitalized in the fiscal year reported, applying a financing cost rate of 1.7 % (previous year: 1.7 %). Scheduled depreciation is charged using the straight-line method. In this context, depreciation periods used correspond to the expected economic useful lives of the assets, as applicable within the Group. The following main useful lives are applied:
Buildings 25 to 40 years
Site installations 10 to 25 years
Technical equipment and machinery 5 to 20 years
Technical minimum stock unlimited useful life
Factory and office equipment 3 to 20 years
General overhauls or maintenance measures resulting in the replacement of components are recognized as an asset if it is probable that future economic benefits will flow to the Group and the costs can be measured reliably.
LEASINGLeased items of property, plant, and equipment that satisfy the criteria of IAS 17 for a finance lease are recognized as fixed assets. This is the case if all significant risks and rewards of economic ownership lie with the respective Group company. Such items of property, plant, and equipment are recognized at fair value or, if lower, at the present value of the minimum lease payments, and are depreciated using the straight-line method over the lease term or, if it is expected that ownership will be obtained at the end of the lease term, over the economic useful life of the respective assets. The future lease installment payment obligations are recognized as a liability at their present value or current market value. The lease installment is divided into an interest component and a redemption component, to ensure that the lease liability bears interest at a constant rate. The noncurrent part of the leasing obligation is recorded under non-current financial liabilities and the current part is recorded under current financial liabilities. The interest component of the leasing rate is recognized in the income statement, leading to a constant interest charge over the term of the leasing agreement.
Aurubis Annual Report 2017/18
116 Notes to the Consolidated Financial StatementsSignificant accounting principles

INVESTMENT PROPERTYInvestment property is property that is held for the purpose of earning rental income and/or increasing value, and not for producing or delivering goods, performing services, or carrying out administrative tasks, or that is held to be sold by the company in the course of its usual business activities.
Aurubis’ investment property in the previous fiscal year reported concerned a property site consisting of land and buildings belonging to Aurubis Switzerland SA. The real estate was accounted for at its fair value Investment property, page 134.
IMPAIRMENT OF NON-FINANCIAL ASSETSIntangible assets that have an indefinite useful life, such as goodwill, are not amortized on a scheduled basis but are subjected to an annual impairment test. Furthermore, an assessment is made at every reporting date to determine whether there are any indications that the asset could be impaired. In the same way, items of property, plant, and equipment are tested for impairment if there are any indications of such impairment.
Since the metals contained in the minimum stock can be recovered and the utilization potential of the minimum stock is not subject to wear and tear as it is not used in the production process, an unlimited useful life is assumed. The minimum stocks are therefore not amortized on a scheduled basis but are instead tested for impairment in conjunction with the respective production facilities if there are any indications of such impairment.
Assets that are amortized or depreciated on a scheduled basis are tested for impairment if events or changes in circumstances indicate that the carrying amount might not be recoverable. Impairment losses are recorded in the amount by which the carrying amount exceeds the recoverable amount. The recoverable amount is the higher of the fair value of the asset less costs to sell and its value in use. For impairment tests, assets are combined at the lowest level for which cash flows can be separately identified (cash-generating units). With the exception of goodwill, non-monetary assets on which impairment losses were recognized in the past are reviewed as at each reporting date to ascertain whether the impairment losses possibly need to be reversed.
INVENTORIESInventories are measured at acquisition or production cost. Production cost includes all direct costs attributable to the production process, as well as a systematically allocated share of the production-related overheads.
The acquisition costs of copper concentrates and raw materials for recycling are determined by deducting the treatment and refining charges negotiated with the supplier from the purchase value of the metal. Treatment and refining charges are deductions that are made due to the processing of ore concentrates and raw materials for recycling into copper and precious metals.
In the smelters, work in process is measured by initially measuring the metal content. The equivalent cost of the processing that is still required for production of the fine metal is deducted from this figure. In this manner, the costs incurred during the production process are successively recognized as a component of the total production cost. This procedure applies to the production of copper, precious metals, and minor metals.
When it comes to the production of copper products, in addition to the metal components, the incurred costs of further processing copper into special formats such as wire rod, shapes, and rolled products are taken into consideration for the measurement of finished goods by way of a surcharge calculation.
Inventories are measured using the average cost method in accordance with IAS 2. This is recognized as at the reporting date at the lower of cost and net realizable value. Net realizable value is determined on the basis of quoted commodity exchange or market prices as at the reporting date.
OTHER NON-FINANCIAL ASSETSOther non-financial assets are recognized at amortized cost. Write-downs are made to the extent that the assets are at risk.
INCOME TAXESIncome taxes are made up of current and deferred taxes. The tax expense and/or tax credit is recorded in profit or loss. If, however, the related source transactions are recognized directly in equity or in other comprehensive income, then the income taxes attributed to them are also directly accounted for in equity or in other comprehensive income.
117
Annual Report 2017/18 Aurubis
Significant accounting principles Notes to the Consolidated Financial Statements

The Aurubis Group companies are subject to income taxes in many countries around the world. The tax expense and/or tax credit is calculated by applying the tax regulations of the individual countries that are applicable as at the reporting date.
Deferred tax assets and liabilities result from temporary differences between the tax-based carrying amounts of assets and liabilities and those taken into account in the IFRS financial statements or from tax loss carryforwards and tax credits not yet utilized. The calculation of deferred taxes is based on the tax rates expected in the individual countries at the time of realization. These tax rates are generally based on legislation that is valid, or has been enacted, as at the reporting date.
Deferred tax assets deriving from temporary differences, tax loss carryforwards, and tax credits are recognized by the respective company entities to the extent that deferred tax liabilities exist. If deferred tax assets exceed deferred tax liabilities, they are recognized to the extent that it is probable that sufficient taxable income will be available in the future to ensure the utilization of these tax assets. The recoverability of the recognized deferred tax assets is reviewed on an individual basis each year.
Deferred tax liabilities that arise due to temporary differences in connection with investments in subsidiaries and associated companies are recognized unless the point in time for the reversal of the temporary differences can be determined by the Group and it is likely that the temporary differences will not reverse in the foreseeable future due to this determining influence.
Deferred tax assets and liabilities are offset gainst one another in cases where a legal right of set-off exists and if they relate to income taxes levied on the same company by the same taxation authority.
DISCONTINUED OPERATIONS AND ASSETS HELD FOR SALEDiscontinued operations are recognized as soon as part of a company is classified as held for sale, the business area is a separate, significant line of business, and it is for sale as part of a coordinated overall plan.
In accordance with IFRS 5, assets held for sale are measured at the lower of their carrying amount and their fair value less costs to sell. No write-downs were made for impairment.
The consolidated net income from discontinued operations is reported in the consolidated income statement separately from expenditures and income from continuing operations; prior-year figures are shown on a comparable basis. In the consolidated cash flow statement, discontinued operations are included in the cash inflows/outflows from operating, investing, and financing activities; prior-year figures are shown on a comparable basis. Furthermore, assets and liabilities held for sale are disclosed in the consolidated statement of financial position in aggregated form.
To the extent that the disclosures in the notes to the financial statements are related to the consolidated income statement, they refer to continuing operations (with the exception of the section of the Notes entitled “Acquisitions and discontinued operations”).
PROVISIONSProvisions for pensions and similar obligations are determined in accordance with the projected unit credit method prescribed by IAS 19, based on actuarial reports, applying the mortality tales “Richtafeln 2005 G” issued by Heubeck AG. In this connection, the demographic assumptions applied, as well as expected salary and pension trends and the interest rate to be used, are determined on the basis of current estimates as at the reporting date. Accordingly, actuarial gains and losses can result from deviations between the actual parameters as at the reporting date and the assumptions used for the calculation. These actuarial results – as well as revenues from plan assets that are not included in net interest – are recognized immediately and completely as they arise and are disclosed as generated Group earnings in equity. Past service cost is recognized immediately as an expense in profit or loss.
To determine the net obligation deriving from defined benefit retirement plans, the fair value of the plan assets is deducted from the present value of the pension obligations.
Other provisions are set up for all other uncertain obligations and risks of the Aurubis Group provided that a related obligation to third parties results from a past event, the settlement of which is expected to result in an outflow of cash resources, and the respective amount can be reliably estimated. If the effect of the time value of money is material, non-current provisions are recognized at their present value.
OTHER NON-FINANCIAL LIABILITIESOther non-financial assets are recognized at amortized cost.
Aurubis Annual Report 2017/18
118 Notes to the Consolidated Financial StatementsSignificant accounting principles

Significant estimates and assumptions
Accounting and measurement in the consolidated financial statements are influenced by a large number of estimates and assumptions that are based on past experience, as well as additional factors, including expectations about future events. All estimates and assessments are subject to continuous review and re-evaluation. The use of estimates and assumptions is especially necessary in the following areas:
IMPAIRMENT OF GOODWILLGoodwill is tested for impairment at least annually in line with the accounting policies. In this context, the recoverable amount is calculated on the basis of the value in use Intangible assets,
page 131. The calculation of the value in use in particular requires estimates of future cash flows on the basis of calculations made for planning purposes. The impairment test of the Aurubis Hamburg Copper Products cash-generating unit (CGU) resulted in no impairment of goodwill either in the current or past fiscal year. A 10 % reduction in the predicted cash flows or an increase of 0.5 percentage points in the WACC after taxes – from 6.1 % to 6.6 % – would also not result in the requirement to recognize any impairment losses.
FAIR VALUES IN CONJUNCTION WITH BUSINESS COMBINATIONSAcquired assets, liabilities, and contingent liabilities are recognized with their fair values when accounting for business combinations. Discounted cash flow (DCF)-based procedures, the results of which depend on assumed future cash flows and other assumptions, are often used in this context. The measurement of contingent liabilities depends significantly on the assumptions with respect to the future resource outflows and the probability of their occurrence.
FAIR VALUES OF DERIVATIVES AND OTHER FINANCIAL INSTRUMENTSThe fair values of financial instruments for which there are no quoted prices in an active market are determined on the basis of financial calculation procedures and are influenced by assumptions specific to the instrument. Estimates have a particularly significant influence when the fair value needs to be determined for financial instruments for which at least one significant parameter is not based on observable market data (Level 3 of the fair value hierarchy). The selection and application of suitable parameters and assumptions require an assessment by management. Extrapolation and interpolation procedures have to be applied in particular when data are derived from uncommon market transactions. Detailed information can be found in the section Financial instruments,
pages 113-116.
ACCOUNTING FOR INVENTORIESVarious estimates have to be made in connection with the accounting treatment of inventories. For example, individual estimation procedures are applied when quantifying inventories as well as in the determination of the metal yield content.
PENSION PROVISIONS AND OTHER PROVISIONSWithin the Aurubis Group, retirement benefits for employees are provided on the basis of both defined benefit plans and defined contribution plans.
Obligations deriving from defined benefit pension plans are measured in accordance with actuarial procedures. These procedures are based on several actuarial assumptions, such as, for example, the assumed interest rate, expected salary and pension developments, employee fluctuations, and life expectancy. For the purposes of determining the assumed interest rate, high-quality corporate bonds with commensurate terms and currencies are used as a source of reference. Deviations of the actual development from the assumptions at the beginning of the reporting period lead to remeasurement of the net liability.
When recognizing other provisions, assumptions are made with regard to the probability of the occurrence and the amount and timing of the outflow of resources, which by their nature are subject to uncertainty.
Other significant estimates relate to the determination of the useful lives of intangible assets and items of property, plant, and equipment, the collectability of receivables, and the measurement of inventory risks within inventories.
DISCONTINUED OPERATIONS AND ASSETS HELD FOR SALE In accordance with IFRS 5, discontinued operations are measured at the lower of their carrying amount and their fair value less costs to sell. No write-downs were made for impairment.
119
Annual Report 2017/18 Aurubis
Significant estimates and assumptions Notes to the Consolidated Financial Statements

Changes in accounting and measurement methods due to new standards and interpretations
The following standards which affected the Group were applied for the first time in fiscal year 2017/18.
Standards and interpretations compulsorily applied for the first time
Standard/interpretation
Compulsory application in the EU
Adoption by European Commission Impact
IAS 7
Amendments: Cash Flow Statement
1/1/2017
11/6/2017
More detailed disclosures on changes in liabilities deriving from financing activities are presented in a reconciliation table. See also the notes to the cash flow statement.
IAS 12 Recognition of Deferred Tax Assets for Unrealized Losses Follow-up project from the Annual Improvements to IFRS (2012–14 cycle)
1/1/2017 11/6/2017 no impacts
IFRS 12 Annual Improvements to IFRS (2014–16 cycle)
1/1/2017 2/7/2018 no impacts
The following standards are to be applied to all fiscal years beginning after October 1, 2017. They were not adopted early in the consolidated financial statements.
Standards and interpretations not adopted early
Standard/interpretation
Compulsory application in the EU
Adoption by European Commission Impact
IFRS 9
Financial Instruments – Classification and Measurement
1/1/2018
11/22/2016
A detailed description of the impacts follows the overview in this table
IFRS 15 Revenue from Contracts with Customers
1/1/2018 9/22/2016 A detailed description of the impacts follows the overview in this table
IFRS 15 Amendments: Revenue from Contracts with Customers
1/1/2018 10/31/2017 A detailed description of the impacts follows the overview in this table
IFRS 1, IAS 28
Annual Improvements to IFRS (2014–16 cycle)
1/1/2018 2/7/2018 no impacts
IFRS 2 Amendments: Share-based Payment 1/1/2018 2/26/2018 no impacts
IFRS 4 Amendments: Insurance Contracts 1/1/2018 11/3/2017 no impacts
IAS 40 Amendments: Investment Property 1/1/2018 3/14/2018 no impacts
IFRIC 22 Foreign Currency Transactions and Advance Consideration
1/1/2018 3/28/2018 Translation of advance consideration designated in a foreign currency into the functional currency at the spot exchange rate on the day of payment. Aurubis does not expect any material effects.
IFRIC 23 Uncertainty over Income Tax Treatments 1/1/2019 10/23/2018 no impacts
IFRS 16 Leases 1/1/2019 10/31/2017 A detailed description of the impacts follows the overview in this table
IFRS 9 Amendments: Financial instruments 1/1/2019 3/22/2018 A detailed description of the impacts follows the overview in this table
IAS 19 Amendments: Employee Benefits 1/1/2019 open no impacts
IAS 28 Amendments: Investments in Associates and Joint Ventures
1/1/2019 open no impacts
Aurubis Annual Report 2017/18
120 Notes to the Consolidated Financial StatementsChanges in accounting and measurement methods due to new standards and interpretations

In addition to the allocation based on the business model, an analysis was also carried out with regard to the characteristics of the contractual cash flows of the underlying financial assets on the basis of the so-called SPPI criteria (Solely Payment of Principal and Interest). In the case of financial assets, it was therefore examined whether the contractual cash flows solely represent payments of principal and interest on the principal amount outstanding.
The classification of financial liabilities under IFRS 9 is unchanged from the current accounting requirements that are applicable under IAS 39.
As far as the classification and measurement of financial assets is concerned, Aurubis expects a conversion effect of € 24.6 million to derive from the use of the option to measure investment securities at fair value through OCI.
The determination of any impairment and the creation of risk provisions changes from an incurred loss model to an expected credit loss model. The expected credit loss model is also applicable to all financial instruments that are either measured at amortized cost, such as bank balances, loans receivable, and other receivables, or at fair value through OCI. In this context, a risk provision is established for the entire term of the financial instrument at the time it is acquired. The general approach stipulates a three-stage process for determining risk provisions. Depending on the counterparty’s credit default risk, the model requires different levels of impairment assessment at these various stages. A simplified approach for the recognition of impairment losses is applied for trade receivables. In this approach, the expected credit losses are calculated using a so-called cohort model, which is based on the data of the past three fiscal years. Actual historical bad debt losses are applied to the outstanding receivables, taking into account forward-looking information.
Standard/interpretation
Compulsory application in the EU
Adoption by European Commission Impact
Various Annual Improvements to IFRS (2015–17 cycle)
1/1/2019 open no impacts
Framework 1/1/2020 open Based on our current understanding, Aurubis does not expect any material effects.
IFRS 17 Insurance Contracts 1/1/2021 open The standard regulates the principles covering recognition, measurement, reporting, and disclosures for insurance contracts within the scope of the standard. IFRS 17 will replace the previously applicable IFRS 4. Based on our current understanding, Aurubis does not expect any material effects.
IFRS 9IFRS 9 “Financial Instruments” amends the accounting requirements for the classification and measurement of financial assets, the impairment of financial assets, and for hedge accounting.
The classification and measurement of financial assets are determined on the basis of the business model in use and the structure of the cash flows. In this connection, a financial asset is initially classified as either measured “at amortized cost,” “at fair value through other comprehensive income,” or “at fair value through profit and loss.”
The classification is initially based on the allocation of financial assets according to the business model. For this purpose, Aurubis examined the financial assets and determined which of them were held for the purpose of collecting contractual cash and cash equivalents (“held to collect”), which were “held to collect and sell,” and which could not be allocated to any of the two categories (“other”).
Trade receivables held for sale within the context of factoring arrangements will be classified as “held to collect and sell.” Accordingly, these receivables will therefore be measured at market value.
For equity instruments that are not classified as “held for trading,” the measurement category “at fair value though OCI” (FVOCI) can be optionally selected. When these equity instruments are sold, the profits and losses deriving from these instruments that are unrealized up to this point are transferred to revenue reserves and are not disclosed in the income statement. Aurubis will allocate fixed asset securities to the FVOCI category.
121
Annual Report 2017/18 Aurubis
Changes in accounting and measurement methods due to new standards and interpretationsNotes to the Consolidated Financial Statements

Based on our investigations, there are no material effects deriving from the application of the expected credit loss model.
The designation option for risk components in non-financial underlying transactions is regulated within the scope of hedge accounting. In addition, IFRS 9 eliminates the quantitative limits for the effectiveness test. The requirements for documentation and disclosure are broadened.
Furthermore, there is an option to remove certain derivative components, such as the fair values of options, from the designation as being in a hedging relationship and to segregate the changes in fair values of these components by recognizing them directly in equity.
For Aurubis, there are no material affects for hedge accounting purposes.
The transition to IFRS 9 takes place retrospectively without a change in prior-year figures as at October 1, 2018. This does not apply to the segregation of certain, non-designated components of derivatives, through recognition of the related impacts directly in equity, which is carried out retroactively for the purpose of presenting comparative figures. The effects of the transition are recognized in equity when IFRS 9 is applied for the first time.
IFRS 15IFRS 15 regulates the point in time and amount at which revenues from customer contracts are to be recognized and the extent of the required disclosures in the notes to the financial statements. The new standard does not differentiate between different types of contracts and activities performed, but establishes uniform criteria for when a performance obligation is to be recognized as revenue. Accordingly, revenue is recognized when the customer obtains control of the agreed goods and services and can derive benefit from them. Revenues are measured at the amount of consideration expected to be received by the company. In this context, the determination of revenues is based on a five-stage model that must be applied to all contracts with customers.
The impact analysis was concluded and the need for adjustments was determined in the past fiscal year.
The insights derived from this process with regard to a change in accounting under IFRS 15 mainly affect the point in time at which revenue is recognized, this being dependent on the point in time when control over, or respectively, when the authority to dispose of, the goods or services is transferred.
Revenues are generally recognized by Aurubis at the time they are generated, as the performance obligations entered into primarily relate to the transfer of goods. The point in time of recognition will be delayed slightly under the new standard.
Furthermore, the measurement effect deriving from price adjustments for contracts with customers that had not yet been fixed at the previous reporting date will be made as a separate disclosure within the notes to the financial statements.
No significant impact on the Aurubis Group’s results of operations, assets, and financial position are expected to result from the implementation of IFRS 15.
The transition to IFRS 15 takes place retrospectively without a change in prior-year figures as at October 1, 2018. The conversion effects will therefore be cumulatively recognized at the time of first application. Receivables from customer contracts will decrease by a figure in the single-digit million range at this point in time. A compensating effect, taking into account related tax impacts, will result in changes in the amounts reported for inventories and equity.
IFRS 16This standard regulates the accounting treatment for leases. IFRS 16 replaces the previously applicable IAS 17, as well as three leasing-related interpretations. The application of IFRS 16 is compulsory for all companies using IFRS and is valid for all leasing arrangements. IFRS 16 provides for a single accounting model for the lessee. Accordingly, right-of-use assets and liabilities deriving from leasing agreements must be recognized in the lessee’s statement of financial position except for those with a term of 12 months (or less) or those that can be classified as low-value assets (optional). Aurubis will make use of this option.
For the lessor, the accounting model prescribed by IFRS 16 does not differ materially from the requirements of IAS 17. For accounting purposes, a distinction must still be made here between finance and operating leases.
Aurubis will first apply IFRS 16 in the fiscal year commencing October 1, 2019.
For purposes of the transition to IFRS 16, we currently expect to apply the modified retrospective method.
The impacts of the implementation of IFRS 16 on the Aurubis Group are currently being reviewed in detail. Based on current knowledge, an increase in total assets in the mid-double-digit million range and a slight change in the key control parameters EBT and ROCE are to be expected.
Aurubis Annual Report 2017/18
122 Notes to the Consolidated Financial StatementsChanges in accounting and measurement methods due to new standards and interpretations

Acquisitions and discontinued operations
ACQUISITIONSOn January 19, 2018, Aurubis AG and Codelco Kupferhandel GmbH signed a purchase agreement covering Aurubis’ acquisition of all shares of Deutsche Giessdraht GmbH in Emmerich am Rhein. On July 13, 2018, the German “Bundeskartellamt” (federal antitrust office) issued authorization for the planned acquisition of the outstanding shares (40 %). The competition authority’s consent was a prerequisite for completing the acquisition. The transaction was concluded as of July 31, 2018 (date of closing). The increase in Aurubis AG’s ownership interest in Deutsche Giessdraht GmbH from 60 % to 100 % does not lead to a change in the control relationship. Pursuant to IFRS 10, the acquisition of the non-controlling interests was shown as a transaction between shareholders. The impacts are shown in the following breakdown:
in € million
Carrying amount of acquired non-controlling interests 2
Purchase price paid to non-controlling interests, including incidental costs -19
Decrease in equity attributable to the shareholders of the parent company -17
DISCONTINUED OPERATIONSThe negotiations for the sale of Segment FRP to Wieland-Werke AG that started in Q1 2017/18 led to the signing of the term sheet, which covers key aspects of the intended sale, on February 12, 2018. From this date on, Segment FRP has been classified as discontinued operations pursuant to IFRS 5. The contract for the sale of Segment FRP was signed on March 29, 2018. The final execution of the sales contract is subject to approval by the antitrust authorities.
Consolidated net income from discontinued operations
in € million12 months
2017/1812 months
2016/17
Revenues 1,270 1,160
Changes in inventories of finished goods and work in process -1 22
Expenses -1,224 -1,134
Earnings before taxes (EBT) 45 48
Income taxes -16 -14
Consolidated net income from discontinued operations 29 34
Consolidated net income attributable to Aurubis AG shareholders from discontinued operations 29 34
Internal Group expenses and income are fully eliminated in the process of determining the consolidated result for both continuing and discontinued operations. The internal Group transactions are eliminated from an economic perspective, i.e., taking the Aurubis Group’s future trading relationships into account. The Group will maintain existing supply relationships with the discontinued business division after the sale of Segment FRP. Revenues of Aurubis AG and its subsidiaries deriving from deliveries to the discontinued business division were therefore fully eliminated there.
Carrying amounts of the main groups of assets held for sale and related liabilities
in € million 9/30/2018
Assets
Fixed assets 173
Deferred tax assets 1
Non-current receivables and other assets 2
Inventories 274
Current receivables and other assets 122
Cash and cash equivalents 18
Assets held for sale 590
Equity and liabilities
Deferred tax liabilities 16
Non-current provisions 34
Non-current liabilities 1
Current provisions 8
Current liabilities 103
Liabilities deriving from assets held for sale 162
in € million12 months
2017/1812 months
2016/17
Cash flows from discontinued operations
Cash inflow from operating activities (net cash flow) 18 13
Cash outflow from investing activities -16 -14
Cash outflow from financing activities -1 -1
123
Annual Report 2017/18 Aurubis
Acquisitions and discontinued operationsNotes to the Consolidated Financial Statements

Notes to the Income Statement
1. REVENUES
Analysis by product group in € thousand 2017/18 2016/17
Wire rod 4,282,959 3,740,631
Precious metals 2,383,450 2,419,959
Copper cathodes 2,211,942 2,328,930
Continuous cast products 892,383 802,644
Strip, profiles, and shapes 349,968 328,056
Chemicals and other products 303,046 259,503
10,423,748 9,879,723
A further breakdown of Aurubis Group revenues by Group segments is provided in the context of segment reporting.
2. CHANGES IN INVENTORIES OF FINISHED GOODS AND WORK IN PROCESS
in € thousand 2017/18 2016/17
Finished goods -67,518 -13,578
Work in process 67,958 -2,959
440 -16,537
The changes in inventories in the year reported were due to increased volumes of intermediate products, which were nearly compensated by volume counter-effects in finished products. The changes in inventories in the previous year were primarily due to decreased inventory volumes that were not fully compensated by price counter-effects.
3. OWN WORK CAPITALIZEDOwn work capitalized of € 18,923 thousand (previous year: € 8,484 thousand) primarily includes production costs and purchased materials and is mainly related to the Industrial Heat and Future Complex Metallurgy projects.
4. OTHER OPERATING INCOME
in € thousand 2017/18 2016/17
Cost reimbursements 22,297 25,844
Income from commissions and refunded freight expenses 9,941 7,800
Compensation and damages 370 1,641
Income deriving from the reversal of provisions 1,585 415
Other income 9,205 11,581
43,398 47,281
5. COST OF MATERIALS
in € thousand 2017/18 2016/17
Raw materials, supplies, and merchandise 9,212,758 8,587,965
Cost of purchased services 251,942 237,685
9,464,700 8,825,650
The cost of materials ratio, represented by the ratio of the cost of materials to revenues and changes in inventories, was 90.8 % (previous year: 89.5 %).
6. PERSONNEL EXPENSES
in € thousand 2017/18 2016/17
Wages and salaries 281,957 265,895
Social security contributions, pension and other benefit expenses 69,985 72,264
351,942 338,159
Pension expenses include allocations to the provisions for pensions.
The average number of employees in the Group during the year was as follows:
2017/18 2016/17
Blue collar 4,096 4,057
White collar 2,219 2,159
Apprentices 256 261
6,571 6,477
Aurubis Annual Report 2017/18
124 Notes to the Consolidated Financial StatementsNotes to the Income Statement

Continuing operations account for 4,803 employees (previous year: 4,730 employees) on average for the year. Total compensation of the Aurubis AG Executive Board members newly appointed in fiscal year 2017/18 includes, among other components, a share-based compensation component with a cash settlement.
The recognition and measurement standards of IFRS 2 are to be applied to this compensation component. The component relates to virtual deferred stock with a two-year, forward-looking assessment basis, whereby this assessment basis is dependent upon the achievement of targets for the operating EBT component and individual performance. The virtual deferred stock compensation plan does not include dividend payments, and the payout is limited to 150 % of the starting value. To determine the fair value of the limitation of the share price development, the value of a European call option is calculated using the Black Scholes formula.
The following parameters were taken as a basis for the calculation of the fair value of the virtual deferred stock compensation plan:
9/30/2018
Share price (in €) 60.24
Exercise price (in €) 90.59
Expected volatility (weighed average, in %) 27.00
Expected term (weighed average, in years) 2
Expected dividend (in %) 2.41
Risk-free interest rate (based on government bonds, in %) 0.50
Fair value (in € thousand) 93
The expected volatility is based on an assessment of the historic volatility of the company’s share price, especially in the period that corresponds to the expected term.
The personnel expenses deriving from the deferred stock compensation plan amounted to € 93 thousand (previous year: € 0 thousand) and are included in the same amount as provisions at the balance sheet date.
7. DEPRECIATION AND AMORTIZATIONDepreciation of property, plant, and equipment and amortization of intangible assets totaled € 119,470 thousand (previous year: € 120,715 thousand) for the Group. This comprises depreciation of € 117,279 thousand (previous year: € 118,750 thousand) on property, plant, and equipment and amortization of € 2,191 thousand (previous year: € 1,965 thousand) on intangible assets.
No impairment losses were recognized on intangible assets and property, plant, and equipment during the current or previous fiscal year.
The figure of € 124,677 thousand that is reported for depreciation of property, plant, and equipment and amortization of intangible assets in the table showing changes in assets includes depreciation on investments in connection with an electricity supply contract of € 5,207 thousand, which is disclosed under the cost of materials.
A breakdown of the depreciation of property, plant, and equipment and amortization of intangible assets is provided in the summary of changes in the Group’s intangible assets and property, plant, and equipment Intangible assets, page 129, and Property, plant, and equipment,
page 132.
8. OTHER OPERATING EXPENSES
in € thousand 2017/18 2016/17
Selling expenses 88,349 84,922
Administrative expenses 71,021 70,037
Other taxes 2,514 2,548
Sundry operating expenses 54,915 53,082
216,799 210,589
The selling expenses mainly comprise freight costs.
9. INTEREST
in € thousand 2017/18 2016/17
Interest income 3,592 2,680
Interest expense -15,775 -17,732
-12,183 -15,052
The interest income mainly derives from interest-bearing customer receivables.
The interest expense primarily results from borrowings. Among other items, the interest expense includes the net interest deriving from defined benefit plans, amounting to € 3,647 thousand (previous year: € 3,080 thousand).
10. OTHER FINANCIAL RESULT
in € thousand 2017/18 2016/17
Other financial income 689 219
Other financial expenses -51 -720
638 -501
125
Annual Report 2017/18 Aurubis
Notes to the Income StatementNotes to the Consolidated Financial Statements

As in the previous year, other financial income results primarily from securities.
11. INCOME TAXESIncome taxes comprise both current income taxes, as well as deferred taxes. Tax liabilities and receivables include obligations or claims from domestic and foreign income taxes from previous years and the current year. Income taxes consist of the following:
in € thousand 2017/18 2016/17
Current taxes 64,168 71,664
Deferred taxes -4,621 18,393
Income taxes 59,547 90,057
Prior-year figures have been adjusted due to IFRS 5.
Current taxes include tax credits of € 426 thousand (previous year: tax expenses of € 994 thousand) and deferred taxes include tax expenses of € 280 thousand (previous year: € 282 thousand) deriving from earlier fiscal years.
The difference between the deferred tax credit of € 4,621 thousand and deferred tax expense of € 18,393 thousand in the previous year mainly results from the change of the tax rate in Belgium and the change in temporary differences relating to the statement of financial position, as well as from tax loss carryforwards.
Applicable German tax legislation for fiscal year 2017/18 foresees a corporate income tax rate of 15 % (previous year: 15 %), plus a solidarity surcharge of 5.5 % (previous year: 5.5 %). The trade tax rate applicable for Aurubis AG amounts to 16.59 % (previous year: 16.59 %). For the other German Group companies, trade tax rates between 11.09 % and 16.45 % (previous year: 11.09 % and 16.45 %) are applicable. The foreign companies are subject to their respective national income tax rates, which vary between 10 % and 33.99 % (previous year: 10 % and 33.99 %).
Measurement is carried out using the tax rates that are in force as of the closing date or that apply shortly thereafter. Due to the adoption of the US tax reform on December 22, 2017, the tax rates for fiscal years that start after December 31, 2017 decrease from 35.98 % and 34 % to 23.37 % and 21 %, respectively. For 2017/18, a mixed tax rate of 26.52 % and 24.25 % was used. In Belgium, the tax rate for fiscal years that end on December 31, 2018 or later is 29.58 % (previously 33.99 %) and the tax rate for fiscal years that end on December 31, 2020 or later is 25 %. We therefore determined a rate of 33.99 % for the purpose of calculating current taxes, and respective rates of 29.58 % and 25 % for the purpose of calculating short-term and long-term deferred taxes. This measurement approach leads to one-time effects from the remeasurement of deferred tax assets and liabilities.
The Group taxes include tax effects from foreign subsidiaries to a significant degree. As a consequence, the tax rate of the German parent company of 32.41 % (previous year: 32.41 %) is not applied as the Group tax rate for calculation purposes, but a Group-wide mixed tax rate of 23.18 % (previous year: 21.73 %) is used instead. As in the prior year, the main contributions to earnings come from Aurubis AG and Aurubis Bulgaria AD.
The actual income taxes of € 59,547 thousand (previous year: € 90,057 thousand) were € 15,094 thousand lower (previous year: € 1,354 thousand higher) than the expected income tax expense of € 74,641 thousand (previous year: € 88,703 thousand). The difference between the expected and the actual income tax expense is due to the reasons outlined in the following tax reconciliation:
Reconciliation
in € thousand 2017/18 2016/17
Earnings before taxes 322,053 408,285
Expected tax charge at 23.18 % (previous year: 21.73 %) 74,641 88,703
Changes in the expected tax charge due to:
– changes in tax rates -15,662 -152
– non-recognition and correction of deferred taxes 137 495
– taxes for previous years -146 1,276
– non-deductible expenses 1,952 2,400
– non-taxable income/ trade tax reductions -733 -217
– notional interest deduction (Belgium) -585 -2,763
– outside basis differences -56 293
– other -1 22
Income taxes 59,547 90,057
Prior-year figures have been adjusted due to IFRS 5.
The effects deriving from changes in tax rates, amounting to € -15,662 thousand, mainly result from the change in the tax rate in Belgium used for calculating both short-term and long-term deferred taxes.
Effects deriving from the non-recognition of deferred taxes result from non-recognized loss carryforwards, amounting to € 126 thousand (previous year: € 393 thousand).
Aurubis Annual Report 2017/18
126 Notes to the Consolidated Financial StatementsNotes to the Income Statement

The “notional interest deduction” is a special feature to be observed under Belgian tax law, which results in a lower assessment basis for the current taxes of Aurubis Belgium NV/SA in the reporting period amounting to € 1,720 thousand (previous year: € 8,129 thousand).
The recognized deferred tax assets and deferred tax liabilities result from the following recognition and measurement differences in individual items in the statement of financial position, from tax loss carryforwards and from outside basis differences (OBD):
9/30/2018 1 9/30/2017
in € thousandDeferred
tax assetsDeferred
tax liabilitiesDeferred
tax assetsDeferred
tax liabilities
Intangible assets 5,918 202 7,896 204
Property, plant, and equipment 1,029 81,283 974 109,460
Financial fixed assets 0 0 2 371
Financial fixed assets accounted for using the equity method 0 0 105 3,135
Inventories 7,182 168,277 23,257 188,989
Receivables and other assets 2,900 29,309 5,911 32,750
Pension provisions 43,220 55 61,962 3,647
Other provisions 5,662 174 8,875 579
Liabilities 32,021 2,960 31,912 5,960
Tax loss carryforwards 196 0 5,764 0
Outside basis differences 0 894 0 950
Offsetting -95,386 -95,386 -140,911 -140,911
Consolidated Statement of Financial Position 2,742 187,768 5,747 205,1341 Only continuing operations.
€ 10,082 thousand (previous year: € 29,168 thousand) of the deferred tax assets and € 197,586 thousand (previous year: € 221,740 thousand) of the deferred tax liabilities will be realized within the next twelve months. Deferred tax assets of € 88,046 thousand (previous year: € 117,490 thousand) and deferred tax liabilities of € 85,568 thousand (previous year: € 124,305 thousand) will be realized after more than twelve months. These figures represent the amounts prior to offsetting.
127
Annual Report 2017/18 Aurubis
Notes to the Income StatementNotes to the Consolidated Financial Statements

The income taxes to be accounted for in equity (other comprehensive income) are distributed among the following areas:
9/30/2018 1 9/30/2017 1 9/30/2017
in € thousand Balance ChangeAdjusted
balance Balance Change
Deferred taxes
Derivatives 1,620 6,283 -4,663 -4,663 -6,314
Pension provisions 10,732 -3,769 14,501 12,281 -26,484
Total 12,352 2,514 9,838 7,618 -32,798
Also included: exchange rate differences 0 0 0 -619 -26
Current taxes -1,880 -189 -1,691 -1,691 2041 Only continuing operations.
The realization of deferred tax assets is considered to be sufficiently probable after taking the Group’s forecast development plans and the profit expectations of the subsidiaries into account.
Loss carryforwards existed totaling € 35,474 thousand (previous year: € 45,415 thousand). Deferred tax assets of € 196 thousand (previous year: € 523 thousand) were recognized in respect of income tax losses of € 882 thousand (previous year: € 2,383 thousand) to the extent that deferred tax liabilities were available or if the companies concerned had positive future earnings forecasts.
No deferred tax assets were set up with respect to loss carryforwards of € 34,567 thousand (previous year: € 43,032 thousand), as the possibility of utilizing them is believed to be unlikely from a current perspective. The tax loss carryforwards deemed not to be utilizable can be carried forward without limitation.
Deferred tax liabilities of € 894 thousand (previous year: € 950 thousand) were set up with respect to the differences between the proportional equity of subsidiaries recognized in the consolidated statement of financial position and the investment carrying amounts for these subsidiaries shown in the tax-based records of the respective parent company (so-called outside basis differences) as at the reporting date. No deferred tax liabilities were set up for outside basis differences deriving from undistributed earnings of subsidiaries amounting to € 15,722 thousand (previous year: € 16,114 thousand), since the reversal of these differences is unlikely in the foreseeable future.
12. CONSOLIDATED NET INCOME ATTRIBUTABLE TO NON-CONTROLLING INTERESTS
Of the reported consolidated net income for 2017/18 of € 291,414 thousand (previous year: € 352,384 thousand), a share of income of € 1,161 thousand (previous year: € 1,501 thousand) is attributable to shareholders other than the shareholders of Aurubis AG, Hamburg.
On the one hand, this relates to the non-controlling interests in Aurubis Bulgaria AD, Pirdop, and, on the other hand, to the non-controlling intrests in the results generated by Deutsche Giessdraht GmbH, Emmerich, up until the point in time that the Group increased its interest in this company.
13. EARNINGS PER SHAREBasic earnings per share are calculated by dividing the consolidated net earnings excluding the non-controlling interests by the weighted average number of shares outstanding during the fiscal year.
2017/18 2016/17
Consolidated net income attributable to Aurubis AG shareholders from continuing operations (in € thousand) 261,345 316,727
Weighted average number of shares (in thousand units) 44,957 44,957
Basic earnings per share from continuing operations (in €) 5.81 7.04
Diluted earnings per share from continuing operations (in €) 5.81 7.04
Diluted earnings per share are determined by augmenting the average number of the shares outstanding during the fiscal year to include the maximum number of shares that could have been issued if all conversion rights on convertible bonds had been exercised. Where applicable, the consolidated net income is increased at the same time by the interest expense incurred on convertible bonds less the corresponding taxes.
Since conversion rights on convertible bonds existed neither in the reporting year nor in the prior year, the diluted earnings per share for the Aurubis Group correspond to the basic earnings per share.
Aurubis Annual Report 2017/18
128 Notes to the Consolidated Financial StatementsNotes to the Income Statement

Notes to the Statement of Financial Position
14. INTANGIBLE ASSETSThe development of the costs of acquisition or generation and the accumulated amortization and impairment-related write-downs of the intangible assets are as follows:
Costs of acquisition or generation
in € thousand 10/1/2017Discontinued
operations Additions Disposals Transfers 9/30/2018
Intangible assets
Franchises, industrial property rights, and licenses 155,750 -4,326 1,741 -7,781 654 146,038
Goodwill 43,170 0 0 0 0 43,170
Payments on account for intangible assets 4,312 0 5,147 0 -654 8,805
203,232 -4,326 6,888 -7,781 0 198,013
Amortization and impairment losses
in € thousand 10/1/2017Discontinued
operations
Amortization and impairment
losses for the fiscal year Disposals Transfers 9/30/2018
Intangible assets
Franchises, industrial property rights, and licenses -47,092 2,866 -7,398 1,182 0 -50,442
Goodwill -24,522 0 0 0 0 -24,522
Payments on account for intangible assets 0 0 0 0 0 0
-71,614 2,866 -7,398 1,182 0 -74,964
Carrying amount
in € thousand 9/30/2018 9/30/2017
Intangible assets
Franchises, industrial property rights, and licenses 95,596 108,658
Goodwill 18,648 18,648
Payments on account for intangible assets 8,805 4,312
123,049 131,618
129
Annual Report 2017/18 Aurubis
Notes to the Statement of Financial PositionNotes to the Consolidated Financial Statements

Costs of acquisition or generation
in € thousand 10/1/2016 Additions Disposals Transfers 9/30/2017
Intangible assets
Franchises, industrial property rights, and licenses 105,802 49,521 -885 1,312 155,750
Goodwill 43,170 0 0 0 43,170
Payments on account for intangible assets 1,594 4,031 0 -1,312 4,312
150,566 53,552 -885 0 203,232
Amortization and impairment losses
in € thousand 10/1/2016
Amortization and impairment
losses for the fiscal year Disposals Transfers 9/30/2017
Intangible assets
Franchises, industrial property rights, and licenses -41,304 -6,674 885 0 -47,092
Goodwill -24,522 0 0 0 -24,522
Payments on account for intangible assets 0 0 0 0 0
-65,826 -6,674 885 0 -71,614
Carrying amount
in € thousand 9/30/2017 9/30/2016
Intangible assets
Franchises, industrial property rights, and licenses 108,658 64,498
Goodwill 18,648 18,648
Payments on account for intangible assets 4,312 1,594
131,618 84,740
Aurubis Annual Report 2017/18
130 Notes to the Consolidated Financial StatementsNotes to the Statement of Financial Position

Intangible assets comprise licenses acquired for a consideration, primarily in connection with a long-term electricity supply contract, as well as goodwill on consolidation arising in the Aurubis Group.
The additions in the previous year included a large individual investment (€ 46,981 thousand) related to our long-term electricity supply agreement.
As in the prior year, most of the goodwill (€ 17,439 thousand) is attributable to the Aurubis Hamburg Copper Products cash-generating unit (CGU).
Aurubis carries out an impairment test on goodwill at least annually. For the impairment test on goodwill, the goodwill acquired in conjunction with a business combination is allocated to the CGU that is expected to benefit from the synergies of the business combination. If the carrying amount of the CGU to which the goodwill was allocated exceeds its recoverable amount, a commensurate impairment loss is recognized on the allocated goodwill.
As in the prior year, there was no requirement to recognize an impairment loss for the Aurubis Hamburg Copper Products CGU.
The recoverable amount is the higher of the fair value less costs to sell and value in use. Aurubis determines the recoverable amount on the basis of the value in use. The value in use is determined by means of discounting future cash flows after taxes with a risk-adjusted discount rate (WACC) after taxes (discounted cash flow method). Due to the calculated cash flows after taxes, a cost of capital after taxes is used as well.
The cash flow estimates cover a planning horizon of four years before transferring to perpetuity. The cash flows were established within the scope of a qualified planning process including use of internal company values based on past experience and extensive market knowledge, and they take into consideration management’s assessment and estimates regarding the future development of the regional market.
In addition to the weighted capital costs, the significant assumptions used to calculate the value in use are the forecast earnings trend and the sustainable growth rate of the terminal value at a level of 1 %. The growth rate was derived from future expectations and does not exceed the long-term average growth rates of the respective markets.
The WACC used for discounting purposes amounted to 6.1 % after taxes or 8.6 % before taxes as at September 30, 2018 (previous year: 5.1 % after taxes or 7.2 % before taxes).
As in the prior year, there was no requirement to recognize impairment losses on intangible assets with a limited useful life.
Capitalized development costs of € 673 thousand were recognized during the fiscal year (previous year: € 381 thousand). Research costs are recognized in profit or loss for the respective periods Research
and development, page 162.
131
Annual Report 2017/18 Aurubis
Notes to the Statement of Financial PositionNotes to the Consolidated Financial Statements

15. PROPERTY, PLANT, AND EQUIPMENTThe costs of acquisition or construction and the accumulated depreciation and impairment losses on property, plant, and equipment are as follows:
Costs of acquisition or construction
in € thousand 10/1/2017Discontinued
operationsExchange rate
differences Additions Disposals Transfers 9/30/2018
Property, plant, and equipment
Land and buildings 662,485 -42,581 -469 4,959 -3,419 7,281 628,256
Technical equipment and machinery 2,115,720 -220,228 -579 29,495 -38,252 32,527 1,918,683
Other equipment, factory, and office equipment 92,455 -14,916 -25 6,307 -3,958 2,141 82,004
Leased assets * 43,999 -348 0 13,748 0 0 57,399
Payments on account for assets under construction 62,740 -6,236 -29 104,454 -184 -41,949 118,796
2,977,399 -284,309 -1,102 158,963 -45,813 0 2,805,138
Depreciation and impairment losses
in € thousand 10/1/2017Discontinued
operationsExchange rate
differences
Depreciation and impairment
losses for the fiscal year Disposals Transfers 9/30/2018
Property, plant, and equipment
Land and buildings -372,588 11,851 395 -17,261 3,268 0 -374,335
Technical equipment and machinery -1,250,734 148,141 576 -90,618 37,433 928 -1,154,274
Other equipment, factory and office equipment -64,805 11,843 25 -6,256 3,837 0 -55,356
Leased assets * -19,015 348 0 -3,144 0 0 -21,811
Payments on account for assets under construction -421 0 29 0 0 -928 -1,320
-1,707,563 172,183 1,025 -117,279 44,538 0 -1,607,096
Carrying amount
in € thousand 9/30/2018 9/30/2017
Property, plant, and equipment
Land and buildings 253,921 289,897
Technical equipment and machinery 764,409 864,986
Other equipment, factory and office equipment 26,648 27,650
Leased assets * 35,588 24,984
Payments on account for assets under construction 117,476 62,319
1,198,042 1,269,836
* Leased assets primarily comprise buildings, as well as technical equipment and machinery.
Aurubis Annual Report 2017/18
132 Notes to the Consolidated Financial StatementsNotes to the Statement of Financial Position

Costs of acquisition or construction
in € thousand 10/1/2016Exchange rate
differences Additions Disposals Transfers 9/30/2017
Property, plant, and equipment
Land and buildings 650,508 -536 10,015 -4,570 7,068 662,485
Technical equipment and machinery 2,057,740 -3,453 32,431 -28,777 57,779 2,115,720
Other equipment, factory and office equipment 90,880 -363 6,719 -5,776 995 92,455
Leased assets * 34,678 0 9,600 -279 0 43,999
Payments on account for assets under construction 66,593 -220 62,209 0 -65,842 62,740
2,900,398 -4,572 120,974 -39,402 0 2,977,399
Depreciation and impairment losses
in € thousand 10/1/2016Exchange rate
differences
Depreciation and impairment
losses for the fiscal year Disposals Transfers 9/30/2017
Property, plant, and equipment
Land and buildings -357,174 74 -19,591 4,103 0 -372,588
Technical equipment and machinery -1,174,399 1,644 -103,657 25,678 0 -1,250,734
Other equipment, factory and office equipment -63,212 329 -7,516 5,594 0 -64,805
Leased assets * -17,037 0 -2,257 279 0 -19,015
Payments on account for assets under construction -422 1 0 0 0 -421
-1,612,244 2,048 -133,021 35,654 0 -1,707,563
Carrying amount
in € thousand 9/30/2017 9/30/2016
Property, plant, and equipment
Land and buildings 289,897 293,334
Technical equipment and machinery 864,986 883,341
Other equipment, factory and office equipment 27,650 27,668
Leased assets * 24,984 17,641
Payments on account for assets under construction 62,319 66,171
1,269,836 1,288,155
* Leased assets primarily comprise buildings, as well as technical equipment and machinery.
133
Annual Report 2017/18 Aurubis
Notes to the Statement of Financial PositionNotes to the Consolidated Financial Statements

Depreciation in the current fiscal year does not include any impairment losses.
Rented or leased items of property, plant, and equipment recognized as fixed assets totaled € 35,588 thousand (previous year: € 24,984 thousand).
The addition of € 13,748 thousand in the fiscal year resulted from new leased facilities in connection with the storage and transshipment of copper concentrates in Bulgaria. The carrying amount of the leased facilities was € 21,388 thousand as at September 30, 2018. The terms of these contracts provide for fixed installment payments over fixed periods. No collateral has been provided.
Furthermore, the carrying amount of the leased facilities includes carrying amounts of € 4,747 thousand (previous year: € 5,268 thousand) for ships used for transporting copper concentrates and sulfuric acid, and carrying amounts of € 3,654 thousand (previous year: € 4,097 thousand) for the warehouse used for storing copper concentrates in Brunsbüttel. Some of the lease payments are adjusted annually based on the indexed price trend for industrial products. The lease agreements are mainly based on fixed rental arrangements. Collateral has not been provided for them.
No property, plant, and equipment was pledged as security for loans within the Group as at September 30, 2018 and September 30, 2017. Purchase commitments for fixed assets amounted to € 105,554 thousand as at September 30, 2018 (previous year: € 69,335 thousand).
Minimum stocks are recognized in technical equipment and machinery as components of the respective technical equipment and machinery. Minimum stocks are quantities of materials that are necessary to establish and ensure a production facility’s continuing functionality for its intended use. A total of € 291,359 thousand was attributable to the technical minimum stock as at September 30, 2018 (previous year: € 291,381 thousand).
16. INVESTMENT PROPERTYThe investment property held in the previous fiscal year by Aurubis Switzerland SA was sold during the fiscal year reported.
The fair value of the property was € 7,955 thousand as at September 30, 2017. Due to the limited availability of market data and/or data and measurement parameters that are not directly observable on the market (such as market rents and rates of return), the fair value measurement of the investment property was classified as Level 3 in the measurement hierarchy according to IFRS 13.
The following table shows the development in the carrying amount of investment property:
in € thousand 9/30/2018 9/30/2017
Balance as at October 1 7,955 8,515
Disposal due to the sale -7,842 0
Loss/gain from the change in fair value 0 -135
Exchange rate impacts -113 -425
Balance as at September 30 0 7,955
17. FINANCIAL FIXED ASSETS
in € thousand 9/30/2018 9/30/2017
Interests in affiliated companies 1,321 1,419
Investments 115 174
Other financial fixed assets 31,493 28,087
32,929 29,680
The interests in affiliated companies and investments included in the financial fixed assets in the amount of € 1,436 thousand (previous year: € 1,593 thousand) are classified as “available for sale.” In the fiscal year reported, all interests in affiliated companies were measured at amortized cost since it would only be possible to ascertain the market value reliably within the context of concrete sales negotiations. These interests are not quoted and there is no active market. There is no current intention to sell the interests.
An overview of the investments included in the financial assets of Aurubis AG, Hamburg, is presented at the end of this report.
Other financial fixed assets primarily include fixed asset securities, which mainly comprise investments in Salzgitter AG, Salzgitter, and are classified as “available for sale.”
Aurubis Annual Report 2017/18
134 Notes to the Consolidated Financial StatementsNotes to the Statement of Financial Position

18. INVESTMENTS ACCOUNTED FOR USING THE EQUITY METHOD
Schwermetall Halbzeugwerk GmbH & Co. KG, Stolberg, is a joint venture in which Aurubis holds a 50 % interest. It is operated as a joint venture with a partner and is assigned to Segment FRP. The business objective of the company is the fabrication and marketing of pre-rolled strip made of copper and copper alloys. Pursuant to IFRS 11.24, in conjunction with IAS 28, Schwermetall Halbzeugwerk GmbH & Co. KG is accounted for using the equity method. The shares are categorized as discontinued operations and are accounted for as assets held for sale.
The following table provides a reconciliation of the net assets of Schwermetall Halbzeugwerk GmbH & Co. KG to the investment carrying amount.
Reconciliation of the combined financial information
in € thousand 2017/18 2016/17
Net assets as at October 1 100,976 89,007
Profit/loss of the period (5 months in the fiscal year reported) 7,395 23,317
Other comprehensive income 0 552
Distribution -11,376 -11,900
Net assets as at September 30 96,995 100,976
Share of joint ventures (50 %) 48,498 50,489
Elimination of unrealized intra-Group profits 149 149
Effects deriving from income taxes -415 -415
Reclassification as assets held for sale -48,232 0
Carrying amount 0 50,223
19. INVENTORIES
in € thousand 9/30/2018 9/30/2017
Raw materials and supplies 812,866 702,605
Work in process 605,346 642,922
Finished goods, merchandise 262,216 405,363
Payments on account of inventories 270 1,382
1,680,698 1,752,272
As at the reporting date, write-downs of € 29,920 thousand were recorded against inventories (previous year: € 10,248 thousand).
135
Annual Report 2017/18 Aurubis
Notes to the Statement of Financial PositionNotes to the Consolidated Financial Statements

20. TRADE ACCOUNTS RECEIVABLEThe trade accounts receivable as at September 30, 2018 and as at September 30, 2017 were due within one year.
The age structure of the trade accounts receivable is as follows:
in € thousandCarrying
amount
of which: neither written down as at the reporting date
nor overdue
of which: not written down as at the reporting date and overdue in the following time spans
less than 30 days
between 30 and 180 days
more than 180 days
as at September 30, 2018 Trade accounts receivable 274,501 230,928 39,209 1,480 2,884
as at September 30, 2017 Trade accounts receivable 357,403 304,694 42,460 6,695 3,554
Movements on the allowances for trade accounts receivable that were not covered by commercial credit insurance were as follows:
in € thousand 9/30/2018 9/30/2017
Specific allowancesBalance as at October 1 3,048 2,946
Discontinued operations -1,228 0
Changes in allowances during the period -28 102
Additions 57 105
Reversals -71 0
Exchange rate impacts -14 -3
Balance as at September 30 1,792 3,048
All expenses and income deriving from allowances and write-offs of trade accounts receivable are shown respectively under other operating expenses or other operating income.
As regards the balances of trade accounts receivable that are neither impaired nor overdue, there is no indication as at the reporting date that the debtors will not fulfill their payment obligations.
Credit risks from trade accounts receivable were largely secured through commercial credit insurance.
Aurubis Annual Report 2017/18
136 Notes to the Consolidated Financial StatementsNotes to the Statement of Financial Position

21. OTHER RECEIVABLES AND OTHER ASSETSOther receivables and other assets comprise both other financial and other non-financial assets.
Non-current receivables and other assets are made up as follows as at the reporting date:
in € thousand 9/30/2018 9/30/2017
Non-current (with a residual term of more than 1 year)
Derivative financial instruments of the held-for-trading category 14,530 5,195
Derivative financial instruments held as hedging instruments in the context of hedge accounting 0 3,459
Other non-current financial assets 13,400 21,440
Non-current financial assets 27,930 30,094
Other non-current non-financial assets 764 2,226
Other non-current non-financial assets 764 2,226
Current receivables and other assets are made up as follows as at the balance sheet date:
in € thousand 9/30/2018 9/30/2017
Current (with a residual term of less than 1 year)
Derivative financial instruments of the held-for-trading category 40,727 28,089
Derivative financial instruments held as hedging instruments in the context of hedge accounting 2,145 18,878
Receivables from related parties 2,096 19,187
Sundry other current financial assets 26,451 33,942
Other current financial assets 71,419 100,096
Income tax receivables 2,492 6,842
Sundry other current non-financial assets 37,358 46,458
Other current non-financial assets 39,850 53,300
The sundry other current non-financial assets mainly comprise VAT receivables of Aurubis Bulgaria AD, Pirdop.
The receivables from related parties disclosed in the previous year primarily comprise receivables from Schwermetall Halbzeugwerk GmbH & Co. KG, Stolberg. The decrease resulted in part from the classification of the company as a discontinued operation.
The sundry other current financial assets include a continuing involvement arising from del credere risks with factoring companies and late payment and currency risks deriving from current trade
accounts receivable in the amount of € 13,358 thousand (previous year: € 22,210 thousand). The level of continuing involvement corresponds to the maximum risk of loss, mainly based on the assumption that all receivables open on the reporting date that were sold remain outstanding for the entire period for which Aurubis can be held responsible for the late payment risk.
A liability of € 13,372 thousand was reported in connection with the continuing involvement (previous year: € 23,719 thousand). All trade accounts receivable sold to factoring companies have a term of less than one year, meaning that the fair value of the continuing
137
Annual Report 2017/18 Aurubis
Notes to the Statement of Financial PositionNotes to the Consolidated Financial Statements

involvement and the associated liability each correspond to the carrying amount.
All of the receivables covered by two factoring contracts for which the main opportunities and risks were transferred to the purchaser of the receivables were completely derecognized.
For one of the contracts, which has been classified to discontinued operations, the maximum loss Aurubis has to bear from credit risks is limited to a purchase price reduction. This is retained by the buyer at the time of sale of the receivables and is ultimately repaid in the amount of the unused portion. The purchase price reduction for the sold and derecognized receivables (nominal volume: € 12,664 thousand) amounted to € 1,500 thousand in the previous year and is included in sundry other financial assets. In the previous year, a total of € 434 thousand was recorded as an expense deriving from the sale of the receivables.
In total, outstanding receivables of € 285,807 thousand (previous year: € 252,863 thousand) had been sold to factoring companies as at the reporting date.
With the exception of interest derivatives, there is no interest rate fluctuation risk deriving from any receivable or other asset. Further information on the interest derivatives is provided in
Financial instruments, pages 149-154.
There were no allowances on other financial assets in the fiscal year reported (previous year: € 1,089 thousand).
As regards other financial assets that are neither impaired nor overdue, there is no indication as at the reporting date that the debtors will not fulfill their payment obligations.
22. CASH AND CASH EQUIVALENTSCash and cash equivalents consist of current account balances with banks, cash in hand, and checks. Cash at banks mainly comprises euro balances.
23. EQUITYThe share capital amounted to € 115,089,210.88 and is divided into 44,956,723 no-par-value shares, each with a notional amount of € 2.56. The share capital is fully paid in.
The Executive Board is authorized, subject to the approval of the Supervisory Board, to increase the share capital by February 23, 2021, by up to € 57,544,604.16 once or in several installments.
The share capital has been conditionally increased by up to € 57,544,604.16 by issuing up to 22,478,361 new no-par-value shares with a proportionate notional amount per share of € 2.56 of the share capital (conditional capital increase). It will be used to grant shares to the holders or creditors of conversion and/or option rights from convertible bonds, bonds with warrants, profit participation rights, or participating bonds (or combinations of these instruments) that can be issued by March 1, 2022.
Generated Group equity comprises consolidated net income, the revenue reserves of all Group companies, the accumulated unappropriated earnings of the subsidiaries since their initial consolidation, and the accumulated amounts resulting from consolidation adjustments recognized in profit or loss. In addition, the effects deriving from the remeasurement of the net liability resulting from the defined benefit pension plans (after taxes), which are recorded directly in equity, are also included.
The legal reserve of € 6,391 thousand, which is not available for distribution, is also included in this amount. The change in generated Group equity from € 1,870,573 thousand as at September 30, 2017, to € 2,090,677 thousand as at September 30, 2018, includes the dividend payment of € 65,187 thousand, the acquisition of non-controlling interests of € 16,912 thousand, positive effects of € 11,950 thousand (after taxes) recognized in equity deriving from the remeasurement of the net liability resulting from the defined benefit pension plans, and the consolidated net income for fiscal year 2017/18 of € 290,253 thousand.
Changes in accumulated other comprehensive income totaling € -16,981 thousand (previous year: € 24,490 thousand) mainly comprise gains and losses of € -26,795 thousand (previous year: € 25,688 thousand) deriving from the measurement of hedges and was partially compensated for by income taxes and the measurement at market of financial investments.
An amount of € 17,201 thousand (previous year: € -10,677 thousand) was transferred during the period from other comprehensive income to the consolidated income statement in conjunction with cash flow hedge accounting, which is primarily reflected in the cost of materials.
Aurubis Annual Report 2017/18
138 Notes to the Consolidated Financial StatementsNotes to the Statement of Financial Position

The non-controlling interests amounting to € 556 thousand (previous year: € 3,097 thousand) comprise the interests of non-Group shareholders in the equity of one company (two in the previous year) that is fully consolidated by Aurubis AG. This only applies to Aurubis Bulgaria AD, Pirdop, as at September 30, 2018. Aurubis’ interest in Deutsche Giessdraht GmbH, Emmerich, increased from 60 % to 100 % Acquisitions and discontinued operations,
page 123.
The change in non-controlling interests includes a proportional share of the dividend payment, amounting to € 1,370 thousand, and the acquisition of non-controlling interests in the amount of € 2,332 thousand. The consolidated result of € 1,161 thousand in fiscal year 2017/18 had an opposite effect.
Changes in equity are presented in detail in the consolidated statement of changes in equity.
PROPOSED APPROPRIATION OF EARNINGSThe separate financial statements of Aurubis AG, Hamburg, have been prepared in accordance with German accounting principles (HGB – German Commercial Code).
Net income for the year of Aurubis AG € 119,660,056.48
Retained profit brought forward from the prior year € 74,967,948.39
Allocations to other revenue reserves € 59,800,000.00
Unappropriated earnings € 134,828,004.87
A proposal will be made to the Annual General Meeting that Aurubis AG’s unappropriated earnings of € 134,828,004.87 are used to pay a dividend of € 1.55 per no-par-value share (= € 69,682,920.65) and that € 65,145,084.22 be carried forward.
The company currently does not hold any own shares. If the number of no-par-value shares changes until the Annual General Meeting, an accordingly adjusted proposal on the distribution of profits will be presented at the Annual General Meeting, with an unchanged proposal for the appropriation of the profit of € 1.55 per no-par-value share with a dividend entitlement.
A dividend of € 1.45 per share was paid in fiscal year 2017/18, totaling € 65,187,248.35.
ADDITIONAL INFORMATION ON CAPITAL MANAGEMENT The main purpose of management control is to increase the corporate value of the Aurubis Group, in that a positive contribution to the enterprise as a whole is generated beyond the capital costs. The Group’s liquidity sourcing is secured through a combination of the Group’s cash flow, borrowings, as well as lines of credit available from our banks. Existing credit facilities and lines of credit can compensate for fluctuations in the cash flow development at any time. The objective is to keep the Group’s debt structure in equilibrium in the long term. Control and monitoring are carried out on the basis of defined key ratios. Net debt and liquidity are controlled in the medium and short term by means of regular cash flow forecasts.
One of the main key ratios used to determine and compare profitability is ROCE (return on capital employed), which reflects the yield on the capital that is utilized in the operating business or for investments. ROCE is defined as the ratio of EBIT (earnings before interest and taxes) to capital employed as at the reporting date. Capital employed comprises equity and interest-bearing liabilities, less cash and cash equivalents.
The Aurubis Group’s operating ROCE decreased slightly from 15.1 % in the previous year to 14.8 % in the current fiscal year. This is primarily due to the increase in capital employed.
All external requirements under financial covenants were fulfilled in the fiscal year reported.
24. DEFERRED TAXESThe breakdown of the deferred tax liabilities is presented in
Income taxes, pages 126-128.
25. PENSION PROVISIONS AND SIMILAR OBLIGATIONSWithin the Aurubis Group, retirement benefits for eligible employees are provided on the basis of both defined benefit plans and defined contribution plans.
The majority of defined benefit plan obligations in the Aurubis Group relate to Germany and the US. On the one hand, these represent individual contractual direct obligations. On the other hand, the Group provides benefits in the form of defined benefit obligations within collective plans. Both funded and unfunded plans exist. The subsidiaries in the US were classified as discontinued operations, so the obligations from these pension plans as at the balance sheet date are no longer recognized as pension provisions
139
Annual Report 2017/18 Aurubis
Notes to the Statement of Financial PositionNotes to the Consolidated Financial Statements

but as liabilities deriving from assets held for sale. In the following reconciliations, the reclassification effect is included in the line “Discontinued operations.”
In Germany, the Group provides eligible employees with pension benefits as well as disability and surviving dependent benefits. These are provided to a great extent through pension and support funds, the assets of which may solely be utilized to satisfy the Aurubis Group’s pension obligations.
Generally, the amount of the pension benefit per qualified year of service is determined as a percentage of a pensionable salary. In Germany, pensions are reviewed every three years and adjusted, where necessary, in a manner corresponding to the price index development.
In Germany, the company pension plan arrangements for new employees hired after September 29, 2003, were converted to the form of defined contribution plans. Processing is carried out by an external pension fund and an insurance company.
Furthermore, a subsidiary in the US grants employees pension, health care, and life insurance benefits for the period after retirement under specific conditions related to age and duration of employment with the company. These retirement benefits are based on collective agreements that only apply to unionized employees. These represent lifelong pension benefits whose level depends on the duration of employment. The amount of the benefits does not depend on the salary. Health care benefits are provided after the employee leaves the company until an established minimum age. While the pension commitments are mainly financed through the specific assets of a separate pension fund, there is no separate fund for the health care and life insurance benefits provided in the US.
Within the Group, actuarial reports were obtained for all pension obligations. The reports take uniform Group-wide accounting policies into consideration, while nevertheless reflecting special country-specific circumstances.
The company has refrained from using the new “Richttafeln 2018 G” mortality tables published by Heubeck AG on October 4, 2018 as at the reporting date of September 30, 2018, as the final validation and implementation of the new mortality tables was not yet completed at the time the annual financial statements were being prepared. The company continues to apply the “Richttafeln 2005 G” mortality tables.
In addition, the following market discount rates, salary, and pension trends were used as a basis to calculate the pension obligations:
9/30/2018 9/30/2017
Discount rate 1.70 % 1.80 %
Expected income development 2.75 % 2.75 %
Expected pension development 1.60 % 1.60 %
A discount rate of 3.67 % was taken as a basis for the measurement of the pension provision of Aurubis Buffalo, Inc., Buffalo, in the previous year. Salary and pension trends are not relevant for the calculation of the pension obligations of the US subsidiary. Aurubis Buffalo Inc., Buffalo, is classified as a discontinued operation in the fiscal year reported. A discount rate of 4.11 % was used for the measurement of the pension provision included in the liabilities deriving from the assets held for sale.
The net pension provision for defined benefit obligations disclosed in the consolidated statement of financial position as at September 30, 2018 and September 30, 2017 is as follows:
in € thousand 9/30/2018 9/30/2017
Present value of pension obligations 509,158 570,537
of which funded 409,156 442,188
– Fair value of plan assets 310,152 326,855
Net carrying amount on September 30 199,006 243,682
of which disclosed as assets 0 0
of which disclosed as liabilities 199,006 243,682
The net liability for benefit obligations, taking into account separate reconciliations for the present value of the defined benefit obligation as well as the plan assets, is derived as follows:
Aurubis Annual Report 2017/18
140 Notes to the Consolidated Financial StatementsNotes to the Statement of Financial Position

Development of the present value of the pension obligations
in € thousand 9/30/2018 9/30/2017
Present value of unfunded benefit obligations 128,349 141,999
Present value of funded benefit obligations 442,188 496,440
Present value of the pension obligations as at October 1 570,537 638,439
Discontinued operations -68,758 0
Current service cost 8,618 13,794
Past service cost 0 377
Loss from plan settlements 64 20
Interest cost on the pension obligations 8,778 8,202
Remeasurements 7,977 -62,616
Actuarial gains/losses from demographic assumptions 0 0
Actuarial gains/losses from financial assumptions 8,159 -67,676
Actuarial gains/losses from adjustments based on experience -182 5,060
Benefits paid -18,058 -19,708
Payments for settlements 0 -4,837
Exchange rate difference 0 -3,136
= Present value of the pension obligations as at September 30 509,158 570,537
In the previous year, the present value of the defined benefit pension obligation included € 54,473 thousand in obligations for a US subsidiary, € 16,517 thousand of which related to health care and life insurance benefits.
141
Annual Report 2017/18 Aurubis
Notes to the Statement of Financial PositionNotes to the Consolidated Financial Statements

Development of the plan assets
in € thousand 2017/18 2016/17
Fair value of the plan assets as at October 1 326,855 316,439
Discontinued operations -36,147 0
Interest income 5,131 4,238
Remeasurement effects 19,594 19,623
Benefits paid -12,619 -12,983
Payments for plan settlements 0 -4,837
Contributions made by employer 7,338 6,309
Exchange rate difference 0 -1,934
Fair value of the plan assets as at September 30 310,152 326,855
Development of the net liability
in € thousand 2017/18 2016/17
Net liability as at October 1 243,682 322,000
Discontinued operations -32,611 0
Current service cost 8,618 13,794
Past service cost 0 377
Loss from plan settlements 64 20
Net interest result 3,647 3,964
Remeasurement effects -11,617 -82,239
Benefits paid -5,439 -6,725
Employer contributions to the plan -7,338 -6,309
Exchange rate difference 0 -1,200
Net liability as at September 30 199,006 243,682
Aurubis Annual Report 2017/18
142 Notes to the Consolidated Financial StatementsNotes to the Statement of Financial Position

The remeasurement effects are directly recorded in other comprehensive income and are disclosed under generated Group equity. The net interest result is disclosed under interest expense. In contrast, the other components of the pension expenses (current and past service cost and the loss deriving from plan settlements) are recorded in personnel expenses.
In Germany, the defined benefit plans are primarily administered through processes in operation within the pension fund and the benefit fund. In this context, the pension fund is overseen by the German Federal Financial Supervisory Authority (BaFin).
Regulations related to the pension fund’s capital investment portfolio are established by the “Ordinance on the Investment of Restricted Assets of Insurance Undertakings (Investment Ordinance).” The Investment Ordinance regulates the permitted quantitative distribution and mix of capital investments for the pension fund. A large portion of the pension fund’s assets are invested in a segmented special fund. The contributions are calculated in accordance with the respectively valid technical business plan.
The risk capital investments (equity instruments and debt instruments with a rating lower than investment grade) may account for a maximum of 35 % of the carrying amount of the coverage assets. The real estate rate is a maximum of 25 % of the coverage assets’ carrying amount. Derivatives are primarily used for hedging purposes. The risk of longevity is taken into account by the actuary, after performing a review, by adjusting the biometric parameters where necessary.
The benefit fund is also oriented to the Investment Ordinance with respect to permitted capital investments. The contributions are within the range of the tax-related possibilities.
The plan assets in the Group are made up as follows:
in € thousand 9/30/2018 9/30/2017
Cash and cash equivalents 4,592 3,173
Equity instruments 37,997 71,193
Debt instruments 108,375 115,527
Real estate 148,839 126,782
Reinsurance policies 4,509 3,857
Other current net assets 5,840 6,323
Total plan assets 310,152 326,855
The plan assets include neither internal financial instruments nor real estate used internally. The equity and debt instruments held via security funds are allocated to their corresponding investment classes in the overview.
Market prices are generally available for the equity instruments as a result of their respective quotations on an active market. The fair value in the previous year included € 20,117 thousand in plan assets of a US subsidiary.
The debt instruments are also regularly traded on an active market. The fair value in the previous year included € 13,129 thousand in plan assets of a US subsidiary.
Real estate is held directly and is located exclusively in Germany. There is no active market from which market prices can be derived. Appraisals were obtained for all of the real estate in the plan assets.
The company is subject to various risks in connection with the defined benefit plans. The company is subject to general actuarial risks in particular, such as the risk of longevity, the risk of interest rate changes, the market price risk, and, to a small extent, a risk of inflation.
SENSITIVITY ANALYSISThe following sensitivity analysis shows the effect of changes in the parameters on the present value of the defined benefit obligations. Each change in a significant actuarial assumption was analyzed separately, i.e., if one parameter varied, the other parameters remained constant. Possible correlation effects between the individual assumptions are not taken into consideration:
Effect on the obligation
9/30/2018 9/30/2017
in € thousandChange in parameter Increase Decrease Increase Decrease
Actuarial interest rate
± 50 basis
points -39,124 44,649 -43,905 48,699
Expected income development
± 50 basis
points 9,493 -8,998 9,224 -9,902
Expected pension development
± 50 basis
points 30,708 -32,859 30,307 -28,863
Life expectancy ± 1 year 23,605 -23,625 24,270 -25,558
143
Annual Report 2017/18 Aurubis
Notes to the Statement of Financial PositionNotes to the Consolidated Financial Statements

The undiscounted pension payments are expected to fall due within the following time bands:
in € thousand 9/30/2018 9/30/2017
Less than 1 year 19,055 21,145
Between 1 and 5 years 79,086 92,586
More than 5 years 586,785 701,948
Total 684,926 815,679
The weighted average duration of obligations from defined benefit plans as at September 30, 2018 is 16.6 years (previous year: 16.5 years).
The expense for defined contribution pension plans amounted to € 20,179 thousand in the year reported (previous year: € 19,140 thousand). These include both voluntary commitments and the employer’s contribution made by the Group to statutory pension schemes.
26. OTHER PROVISIONS
Non-current Current Total
in € thousand 9/30/2018 9/30/2017 9/30/2018 9/30/2017 9/30/2018 9/30/2017
Personnel provisions 41,803 45,539 19,915 24,469 61,718 70,008
Provisions for onerous contracts 0 0 3,213 3,777 3,213 3,777
Environmental provisions 11,966 16,470 603 2,181 12,569 18,651
Sundry provisions 1,806 1,669 10,045 8,586 11,851 10,255
55,575 63,678 33,776 39,013 89,351 102,691
Aurubis Annual Report 2017/18
144 Notes to the Consolidated Financial StatementsNotes to the Statement of Financial Position

The individual classes of provisions developed as follows during the fiscal year reported:
in € thousandBalance as at
10/1/2017Discontinued
operations Used Released Allocated Interest effectExchange rate
differenceBalance as at
9/30/2018
Personnel provisions 70,008 -9,436 -18,722 -64 19,637 328 -33 61,718
Provisions for onerous contracts 3,777 0 -3,772 0 3,208 0 0 3,213
Environmental provisions 18,651 -6,819 -1,918 -1,300 3,930 87 -62 12,569
Sundry provisions 10,255 -1,377 -4,803 -221 7,997 0 0 11,851
102,691 -17,632 -29,215 -1,585 34,772 415 -95 89,351
The personnel provisions consisted mainly of obligations to employees relating to anniversary bonuses, temporary assistance benefits, and those deriving from early retirement agreements. Provisions for environmental risks primarily relate to clean-up measures at the Lünen site. The provisions have terms of up to 23 years. The probable costs were determined taking into account past experience in comparable cases, existing appraisals, and the clean-up methods that will be used on the basis of present knowledge.
The increase in sundry provisions is mainly due to higher provisions for lawsuits.
145
Annual Report 2017/18 Aurubis
Notes to the Statement of Financial PositionNotes to the Consolidated Financial Statements

27. LIABILITIESFinancial liabilities as at the reporting date are as follows:
in € thousand 9/30/2018 9/30/2017
Non-current (with a residual term of more than 1 year)
Bank borrowings 247,540 317,297
Liabilities under finance leases 33,324 22,969
Non-current borrowings 280,864 340,266
Derivative financial instruments of the held-for-trading category 68 1,007
Liabilities to related parties 0 950
Derivative financial instruments held as hedging instruments in the context of hedge accounting 0 795
Other non-current financial liabilities 68 2,752
Non-current financial liabilities 280,932 343,018
Current (with a residual term of less than 1 year)
Trade accounts payable 836,748 905,083
Trade accounts payable 836,748 905,083
Bank borrowings 29,767 8,467
Liabilities under finance leases 3,045 2,601
Current borrowings 32,812 11,068
Derivative financial instruments of the held-for-trading category 27,111 32,368
Liabilities to related parties 1,136 1,139
Derivative financial instruments held as hedging instruments in the context of hedge accounting 9,065 0
Sundry other current financial liabilities 76,638 96,222
Other current financial liabilities 113,950 129,729
Current financial liabilities 983,510 1,045,880
Sundry other current financial liabilities include personnel obligations such as Christmas bonus payments, outstanding vacation entitlements, and success-based bonus payments.
Aurubis Annual Report 2017/18
146 Notes to the Consolidated Financial StatementsNotes to the Statement of Financial Position

The liabilities under finance leases represent the present value of the lease installments and the contractually guaranteed residual values at the end of the lease term. Payments are due as follows:
9/30/2018 9/30/2017
in € thousandless than
1 year1 to
5 yearsmore than
5 years Totalless than
1 year1 to
5 yearsmore than
5 years Total
Expected lease payments 5,051 18,276 30,194 53,521 3,752 13,377 16,668 33,797
Interest portion 2,006 6,705 8,441 17,152 1,151 3,696 3,380 8,227
Redemption portion 3,045 11,571 21,753 36,369 2,601 9,681 13,288 25,570
The finance leasing agreements include both extension and purchase options, as well as price adjustment clauses.
The following table shows the Aurubis Group’s contractually agreed undiscounted interest and redemption payments for non-derivative financial liabilities and the discounted net cash flows of the derivative financial instruments with negative fair values.
Payments in the amount of € 328,229 thousand (previous year: € 378,819 thousand) deriving from forward foreign exchange transactions with a negative fair value are matched by receipts of € 317,716 thousand as at September 30, 2018 (previous year: € 373,340 thousand). Derivatives with positive fair values qualify as assets and are therefore not included here.
Payments
in € thousand
Carrying amount as at
9/30/2018less than
1 year1 to
5 yearsmore than
5 years
Bank borrowings 277,307 29,767 243,840 3,700
Liabilities under finance leases 36,369 3,045 11,571 21,753
Trade accounts payable 836,748 836,748 0 0
Liabilities to related parties 1,136 1,136 0 0
Derivatives of the held-for-trading category 27,179 27,111 68 0
Derivatives designated as hedging instruments for hedge accounting purposes 9,065 9,065 0 0
Sundry other financial liabilities 76,638 76,638 0 0
Total 1,264,442 983,510 255,479 25,453
147
Annual Report 2017/18 Aurubis
Notes to the Statement of Financial PositionNotes to the Consolidated Financial Statements

Payments
in € thousand
Carrying amount as at
9/30/2017less than
1 year1 to
5 yearsmore than
5 years
Bank borrowings 325,764 8,467 317,297 0
Liabilities under finance leases 25,570 2,601 9,681 13,288
Trade accounts payable 905,083 905,083 0 0
Liabilities to related parties 2,089 1,139 950 0
Derivatives of the held-for-trading category 33,375 32,368 1,007 0
Derivatives designated as hedging instruments for hedge accounting purposes 795 0 795 0
Sundry other financial liabilities 96,222 96,222 0 0
Total 1,388,898 1,045,880 329,730 13,288
The presentation above shows the financial instruments that were held as at September 30, 2018 and September 30, 2017 respectively, and for which contractual agreements on the payments existed. Foreign currency amounts are translated at the closing rate.
Aurubis had no bank borrowings secured by mortgages and fixed assets. Financial assets have not been pledged as collateral for bank borrowings.
Non-financial liabilities as at the reporting date are as follows:
in € thousand 9/30/2018 9/30/2017
Non-current (with a residual term of more than 1 year)
Non-current non-financial liabilities 0 1,213
Non-current non-financial liabilities 0 1,213
Current (with a residual term of less than 1 year)
Income tax liabilities 9,662 19,959
Income tax liabilities 9,662 19,959
Other tax liabilities 4,941 13,289
Social security obligations 9,163 8,526
Advance payments received on orders 5,252 4,884
Sundry other current non-financial liabilities 4,484 6,998
Other current non-financial liabilities 23,840 33,697
Current non-financial liabilities 33,502 53,656
Other tax liabilities mainly comprise VAT liabilities.
Aurubis Annual Report 2017/18
148 Notes to the Consolidated Financial StatementsNotes to the Statement of Financial Position

28. OTHER FINANCIAL COMMITMENTS AND CONTINGENT LIABILITIES
in € thousand 9/30/2018 9/30/2017
Capital expenditure commitments 105,554 69,335
Obligations under long-term contracts 200,862 237,331
Warranty obligations 1,184 1,285
Commitments relating to discounted bills of exchange 1,324 1,341
308,924 309,292
The capital expenditure commitments mainly relate to property, plant, and equipment.
Obligations under long-term contracts are mainly related to the provision of transport and handling services by various service providers.
Furthermore, an agreement is in place with an energy utility for the cost-based procurement of one billion kilowatt hours of electricity per annum over a term of 30 years commencing in 2010.
In addition, there is a long-term Group agreement for the supply of oxygen for different sites.
FINANCIAL COMMITMENTS UNDER LEASESAs at September 30, 2018, commitments under operating leases amounted to € 27,780 thousand (previous year: € 31,305 thousand). These are due as follows:
in € thousandless than
1 year1 to
5 years
more than
5 years Total
9/30/2018 Commitments under operating leases 8,543 14,887 4,350 27,780
9/30/2017 Commitments under operating leases 9,165 15,252 6,888 31,305
Lease payments in fiscal year 2017/18 recognized as expenses amounted to € 7,170 thousand (previous year: € 8,078 thousand).
As at September 30, 2018, contingent liabilities of € 1,683 thousand (previous year: € 0 thousand) result from tax risks.
29. FINANCIAL INSTRUMENTSThe Aurubis Group is exposed to market risks, liquidity risks, and default risks as a result of the deployment of financial instruments.
MARKET RISKSMarket risks arise as a result of a possible change in risk factors that lead to a decrease in the market value of the transactions affected by these risk factors. The following groups of general risk factors are relevant for the Aurubis Group: currency exchange rate risks, interest rate risks, and other price risks.
CURRENCY EXCHANGE RATE RISKSAs a result of its business operations, the Aurubis Group is exposed to currency exchange rate fluctuations. Changes in exchange rates can lead to losses in the value of financial instruments. Foreign currency forward and option contracts are concluded to limit currency risks. These mainly relate to the US dollar. For this purpose, the daily foreign currency positions from underlying transactions are offset against each other each day and any remaining open positions are squared by means of foreign exchange derivatives. Aurubis works exclusively with business partners with good credit standing on all foreign exchange hedge transactions.
Furthermore, foreign currency forward and option contracts were concluded in the past fiscal year to hedge future receipts. Provided the criteria for cash flow hedges were fulfilled, the results of these hedge transactions are recognized in the accompanying financial statements initially in other comprehensive income in the amount of the effective part of the hedge transaction.
These results are recognized in profit or loss as soon as the underlying hedged transaction is recognized in profit or loss. Fundamental shifts in currency relationships, in particular between the euro and the US dollar, can, however, only be hedged for a limited time.
Information on the management of exchange rate risks is provided in the Risk Report in the Management Report.
The foreign currency risk constitutes a cash flow risk and represents the risk position for the following period. This corresponds to the net amount of the nominal volume of the non-derivative and derivative financial instruments held, which are exposed to exchange rate risks. In addition, planned revenue transactions of the following periods are included to the extent that these are taken into account for currency risk management purposes to show the risk position for the following period.
149
Annual Report 2017/18 Aurubis
Notes to the Statement of Financial PositionNotes to the Consolidated Financial Statements

Foreign currency risk
EUR/USD
in € thousand 9/30/2018 9/30/2017
Risk position deriving from recognized transactions -756,824 -845,444
Budgeted revenues 453,640 539,182
Forward foreign exchange contracts 499,927 601,500
Put option transactions -30,883 -132,136
Net exposure 165,860 163,102
IFRS 7 requires a sensitivity analysis to be performed for each type of risk to indicate the market risks. The use of sensitivity analyses determines the potential impacts on profit or loss and on equity, as at the reporting date, of a change in the respective risk variable for each type of risk. The impacts for the periods are determined by relating the hypothetical changes in the risk variables to the amount reported as at the reporting date. In doing so, it is assumed that the amount reported as at the reporting date is representative for the entire year.
In order to determine the exchange rate risk, a sensitivity analysis is performed for the foreign currencies that pose a significant risk for the business; in this instance, the US dollar. For the purpose of the sensitivity analysis for the currencies, it was assumed that the exchange rate of the euro compared with the US dollar would change by ±10 %, respectively.
If the euro had been 10 % stronger or weaker against the US dollar on September 30, 2018 or September 30, 2017 as compared to the closing rate prevailing on the reporting date, then – from a foreign currency risk perspective – equity and net income for the year would have changed to the extent shown in the following table. All relevant recognized foreign currency items have been included in the calculation, as well as the budgeted revenues of the following period that were considered in the foreign currency risk exposure assessment.
Currency sensitivity
EUR/USD
in € thousand 9/30/2018 9/30/2017
Closing rate 1.1576 1.1806
Devaluated rate (EUR against USD) 1.0418 1.0625
Effect on earnings 50,162 57,466
of which budgeted revenues 50,404 59,909
of which non-derivative transactions 22,248 27,258
of which derivative transactions -22,490 -29,701
Effect on equity -22,601 -22,030
Appreciated rate (EUR against USD) 1.2734 1.2987
Effect on earnings -40,199 -49,101
of which budgeted revenues -41,240 -49,017
of which non-derivative transactions -17,360 -24,385
of which derivative transactions 18,401 24,301
Effect on equity 18,058 23,021
INTEREST RATE FLUCTUATION RISKSInterest rate fluctuation risks arise due to potential changes in market interest rates and can result in a change in the fair value of fixed-interest financial instruments and interest payment fluctuations for variable interest rate financial instruments. Any interest rate risks that arise are hedged by interest rate swaps. Interest rate fluctuation risks are of significant importance in the financial sector. Provided the criteria for cash flow hedges are fulfilled for the hedging of variable interest payments, the results of these hedge transactions are initially recognized in other comprehensive income in the amount of the effective portion of the hedge transaction. They are recognized in profit or loss as soon as the underlying hedged transaction is recognized in profit or loss in the respective fiscal year. During the fiscal year reported, financial liabilities bearing variable interest were redeeemed prematurely, resulting in the cancellation of the related interest swap.
Details of how interest rate fluctuation risks are managed are provided in the Risk Report in the Management Report.
The table below shows the net exposure for variable interest-bearing risk positions.
Aurubis Annual Report 2017/18
150 Notes to the Consolidated Financial StatementsNotes to the Statement of Financial Position

Variable interest-bearing risk positions
Total amount less than 1 year 1 to 5 years more than 5 years
in € thousand 9/30/2018 9/30/2017 9/30/2018 9/30/2017 9/30/2018 9/30/2017 9/30/2018 9/30/2017
Loans/time deposits 424,429 526,309 424,429 526,309 0 0 0 0
Other risk positions -269,014 -299,050 -269,014 -228,050 0 -71,000 0 0
of which hedged against the interest rate risk 0 71,000 0 0 0 71,000 0 0
Net exposure 155,415 298,259 155,415 298,259 0 0 0 0
In accordance with IFRS 7, interest rate fluctuation risks are presented in a sensitivity analysis, which reflects the effects of a change in market interest rates on interest income, interest expenses and equity.
Interest rate sensitivities
9/30/2018 9/30/2017
in € thousand +100 BP –50 BP +100 BP –50 BP
Effect on earnings 2,478 -2,019 3,758 -2,533
Effect on equity 0 0 1,286 -660
OTHER PRICE RISKSAs a result of its business operations, the Aurubis Group is exposed to commodity price risks. Among other measures, non-ferrous metals futures contracts are entered into in order to mitigate these price risks. The contracts are mainly focused on the hedging of the copper price. For this purpose, incoming and outgoing metal quantities from underlying transactions are offset against each other each day and remaining open positions are squared by means of metal exchange transactions. We work exclusively with business partners with good credit standing on all metal hedge transactions.
If price-fixed metal delivery agreements for non-ferrous metals, which are contracted to cover the expected raw material requirement or the expected sale of finished products, are accounted for as derivative financial instruments, then market value changes in these are recognized in profit or loss. Gains
In the event of an increase (decrease) in all relevant interest rates by 100 basis points (50 basis points), equity and earnings for the year as at September 30, 2018 and September 30, 2017, respectively, would change, as shown by the following table. The same items have been included in the calculation as were considered for the determination of the net exposure presented above.
and losses from the contrary development of the fair value of the hedged items and the hedge transactions are therefore recognized directly in profit or loss.
Details of metal price risk management processes are provided in the Risk Report in the Management Report.
The Aurubis Group has secured its electricity consumption by concluding a long-term agreement with an energy utility. Aurubis is exposed to an electricity price risk from the measurement of part of this agreement.
The nominal volumes of the derivative financial instruments covering copper, silver, gold, as well as electricity, coal, and CO2, which result from the gross total of the nominal amounts of the individual purchasing and sales contracts, are as follows.
151
Annual Report 2017/18 Aurubis
Notes to the Statement of Financial PositionNotes to the Consolidated Financial Statements

Nominal volumes of the derivatives
in € thousand 9/30/2018 9/30/2017
Copper 1,323,799 1,186,467
Silver 82,665 91,615
Gold 274,114 368,403
Electricity, coal, CO2 111,723 82,869
1,792,301 1,729,354
In accordance with IFRS 7, commodity price risks are shown in the form of a sensitivity analysis, which reflects the effects of a change in the commodity prices on the net income for the period. In the event of a 10 % increase (decrease) in all relevant commodity prices, earnings for the year would be changed as at September 30, 2018 and September 30, 2017, respectively, as shown in the following table. The calculation includes all derivatives for copper, silver, gold, as well as electricity, coal, and CO2 as at the balance sheet date.
Commodity price sensitivity
Copper Silver Gold Electricity, coal, CO2
in € thousand 9/30/2018 9/30/2017 9/30/2018 9/30/2017 9/30/2018 9/30/2017 9/30/2018 9/30/2017
Price increase
Effect on earnings 36,662 37,720 6,085 6,367 19,180 25,232 4,434 3,876
Price decrease
Effect on earnings -36,662 -37,720 -6,085 -6,367 -19,180 -25,232 -4,434 -3,876
The effects on earnings shown in the commodity price sensitivity table for metals are partially or completely compensated through the measurement of the purchase or sales contracts that are not yet fixed, since these positions are provisionally measured at the respective price on the reporting date.
DERIVATIVE FINANCIAL INSTRUMENTSThe Aurubis Group uses derivative financial instruments to hedge exchange rate, interest rate, and other price risks. Provided the criteria for the application of hedge accounting are fulfilled, these are reflected by cash flow hedges.
Aurubis Annual Report 2017/18
152 Notes to the Consolidated Financial StatementsNotes to the Statement of Financial Position

Financial derivatives
Assets Liabilities
9/30/2018 9/30/2017 9/30/2018 9/30/2017
in € thousandCarrying amount
Nominal volume
Carrying amount
Nominal volume
Carrying amount
Nominal volume
Carrying amount
Nominal volume
Interest rate swaps
without a hedging relationship 0 0 0 0 0 0 0 0
as cash flow hedges 0 0 0 0 0 0 795 71,000
Foreign exchange forward contracts
without a hedging relationship 9,802 845,222 5,229 572,747 1,448 130,537 5,479 378,628
as cash flow hedges 2,014 58,053 20,123 260,325 9,065 187,397 0 0
Foreign currency options
without a hedging relationship 0 0 0 0 0 0 0 0
as cash flow hedges 131 27,918 2,214 140,390 0 0 0 0
Metal futures contracts
without a hedging relationship 30,754 900,503 23,010 725,486 25,279 838,578 27,818 1,002,548
as cash flow hedges 0 0 0 0 0 0 0 0
Other transactions
without a hedging relationship 14,701 231,950 5,045 79,357 452 837 78 3,536
as cash-flow hedges 0 0 0 0 0 0 0 0
The nominal volume of the derivative financial instruments is the sum of the nominal amounts of the individual purchase and sales contracts. By contrast, the fair value is based on the measurement of all contracts at the prices applicable on the measurement date. It indicates the potential impact on income of the prompt settlement of all derivatives as at the balance sheet date, without considering the hedged transactions.
The impact on earnings of changes in the fair value of financial derivatives that relate to a cash flow hedge is recognized in equity through other comprehensive income in the amount of the effective portion.
The effective portion of the changes in the value of derivative financial instruments, which was recognized in equity through other comprehensive income in the period reported, amounted to
€ -9,594 thousand (previous year: € 15,010 thousand). The amount that was transferred during the period from equity into the income statement in the context of cash flow hedge accounting was € 17,201 thousand (previous year: € -10,677 thousand) and is mainly included in the income statement item “Cost of materials.”
The ineffective portion of the fair value change is, by contrast, recognized directly in profit or loss.
As was the case in the previous year, no ineffective portions of the change in fair value of the hedge instruments were identified that had to be recognized during the fiscal year reported.
The following two tables show when the cash flows from cash flow hedges will occur and when they will influence the income statement:
153
Annual Report 2017/18 Aurubis
Notes to the Statement of Financial PositionNotes to the Consolidated Financial Statements

Cash flow hedges as at September 30, 2018
Occurrence and impact on income statement in € thousand
Carrying amount
Nominal volume
less than 1 year
1 to 5 years
more than 5 years
Interest rate swaps
Assets 0 0 0 0 0
Liabilities 0 0 0 0 0
Foreign exchange forward contracts
Assets 2,014 58,053 58,053 0 0
Liabilities 9,065 187,397 187,397 0 0
Foreign currency options
Assets 131 27,918 27,918 0 0
Liabilities 0 0 0 0 0
Cash flow hedges as at September 30, 2017
Occurrence and impact on income statement in € thousand
Carrying amount
Nominal volume
less than 1 year
1 to 5 years
more than 5 years
Interest rate swaps
Assets 0 0 0 0 0
Liabilities 795 71,000 0 71,000 0
Foreign exchange forward contracts
Assets 20,123 260,325 217,609 42,716 0
Liabilities 0 0 0 0 0
Foreign currency options
Assets 2,214 140,390 140,390 0 0
Liabilities 0 0 0 0 0
Aurubis Annual Report 2017/18
154 Notes to the Consolidated Financial StatementsNotes to the Statement of Financial Position

LIQUIDITY RISKSLiquidity risks represent the risk that the business cannot meet its own liability obligations. The contractually agreed undiscounted interest and redemption payments of the financial liabilities are shown in Liabilities, pages 147-148.
The adequate sourcing of the Group with cash and cash equivalents is ensured not only by the Group’s cash flow but also by the existing short-term and long-term credit lines with our banks. Fluctuations in cash flow can therefore be cushioned. An autonomous executive committee monitors the development of Aurubis’ liquidity position on a timely and regular basis and reports to the Executive Board. Further management measures taken regarding liquidity risks are described in the Risk Report in the Management Report.
DEFAULT RISKSDefault risks exist for all classes of financial instruments, in particular for trade accounts receivable. The concentration of the credit risk is limited due to the wide-ranging and heterogeneous customer base. The largest individual customer account receivable balances are regularly controlled. The credit risk arising from derivative financial instruments is limited since the corresponding contracts are only concluded with contractual parties and banks that have a good credit standing.
The customers were classified by their credit rating within the context of the credit risk management process and each customer was given a specific credit limit.
The carrying amounts of the financial assets in the statement of financial position, less any write-downs, represent the maximum potential default risk without taking into account the value of any securities received or other risk-mitigating agreements.
Furthermore, to minimize default risks as far as possible, we monitor the receivables from our business associates on a regular basis. Apart from instruments that are customary within the market, such as letters of credit and guarantees, we also make particular use of commercial credit insurance to safeguard against potential bad debts. If receivables are sold under factoring agreements, this is done without recourse.
155
Annual Report 2017/18 Aurubis
Notes to the Statement of Financial PositionNotes to the Consolidated Financial Statements

Additional disclosures for financial instruments
2017/18 2016/17
Measurement in the statement of financial position under IAS 39
Measurement in the statement of financial position under IAS 39
Carrying amounts, valuations, and fair values by measurement category in € thousand
Measure-ment category under IAS 39
Carrying amount
9/30/2018Amortized
cost
Fair value recognized
in equity
Fair value recognized in profit or loss
Measurement in the statement
of financial position under
IAS 17Fair value
9/30/2018
Carrying amount
9/30/2017Amortized
cost
Fair value recognized
in equity
Fair value recognized in profit or loss
Measurement in the statement
of financial position under
IAS 17Fair value
9/30/2017
Assets
Interests in affiliated companies AfS 1,321 1,321 0 0 0 n/a 1,419 1,419 0 0 0 n/a
Investments AfS 115 115 0 0 0 n/a 174 174 0 0 0 n/a
Fixed asset securities AfS 31,448 0 31,448 0 0 31,448 28,039 0 28,039 0 0 28,039
Other financial fixed assets
Other loans LaR 45 45 0 0 0 45 48 48 0 0 0 48
Trade accounts receivable LaR 274,501 274,501 0 0 0 274,501 357,403 357,403 0 0 0 357,403
Other receivables and financial assets
Receivables from related parties LaR 2,096 2,096 0 0 0 2,096 19,187 19,187 0 0 0 19,187
Other financial assets LaR 39,851 39,851 0 0 0 39,851 55,382 55,382 0 0 0 55,382
Derivative financial assets
Derivatives without a hedging relationship FAHfT 55,257 0 0 55,257 0 55,257 33,284 0 0 33,284 0 33,284
Derivatives with a hedging relationship (hedge accounting) n/a 2,145 0 2,145 0 0 2,145 22,337 0 22,337 0 0 22,337
Cash and cash equivalents LaR 461,045 461,045 0 0 0 461,045 570,569 570,569 0 0 0 570,569
Liabilities
Bank borrowings FLAC 277,307 277,307 0 0 0 285,969 325,764 325,764 0 0 0 335,898
Liabilities under finance leases n/a 36,369 0 0 0 36,369 36,369 25,570 0 0 0 25,570 25,570
Trade accounts payable FLAC 836,748 836,748 0 0 0 836,748 905,083 905,083 0 0 0 905,083
Liabilities to related parties FLAC 1,136 1,136 0 0 0 1,136 2,089 2,089 0 0 0 2,089
Other non-derivative financial liabilities FLAC 76,638 76,638 0 0 0 76,638 96,221 96,221 0 0 0 96,221
Derivative financial liabilities
Derivatives without a hedging relationship FLHfT 27,179 0 0 27,179 0 27,179 33,375 0 0 33,375 0 33,375
Derivatives with a hedging relationship (hedge accounting) n/a 9,065 0 9,065 0 0 9,065 795 0 795 0 0 795
of which aggregated by measurement categories in accordance with IAS 39
Loans and receivables (LaR) 777,538 777,538 0 0 0 777,538 1,002,589 1,002,589 0 0 0 1,002,589
Available-for-sale (AfS) 32,884 1,436 31,448 0 0 31,448 29,632 1,593 28,039 0 0 28,039
Financial assets held for trading (FAHfT) 55,257 0 0 55,257 0 55,257 33,284 0 0 33,284 0 33,284
Financial liabilities at amortized cost (FLAC) 1,191,829 1,191,829 0 0 0 1,200,491 1,329,157 1,329,157 0 0 0 1,339,291
Financial liabilities held for trading (FLHfT) 27,179 0 0 27,179 0 27,179 33,375 0 0 33,375 0 33,375
Aurubis Annual Report 2017/18
156 Notes to the Consolidated Financial StatementsNotes to the Statement of Financial Position

Additional disclosures for financial instruments
2017/18 2016/17
Measurement in the statement of financial position under IAS 39
Measurement in the statement of financial position under IAS 39
Carrying amounts, valuations, and fair values by measurement category in € thousand
Measure-ment category under IAS 39
Carrying amount
9/30/2018Amortized
cost
Fair value recognized
in equity
Fair value recognized in profit or loss
Measurement in the statement
of financial position under
IAS 17Fair value
9/30/2018
Carrying amount
9/30/2017Amortized
cost
Fair value recognized
in equity
Fair value recognized in profit or loss
Measurement in the statement
of financial position under
IAS 17Fair value
9/30/2017
Assets
Interests in affiliated companies AfS 1,321 1,321 0 0 0 n/a 1,419 1,419 0 0 0 n/a
Investments AfS 115 115 0 0 0 n/a 174 174 0 0 0 n/a
Fixed asset securities AfS 31,448 0 31,448 0 0 31,448 28,039 0 28,039 0 0 28,039
Other financial fixed assets
Other loans LaR 45 45 0 0 0 45 48 48 0 0 0 48
Trade accounts receivable LaR 274,501 274,501 0 0 0 274,501 357,403 357,403 0 0 0 357,403
Other receivables and financial assets
Receivables from related parties LaR 2,096 2,096 0 0 0 2,096 19,187 19,187 0 0 0 19,187
Other financial assets LaR 39,851 39,851 0 0 0 39,851 55,382 55,382 0 0 0 55,382
Derivative financial assets
Derivatives without a hedging relationship FAHfT 55,257 0 0 55,257 0 55,257 33,284 0 0 33,284 0 33,284
Derivatives with a hedging relationship (hedge accounting) n/a 2,145 0 2,145 0 0 2,145 22,337 0 22,337 0 0 22,337
Cash and cash equivalents LaR 461,045 461,045 0 0 0 461,045 570,569 570,569 0 0 0 570,569
Liabilities
Bank borrowings FLAC 277,307 277,307 0 0 0 285,969 325,764 325,764 0 0 0 335,898
Liabilities under finance leases n/a 36,369 0 0 0 36,369 36,369 25,570 0 0 0 25,570 25,570
Trade accounts payable FLAC 836,748 836,748 0 0 0 836,748 905,083 905,083 0 0 0 905,083
Liabilities to related parties FLAC 1,136 1,136 0 0 0 1,136 2,089 2,089 0 0 0 2,089
Other non-derivative financial liabilities FLAC 76,638 76,638 0 0 0 76,638 96,221 96,221 0 0 0 96,221
Derivative financial liabilities
Derivatives without a hedging relationship FLHfT 27,179 0 0 27,179 0 27,179 33,375 0 0 33,375 0 33,375
Derivatives with a hedging relationship (hedge accounting) n/a 9,065 0 9,065 0 0 9,065 795 0 795 0 0 795
of which aggregated by measurement categories in accordance with IAS 39
Loans and receivables (LaR) 777,538 777,538 0 0 0 777,538 1,002,589 1,002,589 0 0 0 1,002,589
Available-for-sale (AfS) 32,884 1,436 31,448 0 0 31,448 29,632 1,593 28,039 0 0 28,039
Financial assets held for trading (FAHfT) 55,257 0 0 55,257 0 55,257 33,284 0 0 33,284 0 33,284
Financial liabilities at amortized cost (FLAC) 1,191,829 1,191,829 0 0 0 1,200,491 1,329,157 1,329,157 0 0 0 1,339,291
Financial liabilities held for trading (FLHfT) 27,179 0 0 27,179 0 27,179 33,375 0 0 33,375 0 33,375
157
Annual Report 2017/18 Aurubis
Notes to the Statement of Financial PositionNotes to the Consolidated Financial Statements

The market value of financial instruments to be recognized at fair value is as a general rule determined on the basis of quotations on the relevant exchanges. If no such quotations are available, measurement is carried out applying a process that is customary for the market (measurement methods), based on instrument-specific market parameters and interest rates drawn from recognized sources.
If observable input parameters are not available or only partially available, the fair value is calculated on the basis of appropriate measurement methods. In the Aurubis Group, this applies in particular to the extrapolation of market data for electricity and coal, with due regard to market information about price determination and liquidity considerations. If insufficient market information is available, management’s best estimate for a certain input parameter is used to determine the value. Thus, if observable input parameters are not available or are only partially available on the market, the measurement process is significantly influenced by the use of estimates and assumptions.
Due to the predominantly short-term nature of cash and cash equivalents, trade accounts receivable and payable, other receivables of the category “loans and receivables,” payables to related parties, and other non-derivative financial liabilities, an assumption is made that the fair values correspond to the carrying amounts.
An assumption has been made for investments in non-corporate entities and non-quoted corporate entities that the carrying amount corresponds to the market value. It would only be possible to reliably determine the market value in conjunction with specific sales negotiations.
Pursuant to IFRS 13, the following tables show the measurement methods used to determine the fair value for Level 1, Level 2, and Level 3, as well as the main non-observable parameters that were used for measurement.
In this connection, the individual levels are defined in accordance with IFRS 13 as follows:
» Level 1: quoted prices (unadjusted) in active markets for identical assets or liabilities.
» Level 2: procedures under which all input parameters with a significant effect on the fair value are observable either directly or indirectly in the market.
» Level 3: procedures that use input parameters that have a significant influence on the fair value and are not based on observable market data.
Financial instruments from Level 1 measured at fair value
Type Measurement method
Fixed asset securities Exchange quotations
Aurubis Annual Report 2017/18
158 Notes to the Consolidated Financial StatementsNotes to the Statement of Financial Position

Financial instruments from Level 2 measured at fair value
Type Measurement method and applied input parameters
Foreign exchange forward contracts
Par method, taking into account actively traded forward rates and the currently valid interest rate for discounting purposes as at the reporting date
Foreign currency options Black-Scholes model. Calculation based on the exchange rates as at the reporting date, taking into account the expected volatility of the respective exchange rate during the term of the option and customary market interest rates
Interest rate swaps Discounted cash flow method. This adds together the present value of the expected future cash flows and discounts them, utilizing a market-conform interest rate
Metal futures contracts Discounted cash flow method, taking into account actively traded metal forward rates and customary market interest rates for discounting purposes as at the reporting date
Other transactions Discounted cash flow method. Discounting of the expected future cash flows over the remaining term of the contracts, based on use of current market interest rates
Financial instruments from Level 2 not measured at fair value
Type Measurement method and applied input parameters
Borrowings
Discounted cash flow method. Discounting of expected future cash flows with currently applicable interest rates for financial liabilities with comparable conditions and residual terms
Financial instruments from Level 3 measured at fair value
Type Measurement methodSignificant non-observable measurement parameters
Interdependence between significant non-observable parameters and fair value
Energy supply contract
Discounted cash flow method
Extrapolation of market data for electricity and coal
The fair value would be higher (lower) if: – the price for electricity increased more (less)
than expected– the price for coal increased more (less)
than expected
159
Annual Report 2017/18 Aurubis
Notes to the Statement of Financial PositionNotes to the Consolidated Financial Statements

If the parameters used for measurement fall into different levels of the measurement hierarchy, the fair value measurement is fully classified as belonging to the lowest level to which an input parameter is attributed, where this parameter significantly influences the entire fair value.
If there are any reclassifications to other levels in the measurement hierarchy, the Aurubis Group accounts for these as at the beginning of the relevant fiscal year.
The following overview shows the main measurement parameters that provide the basis for those financial instruments that are accounted for at fair value and presented in the Notes to the Consolidated Financial Statements.
Hierarchical classification of fair values of financial instruments in accordance with IFRS 7 as at September 30, 2018
Aggregated by classes in € thousand
Fair value 9/30/2018 Level 1 Level 2 Level 3
Fixed asset securities 31,448 31,448 0 0
Derivative financial assets
Derivatives without a hedging relationship 55,257 0 41,987 13,270
Derivatives with a hedging relationship 2,145 0 2,145 0
Assets 88,850 31,448 44,132 13,270
Bank borrowings 285,969 0 285,969 0
Derivative financial liabilities
Derivatives without a hedging relationship 27,179 0 27,179 0
Derivatives with a hedging relationship 9,065 0 9,065 0
Liabilities 322,213 0 322,213 0
Hierarchical classification of fair values of financial instruments in accordance with IFRS 7 as at September 30, 2017
Aggregated by classes in € thousand
Fair value 9/30/2017 Level 1 Level 2 Level 3
Fixed asset securities 28,039 28,039 0 0
Derivative financial assets
Derivatives without a hedging relationship 33,284 0 29,088 4,196
Derivatives with a hedging relationship 22,337 0 22,337 0
Assets 83,660 28,039 51,425 4,196
Bank borrowings 335,898 0 335,898 0
Derivative financial liabilities
Derivatives without a hedging relationship 33,375 0 33,375 0
Derivatives with a hedging relationship 795 0 795 0
Liabilities 370,068 0 370,068 0
Aurubis Annual Report 2017/18
160 Notes to the Consolidated Financial StatementsNotes to the Statement of Financial Position

There were no reclassifications between the individual levels in fiscal year 2017/18 or in the previous year.
The following overview shows a reconciliation of the financial instruments measured at fair value and classified in Level 3:
Reconciliation of financial instruments in Level 3 as at September 30, 2018
Aggregated by classes in € thousand
Balance as at 10/1/2017
Sales/ purchases
Gains (+)/ losses (–)
recorded in the income statement
Balance as at 9/30/2018
Gains (+)/ losses (–)
for derivatives held at the
reporting date
Derivative assets without a hedging relationship 4,196 6,222 2,852 13,270 2,852
Reconciliation of financial instruments in Level 3 as at September 30, 2017
Aggregated by classes in € thousand
Balance as at 10/1/2016
Sales/ purchases
Gains (+)/ losses (–)
recorded in the income statement
Balance as at 9/30/2017
Gains (+)/ losses (–)
for derivatives held at the
reporting date
Derivative liabilities without a hedging relationship -16,776 14,135 2,641 0 0
Derivative assets without a hedging relationship 0 1,598 2,598 4,196 2,598
Gains and losses deriving from derivative financial instruments classified as Level 3 relate to part of an energy supply contract and are recognized in the income statement under “Cost of materials.” A new derivative instrument was acquired in connection with our agreement for the long-term procurement of electricity.
The fair value of these financial instruments is partially based on non-observable input parameters, which are largely related to the price of electricity and coal. If the Aurubis Group had taken other possible suitable alternative measurement parameters as a basis for measuring the relevant financial instruments on September 30, 2018, the recorded fair value would have been € 10,728 thousand (previous year: € 7,056 thousand) higher in the case of an increase in the electricity price and a decrease in the coal price by 20 %, respectively, at the end of the term or € 7,179 thousand (previous year: € 5,866 thousand) lower in the case of a decrease in the electricity price and an increase in the coal price by 20 %, respectively, at the end of the term. In order to calculate the maximum impacts which can arise from the relative uncertainty in the determination of the fair values of financial instruments whose measurement is based on non-observable parameters,
the Aurubis Group remeasures such financial instruments by incorporating parameters that are at the outer limits of the range of reasonably possible alternatives for non-observable input data. Since it is nevertheless unlikely that a scenario will arise in which all of the non-observable parameters are at the outer limits of the range of reasonably possible alternatives at the same time, the estimated values previously mentioned should exceed the actual uncertainty factors when determining the fair value as at the reporting date. Thus, the disclosures shown do not represent a prediction or an indication of any future changes in the fair value.
OFFSETTING OPTIONS FOR DERIVATIVE FINANCIAL ASSETS AND LIABILITIESThe financial instruments that Aurubis enters into are subject to netting agreements with financial institutions that include a mutual right of offset. However, these agreements do not fulfill the criteria for offsetting in the statement of financial position, as the netting right can only be utilized if one of the contracting parties defaults.
The following table shows the financial assets and liabilities in the Aurubis Group that are subject to offsetting options.
161
Annual Report 2017/18 Aurubis
Notes to the Statement of Financial PositionNotes to the Consolidated Financial Statements

Offsetting options for derivative financial assets and liabilities
in € thousand 2017/18 2016/17
Financial assets
Gross amount of financial assets in the statement of financial position 57,402 55,621
Financial instruments that qualify for offsetting in the statement of financial position 0 0
Net value of financial assets in the statement of financial position 57,402 55,621
Offsettable due to framework agreements -18,262 -13,192
Total net value of financial assets 39,140 42,429
Financial liabilities
Gross amount of financial liabilities in the statement of financial position -36,244 -34,170
Financial instruments that qualify for offsetting in the statement of financial position 0 0
Net value of financial liabilities in the statement of financial position -36,244 -34,170
Offsettable due to framework agreements 18,262 13,192
Total net value of financial liabilities -17,982 -20,978
Net earnings by measurement category
in € thousand 2017/18 2016/17
Loans and receivables (LaR) -23,889 20,011
Available-for-sale financial assets (AfS) 277 -281
Financial instruments held for trading (FAHfT and FLHfT) 10,542 64,455
Financial liabilities at amortized cost (FLAC) 5,805 -15,022
-7,265 69,163
The net earnings of the financial instruments held for trading mainly include the gains/losses deriving from metal futures contracts on the exchanges and forward foreign exchange contracts, as well as from price-fixed metal delivery transactions treated as derivatives. Purchase or sales contracts that are not yet fixed, which result in a partial compensation effect since they are measured provisionally at the respective price on the reporting date, are not included. Dividends, but not interest, are included in the calculated earnings. The foreign currency impact deriving from items accounted for at amortized cost, which is included in the net result in fiscal year 2017/18, amounts to € -17,643 thousand (previous year: € 5,049 thousand).
In conjunction with the recognition in equity of the change in value of “available-for-sale” financial assets, net measurement impacts of € 3,410 thousand (previous year: € 6,728 thousand) were recorded in other comprehensive income in fiscal year 2017/18.
30. RESEARCH AND DEVELOPMENTResearch and development costs of € 10,227 thousand were recognized in profit or loss for the Aurubis Group for fiscal year 2017/18 (previous year: € 11,330 thousand). Moreover, development costs of € 673 thousand (previous year: € 381 thousand) were capitalized in the fiscal year.
Aurubis Annual Report 2017/18
162 Notes to the Consolidated Financial StatementsNotes to the Statement of Financial Position

Notes to the Cash Flow Statement
The Consolidated Cash Flow Statement reports the cash flows in the Aurubis Group in fiscal year 2017/18 and in the prior-year comparative period. In accordance with IAS 7, a distinction is made between the cash inflow from operating activities, the cash outflow from investing activities, and the cash outflow from financing activities.
Commencing with earnings before taxes, adjustment is made for all non-cash expenses and income, the financial result (consisting of the result from investments measured using the equity method, interest expenses, interest income, and other financial expenses and income), income taxes paid out, and changes in working capital to arrive at the cash inflow from operating activities (net cash flow).
The net cash flow as at September 30, 2018 amounted to € 203 million, compared to € 480 million in the previous year. The decrease was due in particular to higher inventories as at the balance sheet date.
Investments in fixed assets totaled € 168 million in the reporting period (previous year: € 165 million). The largest individual investments concerned the Industrial Heat project and the Future Complex Metallurgy project. In contrast, the sale of investment property had a positive effect on the cash flow from investing activities.
After deducting the cash outflow from investing activities from the net cash flow, the free cash flow amounted to € 60 million (previous year: € 325 million). The cash outflow from investing activities totaled € 143 million (previous year: € 155 million).
The cash outflow from financing activities amounted to € 151 million (previous year: € 225 million) and, in the reporting year and the year prior, mainly resulted from the repayment of bonded loans (Schuldscheindarlehen). Furthermore, payments of € 19 million were made for the acquisition of non-controlling interests Acquisitions,
page 123.
Cash and cash equivalents of € 479 million were available to the Group as at September 30, 2018 (previous year: € 571 million).
The table below shows the cash-related and non-cash-related changes in borrowings.
Cash-related Non-cash-related
in € millionBalance as at
10/1/2017 Additions from finance leases
Balance as at 9/30/2018
Bank borrowings 325 -48 0 277
Liabilities under finance leases 26 -5 15 36
351 -53 15 313
163
Annual Report 2017/18 Aurubis
Notes to the Cash Flow StatementNotes to the Consolidated Financial Statements

Segment reporting
Segment Metal Refining & Processing
Segment Flat Rolled Products Other Total
Reconciliation/ consolidation
Effects from discontinued operations
Group continuing operations
in € thousand2017/18
operating2016/17
operating2017/18
operating2016/17
operating2017/18
operating2016/17
operating 2017/18
operating2016/17
operating2017/18
IFRS2016/17
IFRS2017/18
IFRS2016/17
IFRS2017/18
IFRS2016/17
IFRS
Revenues
Total revenues 10,407,246 9,866,337 1,452,014 1,347,530 17,488 14,396
Inter-segment revenue 161,037 178,933 19,216 6,502 2,646 2,728
Revenues with third parties 10,246,209 9,687,404 1,432,798 1,341,028 14,842 11,668 11,693,850 11,040,100 0 0 -1,270,102 -1,160,377 10,423,748 9,879,723
EBITDA 476,772 466,270 29,874 13,908 -43,807 -40,103 462,839 440,075 39,993 157,627 -49,764 -53,148 453,068 544,553
Depreciation and amortization -118,204 -119,282 -11,460 -11,454 -1,124 -1,162 -130,788 -131,897 -2,579 -3,313 13,897 14,495 -119,470 -120,715
EBIT 358,568 346,988 18,414 2,454 -44,931 -41,265 332,051 308,177 37,414 154,314 -35,867 -38,653 333,598 423,838
Interest income 14,241 11,934 1,576 1,967 0 91 15,817 13,992 -12,186 -11,277 -39 -35 3,592 2,680
Interest expense -20,116 -21,220 -9,697 -9,437 -323 -195 -30,136 -30,852 12,185 11,277 2,176 1,843 -15,775 -17,732
Result from investments measured using the equity method 0 0 10,868 7,468 0 0 10,868 7,468 1,691 3,464 -12,559 -10,932 0 0
Other financial income 357 0 0 0 332 219 689 219 0 0 0 0 689 219
Other financial expenses -38 -720 0 0 -13 0 -51 -720 0 0 0 0 -51 -720
Earnings before taxes 353,012 336,982 21,161 2,452 -44,935 -41,149 329,238 298,284 39,104 157,778 -46,289 -47,778 322,053 408,285
Income taxes 0 0 0 0 0 0 -59,547 -90,057
Consolidated net income 262,506 318,228
Return on capital employed (ROCE) (in %) 19.4 20.9 5.2 0.7
Capital expenditure on intangible assets and property, plant, and equipment 152,081 160,535 17,435 13,984 12,383 0 181,899 174,519 0 0 -16,048 -13,984 165,851 160,535
Average number of employees 4,473 4,423 1,768 1,746 330 307 6,571 6,477 0 0 -1,768 -1,746 4,803 4,731
Prior-year figures have been partially adjusted to reflect changes in allocations between segments. Regarding the basic derivation of the ROCE, we refer to the Combined Management Report
Results of operations, net assets, and financial position of the Aurubis Group, pages 67-68.
Aurubis Annual Report 2017/18
164 Notes to the Consolidated Financial StatementsSegment reporting

Segment reporting
Segment Metal Refining & Processing
Segment Flat Rolled Products Other Total
Reconciliation/ consolidation
Effects from discontinued operations
Group continuing operations
in € thousand2017/18
operating2016/17
operating2017/18
operating2016/17
operating2017/18
operating2016/17
operating 2017/18
operating2016/17
operating2017/18
IFRS2016/17
IFRS2017/18
IFRS2016/17
IFRS2017/18
IFRS2016/17
IFRS
Revenues
Total revenues 10,407,246 9,866,337 1,452,014 1,347,530 17,488 14,396
Inter-segment revenue 161,037 178,933 19,216 6,502 2,646 2,728
Revenues with third parties 10,246,209 9,687,404 1,432,798 1,341,028 14,842 11,668 11,693,850 11,040,100 0 0 -1,270,102 -1,160,377 10,423,748 9,879,723
EBITDA 476,772 466,270 29,874 13,908 -43,807 -40,103 462,839 440,075 39,993 157,627 -49,764 -53,148 453,068 544,553
Depreciation and amortization -118,204 -119,282 -11,460 -11,454 -1,124 -1,162 -130,788 -131,897 -2,579 -3,313 13,897 14,495 -119,470 -120,715
EBIT 358,568 346,988 18,414 2,454 -44,931 -41,265 332,051 308,177 37,414 154,314 -35,867 -38,653 333,598 423,838
Interest income 14,241 11,934 1,576 1,967 0 91 15,817 13,992 -12,186 -11,277 -39 -35 3,592 2,680
Interest expense -20,116 -21,220 -9,697 -9,437 -323 -195 -30,136 -30,852 12,185 11,277 2,176 1,843 -15,775 -17,732
Result from investments measured using the equity method 0 0 10,868 7,468 0 0 10,868 7,468 1,691 3,464 -12,559 -10,932 0 0
Other financial income 357 0 0 0 332 219 689 219 0 0 0 0 689 219
Other financial expenses -38 -720 0 0 -13 0 -51 -720 0 0 0 0 -51 -720
Earnings before taxes 353,012 336,982 21,161 2,452 -44,935 -41,149 329,238 298,284 39,104 157,778 -46,289 -47,778 322,053 408,285
Income taxes 0 0 0 0 0 0 -59,547 -90,057
Consolidated net income 262,506 318,228
Return on capital employed (ROCE) (in %) 19.4 20.9 5.2 0.7
Capital expenditure on intangible assets and property, plant, and equipment 152,081 160,535 17,435 13,984 12,383 0 181,899 174,519 0 0 -16,048 -13,984 165,851 160,535
Average number of employees 4,473 4,423 1,768 1,746 330 307 6,571 6,477 0 0 -1,768 -1,746 4,803 4,731
Prior-year figures have been partially adjusted to reflect changes in allocations between segments. Regarding the basic derivation of the ROCE, we refer to the Combined Management Report
Results of operations, net assets, and financial position of the Aurubis Group, pages 67-68.
165
Annual Report 2017/18 Aurubis
Segment reportingNotes to the Consolidated Financial Statements

From October 1, 2017 onwards, Aurubis has had a new organizational structure. Since that date, the reporting has been separated into two operational business segments, Metal Refining & Processing (MRP) and Flat Rolled Products (FRP):
Segment MRP processes complex metal concentrates, copper scrap, and metal-bearing recycling materials into metals of the highest quality. From an organizational perspective, it includes the Commercial and Operations divisions. The Commercial division combines all market-relevant organizational units (i.e., raw material procurement and product sales). The Operations division is responsible for the production of all basic products and metals, as well as their further processing into other products such as wire rod and shapes.
Segment FRP processes copper and copper alloys – primarily brass, bronze, and high-performance alloys – into flat rolled products and specialty wire and then markets them.
Segment FRP is a discontinued business division that is to be reported separately on an aggregated basis in the consolidated income statement and in the consolidated statement of financial position in accordance with IFRS 5. As Segment FRP’s operating business activities are continuing unchanged and are being monitored and managed by the Aurubis Group’s Executive Board, this company division also fulfills the definition of a segment that must be reported on, even after its classification as a discontinued business division, and is accordingly presented separately for segment reporting purposes, and will be until the sales transaction has been completed.
Prior-year figures are shown on a comparable basis.
We report on the operating segments in the same way as in the internal reporting to the chief operating decision makers. The chief operating decision makers are defined as the full Executive Board of Aurubis AG.
The Aurubis Group is divided into two reportable segments, which differ as regards their production processes and their products, and are managed separately. The “other” column discloses central administrative income and costs that cannot be directly allocated to one of the reportable segments.
The internal reporting is generally based on the accounting policies in accordance with IFRS, which are applied in the consolidated financial statements. For internal management purposes, the IFRS-based results are reconciled to the operating result. The operating result of the Group and of the respective Segment is determined by adjusting the IFRS-based results for:
» Effects deriving from the application of IFRS 5. The items reported as discontinued operations are again shown separately. For purposes of measurement, scheduled depreciation and amortization of fixed assets and the application of equity accounting for the purpose of consolidating the investment are continued.
» Measurement results from the use of IAS 2. The metal price fluctuations resulting from the application of the average cost method are thereby eliminated in the same manner as write-downs and write-ups to the value of copper inventories at the reporting date.
» Effects deriving from purchase price allocations, primarily on property, plant, and equipment, commencing in fiscal year 2010/11.
The reconciliation to the IFRS-based consolidated financial statements is shown in the reconciliation/consolidation column. In this connection, a total of € -491 thousand (previous year: € -423 thousand) in earnings before taxes (EBT) derives from consolidation impacts, while € 39,596 thousand (previous year: € 158,201 thousand) derives from reconciliation to the IFRS EBT.
The elimination of external sales, amounting to € 1,270,102 thousand and shown in the column “Effects from discontinued operations” (previous year: € 1,160,377 thousand), represents the external sales of Segment FRP less Segment FRP’s internal Group sales with Segment MRP that are fully eliminated in the discontinued business division, amounting to € 162,664 thousand (previous year: € 180,594 thousand). With respect to measurement in accordance with IFRS 5, any impact on income deriving from scheduled depreciation and amortization (€ 7,959 thousand) in Segment FRP, or from application of equity accounting for the purpose of consolidating the investment in a joint venture (€ -8,862 thousand) must be discontinued.
The Group generates most of its revenues with business associates in countries within the European Union. The breakdown of external revenues by region is based on the location of the customers, and is as follows:
in € thousand 2017/18 2016/1 7
Germany 3,927,859 3,913,465
Other European Union countries 4,347,272 3,936,135
Rest of Europe 439,037 517,530
Asia 1,324,856 1,168,391
America 1,099,237 1,067,605
Other countries 555,589 436,974
Group total 11,693,850 11,040,100
Aurubis Annual Report 2017/18
166 Notes to the Consolidated Financial StatementsSegment reporting

The breakdown of capital expenditure and non-current assets by region is based on the location of the respective assets:
Investments 1 Fixed assets 1
in € thousand 2017/18 2016/17 2017/18 2016/1 7
Germany 108,906 118,054 896,181 866,018
Bulgaria 45,719 32,021 338,767 334,955
Belgium 13,237 11,933 171,935 169,655
Other European countries 5,730 7,104 69,608 75,660
North America 8,307 5,407 50,566 43,023
Group total 181,899 174,519 1,527,057 1,489,3111 This information relates to the entire Group, including discontinued operations.
The locations in other European countries are mainly operational sites within the European Union.
SEGMENT DATAThe revenues of the individual segments consist of inter-segment revenues and of revenues with third parties outside the Group. The total third-party revenues of the individual segments correspond to the consolidated revenues of the Group. The prices and conditions for products and services exchanged between Group companies and segments correspond to those with third parties.
A breakdown of the revenues by product group is provided in the information on revenues Revenues, page 124.
Operating EBIT (earnings before interest and taxes) represents operating earnings before taxes, adjusted for the financial result attributable to the segment. Based on this, operating EBITDA (earnings before interest, taxes, depreciation, and amortization) is operating EBIT adjusted for depreciation of property, plant, and equipment and amortization of intangible assets belonging to the segment.
In total, impairment losses amounting to € 3,856 thousand were recognized in respect of assets (previous year: € 10,614 thousand), of which € 3,865 thousand (previous year: € 9,298 thousand) related to Segment MRP and reversals of impairment losses of € 9 thousand (previous year: impairment losses amounting to € 1,316 thousand) related to Segment FRP. As was the case with the impairment losses in the previous year, the impairment losses recognized in Segment MRP related exclusively to current assets. In Segment FRP, all reversals of impairment losses in the fiscal year reported (impairment losses in the previous year) again related to current assets.
The average number of employees for each segment includes all the employees of companies that were consolidated in the accompanying consolidated financial statements.
167
Annual Report 2017/18 Aurubis
Segment reportingNotes to the Consolidated Financial Statements

Other Disclosures
DISCLOSURES CONCERNING RELATIONSHIPS TO RELATED PARTIESIn accordance with IAS 24, related parties are regarded as all individual persons and entities that can be influenced by, or that can themselves influence, the company.
The employees’ representatives on the Supervisory Board received compensation for their employment at Aurubis AG at a level that is normal for the market.
Within the Aurubis Group, various Group companies purchase different types of services from and provide different types of services to related companies as part of their normal business activities. Such delivery and service relationships are conducted using market prices. In the case of services, these are charged on the basis of existing contracts.
The following amounts relate to a joint venture that is shown in discontinued operations and accounted for using the equity method:
9/30/2018
in € thousand Income Expenses Receivables Liabilities
Schwermetall Halbzeugwerk GmbH & Co. KG 106,480 29,908 0 775
9/30/2017
in € thousand Income Expenses Receivables Liabilities
Schwermetall Halbzeugwerk GmbH & Co. KG 120,050 29,863 7,848 887
Aurubis Annual Report 2017/18
168 Notes to the Consolidated Financial StatementsOther Disclosures

The following amounts relate to non-consolidated related companies:
9/30/2018
in € thousand Income Expenses Receivables Liabilities
Joint ventures 1 0 0 1,300
Subsidiaries 11,003 1,493 4,371 1,149
9/30/2017
in € thousand Income Expenses Receivables Liabilities
Joint ventures 122 0 109 0
Subsidiaries 7,894 1,164 3,289 1,141
With the exception of Salzgitter AG, no individual shareholders of Aurubis AG are able to exercise a significant influence on the Aurubis Group.
Salzgitter Group companies account for € 2,455 thousand in expenses for the fiscal year (previous year: € 2,758 thousand) and income of € 47 thousand (previous year: € 0 thousand). As at the reporting date, there were related liabilities of € 119 thousand (previous year: € 3 thousand) and receivables of € 3 thousand (previous year: € 0 thousand).
As at the reporting date, no letters of comfort had been issued to related parties.
SUBSEQUENT EVENTSIn the course of the merger control proceedings that are currently underway for the sale of Segment Flat Rolled Products by Aurubis AG (Aurubis) to Wieland-Werke AG (Wieland), the European Commission informed Aurubis and Wieland after the balance sheet date that the transaction is unlikely to be authorized based on the commitment proposals submitted. The Executive Board therefore stated in an ad hoc notification issued on October 10, 2018 that it at that point no longer viewed the completion of the transaction with Wieland as highly likely.
The parties agreed to continue the proceedings with the European Commission in order to receive authorization under merger control law, in particular on the basis of a modified assessment under competition law. Although Aurubis is fully supporting this process, the Executive Board has actively identified strategic sales alternatives for Segment FRP as part of its contingency planning in case the antitrust authorities fully or partially prohibit the sale to Wieland.
The Executive Board still sees the sale of Segment FRP, either as a whole or in several parts, as highly likely due to the purchase interest shown by various market participants and intends to conclude the sales transaction in fiscal year 2018/19.
Segment FRP is therefore still classified as held for sale with the result that the disposal group is still measured at the lower of its carrying amount and its fair value less costs to sell.
169
Annual Report 2017/18 Aurubis
Other DisclosuresNotes to the Consolidated Financial Statements

DISCLOSURES CONCERNING THE EXECUTIVE BOARD AND THE SUPERVISORY BOARDTOTAL COMPENSATIONThe total compensation received by the active Executive Board members for fiscal year 2017/18 amounts to € 3,149,131 and, in addition to a fixed component in the amount of € 1,265,000, includes fringe benefits of € 48,879 and a variable component of € 1,835,252 in the fiscal year reported. In addition, expenses for pension provisions in the amount of € 570,000 (IFRS) and for a virtual deferred stock compensation plan in the amount of € 93,149 were recognized in the income statement.
Dr. Boel receives a one-time payment in the amount of € 1,600,000 within the scope of a contract termination agreement, fixed compensation for the period from October 1, 2017 to July 31, 2018 in the amount of € 350,000, as well as variable compensation for one year of € 262,500 and multiannual variable compensation of € 310,833.
Former members of the Executive Board and their surviving dependents received a total of € 2,246,373; € 27,403,439 has been provided for their pension entitlement.
Total compensation of the Aurubis AG Executive Board members newly appointed in fiscal year 2017/18 includes a share-based compensation component with a cash settlement and a Performance Cash Plan.
The recognition and measurement standards of IFRS 2 are to be applied to the share-based compensation component with a cash settlement. This component involves virtual deferred stock. The resulting obligation equals the fair value of the virtual stock. The expenses amounted to € 93 thousand (previous year: € 0 thousand). The carrying amount of the provisions as at the fiscal year-end also amounted to € 93 thousand (previous year: € 0 thousand).
Furthermore, expenses of € 241 thousand for the Performance Cash Plan were recognized (previous year: € 0 thousand), which are included in the same amount in the provisions as at the balance sheet date.
The compensation of the Supervisory Board for fiscal year 2017/18 amounted in total to € 1,571,002.
Details of the individual compensation of the members of the Executive Board and the Supervisory Board are presented and explained in the compensation report.
REPORTABLE SECURITIES TRANSACTIONSDIRECTORS’ DEALINGSIn accordance with Art. 19 of the Market Abuse Regulation (EU No. 596/2014), the members of the Executive Board and the Supervisory
Board must disclose the acquisition and sale of shares in the company. This does not apply if the total transactions per person do not exceed € 5,000 per calendar year.
No reportable securities transactions were reported in the period from October 1, 2017 to September 30, 2018.
DECLARATION OF CONFORMITY WITH THE GERMAN CORPORATE GOVERNANCE CODE IN ACCORDANCE WITH SECTION 161 OF THE GERMAN STOCK CORPORATION ACT (AKTG)The declaration required under Section 161 of the German Stock Corporation Act (AktG) has been issued by the Executive Board and the Supervisory Board and has been made permanently accessible to the shareholders on the company’s website.
NOTIFICATION PURSUANT TO SECTION 160 (1) NO. 8 OF THE GERMAN STOCK CORPORATION ACT (AKTG)Up to the date of preparation of the financial statements, Aurubis AG had received the following voting rights notifications from shareholders with respect to exceeding and falling below the relevant notification thresholds, in accordance with Section 33 (1) of the German Securities Trading Act (WpHG):
Shareholder structure
Shareholders
Thresh-old
in %Stake
in %
Relevant threshold
dateDate of
publication
Dimensional Holdings Inc., Santa Monica, USA > 3 3.01 1/21/2008 2/4/2008
Salzgitter Mannesmann GmbH, Salzgitter 3 < 20 15.751 10/25/2017 10/27/2017
Salzgitter Mannesmann GmbH, Salzgitter 3 > 20 20.0000009 4/9/2018 4/11/2018
Salzgitter Mannesmann GmbH, Salzgitter 3
pursuant to Section 43
WpHG 4 4/27/2018 4/27/2018
UBS AG, Zurich, Switzerland < 5 4.99 3/4/2013 3/20/2013
Allianz Global Investors GmbH, Frankfurt am Main < 5 4.87 7/13/2017 7/17/2017
BlackRock, Inc., Wilmington, DE, USA 2 < 5 4.99 12/4/2017 12/8/2017
BlackRock, Inc., Wilmington, DE, USA 2 > 5 5.02 12/11/2017 12/15/2017
BlackRock, Inc., Wilmington, DE, USA 2 < 5 4.91 12/12/2017 12/18/2017
BlackRock, Inc., Wilmington, DE, USA 2 > 5 5.12 12/15/2017 12/21/2017
BlackRock, Inc., Wilmington, DE, USA 2 < 5 4.94 2/26/2018 3/2/2018
BlackRock, Inc., Wilmington, DE, USA 2 > 5 5.20 3/12/2018 3/16/2018
Aurubis Annual Report 2017/18
170 Notes to the Consolidated Financial StatementsOther Disclosures

Shareholders
Thresh-old
in %Stake
in %
Relevant threshold
dateDate of
publication
BlackRock, Inc., Wilmington, DE, USA 2 < 5 4.85 3/14/2018 3/20/2018
BlackRock, Inc., Wilmington, DE, USA 2 > 5 5.10 4/3/2018 4/9/2018
BlackRock, Inc., Wilmington, DE, USA 2 < 5 4.75 4/4/2018 4/10/2018
BlackRock, Inc., Wilmington, DE, USA 2 < 3 2.997 10/31/2018 11/6/2018
BlackRock, Inc., Wilmington, DE, USA 2 > 3 3.04 11/1/2018 11/7/2018
BlackRock, Inc., Wilmington, DE, USA 2 < 3 2.98 11/9/2018 11/15/2018
BlackRock, Inc., Wilmington, DE, USA 2 > 3 3.02 11/14/2018 11/20/2018
BlackRock, Inc., Wilmington, DE, USA 2 < 3 2.999 11/15/2018 11/21/2018
BlackRock, Inc., Wilmington, DE, USA 2 > 3 3.004 11/19/2018 11/23/2018
BlackRock, Inc., Wilmington, DE, USA 2 < 3 2.95 11/20/2018 11/26/2018
Norges Bank, Oslo, Norway 1 > 3 3.01 12/15/2017 12/19/2017
Norges Bank, Oslo, Norway 1 < 3 2.99 12/18/2017 12/20/2017
Norges Bank, Oslo, Norway 1 > 3 3.01 12/21/2017 12/22/2017
Norges Bank, Oslo, Norway 1 < 3 2.98 1/23/2018 1/25/2018
Norges Bank, Oslo, Norway 1 > 3 3.08 2/9/2018 2/14/2018
Norges Bank, Oslo, Norway 1 < 3 2.76 2/23/2018 2/27/2018
Norges Bank, Oslo, Norway 1 > 3 3.01 8/16/2018 8/20/2018
Norges Bank, Oslo, Norway 1 < 3 2.96 8/17/2018 8/21/2018
Norges Bank, Oslo, Norway 1 > 3 3.02 9/10/2018 9/12/2018
Norges Bank, Oslo, Norway 1 < 3 2.97 9/13/2018 9/18/2018
Norges Bank, Oslo, Norway 1 > 3 3.53 9/14/2018 9/18/2018
Norges Bank, Oslo, Norway 1 < 3 2.85 9/20/2018 9/24/20181 The shares are attributable to the state of Norway, represented by its
Ministry of Finance; the transaction was conducted via the Norges Bank.2 Held directly or indirectly through subsidiaries. 3 The shares are attributable to Salzgitter AG, Salzgitter. 4 German Securities Trading Act. The voting rights notifications are available online at
www.aurubis.com/en/about-aurubis/corporate-governance/ voting-rights-notifications.
Notifications from previous fiscal years are available online at www.aurubis.com/en/about-aurubis/corporate-governance/voting-rights-
notifications.
DISCLOSURES CONCERNING AUDITORS’ FEESThe following fees were recorded as expenses for fiscal year 2017/18 and the prior year for services rendered by the global PricewaterhouseCoopers network:
in € thousand 2017/18 2016/17
Financial statement auditing services 1,140 1,107
Other assurance services 50 32
Tax advisory services 150 128
Other services 171 38
Total 1,511 1,305
Of these, the following fees related to services rendered by PricewaterhouseCoopers GmbH Wirtschaftsprüfungsgesellschaft:
in € thousand 2017/18 2016/17
Financial statement auditing services 710 693
Other assurance services 49 32
Tax advisory services 146 118
Other services 110 10
Total 1,015 853
The tax advisory services related primarily to advice provided in connection with intra-group transfer pricing. In addition, the auditor provided additional assurance services that were contractually agreed upon or requested voluntarily. The “Other services” were primarily transaction consulting services.
171
Annual Report 2017/18 Aurubis
Other DisclosuresNotes to the Consolidated Financial Statements

Investments pursuant to Section 313 (2) of the German Commercial Code (HGB) as at September 30, 2018
Company name and registered office
% of capital held directly and
indirectlyHeld
directly by
1 Aurubis AG
Fully consolidated companies
2 Aurubis Belgium NV/SA, Brussels 100 1
3 Aurubis Holding Sweden AB, Stockholm 100 2
4 Aurubis Sweden AB, Finspång 100 3
5 Aurubis Finland Oy, Pori 100 2
6 Aurubis Holding USA LLC, Buffalo 100 2
7 Aurubis Buffalo Inc., Buffalo 100 6
8 Aurubis Netherlands BV, Zutphen 100 2
9 Aurubis Mortara S.p.A., Mortara 100 2
10 Cumerio Austria GmbH, Vienna 100 1
11 Aurubis Bulgaria AD, Pirdop 99.86 10
12 Aurubis Engineering EAD, Sofia 100 10
13 Aurubis Italia Srl, Avellino 100 1
14 Aurubis Switzerland SA, Yverdon-les-Bains 100 1
15 Aurubis Stolberg GmbH & Co. KG, Stolberg 100 1
16 Aurubis U.K. Ltd., Smethwick 100 15
17 Aurubis Slovakia s.r.o., Dolný Kubín 100 15
18 CABLO Metall-Recycling & Handel GmbH, Fehrbellin 100 1
19 Peute Baustoff GmbH, Hamburg 100 1
20 RETORTE GmbH Selenium Chemicals & Metals, Röthenbach 100 1
21 E. R. N. Elektro-Recycling NORD GmbH, Hamburg 100 1
22 Aurubis Product Sales GmbH, Hamburg 100 1
23 Deutsche Giessdraht GmbH, Emmerich 100 1
Companies accounted for using the equity method
24 Schwermetall Halbzeugwerk GmbH & Co. KG, Stolberg 50 15
172
Aurubis Annual Report 2017/18
InvestmentsNotes to the Consolidated Financial Statements

Company name and registered office
% of capital held directly and
indirectlyHeld
directly by
Non-consolidated companies
25 Aurubis Stolberg Verwaltungs-GmbH, Stolberg 100 1
26 Hüttenbau-Gesellschaft Peute mbH, Hamburg 100 1
27 Aurubis Hong Kong Ltd., Hong Kong 100 2
28 Aurubis Metal Products (Shanghai) Co., Ltd, Shanghai 100 27
29 Aurubis Rus LLC, St. Petersburg 100 2
30 Aurubis Canada Metals Inc., Vancouver 100 1
31 BCPC B.V., Zutphen 100 1
32 Retorte do Brasil, Joinville 51 20
33 C.M.R. International N.V., Antwerp 50 1
34 Schwermetall Halbzeugwerk GmbH & Co. KG, Stolberg 50 15
35 JoSeCo GmbH, Kirchheim/Swabia 50 20
36 Aurubis Middle East FZE, Dubai 100 22
37 Aurubis Turkey Kimya Anonim Sirketi, Istanbul 100 11
Hamburg, December 10, 2018
The Executive Board
Jürgen Schachler Dr. Thomas Bünger Rainer Verhoeven Chairman Member Member
173
Annual Report 2017/18 Aurubis
InvestmentsNotes to the Consolidated Financial Statements

Responsibility StatementTo the best of our knowledge, and in accordance with the applicable reporting principles, the Consolidated Financial Statements give a true and fair view of the net assets, financial position, and results of operations of the Group, and the Combined Management Report includes a fair review of the development and performance of the business and the position of the Group, together with a description of the principal opportunities and risks associated with the expected development of the Group.
Hamburg, December 10, 2018
The Executive Board
Jürgen Schachler Dr. Thomas Bünger Rainer Verhoeven Chairman Member Member
Aurubis Annual Report 2017/18
174 Responsibility Statement

Independent Auditor’s ReportTo Aurubis AG, Hamburg
Report on the Audit of the Consolidated Financial Statements and of the Group Management Report
AUDIT OPINIONSWe have audited the consolidated financial statements of Aurubis AG, Hamburg, and its subsidiaries (the Group), which comprise the consolidated statement of financial position as at 30 September 2018, and the consolidated statement of comprehensive income, consolidated statement of profit or loss, consolidated statement of changes in equity and consolidated statement of cash flows for the financial year from 1 October 2017 to 30 September 2018, and notes to the consolidated financial statements, including a summary of significant accounting policies. In addition, we have audited the group management report of Aurubis AG, which is combined with the Company’s management report, for the financial year from 1 October 2017 to 30 September 2018. In accordance with the German legal requirements, we have not audited the content of those parts of the group management report listed in the “Other Information” section of our auditor’s report.
In our opinion, on the basis of the knowledge obtained in the audit,
» the accompanying consolidated financial statements comply, in all material respects, with the IFRSs as adopted by the EU, and the additional requirements of German commercial law pursuant to § (Article) 315e Abs. (paragraph) 1 HGB [Handelsgesetzbuch: German Commercial Code] and, in compliance with these requirements, give a true and fair view of the assets, liabilities, and financial position of the Group as at 30 September 2018, and of its financial performance for the financial year from 1 October 2017 to 30 September 2018 and
» the accompanying group management report as a whole provides an appropriate view of the Group’s position. In all material respects, this group management report is consistent with the consolidated financial statements, complies with German legal requirements and appropriately presents the opportunities and risks of future development. Our audit opinion on the group management report does not cover the content of those parts of the group management report listed in the “Other Information” section of our auditor’s report.
Pursuant to § 322 Abs. 3 Satz (sentence) 1 HGB, we declare that our audit has not led to any reservations relating to the legal compliance of the consolidated financial statements and of the group management report.
BASIS FOR THE AUDIT OPINIONSWe conducted our audit of the consolidated financial statements and of the group management report in accordance with § 317 HGB and the EU Audit Regulation (No. 537/2014, referred to subsequently as “EU Audit Regulation”) in compliance with German Generally Accepted Standards for Financial Statement Audits promulgated by the Institut der Wirtschaftsprüfer (Institute of Public Auditors in Germany) (IDW). Our responsibilities under those requirements and principles are further described in the “Auditor’s Responsibilities for the Audit of the Consolidated Financial Statements and of the Group Management Report” section of our auditor’s report. We are independent of the group entities in accordance with the requirements of European law and German commercial and professional law, and we have fulfilled our other German professional responsibilities in accordance with these requirements. In addition, in accordance with Article 10 (2) point (f) of the EU Audit Regulation, we declare that we have not provided non-audit services prohibited under Article 5 (1) of the EU Audit Regulation. We believe that the audit evidence we have obtained is sufficient and appropriate to provide a basis for our audit opinions on the consolidated financial statements and on the group management report.
KEY AUDIT MATTERS IN THE AUDIT OF THE CONSOLIDATED FINANCIAL STATEMENTSKey audit matters are those matters that, in our professional judgment, were of most significance in our audit of the consolidated financial statements for the financial year from 1 October 2017 to 30 September 2018. These matters were addressed in the context of our audit of the consolidated financial statements as a whole, and in forming our audit opinion thereon; we do not provide a separate audit opinion on these matters.
In our view, the matters of most significance in our audit were as follows:
1 ACCOUNTING TREATMENT OF HEDGING INSTRUMENTS 2 DERIVING AND PRESENTING FINANCIAL MEASURES 3 PENSION OBLIGATIONS AND PLAN ASSETS 4 PRESENTATION OF THE FLAT ROLLED PRODUCTS (FRP)
SEGMENT AS A DISPOSAL GROUP AND DISCONTINUED OPERATION
175
Annual Report 2017/18 Aurubis
Independent Auditor’s Report

Our presentation of these key audit matters has been structured in each case as follows:
1 Matter and issue 2 Audit approach and findings 3 Reference to further information Hereinafter we present the key audit matters:
1 ACCOUNTING TREATMENT OF HEDGING INSTRUMENTS 1 The companies of the Aurubis Group use a variety of derivative
financial instruments to hedge against currency, commodity and interest rate risks arising from their ordinary business activities. The hedging policy defined by the executive directors serves as the basis for these transactions and is documented in corresponding internal guidelines.
Currency risk mainly reflects revenue and costs of materials denominated in foreign currency. The risk of changes in commodities prices focuses on copper prices in purchasing and selling metal. The risk of changes in interest rates results from floating-rate financing. Derivative financial instruments are recognized at fair value as of the balance sheet date. The positive fair values of the derivative financial instruments used as hedges amount to EUR 42.0 million as of the balance sheet date and the negative fair values amount to EUR 32.4 million.
Insofar the derivative financial instruments used by the Aurubis Group are effective hedges of future cash flows in the context of hedging relationships in accordance with the requirements of IAS 39, the respective changes in value are recognized over the duration of the hedging relationships directly in equity. As of the balance sheet date, a cumulative positive net amount of EUR 7.1 million was recognized outside profit or loss as expenses and income before taxes on income. We believe that these matters were of particular importance for our audit due to the high complexity and number of hedging transactions as well as the extensive accounting and measurement requirements of IAS 39.
2 We involved specialists from our Corporate Treasury Solutions (CTS) area to in the audit of the accounting including the effects of the various hedging instruments on equity and profit or loss. Together, among other things we gained an
understanding of the processes relating to derivative financial instruments and assessed the internal control system, including the internal monitoring of compliance with the hedging policy.
In auditing the fair values we also assess the measurement methods applied using market data and the underlying contractual data. With respect to the hedging of expected future cash flows, we mainly carried out a retrospective assessment of past hedge effectiveness and assessed the expected future hedge effectiveness as well as the corresponding effectiveness tests.
We obtained bank and broker confirmations and made our own calculations in order to assess completeness and to examine the fair values of the recorded transactions. We were able to satisfy ourselves that, overall, the hedging instruments were appropriately accounted for and measured.
3 The disclosures on hedging instruments can be found in section “29 Financial instruments” of the notes to the consolidated financial statements.
2 DERIVING AND PRESENTING FINANCIAL MEASURES 1 The Aurubis Group uses operating earnings before taxes (EBT)
and the operating return on capital employed (ROCE) as financial measures for the purposes of management and analysis. Both measures are calculated in accordance with the respective definition and approach presented in the notes on segment reporting by means of adjusting the corresponding IFRS results for measurement impacts deriving from the application of IAS 2 and effects deriving from purchase price allocations. The consolidated financial statements of Aurubis AG included adjustments to EBT in the amount of EUR 39.6 million and to capital employed to calculate the ROCE in the amount of EUR 293.3 million (indirectly by adjusting the individual items in the statement of financial position excluding investments measured using the equity method). The Company uses EBT and ROCE as core financial performance indicators in its capital market communication. They are also used as a measure of target achievement for the annual performance-related remuneration of the Aurubis Group’s employees. Against this background, the adjustments to operating earnings before taxes and the operating return on
Aurubis Annual Report 2017/18
176 Independent Auditor’s Report

capital employed were of particular importance during our audit since they are based on the Aurubis Group’s internal accounting guidelines and there is a risk of bias in the executive directors’ judgment.
2 Our audit included assessing the calculation of EBT and ROCE, and critically evaluating the identification and definition of non-operational measurement influences taken into account by the executive directors. Based on the findings of our audit and the information provided to us by the executive directors, we examined whether the adjustments had been applied in accordance with the respective definition and approach presented in the notes on segment reporting. We were able to satisfy ourselves that the adjustments applied to EBT and ROCE by the executive directors were in line with the notes on segment reporting and had been applied consistently.
3 The disclosures on deriving and presenting financial measures can be found in the section entitled “Economic development in the Aurubis Group” in the Group management report.
3 PENSION OBLIGATIONS AND PLAN ASSETS 1 Pension provisions amounting to EUR 199.0 million are reported
in the consolidated financial statements, comprising the net amount of the obligations under various pension plans (EUR 509.2 million) and the fair value of plan assets (EUR 310.2 million). The majority of these provisions relate to old-age and transitional pension commitments in Germany. Obligations under defined benefit plans are measured using the projected unit credit method. This requires in particular that assumptions be made as to long-term salary and pension trends, average life expectancy and staff fluctuations. Furthermore, the discount rate is derived on the basis of the return on high-quality corporate bonds issued in currencies and with maturities that match those of the underlying obligations. Changes to these measurement assumptions are recognized directly in equity as remeasurements. The plan assets largely comprise real estate assets, which are measured at fair value based on real estate appraisals. From our point of view, these matters were of particular importance during our audit because the recognition and measurement of these items – which are significant in terms of their total amount – are based to a large extent on estimates and assumptions made by the Company’s executive directors.
2 Our audit included among other procedures evaluating the actuarial reports obtained. Due to the specific features of the actuarial calculations, we were assisted by pensions specialists from our People & Organisation area (T&L P&O). In order to use the reports for the purposes of our audit, we assessed the professional qualification of the external actuaries as well as the measurement methods and assumptions used. On this basis, among other things we checked the numerical data, the actuarial parameters, the calculation of the provisions as well as the disclosures in the consolidated statement of financial position and the notes to the consolidated financial statements based on the actuarial reports. Our audit of the fair value of the plan assets was carried out in particular on the basis of real estate appraisals, bank and fund confirmations as well as other evidence of assets, which we evaluated. Based on our audit procedures, we were able to satisfy ourselves that the estimates and assumptions made by the executive directors are substantiated and sufficiently documented.
3 The disclosures on pension obligations and plan assets can be found in section “26 Pension provisions and similar obligations” of the notes to the consolidated financial statements.
4 PRESENTATION OF THE FLAT ROLLED PRODUCTS (FRP) SEGMENT AS A DISPOSAL GROUP AND DISCONTINUED OPERATION
1 The assets and liabilities of the Flat Rolled Products (FRP) reporting segment are presented in the consolidated financial statements under the balance sheet items “Assets held for sale” in the amount of EUR 589.5 million and “Liabilities deriving from assets held for sale” in the amount of EUR 162.1 million. On 12 February 2018, Aurubis AG signed a term sheet with Wieland-Werke Aktiengesellschaft, Ulm, regarding the sale of the companies of the FRP segment. The purchase agreement was entered into on 29 March 2018 and is subject to the approval in connection with the merger control proceedings by the European Commission. After the European Commission informed Aurubis AG that the transaction was unlikely to be approved as submitted, the Executive Board published an ad hoc disclosure on 10 October 2018 stating that, in its estimation, the execution of the transaction with Wieland- Werke Aktiengesellschaft, Ulm, as submitted to the European Commission, was no longer highly probable at that time.
177
Annual Report 2017/18 Aurubis
Independent Auditor’s Report

Aurubis AG and Wieland-Werke Aktiengesellschaft, Ulm, agreed to continue the European Commission’s merger control proceedings. In the event the sale to Wieland-Werke Aktiengesellschaft, Ulm, is prohibited, either in full or in part, the Executive Board has actively identified sales alternatives. The Executive Board continues to regard the sale of the FRP segment as highly probable due to the buying interest expressed by various market participants. Therefore, the assets and liabilities of the FRP segment will continued to be reported and measured as a disposal group and discontinued operation after the balance sheet date. Against this background and due to the high complexity of the accounting treatment, this matter was of particular importance for our audit.
2 As part of our audit and with the support of our internal specialists from Capital Markets & Accounting Advisory Services (CMAAS), we first obtained an understanding of the underlying contractual agreements and their effects on the presentation of the assets and liabilities of the FRP segment. Therewith, we, among other things, assessed the accounting treatment of the FRP segment as a disposal group and discontinued operation in accordance with IFRS 5. In order to assess whether the conditions had been met for classification during the year as a disposal group and discontinued operation, in particular the classification of the execution of a sales transaction as highly probable, also taking into account the ad hoc disclosure on 10 October 2018, we furthermore held discussions with the responsible persons of the Aurubis Group involved in the transaction and obtained further evidence. In doing so, we also used minutes from Executive Board and Supervisory Board meetings as well as correspondence with potential buyers to assess whether there was a corresponding buying interest in the market. We were able to satisfy ourselves that the assumptions underlying the classification as a discontinued operation and the measurement of the FRP segment’s assets and liabilities are sufficiently documented and substantiated and that the presentation as a disposal group and discontinued operation as well as the corresponding disclosures are appropriate.
3 The disclosures on the planned disposal of the FRP segment can be found in the sections “Acquisitions and discontinued operations” and “Events after the balance sheet date” of the notes to the consolidated financial statements.
OTHER INFORMATIONThe executive directors are responsible for the other information. The other information comprises the following non-audited parts of the group management report:
» the statement on corporate governance pursuant to § 289f HGB and § 315d HGB included in section “Legal Disclosures” of the group management report
» the corporate governance report pursuant to No. 3.10 of the German Corporate Governance Code
» the separate non-financial report pursuant to § 289b Abs. 3 HGB and § 315b Abs. 3 HGB
The other information comprises further the remaining parts of the annual report – excluding cross-references to external information – with the exception of the audited consolidated financial statements, the audited group management report and our auditor’s.
Our audit opinions on the consolidated financial statements and on the group management report do not cover the other information, and consequently we do not express an audit opinion or any other form of assurance conclusion thereon.
In connection with our audit, our responsibility is to read the other information and, in so doing, to consider whether the other information
» is materially inconsistent with the consolidated financial statements, with the group management report or our knowledge obtained in the audit, or
» otherwise appears to be materially misstated.
Aurubis Annual Report 2017/18
178 Independent Auditor’s Report

RESPONSIBILITIES OF THE EXECUTIVE DIRECTORS AND THE SUPERVISORY BOARD FOR THE CONSOLIDATED FINANCIAL STATEMENTS AND THE GROUP MANAGEMENT REPORTThe executive directors are responsible for the preparation of the consolidated financial statements that comply, in all material respects, with IFRSs as adopted by the EU and the additional requirements of German commercial law pursuant to § 315e Abs. 1 HGB and that the consolidated financial statements, in compliance with these requirements, give a true and fair view of the assets, liabilities, financial position, and financial performance of the Group. In addition the executive directors are responsible for such internal control as they have determined necessary to enable the preparation of consolidated financial statements that are free from material misstatement, whether due to fraud or error.
In preparing the consolidated financial statements, the executive directors are responsible for assessing the Group’s ability to continue as a going concern. They also have the responsibility for disclosing, as applicable, matters related to going concern. In addition, they are responsible for financial reporting based on the going concern basis of accounting unless there is an intention to liquidate the Group or to cease operations, or there is no realistic alternative but to do so.
Furthermore, the executive directors are responsible for the preparation of the group management report that, as a whole, provides an appropriate view of the Group’s position and is, in all material respects, consistent with the consolidated financial statements, complies with German legal requirements, and appropriately presents the opportunities and risks of future development. In addition, the executive directors are responsible for such arrangements and measures (systems) as they have considered necessary to enable the preparation of a group management report that is in accordance with the applicable German legal requirements, and to be able to provide sufficient appropriate evidence for the assertions in the group management report.
The supervisory board is responsible for overseeing the Group’s financial reporting process for the preparation of the consolidated financial statements and of the group management report.)
AUDITOR’S RESPONSIBILITIES FOR THE AUDIT OF THE CONSOLIDATED FINANCIAL STATEMENTS AND OF THE GROUP MANAGEMENT REPORT Our objectives are to obtain reasonable assurance about whether the consolidated financial statements as a whole are free from material misstatement, whether due to fraud or error, and whether the group management report as a whole provides an appropriate view of the Group’s position and, in all material respects, is consistent with the consolidated financial statements and the knowledge obtained in the audit, complies with the German legal requirements and appropriately presents the opportunities and risks of future development, as well as to issue an auditor’s report that includes our audit opinions on the consolidated financial statements and on the group management report.
Reasonable assurance is a high level of assurance, but is not a guarantee that an audit conducted in accordance with § 317 HGB and the EU Audit Regulation and in compliance with German Generally Accepted Standards for Financial Statement Audits promulgated by the Institut der Wirtschaftsprüfer (IDW) will always detect a material misstatement. Misstatements can arise from fraud or error and are considered material if, individually or in the aggregate, they could reasonably be expected to influence the economic decisions of users taken on the basis of these consolidated financial statements and this group management report.
We exercise professional judgment and maintain professional skepticism throughout the audit. We also:
» Identify and assess the risks of material misstatement of the consolidated financial statements and of the group management report, whether due to fraud or error, design and perform audit procedures responsive to those risks, and obtain audit evidence that is sufficient and appropriate to provide a basis for our audit opinions. The risk of not detecting a material misstatement resulting from fraud is higher than for one resulting from error, as fraud may involve collusion, forgery, intentional omissions, misrepresentations, or the override of internal control.
179
Annual Report 2017/18 Aurubis
Independent Auditor’s Report

» Obtain an understanding of internal control relevant to the audit of the consolidated financial statements and of arrangements and measures (systems) relevant to the audit of the group management report in order to design audit procedures that are appropriate in the circumstances, but not for the purpose of expressing an audit opinion on the effectiveness of these systems.
» Evaluate the appropriateness of accounting policies used by the executive directors and the reasonableness of estimates made by the executive directors and related disclosures.
» Conclude on the appropriateness of the executive directors’ use of the going concern basis of accounting and, based on the audit evidence obtained, whether a material uncertainty exists related to events or conditions that may cast significant doubt on the Group’s ability to continue as a going concern. If we conclude that a material uncertainty exists, we are required to draw attention in the auditor’s report to the related disclosures in the consolidated financial statements and in the group management report or, if such disclosures are inadequate, to modify our respective audit opinions. Our conclusions are based on the audit evidence obtained up to the date of our auditor’s report. However, future events or conditions may cause the Group to cease to be able to continue as a going concern.
» Evaluate the overall presentation, structure and content of the consolidated financial statements, including the disclosures, and whether the consolidated financial statements present the underlying transactions and events in a manner that the consolidated financial statements give a true and fair view of the assets, liabilities, financial position and financial performance of the Group in compliance with IFRSs as adopted by the EU and the additional requirements of German commercial law pursuant to § 315e Abs. 1 HGB.
» Obtain sufficient appropriate audit evidence regarding the financial information of the entities or business activities within the Group to express audit opinions on the consolidated financial statements and on the group management report.
We are responsible for the direction, supervision and performance of the group audit. We remain solely responsible for our audit opinions.
» Evaluate the consistency of the group management report with the consolidated financial statements, its conformity with German law, and the view of the Group’s position it provides.
» Perform audit procedures on the prospective information presented by the executive directors in the group management report. On the basis of sufficient appropriate audit evidence we evaluate, in particular, the significant assumptions used by the executive directors as a basis for the prospective information, and evaluate the proper derivation of the prospective information from these assumptions. We do not express a separate audit opinion on the prospective information and on the assumptions used as a basis. There is a substantial unavoidable risk that future events will differ materially from the prospective information.
We communicate with those charged with governance regarding, among other matters, the planned scope and timing of the audit and significant audit findings, including any significant deficiencies in internal control that we identify during our audit.
We also provide those charged with governance with a statement that we have complied with the relevant independence requirements, and communicate with them all relationships and other matters that may reasonably be thought to bear on our independence, and where applicable, the related safeguards.
From the matters communicated with those charged with governance, we determine those matters that were of most significance in the audit of the consolidated financial statements of the current period and are therefore the key audit matters. We describe these matters in our auditor’s report unless law or regulation precludes public disclosure about the matter.
Aurubis Annual Report 2017/18
180 Independent Auditor’s Report

Other legal and regulatory Requirements
FURTHER INFORMATION PURSUANT TO ARTICLE 10 OF THE EU AUDIT REGULATIONWe were elected as group auditor by the annual general meeting on 1 March 2018. We were engaged by the supervisory board on 13 June 2018. We have been the group auditor of the Aurubis AG, Hamburg, without interruption since the financial year 2008/2009.
We declare that the audit opinions expressed in this auditor’s report are consistent with the additional report to the audit committee pursuant to Article 11 of the EU Audit Regulation (long-form audit report).
German public Auditor responsible for the Engagement
The German Public Auditor responsible for the engagement is Claus Brandt.
Hamburg, 10. December 2018
PricewaterhouseCoopers GmbHWirtschaftsprüfungsgesellschaft
Claus Brandt Alexander FernisWirtschaftsprüfer Wirtschaftsprüfer(German Public Auditor) (German Public Auditor)
181
Annual Report 2017/18 Aurubis
Independent Auditor’s Report

GlossaryExplanation of technical terms
Aurubis Operating System (AOS): Management system for achieving continuous and sustainable process improvement.
Blister copper: Unrefined porous copper. During solidification, dissolved gases form small blisters in the copper. Blister copper is also purchased as a raw material.
CDP: (Formerly Carbon Disclosure Project) non-profit organization with the objective of encouraging companies and towns to publish their environmental data.
Complex materials: Both primary and secondary raw materials are becoming more complex, that is, their copper content is decreasing and the levels of by-elements and impurities contained in them are increasing.
Compliance: Compliance means conforming to certain rules. Apart from laws, directives, and other standards, it also refers to corporate guidelines (e.g., codes of conduct).
Continuous cast shapes: Products manufactured from endless strands produced in a continuous casting process. Continuous cast shapes are processed into sheets, foils, profiles, and tubes by rolling and extrusion.
Continuous cast wire rod: Semi-finished product produced in a continuous process and used for the fabrication of copper wire.
Copper cathodes : Quality product of the copper tankhouse (copper content: 99.99 %) and the first marketable product in copper production, which can be sold on the metal exchanges.
Copper concentrates: A product resulting from the processing (enriching) of copper ores, the Aurubis Group’s main raw material. Since copper is found almost exclusively in ores, in compound form, and in low concentrations (usually below 1 % copper content), the ores are enriched in processing facilities into concentrates (copper content of 25 to 40 %) after production in the mine.
Copper premium: Surcharge for high-quality cathodes, which are used for the production of continuous cast wire rod and continuous cast shapes, among other products.
CSR Directive Implementation Act (referred to as CSR-RUG in German): The EU’s Corporate Social Responsibility Directive requires exchange-listed companies of a certain size to disclose non-financial information.
EMAS: Eco-Management and Audit Scheme (also known as the EU eco-audit). EMAS was developed by the EU and is a joint system comprising environmental management and environmental auditing for organizations that want to improve their environmental performance.
Future Complex Metallurgy (FCM): New, innovative metallurgical procedure for the processing of complex raw materials.
Global Reporting Initiative (GRI): This organization publishes the GRI Standards, which are the standards and indicators for sustainability reporting. The GRI Standards are established internationally as a framework for voluntary sustainability reporting.
ILO Core Labour Standards: The Core Labour Standards of the International Labour Organization (ILO) of the United Nations comprise four basic principles: upholding freedom of association and the right to collective bargaining, eliminating forced labor, abolishing child labor, and eliminating discrimination in respect of employment and occupation. These are found in the eight fundamental ILO Conventions, which are referred to as the ILO Core Labour Standards.
ISO 14001: An international standard that establishes the criteria for setting up and monitoring companies’ environmental management systems. A company can receive proof of a functioning environmental management system (certification) through an external expert.
ISO 50001: An international standard that establishes criteria for initiating, operating, and continuously improving an energy management system. The objective of the standard is to steadily improve companies’ energy-related performance. Energy-intensive companies have to be certified in accordance with EMAS or ISO 50001 to be eligible to receive concessions on the levies under the German Renewable Energies Act.
Iron silicate: A by-product of copper production in the refining process. Formed using sand from iron that is chemically bonded to copper concentrates and recycling raw materials. Mainly used in the construction industry as granules/sand or in lump form.
KRS: Kayser Recycling System, a modern recycling plant in Lünen for the treatment of a wide range of copper-bearing secondary raw materials.
Aurubis Annual Report 2017/18
182 Glossary

London Metal Exchange (LME): The most important metal exchange in the world, with the highest turnover.
LTIFR: Lost time injury frequency rate (accident frequency).
Metal gain: Metal yield that a smelter can extract beyond the paid metal content in the raw input materials.
ONE Aurubis: Transformation program to achieve the Vision 2025.
PRIMA: Performance, Responsibility, Integrity, Mutability, Appreciation. The first letters of these values spell the German word “prima,” meaning “great”.
Primary copper production: Production of copper from copper concentrates.
Product surcharge: Fee for the processing of copper cathodes into copper products.
Recycling materials: Materials in a closed-loop economy. They arise as residues from production processes or during the preparation of end-of-life products and rejects.
Secondary copper production: Production of copper from recycling materials.
Settlement: Official cash selling rate on the LME. Price basis in annual sales agreements.
Spot market: Daily business, market for prompt deliveries.
Tankhouse: In the tankhouse, an electrochemical process, the last refining stage in metal recovery, takes place. For copper, anodes and cathodes are hung in a sulfuric acid solution (electrolyte) and connected to an electric current. Copper and baser elements (e.g., nickel) are then dissolved from the anode in the electrolyte. Copper from the solution is deposited on the cathode with a purity of 99.99 %. Precious metals (e.g., silver and gold) and insoluble components settle as “anode slimes” on the bottom of the tankhouse cell.
Treatment and refining charges (TC/RCs), refining charges (RCs): Surcharges on the purchase price of metals, charged for turning these raw materials into the commodity exchange product – copper cathodes – and other metals.
UN Global Compact (UNGC): The United Nations Global Compact is an international initiative for responsible corporate governance. Companies that commit to upholding the UNGC acknowledge its ten principles, which include the topics of human rights, labor standards, the environment, and preventing corruption.
Waste Electrical and Electronic Equipment (WEEE): The purpose of the EU’s WEEE directive 2002/96/EC for waste electrical and electronic equipment is to responsibly handle the increasing volumes of electronic scrap. The WEEE End Processor Standard is a voluntary standard for the treatment and/or processing of precious metal-bearing WEEE fractions. Aurubis supported the development of this standard and has been certified in accordance with it since 2015.
Explanation of financial terms
Capital employed: The sum of equity, provisions for pension liabilities, and financial liabilities, less cash and cash equivalents.
EBIT: Earnings before interest and taxes are an indicator of a company’s operative earning power, ignoring its capital structure.
EBITDA: Earnings before interest, taxes, depreciation, and amorti zation are an indicator of a company’s operative earning power, ignoring its capital structure and propensity to invest.
EBT: Earnings before taxes are an indicator of a company’s earning power.
Free cash flow: The generated surplus of cash and cash equivalents, taking into account cash-related changes in working capital, and after deducting capital expenditure. It is available for a company’s dividend and interest payments, as well as for the redemption of financial liabilities.
Net borrowings: Consist of long- and short-term financial liabilities, less cash and cash equivalents.
Net cash flow: The generated surplus of cash and cash equivalents after taking into account cash-related changes in working capital. It is available for payments in conjunction with a company’s investing and financing activities.
ROCE: Return on capital employed is the ratio of EBIT to capital employed as at the balance sheet date. It describes the efficiency with which capital was utilized during the reporting period.
183
Annual Report 2017/18 Aurubis
Glossary
ImprintIf you would like more information, please contact:
Aurubis AGHovestrasse 50, 20539 Hamburg, [email protected]
Investor RelationsAngela SeidlerPhone + 49 40 7883-3178Fax + 49 40 [email protected]
Elke BrinkmannPhone + 49 40 7883-2379Fax + 49 40 [email protected]
Christoph TeschPhone + 49 40 7883-2178Fax + 49 40 [email protected]
Concept, consulting, and designKirchhoff Consult AG, Hamburg, Germany
PhotosAdam Walker (cover photo) Johannes Arlt (pages 2-5)Thomas Panzau (page 7)
PrintBeisner Druck GmbH & Co. KG, Buchholz in der Nordheide, Germany
Paper Printed on FSC-certified paper. By using FSC paper, we are actively supporting the preservation of our forests, promoting plant and wildlife protection, and are taking a stand against human exploitation of forest resources.
DisclaimerThis Annual Report contains forward-looking statements based on current assumptions and forecasts. Various known and unknown risks, uncertainties, and other factors could cause the actual future results, financial situation, or developments to differ from the estimates provided here. We assume no liability to update forward-looking statements.
Financial Calendar February 13, 2019 Quarterly Report on the First 3 Months 2018/19
February 28, 2019 Annual General Meeting
May 15, 2019 Interim Report on the First 6 Months 2018/19
August 8, 2019 Quarterly Report on the First 9 Months 2018/19
December 11, 2019 Annual Report 2018/19
Our fiscal year starts on October 1 and ends on September 30.
Aurubis Annual Report 2017/18
184 Imprint | Financial Calendar

5-Year OverviewAurubis Group (IFRS)
2017/18 2016/17 2015/16 2014/15 2013/14
Results
Revenues 1 € million 10,424 9,880 9,475 10,995 11,241
EBITDA 1 € million 453 545 312 336 216
Operating EBITDA2 € million 462 440 358 500 288
Depreciation and amortization 1 € million 119 121 135 136 128
EBIT 1 € million 334 424 177 200 88
Operating EBIT 2 € million 332 308 229 370 167
EBT 1 € million 322 408 159 170 58
Operating EBT 2, 3 € million 329 298 213 343 137
Consolidated net income 1 € million 263 318 124 134 44
Operating consolidated net income 2 € million 265 236 165 257 99
Net cash flow € million 203 480 239 365 401
Capital expenditure (incl. finance leases) € million 182 175 143 112 128
Operating ROCE 3 % 14.8 15.1 10.9 18.7 8.5
Consolidated statement of financial position
Total assets € million 4,502 4,361 4,027 4,044 3,943
Fixed assets € million 1,354 1,489 1,450 1,440 1,468
Equity € million 2,566 2,366 1,991 1,969 1,877
Aurubis shares
Market capitalization € million 2,708 3,081 2,242 2,558 1,761
Earnings per share 1 € 5.81 7.04 2.71 2.95 0.95
Operating earnings per share 2 € 5.87 5.21 3.64 5.68 2.17
Dividend per share 4 € 1.55 1.45 1.25 1.35 1.001 To the extent that they relate to the consolidated income statement, these values refer to continued operations in the fiscal year and in the previous year.2 Values have been “operationally” adjusted for measurement effects in accordance with IAS 2. Metal price fluctuations resulting from the application of
the average cost method are thereby eliminated in the same manner as write-downs and write-ups to the value of copper inventories as at the reporting date. For fixed assets, the adjustment for measurement influences deriving from purchase price allocations (PPA) are made tp property, plant and equipment, commencing from fiscal year 2010/11 onwards. Furthermore, the application of IFRS 5 was reversed.
3 Corporate control parameter. 4 The 2017/18 figure represents the proposed dividend.
Certain prior-year figures have been adjusted.
Annual Report 2017/18 Aurubis
5-Year Overview U3

EN_1
8/12
aurubis.com
Metals for Progress
Aurubis AGHovestrasse 5020539 Hamburg, Germany Phone +49 40 7883-0Fax +49 40 [email protected]
Ann
ual R
epor
t 201
7/18
THER
E’S
MO
RE
TO IT