annual report - ir.smb-t.comir.smb-t.com/interactive/lookandfeel/100656/annualreport2017.pdfsmb...
TRANSCRIPT

ANNUALREPORT
2017
Southern Michigan Bancorp, Inc.51 West Pearl Street | Coldwater, MI 49036517.279.5500 | www.smb-t.com
Southern Michigan B
ancorp, Inc. | 2017 A
NN
UA
L REP
OR
T

Kurtis Condon, Plant Manager at the Hillsdale Industrial Drive facility, speaks with Kurt Miller, Southern Michigan Bank & Trust President/Chief Credit Officer about the Hillsdale Terminal manufacturing facility. View from inside Southern’s Portage Branch.

02
CONTENTS03
09
15
05
1314
1734
Message to Shareholders
Financial Summary
Shareholder Information
Client Profiles
Executive Staff / Board of Directors
SMB&T Officers
Management Discussion & Analysis
Consolidated Financial Statements

2017 ANNUAL REPORT
TO OURSHAREHOLDERS
Southern Michigan Bancorp, Inc. attained record-breaking results for 2017 by several key measures of financial performance,
including balance sheet and loan growth, deposit growth, asset quality, and stock performance.
The possibility of a major income tax overhaul dominated the news last fall and the Tax Cuts and Jobs Act was signed into law on December 22, 2017. One result was that corporate tax rates were lowered from 35 percent to 21 percent. We expect to see substantial future benefits from changes to the U.S. tax code, both through lower taxes and a stronger economy.
As a result of tax reform, Southern incurred a significant, one-time income tax charge of $989,000, or $.42 per share, in the fourth quarter. The reduction of corporate tax rates necessitated writing down the value of tax deferred assets and liabilities on the balance sheet, the largest being the Allowance for Loan Losses. The $989,000 one-time charge covers the change in value of those net assets.
Southern reported net income of $5,421,000 for 2017 compared to $6,097,000 for 2016. Earnings per share were $2.30 for 2017 compared to $2.54 in 2016. Fourth quarter net income was $739,000, or $0.32 per share, compared to $1,667,000, or $0.70 per share in the fourth quarter of 2016. We anticipate future benefits from tax reform, and for 2018 expect more than $700,000 in income tax savings. Excluding the one-time tax charge of $989,000, net income for the year grew 5.1 percent to $6,410,000.
John Castle | Chairman and CEO

04
Our growth, for the most part, has come from across our entire service area, with a significant portion from the Kalamazoo/Portage region. We recently opened new offices at 950 Trade Centre in Portage for our Commercial Lending Group and Wealth Management personnel. In addition, we are exploring the building of a third office with several locations under consideration at this time. New customers appreciate our commitment to customer service, and the sophisticated technology we have available. We continuously evaluate our electronic banking products to ensure we remain on par with larger bank and non-bank providers of similar services.
Our 2017 Annual Report spotlights two important clients of the bank. Hillsdale Terminal is a family-owned company, established in 1976 by Frank Condon. The successful manufacturing organization is currently managed by four of Frank’s six children, as well as two grandsons, shipping more than one million parts per day to distributors across the country and internationally.
Schweitzer, Inc., a construction management company with headquarters in downtown Battle Creek, is a third-generation family business. Founded by John Schweitzer in 1962, they are responsible for many of the impressive buildings and structures
that have contributed to the revitalization of Battle Creek over the past fifty years.
We are proud to recognize their success and contributions to their communities.
As always, we thank you for your continued support.
Sincerely,
John H. CastleChairman and Chief Executive Officer
Southern’s financial performance for 2017 was favorably impacted by overall growth in the balance sheet, including loans and deposits, and ongoing strong asset quality. Southern ended 2017 with total assets at a year-end record $712.3 million, which is $70.8 million, or 11 percent, higher than 2016 levels of $641.5 million. Historic high gross loan totals of $523.4 million represent an increase of $73.6 million, or 16.4 percent, compared to 2016 year-end loan totals of $449.8 million. Deposits finished the year at a record high $577.1 million, an increase of $41.3 million over December 31, 2016 levels of $535.8 million.
Southern’s return on average assets and return on average equity for 2017 was .80 percent and 7.64 percent, respectively. Our return on average tangible equity, which is total shareholders’ equity less goodwill and other intangibles, was 9.71 percent.
Delinquent loans at December 31, 2017 totaled only $1.614 million, or .31 percent of gross loans. Non-performing assets totaled $2.305 million at year end, a decrease of $623,000, or 21 percent, from $2.928 million at year-end 2016. Unprecedented net charge-offs for 2017 totaled just $8,000. Southern’s provision expense of $175,000 resulted from growth in the loan portfolio, an increase of $75,000 from $100,000 in 2016. The allowance for loan losses at December 31, 2017 was $5,009,000, or 0.96 percent of loans. From a coverage perspective, the allowance increased to 5.7 times the dollar amount of non-accrual loans at year end.
The board of directors approved an increase in the quarterly cash dividend from $0.20 per share to $0.21 per share beginning with the July 2017 dividend payment. The new annualized cash dividend rate is $0.84 per share. Southern’s stock continues to perform well and ended the year at $37.10 per share, an increase of $7.20 per share, from year-end 2016 levels of $29.90 per share.
Southern Michigan Bancorp, Inc. attained record-breaking results for 2017 by several key measures of financial performance, including balance sheet and loan growth, deposit growth, asset quality, and stock performance.

2017 ANNUAL REPORT
HILLSDALETERMINAL
client profile
with little debt. In describing the impressive growth they’ve experienced, they like to quote his philosophy, “If you’re not going forward, you’re going backwards.”
Today, all of Frank’s children share ownership of the company, with four of them running the operation along with two of his grandsons, making it a third-generation family business. Jim Condon is President of Hillsdale Terminal and John Condon is Vice President of Engineering and Technology. Lori Condon-Atkins is VP of Inside Sales as well as accounting and secretarial services, and Tom Condon, a CPA, serves as their CFO. Grandsons Mickey,
year 2016, Hillsdale Terminal reached a milestone of one million dollars in sales per month. By anticipating customer needs, they maintain an extensive inventory in order to provide rapid shipping of products, with over 80% of orders shipped the same day.
The Condon family agrees that the success of the organization is the result of the conservative business principles established by their father and grandfather, Frank. They say Hillsdale Terminal was his seventh child - he put great pride and effort into his company, consistently reinvesting profits so the business could grow
In 1976, Frank Condon took his engineering degree from Michigan State University, along with his
experience working for Vaco Products Company in Jonesville, and made a decision that would change the course of his and his family’s lives. The father of six founded his new company, Hillsdale Terminal, in a small building in Hillsdale, the same year his son, John, graduated from high school and started in the Tool and Die trade. From those humble beginnings, Hillsdale Terminal has grown to provide over one million terminals a day to as many as 1,400 individual customers and distributors in all 50 states and 4 different countries. In fiscal
Hillsdale Terminal’s product wall featuring terminals they manufacture.

06
respect each other’s talents and share their father’s vision for the company’s future. We are proud to play a small part in their story.”
Kurtis says, “On any given day, when I visit the local bank branch, on the way to the line, Jennifer will ask, ‘Hey, how’s it going?’ Then Lori will ask, ‘How are your kids doing?’ By this time Rachel has heard me talking and comes out of her office in the back to say hi.”
“We appreciate that person-to-person contact that you just don’t get with some banks,” John says. “We’ve talked to people who are having trouble with their bank and tell them to try Southern Michigan Bank and Trust. You’ll have a good relationship with them, and they’ll do the right things for you.”
the same. “Other banks have the technology, but not the personal support. At Southern, if I have a question, or something is not right, I’m on the phone, and ten minutes later it’s resolved. I can’t wait weeks to deposit checks.” In fact, they have encouraged their
suppliers and customers to manage their financial transactions electronically as well.
In addition to deposit and lending relationships, Hillsdale Terminal also utilizes services such as Remote Deposit Capture, Business Bill Pay, ACH services, Corporate Credit Cards and PayCards. Kurtis Condon says, “Southern offered something that wasn’t an added cost for us or our employees. If
our employees don’t have a bank account or are having trouble with their bank account, their option is to get the PayCard, versus a printed check. It’s a great alternative for us, and our employees like it as well.”
“Hillsdale Terminal is the kind of family business that every community banker wants to partner with,” says Rachel. “The siblings
Quality Assurance Manager, and Kurtis, Plant Manager at the Hillsdale Industrial Drive facility, represent the third generation.
An operation as large and complex as Hillsdale Terminal requires a bank with the technology and support to meet their unique needs. John Condon reflects on how they came to partner with Southern Michigan Bank and Trust, “We hired a new bookkeeper whose first question was, ‘What are all these bank fees? I think we should look at other banks and make sure these fees are competitive,’” he recalls.
“It’s hard to change banks, there’s a lot in-volved,” says John. But after meeting with Rachel Doty, Southern Michigan Bank and Trust Vice President/Commercial Loan Officer, and Laurel Walkup, Vice President/eServices Manager, they made a decision to switch to Southern.
Their need for excellence in electronic banking was especially important, and John noted that all electronic banking solutions are not
“Other banks have the technology, but not the personal support... We appreciate that person-to-person contact that you just don’t get with some banks.”
-John Condon
(pictured left to right): Lori Condon-Atkins, along with Jennifer Crist, Hillsdale Regional Branch Manager of SMB&T and Rachel Doty, Vice President/Commercial Loan Officer of SMB&T listen as John Condon, Vice President of Engineering and Technology at Hillsdale Terminal, talks about Hillsdale Terminal’s manufacturing facility. (pictured in center): John Castle, Chairman and CEO of SMB&T has questions during the tour for Jim Condon, President of Hillsdale Terminal and Mickey Condon, Quality Assurance Manager of Hillsdale Terminal. (pictured on right): Kurt Miller, President of SMB&T, and Tom Condon, Chief Financial Officer of Hillsdale Terminal discuss features of the facility.
Laurel Walkup, Vice President/eServices Manager of SMB&T meets with Kurtis Condon, Plant Manager at the Hillsdale Industrial Drive facility and Lori Condon-Atkins, Vice President of Inside Sales, regarding electronic services.

2017 ANNUAL REPORT
SCHWEITZERCONSTRUCTION, INC.
client profile
in 2007. In 2009 he became President/CEO and partnered with Drew, who was named Vice President/COO. They have been running the company together and added numerous members to the team since then. The Schweitzer motto, passed down from father to son to grandson, remains: Be honest, be fair, and be good.
Schweitzer Inc. has made their mark on the city of Battle Creek, managing everything from small jobs for repeat loyal customers to complex projects such as the Battle Creek Math and Science Center and the new Police Headquarters. After growing beyond the constrained
John Schweitzer founded the company in 1962 after years of working in the Battle Creek
community with a prior employer based out of Chicago. For the first few years, the company worked out of a small office in Springfield, then moved to a farmhouse in Pennfield, where John established his family on a sixty-eight-acre hobby farm. When John retired in 1980, his sons, Chris and David, took over and ran the company for the next twenty-five years. When Chris passed away unexpectedly in 2006, David worked with Chris’s son, Drew, until his retirement in 2008. Tom Beuchler, an experienced construction manager, joined Schweitzer Inc.
“I think for anyone involved in construction, you take pride as you drive through the community and see the buildings your teams have built or renovated over the years,” says Tom Beuchler, President and CEO of Schweitzer, Inc. “I find myself pointing out to my children and grandchildren the buildings that our company built, some of them years ago, and they are still there and still looking great. They take pride in knowing that their dad or grandpa’s company built them.”
The board room of Schweitzer Inc.’s newly renovated office space.

08
“It is a privilege to work with an industry leader who understands what it means to be a responsible corporate citizen,” says Deb Davis, SMB&T Vice President/Commercial Loan Officer. “They take pride in making a difference for Battle Creek.”
“Knowing and seeing the folks from Southern Michigan Bank and Trust out in the community – at service clubs and working on service projects together – to us it’s important that they are reinvesting in the community,” says Tom. “We look forward to other partnerships with Southern in the future.”
Schweitzer, Inc.’s new office space and warehouse in downtown Battle Creek.
space of the farmhouse, Schweitzer, Inc. decided to renovate the old Nor-man’s Food Warehouse in down-town Battle Creek. “The business-es, the community, and the City of Battle Creek have been good to Schweitzer,” Tom states. “So, we thought we needed to show that we were willing to invest in the commu-nity and be part of the downtown revitalization.”
As they planned for the financing of their down-town office renovation, Tom and Drew began to reconsider the as-sociation they had with the “big bank” they had worked with for many years because they had lost a sense of relationship. A conversation with Drew’s friend, Bryan Smith, of US Lumber in Battle Creek, encouraged them to reach out to Southern Michigan Bank and Trust. Tom says, “South-ern’s business, like our business, is all about relationships. We met with
them, I believe on a Wednesday, and by Friday we had a proposal, and by Monday we had the loan commitment. It was very responsive, low impact, and the transition has
been smooth. Southern is based out of a small community in our region and that personal touch meant a lot to us. That’s the way we do business, and to have John (Castle, SMB&T CEO) and Kurt (Miller, SMB&T President) there for the initial meeting was important.”
Drew adds, “It was nice to have the decision-makers at the table. Our project for the new headquarters was made possible through a loan
with Southern Michigan Bank and Trust.” In addition to loans, Schweitzer, Inc. takes advantage of the many payroll and accounting services, as well as electronic banking solutions, such as Remote Deposit Capture, Positive Pay, ACH services, Business Bill Pay, and PayCards.
“Southern is based out of a small community in our region and that personal touch meant a lot to us. That’s the way we do business...”
-Tom Beuchler
(Pictured left to right): Lisa Walker, Assistant Vice President/Branch Manager; Deb Davis, Vice President/Commercial Loan Officer; John Castle, Chairman and CEO; and Kurt Miller, President of Southern Michigan Bank & Trust meet with Drew Schweitzer, Vice President/COO, and Tom Beuchler, President and CEO of Schweitzer, Inc. in their board room.

2017 ANNUAL REPORT
FINANCIAL SUMMARY
FOR THE YEAR
Net interest income Provision for loan lossesNon-interest incomeNon-interest expenseNet income
PER SHARE
Basic earningsDiluted earningsCash dividends declared
AT YEAR END
AssetsGross loansAllowance for loan lossDepositsOther borrowingsShareholders’ equity
RATIOS
Return on average assetsReturn on average equityTotal risk-based capital ratioALLL as percentage of loans
Southern Michigan Bancorp, Inc. is a bank holding company. The Company’s wholly-owned subsidiary, Southern Michigan Bank & Trust (SMB&T) offers individuals, businesses, institutions and governmental agencies a full range of commercial banking services primarily in the southern Michigan communities in which they are located and in areas immediately surrounding these communities.
2017
$22,583,000175,000
6,408,00020,353,000
5,421,000
$2.302.290.83
$712,345,000523,447,000
5,009,000577,144,00039,500,00070,037,000
0.80%7.64%
11.08%0.96%
2016
$20,217,000 100,000
6,851,000 18,736,000 6,097,000
$2.542.540.76
$641,532,000449,815,000
4,842,000535,845,000
10,200,00070,131,000
1.00%8.69%
12.69%1.08%

10
Record High Year-End Total Assets
$712,345,000
Dividends Per Share/Yield
$0.83/2.24%
Record Loan Assets
$523,447,000
2013-2017 Dividend CompoundAnnual Growth Rate
17.54%
Record Deposits
$577,144,000
158.29%
SOMC 5-Year
Total Return

2017 ANNUAL REPORT
FINANCIAL SUMMARY
Total Assets
$500
$600
$700
$800
$539.5
2013Y 2014Y 2015Y 2016Y 2017Y
$543.3
$582.8
$641.5
$712.3
Total Loans
$386.0$410.1 $422.0
$449.8
$523.4
2013Y 2014Y 2015Y 2016Y 2017Y$300
$400
$500
$600
Total Deposits
$450.4 $444.3
$477.5
$535.8
$577.1
2013Y 2014Y 2015Y 2016Y 2017Y$400
$450
$550
$500
$600
Note: Data in $ millions
Note: Data in $ millions(excludes loans held for sale)
Note: Data in $ millions

12
Non-Performing Assets
2013Y 2014Y 2015Y 2016Y 2017Y
1.87%
1.58%
1.12%
0.46%0.32%
0.0%
0.5%
1.0%
1.5%
2.0%
SOMC Stock Price
2013Y 2014Y 2015Y 2016Y 2017Y
$17.70
$21.05
$25.35
$29.90
$37.10
$15.00
$20.00
$25.00
$30.00
$35.00
$40.00
Texas Ratio
2013Y 2014Y 2015Y 2016Y 2017Y
19.01%
15.04%
10.52%
4.60%2.87%
0%
5%
10%
15%
20%
(Nonaccrual Loans + 90 days past due + Restructured Loans +Other Real Estate Owned) /Total Assets
The Texas Ratio is determined by dividing the bank’s non-performing assets by its tangible equity plus loan loss reserves.
Southern’s low Texas Ratio indicates our financial strength and ability to absorb future losses.
End of the year Stock Price

2017 ANNUAL REPORT
John H. CastleChairman /
Chief Executive Officer
Kurt G. MillerPresident /
Chief Credit Officer
Nicholas M. GrabowskiExecutive Vice President /
Head of Lending
Danice L. ChartrandSenior Vice President /Chief Financial Officer
SMB AND SMB&T EXECUTIVE STAFF
HONORARY DIRECTORSJohn S. CartonJames T. GrohalskiThomas D. MeyerJane L. Randall
SMB AND SMB&T BOARD OF DIRECTORS
Dean CalhounCalhoun Corporation
John H. CastleChairman / Chief Executive
Officer of SMB, Inc. and SMB&T
Charles James Scott ClarkClark Logic
H. Kenneth ColeRetired Executive
Patrick H. FlanneryHillsdale College
Kurt G. MillerPresident / Chief Credit Officer
of SMB, Inc. and SMB&T
Freeman E. RiddleRetired Executive
Gary H. HartRetired Executive
Thomas E. KolassaRetired Executive
Brian P. McConnellBurr Oak Tool, Inc.
Nolan E. (Rick) HookerBest American Car Washes
Gregory J. HullFarmer

14
SMB&T OFFICERSCOMMERCIAL LOANSSarah HeadleyRegional Vice President /Commercial Loan Manager
Doug KiesslingRegional Vice President /Commercial Loan Manager
Tom SwoishRegional Vice President /Commercial Loan Manager
Deborah DavisVice President
Corey DonnerVice President
Rachel DotyVice President
Adam LosinskiVice President
Greg MillerVice President
James SobeskeVice President
RETAIL LOANSPhyllis WingateVice President / Head of RetailLoan Operations
DeAnne HawleyAssistant Vice President
Shari KlineAssistant Vice President
Diane KrimmelAssistant Vice President
Lori LemmonAssistant Vice President
Cassidy MunnAssistant Vice President
Tina MackAssistant Vice President /Retail Loan Operations Manager
Desiree KauffmanLoan Operations Specialist
Connie CaudillAssistant Vice President / Senior Collections Manager
Lynn RoperSecondary Market /Loan Servicing Officer
ANGOLA, INLENDING OFFICEKristie PraterAssistant Vice President
RETAIL BANKINGEric AnglinFirst Vice President ofRetail Banking Services /Chief Deposit Officer
Lori NeillAssistant Vice PresidentRetail BankingOperations Manager
COLDWATER MAIN &EAST CHICAGO BRANCHESDeb LarrBranch Manager
BATTLE CREEK BRANCHLisa WalkerAssistant Vice President /Branch Manager
MARSHALL BRANCHKara MeadVice President / Commercial Loan Officer /Branch Manager
HILLSDALE & CAMDEN BRANCHESJennifer CristRegional Branch Manager
UNION CITY BRANCHTim FoxAssistant Vice President / Branch Manager / Retail Loan Officer
TEKONSHA BRANCHDawn CopasBranch Manager
CENTREVILLE & CONSTANTINE BRANCHESTina CronkhiteAssistant Vice President /Regional Branch Manager
MENDON BRANCHDoreen TobinAssistant Vice President /Branch Manager
THREE RIVERS BRANCHSharon BachinskiAssistant Vice President / Branch Manager
PORTAGE BRANCHCammy FleckensteinBranch Manager
PORTAGE TRADE CENTRETimothy KilmartinKalamazoo Regional President
Thomas SchlueterVice President of Market Development
Mary MarshallVice President /Investment Officer
Joseph SpoerlVice President /Investment Officer
eSERVICESLaurel WalkupVice President /Business eServices Manager
FINANCEKevin VaughnFirst Vice President of Finance
INFORMATIONTECHNOLOGYJoseph DukeNetwork Administrator
MARKETINGQuinn WhiteVice President /Head of Marketing
OPERATIONSAngie SmithFirst Vice President /Head of Operations
Becky OmoAssistant Vice President /Deposit Operations Manager
Vikki KlineCore System AdministrationOfficer
RISK MANAGEMENTPetrea SchumacherVice President /Compliance Officer
Robin TateBSA Officer
WEALTH MANAGEMENTMary GuthrieSenior Vice President /Senior Trust Officer
Matt MosesFirst Vice President /Head of Wealth Management
Melissa BarlowVice President /Senior Investment Officer
R. David Rumsey Vice President /Senior Investment Officer
Susan WhiteVice President /Trust Officer

2017 ANNUAL REPORT
SHAREHOLDER INFORMATION
ANNUAL MEETING
MARKET INFORMATION
MARKET MAKERS
The annual meeting of shareholders of Southern Michigan Bancorp, Inc. will be held on Thursday, May 10, 2018 at 4:00 p.m. local time, at the ProMedica Community Care and Conference Center, located at 370 E. Chicago Street, Coldwater, Michigan.
Inquiries regarding stock certificate administration, address changes, transfers, and other related services should be directed to:
American Stock Transfer and Trust Company, LLC
Website: www.astfinancial.comPhone: (718) 921-8124Toll Free: (800) 937-5449Email: [email protected]: 6201 15th Avenue Brooklyn, NY 11219
Boenning & ScattergoodPowell, Ohio(866) 326-8113
Stifel, Nicolaus & Company, Inc.Grand Rapids, Michigan(800) 676-0477
Hilliard Lyons, Inc.Coldwater, Michigan(517) 278-4333 or(800) 211-5257
Robert Baird & CompanyGrand Rapids, Michigan(616) 459-4491 or(800) 888-6200
Royal Securities CompanyGrand Rapids, Michigan(616) 459-2844 or(888) 804-8891

16
FORWARD-LOOKING STATEMENTS
This Southern Michigan Bancorp, Inc. Annual Report contains forward-looking statements that are based on management’s beliefs, assumptions, current expectations, estimates and projections about the financial services industry, the economy, and Southern Michigan Bancorp, Inc. Forward-looking statements are identifiable by words or phrases such as “anticipates”, “believes”, “expects”, “forecasts”, “intends”, “is likely”, “may”, “plans”, or “projects”, and variations of such words and similar expressions. Management’s determination of the provision and allowance for loan losses, the appropriate carrying value of intangible assets (including goodwill and mortgage servicing rights), deferred tax assets and other real estate owned, and the fair value of investment securities (including whether any impairment on any investment security is temporary or other-than-temporary and the amount of any impairment), involves judgments that are inherently forward-looking. All statements with references to future time periods are forward-looking. All of the information concerning interest rate sensitivity is forward-looking. These statements are not guarantees of future performance and involve certain risks, uncertainties and assumptions (“risk factors”) that are difficult to predict with regard to timing, extent, likelihood and degree of occurrence. Therefore, actual results and outcomes may materially differ from what may be expressed or forecasted in such forward-looking statements.
Risk factors may emerge and could cause a difference between an ultimate actual outcome and a preceding forward-looking statement. Southern Michigan Bancorp, Inc. undertakes no obligation to update, clarify or revise forward-looking statements whether as a result of new information, future events, or otherwise.
CONTENTSManagement Discussion and Analysis 17Management Responsibility for Financial Reporting 32Report of Independent Auditors 33 Consolidated Financial Statements 34Notes to Consolidated Financial Statements 39Selected Financial Data/Common Stock Market Prices and Dividends 73

2017 ANNUAL REPORT
Management Discussion and Analysis of Financial Condition and Results of Operations
The following discussion provides a review of the consolidated financial condition and results of operations of Southern Michigan Bancorp, Inc. (Southern) and its subsidiaries for the periods indicated. This discussion should be read in conjunction with the consolidated financial statements and related notes to the consolidated financial statements. Overview
Southern is a Michigan Corporation and registered financial holding company. Southern wholly owns Southern Michigan Bank & Trust (the Bank), Southern Michigan Bancorp Capital Trust I (a Delaware statutory trust), SMB Risk Management, Inc. (a Nevada captive insurance company), and 27 Marshall Street LLC. The Bank wholly owns SMB Financial Services, Inc., a Michigan corporation. Our business, which we conduct primarily through the Bank, is concentrated in a single industry segment – commercial banking. We offer a variety of deposit, payment, credit, and other financial services to all types of customers. These services include time, savings, and demand deposits; safe deposit box services; and, automated teller machine services. Loans, including both commercial and consumer, are extended primarily on a secured basis to corporations, partnerships, and individuals. Commercial lending covers such categories as business, industrial, agricultural, construction, inventory, and real estate. Consumer lending covers direct and indirect loans to purchasers of residential real property and consumer goods. We offer trust and investment services, which include investment management, trustee services, IRA rollovers and retirement plans, institutional and personal custody, estate settlement, wealth management, estate planning assistance, wealth transfer planning assistance, charitable gift planning assistance, and cash management custody. We operate 14 banking offices located in Battle Creek, Camden, Centreville, Coldwater, Constantine, Hillsdale, Marshall, Mendon, Portage, Tekonsha, Three Rivers, and Union City, Michigan, as well as a loan production office located in Angola, Indiana. At December 31, 2017, on a consolidated basis, we had assets of $712 million, deposits of $577 million, a net loan portfolio of $518 million, trust assets under management totaling $273 million, and shareholders’ equity of $70 million. Results of Operations Southern’s net income for 2017 was $5,421,000, compared to $6,097,000 in 2016, a decrease of $676,000, or 11.09%. Income was negatively impacted by the passage of tax reform legislation on December 22, 2017. As a result of the legislation, an income tax charge of $989,000 was recorded in the fourth quarter of 2017 after deferred tax assets and liabilities were revalued as a result of the reduction of corporate tax rates from 34% to 21%. Provision for loan losses of $175,000 was expensed in 2017, up from $100,000 in 2016. Non-interest income decreased 6.47%, or $443,000, to $6,408,000 in 2017. Non-interest expense increased 8.63%, or $1,617,000, to $20,353,000 in 2017. The following is a summary of percentage changes from the prior year for various financial statement elements:
Percent Change from Prior Year
Percent Change from Prior Year
2017 2016 2017 2016 Net interest income 11.70% 3.32% Total assets 11.04% 10.08% Provision for loan losses 75.00% -60.00% Securities available-for-sale -4.35% 13.19% Non-interest income -6.47% -6.32% Gross loans 16.37% 6.59% Non-interest expense 8.63% -0.74% Allowance for loan losses 3.45% -8.17% Federal income tax 42.48% 9.49% Deposits 7.71% 12.22% Net income -11.09% 5.01% Shareholders' equity -0.13% 3.49% Results of operations can be measured by various ratio analyses. Two widely recognized performance indicators are return on average equity and return on average assets. Southern’s return on average equity was 7.64% in 2017, 8.69% in 2016, and 8.82% in 2015. The return on average assets was 0.80% in 2017, 1.00% in 2016, and 1.02% in 2015.

18
Net Interest Income Interest income is the total amount earned on funds invested in loans, investment securities, interest bearing correspondent bank balances, and federal funds sold. Interest expense is the amount of interest paid on interest bearing checking and savings accounts, time deposits, short-term advances, subordinated debentures, and other long-term borrowings. Net interest income, on a fully taxable equivalent (FTE) basis, is the difference between interest income and interest expense, adjusted for the tax benefit received on tax-exempt loan and investment securities. Net interest margin is calculated by dividing net interest income (FTE) by average interest earning assets. Net interest spread is the difference between the average yield on interest earning assets and the average cost of interest bearing liabilities. Because non-interest bearing sources of funds also support earning assets, the net interest margin exceeds the net interest spread. The presentation of net interest income on an FTE basis is not in accordance with Generally Accepted Accounting Principles (GAAP), but is customary in the banking industry. This non-GAAP measure ensures comparability of net interest income arising from both taxable and tax-exempt loans and investment securities. The adjustments to determine tax equivalent net interest income are itemized in Table 1 on the following page. Net interest income is the most important source of Southern’s earnings. Changes in Southern’s net interest income are influenced by a number of factors, including changes in the level of interest earning assets, changes in the mix of interest earning assets and interest bearing liabilities, the level and direction of interest rates, and the steepness of the yield curve. For 2017, Southern’s net interest margin (FTE) was 3.79%, compared to 3.78% in 2016. Southern’s interest rate spread was 3.67% in 2017, compared to 3.69% in 2016. The decline in the interest spread was due to funding costs increasing at a slightly faster rate than asset yields in terms of basis point cost. Growth in interest expense from interest bearing liabilities was 55.61% in 2017, compared to 2016. This outpaced the increase in interest income from earning assets, which grew 14.77% in 2017, compared to 2016. However, given the volume of interest income in relation to interest expense, the net effect remained positive as net interest income (FTE) increased $2,395,000, compared to 2016.
For 2016, Southern’s net interest margin (FTE) was 3.78%, compared to 3.92% for 2015. Southern’s interest rate spread was 3.69%, compared to 3.83% in 2015. The decline in both the margin and the spread is attributed to declining asset yields (12 basis points) and slightly increasing funding costs (2 basis points). Growth in interest income from earning assets was 3.85% in 2016. Growth in interest expense from interest bearing liabilities increased 10.73% in 2016, compared to 2015. The net effect was an increase of $674,000 in net interest income (FTE), compared to 2015.

2017 ANNUAL REPORT
The following table presents a summary of net interest income (FTE) for 2017, 2016, and 2015.
Table 1: Average Balances and Tax Equivalent Interest Rates 2017 2016 2015 (Dollars in Thousands) Average
Balance
Interest Yield/
Rate Average
Balance Interest
Yield/ Rate
Average Balance
Interest
Yield/ Rate
ASSETS Interest earning assets: Loans(1)(2)(3) $ 480,194 $ 23,043 4.80 % $ 423,240 $ 20,085 4.75 % $ 410,867 $ 19,618 4.77 % Taxable investment securities(4) 61,984 1,183 1.91 58,753 1,023 1.74 45,850 742 1.62 Tax-exempt investment securities(1) 43,213 1,373 3.18 41,787 1,324 3.17 38,390 1,319 3.44 Federal funds sold and other(5) 28,457 318 1.12 28,969 150 0.52 21,141 65 0.31 Total interest earning assets 613,848 25,917 4.22 552,749 22,582 4.09 516,248 21,744 4.21 Non-interest earning assets: Cash and due from banks 11,777 12,287 10,877 Other assets(6) 53,263 51,124 49,192 Less allowance for loan losses (4,893 ) (5,051 ) (5,169 ) Total assets $ 673,995 $ 611,109 $ 571,148 LIABILITIES AND SHAREHOLDERS’ EQUITY
Interest bearing liabilities: Demand deposits $ 244,583 $ 529 0.22 % $ 235,647 $ 475 0.20 % $ 211,736 $ 399 0.19 % Savings deposits 83,439 47 0.06 75,090 20 0.03 71,573 36 0.05 Time deposits 105,839 1,177 1.11 88,280 789 0.89 88,271 784 0.89 Securities sold under agreements to repurchase and overnight borrowings
12,643 33 0.26
12,581 34 0.27 14,442 29 0.20
Other borrowings 25,819 647 2.51 10,070 198 1.97 10,075 127 1.26 Subordinated debentures 5,155 200 3.88 5,155 177 3.43 5,155 154 2.99 Total interest bearing liabilities(7) 477,478 2,633 0.55 426,823 1,693 0.40 401,252 1,529 0.38 Non-interest bearing liabilities: Demand deposits 118,967 108,116 97,877 Other 6,640 5,969 6,210 Shareholders’ equity 70,910 70,201 65,809 Total liabilities and shareholders’ equity
$ 673,995
$ 611,109
$ 571,148
Net interest income $ 23,284 $ 20,889 $ 20,215 Interest rate spread 3.67 % 3.69 % 3.83 % Net margin on interest earning assets 3.79 % 3.78 % 3.92 % (1) Includes tax equivalent adjustment of interest (assuming a 34% tax rate) for securities and loans of $467,000 and
$99,000, respectively, for 2017; $450,000 and $101,000, respectively, for 2016; and $442,000 and $107,000, respectively, for 2015.
(2) Average balance includes average non-accrual loan balances of $1,010,000 in 2017, $1,287,000 in 2016, and $2,211,000 in 2015.
(3) Interest income includes loan fees of $263,000 in 2017, $210,000 in 2016, and $253,000 in 2015. (4) Average balance includes average unrealized loss of $200,000 in 2017, unrealized gains of $1,207,000 in 2016,
and unrealized gains of $782,000 in 2015. (5) Includes average federal reserve deposit account balances of $19,465,000 in 2017, $2,269,000 in 2016, and
$19,563,000 in 2015. (6) Includes $13,543,000 in 2017, $13,789,000 in 2016, and $14,055,000 in 2015 relating to goodwill and other
intangible assets. (7) Interest expense on deferred compensation balances totaling $135,000, $121,000, and $98,000 for 2017, 2016,
and 2015, respectively, is excluded from interest expense.

20
The next table sets forth, for the periods indicated, a summary of changes in interest income and interest expense. The changes are based upon a tax equivalent basis resulting from changes in volume and changes in rates:
Volume Variance – change in volume multiplied by the previous year’s rate.
Rate Variance – change in rate multiplied by the previous year’s volume.
Rate/Volume Variance – change in volume multiplied by the change in rate. This variance was allocated to volume variance and rate variance in proportion to the relationship of the absolute dollar amount of the change in each.
Table 2: Changes in Tax Equivalent Net Interest Income (Dollars in Thousands) 2017 Compared to 2016
Increase (Decrease) Due To: 2016 Compared to 2015
Increase (Decrease) Due To:
Interest income on: Rate Volume Net Rate Volume Net Loans $ 227 $ 2,731 $ 2,958 $ (121 ) $ 588 $ 467 Taxable investment securities 102 58 160 60 221 281 Tax-exempt investment securities 4 45 49 (107 ) 112 5 Federal funds sold and other 171 (3) 168 55 30 85 Total interest earning assets $ 504 $ 2,831 $ 3,335 $ (113 ) $ 951 $ 838 Interest expense on: Demand deposits $ 36 $ 18 $ 54 $ 29 $ 47 $ 76 Savings deposits 25 2 27 (18 ) 2 (16 ) Time deposits 214 174 388 5 - 5 Securities sold under agreements to repurchase and overnight borrowings
(1 ) - (1 ) 9 (4 ) 5 Other borrowings 67 382 449 71 - 71 Subordinated debentures 23 - 23 23 - 23 Total interest bearing liabilities $ 364 $ 576 $ 940 $ 119 $ 45 $ 164 Net interest income $ 140 $ 2,255 $ 2,395 $ (232 ) $ 906 $ 674 Provision for Loan Losses The provision for loan losses is based on an analysis of the required additions to the allowance for loan losses. The provision is charged to income to bring the allowance for loan losses to a level believed adequate by management to absorb probable incurred losses in the loan portfolio. Some factors considered by management in determining the level at which the allowance is maintained include the following: specific credit reviews; historical loan loss experiences; current economic conditions and trends; results of examinations by regulatory agencies; and, the volume, growth, and composition of the loan portfolio. The provision is adjusted quarterly to reflect changes in the factors above, as well as actual charge-off experience and any known losses. For further information, see “Allowance for Loan Losses” below. The provision for loan losses was $175,000 in 2017, compared to $100,000 in 2016, and $250,000 in 2015. The modest increase in provision in 2017 results from the growth within the commercial loan portfolio. The majority of the other factors that influence the allowance improved.
Net loan charge-offs totaled $8,000 in 2017, compared to $531,000 in 2016, and $154,000 in 2015.

2017 ANNUAL REPORT
Non-Interest Income Total non-interest income decreased $443,000, or -6.5%, when comparing 2017 to 2016. The decrease is primarily attributed to a $297,000, or -28.4%, reduction in net gains on loan sales and a $99,000, or -97.1%, decrease in net securities gains. The decline in these areas was somewhat offset by a $109,000, or 7.0%, increase in trust fees. Total non-interest income decreased $462,000, or -6.3%, when comparing 2016 to 2015. The decrease is primarily attributed to a $482,000, or -56.1%, decrease in earnings on life insurance assets, a $176,000, or -9.9%, decrease in service charges on deposit accounts, and an $111,000, or -9.6%, decrease in net gains on loan sales. The decline in these areas was partially offset by a $291,000, or 23.1%, increase in trust fees. Net securities gains of $3,000, $102,000, and $26,000 were recognized in 2017, 2016, and 2015, respectively. The gains resulted primarily from the sale of securities to fund loan growth. In order to reduce the risk associated with changing interest rates, Southern regularly sells fixed-rate, real estate mortgage loans to the secondary market. Southern recognizes a gain at the time of the sale to the extent proceeds exceed the basis of the loan, excluding any value assigned to capitalized servicing rights. Southern originated real estate mortgage loans for sale on the secondary market of $23,592,000 in 2017, compared to $34,546,000 in 2016 and $37,444,000 in 2015. Net gains on loan sales decreased $297,000 when comparing 2017 to 2016, and decreased $111,000 when comparing 2016 to 2015.
Income and fees from automated teller machines (ATMs) and debit cards decreased $5,000, or -0.4%, when comparing 2017 to 2016, and increased $40,000, or 3.0%, when comparing 2016 to 2015. The decrease in 2017 was a result of lower ATM fees being charged to bank customers and the increase in 2016 was primarily due to higher volumes of approved transactions.
In 2016, the significant decrease in earnings on life insurance assets was due to life insurance policies paying out death benefits in excess of recorded cash values in 2015, which totaled approximately $528,000. The increase in trust fees was due to a shift to monthly billing and fee recognition, which caused fourteen months of trust fees to be recorded in 2016.
Non-Interest Expense Non-interest expense increased $1,617,000, or 8.6%, when comparing 2017 to 2016. Salary and employee benefit costs increased $1,521,000, or 14.5%, in 2017. In addition, software maintenance increased $197,000, or 18.9%, and equipment expenses increased $133,000, or 16.0%, in 2017. Additional modest increases in expenses were noted in the professional and outside services ($97,000), as well as telecommunications ($14,000) areas. ATM expenses declined $187,000, or 27.7%, when comparing 2017 to 2016. Additional, more modest expense declines included the other real estate owned ($67,000); loss or gain on the sale or write down of other real estate owned expenses ($57,000); advertising and marketing ($33,000); amortization of other intangibles ($31,000); FDIC deposit assessment ($13,000); occupancy cost ($5,000); and printing, postage, and supplies ($4,000).
Other non-interest expense increased $52,000, or 3.9%, when comparing 2017 to 2016. Three areas had the largest changes year-over-year within this category. Trust expense increased $65,000 in 2017, compared to 2016, and a significant portion of the Michigan Business Tax refund accrued in 2016 was non-recurring, and decreased $70,000 in 2017. Conversely, miscellaneous expenses declined $97,000 due to the reduction of fraudulent activity in 2017, as compared to 2016.

22
Non-interest expense decreased $139,000, or 0.7%, when comparing 2016 to 2015. Salary and employee benefit costs declined $378,000, or 3.5%, in 2016. The elimination of the employee pension plan drove up expenses in 2015. In addition, the loss on the sale or write down of other real estate owned and other real estate owned expenses decreased $248,000 and $171,000, respectively, when comparing 2016 to 2015. Finally, FDIC deposit assessments declined $97,000. Occupancy costs increased $249,000, or 22.9%, when comparing 2016 to 2015. This was partially due to the opening of the Portage, MI branch. Software maintenance expenses increased $178,000 due to additional software being utilized and the expiration of a core processing conversion credit during 2016. A $138,000 increase in ATM expenses occurred as ATM processing was converted to a new platform during the year and losses associated with ATM/debit card customer disputes increased in 2016. Professional and outside services experienced a $130,000 increase, which is mostly related to the formation of the organization’s captive insurance subsidiary, SMB Risk Management, Inc. Additional, more modest expense increases included equipment ($109,000); telecommunication ($33,000); advertising and marketing ($26,000); and, printing, postage, and supplies ($8,000) areas.
Other non-interest expense declined $104,000, or 7.2%, when comparing 2016 to 2015. The two most significant factors in the improvement was the absence of a one-time expense related to the write down of a low-income housing project that occurred in 2015, totaling $223,000. In addition, a Michigan Business Tax refund of $93,000 was accrued by the Bank in 2016. Partially offsetting the aforementioned savings was an increase in miscellaneous expenses, totaling $140,000, a significant portion of which was losses due to fraudulent activity that totaled $124,000.
Income Taxes Income tax provision was $3,042,000 in 2017, $2,135,000 in 2016, and $1,950,000 in 2015. The Tax Cuts and Jobs Act signed on December 22, 2017, reduced corporate federal tax rate from 34% to 21%, effective January 1, 2018. As a result, Southern is required to re-measure the deferred tax assets and liabilities recorded using the enacted rate at which we expect them to be recovered or settled. The effect of this re-measurement is recorded to income tax expense in the year the tax law is enacted. For 2017, the re-measurement of our net deferred tax asset resulted in additional income tax expense of $989,000.
Tax-exempt income continues to have a major impact on Southern’s tax expense. The benefit offsetting lower coupon rates on municipal instruments is the non-taxable feature of the income earned on such instruments. This resulted in a lower effective tax rate and it reduced federal income tax expense by $362,000 in 2017, $354,000 in 2016, and $354,000 in 2015. Furthermore, tax-exempt income from the captive insurance company reduced federal income tax by $239,000 in 2017 and $168,000 in 2016. Finally, tax-exempt income from earnings on life insurance assets resulted in a lower effective tax rate and reduced federal income tax expense by $127,000 in 2017, $128,000 in 2016, and $290,000 in 2015. Additional income tax information is reported in Note K to the consolidated financial statements. Financial Condition Total assets were $712,345,000 as of December 31, 2017, an increase of $70,813,000, or 11.0%, compared to December 31, 2016. Gross loans increased $73,632,000, or 16.4%, in 2017, with the growth occurring primarily in commercial real estate. The securities portfolio decreased $4,779,000, or 4.3%, in 2017, with the declines occurring in US Agencies and corporate bonds. The aforementioned loan growth was funded primarily with deposits and borrowings. Deposit volumes increased $41,299,000, or 7.7%, during 2017. The growth occurred in time deposits, non-interest bearing checking deposits, and savings deposits, while interest-bearing checking deposits and money market account deposits declined. Borrowings increased $29,300,000, or 287.3%, in 2017. The growth in borrowings was a mix between FHLB borrowings and a term loan with United Banker’s Bank.
Cash and Cash Equivalents Cash and cash equivalents at December 31, 2017, increased $1,101,000, or 6.7%, compared to balances at December 31, 2016. Cash and cash equivalents increased during 2017 due to deposit and borrowing growth, coupled with declines in investments, outpacing loan growth.

2017 ANNUAL REPORT
Federal Funds Sold
Federal funds sold totaled $18,492,000 at December 31, 2017, compared to $18,486,000 at December 31, 2016. The Bank sells excess overnight funds to its primary correspondent in lieu of maintaining the balances in interest bearing deposit accounts when there is a higher interest rate being paid by correspondents.
Securities Available-for-Sale The available-for-sale securities portfolio decreased $4,779,000, or 4.3%, from December 31, 2016, to December 31, 2017. The portfolio is monitored and securities or federal funds are purchased as deemed prudent by the Asset Liability Management Committee (ALCO). The available-for-sale securities portfolio had a net unrealized loss of $929,000 at December 31, 2017, and a net unrealized loss of $1,522,000 at December 31, 2016. Management has concluded that unrealized losses within the investment portfolio are temporary because management believes they are a result of market changes, rather than a reflection of credit quality.
At December 31, 2017, Southern had no investment in securities of issuers outside of the United States.
Loans Substantially all loans are granted to customers located in Southern’s service area, which is primarily southwest Michigan. Gross loans increased $73,632,000, or 16.4%, in 2017. Gross loans increased $27,826,000, or 6.6%, in 2016. The increases in 2017 and 2016 were primarily a result of increased loan demand in the Portage region.
Loan commitments consisting of unused credit card and home equity lines, available amounts on revolving lines of credit, and other approved loans that have not been funded were $146,784,000 and $155,137,000 at December 31, 2017, and 2016, respectively. The 2017 commitments consist of $87,191,000 in fixed-rate commitments and $59,593,000 in variable rate commitments. Nonperforming Assets Nonperforming assets include non-accrual loans, loans modified under troubled debt restructurings, accruing loans past due 90 days or more, and other real estate owned, which includes real estate acquired through foreclosures and deeds in lieu of foreclosure. A loan generally is classified as non-accrual when full collectability of principal or interest is doubtful or a loan becomes 90 days past due as to principal or interest, unless management determines that the estimated net realizable value of the collateral is sufficient to cover the principal balance and accrued interest. When interest accruals are discontinued, unpaid interest is reversed. Nonperforming loans are returned to performing status when the loan is brought current and has performed in accordance with contract terms for a period of time.
In the course of working with borrowers, Southern may choose to restructure the contractual terms of certain loans. In certain circumstances, Southern attempts to work out an alternative payment schedule with the borrower in order to optimize collectability of the loan. Any loans that are modified are reviewed by Southern to identify if a troubled debt restructuring (TDR) has occurred, which is when, for economic or legal reasons related to a borrower’s financial difficulties, Southern grants a concession to the borrower that it would not otherwise consider. Terms may be modified to fit the ability of the borrower to repay in line with its current financial status and the restructuring of the loan may include the transfer of assets from the borrower to satisfy the debt, a modification of loan terms, or a combination of the two.

24
The following table sets forth the aggregate amount of nonperforming assets in each of the following categories: December 31 2017 2016 2015 Non-accrual loans: (Dollars in thousands) Commercial and commercial real estate $ 45 $ 74 $ 1,151 Real estate mortgage 815 932 630 Consumer 16 17 46 876 1,023 1,827 Loans contractually past due 90 days or more and still on accrual: Commercial and commercial real estate (1) 105 417 991 Real estate mortgage - 23 - Consumer 6 26 - 111 466 991 Accruing loans modified under troubled debt restructurings: Commercial and commercial real estate 341 432 1,395 Real estate mortgage 893 1,007 1,321 Consumer - - - 1,234 1,439 2,716 Total nonperforming loans (2) 2,221 2,620 5,534 Other real estate owned 84 308 1,014 Total nonperforming assets $ 2,305 $ 2,928 $ 6,548 Nonperforming loans to year-end loans 0.42 % 0.58 % 1.31 % Nonperforming assets to total assets 0.32 % 0.46 % 1.12 %
(1) 2017 is net of $180,000 guarantee. (2) In 2016, one loan, totaling $308,000, is in both the 90 days past due category and the accruing loans under troubled
debt restructurings. This loan is only included once in the total nonperforming line.
The balance of non-accrual restructured loans, which is included in non-accrual loans, was $430,000 at December 31, 2017, $481,000 at December 31, 2016, and $561,000 at December 31, 2015.
Nonperforming loans are subject to continuous monitoring by management and estimated losses are specifically allocated for in the allowance for loan losses, where appropriate. Nonperforming loans decreased slightly from December 31, 2016, to December 31, 2017, and significantly from December 31, 2015, to December 31, 2016. At December 31, 2017, 2016, and 2015, Southern had loans of $2,902,000; $2,462,000; and, $4,543,000, respectively, which were considered impaired. Other real estate owned assets at December 31, 2017, totaled $84,000, a decrease of $224,000, or 72.7%, from December 31, 2016. During 2017 and 2016, loans of $190,000 and $543,000, respectively, were transferred to foreclosed assets.
In management’s evaluation of the loan portfolio risks, any significant future increases in nonperforming loans are dependent largely on the economic environment. In a deteriorating or uncertain economy, management applies assumptions that are more conservative when assessing the future prospects of borrowers and when estimating collateral values. This may result in a higher number of loans being classified as nonperforming.

2017 ANNUAL REPORT
Allowance for Loan Losses The allowance for loan losses is based on quarterly assessments of the probable estimated incurred losses inherent in the loan portfolio. The allowance is maintained at a level which, in management’s judgment, is believed adequate to absorb probable incurred loan losses in the loan portfolio. While management uses the information available to make these estimates, future adjustments to the allowance may be necessary due to economic, operating, or regulatory conditions beyond Southern’s control.
The allowance is based on two accounting standards: Accounting Standards Codification (ASC) 450-10, Accounting for Contingencies, and ASC 310-10, Accounting by Creditors for Impairment of a Loan. The methodology used relies on several key features, including historical loss experience, specific allowances for identified problem loans, and a number of other factors recommended in regulatory guidance. The historical loss component of the allowance is based on considering historical loss experience for each loan category. The component may be adjusted for significant factors that, in management’s judgment, will affect the collectability of the portfolio. The resulting loss estimate could materially differ from the losses actually incurred in the future. Specific allowances are established in cases where management has identified significant conditions or circumstances related to a specific loan credit. As of December 31, 2017, specific reserves totaled $41,000, compared to $88,000 at December 31, 2016, a decrease of $47,000, or 53.4%.
The final components of the allowance are based on management’s evaluation of conditions that are not directly measured in the historical loss component or specific allowances. The evaluation of the inherent incurred loss with respect to these conditions is subject to a higher degree of uncertainty. The conditions evaluated in connection with these components of the allowance include the following: current economic conditions; delinquency and charge-off trends; loan volume; portfolio mix; concentrations of credit; lending policies and procedures; and, lending personnel. The allowance for loan losses was $5,009,000, or 0.96% of loans, at December 31, 2017, compared to $4,842,000, or 1.08% of loans, at December 31, 2016. The allowance for loan losses at December 31, 2017, consisted of $809,000 from the historical loss experience component and specifically allocated reserves, leaving $4,200,000 from the other factors. This compares to $1,075,000 from the historical loss experience component and specifically allocated reserves and $3,767,000 from the other factors at December 31, 2016. At December 31, 2017, management was not aware of any problem loan that would have a material effect on loan delinquency or loan charge-offs. Loans are subject to continual review and are given management’s attention whenever a problem situation appears to be developing. Deposits Deposits have traditionally represented Southern’s principal funding source. Total deposits increased 7.7%, or $41,299,000, in 2017 compared to 2016; and increased 12.2%, or $58,360,000, in 2016 compared to 2015. The majority of deposits are derived from core client sources, relating to long-term relationships with local individual, business, and public clients. A small amount of brokered deposits, $2,583,000 at December 31, 2017, is maintained. In addition, the Bank originated $16,759,000 in listing service deposits during 2017. Attracting and keeping traditional deposit relationships will continue to be a focus of Southern.

26
Other Borrowings
Southern borrowed $10,000,000 in May 2017 from United Bankers Bank that was used to fund a stock repurchase and to provide a capital infusion into the Bank. The note’s rate was fixed at 4.5% with a five-year term. At December 31, 2017, $9,500,000 was outstanding on the term loan.
As another funding source, Southern obtains advances from the Federal Home Loan Bank (FHLB). The advances are secured by a blanket collateral agreement with the FHLB giving them an unperfected security interest in select 1-4 family mortgage and commercial real estate loans. FHLB advances are used as an alternative funding source to paying a premium for long-term deposits. At December 31, 2017, Southern had $30,000,000 in FHLB advances with interest rates between 1.59% and 1.93%, with a weighted average rate of 1.75%. Subordinated Debentures In March 2004, Southern Michigan Bancorp Capital Trust I, a trust formed by Southern, closed a pooled private offering of 5,000 trust preferred securities with a liquidation amount of $1,000 per security. Southern issued $5,155,000 of subordinated debentures to the trust in exchange for ownership of all of the common securities of the trust and the proceeds of the preferred securities sold by the trust. Southern is not considered the primary beneficiary of this trust, therefore the trust is not consolidated in Southern’s financial statements, but rather the subordinated debentures are shown as a liability. Southern may redeem the subordinated debentures, subject to the receipt by Southern of the proper approval of the Federal Reserve, if such approval is required under applicable capital guidelines or policies of the Federal Reserve. The subordinated debentures may be redeemed on January 7, April 7, July 7, and October 7 of each year and may occur either in whole or in integrals of $1,000 at 100% of the principal amount, plus accrued and unpaid interest. The subordinated debentures mature on April 6, 2034. The subordinated debentures are also redeemable in whole, but not in part, from time to time upon the occurrence of specific events defined within the trust indenture. Southern has the option to defer interest payments on the subordinated debentures from time to time for a period, not to exceed 20 consecutive quarterly periods. Southern’s investment in the common stock of the trust is $155,000 and is included in other assets. The $5,000,000 in trust preferred securities is included in Tier I capital (with certain limitations applicable) under current regulatory guidelines and interpretations. The trust preferred securities and subordinated debentures have a variable rate of interest equal to the three-month London Interbank Offered Rate (LIBOR), plus 2.75%. The rate at December 31, 2017, was 4.11%. Capital Resources Southern obtains funds for operating expenses and dividends to shareholders through dividends from the Bank. In general, the Bank pays only those amounts required to meet the liquidity requirements of Southern, while maintaining appropriate capital levels at the Bank. Capital is maintained at the Bank to support its current operations and projected future growth. See additional discussion under the section titled “Liquidity” below. Shareholders’ equity decreased $94,000, or 0.1%, from December 31, 2016, to December 31, 2017; and increased $2,362,000, or 3.5%, from December 31, 2015, to December 31, 2016. The slight decline in 2017 was due to Southern repurchasing common stock shares that totaled $5,031,000 in reductions to common stock and additional paid-in capital. The increases in 2016 were primarily attributable to net income offset by dividends to shareholders. The Federal Reserve Board uses capital adequacy guidelines in its examination and regulation of bank holding companies. If capital falls below minimum guidelines, a bank holding company may, among other items, be denied approval to acquire or establish additional banks or non-bank businesses.
The FDIC Improvement Act of 1991 established a system of prompt corrective action to resolve the problems of undercapitalized banks. Under this system, federal banking regulators have established five capital categories in which all institutions are placed: well capitalized, adequately capitalized, undercapitalized, significantly undercapitalized, and critically undercapitalized. The FDIC has also specified by regulation the relevant capital levels for each of the categories.

2017 ANNUAL REPORT
The FDIC is required to take specified mandatory supervisory actions and is authorized to take other discretionary actions with respect to banks in the three undercapitalized categories. The severity of the action depends upon the capital category in which a bank is placed. Subject to a narrow exception, the FDIC must generally appoint a receiver or conservator for a bank that is critically undercapitalized. A bank in any of the under-capitalized categories is required to submit an acceptable capital restoration plan to its appropriate federal banking agency. An undercapitalized bank is also generally prohibited from paying any dividends, increasing its average total assets, making acquisitions, establishing any branches, or engaging in any new line of business, except under an accepted capital restoration plan or with FDIC approval. Failure to meet capital guidelines could subject a bank to a variety of enforcement remedies, including issuance of a capital directive, the termination of deposit insurance by the FDIC, a prohibition on accepting brokered deposits, and other restrictions on its business. In addition, such a bank would generally not receive regulatory approval of any application that requires the consideration of capital adequacy, such as a branch or merger application, unless the bank could demonstrate a reasonable plan to meet the capital requirement within a reasonable time period. With the implementation of BASEL III in 2015, regulatory agencies granted banks a one-time election to determine whether the capital component created by the net unrealized gain or loss on available-for- sale securities is included in Tier 1 capital. Southern elected not to include the net unrealized gain or loss on available-for-sale investments in Tier 1 capital. Therefore, the net unrealized gain or loss is not included in the capital ratios listed in Note U to the consolidated financial statements.
As of December 31, 2017, the capital ratios of the Bank exceeded the minimum thresholds to be categorized as “well-capitalized” under applicable regulations. Note U of our consolidated financial statements provides additional information regarding our capital ratios. Liquidity Liquidity management involves the ability to meet the cash flow requirements of customers who may be either depositors wanting to withdraw funds or borrowers needing assurance that sufficient funds will be available to meet their credit needs. Southern maintains certain levels of liquid assets (the most liquid of which are cash and cash equivalents, federal funds sold, and investment securities) in order to meet these demands. Cash and equivalents, maturing loans, and investment securities are the principal sources of asset liquidity. Liquidity is monitored and closely managed by the ALCO, whose members are comprised of senior management. Southern maintains correspondent accounts with regional and national banks for various purposes. Historically, cash sufficient to meet the operating needs of the Bank’s branches is maintained at its lowest practical level. From time to time, Southern is a participant in the federal funds market. Federal funds are generally borrowed or sold for one-day periods. The average balance of federal funds sold was $6,867,000 in 2017 and $25,435,000 in 2016. During 2017 and 2016, Southern averaged $19,465,000 and $2,269,000, respectively, on deposit at the Federal Reserve. In the past, Southern has used overnight federal funds lines of credit with correspondent banks as a short-term source of liquidity. As of December 31, 2017, Southern had available an $8 million line of credit with a correspondent bank. In addition, collateral has been pledged at the Federal Reserve Bank “Discount Window”. At December 31, 2016, $2 million of securities were pledged that could be used for future borrowings. Southern also has the ability to borrow $39 million from the Federal Home Loan Bank based on collateral pledged. Southern has $76 million of unencumbered securities, which could be pledged at the Federal Home Loan Bank or Federal Reserve Discount Window to secure additional borrowing capacity. Southern’s principal source of funds to pay cash dividends is the dividends paid by the Bank from its earnings. Dividend amounts are restricted under current banking laws and regulations. Capital guidelines adopted by federal and state regulatory agencies, as well as restrictions imposed by law, limit the amount of cash dividends the Bank can pay to Southern. At December 31, 2017, using the most restrictive of these conditions, the aggregate cash dividends the Bank could pay Southern without prior regulatory approval was $12.4 million.

28
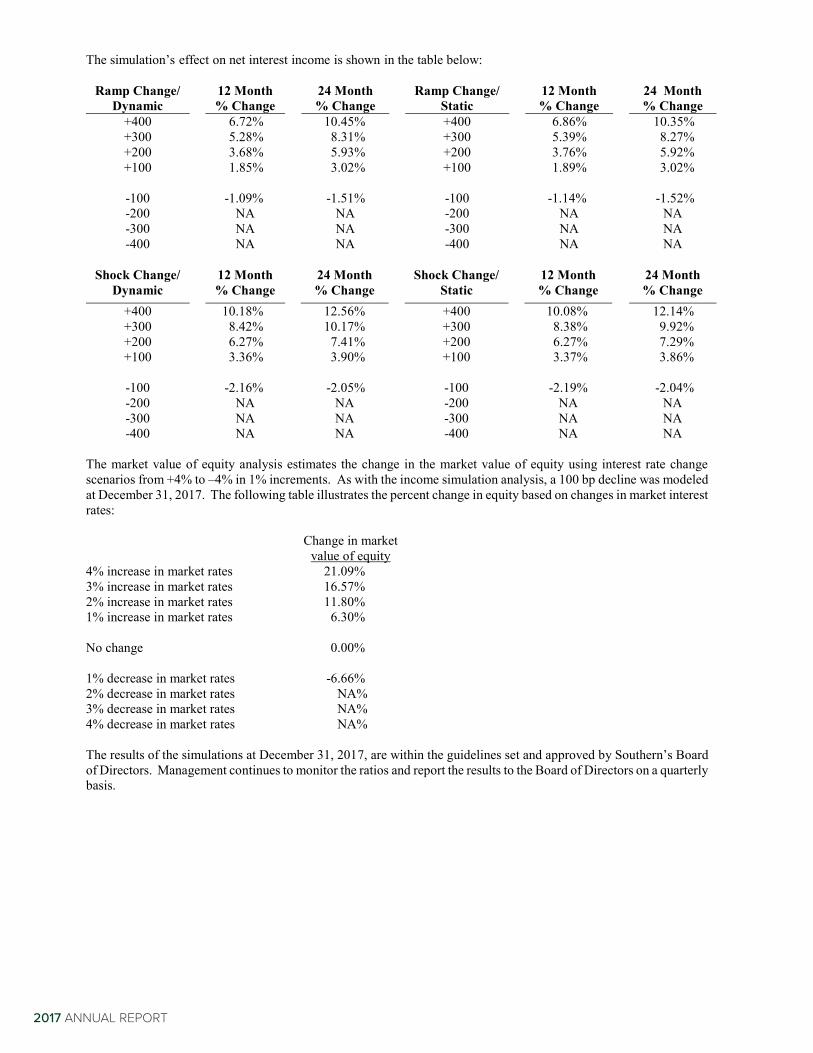
Impact of Inflation and Changing Prices The majority of assets and liabilities of a financial institution are monetary in nature and differ greatly from most commercial and industrial companies that have significant investments in fixed assets or inventories. However, inflation does have an important impact on the growth of total assets in the banking industry and the resulting need to increase equity capital at higher than normal rates in order to maintain an appropriate equity-to-assets ratio. Another significant effect of inflation is on other expenses, which tend to rise during periods of general inflation. Commitments and Off-Balance Sheet Risk Southern maintains off-balance sheet financial instruments in the normal course of business to meet the financing needs of its customers. These financial instruments include commitments to extend credit, letters of credit, and standby letters of credit. Loan commitments to extend credit are agreements to lend to customers at any time, as the customers’ needs vary, as long as there is no violation of any condition established in the contract. Letters of credit are used to facilitate customers’ trade transactions. Under standby letters of credit agreements, Southern agrees to honor certain commitments in the event that its customers are unable to do so. Commitments generally have fixed expiration dates or other termination clauses and may require payment of a fee. Because many of the commitments are expected to expire without being drawn upon, the total commitment amounts do not necessarily represent future cash requirements. At December 31, 2017, Southern had loan commitments of $146,784,000, $8,795,000 in standby letters of credit, and no commitments under commercial letters of credit outstanding. These arrangements have credit risk similar to that involved in extending loans to customers and are subject to Southern’s normal credit policies. Collateral generally consists of receivables, inventory, and equipment and is obtained based on management’s credit assessment of the customer. These financial instruments are recorded when they are funded. Interest Rate Sensitivity Net interest income is the largest component of Southern’s earnings. Net interest income is the difference between the yield on interest earning assets and the cost of interest bearing liabilities. Management of interest rate sensitivity seeks to avoid fluctuating net interest margins and enhance consistent growth of net interest income through periods of changing interest rates. Interest rate risk arises when the maturity or repricing characteristics of assets differ significantly from the maturity or repricing characteristics of liabilities. Accepting this risk can be an important source of profitability and shareholder value. However, excessive levels of interest rate risk could pose a significant threat to Southern’s earnings and capital base. Accordingly, effective risk management that maintains interest rate risk at prudent levels is essential to Southern’s safety and soundness. A number of tools are used to monitor and manage interest rate risk, including income simulation and market value of equity analyses. The income simulation model is used to estimate the effect that specific interest rate changes would have on net interest income. The changes include ramped and shocked changes of 1%, 2%, 3%, and 4% to interest rates on both a static and dynamic balance sheet over 12 and 24 month timeframes. A 1% declining scenario was also modeled at December 31, 2017. Assumptions in the simulation are based on management’s estimates, and are inherently uncertain. As a result, the models cannot predict precisely the impact of higher or lower interest rates on net interest income. All of the results from the December 31, 2017, model run are within the guidelines established by the Board of Directors.
2017 ANNUAL REPORT
The simulation’s effect on net interest income is shown in the table below:
Ramp Change/ Dynamic
12 Month % Change
24 Month % Change
Ramp Change/ Static
12 Month % Change
24 Month % Change
+400 6.72% 10.45% +400 6.86% 10.35% +300 5.28% 8.31% +300 5.39% 8.27% +200 3.68% 5.93% +200 3.76% 5.92% +100 1.85% 3.02% +100 1.89% 3.02%
-100 -1.09% -1.51% -100 -1.14% -1.52% -200 NA NA -200 NA NA -300 NA NA -300 NA NA -400 NA NA -400 NA NA
Shock Change/
Dynamic 12 Month
% Change 24 Month
% Change Shock Change/
Static 12 Month
% Change 24 Month
% Change +400 10.18% 12.56% +400 10.08% 12.14% +300 8.42% 10.17% +300 8.38% 9.92% +200 6.27% 7.41% +200 6.27% 7.29% +100 3.36% 3.90% +100 3.37% 3.86%
-100 -2.16% -2.05% -100 -2.19% -2.04% -200 NA NA -200 NA NA -300 NA NA -300 NA NA -400 NA NA -400 NA NA
The market value of equity analysis estimates the change in the market value of equity using interest rate change scenarios from +4% to –4% in 1% increments. As with the income simulation analysis, a 100 bp decline was modeled at December 31, 2017. The following table illustrates the percent change in equity based on changes in market interest rates: Change in market
value of equity
4% increase in market rates 21.09% 3% increase in market rates 16.57% 2% increase in market rates 11.80% 1% increase in market rates 6.30% No change 0.00% 1% decrease in market rates -6.66% 2% decrease in market rates NA% 3% decrease in market rates NA% 4% decrease in market rates NA% The results of the simulations at December 31, 2017, are within the guidelines set and approved by Southern’s Board of Directors. Management continues to monitor the ratios and report the results to the Board of Directors on a quarterly basis.
30
Critical Accounting Policies The discussion and analysis of the financial condition and results of operations are based upon Southern’s consolidated financial statements, which have been prepared in accordance with accounting principles generally accepted in the United States of America. The preparation of these consolidated financial statements requires Southern to make estimates and judgments that affect the reported amount of assets and liabilities, revenues and expenses, and related disclosure of contingent assets and liabilities at the date of our consolidated financial statements. Actual results may differ from these estimates under different assumptions or conditions. Critical accounting policies are defined as those that are reflective of significant judgments and uncertainties, and potentially could result in materially different results under different assumptions and conditions. A summary of significant accounting policies of Southern are detailed in Note A to the consolidated financial statements. Allowance for Loan Losses The allowance for loan losses is maintained at a level management believes is adequate to absorb probable, incurred credit losses inherent in Southern’s loan portfolio. Accounting for loan classification, accrual status, and determination of the allowance for loan losses is based on regulatory guidance. This guidance includes, but is not limited to, generally accepted accounting principles, the uniform retail credit classification and account management policy issued by the Federal Financial Institutions Examination Council, and the joint policy statement on the allowance for loan loss methodologies also issued by the Federal Financial Institutions Examination Council. Using this guidance, management estimates the allowance balance based on past loan loss experience, nature and volume of the portfolio, information about specific borrower situations and estimated collateral values, economic conditions, information in regulatory examination reports, and other factors. Many of the factors listed are inherently subjective and require the use of significant management estimates. Fair Value Measurements Southern uses fair value measurements to record certain financial instruments and to determine fair value disclosures. Available-for-sale securities are financial instruments recorded at fair value on a recurring basis. Additionally, Southern may be required to record at fair value other financial assets on a nonrecurring basis. These nonrecurring fair value adjustments typically involve write-downs of, or specific reserves against, individual assets. ASC 820-10-55 establishes a three level hierarchy for disclosure of assets and liabilities recorded at fair value. The classification of assets and liabilities within the hierarchy is based on whether the inputs to the valuation methodology used in the measurement are observable or unobservable. Observable inputs reflect market driven or market based information obtained from independent sources, while unobservable inputs reflect management estimates about market data. The degree of management judgment involved in determining the fair value of a financial instrument is dependent upon the availability of quoted market prices or observable market data. For financial instruments that trade actively and have quoted market prices or observable market data, there is minimal subjectivity involved in measuring fair value. When observable market prices and data are not fully available, management’s judgment is necessary to estimate fair value. In addition, changes in the market conditions may reduce the availability of quoted prices or observable data. When market data is not available, management uses valuation techniques that require more judgment to estimate the appropriate fair value measurement. Fair value is discussed further in Note A under the heading “Fair Values of Financial Instruments” and in Note T, “Fair Value Measurements”, of the notes to the consolidated financial statements. Mortgage Servicing Rights Mortgage servicing rights represent the allocated value of servicing loans that are sold with servicing retained by Southern. Servicing rights are expensed in proportion to, and over the period of, estimated net servicing revenues. Management’s accounting treatment of loan servicing rights is estimated utilizing a discounted cash flow model to determine the value of its servicing rights. The valuation model utilizes mortgage prepayment speeds, the remaining life of the mortgage pool, delinquency rates, our cost to service loans, and other factors to determine the cash flow that we will receive from serving each grouping of loans. These cash flows are then discounted based on current interest rate assumptions to arrive at the fair value for the right to service those loans.

2017 ANNUAL REPORT
Acquisition Intangibles Generally accepted accounting principles require a determination of the fair value of all of the assets and liabilities of an acquired entity, and a recording of their fair value on the date of acquisition. A variety of means are employed in determination of fair value, including the use of discounted cash flow analyses, market comparisons, and projected future revenue streams. Once valuations have been adjusted, the net difference between the price paid for the acquired company and the value of its balance sheet is recorded as goodwill. Goodwill is subject to an impairment analysis, performed at least annually. Southern has elected to perform its annual goodwill impairment test as of November 30 each year. No material issues were noted during December 2017 that would have impacted the analysis within the goodwill impairment test.

32
MANAGEMENT RESPONSIBILITY FOR FINANCIAL REPORTING Management of Southern has prepared and is responsible for the accompanying consolidated financial statements and for their integrity and objectivity. In the opinion of management, the financial statements, which necessarily include amounts based on management’s estimates and judgments, have been prepared in conformity with accounting principles generally accepted in the United States of America, on a consistent basis. Management also prepared the other information in the Annual Report and is responsible for its accuracy and consistency with the financial statements. Southern maintains a system of internal accounting controls designed to provide reasonable assurance that assets are safeguarded and that transactions are executed in accordance with the Southern’s authorizations and policies. Further, such a system provides reasonable assurances as to the integrity and reliability of the financial statements which fairly present financial position and results of operations in conformity with accounting principles generally accepted in the United States of America. Internal accounting controls are augmented by written policies covering standards of personal and business conduct and an organizational structure providing for division of responsibility and authority. Management monitors the effectiveness of and compliance with established control systems through a continuous program of internal audit and credit examinations and recommends possible improvements thereto. Management believes that, as of December 31, 2017, Southern’s system of internal controls has prevented or detected on a timely basis any occurrences that could be material to the financial statements and that timely corrective actions have been initiated when appropriate. The Board of Directors exercises its responsibility for the financial statements and related information through the Audit Committee, which is composed entirely of outside directors. The Audit Committee meets regularly with management and CliftonLarsonAllen LLP. CliftonLarsonAllen LLP has direct and confidential access to the Audit Committee to discuss the results of their audit. The 2017 consolidated financial statements have been audited by the independent accounting firm of CliftonLarsonAllen LLP, which was given unrestricted access to all financial records and related data, including minutes of all meetings of shareholders, the Board of Directors, and committees of the Board. Management believes that all representations made to the independent auditors during their audit were valid and appropriate. CliftonLarsonAllen LLP’s Auditor’s Report is presented on the following page. John H. Castle Chairman and Chief Executive Officer
Danice L. Chartrand Chief Financial Officer
February 16, 2018

2017 ANNUAL REPORT
CliftonLarsonAllen LLP CLAconnect.com
SOUTHERN MICHIGAN BANCORP, INC.REPORT OF INDEPENDENT AUDITORS
Shareholders and Board of DirectorsSouthern Michigan Bancorp, Inc.Coldwater, Michigan
We have audited the accompanying consolidated financial statements of Southern Michigan Bancorp, Inc. and its subsidiaries, which comprise the consolidated balance sheets as of December 31, 2017 and 2016, and the related consolidated statements of income, comprehensive income, changes in shareholders’ equity and cash flows for each of the three years in the period ended December 31, 2017, and the related notes to the consolidated financial statements.
Management’s Responsibility for the Financial Statements
Management is responsible for the preparation and fair presentation of these consolidated financial statements in accordance with accounting principles generally accepted in the United States of America; this includes the design, implementation, and maintenance of internal control relevant to the preparation and fair presentation of consolidated financial statements that are free from material misstatement, whether due to fraud or error.
Auditors’ Responsibility
Our responsibility is to express an opinion on these consolidated financial statements based on our audits. We conducted our audits in accordance with auditing standards generally accepted in the United States of America. Those standards require that we plan and perform the audit to obtain reasonable assurance about whether the consolidated financial statements are free of material misstatement.
An audit involves performing procedures to obtain audit evidence about the amounts and disclosures in the consolidated financial statements. The procedures selected depend on the auditors’ judgment, including the assessment of the risks of material misstatement of the consolidated financial statements, whether due to fraud or error. In making those risk assessments, the auditor considers internal control relevant to the entity’s preparation and fair presentation of the consolidated financial statements in order to design audit procedures that are appropriate in the circumstances, but not for the purpose of expressing an opinion on the effectiveness of the entity’s internal control. Accordingly, we express no such opinion. An audit also includes evaluating the appropriateness of accounting policies used and the reasonableness of significant accounting estimates made by management, as well as evaluating the overall presentation of the consolidated financial statements.
We believe that the audit evidence we have obtained is sufficient and appropriate to provide a basis for our audit opinion.
Opinion
In our opinion, the consolidated financial statements referred to above present fairly, in all material respects, the financial position of Southern Michigan Bancorp, Inc. and its subsidiaries as of December 31, 2017 and 2016, and the results of their operations and their cash flows for each of the three years in the period ended December 31, 2017in accordance with accounting principles generally accepted in the United States of America.
aCliftonLarsonAllen LLP
Toledo, OhioMarch 6, 2018

34
SOUTHERN MICHIGAN BANCORP, INC. CONSOLIDATED BALANCE SHEETS (In thousands, except share data) December 31, 2017 2016 ASSETS Cash $ 4,177 $ 3,966 Due from banks 13,244 12,354 Cash and cash equivalents 17,421 16,320 Federal funds sold 18,492 18,486 Securities available-for-sale 105,184 109,963 Loans held for sale 515 84 Loans, net of allowance for loan losses of $5,009 – 2017 ($4,842 – 2016) 518,438 444,973 Premises and equipment, net 14,265 12,798 Accrued interest receivable 3,211 2,871 Cash surrender value of life insurance 14,796 14,422 Goodwill 13,422 13,422 Other intangible assets, net - 229 Other assets 6,601 7,964 Total Assets $ 712,345 $ 641,532 LIABILITIES AND SHAREHOLDERS’ EQUITY Liabilities: Deposits Non-interest bearing $ 129,098 $ 107,410 Interest bearing 448,046 428,435 Total deposits 577,144 535,845 Securities sold under agreements to repurchase and overnight borrowings
13,950
13,311
Accrued expenses and other liabilities 6,559 6,890 Other borrowings 39,500 10,200 Subordinated debentures 5,155 5,155 Total Liabilities 642,308 571,401 Shareholders’ Equity: Preferred stock, 100,000 shares authorized; none issued or outstanding - - Common stock, $2.50 par value: Authorized – 4,000,000 shares Issued and outstanding – 2,316,779 shares in 2017 (2,406,538 shares in 2016) 5,787 6,011 Additional paid-in capital 15,415 19,246 Retained earnings 49,747 46,282 Accumulated other comprehensive loss, net (613 ) (1,004 ) Unearned Employee Stock Ownership Plan (ESOP) shares (299 ) (404 ) Total Shareholders’ Equity 70,037 70,131 Total Liabilities and Shareholders’ Equity $ 712,345 $ 641,532 The accompanying notes are an integral part of the consolidated financial statements.

2017 ANNUAL REPORT
SOUTHERN MICHIGAN BANCORP, INC. CONSOLIDATED STATEMENTS OF INCOME (In thousands, except per share data) Year Ended December 31, 2017 2016 2015 Interest income: Loans, including fees $ 22,944 $ 19,984 $ 19,511 Securities: Taxable 1,183 1,023 742 Tax-exempt 906 874 877 Other 318 150 65 Total interest income 25,351 22,031 21,195 Interest expense: Deposits 1,753 1,284 1,218 Other 1,015 530 409 Total interest expense 2,768 1,814 1,627 Net Interest Income 22,583 20,217 19,568 Provision for loan losses 175 100 250 Net Interest Income After Provision for Loan Losses 22,408 20,117 19,318 Non-interest income: Service charges on deposit accounts 1,642 1,594 1,770 Trust fees 1,658 1,549 1,258 Net securities gains 3 102 26 Net gains on loan sales 749 1,046 1,157 Earnings on life insurance assets 374 377 859 ATM and debit card fee income 1,374 1,379 1,339 Other 608 804 904 Total non-interest income 6,408 6,851 7,313 Non-interest expense: Salaries and employee benefits 12,050 10,529 10,907 Occupancy, net 1,330 1,335 1,086 Equipment 967 834 725 Printing, postage, and supplies 421 425 417 Telecommunication 297 283 250 Professional and outside services 1,375 1,278 1,148 Software maintenance 1,240 1,043 865 Amortization of other intangibles 229 260 272 ATM expenses 489 676 538 Advertising and marketing 317 350 324 FDIC deposit assessments 219 232 329 Other real estate owned expenses 39 106 277 (Gain)/loss on sale or write down of other real estate owned (10 ) 47 295 Other 1,390 1,338 1,442 Total non-interest expense 20,353 18,736 18,875 Income before income taxes 8,463 8,232 7,756 Income tax provision 3,042 2,135 1,950 Net Income $ 5,421 $ 6,097 $ 5,806 Basic Earnings Per Common Share $ 2.30 $ 2.54 $ 2.42 Diluted Earnings Per Common Share $ 2.29 $ 2.54 $ 2.42 The accompanying notes are an integral part of the consolidated financial statements.

36
SOUTHERN MICHIGAN BANCORP, INC. CONSOLIDATED STATEMENTS OF COMPREHENSIVE INCOME (In thousands) Year Ended December 31, 2017 2016 2015 Net Income $ 5,421 $ 6,097 $ 5,806 Other Comprehensive Income (Loss): Unrealized gain (loss) on available-for-sale securities 596 (2,047 ) 410 Accrued pension liability - - 558 Reclassification adjustments for net realized securities gains included in net income (3 ) (102 ) (26 ) 593 (2,149 ) 942 Income tax effect (202 ) 731 320 Other comprehensive income (loss) 391 (1,418 ) 622 Total Comprehensive Income $ 5,812 $ 4,679 $ 6,428 The accompanying notes are an integral part of the consolidated financial statements.

2017 ANNUAL REPORT
SOUTHERN MICHIGAN BANCORP, INC. CONSOLIDATED STATEMENTS OF CHANGES IN SHAREHOLDERS’ EQUITY (In thousands, except number of shares and per share data) Years Ended December 31, 2017, 2016, and 2015:
Common Stock
Additional Paid-In Capital
Retained Earnings
Accumulated Other
Comprehensive Income
(Loss), Net
Unearned ESOP Shares
Total
Balance at January 1, 2015 $ 6,005 $ 19,622 $ 37,741 $ (208 ) $ - $ 63,160 Net income for 2015 5,806 5,806 Net change in other comprehensive income items 622 622 Cash dividends declared – $.63 per share (1,518 ) (1,518 ) Issuance of restricted stock (17,050 shares of common stock at $21.05 per share)
43 (43 )
-
Vesting of restricted stock 265 265 Stock options exercised (42,486 shares) 106 761 867 Tax benefit from exercise of stock options 127 127 Repurchase of common stock (57,497 shares) (143 ) (1,185 ) (1,328 ) Increase in ESOP obligation (257 ) (257 ) Stock option expense 25 25 Balance at December 31, 2015 6,011 19,572 42,029 414 (257 ) 67,769 Net income for 2016 6,097 6,097 Net change in other comprehensive income item (1,418 ) (1,418 ) Cash dividends declared – $.76 per share (1,844 ) (1,844 ) Issuance of restricted stock (19,900 shares of common stock at $25.25 per share)
50 (50 )
-
Vesting of restricted stock 344 344 Restricted stock forfeiture (1 ) 1 - Stock options exercised (75,935 shares) 190 1,595 1,785 Tax benefit from exercise of stock options 25 25 Repurchase of common stock (95,425 shares) (239 ) (2,276 ) (2,515 ) Net increase in ESOP obligation (147 ) (147 ) Stock option expense 35 35 Balance at December 31, 2016 6,011 19,246 46,282 (1,004 ) (404 ) 70,131 Net income for 2017 5,421 5,421 Net change in other comprehensive income item 391 391 Cash dividends declared – $.83 per share (1,956 ) (1,956 ) Issuance of restricted stock (66,000 shares of common stock at $29.90 per share)
165 (165 )
-
Vesting of restricted stock 689 689 Restricted stock forfeiture (5 ) 5 - Stock options exercised (10,425 shares) 26 215 241 Repurchase of common stock (163,965 shares) (410 ) (4,621 ) (5,031 ) Net decrease in ESOP obligation 105 105 Stock option expense 46 46 Balance at December 31, 2017 $ 5,787 $ 15,415 $ 49,747 $ (613 ) $ (299 ) $ 70,037 The accompanying notes are an integral part of the consolidated financial statements.

38
SOUTHERN MICHIGAN BANCORP, INC. CONSOLIDATED STATEMENTS OF CASH FLOWS (In thousands) Year ended December 31, 2017 2016 2015 Operating Activities Net income $ 5,421 $ 6,097 $ 5,806 Adjustments to reconcile net income to net cash from operating activities: Provision for loan losses 175 100 250 Depreciation of premises and equipment 1,052 989 815 Deferred income taxes 938 447 (494 ) Amortization of other intangible assets 229 260 272 Net amortization of available-for-sale securities 476 652 518 Stock option and restricted stock grant compensation expense 735 379 290 Net gains on security calls and sales (3 ) (102 ) (26 ) Loans originated for sale (23,592 ) (34,546 ) (37,444 ) Proceeds on loans sold 23,910 35,836 38,756 Net gains on loan sales (749 ) (1,046 ) (1,157 ) Gain on life insurance proceeds - - (528 ) Net (gain) loss from sale or write down of other real estate owned (10 ) 47 295 Net gain/(loss) on disposal of premises and equipment 41 (34 ) - Net change in obligation under ESOP 105 62 62 Net change in: Accrued interest receivable (340 ) (354 ) (139 ) Cash surrender value (374 ) (377 ) (331 ) Other assets (756 ) (1,288 ) 405 Accrued expenses and other liabilities (326 ) 389 964 Net cash from operating activities 6,932 7,511 8,314 Investing Activities Activity in available-for-sale securities: Proceeds on securities sold 7,058 7,592 1,659 Proceeds from maturities and calls 11,717 32,927 13,857 Purchases (13,876 ) (56,031 ) (39,895 ) Net change in federal funds sold (6 ) (11,545 ) (6,694 ) Loan originations and payments, net (73,830 ) (28,900 ) (12,590 ) Proceeds from sale of other real estate owned 424 1,201 2,409 Purchase of Federal Home Loan Bank stock 755 - - Purchase of life insurance - (2,106 ) (1,132 ) Proceeds from life insurance - - 1,351 Proceeds from sale of equipment 274 46 - Proceeds from sale of restricted stock - - 196 Additions to premises and equipment (2,834 ) (1,114 ) (1,602 ) Net cash from investing activities (70,318 ) (57,930 ) (42,441 ) Financing Activities Net change in deposits 41,299 58,360 33,215 Net change in securities sold under agreements to repurchase and overnight borrowings 639 (2,632 ) 1,299 Proceeds from other borrowings 40,000 200 10,319 Repayments of other borrowings (10,700 ) - (10,319 ) Stock options exercised 241 1,785 867 Purchase of ESOP shares - (209 ) (319 ) Cash dividends paid (1,961 ) (1,737 ) (1,494 ) Repurchase of common stock (5,031 ) (2,515 ) (1,328 ) Net cash from financing activities 64,487 53,252 32,240 Net Change in Cash and Cash Equivalents 1,101 2,833 (1,887 ) Beginning cash and cash equivalents 16,320 13,487 15,374 Ending Cash and Cash Equivalents $ 17,421 $ 16,320 $ 13,487 The accompanying notes are an integral part of the consolidated financial statements.
2017 ANNUAL REPORT
SOUTHERN MICHIGAN BANCORP, INC. NOTES TO CONSOLIDATED FINANCIAL STATEMENTS NOTE A – NATURE OF OPERATIONS AND SIGNIFICANT ACCOUNTING POLICIES Nature of Operations and Industry Segments: Southern Michigan Bancorp, Inc. (the Company) is a Michigan corporation and registered financial holding company. The Company’s principal activity is the ownership and management of its wholly-owned subsidiary bank, Southern Michigan Bank & Trust (the Bank). The Bank offers individuals, businesses, institutions, and government agencies a full range of commercial banking services primarily in the southwest Michigan communities in which the Bank is located and in areas immediately surrounding these communities. The Bank makes commercial and consumer loans to customers. The majority of loans are secured by business assets, commercial and residential real estate, and consumer assets. There are no foreign loans. Principles of Consolidation: The consolidated financial statements include the accounts of the Company and its wholly-owned subsidiaries, SMB Risk Management, Inc., 27 Marshall Street, LLC, and the Bank. The Bank owns SMB Financial Services, Inc., which conducts a brokerage business. On November 18, 2015, 27 Marshall Street, LLC was formed as a wholly-owned subsidiary of the Company. On May 31, 2016, SMB Risk Management, Inc., a captive insurance company incorporated in Nevada, was formed as a wholly-owned subsidiary of the Company. During 2004, the Company formed a special purpose trust, Southern Michigan Bancorp Capital Trust I, for the sole purpose of issuing trust preferred securities. Under generally accepted accounting principles, the trust is not consolidated into the financial statements of the Company. All inter-company transactions and balances are eliminated in consolidation. Use of Estimates: The preparation of financial statements in conformity with accounting principles generally accepted in the United States of America requires management to make estimates and assumptions that affect the reported amounts of assets, liabilities and disclosure of contingent liabilities at the date of the financial statements and the reported amounts of revenues and expenses during the reporting period. Actual results could differ from those estimates. Estimates that are more susceptible to change in the near term include the allowance for loan losses, deferred tax assets, fair values of securities, and other financial instruments. Securities: Management determines the appropriate classification of securities at the time of purchase. If management has the intent and the Company has the ability at the time of purchase to hold securities until maturity, they are classified as held to maturity and carried at amortized historical cost. Securities to be held for indefinite periods of time and not intended to be held to maturity are classified as available-for-sale and carried at fair value, with unrealized gains and losses reported in other comprehensive income or loss, net of tax. Securities classified as available-for-sale include securities that management intends to use as part of its asset/liability management strategy and that may be sold in response to changes in interest rates, prepayment risk, and other factors. Premiums and discounts on securities are recognized in interest income using the level yield method over the estimated life of the security. Gains and losses on the sale of available-for-sale securities are determined using the specific identification method. Securities are written down to fair value and reflected as a loss when a decline in fair value is not temporary. In estimating other than temporary losses, management considers: (1) the length of time and extent that fair value has been less than cost, (2) the financial condition and near term prospects of the issuer, and (3) the fact that the Company has the intention and the ability to hold the security to maturity. Loans Held for Sale: Loans held for sale are reported at the lower of cost or market value in the aggregate. Net unrealized losses are recorded in a valuation allowance by charges to income. Loans: Loans are reported at the principal balance outstanding, net of unearned interest, deferred loan fees and costs, and an allowance for loan losses. Interest income is reported on the interest method and includes amortization of net deferred loan fees and costs over the loan term. Interest income is not reported when full loan repayment is in doubt, typically when payments are past due over 90 days, unless the loan is both well secured and in the process of collection. Past due status is based on the contractual terms of the loan. All interest accrued but not received for these loans is reversed against interest income. Payments received on such loans are reported as principal reductions until qualifying for return to accrual. Loans are returned to accrual status when all the principal and interest contractually due are brought current and future payments are reasonably assured.

40
SOUTHERN MICHIGAN BANCORP, INC. NOTES TO CONSOLIDATED FINANCIAL STATEMENTS (CONTINUED) NOTE A – NATURE OF OPERATIONS AND SIGNIFICANT ACCOUNTING POLICIES (CONTINUED) Allowance for Loan Losses: The allowance for loan losses is a valuation allowance for probable incurred credit losses, increased by the provision for loan losses and decreased by charge-offs net of recoveries. Estimating the risk of loss and the amount of loss on any loan is necessarily subjective. Management estimates the allowance balance based on past loan loss experience, nature and volume of the portfolio, information about specific borrower situations and estimated collateral values, economic conditions, information in regulatory examination reports, and other factors. Allocations of the allowance may be made for specific loans, but the entire allowance is available for any loan that, in management’s judgment, should be charged off. Loan losses are charged against the allowance when management believes the uncollectibility of a loan balance is confirmed. The allowance consists of specific and general components. The specific component relates to loans that are individually classified as impaired. Loans are considered impaired when full contractual payment under the loan terms is not expected. Impairment is measured in total for smaller-balance loans of similar nature, such as residential mortgage and consumer loans, and on an individual loan basis for other loans. If a loan is determined to be impaired, a portion of the allowance is allocated so that the loan is reported, net, at the present value of estimated future cash flows using the loan’s effective interest rate or at the fair value of collateral if repayment is collateral dependent. Loans are evaluated as potentially impaired when payments are delayed, typically 90 days or more, or when it is probable, in the judgment of management, that all principal and interest amounts will not be collected according to the original terms of the loan. Consumer loans are typically charged off no later than when they become 120 days past due. Real estate mortgage loans in the process of collection are charged-off on or before they become 365 days past due. Commercial loans are charged off promptly upon the determination that all or a portion of any loan balance is uncollectible. In all cases, loans are placed on nonaccrual status or charged off at an earlier date if collection of principal or interest is considered doubtful. Under certain circumstances, the Bank may provide borrowers relief through loan restructurings. A restructuring of debt constitutes a troubled debt restructuring (TDR) if the Bank, for economic or legal reasons related to the borrower’s financial difficulties, grants a concession to the borrower that it would not otherwise consider. Concessions may include reduction of interest rates, extension of maturity dates, forgiveness of principal or interest due, or acceptance of other assets in full or partial satisfaction of the debt. TDR loans typically present an elevated level of credit risk, as the borrowers are not able to perform according to the original contractual terms. Loans that are reported as TDRs are considered impaired and measured for impairment, as previously described. TDR loans that have performed as agreed under the restructured terms for a period of 12 months or longer may cease to be reported as a TDR loan. However, the loan continues to be individually evaluated for impairment. Premises and Equipment: Premises and equipment are stated at cost, less accumulated depreciation. Depreciation is computed principally using straight line or accelerated methods over their estimated useful lives. The estimated useful lives are 10 to 40 years for buildings and improvements, and 3 to 10 years for furniture and equipment. These assets are reviewed for impairment when events indicate their carrying amount may not be recoverable from future undiscounted cash flows. Maintenance, repairs, and minor alterations are charged to current operations as expenditures occur. Major improvements are capitalized. Land is carried at cost. Mortgage Servicing Rights: Mortgage servicing rights, included in other assets, represent the allocated fair value of mortgage servicing rights retained on loans sold. Mortgage servicing rights are amortized to expense in proportion to, and over the period of, estimated net servicing revenues. Impairment is evaluated based on the fair value of the rights, using groupings of the underlying loans as to interest rates and then, secondarily, as to geographic and prepayment characteristics. Any impairment of a grouping is reported as a valuation allowance.

2017 ANNUAL REPORT
SOUTHERN MICHIGAN BANCORP, INC. NOTES TO CONSOLIDATED FINANCIAL STATEMENTS (CONTINUED) NOTE A – NATURE OF OPERATIONS AND SIGNIFICANT ACCOUNTING POLICIES (CONTINUED) Transfers of Financial Assets: Transfers of financial assets are accounted for as sales, when control over the assets has been surrendered. Control over transferred assets is deemed to be surrendered when (1) the assets have been isolated from the Bank; (2) the transferee obtains the right (free of conditions that constrain it from taking advantage of that right) to pledge or exchange the transferred assets; and (3) the Bank does not maintain effective control over the transferred assets through an agreement to repurchase them before their maturity. The transfer of a participating interest in a financial asset must have all of the following characteristics: (1) from the date of transfer, it must represent a proportionate ownership interest in the financial asset; (2) from the date of transfer, all cash flows received, except cash flows allocated as compensation for servicing or other services performed, must be divided proportionately among participating interest holders in the amount equal to their share ownership; (3) the rights of each participating interest holder must have the same priority; and (4) no party has the right to pledge or change the entire financial asset unless all participating interest holders agree to do so. Cash Surrender Value of Life Insurance: The Bank has purchased life insurance policies on certain key executives. Bank-owned life insurance is recorded at its net cash surrender value, or the amount that can be realized. Goodwill and Other Intangible Assets: Goodwill resulting from acquisitions is not amortized, but is tested for impairment annually. As part of its testing, the Company first assesses the qualitative factors to determine whether it is more likely than not that the fair value of a reporting unit is less than its carrying amount. If the Company determines the fair value of a reporting unit is less than its carrying amount using these qualitative factors, the Company compares the fair value of the goodwill with its carrying amount, and then measures impairment loss by comparing the implied fair value of goodwill with the carrying amount of that goodwill. Significant judgment is applied when goodwill is assessed for impairment. If qualitative factors indicate the potential for impairment, then further analysis includes developing cash flow projections, selecting appropriate discount rates, identifying relevant market comparables, incorporating general economic and market conditions, and selecting an appropriate control premium. At December 31, 2017, the Company believes the Bank does not have any indicators of potential impairment. Intangible assets with definite useful lives are amortized over their estimated useful lives to their estimated residual values. Goodwill is the only intangible asset with an indefinite life on the Company’s balance sheet. Other intangible assets consist of core deposit intangible assets arising from past acquisitions. They are initially measured at fair value and then amortized on an accelerated method over their estimated useful lives, which is 10 years. Other Real Estate Owned: Other real estate owned was $84,000 and $308,000 at December 31, 2017, and 2016, respectively, and is included in other assets. Other real estate owned is comprised of properties acquired through a foreclosure proceeding or acceptance of a deed in lieu of foreclosure. These properties are initially recorded at fair value, less estimated cost to sell at the date of foreclosure, establishing a new cost basis. After foreclosure, valuations are periodically performed by management, and other real estate owned is carried at the lower of carrying amount or fair value, less estimated cost to sell. Expenses, gains and losses on disposition, and reductions in carrying value are reported as non-interest expense. Stock Based Compensation: The Company follows the requirements of “share-based payment transactions”, using the modified prospective transition method. Under this method, the Company recognizes compensation cost for stock based compensation for all new or modified grants. See Note M regarding the various assumptions used in computing the compensation expense. Advertising Costs: Advertising costs are expensed as incurred.

42
SOUTHERN MICHIGAN BANCORP, INC. NOTES TO CONSOLIDATED FINANCIAL STATEMENTS (CONTINUED) NOTE A – NATURE OF OPERATIONS AND SIGNIFICANT ACCOUNTING POLICIES (CONTINUED) Income Taxes: The income tax provision is the total of the current year income tax due or refundable and the change in deferred tax assets and liabilities. Deferred tax assets and liabilities are the expected future tax amounts for the temporary differences between carrying amounts and tax bases of assets and liabilities, computed using enacted tax rates. A valuation allowance, if needed, reduces deferred tax assets to the amount expected to be realized. Benefits from tax positions taken or expected to be taken in a tax return are not recognized if the likelihood that the tax position would be sustained upon examination by a taxing authority is considered to be 50% or less. Any interest and penalties resulting from the filing of the income tax returns are included in the provision for income taxes. Cash Flow Definition: For purposes of the consolidated statements of cash flows, the Company considers cash and due from banks as cash and cash equivalents. The Company reports net cash flows for customer loan and deposit transactions and short term borrowings with a maturity of 90 days or less. Earnings and Dividends Per Common Share: Basic earnings per common share is based on net income divided by the weighted average number of common shares outstanding during the period. Employee Stock Ownership Plan shares are considered outstanding for this calculation unless unearned. Diluted earnings per common share reflects the dilutive effect of any additional, potential common shares issuable under stock options. Earnings and dividends per share are restated for all stock splits and stock dividends through the date of issuance of the financial statements. Comprehensive Income: Comprehensive income consists of net income and other comprehensive income or loss. Other comprehensive income or loss includes the net change in unrealized gains and losses on securities available-for-sale and, in 2015, the changes in the funded status of the pension plan, each net of tax, which are also recognized as a separate component of shareholders’ equity. Employee Stock Ownership Plan (ESOP): Compensation expense is based on the market price of shares as they are committed to be released to participants’ accounts. Dividends on allocated ESOP shares reduce retained earnings; dividends on unearned ESOP shares reduce debt and accrued interest. Fair Values of Financial Instruments: Fair values of financial instruments are estimated using relevant market information and other assumptions, as more fully disclosed in Note S. Fair value estimates involve uncertainties and matters of significant judgment regarding interest rates, credit risk, prepayments, and other factors, especially in the absence of broad markets for particular items. Changes in assumptions or in market conditions could significantly affect such estimates. Concentrations of Credit Risk: The Company grants commercial, real estate, and installment loans to customers mainly in southwest Michigan. Commercial loans include loans collateralized by commercial real estate, business assets, and agricultural loans collateralized by crops and farm equipment. Commercial loans make up approximately 84% of the loan portfolio at December 31, 2017 (80% at December 31, 2016), and such loans are expected to be repaid from cash flow from operations of businesses. Residential mortgage loans make up approximately 14% of the loan portfolio at December 31, 2017 (18% at December 31, 2016), and are collateralized by mortgages on residential real estate. Consumer loans make up approximately 2% of the loan portfolio at December 31, 2017 (2% at December 31, 2016), and are primarily collateralized by consumer assets. Operating Segments: While the chief decision makers monitor the revenue streams of the various products and services, operations are managed and financial performance is evaluated on a Company wide basis. Operating segments are aggregated into one, as operating results for all segments are similar. Accordingly, all of the financial service operations are considered by management to be aggregated in one reportable operating segment: commercial banking.

2017 ANNUAL REPORT
SOUTHERN MICHIGAN BANCORP, INC. NOTES TO CONSOLIDATED FINANCIAL STATEMENTS (CONTINUED) NOTE A – NATURE OF OPERATIONS AND SIGNIFICANT ACCOUNTING POLICIES (CONTINUED) Financial Instruments with Off-Balance-Sheet Risk: Financial instruments include off-balance-sheet credit instruments, such as commitments to make loans and standby letters of credit issued to meet customer needs. The face amount for these items represents the exposure to loss before considering customer collateral or ability to repay. Such financial instruments are recorded when they are funded. Commitments may include interest rates determined prior to funding the loan (rate lock commitments). Rate lock commitments on loans intended to be sold are considered to be derivatives. Such commitments were not material at December 31, 2017, and 2016. Cash Balances: The Company maintains deposits with other correspondent banks. Certain of these deposits may exceed FDIC insured limits. Loss Contingencies: Loss contingencies, including claims and legal actions arising in the ordinary course of business, are recorded as liabilities when the likelihood of loss is probable and an amount or range of loss can be reasonably estimated. Management does not believe there are any such matters outstanding as of December 31, 2017 that will have a material future adverse effect on the consolidated financial statements. Subsequent Events: Management evaluated subsequent events through March 6, 2018, the date the consolidated financial statements were available to be issued. Events or transactions occurring after December 31, 2017, but prior to when the consolidated financial statements were available to be issued, that provided additional evidence about conditions that existed at December 31, 2017, have been recognized in the consolidated financial statements for the year ended December 31, 2017. Events or transactions that provided evidence about conditions that did not exist at December 31, 2017, but arose before the consolidated financial statements were available to be issued, have not been recognized in the consolidated financial statements for the year ended December 31, 2017. New Accounting Standards: In 2017, the Company adopted Accounting Standards Update (ASU) 2016-09, Compensation – Stock Compensation – Improvements to Employee Share-Based Payment Accounting (“ASU 2016-09”). ASU 2016-09 requires all income tax effects of awards to be recognized in the income statement when the awards vest or are settled. It also allows an employer to repurchase more of an employee's shares than it previously could for tax withholding purposes without triggering liability accounting and to make a policy election for forfeitures as they occur. The adoption of ASU 2016-09 did not have a material effect on the Company’s consolidated financial condition and results of operations. In January 2016, the FASB issued ASU No. 2016-01, Financial Instruments – Overall (Subtopic 825-10): Recognition and Measurement of Financial Assets and Financial Liabilities ("ASU 2016-01"). ASU 2016-01 amends previous guidance by: (i) requiring equity investments with readily determinable fair values to be measured at fair value with changes in fair value recognized in net income; (ii) allowing an entity to measure equity investments that do not have readily determinable fair values at either fair value or cost minus impairment, if any, plus or minus changes in observable prices, with changes in measurement recognized in net income; (iii) simplifying the impairment assessment of equity investments without readily determinable fair values by requiring a qualitative assessment to identify impairment; (iv) eliminating the requirement to disclose the methods and significant assumptions used to estimate the fair value for financial instruments measured at amortized cost on the balance sheet; (v) requiring use the of exit price notion when measuring the fair value of financial instruments for disclosure purposes; (vi) requiring recognition of changes in the fair value related to instrument-specific credit risk in other comprehensive income if the fair value option for financial liabilities is elected; (vii) requiring separate presentations in the financial statements of financial assets and financial liabilities by measurement category; and (viii) clarifying that an entity should evaluate the need for a valuation allowance on deferred tax assets related to available-for-sale securities in combination with the entity’s other deferred tax assets. ASU 2016-01 is effective for interim and annual reporting periods beginning after December 15, 2017. Early application is permitted, as of the beginning of the fiscal year of adoption, only for items (iv) and (vi) above. Early adoption of the other items mentioned above is not permitted. The adoption of ASU 2016-01 is not expected to have a material impact on the Company’s consolidated financial condition or results of operations.

44
SOUTHERN MICHIGAN BANCORP, INC. NOTES TO CONSOLIDATED FINANCIAL STATEMENTS (CONTINUED) NOTE A – NATURE OF OPERATIONS AND SIGNIFICANT ACCOUNTING POLICIES (CONTINUED) In May 2014, the Financial Accounting Standards Board ("FASB") issued ASU 2014-09, Revenue from Contracts with Customers (“ASU 2014-09”), which outlines a single comprehensive model for entities to use in accounting for revenue arising from contracts with customers and supersedes most current revenue recognition guidance. The new revenue recognition standard provides a unified model to determine when and how revenue is recognized. The core principle is that a company should recognize revenue to depict the transfer of promised goods or services to customers in an amount that reflects the consideration for which the entity expects to be entitled in exchange for those goods or services. This guidance will be effective for the Company beginning January 1, 2018, and can be applied either retrospectively to each period presented or as a cumulative-effect adjustment as of the date of adoption. ASU 2014-09 is not expected to have a material impact on the Company’s consolidated financial condition or results of operations. In February 2016, the FASB issued ASU No. 2016-02, Leases (Topic 842) ("ASU 2016-02"). Under ASU 2016-02, the Company will be required to recognize the following for all leases (with the exception of short-term leases): (i) a right to use asset, which is an asset that represents the lessee's right to use, or control the use of, a specified asset for the lease term; and (ii) a lease liability, which is a liability that represents lessee's obligation to make lease payments arising from a lease, measured on a discounted basis. ASU 2016-02 requires a modified retrospective transition approach for leases existing at, or entered into after, the beginning of the earliest comparative period presented in the financial statements. ASU 2016-02 is effective for the Company beginning January 1, 2019. The Company is currently evaluating the provisions of ASU 2016-02 on the Company’s consolidated financial condition and results of operations. In June 2016, the FASB issued ASU No. 2016-13, Financial Instruments – Credit Losses (“ASU 2016-13”). This update, effective for the Company beginning January 1, 2020, will change the accounting for credit losses on loans and debt securities. For loans, the proposal will require an expected credit loss model rather than the current incurred loss model to determine the allowance for credit losses. The expected credit loss model would estimate losses for the estimated life of the financial asset. In addition, the guidance will modify the other-than-temporary impairment model for available-for-sale debt securities to require an allowance for credit impairment instead of a direct write-down, which will allow for reversal of credit impairments in future periods. The Company is evaluating the provisions of ASU 2016-13 on the Company’s consolidated financial condition and results of operations.
In August 2016, the FASB issued ASU No. 2016-15, Statement of Cash Flows (Topic 320) – Classification of Certain Cash Receipts and Cash Payments (“ASU 2016-15”). ASU 2016-15 provides cash flow statement classification guidance for certain transactions, including how the predominance principle should be applied when cash receipts and cash payments have aspects of more than one class of cash flow. The guidance is effective for public business entities for fiscal years beginning after December 15, 2017, and interim periods within those fiscal years, and should be applied retrospectively. Early adoption is permitted, including adoption in an interim period. ASU 2016-13 is not expected to have a material impact on the Company’s consolidated financial condition or results of operations.

2017 ANNUAL REPORT
SOUTHERN MICHIGAN BANCORP, INC. NOTES TO CONSOLIDATED FINANCIAL STATEMENTS (CONTINUED) NOTE B – BASIC AND DILUTED EARNINGS PER COMMON SHARE A reconciliation of the numerators and denominators of basic and diluted earnings per common share for the years ended December 31, 2017, 2016, and 2015 is presented below: 2017 2016 2015 Basic Earnings Per Common Share Net income (in thousands) $ 5,421 $ 6,097 $ 5,806 Weighted average common shares outstanding 2,370,777 2,410,619 2,405,969 Less: Unallocated ESOP shares (15,092 ) (14,154 ) (10,908 ) Weighted average common shares outstanding for basic earnings per common share 2,355,685 2,396,465 2,395,061 Basic earnings per common share $ 2.30 $ 2.54 $ 2.42 Diluted Earnings Per Common Share Net income (in thousands) $ 5,421 $ 6,097 $ 5,806 Weighted average common shares outstanding for basic earnings per common share 2,355,685 2,396,465 2,395,061 Add: Dilutive effects of assumed exercises of stock options 7,650 6,681 4,783 Average shares and dilutive potential of common shares outstanding 2,363,335 2,403,146 2,399,844 Diluted earnings per common share $ 2.29 $ 2.54 $ 2.42 78,230 shares of common stock were not considered in computing diluted earnings per share for 2015 because they were anti-dilutive. In 2017 and 2016 there were no stock options considered anti-dilutive.

46
SOUTHERN MICHIGAN BANCORP, INC. NOTES TO CONSOLIDATED FINANCIAL STATEMENTS (CONTINUED) NOTE C – SECURITIES Year-end investment securities were as follows (in thousands): Available-for-sale, December 31, 2017
Amortized
Cost
Gross Unrealized
Gains
Gross Unrealized
Losses
Fair
Value Federal agencies $ 41,931 $ - $ (896 ) $ 41,035 U.S. Treasuries 2,032 - (32 ) 2,000 States and political subdivisions 62,146 538 (539 ) 62,145 Mortgage-backed securities 4 - - 4 Total $ 106,113 $ 538 $ (1,467 ) $ 105,184 Available-for-sale, December 31, 2016
Amortized
Cost
Gross Unrealized
Gains
Gross Unrealized
Losses
Fair
Value Federal agencies $ 44,564 $ 20 $ (948 ) $ 43,636 U.S. Treasuries 2,042 - (30 ) 2,012 States and political subdivisions 62,544 352 (910 ) 61,986 Mortgage-backed securities 8 - - 8 Corporate security 2,327 - (6 ) 2,321 Total $ 111,485 $ 372 $ (1,894 ) $ 109,963 Securities with unrealized losses at December 31, 2017, and 2016, that have not been recognized in income are as follows (in thousands):
2017
Continued Unrealized Loss for
Less than 12 Months
Continued Unrealized Loss for
12 Months or More
Total
Description of Securities
Fair Value
Unrealized Loss
Fair Value
Unrealized Loss
Fair Value
Unrealized Loss
Federal agencies $ 14,619 $ (131 ) $ 26,416 $ (765 ) $ 41,035 $ (896 ) U.S. Treasuries - - 2,000 (32 ) 2,000 (32 ) States and political subdivisions 22,093 (172 ) 9,445 (367 ) 31,538 (539 ) Total temporarily impaired $ 36,712 $ (303 ) $ 37,861 $ (1,164 ) $ 74,573 $ (1,467 )
2016
Continued Unrealized Loss for
Less than 12 Months
Continued Unrealized Loss for
12 Months or More
Total
Description of Securities
Fair Value
Unrealized Loss
Fair Value
Unrealized Loss
Fair Value
Unrealized Loss
Federal agencies $ 36,125 $ (948 ) $ - $ - $ 36,125 $ (948 ) U.S. Treasuries 2,012 (30 ) - - 2,012 (30 ) States and political subdivisions 40,490 (910 ) - - 40,490 (910 ) Corporate security 1,290 (6 ) - - 1,290 (6 ) Total temporarily impaired $ 79,917 $ (1,894 ) $ - $ - $ 79,917 $ (1,894 ) Unrealized losses have not been recognized through the income statement, as management believes the issuers are of sound credit quality, management has no intent to sell the securities, the Company has the ability to hold the securities to maturity, and the decline in fair value is largely due to changes in market interest rates. The fair value is expected to recover as the bonds approach their maturity date.

2017 ANNUAL REPORT
SOUTHERN MICHIGAN BANCORP, INC. NOTES TO CONSOLIDATED FINANCIAL STATEMENTS (CONTINUED) NOTE C – SECURITIES (CONTINUED) The proceeds from sales of securities and the associated gains are listed below (in thousands): 2017 2016 2015 Proceeds $ 7,498 $ 7,592 $ 1,659 Gross gains 3 98 23 The tax provision related to gross realized gains was $1,000, $33,000, and $8,000 for 2017, 2016, and 2015, respectively. Gains on calls of securities were $0, $4,000, and $3,000 for 2017, 2016, and 2015, respectively. The amortized cost and fair value of the investment securities portfolio are shown by contractual maturity. Contractual maturities of debt securities at year-end 2017 were as follows (in thousands): Amortized
Cost
Fair
Value Due in one year or less $ 8,604 $ 8,610 Due from one to five years 59,662 59,010 Due from five to ten years 34,078 33,753 Due after ten years 3,765 3,807 Mortgage-backed securities 4 4 Total $ 106,113 $ 105,184 Securities not due at a single maturity date, primarily mortgage-backed securities, are shown separately. Expected maturities may differ from contractual maturities because borrowers may have the right to call or prepay obligations with or without call or prepayment penalties. Securities with a carrying value of $29,829,000 and $25,795,000, respectively, were pledged as collateral for repurchase accounts and for other purposes at December 31, 2017, and 2016. At December 31, 2017, and 2016, the fair value of securities issued by the State of Michigan and all its political subdivisions totaled $43,224,000 and $43,724,000, respectively. No other securities of any single issuer were greater than 10% of shareholders’ equity. Investments in the Federal Home Loan Bank of Indianapolis stock totaled $2,025,000 and $1,270,000 at December 31, 2017, and 2016, respectively, and are included in other assets because such investments are considered restricted. Such investments are recorded at cost and evaluated for impairment. Cash dividends received are recorded in other interest income. At December 31, 2017, the Company had no investment in securities of issuers outside of the United States. NOTE D – LOANS AND ALLOWANCE FOR LOAN LOSSES Loans at year-end were as follows (in thousands): 2017 2016 Commercial $ 109,432 $ 88,334 Real estate – commercial 300,458 253,588 Real estate – construction 30,473 20,030 Real estate – mortgage 75,518 80,049 Consumer 7,566 7,814 523,447 449,815 Less allowance for loan losses (5,009 ) (4,842 ) Loans, net $ 518,438 $ 444,973

48
SOUTHERN MICHIGAN BANCORP, INC. NOTES TO CONSOLIDATED FINANCIAL STATEMENTS (CONTINUED) NOTE D – LOANS AND ALLOWANCE FOR LOAN LOSSES (CONTINUED) Credit Risk Elements: Commercial: Construction loans are underwritten utilizing independent appraisals, sensitivity analysis of absorption, vacancy and lease rates, and financial analysis of the developers and property owners. Construction loans are generally based upon estimates of costs and value associated with completion of the project. Construction loans often involve the disbursement of funds with repayment substantially dependent on the success of the ultimate project. These loans are closely monitored by on-site inspections and are considered to have higher risks than other real estate loans due to their ultimate repayment being sensitive to interest rate changes, general economic conditions, and the availability of long-term financing. The Bank typically requires guarantees on these loans. The Bank’s construction loans are secured predominantly by properties located in its primary market area. Commercial and agricultural real estate loans are subject to underwriting standards and processes similar to commercial and agricultural operating loans, in addition to underwriting standards unique to real estate loans. These loans are viewed primarily as cash flow loans and secondarily as loans secured by real estate. Commercial and agricultural real estate lending typically involves higher loan principal amounts and the repayment of these loans is generally dependent on the successful operation of the property securing the loan or the business conducted on the property securing the loan. Loan-to-value is generally 75% of the lower of the cost or appraised value of the assets. Appraisals on properties securing these loans are generally performed by fee appraisers approved by the Commercial Loan Committee. Because payments on commercial and agricultural real estate loans are often dependent on the successful operation or management of the properties, repayment of such loans may be subject to adverse conditions in the real estate market or the economy. Management monitors and evaluates commercial and agricultural real estate loans based on collateral and risk rating criteria. The Bank typically requires guarantees on these loans. The Bank’s commercial and agricultural real estate loans are secured largely by properties located in its primary market area. Commercial and agricultural operating loans are underwritten based on the Bank’s examination of current and projected cash flows to determine the ability of the borrower to repay their obligations as agreed. This underwriting includes the evaluation of cash flows of the borrower, underlying collateral, if applicable, and the borrower’s ability to manage its business activities. The cash flows of borrowers and the collateral securing these loans may fluctuate in value after the initial evaluation. A first priority lien on the general assets of the business normally secures these types of loans. Loan-to-value limits vary and are dependent upon the nature and type of the underlying collateral and the financial strength of the borrower. Crop and hail insurance is required for most agricultural borrowers. Loans are generally guaranteed by the principal(s). The Bank’s commercial and agricultural operating lending is principally in its primary market area. Real Estate Mortgage and Consumer: The Bank originates 1-4 family real estate and consumer loans utilizing credit reports to supplement the underwriting process. The Bank’s manual underwriting standards for 1-4 family loans are generally in accordance with Federal Home Loan Mortgage Corporation and loan policy manual underwriting guidelines. Properties securing 1-4 family real estate loans are appraised by fee appraisers, which are independent of the loan origination function and have been approved by management. The loan-to-value ratios normally do not exceed 80% without credit enhancements such as mortgage insurance. The Bank will lend up to 100% of the lesser of the appraised value or purchase price for conventional 1-4 family real estate loans, provided private mortgage insurance is obtained. The underwriting standards for consumer loans include a determination of the applicant’s payment history on other debts and an assessment of their ability to meet existing obligations and payments on the proposed loan. To monitor and manage loan risk, policies and procedures are developed and modified, as needed, by management. This activity, coupled with smaller loan amounts that are spread across many individual borrowers, minimizes risk. Additionally, market conditions are reviewed by management on a regular basis. The Bank’s 1-4 family real estate loans are secured predominantly by properties located in its primary market area.

2017 ANNUAL REPORT
SOUTHERN MICHIGAN BANCORP, INC. NOTES TO CONSOLIDATED FINANCIAL STATEMENTS (CONTINUED) NOTE D – LOANS AND ALLOWANCE FOR LOAN LOSSES (CONTINUED) The Bank’s internal credit analysis staff reviews and validates credit risk on a periodic basis. In addition, an independent loan review is performed annually. Credit analysts’ results are presented to management. The independent loan review is presented to management and the Audit Committee. The credit analysts’ results and loan review processes complement and reinforce the risk identification and assessment decisions made by lenders and credit personnel, as well as the Bank’s policies and procedures. At December 31, 2017, 2016, and 2015, certain directors and executive officers of the Company, including their associates and companies in which they are principal owners, were indebted to the Bank. The following is a summary of activity of loans (in thousands) exceeding $60,000 in the aggregate to these individuals and their associates. All of these loans were made in the ordinary course of business, were made on substantially the same terms (including interest rates and collateral, as those prevailing at the time for comparable loans with persons not related to the Company), and did not involve more than the normal risk of collectability or present other unfavorable features. None of these loans were in default at December 31, 2017. Other changes include adjustments for loans applicable to one reporting period that are excludable from the other reporting period, including changes in the directorate. 2017 2016 2015 Balance at January 1 $ 20,222 $ 18,622 $ 22,647 New loans, including renewals 12,494 7,170 13,914 Repayments (8,244 ) (5,570 ) (17,594 ) Other changes, net - - (345 ) Balance at December 31 $ 24,472 $ 20,222 $ 18,622 The unpaid principal balance of mortgage loans serviced for others, which are not included on the consolidated balance sheet, was $213,490,000 and $219,822,000 at December 31, 2017, and 2016, respectively. Activity for capitalized mortgage servicing rights, included in other assets, was as follows (in thousands): 2017 2016 2015 Balance at January 1 $ 1,436 $ 1,431 $ 1,349 Additions 291 379 454 Amortized to expense (359 ) (374 ) (372 ) Balance at December 31 $ 1,368 $ 1,436 $ 1,431 No valuation allowance for capitalized mortgage servicing rights was considered necessary at December 31, 2017, or 2016, because the estimated fair value of such rights exceeded the carrying value. In evaluating the allowance for loan losses, loans are analyzed based on the department originating the loan (commercial, mortgage, or consumer), which in some instances may be different than how the loans are categorized for regulatory reporting purposes. Consequently, loan groupings may vary within the disclosures.

50
SOUTHERN MICHIGAN BANCORP, INC. NOTES TO CONSOLIDATED FINANCIAL STATEMENTS (CONTINUED) NOTE D – LOANS AND ALLOWANCE FOR LOAN LOSSES (CONTINUED) The following is an analysis of the allowance for loan loss activity, listed by portfolio segment. Information is based on impairment method as of, and for the years ended, December 31, 2017, 2016, and 2015 (in thousands):
December 31, 2017
Commercial including
Commercial Real Estate
Consumer
Real Estate Mortgage
1st Lien
Real Estate
Mortgage Junior Lien
Total
Balance at January 1 $ 4,135 $ 21 $ 603 $ 83 $ 4,842 Provision (credit) for loan
losses 232 (12 ) (40 ) (5 ) 175
Loans charged off (160 ) (5 ) (120 ) (1 ) (286 ) Recoveries 221 16 31 10 278 Balance at December 31 $ 4,428 $ 20 $ 474 $ 87 $ 5,009 Ending balance individually
evaluated for impairment $ 2
$ - $ 29 $ 10 $ 41
Ending balance collectively evaluated for impairment 4,426 20 445 77 4,968
Total $ 4,428 $ 20 $ 474 $ 87 $ 5,009 December 31, 2016 Balance at January 1 $ 4,318 $ 31 $ 810 $ 114 $ 5,273 Provision (credit) for loan losses 294 21 (174 ) (41 ) 100
Loans charged off (601 ) (41 ) (57 ) (28 ) (727 ) Recoveries 124 10 24 38 196 Balance at December 31 $ 4,135 $ 21 $ 603 $ 83 $ 4,842 Ending balance individually
evaluated for impairment $ 13
$ - $ 75 $ - $ 88
Ending balance collectively evaluated for impairment 4,122 21 528 83 4,754
Total $ 4,135 $ 21 $ 603 $ 83 $ 4,842 December 31, 2015 Balance at January 1 $ 4,074 $ 45 $ 945 $ 113 $ 5,177 Provision for loan losses 338 (17 ) (31 ) (40 ) 250 Loans charged off (225 ) (22 ) (152 ) (10 ) (409 ) Recoveries 131 25 48 51 255 Balance at December 31 $ 4,318 $ 31 $ 810 $ 114 $ 5,273 Ending balance individually
evaluated for impairment $ 360
$ - $ 74 $ - $ 434 Ending balance collectively
evaluated for impairment 3,958 31 736 114 4,839 Total $ 4,318 $ 31 $ 810 $ 114 $ 5,273

2017 ANNUAL REPORT
SOUTHERN MICHIGAN BANCORP, INC. NOTES TO CONSOLIDATED FINANCIAL STATEMENTS (CONTINUED) NOTE D – LOANS AND ALLOWANCE FOR LOAN LOSSES (CONTINUED) Commercial loans also include demand deposit loan account charge-offs and recoveries. These amounted to $148,000 and $86,000, respectively, for the year ended December 31, 2017; $156,000 and $109,000, respectively, for the year ended December 31, 2016; and $174,000 and $111,000, respectively, for the year ended December 31, 2015. The following is a summary of the recorded investment in loans, by portfolio segment, and based on impairment method, as of December 31, 2017, and 2016 (in thousands): December 31, 2017
Commercial Including
Commercial Real Estate
Consumer
Real Estate Mortgage
1st Lien
Real
Estate Mortgage
Junior Lien
Total
Ending balance individually evaluated for impairment $ 851 $ 16 $ 2,008 $ 27 $ 2,902 Ending balance collectively evaluated for impairment 451,509 4,713 53,074 11,249 520,545 Ending balance $ 452,360 $ 4,729 $ 55,082 $ 11,276 $ 523,447 December 31, 2016: Ending balance individually evaluated for impairment $ 506 $ 16 $ 1,907 $ 33 $ 2,462
Ending balance collectively evaluated for impairment 373,204 5,569 58,675 9,905 447,353
Ending balance $ 373,710 $ 5,585 $ 60,582 $ 9,938 $ 449,815 The following tables present loans individually evaluated for impairment by class of loans, as of December 31, 2017, and December 31, 2016 (in thousands):
December 31, 2017
Unpaid Principal Balance
Recorded
Investment
Allowance for Loan Losses
Allocated
With no related allowance recorded: Commercial $ 20 $ 20 $ - Real estate – commercial 491 491 - Real estate – construction - - - Real estate – mortgage 1,187 1,170 - Consumer 16 16 - With an allowance recorded: Commercial - - - Real estate – commercial 340 340 2 Real estate – construction - - - Real estate – mortgage 865 865 39 Consumer - - - Total $ 2,919 $ 2,902 $ 41

52
SOUTHERN MICHIGAN BANCORP, INC. NOTES TO CONSOLIDATED FINANCIAL STATEMENTS (CONTINUED) NOTE D – LOANS AND ALLOWANCE FOR LOAN LOSSES (CONTINUED)
December 31, 2016
Unpaid Principal Balance
Recorded
Investment
Allowance for Loan
Losses Allocated
With no related allowance recorded: Commercial $ - $ - $ - Real estate – commercial 382 382 - Real estate – construction - - - Real estate – mortgage 486 468 - Consumer 16 16 - With an allowance recorded: Commercial - - - Real estate – commercial 124 124 1 Real estate – construction - - - Real estate – mortgage 1,500 1,472 87 Consumer - - - Total $ 2,508 $ 2,462 $ 88 Information regarding impaired loans at December 31 follows (in thousands): 2017 2016 2015 Average balance of impaired loans during the year $ 2,682 $ 3,502 $ 4,855 Cash basis interest income recognized during the year $ 123 $ 93 $ 146 Interest income recognized during the year $ 117 $ 127 $ 192 The Company’s loan portfolio also includes certain loans that have been modified in a TDR, where economic concessions have been granted to borrowers who have experienced or are expected to experience financial difficulties. These concessions typically result from the Company’s loss mitigation activities and could include reductions in the interest rate, payment extensions, forgiveness of principal, forbearance, or other actions. When the Company modifies a loan, management evaluates any possible concession based on the present value of expected future cash flows, discounted at the contractual interest rate of the original loan agreement, except when the sole source of repayment for the loan is the liquidation of collateral. In these cases, management uses the current fair value of the collateral, less selling costs. If management determines that the value of the modified loan is less than the recorded investment in the loan (net of previous charge-offs and deferred loan fees or costs), impairment is recognized through an allowance estimate or a charge-off to the allowance.

2017 ANNUAL REPORT
SOUTHERN MICHIGAN BANCORP, INC. NOTES TO CONSOLIDATED FINANCIAL STATEMENTS (CONTINUED) NOTE D – LOANS AND ALLOWANCE FOR LOAN LOSSES (CONTINUED) The following table summarizes the number and volume of TDRs the Company has recorded in its loan portfolio, as of December 31, 2017, and 2016. It also shows the number of TDR loans added each year and the amount of specific reserves in the allowance for loan losses relating to TDRs (dollars in thousands): Total Added During the Year December 31, 2017
Number of Loans
Amount
Specific Reserves Allocated
Number of
Loans
Amount
Specific Reserves Allocated
Commercial - $ - $ - - $ - $ - Real estate – commercial 6 771 - - - - Real estate – construction - - - - - - Real estate – mortgage 11 893 18 - - - Consumer - - - Total 17 $ 1,664 $ 18 - $ - $ - December 31, 2016 Commercial - $ - $ - - $ - $ - Real estate – commercial 7 913 13 1 21 - Real estate – construction - - - - - - Real estate – mortgage 12 1,007 54 - - - Consumer - - - - - - Total 19 $ 1,920 $ 67 1 $ 21 $ - The modification of loan terms that resulted in a TDR included one of, or a combination of, the following: a reduction of the stated interest rate of the loan; an extension of the maturity date; or, an extension of the amortization period. The post-modified loan balance for TDRs was essentially the same as the pre-modified balance. The Company has not committed to lend any additional funds to these borrowers. The loan modified during 2016 was not in default of its modified terms, as of December 31, 2017. The following table presents the aging of the recorded investment in past due and nonaccrual loans, as of December 31, 2017, and December 31, 2016. It is shown by class of loans (in thousands): December 31, 2017 Loans Past Due Accruing Interest
30-59
Days
60-89 Days
Over
90 Days
Total
Loans
on Non- Accrual
Loans Not Past Due
or Non- Accrual
Total Commercial $ 265 $ - $ - $ 265 $ 14 $ 109,153 $ 109,432 Real estate – commercial 87 34 285 406 31 300,021 300,458 Real estate – construction - - - - - 30,473 30,473 Real estate – mortgage 190 37 - 227 815 74,476 75,518 Consumer 10 4 6 20 16 7,530 7,566 Total $ 552 $ 75 $ 291 $ 918 ¤ $ 876 $ 521,653 $ 523,447

54
SOUTHERN MICHIGAN BANCORP, INC. NOTES TO CONSOLIDATED FINANCIAL STATEMENTS (CONTINUED) NOTE D – LOANS AND ALLOWANCE FOR LOAN LOSSES (CONTINUED) December 31, 2016 Loans Past Due Accruing Interest 30-59
Days
60-89 Days
Over
90 Days
Total
Loans
on Non- Accrual
Loans Not Past Due
or Non- Accrual
Total Commercial $ 19 $ - $ - $ 19 $ 21 $ 88,294 $ 88,334 Real estate – commercial 327 36 417 780 53 252,755 253,588 Real estate – construction 80 - - 80 - 19,950 20,030 Real estate – mortgage 365 38 23 426 932 78,691 80,049 Consumer 4 - 26 30 17 7,767 7,814 Total $ 795 $ 74 $ 466 $ 1,335 $ 1,023 $ 447,457 $ 449,815 Credit Quality Indicators: The Company categorizes loans into risk categories based on relevant information about the ability of borrowers to service their debt, such as current financial information, historical payment experience, credit documentation, public information, and current economic trends, among other factors. The Company analyzes loans individually by classifying them based upon each loan’s credit risk. This analysis includes all loans from the commercial loan department and is performed at least annually. The Company uses the following definitions for risk ratings:
Pass: Loans classified as pass have no existing or known potential weaknesses deserving of management’s close attention. Special Mention: Loans classified as special mention have a potential weakness that deserves management’s close attention. If left uncorrected, these potential weaknesses may result in deterioration of the repayment prospects for the loan or of the Company’s credit position at some future date. Substandard: Loans classified as substandard are inadequately protected by the current net worth and paying capacity of the obligor or of the collateral pledged, if any. Loans so classified have a well-defined weakness or weaknesses that jeopardize the liquidation of the debt. They are characterized by the distinct possibility that the Company will sustain some loss if the deficiencies are not corrected. Doubtful: Loans classified as doubtful have all the weaknesses inherent in those classified as substandard, with the added characteristic that the weaknesses make collection or liquidation in full, on the basis of currently existing facts, conditions, and values, highly questionable and improbable.
As of December 31, 2017, and December 31, 2016, based on the most recent analysis performed, the risk category of loans by class of loans was as follows (in thousands):
December 31, 2017 Pass Special
Mention
Substandard
Doubtful Not Risk
Rated
Total Commercial $ 103,279 $ 6,139 $ 14 $ - $ - $ 109,432 Real estate – commercial 289,823 9,010 1,625 - - 300,458 Real estate – construction 24,700 918 - - 4,855 30,473 Real estate – mortgage 10,407 1,912 494 - 62,705 75,518 Consumer 1,776 41 - - 5,749 7,566 Total $ 429,985 $ 18,020 $ 2,133 $ - $ 73,309 $ 523,447

2017 ANNUAL REPORT
SOUTHERN MICHIGAN BANCORP, INC. NOTES TO CONSOLIDATED FINANCIAL STATEMENTS (CONTINUED) NOTE D – LOANS AND ALLOWANCE FOR LOAN LOSSES (CONTINUED)
December 31, 2016 Pass Special
Mention
Substandard
Doubtful Not Risk
Rated
Total Commercial $ 80,647 $ 7,528 $ 159 $ - $ - $ 88,334 Real estate – commercial 236,078 15,984 1,526 - - 253,588 Real estate – construction 15,733 113 - - 4,184 20,030 Real estate – mortgage 11,804 1,817 535 - 65,893 80,049 Consumer 1,668 - - - 6,146 7,814 Total $ 345,930 $ 25,442 $ 2,220 $ - $ 76,223 $ 449,815
NOTE E – PREMISES AND EQUIPMENT, NET Premises and equipment, net at December 31 consisted of (in thousands): 2017 2016 Land $ 2,185 $ 2,339 Buildings and improvements 18,886 18,628 Furniture and equipment 6,656 6,401 27,727 27,368 Less accumulated depreciation (13,462 ) (14,570 ) Totals $ 14,265 $ 12,798 Depreciation of premises and equipment charged to operations was $1,052,000, $989,000, and $815,000 in 2017, 2016, and 2015, respectively. Rent expense under operating leases amounted to $167,000, $249,000, and $156,000 in 2017, 2016, and 2015, respectively. Lease commitments under non-cancelable operating equipment leases at December 31, 2017, were as follows (in thousands): 2018 $ 121 2019 85 2020 83 2021 79 2022 80 Thereafter 945 Total $ 1,393
NOTE F – OTHER INTANGIBLE ASSETS Acquired core deposit intangible assets as of December 31 were as follows (in thousands): 2017 2016 Gross carrying amount $ 3,122 $ 3,122 Accumulated amortization (3,122 ) (2,893 ) Unamortized balance $ - $ 229 Amortization of core deposit intangible assets for the years ended December 31, 2017, 2016, and 2015 was $229,000, $260,000 and $272,000, respectively. There is no future amortization of core deposit intangible assets.

56
SOUTHERN MICHIGAN BANCORP, INC. NOTES TO CONSOLIDATED FINANCIAL STATEMENTS (CONTINUED) NOTE G – DEPOSITS The carrying amount of domestic deposits at year-end follows (in thousands): 2017 2016 Non-interest bearing checking $ 129,098 $ 107,410 Interest bearing checking 154,917 170,810 Savings 93,995 78,077 Money market accounts 71,456 89,891 Time deposits 127,678 89,657 Totals $ 577,144 $ 535,845 The carrying amount of time deposits over $250,000 at December 31, 2017, and 2016, was $44,856,000 and $17,090,000, respectively. Interest expense on these deposits was $359,000, $127,000, and $85,000 for the years ended December 31, 2017, 2016, and 2015, respectively. At December 31, 2017, scheduled maturities of time deposits were as follows for the years ending December 31 (in thousands): 2018 $ 59,882 2019 29,432 2020 21,150 2021 10,987 2022 6,227 Total $ 127,678 Related party deposits were $16,794,000 and $24,284,000 at December 31, 2017, and 2016, respectively. NOTE H – OTHER BORROWINGS Other borrowings at December 31, 2017 and 2016 included $30,000,000 and $10,000,000, respectively, in advances from the Federal Home Loan Bank (FHLB) of Indianapolis. Principal is due at maturity for the advances outstanding at December 31, 2017. Each advance has a fixed interest rate ranging from 1.59% - 1.93%, with a weighted average rate of 1.75%. All of the advances from the FHLB are secured by a blanket collateral agreement, which gives the FHLB an unperfected security interest in certain 1-4 family mortgage, home equity, and commercial real estate loans. Eligible FHLB loan collateral at December 31, 2017 and 2016, was approximately $82,308,000 and $64,399,000, respectively. On May 9, 2017, the Company entered into a Loan agreement with United Bankers Bank (UBB), consisting of a $10,000,000 term loan, maturing in five years with a fixed rate equal to 4.5% percent. Repayment terms require quarterly principal payments of $250,000 each, plus interest with a final balloon payment of all outstanding principal and interest due upon maturity. The loan requires compliance with various specified financial covenants and is secured by 100% of the stock of the Bank. At December 31, 2017, $9,500,000 was outstanding under the loan. At December 31, 2017, scheduled principal reductions on other borrowings were as follows for the years ending December 31 (in thousands): FHLB UBB Total 2018 $ 10,000 $ 1,000 $ 11,000 2019 - 1,000 1,000 2020 10,000 1,000 11,000 2021 - 1,000 1,000 2022 - 5,500 5,500 2023 and thereafter 10,000 - 10,000 Total other borrowings $ 30,000 $ 9,500 $ 39,500

2017 ANNUAL REPORT
SOUTHERN MICHIGAN BANCORP, INC. NOTES TO CONSOLIDATED FINANCIAL STATEMENTS (CONTINUED) NOTE I – SECURITIES SOLD UNDER AGREEMENTS TO REPURCHASE AND OVERNIGHT BORROWINGS Securities sold under agreements to repurchase (repurchase agreements) are direct obligations and are secured by securities held in safekeeping at a correspondent bank. Repurchase agreements are offered primarily to certain large deposit customers as deposit equivalent investments. Information relating to securities sold under agreements to repurchase is as follows (in thousands):
2017 2016 At December 31: Outstanding balance $ 13,950 $ 13,311 Average interest rate 0.25% 0.27% Daily average for the year: Outstanding balance $ 12,643 $ 12,581 Average interest rate 0.26% 0.27% Maximum outstanding at any month end $ 14,778 $ 15,562
At December 31, 2017 and 2016, the Bank had an $8,000,000 and $3,000,000, respectively, line of credit arrangement available to purchase federal funds, with no outstanding borrowings. NOTE J – SUBORDINATED DEBENTURES AND TRUST PREFERRED SECURITIES In March 2004, Southern Michigan Bancorp Capital Trust I, a trust formed by the Company, closed a pooled, private offering of 5,000 trust preferred securities with a liquidation amount of $1,000 per security. The Company issued $5,155,000 of subordinated debentures to the trust in exchange for ownership of all of the common securities of the trust and the proceeds of the preferred securities sold by the trust. The Company is not considered the primary beneficiary of this trust, therefore the trust is not consolidated in the Company’s financial statements, but rather the subordinated debentures are shown as a liability. The Company may redeem the subordinated debentures, subject to the receipt by the Company of the proper approval of the Federal Reserve, if such approval is required under applicable capital guidelines or policies of the Federal Reserve. The subordinated debentures may be redeemed on January 7, April 7, July 7, and October 7 of each year, either in whole or in integrals of $1,000 at 100% of the principal amount, plus accrued and unpaid interest. The subordinated debentures mature on April 6, 2034. The subordinated debentures are also redeemable in whole, but not in part, from time to time upon the occurrence of specific events defined within the trust indenture. The Company has the option to defer interest payments on the subordinated debentures from time to time for a period not to exceed 20 consecutive quarters. The $5,000,000 in trust preferred securities may be included in Tier I capital (with certain limitations applicable) under current regulatory guidelines and interpretations. The trust preferred securities and subordinated debentures have a variable rate of interest equal to the three month London Interbank Offered Rate (LIBOR) plus 2.75%. The rate at December 31, 2017, was 4.11%. Interest expense related to the subordinated debentures amounted to $200,000 in 2017, $177,000 in 2016, and $154,000 in 2015. The Company’s investment in the common stock of the trust is $155,000 and is included in other assets. NOTE K – INCOME TAXES On December 22, 2017, H.R. 1, commonly known as the Tax Cuts and Jobs Act (the Act) was signed into law. The Act reduces the corporate federal tax rate from 34% to 21%, effective January 1, 2018. As a result, the Company was required to re-measure its deferred tax assets and liabilities using the enacted rate at which the deferred tax assets and liabilities are expected to be recovered or settled. The effect of this re-measurement is recorded in the year the tax law is enacted. For 2017, the re-measurement of the Company’s net deferred tax asset resulted in additional income tax expense of $989,000.

58
SOUTHERN MICHIGAN BANCORP, INC. NOTES TO CONSOLIDATED FINANCIAL STATEMENTS (CONTINUED) NOTE K – INCOME TAXES (CONTINUED) Income tax provision consists of the following (in thousands): 2017 2016 2015 Current $ 2,104 $ 1,688 $ 2,444 Deferred (51 ) 447 (494 ) Effect of federal tax law change 989 - - Total income tax provision $ 3,042 $ 2,135 $ 1,950 Income tax provision calculated at the statutory federal income tax rate of 34% differs from actual income tax provision as follows (in thousands): 2017 2016 2015 Income tax at statutory rate $ 2,877 $ 2,799 $ 2,637 Tax-exempt interest income, net (362 ) (354 ) (354 ) Earnings on life insurance assets (127 ) (128 ) (290 ) Low income housing partnership tax credits (47 ) (38 ) (11 ) Captive insurance (239 ) (168 ) - Effect of federal tax law change 989 - - Other items, net (49 ) 24 (32 ) Totals $ 3,042 $ 2,135 $ 1,950 Deferred tax assets and liabilities consist of the following at December 31 (in thousands): 2017 2016 Deferred tax assets: Allowance for loan losses $ 1,052 $ 1,646 Deferred compensation and supplemental retirement liability 932 1,461 Net unrealized loss on available-for-sale securities 195 518 Nonaccrual loan interest 85 114 Stock based compensation 177 166 Other 206 273 Total deferred tax assets 2,647 4,178 Deferred tax liabilities: Mortgage servicing rights (287 ) (488 ) Goodwill (130 ) (211 ) Purchase accounting adjustments (41 ) (146 ) Depreciation (423 ) (345 ) Prepaid expenses (134 ) (198 ) Other (35 ) (53 ) Total deferred tax liabilities (1,050 ) (1,441 ) Net deferred tax assets included in other assets $ 1,597 $ 2,737 The Company and its subsidiaries file U.S. federal and certain state tax returns. In general, tax returns are no longer subject to tax examinations by tax authorities for years before 2014. SMB Risk Management, Inc. has elected, under IRC Section 831(b), to be taxed only on its investment income, which excludes the premium payments received under its insurance contracts from taxable income. The Company believes that it had no significant uncertain tax positions as of December 31, 2017, and 2016.

2017 ANNUAL REPORT
SOUTHERN MICHIGAN BANCORP, INC. NOTES TO CONSOLIDATED FINANCIAL STATEMENTS (CONTINUED) NOTE L – BENEFIT PLANS Defined Benefit Pension Plan: Due to the September 1, 2015 termination of the Defined Benefit Pension Plan, 2017 and 2016 information about the pension plan, components of pension expense, and related actuarial assumptions are not disclosed below. In addition, there was no accumulated benefit obligation for the Pension Plan at December 31, 2017 or 2016. The components of pension expense and related actuarial assumptions were as follows (in thousands): 2015 Components of net periodic benefit cost: Service cost, including plan expenses $ 26 Interest cost 96 Expected return on plan assets (47 ) Recognized net actuarial loss 265 Settlement adjustment 413 Net periodic benefit cost $ 753 At December 31, 2017, 2016, and 2015, there were no net actuarial losses to be recognized as a component of net periodic benefit cost. Due to the September 1, 2015 pension plan termination, there will be no further net losses amortized from accumulated other comprehensive income into net periodic benefit cost. Weighted average assumptions for determining projected benefit obligation and net periodic benefit cost were as follows: 2015 Discount rate on benefit obligation 4.5% Long-term expected rate of return on plan assets 3.0% Rate of compensation increase N/A

60
SOUTHERN MICHIGAN BANCORP, INC. NOTES TO CONSOLIDATED FINANCIAL STATEMENTS (CONTINUED) NOTE L – BENEFIT PLANS (CONTINUED) Employee Stock Ownership Plan: The Company has an employee stock ownership plan (ESOP) for substantially all full-time employees. The ESOP includes a 401(k) provision with the Company’s matching contribution provided in Company stock. The Board of Directors determines the Company’s contribution level annually. Assets of the ESOP are held in trust by the Bank and administrative costs of the ESOP are borne by the Company. Expense charged to operations for contributions to the ESOP totaled $394,000, $268,000, and $246,000 in 2017, 2016, and 2015, respectively. Shares held by the ESOP at year-end are as follows: 2017 2016 Allocated shares 129,256 130,320 Unallocated shares 12,400 17,000 Total ESOP shares 141,656 147,320 The fair value of allocated shares held by the ESOP is $4,795,000 and $3,897,000 at December 31, 2017, and 2016, respectively. Upon distribution of shares to a participant, the participant has the right to require the Company to purchase shares at their fair value, in accordance with terms and conditions of the plan. Deferred Compensation Plan: Directors and certain officers of the Bank may defer a portion of their director fees or compensation in a non-qualified deferred compensation plan. An account is established for each participant in the plan and credited with the participant’s annual deferred compensation, plus interest based on the stated rate determined annually. Upon retirement, participants receive the balance in their account over 15 years. Participants also continue to earn interest during retirement based on their remaining account balance. Participants are immediately vested in their account balances. The plan is intended to be funded by certain bank-owned life insurance contracts. The interest rate paid on deferred compensation balances, as of December 31, 2017, ranged from 4.41% to 6.82%. Deferred compensation expense was $342,000, $471,000, and $266,000 in 2017, 2016, and 2015, respectively. The liability for deferred compensation benefits was $3,047,000 and $3,000,000 at December 31, 2017, and 2016, respectively, and is included in accrued expenses and other liabilities in the accompanying consolidated balance sheets. Supplemental Retirement Plans: The Bank also maintains a supplemental retirement plan (SERP) to provide annual payments to certain current and former executives, subsequent to their retirement. Benefits under the SERP were frozen, effective December 31, 2008. The SERP was terminated in 2015 for current executives. Expense associated with the SERP totaled $1,000, $1,000, and $48,000 in 2017, 2016, and 2015, respectively. Liabilities associated with the SERP totaled $0 and $17,000 at December 31, 2017, and 2016, respectively. In December 2011, the Board of Directors approved the Defined Contribution Supplemental Executive Retirement Plan (2011 SERP), which is intended to provide select executive officers with a retirement benefit that is competitive with industry practices for bank executives when combined with the executive’s other employer-funded retirement benefits. In contrast to the terminated SERP, the 2011 SERP is a defined contribution arrangement which gives the Bank the discretion to make a specific annual, nonqualified, deferred compensation contribution to the account of participating executives. Whether an annual deferred compensation contribution will be made to the account balance of a participating executive, as well as the amount of the contribution, is at the discretion of the Bank's Board of Directors. The contribution that will be made by the Bank to the account of each executive is determined based on a percentage of base salary. Participants are generally entitled to receive payment of the benefit in their account in 120 equal monthly installments commencing at age 65. Expense associated with the 2011 SERP amounted to $107,000 in 2017, $103,000 in 2016, and $507,000 in 2015. Liabilities associated with the 2011 SERP totaled $1,389,000 and $1,282,000 at December 31, 2017, and 2016, respectively.

2017 ANNUAL REPORT
SOUTHERN MICHIGAN BANCORP, INC. NOTES TO CONSOLIDATED FINANCIAL STATEMENTS (CONTINUED) NOTE M – STOCK BASED COMPENSATION The Company has stock based compensation plans as described below. Total compensation cost charged against income for those plans, was $735,000, $379,000, and $290,000 in 2017, 2016, and 2015, respectively. The Southern Michigan Bancorp, Inc. Stock Incentive Plan of 2014 was created to advance the interest of the Company and its shareholders by affording to directors, officers, and other employees of the Company an opportunity for increased stock ownership. The plan permits the grant and award of stock options, stock appreciation rights, restricted stock, and stock awards. A maximum of 400,000 shares of common stock are available under the plan. At December 31, 2017, 272,092 shares were available for issuance under the plan. The fair value of each option award is estimated on the date of grant, using a Black-Scholes option valuation model that uses the weighted average assumptions noted in the following table. The expected volatility and life assumptions are based on historical experience. The interest rate is based on the U.S. Treasury yield curve and the dividend yield assumption is based on the Company’s history and expected dividend payouts. 2017 2016 2015 Risk-free interest rate 1.21% 0.92% 0.67% Expected option life 8 years 8 years 8 years Expected stock price volatility 23.37% 23.56% 23.26% Dividend yield 2.79% 2.83% 2.84% Weighted-average fair value of options granted during year $5.13 $4.18 $3.80 A summary of the activity in the stock based compensation plans for 2017 follows: Stock Options
Shares Subject
to Options
Weighted Average Exercise
Price
Weighted Average
Remaining Contractual
Term
Aggregate Intrinsic
Value
Outstanding at beginning of year 35,130 $ 21.28 Granted 10,000 29.90 Exercised (10,425 ) 22.70 Forfeited (300 ) 27.58 Outstanding at end of year 34,405 $ 23.30 7.0 years $ 475,000 Exercisable at year-end 15,205 $ 17.83 5.0 years $ 293,000 2017 2016 2015 Intrinsic value of options exercised $110,000 $227,000 $140,000 Cash received from options exercise 237,000 1,785,000 867,000 Tax benefit realized from options exercises 88,000 25,000 127,000 As of December 31, 2017, there was $26,000 of total, unrecognized compensation cost related to nonvested stock options granted under the plans. The cost is expected to be recognized over a weighted average period of one year.

62
SOUTHERN MICHIGAN BANCORP, INC. NOTES TO CONSOLIDATED FINANCIAL STATEMENTS (CONTINUED) NOTE M – STOCK BASED COMPENSATION (CONTINUED) Restricted Stock – Restricted shares may be issued under the 2014 plan described above. Compensation expense is recognized over the vesting period of the shares, based on the market value of the shares on the issue date. The total fair value of shares vested during the years ended December 31, 2017, 2016, and 2015 was $532,000, $427,000, and $341,000, respectively. As of December 31, 2017, there was $2,035,000 of total unrecognized compensation cost related to unvested shares granted under the plan. The cost is expected to be recognized over a weighted average period of 3.3 years. A summary of activity for restricted stock for 2017 follows:
Shares
Weighted Average Grant
Date Fair Value
Nonvested at January 1, 2017 52,450 $ 20.89 Granted 66,000 29.90 Vested (17,716 ) 30.02 Forfeited (2,219 ) 24.78 Nonvested at December 31, 2017 98,515 $ 27.18
NOTE N – COMMITMENTS There are various commitments which arise in the normal course of business, such as commitments under commercial letters of credit, standby letters of credit, and commitments to extend credit. These arrangements have credit risk essentially the same as that involved in extending loans to customers and are subject to the Bank’s normal credit policies. Collateral generally consists of receivables, inventory, and equipment and is obtained based on management’s credit assessment of the customer. At December 31, 2017, and 2016, the Company had no commitments under commercial letters of credit used to facilitate customers’ trade transactions. Under standby letter of credit agreements, the Company agrees to honor certain commitments in the event that its customers are unable to do so. At December 31, 2017, and 2016, commitments under outstanding standby letters of credit were $8,795,000 and $6,340,000, respectively. Loan commitments outstanding to extend credit are detailed below (in thousands): 2017 2016 Fixed rate $ 59,593 $ 76,838 Variable rate 87,191 78,299 Totals $ 146,784 $ 155,137 The fixed rate commitments have stated interest rates ranging from 3.00% to 15.00%. The terms of the above commitments range from 1 to 240 months. Management does not anticipate any losses as a result of the above related transactions; however, the above amount represents the maximum exposure to credit loss for loan commitments, as well as commercial and standby letters of credit. Certain executives of the Bank have employment contracts which have change of control clauses. The employment contracts provide for the payment of 2.99 times the officer's base salary and bonus if the officer is terminated in the event of a change of control.

2017 ANNUAL REPORT
SOUTHERN MICHIGAN BANCORP, INC. NOTES TO CONSOLIDATED FINANCIAL STATEMENTS (CONTINUED) NOTE O – RESTRICTIONS ON TRANSFERS FROM SUBSIDIARIES Capital guidelines adopted by federal and state regulatory agencies and restrictions imposed by law limit the amount of cash dividends the Bank can pay to the Company. At December 31, 2017, using the most restrictive of these conditions, the aggregate cash dividends that the Bank could pay the Company without prior regulatory approval was approximately $12.4 million. NOTE P – ACCUMULATED OTHER COMPREHENSIVE INCOME The following table presents the activity and accumulated balances for the components of other comprehensive income (loss) for the years ended December 31, 2017, and 2016 (in thousands): Unrealized
Gains (Losses) Available-for-Sale Securities
Balance at January 1, 2016 $ 414 Other comprehensive loss before reclassifications (2,047 ) Amounts reclassified from accumulated other comprehensive loss (102 ) Current year other comprehensive loss, before tax (2,149 ) Income tax effect 731 Current year other comprehensive loss, net of tax (1,418 ) Balance at December 31, 2016 $ (1,004 ) Other comprehensive income before reclassifications 596 Amounts reclassified from accumulated other comprehensive income (3 ) Current year other comprehensive income, before tax 593 Income tax effect (202 ) Current year other comprehensive income, net of tax 391 Balance at December 31, 2017 $ (613 ) Accumulated other comprehensive loss amounted to $(613,000) at December 31, 2017, and $(1,004,000) at December 31, 2016, consisting of the following (in thousands): 2017 2016 Unrealized loss on available-for-sale securities, net of income taxes of $(195) in 2017 and $(518) in 2016 $ (613 ) $ (1,004 )

64
SOUTHERN MICHIGAN BANCORP, INC. NOTES TO CONSOLIDATED FINANCIAL STATEMENTS (CONTINUED) NOTE Q – SOUTHERN MICHIGAN BANCORP, INC. (PARENT COMPANY ONLY) FINANCIAL INFORMATION Condensed financial statements of Southern Michigan Bancorp, Inc. follow (in thousands): Balance Sheets December 31, 2017 2016 Assets Cash and cash equivalents $ 1,166 $ 573 Investment in subsidiary bank 80,533 72,515 Investment in non-banking subsidiaries 1,634 926 Premises and equipment, net 729 760 Other assets 1,247 1,262 Total Assets $ 85,309 $ 76,036 Liabilities and Shareholders’ Equity Dividends payable $ 487 $ 492 Other liabilities 130 58 Other borrowings 9,500 200 Subordinated debentures 5,155 5,155 Shareholders’ equity 70,037 70,131 Total Liabilities and Shareholders’ Equity $ 85,309 $ 76,036 Statements of Income Year ended December 31, 2017 2016 2015 Dividends from subsidiary bank $ 3,048 $ 3,041 $ 2,005 Interest income 6 4 5 Interest expense (501 ) (179 ) (157 ) Rental income from subsidiary bank 137 137 137 Other expenses (938 ) (711 ) (380 ) 1,752 2,292 1,610 Federal income tax credit (334 ) (255 ) (135 ) 2,086 2,547 1,745 Equity in net income, less dividends received from: Subsidiary bank 2,627 3,056 4,062 Non-banking subsidiaries 708 494 (1 ) Net Income $ 5,421 $ 6,097 $ 5,806

2017 ANNUAL REPORT
SOUTHERN MICHIGAN BANCORP, INC. NOTES TO CONSOLIDATED FINANCIAL STATEMENTS (CONTINUED) NOTE Q – SOUTHERN MICHIGAN BANCORP, INC. (PARENT COMPANY ONLY) FINANCIAL INFORMATION (CONTINUED) Statements of Cash Flows Year ended December 31, 2017 2016 2015 Operating Activities Net income $ 5,421 $ 6,097 $ 5,806 Adjustments to reconcile net income to net cash from operating activities: Equity in net income, less dividends received from: Subsidiary bank (2,627 ) (3,056 ) (4,062 ) Non-banking subsidiary (708 ) (494 ) 1 Stock option and restricted stock grant compensation expense 735 379 290 Depreciation of premises and equipment 31 31 31 Net change in obligation under ESOP 105 (147 ) (257 ) Other, net 87 (164 ) 16 Net cash from operating activities 3,044 2,646 1,825 Investing Activities Capital investment in subsidiary (5,000 ) (250 ) - Additions to premises and equipment - - (71 ) Net cash from investing activities (5,000 ) (250 ) (71 ) Financing Activities Repayments of other borrowings (700 ) - (319 ) Proceeds from other borrowings 10,000 200 319 Cash dividends paid (1,961 ) (1,737 ) (1,494 ) Stock options exercised 241 1,785 867 Repurchase of common stock (5,031 ) (2,515 ) (1,328 ) Net cash from financing activities 2,549 (2,267 ) (1,955 ) Net change in cash and cash equivalents 593 129 (201 ) Beginning cash and cash equivalents 573 444 645 Ending cash and cash equivalents $ 1,166 $ 573 $ 444 NOTE R – SUPPLEMENTAL CASH FLOW DISCLOSURES The following supplemental cash flow disclosures are provided for the years ended December 31, 2017, 2016, and 2015 (in thousands): 2017 2016 2015 Cash paid during the year for: Interest $ 2,661 $ 1,795 $ 1,613 Income taxes 1,960 2,425 2,155 Non-cash operating activities: Change in deferred income taxes on net unrealized gain (loss) on available-for-sale securities
202
(731
)
130
Change in deferred income taxes on pension liability - - 190 Change in pension liability - - (558 ) Non-cash investing activities: Change in unrealized gain (loss) on available-for-sale securities 593 (2,149 ) 384 Transfers from loans to other real estate owned 190 543 559
66
SOUTHERN MICHIGAN BANCORP, INC. NOTES TO CONSOLIDATED FINANCIAL STATEMENTS (CONTINUED) NOTE S – FAIR VALUE INFORMATION The following methods and assumptions were used by the Company in estimating fair values for financial instruments, as well as an indication of where the instrument falls within the fair value hierarchy. This is described in greater detail in Note T.
Cash and cash equivalents: The carrying amount reported in the balance sheet approximates fair value and results in a level 1 classification. Securities available-for-sale: Fair values for securities available-for-sale are based on quoted market prices, where available. For all other securities, the Company obtains fair value measurements from an independent pricing service. The fair value measurements consider observable data that may include dealer quotes, market spreads, cash flows, the U.S. Treasury yield curve, live trading levels, trade execution data, market consensus prepayment speeds, credit information, and bond terms and conditions, among other things. Securities are classified as either level 1, 2, or 3. See Footnote T for the hierarchy level breakdown. Loans, net: For variable-rate loans that reprice frequently and have no significant change in credit risk, fair values are based on carrying values and result in a level 3 classification. The fair values for other loans are estimated using discounted cash flows analyses, using interest rates currently offered for loans with similar terms to borrowers of similar credit quality and result in a level 3 classification. The allowance for loan losses is considered to be a reasonable estimate of discount for credit quality concerns. Loans held for sale: The fair value of loans held for sale is estimated based upon binding contracts and quotes from third party investors and results in a level 2 classification. Accrued interest receivable: The carrying amount reported in the balance sheet approximates fair value. Off-balance-sheet financial instruments: The estimated fair value of off-balance-sheet financial instruments is based on current fees or costs that would be charged to enter or terminate the arrangements. The estimated fair value is not considered to be significant for this presentation. Deposits: The fair values disclosed for demand deposits (e.g., interest and non-interest checking, passbook savings, and certain types of money market accounts) are, by definition, equal to the amount payable on demand at the reporting date (i.e., their carrying amounts) and result in a level 2 classification. Fair values for fixed-rate certificates of deposit are estimated using a discounted cash flow calculation that applies interest rates currently being offered on certificates to a schedule of expected monthly maturities on time deposits, resulting in a level 2 classification.
Securities sold under agreements to repurchase, overnight borrowings, and federal funds sold: The carrying amount reported in the balance sheet approximates fair value and results in a level 2 classification. Other borrowings: The fair value of other borrowings is estimated using discounted cash flows analyses. Such analyses are based on the current incremental borrowing rate for similar types of borrowing arrangements. This results in a level 2 classification. Subordinated debentures: The carrying amount reported in the balance sheet approximates fair value of the variable-rate subordinated debentures. The fair value is estimated using discounted cash flow analyses. Such analyses are based on the current borrowing rates for similar types of borrowing arrangements. This results in a level 3 classification. Accrued interest payable: The carrying amount reported in the balance sheet approximates fair value.

2017 ANNUAL REPORT
SOUTHERN MICHIGAN BANCORP, INC. NOTES TO CONSOLIDATED FINANCIAL STATEMENTS (CONTINUED) NOTE S – FAIR VALUE INFORMATION (CONTINUED) While these estimates of fair value are based on management’s judgment of appropriate factors, there is no assurance that if the Company had disposed of such items at December 31, 2017, and 2016, the estimated fair values would have been achieved. Market values may differ depending on various circumstances not taken into consideration in this methodology. The estimated fair values at December 31, 2017, and 2016 should not necessarily be considered to apply at subsequent dates. In addition, other assets and liabilities that are not defined as financial instruments are not included in the following disclosures, such as property and equipment. In addition, non-financial instruments typically not recognized in financial statements may have value, but are not included in the following disclosures. These include, among other items, the estimated earnings power of core deposit accounts, the trained work force, customer goodwill, and similar items. The estimated fair values of the Company’s financial instruments at year end are as follows (in thousands): Fair 2017 2016 Value
Hierarchy Carrying
Amount Fair
Value Carrying
Amount Fair
Value
Financial assets: Cash and cash equivalents Level 1 $ 17,421 $ 17,421 $ 16,320 $ 16,320 Federal funds sold Level 1 18,492 18,492 18,486 18,486 Securities available-for-sale See Note T 105,184 105,184 109,963 109,963 Loans held for sale Level 2 515 515 84 84 Loans, net of allowance for loan losses Level 3 518,438 516,554 444,973 447,117 Accrued interest receivable Level 1 3,211 3,211 2,871 2,871 Financial liabilities: Deposits Level 2 $ (577,144 ) $ (579,230 ) $ (535,845 ) $ (537,003 ) Securities sold under agreements to repurchase and overnight borrowings Level 2
(13,950 )
(13,950 )
(13,311
)
(13,311
)
Other borrowings Level 2 (39,500 ) (39,519 ) (10,200 ) (10,117 ) Subordinated debentures Level 3 (5,155 ) (5,155 ) (5,155 ) (5,155 ) Accrued interest payable Level 1 (218 ) (218 ) (110 ) (110 ) The preceding table does not include net cash surrender value of life insurance and dividends payable, which are also considered financial instruments. The estimated fair value of such items is considered to be their carrying amount. The Company also has unrecognized financial instruments which relate to commitments to extend credit and standby letters of credit, as described in Note N. The contract amount of such instruments is considered to be the fair value.

68
SOUTHERN MICHIGAN BANCORP, INC. NOTES TO CONSOLIDATED FINANCIAL STATEMENTS (CONTINUED) NOTE T – FAIR VALUE MEASUREMENTS Fair value is defined as the price that would be received to sell an asset or paid to transfer a liability in an orderly transaction between market participants. A fair value measurement assumes that the transaction to sell the asset or transfer the liability occurs in the principal market for the asset or liability. In the absence of a principal market, the most advantageous market for the asset or liability is used. The price in the principal (or most advantageous) market, used to measure the fair value of the asset or liability shall not be adjusted for transaction costs. An orderly transaction is a transaction that assumes exposure to the market for a period prior to the measurement date to allow for marketing activities that are usual and customary for transactions involving such assets and liabilities; it is not a forced transaction. Market participants are buyers and sellers in the principal market that are (i) independent; (ii) knowledgeable; (iii) able to transact; and (iv) willing to transact. Fair value must be determined using valuation techniques consistent with the market approach, the income approach, and/or the cost approach. The market approach uses prices and other relevant information generated by market transactions involving identical or comparable assets and liabilities. The income approach uses valuation techniques to convert future amounts, such as cash flows or earnings, to a single present amount on a discounted basis. The cost approach is based on the amount that currently would be required to replace the service capacity of an asset (replacement cost). Valuation techniques should be consistently applied. Inputs to valuation techniques refer to the assumptions that market participants would use in pricing the asset or liability. Inputs may be observable, meaning those that reflect the assumptions market participants would use in pricing the asset or liability, developed based on market data obtained from independent sources, or unobservable, meaning those that reflect the reporting entity’s own assumptions about the assumptions market participants would use in pricing the asset or liability, developed based on the best information available in the circumstances. A fair value hierarchy for valuation inputs has been established that gives the highest priority to quoted prices in active markets for identical assets or liabilities and the lowest priority to unobservable inputs. The fair value hierarchy is as follows:
Level 1 Inputs – Unadjusted, quoted prices in active markets for identical assets or liabilities that the reporting entity has the ability to access at the measurement date. Level 2 Inputs – Inputs other than quoted prices included in Level 1 that are observable for the asset or liability, either directly or indirectly. These might include: 1) quoted prices for similar assets or liabilities in active markets; 2) quoted prices for identical, or similar, assets or liabilities in markets that are not active; 3) inputs other than quoted prices that are observable for the asset or liability (such as interest rates, volatilities, prepayment speeds, credit risks, etc.); or 4) inputs derived principally from, or corroborated by, market data by correlation or other means. Level 3 Inputs – Unobservable inputs for determining the fair values of assets or liabilities that reflect an entity’s own assumptions about the assumptions that market participants would use in pricing the assets or liabilities.
A description of the valuation methodologies used for instruments measured at fair value, as well as the general classification of such instruments, pursuant to the valuation hierarchy, follows. These valuation methodologies were applied to all of the Company’s financial and non-financial assets and liabilities carried at fair value.
In general, fair value is based upon quoted market prices, where available. If such quoted market prices are not available, fair value is based upon internally developed models that primarily use, as inputs, observable market-based parameters. Valuation adjustments may be made to ensure that financial instruments are recorded at fair value. These adjustments may include amounts to reflect counterparty credit quality, the company’s creditworthiness, among other things, as well as unobservable parameters. Any such valuation adjustments are applied consistently over time. The Company’s valuation methodologies may produce a fair value calculation that may not be indicative of net realizable value or reflective of future fair values. While management believes the Company’s valuation methodologies are appropriate and consistent with other market participants, the use of different methodologies or assumptions to determine the fair value of certain financial instruments could result in a different estimate of fair value at the reporting date.

2017 ANNUAL REPORT
SOUTHERN MICHIGAN BANCORP, INC. NOTES TO CONSOLIDATED FINANCIAL STATEMENTS (CONTINUED) NOTE T – FAIR VALUE MEASUREMENTS (CONTINUED) Securities Available-for-Sale: Securities classified as available-for-sale are reported at fair value utilizing Level 1, Level 2, and Level 3 inputs. Unadjusted, quoted prices in active markets for identical assets are utilized to determine fair value at the measurement date for Level 1 securities. For all other securities, the Company obtains fair value measurements from an independent pricing service. The fair value measurements consider observable data that may include dealer quotes, market spreads, the U.S. Treasury yield curve, live trading levels, trade execution data, market consensus prepayment speeds, credit information, and the bond’s terms and conditions, among other things. When there are unobservable inputs, such securities are classified as Level 3. Securities available-for-sale, when classified as Level 3 inputs, represent non-publicly traded municipal issues with limited trading activity from entities within the Company’s market area. The fair value of these investments was determined using Level 3 valuation techniques, as there is no market available to price these investment securities. The method used for determining the fair value for these investment securities included a comparison to the fair value of other investment securities valued with Level 2 inputs with similar characteristics (credit, time to maturity, call structure, etc.) and the interest yield curve for comparable debt investment securities. Impaired Loans: The Company does not record impaired loans at fair value on a recurring basis. However, periodically, a loan is considered impaired and is reported at the fair value of the underlying collateral, less estimated costs to sell if repayment is expected solely from the collateral, or at estimated discounted cash flows if the credit is performing. Impaired loans measured at fair value typically consist of loans on nonaccrual status and loans with a portion of the allowance for loan losses allocated specific to the loan. Some loans may be included in both categories, whereas other loans may only be included in one category. Collateral values are estimated using level 2 and level 3 inputs, including recent appraisals and customized discounting criteria which include the discounting of appraisals based on age, changes in the property, or market conditions. These discounts generally range from 10% to 55%, and include a discount for estimated selling costs of 10%. Estimated cash flows are discounted considering the loan rate and current market rates; such discounts generally range from 3.6% to 7.8%. Due to the significance of the level 3 inputs, impaired loans have been classified as level 3. Other Real Estate Owned (OREO): The Company values OREO at the fair value of the underlying collateral, less expected selling costs. Collateral values are estimated primarily using discounted appraisals and reflect a market value approach. These discounts generally range from 25% to 55%. Due to the significance of unobservable inputs used in estimating fair value, OREO has been classified as level 3. The following table summarizes financial and non-financial assets (there were no financial or non-financial liabilities) measured at fair value as of December 31, 2017, and 2016. Information is segregated by the level of the valuation inputs within the fair value hierarchy utilized to measure fair value (in thousands): 2017
Level 1 Inputs
Level 2 Inputs
Level 3 Inputs
Total Fair Value
Recurring: Securities available-for-sale: U.S. Treasuries $ 2,000 $ - $ - $ 2,000 Federal agencies 41,035 - - 41,035 States and political subdivisions - 42,860 19,285 62,145 Mortgage-backed securities - 4 - 4 Total available-for-sale $ 43,035 $ 42,864 $ 19,285 $ 105,184 Nonrecurring: Impaired loans $ - $ - $ 2,861 $ 2,861 Other real estate owned: Commercial $ - $ - $ 33 $ 33 Residential real estate $ - $ - $ 51 $ 51

70
SOUTHERN MICHIGAN BANCORP, INC. NOTES TO CONSOLIDATED FINANCIAL STATEMENTS (CONTINUED) NOTE T – FAIR VALUE MEASUREMENTS (CONTINUED) 2016
Level 1 Inputs
Level 2 Inputs
Level 3 Inputs
Total Fair Value
Recurring: Securities available-for-sale: U.S. Treasuries $ 2,012 $ - $ - $ 2,012 Federal agencies 43,636 - - 43,636 States and political subdivisions - 42,085 19,901 61,986 Mortgage-backed securities - 8 - 8 Corporate security 2,321 - - 2,321 Total available-for-sale $ 47,969 $ 42,093 $ 19,901 $ 109,963 Nonrecurring: Impaired loans $ - $ - $ 2,374 $ 2,374 Other real estate owned: Commercial $ - $ - $ 210 $ 210 Residential real estate $ - $ - $ 98 $ 98 Impaired loans are reported net of an allowance for loan losses of $41,000 at December 31, 2017, and $88,000 at December 31, 2016. Other real estate owned, which is measured at the lower of carrying or fair value, less costs to sell, had a net carrying amount of $84,000 as of December 31, 2017, ($103,000, net of a valuation allowance of $19,000). Other real estate owned had a net carrying amount of $308,000 at December 31, 2016, ($351,000, net of a valuation allowance of $43,000). The following is a reconciliation of the beginning and ending balances of securities available-for-sale. These are measured at fair value on a recurring basis, using significant unobservable (Level 3) inputs during the years ended December 31, 2017, and 2016 (in thousands): 2017 2016 Balance at January 1 $ 19,901 $ 19,160 Net maturities and calls (5,194 ) (6,725 ) Unrealized net gains/(losses) included in other comprehensive income (180 ) (685 ) Purchases 4,758 8,151 Balance at December 31 $ 19,285 $ 19,901 NOTE U – REGULATORY MATTERS Banks and bank holding companies are subject to regulatory capital requirements administered by federal banking agencies. Capital adequacy guidelines and, additionally for banks, prompt corrective action regulations involve quantitative measures of assets, liabilities, and certain off-balance-sheet items calculated under regulatory accounting practices. Capital amounts and classifications are also subject to qualitative judgments by regulators. Failure to meet capital requirements can initiate regulatory action that could have a direct material adverse effect on the consolidated financial statements. Prompt corrective action provisions are not applicable to bank holding companies. These capital requirements were modified in 2013 with the Basel III capital rules, which establish a new comprehensive capital framework for U.S. banking organizations. The Company and Bank became subject to the new rules on January 1, 2015, with a phase-in period for many of the new provisions.

2017 ANNUAL REPORT
SOUTHERN MICHIGAN BANCORP, INC. NOTES TO CONSOLIDATED FINANCIAL STATEMENTS (CONTINUED) NOTE U – REGULATORY MATTERS (CONTINUED) The prompt corrective action regulations provide five capital categories, including well capitalized, adequately capitalized, undercapitalized, significantly undercapitalized, and critically undercapitalized, although these terms are not used to represent overall financial condition. If adequately capitalized or worse, regulatory approval is required to, among other things, accept brokered deposits. If undercapitalized, capital distributions and asset growth are limited, while plans for capital restoration are required. Under the amended Small Bank Holding Company Policy Statement (Regulation Y, Appendix C) (the “Policy Statement”) the Company qualifies for treatment as a small bank holding company and is no longer subject to consolidated capital rules. At year end, actual capital levels and minimum required levels were as follows (in thousands):
Actual
Minimum Required For Capital
Adequacy Purposes
Minimum Required To Be
Well Capitalized Under Prompt Corrective
Action Regulations Amount Ratio Amount Ratio Amount Ratio 2017 Total Capital to risk weighted assets: Consolidated $67,237 11.1 % N/A N/A N/A N/A Bank 72,733 12.1 $ 48,293 8.0 % $60,366 10.0 % Tier 1 (Core) Capital to risk weighted assets:
Consolidated 62,228 10.3 N/A N/A N/A N/A Bank 67,724 11.2 36,220 6.0 48,293 8.0 Common Tier 1 Capital to risk weighted assets (CET1):
Consolidated 62,228 10.3 N/A N/A N/A N/A Bank 67,724 11.2 27,165 4.5 39,238 6.5 Tier 1 (Core) Capital to average assets:
Consolidated 62,228 9.0 N/A N/A N/A N/A Bank 67,724 9.8 27,581 4.0 34,476 5.0 2016 Total Capital to risk weighted assets: Consolidated $67,463 12.7 % N/A N/A N/A N/A Bank 64,847 12.3 $ 42,339 8.0 % $52,923 10.0 % Tier 1 (Core) Capital to risk weighted assets:
Consolidated 62,622 11.8 N/A N/A N/A N/A Bank 60,006 11.3 31,754 6.0 42,339 8.0 Common Tier 1 Capital to risk weighted assets (CET1):
Consolidated 62,622 11.8 N/A N/A N/A N/A Bank 60,006 11.3 23,816 4.5 34,400 6.5 Tier 1 (Core) Capital to average assets:
Consolidated 62,622 10.1 N/A N/A N/A N/A Bank 60,006 9.7 24,715 4.0 30,894 5.0

72
SOUTHERN MICHIGAN BANCORP, INC. NOTES TO CONSOLIDATED FINANCIAL STATEMENTS (CONTINUED) NOTE V – QUALIFIED AFFORDABLE HOUSING PROJECT INVESTMENTS The Company invests in qualified investment housing projects. At December 31, 2017, and 2016, the balance of the investment for qualified affordable housing projects was $402,000 and $447,000, respectively. These balances are reflected in the other assets line on the consolidated balance sheets. Total unfunded commitments related to the investments in qualified affordable housing projects totaled $190,000 and $285,000 at December 31, 2017, and 2016. The Company expects to fulfill these commitments during the year ending 2029. During the years ended December 31, 2017, 2016, and 2015, the Company recognized amortization expense of $45,000, $41,000 and $11,000, respectively, which was included within income tax expense on the consolidated statements of income. Additionally, during the years ended December 31, 2017, 2016, and 2015, the Company recognized tax credits and other benefits from its investment in affordable housing tax credits of $47,000, $38,000 and $14,000, respectively. NOTE W – QUARTERLY FINANCIAL DATA (IN THOUSANDS, EXCEPT PER SHARE DATA) (UNAUDITED)
Interest Income
Net Interest Income
Provision for Loan Losses
Net
Income
Earnings Per Share
Basic Fully
Diluted 2017 First Quarter $ 5,820 $ 5,321 $ - $ 1,446 $ .59 $ .59 Second Quarter 6,114 5,579 - 1,493 .63 .63 Third Quarter 6,587 5,753 175 1,743 .76 .75 Fourth Quarter 6,830 5,930 - 739 .32 .32 2016 First Quarter $ 5,495 $ 5,068 $ 100 $ 1,374 $ .57 $ .57 Second Quarter 5,406 4,972 - 1,398 .58 .58 Third Quarter 5,461 5,002 - 1,658 .69 .69 Fourth Quarter 5,669 5,175 - 1,667 .70 .70

2017 ANNUAL REPORT
SELECTED FINANCIAL DATA (in thousands, except per share data) Year Ended December 31 2017 2016 2015 2014 2013 Total interest income $ 25,351 $ 22,031 $ 21,195 $ 20,320 $ 19,915 Net interest income 22,583 20,217 19,568 18,707 17,767 Provision for loan losses 175 100 250 400 750 Net income 5,421 6,097 5,806 4,792 4,499 Per share data: Basic earnings per share 2.30 2.54 2.42 1.99 1.88 Cash dividends declared .83 .76 .63 .58 .50 Balance sheet data: Gross loans 523,447 449,815 421,989 410,112 386,011 Deposits 577,144 535,845 477,485 444,270 450,400 Other borrowings 39,500 10,200 10,000 10,000 - Equity 70,037 70,131 67,769 63,160 59,074 Total assets 712,345 641,532 582,771 543,345 539,459 Return on average assets .80 % 1.00 % 1.02 % .87 % .84 % Return on average equity (1) 7.64 8.69 8.82 7.79 7.72 Dividend payout ratio (2) 36.08 30.26 26.15 29.15 26.65 Average equity to average assets (1) 10.52 11.49 11.52 11.18 10.94 (1) Average equity in the above table includes common shares subject to a repurchase obligation held in the
Company’s ESOP plan and includes average unrealized appreciation or depreciation on securities available-for-sale.
(2) Dividends declared, divided by net income. COMMON STOCK MARKET PRICES AND DIVIDENDS The Company’s common stock is regularly quoted on the OTC Pink, under the symbol SOMC. The sale prices described below are quotations reflecting inter-dealer prices, without retail markup, markdown, or commissions, and may not necessarily represent actual transactions. As of March 12, 2018, there were 2,320,737 shares of Southern common stock, issued and outstanding, held by 318 holders of record. The following table sets forth the range of high and low closing sales prices and dividends declared on the Company’s common stock for the two most recent fiscal years: 2016 2017 Cash
Dividends Declared
Cash Dividends Declared
Closing Price Closing Price High Low High Low Quarter Ended March 31 $ 25.75 $ 24.71 $ .18 $ 35.00 $ 29.50 $ .20 June 30 26.75 24.85 .18 35.00 32.01 .21 September 30 26.40 25.50 .20 34.60 32.01 .21 December 31 29.90 26.15 .20 38.00 33.15 .21 There are restrictions that currently limit the Company’s ability to pay cash dividends. Information regarding dividend payment restrictions is described in Note O to the consolidated financial statements.

Kurtis Condon, Plant Manager at the Hillsdale Industrial Drive facility, speaks with Kurt Miller, Southern Michigan Bank & Trust President/Chief Credit Officer about the Hillsdale Terminal manufacturing facility. View from inside Southern’s Portage Branch.

ANNUALREPORT
2017
Southern Michigan Bancorp, Inc.51 West Pearl Street | Coldwater, MI 49036517.279.5500 | www.smb-t.com
Southern Michigan B
ancorp, Inc. | 2017 A
NN
UA
L REP
OR
T