annual report informe anual 2014 · institución bancaria líder, tanto en activos como en...
TRANSCRIPT

ANNUAL REPORT INFORME ANUAL
2014

Popular, Inc. (NASDAQ:BPOP) is a full-service financial
provider based in Puerto Rico, with operations in Puerto
Rico, the Virgin Islands and the United States. In Puerto Rico,
Popular is the leading banking institution, by both assets and
deposits, and ranks among the largest 40 banks in the U.S.
by assets.
CORPORATE INFORMATION
Independent Registered Public Accounting Firm:
PricewaterhouseCoopers LLP
The company’s Form 10-K, proxy statement, corporate social
responsibility report and any other financial information, is
available on our website www.popular.com
Annual Meeting
The 2015 Annual Stockholders’ Meeting of Popular, Inc. will
be held on Wednesday, April 29, at 9:00 a.m. at Centro Europa
Building in San Juan, Puerto Rico.
Popular, Inc. (NASDAQ:BPOP) es un proveedor de servicios
financieros con sede en Puerto Rico y operaciones en Puerto
Rico, Islas Vírgenes y Estados Unidos. En Puerto Rico es la
institución bancaria líder, tanto en activos como en depósitos,
y se encuentra entre los 40 bancos más grandes de Estados
Unidos por total de activos.
INFORMACIÓN CORPORATIVA
Firma Registrada de Contabilidad Pública Independiente:
PricewaterhouseCoopers LLP
El Formulario 10-K, proxy, reporte de responsabilidad social,
así como otra información financiera, están disponibles en
nuestra página de Internet www.popular.com
Reunión Anual
La Reunión Anual de Accionistas 2015 de Popular, Inc., se
llevará a cabo el miércoles, 29 de abril, a las 9:00 a.m. en el
edificio Centro Europa en San Juan, Puerto Rico.
Contents/Índice
1 Popular, Inc. Year in Review
3 Fast Facts
4 25-Year Historical Financial Summary
6 Popular, Inc. Management
7 Popular, Inc. – Resumen del Año
9 Cifras a la Mano
10 Resumen Financiero Histórico – 25 Años
12 Popular, Inc. Gerencia

1
RICHARD L. CARRIÓNChairman & Chief Executive Officer
THE REPAYMENT OF THE TARP FUNDS BETTER POSITIONS US FOR MORE ACTIVE CAPITAL MANAGEMENT IN THE FUTURE.
POPULAR, INC. 2014 ANNUAL REPORT
POPULAR, INC.
Year in Review
In 2014 we achieved significant milestones and
made important progress on various fronts.
The repayment of TARP and the restructuring
of our U.S. operations were two of our main of our U.S. op
s during the year. Including theachievement
ese events, we reported a net lossimpact of the
on. Although these actions affectedof $313 millio
sults, we are now in a muchthe year’s res
ition moving forward. Adjusted netstronger pos
he year, excluding these events, income for th
llion. These solid results in 2014 was $301 mil
by higher net interest income duewere driven b
rest expense, a lower provision forto lower inter
lower operating expenses, mainlyloan losses, l
s and FDIC insurance, and lower pension costs
s.income taxes
y remained stable despite the Credit quality
economic conditions in Puerto challenging e
arge-offs declined in Puerto Rico. Net cha
United States, both in absolute Rico and the
ll as a percentage of loans. Non-terms as wel
oans as a percentage of total performing lo
2014 at 2.95%, fairly stable whenloans closed
the previous year if we exclude compared to
s from the regions that were sold loan balances
e U.S. restructuring. While weas part of the
nt due to economic conditions inremain vigila
we are encouraged by the general Puerto Rico, w
of our portfolios.performance
to enjoy strong capital levels We continue
ers and regulatory requirements. relative to pe
mmon equity ratio stood at 15.9% Our Tier 1 co
or 110 basis points higher than at year-end, o
h still included our TARP capital. in 2013, whic
ent of TARP funds, completed inThe repayme
July of 2014 without issuing additional equity,
better positions us for more active capital
management in the future.
The restructuring of our U.S. operations was a
defining event of 2014. In April, we announced
our plan to sell our California, Chicago and
Central Florida regions in order to focus our
business on the New York Metro and Miami
regions. The plan also includes the transfer of
most support functions to Puerto Rico and New
York to leverage the talent and infrastructure
we have in place in our headquarters and to
benefit from Puerto Rico’s lower personnel
cost structure. During the course of the year,
we completed the sale of the three regions and
made significant progress in the operational
restructuring. Once the transfer of support
functions is completed in the first half of
2015, we will have reduced the number of
back-office employees supporting our U.S.
operations by 43%, with approximately two-
thirds of them based in Puerto Rico. I would
like to acknowledge the hard work of all of our
colleagues at Popular Community Bank and
those supporting them in Puerto Rico that have
made possible the successful execution of an
extremely complex restructuring project. We
are now ready to move forward with a leaner,
more focused operation in the U.S.
Our franchise in Puerto Rico was strengthened
in 2014. We increased our market share in
most categories and maintained our leadership
position in the majority of them. In the auto
business, where we have intensified our sales
efforts, we reached the second position in
the market for the first time. Despite a weak

22
Puerto Rico economy, we also experienced
growth in the corporate segment.
We deepened our efforts to enhance service
and offer greater convenience to our clients.
Most business units improved their customer
satisfaction metrics. Results reflect the
conscientious effort of all groups, as well
as initiatives related to efficiency that have
also had a positive impact on customer
satisfaction. The redesign of branch
processes, based on the LEAN methodology,
was completed in 17% of our branches which
account for 28% of total transactions. Results
to date in these branches show higher
service levels and significant reductions in
waiting times. As we roll out this project to
other branches, we expect to see additional
improvements in our customer satisfaction.
We also continued the implementation of
projects designed to transform our retail
delivery network, placing a greater emphasis
on digital transactions. The digitalization of
our clients’ interactions is a critical move to
offer convenient alternatives and generate
cost efficiencies. In December of 2014,
deposits made through automatic teller
machines (ATMs) in Puerto Rico reached
29% of deposits in branches with upgraded
ATMs, compared to 17% in December of 2013.
At the same time we migrate transactional,
service and sales interactions to digital
channels, we will revise our physical footprint
in order to meet our clients’ needs in a more
effective way.
We also embarked on several key initiatives
regarding our most important asset – our
people. In August, we increased the minimum
hourly base salary for all our employees
in Puerto Rico to $9.00, which applied to
approximately 2,400 of our colleagues. In
2015 we will increase salaries to $10.00
for those employees demonstrating good
performance. We are well aware that it is
critical to attract, retain and develop the
best talent available in order to reach our
ambitious goals. We are convinced that this
investment will produce benefits in terms
of retention, engagement, customer service
and productivity. Another important event
this year was the inauguration of the On-Site
Health and Wellness Center in Puerto Rico,
focused on the prevention and early detection
of health conditions. The objective of this
innovative approach is to improve the health of
our employees, which will translate into lower
medical expenses and increased productivity.
As a result of these and other efforts, our
employee engagement metrics, which were
already solid, improved even more in 2014.
We are continuously raising the bar, expecting
a higher level of performance from our
employees. We feel confident that our focus
on performance, coupled with the investments
we are making on our people, make them our
strongest competitive advantage.
Our commitment to our communities
continued unabated. We expanded our
financial education program Finance in Your
Hands, which has reached over 100,000
individuals in Puerto Rico and was recognized
by the American Banking Association as
the best financial education program in the
United States. We remain committed to Echar
Pa’lante, a multisectoral social collaboration
FUNDACIÓN BANCO
POPULAR AND THE
COMMUNITY BANK
FOUNDATION DONATED
OVER $3.1 MILLION
TO 128 NONPROFIT
ORGANIZATIONS.
POPULAR, INC.
Year in Review
BPOP
US Peers
KBW Index
PR Peers
-40%
-30%
-20%
-10%
0%
10%
20%
30%
DEC
-13
JAN
-14
FEB
-14
MA
R-1
4
AP
R-1
4
MA
Y-14
JUN
-14
JUL-
14
AU
G-1
4
SEP
T-14
OC
T-14
NO
V-14
DEC
-14
BPOP STOCK PRICE CHANGE vs. PEERS (2013-2014)
19%
8%7%
-32%
3
program we launched in 2011, that has
brought together over 300 organizations
and experts to foster education and
entrepreneurship. Employee contributions to
our foundations increased in 2014, reaching
$730,000. In large part thanks to these
contributions, Fundación Banco Popular and
the Popular Community Bank Foundation
donated over $3.1 million to 128 nonprofit
organizations. Volunteerism also remained
strong. Our employees donated their time to
collaborate with many of the organizations we
support financially. In December, as part of
the celebration of the 35th anniversary of the
Banco Popular Foundation in Puerto Rico, we
inaugurated its new headquarters. In addition
to serving as a home to our Foundation,
the building houses 11 other nonprofit
organizations, turning our space into a center
for collaboration and social innovation.
Our stock closed the year at $34.05,
19% higher than at the end of 2013. This
performance compares favorably to that of
industry indices, our U.S. peers, and other
banks in Puerto Rico.
In September of 2014, Ignacio Alvarez, Esq.
was named President and Chief Operating
Officer of Popular, Inc. and Banco Popular de
Puerto Rico, as well as President of Banco
Popular North America. Ignacio had been
serving as General Counsel since 2010,
demonstrating outstanding leadership and
making important contributions in strategic
initiatives across the organization.
We are pleased to have brought on board
Javier D. Ferrer, Esq. as the new General
Counsel and Secretary of the Board of
Directors of Popular, Inc. As one of the
founding partners of Pietrantoni Méndez
& Alvarez LLC and a former president of
the Government Development Bank for
Puerto Rico, Javier brings with him extensive
experience in the corporate and banking
law fields and has been a great addition to
our team.
I want to express my deepest gratitude to
Jorge A. Junquera for 43 years of outstanding
service to Popular. From his early years in
Investments, to his most recent role as Vice-
Chairman, Jorge’s passion and dedication
made him an integral part of the management
team. It is impossible for me to enumerate
the countless initiatives he led, but I would
like to highlight that his advice, expertise
and leadership during his 17 years as Chief
Financial Officer were key to help strengthen
the financial position of our organization.
Finally, I would also like to acknowledge
Samuel T. Céspedes, Esq. who decided to
retire after serving as the Secretary of the
Board of Directors for 24 years. I know I speak
on behalf of the entire Board when I say that
we are all grateful for his commitment and his
contributions throughout these years.
As you can see, our accomplishments for 2014
extend well beyond financial results. They
demonstrate how commitment to our clients,
employees, shareholders and communities
translates into concrete results that pave the
way for future successes.
I am grateful to the management team and
Board of Directors for their support and
leadership. They are responsible for all of
these achievements.
The year 2015 brings a new set of
opportunities and challenges. In the case
of our U.S. operations, we will complete the
transfer of the support functions to Puerto
Rico and, at the same time, strive to achieve
aggressive business goals. In Puerto Rico, the
economy still presents significant challenges,
but we will remain focused on serving our
clients and growing our business where
opportunities exist.
I am confident that, guided by clear objectives
and energized by the opportunities that lie
ahead of us, we will continue forging ahead
in 2015.
POPULAR, INC. 2014 ANNUAL REPORT
RICHARD L. CARRIÓNChairman & Chief Executive Officer
FAST FACTS 2014 Highlights
$301 MILLION in adjusted net income
$1.8 BILLION adjusted gross revenues
$2 BILLION amount by which our total capital
exceeded the current
well-capitalized threshold

44
(Dollars in millions, except per share data) 1990 1991 1992 1993 1994 1995 1996 1997 1998 1999 2000
Selected Financial Information
Net Income (Loss) $ 63.4 $ 64.6 $ 85.1 $ 109.4 $ 124.7 $ 146.4 $ 185.2 $ 209.6 $ 232.3 $ 257.6 $ 276.1
Assets 8,983.6 8,780.3 10,002.3 11,513.4 12,778.4 15,675.5 16,764.1 19,300.5 23,160.4 25,460.5 28,057.1
Gross Loans 5,373.3 5,195.6 5,252.1 6,346.9 7,781.3 8,677.5 9,779.0 11,376.6 13,078.8 14,907.8 16,057.1
Deposits 7,422.7 7,207.1 8,038.7 8,522.7 9,012.4 9,876.7 10,763.3 11,749.6 13,672.2 14,173.7 14,804.9
Stockholders’ Equity 588.9 631.8 752.1 834.2 1,002.4 1,141.7 1,262.5 1,503.1 1,709.1 1,661.0 1,993.6
Market Capitalization $ 479.1 $ 579.0 $ 987.8 $ 1,014.7 $ 923.7 $ 1,276.8 $ 2,230.5 $ 3,350.3 $ 4,611.7 $ 3,790.2 $ 3,578.1
Return on Assets (ROA) 1.09% 0.72% 0.89% 1.02% 1.02% 1.04% 1.14% 1.14% 1.14% 1.08% 1.04%
Return on Common Equity (ROE) 15.55% 10.57% 12.72% 13.80% 13.80% 14.22% 16.17% 15.83% 15.41% 15.45% 15.00%
Per Common Share1
Net Income (Loss) – Basic $ 3.94 $ 2.69 $ 3.49 $ 4.18 $ 4.59 $ 5.24 $ 6.69 $ 7.51 $ 8.26 $ 9.19 $ 9.85
Net Income (Loss) – Diluted 3.94 2.69 3.49 4.18 4.59 5.24 6.69 7.51 8.26 9.19 9.85
Dividends (Declared) 1.00 1.00 1.00 1.20 1.25 1.54 1.83 2.00 2.50 3.00 3.20
Book Value 24.58 26.24 28.79 31.86 34.35 39.52 43.98 51.83 59.32 57.54 69.62
Market Price 20.00 24.06 37.81 39.38 35.16 48.44 84.38 123.75 170.00 139.69 131.56
Assets by Geographical Area
Puerto Rico 89% 87% 87% 79% 76% 75% 74% 74% 71% 71% 72%
United States 9% 11% 10% 16% 20% 21% 22% 23% 25% 25% 26%
Caribbean and Latin America 2% 2% 3% 5% 4% 4% 4% 3% 4% 4% 2%
Total 100% 100% 100% 100% 100% 100% 100% 100% 100% 100% 100%
Traditional Delivery System
Banking Branches
Puerto Rico 173 161 162 165 166 166 178 201 198 199 199
Virgin Islands 3 3 3 8 8 8 8 8 8 8 8
United States 24 24 30 32 34 40 44 63 89 91 95
Subtotal 200 188 195 205 208 214 230 272 295 298 302
Non-Banking Offices
Popular Financial Holdings 27 41 58 73 91 102 117 128 137 136
Popular Cash Express 51 102 132
Popular Finance 26 26 26 26 28 31 39 44 48 47 61
Popular Auto 9 9 9 8 10 9 8 10 10 12 12
Popular Leasing, U.S.A. 7 8 10 11
Popular Mortgage 3 3 3 11 13 21
Popular Securities 1 2 2 2 3
Popular One
Popular Insurance 2
Popular Insurance Agency, U.S.A.
Popular Insurance, V.I.
E-LOAN
EVERTEC 4 4
Subtotal 35 62 76 92 111 134 153 183 258 327 382
Total 235 250 271 297 319 348 383 455 553 625 684
Electronic Delivery System
ATMs Owned
Puerto Rico 211 206 211 234 262 281 327 391 421 442 478
Virgin Islands 3 3 3 8 8 8 9 17 59 68 37
United States 6 11 26 38 53 71 94 99 109
Total 214 209 220 253 296 327 389 479 574 609 624
Transactions (in millions)
Electronic Transactions2 18.0 23.9 28.6 33.2 43.0 56.6 78.0 111.2 130.5 159.4 199.5
Items Processed3 164.0 166.1 170.4 171.8 174.5 175.0 173.7 171.9 170.9 171.0 160.2
Employees (full-time equivalent) 7,023 7,006 7,024 7,533 7,606 7,815 7,996 8,854 10,549 11,501 10,651
25 YEAR
Historical Financial Summary
55
POPULAR, INC. 2014 ANNUAL REPORT
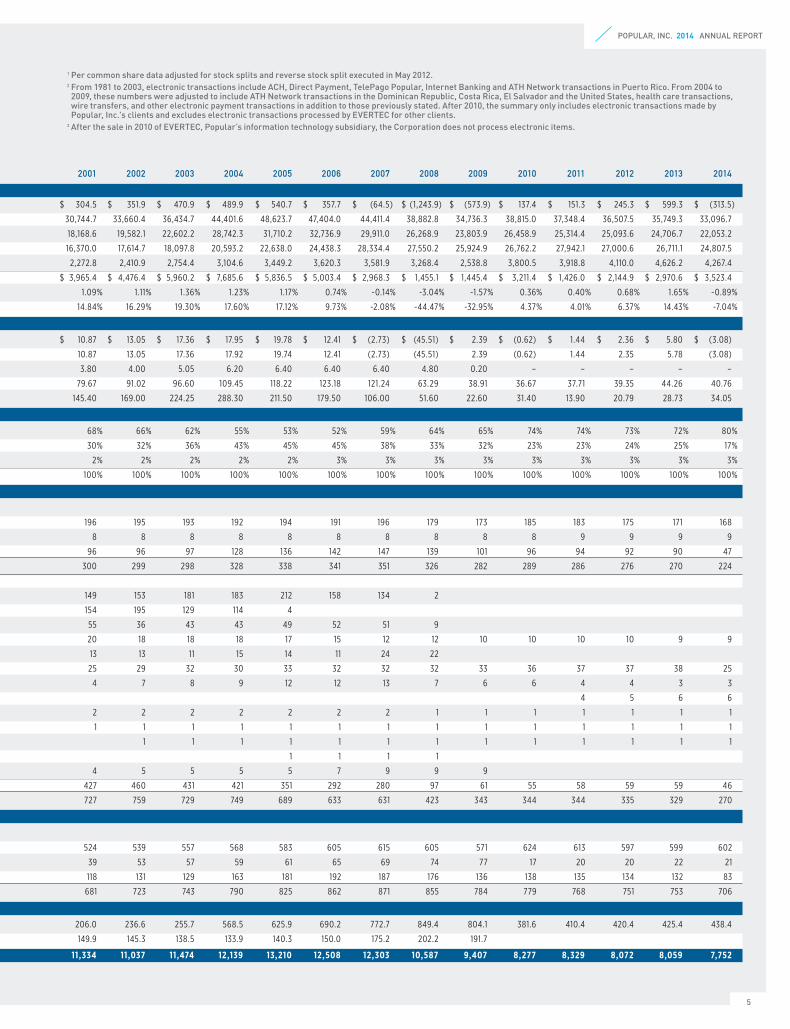
2001 2002 2003 2004 2005 2006 2007 2008 2009 2010 2011 2012 2013 2014
$ 304.5 $ 351.9 $ 470.9 $ 489.9 $ �540.7 $ �357.7 $ �(64.5) $ (1,243.9) $ �(573.9) $ 137.4 $ 151.3 $ 245.3 $ 599.3 $ (313.5)
30,744.7 33,660.4 36,434.7 44,401.6 48,623.7 47,404.0 44,411.4 38,882.8 34,736.3 38,815.0 37,348.4 36,507.5 35,749.3 33,096.7
18,168.6 19,582.1 22,602.2 28,742.3 31,710.2 32,736.9 29,911.0 26,268.9 23,803.9 26,458.9 25,314.4 25,093.6 24,706.7 22,053.2
16,370.0 17,614.7 18,097.8 20,593.2 22,638.0 24,438.3 28,334.4 27,550.2 25,924.9 26,762.2 27,942.1 27,000.6 26,711.1 24,807.5
2,272.8 2,410.9 2,754.4 3,104.6 3,449.2 3,620.3 3,581.9 3,268.4 2,538.8 3,800.5 3,918.8 4,110.0 4,626.2 4,267.4
$ 3,965.4 $ 4,476.4 $ 5,960.2 $ 7,685.6 $ 5,836.5 $ 5,003.4 $ 2,968.3 $ 1,455.1 $ 1,445.4 $ 3,211.4 $ 1,426.0 $ 2,144.9 $ 2,970.6 $ 3,523.4
1.09% 1.11% 1.36% 1.23% 1.17% 0.74% -0.14% -3.04% -1.57% 0.36% 0.40% 0.68% 1.65% -0.89%
14.84% 16.29% 19.30% 17.60% 17.12% 9.73% -2.08% -44.47% -32.95% 4.37% 4.01% 6.37% 14.43% -7.04%
$ 10.87 $ 13.05 $ 17.36 $ 17.95 $ 19.78 $ 12.41 $ (2.73) $ (45.51) $ 2.39 $ (0.62) $ 1.44 $ 2.36 $ 5.80 $ (3.08)
10.87 13.05 17.36 17.92 19.74 12.41 (2.73) (45.51) 2.39 (0.62) 1.44 2.35 5.78 (3.08)
3.80 4.00 5.05 6.20 6.40 6.40 6.40 4.80 0.20 – – – – –
79.67 91.02 96.60 109.45 118.22 123.18 121.24 63.29 38.91 36.67 37.71 39.35 44.26 40.76
145.40 169.00 224.25 288.30 211.50 179.50 106.00 51.60 22.60 31.40 13.90 20.79 28.73 34.05
68% 66% 62% 55% 53% 52% 59% 64% 65% 74% 74% 73% 72% 80%
30% 32% 36% 43% 45% 45% 38% 33% 32% 23% 23% 24% 25% 17%
2% 2% 2% 2% 2% 3% 3% 3% 3% 3% 3% 3% 3% 3%
100% 100% 100% 100% 100% 100% 100% 100% 100% 100% 100% 100% 100% 100%
196 195 193 192 194 191 196 179 173 185 183 175 171 168
8 8 8 8 8 8 8 8 8 8 9 9 9 9
96 96 97 128 136 142 147 139 101 96 94 92 90 47
300 299 298 328 338 341 351 326 282 289 286 276 270 224
149 153 181 183 212 158 134 2
154 195 129 114 4
55 36 43 43 49 52 51 9
20 18 18 18 17 15 12 12 10 10 10 10 9 9
13 13 11 15 14 11 24 22
25 29 32 30 33 32 32 32 33 36 37 37 38 25
4 7 8 9 12 12 13 7 6 6 4 4 3 3
4 5 6 6
2 2 2 2 2 2 2 1 1 1 1 1 1 1
1 1 1 1 1 1 1 1 1 1 1 1 1 1
1 1 1 1 1 1 1 1 1 1 1 1 1
1 1 1 1
4 5 5 5 5 7 9 9 9
427 460 431 421 351 292 280 97 61 55 58 59 59 46
727 759 729 749 689 633 631 423 343 344 344 335 329 270
524 539 557 568 583 605 615 605 571 624 613 597 599 602
39 53 57 59 61 65 69 74 77 17 20 20 22 21
118 131 129 163 181 192 187 176 136 138 135 134 132 83
681 723 743 790 825 862 871 855 784 779 768 751 753 706
206.0 236.6 255.7 568.5 625.9 690.2 772.7 849.4 804.1 381.6 410.4 420.4 425.4 438.4
149.9 145.3 138.5 133.9 140.3 150.0 175.2 202.2 191.7
11,334 11,037 11,474 12,139 13,210 12,508 12,303 10,587 9,407 8,277 8,329 8,072 8,059 7,752
1 Per common share data adjusted for stock splits and reverse stock split executed in May 2012.2 From 1981 to 2003, electronic transactions include ACH, Direct Payment, TelePago Popular, Internet Banking and ATH Network transactions in Puerto Rico. From 2004 to 2009, these numbers were adjusted to include ATH Network transactions in the Dominican Republic, Costa Rica, El Salvador and the United States, health care transactions, wire transfers, and other electronic payment transactions in addition to those previously stated. After 2010, the summary only includes electronic transactions made by Popular, Inc.'s clients and excludes electronic transactions processed by EVERTEC for other clients.
3 After the sale in 2010 of EVERTEC, Popular’s information technology subsidiary, the Corporation does not process electronic items.

66
BOARD OF DIRECTORS
SENIOR MANAGEMENT TEAM
POPULAR, INC.
Management
RICHARD L. CARRIÓNChairman & Chief Executive Officer Popular, Inc.
JUAN O. GUERREROExecutive Vice President Financial & Insurance Services Group Banco Popular de Puerto Rico
ELI S. SEPÚLVEDA Executive Vice President & Chief Lending OfficerCommercial Credit GroupBanco Popular de Puerto Rico
IGNACIO ÁLVAREZPresident & Chief Operating Officer Popular, Inc., Banco Popular de Puerto Rico President Popular Community Bank
JAVIER D. FERRERExecutive Vice President & Chief Legal Officer General Counsel & Corporate Matters Group Popular, Inc.
CARLOS J. VÁZQUEZExecutive Vice President & Chief Financial Officer Popular, Inc.
GILBERTO MONZÓNExecutive Vice President Individual Credit Group Banco Popular de Puerto Rico
LIDIO SORIANOExecutive Vice President & Chief Risk Officer Corporate Risk Management Group Popular, Inc.
EDUARDO J. NEGRÓN Executive Vice President Administration Group Popular, Inc.
NÉSTOR O. RIVERAExecutive Vice President Retail Banking Group Banco Popular de Puerto Rico
ILEANA GONZÁLEZExecutive Vice President Commercial Credit Administration Group Banco Popular de Puerto Rico
DAVID E. GOELManaging Member Matrix Capital Management Company, L.P.
CARLOS A. UNANUEPresident Goya de Puerto Rico
ALEJANDRO M. BALLESTERPresident Ballester Hermanos, Inc.
RICHARD L. CARRIÓNChairman & Chief Executive Officer Popular, Inc.
C. KIM GOODWINPrivate Investor
JOHN W. DIERCKSENPrincipal Greycrest, LLC
JOAQUÍN E. BACARDÍ, IIIPresident & Chief Executive Officer Bacardí Corporation
MARÍA LUISA FERRÉPresident & Chief Executive Officer Grupo Ferré Rangel
WILLIAM J. TEUBER JR.Vice Chairman EMC Corporation

77
RICHARD L. CARRIÓNPresidente de la Junta de Directores y Principal Oficial Ejecutivo
EL REPAGO DE LOS FONDOS TARP NOS COLOCA EN MEJOR POSICIÓN PARA UN MANEJO MÁS EFECTIVO DEL CAPITAL EN EL FUTURO.
POPULAR, INC. 2014 INFORME ANUAL
POPULAR, INC.
Resumen del Año
RICHARD L. CARRIÓNPresidente de la Juntade Directores y Principal Oficial Ejecutivo
En el 2014 alcanzamos logros significativos y
progresamos en varios frentes.
El repago del TARP y la reestructuración de
nuestras operaciones en los Estados Unidos p
e los logros principales durante el fueron dos de
ndo el impacto de estos eventos, año. Incluyen
una pérdida neta de $313 millones.reportamos u
s acciones afectaron nuestrosAunque estas
os encontramos ahora en unaresultados, n
cho más fuerte de cara al futuro. Al posición muc
eventos, el ingreso neto ajustadoexcluir estos
millones. Estos sólidos resultadosfue de $301 m
sados por un ingreso neto porfueron impul
ás alto, debido a un gasto menor en intereses má
a reducción en la provisión paraintereses, un
préstamos, gastos operacionalespérdidas en p
rincipalmente en costos de más bajos, pr
guro del FDIC, y contribucionespensión y seg
os más bajas. sobre ingreso
e crédito se mantuvo estable aLa calidad de
retos que presenta la economía de pesar de los
Las pérdidas netas en préstamos Puerto Rico.
en Puerto Rico y los Estadosse redujeron
rminos absolutos y como porUnidos en tér
stamos. Del total de préstamos,ciento de pré
2014 con 2.95% en préstamos nocerramos el 2
s, una cifra estable, si se excluyenacumulativos
de las regiones vendidas comolos balances
eestructuración en Estados parte de la re
mantenemos atentos, dadas lasUnidos. Nos
económicas en Puerto Rico, perocondiciones e
s satisfechos con el desempeñonos sentimos
uestras carteras. general de nu
s disfrutando de niveles de capitalContinuamos
elación a nuestros pares y los sólidos con re
tos regulatorios. Nuestra relación requerimient
sico (“Tier 1 Common Equity”)de capital bás
ba en 15.9% al final del año, ose encontrab
ase más alto que el de 2013, que 110 puntos b
todavía incluía nuestro capital de TARP. El
repago de los fondos TARP, completado en julio
de 2014 sin emitir capital adicional, nos coloca
en mejor posición para un manejo de capital
más activo en el futuro.
La reestructuración de nuestras operaciones
en los Estados Unidos fue un evento clave en
el 2014. En abril anunciamos nuestro plan de
vender las regiones de California, Chicago y
Florida Central para enfocar nuestro negocio
en las regiones de Nueva York Metro y Miami.
El plan también incluye la transferencia de
la mayor parte de las funciones de apoyo a
Puerto Rico y Nueva York para aprovechar el
talento y la infraestructura que tenemos en
nuestra sede y beneficiarnos de costos de
personal más bajos en Puerto Rico. Durante
el año, completamos la venta de las tres
regiones y progresamos significativamente
en la reestructuración operacional. Una
vez se complete la transferencia de las
operaciones de apoyo en la primera mitad de
2015, habremos reducido en 43% el número
de empleados administrativos que proveen
apoyo a nuestra operación en los Estados
Unidos, con aproximadamente dos terceras
partes de ellos con base en Puerto Rico. Quiero
reconocer el trabajo arduo de todos nuestros
compañeros en Popular Community Bank y
los que apoyaron desde Puerto Rico, haciendo
posible la ejecución exitosa de un proceso de
reestructuración extremadamente complejo.
Ahora estamos listos para seguir adelante
con una operación en los Estados Unidos más
eficiente y enfocada.
Nuestra franquicia en Puerto Rico se fortaleció
en el 2014. Aumentó nuestra participación de
mercado en muchas categorías y mantuvimos
nuestro liderato en la mayoría de ellas. En el
negocio de autos, en el cual intensificamos

88
nuestros esfuerzos de ventas, alcanzamos
por primera vez la segunda posición en el
mercado. A pesar de la debilidad económica
en Puerto Rico, también experimentamos
crecimiento en el segmento corporativo.
Intensificamos nuestros esfuerzos por
mejorar el servicio y ofrecer mayor
conveniencia a nuestros clientes. La mayor
parte de las unidades de negocio mejoraron
sus métricas de satisfacción al cliente. Los
resultados reflejan el esfuerzo consciente
de todos los grupos, así como iniciativas
relacionadas a la eficiencia que han tenido,
además, un impacto positivo en la satisfacción
de nuestros clientes. El rediseño de procesos
en sucursales, basado en la metodología
LEAN, se completó en 17% de nuestras
sucursales que representan un 28% del total
de transacciones. Los resultados hasta el
momento reflejan una mejora en los niveles
de servicio y reducciones significativas en el
tiempo de espera. A medida que vayamos
extendiendo el proyecto a otras sucursales,
anticipamos mejoras adicionales en la
satisfacción de nuestros clientes.
También continuamos la implementación
de proyectos diseñados para transformar
nuestra red de distribución, poniendo mayor
énfasis en las transacciones digitales.
La digitalización de las interacciones de
nuestros clientes es vital para ofrecer
alternativas convenientes y generar
eficiencias en costos. Durante el mes
de diciembre del 2014, los depósitos
realizados en cajeros automáticos en Puerto
Rico alcanzaron el 29% de los depósitos
en sucursales con cajeros avanzados,
comparado con un 17% para la misma fecha
en el 2013. Al mismo tiempo que migramos
transacciones, servicios y ventas a canales
digitales, revisaremos nuestra red de locales
físicos para satisfacer de una forma más
efectiva las necesidades de nuestros clientes.
Además, emprendimos iniciativas claves
relacionadas a nuestro activo más importante
– nuestra gente. En agosto, aumentamos
a $9.00 el salario base mínimo por hora
para nuestros empleados en Puerto Rico,
beneficiando aproximadamente 2,400
compañeros. En el 2015, lo aumentaremos
a $10.00 para aquellos empleados con
buen desempeño. Estamos conscientes
que es crítico, atraer, retener y desarrollar
el mejor talento disponible, para así
poder alcanzar nuestras ambiciosas
metas. Estamos convencidos que esta
inversión será beneficiosa en términos de
retención, compromiso, servicio al cliente y
productividad.
Otro suceso importante este año fue la
inauguración del Centro Interno de Salud
y Bienestar en Puerto Rico, enfocado en
la prevención y detección temprana de
condiciones de salud. El objetivo de este
enfoque innovador es mejorar la salud de
nuestros empleados, que se traducirá en
gastos médicos menores y en un aumento
en productividad. Como resultado de estos y
otros esfuerzos, la métrica del compromiso
de nuestros empleados, que ya de por sí era
alta, mejoró aún más en 2014. Continuamente
estamos elevando las expectativas, esperando
un nivel más alto en el desempeño de
nuestros empleados. Estamos confiados
que este enfoque, sumado a las inversiones
que estamos haciendo en nuestra gente,
los convierten en nuestra mayor ventaja
competitiva.
Nuestro compromiso con nuestras
comunidades continuó firme. Expandimos
nuestro programa de educación financiera,
LA FUNDACIÓN BANCO
POPULAR Y POPULAR
COMMUNITY BANK
FOUNDATION DONARON
MÁS DE $3.1 MILLONES
A 128 ORGANIZACIONES
SIN FINES DE LUCRO.
POPULAR, INC.
Resumen del Año
BPOP
Pares EE.UU.
Índice KBW
Pares PR
-40%
-30%
-20%
-10%
0%
10%
20%
30%
DEC
-13
ENE-
14
FEB
-14
MA
R-1
4
AB
R-1
4
MA
Y-14
JUN
-14
JUL-
14
AG
O-1
4
SEP
T-14
OC
T-14
NO
V-14
DEC
-14
19%
8%7%
-32%
CAMBIO EN PRECIO DE LA ACCIÓN COMPARADO CON LOS PARES (2013-2014)
99
Finanzas en tus Manos, que ha llegado a
más de 100,000 personas en Puerto Rico
y fue reconocido por la American Banking
Association como el mejor programa de
educación financiera en los Estados Unidos.
Continuamos comprometidos con Echar
Pa’lante, un programa social de colaboración
multisectorial que lanzamos en 2011,
enlazando a más de 300 organizaciones
y expertos para fomentar la educación
y el empresarismo. La aportación de
los empleados a nuestras fundaciones
aumentó en 2014, alcanzando $730,000. En
gran medida gracias a esta contribución,
la Fundación Banco Popular y Popular
Community Bank Foundation donaron más
de $3.1 millones a 128 organizaciones sin
fines de lucro. El voluntariado también
se mantuvo sólido. Nuestros empleados
donaron su tiempo para colaborar con
muchas organizaciones que apoyamos
financieramente. En diciembre, como parte
de la celebración del 35to aniversario de la
Fundación Banco Popular en Puerto Rico,
inauguramos su nueva sede. Además de
servir como base para nuestra Fundación,
el edificio alberga otras 11 organizaciones
sin fines de lucro, convirtiendo así nuestro
espacio en un centro de colaboración e
innovación social.
Nuestra acción cerró el año en $34.05,
19% más alto que al final de 2013. Este
desempeño compara favorablemente con
índices de la industria, nuestros pares en los
Estados Unidos y otros bancos en Puerto Rico.
En septiembre de 2014, el Lcdo. Ignacio
Álvarez fue nombrado Presidente y Principal
Oficial de Operaciones de Popular, Inc. y
Banco Popular de Puerto Rico, así como
Presidente de Banco Popular North America.
Ignacio se desempeñaba como Principal
Oficial Legal desde 2010, demostrando
gran liderazgo y realizando aportaciones
importantes a iniciativas estratégicas a través
de la organización.
Nos complace la llegada del Lcdo. Javier
D. Ferrer como el nuevo Principal Oficial
Legal y Secretario de la Junta de Directores
de Popular, Inc. Como uno de los socios
fundadores de la firma de abogados
Pietrantoni Méndez & Alvarez LLC y pasado
presidente del Banco Gubernamental de
Fomento para Puerto Rico, Javier trae consigo
una vasta experiencia en el campo de ley
corporativa y bancaria y ha sido un gran
complemento a nuestro equipo.
Quiero expresar mi más profunda gratitud a
Jorge A. Junquera por sus 43 años de servicio
excepcional a Popular. Desde sus primeros
años en Inversiones, hasta su función más
reciente como Vicepresidente de la Junta
de Directores, la pasión y dedicación de
Jorge lo hizo una parte integral de nuestro
equipo gerencial. Es imposible enumerar
las múltiples iniciativas que dirigió, pero me
gustaría resaltar que su asesoramiento,
experiencia y liderazgo en sus 17 años como
Principal Oficial Financiero fueron clave para
ayudar a fortalecer la posición financiera de
nuestra organización.
Finalmente, quiero reconocer al Lcdo.
Samuel T. Céspedes, quien decidió retirarse
luego de servir como Secretario de la Junta
de Directores durante 24 años. Sé que
hablo en representación de toda la Junta
cuando digo que estamos muy agradecidos
de su compromiso y su contribución todos
estos años.
Como pueden ver, nuestros logros en
el 2014 se extienden más allá de los
resultados financieros. Demuestran como
el compromiso con nuestros clientes,
empleados, accionistas y comunidades se
traduce en resultados concretos que preparan
el camino para éxitos futuros.
Le agradezco a nuestro equipo gerencial
y a la Junta de Directores, quienes son
responsables de estos logros, por su apoyo
y liderazgo.
El 2015 trae consigo nuevas oportunidades
y desafíos. En términos de nuestras
operaciones en los Estados Unidos,
completaremos la transferencia de las
funciones de apoyo a Puerto Rico y, a la
vez, nos esforzaremos por lograr metas
ambiciosas de negocio. En Puerto Rico,
la economía todavía representa retos
significativos, pero permaneceremos
enfocados en servir a nuestros clientes y
hacer crecer nuestro negocio donde existan
oportunidades.
Confío que, guiados por objetivos claros y
motivados por las oportunidades que vemos
en el futuro, continuaremos avanzando con
determinación en el 2015.
POPULAR, INC. 2014 INFORME ANUAL
RICHARD L. CARRIÓNPresidente de la Junta de Directores y Principal Oficial Ejecutivo
CIFRAS A LA MANO Puntos Principales de 2014
$301 MILLONES en ingreso neto ajustado
$1,800 MILLONES en ingreso bruto ajustado
$2,000 MILLONES cantidad por la cual el capital
total excedió el mínimo requerido para
ser considerado bien capitalizado.

1010
(Dólares en millones, excepto información por acción) 1990 1991 1992 1993 1994 1995 1996 1997 1998 1999 2000
Información Financiera Seleccionada
Ingreso neto (Pérdida Neta) $ 63.4 $ 64.6 $ 85.1 $ 109.4 $ 124.7 $ 146.4 $ 185.2 $ 209.6 $ 232.3 $ 257.6 $ 276.1
Activos 8,983.6 8,780.3 10,002.3 11,513.4 12,778.4 15,675.5 16,764.1 19,300.5 23,160.4 25,460.5 28,057.1
Préstamos Brutos 5,373.3 5,195.6 5,252.1 6,346.9 7,781.3 8,677.5 9,779.0 11,376.6 13,078.8 14,907.8 16,057.1
Depósitos 7,422.7 7,207.1 8,038.7 8,522.7 9,012.4 9,876.7 10,763.3 11,749.6 13,672.2 14,173.7 14,804.9
Capital de Accionistas 588.9 631.8 752.1 834.2 1,002.4 1,141.7 1,262.5 1,503.1 1,709.1 1,661.0 1,993.6
Valor agregado en el mercado $ 479.1 $ 579.0 $ 987.8 $ 1,014.7 $ 923.7 $ 1,276.8 $ 2,230.5 $ 3,350.3 $ 4,611.7 $ 3,790.2 $ 3,578.1
Rendimiento de Activos (ROA) 1.09% 0.72% 0.89% 1.02% 1.02% 1.04% 1.14% 1.14% 1.14% 1.08% 1.04%
Rendimiento de Capital Común (ROE) 15.55% 10.57% 12.72% 13.80% 13.80% 14.22% 16.17% 15.83% 15.41% 15.45% 15.00%
Por Acción Común1
Ingreso neto (Pérdida Neta) - Básico $ 3.94 $ 2.69 $ 3.49 $ 4.18 $ 4.59 $ 5.24 $ 6.69 $ 7.51 $ 8.26 $ 9.19 $ 9.85
Ingreso neto (Pérdida Neta) - Diluido 3.94 2.69 3.49 4.18 4.59 5.24 6.69 7.51 8.26 9.19 9.85
Dividendos (Declarados) 1.00 1.00 1.00 1.20 1.25 1.54 1.83 2.00 2.50 3.00 3.20
Valor en los Libros 24.58 26.24 28.79 31.86 34.35 39.52 43.98 51.83 59.32 57.54 69.62
Precio en el Mercado 20.00 24.06 37.81 39.38 35.16 48.44 84.38 123.75 170.00 139.69 131.56
Activos por Área Geográfica
Puerto Rico 89% 87% 87% 79% 76% 75% 74% 74% 71% 71% 72%
Estados Unidos 9% 11% 10% 16% 20% 21% 22% 23% 25% 25% 26%
Caribe y Latinoamérica 2% 2% 3% 5% 4% 4% 4% 3% 4% 4% 2%
Total 100% 100% 100% 100% 100% 100% 100% 100% 100% 100% 100%
Sistema de Distribución Tradicional
Sucursales Bancarias
Puerto Rico 173 161 162 165 166 166 178 201 198 199 199
Islas Vírgenes 3 3 3 8 8 8 8 8 8 8 8
Estados Unidos 24 24 30 32 34 40 44 63 89 91 95
Subtotal 200 188 195 205 208 214 230 272 295 298 302
Oficinas No Bancarias
Popular Financial Holdings 27 41 58 73 91 102 117 128 137 136
Popular Cash Express 51 102 132
Popular Finance 26 26 26 26 28 31 39 44 48 47 61
Popular Auto 9 9 9 8 10 9 8 10 10 12 12
Popular Leasing, U.S.A. 7 8 10 11
Popular Mortgage 3 3 3 11 13 21
Popular Securities 1 2 2 2 3
Popular One
Popular Insurance 2
Popular Insurance Agency, U.S.A.
Popular Insurance, V.I.
E-LOAN
EVERTEC 4 4
Subtotal 35 62 76 92 111 134 153 183 258 327 382
Total 235 250 271 297 319 348 383 455 553 625 684
Sistema Electrónico de Distribución
Cajeros AutomáticosPropios y Administrados
Puerto Rico 211 206 211 234 262 281 327 391 421 442 478
Islas Virgenes 3 3 3 8 8 8 9 17 59 68 37
Estados Unidos 6 11 26 38 53 71 94 99 109
Total 214 209 220 253 296 327 389 479 574 609 624
Transacciones (en millones)
Transacciones Electrónicas2 18.0 23.9 28.6 33.2 43.0 56.6 78.0 111.2 130.5 159.4 199.5
Efectos Procesados3 164.0 166.1 170.4 171.8 174.5 175.0 173.7 171.9 170.9 171.0 160.2
Empleados (equivalente a tiempo completo) 7,023 7,006 7,024 7,533 7,606 7,815 7,996 8,854 10,549 11,501 10,651
25 AÑOS
Resumen Financiero Histórico

1111
POPULAR, INC. 2014 INFORME ANUAL
2001 2002 2003 2004 2005 2006 2007 2008 2009 2010 2011 2012 2013 2014
$ 304.5 $ 351.9 $ 470.9 $ 489.9 $ �540.7 $ �357.7 $ �(64.5) $ (1,243.9) $ �(573.9) $ 137.4 $ 151.3 $ 245.3 $ 599.3 $ (313.5)
30,744.7 33,660.4 36,434.7 44,401.6 48,623.7 47,404.0 44,411.4 38,882.8 34,736.3 38,815.0 37,348.4 36,507.5 35,749.3 33,096.7
18,168.6 19,582.1 22,602.2 28,742.3 31,710.2 32,736.9 29,911.0 26,268.9 23,803.9 26,458.9 25,314.4 25,093.6 24,706.7 22,053.2
16,370.0 17,614.7 18,097.8 20,593.2 22,638.0 24,438.3 28,334.4 27,550.2 25,924.9 26,762.2 27,942.1 27,000.6 26,711.1 24,807.5
2,272.8 2,410.9 2,754.4 3,104.6 3,449.2 3,620.3 3,581.9 3,268.4 2,538.8 3,800.5 3,918.8 4,110.0 4,626.2 4,267.4
$ 3,965.4 $ 4,476.4 $ 5,960.2 $ 7,685.6 $ 5,836.5 $ 5,003.4 $ 2,968.3 $ 1,455.1 $ 1,445.4 $ 3,211.4 $ 1,426.0 $ 2,144.9 $ 2,970.6 $ 3,523.4
1.09% 1.11% 1.36% 1.23% 1.17% 0.74% -0.14% -3.04% -1.57% 0.36% 0.40% 0.68% 1.65% -0.89%
14.84% 16.29% 19.30% 17.60% 17.12% 9.73% -2.08% -44.47% -32.95% 4.37% 4.01% 6.37% 14.43% -7.04%
$ 10.87 $ 13.05 $ 17.36 $ 17.95 $ 19.78 $ 12.41 $ (2.73) $ (45.51) $ 2.39 $ (0.62) $ 1.44 $ 2.36 $ 5.80 $ (3.08)
10.87 13.05 17.36 17.92 19.74 12.41 (2.73) (45.51) 2.39 (0.62) 1.44 2.35 5.78 (3.08)
3.80 4.00 5.05 6.20 6.40 6.40 6.40 4.80 0.20 – – – – –
79.67 91.02 96.60 109.45 118.22 123.18 121.24 63.29 38.91 36.67 37.71 39.35 44.26 40.76
145.40 169.00 224.25 288.30 211.50 179.50 106.00 51.60 22.60 31.40 13.90 20.79 28.73 34.05
68% 66% 62% 55% 53% 52% 59% 64% 65% 74% 74% 73% 72% 80%
30% 32% 36% 43% 45% 45% 38% 33% 32% 23% 23% 24% 25% 17%
2% 2% 2% 2% 2% 3% 3% 3% 3% 3% 3% 3% 3% 3%
100% 100% 100% 100% 100% 100% 100% 100% 100% 100% 100% 100% 100% 100%
196 195 193 192 194 191 196 179 173 185 183 175 171 168
8 8 8 8 8 8 8 8 8 8 9 9 9 9
96 96 97 128 136 142 147 139 101 96 94 92 90 47
300 299 298 328 338 341 351 326 282 289 286 276 270 224
149 153 181 183 212 158 134 2
154 195 129 114 4
55 36 43 43 49 52 51 9
20 18 18 18 17 15 12 12 10 10 10 10 9 9
13 13 11 15 14 11 24 22
25 29 32 30 33 32 32 32 33 36 37 37 38 25
4 7 8 9 12 12 13 7 6 6 4 4 3 3
4 5 6 6
2 2 2 2 2 2 2 1 1 1 1 1 1 1
1 1 1 1 1 1 1 1 1 1 1 1 1 1
1 1 1 1 1 1 1 1 1 1 1 1 1
1 1 1 1
4 5 5 5 5 7 9 9 9
427 460 431 421 351 292 280 97 61 55 58 59 59 46
727 759 729 749 689 633 631 423 343 344 344 335 329 270
524 539 557 568 583 605 615 605 571 624 613 597 599 602
39 53 57 59 61 65 69 74 77 17 20 20 22 21
118 131 129 163 181 192 187 176 136 138 135 134 132 83
681 723 743 790 825 862 871 855 784 779 768 751 753 706
206.0 236.6 255.7 568.5 625.9 690.2 772.7 849.4 804.1 381.6 410.4 420.4 425.4 438.4
149.9 145.3 138.5 133.9 140.3 150.0 175.2 202.2 191.7
11,334 11,037 11,474 12,139 13,210 12,508 12,303 10,587 9,407 8,277 8,329 8,072 8,059 7,752
1 Los datos de las acciones comunes han sido ajustados por las divisiones en acciones y la división de acciones a la inversa realizada en mayo de 2012.2 Desde el 1981 hasta el 2003, las transacciones electrónicas incluyen transacciones ACH, Pago Directo, TelePago Popular, Banca por Internet y transacciones por la Red ATH en Puerto Rico. Desde el 2004 hasta el 2009, estos números incluyen el total de transacciones por la Red ATH en República Dominicana, Costa Rica, El Salvador y Estados Unidos, transacciones de facturación médica, transferencias cablegráficas y otros pagos electrónicos además de lo previamente señalado. A partir del 2010, esta cifra incluye solamente las transacciones realizadas por los clientes de Popular, Inc. y excluye las transacciones procesadas por EVERTEC para otros clientes.
3 A partir del 2010, luego de la venta de EVERTEC, la subsidiaria de tecnología de Popular, Inc., no se procesan efectos electrónicos.

1212
JUNTA DE DIRECTORES
EQUIPO GERENCIAL EJECUTIVO
RICHARD L. CARRIÓNPresidente de la Junta de Directores y Principal Oficial Ejecutivo Popular, Inc.
JUAN O. GUERREROVicepresidente Ejecutivo Grupo de Servicios Financieros y Seguros Banco Popular de Puerto Rico
ELI S. SEPÚLVEDA Vicepresidente Ejecutivo y Principal Oficial de Préstamos Grupo de Crédito Comercial Banco Popular de Puerto Rico
IGNACIO ÁLVAREZPresidente y Principal Oficial de Operaciones Popular, Inc., Banco Popular de Puerto Rico Presidente Popular Community Bank
JAVIER D. FERRERVicepresidente Ejecutivo y Principal Oficial Legal Grupo de Consejería General y Asuntos Corporativos Popular, Inc.
CARLOS J. VÁZQUEZVicepresidente Ejecutivo y Principal Oficial Financiero Popular, Inc.
GILBERTO MONZÓNVicepresidente Ejecutivo Grupo de Crédito a Individuo Banco Popular de Puerto Rico
LIDIO SORIANOVicepresidente Ejecutivo y Principal Oficial de Riesgo Grupo Corporativo de Manejo de Riesgo Popular, Inc.
EDUARDO J. NEGRÓN Vicepresidente Ejecutivo Grupo de Administración Popular, Inc.
NÉSTOR O. RIVERAVicepresidente Ejecutivo Grupo de Banca Individual Banco Popular de Puerto Rico
ILEANA GONZÁLEZVicepresidenta Ejecutiva Grupo de Administración de Crédito Comercial Banco Popular de Puerto Rico
DAVID E. GOELSocio Gerente Matrix Capital Management Company, L.P.
CARLOS A. UNANUEPresidente Goya de Puerto Rico
ALEJANDRO M. BALLESTERPresidente Ballester Hermanos, Inc.
RICHARD L. CARRIÓNPresidente de la Junta de Directores y Principal Oficial Ejecutivo Popular, Inc.
C. KIM GOODWINInversionista Privada
JOHN W. DIERCKSENPrincipal Greycrest, LLC
JOAQUÍN E. BACARDÍ, IIIPresidente y Principal Oficial Ejecutivo Bacardí Corporation
MARÍA LUISA FERRÉPresidenta y Principal Oficial Ejecutiva Grupo Ferré Rangel
WILLIAM J. TEUBER JR.Vicepresidente Ejecutivo EMC Corporation
POPULAR, INC.
Gerencia

Financial Review andSupplementary Information
Management’s Discussion and Analysis of Financial Conditionand Results of Operations 2
Statistical Summaries 101
Financial Statements
Management’s Report to Stockholders 106
Report of Independent Registered Public Accounting Firm 107
Consolidated Statements of Financial Condition as ofDecember 31, 2014 and 2013 109
Consolidated Statements of Operations for the years endedDecember 31, 2014, 2013 and 2012 110
Consolidated Statements of Comprehensive (Loss) Incomefor the years ended December 31, 2014, 2013 and 2012 111
Consolidated Statements of Changes in Stockholders’ Equityfor the years ended December 31, 2014, 2013 and 2012 112
Consolidated Statements of Cash Flows for the years endedDecember 31, 2014, 2013 and 2012 113
Notes to Consolidated Financial Statements 114

2
Management’s Discussion andAnalysis of Financial Conditionand Results of Operations
Forward-Looking Statements 03
Overview 03
Critical Accounting Policies / Estimates 12
Statement of Operations Analysis 25
Net Interest Income 25
Provision for Loan Losses 29
Non-Interest Income 31
Operating Expenses 33
Income Taxes 34
Fourth Quarter Results 36
Reportable Segment Results 36
Statement of Financial Condition Analysis 39
Assets 39
Deposits and Borrowings 45
Stockholders’ Equity 46
Regulatory Capital 46
Off-Balance Sheet Arrangements and Other Commitments 50
Contractual Obligations and Commercial Commitments 50
Guarantees 52
Risk Management 54
Market / Interest Rate Risk 56
Liquidity 62
Credit Risk Management and Loan Quality 68
Enterprise Risk and Operational Risk Management 96
Adoption of New Accounting Standards and Issued ButNot Yet Effective Accounting Standards 97
Statistical Summaries
Statements of Financial Condition 101
Statements of Operations 102
Average Balance Sheet and Summary of Net InterestIncome 103
Quarterly Financial Data 105
3 POPULAR, INC. 2014 ANNUAL REPORT
The following Management’s Discussion and Analysis(“MD&A”) provides information which management believes isnecessary for understanding the financial performance ofPopular, Inc. and its subsidiaries (the “Corporation” or“Popular”). All accompanying tables, consolidated financialstatements, and corresponding notes included in this “FinancialReview and Supplementary Information - 2014 Annual Report”(“the report”) should be considered an integral part of thisMD&A.
FORWARD-LOOKING STATEMENTSThe information included in this report contains certainforward-looking statements within the meaning of the PrivateSecurities Litigation Reform Act of 1995. These forward-lookingstatements may relate to the Corporation’s financial condition,results of operations, plans, objectives, future performance andbusiness, including, but not limited to, statements with respectto the adequacy of the allowance for loan losses, delinquencytrends, market risk and the impact of interest rate changes,capital market conditions, capital adequacy and liquidity, theanticipated impacts of our acquisition of certain assets anddeposits (other than certain brokered deposits) of Doral Bankfrom the Federal Deposit Insurance Corporation (“FDIC”) asreceiver, including transaction expenses and our expectationthat the transaction will be accretive and the effect of legalproceedings and new accounting standards on theCorporation’s financial condition and results of operations. Allstatements contained herein that are not clearly historical innature are forward-looking, and the words “anticipate”,“believe”, “continues”, “expect”, “estimate”, “intend”, “project”and similar expressions and future or conditional verbs such as“will”, “would”, “should”, “could”, “might”, “can”, “may” orsimilar expressions are generally intended to identify forward-looking statements.
Forward-looking statements are not guarantees of futureperformance, are based on management’s current expectationsand, by their nature, involve certain risks, uncertainties,estimates and assumptions by management that are difficult topredict. Various factors, some of which are beyond theCorporation’s control, could cause actual results to differmaterially from those expressed in, or implied by, suchforward-looking statements. Factors that might cause such adifference include, but are not limited to, the rate of growth inthe economy and employment levels, as well as generalbusiness and economic conditions; changes in interest rates, aswell as the magnitude of such changes; the fiscal and monetarypolicies of the federal government and its agencies; changes infederal bank regulatory and supervisory policies, includingrequired levels of capital and the impact of proposed capitalstandards on our capital ratios; the impact of the Dodd-FrankWall Street Reform and Consumer Protection Act (FinancialReform Act) on the Corporation’s businesses, business practicesand costs of operations; the relative strength or weakness of the
consumer and commercial credit sectors and of the real estatemarkets in Puerto Rico and the other markets in whichborrowers are located; the performance of the stock and bondmarkets; competition in the financial services industry;additional FDIC assessments; and possible legislative, tax orregulatory changes. Other possible events or factors that couldcause results or performance to differ materially from thoseexpressed in these forward-looking statements include thefollowing: negative economic conditions that adversely affectthe housing prices, the job market, consumer confidence andspending habits which may affect, among other things, the levelof non-performing assets, charge-offs and provision expense;risks associated with maintaining customer relationships fromour acquisition of certain assets and deposits (other thancertain brokered deposits) of Doral Bank from the FederalDeposit Insurance Corporation (FDIC) as receiver, includingmanaging any potential customer confusion caused by thealliance structure; changes in interest rates and market liquiditywhich may reduce interest margins, impact funding sources andaffect our ability to originate and distribute financial productsin the primary and secondary markets; changes in market ratesand prices which may adversely impact the value of financialassets and liabilities; difficulties in converting or integrating theDoral branches or difficulties in providing transition support toalliance co-bidders; liabilities resulting from litigation andregulatory investigations; changes in accounting standards,rules and interpretations; our ability to grow our corebusinesses; decisions to downsize, sell or close units orotherwise change our business mix; and management’s abilityto identify and manage these and other risks. Moreover, theoutcome of legal proceedings, as discussed in “Part I, Item 3.Legal Proceedings”, is inherently uncertain and depends onjudicial interpretations of law and the findings of regulators,judges and juries.
All forward-looking statements included in this report arebased upon information available to the Corporation as of thedate of this report, and other than as required by law, includingthe requirements of applicable securities laws, managementassumes no obligation to update or revise any such forward-looking statements to reflect occurrences or unanticipatedevents or circumstances after the date of such statements.
The description of the Corporation’s business and riskfactors contained in Item 1 and 1A of its Form 10-K for the yearended December 31, 2014 discusses additional informationabout the business of the Corporation and the material riskfactors that, in addition to the other information in this report,readers should consider.
OVERVIEWThe Corporation is a diversified, publicly-owned financialholding company subject to the supervision and regulation ofthe Board of Governors of the Federal Reserve System. TheCorporation has operations in Puerto Rico, the United States

4
(“U.S.”) mainland, and the U.S. and British Virgin Islands. InPuerto Rico, the Corporation provides retail, includingresidential mortgage loans originations, and commercialbanking services through its principal banking subsidiary,Banco Popular de Puerto Rico (“BPPR”), as well as investmentbanking, broker-dealer, auto and equipment leasing andfinancing, and insurance services through specializedsubsidiaries. Effective December 31, 2012, Popular Mortgage,which was a wholly-owned subsidiary of BPPR prior to thatdate, was merged with and into BPPR as part of an internalreorganization. The Corporation’s mortgage originationbusiness continues to be conducted under the brand namePopular Mortgage, a division of BPPR. In the U.S. mainland, theCorporation operates Banco Popular North America (“BPNA”),including its wholly-owned subsidiary E-LOAN. The BPNAfranchise operates under the brand name of PopularCommunity Bank. BPNA focuses efforts and resources on thecore community banking business. BPNA operates branches inNew York, New Jersey and Southern Florida. E-LOAN marketsdeposit accounts under its name for the benefit of BPNA. Note41 to the consolidated financial statements presentsinformation about the Corporation’s business segments.
The Corporation has several investments which accounts forunder the equity method. These include the 14.96% interest inEVERTEC, a 15.82% interest in Centro Financiero BHD Leon,S.A. (“BHD Leon”), a 24.9% interest in PR Asset Portfolio2013-1 International, LLC and a 24.9% interest in PRLP 2011Holdings LLP, among other investments in limited partnershipswhich mainly hold investment securities. EVERTEC providestransaction processing services throughout the Caribbean andLatin America, including servicing many of the Corporation’ssystems infrastructure and transaction processing businesses.Centro Financiero BHD is a diversified financial servicesinstitution operating in the Dominican Republic. PR AssetPortfolio 2013-1 International, LLC is a joint venture to whichthe Corporation sold construction and commercial loans andcommercial and residential real estate owned assets, most ofwhich were non-performing, with a fair value of $306 millionduring the year 2013. PRLP 2011 Holdings LLP is a jointventure to which the Corporation sold construction andcommercial loans, most of which were non-performing, with afair value of $148 million during the year 2011. For the yearended December 31, 2014, the Corporation recordedapproximately $38.2 million in earnings from these investmentson an aggregate basis. The carrying amounts of theseinvestments as of December 31, 2014 were $188.1 million.Refer to Note 16 to the consolidated financial statements foradditional information of the Corporation’s investments atequity.
Significant eventsAcquisition of certain assets and deposits of Doral Bankfrom the FDIC as receiverOn February 27, 2015, the Corporation’s Puerto Rico bankingsubsidiary, Banco Popular de Puerto Rico (“BPPR”), in analliance with co-bidders, including the Corporation’s U.S.mainland banking subsidiary, Banco Popular North America,doing business as Popular Community Bank (“PCB”), hadacquired certain assets and all deposits (other than certainbrokered deposits) of Doral Bank from the Federal DepositInsurance Corporation (FDIC) as receiver.
Under the FDIC’s bidding format, BPPR was the lead bidderand party to the purchase and assumption agreement with theFDIC covering all assets and deposits to be acquired by it andits alliance co-bidders. BPPR entered into back to back purchaseand assumption agreements with the alliance co-bidders for thetransferred assets and deposits.
After taking into account the transfers to the unaffiliatedalliance co-bidders, BPPR and PCB together assumedapproximately $2.3 billion in deposits and acquiredapproximately $1.8 billion in performing commercial andresidential loans, including:
• BPPR assumed approximately $612 million in depositsassociated with eight of the 18 Puerto Rico branches ofDoral Bank and approximately $431 million from itsonline deposit platform, and approximately $848 millionin performing Puerto Rico residential and commercialloans. BPPR purchased the loans at an aggregate discountof 4.71% or $40 million and paid an aggregate premium of0.93% or $10 million for the deposits it assumed.
• PCB assumed approximately $1.3 billion in deposits inthree New York branches of Doral Bank, and acquiredapproximately $931 million in performing commercialloans primarily in the New York metropolitan area. PCBpurchased the loans at an aggregate premium of 0.57% or$5 million and paid an aggregate premium of 1.99% or$25 million for the deposits it assumed.
In addition, on February 27, 2015, the FDIC, as Receiver forDoral Bank, awarded BPPR the mortgage servicing rights for aloan portfolio of approximately $5 billion in unpaid principalbalance, for a purchase price currently estimated at $48.6million. The transfers of the mortgage servicing rights aresubject to a number of specified closing conditions, includingthe consent of each of Ginnie Mae, Fannie Mae and FreddieMac in a form acceptable to BPPR, and other customary closingconditions. The transfers are expected to close within the next60 days, subject to the conditions described above.
There is no loss-sharing arrangement with the FDIC on theacquired assets.
Management believes that this transaction allows theCorporation to effectively deploy excess capital by acquiringbanking operations that complement its main market in Puerto
5 POPULAR, INC. 2014 ANNUAL REPORT
Rico and further support the recent reorganization and focus ofits US mainland operations in the New York and South Floridamarkets. The transaction will reduce regulatory capital ratios byapproximately 1.5%, excluding the impact of goodwill. TheCorporation would continue to reflect excess capital over wellcapitalized targets in excess of approximately $1.7 billion. TheCompany expects to record goodwill based on the pricing forthe acquired loans at a discount and deposits at a premium of1.9% and 1.5%, respectively. The transaction is expected to beaccretive to earnings in the first twelve months, includingtransaction costs estimated between $20 to $25 million. Pleaserevise “Forward-Looking Statements” factors to include thesestatements as forward-looking statements. Furthermore, theincremental earnings expected to be generated from the USbased operations would be considered additional positiveevidence in our analysis that could result in the realization of aportion of the fully reserved deferred tax asset recorded at PCB.
The transaction was completed based on December 31, 2014balances and is subject to customary true-up and purchaseaccounting adjustments through the date of the close. The $1.8billion in loans and $2.3 billion in deposits acquired by Popularin the transaction did not include any non-performing assetsand do not enjoy a loss sharing agreement with the FDIC.
Repayment of TARP fundsOn July 2, 2014, the Corporation completed the repayment ofTARP funds to the U.S. Treasury through the repurchase of$935 million of trust capital securities issued to the U.S.Treasury under the TARP Capital Purchase Program. TheCorporation funded the repurchase through a combination ofavailable cash and approximately $400 million from theproceeds of the issuance of its $450 million aggregate principalamount of 7% Senior Notes due on 2019 which settled onJuly 1, 2014.
On July 23, 2014, the Corporation also completed therepurchase of the outstanding warrant initially issued to theU.S. Treasury under the TARP Capital Purchase Program in2008 for a repurchase price of $3.0 million. The warrantrepresented the right to purchase 2,093,284 shares of theCorporation’s common stock at an exercise price of $67 pershare with an original term of 10 years. With the completion ofthis transaction, the Corporation completed its exit from theTARP Capital Purchase Program.
Reorganization of the U.S operationsDuring the year ended December 31, 2014, the Corporationcompleted the sale of its California, Illinois and Central Floridaregional operations to three different buyers as part of aninternal reorganization. The Corporation recorded a net gain ofapproximately $33.8 million, after customary transaction costs,as a result of these transactions. In connection with thesetransactions, the Corporation is relocating certain back officeoperations to Puerto Rico and New York. After the
reorganization is complete, annual operating expenses areexpected to decrease by approximately $34 million. Thisdecrease in expenses is expected to offset a similar reduction inrevenues that will result from the sale of the regionaloperations. The Corporation recorded a non-cash goodwillimpairment charge of $186.5 million, related to the goodwillasset allocated to these regions. This non-cash charge had noimpact on the Corporation’s tangible capital or regulatorycapital ratios. The Corporation also executed other transactionsas part of the reorganization of its U.S. operations. Theseincluded the refinancing of $638 million in structured repos,which resulted in increased margins, at a cost of approximately$39.8 million recognized during 2014. Also, the Corporationcompleted bulk sales or agreements to sell of non-performingand legacy assets with an aggregate book value ofapproximately $249 million, at a net loss of $11.1 million.
Current and prior period’s financial information coveringincome and expense amounts presented in this MD&A hasbeen retrospectively adjusted for the impact of the discontinuedoperations for comparative purposes. The financial informationfor prior periods included in this MD&A does not reflect thereclassification of assets and liabilities to discontinuedoperations.
Adjusted results of operations - Non-GAAP financialmeasureThe Corporation prepares its Consolidated FinancialStatements using accounting principles generally accepted inthe U.S. (“U.S. GAAP”), the (“reported basis”). These financialstatements appear on pages 109 to 113. In addition to analyzingthe Corporation’s results on a reported basis, managementmonitors the performance of the Corporation on an “adjustedbasis” and excludes the impact of certain unusual transactionson the results of its operations. Throughout this MD&A, theCorporation presents a discussion of its financial resultsexcluding the impact of these events to arrive at the “adjustedresults”. Management believes that the “adjusted results”provide meaningful information about the underlyingperformance of the Corporation’s ongoing operations. The“adjusted results” are a Non-GAAP financial measure. Refer toTables 72-74, for a reconciliation of the reported results to the“adjusted results” for the years ended December 31, 2014 and2013.
Non-GAAP financial measures used by the Corporation maynot be comparable to similarly named non-GAAP financialmeasures used by other companies.
Adjustment to our reserve for loans sold with credit recourseOur net loss from continuing operations for the year endedDecember 31, 2014 reported in this annual report is differentfrom what we reported in our earnings release issued onJanuary 23, 2014. The difference is related to an adjustmentrecorded to increase our reserve for loans sold with credit

6
recourse by approximately $6.5 million. The impact of theadjustment after the applicable income tax is to increase our netloss from continuing operations for the year endedDecember 31, 2014 by approximately $4.0 million. The impacton our total basic and diluted earnings (loss) per share for theyear ended December 31, 2014 was an increase in the net lossof $.03 per share. The impact on our total basic and dilutedearnings per share for the quarter ended December 31, 2014was a reduction in the net income of $0.03 and $0.04 per share,respectively.
Financial highlights for the year ended December 31, 2014The Corporation’s net loss for the year ended December 31,2014 amounted to $313.5 million, compared to a net income$599.3 million and $245.3 million, for 2013 and 2012,respectively. Net loss from continuing operations for the yearended December 31, 2014 was $190.5 million, compared to anet income of $558.9 million and $207.5 million, for 2013 and2012, respectively. The continuing operations for the year 2014reflect a $414.1 million expense related to the amortization ofthe discount associated with the TARP funds which were repaidduring 2014; a positive adjustment of $12.5 million in theamortization of the FDIC indemnification asset to reverse theimpact of accelerated amortization expense recorded in priorperiods; and the impact of the BPNA reorganization whichincluded losses on bulk sales of non-performing assets totalling$11.1 million, a $39.7 million expense related to therefinancing of structured repos and restructuring charges of$26.7 million. In addition, during 2014 the Corporationrecorded an income tax expense of $20.0 million related to thechange in the capital gains tax rate from 15% to 20% and a $8.0million charge to record a valuation allowance on the deferredtax asset at the holding company, offset by an income taxbenefit of $23.4 million resulting from the Closing Agreementwith the PR Treasury Department related to the treatment ofcertain charge-offs for the loans acquired from Westernbank.
The results for 2013 reflect the impact of two bulk sale ofnon-performing assets resulting in an aggregate after tax loss of$287.7 million, $412.8 million in after tax gains resulting fromthe initial and subsequent public offerings and relatedtransactions completed by EVERTEC in which the Corporationparticipated as a selling stockholder and an income tax benefitof $197.5 million reflecting the impact on the deferred tax assetrelated to the change in the corporate tax rate from 30% to39%. The results for 2012 reflect an income tax benefit of $72.9million related to reduction of the deferred tax liability on theestimated gains for tax purposes related to the loans acquiredfrom Westernbank as a result of the closing agreement with thePuerto Rico Department of Treasury, which established thatthese would be taxed at a capital gain rate. Also, the resultsfrom 2012 reflect a benefit of approximately $26.9 million fromthe Corporation’s share of a tax benefit from a grant received byEVERTEC from the Puerto Rico Government.
Excluding the impact of the above mentioned transactions,the adjusted net income from continuing operations for theyear ended December 31, 2014 was $300.7 million, comparedto $215.7 million for 2013, while the net income was $343.6million and $256.2 million for 2014 and 2013, respectively.Refer to Table 72-74 for the reconciliation to the adjusted, Non-GAAP net income.
For the year ended December 31, 2014, net loss fromdiscontinued operations was $123.0 million, compared to a netincome of $40.9 million and $37.8 million for 2013 and 2012,respectively. The results for 2014 include a goodwillimpairment charge of $186.5 million and the net gain on thesale of the U.S. regional operations amounting to $33.8 million.
Table 1 provides selected financial data for the past fiveyears. For purposes of the discussions, assets subject to losssharing agreements with the FDIC, including loans and otherreal estate owned, are referred to as “covered assets” or“covered loans” since the Corporation expects to be reimbursedfor 80% of any future losses on those assets, subject to theterms of the FDIC loss sharing agreements.
7 POPULAR, INC. 2014 ANNUAL REPORT
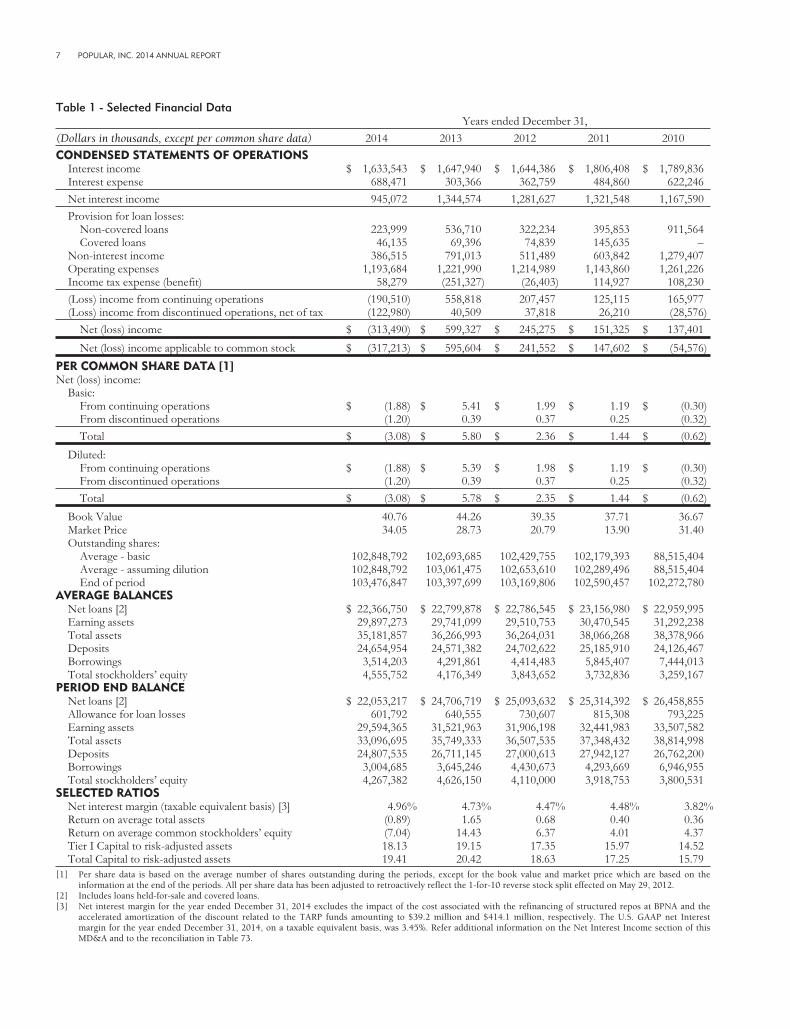
Table 1 - Selected Financial DataYears ended December 31,
(Dollars in thousands, except per common share data) 2014 2013 2012 2011 2010
CONDENSED STATEMENTS OF OPERATIONSInterest income $ 1,633,543 $ 1,647,940 $ 1,644,386 $ 1,806,408 $ 1,789,836Interest expense 688,471 303,366 362,759 484,860 622,246
Net interest income 945,072 1,344,574 1,281,627 1,321,548 1,167,590
Provision for loan losses:Non-covered loans 223,999 536,710 322,234 395,853 911,564Covered loans 46,135 69,396 74,839 145,635 –
Non-interest income 386,515 791,013 511,489 603,842 1,279,407Operating expenses 1,193,684 1,221,990 1,214,989 1,143,860 1,261,226Income tax expense (benefit) 58,279 (251,327) (26,403) 114,927 108,230
(Loss) income from continuing operations (190,510) 558,818 207,457 125,115 165,977(Loss) income from discontinued operations, net of tax (122,980) 40,509 37,818 26,210 (28,576)
Net (loss) income $ (313,490) $ 599,327 $ 245,275 $ 151,325 $ 137,401
Net (loss) income applicable to common stock $ (317,213) $ 595,604 $ 241,552 $ 147,602 $ (54,576)
PER COMMON SHARE DATA [1]Net (loss) income:
Basic:From continuing operations $ (1.88) $ 5.41 $ 1.99 $ 1.19 $ (0.30)From discontinued operations (1.20) 0.39 0.37 0.25 (0.32)
Total $ (3.08) $ 5.80 $ 2.36 $ 1.44 $ (0.62)
Diluted:From continuing operations $ (1.88) $ 5.39 $ 1.98 $ 1.19 $ (0.30)From discontinued operations (1.20) 0.39 0.37 0.25 (0.32)
Total $ (3.08) $ 5.78 $ 2.35 $ 1.44 $ (0.62)
Book Value 40.76 44.26 39.35 37.71 36.67Market Price 34.05 28.73 20.79 13.90 31.40Outstanding shares:
Average - basic 102,848,792 102,693,685 102,429,755 102,179,393 88,515,404Average - assuming dilution 102,848,792 103,061,475 102,653,610 102,289,496 88,515,404End of period 103,476,847 103,397,699 103,169,806 102,590,457 102,272,780
AVERAGE BALANCESNet loans [2] $ 22,366,750 $ 22,799,878 $ 22,786,545 $ 23,156,980 $ 22,959,995Earning assets 29,897,273 29,741,099 29,510,753 30,470,545 31,292,238Total assets 35,181,857 36,266,993 36,264,031 38,066,268 38,378,966Deposits 24,654,954 24,571,382 24,702,622 25,185,910 24,126,467Borrowings 3,514,203 4,291,861 4,414,483 5,845,407 7,444,013Total stockholders’ equity 4,555,752 4,176,349 3,843,652 3,732,836 3,259,167
PERIOD END BALANCENet loans [2] $ 22,053,217 $ 24,706,719 $ 25,093,632 $ 25,314,392 $ 26,458,855Allowance for loan losses 601,792 640,555 730,607 815,308 793,225Earning assets 29,594,365 31,521,963 31,906,198 32,441,983 33,507,582Total assets 33,096,695 35,749,333 36,507,535 37,348,432 38,814,998Deposits 24,807,535 26,711,145 27,000,613 27,942,127 26,762,200Borrowings 3,004,685 3,645,246 4,430,673 4,293,669 6,946,955Total stockholders’ equity 4,267,382 4,626,150 4,110,000 3,918,753 3,800,531
SELECTED RATIOSNet interest margin (taxable equivalent basis) [3] 4.96% 4.73% 4.47% 4.48% 3.82%Return on average total assets (0.89) 1.65 0.68 0.40 0.36Return on average common stockholders’ equity (7.04) 14.43 6.37 4.01 4.37Tier I Capital to risk-adjusted assets 18.13 19.15 17.35 15.97 14.52Total Capital to risk-adjusted assets 19.41 20.42 18.63 17.25 15.79
[1] Per share data is based on the average number of shares outstanding during the periods, except for the book value and market price which are based on theinformation at the end of the periods. All per share data has been adjusted to retroactively reflect the 1-for-10 reverse stock split effected on May 29, 2012.
[2] Includes loans held-for-sale and covered loans.[3] Net interest margin for the year ended December 31, 2014 excludes the impact of the cost associated with the refinancing of structured repos at BPNA and the
accelerated amortization of the discount related to the TARP funds amounting to $39.2 million and $414.1 million, respectively. The U.S. GAAP net Interestmargin for the year ended December 31, 2014, on a taxable equivalent basis, was 3.45%. Refer additional information on the Net Interest Income section of thisMD&A and to the reconciliation in Table 73.

8
The Corporation has strived to mitigate the decline inearning assets amid challenging economic conditions in PuertoRico. During the first half of 2013, the Corporation completedtwo bulk purchases from Puerto Rico financial institutionsacquiring $761.3 million in mortgage loans. Also, during 2012,the BPPR reportable segment purchased $265 million inconsumer loans. During the first half of 2011, the Corporationcompleted two bulk purchases of residential mortgage loansfrom a Puerto Rico financial institution, adding $518 million in
performing mortgage loans to its portfolio. The Corporationwill continue to look for opportunities to supplement itsorganic growth with portfolio purchases.
On April 30, 2010, BPPR acquired certain assets andassumed certain liabilities of Westernbank from the FDIC in anassisted transaction. Table 2 provides a summary of the grossrevenues derived from the assets acquired in the FDIC-assistedtransaction during 2014, 2013 and 2012.
Table 2 - Financial Information - Westernbank FDIC-Assisted Transaction
Years ended December 31,
(In thousands) 2014 2013 2012
Interest income:Interest income on covered loans $293,610 $300,745 $301,441
Total interest income on covered loans 293,610 300,745 301,441
FDIC loss share expense:Amortization of loss share indemnification asset (189,959) (161,635) (129,676)Reversal of accelerated amortization in prior periods 12,492 – –80% mirror accounting on credit impairment losses [1] 32,038 60,454 58,18780% mirror accounting on reimbursable expenses 58,117 50,985 30,77180% mirror accounting on recoveries on covered assets, including rental income on OREOs, subject to
reimbursement to the FDIC (13,124) (16,057) (2,979)80% mirror accounting on amortization of contingent liability on unfunded commitments – (473) (969)Change in true-up payment obligation (1,791) (15,993) (13,178)Other (797) 668 1,633
Total FDIC loss share expense (103,024) (82,051) (56,211)
Fair value change in equity appreciation instrument – – –Amortization of contingent liability on unfunded commitments (included in other operating income) – 593 1,211
Total revenues 190,586 219,287 246,441
Provision for loan losses 46,135 69,396 74,839
Total revenues less provision for loan losses $144,451 $149,891 $171,602
[1] Reductions in expected cash flows for ASC 310-30 loans, which may impact the provision for loan losses, may consider reductions in both principal and interestcash flow expectations. The amount covered under the FDIC loss sharing agreements for interest not collected from borrowers is limited under the agreements(approximately 90 days); accordingly, these amounts are not subject fully to the 80% mirror accounting.
Average balances
Years ended December 31,
(In millions) 2014 2013 2012
Covered loans $2,771 $3,228 $4,050FDIC loss share asset 748 1,310 1,680
Interest income on covered loans for the year 2014amounted to $ 294 million vs. $ 301million in 2013, reflectinga yield of 10.60% vs. 9.32%, for each year respectively. Theincrease in the yield was due to higher expected cash flowswhich are reflected in the accretable yield and recognized overthe life of the loans and resolutions of loans during the year.This portfolio, due to its nature, should continue to decline asscheduled payments are received and workout arrangementsare made. The yield improvement in 2014 reflects highercollections and estimated cash flows, which increase theaccretable yield to be taken over the life of the loan pools.
The FDIC loss share reflected an expense of $ 103 millionfor 2014, compared to $ 82 million for 2013. This was mainlythe result of higher amortization of the indemnification asset by$ 28 million, lower mirror accounting on credit impairmentlosses of $ 28 million, offset by lower unfavorable valuationadjustment on true up payment obligation of $14 million andhigher mirror accounting income on reimbursable expenses of$7 million. For 2013, when compared to 2012 this line reflecteda negative variance of $ 26 million due to higher amortizationof the indemnification asset partially offset by higher mirroraccounting on reimbursable expenses.

9 POPULAR, INC. 2014 ANNUAL REPORT
Although the increase in cash flows increases the accretableyield to be recognized over the life of the loans, it also has theeffect of lowering the realizable value of the loss share asset sincethe Corporation would receive lower FDIC payments under theloss share agreements. This is reflected in the increasedamortization of the loss share asset for 2014. The change in theamortization of the loss share asset from 2012 to 2013 alsoreflected higher expected cash flows from year to year.
The discussion that follows provides highlights of theCorporation’s results of operations for the year endedDecember 31, 2014 compared to the results of operations of2013. It also provides some highlights with respect to theCorporation’s financial condition, credit quality, capital andliquidity. Table 3 presents a five-year summary of thecomponents of net income (loss) as a percentage of averagetotal assets.
Table 3 - Components of Net Income (Loss) as a Percentage of Average Total Assets
2014 2013 2012 2011 2010
Net interest income 2.69% 3.71% 3.54% 3.47% 3.04%Provision for loan losses (0.77) (1.67) (1.10) (1.42) (2.37)Mortgage banking activities 0.09 0.21 0.23 (0.01) 0.04Net gain and valuation adjustments on investment securities – 0.02 – 0.03 0.01Net gain (loss) on sale of loans, including valuation adjustments on loans held-for-sale 0.12 (0.15) (0.08) 0.01 0.01Adjustments (expense) to indemnity reserves (0.12) (0.10) (0.06) (0.09) (0.19)Trading account profit (loss) 0.01 (0.04) 0.01 0.13 0.09FDIC loss share (expense) income (0.29) (0.23) (0.15) 0.17 (0.07)Fair value change in equity appreciation instrument – – – 0.02 0.11Gain on sale of processing and technology business – – – – 1.67Other non-interest income 1.29 2.47 1.46 1.32 1.66
Total net interest income and non-interest income, net of provision for loan losses 3.02 4.22 3.85 3.63 4.00Operating expenses (3.39) (3.37) (3.34) (3.00) (3.29)
(Loss) income from continuing operations before income tax (0.37) 0.85 0.51 0.63 0.71Income tax expense (benefit) 0.17 (0.69) (0.07) 0.30 0.28
(Loss) income from continuing operations (0.54) 1.54 0.58 0.33 0.43(Loss) income from discontinued operations, net of tax (0.35) 0.11 0.10 0.07 (0.07)
Net (loss) income (0.89)% 1.65% 0.68% 0.40% 0.36%
Net interest income from the continuing business, on ataxable equivalent basis, for the year ended December 31, 2014was $1.0 billion compared to $1.4 billion in 2013. Excludingthe impact of the repayment of TARP funds and the refinancingof structured repos in the US, the net interest income, on ataxable equivalent basis, in 2014 was $1.5 billion compared to$1.4 billion during 2013. Net interest margin, on a taxableequivalent basis, was 3.45% in 2014. The adjusted net interestmargin was 4.96% compared to 4.73% for 2013. The increase inthe adjusted net interest margin was mainly related to higheryields from the commercial and mortgage loan portfolios aswell as the impact of lower expected losses for the coveredportfolio, which increases the accretable yield. Also, therenewal of time deposits at lower rates and lower cost ofborrowings, after the repayment of TARP funds and refinancingof structured repos, helped improve margins for 2014. Refer tothe Net Interest Income section of this MD&A for a discussionof the major variances in net interest income, including yieldsand costs.
The provision for loan losses for the non-covered portfoliowas $224.0 million for the year ended December 31, 2014,compared to 536.7 million for 2013. Excluding the impact of
the bulk loan sales in each respective year, the adjustedprovision for the non-covered portfolio was $211.2 million and$218.6 million for 2014 and 2013, respectively. The decline inthe adjusted provision was mainly related to higher reservereleases at BPNA, offset by higher provisions at the BPPRsegment. The continued economic weakness in Puerto Rico,our principal market, continues to present challenges which arebeing reflected in its overall reserve levels. The credit metrics inthe U.S. reflect strong performance led by the improved riskprofile of its loan portfolios, further strengthened by the sale ofcertain non-performing and legacy assets during the second halfof the year 2014. Non-performing loans held in portfolio, atDecember 31, 2014 were $630.5 million, an increase of $32.6million from 2013, driven by higher inflows in the BPPRsegment, offset by a decline in BPNA due in part to theaforementioned bulk sales of non-performing and legacy assets.
Refer to the Provision for Loan Losses and Credit RiskManagement and Loan Quality section of this MD&A forinformation on the allowance for loan losses, non-performingassets, troubled debt restructurings, net charge-offs and creditquality metrics.

10
Non-interest income for the year ended December 31, 2014amounted to $386.5 million, a decrease of $404.5 million,compared with 2013. The FDIC indemnity asset amortizationfor the year 2014 included a benefit of approximately $12.5million to reverse the impact of accelerated amortizationexpense recorded in prior periods. This amount will berecognized as expense over the remaining portion of the losssharing agreement that expires in the quarter ending June 30,2015. Excluding the impact of the $12.5 million FDICindemnity asset amortization adjustment during 2014 and the$357.2 million of significant events during 2013, which includethe impact of the NPA’s sales and EVERTEC’s public offerings,non-interest income decreased by $61.5 million principally dueto lower income from mortgage banking activities, higherprovision for indemnity reserves, and lower service fees andcharges on deposits, offset by higher gain on sales of loans,mainly at BPNA, and trading account profits. Refer to the Non-Interest Income section of this MD&A for a table that providesa breakdown of the different categories of non-interest income.
Total operating expenses for the year 2014 amounted to $1.2billion, a decrease of $28.3 million, when compared with theprevious year. Operating expenses for 2014 included non-recurring restructuring charges related to the U.S. operationsfor $26.7 million, executive compensation costs for $3.0million, lease cancellation costs for $1.9 million and early debtextinguishment costs for $532 thousand. For the year 2013,operating expenses included $37.0 million in OREO expensesrelated to the bulk sale of non-performing assets and $1.1million in professional services mainly related to EVERTEC’spublic offerings. Excluding the impact of these charges, detailedin tables 72 and 73, operating expenses for 2014 declined by$22.3 million due mainly to lower pension and medical costsand lower FDIC insurance expense, partially offset by higherprofessional fees and OREO expenses. Refer to the OperatingExpenses section of this MD&A for additional explanations onthe major variances in the different categories of operatingexpenses.
For the year 2014, the Corporation recorded an income taxexpense of $58.3 million, compared to a benefit of $251.3million for the year 2013. During the year 2014, theCorporation recorded an income tax benefit of $23.4 million inconnection with a Closing Agreement with the Puerto RicoDepartment of Treasury related to the income tax treatment ofcertain charge-offs of the covered portfolio and an expense ofapproximately $8.0 million to record a valuation allowance inthe deferred tax asset at the Holding Company, which werepartially offset by an expense of $20.0 million related to thechange in the capital gains tax rate from 15% to 20%, pursuantto an amendment to the Puerto Rico Internal Revenue Code.During the year 2013, the Corporation recorded an income taxbenefit of $197.5 million reflecting the impact on its deferredtax assets of an amendment to the Puerto Rico Internal RevenueCode which, among other things, increased the marginal tax
rate from 30% to 39%. In addition, the Corporation recorded anincome tax benefit of $146.4 million in connection with theloss generated on the Puerto Rico operations by the sales ofnon-performing assets that took place during the year 2013 anda tax expense of $23.7 million related to the gain realized onthe sale of a portion of EVERTEC’s shares which was taxable ata preferential tax rate. Refer to the Income Taxes section in thisMD&A and Note 43 to the consolidated financial statements foradditional information on income taxes.
At December 31, 2014, the Corporation’s total assets were$33.1 billion, compared with $35.7 billion at December 31,2013, a decrease of $2.6 billion, or 7%. Total earning assets atDecember 31, 2014 amounted to $29.5 billion, a decrease of$2.0 billion, or 7%, compared with December 31, 2013.
Loans held-in-portfolio, excluding covered loans, totaled$19.4 billion, a decrease of $2.2 billion compared to 2013. Thedecrease is due mainly to the sale of approximately $1.8 billionin loans from the U.S. discontinued businesses in California,Illinois and Central Florida. Also, during the year, the U.S.operations completed the sale or entered into agreements to sellapproximately $249 million of non-performing and legacy loansin addition to sales under its normal workout strategies. Thecovered portfolio declined by $442.0 million as this portfoliocontinues its normal run-off. Loans held-for-sale declined by$4.3 million from 2013, due to a decline in mortgageoriginations for sale in the secondary market, offset by a highervolume of consumer loans, particularly auto loans.
Refer to Table 19 in the Statement of Financial ConditionAnalysis section of this MD&A for the percentage allocation ofthe composition of the Corporation’s financing to total assets.Deposits amounted to $24.8 billion at December 31, 2014,compared with $26.7 billion at December 31, 2013. Table 20presents a breakdown of deposits by major categories. Thedecrease in deposits is due mainly to the sale of approximately$2.0 billion in deposits in connection with the sale of theCalifornia, Illinois and Central Florida regional operations. TheCorporation’s borrowings amounted to $3.0 billion atDecember 31, 2014, compared with $3.6 billion atDecember 31, 2013. The decline in borrowings is mainly due tolower balance of repos and advances from the Federal HomeLoan Bank of NY.
Stockholders’ equity amounted to $4.3 billion atDecember 31, 2014, compared with $4.6 billion atDecember 31, 2013. The Corporation continues to be well-capitalized at December 31, 2014. The Tier 1 risk-based capitaland Tier 1 common equity to risk-weighted assets stood at18.13% and 15.89%, respectively, at December 31, 2014,compared with 19.15% and 14.83%, respectively, atDecember 31, 2013. The change in the Corporation’s regulatorycapital ratios from the end of 2013 to December 31, 2014 wasprincipally due to the repurchase on July 2, 2014 of $935million of capital securities held by the U.S. Treasury inconnection with the TARP Capital Purchase Program. This

11 POPULAR, INC. 2014 ANNUAL REPORT
unfavorable impact to the regulatory capital ratios was in partoff-set by a reduction in risk-weighted assets, mostly driven bythe U.S. regional sales.
In summary, during 2014, the Corporation achievedsignificant milestones on its continuing efforts to strengthen itsoperations and the outlook for future profitability as evidencedby the repayment of TARP funds and substantial progresstoward the completion of the restructuring of the U.S.operations. The Corporation continues to benefit from its stakein EVERTEC and BHD, the second largest bank in theDominican Republic, and improved performance of its U.S.operations.
Moving forward, in Puerto Rico, the Corporation willcontinue to focus on its credit performance and to identify
opportunities to complement its organic growth withopportunistic portfolio acquisitions. In the U.S. mainland, theCorporation expects to solidify the trend of improving creditquality by continuing the run-off or disposition of legacyportfolios, actively managing the existing classified portfolio,and identifying new asset growth opportunities in selected loancategories.
For further discussion of operating results, financialcondition and business risks refer to the narrative and tablesincluded herein.
The shares of the Corporation’s common stock are traded onthe NASDAQ Global Select Market under the symbol BPOP.Table 4 shows the Corporation’s common stock performance ona quarterly basis during the last five years.
Table 4 - Common Stock Performance
Market PriceCash Dividends
Declaredper Share
Book ValuePer Share
DividendYield [1]
Price/Earnings
RatioMarket/Book
RatioHigh Low
2014 $40.76 N.M. (11.06)x 83.54%
4th quarter $34.14 $27.34 $–
3rd quarter 34.64 29.44 –
2nd quarter 34.18 28.93 –
1st quarter 31.50 25.50 –
2013 44.26 N.M. 4.95 64.91
4th quarter $29.17 $24.07 $–
3rd quarter 34.20 26.25 –
2nd quarter 30.60 26.88 –
1st quarter 28.92 21.70 –
2012 39.35 N.M. 8.85 52.83
4th quarter $20.90 $17.42 $–
3rd quarter 18.74 13.55 –
2nd quarter 21.20 13.58 –
1st quarter 23.00 14.30 –
2011 37.71 N.M. 9.65 36.86
4th quarter $19.00 $11.15 $–
3rd quarter 28.30 13.70 –
2nd quarter 32.40 26.30 –
1st quarter 35.33 28.70 –
2010 36.67 N.M. (50.65) 85.63
4th quarter $31.40 $27.01 $–
3rd quarter 29.50 24.50 –
2nd quarter 40.20 26.40 –
1st quarter 29.10 17.50 –[1] Based on the average high and low market price for the four quarters.Note: All per share data has been adjusted to retroactively reflect the 1-for-10 reverse stock split effected on May 29, 2012.N.M. – Not meaningful.

12
CRITICAL ACCOUNTING POLICIES / ESTIMATESThe accounting and reporting policies followed by theCorporation and its subsidiaries conform with generallyaccepted accounting principles (“GAAP”) in the United Statesof America and general practices within the financial servicesindustry. The Corporation’s significant accounting policies aredescribed in detail in Note 2 to the consolidated financialstatements and should be read in conjunction with this section.
Critical accounting policies require management to makeestimates and assumptions, which involve significant judgmentabout the effect of matters that are inherently uncertain andthat involve a high degree of subjectivity. These estimates aremade under facts and circumstances at a point in time andchanges in those facts and circumstances could produce actualresults that differ from those estimates. The following MD&Asection is a summary of what management considers theCorporation’s critical accounting policies / estimates.
Fair Value Measurement of Financial InstrumentsThe Corporation measures fair value as required by ASCSubtopic 820-10 “Fair Value Measurements and Disclosures”,which defines fair value as the exchange price that would bereceived for an asset or paid to transfer a liability in theprincipal or most advantageous market for the asset or liabilityin an orderly transaction between market participants on themeasurement date. The Corporation currently measures at fairvalue on a recurring basis its trading assets, available-for-salesecurities, derivatives, mortgage servicing rights and contingentconsideration. Occasionally, the Corporation may be requiredto record at fair value other assets on a nonrecurring basis, suchas loans held-for-sale, impaired loans held-in-portfolio that arecollateral dependent and certain other assets. Thesenonrecurring fair value adjustments typically result from theapplication of lower of cost or fair value accounting or write-downs of individual assets.
The Corporation categorizes its assets and liabilitiesmeasured at fair value under the three-level hierarchy. The levelwithin the hierarchy is based on whether the inputs to thevaluation methodology used for fair value measurement areobservable. The hierarchy is broken down into three levelsbased on the reliability of inputs as follows:
• Level 1 - Unadjusted quoted prices in active markets foridentical assets or liabilities that the Corporation has theability to access at the measurement date. No significantdegree of judgment for these valuations is needed, as theyare based on quoted prices that are readily available in anactive market.
• Level 2 - Quoted prices other than those included in Level1 that are observable either directly or indirectly. Level 2inputs include quoted prices for similar assets or liabilitiesin active markets, quoted prices for identical or similarassets or liabilities in markets that are not active, and
other inputs that are observable or that can becorroborated by observable market data for substantiallythe full term of the financial instrument.
• Level 3 - Unobservable inputs that are supported by littleor no market activity and that are significant to the fairvalue measurement of the financial asset or liability.Unobservable inputs reflect the Corporation’s ownassumptions about what market participants would use toprice the asset or liability, including assumptions aboutrisk. The inputs are developed based on the best availableinformation, which might include the Corporation’s owndata such as internally-developed models and discountedcash flow analyses.
The Corporation requires the use of observable inputs whenavailable, in order to minimize the use of unobservable inputsto determine fair value. The inputs or methodologies used forvaluing securities are not necessarily an indication of the riskassociated with investing on those securities. The amount ofjudgment involved in estimating the fair value of a financialinstrument depends upon the availability of quoted marketprices or observable market parameters. In addition, it may beaffected by other factors such as the type of instrument, theliquidity of the market for the instrument, transparency aroundthe inputs to the valuation, as well as the contractualcharacteristics of the instrument.
If listed prices or quotes are not available, the Corporationemploys valuation models that primarily use market-basedinputs including yield curves, interest rate curves, volatilities,credit curves, and discount, prepayment and delinquency rates,among other considerations. When market observable data isnot available, the valuation of financial instruments becomesmore subjective and involves substantial judgment. The need touse unobservable inputs generally results from diminishedobservability of both actual trades and assumptions resultingfrom the lack of market liquidity for those types of loans orsecurities. When fair values are estimated based on modelingtechniques such as discounted cash flow models, theCorporation uses assumptions such as interest rates,prepayment speeds, default rates, loss severity rates anddiscount rates. Valuation adjustments are limited to thosenecessary to ensure that the financial instrument’s fair value isadequately representative of the price that would be received orpaid in the marketplace.
The fair value measurements and disclosures guidance inASC Subtopic 820-10 also addresses measuring fair value insituations where markets are inactive and transactions are notorderly. Transactions or quoted prices for assets and liabilitiesmay not be determinative of fair value when transactions arenot orderly and thus may require adjustments to estimate fairvalue. Price quotes based on transactions that are not orderlyshould be given little, if any, weight in measuring fair value.Price quotes based upon transactions that are orderly shall be

13 POPULAR, INC. 2014 ANNUAL REPORT
considered in determining fair value and the weight given isbased on facts and circumstances. If sufficient information isnot available to determine if price quotes are based uponorderly transactions, less weight should be given to the pricequote relative to other transactions that are known to beorderly.
The lack of liquidity is incorporated into the fair valuemeasurement based on the type of asset measured and thevaluation methodology used. An illiquid market is one in whichlittle or no observable activity has occurred or one that lackswilling buyers or willing sellers. Discounted cash flowtechniques incorporate forecasting of expected cash flowsdiscounted at appropriate market discount rates which reflectthe lack of liquidity in the market which a market participantwould consider. Broker quotes used for fair valuemeasurements inherently reflect any lack of liquidity in themarket since they represent an exit price from the perspectiveof the market participants.
Management believes that fair values are reasonable andconsistent with the fair value measurement guidance based onthe Corporation’s internal validation procedure and consistencyof the processes followed, which include obtaining marketquotes when possible or using valuation techniques thatincorporate market-based inputs.
Refer to Note 35 to the consolidated financial statements forinformation on the Corporation’s fair value measurementdisclosures required by the applicable accounting standard. AtDecember 31, 2014, approximately $ 5.5 billion, or 97%, of theassets measured at fair value on a recurring basis used market-based or market-derived valuation methodology and, therefore,were classified as Level 1 or Level 2. The majority ofinstruments measured at fair value were classified as Level 2,including U.S. Treasury securities, obligations of U.S.Government sponsored entities, obligations of Puerto Rico,States and political subdivisions, most mortgage-backedsecurities (“MBS”) and collateralized mortgage obligations(“CMOs”), and derivative instruments. U.S. Treasury securitieswere valued based on yields that were interpolated from theconstant maturity treasury curve. Obligations of U.S.Government sponsored entities were priced based on an activeexchange market and on quoted prices for similar securities.Obligations of Puerto Rico, States and political subdivisionswere valued based on trades, bid price or spread, two sidedmarkets, quotes, benchmark curves, market data feeds,discount and capital rates and trustee reports. MBS and CMOswere priced based on a bond’s theoretical value from similarbonds defined by credit quality and market sector. Refer to theDerivatives section below for a description of the valuationtechniques used to value these derivative instruments.
The remaining 3% of assets measured at fair value on arecurring basis at December 31, 2014 were classified as Level 3since their valuation methodology considered significantunobservable inputs. The financial assets measured as Level 3
included mostly Puerto Rico tax-exempt GNMA mortgage-backed securities and mortgage servicing rights (“MSRs”).GNMA tax exempt mortgage-backed securities are priced usinga local demand price matrix prepared from local dealer quotes,and other local investments such as corporate securities andlocal mutual funds which are priced by local dealers. MSRs, onthe other hand, are priced internally using a discounted cashflow model which considers servicing fees, portfoliocharacteristics, prepayment assumptions, delinquency rates,late charges, other ancillary revenues, cost to service and othereconomic factors. Additionally, the Corporation reported $93 million of financial assets that were measured at fair valueon a nonrecurring basis at December 31, 2014, all of whichwere classified as Level 3 in the hierarchy.
Broker quotes used for fair value measurements inherentlyreflect any lack of liquidity in the market since they representan exit price from the perspective of the market participants.Financial assets that were fair valued using broker quotesamounted to $ 22 million at December 31, 2014, of which $14 million were Level 3 assets and $ 8 million were Level 2assets. Level 3 assets consisted principally of tax-exempt GNMAmortgage-backed securities. Fair value for these securities wasbased on an internally-prepared matrix derived from an averageof two indicative local broker quotes. The main input used inthe matrix pricing was non-binding local broker quotesobtained from limited trade activity. Therefore, these securitieswere classified as Level 3.
There were no transfers in and/or out of Level 1, Level 2, orLevel 3 for financial instruments measured at fair value on arecurring basis during the year ended December 31, 2014 and2013. There were no transfers in and/or out of Level 1 forfinancial instruments measured at fair value on a recurringbasis during the year ended December 31, 2012. There were $2 million in transfers from Level 2 to Level 3 and $8 million intransfers from Level 3 to Level 2 for financial instrumentsmeasured at fair value on a recurring basis during the yearended December 31, 2012. The transfers from Level 2 to Level3 of trading mortgage-backed securities were the result of achange in valuation technique to a matrix pricing model, basedon indicative prices provided by brokers. The transfers fromLevel 3 to Level 2 of trading mortgage-backed securitiesresulted from observable market data becoming available forthese securities. The Corporation’s policy is to recognizetransfers as of the end of the reporting period.
Trading Account Securities and Investment SecuritiesAvailable-for-SaleThe majority of the values for trading account securities andinvestment securities available-for-sale are obtained from third-party pricing services and are validated with alternate pricingsources when available. Securities not priced by a secondarypricing source are documented and validated internallyaccording to their significance to the Corporation’s financial

14
statements. Management has established materiality thresholdsaccording to the investment class to monitor and investigatematerial deviations in prices obtained from the primary pricingservice provider and the secondary pricing source used assupport for the valuation results. During the year endedDecember 31, 2014, the Corporation did not adjust any pricesobtained from pricing service providers or broker dealers.
Inputs are evaluated to ascertain that they consider currentmarket conditions, including the relative liquidity of themarket. When a market quote for a specific security is notavailable, the pricing service provider generally uses observabledata to derive an exit price for the instrument, such asbenchmark yield curves and trade data for similar products. Tothe extent trading data is not available, the pricing serviceprovider relies on specific information including dialogue withbrokers, buy side clients, credit ratings, spreads to establishedbenchmarks and transactions on similar securities, to drawcorrelations based on the characteristics of the evaluatedinstrument. If for any reason the pricing service providercannot observe data required to feed its model, it discontinuespricing the instrument. During the year ended December 31,2014, none of the Corporation’s investment securities weresubject to pricing discontinuance by the pricing serviceproviders. The pricing methodology and approach of ourprimary pricing service providers is concluded to be consistentwith the fair value measurement guidance.
Furthermore, management assesses the fair value of itsportfolio of investment securities at least on a quarterly basis,which includes analyzing changes in fair value that haveresulted in losses that may be considered other-than-temporary.Factors considered include, for example, the nature of theinvestment, severity and duration of possible impairments,industry reports, sector credit ratings, economic environment,creditworthiness of the issuers and any guarantees.
Securities are classified in the fair value hierarchy accordingto product type, characteristics and market liquidity. At the endof each period, management assesses the valuation hierarchy foreach asset or liability measured. The fair value measurementanalysis performed by the Corporation includes validationprocedures and review of market changes, pricingmethodology, assumption and level hierarchy changes, andevaluation of distressed transactions.
At December 31, 2014, the Corporation’s portfolio of tradingand investment securities available-for-sale amounted to $ 5.5billion and represented 97% of the Corporation’s assetsmeasured at fair value on a recurring basis. At December 31,2014, net unrealized gains on the trading securitiesapproximated $7 million and net unrealized losses on available-for-sale investment securities portfolio approximated to $ 8million. Fair values for most of the Corporation’s trading andinvestment securities available-for-sale were classified as Level2. Trading and investment securities available-for-sale classifiedas Level 3, which were the securities that involved the highest
degree of judgment, represent less than 1% of the Corporation’stotal portfolio of trading and investment securities available-for-sale.
Mortgage Servicing RightsMortgage servicing rights (“MSRs”), which amounted to $149 million at December 31, 2014, and are primarily related toresidential mortgage loans originated in Puerto Rico, do nottrade in an active, open market with readily observable prices.Fair value is estimated based upon discounted net cash flowscalculated from a combination of loan level data and marketassumptions. The valuation model combines loans withcommon characteristics that impact servicing cash flows (e.g.investor, remittance cycle, interest rate, product type, etc.) inorder to project net cash flows. Market valuation assumptionsinclude prepayment speeds, discount rate, cost to service,escrow account earnings, and contractual servicing fee income,among other considerations. Prepayment speeds are derivedfrom market data that is more relevant to the U.S. mainlandloan portfolios and, thus, are adjusted for the Corporation’sloan characteristics and portfolio behavior since prepaymentrates in Puerto Rico have been historically lower. Otherassumptions are, in the most part, directly obtained from third-party providers. Disclosure of two of the key economicassumptions used to measure MSRs, which are prepaymentspeed and discount rate, and a sensitivity analysis to adversechanges to these assumptions, is included in Note 15 to theconsolidated financial statements.
DerivativesDerivatives, such as interest rate swaps, interest rate caps andindexed options, are traded in over-the-counter active markets.These derivatives are indexed to an observable interest ratebenchmark, such as LIBOR or equity indexes, and are pricedusing an income approach based on present value and optionpricing models using observable inputs. Other derivatives areliquid and have quoted prices, such as forward contracts or “tobe announced securities” (“TBAs”). All of these derivatives heldby the Corporation were classified as Level 2. Valuations ofderivative assets and liabilities reflect the values associated withcounterparty risk and nonperformance risk, respectively. Thenon-performance risk, which measures the Corporation’s owncredit risk, is determined using internally-developed modelsthat consider the net realizable value of the collateral posted,remaining term, and the creditworthiness or credit standing ofthe Corporation. The counterparty risk is also determined usinginternally-developed models which incorporate thecreditworthiness of the entity that bears the risk, net realizablevalue of the collateral received, and available public data orinternally-developed data to determine their probability ofdefault. To manage the level of credit risk, the Corporationemploys procedures for credit approvals and credit limits,monitors the counterparties’ credit condition, enters into

15 POPULAR, INC. 2014 ANNUAL REPORT
master netting agreements whenever possible and, whenappropriate, requests additional collateral. During the yearended December 31, 2014, inclusion of credit risk in the fairvalue of the derivatives resulted in a net gain of $1.1 millionrecorded in the other operating income and interest expensecaptions of the consolidated statement of operations, whichconsisted of a loss of $0.1 million resulting from theCorporation’s own credit standing adjustment and a gain of$1.2 million from the assessment of the counterparties’ creditrisk.
Contingent consideration liabilityThe fair value of the true-up payment obligation (contingentconsideration) to the FDIC as it relates to the WesternbankFDIC-assisted transaction amounted to $ 129 million atDecember 31, 2014. The fair value was estimated usingprojected cash flows related to the loss sharing agreements atthe true-up measurement date, taking into consideration theintrinsic loss estimate, asset premium/discount, cumulativeshared loss payments, and the cumulative servicing amountrelated to the loan portfolio. Refer to Note 13 to theconsolidated financial statements for a description of the true-up payment formula. The true-up payment obligation wasdiscounted using a term rate consistent with the time remaininguntil the payment is due. The discount rate was an estimate ofthe sum of the risk-free benchmark rate for the term remainingbefore the true-up payment is due and a risk premium toaccount for the credit risk profile of BPPR. The risk premiumwas calculated using a three day average of Popular, Inc.’s 5-year note issuance.
Loans held-in-portfolio considered impaired under ASCSection 310-10-35 that are collateral dependentThe impairment is measured based on the fair value of thecollateral, which is derived from appraisals that take intoconsideration prices in observed transactions involving similarassets in similar locations, size and supply and demand. Thechallenging conditions of the housing markets continue toaffect the market activity related to real estate properties. Thesecollateral dependent impaired loans are classified as Level 3 andare reported as a nonrecurring fair value measurement.
Loans measured at fair value pursuant to lower of cost orfair value adjustmentsLoans measured at fair value on a nonrecurring basis pursuantto lower of cost or fair value were priced based on secondarymarket prices and discounted cash flow models whichincorporate internally-developed assumptions for prepaymentsand credit loss estimates. These loans are classified as Level 3.
Other real estate owned and other foreclosed assetsOther real estate owned includes real estate properties securingmortgage, consumer, and commercial loans. Other foreclosed
assets include automobiles securing auto loans. The fair valueof foreclosed assets may be determined using an externalappraisal, broker price opinion, internal valuation or bindingoffer. The majority of these foreclosed assets is classified asLevel 3 since they are subject to internal adjustments andreported as a nonrecurring fair value measurement.
Loans and Allowance for Loan LossesInterest on loans is accrued and recorded as interest incomebased upon the principal amount outstanding.
Non-accrual loans are those loans on which the accrual ofinterest is discontinued. When a loan is placed on non-accrualstatus, all previously accrued and unpaid interest is chargedagainst income and the loan is accounted for either on a cash-basis method or on the cost-recovery method. Loans designatedas non-accruing are returned to accrual status when theCorporation expects repayment of the remaining contractualprincipal and interest. The determination as to the ultimatecollectability of the loan’s balance may involve management’sjudgment in the evaluation of the borrower’s financial conditionand prospects for repayment.
Refer to the MD&A section titled Credit Risk Managementand Loan Quality, particularly the Non-performing assets sub-section, for a detailed description of the Corporation’s non-accruing and charge-off policies by major loan categories.
One of the most critical and complex accounting estimates isassociated with the determination of the allowance for loanlosses. The provision for loan losses charged to currentoperations is based on this determination. The Corporation’sassessment of the allowance for loan losses is determined inaccordance with accounting guidance, specifically guidance ofloss contingencies in ASC Subtopic 450-20 and loanimpairment guidance in ASC Section 310-10-35.
The accounting guidance provides for the recognition of aloss allowance for groups of homogeneous loans. Thedetermination for general reserves of the allowance for loanlosses includes the following principal factors:
• Base net loss rates, which are based on the movingaverage of annualized net loss rates computed over a 3-year historical loss period for the commercial andconstruction loan portfolios, and an 18-month period forthe consumer and mortgage loan portfolios. The base netloss rates are applied by loan type and by legal entity.
• Recent loss trend adjustment, which replaces the base lossrate with a 12-month average loss rate, when these trendsare higher than the respective base loss rates. Theobjective of this adjustment is to allow for a more recentloss trend to be captured and reflected in the ALLLestimation process. As part of the annual review of thecomponents of the ALLL models, as discussed in thefollowing paragraphs and implemented as of June 30,2014, the Corporation eliminated the use of caps in the

16
recent loss trend adjustment for the consumer andmortgage portfolios, among other enhancements. For theperiod ended December 31, 2013, the recent loss trendadjustment caps for the consumer and mortgage portfolioswere triggered in only one portfolio segment within thePuerto Rico consumer portfolio. Management assessed theimpact of the applicable cap through a review ofqualitative factors that specifically considered the driversof recent loss trends and changes to the portfoliocomposition. The related effect of the aforementioned capwas immaterial for the overall level of the Allowance forLoan and Lease Losses for the Puerto Rico Consumerportfolio.
For the period ended December 31, 2014, 50%(December 31, 2013 - 27%) of the ALLL for BPPR non-covered loan portfolios utilized the recent loss trendadjustment instead of the base loss. The effect of replacingthe base loss with the recent loss trend adjustment wasmainly concentrated in the commercial multi-family,commercial and industrial, personal and auto loanportfolios for 2014, and in the commercial multi-family,mortgage, and leasing portfolios for 2013.
For the period ended December 31, 2014, 21%(December 31, 2013 - 29%) of the ALLL for BPNA loanportfolios utilized the recent loss trend adjustment insteadof the base loss. The effect of replacing the base loss withthe recent loss trend adjustment was mainly concentratedin the commercial multi-family, commercial and industrialand legacy loan portfolios for 2014 and in the commercialmulti-family, commercial real estate non-owner occupiedand commercial and industrial portfolios for 2013.
• Environmental factors, which include credit andmacroeconomic indicators such as unemployment rate,economic activity index and delinquency rates, adopted toaccount for current market conditions that are likely tocause estimated credit losses to differ from historicallosses. The Corporation reflects the effect of theseenvironmental factors on each loan group as anadjustment that, as appropriate, increases the historicalloss rate applied to each group. Environmental factorsprovide updated perspective on credit and economicconditions. Regression analysis is used to select theseindicators and quantify the effect on the general reserve ofthe allowance for loan losses.
During the second quarter of 2014, management completedthe annual review of the components of the ALLL models. Aspart of this review management updated core metrics andrevised certain components related to the estimation process forevaluating the adequacy of the general reserve of the allowancefor loan losses. These enhancements to the ALLL methodology,which are described in the paragraphs below, were
implemented as of June 30, 2014 and resulted in a net decreaseto the allowance for loan losses of $18.7 million for the non-covered portfolio and a net increase to the allowance for loanlosses of $0.8 million for the covered portfolio.
Management made the following principal enhancements tothe methodology during the second quarter of 2014:
• Annual review and recalibration of the environmentalfactors adjustment. The environmental factor adjustmentsare developed by performing regression analyses onselected credit and economic indicators for eachapplicable loan segment. During the second quarter of2014, the environmental factor models used to accountfor changes in current credit and macroeconomicconditions were reviewed and recalibrated based on thelatest applicable trends. Management also revised theapplication of environmental factors to the historical lossrates to consider last 12 month trends of the applicablecredit and macroeconomic indicators applied as anincremental adjustment to account for emerging risks notnecessarily considered in the historical loss rates.
The combined effect of the aforementioned recalibrationand enhancements to the environmental factorsadjustment resulted in a decrease to the allowance forloan losses of $17 million at June 30, 2014, of which$14.1 million related to the non-covered BPPR segmentand $3.7 million related to the BPNA segment, offset inpart by a $0.8 million increase in the BPPR coveredsegment.
• Increased the historical look-back period for determiningthe recent loss trend adjustment for consumer andmortgage loans. The Corporation increased the look-backperiod for assessing recent trends applicable to thedetermination of consumer and mortgage loan net charge-offs from 6 months to 12 months and eliminated the useof caps. Previously, the Corporation used a recent losstrend adjustment based on 6 months of net charge-offs upto a determined cap. Given the current overall consumerand mortgage credit quality improvements, managementconcluded that a 12-month look-back period for therecent loss trend adjustment aligns the Corporation’sallowance for loan losses methodology to current creditquality trends while limiting excessive pro-cyclicalitygiven the longer look-back period analysis, thus,eliminating the aforementioned caps.
The combined effect of the aforementioned enhancementsto the recent loss trend adjustment resulted in a decreaseto the allowance for loan losses of $1 million at June 30,2014, of which $0.9 million related to the non-coveredBPPR segment and $0.1 million related to the BPNAsegment.
17 POPULAR, INC. 2014 ANNUAL REPORT
According to the loan impairment accounting guidance inASC Section 310-10-35, a loan is impaired when, based oncurrent information and events, it is probable that the principaland/or interest are not going to be collected according to theoriginal contractual terms of the loan agreement. Currentinformation and events include “environmental” factors, e.g.existing industry, geographical, economic and political factors.Probable means the future event or events which will confirmthe loss or impairment of the loan is likely to occur.
The Corporation defines commercial and constructionimpaired loans as borrowers with total debt greater than orequal to $1 million with 90 days or more past due, as well as allloans whose terms have been modified in a trouble debtrestructuring (“TDRs”). In addition, larger commercial andconstruction loans ($1 million and over) that exhibit probableor observed credit weaknesses are subject to individual reviewand thus evaluated for impairment. Commercial andconstruction loans that originally met the Corporation’sthreshold for impairment identification in a prior period, butdue to charge-offs or payments are currently below the $1million threshold and are still 90 days past due, except forTDRs, are accounted for under the Corporation’s generalreserve methodology. Although the accounting codificationguidance for specific impairment of a loan excludes largegroups of smaller balance homogeneous loans that arecollectively evaluated for impairment (e.g. mortgage andconsumer loans), it specifically requires that loan modificationsconsidered troubled debt restructurings (“TDRs”) be analyzedunder its provisions. An allowance for loan impairment isrecognized to the extent that the carrying value of an impairedloan exceeds the present value of the expected future cash flowsdiscounted at the loan’s effective rate, the observable marketprice of the loan, if available, or the fair value of the collateral ifthe loan is collateral dependent.
The fair value of the collateral on commercial andconstruction loans is generally derived from appraisals. TheCorporation periodically requires updated appraisal reports forloans that are considered impaired. The frequency of updatedappraisals depends on total debt outstanding and type ofcollateral. Currently, for commercial and construction loanssecured by real estate, if the borrower’s total debt is equal to orgreater than $1 million, the appraisal is updated annually. If theborrower’s total debt is less than $1 million, the appraisal isupdated at least every two years.
As a general procedure, the Corporation internally reviewsappraisals as part of the underwriting and approval process andalso for credits considered impaired following certainmateriality benchmarks. Appraisals may be adjusted due totheir age, property conditions, geographical area or generalmarket conditions. The adjustments applied are based uponinternal information, like other appraisals and/or loss severityinformation that can provide historical trends in the real estatemarket. Discount rates used may change from time-to-time
based on management’s estimates. Refer to the Credit RiskManagement and Loan Quality section of this MD&A for moredetailed information on the Corporation’s collateral valueestimation for other real estate.
The Corporation’s management evaluates the adequacy ofthe allowance for loan losses on a quarterly basis following asystematic methodology in order to provide for known andinherent risks in the loan portfolio. In developing itsassessment of the adequacy of the allowance for loan losses, theCorporation must rely on estimates and exercise judgmentregarding matters where the ultimate outcome is unknownsuch as economic developments affecting specific customers,industries or markets. Other factors that can affectmanagement’s estimates are the years of historical data toinclude when estimating losses, the level of volatility of lossesin a specific portfolio, changes in underwriting standards,financial accounting standards and loan impairmentmeasurement, among others. Changes in the financial conditionof individual borrowers, in economic conditions, in historicalloss experience and in the condition of the various markets inwhich collateral may be sold may all affect the required level ofthe allowance for loan losses. Consequently, the business,financial condition, liquidity, capital and results of operationscould also be affected.
The collateral dependent method is generally used for theimpairment determination on commercial and constructionloans since the expected realizable value of the loan is basedupon the proceeds received from the liquidation of thecollateral property. For commercial properties, the “as is” valueor the “income approach” value is used depending on thefinancial condition of the subject borrower and/or the nature ofthe subject collateral. In most cases, impaired commercial loansdo not have reliable or sustainable cash flow to use thediscounted cash flow valuation method. On construction loans,“as developed” collateral values are used when the loan isoriginated since the assumption is that the cash flow of theproperty once leased or sold will provide sufficient funds torepay the loan. In the case of many impaired constructionloans, the “as developed” collateral value is also used sincecompleting the project reflects the best exit strategy in terms ofpotential loss reduction. In these cases, the costs to completeare considered as part of the impairment determination. As ageneral rule, the appraisal valuation used by the Corporationfor impaired construction loans is based on discounted value toa single purchaser, discounted sell out or “as is” depending onthe condition and status of the project and the performance ofthe same.
A restructuring constitutes a TDR when the Corporationseparately concludes that both of the following conditions exist:(i) the restructuring constitutes a concession and (ii) the debtoris experiencing financial difficulties. The concessions stem froman agreement between the creditor and the debtor or areimposed by law or a court. These concessions could include a

18
reduction in the interest rate on the loan, payment extensions,forgiveness of principal, forbearance or other actions intendedto maximize collection. A concession has been granted when, asa result of the restructuring, the Corporation does not expect tocollect all amounts due, including interest accrued at theoriginal contract rate. If the payment of principal is dependenton the value of collateral, the current value of the collateral istaken into consideration in determining the amount ofprincipal to be collected; therefore, all factors that changed areconsidered to determine if a concession was granted, includingthe change in the fair value of the underlying collateral thatmay be used to repay the loan. In addition, in order to expeditethe resolution of delinquent construction and commercialloans, the Corporation routinely enters into liquidationagreements with borrowers and guarantors through the regularlegal process, bankruptcy procedures and in certain occasions,out of Court transactions. These liquidation agreements, ingeneral, contemplate the following conditions: (1) consent tojudgment by the borrowers and guarantors; (2)acknowledgement by the borrower of debt, its liquidity andmaturity; (3) acknowledgement of the default payments. Thecontractual interest rate is not reduced and continues to accrueduring the term of the agreement. At the end of the period,borrower is obligated to remit all amounts due or be subject tothe Corporation’s exercise of its foreclosure rights and furthercollection efforts. Likewise, the borrower’s failure to makestipulated payments will grant the Corporation the ability toexercise its foreclosure rights. This strategy procures toexpedite the foreclosure process, resulting in a more effectiveand efficient collection process. Although in general, theseliquidation agreements do not contemplate the forgiveness ofprincipal or interest as debtor is required to cover alloutstanding amounts when the agreement becomes due, itcould be construed that the Corporation has granted aconcession by temporarily accepting a payment schedule that isdifferent from the contractual payment schedule. Accordingly,loans under this program are considered TDRs.
Classification of loan modifications as TDRs involves adegree of judgment. Indicators that the debtor is experiencingfinancial difficulties which are considered include: (i) theborrower is currently in default on any of its debt or it isprobable that the borrower would be in payment default on anyof its debt in the foreseeable future without the modification;(ii) the borrower has declared or is in the process of declaringbankruptcy; (iii) there is significant doubt as to whether theborrower will continue to be a going concern; (iv) the borrowerhas securities that have been delisted, are in the process ofbeing delisted, or are under threat of being delisted from anexchange; (v) based on estimates and projections that onlyencompass the borrower’s current business capabilities, it isforecasted that the entity-specific cash flows will be insufficientto service the debt (both interest and principal) in accordancewith the contractual terms of the existing agreement through
maturity; and (vi) absent the current modification, theborrower cannot obtain funds from sources other than theexisting creditors at an effective interest rate equal to thecurrent market interest rate for similar debt for a non-troubleddebtor. The identification of TDRs is critical in thedetermination of the adequacy of the allowance for loan losses.Loans classified as TDRs are excluded from TDR status ifperformance under the restructured terms exists for areasonable period (at least twelve months of sustainedperformance) and the loan yields a market rate.
For mortgage and other consumer loans that are modifiedwith regard to payment terms and which constitute TDRs, thediscounted cash flow value method is used as the impairmentvaluation is more appropriately calculated based on the ongoingcash flow from the individuals rather than the liquidation of thecollateral asset. The computations give consideration toprobability of default and loss-given default on the relatedestimated cash flows.
Refer to Note 12 to the consolidated financial statements fordisclosures on the impact of adopting ASU 2011-02 and to Note3 for a general description of the ASU 2011-02 guidance.
Acquisition Accounting for Covered Loans and RelatedIndemnification AssetThe Corporation accounted for the Westernbank FDIC-assistedtransaction under the accounting guidance of ASC Topic 805,Business Combinations, which requires the use of the purchasemethod of accounting. All identifiable assets and liabilitiesacquired were initially recorded at fair value. No allowance forloan losses related to the acquired loans was recorded on theacquisition date as the fair value of the loans acquiredincorporated assumptions regarding credit risk. Loans acquiredwere recorded at fair value in accordance with the fair valuemethodology prescribed in ASC Topic 820, exclusive of theshared-loss agreements with the FDIC. These fair valueestimates associated with the loans included estimates related toexpected prepayments and the amount and timing of expectedprincipal, interest and other cash flows.
Because the FDIC has agreed to reimburse the Corporationfor losses related to the acquired loans in the WesternbankFDIC-assisted transaction, subject to certain provisionsspecified in the agreements, an indemnification asset wasrecorded at fair value at the acquisition date. Theindemnification asset was recognized at the same time as theindemnified loans, and is measured on the same basis, subjectto collectability or contractual limitations. The loss shareindemnification asset on the acquisition date reflected thereimbursements expected to be received from the FDIC, usingan appropriate discount rate, which reflected counterpartycredit risk and other uncertainties.
The initial valuation of these loans and relatedindemnification asset required management to make subjectivejudgments concerning estimates about how the acquired loans

19 POPULAR, INC. 2014 ANNUAL REPORT
would perform in the future using valuation methods,including discounted cash flow analyses and independent third-party appraisals. Factors that may significantly affect the initialvaluation included, among others, market-based and industrydata related to expected changes in interest rates, assumptionsrelated to probability and severity of credit losses, estimatedtiming of credit losses including the timing of foreclosure andliquidation of collateral, expected prepayment rates, required oranticipated loan modifications, unfunded loan commitments,the specific terms and provisions of any loss share agreements,and specific industry and market conditions that may impactdiscount rates and independent third-party appraisals.
The Corporation applied the guidance of ASC Subtopic310-30 to all loans acquired in the Westernbank FDIC-assistedtransaction (including loans that do not meet the scope of ASCSubtopic 310-30), except for credit cards and revolving lines ofcredit. ASC Subtopic 310-30 provides two specific criteria thathave to be met in order for a loan to be within its scope:(1) credit deterioration on the loan from its inception until theacquisition date and (2) that it is probable that not all of thecontractual cash flows will be collected on the loan. Once in thescope of ASC Subtopic 310-30, the credit portion of the fairvalue discount on an acquired loan cannot be accreted intoincome until the acquirer has assessed that it expects to receivemore cash flows on the loan than initially anticipated.
Acquired loans that meet the definition of nonaccrual statusfall within the Corporation’s definition of impaired loans underASC Subtopic 310-30. It is possible that performing loanswould not meet criteria number 1 above related to evidence ofcredit deterioration since the date of loan origination, andtherefore not fall within the scope of ASC Subtopic 310-30.Based on the fair value determined for the acquired portfolio,acquired loans that did not meet the Corporation’s definition ofnon-accrual status also resulted in the recognition of asignificant discount attributable to credit quality.
Given the significant discount related to credit in thevaluation of the Westernbank acquired portfolio, theCorporation considered two possible options for the performingloans (1) accrete the entire fair value discount (including thecredit portion) using the interest method over the life of theloan in accordance with ASC Subtopic 310-20; or (2) analogizeto ASC Subtopic 310-30 and only accrete the portion of the fairvalue discount unrelated to credit.
Pursuant to an AICPA letter dated December 18, 2009, theAICPA summarized the SEC Staff’s view regarding theaccounting in subsequent periods for discount accretionassociated with loan receivables acquired in a businesscombination or asset purchase. Regarding the accounting forsuch loan receivables, in the absence of further standard setting,the AICPA understands that the SEC Staff would not object toan accounting policy based on contractual cash flows (Option 1- ASC Subtopic 310-20 approach) or an accounting policy basedon expected cash flows (Option 2 - ASC Subtopic 310-30
approach). As such, the Corporation considered the twoallowable options as follows:
• Option 1 - Since the credit portion of the fair valuediscount is associated with an expectation of cash flowsthat an acquirer does not expect to receive over the life ofthe loan, it does not appear appropriate to accrete thatportion over the life of the loan as doing so couldeventually overstate the acquirer’s expected value of theloan and ultimately result in recognizing income (i.e.through the accretion of the yield) on a portion of theloan it does not expect to receive. Therefore, theCorporation does not believe this is an appropriatemethod to apply.
• Option 2 - The Corporation believes analogizing to ASCSubtopic 310-30 is the more appropriate option to followin accounting for the credit portion of the fair valuediscount. By doing so, the loan is only being accreted upto the value that the acquirer expected to receive atacquisition of the loan.
Based on the above, the Corporation elected Option 2 - theASC Subtopic 310-30 approach to the outstanding balance forall the acquired loans in the Westernbank FDIC-assistedtransaction with the exception of revolving lines of credit withactive privileges as of the acquisition date, which are explicitlyscoped out by the ASC Subtopic 310-30 accounting guidance.New advances / draws after the acquisition date under existingcredit lines that did not have revolving privileges as of theacquisition date, particularly for construction loans, willeffectively be treated as a “new” loan for accounting purposesand accounted for under the provisions of ASC Subtopic 310-20, resulting in a hybrid accounting for the overall constructionloan balance.
Management used judgment in evaluating factors impactingexpected cash flows and probable loss assumptions, includingthe quality of the loan portfolio, portfolio concentrations,distressed economic conditions in Puerto Rico, quality ofunderwriting standards of the acquired institution, reductionsin collateral real estate values, and material weaknessesdisclosed by the acquired institution, including matters relatedto credit quality review and appraisal report review.
At April 30, 2010, the acquired loans accounted for pursuantto ASC Subtopic 310-30 by the Corporation totaled $4.9 billionwhich represented undiscounted unpaid contractually-requiredprincipal and interest balances of $9.9 billion reduced by adiscount of $5.0 billion resulting from acquisition date fairvalue adjustments. The non-accretable discount on loansaccounted for under ASC Subtopic 310-30 amounted to $3.4billion or approximately 68% of the total discount, thusindicating a significant amount of expected credit losses on theacquired portfolios.
Pursuant to ASC Section 310-20-15-5, the Corporationaggregated loans acquired in the FDIC-assisted transaction into

20
pools with common risk characteristics for purposes ofapplying the recognition, measurement and disclosureprovisions of this subtopic. Each loan pool is accounted for as asingle asset with a single composite interest rate and anaggregate expectation of cash flows. Characteristics consideredin pooling loans in the Westernbank FDIC-assisted transactionincluded loan type, interest rate type, accruing status,amortization type, rate index and source type. Once the poolsare defined, the Corporation maintains the integrity of the poolof multiple loans accounted for as a single asset.
Under ASC Subtopic 310-30, the difference between theundiscounted cash flows expected at acquisition and the fairvalue of the loans, or the “accretable yield,” is recognized asinterest income using the effective yield method over theestimated life of the loan if the timing and amount of the futurecash flows of the pool is reasonably estimable. The non-accretable difference represents the difference betweencontractually required principal and interest and the cash flowsexpected to be collected. Subsequent to the acquisition date,increases in cash flows over those expected at the acquisitiondate are recognized as interest income prospectively as anadjustment to accretable yield over the pool’s remaining life.Decreases in expected cash flows after the acquisition date aregenerally recognized by recording an allowance for loan losses.
The fair value discount of lines of credit with revolvingprivileges that are accounted for pursuant to the guidance ofASC Subtopic 310-20, represented the difference between thecontractually required loan payment receivable in excess of theinitial investment in the loan. Any cash flows collected inexcess of the carrying amount of the loan are recognized inearnings at the time of collection. The carrying amount of linesof credit with revolving privileges, which are accountedpursuant to the guidance of ASC Subtopic 310-20, are subjectto periodic review to determine the need for recognizing anallowance for loan losses.
The FDIC loss share indemnification asset for loss shareagreements is measured separately from the related coveredassets as it is not contractually embedded in the assets and isnot transferable with the assets should the assets be sold.
The FDIC loss share indemnification asset is recognized onthe same basis as the assets subject to loss share protection,except that the amortization / accretion terms differ for eachasset. For covered loans accounted for pursuant to ASCSubtopic 310-30, decreases in expected reimbursements fromthe FDIC due to improvements in expected cash flows to bereceived from borrowers are recognized in non-interest incomeprospectively over the life of the FDIC loss sharing agreements.For covered loans accounted for under ASC Subtopic 310-20, asthe loan discount recorded as of the acquisition date wasaccreted into income, a reduction of the related indemnificationasset was recorded as a reduction in non-interest income.Increases in expected reimbursements from the FDIC arerecognized in non-interest income in the same period that the
allowance for credit losses for the related loans is recognized.Over the life of the acquired loans that are accounted under
ASC Subtopic 310-30, the Corporation continues to estimatecash flows expected to be collected on individual loans or onpools of loans sharing common risk characteristics. TheCorporation evaluates at each balance sheet date whether thepresent value of its loans determined using the effective interestrates has decreased based on revised estimated cash flows and ifso, recognizes a provision for loan loss in its consolidatedstatement of operations and an allowance for loan losses in itsconsolidated statement of financial condition. For any increasesin cash flows expected to be collected from borrowers, theCorporation adjusts the amount of accretable yield recognizedon the loans on a prospective basis over the pool’s remaininglife.
The evaluation of estimated cash flows expected to becollected subsequent to acquisition on loans accountedpursuant to ASC Subtopic 310-30 and inherent losses on loansaccounted pursuant to ASC Subtopic 310-20 require thecontinued usage of key assumptions and estimates. Given thecurrent economic environment, the Corporation must applyjudgment to develop its estimates of cash flows considering theimpact of home price and property value changes, changingloss severities and prepayment speeds. Decreases in theexpected cash flows for ASC Subtopic 310-30 loans anddecreases in the net realizable value of ASC Subtopic 310-20loans will generally result in a charge to the provision for creditlosses resulting in an increase to the allowance for loan losses.These estimates are particularly sensitive to changes in loancredit quality.
The amount that the Corporation realizes on the coveredloans and related indemnification assets could differ materiallyfrom the carrying value reflected in these financial statements,based upon the timing and amount of collections on theacquired loans in future periods. The Corporation’s losses onthese assets may be mitigated to the extent covered under thespecific terms and provisions of the loss share agreements.
Income TaxesIncome taxes are accounted for using the asset and liabilitymethod. Under this method, deferred tax assets and liabilitiesare recognized based on the future tax consequencesattributable to temporary differences between the financialstatement carrying amounts of existing assets and liabilities andtheir respective tax basis, and attributable to operating loss andtax credit carryforwards. Deferred tax assets and liabilities aremeasured using enacted tax rates expected to apply in the yearsin which the temporary differences are expected to be recoveredor paid. The effect on deferred tax assets and liabilities of achange in tax rates is recognized in earnings in the period whenthe changes are enacted.
The calculation of periodic income taxes is complex andrequires the use of estimates and judgments. The Corporation

21 POPULAR, INC. 2014 ANNUAL REPORT
has recorded two accruals for income taxes: (i) the netestimated amount currently due or to be received from taxingjurisdictions, including any reserve for potential examinationissues, and (ii) a deferred income tax that represents theestimated impact of temporary differences between how theCorporation recognizes assets and liabilities under accountingprinciples generally accepted in the United States (GAAP), andhow such assets and liabilities are recognized under the taxcode. Differences in the actual outcome of these future taxconsequences could impact the Corporation’s financial positionor its results of operations. In estimating taxes, managementassesses the relative merits and risks of the appropriate taxtreatment of transactions taking into consideration statutory,judicial and regulatory guidance.
A deferred tax asset should be reduced by a valuationallowance if based on the weight of all available evidence, it ismore likely than not (a likelihood of more than 50%) that someportion or the entire deferred tax asset will not be realized. Thevaluation allowance should be sufficient to reduce the deferredtax asset to the amount that is more likely than not to berealized. The determination of whether a deferred tax asset isrealizable is based on weighting all available evidence,including both positive and negative evidence. The realizationof deferred tax assets, including carryforwards and deductibletemporary differences, depends upon the existence of sufficienttaxable income of the same character during the carryback orcarryforward period. The realization of deferred tax assetsrequires the consideration of all sources of taxable incomeavailable to realize the deferred tax asset, including the futurereversal of existing temporary differences, future taxableincome exclusive of reversing temporary differences andcarryforwards, taxable income in carryback years and tax-planning strategies.
Management evaluates the realization of the deferred taxasset by taxing jurisdiction, the US mainland operations areevaluated as a whole since a consolidated income tax return isfiled, on the other hand the deferred tax asset related to thePuerto Rico operations is evaluated on an entity by entity basis,since no consolidation is allowed in the income tax filing.Accordingly this evaluation is composed of three majorcomponents, US mainland operations, Puerto Rico bankingoperations and Holding Company.
For purposes of assessing the realization of the deferred taxassets in the U.S. mainland operations management evaluatesand weights all available positive and negative evidence. TheCorporation’s U.S. mainland operations are no longer in acumulative loss position for the three-year period endedDecember 31, 2014 taking into account taxable incomeexclusive of reversing temporary differences (“adjusted bookincome”). This represents positive evidence withinmanagement’s evaluation. However, the book income for theyears 2013 and 2014 was significantly impacted by a reversal ofthe loan loss provision due to the improved credit quality of the
loan portfolios. The U.S. mainland operations did not reporttaxable income for the years 2011, 2012 and 2013, although itdid report taxable income for the year ended December 31,2014. Also, the normalized future performance of this operationis uncertain to estimate since the business operation haschanged after the sale of three regions and the restructure ofadministrative functions has not been completed. The lack of asustained level of taxable income together with theuncertainties regarding the estimate of future normalized levelof profitability and cost savings related to the restructurerepresents strong negative evidence within management’sevaluation. This determination is updated each quarter andadjusted as any changes arise. After weighting of all positiveand negative evidence management concluded, as of thereporting date, that it is more likely than not that theCorporation will not be able to realize any portion of thedeferred tax assets related to the U.S. mainland operations,considering the criteria of ASC Topic 740. If the Corporation isable to meet its operating targets in the U.S. and the results ofthe reorganization yield the expected results, this would beconsidered positive evidence within management’s evaluationwhich could outweigh the negative evidence and result in therealization of a portion of the fully reserved deferred tax assetrecorded at PCB.
At December 31, 2014, the Corporation’s net deferred taxassets related to its Puerto Rico operations amounted to $812million. The Corporation’s Puerto Rico Banking operation isnot in a cumulative loss position and has sustained profitabilityfor the three year period ended December 31, 2014, exclusive ofthe loss generated on the sales of non performing assets thattook place in 2013 which is not a continuing condition of theoperations. This is considered a strong piece of objectivelyverifiable positive evidence that out weights any negativeevidence considered by management in the evaluation of therealization of the deferred tax asset. Based on this evidence, theCorporation has concluded that it is more likely than not thatsuch net deferred tax asset of the Puerto Rico operations will berealized.
The Holding Company operation is not in a cumulative lossposition for the three year period ended December 31, 2014.However, the interest expense under the newly issued $450million subordinated notes which partially funded therepayment of TARP funds in 2014, bearing interest at 7%, willbe tax deductible, and contrary to the interest expense payableon the note issued to the U.S. Treasury under TARP. Based onthis new fact pattern the Holding Company is expecting to havelosses for income tax purposes exclusive of reversing temporarydifferences. Since as required by ASC 740 the historicalinformation should be supplemented by all currently availableinformation about future years, the expected losses in futureyears is considered by management a strong negative evidencethat suggests that income in future years will be insufficient tosupport the realization of all deferred tax asset. After weighting

22
of all positive and negative evidence management concluded, asof the reporting date, that it is more likely than not that theHolding Company will not be able to realize any portion of thedeferred tax assets, considering the criteria of ASC Topic 740.
Under the Puerto Rico Internal Revenue Code, theCorporation and its subsidiaries are treated as separate taxableentities and are not entitled to file consolidated tax returns. TheCode provides a dividends-received deduction of 100% ondividends received from “controlled” subsidiaries subject totaxation in Puerto Rico and 85% on dividends received fromother taxable domestic corporations.
Changes in the Corporation’s estimates can occur due tochanges in tax rates, new business strategies, newly enactedguidance, and resolution of issues with taxing authoritiesregarding previously taken tax positions. Such changes couldaffect the amount of accrued taxes. The current income taxpayable for 2014 has been paid during the year in accordancewith estimated tax payments rules. Any remaining payment willnot have any significant impact on liquidity and capitalresources.
The valuation of deferred tax assets requires judgment inassessing the likely future tax consequences of events that havebeen recognized in the financial statements or tax returns andfuture profitability. The accounting for deferred taxconsequences represents management’s best estimate of thosefuture events. Changes in management’s current estimates, dueto unanticipated events, could have a material impact on theCorporation’s financial condition and results of operations.
The Corporation establishes tax liabilities or reduces taxassets for uncertain tax positions when, despite its assessmentthat its tax return positions are appropriate and supportableunder local tax law, the Corporation believes it may notsucceed in realizing the tax benefit of certain positions ifchallenged. In evaluating a tax position, the Corporationdetermines whether it is more-likely-than-not that the positionwill be sustained upon examination, including resolution of anyrelated appeals or litigation processes, based on the technicalmerits of the position. The Corporation’s estimate of theultimate tax liability contains assumptions based on pastexperiences, and judgments about potential actions by taxingjurisdictions as well as judgments about the likely outcome ofissues that have been raised by taxing jurisdictions. The taxposition is measured as the largest amount of benefit that isgreater than 50% likely of being realized upon ultimatesettlement. The Corporation evaluates these uncertain taxpositions each quarter and adjusts the related tax liabilities orassets in light of changing facts and circumstances, such as theprogress of a tax audit or the expiration of a statute oflimitations. The Corporation believes the estimates andassumptions used to support its evaluation of uncertain taxpositions are reasonable.
The amount of unrecognized tax benefits, including accruedinterest, at December 31, 2014 amounted to $9.8 million. Refer
to Note 43 to the consolidated financial statements for furtherinformation on this subject matter. The Corporation anticipatesa reduction in the total amount of unrecognized tax benefitswithin the next 12 months, which could amount toapproximately $6.7 million.
The amount of unrecognized tax benefits may increase ordecrease in the future for various reasons including addingamounts for current tax year positions, expiration of openincome tax returns due to the statutes of limitation, changes inmanagement’s judgment about the level of uncertainty, status ofexaminations, litigation and legislative activity and the additionor elimination of uncertain tax positions. Although theoutcome of tax audits is uncertain, the Corporation believesthat adequate amounts of tax, interest and penalties have beenprovided for any adjustments that are expected to result fromopen years. From time to time, the Corporation is audited byvarious federal, state and local authorities regarding income taxmatters. Although management believes its approach indetermining the appropriate tax treatment is supportable and inaccordance with the accounting standards, it is possible that thefinal tax authority will take a tax position that is different thanthe tax position reflected in the Corporation’s income taxprovision and other tax reserves. As each audit is conducted,adjustments, if any, are appropriately recorded in theconsolidated financial statement in the period determined. Suchdifferences could have an adverse effect on the Corporation’sincome tax provision or benefit, or other tax reserves, in thereporting period in which such determination is made and,consequently, on the Corporation’s results of operations,financial position and / or cash flows for such period.
GoodwillThe Corporation’s goodwill and other identifiable intangibleassets having an indefinite useful life are tested for impairment.Intangibles with indefinite lives are evaluated for impairment atleast annually, and on a more frequent basis, if events orcircumstances indicate impairment could have taken place.Such events could include, among others, a significant adversechange in the business climate, an adverse action by a regulator,an unanticipated change in the competitive environment and adecision to change the operations or dispose of a reporting unit.
Under applicable accounting standards, goodwillimpairment analysis is a two-step test. The first step of thegoodwill impairment test involves comparing the fair value ofthe reporting unit with its carrying amount, including goodwill.If the fair value of the reporting unit exceeds its carryingamount, goodwill of the reporting unit is considered notimpaired; however, if the carrying amount of the reporting unitexceeds its fair value, the second step must be performed. Thesecond step involves calculating an implied fair value ofgoodwill for each reporting unit for which the first stepindicated possible impairment. The implied fair value ofgoodwill is determined in the same manner as the amount of

23 POPULAR, INC. 2014 ANNUAL REPORT
goodwill recognized in a business combination, which is theexcess of the fair value of the reporting unit, as determined inthe first step, over the aggregate fair values of the individualassets, liabilities and identifiable intangibles (including anyunrecognized intangible assets, such as unrecognized coredeposits and trademark) as if the reporting unit was beingacquired in a business combination and the fair value of thereporting unit was the price paid to acquire the reporting unit.The Corporation estimates the fair values of the assets andliabilities of a reporting unit, consistent with the requirementsof the fair value measurements accounting standard, whichdefines fair value as the price that would be received to sell anasset or paid to transfer a liability in an orderly transactionbetween market participants at the measurement date. The fairvalue of the assets and liabilities reflects market conditions,thus volatility in prices could have a material impact on thedetermination of the implied fair value of the reporting unitgoodwill at the impairment test date. The adjustments tomeasure the assets, liabilities and intangibles at fair value arefor the purpose of measuring the implied fair value of goodwilland such adjustments are not reflected in the consolidatedstatement of condition. If the implied fair value of goodwillexceeds the goodwill assigned to the reporting unit, there is noimpairment. If the goodwill assigned to a reporting unit exceedsthe implied fair value of the goodwill, an impairment charge isrecorded for the excess. An impairment loss recognized cannotexceed the amount of goodwill assigned to a reporting unit, andthe loss establishes a new basis in the goodwill. Subsequentreversal of goodwill impairment losses is not permitted underapplicable accounting standards.
At December 31, 2014, goodwill amounted to $466 million.Note 20 to the consolidated financial statements provides theassignment of goodwill by reportable segment and theCorporate group.
The Corporation performed the annual goodwill impairmentevaluation for the entire organization during the third quarterof 2014 using July 31, 2014 as the annual evaluation date. Thereporting units utilized for this evaluation were those that areone level below the business segments, which are the legalentities within the reportable segment. The Corporation assignsgoodwill to the reporting units when carrying out a businesscombination.
In determining the fair value of a reporting unit, theCorporation generally uses a combination of methods,including market price multiples of comparable companies andtransactions, as well as discounted cash flow analysis.Management evaluates the particular circumstances of eachreporting unit in order to determine the most appropriatevaluation methodology. The Corporation evaluates the resultsobtained under each valuation methodology to identify andunderstand the key value drivers in order to ascertain that theresults obtained are reasonable and appropriate under thecircumstances. Elements considered include current market
and economic conditions, developments in specific lines ofbusiness, and any particular features in the individual reportingunits.
The computations require management to make estimatesand assumptions. Critical assumptions that are used as part ofthese evaluations include:
• a selection of comparable publicly traded companies,based on nature of business, location and size;
• a selection of comparable acquisition and capital raisingtransactions;
• the discount rate applied to future earnings, based on anestimate of the cost of equity;
• the potential future earnings of the reporting unit; and
• the market growth and new business assumptions.
For purposes of the market comparable approach, valuationswere determined by calculating average price multiples ofrelevant value drivers from a group of companies that arecomparable to the reporting unit being analyzed and applyingthose price multiples to the value drivers of the reporting unit.Multiples used are minority based multiples and thus, nocontrol premium adjustment is made to the comparablecompanies market multiples. While the market price multiple isnot an assumption, a presumption that it provides an indicatorof the value of the reporting unit is inherent in the valuation.The determination of the market comparables also involves adegree of judgment.
For purposes of the discounted cash flows (“DCF”)approach, the valuation is based on estimated future cash flows.The financial projections used in the DCF valuation analysis foreach reporting unit are based on the most recent (as of thevaluation date) financial projections presented to theCorporation’s Asset / Liability Management Committee(“ALCO”). The growth assumptions included in theseprojections are based on management’s expectations for eachreporting unit’s financial prospects considering economic andindustry conditions as well as particular plans of each entity(i.e. restructuring plans, de-leveraging, etc.). The cost of equityused to discount the cash flows was calculated using theIbbotson Build-Up Method and ranged from 12.15% to 16.83%for the 2014 analysis. The Ibbotson Build-Up Method builds upa cost of equity starting with the rate of return of a “risk-free”asset (20-year U.S. Treasury note) and adds to it additional riskelements such as equity risk premium, size premium andindustry risk premium. The resulting discount rates wereanalyzed in terms of reasonability given the current marketconditions and adjustments were made when necessary.
For BPNA reporting unit, the average estimated fair valuecalculated in Step 1, using all valuation methodologies exceededBPNA’s equity value by approximately $205 million in theJuly 31, 2014 annual test. Accordingly, there is no indication ofimpairment of goodwill recorded in BPNA at July 31, 2014 and

24
there is no need for a Step 2 analysis. BPNA failed Step 1 in theannual test as of July 31, 2013 requiring the completion of Step2. The results of the Step 2 indicated that the implied fair valueof goodwill exceeded the goodwill carrying value at July 31,2013 resulting in no goodwill impairment.
For the BPPR reporting unit, the average estimated fair valuecalculated in Step 1 using all valuation methodologies exceededBPPR’s equity value by approximately $337 million in theJuly 31, 2014 annual test as compared with approximately $387million at July 31, 2013. This result indicates there would be noindication of impairment on the goodwill recorded in BPPR atJuly 31, 2014. The goodwill balance of BPPR and BPNA, as legalentities, represented approximately 95% of the Corporation’stotal goodwill balance as of the July 31, 2014 valuation date.
Furthermore, as part of the analyses, managementperformed a reconciliation of the aggregate fair valuesdetermined for the reporting units to the market capitalizationof Popular, Inc. concluding that the fair value resultsdetermined for the reporting units in the July 31, 2014 annualassessment were reasonable.
The goodwill impairment evaluation process requires theCorporation to make estimates and assumptions with regard tothe fair value of the reporting units. Actual values may differsignificantly from these estimates. Such differences could resultin future impairment of goodwill that would, in turn, negativelyimpact the Corporation’s results of operations and the reportingunits where the goodwill is recorded. Declines in theCorporation’s market capitalization could increase the risk ofgoodwill impairment in the future. Management monitorsevents or changes in circumstances between annual tests todetermine if these events or changes in circumstances wouldmore likely than not reduce the fair value of a reporting unitbelow its carrying amount.
At December 31, 2014 and 2013, other than goodwill, theCorporation had $ 6 million of identifiable intangible assets,with indefinite useful lives, mostly associated with E-LOAN’Strademark.
The valuation of the E-LOAN trademark was performedusing the “relief-from-royalty” valuation approach. The basis ofthe “relief-from-royalty” method is that, by virtue of havingownership of the trademark, the Corporation is relieved fromhaving to pay a royalty, usually expressed as a percentage ofrevenue, for the use of trademark. The main attributes involvedin the valuation of this intangible asset include the royalty rate,revenue projections that benefit from the use of this intangible,after-tax royalty savings derived from the ownership of theintangible, and the discount rate to apply to the projectedbenefits to arrive at the present value of this intangible. Sinceestimates are an integral part of this trademark impairmentanalysis, changes in these estimates could have a significantimpact on the calculated fair value. There were no impairmentsrecognized during the years ended December 31, 2014 and2013 related to E-LOAN’s trademark.
Pension and Postretirement Benefit ObligationsThe Corporation provides pension and restoration benefit plansfor certain employees of various subsidiaries. The Corporationalso provides certain health care benefits for retired employeesof BPPR. The non-contributory defined pension and benefitrestoration plans (“the Plans”) are frozen with regards to allfuture benefit accruals.
The estimated benefit costs and obligations of the pensionand postretirement benefit plans are impacted by the use ofsubjective assumptions, which can materially affect recordedamounts, including expected returns on plan assets, discountrates, termination rates, retirement rates and health care trendrates. Management applies judgment in the determination ofthese factors, which normally undergo evaluation againstcurrent industry practice and the actual experience of theCorporation. The Corporation uses an independent actuarialfirm for assistance in the determination of the pension andpostretirement benefit costs and obligations. Detailedinformation on the Plans and related valuation assumptions areincluded in Note 37 to the consolidated financial statements.
The Corporation periodically reviews its assumption for thelong-term expected return on pension plan assets. The Plans’assets fair value at December 31, 2014 was $697.2 million. Theexpected return on plan assets is determined by consideringvarious factors, including a total fund return estimate based ona weighted-average of estimated returns for each asset class inthe plan. Asset class returns are estimated using current andprojected economic and market factors such as real rates ofreturn, inflation, credit spreads, equity risk premiums andexcess return expectations.
As part of the review, the Corporation’s independentconsulting actuaries performed an analysis of expected returnsbased on the plan’s asset allocation at January 1, 2015. Thisanalysis is reviewed by the Corporation and used as a tool todevelop expected rates of return, together with other data. Thisforecast reflects the actuarial firm’s view of expected long-termrates of return for each significant asset class or economicindicator; for example, 8.8% for large cap stocks, 9.0% for smallcap stocks, 9.2% for international stocks and 3.8% for aggregatefixed-income securities at January 1, 2015. A range of expectedinvestment returns is developed, and this range relies both onforecasts and on broad-market historical benchmarks forexpected returns, correlations, and volatilities for each asset class.
As a consequence of recent reviews, the Corporation decreasedits expected return on plan assets for year 2015 to 7.00%. The7.25% had been used as the expected rate of return in 2014 and2013. Since the expected return assumption is on a long-termbasis, it is not materially impacted by the yearly fluctuations(either positive or negative) in the actual return on assets.
During 2013, the Corporation offered a Lump SumDistribution to terminated vested participants whose deferredpension has a current value of up to $40 thousand. Theacceptance of this offer was voluntary and relieved the

25 POPULAR, INC. 2014 ANNUAL REPORT
Corporation of all future obligations related to the terminatedvested participants who accepted the offer.
Pension expense for the Plans amounted to the credit of $8.9million in 2014. The total pension expense included a credit of$48.9 million for the expected return on assets.
Pension expense is sensitive to changes in the expectedreturn on assets. For example, decreasing the expected rate ofreturn for 2015 from 7.00% to 6.75% would increase theprojected 2015 expense for the Banco Popular de Puerto RicoRetirement Plan, the Corporation’s largest plan, byapproximately $1.6 million.
If the projected benefit obligation exceeds the fair value ofplan assets, the Corporation shall recognize a liability equal tothe unfunded projected benefit obligation and vice versa, if thefair value of plan assets exceeds the projected benefitobligation, the Corporation recognizes an asset equal to theoverfunded projected benefit obligation. This asset or liabilitymay result in a taxable or deductible temporary difference andits tax effect shall be recognized as an income tax expense orbenefit which shall be allocated to various components of thefinancial statements, including other comprehensive income.The determination of the fair value of pension plan obligationsinvolves judgment, and any changes in those estimates couldimpact the Corporation’s consolidated statement of financialcondition. The valuation of pension plan obligations isdiscussed above. Management believes that the fair valueestimates of the pension plan assets are reasonable given thevaluation methodologies used to measure the investments atfair value as described in Note 34. Also, the compositions of theplan assets are primarily in equity and debt securities, whichhave readily determinable quoted market prices.
The Corporation uses the Towers Watson RATE: Link(10/90) Model to discount the expected program cash flows ofthe plans as a guide in the selection of the discount rate. TheCorporation used a discount rate of 3.90% to determine theplans benefit obligation at December 31, 2014, compared with4.70% at December 31, 2013.
A 50 basis point decrease in the assumed discount rate of3.90% as of the beginning of 2015 would increase the projected2015 expense for the Banco Popular de Puerto Rico RetirementPlan by approximately $2.5 million. The change would notaffect the minimum required contribution to the Plan.
For 2014 the Corporation elected to use the base mortalitytable reviewed by the Society of Actuaries (“SOA”) (“RP 2014”)adjusted for its own experience using the Tower Watson’sMortality Credibility Tool. The RP 2014 mortality rates werereduced by 6.5% at all ages. These rates are first applied as ofDecember 31, 2014 for the financial statement obligationdisclosure and 2015 expense. The Corporation also adopted, asof December 31, 2014, the future mortality improvement scale
released by the SOA (“MP 2014”) without adjustments as themortality improvement scale. MP 2014 is applied on agenerational basis.
The Corporation also provides a postretirement health carebenefit plan for certain employees of BPPR. This plan wasunfunded (no assets were held by the plan) at December 31,2014. The Corporation had an accrual for postretirementbenefit costs of $161.8 million at December 31, 2014 using adiscount rate of 4.00%. Assumed health care trend rates mayhave significant effects on the amounts reported for the healthcare plan. Note 37 to the consolidated financial statementsprovides information on the assumed rates considered by theCorporation and on the sensitivity that a one-percentage pointchange in the assumed rate may have on specified costcomponents and the postretirement benefit obligation of theCorporation.
STATEMENT OF OPERATIONS ANALYSISNet Interest IncomeNet interest income is the principal source of earnings of theCorporation. It is defined as the difference between the revenuegenerated from earning assets less the interest cost of fundingthose assets. Net interest income is subject to several riskfactors, including market driven events, changes in volumesand repricing characteristics of assets and liabilities, as well asstrategic decisions made by the Corporation’s management. Netinterest income from the continuing business, on a taxableequivalent basis, for the year ended December 31, 2014 was$1,032 million compared to $1,407 million in 2013. During theyear 2014, two important events affected the net interestmargin of the Corporation: on July 2, 2014, upon repayment ofTARP, the Corporation recognized $414.1 million as interestexpense from the accelerated amortization of the relateddiscount and deferred costs, and during the third quarter of2014, $39.2 million was recognized as interest expenseassociated to the refinancing of $638 million in long termstructured repos in the U.S. with a cost of 4.41%, which werereplaced with lower cost short term repos of a similar amount.Excluding the impact of these transactions, the net interestincome of the Corporation on a taxable equivalent basis was$1,485 million compared to $1,407 million during 2013.
As mentioned above, during 2014, the Corporationcompleted the sale of its California, Central Florida and Illinoisregions, as part of the reorganization of its U.S. operations. Theoperating results from these regions have been separatelypresented for all periods as discontinued operations, as requiredby US GAAP. The 2013 levels and yields have been adjusted toexclude the net interest income and respective volumes ofassets and liabilities from the regions sold to presentcomparable results.

26
The average key index rates for the years 2012 through 2014were as follows:
2014 2013 2012
Prime rate 3.25% 3.25% 3.25%Fed funds rate 0.08 0.07 0.143-month LIBOR 0.23 0.27 0.423-month Treasury Bill 0.05 0.05 0.0810-year Treasury 2.53 2.36 1.74FNMA 30-year 3.41 3.61 3.07
Net interest income on a taxable equivalent basis -Non-GAAP financial measureThe interest earning assets include investment securities andloans that are exempt from income tax, principally in PuertoRico. The main sources of tax-exempt interest income arecertain investments in obligations of the U.S. Government, itsagencies and sponsored entities, and certain obligations of theCommonwealth of Puerto Rico and its agencies and assets heldby the Corporation’s international banking entities. To facilitatethe comparison of all interest related to these assets, the interestincome has been converted to a taxable equivalent basis, usingthe applicable statutory income tax rates for each period. Thetaxable equivalent computation considers the interest expenseand other related expense disallowances required by the PuertoRico tax law. Under this law, the exempt interest can bededucted up to the amount of taxable income. Net interestincome on a taxable equivalent basis is a non-GAAP financialmeasure. Management believes that this presentation providesmeaningful information since it facilitates the comparison ofrevenues arising from taxable and exempt sources. Tables 5 and6 present the net interest income on a taxable equivalent basisand present the impact of the taxable equivalent adjustment toreconcile to the net interest income as presented in theCorporations’ financial statements under U.S.GAAP.
The increase in the taxable equivalent adjustment in 2014 ascompared to 2013 is mainly due to a higher yield on loans tothe public sector, higher volume of US Treasury and Agencysecurities and higher exempt income from investments at theinternational banking entities. Also, the year 2014 reflectedhigher interest income from exempt mortgage loans due to thereversal of $5.9 million of interest from reverse mortgages atBPPR during the third quarter of 2013 which had been accruedin excess of the amount insured by FHA.
Average outstanding securities balances are based uponamortized cost excluding any unrealized gains or losses onsecurities available-for-sale. Non-accrual loans have been includedin the respective average loans and leases categories. Loan feescollected and costs incurred in the origination of loans aredeferred and amortized over the term of the loan as an adjustmentto interest yield. Prepayment penalties, late fees collected and theamortization of premiums / discounts on purchased loans are alsoincluded as part of the loan yield. Interest income for the period
ended December 31, 2014 included a favorable impact, excludingthe discount accretion on covered loans accounted for under ASCSubtopic 310-30, of $5.2 million, related to those items, comparedto a favorable impact of $12.0 million for the same period in 2013,and $18.4 million in 2012. The $6.8 million reduction from 2013to 2014 resulted in part from higher amortization of fees, underSFAS 91, from commercial loans.
Table 5 presents the different components of theCorporation’s net interest income, on a taxable equivalent basis,for the year ended December 31, 2014, as compared with thesame period in 2013, segregated by major categories of interestearning assets and interest bearing liabilities. Net interestmargin, on a taxable equivalent basis was 3.45% in 2014;excluding the above mentioned non recurring interest expensecharges related to the repayment of TARP funds and therefinancing of structured repos in the US, the net interestmargin was 4.96% compared to 4.73% and 4.47% for 2013 and2012, respectively. The main variances are discussed below:
• Higher yield from commercial loans mainly related to newor repriced loans at higher yields, particularly loans to thePuerto Rico public sector.
• A higher yield from mortgage loans due to a reversal of$5.9 million of interest from reverse mortgages at BPPRduring the third quarter of 2013 which had been accruedin excess of the amount insured by FHA. Higher volumeof consumer loans, mainly auto loans from Popular Auto.
• A higher yield from covered loans due to higher expectedcash flows which are reflected in the accretable yield to berecognized over the average life of the loans and loanresolutions during 2014; partially offset by the change inthe estimated life of certain commercial loans thatresulted in an extension of the period in which theaccretion of income will be recorded. The positivevariance in yield was partially offset by a lower proportionof covered loans to total earning assets. This portfolio, dueto its nature, will continue to decline as scheduledpayments are received and workout arrangements aremade. For a detailed movement of covered loans refer toNote 11 of this Annual Report.
• Lower cost of interest bearing deposits, mainly individualcertificates of deposits, IRAs and brokered CDs related torenewal of maturities in a low interest rate environmentand management’s efforts to reduce deposit costs.
• A lower cost of borrowings due to the repayment of TARPfunds and the refinancing of US structure repos, asdescribed above. Also, during the third quarter of 2013,$233.2 million in senior notes were repaid with anaverage cost of approximately 7.77%. These positivevariances were partially offset by the issuance of $450million of senior notes at 7%, which were used to partiallyfund the repayment of TARP.

27 POPULAR, INC. 2014 ANNUAL REPORT
These positive variances were partially offset by a loweryield from leases due mainly to new activity at lower rates.
Average earning assets increased $156 million whencompared with 2013 mainly a higher volume of investmentsecurities and consumer loans primarily related to Popular Autoinitiatives, partially offset by a lower volume of constructionloans and a reduction in the covered loan portfolio asmentioned above.
Average interest bearing liabilities decreased $864 million in2014 mainly a lower volume of borrowed money and brokerCDs due to lower funding needs, partially offset by highervolume of non maturity deposits. Also, for 2014 there was ahigher volume of non interest bearing sources of funds, whichhelped improve the net interest margin.
Net interest margin, on a taxable equivalent basis, increased26 basis points to 4.73% in 2013 compared to 4.47% for theyear ended December 31, 2012. The taxable equivalentadjustment for the year ended December 31, 2013 increased by$25.7 million from the year 2012. This increase was mainly dueto the amendment in 2013 of the Commonwealth’s InternalRevenue Code that increased the corporate marginal income taxrate from 30% to 39% and higher exempt loan volume resultingfrom approximately $225 million in consumer loans purchasedat the end of the second quarter 2012. The main variances innet interest margin for the years ended December 31, 2013 and2012 are discussed below:
• A higher yield from commercial loans due to lower levelsof non- performing loans after the bulk sale completedduring the first quarter of 2013.
• A higher yield from covered loans due to higher expectedcash flows which are reflected in the accretable yield to berecognized over the average life of the loans and loanresolutions during 2013. The positive yield was partiallyoffset by a lower proportion of covered loans to totalearning assets.
• Higher yield from consumer loans resulting from theloans purchased at the end of the second quarter 2012.
• Lower cost of interest bearing deposits, mainly individualcertificates of deposits, IRAs and brokered CDs related torenewal of maturities in a low interest rate environmentand management’s efforts to reduce deposit costs.
• A lower cost of borrowings due to the early repayment of$233.2 million in senior notes during the third quarter of2013 with an average cost of approximately 7.77% and thecancellation, during June 2012 of $350 million inrepurchase agreements with an average cost of 4.36%.
The positive impacts in net interest margin detailed abovewere partially offset by the following:
• Decrease in the yield of mortgage loans due toacquisitions made, mainly in the US, of high quality loans,which generally carry a lower rate and originations in alower rate environment. Also during the third quarter of2013 the Corporation reversed $5.9 million of interestincome from reverse mortgages at BPPR, which had beenaccrued in excess of the amount insured by FHA.
• Lower interest income from investment securities due toreinvestment of cash flows received from mortgagebacked securities in lower yielding collateralized mortgageobligations as well as the acquisition of lower yieldingagency securities.
Average earning assets increased $230 million in 2013 whencompared with 2012. An increase in mortgage loans, mostthrough acquisitions both in PR and the US was partially offsetby reductions in the covered loans portfolio. Investmentsecurities also increased due to reinvestment and currentinvestment strategy to shorten the duration of the portfolio.The decrease in commercial and construction loans can beattributed to the sale of non-performing loans in the firstquarter of 2013 and slower origination activity both in PuertoRico and the U.S.
Average interest bearing liabilities decreased $593 million in2013 mainly due to lower volumes of borrowed money, brokerCDs and individual time deposits. Demand deposits increasedby $338 million in 2013 on average when compared to 2012,positively impacting net interest margin.

28
Table 5 - Analysis of Levels & Yields on a Taxable Equivalent Basis from Continuing Operations (Non-GAAP)
Years ended December 31,
Average Volume Average Yields / Costs InterestVariance
Attributable to
2014 2013 Variance 2014 2013 Variance 2014 2013 Variance Rate Volume
(In millions) (In thousands)
$1,305 $ 1,036 $ 269 0.32% 0.33% (0.01)% Money market investments $ 4,224 $ 3,464 $ 760 $ 267 $ 4935,886 5,488 398 2.75 2.95 (0.20) Investment securities 162,008 161,868 140 728 (588)
340 417 (77) 6.16 6.25 (0.09) Trading securities 20,914 26,026 (5,112) (366) (4,746)
7,531 6,941 590 2.49 2.76 (0.27)Total money market, investment and
trading securities 187,146 191,358 (4,212) 629 (4,841)
Loans:8,347 8,284 63 5.12 4.97 0.15 Commercial 427,314 412,083 15,231 12,116 3,115
199 319 (120) 6.78 4.73 2.05 Construction 13,482 15,076 (1,594) 5,210 (6,804)547 540 7 7.33 8.07 (0.74) Leasing 40,135 43,542 (3,407) (4,034) 627
6,641 6,688 (47) 5.40 5.33 0.07 Mortgage 358,597 356,739 1,858 4,377 (2,519)3,861 3,741 120 10.36 10.45 (0.09) Consumer 399,941 390,909 9,032 (1,869) 10,901
19,595 19,572 23 6.33 6.22 0.11 Sub-total loans 1,239,469 1,218,349 21,120 15,800 5,3202,771 3,228 (457) 10.60 9.32 1.28 Covered loans 293,610 300,745 (7,135) 33,600 (40,735)
22,366 22,800 (434) 6.85 6.66 0.19 Total loans 1,533,079 1,519,094 13,985 49,400 (35,415)
$29,897 $29,741 $ 156 5.75% 5.75% –% Total earning assets $1,720,225 $1,710,452 $ 9,773 $ 50,029 $(40,256)
Interest bearing deposits:$4,825 $ 4,658 $ 167 0.32% 0.34% (0.02)% NOW and money market [1] $ 15,523 $ 15,718 $ (195) $ (629) $ 4346,733 6,585 148 0.22 0.23 (0.01) Savings 14,664 15,361 (697) (987) 2907,556 7,957 (401) 0.99 1.18 (0.19) Time deposits 74,900 93,778 (18,878) (12,693) (6,185)
19,114 19,200 (86) 0.55 0.65 (0.10) Total deposits 105,087 124,857 (19,770) (14,309) (5,461)
1,887 2,572 (685) 1.49 1.49 – Short-term borrowings [2] 28,123 38,430 (10,307) (5,504) (4,803)267 515 (248) 16.05 15.98 0.07 TARP funds [3] 42,906 82,345 (39,439) 348 (39,787)
1,360 1,205 155 4.34 4.79 (0.45) Other medium and long-term debt 59,034 57,734 1,300 (4,720) 6,020
22,628 23,492 (864) 1.04 1.29 (0.25) Total interest bearing liabilities 235,150 303,366 (68,216) (24,185) (44,031)
5,534 5,371 163 Non-interest bearing demand deposits1,735 878 857 Other sources of funds
$29,897 $29,741 $ 156 0.79% 1.02% (0.23)% Total source of funds 235,150 303,366 (68,216) (24,185) (44,031)
4.96% 4.73% 0.23%Adjusted net interest margin/income
on a taxable equivalent basis 1,485,075 1,407,086 77,989 $ 74,214 $ 3,775
4.71% 4.46% 0.25% Adjusted net interest spread
Accelerated amortization of TARPdiscount and BPNA reporefinancing fees 453,321 – 453,321
3.45% 4.73% (1.28)%Net interest margin/income on a
taxable equivalent basis 1,031,754 1,407,086 (375,332)
Taxable equivalent adjustment 86,682 62,512 24,170
Net interest income $ 945,072 $1,344,574 $(399,502)
Note: The changes that are not due solely to volume or rate are allocated to volume and rate based on the proportion of the change in each category.
[1] Includes interest bearing demand deposits corresponding to certain government entities in Puerto Rico.[2] Cost of short-term borrowings excludes the impact of the fees related to PCB repo refinancing. Cost of short-term borrowings for the year ended December 31,
2014 including such fees would have been 3.57%.[3] Cost of TARP funds excludes the impact of the accelerated amortization. Total cost of TARP funds for the year ended December 31, 2014 including the accelerated
amortization of TARP discount would have been 170.91%.

29 POPULAR, INC. 2014 ANNUAL REPORT
Table 6 - Analysis of Levels & Yields on a Taxable Equivalent Basis from Continuing Operations (Non-GAAP)
Years ended December 31,
Average Volume Average Yields / Costs InterestVariance
Attributable to
2013 2012 Variance 2013 2012 Variance 2013 2012 Variance Rate Volume
(In millions) (In thousands)
$1,036 $1,051 $(15) 0.33% 0.35% (0.02)% Money market investments $ 3,464 $ 3,704 $ (240) $ (129) $ (111)5,488 5,227 261 2.95 3.48 (0.53) Investment securities 161,868 182,094 (20,226) (22,125) 1,899
417 446 (29) 6.25 5.81 0.44 Trading securities 26,026 25,909 117 1,882 (1,765)
6,941 6,724 217 2.76 3.15 (0.39)Total money market, investment and
trading securities 191,358 211,707 (20,349) (20,372) 23
Loans:8,284 8,310 (26) 4.97 4.86 0.11 Commercial 412,083 404,159 7,924 9,169 (1,245)
319 450 (131) 4.73 3.46 1.27 Construction 15,076 15,556 (480) 4,803 (5,283)540 545 (5) 8.07 8.62 (0.55) Leasing 43,542 46,960 (3,418) (2,978) (440)
6,688 5,817 871 5.33 5.58 (0.25) Mortgage 356,739 324,573 32,166 (14,814) 46,9803,741 3,615 126 10.45 10.43 0.02 Consumer 390,909 376,843 14,066 3,747 10,319
19,572 18,737 835 6.22 6.23 (0.01) Sub-total loans 1,218,349 1,168,091 50,258 (73) 50,3313,228 4,050 (822) 9.32 7.44 1.88 Covered loans 300,745 301,441 (696) 63,728 (64,424)
22,800 22,787 13 6.66 6.45 0.21 Total loans 1,519,094 1,469,532 49,562 63,655 (14,093)
$29,741 $29,511 $ 230 5.75% 5.70% 0.05% Total earning assets $1,710,452 $1,681,239 $ 29,213 $ 43,283 $(14,070)
Interest bearing deposits:$4,658 $ 4,449 $ 209 0.34% 0.43% (0.09)% NOW and money market [1] $ 15,718 $ 19,011 $ (3,293) $ (4,402) $ 1,1096,585 6,386 199 0.23 0.33 (0.10) Savings 15,361 21,058 (5,697) (6,185) 4887,957 8,835 (878) 1.18 1.45 (0.27) Time deposits 93,778 127,696 (33,918) (21,842) (12,076)
19,200 19,670 (470) 0.65 0.85 (0.20) Total deposits 124,857 167,765 (42,908) (32,429) (10,479)
2,572 2,564 8 1.49 1.83 (0.34) Short-term borrowings 38,430 46,802 (8,372) (7,515) (857)515 484 31 15.98 15.92 0.06 TARP funds [2] 82,345 76,977 5,368 311 5,057
1,205 1,367 (162) 4.79 5.21 (0.42) Other medium and long-term debt 57,734 71,215 (13,481) (2,761) (10,720)
23,492 24,085 (593) 1.29 1.51 (0.22) Total interest bearing liabilities 303,366 362,759 (59,393) (42,394) (16,999)
5,371 5,033 338 Non-interest bearing demand deposits878 393 485 Other sources of funds
$29,741 $29,511 $ 230 1.02% 1.23% (0.21)% Total source of funds 303,366 362,759 (59,393) (42,394) (16,999)
4.73% 4.47% 0.26% Net interest margin
Net interest income on a taxableequivalent basis 1,407,086 1,318,480 88,606 $ 85,677 $ 2,929
4.46% 4.19% 0.27% Net interest spread
Taxable equivalent adjustment 62,512 36,853 25,659
Net interest income $1,344,574 $1,281,627 $62,947
Note: The changes that are not due solely to volume or rate are allocated to volume and rate based on the proportion of the change in each category.
[1] Includes interest bearing demand deposits corresponding to certain government entities in Puerto Rico.[2] Junior subordinated deferrable interest debentures held by the U.S. Treasury.
Provision for Loan LossesThe Corporation’s total provision for loan losses for continuingoperations totaled $270.1 million for the year endedDecember 31, 2014, compared with $606.1 million for 2013,and $397.1 million for 2012.
The provision for loan losses for the non-covered loanportfolio totaled $224.0 million for the year endedDecember 31, 2014, compared to $536.7 million for the yearended December 31, 2013. The decrease of $312.7 million from2013 to 2014 was mostly due to the impact of $318.1 millionrelated to the bulk loan sales completed during 2013. In
addition, the provision for 2014 includes an impact of $12.8million related to certain non-performing and legacy loans soldor transferred to loans held-for-sale as part of the U.S.reorganization, as these loans required a $35.7 million write-down and carried $21.7 million in reserves. Excluding theimpact of these sales in 2013 and 2014, the provision wouldhave declined by $7.4 million for year ended December 31,2014, compared to same period in 2013, reflecting higherreserve releases at BPNA, offset by higher provisions at BPPR.The results for the year ended December 31, 2014 include a$18.7 million reserve release as part of the annual review of the

30
components of the ALLL models during the second quarter of2014, compared to a reserve increase of $19.3 million for thesame period of 2013 due to enhancements to the allowance forloan losses methodology. Excluding the $35.7 million write-down mentioned above, net charge-offs for the continuingoperations decreased by $49.2 million from the prior year,primarily driven by a reduction of $54.3 million in commercialnet charge-offs.
The provision for the Puerto Rico non-covered portfolioamounted to $242.9 million for the year ended December 31,2014, compared to $547.9 million for the year endedDecember 31, 2013. The decrease of $305.0 million waspredominantly driven by the above mentioned impact of $318.1million related to the bulk loan sales completed during 2013.Excluding the bulk sales impact, the provision increased by$13.1 million mainly led by environmental factors due tochallenging economic conditions that persist in Puerto Rico andthe effect of downgrades in the internal risk ratings of certainlarge corporate and public sector relationships, in part offset bya $14.9 million reserve release as part of the annual review ofthe components of the ALLL models during the second quarterof 2014. Net charge-offs decreased by $23.3 million from theprevious year mostly driven by lower commercial net charge-offs of $46.2 million, in part offset by an increase of $21.1million in the consumer portfolio net charge-offs, which for2013 included a recovery of $8.9 million associated with thesale of a portfolio of previously charged-off loans.
The U.S. continuing operations recorded a provision releaseof $18.9 million for the year ended December 31, 2014,compared to a release of $11.2 million for the same period in2013. The provision for 2014 includes the previouslymentioned impact of $12.8 million related to loan sales or loanstransferred to loans-held-for sale. Excluding the effect of thesetransactions, the provision for 2014 would have amounted to arelease of $31.7 million, or $20.5 million higher release than in2013. This reversal of provision was prompted by improvedcredit quality trends, the de-risking of the U.S. portfolio and theeffect of a $3.8 million reserve release as part of the annualreview of the components of the ALLL models during thesecond quarter of 2014. Net charge-offs decreased by $25.9million from the previous year driven by improvements in allportfolios.
The provision for the covered portfolio was $46.1 million forthe year ended December 31, 2014, compared to $69.4 millionfor same period of the previous year. This decrease of $23.3million was due to lower impairment losses on commercial loanpools accounted for under ASC 310-30 and the impact of a $7.5
million reserve increase related to the enhancements to theallowance for loan losses methodology implemented during thesecond quarter of 2013. These positive variances were offset bythe $0.8 million reserve increase recorded during the secondquarter of 2014, as part of the annual review of the componentsof the ALLL models.
The provision for loan losses for the non-covered loanportfolio increased $214.5 million from 2012 to 2013. Thisincrease was mostly due to the $318.1 million impact related tothe bulk loan sales completed during 2013, as mentionedabove. Excluding the impact of these sales, the provision forloan losses for the continuing operations declined by $103.6million, mainly due to continued credit quality improvementsevidenced by a decline in net charge-offs of $129.7 million,partly offset by the enhancements made to the allowance forloan losses implemented during the second quarter of 2013,which resulted in a reserve increase of $11.8 million for thenon-covered portfolio. The results for 2012 reflect the impact ofa reduction in the reserve of $24.8 million due to certainenhancements to the methodology implemented during the firstquarter of 2012.
The provision for the Puerto Rico non-covered portfoliodeclined by $52.3 million for 2013 compared to 2012,excluding the impact of the bulk non-performing assets sales.The reduction was the result of improved credit metrics, partlyoffset by the impact of the enhancements to the allowance forloan losses methodology which resulted in reserve increases of$22.6 million. Also, BPPR recorded a recovery of $8.9 millionassociated with the sale of a portfolio of previously charged-offcredit cards and personal loans during 2013.
The U.S. continuing operations recorded a reserve release of$11.2 million for 2013, compared to a provision of $40.2million for 2012, a decrease of $51.4 million. The reserverelease was due to improved credit performance and the impactof the enhancements to the allowance for loan lossesmethodology implemented during 2013, which reduced reservelevels by $10.8 million.
The provision for covered loans totaled $69.4 million for theyear ended December 31, 2013, compared with $74.8 millionfor the year ended December 31, 2012, reflecting a decrease of$5.4 million, mostly driven by lower impairment losses, in partoffset by $7.5 million increase related to the enhancements tothe allowance for loan losses methodology.
Refer to the Credit Risk Management and Loan Qualitysections of this MD&A for a detailed analysis of net charge-offs,non-performing assets, the allowance for loan losses andselected loan losses statistics.

31 POPULAR, INC. 2014 ANNUAL REPORT
Non-Interest IncomeThe following tables present the breakdown of non-interest income and mortgage banking activities by major categories for thepast five years.
Table 7 - Non-Interest Income
Years ended December 31,
(In thousands) 2014 2013 2012 2011 2010
Service charges on deposit accounts $158,637 $162,870 $171,226 $171,218 $180,816
Other service fees:Debit card fees 43,146 41,912 43,528 56,439 97,597Credit card fees 67,639 65,727 61,071 52,226 85,413Insurance fees 54,158 52,309 51,363 51,596 47,052Processing fees – – 6,330 6,839 45,055Sale and administration of investment products 27,711 35,272 37,766 34,388 37,783Trust fees 18,209 17,285 16,353 15,333 14,217Check cashing fees 123 191 244 339 408Other fees 14,279 16,655 15,860 16,738 18,931
Total other services fees 225,265 229,351 232,515 233,898 346,456
Mortgage banking activities 30,615 71,657 84,771 (4,505) 16,153Net (loss) gain on sale and valuation adjustments of investment securities (870) 7,966 (1,707) 10,844 3,992Trading account profit (loss) 4,358 (13,483) 4,478 48,098 33,017Net gain (loss) on sale of loans, including valuation adjustments on loans
held-for-sale 40,591 (52,708) (29,414) 4,054 5,101Adjustments (expense) to indemnity reserves on loans sold (40,629) (37,054) (21,198) (33,068) (72,013)FDIC loss share (expense) income (103,024) (82,051) (56,211) 66,791 (25,751)Fair value change in equity appreciation instrument – – – 8,323 42,555Gain on sale of processing and technology business – – – – 640,802Other operating income 71,572 504,465 127,029 98,189 108,279
Total non-interest income $386,515 $791,013 $511,489 $603,842 $1,279,407
Table 8 - Mortgage Banking Activities
Years ended December 31,
(In thousands) 2014 2013 2012 2011 2010
Mortgage servicing fees, net of fair value adjustments:Mortgage servicing fees $41,761 $45,465 $48,156 $49,136 $47,636Mortgage servicing rights fair value adjustments (24,683) (11,403) (17,406) (37,061) (22,860)
Total mortgage servicing fees, net of fair value adjustments 17,078 34,062 30,750 12,075 24,776
Net gain on sale of loans, including valuation on loans held-for-sale 31,213 26,719 76,181 25,621 7,990
Trading account (loss) profit:Unrealized (losses) gains on outstanding derivative positions (726) 746 304 956 (2,613)Realized (losses) gains on closed derivative positions (16,950) 10,130 (22,464) (43,157) (14,000)
Total trading account (loss) profit (17,676) 10,876 (22,160) (42,201) (16,613)
Total mortgage banking activities $30,615 $71,657 $84,771 $(4,505) $16,153
For the year ended December 31, 2014, non-interest incomedecreased by $404.5 million when compared with the previousyear. The FDIC indemnity asset amortization for the year 2014included a benefit of approximately $12.5 million to reverse theimpact of accelerated amortization expense recorded in priorperiods. This amount will be recognized as expense over the
remaining portion of the loss sharing agreement that expires inthe quarter ending June 30, 2015. Excluding the impact of the$12.5 million FDIC indemnity asset amortization adjustmentduring 2014 and the significant events during 2013 of $357.2million that includes the impact of the NPA’s sales and theimpact of EVERTEC’s public offerings during 2013, non-
32
interest income decreased by $61.5 million principally due tothe following. Refer to tables 72 and 73 for non-GAAPreconciliations for the years 2014 and 2013.
• Lower income from mortgage banking activities by $41.0million mainly due to an unfavorable variance in therealized (losses) / gains on closed derivatives positions, inaddition to an unfavorable variance in the fair valueadjustment of mortgage servicing rights. Refer to Table 8for additional details on mortgage banking activities;
• Higher FDIC loss share expense by $33.5 million,principally due to higher amortization of theindemnification asset due to a decrease in expected losses,and lower mirror accounting income on creditimpairment losses; partially offset by lower unfavorablevaluation adjustment on the true up payment obligationand higher mirror accounting income on reimbursableexpenses. Refer to Table 2 for a breakdown of FDIC lossshare (expense) income by major categories;
• Higher provision for indemnity reserves by $17.3 million,excluding the provision of $13.7 million related to thebulk sales of NPA’s during 2013, due to reserves for loanssold with credit recourse, mainly at BPPR;
• Lower service charges on deposit accounts of $4.2 milliondue to lower volume of overdrafts and other transactionfees; and
• Lower other service fees by $4.1 million due to a declinein the market value of assets under management, mainlyPuerto Rico Government obligations and closed-endfunds, which drive lower investment management feesand mutual funds administration fees.
These unfavorable variances were partially offset by thefollowing:
• Higher net gains on sale of loans, net of valuationadjustments by $26.4 million, excluding the impact of theNPAs sales mentioned above, mostly driven by BPNAindividual sales of non-performing commercial loansduring 2014; and
• A favorable variance in the trading account profit / (loss)caption of $17.8 million mainly at the BPPR segment dueto inventory positions mark downs in 2013 (mostlyPuerto Rico government obligations and closed-endfunds), and a favorable variance in the realized andunrealized gains / (losses) on outstanding mortgage-backed securities, mainly market driven at BPPR.
For the year ended December 31, 2013, non-interest incomeincreased by $279.5 million when compared to 2012. Excludingthe impact of the significant events during 2013 mentionedabove, non-interest income decreased by $77.6 millionprincipally due to the following:
• Lower other operating income by $52.9 million mostlydue to lower net earnings on investments under the equitymethod mainly due to income of $31.6 million recordedin 2012 related to the Corporation’s proportionate shareof a benefit from a tax grant received by EVERTEC fromthe Puerto Rico government;
• Higher FDIC loss share expense by $25.8 million,principally due to higher amortization of the FDIC lossshare asset due to a decrease in expected losses, highermirror accounting on recoveries on covered loans,including rental income on OREOs, and the impact of fairvalue adjustments in the true-up payment obligation,partially offset by higher mirror accounting on creditimpairment losses and reimbursable loan related expenseson covered loans;
• Unfavorable variance in trading account profit / (loss) by$18.0 million mainly driven by higher unrealized losseson outstanding mortgage-backed securities and higherlosses on Puerto Rico government obligations and closed-end funds;
• Lower mortgage banking activities by $13.1 million due tolower gains on sale of loans driven by lower marketprices, partially offset by higher trading account related toderivative positions and a favorable variance in the fairvalue adjustment of mortgage servicing rights; and
• Lower service charges on deposit accounts by $8.4million, mainly driven by lower commercial account feesand non-sufficient funds and overdraft fees.
These unfavorable variances were partially offset by afavorable variance in net gains on sale of loans, net of valuationadjustments by $42.0 million driven mostly by valuationadjustments of $27.3 million on commercial and constructionloans held-for-sale at the BPPR segment during 2012 as a resultof updated appraisals and market indicators.
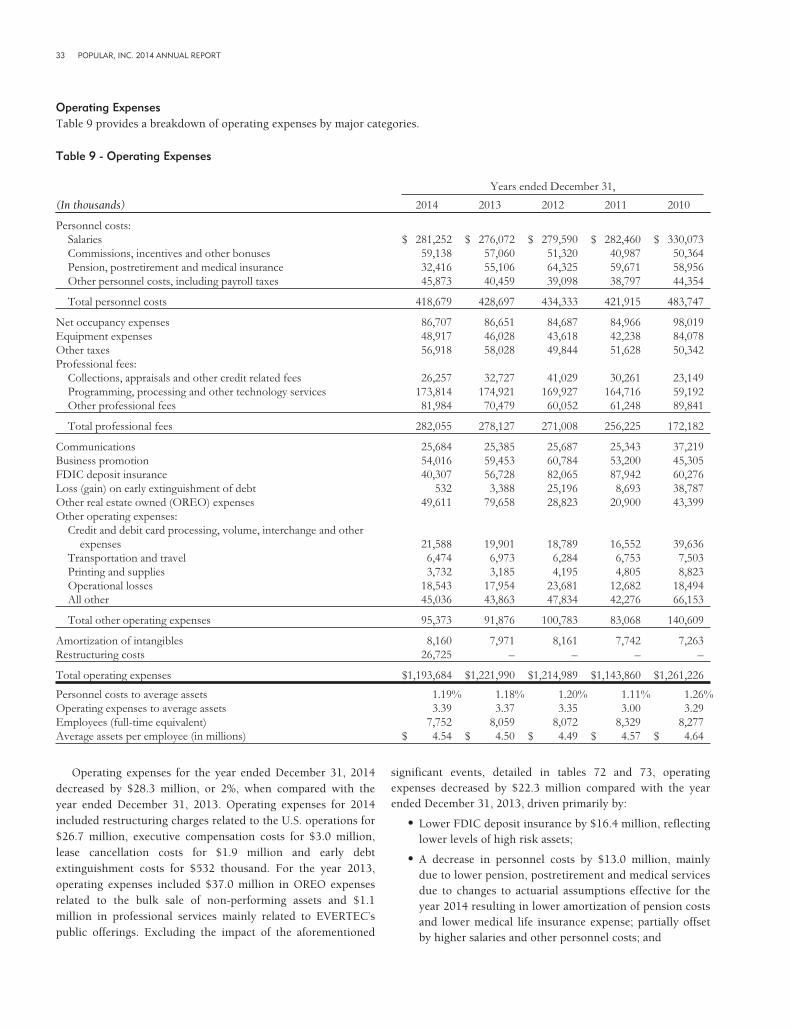
33 POPULAR, INC. 2014 ANNUAL REPORT
Operating ExpensesTable 9 provides a breakdown of operating expenses by major categories.
Table 9 - Operating Expenses
Years ended December 31,
(In thousands) 2014 2013 2012 2011 2010
Personnel costs:Salaries $ 281,252 $ 276,072 $ 279,590 $ 282,460 $ 330,073Commissions, incentives and other bonuses 59,138 57,060 51,320 40,987 50,364Pension, postretirement and medical insurance 32,416 55,106 64,325 59,671 58,956Other personnel costs, including payroll taxes 45,873 40,459 39,098 38,797 44,354
Total personnel costs 418,679 428,697 434,333 421,915 483,747
Net occupancy expenses 86,707 86,651 84,687 84,966 98,019Equipment expenses 48,917 46,028 43,618 42,238 84,078Other taxes 56,918 58,028 49,844 51,628 50,342Professional fees:
Collections, appraisals and other credit related fees 26,257 32,727 41,029 30,261 23,149Programming, processing and other technology services 173,814 174,921 169,927 164,716 59,192Other professional fees 81,984 70,479 60,052 61,248 89,841
Total professional fees 282,055 278,127 271,008 256,225 172,182
Communications 25,684 25,385 25,687 25,343 37,219Business promotion 54,016 59,453 60,784 53,200 45,305FDIC deposit insurance 40,307 56,728 82,065 87,942 60,276Loss (gain) on early extinguishment of debt 532 3,388 25,196 8,693 38,787Other real estate owned (OREO) expenses 49,611 79,658 28,823 20,900 43,399Other operating expenses:
Credit and debit card processing, volume, interchange and otherexpenses 21,588 19,901 18,789 16,552 39,636
Transportation and travel 6,474 6,973 6,284 6,753 7,503Printing and supplies 3,732 3,185 4,195 4,805 8,823Operational losses 18,543 17,954 23,681 12,682 18,494All other 45,036 43,863 47,834 42,276 66,153
Total other operating expenses 95,373 91,876 100,783 83,068 140,609
Amortization of intangibles 8,160 7,971 8,161 7,742 7,263Restructuring costs 26,725 – – – –
Total operating expenses $1,193,684 $1,221,990 $1,214,989 $1,143,860 $1,261,226
Personnel costs to average assets 1.19% 1.18% 1.20% 1.11% 1.26%Operating expenses to average assets 3.39 3.37 3.35 3.00 3.29Employees (full-time equivalent) 7,752 8,059 8,072 8,329 8,277Average assets per employee (in millions) $ 4.54 $ 4.50 $ 4.49 $ 4.57 $ 4.64
Operating expenses for the year ended December 31, 2014decreased by $28.3 million, or 2%, when compared with theyear ended December 31, 2013. Operating expenses for 2014included restructuring charges related to the U.S. operations for$26.7 million, executive compensation costs for $3.0 million,lease cancellation costs for $1.9 million and early debtextinguishment costs for $532 thousand. For the year 2013,operating expenses included $37.0 million in OREO expensesrelated to the bulk sale of non-performing assets and $1.1million in professional services mainly related to EVERTEC’spublic offerings. Excluding the impact of the aforementioned
significant events, detailed in tables 72 and 73, operatingexpenses decreased by $22.3 million compared with the yearended December 31, 2013, driven primarily by:
• Lower FDIC deposit insurance by $16.4 million, reflectinglower levels of high risk assets;
• A decrease in personnel costs by $13.0 million, mainlydue to lower pension, postretirement and medical servicesdue to changes to actuarial assumptions effective for theyear 2014 resulting in lower amortization of pension costsand lower medical life insurance expense; partially offsetby higher salaries and other personnel costs; and

34
• Lower loss on extinguishment of debt by $3.4 million,mainly due to the early cancellation of medium termnotes during 2013.
The above variances were partially offset by:
• An increase in OREO expenses by $7.0 million mainlydue to due to higher write downs on OREO properties,offset by higher gains on sales of mainly commercial andconstruction properties; and
• Higher professional fees by $5.0 million, mainly at BPPRdue to higher legal fees mostly as a result of the FDICarbitration proceedings and other corporate matters.
Operating expenses for the year ended December 31, 2013increased by $7.0 million, or 6%, when compared with the yearended December 31, 2012. Excluding the impact of thesignificant events detailed in table 73 and discussed above,operating expenses decreased by $31.1 million compared withthe year ended December 31, 2012, driven primarily by:
• Lower FDIC deposit insurance by $25.3 million, whichincludes a credit of $11.3 million received from the FDICduring the first quarter, mainly driven by revisions in thedeposit insurance premium calculation, lower levels ofhigh risk assets and efficiencies achieved from the internalreorganization in which Popular Mortgage was mergedinto BPPR, completed at the end of 2012;
• A decrease in loss on extinguishment of debt by $21.8million as a result of prepayment expense of $25 millionpaid in 2012 related to the early termination of repurchaseagreements of $350 million; and
• Lower other operating expenses by $8.9 million mainlydue to lower operational losses.
The above variances were partially offset by:
• An increase in OREO expenses by $13.8 million mainlydue to the higher valuation write downs consistingprimarily of covered assets which are subject to 80%reimbursement from the FDIC;
• Higher other taxes by $8.2 million related to the new PRgross receipts tax enacted in June 2013, partially offset bylower personal property tax and lower income subject tomunicipal tax; and
• An increase in professional fees by $6.0 million as a resultof higher professional services, legal fees and attorneysfees, mainly in the BPPR reportable segment.
INCOME TAXESIncome tax expense amounted to $58.3 million for the yearended December 31, 2014, compared with an income taxbenefit of $251.3 million for the previous year. The increase inincome tax expense was primarily due to the recognition duringthe year 2013 of a tax benefit of $197.5 million and a
corresponding increase in the net deferred tax asset of thePuerto Rico operations as a result of the increase in thestatutory corporate income tax rate from 30% to 39%introduced as part of the amendments to the Puerto RicoInternal Revenue Code effective for taxable years beginningafter December 31, 2012. In addition, during 2013 theCorporation recorded an income tax benefit due to the lossgenerated on the Puerto Rico operations by the sales of non-performing assets net of the gain realized on the sale of aportion of EVERTEC’s shares which was taxable at apreferential tax rate according to Act Number 73 of May 28,2008 known as “Economic Incentives Act for the Developmentof Puerto Rico”.
On July 1, 2014, the Government of Puerto Rico approvedcertain amendments to the Internal Revenue Code, which,among other things, changed the income tax rate for capitalgains from 15% to 20%. As a result, the Corporation recognizedan income tax expense of $20.0 million mainly related to thedeferred tax liability associated with the portfolio acquired fromWesternbank.
During the second quarter of 2014 the Corporation enteredinto a Closing Agreement with the Puerto Rico Department ofTreasury. The Agreement, among other matters, was related tothe income tax treatment of certain charge-offs related to theloans acquired from Westernbank as part of the FDIC assistedtransaction in the year 2010. As a result of the Agreement, theCorporation recorded a tax benefit of $23.4 million due to areduction in the deferred tax liability associated with theWesternbank loan portfolio. Additionally, in connection withthis Closing, the Corporation made an estimated tax paymentof $45 million which will be used as a credit to offset futureincome tax liabilities.
In addition, as further detailed below, during 2014 an initialvaluation allowance on the deferred tax asset of approximately$8.0 million was recorded at the Holding Company, due to thedifference in the tax treatment of the interest expense related tothe TARP funds and the newly issued $450 million of seniornotes, bearing interest at 7%.
Excluding the impact of the events listed above, the incometax expense for the year ended December 31, 2014 was $51.1million, compared to $89.4 million for 2013. The decrease inincome taxes was mainly due to a higher level of exemptincome, higher deductible interest expense related to theissuance of the $450 million Senior Notes as compared to thenon-deductible interest related to the TARP funds and a lowerincome tax expense related to charge-offs of the coveredportfolio, after the closing agreement with the PR TreasuryDepartment.
Income tax benefit for the year ended December 31, 2013was $251.3 million, compared with an income tax benefit of$26.4 million for 2012. The increase in income tax benefit wasprimarily due to the recognition during 2013 of a tax benefit of$197.5 million as a result of the change in the statutory

35 POPULAR, INC. 2014 ANNUAL REPORT
corporate income tax rate from 30% to 39% and the lossgenerated on the sale of non-performing assets as explainedabove., as compared with an income tax benefit of $72.9million during 2012 related to the reduction of the deferred taxliability on the estimated gains for tax purposes related to theloans acquired from Westernbank as a result of a ClosingAgreement signed by the Corporation and P.R. Department ofthe Treasury.
The Corporation’s net deferred tax assets at December 31,2014 amounted to $779 million (net of the valuation allowanceof $1.2 billion) compared to $760 million at December 31, 2013
(net of a valuation allowance of $1.3 billion). Note 43 to theconsolidated financial statements provides the composition ofthe net deferred tax assets as of such dates. All of the netdeferred tax assets at December 31, 2014 pertain to the PuertoRico operations. Of the amount related to the U.S. operations,without considering the valuation allowance, $1.1 billion isattributable to net operating losses of such operations.
The components of income tax expense (benefit) for theyears ended December 31, 2014, 2013 and 2012 are included inthe following table:
Table 10 - Components of Income Tax Expense (Benefit)
2014 2013 2012
(In thousands) Amount% of pre-tax
income Amount% of pre-tax
income Amount% of pre-tax
income
Computed income tax at statutory rates $(51,570) 39% $135,720 39% $65,662 30%Benefit of net tax exempt interest income (55,862) 43 (36,993) (11) (25,540) (12)Effect of income subject to preferential tax rate [1] (21,909) 18 (137,793) (40) (78,132) (36)Deferred tax asset valuation allowance (4,281) 3 (32,990) (9) 166 –Non-deductible expenses [2] 178,219 (135) 32,115 9 23,093 11Difference in tax rates due to multiple jurisdictions (14,178) 10 (12,029) (3) (6,034) (3)Initial adjustment in deferred tax due to change in tax rate 20,048 (16) (197,467) (57) – –Unrecognized tax benefits (3,601) 3 (7,727) (2) (8,985) (4)Others 11,413 (9) 5,837 2 3,367 2
Income tax expense (benefit) $58,279 (44)% $(251,327) (72)% $(26,403) (12)%
[1] Includes the impact of the Closing Agreement with the P.R. Treasury signed in June 2012, the tax expense related to a gain on the sale of EVERTEC shares andincome from investments in subsidiaries subject to preferential tax rates and the Closing Agreement with the P.R. Treasury signed in 2014.
[2] For the year ended December 31, 2014, includes approximately $161.5 million of amortization of the discount and deferred cost associated with the TARP funds,which are not deductible.
The Corporations maintains a valuation allowance on itsdeferred tax asset for the U.S. operations, since in considerationof the requirement of ASC 740 management considered that it ismore likely than not that all of this deferred tax asset will not berealized. For purposes of assessing the realization of the deferredtax assets in the U.S. mainland management evaluates andweights all available positive and negative evidence. TheCorporation’s U.S. mainland operations are not in a cumulativeloss position for the three-year period ended December 31, 2014taking into account taxable income exclusive of reversingtemporary differences (“adjusted book income”). Thisrepresents positive evidence within management’s evaluation.The book income for the years 2013 and 2014 was significantlyimpacted by a reversal of the loan loss provision due to theimproved credit quality of the loan portfolios. However, the U.S.mainland operations did not report taxable income for the years2011, 2012 and 2013, although they did report taxable incomefor the year ended December 31, 2014. Future realization of thedeferred tax assets ultimately depends on the existence ofsufficient taxable income of the appropriate character within thecarryforward period available under the tax law. The lack of asustained level of taxable income together with the uncertaintiesregarding the estimate of future normalized level of profitability
and cost savings related to the restructure represents strongnegative evidence within management’s evaluation. Thisdetermination is updated each quarter and adjusted as anychanges arise. After weighting of all positive and negativeevidence management concluded, as of the reporting date, that itis more likely than not that the Corporation will not be able torealize any portion of the deferred tax assets related to the U.S.mainland operations, considering the criteria of ASC Topic 740.If the Corporation is able to meet its operating targets in the U.S.and the results of the reorganization yield the expected results,this would be considered positive evidence within management’sevaluation which could outweigh the negative evidence andresult in the realization of a portion of the fully reserveddeferred tax asset recorded at PCB.
The Corporation’s Puerto Rico Banking operation is not in acumulative loss position and has sustained profitability for thethree year period ended December 31, 2014, exclusive of theloss generated on the sales of non-performing assets that tookplace in 2013 which is not a continuing condition of theoperations. This is considered a strong piece of objectivelyverifiable positive evidence that out weight any negativeevidence considered by management in the evaluation of therealization of the deferred tax asset. Based on this evidence and

36
management’s estimate of future taxable income, theCorporation has concluded that it is more likely than not thatsuch net deferred tax asset of the Puerto Rico Bankingoperations will be realized.
The Holding Company operation is not in a cumulative lossposition for the three year period ended December 31, 2014.However, the interest expense that will be paid on the newlyissued $450 million subordinated notes which partially fundedthe repayment of TARP funds in 2014, bearing interest at 7%,will be tax deductible in contrast to the interest expensepayable on the note issued to the U.S. Treasury under TARP.Based on this new fact pattern the Holding Company isexpecting to have losses for income tax purposes exclusive ofreversing temporary differences. Since as required by ASC 740the historical information should be supplemented by allcurrently available information about future years, the expectedlosses in future years are considered by management strongnegative evidence that suggests that income in future years willbe insufficient to support the realization of all deferred taxasset. After weighting of all positive and negative evidencemanagement concluded, as of the reporting date, that it is morelikely than not that the Holding Company will not be able torealize any portion of the deferred tax assets, considering thecriteria of ASC Topic 740. Accordingly, a valuation allowanceon the deferred tax asset of $17.8 million was recorded duringthe year 2014.
Refer to Note 43 to the consolidated financial statements foradditional information on income taxes.
Fourth Quarter ResultsThe Corporation recognized net income of $48.8 million for thequarter ended December 31, 2014, compared with a net incomeof $163.0 million for the same quarter of 2013. The variance inthe quarterly results was mainly driven by the after-tax gain of$88.4 million recorded in the fourth quarter of 2013 from thesale of EVERTEC shares in connection with its public offering.
Net interest income for the fourth quarter of 2014 amountedto $326.9 million, compared with $354.5 million for the fourthquarter of 2013. The decrease in net interest income wasprimarily due to a decrease of $25.5 million on covered loansinterest income, coupled with a decrease of $6.1 million frommoney market, trading and investment securities. This waspartially offset by a decrease of $4.9 million on interest expensefrom total interest bearing liabilities.
The provision for loan losses amounted to $48.0 million forthe quarter ended December 31, 2014, compared to $58.8million for the fourth quarter of 2013. The decrease of $10.8million is mainly at BPPR due to a reserve release from thecovered loans portfolio of $3.6 million during the fourthquarter of 2014 compared to a provision of $12.5 million forthe same period of 2013, coupled with a decrease of provisionfrom the non-covered portfolio of $10.1 million. This was offsetby a $14.4 million reduction in reserve releases at BPNA.
Non-interest income amounted to $103.4 million for thequarter ended December 31, 2014, compared with $185.3million for the same quarter in 2013. The decrease in non-interest income was mainly driven by a $92.4 million gainrecorded in the fourth quarter of 2013 from the sale ofEVERTEC shares in connection with its public offering,partially offset by a decrease of $18.5 million in FDIC loss shareexpense.
Operating expenses totaled $330.0 million for the quarterended December 31, 2014, compared with $304.6 million forthe same quarter in the previous year. The increase is duemainly to restructuring costs of $13.9 million incurred inconnection with the reorganization of the U.S. operations,higher OREO expenses of $10.5 million mainly due to higherwrite-downs on commercial and construction properties, andhigher professional fees by $6.2 million. These unfavorablevariances were partially offset by lower FDIC deposit insuranceof $5.3 million reflecting a lower level of high risk assets.
Income tax expense amounted to $12.5 million for thequarter ended December 31, 2014, compared with $25.2million for the same quarter of 2013. The decrease in incometaxes was mainly due to the higher level of exempt income,higher deductible interest expense related to the issuance of the$450 million Senior Notes as compared to the non-deductibleinterest related to the TARP funds, and a lower income taxexpense related to charge-offs of the covered portfolio as aresult of the closing agreement with the PR TreasuryDepartment.
REPORTABLE SEGMENT RESULTSThe Corporation’s reportable segments for managerial reportingpurposes consist of Banco Popular de Puerto Rico and BancoPopular North America. A Corporate group has been defined tosupport the reportable segments. For managerial reportingpurposes, the costs incurred by the Corporate group are notallocated to the reportable segments.
For a description of the Corporation’s reportable segments,including additional financial information and the underlyingmanagement accounting process, refer to Note 45 to theconsolidated financial statements.
The Corporate group reported a net loss of $510.2 millionfor the year ended December 31, 2014, compared with netincome of $309.1 million for the year ended December 31,2013. The unfavorable variance at the Corporate group was dueto the acceleration of the amortization during 2014 of thediscount and deferred costs related to the TARP debt, whichamounted to $414.1 million, coupled with the effect of the$412.8 million after tax gain recognized during 2013 as a resultof EVERTEC’s public offerings and connected transactions. Fordetails on the EVERTEC transactions refer to Note 34 “Relatedparty transactions with affiliated company/joint venture” to theconsolidated financial statements.

37 POPULAR, INC. 2014 ANNUAL REPORT
Highlights on the earnings results for the reportablesegments are discussed below:
Banco Popular de Puerto RicoThe Banco Popular de Puerto Rico reportable segment’s netincome amounted to $274.3 million for the year endedDecember 31, 2014, compared with $173.6 million for the yearended December 31, 2013. The principal factors thatcontributed to the variance in the financial results included thefollowing:
• higher net interest income by $28.4 million, or 2% mainlyimpacted by lower interest expense from borrowings by$16.8 million, or lower interest cost by 191 basis points,mainly from the conversion into shares of common stockof $185 million in subordinated notes due to Popular, Inc.during the fourth quarter of 2013. Also, the cost ofdeposits decreased by $12.3 million or 8 basis points, dueto lower levels and rates on IRA deposits and brokeredCD’s. The decreases in interest expense were slightlyoffset by a $0.8 million decrease in interest income;
• lower provision for loan losses by $327.7 million, or 53%,mostly due to the decrease in the provision for loan losseson the non-covered loan portfolio of $304.4, which wasmainly due to the incremental provision of $318.0 millionrelated to the bulk sales of non-performing loans during2013. Excluding the impact of the 2013 bulk sales, theprovision for loan losses declined by $9.7 million or 3% to$289.2 million, due to reserve releases from the annualreview of the components of the allowance for loan losses;
• higher non-interest income by $1.4 million, or less than1% mainly due to:
• favorable variance on sale of loans by $62.5 million dueto the impact of the bulk sales of non-performing loanscompleted during 2013; and
• higher trading account profits by $18.0 million due toinventory positions mark downs in 2013 (mostlyPuerto Rico government obligations and closed-endfunds) and a favorable variance in the realized andunrealized gains/losses on outstanding mortgage-backed securities.
The positive impact in non-interest income detailed abovewas partially offset by:
• lower mortgage banking activities by $40.8 million dueto higher losses on closed derivative positions andunfavorable fair value adjustments on mortgageservicing rights, offset by higher gains on sale of loans;
• higher FDIC loss share expense by $21.0 million due tohigher amortization of the indemnification asset andlower mirror accounting on credit impairment lossesand reimbursable expenses, offset by the positive
adjustment of $12.5 million related to the amortizationof the indemnification asset;
• lower other operating income by $6.5 million due tolower income from equity investments and lowerunderwriting income from the broker dealer;
• lower other service fees by $4.4 million due to a declinein the market value of assets under management,mainly Puerto Rico Government obligations and closed-end funds, which drive lower investment managementfees and mutual funds administration fees.
• lower operating expenses by $58.2 million, or 6%, mainlydue to:
• a decrease of $31.0 million in OREO expenses primarilyrelated to the loss of $37.0 million recorded in 2013 onthe bulk sale of commercial and single family real estateowned assets, which was partially offset by higherexpenses;
• a decrease of $17.3 million in personnel costs due tolower pension and post retirement expenses fromchanges to actuarial assumptions in pension obligations;
• a decrease of $16.5 million in FDIC deposit insurancedue to a lower level of high risk assets.
The favorable variances in operating expenses were partiallyoffset by higher other operating expenses by $10.1 million dueto higher provision for unused commitments.
• higher income tax expense by $314.9 million, mainly dueto the $197.5 million benefit recognized in 2013 for theincrease on the net deferred tax asset due to the change inthe corporate tax rate in P.R. from 30% to 39%, as well asthe tax benefits derived from the 2013 losses on the bulksales of non-performing assets.
The main factors that contributed to the variance in thefinancial results for the year ended December 31, 2013, whencompared with 2012, included the following:
• higher net interest income by $61.3 million, or 5% mainlyimpacted by lower interest expense from deposits by$28.3 million, or lower interest cost by 16 basis points,mainly from individual certificates of deposits, IRA’s andbrokered CD’s related to renewal of maturities at lowerprevailing rates and to lower volume of deposits. Also, thecost of borrowings decreased by $17.7 million mostly dueto the cancellation of $350 million of repurchaseagreements in June 2012 that carried a cost of 4.36% andreplacing them with lower cost borrowings. In addition,contributing to the positive impact in net interest incomewas an increase of $26 million in interest from mortgageloans mostly from acquisitions during the first quarter of2013, partially offset by the reversal during the thirdquarter of 2013 of $5.9 million in interest from reverse

38
mortgages which had been accrued in excess of theamount insured by FHA. Also the year 2013 reflected anincrease of $7.8 million in interest income from consumerloans mostly resulting from an acquisition of $225 millionmade during the second quarter of 2012 and an increasein the auto loan business, partially offset by lower interestincome from credit cards. These positive impacts werepartially offset by a reduction of $19.4 million in interestincome from investment securities due to thereinvestment of cash flows received from mortgagebacked securities in lower yielding collateralized mortgageobligations as well as the acquisitions of lower yieldingagency securities. Although yield in covered portfolioincreased by 188 basis points, this was offset by lowerbalances, resulting in interest income of $300.7 million,relatively flat to 2012. The BPPR reportable segment had anet interest margin of 5.32% for the year endedDecember 31, 2013, compared with 5.06% for 2012;
• higher provision for loan losses by $260.4 million, or 73%,mostly due to the increase in the provision for loan losseson the non-covered loan portfolio of $265.8 million, mainlyrelated to the incremental provision of $148.8 million and$169.2 million recognized in the first and second quartersof 2013, respectively, related to the non-performing loansbulk sales. Excluding the impact of the sales, the provisionfor loan losses declined by $52.2 million or 19% to $229.4million, due to positive trends in credit quality offset by theenhancements to the allowance for loan losses framework;
• lower non-interest income by $119.5 million, or 30%mainly due to:
• higher FDIC loss share expense by $25.8 million (referto Table 2 for components of such variance);
• lower other operating income by $20.0 millionresulting from lower net earnings from the equityinvestments in PRLP 2011 Holdings, LLC by $4.0million, and gains of $4.7 million and $2.5 millionrecognized during 2012 from the sale of a bank premiseproperty and the wholesale indirect property andcasualty business of Popular Insurance, respectively;
• higher trading account losses by $18.0 million mostlyrelated to higher losses on Puerto Rico governmentobligations and close-end funds and net realized losseson mortgage backed securities sold as compared to netgains reported for the same period in 2012;
• a decrease of $13.0 million in mortgage bankingactivities mainly due to lower gain on sale of loans by$49.4 million, mainly for securitization transactions,partially offset by the related closed derivative positionsof $32.6 million. Refer to Table 8 for details ofMortgage banking activities.
The negative impact in non-interest income detailed abovewas partially offset by a favorable variance in valuationadjustments on loans held-for-sale by $30.7 million, principallyrelated to $27.3 million in valuation adjustments recordedduring the second quarter of 2012 on commercial andconstruction loans held-for-sale as a result of updatedappraisals and market indicators;
• higher operating expenses by $15.3 million, or 2%, mainlydue to:
• an increase of $ 50.9 million in OREO expensesprimarily related to the loss of $37.0 million on thebulk sale of commercial and single family real estateowned assets during the first quarter of 2013 and to fairvalue adjustments on commercial properties, mainlycovered assets which are subject to 80% reimbursementfrom the FDIC;
• an increase of $10.2 million in other operating taxesprincipally related to the gross receipts tax imposed oncorporations in Puerto Rico during 2013;
• higher professional fees by $9.5 million mostly due tohigher legal, transaction processing and consulting fees;
The unfavorable variances in operating expenses werepartially offset by lower FDIC deposit insurance assessment by$25.5 million resulting from revisions in the deposit-insurancepremium calculation, lower levels of high risk assets, andsavings achieved from the internal reorganization of PopularMortgage into BPPR during the fourth quarter of 2012; $25.2million loss in early extinguishment of debt recorded duringthe second quarter of 2012 related to the cancellation ofrepurchase agreements; and $5.0 million in personnel costsmainly due to lower net periodic pension costs, medicalinsurance costs and postretirement health benefits;
• higher income tax benefit by $216.7 million, mainly dueto the $197.5 million benefit recognized during thesecond quarter of 2013 for the increase on the netdeferred tax asset due to the change in the corporate taxrate in P.R. from 30% to 39% as compared with a taxbenefit of $72.9 million recognized in 2012 resulting fromthe Closing Agreement with the P.R. Treasury related tothe tax treatment of the loans acquired in theWesternbank FDIC-assisted transaction. The increase inincome tax benefit was also driven by the loss on the bulksales of non-performing assets during 2013.
Banco Popular North AmericaFor the year ended December 31, 2014, the reportable segmentof Banco Popular North America reported net income of $45.4million, compared with $76.0 million for the year endedDecember 31, 2013. During the third quarter of 2014, BPNArefinanced approximately $638 million in long term structured

39 POPULAR, INC. 2014 ANNUAL REPORT
repos and replaced them with lower cost short-term repos of asimilar amount. The fees associated with the refinancing ofthese repos were $39.7 million, which were recorded asexpense during 2014. Also, BPNA sold or entered intoagreements to sell $249 million in legacy and classified loans,resulting in a loss of approximately $11.1 million.Restructuring costs associated with BPNA’s reorganization were$26.7 million for the year 2014. Adjusted for these transactions,BPNA recorded a net income from continuing operations of$122.9 million, an increase of $46.9 million when compared to2013. The principal factors that contributed to the variance inthe financial results included the following: The principalfactors that contributed to the variance in the financial resultsincluded the following:
• higher net interest income by $4.7 million, excluding theimpact of the repo refinancing mentioned above, impactedby lower interest expense from deposits by $7.4 million,or a lower cost of 19 basis points, driven by the renewal ofmaturities from time deposits at lower prevailing rates,and lower interest expense from short term borrowings by$7.3 million, or a lower cost of 91 basis points, due to therepos refinancing mentioned above. This was partiallyoffset by lower income from loans by $6.2 million andlower income from investment securities by $3.6 million,both due mainly to lower levels. The BPNA reportablesegment’s net interest margin was 3.10% for 2014 and theadjusted net interest margin was 3.42%, compared with3.20% for the same period in 2013;
• favorable variance in the provision for loan losses by $7.7million, which includes the previously mentioned impactof $12.8 million related to loan sales or loans transferredto loans held-for-sale. Excluding the effect of thesetransactions, the provision would have amounted to arelease of $31.7 million, or $20.5 million higher releasethan in 2013. This reversal of provision was prompted byimproved credit quality trends, the de-risking of the USportfolio and the effect of a $3.8 million reserve release aspart of the annual review of the components of the ALLLmodels during the second quarter of 2014;
• higher non-interest income by $28.1 million, or 77%,mostly due to an increase of $30.8 million in gains fromsales of loans due to higher volume of sales of non-performing commercial loans during 2014. This waspartially offset by a $2.8 million decrease on servicecharges on deposit accounts; and
• lower operating expenses by $3.2 million, excluding $26.7million in restructuring charges, due to lower personnelcosts by $8.9 million, partially offset by increases of $2.7million in professional fees and $2.1 million in otheroperating expenses.
The main factors that contributed to the variance in thefinancial results for the year ended December 31, 2013, whencompared with 2012, included the following:
• higher net interest income by $5.6 million, or 3%, drivenby lower interest expense by $13.4 million, largely due toa decrease of $14.5 million on interest expense fromdeposits due lower costs related to the renewal ofmaturities from time deposits at lower prevailing rates, aswell as lower deposits volume. This was partially offset bylower interest income of $7.9 million, mainly investmentsecurities by $4.3 million due to reinvestment of cashflows from prepayments and maturities in lower yieldinginvestments due to the prevailing interest rate scenarios,and loans by $3.6 million due mainly to lower volumesand yields in the commercial and construction portfolios.
• lower provision for loan losses by $51.3 million, or 128%,principally as a result of a reserve release reflectingimprovements in credit quality and economic trends, andthe effect of the enhancements to the allowance for loanlosses methodology completed during the second quarterof 2013;
• lower non-interest income by $0.9 million, or 2%, mostlydue to a decrease in service charges on deposits by $4.5million related to lower non-sufficient funds and checkingfees; partially offset by higher gains on sale of loans by$2.0 million mainly related to commercial andconstruction loans; lower adjustments to indemnityreserves by $1.6 million; and an increase in gains on saleof securities by $1.3 million mainly due to the loss on thesale of non-agency collateralized mortgage obligationsduring the fourth quarter of 2012; and
• lower operating expenses by $10.9 million, or 6%, mainlydue to a decrease in other operating expenses by $7.8million and $4.5 million in professional fees, both mainlyrelated to legal settlements recognized during 2012. Thesefavorable variances were partially offset by an increase innet occupancy expenses by $2.0 million due to anadjustment to the outstanding deferred rent liability.
STATEMENT OF FINANCIAL CONDITION ANALYSISAssetsAt December 31, 2014, the Corporation’s total assets were$33.1 billion, compared with $35.7 billion at December 31,2013. Refer to the consolidated financial statements included inthis 2014 Annual Report for the Corporation’s consolidatedstatements of financial condition at December 31, 2014 andDecember 31, 2013. Also, refer to the Statistical Summary2010-2014 in this MD&A for condensed statements of financialcondition for the past five years.

40
Money market, trading and investment securitiesMoney market investments amounted to $1.8 billion atDecember 31, 2014 compared with $858 million at the samedate in 2013. The increase from the end of 2013 to 2014 wasmainly due to an increase at BPPR of $1 billion in time depositswith the Federal Reserve Bank of New York.
Trading account securities amounted to $139 million atDecember 31, 2014, compared with $340 million atDecember 31, 2013. The decrease in trading account securitieswas at the BPPR segment mainly due to a decrease in mortgagebacked securities as loan originations during 2014 were lowercompared to 2013. Refer to the Market / Interest Rate Risksection of this MD&A included in the Risk Management sectionfor a table that provides a breakdown of the trading portfolio bysecurity type.
Investment securities available-for-sale and held-to-maturityamounted to $5.4 billion at December 31, 2014 and 2013. Table11 provides a breakdown of the Corporation’s portfolio ofinvestment securities available-for-sale (“AFS”) and held-to-maturity (“HTM”) on a combined basis at December 31, 2014and 2013. Notes 9 and 10 to the consolidated financialstatements provide additional information with respect to theCorporation’s investment securities AFS and HTM.
Investment securities available-for-sale and held-to-maturitydeclined by $17 million. CMO’s from federal agencies andmortgage backed securities decreased by $509 million and $231million, respectively, mainly at BPNA, while US Treasurysecurities increased by $672 million, mainly at BPPR.
Table 11 - AFS and HTM Securities
(In millions) 2014 2013
U.S. Treasury securities $ 700,154 $ 28,482Obligations of U.S. government
sponsored entities 1,724,973 1,629,205Obligations of Puerto Rico, States and
political subdivisions 163,285 180,258Collateralized mortgage obligations 1,910,127 2,418,924Mortgage-backed securities 904,362 1,135,641Equity securities 2,622 4,116Other 12,806 38,670
Total AFS and HTM investmentsecurities $5,418,329 $5,435,296
LoansRefer to Table 12 for a breakdown of the Corporation’s loanportfolio, the principal category of earning assets. Loanscovered under the FDIC loss sharing agreements are presentedin a separate line item in Table 12. The risks on covered loansare significantly different as a result of the loss protectionprovided by the FDIC.
The Corporation’s total loan portfolio amounted to $22.1billion at December 31, 2014, compared to $24.7 billion atDecember 31, 2013. Excluding the reclassification of $1.8billion in loans to discontinued operations, the total loanportfolio decreased by $854 million mainly in the covered loanportfolio due to the continuation of loan resolutions and thenormal portfolio run-off and sales of non-performing loansheld-in-portfolio mainly at BPNA.

41 POPULAR, INC. 2014 ANNUAL REPORT
Table 12 - Loans Ending Balances
At December 31,
(in thousands) 2014 2013 2012 2011 2010
Loans not covered under FDIC loss sharing agreements:Commercial $8,134,267 $10,037,184 $9,858,202 $9,973,327 $10,570,502Construction 251,820 206,084 252,857 239,939 340,556Legacy [1] 80,818 211,135 384,217 648,409 1,013,484Lease financing 564,389 543,761 540,523 548,706 572,787Mortgage 6,502,886 6,681,476 6,078,507 5,518,460 4,524,722Consumer 3,870,271 3,932,226 3,868,886 3,673,755 3,705,984
Total non-covered loans held-in-portfolio 19,404,451 21,611,866 20,983,192 20,602,596 20,728,035
Loans covered under FDIC loss sharing agreements:Commercial 1,614,781 1,812,804 2,244,647 2,512,742 2,767,181Construction 70,336 190,127 361,396 546,826 640,492Mortgage 822,986 934,373 1,076,730 1,172,954 1,259,459Consumer 34,559 47,123 73,199 116,181 169,750
Loans covered under FDIC loss sharing agreements 2,542,662 2,984,427 3,755,972 4,348,703 4,836,882
Total loans held-in-portfolio 21,947,113 24,596,293 24,739,164 24,951,299 25,564,917
Loans held-for-sale:Commercial 309 603 16,047 25,730 60,528Construction – – 78,140 236,045 412,744Legacy [1] 319 – 2,080 468 –Mortgage 100,166 109,823 258,201 100,850 420,666Consumer 5,310 – – – –
Total loans held-for-sale 106,104 110,426 354,468 363,093 893,938
Total loans $22,053,217 $24,706,719 $25,093,632 $25,314,392 $26,458,855
[1] The legacy portfolio is comprised of commercial loans, construction loans and lease financings related to certain lending products exited by the Corporation as partof restructuring efforts carried out in prior years at the BPNA reportable segment.
The explanations for loan portfolio variances discussedbelow exclude the impact of the covered loans.
Loans held-in-portfolioLoans held-in-portfolio decreased by $2.2 billion fromDecember 31, 2013. Most of the decrease was at the BPNAsegment as a result of the sale of the California, Illinois andCentral Florida regions, which included the sale of $1.8 billionin loans and the bulk sales or agreements to sell non-performing loans for a total of approximately $249 million, aswell as other sales as part of the regular workout strategy. Referto Note 4 to the consolidated financial statements for furtherdetails on the sales of BPNA’s discontinued operations during2014.
Commercial loans decreased $1.9 billion from December 31,2013. Most of the decrease is attributed to the sale of the U.S.regions which included the sale of approximately $1.7 billion incommercial loans as well as the bulk sales of non-performingloans at BPNA, which included $178 million in commercialloans.
Construction loans held-in-portfolio increased $46 millionfrom December 31, 2013 to December 31, 2014, principally atthe BPNA segment, which increased by $39 million.
The BPNA legacy portfolio, which is comprised ofcommercial loans, construction loans and lease financingsrelated to certain lending products exited by the Corporation aspart of restructuring efforts carried out in prior years at theBPNA reportable segment, declined $130 million, mostly due tothe run-off status of this portfolio.
The mortgage loans held-in-portfolio decreased $179million. This was reflected mainly at BPNA and was mainlyattributed to lower origination volumes as well as the impact ofa bulk sale or agreements to sell non-performing mortgageloans amounting to approximately $72 million.
The consumer loans held-in-portfolio decreased $62 millionfrom December 31, 2013 to December 31, 2014. The decreasewas mainly at BPNA by $134 million, due in part to the sale ofthe U.S. regions which included the sale of approximately $81million in consumer loans, mainly home equity lines of creditand personal loans. This was partially offset by an increase of$47 million at BPPR, mainly in auto loans originations.
Loans held-for-saleLoans held-for-sale declined by $4.3 million. The portfolio ofmortgage loans held-for-sale decreased $10 million fromDecember 31, 2013. The decrease was mainly at BPPR segment,
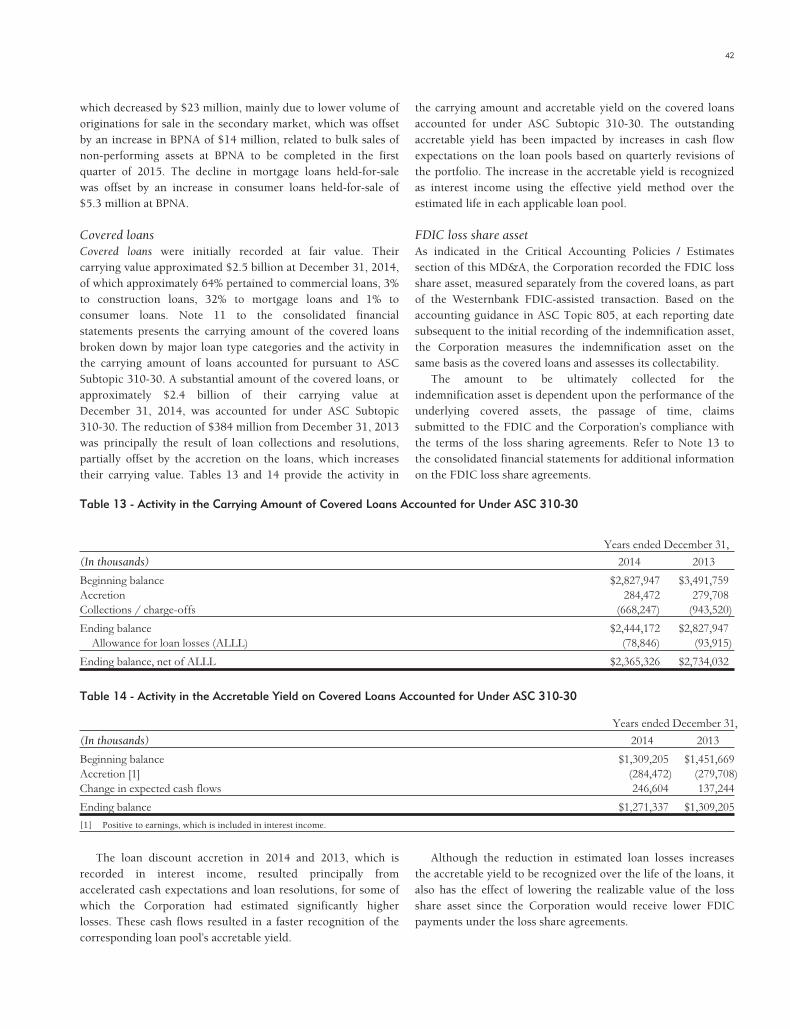
42
which decreased by $23 million, mainly due to lower volume oforiginations for sale in the secondary market, which was offsetby an increase in BPNA of $14 million, related to bulk sales ofnon-performing assets at BPNA to be completed in the firstquarter of 2015. The decline in mortgage loans held-for-salewas offset by an increase in consumer loans held-for-sale of$5.3 million at BPNA.
Covered loansCovered loans were initially recorded at fair value. Theircarrying value approximated $2.5 billion at December 31, 2014,of which approximately 64% pertained to commercial loans, 3%to construction loans, 32% to mortgage loans and 1% toconsumer loans. Note 11 to the consolidated financialstatements presents the carrying amount of the covered loansbroken down by major loan type categories and the activity inthe carrying amount of loans accounted for pursuant to ASCSubtopic 310-30. A substantial amount of the covered loans, orapproximately $2.4 billion of their carrying value atDecember 31, 2014, was accounted for under ASC Subtopic310-30. The reduction of $384 million from December 31, 2013was principally the result of loan collections and resolutions,partially offset by the accretion on the loans, which increasestheir carrying value. Tables 13 and 14 provide the activity in
the carrying amount and accretable yield on the covered loansaccounted for under ASC Subtopic 310-30. The outstandingaccretable yield has been impacted by increases in cash flowexpectations on the loan pools based on quarterly revisions ofthe portfolio. The increase in the accretable yield is recognizedas interest income using the effective yield method over theestimated life in each applicable loan pool.
FDIC loss share assetAs indicated in the Critical Accounting Policies / Estimatessection of this MD&A, the Corporation recorded the FDIC lossshare asset, measured separately from the covered loans, as partof the Westernbank FDIC-assisted transaction. Based on theaccounting guidance in ASC Topic 805, at each reporting datesubsequent to the initial recording of the indemnification asset,the Corporation measures the indemnification asset on thesame basis as the covered loans and assesses its collectability.
The amount to be ultimately collected for theindemnification asset is dependent upon the performance of theunderlying covered assets, the passage of time, claimssubmitted to the FDIC and the Corporation’s compliance withthe terms of the loss sharing agreements. Refer to Note 13 tothe consolidated financial statements for additional informationon the FDIC loss share agreements.
Table 13 - Activity in the Carrying Amount of Covered Loans Accounted for Under ASC 310-30
Years ended December 31,
(In thousands) 2014 2013
Beginning balance $2,827,947 $3,491,759Accretion 284,472 279,708Collections / charge-offs (668,247) (943,520)
Ending balance $2,444,172 $2,827,947Allowance for loan losses (ALLL) (78,846) (93,915)
Ending balance, net of ALLL $2,365,326 $2,734,032
Table 14 - Activity in the Accretable Yield on Covered Loans Accounted for Under ASC 310-30
Years ended December 31,
(In thousands) 2014 2013
Beginning balance $1,309,205 $1,451,669Accretion [1] (284,472) (279,708)Change in expected cash flows 246,604 137,244
Ending balance $1,271,337 $1,309,205
[1] Positive to earnings, which is included in interest income.
The loan discount accretion in 2014 and 2013, which isrecorded in interest income, resulted principally fromaccelerated cash expectations and loan resolutions, for some ofwhich the Corporation had estimated significantly higherlosses. These cash flows resulted in a faster recognition of thecorresponding loan pool’s accretable yield.
Although the reduction in estimated loan losses increasesthe accretable yield to be recognized over the life of the loans, italso has the effect of lowering the realizable value of the lossshare asset since the Corporation would receive lower FDICpayments under the loss share agreements.

43 POPULAR, INC. 2014 ANNUAL REPORT
Table 15 sets forth the activity in the FDIC loss share asset for the years ended December 31, 2014, 2013 and 2012.
Table 15 - Activity of Loss Share Asset
Years ended December 31,
(In thousands) 2014 2013 2012
Balance at beginning of year $ 948,608 $1,399,098 $1,915,128Amortization of loss share indemnification asset (189,959) (161,635) (129,676)Reversal of accelerated amortization 12,492 – –Credit impairment losses to be covered under loss sharing agreements 32,038 60,454 58,187Reimbursable expenses 58,117 50,985 30,771Decrease due to reciprocal accounting on amortization of contingent liability on unfunded
commitments – (473) (969)Payments from FDIC under loss sharing agreements (269,397) (396,223) (462,016)Other adjustments attributable to FDIC loss sharing agreements (193) (3,598) (12,327)
Balance at end of period 591,706 948,608 1,399,098
Balance due to the FDIC for recoveries on covered assets (49,252) (39,194) (16,763)
Net balance of indemnity asset and amounts due from the FDIC $ 542,454 $ 909,414 $1,382,335
Table 16 - Activity in the Remaining FDIC Loss Share Asset Discount
Years ended December 31,
(In thousands) 2014 2013 2012
Balance at beginning of period [1] $ 103,691 $ 141,800 $ 117,916Amortization of negative discount [2] (189,959) (161,635) (129,676)Impact of lower projected losses 139,363 123,526 153,560
Balance at end of period $ 53,095 $ 103,691 $ 141,800
[1] Positive balance represents negative discount (debit to assets), while a negative balance represents a discount (credit to assets).[2] Amortization results in a negative impact to non-interest income, while a positive balance results in a positive impact to non-interest income, particularly FDIC
loss share income / expense.
During the year ended December 31, 2014, the Corporationrevised its analysis of expected cash flow which resulted in anet decrease in estimated credit losses, which was drivenmainly by commercial loan pools. The lowered loss estimatesrequires the Corporation to amortize the loss share asset to itscurrently lower expected collectible balance, thus resulting innegative accretion. Due to the shorter life of the indemnity assetcompared with the expected life of the covered loans, thisnegative accretion temporarily offsets the benefit of higher cashflows accounted through the accretable yield on the loans.
Other real estate ownedOther real estate owned represents real estate property receivedin satisfaction of debt. At December 31, 2014, OREO decreasedto $266 million from $304 million at December 31, 2013. Referto Table 17 for the activity in other real estate owned. Theamounts included as “covered other real estate” are subject tothe FDIC loss sharing agreements.

44
Table 17 - Other Real Estate Owned Activity
For the year ended December 31, 2014
(In thousands)
Non-coveredOREO
Commercial/ ConstructionNon-covered
OREO Mortgage
CoveredOREO
Commercial/ Construction
CoveredOREO
Mortgage Total
Balance at beginning of period $ 48,649 $ 86,852 $120,215 $ 47,792 $ 303,508Write-downs in value (7,112) (3,628) (26,657) (4,969) (42,366)Additions 16,200 65,300 55,582 21,769 158,851Sales (20,042) (49,618) (59,219) (19,028) (147,907)Other adjustments 1,288 (2,389) (4,527) (692) (6,320)
Ending balance $ 38,983 $ 96,517 $ 85,394 $ 44,872 $ 265,766
For the year ended December 31, 2013
(In thousands)
Non-coveredOREO
Commercial/ ConstructionNon-covered
OREO Mortgage
CoveredOREO
Commercial/ Construction
CoveredOREO
Mortgage Total
Balance at beginning of period $ 135,862 $ 130,982 $ 99,398 $ 39,660 $ 405,902Write-downs in value (11,377) (9,525) (18,857) (4,102) (43,861)Additions 32,175 82,985 87,800 30,037 232,997Sales (108,254) (118,596) (48,447) (17,720) (293,017)Other adjustments 243 1,006 321 (83) 1,487
Ending balance $ 48,649 $ 86,852 $120,215 $ 47,792 $ 303,508
For the year ended December 31, 2012
(In thousands)
Non-coveredOREO
Commercial/ ConstructionNon-covered
OREO Mortgage
CoveredOREO
Commercial/ Construction
CoveredOREO
Mortgage Total
Balance at beginning of period $ 90,230 $ 82,267 $ 77,776 $ 31,359 $ 281,632Write-downs in value (13,727) (10,823) (7,466) (767) (32,783)Additions 110,947 108,312 60,920 23,195 303,374Sales (51,422) (46,091) (32,022) (13,122) (142,657)Other adjustments (166) (2,683) 190 (1,005) (3,664)
Ending balance $135,862 $130,982 $ 99,398 $ 39,660 $ 405,902
Other assetsTable 18 provides a breakdown of the principal categories that comprise the caption of “Other assets” in the consolidatedstatements of financial condition at December 31, 2014 and 2013.
Table 18 - Other Assets
(In thousands) 2014 2013 Change
Net deferred tax assets (net of valuation allowance) $812,819 $761,768 $51,051Investments under the equity method 225,625 197,006 28,619Bank-owned life insurance program – 228,805 (228,805)Prepaid FDIC insurance assessment 360 383 (23)Prepaid taxes 198,120 91,504 106,616Other prepaid expenses 83,719 67,108 16,611Derivative assets 25,362 34,710 (9,348)Trades receivables from brokers and counterparties 66,949 71,680 (4,731)Others 233,489 234,594 (1,105)
Total other assets $1,646,443 $1,687,558 $(41,115)

45 POPULAR, INC. 2014 ANNUAL REPORT
The decrease in other assets from December 31, 2013 toDecember 31, 2014 was principally due to BPNA’s surrenderingof its bank owned life insurance contracts, which had a balanceof $231.2 million as of the transaction date. BPNA receivedapproximately $231.4 million in satisfaction of its surrenderrequest. This was partially offset by increases of $106.6 millionin prepaid taxes, $51.1 million in deferred taxes, and $28.6million from investments under the equity method. Theincrease in prepaid taxes includes a payment of $45 millionmade during the second quarter of 2014 in connection with theClosing Agreement signed with the PR Department of Treasuryand $25.7 million of unamortized corporate personal propertytax and municipal tax paid during the second quarter of 2014.The increase in investments under the equity method was duemainly to a $24.1 million increase from the investment in BHDLeón, which in part was due to the merger transaction in which
BHD acquired the net assets of Centro Financiero León. As aresult of this transaction, the Corporation recognized a net gainof $14.2 million during the first quarter of 2014. The increasein net deferred tax assets (net of valuation allowance) was duein part to the deferred tax asset associated with the additionalminimum pension liability recorded as of December 31, 2014,which increased as a result of changes to the mortality table andthe impact of using a lower discount rate.
Refer to Notes 19 and 34 for additional information on theCorporation’s investments under the equity method.
Deposits and BorrowingsThe composition of the Corporation’s financing to total assets atDecember 31, 2014 and December 31, 2013 is included inTable 19.
Table 19 - Financing to Total Assets
December 31, December 31, % increase (decrease) % of total assets(In millions) 2014 2013 from 2013 to 2014 2014 2013
Non-interest bearing deposits $ 5,784 $ 5,923 (2.3)% 17.5% 16.6%Interest-bearing core deposits 14,775 16,026 (7.8) 44.6 44.8Other interest-bearing deposits 4,249 4,762 (10.8) 12.8 13.3Fed funds purchased and repurchase agreements 1,272 1,659 (23.3) 3.8 4.6Other short-term borrowings 21 401 (94.8) 0.1 1.1Notes payable 1,712 1,585 8.0 5.2 4.4Other liabilities 1,012 767 31.9 3.1 2.2Liabilities from discontinued operations 5 – – – –Stockholders’ equity 4,267 4,626 (7.8) 12.9 13.0
Deposits
Table 20 - Deposits Ending Balances
(In thousands) 2014 2013 2012 2011 2010
Demand deposits [1] $ 6,606,060 $ 6,590,963 $ 6,442,739 $ 6,256,530 $ 5,501,430Savings, NOW and money market deposits (non-brokered) 10,320,782 11,255,309 11,190,335 10,762,869 10,371,580Savings, NOW and money market deposits (brokered) 406,248 553,521 456,830 212,688 –Time deposits (non-brokered) 5,960,401 6,478,103 6,541,660 7,552,434 8,594,759Time deposits (brokered CDs) 1,514,044 1,833,249 2,369,049 3,157,606 2,294,431
Total deposits $24,807,535 $26,711,145 $27,000,613 $27,942,127 $26,762,200
[1] Includes interest and non-interest bearing demand deposits.
At December 31, 2014, the Corporation’s total depositsamounted to $24.8 billion, compared to $26.7 billion atDecember 31, 2013. The decrease in total deposits from the end of2013 to December 31, 2014 was mainly due to the deposits sold aspart of the sale of the California, Illinois and Central Floridaregions, which had aggregate deposits of $2.0 billion at the time ofthe sales. Refer to Table 20 for a breakdown of the Corporation’sdeposits at December 31, 2014 and December 31, 2013, and toNote 4 to the consolidated financial statements for detailedinformation on the sales of BPNA’s discontinued operations.
BorrowingsThe Corporation’s borrowings amounted to $3.0 billion atDecember 31, 2014, compared with $3.6 billion atDecember 31, 2013. The decrease in borrowings was mostlydue to lower balances of repurchase agreements and advancesfrom the Federal Home Loan Bank of New York, as part of theCorporation’s funding strategies.
On July 2, 2014, the Corporation completed the repaymentof TARP funds to the U.S. Treasury through the repurchase of$935 million of trust capital securities issued to the U.S.

46
Treasury under the TARP Capital Purchase Program. At thetime of the transaction, the debt had a carrying amount of $521million, net of a discount of $414 million. The Corporationfunded the repurchase through a combination of available cashand approximately $400 million from the proceeds of theissuance of its $450 million aggregate principal amount of 7%Senior Notes due on 2019 which settled on July 1, 2014.
Refer to the Off-Balance Sheet Arrangements and OtherCommitments section in this MD&A for additional informationon the Corporation’s contractual obligations at December 31,2014.
Other liabilitiesThe Corporation’s other liabilities amounted to $1 billion atDecember 31, 2014, compared with $767 million atDecember 31, 2013. The increase in other liabilities of $245million was mostly due to an increase of approximately $139million in the minimum pension liability due to adjustments tothe mortality table and the impact of using a lower discountrate, and an increase of $34 million in the GNMA loansrepurchase option liability due to lower repurchase activityduring the fourth quarter of 2014.
Stockholders’ EquityStockholders’ equity totaled $4.3 billion at December 31, 2014,compared with $4.6 billion at December 31, 2013. The decrease
was principally due to the net loss of $313.5 million recordedfor the year and an increase of $41.1 million in accumulatedother comprehensive loss. The increase in accumulated othercomprehensive loss was due mainly to the additional pensionliability of $100.9 million due to adjustments to the mortalitytable and the impact of using a lower discount rate, which waspartially offset by higher unrealized gains on securities availablefor sale of $56.8 million.
On July 23, 2014, the Corporation completed the repurchaseof the outstanding warrant initially issued to the U.S. Treasuryunder the TARP Capital Purchase Program in 2008 for arepurchase price of $3.0 million. Refer to the consolidatedstatements of financial condition and of stockholders’ equity forinformation on the composition of stockholders’ equity. Also,refer to Note 29 for a detail of the accumulated othercomprehensive income (loss), an integral component ofstockholders’ equity.
REGULATORY CAPITALTable 21 presents the Corporation’s capital adequacyinformation for the years 2010 through 2014. Note 28 to theconsolidated financial statements presents further informationon the Corporation’s regulatory capital requirements, includingthe regulatory capital ratios of its depository institutions, BPPRand BPNA. The Corporation continues to exceed the well-capitalized guidelines under the federal banking regulations.
Table 21 - Capital Adequacy Data
At December 31,
(Dollars in thousands) 2014 2013 2012 2011 2010
Risk-based capital:Tier 1 capital $ 3,849,891 $ 4,464,742 $ 4,058,242 $ 3,899,593 $ 3,733,776Supplementary (Tier 2) capital 272,347 296,813 298,906 312,477 328,522
Total capital $ 4,122,238 $ 4,761,555 $ 4,357,148 $ 4,212,070 $ 4,062,298
Risk-weighted assets:Balance sheet items $19,485,230 $21,409,548 $21,175,833 $21,775,369 $22,621,779Off-balance sheet items 1,748,672 1,909,126 2,215,739 2,638,954 3,099,186
Total risk-weighted assets $21,233,902 $23,318,674 $23,391,572 $24,414,323 $25,720,965
Adjusted average quarterly assets $32,250,173 $34,746,137 $35,226,183 $35,783,749 $38,490,597
Ratios:Tier 1 capital (minimum required - 4.00%) 18.13% 19.15% 17.35% 15.97% 14.52%Total capital (minimum required - 8.00%) 19.41 20.42 18.63 17.25 15.79Leverage ratio [1] 11.94 12.85 11.52 10.90 9.70Average equity to assets 12.95 11.52 10.60 9.81 8.49Average tangible equity to assets 11.45 9.78 8.82 8.10 6.77Average equity to loans 19.17 16.88 15.47 14.57 12.62
[1] All banks are required to have minimum Tier 1 leverage ratio of 3% or 4% of adjusted quarterly average assets, depending on the bank’s classification.
Under the Federal Reserve Board’s risk-based capitalguidelines for bank holding companies and member banks ineffect as of December 31, 2014, to meet minimum adequately-
capitalized regulatory requirements, an institution had tomaintain a Tier 1 capital ratio of 4% and a total capital ratio of8%. A “well-capitalized” institution must generally maintained

47 POPULAR, INC. 2014 ANNUAL REPORT
capital ratios 200 basis points higher than the minimumguidelines. The risk-based capital rules are furthersupplemented by a Tier 1 leverage ratio, defined as Tier 1capital divided by adjusted quarterly average total assets, aftercertain adjustments. “Well capitalized” bank holdingcompanies had to maintain a minimum Tier 1 leverage ratio of5%. The Corporation’s ratios presented in Table 21 show thatthe Corporation was “well capitalized” for regulatory purposes,the highest classification, for all years presented. BPPR andBPNA were also well-capitalized for all years presented.
The reduction in the regulatory capital ratios fromDecember 31, 2013 to the same date in 2014 was mainly theresult of the reduction in total capital resulting from therepurchase on July 2, 2014 of $935 million of capital securitiesheld by the U.S. Treasury in connection with the TARP CapitalPurchase Program. This unfavorable impact to the regulatorycapital ratios was in part off-set by a reduction in risk-weightedassets, mostly driven by the U.S. regional sales.
In accordance with the Federal Reserve Board guidanceunder general risk-based capital rules in effect as ofDecember 31, 2014, the trust preferred securities representrestricted core capital elements and qualify as Tier 1 capital,subject to certain quantitative limits. The aggregate amount ofrestricted core capital elements that may had been included inthe Corporation’s Tier 1 capital under the risk-based capitalrules in effect as of December 31, 2014 could not have exceeded25% of the sum of all core capital elements (includingcumulative perpetual preferred stock and trust preferredsecurities). Amounts of restricted core capital elements inexcess of this limit generally may have been included in Tier 2capital, subject to further limitations. At December 31, 2014and 2013, the Corporation’s restricted core capital elements didnot exceed the 25% limitation.
Non-GAAP financial measuresThe tangible common equity ratio and tangible book value percommon share, which are presented in the table that follows,are non-GAAP measures. Management and many stock analystsuse the tangible common equity ratio and tangible book valueper common share in conjunction with more traditional bankcapital ratios to compare the capital adequacy of bankingorganizations with significant amounts of goodwill or otherintangible assets, typically stemming from the use of thepurchase accounting method of accounting for mergers andacquisitions. Neither tangible common equity nor tangibleassets or related measures should be considered in isolation oras a substitute for stockholders’ equity, total assets or any othermeasure calculated in accordance with generally acceptedaccounting principles in the United States of America(“GAAP”). Moreover, the manner in which the Corporationcalculates its tangible common equity, tangible assets and anyother related measures may differ from that of other companiesreporting measures with similar names.
Table 22 provides a reconciliation of total stockholders’equity to tangible common equity and total assets to tangibleassets at December 31, 2014 and 2013.
Table 22 - Reconciliation Tangible Common Equity andAssets
At December 31,
(In thousands, except share orper share information) 2014 2013
Total stockholders’ equity $ 4,267,382 $ 4,626,150Less: Preferred stock (50,160) (50,160)Less: Goodwill (465,676) (647,757)Less: Other intangibles (37,595) (45,132)
Total tangible common equity $ 3,713,951 $ 3,883,101
Total assets $ 33,096,695 $ 35,749,333Less: Goodwill (465,676) (647,757)Less: Other intangibles (37,595) (45,132)
Total tangible assets $ 32,593,424 $ 35,056,444
Tangible common equity to tangibleassets at end of period 11.39% 11.08%
Common shares outstanding at endof period 103,476,847 103,397,699
Tangible book value per commonshare $ 35.89 $ 37.56
The Tier 1 common equity to risk-weighted assets ratio isanother non-GAAP measure. Ratios calculated based upon Tier1 common equity have become a focus of regulators andinvestors, and management believes ratios based on Tier 1common equity assist investors in analyzing the Corporation’scapital position.
Because Tier 1 common equity is not formally defined byGAAP or, unlike Tier 1 capital, codified in the federal bankingregulations currently in effect for the Corporation as ofDecember 31, 2014, this measure is considered to be a non-GAAP financial measure. Non-GAAP financial measures haveinherent limitations, are not required to be uniformly appliedand are not audited. To mitigate these limitations, theCorporation has procedures in place to calculate thesemeasures using the appropriate GAAP or regulatorycomponents. Although these non-GAAP financial measures arefrequently used by stakeholders in the evaluation of a company,they have limitations as analytical tools, and should not beconsidered in isolation, or as a substitute for analyses of resultsas reported under GAAP.
Table 23 reconciles the Corporation’s total commonstockholders’ equity (GAAP) to Tier 1 common equity asdefined by the Federal Reserve Board, FDIC and other bankregulatory agencies (non-GAAP).

48
Table 23 - Reconciliation Tier 1 Common Equity
At December 31,
(In thousands) 2014 2013
Common stockholders’ equity $4,217,222 $4,575,990Less: Unrealized losses (gains) on available-for-sale securities, net of tax [1] (8,465) 48,344Less: Disallowed deferred tax assets [2] (592,065) (626,570)Less: Disallowed goodwill and other intangible assets, net of deferred tax liability (447,770) (643,185)Less: Aggregate adjusted carrying value of non-financial equity investments (1,298) (1,442)Add: Adjustment of pension and postretirement benefit plans and unrealized gains (losses) on cash flow
hedges, net of tax [3] 205,505 104,302
Total Tier 1 common equity $3,373,129 $3,457,439
Tier 1 common equity to risk-weighted assets 15.89% 14.83%
[1] In accordance with regulatory risk-based capital guidelines, Tier 1 capital excludes net unrealized gains (losses) on available-for-sale debt securities and netunrealized gains on available-for-sale equity securities with readily determinable fair values. In arriving at Tier 1 capital, institutions are required to deduct netunrealized losses on available-for-sale equity securities with readily determinable fair values, net of tax.
[2] Approximately $162 million of the Corporation’s $813 million of net deferred tax assets included as “Other assets” in the consolidated statement of condition atDecember 31, 2014 ($167 million and $762 million, respectively, at December 31, 2013), were included without limitation in regulatory capital pursuant to therisk-based capital guidelines, while approximately $592 million of such assets at December 31, 2014 ($627 million at December 31, 2013) exceeded the limitationimposed by these guidelines and, as “disallowed deferred tax assets”, were deducted in arriving at Tier 1 capital. The remaining $59 million of the Corporation’sother net deferred tax components at December 31, 2014 (($32) million at December 31, 2013) represented primarily the following items (a) the deferred taxeffects of unrealized gains and losses on available-for-sale debt securities, which are permitted to be excluded prior to deriving the amount of net deferred tax assetssubject to limitation under the guidelines; (b) the deferred tax asset corresponding to the pension liability adjustment recorded as part of accumulated othercomprehensive income; and (c) the deferred tax liability associated with goodwill and other intangibles.
[3] The Federal Reserve Board has granted interim capital relief for the impact of pension liability adjustment.
Basel III Capital RequirementsIn July 2013, the Board of Governors of the Federal ReserveSystem (the “Board”), the Office of the Comptroller of theCurrency (the “OCC”) and the Federal Deposit InsuranceCorporation (the “FDIC”) and together with the Board and theOCC (the “Agencies”) approved the Basel III Capital Rules toestablish a revised comprehensive regulatory capital frameworkfor all U.S. banking organizations. On July 9, 2013, the Basel IIICapital Rules were approved by the Office of the Comptroller ofthe Currency (“OCC”) and (as interim final rules) by theFederal Deposit Insurance Corporation (“FDIC”) (togetherwith the Board, the “Agencies”).
The Basel III Capital Rules generally implement the BaselCommittee on Banking Supervision’s (the “Basel Committee”)December 2010 final capital framework referred to as “Basel III”for strengthening international capital standards. The Basel IIICapital Rules substantially revise the risk-based capitalrequirements applicable to bank holding companies and theirdepository institution subsidiaries, including Popular, BPPR andBPNA, as compared to the prior U.S. general risk-based capitalrules. The Basel III Capital Rules revise the definitions and thecomponents of regulatory capital, as well as address other issuesaffecting the numerator in banking institutions’ regulatory capitalratios. The Basel III Capital Rules also address asset risk weightsand other matters affecting the denominator in bankinginstitutions’ regulatory capital ratios and replace the prior generalrisk-weighting approach, which was derived from the BaselCommittee’s 1988 “Basel I” capital accords, with a more risk-sensitive approach based, in part, on the “standardized approach”
in the Basel Committee’s 2004 “Basel II” capital accords. Inaddition, the Basel III Capital Rules implement certain provisionsof Dodd-Frank Act, including the requirements of Section 939Ato remove references to credit ratings from the federal agencies’rules. The Basel III Capital Rules became effective for Popular,BPPR and BPNA on January 1, 2015, subject to phase-in periodsfor certain of their components and other provisions.
Among other matters, the Basel III Capital Rules:(i) introduce a new capital measure called “Common EquityTier 1” (“CET1”) and related regulatory capital ratio of CET1 torisk-weighted assets; (ii) specify that Tier 1 capital consists ofCET1 and “Additional Tier 1 capital” instruments meetingcertain revised requirements; (iii) mandate that mostdeductions/adjustments to regulatory capital measures be madeto CET1 and not to the other components of capital; and(iv) expand the scope of the deductions from and adjustments tocapital as compared to prior regulations. Under the Basel IIICapital Rules, for most banking organizations, including theCorporation, the most common form of Additional Tier 1 capitalis non-cumulative perpetual preferred stock and the mostcommon form of Tier 2 capital is subordinated notes and aportion of the allocation for loan and lease losses, in each case,subject to the Basel III Capital Rules’ specific requirements.
Pursuant to the Basel III Capital Rules, the minimum capitalratios that became effective on January 1, 2015 are as follows:
• 4.5% CET1 to risk-weighted assets;
• 6.0% Tier 1 capital (that is, CET1 plus Additional Tier 1capital) to risk-weighted assets;
49 POPULAR, INC. 2014 ANNUAL REPORT
• 8.0% Total capital (that is, Tier 1 capital plus Tier 2capital) to risk-weighted assets; and
• 4% Tier 1 capital to average consolidated assets asreported on consolidated financial statements (known asthe “leverage ratio”).
The Basel III Capital Rules also introduce a new 2.5%“capital conservation buffer”, composed entirely of CET1, ontop of the three minimum risk-weighted asset ratios. Thecapital conservation buffer is designed to absorb losses duringperiods of economic stress. Banking institutions with a ratio ofCET1 to risk-weighted assets above the minimum but belowthe capital conservation buffer will face constraints ondividends, equity repurchases and compensation based on theamount of the shortfall. Thus, when fully phased-in onJanuary 1, 2019, Popular, BPPR and BPNA will be required tomaintain such an additional capital conservation buffer of 2.5%of CET1, effectively resulting in minimum ratios of (i) CET1 torisk-weighted assets of at least 7%, (ii) Tier 1 capital to risk-weighted assets of at least 8.5%, and (iii) Total capital to risk-weighted assets of at least 10.5%.
The Basel III Capital Rules provide for a number ofdeductions from and adjustments to CET1. These include, forexample, the requirement that mortgage servicing rights,deferred tax assets arising from temporary differences thatcould not be realized through net operating loss carrybacks andsignificant investments in non-consolidated financial entities bededucted from CET1 to the extent that any one such categoryexceeds 10% of CET1 or all such items, in the aggregate, exceed15% of CET1.
In addition (as noted above), under the prior general risk-based capital rules, the effects of AOCI items included inshareholders’ equity (for example, mark-to-market adjustmentsto the value of securities held in the available for sale portfolio)under U.S. GAAP are reversed for the purposes of determiningregulatory capital ratios. Pursuant to the Basel III Capital Rules,the effects of certain AOCI items are not excluded; however,non-advanced approach banking organizations, includingPopular, BPPR and BPNA, may make a one-time permanentelection to continue to exclude these items. This election mustbe made concurrently with the first filing of certain of thePopular’s, BPPR’s and BPNA’s periodic regulatory reports in thebeginning of 2015. Popular, BPPR and BPNA expect to makethis election in order to avoid significant variations in the levelof capital depending upon the impact of interest ratefluctuations on the fair value of their securities portfolio. TheBasel III Capital Rules also preclude certain hybrid securities,such as trust preferred securities, from inclusion in bankholding companies’ Tier 1 capital, subject to phase-out in thecase of bank holding companies that had $15 billion or more intotal consolidated assets as of December 31, 2009. TheCorporation’s Tier 1 capital level at December 31, 2014,included $ 427 million of trust preferred securities that are
subject to the phase-out provisions of the Basel III CapitalRules. The Corporation would be allowed to include only 25percent of such trust preferred securities in Tier 1 capital as ofJanuary 1, 2015 and 0 percent as of January 1, 2016, andthereafter. Trust preferred securities no longer included inPopular’s Tier 1 capital may nonetheless be included as acomponent of Tier 2 capital on a permanent basis withoutphase-out and irrespective of whether such securities otherwisemeet the revised definition of Tier 2 capital set forth in theBasel III Capital Rules.
Implementation of the deductions and other adjustments toCET1 will begin on January 1, 2015 and will be phased-in overa 4-year period (beginning at 40% on January 1, 2015 and anadditional 20% per year thereafter). The implementation of thecapital conservation buffer will begin on January 1, 2016 at the0.625% level and increase by 0.625% on each subsequentJanuary 1, until it reaches 2.5% on January 1, 2019.
With respect to BPPR and BPNA, the Basel III Capital Rulesrevise the “prompt corrective action” (“PCA”) regulationsadopted pursuant to Section 38 of the Federal DepositInsurance Act, by: (i) introducing a CET1 ratio requirement ateach PCA category (other than critically undercapitalized), withthe required CET1 ratio being 6.5% for well-capitalized status;(ii) increasing the minimum Tier 1 capital ratio requirement foreach category, with the minimum Tier 1 capital ratio for well-capitalized status being 8% (as compared to the prior 6%); and(iii) eliminating the prior provision that provides that a bankwith a composite supervisory rating of 1 may have a 3%leverage ratio and still be adequately capitalized. The Basel IIICapital Rules do not change the total risk-based capitalrequirement for any PCA category. Failure to meet capitalguidelines could subject the Corporation and its depositoryinstitution subsidiaries to a variety of enforcement remedies,including the termination of deposit insurance by the FDIC andto certain restrictions on our business.
The Basel III Capital Rules prescribe a new standardizedapproach for risk weightings that expand the risk-weightingcategories from the prior four Basel I-derived categories (0%,20%, 50% and 100%) to a larger and more risk-sensitivenumber of categories, depending on the nature of the assets,and resulting in higher risk weights for a variety of asset classes.
The Corporation has evaluated the impact of the Basel IIICapital Rules on our regulatory capital ratios and estimates areduction of approximately 126 basis points to our Basel I Tier1 Common risk-based capital ratio based on our December 31,2014 balance sheet composition, assuming a full phase-in of theBasel III Capital Rules, and an increase of approximately 58basis points assuming a transitional phase-in considering theapplicable criteria for non-advanced banking organizations ineffect as of January 1, 2015. The following table presents apreliminary estimate of the Corporation’s regulatory capitalratios and risk-weighted assets on a fully-phased in basis and ona transitional basis under the methodologies set forth in the

50
Basel III Capital Rules based on our current understanding ofthose Rules and subject to certain assumptions.
We believe that Popular, BPPR and BPNA will be able to meetthe required well-capitalized capital ratios on a Basel III basis.
Table 24 - Estimated Regulatory Capital Ratios Under Basel III Rules
(Dollars in thousands)Transitional phase-inDecember 31, 2014
Fully phase-inDecember 31, 2014
Tier 1 common equity (Basel I) $ 3,373,129 $ 3,373,129Adjustment related to capital components 369,067 [a] 22,445
Estimated Tier 1 common equity under Basel III rules without AOCI $ 3,742,196 $ 3,395,574
Additional Tier 1 equity (Basel I) $ 476,762 $ 476,762Adjustment related to capital components (388,667)[b] (426,602)[b]
Estimated additional Tier 1 equity under Basel III rules $ 88,095 $ 50,160
Tier 2 capital (Basel I) $ 272,347 $ 272,347Adjustment related to capital components 336,987 [b] 449,713 [b]
Estimated Tier 2 capital under Basel III rules $ 609,334 $ 722,060
Total capital (Basel I) $ 4,122,238 $ 4,122,238Adjustment related to capital components 317,387 45,556
Estimated total capital under Basel III rules $ 4,439,625 $ 4,167,794
Risk-weighted assets under Basel I rules $21,233,902 $21,233,902Adjustment related to RWA components 1,483,298 [c] 1,975,471 [c]
Estimated risk-weighted assets under Basel III rules $22,717,200 $23,209,373
Estimated ratios:Tier 1 capital 16.86% 14.85%Tier 1 common equity 16.47 14.63Total capital 19.54 17.96Leverage 11.76 10.67[a] Primarily relates to the favorable impact of the phase-in of deductions related items subject to the 10 and 15 percent common equity Tier 1 capital deduction
thresholds, principally the impact to the Corporation of disallowed deferred tax assets.[b] Under Basel III, only 25% of the outstanding balance of trust preferred securities under the transition provision is allowed as additional Tier 1 capital as of
January 1, 2015, with the remaining balance included in Tier 2 capital. Under a fully phase-in approach, 100 percent of the trust preferred securities is treated asTier 2 capital.
[c] The main differences between the Corporation’s risk-weighted assets as calculated under Basel I compared with Basel III include mainly risk-weighting for non-performing loans, unfunded commitments and high volatility commercial real estate loans.
OFF-BALANCE SHEET ARRANGEMENTS AND OTHERCOMMITMENTSIn the ordinary course of business, the Corporation engages infinancial transactions that are not recorded on the balancesheet, or may be recorded on the balance sheet in amounts thatare different than the full contract or notional amount of thetransaction. As a provider of financial services, the Corporationroutinely enters into commitments with off-balance sheet riskto meet the financial needs of its customers. Thesecommitments may include loan commitments and standbyletters of credit. These commitments are subject to the samecredit policies and approval process used for on-balance sheetinstruments. These instruments involve, to varying degrees,elements of credit and interest rate risk in excess of the amountrecognized in the statement of financial position. Other types ofoff-balance sheet arrangements that the Corporation enters inthe ordinary course of business include derivatives, operatingleases and provision of guarantees, indemnifications, andrepresentation and warranties.
Contractual Obligations and Commercial CommitmentsThe Corporation has various financial obligations, includingcontractual obligations and commercial commitments, whichrequire future cash payments on debt and lease agreements.Also, in the normal course of business, the Corporation entersinto contractual arrangements whereby it commits to futurepurchases of products or services from third parties.Obligations that are legally binding agreements, whereby theCorporation agrees to purchase products or services with aspecific minimum quantity defined at a fixed, minimum orvariable price over a specified period of time, are defined aspurchase obligations.
Purchase obligations include major legal and bindingcontractual obligations outstanding at the end of 2014,primarily for services, equipment and real estate constructionprojects. Services include software licensing and maintenance,facilities maintenance, supplies purchasing, and other goods orservices used in the operation of the business. Generally, thesecontracts are renewable or cancelable at least annually,

51 POPULAR, INC. 2014 ANNUAL REPORT
although in some cases the Corporation has committed tocontracts that may extend for several years to secure favorablepricing concessions.
As previously indicated, the Corporation also enters intoderivative contracts under which it is required either to receiveor pay cash, depending on changes in interest rates. Thesecontracts are carried at fair value on the consolidatedstatements of financial condition with the fair valuerepresenting the net present value of the expected future cash
receipts and payments based on market rates of interest as ofthe statement of condition date. The fair value of the contractchanges daily as interest rates change. The Corporation mayalso be required to post additional collateral on margin calls onthe derivatives and repurchase transactions.
At December 31, 2014, the aggregate contractual cashobligations, including purchase obligations and borrowings, bymaturities, are presented in Table 25.
Table 25 - Contractual Obligations
Payments Due by Period
(In millions)Less than
1 year1 to 3years
3 to 5years
After 5years Total
Certificates of deposits $5,011 $1,531 $ 860 $ 72 $ 7,474Federal funds purchased and repurchase agreements 1,168 104 – – 1,272Other short-term borrowings 21 – – – 21Long-term debt 328 332 567 465 1,692Purchase obligations 120 50 19 6 195Annual rental commitments under operating leases 56 50 35 115 256Capital leases 1 2 3 14 20
Total contractual cash obligations $6,705 $2,069 $1,484 $672 $10,930
Under the Corporation’s repurchase agreements, Popular isrequired to deposit cash or qualifying securities to meet marginrequirements. To the extent that the value of securitiespreviously pledged as collateral declines because of changes ininterest rates, the Corporation will be required to depositadditional cash or securities to meet its margin requirements,thereby adversely affecting its liquidity.
At December 31, 2014, the Corporation’s liability on itspension, restoration and postretirement benefit plans amountedto $285 million, compared with $130 million at December 31,2013. The Corporation’s expected contributions to the pensionand benefit restoration plans are minimal, while the expectedcontributions to the postretirement benefit plan to fund currentbenefit payment requirements are estimated at $5.8 million for2015. Obligations to these plans are based on current andprojected obligations of the plans, performance of the planassets, if applicable, and any participant contributions. Refer toNote 37 to the consolidated financial statements for furtherinformation on these plans. Management believes that the effectof the pension and postretirement plans on liquidity is notsignificant to the Corporation’s overall financial condition. TheBPPR’s non-contributory defined pension and benefitrestoration plans are frozen with regards to all future benefitaccruals.
At December 31, 2014, the liability for uncertain taxpositions was $7.9 million, compared with $9.8 million as ofthe end of 2013. This liability represents an estimate of tax
positions that the Corporation has taken in its tax returnswhich may ultimately not be sustained upon examination bythe tax authorities. The ultimate amount and timing of anyfuture cash settlements cannot be predicted with reasonablecertainty. Under the statute of limitations, the liability foruncertain tax positions expires as follows: 2015 - $2.2 million,2016 - $0.8 million, 2017 - $0.8 million, 2018 - $1.1 million,and 2019 - $1.1 million, additionally $1.9 million not subject tostatute of limitation. As a result of examinations, theCorporation anticipates a reduction in the total amount ofunrecognized tax benefits within the next 12 months, whichcould amount to approximately $6.7 million.
The Corporation also utilizes lending-related financialinstruments in the normal course of business to accommodatethe financial needs of its customers. The Corporation’sexposure to credit losses in the event of nonperformance by theother party to the financial instrument for commitments toextend credit, standby letters of credit and commercial letters ofcredit is represented by the contractual notional amount ofthese instruments. The Corporation uses credit procedures andpolicies in making those commitments and conditionalobligations as it does in extending loans to customers. Sincemany of the commitments may expire without being drawnupon, the total contractual amounts are not representative ofthe Corporation’s actual future credit exposure or liquidityrequirements for these commitments.

52
The following table presents the contractual amounts related to the Corporation’s off-balance sheet lending and other activitiesat December 31, 2014:
Table 26 - Off-Balance Sheet Lending and Other Activities
Amount of Commitment - Expiration Period
(In millions) 20152016 -2017
2018 -2019
2020 -thereafter Total
Commitments to extend credit $6,418 $490 $174 $53 $7,135Commercial letters of credit 3 – – – 3Standby letters of credit 43 3 – – 46Commitments to originate mortgage loans 21 5 – – 26Unfunded investment obligations – 9 – – 9
Total $6,485 $507 $174 $53 $7,219
Guarantees Associated with Loans Sold / ServicedAt December 31, 2014, the Corporation serviced $2.1 billion inresidential mortgage loans subject to lifetime credit recourseprovisions, principally loans associated with FNMA andFHLMC residential mortgage loan securitization programs,compared with $2.5 billion at December 31, 2013. TheCorporation has not sold any mortgage loans subject to creditrecourse since 2010.
In the event of any customer default, pursuant to the creditrecourse provided, the Corporation is required to repurchasethe loan or reimburse the third party investor for the incurredloss. The maximum potential amount of future payments thatthe Corporation would be required to make under the recoursearrangements in the event of nonperformance by the borrowersis equivalent to the total outstanding balance of the residentialmortgage loans serviced with recourse and interest, ifapplicable. In the event of nonperformance by the borrower,the Corporation has rights to the underlying collateral securingthe mortgage loan. The Corporation suffers losses on theseloans when the proceeds from a foreclosure sale of the propertyunderlying a defaulted mortgage loan are less than theoutstanding principal balance of the loan plus any uncollectedinterest advanced and the costs of holding and disposing therelated property.
In the case of Puerto Rico, most claims are settled byrepurchases of delinquent loans, the majority of which aregreater than 90 days past due. The average time period toprepare an initial response to a repurchase request is from 30 to120 days from the initial written notice depending on thetype of the repurchase request. Failure by the Corporation torespond to a request for repurchase on a timely basis couldresult in a deterioration of the seller/servicer relationship andthe seller/servicer’s overall standing. In certain instances,investors could require additional collateral to ensure
compliance with the servicer’s repurchase obligation or cancelthe seller/servicer license and exercise their rights to transferthe servicing to an eligible seller/servicer.
The following table presents the delinquency status of theresidential mortgage loans serviced by the Corporation that aresubject to lifetime credit recourse provisions at December 31,2014 and December 31, 2013.
Table 27 - Delinquency of Residential Mortgage LoansSubject to Lifetime Credit Recourse
(In thousands) 2014 2013
Total portfolio $2,138,705 $2,524,155Days past due:
30 days and over $ 302,992 $ 347,04690 days and over $ 129,590 $ 138,018
As a percentage of total portfolio:30 days past due or more 14.17 % 13.75 %90 days past due or more 6.06 % 5.47 %
During the year ended December 31, 2014, the Corporationrepurchased approximately $89 million of unpaid principalbalance in mortgage loans subject to the credit recourseprovisions (December 31, 2013 - $126 million). There are noparticular loan characteristics, such as loan vintages, loan type,loan-to-value ratio, or other criteria, that denote any specifictrend or a concentration of repurchases in any particularsegment. Based on historical repurchase experience, the loandelinquency status is the main factor which causes therepurchase request. The current economic situation has forcedthe investors to take a closer review at loan performance andrecourse triggers, thus causing an elevated level of loanrepurchases.

53 POPULAR, INC. 2014 ANNUAL REPORT
At December 31, 2014, there were 5 outstanding unresolvedclaims related to the recourse portfolio with a principal balanceoutstanding of $589 thousand, compared with 5 and $769thousand, respectively, at December 31, 2013. The outstandingunresolved claims at December 31, 2014 and 2013 pertained toFNMA.
At December 31, 2014, the Corporation’s liabilityestablished to cover the estimated credit loss exposure relatedto loans sold or serviced with credit recourse amounted to $59million, compared with $41 million at December 31, 2013.
The following table presents the changes in theCorporation’s liability of estimated losses from these creditrecourses agreements, included in the consolidated statementsof financial condition for the years ended December 31, 2014and 2013.
Table 28 - Changes in Liability of Estimated Losses fromCredit Recourse Agreements
December 31,
(In thousands) 2014 2013
Balance as of beginning of period $ 41,463 $ 51,673Provision for recourse liability 41,312 21,793Net charge-offs / terminations (23,337) (32,003)
Balance as of end of period $ 59,438 $ 41,463
The provision for credit recourse liability increased $19.5million for the year ended December 31, 2014, when comparedto 2013. The increase in the provision was due in part to certainenhancements in the estimated losses for certain credit recourseat BPPR.
The estimated losses to be absorbed under the creditrecourse arrangements are recorded as a liability when the loansare sold and are updated by accruing or reversing expense(categorized in the line item “adjustments (expense) toindemnity reserves on loans sold” in the consolidatedstatements of operations) throughout the life of the loan, asnecessary, when additional relevant information becomesavailable. The methodology used to estimate the recourseliability is a function of the recourse arrangements given andconsiders a variety of factors, which include actual defaults andhistorical loss experience, foreclosure rate, estimated futuredefaults and the probability that a loan would be delinquent.Statistical methods are used to estimate the recourse liability.Expected loss rates are applied to different loan segmentations.The expected loss, which represents the amount expected to belost on a given loan, considers the probability of default andloss severity. The probability of default represents theprobability that a loan in good standing would become 90 daysdelinquent within the following twelve-month period.Regression analysis quantifies the relationship between thedefault event and loan-specific characteristics, including creditscores, loan-to-value ratios and loan aging, among others.
When the Corporation sells or securitizes mortgage loans, itgenerally makes customary representations and warrantiesregarding the characteristics of the loans sold. TheCorporation’s mortgage operations in the Puerto Rico groupconforming mortgage loans into pools which are exchanged forFNMA and GNMA mortgage-backed securities, which aregenerally sold to private investors, or are sold directly to FNMAor other private investors for cash. As required under thegovernment agency programs, quality review procedures areperformed by the Corporation to ensure that asset guidelinequalifications are met. To the extent the loans do not meetspecified characteristics, the Corporation may be required torepurchase such loans or indemnify for losses and bear anysubsequent loss related to the loans. Repurchases underrepresentation and warranty arrangements in which theCorporation’s Puerto Rico banking subsidiaries were obligatedto repurchase the loans amounted to $2.2 million in unpaidprincipal balance with losses amounting to $1.7 million for theyear ended December 31, 2014 ($4.7 million and $1.0 million,respectively, at December 31, 2013). A substantial amount ofthese loans reinstate to performing status or have mortgageinsurance, and thus the ultimate losses on the loans are notdeemed significant.
As discussed on Note 4 - Discontinued Operations, onNovember 8, 2014, the Corporation completed the sale of theCalifornia regional operations. In connection with thistransaction, the Corporation agreed to provide, subject tocertain limitations, customary indemnification to the purchaser,including with respect to certain pre-closing liabilities andviolations of representations and warranties. The Corporationalso agreed to indemnify the purchaser for up to 1.5% of creditlosses on transferred loans for a period of two years after theclosing. Pursuant to this indemnification provision, theCorporation’s maximum exposure is approximately $16.0million. The Corporation recognized a reserve of approximately$2.2 million, representing its best estimate of the loss thatwould be incurred in connection with this indemnification.This reserve is included within the liabilities from discontinuedoperations.
During the quarter ended June 30, 2013, the Corporationestablished a reserve for certain specific representation andwarranties made in connection with BPPR’s sale of non-performing mortgage loans. The purchaser’s sole remedy underthe indemnity clause is to seek monetary damages from BPPR,for a maximum of $16.3 million. BPPR recognized a reserve ofapproximately $3.0 million, representing its best estimate of theloss that would be incurred in connection with thisindemnification. BPPR’s obligations under this clause end oneyear after the closing except to any claim asserted prior to suchtermination date. At December 31, 2014 the Corporation has areserve balance of $2.8 million to cover claims received fromthe purchaser, which are currently being evaluated.

54
During the quarter ended March 31, 2013, the Corporationestablished a reserve for certain specific representation andwarranties made in connection with BPPR’s sale of commercialand construction loans, and commercial and single family realestate owned. The purchaser’s sole remedy under the indemnityclause is to seek monetary damages from BPPR, for a maximumof $18.0 million. BPPR is not required to repurchase any of theassets. BPPR recognized a reserve of approximately $10.7million, representing its best estimate of the loss that would beincurred in connection with this indemnification. During thequarter ended March 31, 2014, the Corporation released $2.0million based on an evaluation of claims received under thisclause. At December 31, 2014 the Corporation has a reservebalance of $7.4 million to cover claims received from thepurchaser, which are currently being evaluated.
In addition, at December 31, 2014, the Corporation hasreserves for customary representations and warranties related toloans sold by its U.S. subsidiary E-LOAN prior to 2009. Loanshad been sold to investors on a servicing released basis subjectto certain representations and warranties. Although the risk ofloss or default was generally assumed by the investors, theCorporation made certain representations relating to borrowercreditworthiness, loan documentation and collateral, which ifnot correct, may result in requiring the Corporation torepurchase the loans or indemnify investors for any relatedlosses associated to these loans. At December 31, 2014 andDecember 31, 2013, the Corporation’s reserve for estimatedlosses from such representation and warranty arrangementsamounted to $ 5 million and $ 7 million, respectively. E-LOANis no longer originating and selling loans since the subsidiaryceased these activities in 2008 and most of the outstandingagreements with major counterparties were settled during 2010and 2011.
Servicing agreements relating to the mortgage-backedsecurities programs of FNMA and GNMA, and to mortgageloans sold or serviced to certain other investors, includingFHLMC, require the Corporation to advance funds to makescheduled payments of principal, interest, taxes and insurance,if such payments have not been received from the borrowers. AtDecember 31, 2014, the Corporation serviced $15.6 billion inmortgage loans for third-parties, including the loans servicedwith credit recourse, compared with $16.3 billion atDecember 31, 2013. The Corporation generally recovers fundsadvanced pursuant to these arrangements from the mortgageowner, from liquidation proceeds when the mortgage loan isforeclosed or, in the case of FHA/VA loans, under the applicableFHA and VA insurance and guarantees programs. However, inthe meantime, the Corporation must absorb the cost of thefunds it advances during the time the advance is outstanding.The Corporation must also bear the costs of attempting tocollect on delinquent and defaulted mortgage loans. Inaddition, if a defaulted loan is not cured, the mortgage loanwould be canceled as part of the foreclosure proceedings and
the Corporation would not receive any future servicing incomewith respect to that loan. At December 31, 2014, theoutstanding balance of funds advanced by the Corporationunder such mortgage loan servicing agreements wasapproximately $36 million, compared with $29 million atDecember 31, 2013. To the extent the mortgage loansunderlying the Corporation’s servicing portfolio experienceincreased delinquencies, the Corporation would be required todedicate additional cash resources to comply with its obligationto advance funds as well as incur additional administrative costsrelated to increases in collection efforts.
Popular, Inc. Holding Company (“PIHC”) fully andunconditionally guarantees certain borrowing obligationsissued by certain of its wholly-owned consolidated subsidiariesamounting to $ 0.2 billion at December 31, 2014 (December 31,2013 - $ 0.2 billion). In addition, at December 31, 2014 andDecember 31, 2013, PIHC fully and unconditionally guaranteedon a subordinated basis $ 0.4 billion and $ 1.4 billion,respectively, of capital securities (trust preferred securities)issued by wholly-owned issuing trust entities to the extent setforth in the applicable guarantee agreement. Refer to Note 26 tothe consolidated financial statements for further information onthe trust preferred securities.
The Corporation is a defendant in a number of legalproceedings arising in the ordinary course of business asdescribed in Note 31 to the consolidated financial statements.
RISK MANAGEMENTManaging risk is an essential component of the Corporation’sbusiness. Risk identification and monitoring are key elementsin overall risk management. The following principal risks,which have been incorporated into the Corporation’s riskmanagement program, include:
• Credit Risk - Potential for default or loss resulting from anobligor’s failure to meet the terms of any contract with theCorporation or any of its subsidiaries, or failure otherwiseto perform as agreed. Credit risk arises from all activitieswhere success depends on counterparty, issuer, orborrower performance.
• Interest Rate Risk (“IRR”) - Interest rate risk is the risk toearnings or capital arising from changes in interest rates.Interest rate risk arises from differences between thetiming of rate changes and the timing of cash flows(repricing risk); from changing rate relationships amongdifferent yield curves affecting bank lending andborrowing activities (basis risk); from changing raterelationships across the spectrum of maturities (yieldcurve risk); and from interest related options embeddedin bank products (options risk).
• Market Risk - Potential for loss resulting from changes inmarket prices of the assets or liabilities in theCorporation’s or in any of its subsidiaries’ portfolios.

55 POPULAR, INC. 2014 ANNUAL REPORT
Market prices may change as a result of changes in rates,credit and liquidity for the product or general economicconditions.
• Liquidity Risk - Potential for loss resulting from theCorporation or its subsidiaries not being able to meettheir financial obligations when they come due. Thiscould be a result of market conditions, the ability of theCorporation to liquidate assets or manage or diversifyvarious funding sources. This risk also encompasses thepossibility that an instrument cannot be closed out or soldat its economic value, which might be a result of stress inthe market or in a specific security type given its credit,volume and maturity.
• Operational Risk - This risk is the possibility thatinadequate or failed systems and internal controls orprocedures, human error, fraud or external influencessuch as disasters, can cause losses.
• Compliance Risk and Legal Risk - Potential for lossresulting from violations of or non-conformance withlaws, rules, regulations, prescribed practices, existingcontracts or ethical standards.
• Strategic Risk - Potential for loss arising from adversebusiness decisions or improper implementation ofbusiness decisions. Also, it incorporates how managementanalyzes external factors that impact the strategicdirection of the Corporation.
• Reputational Risk - Potential for loss arising from negativepublic opinion.
The Corporation’s Board of Directors (the “Board”) hasestablished a Risk Management Committee (“RMC”) toundertake the responsibilities of overseeing and approving theCorporation’s Risk Management Program, as well as theCorporation’s Capital Plan. The Capital Plan is a plan tomaintain sufficient regulatory capital at the Corporation, BPPRand BPNA, which considers current and future regulatorycapital requirements, expected future profitability and credittrends and, at least, two macroeconomic scenarios, including abase and stress scenario.
The RMC, as an oversight body, monitors and approves theoverall business strategies, and corporate policies to identify,measure, monitor and control risks while maintaining theeffectiveness and efficiency of the business and operationalprocesses. As an approval body for the Corporation, the RMCreviews and approves relevant risk management policies andcritical processes. Also, it periodically reports to the Boardabout its activities.
The Board and RMC have delegated to the Corporation’smanagement the implementation of the risk managementprocesses. This implementation is split into two separate butcoordinated efforts that include (i) business and / or operationalunits who identify, manage and control the risks resulting from
their activities, and (ii) a Risk Management Group (“RMG”). Ingeneral, the RMG is mandated with responsibilities such asassessing and reporting to the Corporation’s management andRMC the risk positions of the Corporation; developing andimplementing mechanisms, policies and procedures to identify,measure and monitor risks; implementing measurementmechanisms and infrastructure to achieve effective riskmonitoring; developing and implementing the necessarymanagement information and reporting mechanisms; andmonitoring and testing the adequacy of the Corporation’spolicies, strategies and guidelines.
The RMG is responsible for the overall coordination of riskmanagement efforts throughout the Corporation and iscomposed of three reporting divisions: (i) Credit RiskManagement, (ii) Compliance Management, and (iii) Financialand Operational Risk Management. The latter includes anEnterprise Risk Management function that facilitates, amongother aspects, the identification, coordination, and managementof multiple and cross-enterprise risks.
Additionally, the Internal Auditing Division provides anindependent assessment of the Corporation’s internal controlstructure and related systems and processes.
Moreover, management oversight of the Corporation’s risk-taking and risk management activities is conducted throughmanagement committees:
• CRESCO (Credit Strategy Committee) - Manages theCorporation’s overall credit exposure and approves creditpolicies, standards and guidelines that define, quantify,and monitor credit risk. Through this committee,management reviews asset quality ratios, trends andforecasts, problem loans, establishes the provision for loanlosses and assesses the methodology and adequacy of theallowance for loan losses on a quarterly basis.
• ALCO (Asset / Liability Management Committee) -Oversees and approves the policies and processesdesigned to ensure sound market risk and balance sheetstrategies, including the interest rate, liquidity, investmentand trading policies. The ALCO monitors the capitalposition and plan for the Corporation and approves allcapital management strategies, including capital markettransactions and capital distributions. The ALCO alsomonitors forecasted results and their impact on capital,liquidity, and net interest margin of the Corporation.
• ORCO (Operational Risk Committee) - Monitorsoperational risk management activities to ensure thedevelopment and consistent application of operationalrisk policies, processes and procedures that measure, limitand manage the Corporation’s operational risks whilemaintaining the effectiveness and efficiency of theoperating and businesses’ processes.

56
Market / Interest Rate RiskThe financial results and capital levels of the Corporation areconstantly exposed to market, interest rate and liquidity risks.The ALCO and the Corporate Finance Group are responsiblefor planning and executing the Corporation’s market, interestrate risk, funding activities and strategy, and for implementingthe policies and procedures approved by the RMC and theALCO. In addition, the Financial and Operational RiskManagement Division is responsible for the independentmonitoring and reporting of adherence with establishedpolicies, and enhancing and strengthening controlssurrounding interest, liquidity and market risk. The ALCOgenerally meets on a weekly basis and reviews the Corporation’scurrent and forecasted asset and liability levels as well asdesired pricing strategies and other relevant financialmanagement and interest rate and risk topics. Also, on amonthly basis the ALCO reviews various interest rate risksensitivity metrics, ratios and portfolio information, includingbut not limited to, the Corporation’s liquidity positions,projected sources and uses of funds, interest rate risk positionsand economic conditions.
Market risk refers to the risk of a reduction in theCorporation’s capital due to changes in the market valuation ofits assets and/or liabilities.
Most of the assets subject to market valuation risk aresecurities in the investment portfolio classified available forsale. Refer to Notes 9 and 10 for further information on theinvestment portfolio. Investment securities classified asavailable for sale amounted to $5.3 billion as of December 31,2014. Other assets subject to market risk include loans held-for-sale, which amounted to $106 million, the mortgageservicing rights (“MSRs”) which amounted to $149 million andsecurities classified as “trading” which amounted to $139million, as of December 31, 2014.
Liabilities subject to market risk include the FDIC clawbackobligation, which amounted to $ 129 million at December 31,2014.
The Corporation’s market risk is independently measuredand reported by the Financial and Operational RiskManagement Division and is reviewed by the Risk ManagementCommittee of the Board.
Management believes that market risk is not a materialsource of risk at the Corporation. A significant portion of theCorporation’s financial activities is concentrated in Puerto Rico,which has been going through a challenging economic cycle.Refer to the Geographic and Government Risk section of thisMD&A for some highlights on the current status of the PuertoRico economy.
Interest Rate RiskThe Corporation’s net interest income is subject to variouscategories of interest rate risk, including repricing, basis, yieldcurve and option risks. In managing interest rate risk,
management may alter the mix of floating and fixed rate assetsand liabilities, change pricing schedules, adjust maturitiesthrough sales and purchases of investment securities, and enterinto derivative contracts, among other alternatives.
Interest rate risk management is an active process thatencompasses monitoring loan and deposit flows complementedby investment and funding activities. Effective management ofinterest rate risk begins with understanding the dynamiccharacteristics of assets and liabilities and determining theappropriate rate risk position given line of business forecasts,management objectives, market expectations and policyconstraints.
Management utilizes various tools to assess IRR, includingsimulation modeling, static gap analysis, and Economic Valueof Equity (EVE). The three methodologies complement eachother and are used jointly in the evaluation of the Corporation’sIRR. Simulation modeling is prepared for a five year period,which in conjunction with the EVE analysis, providesManagement a better view of long term IRR.
Net interest income simulation analysis performed by legalentity and on a consolidated basis is a tool used by theCorporation in estimating the potential change in net interestincome resulting from hypothetical changes in interest rates.Sensitivity analysis is calculated using a simulation modelwhich incorporates actual balance sheet figures detailed bymaturity and interest yields or costs. It also incorporatesassumptions on balance sheet growth and expected changes inits composition, estimated prepayments in accordance withprojected interest rates, pricing and maturity expectations onnew volumes and other non-interest related data. It is adynamic process, emphasizing future performance underdiverse economic conditions.
Management assesses interest rate risk by comparing variousnet interest income simulations under different interest ratescenarios that differ in direction of interest rate changes, thedegree of change over time, the speed of change and theprojected shape of the yield curve. For example, the types ofrate scenarios processed during the year included economicmost likely scenarios, flat rates, yield curve twists, + 200 and +400 basis points parallel ramps and + 200 basis points parallelshocks. Management also performs analyses to isolate andmeasure basis and prepayment risk exposures.
The asset and liability management group performsvalidation procedures on various assumptions used as part ofthe sensitivity analysis as well as validations of results on amonthly basis. In addition, the model and processes used toassess IRR are subject to third-party validations according tothe guidelines established in the Model Governance andValidation policy. Due to the importance of critical assumptionsin measuring market risk, the risk models incorporate third-party developed data for critical assumptions such asprepayment speeds on mortgage loans and mortgage-backedsecurities, estimates on the duration of the Corporation’s

57 POPULAR, INC. 2014 ANNUAL REPORT
deposits and interest rate scenarios. These interest ratesimulations exclude the impact on loans accounted pursuant toASC Subtopic 310-30, whose yields are based on management’scurrent expectation of future cash flows.
The Corporation processes net interest income simulationsunder interest rate scenarios in which the yield curve isassumed to rise and decline gradually by the same amount. Therising rate scenarios considered in these market risksimulations reflect gradual parallel changes of 200 and 400basis points during the twelve-month period endingDecember 31, 2015. Under a 200 basis points rising ratescenario, 2015 projected net interest income increases by $60million, while under a 400 basis points rising rate scenario,2015 projected net interest income increases by $106 million.These scenarios were compared against the Corporation’s flat orunchanged interest rates forecast scenario. Simulation analysesare based on many assumptions, including relative levels ofmarket interest rates, interest rate spreads, loan prepaymentsand deposit decay. Thus, they should not be relied upon asindicative of actual results. Further, the estimates do notcontemplate actions that management could take to respond tochanges in interest rates. By their nature, these forward-lookingcomputations are only estimates and may be different fromwhat may actually occur in the future.
Static gap analysis measures the volume of assets andliabilities maturing or repricing at a future point in time. Staticgap reports stratify all of the Corporation’s assets, liabilities andoff-balance sheet positions according to the instrument’smaturity, repricing characteristics and optionality, assuming nonew business. The repricing volumes typically include
adjustments for anticipated future asset prepayments and fordifferences in sensitivity to market rates. The volume of assetsand liabilities repricing during future periods, particularlywithin one year, is used as one short-term indicator of IRR.Depending on the duration and repricing characteristics,changes in interest rates could either increase or decrease thelevel of net interest income. For any given period, the pricingstructure of the assets and liabilities is generally matched whenan equal amount of such assets and liabilities mature or repricein that period. Any mismatch of interest earning assets andinterest bearing liabilities is known as a gap position. A positivegap denotes asset sensitivity, which means that an increase ininterest rates could have a positive effect on net interestincome, while a decrease in interest rates could have a negativeeffect on net interest income. As shown in Table 29, atDecember 31, 2014, the Corporation’s one-year cumulativepositive gap was $5.3 billion, or 17.8% of total earning assets.This compares with $3.7 billion or 11.8%, respectively, atDecember 31, 2013. The change in the one-year cumulative gapposition was influenced by a lower level of short-termborrowings that resulted mainly from cash inflows and lowervolume of assets and higher level of capital from operations.These static measurements do not reflect the results of anyprojected activity and are best used as early indicators ofpotential interest rate exposures. They do not incorporatepossible actions that could be taken to manage theCorporation’s IRR, nor do they capture the basis risks thatmight be included within the cumulative gap, given possiblechanges in the spreads between asset rates and the rates used tofund them.
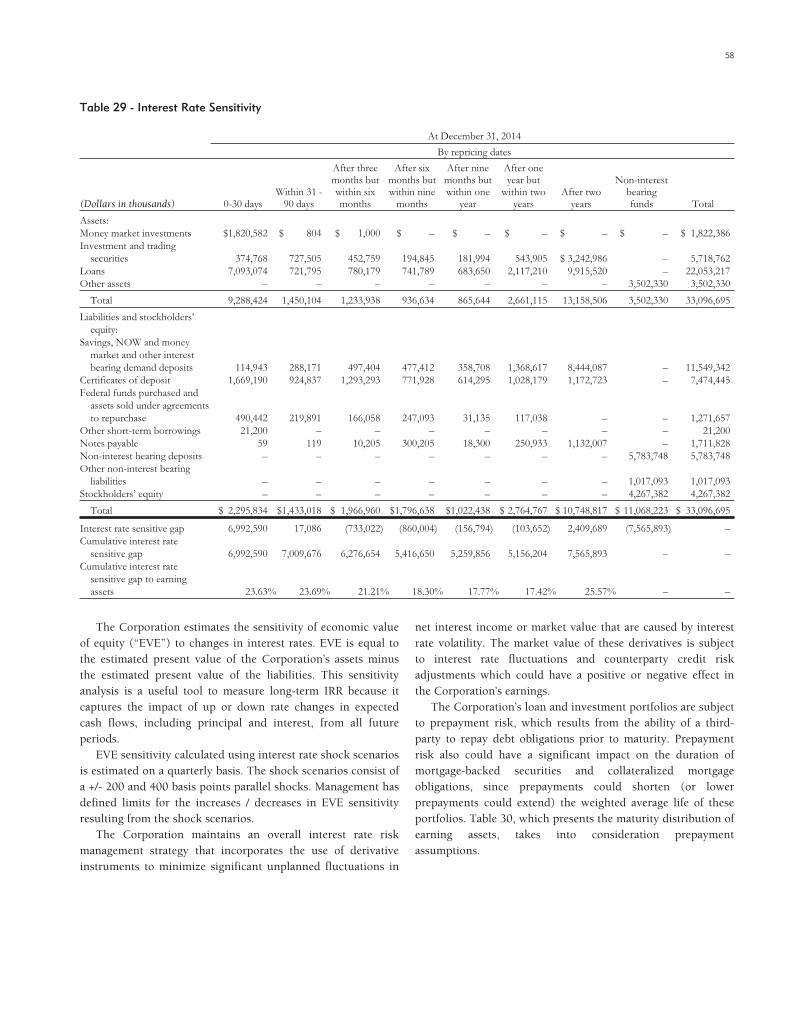
58
Table 29 - Interest Rate Sensitivity
At December 31, 2014
By repricing dates
(Dollars in thousands) 0-30 daysWithin 31 -
90 days
After threemonths butwithin sixmonths
After sixmonths butwithin nine
months
After ninemonths butwithin one
year
After oneyear but
within twoyears
After twoyears
Non-interestbearingfunds Total
Assets:Money market investments $1,820,582 $ 804 $ 1,000 $ – $ – $ – $ – $ – $ 1,822,386Investment and trading
securities 374,768 727,505 452,759 194,845 181,994 543,905 $ 3,242,986 – 5,718,762Loans 7,093,074 721,795 780,179 741,789 683,650 2,117,210 9,915,520 – 22,053,217Other assets – – – – – – – 3,502,330 3,502,330
Total 9,288,424 1,450,104 1,233,938 936,634 865,644 2,661,115 13,158,506 3,502,330 33,096,695
Liabilities and stockholders’equity:
Savings, NOW and moneymarket and other interestbearing demand deposits 114,943 288,171 497,404 477,412 358,708 1,368,617 8,444,087 – 11,549,342
Certificates of deposit 1,669,190 924,837 1,293,293 771,928 614,295 1,028,179 1,172,723 – 7,474,445Federal funds purchased and
assets sold under agreementsto repurchase 490,442 219,891 166,058 247,093 31,135 117,038 – – 1,271,657
Other short-term borrowings 21,200 – – – – – – – 21,200Notes payable 59 119 10,205 300,205 18,300 250,933 1,132,007 – 1,711,828Non-interest bearing deposits – – – – – – – 5,783,748 5,783,748Other non-interest bearing
liabilities – – – – – – – 1,017,093 1,017,093Stockholders’ equity – – – – – – – 4,267,382 4,267,382
Total $ 2,295,834 $1,433,018 $ 1,966,960 $1,796,638 $1,022,438 $ 2,764,767 $ 10,748,817 $ 11,068,223 $ 33,096,695
Interest rate sensitive gap 6,992,590 17,086 (733,022) (860,004) (156,794) (103,652) 2,409,689 (7,565,893) –Cumulative interest rate
sensitive gap 6,992,590 7,009,676 6,276,654 5,416,650 5,259,856 5,156,204 7,565,893 – –Cumulative interest rate
sensitive gap to earningassets 23.63% 23.69% 21.21% 18.30% 17.77% 17.42% 25.57% – –
The Corporation estimates the sensitivity of economic valueof equity (“EVE”) to changes in interest rates. EVE is equal tothe estimated present value of the Corporation’s assets minusthe estimated present value of the liabilities. This sensitivityanalysis is a useful tool to measure long-term IRR because itcaptures the impact of up or down rate changes in expectedcash flows, including principal and interest, from all futureperiods.
EVE sensitivity calculated using interest rate shock scenariosis estimated on a quarterly basis. The shock scenarios consist ofa +/- 200 and 400 basis points parallel shocks. Management hasdefined limits for the increases / decreases in EVE sensitivityresulting from the shock scenarios.
The Corporation maintains an overall interest rate riskmanagement strategy that incorporates the use of derivativeinstruments to minimize significant unplanned fluctuations in
net interest income or market value that are caused by interestrate volatility. The market value of these derivatives is subjectto interest rate fluctuations and counterparty credit riskadjustments which could have a positive or negative effect inthe Corporation’s earnings.
The Corporation’s loan and investment portfolios are subjectto prepayment risk, which results from the ability of a third-party to repay debt obligations prior to maturity. Prepaymentrisk also could have a significant impact on the duration ofmortgage-backed securities and collateralized mortgageobligations, since prepayments could shorten (or lowerprepayments could extend) the weighted average life of theseportfolios. Table 30, which presents the maturity distribution ofearning assets, takes into consideration prepaymentassumptions.

59 POPULAR, INC. 2014 ANNUAL REPORT
Table 30 - Maturity Distribution of Earning Assets
As of December 31, 2014
Maturities
After one yearthrough five years After five years
(In thousands)One year
or less
Fixedinterest
rates
Variableinterest
rates
Fixedinterest
rates
Variableinterest
rates Total
Money market securities $ 1,822,386 – – – – $ 1,822,386Investment and trading securities 1,851,748 $2,414,585 $ 28,817 $1,231,631 $ 27,453 5,554,234Loans:
Commercial 2,973,185 1,552,149 1,970,539 882,950 835,277 8,214,100Construction 129,373 21,914 64,122 33,797 2,468 251,674Lease financing 202,945 347,918 – 15,287 – 566,150Consumer 2,009,048 1,400,188 251,933 71,060 143,351 3,875,580Mortgage 818,880 1,435,107 363,246 3,551,732 434,086 6,603,051
Total non-covered loans 6,133,431 4,757,276 2,649,840 4,554,826 1,415,182 19,510,555Covered loans under FDIC loss sharing agreements 1,220,220 452,795 391,464 363,169 115,014 2,542,662
Total earning assets $11,027,785 $7,624,656 $3,070,121 $6,149,626 $1,557,649 $29,429,837
Note: Equity securities available-for-sale and other investment securities, including Federal Reserve Bank stock and Federal Home Loan Bank stock held by theCorporation, are not included in this table.Loans held-for-sale have been allocated according to the expected sale date.
Covered loansThe loans acquired in the Westernbank FDIC-assistedtransaction were initially recorded at estimated fair values. Asexpressed in the Critical Accounting Policies / Estimates sectionof this MD&A, most of the covered loans have an accretableyield. The accretable yield includes the future interest expectedto be collected over the remaining life of the acquired loans andthe purchase premium or discount. The remaining life includesthe effects of estimated prepayments and expected credit losses.For covered loans accounted for under ASC Subtopic 310-30,the Corporation is required to periodically evaluate its estimateof cash flows expected to be collected. These evaluations,performed quarterly, require the continued usage of keyassumptions and estimates. Management must apply judgmentto develop its estimates of cash flows for those covered loansgiven the impact of home price and property value changes,changes in interest rates and loss severities and prepaymentspeeds. Decreases in the expected cash flows by pool willgenerally result in a charge to the provision for credit lossesresulting in an increase to the allowance for loan losses, whileincreases in the expected cash flows of a pool will generallyresult in an increase in interest income over the remaining lifeof the loan, or pool of loans.
TradingThe Corporation engages in trading activities in the ordinarycourse of business at its subsidiaries, Banco Popular de PuertoRico (“BPPR”) and Popular Securities. Popular Securities’trading activities consist primarily of market-making activities
to meet expected customers’ needs related to its retail brokeragebusiness and purchases and sales of U.S. Government andgovernment sponsored securities with the objective of realizinggains from expected short-term price movements. BPPR’strading activities consist primarily of holding U.S. Governmentsponsored mortgage-backed securities classified as “trading”and hedging the related market risk with “TBA” (to-be-announced) market transactions. The objective is to derivespread income from the portfolio and not to benefit from short-term market movements. In addition, BPPR uses forwardcontracts or TBAs to hedge its securitization pipeline. Risksrelated to variations in interest rates and market volatility arehedged with TBAs that have characteristics similar to that of theforecasted security and its conversion timeline.
At December 31, 2014, the Corporation held tradingsecurities with a fair value of $139 million, representingapproximately 0.4% of the Corporation’s total assets, comparedwith $340 million and 1.0% at December 31, 2013. As shown inTable 31, the trading portfolio consists principally of mortgage-backed securities relating to BPPR’s mortgage activitiesdescribed above, which at December 31, 2014 were investmentgrade securities. As of December 31, 2014, the trading portfolioalso included $9.9 million in Puerto Rico governmentobligations and shares of Closed-end funds that invest primarilyin Puerto Rico government obligations (December 31, 2013 -$11.1 million). Trading instruments are recognized at fairvalue, with changes resulting from fluctuations in marketprices, interest rates or exchange rates reported in currentperiod earnings. The Corporation recognized a net trading

60
account gain of $4.4 million for the year ended December 31,2014, compared with a loss of $13.5 million for 2013. Table 31
provides the composition of the trading portfolio atDecember 31, 2014 and December 31, 2013.
Table 31 - Trading Portfolio
December 31, 2014 December 31, 2013
(Dollars in thousands) AmountWeighted
Average Yield [1] AmountWeighted
Average Yield [1]
Mortgage-backed securities $110,692 6.19% $312,751 4.90%Collateralized mortgage obligations 1,636 5.01 1,849 4.75Puerto Rico government obligations 7,954 5.23 7,586 5.15Interest-only strips 769 12.11 915 12.01Other 17,476 3.26 16,642 3.14
Total $138,527 5.78% $339,743 4.84%
[1] Not on a taxable equivalent basis.
The Corporation’s trading activities are limited by internalpolicies. For each of the two subsidiaries, the market riskassumed under trading activities is measured by the 5-day netvalue-at-risk (“VAR”), with a confidence level of 99%. The VARmeasures the maximum estimated loss that may occur over a 5-day holding period, given a 99% probability.
The Corporation’s trading portfolio had a 5-day VAR ofapproximately $1.1 million for the last week in December 2014.There are numerous assumptions and estimates associated withVAR modeling, and actual results could differ from theseassumptions and estimates. Backtesting is performed tocompare actual results against maximum estimated losses, inorder to evaluate model and assumptions accuracy.
In the opinion of management, the size and composition ofthe trading portfolio does not represent a significant source ofmarket risk for the Corporation.
DerivativesDerivatives are used by the Corporation as part of its overallinterest rate risk management strategy to minimize significantunexpected fluctuations in earnings and cash flows that arecaused by fluctuations in interest rates. Derivative instrumentsthat the Corporation may use include, among others, interestrate swaps, caps, floors, indexed options, and forward contracts.The Corporation does not use highly leveraged derivativeinstruments in its interest rate risk management strategy. TheCorporation enters into interest rate swaps, interest rate capsand foreign exchange contracts for the benefit of commercialcustomers. Credit risk embedded in these transactions isreduced by requiring appropriate collateral from counterpartiesand entering into netting agreements whenever possible. Alloutstanding derivatives are recognized in the Corporation’sconsolidated statement of condition at their fair value. Refer toNote 33 to the consolidated financial statements for furtherinformation on the Corporation’s involvement in derivativeinstruments and hedging activities.
The Corporation’s derivative activities are entered primarilyto offset the impact of market volatility on the economic valueof assets or liabilities. The net effect on the market value ofpotential changes in interest rates of derivatives and otherfinancial instruments is analyzed. The effectiveness of thesehedges is monitored to ascertain that the Corporation isreducing market risk as expected. Derivative transactions aregenerally executed with instruments with a high correlation tothe hedged asset or liability. The underlying index orinstrument of the derivatives used by the Corporation isselected based on its similarity to the asset or liability beinghedged. As a result of interest rate fluctuations, fixed andvariable interest rate hedged assets and liabilities will appreciateor depreciate in fair value. The effect of this unrealizedappreciation or depreciation is expected to be substantiallyoffset by the Corporation’s gains or losses on the derivativeinstruments that are linked to these hedged assets andliabilities. Management will assess if circumstances warrantliquidating or replacing the derivatives position in thehypothetical event that high correlation is reduced. Based onthe Corporation’s derivative instruments outstanding atDecember 31, 2014, it is not anticipated that such a scenariowould have a material impact on the Corporation’s financialcondition or results of operations.
Certain derivative contracts also present credit risk andliquidity risk because the counterparties may not comply withthe terms of the contract, or the collateral obtained might beilliquid or become so. The Corporation controls credit riskthrough approvals, limits and monitoring procedures, andthrough master netting and collateral agreements wheneverpossible. Further, as applicable under the terms of the masteragreements, the Corporation may obtain collateral, whereappropriate, to reduce credit risk. The credit risk attributed tothe counterparty’s nonperformance risk is incorporated in thefair value of the derivatives. Additionally, as required by the fairvalue measurements guidance, the fair value of the

61 POPULAR, INC. 2014 ANNUAL REPORT
Corporation’s own credit standing is considered in the fairvalue of the derivative liabilities. During the year endedDecember 31, 2014, inclusion of the credit risk in the fair valueof the derivatives resulted in a net gain of $1.1 million (2013 -net gain of $1.5 million; 2012 - net gain of $2.9 million), whichconsisted of a loss of $0.1 million (2013 - gain of $ 0.5 million;2012 - loss of $ 0.5 million) resulting from the Corporation’scredit standing adjustment and a gain of $1.2 million (2013 -gain of $1 million; 2012 - gain of $3.4 million) from theassessment of the counterparties’ credit risk. At December 31,2014, the Corporation had $15 million (2013 - $ 19 million)recognized for the right to reclaim cash collateral posted. Onthe other hand, the Corporation did not have any obligation toreturn cash collateral received at December 31, 2014 and 2013.
The Corporation performs appropriate due diligence andmonitors the financial condition of counterparties thatrepresent a significant volume of credit exposure. Additionally,the Corporation has exposure limits to prevent any unduefunding exposure.
Cash Flow HedgesThe Corporation manages the variability of cash payments dueto interest rate fluctuations by the effective use of derivativesdesignated as cash flow hedges and that are linked to specifiedhedged assets and liabilities. The cash flow hedges relate toforward contracts or “to be announced” (“TBA”) mortgage-backed securities that are sold and bought for future settlementto hedge mortgage-backed securities and loans prior tosecuritization. The seller agrees to deliver on a specified futuredate a specified instrument at a specified price or yield. Thesesecurities are hedging a forecasted transaction and aredesignated for cash flow hedge accounting. The notionalamount of derivatives designated as cash flow hedges atDecember 31, 2014 amounted to $93 million, while it did nothave any derivative that qualified to be accounted for as cashflow hedges outstanding at December 31, 2013.
Refer to Note 33 to the consolidated financial statements foradditional quantitative information on these derivativecontracts.
Fair Value HedgesThe Corporation did not have any derivatives designated as fairvalue hedges during the years ended December 31, 2014 and2013.
Trading and Non-Hedging Derivative ActivitiesThe Corporation enters into derivative positions based onmarket expectations or to benefit from price differentialsbetween financial instruments and markets mostly toeconomically hedge a related asset or liability. The Corporationalso enters into various derivatives to provide these types ofderivative products to customers. These free-standingderivatives are carried at fair value with changes in fair value
recorded as part of the results of operations for the period.Following is a description of the most significant of the
Corporation’s derivative activities that are not designated forhedge accounting. Refer to Note 33 to the consolidatedfinancial statements for additional quantitative and qualitativeinformation on these derivative instruments.
At December 31, 2014, the Corporation had outstanding$ 238 million (2013 - $ 283 million) in notional amount ofinterest rate swap agreements with a net negative fair value of$1 million (2013 - net negative fair value of $2 million), whichwere not designated as accounting hedges. These swaps wereentered in the Corporation’s capacity as an intermediary onbehalf of its customers and their offsetting swap position.
For the year ended December 31, 2014, the impact of themark-to-market of interest rate swaps not designated asaccounting hedges was a net increase in earnings ofapproximately $ 1.2 million, recorded in the other operatingincome category of the consolidated statement of operations,compared with an earnings increase of approximately$ 1.0 million and $ 3.0 million, in 2013 and in 2012 respectively.
At December 31, 2014, the Corporation did not have anyforward contracts outstanding, while on December 31, 2013 ithave $ 282 million in notional amount of forward contractsoutstanding with a net negative fair value of $ 696 thousand notdesignated as accounting hedges. These forward contracts areconsidered derivatives and are recorded at fair value.Subsequent changes in the value of these forward contracts arerecorded in the consolidated statement of operations. For theyear ended December 31, 2014, the impact of the mark-to-market of the forward contracts not designated as accountinghedges was a reduction to non-interest income of $ 10.9 million(2013 - gain of $ 9.0 million; 2012 - loss of $ 8.0 million),which was included in the category of mortgage bankingactivities in the consolidated statement of operations.
Furthermore, the Corporation has over-the-counter optioncontracts which are utilized in order to limit the Corporation’sexposure on customer deposits whose returns are tied to theS&P 500 or to certain other equity securities or commodityindexes. The Corporation offers certificates of deposit withreturns linked to these indexes to its retail customers,principally in connection with individual retirement accounts(IRAs), and certificates of deposit. At December 31, 2014, thesedeposits amounted to $ 83 million (2013 - $ 83 million), or lessthan 1% (2013 - less than 1%) of the Corporation’s totaldeposits. In these certificates, the customer’s principal isguaranteed by the Corporation and insured by the FDIC to themaximum extent permitted by law. The instruments pay areturn based on the increase of these indexes, as applicable,during the term of the instrument. Accordingly, this productgives customers the opportunity to invest in a product thatprotects the principal invested but allows the customer thepotential to earn a return based on the performance of theindexes.

62
The risk of issuing certificates of deposit with returns tied tothe applicable indexes is economically hedged by theCorporation. BPPR and BPNA purchase indexed options fromfinancial institutions with strong credit standings, whose returnis designed to match the return payable on the certificates ofdeposit issued by these banking subsidiaries. By hedging therisk in this manner, the effective cost of these deposits is fixed.The contracts have a maturity and an index equal to the termsof the pool of retail deposits that they are economicallyhedging.
The purchased option contracts are initially accounted for atcost (i.e., amount of premium paid) and recorded as aderivative asset. The derivative asset is marked-to-market on aquarterly basis with changes in fair value charged to earnings.The deposits are hybrid instruments containing embeddedoptions that must be bifurcated in accordance with thederivatives and hedging activities guidance. The initial value ofthe embedded option (component of the deposit contract thatpays a return based on changes in the applicable indexes) isbifurcated from the related certificate of deposit and is initiallyrecorded as a derivative liability and a corresponding discounton the certificate of deposit is recorded. Subsequently, thediscount on the deposit is accreted and included as part ofinterest expense while the bifurcated option is marked-to-market with changes in fair value charged to earnings.
The purchased indexed options are used to economicallyhedge the bifurcated embedded option. These option contractsdo not qualify for hedge accounting, and therefore, cannot bedesignated as accounting hedges. At December 31, 2014, thenotional amount of the indexed options on depositsapproximated $ 87 million (2013 - $ 86 million) with a fairvalue of $ 17 million (asset) (2013 - $ 20 million) while theembedded options had a notional value of $ 83 million (2013 -$ 83 million) with a fair value of $ 13 million (liability) (2013 -$ 16 million).
Refer to Note 33 to the consolidated financial statements fora description of other non-hedging derivative activities utilizedby the Corporation during 2014 and 2013.
Foreign ExchangeThe Corporation holds an interest in BHD León in theDominican Republic, which is an investment accounted forunder the equity method. The Corporation’s carrying value ofthe equity interest in BHD approximated $108 million atDecember 31, 2014. This business is conducted in the country’sforeign currency. The resulting foreign currency translationadjustment, from operations for which the functional currencyis other than the U.S. dollar, is reported in accumulated othercomprehensive loss in the consolidated statements of condition,except for highly-inflationary environments in which the effectswould be included in the consolidated statements of operations.At December 31, 2014, the Corporation had approximately$33 million in an unfavorable foreign currency translation
adjustment as part of accumulated other comprehensive loss,compared with an unfavorable adjustment of $36 million atDecember 31, 2013 and $31 million at December 31, 2012.
Additionally, during 2013, the Corporation sold itsinvestment in Tarjetas y Transacciones en Red Tranred, C.A.(formerly EVERTEC DE VENEZUELA, C.A.) which waswritten-down during 2011 as the Corporation determined towind-down those operations.
LiquidityThe objective of effective liquidity management is to ensurethat the Corporation has sufficient liquidity to meet all of itsfinancial obligations, finance expected future growth andmaintain a reasonable safety margin for cash commitmentsunder both normal and stressed market conditions. The Boardis responsible for establishing the Corporation’s tolerance forliquidity risk, including approving relevant risk limits andpolicies. The Board has delegated the monitoring of these risksto the RMC and the ALCO. The management of liquidity risk,on a long-term and day-to-day basis, is the responsibility of theCorporate Treasury Division. The Corporation’s CorporateTreasurer is responsible for implementing the policies andprocedures approved by the Board and for monitoring theCorporation’s liquidity position on an ongoing basis. Also, theCorporate Treasury Division coordinates corporate wideliquidity management strategies and activities with thereportable segments, oversees policy breaches and manages theescalation process. The Financial and Operational RiskManagement Division is responsible for the independentmonitoring and reporting of adherence with establishedpolicies.
An institution’s liquidity may be pressured if, for example,its credit rating is downgraded, it experiences a sudden andunexpected substantial cash outflow, or some other eventcauses counterparties to avoid exposure to the institution.Factors that the Corporation does not control, such as theeconomic outlook, adverse ratings of its principal markets andregulatory changes, could also affect its ability to obtainfunding.
Liquidity is managed by the Corporation at the level of theholding companies that own the banking and non-bankingsubsidiaries. It is also managed at the level of the banking andnon-banking subsidiaries. The Corporation has adopted policiesand limits to monitor more effectively the Corporation’sliquidity position and that of the banking subsidiaries.Additionally, contingency funding plans are used to modelvarious stress events of different magnitudes and affectingdifferent time horizons that assist management in evaluatingthe size of the liquidity buffers needed if those stress eventsoccur. However, such models may not predict accurately howthe market and customers might react to every event, and aredependent on many assumptions.

63 POPULAR, INC. 2014 ANNUAL REPORT
Deposits, including customer deposits, brokered depositsand public funds deposits, continue to be the most significantsource of funds for the Corporation, funding 75% of theCorporation’s total assets at December 31, 2014 andDecember 31, 2013. The ratio of total ending loans to depositswas 89% at December 31, 2014, compared to 93% atDecember 31, 2013. In addition to traditional deposits, theCorporation maintains borrowing arrangements. AtDecember 31, 2014, these borrowings consisted primarily of $1.2 billion in assets sold under agreement to repurchase, $822 million in advances with the FHLB, $440 million in juniorsubordinated deferrable interest debentures related to trustpreferred securities and $450 million in term notes issued topartially fund the repayment of TARP funds. A detaileddescription of the Corporation’s borrowings, including theirterms, is included in Notes 22 to 24 to the consolidatedfinancial statements. Also, the consolidated statements of cashflows in the accompanying consolidated financial statementsprovide information on the Corporation’s cash inflows andoutflows.
On April 22, 2014, the Corporation’s U.S. bank subsidiary(“PCB”) declared a $250 million cash dividend to the BankHolding Company (“BHC”), $100 million of which wascontributed by the BHC to BPPR.
On July 2, 2014, the Corporation completed the repaymentof TARP funds to the U.S. Treasury through the repurchase of$935 million of trust capital securities issued to the U.S.Treasury under the TARP Capital Purchase Program. TheCorporation funded the repurchase through a combination ofavailable cash and approximately $400 million from theproceeds of the issuance of its $450 million aggregate principalamount of 7% Senior Notes due on 2019 which settled onJuly 1, 2014.
On July 23, 2014, the Corporation also completed therepurchase of the outstanding warrant initially issued to theU.S. Treasury under the TARP Capital Purchase Program in2008. The warrant represented the right to purchase 2,093,284shares of the Corporation’s common stock at an exercise priceof $67 per share with an original term of 10 years. TheCorporation and the U.S. Treasury agreed upon a repurchaseprice of $3.0 million for the warrant. With the completion ofthis transaction, the Corporation completed its exit from theTARP Capital Purchase Program.
The following sections provide further information on theCorporation’s major funding activities and needs, as well as therisks involved in these activities. A detailed description of theCorporation’s borrowings and available lines of credit,including its terms, is included in Notes 22 to 24 to theconsolidated financial statements. Also, the consolidatedstatements of cash flows in the accompanying consolidatedfinancial statements provide information on the Corporation’scash inflows and outflows.
Banking SubsidiariesPrimary sources of funding for the Corporation’s bankingsubsidiaries (BPPR and BPNA), or “the banking subsidiaries,”include retail and commercial deposits, brokered deposits,unpledged investment securities, and, to a lesser extent, loansales. In addition, the Corporation maintains borrowingfacilities with the FHLB and at the discount window of the Fed,and has a considerable amount of collateral pledged that can beused to quickly raise funds under these facilities.
The principal uses of funds for the banking subsidiariesinclude loan originations, investment portfolio purchases, loanpurchases and repurchases, repayment of outstandingobligations (including deposits), and operational expenses.Also, the banking subsidiaries assume liquidity risk related tocollateral posting requirements for certain activities mainly inconnection with contractual commitments, recourse provisions,servicing advances, derivatives, credit card licensing agreementsand support to several mutual funds administered by BPPR.
Note 48 to the consolidated financial statements provides aconsolidating statement of cash flows which includes theCorporation’s banking subsidiaries as part of the “All othersubsidiaries and eliminations” column.
The banking subsidiaries maintain sufficient fundingcapacity to address large increases in funding requirementssuch as deposit outflows. This capacity is comprised mainly ofavailable liquidity derived from secured funding sources, aswell as on-balance sheet liquidity in the form of cash balancesmaintained at the Fed and unused secured lines held at the Fedand FHLB, in addition to liquid unpledged securities. TheCorporation has established liquidity guidelines that require thebanking subsidiaries to have sufficient liquidity to cover allshort-term borrowings and a portion of deposits.
The Corporation’s ability to compete successfully in themarketplace for deposits, excluding brokered deposits, dependson various factors, including pricing, service, convenience andfinancial stability as reflected by operating results, credit ratings(by nationally recognized credit rating agencies), andimportantly, FDIC deposit insurance. Although a downgrade inthe credit ratings of the Corporation’s banking subsidiaries mayimpact their ability to raise retail and commercial deposits orthe rate that it is required to pay on such deposits, managementdoes not believe that the impact should be material. Deposits atall of the Corporation’s banking subsidiaries are federallyinsured (subject to FDIC limits) and this is expected to mitigatethe potential effect of a downgrade in the credit ratings.
Deposits are a key source of funding as they tend to be lessvolatile than institutional borrowings and their cost is lesssensitive to changes in market rates. Refer to Table 20 for abreakdown of deposits by major types. Core deposits aregenerated from a large base of consumer, corporate andinstitutional customers. Core deposits include all non-interestbearing deposits, savings deposits and certificates of deposit under$100,000, excluding brokered deposits with denominations under

64
$100,000. Core deposits have historically provided theCorporation with a sizable source of relatively stable and low-costfunds. Core deposits totaled $20.6 billion, or 83% of totaldeposits, at December 31, 2014, compared with $21.9 billion, or82% of total deposits, at December 31, 2013. Core depositsfinanced 69% of the Corporation’s earning assets at December 31,2014, compared with 70% at December 31, 2013.
Certificates of deposit with denominations of $100,000 andover at December 31, 2014 totaled $3.3 billion, or 13% of totaldeposits (December 31, 2013 - $3.2 billion, or 12% of totaldeposits). Their distribution by maturity at December 31, 2014is presented in the table that follows:
Table 32 - Distribution by Maturity of Certificate of Depositsof $100,000 and Over
(In thousands)
3 months or less $1,614,6643 to 6 months 426,9546 to 12 months 595,150Over 12 months 626,497
Total $3,263,265
Average deposits, including brokered deposits, for the yearended December 31, 2014 represented 82% of average earningassets, compared with 85% for the years ended December 31,2013 and 2012. Table 33 summarizes average deposits for thepast five years.
Table 33 - Average Total Deposits
For the years ended December 31,
(In thousands) 2014 2013 2012 2011 2010
Non-interest bearing demand deposits $ 5,533,649 $ 5,728,228 $ 5,356,649 $ 5,058,424 $ 4,732,132
Savings accounts 6,733,195 6,792,137 6,571,133 6,320,825 5,970,000
NOW, money market and other interest bearing demandaccounts 4,824,402 5,738,189 5,555,203 5,204,235 4,981,332
Certificates of deposit:Under $100,000 3,708,622 4,817,831 5,276,389 5,966,089 6,099,741$100,000 and over 3,107,735 2,995,175 3,375,846 4,026,042 4,073,047
Certificates of deposit 6,816,357 7,813,006 8,652,235 9,992,131 10,172,788Other time deposits 739,752 700,815 768,713 927,776 794,245
Total interest bearing deposits 19,113,706 21,044,147 21,547,284 22,444,967 21,918,365
Total average deposits $24,647,355 $26,772,375 $26,903,933 $27,503,391 $26,650,497
At December 31, 2014 approximately 6% of theCorporation’s assets were financed by brokered deposits, ascompared to 7% at December 31, 2013. The Corporation had $1.9 billion in brokered deposits at December 31, 2014 and $2.4billion in December 31, 2013. In the event that any of theCorporation’s banking subsidiaries’ regulatory capital ratios fallbelow those required by a well-capitalized institution or aresubject to capital restrictions by the regulators, that bankingsubsidiary faces the risk of not being able to raise or maintainbrokered deposits and faces limitations on the rate paid ondeposits, which may hinder the Corporation’s ability toeffectively compete in its retail markets and could affect itsdeposit raising efforts.
To the extent that the banking subsidiaries are unable toobtain sufficient liquidity through core deposits, the Corporationmay meet its liquidity needs through short-term borrowings bypledging securities for borrowings under repurchase agreements,by pledging additional loans and securities through the availablesecured lending facilities, or by selling liquid assets. Thesemeasures are subject to availability of collateral.
The Corporation’s banking subsidiaries have the ability toborrow funds from the FHLB. At December 31, 2014 andDecember 31, 2013, the banking subsidiaries had creditfacilities authorized with the FHLB aggregating to $3.7 billionand $3.0 billion, respectively, based on assets pledged with theFHLB at those dates. Outstanding borrowings under thesecredit facilities totaled $ 822 million at December 31, 2014 and$1.2 billion at December 31, 2013. Such advances arecollateralized by loans held-in-portfolio, do not have restrictivecovenants and do not have any callable features. AtDecember 31, 2014 and December 31, 2013 the credit facilitiesauthorized with the FHLB were collateralized by $ 4.5 billion inloans held-in-portfolio. Refer to Notes 23 and 24 to theconsolidated financial statements for additional information onthe terms of FHLB advances outstanding.
At December 31, 2014 and December 31, 2013, theCorporation’s borrowing capacity at the Fed’s DiscountWindow amounted to approximately $2.1 billion and $3.4billion, respectively, which remained unused as of both dates.This facility is a collateralized source of credit that is highly

65 POPULAR, INC. 2014 ANNUAL REPORT
reliable even under difficult market conditions. The amountavailable under this borrowing facility is dependent upon thebalance of performing loans, securities pledged as collateral andthe haircuts assigned to such collateral. At December 31, 2014and December 31, 2013, this credit facility with the Fed wascollateralized by $ 4.1 billion and $4.5 billion, respectively, inloans held-in-portfolio.
On October 20, 2014, the Memorandum of Understanding(the “FRB-NY MOU”) entered into on July 20, 2011 amongPopular, Inc., BPPR, the Federal Reserve Bank of New York (the“FRB-NY”) and the Office of the Commissioner of FinancialInstitutions of Puerto Rico was terminated. The FRB-NY MOUprovided, among other things, for the Corporation to take stepsto improve its credit risk management practices and assetquality, and for the Corporation to develop strategic plans toimprove earnings and to develop capital plans. The FRB-NYMOU also required the Corporation to obtain approval from theapplicable FRB-NY MOU counterparties prior to, among otherthings, declaring or paying dividends, purchasing or redeemingany shares of its stock, consummating acquisitions or mergers,or making any distributions on its trust preferred securities orsubordinated debentures. On January 9, 2015, anotherMemorandum of Understanding entered into among BPNA, theFRB-NY and the New York State Department of FinancialServices (the “NYSDFS”), effective on July 25, 2011, was alsoterminated. This Memorandum of Understanding provided thatBPNA could not declare dividends without the approval of theFRB-NY and the NYSDFS.
As disclosed in Note 4- Discontinued Operations, during2014, the Corporation completed the sale of its California,Central Florida and Illinois operations. The sale of theseregions resulted in a net gain of $33.8 million, after customarytransaction costs. The sales resulted in a transfer of a netliability position. Accordingly, BPNA had to fund this differencewith its available liquidity sources and made payments to thepurchasers upon the closing of the transactions amounting toapproximately $206.0 million, inclusive of certain agreed uponcosts. The Corporation recorded a non-cash goodwillimpairment charge of $186.5 million, related to the goodwillasset allocated to these regions. This non-cash charge had noimpact on the Corporation’s tangible capital or regulatorycapital ratios.
In connection with the restructuring of its U.S. mainlandoperations, the Corporation is taking steps to restructure itsbalance sheet and funding strategies. As part of the strategy,during the third quarter of 2014, the Corporation soldapproximately $94.2 million in securities available for sale andrefinanced approximately $638 million in long term structuredrepos in the U.S. with a yield of 4.41% and replaced them withlower cost short term repos of a similar amount. During 2014,the Corporation recognized approximately $39.8 millionrelated to the fees associated with the refinancing of theserepos.
At December 31, 2014, management believes that thebanking subsidiaries had sufficient current and projectedliquidity sources to meet their anticipated cash flow obligations,as well as special needs and off-balance sheet commitments, inthe ordinary course of business and have sufficient liquidityresources to address a stress event. Although the bankingsubsidiaries have historically been able to replace maturingdeposits and advances if desired, no assurance can be given thatthey would be able to replace those funds in the future if theCorporation’s financial condition or general market conditionswere to deteriorate. The Corporation’s financial flexibility willbe severely constrained if its banking subsidiaries are unable tomaintain access to funding or if adequate financing is notavailable to accommodate future financing needs at acceptableinterest rates. The banking subsidiaries also are required todeposit cash or qualifying securities to meet marginrequirements. To the extent that the value of securitiespreviously pledged as collateral declines because of marketchanges, the Corporation will be required to deposit additionalcash or securities to meet its margin requirements, therebyadversely affecting its liquidity. Finally, if management isrequired to rely more heavily on more expensive fundingsources to meet its future growth, revenues may not increaseproportionately to cover costs. In this case, profitability wouldbe adversely affected.
Westernbank FDIC-assisted Transaction and Impact onLiquidityThe effects of the loss sharing agreements on cash flows andoperating results will depend primarily on the ability of theborrowers whose loans are covered by the loss sharingagreements to make payments over time and our ability toreceive reimbursements for losses from the FDIC. As the losssharing agreements are in effect for a period of ten years forone-to-four family loans and five years for commercial,construction and consumer loans (with periods commencingon April 30, 2010), changing economic conditions will likelyimpact the timing of future charge-offs and the resultingreimbursements from the FDIC. Management believes that anyrecapture of interest income and recognition of cash flows fromthe borrowers or received from the FDIC on the claims filedmay be recognized unevenly over this period, as managementexhausts its collection efforts under the Corporation’s normalpractices.
BPPR’s liquidity may also be impacted by the loan paymentperformance and timing of claims made and receipt ofreimbursements under the FDIC loss sharing agreements.Please refer to the Legal Proceedings section of Note 31 to theconsolidated financial statements and to Part II, Item 1A- Riskfactors herein for a discussion of the settlement of a contractualdispute between BPPR and the FDIC which has impacted thetiming of the payment of claims under the loss shareagreements.

66
Bank Holding CompaniesThe principal sources of funding for the holding companiesinclude cash on hand, investment securities, dividends receivedfrom banking and non-banking subsidiaries (subject toregulatory limits and authorizations) asset sales, credit facilitiesavailable from affiliate banking subsidiaries and proceeds frompotential securities offerings.
The principal use of these funds include the repayment ofdebt, and interest payments to holders of senior debt and juniorsubordinated deferrable interest (related to trust preferredsecurities) and capitalizing its banking subsidiaries.
During the year ended December 31, 2014, PIHC received$ 4.7 million in dividends from EVERTEC’s parent company.PIHC also received $10.1 million in dividends from itsinvestment in BHD.
On April 22, 2014, the Corporation’s U.S. bank subsidiary(“PCB”) declared a $250 million cash dividend to the BankHolding Company (“BHC”), $100 million of which wascontributed by the BHC to the Puerto Rico banking subsidiary(“BPPR”).
As mentioned above, on July 2, 2014, the Corporationcompleted the repayment of TARP funds to the U.S. Treasurythrough the repurchase of $935 million of trust capitalsecurities, which was partially funded with $400 million fromthe issuance of $450 million aggregate principal amount of 7%Senior Notes due on 2019 which settled on July 1, 2014.
On July 23, 2014, the Corporation also completed therepurchase of the outstanding warrant initially issued to theU.S. Treasury under the TARP Capital Purchase Program in2008, for a purchase price of $3.0 million. With the completionof this transaction, the Corporation completed its exit from theTARP Capital Purchase Program.
In connection with the repayment of TARP on July 2, 2014,the Corporation accelerated the related amortization of thediscount and deferred costs amounting to $414.1 millionduring the second quarter of 2014, which is reflected as part ofinterest expense in the consolidated statement of operations.
Another use of liquidity at the parent holding company isthe payment of dividends on preferred stock. At the end of2010, the Corporation resumed paying dividends on its Series Aand B preferred stock. The preferred stock dividends amountedto $3.7 million for the year ended December 31, 2014. Thepreferred stock dividends paid were financed by issuing newshares of common stock to the participants of the Corporation’squalified employee savings plans. The Corporation anticipatesthat any future preferred stock dividend payments wouldcontinue to be financed with the issuance of new commonstock in connection with its qualified employee savings plans.The Corporation is not paying dividends to holders of itscommon stock.
The BHC’s have in the past borrowed in the money marketsand in the corporate debt market primarily to finance their non-banking subsidiaries, however, the cash needs of the
Corporation’s non-banking subsidiaries other than to repayindebtedness and interest are now minimal. These sources offunding have become more costly due to the reductions in theCorporation’s credit ratings. The Corporation’s principal creditratings are below “investment grade” which affects theCorporation’s ability to raise funds in the capital markets. TheCorporation has an automatic shelf registration statement filedand effective with the Securities and Exchange Commission,which permits the Corporation to issue an unspecified amountof debt or equity securities.
Note 48 to the consolidated financial statements provides astatement of condition, of operations and of cash flows for thetwo BHC’s. The loans held-in-portfolio in such financialstatements is principally associated with intercompanytransactions.
The outstanding balance of notes payable at the BHC’samounted to $890 million at December 31, 2014 and to $972million on December 31, 2013. The repayment of the BHC’sobligations represents a potential cash need which is expectedto be met with a combination of internal liquidity resourcesstemming mainly from future dividend receipts and newborrowings.
The contractual maturities of the BHC’s notes payable atDecember 31, 2014 are presented in Table 34.
Table 34 - Distribution of BHC’s Notes Payable byContractual Maturity
Year (In thousands)
2015 $ –2016 –2017 –2018 –2019 450,000Later years 439,800
Total $889,800
As indicated previously, the BHC did not issue newregistered debt in the capital markets during the year endedDecember 31, 2014.
The BHCs liquidity position continues to be adequate withsufficient cash on hand, investments and other sources ofliquidity which are expected to be enough to meet all BHCsobligations during the foreseeable future.
Non-banking subsidiariesThe principal sources of funding for the non-bankingsubsidiaries include internally generated cash flows fromoperations, loan sales, repurchase agreements, and borrowedfunds from their direct parent companies or the holdingcompanies. The principal uses of funds for the non-bankingsubsidiaries include repayment of maturing debt, operationalexpenses and payment of dividends to the BHCs. The liquidityneeds of the non-banking subsidiaries are minimal since most
67 POPULAR, INC. 2014 ANNUAL REPORT
of them are funded internally from operating cash flows or fromintercompany borrowings from their holding companies, BPPRor BPNA.
Other Funding Sources and CapitalThe investment securities portfolio provides an additionalsource of liquidity, which may be realized through eithersecurities sales or repurchase agreements. The Corporation’sinvestment securities portfolio consists primarily of liquid U.S.government investment securities, sponsored U.S. agencysecurities, government sponsored mortgage-backed securities,and collateralized mortgage obligations that can be used to raisefunds in the repo markets. At December 31, 2014, theinvestment and trading securities portfolios, as shown in Table30, totaled $5.6 billion, of which $1.9 billion, or 33%, hadmaturities of one year or less. Mortgage-related investments inTable 30 are presented based on expected maturities, whichmay differ from contractual maturities, since they could besubject to prepayments. The availability of the repurchaseagreement would be subject to having sufficient unpledgedcollateral available at the time the transactions are to beconsummated, in addition to overall liquidity and risk appetiteof the various counterparties. The Corporation’s unpledgedinvestment and trading securities, excluding other investmentsecurities, amounted to $ 2.7 billion at December 31, 2014 and$2.5 billion at December 31, 2013. A substantial portion ofthese securities could be used to raise financing quickly in theU.S. money markets or from secured lending sources.
Additional liquidity may be provided through loanmaturities, prepayments and sales. The loan portfolio can alsobe used to obtain funding in the capital markets. In particular,mortgage loans and some types of consumer loans, havesecondary markets which the Corporation could use. Thematurity distribution of the total loan portfolio at December 31,2014 is presented in Table 30. As of that date, $7.4 billion, or33% of the loan portfolio was expected to mature within oneyear, compared with $8.5 billion, or 34% of the loan portfolioin the previous year. The contractual maturities of loans havebeen adjusted to include prepayments based on historical dataand prepayment trends.
Risks to LiquidityTotal lines of credit outstanding are not necessarily a measureof the total credit available on a continuing basis. Some of theselines could be subject to collateral requirements, standards ofcreditworthiness, leverage ratios and other regulatoryrequirements, among other factors. Derivatives, such as thoseembedded in long-term repurchase transactions or interest rateswaps, and off-balance sheet exposures, such as recourse,performance bonds or credit card arrangements, are subject tocollateral requirements. As their fair value increases, thecollateral requirements may increase, thereby reducing thebalance of unpledged securities.
The importance of the Puerto Rico market for theCorporation is an additional risk factor that could affect itsfinancing activities. In the case of a deterioration in economicconditions in Puerto Rico, the credit quality of the Corporationcould be affected and result in higher credit costs. The PuertoRico economy continues to face various challenges, includingsignificant pressures in some sectors of the residential realestate market. Refer to the Geographic and Government Risksection of this MD&A for some highlights on the current statusof the Puerto Rico economy.
Factors that the Corporation does not control, such as theeconomic outlook and credit ratings of its principal marketsand regulatory changes, could also affect its ability to obtainfunding. In order to prepare for the possibility of such scenario,management has adopted contingency plans for raisingfinancing under stress scenarios when important sources offunds that are usually fully available are temporarilyunavailable. These plans call for using alternate fundingmechanisms, such as the pledging of certain asset classes andaccessing secured credit lines and loan facilities put in placewith the FHLB and the Fed.
The credit ratings of Popular’s debt obligations are a relevantfactor for liquidity because they impact the Corporation’s abilityto borrow in the capital markets, its cost and access to fundingsources. Credit ratings are based on the financial strength,credit quality and concentrations in the loan portfolio, the leveland volatility of earnings, capital adequacy, the quality ofmanagement, the liquidity of the balance sheet, the availabilityof a significant base of core retail and commercial deposits, andthe Corporation’s ability to access a broad array of wholesalefunding sources, among other factors.
The Corporation’s banking subsidiaries have historically notused unsecured capital market borrowings to finance itsoperations, and therefore are less sensitive to the level andchanges in the Corporation’s overall credit ratings. At theBHCs, the volume of capital market borrowings has declinedsubstantially, as the non-banking lending businesses that it hadhistorically funded have been shut down and the need to raiseunsecured senior debt has been substantially reduced.
Obligations Subject to Rating Triggers or CollateralRequirementsThe Corporation’s banking subsidiaries currently do not useborrowings that are rated by the major rating agencies, as thesebanking subsidiaries are funded primarily with deposits andsecured borrowings. The banking subsidiaries had $19 millionin deposits at December 31, 2014 that are subject to ratingtriggers.
Some of the Corporation’s derivative instruments includefinancial covenants tied to the bank’s well-capitalized status andcertain formal regulatory actions. These agreements couldrequire exposure collateralization, early termination or both.The fair value of derivative instruments in a liability position

68
subject to financial covenants approximated $9 million atDecember 31, 2014, with the Corporation providing collateraltotaling $15 million to cover the net liability position withcounterparties on these derivative instruments.
In addition, certain mortgage servicing and custodialagreements that BPPR has with third parties include ratingcovenants. In the event of a credit rating downgrade, the thirdparties have the right to require the institution to engage asubstitute cash custodian for escrow deposits and/or increasecollateral levels securing the recourse obligations. Also, asdiscussed in the Guarantees section of this MD&A, theCorporation services residential mortgage loans subject tocredit recourse provisions. Certain contractual agreementsrequire the Corporation to post collateral to secure suchrecourse obligations if the institution’s required credit ratingsare not maintained. Collateral pledged by the Corporation tosecure recourse obligations amounted to approximately $92million at December 31, 2014. The Corporation could berequired to post additional collateral under the agreements.Management expects that it would be able to meet additionalcollateral requirements if and when needed. The requirementsto post collateral under certain agreements or the loss of escrowdeposits could reduce the Corporation’s liquidity resources andimpact its operating results.
Credit Risk Management and Loan QualityCredit risk occurs any time funds are advanced, committed,invested or otherwise exposed. Credit risk arises primarily fromthe Corporation’s lending activities, as well as from other on-balance sheet and off-balance sheet credit instruments. Creditrisk management is based on analyzing the creditworthiness ofthe borrower or counterparty, the adequacy of underlyingcollateral given current events and conditions, and theexistence and strength of any guarantor support.
Business activities that expose the Corporation to credit riskare managed within the Board’s established limits that considerfactors, such as maintaining a prudent balance of risk-takingacross diversified risk types and business units (compliancewith regulatory guidance, considering factors such asconcentrations and loan-to-value ratios), controlling theexposure to lower credit quality assets, and limiting growth in,and overall exposure to, any product or risk segment where theCorporation does not have sufficient experience and a provenability to predict credit losses.
The significant changes in the economic conditions and theresulting changes in the borrower’s profile over the past severalyears requires the Corporation to continue to focus on theidentification, monitoring and managing of its credit risk. TheCorporation manages credit risk by maintaining soundunderwriting standards, monitoring and evaluating loanportfolio quality, its trends and collectability, and assessingreserves and loan concentrations. Also, credit risk is mitigatedby implementing and monitoring lending policies and collateral
requirements, and instituting credit review procedures toensure appropriate actions to comply with laws and regulations.The Corporation’s credit policies require prompt identificationand quantification of asset quality deterioration or potential lossin order to ensure the adequacy of the allowance for loan losses.Included in these policies, primarily determined by the amount,type of loan and risk characteristics of the credit facility, arevarious approval levels and lending limit constraints, rangingfrom the branch or department level to those that are morecentralized. When considered necessary, the Corporationrequires collateral to support credit extensions andcommitments, which is generally in the form of real estate andpersonal property, cash on deposit and other highly liquidinstruments.
The Corporation’s Credit Strategy Committee (“CRESCO”)is management’s top policy-making body with respect to credit-related matters and credit strategies. CRESCO reviews theactivities of each subsidiary, in the detail that it deemsappropriate, to ensure a proactive and coordinated managementof credit granting, credit exposures and credit procedures.CRESCO’s principal functions include reviewing the adequacyof the allowance for loan losses and periodically approvingappropriate provisions, monitoring compliance with charge-offpolicy, establishing portfolio diversification, yield and qualitystandards, establishing credit exposure reporting standards,monitoring asset quality, and approving credit policies andamendments thereto for the subsidiaries and/or business lines,including special lending approval authorities when and ifappropriate. The analysis of the allowance adequacy ispresented to the Risk Management Committee of the Board ofDirectors for review, consideration and ratification on aquarterly basis.
The Corporation also has a Corporate Credit RiskManagement Division (“CCRMD”). CCRMD is a centralizedunit, independent of the lending function. The CCRMD’sfunctions include identifying, measuring and controlling creditrisk independently from the business units, evaluating thecredit risk rating system and reviewing the adequacy of theallowance for loan losses in accordance with GAAP andregulatory standards. CCRMD also ensures that the subsidiariescomply with the credit policies and applicable regulations, andmonitors credit underwriting standards. Also, the CCRMDperforms ongoing monitoring of the portfolio, includingpotential areas of concern for specific borrowers and/orgeographic regions. The CCRMD has strengthened itsquantitative measurement capabilities, part of continuedimprovements to the credit risk management processes.
The Corporation has a Loan Review Department within theCCRMD, which performs annual credit process reviews ofseveral small and middle markets, construction, asset-based andcorporate banking lending groups in BPPR. This groupevaluates the credit risk profile of each originating unit alongwith each unit’s credit administration effectiveness, including
69 POPULAR, INC. 2014 ANNUAL REPORT
the assessment of the risk rating representative of the currentcredit quality of the loans, and the evaluation of collateraldocumentation. The monitoring performed by this groupcontributes to assess compliance with credit policies andunderwriting standards, determine the current level of creditrisk, evaluate the effectiveness of the credit managementprocess and identify control deficiencies that may arise in thecredit-granting process. Based on its findings, the CorporateLoan Review Department recommends corrective actions, ifnecessary, that help in maintaining a sound credit process. Inthe case of the portfolios of commercial and construction loansin the U.S. mainland operations, credit process reviews areperformed by an outside contractor. The CCRMD participatesin defining the review plan with the outside loan review firmand actively participates in the discussions of the results of theloan reviews with the business units. The CCRMD mayperiodically review the work performed by the outside loanreview firm. CCRMD reports the results of the credit processreviews to the Risk Management Committee of theCorporation’s Board of Directors.
The Corporation also created during the first quarter of2012 the Commercial Credit Administration Group, whichincludes the Special Loans Division, the Commercial CreditOperations Division and the Loss-Sharing AgreementAdministration Group. This unit focuses on maximizing thevalue of the Corporation’s special loans and other real estateowned of the commercial portfolio, as well as the FDIC coveredloans portfolio. The continued expansion of the workoutresources demonstrates the Corporation’s commitment onproactively identifying problem loans in order to reduce thelevel of non-performing assets.
At December 31, 2014, the Corporation’s credit exposurewas centered in its $22.1 billion total loan portfolio, whichrepresented 75% of its earning assets. The portfoliocomposition for the last five years is presented in Table 12.
The Corporation issues certain credit-related off-balancesheet financial instruments including commitments to extendcredit, standby letters of credit and commercial letters of creditto meet the financing needs of its customers. For these financialinstruments, the contract amount represents the credit riskassociated with failure of the counterparty to perform inaccordance with the terms and conditions of the contract andthe decline in value of the underlying collateral. The credit riskassociated with these financial instruments varies depending onthe counterparty’s creditworthiness and the value of anycollateral held. Refer to Note 31 to the consolidated financialstatements and to the Contractual Obligations and CommercialCommitments section of this MD&A for the Corporation’sinvolvement in these credit-related activities.
At December 31, 2014, the Corporation maintained areserve of approximately $13 million for potential lossesassociated with unfunded loan commitments related tocommercial and consumer lines of credit (2013 - $7 million).
The Corporation is also exposed to credit risk by usingderivative instruments but manages the level of risk by onlydealing with counterparties of good credit standing, enteringinto master netting agreements whenever possible and, whenappropriate, obtaining collateral. Refer to Note 33 to theconsolidated financial statements for further information on theCorporation’s involvement in derivative instruments andhedging activities, and the Derivatives sub-section includedunder Risk Management in this MD&A.
The Corporation may also encounter risk of default inrelation to its investment securities portfolio. Refer to Notes 9and 10 for the composition of the investment securitiesavailable-for-sale and held-to-maturity. The investmentsecurities portfolio held by the Corporation at December 31,2014 are mostly Obligations of U.S. Government sponsoredentities, collateralized mortgage obligations, mortgage-backedsecurities and Obligations of Puerto Rico, States and politicalsubdivisions.
The Corporation’s credit risk exposure is spread amongindividual consumers, small and medium businesses, as well ascorporate borrowers engaged in a wide variety of industries.Only 168 of these commercial lending relationships have anaggregate exposure of $10 million or more. At December 31,2014, highly leveraged transactions and credit facilities tofinance real estate ventures or business acquisitions amountedto $156 million, and there are no loans to less developedcountries. The Corporation limits its exposure toconcentrations of credit risk by the nature of its lending limits.
The Corporation has a significant portfolio of commercialloans, mostly secured by commercial real estate properties. Dueto their nature, these loans entail a higher credit risk thanconsumer and residential mortgage loans, since they are largerin size, may have less collateral coverage, higher concentratedrisk in a single borrower and are generally more sensitive toeconomic downturns. General economic conditions andnumerous other factors continue to create volatility in collateralvalues and have increased the possibility that additional lossesmay have to be recognized with respect to the Corporation’scurrent nonperforming assets. Furthermore, given the currentslowdown in the real estate market, particularly in Puerto Rico,the properties securing these loans may be difficult to disposeof, if foreclosed.
Historically, the levels of real estate prices in Puerto Ricowere more stable than in other U.S. markets. Nevertheless, thecurrent economic environment has accelerated the devaluationof properties when compared with the previous periods. Also,additional economic weakness, the effect of the downgrade ofPuerto Rico’s general obligation debt to non-investment grade,among others, could further pressure property values. Furtherdeclines in property values could impact the credit quality ofthe loan portfolios in Puerto Rico as the value of the collateralunderlying the loans is the primary source of repayment in theevent of foreclosure. Lower real estate values could increase the

70
provision for loan losses, loan delinquencies, foreclosures andthe cost of repossessing and disposing of real estate collateral.
Over the past several years, the Corporation has focused inde-risking its loan portfolios by reducing its exposure in assetclasses with historically high loss content. During the secondhalf of 2014, the divesture of its regional operations inCalifornia, Illinois, and Central Florida, as well as the sale ofcertain non-performing and legacy assets were completed, aspart of the US operations reorganization. Furthermore, theCorporation has significantly curtailed the production of non-traditional mortgages as it ceased originating non-conventionalmortgage loans in its U.S. mainland operations.
Management continues to refine the Corporation’s creditstandards to meet the changing economic environment. TheCorporation has strengthened its underwriting criteria, as wellas enhanced its line management, collection strategies andproblem loan management process. The commercial lendingand administration groups continue strengthening critical areasto manage more effectively the current scenario, focusingstrategies on critical steps in the origination and portfoliomanagement processes to ensure the quality of incoming loansas well as to detect and manage potential problem loans early.The consumer lending group has also tightened theunderwriting standards across all business lines and reduced itsexposure in areas that are more likely to be impacted under thecurrent economic conditions.
Geographic and government riskPopular is exposed to geographical and government risk. Asignificant portion of our financial activities and creditexposure is concentrated in Puerto Rico, which entered into arecession in the second quarter of 2006. Puerto Rico’s grossnational product contracted in real terms in every year betweenfiscal year 2007 and fiscal year 2011 (inclusive), and grew by0.9% (revised figures) and 0.3% (preliminary) in fiscal years2012 and 2013. According to the Puerto Rico Planning Board,for fiscal years 2014 and 2015, gross national product isprojected to increase by only 0.1% and 0.2%. However, themonthly economic indicators for fiscal year 2014 indicate thatthe final GNP figures may be lower than the last projectionpresented by the Puerto Rico Planning Board. The latestGovernment Development Bank for Puerto Rico (“GDB”)Economic Activity Index, which is a coincident indicator ofongoing economic activity, reflected a 1.4% year-over-yearreduction for December 2014, after showing a 2.1% year-over-year reduction for November 2014.
This persistent contraction or minimal growth has had anadverse effect on employment. A reduction in total employmentbegan in the fourth quarter of fiscal year 2007 (ending June 30,2007) and has continued consistently through fiscal year 2014(ending June 30, 2014) due to the current recession andcontractionary fiscal adjustment measures. According to theHousehold Survey (conducted by the Puerto Rico Department
of Labor and Human Resources), the number of personsemployed in Puerto Rico during fiscal year 2013 (endedJune 30, 2013) averaged 1,029,019, a decrease of 0.6%compared to the previous fiscal year; and the unemploymentrate averaged 14.0%. For fiscal year 2014 (ended June 30,2014), the number of persons employed in Puerto Ricoaveraged 1,006,646, a decrease of 2.2% compared to theprevious fiscal year; and the unemployment rate averaged14.3%. During the first three months of fiscal year 2015 (July 1,2014 through September 30, 2014), total employment averaged974,800, a 3.3% reduction with respect to the same period ofthe prior year, and the unemployment rate averaged 14.7%.
In February 2014, the three principal rating agencies(Moody’s, S&P and Fitch) lowered their ratings on the GeneralObligation bonds of the Commonwealth of Puerto Rico and thebonds of several other Commonwealth instrumentalities tonon-investment grade ratings. In connection with their ratingactions, the rating agencies noted various factors, includinghigh levels of public debt, the lack of a clear economic growthcatalyst, recurring fiscal budget deficits, the financial conditionof the public sector employee pension plans and, more recently,liquidity concerns regarding the Commonwealth and the GDBand their ability to access the capital markets.
On June 28, 2014, Governor Alejandro García Padilla signedinto law the Puerto Rico Public Corporation Debt Enforcementand Recovery Act (the “Recovery Act”) which provides aframework for certain public corporations, including the PuertoRico Electric Power Authority (“PREPA”), the Puerto RicoAqueduct and Sewer Authority and the Puerto Rico Highwaysand Transportation Authority, to restructure their debtobligations in order to ensure that the services they provide tothe public are not interrupted. On July 1, 2014, Moody’s, as aconsequence of the enactment of the Recovery Act, againdowngraded the majority of the Puerto Rico central governmentand public instrumentalities’ obligations, expressing its concernfor all of Puerto Rico’s municipal debt based on thedeteriorating fiscal situation on the Island and the possibilitythat application of the new law may further limit theCommonwealth’s ability to access the capital markets.
In July 2014, certain holders of PREPA bonds and aninvestment manager, on behalf of funds which hold PREPAbonds, filed separate lawsuits in the United States District Courtfor the District of Puerto Rico (the “District Court”) seeking adeclaratory judgment that the Recovery Act violates severalprovisions of the United States Constitution. The District Courtconsolidated the actions. On February 10, 2015, the DistrictCourt entered judgment that the Recovery Act is preempted bythe federal Bankruptcy Code and is therefore void pursuant tothe Supremacy Clause of the United States Constitution. TheDistrict Court permanently enjoined the Commonwealth officersfrom enforcing the Recovery Act. The Commonwealth has fileda notice of appeal and has indicated that it will continue todefend vigorously the constitutionality of the Recovery Act.

71 POPULAR, INC. 2014 ANNUAL REPORT
On February 10, 2015, the Governor announced a proposalfor a new tax code that would replace the current 7% sales anduse tax with a 16% value-added tax, while significantlylowering income taxes. The proposal seeks to create a fair andeffective system by primarily taxing consumption, rather thanproductivity, and to increase tax revenues to the government byreducing tax evasion. While legislation for the new tax code hasbeen filed, it is too early to determine what changes will bemade during the legislative process and what effect thisproposal, if enacted into law, will have on economic activity.
On February 12, 2015, S&P further downgraded the debtrating of the Commonwealth general obligation bonds and ofvarious public instrumentalities. S&P stated that, in their view,Puerto Rico’s current economic and financial trajectory is nowmore susceptible to adverse financial, economic and marketconditions that could ultimately impair the Commonwealth’sability to fund services and its debt commitments. S&P alsocited implementation risk with respect to the value-added taxand expressed concern that, while higher taxes could improvethe budget balance, there could be potential negative economicimplications. On February 19, 2015, Moody’s also downgradedits debt ratings for the Commonwealth general obligation bondsand of various public instrumentalities, citing similar concernsas S&P. The portfolio of obligations of the Puerto RicoGovernment is comprised of securities with specific sources ofincome or revenues identified for repayments. The Corporationperforms periodic credit quality reviews on these issuers.
The lingering effects of the prolonged recession are stillreflected in limited loan demand, an increase in the rate offoreclosures and delinquencies on mortgage loans granted inPuerto Rico. If global or local economic conditions worsen or
the Government is unable to access the capital markets andmanage its fiscal problems in an orderly manner, those adverseeffects could continue or worsen. Any reduction in consumerspending as a result of these issues may also adversely impactour non-interest revenues.
At December 31, 2014, the Corporation’s direct exposure tothe Puerto Rico government and its instrumentalities andmunicipalities amounted to $ 1.0 billion, of whichapproximately $ 811 million is outstanding. Of the amountoutstanding, $ 689 million consists of loans and $ 122 millionare securities. Of this amount, $ 336 million representsobligations from the Government of Puerto Rico and publiccorporations that are either collateralized loans or obligationsthat have a specific source of income or revenues identified fortheir repayment. Some of these obligations consist of senior andsubordinated loans to public corporations that obtain revenuesfrom rates charged for services or products, such as publicutilities. Public corporations have varying degrees ofindependence from the central Government and many receiveappropriations or other payments from it. The remaining $475 million represents obligations from various municipalitiesin Puerto Rico for which, in most cases, the good faith, creditand unlimited taxing power of the applicable municipality hasbeen pledged to their repayment. These municipalities arerequired by law to levy special property taxes in such amountsas shall be required for the payment of all of its generalobligation bonds and loans. These loans have seniority to thepayment of operating cost and expenses of the municipality.Table 35 has a summary of the Corporation’s direct exposure tothe Puerto Rico Government.
Table 35 - Direct Exposure to the Puerto Rico Government
(In thousands)InvestmentPortfolio Loans
TotalOutstanding
TotalExposure
Central Government $ 53,935 $ – $ 53,935 $ 184,207Government Development Bank (GDB) 7,008 100,000 107,008 107,008Public Corporations:
Puerto Rico Aqueduct and Sewer Authority 502 100,000 100,502 131,192Puerto Rico Electric Power Authority 17 74,993 75,010 75,017Puerto Rico Highways and Transportation Authority 4 – 4 4Other – – – 1,500
Municipalities 60,515 414,052 474,567 518,160
Total Direct Government Exposure $121,981 $689,045 $811,026 $1,017,088
In addition, at December 31, 2014, the Corporation had $370million in indirect exposure to loans or securities that arepayable by non-governmental entities, but which carry agovernment guarantee to cover any shortfall in collateral in theevent of borrower default. These included $289 million inresidential mortgage loans that are guaranteed by the PuertoRico Housing Finance Authority. These mortgage loans are
secured by the underlying properties and the guarantees serve tocover shortfalls in collateral in the event of a borrower default.Also, the Corporation had $49 million in Puerto Rico pass-through housing bonds backed by FNMA, GNMA or residentialloans CMO’s, and $32 million of industrial development notes.
On October 10, 2014, GDB entered into a note purchase,revolving credit and term loan agreement with a syndicate of

72
banks and other financial institutions providing for the issuanceof up to $900 million of GDB short-term senior notes,guaranteed by the Commonwealth of Puerto Rico, the proceedsof which will be used to fund the purchase of an equal amountof tax and revenue anticipation notes of the Commonwealth.The Commonwealth’s tax and revenue anticipation notes,which also serve as collateral for the GDB notes, provide intra-year financing to the central Government to address timingdifferences between expected disbursements and receipts oftaxes and revenues for fiscal year 2015. The GDB notes and therelated Commonwealth’s tax and revenue anticipation notesmature on June 30, 2015. BPPR participated in this creditfacility with an aggregate commitment of $100 million in theterm loan and revolving credit facilities.
As further detailed in Notes 9 and 10 to the consolidatedfinancial statements, a substantial portion of the Corporation’sinvestment securities represented exposure to the U.S.Government in the form of U.S. Government sponsoredentities, as well as agency mortgage-backed and U.S. Treasurysecurities. In addition, $804 million of residential mortgagesand $118 million in commercial loans were insured orguaranteed by the U.S. Government or its agencies atDecember 31, 2014. The Corporation does not have anyexposure to European sovereign debt.
Non-Performing AssetsNon-performing assets include primarily past-due loans that areno longer accruing interest, renegotiated loans, and real estateproperty acquired through foreclosure. A summary, includingcertain credit quality metrics, is presented in Table 36.
The Corporation’s non-accruing and charge-off policies bymajor categories of loan portfolios are as follows:
• Commercial and construction loans - recognition of interestincome on commercial and construction loans isdiscontinued when the loans are 90 days or more in arrearson payments of principal or interest or when other factorsindicate that the collection of principal and interest isdoubtful. The impaired portions of secured loans past dueas to principal and interest is charged-off not later than 365days past due. However, in the case of collateral dependentloans individually evaluated for impairment, the excess ofthe recorded investment over the fair value of the collateral(portion deemed uncollectible) is generally promptlycharged-off, but in any event, not later than the quarterfollowing the quarter in which such excess was firstrecognized. Commercial unsecured loans are charged-offno later than 180 days past due. Overdrafts are generallycharged-off no later than 60 days past their due date.
• Lease financing - recognition of interest income for leasefinancing is ceased when loans are 90 days or more inarrears. Leases are charged-off when they are 120 days inarrears.
• Mortgage loans - recognition of interest income onmortgage loans is generally discontinued when loans are90 days or more in arrears on payments of principal orinterest. The impaired portion of a mortgage loan ischarged-off when the loan is 180 days past due. TheCorporation discontinues the recognition of interestincome on residential mortgage loans insured by theFederal Housing Administration (“FHA”) or guaranteedby the U.S. Department of Veterans Affairs (“VA”) when18 months delinquent as to principal or interest. Theprincipal repayment on these loans is insured.
• Consumer loans - recognition of interest income onclosed-end consumer loans and home-equity lines ofcredit is discontinued when the loans are 90 days or morein arrears on payments of principal or interest. Income isgenerally recognized on open-end consumer loans, exceptfor home equity lines of credit, until the loans arecharged-off. Closed-end consumer loans are charged-offwhen they are 120 days in arrears. Open-end consumerloans are charged-off when they are 180 days in arrears.Overdrafts in excess of 60 days are generally charged-offno later than 60 days past their due date.
• Troubled debt restructurings (“TDRs”) - loans classifiedas TDRs are typically in non-accrual status at the time ofthe modification. The TDR loan continues in non-accrualstatus until the borrower has demonstrated a willingnessand ability to make the restructured loan payments(generally at least six months of sustained performanceafter the modification (or one year for loans providing forquarterly or semi-annual payments)) and managementhas concluded that it is probable that the borrower wouldnot be in payment default in the foreseeable future.
• Covered loans acquired in the Westernbank FDIC-assistedtransaction, except for revolving lines of credit, areaccounted for by the Corporation in accordance with ASCSubtopic 310-30. Under ASC Subtopic 310-30, theacquired loans were aggregated into pools based onsimilar characteristics. Each loan pool is accounted for asa single asset with a single composite interest rate and anaggregate expectation of cash flows. The covered loans,which are accounted for under ASC Subtopic 310-30 bythe Corporation, are not considered non-performing andwill continue to have an accretable yield as long as there isa reasonable expectation about the timing and amount ofcash flows expected to be collected. Also, loans charged-off against the non-accretable difference established inpurchase accounting are not reported as charge-offs.Charge-offs will be recorded only to the extent that lossesexceed the purchase accounting estimates.
Because of the application of ASC Subtopic 310-30 to theWesternbank acquired loans and the loss protection provided
73 POPULAR, INC. 2014 ANNUAL REPORT
by the FDIC which limits the risks on the covered loans, theCorporation has determined to provide certain quality metricsin this MD&A that exclude such covered loans to facilitate thecomparison between loan portfolios and across periods. Giventhe significant amount of covered loans that are past due butstill accruing due to the accounting under ASC Subtopic 310-30, the Corporation believes the inclusion of these loans incertain asset quality ratios in the numerator or denominator (orboth) would result in a significant distortion to these ratios. Inaddition, because charge-offs related to the acquired loans arerecorded against the non-accretable balance, the net charge-offratio including the acquired loans is lower for portfolios thathave significant amounts of covered loans. The inclusion ofthese loans in the asset quality ratios could result in a lack ofcomparability across periods, and could negatively impactcomparability with other portfolios that were not impacted byacquisition accounting. The Corporation believes that thepresentation of asset quality measures, excluding covered loansand related amounts from both the numerator anddenominator, provides a better perspective into underlyingtrends related to the quality of its loan portfolio.
Total non-performing non-covered assets were $785 millionat December 31, 2014, increasing by $50 million, or 7%,
compared with December 31, 2013, and decreasing by $1.0billion, or 56%, compared with December 31, 2012. Non-covered non-performing loans held-in-portfolio stand at $630million, increasing by $33 million, or 5%, from December 31,2013. The ratio of non-performing loans to loans held-in-portfolio, excluding covered loans, increased to 3.25% atDecember 31, 2014 from 2.77% at December 31, 2013. Theincrease was largely reflective of higher commercial inflowsrelated to the $75 million public sector borrower, offset by thereturn to accrual status of a $51 million addition during thefirst quarter of 2014.
At December 31, 2014, non-performing loans secured byreal estate held-in-portfolio, excluding covered loans, amountedto $482 million in the Puerto Rico operations and $35 millionin the U.S. mainland operations. These figures compare to $388million in the Puerto Rico operations and $141 million in theU.S. mainland operations at December 31, 2013. In addition tothe non-performing loans included in Table 36, atDecember 31, 2014, there were $146 million of non-coveredperforming loans, mostly commercial loans, that inmanagement’s opinion, are currently subject to potential futureclassification as non-performing and are considered impaired,compared with $103 million at December 31, 2013.

74
Table 36 - Non-Performing Assets
At December 31,
(Dollars in thousands) 2014 2013 2012 2011 2010
Non-accrual loans:Commercial $260,225 $279,053 $ 665,289 $ 830,092 $ 665,463Construction 13,812 23,771 43,350 96,286 132,897Legacy [1] 1,545 15,050 40,741 75,660 165,484Leasing 3,102 3,495 4,865 5,642 5,674Mortgage 304,913 232,681 630,130 686,502 542,033Consumer 46,886 43,898 40,758 43,668 60,302
Total non-performing loans held-in-portfolio, excluding covered loans 630,483 597,948 1,425,133 1,737,850 1,571,853Non-performing loans held-for-sale [2] 18,899 1,092 96,320 262,302 671,757Other real estate owned (“OREO”), excluding covered OREO 135,500 135,501 266,844 172,497 161,496
Total non-performing assets, excluding covered assets $784,882 $734,541 $1,788,297 $2,172,649 $2,405,106Covered loans and OREO [3] 148,099 197,388 213,483 201,348 100,718
Total non-performing assets $932,981 $931,929 $2,001,780 $2,373,997 $2,505,824
Accruing loans past-due 90 days or more [4] [5] $447,990 $418,028 $ 388,712 $ 316,614 $ 338,359
Excluding covered loans: [6]Non-performing loans to loans held-in-portfolio 3.25% 2.77% 6.79% 8.44% 7.58%
Including covered loans:Non-performing loans to loans held-in-portfolio 2.95 2.55 6.06 7.33 6.32Interest lost $ 23,413 $ 29,766 $ 86,442 $ 103,390 $ 75,684
[1] The legacy portfolio is comprised of commercial loans, construction loans and lease financings related to certain lending products exited by the Corporation as partof restructuring efforts carried out in prior years at the BPNA reportable segment.
[2] Non-performing loans held-for-sale consist of $14.0 million in mortgage loans, $309 thousand in commercial loans and $4.5 million in consumer loans atDecember 31, 2014 (December 31, 2013 - $603 thousand in commercial loans and $489 thousand in mortgage loans).
[3] The amount consists of $18 million in non-performing covered loans accounted for under ASC Subtopic 310-20 and $130 million in covered OREO atDecember 31, 2014 (December 31, 2013 - $29 million and $168 million, respectively). It excludes covered loans accounted for under ASC Subtopic 310-30 as theyare considered to be performing due to the application of the accretion method, in which these loans will accrete interest income over the remaining life of theloans using estimated cash flow analyses.
[4] The carrying value of covered loans accounted for under ASC Subtopic 310-30 that are contractually 90 days or more past due was $0.5 billion at December 31,2014 (December 31, 2013 - $0.7 billion). This amount is excluded from the above table as the covered loans’ accretable yield interest recognition is independentfrom the underlying contractual loan delinquency status.
[5] It is the Corporation’s policy to report delinquent residential mortgage loans insured by FHA or guaranteed by the VA as accruing loans past due 90 days or moreas opposed to non-performing since the principal repayment is insured. These balances include $125 million and $115 million, respectively, of residentialmortgage loans insured by FHA or guaranteed by the VA that are no longer accruing interest as of December 31, 2014 and December 31, 2013. Furthermore, theCorporation has approximately $66 million in reverse mortgage loans which are guaranteed by FHA, but which are currently not accruing interest. Due to theguaranteed nature of the loans, it is the Corporation’s policy to exclude these balances from non-performing assets (December 31, 2013 - $50 million).
[6] These asset quality ratios have been adjusted to remove the impact of covered loans. Appropriate adjustments to the numerator and denominator have beenreflected in the calculation of these ratios. Management believes the inclusion of acquired loans in certain asset quality ratios that include non-performing assets,past due loans or net charge-offs in the numerator and denominator results in distortions of these ratios and they may not be comparable to other periodspresented or to other portfolios that were not impacted by purchase accounting.
75 POPULAR, INC. 2014 ANNUAL REPORT
Another key measure used to evaluate and monitor theCorporation’s asset quality is loan delinquencies. Loansdelinquent 30 days or more and delinquencies, as a percentageof their related portfolio category at December 31, 2014 and2013, are presented below.
Table 37 - Loan Delinquencies
(Dollars in millions) 2014 2013
Loans delinquent 30 days or more $2,524 $2,635
Total delinquencies as a percentage of total loans:Commercial 3.91% 3.52%Construction 6.80 12.66Legacy 5.45 12.42Lease financing 1.97 2.31Mortgage 19.99 17.72Consumer 4.27 4.11Covered loans 27.02 29.13Loans held-for-sale 20.11 1.41
Total 11.45% 10.66%
Accruing loans past due 90 days or more are composedprimarily of credit cards, residential mortgage loans insured byFHA / VA, and delinquent mortgage loans included in theCorporation’s financial statements pursuant to GNMA’s buy-back option program. Servicers of loans underlying GNMAmortgage-backed securities must report as their own assets thedefaulted loans that they have the option to purchase, evenwhen they elect not to exercise that option. Also, accruing loanspast due 90 days or more include residential conventional loanspurchased from other financial institutions that, althoughdelinquent, the Corporation has received timely payment fromthe sellers / servicers, and, in some instances, have partialguarantees under recourse agreements.
Refer to Table 40 for a summary of the activity in theallowance for loan losses and selected loan losses statistics forthe past 5 years.
Table 38 - Activity in Non-Performing Loans Held-in-Portfolio (Excluding Consumer and Covered Loans)
For the year ended December 31, 2014
(Dollars in thousands) BPPR BPNA Popular, Inc.
Beginning balance $ 410,594 $139,961 $ 550,555Plus:
New non-performing loans 643,216 56,230 699,446Advances on existing non-performing loans – 1,257 1,257
Less:Non-performing loans transferred to OREO (21,290) (2,915) (24,205)Non-performing loans charged-off (89,138) (22,207) (111,345)Loans returned to accrual status / loan collections (369,275) (62,774) (432,049)Loans transferred to held-for-sale – (96,180) (96,180)Non-performing loans transferred from (to) discontinued operations – (228) (228)Non-performing mortgage loans reclassified to non-performing consumer loans (6,756) – (6,756)
Ending balance NPLs $ 567,351 $ 13,144 $ 580,495

76
Table 39 - Activity in Non-Performing Loans Held-in-Portfolio (Excluding Consumer and Covered Loans)
For the year ended December 31, 2013
(Dollars in thousands) BPPR BPNA Popular, Inc.
Beginning balance $1,156,229 $ 223,281 $1,379,510Plus:
New non-performing loans 578,463 95,575 674,038Advances on existing non-performing loans – 1,685 1,685Loans transferred from held-for-sale 14,942 400 15,342Other – 4,310 4,310
Less:Non-performing loans transferred to OREO (62,537) (7,430) (69,967)Non-performing loans charged-off (139,191) (67,490) (206,681)Loans returned to accrual status / loan collections (354,985) (102,103) (457,088)Loans transferred to held-for-sale (14,968) (3,958) (18,926)Non-performing loans sold (767,359) – (767,359)Other – (4,309) (4,309)
Ending balance NPLs $ 410,594 $ 139,961 $ 550,555

77 POPULAR, INC. 2014 ANNUAL REPORT
Table 40 - Allowance for Loan Losses and Selected Loan Losses Statistics
2014 2013 2012
(Dollars in thousands)Non-covered
loans [4]Covered
loans Total [4]Non-covered
loans [4]Covered
loans Total [4]Non-covered
loans [4]Covered
loans Total [4]
Balance at the beginning of year $ 538,463 $102,092 $ 640,555 $ 621,701 $108,906 $ 730,607 $ 690,363 $124,945 $ 815,308Provision for loan losses - Continuing
operations 223,999 46,135 270,134 536,710 69,396 606,106 322,240 74,839 397,079Provision for loan losses (reversal of
provision) - Discontinued operations (6,764) – (6,764) (3,543) – (3,543) 11,862 – 11,862
755,698 148,227 903,925 1,154,868 178,302 1,333,170 1,024,465 199,784 1,224,249
Charged-offs:Commercial 87,030 34,741 121,771 138,383 28,423 166,806 209,935 46,290 256,225Construction 1,722 36,223 37,945 6,757 39,729 46,486 3,936 30,556 34,492Legacy [1] 8,071 – 8,071 17,423 – 17,423 31,113 – 31,113Leasing 6,028 – 6,028 6,034 – 6,034 4,680 – 4,680Mortgage 48,906 9,156 58,062 59,573 10,679 70,252 75,994 5,909 81,903Consumer 138,348 (2,589) 135,759 135,238 3,952 139,190 156,694 8,225 164,919Discontinued operations 4,452 – 4,452 38,957 – 38,957 57,140 – 57,140
294,557 77,531 372,088 402,365 82,783 485,148 539,492 90,980 630,472
Recoveries:Commercial 46,543 1,835 48,378 43,598 816 44,414 51,285 31 51,316Construction 5,468 8,537 14,005 15,399 5,621 21,020 7,411 61 7,472Legacy [1] 17,141 – 17,141 21,320 – 21,320 16,260 – 16,260Leasing 2,067 – 2,067 2,528 – 2,528 3,737 – 3,737Mortgage 3,710 714 4,424 4,034 65 4,099 4,054 – 4,054Consumer 29,528 291 29,819 41,674 71 41,745 35,022 10 35,032Discontinued operations 9,997 – 9,997 20,052 – 20,052 18,993 – 18,993
114,454 11,377 125,831 148,605 6,573 155,178 136,762 102 136,864
Net loans charged-offs (recoveries):Commercial 40,487 32,906 73,393 94,785 27,607 122,392 158,650 46,259 204,909Construction (3,746) 27,686 23,940 (8,642) 34,108 25,466 (3,475) 30,495 27,020Legacy [1] (9,070) – (9,070) (3,897) – (3,897) 14,853 – 14,853Leasing 3,961 – 3,961 3,506 – 3,506 943 – 943Mortgage 45,196 8,442 53,638 55,539 10,614 66,153 71,940 5,909 77,849Consumer 108,820 (2,880) 105,940 93,564 3,881 97,445 121,672 8,215 129,887Discontinued operations (5,545) – (5,545) 18,905 – 18,905 38,147 – 38,147
180,103 66,154 246,257 253,760 76,210 329,970 402,730 90,878 493,608
Net write-downs [3] (35,674) – (35,674) (362,645) – (362,645) (34) – (34)Net write-downs related to loans transferred
to discontinued operations (20,202) – (20,202) – – – – – –
Balance at end of year $ 519,719 $ 82,073 $ 601,792 $ 538,463 $102,092 $ 640,555 $ 621,701 $108,906 $ 730,607
Loans held-in-portfolio:Outstanding at year end $19,404,451 $21,947,113 $21,611,866 $24,596,293 $20,983,192 $24,739,164Average 19,990,182 22,760,961 21,354,143 24,581,862 20,477,264 24,527,602Ratios:Allowance for loan losses to loans held-in-
portfolio 2.68% 2.74% 2.49% 2.60% 2.96% 2.95%Recoveries to charge-offs 38.86 33.82 36.93 31.99 25.35 21.71Net charge-offs to average loans held-in-
portfolio 0.90 1.08 1.19 1.34 1.97 2.01Allowance for loans losses to net charge-offs 2.89x 2.44x 2.12x 1.94x 1.54x 1.48xProvision for loan losses to:Net charge-offs [2] 1.17 1.04 0.85 0.86 0.83 0.83Average loans held-in-portfolio 1.05% 1.13% 2.50% 2.45% 1.63% 1.67%Allowance to non performing loans held-
in-portfolio 82.43 92.82 90.05 103.78 43.62 48.72
[1] The legacy portfolio is comprised of commercial loans, construction loans and lease financings related to certain lending products exited by the Corporation as partof restructuring efforts carried out in prior years at the BPNA segment.
[2] Excluding the provision for loans losses and net write-down related to loans sold or reclassified to held-for-sale.[3] Net write-downs are related to loans sold or transferred to held-for-sale.[4] Current and prior periods provision for loan losses and net-charge offs presented in this table has been retrospectively adjusted for the impact of the discontinued
operations for comparative purposes. Loans (ending and average) balances and credit quality ratios for prior periods included in this table has not beenretrospectively adjusted for the impact of the discontinued operations.

78
Table 40 (continued) - Allowance for Loan Losses and Selected Loan Losses Statistics
2011 2010
(Dollars in thousands)Non-covered
loans [4]Covered
loans Total [4]Non-covered
loans [4]Covered
loans Total [4]
Balance at the beginning of year $ 793,225 $ – $ 793,225 $ 1,261,204 $– $ 1,261,204Provision for loan losses - Continuing operations 395,937 145,635 541,572 864,661 – 864,661Provision for loan losses - Discontinued operations 34,148 – 34,148 147,219 – 147,219
1,223,310 145,635 1,368,945 2,273,084 – 2,273,084
Commercial 257,027 13,774 270,801 300,959 – 300,959Construction 18,921 4,353 23,274 303,085 – 303,085Legacy [1] 71,466 – 71,466 150,260 – 150,260Leasing 6,527 – 6,527 10,517 – 10,517Mortgage 45,785 826 46,611 99,835 – 99,835Consumer 189,864 3,253 193,117 246,531 – 246,531Discontinued operations 81,915 – 81,915 138,169 – 138,169
671,505 22,206 693,711 1,249,356 – 1,249,356
Recoveries:Commercial 41,836 – 41,836 23,947 – 23,947Construction 9,924 1,500 11,424 915 – 915Legacy [1] 21,313 – 21,313 15,768 – 15,768Leasing 3,083 – 3,083 4,058 – 4,058Mortgage 3,974 15 3,989 5,056 – 5,056Consumer 40,243 1 40,244 37,247 – 37,247Discontinued operations 17,084 – 17,084 9,713 – 9,713
137,457 1,516 138,973 96,704 – 96,704
Net loans charged-offs (recoveries):Commercial 215,191 13,774 228,965 277,012 – 277,012Construction 8,997 2,853 11,850 302,170 – 302,170Legacy [1] 50,153 – 50,153 134,492 – 134,492Leasing 3,444 – 3,444 6,459 – 6,459Mortgage 41,811 811 42,622 94,779 – 94,779Consumer 149,621 3,252 152,873 209,284 – 209,284Discontinued operations 64,831 – 64,831 128,456 – 128,456
534,048 20,690 554,738 1,152,652 – 1,152,652
Net write-downs [3] 1,101 – 1,101 (327,207) – (327,207)
Balance at end of year $ 690,363 $124,945 $ 815,308 $ 793,225 $– $ 793,225
Loans held-in-portfolio:Outstanding at year end $20,602,596 $24,951,299 $20,728,035 $25,564,917Average 20,496,966 25,110,328 22,376,612 25,741,544Ratios:Allowance for loan losses to loans held-in-portfolio 3.35% 3.27% 3.83% 3.10%Recoveries to charge-offs 20.47 20.03 7.74 7.74Net charge-offs to average loans held-in-portfolio 2.61 2.21 5.15 4.48Allowance for loans losses to net charge-offs 1.29x 1.47x 0.69x 0.69xProvision for loan losses to:Net charge-offs [2] 0.81 1.04 0.88 0.88Average loans held-in-portfolio 2.10% 2.29% 4.52% 3.93%Allowance to non performing loans held-in-portfolio 39.73 44.76 50.46 49.64
[1] The legacy portfolio is comprised of commercial loans, construction loans and lease financing related to certain lending products exited by the Corporation as partof restructuring efforts carried out in prior years at the BPNA segment.
[2] Excluding the provision for loans losses and net write-down related to loans sold or reclassified to held-for-sale.[3] Net write-downs are related to loans sold or transferred to held-for-sale.[4] Current and prior periods provision for loan losses and net-charge offs presented in this table has been retrospectively adjusted for the impact of the discontinued
operations for comparative purposes. Loans (ending and average) balances and credit quality ratios for prior periods included in this table has not beenretrospectively adjusted for the impact of the discontinued operations.

79 POPULAR, INC. 2014 ANNUAL REPORT
The following table presents net charge-offs to average loans held-in-portfolio (“HIP”) ratio by loan category for the years endedDecember 31, 2014, 2013 and 2012:
Table 41 - Net Charge-Offs (Recoveries) to Average Loans HIP (Non-covered loans)
2014 2013 2012
Commercial 0.40% 1.11% 1.94%Construction (2.22) (3.13) (0.77)Lease financing 0.73 0.65 0.18Legacy (7.01) (0.99) 3.12Mortgage 0.69 0.85 1.27Consumer 2.81 2.50 3.36
Total 0.90% 1.19% 1.97%
Note: The above table excludes the net write-downs related to the asset sales during the first and second quarters of 2013, and the third and fourth quarters of 2014.
The Corporation’s net charge-offs to average non-coveredloans held-in-portfolio ratio was 0.90% for the year endedDecember 31, 2014, down from 1.19% and 1.97% for the sameperiods in 2013 and 2012, respectively. Net charge-offs,excluding covered loans, for the year ended December 31,2014, decreased by $73.7 million and $222.6 million, comparedto the years ended December 31, 2013 and 2012. The decline ismostly driven by credit quality improvements, as well as theresult of strategic loans sales executed by the Corporation overthe past years to reduce high risk assets and improve the riskprofile of its portfolios. Write-downs associated with the sale ofcertain classified and legacy loan portfolios in the US operationsduring the second half of 2014 amounted to $35.7 million.Write-downs related to the commercial and residentialmortgage non-performing loans bulk sales completed duringthe first half of 2013 amounted to $163.1 million and $199.5million, respectively, in the BPPR operations.
The Corporation’s credit quality trends were generally stableduring 2014 with the US region exhibiting significantimprovements and the Puerto Rico region remaining stable. TheBPNA segment continued to reflect strong performance led bythe improved risk profile of its loan portfolios, furtherstrengthened by the sale of certain non-performing and legacyassets. Notwithstanding, Puerto Rico’s fiscal and economicconditions continued to present a challenging operatingenvironment.
The discussions in the sections that follow assess creditquality performance for 2014 for each of the Corporation’s non-covered loan portfolios.
Commercial loansNon-covered non-performing commercial loans held-in-portfolio were $260 million at December 31, 2014, comparedwith $279 million at December 31, 2013, and $665 million atDecember 31, 2012. The decrease of $19 million, or 7%, fromDecember 31, 2013 was principally attributed to improvementsin the BPNA segment. The percentage of non-performingcommercial loans held-in-portfolio to commercial loans held-in-portfolio increased to 3.20% at December 31, 2014 from2.78% at December 31, 2013, primarily due to the reduction inloan balance from the sale of the regional operations in the US.The percentage of non-performing commercial loans held-in-portfolio to commercial loans held-in-portfolio was 6.75% atDecember 31, 2012.
Commercial non-covered non-performing loans held-in-portfolio at the BPPR segment increased by $72 million fromDecember 31, 2013, mainly driven by a single $75 millionpublic sector borrower. Commercial non-performing loansheld-in-portfolio at the BPNA segment decreased by $91 millionfrom December 31, 2013, reflective of sustained improvementsin credit performance and loan resolutions. The loans includedin the regional operations sale, as well as the bulk sales ofcertain commercial loans completed in the second half of theyear, were mostly loans in accruing status.
Tables 42 and 43 present the changes in the non-performingcommercial loans held-in-portfolio for the years endedDecember 31, 2014 and 2013 for the BPPR (excluding coveredloans) and BPNA segments.

80
Table 42 - Activity in Non-Performing Commercial Loans Held-In-Portfolio (Excluding Covered Loans)
For the year ended December 31, 2014
(In thousands) BPPR BPNA Popular, Inc.
Beginning Balance - NPLs $ 186,097 $ 92,956 $ 279,053Plus:
New non-performing loans 252,292 30,668 282,960Advances on existing non-performing loans – 957 957
Less:Non-performing loans transferred to OREO (12,581) – (12,581)Non-performing loans charged-off (52,232) (13,963) (66,195)Loans returned to accrual status / loan collections (115,666) (35,953) (151,619)Loans transferred to held-for-sale – (72,216) (72,216)Non-performing loans transferred from (to) discontinued operations – (134) (134)
Ending balance - NPLs $ 257,910 $ 2,315 $ 260,225
Table 43 - Activity in Non-Performing Commercial Loans Held-in-Portfolio (Excluding Covered Loans)
For the year ended December 31, 2013
(In thousands) BPPR BPNA Popular, Inc.
Beginning Balance - NPLs $ 522,733 $142,556 $ 665,289Plus:
New non-performing loans 179,377 56,677 236,054Advances on existing non-performing loans – 1,535 1,535Loans transferred from held-for-sale 790 – 790Other – 4,310 4,310
Less:Non-performing loans transferred to OREO (17,000) (3,631) (20,631)Non-performing loans charged-off (100,682) (39,702) (140,384)Loans returned to accrual status / loan collections (69,853) (64,831) (134,684)Loans transferred to held-for-sale – (3,958) (3,958)Non-performing loans sold (329,268) – (329,268)
Ending balance - NPLs $ 186,097 $ 92,956 $ 279,053
For the year ended December 31, 2014, inflows ofcommercial non-performing loans held-in-portfolio at the BPPRsegment amounted to $252 million, an increase of $73 million,or 41%, when compared to inflows for the same period in 2013.This increase was impacted by two large additions during 2014,including the aforementioned $75 million public sectorborrower and a $52 million single borrower which returned toaccrual status during the fourth quarter of 2014. Inflows ofcommercial non-performing loans held-in-portfolio at the
BPNA segment amounted to $32 million, a decrease of $27million, or 46%, compared to inflows for 2013. The reductionwas driven by improvements in the underlying quality of theloan portfolio.
Table 44 provides information on commercial non-performing loans and net charge-offs for the years endedDecember 31, 2014, December 31, 2013, and December 31,2012 for the BPPR (excluding the Westernbank covered loanportfolio) and BPNA segments.

81 POPULAR, INC. 2014 ANNUAL REPORT
Table 44 - Non-Performing Commercial Loans and Net Charge-offs (Excluding Covered Loans)
BPPR BPNA Popular, Inc.
(Dollars in thousands)December 31,
2014December 31,
2013December 31,
2012December 31,
2014December 31,
2013December 31,
2012December 31,
2014December 31,
2013December 31,
2012
Non-performingcommercial loans $257,910 $186,097 $522,733 $ 2,315 $92,956 $142,556 $260,225 $279,053 $665,289
Non-performingcommercial loansto commercialloans HIP 4.05% 2.88% 8.30% 0.13% 2.60% 4.00% 3.20% 2.78% 6.75%
BPPR BPNA Popular, Inc.
For the year ended For the year ended For the year ended
(Dollars in thousands)December 31,
2014December 31,
2013December 31,
2012December 31,
2014December 31,
2013December 31,
2012December 31,
2014December 31,
2013December 31,
2012
Commercial loan netcharge-offs(recoveries) $ 39,382 $ 85,601 $144,640 $(4,574) $23,368 $ 44,653 $ 34,808 $108,969 $189,293
Commercial loan netcharge-offs(recoveries) toaverage commercialloans HIP 0.62% 1.37% 2.30% (0.20)% 0.65% 1.29% 0.40% 1.11% 1.94%
There are two commercial loan relationships greater than$10 million in non-accrual status with an outstanding aggregatebalance of $88 million at December 31, 2014, compared withone commercial loan relationship with an outstandingaggregate balance of $15 million at December 31, 2013.
Commercial loan net charge-offs, excluding net charge-offsfor covered loans, amounted to $34.8 million for the year endedDecember 31, 2014, compared to $109.0 million inDecember 31, 2013 and $189.3 million in December 31, 2012.The decline of $74.2 million, or 68%, for the year endedDecember 31, 2014 when compared with the year endedDecember 31, 2013 primarily reflects improvements in creditquality and successful actions taken by the Corporation toaddress problem loans. Commercial loans net charge-offs toaverage non-covered loans held-in-portfolio decreased to 0.40%for the year ended December 31, 2014 from 1.11% for the yearended December 31, 2013 and 1.94% for the year endedDecember 31, 2012.
Commercial loan net charge-offs in the BPPR segmentamounted to $39.4 million for the year ended December 31,2014, compared to $85.6 million in December 31, 2013 and$144.6 million in December 31, 2012. The decline of $46.2million for the year ended December 31, 2014 when comparedwith the year ended December 31, 2013, was mainly reflectiveof the improved risk profile of the portfolio after the bulk salescompleted in 2013. Commercial loans annualized net charge-offs to average non-covered loans held-in-portfolio decreased to0.62% for the year ended December 31, 2014 from 1.37% forthe year ended December 31, 2013 and 2.30% for the yearended December 31, 2012. For the year ended December 31,
2014, the charge-offs associated with collateral dependentimpaired commercial loans amounted to approximately $30.0million at the BPPR segment.
Commercial loan net charge-offs (recoveries) in the BPNAsegment amounted to recoveries of $4.6 million for the yearended December 31, 2014, compared to $23.4 million incharge-offs in December 31, 2013 and $44.7 million inDecember 31, 2012. The decline of $27.9 million for the yearended December 31, 2014 when compared with the sameperiod in 2013 was primarily due to improved credit qualityand lower level of non-performing loans. Commercial loans netcharge-offs to average non-covered loans held-in-portfoliodecreased to (0.20%) for the year ended December 31, 2014from 0.65% for the year ended December 31, 2013, and 1.29%for the year ended December 31, 2012 due to recoveryactivity. For the year ended December 31, 2014, there were nocharge-offs associated with collateral dependent impairedcommercial loans from continuing operations at the BPNAsegment.
The Corporation’s commercial loan portfolio secured by realestate (“CRE”), excluding covered loans, amounted to $4.7billion at December 31, 2014, of which $1.7 billion was securedwith owner occupied properties, compared with $6.4 billionand $2.3 billion, respectively, at December 31, 2013. CRE non-performing loans, excluding covered loans, amounted to $129million at December 31, 2014, compared with $221 million atDecember 31, 2013. The CRE non-performing loans ratios forthe BPPR and BPNA segments were 3.60% and 0.07%,respectively, at December 31, 2014, compared with 3.80% and3.10%, respectively, at December 31, 2013.

82
Construction loansNon-covered non-performing construction loans held-in-portfolio amounted to $14 million at December 31, 2014,compared to $24 million at December 31, 2013, and $43million at December 31, 2012. The decrease of $10 million, or42%, from December 31, 2013 was mainly driven by declines of$4 million and $6 million in the BPPR and BPNA segments,respectively, principally driven by loan collections and minimalinflows of new construction non-performing loans. Stable credittrends in the construction portfolio were the result of de-
risking strategies executed by the Corporation over the pastseveral years to downsize its construction loan portfolio. Theratio of non-performing construction loans to constructionloans held-in-portfolio, excluding covered loans, decreased to5.48% at December 31, 2014 from 11.53% at December 31,2013, and 17.14% at December 31, 2012.
Tables 45 and 46 present changes in non-performingconstruction loans held-in-portfolio for the years endedDecember 31, 2014 and 2013 for the BPPR (excluding coveredloans) and BPNA segments.
Table 45 - Activity in Non-Performing Construction Loans Held-In-Portfolio (Excluding Covered Loans)
For the year ended December 31, 2014
(In thousands) BPPR BPNA Popular, Inc.
Beginning Balance - NPLs $ 18,108 $ 5,663 $ 23,771Plus:
New non-performing loans 9,485 – 9,485Less:
Non-performing loans charged-off (1,687) – (1,687)Loans returned to accrual status / loan collections (12,094) (5,663) (17,757)
Ending balance - NPLs $ 13,812 $ – $ 13,812
Table 46 - Activity in Non-Performing Construction Loans Held-in-Portfolio (Excluding Covered Loans)
For the year ended December 31, 2013
(In thousands) BPPR BPNA Popular, Inc.
Beginning Balance - NPLs $ 37,390 $5,960 $ 43,350Plus:
New non-performing loans 2,000 – 2,000Loans transferred from held-for-sale 14,152 – 14,152
Less:Non-performing loans transferred to OREO (775) – (775)Non-performing loans charged-off (6,210) – (6,210)Loans returned to accrual status / loan collections (24,965) (297) (25,262)Non-performing loans sold (3,484) – (3,484)
Ending balance - NPLs $ 18,108 $5,663 $ 23,771
For the year ended December 31, 2014, inflows ofconstruction non-performing loans held-in-portfolio at theBPPR segment amounted to $9 million, an increase of $7million when compared to additions for the year endedDecember 31, 2013, principally related to one single borrower.There were no additions of construction non-performing loansheld-in-portfolio at the BPNA segment during 2014.
There are no construction loan relationships greater than$10 million in non-performing status at December 31, 2014 andDecember 31, 2013.
Construction loan net charge-offs (recoveries), excludingnet charge-offs for covered loans, amounted to recoveries of$3.7 million for the year ended December 31, 2014, comparedto recoveries of $8.6 million in December 31, 2013 and $1.9million in December 31, 2012. Construction loans net charge-
offs (recoveries) to average non-covered loans held-in-portfolioresulted in (2.22%) for the year ended December 31, 2014compared to (3.13%) for the year ended December 31, 2013and (0.77%) for the year ended December 31, 2012. For theyear ended December 31, 2014, the charge-offs associated withcollateral dependent impaired construction loans amounted to$2.3 million in the BPPR segment and none in the BPNAsegment. Management identified construction loans consideredimpaired and charged-off specific reserves based on the value ofthe collateral.
Table 47 provides information on construction non-performing loans and net charge-offs for the BPPR and BPNA(excluding the covered loan portfolio) segments for the yearsended December 31, 2014, December 31, 2013, andDecember 31, 2012.
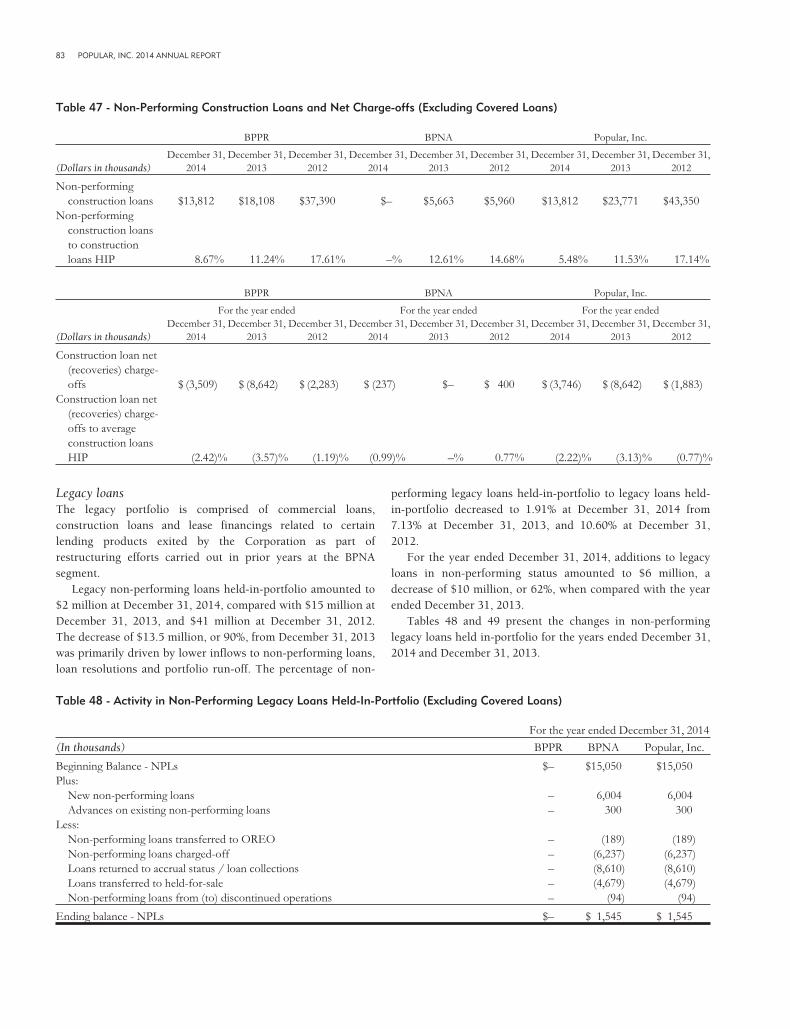
83 POPULAR, INC. 2014 ANNUAL REPORT
Table 47 - Non-Performing Construction Loans and Net Charge-offs (Excluding Covered Loans)
BPPR BPNA Popular, Inc.
(Dollars in thousands)December 31,
2014December 31,
2013December 31,
2012December 31,
2014December 31,
2013December 31,
2012December 31,
2014December 31,
2013December 31,
2012
Non-performingconstruction loans $13,812 $18,108 $37,390 $– $5,663 $5,960 $13,812 $23,771 $43,350
Non-performingconstruction loansto constructionloans HIP 8.67% 11.24% 17.61% –% 12.61% 14.68% 5.48% 11.53% 17.14%
BPPR BPNA Popular, Inc.
For the year ended For the year ended For the year ended
(Dollars in thousands)December 31,
2014December 31,
2013December 31,
2012December 31,
2014December 31,
2013December 31,
2012December 31,
2014December 31,
2013December 31,
2012
Construction loan net(recoveries) charge-offs $ (3,509) $ (8,642) $ (2,283) $ (237) $– $ 400 $ (3,746) $ (8,642) $ (1,883)
Construction loan net(recoveries) charge-offs to averageconstruction loansHIP (2.42)% (3.57)% (1.19)% (0.99)% –% 0.77% (2.22)% (3.13)% (0.77)%
Legacy loansThe legacy portfolio is comprised of commercial loans,construction loans and lease financings related to certainlending products exited by the Corporation as part ofrestructuring efforts carried out in prior years at the BPNAsegment.
Legacy non-performing loans held-in-portfolio amounted to$2 million at December 31, 2014, compared with $15 million atDecember 31, 2013, and $41 million at December 31, 2012.The decrease of $13.5 million, or 90%, from December 31, 2013was primarily driven by lower inflows to non-performing loans,loan resolutions and portfolio run-off. The percentage of non-
performing legacy loans held-in-portfolio to legacy loans held-in-portfolio decreased to 1.91% at December 31, 2014 from7.13% at December 31, 2013, and 10.60% at December 31,2012.
For the year ended December 31, 2014, additions to legacyloans in non-performing status amounted to $6 million, adecrease of $10 million, or 62%, when compared with the yearended December 31, 2013.
Tables 48 and 49 present the changes in non-performinglegacy loans held in-portfolio for the years ended December 31,2014 and December 31, 2013.
Table 48 - Activity in Non-Performing Legacy Loans Held-In-Portfolio (Excluding Covered Loans)
For the year ended December 31, 2014
(In thousands) BPPR BPNA Popular, Inc.
Beginning Balance - NPLs $– $15,050 $15,050Plus:
New non-performing loans – 6,004 6,004Advances on existing non-performing loans – 300 300
Less:Non-performing loans transferred to OREO – (189) (189)Non-performing loans charged-off – (6,237) (6,237)Loans returned to accrual status / loan collections – (8,610) (8,610)Loans transferred to held-for-sale – (4,679) (4,679)Non-performing loans from (to) discontinued operations – (94) (94)
Ending balance - NPLs $– $ 1,545 $ 1,545

84
Table 49 - Activity in non-Performing Legacy Loans Held-in-Portfolio (Excluding Covered Loans)
For the year ended December 31, 2013
(In thousands) BPPR BPNA Popular, Inc.
Beginning Balance - NPLs $– $ 40,741 $ 40,741Plus:
New non-performing loans – 16,645 16,645Advances on existing non-performing loans – 150 150Loans transferred from held-for-sale – 400 400
Less:Non-performing loans charged-off – (19,426) (19,426)Loans returned to accrual status / loan collections – (19,151) (19,151)Other – (4,309) (4,309)
Ending balance - NPLs $– $ 15,050 $ 15,050
In the loans held-in-portfolio, there was no legacy loanrelationship greater than $10 million in non-accrual status atDecember 31, 2014 and December 31, 2013.
Legacy loan net charge-offs (recoveries) amounted torecoveries of $9.7 million for the year ended December 31,2014, compared to recoveries of $2.6 million in December 31,2013 and net charge-offs of $16.3 million in December 31,2012. Legacy loan net charge-offs (recoveries) to average non-covered loans held-in-portfolio decreased to (7.01%) for theyear ended December 31, 2014 from (0.99%) for the year ended
December 31, 2013 and 3.12% for the year ended December 31,2012. For the year ended December 31, 2014, there were nocharge-offs associated with collateral dependent legacy loansfrom continuing operations.
Continued improvements in credit performance was mainlydriven lower level of problem loans, loan resolutions, and thecontinued run-off of the portfolio.
Table 50 provides information on legacy non-performingloans and net charge-offs.
Table 50 - Non-Performing Legacy Loans and Net Charge-offs
BPNA
(Dollars in thousands) December 31, 2014 December 31, 2013 December 31, 2012
Non-performing legacy loans $ 1,545 $15,050 $40,741Non-performing legacy loans to legacy loans HIP 1.91% 7.13% 10.60%
BPNA
For the year ended
(Dollars in thousands) December 31, 2014 December 31, 2013 December 31, 2012
Legacy loan net (recoveries) charge-offs $(9,742) $ (2,583) $16,338Legacy loan net (recoveries) charge-offs to average legacy loans HIP (7.01)% (0.99)% 3.12%
Mortgage loansNon-covered non-performing mortgage loans held-in-portfoliowere $305 million at December 31, 2014, compared to $233million at December 31, 2013, and $630 million atDecember 31, 2012. The increase of $72 million fromDecember 31, 2013 was mainly driven by an increase of $89million in the BPPR segment, in part offset by a decrease of $17million in the BPNA segment. The decrease in the BPNAsegment was mainly due to the sale of certain mortgage non-
performing loans, as part of the US operations reorganization.The percentage of non-performing mortgage loans held-in-portfolio to mortgage loans held-in-portfolio increased to 4.69%at December 31, 2014 from 3.48% at December 31, 2013. Thisratio was 10.37% at December 31, 2012.
Tables 51 and 52 present changes in non-performingmortgage loans held-in-portfolio for the years endedDecember 31, 2014 and 2013 for the BPPR (excluding coveredloans) and BPNA segments.

85 POPULAR, INC. 2014 ANNUAL REPORT
Table 51 - Activity in Non-Performing Mortgage Loans Held-in-Portfolio (Excluding Covered Loans)
For the year ended December 31, 2014
(In thousands) BPPR BPNA Popular, Inc.
Beginning Balance - NPLs $ 206,389 $ 26,292 $ 232,681Plus:
New non-performing loans 381,439 19,558 400,997Less:
Non-performing loans transferred to OREO (8,709) (2,726) (11,435)Non-performing loans charged-off (35,219) (2,007) (37,226)Loans returned to accrual status / loan collections (241,515) (12,548) (254,063)Loans transferred to held-for-sale – (19,285) (19,285)Non-performing mortgage loans reclassified to non-performing consumer loans (6,756) – (6,756)
Ending balance - NPLs $ 295,629 $ 9,284 $ 304,913
Table 52 - Activity in Non-Performing Mortgage Loans Held-in-Portfolio (Excluding Covered Loans)
For the year ended December 31, 2013
(In thousands) BPPR BPNA Popular, Inc.
Beginning Balance - NPLs $ 596,106 $ 34,024 $ 630,130Plus:
New non-performing loans 397,086 22,253 419,339Less:
Non-performing loans transferred to OREO (44,762) (3,799) (48,561)Non-performing loans charged-off (32,299) (8,362) (40,661)Loans returned to accrual status / loan collections (260,167) (17,824) (277,991)Loans transferred to held-for-sale (14,968) – (14,968)Non-performing loans sold (434,607) – (434,607)
Ending balance - NPLs $ 206,389 $ 26,292 $ 232,681
For the year ended December 31, 2014, inflows of mortgagenon-performing loans held-in-portfolio at the BPPR segmentamounted to $381 million, a decrease of $16 million, or 4%,when compared to inflows for the same period in 2013. Inflowsof mortgage non-performing loans held-in-portfolio at theBPNA segment amounted to $20 million, a decrease of $3million, or 12%, compared to inflows for 2013.
Mortgage loan net charge-offs, excluding net charge-offs forcovered loans, amounted to $45.2 million for the year endedDecember 31, 2014, compared to $55.5 million inDecember 31, 2013 and $71.9 million in December 31, 2012.The decrease of $10.3 million for the year ended December 31,2014, when compared with the same period in 2013 was mainlyrelated to reductions in the BPNA segment. Mortgage loan netcharge-offs to average mortgage non-covered loans held-in-portfolio was 0.69% in December 31, 2014, compared to 0.85%for the year ended December 31, 2013, and 1.27% for the yearended December 31, 2012.
Mortgage loan net charge-offs at the BPPR segment,excluding covered loans, remained stable at $44.0 million, or
0.82% of average non-covered loans held-in-portfolio,compared to $47.7 million, or 0.89% of average loans in thesame period in 2013. For the year ended December 31, 2014,charge-offs associated with mortgage loans individuallyevaluated for impairment amounted to $9.1 million in the BPPRsegment.
Mortgage loan net charge-offs at the BPNA segmentamounted to $1.2 million for the year ended December 31,2014, a decrease of $6.6 million when compared with the sameperiod in 2013, mainly reflective of credit quality improvementsand the stabilization of the US economic environment.Mortgage loan net charge-offs to average mortgage non-coveredloans held-in-portfolio decreased to 0.10% for the year endedDecember 31, 2014 from 0.64% for the year endedDecember 31, 2013.
Table 53 provides information on mortgage non-performingloans and net charge-offs for the BPPR and BPNA (excludingthe covered loan portfolio) segments for the years endedDecember 31, 2014, 2013, and 2012.

86
Table 53 - Non-Performing Mortgage Loans and Net Charge-offs (Excluding Covered Loans)
BPPR BPNA Popular, Inc.
(Dollars in thousands)December 31,
2014December 31,
2013December 31,
2012December 31,
2014December 31,
2013December 31,
2012December 31,
2014December 31,
2013December 31,
2012
Non-performingmortgage loans $295,629 $206,389 $596,106 $ 9,284 $26,292 $ 34,024 $304,913 $232,681 $630,130
Non-performingmortgage loans tomortgage loans HIP 5.42% 3.82% 12.05% 0.88% 2.05% 3.01% 4.69% 3.48% 10.37%
BPPR BPNA Popular, Inc.
For the year ended For the year ended For the year ended
(Dollars in thousands)December 31,
2014December 31,
2013December 31,
2012December 31,
2014December 31,
2013December 31,
2012December 31,
2014December 31,
2013December 31,
2012
Mortgage loan netcharge-offs $44,000 $47,736 $56,777 $1,196 $7,803 $15,163 $45,196 $55,539 $71,940
Mortgage loan netcharge-offs toaverage mortgageloans HIP 0.82% 0.89% 1.21% 0.10% 0.64% 1.52% 0.69% 0.85% 1.27%
Consumer loansNon-covered non-performing consumer loans held-in-portfoliowere $47 million at December 31, 2014, compared to $44 millionat December 31, 2013, and $41 million at December 31, 2012.Consumer non-covered non-performing loans held-in-portfolioincreased slightly by $3 million when compared to December 31,2013, primarily as a result of an increase of $8 million in theBPPR segment, mainly related to personal and auto loans.
For the year ended December 31, 2014, inflows of consumernon-performing loans held-in-portfolio at the BPPR segmentamounted to $97 million, an increase of $9 million, or 10%,when compared to inflows for the same period of 2013. Inflowsof consumer non-performing loans held-in-portfolio at theBPNA segment amounted to $20 million, a decrease of $7million, or 26% compared to inflows for 2013.
The Corporation’s consumer loan net charge-offs, excludingcovered loans, amounted to $109.6 million for the year ended
December 31, 2014, compared to $97.0 million inDecember 31, 2013 and $126.1 million in December 31, 2012.The increase of $12.6 million in consumer net charge-offs forthe year ended December 31, 2014, when compared with thesame period in 2013, was driven by an increase of $21.1 millionin the BPPR segment, reflective of certain deterioration in creditquality trends. In addition, 2013 net charge-offs include an $8.9million recovery associated with an opportunistic sale of aportfolio of previously charged-off credit cards and personalloans in the BPPR segment. Consumer loan net charge-offs toaverage consumer non-covered loans held-in-portfolio was2.81% for the year ended December 31, 2014, compared with2.50% for December 31, 2013 and 3.36% for December 31,2012.
Table 54 provides information on consumer non-performingloans and net charge-offs by segments.
Table 54 - Non-Performing Consumer Loans and Net Charge-offs (Excluding Covered Loans)
BPPR BPNA Popular, Inc.
(Dollars in thousands)December 31,
2014December 31,
2013December 31,
2012December 31,
2014December 31,
2013December 31,
2012December 31,
2014December 31,
2013December 31,
2012
Non-performingconsumer loans $40,930 $33,166 $30,888 $5,956 $10,732 $9,870 $46,886 $43,898 $40,758
Non-performingconsumer loans toconsumer loans HIP 1.21% 1.00% 0.96% 1.24% 1.74% 1.56% 1.21% 1.63% 1.05%
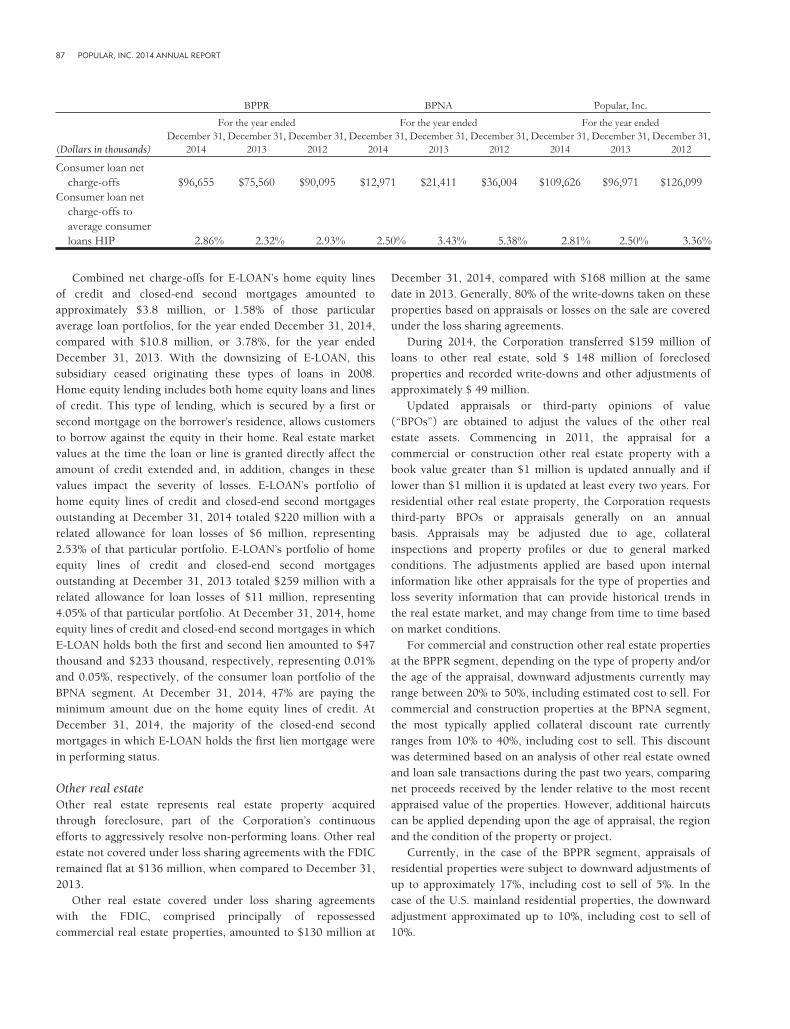
87 POPULAR, INC. 2014 ANNUAL REPORT
BPPR BPNA Popular, Inc.
For the year ended For the year ended For the year ended
(Dollars in thousands)December 31,
2014December 31,
2013December 31,
2012December 31,
2014December 31,
2013December 31,
2012December 31,
2014December 31,
2013December 31,
2012
Consumer loan netcharge-offs $96,655 $75,560 $90,095 $12,971 $21,411 $36,004 $109,626 $96,971 $126,099
Consumer loan netcharge-offs toaverage consumerloans HIP 2.86% 2.32% 2.93% 2.50% 3.43% 5.38% 2.81% 2.50% 3.36%
Combined net charge-offs for E-LOAN’s home equity linesof credit and closed-end second mortgages amounted toapproximately $3.8 million, or 1.58% of those particularaverage loan portfolios, for the year ended December 31, 2014,compared with $10.8 million, or 3.78%, for the year endedDecember 31, 2013. With the downsizing of E-LOAN, thissubsidiary ceased originating these types of loans in 2008.Home equity lending includes both home equity loans and linesof credit. This type of lending, which is secured by a first orsecond mortgage on the borrower’s residence, allows customersto borrow against the equity in their home. Real estate marketvalues at the time the loan or line is granted directly affect theamount of credit extended and, in addition, changes in thesevalues impact the severity of losses. E-LOAN’s portfolio ofhome equity lines of credit and closed-end second mortgagesoutstanding at December 31, 2014 totaled $220 million with arelated allowance for loan losses of $6 million, representing2.53% of that particular portfolio. E-LOAN’s portfolio of homeequity lines of credit and closed-end second mortgagesoutstanding at December 31, 2013 totaled $259 million with arelated allowance for loan losses of $11 million, representing4.05% of that particular portfolio. At December 31, 2014, homeequity lines of credit and closed-end second mortgages in whichE-LOAN holds both the first and second lien amounted to $47thousand and $233 thousand, respectively, representing 0.01%and 0.05%, respectively, of the consumer loan portfolio of theBPNA segment. At December 31, 2014, 47% are paying theminimum amount due on the home equity lines of credit. AtDecember 31, 2014, the majority of the closed-end secondmortgages in which E-LOAN holds the first lien mortgage werein performing status.
Other real estateOther real estate represents real estate property acquiredthrough foreclosure, part of the Corporation’s continuousefforts to aggressively resolve non-performing loans. Other realestate not covered under loss sharing agreements with the FDICremained flat at $136 million, when compared to December 31,2013.
Other real estate covered under loss sharing agreementswith the FDIC, comprised principally of repossessedcommercial real estate properties, amounted to $130 million at
December 31, 2014, compared with $168 million at the samedate in 2013. Generally, 80% of the write-downs taken on theseproperties based on appraisals or losses on the sale are coveredunder the loss sharing agreements.
During 2014, the Corporation transferred $159 million ofloans to other real estate, sold $ 148 million of foreclosedproperties and recorded write-downs and other adjustments ofapproximately $ 49 million.
Updated appraisals or third-party opinions of value(“BPOs”) are obtained to adjust the values of the other realestate assets. Commencing in 2011, the appraisal for acommercial or construction other real estate property with abook value greater than $1 million is updated annually and iflower than $1 million it is updated at least every two years. Forresidential other real estate property, the Corporation requeststhird-party BPOs or appraisals generally on an annualbasis. Appraisals may be adjusted due to age, collateralinspections and property profiles or due to general markedconditions. The adjustments applied are based upon internalinformation like other appraisals for the type of properties andloss severity information that can provide historical trends inthe real estate market, and may change from time to time basedon market conditions.
For commercial and construction other real estate propertiesat the BPPR segment, depending on the type of property and/orthe age of the appraisal, downward adjustments currently mayrange between 20% to 50%, including estimated cost to sell. Forcommercial and construction properties at the BPNA segment,the most typically applied collateral discount rate currentlyranges from 10% to 40%, including cost to sell. This discountwas determined based on an analysis of other real estate ownedand loan sale transactions during the past two years, comparingnet proceeds received by the lender relative to the most recentappraised value of the properties. However, additional haircutscan be applied depending upon the age of appraisal, the regionand the condition of the property or project.
Currently, in the case of the BPPR segment, appraisals ofresidential properties were subject to downward adjustments ofup to approximately 17%, including cost to sell of 5%. In thecase of the U.S. mainland residential properties, the downwardadjustment approximated up to 10%, including cost to sell of10%.

88
Troubled debt restructuringsThe following tables present the loans classified as TDRsaccording to their accruing status at December 31, 2014, 2013and 2012.
The Corporation’s TDR loans, excluding covered loans)totaled $1.1 billion at December 31, 2014, an increase of $157
million, or 17%, from December 31, 2013. TDRs in accruingstatus increased by $56 million from December 31, 2013, due tosustained borrower performance.
Table 55 - TDRs Non-Covered Loans 2014
December 31, 2014
(In thousands) Accruing Non-Accruing Total
Commercial $153,380 $150,069 $ 303,449Construction 453 5,488 5,941Mortgage 556,346 116,465 672,811Leases 775 2,248 3,023Consumer 107,530 14,848 122,378
Total $818,484 $289,118 $1,107,602
Table 56 - TDRs Non-Covered Loans 2013
December 31, 2013
(In thousands) Accruing Non-Accruing Total
Commercial $109,462 $ 80,140 $189,602Construction 425 10,865 11,290Legacy – 949 949Mortgage 535,357 82,786 618,143Leases 270 2,623 2,893Consumer 116,719 10,741 127,460
Total $762,233 $188,104 $950,337
Table 57 - TDRs Non-Covered Loans 2012
December 31, 2012
(In thousands) Accruing Non-Accruing Total
Commercial $105,648 $208,119 $ 313,767Construction 2,969 10,310 13,279Legacy – 5,978 5,978Mortgage 405,063 273,042 678,105Leases 1,726 3,155 4,881Consumer 125,955 8,981 134,936
Total $641,361 $509,585 $1,150,946
The following tables present the covered loans classified as TDRs according to their accruing status at December 31, 2014, 2013and 2012.
Table 58 - TDRs Covered Loans 2014
December 31, 2014
(In thousands) Accruing Non-Accruing Total
Commercial $1,689 $3,257 $ 4,946Construction – 2,419 2,419Mortgage 3,629 3,990 7,619Consumer 26 5 31
Total $5,344 $9,671 $15,015

89 POPULAR, INC. 2014 ANNUAL REPORT
Table 59 - TDRs Covered Loans 2013
December 31, 2013
(In thousands) Accruing Non-Accruing Total
Commercial $7,389 $10,017 $17,406Construction – 3,464 3,464Mortgage 146 189 335Consumer 221 22 243
Total $7,756 $13,692 $21,448
Table 60 - TDRs Covered Loans 2012
December 31, 2012
(In thousands) Accruing Non-Accruing Total
Commercial $46,142 $ 4,071 $50,213Construction – 7,435 7,435Mortgage 149 220 369Consumer 517 106 623
Total $ 46,808 $11,832 $ 58,640
At December 31, 2014, the Corporation’s commercial loanTDRs, excluding covered loans, for the BPPR and BPNA segmentsamounted to $303 million and $250 thousand, respectively, ofwhich $150 million and none, respectively, were in non-performing status. This compares with $172 million and $18million, respectively, of which $63 million and $17 million werein non-performing status at December 31, 2013. The outstandingcommitments for these commercial loan TDRs amounted to $5million in the BPPR segment and no commitments outstanding inthe BPNA segment at December 31, 2014. Commercial loans thathave been modified as part of loss mitigation efforts wereevaluated individually for impairment, resulting in a specificreserve of $65 million for the BPPR segment and none for theBPNA segment at December 31, 2014, compared with $13 millionand none, respectively, at December 31, 2013.
At December 31, 2014, the Corporation’s construction loanTDRs, excluding covered loans, for the BPPR and the BPNAsegments amounted to $6 million and none, respectively, ofwhich $5 million and none, respectively, which were in non-performing status. This compares with $6 million each, ofwhich $5 million and $6 million were in non-performing statusat December 31, 2013. The outstanding commitments for theseconstruction loan TDRs amounted to $1 million in the BPPRsegment and no commitments outstanding in the BPNAsegment at December 31, 2014. These construction loan TDRswere individually evaluated for impairment resulting in aspecific reserve of $363 thousand for the BPPR and none for theBPNA segments at December 31, 2014, compared with $177thousand and none, respectively, at December 31, 2013.
At December 31, 2014, the Corporation’s had no legacy loansmodifications, compared with $949 thousand at December 31,2013. These loans were in non-performing status atDecember 31, 2013. There were no commitments outstanding
for these legacy loan TDRs at December 31, 2014. The legacyloan TDRs were evaluated for impairment requiring no specificreserves at December 31, 2014 and December 31, 2013.
At December 31, 2014, the mortgage loan TDRs for the BPPRand BPNA segments amounted to $669 million (including $290million guaranteed by U.S. sponsored entities) and $4 million,respectively, of which $115 million and $987 thousand,respectively, were in non-performing status. This compares with$565 million (including $240 million guaranteed by U.S.sponsored entities) and $53 million, respectively, of which $73million and $10 million were in non-performing status atDecember 31, 2013. These mortgage loan TDRs were evaluatedfor impairment resulting in a specific allowance for loan lossesof $46 million and $273 thousand for the BPPR and BPNAsegments, respectively, at December 31, 2014, compared to $38million and $18 million, respectively, at December 31, 2013.
At December 31, 2014, the consumer loan TDRs for theBPPR and BPNA segments amounted to $120 million and $2million, respectively, of which $15 million and $35 thousand,respectively, were in non-performing status, compared with$125 million and $2 million, respectively, of which $10 millionand $587 thousand, respectively, were in non-performing statusat December 31, 2013. These consumer loan TDRs wereevaluated for impairment resulting in a specific allowance forloan losses of $28 million and $365 thousand for the BPPR andBPNA segments, respectively, at December 31, 2014, comparedwith $30 million and $280 thousand, respectively, atDecember 31, 2013.
Refer to Note 12 to the consolidated financial statements foradditional information on modifications considered troubleddebt restructurings, including certain qualitative andquantitative data about troubled debt restructurings performedin the past twelve months.

90
Allowance for Loan Losses
Non-Covered Loan PortfolioThe allowance for loan losses, which represents management’sestimate of credit losses inherent in the loan portfolio, ismaintained at a sufficient level to provide for estimated creditlosses on individually evaluated loans as well as estimatedcredit losses inherent in the remainder of the loan portfolio.The Corporation’s management evaluates the adequacy of theallowance for loan losses on a quarterly basis. In thisevaluation, management considers current economic conditionsand the resulting impact on Popular Inc.’s loan portfolio, thecomposition of the portfolio by loan type and riskcharacteristics, historical loss experience, results of periodiccredit reviews of individual loans, regulatory requirements andloan impairment measurement, among other factors.
The Corporation must rely on estimates and exercisejudgment regarding matters where the ultimate outcome isunknown, such as economic developments affecting specificcustomers, industries or markets. Other factors that can affectmanagement’s estimates are the years of historical data whenestimating losses, changes in underwriting standards, financialaccounting standards and loan impairment measurements,among others. Changes in the financial condition of individualborrowers, in economic conditions, in historical loss experienceand in the condition of the various markets in which collateralmay be sold may all affect the required level of the allowance forloan losses. Consequently, the business financial condition,liquidity, capital and results of operations could also be affected.
The Corporation’s assessment of the allowance for loanlosses is determined in accordance with accounting guidance,specifically guidance of loss contingencies in ASC Subtopic450-20 (general reserve for inherent losses) and loanimpairment guidance in ASC Section 310-10-35 (loansindividually assessed for impairment). Decreases in expectedcash flows after the acquisition date for loans (pools) accountedfor under ASC Subtopic 310-30 are recognized by recording anallowance for loan losses in the current period. For purposes ofloans accounted for under ASC Subtopic 310-20 and new loansoriginated as a result of loan commitments assumed, theCorporation’s assessment of the allowance for loan losses isdetermined in accordance with the accounting guidance of losscontingencies in ASC Subtopic 450-20 (general reserve forinherent losses) and loan impairment guidance in ASCSection 310-10-35 for loans individually evaluated forimpairment. Refer to the Critical Accounting Policies /Estimates section of this MD&A for a description of theCorporation’s allowance for loan losses methodology.
The following tables set forth information concerning thecomposition of the Corporation’s allowance for loan losses(“ALLL”) at December 31, 2014, December 31, 2013 andDecember 31, 2012 by loan category and by whether theallowance and related provisions were calculated individuallypursuant to the requirements for specific impairment orthrough a general valuation allowance.
Table 61 - Composition of the Allowance for Loan Losses
December 31, 2014
(Dollars in thousands) Commercial Construction Legacy [3] Leasing Mortgage Consumer Total [2]
Specific ALLL $ 64,736 $ 363 $ – $ 770 $ 46,111 $ 28,161 $ 140,141Impaired loans [1] $ 357,161 $ 13,268 $ – $ 3,023 $ 435,824 $ 117,732 $ 927,008Specific ALLL to impaired loans [1] 18.13% 2.74% –% 25.47% 10.58% 23.92% 15.12%General ALLL $ 146,501 $ 6,307 $ 2,944 $ 6,361 $ 77,211 $ 140,254 $ 379,578Loans held-in-portfolio, excluding impaired
loans [1] $7,777,106 $238,552 $80,818 $561,366 $6,067,062 $3,752,539 $18,477,443General ALLL to loans held-in-portfolio,
excluding impaired loans [1] 1.88% 2.64% 3.64% 1.13% 1.27% 3.74% 2.05%Total ALLL $ 211,237 $ 6,670 $ 2,944 $ 7,131 $ 123,322 $ 168,415 $ 519,719Total non-covered loans held-in-
portfolio [1] $8,134,267 $251,820 $80,818 $564,389 $6,502,886 $3,870,271 $19,404,451ALLL to loans held-in-portfolio [1] 2.60% 2.65% 3.64% 1.26% 1.90% 4.35% 2.68%
[1] Excludes covered loans acquired on the Westernbank FDIC-assisted transaction.[2] Excludes covered loans acquired on the Westernbank FDIC-assisted transaction. At December 31, 2014, the general allowance on the covered loans amounted to
$82.1 million while the specific reserve amounted to $5 thousand.[3] The legacy portfolio is comprised of commercial loans, construction loans and lease financings related to certain lending products exited by the Corporation as part
of restructuring efforts carried out in prior years at the BPNA reportable segment.

91 POPULAR, INC. 2014 ANNUAL REPORT
Table 62 - Composition of the Allowance for Loan Losses
December 31, 2013
(Dollars in thousands) Commercial Construction Legacy [3] Leasing Mortgage Consumer Total [2]
Specific ALLL $ 16,409 $ 177 $ - $ 1,053 $ 55,667 $ 30,200 $ 103,506Impaired loans [1] $ 297,516 $ 22,486 $ 6,045 $ 2,893 $ 452,073 $ 127,703 $ 908,716Specific ALLL to impaired loans [1] 5.52% 0.79% –% 36.40% 12.31% 23.65% 11.39%General ALLL $ 158,573 $ 5,165 $ 13,704 $ 9,569 $ 101,262 $ 146,684 $ 434,957Loans held-in-portfolio, excluding
impaired loans [1] $ 9,739,669 $183,598 $205,090 $540,868 $6,229,403 $3,804,523 $20,703,151General ALLL to loans held-in-portfolio,
excluding impaired loans [1] 1.63% 2.81% 6.68% 1.77% 1.63% 3.86% 2.10%Total ALLL $ 174,982 $ 5,342 $ 13,704 $ 10,622 $ 156,929 $ 176,884 $ 538,463Total non-covered loans held-in-
portfolio [1] $10,037,185 $206,084 $211,135 $543,761 $6,681,476 $3,932,226 $21,611,867ALLL to loans held-in-portfolio [1] 1.74% 2.59% 6.49% 1.95% 2.35% 4.50% 2.49%
[1] Excludes covered loans acquired on the Westernbank FDIC-assisted transaction.[2] Excludes covered loans acquired on the Westernbank FDIC-assisted transaction. At December 31, 2013, the general allowance on the covered loans amounted to
$101.8 million while the specific reserve amounted to $0.3 million.[3] The legacy portfolio is comprised of commercial loans, construction loans and lease financings related to certain lending products exited by the Corporation as part
of restructuring efforts carried out in prior years at the BPNA reportable segment.
Table 63 - Composition of the Allowance for Loan Losses
December 31, 2012
(Dollars in thousands) Commercial Construction Legacy [3] Leasing Mortgage Consumer Total [2]
Specific ALLL $ 17,348 $ 120 $ – $ 1,066 $ 74,667 $ 17,886 $ 111,087Impaired loans [1] $ 527,664 $ 41,809 $ 18,744 $ 4,881 $ 611,230 $ 133,377 $ 1,337,705Specific ALLL to impaired loans [1] 3.29% 0.29% –% 21.84% 12.22% 13.41% 8.30%General ALLL $ 280,334 $ 7,309 $ 33,102 $ 1,828 $ 74,708 $ 113,333 $ 510,614Loans held-in-portfolio, excluding
impaired loans [1] $9,330,538 $211,048 $365,473 $535,642 $5,467,277 $3,735,509 $19,645,487General ALLL to loans held-in-portfolio,
excluding impaired loans [1] 3.00% 3.46% 9.06% 0.34% 1.37% 3.03% 2.60%Total ALLL $ 297,682 $ 7,429 $ 33,102 $ 2,894 $ 149,375 $ 131,219 $ 621,701Total non-covered loans held-in-
portfolio [1] $9,858,202 $252,857 $384,217 $540,523 $6,078,507 $3,868,886 $20,983,192ALLL to loans held-in-portfolio [1] 3.02% 2.94% 8.62% 0.54% 2.46% 3.39% 2.96%
[1] Excludes covered loans acquired on the Westernbank FDIC-assisted transaction.[2] Excludes covered loans acquired on the Westernbank FDIC-assisted transaction. At December 31, 2012, the general allowance on the covered loans amounted to
$100 million while the specific reserve amounted to $9 million.[3] The legacy portfolio is comprised of commercial loans, construction loans and lease financings related to certain lending products exited by the Corporation as part
of restructuring efforts carried out in prior years at the BPNA reportable segment.
Table 64 details the breakdown of the allowance for loanlosses by loan categories. The breakdown is made for analytical
purposes, and it is not necessarily indicative of the categories inwhich future loan losses may occur.

92
Table 64 - Allocation of the Allowance for Loan Losses
At December 31,
2014 2013 2012 2011 2010
(Dollars in millions) ALLL
% of loansin each
category tototal loans ALLL
% of loansin each
category tototal loans ALLL
% of loansin each
category tototal loans ALLL
% of loansin each
category tototal loans ALLL
% of loansin each
category tototal loans
Commercial $211.2 41.9% $175.0 46.4% $297.7 47.0% $369.4 48.4% $399.8 51.0%Construction 6.7 1.3 5.3 1.0 7.4 1.2 8.5 1.2 39.8 1.6Legacy 3.0 0.4 13.7 1.0 33.1 1.8 46.2 3.1 76.4 4.9Leasing 7.1 2.9 10.6 2.5 2.9 2.6 4.7 2.7 7.2 2.8Mortgage 123.3 33.5 156.9 30.9 149.4 29.0 102.3 26.8 70.9 21.8Consumer 168.4 20.0 176.9 18.2 131.2 18.4 159.3 17.8 199.1 17.9
Total[1] $519.7 100.0% $538.4 100.0% $621.7 100.0% $690.4 100.0% $793.2 100.0%
[1] Note: For purposes of this table the term loans refers to loans held-in-portfolio excluding covered loans and held-for-sale.
At December 31, 2014, the allowance for loan losses,excluding covered loans, decreased by approximately $19million when compared with the same date in the previousyear, mainly driven by a reserve release of $81 million in theBPNA segment, offset in part by higher reserve in the BPPRsegment of $62 million. The general and specific reservesrelated to the non-covered loans totaled $380 million and $140million, respectively, compared with $435 million and $104million, respectively, as of December 31, 2013. The ratio of theallowance for loan losses to loans held-in-portfolio was 2.68%of non-covered loans held-in-portfolio at December 31, 2014,compared with 2.49% at December 31, 2013. The ratio of theallowance to non-performing loans held-in-portfolio was82.43% at December 31, 2014, compared with 90.05% atDecember 31, 2013.
At December 31, 2014, the allowance for loan losses fornon-covered loans at the BPPR segment totaled $489 million, or3.07% of non-covered loans held-in-portfolio, compared with$427 million, or 2.69% of non-covered loans held-in-portfolio,at December 31, 2013. The increase in the allowance wasmostly driven by: (1) qualitative factors adjustments accountingfor prevailing macroeconomic conditions in Puerto Rico andthe public sector utilities exposures, (2) the effect ofdowngrades in the internal risk ratings of certain largecorporate and public sector relationships, and (3) higherspecific reserves. These increases were partially offset by a$14.9 million reserve release as part of the annual review of thecomponents of the ALLL models. The ratio of the allowance tonon-performing loans held-in-portfolio was 80.00% atDecember 31, 2014, compared with 95.42% at December 31,2013.
The allowance for loan losses at the BPNA segment totaled$31 million, or 0.88% of loans held-in-portfolio, compared with$112 million, or 1.95% of loans held-in-portfolio, atDecember 31, 2013. The decrease was mainly prompted bycontinued improvements in credit quality trends, $20 million
reduction related to the sale of the regional operations, $35million related to the sale or transfer to loans held-for-sale ofcertain classified and legacy loans during the second half of2014, and a $3.8 million reserve release as part of the annualreview of the components of the ALLL models during thesecond quarter of 2014. The ratio of the allowance to non-performing loans held-in-portfolio was 160.13% atDecember 31, 2014, compared with 74.12% at December 31,2013.
The allowance for loan losses for commercial loans held-in-portfolio, excluding covered loans, amounted to $211 million,or 2.60% of that portfolio, at December 31, 2014, comparedwith $175 million, or 1.74%, at December 31, 2013, and $298million, or 3.02%, at December 31, 2012. The allowance forloan losses for the commercial loan portfolio in the BPPRsegment, excluding the allowance for covered loans, totaled$202 million, or 3.16% of non-covered commercial loans held-in-portfolio, at December 31, 2014, compared with $128million, or 1.98%, at December 31, 2013. The increase in theallowance was mainly prompted by challenging economicconditions that persist in Puerto Rico, as mentioned above. Atthe BPNA segment, the allowance for loan losses of thecommercial loan portfolio totaled $10 million, or 0.55% ofcommercial loans held-in-portfolio, at December 31, 2014,compared with $47 million, or 1.31%, at December 31, 2013.This decrease in the allowance for loan losses in the BPNAsegment results from continued improvements in credit quality,the sale of its regional operations, the sale of certain classifiedand legacy loans, and a reserve release as part of the annualreview of the components of the ALLL models, as previouslymentioned. The ratio of allowance to non-performing loansheld-in-portfolio in the commercial loan category was 81.18%at December 31, 2014, compared with 62.71% at December 31,2013 and 44.74% at December 31, 2012.
The allowance for loan losses for construction loans held-in-portfolio, excluding covered loans, amounted to $7 million, or

93 POPULAR, INC. 2014 ANNUAL REPORT
2.65% of that portfolio, at December 31, 2014, compared with$5 million, or 2.59%, at December 31, 2013, and $7 million, or2.94%, at December 31, 2012. The allowance for loan lossescorresponding to the construction loan portfolio for the BPPRsegment, excluding the allowance for covered loans, totaled $5million, or 3.44% of non-covered construction loans held-in-portfolio, at December 31, 2014, compared with $5 million, or3.16%, at December 31, 2013. At the BPNA segment, theallowance for loan losses of the construction loan portfoliototaled $1 million, or 1.28% of construction loans held-in-portfolio, at December 31, 2014, compared with $247thousand, or 0.55%, at December 31, 2013. The ratio ofallowance to non-performing loans held-in portfolio in theconstruction loan category was 48.29% at December 31, 2014,compared with 22.47% at December 31, 2013 and 17.14% atDecember 31, 2012. Stable allowance levels in the constructionportfolio result from the de-risking strategies executed by theCorporation over the past several years to downsize itsconstruction loan portfolio.
The allowance for loan losses for the legacy loans held-in-portfolio amounted to $3 million, or 3.64% of that portfolio, atDecember 31, 2014, compared with $14 million, or 6.49%, atDecember 31, 2013, and $33 million, or 8.62%, atDecember 31, 2012. The decrease in the allowance for loanlosses was primarily driven by improved credit performance,lower loan balances and lower non-performing loans. The ratioof allowance to non-performing loans held-in portfolio in thelegacy loan category was 190.55% at December 31, 2014,compared with 91.06% at December 31, 2013 and 81.25% atDecember 31, 2012.
The allowance for loan losses for mortgage loans held-in-portfolio, excluding covered loans, amounted to $123 million,or 1.90% of that portfolio, at December 31, 2014, comparedwith $157 million, or 2.35%, at December 31, 2013, and $149million, or 2.46%, at December 31, 2012. The allowance forloan losses corresponding to the mortgage loan portfolio at theBPPR segment totaled $121 million, or 2.22% of mortgage loans
held-in-portfolio, excluding covered loans, at December 31,2014 compared with $130 million, or 2.41%, respectively, atDecember 31, 2013. The decrease in the allowance arises from alower environmental factors adjustment as a result of theannual review of the components of the ALLL model during thesecond quarter of 2014. At the BPNA segment, the allowancefor loan losses corresponding to the mortgage loan portfoliototaled $2 million, or 0.23% of mortgage loans held-in-portfolio, at December 31, 2014, compared with $27 million, or2.08%, at December 31, 2013. The decrease in the allowancewas mainly driven by the sale of certain classified loans,including mortgage TDRs and non-performing loans. Theallowance for loan losses for BPNA’s non-conventionalmortgage loan portfolio amounted to $2 million, or 0.61% ofthat particular loan portfolio, compared with $23 million, or5.57%, at December 31, 2013. The Corporation is no longeroriginating non-conventional mortgage loans at BPNA.
The allowance for loan losses for the consumer portfolio,excluding covered loans, amounted to $168 million, or 4.35%of that portfolio, at December 31, 2014, compared to $177million, or 4.50%, at December 31, 2013, and $131 million, or3.39%, at December 31, 2012. The allowance for loan losses ofthe non-covered consumer loan portfolio in the BPPR segmentremained stable at $154 million, or 4.55% of that portfolio, atDecember 31, 2014, compared with $153 million, or 4.60%, atDecember 31, 2013. At the BPNA segment, the allowance forloan losses of the consumer loan portfolio totaled $14 million,or 2.98% of consumer loans, at December 31, 2014, comparedwith $24 million, or 3.95%, at December 31, 2013. Thedecrease in the allowance for loan losses for the consumer loanportfolio was principally driven by the sale of certain classifiedconsumer loans.
The following table presents the Corporation’s recordedinvestment in non-covered loans that were considered impairedand the related valuation allowance at December 31, 2014,2013, and 2012.
Table 65 - Impaired Loans (Non-Covered Loans) and the Related Valuation Allowance
2014 2013 2012
(In millions)Recorded
Investment [1]Valuation
Allowance [2]Recorded
Investment [1]Valuation
Allowance [2]Recorded
Investment [1]Valuation
Allowance [2]
Impaired loans:Valuation allowance $831.5 $140.1 $642.6 $103.5 $ 897.6 $111.1No valuation allowance required 95.5 – 266.1 – 440.1 –
Total impaired loans $927.0 $140.1 $908.7 $103.5 $1,337.7 $111.1
[1] Excludes covered loans acquired on the Westernbank FDIC-assisted transaction.[2] Excludes the specific reserve related to covered loans acquired on the Westernbank FDIC-assisted transaction which amounted to $5 thousand at December 31,
2014 (2013 - $0.3 million; 2012 - $9 million).

94
With respect to the $96 million portfolio of the non-coveredimpaired loans for which no allowance for loan losses wasrequired at December 31, 2014, management followed theguidance for specific impairment of a loan. When a loan isimpaired, the measurement of the impairment may be based on:(1) the present value of the expected future cash flows of theimpaired loan discounted at the loan’s original effective interestrate; (2) the observable market price of the impaired loan; or(3) the fair value of the collateral, if the loan is collateraldependent. A loan is collateral dependent if the repayment ofthe loan is expected to be provided solely by the underlyingcollateral. Impaired loans with no valuation allowance were
mostly collateral dependent loans for which managementcharged-off specific reserves based on the fair value of thecollateral less estimated costs to sell.
Average non-covered impaired loans for the years endedDecember 31, 2014 and December 31, 2013 were $932 millionand $1.1 billion, respectively. The Corporation recognizedinterest income on non-covered impaired loans of $35.1 millionand $39.0 million for the years ended December 31, 2014 andDecember 31, 2013, respectively.
The following tables set forth the activity in the specificreserves for non-covered impaired loans for the years endedDecember 31, 2014 and 2013.
Table 66 - Activity in Specific ALLL for the Year Ended December 31, 2014
(In thousands) Commercial Construction Mortgage Legacy Consumer Leasing Total
Beginning balance $ 16,409 $ 177 $55,667 $– $ 30,200 $1,053 $103,506Provision for impaired loans (reversal of provision)
- Continuing operations 78,340 2,444 (276) – 13,800 (273) 94,035Reversal of provision for impaired loans -
Discontinued operations – – – – (70) – (70)Net charge-offs (30,013) (2,258) (9,280) – (15,769) (10) (57,330)
Specific allowance for loan losses at December 31,2014 $ 64,736 $ 363 $46,111 $– $ 28,161 $ 770 $140,141
Table 67 - Activity in Specific ALLL for the Year Ended December 31, 2013
(In thousands) Commercial Construction Mortgage Legacy Consumer Leasing Total
Beginning balance $ 17,348 $ 120 $ 74,667 $ – $17,886 $1,066 $ 111,087Provision for impaired loans (reversal of provision) 176,104 4,776 70,336 1,248 19,089 (13) 271,540Net charge-offs (115,741) (3,880) (13,668) (1,248) (6,775) – (141,312)Net write-downs (61,302) (839) (75,668) – – – (137,809)
Specific allowance for loan losses at December 31,2013 $ 16,409 $ 177 $ 55,667 $ – $30,200 $1,053 $ 103,506
For the year ended December 31, 2014, total net charge-offsfor individually evaluated impaired loans amounted toapproximately $57.3 million, of which $56.8 million pertainedto the BPPR segment and $505 thousand to the BPNAsegment. Most of these net charge-offs were related to thecommercial loan portfolio.
The Corporation requests updated appraisal reports frompre-approved appraisers for loans that are considered impaired,and individually analyzes them following the Corporation’sreappraisal policy. This policy requires updated appraisals forloans secured by real estate (including construction loans)either annually or every two years depending on the totalexposure of the borrower. As a general procedure, theCorporation internally reviews appraisals as part of theunderwriting and approval process and also for creditsconsidered impaired. Generally, the specialized appraisal reviewunit of the Corporation’s Credit Risk Management Division
internally reviews appraisals following certain materialitybenchmarks. In addition to evaluating the reasonability of theappraisal reports, these reviews monitor that appraisals areperformed following the Uniform Standards of ProfessionalAppraisal Practice (“USPAP”).
Appraisals may be adjusted due to age or general marketconditions. The adjustments applied are based upon internalinformation, like other appraisals and/or loss severityinformation that can provide historical trends in the real estatemarket. Specifically, in commercial and construction impairedloans for the BPPR segment, and depending on the type ofproperty and/or the age of the appraisal, downward adjustmentscurrently range from 25% to 45% (including costs to sell). AtDecember 31, 2014, the weighted average discount rate for theBPPR segment was 27%.
For commercial and construction loans at the BPNAsegment, downward adjustments to the collateral value

95 POPULAR, INC. 2014 ANNUAL REPORT
currently range from 10% to 40% depending on the age of theappraisals and the type, location and condition of theproperty. This discount used was determined based on a studyof other real estate owned and loan sale transactions during thepast two years, comparing net proceeds received by the bankrelative to the most recent appraised value of theproperties. However, additional haircuts can be applieddepending upon the age of appraisal, the region and thecondition of the project. Factors are based on appraisal changesand/or trends in loss severities. Discount rates discussed aboveinclude costs to sell and may change from time to time based onmarket conditions.
For mortgage loans secured by residential real estateproperties, a current assessment of value is made not later than180 days past the contractual due date. Any outstandingbalance in excess of the estimated value of the collateral
property, less estimated costs to sell, is charged-off. For thispurpose, the Corporation requests third-party Broker PriceOpinion of Value “BPOs” of the subject collateral property atleast annually. In the case of the mortgage loan portfolio for theBPPR segment, BPOs of the subject collateral properties arecurrently subject to downward adjustment of up toapproximately 30%, including cost to sell of 5%. In the case ofthe U.S. mortgage loan portfolio, a 10% haircut is taken, whichincludes costs to sell.
Discount rates discussed above include costs to sell and maychange from time to time based on market conditions.
The table that follows presents the approximate amount andpercentage of non-covered impaired loans for which theCorporation relied on appraisals dated more than one year oldfor purposes of impairment requirements at December 31,2014.
Table 68 - Non-Covered Impaired Loans With Appraisals Dated 1 Year Or Older
December 31, 2014
Total Impaired Loans - Held-in-portfolio (HIP)Impaired Loans with
Appraisals OverOne-Year Old [1](In thousands) Count
Outstanding PrincipalBalance
Commercial 140 $303,128 12%Construction 6 10,693 79[1] Based on outstanding balance of total impaired loans.
Table 69 - Non-Covered Impaired Loans With Appraisals Dated 1 Year Or Older
December 31, 2013
Total Impaired Loans - Held-in-portfolio (HIP)Impaired Loans with
Appraisals OverOne-Year Old [1](In thousands) Count
Outstanding PrincipalBalance
Commercial 174 $248,154 18%Construction 9 20,162 27Legacy 4 6,045 –[1] Based on outstanding balance of total impaired loans.
The percentage of the Corporation’s impaired construction loans that were relied upon “as developed” and “as is” for theperiods ended December 31, 2014 and 2013 are presented in the tables below.
Table 70 - Impaired Construction Loans Relied Upon “As is” or “As Developed”
December 31, 2014
“As is” “As developed”
(In thousands) Count Amount in $
As a % oftotal construction
impaired loans HIP Count Amount in $
As a % oftotal construction
impaired loans HIPAverage % ofcompletion
Loans held-in-portfolio 7 $7,653 58% 2 $5,616 42% 87%

96
Table 71 - Impaired Construction Loans Relied Upon “As is” or “As Developed”
December 31, 2013
“As is” “As developed”
(In thousands) Count Amount in $
As a % oftotal construction
impaired loans HIP Count Amount in $
As a % oftotal construction
impaired loans HIPAverage % ofcompletion
Loans held-in-portfolio 12 $18,835 77% 2 $5,703 23% 90%
At December 31, 2014, the Corporation accounted for $6million impaired construction loans under the “as developed”value. This approach is used since the current plan is that theproject will be completed and it reflects the best strategy toreduce potential losses based on the prospects of theproject. The costs to complete the project and the relatedincrease in debt are considered an integral part of the individualreserve determination.
Costs to complete are deducted from the subject “asdeveloped” collateral value on impaired construction loans.Impairment determinations are calculated following thecollateral dependent method, comparing the outstandingprincipal balance of the respective impaired construction loanagainst the expected realizable value of the subject collateral.Realizable values of subject collaterals have been defined as the“as developed” appraised value less costs to complete, costs tosell and discount factors. Costs to complete represent anestimate of the amount of money to be disbursed to complete aparticular phase of a construction project. Costs to sell havebeen determined as a percentage of the subject collateral value,to cover related collateral disposition costs (e.g. legal andcommission fees). As discussed previously, discount factorsmay be applied to the appraised amounts due to age or generalmarket conditions.
Allowance for loan losses - Covered loan portfolioThe Corporation’s allowance for loan losses for the covered loanportfolio acquired in the Westernbank FDIC-assisted transactionamounted to $82 million at December 31, 2014. This allowancecovers the estimated credit loss exposure related to: (i) acquiredloans accounted for under ASC Subtopic 310-30, which requiredan allowance for loan losses of $79 million at December 31,2014, compared with $94 million at December 31, 2013; and(ii) acquired loans accounted for under ASC Subtopic 310-20,which required an allowance for loan losses of $3 million atDecember 31, 2014 and $8 million at December 31, 2013.
Decreases in expected cash flows after the acquisition date forloans (pools) accounted for under ASC Subtopic 310-30 arerecognized by recording an allowance for loan losses in thecurrent period. For purposes of loans accounted for under ASCSubtopic 310-20 and new loans originated as a result of loancommitments assumed, the Corporation’s assessment of theallowance for loan losses is determined in accordance with theaccounting guidance of loss contingencies in ASC Subtopic 450-
20 (general reserve for inherent losses) and loan impairmentguidance in ASC Section 310-10-35 for loans individuallyevaluated for impairment. Concurrently, the Corporation recordsan increase in the FDIC loss share asset for the expectedreimbursement from the FDIC under the loss sharing agreements.
Enterprise Risk and Operational Risk ManagementThe Financial and Operational Risk Management Division (the“FORM Division”) is responsible for overseeing theimplementation of the Enterprise Risk Management (ERM)framework, as well as developing and overseeing theimplementation of risk programs and reporting that facilitate abroad integrated view of risks. The FORM Division also leadsthe ongoing development of a strong risk management cultureand the framework that support effective risk governance. Fornew products and initiatives, the Corporate ComplianceDivision has put in place processes to ensure that anappropriate standard readiness assessment is performed beforelaunching a new product or initiative. Similar procedures arefollowed with the Treasury Division for transactions involvingthe purchase and sale of assets.
Operational risk can manifest itself in various ways,including errors, fraud, cyber attacks, business interruptions,inappropriate behavior of employees, and failure to perform ina timely manner, among others. These events can potentiallyresult in financial losses and other damages to the Corporation,including reputational harm. The successful management ofoperational risk is particularly important to a diversifiedfinancial services company like Popular because of the nature,volume and complexity of its various businesses.
To monitor and control operational risk and mitigate relatedlosses, the Corporation maintains a system of comprehensivepolicies and controls. The Corporation’s Operational RiskCommittee (ORCO), which is composed of senior levelrepresentatives from the business lines and corporate functions,provides executive oversight to facilitate consistency of effectivepolicies, best practices, controls and monitoring tools formanaging and assessing all types of operational risks across theCorporation. The FORM Division, within the Corporation’s RiskManagement Group, serves as ORCO’s operating arm and isresponsible for establishing baseline processes to measure,monitor, limit and manage operational risk. In addition, theAuditing Division provides oversight about policy compliance andensures adequate attention is paid to correct the identified issues.
97 POPULAR, INC. 2014 ANNUAL REPORT
Operational risks fall into two major categories: businessspecific and corporate-wide affecting all business lines. Theprimary responsibility for the day-to-day management ofbusiness specific risks relies on business unit managers.Accordingly, business unit managers are responsible forensuring that appropriate risk containment measures, includingcorporate-wide or business segment specific policies andprocedures, controls and monitoring tools, are in place tominimize risk occurrence and loss exposures. Examples ofthese include personnel management practices, datareconciliation processes, transaction processing monitoring andanalysis and contingency plans for systems interruptions. Tomanage corporate-wide risks, specialized functions, such asLegal, Information Security, Business Continuity, and Financeand Compliance, among others, assist the business units in thedevelopment and implementation of risk management practicesspecific to the needs of the individual businesses.
Operational risk management plays a different role in eachcategory. For business specific risks, the FORM Division workswith the segments to ensure consistency in policies, processes,and assessments. With respect to corporate-wide risks, such asinformation security, business continuity, legal and compliance,the risks are assessed and a consolidated corporate view isdeveloped and communicated to the business level. Proceduresexist that are designed to ensure that policies relating toconduct, ethics, and business practices are followed. Wecontinually monitor the system of internal controls, dataprocessing systems, and corporate-wide processes andprocedures to manage operational risk at appropriate, cost-effective levels. An additional level of review is applied tocurrent and potential regulation and its impact on businessprocesses, to ensure that appropriate controls are put in place
to address regulation requirements. Today’s threats to customerinformation and information systems are complex, more widespread, continually emerging, and increasing at a rapid pace.The Corporation continuously monitors these threats and, todate, we have not experienced any material losses as a result ofcyber attacks.
ADOPTION OF NEW ACCOUNTING STANDARDS ANDISSUED BUT NOT YET EFFECTIVE ACCOUNTINGSTANDARDSRefer to Note 3, “New Accounting Pronouncements” to theconsolidated financial statements.
Adjusted results of operations - Non-GAAP financialmeasureThe Corporation prepares its Consolidated FinancialStatements using accounting principles generally accepted inthe U.S. (“U.S. GAAP”), the (“reported basis”). These financialstatements appear on pages 109 to 113. In addition to analyzingthe Corporation’s results on a reported basis, managementmonitors the performance of the Corporation on an “adjustedbasis” and excludes the impact of certain transactions on theresults of its operations. Throughout this MD&A, theCorporation presents a discussion of its financial resultsexcluding the impact of these events to arrive at the “adjustedresults”. Management believes that the “adjusted results”provide meaningful information about the underlyingperformance of the Corporation’s ongoing operations. The“adjusted results” are a Non-GAAP financial measure. Refer toTables 72-74, for a reconciliation of the reported results to the“adjusted results” for the years ended December 31, 2014 and2013.

98
Table 72 - Adjusted Consolidated Statement of Operations for the Year Ended December 31, 2014 (Non-GAAP)
Year ended31-Dec-14
2nd QTR 3rd QTR 4th QTR
(In thousands)Actual Results(US GAAP)
TARPrepaymentdiscount
amortizationand Income
Taxadjustments
[2]
BPNAReorganization
[3]
BPNAReorganization
[3]Income Tax
Adjustments [4]
IndemnificationAssets
Adjustment [5]
BPNAReorganization
[3]Other
Adjustments
AdjustedResults
(Non-GAAP)
Net interest income $ 945,072 $(414,068) $ – $(20,663) $ – $ – $(18,591) $ – $1,398,394Provision for loan losses - non-
covered loans 223,999 – – 11,950 – – 878 – 211,171Provision for loan losses -
covered loans [1] 46,135 – – – – – – – 46,135Net interest income after
provision for loan losses 674,938 (414,068) – (32,613) – – (19,469) – 1,141,088Service charges on deposit
accounts and other servicefees 383,902 – – – – – – – 383,902
Mortgage banking activities 30,615 – – – – – – – 30,615Net loss and valuation
adjustments on investmentssecurities (870) – – – – – – – (870)
Trading account profit 4,358 – – – – – – – 4,358Net gain (loss) on sale of loans,
including valuationadjustments on loans held-for-sale 40,591 – – – – – 1,684 – 38,907
Adjustments (expense) toindemnity reserves on loanssold (40,629) – – – – – – – (40,629)
FDIC loss share expense (103,024) – – – – 12,492 – – (115,516)Other non-interest income 71,572 – – – – – – – 71,572
Total non-interest income 386,515 – – – – 12,492 1,684 – 372,339Personnel costs 418,679 – – – – – – 2,974[6] 415,705Net occupancy expenses 86,707 – – – – – – 1,895[7] 84,812Other taxes 56,918 – – – – – – – 56,918Loss on early extinguishment of
debt 532 – – – – – 532 – –Professional fees 282,055 – – – – – – – 282,055FDIC deposit insurance 40,307 – – – – – – – 40,307OREO expense 49,611 – – – – – – – 49,611Restructuring costs 26,725 – 4,574 8,290 – – 13,861 – –Other operating expenses 232,150 – – – – – – – 232,150
Total operating expenses 1,193,684 – 4,574 8,290 – – 14,393 4,869 1,161,558(Loss) income from continuing
operations before income tax (132,231) (414,068) (4,574) (40,903) – 12,492 (32,178) (4,869) 351,869Income tax expense (benefit) 58,279 (15,393) – – 20,048 2,498 – – 51,126(Loss) income from continuing
operations $ (190,510) $(398,675) $ (4,574) $(40,903) $(20,048) $ 9,994 $(32,178) $(4,869) $ 300,743
(Loss) income from discontinuedoperations, net of tax [8] (122,980) – (193,363) 20,949 – – 6,534 – 42,900
Net (loss) income $ (313,490) $(398,675) $(197,937) $(19,954) $(20,048) $ 9,994 $(25,644) $(4,869) $ 343,643
[1] Covered loans represent loans acquired in the Westernbank FDIC-assisted transaction that are covered under FDIC loss sharing agreements.[2] Income tax adjustments include a benefit of approximately $23.4 million related to a Closing Agreement with the PR Department of Treasury, completed during
the second quarter of 2014 and the negative impact of the deferred tax asset valuation allowance of approximately $8.0 million recorded at the Holding Company,due to the difference in the tax treatment of the interest expense related to the TARP funds and the newly issued $450 million senior notes.
[3] Includes the aggregated impact of $39.8 million refinancing fees of structured repos, net loss of $11.1 million in bulk loan sales and $26.7 million in restructuringincurred in connection with the reorganization of PCB.
[4] On July 1, 2014, the Government of Puerto Rico approved an amendment to the Internal Revenue Code, which, among things, changed the income tax rate forcapital gains from 15% to 20%. As a result, the Corporation recognized an income tax expense of $20.0 million, mainly related to the deferred tax liabilityassociated with the portfolio acquired from Westernbank.
[5] The FDIC indemnity assets amortization included a positive adjustment of $12.5 million to reverse the impact of accelerated amortization expense recorded inprior periods.
[6] Represents the impact of the compensation package granted upon separation of an officer of the Corporation equal to approximately $3.0 million.[7] Represents the net loss on the early cancellation of a lease at BPNA of $1.9 million.[8] Adjustments included within loss from discontinued operations include approximately $186.5 million of goodwill impairment charge, $33.8 million in the net gain
on the sale of the U.S. regional operations and approximately $13.7 million in transaction costs, which include severance payment expenses, legal and otherprofessional services, among others incurred in connection with the agreements to sell the U.S. regional operations

99 POPULAR, INC. 2014 ANNUAL REPORT
Table 73 - Adjusted Consolidated Statement of Operations for the Year Ended December 31, 2013 (Non-GAAP)
Year ended31-Dec-13
1st QTR 2nd QTR 3rd QTR 4th QTR
(In thousands)Actual Results(US GAAP)
Impact of Saleof NPAs [2]
Impact ofSale of NPLs
Impact ofEVERTEC’s
IPOIncome Tax
Adjustment [3]
Impact ofEVERTEC’s
SPO
Impact ofEVERTEC’s
SPO
AdjustedResults
(Non-GAAP)
Net interest income $1,344,574 $ – $ – $ 1,502 $ – $ – $ – $1,343,072Provision for loan losses - non-
covered loans 536,710 148,823 169,248 – – – – 218,639Provision for loan losses - covered
loans [1] 69,396 – – – – – – 69,396
Net interest income after provision forloan losses 738,468 (148,823) (169,248) 1,502 – – – 1,055,037
Service charges on deposit accountsand other service fees 392,221 – – – – – – 392,221
Mortgage banking activities 71,657 – – – – – – 71,657Net gain and valuation adjustments
on investments securities 7,966 – – 5,856 – – – 2,110Trading account loss (13,483) – – – – – – (13,483)Net (loss) gain on sale of loans,
including valuation adjustments onloans held-for-sale (52,708) (61,387) (3,865) – – – – 12,544
Adjustments (expense) to indemnityreserves on loans sold (37,054) (10,700) (3,047) – – – – (23,307)
FDIC loss share expense (82,051) – – – – – – (82,051)Other non-interest income 504,465 – – 162,091 – 175,867 92,358 74,149
Total non-interest income 791,013 (72,087) (6,912) 167,947 – 175,867 92,358 433,840
Personnel costs 428,697 – – – – – – 428,697Net occupancy expenses 86,651 – – – – – – 86,651Other taxes 58,028 – – – – – 58,028Loss on early extinguishment of debt 3,388 3,388Professional fees 278,127 5 – 856 – 250 – 277,016FDIC deposit insurance 56,728 – – – – – – 56,728OREO expense 79,658 37,046 – – – – – 42,612Other operating expenses 230,713 – – – – – – 230,713
Total operating expenses 1,221,990 37,051 – 856 – 250 – 1,183,833
Income (loss) before income tax 307,491 (257,961) (176,160) 168,593 – 175,617 92,358 305,044Income tax (benefit) expense (251,327) (77,388) (68,987) 11,988 (218,035) 7,789 3,945 89,361
Income (loss) from continuingoperations $ 558,818 $(180,573) $(107,173) $156,605 $ 218,035 $167,828 $88,413 $ 215,683
Income (loss) from discontinuedoperations, net of tax 40,509 – – – – – – 40,509
Net income (loss) $ 599,327 $(180,573) $(107,173) $156,605 $ 218,035 $167,828 $88,413 $ 256,192
[1] Covered loans represent loans acquired in the Westernbank FDIC-assisted transaction that are covered under FDIC loss sharing agreements.[2] Net (loss) gain on sale of loans for the first quarter includes $8.8 million of negative valuation adjustments on loans held for sale which were transferred to held-in-
portfolio subsequent to the sale.[3] Represents the net benefit of $215.6 million for the increase on the net deferred tax asset from the change of the corporate tax rate from 30% to 39% which
includes the adjustment for the results of the first quarter of 2013, $7.9 million resulting from the adjustment in tax rate for distributions from EVERTEC from15% to 4%, offset by an adjustment of $5.5 million on the deferred tax liability related to the covered loans portfolio.

100
Table 74 - Adjusted Consolidated Statement of Operations (Non-GAAP) - Comparative
Adjusted Results (Non-GAAP)
(In thousands) 2014 2013 Variance
Net interest income $1,398,394 $1,343,072 $ 55,322Provision for loan losses - non-covered loans 211,171 218,639 (7,468)Provision for loan losses - covered loans [1] 46,135 69,396 (23,261)
Net interest income after provision for loan losses 1,141,088 1,055,037 86,051
Service charges on deposit accounts and other service fees 383,902 392,221 (8,319)Mortgage banking activities 30,615 71,657 (41,042)Net loss and valuation adjustments on investments securities (870) 2,110 (2,980)Trading account profit 4,358 (13,483) 17,841Net gain on sale of loans, including valuation adjustments on loans held-for-sale 38,907 12,544 26,363Adjustments (expense) to indemnity reserves on loans sold (40,629) (23,307) (17,322)FDIC loss share expense (115,516) (82,051) (33,465)Other non-interest income 71,572 74,149 (2,577)
Total non-interest income 372,339 433,840 (61,501)
Personnel costs 415,705 428,697 (12,992)Net occupancy expenses 84,812 86,651 (1,839)Other taxes 56,918 58,028 (1,110)Loss on early extinguishment of debt – 3,388 (3,388)Professional fees 282,055 277,016 5,039FDIC deposit insurance 40,307 56,728 (16,421)OREO expense 49,611 42,612 6,999Other operating expenses 232,150 230,713 1,437
Total operating expenses 1,161,558 1,183,833 (22,275)
Income from continuing operations before income tax 351,869 305,044 46,825Income tax expense (benefit) 51,126 89,361 (38,235)
Income from continuing operations $ 300,743 $ 215,683 $ 85,060
Income from discontinued operations, net of tax $ 42,900 $ 40,509 $ 2,391
Net income (loss) $ 343,643 $ 256,192 $ 87,451

101 POPULAR, INC. 2014 ANNUAL REPORT
Statistical Summary 2010-2014Statements of Financial Condition
At December 31,
(In thousands) 2014 2013 2012 2011 2010
Assets:Cash and due from banks $ 381,095 $ 423,211 $ 439,363 $ 535,282 $ 452,373
Money market investments:Federal funds sold and securities purchased under agreements to
resell 151,134 181,020 246,977 327,668 181,961Time deposits with other banks 1,671,252 677,433 838,603 1,048,506 797,334
Total money market investments 1,822,386 858,453 1,085,580 1,376,174 979,295
Trading account securities, at fair value 138,527 339,743 314,525 436,331 546,713Investment securities available-for-sale, at fair value 5,315,159 5,294,800 5,084,201 5,009,823 5,236,852Investment securities held-to-maturity, at amortized cost 103,170 140,496 142,817 125,383 122,354Other investment securities, at lower of cost or realizable value 161,906 181,752 185,443 179,880 163,513Loans held-for-sale, at lower of cost or fair value 106,104 110,426 354,468 363,093 893,938
Loans held-in-portfolio:Loans not covered under loss sharing agreements with the FDIC 19,498,286 21,704,010 21,080,005 20,703,192 20,834,276Loans covered under loss sharing agreements with the FDIC 2,542,662 2,984,427 3,755,972 4,348,703 4,836,882Less - Unearned income 93,835 92,144 96,813 100,596 106,241
Allowance for loan losses 601,792 640,555 730,607 815,308 793,225
Total loans held-in-portfolio, net 21,345,321 23,955,738 24,008,557 24,135,991 24,771,692
FDIC loss share asset 542,454 948,608 1,399,098 1,915,128 2,410,219Premises and equipment, net 494,581 519,516 535,793 538,486 545,453Other real estate not covered under loss sharing agreements with the
FDIC 135,500 135,501 266,844 172,497 161,496Other real estate covered under loss sharing agreements with the FDIC 130,266 168,007 139,058 109,135 57,565Accrued income receivable 121,818 131,536 125,728 125,209 150,658Mortgage servicing assets, at fair value 148,694 161,099 154,430 151,323 166,907Other assets 1,646,443 1,687,558 1,569,578 1,462,393 1,449,887Goodwill 465,676 647,757 647,757 648,350 647,387Other intangible assets 37,595 45,132 54,295 63,954 58,696
Total assets $33,096,695 $35,749,333 $36,507,535 $37,348,432 $38,814,998
Liabilities and Stockholders’ EquityLiabilities:
Deposits:Non-interest bearing $ 5,783,748 $ 5,922,682 $ 5,794,629 $ 5,655,474 $ 4,939,321Interest bearing 19,023,787 20,788,463 21,205,984 22,286,653 21,822,879
Total deposits 24,807,535 26,711,145 27,000,613 27,942,127 26,762,200
Assets sold under agreements to repurchase 1,271,657 1,659,292 2,016,752 2,141,097 2,412,550Other short-term borrowings 21,200 401,200 636,200 296,200 364,222Notes payable 1,711,828 1,584,754 1,777,721 1,856,372 4,170,183Other liabilities 1,012,029 766,792 966,249 1,193,883 1,305,312Liabilities from discontinued operations 5,064 – – – –
Total liabilities 28,829,313 31,123,183 32,397,535 33,429,679 35,014,467
Stockholders’ equity:Preferred stock 50,160 50,160 50,160 50,160 50,160Common stock 1,036 1,034 1,032 1,026 1,023Surplus 4,196,458 4,170,152 4,150,294 4,123,898 4,103,211Retained earnings (accumulated deficit) 253,717 594,430 11,826 (212,726) (347,328)Treasury stock - at cost (4,117) (881) (444) (1,057) (574)Accumulated other comprehensive loss, net of tax (229,872) (188,745) (102,868) (42,548) (5,961)
Total stockholders’ equity 4,267,382 4,626,150 4,110,000 3,918,753 3,800,531
Total liabilities and stockholders’ equity $33,096,695 $35,749,333 $36,507,535 $37,348,432 $38,814,998

102
Statistical Summary 2010-2014Statements of Operations
For the years ended December 31,
(In thousands) 2014 2013 2012 2011 2010
Interest income:Loans $1,478,750 $1,481,096 $1,449,227 $1,561,377 $1,517,852Money market investments 4,224 3,464 3,703 3,596 5,384Investment securities 132,631 141,807 168,632 205,828 238,682Trading account securities 17,938 21,573 22,824 35,607 27,918
Total interest income 1,633,543 1,647,940 1,644,386 1,806,408 1,789,836Less - Interest expense 688,471 303,366 362,759 484,860 622,246
Net interest income 945,072 1,344,574 1,281,627 1,321,548 1,167,590Provision for loan losses - non-covered
loans 223,999 536,710 322,234 395,853 911,564Provision for loan losses - covered loans 46,135 69,396 74,839 145,635 –
Net interest income after provision for loanlosses 674,938 738,468 884,554 780,060 256,026
Mortgage banking activities 30,615 71,657 84,771 (4,505) 16,153Net (loss) gain and valuation adjustments on
investment securities (870) 7,966 (1,707) 10,844 3,992Trading account profit (loss) 4,358 (13,483) 4,478 48,098 33,017Net gain (loss) on sale of loans, including
valuation adjustments on loans held-for-sale 40,591 (52,708) (29,414) 4,054 5,101
Adjustments (expense) to indemnityreserves (40,629) (37,054) (21,198) (33,068) (72,013)
FDIC loss share (expense) income (103,024) (82,051) (56,211) 66,791 (25,751)Fair value change in equity appreciation
instrument – – – 8,323 42,555Gain on sale of processing and technology
business – – – – 640,802Other non-interest income 455,474 896,686 530,770 503,305 635,551
Total non-interest income 386,515 791,013 511,489 603,842 1,279,407
Operating expenses:Personnel costs 418,679 428,697 434,333 421,915 483,747All other operating expenses 775,005 793,293 780,656 721,945 777,479
Total operating expenses 1,193,684 1,221,990 1,214,989 1,143,860 1,261,226
(Loss) income from continuing operations,before income tax (132,231) 307,491 181,054 240,042 274,207
Income tax expense (benefit) 58,279 (251,327) (26,403) 114,927 108,230
(Loss) income from continuing operations $ (190,510) $ 558,818 $ 207,457 $ 125,115 $ 165,977(Loss) income from discontinued
operations, net of income tax (122,980) 40,509 37,818 26,210 (28,576)
Net (Loss) Income $ (313,490) $ 599,327 $ 245,275 $ 151,325 $ 137,401
Net (Loss) Income Applicable to CommonStock $ (317,213) $ 595,604 $ 241,552 $ 147,602 $ (54,576)

103 POPULAR, INC. 2014 ANNUAL REPORT
Statistical Summary 2010-2014Average Balance Sheet and Summary of Net Interest IncomeOn a Taxable Equivalent Basis*
2014 2013 2012
(Dollars in thousands)AverageBalance Interest
AverageRate
AverageBalance Interest
AverageRate
AverageBalance Interest
AverageRate
AssetsInterest earning assets:Money market investments $ 1,305,326 $ 4,224 0.32% $ 1,036,495 $ 3,464 0.33% $ 1,051,373 $ 3,704 0.35%
U.S. Treasury securities 264,393 4,730 1.79 37,429 1,505 4.02 34,757 1,418 4.08
Obligations of U.S. Government sponsoredentities 2,006,170 31,913 1.59 1,273,766 28,926 2.27 1,038,829 34,881 3.36
Obligations of Puerto Rico, States andpolitical subdivisions 188,125 13,450 7.15 172,403 12,295 7.13 152,697 9,850 6.45
Collateralized mortgage obligations andmortgage-backed securities 3,231,806 101,650 3.15 3,758,610 106,377 2.83 3,752,954 121,494 3.24
Other 195,139 10,265 5.26 245,980 12,765 5.19 247,717 14,451 5.83
Total investment securities 5,885,633 162,008 2.75 5,488,188 161,868 2.95 5,226,954 182,094 3.48
Trading account securities 339,563 20,914 6.16 416,538 26,026 6.25 445,881 25,909 5.81
Non-covered loans 19,595,972 1,239,469 6.33 19,572,159 1,218,349 6.22 18,736,207 1,168,091 6.23Covered loans 2,770,779 293,610 10.60 3,227,719 300,745 9.32 4,050,338 301,441 7.44
Total loans (net of unearned income) 22,366,751 1,533,079 6.85 22,799,878 1,519,094 6.66 22,786,545 1,469,532 6.45
Total interest earning assets/Interestincome $29,897,273 $1,720,225 5.75% $29,741,099 $1,710,452 5.75% $ 29,510,753 $1,681,239 5.70%
Total non-interest earning assets 3,758,897 4,362,183 4,486,835
Total assets from continuing operations $33,656,170 $34,103,282 $ 33,997,588
Total assets from discontinuedoperations 1,525,687 – – 2,163,711 – – 2,266,443 – –
Total assets $35,181,857 $36,266,993 $ 36,264,031
Liabilities and Stockholders’ EquityInterest bearing liabilities:Savings, NOW, money market and other
interest bearing demand accounts $11,557,597 $ 30,187 0.26% $11,243,095 $ 31,080 0.28% $ 10,834,812 $ 40,069 0.37%Time deposits 7,556,109 74,900 0.99 7,956,922 93,777 1.18 8,835,308 127,696 1.45Short-term borrowings 1,886,662 67,376 3.57 2,571,875 38,430 1.49 2,563,970 46,802 1.83Notes payable 1,627,541 516,008 31.70 1,719,985 140,079 8.14 1,850,514 148,192 8.01
Total interest bearing liabilities/Interestexpense 22,627,909 688,471 3.04 23,491,877 303,366 1.29 24,084,604 362,759 1.51
Total non-interest bearing liabilities 6,409,810 6,390,174 6,130,890
Total liabilities from continuingoperations 29,037,719 29,882,051 30,215,494
Total liabilities from discontinuedoperations 1,588,386 – – 2,208,593 – – 2,204,885 – –
Total liabilities 30,626,105 32,090,644 32,420,379
Stockholders’ equity 4,555,752 4,176,349 3,843,652
Total liabilities and stockholders’ equity $35,181,857 $36,266,993 $ 36,264,031
Net interest income on a taxable equivalentbasis $1,031,754 $1,407,086 $1,318,480
Cost of funding earning assets 2.30% 1.02% 1.23%
Net interest margin 3.45% 4.73% 4.47%
Effect of the taxable equivalent adjustment 86,682 62,512 36,853
Net interest income per books $ 945,072 $1,344,574 $1,281,627
* Shows the effect of the tax exempt status of some loans and investments on their yield, using the applicable statutory income tax rates. The computation considersthe interest expense disallowance required by the Puerto Rico Internal Revenue Code. This adjustment is shown in order to compare the yields of the tax exemptand taxable assets on a taxable basis.
Note: Average loan balances include the average balance of non-accruing loans. No interest income is recognized for these loans in accordance with the Corporation’s policy.

104
Statistical Summary 2010-2014Average Balance Sheet and Summary of Net Interest IncomeOn a Taxable Equivalent Basis
2011 2010
(Dollars in thousands)AverageBalance Interest
AverageRate
AverageBalance Interest
AverageRate
AssetsInterest earning assets:Money market investments $ 1,152,014 $ 3,597 0.31% $ 1,539,046 $ 5,384 0.35%
U.S. Treasury securities 50,971 1,502 2.95 80,740 1,527 1.89Obligations of U.S. Government sponsored entities 1,180,680 49,781 4.22 1,473,227 54,748 3.72Obligations of Puerto Rico, States and political subdivisions 139,847 8,972 6.42 228,291 11,171 4.89Collateralized mortgage obligations and mortgage-backed
securities 3,896,743 148,884 3.82 4,340,545 160,632 3.70Other 226,033 15,213 6.73 176,766 11,048 6.25
Total investment securities 5,494,274 224,352 4.08 6,299,569 239,126 3.80
Trading account securities 667,277 38,850 5.82 493,628 32,333 6.55
Non-covered loans 18,543,619 1,168,446 6.30 19,595,062 1,218,988 6.22Covered loans 4,613,361 412,678 8.95 3,364,932 303,096 9.01
Total loans (net of unearned income) 23,156,980 1,581,124 6.83 22,959,994 1,522,084 6.63
Total interest earning assets/Interest income $30,470,545 $1,847,923 6.06% $31,292,237 $1,798,927 5.75%
Total non-interest earning assets 4,958,125 4,037,238
Total assets from continuing operations $35,428,670 $35,329,475
Total assets from discontinued operations 2,637,598 – – 3,049,491 – –
Total assets $38,066,268 $38,378,966
Liabilities and Stockholders’ EquityInterest bearing liabilities:Savings, NOW, money market and other interest bearing
demand accounts $10,204,438 $ 61,004 0.60% $ 9,578,557 $ 82,048 0.86%Time deposits 10,233,566 187,838 1.84 10,117,636 237,708 2.35Short-term borrowings 2,628,511 55,255 2.10 2,396,645 60,268 2.51Notes payable 1,834,915 148,603 8.10 2,293,878 183,701 8.01Note issued to the FDIC 1,381,981 32,161 2.33 2,753,490 58,521 2.13
Total interest bearing liabilities/Interest expense 26,283,411 484,861 1.84 27,140,206 622,246 2.29
Total non-interest bearing liabilities 5,728,630 5,447,916
Total liabilities from continuing operations 32,012,041 32,588,122
Total liabilities from discontinued operations 2,321,391 – – 2,531,677 – –
Total liabilities 34,333,432 35,119,799
Stockholders’ equity 3,732,836 3,259,167
Total liabilities and stockholders’ equity $38,066,268 $38,378,966
Net interest income on a taxable equivalent basis $1,363,062 $1,176,681
Cost of funding earning assets 1.59% 1.99%
Net interest margin 4.47% 3.76%
Effect of the taxable equivalent adjustment 41,515 9,092
Net interest income per books $1,321,547 $1,167,589
* Shows the effect of the tax exempt status of loans and investments on their yield, using the applicable statutory income tax rates. The computation considers theinterest expense disallowance required by the Puerto Rico Internal Revenue Code. This adjustment is shown in order to compare the yield of the tax exempt andtaxable assets on a taxable basis.
Note: Average loan balances include the average balance of non-accruing loans. No interest income is recognized for these loans in accordance with the Corporation’s policy.

105 POPULAR, INC. 2014 ANNUAL REPORT
Statistical Summary 2013-2014Quarterly Financial Data
2014 2013 [1]
(In thousands, except per common shareinformation)
FourthQuarter
ThirdQuarter
SecondQuarter
FirstQuarter
FourthQuarter
ThirdQuarter
SecondQuarter
FirstQuarter
Summary of OperationsInterest income $391,935 $401,199 $ 421,450 $418,959 $424,525 $405,918 $ 412,689 $ 404,808Interest expense 65,074 74,778 480,831 67,788 70,018 74,906 78,278 80,164
Net interest income 326,861 326,421 (59,381) 351,171 354,507 331,012 334,411 324,644Provision for loan losses - non-covered
loans 51,637 68,166 50,074 54,122 49,927 48,715 228,975 209,093Provision for loan losses - covered loans (3,646) 12,463 11,604 25,714 8,907 17,433 25,500 17,556Mortgage banking activities 8,747 14,402 3,788 3,678 14,387 18,892 18,081 20,297Net gain (loss) and valuation adjustments on
investment securities 893 (1,763) – – 2,110 – 5,856 –Trading account profit (loss) 586 740 1,055 1,977 (1,547) (6,607) (4,345) (984)Gain (loss) on sale of loans, including
valuation adjustments on loans held-for-sale 10,946 15,593 9,659 4,393 3,346 2,374 4,291 (62,719)
Adjustments (expense) to indemnityreserves on loans sold (13,348) (9,480) (7,454) (10,347) (6,892) (2,387) (11,632) (16,143)
FDIC loss share (expense) income (18,693) (4,864) (55,261) (24,206) (37,164) (14,866) (3,755) (26,266)Other non-interest income 114,233 109,702 111,002 120,537 211,036 289,303 280,222 116,125Operating expenses 330,006 310,640 275,439 277,599 304,609 308,292 293,864 315,225
Income (loss) from continuing operationsbefore income tax 52,228 59,482 (333,709) 89,768 176,340 243,281 74,790 (186,920)
Income tax expense (benefit) 12,472 26,667 (4,124) 23,264 25,162 17,768 (237,380) (56,877)
Income (loss) from continuing operations $ 39,756 $ 32,815 $(329,585) $ 66,504 $151,178 $225,513 $ 312,170 $(130,043)
Income (loss) from discontinuedoperations, net of tax 9,086 29,758 (181,729) 19,905 11,853 3,622 15,298 9,736
Net income (loss) $ 48,842 $ 62,573 $(511,314) $ 86,409 $163,031 $229,135 $ 327,468 $(120,307)
Net income (loss) applicable to commonstock $ 47,911 $ 61,643 $(512,245) $ 85,478 $162,100 $228,204 $ 326,537 $(121,237)
Net income (loss) per common share -basic: $ 0.47 $ 0.60 $ (4.98) $ 0.83 $ 1.58 $ 2.22 $ 3.18 $ (1.18)
Net income (loss) per common share -diluted: $ 0.46 $ 0.60 $ (4.98) $ 0.83 $ 1.57 $ 2.22 $ 3.17 $ (1.18)
Selected Average Balances(In millions)Total assets $ 33,309 $ 35,024 $ 36,236 $ 36,196 $ 33,773 $ 34,195 $ 34,678 $ 34,334Loans 22,044 22,263 22,563 22,604 22,625 22,710 23,068 22,798Interest earning assets 29,265 29,764 30,402 30,169 29,664 29,523 30,011 29,769Deposits 24,629 24,656 24,775 24,559 24,559 24,382 24,742 24,638Interest-bearing liabilities 21,977 22,776 22,933 22,834 22,876 23,390 23,833 23,881
Selected RatiosReturn on assets 0.58% 0.71% -5.66% 0.97% 1.79% 2.51% 3.60% -1.34%Return on equity 4.41 5.75 -43.04 7.39 14.59 21.64 32.77 -12.58
[1] Per share data has been adjusted to retroactively reflect the 1-for-10 reverse stock split effected on May 29, 2012.Note: Because each reporting period stands on its own the sum of the net income (loss) per common share for the quarters may not equal to the net income (loss) percommon share for the year.
106
Report of Management on Internal Control Over Financial Reporting
The management of Popular, Inc. (the Corporation) is responsible for establishing and maintaining adequate internal control overfinancial reporting as defined in Rules 13a - 15(f) and 15d - 15(f) under the Securities Exchange Act of 1934 and for ourassessment of internal control over financial reporting. The Corporation’s internal control over financial reporting is a processdesigned to provide reasonable assurance regarding the reliability of financial reporting and the preparation of financial statementsfor external purposes in accordance with accounting principles generally accepted in the United States of America, and includescontrols over the preparation of financial statements in accordance with the instructions to the Consolidated Financial Statementsfor Bank Holding Companies (Form FR Y-9C) to comply with the reporting requirements of Section 112 of the Federal DepositInsurance Corporation Improvement Act (FDICIA). The Corporation’s internal control over financial reporting includes thosepolicies and procedures that:
(i) pertain to the maintenance of records that, in reasonable detail, accurately and fairly reflect the transactions and dispositionsof the assets of the Corporation;
(ii) provide reasonable assurance that transactions are recorded as necessary to permit preparation of financial statements inaccordance with accounting principles generally accepted in the United States of America, and that receipts and expenditures ofthe Corporation are being made only in accordance with authorizations of management and directors of the Corporation; and
(iii) provide reasonable assurance regarding prevention or timely detection of unauthorized acquisition, use or disposition ofthe Corporation’s assets that could have a material effect on the financial statements.
Because of its inherent limitations, internal control over financial reporting may not prevent or detect misstatements. Also,projections of any evaluation of effectiveness to future periods are subject to the risk that controls may become inadequate becauseof changes in conditions, or that the degree of compliance with the policies or procedures may deteriorate.
The management of Popular, Inc. has assessed the effectiveness of the Corporation’s internal control over financial reporting asof December 31, 2014. In making this assessment, management used the criteria set forth in the Internal Control-IntegratedFramework (2013) issued by the Committee of Sponsoring Organizations of the Treadway Commission (COSO).
Based on our assessment, management concluded that the Corporation maintained effective internal control over financialreporting as of December 31, 2014 based on the criteria referred to above.
The Corporation’s independent registered public accounting firm, PricewaterhouseCoopers, LLP, has audited the effectivenessof the Corporation’s internal control over financial reporting as of December 31, 2014, as stated in their report dated March 2,2015 which appears herein.
Richard L. Carrión Carlos J. VázquezChairman of the Board Executive Vice Presidentand Chief Executive Officer and Chief Financial Officer

107 POPULAR, INC. 2014 ANNUAL REPORT
Report of Independent RegisteredPublic Accounting Firm
To the Board of Directors andStockholders of Popular, Inc.
In our opinion, the accompanying consolidated statements of financial condition and the related consolidated statements ofoperations, comprehensive (loss) income, changes in stockholders’ equity and cash flows present fairly, in all material respects, thefinancial position of Popular, Inc. and its subsidiaries at December 31, 2014 and 2013, and the results of their operations and theircash flows for each of the three years in the period ended December 31, 2014 in conformity with accounting principles generallyaccepted in the United States of America. Also in our opinion, the Corporation maintained, in all material respects, effectiveinternal control over financial reporting as of December 31, 2014, based on criteria established in Internal Control - IntegratedFramework (2013) issued by the Committee of Sponsoring Organizations of the Treadway Commission (COSO). The Corporation’smanagement is responsible for these financial statements, for maintaining effective internal control over financial reporting and forits assessment of the effectiveness of internal control over financial reporting, included in the accompanying Report ofManagement on Internal Control Over Financial Reporting. Our responsibility is to express opinions on these financial statementsand on the Corporation’s internal control over financial reporting based on our integrated audits. We conducted our audits inaccordance with the standards of the Public Company Accounting Oversight Board (United States). Those standards require thatwe plan and perform the audits to obtain reasonable assurance about whether the financial statements are free of materialmisstatement and whether effective internal control over financial reporting was maintained in all material respects. Our audits ofthe financial statements included examining, on a test basis, evidence supporting the amounts and disclosures in the financialstatements, assessing the accounting principles used and significant estimates made by management, and evaluating the overallfinancial statement presentation. Our audit of internal control over financial reporting included obtaining an understanding ofinternal control over financial reporting, assessing the risk that a material weakness exists, and testing and evaluating the designand operating effectiveness of internal control based on the assessed risk. Our audits also included performing such otherprocedures as we considered necessary in the circumstances. We believe that our audits provide a reasonable basis for ouropinions.
A company’s internal control over financial reporting is a process designed to provide reasonable assurance regarding thereliability of financial reporting and the preparation of financial statements for external purposes in accordance with generallyaccepted accounting principles. Management’s assessment and our audit of Popular, Inc.’s internal control over financial reportingalso included controls over the preparation of financial statements in accordance with the instructions to the ConsolidatedFinancial Statements for Bank Holding Companies (Form FR Y-9C) to comply with the reporting requirements of Section 112 ofthe Federal Deposit Insurance Corporation Improvement Act (FDICIA). A company’s internal control over financial reportingincludes those policies and procedures that (i) pertain to the maintenance of records that, in reasonable detail, accurately and fairlyreflect the transactions and dispositions of the assets of the company; (ii) provide reasonable assurance that transactions arerecorded as necessary to permit preparation of financial statements in accordance with generally accepted accounting principles,and that receipts and expenditures of the company are being made only in accordance with authorizations of management anddirectors of the company; and (iii) provide reasonable assurance regarding prevention or timely detection of unauthorizedacquisition, use, or disposition of the company’s assets that could have a material effect on the financial statements.

108
Because of its inherent limitations, internal control over financial reporting may not prevent or detect misstatements. Also,projections of any evaluation of effectiveness to future periods are subject to the risk that controls may become inadequate becauseof changes in conditions, or that the degree of compliance with the policies or procedures may deteriorate.
PRICEWATERHOUSECOOPERS LLPSan Juan, Puerto RicoMarch 2, 2015
CERTIFIED PUBLIC ACCOUNTANTS(OF PUERTO RICO)License No. LLP-216 Expires Dec. 1, 2016Stamp E139737 of the P.R.Society of Certified PublicAccountants has been affixedto the file copy of this report

109 POPULAR, INC. 2014 ANNUAL REPORT
POPULAR, INC.CONSOLIDATED STATEMENTS OF FINANCIAL CONDITION
(In thousands, except share information)December 31,
2014December 31,
2013Assets:Cash and due from banks $ 381,095 $ 423,211Money market investments:
Federal funds sold – 5,055Securities purchased under agreements to resell 151,134 175,965Time deposits with other banks 1,671,252 677,433
Total money market investments 1,822,386 858,453
Trading account securities, at fair value:Pledged securities with creditors’ right to repledge 80,945 308,978Other trading securities 57,582 30,765
Investment securities available-for-sale, at fair value:Pledged securities with creditors’ right to repledge 1,020,529 1,286,839Other investment securities available-for-sale 4,294,630 4,007,961
Investment securities held-to-maturity, at amortized cost (fair value 2014 - $94,199; 2013 - $120,688) 103,170 140,496Other investment securities, at lower of cost or realizable value (realizable value 2014 - $165,024; 2013 - $184,526) 161,906 181,752Loans held-for-sale, at lower of cost or fair value 106,104 110,426
Loans held-in-portfolio:Loans not covered under loss sharing agreements with the FDIC 19,498,286 21,704,010Loans covered under loss sharing agreements with the FDIC 2,542,662 2,984,427Less – Unearned income 93,835 92,144
Allowance for loan losses 601,792 640,555
Total loans held-in-portfolio, net 21,345,321 23,955,738
FDIC loss share asset 542,454 948,608Premises and equipment, net 494,581 519,516Other real estate not covered under loss sharing agreements with the FDIC 135,500 135,501Other real estate covered under loss sharing agreements with the FDIC 130,266 168,007Accrued income receivable 121,818 131,536Mortgage servicing assets, at fair value 148,694 161,099Other assets 1,646,443 1,687,558Goodwill 465,676 647,757Other intangible assets 37,595 45,132
Total assets $33,096,695 $35,749,333
Liabilities and Stockholders’ EquityLiabilities:
Deposits:Non-interest bearing $5,783,748 $5,922,682Interest bearing 19,023,787 20,788,463
Total deposits 24,807,535 26,711,145
Federal funds purchased and assets sold under agreements to repurchase 1,271,657 1,659,292Other short-term borrowings 21,200 401,200Notes payable 1,711,828 1,584,754Other liabilities 1,012,029 766,792Liabilities from discontinued operations (Refer to Note 4) 5,064 –
Total liabilities 28,829,313 31,123,183
Commitments and contingencies (Refer to Note 31)
Stockholders’ equity:Preferred stock, 30,000,000 shares authorized; 2,006,391 shares issued and outstanding 50,160 50,160Common stock, $0.01 par value; 170,000,000 shares authorized; 103,614,553 shares issued (2013 – 103,435,967) and
103,476,847 shares outstanding (2013 – 103,397,699) 1,036 1,034Surplus 4,196,458 4,170,152Retained earnings 253,717 594,430Treasury stock – at cost, 137,706 shares (2013 – 38,268) (4,117) (881)Accumulated other comprehensive loss, net of tax (229,872) (188,745)
Total stockholders’ equity 4,267,382 4,626,150
Total liabilities and stockholders’ equity $33,096,695 $35,749,333
The accompanying notes are an integral part of these consolidated financial statements.

110
POPULAR, INC.CONSOLIDATED STATEMENTS OF OPERATIONS
Years ended December 31,
(In thousands, except per share information) 2014 2013 2012Interest income:
Loans $1,478,750 $1,481,096 $1,449,227Money market investments 4,224 3,464 3,703Investment securities 132,631 141,807 168,632Trading account securities 17,938 21,573 22,824
Total interest income 1,633,543 1,647,940 1,644,386
Interest expense:Deposits 105,087 124,857 167,765Short-term borrowings 67,376 38,430 46,802Long-term debt 516,008 140,079 148,192
Total interest expense 688,471 303,366 362,759
Net interest income 945,072 1,344,574 1,281,627Provision for loan losses - non-covered loans 223,999 536,710 322,234Provision for loan losses - covered loans 46,135 69,396 74,839
Net interest income after provision for loan losses 674,938 738,468 884,554
Service charges on deposit accounts 158,637 162,870 171,226Other service fees (Refer to Note 40) 225,265 229,351 232,515Mortgage banking activities (Refer to Note 14) 30,615 71,657 84,771Net (loss) gain and valuation adjustments on investment securities (870) 7,966 (1,707)Trading account profit (loss) 4,358 (13,483) 4,478Net gain (loss) on sale of loans, including valuation adjustments on loans held-for-sale 40,591 (52,708) (29,414)Adjustments (expense) to indemnity reserves on loans sold (40,629) (37,054) (21,198)FDIC loss share (expense) income (Refer to Note 41) (103,024) (82,051) (56,211)Other operating income 71,572 504,465 127,029
Total non-interest income 386,515 791,013 511,489
Operating expenses:Personnel costs 418,679 428,697 434,333Net occupancy expenses 86,707 86,651 84,687Equipment expenses 48,917 46,028 43,618Other taxes 56,918 58,028 49,844Professional fees 282,055 278,127 271,008Communications 25,684 25,385 25,687Business promotion 54,016 59,453 60,784FDIC deposit insurance 40,307 56,728 82,065Loss on early extinguishment of debt 532 3,388 25,196Other real estate owned (OREO) expenses 49,611 79,658 28,823Other operating expenses 95,373 91,876 100,783Amortization of intangibles 8,160 7,971 8,161Restructuring costs (Refer to Note 5) 26,725 – –
Total operating expenses 1,193,684 1,221,990 1,214,989
(Loss) income from continuing operations before income tax (132,231) 307,491 181,054Income tax expense (benefit) 58,279 (251,327) (26,403)
(Loss) income from continuing operations (190,510) 558,818 207,457(Loss) income from discontinued operations, net of tax (Refer to Note 4) (122,980) 40,509 37,818
Net (Loss) Income $ (313,490) $ 599,327 $ 245,275
Net (Loss) Income Applicable to Common Stock $ (317,213) $ 595,604 $ 241,552
Net (Loss) Income per Common Share – BasicNet (loss) income from continuing operations (1.88) 5.41 1.99Net (loss) income from discontinued operations (1.20) 0.39 0.37
Net (Loss) Income per Common Share - Basic $ (3.08) $ 5.80 $ 2.36
Net (Loss) Income per Common Share - DilutedNet (loss) income from continuing operations (1.88) 5.39 1.98Net (loss) income from discontinued operations (1.20) 0.39 0.37
Net (Loss) Income per Common Share - Diluted $ (3.08) $ 5.78 $ 2.35
The accompanying notes are an integral part of these consolidated financial statements.
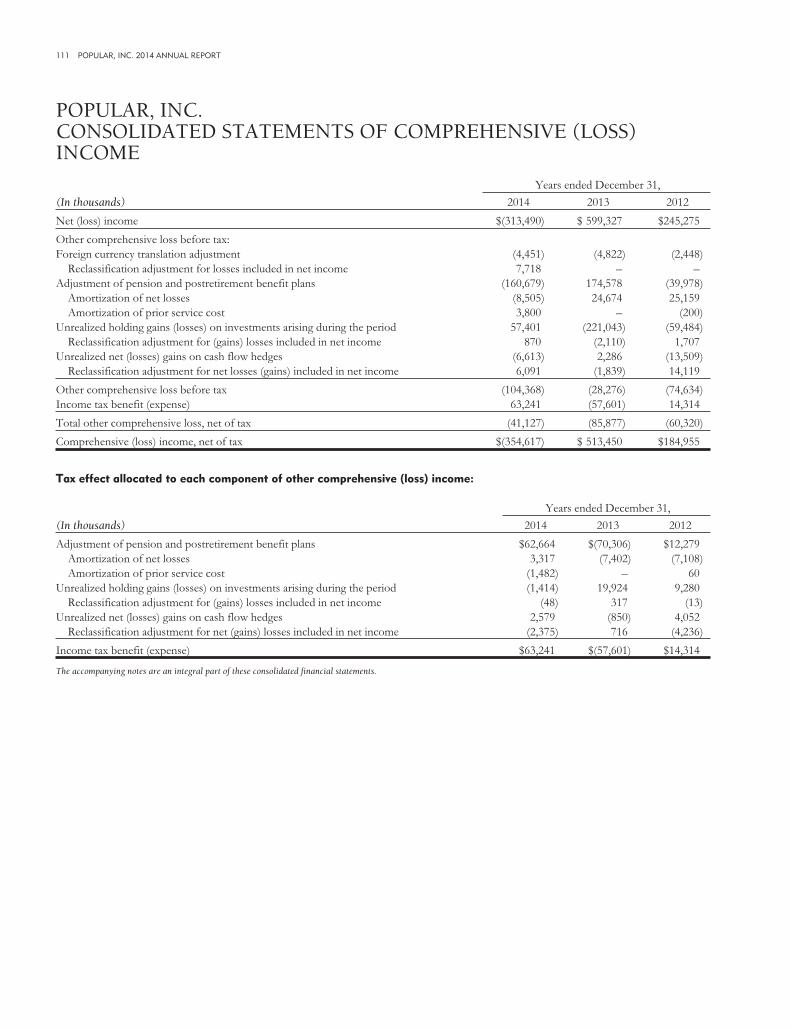
111 POPULAR, INC. 2014 ANNUAL REPORT
POPULAR, INC.CONSOLIDATED STATEMENTS OF COMPREHENSIVE (LOSS)INCOME
Years ended December 31,
(In thousands) 2014 2013 2012
Net (loss) income $(313,490) $ 599,327 $245,275
Other comprehensive loss before tax:Foreign currency translation adjustment (4,451) (4,822) (2,448)
Reclassification adjustment for losses included in net income 7,718 – –Adjustment of pension and postretirement benefit plans (160,679) 174,578 (39,978)
Amortization of net losses (8,505) 24,674 25,159Amortization of prior service cost 3,800 – (200)
Unrealized holding gains (losses) on investments arising during the period 57,401 (221,043) (59,484)Reclassification adjustment for (gains) losses included in net income 870 (2,110) 1,707
Unrealized net (losses) gains on cash flow hedges (6,613) 2,286 (13,509)Reclassification adjustment for net losses (gains) included in net income 6,091 (1,839) 14,119
Other comprehensive loss before tax (104,368) (28,276) (74,634)Income tax benefit (expense) 63,241 (57,601) 14,314
Total other comprehensive loss, net of tax (41,127) (85,877) (60,320)
Comprehensive (loss) income, net of tax $(354,617) $ 513,450 $184,955
Tax effect allocated to each component of other comprehensive (loss) income:
Years ended December 31,
(In thousands) 2014 2013 2012
Adjustment of pension and postretirement benefit plans $62,664 $(70,306) $12,279Amortization of net losses 3,317 (7,402) (7,108)Amortization of prior service cost (1,482) – 60
Unrealized holding gains (losses) on investments arising during the period (1,414) 19,924 9,280Reclassification adjustment for (gains) losses included in net income (48) 317 (13)
Unrealized net (losses) gains on cash flow hedges 2,579 (850) 4,052Reclassification adjustment for net (gains) losses included in net income (2,375) 716 (4,236)
Income tax benefit (expense) $63,241 $(57,601) $14,314
The accompanying notes are an integral part of these consolidated financial statements.

112
POPULAR, INC.CONSOLIDATED STATEMENTS OF CHANGES IN STOCKHOLDERS’EQUITY
(In thousands)Commonstock [1]
Preferredstock Surplus [1]
(Accumulateddeficit)
Retainedearnings
Treasurystock
Accumulatedother
comprehensiveloss Total
Balance at December 31, 2011 $1,026 $50,160 $4,123,898 $(212,726) $(1,057) $ (42,548) $3,918,753Net income 245,275 245,275Issuance of stock 6 9,396 9,402Dividends declared:
Preferred stock (3,723) (3,723)Common stock purchases (450) (450)Common stock reissuance 1,063 1,063Other comprehensive loss, net of tax (60,320) (60,320)Transfer to statutory reserve 17,000 (17,000) –
Balance at December 31, 2012 $1,032 $50,160 $4,150,294 $ 11,826 $ (444) $(102,868) $4,110,000
Net income 599,327 599,327Issuance of stock 2 6,858 6,860Dividends declared:
Preferred stock (3,723) (3,723)Common stock purchases (470) (470)Common stock reissuance 33 33Other comprehensive loss, net of tax (85,877) (85,877)Transfer to statutory reserve 13,000 (13,000) –
Balance at December 31, 2013 $1,034 $50,160 $4,170,152 $ 594,430 $ (881) $(188,745) $4,626,150
Net loss (313,490) (313,490)Issuance of stock 2 5,392 5,394Tax windfall benefit on vesting of restricted stock 414 414Repurchase of TARP-related warrants (3,000) (3,000)Dividends declared:
Preferred stock (3,723) (3,723)Common stock purchases (3,272) (3,272)Common stock reissuance 36 36Other comprehensive loss, net of tax (41,127) (41,127)Transfer to statutory reserve 23,500 (23,500) –
Balance at December 31, 2014 $1,036 $50,160 $4,196,458 $ 253,717 $(4,117) $(229,872) $4,267,382
Year ended December 31,
Disclosure of changes in number of shares: [1] 2014 2013 2012Preferred Stock:
Balance at beginning and end of year 2,006,391 2,006,391 2,006,391
Common Stock:Balance at beginning of year 103,435,967 103,193,303 102,634,640Issuance of stock 178,586 242,664 558,663
Balance at end of year 103,614,553 103,435,967 103,193,303Treasury stock (137,706) (38,268) (23,497)
Common Stock – Outstanding 103,476,847 103,397,699 103,169,806
The accompanying notes are an integral part of these consolidated financial statements.

113 POPULAR, INC. 2014 ANNUAL REPORT
POPULAR, INC.CONSOLIDATED STATEMENTS OF CASH FLOWS
Year ended December 31,
(In thousands) 2014 2013 2012Cash flows from operating activities:Net (loss) income $ (313,490) $ 599,327 $ 245,275Adjustments to reconcile net income to net cash provided by operating activities:
Provision for loan losses 263,369 602,563 408,941Goodwill impairment losses 186,511 – –Amortization of intangibles 9,434 9,883 10,072Depreciation and amortization of premises and equipment 47,137 48,162 46,736Net accretion of discounts and amortization of premiums and deferred fees 278,576 (79,004) (37,899)Fair value adjustments on mortgage servicing rights 24,683 11,403 17,406FDIC loss share expense 103,024 82,051 56,211Amortization of prepaid FDIC assessment – – 32,778Adjustments (expense) to indemnity reserves on loans sold 40,629 37,054 21,198Earnings from investments under the equity method (39,578) (42,873) (73,478)Deferred income tax expense (benefit) 43,512 (288,754) (135,491)(Gain) loss on:
Disposition of premises and equipment (1,716) (3,392) (8,619)Sale and valuation adjustments of investment securities 870 (2,110) 1,707Sale of loans, including valuation adjustments on loans held-for-sale and mortgage banking activities (88,724) 22,411 (48,765)Sale of stock in equity method investee – (416,113) –Sale of other assets – – (2,545)Sale of foreclosed assets, including write-downs 28,005 50,740 (4,511)Disposal of discontinued business (38,355) – –
Acquisitions of loans held-for-sale (308,600) (390,018) (417,108)Proceeds from sale of loans held-for-sale 123,375 218,379 325,014Net originations on loans held-for-sale (753,312) (1,049,474) (1,233,240)Net (increase) decrease in:
Trading securities 1,105,374 1,430,835 1,387,910Accrued income receivable 9,719 (5,809) (519)Other assets 132,500 2,827 (19,390)
Net increase (decrease) in:Interest payable (707) (2,466) (9,164)Pension and other postretirement benefits obligation (10,171) 10,635 (40,241)Other liabilities 30,937 (26,952) 1,848
Total adjustments 1,186,492 219,978 278,851Net cash provided by operating activities 873,002 819,305 524,126Cash flows from investing activities:
Net (increase) decrease in money market investments (963,933) 227,127 290,594Purchases of investment securities:
Available-for-sale (2,001,940) (2,257,976) (1,843,922)Held-to-maturity (1,000) (250) (25,792)Other (110,010) (178,093) (212,419)
Proceeds from calls, paydowns, maturities and redemptions of investment securities:Available-for-sale 1,722,650 1,823,474 1,636,723Held-to-maturity 39,962 4,632 9,751Other 92,752 181,784 206,856
Proceeds from sale of investment securities:Available-for-sale 310,210 5,438 52,058Other 37,104 – –
Net repayments on loans 775,900 680,819 629,006Proceeds from sale of loans 355,145 333,021 68,396Acquisition of loan portfolios (389,067) (1,592,603) (1,357,628)Net payments from FDIC under loss sharing agreements 256,498 396,223 462,016Cash paid related to business acquisitions (6,330) – –Return of capital from equity method investments – 491 151,196Proceeds from sale of stock in equity method investee – 481,377 –Net cash disbursed from disposal of discontinued business (205,895) – –Mortgage servicing rights purchased – (45) (2,231)Acquisition of premises and equipment (51,046) (38,573) (54,899)Proceeds from sale of:
Premises and equipment 14,337 10,090 19,841Other productive assets – – 1,026Foreclosed assets 150,115 226,063 206,070
Net cash provided by investing activities 25,452 302,999 236,642Cash flows from financing activities:
Net increase (decrease) in:Deposits 109,015 (323,404) (969,596)Federal funds purchased and assets sold under agreements to repurchase (387,635) (357,460) (124,345)Other short-term borrowings (380,000) (235,000) 340,000
Payments of notes payable (1,059,290) (332,031) (214,898)Proceeds from issuance of notes payable 781,905 106,739 106,923Proceeds from issuance of common stock 5,394 6,860 9,402Dividends paid (3,723) (3,723) (3,723)Repurchase of TARP - related warrants (3,000) – –Net payments for repurchase of common stock (3,236) (437) (450)
Net cash used in financing activities (940,570) (1,138,456) (856,687)Net decrease in cash and due from banks (42,116) (16,152) (95,919)Cash and due from banks at beginning of period 423,211 439,363 535,282Cash and due from banks at end of period $ 381,095 $ 423,211 $ 439,363
The accompanying notes are an integral part of these consolidated financial statements.
The Consolidated Statement of Cash Flows for the periods ended December 31, 2014, 2013 and 2012 include the cash flows fromoperating, investing and finance activities associated with discontinued operations.

114
Notes to ConsolidatedFinancial Statements
Note 1 - Nature of Operations and Basis of Presentation 115Note 2 - Summary of Significant Accounting Policies 115Note 3 - New Accounting Pronouncements 127Note 4 - Discontinued Operations 131Note 5 - Restructuring Plan 132Note 6 - Restrictions on Cash and Due from Banks and Certain Securities 132Note 7 - Securities Purchased under Agreements to Resell 133Note 8 - Pledged Assets 133Note 9 - Investment Securities Available-For-Sale 134Note 10 - Investment Securities Held-to-Maturity 138Note 11 - Loans 140Note 12 - Allowance for Loan Losses 149Note 13 - FDIC Loss Share Asset and True-Up Payment Obligation 172Note 14 - Mortgage Banking Activities 174Note 15 - Transfers of Financial Assets and Servicing Assets 174Note 16 - Premises and Equipment 178Note 17 - Other Real Estate Owned 178Note 18 - Other Assets 179Note 19 - Investment in Equity Investees 179Note 20 - Goodwill and Other Intangible Assets 180Note 21 - Deposits 183Note 22 - Federal Funds Purchased and Assets Sold Under Agreements to
Repurchase 184Note 23 - Other Short-Term Borrowings 185Note 24 - Notes Payable 186Note 25 - Offsetting of Financial Assets and Liabilities 187Note 26 - Trust Preferred Securities 188Note 27 - Stockholders’ Equity 190Note 28 - Regulatory Capital Requirements 191Note 29 - Other Comprehensive Loss 193Note 30 - Guarantees 194Note 31 - Commitments and Contingencies 197Note 32 - Non-consolidated Variable Interest Entities 201Note 33 - Derivative Instruments and Hedging Activities 204Note 34 - Related Party Transactions 207Note 35 - Fair Value Measurement 211Note 36 - Fair Value of Financial Instruments 219Note 37 - Employee Benefits 224Note 38 - Net (Loss) Income per Common Share 231Note 39 - Rental Expense and Commitments 232Note 40 - Other Service Fees 232Note 41 - FDIC Loss Share (Expense) Income 232Note 42 - Stock-Based Compensation 233Note 43 - Income Taxes 235Note 44 - Supplemental Disclosure on the Consolidated Statements of Cash
Flows 239Note 45 - Segment Reporting 239Note 46 - Subsequent Events 243Note 47 - Popular, Inc. (Holding company only) Financial Information 243Note 48 - Condensed Consolidating Financial Information of Guarantor and
Issuers of Registered Guaranteed Securities 247

115 POPULAR, INC. 2014 ANNUAL REPORT
Note 1 – Nature of operations and basis of presentationNature of OperationsPopular, Inc. (the “Corporation”) is a diversified,publicly owned financial holding company subject to thesupervision and regulation of the Board of Governors ofthe Federal Reserve System. The Corporation hasoperations in Puerto Rico, the United States and theCaribbean. In Puerto Rico, the Corporation providescommercial and retail banking services, includingmortgage loan originations, through its principal bankingsubsidiary, Banco Popular de Puerto Rico (“BPPR”), aswell as investment banking, broker-dealer, auto andequipment leasing and financing, and insurance servicesthrough specialized subsidiaries. In the U.S. mainland,the Corporation operates Banco Popular North America(“BPNA”), including its wholly-owned subsidiary E-LOAN. BPNA focuses efforts and resources on the corecommunity banking business. BPNA operates branchesin New York, New Jersey and South Florida. E-LOANmarkets deposit accounts under its name for the benefitof BPNA. Refer to Note 4 for discussion of the sales of theIllinois, Central Florida and California regionaloperations during the year ended December 31, 2014.The BPNA branches operate under the name of PopularCommunity Bank. Note 45 to the consolidated financialstatements presents information about the Corporation’sbusiness segments.
On April 30, 2010, BPPR entered into a purchase andassumption agreement with the Federal Deposit InsuranceCorporation (the “FDIC”) to acquire certain assets and assumecertain deposits and liabilities of Westernbank Puerto Rico(“Westernbank”), a Puerto Rico state-chartered bankheadquartered in Mayaguez, Puerto Rico (the “WesternbankFDIC-assisted transaction”). Westernbank was a wholly-ownedcommercial bank subsidiary of W Holding Company, Inc. andoperated in Puerto Rico. Refer to Note 13 – FDIC loss shareassets and true-up payment obligation, to these consolidatedfinancial statements for detailed information on this businesscombination.
Basis of PresentationCertain reclassifications have been made to the 2012 and 2013consolidated financial statements and notes to the financialstatements to conform with the 2014 presentation. As discussedin Note 4, current and prior periods presented in theconsolidated statement of operations as well as the related notedisclosures covering income and expense amounts have beenretrospectively adjusted for the impact of the discontinuedoperations for comparative purposes. The consolidatedstatement of financial condition and related note disclosure forprior periods do not reflect the reclassification of BPNA’s assetsand liabilities to discontinued operations.
During the year ended December 31, 2014, the Corporationrecorded an out-of-period adjustment to correct an error in theamortization expense of the FDIC indemnification assetrecorded during the years 2012 and 2013. The FDIC indemnityasset amortization for the year ended December 31, 2014,included a benefit of approximately $12.5 million to reverse theimpact of accelerated amortization expense recorded duringprior periods. This amount will be recognized as expense overthe remaining portion of the Loss Sharing Agreement thatexpires in the quarter ending June 30, 2015. After evaluatingthe quantitative and qualitative aspects of the error and the out-of-period adjustment to the Corporation’s financial results,management has determined that the misstatement and the out-of-period adjustment are not material to the 2012, 2013 and2014 financial statements, respectively.
Note 2 – Summary of significant accounting policiesThe accounting and financial reporting policies of Popular, Inc.and its subsidiaries (the “Corporation”) conform withaccounting principles generally accepted in the United States ofAmerica and with prevailing practices within the financialservices industry.
The following is a description of the most significant ofthese policies:
Principles of consolidationThe consolidated financial statements include the accounts ofPopular, Inc. and its subsidiaries. Intercompany accounts andtransactions have been eliminated in consolidation. Inaccordance with the consolidation guidance for variable interestentities, the Corporation would also consolidate any variableinterest entities (“VIEs”) for which it has a controlling financialinterest; and therefore, it is the primary beneficiary. Assets heldin a fiduciary capacity are not assets of the Corporation and,accordingly, are not included in the consolidated statements offinancial condition.
Unconsolidated investments, in which there is at least 20%ownership, are generally accounted for by the equity methodwhich the Corporation exercises significant influence, withearnings recorded in other operating income. Theseinvestments are included in other assets and the Corporation’sproportionate share of income or loss is included in otheroperating income. Those investments in which there is lessthan 20% ownership, are generally carried under the costmethod of accounting, unless significant influence is exercised.Under the cost method, the Corporation recognizes incomewhen dividends are received. Limited partnerships areaccounted for by the equity method unless the investor’sinterest is so “minor” that the limited partner may havevirtually no influence over partnership operating and financialpolicies.

116
Statutory business trusts that are wholly-owned by theCorporation and are issuers of trust preferred securities are notconsolidated in the Corporation’s consolidated financialstatements.
On May 29, 2012, the Corporation effected a 1-for-10reverse split of its common stock. All share and per shareinformation in the consolidated financial statements andaccompanying notes have been adjusted to retroactively reflectthe 1-for-10 reverse stock split.
Discontinued OperationsComponents of the Corporation that will be disposed of by sale,where the Corporation does not have a significant continuinginvolvement in the operations after the disposal, are accountedfor as discontinued operations. The results of operations of thediscontinued operations exclude allocations of corporateoverhead. Refer to Note 4 - Discontinued Operations, foradditional information on the discontinued operations.
Business combinationsBusiness combinations are accounted for under the acquisitionmethod. Under this method, assets acquired, liabilities assumedand any noncontrolling interest in the acquiree at theacquisition date are measured at their fair values as of theacquisition date. The acquisition date is the date the acquirerobtains control. Also, assets or liabilities arising fromnoncontractual contingencies are measured at their acquisitiondate at fair value only if it is more likely than not that they meetthe definition of an asset or liability. Adjustments subsequentlymade to the provisional amounts recorded on the acquisitiondate as a result of new information obtained about facts andcircumstances that existed as of the acquisition date but wereknown to the Corporation after acquisition will be maderetroactively during a measurement period not to exceed oneyear. Furthermore, acquisition-related restructuring costs thatdo not meet certain criteria of exit or disposal activities areexpensed as incurred. Transaction costs are expensed asincurred. Changes in income tax valuation allowances foracquired deferred tax assets are recognized in earningssubsequent to the measurement period as an adjustment toincome tax expense. Contingent consideration classified as anasset or a liability is remeasured to fair value at each reportingdate until the contingency is resolved. The changes in fair valueof the contingent consideration are recognized in earningsunless the arrangement is a hedging instrument for whichchanges are initially recognized in other comprehensiveincome.
There were no significant business combinations during2014, 2013 or 2012.
Deconsolidation of a subsidiaryThe Corporation accounts for the deconsolidation of asubsidiary when it ceases to have a controlling financial interest
in the subsidiary. Accordingly, it recognizes a gain or loss inresults of operations measured as the difference between thesum of the fair value of the consideration received, the fairvalue of any retained non-controlling investment in the formersubsidiary and the carrying amount of any non-controllinginterest in the former subsidiary, as compared with the carryingamount of the former subsidiary’s assets and liabilities.
Use of estimates in the preparation of financial statementsThe preparation of financial statements in conformity withaccounting principles generally accepted in the United States ofAmerica requires management to make estimates andassumptions that affect the reported amounts of assets andliabilities and contingent assets and liabilities at the date of thefinancial statements, and the reported amounts of revenues andexpenses during the reporting period. Actual results coulddiffer from those estimates.
ReclassificationsCertain reclassifications have been made to the 2013 and 2012consolidated financial statements to conform with the 2014presentation. Such reclassifications did not have an effect onpreviously reported statement of operations and of cash flows.
Fair value measurementsThe Corporation determines the fair values of its financialinstruments based on the fair value framework established inthe guidance for Fair Value Measurements in ASC Subtopic820-10, which requires an entity to maximize the use ofobservable inputs and minimize the use of unobservable inputswhen measuring fair value. Fair value is defined as theexchange price that would be received for an asset or paid totransfer a liability (an exit price) in the principal or mostadvantageous market for the asset or liability in an orderlytransaction between market participants on the measurementdate. The standard describes three levels of inputs that may beused to measure fair value which are (1) quoted market pricesfor identical assets or liabilities in active markets,(2) observable market-based inputs or unobservable inputs thatare corroborated by market data, and (3) unobservable inputsthat are not corroborated by market data. The fair valuehierarchy ranks the quality and reliability of the informationused to determine fair values.
The guidance in ASC Subtopic 820-10 also addressesmeasuring fair value in situations where markets are inactiveand transactions are not orderly. Transactions or quoted pricesfor assets and liabilities may not be determinative of fair valuewhen transactions are not orderly, and thus, may requireadjustments to estimate fair value. Price quotes based ontransactions that are not orderly should be given little, if any,weight in measuring fair value. Price quotes based ontransactions that are orderly shall be considered in determiningfair value, and the weight given is based on facts and

117 POPULAR, INC. 2014 ANNUAL REPORT
circumstances. If sufficient information is not available todetermine if price quotes are based on orderly transactions, lessweight should be given to the price quote relative to othertransactions that are known to be orderly.
Covered assetsAssets subject to loss sharing agreements with the FDIC,including certain loans and other real estate properties, arelabeled “covered” on the consolidated statements of financialcondition and throughout the notes to the consolidatedfinancial statements. Loans acquired in the Westernbank FDIC-assisted transaction, except for credit cards, are considered“covered loans” because the Corporation will be reimbursed for80% of any future losses on these loans subject to the terms ofthe FDIC loss sharing agreements.
Investment securitiesInvestment securities are classified in four categories andaccounted for as follows:
• Debt securities that the Corporation has the intent andability to hold to maturity are classified as securities held-to-maturity and reported at amortized cost. TheCorporation may not sell or transfer held-to-maturitysecurities without calling into question its intent to holdother debt securities to maturity, unless a nonrecurring orunusual event that could not have been reasonablyanticipated has occurred. An investment in debt securitiesis considered impaired if the fair value of the investmentis less than its amortized cost. For other-than-temporaryimpairments the Corporation assesses if it has both theintent and the ability to hold the security for a period oftime sufficient to allow for an anticipated recovery in itsfair value to its amortized cost. For other-than-temporaryimpairment not related to a credit loss (defined as thedifference between the present value of the cash flowsexpected to be collected and the amortized cost basis) fora held-to-maturity security is recognized in othercomprehensive loss and amortized over the remaining lifeof the debt security. The amortized cost basis for a debtsecurity is adjusted by the credit loss amount of other-than-temporary impairments.
• Debt and equity securities classified as trading securitiesare reported at fair value, with unrealized gains and lossesincluded in non-interest income.
• Debt and equity securities (equity securities with readilyavailable fair value) not classified as either securities held-to-maturity or trading securities, and which have a readilyavailable fair value, are classified as securities available-for-sale and reported at fair value, with unrealized gainsand losses excluded from earnings and reported, net oftaxes, in accumulated other comprehensive income orloss. The specific identification method is used to
determine realized gains and losses on securities available-for-sale, which are included in net gains or losses on saleand valuation adjustment of investment securities in theconsolidated statements of operations. Declines in thevalue of debt and equity securities that are consideredother-than-temporary reduce the value of the asset, andthe estimated loss is recorded in non-interest income. Fordebt securities, the Corporation assesses whether (a) ithas the intent to sell the debt security, or (b) it is morelikely than not that it will be required to sell the debtsecurity before its anticipated recovery. If either of theseconditions is met, an other-than-temporary impairmenton the security is recognized. In instances in which adetermination is made that a credit loss (defined as thedifference between the present value of the cash flowsexpected to be collected and the amortized cost basis)exists but the entity does not intend to sell the debtsecurity and it is not more likely than not that the entitywill be required to sell the debt security before theanticipated recovery of its remaining amortized cost basis(i.e., the amortized cost basis less any current-periodcredit loss), the impairment is separated into (a) theamount of the total impairment related to the credit loss,and (b) the amount of the total impairment related to allother factors. The amount of the total other-than-temporary impairment related to the credit loss isrecognized in the statement of operations. The amount ofthe total impairment related to all other factors isrecognized in other comprehensive loss. The other-than-temporary impairment analyses for both debt and equitysecurities are performed on a quarterly basis.
• Investments in equity or other securities that do not havereadily available fair values are classified as otherinvestment securities in the consolidated statements offinancial condition, and are subject to impairment testing,if applicable. These securities are stated at the lower ofcost or realizable value. The source of this value variesaccording to the nature of the investment, and is primarilyobtained by the Corporation from valuation analysesprepared by third-parties or from information derivedfrom financial statements available for the correspondingventure capital and mutual funds. Stock that is owned bythe Corporation to comply with regulatory requirements,such as Federal Reserve Bank and Federal Home LoanBank (“FHLB”) stock, is included in this category, andtheir realizable value equals their cost.
The amortization of premiums is deducted and the accretionof discounts is added to net interest income based on theinterest method over the outstanding period of the relatedsecurities. The cost of securities sold is determined by specificidentification. Net realized gains or losses on sales ofinvestment securities and unrealized loss valuation adjustmentsconsidered other-than-temporary, if any, on securities available-

118
for-sale, held-to-maturity and other investment securities aredetermined using the specific identification method and arereported separately in the consolidated statements ofoperations. Purchases and sales of securities are recognized on atrade date basis.
Derivative financial instrumentsAll derivatives are recognized on the statements of financialcondition at fair value. The Corporation’s policy is not to offsetthe fair value amounts recognized for multiple derivativeinstruments executed with the same counterparty under amaster netting arrangement nor to offset the fair value amountsrecognized for the right to reclaim cash collateral (a receivable)or the obligation to return cash collateral (a payable) arisingfrom the same master netting arrangement as the derivativeinstruments.
When the Corporation enters into a derivative contract, thederivative instrument is designated as either a fair value hedge,cash flow hedge or as a free-standing derivative instrument. Fora fair value hedge, changes in the fair value of the derivativeinstrument and changes in the fair value of the hedged asset orliability or of an unrecognized firm commitment attributable tothe hedged risk are recorded in current period earnings. For acash flow hedge, changes in the fair value of the derivativeinstrument, to the extent that it is effective, are recorded net oftaxes in accumulated other comprehensive income andsubsequently reclassified to net income (loss) in the sameperiod(s) that the hedged transaction impacts earnings. Theineffective portion of cash flow hedges is immediatelyrecognized in current earnings. For free-standing derivativeinstruments, changes in fair values are reported in currentperiod earnings.
Prior to entering a hedge transaction, the Corporationformally documents the relationship between hedginginstruments and hedged items, as well as the risk managementobjective and strategy for undertaking various hedgetransactions. This process includes linking all derivativeinstruments that are designated as fair value or cash flowhedges to specific assets and liabilities on the statements offinancial condition or to specific forecasted transactions or firmcommitments along with a formal assessment, at both inceptionof the hedge and on an ongoing basis, as to the effectiveness ofthe derivative instrument in offsetting changes in fair values orcash flows of the hedged item. Hedge accounting isdiscontinued when the derivative instrument is not highlyeffective as a hedge, a derivative expires, is sold, terminated,when it is unlikely that a forecasted transaction will occur orwhen it is determined that is no longer appropriate. Whenhedge accounting is discontinued the derivative continues to becarried at fair value with changes in fair value included inearnings.
For non-exchange traded contracts, fair value is based on dealerquotes, pricing models, discounted cash flow methodologies or
similar techniques for which the determination of fair may requiresignificant management judgment or estimation.
The fair value of derivative instruments considers the risk ofnon-performance by the counterparty or the Corporation, asapplicable.
The Corporation obtains or pledges collateral in connectionwith its derivative activities when applicable under theagreement.
LoansLoans are classified as loans held-in-portfolio whenmanagement has the intent and ability to hold the loan for theforeseeable future, or until maturity or payoff. The foreseeablefuture is a management judgment which is determined basedupon the type of loan, business strategies, current marketconditions, balance sheet management and liquidity needs.Management’s view of the foreseeable future may change basedon changes in these conditions. When a decision is made to sellor securitize a loan that was not originated or initially acquiredwith the intent to sell or securitize, the loan is reclassified fromheld-in-portfolio into held-for-sale. Due to changing marketconditions or other strategic initiatives, management’s intentwith respect to the disposition of the loan may change, andaccordingly, loans previously classified as held-for-sale may bereclassified into held-in-portfolio. Loans transferred betweenloans held-for-sale and held-in-portfolio classifications arerecorded at the lower of cost or fair value at the date of transfer.
Purchased loans are accounted at fair value uponacquisition.
Loans held-for-sale are stated at the lower of cost or fairvalue, cost being determined based on the outstanding loanbalance less unearned income, and fair value determined,generally in the aggregate. Fair value is measured based oncurrent market prices for similar loans, outstanding investorcommitments, prices of recent sales or discounted cash flowanalyses which utilize inputs and assumptions which arebelieved to be consistent with market participants’ views. Thecost basis also includes consideration of deferred originationfees and costs, which are recognized in earnings at the time ofsale. Upon reclassification to held-for-sale, credit related fairvalue adjustments are recorded as a reduction in the allowancefor loan losses (“ALLL”). To the extent that the loan’s reductionin value has not already been provided for in the allowance forloan losses, an additional loan loss provision is recorded.Subsequent to reclassification to held-for-sale, the amount, bywhich cost exceeds fair value, if any, is accounted for as avaluation allowance with changes therein included in thedetermination of net income (loss) for the period in which thechange occurs.
Loans held-in-portfolio are reported at their outstandingprincipal balances net of any unearned income, charge-offs,unamortized deferred fees and costs on originated loans, andpremiums or discounts on purchased loans. Fees collected and

119 POPULAR, INC. 2014 ANNUAL REPORT
costs incurred in the origination of new loans are deferred andamortized using the interest method or a method whichapproximates the interest method over the term of the loan asan adjustment to interest yield.
The past due status of a loan is determined in accordancewith its contractual repayment terms. Furthermore, loans arereported as past due when either interest or principal remainsunpaid for 30 days or more in accordance with its contractualrepayment terms.
Non-accrual loans are those loans on which the accrual ofinterest is discontinued. When a loan is placed on non-accrualstatus, all previously accrued and unpaid interest is chargedagainst income and the loan is accounted for either on a cash-basis method or on the cost-recovery method. Loans designatedas non-accruing are returned to accrual status when theCorporation expects repayment of the remaining contractualprincipal and interest.
Recognition of interest income on commercial andconstruction loans is discontinued when the loans are 90 days ormore in arrears on payments of principal or interest or whenother factors indicate that the collection of principal and interestis doubtful. The impaired portion of secured loan past due as toprincipal and interest is charged-off not later than 365 days pastdue. However, in the case of a collateral dependent loanindividually evaluated for impairment, the excess of therecorded investment over the fair value of the collateral (portiondeemed uncollectible) is generally promptly charged-off, but inany event, not later than the quarter following the quarter inwhich such excess was first recognized. Commercial unsecuredloans are charged-off no later than 180 days past due.Recognition of interest income on mortgage loans is generallydiscontinued when loans are 90 days or more in arrears onpayments of principal or interest. The impaired portion of amortgage loan is charged-off when the loan is 180 days past due.The Corporation discontinues the recognition of interest onresidential mortgage loans insured by the Federal HousingAdministration (“FHA”) or guaranteed by the U.S. Departmentof Veterans Affairs (“VA”) when 18-months delinquent as toprincipal or interest. The principal repayment on these loans isinsured. Recognition of interest income on closed-end consumerloans and home equity lines of credit is discontinued when theloans are 90 days or more in arrears on payments of principal orinterest. Income is generally recognized on open-end consumerloans, except for home equity lines of credit, until the loans arecharged-off. Recognition of interest income for lease financing isceased when loans are 90 days or more in arrears. Closed-endconsumer loans and leases are charged-off when they are 120days in arrears. Open-end (revolving credit) consumer loans arecharged-off when 180 days in arrears. Commercial andconsumer overdrafts are generally charged-off no later than 60days past their due date.
Purchased impaired loans accounted for under ASCSubtopic 310-30 are not considered non-performing and
continue to have an accretable yield as long as there is areasonable expectation about the timing and amount of cashflows expected to be collected. Also, loans charged-off againstthe non-accretable difference established in purchaseaccounting are not reported as charge-offs. Charge-offs on loansaccounted under ASC Subtopic 310-30 are recorded only to theextent that losses exceed the non-accretable differenceestablished with purchase accounting.
A loan classified as a troubled debt restructuring (“TDR”) istypically in non-accrual status at the time of the modification.The TDR loan continues in non-accrual status until theborrower has demonstrated a willingness and ability to make therestructured loan payments (at least six months of sustainedperformance after the modification (or one year for loansproviding for quarterly or semi-annual payments)) andmanagement has concluded that it is probable that the borrowerwould not be in payment default in the foreseeable future.
Lease financingThe Corporation leases passenger and commercial vehicles andequipment to individual and corporate customers. The financemethod of accounting is used to recognize revenue on leasecontracts that meet the criteria specified in the guidance forleases in ASC Topic 840. Aggregate rentals due over the term ofthe leases less unearned income are included in finance leasecontracts receivable. Unearned income is amortized using amethod which results in approximate level rates of return onthe principal amounts outstanding. Finance lease originationfees and costs are deferred and amortized over the average lifeof the lease as an adjustment to the interest yield.
Revenue for other leases is recognized as it becomes dueunder the terms of the agreement.
Loans acquired in an FDIC-assisted transactionLoans acquired in a business acquisition are recorded at fairvalue at the acquisition date. Credit discounts are included inthe determination of fair value; therefore, an allowance for loanlosses is not recorded at the acquisition date.
The Corporation applied the guidance of ASC Subtopic 310-30 to all loans acquired in Westernbank FDIC-assistedtransaction (including loans that do not meet scope of ASCSubtopic 310-30), except for credit cards and revolving lines ofcredit that were expressly scoped out from the application ofthis guidance since they continued to have revolving privilegesafter acquisition. Management used its judgment in evaluatingfactors impacting expected cash flows and probable lossassumptions, including the quality of the loan portfolio,portfolio concentrations, distressed economic conditions, qualityof underwriting standards of the acquired institution, reductionsin collateral real estate values, among other considerations thatcould also impact the expected cash inflows on the loans.
Loans accounted for under ASC Subtopic 310-30 representloans showing evidence of credit deterioration and that it is
120
probable, at the date of acquisition, that the Corporation wouldnot collect all contractually required principal and interestpayments. Generally, acquired loans that meet the definition fornonaccrual status fall within the Corporation’s definition ofimpaired loans under ASC Subtopic 310-30. Also, based on thefair value determined for the acquired portfolio, acquired loansthat did not meet the definition of nonaccrual status alsoresulted in the recognition of a significant discount attributableto credit quality. Accordingly, an election was made by theCorporation to apply the accretable yield method (expectedcash flow model of ASC Subtopic 310-30), as a loan with creditdeterioration and impairment, instead of the standard loandiscount accretion guidance of ASC Subtopic 310-20, for theloans acquired in the Westernbank FDIC-assisted transaction.These loans are disclosed as a loan that was acquired withcredit deterioration and impairment.
Under ASC Subtopic 310-30, the covered loans acquiredfrom the FDIC were aggregated into pools based on loans thathad common risk characteristics. Each loan pool is accountedfor as a single asset with a single composite interest rate and anaggregate expectation of cash flows. Characteristics consideredin pooling loans in the FDIC-assisted transaction included loantype, interest rate type, accruing status, amortization type, rateindex and source type. Once the pools are defined, theCorporation maintains the integrity of the pool of multipleloans accounted for as a single asset.
Under ASC Subtopic 310-30, the difference between theundiscounted cash flows expected at acquisition and the fairvalue in the loans, or the “accretable yield,” is recognized asinterest income using the effective yield method over theestimated life of the loan if the timing and amount of the futurecash flows of the pool is reasonably estimable. The non-accretable difference represents the difference betweencontractually required principal and interest and the cash flowsexpected to be collected. Subsequent to the acquisition date,increases in cash flows over those expected at the acquisitiondate are recognized as interest income prospectively. Decreasesin expected cash flows after the acquisition date are recognizedby recording an allowance for loan losses.
The fair value discount of lines of credit with revolvingprivileges that are accounted for pursuant to the guidance ofASC Subtopic 310-20 represents the difference between thecontractually required loan payment receivable in excess of theinitial investment in the loan. This discount is accreted intointerest income over the life of the loan if the loan is in accruingstatus. Any cash flows collected in excess of the carrying amountof the loan are recognized in earnings at the time of collection.The carrying amount of lines of credit with revolving privileges,which are accounted pursuant to the guidance of ASC Subtopic310-20, are subject to periodic review to determine the need forrecognizing an allowance for loan losses.
Allowance for loan lossesThe Corporation follows a systematic methodology to establishand evaluate the adequacy of the allowance for loan losses toprovide for inherent losses in the loan portfolio. Thismethodology includes the consideration of factors such ascurrent economic conditions, portfolio risk characteristics,prior loss experience and results of periodic credit reviews ofindividual loans. The provision for loan losses charged tocurrent operations is based on this methodology. Loan lossesare charged and recoveries are credited to the allowance forloan losses.
The Corporation’s assessment of the allowance for loanlosses is determined in accordance with the guidance of losscontingencies in ASC Subtopic 450-20 and loan impairmentguidance in ASC Section 310-10-35. Also, the Corporationdetermines the allowance for loan losses on purchased impairedloans and purchased loans accounted for under ASC Subtopic310-30 by analogy, by evaluating decreases in expected cashflows after the acquisition date.
The accounting guidance provides for the recognition of aloss allowance for groups of homogeneous loans. Thedetermination for general reserves of the allowance for loanlosses includes the following principal factors:
• Base net loss rates, which are based on the movingaverage of annualized net loss rates computed over a 3-year historical loss period for the commercial andconstruction loan portfolios, and an 18-month period forthe consumer and mortgage loan portfolios. The base netloss rates are applied by loan type and by legal entity.
• Recent loss trend adjustment, which replaces the base lossrate with a 12-month average loss rate, when these trendsare higher than the respective base loss rates. Theobjective of this adjustment is to allow for a more recentloss trend to be captured and reflected in the ALLLestimation process. As part of the annual review of thecomponents of the ALLL models, as discussed in thefollowing paragraphs and implemented as of June 30,2014, the Corporation eliminated the use of caps in therecent loss trend adjustment for the consumer andmortgage portfolios, among other enhancements. For theperiod ended December 31, 2013, the recent loss trendadjustment caps for the consumer and mortgage portfolioswere triggered in only one portfolio segment within thePuerto Rico consumer portfolio. Management assessed theimpact of the applicable cap through a review ofqualitative factors that specifically considered the driversof recent loss trends and changes to the portfoliocomposition. The related effect of the aforementioned capwas immaterial for the overall level of the Allowance forLoan and Lease Losses for the Puerto Rico Consumerportfolio.

121 POPULAR, INC. 2014 ANNUAL REPORT
For the period ended December 31, 2014, 50%(December 31, 2013 - 27%) of the ALLL for BPPR non-covered loan portfolios utilized the recent loss trendadjustment instead of the base loss. The effect of replacingthe base loss with the recent loss trend adjustment wasmainly concentrated in the commercial multi-family,commercial and industrial, personal and auto loanportfolios for 2014, and in the commercial multi-family,mortgage, and leasing portfolios for 2013.
For the period ended December 31, 2014, 21%(December 31, 2013 - 29%) of the ALLL for BPNA loanportfolios utilized the recent loss trend adjustment insteadof the base loss. The effect of replacing the base loss withthe recent loss trend adjustment was mainly concentratedin the commercial multi-family, commercial andindustrial and legacy loan portfolios for 2014 and in thecommercial multi-family, commercial real estate non-owner occupied and commercial and industrial portfoliosfor 2013.
• Environmental factors, which include credit andmacroeconomic indicators such as unemployment rate,economic activity index and delinquency rates, adopted toaccount for current market conditions that are likely tocause estimated credit losses to differ from historicallosses. The Corporation reflects the effect of theseenvironmental factors on each loan group as anadjustment that, as appropriate, increases the historicalloss rate applied to each group. Environmental factorsprovide updated perspective on credit and economicconditions. Regression analysis is used to select theseindicators and quantify the effect on the general reserve ofthe allowance for loan losses.
During the second quarter of 2014, management completedthe annual review of the components of the ALLL models. Aspart of this review management updated core metrics andrevised certain components related to the estimation process forevaluating the adequacy of the general reserve of the allowancefor loan losses. These enhancements to the ALLL methodology,which are described in the paragraphs below, wereimplemented as of June 30, 2014 and resulted in a net decreaseto the allowance for loan losses of $18.7 million for the non-covered portfolio and a net increase to the allowance for loanlosses of $0.8 million for the covered portfolio.
Management made the following principal enhancements tothe methodology during the second quarter of 2014:
• Annual review and recalibration of the environmentalfactors adjustment. The environmental factor adjustmentsare developed by performing regression analyses onselected credit and economic indicators for eachapplicable loan segment. During the second quarter of2014, the environmental factor models used to accountfor changes in current credit and macroeconomic
conditions were reviewed and recalibrated based on thelatest applicable trends. Management also revised theapplication of environmental factors to the historical lossrates to consider last 12 month trends of the applicablecredit and macroeconomic indicators applied as anincremental adjustment to account for emerging risks notnecessarily considered in the historical loss rates.
The combined effect of the aforementioned recalibrationand enhancements to the environmental factorsadjustment resulted in a decrease to the allowance forloan losses of $17 million at June 30, 2014, of which$14.1 million related to the non-covered BPPR segmentand $3.7 million related to the BPNA segment, offset inpart by a $0.8 million increase in the BPPR coveredsegment.
• Increased the historical look-back period for determiningthe recent loss trend adjustment for consumer andmortgage loans. The Corporation increased the look-backperiod for assessing recent trends applicable to thedetermination of consumer and mortgage loan net charge-offs from 6 months to 12 months and eliminated the useof caps. Previously, the Corporation used a recent losstrend adjustment based on 6 months of net charge-offs upto a determined cap. Given the current overall consumerand mortgage credit quality improvements, managementconcluded that a 12-month look-back period for therecent loss trend adjustment aligns the Corporation’sallowance for loan losses methodology to current creditquality trends while limiting excessive pro-cyclicalitygiven the longer look-back period analysis, thus,eliminating the aforementioned caps.
The combined effect of the aforementioned enhancementsto the recent loss trend adjustment resulted in a decreaseto the allowance for loan losses of $1 million at June 30,2014, of which $0.9 million related to the non-coveredBPPR segment and $0.1 million related to the BPNAsegment.
According to the loan impairment accounting guidance inASC Section 310-10-35, a loan is impaired when, based oncurrent information and events, it is probable that the principaland/or interest are not going to be collected according to theoriginal contractual terms of the loan agreement. Currentinformation and events include “environmental” factors, e.g.existing industry, geographical, economic and political factors.Probable means the future event or events which will confirmthe loss or impairment of the loan is likely to occur.
The Corporation defines commercial and constructionimpaired loans as borrowers with total debt greater than orequal to $1 million with 90 days or more past due, as well as allloans whose terms have been modified in a trouble debtrestructuring (“TDRs”). In addition, larger commercial and

122
construction loans ($1 million and over) that exhibit probableor observed credit weaknesses are subject to individual reviewand thus evaluated for impairment. Commercial andconstruction loans that originally met the Corporation’sthreshold for impairment identification in a prior period, butdue to charge-offs or payments are currently below the $1million threshold and are still 90 days past due, except forTDRs, are accounted for under the Corporation’s generalreserve methodology. Although the accounting codificationguidance for specific impairment of a loan excludes largegroups of smaller balance homogeneous loans that arecollectively evaluated for impairment (e.g. mortgage andconsumer loans), it specifically requires that loan modificationsconsidered troubled debt restructurings (“TDRs”) be analyzedunder its provisions. An allowance for loan impairment isrecognized to the extent that the carrying value of an impairedloan exceeds the present value of the expected future cash flowsdiscounted at the loan’s effective rate, the observable marketprice of the loan, if available, or the fair value of the collateral ifthe loan is collateral dependent. The fair value of the collateralis generally based on appraisals. Appraisals may be adjusted dueto their age, and the type, location, and condition of theproperty or area or general market conditions to reflect theexpected change in value between the effective date of theappraisal and the impairment measurement date. TheCorporation requests updated appraisal reports from pre-approved appraisers for loans that are considered impairedfollowing the Corporation’s reappraisals policy. This policyrequires updated appraisals for loans secured by real estate(including construction loans) either annually or every twoyears depending on the total exposure of the borrower. As ageneral procedure, the Corporation internally reviewsappraisals as part of the underwriting and approval process andalso for credits considered impaired.
Troubled debt restructuringsA restructuring constitutes a TDR when the Corporationseparately concludes that both of the following conditions exist:1) the restructuring constitute a concession and 2) the debtor isexperiencing financial difficulties. The concessions stem froman agreement between the creditor and the debtor or areimposed by law or a court. These concessions could include areduction in the interest rate on the loan, payment extensions,forgiveness of principal, forbearance or other actions intendedto maximize collection. A concession has been granted when, asa result of the restructuring, the Corporation does not expect tocollect all amounts due, including interest accrued at theoriginal contract rate. If the payment of principal is dependenton the value of collateral, the current value of the collateral istaken into consideration in determining the amount ofprincipal to be collected; therefore, all factors that changed are
considered to determine if a concession was granted, includingthe change in the fair value of the underlying collateral thatmay be used to repay the loan. Classification of loanmodifications as TDRs involves a degree of judgment.Indicators that the debtor is experiencing financial difficultieswhich are considered include: (i) the borrower is currently indefault on any of its debt or it is probable that the borrowerwould be in payment default on any of its debt in theforeseeable future without the modification; (ii) the borrowerhas declared or is in the process of declaring bankruptcy;(iii) there is significant doubt as to whether the borrower willcontinue to be a going concern; (iv) the borrower has securitiesthat have been delisted, are in the process of being delisted, orare under threat of being delisted from an exchange; (v) basedon estimates and projections that only encompass theborrower’s current business capabilities, it is forecasted that theentity-specific cash flows will be insufficient to service the debt(both interest and principal) in accordance with the contractualterms of the existing agreement through maturity; and(vi) absent the current modification, the borrower cannotobtain funds from sources other than the existing creditors atan effective interest rate equal to the current market interestrate for similar debt for a non-troubled debtor. Theidentification of TDRs is critical in the determination of theadequacy of the allowance for loan losses. Loans classified asTDRs may be excluded from TDR status if performance underthe restructured terms exists for a reasonable period (at leasttwelve months of sustained performance) and the loan yields amarket rate.
A loan may be restructured in a troubled debt restructuringinto two (or more) loan agreements, for example, Note A andNote B. Note A represents the portion of the original loanprincipal amount that is expected to be fully collected alongwith contractual interest. Note B represents the portion of theoriginal loan that may be considered uncollectible and charged-off, but the obligation is not forgiven to the borrower. Note Amay be returned to accrual status provided all of the conditionsfor a TDR to be returned to accrual status are met. Themodified loans are considered TDRs and thus, are evaluatedunder the framework of ASC Section 310-10-35 as long as theloans are not part of a pool of loans accounted for under ASCSubtopic 310-30.
Refer to Note 12 to the consolidated financial statements foradditional qualitative information on TDRs and theCorporation’s determination of the allowance for loan losses.
Reserve for unfunded commitmentsThe reserve for unfunded commitments is maintained at a levelbelieved by management to be sufficient to absorb estimatedprobable losses related to unfunded credit facilities and isincluded in other liabilities in the consolidated statements of

123 POPULAR, INC. 2014 ANNUAL REPORT
financial condition. The determination of the adequacy of thereserve is based upon an evaluation of the unfunded creditfacilities. Net adjustments to the reserve for unfundedcommitments are included in other operating expenses in theconsolidated statements of operations.
FDIC loss share indemnification asset and true-up paymentobligation (contingent consideration)The FDIC loss share indemnification asset was initiallyrecorded at fair value. Fair value was estimated using projectedcash flows related to the loss sharing agreements.
The FDIC loss share indemnification asset for loss shareagreements is measured separately from the related coveredassets as it is not contractually embedded in the assets and isnot transferable with the assets should the assets be sold.
The FDIC loss share indemnification asset is recognized onthe same basis as the assets subject to loss share protection. Assuch, for covered loans accounted pursuant to ASC Subtopic310-30, decreases in expected reimbursements from the FDICdue to improvements in expected cash flows to be receivedfrom borrowers, are recognized in non-interest incomeprospectively over the life of the FDIC loss sharing agreements.For covered loans accounted for under ASC Subtopic 310-20, asthe loan discount recorded as of the acquisition date wasaccreted into income, a reduction of the related indemnificationasset was recorded as a reduction in non-interest income.Increases in expected reimbursements from the FDIC arerecognized in non-interest income in the same period that theallowance for credit losses for the related loans is recognized.
The amortization or accretion due to discounting of the lossshare asset and changes in expected loss sharingreimbursements is included in non-interest income, particularlyin the category of FDIC loss share income (expense).
The true-up payment obligation associated with the lossshare agreements is accounted for at fair value in accordancewith ASC Section 805-30-25-6 as it is considered contingentconsideration. The true-up payment obligation is included aspart of other liabilities in the consolidated statements offinancial condition. Any changes in the carrying value of theobligation are included in the category of FDIC loss shareincome (expense) in the consolidated statements of operations.
Refer to Note 13 for additional information on the FDIC lossshare indemnification asset and true-up payment obligation.
Transfers and servicing of financial assetsThe transfer of an entire financial asset, a group of entirefinancial assets, or a participating interest in an entire financialasset in which the Corporation surrenders control over theassets is accounted for as a sale if all of the following conditionsset forth in ASC Topic 860 are met: (1) the assets must beisolated from creditors of the transferor, (2) the transferee mustobtain the right (free of conditions that constrain it from takingadvantage of that right) to pledge or exchange the transferred
assets, and (3) the transferor cannot maintain effective controlover the transferred assets through an agreement to repurchasethem before their maturity. When the Corporation transfersfinancial assets and the transfer fails any one of these criteria,the Corporation is prevented from derecognizing thetransferred financial assets and the transaction is accounted foras a secured borrowing. For federal and Puerto Rico income taxpurposes, the Corporation treats the transfers of loans which donot qualify as “true sales” under the applicable accountingguidance, as sales, recognizing a deferred tax asset or liabilityon the transaction.
For transfers of financial assets that satisfy the conditions tobe accounted for as sales, the Corporation derecognizes allassets sold; recognizes all assets obtained and liabilitiesincurred in consideration as proceeds of the sale, includingservicing assets and servicing liabilities, if applicable; initiallymeasures at fair value assets obtained and liabilities incurred ina sale; and recognizes in earnings any gain or loss on the sale.
The guidance on transfer of financial assets requires a truesale analysis of the treatment of the transfer under state law as ifthe Corporation was a debtor under the bankruptcy code. Atrue sale legal analysis includes several legally relevant factors,such as the nature and level of recourse to the transferor, andthe nature of retained interests in the loans sold. The analyticalconclusion as to a true sale is never absolute and unconditional,but contains qualifications based on the inherent equitablepowers of a bankruptcy court, as well as the unsettled state ofthe common law. Once the legal isolation test has been met,other factors concerning the nature and extent of thetransferor’s control over the transferred assets are taken intoaccount in order to determine whether derecognition of assetsis warranted.
The Corporation sells mortgage loans to the GovernmentNational Mortgage Association (“GNMA”) in the normal courseof business and retains the servicing rights. The GNMAprograms under which the loans are sold allow the Corporationto repurchase individual delinquent loans that meet certaincriteria. At the Corporation’s option, and without GNMA’s priorauthorization, the Corporation may repurchase the delinquentloan for an amount equal to 100% of the remaining principalbalance of the loan. Once the Corporation has theunconditional ability to repurchase the delinquent loan, theCorporation is deemed to have regained effective control overthe loan and recognizes the loan on its balance sheet as well asan offsetting liability, regardless of the Corporation’s intent torepurchase the loan.
Servicing assetsThe Corporation periodically sells or securitizes loans whileretaining the obligation to perform the servicing of such loans.In addition, the Corporation may purchase or assume the rightto service loans originated by others. Whenever theCorporation undertakes an obligation to service a loan,
124
management assesses whether a servicing asset or liabilityshould be recognized. A servicing asset is recognized wheneverthe compensation for servicing is expected to more thanadequately compensate the servicer for performing theservicing. Likewise, a servicing liability would be recognized inthe event that servicing fees to be received are not expected toadequately compensate the Corporation for its expected cost.Mortgage servicing assets recorded at fair value are separatelypresented on the consolidated statements of financial condition.
All separately recognized servicing assets are initiallyrecognized at fair value. For subsequent measurement of servicingrights, the Corporation has elected the fair value method formortgage loans servicing rights (“MSRs”) while all other servicingassets, particularly those related to Small Business Administration(“SBA”) commercial loans, follow the amortization method.Under the fair value measurement method, MSRs are recorded atfair value each reporting period, and changes in fair value arereported in mortgage banking activities in the consolidatedstatement of operations. Under the amortization method, servicingassets are amortized in proportion to, and over the period of,estimated servicing income, and assessed for impairment based onfair value at each reporting period. Contractual servicing feesincluding ancillary income and late fees, as well as fair valueadjustments, and impairment losses, if any, are reported inmortgage banking activities in the consolidated statement ofoperations. Loan servicing fees, which are based on a percentageof the principal balances of the loans serviced, are credited toincome as loan payments are collected.
The fair value of servicing rights is estimated by using a cashflow valuation model which calculates the present value ofestimated future net servicing cash flows, taking intoconsideration actual and expected loan prepayment rates,discount rates, servicing costs, and other economic factors,which are determined based on current market conditions.
For purposes of evaluating and measuring impairment ofcapitalized servicing assets that are accounted under theamortization method, the amount of impairment recognized, ifany, is the amount by which the capitalized servicing assets perstratum exceed their estimated fair value. Temporaryimpairment is recognized through a valuation allowance withchanges included in results of operations for the period inwhich the change occurs. If it is later determined that all or aportion of the temporary impairment no longer exists for aparticular stratum, the valuation allowance is reduced througha recovery in earnings. Any fair value in excess of the cost basisof the servicing asset for a given stratum is not recognized.Servicing rights subsequently accounted under the amortizationmethod are also reviewed for other-than-temporaryimpairment. When the recoverability of an impaired servicingasset accounted under the amortization method is determinedto be remote, the unrecoverable portion of the valuationallowance is applied as a direct write-down to the carryingvalue of the servicing rights, precluding subsequent recoveries.
Premises and equipmentPremises and equipment are stated at cost less accumulateddepreciation and amortization. Depreciation is computed on astraight-line basis over the estimated useful life of each type ofasset. Amortization of leasehold improvements is computedover the terms of the respective leases or the estimated usefullives of the improvements, whichever is shorter. Costs ofmaintenance and repairs which do not improve or extend thelife of the respective assets are expensed as incurred. Costs ofrenewals and betterments are capitalized. When assets aredisposed of, their cost and related accumulated depreciation areremoved from the accounts and any gain or loss is reflected inearnings as realized or incurred, respectively.
The Corporation capitalizes interest cost incurred in theconstruction of significant real estate projects, which consistprimarily of facilities for its own use or intended for lease. Theamount of interest cost capitalized is to be an allocation of theinterest cost incurred during the period required tosubstantially complete the asset. The interest rate forcapitalization purposes is to be based on a weighted averagerate on the Corporation’s outstanding borrowings, unless thereis a specific new borrowing associated with the asset. Interestcost capitalized for the years ended December 31, 2014, 2013and 2012 was not significant.
The Corporation has operating lease arrangements primarilyassociated with the rental of premises to support its branchnetwork or for general office space. Certain of thesearrangements are non-cancellable and provide for rentescalations and renewal options. Rent expense on non-cancellable operating leases with scheduled rent increases arerecognized on a straight-line basis over the lease term.
Impairment of long-lived assetsThe Corporation evaluates for impairment its long-lived assetsto be held and used, and long-lived assets to be disposed of,whenever events or changes in circumstances indicate that thecarrying amount of an asset may not be recoverable.
Restructuring costsA liability for a cost associated with an exit or disposal activityis recognized and measured initially at its fair value in theperiod in which the liability is incurred. If future service isrequired for employees to receive the one-time terminationbenefit, the liability is initially measured at its fair value as ofthe termination date and recognized over the future serviceperiod.
Other real estateOther real estate, received in satisfaction of a loan, is recordedat fair value less estimated costs of disposal. The amount bywhich the carrying amount of the loan exceeds the fair valueless cost to sell is recorded as a charge against the allowance forloan losses. Subsequent to foreclosure, any losses in the

125 POPULAR, INC. 2014 ANNUAL REPORT
carrying value arising from periodic re-evaluations of theproperties, and any gains or losses on the sale of theseproperties are credited or charged to expense in the periodincurred and are included as a component of other operatingexpenses. The cost of maintaining and operating suchproperties is expensed as incurred.
Updated appraisals or third-party broker price opinions ofvalue (“BPO”) are obtained to adjust the value of the other realestate assets. The frequency depends on the loan type and totalcredit exposure. The appraisal for a commercial or constructionother real estate property with a book value greater than $1million is updated annually and if lower than $1 million it isupdated every two years. For residential mortgage properties,the Corporation requests third-party BPOs or appraisals,generally on an annual basis.
Appraisals may be adjusted due to age, collateralinspections, property profiles, or general market conditions.The adjustments applied are based upon internal informationsuch as other appraisals for the type of properties and/or lossseverity information that can provide historical trends in thereal estate market, and may change from time to time based onmarket conditions.
Goodwill and other intangible assetsGoodwill is recognized when the purchase price is higher thanthe fair value of net assets acquired in business combinationsunder the purchase method of accounting. Goodwill is notamortized, but is tested for impairment at least annually ormore frequently if events or circumstances indicate possibleimpairment using a two-step process at each reporting unitlevel. The first step of the goodwill impairment test, used toidentify potential impairment, compares the fair value of areporting unit with its carrying amount, including goodwill. Ifthe fair value of a reporting unit exceeds its carrying amount,the goodwill of the reporting unit is not considered impairedand the second step of the impairment test is unnecessary. Ifneeded, the second step consists of comparing the implied fairvalue of the reporting unit goodwill with the carrying amountof that goodwill. In determining the fair value of a reportingunit, the Corporation generally uses a combination of methods,which include market price multiples of comparable companiesand the discounted cash flow analysis. Goodwill impairmentlosses are recorded as part of operating expenses in theconsolidated statement of operations.
Other intangible assets deemed to have an indefinite life arenot amortized, but are tested for impairment using a one-stepprocess which compares the fair value with the carryingamount of the asset. In determining that an intangible asset hasan indefinite life, the Corporation considers expected cashinflows and legal, regulatory, contractual, competitive,economic and other factors, which could limit the intangibleasset’s useful life.
Other identifiable intangible assets with a finite useful life,mainly core deposits, are amortized using various methods overthe periods benefited, which range from 4 to 10 years. Theseintangibles are evaluated periodically for impairment whenevents or changes in circumstances indicate that the carryingamount may not be recoverable. Impairments on intangibleassets with a finite useful life are evaluated under the guidancefor impairment or disposal of long-lived assets.
Assets sold / purchased under agreements to repurchase /resellRepurchase and resell agreements are treated as collateralizedfinancing transactions and are carried at the amounts at whichthe assets will be subsequently reacquired or resold as specifiedin the respective agreements.
It is the Corporation’s policy to take possession of securitiespurchased under agreements to resell. However, thecounterparties to such agreements maintain effective controlover such securities, and accordingly those securities are notreflected in the Corporation’s consolidated statements offinancial condition. The Corporation monitors the fair value ofthe underlying securities as compared to the related receivable,including accrued interest.
It is the Corporation’s policy to maintain effective controlover assets sold under agreements to repurchase; accordingly,such securities continue to be carried on the consolidatedstatements of financial condition.
The Corporation may require counterparties to depositadditional collateral or return collateral pledged, whenappropriate.
SoftwareCapitalized software is stated at cost, less accumulatedamortization. Capitalized software includes purchased softwareand capitalizable application development costs associated withinternally-developed software. Amortization, computed on astraight-line method, is charged to operations over theestimated useful life of the software. Capitalized software isincluded in “Other assets” in the consolidated statement offinancial condition.
Guarantees, including indirect guarantees of indebtedness ofothersThe Corporation, as a guarantor, recognizes at the inception ofa guarantee, a liability for the fair value of the obligationundertaken in issuing the guarantee. Refer to Note 30 to theconsolidated financial statements for further disclosures onguarantees.
Treasury stockTreasury stock is recorded at cost and is carried as a reduction ofstockholders’ equity in the consolidated statements of financial
126
condition. At the date of retirement or subsequent reissue, thetreasury stock account is reduced by the cost of such stock. Atretirement, the excess of the cost of the treasury stock over itspar value is recorded entirely to surplus. At reissuance, thedifference between the consideration received upon issuance andthe specific cost is charged or credited to surplus.
Income Recognition - Insurance agency businessCommissions and fees are recognized when related policies areeffective. Additional premiums and rate adjustments arerecorded as they occur. Contingent commissions are recordedon the accrual basis when the amount to be received is notifiedby the insurance company. Commission income from advancebusiness is deferred. An allowance is created for expectedadjustments to commissions earned relating to policycancellations.
Income Recognition - Investment banking revenues andcommissionsInvestment banking revenue is recorded as follows:underwriting fees at the time the underwriting is completed andincome is reasonably determinable; corporate finance advisoryfees as earned, according to the terms of the specific contracts;and sales commissions on a trade-date basis. Commissionincome and expenses related to customers’ securitiestransactions are recorded on a trade-date basis.
Foreign exchangeAssets and liabilities denominated in foreign currencies aretranslated to U.S. dollars using prevailing rates of exchange atthe end of the period. Revenues, expenses, gains and losses aretranslated using weighted average rates for the period. Theresulting foreign currency translation adjustment fromoperations for which the functional currency is other than theU.S. dollar is reported in accumulated other comprehensiveloss, except for highly inflationary environments in which theeffects are included in other operating expenses.
The Corporation holds interests in Centro Financiero BHDLeón, S.A. (“BHD León”) in the Dominican Republic. Thebusiness of BHD León is mainly conducted in their country’sforeign currency. The resulting foreign currency translationadjustment from these operations is reported in accumulatedother comprehensive loss. During 2014, BHD León entered intoa merger agreement with Grupo Financiero León, as part of thistransaction BHD León issued additional stock which had adilutive effect of Popular’s equity participation. Refer to note18, Other Assets, for additional information. Therefore, a prorata portion of the accumulated translation adjustmentcomponent of the equity attributable to this equity methodinvestment was recognized as a loss through earnings.
During 2013, the Corporation sold its investment in Tarjetasy Transacciones en Red Tranred, C.A. (formerly EVERTEC DEVENEZUELA, C.A.) which was written-down during 2011 as
the Corporation determined to wind-down those operations.Refer to the disclosure of accumulated other comprehensive
loss included in the Note 29 for the outstanding balances of theforeign currency translation adjustments at December 31, 2014and 2013.
Income taxesThe Corporation recognizes deferred tax assets and liabilitiesfor the expected future tax consequences of events that havebeen recognized in the Corporation’s financial statements or taxreturns. Deferred income tax assets and liabilities aredetermined for differences between financial statement and taxbases of assets and liabilities that will result in taxable ordeductible amounts in the future. The computation is based onenacted tax laws and rates applicable to periods in which thetemporary differences are expected to be recovered or settled.
The guidance for income taxes requires a reduction of thecarrying amounts of deferred tax assets by a valuationallowance if, based on the available evidence, it is more likelythan not (defined as a likelihood of more than 50 percent) thatsuch assets will not be realized. Accordingly, the need toestablish valuation allowances for deferred tax assets is assessedperiodically by the Corporation based on the more likely thannot realization threshold criterion. In the assessment for avaluation allowance, appropriate consideration is given to allpositive and negative evidence related to the realization of thedeferred tax assets. This assessment considers, among othermatters, all sources of taxable income available to realize thedeferred tax asset, including the future reversal of existingtemporary differences, the future taxable income exclusive ofreversing temporary differences and carryforwards, taxableincome in carryback years and tax-planning strategies. Inmaking such assessments, significant weight is given toevidence that can be objectively verified.
The valuation of deferred tax assets requires judgment inassessing the likely future tax consequences of events that havebeen recognized in the Corporation’s financial statements or taxreturns and future profitability. The Corporation’s accountingfor deferred tax consequences represents management’s bestestimate of those future events.
Positions taken in the Corporation’s tax returns may besubject to challenge by the taxing authorities uponexamination. Uncertain tax positions are initially recognized inthe financial statements when it is more likely than not theposition will be sustained upon examination by the taxauthorities. Such tax positions are both initially andsubsequently measured as the largest amount of tax benefit thatis greater than 50% likely of being realized upon settlementwith the tax authority, assuming full knowledge of the positionand all relevant facts. Interest on income tax uncertainties isclassified within income tax expense in the statement ofoperations; while the penalties, if any, are accounted for asother operating expenses.

127 POPULAR, INC. 2014 ANNUAL REPORT
The Corporation accounts for the taxes collected fromcustomers and remitted to governmental authorities on a netbasis (excluded from revenues).
Income tax expense or benefit for the year is allocated amongcontinuing operations, discontinued operations, and othercomprehensive income, as applicable. The amount allocated tocontinuing operations is the tax effect of the pretax income orloss from continuing operations that occurred during the year,plus or minus income tax effects of (a) changes in circumstancesthat cause a change in judgment about the realization of deferredtax assets in future years, (b) changes in tax laws or rates,(c) changes in tax status, and (d) tax-deductible dividends paidto shareholders, subject to certain exceptions.
Employees’ retirement and other postretirement benefit plansPension costs are computed on the basis of accepted actuarialmethods and are charged to current operations. Net pensioncosts are based on various actuarial assumptions regardingfuture experience under the plan, which include costs forservices rendered during the period, interest costs and returnon plan assets, as well as deferral and amortization of certainitems such as actuarial gains or losses. The funding policy is tocontribute to the plan as necessary to provide for services todate and for those expected to be earned in the future. To theextent that these requirements are fully covered by assets in theplan, a contribution may not be made in a particular year.
The cost of postretirement benefits, which is determinedbased on actuarial assumptions and estimates of the costs ofproviding these benefits in the future, is accrued during theyears that the employee renders the required service.
The guidance for compensation retirement benefits of ASCTopic 715 requires the recognition of the funded status of eachdefined pension benefit plan, retiree health care and otherpostretirement benefit plans on the statement of financialcondition.
Stock-based compensationThe Corporation opted to use the fair value method ofrecording stock-based compensation as described in theguidance for employee share plans in ASC Subtopic 718-50.
Comprehensive income (loss)Comprehensive income (loss) is defined as the change in equityof a business enterprise during a period from transactions andother events and circumstances, except those resulting frominvestments by owners and distributions to owners. Thepresentation of comprehensive income (loss) is included inseparate consolidated statements of comprehensive income(loss).
Net income (loss) per common shareBasic income (loss) per common share is computed by dividingnet income (loss) adjusted for preferred stock dividends,
including undeclared or unpaid dividends if cumulative, andcharges or credits related to the extinguishment of preferredstock or induced conversions of preferred stock, by theweighted average number of common shares outstandingduring the year. Diluted income per common share take intoconsideration the weighted average common shares adjusted forthe effect of stock options, restricted stock and warrants oncommon stock, using the treasury stock method.
Statement of cash flowsFor purposes of reporting cash flows, cash includes cash onhand and amounts due from banks.
Note 3 - New accounting pronouncementsFASB Accounting Standards Update 2015-01, IncomeStatement - Extraordinary and Unusual Items (Subtopic225-20): Simplifying Income Statement Presentation byEliminating the Concept of Extraordinary Items (“ASU2015-01”)The FASB issued ASU 2015-01 in January 2015, whicheliminates from GAAP the concept of extraordinary items.Presently, an event or transaction is presumed to be an ordinaryand usual activity of the reporting entity unless evidence clearlysupports the classification as an extraordinary item. If an eventor transaction meets the criteria for extraordinary classification,an entity is required to segregate the extraordinary item fromthe results of ordinary operations and show the item separatelyin the income statement, net of tax, after income fromcontinuing operations. The entity is also required to discloseapplicable income taxes and either present or disclose earnings-per-share data applicable to the extraordinary item.
Eliminating the concept of extraordinary items will savetime and reduce costs for preparers because they will not haveto assess whether a particular event or transaction event isextraordinary. This will alleviate uncertainty for preparers,auditors, and regulators because auditors and regulators nolonger will need to evaluate whether a preparer treated anunusual and/or infrequent item appropriately.
The presentation and disclosure guidance for items that areunusual in nature and occur infrequently will be retained andwill be expanded to include items that are both unusual innature and infrequently occurring.
The amendments of this Update are effective for fiscal years,and interim periods within those fiscal years, beginning afterDecember 31, 2015. The amendments may be appliedprospectively or retrospectively to all prior periods presented inthe financial statements. Early adoption is permitted provided isapplied from the beginning of the fiscal year of adoption.
The Corporation does not anticipate that the adoption ofthis guidance will have a material effect on its consolidatedstatements of financial condition, results of operations orpresentation and disclosures.

128
FASB Accounting Standards Update 2014-17, BusinessCombination (Topic 805): Pushdown Accounting (“ASU2014-17”)The FASB issued ASU 2014-17 in November 2014, whichprovides an acquired entity with an option to apply pushdownaccounting to its separate financial statements upon occurrenceof an event in which an acquirer obtains control of the acquiredentity. An acquired entity may elect the option to applypushdown accounting in the reporting period in which thechange-in-control event occurs. An acquired entity shoulddetermine whether to elect to apply pushdown accounting foreach individual change-in-control event in which an acquirerobtains control of the acquired entity. If pushdown accountingis not applied in the reporting period in which the change-in-control event occurs, an acquired entity will have the option toelect to apply pushdown accounting in a subsequent reportingperiod to the acquired entity’s most recent change-in-controlevent.
An election to apply pushdown accounting in a reportingperiod after the reporting period in which the change-in-controlevent occurred should be considered a change in accountingprinciple. If pushdown accounting is applied to an individualchange-in-control event, the election is irrevocable.
If an acquired entity elects the option to apply pushdownaccounting in its separate financial statements, it shoulddisclose information in the current reporting period thatenables users of financial statements to evaluate the effect ofpushdown accounting.
The amendments in this ASU are effective on November 18,2014. After the effective date, an acquired entity can make anelection to apply the guidance to future change-in-controlevents or to its most recent change-in-control event.
The provisions of this ASU did not had a material effect onthe consolidated statements of financial condition or results ofoperations.
FASB Accounting Standards Update 2014-16, Derivativesand Hedging (Topic 815): Determining Whether the HostContract in a Hybrid Financial Instrument Issued in theForm of a Share is more Akin to Debt or to Equity (“ASU2014-16”)The FASB issued ASU 2014-16 in November 2014, whichintends to eliminate the use of different methods in practice andthereby reduce existing diversity under GAAP in the accountingfor hybrid financial instruments issued in the form of a share.An entity should determine the nature of the host contract byconsidering the economic characteristics and risks of the entirehybrid financial instrument, including the embedded derivativefeature that is being evaluated for separate accounting from thehost contract. In evaluating the stated and implied substantiveterms and features, the existence or omission of any single termor feature does not necessarily determine the economiccharacteristics and risks of the host contract. Although an
individual term or feature may weigh more heavily in theevaluation on the basis of facts and circumstances, an entityshould use judgment based on an evaluation of all relevantterms and features.
The amendment in this ASU does not change the currentcriteria in GAAP for determining when separation of certainembedded derivative features in a hybrid financial instrument isrequired. An entity will continue to evaluate whether theeconomic characteristics and risks of the embedded derivativefeature are clearly and closely related to those of the hostcontract, among other relevant criteria.
The amendments in the ASU are effective for annual periods,and interim periods within those annual periods, beginning inthe first quarter of 2016. Early adoption is permitted. Theeffects of initially adopting the amendments of this ASU shouldbe applied on a modified retrospective basis to existing hybridfinancial instruments issued in the form of a share as of thebeginning of the fiscal year for which the amendments areeffective. Retrospective application is permitted to all relevantprior periods.
The Corporation does not anticipate that the adoption ofthis guidance will have a material effect on its consolidatedstatements of financial condition or results of operations.
FASB Accounting Standards Update 2014-15, Presentationof Financial Statements - Going Concern (Subtopic 205-40):Disclosure of Uncertainties about an Entity’s Ability as aGoing Concern (“ASU 2014-15”)The FASB issued ASU 2014-15 in August 2014, which providesguidance in GAAP about management’s responsibility toevaluate whether there is substantial doubt about an entity’sability to continue as a going concern and to provide the relatedfootnote disclosures. These amendments should reducediversity in the timing and content of footnote disclosures.
In connection with preparing financial statements for eachannual and interim reporting period, an entity’s managementshould evaluate whether there are conditions or events,considered in the aggregate, that raise substantial doubt aboutthe entity’s ability to continue as a going concern within oneyear after the date that the financial statements are issued (orwithin one year after the date that the financial statements areavailable to be issued when applicable).
When management identifies conditions or events that raisesubstantial doubt about an entity’s ability to continue as a goingconcern, management should consider whether its plans thatare intended to mitigate those relevant conditions or events willalleviate the substantial doubt. The mitigating effect ofmanagement’s plans should be considered only to the extentthat (1) it is probable that the plans will be effectivelyimplemented and, if so, (2) it is probable that the plans willmitigate the conditions or events that raise substantial doubtabout the entity’s ability to continue as a going concern.

129 POPULAR, INC. 2014 ANNUAL REPORT
The amendments in this Update are effective for the annualperiod ending after December 15, 2016, and for annual periodsand interim periods thereafter. Early application is permitted.
The Corporation does not anticipate that the adoption ofthis guidance will have a material effect on its consolidatedstatements of financial condition, results of operations orpresentation and disclosures.
FASB Accounting Standards Update 2014-14, Receivables -Troubled Debt Restructurings by Creditors (Subtopic 310-40): Classification of Certain Government-GuaranteedMortgage Loans upon Foreclosure (“ASU 2014-14”)The FASB issued ASU 2014-14 in August 2014, which intendsto resolve the diversity in practice related to how creditorsclassify government-guaranteed mortgage loans, including FHAor VA guaranteed loans, upon foreclosure. Some creditorsreclassify those loans to real estate consistent with otherforeclosed loans that do not have guarantees; others reclassifythe loans to receivables. This ASU address the classification ofcertain foreclosed mortgage loans held by creditors that areeither fully or partially guaranteed under governmentprograms.
The amendments of the ASU require that a mortgage loan bederecognized and that a separate other receivable be recognizedupon foreclosure if the following conditions are met:
1- The loan has a government guarantee that is notseparable from the loan before foreclosure.
2- At the time of foreclosure, the creditor has the intentto convey the real estate property to the guarantor andmake a claim on the guarantee, and the creditor hasthe ability to recover under that claim.
3- At the time of foreclosure, any amount of the claimthat is determined on the basis of the fair value of thereal estate is fixed.
Upon foreclosure, the separate other receivable should bemeasured based on the amount of the loan balance expected tobe recovered from the guarantor.
The amendments in the ASU are effective for annual periods,and interim periods within those annual periods, beginning inthe first quarter of 2015. The amendments of this ASU can beapplied using either a prospective transition method or amodified retrospective transition method. For prospectivetransition, an entity should apply the amendments in thisUpdate to foreclosures that occur after the date of adoption. Formodified retrospective transition, an entity should apply theamendments in this Update by means of a cumulative-effectadjustment as of the beginning of the annual period ofadoption. Prior periods should not be adjusted. However, areporting entity must apply the same method of transition aselected under ASU 2014-04.
The Corporation does not anticipate that the adoption ofthis guidance will have a material effect on its consolidatedstatements of financial condition or results of operations.
FASB Accounting Standards Update 2014-13, Consolidation(Topic 810): Measuring the Financial Assets and theFinancial Liabilities of a Consolidated CollateralizedFinancial Entity (“ASU 2014-13”)The FASB issued ASU 2014-13 in August 2014, which intendsto clarify that when a reporting entity that consolidates acollateralized financing entity may elect to measure thefinancial assets and the financial liabilities of that collateralizedfinancing entity using either the measurement alternativeincluded in this Update or Topic 820 on fair valuemeasurement. When the measurement alternative is notelected, the amendments of this Update clarify that the fairvalue of the financial assets and the fair value of the financialliabilities of the consolidated collateralized financing entityshould be measured using the requirements of Topic 820 andany differences in the fair value of the financial assets and thefair value of the financial liabilities of that entity should bereflected in earnings and attributed to the reporting entity inthe consolidated statement of income.
When a reporting entity elects the measurement alternativeincluded in this Update for a collateralized financing entity, thereporting entity should measure both the financial assets andthe financial liabilities of that entity in its consolidated financialstatements using the more observable of the fair value of thefinancial assets and the fair value of the financial liabilities.
The amendments in the ASU are effective in the first quarterof 2016. Early adoption is permitted as of the beginning of anannual period. The amendments of this ASU can be appliedusing a modified retrospective approach by recording acumulative-effect adjustment to equity as of the beginning ofthe annual period of adoption. A reporting entity also mayapply the amendments retrospectively to all relevant priorperiods beginning with the annual period in which theamendments of ASU 2009-17 were initially adopted.
The Corporation does not anticipate that the adoption ofthis guidance will have a material effect on its consolidatedstatements of financial condition or results of operations.
FASB Accounting Standards Update 2014-12, Compensation- Stock Compensation (Topic 718): Accounting for Share-Based Payments When the Terms of an Award Provide Thata Performance Target Could Be Achieved after the RequisiteService Period (“ASU 2014-12”)The FASB issued ASU 2014-12 in June 2014, which intends toresolve the diverse accounting treatment of awards with aperformance target that could be achieved after an employeecompletes the requisite service period. That is, the employee

130
would be eligible to vest in the award regardless of whether theemployee is rendering service on the date the performancetarget is achieved.
The amendments of the ASU require that a performancetarget that affects vesting and that could be achieved after therequisite service period be treated as a performance condition.As such, the performance target should not be reflected inestimating the grant-date fair value of the award.
Compensation cost should be recognized in the period inwhich it becomes probable that the performance target will beachieved and should represent the compensation costattributable to the periods for which the requisite service hasalready been rendered. If the performance target becomesprobable of being achieved before the end of the requisiteservice period, the remaining unrecognized compensation costshould be recognized prospectively over the remaining requisiteservice period.
The amendments in the ASU are effective in the first quarter of2016. Early adoption is permitted. The amendments of this ASUcan be applied (a) prospectively to all awards granted or modifiedafter the effective date or (b) retrospectively to all awards withperformance targets outstanding at the beginning of the period ofadoption and to all new or modified awards thereafter.
The Corporation does not anticipate that the adoption ofthis guidance will have a material effect on its consolidatedstatements of financial condition or results of operations.
FASB Accounting Standards Update 2014-11, Transfers andServicing (Topic 860) Repurchase-to-MaturityTransactions, Repurchase Financings, and Disclosures(“ASU 2014-11”)The FASB issued ASU 2014-11 in June 2014, which requirestwo accounting changes. First, the amendments in this Updatechange the accounting for repurchase-to-maturity transactionsto secured borrowing accounting. Second, for repurchasefinancing arrangements, the amendments require separateaccounting for a transfer of a financial asset executedcontemporaneously with a repurchase agreement with the samecounterparty, which will result in secured borrowingaccounting for the repurchase agreement.
The amendments in this Update require disclosures forcertain transactions comprising (1) a transfer of a financial assetaccounted for as a sale and (2) an agreement with the sametransferee entered into in contemplation of the initial transferthat results in the transferor retaining substantially all of theexposure to the economic return on the transferred financialasset throughout the term of the transaction.
The accounting changes in this ASU are effective in the firstquarter of 2015. Early adoption is prohibited. An entity isrequired to present changes in accounting for transactionsoutstanding on the effective date as a cumulative-effectadjustment to retained earnings as of the beginning of theperiod of adoption.
The Corporation does not anticipate that the adoption ofthis guidance will have a material effect on its consolidatedstatements of financial condition or results of operations.
FASB Accounting Standards Update 2014-09, Revenue fromContracts with Customers (Topic 606); (“ASU 2014-09”)The FASB issued ASU 2014-09 in May 2014, which clarifies theprinciples for recognizing revenue and develop a commonrevenue standard that would (1) remove inconsistencies andweaknesses in revenue requirements, (2) provide a more robustframework for addressing revenue issues, (3) improvecomparability of revenue recognition practices across entities,industries, jurisdictions, and capital markets, (4) provide moreuseful information to users of financial statement throughimproved disclosure requirements and (5) simplify thepreparation of financial statements by reducing the number ofrequirements to which an entity must refer. ASU 2014-09amends the ASC Codification and creates a new Topic 606,Revenue from Contracts with Customers.
The core principle of the guidance is that an entity shouldrecognize revenue to depict the transfer of promised goods orservices to customers in an amount that reflects theconsideration to which the entity expects to be entitled inexchange for those goods or services.
In addition, the new guidance requires disclosures to enableusers of financial statements to understand the nature, timing,and uncertainty of revenue and cash flows arising fromcontracts with customers. Qualitative and quantitativeinformation is required about contract with customers,significant judgments and changes in judgments, and assetsrecognized from the cost to obtain or fulfill a contract.
The amendments in this ASU are effective in the first quarterof 2017. Early adoption is not permitted.
The Corporation is currently evaluating the impact that theadoption of this guidance will have on the presentation anddisclosures in its consolidated financial statements.
FASB Accounting Standards Update 2014-08, Presentationof Financial Statements (Topic 205) and Property, Plant,and Equipment (Topic 360): Reporting DiscontinuedOperations and Disclosures of Disposal of Components of anEntity (“ASU 2014-08”)The FASB issued ASU 2014-08 in April 2014, which changesthe criteria for reporting discontinued operations whileenhancing disclosures in this area. Under the new guidance,only disposals representing a strategic shift in operationsshould be presented as discontinued operations. Those strategicshifts should have a major effect on the organization’soperations and financial results. Examples include a disposal ofa major geographic area, a major line of business, or a majorequity investment.
In addition, the new guidance requires expanded disclosuresabout discontinued operations that will include more
131 POPULAR, INC. 2014 ANNUAL REPORT
information about the assets, liabilities, income, and expensesof discontinued operations.
The new guidance also requires disclosure of the pre-taxincome attributable to a disposal of a significant part of anorganization that does not qualify for discontinued operationsreporting. This disclosure will provide information about theongoing trends in the reporting organization’s results fromcontinuing operations.
The amendments in the ASU are effective in the first quarterof 2015. Early adoption is permitted.
The Corporation does not anticipate that the adoption ofthis guidance will have a material effect on its consolidatedstatement of financial condition or result of operations, thoughwill require additional disclosures in the event that theCorporation reclassifies assets and liabilities to discontinuedoperations after the effective date of this pronouncement.
FASB Accounting Standards Update 2014-04, Receivables-Troubled Debt Restructuring by Creditors (SubTopic 310-40): Reclassification of Residential Real EstateCollateralized Consumer Mortgage Loans upon Foreclosure(“ASU 2014-04”)The FASB issued ASU 2014-04 in January 2014 which clarifieswhen a creditor should be considered to have received physicalpossession of a residential real estate property collateralizing aconsumer mortgage loan such that the loan should bederecognized and the real estate property recognized.
The amendments of this ASU clarify that an in substancerepossession or foreclosure occurs, and a creditor is consideredto have received physical possession of residential real estateproperty collateralizing a consumer mortgage loan, upon either:a) the creditor obtaining legal title to the residential real estateproperty upon completion of a foreclosure; or b) the borrowerconveying all interest in the residential real estate property tothe creditor to satisfy that loan through completion of a deed inlieu of foreclosure or through a similar legal agreement.
The amendment of this guidance requires interim andannual disclosures of both the amount of foreclosed residentialreal estate property held by the creditor and the recordedinvestment in consumer mortgage loans collateralized byresidential real estate property that are in the process offoreclosure according to local requirements of the applicablejurisdiction.
ASU 2014-04 is effective for annual periods, and interimperiods within those years, beginning after December 15, 2014.The amendments in this ASU can be elected using either amodified retrospective transition method or a prospectivetransition method. Early adoption is permitted.
The Corporation does not anticipate that the adoption ofthis guidance will have a material effect on its consolidatedstatements of financial condition or results of operations.
Note 4 - Discontinued operationsOn April 22, 2014, BPNA, the Corporation’s U.S. mainlandbanking subsidiary, entered into definitive agreements to sell itsCalifornia, Illinois and Central Florida regional operations tothree different buyers.
During the quarter ended June 30, 2014, the Corporationrecorded non-cash goodwill impairment charge of $186.5million, related to the goodwill allocated, on a relative fair valuebasis, to these operations. However, this non-cash charge hadno impact on the Corporation’s tangible capital or regulatorycapital ratios. Refer to Note 20, for additional information onthe goodwill impairment charge.
On August 8, 2014, BPNA completed the sale of its Illinoisregional operations. As part of the transaction, BPNA sold its 12branches in the Chicago metropolitan area, including $562million in loans, and $726 million in deposits, each as ofJuly 31, 2014. The transaction resulted in a net gain of $24.6million.
On September 15, 2014, BPNA completed the sale of itsCentral Florida regional operations. As part of the transaction,BPNA sold its 9 branches in the Central Florida area, including$104 million in loans and $217 million in deposits, each as ofAugust 31, 2014. The transaction resulted in a net gain of $1.2million.
On November 8, 2014, the Corporation completed the saleof the California regional operations. The Corporation sold 20branches and transferred $1.1 billion in loans and $1.1 billionin deposits to Banc of California National Association, a whollyowned subsidiary of Banc of California, Inc. The transactionresulted in a net gain of $8.1 million, net of transaction costs.The Corporation agreed to provide, subject to certainlimitations, customary indemnification to the purchaser,including with respect to certain pre-closing liabilities andviolations of representations and warranties. The Corporationalso agreed to indemnify the purchaser for up to 1.5% of creditlosses on transferred loans for a period of two years after theclosing. Pursuant to this indemnification provision, theCorporation’s maximum exposure is approximately $16million. The Corporation recognized a reserve of approximately$2.2 million, representing its best estimate of the loss thatwould be incurred in connection with this indemnification.
In connection with these transactions, the Corporation isrelocating certain back office operations to Puerto Rico andNew York. The Corporation incurred restructuring charges of$26.7 million during the year ended December 31, 2014.Additional restructuring charges amounting to approximately$22.0 million are expected to be incurred in the year 2015,comprised of $13.0 million in personnel related costs and $9.0million in lease cancelations and other restructuring costs.Refer to Note 5, for restructuring charges incurred during theyear ended December 31, 2014.

132
The regional operations sold constituted a business, asdefined in ASC 805-10-55. Accordingly, the decision to sellthese businesses resulted in the discontinuance of each of theserespective operations and classification as held-for-sale. Forfinancial reporting purposes, the results of the discontinuedoperations are presented as “Assets / Liabilities fromdiscontinued operations” in the consolidated statement ofcondition and “(Loss) income from discontinued operations,net of tax” in the consolidated statement of operations. Asrequired by ASC 205-20, current and prior periods presented inthe consolidated statement of operations as well as the relatednote disclosures covering income and expense amounts havebeen retrospectively adjusted for the impact of the discontinuedoperations for comparative purposes. The consolidatedstatement of financial condition and related note disclosure forprior periods do not reflect the reclassification of these assetsand liabilities to discontinued operations.
After the sale of these three regions, at December 31, 2014,there were no assets held within the discontinued operations.Liabilities within discontinued operations were $5.1 million,which includes the indemnity reserve of $2.2 million related tothe California regional sale, as mentioned above, in addition toaccruals for legal and professional fees.
The following table provides the components of net income(loss) from the discontinued operations for the years endedDecember 31, 2014 and 2013.
Years ended December 31,
(In thousands) 2014 2013
Net interest income $ 61,352 $88,006Provision (reversal) for loan losses (6,764) (3,543)Net gain on sale of regions 33,829 –Other non-interest income 27,823 19,556
Total non-interest income 61,652 19,556
Operating expenses:Personnel costs 36,675 33,170Net occupancy expenses 3,086 12,680Professional fees 15,642 11,153Goodwill impairment charge 186,511 –Other operating expenses 10,834 13,593
Total operating expenses 252,748 70,596
Net (loss) income from discontinuedoperations $(122,980) $40,509
Note 5 - Restructuring planAs discussed in Note 4, in connection with the sale of theoperations of the California, Illinois and Central Floridaregions, the Corporation is relocating certain back officeoperations, previously conducted in these regions, to PuertoRico and New York. The Corporation has undertaken arestructuring plan (the “PCB Restructuring Plan”) to eliminateand re-locate employment positions, terminate contracts andincur other costs associated with moving the operations toPuerto Rico and New York. The Corporation estimates that it
will incur restructuring charges of approximately $49 million,of which approximately $27 million were incurred during 2014and $22 million are expected to be incurred in 2015, comprisedof $13.0 million in personnel related costs and $9.0 million inlease cancellations and other restructuring costs.
Full-time equivalent employees at the California, Illinois andCentral Florida regions were 37 as of December 31, 2014,compared with 365 as of December 31, 2013. Some of theemployees at these regions were transferred to the acquiringentities. The remaining employees at these regions are expectedto be transferred to other areas of the Corporation’s U.S.mainland or Puerto Rico operations or depart by mid-2015.
The following table details the expenses recorded by theCorporation that were associated with the PCB RestructuringPlan:
(In thousands)Year ended
December 31, 2014
Personnel costs $17,516Net occupancy expenses 3,905Equipment expenses 457Professional fees 3,133Other operating expenses 1,714
Total restructuring costs $26,725
The following table presents the activity in the reserve forthe restructuring costs associated with the PCB RestructuringPlan:
(In thousands)
Balance at January 1, 2014 $ –Charges expensed during the period 14,785Payments made during the period (1,249)
Balance as of December 31, 2014 $13,536
Note 6 - Restrictions on cash and due from banks andcertain securitiesThe Corporation’s banking subsidiaries, BPPR and BPNA, arerequired by federal and state regulatory agencies to maintainaverage reserve balances with the Federal Reserve Bank of NewYork (the “Fed”) or other banks. Those required averagereserve balances amounted to $1.0 billion at December 31, 2014(December 31, 2013 - $992 million). Cash and due from banks,as well as other short-term, highly liquid securities, are used tocover the required average reserve balances.
At December 31, 2014, the Corporation held $45 million inrestricted assets in the form of funds deposited in moneymarket accounts, trading account securities and investmentsecurities available for sale (December 31, 2013 - $44 million).The amounts held in trading account securities and investmentsecurities available for sale consist primarily of restricted assetsheld for the Corporation’s non-qualified retirement plans andfund deposits guaranteeing possible liens or encumbrances overthe title of insured properties.

133 POPULAR, INC. 2014 ANNUAL REPORT
Note 7 - Securities purchased under agreements to resellThe securities purchased underlying the agreements to resell were delivered to, and are held by, the Corporation. Thecounterparties to such agreements maintain effective control over such securities. The Corporation is permitted by contract torepledge the securities, and has agreed to resell to the counterparties the same or substantially similar securities at the maturity ofthe agreements.
The fair value of the collateral securities held by the Corporation on these transactions at December 31, was as follows:
(In thousands) 2014 2013
Repledged $145,866 $189,308Not repledged 33,258 20,734
Total $179,124 $210,042
The repledged securities were used as underlying securities for repurchase agreement transactions.
Note 8 - Pledged assetsCertain securities and loans were pledged to secure public and trust deposits, assets sold under agreements to repurchase, otherborrowings and credit facilities available, derivative positions, and loan servicing agreements. The classification and carryingamount of the Corporation’s pledged assets, in which the secured parties are not permitted to sell or repledge the collateral, were asfollows:
(In thousands)December 31,
2014December 31,
2013
Investment securities available-for-sale, at fair value $ 1,700,820 $ 1,638,558Investment securities held-to-maturity, at amortized cost 60,515 35,000Loans held-for-sale measured at lower of cost or fair value – 363Loans held-in-portfolio covered under loss sharing agreements with the FDIC 480,441 407,257Loans held-in-portfolio not covered under loss sharing agreements with the FDIC 8,820,204 9,108,984
Total pledged assets $11,061,980 $11,190,162
Pledged securities that the creditor has the right by customor contract to repledge are presented separately on theconsolidated statements of financial condition.
At December 31, 2014, the Corporation had $ 0.7 billion ininvestment securities available-for-sale and $ 0.7 billion inloans that served as collateral to secure public funds(December 31, 2013 - $ 1.0 billion and $ 0.5 billion,respectively).
At December 31, 2014, the Corporation’s bankingsubsidiaries had short-term and long-term credit facilitiesauthorized with the Federal Home Loan Bank system (the“FHLB”) aggregating to $3.7 billion (December 31, 2013 - $3.0billion). Refer to Note 23 to the consolidated financialstatements for borrowings outstanding under these creditfacilities. At December 31, 2014, the credit facilities authorizedwith the FHLB were collateralized by $ 4.5 billion in loans held-
in-portfolio (December 31, 2013 - $ 4.5 billion). Also, atDecember 31, 2014, the Corporation’s banking subsidiaries hada borrowing capacity at the Federal Reserve (“Fed”) discountwindow of $2.1 billion, which remained unused as of such date(December 31, 2013 - $3.4 billion). The amount availableunder these credit facilities with the Fed is dependent upon thebalance of loans and securities pledged as collateral. AtDecember 31, 2014, the credit facilities with the Fed discountwindow were collateralized by $ 4.1 billion in loans held-in-portfolio (December 31, 2013 - $ 4.5 billion). These pledgedassets are included in the above table and were not reclassifiedand separately reported in the consolidated statements offinancial condition.
In addition, at December 31, 2014, there were no tradereceivables from brokers and counterparties pledged to securerepurchase agreements ($69 million as of December 31, 2013).

134
Note 9 - Investment securities available-for-saleThe following table presents the amortized cost, gross unrealized gains and losses, approximate fair value, weighted average yieldand contractual maturities of investment securities available-for-sale at December 31, 2014 and 2013.
At December 31, 2014
(In thousands)Amortized
cost
Grossunrealized
gains
Grossunrealized
lossesFair
value
Weightedaverage
yield
U.S. Treasury securitiesAfter 1 to 5 years $ 698,003 $ 2,226 $ 75 $ 700,154 1.14%
Total U.S. Treasury securities 698,003 2,226 75 700,154 1.14
Obligations of U.S. Government sponsored entitiesWithin 1 year 42,140 380 – 42,520 1.61After 1 to 5 years 1,603,245 1,168 9,936 1,594,477 1.26After 5 to 10 years 67,373 58 2,271 65,160 1.72After 10 years 23,000 – 184 22,816 3.18
Total obligations of U.S. Government sponsored entities 1,735,758 1,606 12,391 1,724,973 1.31
Obligations of Puerto Rico, States and political subdivisionsWithin 1 year 2,765 17 – 2,782 3.83After 1 to 5 years 1,024 38 – 1,062 8.40After 5 to 10 years 22,552 2 2,331 20,223 5.82After 10 years 48,823 40 11,218 37,645 6.22
Total obligations of Puerto Rico, States and political subdivisions 75,164 97 13,549 61,712 6.04
Collateralized mortgage obligations - federal agenciesAfter 1 to 5 years 3,687 87 – 3,774 2.66After 5 to 10 years 25,202 985 – 26,187 2.93After 10 years 1,905,763 13,109 38,803 1,880,069 2.03
Total collateralized mortgage obligations - federal agencies 1,934,652 14,181 38,803 1,910,030 2.04
Mortgage-backed securitiesAfter 1 to 5 years 27,339 1,597 – 28,936 4.68After 5 to 10 years 147,182 7,314 1 154,495 3.51After 10 years 676,567 45,047 683 720,931 3.93
Total mortgage-backed securities 851,088 53,958 684 904,362 3.88
Equity securities (without contractual maturity) 1,351 1,271 – 2,622 5.03
OtherAfter 1 to 5 years 9,277 10 – 9,287 1.69After 5 to 10 years 1,957 62 – 2,019 3.63
Total other 11,234 72 – 11,306 2.03
Total investment securities available-for-sale $5,307,250 $73,411 $65,502 $5,315,159 2.04%

135 POPULAR, INC. 2014 ANNUAL REPORT
At December 31, 2013
(In thousands)Amortized
cost
Grossunrealized
gains
Grossunrealized
lossesFair
value
Weightedaverage
yield
U.S. Treasury securitiesAfter 1 to 5 years $ 26,474 $ 2,008 $ – $ 28,482 3.85%
Total U.S. Treasury securities 26,474 2,008 – 28,482 3.85
Obligations of U.S. Government sponsored entitiesWithin 1 year 25,021 39 – 25,060 1.85After 1 to 5 years 1,087,453 1,678 12,715 1,076,416 1.26After 5 to 10 years 528,611 100 21,742 506,969 1.52After 10 years 23,000 – 2,240 20,760 3.12
Total obligations of U.S. Government sponsored entities 1,664,085 1,817 36,697 1,629,205 1.38
Obligations of Puerto Rico, States and political subdivisionsAfter 1 to 5 years 6,228 45 85 6,188 4.64After 5 to 10 years 23,147 – 1,978 21,169 6.33After 10 years 48,803 29 9,812 39,020 5.84
Total obligations of Puerto Rico, States and political subdivisions 78,178 74 11,875 66,377 5.89
Collateralized mortgage obligations - federal agenciesAfter 1 to 5 years 5,131 101 – 5,232 1.79After 5 to 10 years 31,613 921 – 32,534 2.98After 10 years 2,438,021 18,532 76,023 2,380,530 2.05
Total collateralized mortgage obligations - federal agencies 2,474,765 19,554 76,023 2,418,296 2.06
Collateralized mortgage obligations - private labelAfter 10 years 509 4 – 513 3.78
Total collateralized mortgage obligations - private label 509 4 – 513 3.78
Mortgage-backed securitiesWithin 1 year 419 24 – 443 3.14After 1 to 5 years 15,921 833 – 16,754 4.50After 5 to 10 years 62,373 3,058 1,214 64,217 4.12After 10 years 1,007,733 50,807 4,313 1,054,227 3.93
Total mortgage-backed securities 1,086,446 54,722 5,527 1,135,641 3.95
Equity securities (without contractual maturity) 3,178 1,109 171 4,116 4.06
OtherAfter 1 to 5 years 9,638 – 141 9,497 1.68After 10 years 2,604 69 – 2,673 3.61
Total other 12,242 69 141 12,170 2.09
Total investment securities available-for-sale $5,345,877 $79,357 $130,434 $5,294,800 2.30%
The weighted average yield on investment securitiesavailable-for-sale is based on amortized cost; therefore, it doesnot give effect to changes in fair value.
Securities not due on a single contractual maturity date,such as mortgage-backed securities and collateralized mortgageobligations, are classified in the period of final contractual
maturity. The expected maturities of collateralized mortgageobligations, mortgage-backed securities and certain othersecurities may differ from their contractual maturities becausethey may be subject to prepayments or may be called by theissuer.

136
The following table presents the aggregate amortized costand fair value of investment securities available-for-sale atDecember 31, 2014 by contractual maturity.
(In thousands) Amortized cost Fair value
Within 1 year $ 44,905 $ 45,302After 1 to 5 years 2,342,575 2,337,690After 5 to 10 years 264,266 268,084After 10 years 2,654,153 2,661,461
Total 5,305,899 5,312,537Equity securities 1,351 2,622
Total investment securities available-for-sale $5,307,250 $5,315,159
During the year ended December 31, 2014, the Corporationsold U.S. agency securities, mortgage-backed securities and
collateralized mortgage obligations with an approximateamortized cost of $311.1 million (2013 - equity securities withan approximate amortized cost of $3.3 million). The proceedsfrom these sales were $ 310.2 million (2013 - $ 5.4 million).Gross realized gains and losses on the sale of investmentsecurities available-for-sale, for the years ended December 31,2014, 2013 and 2012 were as follows:
Years ended December 31,
(In thousands) 2014 2013 2012
Gross realized gains $ 4,461 $2,110 $ 65Gross realized losses (5,331) – (1,684)
Net realized (losses) gains on sale ofinvestment securities available-for-sale $ (870) $2,110 $(1,619)
The following tables present the Corporation’s fair value and gross unrealized losses of investment securities available-for-sale,aggregated by investment category and length of time that individual securities have been in a continuous unrealized loss position,at December 31, 2014, and 2013.
At December 31, 2014
Less than 12 months 12 months or more Total
(In thousands)Fair
value
Grossunrealized
lossesFair
value
Grossunrealized
lossesFair
value
Grossunrealized
losses
U.S. Treasury securities $ 49,465 $ 75 $ – $ – $ 49,465 $ 75Obligations of U.S. Government sponsored entities 888,325 6,866 429,835 5,525 1,318,160 12,391Obligations of Puerto Rico, States and political subdivisions 14,419 3,031 41,084 10,518 55,503 13,549Collateralized mortgage obligations - federal agencies 539,658 13,774 733,814 25,029 1,273,472 38,803Mortgage-backed securities 457 4 25,486 680 25,943 684
Total investment securities available-for-sale in an unrealizedloss position $1,492,324 $ 23,750 $1,230,219 $41,752 $2,722,543 $ 65,502
At December 31, 2013
Less than 12 months 12 months or more Total
(In thousands)Fair
value
Grossunrealized
lossesFair
value
Grossunrealized
lossesFair
value
Grossunrealized
losses
Obligations of U.S. Government sponsored entities $1,326,866 $ 32,457 $ 69,257 $ 4,240 $1,396,123 $ 36,697Obligations of Puerto Rico, States and political subdivisions 54,256 11,685 8,330 190 62,586 11,875Collateralized mortgage obligations - federal agencies 1,567,654 70,378 96,676 5,645 1,664,330 76,023Mortgage-backed securities 105,455 4,762 7,225 765 112,680 5,527Equity securities 1,657 171 – – 1,657 171Other – – 9,497 141 9,497 141
Total investment securities available-for-sale in an unrealizedloss position $3,055,888 $119,453 $ 190,985 $10,981 $3,246,873 $130,434

137 POPULAR, INC. 2014 ANNUAL REPORT
As of December 31, 2014, the available-for-sale investmentportfolio reflects gross unrealized losses of approximately $66million, driven by U.S. Agency Collateralized MortgageObligations, obligations from the U.S. Government sponsoredentities, and obligations of the Puerto Rico Government and itspolitical subdivisions. As part of its analysis for all US Agencies’securities, management considers the U.S. Agency guarantee.
In February 2014, the three principal nationally recognizedrating agencies (Moody’s Investor Services, Standard and Poor’sand Fitch Ratings) downgraded the general-obligation bonds ofthe Commonwealth and other obligations of Puerto Ricoinstrumentalities to non-investment grade categories, citingconcerns about financial flexibility and a reduced capacity toborrow in the financial markets. In July 2014, the Puerto Ricogeneral obligations were further downgraded by the ratingagencies, after the Commonwealth enacted a law that allowedcertain Puerto Rico public corporations to restructure theirdebt.
On February 12, 2015, S&P further downgraded the debtrating of the Commonwealth general obligation bonds and ofvarious public instrumentalities. S&P stated that, in their view,Puerto Rico’s current economic and financial trajectory is nowmore susceptible to adverse financial, economic and marketconditions that could ultimately impair the Commonwealth’sability to fund services and its debt commitments. S&P alsocited implementation risk with respect to the value-added taxand expressed concern that, while higher taxes could improvethe budget balance, there could be potential negative economicimplications. On February 19, 2015, Moody’s also downgradedits debt ratings for the Commonwealth general obligation bondsand of various public instrumentalities, citing similar concernsas S&P. The portfolio of obligations of the Puerto RicoGovernment is comprised of securities with specific sources ofincome or revenues identified for repayments. The Corporationperforms periodic credit quality reviews on these issuers.
Management evaluates investment securities for other-than-temporary (“OTTI”) declines in fair value on a quarterly basis.Once a decline in value is determined to be other-than-temporary, the value of a debt security is reduced and acorresponding charge to earnings is recognized for anticipatedcredit losses. Also, for equity securities that are consideredother-than-temporarily impaired, the excess of the security’s
carrying value over its fair value at the evaluation date isaccounted for as a loss in the results of operations. The OTTIanalysis requires management to consider various factors,which include, but are not limited to: (1) the length of time andthe extent to which fair value has been less than the amortizedcost basis, (2) the financial condition of the issuer or issuers,(3) actual collateral attributes, (4) the payment structure of thedebt security and the likelihood of the issuer being able to makepayments, (5) any rating changes by a rating agency,(6) adverse conditions specifically related to the security,industry, or a geographic area, and (7) management’s intent tosell the debt security or whether it is more likely than not thatthe Corporation would be required to sell the debt securitybefore a forecasted recovery occurs.
At December 31, 2014, management performed its quarterlyanalysis of all debt securities in an unrealized loss position.Based on the analyses performed, management concluded thatno individual debt security was other-than-temporarilyimpaired as of such date. At December 31, 2014, theCorporation did not have the intent to sell debt securities in anunrealized loss position and it is not more likely than not thatthe Corporation will have to sell the investment securities priorto recovery of their amortized cost basis.
The following table states the name of issuers, and theaggregate amortized cost and fair value of the securities of suchissuer (includes available-for-sale and held-to-maturitysecurities), in which the aggregate amortized cost of suchsecurities exceeds 10% of stockholders’ equity. Thisinformation excludes securities backed by the full faith andcredit of the U.S. Government. Investments in obligationsissued by a state of the U.S. and its political subdivisions andagencies, which are payable and secured by the same source ofrevenue or taxing authority, other than the U.S. Government,are considered securities of a single issuer.
2014 2013
(Inthousands)
Amortizedcost Fair value
Amortizedcost Fair value
FNMA $1,746,807 $1,736,987 $2,318,171 $2,266,610FHLB 737,149 732,894 336,933 326,220Freddie Mac 1,117,865 1,112,485 1,434,346 1,418,216

138
Note 10 - Investment securities held-to-maturityThe following tables present the amortized cost, gross unrealized gains and losses, approximate fair value, weighted average yieldand contractual maturities of investment securities held-to-maturity at December 31, 2014 and 2013.
At December 31, 2014
(In thousands)Amortized
cost
Grossunrealized
gains
Grossunrealized
lossesFair
value
Weightedaverage
yield
Obligations of Puerto Rico, States and political subdivisionsWithin 1 year $ 2,740 $ – $ 8 $ 2,732 5.84%After 1 to 5 years 12,830 – 764 12,066 5.95After 5 to 10 years 21,325 – 6,003 15,322 6.09After 10 years 64,678 3,342 5,543 62,477 2.22
Total obligations of Puerto Rico, States and political subdivisions 101,573 3,342 12,318 92,597 3.60
Collateralized mortgage obligations - federal agenciesAfter 5 to 10 years 97 5 – 102 5.45
Total collateralized mortgage obligations - federal agencies 97 5 – 102 5.45
OtherWithin 1 year 250 – – 250 1.33After 1 to 5 years 1,250 – – 1,250 1.10
Total other 1,500 – – 1,500 1.14
Total investment securities held-to-maturity $103,170 $3,347 $12,318 $94,199 3.57%
At December 31, 2013
(In thousands)Amortized
cost
Grossunrealized
gains
Grossunrealized
lossesFair
value
Weightedaverage
yield
Obligations of Puerto Rico, States and political subdivisionsWithin 1 year $ 12,570 $ – $ 12 $ 12,558 2.06%After 1 to 5 years 12,060 – 984 11,076 5.91After 5 to 10 years 20,015 – 5,251 14,764 6.06After 10 years 69,236 257 13,179 56,314 2.43
Total obligations of Puerto Rico, States and political subdivisions 113,881 257 19,426 94,712 3.40
Collateralized mortgage obligations - federal agenciesAfter 10 years 115 7 – 122 5.45
Total collateralized mortgage obligations - federal agencies 115 7 – 122 5.45
OtherWithin 1 year 26,000 – 645 25,355 3.41After 1 to 5 years 500 – 1 499 1.33
Total other 26,500 – 646 25,854 3.37
Total investment securities held-to-maturity $140,496 $264 $20,072 $120,688 3.40%
Securities not due on a single contractual maturity date,such as collateralized mortgage obligations, are classified in theperiod of final contractual maturity. The expected maturities of
collateralized mortgage obligations and certain other securitiesmay differ from their contractual maturities because they maybe subject to prepayments or may be called by the issuer.

139 POPULAR, INC. 2014 ANNUAL REPORT
The following table presents the aggregate amortized cost and fair value of investments securities held-to-maturity atDecember 31, 2014 by contractual maturity.
(In thousands) Amortized cost Fair value
Within 1 year $ 2,990 $ 2,982After 1 to 5 years 14,080 13,316After 5 to 10 years 21,422 15,424After 10 years 64,678 62,477
Total investment securities held-to-maturity $103,170 $94,199
The following tables present the Corporation’s fair value and gross unrealized losses of investment securities held-to-maturity,aggregated by investment category and length of time that individual securities have been in a continuous unrealized loss position,at December 31, 2014 and 2013:
At December 31, 2014
Less than 12 months 12 months or more Total
(In thousands)Fair
value
Grossunrealized
lossesFair
value
Grossunrealized
lossesFair
value
Grossunrealized
losses
Obligations of Puerto Rico, States and political subdivisions $373 $2 $45,969 $12,316 $46,342 $12,318
Total investment securities held-to-maturity in an unrealized loss position $373 $2 $45,969 $12,316 $46,342 $12,318
At December 31, 2013
Less than 12 months 12 months or more Total
(In thousands)Fair
value
Grossunrealized
lossesFair
value
Grossunrealized
lossesFair
value
Grossunrealized
losses
Obligations of Puerto Rico, States and political subdivisions $60,028 $12,180 $13,044 $7,246 $73,072 $19,426Other 24,604 646 – – 24,604 646
Total investment securities held-to-maturity in an unrealized loss position $84,632 $12,826 $13,044 $7,246 $97,676 $20,072
As indicated in Note 9 to these consolidated financialstatements, management evaluates investment securities forOTTI declines in fair value on a quarterly basis.
The “Obligations of Puerto Rico, States and politicalsubdivisions” classified as held-to-maturity at December 31,2014 are primarily associated with securities issued bymunicipalities of Puerto Rico and are generally not rated by acredit rating agency. This includes $61 million of securitiesissued by three municipalities of Puerto Rico that are payablefrom the real and personal property taxes collected within suchmunicipalities. These bonds have seniority to the payment ofoperating cost and expenses of the municipality. The portfolioalso includes approximately $41 million in securities for whichthe underlying source of payment is not the centralgovernment, but in which it provides a guarantee in the eventof default. In February 2014, the three principal nationallyrecognized rating agencies (Moody’s Investor Services, Standardand Poor’s and Fitch Ratings) downgraded the general-obligation bonds of the Commonwealth and other obligationsof Puerto Rico instrumentalities to non-investment gradecategories, citing concerns about financial flexibility and areduced capacity to borrow in the financial markets. In July
2014, the Puerto Rico general obligations were furtherdowngraded by the rating agencies, after the Commonwealthenacted a law that allowed certain Puerto Rico publiccorporations to restructure their debt.
On February 12, 2015, S&P further downgraded the debtrating of the Commonwealth general obligation bonds and ofvarious public instrumentalities. S&P stated that, in their view,Puerto Rico’s current economic and financial trajectory is nowmore susceptible to adverse financial, economic and marketconditions that could ultimately impair the Commonwealth’sability to fund services and its debt commitments. S&P also citedimplementation risk with respect to the value-added tax andexpressed concern that, while higher taxes could improve thebudget balance, there could be potential negative economicimplications. On February 19, 2015, Moody’s also downgraded itsdebt ratings for the Commonwealth general obligation bonds andof various public instrumentalities, citing similar concerns as S&P.
The Corporation performs periodic credit quality reviews onthese issuers. The Corporation does not have the intent to sellsecurities held-to-maturity and it is not more likely than notthat the Corporation will have to sell these investmentsecurities prior to recovery of their amortized cost basis.

140
Note 11 - LoansCovered loans acquired in the Westernbank FDIC-assistedtransaction, except for lines of credit with revolving privileges,are accounted for by the Corporation in accordance with ASCSubtopic 310-30. Under ASC Subtopic 310-30, the acquiredloans were aggregated into pools based on similarcharacteristics. Each loan pool is accounted for as a single assetwith a single composite interest rate and an aggregateexpectation of cash flows. The covered loans which areaccounted for under ASC Subtopic 310-30 by the Corporationare not considered non-performing and will continue to havean accretable yield as long as there is a reasonable expectationabout the timing and amount of cash flows expected to becollected. The Corporation measures additional losses for thisportfolio when it is probable the Corporation will be unable tocollect all cash flows expected at acquisition plus additionalcash flows expected to be collected arising from changes inestimates after acquisition. Lines of credit with revolvingprivileges that were acquired as part of the Westernbank FDIC-assisted transaction are accounted for under the guidance ofASC Subtopic 310-20, which requires that any differencesbetween the contractually required loan payment receivable inexcess of the Corporation’s initial investment in the loans be
accreted into interest income. Loans accounted for under ASCSubtopic 310-20 are placed in non-accrual status when past duein accordance with the Corporation’s non-accruing policy andany accretion of discount is discontinued.
The risks on loans acquired in the FDIC-assisted transactionare significantly different from the risks on loans not coveredunder the FDIC loss sharing agreements because of the lossprotection provided by the FDIC. Accordingly, the Corporationpresents loans subject to the loss sharing agreements as“covered loans” in the information below and loans that are notsubject to the FDIC loss sharing agreements as “non-coveredloans”. The FDIC loss sharing agreements expires at the end ofthe quarter ending June 30, 2015 for commercial (includingconstruction) and consumer loans, and at the end of the quarterending June 30, 2020 for single-family residential mortgageloans, as explained in Note 13.
For a summary of the accounting policy related to loans,interest recognition and allowance for loan losses refer to thesummary of significant accounting policies included in Note 2to these consolidated financial statements.
The following table presents the composition of non-coveredloans held-in-portfolio (“HIP”), net of unearned income, atDecember 31, 2014 and 2013.
(In thousands) December 31, 2014 December 31, 2013
Commercial multi-family $ 487,280 $ 1,175,937Commercial real estate non-owner occupied 2,526,146 2,970,505Commercial real estate owner occupied 1,667,267 2,166,545Commercial and industrial 3,453,574 3,724,197Construction 251,820 206,084Mortgage 6,502,886 6,681,476Leasing 564,389 543,761Legacy [2] 80,818 211,135Consumer:
Credit cards 1,155,229 1,185,272Home equity lines of credit 366,162 478,211Personal 1,375,452 1,349,119Auto 767,369 699,980Other 206,059 219,644
Total loans held-in-portfolio [1] $19,404,451 $21,611,866
[1] Non-covered loans held-in-portfolio at December 31, 2014 are net of $94 million in unearned income and exclude $106 million in loans held-for-sale(December 31, 2013 - $92 million in unearned income and $110 million in loans held-for-sale).
[2] The legacy portfolio is comprised of commercial loans, construction loans and lease financings related to certain lending products exited by the Corporation as partof restructuring efforts carried out in prior years at the BPNA segment.

141 POPULAR, INC. 2014 ANNUAL REPORT
The following table presents the composition of coveredloans at December 31, 2014 and 2013.
(In thousands) December 31, 2014 December 31, 2013
Commercial real estate $1,511,472 $1,710,229Commercial and
industrial 103,309 102,575Construction 70,336 190,127Mortgage 822,986 934,373Consumer 34,559 47,123
Total loans held-in-portfolio $2,542,662 $2,984,427
The following table provides a breakdown of loans held-for-sale (“LHFS”) at December 31, 2014 and 2013 by maincategories.
(In thousands) December 31, 2014 December 31, 2013
Commercial $ 309 $ 603Legacy 319 –Mortgage 100,166 109,823Consumer 5,310 –
Total loans held-for-sale $106,104 $110,426
During the year ended December 31, 2014, the Corporationrecorded purchases (including repurchases) of mortgage loansamounting to $574 million (2013 - $1.9 billion). For 2013, thisincludes two bulk purchases of $761 million in mortgage loansto financial institutions in Puerto Rico. Additionally, theCorporation recorded purchases of $92 million in consumer
loans during the year ended December 31, 2014 (December 31,2013 - $42 million) and purchases of $24 million incommercial loans during the year ended December 31, 2014(December 31, 2013 - $15 million).
The Corporation performed whole-loan sales involvingapproximately $185 million of residential mortgage loansduring the year ended December 31, 2014 (December 31, 2013- $661 million). During the third quarter of 2014, BPNA soldapproximately $115.7 million and reclassified to held-for-saleapproximately $105.0 million in classified and legacyresidential mortgage and commercial loans. The 2013 activityincluded $435 million from the bulk sale of non-performingmortgage loans, completed during the quarter ended June 30,2013. Also, during the year ended December 31, 2014, theCorporation securitized approximately $675 million ofmortgage loans into Government National MortgageAssociation (“GNMA”) mortgage-backed securities and $225million of mortgage loans into Federal National MortgageAssociation (“FNMA”) mortgage-backed securities, comparedto $920 million and $438 million, respectively, during the yearended December 31, 2013. The Corporation did not securitizemortgage loans into Federal Home Loan Mortgage Corporation(“FHLMC”) mortgage-backed securities during the year endedDecember 31, 2014 (December 31, 2013 - $33 million).TheCorporation sold commercial and construction loans with abook value of approximately $260 million during the yearended December 31, 2014 (December 31, 2013 - $421 million).The sales activity for 2013 included $401 million from the bulksale of non-performing commercial and construction loanscompleted during the quarter ended March 31, 2013.

142
Non-covered loansThe following tables present non-covered loans held-in-portfolio by loan class that are in non-performing status or areaccruing interest but are past due 90 days or more atDecember 31, 2014 and 2013. Accruing loans past due 90 daysor more consist primarily of credit cards, FHA / VA, and otherinsured mortgage loans, and delinquent mortgage loans whichare included in the Corporation’s financial statements pursuantto GNMA’s buy-back option program. Servicers of loansunderlying GNMA mortgage-backed securities must report astheir own assets the defaulted loans that they have the option(but not the obligation) to repurchase, even when they elect notto exercise that option. Accruing loans past due 90 days or
more also include reverse mortgage loans in Puerto Rico whichare guaranteed by FHA, but which are currently not accruinginterest. Due to the guaranteed nature of the loans, it is theCorporation’s policy to exclude these balances from non-performing assets. In addition, accruing loans past due 90 daysor more include residential conventional loans purchased fromanother financial institution that, although delinquent, theCorporation has received timely payment from the seller /servicer, and, in some instances, have partial guarantees underrecourse agreements. However, residential conventional loanspurchased from another financial institution, which are in theprocess of foreclosure, are classified as non-performingmortgage loans.
At December 31, 2014
Puerto Rico U.S. mainland Popular, Inc.
(In thousands)Non-accrual
loans
Accruingloans past-due
90 days or moreNon-accrual
loans
Accruingloans past-due
90 days or moreNon-accrual
loans
Accruingloans past-due
90 days or more
Commercial multi-family $ 2,199 $ – $ – $– $ 2,199 $ –Commercial real estate non-owner
occupied 33,452 – – – 33,452 –Commercial real estate owner
occupied 92,648 – 805 – 93,453 –Commercial and industrial 129,611 494 1,510 – 131,121 494Construction 13,812 – – – 13,812 –Mortgage [2] [3] 295,629 426,387 9,284 – 304,913 426,387Leasing 3,102 – – – 3,102 –Legacy – – 1,545 – 1,545 –Consumer:
Credit cards – 20,368 449 – 449 20,368Home equity lines of credit – 21 4,090 – 4,090 21Personal 25,678 10 1,410 – 27,088 10Auto 11,387 – – – 11,387 –Other 3,865 682 7 – 3,872 682
Total [1] $611,383 $447,962 $19,100 $– $630,483 $447,962
[1] For purposes of this table non-performing loans exclude $ 19 million in non-performing loans held-for-sale.[2] Non-covered loans of $59 million accounted for under ASC Subtopic 310-30 are excluded from the above table as they are considered to be performing due to the
application of the accretion method, in which these loans will accrete interest income over the remaining life of the loans using estimated cash flow analysis.[3] It is the Corporation’s policy to report delinquent residential mortgage loans insured by FHA or guaranteed by the VA as accruing loans past due 90 days or more
as opposed to non-performing since the principal repayment is insured. These balances include $125 million of residential mortgage loans in Puerto Rico insuredby FHA or guaranteed by the VA that are no longer accruing interest as of December 31, 2014. Furthermore, the Corporation has approximately $66 million inreverse mortgage loans in Puerto Rico which are guaranteed by FHA, but which are currently not accruing interest. Due to the guaranteed nature of the loans, it isthe Corporation’s policy to exclude these balances from non-performing assets.
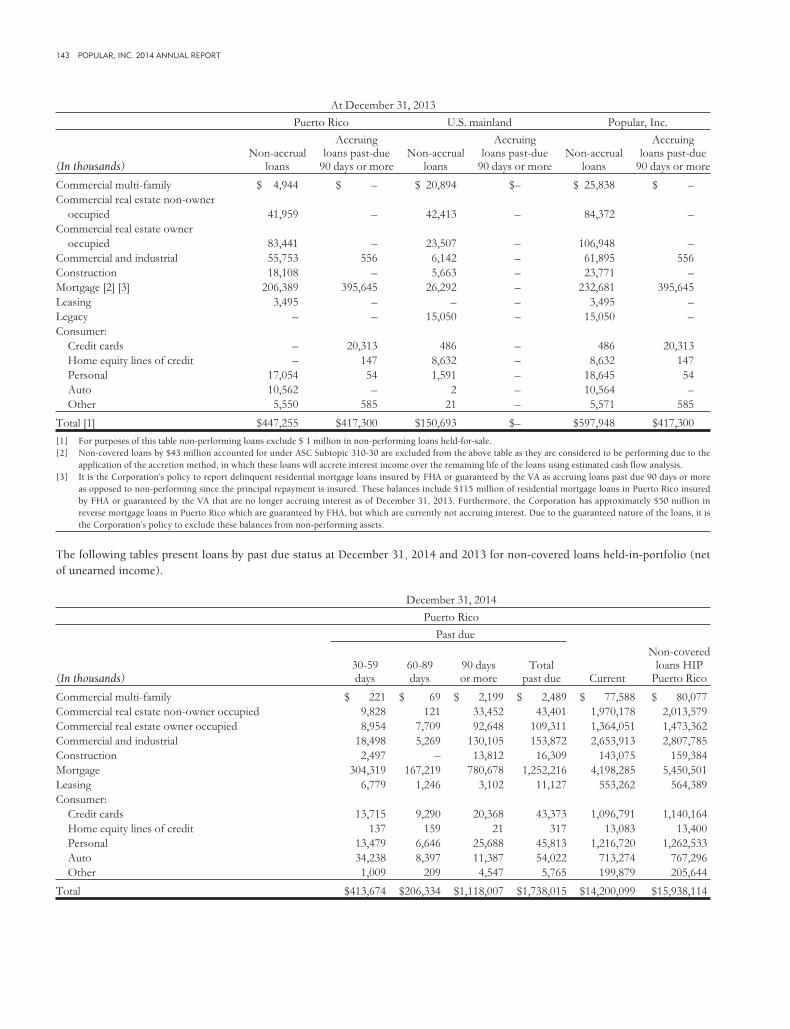
143 POPULAR, INC. 2014 ANNUAL REPORT
At December 31, 2013
Puerto Rico U.S. mainland Popular, Inc.
(In thousands)Non-accrual
loans
Accruingloans past-due
90 days or moreNon-accrual
loans
Accruingloans past-due
90 days or moreNon-accrual
loans
Accruingloans past-due
90 days or more
Commercial multi-family $ 4,944 $ – $ 20,894 $– $ 25,838 $ –Commercial real estate non-owner
occupied 41,959 – 42,413 – 84,372 –Commercial real estate owner
occupied 83,441 – 23,507 – 106,948 –Commercial and industrial 55,753 556 6,142 – 61,895 556Construction 18,108 – 5,663 – 23,771 –Mortgage [2] [3] 206,389 395,645 26,292 – 232,681 395,645Leasing 3,495 – – – 3,495 –Legacy – – 15,050 – 15,050 –Consumer:
Credit cards – 20,313 486 – 486 20,313Home equity lines of credit – 147 8,632 – 8,632 147Personal 17,054 54 1,591 – 18,645 54Auto 10,562 – 2 – 10,564 –Other 5,550 585 21 – 5,571 585
Total [1] $447,255 $417,300 $150,693 $– $597,948 $417,300
[1] For purposes of this table non-performing loans exclude $ 1 million in non-performing loans held-for-sale.[2] Non-covered loans by $43 million accounted for under ASC Subtopic 310-30 are excluded from the above table as they are considered to be performing due to the
application of the accretion method, in which these loans will accrete interest income over the remaining life of the loans using estimated cash flow analysis.[3] It is the Corporation’s policy to report delinquent residential mortgage loans insured by FHA or guaranteed by the VA as accruing loans past due 90 days or more
as opposed to non-performing since the principal repayment is insured. These balances include $115 million of residential mortgage loans in Puerto Rico insuredby FHA or guaranteed by the VA that are no longer accruing interest as of December 31, 2013. Furthermore, the Corporation has approximately $50 million inreverse mortgage loans in Puerto Rico which are guaranteed by FHA, but which are currently not accruing interest. Due to the guaranteed nature of the loans, it isthe Corporation’s policy to exclude these balances from non-performing assets.
The following tables present loans by past due status at December 31, 2014 and 2013 for non-covered loans held-in-portfolio (netof unearned income).
December 31, 2014
Puerto Rico
Past due
(In thousands)30-59days
60-89days
90 daysor more
Totalpast due Current
Non-coveredloans HIP
Puerto Rico
Commercial multi-family $ 221 $ 69 $ 2,199 $ 2,489 $ 77,588 $ 80,077Commercial real estate non-owner occupied 9,828 121 33,452 43,401 1,970,178 2,013,579Commercial real estate owner occupied 8,954 7,709 92,648 109,311 1,364,051 1,473,362Commercial and industrial 18,498 5,269 130,105 153,872 2,653,913 2,807,785Construction 2,497 – 13,812 16,309 143,075 159,384Mortgage 304,319 167,219 780,678 1,252,216 4,198,285 5,450,501Leasing 6,779 1,246 3,102 11,127 553,262 564,389Consumer:
Credit cards 13,715 9,290 20,368 43,373 1,096,791 1,140,164Home equity lines of credit 137 159 21 317 13,083 13,400Personal 13,479 6,646 25,688 45,813 1,216,720 1,262,533Auto 34,238 8,397 11,387 54,022 713,274 767,296Other 1,009 209 4,547 5,765 199,879 205,644
Total $413,674 $206,334 $1,118,007 $1,738,015 $14,200,099 $15,938,114

144
December 31, 2014
U.S. mainland
Past due
(In thousands)30-59days
60-89days 90 days or more
Total pastdue Current
Loans HIPU.S. mainland
Commercial multi-family $ 87 $ 376 $ – $ 463 $ 406,740 $ 407,203Commercial real estate non-owner occupied 1,478 – – 1,478 511,089 512,567Commercial real estate owner occupied 45 3,631 805 4,481 189,424 193,905Commercial and industrial 1,133 123 1,510 2,766 643,023 645,789Construction 810 – – 810 91,626 92,436Mortgage 29,582 8,646 9,284 47,512 1,004,873 1,052,385Legacy 929 1,931 1,545 4,405 76,413 80,818Consumer:
Credit cards 314 246 449 1,009 14,056 15,065Home equity lines of credit 5,036 1,025 4,090 10,151 342,611 352,762Personal 2,476 893 1,410 4,779 108,140 112,919Auto – – – – 73 73Other 10 4 7 21 394 415
Total $ 41,900 $ 16,875 $ 19,100 $ 77,875 $ 3,388,462 $ 3,466,337
December 31, 2014
Popular, Inc.
Past due
(In thousands)30-59days
60-89days 90 days or more
Totalpast due Current
Non-coveredloans HIP
Popular, Inc.
Commercial multi-family $ 308 $ 445 $ 2,199 $ 2,952 $ 484,328 $ 487,280Commercial real estate non-owner occupied 11,306 121 33,452 44,879 2,481,267 2,526,146Commercial real estate owner occupied 8,999 11,340 93,453 113,792 1,553,475 1,667,267Commercial and industrial 19,631 5,392 131,615 156,638 3,296,936 3,453,574Construction 3,307 – 13,812 17,119 234,701 251,820Mortgage 333,901 175,865 789,962 1,299,728 5,203,158 6,502,886Leasing 6,779 1,246 3,102 11,127 553,262 564,389Legacy 929 1,931 1,545 4,405 76,413 80,818Consumer:
Credit cards 14,029 9,536 20,817 44,382 1,110,847 1,155,229Home equity lines of credit 5,173 1,184 4,111 10,468 355,694 366,162Personal 15,955 7,539 27,098 50,592 1,324,860 1,375,452Auto 34,238 8,397 11,387 54,022 713,347 767,369Other 1,019 213 4,554 5,786 200,273 206,059
Total $455,574 $223,209 $1,137,107 $1,815,890 $17,588,561 $19,404,451
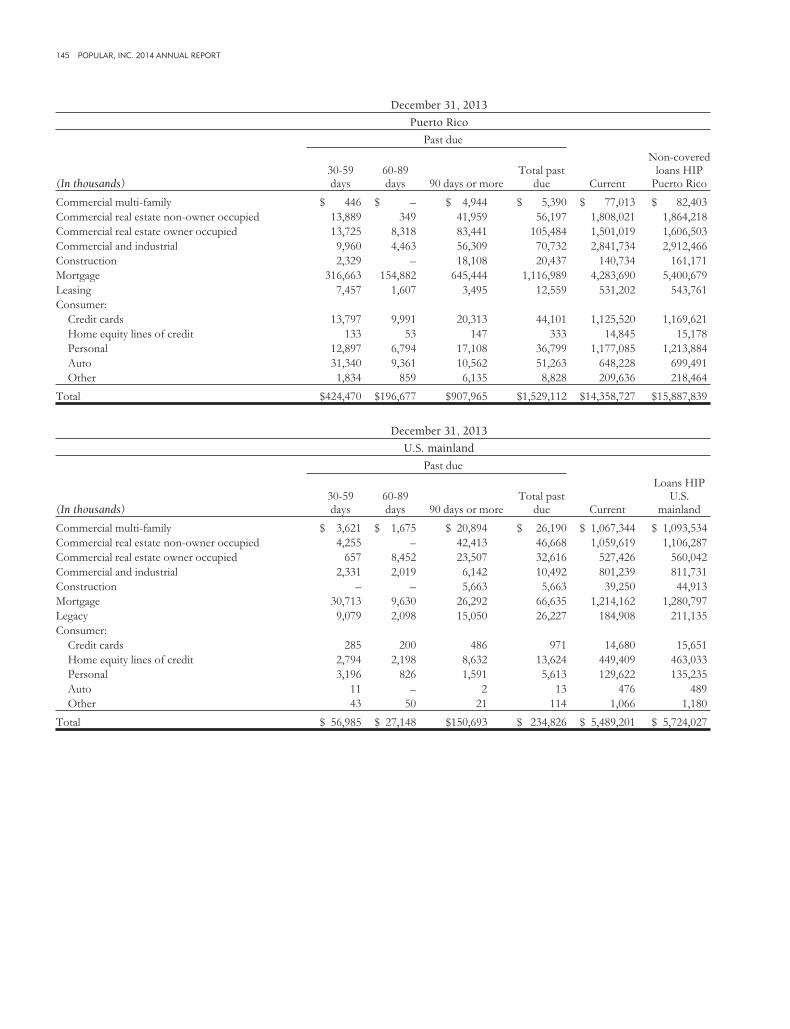
145 POPULAR, INC. 2014 ANNUAL REPORT
December 31, 2013
Puerto Rico
Past due
(In thousands)30-59days
60-89days 90 days or more
Total pastdue Current
Non-coveredloans HIP
Puerto Rico
Commercial multi-family $ 446 $ – $ 4,944 $ 5,390 $ 77,013 $ 82,403Commercial real estate non-owner occupied 13,889 349 41,959 56,197 1,808,021 1,864,218Commercial real estate owner occupied 13,725 8,318 83,441 105,484 1,501,019 1,606,503Commercial and industrial 9,960 4,463 56,309 70,732 2,841,734 2,912,466Construction 2,329 – 18,108 20,437 140,734 161,171Mortgage 316,663 154,882 645,444 1,116,989 4,283,690 5,400,679Leasing 7,457 1,607 3,495 12,559 531,202 543,761Consumer:
Credit cards 13,797 9,991 20,313 44,101 1,125,520 1,169,621Home equity lines of credit 133 53 147 333 14,845 15,178Personal 12,897 6,794 17,108 36,799 1,177,085 1,213,884Auto 31,340 9,361 10,562 51,263 648,228 699,491Other 1,834 859 6,135 8,828 209,636 218,464
Total $424,470 $196,677 $907,965 $1,529,112 $14,358,727 $15,887,839
December 31, 2013
U.S. mainland
Past due
(In thousands)30-59days
60-89days 90 days or more
Total pastdue Current
Loans HIPU.S.
mainland
Commercial multi-family $ 3,621 $ 1,675 $ 20,894 $ 26,190 $ 1,067,344 $ 1,093,534Commercial real estate non-owner occupied 4,255 – 42,413 46,668 1,059,619 1,106,287Commercial real estate owner occupied 657 8,452 23,507 32,616 527,426 560,042Commercial and industrial 2,331 2,019 6,142 10,492 801,239 811,731Construction – – 5,663 5,663 39,250 44,913Mortgage 30,713 9,630 26,292 66,635 1,214,162 1,280,797Legacy 9,079 2,098 15,050 26,227 184,908 211,135Consumer:
Credit cards 285 200 486 971 14,680 15,651Home equity lines of credit 2,794 2,198 8,632 13,624 449,409 463,033Personal 3,196 826 1,591 5,613 129,622 135,235Auto 11 – 2 13 476 489Other 43 50 21 114 1,066 1,180
Total $ 56,985 $ 27,148 $150,693 $ 234,826 $ 5,489,201 $ 5,724,027

146
December 31, 2013
Popular, Inc.
Past due
(In thousands)30-59days
60-89days 90 days or more
Totalpast due Current
Non-coveredloans HIP
Popular, Inc.
Commercial multi-family $ 4,067 $ 1,675 $ 25,838 $ 31,580 $ 1,144,357 $ 1,175,937Commercial real estate non-owner occupied 18,144 349 84,372 102,865 2,867,640 2,970,505Commercial real estate owner occupied 14,382 16,770 106,948 138,100 2,028,445 2,166,545Commercial and industrial 12,291 6,482 62,451 81,224 3,642,973 3,724,197Construction 2,329 – 23,771 26,100 179,984 206,084Mortgage 347,376 164,512 671,736 1,183,624 5,497,852 6,681,476Leasing 7,457 1,607 3,495 12,559 531,202 543,761Legacy 9,079 2,098 15,050 26,227 184,908 211,135Consumer:
Credit cards 14,082 10,191 20,799 45,072 1,140,200 1,185,272Home equity lines of credit 2,927 2,251 8,779 13,957 464,254 478,211Personal 16,093 7,620 18,699 42,412 1,306,707 1,349,119Auto 31,351 9,361 10,564 51,276 648,704 699,980Other 1,877 909 6,156 8,942 210,702 219,644
Total $481,455 $223,825 $1,058,658 $1,763,938 $19,847,928 $21,611,866
The following table provides a breakdown of loans held-for-sale (“LHFS”) in non-performing status at December 31, 2014 and2013 by main categories.
(In thousands) December 31, 2014 December 31, 2013
Commercial $ 309 $ 603Mortgage 14,041 489Consumer 4,549 –
Total $18,899 $1,092
The outstanding principal balance of non-covered loansaccounted pursuant to ASC Subtopic 310-30, net of amountscharged off by the Corporation, amounted to $243 million atDecember 31, 2014 (December 31, 2013 - $197 million). AtDecember 31, 2014, none of the acquired non-covered loansaccounted under ASC Subtopic 310-30 were considered non-performing loans. Therefore, interest income, through accretion
of the difference between the carrying amount of the loans andthe expected cash flows, was recognized on all acquired loans.
Changes in the carrying amount and the accretable yield forthe non-covered loans accounted pursuant to the ASC Subtopic310-30, for the years ended December 31, 2014 and 2013 wereas follows:
Activity in the accretable yield - Non-covered loans ASC 310-30
For the years ended
(In thousands)December 31,
2014December 31,
2013
Beginning balance $ 49,398 $ –Additions 19,190 60,805Accretion (10,074) (7,396)Change in expected cash flows 57,790 (4,011)
Ending balance $116,304 $49,398

147 POPULAR, INC. 2014 ANNUAL REPORT
Carrying amount of non-covered loans accounted for pursuant to ASC 310-30
For the years ended
(In thousands)December 31,
2014December 31,
2013
Beginning balance $173,659 $ –Additions 58,799 195,283Accretion 10,074 7,396Collections and charge-offs (29,769) (29,020)
Ending balance $212,763 $173,659Allowance for loan losses ASC 310-30 non-covered loans (16,159) (14,536)
Ending balance, net of allowance for loan losses $196,604 $159,123
The components of the net financing leases receivable atDecember 31, 2014 and 2013 were as follows:
(In thousands) 2014 2013
Total minimum lease payments $497,895 $493,022Estimated residual value of leased property 149,079 134,198Deferred origination costs, net of fees 8,727 7,773
Less - Unearned financing income 89,552 88,230
Net minimum lease payments 566,149 546,763Less - Allowance for loan losses 7,184 10,737
Net minimum lease payments, net ofallowance for loan losses $558,965 $536,026
At December 31, 2014, future minimum lease payments areexpected to be received as follows:
(In thousands)
2015 $127,9012016 112,7682017 99,5312018 83,5182019 and thereafter 74,177
Total $497,895
Covered loansThe following table presents covered loans in non-performing status and accruing loans past-due 90 days or more by loan class atDecember 31, 2014 and 2013.
December 31, 2014 December 31, 2013
(In thousands)Non-accrual
loansAccruing loans pastdue 90 days or more
Non-accrualloans
Accruing loans pastdue 90 days or more
Commercial real estate $ 8,810 $ – $ 8,345 $ –Commercial and industrial 1,142 – 7,335 456Construction 2,770 – 11,872 –Mortgage 4,376 28 1,739 69Consumer 735 – 90 112
Total [1] $17,833 $28 $29,381 $637
[1] Covered loans accounted for under ASC Subtopic 310-30 are excluded from the above table as they are considered to be performing due to the application of theaccretion method, in which these loans will accrete interest income over the remaining life of the loans using estimated cash flow analyses.

148
The following tables present loans by past due status at December 31, 2014 and 2013 for covered loans held-in-portfolio. Theinformation considers covered loans accounted for under ASC Subtopic 310-20 and ASC Subtopic 310-30.
December 31, 2014
Past due
(In thousands)30-59days
60-89days 90 days or more
Totalpast due Current
Coveredloans HIP
Commercial real estate $ 98,559 $12,597 $291,010 $402,166 $1,109,306 $1,511,472Commercial and industrial 512 7 7,756 8,275 95,034 103,309Construction – 384 58,665 59,049 11,287 70,336Mortgage 45,764 23,531 143,140 212,435 610,551 822,986Consumer 1,884 747 2,532 5,163 29,396 34,559
Total covered loans $146,719 $37,266 $503,103 $687,088 $1,855,574 $2,542,662
December 31, 2013
Past due
(In thousands)30-59days
60-89days 90 days or more
Totalpast due Current
Coveredloans HIP
Commercial real estate $ 42,898 $ 8,745 $374,301 $425,944 $1,284,285 $1,710,229Commercial and industrial 1,584 349 16,318 18,251 84,324 102,575Construction 399 – 178,007 178,406 11,721 190,127Mortgage 50,222 23,384 165,030 238,636 695,737 934,373Consumer 2,588 1,328 4,200 8,116 39,007 47,123
Total covered loans $ 97,691 $33,806 $737,856 $869,353 $2,115,074 $2,984,427
The carrying amount of the covered loans consisted of loansdetermined to be impaired at the time of acquisition, which areaccounted for in accordance with ASC Subtopic 310-30 (“creditimpaired loans”), and loans that were considered to be
performing at the acquisition date, accounted for by analogy toASC Subtopic 310-30 (“non-credit impaired loans”), as detailedin the following table.
December 31, 2014 December 31, 2013
Carrying amount Carrying amount
(In thousands)Non-credit
impaired loansCredit impaired
loans TotalNon-credit
impaired loansCredit impaired
loans Total
Commercial real estate $1,392,482 $ 90,202 $1,482,684 $1,483,331 $149,341 $1,632,672Commercial and industrial 57,059 2,197 59,256 55,192 3,069 58,261Construction 32,836 32,409 65,245 71,864 104,356 176,220Mortgage 764,148 45,829 809,977 862,878 59,483 922,361Consumer 25,617 1,393 27,010 35,810 2,623 38,433
Carrying amount 2,272,142 172,030 2,444,172 2,509,075 318,872 2,827,947Allowance for loan losses (52,798) (26,048) (78,846) (57,594) (36,321) (93,915)
Carrying amount, net of allowance $2,219,344 $145,982 $2,365,326 $2,451,481 $282,551 $2,734,032
The outstanding principal balance of covered loansaccounted pursuant to ASC Subtopic 310-30, net of amountscharged off by the Corporation, amounted to $3.1 billion atDecember 31, 2014 (December 31, 2013 - $3.8 billion). AtDecember 31, 2014, none of the acquired loans from the
Westernbank FDIC-assisted transaction accounted for underASC Subtopic 310-30 were considered non-performing loans.Therefore, interest income, through accretion of the differencebetween the carrying amount of the loans and the expectedcash flows, was recognized on all acquired loans.

149 POPULAR, INC. 2014 ANNUAL REPORT
Changes in the carrying amount and the accretable yield for the covered loans accounted pursuant to the ASC Subtopic 310-30,for the years ended December 31, 2014 and 2013, were as follows:
Activity in the accretable yield
Covered loans ASC 310-30
For the years ended
December 31, 2014 December 31, 2013
(In thousands)
Non-creditimpaired
loans
Creditimpaired
loans Total
Non-creditimpaired
loans
Creditimpaired
loans Total
Beginning balance $1,297,725 $ 11,480 $1,309,205 $1,446,381 $ 5,288 $1,451,669Accretion (268,063) (16,409) (284,472) (268,005) (11,703) (279,708)Change in expected cash flows 236,090 10,514 246,604 119,349 17,895 137,244
Ending balance $1,265,752 $ 5,585 $1,271,337 $1,297,725 $ 11,480 $1,309,205
Carrying amount of loans accounted for pursuant to ASC 310-30
For the years ended
December 31, 2014 December 31, 2013
(In thousands)
Non-creditimpaired
loans
Creditimpaired
loans Total
Non-creditimpaired
loans
Creditimpaired
loans Total
Beginning balance $2,509,075 $ 318,872 $2,827,947 $3,051,964 $ 439,795 $3,491,759Accretion 268,063 16,409 284,472 268,005 11,703 279,708Collections and charge offs (504,996) (163,251) (668,247) (810,894) (132,626) (943,520)
Ending balance $2,272,142 $ 172,030 $2,444,172 $2,509,075 $ 318,872 $2,827,947Allowance for loan losses ASC 310-30 covered loans (52,798) (26,048) (78,846) (57,594) (36,321) (93,915)
Ending balance, net of ALLL $2,219,344 $ 145,982 $2,365,326 $2,451,481 $ 282,551 $2,734,032
The Corporation accounts for lines of credit with revolvingprivileges under the accounting guidance of ASC Subtopic 310-20, which requires that any differences between thecontractually required loans payment receivable in excess of theinitial investment in the loans be accreted into interest incomeover the life of the loans, if the loan is accruing interest.Covered loans accounted for under ASC Subtopic 310-20amounted to $0.1 billion at December 31, 2014 (December 31,2013 - $0.2 billion).
Note 12 - Allowance for loan lossesThe Corporation follows a systematic methodology to establishand evaluate the adequacy of the allowance for loan losses toprovide for inherent losses in the loan portfolio. Thismethodology includes the consideration of factors such ascurrent economic conditions, portfolio risk characteristics,prior loss experience and results of periodic credit reviews ofindividual loans. The provision for loan losses charged tocurrent operations is based on this methodology. Loan lossesare charged and recoveries are credited to the allowance forloan losses.
The Corporation’s assessment of the allowance for loanlosses is determined in accordance with the guidance of losscontingencies in ASC Subtopic 450-20 and loan impairment
guidance in ASC Section 310-10-35. Also, the Corporationdetermines the allowance for loan losses on purchased impairedloans and purchased loans accounted for under ASC Subtopic310-30 by analogy, by evaluating decreases in expected cashflows after the acquisition date.
The accounting guidance provides for the recognition of aloss allowance for groups of homogeneous loans. Thedetermination for general reserves of the allowance for loanlosses includes the following principal factors:
• Base net loss rates, which are based on the movingaverage of annualized net loss rates computed over a 3-year historical loss period for the commercial andconstruction loan portfolios, and an 18-month period forthe consumer and mortgage loan portfolios. The base netloss rates are applied by loan type and by legal entity.
• Recent loss trend adjustment, which replaces the base lossrate with a 12-month average loss rate, when these trendsare higher than the respective base loss rates. Theobjective of this adjustment is to allow for a more recentloss trend to be captured and reflected in the ALLLestimation process. As part of the annual review of thecomponents of the ALLL models, as discussed in thefollowing paragraphs and implemented as of June 30,

150
2014, the Corporation eliminated the use of caps in therecent loss trend adjustment for the consumer andmortgage portfolios, among other enhancements. For theperiod ended December 31, 2013, the recent loss trendadjustment caps for the consumer and mortgage portfolioswere triggered in only one portfolio segment within thePuerto Rico consumer portfolio. Management assessed theimpact of the applicable cap through a review ofqualitative factors that specifically considered the driversof recent loss trends and changes to the portfoliocomposition. The related effect of the aforementioned capwas immaterial for the overall level of the Allowance forLoan and Lease Losses for the Puerto Rico Consumerportfolio.
For the period ended December 31, 2014, 50% (December31, 2013, 27%) of the ALLL for BPPR non-covered loanportfolios utilized the recent loss trend adjustment insteadof the base loss. The effect of replacing the base loss withthe recent loss trend adjustment was mainly concentratedin the commercial multi-family, commercial andindustrial, personal and auto loan portfolios for 2014, andin commercial multi-family, mortgage and leasingportfolios for 2013.
For the period ended December 31, 2014, 21% (December31, 2013, 29%) of the ALLL for BPNA loan portfoliosutilized the recent loss trend adjustment instead of thebase loss. The effect of replacing the base loss with therecent loss trend adjustment was mainly concentrated inthe commercial multi-family, commercial and industrialand legacy loan portfolios for 2014 and in the commercialmulti-family, commercial real estate non-owner occupied,commercial and industrial loan portfolios for 2013.
• Environmental factors, which include credit andmacroeconomic indicators such as unemployment rate,economic activity index and delinquency rates, adopted toaccount for current market conditions that are likely tocause estimated credit losses to differ from historicallosses. The Corporation reflects the effect of theseenvironmental factors on each loan group as anadjustment that, as appropriate, increases the historicalloss rate applied to each group. Environmental factorsprovide updated perspective on credit and economicconditions. Regression analysis is used to select theseindicators and quantify the effect on the general reserve ofthe allowance for loan losses.
During the second quarter of 2014, management completedthe annual review of the components of the ALLL models. Aspart of this review management updated core metrics andrevised certain components related to the estimation process forevaluating the adequacy of the general reserve of the allowancefor loan losses. These enhancements to the ALLL methodology,
which are described in the paragraphs below, wereimplemented as of June 30, 2014 and resulted in a net decreaseto the allowance for loan losses of $18.7 million for the non-covered portfolio and a net increase to the allowance for loanlosses of $0.8 million for the covered portfolio.
Management made the following principal enhancements tothe methodology during the second quarter of 2014:
• Annual review and recalibration of the environmentalfactors adjustment. The environmental factor adjustmentsare developed by performing regression analyses onselected credit and economic indicators for eachapplicable loan segment. During the second quarter of2014, the environmental factor models used to accountfor changes in current credit and macroeconomicconditions were reviewed and recalibrated based on thelatest applicable trends. Management also revised theapplication of environmental factors to the historical lossrates to consider last 12 month trends of the applicablecredit and macroeconomic indicators applied as anincremental adjustment to account for emerging risks notnecessarily considered in the historical loss rates.
The combined effect of the aforementioned recalibrationand enhancements to the environmental factorsadjustment resulted in a decrease to the allowance for loanlosses of $17 million at June 30, 2014, of which $14.1million related to the non-covered BPPR segment and $3.7million related to the BPNA segment, offset in part by a$0.8 million increase in the BPPR covered segment.
• Increased the historical look-back period for determiningthe recent loss trend adjustment for consumer andmortgage loans. The Corporation increased the look-backperiod for assessing recent trends applicable to thedetermination of consumer and mortgage loan net charge-offs from 6 months to 12 months and eliminated the useof caps. Previously, the Corporation used a recent losstrend adjustment based on 6 months of net charge-offs upto a determined cap. Given the current overall consumerand mortgage credit quality improvements, managementconcluded that a 12-month look-back period for therecent loss trend adjustment aligns the Corporation’sallowance for loan losses methodology to current creditquality trends while limiting excessive pro-cyclicalitygiven the longer look-back period analysis, thus,eliminating the aforementioned caps.
The combined effect of the aforementioned enhancementsto the recent loss trend adjustment resulted in a decreaseto the allowance for loan losses of $1 million at June 30,2014, of which $0.9 million related to the non-coveredBPPR segment and $0.1 million related to the BPNAsegment.

151 POPULAR, INC. 2014 ANNUAL REPORT
The following tables present the changes in the allowance for loan losses for the years ended December 31, 2014 and 2013.
For the year ended December 31, 2014
Puerto Rico - Non-covered loans
(In thousands) Commercial Construction Mortgage Leasing Consumer Total
Allowance for credit losses:Beginning balance $128,150 $ 5,095 $130,330 $10,622 $ 152,578 $ 426,775
Provision (reversal of provision) 112,821 (3,121) 34,530 470 98,149 242,849Charge-offs (70,402) (1,722) (45,389) (6,028) (122,400) (245,941)Recoveries 31,020 5,231 1,389 2,067 25,745 65,452
Ending balance $201,589 $ 5,483 $120,860 $ 7,131 $ 154,072 $ 489,135
For the year ended December 31, 2014
Puerto Rico - Covered loans
(In thousands) Commercial Construction Mortgage Leasing Consumer Total
Allowance for credit losses:Beginning balance $ 42,198 $ 19,491 $ 36,006 $ – $ 4,397 $ 102,092
Provision (reversal of provision) 21,579 15,397 13,384 – (4,225) 46,135Charge-offs (34,741) (36,223) (9,156) – 2,589 (77,531)Recoveries 1,835 8,537 714 – 291 11,377
Ending balance $ 30,871 $ 7,202 $ 40,948 $ – $ 3,052 $ 82,073
For the year ended December 31, 2014
U.S. Mainland - Continuing Operations
(In thousands) Commercial Construction Mortgage Legacy Consumer Total
Allowance for credit losses:Beginning balance $ 24,930 $ 214 $ 26,599 $11,335 $ 19,205 $ 82,283
Allowance transferred from discontinued operations 7,984 – – – – 7,984Provision (reversal of provision) (2,979) 736 (15,410) (8,611) 7,414 (18,850)Charge-offs (16,628) – (3,517) (8,071) (15,948) (44,164)Recoveries 15,523 237 2,321 17,141 3,783 39,005Net write-down related to loans transferred to LHFS (19,182) – (7,531) (8,850) (111) (35,674)
Ending balance $ 9,648 $1,187 $ 2,462 $ 2,944 $ 14,343 $ 30,584
For the year ended December 31, 2014
U.S. Mainland - Discontinued Operations
(In thousands) Commercial Construction Mortgage Legacy Consumer Total
Allowance for credit losses:Beginning balance $ 21,902 $ 33 $ – $ 2,369 $ 5,101 $ 29,405
Allowance transferred to continuing operations (7,984) – – – – (7,984)Provision (reversal of provision) (2,831) (226) – (1,812) (1,895) (6,764)Charge-offs (2,995) – – (557) (900) (4,452)Recoveries 8,283 220 – 1,400 94 9,997Net write-downs related to loans transferred to
discontinued operations (16,375) (27) – (1,400) (2,400) (20,202)
Ending balance $ – $ – $ – $ – $ – $ –
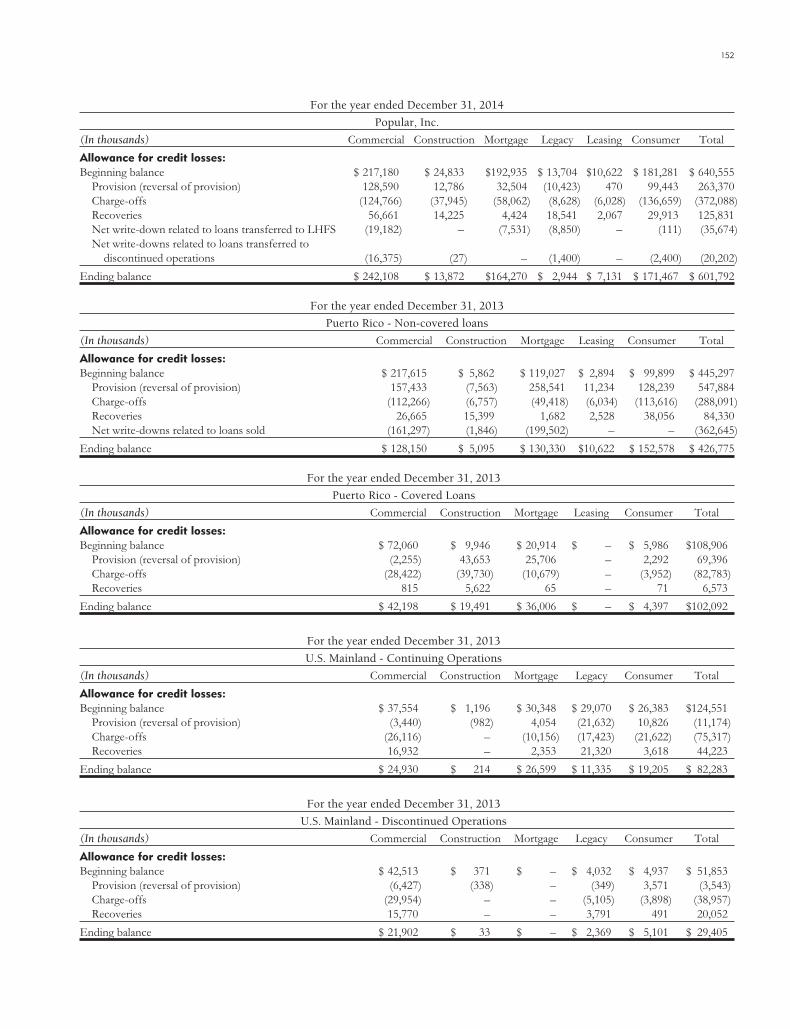
152
For the year ended December 31, 2014
Popular, Inc.
(In thousands) Commercial Construction Mortgage Legacy Leasing Consumer Total
Allowance for credit losses:Beginning balance $ 217,180 $ 24,833 $192,935 $ 13,704 $10,622 $ 181,281 $ 640,555
Provision (reversal of provision) 128,590 12,786 32,504 (10,423) 470 99,443 263,370Charge-offs (124,766) (37,945) (58,062) (8,628) (6,028) (136,659) (372,088)Recoveries 56,661 14,225 4,424 18,541 2,067 29,913 125,831Net write-down related to loans transferred to LHFS (19,182) – (7,531) (8,850) – (111) (35,674)Net write-downs related to loans transferred to
discontinued operations (16,375) (27) – (1,400) – (2,400) (20,202)
Ending balance $ 242,108 $ 13,872 $164,270 $ 2,944 $ 7,131 $ 171,467 $ 601,792
For the year ended December 31, 2013
Puerto Rico - Non-covered loans
(In thousands) Commercial Construction Mortgage Leasing Consumer Total
Allowance for credit losses:Beginning balance $ 217,615 $ 5,862 $ 119,027 $ 2,894 $ 99,899 $ 445,297
Provision (reversal of provision) 157,433 (7,563) 258,541 11,234 128,239 547,884Charge-offs (112,266) (6,757) (49,418) (6,034) (113,616) (288,091)Recoveries 26,665 15,399 1,682 2,528 38,056 84,330Net write-downs related to loans sold (161,297) (1,846) (199,502) – – (362,645)
Ending balance $ 128,150 $ 5,095 $ 130,330 $10,622 $ 152,578 $ 426,775
For the year ended December 31, 2013
Puerto Rico - Covered Loans
(In thousands) Commercial Construction Mortgage Leasing Consumer Total
Allowance for credit losses:Beginning balance $ 72,060 $ 9,946 $ 20,914 $ – $ 5,986 $108,906
Provision (reversal of provision) (2,255) 43,653 25,706 – 2,292 69,396Charge-offs (28,422) (39,730) (10,679) – (3,952) (82,783)Recoveries 815 5,622 65 – 71 6,573
Ending balance $ 42,198 $ 19,491 $ 36,006 $ – $ 4,397 $102,092
For the year ended December 31, 2013
U.S. Mainland - Continuing Operations
(In thousands) Commercial Construction Mortgage Legacy Consumer Total
Allowance for credit losses:Beginning balance $ 37,554 $ 1,196 $ 30,348 $ 29,070 $ 26,383 $124,551
Provision (reversal of provision) (3,440) (982) 4,054 (21,632) 10,826 (11,174)Charge-offs (26,116) – (10,156) (17,423) (21,622) (75,317)Recoveries 16,932 – 2,353 21,320 3,618 44,223
Ending balance $ 24,930 $ 214 $ 26,599 $ 11,335 $ 19,205 $ 82,283
For the year ended December 31, 2013
U.S. Mainland - Discontinued Operations
(In thousands) Commercial Construction Mortgage Legacy Consumer Total
Allowance for credit losses:Beginning balance $ 42,513 $ 371 $ – $ 4,032 $ 4,937 $ 51,853
Provision (reversal of provision) (6,427) (338) – (349) 3,571 (3,543)Charge-offs (29,954) – – (5,105) (3,898) (38,957)Recoveries 15,770 – – 3,791 491 20,052
Ending balance $ 21,902 $ 33 $ – $ 2,369 $ 5,101 $ 29,405

153 POPULAR, INC. 2014 ANNUAL REPORT
For the year ended December 31, 2013
Popular, Inc.
(In thousands) Commercial Construction Mortgage Legacy Leasing Consumer Total
Allowance for credit losses:Beginning balance $ 369,742 $ 17,375 $ 170,289 $ 33,102 $ 2,894 $ 137,205 $ 730,607
Provision (reversal of provision) 145,311 34,770 288,301 (21,981) 11,234 144,928 602,563Charge-offs (196,758) (46,487) (70,253) (22,528) (6,034) (143,088) (485,148)Recoveries 60,182 21,021 4,100 25,111 2,528 42,236 155,178Net write-down related to loans sold (161,297) (1,846) (199,502) – – – (362,645)
Ending balance $ 217,180 $ 24,833 $ 192,935 $ 13,704 $10,622 $ 181,281 $ 640,555
The following table provides the activity in the allowance for loan losses related to covered loans accounted for pursuant to ASCSubtopic 310-30.
ASC 310-30 Covered loans
For the years ended
(In thousands) December 31, 2014 December 31, 2013
Balance at beginning of period $ 93,915 $ 95,407Provision for loan losses 48,559 58,858Net charge-offs (63,628) (60,350)
Balance at end of period $ 78,846 $ 93,915
The following tables present information at December 31, 2014 and December 31, 2013 regarding loan ending balances and theallowance for loan losses by portfolio segment and whether such loans and the allowance pertains to loans individually orcollectively evaluated for impairment.
At December 31, 2014
Puerto Rico
(In thousands) Commercial Construction Mortgage Leasing Consumer Total
Allowance for credit losses:Specific ALLL non-covered loans $ 64,736 $ 363 $ 45,838 $ 770 $ 27,796 $ 139,503General ALLL non-covered loans 136,853 5,120 75,022 6,361 126,276 349,632
ALLL - non-covered loans 201,589 5,483 120,860 7,131 154,072 489,135
Specific ALLL covered loans 5 – – – – 5General ALLL covered loans 30,866 7,202 40,948 – 3,052 82,068
ALLL - covered loans 30,871 7,202 40,948 – 3,052 82,073
Total ALLL $ 232,460 $ 12,685 $ 161,808 $ 7,131 $ 157,124 $ 571,208
Loans held-in-portfolio:Impaired non-covered loans $ 356,911 $ 13,268 $ 431,569 $ 3,023 $ 115,759 $ 920,530Non-covered loans held-in-portfolio excluding impaired
loans 6,017,892 146,116 5,018,932 561,366 3,273,278 15,017,584
Non-covered loans held-in-portfolio 6,374,803 159,384 5,450,501 564,389 3,389,037 15,938,114
Impaired covered loans 4,487 2,419 – – – 6,906Covered loans held-in-portfolio excluding impaired
loans 1,610,294 67,917 822,986 – 34,559 2,535,756
Covered loans held-in-portfolio 1,614,781 70,336 822,986 – 34,559 2,542,662
Total loans held-in-portfolio $7,989,584 $229,720 $6,273,487 $564,389 $3,423,596 $18,480,776

154
At December 31, 2014
U.S. Mainland
(In thousands) Commercial Construction Mortgage Legacy Consumer Total
Allowance for credit losses:Specific ALLL $ – $ – $ 273 $ – $ 365 $ 638General ALLL 9,648 1,187 2,189 2,944 13,978 29,946
Total ALLL $ 9,648 $ 1,187 $ 2,462 $ 2,944 $ 14,343 $ 30,584
Loans held-in-portfolio:Impaired loans $ 250 $ – $ 4,255 $ – $ 1,973 $ 6,478Loans held-in-portfolio, excluding impaired loans 1,759,214 92,436 1,048,130 80,818 479,261 3,459,859
Total loans held-in-portfolio $1,759,464 $92,436 $1,052,385 $80,818 $481,234 $3,466,337
At December 31, 2014
Popular, Inc.
(In thousands) Commercial Construction Mortgage Legacy Leasing Consumer Total
Allowance for credit losses:Specific ALLL non-covered loans $ 64,736 $ 363 $ 46,111 $ – $ 770 $ 28,161 $ 140,141General ALLL non-covered loans 146,501 6,307 77,211 2,944 6,361 140,254 379,578
ALLL - non-covered loans 211,237 6,670 123,322 2,944 7,131 168,415 519,719
Specific ALLL covered loans 5 – – – – – 5General ALLL covered loans 30,866 7,202 40,948 – – 3,052 82,068
ALLL - covered loans 30,871 7,202 40,948 – – 3,052 82,073
Total ALLL $ 242,108 $ 13,872 $ 164,270 $ 2,944 $ 7,131 $ 171,467 $ 601,792
Loans held-in-portfolio:Impaired non-covered loans $ 357,161 $ 13,268 $ 435,824 $ – $ 3,023 $ 117,732 $ 927,008Non-covered loans held-in-portfolio
excluding impaired loans 7,777,106 238,552 6,067,062 80,818 561,366 3,752,539 18,477,443
Non-covered loans held-in-portfolio 8,134,267 251,820 6,502,886 80,818 564,389 3,870,271 19,404,451
Impaired covered loans 4,487 2,419 – – – – 6,906Covered loans held-in-portfolio excluding
impaired loans 1,610,294 67,917 822,986 – – 34,559 2,535,756
Covered loans held-in-portfolio 1,614,781 70,336 822,986 – – 34,559 2,542,662
Total loans held-in-portfolio $9,749,048 $322,156 $7,325,872 $80,818 $564,389 $3,904,830 $21,947,113
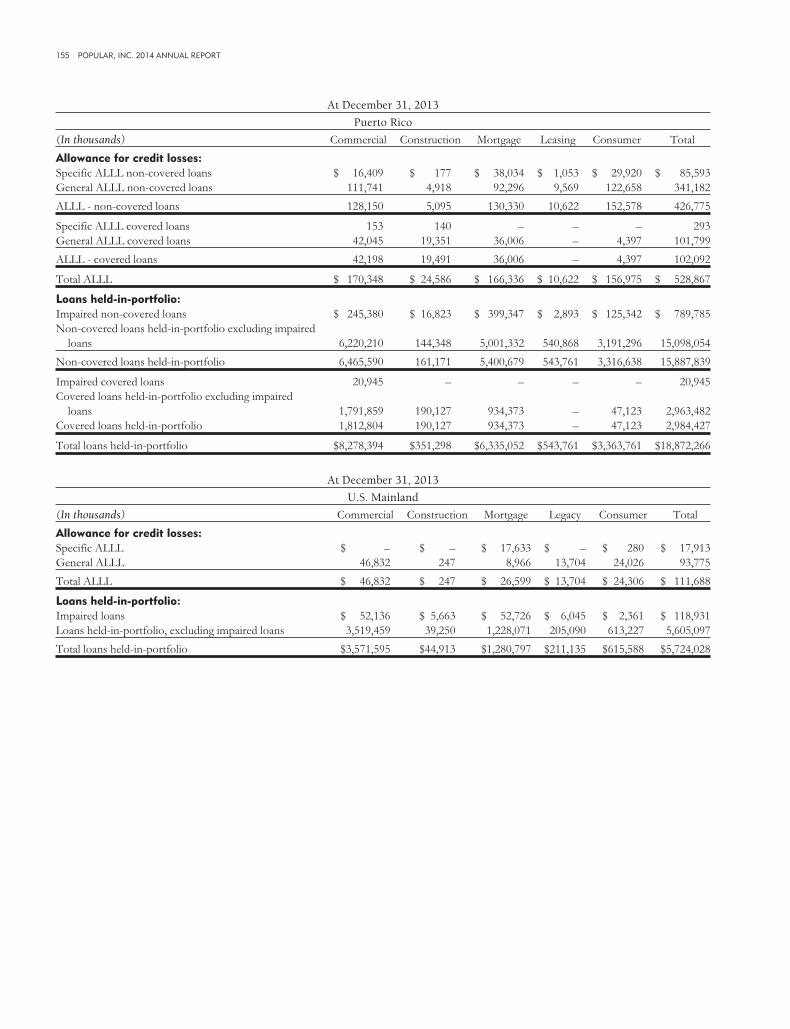
155 POPULAR, INC. 2014 ANNUAL REPORT
At December 31, 2013
Puerto Rico
(In thousands) Commercial Construction Mortgage Leasing Consumer Total
Allowance for credit losses:Specific ALLL non-covered loans $ 16,409 $ 177 $ 38,034 $ 1,053 $ 29,920 $ 85,593General ALLL non-covered loans 111,741 4,918 92,296 9,569 122,658 341,182
ALLL - non-covered loans 128,150 5,095 130,330 10,622 152,578 426,775
Specific ALLL covered loans 153 140 – – – 293General ALLL covered loans 42,045 19,351 36,006 – 4,397 101,799
ALLL - covered loans 42,198 19,491 36,006 – 4,397 102,092
Total ALLL $ 170,348 $ 24,586 $ 166,336 $ 10,622 $ 156,975 $ 528,867
Loans held-in-portfolio:Impaired non-covered loans $ 245,380 $ 16,823 $ 399,347 $ 2,893 $ 125,342 $ 789,785Non-covered loans held-in-portfolio excluding impaired
loans 6,220,210 144,348 5,001,332 540,868 3,191,296 15,098,054
Non-covered loans held-in-portfolio 6,465,590 161,171 5,400,679 543,761 3,316,638 15,887,839
Impaired covered loans 20,945 – – – – 20,945Covered loans held-in-portfolio excluding impaired
loans 1,791,859 190,127 934,373 – 47,123 2,963,482Covered loans held-in-portfolio 1,812,804 190,127 934,373 – 47,123 2,984,427
Total loans held-in-portfolio $8,278,394 $351,298 $6,335,052 $543,761 $3,363,761 $18,872,266
At December 31, 2013
U.S. Mainland
(In thousands) Commercial Construction Mortgage Legacy Consumer Total
Allowance for credit losses:Specific ALLL $ – $ – $ 17,633 $ – $ 280 $ 17,913General ALLL 46,832 247 8,966 13,704 24,026 93,775
Total ALLL $ 46,832 $ 247 $ 26,599 $ 13,704 $ 24,306 $ 111,688
Loans held-in-portfolio:Impaired loans $ 52,136 $ 5,663 $ 52,726 $ 6,045 $ 2,361 $ 118,931Loans held-in-portfolio, excluding impaired loans 3,519,459 39,250 1,228,071 205,090 613,227 5,605,097
Total loans held-in-portfolio $3,571,595 $44,913 $1,280,797 $211,135 $615,588 $5,724,028

156
At December 31, 2013
Popular, Inc.
(In thousands) Commercial Construction Mortgage Legacy Leasing Consumer Total
Allowance for credit losses:Specific ALLL non-covered loans $ 16,409 $ 177 $ 55,667 $ – $ 1,053 $ 30,200 $ 103,506General ALLL non-covered loans 158,573 5,165 101,262 13,704 9,569 146,684 434,957
ALLL - non-covered loans 174,982 5,342 156,929 13,704 10,622 176,884 538,463
Specific ALLL covered loans 153 140 – – – – 293General ALLL covered loans 42,045 19,351 36,006 – – 4,397 101,799
ALLL - covered loans 42,198 19,491 36,006 – – 4,397 102,092
Total ALLL $ 217,180 $ 24,833 $ 192,935 $ 13,704 $ 10,622 $ 181,281 $ 640,555
Loans held-in-portfolio:Impaired non-covered loans $ 297,516 $ 22,486 $ 452,073 $ 6,045 $ 2,893 $ 127,703 $ 908,716Non-covered loans held-in-portfolio
excluding impaired loans 9,739,669 183,598 6,229,403 205,090 540,868 3,804,523 20,703,151
Non-covered loans held-in-portfolio 10,037,185 206,084 6,681,476 211,135 543,761 3,932,226 21,611,867
Impaired covered loans 20,945 – – – – – 20,945Covered loans held-in-portfolio excluding
impaired loans 1,791,859 190,127 934,373 – – 47,123 2,963,482
Covered loans held-in-portfolio 1,812,804 190,127 934,373 – – 47,123 2,984,427
Total loans held-in-portfolio $11,849,989 $396,211 $7,615,849 $211,135 $543,761 $3,979,349 $24,596,294
Impaired loansThe following tables present loans individually evaluated for impairment at December 31, 2014 and December 31, 2013.
December 31, 2014
Puerto Rico
Impaired Loans – With anAllowance
Impaired Loans WithNo Allowance Impaired Loans - Total
(In thousands)Recorded
investment
Unpaidprincipalbalance
Relatedallowance
Recordedinvestment
Unpaidprincipalbalance
Recordedinvestment
Unpaidprincipalbalance
Relatedallowance
Commercial real estate non-owneroccupied $ 50,324 $ 53,154 $ 5,182 $ 7,929 $ 7,929 $ 58,253 $ 61,083 $ 5,182
Commercial real estate owneroccupied 114,163 127,855 16,770 14,897 16,110 129,060 143,965 16,770
Commercial and industrial 145,633 148,204 42,784 23,965 31,722 169,598 179,926 42,784Construction 2,575 7,980 363 10,693 28,994 13,268 36,974 363Mortgage 395,911 426,502 45,838 35,658 39,248 431,569 465,750 45,838Leasing 3,023 3,023 770 – – 3,023 3,023 770Consumer:
Credit cards 41,477 41,477 8,023 – – 41,477 41,477 8,023Personal 71,825 71,825 19,410 – – 71,825 71,825 19,410Auto 1,932 1,932 262 – – 1,932 1,932 262Other 525 525 101 – – 525 525 101
Covered loans 2,419 7,500 5 4,487 4,487 6,906 11,987 5
Total Puerto Rico $829,807 $889,977 $139,508 $97,629 $128,490 $927,436 $1,018,467 $139,508

157 POPULAR, INC. 2014 ANNUAL REPORT
December 31, 2014
U.S. mainland [1]
Impaired Loans – With anAllowance
Impaired Loans WithNo Allowance Impaired Loans - Total
(In thousands)Recorded
investment
Unpaidprincipalbalance
Relatedallowance
Recordedinvestment
Unpaidprincipalbalance
Recordedinvestment
Unpaidprincipalbalance
Relatedallowance
Commercial and industrial $ – $ – $ – $ 250 $ 250 $ 250 $ 250 $ –Mortgage 3,049 3,443 273 1,206 2,306 4,255 5,749 273Consumer:
HELOCs 1,095 1,095 362 791 791 1,886 1,886 362Other 3 3 3 84 – 87 3 3
Total U.S. mainland $4,147 $4,541 $638 $2,331 $3,347 $6,478 $7,888 $638
[1] Excludes impaired loans from discontinued operations.
December 31, 2014
Popular, Inc.
Impaired Loans – With anAllowance
Impaired Loans WithNo Allowance Impaired Loans - Total
(In thousands)Recorded
investment
Unpaidprincipalbalance
Relatedallowance
Recordedinvestment
Unpaidprincipalbalance
Recordedinvestment
Unpaidprincipalbalance
Relatedallowance
Commercial real estate non-owneroccupied $ 50,324 $ 53,154 $ 5,182 $ 7,929 $ 7,929 $ 58,253 $ 61,083 $ 5,182
Commercial real estate owneroccupied 114,163 127,855 16,770 14,897 16,110 129,060 143,965 16,770
Commercial and industrial 145,633 148,204 42,784 24,215 31,972 169,848 180,176 42,784Construction 2,575 7,980 363 10,693 28,994 13,268 36,974 363Mortgage 398,960 429,945 46,111 36,864 41,554 435,824 471,499 46,111Leasing 3,023 3,023 770 – – 3,023 3,023 770Consumer:
Credit cards 41,477 41,477 8,023 – – 41,477 41,477 8,023HELOCs 1,095 1,095 362 791 791 1,886 1,886 362Personal 71,825 71,825 19,410 – – 71,825 71,825 19,410Auto 1,932 1,932 262 – – 1,932 1,932 262Other 528 528 104 84 – 612 528 104
Covered loans 2,419 7,500 5 4,487 4,487 6,906 11,987 5
Total Popular, Inc. $833,954 $894,518 $140,146 $99,960 $131,837 $933,914 $1,026,355 $140,146

158
December 31, 2013
Puerto Rico
Impaired Loans – With anAllowance
Impaired Loans WithNo Allowance Impaired Loans - Total
(In thousands)Recorded
investment
Unpaidprincipalbalance
Relatedallowance
Recordedinvestment
Unpaidprincipalbalance
Recordedinvestment
Unpaidprincipalbalance
Relatedallowance
Commercial multi-family $ – $ – $ – $ 3,405 $ 6,942 $ 3,405 $ 6,942 $ –Commercial real estate non-owner
occupied 19,120 19,407 2,368 47,245 55,397 66,365 74,804 2,368Commercial real estate owner
occupied 55,826 74,420 6,473 33,749 47,545 89,575 121,965 6,473Commercial and industrial 30,370 33,152 7,568 55,665 68,141 86,035 101,293 7,568Construction 2,324 9,047 177 14,499 36,951 16,823 45,998 177Mortgage 358,437 376,393 38,034 40,910 45,181 399,347 421,574 38,034Leasing 2,893 2,893 1,053 – – 2,893 2,893 1,053Consumer:
Credit cards 45,015 45,015 8,344 – – 45,015 45,015 8,344Personal 78,475 78,475 21,313 – – 78,475 78,475 21,313Auto 1,354 1,354 171 – – 1,354 1,354 171Other 498 498 92 – – 498 498 92
Covered loans 12,837 17,538 293 8,108 10,063 20,945 27,601 293
Total Puerto Rico $607,149 $658,192 $85,886 $203,581 $270,220 $810,730 $928,412 $85,886
December 31, 2013
U.S. mainland
Impaired Loans – With anAllowance
Impaired Loans WithNo Allowance Impaired Loans - Total
(In thousands)Recorded
investment
Unpaidprincipalbalance
Relatedallowance
Recordedinvestment
Unpaidprincipalbalance
Recordedinvestment
Unpaidprincipalbalance
Relatedallowance
Commercial multi-family $ – $ – $ – $ 7,668 $10,870 $ 7,668 $ 10,870 $ –Commercial real estate non-owner
occupied – – – 27,016 37,393 27,016 37,393 –Commercial real estate owner occupied – – – 15,624 19,910 15,624 19,910 –Commercial and industrial – – – 1,828 1,828 1,828 1,828 –Construction – – – 5,663 5,663 5,663 5,663 –Mortgage 46,192 50,570 17,633 6,534 8,513 52,726 59,083 17,633Legacy – – – 6,045 8,715 6,045 8,715 –Consumer:
HELOCs – – – 198 198 198 198 –Auto – – – 88 88 88 88 –Other 2,075 2,075 280 – – 2,075 2,075 280
Total U.S. mainland $48,267 $52,645 $17,913 $70,664 $93,178 $118,931 $145,823 $17,913

159 POPULAR, INC. 2014 ANNUAL REPORT
December 31, 2013
Popular, Inc.
Impaired Loans – With anAllowance
Impaired Loans WithNo Allowance Impaired Loans - Total
(In thousands)Recorded
investment
Unpaidprincipalbalance
Relatedallowance
Recordedinvestment
Unpaidprincipalbalance
Recordedinvestment
Unpaidprincipalbalance
Relatedallowance
Commercial multi-family $ – $ – $ – $ 11,073 $ 17,812 $ 11,073 $ 17,812 $ –Commercial real estate non-owner
occupied 19,120 19,407 2,368 74,261 92,790 93,381 112,197 2,368Commercial real estate owner
occupied 55,826 74,420 6,473 49,373 67,455 105,199 141,875 6,473Commercial and industrial 30,370 33,152 7,568 57,493 69,969 87,863 103,121 7,568Construction 2,324 9,047 177 20,162 42,614 22,486 51,661 177Mortgage 404,629 426,963 55,667 47,444 53,694 452,073 480,657 55,667Legacy – – – 6,045 8,715 6,045 8,715 –Leasing 2,893 2,893 1,053 – – 2,893 2,893 1,053Consumer:
Credit cards 45,015 45,015 8,344 – – 45,015 45,015 8,344HELOCs – – – 198 198 198 198 –Personal 78,475 78,475 21,313 – – 78,475 78,475 21,313Auto 1,354 1,354 171 88 88 1,442 1,442 171Other 2,573 2,573 372 – – 2,573 2,573 372
Covered loans 12,837 17,538 293 8,108 10,063 20,945 27,601 293
Total Popular, Inc. $655,416 $710,837 $103,799 $274,245 $363,398 $929,661 $1,074,235 $103,799
The following tables present the average recorded investment and interest income recognized on impaired loans for the yearsended December 31, 2014 and 2013.
For the year ended December 31, 2014
Puerto Rico U.S. Mainland [1] Popular, Inc.
(In thousands)
Averagerecorded
investment
Interestincome
recognized
Averagerecorded
investment
Interestincome
recognized
Averagerecorded
investment
Interestincome
recognized
Commercial multi-family $ 1,539 $ – $ 2,657 $ – $ 4,196 $ –Commercial real estate non-owner occupied 70,154 2,719 9,264 – 79,418 2,719Commercial real estate owner occupied 114,893 3,994 5,778 – 120,671 3,994Commercial and industrial 130,940 7,852 955 – 131,895 7,852Construction 18,418 – 1,133 – 19,551 –Mortgage 415,188 19,319 33,686 1,187 448,874 20,506Legacy – – 2,920 – 2,920 –Leasing 2,747 – – – 2,747 –Consumer:
Credit cards 42,345 – – – 42,345 –HELOCs – – 1,768 – 1,768 –Personal 74,593 – – – 74,593 –Auto 1,884 – 52 – 1,936 –Other 748 – 452 – 1,200 –
Covered loans 8,763 469 – – 8,763 469
Total Popular, Inc. $882,212 $34,353 $58,665 $1,187 $940,877 $35,540
[1] Excludes impaired loans from discontinued operations.

160
For the year ended December 31, 2013
Puerto Rico U.S. Mainland Popular, Inc.
(In thousands)
Averagerecorded
investment
Interestincome
recognized
Averagerecorded
investment
Interestincome
recognized
Averagerecorded
investment
Interestincome
recognized
Commercial multi-family $ 8,356 $ 259 $ 7,493 $ 120 $ 15,849 $ 379Commercial real estate non-owner occupied 58,773 2,225 36,688 223 95,461 2,448Commercial real estate owner occupied 125,091 2,956 19,024 150 144,115 3,106Commercial and industrial 102,408 4,206 2,328 15 104,736 4,221Construction 31,491 – 5,821 – 37,312 –Mortgage 461,534 25,610 53,137 1,955 514,671 27,565Legacy – – 12,957 – 12,957 –Leasing 3,822 – – – 3,822 –Consumer:
Credit cards 40,044 – – – 40,044 –HELOCs – – 199 – 199 –Personal 82,687 – – – 82,687 –Auto 1,003 – 89 – 1,092 –Other 417 – 2,260 – 2,677 –
Covered loans 42,791 1,245 – – 42,791 1,245
Total Popular, Inc. $958,417 $36,501 $139,996 $2,463 $1,098,413 $38,964
ModificationsTroubled debt restructurings related to non-covered loanportfolios amounted to $ 1.1 billion at December 31, 2014(December 31, 2013 - $ 1.0 billion). The amount of outstandingcommitments to lend additional funds to debtors owingreceivables whose terms have been modified in troubled debtrestructurings amounted $5 million related to the commercialloan portfolio and $1 million related to the construction loanportfolio at December 31, 2014 (December 31, 2013 - $3million and $0, respectively).
A modification of a loan constitutes a troubled debtrestructuring (“TDR”) when a borrower is experiencingfinancial difficulty and the modification constitutes aconcession.
Commercial and industrial loans modified in a TDR ofteninvolve temporary interest-only payments, term extensions, andconverting evergreen revolving credit lines to long-termloans. Commercial real estate (“CRE”), which includesmultifamily, owner-occupied and non-owner occupied CRE,and construction loans modified in a TDR often involvereducing the interest rate for a limited period of time or theremaining term of the loan, extending the maturity date at aninterest rate lower than the current market rate for new debtwith similar risk, or reductions in the paymentplan. Construction loans modified in a TDR may also involveextending the interest-only payment period.
Residential mortgage loans modified in a TDR are primarilycomprised of loans where monthly payments are lowered toaccommodate the borrowers’ financial needs for a period oftime, normally five years to ten years. After the lowered
monthly payment period ends, the borrower reverts back topaying principal and interest per the original terms with thematurity date adjusted accordingly.
Home equity loans modifications are made infrequently andare not offered if the Corporation also holds the firstmortgage. Home equity loans modifications are uniquelydesigned to meet the specific needs of eachborrower. Automobile loans modified in a TDR are primarilycomprised of loans where the Corporation has lowered monthlypayments by extending the term. Credit cards modified in aTDR are primarily comprised of loans where monthly paymentsare lowered to accommodate the borrowers’ financial needs fora period of time, normally up to 24 months.
As part of its NPL reduction strategy and in order toexpedite the resolution of delinquent construction andcommercial loans, commencing in 2012, the Corporationroutinely enters into liquidation agreements with borrowersand guarantors through the regular legal process, bankruptcyprocedures and in certain occasions, out of court transactions.These liquidation agreements, in general, contemplate thefollowing conditions: (1) consent to judgment by the borrowersand guarantors; (2) acknowledgement by the borrower of thedebt, its liquidity and maturity; and (3) acknowledgment of thedefault in payments. The contractual interest rate is notreduced and continues to accrue during the term of theagreement. At the end of the period, the borrower is obligatedto remit all amounts due or be subject to the Corporation’sexercise of its foreclosure rights and further collection efforts.Likewise, the borrower’s failure to make stipulated paymentswill grant the Corporation the ability to exercise its foreclosure

161 POPULAR, INC. 2014 ANNUAL REPORT
rights. This strategy tends to expedite the foreclosure process,resulting in a more effective and efficient collection process.Although in general, these liquidation agreements do notcontemplate the forgiveness of principal or interest as debtor isrequired to cover all outstanding amounts when the agreementbecomes due, it could be construed that the Corporation hasgranted a concession by temporarily accepting a paymentschedule that is different from the contractual paymentschedule. Accordingly, loans under these program agreementsare considered TDRs.
Loans modified in a TDR that are not accounted pursuant toASC Subtopic 310-30 are typically already in non-accrual statusat the time of the modification and partial charge-offs have insome cases already been taken against the outstanding loanbalance. The TDR loan continues in non-accrual status until theborrower has demonstrated a willingness and ability to makethe restructured loan payments (generally at least six months ofsustained performance after the modification (or one year forloans providing for quarterly or semi-annual payments)) andmanagement has concluded that it is probable that theborrower would not be in payment default in the foreseeablefuture.
Loans modified in a TDR may have the financial effect to theCorporation of increasing the specific allowance for loan lossesassociated with the loan. Consumer and residential mortgage
loans modified under the Corporation’s loss mitigationprograms that are determined to be TDRs are individuallyevaluated for impairment based on an analysis of discountedcash flows.
For consumer and mortgage loans that are modified withregard to payment terms and which constitute TDRs, thediscounted cash flow value method is used as the impairmentvaluation is more appropriately calculated based on the ongoingcash flow from the individuals rather than the liquidation of theasset. The computations give consideration to probability ofdefaults and loss-given-foreclosure on the related estimatedcash flows.
Commercial and construction loans that have been modifiedas part of loss mitigation efforts are evaluated individually forimpairment. The vast majority of the Corporation’s modifiedcommercial loans are measured for impairment using theestimated fair value of the collateral, as these are normallyconsidered as collateral dependent loans. The Corporation mayalso measure commercial loans at their estimated realizablevalues determined by discounting the expected future cashflows. Construction loans that have been modified are alsoaccounted for as collateral dependent loans. The Corporationdetermines the fair value measurement dependent upon its exitstrategy for the particular asset(s) acquired in foreclosure.
The following tables present the non-covered and covered loans classified as TDRs according to their accruing status atDecember 31, 2014 and December 31, 2013.
Popular, Inc.
Non-Covered Loans
December 31, 2014 [1] December 31, 2013
(In thousands) Accruing Non-Accruing Total Accruing Non-Accruing Total
Commercial $153,380 $150,069 $303,449 $109,462 $80,140 $189,602Construction 453 5,488 5,941 425 10,865 11,290Legacy – – – – 949 949Mortgage 556,346 116,465 672,811 535,357 82,786 618,143Leases 775 2,248 3,023 270 2,623 2,893Consumer 107,530 14,848 122,378 116,719 10,741 127,460
Total $818,484 $289,118 $1,107,602 $762,233 $188,104 $950,337
[1] Excludes TDRs from discontinued operations.
Popular, Inc.
Covered Loans
December 31, 2014 December 31, 2013
(In thousands) Accruing Non-Accruing Total Accruing Non-Accruing Total
Commercial $1,689 $3,257 $4,946 $7,389 $10,017 $17,406Construction – 2,419 2,419 – 3,464 3,464Mortgage 3,629 3,990 7,619 146 189 335Consumer 26 5 31 221 22 243
Total $5,344 $9,671 $15,015 $7,756 $13,692 $21,448

162
The following tables present the loan count by type of modification for those loans modified in a TDR during the years endedDecember 31, 2014 and 2013.
Puerto Rico
For the year ended December 31, 2014
Reduction ininterest rate
Extension ofmaturity date
Combination ofreduction in interestrate and extensionof maturity date Other
Commercial real estate non-owner occupied 5 8 – –Commercial real estate owner occupied 25 12 – –Commercial and industrial 37 43 – –Construction – 4 – –Mortgage 52 61 413 142Leasing – 15 48 –Consumer:
Credit cards 1,070 – – 653Personal 955 71 – 6Auto – 13 5 –Other 103 – – 2
Total 2,247 227 466 803
U.S. mainland
For the year ended December 31, 2014
Reduction ininterest rate
Extension ofmaturity date
Combination ofreduction in interestrate and extensionof maturity date Other
Mortgage – – 18 –Consumer:
HELOCs 5 – – –
Total 5 – 18 –
Popular, Inc.
For the year ended December 31, 2014
Reduction ininterest rate
Extension ofmaturity date
Combination ofreduction in interestrate and extensionof maturity date Other
Commercial real estate non-owner occupied 5 8 – –Commercial real estate owner occupied 25 12 – –Commercial and industrial 37 43 – –Construction – 4 – –Mortgage 52 61 431 142Leasing – 15 48 –Consumer:
Credit cards 1,070 – – 653HELOCs 5 – – –Personal 955 71 – 6Auto – 13 5 –Other 103 – – 2
Total 2,252 227 484 803
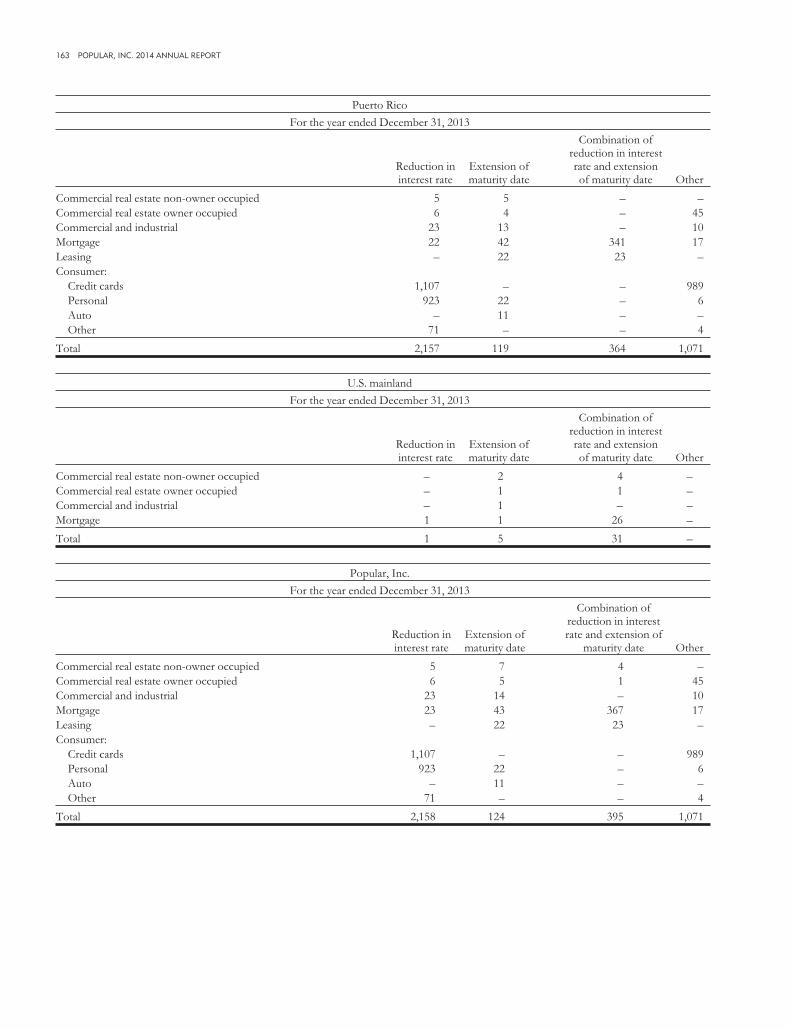
163 POPULAR, INC. 2014 ANNUAL REPORT
Puerto Rico
For the year ended December 31, 2013
Reduction ininterest rate
Extension ofmaturity date
Combination ofreduction in interestrate and extensionof maturity date Other
Commercial real estate non-owner occupied 5 5 – –Commercial real estate owner occupied 6 4 – 45Commercial and industrial 23 13 – 10Mortgage 22 42 341 17Leasing – 22 23 –Consumer:
Credit cards 1,107 – – 989Personal 923 22 – 6Auto – 11 – –Other 71 – – 4
Total 2,157 119 364 1,071
U.S. mainland
For the year ended December 31, 2013
Reduction ininterest rate
Extension ofmaturity date
Combination ofreduction in interestrate and extensionof maturity date Other
Commercial real estate non-owner occupied – 2 4 –Commercial real estate owner occupied – 1 1 –Commercial and industrial – 1 – –Mortgage 1 1 26 –
Total 1 5 31 –
Popular, Inc.
For the year ended December 31, 2013
Reduction ininterest rate
Extension ofmaturity date
Combination ofreduction in interestrate and extension of
maturity date Other
Commercial real estate non-owner occupied 5 7 4 –Commercial real estate owner occupied 6 5 1 45Commercial and industrial 23 14 – 10Mortgage 23 43 367 17Leasing – 22 23 –Consumer:
Credit cards 1,107 – – 989Personal 923 22 – 6Auto – 11 – –Other 71 – – 4
Total 2,158 124 395 1,071
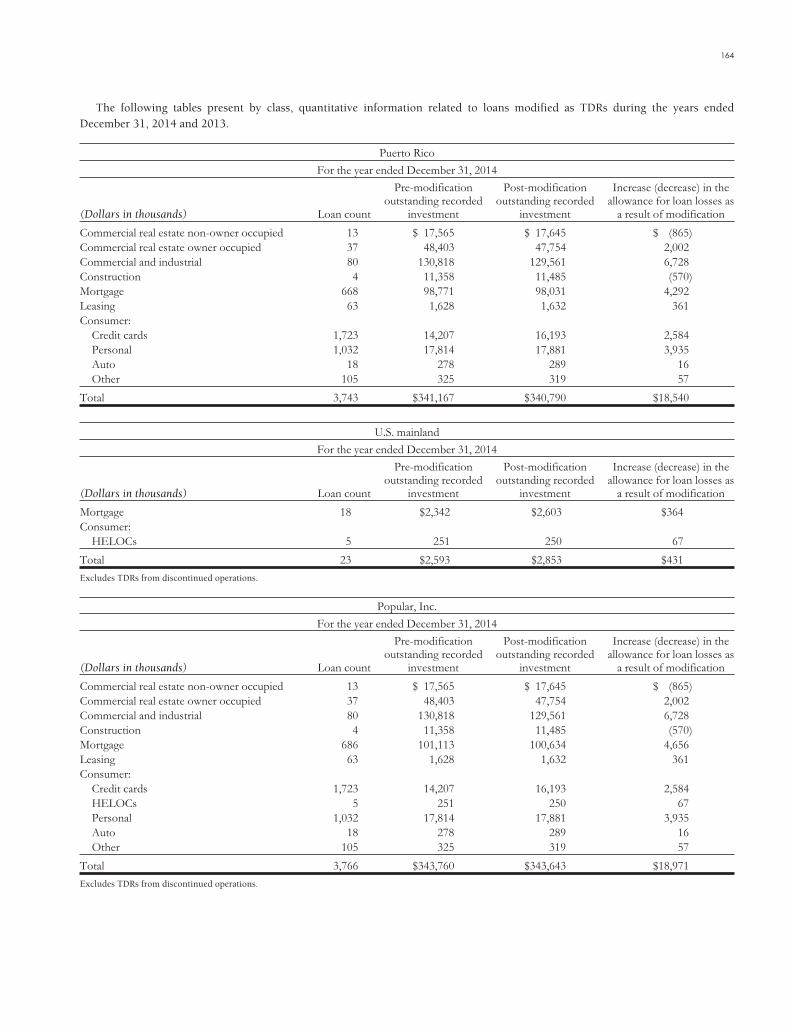
164
The following tables present by class, quantitative information related to loans modified as TDRs during the years endedDecember 31, 2014 and 2013.
Puerto Rico
For the year ended December 31, 2014
(Dollars in thousands) Loan count
Pre-modificationoutstanding recorded
investment
Post-modificationoutstanding recorded
investment
Increase (decrease) in theallowance for loan losses as
a result of modification
Commercial real estate non-owner occupied 13 $ 17,565 $ 17,645 $ (865)Commercial real estate owner occupied 37 48,403 47,754 2,002Commercial and industrial 80 130,818 129,561 6,728Construction 4 11,358 11,485 (570)Mortgage 668 98,771 98,031 4,292Leasing 63 1,628 1,632 361Consumer:
Credit cards 1,723 14,207 16,193 2,584Personal 1,032 17,814 17,881 3,935Auto 18 278 289 16Other 105 325 319 57
Total 3,743 $341,167 $340,790 $18,540
U.S. mainland
For the year ended December 31, 2014
(Dollars in thousands) Loan count
Pre-modificationoutstanding recorded
investment
Post-modificationoutstanding recorded
investment
Increase (decrease) in theallowance for loan losses as
a result of modification
Mortgage 18 $2,342 $2,603 $364Consumer:
HELOCs 5 251 250 67
Total 23 $2,593 $2,853 $431
Excludes TDRs from discontinued operations.
Popular, Inc.
For the year ended December 31, 2014
(Dollars in thousands) Loan count
Pre-modificationoutstanding recorded
investment
Post-modificationoutstanding recorded
investment
Increase (decrease) in theallowance for loan losses as
a result of modification
Commercial real estate non-owner occupied 13 $ 17,565 $ 17,645 $ (865)Commercial real estate owner occupied 37 48,403 47,754 2,002Commercial and industrial 80 130,818 129,561 6,728Construction 4 11,358 11,485 (570)Mortgage 686 101,113 100,634 4,656Leasing 63 1,628 1,632 361Consumer:
Credit cards 1,723 14,207 16,193 2,584HELOCs 5 251 250 67Personal 1,032 17,814 17,881 3,935Auto 18 278 289 16Other 105 325 319 57
Total 3,766 $343,760 $343,643 $18,971
Excludes TDRs from discontinued operations.

165 POPULAR, INC. 2014 ANNUAL REPORT
Puerto Rico
For the year ended December 31, 2013
(Dollars in thousands) Loan count
Pre-modificationoutstanding recorded
investment
Post-modificationoutstanding recorded
investment
Increase (decrease) in theallowance for loan losses as
a result of modification
Commercial real estate non-owner occupied 10 $ 10,729 $ 9,194 $ (7)Commercial real estate owner occupied 55 29,975 25,629 (1,047)Commercial and industrial 46 15,947 14,855 (253)Mortgage 422 72,899 76,839 8,869Leasing 45 928 900 271Consumer:
Credit cards 2,096 16,622 19,810 2,380Personal 951 15,474 15,507 3,864Auto 11 122 199 15Other 75 267 264 36
Total 3,711 $162,963 $163,197 $14,128
U.S. mainland
For the year ended December 31, 2013
(Dollars in thousands) Loan count
Pre-modificationoutstanding recorded
investment
Post-modificationoutstanding recorded
investment
Increase (decrease) in theallowance for loan losses as
a result of modification
Commercial real estate non-owner occupied 6 $ 4,798 $4,552 $ (65)Commercial real estate owner occupied 2 1,263 836 (144)Commercial and industrial 1 2,125 1,060 (216)Mortgage 28 3,240 3,395 1,099
Total 37 $11,426 $9,843 $ 674
Popular, Inc.
For the year ended December 31, 2013
(Dollars in thousands) Loan count
Pre-modificationoutstanding recorded
investment
Post-modificationoutstanding recorded
investment
Increase (decrease) in theallowance for loan losses as
a result of modification
Commercial real estate non-owner occupied 16 $ 15,527 $ 13,746 $ (72)Commercial real estate owner occupied 57 31,238 26,465 (1,191)Commercial and industrial 47 18,072 15,915 (469)Mortgage 450 76,139 80,234 9,968Leasing 45 928 900 271Consumer:
Credit cards 2,096 16,622 19,810 2,380Personal 951 15,474 15,507 3,864Auto 11 122 199 15Other 75 267 264 36
Total 3,748 $174,389 $173,040 $14,802
During the years ended December 31, 2014 and 2013, sixloans with an aggregate unpaid principal balance of $10.1million and six loans of $165 million, respectively, wererestructured into multiple notes (“Note A / B split”). TheCorporation recorded $2.1 million charge-offs as part of thoseloan restructurings during the year ended December 31, 2014(December 31, 2013 - $26.6 million). The restructuring of
those loans was made after analyzing the borrowers’ capacity torepay the debt, collateral and ability to perform under themodified terms. The recorded investment on those commercialTDRs amounted to approximately $2.9 million at December 31,2014 (December 31, 2013 - $130 million) with a relatedallowance for loan losses amounting to approximately $166thousand (December 31, 2013 - $64 million).

166
The following tables present by class, TDRs that weresubject to payment default and that had been modified as aTDR during the twelve months preceding the default date.Payment default is defined as a restructured loan becoming 90days past due after being modified, foreclosed or charged-off,
whichever occurs first. The recorded investment atDecember 31, 2014 is inclusive of all partial paydowns andcharge-offs since the modification date. Loans modified as aTDR that were fully paid down, charged-off or foreclosed uponby period end are not reported.
Puerto Rico
Defaulted during the year ended December 31, 2014
(Dollars In thousands) Loan count Recorded investment as of first default date
Commercial real estate non-owner occupied 3 $ 433Commercial real estate owner occupied 5 1,191Commercial and industrial 5 609Construction 1 952Mortgage 125 22,819Leasing 8 72Consumer:
Credit cards 465 4,176Personal 101 1,331Auto 14 255
Total [1] 727 $31,838
[1] Excludes loans for which the Corporation has entered into liquidation agreements with borrowers and guarantors and is accepting payments which differ from thecontractual payment schedule. The Corporation considers these as defaulted loans and does not intent to return them to accrual status.
U.S. mainland
Defaulted during the year ended December 31, 2014
(Dollars In thousands) Loan count Recorded investment as of first default date
Commercial real estate non-owner occupied 1 $ 907Mortgage 1 110
Total 2 $1,017
Popular, Inc.
Defaulted during the year ended December 31, 2014
(Dollars In thousands) Loan count Recorded investment as of first default date
Commercial real estate non-owner occupied 4 $ 1,340Commercial real estate owner occupied 5 1,191Commercial and industrial 5 609Construction 1 952Mortgage 126 22,929Leasing 8 72Consumer:
Credit cards 465 4,176Personal 101 1,331Auto 14 255
Total 729 $32,855
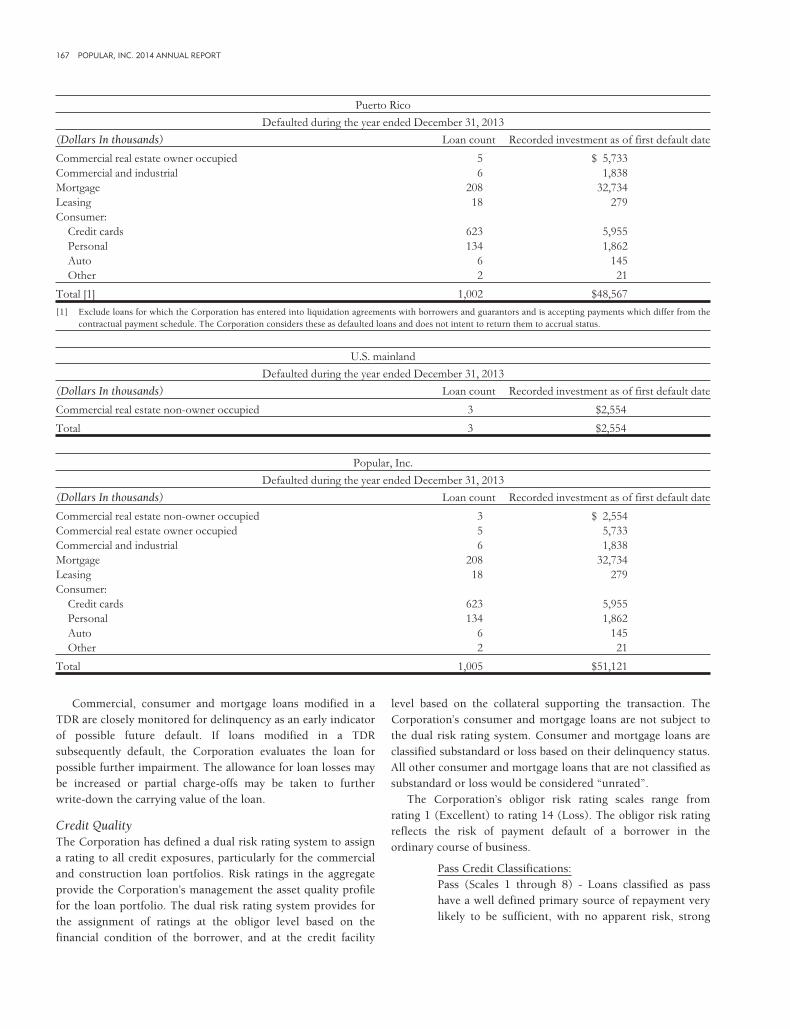
167 POPULAR, INC. 2014 ANNUAL REPORT
Puerto Rico
Defaulted during the year ended December 31, 2013
(Dollars In thousands) Loan count Recorded investment as of first default date
Commercial real estate owner occupied 5 $ 5,733Commercial and industrial 6 1,838Mortgage 208 32,734Leasing 18 279Consumer:
Credit cards 623 5,955Personal 134 1,862Auto 6 145Other 2 21
Total [1] 1,002 $48,567
[1] Exclude loans for which the Corporation has entered into liquidation agreements with borrowers and guarantors and is accepting payments which differ from thecontractual payment schedule. The Corporation considers these as defaulted loans and does not intent to return them to accrual status.
U.S. mainland
Defaulted during the year ended December 31, 2013
(Dollars In thousands) Loan count Recorded investment as of first default date
Commercial real estate non-owner occupied 3 $2,554
Total 3 $2,554
Popular, Inc.
Defaulted during the year ended December 31, 2013
(Dollars In thousands) Loan count Recorded investment as of first default date
Commercial real estate non-owner occupied 3 $ 2,554Commercial real estate owner occupied 5 5,733Commercial and industrial 6 1,838Mortgage 208 32,734Leasing 18 279Consumer:
Credit cards 623 5,955Personal 134 1,862Auto 6 145Other 2 21
Total 1,005 $51,121
Commercial, consumer and mortgage loans modified in aTDR are closely monitored for delinquency as an early indicatorof possible future default. If loans modified in a TDRsubsequently default, the Corporation evaluates the loan forpossible further impairment. The allowance for loan losses maybe increased or partial charge-offs may be taken to furtherwrite-down the carrying value of the loan.
Credit QualityThe Corporation has defined a dual risk rating system to assigna rating to all credit exposures, particularly for the commercialand construction loan portfolios. Risk ratings in the aggregateprovide the Corporation’s management the asset quality profilefor the loan portfolio. The dual risk rating system provides forthe assignment of ratings at the obligor level based on thefinancial condition of the borrower, and at the credit facility
level based on the collateral supporting the transaction. TheCorporation’s consumer and mortgage loans are not subject tothe dual risk rating system. Consumer and mortgage loans areclassified substandard or loss based on their delinquency status.All other consumer and mortgage loans that are not classified assubstandard or loss would be considered “unrated”.
The Corporation’s obligor risk rating scales range fromrating 1 (Excellent) to rating 14 (Loss). The obligor risk ratingreflects the risk of payment default of a borrower in theordinary course of business.
Pass Credit Classifications:Pass (Scales 1 through 8) - Loans classified as passhave a well defined primary source of repayment verylikely to be sufficient, with no apparent risk, strong

168
financial position, minimal operating risk,profitability, liquidity and capitalization better thanindustry standards.
Watch (Scale 9) - Loans classified as watch haveacceptable business credit, but borrower’s operations,cash flow or financial condition evidence more thanaverage risk, requires above average levels ofsupervision and attention from Loan Officers.
Special Mention (Scale 10) - Loans classified as specialmention have potential weaknesses that deservemanagement’s close attention. If left uncorrected,these potential weaknesses may result in deteriorationof the repayment prospects for the loan or of theCorporation’s credit position at some future date.
Adversely Classified Classifications:Substandard (Scales 11 and 12) - Loans classified assubstandard are deemed to be inadequately protectedby the current net worth and payment capacity of theobligor or of the collateral pledged, if any. Loansclassified as such have well-defined weaknesses thatjeopardize the liquidation of the debt. They arecharacterized by the distinct possibility that theinstitution will sustain some loss if the deficiencies arenot corrected.
Doubtful (Scale 13) - Loans classified as doubtful haveall the weaknesses inherent in those classified assubstandard, with the additional characteristic that theweaknesses make the collection or liquidation in full,on the basis of currently existing facts, conditions, andvalues, highly questionable and improbable.
Loss (Scale 14) - Uncollectible and of such little valuethat continuance as a bankable asset is not warranted.This classification does not mean that the asset hasabsolutely no recovery or salvage value, but rather it isnot practical or desirable to defer writing off this asseteven though partial recovery may be effected in thefuture.
Risk ratings scales 10 through 14 conform to regulatoryratings. The assignment of the obligor risk rating is based onrelevant information about the ability of borrowers to servicetheir debts such as current financial information, historicalpayment experience, credit documentation, public information,and current economic trends, among other factors.
The Corporation periodically reviews loans classified aswatch or worse, to evaluate if they are properly classified, andto determine impairment, if any. The frequency of these reviewswill depend on the amount of the aggregate outstanding debt,and the risk rating classification of the obligor. In addition,during the renewal process of applicable credit facilities, theCorporation evaluates the corresponding loan grades.
Loans classified as pass credits are excluded from the scopeof the review process described above until: (a) they becomepast due; (b) management becomes aware of deterioration inthe creditworthiness of the borrower; or (c) the customercontacts the Corporation for a modification. In thesecircumstances, the credit facilities are specifically evaluated toassign the appropriate risk rating classification.
The Corporation has a Credit Process Review Group withinthe Corporate Credit Risk Management Division (“CCRMD”),which performs annual comprehensive credit process reviewsof several middle markets, construction, asset-based andcorporate banking lending groups in BPPR. This groupevaluates the credit risk profile of each originating unit alongwith each unit’s credit administration effectiveness, includingthe assessment of the risk rating representative of the currentcredit quality of the loans, and the evaluation of collateraldocumentation. The monitoring performed by this groupcontributes to assess compliance with credit policies andunderwriting standards, determine the current level of creditrisk, evaluate the effectiveness of the credit managementprocess and identify control deficiencies that may arise in thecredit-granting process. Based on its findings, the CreditProcess Review Group recommends corrective actions, ifnecessary, that help in maintaining a sound credit process.CCRMD has contracted an outside loan review firm to performthe credit process reviews for the portfolios of commercial andconstruction loans in the U.S. mainland operations. TheCCRMD participates in defining the review plan with theoutside loan review firm and actively participates in thediscussions of the results of the loan reviews with the businessunits. The CCRMD may periodically review the workperformed by the outside loan review firm. CCRMD reports theresults of the credit process reviews to the Risk ManagementCommittee of the Corporation’s Board of Directors.

169 POPULAR, INC. 2014 ANNUAL REPORT
The following table presents the outstanding balance, net of unearned income, of non-covered loans held-in-portfolio based onthe Corporation’s assignment of obligor risk ratings as defined at December 31, 2014 and 2013.
December 31, 2014
(In thousands) WatchSpecial
Mention Substandard Doubtful Loss Sub-totalPass/
Unrated Total
Puerto Rico [1]Commercial multi-family $ 2,306 $ 5,021 $ 3,186 $ – $ – $ 10,513 $ 69,564 $ 80,077Commercial real estate non-owner occupied 171,771 144,104 169,900 – – 485,775 1,527,804 2,013,579Commercial real estate owner occupied 212,236 144,536 306,014 3,595 – 666,381 806,981 1,473,362Commercial and industrial 421,332 367,834 272,880 849 255 1,063,150 1,744,635 2,807,785
Total Commercial 807,645 661,495 751,980 4,444 255 2,225,819 4,148,984 6,374,803Construction 4,612 6,204 16,908 – – 27,724 131,660 159,384Mortgage – – 218,680 – – 218,680 5,231,821 5,450,501Leasing – – 3,102 – – 3,102 561,287 564,389Consumer:
Credit cards – – 21,070 – – 21,070 1,119,094 1,140,164HELOCs – – 8,186 – 7 8,193 5,207 13,400Personal – – 8,380 – 77 8,457 1,254,076 1,262,533Auto – – 11,348 – 40 11,388 755,908 767,296Other – – 2,130 – 1,735 3,865 201,779 205,644Total Consumer – – 51,114 – 1,859 52,973 3,336,064 3,389,037
Total Puerto Rico $812,257 $667,699 $1,041,784 $4,444 $2,114 $2,528,298 $13,409,816 $15,938,114
U.S. mainland [2]Commercial multi-family $ 11,283 $ 6,818 $ 13,653 $ – $ – $ 31,754 $ 375,449 $ 407,203Commercial real estate non-owner occupied 17,424 8,745 13,446 – – 39,615 472,952 512,567Commercial real estate owner occupied 24,284 4,707 4,672 – – 33,663 160,242 193,905Commercial and industrial 5,357 2,548 7,988 – – 15,893 629,896 645,789
Total Commercial 58,348 22,818 39,759 – – 120,925 1,638,539 1,759,464Construction – – – – – – 92,436 92,436Mortgage – – 23,100 – – 23,100 1,029,285 1,052,385Legacy 7,902 2,491 9,204 – – 19,597 61,221 80,818Consumer:
Credit cards – – – – – – 15,065 15,065HELOCs – – 2,457 – 1,632 4,089 348,673 352,762Personal – – 571 – 835 1,406 111,513 112,919Auto – – – – – – 73 73Other – – 7 – – 7 408 415Total Consumer – – 3,035 – 2,467 5,502 475,732 481,234
Total U.S. mainland $ 66,250 $ 25,309 $ 75,098 $ – $2,467 $ 169,124 $ 3,297,213 $ 3,466,337
Popular, Inc.Commercial multi-family $ 13,589 $ 11,839 $ 16,839 $ – $ – $ 42,267 $ 445,013 $ 487,280Commercial real estate non-owner occupied 189,195 152,849 183,346 – – 525,390 2,000,756 2,526,146Commercial real estate owner occupied 236,520 149,243 310,686 3,595 – 700,044 967,223 1,667,267Commercial and industrial 426,689 370,382 280,868 849 255 1,079,043 2,374,531 3,453,574
Total Commercial 865,993 684,313 791,739 4,444 255 2,346,744 5,787,523 8,134,267Construction 4,612 6,204 16,908 – – 27,724 224,096 251,820Mortgage – – 241,780 – – 241,780 6,261,106 6,502,886Legacy 7,902 2,491 9,204 – – 19,597 61,221 80,818Leasing – – 3,102 – – 3,102 561,287 564,389Consumer:
Credit cards – – 21,070 – – 21,070 1,134,159 1,155,229HELOCs – – 10,643 – 1,639 12,282 353,880 366,162Personal – – 8,951 – 912 9,863 1,365,589 1,375,452Auto – – 11,348 – 40 11,388 755,981 767,369Other – – 2,137 – 1,735 3,872 202,187 206,059Total Consumer – – 54,149 – 4,326 58,475 3,811,796 3,870,271
Total Popular, Inc. $878,507 $693,008 $1,116,882 $4,444 $4,581 $2,697,422 $16,707,029 $19,404,451

170
The following table presents the weighted average obligor risk rating at December 31, 2014 for those classifications thatconsider a range of rating scales.
Weighted average obligor risk ratingPuerto Rico: [1]
(Scales 11 and 12)Substandard
(Scales 1 through 8)Pass
Commercial multi-family 11.69 5.63Commercial real estate non-owner occupied 11.20 6.83Commercial real estate owner occupied 11.28 6.96Commercial and industrial 11.48 6.89
Total Commercial 11.33 6.87
Construction 11.82 7.43
U.S. mainland: [2] Substandard Pass
Commercial multi-family 11.00 7.24Commercial real estate non-owner occupied 11.00 6.83Commercial real estate owner occupied 11.17 7.04Commercial and industrial 11.09 6.29
Total Commercial 11.04 6.74
Construction – 7.76
Legacy 11.11 7.70
[1] Excludes covered loans acquired in the Westernbank FDIC-assisted transaction.
[2] Excludes discontinued operations.
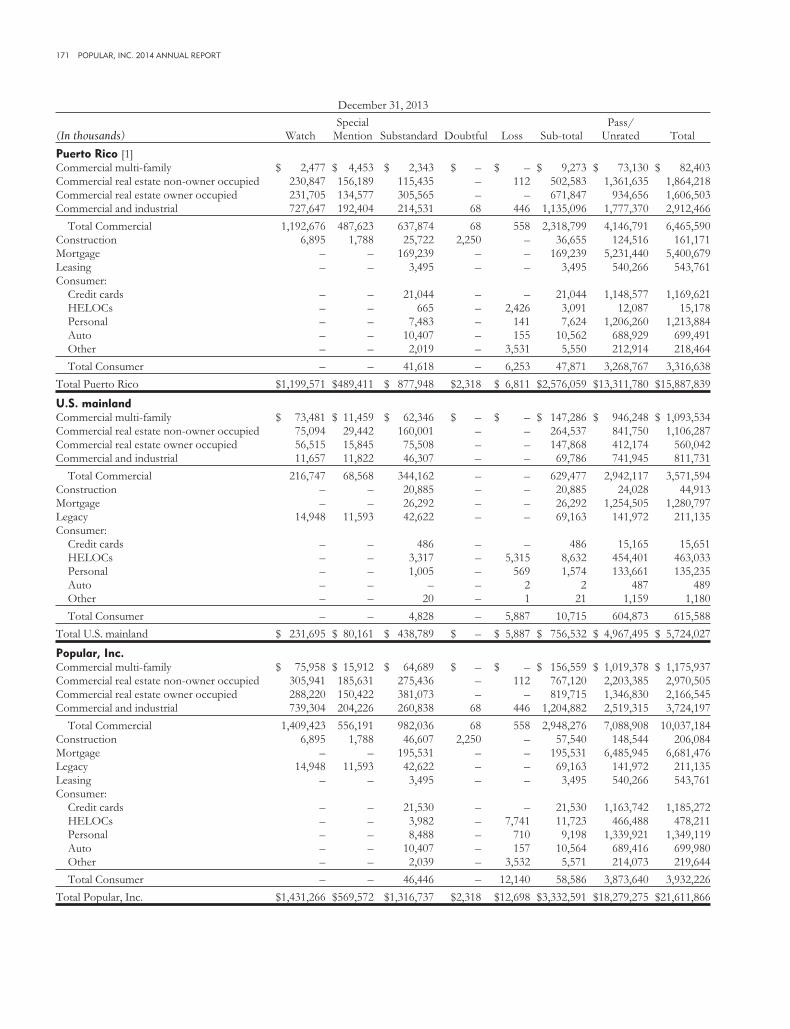
171 POPULAR, INC. 2014 ANNUAL REPORT
December 31, 2013
(In thousands) WatchSpecial
Mention Substandard Doubtful Loss Sub-totalPass/
Unrated Total
Puerto Rico [1]Commercial multi-family $ 2,477 $ 4,453 $ 2,343 $ – $ – $ 9,273 $ 73,130 $ 82,403Commercial real estate non-owner occupied 230,847 156,189 115,435 – 112 502,583 1,361,635 1,864,218Commercial real estate owner occupied 231,705 134,577 305,565 – – 671,847 934,656 1,606,503Commercial and industrial 727,647 192,404 214,531 68 446 1,135,096 1,777,370 2,912,466
Total Commercial 1,192,676 487,623 637,874 68 558 2,318,799 4,146,791 6,465,590Construction 6,895 1,788 25,722 2,250 – 36,655 124,516 161,171Mortgage – – 169,239 – – 169,239 5,231,440 5,400,679Leasing – – 3,495 – – 3,495 540,266 543,761Consumer:
Credit cards – – 21,044 – – 21,044 1,148,577 1,169,621HELOCs – – 665 – 2,426 3,091 12,087 15,178Personal – – 7,483 – 141 7,624 1,206,260 1,213,884Auto – – 10,407 – 155 10,562 688,929 699,491Other – – 2,019 – 3,531 5,550 212,914 218,464
Total Consumer – – 41,618 – 6,253 47,871 3,268,767 3,316,638
Total Puerto Rico $1,199,571 $489,411 $ 877,948 $2,318 $ 6,811 $2,576,059 $13,311,780 $15,887,839
U.S. mainlandCommercial multi-family $ 73,481 $ 11,459 $ 62,346 $ – $ – $ 147,286 $ 946,248 $ 1,093,534Commercial real estate non-owner occupied 75,094 29,442 160,001 – – 264,537 841,750 1,106,287Commercial real estate owner occupied 56,515 15,845 75,508 – – 147,868 412,174 560,042Commercial and industrial 11,657 11,822 46,307 – – 69,786 741,945 811,731
Total Commercial 216,747 68,568 344,162 – – 629,477 2,942,117 3,571,594Construction – – 20,885 – – 20,885 24,028 44,913Mortgage – – 26,292 – – 26,292 1,254,505 1,280,797Legacy 14,948 11,593 42,622 – – 69,163 141,972 211,135Consumer:
Credit cards – – 486 – – 486 15,165 15,651HELOCs – – 3,317 – 5,315 8,632 454,401 463,033Personal – – 1,005 – 569 1,574 133,661 135,235Auto – – – – 2 2 487 489Other – – 20 – 1 21 1,159 1,180
Total Consumer – – 4,828 – 5,887 10,715 604,873 615,588
Total U.S. mainland $ 231,695 $ 80,161 $ 438,789 $ – $ 5,887 $ 756,532 $ 4,967,495 $ 5,724,027
Popular, Inc.Commercial multi-family $ 75,958 $ 15,912 $ 64,689 $ – $ – $ 156,559 $ 1,019,378 $ 1,175,937Commercial real estate non-owner occupied 305,941 185,631 275,436 – 112 767,120 2,203,385 2,970,505Commercial real estate owner occupied 288,220 150,422 381,073 – – 819,715 1,346,830 2,166,545Commercial and industrial 739,304 204,226 260,838 68 446 1,204,882 2,519,315 3,724,197
Total Commercial 1,409,423 556,191 982,036 68 558 2,948,276 7,088,908 10,037,184Construction 6,895 1,788 46,607 2,250 – 57,540 148,544 206,084Mortgage – – 195,531 – – 195,531 6,485,945 6,681,476Legacy 14,948 11,593 42,622 – – 69,163 141,972 211,135Leasing – – 3,495 – – 3,495 540,266 543,761Consumer:
Credit cards – – 21,530 – – 21,530 1,163,742 1,185,272HELOCs – – 3,982 – 7,741 11,723 466,488 478,211Personal – – 8,488 – 710 9,198 1,339,921 1,349,119Auto – – 10,407 – 157 10,564 689,416 699,980Other – – 2,039 – 3,532 5,571 214,073 219,644
Total Consumer – – 46,446 – 12,140 58,586 3,873,640 3,932,226
Total Popular, Inc. $1,431,266 $569,572 $1,316,737 $2,318 $12,698 $3,332,591 $18,279,275 $21,611,866

172
The following table presents the weighted average obligor risk rating at December 31, 2013 for those classifications thatconsider a range of rating scales.
Weighted average obligor risk ratingPuerto Rico: [1]
(Scales 11 and 12)Substandard
(Scales 1 through 8)Pass
Commercial multi-family 11.33 5.31Commercial real estate non-owner occupied 11.38 6.73Commercial real estate owner occupied 11.31 6.89Commercial and industrial 11.34 6.63
Total Commercial 11.33 6.71
Construction 11.63 7.86
U.S. mainland: Substandard Pass
Commercial multi-family 11.34 7.08Commercial real estate non-owner occupied 11.27 6.89Commercial real estate owner occupied 11.31 7.04Commercial and industrial 11.09 6.53
Total Commercial 11.27 6.89
Construction 11.27 7.64
Legacy 11.24 7.72
[1] Excludes covered loans acquired in the Westernbank FDIC-assisted transaction.
Note 13 – FDIC loss share asset and true-up paymentobligationIn connection with the Westernbank FDIC-assisted transaction,BPPR entered into loss share agreements with the FDIC withrespect to the covered loans and other real estate owned.Pursuant to the terms of the loss share agreements, the FDIC’sobligation to reimburse BPPR for losses with respect to coveredassets begins with the first dollar of loss incurred. The FDICreimburses BPPR for 80% of losses with respect to coveredassets, and BPPR reimburses the FDIC for 80% of recoverieswith respect to losses for which the FDIC paid 80%reimbursement under loss share agreements. The loss share
agreement applicable to single-family residential mortgageloans provides for FDIC loss and recoveries sharing for tenyears expiring at the end of the quarter ending June 30, 2020.The loss share agreement applicable to commercial (includingconstruction) and consumer loans provides for FDIC losssharing for five years expiring at the end of the quarter endingJune 30, 2015 and BPPR reimbursement to the FDIC for eightyears expiring at the end of the quarter ending June 30, 2018,in each case, on the same terms and conditions as describedabove.
The following table sets forth the activity in the FDIC lossshare asset for the periods presented.
Years ended December 31,
(In thousands) 2014 2013 2012
Balance at beginning of year $ 948,608 $1,399,098 $1,915,128Amortization of loss share indemnification asset (189,959) (161,635) (129,676)Reversal of accelerated amortization 12,492 – –Credit impairment losses to be covered under loss sharing agreements 32,038 60,454 58,187Reimbursable expenses 58,117 50,985 30,771Decrease due to reciprocal accounting on amortization of contingent liability on unfunded
commitments – (473) (969)Payments from FDIC under loss sharing agreements (269,397) (396,223) (462,016)Other adjustments attributable to FDIC loss sharing agreements (193) (3,598) (12,327)
Balance at end of period 591,706 948,608 1,399,098
Balance due to the FDIC for recoveries on covered assets (49,252) (39,194) (16,763)
Net balance of indemnity asset and amounts due from the FDIC $ 542,454 $ 909,414 $1,382,335

173 POPULAR, INC. 2014 ANNUAL REPORT
As discussed in Note 1, the FDIC indemnity assetamortization for the year ended December 31, 2014 included abenefit of approximately $12.5 million to reverse the impact ofaccelerated amortization expense recorded in prior periods.This amount will be recognized as expense over the remainingportion of the loss sharing agreement that expires in the quarterending June 30, 2015.
During 2014, the Corporation revised its analysis ofexpected cash flows which resulted in a net decrease inestimated credit losses, which was driven mainly by certaincommercial loan pools. Though this will have a positive impacton the Corporation’s interest accretion in future periods, thecarrying value of the indemnification asset was amortized toreflect lower levels of expected losses. This amortization isrecognized over the shorter of the remaining life of the loanpools, which had an average life of approximately six years, orthe indemnification asset, which expires at June 30, 2015, forcommercial, construction and consumer loans and June 30,2020 for single-family residential mortgage loans.
The following table presents the weighted average life of theloan portfolios subject to the FDIC loss sharing agreement atDecember 31, 2014 and December 31, 2013.
Weighted Average Life
December 31, 2014 December 31, 2013
Commercial 5.87 years 6.43 yearsConsumer 5.76 3.13Construction 0.99 1.30Mortgage 7.30 6.91
As part of the loss share agreement, BPPR agreed to make atrue-up payment obligation (the “true-up payment”) to theFDIC on the date that is 45 days following the last day (the“true-up measurement date”) of the final shared loss month, orupon the final disposition of all covered assets under the losssharing agreements in the event losses on the loss sharingagreements fail to reach expected levels. The estimated fairvalue of such true-up payment obligation is recorded ascontingent consideration, which is included in the caption ofother liabilities in the consolidated statements of financialcondition. Under the loss sharing agreements, BPPR will pay tothe FDIC 50% of the excess, if any, of: (i) 20% of the intrinsicloss estimate of $4.6 billion (or $925 million) (as determined bythe FDIC) less (ii) the sum of: (A) 25% of the asset discount(per bid) (or ($1.1 billion)); plus (B) 25% of the cumulativeshared-loss payments (defined as the aggregate of all of thepayments made or payable to BPPR minus the aggregate of allof the payments made or payable to the FDIC); plus (C) thesum of the period servicing amounts for every consecutivetwelve-month period prior to and ending on the true-upmeasurement date in respect of each of the loss sharingagreements during which the loss sharing provisions of theapplicable loss sharing agreement is in effect (defined as the
product of the simple average of the principal amount of sharedloss loans and shared loss assets at the beginning and end ofsuch period times 1%).
The following table provides the fair value and theundiscounted amount of the true-up payment obligation atDecember 31, 2014 and 2013.
(In thousands) December 31, 2014 December 31, 2013
Carrying amount (fairvalue) $129,304 $127,513
Undiscounted amount $187,238 $185,372
The loss share agreements contain specific terms andconditions regarding the management of the covered assets thatBPPR must follow in order to receive reimbursement on lossesfrom the FDIC. Under the loss share agreements, BPPR must:
• manage and administer the covered assets and collect andeffect charge-offs and recoveries with respect to suchcovered assets in a manner consistent with its usual andprudent business and banking practices and, with respectto single family shared-loss loans, the procedures(including collection procedures) customarily employedby BPPR in servicing and administering mortgage loansfor its own account and the servicing proceduresestablished by FNMA or the Federal Home Loan MortgageCorporation (“FHLMC”), as in effect from time to time,and in accordance with accepted mortgage servicingpractices of prudent lending institutions;
• exercise its best judgment in managing, administering andcollecting amounts on covered assets and effecting charge-offs with respect to the covered assets;
• use commercially reasonable efforts to maximizerecoveries with respect to losses on single family shared-loss assets and best efforts to maximize collections withrespect to commercial shared-loss assets;
• retain sufficient staff to perform the duties under the lossshare agreements;
• adopt and implement accounting, reporting, record-keeping and similar systems with respect to thecommercial shared-loss assets;
• comply with the terms of the modification guidelinesapproved by the FDIC or another federal agency for anysingle-family shared-loss loan;
• provide notice with respect to proposed transactionspursuant to which a third party or affiliate will manage,administer or collect any commercial shared-loss assets;
• file monthly and quarterly certificates with the FDICspecifying the amount of losses, charge-offs andrecoveries; and

174
• maintain books and records sufficient to ensure anddocument compliance with the terms of the loss shareagreements.
Refer to Note 31, Commitment and Contingencies, foradditional information on the settlement of the arbitrationproceedings with the FDIC regarding the commercial loss shareagreement.
Note 14 – Mortgage banking activitiesIncome from mortgage banking activities includes mortgageservicing fees earned in connection with administeringresidential mortgage loans and valuation adjustments onmortgage servicing rights. It also includes gain on sales andsecuritizations of residential mortgage loans and trading gainsand losses on derivative contracts used to hedge theCorporation’s securitization activities. In addition, lower-of-cost-or-market valuation adjustments to residential mortgageloans held for sale, if any, are recorded as part of the mortgagebanking activities.
The following table presents the components of mortgage banking activities:
Years ended December 31,
(In thousands) 2014 2013 2012
Mortgage servicing fees, net of fair value adjustments:Mortgage servicing fees $41,761 $45,465 $48,156
Mortgage servicing rights fair value adjustments (24,683) (11,403) (17,406)
Total mortgage servicing fees, net of fair value adjustments 17,078 34,062 30,750
Net gain on sale of loans, including valuation on loans held for sale 31,213 26,719 76,181
Trading account profit (loss):
Unrealized (losses) gains on outstanding derivative positions (726) 746 304Realized (losses) gains on closed derivative positions (16,950) 10,130 (22,464)
Total trading account (loss) profit (17,676) 10,876 (22,160)
Total mortgage banking activities $30,615 $71,657 $84,771
Note 15 – Transfers of financial assets and servicing assetsThe Corporation typically transfers conforming residentialmortgage loans in conjunction with GNMA, FNMA andFHLMC securitization transactions whereby the loans areexchanged for cash or securities and servicing rights. Thesecurities issued through these transactions are guaranteed bythe corresponding agency and, as such, under seller/serviceagreements the Corporation is required to service the loans inaccordance with the agencies’ servicing guidelines andstandards. Substantially, all mortgage loans securitized by theCorporation in GNMA, FNMA and FHLMC securities havefixed rates and represent conforming loans. As seller, the
Corporation has made certain representations and warrantieswith respect to the originally transferred loans and, in the past,has sold certain loans with credit recourse to a government-sponsored entity, namely FNMA. Refer to Note 30 to theconsolidated financial statements for a description of sucharrangements.
No liabilities were incurred as a result of these securitizationsduring the years ended December 31, 2014 and 2013 because theydid not contain any credit recourse arrangements. TheCorporation recorded a net gain of $32.8 million and $37.3million, respectively, during the years ended December 31, 2014and 2013 related to the residential mortgage loan securitized.
The following tables present the initial fair value of the assets obtained as proceeds from residential mortgage loans securitizedduring the years ended December 31, 2014 and 2013:
Proceeds obtained during the year ended December 31, 2014
(In thousands) Level 1 Level 2 Level 3 Initial fair value
Assets
Trading account securities:Mortgage-backed securities - GNMA – $674,557 – $674,557Mortgage-backed securities - FNMA – 225,047 – 225,047
Total trading account securities – $899,604 – $899,604Mortgage servicing rights – – $11,560 $11,560Total – $899,604 $11,560 $911,164

175 POPULAR, INC. 2014 ANNUAL REPORT
Proceeds obtained during the year ended December 31, 2013
(In thousands) Level 1 Level 2 Level 3 Initial fair value
Assets
Trading account securities:Mortgage-backed securities - GNMA – $919,980 – $919,980Mortgage-backed securities - FNMA – 438,236 – 438,236Mortgage-backed securities - FHLMC – 33,378 – 33,378
Total trading account securities – $1,391,594 – $1,391,594
Mortgage servicing rights – – $17,639 $17,639
Total – $1,391,594 $17,639 $1,409,233
During the year ended December 31, 2014 the Corporationretained servicing rights on whole loan sales involvingapproximately $86 million in principal balance outstanding(2013 - $152 million), with net realized gains of approximately$3.2 million (2013 - $5.3 million). All loan sales performedduring the year ended December 31, 2014 and 2013 werewithout credit recourse agreements.
The Corporation recognizes as assets the rights to serviceloans for others, whether these rights are purchased or resultfrom asset transfers such as sales and securitizations. Thesemortgage servicing rights (“MSR”) are measured at fair value.
The Corporation uses a discounted cash flow model toestimate the fair value of MSRs. The discounted cash flowmodel incorporates assumptions that market participants woulduse in estimating future net servicing income, includingestimates of prepayment speeds, discount rate, cost to service,escrow account earnings, contractual servicing fee income,prepayment and late fees, among other considerations.Prepayment speeds are adjusted for the Corporation’s loancharacteristics and portfolio behavior.
The following table presents the changes in MSRs measuredusing the fair value method for the years ended December 31,2014 and 2013.
Residential MSRs
(In thousands) 2014 2013
Fair value at beginning of period $161,099 $154,430Purchases – 45Servicing from securitizations or asset
transfers 12,583 19,262Changes due to payments on loans[1] (15,887) (22,556)Reduction due to loan repurchases (2,759) (3,871)Changes in fair value due to changes in
valuation model inputs or assumptions (6,127) 15,024Other disposals (215) (1,235)
Fair value at end of period $148,694 $161,099
[1] Represents the change due to collection / realization of expected cash flowover time.
Residential mortgage loans serviced for others were $15.6billion at December 31, 2014 (2013 - $16.3 billion).
Net mortgage servicing fees, a component of mortgagebanking activities in the consolidated statements of operations,include the changes from period to period in the fair value ofthe MSRs, including changes due to collection / realization ofexpected cash flows. Mortgage servicing fees, excluding fairvalue adjustments, for the year ended December 31, 2014amounted to $41.8 million (2013 - $45.5 million; 2012 - $48.2million). The banking subsidiaries receive servicing fees basedon a percentage of the outstanding loan balance. AtDecember 31, 2014, those weighted average mortgage servicingfees were 0.26% (2013 – 0.27%). Under these servicingagreements, the banking subsidiaries do not generally earnsignificant prepayment penalty fees on the underlying loansserviced.
The section below includes information on assumptionsused in the valuation model of the MSRs, originated andpurchased.
Key economic assumptions used in measuring the servicingrights derived from loans securitized or sold by the Corporationduring the years ended December 31, 2014 and 2013 were asfollows:
Years ended
December 31, 2014 December 31, 2013
Prepayment speed 6.1% 6.6%Weighted average life 16.4 years 15.2 yearsDiscount rate (annual
rate) 10.8% 11.0%
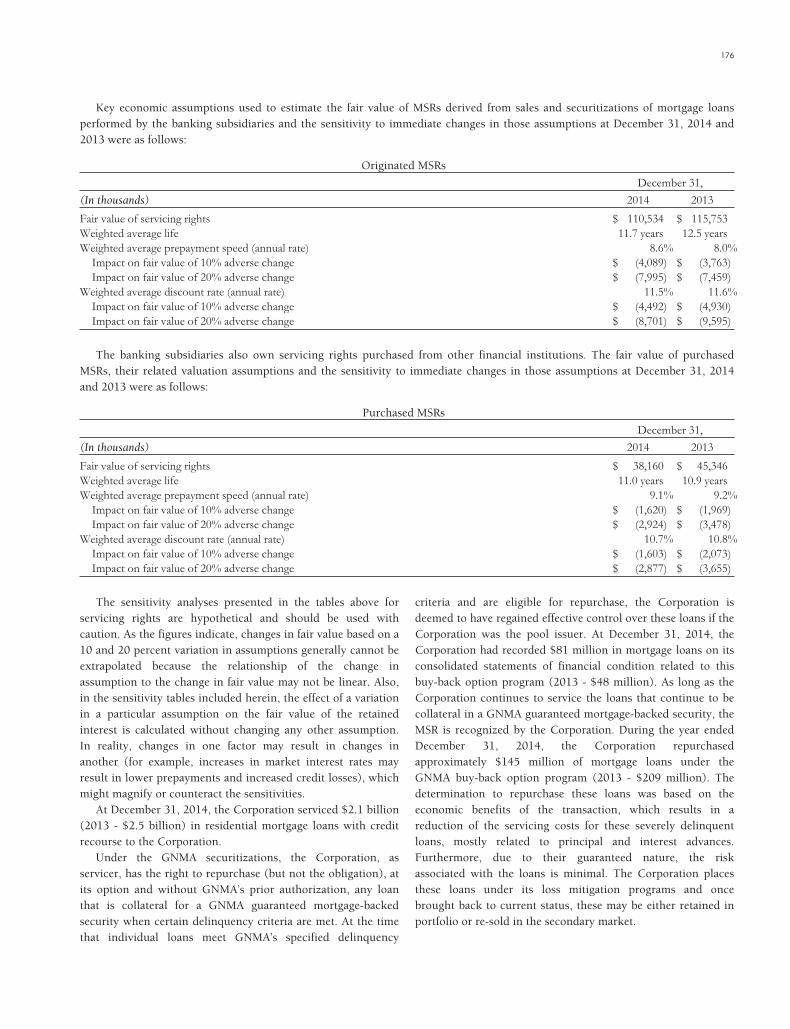
176
Key economic assumptions used to estimate the fair value of MSRs derived from sales and securitizations of mortgage loansperformed by the banking subsidiaries and the sensitivity to immediate changes in those assumptions at December 31, 2014 and2013 were as follows:
Originated MSRs
December 31,
(In thousands) 2014 2013
Fair value of servicing rights $ 110,534 $ 115,753Weighted average life 11.7 years 12.5 yearsWeighted average prepayment speed (annual rate) 8.6% 8.0%
Impact on fair value of 10% adverse change $ (4,089) $ (3,763)Impact on fair value of 20% adverse change $ (7,995) $ (7,459)
Weighted average discount rate (annual rate) 11.5% 11.6%Impact on fair value of 10% adverse change $ (4,492) $ (4,930)Impact on fair value of 20% adverse change $ (8,701) $ (9,595)
The banking subsidiaries also own servicing rights purchased from other financial institutions. The fair value of purchasedMSRs, their related valuation assumptions and the sensitivity to immediate changes in those assumptions at December 31, 2014and 2013 were as follows:
Purchased MSRs
December 31,
(In thousands) 2014 2013
Fair value of servicing rights $ 38,160 $ 45,346Weighted average life 11.0 years 10.9 yearsWeighted average prepayment speed (annual rate) 9.1% 9.2%
Impact on fair value of 10% adverse change $ (1,620) $ (1,969)Impact on fair value of 20% adverse change $ (2,924) $ (3,478)
Weighted average discount rate (annual rate) 10.7% 10.8%Impact on fair value of 10% adverse change $ (1,603) $ (2,073)Impact on fair value of 20% adverse change $ (2,877) $ (3,655)
The sensitivity analyses presented in the tables above forservicing rights are hypothetical and should be used withcaution. As the figures indicate, changes in fair value based on a10 and 20 percent variation in assumptions generally cannot beextrapolated because the relationship of the change inassumption to the change in fair value may not be linear. Also,in the sensitivity tables included herein, the effect of a variationin a particular assumption on the fair value of the retainedinterest is calculated without changing any other assumption.In reality, changes in one factor may result in changes inanother (for example, increases in market interest rates mayresult in lower prepayments and increased credit losses), whichmight magnify or counteract the sensitivities.
At December 31, 2014, the Corporation serviced $2.1 billion(2013 - $2.5 billion) in residential mortgage loans with creditrecourse to the Corporation.
Under the GNMA securitizations, the Corporation, asservicer, has the right to repurchase (but not the obligation), atits option and without GNMA’s prior authorization, any loanthat is collateral for a GNMA guaranteed mortgage-backedsecurity when certain delinquency criteria are met. At the timethat individual loans meet GNMA’s specified delinquency
criteria and are eligible for repurchase, the Corporation isdeemed to have regained effective control over these loans if theCorporation was the pool issuer. At December 31, 2014, theCorporation had recorded $81 million in mortgage loans on itsconsolidated statements of financial condition related to thisbuy-back option program (2013 - $48 million). As long as theCorporation continues to service the loans that continue to becollateral in a GNMA guaranteed mortgage-backed security, theMSR is recognized by the Corporation. During the year endedDecember 31, 2014, the Corporation repurchasedapproximately $145 million of mortgage loans under theGNMA buy-back option program (2013 - $209 million). Thedetermination to repurchase these loans was based on theeconomic benefits of the transaction, which results in areduction of the servicing costs for these severely delinquentloans, mostly related to principal and interest advances.Furthermore, due to their guaranteed nature, the riskassociated with the loans is minimal. The Corporation placesthese loans under its loss mitigation programs and oncebrought back to current status, these may be either retained inportfolio or re-sold in the secondary market.

177 POPULAR, INC. 2014 ANNUAL REPORT
The Corporation also has the rights to service a portfolio of Small Business Administration (“SBA”) commercial loans. The SBAservicing rights are measured at the lower of cost or fair value method. The following table presents the activity in the SBAservicing rights for the years ended December 31, 2014 and 2013. During 2014 and 2013, the Corporation did not execute any saleof SBA loans.
(In thousands) 2014 2013
Balance at beginning of year $ 440 $ 695Amortization (180) (255)
Balance at end of year $ 260 $ 440
Fair value at end of year $1,016 $1,609
SBA loans serviced for others were $427 million atDecember 31, 2014 (2013 - $451 million).
In 2014 weighted average servicing fees on the SBA servicedloans were approximately 1.00% (2013 - 1.02%).
Key economic assumptions used to estimate the fair value ofSBA loans and the sensitivity to immediate changes in thoseassumptions were as follows:
SBA Loans
(In thousands) 2014 2013
Carrying amount of retained interests $ 260 $ 440Fair value of retained interests $ 1,016 $ 1,609Weighted average life 2.8 years 3.0 yearsWeighted average prepayment speed (annual rate) 7.9% 7.2%
Impact on fair value of 10% adverse change $ (18) $ (27)Impact on fair value of 20% adverse change $ (38) $ (56)
Weighted average discount rate (annual rate) 13.0% 13.0%Impact on fair value of 10% adverse change $ (28) $ (46)Impact on fair value of 20% adverse change $ (57) $ (94)
Quantitative information about delinquencies, net creditlosses, and components of securitized financial assets and otherassets managed together with them by the Corporation,including its own loan portfolio, for the years ended
December 31, 2014 and 2013, are disclosed in the followingtables. Loans securitized/sold represent loans in which theCorporation has continuing involvement in the form of creditrecourse.
2014
(In thousands)Total principal amount of
loans, net of unearnedPrincipal amount 60 days
or more past dueNet credit losses
(recoveries)
Loans (owned and managed):Commercial $ 8,134,576 $ 278,326 $ 53,990Construction 251,820 13,812 (3,746)Legacy 81,137 3,476 (892)Lease financing 564,389 4,348 3,961Mortgage 8,741,757 1,164,513 54,041Consumer 3,875,581 99,595 109,737Covered loans 2,542,662 540,369 66,154Less:
Loans securitized / sold (2,138,705) (183,876) (1,314)Loans held-for-sale (106,104) (19,878) (35,674)
Loans held-in-portfolio $21,947,113 $1,900,685 $246,257

178
2013
(In thousands)Total principal amount of
loans, net of unearnedPrincipal amount 60 days
or more past dueNet credit losses
(recoveries)
Loans (owned and managed):Commercial $10,037,787 $ 305,488 $270,266Construction 206,084 23,771 (6,796)Legacy 211,135 17,148 (2,583)Lease financing 543,761 5,102 3,506Mortgage 9,315,454 1,033,419 260,682Consumer 3,932,226 95,329 96,971Covered loans 2,984,427 771,662 76,210Less:
Loans securitized / sold (2,524,155) (196,590) (5,641)Loans held-for-sale (110,426) (1,184) (362,645)
Loans held-in-portfolio $ 24,596,293 $ 2,054,145 $ 329,970
Note 16 - Premises and equipmentThe premises and equipment are stated at cost less accumulated depreciation and amortization as follows:
(In thousands) Useful life in years 2014 2013
Land $115,176 $110,453
Buildings 10-50 483,983 500,474Equipment 2-10 290,444 305,814Leasehold improvements 3-10 69,443 86,020
843,870 892,308Less - Accumulated depreciation and amortization 475,162 488,497
Subtotal 368,708 403,811
Construction in progress 10,697 5,252
Total premises and equipment, net $494,581 $519,516
Depreciation and amortization of premises and equipment forthe year 2014 was $47.1 million (2013 -$48.2 million; 2012 -$46.7 million), of which $23.8 million (2013 - $24.8 million;2012 - $24.2 million) was charged to occupancy expense and
$23.3 million (2013 - $23.4 million; 2012 - $22.5 million) wascharged to equipment, communications and other operatingexpenses. Occupancy expense is net of rental income of $28.1million (2013 - $26.6 million; 2012 - $22.9 million).
Note 17 - Other real estate ownedThe following tables present the other real estate owned activity, for the years ended December 31, 2014, 2013 and 2012.
For the year ended December 31, 2014
(In thousands)
Non-coveredOREO
Commercial/ Construction
Non-coveredOREO
Mortgage
CoveredOREO
Commercial/ Construction
CoveredOREO
Mortgage Total
Balance at beginning of period $ 48,649 $ 86,852 $120,215 $ 47,792 $ 303,508Write-downs in value (7,112) (3,628) (26,657) (4,969) (42,366)Additions 16,200 65,300 55,582 21,769 158,851Sales (20,042) (49,618) (59,219) (19,028) (147,907)Other adjustments 1,288 (2,389) (4,527) (692) (6,320)
Ending balance $ 38,983 $ 96,517 $ 85,394 $ 44,872 $ 265,766

179 POPULAR, INC. 2014 ANNUAL REPORT
For the year ended December 31, 2013
(In thousands)
Non-coveredOREO
Commercial/Construction
Non-coveredOREO
Mortgage
CoveredOREO
Commercial/ Construction
CoveredOREO
Mortgage Total
Balance at beginning of period $ 135,862 $ 130,982 $ 99,398 $ 39,660 $ 405,902Write-downs in value (11,377) (9,525) (18,857) (4,102) (43,861)Additions 32,175 82,985 87,800 30,037 232,997Sales (108,254) (118,596) (48,447) (17,720) (293,017)Other adjustments 243 1,006 321 (83) 1,487
Ending balance $ 48,649 $ 86,852 $120,215 $ 47,792 $ 303,508
For the year ended December 31, 2012
(In thousands)
Non-coveredOREO
Commercial/ Construction
Non-coveredOREO
Mortgage
CoveredOREO
Commercial/ Construction
CoveredOREO
Mortgage Total
Balance at beginning of period $ 90,230 $ 82,267 $ 77,776 $ 31,359 $ 281,632Write-downs in value (13,727) (10,823) (7,466) (767) (32,783)Additions 110,947 108,312 60,920 23,195 303,374Sales (51,422) (46,091) (32,022) (13,122) (142,657)Other adjustments (166) (2,683) 190 (1,005) (3,664)
Ending balance $135,862 $130,982 $ 99,398 $ 39,660 $ 405,902
Note 18 - Other assetsThe caption of other assets in the consolidatedstatements of financial condition consists of the followingmajor categories:
(In thousands) 2014 2013
Net deferred tax assets (net of valuationallowance) $ 812,819 $ 761,768
Investments under the equity method 225,625 197,006Bank-owned life insurance program – 228,805Prepaid FDIC insurance assessment 360 383Prepaid taxes 198,120 91,504Other prepaid expenses 83,719 67,108Derivative assets 25,362 34,710Trades receivables from brokers and
counterparties 66,949 71,680Others 233,489 234,594
Total other assets $1,646,443 $1,687,558
On February 1, 2014, BHD, the Corporation’s equity methodinvestee based in the Dominican Republic, completed a mergertransaction in which it acquired the net assets of CentroFinanciero León. Centro Financiero León was the holdingcompany of Banco León, the fourth largest bank in terms ofassets in the Dominican Republic. In connection with thetransaction, BHD issued additional shares which diluted theCorporation’s equity participation from 19.99% to 15.79%. As aresult of this transaction, the Corporation recognized a net gainof $14.2 million during the first quarter of 2014, due to BHD’sincrease in net assets. The gain was partially offset byapproximately $7.7 million resulting from the reclassification
from other comprehensive income into earnings of thecumulative foreign currency translation adjustment due to thereduction in the Corporation’s ownership percentage. As ofDecember 31, 2014, the Corporation had a 15.82% equityparticipation and continues to have significant influence overBHD León. Accordingly, this investment is accounted for underthe equity method and is evaluated for impairment if events orcircumstances indicate that a decrease in value of theinvestment has occurred that is other than temporary.
On September 25, 2014, BPNA surrendered its bank ownedlife insurance contracts, which had a balance of $231.2 millionat the time of the transaction. BPNA received approximately$231.4 million in satisfaction of its surrender request. Thetransaction resulted in a gain of $0.1 million.
Prepaid taxes at December 31, 2014 include payments of$45 million in income taxes in connection with the ClosingAgreement signed with the Puerto Rico Department of Treasuryon June 30, 2014, and $25.7 million of unamortized corporatepersonal property tax and municipal tax paid during the secondquarter of 2014.
Note 19 - Investments in equity investeesDuring the year ended December 31, 2014, the Corporationrecorded pre-tax earnings of $39,6 million, from its equityinvestments, compared to $42.9 million for the year endedDecember 31, 2013. The carrying value of the Corporation’sequity method investments was $226 million and $197 millionat December 31, 2014 and 2013, respectively.

180
The following table presents aggregated summarized financial information of the Corporation’s equity method investees:
Years ended December 31, 2014 2013 2012
(in thousands)
Operating results:Total revenues $715,966 $1,302,637 $796,185Total expenses 343,100 1,024,713 570,450Income tax (benefit) expense 43,993 39,301 (36,914)
Net income $328,873 $ 238,623 $262,649
At December 31, 2014 2013
(in thousands)
Balance Sheet:Total assets $7,421,225 $5,987,802
Total liabilities $5,182,478 $4,036,484
Summarized financial information for these investees may bepresented on a lag, due to the unavailability of information forthe investees, at the respective balance sheet dates.
Note 20 - Goodwill and other intangible assetsThe changes in the carrying amount of goodwill for the years ended December 31, 2014, and 2013, allocated by reportablesegments and corporate group, were as follows (refer to Note 45 for the definition of the Corporation’s reportable segments):
2014
(In thousands)Balance at
January 1, 2014Goodwill onacquisition
Purchaseaccountingadjustments
Goodwill written offrelated to discontinued
operations Other
Balance atDecember 31,
2014
Banco Popular de Puerto Rico $245,679 $4,430 $– $ – $– $250,109Banco Popular North America 402,078 – – (186,511) – 215,567
Total Popular, Inc. $647,757 $4,430 $– $(186,511) $– $465,676
2013
(In thousands)Balance at
January 1, 2013Goodwill onacquisition
Purchaseaccountingadjustments Other
Balance atDecember 31, 2013
Banco Popular de Puerto Rico $245,679 $– $– $– $245,679Banco Popular North America 402,078 – – – 402,078
Total Popular, Inc. $647,757 $– $– $– $647,757
The goodwill acquired during 2014 of $4.4 million was relatedto the acquisition of an insurance benefits business.
Goodwill Impairment TestAs discussed in Note 4, Discontinued Operations, on April 22,2014, BPNA entered into definitive agreements to sell itsregional operations in California, Illinois and Central Florida tothree different buyers. In connection with the transactions, theCorporation is relocating certain back office operations toPuerto Rico and New York. During the second quarter of 2014,the assets and liabilities for those regions were reclassified asheld-for-sale in accordance with ASC 360-10-45. As a result ofthe reclassification, and in accordance with ASC 350-20-40,BPNA allocated a proportionate share of the goodwill balance tothe discontinued businesses on a relative fair value basis andperformed an impairment test for the goodwill allocated to eachof the discontinued operations as well as for retained business,
each as a separate reporting unit. This allocation of goodwilland related impairment analysis resulted in an impairmentcharge of $186.5 million during the second quarter of 2014.The goodwill impairment charge is a non-cash charge that didnot have an impact on the Corporation’s tangible capital orregulatory capital ratios. The goodwill impairment analysis ofthe retained portion of the BPNA operations resulted in noimpairment as of June 30, 2014.
The methodology used to determine the relative value of theregions sold and the retained portion of the BPNA reportingunit for purpose of the goodwill allocation among thesereporting units takes into consideration the fair value estimatesresulting from a combination of: (1) the average price totangible book multiple based on a regression analysis of theprojected return on equity for comparable companies, (2) theaverage price to revenue multiple based on a regression analysisof the projected revenue margin for comparable companies, and

181 POPULAR, INC. 2014 ANNUAL REPORT
(3) the average price to earnings multiple based on comparablecompanies. After allocating the carrying amount of goodwill tothe regions sold and the retained portion, the Corporationperformed the goodwill impairment test of ASC 350-20 to eachregion sold and to the retained business reporting unit. The fairvalue of each region was based on the transaction price agreedwith the buyers as part of the step 2 of the goodwill impairmentanalysis. This fair value was compared to the fair value of the
assets and liabilities sold including any unrecognized intangibleasset. The goodwill impairment analysis of the regions soldindicated that all the goodwill allocated to each region sold wasimpaired, and accordingly, the Corporation recorded animpairment charge of $186.5 million during the second quarterof 2014.
The following table presents the gross amount of goodwilland accumulated impairment losses by reportable segments.
December 31, 2014
(In thousands)
Balance atJanuary 1,
2014(gross amounts)
Accumulatedimpairment
losses
Balance atJanuary 1,
2014(net amounts)
Balance atDecember 31,
2014(gross amounts)
Accumulatedimpairment
losses
Balance atDecember 31,
2014(net amounts)
Banco Popular de Puerto Rico $245,679 $ – $245,679 $250,109 $ – $250,109Banco Popular North America 566,489 164,411 402,078 379,978 164,411 215,567
Total Popular, Inc. $812,168 $164,411 $647,757 $630,087 $164,411 $465,676
December 31, 2013
(In thousands)
Balance atJanuary 1,
2013(gross amounts)
Accumulatedimpairment
losses
Balance atJanuary 1,
2013(net amounts)
Balance atDecember 31,
2013(gross amounts)
Accumulatedimpairment
losses
Balance atDecember 31,
2013(net amounts)
Banco Popular de Puerto Rico $245,679 $ – $245,679 $245,679 $ – $245,679Banco Popular North America 566,489 164,411 402,078 566,489 164,411 402,078
Total Popular, Inc. $812,168 $164,411 $647,757 $812,168 $164,411 $647,757
The accumulated impairment losses in the BPNA reportable segment are associated with E-LOAN.At December 31, 2014 and 2013, the Corporation had $ 6 million of identifiable intangible assets, with indefinite useful lives,
mostly associated with E-LOAN’s trademark.The following table reflects the components of other intangible assets subject to amortization:
(In thousands)
GrossCarryingAmount
AccumulatedAmortization
NetCarrying
Value
December 31, 2014Core deposits $50,679 $32,006 $18,673Other customer relationships 19,452 6,644 12,808
Total other intangible assets $70,131 $38,650 $31,481
December 31, 2013Core deposits $77,885 $51,737 $26,148Other customer relationships 17,555 4,712 12,843Other intangibles 135 107 28
Total other intangible assets $95,575 $56,556 $39,019
During the year ended 2014 the Corporation acquired $1.9million in other customer relationships intangible assets relatedto the purchase of the above mentioned insurance benefitsbusiness, which are to be amortized to operating expenses overa 5-year period. During the year ended 2013, the Corporationrecognized $720 thousand of other customer relationshipintangible assets associated with the purchase of a dwelling andflood insurance portfolio.
Core deposits and other intangibles with gross amount of $27million became fully amortized during 2014 and, as such, theirgross amount and accumulated amortization were eliminated fromthe tabular disclosure presented in the preceding table.
During the year ended December 31, 2014, the Corporationrecognized $ 8.2 million in amortization expense related toother intangible assets with definite useful lives (2013 - $ 8.0million; 2012 - $ 8.2 million).

182
The following table presents the estimated amortization ofthe intangible assets with definite useful lives for each of thefollowing periods:
(In thousands)
Year 2015 $7,607Year 2016 7,322Year 2017 4,574Year 2018 4,481Year 2019 4,285
Results of the Goodwill Impairment TestThe Corporation’s goodwill and other identifiable intangibleassets having an indefinite useful life are tested for impairmentat least annually and on a more frequent basis if events orcircumstances indicate impairment could have taken place.Such events could include, among others, a significant adversechange in the business climate, an adverse action by a regulator,an unanticipated change in the competitive environment and adecision to change the operations or dispose of a reporting unit.
Under applicable accounting standards, goodwillimpairment analysis is a two-step test. The first step of thegoodwill impairment test involves comparing the fair value ofthe reporting unit with its carrying amount, including goodwill.If the fair value of the reporting unit exceeds its carryingamount, goodwill of the reporting unit is considered notimpaired; however, if the carrying amount of the reporting unitexceeds its fair value, the second step must be performed. Thesecond step involves calculating an implied fair value ofgoodwill for each reporting unit for which the first stepindicated possible impairment. The implied fair value ofgoodwill is determined in the same manner as the amount ofgoodwill recognized in a business combination, which is theexcess of the fair value of the reporting unit, as determined inthe first step, over the aggregate fair values of the individualassets, liabilities and identifiable intangibles (including anyunrecognized intangible assets, such as unrecognized coredeposits and trademark) as if the reporting unit was beingacquired in a business combination and the fair value of thereporting unit was the price paid to acquire the reporting unit.The Corporation estimates the fair values of the assets andliabilities of a reporting unit, consistent with the requirementsof the fair value measurements accounting standard, whichdefines fair value as the price that would be received to sell anasset or paid to transfer a liability in an orderly transactionbetween market participants at the measurement date. The fairvalue of the assets and liabilities reflects market conditions,thus volatility in prices could have a material impact on thedetermination of the implied fair value of the reporting unitgoodwill at the impairment test date. The adjustments tomeasure the assets, liabilities and intangibles at fair value arefor the purpose of measuring the implied fair value of goodwilland such adjustments are not reflected in the consolidated
statement of financial condition. If the implied fair value ofgoodwill exceeds the goodwill assigned to the reporting unit,there is no impairment. If the goodwill assigned to a reportingunit exceeds the implied fair value of the goodwill, animpairment charge is recorded for the excess. An impairmentloss recognized cannot exceed the amount of goodwill assignedto a reporting unit, and the loss establishes a new basis in thegoodwill. Subsequent reversal of goodwill impairment losses isnot permitted under applicable accounting standards.
The Corporation performed the annual goodwill impairmentevaluation for the entire organization during the third quarterof 2014 using July 31, 2014 as the annual evaluation date. Thereporting units utilized for this evaluation were those that areone level below the business segments, which are the legalentities within the reportable segment. The Corporation assignsgoodwill to the reporting units when carrying out a businesscombination.
In determining the fair value of a reporting unit, theCorporation generally uses a combination of methods,including market price multiples of comparable companies andtransactions, as well as discounted cash flow analysis.Management evaluates the particular circumstances of eachreporting unit in order to determine the most appropriatevaluation methodology. The Corporation evaluates the resultsobtained under each valuation methodology to identify andunderstand the key value drivers in order to ascertain that theresults obtained are reasonable and appropriate under thecircumstances. Elements considered include current marketand economic conditions, developments in specific lines ofbusiness, and any particular features in the individual reportingunits.
The computations require management to make estimatesand assumptions. Critical assumptions that are used as part ofthese evaluations include:
• a selection of comparable publicly traded companies,based on nature of business, location and size;
• a selection of comparable acquisition and capital raisingtransactions;
• the discount rate applied to future earnings, based on anestimate of the cost of equity;
• the potential future earnings of the reporting unit; and
• the market growth and new business assumptions.
For purposes of the market comparable approach, valuationswere determined by calculating average price multiples ofrelevant value drivers from a group of companies that arecomparable to the reporting unit being analyzed and applyingthose price multiples to the value drivers of the reporting unit.Multiples used are minority based multiples and thus, nocontrol premium adjustment is made to the comparablecompanies market multiples. While the market price multiple isnot an assumption, a presumption that it provides an indicator
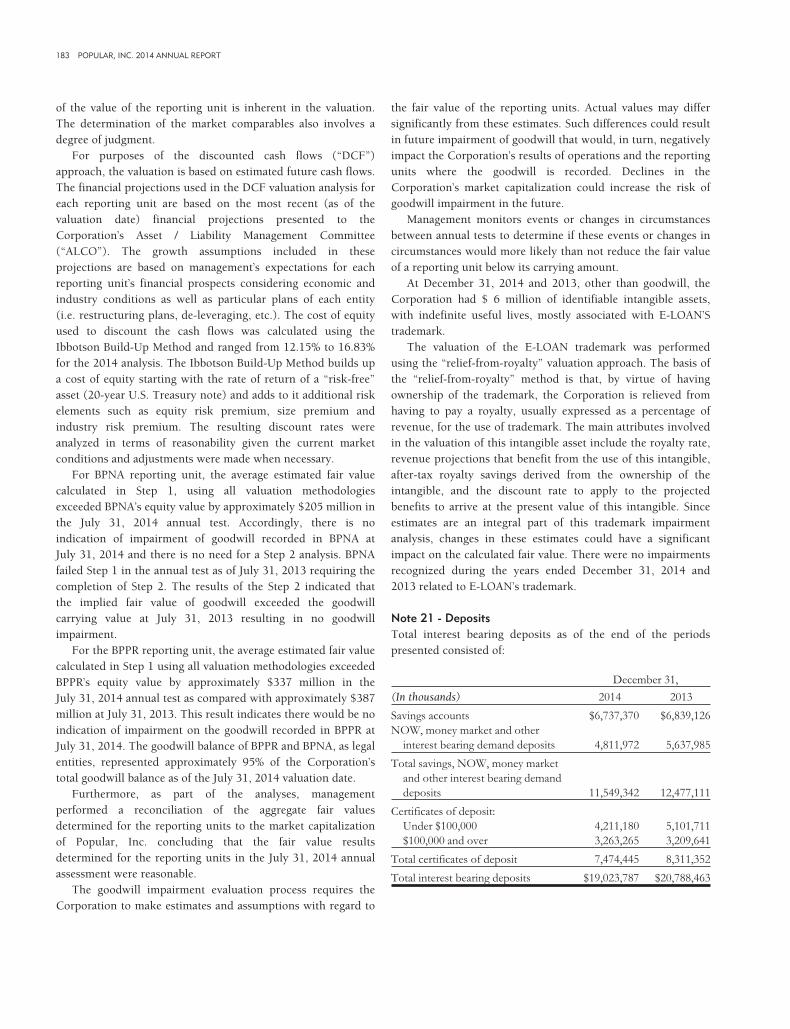
183 POPULAR, INC. 2014 ANNUAL REPORT
of the value of the reporting unit is inherent in the valuation.The determination of the market comparables also involves adegree of judgment.
For purposes of the discounted cash flows (“DCF”)approach, the valuation is based on estimated future cash flows.The financial projections used in the DCF valuation analysis foreach reporting unit are based on the most recent (as of thevaluation date) financial projections presented to theCorporation’s Asset / Liability Management Committee(“ALCO”). The growth assumptions included in theseprojections are based on management’s expectations for eachreporting unit’s financial prospects considering economic andindustry conditions as well as particular plans of each entity(i.e. restructuring plans, de-leveraging, etc.). The cost of equityused to discount the cash flows was calculated using theIbbotson Build-Up Method and ranged from 12.15% to 16.83%for the 2014 analysis. The Ibbotson Build-Up Method builds upa cost of equity starting with the rate of return of a “risk-free”asset (20-year U.S. Treasury note) and adds to it additional riskelements such as equity risk premium, size premium andindustry risk premium. The resulting discount rates wereanalyzed in terms of reasonability given the current marketconditions and adjustments were made when necessary.
For BPNA reporting unit, the average estimated fair valuecalculated in Step 1, using all valuation methodologiesexceeded BPNA’s equity value by approximately $205 million inthe July 31, 2014 annual test. Accordingly, there is noindication of impairment of goodwill recorded in BPNA atJuly 31, 2014 and there is no need for a Step 2 analysis. BPNAfailed Step 1 in the annual test as of July 31, 2013 requiring thecompletion of Step 2. The results of the Step 2 indicated thatthe implied fair value of goodwill exceeded the goodwillcarrying value at July 31, 2013 resulting in no goodwillimpairment.
For the BPPR reporting unit, the average estimated fair valuecalculated in Step 1 using all valuation methodologies exceededBPPR’s equity value by approximately $337 million in theJuly 31, 2014 annual test as compared with approximately $387million at July 31, 2013. This result indicates there would be noindication of impairment on the goodwill recorded in BPPR atJuly 31, 2014. The goodwill balance of BPPR and BPNA, as legalentities, represented approximately 95% of the Corporation’stotal goodwill balance as of the July 31, 2014 valuation date.
Furthermore, as part of the analyses, managementperformed a reconciliation of the aggregate fair valuesdetermined for the reporting units to the market capitalizationof Popular, Inc. concluding that the fair value resultsdetermined for the reporting units in the July 31, 2014 annualassessment were reasonable.
The goodwill impairment evaluation process requires theCorporation to make estimates and assumptions with regard to
the fair value of the reporting units. Actual values may differsignificantly from these estimates. Such differences could resultin future impairment of goodwill that would, in turn, negativelyimpact the Corporation’s results of operations and the reportingunits where the goodwill is recorded. Declines in theCorporation’s market capitalization could increase the risk ofgoodwill impairment in the future.
Management monitors events or changes in circumstancesbetween annual tests to determine if these events or changes incircumstances would more likely than not reduce the fair valueof a reporting unit below its carrying amount.
At December 31, 2014 and 2013, other than goodwill, theCorporation had $ 6 million of identifiable intangible assets,with indefinite useful lives, mostly associated with E-LOAN’Strademark.
The valuation of the E-LOAN trademark was performedusing the “relief-from-royalty” valuation approach. The basis ofthe “relief-from-royalty” method is that, by virtue of havingownership of the trademark, the Corporation is relieved fromhaving to pay a royalty, usually expressed as a percentage ofrevenue, for the use of trademark. The main attributes involvedin the valuation of this intangible asset include the royalty rate,revenue projections that benefit from the use of this intangible,after-tax royalty savings derived from the ownership of theintangible, and the discount rate to apply to the projectedbenefits to arrive at the present value of this intangible. Sinceestimates are an integral part of this trademark impairmentanalysis, changes in these estimates could have a significantimpact on the calculated fair value. There were no impairmentsrecognized during the years ended December 31, 2014 and2013 related to E-LOAN’s trademark.
Note 21 - DepositsTotal interest bearing deposits as of the end of the periodspresented consisted of:
December 31,
(In thousands) 2014 2013
Savings accounts $6,737,370 $6,839,126NOW, money market and other
interest bearing demand deposits 4,811,972 5,637,985
Total savings, NOW, money marketand other interest bearing demanddeposits 11,549,342 12,477,111
Certificates of deposit:Under $100,000 4,211,180 5,101,711$100,000 and over 3,263,265 3,209,641
Total certificates of deposit 7,474,445 8,311,352
Total interest bearing deposits $19,023,787 $20,788,463

184
A summary of certificates of deposit by maturity atDecember 31, 2014 follows:
(In thousands)
2015 $5,011,2622016 958,2462017 572,7062018 363,6912019 495,9312020 and thereafter 72,609
Total certificates of deposit $7,474,445
At December 31, 2014, the Corporation had brokereddeposits amounting to $ 1.9 billion (2013 - $ 2.4 billion).
The aggregate amount of overdrafts in demand depositaccounts that were reclassified to loans was $9 million atDecember 31, 2014 (2013 - $10 million).
Note 22 - Federal funds purchased and assets sold underagreements to repurchaseThe following table summarizes certain information on federalfunds purchased and assets sold under agreements torepurchase at December 31, 2014 and 2013:
(Dollars in thousands) 2014 2013
Federal funds purchased $ 100,000 $ –Assets sold under agreements to
repurchase 1,171,657 1,659,292
Total federal funds purchased andassets sold under agreements torepurchase $1,271,657 $1,659,292
Maximum aggregate balanceoutstanding at any month-end $2,208,213 $2,269,565
Average monthly aggregate balanceoutstanding $1,732,199 $1,842,879
Weighted average interest rate:For the year 3.85% 1.92%At December 31 0.62% 2.07%
The repurchase agreements outstanding at December 31,2014 were collateralized by $ 1.0 billion in investmentsecurities available for sale and $ 81 million in tradingsecurities, compared with $ 1.3 billion in investment securitiesavailable for sale, $ 309 million in trading securities and $70 million in securities sold not yet delivered classified as otherassets at December 31, 2013. It is the Corporation’s policy tomaintain effective control over assets sold under agreements torepurchase; accordingly, such securities continue to be carriedon the consolidated statement of financial condition.
In addition, there were repurchase agreements outstandingcollateralized by $ 146 million at December 31, 2014 and$ 189 million at December 31, 2013, in securities purchasedunderlying agreements to resell to which the Corporation hasthe right to repledge. It is the Corporation’s policy to takepossession of securities purchased under agreements to resell.However, the counterparties to such agreements maintaineffective control over such securities, and accordingly are notreflected in the Corporation’s consolidated statements offinancial condition.

185 POPULAR, INC. 2014 ANNUAL REPORT
The following table presents the liability associated with therepurchase transactions (including accrued interest), theirmaturities and weighted average interest rates. Also, it includesthe carrying value and approximate market value of thecollateral (including accrued interest) at December 31, 2014
and 2013. The information excludes repurchase agreementtransactions which were collateralized with securities or otherassets held-for-trading purposes or which have been obtainedunder agreements to resell.
2014 2013
(Dollars in thousands)Repurchase
liability
Carryingvalue ofcollateral
Marketvalue ofcollateral
Repurchaseliability
weightedaverage
interest rateRepurchase
liability
Carryingvalue ofcollateral
Marketvalue ofcollateral
Repurchaseliability
weightedaverage
interest rate
Obligations of U.S. governmentsponsored entitiesWithin 30 days $210,292 $ 220,229 $ 220,229 0.36% $ 64,109 $ 67,721 $ 67,721 0.23%After 30 to 90 days 25,765 27,349 27,349 0.34 – – – –After 90 days 420,602 448,992 448,992 0.44 156,092 177,031 177,031 4.89
Total obligations of U.S. governmentsponsored entities 656,659 696,570 696,570 0.41 220,201 244,752 244,752 3.53
Mortgage-backed securitiesWithin 30 days 3,227 3,612 3,612 0.40 23,998 26,591 26,591 0.46After 90 days 166,226 183,782 183,782 1.25 240,313 286,166 286,166 3.61
Total mortgage-backed securities 169,453 187,394 187,394 1.23 264,311 312,757 312,757 3.32
Collateralized mortgage obligationsWithin 30 days 15,277 19,087 19,087 0.27 235,306 267,120 267,120 0.39After 30 to 90 days 55,427 59,472 59,472 0.56 103,754 114,643 114,643 0.44After 90 days 71,448 78,683 78,683 0.60 322,881 370,197 370,197 4.24
Total collateralized mortgageobligations 142,152 157,242 157,242 0.55 661,941 751,960 751,960 2.28
Total $968,264 $1,041,206 $1,041,206 0.57% $1,146,453 $1,309,469 $1,309,469 2.76%
Note 23 - Other short-term borrowingsThe following table presents a breakdown of other short-term borrowings at December 31, 2014 and 2013.
(In thousands) 2014 2013
Advances with the FHLB paying interest atmaturity, at fixed rate of 0.39% (2013 -0.44%) $20,000 $400,000Others 1,200 1,200
Total other short-term borrowings $21,200 $401,200
The maximum aggregate balance outstanding at any month-end was approximately $ 801 million (2013 - $ 1,226 million).
The weighted average interest rate of other short-termborrowings at December 31, 2014 was 0.36% (2013 – 0.38%).The average aggregate balance outstanding during the year wasapproximately $ 154 million (2013 - $729 million). Theweighted average interest rate during the year was 0.44% (2013– 0.41%).
Note 24 presents additional information with respect toavailable credit facilities.
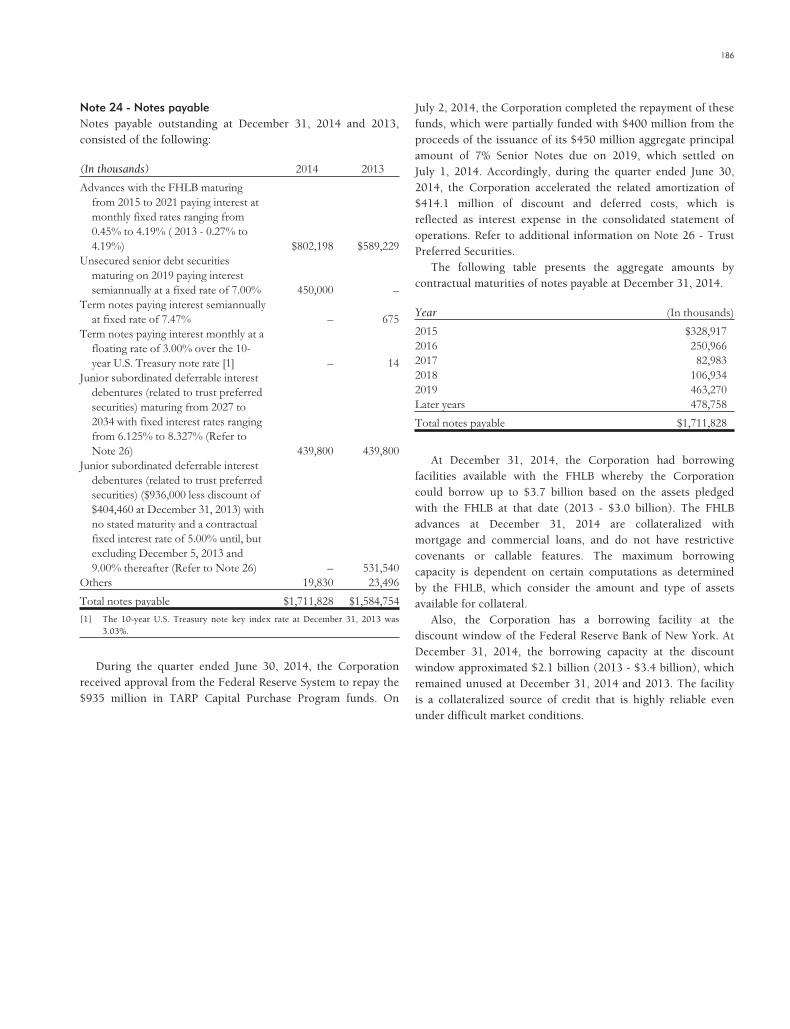
186
Note 24 - Notes payableNotes payable outstanding at December 31, 2014 and 2013,consisted of the following:
(In thousands) 2014 2013
Advances with the FHLB maturingfrom 2015 to 2021 paying interest atmonthly fixed rates ranging from0.45% to 4.19% ( 2013 - 0.27% to4.19%) $802,198 $589,229
Unsecured senior debt securitiesmaturing on 2019 paying interestsemiannually at a fixed rate of 7.00% 450,000 –
Term notes paying interest semiannuallyat fixed rate of 7.47% – 675
Term notes paying interest monthly at afloating rate of 3.00% over the 10-year U.S. Treasury note rate [1] – 14
Junior subordinated deferrable interestdebentures (related to trust preferredsecurities) maturing from 2027 to2034 with fixed interest rates rangingfrom 6.125% to 8.327% (Refer toNote 26) 439,800 439,800
Junior subordinated deferrable interestdebentures (related to trust preferredsecurities) ($936,000 less discount of$404,460 at December 31, 2013) withno stated maturity and a contractualfixed interest rate of 5.00% until, butexcluding December 5, 2013 and9.00% thereafter (Refer to Note 26) – 531,540
Others 19,830 23,496
Total notes payable $1,711,828 $1,584,754
[1] The 10-year U.S. Treasury note key index rate at December 31, 2013 was3.03%.
During the quarter ended June 30, 2014, the Corporationreceived approval from the Federal Reserve System to repay the$935 million in TARP Capital Purchase Program funds. On
July 2, 2014, the Corporation completed the repayment of thesefunds, which were partially funded with $400 million from theproceeds of the issuance of its $450 million aggregate principalamount of 7% Senior Notes due on 2019, which settled onJuly 1, 2014. Accordingly, during the quarter ended June 30,2014, the Corporation accelerated the related amortization of$414.1 million of discount and deferred costs, which isreflected as interest expense in the consolidated statement ofoperations. Refer to additional information on Note 26 - TrustPreferred Securities.
The following table presents the aggregate amounts bycontractual maturities of notes payable at December 31, 2014.
Year (In thousands)
2015 $328,9172016 250,9662017 82,9832018 106,9342019 463,270Later years 478,758
Total notes payable $1,711,828
At December 31, 2014, the Corporation had borrowingfacilities available with the FHLB whereby the Corporationcould borrow up to $3.7 billion based on the assets pledgedwith the FHLB at that date (2013 - $3.0 billion). The FHLBadvances at December 31, 2014 are collateralized withmortgage and commercial loans, and do not have restrictivecovenants or callable features. The maximum borrowingcapacity is dependent on certain computations as determinedby the FHLB, which consider the amount and type of assetsavailable for collateral.
Also, the Corporation has a borrowing facility at thediscount window of the Federal Reserve Bank of New York. AtDecember 31, 2014, the borrowing capacity at the discountwindow approximated $2.1 billion (2013 - $3.4 billion), whichremained unused at December 31, 2014 and 2013. The facilityis a collateralized source of credit that is highly reliable evenunder difficult market conditions.

187 POPULAR, INC. 2014 ANNUAL REPORT
Note 25 - Offsetting of financial assets and liabilitiesThe following tables present the potential effect of rights of setoff associated with the Corporation’s recognized financial assets andliabilities at December 31, 2014 and December 31, 2013.
As of December 31, 2014
Gross Amounts Not Offset in the Statement ofFinancial Position
(In thousands)
Gross Amountof Recognized
Assets
Gross AmountsOffset in theStatement of
FinancialPosition
Net Amounts ofAssets
Presented in theStatement of
FinancialPosition
FinancialInstruments
SecuritiesCollateralReceived
CashCollateralReceived Net Amount
Derivatives $ 25,361 $– $ 25,361 $ 320 $ – $– $25,041Reverse repurchase
agreements 151,134 – 151,134 – 151,134 – –
Total $ 176,495 $– $ 176,495 $ 320 $ 151,134 $– $25,041
As of December 31, 2014
Gross Amounts Not Offset in the Statement ofFinancial Position
(In thousands)
Gross Amountof Recognized
Liabilities
Gross AmountsOffset in theStatement of
FinancialPosition
Net Amounts ofLiabilities
Presented in theStatement of
FinancialPosition
FinancialInstruments
SecuritiesCollateralPledged
CashCollateralPledged Net Amount
Derivatives $ 23,032 $– $ 23,032 $ 320 $ 8,781 $– $13,931Repurchase agreements 1,171,657 – 1,171,657 – 1,171,657 – –
Total $1,194,689 $– $1,194,689 $ 320 $1,180,438 $– $13,931
As of December 31, 2013
Gross Amounts Not Offset in the Statement ofFinancial Position
(In thousands)
Gross Amountof Recognized
Assets
Gross AmountsOffset in theStatement of
FinancialPosition
Net Amounts ofAssets
Presented in theStatement of
FinancialPosition
FinancialInstruments
SecuritiesCollateralReceived
CashCollateralReceived Net Amount
Derivatives $ 34,793 $– $ 34,793 $1,220 $ – $– $33,573Reverse repurchase
agreements 175,965 – 175,965 – 175,965 – –
Total $ 210,758 $– $ 210,758 $1,220 $ 175,965 $– $33,573

188
As of December 31, 2013
Gross Amounts Not Offset in the Statement ofFinancial Position
(In thousands)
Gross Amountof Recognized
Liabilities
Gross AmountsOffset in theStatement of
FinancialPosition
Net Amounts ofLiabilities
Presented in theStatement of
FinancialPosition
FinancialInstruments
SecuritiesCollateralPledged
CashCollateralReceived Net Amount
Derivatives $ 32,378 $– $ 32,378 $1,220 $ 14,003 $– $17,155Repurchase agreements 1,659,292 – 1,659,292 – 1,659,292 – –
Total $1,691,670 $– $1,691,670 $1,220 $1,673,295 $– $17,155
The Corporation’s derivatives are subject to agreementswhich allow a right of set-off with each respective counterparty.In addition, the Corporation’s Repurchase Agreements andReverse Repurchase Agreements have a right of set-off with therespective counterparty under the supplemental terms of theMaster Repurchase Agreements. In an event of default eachparty has a right of set-off against the other party for amountsowed in the related agreement and any other amount orobligation owed in respect of any other agreement ortransaction between them.
Note 26 - Trust preferred securitiesAt December 31, 2014 and December 31, 2013, statutory trustsestablished by the Corporation (BanPonce Trust I, PopularCapital Trust I, Popular North America Capital Trust I andPopular Capital Trust II) had issued trust preferred securities(also referred to as “capital securities”) to the public. Theproceeds from such issuances, together with the proceeds of therelated issuances of common securities of the trusts (the“common securities”), were used by the trusts to purchasejunior subordinated deferrable interest debentures (the “juniorsubordinated debentures”) issued by the Corporation. InAugust 2009, the Corporation established the Popular Capital
Trust III for the purpose of exchanging the shares of Series Cpreferred stock held by the U.S. Treasury at the time for trustpreferred securities issued by this trust. In connection with thisexchange, the trust used the Series C preferred stock, togetherwith the proceeds of issuance and sale of common securities ofthe trust, to purchase junior subordinated debentures issued bythe Corporation. As further explained below, the PopularCapital Trust III was dissolved following the repurchase of theircapital securities on July 2, 2014.
The sole assets of the trusts consisted of the juniorsubordinated debentures of the Corporation and the relatedaccrued interest receivable. These trusts are not consolidated bythe Corporation pursuant to accounting principles generallyaccepted in the United States of America.
The junior subordinated debentures are included by theCorporation as notes payable in the consolidated statements offinancial condition, while the common securities issued by theissuer trusts are included as other investment securities. Thecommon securities of each trust are wholly-owned, or indirectlywholly-owned, by the Corporation.
The following table presents financial data pertaining to thedifferent trusts at December 31, 2014 and December 31, 2013.
(Dollars in thousands) As of December 31, 2014
IssuerBanPonce
Trust IPopular
Capital Trust I
PopularNorth AmericaCapital Trust I
PopularCapital Trust Il
Capital securities $52,865 $181,063 $91,651 $101,023Distribution rate 8.327% 6.700% 6.564% 6.125%Common securities $ 1,637 $ 5,601 $ 2,835 $ 3,125Junior subordinated debentures aggregate liquidation
amount $54,502 $186,664 $94,486 $104,148Stated maturity date February 2027 November 2033 September 2034 December 2034Reference notes [1],[3],[6] [2],[4],[5] [1],[3],[5] [2],[4],[5]

189 POPULAR, INC. 2014 ANNUAL REPORT
(Dollars in thousands) As of December 31, 2013
IssuerBanPonce
Trust IPopular
Capital Trust I
PopularNorth AmericaCapital Trust I
PopularCapital Trust Il
PopularCapital Trust III
Capital securities $52,865 $181,063 $91,651 $101,023 $935,000Distribution rate
8.327% 6.700% 6.564% 6.125%
5.000% until,but excludingDecember 5,
2013 and9.000%
thereafterCommon securities $1,637 $5,601 $2,835 $3,125 $1,000Junior subordinated debentures aggregate
liquidation amount $54,502 $186,664 $94,486 $104,148 $936,000Stated maturity date February 2027 November 2033 September 2034 December 2034 PerpetualReference notes [1],[3],[6] [2],[4],[5] [1],[3],[5] [2],[4],[5] [2],[4],[7],[8]
[1] Statutory business trust that is wholly-owned by Popular North America and indirectly wholly-owned by the Corporation.[2] Statutory business trust that is wholly-owned by the Corporation.[3] The obligations of PNA under the junior subordinated debentures and its guarantees of the capital securities under the trust are fully and unconditionally
guaranteed on a subordinated basis by the Corporation to the extent set forth in the applicable guarantee agreement.[4] These capital securities are fully and unconditionally guaranteed on a subordinated basis by the Corporation to the extent set forth in the applicable guarantee
agreement.[5] The Corporation has the right, subject to any required prior approval from the Federal Reserve, to redeem after certain dates or upon the occurrence of certain
events mentioned below, the junior subordinated debentures at a redemption price equal to 100% of the principal amount, plus accrued and unpaid interest to thedate of redemption. The maturity of the junior subordinated debentures may be shortened at the option of the Corporation prior to their stated maturity dates(i) on or after the stated optional redemption dates stipulated in the agreements, in whole at any time or in part from time to time, or (ii) in whole, but not in part,at any time within 90 days following the occurrence and during the continuation of a tax event, an investment company event or a capital treatment event as setforth in the indentures relating to the capital securities, in each case subject to regulatory approval.
[6] Same as [5] above, except that the investment company event does not apply for early redemption.[7] The debentures are perpetual and may be redeemed by Popular at any time, subject to the consent of the Board of Governors of the Federal Reserve System.[8] Carrying value of junior subordinated debentures of $ 532 million at December 31, 2013 ($ 936 million aggregate liquidation amount, net of $ 404 million
discount).
During the quarter ended June 30, 2014, the Corporationreceived approval from the Federal Reserve System to repay the$935 million in TARP Capital Purchase Program funds. OnJuly 2, 2014, the Corporation completed the repurchase of $935million of Fixed Rate Popular Capital Trust III CapitalSecurities, $1,000 liquidation amount per security (the “trustcapital securities”), of Popular Capital Trust III, held by theU.S. Treasury. On July 23, 2014, the Corporation exchanged$936 million of Fixed Rate Perpetual Junior SubordinatedDebentures Series A (the “trust debentures”) held by PopularCapital Trust III for the trust capital securities and the commonsecurities of Popular Capital Trust III, in the amount of $1million, held by the Corporation. The trust debentures werethen cancelled and the obligations of the Corporation under therelated indenture were satisfied and discharged. On the samedate, Popular Capital Trust III was dissolved. In connectionwith the repayment of TARP, the Corporation accelerated therelated amortization of the discount and deferred costsamounting to $414.1 million during the second quarter of2014, which was reflected as part of interest expense in theconsolidated statement of operations.
In accordance with the Federal Reserve Board guidanceunder Basel I, the trust preferred securities represent restrictedcore capital elements and currently qualify as Tier 1 capital,
subject to certain quantitative limits. The aggregate amount ofrestricted core capital elements that may be included in the Tier1 capital of a banking organization must not exceed 25% of thesum of all core capital elements (including cumulativeperpetual preferred stock and trust preferred securities).Amounts of restricted core capital elements in excess of thislimit generally may be included in Tier 2 capital, subject tofurther limitations. At December 31, 2014, the Corporation’srestricted core capital elements did not exceed the 25%limitation. Thus, all trust preferred securities were allowed asTier I capital. At December 31, 2013, the Corporation’srestricted core capital elements also did not exceed the 25%limitation.
In July 2013, the Board of Governors of the Federal ReserveSystem approved final rules (“Basel III Capital Rules”) toestablish a new comprehensive regulatory capital framework forall U.S. banking organizations. The New Capital Rules generallyimplement the Basel Committee on Banking Supervision’s (the“Basel Committee”) December 2010 final capital frameworkreferred to as “Basel III” for strengthening international capitalstandards and several changes to the U.S. regulatory capitalregime required by the Dodd-Frank Wall Street Reform andConsumer Protection on Act (“Dodd-Frank”). The Basel IIICapital Rules require that capital instruments such as trust

190
preferred securities be phased-out of Tier 1 capital. TheCorporation’s Tier I capital level at December 31, 2014included $ 427 million of trust preferred securities that aresubject to the phase-out provisions of the Basel III CapitalRules. The Corporation would be allowed to include only 25%of such trust preferred securities in Tier I capital as ofJanuary 1, 2015 and 0% as of January 1, 2016 and thereafter.The Basel III Capital Rules also permanently grandfathers asTier 2 capital such trust preferred securities.
Note 27 - Stockholders’ equityThe Corporation has 30,000,000 shares of authorized preferredstock that may be issued in one or more series, and the sharesof each series shall have such rights and preferences as shall befixed by the Board of Directors when authorizing the issuanceof that particular series. The Corporation’s shares of preferredstock issued and outstanding at December 31, 2014 and 2013consisted of:
• 6.375% non-cumulative monthly income preferred stock,2003 Series A, no par value, liquidation preference valueof $25 per share. Holders on record of the 2003 Series APreferred Stock are entitled to receive, when, as and ifdeclared by the Board of Directors of the Corporation oran authorized committee thereof, out of funds legallyavailable, non-cumulative cash dividends at the annualrate per share of 6.375% of their liquidation preferencevalue, or $0.1328125 per share per month. These sharesof preferred stock are perpetual, nonconvertible, have nopreferential rights to purchase any securities of theCorporation and are redeemable solely at the option of theCorporation with the consent of the Board of Governorsof the Federal Reserve System. The redemption price pershare is $25.00. The shares of 2003 Series A PreferredStock have no voting rights, except for certain rights ininstances when the Corporation does not pay dividendsfor a defined period. These shares are not subject to anysinking fund requirement. Cash dividends declared andpaid on the 2003 Series A Preferred Stock amounted to $1.4 million for the year ended December 31, 2014, 2013and 2012. Outstanding shares of 2003 Series A PreferredStock amounted to 885,726 at December 31, 2014, 2013and 2012.
• 8.25% non-cumulative monthly income preferred stock,2008 Series B, no par value, liquidation preference valueof $25 per share. The shares of 2008 Series B PreferredStock were issued in May 2008. Holders of record of the2008 Series B Preferred Stock are entitled to receive,when, as and if declared by the Board of Directors of theCorporation or an authorized committee thereof, out offunds legally available, non-cumulative cash dividends atthe annual rate per share of 8.25% of their liquidationpreferences, or $0.171875 per share per month. These
shares of preferred stock are perpetual, nonconvertible,have no preferential rights to purchase any securities ofthe Corporation and are redeemable solely at the option ofthe Corporation with the consent of the Board ofGovernors of the Federal Reserve System beginning onMay 28, 2013. The redemption price per share is $25.50from May 28, 2013 through May 28, 2014, $25.25 fromMay 28, 2014 through May 28, 2015 and $25.00 fromMay 28, 2015 and thereafter. Cash dividends declared andpaid on the 2008 Series B Preferred Stock amounted to $2.3 million for the year ended December 31, 2014, 2013and 2012. Outstanding shares of 2008 Series B PreferredStock amounted to 1,120,665 at December 31, 2014, 2013and 2012.
As part of the Series C Preferred Stock transaction with theU.S. Treasury effected on December 5, 2008, the Corporationissued to the U.S. Treasury a warrant to purchase 2,093,284shares of the Corporation’s common stock at an exercise priceof $67 per share. On July 23, 2014, the Corporation completedthe repurchase of the outstanding warrant at a repurchase priceof $3.0 million. With the completion of this transaction, theCorporation completed its exit from the TARP Capital PurchaseProgram.
The Corporation’s common stock trades on the NASDAQStock Market LLC (the “NASDAQ”) under the symbol BPOP.The Corporation voluntarily delisted its 2003 Series A and 2008Series B Preferred Stock from the NASDAQ effective October 8,2009.
On May 29, 2012, the Corporation effected a 1-for-10reverse split of its common stock previously approved by theCorporation’s stockholders on April 27, 2012. Upon theeffectiveness of the reverse split, each 10 shares of authorizedand outstanding common stock were reclassified and combinedinto one new share of common stock. Popular, Inc.’s commonstock began trading on a split-adjusted basis on May 30, 2012.All share and per share information in the consolidatedfinancial statements and accompanying notes have beenretroactively adjusted to reflect the 1-for-10 reverse stock split.
In connection with the reverse stock split, the Corporationamended its Restated Certificate of Incorporation to reduce thenumber of shares of its authorized common stock from1,700,000,000 to 170,000,000.
The reverse stock split did not affect the par value of a shareof the Corporation’s common stock.
At the effective date of the reverse stock split, the statedcapital attributable to common stock on the Corporation’sconsolidated statement of financial condition was reduced bydividing the amount of the stated capital prior to the reversestock split by 10, and the additional paid-in capital (surplus)was credited with the amount by which the stated capital wasreduced. This was also reflected retroactively for prior periodspresented in the financial statements.
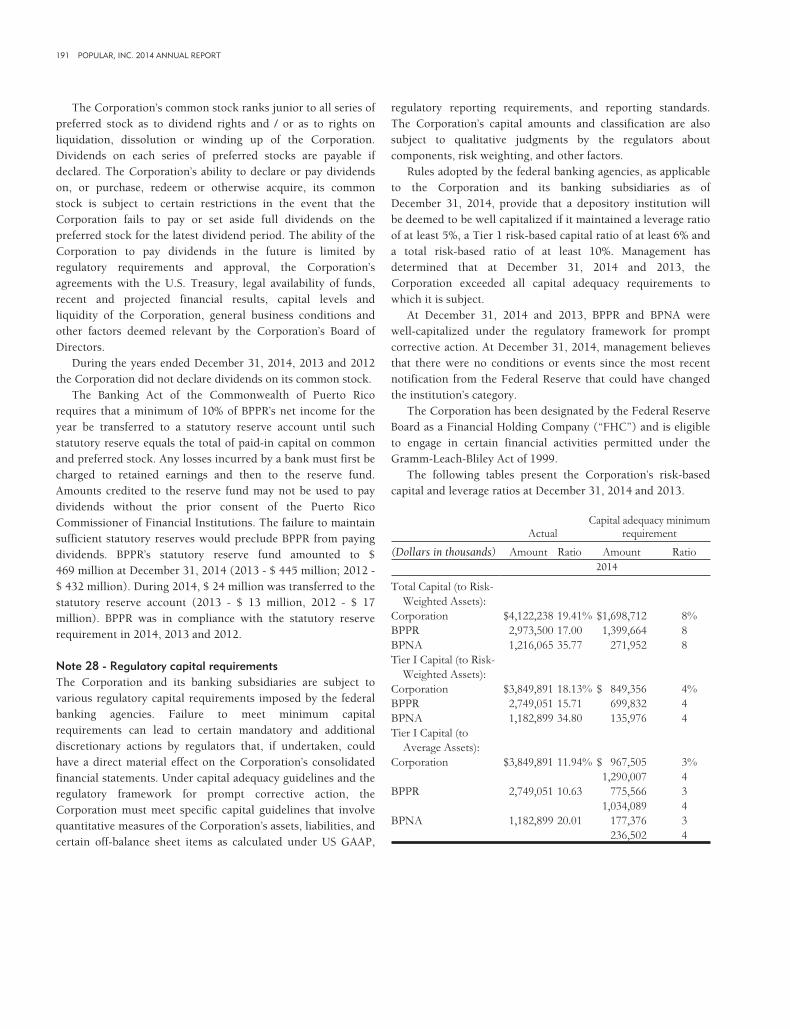
191 POPULAR, INC. 2014 ANNUAL REPORT
The Corporation’s common stock ranks junior to all series ofpreferred stock as to dividend rights and / or as to rights onliquidation, dissolution or winding up of the Corporation.Dividends on each series of preferred stocks are payable ifdeclared. The Corporation’s ability to declare or pay dividendson, or purchase, redeem or otherwise acquire, its commonstock is subject to certain restrictions in the event that theCorporation fails to pay or set aside full dividends on thepreferred stock for the latest dividend period. The ability of theCorporation to pay dividends in the future is limited byregulatory requirements and approval, the Corporation’sagreements with the U.S. Treasury, legal availability of funds,recent and projected financial results, capital levels andliquidity of the Corporation, general business conditions andother factors deemed relevant by the Corporation’s Board ofDirectors.
During the years ended December 31, 2014, 2013 and 2012the Corporation did not declare dividends on its common stock.
The Banking Act of the Commonwealth of Puerto Ricorequires that a minimum of 10% of BPPR’s net income for theyear be transferred to a statutory reserve account until suchstatutory reserve equals the total of paid-in capital on commonand preferred stock. Any losses incurred by a bank must first becharged to retained earnings and then to the reserve fund.Amounts credited to the reserve fund may not be used to paydividends without the prior consent of the Puerto RicoCommissioner of Financial Institutions. The failure to maintainsufficient statutory reserves would preclude BPPR from payingdividends. BPPR’s statutory reserve fund amounted to $469 million at December 31, 2014 (2013 - $ 445 million; 2012 -$ 432 million). During 2014, $ 24 million was transferred to thestatutory reserve account (2013 - $ 13 million, 2012 - $ 17million). BPPR was in compliance with the statutory reserverequirement in 2014, 2013 and 2012.
Note 28 - Regulatory capital requirementsThe Corporation and its banking subsidiaries are subject tovarious regulatory capital requirements imposed by the federalbanking agencies. Failure to meet minimum capitalrequirements can lead to certain mandatory and additionaldiscretionary actions by regulators that, if undertaken, couldhave a direct material effect on the Corporation’s consolidatedfinancial statements. Under capital adequacy guidelines and theregulatory framework for prompt corrective action, theCorporation must meet specific capital guidelines that involvequantitative measures of the Corporation’s assets, liabilities, andcertain off-balance sheet items as calculated under US GAAP,
regulatory reporting requirements, and reporting standards.The Corporation’s capital amounts and classification are alsosubject to qualitative judgments by the regulators aboutcomponents, risk weighting, and other factors.
Rules adopted by the federal banking agencies, as applicableto the Corporation and its banking subsidiaries as ofDecember 31, 2014, provide that a depository institution willbe deemed to be well capitalized if it maintained a leverage ratioof at least 5%, a Tier 1 risk-based capital ratio of at least 6% anda total risk-based ratio of at least 10%. Management hasdetermined that at December 31, 2014 and 2013, theCorporation exceeded all capital adequacy requirements towhich it is subject.
At December 31, 2014 and 2013, BPPR and BPNA werewell-capitalized under the regulatory framework for promptcorrective action. At December 31, 2014, management believesthat there were no conditions or events since the most recentnotification from the Federal Reserve that could have changedthe institution’s category.
The Corporation has been designated by the Federal ReserveBoard as a Financial Holding Company (“FHC”) and is eligibleto engage in certain financial activities permitted under theGramm-Leach-Bliley Act of 1999.
The following tables present the Corporation’s risk-basedcapital and leverage ratios at December 31, 2014 and 2013.
ActualCapital adequacy minimum
requirement
(Dollars in thousands) Amount Ratio Amount Ratio2014
Total Capital (to Risk-Weighted Assets):
Corporation $4,122,238 19.41% $1,698,712 8%BPPR 2,973,500 17.00 1,399,664 8BPNA 1,216,065 35.77 271,952 8Tier I Capital (to Risk-
Weighted Assets):Corporation $3,849,891 18.13% $ 849,356 4%BPPR 2,749,051 15.71 699,832 4BPNA 1,182,899 34.80 135,976 4Tier I Capital (to
Average Assets):Corporation $3,849,891 11.94% $ 967,505 3%
1,290,007 4BPPR 2,749,051 10.63 775,566 3
1,034,089 4BPNA 1,182,899 20.01 177,376 3
236,502 4

192
Actual
Capital adequacyminimum
requirement
(Dollars in thousands) Amount Ratio Amount Ratio
2013
Total Capital (to Risk-Weighted Assets):
Corporation $4,761,555 20.42% $1,865,494 8%BPPR 2,607,018 14.76 1,413,292 8BPNA 1,400,740 25.47 439,908 8Tier I Capital (to Risk-
Weighted Assets):Corporation $4,464,742 19.15% $ 932,747 4%BPPR 2,381,347 13.48 706,646 4BPNA 1,331,471 24.21 219,954 4Tier I Capital (to Average
Assets):Corporation $4,464,742 12.85% $1,042,384 3%
1,389,845 4BPPR 2,381,347 9.21 775,562 3
1,034,083 4BPNA 1,331,471 15.92 250,931 3
334,575 4
The following table presents the minimum amounts andratios for the Corporation’s banks to be categorized as well-capitalized under prompt corrective action.
2014 2013
(Dollars in thousands) Amount Ratio Amount Ratio
Total Capital (to Risk-Weighted Assets):
BPPR $1,749,580 10% $1,766,615 10%BPNA 339,939 10 549,885 10Tier I Capital (to Risk-
Weighted Assets):BPPR $1,049,748 6% $1,059,969 6%BPNA 203,964 6 329,931 6Tier I Capital (to Average
Assets):BPPR $1,292,611 5% $1,292,604 5%BPNA 295,627 5 418,219 5
In 2013, the Federal Reserve issued final Basel III capitalrules that require banking organizations subject to thestandardized approach, such as the Corporation and its bankingsubsidiaries, to meet revised minimum regulatory capital ratiosbeginning January 1, 2015, and begin the transition period forthe revised definitions of regulatory capital and the revisedregulatory capital adjustments and deductions, as well ascomply with the standardized approach for determining risk-weighted assets.
Furthermore, the final Basel III capital rules require thephase out of non-qualifying Tier 1 capital instruments such astrust preferred securities. At December 31, 2014, theCorporation had $427 million in trust preferred securitiesoutstanding. Beginning on January 1, 2015, approximately $320million in principal amount of the trust preferred securities willno longer qualify for Tier 1 capital treatment, but instead willqualify for Tier 2 capital treatment. The Corporation anticipatesthat, by January 1, 2016, all $427 million of its outstandingtrust preferred securities will lose Tier 1 capital treatment, andwill be reclassified to Tier 2 capital.
Beginning January 1, 2016, the Basel III final rules introducea phase-in capital conservation buffer of 2.5% of risk-weightedassets that is effectively layered on top of the minimum capitalrisk-based ratios, which places restrictions on the amount ofretained earnings that may be used for distributions ordiscretionary bonus payments as risk-based capital ratiosapproach their respective “adequately capitalized minimums.”
The following table presents the capital requirements for a standardized approach banking organization under Basel III finalrules.
Minimum Capital Plus Capital Conservation Buffer
Minimum Capital Well-Capitalized 2016 2017 2018 2019
Common Equity Tier 1 to Risk-Weighted Assets 4.5% 6.5% 5.125% 5.750% 6.375% 7.000%Tier 1 Capital to Risk-Weighted Assets 6.0 8.0 6.625 7.250 7.875 8.500Total Capital to Risk-Weighted Assets 8.0 10.0 8.625 9.250 9.875 10.500Leverage Ratio 4.0 5.0 N/A N/A N/A N/A

193 POPULAR, INC. 2014 ANNUAL REPORT
Note 29 - Other comprehensive lossThe following table presents changes in accumulated other comprehensive loss by component for the years ended December 31,2014, 2013 and 2012.
Changes in Accumulated Other Comprehensive Loss by Component [1]
Years ended December 31,
(In thousands) 2014 2013 2012
Foreign currency translation Beginning Balance $ (36,099) $ (31,277) $ (28,829)
Other comprehensive gain (loss) beforereclassifications (4,451) (4,822) (2,448)Amounts reclassified from accumulated othercomprehensive gain (loss) 7,718 – –
Net change 3,267 (4,822) (2,448)
Ending balance $ (32,832) $ (36,099) $ (31,277)
Adjustment of pension andpostretirement benefit plans Beginning Balance $(104,302) $(225,846) $(216,058)
Other comprehensive (loss) income beforereclassifications (98,015) 104,272 (27,699)Amounts reclassified from accumulated othercomprehensive (loss) income for amortizationof net losses (5,188) 17,272 18,051Amounts reclassified from accumulated othercomprehensive (loss) income for amortizationof prior service cost 2,318 – (140)
Net change (100,885) 121,544 (9,788)
Ending balance $(205,187) $(104,302) $(225,846)
Unrealized net holding gains (losses)on investments Beginning Balance $ (48,344) $ 154,568 $ 203,078
Other comprehensive gain (loss) beforereclassifications 55,987 (201,119) (50,204)Amounts reclassified from accumulated othercomprehensive income 822 (1,793) 1,694
Net change 56,809 (202,912) (48,510)
Ending balance $ 8,465 $ (48,344) $ 154,568
Unrealized net gains (losses) on cashflow hedges Beginning Balance $ – $ (313) $ (739)
Other comprehensive (loss) income beforereclassifications (4,034) 1,436 (9,457)Amounts reclassified from other accumulatedother comprehensive (loss) income 3,716 (1,123) 9,883
Net change (318) 313 426
Ending balance $ (318) $ – $ (313)
Total $(229,872) $(188,745) $(102,868)[1] All amounts presented are net of tax.

194
The following table presents the amounts reclassified out of each component of accumulated other comprehensive loss for theyears ended December 31, 2014, 2013, and 2012.
Reclassifications Out of Accumulated Other Comprehensive Loss
Affected Line Item in theConsolidated Statements of Operations
Years ended December 31,
(In thousands) 2014 2013 2012
Foreign currency translationCumulative translation adjustment reclassified
into earnings Other operating income $(7,718) $ – $ –
Total before tax (7,718) – –
Income tax (expense) benefit – – –
Total net of tax $(7,718) $ – $ –
Adjustment of pension and postretirement benefitplansAmortization of net losses Personnel costs $ 8,505 $(24,674) $(25,159)Amortization of prior service cost Personnel costs (3,800) – 200
Total before tax 4,705 (24,674) (24,959)
Income tax benefit (1,835) 7,402 7,048
Total net of tax $ 2,870 $(17,272) $(17,911)
Unrealized holding gains on investmentsRealized gain (loss) on sale of securities Net gain (loss) on sale and valuation adjustments of
investment securities $ (870) $ 2,110 $ (1,707)
Total before tax (870) 2,110 (1,707)
Income tax benefit (expense) 48 (317) 13
Total net of tax $ (822) $ 1,793 $ (1,694)
Unrealized net losses on cash flow hedgesForward contracts Mortgage banking activities $(6,091) $ 1,839 $(14,119)
Total before tax (6,091) 1,839 (14,119)
Income tax benefit (expense) 2,375 (716) 4,236
Total net of tax $(3,716) $ 1,123 $ (9,883)
Total reclassification adjustments, net of tax $(9,386) $(14,356) $(29,488)
Note 30 - GuaranteesThe Corporation has obligations upon the occurrence of certainevents under financial guarantees provided in certaincontractual agreements as summarized below.
The Corporation issues financial standby letters of creditand has risk participation in standby letters of credit issued byother financial institutions, in each case to guarantee theperformance of various customers to third parties. If thecustomers failed to meet its financial or performance obligationto the third party under the terms of the contract, then, upontheir request, the Corporation would be obligated to make thepayment to the guaranteed party. At December 31, 2014, theCorporation recorded a liability of $0.4 million (December 31,2013 - $0.4 million), which represents the unamortized balanceof the obligations undertaken in issuing the guarantees underthe standby letters of credit. In accordance with the provisionsof ASC Topic 460, the Corporation recognizes at fair value theobligation at inception of the standby letters of credit. The fairvalue approximates the fee received from the customer for
issuing such commitments. These fees are deferred and arerecognized over the commitment period. The contracts amountin standby letters of credit outstanding at December 31, 2014and 2013, shown in Note 31, represent the maximum potentialamount of future payments that the Corporation could berequired to make under the guarantees in the event ofnonperformance by the customers. These standby letters ofcredit are used by the customers as a credit enhancement andtypically expire without being drawn upon. The Corporation’sstandby letters of credit are generally secured, and in the eventof nonperformance by the customers, the Corporation hasrights to the underlying collateral provided, which normallyincludes cash, marketable securities, real estate, receivables,and others. Management does not anticipate any material lossesrelated to these instruments.
Also, the Corporation securitized mortgage loans intoguaranteed mortgage-backed securities subject to lifetime creditrecourse on the loans that serve as collateral for the mortgage-backed securities. Also, from time to time, the Corporation may

195 POPULAR, INC. 2014 ANNUAL REPORT
sell, in bulk sale transactions, residential mortgage loans andSmall Business Administration (“SBA”) commercial loanssubject to credit recourse or to certain representations andwarranties from the Corporation to the purchaser. Theserepresentations and warranties may relate, for example, toborrower creditworthiness, loan documentation, collateral,prepayment and early payment defaults. The Corporation maybe required to repurchase the loans under the credit recourseagreements or representation and warranties.
At December 31, 2014, the Corporation serviced $2.1 billion(December 31, 2013 - $2.5 billion) in residential mortgageloans subject to credit recourse provisions, principally loansassociated with FNMA and FHLMC residential mortgage loansecuritization programs. In the event of any customer default,pursuant to the credit recourse provided, the Corporation isrequired to repurchase the loan or reimburse the third partyinvestor for the incurred loss. The maximum potential amountof future payments that the Corporation would be required tomake under the recourse arrangements in the event ofnonperformance by the borrowers is equivalent to the totaloutstanding balance of the residential mortgage loans servicedwith recourse and interest, if applicable. During 2014, theCorporation repurchased approximately $ 89 million of unpaidprincipal balance in mortgage loans subject to the creditrecourse provisions (2013 - $ 126 million). In the event ofnonperformance by the borrower, the Corporation has rights tothe underlying collateral securing the mortgage loan. TheCorporation suffers losses on these loans when the proceedsfrom a foreclosure sale of the property underlying a defaultedmortgage loan are less than the outstanding principal balance ofthe loan plus any uncollected interest advanced and the costs ofholding and disposing the related property. At December 31,2014, the Corporation’s liability established to cover theestimated credit loss exposure related to loans sold or servicedwith credit recourse amounted to $ 59 million (December 31,2013 - $ 41 million). The following table shows the changes inthe Corporation’s liability of estimated losses from these creditrecourses agreements, included in the consolidated statementsof financial condition during the years ended December 31,2014 and 2013.
December 31,
(In thousands) 2014 2013
Balance as of beginning of period $ 41,463 $ 51,673Provision for recourse liability 41,312 21,793Net charge-offs / terminations (23,337) (32,003)
Balance as of end of period $ 59,438 $ 41,463
The probable losses to be absorbed under the credit recoursearrangements are recorded as a liability when the loans are soldand are updated by accruing or reversing expense (categorizedin the line item “adjustments (expense) to indemnity reserveson loans sold” in the consolidated statements of operations)
throughout the life of the loan, as necessary, when additionalrelevant information becomes available. The methodology usedto estimate the recourse liability is a function of the recoursearrangements given and considers a variety of factors, whichinclude actual defaults and historical loss experience,foreclosure rate, estimated future defaults and the probabilitythat a loan would be delinquent. Statistical methods are used toestimate the recourse liability. Expected loss rates are applied todifferent loan segmentations. The expected loss, whichrepresents the amount expected to be lost on a given loan,considers the probability of default and loss severity. Theprobability of default represents the probability that a loan ingood standing would become 90 days delinquent within thefollowing twelve-month period. Regression analysis quantifiesthe relationship between the default event and loan-specificcharacteristics, including credit scores, loan-to-value ratios, andloan aging, among others.
When the Corporation sells or securitizes mortgage loans, itgenerally makes customary representations and warrantiesregarding the characteristics of the loans sold. TheCorporation’s mortgage operations in Puerto Rico groupconforming mortgage loans into pools which are exchanged forFNMA and GNMA mortgage-backed securities, which aregenerally sold to private investors, or are sold directly to FNMAor other private investors for cash. As required under thegovernment agency programs, quality review procedures areperformed by the Corporation to ensure that asset guidelinequalifications are met. To the extent the loans do not meetspecified characteristics, the Corporation may be required torepurchase such loans or indemnify for losses and bear anysubsequent loss related to the loans. Repurchases under BPPR’srepresentation and warranty arrangements in which theCorporation is obligated to repurchase the loans amounted toapproximately $ 2.2 million in unpaid principal balance withlosses amounting to $ 1.7 million for the year endedDecember 31, 2014 ($ 4.7 million and $1.0 million,respectively, during the year ended December 31, 2013). Asubstantial amount of these loans reinstate to performing statusor have mortgage insurance, and thus the ultimate losses on theloans are not deemed significant.
As discussed on Note 4 - Discontinued Operations, onNovember 8, 2014, the Corporation completed the sale of theCalifornia regional operations. In connection with thistransaction, the Corporation agreed to provide, subject tocertain limitations, customary indemnification to the purchaser,including with respect to certain pre-closing liabilities andviolations of representations and warranties. The Corporationalso agreed to indemnify the purchaser for up to 1.5% of creditlosses on transferred loans for a period of two years after theclosing. Pursuant to this indemnification provision, theCorporation’s maximum exposure is approximately $16.0million. The Corporation recognized a reserve of approximately$2.2 million, representing its best estimate of the loss that

196
would be incurred in connection with this indemnification.This reserve is included within the liabilities from discontinuedoperations.
During the quarter ended June 30, 2013, the Corporationestablished a reserve for certain specific representation andwarranties made in connection with BPPR’s sale of non-performing mortgage loans. The purchaser’s sole remedy underthe indemnity clause is to seek monetary damages from BPPR,for a maximum of $16.3 million. BPPR recognized a reserve ofapproximately $3.0 million, representing its best estimate of theloss that would be incurred in connection with thisindemnification. BPPR’s obligations under this clause end oneyear after the closing except to any claim asserted prior to suchtermination date. At December 31, 2014, the Corporation has areserve balance of $2.8 million to cover claims received fromthe purchaser, which are currently being evaluated.
During the quarter ended March 31, 2013, the Corporationestablished a reserve for certain specific representation andwarranties made in connection with BPPR’s sale of commercialand construction loans, and commercial and single family realestate owned. The purchaser’s sole remedy under the indemnityclause is to seek monetary damages from BPPR, for a maximumof $18.0 million. BPPR is not required to repurchase any of theassets. BPPR recognized a reserve of approximately $10.7million, representing its best estimate of the loss that would beincurred in connection with this indemnification. During thequarter ended March 31, 2014, the Corporation released $2.0million based on an evaluation of claims received under thisclause. At December 31, 2014, the Corporation has a reservebalance of $7.4 million to cover claims received from thepurchaser, which are currently being evaluated.
The following table presents the changes in theCorporation’s liability for estimated losses associated with theindemnifications and representations and warranties related toloans sold by BPPR for during the years ended December 31,2014 and 2013.
(In thousands) 2014 2013
Balance as of beginning of period $19,277 $ 7,587Additions for new sales – 13,747Provision (reversal) for representation and
warranties (712) (332)Net charge-offs (2,606) (1,725)
Balance as of end of period $15,959 $19,277
In addition, at December 31, 2014, the Corporation hasreserves for customary representation and warranties related toloans sold by its U.S. subsidiary E-LOAN prior to 2009. Theseloans had been sold to investors on a servicing released basissubject to certain representation and warranties. Although therisk of loss or default was generally assumed by the investors,the Corporation made certain representations relating toborrower creditworthiness, loan documentation and collateral,
which if not correct, may result in requiring the Corporation torepurchase the loans or indemnify investors for any relatedlosses associated to these loans. At December 31, 2014, theCorporation’s reserve for estimated losses from suchrepresentation and warranty arrangements amounted to $5 million, which was included as part of other liabilities in theconsolidated statement of financial condition (December 31,2013 - $ 7 million). E-LOAN is no longer originating andselling loans since the subsidiary ceased these activities in 2008and most of the outstanding agreements with majorcounterparties were settled during 2010 and 2011.
Servicing agreements relating to the mortgage-backedsecurities programs of FNMA and GNMA, and to mortgageloans sold or serviced to certain other investors, includingFHLMC, require the Corporation to advance funds to makescheduled payments of principal, interest, taxes and insurance,if such payments have not been received from the borrowers. AtDecember 31, 2014, the Corporation serviced $15.6 billion inmortgage loans for third-parties, including the loans servicedwith credit recourse (December 31, 2013 - $16.3 billion). TheCorporation generally recovers funds advanced pursuant tothese arrangements from the mortgage owner, from liquidationproceeds when the mortgage loan is foreclosed or, in the case ofFHA/VA loans, under the applicable FHA and VA insurance andguarantees programs. However, in the meantime, theCorporation must absorb the cost of the funds it advancesduring the time the advance is outstanding. The Corporationmust also bear the costs of attempting to collect on delinquentand defaulted mortgage loans. In addition, if a defaulted loan isnot cured, the mortgage loan would be canceled as part of theforeclosure proceedings and the Corporation would not receiveany future servicing income with respect to that loan. AtDecember 31, 2014, the outstanding balance of funds advancedby the Corporation under such mortgage loan servicingagreements was approximately $36 million (December 31, 2013- $29 million). To the extent the mortgage loans underlying theCorporation’s servicing portfolio experience increaseddelinquencies, the Corporation would be required to dedicateadditional cash resources to comply with its obligation toadvance funds as well as incur additional administrative costsrelated to increases in collection efforts.
Popular, Inc. Holding Company (“PIHC”) fully andunconditionally guarantees certain borrowing obligationsissued by certain of its wholly-owned consolidated subsidiariesamounting to $ 0.2 billion at December 31, 2014 (December 31,2013 - $ 0.2 billion). In addition, at December 31, 2014 andDecember 31, 2013, PIHC fully and unconditionally guaranteedon a subordinated basis $ 0.4 billion and $ 1.4 billion,respectively, of capital securities (trust preferred securities)issued by wholly-owned issuing trust entities to the extent setforth in the applicable guarantee agreement. Refer to Note 26 tothe consolidated financial statements for further information onthe trust preferred securities.
197 POPULAR, INC. 2014 ANNUAL REPORT
Note 31 - Commitments and contingenciesOff-balance sheet riskThe Corporation is a party to financial instruments with off-balance sheet credit risk in the normal course of business tomeet the financial needs of its customers. These financialinstruments include loan commitments, letters of credit, andstandby letters of credit. These instruments involve, to varyingdegrees, elements of credit and interest rate risk in excess of theamount recognized in the consolidated statements of financialcondition.
The Corporation’s exposure to credit loss in the event ofnonperformance by the other party to the financial instrumentfor commitments to extend credit, standby letters of credit andfinancial guarantees written is represented by the contractualnotional amounts of those instruments. The Corporation usesthe same credit policies in making these commitments andconditional obligations as it does for those reflected on theconsolidated statements of financial condition.
Financial instruments with off-balance sheet credit risk,whose contract amounts represent potential credit risk as of theend of the periods presented were as follows:
(In thousands) December 31, 2014 December 31, 2013
Commitments to extendcredit:Credit card lines $4,450,284 $4,594,676Commercial lines of
credit 2,415,843 2,569,377Other unused credit
commitments 269,225 326,874Commercial letters of
credit 2,820 3,059Standby letters of credit 46,362 78,948Commitments to
originate or fundmortgage loans 25,919 47,722
At December 31, 2014, the Corporation maintained areserve of approximately $13 million for potential lossesassociated with unfunded loan commitments related tocommercial and consumer lines of credit, as compared to $7million at December 31, 2013.
Other commitmentsAt December 31, 2014, the Corporation also maintained othernon-credit commitments for approximately $9 million,primarily for the acquisition of other investments, as comparedto $10 million at December 31, 2013.
Business concentrationSince the Corporation’s business activities are currentlyconcentrated primarily in Puerto Rico, its results of operationsand financial condition are dependent upon the general trendsof the Puerto Rico economy and, in particular, the residential
and commercial real estate markets. The concentration of theCorporation’s operations in Puerto Rico exposes it to greaterrisk than other banking companies with a wider geographicbase. Its asset and revenue composition by geographical area ispresented in Note 45 to the consolidated financial statements.
At December 31, 2014, the Corporation’s direct exposure tothe Puerto Rico government and its instrumentalities andmunicipalities amounted to $ 1.0 billion, of whichapproximately $ 811 million is outstanding ($1.2 billion and$950 million at December 31, 2013). Of the amountoutstanding, $ 689 million consists of loans and $ 122 millionare securities ($789 million and $161 million at December 31,2013). Of this amount, $ 336 million represents obligationsfrom the Government of Puerto Rico and public corporationsthat are either collateralized loans or obligations that have aspecific source of income or revenues identified for theirrepayment ($527 million at December 31, 2013). Some of theseobligations consist of senior and subordinated loans to publiccorporations that obtain revenues from rates charged forservices or products, such as public utilities. Publiccorporations have varying degrees of independence from thecentral Government and many receive appropriations or otherpayments from it. The remaining $ 475 million representsobligations from various municipalities in Puerto Rico forwhich, in most cases, the good faith, credit and unlimitedtaxing power of the applicable municipality has been pledged totheir repayment ($423 million at December 31, 2013). Thesemunicipalities are required by law to levy special property taxesin such amounts as shall be required for the payment of all ofits general obligation bonds and loans. These loans haveseniority to the payment of operating cost and expenses of themunicipality.
In addition, at December 31, 2014, the Corporation had$370 million in indirect exposure to loans or securities that arepayable by non-governmental entities, but which carry agovernment guarantee to cover any shortfall in collateral in theevent of borrower default ($360 million at December 31, 2013).These included $289 million in residential mortgage loans thatare guaranteed by the Puerto Rico Housing Finance Authority(December 31, 2013 - $274 million). These mortgage loans aresecured by the underlying properties and the guarantees serveto cover shortfalls in collateral in the event of a borrowerdefault. Also, the Corporation had $49 million in Puerto Ricopass-through housing bonds backed by FNMA, GNMA orresidential loans CMO’s, and $32 million of industrialdevelopment notes ($52 million and $34 million atDecember 31, 2013).
Other contingenciesAs indicated in Note 13 to the consolidated financialstatements, as part of the loss sharing agreements related to theWesternbank FDIC-assisted transaction, the Corporationagreed to make a true-up payment to the FDIC on the date that

198
is 45 days following the last day of the final shared loss month,or upon the final disposition of all covered assets under the losssharing agreements in the event losses on the loss sharingagreements fail to reach expected levels. The fair value of thetrue-up payment obligation was estimated at $ 129 million atDecember 31, 2014 (December 31, 2013 - $ 128 million).
Legal ProceedingsThe nature of Popular’s business ordinarily results in a certainnumber of claims, litigation, investigations, and legal andadministrative cases and proceedings. When the Corporationdetermines it has meritorious defenses to the claims asserted, itvigorously defends itself. The Corporation will consider thesettlement of cases (including cases where it has meritoriousdefenses) when, in management’s judgment, it is in the bestinterest of both the Corporation and its shareholders to do so.
On at least a quarterly basis, Popular assesses its liabilitiesand contingencies in connection with outstanding legalproceedings utilizing the latest information available. Formatters where it is probable that the Corporation will incur amaterial loss and the amount can be reasonably estimated, theCorporation establishes an accrual for the loss. Onceestablished, the accrual is adjusted on at least a quarterly basisas appropriate to reflect any relevant developments. For matterswhere a material loss is not probable or the amount of the losscannot be estimated, no accrual is established.
In certain cases, exposure to loss exists in excess of theaccrual to the extent such loss is reasonably possible, but notprobable. Management believes and estimates that the aggregaterange of reasonably possible losses (with respect to thosematters where such limits may be determined, in excess ofamounts accrued), for current legal proceedings ranges from $0to approximately $39 million as of December 31, 2014. Forcertain other cases, management cannot reasonably estimate thepossible loss at this time. Any estimate involves significantjudgment, given the varying stages of the proceedings(including the fact that many of them are currently inpreliminary stages), the existence of multiple defendants inseveral of the current proceedings whose share of liability hasyet to be determined, the numerous unresolved issues in manyof the proceedings, and the inherent uncertainty of the variouspotential outcomes of such proceedings. Accordingly,management’s estimate will change from time-to-time, andactual losses may be more or less than the current estimate.
While the final outcome of legal proceedings is inherentlyuncertain, based on information currently available, advice ofcounsel, and available insurance coverage, managementbelieves that the amount it has already accrued is adequate andany incremental liability arising from the Corporation’s legalproceedings will not have a material adverse effect on theCorporation’s consolidated financial position as a whole.However, in the event of unexpected future developments, it ispossible that the ultimate resolution of these matters, if
unfavorable, may be material to the Corporation’s consolidatedfinancial position in a particular period.
Ongoing Class Action LitigationBanco Popular de Puerto Rico (“BPPR”) and Banco PopularNorth America (“BPNA”) are currently defendants in variousclass action lawsuits:
On November 21, 2012, BPNA was served with a putativeclass action complaint captioned Josefina Valle, et al. v. PopularCommunity Bank, filed in the New York State Supreme Court(New York County). Plaintiffs, existing BPNA customers, allegeamong other things that BPNA has engaged in unfair anddeceptive acts and trade practices in connection with theassessment of overdraft fees and payment processing onconsumer deposit accounts. The complaint further alleges thatBPNA improperly disclosed its consumer overdraft policies and,additionally, that the overdraft rates and fees assessed by BPNAviolate New York’s usury laws. The complaint seeks unspecifieddamages, including punitive damages, interest, disbursements,and attorneys’ fees and costs.
BPNA removed the case to federal court (S.D.N.Y.) andplaintiffs subsequently filed a motion to remand the action tostate court, which the Court granted on August 6, 2013. Amotion to dismiss was filed on September 9, 2013. OnOctober 25, 2013, plaintiffs filed an amended complaint seekingto limit the putative class to New York account holders. Amotion to dismiss the amended complaint was filed in February2014. In August 2014, the Court entered an order granting inpart BPNA’s motion to dismiss. The sole surviving claim relatesto BPNA’s item processing policy. On September 10, 2014,plaintiffs filed a motion for leave to file a second amendedcomplaint to correct certain deficiencies noted in the court’sdecision and order. BPNA subsequently filed a motion inopposition to plaintiff’s motion for leave to amend and furthersought to compel arbitration. The matter has been stayedpending a ruling on such motions.
Between December 2013 and January 2014, BPPR, BPNAand Popular, Inc., along with two executive officers, wereserved with a putative class action complaint captioned NeyshaQuiles et al. v. Banco Popular de Puerto Rico et al. Plaintiffsessentially alleged that they and others, who have beenemployed by the Defendants as “bank tellers” and othersimilarly titled positions, were generally paid only forscheduled work time, rather than time actually worked. TheComplaint sought to maintain a collective action under the FairLabor Standards Act (“FLSA”) on behalf of all individuals whowere employed or were currently employed by the Defendantsin Puerto Rico, the Virgin Islands, New York, New Jersey,Florida, California, and Illinois as hourly paid, non-exempt,bank tellers or other similarly titled positions at any timeduring the past three years and alleged the following claimsunder the FLSA against all Defendants: (i) failure to payovertime premiums; and (ii) that the failure to pay was willful.

199 POPULAR, INC. 2014 ANNUAL REPORT
Similar claims were brought under Puerto Rico law on behalf ofall individuals who were employed or are currently employedby BPPR in Puerto Rico as hourly paid, non-exempt, banktellers or other similarly titled positions at any time during thepast three years. On January 31, 2014, the Popular defendantsfiled an answer to the complaint. On February 24, 2014, theparties reached an agreement to dismiss the complaint againstBPNA and the named BPNA executive officer withoutprejudice. On January 9, 2015, plaintiffs submitted a motion forconditional class certification, which BPPR opposed. OnFebruary 18, 2015, the Court entered an order whereby itgranted plaintiffs’ request for conditional certification of theFLSA action.
On May 5, 2014, a putative class action captioned NoraFernandez, et al. v. UBS, et al. was filed in the United StatesDistrict Court for the Southern District of New York on behalfof investors in 23 Puerto Rico closed-end investment companiesagainst various UBS entities, BPPR and Popular Securities. UBSFinancial Services Incorporated of Puerto Rico is the sponsorand co-sponsor of all 23 funds, while BPPR was co-sponsor,together with UBS, of nine (9) of those funds. The plaintiffsallege breach of fiduciary duties, aiding and abetting breach offiduciary duty and breach of contract against all defendants.The complaint seeks unspecified damages, includingdisgorgement of fees and attorneys’ fees. On May 30, 2014,plaintiffs voluntarily dismissed their class action in the SDNYand on that same date, they filed a virtually identical complaintin the US District Court for the District of Puerto Rico (USDC-PR) and requested that the case be consolidated with the matterof In re: UBS Financial Services Securities Litigation, a classaction currently pending before the USDC-PR in which neitherBPPR nor Popular Securities are parties. The UBS defendantsfiled an opposition to the consolidation request and moved totransfer the case back to the SDNY on the ground that therelevant agreements between the parties contain a choice offorum clause, with New York as the selected forum. ThePopular defendants joined this motion. By order datedJanuary 30, 2015, the court denied the plaintiffs’ motion toconsolidate. The motion to transfer remains pending to date.
On May 6, 2014, a putative class action captioned DavidAlvarez, et al. v. Banco Popular North America was filed in theSuperior Court of the State of California for the County of LosAngeles. Plaintiffs generally assert that BPNA has engaged inpurported violations of §2954.8(a) of the California Civil Codeand §17200 et seq. of the California Business Professions Code,which allegedly require financial institutions that make loanssecured by certain types of real property located within thestate of California to pay interest to borrowers on impoundaccount deposits at a statutory rate of not less than two percent(2%). Plaintiffs maintain that BPNA has not paid interest onsuch deposits and demand that BPNA be enjoined fromengaging in further violations of these provisions and pay anunspecified amount of damages sufficient to repay the unpaid
interest on these deposits. PHH Corporation, which acquiredthe loans at issue in this complaint, has tentatively agreed toindemnify and tender a defense on behalf of BPNA. The courtrecently entered an order staying all substantive activity,including any responsive pleading, until the initial conferencescheduled for August 22, 2014. The parties have subsequentlyreached an agreement in principle. The settlement terms -which do not contemplate a payment by BPNA - are currentlybeing negotiated.
On October 7, 2014, BPNA was served with a putative classaction complaint captioned Josefina Valle, et al. v. BPNA, filed inthe United States District Court for the Southern District ofNew York. The complaint names the same plaintiffs who filedthe above-described overdraft fee class action suit. Plaintiffsallege, among other things, that BPNA engages in unfair anddeceptive acts and trade practices relative to the assessment ofATM fees on ATM transactions initialed at Allpoint brandedATMs. The complaint further alleges that BPNA is in violationof the Electronic Fund Transfer Act and Regulation E withrespect to ATM fees. On December 2, 2014, BPNA filed amotion to compel arbitration, which plaintiffs opposed. OnFebruary 2, 2015, the court entered an opinion and ordergranting defendant’s motion to compel arbitration. OnFebruary 23, 2015, plaintiffs filed a notice of appeal with theUnited States Court of Appeals for the Second Circuitdemanding that the court reverse the district court’s ruling.
On October 3, 2014, BPNA received notice of a potentialclass action submitted by two former assistant branchmanagers. The purported action alleges various wage and hourviolations arising from what they contend is an improper jobclassification under the FLSA and applicable state lawequivalents. In December 2014, BPNA accepted plaintiffs’ offerto mediate this dispute, and mediation took place onFebruary 19, 2015. As a result of the mediation, the partiesentered into an agreement in principle to settle this claim.Under the terms of the agreement in principle, subject tocertain customary conditions including court approval of a finalsettlement agreement in consideration for the full settlementand release of all defendants, defendant will pay the amount of$800,000.
Other MattersThe volatility in prices and declines in value that Puerto Ricomunicipal bonds and closed-end investment companies thatinvest primarily in Puerto Rico municipal bonds haveexperienced since August 2013 have led to regulatory inquiries,customer complaints and arbitrations for most broker-dealers inPuerto Rico, including Popular Securities LLC, a wholly ownedsubsidiary of the Corporation (“Popular Securities”). PopularSecurities has received customer complaints and is named as arespondent (among other broker-dealers) in 39 arbitrationproceedings with aggregate claimed damages of approximately$99 million, including one arbitration with claimed damages of
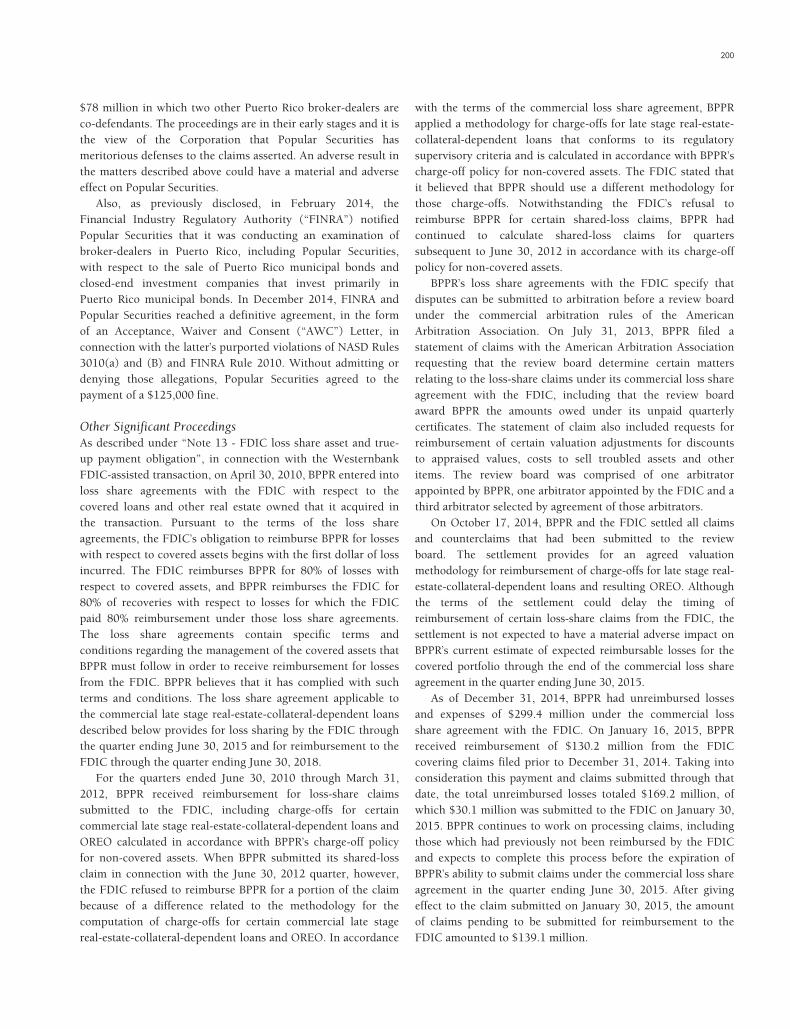
200
$78 million in which two other Puerto Rico broker-dealers areco-defendants. The proceedings are in their early stages and it isthe view of the Corporation that Popular Securities hasmeritorious defenses to the claims asserted. An adverse result inthe matters described above could have a material and adverseeffect on Popular Securities.
Also, as previously disclosed, in February 2014, theFinancial Industry Regulatory Authority (“FINRA”) notifiedPopular Securities that it was conducting an examination ofbroker-dealers in Puerto Rico, including Popular Securities,with respect to the sale of Puerto Rico municipal bonds andclosed-end investment companies that invest primarily inPuerto Rico municipal bonds. In December 2014, FINRA andPopular Securities reached a definitive agreement, in the formof an Acceptance, Waiver and Consent (“AWC”) Letter, inconnection with the latter’s purported violations of NASD Rules3010(a) and (B) and FINRA Rule 2010. Without admitting ordenying those allegations, Popular Securities agreed to thepayment of a $125,000 fine.
Other Significant ProceedingsAs described under “Note 13 - FDIC loss share asset and true-up payment obligation”, in connection with the WesternbankFDIC-assisted transaction, on April 30, 2010, BPPR entered intoloss share agreements with the FDIC with respect to thecovered loans and other real estate owned that it acquired inthe transaction. Pursuant to the terms of the loss shareagreements, the FDIC’s obligation to reimburse BPPR for losseswith respect to covered assets begins with the first dollar of lossincurred. The FDIC reimburses BPPR for 80% of losses withrespect to covered assets, and BPPR reimburses the FDIC for80% of recoveries with respect to losses for which the FDICpaid 80% reimbursement under those loss share agreements.The loss share agreements contain specific terms andconditions regarding the management of the covered assets thatBPPR must follow in order to receive reimbursement for lossesfrom the FDIC. BPPR believes that it has complied with suchterms and conditions. The loss share agreement applicable tothe commercial late stage real-estate-collateral-dependent loansdescribed below provides for loss sharing by the FDIC throughthe quarter ending June 30, 2015 and for reimbursement to theFDIC through the quarter ending June 30, 2018.
For the quarters ended June 30, 2010 through March 31,2012, BPPR received reimbursement for loss-share claimssubmitted to the FDIC, including charge-offs for certaincommercial late stage real-estate-collateral-dependent loans andOREO calculated in accordance with BPPR’s charge-off policyfor non-covered assets. When BPPR submitted its shared-lossclaim in connection with the June 30, 2012 quarter, however,the FDIC refused to reimburse BPPR for a portion of the claimbecause of a difference related to the methodology for thecomputation of charge-offs for certain commercial late stagereal-estate-collateral-dependent loans and OREO. In accordance
with the terms of the commercial loss share agreement, BPPRapplied a methodology for charge-offs for late stage real-estate-collateral-dependent loans that conforms to its regulatorysupervisory criteria and is calculated in accordance with BPPR’scharge-off policy for non-covered assets. The FDIC stated thatit believed that BPPR should use a different methodology forthose charge-offs. Notwithstanding the FDIC’s refusal toreimburse BPPR for certain shared-loss claims, BPPR hadcontinued to calculate shared-loss claims for quarterssubsequent to June 30, 2012 in accordance with its charge-offpolicy for non-covered assets.
BPPR’s loss share agreements with the FDIC specify thatdisputes can be submitted to arbitration before a review boardunder the commercial arbitration rules of the AmericanArbitration Association. On July 31, 2013, BPPR filed astatement of claims with the American Arbitration Associationrequesting that the review board determine certain mattersrelating to the loss-share claims under its commercial loss shareagreement with the FDIC, including that the review boardaward BPPR the amounts owed under its unpaid quarterlycertificates. The statement of claim also included requests forreimbursement of certain valuation adjustments for discountsto appraised values, costs to sell troubled assets and otheritems. The review board was comprised of one arbitratorappointed by BPPR, one arbitrator appointed by the FDIC and athird arbitrator selected by agreement of those arbitrators.
On October 17, 2014, BPPR and the FDIC settled all claimsand counterclaims that had been submitted to the reviewboard. The settlement provides for an agreed valuationmethodology for reimbursement of charge-offs for late stage real-estate-collateral-dependent loans and resulting OREO. Althoughthe terms of the settlement could delay the timing ofreimbursement of certain loss-share claims from the FDIC, thesettlement is not expected to have a material adverse impact onBPPR’s current estimate of expected reimbursable losses for thecovered portfolio through the end of the commercial loss shareagreement in the quarter ending June 30, 2015.
As of December 31, 2014, BPPR had unreimbursed lossesand expenses of $299.4 million under the commercial lossshare agreement with the FDIC. On January 16, 2015, BPPRreceived reimbursement of $130.2 million from the FDICcovering claims filed prior to December 31, 2014. Taking intoconsideration this payment and claims submitted through thatdate, the total unreimbursed losses totaled $169.2 million, ofwhich $30.1 million was submitted to the FDIC on January 30,2015. BPPR continues to work on processing claims, includingthose which had previously not been reimbursed by the FDICand expects to complete this process before the expiration ofBPPR’s ability to submit claims under the commercial loss shareagreement in the quarter ending June 30, 2015. After givingeffect to the claim submitted on January 30, 2015, the amountof claims pending to be submitted for reimbursement to theFDIC amounted to $139.1 million.

201 POPULAR, INC. 2014 ANNUAL REPORT
Pending Disputes with the FDICOn November 25, 2014, the FDIC notified BPPR that it(a) would not reimburse BPPR under the commercial loss shareagreement for a $66.6 million loss claim on eight related realestate loans that BPPR restructured and consolidated(collectively, the “Disputed Asset”), and (b) would no longertreat the Disputed Asset as a “Shared-Loss Asset” under thecommercial loss share agreement. The FDIC alleged that BPPR’srestructure and modification of the underlying loans did notconstitute a “Permitted Amendment” under the commercialloss share agreement, thereby causing the bank to breachArticle III of the commercial loss share agreement.
BPPR disagrees with the FDIC’s determinations relating tothe Disputed Asset, and accordingly, on December 19, 2014,delivered to the FDIC a notice of dispute under the commercialloss share agreement.
The commercial loss share agreement provides that certaindisputes be submitted to arbitration before a review board, toinclude two party-appointed members, under the commercialarbitration rules of the American Arbitration Association. BPPRand the FDIC have agreed that, if they are not able to resolvetheir disputes concerning the Disputed Asset throughnegotiation prior to March 13, 2015, they will name theirrespective party-appointed members of the review board onMarch 16, 2015.
To the extent we are not able to successfully resolve thismatter through negotiation or the arbitration process describedabove, a write-off in the amount of approximately $53.3 millionof the aforementioned pending claims would be recorded.
In addition, in November and December 2014, BPPRproposed separate portfolio sales to the FDIC. The FDIC hasrefused to consent to either sale, stating that those sales did notrepresent best efforts to maximize collections on Shared-LossAssets under the commercial loss share agreement. We disputethat characterization, and negotiations are continuing.
No assurance can be given that we will receivereimbursement from the FDIC with respect to the foregoingitems, which could require us to make a material adjustment tothe value of our loss share asset and the related true uppayment obligation to the FDIC and could have a materialadverse effect on our financial results for the period in whichsuch adjustment is taken.
The loss share agreement applicable to single-familyresidential mortgage loans provides for FDIC loss sharing andBPPR reimbursement to the FDIC for ten years (ending onJune 30, 2020), and the loss share agreement applicable tocommercial and other assets provides for FDIC loss sharing andBPPR reimbursement to the FDIC for five years (ending onJune 30, 2015), with additional recovery sharing for three yearsthereafter. As of December 31, 2014, the carrying value ofcovered loans approximated $2.5 billion, of whichapproximately 64% pertained to commercial loans, 3% toconstruction loans, 32% to mortgage loans and 1% to consumer
loans. To the extent that estimated losses on covered loans arenot realized before the expiration of the applicable loss shareagreement, such losses would not be subject to reimbursementfrom the FDIC and, accordingly, would require us to make amaterial reduction in the value of our loss share asset and therelated true up payment obligation to the FDIC and could havea material adverse effect on our financial results for the periodin which such adjustment is taken.
Note 32 - Non-consolidated variable interest entitiesThe Corporation is involved with four statutory trusts which itestablished to issue trust preferred securities to the public. Also,it established Popular Capital Trust III for the purpose ofexchanging Series C preferred stock shares held by the U.S.Treasury for trust preferred securities issued by this trust.These trusts are deemed to be variable interest entities (“VIEs”)since the equity investors at risk have no substantial decision-making rights. The Corporation does not hold any variableinterest in the trusts, and therefore, cannot be the trusts’primary beneficiary. Furthermore, the Corporation concludedthat it did not hold a controlling financial interest in thesetrusts since the decisions of the trusts are predeterminedthrough the trust documents and the guarantee of the trustpreferred securities is irrelevant since in substance the sponsoris guaranteeing its own debt.
Also, the Corporation is involved with various specialpurpose entities mainly in guaranteed mortgage securitizationtransactions, including GNMA, FNMA and FHLMC. Thesespecial purpose entities are deemed to be VIEs since they lackequity investments at risk. The Corporation’s continuinginvolvement in these guaranteed loan securitizations includesowning certain beneficial interests in the form of securities aswell as the servicing rights retained. The Corporation is notrequired to provide additional financial support to any of thevariable interest entities to which it has transferred the financialassets. The mortgage-backed securities, to the extent retained,are classified in the Corporation’s consolidated statements offinancial condition as available-for-sale or trading securities.The Corporation concluded that, essentially, these entities(FNMA, GNMA, and FHLMC) control the design of theirrespective VIEs, dictate the quality and nature of the collateral,require the underlying insurance, set the servicing standards viathe servicing guides and can change them at will, and canremove a primary servicer with cause, and without cause in thecase of FNMA and FHLMC. Moreover, through their guaranteeobligations, agencies (FNMA, GNMA, and FHLMC) have theobligation to absorb losses that could be potentially significantto the VIE.
ASU 2009-17 requires that an ongoing primary beneficiaryassessment should be made to determine whether theCorporation is the primary beneficiary of any of the VIEs it isinvolved with. The conclusion on the assessment of these trustsand guaranteed mortgage securitization transactions has not

202
changed since their initial evaluation. The Corporationconcluded that it is still not the primary beneficiary of theseVIEs, and therefore, these VIEs are not required to beconsolidated in the Corporation’s financial statements atDecember 31, 2014.
The Corporation holds variable interests in these VIEs in theform of agency mortgage-backed securities and collateralizedmortgage obligations, including those securities originated bythe Corporation and those acquired from third parties.Additionally, the Corporation holds agency mortgage-backedsecurities, agency collateralized mortgage obligations andprivate label collateralized mortgage obligations issued by thirdparty VIEs in which it has no other form of continuinginvolvement. Refer to Note 35 to the consolidated financialstatements for additional information on the debt securitiesoutstanding at December 31, 2014 and 2013, which areclassified as available-for-sale and trading securities in theCorporation’s consolidated statement of financial condition. Inaddition, the Corporation may retain the right to service thetransferred loans in those government-sponsored specialpurpose entities (“SPEs”) and may also purchase the right toservice loans in other government-sponsored SPEs that weretransferred to those SPEs by a third-party. Pursuant to ASCSubtopic 810-10, the servicing fees that the Corporationreceives for its servicing role are considered variable interests inthe VIEs since the servicing fees are subordinated to theprincipal and interest that first needs to be paid to themortgage-backed securities’ investors and to the guaranty feesthat need to be paid to the federal agencies.
The following table presents the carrying amount andclassification of the assets related to the Corporation’s variableinterests in non-consolidated VIEs and the maximum exposureto loss as a result of the Corporation’s involvement as servicerwith non-consolidated VIEs at December 31, 2014 and 2013.
(In thousands) 2014 2013
AssetsServicing assets:
Mortgage servicing rights $103,828 $113,437
Total servicing assets $103,828 $113,437
Other assets:Servicing advances $ 8,974 $ 1,416
Total other assets $ 8,974 $ 1,416
Total assets $112,802 $114,853
Maximum exposure to loss $112,802 $114,853
The size of the non-consolidated VIEs, in which theCorporation has a variable interest in the form of servicing fees,measured as the total unpaid principal balance of the loans,amounted to $9.0 billion at December 31, 2014 ($9.2 billion atDecember 31, 2013).
Maximum exposure to loss represents the maximum loss,under a worst case scenario, that would be incurred by theCorporation, as servicer for the VIEs, assuming all loansserviced are delinquent and that the value of the Corporation’sinterests and any associated collateral declines to zero, withoutany consideration of recovery. The Corporation determinedthat the maximum exposure to loss includes the fair value ofthe MSRs and the assumption that the servicing advances atDecember 31, 2014 and 2013 will not be recovered. The agencydebt securities are not included as part of the maximumexposure to loss since they are guaranteed by the relatedagencies.
In September of 2011, BPPR sold construction andcommercial real estate loans with a fair value of $148 million,and most of which were non-performing, to a newly createdjoint venture, PRLP 2011 Holdings, LLC. The joint venture ismajority owned by Caribbean Property Group (“CPG”),Goldman Sachs & Co. and East Rock Capital LLC. The jointventure was created for the limited purpose of acquiring theloans from BPPR; servicing the loans through a third-partyservicer; ultimately working out, resolving and/or foreclosingthe loans; and indirectly owning, operating, constructing,developing, leasing and selling any real properties acquired bythe joint venture through deed in lieu of foreclosure,foreclosure, or by resolution of any loan.
BPPR provided financing to the joint venture for theacquisition of the loans in an amount equal to the sum of 57%of the purchase price of the loans, or $84 million, and $2million of closing costs, for a total acquisition loan of $86million (the “acquisition loan”). The acquisition loan has a 5-year maturity and bears a variable interest at 30-day LIBOR plus300 basis points and is secured by a pledge of all of theacquiring entity’s assets. In addition, BPPR provided the jointventure with a non-revolving advance facility (the “advancefacility”) of $68.5 million to cover unfunded commitments andcosts-to-complete related to certain construction projects, and arevolving working capital line (the “working capital line”) of$20 million to fund certain operating expenses of the jointventure. Cash proceeds received by the joint venture are firstused to cover debt service payments for the acquisition loan,advance facility, and the working capital line described abovewhich must be paid in full before proceeds can be used forother purposes. The distributable cash proceeds are determinedbased on a pro-rata basis in accordance with the respectiveequity ownership percentages. BPPR’s equity interest in thejoint venture ranks pari-passu with those of other partiesinvolved. As part of the transaction executed in September2011, BPPR received $ 48 million in cash and a 24.9% equityinterest in the joint venture. The Corporation is not required toprovide any other financial support to the joint venture.
BPPR accounted for this transaction as a true sale pursuantto ASC Subtopic 860-10 and thus recognized the cash received,its equity investment in the joint venture, and the acquisition

203 POPULAR, INC. 2014 ANNUAL REPORT
loan provided to the joint venture and derecognized the loanssold.
The Corporation has determined that PRLP 2011 Holdings,LLC is a VIE but it is not the primary beneficiary. All decisionsare made by CPG (or an affiliate thereof) (the “Manager”),except for certain limited material decisions which wouldrequire the unanimous consent of all members. The Manager isauthorized to execute and deliver on behalf of the joint ventureany and all documents, contracts, certificates, agreements andinstruments, and to take any action deemed necessary in thebenefit of the joint venture. Also, the Manager delegates theday-to-day management and servicing of the loans to CPGIsland Servicing, LLC, an affiliate of CPG, which contracted asub-servicer, but has the responsibility to oversee suchservicing responsibilities.
The Corporation holds variable interests in this VIE in theform of the 24.9% equity interest and the financing provided tothe joint venture. The equity interest is accounted for using theequity method of accounting pursuant to ASC Subtopic 323-10.
The initial fair value of the Corporation’s equity interest inthe joint venture was determined based on the fair value of theloans and real estate owned transferred to the joint venture of$148 million which represented the purchase price of the loansagreed by the parties and was an arm’s-length transactionbetween market participants in accordance with ASC Topic820, reduced by the acquisition loan provided by BPPR to thejoint venture, for a total net equity of $63 million. Accordingly,the 24.9% equity interest held by the Corporation was valued at$16 million. Thus, the fair value of the equity interest isconsidered a Level 2 fair value measurement since the inputswere based on observable market inputs.
The following table presents the carrying amount andclassification of the assets related to the Corporation’s variableinterests in the non-consolidated VIE, PRLP 2011 Holdings,LLC and its maximum exposure to loss at December 31:
(In thousands) 2014 2013
AssetsLoans held-in-portfolio:
Acquisition loan $ – $ 3,233Working capital line advances 426 390Advance facility advances 4,226 16,024
Total loans held-in-portfolio $ 4,652 $19,647
Accrued interest receivable $ 22 $ 65Other assets:
Investment in PRLP 2011 Holdings LLC $23,650 $26,596
Total assets $28,324 $46,308
Deposits $ (2,685) $ (3,621)
Total liabilities $ (2,685) $ (3,621)
Total net assets $25,639 $42,687
Maximum exposure to loss $25,639 $42,687
The Corporation determined that the maximum exposure toloss under a worst case scenario at December 31, 2014 wouldbe not recovering the carrying amount of the acquisition loan,the advances on the advance facility and working capital line, ifany, and the equity interest held by the Corporation, net of thedeposits.
On March 25, 2013, BPPR completed a sale of assets with abook value of $509.0 million, of which $500.6 million were innon-performing status, comprised of commercial andconstruction loans, and commercial and single family real estateowned, with a combined unpaid principal balance on loans andappraised value of other real estate owned of approximately$987.0 million to a newly created joint venture, PR AssetPortfolio 2013-1 International, LLC. The joint venture ismajority owned by Caribbean Property Group LLC (“CPG”)and certain affiliates of Perella Weinberg Partners’Asset BasedValue Strategy. The joint venture was created for the limitedpurpose of acquiring the loans from BPPR; servicing the loansthrough a third-party servicer; ultimately working out,resolving and/or foreclosing the loans; and indirectly owning,operating, constructing, developing, leasing and selling any realproperties acquired by the joint venture through deed in lieu offoreclosure, foreclosure, or by resolution of any loan.
BPPR provided financing to the joint venture for theacquisition of the assets in an amount equal to the sum of 57%of the purchase price of the assets, and closing costs, for a totalacquisition loan of $182.4 million (the “acquisition loan”). Theacquisition loan has a 5-year maturity and bears a variableinterest at 30-day LIBOR plus 300 basis points and is securedby a pledge of all of the acquiring entity’s assets. In addition,BPPR provided the joint venture with a non-revolving advancefacility (the “advance facility”) of $35.0 million to coverunfunded commitments and costs-to-complete related tocertain construction projects, and a revolving working capitalline (the “working capital line”) of $30.0 million to fund certainoperating expenses of the joint venture. Cash proceeds receivedby the joint venture are first used to cover debt servicepayments for the acquisition loan, advance facility, and theworking capital line described above which must be paid in fullbefore proceeds can be used for other purposes. Thedistributable cash proceeds are determined based on a pro-ratabasis in accordance with the respective equity ownershippercentages. BPPR’s equity interest in the joint venture rankspari-passu with those of other parties involved. As part of thetransaction executed in March 2013, BPPR received $92.3million in cash and a 24.9% equity interest in the joint venture.The Corporation is not required to provide any other financialsupport to the joint venture.
BPPR accounted for this transaction as a true sale pursuantto ASC Subtopic 860-10 and thus recognized the cash received,its equity investment in the joint venture, and the acquisitionloan provided to the joint venture and derecognized the loansand real estate owned sold.

204
The Corporation has determined that PR Asset Portfolio2013-1 International, LLC is a VIE but the Corporation is notthe primary beneficiary. All decisions are made by CPG (or anaffiliate thereof) (the “Manager”), except for certain limitedmaterial decisions which would require the unanimous consentof all members. The Manager is authorized to execute anddeliver on behalf of the joint venture any and all documents,contracts, certificates, agreements and instruments, and to takeany action deemed necessary in the benefit of the joint venture.Also, the Manager delegates the day-to-day management andservicing of the loans to PR Asset Portfolio ServicingInternational, LLC, an affiliate of CPG.
The initial fair value of the Corporation’s equity interest inthe joint venture was determined based on the fair value of theloans and real estate owned transferred to the joint venture of$306 million which represented the purchase price of the loansagreed by the parties and was an arm’s-length transactionbetween market participants in accordance with ASC Topic820, reduced by the acquisition loan provided by BPPR to thejoint venture, for a total net equity of $124 million.Accordingly, the 24.9% equity interest held by the Corporationwas valued at $31 million. Thus, the fair value of the equityinterest is considered a Level 2 fair value measurement sincethe inputs were based on observable market inputs.
The Corporation holds variable interests in this VIE in theform of the 24.9% equity interest (the “Investment in PR AssetPortfolio 2013-1 International, LLC”) and the financing providedto the joint venture. The equity interest is accounted for under theequity method of accounting pursuant to ASC Subtopic 323-10.
The following table presents the carrying amount andclassification of the assets and liabilities related to theCorporation’s variable interests in the non-consolidated VIE, PRAsset Portfolio 2013-1 International, LLC, and its maximumexposure to loss at December 31, 2014 and December 31, 2013.
(In thousands)December 31,
2014December 31,
2013
AssetsLoans held-in-portfolio:
Acquisition loan $ 97,193 $157,660Advances under the working capital
line 990 1,196Advances under the advance facility 12,460 1,427
Total loans held-in-portfolio $110,643 $160,283
Accrued interest receivable $ 314 $ 436Other assets:
Investment in PR Asset Portfolio2013-1 International, LLC $ 31,374 $ 30,478
Total assets $142,331 $191,197
Deposits $ (12,960) $ (20,808)
Total liabilities $ (12,960) $ (20,808)
Total net assets $129,371 $170,389
Maximum exposure to loss $129,371 $170,389
The Corporation determined that the maximum exposure toloss under a worst case scenario at December 31, 2014 wouldbe not recovering the carrying amount of the acquisition loan,the advances on the advance facility and working capital line, ifany, and the equity interest held by the Corporation, net ofdeposits.
Note 33 - Derivative instruments and hedging activitiesThe use of derivatives is incorporated as part of theCorporation’s overall interest rate risk management strategy tominimize significant unplanned fluctuations in earnings andcash flows that are caused by interest rate volatility. TheCorporation’s goal is to manage interest rate sensitivity bymodifying the repricing or maturity characteristics of certainbalance sheet assets and liabilities so that the net interest incomeis not materially affected by movements in interest rates. TheCorporation uses derivatives in its trading activities to facilitatecustomer transactions, and as a means of risk management. As aresult of interest rate fluctuations, hedged fixed and variableinterest rate assets and liabilities will appreciate or depreciate infair value. The effect of this unrealized appreciation ordepreciation is expected to be substantially offset by theCorporation’s gains or losses on the derivative instruments thatare linked to these hedged assets and liabilities. As a matter ofpolicy, the Corporation does not use highly leveraged derivativeinstruments for interest rate risk management.
By using derivative instruments, the Corporation exposesitself to credit and market risk. If a counterparty fails to fulfillits performance obligations under a derivative contract, theCorporation’s credit risk will equal the fair value of thederivative asset. Generally, when the fair value of a derivativecontract is positive, this indicates that the counterparty owesthe Corporation, thus creating a repayment risk for theCorporation. To manage the level of credit risk, theCorporation deals with counterparties of good credit standing,enters into master netting agreements whenever possible and,when appropriate, obtains collateral. On the other hand, whenthe fair value of a derivative contract is negative, theCorporation owes the counterparty and, therefore, the fairvalue of derivatives liabilities incorporates nonperformance riskor the risk that the obligation will not be fulfilled.
The credit risk attributed to the counterparty’snonperformance risk is incorporated in the fair value of thederivatives. Additionally, as required by the fair valuemeasurements guidance, the fair value of the Corporation’s owncredit standing is considered in the fair value of the derivativeliabilities. During the year ended December 31, 2014, inclusionof the credit risk in the fair value of the derivatives resulted inloss of $0.1 million (2013 - gain of $ 0.5 million; 2012 - loss of$ 0.5 million) from the Corporation’s credit standingadjustment and a gain of $1.2 million (2013 - gain of $1.0million; 2012 - gain of $3.4 million) from the assessment of thecounterparties’ credit risk.

205 POPULAR, INC. 2014 ANNUAL REPORT
Market risk is the adverse effect that a change in interestrates, currency exchange rates, or implied volatility rates mighthave on the value of a financial instrument. The Corporationmanages the market risk associated with interest rates and, to alimited extent, with fluctuations in foreign currency exchangerates by establishing and monitoring limits for the types anddegree of risk that may be undertaken.
Pursuant to the Corporation’s accounting policy, the fairvalue of derivatives is not offset with the amounts for the rightto reclaim cash collateral or the obligation to return cashcollateral. At December 31, 2014, the amount recognized forthe right to reclaim cash collateral under master nettingagreements was $15 million and no amount was recognized forthe obligation to return cash collateral (December 31, 2013 - $19 million and no amount, respectively).
Certain of the Corporation’s derivative instruments includefinancial covenants tied to the corresponding bankingsubsidiary’s well-capitalized status and credit rating. Theseagreements could require exposure collateralization, earlytermination or both. The aggregate fair value of all derivativeinstruments with contingent features that were in a liabilityposition at December 31, 2014 was $9 million (December 31,2013 - $ 15 million). Based on the contractual obligationsestablished on these derivative instruments, the Corporationhas fully collateralized these positions by pledging collateral of$15 million at December 31, 2014 (December 31, 2013 - $ 19million).
Financial instruments designated as cash flow hedges ornon-hedging derivatives outstanding at December 31, 2014 andDecember 31, 2013 were as follows:
Notional amount Derivative assets Derivative liabilities
At December 31,Statement of
conditionclassification
Fair value atDecember 31,
Statement ofcondition
classification
Fair value atDecember 31,
(In thousands) 2014 2013 2014 2013 2014 2013
Derivatives designated as hedginginstruments:
Forward contracts $ 92,850 $ – Other assets $ – $ – Other liabilities $ 551 $ –
Total derivatives designated ashedging instruments $ 92,850 $ – $ – $ – $ 551 $ –
Derivatives not designated as hedginginstruments:
Forward contracts $ – $129,600 Trading accountsecurities
$ – $ 83 Other liabilities $ – $ 20
Forward contracts – 152,800 Other assets – 658 Other liabilities – 25Interest rate swaps 237,576 283,440 Other assets 8,418 13,289 Other liabilities 9,102 15,196Foreign currency forward contracts 745 – Other assets 16 – Other liabilities 11 –Interest rate caps 96,046 97,338 Other assets 320 1,192 Other liabilities 320 1,192Indexed options on deposits 86,712 85,729 Other assets 16,608 19,571 – – –Bifurcated embedded options 83,244 83,087 – – – Interest
bearingdeposits
13,048 15,945
Total derivatives not designated ashedging instruments: $504,323 $831,994 $25,362 $34,793 $22,481 $32,378
Total derivative assets and liabilities $597,173 $831,994 $25,362 $34,793 $23,032 $32,378

206
Cash Flow HedgesThe Corporation utilizes forward contracts to hedge the sale ofmortgage-backed securities with duration terms over onemonth. Interest rate forwards are contracts for the delayeddelivery of securities, which the seller agrees to deliver on aspecified future date at a specified price or yield. These forwardcontracts are hedging a forecasted transaction and thus qualify
for cash flow hedge accounting. Changes in the fair value of thederivatives are recorded in other comprehensive income (loss).The amount included in accumulated other comprehensiveincome (loss) corresponding to these forward contracts isexpected to be reclassified to earnings in the next twelvemonths. These contracts have a maximum remaining maturityof 82 days at December 31, 2014.
For cash flow hedges, net gains (losses) on derivative contracts that are reclassified from accumulated other comprehensive income(loss) to current period earnings are included in the line item in which the hedged item is recorded and during the period in whichthe forecasted transaction impacts earnings, as presented in the tables below.
Year ended December 31, 2014
(In thousands)
Amount of net gain (loss)recognized in OCI onderivatives (effective
portion)
Classification in the statement ofoperations of the net gain (loss)
reclassified from AOCI into income(effective portion, ineffective portion,
and amount excluded fromeffectiveness testing)
Amount of net gain (loss)reclassified from AOCI intoincome (effective portion)
Amount of net gain (loss)recognized in income onderivatives (ineffectiveportion and amount
excluded fromeffectiveness testing)
Forward contracts $ (6,613) Mortgage banking activities $ (6,091) $(109)
Total $ (6,613) $ (6,091) $(109)
Year ended December 31, 2013
(In thousands)
Amount of net gain (loss)recognized in OCI onderivatives (effective
portion)
Classification in the statement ofoperations of the net gain (loss)
reclassified from AOCI into income(effective portion, ineffective portion,
and amount excluded fromeffectiveness testing)
Amount of net gain (loss)reclassified from AOCI intoincome (effective portion)
Amount of net gain (loss)recognized in income onderivatives (ineffectiveportion and amount
excluded fromeffectiveness testing)
Forward contracts $ 2,286 Mortgage banking activities $ 1,839 $ 577
Total $ 2,286 $ 1,839 $ 577
Year ended December 31, 2012
(In thousands)
Amount of net gain (loss)recognized in OCI onderivatives (effective
portion)
Classification in the statement ofoperations of the net gain (loss)
reclassified from AOCI into income(effective portion, ineffective portion,
and amount excluded fromeffectiveness testing)
Amount of net gain (loss)reclassified from AOCI intoincome (effective portion)
Amount of net gain (loss)recognized in income onderivatives (ineffectiveportion and amount
excluded fromeffectiveness testing)
Forward contracts $(13,509) Mortgage banking activities $14,119 $ (44)
Total $(13,509) $14,119 $ (44)
Fair Value HedgesAt December 31, 2014 and 2013, there were no derivatives designated as fair value hedges.

207 POPULAR, INC. 2014 ANNUAL REPORT
Non-Hedging ActivitiesFor the year ended December 31, 2014, the Corporation recognized a loss of $ 8.5 million (2013 - gain of $ 11.1 million; 2012 -loss of $ 4.8 million) related to its non-hedging derivatives, as detailed in the table below.
Amount of Net Gain (Loss) Recognized in Income on Derivatives
(In thousands)Classification of Net Gain (Loss)
Recognized in Income on Derivatives
Year endedDecember 31,
2014
Year endedDecember 31,
2013
Year endedDecember 31,
2012
Forward contracts Mortgage banking activities $(10,876) $ 9,039 $(8,046)Interest rate swaps Other operating income 1,223 965 2,953Foreign currency forward contracts Other operating income 8 18 31Foreign currency forward contracts Interest expense 5 (1) (5)Indexed options on deposits Interest expense 2,815 5,296 1,965Bifurcated embedded options Interest expense (1,666) (4,230) (1,735)
Total $ (8,491) $11,087 $(4,837)
Forward ContractsThe Corporation has forward contracts to sell mortgage-backedsecurities, which are accounted for as trading derivatives.Changes in their fair value are recognized in mortgage bankingactivities.
Interest Rates Swaps and Foreign Currency and ExchangeRate CommitmentsIn addition to using derivative instruments as part of its interestrate risk management strategy, the Corporation also utilizesderivatives, such as interest rate swaps and foreign exchangeforward contracts, in its capacity as an intermediary on behalfof its customers. The Corporation minimizes its market riskand credit risk by taking offsetting positions under the sameterms and conditions with credit limit approvals andmonitoring procedures. Market value changes on these swapsand other derivatives are recognized in earnings in the period ofchange.
Interest Rate Caps and FloorsThe Corporation enters into interest rate caps and floors as anintermediary on behalf of its customers and simultaneouslytakes offsetting positions under the same terms and conditions,thus minimizing its market and credit risks.
Index and Embedded OptionsThe Corporation offers certain customers’ deposits whosereturn are tied to the performance of the Standard and Poor’s(“S&P 500”) stock market indexes, and other deposits whosereturns are tied to other stock market indexes or other equitysecurities performance. The Corporation bifurcated the relatedoptions embedded within these customers’ deposits from thehost contract in accordance with ASC Subtopic 815 - 15. Inorder to limit the Corporation’s exposure to changes in theseindexes, the Corporation purchases index options whichreturns are tied to the same indexes from major broker dealercompanies in the over the counter market. Accordingly, the
embedded options and the related index options are marked-to-market through earnings.
Note 34 - Related party transactionsThe Corporation grants loans to its directors, executive officersand certain related individuals or organizations in the ordinarycourse of business. The activity and balance of these loans wereas follows:
(In thousands)ExecutiveOfficers Directors Total
Balance at December 31, 2012 $ 4,947 $108,207 $113,154New loans 239 40,827 41,066Payments (301) (51,720) (52,021)Other changes 24,828 (30,473) (5,645)
Balance at December 31, 2013 $29,713 $ 66,841 $ 96,554New loans 1,163 74,327 75,490Payments (1,318) (17,161) (18,479)Other changes 4,529 – 4,529
Balance at December 31, 2014 $34,087 $124,007 $158,094
The amounts reported as “other changes” in the activity for2013 include items such as changes in the status of those whoare considered related parties and a reclassification of a loanacquired as part of the Westernbank acquisition with a carryingvalue of $25 million as a loan related to an executive officerinstead of to a director. This loan was previously classified asrelated to a director because both a former director (who ceasedbeing a director in 2013) and an executive officer were relatedparties of the borrower entity.
At December 31, 2014, the Corporation’s bankingsubsidiaries held deposits from related parties, excludingEVERTEC, Inc. (“EVERTEC”) amounting to $ 24 million(2013 - $ 20 million).
From time to time, the Corporation, in the ordinary courseof business, obtains services from related parties or makescontributions to non-profit organizations that have some

208
association with the Corporation. Management believes theterms of such arrangements are consistent with arrangementsentered into with independent third parties.
During 2014, the Corporation engaged, in the ordinarycourse of business, the legal services of a law firm in PuertoRico, in which the Secretary of the Board of Directors of Popular,Inc. acted as senior counsel or as partner. The fees paid to thislaw firm for the year 2014 amounted to approximately $0.7million (2013 - $1.1 million). During 2014, the Corporation alsoengaged, in the ordinary course of business, the legal services ofa law firm in Puerto Rico, of which the Corporation’s ExecutiveVice President and Chief Legal Officer and Secretary of theBoard of Directors was a member until September 2014. The feespaid to this law firm for fiscal year 2014 amounted toapproximately $3.8 million, which include $0.6 million paid bythe Corporation’s clients in connection with commercial loantransactions. In addition, this law firm leases office space in theCorporation’s headquarters building, which is owned by BPPR,and engages BPPR as custodian of its retirement plan. During2014, this law firm made lease payments to BPPR ofapproximately $0.7 million and paid BPPR approximately $0.1million for its services as custodian. The rent and trustee feespaid by this law firm were at market rates.
For the year ended December 31, 2014, the Corporationmade contributions of approximately $0.7 million to BancoPopular Foundations, which are not-for-profit corporationsdedicated to philanthropic work (2013 - $0.7 million).
In June 2006, family members of a director of theCorporation, obtained a $0.8 million mortgage loan fromPopular Mortgage, Inc., secured by a residential property. Thedirector was not a director of the Corporation at the time theloan was made. In March, 2012 the loan was restructured underthe Corporation’s loss mitigation program. The balance due onthe loan at December 31, 2014 was approximately $0.9 million.
The brother-in-law of an Executive Vice President of theCorporation, became delinquent on a series of commercialloans granted to him by BPPR. The aggregate amount ofprincipal owed on such loans as of December 31, 2014 wasapproximately $0.7 million. Certain of the loans are secured byreal estate and BPPR commenced collection and foreclosureproceedings in February 2014. The Bank has charged-off anaggregate amount of approximately $0.4 million in connectionwith these loans. The book value of these loans at December 31,2014 was of $0.3 million. The same brother-in law of theExecutive Vice President of the Corporation, also has aparticipation in two entities, each of which has a real estatedevelopment loan with BPPR. The first loan is to an entity inwhich he owns a 50% equity interest. The loan is payable fromthe proceeds of the sale of residential units. The outstandingbalance on the loan as of December 31, 2014 was approximately
$0.1 million. The second loan is to an entity in which thisindividual owns a 33% equity interest and which is securedwith undeveloped land. The outstanding balance on the loan asof December 31, 2014 was $0.4 million.
On April 10, 2014, BPPR sold two undeveloped parcels ofland, which had been foreclosed by BPPR, for the aggregateprice of $2.7 million to an entity controlled by a shareholder ofthe Corporation. On June 30, 2014, BPPR sold a parcel of land,which had been foreclosed by BPPR, to an entity controlled bythis same shareholder of the Corporation for $5.3 million.These sales was made on terms and conditions similar to thesale to unaffiliated parties of other real estate assets that havebeen foreclosed by BPPR and are held for sale. On June 5, 2014,certain borrowers of BPPR sold five real estate properties toaffiliates of this same shareholder of the Corporation, as part ofa settlement agreement that was executed by said borrowerswith BPPR. As part of this settlement, BPPR received paymentsamounting to $16.7 million from the borrowers and guarantorsof the loans that were settled. The settlement of these loans wasmade on terms and conditions similar to the settlement of othernon-performing loans previously settled by BPPR intransactions where only unaffiliated parties were involved.
The Corporation has had loan transactions with theCorporation’s directors and officers, and with their associates,and proposes to continue such transactions in the ordinarycourse of its business, on substantially the same terms, includinginterest rates and collateral, as those prevailing for comparableloan transactions with third parties, except as disclosed above.Except as discussed above, the extensions of credit have notinvolved and do not currently involve more than normal risks ofcollection or present other unfavorable features.
Related party transactions with EVERTEC, as an affiliateThe Corporation has an investment in EVERTEC, Inc.(“EVERTEC”), which provides various processing andinformation technology services to the Corporation and itssubsidiaries and gives BPPR access to the ATH network ownedand operated by EVERTEC. As of December 31, 2014, theCorporation’s stake in EVERTEC was 14.96%. The Corporationcontinues to have significant influence over EVERTEC.Accordingly, the investment in EVERTEC is accounted forunder the equity method and is evaluated for impairment ifevents or circumstances indicate that a decrease in value of theinvestment has occurred that is other than temporary.
The Corporation received $4.7 million in dividenddistributions during the year ended December 31, 2014 from itsinvestments in EVERTEC’s holding company (December 31, 2013- $4.4 million). The Corporation’s equity in EVERTEC ispresented in the table which follows and is included as part of“other assets” in the consolidated statement of financial condition.
(In thousands) December 31, 2014 December 31, 2013
Equity investment in EVERTEC $25,146 $19,931

209 POPULAR, INC. 2014 ANNUAL REPORT
The Corporation had the following financial conditionbalances outstanding with EVERTEC at December 31, 2014 and
December 31, 2013. Items that represent liabilities to theCorporation are presented with parenthesis.
(In thousands) December 31, 2014 December 31, 2013
Accounts receivable (Other assets) $ 5,065 $ 8,634Deposits (15,481) (14,289)Accounts payable (Other liabilities) (15,511) (15,862)
Net total $(25,927) $(21,517)
The Corporation’s proportionate share of income or lossfrom EVERTEC is included in other operating income in theconsolidated statements of operations. The following table
presents the Corporation’s proportionate share of EVERTEC’sincome (loss) and changes in stockholders’ equity for the yearsended December 31, 2014, 2013 and 2012.
Years ended December 31,
(In thousands) 2014 2013 2012
Share of income (loss) from investment in EVERTEC $10,536 $ (3,762) $38,461Share of other changes in EVERTEC’s stockholders’ equity 381 18,965 (187)
Share of EVERTEC’s changes in equity recognized in income $10,917 $15,203 $38,274
The following tables present the impact of transactions andservice payments between the Corporation and EVERTEC (asan affiliate) and their impact on the results of operations for the
years ended December 31, 2014, 2013 and 2012. Items thatrepresent expenses to the Corporation are presented withparenthesis.
Years ended December 31,
(In thousands) 2014 2013 2012 Category
Interest income on loan to EVERTEC $ – $ 2,490 $ 3,373 Interest incomeInterest income on investment securities issued by EVERTEC – 1,269 3,850 Interest incomeInterest expense on deposits (67) (128) (267) Interest expenseATH and credit cards interchange income from services to EVERTEC 26,646 25,571 25,188 Other service fees
Debt prepayment penalty paid by EVERTEC – 5,856 –
Net gain (loss)and valuation
adjustments oninvestment securities
Consulting fee paid by EVERTEC – 9,854 – Other operating incomeRental income charged to EVERTEC 6,874 6,560 6,647 Net occupancyProcessing fees on services provided by EVERTEC (154,839) (155,521) (150,677) Professional feesOther services provided to EVERTEC 1,012 843 751 Other operating expenses
Total $(120,374) $(103,206) $(111,135)
EVERTEC has a letter of credit issued by BPPR, for anamount of $3.6 million at December 31, 2014 (2013 - $3.6million). The Corporation also agreed to maintain outstandingthis letter of credit for a 5-year period which expires onSeptember 30, 2015. EVERTEC and the Corporation enteredinto a Reimbursement Agreements, in which EVERTEC willreimburse the Corporation for any losses incurred by theCorporation in connection with the performance bonds and the
letter of credit. Possible losses resulting from these agreementsare considered insignificant.
PRLP 2011 Holdings, LLCAs indicated in Note 32 to the consolidated financialstatements, the Corporation holds a 24.9% equity interest inPRLP 2011 Holdings, LLC and currently provides certainfinancing to the joint venture as well as holds certain depositsfrom the entity.

210
The Corporation’s equity in PRLP 2011 Holdings, LLC is presented in the table which follows and is included as part of “otherassets” in the consolidated statements of financial condition.
(In thousands) December 31, 2014 December 31, 2013
Equity investment in PRLP 2011 Holdings, LLC $23,650 $26,596
The Corporation had the following financial condition balances outstanding with PRLP 2011 Holdings, LLC at December 31,2014 and December 31, 2013.
(In thousands) December 31, 2014 December 31, 2013
Loans $ 4,652 $19,647Accrued interest receivable 22 65Deposits (non-interest bearing) (2,685) (3,621)
Net total $ 1,989 $16,091
The Corporation’s proportionate share of income or loss from PRLP 2011 Holdings, LLC is included in other operating incomein the consolidated statements of operations. The following table presents the Corporation’s proportionate share of income (loss)from PRLP 2011 Holdings, LLC for the years ended December 31, 2014, 2013 and 2012.
Years ended December 31,
(In thousands) 2014 2013 2012
Share of (loss) income from the equity investment in PRLP 2011 Holdings, LLC $(2,947) $3,347 $7,128
The following table presents transactions between the Corporation and PRLP 2011 Holdings, LLC and their impact on theCorporation’s results of operations for the years ended December 31, 2014, 2013 and 2012.
Years ended December 31,
(In thousands) 2014 2013 2012 Category
Interest income on loan to PRLP 2011 Holdings, LLC $425 $1,162 $2,688 Interest income
PR Asset Portfolio 2013-1 International, LLCAs indicated in Note 32 to the consolidated financialstatements, effective March 2013 the Corporation holds a24.9% equity interest in PR Asset Portfolio 2013-1International, LLC and currently provides certain financing tothe joint venture as well as holds certain deposits from theentity.
The Corporation’s equity in PR Asset Portfolio 2013-1International, LLC is presented in the table which follows andis included as part of “other assets” in the consolidatedstatements of financial condition.
(In thousands) December 31, 2014 December 31, 2013
Equity investment in PRAsset Portfolio 2013-1International, LLC $31,374 $30,478
The Corporation had the following financial conditionbalances outstanding with PR Asset Portfolio 2013-1International, LLC, at December 31, 2014 and December 31,2013.
(In thousands) December 31, 2014 December 31, 2013
Loans $110,643 $160,283Accrued interest
receivable 314 436Deposits (12,960) (20,808)
Net total $ 97,997 $139,911
211 POPULAR, INC. 2014 ANNUAL REPORT
The Corporation’s proportionate share of income or lossfrom PR Asset Portfolio 2013-1 International, LLC isincluded in other operating income in the consolidatedstatements of operations. The following table presentsthe Corporation’s proportionate share of income (loss)from PR Asset Portfolio 2013-1 International, LLC foryears ended December 31, 2014 and 2013.
Years ended December 31,
(In thousands) 2014 2013
Share of income from the equityinvestment in PR Asset Portfolio2013-1 International, LLC $745 $(1,979)
The following table presents transactions between theCorporation and PR Asset Portfolio 2013-1 International, LLCand their impact on the Corporation’s results of operations forthe years ended December 31, 2014 and 2013.
Years ended December 31,
(In thousands) 2014 2013 Category
Interest income onloan to PR AssetPortfolio 2013-1International, LLC $4,340 $2,966 Interest income
Servicing fee paid byPR Asset Portfolio2013-1International, LLC 70 150 Other service fees
Total $4,410 $3,116
Note 35 - Fair value measurementASC Subtopic 820 - 10 “Fair Value Measurements andDisclosures” establishes a fair value hierarchy that prioritizesthe inputs to valuation techniques used to measure fair valueinto three levels in order to increase consistency andcomparability in fair value measurements and disclosures. Thehierarchy is broken down into three levels based on thereliability of inputs as follows:
• Level 1 - Unadjusted quoted prices in active markets foridentical assets or liabilities that the Corporation has theability to access at the measurement date. Valuation onthese instruments does not necessitate a significant degreeof judgment since valuations are based on quoted pricesthat are readily available in an active market.
• Level 2 - Quoted prices other than those included in Level1 that are observable either directly or indirectly. Level 2inputs include quoted prices for similar assets or liabilitiesin active markets, quoted prices for identical or similarassets or liabilities in markets that are not active, or otherinputs that are observable or that can be corroborated byobservable market data for substantially the full term ofthe financial instrument.
• Level 3 - Inputs are unobservable and significant to thefair value measurement. Unobservable inputs reflect theCorporation’s own assumptions about assumptions thatmarket participants would use in pricing the asset orliability.
The Corporation maximizes the use of observable inputs andminimizes the use of unobservable inputs by requiring that theobservable inputs be used when available. Fair value is basedupon quoted market prices when available. If listed prices orquotes are not available, the Corporation employs internally-developed models that primarily use market-based inputsincluding yield curves, interest rates, volatilities, and creditcurves, among others. Valuation adjustments are limited tothose necessary to ensure that the financial instrument’s fairvalue is adequately representative of the price that would bereceived or paid in the marketplace. These adjustments includeamounts that reflect counterparty credit quality, theCorporation’s credit standing, constraints on liquidity andunobservable parameters that are applied consistently.
The estimated fair value may be subjective in nature andmay involve uncertainties and matters of significant judgmentfor certain financial instruments. Changes in the underlyingassumptions used in calculating fair value could significantlyaffect the results.

212
Fair Value on a Recurring and Nonrecurring BasisThe following fair value hierarchy tables present informationabout the Corporation’s assets and liabilities measured at fairvalue on a recurring basis at December 31, 2014 and 2013 and
on a nonrecurring basis in periods subsequent to initialrecognition for the years ended December 31, 2014, 2013, and2012:
At December 31, 2014
(In thousands) Level 1 Level 2 Level 3 Total
RECURRING FAIR VALUE MEASUREMENTSAssetsInvestment securities available-for-sale:U.S. Treasury securities $ – $ 700,154 $ – $ 700,154Obligations of U.S. Government sponsored entities – 1,724,973 – 1,724,973Obligations of Puerto Rico, States and political subdivisions – 61,712 – 61,712Collateralized mortgage obligations - federal agencies – 1,910,030 – 1,910,030Mortgage-backed securities – 903,037 1,325 904,362Equity securities 323 2,299 – 2,622Other – 11,306 – 11,306
Total investment securities available-for-sale $323 $5,313,511 $ 1,325 $5,315,159
Trading account securities, excluding derivatives:Obligations of Puerto Rico, States and political subdivisions $ – $ 7,954 $ – $ 7,954Collateralized mortgage obligations – 261 1,375 1,636Mortgage-backed securities - federal agencies – 104,463 6,229 110,692Other – 16,682 1,563 18,245
Total trading account securities $ – $ 129,360 $ 9,167 $ 138,527
Mortgage servicing rights $ – $ – $ 148,694 $ 148,694Derivatives – 25,362 – 25,362
Total assets measured at fair value on a recurring basis $323 $5,468,233 $ 159,186 $5,627,742
LiabilitiesDerivatives $ – $ (23,032) $ – $ (23,032)Contingent consideration – – (133,634) (133,634)
Total liabilities measured at fair value on a recurring basis $ – $ (23,032) $(133,634) $ (156,666)

213 POPULAR, INC. 2014 ANNUAL REPORT
At December 31, 2013
(In thousands) Level 1 Level 2 Level 3 Total
RECURRING FAIR VALUE MEASUREMENTSAssetsInvestment securities available-for-sale:U.S. Treasury securities $ – $ 28,482 $ – $ 28,482Obligations of U.S. Government sponsored entities – 1,629,205 – 1,629,205Obligations of Puerto Rico, States and political subdivisions – 66,377 – 66,377Collateralized mortgage obligations - federal agencies – 2,418,296 – 2,418,296Collateralized mortgage obligations - private label – 513 – 513Mortgage-backed securities – 1,129,118 6,523 1,135,641Equity securities 412 3,704 – 4,116Other – 12,170 – 12,170
Total investment securities available-for-sale $412 $5,287,865 $ 6,523 $5,294,800
Trading account securities, excluding derivatives:Obligations of Puerto Rico, States and political subdivisions $ – $ 7,586 $ – $ 7,586Collateralized mortgage obligations – 426 1,423 1,849Mortgage-backed securities - federal agencies – 302,952 9,799 312,751Other – 15,545 1,929 17,474
Total trading account securities $ – $ 326,509 $ 13,151 $ 339,660
Mortgage servicing rights $ – $ – $ 161,099 $ 161,099Derivatives – 34,793 – 34,793
Total assets measured at fair value on a recurring basis $412 $5,649,167 $ 180,773 $5,830,352
LiabilitiesDerivatives $ – $ (32,378) $ – $ (32,378)Contingent consideration – – (128,299) (128,299)
Total liabilities measured at fair value on a recurring basis $ – $ (32,378) $(128,299) $ (160,677)
Year ended December 31, 2014
(In thousands) Level 1 Level 2 Level 3 Total
NONRECURRING FAIR VALUE MEASUREMENTSAssets Write-downs
Loans [1] $– $ – $ 71,750 $ 71,750 $ (15,405)Loans held-for-sale [2] – – 21,609 21,609 (38)Other real estate owned [3] – 6,610 86,520 93,130 (42,366)Other foreclosed assets [3] – – 1,368 1,368 (1,622)
Total assets measured at fair value on a nonrecurring basis $– $6,610 $181,247 $187,857 $ (59,431)
[1] Relates mostly to certain impaired collateral dependent loans. The impairment was measured based on the fair value of the collateral, which is derived fromappraisals that take into consideration prices in observed transactions involving similar assets in similar locations, in accordance with the provisions of ASCSection 310-10-35. Costs to sell are excluded from the reported fair value amount.
[2] Relates to lower of cost or fair value adjustments on loans held-for-sale and loans transferred from loans held-in-portfolio to loans held-for-sale. Costs to sell areexcluded from the reported fair value amount.
[3] Represents the fair value of foreclosed real estate and other collateral owned that were written down to their fair value. Costs to sell are excluded from the reportedfair value amount.

214
Year ended December 31, 2013
(In thousands) Level 1 Level 2 Level 3 Total
NONRECURRING FAIR VALUE MEASUREMENTSAssets Write-downs
Loans [1] $– $ – $ 25,673 $ 25,673 $ (21,348)Loans held-for-sale [2] – – – – (364,820)Other real estate owned [3] – 2,849 84,732 87,581 (43,861)Other foreclosed assets [3] – – 638 638 (617)
Total assets measured at fair value on a nonrecurring basis $– $2,849 $111,043 $113,892 $ (430,646)
[1] Relates mostly to certain impaired collateral dependent loans. The impairment was measured based on the fair value of the collateral, which is derived fromappraisals that take into consideration prices in observed transactions involving similar assets in similar locations, in accordance with the provisions of ASCSection 310-10-35. Costs to sell are excluded from the reported fair value amount.
[2] Relates to lower of cost or fair value adjustments on loans held-for-sale and loans transferred from loans held-in-portfolio to loans held-for-sale. Costs to sell areexcluded from the reported fair value amount.
[3] Represents the fair value of foreclosed real estate and other collateral owned that were written down to their fair value. Costs to sell are excluded from the reportedfair value amount.
Year ended December 31, 2012
(In thousands) Level 1 Level 2 Level 3 Total
NONRECURRING FAIR VALUE MEASUREMENTSAssets Write-downsLoans [1] $– $– $ 10,445 $ 10,445 $ (23,972)Loans held-for-sale [2] – – 93,429 93,429 (43,937)Other real estate owned [3] – – 111,425 111,425 (32,783)Other foreclosed assets [3] – – 128 128 (360)Long-lived assets held-for-sale [4] – – – – (123)
Total assets measured at fair value on a nonrecurring basis $– $– $215,427 $215,427 $ (101,175)
[1] Relates mostly to certain impaired collateral dependent loans. The impairment was measured based on the fair value of the collateral, which is derived fromappraisals that take into consideration prices in observed transactions involving similar assets in similar locations, in accordance with the provisions of ASCSection 310-10-35. Costs to sell are excluded from the reported fair value amount.
[2] Relates to lower of cost or fair value adjustments on loans held-for-sale and loans transferred from loans held-in-portfolio to loans held-for-sale. Costs to sell areexcluded from the reported fair value amount.
[3] Represents the fair value of foreclosed real estate and other collateral owned that were written down to their fair value. Costs to sell are excluded from the reportedfair value amount.
[4] Represents the fair value of long-lived assets held-for-sale that were written down to their fair value.

215 POPULAR, INC. 2014 ANNUAL REPORT
The following tables present the changes in Level 3 assets and liabilities measured at fair value on a recurring basis for the yearsended December 31, 2014, 2013, and 2012.
Year ended December 31, 2014
(In thousands)
MBSclassified
as investmentsecuritiesavailable-for-sale
CMOsclassifiedas tradingaccount
securities
MBSclassified as
trading accountsecurities
Othersecuritiesclassifiedas tradingaccount
securities
Mortgageservicing
rightsTotalassets
Contingentconsideration
Totalliabilities
Balance at January 1, 2014 $ 6,523 $1,423 $ 9,799 $1,929 $161,099 $180,773 $(128,299) $(128,299)Gains (losses) included in earnings (31) (11) (165) (366) (24,773) (25,346) (1,791) (1,791)Gains (losses) included in OCI (249) – – – – (249) – –Additions – 270 805 – 12,583 13,658 (4,330) (4,330)Sales (4,350) – (2,110) – – (6,460) – –Settlements (568) (307) (2,100) – (215) (3,190) 786 786
Balance at December 31, 2014 $ 1,325 $1,375 $ 6,229 $1,563 $148,694 $159,186 $(133,634) $(133,634)
Changes in unrealized gains (losses)included in earnings relating to assetsstill held at December 31, 2014 $ – $ (7) $ (72) $ (144) $ (6,120) $ (6,343) $ (1,791) $ (1,791)
Year ended December 31, 2013
(In thousands)
MBSclassified
as investmentsecuritiesavailable-for-sale
CMOsclassifiedas tradingaccount
securities
MBSclassified as
trading accountsecurities
Othersecuritiesclassifiedas tradingaccount
securities
Mortgageservicing
rightsTotalassets
Contingentconsideration
Totalliabilities
Balance at January 1, 2013 $7,070 $2,499 $11,817 $2,240 $154,430 $178,056 $(112,002) $(112,002)Gains (losses) included in earnings (7) (18) (39) (311) (11,403) (11,778) (16,297) (16,297)Gains (losses) included in OCI (40) – – – – (40) – –Additions – 25 859 – 19,307 20,191 – –Sales – (802) (100) – – (902) – –Settlements (500) (281) (2,738) – (1,235) (4,754) – –
Balance at December 31, 2013 $6,523 $1,423 $ 9,799 $1,929 $161,099 $180,773 $(128,299) $(128,299)
Changes in unrealized gains (losses)included in earnings relating to assetsstill held at December 31, 2013 $ – $ (4) $ 159 $ 14 $ 15,024 $ 15,193 $ (16,297) $ (16,297)
Year ended December 31, 2012
(In thousands)
MBSclassified
as investmentsecuritiesavailable-for-sale
CMOsclassifiedas tradingaccount
securities
MBSclassified as
trading accountsecurities
Othersecuritiesclassifiedas tradingaccount
securities
Mortgageservicing
rightsTotalassets
Contingentconsideration
Totalliabilities
Balance at January 1, 2012 $7,435 $2,808 $21,777 $ 4,036 $151,323 $187,379 $ (99,762) $ (99,762)Gains (losses) included in earnings (6) 30 680 (123) (17,406) (16,825) (12,600) (12,600)Gains (losses) included in OCI 66 – – – – 66 – –Additions – 608 6,499 2,116 20,726 29,949 – –Sales – (250) (9,824) (1,834) (103) (12,011) – –Settlements (425) (697) (2,104) (1,955) (110) (5,291) 360 360Transfers into Level 3 – – 2,405 – – 2,405 – –Transfers out of Level 3 – – (7,616) – – (7,616) – –
Balance at December 31, 2012 $7,070 $2,499 $11,817 $ 2,240 $154,430 $178,056 $(112,002) $(112,002)
Changes in unrealized gains (losses)included in earnings relating to assetsstill held at December 31, 2012 $ – $ 23 $ (165) $ (333) $ 8,130 $ 7,655 $ (13,347) $ (13,347)

216
There were no transfers in and/or out of Level 1, Level 2, orLevel 3 for financial instruments measured at fair value on arecurring basis during the year ended December 31, 2014 and2013. There were no transfers in and/or out of Level 1 forfinancial instruments measured at fair value on a recurringbasis during the year ended December 31, 2012. There were $2 million in transfers from Level 2 to Level 3 and $8 million intransfers from Level 3 to Level 2 for financial instrumentsmeasured at fair value on a recurring basis during the year
ended December 31, 2012. The transfers from Level 2 to Level3 of trading mortgage-backed securities were the result of achange in valuation technique to a matrix pricing model, basedon indicative prices provided by brokers. The transfers fromLevel 3 to Level 2 of trading mortgage-backed securitiesresulted from observable market data becoming available forthese securities. The Corporation’s policy is to recognizetransfers as of the end of the reporting period.
Gains and losses (realized and unrealized) included in earnings for the years ended December 31, 2014, 2013, and 2012 forLevel 3 assets and liabilities included in the previous tables are reported in the consolidated statement of operations as follows:
2014 2013 2012
(In thousands)
Totalgains (losses)
includedin earnings
Changes in unrealizedgains (losses)
relating to assets stillheld at reporting date
Totalgains (losses)
includedin earnings
Changes in unrealizedgains (losses)
relating to assets stillheld at reporting date
Totalgains (losses)
includedin earnings
Changes in unrealizedgains (losses)
relating to assets stillheld at reporting date
Interest income $ (31) $ – $ (7) $ – $ (6) $ –FDIC loss share (expense)
income (1,791) (1,791) (15,994) (15,994) (13,178) (13,178)Mortgage banking
activities (24,773) (6,120) (11,403) 15,024 (17,406) 8,130Trading account (loss)
profit (542) (223) (368) 169 587 (475)Other operating income – – (303) (303) 578 (169)
Total $(27,137) $(8,134) $(28,075) $ (1,104) $(29,425) $ (5,692)
The following table includes quantitative information about significant unobservable inputs used to derive the fair value ofLevel 3 instruments, excluding those instruments for which the unobservable inputs were not developed by the Corporation suchas prices of prior transactions and/or unadjusted third-party pricing sources.
(In thousands)
Fair value atDecember 31,
2014Valuationtechnique
Unobservableinputs
Weightedaverage(range)
CMO’s - trading $ 1,375 Discounted cash flow model Weighted average life 2.2 years (0.6 - 4.8 years)Yield 4.0% (1.3% - 4.7%)
Constant prepayment rate 23.9% (19.5% - 27.9%)
Other - trading $ 769 Discounted cash flow model Weighted average life 5.5 yearsYield 12.1%
Constant prepayment rate 10.8%
Mortgage servicing rights $ 148,694 Discounted cash flow model Prepayment speed 8.7% (5.3% - 22.7%)Weighted average life 11.5 years (4.4 - 18.8 years)
Discount rate 11.3% (9.5% - 15.0%)
Contingent consideration $(133,634) Discounted cash flow model Credit loss rate oncovered loans
7.3% (0.0% - 100.0%)
Risk premiumcomponent of discount
rate
5.0%
Loans held-in-portfolio $ 71,090[1] External appraisal Haircut applied onexternal appraisals
26.6% (20.0% - 30.0%)
Other real estate owned $ 29,715[2] External appraisal Haircut applied onexternal appraisals
12.5% (10.0% - 30.0%)
Other foreclosed assets $ 1,354[3] External appraisal Haircut applied onexternal appraisals
3.3% (1.0% - 6.0%)
[1] Loans held-in-portfolio in which haircuts were not applied to external appraisals were excluded from this table.[2] Other real estate owned in which haircuts were not applied to external appraisals were excluded from this table.[3] Other foreclosed assets in which haircuts were not applied to external appraisals were excluded from this table.

217 POPULAR, INC. 2014 ANNUAL REPORT
The significant unobservable inputs used in the fair valuemeasurement of the Corporation’s collateralized mortgageobligations and interest-only collateralized mortgage obligation(reported as “other”), which are classified in the “trading”category, are yield, constant prepayment rate, and weightedaverage life. Significant increases (decreases) in any of thoseinputs in isolation would result in significantly lower (higher)fair value measurement. Generally, a change in the assumptionused for the constant prepayment rate will generate adirectionally opposite change in the weighted average life. Forexample, as the average life is reduced by a higher constantprepayment rate, a lower yield will be realized, and when thereis a reduction in the constant prepayment rate, the average lifeof these collateralized mortgage obligations will extend, thusresulting in a higher yield. These particular financialinstruments are valued internally by the Corporation’sinvestment banking and broker-dealer unit utilizing internalvaluation techniques. The unobservable inputs incorporatedinto the internal discounted cash flow models used to derivethe fair value of collateralized mortgage obligations andinterest-only collateralized mortgage obligation (reported as“other”), which are classified in the “trading” category, arereviewed by the Corporation’s Corporate Treasury unit on aquarterly basis. In the case of Level 3 financial instrumentswhich fair value is based on broker quotes, the Corporation’sCorporate Treasury unit reviews the inputs used by the broker-dealers for reasonableness utilizing information available fromother published sources and validates that the fair valuemeasurements were developed in accordance with ASC Topic820. The Corporate Treasury unit also substantiates the inputsused by validating the prices with other broker-dealers,whenever possible.
The significant unobservable inputs used in the fair valuemeasurement of the Corporation’s mortgage servicing rights areconstant prepayment rates and discount rates. Increases ininterest rates may result in lower prepayments. Discount ratesvary according to products and / or portfolios depending on theperceived risk. Increases in discount rates result in a lower fairvalue measurement. The Corporation’s Corporate Comptroller’sunit is responsible for determining the fair value of MSRs,which is based on discounted cash flow methods based onassumptions developed by an external service provider, exceptfor prepayment speeds, which are adjusted internally for thelocal market based on historical experience. The Corporation’sCorporate Treasury unit validates the economic assumptionsdeveloped by the external service provider on a quarterly basis.In addition, an analytical review of prepayment speeds isperformed quarterly by the Corporate Comptroller’s unit.Significant variances in prepayment speeds are investigated bythe Corporate Treasury unit. The Corporation’s MSRCommittee analyzes changes in fair value measurements ofMSRs and approves the valuation assumptions at each reportingperiod. Changes in valuation assumptions must also be
approved by the MSR Committee. The fair value of MSRs arecompared with those of the external service provider on aquarterly basis in order to validate if the fair values are withinthe materiality thresholds established by management tomonitor and investigate material deviations. Back-testing isperformed to compare projected cash flows with actualhistorical data to ascertain the reasonability of the projected netcash flow results.
Following is a description of the Corporation’s valuationmethodologies used for assets and liabilities measured at fairvalue. The disclosure requirements exclude certain financialinstruments and all non-financial instruments. Accordingly, theaggregate fair value amounts of the financial instrumentsdisclosed do not represent management’s estimate of theunderlying value of the Corporation.
Trading Account Securities and Investment SecuritiesAvailable-for-Sale
• U.S. Treasury securities: The fair value of U.S. Treasurysecurities is based on yields that are interpolated from theconstant maturity treasury curve. These securities areclassified as Level 2.
• Obligations of U.S. Government sponsored entities: TheObligations of U.S. Government sponsored entitiesinclude U.S. agency securities, which fair value is basedon an active exchange market and on quoted marketprices for similar securities. The U.S. agency securities areclassified as Level 2.
• Obligations of Puerto Rico, States and politicalsubdivisions: Obligations of Puerto Rico, States andpolitical subdivisions include municipal bonds. The bondsare segregated and the like characteristics divided intospecific sectors. Market inputs used in the evaluationprocess include all or some of the following: trades, bidprice or spread, two sided markets, quotes, benchmarkcurves including but not limited to Treasury benchmarks,LIBOR and swap curves, market data feeds such as thoseobtained from municipal market sources, discount andcapital rates, and trustee reports. The municipal bonds areclassified as Level 2.
• Mortgage-backed securities: Certain agency mortgage-backed securities (“MBS”) are priced based on a bond’stheoretical value derived from similar bonds defined bycredit quality and market sector. Their fair valueincorporates an option adjusted spread. The agency MBSare classified as Level 2. Other agency MBS such asGNMA Puerto Rico Serials are priced using an internally-prepared pricing matrix with quoted prices from localbrokers dealers. These particular MBS are classified asLevel 3.

218
• Collateralized mortgage obligations: Agency and private-label collateralized mortgage obligations (“CMOs”) arepriced based on a bond’s theoretical value derived fromsimilar bonds defined by credit quality and market sectorand for which fair value incorporates an option adjustedspread. The option adjusted spread model includesprepayment and volatility assumptions, ratings (wholeloans collateral) and spread adjustments. These CMOs areclassified as Level 2. Other CMOs, due to their limitedliquidity, are classified as Level 3 due to the insufficiencyof inputs such as broker quotes, executed trades, creditinformation and cash flows.
• Equity securities: Equity securities with quoted marketprices obtained from an active exchange market areclassified as Level 1. Other equity securities that do nottrade in highly liquid markets are classified as Level 2.
• Corporate securities and debentures from a not-for-profitorganization (included as “other” in the “available-for-sale” category): Given that the quoted prices are forsimilar instruments, these securities are classified asLevel 2.
• Corporate securities, commercial paper, mutual funds,and other equity securities (included as “other” in the“trading account securities” category): Quoted prices forthese security types are obtained from broker dealers.Given that the quoted prices are for similar instruments ordo not trade in highly liquid markets, these securities areclassified as Level 2. The important variables indetermining the prices of Puerto Rico tax-exempt mutualfund shares are net asset value, dividend yield and type ofassets in the fund. All funds trade based on a relevantdividend yield taking into consideration theaforementioned variables. In addition, demand and supplyalso affect the price. Corporate securities that trade lessfrequently or are in distress are classified as Level 3.
Mortgage servicing rightsMortgage servicing rights (“MSRs”) do not trade in an activemarket with readily observable prices. MSRs are pricedinternally using a discounted cash flow model. The discountedcash flow model incorporates assumptions that marketparticipants would use in estimating future net servicingincome, including portfolio characteristics, prepaymentsassumptions, discount rates, delinquency and foreclosure rates,late charges, other ancillary revenues, cost to service and othereconomic factors. Prepayment speeds are adjusted for theCorporation’s loan characteristics and portfolio behavior. Dueto the unobservable nature of certain valuation inputs, theMSRs are classified as Level 3.
DerivativesInterest rate swaps, interest rate caps and indexed options aretraded in over-the-counter active markets. These derivatives areindexed to an observable interest rate benchmark, such asLIBOR or equity indexes, and are priced using an incomeapproach based on present value and option pricing modelsusing observable inputs. Other derivatives are liquid and havequoted prices, such as forward contracts or “to be announcedsecurities” (“TBAs”). All of these derivatives are classified asLevel 2. The non-performance risk is determined usinginternally-developed models that consider the collateral held,the remaining term, and the creditworthiness of the entity thatbears the risk, and uses available public data or internally-developed data related to current spreads that denote theirprobability of default.
Contingent consideration liabilityThe fair value of the true-up payment obligation (contingentconsideration) to the FDIC as it relates to the WesternbankFDIC-assisted transaction was estimated using projected cashflows related to the loss sharing agreements at the true-upmeasurement date. It took into consideration the intrinsic lossestimate, asset premium/discount, cumulative shared losspayments, and the cumulative servicing amount related to theloan portfolio. Refer to Note 13 to the consolidated financialstatements for a description of the formula established in theloss share agreements for determining the true-up payment.
On a quarterly basis, management evaluates and revises theestimated credit loss rates that are used to determine expectedcash flows on the covered loan pools. The expected creditlosses on the loan pools are used to determine the loss sharecash flows expected to be paid to the FDIC when the true-uppayment is due.
The true-up payment obligation was discounted using aterm rate consistent with the time remaining until the paymentis due. The discount rate was an estimate of the sum of the risk-free benchmark rate for the term remaining before the true-uppayment is due and a risk premium to account for the creditrisk profile of BPPR. The risk premium was calculated based ona 12-month trailing average spread of the yields on corporatebonds with credit ratings similar to BPPR.
Loans held-in-portfolio considered impaired under ASCSection 310-10-35 that are collateral dependentThe impairment is measured based on the fair value of thecollateral, which is derived from appraisals that take intoconsideration prices in observed transactions involving similarassets in similar locations, in accordance with the provisions ofASC Section 310-10-35, and which could be subject to internaladjustments based on the age of the appraisal. Currently, theassociated loans considered impaired are classified as Level 3.

219 POPULAR, INC. 2014 ANNUAL REPORT
Loans measured at fair value pursuant to lower of cost orfair value adjustmentsLoans measured at fair value on a nonrecurring basis pursuantto lower of cost or fair value were priced based on secondarymarket prices and discounted cash flow models whichincorporate internally-developed assumptions for prepaymentsand credit loss estimates. These loans are classified as Level 3.
Other real estate owned and other foreclosed assetsOther real estate owned includes real estate properties securingmortgage, consumer, and commercial loans. Other foreclosedassets include automobiles securing auto loans. The fair valueof foreclosed assets may be determined using an externalappraisal, broker price opinion, internal valuation or bindingoffer. The majority of these foreclosed assets are classified asLevel 3 since they are subject to internal adjustments. Certainforeclosed assets which are measured based on binding offersare classified as Level 2.
Note 36 – Fair value of financial instrumentsThe fair value of financial instruments is the amount at whichan asset or obligation could be exchanged in a currenttransaction between willing parties, other than in a forced orliquidation sale. Fair value estimates are made at a specificpoint in time based on the type of financial instrument andrelevant market information. Many of these estimates involvevarious assumptions and may vary significantly from amountsthat could be realized in actual transactions.
The information about the estimated fair values of financialinstruments presented hereunder excludes all nonfinancialinstruments and certain other specific items.
For those financial instruments with no quoted marketprices available, fair values have been estimated using presentvalue calculations or other valuation techniques, as well asmanagement’s best judgment with respect to current economicconditions, including discount rates, estimates of future cashflows, and prepayment assumptions.
The fair values reflected herein have been determined basedon the prevailing interest rate environment at December 31,2014 and December 31, 2013, as applicable. In different interestrate environments, fair value estimates can differ significantly,especially for certain fixed rate financial instruments. Inaddition, the fair values presented do not attempt to estimatethe value of the Corporation’s fee generating businesses andanticipated future business activities, that is, they do notrepresent the Corporation’s value as a going concern.Accordingly, the aggregate fair value amounts presented do notrepresent the underlying value of the Corporation.
Following is a description of the Corporation’s valuationmethodologies and inputs used to estimate the fair values foreach class of financial assets and liabilities not measured at fairvalue, but for which the fair value is disclosed. The disclosurerequirements exclude certain financial instruments and all non-
financial instruments. Accordingly, the aggregate fair valueamounts of the financial instruments disclosed do not representmanagement’s estimate of the underlying value of theCorporation. For a description of the valuation methodologiesand inputs used to estimate the fair value for each class offinancial assets and liabilities measured at fair value, refer toNote 35.
Cash and due from banksCash and due from banks include cash on hand, cash items inprocess of collection, and non-interest bearing deposits duefrom other financial institutions. The carrying amount of cashand due from banks is a reasonable estimate of its fair value.Cash and due from banks are classified as Level 1.
Money market investmentsInvestments in money market instruments include highly liquidinstruments with an average maturity of three months or less.For this reason, they carry a low risk of changes in value as aresult of changes in interest rates, and the carrying amountapproximates their fair value. Money market investmentsinclude federal funds sold, securities purchased underagreements to resell, time deposits with other banks, and cashbalances, including those held at the Federal Reserve. Thesemoney market investments are classified as Level 2, except forcash balances which generate interest, including those held atthe Federal Reserve, which are classified as Level 1.
Investment securities held-to-maturity
• Obligations of Puerto Rico, States and politicalsubdivisions: Municipal bonds include Puerto Rico publicmunicipalities debt and bonds collateralized by secondmortgages under the Home Purchase Stimulus Program.Puerto Rico public municipalities debt was valuedinternally based on benchmark treasury notes and a creditspread derived from comparable Puerto Rico governmenttrades and recent issuances. Puerto Rico publicmunicipalities debt is classified as Level 3. Given that thefair value of municipal bonds collateralized by secondmortgages was based on internal yield and prepaymentspeed assumptions, these municipal bonds are classifiedas Level 3.
• Agency collateralized mortgage obligation: The fair valueof the agency collateralized mortgage obligation (“CMO”),which is guaranteed by GNMA, was based on internalyield and prepayment speed assumptions. This agencyCMO is classified as Level 3.
• Other: Other securities include foreign and corporatedebt. Given that the fair value was based on quoted pricesfor similar instruments, foreign debt is classified as Level2. The fair value of corporate debt, which is collateralized

220
by municipal bonds of Puerto Rico, was internally derivedfrom benchmark treasury notes and a credit spread basedon comparable Puerto Rico government trades, similarsecurities, and/or recent issuances. Corporate debt isclassified as Level 3.
Other investment securities
• Federal Home Loan Bank capital stock: Federal HomeLoan Bank (FHLB) capital stock represents an equityinterest in the FHLB of New York. It does not have areadily determinable fair value because its ownership isrestricted and it lacks a market. Since the excess stock isrepurchased by the FHLB at its par value, the carryingamount of FHLB capital stock approximates fair value.Thus, these stocks are classified as Level 2.
• Federal Reserve Bank capital stock: Federal Reserve Bank(FRB) capital stock represents an equity interest in theFRB of New York. It does not have a readily determinablefair value because its ownership is restricted and it lacks amarket. Since the canceled stock is repurchased by theFRB for the amount of the cash subscription paid, thecarrying amount of FRB capital stock approximates fairvalue. Thus, these stocks are classified as Level 2.
• Trust preferred securities: These securities represent theequity-method investment in the common stock of thesetrusts. Book value is the same as fair value for thesesecurities since the fair value of the junior subordinateddebentures is the same amount as the fair value of thetrust preferred securities issued to the public. The equity-method investment in the common stock of these trusts isclassified as Level 2, except for that of Popular CapitalTrust III (Troubled Asset Relief Program) which isclassified as Level 3. Refer to Note 26 for additionalinformation on these trust preferred securities.
• Other investments: Other investments include privateequity method investments and Visa Class B commonstock held by the Corporation. Since there are noobservable market values, private equity methodinvestments are classified as Level 3. The Visa Class Bcommon stock was priced by applying the quoted price ofVisa Class A common stock, net of a liquidity adjustment,to the as converted number of Class A common sharessince these Class B common shares are restricted and notconvertible to Class A common shares until pendinglitigation is resolved. Thus, these stocks are classified asLevel 3.
Loans held-for-saleThe fair value of certain impaired loans held-for-sale was basedon a discounted cash flow model that assumes that no principalpayments are received prior to the effective average maturity
date, that the outstanding unpaid principal balance is reducedby a monthly net loss rate, and that the remaining unpaidprincipal balance is received as a lump sum principal paymentat the effective average maturity date. The remaining unpaidprincipal balance expected to be received, which is based on theprior 12-month cash payment experience of these loans andtheir expected collateral recovery, was discounted using theinterest rate currently offered to clients for the origination ofcomparable loans. These loans were classified as Level 3. As ofDecember 31, 2014, no loans were valued under thismethodology. For loans held-for-sale originated with the intentto sell in the secondary market, its fair value was determinedusing similar characteristics of loans and secondary marketprices assuming the conversion to mortgage-backed securities.Given that the valuation methodology uses internalassumptions based on loan level data, these loans are classifiedas Level 3. The fair value of certain other loans held-for-sale isbased on bids received from potential buyers; binding offers; orexternal appraisals, net of internal adjustments and estimatedcosts to sell. Loans held-for-sale based on binding offers areclassified as Level 2. Loans held-for-sale based on indicativeoffers and/or external appraisals are classified as Level 3.
Loans held-in-portfolioThe fair values of the loans held-in-portfolio have beendetermined for groups of loans with similar characteristics.Loans were segregated by type such as commercial,construction, residential mortgage, consumer, and credit cards.Each loan category was further segmented based on loancharacteristics, including interest rate terms, credit quality andvintage. Generally, fair values were estimated based on an exitprice by discounting expected cash flows for the segmentedgroups of loans using a discount rate that considers interest,credit and expected return by market participant under currentmarket conditions. Additionally, prepayment, default andrecovery assumptions have been applied in the mortgage loanportfolio valuations. Generally accepted accounting principlesdo not require a fair valuation of the lease financing portfolio,therefore it is included in the loans total at its carrying amount.Loans held-in-portfolio are classified as Level 3.
FDIC loss share assetFair value of the FDIC loss share asset was estimated usingprojected net losses related to the loss sharing agreements,which are expected to be reimbursed by the FDIC. Theprojected net losses were discounted using the U.S.Government agency curve. The loss share asset is classified asLevel 3.
Deposits
• Demand deposits: The fair value of demand deposits,which have no stated maturity, was calculated based on

221 POPULAR, INC. 2014 ANNUAL REPORT
the amount payable on demand as of the respective dates.These demand deposits include non-interest bearingdemand deposits, savings, NOW, and money marketaccounts. Thus, these deposits are classified as Level 2.
• Time deposits: The fair value of time deposits wascalculated based on the discounted value of contractualcash flows using interest rates being offered on timedeposits with similar maturities. The non-performancerisk was determined using internally-developed modelsthat consider, where applicable, the collateral held,amounts insured, the remaining term, and the creditpremium of the institution. For certain 5-year certificatesof deposit in which customers may withdraw their moneyanytime with no penalties or charges, the fair value ofthese certificates of deposit incorporate an earlycancellation estimate based on historical experience. Timedeposits are classified as Level 2.
Assets sold under agreements to repurchase
• Securities sold under agreements to repurchase(structured and non-structured): Securities sold underagreements to repurchase with short-term maturitiesapproximate fair value because of the short-term nature ofthose instruments. Resell and repurchase agreements withlong-term maturities were valued using discounted cashflows based on the three-month LIBOR. In determiningthe non-performance credit risk valuation adjustment, thecollateralization levels of these long-term securities soldunder agreements to repurchase were considered. In thecase of callable structured repurchase agreements, thecallable feature is not considered when determining thefair value of those repurchase agreements, since there is aremote possibility, based on forward rates, that theinvestor will call back these agreements before maturitysince it is not expected that the interest rates would risemore than the specified interest rate of these agreements.Securities sold under agreements to repurchase(structured and non-structured) are classified as Level 2.
Other short-term borrowingsThe carrying amount of other short-term borrowingsapproximate fair value because of the short-term maturity ofthose instruments or because they carry interest rates whichapproximate market. Thus, these other short-term borrowingsare classified as Level 2.
Notes payable
• FHLB advances: The fair value of FHLB advances wasbased on the discounted value of contractual cash flowsover their contractual term. In determining the non-performance credit risk valuation adjustment, thecollateralization levels of these advances were considered.These advances are classified as Level 2.
• Medium-term notes: The fair value of publicly-tradedmedium-term notes was determined using recent trades ofsimilar transactions. Publicly-traded medium-term notesare classified as Level 2. The fair value of non-publiclytraded debt was based on remaining contractual cashoutflows, discounted at a rate commensurate with thenon-performance credit risk of the Corporation, which issubjective in nature. Non-publicly traded debt is classifiedas Level 3.
• Junior subordinated deferrable interest debentures(related to trust preferred securities): The fair value ofjunior subordinated interest debentures was determinedusing recent trades of similar transactions. Thus, thesejunior subordinated deferrable interest debentures areclassified as Level 2.
• Junior subordinated deferrable interest debentures(Troubled Asset Relief Program): The fair value of juniorsubordinated deferrable interest debentures was based onthe discounted value of contractual cash flows over theircontractual term. The discount rate was based on the rateat which a similar security was priced in the open market.Thus, these junior subordinated deferrable interestdebentures are classified as Level 3.
• Others: The other category includes capital leaseobligations. Generally accepted accounting principles donot require a fair valuation of capital lease obligations,therefore; it is included at its carrying amount. Capitallease obligations are classified as Level 3.
Commitments to extend credit and letters of creditCommitments to extend credit were valued using the feescurrently charged to enter into similar agreements. For thosecommitments where a future stream of fees is charged, the fairvalue was estimated by discounting the projected cash flows offees on commitments. Since the fair value of commitments toextend credit varies depending on the undrawn amount of thecredit facility, fees are subject to constant change, and cashflows are dependent on the creditworthiness of borrowers,commitments to extend credit are classified as Level 3. The fairvalue of letters of credit was based on fees currently charged onsimilar agreements. Given that the fair value of letters of creditconstantly vary due to fees being subject to constant changeand whether the fees are received depends on thecreditworthiness of the account parties, letters of credit areclassified as Level 3.

222
The following tables present the carrying or notional amounts, as applicable, and estimated fair values for financial instrumentswith their corresponding level in the fair value hierarchy.
December 31, 2014
(In thousands)Carryingamount Level 1 Level 2 Level 3 Fair value
Financial Assets:Cash and due from banks $ 381,095 $ 381,095 $ – $ – $ 381,095Money market investments 1,822,386 1,671,477 150,909 – 1,822,386Trading account securities, excluding derivatives [1] 138,527 – 129,360 9,167 138,527Investment securities available-for-sale [1] 5,315,159 323 5,313,511 1,325 5,315,159Investment securities held-to-maturity:
Obligations of Puerto Rico, States and political subdivisions 101,573 – – 92,597 92,597Collateralized mortgage obligation-federal agency 97 – – 102 102Other 1,500 – 1,500 – 1,500
Total investment securities held-to-maturity $ 103,170 $ – $ 1,500 $ 92,699 $ 94,199
Other investment securities:FHLB stock $ 66,773 $ – $ 66,773 $ – $ 66,773FRB stock 80,025 – 80,025 – 80,025Trust preferred securities 13,197 – 12,197 1,000 13,197Other investments 1,911 – – 5,028 5,028
Total other investment securities $ 161,906 $ – $ 158,995 $ 6,028 $ 165,023
Loans held-for-sale $ 106,104 $ – $ 27,074 $ 87,862 $ 114,936Loans not covered under loss sharing agreement with the FDIC 18,884,732 – – 18,079,609 18,079,609Loans covered under loss sharing agreements with the FDIC 2,460,589 – – 2,947,909 2,947,909FDIC loss share asset 542,454 – – 481,420 481,420Mortgage servicing rights 148,694 – – 148,694 148,694Derivatives 25,362 – 25,362 – 25,362
December 31, 2014
(In thousands)Carryingamount Level 1 Level 2 Level 3 Fair value
Financial Liabilities:Deposits:
Demand deposits $17,333,090 $– $17,333,090 $ – $17,333,090Time deposits 7,474,445 – 7,512,683 – 7,512,683
Total deposits $24,807,535 $– $24,845,773 $ – $24,845,773
Assets sold under agreements to repurchase:Securities sold under agreements to repurchase $ 1,271,657 $– $ 1,269,398 $ – $ 1,269,398
Total assets sold under agreements to repurchase $ 1,271,657 $– $ 1,269,398 $ – $ 1,269,398
Other short-term borrowings [2] $ 21,200 $– $ 20,200 $ 1,000 $ 21,200Notes payable:
FHLB advances 802,198 – 814,877 – 814,877Unsecured senior debt securities 450,000 – 460,530 – 460,530Junior subordinated deferrable interest debentures (related to trust
preferred securities) 439,800 – 379,400 – 379,400Junior subordinated deferrable interest debentures (TroubledOthers 19,830 – – 19,830 19,830
Total notes payable $ 1,711,828 $– $ 1,654,807 $ 19,830 $ 1,674,637
Derivatives $ 23,032 $– $ 23,032 $ – $ 23,032
Contingent consideration $ 133,634 $– $ – $133,634 $ 133,634
(In thousands)Notionalamount Level 1 Level 2 Level 3 Fair value
Commitments to extend credit $ 7,135,352 $– $ – $ 1,716 $ 1,716Letters of credit 49,182 – – 486 486
[1] Refer to Note 35 to the consolidated financial statements for the fair value by class of financial asset and its hierarchy level.[2] Refer to Note 23 to the consolidated financial statements for the composition of short-term borrowings.
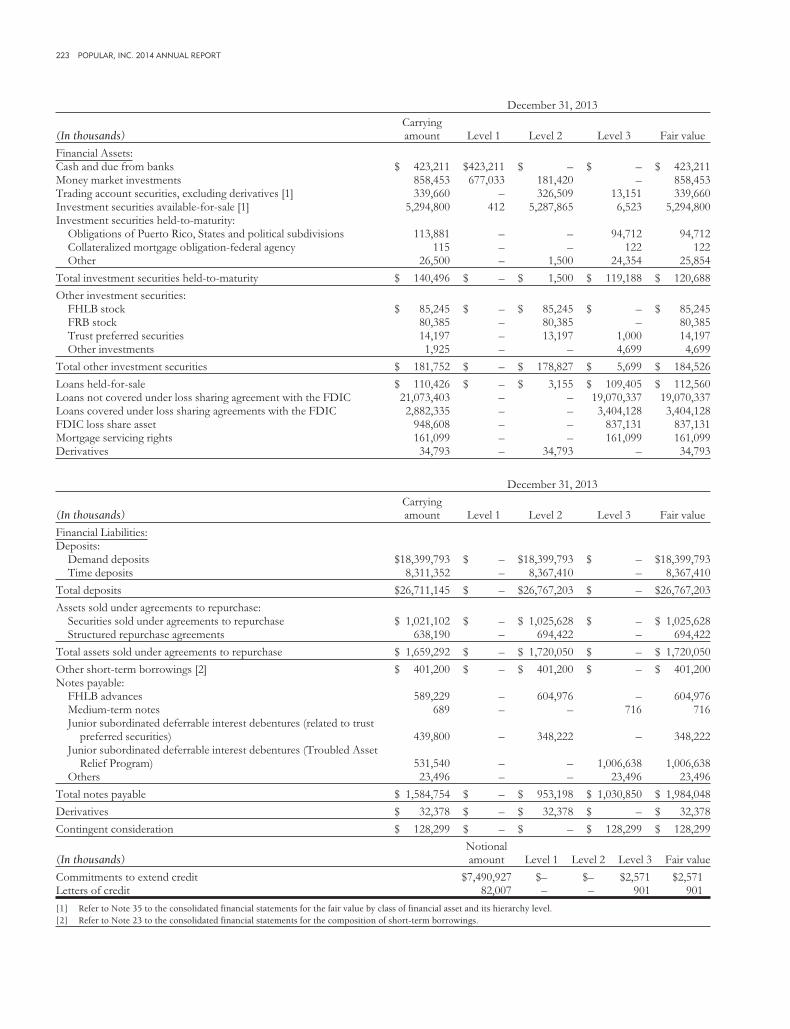
223 POPULAR, INC. 2014 ANNUAL REPORT
December 31, 2013
(In thousands)Carryingamount Level 1 Level 2 Level 3 Fair value
Financial Assets:Cash and due from banks $ 423,211 $423,211 $ – $ – $ 423,211Money market investments 858,453 677,033 181,420 – 858,453Trading account securities, excluding derivatives [1] 339,660 – 326,509 13,151 339,660Investment securities available-for-sale [1] 5,294,800 412 5,287,865 6,523 5,294,800Investment securities held-to-maturity:
Obligations of Puerto Rico, States and political subdivisions 113,881 – – 94,712 94,712Collateralized mortgage obligation-federal agency 115 – – 122 122Other 26,500 – 1,500 24,354 25,854
Total investment securities held-to-maturity $ 140,496 $ – $ 1,500 $ 119,188 $ 120,688
Other investment securities:FHLB stock $ 85,245 $ – $ 85,245 $ – $ 85,245FRB stock 80,385 – 80,385 – 80,385Trust preferred securities 14,197 – 13,197 1,000 14,197Other investments 1,925 – – 4,699 4,699
Total other investment securities $ 181,752 $ – $ 178,827 $ 5,699 $ 184,526
Loans held-for-sale $ 110,426 $ – $ 3,155 $ 109,405 $ 112,560Loans not covered under loss sharing agreement with the FDIC 21,073,403 – – 19,070,337 19,070,337Loans covered under loss sharing agreements with the FDIC 2,882,335 – – 3,404,128 3,404,128FDIC loss share asset 948,608 – – 837,131 837,131Mortgage servicing rights 161,099 – – 161,099 161,099Derivatives 34,793 – 34,793 – 34,793
December 31, 2013
(In thousands)Carryingamount Level 1 Level 2 Level 3 Fair value
Financial Liabilities:Deposits:
Demand deposits $18,399,793 $ – $18,399,793 $ – $18,399,793Time deposits 8,311,352 – 8,367,410 – 8,367,410
Total deposits $26,711,145 $ – $26,767,203 $ – $26,767,203
Assets sold under agreements to repurchase:Securities sold under agreements to repurchase $ 1,021,102 $ – $ 1,025,628 $ – $ 1,025,628Structured repurchase agreements 638,190 – 694,422 – 694,422
Total assets sold under agreements to repurchase $ 1,659,292 $ – $ 1,720,050 $ – $ 1,720,050
Other short-term borrowings [2] $ 401,200 $ – $ 401,200 $ – $ 401,200Notes payable:
FHLB advances 589,229 – 604,976 – 604,976Medium-term notes 689 – – 716 716Junior subordinated deferrable interest debentures (related to trust
preferred securities) 439,800 – 348,222 – 348,222Junior subordinated deferrable interest debentures (Troubled Asset
Relief Program) 531,540 – – 1,006,638 1,006,638Others 23,496 – – 23,496 23,496
Total notes payable $ 1,584,754 $ – $ 953,198 $ 1,030,850 $ 1,984,048
Derivatives $ 32,378 $ – $ 32,378 $ – $ 32,378
Contingent consideration $ 128,299 $ – $ – $ 128,299 $ 128,299
(In thousands)Notionalamount Level 1 Level 2 Level 3 Fair value
Commitments to extend credit $7,490,927 $– $– $2,571 $2,571Letters of credit 82,007 – – 901 901
[1] Refer to Note 35 to the consolidated financial statements for the fair value by class of financial asset and its hierarchy level.[2] Refer to Note 23 to the consolidated financial statements for the composition of short-term borrowings.
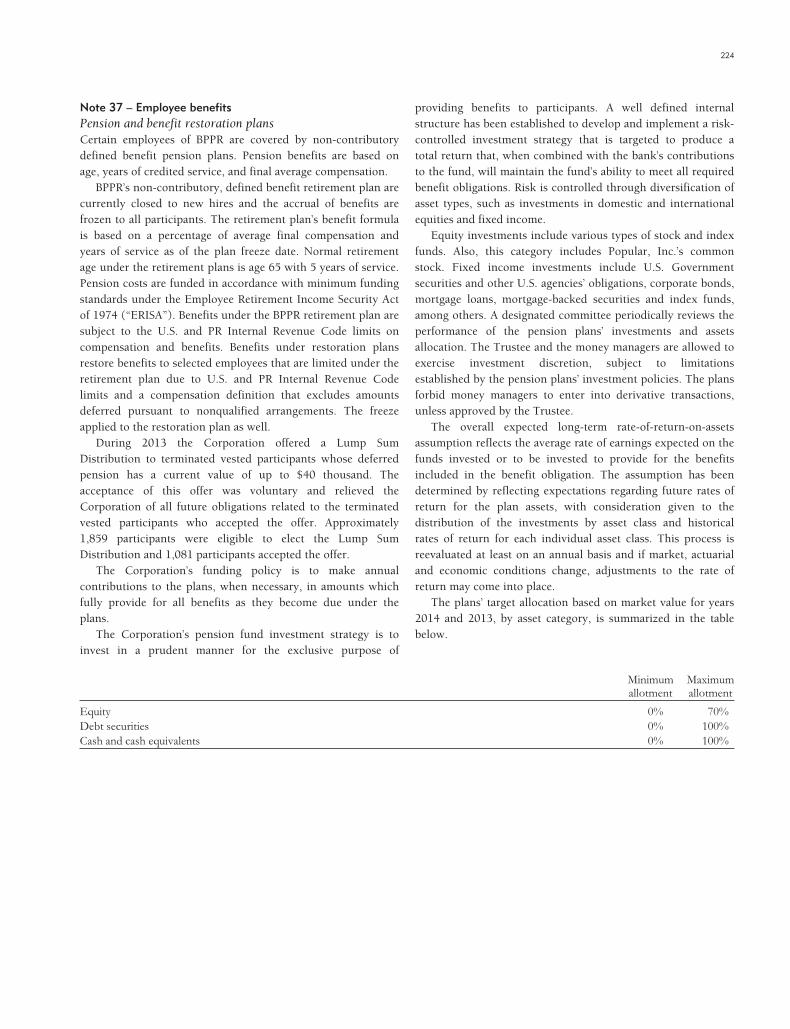
224
Note 37 – Employee benefitsPension and benefit restoration plansCertain employees of BPPR are covered by non-contributorydefined benefit pension plans. Pension benefits are based onage, years of credited service, and final average compensation.
BPPR’s non-contributory, defined benefit retirement plan arecurrently closed to new hires and the accrual of benefits arefrozen to all participants. The retirement plan’s benefit formulais based on a percentage of average final compensation andyears of service as of the plan freeze date. Normal retirementage under the retirement plans is age 65 with 5 years of service.Pension costs are funded in accordance with minimum fundingstandards under the Employee Retirement Income Security Actof 1974 (“ERISA”). Benefits under the BPPR retirement plan aresubject to the U.S. and PR Internal Revenue Code limits oncompensation and benefits. Benefits under restoration plansrestore benefits to selected employees that are limited under theretirement plan due to U.S. and PR Internal Revenue Codelimits and a compensation definition that excludes amountsdeferred pursuant to nonqualified arrangements. The freezeapplied to the restoration plan as well.
During 2013 the Corporation offered a Lump SumDistribution to terminated vested participants whose deferredpension has a current value of up to $40 thousand. Theacceptance of this offer was voluntary and relieved theCorporation of all future obligations related to the terminatedvested participants who accepted the offer. Approximately1,859 participants were eligible to elect the Lump SumDistribution and 1,081 participants accepted the offer.
The Corporation’s funding policy is to make annualcontributions to the plans, when necessary, in amounts whichfully provide for all benefits as they become due under theplans.
The Corporation’s pension fund investment strategy is toinvest in a prudent manner for the exclusive purpose of
providing benefits to participants. A well defined internalstructure has been established to develop and implement a risk-controlled investment strategy that is targeted to produce atotal return that, when combined with the bank’s contributionsto the fund, will maintain the fund’s ability to meet all requiredbenefit obligations. Risk is controlled through diversification ofasset types, such as investments in domestic and internationalequities and fixed income.
Equity investments include various types of stock and indexfunds. Also, this category includes Popular, Inc.’s commonstock. Fixed income investments include U.S. Governmentsecurities and other U.S. agencies’ obligations, corporate bonds,mortgage loans, mortgage-backed securities and index funds,among others. A designated committee periodically reviews theperformance of the pension plans’ investments and assetsallocation. The Trustee and the money managers are allowed toexercise investment discretion, subject to limitationsestablished by the pension plans’ investment policies. The plansforbid money managers to enter into derivative transactions,unless approved by the Trustee.
The overall expected long-term rate-of-return-on-assetsassumption reflects the average rate of earnings expected on thefunds invested or to be invested to provide for the benefitsincluded in the benefit obligation. The assumption has beendetermined by reflecting expectations regarding future rates ofreturn for the plan assets, with consideration given to thedistribution of the investments by asset class and historicalrates of return for each individual asset class. This process isreevaluated at least on an annual basis and if market, actuarialand economic conditions change, adjustments to the rate ofreturn may come into place.
The plans’ target allocation based on market value for years2014 and 2013, by asset category, is summarized in the tablebelow.
Minimumallotment
Maximumallotment
Equity 0% 70%Debt securities 0% 100%Cash and cash equivalents 0% 100%

225 POPULAR, INC. 2014 ANNUAL REPORT
The following table presents the composition of the assets of the pension and benefit restoration plans.
(In thousands) 2014 2013
Obligations of the U.S. Government and its agencies $210,549 $198,992Corporate bonds and debentures 50,708 43,885Equity securities 241,458 238,792Index fund - equity 27,888 33,347Foreign commingled trust fund 9,998 –Foreign equity fund 79,666 87,336Foreign index fund 29,643 43,711Commodity fund 13,480 16,451Mortgage-backed securities 12,913 12,950Private equity investments 546 922Cash and cash equivalents 18,834 27,456Accrued investment income 1,557 1,640
Total assets $697,240 $705,482
Until September 30, 2013 certain assets of the plans weremaintained, for investment purposes only in a Master Trust(the “Master Trust”). Neither the pension or benefit restorationplan had any interest in the specific assets of the Master Trust,but maintained beneficial interests in such assets. The MasterTrust was managed by the Trust Division of BPPR and byseveral investment managers.
At December 31, 2012, the pension and restoration plans’interest in the net assets of the Master Trust was 100%. At
September 30, 2013 the Master Trust was dissolved and all theinvestments were allocated to the plans based on their relativeinterest on the net assets of the Master Trust.
The following table sets forth by level, within the fair valuehierarchy, the plans’ assets at fair value at December 31, 2014and 2013.
2014 2013
(In thousands) Level 1 Level 2 Level 3 Total Level 1 Level 2 Level 3 Total
Obligations of the U.S. Government and itsagencies $ – $210,549 $ – $210,549 $ – $198,992 $ – $198,992
Corporate bonds and debentures – 50,708 – 50,708 – 43,885 – 43,885Equity securities 241,458 – – 241,458 238,792 – – 238,792Index fund - equity 27,888 – – 27,888 33,347 – – 33,347Foreign commingled trust fund – 9,998 – 9,998 – – – –Foreign equity fund – 79,666 – 79,666 – 87,336 – 87,336Foreign index fund – 29,643 – 29,643 – 43,711 – 43,711Commodity fund – 13,480 – 13,480 – 16,451 – 16,451Mortgage-backed securities – 12,913 – 12,913 – 12,950 – 12,950Private equity investments – – 546 546 – – 922 922Cash and cash equivalents 18,834 – – 18,834 27,456 – – 27,456Accrued investment income – – 1,557 1,557 – – 1,640 1,640
Total assets $288,180 $406,957 $2,103 $697,240 $299,595 $403,325 $2,562 $705,482
The closing prices reported in the active markets in whichthe securities are traded are used to value the investments.
Following is a description of the valuation methodologiesused for investments measured at fair value:
• Obligations of U.S. Government and its agencies - The fairvalue of Obligations of U.S. Government and agenciesobligations is based on an active exchange market and isbased on quoted market prices for similar securities.These securities are classified as Level 2. U.S. agency
structured notes are priced based on a bond’s theoreticalvalue from similar bonds defined by credit quality andmarket sector and for which the fair value incorporates anoption adjusted spread in deriving their fair value. Thesesecurities are classified as Level 2.
• Corporate bonds and debentures - Corporate bonds anddebentures are valued at fair value at the closing pricereported in the active market in which the bond is traded.These securities are classified as Level 2.

226
• Equity securities - Equity securities with quoted marketprices obtained from an active exchange market and highliquidity are classified as Level 1.
• Equity index funds - Equity with quoted market pricesobtained from an active exchange market and highliquidity are classified as Level 1.
• Foreign commingled trust fund – are collectiveinvestment funds that are valued at the net asset value(NAV) of shares held by the plan at year end. Thesesecurities are classified as Level 2.
• Index funds – Fixed income, foreign equity, foreign indexand commodity funds are valued at the net asset value(NAV) of shares held by the plan at year end. Thesesecurities are classified as Level 2.
• Mortgage-backed securities - Certain agency mortgageand other asset backed securities (“MBS”) are pricedbased on a bond’s theoretical value from similar bondsdefined by credit quality and market sector. Their fairvalue incorporates an option adjusted spread. The agencyMBS are classified as Level 2.
• Private equity investments - Private equity investmentsinclude an investment in a private equity fund. The fundvalue is recorded at its net asset value (NAV) which isaffected by the changes in the fair market value of theinvestments held in the fund. This fund is classified asLevel 3.
• Cash and cash equivalents - The carrying amount of cashand cash equivalents is a reasonable estimate of the fairvalue since it is available on demand or due to their short-term maturity.
• Accrued investment income - Given the short-term natureof these assets, their carrying amount approximates fairvalue. Since there is a lack of observable inputs related toinstrument specific attributes, these are reported asLevel 3.
The preceding valuation methods may produce a fair valuecalculation that may not be indicative of net realizable value orreflective of future fair values. Furthermore, although the planbelieves its valuation methods are appropriate and consistentwith other market participants, the use of differentmethodologies or assumptions to determine the fair value ofcertain financial instruments could result in a different fairvalue measurement at the reporting date.
The following table presents the change in Level 3 assetsmeasured at fair value.
(In thousands) 2014 2013
Balance at beginning of year $2,562 $2,848Actual return on plan assets:
Change in unrealized (loss) gain relating toinstruments still held at the reporting date (459) (286)
Settlements – –
Balance at end of year $2,103 $2,562
There were no transfers in and/or out of Level 3 for financialinstruments measured at fair value on a recurring basis duringthe years ended December 31, 2014 and 2013. There were notransfers in and/or out of Level 1 and Level 2 during the yearsended December 31, 2014 and 2013.
Information on the shares of common stock held by thepension and restoration plans is provided in the table thatfollows.
2014 2013
Shares of Popular, Inc. common stock 274,572 274,572Fair value of shares of Popular, Inc.
common stock $9,349,177 $7,888,454Dividends paid on shares of Popular, Inc.
common stock held by the plan $ – $ –

227 POPULAR, INC. 2014 ANNUAL REPORT
The following table sets forth the aggregate status of the plans and the amounts recognized in the consolidated financial statementsat December 31, 2014 and 2013.
Pension planBenefit restoration
plans
(In thousands) 2014 2013 2014 2013
Change in benefit obligation:Benefit obligation at beginning of year $ 653,396 $ 751,605 $ 36,096 $40,051Interest cost 29,844 27,863 1,659 1,493Actuarial (gain) loss 131,610 (76,997) 6,238 (4,169)Benefits paid (37,035) (49,075) (1,329) (1,279)
Benefit obligation at end of year $ 777,815 $ 653,396 $ 42,664 $36,096
Change in fair value of plan assets:Fair value of plan assets at beginning of year $ 671,299 $ 625,519 $ 34,183 $30,616Actual return on plan assets 28,501 94,855 1,570 4,795Employer contributions – – 51 51Benefits paid (37,035) (49,075) (1,329) (1,279)
Fair value of plan assets at end of year $ 662,765 $ 671,299 $ 34,475 $34,183
Amounts recognized in accumulated other comprehensive loss:Net loss $ 289,233 $ 147,677 $ 13,588 $ 6,928
Accumulated other comprehensive loss (AOCL) $ 289,233 $ 147,677 $ 13,588 $ 6,928
Reconciliation of net assets (liabilities):Net liabilities at beginning of year $ 17,903 $(126,086) $(1,912) $(9,434)Amount recognized in AOCL at beginning of year, pre-tax 147,677 297,765 6,928 15,055
Amount prepaid at beginning of year 165,580 171,679 5,016 5,621Net periodic benefit income (cost) 8,603 (6,099) 332 (656)Contributions – – 51 51
Amount prepaid at end of year 174,183 165,580 5,399 5,016Amount recognized in AOCL (289,233) (147,677) (13,588) (6,928)
Net assets (liabilities) at end of year $(115,050) $ 17,903 $ (8,189) $ (1,912)
The table below presents a breakdown of the plans’ assets and liabilities at December 31, 2014 and 2013.
Pension plan Benefit restoration plans
(In thousands) 2014 2013 2014 2013
Non-current assets $ – $17,903 $ – $ 504Current liabilities – – 173 51Non-current liabilities 115,050 – 8,016 2,365
The following table presents the funded status of the plans at year end December 31, 2014 and 2013.
Pension Plan Tax Qualified Restoration PlanBenefit
Restoration Plan
(In thousands) 2014 2013 2014 2013 2014 2013
Benefit obligation at end of year $(777,815) $(653,396) $(39,768) $(33,679) $(2,896) $(2,416)Fair value of plan assets at end of year 662,765 671,299 34,475 34,183 — —
Funded status at year end $(115,050) $ 17,903 $ (5,293) $ 504 $(2,896) $(2,416)

228
The following table presents the change in accumulated other comprehensive loss (“AOCL”), pre-tax, for the years endedDecember 31, 2014 and 2013.
(In thousands) Pension plan Benefit restoration plans
2014 2013 2014 2013
Accumulated other comprehensive loss at beginning of year $147,677 $ 297,765 $ 6,928 $15,055
Increase (decrease) in AOCL:Recognized during the year:
Amortization of actuarial losses (8,074) (21,452) (431) (1,330)Occurring during the year:
Net actuarial (gains) losses 149,630 (128,636) 7,091 (6,797)
Total (decrease) increase in AOCL 141,556 (150,088) 6,660 (8,127)
Accumulated other comprehensive loss at end of year $289,233 $ 147,677 $13,588 $ 6,928
The following table presents the amounts in accumulated other comprehensive loss that are expected to be recognized ascomponents of net periodic benefit cost during 2015.
(In thousands) Pension plan Benefit restoration plans
Net loss $17,859 $1,244
The following table presents information for plans with an accumulated benefit obligation in excess of plan assets.
Pension plan Benefit restoration plans(In thousands) 2014 2013 2014 2013
Projected benefit obligation $777,815 $– $42,664 $2,416Accumulated benefit obligation 777,815 – 42,664 2,416Fair value of plan assets 662,765 – 34,475 –
The following table presents information for plans with an accumulated benefits obligation less than plan assets.
Pension plan Benefit restoration plans
(In thousands) 2014 2013 2014 2013
Projected benefit obligation $– $653,396 $– $33,680Accumulated benefit obligation – 653,396 – 33,680Fair value of plan assets – 671,299 – 34,183
The actuarial assumptions used to determine the benefit obligations at year end were as follows:
Pension plan Benefit restoration plans
2014 2013 2014 2013
Discount rate 3.90% 4.70% 3.90% 4.70%
The following table presents the actuarial assumptions used to determine the components of net periodic benefit cost.
Pension plan Benefit restoration plans
2014 2013 2012 2014 2013 2012
Discount rate 4.70% 3.80% 4.40% 4.70% 3.80% 4.40%Expected return on plan assets 7.25% 7.25% 7.60% 7.25% 7.25% 7.60%

229 POPULAR, INC. 2014 ANNUAL REPORT
The following table presents the components of net periodic benefit cost.
Pension plan Benefit restoration plans
(In thousands) 2014 2013 2012 2014 2013 2012
Interest cost $ 29,844 $ 27,863 $ 29,981 $ 1,659 $ 1,493 $ 1,572Expected return on plan assets (46,521) (43,216) (39,240) (2,422) (2,167) (2,105)Recognized net actuarial loss 8,074 21,452 21,703 431 1,330 1,294
Net periodic benefit (credit) cost $ (8,603) $ 6,099 $ 12,444 $ (332) $ 656 $ 761
The Corporation expects to pay the following contributionsto the benefit plans during 2015.
(In thousands) 2015
Pension plan $ –Benefit restoration plans $173
Benefit payments projected to be made from the pension andbenefit restoration plans are presented in the table below.
(In thousands) Pension plan Benefit restoration plans
2015 $ 36,977 $ 1,7632016 37,473 1,9142017 38,129 2,0582018 38,786 2,1612019 39,483 2,3042020 - 2024 205,506 12,126
Postretirement health care benefitsIn addition to providing pension benefits, BPPR providescertain health care benefits for certain retired employees.Regular employees of BPPR, hired before February 1, 2000, maybecome eligible for health care benefits, provided they reachretirement age while working for BPPR.
The Corporation amended the postretirement health carebenefits plan effective January 1, 2014 to increase theparticipant’s share of the plan cost. The postretirement healthcare benefit obligation as of December 31, 2013 reflects suchamendments to the plan.

230
The following table presents the status of the Corporation’sunfunded postretirement health care benefit plan and therelated amounts recognized in the consolidated financialstatements at December 31, 2014 and 2013.
(In thousands) 2014 2013
Change in benefit obligation:Benefit obligation at beginning of the year $ 145,732 $ 183,611Service cost 1,457 2,257Interest cost 6,846 6,848Amendments — (18,670)Benefits paid (5,688) (7,066)Actuarial (gain) loss 13,471 $ (21,248)
Benefit obligation end of year $ 161,818 145,732
Amounts recognized in accumulatedother comprehensive loss:
Net prior service cost $(14,870) $(18,670)Net loss 25,817 12,346
Accumulated other comprehensive (gain)loss $ 10,947 $ (6,324)
Reconciliation of net liability:Net liability at beginning of year $(145,732) $(183,611)Amount recognized in accumulated other
comprehensive loss at beginning of year,pre-tax (6,324) 35,486
Amount accrued at beginning of year (152,056) (148,125)Net periodic benefit cost (4,503) (10,997)Contributions 5,688 7,066
Amount accrued at end of year (150,871) (152,056)Amount recognized in accumulated other
comprehensive gain (loss) (10,947) 6,324
Net liability at end of year $(161,818) $(145,732)
The table below presents a breakdown of the liabilityassociated with the postretirement health care benefit plan.
(In thousands) 2014 2013
Current liabilities $ 5,820 $ 6,199Non-current liabilities 155,998 139,532
The following table presents the funded status of thepostretirement health care benefit plan at year endDecember 31, 2014 and 2013.
(In thousands) 2014 2013
Benefit obligation at end of year $(161,818) $(145,732)Fair value of plan assets at end of year — —
Funded status at year end (161,818) (145,732)
The following table presents the changes in accumulatedother comprehensive loss (income), pre-tax, for thepostretirement health care benefit plan.
(In thousands) 2014 2013
Accumulated other comprehensive (income)loss at beginning of year $ (6,324) $ 35,486
Increase (decrease) in accumulated othercomprehensive loss:
Recognized during the year:Prior service credit 3,800 —Amortization of actuarial losses — (1,892)
Occurring during the year:Prior service cost (credit) — (18,670)Net actuarial (gains) losses 13,471 (21,248)
Total increase (decrease) in accumulated othercomprehensive loss 17,271 (41,810)
Accumulated other comprehensive (income)loss at end of year $10,947 $ (6,324)
The following table presents the amounts in accumulatedother comprehensive loss that are expected to be recognized ascomponents of net periodic benefit cost for the postretirementhealth care benefit plan during 2015.
(In thousands) 2015
Net prior service credit $(3,800)Net loss $ 996
The following table presents the components of net periodicpostretirement health care benefit cost.
(In thousands) 2014 2013 2012
Service cost $ 1,457 $ 2,257 $ 2,190Interest cost 6,846 6,848 7,801Amortization of prior service credit (3,800) — (200)Recognized net actuarial loss (gain) — 1,892 2,162
Net periodic benefit cost $ 4,503 $10,997 $11,953
The following tables present the discount rate and assumedhealth care cost trend rates used to determine the benefitobligation and the net periodic benefit cost for thepostretirement health care benefit plan.
To determine benefit obligation: 2014 2013
Discount rate 4.00% 4.80%Initial health care cost trend rates 7.00% 7.50%Ultimate health care cost trend rate 5.00% 5.00%Year that the ultimate trend rate is reached 2019 2019
To determine net periodic benefit cost: 2014 2013 2012
Discount rate 4.80% 3.80% 4.40%Initial health care cost trend rates:
Medicare Advantage plans 7.50% 6.50% 25.00%All other plans 7.50 6.50 7.00
Ultimate health care cost trend rate 5.00% 5.00% 5.00%Year that the ultimate trend rate is reached 2019 2016 2016

231 POPULAR, INC. 2014 ANNUAL REPORT
Assumed health care trend rates generally have a significanteffect on the amounts reported for a health care plan. Thefollowing table presents the effects of changes in the assumedhealth care cost trend rates.
(In thousands)1-percentagepoint increase
1-percentagepoint decrease
Effect on total service cost andinterest cost components $ 290 $ (363)
Effect on postretirement benefitobligation $8,449 $(9,955)
The following table presents information for thepostretirement health care benefit plan with an accumulatedbenefit obligation in excess of plan assets.
(In thousands) 2014 2013
Projected benefit obligation $161,818 $145,732Accumulated benefit obligation 161,818 145,732Fair value of plan assets – –
The Corporation expects to contribute $5.8 million to thepostretirement benefit plan in 2015 to fund current benefitpayment requirements.
Benefit payments projected to be made on thepostretirement health care benefit plan are presented in thefollowing table.
(In thousands)
2015 $ 5,8202016 5,9982017 6,2902018 6,5652019 6,8442020 - 2024 37,668
Savings plansThe Corporation also provides defined contribution savingsplans pursuant to Section 1081.01(d) of the Puerto RicoInternal Revenue Code and Section 401(k) of the U.S. InternalRevenue Code, as applicable, for substantially all the employeesof the Corporation. Investments in the plans are participant-directed, and employer matching contributions are determinedbased on the specific provisions of each plan. Employees arefully vested in the employer’s contribution after five years ofservice. Effective March 20, 2009, the savings plans wereamended to suspend the employer matching contribution to theplan. This matching contribution was restored on April 2013.The cost of providing these benefits in the year endedDecember 31, 2014 was $5.0 million (2013 - $3.6 million).
The plans held 1,820,318 (2013 – 1,939,089) shares ofcommon stock of the Corporation with a market value ofapproximately $62.0 million at December 31, 2014 (2013 -$55.7 million).
Note 38 – Net (loss) income per common shareThe following table sets forth the computation of net (loss) income per common share (“EPS”), basic and diluted, for the yearsended December 31, 2014, 2013 and 2012:
(In thousands, except per share information) 2014 2013 2012
Net (loss) income from continuing operations $(190,510) $558,818 $207,457Net (loss) income from discontinued operations (122,980) 40,509 37,818Preferred stock dividends (3,723) (3,723) (3,723)
Net (loss) income applicable to common stock $(317,213) $595,604 $241,552
Average common shares outstanding 102,848,792 102,693,685 102,429,755Average potential dilutive common shares – 367,790 223,855
Average common shares outstanding - assuming dilution 102,848,792 103,061,475 102,653,610
Basic EPS from continuing operations $(1.88) $5.41 $1.99
Basic EPS from discontinued operations $(1.20) $0.39 $0.37
Total Basic EPS $(3.08) $5.80 $2.36
Diluted EPS from continuing operations $(1.88) $5.39 $1.98
Diluted EPS from discontinued operations $(1.20) $0.39 $0.37
Total Diluted EPS $(3.08) $5.78 $2.35
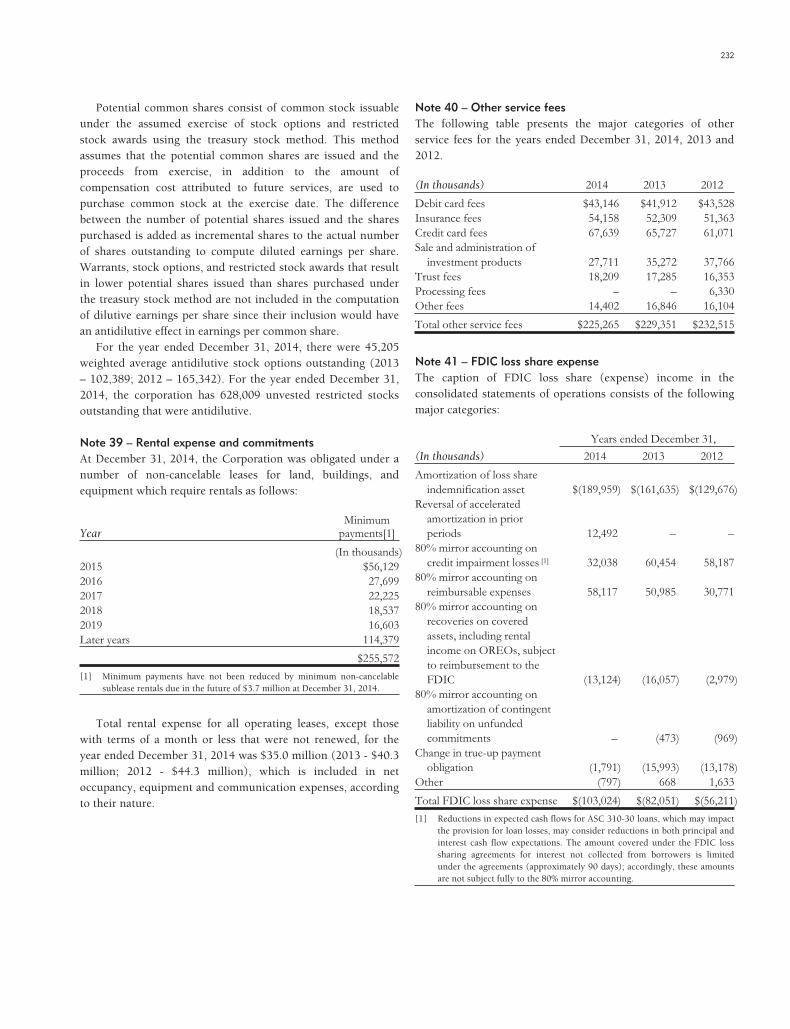
232
Potential common shares consist of common stock issuableunder the assumed exercise of stock options and restrictedstock awards using the treasury stock method. This methodassumes that the potential common shares are issued and theproceeds from exercise, in addition to the amount ofcompensation cost attributed to future services, are used topurchase common stock at the exercise date. The differencebetween the number of potential shares issued and the sharespurchased is added as incremental shares to the actual numberof shares outstanding to compute diluted earnings per share.Warrants, stock options, and restricted stock awards that resultin lower potential shares issued than shares purchased underthe treasury stock method are not included in the computationof dilutive earnings per share since their inclusion would havean antidilutive effect in earnings per common share.
For the year ended December 31, 2014, there were 45,205weighted average antidilutive stock options outstanding (2013– 102,389; 2012 – 165,342). For the year ended December 31,2014, the corporation has 628,009 unvested restricted stocksoutstanding that were antidilutive.
Note 39 – Rental expense and commitmentsAt December 31, 2014, the Corporation was obligated under anumber of non-cancelable leases for land, buildings, andequipment which require rentals as follows:
YearMinimum
payments[1]
(In thousands)2015 $56,1292016 27,6992017 22,2252018 18,5372019 16,603Later years 114,379
$255,572
[1] Minimum payments have not been reduced by minimum non-cancelablesublease rentals due in the future of $3.7 million at December 31, 2014.
Total rental expense for all operating leases, except thosewith terms of a month or less that were not renewed, for theyear ended December 31, 2014 was $35.0 million (2013 - $40.3million; 2012 - $44.3 million), which is included in netoccupancy, equipment and communication expenses, accordingto their nature.
Note 40 – Other service feesThe following table presents the major categories of otherservice fees for the years ended December 31, 2014, 2013 and2012.
(In thousands) 2014 2013 2012
Debit card fees $43,146 $41,912 $43,528Insurance fees 54,158 52,309 51,363Credit card fees 67,639 65,727 61,071Sale and administration of
investment products 27,711 35,272 37,766Trust fees 18,209 17,285 16,353Processing fees – – 6,330Other fees 14,402 16,846 16,104
Total other service fees $225,265 $229,351 $232,515
Note 41 – FDIC loss share expenseThe caption of FDIC loss share (expense) income in theconsolidated statements of operations consists of the followingmajor categories:
Years ended December 31,
(In thousands) 2014 2013 2012
Amortization of loss shareindemnification asset $(189,959) $(161,635) $(129,676)
Reversal of acceleratedamortization in priorperiods 12,492 – –
80% mirror accounting oncredit impairment losses [1] 32,038 60,454 58,187
80% mirror accounting onreimbursable expenses 58,117 50,985 30,771
80% mirror accounting onrecoveries on coveredassets, including rentalincome on OREOs, subjectto reimbursement to theFDIC (13,124) (16,057) (2,979)
80% mirror accounting onamortization of contingentliability on unfundedcommitments – (473) (969)
Change in true-up paymentobligation (1,791) (15,993) (13,178)
Other (797) 668 1,633
Total FDIC loss share expense $(103,024) $(82,051) $(56,211)
[1] Reductions in expected cash flows for ASC 310-30 loans, which may impactthe provision for loan losses, may consider reductions in both principal andinterest cash flow expectations. The amount covered under the FDIC losssharing agreements for interest not collected from borrowers is limitedunder the agreements (approximately 90 days); accordingly, these amountsare not subject fully to the 80% mirror accounting.

233 POPULAR, INC. 2014 ANNUAL REPORT
As discussed in Note 1, the FDIC indemnity assetamortization for the year ended December 31, 2014 included abenefit of approximately $12.5 million to reverse the impact ofaccelerated amortization expense recorded in prior periods.This amount will be recognized as expense over the remainingportion of the Loss Sharing Agreement that expires in thequarter ending June 30, 2015.
During 2014, the Corporation revised its analysis ofexpected cash flows which resulted in a net decrease inestimated credit losses, which was driven mainly by commercialloan pools. Though this will have a positive impact on theCorporation’s interest accretion in future periods, the carryingvalue of the indemnification asset was amortized to reflectlower levels of expected losses. This amortization is recognizedover the shorter of the remaining life of the loan pools, whichhad an average life of approximately six years, or theindemnification asset, which expires at June 30, 2015, forcommercial, construction and consumer loans and June 30,2020 for single-family residential mortgage loans.
Note 42 – Stock-based compensationThe Corporation maintained a Stock Option Plan (the “StockOption Plan”), which permitted the granting of incentiveawards in the form of qualified stock options, incentive stockoptions, or non-statutory stock options of the
Corporation. In April 2004, the Corporation’s shareholdersadopted the Popular, Inc. 2004 Omnibus Incentive Plan (the“Incentive Plan”), which replaced and superseded the StockOption Plan. The adoption of the Incentive Plan did not alterthe original terms of the grants made under the Stock OptionPlan prior to the adoption of the Incentive Plan.
Stock Option PlanEmployees and directors of the Corporation or any of itssubsidiaries were eligible to participate in the Stock OptionPlan. The Board of Directors or the Compensation Committeeof the Board had the absolute discretion to determine theindividuals that were eligible to participate in the Stock OptionPlan. This plan provided for the issuance of Popular, Inc.’scommon stock at a price equal to its fair market value at thegrant date, subject to certain plan provisions. The shares are tobe made available from authorized but unissued shares ofcommon stock or treasury stock. The Corporation’s policy hasbeen to use authorized but unissued shares of common stock tocover each grant. The maximum option term is ten years fromthe date of grant. Unless an option agreement providesotherwise, all options granted are 20% exercisable after the firstyear and an additional 20% is exercisable after each subsequentyear, subject to an acceleration clause at termination ofemployment due to retirement.
(Not in thousands)
Exercise priceper share
Optionsoutstanding
Weighted-averageexercise price of
optionsoutstanding
Weighted-averageremaining
life of optionsoutstanding in
years
Optionsexercisable
(fully vested)
Weighted-averageexercise price of
optionsexercisable
$272.00 44,797 $272.00 0.12 44,797 $272.00
There was no intrinsic value of options outstanding and exercisable at December 31, 2014, 2013 and 2012.

234
The following table summarizes the stock option activityand related information:
(Not in thousands)Options
outstandingWeighted-average
exercise price
Outstanding at January 1, 2012 206,946 $207.83Granted – –Exercised – –Forfeited – –Expired (45,960) 155.68
Outstanding at December 31, 2012 160,986 $222.71Granted – –Exercised – –Forfeited – –Expired (60,549) 171.42
Outstanding at December 31, 2013 100,437 $253.64Granted – –Exercised – –Forfeited – –Expired (55,640) 238.85
Outstanding at December 31, 2014 44,797 $272.00
There was no stock option expense recognized for the yearsended December 31, 2014, 2013 and 2012.
Incentive PlanThe Incentive Plan permits the granting of incentive awards inthe form of Annual Incentive Awards, Long-term PerformanceUnit Awards, Stock Options, Stock Appreciation Rights,Restricted Stock, Restricted Units or Performance Shares.Participants in the Incentive Plan are designated by theCompensation Committee of the Board of Directors (or itsdelegate as determined by the Board). Employees and directorsof the Corporation and/or any of its subsidiaries are eligible toparticipate in the Incentive Plan.
Under the Incentive Plan, the Corporation has issuedrestricted shares, which become vested based on the employees’continued service with Popular. Unless otherwise stated in anagreement, the compensation cost associated with the shares ofrestricted stock is determined based on a two-prong vestingschedule. The first part is vested ratably over five yearscommencing at the date of grant and the second part is vestedat termination of employment after attainment of 55 years ofage and 10 years of service. The vesting schedule for restrictedshares granted on 2014 was modified as follows, the first partratably over four years commencing at the date of the grant andthe second part is vested at termination of employment afterattainment of 55 years of age and 10 years of service or 60 yearsof age and 5 years of service. The four year vesting part isaccelerated at termination of employment after attaining 55years of age and 10 years of service or 60 years of age and 5years of service. The five-year vesting part is accelerated attermination of employment after attaining 55 years of age and
10 years of service. The restricted shares granted, consistentwith the requirements of the Troubled Asset Relief Program(“TARP”) Interim Final Rule, vest in two years from grant date.
The following table summarizes the restricted stock activityunder the Incentive Plan for members of management.
(Not in thousands)Restricted
stock
Weighted-averagegrant datefair value
Non-vested at January 1, 2012 241,934 $31.98Granted 359,427 17.72Vested (96,353) 37.61Forfeited (13,785) 26.59
Non-vested at December 31, 2012 491,223 $20.59Granted 229,131 28.20Vested (131,324) 31.23Forfeited (3,783) 24.63
Non-vested at December 31, 2013 585,247 $21.16Granted 365,831 29.86Vested (311,078) 19.02Forfeited (11,991) 29.33
Non-vested at December 31, 2014 628,009 $27.13
During the year ended December 31, 2014, 365,831 sharesof restricted stock (2013 - 229,131; 2012 - 359,427) wereawarded to management under the Incentive Plan, from which162,332 shares (2013 - 165,304; 2012 - 253,170) were awardedto management consistent with the requirements of the TARPInterim Final Rule.
During the year ended December 31, 2014, the Corporationrecognized $6.8 million of restricted stock expense related tomanagement incentive awards, with a tax benefit of$1.1 million (2013 - $5.3 million, with a tax benefit of $1.7million; 2012 - $4.3 million, with a tax benefit of $1.1 million).During the year ended December 31, 2014, the fair marketvalue of the restricted stock vested was $5.8 million at grantdate and $9.0 million at vesting date. This triggers a shortfall,net of windfalls, of $1.2 million of which $0.4 million wasrecorded as a windfall pool in additional paid in capital. Nowindfall pool was recorded for the remaining $0.8 million dueto the valuation allowance of the deferred tax asset that wasrecorded as an additional income tax expense at the applicableincome tax rate. No income tax expense was recorded for theU.S. employees due to the valuation allowance of the deferredtax asset. The total unrecognized compensation cost related tonon-vested restricted stock awards to members of managementat December 31, 2014 was $10.1 million and is expected to berecognized over a weighted-average period of 1.8 years.

235 POPULAR, INC. 2014 ANNUAL REPORT
The following table summarizes the restricted stock activityunder the Incentive Plan for members of the Board of Directors:
(Not in thousands)Restricted
stock
Weighted-averagegrant datefair value
Nonvested at January 1, 2012 – –Granted 41,174 $16.37Vested (41,174) 16.37Forfeited – –
Non-vested at December 31, 2012 – –Granted 20,930 $29.43Vested (20,930) 29.43Forfeited – –
Non-vested at December 31, 2013 – –Granted 23,135 $30.43Vested (23,135) 30.43Forfeited – –
Non-vested at December 31, 2014 – –
During the year ended December 31, 2014, the Corporationgranted 23,135 shares of restricted stock to members of theBoard of Directors of Popular, Inc., which became vested atgrant date (2013 - 20,930; 2012 – 41,174). During this period,the Corporation recognized $0.5 million of restricted stockexpense related to these restricted stock grants, with a tax
benefit of $57 thousand (2013 - $0.5 million, with a tax benefitof $0.2 million; 2012 - $0.4 million, with a tax benefit of $0.1million). The fair value at vesting date of the restricted stockvested during the year ended December 31, 2014 for directorswas $0.7 million.
Note 43 – Income taxesThe components of income tax expense (benefit) for the yearsended December 31, are summarized in the following table.
(In thousands) 2014 2013 2012
Current income tax expense:Puerto Rico $7,814 $27,118 $108,090Federal and States 6,953 10,309 998
Subtotal 14,767 37,427 109,088
Deferred income tax expense(benefit):
Puerto Rico 12,569 (90,796) (138,632)Federal and States 2,861 (491) 3,141Valuation allowance-Initial
recognition 8,034 – –Adjustment for enacted changes
in income tax laws 20,048 (197,467) –
Subtotal 43,512 (288,754) (135,491)
Total income tax expense(benefit) $58,279 $(251,327) $(26,403)
The reasons for the difference between the income tax expense (benefit) applicable to income before provision for income taxesand the amount computed by applying the statutory tax rate in Puerto Rico, were as follows:
2014 2013 2012
(In thousands) Amount% of pre-tax
income Amount% of pre-tax
income Amount% of pre-tax
income
Computed income tax at statutory rates $ (51,570) 39% $ 135,720 39% $ 65,662 30%Benefit of net tax exempt interest income (55,862) 43 (36,993) (11) (25,540) (12)Effect of income subject to preferential tax rate [1] (21,909) 18 (137,793) (40) (78,132) (36)Deferred tax asset valuation allowance (4,281) 3 (32,990) (9) 166 –Non-deductible expenses [2] 178,219 (135) 32,115 9 23,093 11Difference in tax rates due to multiple jurisdictions (14,178) 10 (12,029) (3) (6,034) (3)Initial adjustment in deferred tax due to change in tax rate 20,048 (16) (197,467) (57) – –Unrecognized tax benefits (3,601) 3 (7,727) (2) (8,985) (4)Others 11,413 (9) 5,837 2 3,367 2
Income tax expense (benefit) $ 58,279 (44)% $(251,327) (72)% $(26,403) (12)%
[1] Includes the impact of the Closing Agreement with the P.R. Treasury signed in June 2012, the tax expense related to a gain on the sale of EVERTEC shares andincome from investments in subsidiaries subject to preferential tax rates and the Closing Agreement with the P.R. Treasury signed in 2014.
[2] For the year ended December 31, 2014, includes approximately $161.5 million of amortization of the discount and deferred cost associated with the TARP funds,which are not deductible.
On July 1, 2014, the Government of Puerto Rico approvedcertain amendments to the Internal Revenue Code, which,among other things, changed the income tax rate for capitalgains from 15% to 20%. As a result, the Corporation recognizedan income tax expense of $20.0 million mainly related to thedeferred tax liability associated with the portfolio acquired fromWesternbank.
During the second quarter of 2014 the Corporation enteredinto a Closing Agreement with the Puerto Rico Department ofTreasury. The Agreement, among other matters, was related tothe income tax treatment of certain charge-offs related to theloans acquired from Westernbank as part of the FDIC assistedtransaction in the year 2010. As a result of the Agreement, theCorporation recorded a tax benefit of $23.4 million due to a

236
reduction in the deferred tax liability associated with theWesternbank loan portfolio. Additionally, in connection withthis Closing, the Corporation made an estimated tax paymentof $45 million which will be used as a credit to offset futureincome tax liabilities.
In addition, as further discussed below, during 2014 aninitial valuation allowance on the deferred tax asset ofapproximately $8.0 million was recorded at the HoldingCompany, due to the difference in the tax treatment of theinterest expense related to the TARP funds and the newlyissued $450 million of senior notes, bearing interest at 7%.
The results for the year ended December 31, 2013 reflect atax benefit of $197.5 million, and a corresponding increase inthe net deferred tax assets of the Puerto Rico operations as aresult of the increase in the marginal tax rate from 30% to 39%.On June 30, 2013 the Governor of Puerto Rico signed ActNumber 40 which includes several amendments to the PuertoRico Internal Revenue Code. Among the most significantchanges applicable to corporations was the increase in themarginal tax rate from 30% to 39% effective for taxable yearsbeginning after December 31, 2012. In addition, theCorporation recorded an income tax benefit of $146.4 millionin connection with the loss generated on the Puerto Ricooperations by the sales of non-performing assets that took placeduring the year 2013 and a tax expense of $23.7 million relatedto the gain realized on the sale of a portion of EVERTEC’sshares which was taxable at a preferential tax rate according toAct Number 73 of May 28, 2008, known as “EconomicIncentives Act for the Development of Puerto Rico”.
The results for the year ended December 31, 2012 reflect atax benefit of $72.9 million, related to the reduction of thedeferred tax liability on the estimated gains for tax purposesrelated to the loans acquired from Westernbank (the “AcquiredLoans”). In June 2012, the Puerto Rico Department of theTreasury (the “P.R. Treasury”) and the Corporation enteredinto a Closing Agreement (the “Closing Agreement”) to clarifythat the Acquired Loans are a capital asset and any gainresulting from such loans will be taxed at the capital gain taxrate instead of the ordinary income tax rate, thus reducing thedeferred tax liability on the estimated gain and recognizing anincome tax benefit for accounting purposes.
Deferred income taxes reflect the net tax effects oftemporary differences between the carrying amounts of assetsand liabilities for financial reporting purposes and their taxbases. Significant components of the Corporation’s deferred taxassets and liabilities at December 31 were as follows:
(In thousands)December 31,
2014December 31,
2013
Deferred tax assets:Tax credits available for
carryforward $ 12,056 $ 8,195Net operating loss and other
carryforward available 1,261,413 1,269,523Postretirement and pension
benefits 111,677 51,742Deferred loan origination fees 7,720 7,164Allowance for loan losses 710,666 760,956Deferred gains 7,500 9,313Accelerated depreciation 7,915 7,577Intercompany deferred gains 2,988 3,235Other temporary differences 27,755 34,443
Total gross deferred tax assets 2,149,690 2,152,148
Deferred tax liabilities:Differences between the assigned
values and the tax basis of assetsand liabilities recognized inpurchase business combinations 37,804 37,938
FDIC-assisted transaction 81,335 79,381Unrealized net gain on trading and
available-for-sale securities 20,817 3,822Other temporary differences 18,093 13,387
Total gross deferred taxliabilities 158,049 134,528
Valuation allowance 1,212,748 1,257,977
Net deferred tax asset $ 778,893 $ 759,643

237 POPULAR, INC. 2014 ANNUAL REPORT
The net deferred tax asset shown in the table above atDecember 31, 2014 is reflected in the consolidated statements offinancial condition as $813 million in net deferred tax assets (inthe “other assets” caption) (2013 - $762 million in deferred taxasset in the “other assets” caption) and $34 million in deferredtax liabilities (in the “other liabilities” caption) (2013 - $2million in deferred tax liabilities in the “other liabilities”caption), reflecting the aggregate deferred tax assets or liabilitiesof individual tax-paying subsidiaries of the Corporation.
Included as part of the other carryforwards available are$47.2 million related to contributions to Banco Popular dePuerto Rico qualified pension plan and $57.8 million of othernet operating loss carryforwards (“NOLs”) primarily related tothe loss on sale of non-performing assets that have noexpiration date since they were realize through a single memberlimited liability company with partnership election.Additionally, the deferred tax asset related to the NOLsoutstanding at December 31, 2014 expires as follows:
(In thousands)
2017 $ 3,3122018 14,9282019 12021 762022 9712023 1,2482024 10,9632027 51,4522028 511,5612029 198,2242030 197,0902031 139,5122032 25,2762033 1,757
$1,156,371
A deferred tax asset should be reduced by a valuationallowance if based on the weight of all available evidence, it ismore likely than not (a likelihood of more than 50%) that someportion or the entire deferred tax asset will not be realized. Thevaluation allowance should be sufficient to reduce the deferredtax asset to the amount that is more likely than not to berealized. The determination of whether a deferred tax asset isrealizable is based on weighting all available evidence,including both positive and negative evidence. The realizationof deferred tax assets, including carryforwards and deductibletemporary differences, depends upon the existence of sufficienttaxable income of the same character during the carryback orcarryforward period. The analysis considers all sources oftaxable income available to realize the deferred tax asset,including the future reversal of existing taxable temporarydifferences, future taxable income exclusive of reversingtemporary differences and carryforwards, taxable income inprior carryback years and tax-planning strategies.
The Corporations maintains a valuation allowance on itsdeferred tax asset for the U.S. operations, since in consideration ofthe requirement of ASC 740 management considered that it ismore likely than not that all of this deferred tax asset will not berealized. For purposes of assessing the realization of the deferredtax assets in the U.S. mainland management evaluates and weightsall available positive and negative evidence. The Corporation’sU.S. mainland operations are no longer in a cumulative lossposition for the three-year period ended December 31, 2014taking into account taxable income exclusive of reversingtemporary differences (“adjusted book income”). This representspositive evidence within management’s evaluation. The bookincome for the years 2013 and 2014 was significantly impacted bya reversal of the loan loss provision due to the improved creditquality of the loan portfolios. However, the U.S. mainlandoperations did not report taxable income for the years 2011, 2012and 2013, although it did report taxable income for the year endedDecember 31, 2014. Future realization of the deferred tax assetsultimately depends on the existence of sufficient taxable income ofthe appropriate character within the carryforward period availableunder the tax law. The lack of a sustained level of taxable incometogether with the uncertainties regarding the estimate of futurenormalized level of profitability and cost savings related to therestructure represents strong negative evidence withinmanagement’s evaluation. This determination is updated eachquarter and adjusted as any changes arise. After weighting of allpositive and negative evidence management concluded, as of thereporting date, that it is more likely than not that the Corporationwill not be able to realize any portion of the deferred tax assetsrelated to the U.S. mainland operations, considering the criteria ofASC Topic 740. If the Corporation is able to meet its operatingtargets in the U.S. and the results of the reorganization yield theexpected results, this would be considered positive evidencewithin management’s evaluation which could outweigh thenegative evidence and result in the realization of a portion of thefully reserved deferred tax asset recorded at PCB.
At December 31, 2014, the Corporation’s net deferred taxassets related to its Puerto Rico operations amounted to $812million.
The Corporation’s Puerto Rico Banking operation is not in acumulative loss position and has sustained profitability for thethree year period ended December 31, 2014, exclusive of theloss generated on the sales of non performing assets that tookplace in 2013 which is not a continuing condition of theoperations. This is considered a strong piece of objectivelyverifiable positive evidence that out weights any negativeevidence considered by management in the evaluation of therealization of the deferred tax asset. Based on this evidence andmanagement’s estimate of future taxable income, theCorporation has concluded that it is more likely than not thatsuch net deferred tax asset of the Puerto Rico Bankingoperations will be realized.
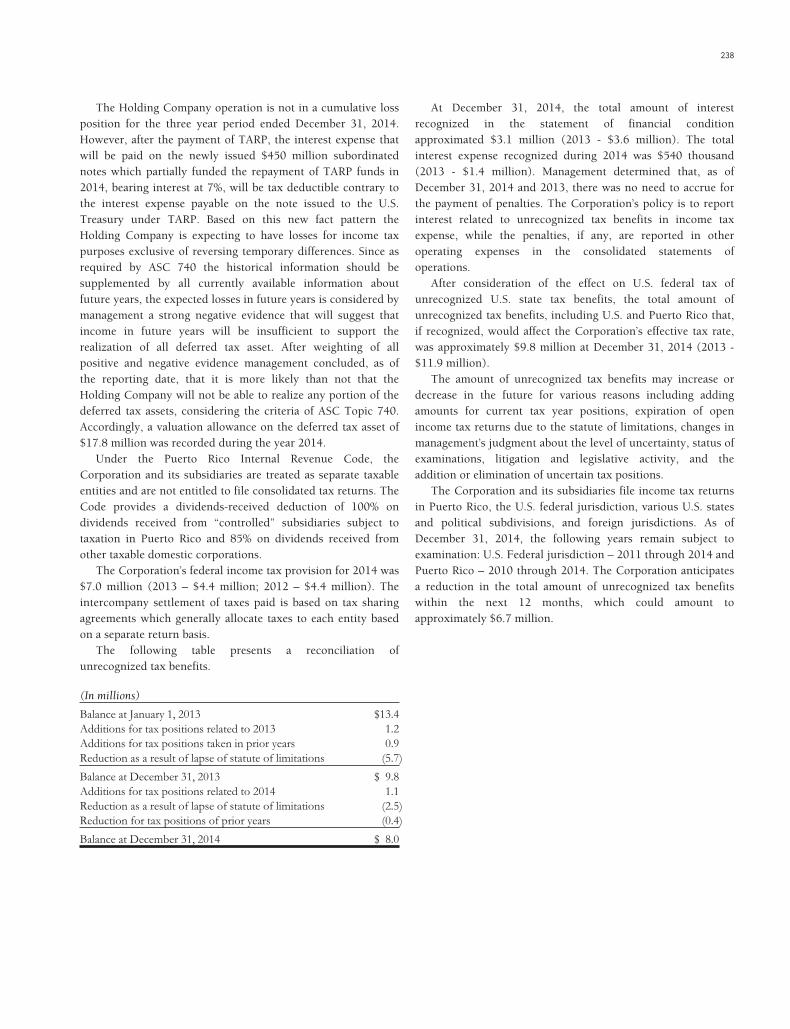
238
The Holding Company operation is not in a cumulative lossposition for the three year period ended December 31, 2014.However, after the payment of TARP, the interest expense thatwill be paid on the newly issued $450 million subordinatednotes which partially funded the repayment of TARP funds in2014, bearing interest at 7%, will be tax deductible contrary tothe interest expense payable on the note issued to the U.S.Treasury under TARP. Based on this new fact pattern theHolding Company is expecting to have losses for income taxpurposes exclusive of reversing temporary differences. Since asrequired by ASC 740 the historical information should besupplemented by all currently available information aboutfuture years, the expected losses in future years is considered bymanagement a strong negative evidence that will suggest thatincome in future years will be insufficient to support therealization of all deferred tax asset. After weighting of allpositive and negative evidence management concluded, as ofthe reporting date, that it is more likely than not that theHolding Company will not be able to realize any portion of thedeferred tax assets, considering the criteria of ASC Topic 740.Accordingly, a valuation allowance on the deferred tax asset of$17.8 million was recorded during the year 2014.
Under the Puerto Rico Internal Revenue Code, theCorporation and its subsidiaries are treated as separate taxableentities and are not entitled to file consolidated tax returns. TheCode provides a dividends-received deduction of 100% ondividends received from “controlled” subsidiaries subject totaxation in Puerto Rico and 85% on dividends received fromother taxable domestic corporations.
The Corporation’s federal income tax provision for 2014 was$7.0 million (2013 – $4.4 million; 2012 – $4.4 million). Theintercompany settlement of taxes paid is based on tax sharingagreements which generally allocate taxes to each entity basedon a separate return basis.
The following table presents a reconciliation ofunrecognized tax benefits.
(In millions)
Balance at January 1, 2013 $13.4Additions for tax positions related to 2013 1.2Additions for tax positions taken in prior years 0.9Reduction as a result of lapse of statute of limitations (5.7)
Balance at December 31, 2013 $ 9.8Additions for tax positions related to 2014 1.1Reduction as a result of lapse of statute of limitations (2.5)Reduction for tax positions of prior years (0.4)
Balance at December 31, 2014 $ 8.0
At December 31, 2014, the total amount of interestrecognized in the statement of financial conditionapproximated $3.1 million (2013 - $3.6 million). The totalinterest expense recognized during 2014 was $540 thousand(2013 - $1.4 million). Management determined that, as ofDecember 31, 2014 and 2013, there was no need to accrue forthe payment of penalties. The Corporation’s policy is to reportinterest related to unrecognized tax benefits in income taxexpense, while the penalties, if any, are reported in otheroperating expenses in the consolidated statements ofoperations.
After consideration of the effect on U.S. federal tax ofunrecognized U.S. state tax benefits, the total amount ofunrecognized tax benefits, including U.S. and Puerto Rico that,if recognized, would affect the Corporation’s effective tax rate,was approximately $9.8 million at December 31, 2014 (2013 -$11.9 million).
The amount of unrecognized tax benefits may increase ordecrease in the future for various reasons including addingamounts for current tax year positions, expiration of openincome tax returns due to the statute of limitations, changes inmanagement’s judgment about the level of uncertainty, status ofexaminations, litigation and legislative activity, and theaddition or elimination of uncertain tax positions.
The Corporation and its subsidiaries file income tax returnsin Puerto Rico, the U.S. federal jurisdiction, various U.S. statesand political subdivisions, and foreign jurisdictions. As ofDecember 31, 2014, the following years remain subject toexamination: U.S. Federal jurisdiction – 2011 through 2014 andPuerto Rico – 2010 through 2014. The Corporation anticipatesa reduction in the total amount of unrecognized tax benefitswithin the next 12 months, which could amount toapproximately $6.7 million.

239 POPULAR, INC. 2014 ANNUAL REPORT
Note 44 – Supplemental disclosure on the consolidated statements of cash flowsAdditional disclosures on cash flow information and non-cash activities for the years ended December 31, 2014, 2013 and 2012 arelisted in the following table:
(In thousands) 2014 2013 2012
Income taxes paid $ 54,520 $ 51,047 $ 189,468Interest paid 696,631 318,342 388,250Non-cash activities:
Loans transferred to other real estate $ 154,358 $ 228,009 $ 294,993Loans transferred to other property 38,958 33,997 25,685
Total loans transferred to foreclosed assets 193,316 262,006 320,678Transfers from loans held-in-portfolio to loans held-for-sale 2,161,669 448,143 141,378Transfers from loans held-for-sale to loans held-in-portfolio 41,293 27,016 10,325Loans securitized into investment securities [1] 899,604 1,391,594 1,330,743Trades receivables from brokers and counterparties 66,949 71,680 137,542Trades payable to brokers and counterparties 2,000 3,576 3,581Recognition of mortgage servicing rights on securitizations or asset transfers 12,583 19,262 18,495Loans sold to a joint venture in exchange for an acquisition loan and an equity interest in the joint
venture – 194,514 –
[1] Includes loans securitized into trading securities and subsequently sold before year end.
During the year ended December 31, 2014 BPNA completedthe sale of its Illinois, Central Florida and California regionaloperations. As part of these transactions, BPNA made net cashdisbursement of $206.0 million for consideration of the assetsand liabilities sold, as follows:
(In thousands) December 31, 2014
Loans held-for-sale $ 1,739,101Premises and equipment, net 16,223Other assets 16,853Deposits (2,009,816)Other liabilities (6,611)
Net liabilities sold $ (244,250)
Note 45 – Segment reportingThe Corporation’s corporate structure consists of tworeportable segments – Banco Popular de Puerto Rico and BancoPopular North America. These reportable segments pertain onlyto the continuing operations of Popular, Inc. As previouslyindicated in Note 4 to the consolidated financial statements, theregional operations in California, Illinois and Central Floridawere classified as discontinued operations in the second quarterof 2014.
Management determined the reportable segments based onthe internal reporting used to evaluate performance and toassess where to allocate resources. The segments weredetermined based on the organizational structure, whichfocuses primarily on the markets the segments serve, as well ason the products and services offered by the segments.
Banco Popular de Puerto Rico:Given that Banco Popular de Puerto Rico constitutes asignificant portion of the Corporation’s results of operationsand total assets at December 31, 2014, additional disclosuresare provided for the business areas included in this reportablesegment, as described below:
• Commercial banking represents the Corporation’sbanking operations conducted at BPPR, which aretargeted mainly to corporate, small and middle sizebusinesses. It includes aspects of the lending anddepository businesses, as well as other finance andadvisory services. BPPR allocates funds across businessareas based on duration matched transfer pricing atmarket rates. This area also incorporates income relatedwith the investment of excess funds, as well as aproportionate share of the investment function of BPPR.
• Consumer and retail banking represents the branchbanking operations of BPPR which focus on retail clients.It includes the consumer lending business operations ofBPPR, as well as the lending operations of Popular Autoand Popular Mortgage. Popular Auto focuses on auto andlease financing, while Popular Mortgage focusesprincipally on residential mortgage loan originations. Theconsumer and retail banking area also incorporatesincome related with the investment of excess funds fromthe branch network, as well as a proportionate share ofthe investment function of BPPR.

240
• Other financial services include the trust and assetmanagement service units of BPPR, the brokerage andinvestment banking operations of Popular Securities, andthe insurance agency and reinsurance businesses ofPopular Insurance, Popular Insurance V.I., Popular RiskServices, and Popular Life Re. Most of the services that areprovided by these subsidiaries generate profits based onfee income.
Banco Popular North America:Banco Popular North America’s reportable segment consists ofthe banking operations of BPNA, E-LOAN, Popular EquipmentFinance, Inc. and Popular Insurance Agency, U.S.A. BPNAoperates through a retail branch network in the U.S. mainlandunder the name of Popular Community Bank, while E-LOANsupports BPNA’s deposit gathering through its online platform.All direct lending activities at E-LOAN were ceased during thefourth quarter of 2008. Popular Equipment Finance, Inc. alsoholds a running-off loan portfolio as this subsidiary ceasedoriginating loans during 2009. Popular Insurance Agency,U.S.A. offers investment and insurance services across theBPNA branch network.
The Corporate group consists primarily of the holdingcompanies: Popular, Inc., Popular North America, PopularInternational Bank and certain of the Corporation’s investmentsaccounted for under the equity method, including EVERTECand Centro Financiero BHD, S.A. The Corporate group alsoincludes the expenses of certain corporate areas that areidentified as critical to the organization: Finance, RiskManagement and Legal.
The accounting policies of the individual operatingsegments are the same as those of the Corporation.Transactions between reportable segments are primarilyconducted at market rates, resulting in profits that areeliminated for reporting consolidated results of operations.
The tables that follow present the results of operations andtotal assets by reportable segments:
December 31, 2014
(In thousands)Banco Popularde Puerto Rico
Banco PopularNorth
AmericaIntersegmentEliminations
Net interest income $ 1,288,889 $ 157,701 $ –Provision (reversal of provision) for
loan losses 289,184 (18,850) –Non-interest income 283,251 64,319 –Amortization of intangibles 7,351 809 –Depreciation expense 39,062 6,617 –Loss on early extinguishment of debt – 532 –Other operating expenses 884,289 184,369 –Income tax expense 77,973 3,101 –
Net income $ 274,281 $ 45,442 $ –
Segment assets $27,384,169 $5,503,433 $(17,972)
December 31, 2014
(In thousands)ReportableSegments Corporate Eliminations Total Popular, Inc.
Net interest income(expense) $ 1,446,590 $ (501,518) $ – $ 945,072
Provision (reversal ofprovision) for loanlosses 270,334 (200) – 270,134
Non-interest income 347,570 41,695 (2,750) 386,515Amortization of
intangibles 8,160 – – 8,160Depreciation expense 45,679 648 – 46,327Loss on early
extinguishment ofdebt 532 – – 532
Other operatingexpenses 1,068,658 72,759 (2,752) 1,138,665
Income tax expense(benefit) 81,074 (22,796) 1 58,279
Net income (loss) $ 319,723 $ (510,234) $ 1 $ (190,510)
Segment assets $32,869,630 $4,937,372 $(4,710,307) $33,096,695
December 31, 2013
(In thousands)
BancoPopular dePuerto Rico
Banco PopularNorth America
IntersegmentEliminations
Net interest income $ 1,260,537 $ 192,265 $ –Provision for loan losses 616,883 (11,175) –Non-interest income 281,894 36,252 –Amortization of intangibles 7,162 809 –Depreciation expense 38,282 6,839 –Other operating expenses 943,444 153,207 –Income tax (benefit) expense (236,898) 2,795 –
Net income $ 173,558 $ 76,042 $ –
Segment assets $26,883,073 $8,724,784 $(24,609)
December 31, 2013
(In thousands)ReportableSegments Corporate Eliminations Total Popular, Inc.
Net interest income(expense) $ 1,452,802 $ (108,228) $ – $ 1,344,574
Provision for loan losses 605,708 398 – 606,106Non-interest income 318,146 475,663 (2,796) 791,013Amortization of
intangibles 7,971 – – 7,971Depreciation expense 45,121 643 – 45,764Loss on early
extinguishment ofdebt – 3,388 – 3,388
Other operatingexpenses 1,096,651 70,997 (2,781) 1,164,867
Income tax benefit (234,103) (17,082) (142) (251,327)
Net income $ 249,600 $ 309,091 $ 127 $ 558,818
Segment assets $35,583,248 $5,495,498 $(5,329,413) $35,749,333

241 POPULAR, INC. 2014 ANNUAL REPORT
December 31, 2012
(In thousands)
BancoPopular dePuerto Rico
Banco PopularNorth America
IntersegmentEliminations
Net interest income $ 1,199,210 $ 186,680 $ –Provision for loan losses 356,496 40,173 –Non-interest income 401,417 37,141 –Amortization of intangibles 7,351 810 –Depreciation expense 37,321 5,785 –Loss on early extinguishment of
debt 25,196 – –Other operating expenses 903,677 165,133 –Income tax expense (20,245) 3,745 –
Net income $ 290,831 $ 8,175 $ –
Segment assets $27,600,235 $8,651,790 $(31,792)
December 31, 2012
(In thousands)ReportableSegments Corporate Eliminations
TotalPopular,
Inc.
Net interest income (expense) $ 1,385,890 $ (104,750) $ 487 $ 1,281,627Provision for loan losses 396,669 404 – 397,073Non-interest income 438,558 76,156 (3,225) 511,489Amortization of intangibles 8,161 – – 8,161Depreciation expense 43,106 1,258 – 44,364Loss on early extinguishment
of debt 25,196 – – 25,196Other operating expenses 1,068,810 71,579 (3,121) 1,137,268Income tax expense (benefit) (16,500) (9,945) 42 (26,403)
Net income (loss) $ 299,006 $ (91,890) $ 341 $ 207,457
Segment assets $36,220,233 $5,308,327 $(5,021,025) $36,507,535
Additional disclosures with respect to the Banco Popular dePuerto Rico reportable segment are as follows:
December 31, 2014
Banco Popular de Puerto Rico
(In thousands)Commercial
Banking
Consumerand RetailBanking
OtherFinancialServices Eliminations
Total BancoPopular dePuerto Rico
Net interest income $ 521,957 $ 757,721 $ 9,207 $ 4 $ 1,288,889Provision for loan
losses 138,213 150,971 – – 289,184Non-interest
(expense) income 3,534 181,117 98,794 (194) 283,251Amortization of
intangibles 4 6,836 511 – 7,351Depreciation
expense 16,407 21,551 1,104 – 39,062Other operating
expenses 254,146 562,345 67,992 (194) 884,289Income tax expense 22,899 38,825 16,249 – 77,973
Net income $ 93,822 $ 158,310 $ 22,145 $ 4 $ 274,281
Segment assets $10,267,633 $18,895,974 $591,955 $(2,371,393) $27,384,169
December 31, 2013
Banco Popular de Puerto Rico
(In thousands)Commercial
Banking
Consumerand RetailBanking
OtherFinancialServices Eliminations
Total BancoPopular dePuerto Rico
Net interest income $ 493,836 $ 757,039 $ 9,662 $ – $ 1,260,537Provision for loan
losses 180,228 436,655 – – 616,883Non-interest
(expense) income (41,362) 224,080 99,243 (67) 281,894Amortization of
intangibles 4 6,837 321 – 7,162Depreciation
expense 16,083 20,981 1,218 – 38,282Other operating
expenses 296,319 578,903 68,289 (67) 943,444Income tax
(benefit) expense (66,747) (182,471) 12,320 – (236,898)
Net income $ 26,587 $ 120,214 $ 26,757 $ – $ 173,558
Segment assets $10,803,992 $18,083,293 $576,299 $(2,580,511) $26,883,073
December 31, 2012
Banco Popular de Puerto Rico
(In thousands)Commercial
Banking
Consumerand RetailBanking
OtherFinancialServices Eliminations
Total BancoPopular dePuerto Rico
Net interest income $ 424,467 $ 762,857 $ 11,882 $ 4 $ 1,199,210Provision for loan
losses 149,597 206,899 – – 356,496Non-interest
income 19,426 269,190 112,949 (148) 401,417Amortization of
intangibles 13 6,833 505 – 7,351Depreciation
expense 16,840 19,522 959 – 37,321Loss on early
extinguishmentof debt 8,037 17,159 – – 25,196
Other operatingexpenses 279,358 555,797 68,670 (148) 903,677
Income tax expense (33,068) (1,460) 14,281 2 (20,245)
Net income $ 23,116 $ 227,297 $ 40,416 $ 2 $ 290,831
Segment assets $12,770,793 $19,668,009 $632,676 $(5,471,243) $27,600,235

242
Additional disclosures with respect to the Banco PopularNorth America reportable segments are as follows:
December 31, 2014
Banco Popular North America
(In thousands)Banco PopularNorth America E-LOAN Eliminations
Total BancoPopular North
America
Net interest income $ 154,806 $ 2,895 $ – $ 157,701Reversal of provision for
loan losses (16,416) (2,434) – (18,850)Non-interest income 61,982 2,337 – 64,319Amortization of
intangibles 809 – – 809Depreciation expense 6,617 – – 6,617Loss on early
extinguishment of debt 532 – – 532Other operating expenses 181,452 2,917 – 184,369Income tax expense 3,101 – – 3,101
Net income $ 40,693 $ 4,749 $ – $ 45,442
Net income ( loss) $6,222,580 $255,757 $(974,904) $5,503,433
December 31, 2013
Banco Popular North America
(In thousands)Banco PopularNorth America E-LOAN Eliminations
Total BancoPopular North
America
Net interest income $ 189,229 $ 3,036 $ – $ 192,265(Reversal of provision)
provision for loanlosses (13,998) 2,823 – (11,175)
Non-interest income 35,833 419 – 36,252Amortization of
intangibles 809 – – 809Depreciation expense 6,839 – – 6,839Other operating expenses 150,767 2,440 – 153,207Income tax expense 4,012 (1,217) – 2,795
Net income (loss) $ 76,633 $ (591) $ – $ 76,042
Segment assets $9,453,934 $315,712 $(1,044,862) $8,724,784
December 31, 2012
Banco Popular North America
(In thousands)Banco PopularNorth America E-LOAN Eliminations
Total BancoPopular North
America
Net interest income $ 183,222 $ 3,458 $ – $ 186,680Provision for loan losses 24,973 15,200 – 40,173Non-interest income 34,026 3,115 – 37,141Amortization of
intangibles 810 – – 810Depreciation expense 5,785 – – 5,785Other operating expenses 162,309 2,824 – 165,133Income tax expense 3,745 – – 3,745
Net income (loss) $ 19,626 $ (11,451) $ – $ 8,175
Segment assets $9,378,779 $367,362 $(1,094,351) $8,651,790
Geographic Information
(In thousands) 2014 2013 2012
Revenues:[1]Puerto Rico $1,024,416 $1,838,657 $1,492,796United States 223,264 218,295 202,177Other 83,907 78,635 98,143
Total consolidated revenues $1,331,587 $2,135,587 $1,793,116
[1] Total revenues include net interest income (expense), service charges ondeposit accounts, other service fees, mortgage banking activities, net gain(loss) and valuation adjustments on investment securities, trading account(loss) profit, net (loss) gain on sale of loans and valuation adjustments onloans held-for-sale, adjustments to indemnity reserves on loans sold, FDICloss share (expense) income and other operating income.
Selected Balance Sheet Information
(In thousands) 2014 2013 2012
Puerto RicoTotal assets $26,276,561 $25,714,758 $26,582,248Loans 17,704,170 18,107,764 18,484,977Deposits 20,365,445 19,730,408 19,984,830
United StatesTotal assets $5,689,604 $8,897,535 $8,816,143Loans 3,568,564 5,839,115 5,852,705Deposits 3,442,084 6,007,159 6,049,168
OtherTotal assets $1,130,530 $1,137,040 $1,109,144Loans 780,483 759,840 755,950Deposits [1] 1,000,006 973,578 966,615
[1] Represents deposits from BPPR operations located in the US and British VirginIslands.
243 POPULAR, INC. 2014 ANNUAL REPORT
Note 46 – Subsequent eventsSubsequent events are events and transactions that occur afterthe balance sheet date but before the financial statements areissued. The effects of subsequent events and transactions arerecognized in the financial statements when they provideadditional evidence about conditions that existed at the balancesheet date. The Corporation has evaluated events andtransactions occurring subsequent to December 31, 2014.
On February 27, 2015, the Corporation’s Puerto Ricobanking subsidiary, Banco Popular de Puerto Rico (“BPPR”), inan alliance with co-bidders, including the Corporation’s U.S.mainland banking subsidiary, Banco Popular North America,doing business as Popular Community Bank (“PCB”), hadacquired certain assets and all deposits (other than certainbrokered deposits) of Doral Bank from the Federal DepositInsurance Corporation (FDIC) as receiver.
Under the FDIC’s bidding format, BPPR was the lead bidderand party to the purchase and assumption agreement with theFDIC covering all assets and deposits to be acquired by it andits alliance co-bidders. BPPR entered into back to back purchaseand assumption agreements with the alliance co-bidders for thetransferred assets and deposits.
After taking into account the transfers to the unaffiliatedalliance co-bidders, BPPR and PCB together assumedapproximately $2.3 billion in deposits and acquiredapproximately $1.8 billion in performing commercial andresidential loans, including:
• BPPR assumed approximately $612 million in depositsassociated with eight of the 18 Puerto Rico branches ofDoral Bank and approximately $431 million from itsonline deposit platform, and approximately $848 millionin performing Puerto Rico residential and commercialloans. BPPR purchased the loans at an aggregate discountof 4.71% or $40 million and paid an aggregate premium of0.93% or $10 million for the deposits it assumed.
• PCB assumed approximately $1.3 billion in deposits inthree New York branches of Doral Bank, and acquiredapproximately $931 million in performing commercialloans primarily in the New York metropolitan area. PCBpurchased the loans at an aggregate premium of 0.57% or$5 million and paid an aggregate premium of 1.99% or $25 million for the deposits it assumed.
In addition, on February 27, 2015, the FDIC, as Receiver forDoral Bank, awarded BPPR the mortgage servicing rights for aloan portfolio of approximately $5 billion in unpaid principalbalance, for a purchase price currently estimated at $48.6million. The transfers of the mortgage servicing rights aresubject to a number of specified closing conditions, includingthe consent of each of Ginnie Mae, Fannie Mae and FreddieMac in a form acceptable to BPPR, and other customary closingconditions. The transfers are expected to close within the next60 days, subject to the conditions described above.
There is no loss-sharing arrangement with the FDIC on theacquired assets.
The other co-bidders that formed part of the alliance led byBPPR are FirstBank Puerto Rico, San Juan, Puerto Rico;Centennial Bank, Conway, Arkansas; and an affiliate of J.C.Flowers III LP. In connection with the transaction, FirstBankacquired 10 Doral Bank branches in Puerto Rico withapproximately $625 million in deposits and $325 million inresidential loans from BPPR; Centennial Bank acquired fiveDoral Bank branches in Florida (all outside of PCB’s area offocus in the state) with approximately $466 million in depositsand $42 million in loans from BPPR; and an affiliate of J.C.Flowers III LP acquired approximately $316 million incommercial real estate loans in the United States from BPPR.BPPR has entered into customary transition service agreementswith each of the alliance co-bidders.
The transaction was completed based on December 31, 2014balances and is subject to customary true-up and purchaseaccounting adjustments through the date of the close. The $1.8billion in loans and $2.3 billion in deposits acquired by Popularin the transaction did not include any non-performing assetsand do not enjoy a loss sharing agreement with the FDIC.
Note 47 – Popular, Inc. (holding company only) financialinformationThe following condensed financial information presents thefinancial position of Popular, Inc. Holding Company only atDecember 31, 2014 and 2013, and the results of its operationsand cash flows for each of the three years in the period endedDecember 31, 2014.

244
Condensed Statements of Condition
December 31,
(In thousands) 2014 2013
ASSETSCash and due from banks (includes $20,269 due from bank subsidiary (2013 - $10,411)) $ 20,448 $ 10,595Money market investments 19,747 18,721Trading account securities 1,640 1,353Investment securities available-for-sale, at fair value 231 204Other investment securities, at lower of cost or realizable value (includes $8,725 in common securities from
statutory trusts (2013 - $9,725)) [1] 9,850 10,850Investment in BPPR and subsidiaries, at equity 3,389,529 3,127,745Investment in Popular North America and subsidiaries, at equity 1,221,670 1,511,335Investment in other non-bank subsidiaries, at equity 267,667 217,486Advances to subsidiaries 53,769 519,500Loans to affiliates – –Other loans 1,717 1,592
Less - Allowance for loan losses 41 304Premises and equipment 2,512 2,135Investment in equity method investees 47,837 41,248Other assets (includes $867 due from subsidiaries and affiliate (2013 - $1,085)) 20,845 25,947
Total assets $5,057,421 $5,488,407
LIABILITIES AND STOCKHOLDERS’ EQUITYNotes payable $ 740,812 $ 822,351Other liabilities (includes $4,583 due to subsidiaries and affiliate (2013 - $929)) 49,226 39,906Stockholders’ equity 4,267,383 4,626,150
Total liabilities and stockholders’ equity $5,057,421 $5,488,407
[1] Refer to Note 26 to the consolidated financial statements for information on the statutory trusts.

245 POPULAR, INC. 2014 ANNUAL REPORT
Condensed Statements of Operations
Years ended December 31,
(In thousands) 2014 2013 2012
Income:Dividends from subsidiaries $ – $ 37,000 $ 5,000Interest income (includes $1,829 due from subsidiaries and affiliates (2013 - $17,551; 2012 - $22,891)) 1,931 17,793 23,038Earnings from investments in equity method investees 12,291 17,308 40,505Other operating income – 425,968 1,461Gain on sale and valuation adjustment of investment securities – 7,966 –Trading account (loss) profit (40) 161 214
Total income 14,182 506,196 70,218
Expenses:Interest expense 492,657 101,245 95,898(Reversal of provision) provision for loan losses (200) 398 404Operating expenses (include expenses for services provided by subsidiaries and affiliate of $6,882
(2013 - $8,412; 2012 - $9,487)), net of reimbursement by subsidiaries for services provided by parentof $67,021 (2013 - $60,402; 2012 - $58,577) 1,633 700 1,705
Total expenses 494,090 102,343 98,007
(Loss) income before income taxes and equity in undistributed earnings of subsidiaries (479,908) 403,853 (27,789)Income taxes 5,580 1,412 1,702
(Loss) income before equity in undistributed earnings of subsidiaries (485,488) 402,441 (29,491)Equity in undistributed earnings of subsidiaries 294,978 156,377 236,948
(Loss) income from continuing operations (190,510) 558,818 207,457Equity in undistributed (losses) earnings of discontinued operations (122,980) 40,509 37,818
Net (loss) income $(313,490) $599,327 $245,275
Comprehensive (loss) income, net of tax $(354,617) $513,450 $184,955

246
Condensed Statements of Cash Flows
Year ended December 31,
(In thousands) 2014 2013 2012
Cash flows from operating activities:Net (loss) income $(313,490) $ 599,327 $ 245,275
Adjustments to reconcile net (loss) income to net cash used in operating activities:Equity in undistributed earnings of subsidiaries and dividends from subsidiaries (171,998) (196,886) (274,766)(Reversal of provision) provision for loan losses (200) 398 404Net accretion of discounts and amortization of premiums and deferred fees 404,461 30,467 29,058Earnings from investments under the equity method (12,291) (17,308) (40,505)Deferred income tax (benefit) expense 8,203 (10,937) (14,109)(Gain) loss on:
Sale and valuation adjustments of investment securities – (2,110) –Sale of stock in equity method investee – (416,113) –
Net (increase) decrease in:Trading securities (288) (94) (1,259)Other assets 4,736 7,747 9,351
Net increase (decrease) in:Interest payable 7,066 2,704 –Other liabilities (180) (5,507) 2,581
Total adjustments 239,509 (607,639) (289,245)
Net cash used in operating activities (73,981) (8,312) (43,970)
Cash flows from investing activities:Net (increase) decrease in money market investments (1,026) (147) 23,665Proceeds from calls, paydowns, maturities and redemptions of investment securities:
Available-for-sale – 35,000 –Other 1,000 – –
Proceeds from sale of investment securities:Available-for-sale – 5,438 –
Capital contribution to subsidiaries (100,000) (272,500) (103,500)Net decrease (increase) in advances to subsidiaries and affiliates 465,731 (234,014) (36,400)Net (originations) repayments on other loans (279) 269 138Return of capital from equity method investments 210,000 – 150,194Proceeds from sale of stock in equity method investee – 481,377 –Acquisition of premises and equipment (1,075) (352) (691)Proceeds from sale of:
Premises and equipment 48 33 73
Net cash provided by investing activities 574,399 15,104 33,479
Cash flows from financing activities:Payments of notes payable and subordinated notes (936,000) – –Proceeds from issuance of notes payable 450,000 – –Proceeds from issuance of common stock 5,394 6,860 9,402Dividends paid (3,723) (3,723) (3,723)Repurchase of TARP-related warrants (3,000) – –Net payments for repurchase of common stock (3,236) (437) (450)
Net cash (used in) provided by financing activities (490,565) 2,700 5,229
Net increase (decrease) in cash and due from banks 9,853 9,492 (5,262)Cash and due from banks at beginning of period 10,595 1,103 6,365
Cash and due from banks at end of period $ 20,448 $ 10,595 $ 1,103
Popular, Inc. (parent company only) received dividend distributions from its direct equity method investees amounting to $4.7million for the year ended December 31, 2014 (2013 - $4 million).

247 POPULAR, INC. 2014 ANNUAL REPORT
Notes payable include junior subordinated debenturesissued by the Corporation that are associated to capitalsecurities issued by the Popular Capital Trust I, Popular CapitalTrust II and Popular Capital Trust III and medium-term notes.Refer to Note 26 for a description of significant provisionsrelated to these junior subordinated debentures. The followingtable presents the aggregate amounts by contractual maturitiesof notes payable at December 31, 2014:
Year (In thousands)
2015 $ –2016 –2017 –2018 –2019 450,000Later years 290,812
Total $740,812
Note 48 – Condensed consolidating financial information ofguarantor and issuers of registered guaranteed securities
The following condensed consolidating financialinformation presents the financial position of Popular, Inc.Holding Company (“PIHC”) (parent only), Popular NorthAmerica, Inc. (“PNA”) and all other subsidiaries of theCorporation at December 31, 2014 and 2013, and the results oftheir operations and cash flows for periods ended December 31,2014, 2013 and 2012.
PNA is an operating, wholly-owned subsidiary of PIHC andis the holding company of its wholly-owned subsidiaries:Equity One, Inc. and Banco Popular North America (“BPNA”),including BPNA’s wholly-owned subsidiaries PopularEquipment Finance, Inc., Popular Insurance Agency, U.S.A.,and E-LOAN, Inc.
PIHC fully and unconditionally guarantees all registereddebt securities issued by PNA.
Popular International Bank, Inc. (“PIBI”) is a wholly-ownedsubsidiary of PIHC and is the holding company of its wholly-owned subsidiaries Popular Insurance V.I., Inc. In July 2013,the Corporation completed the sale of Tarjetas y Transaccionesen Red Tranred,C.A., which was a wholly owned subsidiary of
PIBI. Effective January 1, 2012, PNA, which was a wholly-owned subsidiary of PIBI prior to that date, became a directwholly-owned subsidiary of PIHC after an internalreorganization. Since the internal reorganization, PIBI is nolonger a bank holding company and is no longer a potentialissuer of the Corporation’s debt securities. PIBI has nooutstanding registered debt securities that would also beguaranteed by PIHC.
A potential source of income for PIHC consists of dividendsfrom BPPR and BPNA. Under existing federal bankingregulations any dividend from BPPR or BPNA to the PIHCcould be made if the total of all dividends declared by eachentity during the calendar year would not exceed the total of itsnet income for that year, as defined by the Federal ReserveBoard, combined with its retained net income for the precedingtwo years, less any required transfers to surplus or to a fund forthe retirement of any preferred stock. At December 31, 2014,BPPR could have declared a dividend of approximately $542million (December 31, 2013 - $504 million). On October 20,2014, the Memorandum of Understanding (the “FRB-NYMOU”) entered into on July 20, 2011 among Popular, Inc.,BPPR, the Federal Reserve Bank of New York (the “FRB-NY”)and the Office of the Commissioner of Financial Institutions ofPuerto Rico was terminated. The FRB-NY MOU provided,among other things, for the Corporation to take steps toimprove its credit risk management practices and asset quality,and for the Corporation to develop strategic plans to improveearnings and to develop capital plans. The FRB-NY MOU alsorequired the Corporation to obtain approval from the applicableFRB-NY MOU counterparties prior to, among other things,declaring or paying dividends, purchasing or redeeming anyshares of its stock, consummating acquisitions or mergers, ormaking any distributions on its trust preferred securities orsubordinated debentures. On January 9, 2015, anotherMemorandum of Understanding entered into among BPNA, theFRB-NY and the New York State Department of FinancialServices (the “NYSDFS”), effective on July 25, 2011, was alsoterminated. This Memorandum of Understanding provided thatBPNA could not declare dividends without the approval of theFRB-NY and the NYSDFS.

248
Condensed Consolidating Statement of Financial Condition
At December 31, 2014
(In thousands)Popular Inc.Holding Co.
PNAHolding Co.
All othersubsidiaries and
eliminationsElimination
entriesPopular, Inc.Consolidated
Assets:Cash and due from banks $ 20,448 $ 608 $ 380,890 $ (20,851) $ 381,095Money market investments 19,747 357 1,803,639 (1,357) 1,822,386Trading account securities, at fair value 1,640 – 136,887 – 138,527Investment securities available-for-sale, at fair value 231 – 5,314,928 – 5,315,159Investment securities held-to-maturity, at amortized cost – – 103,170 – 103,170Other investment securities, at lower of cost or realizable
value 9,850 4,492 147,564 – 161,906Investment in subsidiaries 4,878,866 1,353,616 – (6,232,482) –Loans held-for-sale, at lower of cost or fair value – – 106,104 – 106,104
Loans held-in-portfolio:Loans not covered under loss sharing agreements with
the FDIC 55,486 – 19,496,569 (53,769) 19,498,286Loans covered under loss sharing agreements with the
FDIC – – 2,542,662 – 2,542,662Less - Unearned income – – 93,835 – 93,835
Allowance for loan losses 41 – 601,751 – 601,792
Total loans held-in-portfolio, net 55,445 – 21,343,645 (53,769) 21,345,321
FDIC loss share asset – – 542,454 – 542,454Premises and equipment, net 2,512 – 492,069 – 494,581Other real estate not covered under loss sharing agreements
with the FDIC 90 – 135,410 – 135,500Other real estate covered under loss sharing agreements
with the FDIC – – 130,266 – 130,266Accrued income receivable 75 112 121,657 (26) 121,818Mortgage servicing assets, at fair value – – 148,694 – 148,694Other assets 67,962 26,514 1,570,094 (18,127) 1,646,443Goodwill – – 465,677 (1) 465,676Other intangible assets 555 – 37,040 – 37,595
Total assets $5,057,421 $ 1,385,699 $32,980,188 $ (6,326,613) $33,096,695
Liabilities and Stockholders’ EquityLiabilities:Deposits:
Non-interest bearing $ – $ – $ 5,804,599 $ (20,851) $ 5,783,748Interest bearing – – 19,025,144 (1,357) 19,023,787
Total deposits – – 24,829,743 (22,208) 24,807,535
Federal funds purchased and assets sold under agreementsto repurchase – – 1,271,657 – 1,271,657
Other short-term borrowings – 8,169 66,800 (53,769) 21,200Notes payable 740,812 148,988 822,028 – 1,711,828Other liabilities 49,226 6,872 974,147 (18,216) 1,012,029Liabilities from discontinued operations – – 5,064 – 5,064
Total liabilities 790,038 164,029 27,969,439 (94,193) 28,829,313
Stockholders’ equity:Preferred stock 50,160 – – – 50,160Common stock 1,036 2 56,307 (56,309) 1,036Surplus 4,187,931 4,269,208 5,931,161 (10,191,842) 4,196,458Retained earnings (accumulated deficit) 262,244 (3,043,476) (747,702) 3,782,651 253,717Treasury stock, at cost (4,116) – (1) – (4,117)Accumulated other comprehensive loss, net of tax (229,872) (4,064) (229,016) 233,080 (229,872)
Total stockholders’ equity 4,267,383 1,221,670 5,010,749 (6,232,420) 4,267,382
Total liabilities and stockholders’ equity $5,057,421 $ 1,385,699 $32,980,188 $ (6,326,613) $33,096,695

249 POPULAR, INC. 2014 ANNUAL REPORT
Condensed Consolidating Statement of Financial Condition
At December 31, 2013
(In thousands)Popular, Inc.Holding Co.
PNAHolding Co.
All othersubsidiaries and
eliminationsElimination
entriesPopular, Inc.Consolidated
Assets:Cash and due from banks $ 10,595 $ 616 $ 422,967 $ (10,967) $ 423,211Money market investments 18,721 4,804 839,732 (4,804) 858,453Trading account securities, at fair value 1,353 – 338,390 – 339,743Investment securities available-for-sale, at fair value 204 – 5,294,596 – 5,294,800Investment securities held-to-maturity, at amortized cost – – 140,496 – 140,496Other investment securities, at lower of cost or realizable
value 10,850 4,492 166,410 – 181,752Investment in subsidiaries 4,856,566 1,670,809 – (6,527,375) –Loans held-for-sale, at lower of cost or fair value – – 110,426 – 110,426
Loans held-in-portfolio:Loans not covered under loss sharing agreements with
the FDIC 521,092 – 21,702,418 (519,500) 21,704,010Loans covered under loss sharing agreements with the
FDIC – – 2,984,427 – 2,984,427Less - Unearned income – – 92,144 – 92,144
Allowance for loan losses 304 – 640,251 – 640,555
Total loans held-in-portfolio, net 520,788 – 23,954,450 (519,500) 23,955,738
FDIC loss share asset – – 948,608 – 948,608Premises and equipment, net 2,135 – 517,381 – 519,516Other real estate not covered under loss sharing agreements
with the FDIC – – 135,501 – 135,501Other real estate covered under loss sharing agreements
with the FDIC – – 168,007 – 168,007Accrued income receivable 64 114 131,368 (10) 131,536Mortgage servicing assets, at fair value – – 161,099 – 161,099Other assets 66,577 19,407 1,642,760 (41,186) 1,687,558Goodwill – – 647,757 – 647,757Other intangible assets 554 – 44,578 – 45,132
Total assets $5,488,407 $ 1,700,242 $35,664,526 $ (7,103,842) $35,749,333
Liabilities and Stockholders’ EquityLiabilities:Deposits:
Non-interest bearing $ – $ – $ 5,933,649 $ (10,967) $ 5,922,682Interest bearing – – 20,793,267 (4,804) 20,788,463
Total deposits – – 26,726,916 (15,771) 26,711,145
Assets sold under agreements to repurchase – – 1,659,292 – 1,659,292Other short-term borrowings – – 920,700 (519,500) 401,200Notes payable 822,351 149,663 612,740 – 1,584,754Other liabilities 39,906 39,245 728,899 (41,258) 766,792
Total liabilities 862,257 188,908 30,648,547 (576,529) 31,123,183
Stockholders’ equity:Preferred stock 50,160 – – – 50,160Common stock 1,034 2 56,079 (56,081) 1,034Surplus 4,161,625 4,479,208 6,056,774 (10,527,455) 4,170,152Retained earnings (accumulated deficit) 602,957 (2,940,509) (907,972) 3,839,954 594,430Treasury stock, at cost (881) – – – (881)Accumulated other comprehensive loss, net of tax (188,745) (27,367) (188,902) 216,269 (188,745)
Total stockholders’ equity 4,626,150 1,511,334 5,015,979 (6,527,313) 4,626,150
Total liabilities and stockholders’ equity $5,488,407 $ 1,700,242 $35,664,526 $ (7,103,842) $35,749,333

250
Condensed Consolidating Statement of Operations
Year ended December 31, 2014
(In thousands)Popular, Inc.Holding Co.
PNAHolding Co.
All othersubsidiaries and
eliminationsElimination
entriesPopular, Inc.Consolidated
Interest and dividend income:Loans $ 1,294 $ – $1,478,658 $ (1,202) $1,478,750Money market investments 20 7 4,219 (22) 4,224Investment securities 617 322 131,692 – 132,631Trading account securities – – 17,938 – 17,938
Total interest and dividend income 1,931 329 1,632,507 (1,224) 1,633,543
Interest expense:Deposits – – 105,095 (8) 105,087Short-term borrowings – 405 68,187 (1,216) 67,376Long-term debt 492,657 10,826 12,525 – 516,008
Total interest expense 492,657 11,231 185,807 (1,224) 688,471
Net interest (expense) income (490,726) (10,902) 1,446,700 – 945,072Provision for loan losses - non-covered loans (200) – 224,199 – 223,999Provision for loan losses - covered loans – – 46,135 – 46,135
Net interest (expense) income after provision for loan losses (490,526) (10,902) 1,176,366 – 674,938
Service charges on deposit accounts – – 158,637 – 158,637Other service fees – – 228,006 (2,741) 225,265Mortgage banking activities – – 30,615 – 30,615Net loss and valuation adjustments on investment securities – – (870) – (870)Trading account (loss) profit (40) – 4,398 – 4,358Net gain on sale of loans, including valuation adjustments on
loans held-for-sale – – 40,591 – 40,591Adjustments (expense) to indemnity reserves on loans sold – – (40,629) – (40,629)FDIC loss share expense – – (103,024) – (103,024)Other operating income (loss) 12,291 (16) 59,306 (9) 71,572
Total non-interest income (loss) 12,251 (16) 377,030 (2,750) 386,515
Operating expenses:Personnel costs 39,457 – 379,222 – 418,679Net occupancy expenses 3,952 – 82,755 – 86,707Equipment expenses 3,764 – 45,153 – 48,917Other taxes 1,019 – 55,899 – 56,918Professional fees 14,963 1,119 266,202 (229) 282,055Communications 496 – 25,188 – 25,684Business promotion 1,731 – 52,285 – 54,016FDIC deposit insurance – – 40,307 – 40,307Loss on early extinguishment of debt – – 532 – 532Other real estate owned (OREO) expenses 6 – 49,605 – 49,611Other operating expenses (63,755) 435 161,216 (2,523) 95,373Amortization of intangibles – – 8,160 – 8,160Restructuring costs – – 26,725 – 26,725
Total operating expenses 1,633 1,554 1,193,249 (2,752) 1,193,684
(Loss) income before income tax and equity in earnings ofsubsidiaries (479,908) (12,472) 360,147 2 (132,231)
Income tax expense 5,580 – 52,698 1 58,279
(Loss) income before equity in earnings of subsidiaries (485,488) (12,472) 307,449 1 (190,510)Equity in undistributed earnings of subsidiaries 294,978 32,484 – (327,462) –
(Loss) Income from continuing operations (190,510) 20,012 307,449 (327,461) (190,510)Loss from discontinued operations, net of tax – – (122,980) – (122,980)Equity in undistributed losses of discontinued operations (122,980) (122,980) – 245,960 –
Net (Loss) Income $(313,490) $(102,968) $ 184,469 $ (81,501) $ (313,490)
Comprehensive (loss) income, net of tax $(354,617) $ (79,665) $ 144,355 $ (64,690) $ (354,617)

251 POPULAR, INC. 2014 ANNUAL REPORT
Condensed Consolidating Statement of Operations
Year ended December 31, 2013
(In thousands)Popular, Inc.Holding Co.
PNAHolding Co.
All othersubsidiaries and
eliminationsElimination
entriesPopular, Inc.Consolidated
Interest and dividend income:Dividend income from subsidiaries $ 37,000 $ – $ – $ (37,000) $ –Loans 4,543 – 1,478,526 (1,973) 1,481,096Money market investments 127 5 3,462 (130) 3,464Investment securities 13,123 322 139,427 (11,065) 141,807Trading account securities – – 21,573 – 21,573
Total interest and dividend income 54,793 327 1,642,988 (50,168) 1,647,940
Interest expense:Deposits – – 124,862 (5) 124,857Short-term borrowings – 974 39,555 (2,099) 38,430Long-term debt 101,245 24,249 25,650 (11,065) 140,079
Total interest expense 101,245 25,223 190,067 (13,169) 303,366
Net interest (expense) income (46,452) (24,896) 1,452,921 (36,999) 1,344,574Provision for loan losses - non-covered loans 398 – 536,312 – 536,710Provision for loan losses - covered loans – – 69,396 – 69,396
Net interest (expense) income after provision for loan losses (46,850) (24,896) 847,213 (36,999) 738,468
Service charges on deposit accounts – – 162,870 – 162,870Other service fees – – 232,148 (2,797) 229,351Mortgage banking activities – – 71,657 – 71,657Net gain and valuation adjustments on investment securities 7,966 – – – 7,966Trading account profit (loss) 161 – (13,644) – (13,483)Net loss on sale of loans, including valuation adjustments on
loans held-for-sale – – (52,708) – (52,708)Adjustments (expense) to indemnity reserves on loans sold – – (37,054) – (37,054)FDIC loss share expense – – (82,051) – (82,051)Other operating income 443,276 4,012 57,177 – 504,465
Total non-interest income 451,403 4,012 338,395 (2,797) 791,013
Operating expenses:Personnel costs 31,086 – 397,611 – 428,697Net occupancy expenses 3,685 2 82,964 – 86,651Equipment expenses 4,084 – 41,944 – 46,028Other taxes 413 – 57,615 – 58,028Professional fees 13,099 72 265,181 (225) 278,127Communications 421 – 24,964 – 25,385Business promotion 1,838 – 57,615 – 59,453FDIC deposit insurance – – 56,728 – 56,728Loss on early extinguishment of debt – 3,388 – – 3,388Other real estate owned (OREO) expenses – – 79,658 – 79,658Other operating expenses (53,926) 434 147,923 (2,555) 91,876Amortization of intangibles – – 7,971 – 7,971
Total operating expenses 700 3,896 1,220,174 (2,780) 1,221,990
Income (loss) before income tax and equity in earnings ofsubsidiaries 403,853 (24,780) (34,566) (37,016) 307,491
Income tax expense (benefit) 1,412 (1,710) (250,887) (142) (251,327)
Income (loss) before equity in earnings of subsidiaries 402,441 (23,070) 216,321 (36,874) 558,818Equity in undistributed earnings of subsidiaries 156,377 54,417 – (210,794) –
Income from continuing operations 558,818 31,347 216,321 (247,668) 558,818Income from discontinued operations, net of tax – – 40,509 – 40,509Equity in undistributed losses of discontinued operations 40,509 40,509 – (81,018) –
Net Income $599,327 $ 71,856 $ 256,830 $(328,686) $ 599,327
Comprehensive income (loss), net of tax $513,450 $ (5,897) $ 173,754 $(167,857) $ 513,450

252
Condensed Consolidating Statement of Operations
Year ended December 31, 2012
(In thousands)Popular, Inc.Holding Co.
PNAHolding Co.
All othersubsidiaries and
eliminationsElimination
entriesPopular, Inc.Consolidated
Interest and Dividend Income:Dividend income from subsidiaries $ 5,000 $ – $ – $ (5,000) $ –Loans 6,733 – 1,445,886 (3,392) 1,449,227Money market investments 14 25 3,707 (43) 3,703Investment securities 16,291 322 163,179 (11,160) 168,632Trading account securities – – 22,824 – 22,824
Total interest and dividend income 28,038 347 1,635,596 (19,595) 1,644,386
Interest Expense:Deposits – – 167,790 (25) 167,765Short-term borrowings 6 151 50,055 (3,410) 46,802Long-term debt 95,892 32,183 31,765 (11,648) 148,192
Total interest expense 95,898 32,334 249,610 (15,083) 362,759
Net interest (expense) income (67,860) (31,987) 1,385,986 (4,512) 1,281,627Provision for loan losses - non-covered loans 404 – 321,830 – 322,234Provision for loan losses - covered loans – – 74,839 – 74,839
Net interest (expense) income after provision for loan losses (68,264) (31,987) 989,317 (4,512) 884,554
Service charges on deposit accounts – – 171,226 – 171,226Other service fees – – 235,739 (3,224) 232,515Mortgage banking activities – – 84,771 – 84,771Net gain and valuation adjustments on investment securities – – (1,707) – (1,707)Trading account profit 214 – 4,264 – 4,478Net gain on sale of loans, including valuation adjustments on
loans held-for-sale – – (29,414) – (29,414)Adjustments (expense) to indemnity reserves on loans sold – – (21,198) – (21,198)FDIC loss share (expense) income – – (56,211) – (56,211)Other operating income (loss) 41,966 707 84,356 – 127,029
Total non - interest income (loss) 42,180 707 471,826 (3,224) 511,489
Operating Expenses:Personnel costs 29,779 – 404,554 – 434,333Net occupancy expenses 3,434 3 81,250 – 84,687Equipment expenses 3,831 – 39,787 – 43,618Other taxes 2,209 – 47,635 – 49,844Professional fees 11,042 42 260,680 (756) 271,008Communications 464 – 25,223 – 25,687Business promotion 1,823 – 58,961 – 60,784FDIC deposit insurance – – 82,065 – 82,065Loss on early extinguishment of debt – – 25,196 – 25,196Other real estate owned (OREO) expenses – – 28,823 – 28,823Other operating expenses (50,877) 441 153,584 (2,365) 100,783Amortization of intangibles – – 8,161 – 8,161
Total operating expenses 1,705 486 1,215,919 (3,121) 1,214,989
(Loss) income before income tax and equity in earnings ofsubsidiaries (27,789) (31,766) 245,224 (4,615) 181,054
Income tax expense (benefit) 1,702 – (28,147) 42 (26,403)
(Loss) income before equity in earnings of subsidiaries (29,491) (31,766) 273,371 (4,657) 207,457Equity in undistributed earnings (losses) of subsidiaries 236,948 (4,935) – (232,013) 0
Income (loss) from continuing operations $207,457 $(36,701) $ 273,371 $(236,670) $ 207,457
Income from discontinued operations, net of tax – – 37,818 – 37,818
Equity in undistributed earnings of discontinued operations 37,818 37,818 – (75,636) –
Net income 245,275 $ 1,117 311,189 (312,306) 245,275
Comprehensive income, net of tax $184,955 $ (5,444) $ 248,507 $(243,063) $ 184,955

253 POPULAR, INC. 2014 ANNUAL REPORT
Condensed Consolidating Statement of Cash Flows
Year ended December 31, 2014
(In thousands)Popular, Inc.Holding Co.
PNAHolding Co.
All othersubsidiaries
and eliminationsElimination
entriesPopular, Inc.Consolidated
Cash flows from operating activities:Net (loss) income $(313,490) $(102,968) $184,469 $(81,501) $(313,490)
Adjustments to reconcile net (loss) income to net cash (used in) provided by operating activities:Equity in undistributed (earnings) losses of subsidiaries (171,998) 90,496 – 81,502 –(Reversal of provision) provision for loan losses (200) – 263,569 – 263,369Goodwill impairment losses – – 186,511 – 186,511Amortization of intangibles – – 9,434 – 9,434Depreciation and amortization of premises and equipment 648 – 46,489 – 47,137Net accretion of discounts and amortization of premiums and deferred fees 404,461 – (125,885) – 278,576Fair value adjustments on mortgage servicing rights – – 24,683 – 24,683FDIC loss share expense – – 103,024 – 103,024Adjustments (expense) to indemnity reserves on loans sold – – 40,629 – 40,629Earnings from investments under the equity method (12,291) 16 (27,303) – (39,578)Deferred income tax expense 8,203 – 35,308 1 43,512Loss (gain) on:
Disposition of premises and equipment 1 – (1,717) – (1,716)Sale and valuation adjustments of investment securities – – 870 – 870Sale of loans, including valuation adjustments on loans held for sale and mortgage banking activities – – (88,724) – (88,724)Sale of foreclosed assets, including write-downs – – 28,005 – 28,005Disposal of discontinued business – – (38,355) – (38,355)
Acquisitions of loans held-for-sale – – (308,600) – (308,600)Proceeds from sale of loans held-for-sale – – 123,375 – 123,375Net originations on loans held-for-sale – – (753,312) – (753,312)Net (increase) decrease in:
Trading securities (288) – 1,105,662 – 1,105,374Accrued income receivable (12) 2 9,712 17 9,719Other assets 4,099 (7,124) 158,585 (23,060) 132,500
Net increase (decrease) in:Interest payable 7,066 20 (7,776) (17) (707)Pension and other postretirement benefits obligations – – (10,171) – (10,171)Other liabilities (180) (32,391) 40,449 23,059 30,937
Total adjustments 239,509 51,019 814,462 81,502 1,186,492
Net cash (used in) provided by operating activities (73,981) (51,949) 998,931 1 873,002
Cash flows from investing activities:Net (increase) decrease in money market investments (1,026) 4,447 (963,907) (3,447) (963,933)Purchases of investment securities:
Available-for-sale – – (2,001,940) – (2,001,940)Held-to-maturity – – (1,000) – (1,000)Other – – (110,010) – (110,010)
Proceeds from calls, paydowns, maturities and redemptions of investment securities:Available-for-sale – – 1,722,650 – 1,722,650Held-to-maturity – – 39,962 – 39,962Other 1,000 – 91,752 – 92,752
Proceeds from sale of investment securities:Available for sale – – 310,210 – 310,210Other – – 37,104 – 37,104
Net repayments on loans 465,452 – 776,179 (465,731) 775,900Proceeds from sale of loans – – 355,145 – 355,145Acquisition of loan portfolios – – (389,067) – (389,067)Net payments from FDIC under loss sharing agreements – – 256,498 – 256,498Cash paid related to business acquisitions – – (6,330) – (6,330)Capital contribution to subsidiary (100,000) – – 100,000 –Return of capital from wholly-owned subsidiaries 210,000 250,000 – (460,000) –Net cash disbursed from disposal of discontinued business – – (205,895) – (205,895)Acquisition of premises and equipment (1,075) – (49,971) – (51,046)Proceeds from sale of:
Premises and equipment 48 – 14,289 – 14,337Foreclosed assets – – 150,115 – 150,115
Net cash provided by investing activities 574,399 254,447 25,784 (829,178) 25,452
Cash flows from financing activities:Net increase (decrease) in:
Deposits – – 115,453 (6,438) 109,015Federal funds purchased and assets sold under agreements to repurchase – – (387,635) – (387,635)Other short-term borrowings – 8,169 (853,900) 465,731 (380,000)
Payments of notes payable (936,000) (675) (122,615) – (1,059,290)Proceeds from issuance of notes payable 450,000 – 331,905 – 781,905Proceeds from issuance of common stock 5,394 – – – 5,394Dividends paid (3,723) – – – (3,723)Repurchase of TARP-related warrants (3,000) – – – (3,000)Net payments for repurchase of common stock (3,236) – – – (3,236)Return of capital to parent company – (210,000) (250,000) 460,000 –Capital contribution from parent – – 100,000 (100,000) –
Net cash used in financing activities (490,565) (202,506) (1,066,792) 819,293 (940,570)
Net increase (decrease) in cash and due from banks 9,853 (8) (42,077) (9,884) (42,116)Cash and due from banks at beginning of period 10,595 616 422,967 (10,967) 423,211
Cash and due from banks at end of period $20,448 $608 $380,890 $(20,851) $381,095
The Condensed Consolidating Statements of Cash Flows include the cash flows from operating, investing and financing activities associated with discontinued operations.

254
Condensed Consolidating Statement of Cash Flows
Year ended December 31, 2013
(In thousands)Popular, Inc.Holding Co.
PNAHolding Co.
All othersubsidiaries
and eliminationsElimination
entriesPopular, Inc.Consolidated
Cash flows from operating activities:Net income $599,327 $71,856 $256,830 $(328,686) $599,327
Adjustments to reconcile net income to net cash (used in) provided by operating activities:Equity in undistributed earnings of subsidiaries (196,886) (94,926) – 291,812 –Provision for loan losses 398 – 602,165 – 602,563Amortization of intangibles – – 9,883 – 9,883Depreciation and amortization of premises and equipment 641 2 47,519 – 48,162Net accretion of discounts and amortization of premiums and deferred fees 30,467 444 (109,915) – (79,004)Fair value adjustments on mortgage servicing rights – – 11,403 – 11,403FDIC loss share expense – – 82,051 – 82,051Adjustments (expense) to indemnity reserves on loans sold – – 37,054 – 37,054Earnings from investments under the equity method (17,308) (3,946) (21,619) – (42,873)Deferred income tax benefit (10,937) (1,710) (275,965) (142) (288,754)Loss (gain) on:
Disposition of premises and equipment 49 (66) (3,375) – (3,392)Sale and valuation adjustments of investment securities (2,110) – – – (2,110)Sale of loans, including valuation adjustments on loans held for sale and mortgage banking activities – – 22,411 – 22,411Sale of stock in equity method investee (416,113) – – – (416,113)Sale of foreclosed assets, including write-downs – – 50,740 – 50,740
Acquisitions of loans held-for-sale – – (390,018) – (390,018)Proceeds from sale of loans held-for-sale – – 218,379 – 218,379Net originations on loans held-for-sale – – (1,049,474) – (1,049,474)Net (increase) decrease in:
Trading securities (94) – 1,430,929 – 1,430,835Accrued income receivable 1,612 (2) (7,104) (315) (5,809)Other assets 5,445 (1,818) (3,027) 2,227 2,827
Net increase (decrease) in:Interest payable 2,704 (506) (4,663) (1) (2,466)Pension and other postretirement benefits obligations – – 10,635 – 10,635Other liabilities (5,507) (2,370) (17,179) (1,896) (26,952)
Total adjustments (607,639) (104,898) 640,830 291,685 219,978
Net cash (used in) provided by operating activities (8,312) (33,042) 897,660 (37,001) 819,305
Cash flows from investing activities:Net (increase) decrease in money market investments (147) (3,937) 227,274 3,937 227,127Purchases of investment securities:
Available-for-sale – – (2,257,976) – (2,257,976)Held-to-maturity – – (250) – (250)Other – – (178,093) – (178,093)
Proceeds from calls, paydowns, maturities and redemptions of investment securities:Available-for-sale 35,000 – 1,788,474 – 1,823,474Held-to-maturity – – 4,632 – 4,632Other – – 181,784 – 181,784
Proceeds from sale of investment securities:Available for sale 5,438 – – – 5,438
Net (originations) repayments on loans (233,745) – 625,364 289,200 680,819Proceeds from sale of loans – – 333,021 – 333,021Acquisition of loan portfolios – – (1,592,603) – (1,592,603)Net payments from FDIC under loss sharing agreements – – 396,223 – 396,223Return of capital from equity method investments – 491 – – 491Proceeds from sale of sale of stock in equity method investee 481,377 – – – 481,377Capital contribution to subsidiary (272,500) – – 272,500 –Mortgage servicing rights purchased – – (45) – (45)Acquisition of premises and equipment (352) – (38,221) – (38,573)Proceeds from sale of:
Premises and equipment 33 180 9,877 – 10,090Foreclosed assets – – 226,063 – 226,063
Net cash provided by investing activities 15,104 (3,266) (274,476) 565,637 302,999
Cash flows from financing activities:Net increase (decrease) in:
Deposits – – (310,417) (12,987) (323,404)Assets sold under agreements to repurchase – – (357,460) – (357,460)Other short-term borrowings – – 54,200 (289,200) (235,000)
Payments of notes payable – (236,200) (95,831) – (332,031)Proceeds from issuance of notes payable – – 106,739 – 106,739Proceeds from issuance of common stock 6,860 – – – 6,860Dividends paid to parent company – – (37,000) 37,000 –Dividends paid (3,723) – – – (3,723)Net payments for repurchase of common stock (437) – – – (437)Capital contribution from parent – 272,500 – (272,500) –
Net cash provided by (used in) financing activities 2,700 36,300 (639,769) (537,687) (1,138,456)
Net increase (decrease) in cash and due from banks 9,492 (8) (16,585) (9,051) (16,152)Cash and due from banks at beginning of period 1,103 624 439,552 (1,916) 439,363
Cash and due from banks at end of period $10,595 $616 $422,967 $(10,967) $423,211
The Condensed Consolidating Statements of Cash Flows include the cash flows from operating, investing and financing activities associated with discontinued operations.

255 POPULAR, INC. 2014 ANNUAL REPORT
Condensed Consolidating Statement of Cash Flows
Year ended December 31, 2012
(In thousands)Popular, Inc.Holding Co.
PNAHolding Co.
All othersubsidiaries
and eliminationsElimination
entriesPopular, Inc.Consolidated
Cash flows from operating activities:Net income $ 245,275 $ 1,117 $ 311,189 $(312,306) $ 245,275
Adjustments to reconcile net income to net cash (used in) provided by operating activities:Equity in undistributed earnings of subsidiaries (274,766) (32,883) – 307,649 –Provision for loan losses 404 – 408,537 – 408,941Amortization of intangibles – – 10,072 – 10,072Depreciation and amortization of premises and equipment 653 3 46,080 – 46,736Net accretion of discounts and amortization of premiums and deferred fees 29,058 112 (66,582) (487) (37,899)Fair value adjustments on mortgage servicing rights – – 17,406 – 17,406FDIC loss share expense – – 56,211 – 56,211Amortization of prepaid FDIC assessment – – 32,778 – 32,778Adjustments (expense) to indemnity reserves on loans sold – – 21,198 – 21,198Earnings from investments under the equity method (40,505) (706) (32,267) – (73,478)Deferred income tax benefit (14,109) – (121,424) 42 (135,491)Loss (gain) on:
Disposition of premises and equipment 2 – (8,621) – (8,619)Sale and valuation adjustments of investment securities – – 1,707 – 1,707Sale of loans, including valuation adjustments on loans held for sale and mortgage banking
activities – – (48,765) – (48,765)Sale of other assets – – (2,545) – (2,545)Sale of foreclosed assets, including write-downs – – (4,511) – (4,511)
Acquisitions of loans held-for-sale – – (417,108) – (417,108)Proceeds from sale of loans held-for-sale – – 325,014 – 325,014Net disbursements on loans held-for-sale – – (1,233,240) – (1,233,240)Net (increase) decrease in:
Trading securities (1,259) – 1,389,169 – 1,387,910Accrued income receivable (163) – (405) 49 (519)Other assets 8,859 313 (11,972) (16,590) (19,390)
Net increase (decrease) in:Interest payable – (126) (9,091) 53 (9,164)Pension and other postretirement benefits obligations – – (40,241) – (40,241)Other liabilities 2,581 (25) (473) (235) 1,848
Total adjustments (289,245) (33,312) 310,927 290,481 278,851
Net cash (used in) provided by operating activities (43,970) (32,195) 622,116 (21,825) 524,126
Cash flows from investing activities:Net decrease (increase) in money market investments 23,665 (315) 290,990 (23,746) 290,594Purchases of investment securities:
Available-for-sale – – (1,843,922) – (1,843,922)Held-to-maturity – – (25,792) – (25,792)Other – – (212,419) – (212,419)
Proceeds from calls, paydowns, maturities and redemptions of investment securities:Available-for-sale – – 1,636,723 – 1,636,723Held-to-maturity – – 9,751 – 9,751Other – – 206,856 – 206,856
Proceeds from sale of investment securities:Available for sale – – 52,058 – 52,058
Net (disbursements) repayments on loans (36,262) – 628,963 36,305 629,006Proceeds from sale of loans – – 68,396 – 68,396Acquisition of loan portfolios – – (1,357,628) – (1,357,628)Net payments from FDIC under loss sharing agreements – – 462,016 – 462,016Return of capital from equity method investments 150,194 1,002 – – 151,196Capital contribution to subsidiary (103,500) – – 103,500 –Mortgage servicing rights purchased – – (2,231) – (2,231)Acquisition of premises and equipment (691) – (54,208) – (54,899)Proceeds from sale of:
Premises and equipment 73 – 19,768 – 19,841Other productive assets – – 1,026 – 1,026Foreclosed assets – – 206,070 – 206,070
Net cash provided by investing activities 33,479 687 86,417 116,059 236,642
Cash flows from financing activities:Net increase (decrease) in:
Deposits – – (991,097) 21,501 (969,596)Assets sold under agreements to repurchase – – (148,405) 24,060 (124,345)Other short-term borrowings – (30,500) 406,900 (36,400) 340,000
Payments of notes payable – (41,800) (173,098) – (214,898)Proceeds from issuance of notes payable – – 106,923 – 106,923Proceeds from issuance of common stock 9,402 – – – 9,402Dividends paid to parent company – – (5,000) 5,000 –Dividends paid (3,723) – – – (3,723)Payments for repurchase of common stock (450) – – – (450)Capital contribution from parent – 103,500 – (103,500) –
Net cash provided by (used in) financing activities 5,229 31,200 (803,777) (89,339) (856,687)
Net decrease in cash and due from banks (5,262) (308) (95,244) 4,895 (95,919)Cash and due from banks at beginning of period 6,365 932 534,796 (6,811) 535,282
Cash and due from banks at end of period $ 1,103 $ 624 $ 439,552 $(1,916) $ 439,363


P.O. Box 362708 • San Juan, Puerto Rico 00936-2708