annual report front covers 2012 - ariston holdings reports/annual report 2012.pdf · in view of the...
TRANSCRIPT

ANNUALREPORT2012
E X C E L L E N C E
CONTENTSOVERVIEW
1 Corporate Structure
2 Financial Highlights
3 Directorate and Administration
4 Chairman’s Statement
6 Operational Overview
8 Report of the Directors
9 Corporate Governance
FINANCIAL STATEMENTS
12 Report of the Independent Auditors
13 Group Statement of Comprehensive Income 14 Statements of Financial Position 15 Statements of Changes in Shareholders' Equity 16 Group Statement of Cash Flows
17 Notes to the Financial Statements
47 Shareholders' Profile
49 Notice to Shareholders

1ARISTON HOLDINGS LIMITED | ANNUAL REPORT 2012
Corporate Structure

2 ARISTON HOLDINGS LIMITED | ANNUAL REPORT 2012
Financial HighlightsFOR THE YEAR ENDED 30 SEPTEMBER 2012
All figures in US$ 2012 2011
CONSOLIDATED RESULTS
Revenue 14,847,883 14,747,151
Loss before taxation (885,828) (2,758,681)
Loss attributable to shareholders (531,648) (2,002,727)
Total assets employed 28,358,190 21,348,256
Cash utilised in operating activities (4,161,400) (1,785,979)
Capital expenditure 2,953,854 626,892
Net finance costs 803,113 843,948
Cash resources net of short-term borrowings (deficit) (2,641,752) (4,187,410)
ORDINARY SHARE PERFORMANCE
Ordinary shares in issue 1,378,420,595 445,087,262
Loss per ordinary share (dollars) (0.0006) (0.0045)
Ordinary shareholders' equity per ordinary share (dollars) 0.012 0.020
Market price at year end (dollars) 0.0155 0.0140
Industrial Index - 30 September 146.00 157.94
FINANCIAL STATISTICS
Interest cover (times) - -
Ordinary shareholders' equity to total assets 57.39% 42.53%
Return on shareholders’ equity (3.27%) (22.06%)

3ARISTON HOLDINGS LIMITED | ANNUAL REPORT 2012
DIRECTORS Non-Executive * Dr R.M. Mupawose Chairman I. Chagonda * S.G. Chella C.P. Conradie (appointed 28 February 2012) C.W.J. Davidson (resigned 26 January 2012) R.M. Herron (appointed 16 May 2012) * T.C. Mazingi * S.K. Mutepfa * S. Payne (resigned 16 May 2012)
* Independent
Executive P.T. Spear Group Chief Executive OfficerDr A.J. Masuka Chief Operating Officer (appointed 1 November 2012)
BOARD COMMITTEES
Audit Committee
S.G. Chella ChairmanR.M. Herron S. K. Mutepfa I. Chagonda
Human Resources and Remuneration Committee Dr R.M. Mupawose ChairmanC.P. Conradie T.C. Mazingi
Operations / Technical Committee
S.K. Mutepfa ChairmanS.G. Chella C.P. Conradie
SENIOR MANAGEMENT HEAD OFFICE F. V. Chingozho Group Finance Executive B.T. Kagondo Group Human Resources Executive T. Magutsa Group Internal AuditorDr A.J. Masuka Chief Operating Officer (appointed 1 November 2012) T. B. Mukubvu Managing Director - Trading Business
TRADING BUSINESS T. B. Mukubvu Managing DirectorC. Dzvene Finance Manager (transferred to Head office - 1 August 2012)C. Connick Finance Manager (appointed 1 September 2012)
Directorate and Administration
M. Khumalo Regional Fruit and Veg. Manager - Southern RegionG. Mushori Regional Fruit and Veg. Manager - Northern RegionW. Madzingautswa Estate Manager (Kent)E. Makandwa Estate Manager (Claremont)Dr M.S.D. Mutopo Business Development Manager
TEA BUSINESS
D. Mafuvadze Senior Estate Manager - SouthdownW. Chibonda Estate Manager - RoscommonI. Mukandi Estate Manager - ClaremontL. Betah Human Resources Manager (retired 30 September 2012)E. Chafewa SHE ManagerM. Hondova Finance Manager
REGISTERED OFFICE
306 Hillside RoadMsasa WoodlandsP.O. Box 4019Harare
COMPANY SECRETARY
F. N. Musinga
SHARE TRANSFER SECRETARIES ZB Bank Central Scrip Admin. Investment Banking 1st Floor, ZB Centre Corner Kwame Nkrumah Avenue and First Street P.O. Box 2540Harare
AUDITORS
Deloitte & ToucheChartered Accountants (Zimbabwe) Kenilworth Gardens 1 Kenilworth Road Newlands P.O. Box 267 Harare
BANKERS
Agribank LimitedCABSCBZ Bank LimitedIDBZ Bank LimitedStanbic Bank of ZimbabweTetrad Bank LimitedZB Bank Limited

4 ARISTON HOLDINGS LIMITED | ANNUAL REPORT 2012
The Group is now adequately funded such that operations will not be constrained.
Chairman’s Statement
INTRODUCTION
My review of operations in the previous year expressed that the Group had struggled in meeting obligations as they fell due as a result of limited working capital availability. I am glad to report that during the year under review, a new investor came on board, who has greatly assisted in re-capitalising the business as well as availing working capital.
REvIEw OF OPERATIONS
The Group would like to give thanks to our shareholders for the support through the provision of short term finance and equity funding. In the run up to the capital raise, the shareholders availed bridging finance. Soon after the injection of funds the Company embarked on numerous capital projects. The benefits of these investments, while expected to be partially apparent in 2013, will only be fully realised in the years ahead.
During the year under review, although performance has improved, the Group did not achieve the anticipated levels of activity in all areas. This was largely due to the capital raise being finalised later than anticipated.
Despite these set-backs, I am pleased to report that the agricultural portion of the business has performed in line
with expectations. Regrettably this has not been the case with the trading business, which suffered a financial loss as a result of control deficiencies, which have since been attended to by management.
In the financial year under review, the Group registered a loss of US$531,648 (2011: US$2,002,727) mainly as a result of the debtors’ write-off emanating from the trading business as alluded to earlier.
DIvIDEND
In view of the cashflow constraints and the current performance, the Board has once again seen it prudent not to declare a dividend.
DIRECTORATE
During the year Messrs Christiaan Conradie and Raymond Herron were appointed to the Board. On behalf of the Group, I wish to welcome our new members as well as thank them for their contributions to Board activities.
I would also like to thank Mr C.W.J. Davidson and Mrs S. Payne who resigned during the year, for their invaluable contribution to Board.
DR R.M. MUPAWOSE - CHAIRMAN

5ARISTON HOLDINGS LIMITED | ANNUAL REPORT 2012
Chairman’s Statement - cont’d
OUTLOOK
The Group is now adequately funded such that operations will not be constrained. The capital projects already in place will start to yield returns in the year ahead with improvements in quality, output and cost reduction on all farms. Throughput is set to increase significantly in 2013 across all operations. The improvements in operational capacity over the last six months combined with those improvements still to come will set the stage for Ariston’s return to profitability in 2013.
APPRECIATION
I wish to express my appreciation of the cordial relationship Ariston had with Emvest and their representatives on the Board, led by Russell Du Preez. I welcome the involvement of Afrifresh and their colleagues to the Board, led by Christiaan P. Conradie. Thank you for your confidence in Ariston and investment in Zimbabwe.
I would also like to thank management and staff at all levels for their ongoing contribution. I also wish to thank my fellow directors for their support during this recovery period.
DR ROBBIE MATONGO MUPAWOSE
CHAIRMAN
27 December 2012

6 ARISTON HOLDINGS LIMITED | ANNUAL REPORT 2012
Operational Overview
INTRODUCTION
The capital injection in April this year enabled management to focus on the rehabilitation and re-equipping of key aspects of all operations. The timing of these interventions has been such that the anticipated benefits will only be fully realised with time.
MACADAMIA AND TEA
Macadamia volumes rose this season to another record crop at 843 tonnes from 783 tonnes in prior year. Prices continue to firm and contribution from this crop was 40% of Southdown’s total revenue. Quality and yields are set to increase further next season and the market remains firm.Phase one, 66ha, of macadamia irrigation is now in place.
Sales volumes of made tea at 1,256 tonnes were slightly below forecast. Tea volumes were 37% lower than the prior year. This was a result of the deliberate strategy to focus the limited resources on quality at the expense of quantity, the strategy being vindicated by improved financial results despite the lower volume. Low tea volumes did result in blended tea output being restricted in the second half of the year. A very frosty winter delayed the new season’s production.
During the off season, all three tea factories were upgraded in pursuit of quality/price gains. HORTICULTURE
Orchard performance for the 2012 harvest was in line with expectation. Despite a frosty winter and erratic power supplies, fruit set for 2013 in most orchards is very pleasing and early harvest quality is promising. Several non-performing orchards were removed during the year. Phase one of the orchard rehabilitation commenced with the planting of 12,000 apple and 4,000 peach trees during the same period. Rehabilitation of orchard irrigation is in progress, the target for phase one being 65ha.
POULTRY
Placements during the year were below expectation. Work on poultry house upgrades is well underway. Once fully completed, Kent will have a total capacity of 1,200,000 birds per year.
TRADING
Despite constraints in working capital, activity increased in 2012. Sadly, significant weaknesses in internal systems allowed margins to be eroded by an amount of US$760,480 during the period. Corrective action has been implemented in both internal systems and product focus. While demand for FAVCO’s traditional products remains high, management has made progress in expanding product range and balancing activity.
Ariston looks set to return to profitability in 2013 with significant increases in production
MR P.T. SPEAR - CHIEF EXECUTIVE OFFICER

7ARISTON HOLDINGS LIMITED | ANNUAL REPORT 2012
Operational Overview - cont’d
FINANCIAL PERFORMANCE
Group revenues grew by 0.69% to US$14.847 million. The operating loss was US$2.826 million before a fair value gain of US$4.120 million and a loss on orchard scrapping of US$1.376 million, leading to a loss before tax and interest of US$0.083 million. Finance costs declined by 4.8% while total borrowings went down by US$0.760 million. A loss after interest of US$0.886 million was reduced by a tax credit of US$0.354 million to total comprehensive loss for the period under review of US$0.532 million. Kent Estate achieved a turnover of US$1.608 million driven largely by poultry production. This was 11% of Group turnover. However, it represents a decline of 34% from 2011. Reduced placements restricted poultry activity. An operating loss of US$0.309 million was reported compared to US$0.474 million in 2011. The loss before interest and tax was US$0.275 million . Claremont Estate’s turnover of US$1.105 million was 7% of Group turnover; the same contribution as in prior year.
An operating loss of US$0.366 million was reported compared to a US$0.448 million operating loss in 2011. Loss before interest and tax was US$0.748 million compared to US$0.585 million in the prior year, the removal of old orchards having a negative impact on the fair value adjustment.
Southdown reported a turnover of US$3.489 million, which was a decline of 17% from prior year and was 23.5% of current Group turnover. This was as a result of a focus on tea quality, which produced positive results. The fair value adjustment resulted in Southdown reporting a profit before tax of US$2.658 million (2011: US$0.137 million). FAVCO’s turnover grew by 21% and contributed 58% (2011: 48%) to Group turnover due to increased activities. An operating loss before interest and tax of US$0.977 million (2011: US$0.292) was recorded. OUTLOOK
Ariston looks set to return to profitability in 2013 with significant increases in production across all operations. Although most of the capital projects implemented thus far are of a long-term nature, positive signs are already evident. Early season tea quality, and thus prices, are much improved. The tea decaffeination factory has been commissioned after
a four-year break. Adequate spraying capacity has resulted in all tree crops carrying improved quality fruit. Irrigation rehabilitation on all farms has given operations improved control with positive results in tea gardens as well as macadamia and apple orchards. Horticulture at Kent has also benefited.
Improvements in cost reduction and flock management are already producing positive results in poultry output. All farming operations will soon benefit from a strengthened management team with the appointment of a Chief Operations Officer early in the new financial year. At FAVCO, focus on balanced activity and system management will exploit vertical integration opportunities and stabilise margins.
Adequate working capital for 2013 is now in place. Operations will be able to function without constraint at current capacity. In addition numerous capital projects will be implemented in 2013 that will further rehabilitate irrigation and increase orchard capacity. Production at full capacity is still a few seasons away. Nevertheless, thanks to the recapitalisation earlier this year, 2013 will see much improved activity across the Group.
APPRECIATION
As management, we are grateful for the support given to us by the Chairman, Board, shareholders, employees and stakeholders during these difficult times.
PAUL TIMOTHY S PEAR
CHIEF EXECUTIVE OFFICER
27 December 2012

8 ARISTON HOLDINGS LIMITED | ANNUAL REPORT 2012
The directors have pleasure in presenting their report, together with the audited financial statements of the Company, for the year ended 30 September 2012. CAPITAL
Authorised The authorised capital of your Company increased from 700,000,000 to 1,600,000,000 shares of USD 0.001. Issued Changes in the issued share capital are disclosed under note 15 to the financial statements. Unissued At 30 September 2012; 197,364,405 (2011: 230,447,738 shares) were under the control of directors; and 23,000,000 shares (2011: 23,250,000) were set aside under the Senior Staff Option Scheme (2003, 2005 and 2011).
Reserves The movement in the reserves of the Group and the Company are shown on page 15 of the financial statements. GROUP FINANCIAL RESULTS
The results for the year were as follows: $ Loss before taxation (885,828)Income tax expense paid - Income tax credit 354,180Loss attributable to shareholders (531,648) DIvIDENDS
In view of the present environment, the Board has considered it prudent not to declare a dividend for the year ended 30 September 2012.
Report of the Directors
DIRECTORATE
Mr. Chris Conradie joined the Board on 28 February 2012 and Mr. Raymond Herron joined on 16 May 2012. Both members represent Origin Global Holdings Limited. REPORT OF THE DIRECTORS
The directors who held office during the year ended 30 September 2012 held directly and indirectly the followingshares in the Company: At 30/09/12 At 30/09/11 Dr R.M. Mupawose 112,000 -Mr I. Chagonda - -Mrs S.G. Chella - - Mr C.P. Conradie - - Mr R.T. Herron - -Mrs T.C. Mazingi 658,870 216,290Mr S.K. Mutepfa 91,000 91,000Mrs S. Payne - -Mr C.W.J. Davidson - -
AUDITORS
Messrs Deloitte & Touche retire and offer themselves forre-appointment.
By order of the Board
F.N. MUSINGA
COMPANY SECRETARY 27 December 2012

9ARISTON HOLDINGS LIMITED | ANNUAL REPORT 2012
Ariston Holdings Limited is committed to maintaining the highest levels of integrity and accountability in all its business practices and its corporate governance policy is aimed at these objectives. This is achieved by ensuring the Group is correctly structured and appropriate reporting and control mechanisms are in place. 1. BOARD COMPOSITION & APPOINTMENT
The Board of Directors is chaired by a non-executive director and comprises eight non-executive and one executive director.
The Board enjoys a strong mix of skills and experience.
The Board is the primary governance organ. The role of the Board is to determine overall policies, plans and strategies of the Group and to ensure that these are implemented in an ethical and professional manner.
The Board meets regularly, at least four times a year, and guides corporate strategy, risk management practices, annual budgets and business plans.
Special Board meetings may be convened on an ad-hoc basis when necessary to consider issues requiring urgent attention or decision.
The Board Secretary maintains an attendance register
of directors for all scheduled meetings during the year through which directors can assess their devotion of sufficient time to the Group
The Board has overall responsibility for ensuring
the integrity of the Group’s accounting and financial reporting systems including the independent audit, and that appropriate systems of control, risk management and compliance with laws are in place.
Corporate Governance
A breakdown in controls in the retail business which resulted in a substantial loss in revenue of US$760,480 was noted during the year. As a result the Group has undertaken an exercise to strengthen the management with appropriate skills. Staff complement in finance and internal auditing has been re-aligned, in line with the size of the Group and the expected growth.
To ensure effectiveness, Board members have unfettered access to information regarding the Group’s operations which is available through Board meetings, Board and Management Committees as well as strategic planning workshops organised by the Group.
The Board appointments are made to ensure a variety of skills and expertise on the Board. A third of the directors are required to retire on a rotational basis each year ,along with any directors appointed to the Board during the year.
Executive directors are employed under performance-
driven service contracts setting out responsibilities of their particular office.
2. FINANCIAL STATEMENTS AND MANAGEMENT
REPORTING
A decentralised management structure exists with
subsidiary Boards attending to the daily activities of individual business units.
Annual budgets and plans are compiled by each business
unit and reviewed and agreed by the Board. Each business unit has comprehensive management
and financial reporting disciplines, which include monthly management accounts, physical and financial
Directors Board Audit & Risk Committee
Human Resources & Remuneration
Committee
Operations/Technical
Committee
Dr R.M. Mupawose 4/4 - 4/4 -
I. Chagonda 2/4 2/2 - -
S.G. Chella 3/4 2/2 - 1/1
C.P. Conradie 2/2 - 2/2 1/1
C.J. W. Davidson (resigned 26 January 2012) 1/1 1/1 1/1 -
R.M. Herron 2/2 1/1 - -
T.C. Mazingi 4/4 - 4/4 -
S.K. Mutepfa 3/4 1/2 - -
S. Payne 0/4 - - -
P.T. Spear 4/4 2/2 4/4 1/1
Attendance of Directors at board and committee meetings during the year ended 30 September 2012

10 ARISTON HOLDINGS LIMITED | ANNUAL REPORT 2012
expenditure controls, planned capital expenditure programmes and detailed operating budgets.
The Group maintains internal controls and systems to support these disciplines, and the results of each operation are approved by the main Board. Financial progress is monitored monthly and annual forecasts are reviewed quarterly.
Internal auditors are tasked with ensuring adherence to internal controls and systems to minimise risk.
The financial statements are prepared on a going-concern basis, as the directors are satisfied that the Group has adequate resources to continue in operational existence for the foreseeable future. The financial statements are prepared in accordance with International Financial Reporting Standards (IFRS) and are based on policies which are reasonable and prudent. The independent auditors are responsible for carrying out independent examination of the financial statements in accordance with International Standards on Auditing (ISA) and the directors accept responsibility for the preparation of and information presented in the financial statements.
3. BOARD COMMITTEES
Board and accountability and delegated functions
The Board is supported by various committees in executing its responsibilities. The committees meet twice a year to assess, review performance and provide guidance to management on both operational and policy issues.
Each committee acts within certain written terms of
reference under which certain functions of the Board are delegated with clearly defined purposes. The Board may take independent professional advice at the Group’s expense where necessary. The Board monitors the effectiveness of controls through reviews by the combined Audit & Risk Committee and independent assessments by the independent auditors.
3.1 Audit & Risk Committee The Audit & Risk Committee is chaired by a non-
executive director and the independent auditors have unrestricted access to the committee and attend all meetings. It reviews the interim and final financial statements, the Group systems and controls and ensures that audit recommendations are considered and where appropriate, implemented.
3.2 Human Resources & Remuneration Committee The Human Resources & Remuneration Committee is chaired by a non-executive director and reviews remuneration levels of members of staff throughout the Group.
This Committee comprises three (3) independent non-
executive directors and one executive director. This Committee is mandated to deal with staff development and formulate remuneration policies as well as approve remuneration packages for executive directors and senior executives.
The remuneration policy is designed to reward
performance, to attract, motivate and retain high-calibre individuals who will contribute fully to the success of each of the businesses in which Ariston Holdings Limited operates. Accordingly, a performance-related profit share is offered in addition to a basic salary package whilst a discretionary share purchase scheme is in place for staff members who meet certain performance ratings. The committee draws on external market survey data from independent advisors to ensure that the remumeration policy is appropriate and relevant to the prevailing times.
3.3 Operations / Technical Committee
It is chaired by a non-executive director.
The Operation / Technical Committee comprises of three (3) non-executive directors and one executive director. The purpose of the Committee is to assist the Board in its oversight of the technical and operational risks of the Group in delivering its business plans. The Committee assesses management’s operational policies, strategies, budgets and action plans, reviews implementation or execution and makes recommendations to the Board.
4. OTHER CORPORATE GOvERNANCE MEASURES
4.1 Internal Audit The internal audit department is headed by the Group
Internal Auditor. Its main activities are to address the following issues at each of the business units of the Group:
* Appraising of systems, procedures and management controls; * Evaluating the integrity of management and financial information; * Assessing the controls over the Group assets; and
* Reviewing compliance with applicable legislation, regulations, Group policies and procedures.
Corporate Governance - cont’d

11ARISTON HOLDINGS LIMITED | ANNUAL REPORT 2012
The internal audit function reports to the Audit & Risk Committee and has unrestricted access to this committee. Each entity within the Group is audited regularly by the internal auditors, based on the annual work plan and close communication is maintained between internal and external audit.
4.2 worker Participation Worker participation and employer/employee relations
are handled through regular works councils and workers’ committee meetings in each operating division. Regular meetings ensure information dissemination, consultation and resolution of conflict areas timeously and to the benefit of all parties.
4.3 Environment Ariston adopts a responsible approach and complies
with all regulatory and legislative requirements to ensure the protection and maintenance of the environment in which it operates.
4.4 Social Responsibility Ariston contributes to the social well-being of its
employees and their dependents within the communities in which the Group’s operations are located. Provision of health, educational, recreational and sporting facilities on the Group’s estates provides amenities for employees as well as members of the surrounding communities.
The Group participates in fair trade label programmes and subjects its operations to audit by international organisations, to ensure compliance with the highest standards in its respective operations.
4.5 Related P arty Transactions The Company has a process in place whereby the
directors and key management have confirmed that, to the best of their knowledge, the information disclosed in Ariston Holdings Limited’s financial statements fairly represents their shareholding in the Company, both beneficial and indirect, interest in share options of the Company and the compensation earned from the Company for the financial year. In addition, the directors and key management have confirmed that all interests have been declared.
4.6 Insider Trading No director, officer or employee of the Company may
deal directly or indirectly in the Company’s shares on the basis of unpublished price-sensitive information regarding its business or affairs. In addition, no director, officer or employee may trade in the Company’s shares during closed periods. Closed periods are from the end of the interim and annual reporting periods to the announcement of financial and operating results for the respective periods, and while the Company is under a cautionary announcement.
DR ROBBIE MATONGO MUPAWOSE
CHAIRMAN
PAUL TIMOTHY S PEAR
CHIEF EXECUTIVE OFFICER
Corporate Governance - cont’d


13ARISTON HOLDINGS LIMITED | ANNUAL REPORT 2012
GROUP
All figures in US$ Notes 2012 2011
Revenue 5 14,847,883 14,747,151
Cost of production (9,967,984) (11,121,300)
Gross profit 4,879,899 3,625,851
Other operating income 173,688 78,845
5,053,587 3,704,696
Operating expenses (7,879,936) (6,336,208)
Loss from operations 7 (2,826,349) (2,631,512)
Loss on orchard scrapping 11 (1,376,285) -
Fair value adjustments 11 4,119,919 716,779
Loss before taxation and interest (82,715) (1,914,733)
Finance costs (803,113) (843,948)
Loss before taxation (885,828) (2,758,681)
Income tax credit 8 354,180 755,954
Loss for the year (531,648) (2,002,727)
Other comprehensive loss (net of tax) - -
Total comprehensive loss for the year (531,648) (2,002,727)
Basic loss per share (dollars) 9 (0.0006) (0.0045)
Diluted loss per share (dollars) 9 (0.0006) (0.0045)
Group Statement of Comprehensive IncomeFOR THE YEAR ENDED 30 SEPTEMBER 2012
Statement of comprehensive income transactions for the company were immaterial for separate disclosures in current year.

14 ARISTON HOLDINGS LIMITED | ANNUAL REPORT 2012
Statements of Financial PositionAS AT 30 SEPTEMBER 2012
COMPANY GROUP
All figures in US$ Notes 2012 2011 2012 2011
ASSETS
Non-current assets
Property, plant and equipment 10 - - 10,181,461 8,479,107
Biological assets - bearer 11 - - 9,821,815 8,441,668
Investments 12 34,649 34,649 25,650 25,650
Deferred tax 16 - - 2,225,550 1,345,547
34,649 34,649 22,254,476 18,291,972
Current assets
Biological assets - consumable 11 - - 2,084,101 305,456
Inventories 13 - - 1,524,686 961,802
Trade and other receivables 14 8,461,394 767,731 2,488,361 1,689,541
Cash and cash equivalents - - 6,566 99,485
8,461,394 767,731 6,103,714 3,056,284
Total assets 8,496,043 802,380 28,358,190 21,348,256
EQUITY
Share capital and reserves
Share capital 15 1,378,420 445,087 1,378,420 445,087
Share premium 7,059,079 263,142 7,059,079 263,142
Share-based payment reserve 17,631 19,100 17,631 19,100
Non-distributable reserves - 10,998,626 10,998,626
Accumulated losses (34,138) - (3,177,648) (2,647,469)
8,420,992 727,329 16,276,108 9,078,486
LIABILITIES
Non-current liabilities
Deferred tax 16 1,283 1,283 4,764,077 4,238,254
Borrowings 18 - - 1,000,000 121,249
1,283 1,283 5,764,077 4,359,503
Current liabilities
Trade and other payables 17 73,768 73,768 3,669,687 3,623,372
Borrowings 18 - - 2,648,318 4,286,895
73,7 68 73,768 6,318,005 7,910,267
Total equity and liabilities 8,496,043 802,380 28,358,190 21,348,256
DR R .M. MUPAWOSE P.T. SPEAR F.N. MUSINGA
Chairman Chief Executive Officer Company Secretary
19 December 2012

15ARISTON HOLDINGS LIMITED | ANNUAL REPORT 2012
GROUP
All figures in US$Share
capital
Share
premium
Share-based
payment
reserve
Non -
distributable
reserves
Accumulated
lossesTotal
Balance at 30 September 2010 444,337 252,642 30,350 10,998,626 (644,742) 11,081,213
Transfer to share capital on share options exercised 750 - (750) - - -
Transfer to share premium reserve on share options exercised - 10,500 (10,500) - - -
Total comprehensive loss for the year - - - - (2,002,727) (2,002,727)
Balance at 30 September 2011 445,087 263,142 19,100 10,998,626 (2,647,469) 9,078,486
Transfer to share capital on rights issue exercised 933,333 - - - - 933,333
Transfer to share premium reserve on rights issue exercised - 7,466,667 - - - 7,466,667
Share issue expenses - (670,730) - - - (670,730)
Transfer to accumulated loss on share options expired - - (1,469) - 1,469 -
Total comprehensive loss for the year - - - - (531,648) (531,648)
Balance at 30 September 2012 1,378,420 7,059,079 17,631 10,998,626 (3,177,648) 16,276,108
Statements of Changes in Shareholders’ EquityFOR THE YEAR ENDED 30 SEPTEMBER 2012
COMPANY
All figures in US$Share
capital
Share
premium
Share-based
payment
reserve
Non -
distributable
reserves
Accumulated
lossesTotal
Balance at 30 September 2010 444,337 252,642 30,350 - - 727,329
Transfer to share capital on share options exercised 750 - (750) - - -
Transfer to share premium reserve on share options exercised - 10,500 (10,500) - - -
Total comprehensive income for the year - - - - - -
Balance at 30 September 2011 445,087 263,142 19,100 - - 727,329
Transfer to share capital on rights issue exercised 933,333 - - - - 933,333
Transfer to share premium reserve on rights issue exercised - 7,466,667 - - - 7,466,667
Share issue expenses - (670,730) - - - (670,730)
Transfer to accumulated loss on share options expired - - (1,469) - 1,469 -
Total comprehensive loss for the year - - - - (35,607) (35,607)
Balance at 30 September 2012 1,378,420 7,059,079 17,631 - (34,138) 8,420,992

16 ARISTON HOLDINGS LIMITED | ANNUAL REPORT 2012
All figures in US$ Notes 2012 2011
Cash flows from operating activities
(Loss)/profit before taxation and interest (82,715) (1,914,733)
Net non-cash flow items 6.1 (1,984,428) 15,394
Cash outflow from operations (2,067,143) (1,899,339)
Finance costs (803,113) (843,948)
Income taxes paid - 20,026
Change in working capital 6.2 (1,291,144) 937,282
Cash utilised in operating activities (4,161,400) (1,785,979)
Cash flows from investing activities
Purchase of property, plant and equipment (2,522,920) (594,671)
Proceeds from sale of property, plant and equipment 52,891 26,836
Additions to biological assets (430,934) (32,221)
Cash utilised in investing activities (2,900,963) (600,056)
Cash flows from financing activities
(Decrease)/increase in borrowings (759,826) 2,255,978
Proceeds from rights issue 8,400,000 -
Share issue expenses (670,730) -
Cash generated from financing activities 6,969,444 2,255,978
Net cash outflow (92,919) (130,057)
Cash and cash equivalents at beginning of year 99,485 229,542
Cash and cash equivalents at end of year 6,566 99,485
Cash and cash equivalents at end of year comprising:
Cash and cash equivalents 6,566 99,485
Cash and cash equivalents at the end of year 6,566 99,485
Group Statement of CashflowsFOR THE YEAR ENDED 30 SEPTEMBER 2012
There were no cash flow movements in the Company. All cash movements are held in Ariston Management Services
(Private) Limited, a one hundred percent (100%) owned subsidiary.

17ARISTON HOLDINGS LIMITED | ANNUAL REPORT 2012
Notes to the Financial StatementsFOR THE YEAR ENDED 30 SEPTEMBER 2012
1. GENERAL DISCLOSURES
1.1 Country of Incorporation and Main Activities
Ariston Holdings Limited (“the Company”), an investment holding company, its subsidiaries and associated companies (“the Group”) are incorporated in Zimbabwe. The main activity of the Group is horticulture, tea, macadamia nut production, fishery, poultry production and the supply of fresh farm produce.
1.2 Currency
The financial statements are presented in United States dollars (US$) which is the functional currency of the Company and the Group.
1.3 Borrowing Powers
The directors may, at their discretion, borrow an amount equal to the aggregate of shareholders’ funds of the Group.
2. ADOPTION OF NEw AND REvISED STANDARDS AND INTERPRETATIONS
2.1 Standards and Interpretations adopted with no material effect on the financial statements
The following new and revised Standards and Interpretations have been adopted in these financial statements. Their adoption has not had any significant impact on the amounts reported in these financial statements but may affect the accounting for future transactions or arrangements. • InternationalFinancialReportingStandards(IFRS)3BusinessCombinations(issuedMay2010):amendmentprovides clarification that the measurement choice regarding non-controlling interests at the date of acquisition is only available in respect of non-controlling interests that are present ownership interests and that entitle their holders to a proportionate share of the entity’s net assets in the event of liquidation.
• IFRS7FinancialInstruments:Disclosures(issuedMayandOctober2010):amendmentprovidesclarificationonthe required level of disclosure about credit risk and collateral held and provides relief from disclosures previously required regarding renegotiated loans. It increases the disclosure requirements for transactions involving transfers of financial assets.
• InternationalAccountingStandards(IAS)12IncomeTaxes(revisedDecember2010):limitedscopeamendmentrelating to recovery of underlying assets.
• IAS24RelatedPartyDisclosures (revisedNovember2009):Modifies thedefinitionof a relatedparty, simplifies disclosures for government-related entities and includes a specific requirement to disclose commitments involving related parties.
• IAS27GroupandSeparateFinancialStatements(revisedMay2010):Increasesordecreasesinownershipinterests are dealt with in equity, with no impact on goodwill or profit or loss.
• IAS34InterimFinancialReporting(revisedMay2010).
• InternationalFinancialReportingInterpretationsCommittee(IFRIC)13CustomerLoyaltyProgrammes(revised2010).
• IFRIC19ExtinguishingFinancialLiabilitieswithEquityInstruments:Providesguidanceregardingtheaccountingfor the extinguishment of a financial liability by the issue of equity instruments.
2.2 Standards and interpretations in issue but not yet effective
At the date of authorisation of these financial statements, the following Standards and Interpretations were in issue but not yet effective:

18 ARISTON HOLDINGS LIMITED | ANNUAL REPORT 2012
2. ADOPTION OF NEw AND REvISED STANDARDS AND INTERPRETATIONS - continued
• IFRS7-FinancialInstruments:Disclosures-Amendmentsenhancingdisclosuresaboutoffsettingoffinancialassets and financial liabilities (effective for annual financial statements for periods beginning on or after 1 January 2013).
• IFRS7-FinancialInstruments:Disclosures-AmendmentsrequiringdisclosuresabouttheinitialapplicationofIFRS9 (effective for annual financial statements for periods beginning on or after 1 January 2015).
• IFRS9 - Financial Instruments -Classificationandmeasurementoffinancial assets (effective for annualfinancial statements for periods beginning on or after 1 January 2015).
• IFRS9 -Financial Instruments -Accounting forfinancial liabilitiesandderecognition (effective forannualfinancial statements for periods beginning on or after 1 January 2015).
• IFRS10-ConsolidatedFinancialStatements(effectiveforannualfinancialstatementsforperiodsbeginningonor after 1 January 2013).
• IFRS11-JointArrangements(effectiveforannualfinancialstatementsforperiodsbeginningonorafter1January 2013).
• IFRS12-DisclosureofInterestsinOtherEntities(effectiveforannualfinancialstatementsforperiodsbeginningon or after 1 January 2013).
• IFRS13-FairValueMeasurement(effectiveforannualfinancialstatementsforperiodsbeginningonorafter1January 2013).
• RevisedIAS1-PresentationofFinancialStatements-Amendmentstorevisethewayothercomprehensiveincome is presented (effective for annual financial statements for periods beginning on or after 1 July 2012).
• Revised IAS 19 - Employee Benefits - Amended Standard resulting from the Post-Employment Benefits and Termination Benefits projects (effective for annual financial statements for periods beginning on or after 1 July 2012).
• RevisedIAS27-ConsolidatedandSeparateFinancialStatements-ReissuedasIAS27SeparateFinancialStatements (as amended in 2011) (effective for annual financial statements for periods beginning on or after 1 January 2013).
• RevisedIAS28-InvestmentsinAssociates-ReissuedasIAS28InvestmentsinAssociatesandJointVentures(as amended in 2011) (effective for annual financial statements for periods beginning on or after 1 January 2013).
• Revised IAS 32 - Financial Instruments: Presentation -Amendments to application guidance on the offsetting of financial assets and financial liabilities (effective for annual financial statements for periods beginning on or after 1 January 2014).
• IFRICInterpretation20StrippingCostsintheProductionPhaseofaSurfaceMineClarifieswhenproductionstripping should lead to the recognition of an asset and how that asset should be measured, both initially and in subsequent periods.
• AmendmentstoIFRS1:GovernmentLoans Addresses how a first-time adopter would account for a government loan with a below-market rate of interest when transitioning to IFRSs.
Notes to the Financial Statements - cont’dFOR THE YEAR ENDED 30 SEPTEMBER 2012

19ARISTON HOLDINGS LIMITED | ANNUAL REPORT 2012
Notes to the Financial Statements - cont’dFOR THE YEAR ENDED 30 SEPTEMBER 2012
2. ADOPTION OF NEw AND REvISED STANDARDS AND INTERPRETATIONS - continued
• AmendmentstoIFRS7FinancialInstruments:Disclosures Introduces new disclosures to help investors and other financial statement users to better assess the effect or potential effect of offsetting arrangements on a company’s financial position and improves transparency in the reporting of how companies mitigate credit risk, including disclosure of related collateral pledged or received.
The Directors have assessed the impact of the adoption of these Standards and Interpretations and they have no material impact on the financial statements in the period of initial application.
3. SUMMARY OF SIGNIFICANT ACCOUNTING POLICIES
3.1 Statement of compliance
The consolidated financial statements have been prepared in accordance with International Financial Reporting Standards, (IFRS).
3.2 Basis of preparation
The consolidated financial statements have been prepared on the historical-cost basis except for certain biological assets and financial instruments that are measured at fair values, as explained in the accounting policies below.
Historical cost is generally based on the fair value of the consideration given in exchange for assets.
The directors have assessed the ability of the Group to continue as a going concern and believe that the preparation of these financial statements on a going-concern basis is still appropriate. However, the directors believe that under the current economic, political and legal environment a continuous assessment of the environment will need to be performed to determine the continued appropriateness of this assumption.
The principal accounting policies are set out below.
3.3 Basis of consolidation
The consolidated financial statements incorporate the financial statements of the Company and entities (including special purpose entities) controlled by the Company (its subsidiaries). Control is achieved where the Company has the power to govern the financial and operating policies of an entity so as to obtain benefits from its activities. Income and expenses of subsidiaries acquired or disposed of during the year are included in the consolidated statement of comprehensive income from the effective date of acquisition and up to the effective date of disposal, as appropriate. Total comprehensive income of subsidiaries is attributed to the owners of the Company and to the non-controlling interests even if this results in the non-controlling interests having a deficit balance.
When necessary, adjustments are made to the financial statements of subsidiaries to bring their accounting policies into line with those used by other members of the Group.
All intra-group transactions, balances, income and expenses are eliminated in full on consolidation.
The consolidated financial statements have been prepared in conformity with International Financial Reporting Standards (IFRS), promulgated by the International Accounting Standards Board (IASB), which includes standards and interpretations approved by the IASB as well as International Accounting Standards and Standing Interpretations Committee (SIC) interpretations issued under previous constitutions (IFRS’s).
3.3.1 Changes in the Group’s ownership interests in existing subsidiaries
Changes in the Group’s ownership interests in subsidiaries that do not result in the Group losing control over the subsidiaries are accounted for as equity transactions. The carrying amounts of the Group’s interests and the non- controlling interests are adjusted to reflect the changes in their relative interests in the subsidiaries. Any difference

20 ARISTON HOLDINGS LIMITED | ANNUAL REPORT 2012
3. SUMMARY OF SIGNIFICANT ACCOUNTING POLICIES - continued
between the amount by which the non-controlling interests are adjusted and the fair value of the consideration paid or received is recognised directly in equity and attributed to owners of the Company. When the Group loses control of a subsidiary, the profit or loss on disposal is calculated as the difference between (i) the aggregate of the fair value of the consideration received and the fair value of any retained interest and (ii) the previous carrying amount of the assets (including goodwill), and liabilities of the subsidiary and any non-controlling interests. When assets of the subsidiary are carried at revalued amounts or fair values and the related cumulative gain or loss has been recognised in other comprehensive income and accumulated in equity, the amounts previously recognised in other comprehensive income and accumulated in equity are accounted for as if the Company had directly disposed of the relevant assets (i.e. reclassified to profit or loss or transferred directly to retained earnings as specified by applicable IFRSs). The fair value of any investment retained in the former subsidiary at the date when control is lost is regarded as the fair value on initial recognition for subsequent accounting under IAS 39 Financial Instruments: Recognition and Measurement or, when applicable, the cost on initial recognition of an investment in an associate or a jointly controlled entity.
3.4 Business combinations
Acquisitions of businesses are accounted for using the acquisition method. The consideration transferred in a business combination is measured at fair value, which is calculated as the sum of the acquisition date fair values of the assets transferred by the Group, liabilities incurred by the Group to the former owners of the acquiree and the equity interest issued by the Group in exchange for control of the acquiree. Acquisition-related costs are generally recognised in profit or loss as incurred.
At the acquisition date, the identifiable assets acquired and the liabilities assumed are recognised at their fair value, except that: (1) deferred tax assets or liabilities, and assets or liabilities related to employee benefit arrangements, are recognised and measured in accordance with IAS 12 Income Taxes and IAS 19 Employee Benefits respectively;
(2) liabilities or equity instruments related to share-based payment arrangements of the acquiree or share-based payment arrangements of the Group entered into to replace share-based payment arrangements of the acquiree are measured in accordance with IFRS 2 Share-based Payment at the acquisition date, and
(3) assets (or disposal groups) that are classified as held for sale in accordance with IFRS 5 Non-current Assets Held for Sale and Discontinued Operations are measured in accordance with that Standard.
Goodwill is measured as the excess of the sum of the consideration transferred, the amount of any non-controlling interests in the acquiree, and the fair value of the acquirer’s previously held equity interest in the acquiree (if any) over the net of the acquisition date amounts of the identifiable assets acquired and the liabilities assumed. If, after reassessment, the net of the acquisition date amounts of the identifiable assets acquired and liabilities assumed exceeds the sum of the consideration transferred, the amount of any non-controlling interests in the acquiree and the fair value of the acquirer’s previously held interest in the acquiree (if any), the excess is recognised immediately in profit or loss as a bargain purchase gain.
Non-controlling interests that are present ownership interests and entitle their holders to a proportionate share of the entity’s net assets in the event of liquidation, may be initially measured either at fair value or at the non-controlling interests’ proportionate share of the recognised amounts of the acquiree’s identifiable net assets. The choice of measurement basis is made on a transaction-by-transaction basis. Other types of non-controlling interests are measured at fair value or, when applicable, on the basis specified in another IFRS.
When the consideration transferred by the Group in a business combination includes assets or liabilities resulting from a contingent consideration arrangement, the contingent consideration is measured at its acquisition date fair value and included as part of the consideration transferred in a business combination. Changes in the fair value of the contingent consideration that qualify as measurement period adjustments are adjusted retrospectively, with corresponding
FOR THE YEAR ENDED 30 SEPTEMBER 2012
Notes to the Financial Statements - cont’d

21ARISTON HOLDINGS LIMITED | ANNUAL REPORT 2012
3. SUMMARY OF SIGNIFICANT ACCOUNTING POLICIES - continued
adjustments against goodwill. Measurement period adjustments are adjustments that arise from additional information obtained during the “measurement period” (which cannot exceed one year from the acquisition date) about facts and circumstances that existed at the acquisition date.
The subsequent accounting for changes in the fair value of the contingent consideration that do not qualify as measurement period adjustments depends on how the contingent consideration is classified. Contingent consideration that is classified as equity is not remeasured at subsequent reporting dates and its subsequent settlement is accounted for within equity. Contingent consideration that is classified as an asset or a liability is remeasured at subsequent reporting dates in accordance with IAS 39, or IAS 37 Provisions, Contingent Liabilities and Contingent Assets, as appropriate, with the corresponding gain or loss being recognised in profit or loss.
When a business combination is achieved in stages, the Group’s previously held equity interest in the acquiree is remeasured to fair value at the acquisition date (i.e. the date when the Group obtains control) and the resulting gain or loss, if any, is recognised in profit or loss. Amounts arising from interests in the acquiree prior to the acquisition date that have previously been recognised in other comprehensive income are reclassified to profit or loss where such treatment would be appropriate if that interest were disposed of.
If the initial accounting for a business combination is incomplete by the end of the reporting period in which the combination occurs, the Group reports provisional amounts for the items for which the accounting is incomplete. Those provisional amounts are adjusted during the measurement period (see above), or additional assets or liabilities are recognised, to reflect new information obtained about facts and circumstances that existed at the acquisition date that, if known, would have affected the amounts recognised at that date.
3.5 Investments in associates
An associate is an entity over which the Group has significant influence and that is neither a subsidiary nor an interest in a joint venture. Significant influence is the power to participate in the financial and operating policy decisions of the investee, but is not control or joint control over those policies.
The results, assets and liabilities of associates are incorporated in these consolidated financial statements using the equity method of accounting, except when the investment is classified as held for sale, in which case it is accounted for in accordance with IFRS 5 Non-current Assets Held for Sale and Discontinued Operations. Under the equity method, investments in associates are carried in the consolidated statement of financial position at cost as adjusted for post-acquisition changes in the Group’s share of the net assets of the associate, less any impairment in the value of individual investments.
Losses of an associate in excess of the Group’s interest in that associate (which includes any long-term interests that, in substance, form part of the Group’s net investment in the associate) are recognised only to the extent that the Group has incurred legal or constructive obligations or made payments on behalf of the associates.
3.6 Biological assets
Biological assets include the following: - tea - poultry - macadamia - bananas - pome fruit - stone fruit - passion fruit - livestock - trout - avocados - potatoes
FOR THE YEAR ENDED 30 SEPTEMBER 2012
Notes to the Financial Statements - cont’d

22 ARISTON HOLDINGS LIMITED | ANNUAL REPORT 2012
3. SUMMARY OF SIGNIFICANT ACCOUNTING POLICIES - continued
Biological assets are measured at fair value on initial recognition and at each period end date at their fair values. Any change in value is included in the net profit or loss for the period in which it arises, as more fully set out below:
Growing crops and orchards
Growing crops and orchards comprise two elements: • Bearerbiologicalassets–pometrees,stonetrees,deciduoustrees,bananaplantsetc.Bearerbiologicalassets are valued at fair value based on the present value of net cash flows expected to arise from these assets.
• Consumablebiologicalassets–standingpomefruits,deciduousfruit,bananas,tealeaves,standingmacadamia nuts etc. Consumable biological assets are measured at their fair value, determined on current estimated market prices, less estimated harvesting, transport, packing and costs to sell. Growing fruit at estimated yields, quality standards, age and market prices.
The method used to carry out the valuation of these assets is summarised as follows: i. Looking ahead for a period of 10 years for tea, macadamia, fruit trees and flowers and for less, depending on the expected life and susceptibilities of variety changes to the biological asset. ii. Calculating the present value of the net cashflow expected to arise from those assets over the periods stated in (i) above. iii. The net cash flow being based on annual production levels, the selling price less costs to sell for the agricultural produce and deducting the variable costs of agricultural production.
Biological assets which take less than a year to mature are generally valued on the relative stage to maturity multiplied by the selling price less costs to sell at reporting date.
Livestock
Livestock are measured at their fair value less estimated costs to sell, fair value being determined upon the age and size of the animals and relevant market price. Market price is determined on the basis that the animal is either to be sold to be slaughtered or realised through sale to customers at fair market value.
Surpluses or deficits arising from the annual change in the valuation are taken to the income statement as a fair value adjustment.
3.7 Borrowing costs
Borrowing costs directly attributable to the acquisition, construction or production of qualifying assets, which are assets that necessarily take a substantial period of time to get ready for their intended use or sale, are added to the cost of those assets, until such time as the assets are substantially ready for their intended use or sale. Investment income earned on the temporary investment of specific borrowings pending their expenditure on qualifying assets is deducted from the borrowing costs eligible for capitalisation. All other borrowing costs are recognised in profit or loss in the period in which they occur.
3.8 Financial instruments
Financial assets and financial liabilities are recognised in the Group’s statement of financial position when the Group becomes a party to the contractual provisions of the instrument.
Financial assets:
Trade receivables Trade receivables are measured at initial recognition at fair value. Appropriate allowances for estimated irrecoverable amounts are recognised in profit or loss when there is objective evidence that the asset is impaired. The allowance recognised is measured as the difference between the asset’s carrying amount and the present value of estimated future cash flows discounted at the effective interest rate computed at initial recognition.
FOR THE YEAR ENDED 30 SEPTEMBER 2012
Notes to the Financial Statements - cont’d

23ARISTON HOLDINGS LIMITED | ANNUAL REPORT 2012
3. SUMMARY OF SIGNIFICANT ACCOUNTING POLICIES - continued
Cash and cash equivalents Cash and cash equivalents comprise cash on hand and demand deposit and other short term highly liquid investments that are readily convertible to a known amount of cash and are subject to an insignificant risk of changes in value.
Investments Investments are recognised and derecognised on a trade basis where the purchase or sales of an investment is under a contract whose terms require delivery of the investment within the timeframe established by the market concerned, and are initially measured at fair value, plus directly attributable transaction costs.
Subsequent to the reporting date, debt securities that the Group has the expressed intention and ability to hold to maturity (held-to-maturity debt securities) are measured at amortised cost using the effective interest rate method, less any impairment loss recognised to reflect irrecoverable amounts.
Impairment of financial assets Financial assets other than those at fair value through profit or loss, are assessed for indicators of impairment at the end of each reporting period.
Financial assets are impaired where there is objective evidence that, as a result of one or more events that occurred after the initial recognition of the financial asset, the estimated future cash flows of the investment have been impacted. For equity investments, a significant or prolonged decline in the fair value of the security below its cost is considered to be objective evidence of impairment.
For all other financial assets, including redeemable notes classified as available for sale and finance lease receivables, objective evidence of impairment could include: - significant financial difficulty of the issuer or counterparty; or - default or delinquency in interest or principal payments; - it becoming probable that the borrower will enter bankruptcy or financial re-organisation.
For certain categories of financial asset, such as trade receivables, assets that are assessed not to be impaired individually are subsequently assessed for impairment on a collective basis. Objective evidence of impairment for a portfolio of receivables could include the Group’s past experience of collecting payments, an increase in the number of delayed payments in the portfolio, as well as observable changes in national or local economic conditions that correlate with default on receivables. For financial assets carried at amortised cost, the amount of the impairment is the difference between the asset’s carrying amount and the present value of estimated future cashflows, discounted at the financial asset’s original effective interest rate. The carrying amount of the financial asset is reduced by the impairment loss directly for all financial assets with the exception of trade receivables, where the carrying amount is reduced through the use of an allowance account.
When a trade receivable is considered uncollectable, it is written off against the allowance account. Subsequent recoveries of amounts previously written off are credited against the allowance account. Changes in the carrying amount of the allowance account are recognised in profit or loss.
With the exception of available-for-sale equity instruments, if, in a subsequent period, the amount of the impairment loss decreases and the decrease can be related objectively to an event occurring after the impairment was recognised, the previously recognised impairment loss if reversed through profit or loss to the extent that the carrying amount of the investment at the date of impairment is reversed does not exceed what the amortised cost would have been had the impairment not been recognised.
In respect of available-for-sale equity securities, impairment losses previously recognised through profit or loss are not reversed through profit or loss. Any increase in fair value subsequent to an impairment loss is recognised directly in equity.
FOR THE YEAR ENDED 30 SEPTEMBER 2012
Notes to the Financial Statements - cont’d

24 ARISTON HOLDINGS LIMITED | ANNUAL REPORT 2012
3. SUMMARY OF SIGNIFICANT ACCOUNTING POLICIES - continued
Derecognition of financial assets
The Group derecognises a financial asset only when the contractual rights to the cash flows from the asset expire; or it transfers the financial asset and substantially all the risks and rewards of ownership of the asset to another entity. If the Group neither transfers nor retains substantially all the risks and rewards of ownership and continues to control the transferred asset, the Group recognises its retained interest in the asset and an associated liability for amounts it may have to pay. If the Group retains substantially all the risks and rewards of ownership of a transferred financial asset, the Group continues to recognise the financial asset and also recognises a collateralised borrowing for the proceeds received.
On derecognition of a financial asset in its entirety, the difference between the asset’s carrying amount and the sum of the consideration received and receivable and the cumulative gain or loss that had been recognised in other comprehensive income and accumulated in equity is recognised in profit or loss.
Financial liabilities:
Trade and other payables Trade payables are initially measured at fair value, net of transaction costs. They are subsequently measured at amortised cost using the effective interest rate method,with interest expense recognised on an effective yield basis. Borrowings are also measured at amortised cost using the effective interest rate method.
Derecognition of financial liabilties The Group derecognises financial liabilities when, and only when, the Group’s obligations are discharged, cancelled or they expire.
3.9 Taxation
Income tax expense represents the sum of the tax currently payable and deferred tax.
Current tax The tax currently payable is based on taxable profit for the year. Taxable profit differs from profit as reported in the consolidated statement of comprehensive income because it excludes items of income or expense that are taxable or deductible in other years and it further excludes items that are never taxable or deductible. The Group’s liability for current tax is calculated using tax rates that have been enacted or substantively enacted by the reporting date.
Deferred tax Deferred tax is recognised on temporary differences between the carrying amounts of assets and liabilities in the consolidated financial statements and the corresponding tax bases used in the computation of taxable profit. Deferred tax liabilities are generally recognised for all taxable temporary differences and deferred tax assets are generally recognised for all deductible temporary differences to the extent that it is probable that taxable profits will be available against which those deductible temporary differences can be utilised. Such assets and liabilities are not recognised if the temporary difference arises from goodwill or from the initial recognition (other than in a business combination) of other assets and liabilities in a transaction that affects neither the taxable profit nor the accounting profit.
Deferred tax liabilities are recognised for taxable temporary differences associated with investments in subsidiaries and associates, and interests in joint ventures, except where the Group is able to control the reversal of the temporary difference and it is probable that the temporary difference will not reverse in the foreseeable future. Deferred tax assets arising from deductable temporary differences associated with such investments and interests are only recognised to the extent that it is probable that there will be sufficient taxable profits against which to utilise the benefits of the temporary differences and they are expected to reverse in the foreseeable future. The carrying amount of deferred tax assets is reviewed at each reporting date and reduced to the extent that it is no longer probable that sufficient taxable profits will be available to allow all or part of the assets to be recovered.
FOR THE YEAR ENDED 30 SEPTEMBER 2012
Notes to the Financial Statements - cont’d

25ARISTON HOLDINGS LIMITED | ANNUAL REPORT 2012
3. SUMMARY OF SIGNIFICANT ACCOUNTING POLICIES - continued
Deferred tax assets and liabilities are measured at the tax rates that are expected to apply in the period in which the liability is settled or the asset realised, based on tax rates (and tax laws) that have been enacted or substantively enacted by the reporting date. The measurement of deferred tax liabilities and assets reflects the tax consequences that would follow from the manner in which the Group expects, at the reporting date, to recover or settle the carrying amount of its assets and liabilities.
Deferred tax assets and liabilities are offset when there is a legally enforceable right to set off current tax assets against current tax liabilities and when they relate to income taxes levied by the same taxation authority and the Group intends to settle its current tax assets and liabilities on a net basis.
Current and deferred tax for the period Current and deferred taxes are recognised in profit or loss, except when they relate to items recognised in other comprehensive income or directly in equity, in which case, the tax is also recognised directly in other comprehensive income or equity. In the case of a business combination, the tax effect is taken into account in calculating goodwill or in determining the excess of the acquiree’s interest, in the net fair value of the acquiree’s identifiable assets, liabilities and contingent liabilities over the cost of the business combination.
3.10 Property, plant and equipment
Plant, equipment, motor vehicles, freehold land and buildings and leasehold improvements are stated at cost less accumulated depreciation and accumulated impairment losses.
Costs capitalised include all directly attributable costs incurred in bringing the relevant assets to their fully productive state.
Depreciation is recognised so as to write off the cost or valuation of assets (other than freehold land and properties under construction) less their residual values over their useful lives, using the straight-line method. The estimated useful lives, residual values and depreciation method are reviewed at the end of each reporting period, with the effect of any changes in estimate accounted for on a prospective basis.
Plant and equipment 3 - 20 years Motor vehicles 5 years Freeholdimprovements 7–40years Leaseholdimprovements 10–40years(Seebelow) Buildings 40 years
Assets held under finance lease are depreciated over their expected useful lives on the same basis as owned assets or, where shorter, the term of the relevant lease.
Derecognition of property, plant and equipment An item of property, plant and equipment is derecognised upon disposal or when no future economic benefits are expected to arise from the continued use of the asset. Any gain or loss arising on the disposal or retirement of an item of property, plant and equipment is determined as the difference between the sales proceeds and the carrying amount of the asset and is recognised in profit or loss.
3.11 Intangible assets
Intangible assets with finite useful lives that are acquired separately are carried at cost, less accumulated amortisation and accumulated impairment losses. Amortisation is recognised on a straight-line basis over their estimated useful lives. The estimated useful life and amortisation method are reviewed at the end of each reporting period, with the effect of any changes in estimate being accounted for on a prospective basis. Intangible assets with indefinite useful lives that are acquired separately are carried at cost less accumulated impairment losses.
FOR THE YEAR ENDED 30 SEPTEMBER 2012
Notes to the Financial Statements - cont’d

26 ARISTON HOLDINGS LIMITED | ANNUAL REPORT 2012
3. SUMMARY OF SIGNIFICANT ACCOUNTING POLICIES - continued
Derecognition of intangible assets An intangible asset is derecognised on disposal, or when no future economic benefits are expected from use or disposal. Gains or losses arising from derecognition of an intangible asset, measured as the difference between the net disposal proceeds and the carrying amount of the asset, are recognised in profit or loss when the asset is derecognised.
3.12 Impairment of tangible and intangible assets other than goodwill
At the end of each reporting period, the Group reviews the carrying amounts of its tangible and intangible assets to determine whether there is any indication that those assets have suffered an impairment loss. If any such indication exists, the recoverable amount of the asset is estimated in order to determine the extent of the impairment loss (if any). When it is not possible to estimate the recoverable amount of an individual asset, the Group estimates the recoverable amount of the cash-generating unit to which the asset belongs. When a reasonable and consistent basis of allocation can be identified, corporate assets are also allocated to individual cash-generating units, or otherwise they are allocated to the smallest group of cash-generating units for which a reasonable and consistent allocation basis can be identified.
Intangible assets with indefinite useful lives and intangible assets not yet available for use are tested for impairment at least annually, and whenever there is an indication that the asset may be impaired.
Recoverable amount is the higher of fair value less costs to sell and value in use. In assessing value in use, the estimated future cash flows are discounted to their present value using a pre-tax discount rate that reflects current market assessments of the time value of money and the risks specific to the asset for which the estimates of future cash flows have not been adjusted.
If the recoverable amount of an asset (or cash-generating unit) is estimated to be less than its carrying amount, the carrying amount of the asset (or cash-generating unit) is reduced to its recoverable amount. An impairment loss is recognised immediately in profit or loss, unless the relevant asset is carried at a revalued amount, in which case the impairment loss is treated as a revaluation decrease.
When an impairment loss subsequently reverses, the carrying amount of the asset (or a cash-generating unit) is increased to the revised estimate of its recoverable amount, but so that the increased carrying amount does not exceed the carrying amount that would have been determined had no impairment loss been recognised for the asset (or cash-generating unit) in prior years. A reversal of an impairment loss is recognised immediately in profit or loss, unless the relevant asset is carried at a revalued amount, in which case the reversal of the impairment loss is treated as a revaluation increase.
3.13 Investment property
Investment property, which is property held to earn rentals and/or for capital appreciation (including property under construction for such purposes), is measured initially at its cost, including transaction costs. Subsequent to initial recognition, investment property is measured at fair value. Gains and losses arising from changes in the fair value of investment property are included in profit or loss in the period in which they arise.
An investment property is derecognised upon disposal or when the investment property is permanently withdrawn from use and no future economic benefits are expected from the disposal. Any gain or loss arising on derecognition of the property (calculated as the difference between the net disposal proceeds and the carrying amount of the asset) is included in profit or loss in the period in which the property is derecognised.
3.14 Leasing
Leases are classified as finance leases whenever the terms of the lease transfer substantially all the risks and rewards of ownership to the lessee. All other leases are classified as operating leases.
The Group as lessor Amounts due from lessees under finance leases are recorded as receivables at the amount of the Group’s net investment in the leases. Finance lease income is allocated to accounting periods so as to reflect a constant periodic rate of return on the Group’s net investment outstanding in respect of the leases.
Notes To The Financial Statements - cont’dFOR THE YEAR ENDED 30 SEPTEMBER 2012

27ARISTON HOLDINGS LIMITED | ANNUAL REPORT 2012
3. SUMMARY OF SIGNIFICANT ACCOUNTING POLICIES - continued
Rental income from operating leases is recognised on a straight-line basis over the term of the relevant lease. Initial direct costs incurred in negotiating and arranging an operating lease are added to the carrying amount of the leased asset and recognised on a straight-line basis over the lease term. The Group as lessee Assets held under finance leases are initially recognised as assets of the Group at their fair value at the inception of the lease or, if lower, at the present value of the minimum lease payments. The corresponding liability to the lessor is included in the statement of financial position as a finance lease obligation.
Lease payments are apportioned between finance charges and reduction of the lease obligation so as to achieve a constant rate of interest on the remaining balance of the liability. Finance charges are charged directly to profit or loss, unless they are directly attributable to qualifying assets, in which case they are capitalised in accordance with the Group’s general policy on borrowing costs. Contingent rentals are recognised as expenses in the periods in which they are incurred.
Operating lease payments are recognised as an expense on a straight-line basis over the lease term, except where another systematic basis is more representative of the time pattern in which economic benefits from the leased asset are consumed. Contingent rentals arising under operating leases are recognised as an expense in the period in which they are incurred.
In the event that lease incentives are received to enter into operating leases, such incentives are recognised as a liability. The aggregate benefit of incentives is recognised as a reduction of rental expense on a straight-line basis, except where another systematic basis is more representative of the time pattern in which economic benefits from the leased asset are consumed.
3.15 Provisions
Provisions are recognised when: - the Group has a present obligation (legal or constructive) as a result of a past event; - it is probable that an outflow of resources embodying economic benefits will be required to settle the amount of the obligation; and - a reliable estimate can be made of the amount of the obligation.
The amount recognised as a provision is the best estimate of the consideration required to settle the present obligation at the reporting date, taking into account the risks and uncertainties surrounding the obligation. Where a provision is measured using the cash flows estimated to settle the present obligation, its carrying amount is the present value of those cash flows.
When some or all of the economic benefits required to settle a provision are expected to be recovered from a third party, the receivable is recognised as an asset if it is virtually certain that reimbursement will be received and the amount of the receivable can be measured reliably.
Onerous contract
Present obligations arising under onerous contracts are recognised and measured as provisions. An onerous contract is considered to exist where the Group has a contract under which the unavoidable costs of meeting the obligations under the contract exceed the economic benefits expected to be received from the contract.
Restructurings
A restructuring provision is recognised when the Group has developed a detailed formal plan for the restructuring and has raised a valid expectation in those affected that it will carry out the restructuring by starting to implement the plan or announcing its main features to those affected by it. The measurement of a restructuring provision includes only the direct
Notes To The Financial Statements - cont’dFOR THE YEAR ENDED 30 SEPTEMBER 2012

28 ARISTON HOLDINGS LIMITED | ANNUAL REPORT 2012
3. SUMMARY OF SIGNIFICANT ACCOUNTING POLICIES - continued
expenditures arising from the restructuring, which are those amounts that are both necessarily entailed by the restructuring and not associated with the ongoing activities of the entity.
3.16 Retirement benefit costs
The Ariston Holdings Limited Group contributes to a defined contribution plan for the benefit of certain eligible employees. The fund is administered by a life assurance society. In addition, all Group employees contribute to the defined contribution scheme established by the National Social Security Authority Act of 1989.
Payments to defined contribution retirement benefit plans are recognised as an expense when employees have rendered service entitling them to the contributions.
3.17 Inventories
Inventories are stated at the lower of cost and net realisable value. Net realisable value represents the estimated selling price for inventories less all estimated costs of completion and costs necessary to make the sale.
The carrying value of inventories are determined as follows:
Farm produce - Fair value based on market value less estimated costs to sell. Stores and materials - The lower of cost and net realisable value with cost being calculated on a weighted average or first-in first-out basis.
3.18 Revenue recognition
Revenue is measured at the fair value of the consideration received or receivable. Revenue excludes value added and other taxes, and is reduced for estimated customer returns, rebates and other similar allowances.
Sale of goods Revenue from the sale of goods is recognised when all the following conditions are satisfied: • theGrouphastransferredtothebuyerthesignificantrisksandrewardsofownershipofthegoods; • theGroupretainsneithercontinuingmanagerialinvolvementtothedegreeusuallyassociatedwithownershipnor effective control over the goods sold; • theamountofrevenuecanbemeasuredreliably; • itisprobablethattheeconomicbenefitsassociatedwiththetransactionwillflowtotheGroup;and • thecostsincurredortobeincurredinrespectofthetransactioncanbemeasuredreliably.
Rendering of services Revenue from a contract to provide services is recognised by reference to the stage of completion of the contract.
Dividend and interest income Dividend income from investments is recognised when the shareholder’s right to receive payment has been established (provided that it is probable that the economic benefits will flow to the Group and the amount of income can be measured reliably).
Interest income from a financial asset is recognised when it is probable that the economic benefits will flow to the Group and the amount of income can be measured reliably. Interest income is accrued on a time basis, by reference to the principal outstanding and at the effective interest rate applicable, which is the rate that exactly discounts estimated future cash receipts through the expected life of the financial asset to that asset’s net carrying amount on initial recognition.
Rental income The Group’s policy for recognition of revenue from operating leases is described under “leasing” refer to note 3.14.
FOR THE YEAR ENDED 30 SEPTEMBER 2012
Notes to the Financial Statements - cont’d

29ARISTON HOLDINGS LIMITED | ANNUAL REPORT 2012
3. SUMMARY OF SIGNIFICANT ACCOUNTING POLICIES - continued
3.19 Share-based payments
Equity-settled share-based payments to employees and others providing similar services are measured at the fair value of the equity instruments at the grant date using the intrinsic value method.
The fair value determined at the grant date of the equity-settled share-based payments is expensed on a straight-line basis over the vesting period, based on the Group’s estimate of equity instruments that will eventually vest, with a corresponding increase in equity. At the end of each reporting period, the Group revises its estimate of the number of equity instruments expected to vest. The impact of the revision of the original estimates, if any, is recognised in profit or loss such that the cumulative expense reflects the revised estimate, with a corresponding adjustment to the share option reserve. The reserve created is transferred to share premium and share capital as options are exercised. For options that expire or are forfeited, the value relating to the expired or forfeited options is transferred to distributable reserves.
Equity-settled share-based payment transactions with parties other than employees are measured at the fair value of the goods or services received, except where that fair value cannot be estimated reliably, in which case they are measured at the fair value of the equity instruments granted, measured at the date the entity obtains the goods or the counterparty renders the service.
For cash-settled share-based payments, a liability is recognised for the goods or services acquired, measured initially at the fair value of the liability. At the end of each reporting period until the liability is settled, and at the date of settlement, the fair value of the liability is remeasured, with any changes in fair value recognised in profit or loss for the year.
3.20 Related party transactions and balances
Transactions between the Company and its subsidiaries, which are related parties of the Company, have been eliminated on consolidation. Transactions with other related parties such as directors, key management and shareholders are made at arm’s length. The amounts outstanding are unsecured and will be settled in cash. No guarantees have been given or received. No expense has been recognised in the period for bad or doubtful debts, in respect of the amounts owed by related parties.
The directors have assessed the recoverability of the receivables and are confident that the related parties’ balances are recoverable.
3.21 Foreign currencies
In preparing the financial statements of the Group, transactions in currencies other than the Group’s functional currency (foreign currencies) are recognised at the rates of exchange prevailing at the dates of the transactions. At the end of each reporting period, monetary items denominated in foreign currencies are retranslated at the rates prevailing at that date. Non-monetary items carried at fair value that are denominated in foreign currencies are retranslated at the rates prevailing at the date when the fair value was determined. Non-monetary items that are measured in terms of historical cost in a foreign currency are not retranslated. 4. CRITICAL ACCOUNTING JUDGMENTS AND KEY SOURCES OF ESTIMATION UNCERTAINTIES
In the application of the Group’s accounting policies, which are described above, the directors are required to make judgements, estimates and assumptions about the carrying amounts of assets and liabilities that are not readily apparent from other sources. The estimates and associated assumptions are based on historical experience and other factors that are considered to be relevant. Actual results may differ from these estimates.
FOR THE YEAR ENDED 30 SEPTEMBER 2012
Notes to the Financial Statements - cont’d

30 ARISTON HOLDINGS LIMITED | ANNUAL REPORT 2012
4. CRITICAL ACCOUNTING JUDGMENTS AND KEY SOURCES OF ESTIMATION UNCERTAINTIES - continued
Critical judgements in applying accounting policies
The following are the critical judgements, apart from those involving estimations, that the directors have made in the process of applying the Group’s accounting policies and that have the most significant effect on the amounts recognised in the consolidated financial statements. 4.1 Biological Assets
Estimated production per year
Production has been based on the average of the actual production for the past five years adjusted for projected growth. This provides the best possible estimate of the future generating capacities of the business. Selling prices
Selling prices for agricultural produce are quoted in US dollars. The best estimate of the future prices is based on an analysis of future price and production trends, particularly for tea.
Agricultural and Country Risk Factor
A risk factor of 45% has been used for all crops except tea, whose risk factor is 50%. This risk is attributed to inherent farming uncertainties such as changing rainfall patterns in coming seasons and the effects of global warming. The Company is planning to change its mix of tea produced with more emphasis being on value-added products like packaged tea and decaffeinated tea rather than bulk tea. The tea production volume is also expected to increase significantly as a result of fertilising and irrigation. There is thus an added risk that the Company may not be able to achieve the expected product mix and prices. Thus we have applied a further 5% risk attached to tea production crops.
Discount Factor
A discount factor of 21% per annum has been used. This discount factor has been derived from the weighted average cost of capital (WACC) using the Capital Asset Pricing Model (CAPM) for Ariston. The risk-free rate used for the computation of this WACC was derived from the US government bond yield.
The 10-year US government bond yield has been used due to the fact that the country is currently operating using a multi-currency system, and the Zimbabwean money market does not have long-term rates of yields for use as a risk-free rate.
4.2 Inventories
Inventories are stated at the lower of cost and net realisable value. Adjustments to reduce the cost of inventory to its net realisable value, if required, are made at the product level for estimated excess, obsolescence or damages. Factors influencing these adjustments include changes in demand, physical deterioration and quality issues.
FOR THE YEAR ENDED 30 SEPTEMBER 2012
Notes to the Financial Statements - cont’d

31ARISTON HOLDINGS LIMITED | ANNUAL REPORT 2012
4. CRITICAL ACCOUNTING JUDGMENTS AND KEY SOURCES OF ESTIMATION UNCERTAINTIES - continued
4.3 Allowance for credit losses
Allowance for credit losses is determined based upon a combination of factors to ensure that the trade receivables are not overstated due to uncollectability. The allowance for credit losses for all customers is based on a variety of factors, including the overall quality and ageing of the receivables and continuing credit evaluation of the customers’ financial circumstances. Also, specific provisions for individual accounts are recorded when the Group becomes aware of the customers’ inability to meet its financial obligations such as in the case of deterioration in the customer’s operating results or financial position.
4.4 Property, plant and equipment
The cost of property, plant and equipment is depreciated over the estimated useful life of the asset. The estimated useful life is based on expected usage of the asset and expected physical wear and tear, which depends on operational factors such as the number of shifts for which the asset is to be used and the repair and maintenance programme and technological obsolescence arising from changes and residual value. Management has assumed the residual value approximates nil due to the specialised nature and relative age of the property, plant and equipment with the exception of land and buildings.
4.5 Land
The Group has not recognised the value of land because the current legislation in the country vests all the land in the State. However, the Group still holds title deeds to the land that it operates on. The Group in 2003 entered into an agreement with the Government where it ceded part of the land for resettlement and the Government undertook to preserve the Group’s operations on the remaining land. To date, the Group’s operations have largely not been interfered with and the Group is of the view that this will remain so, going forward.
The directors believe that the preparation of the financial statements on a going-concern basis is still appropriate notwithstanding the dynamics of land ownership in Zimbabwe.
5. SEGMENT REPORTING
For management purposes, the Group is organised into four major divisions: Southdown Estates, Claremont Estate, Kent Estate, and FAVCO. These divisions are the basis on which the Group reports its business segment information.
The principal products and services of each of these divisions are as follows: Southdown Estates - the growing and manufacturing of tea, macadamia nuts, avocados and bananas. Claremont Estate - the growing of pome and stone fruit, breeder-protected field flowers and trout. Kent Estate - the growing of horticultural crops, poultry and livestock.
FAVCO - the distribution of fresh fruit and vegetables.
The Group does not report by geographical segments, as such, a split would not be meaningful for our operations and decision-making processes.
FOR THE YEAR ENDED 30 SEPTEMBER 2012
Notes to the Financial Statements - cont’d
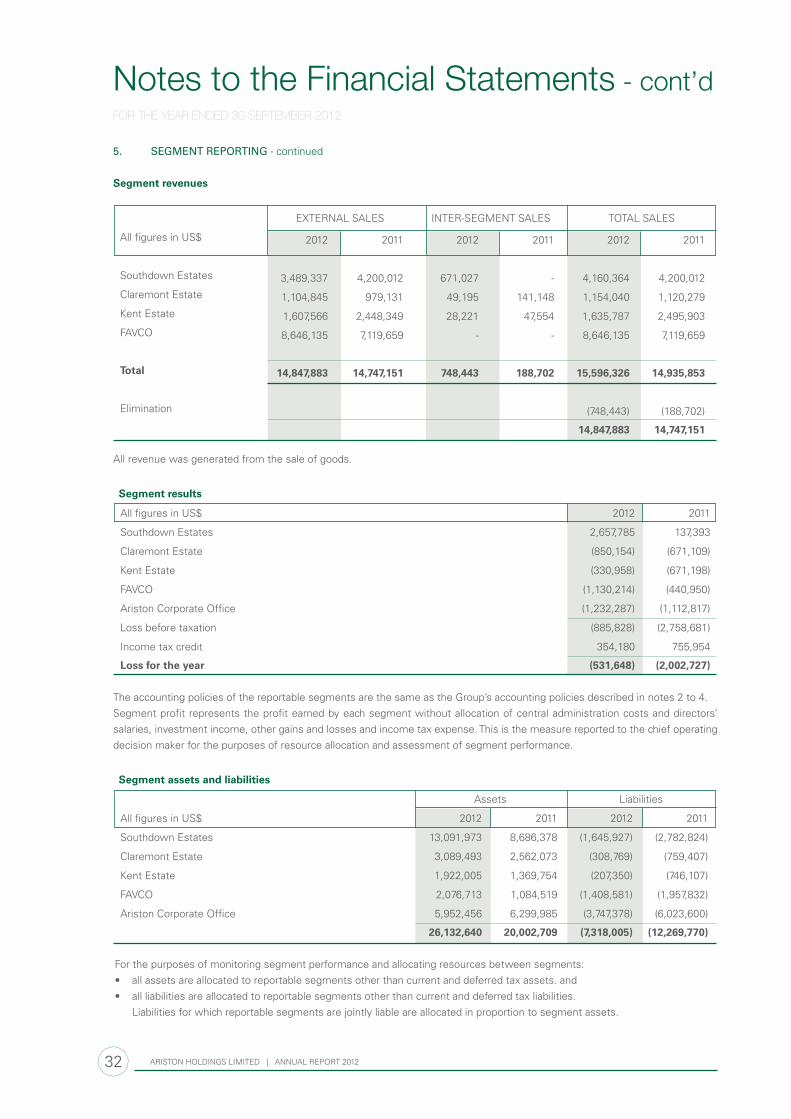
32 ARISTON HOLDINGS LIMITED | ANNUAL REPORT 2012
5. SEGMENT REPORTING - continued
Segment revenues
EXTERNAL SALES INTER-SEGMENT SALES TOTAL SALES
All figures in US$ 2012 2011 2012 2011 2012 2011
Southdown Estates 3,489,337 4,200,012 671,027 - 4,160,364 4,200,012
Claremont Estate 1,104,845 979,131 49,195 141,148 1,154,040 1,120,279
Kent Estate 1,607,566 2,448,349 28,221 47,554 1,635,787 2,495,903
FAVCO 8,646,135 7,119,659 - - 8,646,135 7,119,659
Total 14,847,883 14,747,151 748,443 188,702 15,596,326 14,935,853
Elimination (748,443) (188,702)
14,847,883 14,747,151
All revenue was generated from the sale of goods.
Segment results
All figures in US$ 2012 2011
Southdown Estates 2,657,785 137,393
Claremont Estate (850,154) (671,109)
Kent Estate (330,958) (671,198)
FAVCO (1,130,214) (440,950)
Ariston Corporate Office (1,232,287) (1,112,817)
Loss before taxation (885,828) (2,758,681)
Income tax credit 354,180 755,954
Loss for the year (531,648) (2,002,727)
The accounting policies of the reportable segments are the same as the Group’s accounting policies described in notes 2 to 4.Segment profit represents the profit earned by each segment without allocation of central administration costs and directors’ salaries, investment income, other gains and losses and income tax expense. This is the measure reported to the chief operatingdecision maker for the purposes of resource allocation and assessment of segment performance.
Segment assets and liabilities
Assets Liabilities
All figures in US$ 2012 2011 2012 2011
Southdown Estates 13,091,973 8,686,378 (1,645,927) (2,782,824)
Claremont Estate 3,089,493 2,562,073 (308,769) (759,407)
Kent Estate 1,922,005 1,369,754 (207,350) (746,107)
FAVCO 2,076,713 1,084,519 (1,408,581) (1,957,832)
Ariston Corporate Office 5,952,456 6,299,985 (3,747,378) (6,023,600)
26,132,640 20,002,709 (7,318,005) (12,269,770)
For the purposes of monitoring segment performance and allocating resources between segments:• allassetsareallocatedtoreportablesegmentsotherthancurrentanddeferredtaxassets.and• allliabilitiesareallocatedtoreportablesegmentsotherthancurrentanddeferredtaxliabilities. Liabilities for which reportable segments are jointly liable are allocated in proportion to segment assets.
FOR THE YEAR ENDED 30 SEPTEMBER 2012
Notes to the Financial Statements - cont’d

33ARISTON HOLDINGS LIMITED | ANNUAL REPORT 2012
5. SEGMENT REPORTING - continued
Other segment information
Depreciation and amortisation
Additions to non-current assets
All figures in US$ 2012 2011 2012 2011
Southdown Estates 122,371 142,585 1,214,756 152,725
Claremont Estate 86,472 75,770 590,413 61,906
Kent Estate 79,859 62,898 643,727 158,904
FAVCO 89,797 72,015 439,250 198,001
Ariston Corporate Office 403,476 397,329 65,708 55,356
Total 781,975 750,597 2,953,854 626,892
Revenue from major products and services
The following is an analysis of the Group’s revenue from its major products and services.
All figures in US$ 2012 2011
Tea 2,691,634 2,818,000
Macadamia nuts 1,403,292 1,382,012
Vegetables and fruits 9,084,428 7,897,000
Poultry 1,138,124 2,022,159
Other 530,405 627,980
Total 14,847,883 14,747,151
Information about major customers
Included in revenues arising from direct sales of vegetables and fruits of US$9,084,428 (2011: US$7,897,000) (above) are revenues of approximately US$7,144,133 (2011: US$6,436,000) which arose from sales to the Group’s largest customer which operates in the retail market. No other customer contributed 10% or more to the Group’s revenue for both 2012 and 2011.
FOR THE YEAR ENDED 30 SEPTEMBER 2012
Notes to the Financial Statements - cont’d

34 ARISTON HOLDINGS LIMITED | ANNUAL REPORT 2012
6. CASH FLOw INFORMATION
All figures in US$ 2012 2011
6.1 Non-cash items
Depreciation (including biological assets) 781,975 750,597
Impairment loss of biological assets 1,376,285 -
Fair value adjustments of biological assets (4,119,919) (716,779)
Loss/(profit) on sale of property, plant and equipment 1,476 ( 18,424)
Unrealised exchange gains (24,245) -
(1,984,428) 15,394
6.2 Change in working capital
Movements in:
(Increase)/decrease in inventories (562,884) 576,427
Increase in trade and other receivables (798,820) (312,789)
Increase in trade and other payables 70,560 673,644
(1,291,144) 937,282
7. LOSS FROM OPERATIONS
This is stated after charging and crediting:
- auditors' remuneration 90,000 70,000
- allowance for credit losses 203,673 15,121
- debtors’ write-off (see below) 760,480 3,666
- depreciation (including biological assets) 781,975 750,597
- loss/(profit) on disposal of property, plant and equipment 1,476 (18,424)
- selling and distribution expenses 1,991,497 1,860,635
- staff costs
•salariesandwages 3,895,701 2,455,182
•pensions 63,718 199,848
Directors' emoluments
•fees 58,545 13,880
FOR THE YEAR ENDED 30 SEPTEMBER 2012
8. INCOME TAX CREDIT
Income tax - 20,026
Deferred tax credit 354,180 735,928
354,180 755,954
Reconciliation of income tax credit for the year
Notional tax at statutory rates (0.26) (0.26)
Adjustments relating to:
- Non-taxable / non-deductible items (0.12) (0.01)
Actual income tax (credit)/charge (0.38) (0.27)
The debtor balance written off in current year is in respect of disputed balances between the Group and one of its major customers.
Notes to the Financial Statements - cont’d

35ARISTON HOLDINGS LIMITED | ANNUAL REPORT 2012
9. EARNINGS PER SHARE
All figures in US$ 2012 2011
Loss after tax (531,648) (2,002,727)
(i) Weighted average number of shares in issue at year end 856,776,760 445,087,262
Loss per share (dollars) (0.0006) (0.0045)
(ii) Weighted average number of shares used in the calculation of basic earnings per share 856,776,760 445,087,262
Shares deemed to be issues in respect of employee options 3,000,000 3,000,000
Weighted average number of ordinary shares used in the calculation of diluted earnings per share
859,776,760 448,087,262
Diluted loss per share (dollars) (0.0006) (0.0045)
10. PROPERTY, PLANT AND EqUIPMENT
Land, buildings and leasehold improvements
At cost / valuation 16,139,735 15,922,452
Accumulated depreciation (9,289,375) (9,010,015)
Net carrying amount 6,850,360 6,912,437
Plant, furniture and fittings
At cost / valuation 23,103,681 22,071,155
Accumulated depreciation (21,002,064) (20,759,398)
Net carrying amount 2,101,617 1,311,757
Motor vehicles
At cost / valuation 2,716,525 1,984,308
Accumulated depreciation (1,487,041) (1,729,395)
Net carrying amount 1,229,484 254,913
Total property, plant and equipment
At cost / valuation 41,959,941 39,977,915
Accumulated depreciation (31,778,480) (31,498,808)
Net carrying amount 10,181,461 8,479,107
FOR THE YEAR ENDED 30 SEPTEMBER 2012
Notes to the Financial Statements - cont’d

36 ARISTON HOLDINGS LIMITED | ANNUAL REPORT 2012
10. PROPERTY, PLANT AND EqUIPMENT - CONTINUED
All figures in US$ 2012 2011
Reconciliation of movements for the year
Carrying amount at beginning of year 8,479,107 8,642,749
Additions at cost
- land, buildings and leasehold improvements 217,283 90,881
- plant, furniture and fittings 1,163,721 257,195
- motor vehicles 1,141,916 246,595
2,522,920 594,671
Disposals at carrying amount
- land, buildings and leasehold improvements - -
- plant, furniture and fittings (5,706) (696)
- motor vehicles (33,581) (7,716)
(39,287) (8,412)
Depreciation for the year
- land, buildings and leasehold improvements (279,361) (398,694)
- plant, furniture and fittings (368,155) (276,429)
- motor vehicles (133,763) (74,778)
(781,279) (749,901)
Carrying amount at end of year 10,181,461 8,479,107
11. BIOLOGICAL ASSETS
2012 Tea Macadamia Fruit trees
Livestock,
trout and
poultry
FlowersFresh
produceTotal
Carrying amount at the beginning of the year 3,949,115 2,763,118 1,550,890 368,070 88,735 27,196 8,747,124
Additions - 81,590 309,316 36,400 3,627 - 430,934
Loss on orchard scrapping (1,066,261) - (299,375) - (10,648) - (1,376,285)
Depreciation - - - (696) - - (696)
Disposals - - - (15,080) - - (15,080)
Fair value adjustment 3,724,461 (53,328) 409,664 (83,201) (51,612) 173,936 4,119,919
Carrying amount at
the end of the year 6,607,315 2,791,380 1,970,495 305,493 30,102 201,132 11,905,916
Current 206,829 974,536 507,749 193,158 - 201,828 2,084,101
Non-current 6,400,486 1,816,844 1,462,049 112,335 30,102 - 9,821,815
6,607,315 2,791,380 1,969,799 305,493 30,102 201,828 11,905,916
FOR THE YEAR ENDED 30 SEPTEMBER 2012
Notes to the Financial Statements - cont’d

37ARISTON HOLDINGS LIMITED | ANNUAL REPORT 2012
FOR THE YEAR ENDED 30 SEPTEMBER 2012
2011 Tea Macadamia Fruit trees
Livestock,
trout and
poultry
FlowersFresh
produceTotal
Carrying amount at the beginning of the year 4,171,505 1,538,854 1,987,596 44,195 235,574 21,095 7,998,820
Additions - 32,221 - - - - 32,221
Depreciation - - - (696) - - (696)
Fair value adjustment (222,390) 1,192,043 (436,706) 324,571 (146,839) 6,101 716,779
Carrying amount at
the end of the year 3,949,115 2,763,118 1,550,890 368,070 88,735 27,196 8,747,124
Current - - - 278,260 - 27,196 305,456
Non-current 3,949,115 2,763,118 1,550,890 89,810 88,735 - 8,441,668
3,949,115 2,763,118 1,550,890 368,070 88,735 27,196 8,747,124
During the year, losses of US$1,376,285 were recognised in respect of old and less productive orchards that were scrapped out.
12. INvESTMENTS
COMPANY GROUP
All figures in US$ 2012 2011 2012 2011
Unquoted shares in subsidiaries 8,999 8,999 - -
Unquoted - Europi 25,650 25,650 25,650 25,650
34,649 34,649 25,650 25,650
Details of the Group’s principal subsidiaries, all incorporated in Zimbabwe at 25 September 2012 are as follows:
NAME OF SUBSIDIARY OWNERSHIP INTEREST PRINCIPAL ACTIVITY Claremont Orchards 1988 (Private) Limited 100% Property Company Claremont Orchards Holdings (Private) Limited 100% Property Company Southdown Holdings (Private) Limited 100% Property Company Ariston Mangement Services (Private) Limited 100% Owns Claremont Estate, FAVCO, Southdown Estate and Kent Estate.
13. INvENTORIES
All figures in US$ 2012 2011
Farm produce 487,157 580,104
Stores and materials 1,037,529 381,698
1,524,686 961,802
The cost of inventories recognised as an expense includes US$210,828 (2011: US$215,712) in respect of write- downs of inventory to net realisable value. The significant portion of this write-down relates to fresh produce that would have gone beyond its useful life.
Notes to the Financial Statements - cont’d

38 ARISTON HOLDINGS LIMITED | ANNUAL REPORT 2012
14. TRADE AND OTHER RECEIvABLES
COMPANY GROUP
All figures in US$ 2012 2011 2012 2011
Trade - - 1,365,853 1,689,541
Other 8,461,394 767,731 1,122,508 -
8,461,394 767,731 2,488,361 1,689,541
All Company receivables are deemed to be current and owed by subsidiary companies.
The average credit period for trade receivables is 34 days (2011: 42 days). No interest is charged on overdue trade receivables. The Group provides fully for all receivables outstanding over 365 days because historical experience is such that the receivables that are aged beyond 365 days are generally not recoverable. The Group provides for receivables aged between 91 days and 365 days on a case-by-case basis where subsequent developments suggest that recovery of the amounts is doubtful.
Trade receivables disclosed above include amounts (see below for aged analysis) that are past due at the end of the reporting period, for which the Group has not recognised an allowance for doubtful debts because there has not been a significant change in credit quality and the amounts are still considered recoverable. The Group does not hold any collateral or other credit enhancements over these balances nor does it have a legal right of offset against any amounts owed by the Group to the counterparty. The past due but not impaired balances amount to US$275,074 (2011: US$361,498)
GROUP
All figures in US$ 2012 2011
Current 514,424 -
30-90 days 576,355 1,328,043
Above 90 days 275,074 361,498
1,365,853 1,689,541
Movement in allowance for credit losses
Balance at the beginning of the year 40,794 25,673
Impairment losses recognised on receivables 203,673 15,121
Balance at year end 244,467 40,794
In determining the recoverability of a trade receivable, the Group considers any change in the credit quality of the trade receivable from the date credit was initially granted up to the reporting date. The concentration of credit risk is limited due to the customer base being large and unrelated. Accordingly, management believes that there is no further credit provision required in excess of the allowance for credit losses.
The allowance for credit losses does not include any individually impaired trade receivables which have been placed under liquidation.
Assets pledged as security
A Notarial General Covering Bond incorporating cession of book for US$5 million, has been registered as security to secure borrowings from CABS. This borrowing has since been repaid subsequent to year end. (See note 18)
FOR THE YEAR ENDED 30 SEPTEMBER 2012
Notes to the Financial Statements - cont’d

39ARISTON HOLDINGS LIMITED | ANNUAL REPORT 2012
15. SHARE CAPITAL
NO. OF SHARES
AUTHORISED SHARE CAPITAL 2012 2011
Issued shares at the end of the year 1,378,420,595 445,087,262
Unissued shares :
- Shares allocated to share option scheme 23,000,000 23,250,000
- Shares under the control of directors 197,364,405 230,447,738
- Shares under the control of shareholders 1,215,000 1,215,000
1,600,000,000 700,000,000
All figures in US$ 2012 2011
Issued
1,378,420,595 ordinary shares of US 0.1 cents each (2011: 445,087,262 ordinary shares of US 0.1 cents each) 1,378,420 445,087
Share options exercised -nil (2011: 750,000 ordinary shares of US 0.1 cents each) - 750
Movement in the number of ordinary shares
2012 2011
At beginning of year 445,087,262 444,337,262
Share options exercised - 750,000
Rights Issue 933,333,333 -
At end of year 1,378,420,595 445,087,262
The details of options outstanding under the new schemes are as follows:
2012 2011
Actual Actual
No. of shares No. of shares
(2003) scheme
Date of grant Expiry Date Price
28 March 2003 27 March 2013 ZW$ 0.09 785,000 785,000
18 August 2003 17 August 2013 ZW$ 0.40 1,200,000 1,200,000
5 November 2004 4 November 2014 ZW$ 0.20 2,510,000 2,510,000
4,495,000 4,495,000
FOR THE YEAR ENDED 30 SEPTEMBER 2012
Notes to the Financial Statements - cont’d

40 ARISTON HOLDINGS LIMITED | ANNUAL REPORT 2012
15. SHARE CAPITAL - CONTINUED
2012Actual No. of shares
2011Actual No. of shares
Movements for the year
Options outstanding at beginning of year 1,720,000 1,720,000
- new options granted - -
- options exercised - -
- options cancelled - -
Options outstanding at end of year 1,720,000 1,720,000
(2005) scheme
Date of grant Expiry Date Price
23 May 2006 22 May 2016 ZW$6.80 4,135,000 4,135,000
27 February 2007 26 February 2017 ZW$110 6,000,000 6,000,000
2 May 2008 1 May 2018 ZW$4 500 000 820,000 820,000
10,955,000 10,955,000
Movements for the year
Options outstanding at beginning of year 1,280,000 2,030,000
- new options granted - -
- options exercised - (750,000)
- options cancelled - -
Options outstanding at end of year 1,280,000 1,280,000
Total outstanding 3,000,000 3,000,000
All share options have vested.
16. DEFERRED TAX
COMPANY GROUP
All figures in US$ 2012 2011 2012 2011
Deferred tax liability
At the beginning of year 1,283 1,283 4,238,254 4,266,728
Deferred tax charged / (released) to
- income statement (i) - - 525,823 (28,474)
1,283 1,283 4,764,077 4,238,254
Analysis of deferred tax
Property, plant and equipment - - 2,120,860 2,047,968
Biological assets - - 2,633,323 2,189,004
Prepayments and receivables 1,283 1,283 3,652 1,282
Unrealised foreign exchange gain / (loss) - - 6,242 -
1,283 1,283 4,764,077 4,238,254
Deferred tax asset
At the beginning of year - - 1,345,547 638,093
Deferred tax released to
- income statement (ii) - - 880,003 707,454
Deferred tax asset arising from tax loss - - 2,225,550 1,345,547
Income tax credit (net of (i) and (ii)) - - 354,180 735,928
FOR THE YEAR ENDED 30 SEPTEMBER 2012
Notes to the Financial Statements - cont’d

41ARISTON HOLDINGS LIMITED | ANNUAL REPORT 2012
17. TRADE AND OTHER PAYABLES
COMPANY GROUP
All figures in US$ 2012 2011 2012 2011
Trade - - 1,765,778 3,517,814
Other 73,768 73,768 1,903,909 105,558
73,768 73,768 3,669,687 3,623,372
The average credit period on purchases is 64 days (2011: 87 days). No interest is charged on the trade payables. The Group has financial risk management policies in place to ensure that all payables are settled within the credit timeframe.
All figures in US$ 2012 2011
At 25 September 2012 the ageing analysis of trade payables was as follows:
Current 183,406 -
30-90 days 647,929 1,331,907
91-120 days 576,152 1,214,141
Above 120 days 358,291 971,766
1,765,778 3,517,814
Provisions
Employee benefits (current) 189,296 192,348
189,296 192,348
The provision for employee benefits represents annual leave.
18. BORROwINGS
All figures in US$ 2012 2011
Ariston Management Services (Private) Limited has borrowing facilities totalling US$7,128,000 (2011; US$6,263,000). The utilised portion was: 3,648,318 4,408,144
Unsecured–atamortisedcostLoans from banks 2,331,540 488,994
Bank overdrafts 1,008,670 819,056
Other loans 99,047 406,047
3,439,257 1,714,097
Secured–atamortisedcost
Loans from banks (see note 14) 209,061 2,694,047
209,061 2,694,047
Current 2,648,318 4,286,895
Non-current 1,000,000 121,249
3,648,318 4,408,144
The weighted average effective interest rate on loans is 21% per annum (2011: 17% per annum.)
FOR THE YEAR ENDED 30 SEPTEMBER 2012
Notes to the Financial Statements - cont’d

42 ARISTON HOLDINGS LIMITED | ANNUAL REPORT 2012
19. CAPITAL COMMITMENTS
All figures in US$ 2012 2011
Commitments for capital expenditure approved by the directors:
- authorised but not contracted 3,214,860 1,177,025
3,214,860 1,177,025
The commitments will be financed from the Group’s resources and existing facilities. As at the date of this report, there are no agreements concluded in respect of any acquisitions.
20. FINANCIAL RISK MANAGEMENT
Derivative financial instruments
The Group does not use derivative financial instruments in its management of foreign currency. Derivative financial instruments are not held or issued for trading purposes.
Interest rate risk management
Group policy is to adopt a non-speculative approach to manage interest rate risk whilst maximising profit.
Credit risk management
This refers to the risk that a counterparty will default on its contractual obligations resulting in financial loss to the Group. The Group has adopted a policy of only dealing with creditworthy counterparties. The Group conducts credit assessment on these counterparties based on publicly available information and the Group’s own trading records to rate its major customers. The Group’s exposure and the credit ratings of its counterparties are continuously monitored and the aggregate value of transactions concluded is spread among approved counterparties. Credit exposure is controlled by counterparty limits that are reviewed and approved regularly. Trade receivables consist of a large number of customers, spread across diverse industries and geographical areas. Ongoing credit evaluation is performed on the financial condition of accounts receivable. Apart from one customer in the retail market who is also the largest customer of the Group, the Group does not have significant credit risk exposure to any single counterparty or any group of counterparties having similar characteristics. The Group defines counterparties as having similar characteristics if they are related entities. Concentration of credit risk related to this retail market customer approximates 20% of gross monetary assets at any time during the year. Concentration of credit risk to any other counterparty did not exceed 20% of gross monetary assets at any time during the year.
Liquidity risk management
Ultimate responsibility for liquidity risk management rests with the Board of Directors, which has built an appropriate liquidity risk management framework for the management of the Group’s short, medium and long-term funding and liquidity management requirements. The Group manages liquidity risk by maintaining adequate reserves, banking facilities and reserve borrowing facilities by continuously monitoring forecast and actual cash flows and matching the maturity profiles of financial assets and liabilities.
The following tables detail the Group’s remaining contractual maturity for its non-derivative financial liabilities with agreed repayment periods. The tables have been drawn up based on the undiscounted cash flows of financial liabilities, based on the earliest date on which the Group can be required to pay. The tables include both interest and principal cash flows. The contractual maturity is based on the earliest date on which the Group may be required to pay.
FOR THE YEAR ENDED 30 SEPTEMBER 2012
Notes to the Financial Statements - cont’d

43ARISTON HOLDINGS LIMITED | ANNUAL REPORT 2012
20. FINANCIAL RISK MANAGEMENT - CONTINUED
Weightedaverage effectiveinterest
rateLess than 1 month
1-3 months
3 months to 1 year 1-5 years 5+ years Total
% US$ US$ US$ US$ US$ US$
2012
Fixed interest rate loans 21 1,600,184 - 1,048,134 1,000,000 - 3,648,318
2011
Fixed interest rate loans 17 1,524,773 1,265,216 1,496,906 121,249 - 4,408,144
The Group has access to financing facilities amounting to US$7,128,000 (2011; US$6,263,000) and US$3,479,682 (2011: US$1,854,856) were unused at the end of the reporting period. The Group expects to meet its obligations from cash flows and proceeds of maturing financial assets.
Foreign exchange risk management
The Group operates certain transactions denominated in foreign currencies, hence exposure to exchange rate fluctuations arise. The Group’s net foreign asset exposure as at year end determined at the fair market rates is summarised as:
Foreign Balance US$ Balance
2012 2011 2012 2011
Bank balances
European Union Euro - 201 - 289
South African Rand - 1,115 - 134
- 423
Trade receivables
European Union Euro 1,226 - 1,635 -
Trade payables
South African Rand (4,917,678) - (597,604) -
(595,969) 423
Foreign currency sensitivity analysis
The Group is mainly exposed to the Rand and Euro currencies.
The following table details the Group’s sensitivity to a 10% increase and decrease in the US$ against the relevant foreign currencies. 10% is the sensitivity rate used when reporting foreign currency risk internally to key management personnel and represents management’s assessment of the reasonably possible change in foreign exchange rates. The sensitivity analysis includes only outstanding foreign currency denominated monetary items and adjusts their translation at the period end for a 10% change in foreign currency rates. The sensitivity analysis includes all external
FOR THE YEAR ENDED 30 SEPTEMBER 2012
Notes to the Financial Statements - cont’d

44 ARISTON HOLDINGS LIMITED | ANNUAL REPORT 2012
20. FINANCIAL RISK MANAGEMENT - CONTINUED
balances where the denomination of the balances is in a currency other than the functional currency of the Group. A positive number below indicates an increase in profit or equity where the US$ strengthens 10% against the relevant currency. For a 10% weakening of the US$ against the relevant currency, there would be a comparable impact on the profit or equity, and the balances below would be negative.
Rand impact
2012 2011
US$ US$
10% increase 10% decrease 10% increase 10% decrease
Profit and loss 54,329 (66,399) 12 (15)
Euro impact
2012 2011
US$ US$
10% increase 10% decrease 10% increase 10% decrease
Profit and loss 48 (304) 48 (6)
The Group’s sensitivity to foreign currency has increased during the current year mainly due to the increase in purchases which has resulted in higher Rand denominated trade payables.
Fair values
The carrying amounts of receivables, cash and short-term deposits, payables and accrued expenses, and short-term borrowings approximate their fair values due to the short-term maturities of these assets and liabilities.
21. CAPITAL MANAGEMENT
The Group manages its capital to ensure that entities in the Group will be able to continue as going concerns while maximising the return to stakeholders through the optimisation of the debt and equity balance. The Group’s overall strategy remains unchanged from 2011.
The capital structure of the Group consists of net debt and equity of the Group (comprising issued capital, reserves, and retained earnings. The Group is not subject to any externally imposed capital requirements).
The Group’s Board reviews the capital structure of the Group regularly. As part of this review, the Board considers the cost of capital and the risks associated with each class of capital. The gearing ratio at 25 September 2012 was 22% (2011- 47%).
FOR THE YEAR ENDED 30 SEPTEMBER 2012
Notes to the Financial Statements - cont’d

45ARISTON HOLDINGS LIMITED | ANNUAL REPORT 2012
21. CAPITAL MANAGEMENT - CONTINUED
Gearing ratio
The gearing ratio at end of the reporting period was as follows.
All figures are in US$ 2012 2011
Debt (i) 3,648,318 4,408,144
Cash and bank balances 6,566 99,485
Net debt 3,641,752 4,308,659
Equity (ii) 16,276,108 9,078,486
Net debt to equity ratio 22% 47%
(i) Debt is defined as long and short-term borrowings (ii) Equity includes all capital and reserves of the Group that are managed as capital. 22. RELATED PARTY DISCLOSURES
Trading transactions During the year, Group entities entered into the following trading transactions with related parties that are not members of the Group:
Consultancy fees Purchase of goods
All figures are in US$ 2012 2011 2012 2011
Afrifresh - common ownership 120,109 - 39,479 -
Berfin - common ownership - - 480,768 -
Emvest - former shareholder - - 572,997 1,051,557
Fruit Du Suid - common ownership - - 93,162 -
Sales of goods to related parties were made at the Group’s usual list prices. Purchases were made at market price to reflect the quantity of goods purchased and the relationships between the parties. Emvest is the former major shareholder in the Group.
The following balances were outstanding at the end of the reporting period:
Receivables Payables
All figures are in US$ 2012 2011 2012 2011
Afrifresh - - 120,109 -
Berfin - - 238,174 -
Emvest 137,296 10,607 168,927 85,421
Fruit Du Suid - - 56,169 -
Origin Global Holdings Limited - shareholder 69,678 - - -
Directors and Key Management - - 51,863 54,356
The amounts outstanding are unsecured and will be settled in cash. No guarantees have been given or received. No expense has been recognised in the current or prior years for bad or doubtful debts in respect of the amounts owed by related parties.
FOR THE YEAR ENDED 30 SEPTEMBER 2012
Notes to the Financial Statements - cont’d

46 ARISTON HOLDINGS LIMITED | ANNUAL REPORT 2012
22. RELATED PARTY DISCLOSURES - CONTINUED
Compensation of key management personnel
The remuneration of directors and other members of key management personnel during the year was as follows:
All figures are in US$ 2012 2011
Short-term benefits 495,297 413,474
Post-employment benefits 13,068 62,417
508,365 475,891
The remuneration of directors and key executives is determined by the Human Resources and Remuneration Committee having regard to the performance of individuals and market trends.
23. THE GROUP AS LESSEE
Leasing arrangements
Operating leases relate to leases of land and property . All operating lease contracts are reviewed on a regular basis. The Group does not have an option to purchase the leased land or property at the expiry of the lease periods.
Payments recognised as an expense
All figures are in US$ 2012 2011
Minimum lease payments 243,230 312,051
24. DEFINED CONTRIBUTION PLANS
The Group operates a defined contribution retirement benefit plan for all qualifying employees. The assets of the plan are held separately from those of the Group in funds under the control of trustees. Where employees leave the plan prior to full vesting of the contributions, the contributions payable by the Group are reduced by the amount of forfeited contributions.
The employees of the Group are also members of a State-managed retirement benefit plan operated by the National Social Security Authority (NSSA). The Group is required to contribute a specified percentage of basic pay to the retirement benefit scheme to fund the benefits. The only obligation of the Group with respect to the retirement benefit plan is to make the specified contributions.
The total expense recognised in the consolidated statement of comprehensive income amounts to US$63,718 (2011: US$244,798) representing contributions payable to these plans by the Group at rates specified in the rules of the plans.
Due to lack of cash resources in prior periods, the Group accumulated benefit arrears in respect of both the defined contribution retirement plan and NSSA contributions. The Group applied for a “paid-for” exemption for the defined contribution retirement plan so as to halt the increase in outstanding contributions as well as provide the Group an opportunity to clear its arrears. The Group anticipates to resume contributions to the plan in the next financial year.
FOR THE YEAR ENDED 30 SEPTEMBER 2012
Notes to the Financial Statements - cont’d

47ARISTON HOLDINGS LIMITED | ANNUAL REPORT 2012
ANALYSIS OF
SHAREHOLDERS
SIZE OF SHAREHOLDING NUMBER OF SHAREHOLDERS
% NO. OF SHAREHOLDERS
SHARES HELD
% OF SHARES HELD
1 - 5,000 844 62.15 1,364,761 0.0990
5,001 - 10,000 147 10.82 1,099,329 0.0798
10,001 - 50,000 221 16.27 4,763,258 0.3555
50,001 - 100,000 50 3.68 3,543,663 0.2571
100,001 - 99,999,999,999 96 7.07 1,367,649,584 99.2166
1,358 100.00 1,378,420,595 100.00
CATEGORIES OF
SHAREHOLDERS
SHAREHOLDERS GROUP NUMBER OF SHAREHOLDERS
% NO. OF SHAREHOLDERS
TOTAL HOLDING
% OF TOTAL HOLDING
COMPANIES 172 12.67 40,017,509 2.90
INDIVIDUALS 1,013 74.59 25,807,863 1.88
INSURANCE COMPANIES 8 0.59 54,169,235 3.93
INVESTMENT, TRUST AND PROPERTY COMPANIES
11 0.81 1,055,714 0.08
NOMINEE COMPANY 47 3.46 20,308,873 1.47
NON RESIDENT TRANSFERABLE
74 5.45 1,107,302,980 80.33
PENSION FUNDS 33 2.43 129,758,421 9.41
1,358 100.00 1,378,420,595 100.00
Shareholders’ ProfileFOR THE YEAR ENDED 30 SEPTEMBER 2012

48 ARISTON HOLDINGS LIMITED | ANNUAL REPORT 2012
TOP TwENTY SHAREHOLDERS
HOLDER NAME NO HELD % HELD
ORIGIN GLOBAL HOLDINGS LIMITED 932,436,981 67.65
STANBIC NOMINEES (PRIVATE) LIMITED-NEW NON RESIDENT 84,608,731 6.14
NATIONAL SOCIAL SECURITY AUTHORITY 49,922,208 3.62
AL SHAMS BUILDING MATERIAL & TRADING L. L. C. 46,725,644 3.39
NSSA NPS 41,948,382 3.04
OLD MUTUAL LIFE ASSURANCE COMPANY ZIMBABWE LIMITED 40,741,809 2.96
STANDARD CHARTERED NOMINEES (PRIVATE) LIMITED-NNR 24,291,452 1.76
BARATO INVESTMENTS LIMITED 23,598,810 1.71
STANDARD CHARTERED NOMINEES (PRIVATE) LIMITED-NNR 17,582,418 1.28
NATIONAL SOCIAL SECURITY AUTHORITY - WCIF 12,935,950 0.94
NATIONAL SOCIAL SECURITY AUTHORITY - NPS 12,465,046 0.90
WORKERS’ COMPENSATION INSURANCE FUND 11,596,485 0.84
I H NOMINEES (PRIVATE) LIMITED 7,829,583 0.57
NSSA - WCIF ACCOUNT 7,590,476 0.55
FED NOMINEES (PRIVATE) LIMITED 4,678,128 0.34
NSSA-WCIF 3,795,238 0.28
BARCLAYS PENSION FUND A/C IMARA 2,906,161 0.21
MIMOSA MINING PENSION FUND - IMARA 2,461,908 0.18
EQUIVEST NOMINEES 2,447,103 0.18
EDWARDS NOMINEES (PRIVATE) LIMITED 2,094,017 0.15
TOTAL HOLDING OF TOP TWENTY SHAREHOLDERS 1,332,656,530 96.68
REMAINING HOLDING 45,764,065 3.32
TOTAL ISSUED SHARES 1,378,420,595 100
Shareholders’ Profile - cont’dFOR THE YEAR ENDED 30 SEPTEMBER 2012

49ARISTON HOLDINGS LIMITED | ANNUAL REPORT 2012
Notice to Shareholders
NOTICE IS HEREBY GIVEN that the Sixty Sixth Annual General Meeting of Ariston Holdings Limited will be held in the Centenary Room, Royal Harare Golf Club, 5th Street Extension, Harare on 15 February 2013 at 2:00pm for the transaction of the following business: ORDINARY BUSINESS 1. To receive, consider and adopt the audited financial statements and reports of directors and auditors for the year ended 30 September 2012. 2. To elect directors in place of those retiring in accordance with the provisions of the Articles of Association.3. To appoint auditors for the ensuing year and to fix their remuneration for the past audit. 4. To approve directors’ emoluments for the year ended 30 September 2012. By order of the Board
F.N. MUSINGA
Company Secretary
16 January 2013
REGISTERED OFFICE 306 Hillside Road Msasa Woodlands P.O. Box 4019 Harare
Note:
A member entitled to attend and vote at the above meeting may appoint a proxy to attend, vote, and speak on his behalf. A proxy need not be a member of the Company. A form of proxy is enclosed. For it be valid it should be completed and returned so as to reach the registered office of the Company not less than 24 hours before the time fixed for the meeting. Completion of the proxy form does not preclude a member from subsequently attending and voting in person.

50 ARISTON HOLDINGS LIMITED | ANNUAL REPORT 2012

306 Hillside Road, Msasa WoodlandsP.O. BOX 4019, Harare, Zimbabwe