annual report for the year ended 30 june · pdf fileannual report for the year ended 30 june...
TRANSCRIPT

ANNUAL REPORT FOR THE
YEAR ENDED 30 JUNE 2016


CONTENTS
Corporate Governance 2Statement of Corporate Intent – Performance Reporting
6
Register of Directors’ Interests 8Financial Statements 16Notes to the Consolidated Financial Statements 22Independent Auditor’s Report 48Directory 51
ANNUAL REPORT 2016 1
CORPORATE GOVERNANCE
12

the Company is delegated to the Chief Executive appointed by the Board. The Board agrees targets and objectives with the Chief Executive and monitors and reviews Management’s performance. The Board must make decisions in accordance with the Company’s Statement of Corporate Intent.
Board CompositionThe Company’s Constitution provides that the Board will consist of between six and eight Directors, and not more than two Directors can be members or employees of a local authority that owns voting securities in the Company. One third of the Directors must retire by rotation at each annual meeting. In addition to the Constitution requirements, the Board’s policy is that Directors should possess a balance of skills, knowledge, experience and perspectives so that the Board works effectively.
Continuous ImprovementThe Company provides induction training for new appointees to the Board and Directors, and they are encouraged to undertake ongoing training to remain
ETHICAL STANDARDSCompany Directors and employees are expected to act honestly, in good faith and in the best interests of the Company as required by law at all times. Directors observe and foster high ethical standards throughout the Company. To that end, the Board has adopted a Code of Conduct for employees and a fraud prevention policy which addresses:
• conflicts of interest,
• protection of Company information,
• protection of Company assets and property,
• acceptance of gifts or benefits (and the prohibition of bribes and facilitation payments),
• relations with customers, suppliers and employees, and
• compliance with laws and policies.
Mechanisms are in place for the reporting of unethical behaviour and breaches of the Code of Conduct and other Company policies, which may lead to disciplinary action. A Directors’ interests register is maintained and reviewed at each Board meeting. Directors’ interests are disclosed in the Company’s Annual Report.
ROLE OF BOARDThe Board is responsible for corporate governance and the direction and supervision of the Company’s business. Day to day management of
current on how to best perform their duties as Directors. The Board has a formal procedure for regular evaluation of the effectiveness and performance of the Board and its individual members.
COMMITTEES OF THE BOARDThe Board has the following two Committees:• Audit and Finance
Committee and
• Remuneration Committee.
The Committees make recommendations to the Board and exercise the Board’s decision making powers when they have been delegated authority to do so. The composition, terms of reference and performance of each of the Committees are reviewed regularly by the Board. The Board also has a representation on the Management Health and Safety Committee. The Committee’s responsibilities are detailed below.
Audit and Finance CommitteeThe Audit and Finance Committee (AFC) consists of at least three non-
LYTTELTON PORT COMPANY STRIVES FOR BEST PRACTICE IN CORPORATE GOVERNANCE.
ANNUAL REPORT 2016 3
CORPORATE GOVERNANCE
executive Directors, at least one of whom must have an accounting or financial background. The Chairman of the Board may not be the Chairman of the AFC.
The responsibilities of the AFC include:
• ensuring that processes are in place and monitoring those processes so that the Board is properly and regularly informed and updated on corporate financial matters,
• reviewing the Company’s financial reports,
• liaising with the external auditors on behalf of the Board and ensuring the independence of the auditors is not impaired, or could reasonably be perceived to be impaired,
• monitoring and reviewing the Company’s accounting policies, internal controls and related matters, and
• verifying that the Company has appropriate processes to identify and manage potential and relevant risks.
Remuneration CommitteeThe Remuneration Committee consists of at least three non-executive Directors.
The responsibilities of the Remuneration Committee include:
• assisting the Board in the establishment of the remuneration policies and practices for the Company,
• undertaking the annual performance appraisal of the Chief Executive and reviewing the performance appraisals of Senior Management, and
• reviewing the remuneration of the Chief Executive and Senior Management, and the design and operation of the incentive programme, and making appropriate recommendations to the Board.
Management Health and Safety Committee (with Board representation)The Management Health and Safety Committee is a Management Committee and
has one Director as a member of the Committee.
The responsibilities of the Health and Safety Governance Committee include:
• providing oversight on the Port’s health and safety,
• challenging health and safety strategies for the Port,
• ensuring all Port users understand the health and safety obligations, and
• monitoring progress against health and safety goals.
REMUNERATION POLICYThe Board is committed to a policy that the remuneration of Directors and Senior Management be transparent, fair and reasonable. The Shareholder, by ordinary resolution from time to time, sets a total maximum annual amount payable to the Directors in their capacity as Directors. That aggregate sum is divided among the Directors as they consider appropriate.
The fees paid to each of the Directors in the previous financial year are detailed in the Directors’ interests section of the Company’s Annual Report. A proportion of the Chief Executive and Senior Management remuneration comprises of performance incentive related payments which can be dependent on the performance of the Company and attainment of agreed objectives. Particulars of the remuneration of employees and Senior Management are set out the in the Company’s Annual Report.
REPORTING AND DISCLOSURESThe Board requires Management to provide it with information of sufficient content, quality and timeliness as the Board considers necessary to allow the Board to effectively discharge its duties. Management provides formal Board papers one week in advance of Board meetings. In addition, Board
4

policy is to make regular site visits to view Company operations and to ensure Directors remain familiar with issues associated with the Company’s business. Site visits usually involve interaction between Directors and Management, and direct access to employees when their particular area of expertise is required. A formal process is followed, including representations and certifications from Senior Management, to ensure that the Company’s financial statements comply with international financial reporting standards as applied in New Zealand and fairly represent the financial affairs of the Company.
The Company provides timely and adequate disclosure of information on matters of material impact to the shareholder through its quarterly and annual reporting, as well is through its Statement of Corporate Intent. The Board consults with the Shareholder at all reasonable times on any
particular material matter relating to the affairs of the Company when asked to do so by the shareholder (when notified in writing to the Board by the shareholder from time to time).
INDEPENDENT AUDITORThe Board is responsible for ensuring the quality and independence of the external audit process. Pursuant to the Port Companies Act 1988 and the Public Audit Act 2001, the Auditor-General is the auditor of the Company and its subsidiaries. The Auditor-General may delegate that authority to a professional accounting services firm. The current auditor of the Company on behalf of the Auditor-General is G Edwards, of KPMG. The Board has formal and transparent procedures for communication with the Company’s external auditors. The AFC meets with the auditors at least once a year independently of Management
to discuss any areas of concern or recommendations for improvement. To ensure auditor independence, the AFC is advised of any non-audit services provided by the auditors to the Company. Any such services must be consistent with the independence requirements of the Auditor-General (which incorporate the independence requirements of the External Reporting Board) and the fees for non-audit work must be reported to shareholder in the Company’s Annual Report.
ANNUAL REPORT 2016 5

STATEMENT OF CORPORATE INTENT – PERFORMANCE REPORTING
KEY PERFORMANCE MEASURES
Objectives Key Performance Measures Performance SOI Target
Health and Safety Total recordable injury rate (per 200,000 hours) 7.68 10.1Serious harm accidents 0 0
Operational Crane rate (containers per hour per crane) 31.4 30.0Ship rate (TEU per hour per ship) 59.8 60.0Coal load out rate (tonnes per day) 26,692 25,000
Finance Revenue (in thousands) 105,714 114,000Earnings before interest, tax, depreciation and amortisation (in thousands)
23,444
26,000
Net profit after tax (in thousands) -59,805 12,500Return on average equity NA 2.33%
Customer Truck turnaround time (% less than 30 mins) 86% 90%
Environmental Number of breaches – lagging 1 0
Community Manawhenua advisory group meetings per year 9 5Community meetings attended per year 72 11
6

Health and Safety continues to be a priority of LPC, with the implementation of a Safe System of Work progressing during the year and into 2017. The Executive Management Team have been trained in risk management and core safety principles. Port wide health and safety committees are ensuring that all staff can contribute to making the Port a safer place.
Operationally, LPC has made significant gains in key Port productivity measurements throughout the year. The Operations team continues to target further improvement daily, with a multi-faceted approach focused on people, plant, processes and technology.
The Lyttelton Port Recovery Plan was announced be the Minister for Earthquake Recovery, Hon Gerry Brownlee in November 2015. This was the culmination of more than 12 months of work by a large team who were focused not only on planning the long term future of the Port, but understanding and mitigating the effects of the long term development required to meet the needs of the region’s importers and exporters into the future. The process involved detailed engagement with the community and stakeholders covering the full range of social, cultural, economic and environmental areas by both the Port and Environment Canterbury. This work culminated in a Public Hearing where all stakeholders were able to have their views heard, and included for consideration by an independent panel.
Through this process the business has been able to build effective working relationships with stakeholders and is committed to continuing engagement through the local Community Board and established channels, such as the Port
Liaison Committee, Whakaraupō Catchment Management Plan and Manawhenua Advisory Group. The Port will continue to occupy its site on Norwich Quay, known as Port Talk, where the community can meet, ask questions and discuss their concerns regarding both day to day operations and proposed development initiatives, and will continue to run our very popular monthly Port tours where people can see our operations from the water and learn about our development projects.
Lower volumes led to a lower EBITDA than budgeted, although EBITDA margin was in line. Net profit after tax was impacted by the impairment booked at 30 June 2016.
The Company received substantial insurance proceeds in relation to the Earthquakes in 2010 and 2011. Those proceeds were booked as income and increased the net asset value of the Company. The Company was able to maintain strong earnings throughout the Earthquake period. This means that the incremental returns from replacing and repairing Earthquake damaged assets is not as strong it would have been had those revenue streams ceased post earthquake. This has lead to a mis-match between the net asset value of the Company and its valuation based on future cash flows, leading to the impairment.
Environmental breaches are above the SOI target due to LPC receiving non-compliance within an Environment Canterbury audit report for dust management. No fine or abatement notice was issued and dust management procedures have since been improved.
ANNUAL REPORT 2016 7

REGISTER OF DIRECTORS’ INTERESTS
TREVOR BURT – CHAIRMAN (from 12 Nov 2008 – Director, from 30 June 2013 – Chairman)
Entity Transactions Share dealing
Ngai Tahu Holdings Corporation Ltd – Chairman
None Nil
Ngai Tahu Capital Ltd – ChairmanNZ Lamb Company Ltd – ChairmanPGG Wrightson Ltd – Deputy ChairmanMainPower NZ Ltd – DirectorBreakaway Investments Ltd – DirectorLandpower Holdings Ltd – DirectorSilver Fern Farms Ltd – DirectorAgria Asia Investments Ltd – DirectorAgria (Singapore) Pty Ltd – Director
8

DR ROD CARR(from 27 November 2006)
Entity Transactions Share dealing
Reserve Bank of New Zealand – Chairman
None Nil
Canterbury Employer’s Chamber of Commerce – DirectorJoint Research Consultants (NZ) Limited – DirectorWaingawa Forest Corporation Limited – DirectorCanterprise Ltd – DirectorUC International College – DirectorUniversity of Canterbury Trust Funds – Vice ChancellorUC Foundation – Trustee (ex officio)Waingawa Land Company – PartnerWaingawa Forestry Partners – PartnerNew Zealand Oil and Gas Limited – ShareholderWellington Drive Limited – ShareholderCarnival Labs – ShareholderWaingawa Forest Corporation Limited – ShareholderHome Trust – TrusteeChristchurch Earthquake Appeal Trust – TrusteeQuake Centre for Research Excellence – MemberCanterbury Earthquake Recovery Lessons and Legacy Sponsors Group – MemberCommittee for Canterbury – Member
ANNUAL REPORT 2016 9

KARL SMITH(from 3 November 2011)
Entity Transactions Share dealing
Gough Gough & Hamer Investments Limited – Group Chief Executive Officer
None Nil
The Voyager Trust – Trustee
REGISTER OF DIRECTORS’ INTERESTS
BILL DWYER(from 19 August 2015)
Entity Transactions Share dealing
Development Christchurch Limited – Chairman
None Nil
Christchurch City Holdings Limited – Director
Coconut Culture Limited – DirectorRegenerate Christchurch – Director10 Star Homes – Director
10

BRIAN WOOD(from 1 June 2011)
Entity Transactions Share dealing
Westport Harbour Limited – Chairman
None Nil
Buller Holdings Ltd – ChairmanWestreef Services Ltd – ChairmanBuller Recreation Ltd – ChairmanWestport Harbour Ltd – ChairmanCanterbury Linen Services Ltd – Chairman
Abley Transportation Consultants Ltd – Chairman
Dunedin City Holdings Ltd – DirectorDunedin City Treasury Ltd – DirectorInterpret Geospatial Solutions Ltd – Director
Harrison Grierson Holdings Ltd – Director
Dunedin Ventures Ltd – DirectorFulton Hogan – Member of the Governance Board for NZTA West Coast State Highway Project
Christchurch City Council – Chair Project Steering Group Library Rebuild
Christchurch City Council – Chair Project Steering Group Town Hall Rebuild
ANNUAL REPORT 2016 11

REGISTER OF DIRECTORS’ INTERESTS
JIM QUINN(from 31 March 2014)
Entity Transactions Share dealing
Tubman Heating Ltd – Chairman and Shareholder
None Nil
Q Services Ltd – OwnerPayments New Zealand – DirectorGo Bus – DirectorIntilecta Corporation – ChairmanJ & D Family Trust – TrusteeMarketing Impact – AdvisorAuckland Council – Executive
GRANT GILFILLAN(from 3 February 2016)
Entity Transactions Share dealing
Port Authority of New South Wales – CE and Director
None Nil
Ports Australia – Director
12

CHIEF EXECUTIVE REMUNERATION
The Board, through the Remuneration Committee, sets the remuneration structure for the Chief Executive (CE). His total remuneration is made up of a mixture of:• Fixed Remuneration• Short Term Incentive (STI)
and• Long Term Incentive (LTI).
Fixed RemunerationFixed Remuneration is assessed by independent advisors and is comparable for similar companies in terms of size, industry sector and performance. It includes all benefits, allowances and deductions, as set out in the Individual Employment Agreement.
Annual adjustments are not automatic but determined by performance.
Short Term IncentiveThe CE’s performance is assessed by the Board against agreed objectives, including Health & Safety, Operational, Financial Performance and Leadership. The STI is set at a maximum of 40% of Fixed Remuneration. Of the 40%, 20% is linked to Health & Safety and 20% to Financial Performance. The remaining 60% is based on achieving the strategic objectives that are set annually.
Long Term IncentiveIn 2014 the Board agreed an LTI scheme with the CE. This was a three year scheme to
retain the CE through a critical period in the rebuild of the Port. The key criteria were:
− Profitable Company performance,
− CE remains employed by the Company until 30 June 2016 and
− CE is of ‘good standing’ with the Company at 30 June 2016.
− Payable after 30 June 2016
The Board confirmed the CE met the criteria and the award of 25% of Fixed Remuneration for the period has been agreed.
A new LTI for the CE is under negotiation.
ANNUAL REPORT 2016 13

Chief Executive RemunerationThe table below summarises the Chief Executive’s remuneration earned over the accounting period to 30 June for each year. The timing of remuneration payments will vary in line with the terms of the LTI and STI schemes.
In 2016, the Company identified some non-compliance issues in regard to the payment of holiday pay over the last 6 years. The quantum of any shortfall payments are still being calculated and are not included below.
2015 Actual
2016 Actual
2017 Forecast
$000’s $000’s $000’sEarned in YearFixed Remuneration 567 582 600Short Term Incentive Scheme 159 183 192Long Term Incentive Scheme 142 146 150Total Earned in Year 868 911 943
CHIEF EXECUTIVE REMUNERATION cont.
14

This table has been completed based on remuneration earned in year. The 2015 comparator has been restated on this basis.
LYTTELTON PORT COMPANY LIMITED REMUNERATION
DIRECTORS’ REMUNERATION
Salary Banding 2016 2015
100-110 57 53 110-120 23 23
120-130 24 20
130-140 7 12
140-150 11 9
150-160 5 5
160-170 - 1
170-180 2 1
180-190 1 1
190-200 2 7
200-210 5 1
210-220 1 -
240-250 - 1
260-270 1 1
270-280 - 1
280-290 - 1
300-310 3 -
460-470 1 1
860-870 - 1
910-920 1 -
Total 144 139
Name 2016 2015
T BURT 86,811 84,025 J QUINN 50,558 47,344 K SMITH 50,754 49,125 B WOOD 48,331 46,125 L CROSSEN 5,714 46,500 G GILFILLAN 19,258 – B DWYER 39,365 – R CARR 46,105 44,625
Total 346,897 317,744
ANNUAL REPORT 2016 15

2FINANCIAL STATEMENTS
16

In the opinion of the Directors of Lyttelton Port Company Limited, the consolidated financial statements and notes on pages 18 to 47:
· comply with New Zealand equivalents to International Financial Reporting Standards and fairly present the financial position of the Group as at 30 June 2016, and the results of their operations and cash flows for the year ended on that date; and
· have been prepared using appropriate accounting policies, which have been consistently applied and supported by reasonable judgements and estimates.
The Directors believe that proper accounting records have been kept which enable, with reasonable accuracy, the determination of the financial position of the Group, and facilitate compliance of these consolidated financial statements with the Companies Act 1993 and Financial Reporting Act 2013.
The Directors consider that they have taken adequate steps to safeguard the assets of the Company and the Group, and to prevent and detect fraud and other irregularities. Internal control procedures are also considered to be sufficient to provide a reasonable assurance as to the integrity and reliability of these consolidated financial statements.
The Directors are pleased to present the consolidated financial statements of Lyttelton Port Company Limited and its subsidiaries for the year ended 30 June 2016.
For and on behalf of the Board of Directors:
DIRECTORS’ DECLARATIONFOR THE YEAR ENDED 30 JUNE 2016
Trevor BurtDirector24 August 2016
Brian WoodDirector24 August 2016
ANNUAL REPORT 2016 17

CONSOLIDATED STATEMENT OF COMPREHENSIVE INCOMEFOR THE YEAR ENDED 30 JUNE 2016 In thousands of New Zealand dollars Notes 2016 2015
Revenue 105,714 109,062 Employee expenses (49,740) (48,506)Materials and consumables utilised (23,725) (22,090)Depreciation and amortisation 6, 8, 9 (14,393) (12,353)Administrative and other expenses 4 (8,805) (8,847)
RESULTS FROM OPERATING ACTIVITIES 9,051 17,266Impairment 8, 9, 20 (99,519) –
RESULTS FROM OPERATING ACTIVITIES AND IMPAIRMENT
(90,468)
17,266
Net financing income 5 8,236 12,209
Profit/(loss) before tax for the year (82,232) 29,475
Income tax credit/(expense) 7 22,427 (8,901)
Profit/(loss) for the year (59,805) 20,574
OTHER COMPREHENSIVE INCOME/(EXPENSE)Effective portion of changes in fair value of cash flow hedges – gross of tax
(310) 292
Income tax on other comprehensive income 87 (82)
Total comprehensive income/(expense) for the year
(60,028)
20,784
These financial statements should be read in conjunction with the notes to the financial statements
18

CONSOLIDATED STATEMENT OF FINANCIAL POSITIONAS AT 30 JUNE 2016
In thousands of New Zealand dollars Notes 2016 2015ASSETSProperty, plant and equipment 8 296,548 327,880 Intangible assets 9 7,740 10,818Term deposits - 40,000 Loans and advances 56 240 Prepayments 751 –Total non-current assets 305,095 378,938
Cash and cash equivalents 13 15,192 96,470 Short term deposits 13 150,000 90,000 Trade and other receivables 16,409 13,572 Prepayments 1,723 1,598 Interest receivable 4,139 5,008 Inventories 3,516 3,725 Loans and advances 160 136 Income tax receivable/(payable) 2,382 (928)Total current assets 193,521 209,581
Total assets 498,616 588,519
EQUITYShare capital 11 21,457 21,457 Cash flow hedge reserve 11 (154) 69Retained earnings 447,805 510,221 Total equity 469,108 531,747
Continued over page >
These financial statements should be read in conjunction with the notes to the financial statements
LIABILITIESDeferred lease income 12 171 1,036 Deferred tax liabilities 10 4,752 32,970 Derivatives 13 132 – Employee entitlements 513 – Total non-current liabilities 5,568 34,006
Trade and other payables 13 11,282 12,442 Employee entitlements 11,708 9,553 Derivatives 13 83 (96) Deferred lease income 12 867 867 Total current liabilities 23,940 22,766
Total liabilities 29,508 56,772
Total equity and liabilities 498,616 588,519
ANNUAL REPORT 2016 19

CONSOLIDATED STATEMENT OF CHANGES IN EQUITYFOR THE YEAR ENDED 30 JUNE 2016 In thousands of New Zealand dollars Share
capitalCash flow
hedge reserve
Retained earnings
Total
Balance at 1 July 2014 21,457 (141) 511,805 533,121
PROFIT FOR THE YEAR – – 20,574 20,574
OTHER COMPREHENSIVE INCOMEEffective portion of changes in fair value of cash flow hedges –net of tax
– 210 – 210
TRANSACTIONS WITH OWNERS RECORDED DIRECTLY IN EQUITY
Dividends to equity holders – – (22,158) (22,158)
Balance at 30 June 2015 21,457 69 510,221 531,747
PROFIT/(LOSS) FOR THE YEAR – – (59,805) (59,805)
OTHER COMPREHENSIVE INCOME/(EXPENSE)Effective portion of changes in fair value of cash flow hedges – net of tax
– (223) – (223)
TRANSACTIONS WITH OWNERS RECORDED DIRECTLY IN EQUITYDividends to equity holders – – (2,611) (2,611)
Balance at 30 June 2016 21,457 (154) 447,805 469,108
These financial statements should be read in conjunction with the notes to the financial statements
20

CONSOLIDATED STATEMENT OF CASH FLOWSFOR THE YEAR ENDED 30 JUNE 2016
In thousands of New Zealand dollars Notes 2016 2015
CASH FLOWS FROM OPERATING ACTIVITIES Cash receipts from customers 102,172 109,031 Cash paid to suppliers and employees (81,887) (79,676)Interest and facility fees paid (27) (27)Interest received 9,132 9,296 Subvention payments 22 (7,263) (8,475)Income tax paid (1,750) (5,755)Net cash from operating activities 16 20,377 24,394
CASH FLOWS FROM/(USED IN) INVESTING ACTIVITIES Proceeds from sale of property, plant and equipment 99 85 Net acquisition of term deposits (20,000) (40,000)Acquisition of property, plant and equipment (75,730) (90,867)Acquisition of intangible assets (3,413) (7,158)Net cash used in investing activities (99,044) (137,940)
CASH FLOWS FROM/(USED IN) FINANCING ACTIVITIES Dividends paid (2,611) (22,158)Net cash from financing activities (2,611) (22,158)
Cash and cash equivalents at 1 July 96,470 232,174 Net (decrease)/increase in cash and cash equivalents (81,278) (135,704)Cash and cash equivalents at 30 June 15,192 96,470
These financial statements should be read in conjunction with the notes to the financial statements
ANNUAL REPORT 2016 21

NOTES TO THE CONSOLIDATED FINANCIAL STATEMENTS
322

1. Reporting entity 242. Basis of preparation 243. Significant accounting policies 254. Other expenses 265. Finance income and expenses 276. Net (gain)/loss on sale of property,
plant and equipment 28
7. Income tax expense 298. Property, plant and equipment 309. Intangible assets 3210. Deferred tax assets and liabilities 3311. Capital and reserves 3412. Deferred lease income 3413. Financial instruments 3514. Operating leases 4015. Capital commitments 4116. Reconciliation of net profit for the year with
net cash from operating activities42
17. Related parties 4418. Group entities 4519. Contingent assets 4520. Impairment 4621. Holiday pay 4622. Subvention payments 4723. Subsequent events 47
ANNUAL REPORT 2016 23

1. REPORTING ENTITY
NOTES TO THE CONSOLIDATED FINANCIAL STATEMENTS
Lyttelton Port Company Limited (the "Company") is a company domiciled in New Zealand, is a Port Company under the Port Companies Act 1988, and is registered under the Companies Act 1993. The financial statements have been prepared in accordance with the Companies Act 1993 and the Financial Reporting Act 2013.
On 7 November 2014 the Company delisted from the New Zealand Stock Exchange following Christchurch City Holdings Ltd acquiring all shares in the Company, and it ceased being an issuer under the Financial Reporting Act 2013. The Company's registered office is at 41 Chapmans Road, Hillsborough, Christchurch 8022, New Zealand. These consolidated financial statements comprise the Company and its subsidiaries (collectively the 'Group' and individually 'Group companies'). The Group is primarily involved in providing and managing port services and cargo handling facilities. The Company is a profit-oriented entity.
2. BASIS OF PREPARATION
(a) Statement of compliance
These consolidated financial statements have been prepared in accordance with New Zealand Generally Accepted Accounting Practice (NZ GAAP). They comply with New Zealand equivalents to International Financial Reporting Standards ("NZ IFRS") and other Financial Reporting Standards as applicable to profit-oriented entities. They were authorised for issue by the Company’s board of directors on 24 August 2016.
Details of the Group’s accounting policies, including changes during the year, are included in note 3.
(b) Basis of measurement
The consolidated financial statements have been prepared on the historical cost basis except for derivative financial instruments that are measured at fair value.
(c) Functional and presentation currency
These consolidated financial statements are presented in New Zealand dollars (NZ$), which is the Company’s functional currency. All amounts have been rounded to the nearest thousand, unless otherwise indicated.
(d) Use of estimates and judgements
In preparing these consolidated financial statements, management has made judgements, estimates and assumptions that affect the application of the Group’s accounting policies and the reported amounts of assets, liabilities, income and expenses. Actual results may differ from these estimates.
Estimates and underlying assumptions are reviewed on an ongoing basis. Revisions to estimates are recognised prospectively.
Information about assumptions and estimation uncertainties that have a significant risk of resulting in material adjustment in the year ending 30 June 2016 is included in:
Note 8 – property, plant and equipment.
Note 20 – impairment
Note 21 – holiday pay
24

The Group has consistently applied the following accounting policies to all periods presented in these consolidated financial statements.
(a) Financial instruments
(i) Non-derivative financial instruments
Non-derivative financial instruments comprise trade and other receivables, cash and cash equivalents, loans and borrowings, and trade and other payables.
Non-derivative financial instruments that are not at fair value through profit or loss, are recognised initially at fair value plus any directly attributable transaction costs. Subsequent to initial recognition non-derivative financial instruments are measured as described below.
Cash and cash equivalents
Cash and cash equivalents comprise cash balances, short term deposits maturing in less than three months and call deposits. Bank overdrafts that are repayable on demand and form part of the Group’s cash management are included as a component of cash and cash equivalents for the purpose of the consolidated statement of cash flows.
Other
Subsequent to initial recognition, other non-derivative financial instruments are measured at amortised cost using the effective interest method, less any impairment losses.
(ii) Derivative financial instruments
The Group uses derivative financial instruments to hedge its exposure to foreign exchange, commodity price and interest rate risks arising from operational, financing and investment activities. In accordance with its treasury policy, the Group does not hold or issue derivative financial instruments for trading purposes. However, derivatives that do not qualify for hedge accounting are accounted for as trading instruments.
Derivative financial instruments are recognised initially at fair value and transaction costs are expensed immediately. Subsequent to initial recognition, derivative financial
instruments are stated at fair value. The gain or loss on re-measurement to fair value is recognised immediately in profit or loss. However, where derivatives qualify for hedge accounting, recognition of any resultant gain or loss depends on the nature of the hedging relationship.
(b) Property, plant and equipment
(i) Recognition and measurement
Items of property, plant and equipment are measured at cost less accumulated depreciation and any accumulated impairment losses.
If significant parts of an item of property, plant and equipment have different useful lives, then they are accounted for as separate items (major components) of property, plant and equipment (note 8).
(ii) Subsequent costs
The cost of replacing part of an item of property, plant and equipment is recognised in the carrying amount of the item if it is probable that the future economic benefits embodied within the part will flow to the Group and its cost can be measured reliably. The costs of the day-to-day servicing of property, plant and equipment are recognised in profit or loss as incurred.
(iii) Derecognition
In the event that an asset or part of an asset is damaged and not expected to be able to be used to generate future economic benefits, then it is derecognised as an asset and the carrying value, or part thereof, is charged to profit or loss as ‘assets written off’
(iv) Capital work in progress
Capital work in progress comprises all costs directly attributable to the construction of an asset including cost of materials, professional services, direct labour, finance costs and an appropriate allocation of overhead. Costs cease to be capitalised as soon as the asset, or a significant component of the asset, is in the location and condition necessary for it to be capable of operating in the manner intended by management.
3. SIGNIFICANT ACCOUNTING POLICIES
ANNUAL REPORT 2016 25

NOTES TO THE CONSOLIDATED FINANCIAL STATEMENTS
3. SIGNIFICANT ACCOUNTING POLICIES cont.
(c) Revenue
Revenue is measured at the fair value of the consideration received or receivable, net of allowances, trade discounts and volume rebates.
Services
Revenue from services is recognised in profit or loss when the service is performed. Where services are in progress at the reporting date, revenue is recognised in profit or loss in proportion to the stage of completion of the service at that date.
(d) Finance income and expenses
Finance income comprises interest income on funds invested and gains on derivative instruments that are recognised in profit or loss. Interest income is recognised as it accrues, using the effective interest method.
Finance expenses comprise interest expense on borrowings, bank fees and the ineffective portion of derivative instruments that are recognised in profit or loss. All borrowing costs are recognised in profit or loss using the effective interest method, except with regards to borrowing costs on qualifying assets which are capitalised as part of the cost of those assets, as required by NZ IAS 23 Borrowing Costs.
(e) Dredging costs
Maintenance dredging costs are recorded as a prepayment and expensed over the period of benefit, which has been assessed as one to five years.
(f) Income tax expense
Income tax expense comprises current and deferred tax. Income tax expense is recognised in profit or loss except to the extent that it relates to items recognised directly in equity, in which case it is recognised in equity. Current tax is the expected tax payable on the taxable income for the year, using tax rates enacted or substantively enacted at the reporting date, and any adjustment to tax payable in respect of previous years.
Deferred tax is recognised using the balance sheet method, providing for temporary differences between the carrying amounts of assets and liabilities for financial reporting purposes and the amounts used for taxation purposes.
A deferred tax asset is recognised to the extent that it is probable that future taxable profits will be available against which temporary differences can be utilised. Deferred tax assets are reviewed at each reporting date and are reduced to the extent that it is no longer probable that the related tax benefit will be realised.
(g) New standards and interpretations not yet adopted
LPC has applied all new and revised accounting standards that are effective in the year. This did not result in a material impact on the financial statements.
There are a number of other new and amended accounting standards and interpretation not yet effective that will be adopted by LPC when they become mandatory. Those relevant to LPC include NZ IFRS 9 Financial Instruments, NZ IFRS 15 Revenue, and NZ IFRS 16 Leases. The financial impact of these standards has not yet been assessed.
Effective for the financial year ending
NZ IFRS 9 Financial Instruments 30 June 2019
NZ IFRS 15 Revenue from Contracts with Customers 30 June 2019
NZ IFRS 16 Leases 30 June 2020
26

In thousands of New Zealand dollars 2016 2015
Administrative and other expenses, including: 8,805 8,847Auditor’s remuneration to KPMG comprises:Audit of financial statements 83 82Other non-audit related services – 15Total auditor’s remuneration 83 97
Also included in administration and other expenses is $6k (2015: $6k) paid to tile OAG for audit related overhead.
In 2015, other non-audit related services included an assessment of City Depot revenue processes and controls.
In thousands of New Zealand dollars 2016 2015
Interest income on cash and cash equivalents 8,263 12,236Bank facility fees (24) (26)Interest paid on bank advances (3) (1)Net finance expenses 8,236 12,209
4. OTHER EXPENSES
5. FINANCE INCOME AND EXPENSES
ANNUAL REPORT 2016 27

In thousands of New Zealand dollars 2016 2015
Depreciation and amortisation, including: 14,393 12,353Net (gain)/loss on sale of property, plant and equipment (54) 139
NOTES TO THE CONSOLIDATED FINANCIAL STATEMENTS
6. NET (GAIN)/LOSS ON SALE OF PROPERTY, PLANT AND EQUIPMENT
In thousands of New Zealand dollars 2016 2015
Current tax expense Current period 5,741 9,128Adjustment for prior periods (38) 571Total current tax expense 5,703 9,699
Deferred tax expense Origination and reversal of temporary differences (28,371) (798)Adjustment for prior period 240Total deferred tax (credit)/expense (28,131) (798)
Total income tax (credit)/expense (22,427) 8,901
7. INCOME TAX EXPENSE
Income tax has been calculated based on the tax rates and tax laws enacted or substantively enacted at balance date.
28
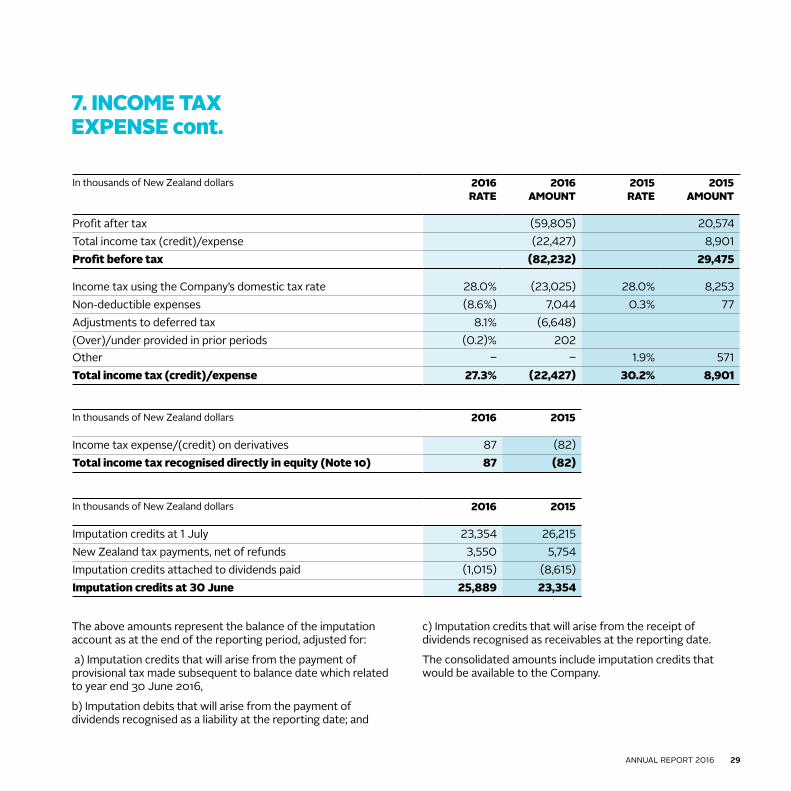
7. INCOME TAX EXPENSE cont.
In thousands of New Zealand dollars 2016 RATE
2016 AMOUNT
2015 RATE
2015 AMOUNT
Profit after tax (59,805) 20,574Total income tax (credit)/expense (22,427) 8,901Profit before tax (82,232) 29,475
Income tax using the Company’s domestic tax rate 28.0% (23,025) 28.0% 8,253Non-deductible expenses (8.6%) 7,044 0.3% 77Adjustments to deferred tax 8.1% (6,648)(Over)/under provided in prior periods (0.2)% 202 Other – – 1.9% 571Total income tax (credit)/expense 27.3% (22,427) 30.2% 8,901
In thousands of New Zealand dollars 2016 2015
Imputation credits at 1 July 23,354 26,215New Zealand tax payments, net of refunds 3,550 5,754Imputation credits attached to dividends paid (1,015) (8,615)Imputation credits at 30 June 25,889 23,354
The above amounts represent the balance of the imputation account as at the end of the reporting period, adjusted for:
a) Imputation credits that will arise from the payment of provisional tax made subsequent to balance date which related to year end 30 June 2016,
b) Imputation debits that will arise from the payment of dividends recognised as a liability at the reporting date; and
c) Imputation credits that will arise from the receipt of dividends recognised as receivables at the reporting date.
The consolidated amounts include imputation credits that would be available to the Company.
In thousands of New Zealand dollars 2016 2015
Income tax expense/(credit) on derivatives 87 (82)Total income tax recognised directly in equity (Note 10) 87 (82)
ANNUAL REPORT 2016 29

NOTES TO THE CONSOLIDATED FINANCIAL STATEMENTS
8. PROPERTY, PLANT AND EQUIPMENT
In thousands of New Zealand dollars Freehold land
Buildings Land improvements
& harbour structures
Plant, equipment &
vehicles
Total
GROSS CARRYING AMOUNT Balance at 1 July 2014 66,283 8,556 168,632 161,895 405,366 Additions 44,460 2,168 44,660 8,792 100,080 Disposals – – (10,611) (530) (11,141)Balance at 30 June 2015 110,743 10,724 202,681 170,157 494,305 Additions – 3,599 64,597 7,994 76,190 Disposals – (8) – (327) (335)Balance at 30 June 2016 110,743 14,315 267,278 177,824 570,160
ACCUMULATED DEPRECIATION AND IMPAIRMENT LOSSESBalance at 1 July 2014 – (4,292) (64,875) (87,285) (156,452)Depreciation expense – (450) (4,321) (6,993) (11,764)Disposals – – 1,261 530 1,791 Balance at 30 June 2015 – (4,742) (67,935) (93,748) (166,425)Depreciation expense – (311) (6,126) (7,356) (13,793)Disposals – 7 – 281 288 Impairment expense (11,116) (3,038) (49,083) (30,445) (93,682)Balance at 30 June 2016 (11,116) (8,084) (123,144) (131,268) (273,612)
CARRYING AMOUNTS Net book value as at 30 June 2015 110,743 5,982 134,746 76,409 327,880 Net book value as at 30 June 2016 99,627 6,231 144,134 46,556 296,548
Accumulated impairment included in the above is $93,682,000
Included in the reconciliation above is “capital work in progress” of $19,371,000 (2015: $59,250,000).
30

During the year, the Group has commenced significant asset additions including the oil berth and inner harbour jetties.
Depreciation is recognised in profit or loss on a straight-line basis over the estimated useful lives of each part of an item of property, plant and equipment from the date that they are available for use, except for capital work in progress. Land is not depreciated.
The estimated useful lives for the current and comparative periods are as follows:
• Buildings 5-50 years
• Harbour structures and land improvements 3-50 years
• Container cranes 30 years
• Plant equipment and vehicles 3-30 years
• Vessels 5-25 years
• Seawalls 100 years
ANNUAL REPORT 2016 31

NOTES TO THE CONSOLIDATED FINANCIAL STATEMENTS
9. INTANGIBLE ASSETS
Accumulated impairment included in the above is $5,837,000
Included in the reconciliation above is “capital work in progress” of $5,759,000 (2015: $8,914,000).
Amortisation is recognised in profit or loss on a straight-line basis over the estimated useful lives of finite intangible assets, from the date that they are available for use.
In thousands of New Zealand dollars Software Easements & resource
consents
Total
GROSS CARRYING AMOUNT Balance at 1 July 2014 6,630 3,310 9,940 Additions 384 6,774 7,158 Balance at 30 June 2015 7,014 10,084 17,098 Additions 560 2,853 3,413 Balance at 30 June 2016 7,574 12,937 20,511
ACCUMULATED DEPRECIATION AND IMPAIRMENT LOSSESBalance at 1 July 2014 (5,137) (606) (5,743)Amortisation expense (479) (58) (537)Balance at 30 June 2015 (5,616) (664) (6,280)Amortisation expense (596) (58) (654)Impairment expense (14) (5,823) (5,837)Balance at 30 June 2016 (6,226) (6,545) (12,771)
CARRYING AMOUNTS Net book value as at 30 June 2015 1,398 9,420 10,818 Net book value as at 30 June 2016 1,348 6,392 7,740
The estimated useful lives for the current and comparative periods are as follows:
• Computer software 3-10 years
• Easements and resource consents 5-35 years
32
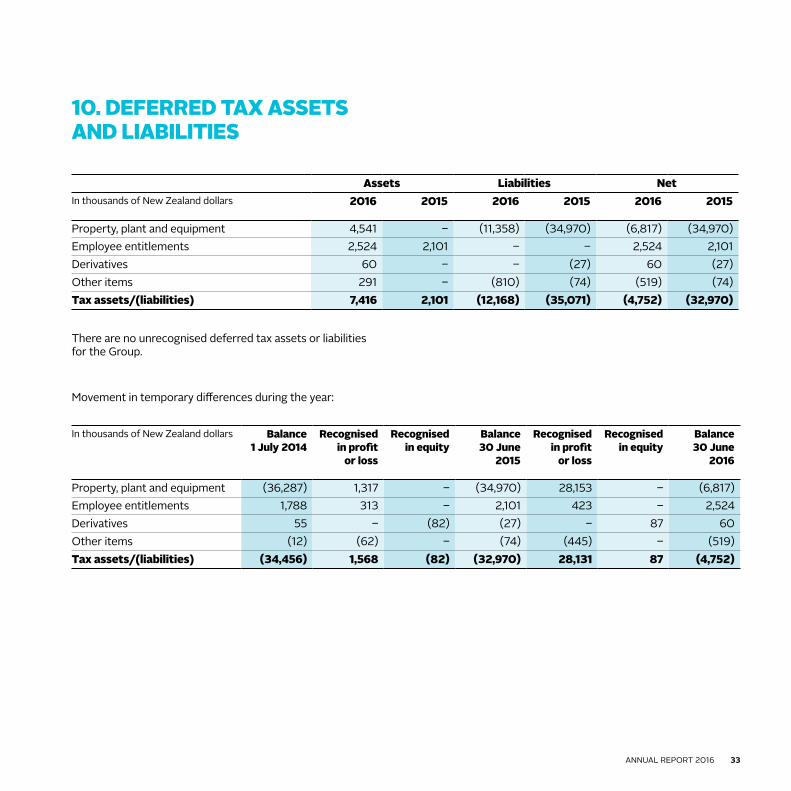
There are no unrecognised deferred tax assets or liabilities for the Group.
Movement in temporary differences during the year:
10. DEFERRED TAX ASSETS AND LIABILITIES
Assets Liabilities NetIn thousands of New Zealand dollars 2016 2015 2016 2015 2016 2015
Property, plant and equipment 4,541 – (11,358) (34,970) (6,817) (34,970)Employee entitlements 2,524 2,101 – – 2,524 2,101 Derivatives 60 – – (27) 60 (27)Other items 291 – (810) (74) (519) (74)Tax assets/(liabilities) 7,416 2,101 (12,168) (35,071) (4,752) (32,970)
In thousands of New Zealand dollars Balance 1 July 2014
Recognised in profit
or loss
Recognised in equity
Balance 30 June
2015
Recognised in profit
or loss
Recognised in equity
Balance 30 June
2016
Property, plant and equipment (36,287) 1,317 – (34,970) 28,153 – (6,817)Employee entitlements 1,788 313 – 2,101 423 – 2,524 Derivatives 55 – (82) (27) – 87 60 Other items (12) (62) – (74) (445) – (519)Tax assets/(liabilities) (34,456) 1,568 (82) (32,970) 28,131 87 (4,752)
ANNUAL REPORT 2016 33
NOTES TO THE CONSOLIDATED FINANCIAL STATEMENTS
11. CAPITAL AND RESERVES
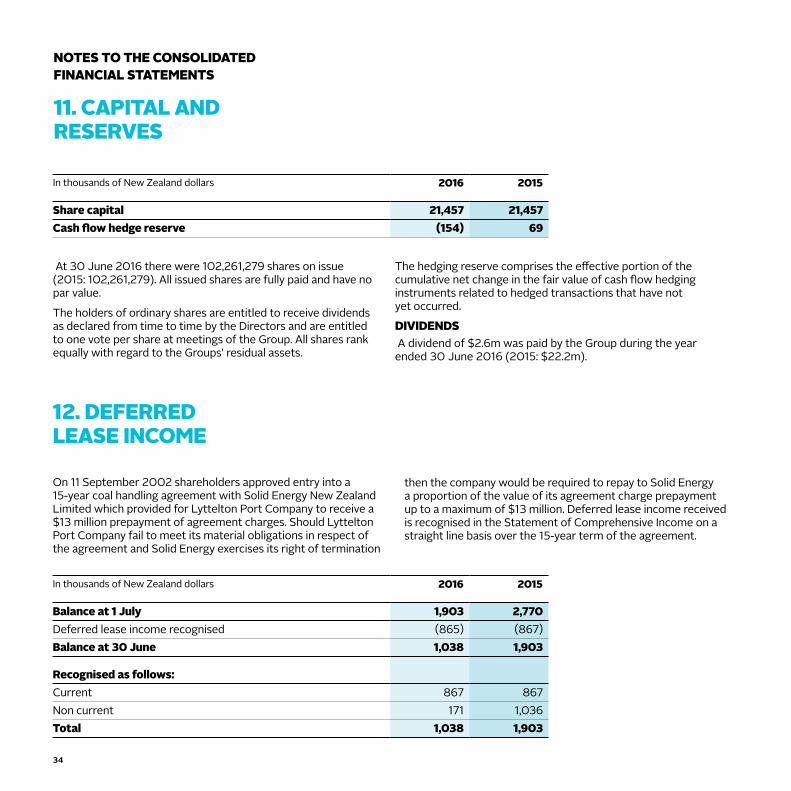
At 30 June 2016 there were 102,261,279 shares on issue (2015: 102,261,279). All issued shares are fully paid and have no par value.
The holders of ordinary shares are entitled to receive dividends as declared from time to time by the Directors and are entitled to one vote per share at meetings of the Group. All shares rank equally with regard to the Groups’ residual assets.
The hedging reserve comprises the effective portion of the cumulative net change in the fair value of cash flow hedging instruments related to hedged transactions that have not yet occurred.
DIVIDENDS A dividend of $2.6m was paid by the Group during the year ended 30 June 2016 (2015: $22.2m).
12. DEFERRED LEASE INCOME
On 11 September 2002 shareholders approved entry into a 15-year coal handling agreement with Solid Energy New Zealand Limited which provided for Lyttelton Port Company to receive a $13 million prepayment of agreement charges. Should Lyttelton Port Company fail to meet its material obligations in respect of the agreement and Solid Energy exercises its right of termination
then the company would be required to repay to Solid Energy a proportion of the value of its agreement charge prepayment up to a maximum of $13 million. Deferred lease income received is recognised in the Statement of Comprehensive Income on a straight line basis over the 15-year term of the agreement.
In thousands of New Zealand dollars 2016 2015
Balance at 1 July 1,903 2,770 Deferred lease income recognised (865) (867)Balance at 30 June 1,038 1,903
Recognised as follows: Current 867 867 Non current 171 1,036 Total 1,038 1,903
In thousands of New Zealand dollars 2016 2015
Share capital 21,457 21,457 Cash flow hedge reserve (154) 69
34

13. FINANCIAL INSTRUMENTS
Exposure to credit, liquidity, and market risks arise in the normal course of the Group’s business.
CREDIT RISKCredit risk is the risk that the counterparty to an arrangement does not meet its obligations under the arrangement.
Management has a credit policy in place under which each new customer is individually analysed for credit worthiness and assigned a purchase limit before the standard payment and trading terms and conditions are offered. Purchase limits are reviewed on a regular basis.
In order to determine which customers are classified as having payment difficulties the Group considers duration and frequency of default and makes provision for specific balances considered to be impaired. The Group does not require collateral in respect of trade and other receivables.
The Group’s exposure to credit risk is reflective of its customer base. As such it is concentrated to the default risk of its customers’ industries. No more than 15 percent of the Group’s operating revenue results from transactions with any one customer. For the year ended 30 June 2016, revenue from Solid Energy Limited represented approximately 10% of the Group’s operating revenue. The Group also had a $0.9m receivable from Solid, offset by $1.0m of deferred income. All amounts due were paid subsequent to 30 June. Geographically there is no significant credit risk concentration outside of New Zealand.
Cash handling and derivative transactions are only carried out with counterparties that have an investment grade credit rating.
The Group had significant cash balances as at 30 June 2016. The Group is exposed to default risk of the counterparty, and this risk is managed by the Group’s Treasury Policy. The Treasury Policy limits the exposure to individual counterparty’s based on class of institution and their individual credit ratings. The Policy also specifies a maximum exposure to each New Zealand registered bank of $100 million and $40 million with a minimum rating of AA- and A+ respectively.
LIQUIDITY RISKLiquidity risk represents the Group’s ability to meet its contractual obligations. The Group evaluates its liquidity requirements on an ongoing basis. In general, the Group generates sufficient cash flows from its operating activities to meet its obligations arising from its financial liabilities and has credit lines in place to cover potential shortfalls and meet capital expenditure requirements.
MARKET RISKMarket risk is the risk that a movement in market prices impacts on the financial viability of the Group’s business.
In accordance with its Treasury Policy the Group may enter into derivative arrangements in the ordinary course of business to manage foreign currency, interest rate and fuel price risks. A Treasury Management Committee, made up of Senior Management supported by an independent advisor, provides oversight for risk management and derivative activities.
FOREIGN CURRENCY RISKThe Group is exposed to foreign currency risk on purchases of capital equipment, operational supplies and bank accounts that are denominated in a currency other than the Company’s functional currency, New Zealand dollars ($), which is the presentation currency of the Group. The foreign currencies in which transactions are primarily denominated are Australian dollars (AUD), U.S. dollars (USD) and Euro (EUR). The Group uses forward exchange contracts to hedge major foreign currency risk arising from payables or commitments in accordance with its policies. The Group’s revenues are billed in NZD.
INTEREST RATE RISKThe Group’s treasury policy requires that term borrowings are hedged within pre-approved thresholds by fixing the rates of interest in order to provide greater certainty. The Group uses interest rate swaps to manage these exposures.
ANNUAL REPORT 2016 35

No trade and other receivables that were neither past due nor impaired are included in the higher risk category in the above table.
FUEL PRICE RISKThe Group’s Treasury Policy states that fuel price exposures may be hedged within pre-approved thresholds by fixing prices in order to provide greater certainty.
QUANTITATIVE DISCLOSURES(i) Credit risk
The carrying amount of financial assets represents the Group’s maximum credit exposure.
The Group has not renegotiated the terms of any financial assets which would result in the carrying amount no longer being past due, or to avoid a possible past due status.
The majority of the Group’s customers are New Zealand based agents or branches of international shipping lines servicing New Zealand importers and exporters. As such there are no concentrations of geographical risk outside New Zealand.
The status of trade receivables at the reporting date is as follows:
2016 2015In thousands of New Zealand dollars Gross
receivableIndividually
impairedGross
receivableIndividually
impaired
Not past due 11,473 – 10,390 – Past due 1-60 days 4,514 – 3,090 – Past due 61-90 days 192 – 65 – Past due more than 90 days 273 43 117 90 Total 16,452 43 13,662 90
NOTES TO THE CONSOLIDATED FINANCIAL STATEMENTS
13. FINANCIAL INSTRUMENTS cont.
36

(ii) Liquidity risk
The following table sets out the undiscounted contractual cash flows for all financial liabilities:
In thousands of New Zealand dollars Carrying value
Contractual cash flows
6 months or less
6-12 months
1-2 years 2-5 years More than 5 years
2016 Trade and other payables 11,282 11,282 11,282 – – – – Non-derivative liabilities total 11,282 11,282 11,282 – – – –
Forward exchange contracts – current
83 4,888 1,203 3,685 – – –
Forward exchange contracts – non current
132 7,486 – – 7,486
Total 11,497 23,656 12,485 3,685 – – –
2015Trade and other payables 12,442 12,442 12,442 – – – – Non-derivative liabilities total 12,442 12,442 12,442 – – – –
Forward exchange contracts (96) 1,129 251 878 – – – Total 12,346 13,571 12,693 878 – – –
ANNUAL REPORT 2016 37
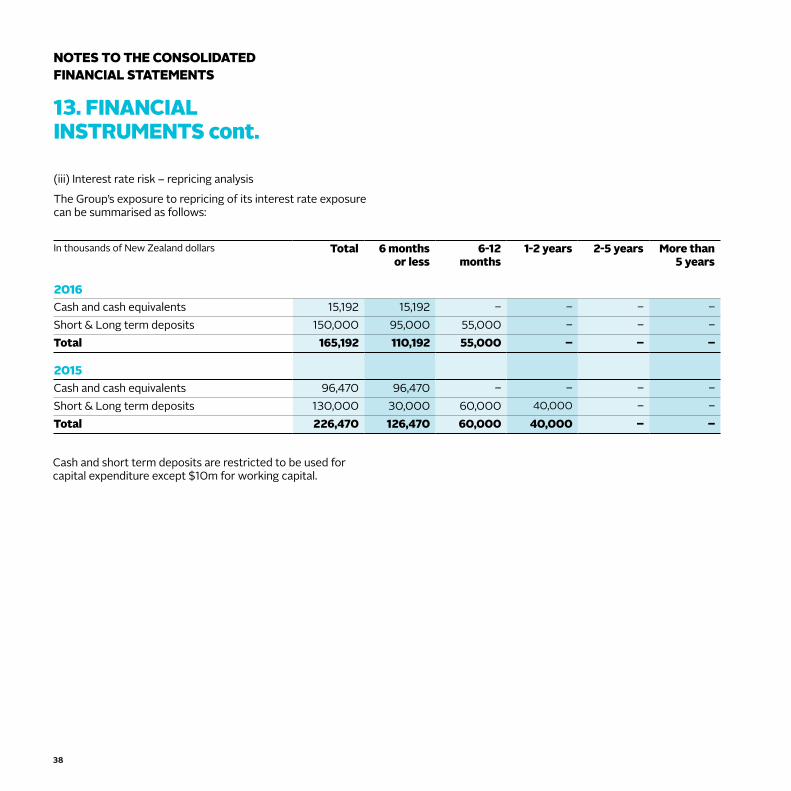
(iii) Interest rate risk – repricing analysis
The Group’s exposure to repricing of its interest rate exposure can be summarised as follows:
Cash and short term deposits are restricted to be used for capital expenditure except $10m for working capital.
NOTES TO THE CONSOLIDATED FINANCIAL STATEMENTS
13. FINANCIAL INSTRUMENTS cont.
In thousands of New Zealand dollars Total 6 months or less
6-12 months
1-2 years 2-5 years More than 5 years
2016 Cash and cash equivalents 15,192 15,192 – – – –Short & Long term deposits 150,000 95,000 55,000 – – –Total 165,192 110,192 55,000 – – –
2015Cash and cash equivalents 96,470 96,470 – – – – Short & Long term deposits 130,000 30,000 60,000 40,000 – –Total 226,470 126,470 60,000 40,000 – –
38

CAPITAL MANAGEMENT The Group’s capital includes share capital, reserves and retained earnings.
The Group’s policy is to maintain a strong capital base so as to maintain investor, creditor and market confidence and to sustain future development of the business. The Group maintains a balance between the higher returns that might be possible with greater gearing and the advantages and security afforded by a sound capital position.
The Group’s policies in respect of capital management and allocation are reviewed, as required, by the Board of Directors.
There have been no material changes in the Group’s management of capital during the period.
SENSITIVITY ANALYSISIn managing interest rate, fuel price and currency risks the Group aims to reduce the impact of short term fluctuations on the Group’s earnings. Over the longer-term, however, permanent changes in foreign exchange, fuel prices and interest rates will have an impact on profit.
At 30 June 2016 it is estimated that an increase of 1.0% in interest rates would increase the Group’s profit before income tax by approximately $1.9 million (2015: $2.3 million).
The Group is not exposed to any material profit variation from changes in exchange rates due to the nature of its operations and underlying forward exchange contracts.
FORECAST TRANSACTIONSThe Group classifies its forward exchange contracts hedging forecast transactions as cash flow hedges. The net fair value of forward exchange contracts used as hedges of forecast transactions at 30 June 2016 was a liability of $215,000 (2015: asset of $96,000), comprising assets of $Nil (2015: $96,000) and liabilities of $215,000 (2015: $Nil).
All financial assets and liabilities are classified as loans and receivables or at amortised cost respectively with the exception of derivatives which are classified as cash flow hedge instruments. The carrying value of all financial instruments is equivalent to fair value.
ANNUAL REPORT 2016 39

LEASES AS LESSEENon-cancellable operating lease rentals are payable as follows:
During the year ended 30 June 2016 the Group recognised $0.3m as an expense in the Statement of Comprehensive Income in respect of operating leases (2015: $0.3m).
LEASES AS LESSOR The Group leases a range of land, buildings and equipment to numerous customers. A number of leases include rights of renewal for further periods including “in perpetuity”. There were no contingent rents recognised as income in the year. The future minimum lease payments under non-cancellable leases are as follows:
14. OPERATING LEASES
In thousands of New Zealand dollars 2016 2015
Less than one year 313 318 Between one and five years 535 751 More than five years – 75 Total 848 1,144
In thousands of New Zealand dollars 2016 2015
Less than one year 5,015 5,326 Between one and five years 15,187 16,453 More than five years 17,418 21,000 Total 37,620 42,779
NOTES TO THE CONSOLIDATED FINANCIAL STATEMENTS
40

15. CAPITAL COMMITMENTS
Consistent with note 20, the Directors are of the view that the Group is committed to capital expenditure as outlined in the Statement of Corporate Intent.
In thousands of New Zealand dollars 2016 2015
Commitments for the purchase of property, plant & equipment 32,088 19,083
ANNUAL REPORT 2016 41

16. RECONCILIATION OF NET PROFIT FOR THE YEAR WITH NET CASH FROM OPERATING ACTIVITIES
In thousands of New Zealand dollars 2016 2015
Profit for the year (59,805) 20,574
ADJUSTMENTS FOR: Depreciation and amortisation (including net loss on sale of property, plant and equipment)
14,393 12,353
Impairment 99,519 – Deferred tax charge (28,130) (1,568)Non-current deferred lease revenue (865) (867)Non-current loans and receivables 184 206 Capital creditors (458) – Non-current creditors prepayments (751) –
83,892 10,124
ADD/(LESS) MOVEMENTS IN WORKING CAPITAL ITEMS: Change in tax payable (3,310) (3,761)Change in inventories 209 636 Change in trade and other receivables (2,861) 630 Change in interest receivable 869 (2,940)Change in prepayments (125) (630)Change in trade and other payables (including employee entitlements)
1,508 (239)
(3,710) (6,304)
Net cash flow from operating activities 20,377 24,394
NOTES TO THE CONSOLIDATED FINANCIAL STATEMENTS
42

17. RELATED PARTIES
PARENT AND ULTIMATE CONTROLLING ENTITYChristchurch City Holdings Limited is the controlling shareholder of Lyttelton Port Company Limited. The ultimate controlling shareholder is Christchurch City Council.
TRANSACTIONS WITH KEY MANAGEMENT PERSONNELKey management personnel compensation comprised:
In thousands of New Zealand dollars 2016 2015
Short term employee benefits 2,710 2,811 Long term incentives 229 384
The Group does not provide any non-cash benefits to Directors and executive officers in addition to their Directors fees or salaries.
ANNUAL REPORT 2016 43

TRANSACTIONS WITH CONTROLLING SHAREHOLDER AND OTHER COMPANIES IN THE GROUP
In thousands of New Zealand dollars 2016 2015
Transactions with CCC Sales 29 28 Purchases (148) (133)Rates (560) (507)Subvention payment (5,967) (2,615)Accounts payable (24) (27)Accounts receivable 3 –
Transactions with CCHLDividend (2,611) (22,158)
Transactions with other Group entitiesSales 127 11 Purchases (1,025) (618)Subvention payments (1,296) (5,860)Accounts payable (332) (19)Accounts receivable 117 –
NOTES TO THE CONSOLIDATED FINANCIAL STATEMENTS
17. RELATED PARTIES cont.
44
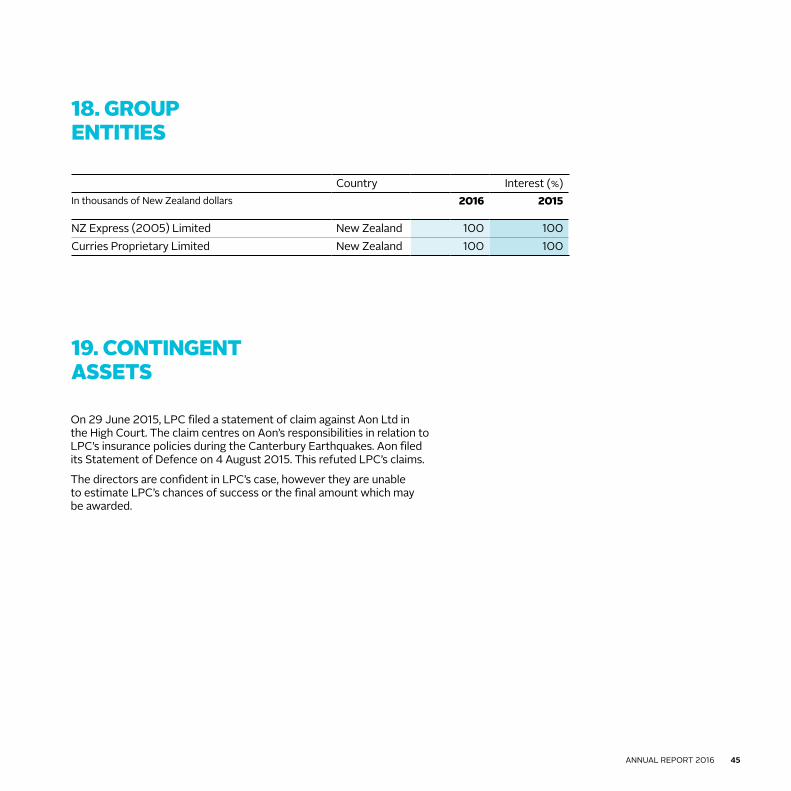
On 29 June 2015, LPC filed a statement of claim against Aon Ltd in the High Court. The claim centres on Aon’s responsibilities in relation to LPC’s insurance policies during the Canterbury Earthquakes. Aon filed its Statement of Defence on 4 August 2015. This refuted LPC’s claims.
The directors are confident in LPC’s case, however they are unable to estimate LPC’s chances of success or the final amount which may be awarded.
19. CONTINGENT ASSETS
18. GROUP ENTITIES
Country Interest (%) In thousands of New Zealand dollars 2016 2015
NZ Express (2005) Limited New Zealand 100 100Curries Proprietary Limited New Zealand 100 100
ANNUAL REPORT 2016 45

It has been brought to the Directors’ attention that there are some non compliance issues with regard to the payment of holiday pay. It was identified during the period that the Group may not have fully complied with the requirements of the Holidays Act 2003 in respect of prior periods. Whilst a full investigation is being undertaken, at 30 June 2016, the Directors have provided for the best estimate of the obligation that is considered to be payable, based on a preliminary investigation. This provision has been recognised within Employee Entitlements.
The Directors have written down the carrying value of Plant Property and Equipment by $99.5 million as at 30 June 2016.
The Company has undertaken a significant capital investment programme to replace assets destroyed in the earthquakes of 2010 and 2011, and to increase the resilience of the Company’s infrastructure. Total capital investment since the earthquake totals $286.9 million which has been principally funded by insurance proceeds received in 2014 of $357.6 million. The Company is committed to significant further capital investment to replace destroyed assets, increase resilience and maintain competitiveness. The Directors consider all investment decisions have been made in the best interests of the Company.
The Company’s shareholder obtains an external valuation of the Company. The external valuation indicates that the carrying value of the Company’s assets exceeds its fair value. Where this indicator exists, NZ IAS36 requires a comparison of the Company’s net asset position to either its fair value less costs to sell, or value in use, using either market information or a discounted cash flow forecast. The Directors have assessed the value in use of the Company to be significantly lower than its net asset position. The value in use calculation is based on reasonable and supportable assumptions that represent the Director’s best estimate of future cash flows.
The impairment has arisen because the return generated by replacing destroyed assets, which do not in isolation increase operating earnings; and some of the capital projects that are necessary for the future of the port do not meet the investment return established by the Directors.
The Company has undertaken the impairment as a single cash generating unit, whereby assets should be written off on a pro-rata basis until they are held at the higher of their value in use, sale value or nil. Assets have been impaired based on their value in use and not as a pro-rata across the entire asset base as disclosed in Notes 8 and 9.
21. HOLIDAY PAY20. IMPAIRMENT
NOTES TO THE CONSOLIDATED FINANCIAL STATEMENTS
46

During the year, subvention payments were made to the entities listed below. LPC is a member of the Christchurch City Council (CCC) Tax Group and pays subvention payments to other members of the CCC Group. It is LPC’s policy to treat the subvention payments as though they were payments of income tax with a corresponding reduction to taxation receivable/(payable).
• Christchurch City Council – $5,967,379 (2015: $2,623,560)
• CDC Consolidated Group – $42,885 (2015: Nil)
• Vbase Group – $1,252,936 (2015: $5,852,334)
22. SUBVENTION PAYMENTS
There were no material subsequent events.
23. SUBSEQUENT EVENTS
ANNUAL REPORT 2016 47

INDEPENDENT AUDITOR’S REPORT
448

INDEPENDENT AUDITOR’S REPORT
TO THE READERS OF LYTTELTON PORT COMPANY LIMITED GROUP’S FINANCIAL STATEMENTS FOR THE YEAR ENDED 30 JUNE 2016 The Auditor-General is the auditor of Lyttelton Port Company Limited Group (the “Group”). The Auditor-General has appointed me, Graeme Edwards, using the staff and resources of KPMG, to carry out the audit of the financial statements of the Group consisting of Lyttelton Port Company Limited and its subsidiaries and other controlled entities, on her behalf.
OPINION We have audited the financial statements of the Group on pages 18 to 47, that comprise the statement of financial position as at 30 June 2016, the statement of comprehensive income, statement of changes in equity and statement of cash flows for the year ended on that date and the notes to the financial statements that include accounting policies and other explanatory information.
In our opinion, the financial statements of the Group:
• present fairly, in all material respects:
– its financial position as at 30 June 2016; and
– its financial performance and cash flows for the year then ended; and
• comply with generally accepted accounting practice in New Zealand in accordance with New Zealand equivalents to International Financial Reporting Standards.
EMPHASIS OF MATTER Without modifying our opinion, we draw attention to Note 20 to the financial statements, which describes the basis for the Group’s recognition of an impairment expense of $99.5 million for the year ended 30 June 2016.
The Directors have determined that the carrying amount of the Group’s assets exceeds the recoverable amount at 30 June 2016, on the basis that the Lyttelton Port Recovery Plan, and the Group’s Statement of Corporate Intent, commit the Directors to future capital expenditure. The impairment has arisen because the return generated by replacing destroyed assets, and some of the capital expenditure that the Directors consider is necessary for the future of the port, does not meet the investment return established by the Directors.
Our audit was completed on 24 August 2016. This is the date at which our opinion is expressed.
The basis of our opinion is explained below. In addition, we outline the responsibilities of the Board of Directors and our responsibilities, and explain our independence.
BASIS OF OPINION We carried out our audit in accordance with the Auditor-General’s Auditing Standards, which incorporate the International Standards on Auditing (New Zealand). Those standards require that we comply with ethical requirements and plan and carry out our audit to obtain reasonable assurance about whether the financial statements are free from material misstatement.
Material misstatements are differences or omissions of amounts and disclosures that, in our judgement, are likely to influence readers’ overall understanding of the financial statements. If we had found material misstatements that were not corrected, we would have referred to them in our opinion.
An audit involves carrying out procedures to obtain audit evidence about the amounts and disclosures in the financial statements. The procedures selected depend on our judgement, including our assessment of risks of material misstatement of the financial statements, whether due to fraud or error. In making those risk assessments, we consider internal control relevant to the preparation of the Group’s financial statements in order to design audit procedures that are appropriate in the circumstances but not for the purpose of expressing an opinion on the effectiveness of the Group’s internal control.
ANNUAL REPORT 2016 49

INDEPENDENT AUDITOR’S REPORT
An audit also involves evaluating:
• the appropriateness of accounting policies used and whether they have been consistently applied;
• the reasonableness of the significant accounting estimates and judgements made by the Board of Directors;
• the adequacy of the disclosures in the financial statements; and
• the overall presentation of the financial statements.
We did not examine every transaction, nor do we guarantee complete accuracy of the financial statements. Also, we did not evaluate the security and controls over the electronic publication of the financial statements.
We believe we have obtained sufficient and appropriate audit evidence to provide a basis for our audit opinion.
RESPONSIBILITIES OF THE BOARD OF DIRECTORS The Board of Directors is responsible for the preparation and fair presentation of financial statements for the Group that comply with generally accepted accounting practice in New Zealand.
The Board of Directors’ responsibilities arise from the Port Companies Act 1988.
The Board of Directors is also responsible for such internal control as it determines is necessary to enable the preparation of financial statements that are free from material misstatement, whether due to fraud or error. The Board of Directors is also responsible for the publication of the financial statements, whether in printed or electronic form.
RESPONSIBILITIES OF THE AUDITOR We are responsible for expressing an independent opinion on the financial statements and reporting that opinion to you based on our audit. Our responsibility arises from the Public Audit Act 2001.
INDEPENDENCE When carrying out the audit, we followed the independence requirements of the Auditor-General, which incorporate the independence requirements of the External Reporting Board.
Other than the audit, we have no relationship with or interests in the Group.
Graeme Edwards KPMG On behalf of the Auditor-General Wellington, New Zealand
50

DIRECTORY
BOARD OF DIRECTORSTrevor Burt ChairmanRod CarrBill DwyerGrant GilfillanJim QuinnKarl SmithBrian Wood
EXECUTIVE MANAGEMENT TEAMPeter Davie Chief ExecutiveJonathan Gardiner Chief Financial OfficerAllanah James Strategic Communications ManagerPaul Monk Operations ManagerSimon Munt Marketing ManagerJohn O’Dea Development ManagerSarah Reilly Senior Health and Safety Manager
REGISTERED OFFICELyttelton Port Company Limited 41 Chapmans Road, Woolston Christchurch, New Zealand Private Bag, 501, Lyttelton 8841Telephone: (03) 328 8198 Facsimile: (03) 328 7828 Email: [email protected]
WEBSITEwww.lpc.co.nz
BANKERSWestpac Banking Corporation
AUDITORSGraeme Edwards, KPMG On behalf of the Auditor-General, New Zealand
ANNUAL REPORT 2016 51

Lyttelton Port Company Limited41 Chapmans Rood, Woolston Christchurch, New Zealand 8022Phone: (03) 328 8198Email: [email protected]
52

