annual report - bombay stock exchange · the healthcare spending in india has a huge rise in the...
TRANSCRIPT

AN
NU
AL
RE
PO
RT
2017-18
Contents
Overview of the Indian Healthcare Industry 02
Expanding our network 10
Chairman’s Letter to the Stakeholders 18
Brief Biographies of Directors 20
Board of Director’s Report 22
Corporate Governance Report 61
Management Discussion and Analysis 78
Standalone Financial Statements 100
Consolidated Financial Statements 170

Getting diagnosed with cancer is not the end. With the advent of leading-edge technologies, cancer can now be successfully treated. Though access to world-class cancer care is paramount when it comes to treating cancer, having a positive outlook towards life can do wonders. An insatiable love for life and an unflinching desire to celebrate every moment no matter what make these cancer survivors awe-inspiring personalities.
1
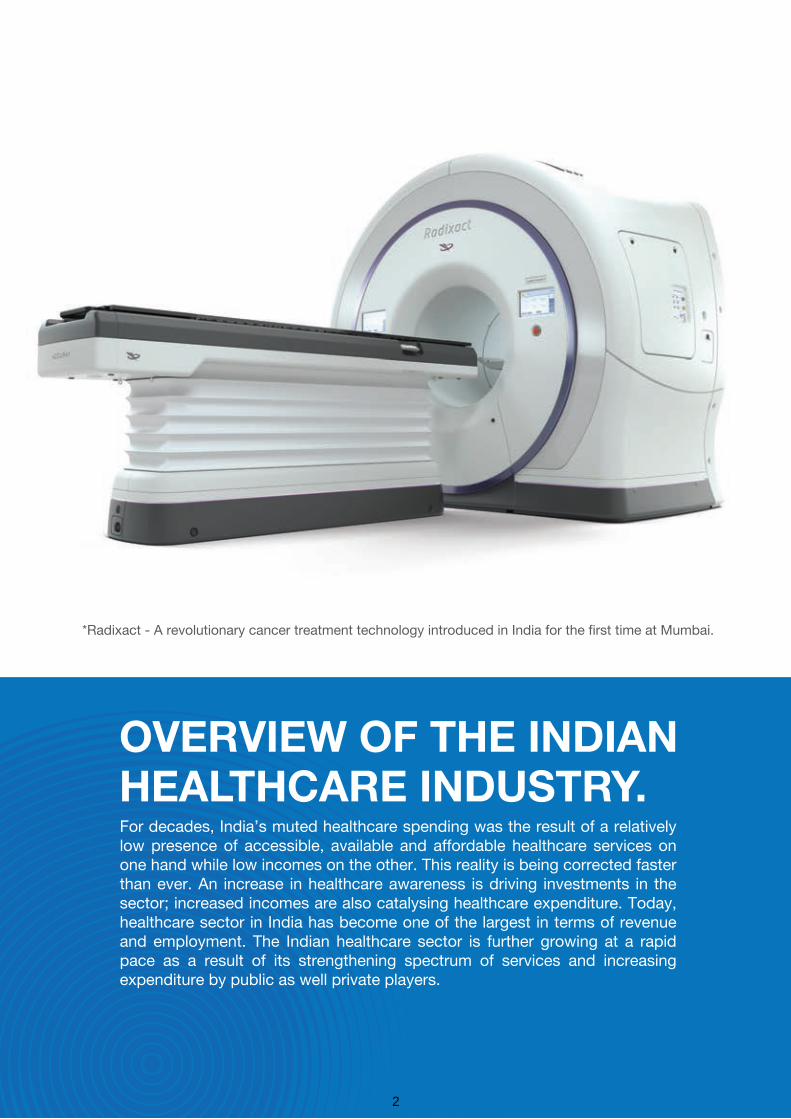
OVERVIEW OF THE INDIANHEALTHCARE INDUSTRY.For decades, India’s muted healthcare spending was the result of a relatively low presence of accessible, available and affordable healthcare services on one hand while low incomes on the other. This reality is being corrected faster than ever. An increase in healthcare awareness is driving investments in the sector; increased incomes are also catalysing healthcare expenditure. Today, healthcare sector in India has become one of the largest in terms of revenue and employment. The Indian healthcare sector is further growing at a rapid pace as a result of its strengthening spectrum of services and increasing expenditure by public as well private players.
*Radixact - A revolutionary cancer treatment technology introduced in India for the first time at Mumbai.
2
In India, the healthcare sector is bucketed into two major spectrums - public and private. The Government managed public healthcare system comprises limited secondary and tertiary care institutions in key cities, which focus on providing basic healthcare facilities in rural areas, while the private sector provides secondary, tertiary and quaternary care with a major concentration in tier I and tier II cities. Over the last two decades, a majority of tertiary care institutions in the public sector have been facing a resource crunch resulting in their inability to maintain their equipment, pay for consumables and upgrade their infrastructure to meet the growing demand for complex diagnostic and therapeutic treatments. As a result, there is an increasing preference for private hospitals. Today, the private sector plays a dominant role in the delivery of healthcare services in India. It is predominant in medical education, training, diagnostics and technology, manufacture of pharmaceuticals, hospital design, and in construction and management of ancillary services. Over 75% of the human resources and advanced medical technology, 68% of all hospitals and 37% of total hospital beds in India are in the private sector. Further, the sector has grown rapidly in the last few years, witnessing the emergence of several large private players and attracting huge capital investment. The growing dominance of the private sector and the consequent increase in competitive forces, is transforming the Indian healthcare sector from a supply driven market to a demand driven/ consumer-centric market.
Today, healthcare in India has increasingly become technology-driven, be it the development of new drugs/vaccines, medical devices/ equipment, or even the diagnostic techniques. The last decade witnessed a significant change in the delivery of healthcare services, with technology having a key role to play. Technological advancements have been made in the field of imaging which has facilitated
to deliver faster and more reliable diagnosis, with reduced doses, procedure time and new interventional application. Considerable advancements have also been made in several other areas, with the introduction of advanced medical technology thus improving the ability to monitor, prevent, diagnose, control, and cure a number of growing health conditions. Healthcare providers are increasingly adopting technology to derive various benefits, including improved patient satisfaction (through reduced turnaround time at points of care); enhanced patient safety (through improved decision-making); enhanced productivity and elimination of human error (by way of seamless integration with medical device/equipment); reduction in operational costs (through reduction in staff needed for back-office tasks); improved inventory management (by way of accurate demand estimation and timely procurement and distribution of materials), among others. Indian healthcare sector, one of the fastest growing industries, is expected to advance at a CAGR of 22.9 per cent during 2015–20 to reach USD 280 billion. There is immense scope for enhancing healthcare services penetration in India. This presents ample opportunity for development of the healthcare industry. Considering the fact that the healthcare spending in India has a huge rise in the percentage of Gross Domestic Product (GDP), there is a vast scope for enhancing healthcare services. Rural India accounts for more than 70 percent of the population of the country and is all set to emerge as a potential demand source for healthcare services. India requires 600,000 to 700,000 additional beds over the next five to six years, indicative of an investment opportunity of USD 25-30 billion. Given this demand for capital, the number of transactions in the healthcare space is expected to witness an increase in the near future. The average investment size by private equity funds in healthcare chains has already increased to USD 20-30 million from USD 5-15 million.
3

Transitioning from Photon to Protons –From the Frontier to the Forefront.
Radiation therapy is one of the cornerstones of contemporary cancer treatment and about 50% of patients will, at some point during their cancer history, require it. It forms a major part of the treatment plan for 40% of those who are cured of their cancer and is primarily responsible for cure in 16%. Since its first use in 1896 the face of clinical radiation therapy has continuously evolved, following a rapid arrow of progress. Thanks to imaging, computing power and technical advances in delivery.
Problems with Photon Treatments:
If given in sufficient doses, X-ray radiation techniques will control many cancers. But, because of the physician's inability to adequately conform the irradiation pattern to the cancer, healthy tissues may receive a similar dose and can be damaged. IMRT and VMAT/Rapid Arc techniques have enabled increase in the target conformity, albeit superior over the routine 3-D Conformal techniques used routinely. Consequently, a less- than-desired dose is frequently used to reduce damage to healthy tissues and avoid unwanted side effects.
Based on 15 years of experience with IMRT, we have learned that the opportunities in improving the plan quality are limited within the constraint of the present linac /MLC delivery. To improve the quality of the new IMRT plans one must inject new degrees of freedom. This may require an overhaul of the existing technologies.
Proton Opportunity:
• Protons are subatomic particles, stable positively charged, travel in straight lines with very little scatter through the tissues they travel. In proton therapy, hydrogen nuclei (protons) are used for treatment after raising their energy level with a particle accelerator, 250 MeV superconducting cyclotron or synchrotron
• Besides electronic interactions (Ionization) proton also produce nuclear interactions
• Different modes of interactions means different dose distributions
Protons have the remarkable ability of losing little energy when entering tissue, but depositing more
and more as they slow down. Finally, depositing a heavy dose of radiation just before they stop, giving rise to the so-called Bragg peak energy loss dE/dx profile.
• The major advantage of this physical properties of protons over conventional radiation results in improved conformity and reduced integral dose resulting in energy distribution of protons getting directed and deposited in tissue volumes designated by the physicians - in a three-dimensional pattern from each beam used. This allows the dose to be increased beyond that which less-conformal radiation will allow. The overall affects lead to the potential for fewer harmful side effects, more direct impact on the tumour, and increased tumour control
• In short – Conventional X-rays deposit most energy before the target while protons deposit most of the energy in the target
Developing Strategies for Selecting Patients:
One approach for selecting patients is based largely on historical series. However, a report for the Dutch government describes rational categories of clinical indications, which are helpful in considering future priorities:
• Standard: Benefit suggested by dosimetric studies, confirmed by phase I/II trials, observational studies; clinical consensus exists
• Potential: Improvement in treatment efficacy may be possible, by dose escalation
• Model-based: to reduce side-effects, especially in re-irradiation context
• Reducing the risk of secondary-radiation-induced tumours-most relevant for children and young adults, but what is the relevant age cut-off is unanswered still
The most intriguing category is the model-based approach, where PBT is aimed primarily at reducing side effects. It is proposed that PBT could be offered if individual planning studies show that side-effects can be reduced significantly. This might include pelvic malignancies, lung, prostate, head and neck, oesophageal and left-sided breast cancers and lymphomas.
4

This is clearly sophisticated, but also hugely ambitious, in that it links decision making to robust data on normal tissue complication probability. Levels for reduction would have to be determined, risk groups and cost-effectiveness balanced against conventional radiotherapy options.
Cardiac dose, for example, in a left-sided breast cancer case, may be reduced by a variety of techniques in conventional radiotherapy, but if a need to treat the internal mammary chain is additionally factored in, it is easy to conceive that a PBT plan might be calculated to deliver a substantially lower risk of late coronary damage. It is difficult to conceive of comparative planning being the main method of access for PBT especially in developed countries.
Challenges remain in developing and prioritising indications over the next few years before the treatment centres open, all of which will need to take into account the limited capacity.
Problems of a wide range of highly selected indications and low numbers, insufficient to obtain robust data, could be addressed by collaborating with other countries.
Evaluating Newer Technologies:
New drugs have to undergo a rigorous three-phase testing process mandated by the Food and Drug Administration. This process, insofar as possible, ensures a rigorous assessment of safety and comparative efficacy for new drugs before they come to market.
New technology is, however, managed differently, recognising that many devices are simple upgrades of pre-existing (or ‘predicate’) devices. Thus, for low- and intermediate-risk devices, simple proof that they perform their stated tasks in a safe manner is sufficient. For ‘high-risk’ devices, some prospectively gathered clinical data are required, although randomised trials are not necessary.
5

Decoding the Proton Bubble:
Until 2004 there were only two clinical centres in the USA, Loma Linda University and the Massachusetts General Hospital, and so proton therapy was not a big resource drain and largely passed unnoticed. These centres generated the evidence supporting the use of proton beam in treating cancers of childhood and tumours of the skull base, the only indications currently held to be secure.
During the last decade and a half, however, the number of proton centres have expanded enormously and stands at 26 at the time of writing, with many more planned.
In addition, many competitive treatments have become established. Stereotactic body radiotherapy - a very patient-friendly alternative to proton beam and robot-assisted surgery has, through a similar advertising blitz, eaten into the radiation, and thus the proton therapy share of the market.
Several US proton centres have accepted ‘reference pricing’ as payment for proton therapy, meaning that they are not paid what it costs to deliver the treatment but are paid according to the next most expensive alternative. This, being better than no payment at all, will allow some to survive. Other academic institutions are trying a new model, forming consortia in which many centres have a share in a single facility. The first of these, in New York City, should open within 2 years, but whether co-operation can be maintained long-term is unknown.
There are now enough academic centres open that there is a critical mass for research co-operation and many trials are underway, including randomised trials against alternative treatments. As European centres open, the trials base will enlarge further and evidence can be rapidly generated that will confirm the benefit of proton therapy in some clinical situations and refute it in others. Payers have complained that they are paying for a therapy without evidence of benefit. They are right, and this needs to be rectified fast.
Potential Clinical Challenges / Underpinnings:
Simply put, proton stops, but they do sharply. But stopping can be dangerous if we don’t know where:
1) Bragg peak placement inaccuracy due to physical reasons, such as heterogeneous tissue densities, patient movement, daily positioning, and beam delivery-related factors, such as lateral scattering of the beam.
2) Within Bragg peaks, energy is deposited as clustered rather than sparse ionisation events. This causes more complex DNA damage that is more difficult or impossible for enzymatic DNA repair mechanisms to restore, resulting in enhanced biological effects. These may be advantageous within a cancer, but possibly deleterious for normal tissues in the tumour vicinity and which require to be treated to full or near-full dose to achieve local tumour control.
3) Currently, the medical prescription of proton therapy dose includes a 10% reduction in dose to all tumours and tissues to compensate for enhanced bio-effectiveness. This correction factor is being challenged, but to understand this issue, it is necessary to be familiar with the physics and biology terms associated with enhanced bio-effectiveness, and how this is modified by physical and biological characteristics.
While technology continues to evolve, majority of these clinical challenges can be overcome by properly configuring the technologies using Advanced Pencil-Beam Scanning technologies, Planning systems, Image guidance tools, etc.
Future of Proton Therapy:
The future for proton therapy has to lie in smaller, more efficient, delivery units.
Current systems can occupy a space the size of a football field. This kind of space may be unavailable within the footprint of a hospital or too expensive in many cities. Several vendors have managed to produce units with just a single gantry costing less than $30 million. These treat far fewer patients than multi-gantry systems but carry somewhat less financial risk for the institution.
Much engineering research has looked at reducing gantry size to cut down on weight and space. Others look to eliminate the gantry altogether and simply manoeuver the patient within a fixed beam. Some are investigating fundamental alternatives to the cyclotron for generating the proton beam.
If these come to pass, and the price can be vastly reduced, then proton therapy can enjoy a revival, and perhaps even an expansion.
PBT is here to stay and is a welcome advance in radiotherapy and we are in a position to make a major contribution to the science and clinical application of PBT.
6

*Photon beam therapy to be introduced in India for the first time.
7
The growing population and ascend in chronic care needs are wielding substantial demands on our healthcare frameworks. It is greatly stressing that about 50-60 million Indians are constrained to spend half of their yearly family income to address medical issues, particularly with regards to hospitalization. The out-of-pocket costs for medical services are extremely high for us, which influence disservice to almost 7% (Rao, n.d.) of our population. Access to capital has been one of the biggest roadblocks to the growth of the Indian healthcare sector. Today, majority of the system constitutes of private healthcare and the Indian government spends only about 1% of its GDP on healthcare, which is among the lowest globally for any country. However, to meet India’s burgeoning healthcare needs, both the public and private sector will have to join hands to build value-based and cashless healthcare. This implies providing high-end care at a subsidized cost compared to other countries; to enhance healthcare services. It is the commitment of the state to give free and universal access to quality healthcare services to its citizens as India keeps on being among the nations of the world that have a high weight of ailments. The various wellbeing projects and policies in the past have not possessed the capacity to accomplish the coveted objectives and targets.
However, with the recent launch of one of the major policy initiatives by the government, Ayushman Bharat – National Health Protection Mission for the underprivileged section of the Indian population, will help in the accomplishment of the dream of Universal Health Coverage of the Indian population. Ayushman Bharat is an attempt to ensure that universal healthcare reaches the weaker section of the society and it may certainly boost the ratio of people availing primary healthcare and some of the secondary healthcare. But the current framework of the scheme will not be beneficial for people who need tertiary care as the remunerations under the scheme will not be sufficient to avail value based healthcare. Under the scheme, tertiary healthcare service providers will be forced to cut cost at every level which will lead to offering sub-standard healthcare to patients under the scheme. They may not be able to avail the necessary medication, technology and clinical expertise to get the best outcome and will soon lose confidence in the system. However, implementation of the scheme will be a big challenge since it would involve focusing on the critical success factors, maintaining good quality of care for patients, strengthening primary care and healthcare infrastructure.
Quality of patient careA scheme of such scale is most likely to face obstacles when ‘quality of patient care’ is considered. In case of serious and major illness, emergency and ICU care, there is a high chance of an Ayushman patient to receive low quality healthcare due to the capped amount to be granted. Hence, the mortality and morbidity rate will be very high. The trust and confidence of the poor will be immensely affected. Let’s say, if I am a below poverty line person and I require a certain drug treatment i.e. for my cure, if the system doesn’t pay, I’m helpless. So, I will not get the right treatment and my survival is at stake. Therefore, if you are an Ayushman patient you will get low quality care as the amount paid is less comparative to the cost of the treatment. For the vulnerable class, the government funding is essential to make healthcare universally available but there is also a need to improve the
outcomes for the money spent - only then we can make value-based healthcare a reality. Strengthening primary care and healthcare infrastructureGiving financial protection to the poor not only gives them access to healthcare but is also cost-effective. That is, it gives great incentives as the advantages of financial protection far exceeds the expenses. However, cost-effective health coverage must cover primary care. The WHO prescribes allotment to primary care, particularly for presently unprivileged low-income population. In India, reallocation of assets is important to fortify primary care and to embrace innovation and well-being programs, to be cost-effective in terms of expenses and anticipated benefits. Solid primary care is crucial to keeping overall access to healthcare reasonable and inexpensive in the nation. Our greatest imperative to get this going isn't due to lack of capital or framework, but an intense deficiency of human resources and infrastructure. Most public healthcare facilities have noteworthy deficiency of specialists, doctors, nurses and other healthcare experts. To address this, the government should use existing foundation in private medical schools, that has been under-used because individuals can't afford the cost of it. To utilize these spaces, bundle rates must be made competitive and at standard with the market rates. The government says that volumes will help take care of the expenses, yet that is after a point of time. Now, they must get the beneficiaries, and make it reasonable for the hospitals as well.
Outcome-based payments Quality healthcare is defined as value-based medicine that is assessed by outcome. Today, nearly 80 percent of healthcare in India is provided by the private healthcare system and in order to meet the burgeoning healthcare needs of the Indian population through value-based medicine, the country needs a synchronized effort by both private and public sector. The scheme encourages hospitals to maintain certain minimum standards. The reward to hospitals is 10% higher if they have NABH accreditation and a basic technology criterion has been stated for hospitals to be qualified for this scheme. Hospitals that meet certain quality benchmarks ought to be permitted to serve NHPS beneficiaries. Quality should be assessed not only by the infrastructure offered at the hospital but also by authentic patient outcomes attained. The only solution is to have a mandatory universal health cover for all sections of the society. This will increase the pool and allow cross-subsidy between the government and the private sector for different sections of the society. Over and above, the power to judge the need should be with an autonomous insurance company that can negotiate with the private service providers on a reasonable remuneration which is beneficial for both parties. It is a proven and successful model followed by various developed countries and will bring a sustenance in India as well. It is a long road to make quality healthcare accessible but we need to take up the challenge and pave way for a correct system where people receive the right treatment at the right time irrespective of their economic status.
Over the long haul, Ayushman Bharat should focus on fortifying of primary care, incorporation of outpatient treatment and general health care delivery framework with a specific end goal to make the government's progress to accomplish Universal Health Coverage.
What is the cost of low cost in healthcare?What is the cost of low cost in healthcare?What is the cost of low cost in healthcare?What is the cost of low cost in healthcare?What is the cost of low cost in healthcare?wielding substantial demands on our healthcare frameworks. The growing population and ascend in chronic care needs are wielding substantial demands on our healthcare frameworks. The growing population and ascend in chronic care needs are
What is the cost of low cost in healthcare?What is the cost of low cost in healthcare?What is the cost of low cost in healthcare?What is the cost of low cost in healthcare?What is the cost of low cost in healthcare?
address medical issues, particularly with regards to constrained to spend half of their yearly family income to It is greatly stressing that about 50-60 million Indians are constrained to spend half of their yearly family income to It is greatly stressing that about 50-60 million Indians are wielding substantial demands on our healthcare frameworks. The growing population and ascend in chronic care needs are The growing population and ascend in chronic care needs are
What is the cost of low cost in healthcare?What is the cost of low cost in healthcare?What is the cost of low cost in healthcare?What is the cost of low cost in healthcare?What is the cost of low cost in healthcare?
hospitalization. The out-of-pocket costs for medical services hospitalization. The out-of-pocket costs for medical services address medical issues, particularly with regards to constrained to spend half of their yearly family income to address medical issues, particularly with regards to constrained to spend half of their yearly family income to It is greatly stressing that about 50-60 million Indians are wielding substantial demands on our healthcare frameworks. It is greatly stressing that about 50-60 million Indians are
The growing population and ascend in chronic care needs are wielding substantial demands on our healthcare frameworks. The growing population and ascend in chronic care needs are
What is the cost of low cost in healthcare?What is the cost of low cost in healthcare?What is the cost of low cost in healthcare?What is the cost of low cost in healthcare?What is the cost of low cost in healthcare?What is the cost of low cost in healthcare?
are extremely high for us, which influence disservice to almost are extremely high for us, which influence disservice to almost hospitalization. The out-of-pocket costs for medical services are extremely high for us, which influence disservice to almost hospitalization. The out-of-pocket costs for medical services address medical issues, particularly with regards to hospitalization. The out-of-pocket costs for medical services address medical issues, particularly with regards to constrained to spend half of their yearly family income to address medical issues, particularly with regards to
It is greatly stressing that about 50-60 million Indians are constrained to spend half of their yearly family income to It is greatly stressing that about 50-60 million Indians are wielding substantial demands on our healthcare frameworks. The growing population and ascend in chronic care needs are
What is the cost of low cost in healthcare?What is the cost of low cost in healthcare?What is the cost of low cost in healthcare?What is the cost of low cost in healthcare?What is the cost of low cost in healthcare?What is the cost of low cost in healthcare?
7% (Rao, n.d.) of our population. Access to capital has been 7% (Rao, n.d.) of our population. Access to capital has been are extremely high for us, which influence disservice to almost are extremely high for us, which influence disservice to almost hospitalization. The out-of-pocket costs for medical services are extremely high for us, which influence disservice to almost hospitalization. The out-of-pocket costs for medical services address medical issues, particularly with regards to hospitalization. The out-of-pocket costs for medical services address medical issues, particularly with regards to constrained to spend half of their yearly family income to It is greatly stressing that about 50-60 million Indians are wielding substantial demands on our healthcare frameworks. It is greatly stressing that about 50-60 million Indians are
The growing population and ascend in chronic care needs are wielding substantial demands on our healthcare frameworks. The growing population and ascend in chronic care needs are
What is the cost of low cost in healthcare?What is the cost of low cost in healthcare?What is the cost of low cost in healthcare?What is the cost of low cost in healthcare?What is the cost of low cost in healthcare?What is the cost of low cost in healthcare?What is the cost of low cost in healthcare?
one of the biggest roadblocks to the growth of the Indian 7% (Rao, n.d.) of our population. Access to capital has been 7% (Rao, n.d.) of our population. Access to capital has been 7% (Rao, n.d.) of our population. Access to capital has been are extremely high for us, which influence disservice to almost 7% (Rao, n.d.) of our population. Access to capital has been are extremely high for us, which influence disservice to almost hospitalization. The out-of-pocket costs for medical services are extremely high for us, which influence disservice to almost hospitalization. The out-of-pocket costs for medical services address medical issues, particularly with regards to constrained to spend half of their yearly family income to address medical issues, particularly with regards to
It is greatly stressing that about 50-60 million Indians are constrained to spend half of their yearly family income to
wielding substantial demands on our healthcare frameworks. It is greatly stressing that about 50-60 million Indians are
The growing population and ascend in chronic care needs are wielding substantial demands on our healthcare frameworks. The growing population and ascend in chronic care needs are
What is the cost of low cost in healthcare?What is the cost of low cost in healthcare?What is the cost of low cost in healthcare?What is the cost of low cost in healthcare?What is the cost of low cost in healthcare?What is the cost of low cost in healthcare?
one of the biggest roadblocks to the growth of the Indian one of the biggest roadblocks to the growth of the Indian one of the biggest roadblocks to the growth of the Indian 7% (Rao, n.d.) of our population. Access to capital has been one of the biggest roadblocks to the growth of the Indian 7% (Rao, n.d.) of our population. Access to capital has been 7% (Rao, n.d.) of our population. Access to capital has been are extremely high for us, which influence disservice to almost are extremely high for us, which influence disservice to almost hospitalization. The out-of-pocket costs for medical services address medical issues, particularly with regards to hospitalization. The out-of-pocket costs for medical services
constrained to spend half of their yearly family income to address medical issues, particularly with regards to
It is greatly stressing that about 50-60 million Indians are constrained to spend half of their yearly family income to
wielding substantial demands on our healthcare frameworks. It is greatly stressing that about 50-60 million Indians are
The growing population and ascend in chronic care needs are wielding substantial demands on our healthcare frameworks. The growing population and ascend in chronic care needs are
What is the cost of low cost in healthcare?What is the cost of low cost in healthcare?What is the cost of low cost in healthcare?What is the cost of low cost in healthcare?What is the cost of low cost in healthcare?What is the cost of low cost in healthcare?What is the cost of low cost in healthcare?What is the cost of low cost in healthcare?
healthcare sector. Today, majority of the system constitutes one of the biggest roadblocks to the growth of the Indian one of the biggest roadblocks to the growth of the Indian one of the biggest roadblocks to the growth of the Indian one of the biggest roadblocks to the growth of the Indian 7% (Rao, n.d.) of our population. Access to capital has been one of the biggest roadblocks to the growth of the Indian 7% (Rao, n.d.) of our population. Access to capital has been are extremely high for us, which influence disservice to almost 7% (Rao, n.d.) of our population. Access to capital has been are extremely high for us, which influence disservice to almost hospitalization. The out-of-pocket costs for medical services address medical issues, particularly with regards to hospitalization. The out-of-pocket costs for medical services
constrained to spend half of their yearly family income to address medical issues, particularly with regards to
It is greatly stressing that about 50-60 million Indians are constrained to spend half of their yearly family income to
wielding substantial demands on our healthcare frameworks. It is greatly stressing that about 50-60 million Indians are wielding substantial demands on our healthcare frameworks. The growing population and ascend in chronic care needs are
What is the cost of low cost in healthcare?What is the cost of low cost in healthcare?What is the cost of low cost in healthcare?What is the cost of low cost in healthcare?What is the cost of low cost in healthcare?What is the cost of low cost in healthcare?What is the cost of low cost in healthcare?What is the cost of low cost in healthcare?The growing population and ascend in chronic care needs are wielding substantial demands on our healthcare frameworks.
healthcare sector. Today, majority of the system constitutes healthcare sector. Today, majority of the system constitutes healthcare sector. Today, majority of the system constitutes healthcare sector. Today, majority of the system constitutes one of the biggest roadblocks to the growth of the Indian one of the biggest roadblocks to the growth of the Indian one of the biggest roadblocks to the growth of the Indian 7% (Rao, n.d.) of our population. Access to capital has been 7% (Rao, n.d.) of our population. Access to capital has been are extremely high for us, which influence disservice to almost hospitalization. The out-of-pocket costs for medical services are extremely high for us, which influence disservice to almost
address medical issues, particularly with regards to hospitalization. The out-of-pocket costs for medical services address medical issues, particularly with regards to constrained to spend half of their yearly family income to It is greatly stressing that about 50-60 million Indians are wielding substantial demands on our healthcare frameworks. The growing population and ascend in chronic care needs are The growing population and ascend in chronic care needs are
What is the cost of low cost in healthcare?What is the cost of low cost in healthcare?What is the cost of low cost in healthcare?What is the cost of low cost in healthcare?What is the cost of low cost in healthcare?What is the cost of low cost in healthcare?What is the cost of low cost in healthcare?What is the cost of low cost in healthcare?What is the cost of low cost in healthcare?The growing population and ascend in chronic care needs are
healthcare sector. Today, majority of the system constitutes healthcare sector. Today, majority of the system constitutes healthcare sector. Today, majority of the system constitutes healthcare sector. Today, majority of the system constitutes healthcare sector. Today, majority of the system constitutes healthcare sector. Today, majority of the system constitutes one of the biggest roadblocks to the growth of the Indian one of the biggest roadblocks to the growth of the Indian 7% (Rao, n.d.) of our population. Access to capital has been one of the biggest roadblocks to the growth of the Indian 7% (Rao, n.d.) of our population. Access to capital has been are extremely high for us, which influence disservice to almost 7% (Rao, n.d.) of our population. Access to capital has been are extremely high for us, which influence disservice to almost hospitalization. The out-of-pocket costs for medical services address medical issues, particularly with regards to constrained to spend half of their yearly family income to It is greatly stressing that about 50-60 million Indians are constrained to spend half of their yearly family income to
wielding substantial demands on our healthcare frameworks. It is greatly stressing that about 50-60 million Indians are
The growing population and ascend in chronic care needs are wielding substantial demands on our healthcare frameworks. The growing population and ascend in chronic care needs are
What is the cost of low cost in healthcare?What is the cost of low cost in healthcare?What is the cost of low cost in healthcare?What is the cost of low cost in healthcare?What is the cost of low cost in healthcare?What is the cost of low cost in healthcare?What is the cost of low cost in healthcare?What is the cost of low cost in healthcare?What is the cost of low cost in healthcare?The growing population and ascend in chronic care needs are wielding substantial demands on our healthcare frameworks.
of private healthcare and the Indian government spends only of private healthcare and the Indian government spends only healthcare sector. Today, majority of the system constitutes healthcare sector. Today, majority of the system constitutes healthcare sector. Today, majority of the system constitutes healthcare sector. Today, majority of the system constitutes one of the biggest roadblocks to the growth of the Indian one of the biggest roadblocks to the growth of the Indian 7% (Rao, n.d.) of our population. Access to capital has been are extremely high for us, which influence disservice to almost 7% (Rao, n.d.) of our population. Access to capital has been are extremely high for us, which influence disservice to almost hospitalization. The out-of-pocket costs for medical services address medical issues, particularly with regards to hospitalization. The out-of-pocket costs for medical services
constrained to spend half of their yearly family income to address medical issues, particularly with regards to
It is greatly stressing that about 50-60 million Indians are constrained to spend half of their yearly family income to
wielding substantial demands on our healthcare frameworks. It is greatly stressing that about 50-60 million Indians are wielding substantial demands on our healthcare frameworks. The growing population and ascend in chronic care needs are The growing population and ascend in chronic care needs are
What is the cost of low cost in healthcare?What is the cost of low cost in healthcare?What is the cost of low cost in healthcare?What is the cost of low cost in healthcare?What is the cost of low cost in healthcare?What is the cost of low cost in healthcare?What is the cost of low cost in healthcare?What is the cost of low cost in healthcare?What is the cost of low cost in healthcare?What is the cost of low cost in healthcare?What is the cost of low cost in healthcare?What is the cost of low cost in healthcare?The growing population and ascend in chronic care needs are wielding substantial demands on our healthcare frameworks.
of private healthcare and the Indian government spends only of private healthcare and the Indian government spends only of private healthcare and the Indian government spends only of private healthcare and the Indian government spends only of private healthcare and the Indian government spends only healthcare sector. Today, majority of the system constitutes healthcare sector. Today, majority of the system constitutes healthcare sector. Today, majority of the system constitutes one of the biggest roadblocks to the growth of the Indian one of the biggest roadblocks to the growth of the Indian 7% (Rao, n.d.) of our population. Access to capital has been one of the biggest roadblocks to the growth of the Indian 7% (Rao, n.d.) of our population. Access to capital has been are extremely high for us, which influence disservice to almost hospitalization. The out-of-pocket costs for medical services are extremely high for us, which influence disservice to almost
address medical issues, particularly with regards to hospitalization. The out-of-pocket costs for medical services
constrained to spend half of their yearly family income to address medical issues, particularly with regards to constrained to spend half of their yearly family income to It is greatly stressing that about 50-60 million Indians are wielding substantial demands on our healthcare frameworks. It is greatly stressing that about 50-60 million Indians are
The growing population and ascend in chronic care needs are wielding substantial demands on our healthcare frameworks. The growing population and ascend in chronic care needs are
What is the cost of low cost in healthcare?What is the cost of low cost in healthcare?What is the cost of low cost in healthcare?What is the cost of low cost in healthcare?What is the cost of low cost in healthcare?What is the cost of low cost in healthcare?What is the cost of low cost in healthcare?What is the cost of low cost in healthcare?What is the cost of low cost in healthcare?What is the cost of low cost in healthcare?What is the cost of low cost in healthcare?What is the cost of low cost in healthcare?What is the cost of low cost in healthcare?What is the cost of low cost in healthcare?What is the cost of low cost in healthcare?What is the cost of low cost in healthcare?What is the cost of low cost in healthcare?What is the cost of low cost in healthcare?What is the cost of low cost in healthcare?What is the cost of low cost in healthcare?The growing population and ascend in chronic care needs are The growing population and ascend in chronic care needs are wielding substantial demands on our healthcare frameworks. It is greatly stressing that about 50-60 million Indians are
of private healthcare and the Indian government spends only of private healthcare and the Indian government spends only of private healthcare and the Indian government spends only of private healthcare and the Indian government spends only of private healthcare and the Indian government spends only of private healthcare and the Indian government spends only healthcare sector. Today, majority of the system constitutes healthcare sector. Today, majority of the system constitutes healthcare sector. Today, majority of the system constitutes one of the biggest roadblocks to the growth of the Indian one of the biggest roadblocks to the growth of the Indian 7% (Rao, n.d.) of our population. Access to capital has been are extremely high for us, which influence disservice to almost 7% (Rao, n.d.) of our population. Access to capital has been
hospitalization. The out-of-pocket costs for medical services are extremely high for us, which influence disservice to almost hospitalization. The out-of-pocket costs for medical services address medical issues, particularly with regards to constrained to spend half of their yearly family income to address medical issues, particularly with regards to
It is greatly stressing that about 50-60 million Indians are constrained to spend half of their yearly family income to It is greatly stressing that about 50-60 million Indians are wielding substantial demands on our healthcare frameworks. The growing population and ascend in chronic care needs are wielding substantial demands on our healthcare frameworks. The growing population and ascend in chronic care needs are
What is the cost of low cost in healthcare?What is the cost of low cost in healthcare?What is the cost of low cost in healthcare?What is the cost of low cost in healthcare?What is the cost of low cost in healthcare?What is the cost of low cost in healthcare?What is the cost of low cost in healthcare?What is the cost of low cost in healthcare?What is the cost of low cost in healthcare?What is the cost of low cost in healthcare?What is the cost of low cost in healthcare?What is the cost of low cost in healthcare?What is the cost of low cost in healthcare?What is the cost of low cost in healthcare?What is the cost of low cost in healthcare?What is the cost of low cost in healthcare?The growing population and ascend in chronic care needs are The growing population and ascend in chronic care needs are wielding substantial demands on our healthcare frameworks. wielding substantial demands on our healthcare frameworks. It is greatly stressing that about 50-60 million Indians are
of private healthcare and the Indian government spends only of private healthcare and the Indian government spends only of private healthcare and the Indian government spends only of private healthcare and the Indian government spends only of private healthcare and the Indian government spends only of private healthcare and the Indian government spends only of private healthcare and the Indian government spends only of private healthcare and the Indian government spends only healthcare sector. Today, majority of the system constitutes healthcare sector. Today, majority of the system constitutes one of the biggest roadblocks to the growth of the Indian one of the biggest roadblocks to the growth of the Indian 7% (Rao, n.d.) of our population. Access to capital has been 7% (Rao, n.d.) of our population. Access to capital has been are extremely high for us, which influence disservice to almost hospitalization. The out-of-pocket costs for medical services address medical issues, particularly with regards to hospitalization. The out-of-pocket costs for medical services address medical issues, particularly with regards to constrained to spend half of their yearly family income to It is greatly stressing that about 50-60 million Indians are wielding substantial demands on our healthcare frameworks. It is greatly stressing that about 50-60 million Indians are wielding substantial demands on our healthcare frameworks. The growing population and ascend in chronic care needs are wielding substantial demands on our healthcare frameworks. The growing population and ascend in chronic care needs are The growing population and ascend in chronic care needs are
What is the cost of low cost in healthcare?What is the cost of low cost in healthcare?What is the cost of low cost in healthcare?What is the cost of low cost in healthcare?What is the cost of low cost in healthcare?What is the cost of low cost in healthcare?What is the cost of low cost in healthcare?What is the cost of low cost in healthcare?What is the cost of low cost in healthcare?What is the cost of low cost in healthcare?What is the cost of low cost in healthcare?What is the cost of low cost in healthcare?What is the cost of low cost in healthcare?The growing population and ascend in chronic care needs are The growing population and ascend in chronic care needs are The growing population and ascend in chronic care needs are wielding substantial demands on our healthcare frameworks. wielding substantial demands on our healthcare frameworks. It is greatly stressing that about 50-60 million Indians are It is greatly stressing that about 50-60 million Indians are constrained to spend half of their yearly family income to
about 1% of its GDP on healthcare, which is among the about 1% of its GDP on healthcare, which is among the about 1% of its GDP on healthcare, which is among the about 1% of its GDP on healthcare, which is among the of private healthcare and the Indian government spends only of private healthcare and the Indian government spends only of private healthcare and the Indian government spends only of private healthcare and the Indian government spends only healthcare sector. Today, majority of the system constitutes healthcare sector. Today, majority of the system constitutes one of the biggest roadblocks to the growth of the Indian 7% (Rao, n.d.) of our population. Access to capital has been one of the biggest roadblocks to the growth of the Indian 7% (Rao, n.d.) of our population. Access to capital has been are extremely high for us, which influence disservice to almost hospitalization. The out-of-pocket costs for medical services are extremely high for us, which influence disservice to almost hospitalization. The out-of-pocket costs for medical services address medical issues, particularly with regards to constrained to spend half of their yearly family income to address medical issues, particularly with regards to constrained to spend half of their yearly family income to It is greatly stressing that about 50-60 million Indians are wielding substantial demands on our healthcare frameworks. It is greatly stressing that about 50-60 million Indians are wielding substantial demands on our healthcare frameworks. The growing population and ascend in chronic care needs are wielding substantial demands on our healthcare frameworks. The growing population and ascend in chronic care needs are The growing population and ascend in chronic care needs are
What is the cost of low cost in healthcare?What is the cost of low cost in healthcare?What is the cost of low cost in healthcare?What is the cost of low cost in healthcare?What is the cost of low cost in healthcare?The growing population and ascend in chronic care needs are The growing population and ascend in chronic care needs are The growing population and ascend in chronic care needs are wielding substantial demands on our healthcare frameworks. wielding substantial demands on our healthcare frameworks. wielding substantial demands on our healthcare frameworks. It is greatly stressing that about 50-60 million Indians are It is greatly stressing that about 50-60 million Indians are constrained to spend half of their yearly family income to
about 1% of its GDP on healthcare, which is among the about 1% of its GDP on healthcare, which is among the about 1% of its GDP on healthcare, which is among the about 1% of its GDP on healthcare, which is among the about 1% of its GDP on healthcare, which is among the about 1% of its GDP on healthcare, which is among the of private healthcare and the Indian government spends only of private healthcare and the Indian government spends only of private healthcare and the Indian government spends only healthcare sector. Today, majority of the system constitutes healthcare sector. Today, majority of the system constitutes one of the biggest roadblocks to the growth of the Indian one of the biggest roadblocks to the growth of the Indian 7% (Rao, n.d.) of our population. Access to capital has been are extremely high for us, which influence disservice to almost 7% (Rao, n.d.) of our population. Access to capital has been are extremely high for us, which influence disservice to almost hospitalization. The out-of-pocket costs for medical services address medical issues, particularly with regards to hospitalization. The out-of-pocket costs for medical services address medical issues, particularly with regards to constrained to spend half of their yearly family income to constrained to spend half of their yearly family income to It is greatly stressing that about 50-60 million Indians are wielding substantial demands on our healthcare frameworks. It is greatly stressing that about 50-60 million Indians are wielding substantial demands on our healthcare frameworks. wielding substantial demands on our healthcare frameworks. The growing population and ascend in chronic care needs are The growing population and ascend in chronic care needs are The growing population and ascend in chronic care needs are The growing population and ascend in chronic care needs are The growing population and ascend in chronic care needs are The growing population and ascend in chronic care needs are The growing population and ascend in chronic care needs are The growing population and ascend in chronic care needs are wielding substantial demands on our healthcare frameworks. wielding substantial demands on our healthcare frameworks. wielding substantial demands on our healthcare frameworks. It is greatly stressing that about 50-60 million Indians are It is greatly stressing that about 50-60 million Indians are constrained to spend half of their yearly family income to constrained to spend half of their yearly family income to address medical issues, particularly with regards to
about 1% of its GDP on healthcare, which is among the about 1% of its GDP on healthcare, which is among the about 1% of its GDP on healthcare, which is among the about 1% of its GDP on healthcare, which is among the about 1% of its GDP on healthcare, which is among the about 1% of its GDP on healthcare, which is among the about 1% of its GDP on healthcare, which is among the of private healthcare and the Indian government spends only of private healthcare and the Indian government spends only of private healthcare and the Indian government spends only healthcare sector. Today, majority of the system constitutes healthcare sector. Today, majority of the system constitutes one of the biggest roadblocks to the growth of the Indian one of the biggest roadblocks to the growth of the Indian 7% (Rao, n.d.) of our population. Access to capital has been are extremely high for us, which influence disservice to almost are extremely high for us, which influence disservice to almost hospitalization. The out-of-pocket costs for medical services address medical issues, particularly with regards to hospitalization. The out-of-pocket costs for medical services address medical issues, particularly with regards to constrained to spend half of their yearly family income to constrained to spend half of their yearly family income to It is greatly stressing that about 50-60 million Indians are It is greatly stressing that about 50-60 million Indians are wielding substantial demands on our healthcare frameworks. wielding substantial demands on our healthcare frameworks. wielding substantial demands on our healthcare frameworks. The growing population and ascend in chronic care needs are wielding substantial demands on our healthcare frameworks. The growing population and ascend in chronic care needs are The growing population and ascend in chronic care needs are The growing population and ascend in chronic care needs are The growing population and ascend in chronic care needs are The growing population and ascend in chronic care needs are The growing population and ascend in chronic care needs are The growing population and ascend in chronic care needs are The growing population and ascend in chronic care needs are The growing population and ascend in chronic care needs are The growing population and ascend in chronic care needs are wielding substantial demands on our healthcare frameworks. wielding substantial demands on our healthcare frameworks. wielding substantial demands on our healthcare frameworks. It is greatly stressing that about 50-60 million Indians are It is greatly stressing that about 50-60 million Indians are constrained to spend half of their yearly family income to address medical issues, particularly with regards to
about 1% of its GDP on healthcare, which is among the about 1% of its GDP on healthcare, which is among the about 1% of its GDP on healthcare, which is among the about 1% of its GDP on healthcare, which is among the about 1% of its GDP on healthcare, which is among the about 1% of its GDP on healthcare, which is among the about 1% of its GDP on healthcare, which is among the about 1% of its GDP on healthcare, which is among the of private healthcare and the Indian government spends only of private healthcare and the Indian government spends only healthcare sector. Today, majority of the system constitutes healthcare sector. Today, majority of the system constitutes one of the biggest roadblocks to the growth of the Indian healthcare sector. Today, majority of the system constitutes one of the biggest roadblocks to the growth of the Indian 7% (Rao, n.d.) of our population. Access to capital has been 7% (Rao, n.d.) of our population. Access to capital has been are extremely high for us, which influence disservice to almost hospitalization. The out-of-pocket costs for medical services are extremely high for us, which influence disservice to almost hospitalization. The out-of-pocket costs for medical services address medical issues, particularly with regards to hospitalization. The out-of-pocket costs for medical services address medical issues, particularly with regards to constrained to spend half of their yearly family income to constrained to spend half of their yearly family income to It is greatly stressing that about 50-60 million Indians are constrained to spend half of their yearly family income to It is greatly stressing that about 50-60 million Indians are It is greatly stressing that about 50-60 million Indians are wielding substantial demands on our healthcare frameworks. wielding substantial demands on our healthcare frameworks. wielding substantial demands on our healthcare frameworks. wielding substantial demands on our healthcare frameworks. wielding substantial demands on our healthcare frameworks. wielding substantial demands on our healthcare frameworks. wielding substantial demands on our healthcare frameworks. wielding substantial demands on our healthcare frameworks. wielding substantial demands on our healthcare frameworks. wielding substantial demands on our healthcare frameworks. wielding substantial demands on our healthcare frameworks. wielding substantial demands on our healthcare frameworks. wielding substantial demands on our healthcare frameworks. wielding substantial demands on our healthcare frameworks. It is greatly stressing that about 50-60 million Indians are It is greatly stressing that about 50-60 million Indians are It is greatly stressing that about 50-60 million Indians are constrained to spend half of their yearly family income to constrained to spend half of their yearly family income to address medical issues, particularly with regards to address medical issues, particularly with regards to
about 1% of its GDP on healthcare, which is among the about 1% of its GDP on healthcare, which is among the about 1% of its GDP on healthcare, which is among the about 1% of its GDP on healthcare, which is among the about 1% of its GDP on healthcare, which is among the of private healthcare and the Indian government spends only of private healthcare and the Indian government spends only of private healthcare and the Indian government spends only healthcare sector. Today, majority of the system constitutes healthcare sector. Today, majority of the system constitutes one of the biggest roadblocks to the growth of the Indian one of the biggest roadblocks to the growth of the Indian 7% (Rao, n.d.) of our population. Access to capital has been 7% (Rao, n.d.) of our population. Access to capital has been are extremely high for us, which influence disservice to almost hospitalization. The out-of-pocket costs for medical services are extremely high for us, which influence disservice to almost hospitalization. The out-of-pocket costs for medical services address medical issues, particularly with regards to hospitalization. The out-of-pocket costs for medical services address medical issues, particularly with regards to constrained to spend half of their yearly family income to address medical issues, particularly with regards to constrained to spend half of their yearly family income to constrained to spend half of their yearly family income to It is greatly stressing that about 50-60 million Indians are It is greatly stressing that about 50-60 million Indians are It is greatly stressing that about 50-60 million Indians are It is greatly stressing that about 50-60 million Indians are wielding substantial demands on our healthcare frameworks. It is greatly stressing that about 50-60 million Indians are wielding substantial demands on our healthcare frameworks. wielding substantial demands on our healthcare frameworks. wielding substantial demands on our healthcare frameworks. wielding substantial demands on our healthcare frameworks. wielding substantial demands on our healthcare frameworks. wielding substantial demands on our healthcare frameworks. It is greatly stressing that about 50-60 million Indians are It is greatly stressing that about 50-60 million Indians are It is greatly stressing that about 50-60 million Indians are It is greatly stressing that about 50-60 million Indians are constrained to spend half of their yearly family income to constrained to spend half of their yearly family income to address medical issues, particularly with regards to address medical issues, particularly with regards to hospitalization. The out-of-pocket costs for medical services
lowest globally for any country. However, to meet India’s lowest globally for any country. However, to meet India’s lowest globally for any country. However, to meet India’s lowest globally for any country. However, to meet India’s about 1% of its GDP on healthcare, which is among the about 1% of its GDP on healthcare, which is among the about 1% of its GDP on healthcare, which is among the about 1% of its GDP on healthcare, which is among the of private healthcare and the Indian government spends only of private healthcare and the Indian government spends only of private healthcare and the Indian government spends only healthcare sector. Today, majority of the system constitutes healthcare sector. Today, majority of the system constitutes one of the biggest roadblocks to the growth of the Indian one of the biggest roadblocks to the growth of the Indian 7% (Rao, n.d.) of our population. Access to capital has been are extremely high for us, which influence disservice to almost 7% (Rao, n.d.) of our population. Access to capital has been are extremely high for us, which influence disservice to almost hospitalization. The out-of-pocket costs for medical services are extremely high for us, which influence disservice to almost hospitalization. The out-of-pocket costs for medical services address medical issues, particularly with regards to hospitalization. The out-of-pocket costs for medical services address medical issues, particularly with regards to address medical issues, particularly with regards to constrained to spend half of their yearly family income to constrained to spend half of their yearly family income to constrained to spend half of their yearly family income to constrained to spend half of their yearly family income to It is greatly stressing that about 50-60 million Indians are It is greatly stressing that about 50-60 million Indians are It is greatly stressing that about 50-60 million Indians are It is greatly stressing that about 50-60 million Indians are It is greatly stressing that about 50-60 million Indians are It is greatly stressing that about 50-60 million Indians are It is greatly stressing that about 50-60 million Indians are It is greatly stressing that about 50-60 million Indians are It is greatly stressing that about 50-60 million Indians are It is greatly stressing that about 50-60 million Indians are constrained to spend half of their yearly family income to constrained to spend half of their yearly family income to constrained to spend half of their yearly family income to address medical issues, particularly with regards to address medical issues, particularly with regards to hospitalization. The out-of-pocket costs for medical services hospitalization. The out-of-pocket costs for medical services
lowest globally for any country. However, to meet India’s lowest globally for any country. However, to meet India’s lowest globally for any country. However, to meet India’s lowest globally for any country. However, to meet India’s lowest globally for any country. However, to meet India’s lowest globally for any country. However, to meet India’s lowest globally for any country. However, to meet India’s about 1% of its GDP on healthcare, which is among the about 1% of its GDP on healthcare, which is among the about 1% of its GDP on healthcare, which is among the about 1% of its GDP on healthcare, which is among the of private healthcare and the Indian government spends only of private healthcare and the Indian government spends only healthcare sector. Today, majority of the system constitutes healthcare sector. Today, majority of the system constitutes one of the biggest roadblocks to the growth of the Indian healthcare sector. Today, majority of the system constitutes one of the biggest roadblocks to the growth of the Indian 7% (Rao, n.d.) of our population. Access to capital has been one of the biggest roadblocks to the growth of the Indian 7% (Rao, n.d.) of our population. Access to capital has been are extremely high for us, which influence disservice to almost 7% (Rao, n.d.) of our population. Access to capital has been are extremely high for us, which influence disservice to almost are extremely high for us, which influence disservice to almost hospitalization. The out-of-pocket costs for medical services hospitalization. The out-of-pocket costs for medical services address medical issues, particularly with regards to address medical issues, particularly with regards to address medical issues, particularly with regards to constrained to spend half of their yearly family income to address medical issues, particularly with regards to constrained to spend half of their yearly family income to constrained to spend half of their yearly family income to constrained to spend half of their yearly family income to constrained to spend half of their yearly family income to constrained to spend half of their yearly family income to constrained to spend half of their yearly family income to constrained to spend half of their yearly family income to constrained to spend half of their yearly family income to constrained to spend half of their yearly family income to constrained to spend half of their yearly family income to constrained to spend half of their yearly family income to constrained to spend half of their yearly family income to constrained to spend half of their yearly family income to address medical issues, particularly with regards to address medical issues, particularly with regards to address medical issues, particularly with regards to address medical issues, particularly with regards to hospitalization. The out-of-pocket costs for medical services hospitalization. The out-of-pocket costs for medical services
lowest globally for any country. However, to meet India’s lowest globally for any country. However, to meet India’s lowest globally for any country. However, to meet India’s lowest globally for any country. However, to meet India’s lowest globally for any country. However, to meet India’s lowest globally for any country. However, to meet India’s lowest globally for any country. However, to meet India’s lowest globally for any country. However, to meet India’s about 1% of its GDP on healthcare, which is among the about 1% of its GDP on healthcare, which is among the about 1% of its GDP on healthcare, which is among the about 1% of its GDP on healthcare, which is among the of private healthcare and the Indian government spends only of private healthcare and the Indian government spends only healthcare sector. Today, majority of the system constitutes healthcare sector. Today, majority of the system constitutes one of the biggest roadblocks to the growth of the Indian one of the biggest roadblocks to the growth of the Indian 7% (Rao, n.d.) of our population. Access to capital has been one of the biggest roadblocks to the growth of the Indian 7% (Rao, n.d.) of our population. Access to capital has been 7% (Rao, n.d.) of our population. Access to capital has been are extremely high for us, which influence disservice to almost are extremely high for us, which influence disservice to almost hospitalization. The out-of-pocket costs for medical services hospitalization. The out-of-pocket costs for medical services hospitalization. The out-of-pocket costs for medical services address medical issues, particularly with regards to address medical issues, particularly with regards to address medical issues, particularly with regards to address medical issues, particularly with regards to address medical issues, particularly with regards to constrained to spend half of their yearly family income to address medical issues, particularly with regards to constrained to spend half of their yearly family income to constrained to spend half of their yearly family income to constrained to spend half of their yearly family income to constrained to spend half of their yearly family income to address medical issues, particularly with regards to address medical issues, particularly with regards to address medical issues, particularly with regards to address medical issues, particularly with regards to address medical issues, particularly with regards to hospitalization. The out-of-pocket costs for medical services hospitalization. The out-of-pocket costs for medical services hospitalization. The out-of-pocket costs for medical services are extremely high for us, which influence disservice to almost are extremely high for us, which influence disservice to almost 7% (Rao, n.d.) of our population. Access to capital has been
lowest globally for any country. However, to meet India’s lowest globally for any country. However, to meet India’s lowest globally for any country. However, to meet India’s lowest globally for any country. However, to meet India’s lowest globally for any country. However, to meet India’s lowest globally for any country. However, to meet India’s lowest globally for any country. However, to meet India’s lowest globally for any country. However, to meet India’s lowest globally for any country. However, to meet India’s about 1% of its GDP on healthcare, which is among the about 1% of its GDP on healthcare, which is among the about 1% of its GDP on healthcare, which is among the of private healthcare and the Indian government spends only of private healthcare and the Indian government spends only healthcare sector. Today, majority of the system constitutes healthcare sector. Today, majority of the system constitutes one of the biggest roadblocks to the growth of the Indian one of the biggest roadblocks to the growth of the Indian one of the biggest roadblocks to the growth of the Indian 7% (Rao, n.d.) of our population. Access to capital has been 7% (Rao, n.d.) of our population. Access to capital has been are extremely high for us, which influence disservice to almost are extremely high for us, which influence disservice to almost are extremely high for us, which influence disservice to almost hospitalization. The out-of-pocket costs for medical services hospitalization. The out-of-pocket costs for medical services hospitalization. The out-of-pocket costs for medical services hospitalization. The out-of-pocket costs for medical services address medical issues, particularly with regards to address medical issues, particularly with regards to address medical issues, particularly with regards to address medical issues, particularly with regards to address medical issues, particularly with regards to address medical issues, particularly with regards to address medical issues, particularly with regards to address medical issues, particularly with regards to address medical issues, particularly with regards to address medical issues, particularly with regards to hospitalization. The out-of-pocket costs for medical services hospitalization. The out-of-pocket costs for medical services hospitalization. The out-of-pocket costs for medical services hospitalization. The out-of-pocket costs for medical services are extremely high for us, which influence disservice to almost are extremely high for us, which influence disservice to almost
lowest globally for any country. However, to meet India’s lowest globally for any country. However, to meet India’s lowest globally for any country. However, to meet India’s lowest globally for any country. However, to meet India’s lowest globally for any country. However, to meet India’s lowest globally for any country. However, to meet India’s lowest globally for any country. However, to meet India’s lowest globally for any country. However, to meet India’s lowest globally for any country. However, to meet India’s lowest globally for any country. However, to meet India’s about 1% of its GDP on healthcare, which is among the about 1% of its GDP on healthcare, which is among the about 1% of its GDP on healthcare, which is among the of private healthcare and the Indian government spends only of private healthcare and the Indian government spends only of private healthcare and the Indian government spends only healthcare sector. Today, majority of the system constitutes healthcare sector. Today, majority of the system constitutes healthcare sector. Today, majority of the system constitutes one of the biggest roadblocks to the growth of the Indian one of the biggest roadblocks to the growth of the Indian 7% (Rao, n.d.) of our population. Access to capital has been 7% (Rao, n.d.) of our population. Access to capital has been 7% (Rao, n.d.) of our population. Access to capital has been are extremely high for us, which influence disservice to almost are extremely high for us, which influence disservice to almost are extremely high for us, which influence disservice to almost are extremely high for us, which influence disservice to almost hospitalization. The out-of-pocket costs for medical services hospitalization. The out-of-pocket costs for medical services hospitalization. The out-of-pocket costs for medical services hospitalization. The out-of-pocket costs for medical services hospitalization. The out-of-pocket costs for medical services hospitalization. The out-of-pocket costs for medical services hospitalization. The out-of-pocket costs for medical services hospitalization. The out-of-pocket costs for medical services hospitalization. The out-of-pocket costs for medical services hospitalization. The out-of-pocket costs for medical services hospitalization. The out-of-pocket costs for medical services hospitalization. The out-of-pocket costs for medical services are extremely high for us, which influence disservice to almost are extremely high for us, which influence disservice to almost are extremely high for us, which influence disservice to almost 7% (Rao, n.d.) of our population. Access to capital has been 7% (Rao, n.d.) of our population. Access to capital has been
lowest globally for any country. However, to meet India’s lowest globally for any country. However, to meet India’s lowest globally for any country. However, to meet India’s lowest globally for any country. However, to meet India’s lowest globally for any country. However, to meet India’s lowest globally for any country. However, to meet India’s about 1% of its GDP on healthcare, which is among the about 1% of its GDP on healthcare, which is among the about 1% of its GDP on healthcare, which is among the of private healthcare and the Indian government spends only of private healthcare and the Indian government spends only of private healthcare and the Indian government spends only healthcare sector. Today, majority of the system constitutes healthcare sector. Today, majority of the system constitutes healthcare sector. Today, majority of the system constitutes one of the biggest roadblocks to the growth of the Indian one of the biggest roadblocks to the growth of the Indian one of the biggest roadblocks to the growth of the Indian 7% (Rao, n.d.) of our population. Access to capital has been 7% (Rao, n.d.) of our population. Access to capital has been 7% (Rao, n.d.) of our population. Access to capital has been are extremely high for us, which influence disservice to almost are extremely high for us, which influence disservice to almost are extremely high for us, which influence disservice to almost are extremely high for us, which influence disservice to almost are extremely high for us, which influence disservice to almost are extremely high for us, which influence disservice to almost are extremely high for us, which influence disservice to almost are extremely high for us, which influence disservice to almost are extremely high for us, which influence disservice to almost are extremely high for us, which influence disservice to almost are extremely high for us, which influence disservice to almost are extremely high for us, which influence disservice to almost are extremely high for us, which influence disservice to almost are extremely high for us, which influence disservice to almost are extremely high for us, which influence disservice to almost are extremely high for us, which influence disservice to almost 7% (Rao, n.d.) of our population. Access to capital has been 7% (Rao, n.d.) of our population. Access to capital has been 7% (Rao, n.d.) of our population. Access to capital has been one of the biggest roadblocks to the growth of the Indian
burgeoning healthcare needs, both the public and private burgeoning healthcare needs, both the public and private burgeoning healthcare needs, both the public and private burgeoning healthcare needs, both the public and private burgeoning healthcare needs, both the public and private burgeoning healthcare needs, both the public and private lowest globally for any country. However, to meet India’s lowest globally for any country. However, to meet India’s lowest globally for any country. However, to meet India’s lowest globally for any country. However, to meet India’s about 1% of its GDP on healthcare, which is among the about 1% of its GDP on healthcare, which is among the about 1% of its GDP on healthcare, which is among the about 1% of its GDP on healthcare, which is among the of private healthcare and the Indian government spends only of private healthcare and the Indian government spends only healthcare sector. Today, majority of the system constitutes healthcare sector. Today, majority of the system constitutes healthcare sector. Today, majority of the system constitutes one of the biggest roadblocks to the growth of the Indian one of the biggest roadblocks to the growth of the Indian one of the biggest roadblocks to the growth of the Indian one of the biggest roadblocks to the growth of the Indian 7% (Rao, n.d.) of our population. Access to capital has been 7% (Rao, n.d.) of our population. Access to capital has been 7% (Rao, n.d.) of our population. Access to capital has been 7% (Rao, n.d.) of our population. Access to capital has been 7% (Rao, n.d.) of our population. Access to capital has been are extremely high for us, which influence disservice to almost are extremely high for us, which influence disservice to almost are extremely high for us, which influence disservice to almost are extremely high for us, which influence disservice to almost are extremely high for us, which influence disservice to almost are extremely high for us, which influence disservice to almost are extremely high for us, which influence disservice to almost are extremely high for us, which influence disservice to almost 7% (Rao, n.d.) of our population. Access to capital has been 7% (Rao, n.d.) of our population. Access to capital has been 7% (Rao, n.d.) of our population. Access to capital has been 7% (Rao, n.d.) of our population. Access to capital has been 7% (Rao, n.d.) of our population. Access to capital has been one of the biggest roadblocks to the growth of the Indian one of the biggest roadblocks to the growth of the Indian one of the biggest roadblocks to the growth of the Indian
burgeoning healthcare needs, both the public and private burgeoning healthcare needs, both the public and private burgeoning healthcare needs, both the public and private burgeoning healthcare needs, both the public and private burgeoning healthcare needs, both the public and private burgeoning healthcare needs, both the public and private burgeoning healthcare needs, both the public and private burgeoning healthcare needs, both the public and private lowest globally for any country. However, to meet India’s lowest globally for any country. However, to meet India’s lowest globally for any country. However, to meet India’s lowest globally for any country. However, to meet India’s about 1% of its GDP on healthcare, which is among the about 1% of its GDP on healthcare, which is among the about 1% of its GDP on healthcare, which is among the of private healthcare and the Indian government spends only of private healthcare and the Indian government spends only of private healthcare and the Indian government spends only healthcare sector. Today, majority of the system constitutes healthcare sector. Today, majority of the system constitutes healthcare sector. Today, majority of the system constitutes one of the biggest roadblocks to the growth of the Indian one of the biggest roadblocks to the growth of the Indian one of the biggest roadblocks to the growth of the Indian one of the biggest roadblocks to the growth of the Indian one of the biggest roadblocks to the growth of the Indian 7% (Rao, n.d.) of our population. Access to capital has been 7% (Rao, n.d.) of our population. Access to capital has been 7% (Rao, n.d.) of our population. Access to capital has been 7% (Rao, n.d.) of our population. Access to capital has been 7% (Rao, n.d.) of our population. Access to capital has been 7% (Rao, n.d.) of our population. Access to capital has been 7% (Rao, n.d.) of our population. Access to capital has been 7% (Rao, n.d.) of our population. Access to capital has been 7% (Rao, n.d.) of our population. Access to capital has been 7% (Rao, n.d.) of our population. Access to capital has been 7% (Rao, n.d.) of our population. Access to capital has been 7% (Rao, n.d.) of our population. Access to capital has been one of the biggest roadblocks to the growth of the Indian one of the biggest roadblocks to the growth of the Indian one of the biggest roadblocks to the growth of the Indian one of the biggest roadblocks to the growth of the Indian
burgeoning healthcare needs, both the public and private burgeoning healthcare needs, both the public and private burgeoning healthcare needs, both the public and private burgeoning healthcare needs, both the public and private burgeoning healthcare needs, both the public and private burgeoning healthcare needs, both the public and private burgeoning healthcare needs, both the public and private burgeoning healthcare needs, both the public and private burgeoning healthcare needs, both the public and private lowest globally for any country. However, to meet India’s lowest globally for any country. However, to meet India’s lowest globally for any country. However, to meet India’s lowest globally for any country. However, to meet India’s about 1% of its GDP on healthcare, which is among the about 1% of its GDP on healthcare, which is among the about 1% of its GDP on healthcare, which is among the of private healthcare and the Indian government spends only of private healthcare and the Indian government spends only of private healthcare and the Indian government spends only of private healthcare and the Indian government spends only healthcare sector. Today, majority of the system constitutes healthcare sector. Today, majority of the system constitutes healthcare sector. Today, majority of the system constitutes healthcare sector. Today, majority of the system constitutes one of the biggest roadblocks to the growth of the Indian one of the biggest roadblocks to the growth of the Indian one of the biggest roadblocks to the growth of the Indian one of the biggest roadblocks to the growth of the Indian one of the biggest roadblocks to the growth of the Indian one of the biggest roadblocks to the growth of the Indian one of the biggest roadblocks to the growth of the Indian one of the biggest roadblocks to the growth of the Indian one of the biggest roadblocks to the growth of the Indian one of the biggest roadblocks to the growth of the Indian one of the biggest roadblocks to the growth of the Indian one of the biggest roadblocks to the growth of the Indian one of the biggest roadblocks to the growth of the Indian one of the biggest roadblocks to the growth of the Indian one of the biggest roadblocks to the growth of the Indian healthcare sector. Today, majority of the system constitutes
burgeoning healthcare needs, both the public and private burgeoning healthcare needs, both the public and private burgeoning healthcare needs, both the public and private burgeoning healthcare needs, both the public and private burgeoning healthcare needs, both the public and private burgeoning healthcare needs, both the public and private burgeoning healthcare needs, both the public and private burgeoning healthcare needs, both the public and private burgeoning healthcare needs, both the public and private burgeoning healthcare needs, both the public and private burgeoning healthcare needs, both the public and private lowest globally for any country. However, to meet India’s lowest globally for any country. However, to meet India’s lowest globally for any country. However, to meet India’s lowest globally for any country. However, to meet India’s about 1% of its GDP on healthcare, which is among the about 1% of its GDP on healthcare, which is among the about 1% of its GDP on healthcare, which is among the about 1% of its GDP on healthcare, which is among the of private healthcare and the Indian government spends only of private healthcare and the Indian government spends only of private healthcare and the Indian government spends only of private healthcare and the Indian government spends only healthcare sector. Today, majority of the system constitutes healthcare sector. Today, majority of the system constitutes healthcare sector. Today, majority of the system constitutes healthcare sector. Today, majority of the system constitutes healthcare sector. Today, majority of the system constitutes healthcare sector. Today, majority of the system constitutes one of the biggest roadblocks to the growth of the Indian one of the biggest roadblocks to the growth of the Indian one of the biggest roadblocks to the growth of the Indian one of the biggest roadblocks to the growth of the Indian one of the biggest roadblocks to the growth of the Indian healthcare sector. Today, majority of the system constitutes healthcare sector. Today, majority of the system constitutes healthcare sector. Today, majority of the system constitutes healthcare sector. Today, majority of the system constitutes healthcare sector. Today, majority of the system constitutes
burgeoning healthcare needs, both the public and private burgeoning healthcare needs, both the public and private burgeoning healthcare needs, both the public and private burgeoning healthcare needs, both the public and private burgeoning healthcare needs, both the public and private burgeoning healthcare needs, both the public and private burgeoning healthcare needs, both the public and private burgeoning healthcare needs, both the public and private burgeoning healthcare needs, both the public and private lowest globally for any country. However, to meet India’s lowest globally for any country. However, to meet India’s lowest globally for any country. However, to meet India’s lowest globally for any country. However, to meet India’s about 1% of its GDP on healthcare, which is among the about 1% of its GDP on healthcare, which is among the about 1% of its GDP on healthcare, which is among the about 1% of its GDP on healthcare, which is among the of private healthcare and the Indian government spends only of private healthcare and the Indian government spends only of private healthcare and the Indian government spends only of private healthcare and the Indian government spends only of private healthcare and the Indian government spends only healthcare sector. Today, majority of the system constitutes healthcare sector. Today, majority of the system constitutes healthcare sector. Today, majority of the system constitutes healthcare sector. Today, majority of the system constitutes healthcare sector. Today, majority of the system constitutes healthcare sector. Today, majority of the system constitutes healthcare sector. Today, majority of the system constitutes healthcare sector. Today, majority of the system constitutes healthcare sector. Today, majority of the system constitutes healthcare sector. Today, majority of the system constitutes healthcare sector. Today, majority of the system constitutes healthcare sector. Today, majority of the system constitutes of private healthcare and the Indian government spends only of private healthcare and the Indian government spends only
burgeoning healthcare needs, both the public and private burgeoning healthcare needs, both the public and private burgeoning healthcare needs, both the public and private burgeoning healthcare needs, both the public and private burgeoning healthcare needs, both the public and private burgeoning healthcare needs, both the public and private lowest globally for any country. However, to meet India’s lowest globally for any country. However, to meet India’s lowest globally for any country. However, to meet India’s lowest globally for any country. However, to meet India’s lowest globally for any country. However, to meet India’s about 1% of its GDP on healthcare, which is among the about 1% of its GDP on healthcare, which is among the about 1% of its GDP on healthcare, which is among the about 1% of its GDP on healthcare, which is among the about 1% of its GDP on healthcare, which is among the of private healthcare and the Indian government spends only of private healthcare and the Indian government spends only of private healthcare and the Indian government spends only of private healthcare and the Indian government spends only of private healthcare and the Indian government spends only of private healthcare and the Indian government spends only of private healthcare and the Indian government spends only of private healthcare and the Indian government spends only of private healthcare and the Indian government spends only of private healthcare and the Indian government spends only of private healthcare and the Indian government spends only of private healthcare and the Indian government spends only of private healthcare and the Indian government spends only of private healthcare and the Indian government spends only of private healthcare and the Indian government spends only about 1% of its GDP on healthcare, which is among the
sector will have to join hands to build value-based and sector will have to join hands to build value-based and sector will have to join hands to build value-based and sector will have to join hands to build value-based and sector will have to join hands to build value-based and sector will have to join hands to build value-based and sector will have to join hands to build value-based and burgeoning healthcare needs, both the public and private burgeoning healthcare needs, both the public and private burgeoning healthcare needs, both the public and private burgeoning healthcare needs, both the public and private burgeoning healthcare needs, both the public and private lowest globally for any country. However, to meet India’s lowest globally for any country. However, to meet India’s lowest globally for any country. However, to meet India’s lowest globally for any country. However, to meet India’s lowest globally for any country. However, to meet India’s about 1% of its GDP on healthcare, which is among the about 1% of its GDP on healthcare, which is among the about 1% of its GDP on healthcare, which is among the about 1% of its GDP on healthcare, which is among the about 1% of its GDP on healthcare, which is among the about 1% of its GDP on healthcare, which is among the about 1% of its GDP on healthcare, which is among the of private healthcare and the Indian government spends only of private healthcare and the Indian government spends only of private healthcare and the Indian government spends only about 1% of its GDP on healthcare, which is among the about 1% of its GDP on healthcare, which is among the about 1% of its GDP on healthcare, which is among the
sector will have to join hands to build value-based and sector will have to join hands to build value-based and sector will have to join hands to build value-based and sector will have to join hands to build value-based and sector will have to join hands to build value-based and sector will have to join hands to build value-based and sector will have to join hands to build value-based and sector will have to join hands to build value-based and sector will have to join hands to build value-based and burgeoning healthcare needs, both the public and private burgeoning healthcare needs, both the public and private burgeoning healthcare needs, both the public and private burgeoning healthcare needs, both the public and private burgeoning healthcare needs, both the public and private lowest globally for any country. However, to meet India’s lowest globally for any country. However, to meet India’s lowest globally for any country. However, to meet India’s lowest globally for any country. However, to meet India’s lowest globally for any country. However, to meet India’s about 1% of its GDP on healthcare, which is among the about 1% of its GDP on healthcare, which is among the about 1% of its GDP on healthcare, which is among the about 1% of its GDP on healthcare, which is among the about 1% of its GDP on healthcare, which is among the about 1% of its GDP on healthcare, which is among the about 1% of its GDP on healthcare, which is among the about 1% of its GDP on healthcare, which is among the about 1% of its GDP on healthcare, which is among the about 1% of its GDP on healthcare, which is among the about 1% of its GDP on healthcare, which is among the
sector will have to join hands to build value-based and sector will have to join hands to build value-based and sector will have to join hands to build value-based and sector will have to join hands to build value-based and sector will have to join hands to build value-based and sector will have to join hands to build value-based and sector will have to join hands to build value-based and sector will have to join hands to build value-based and sector will have to join hands to build value-based and sector will have to join hands to build value-based and burgeoning healthcare needs, both the public and private burgeoning healthcare needs, both the public and private burgeoning healthcare needs, both the public and private burgeoning healthcare needs, both the public and private burgeoning healthcare needs, both the public and private burgeoning healthcare needs, both the public and private lowest globally for any country. However, to meet India’s lowest globally for any country. However, to meet India’s lowest globally for any country. However, to meet India’s lowest globally for any country. However, to meet India’s lowest globally for any country. However, to meet India’s lowest globally for any country. However, to meet India’s lowest globally for any country. However, to meet India’s lowest globally for any country. However, to meet India’s lowest globally for any country. However, to meet India’s lowest globally for any country. However, to meet India’s lowest globally for any country. However, to meet India’s lowest globally for any country. However, to meet India’s lowest globally for any country. However, to meet India’s
sector will have to join hands to build value-based and sector will have to join hands to build value-based and sector will have to join hands to build value-based and sector will have to join hands to build value-based and sector will have to join hands to build value-based and sector will have to join hands to build value-based and sector will have to join hands to build value-based and sector will have to join hands to build value-based and sector will have to join hands to build value-based and sector will have to join hands to build value-based and sector will have to join hands to build value-based and burgeoning healthcare needs, both the public and private burgeoning healthcare needs, both the public and private burgeoning healthcare needs, both the public and private burgeoning healthcare needs, both the public and private burgeoning healthcare needs, both the public and private burgeoning healthcare needs, both the public and private burgeoning healthcare needs, both the public and private lowest globally for any country. However, to meet India’s lowest globally for any country. However, to meet India’s lowest globally for any country. However, to meet India’s lowest globally for any country. However, to meet India’s lowest globally for any country. However, to meet India’s
sector will have to join hands to build value-based and sector will have to join hands to build value-based and sector will have to join hands to build value-based and sector will have to join hands to build value-based and sector will have to join hands to build value-based and sector will have to join hands to build value-based and burgeoning healthcare needs, both the public and private burgeoning healthcare needs, both the public and private burgeoning healthcare needs, both the public and private burgeoning healthcare needs, both the public and private burgeoning healthcare needs, both the public and private burgeoning healthcare needs, both the public and private burgeoning healthcare needs, both the public and private burgeoning healthcare needs, both the public and private burgeoning healthcare needs, both the public and private burgeoning healthcare needs, both the public and private burgeoning healthcare needs, both the public and private
cashless healthcare. This implies providing high-end care at a cashless healthcare. This implies providing high-end care at a cashless healthcare. This implies providing high-end care at a cashless healthcare. This implies providing high-end care at a sector will have to join hands to build value-based and sector will have to join hands to build value-based and sector will have to join hands to build value-based and sector will have to join hands to build value-based and sector will have to join hands to build value-based and sector will have to join hands to build value-based and sector will have to join hands to build value-based and sector will have to join hands to build value-based and sector will have to join hands to build value-based and sector will have to join hands to build value-based and cashless healthcare. This implies providing high-end care at a cashless healthcare. This implies providing high-end care at a cashless healthcare. This implies providing high-end care at a cashless healthcare. This implies providing high-end care at a cashless healthcare. This implies providing high-end care at a cashless healthcare. This implies providing high-end care at a cashless healthcare. This implies providing high-end care at a sector will have to join hands to build value-based and sector will have to join hands to build value-based and cashless healthcare. This implies providing high-end care at a cashless healthcare. This implies providing high-end care at a cashless healthcare. This implies providing high-end care at a cashless healthcare. This implies providing high-end care at a cashless healthcare. This implies providing high-end care at a cashless healthcare. This implies providing high-end care at a cashless healthcare. This implies providing high-end care at a
8

Kausalya - Cancer Winner
“I was on the verge of losing my voice. But I decided not to be a mute spectator.”
9
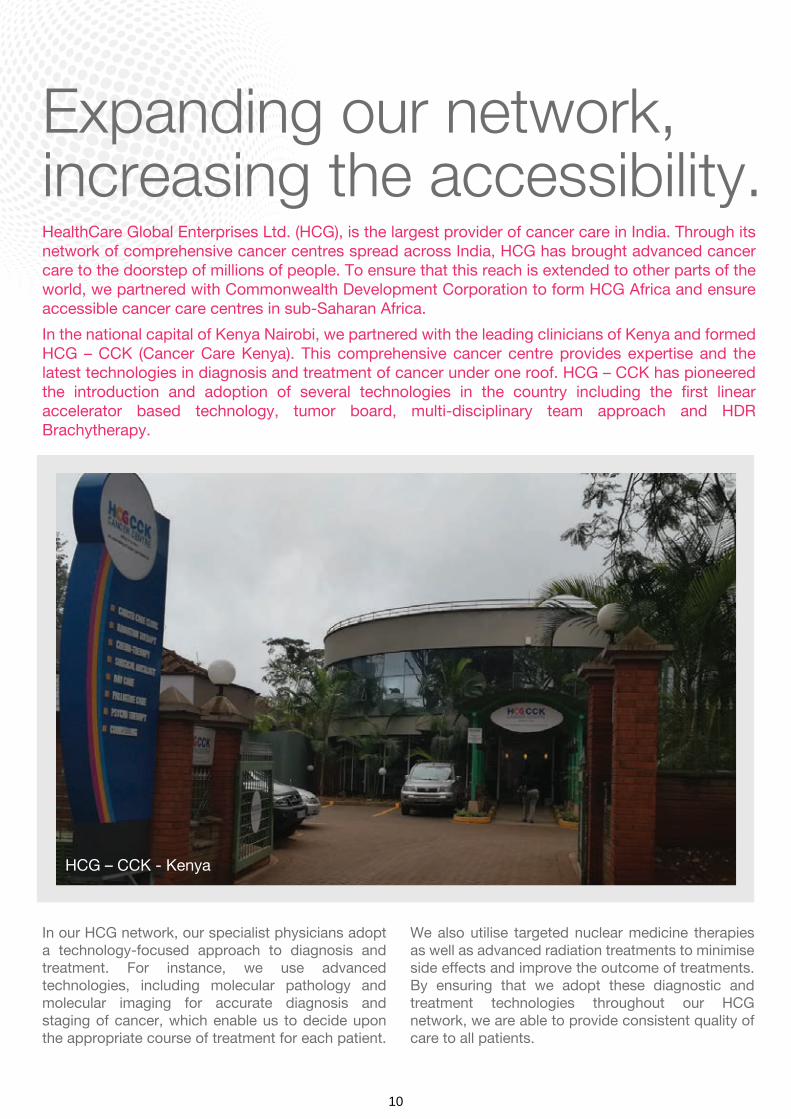
In our HCG network, our specialist physicians adopt a technology-focused approach to diagnosis and treatment. For instance, we use advanced technologies, including molecular pathology and molecular imaging for accurate diagnosis and staging of cancer, which enable us to decide upon the appropriate course of treatment for each patient.
We also utilise targeted nuclear medicine therapies as well as advanced radiation treatments to minimise side effects and improve the outcome of treatments. By ensuring that we adopt these diagnostic and treatment technologies throughout our HCG network, we are able to provide consistent quality of care to all patients.
Expanding our network,increasing the accessibility.HealthCare Global Enterprises Ltd. (HCG), is the largest provider of cancer care in India. Through its network of comprehensive cancer centres spread across India, HCG has brought advanced cancer care to the doorstep of millions of people. To ensure that this reach is extended to other parts of the world, we partnered with Commonwealth Development Corporation to form HCG Africa and ensure accessible cancer care centres in sub-Saharan Africa.
In the national capital of Kenya Nairobi, we partnered with the leading clinicians of Kenya and formed HCG – CCK (Cancer Care Kenya). This comprehensive cancer centre provides expertise and the latest technologies in diagnosis and treatment of cancer under one roof. HCG – CCK has pioneered the introduction and adoption of several technologies in the country including the first linear accelerator based technology, tumor board, multi-disciplinary team approach and HDR Brachytherapy.
HCG – CCK - Kenya
10
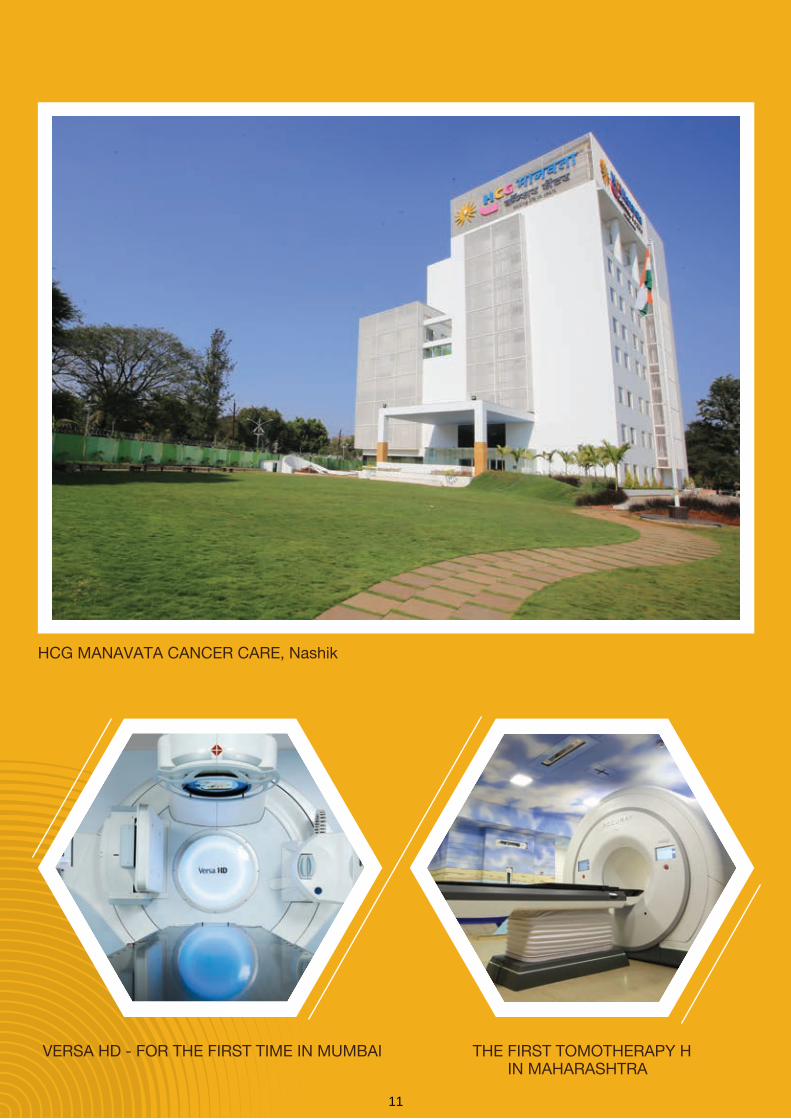
HCG MANAVATA CANCER CARE, Nashik
VERSA HD - FOR THE FIRST TIME IN MUMBAI THE FIRST TOMOTHERAPY HIN MAHARASHTRA
11

In May 2017, the Company launched the first dedicated comprehensive cancer hospital in Mumbai, in collaboration with Apex Criticare LLP, founded with the aim of providing consistently high quality and result oriented cancer treatment by adopting global innovations. HCG APEX Cancer Centre is a state-of-the-art comprising 69 beds along with oncology facilities. The hospital provides quality cancer care through surgical oncology, radiation oncology and medical oncology, all under one roof with a complete range of diagnostics. The cancer centre introduced the 1st Elekta Versa HD Radiation Machine in the city of Mumbai, which is equipped with Agility™ for high-speed, high precision beam shaping to support exceptionally accurate tumor targeting and improved healthy tissue preservation. HCG APEX Cancer Centre, Mumbai, has a clinical team comprising highly qualified, trained and experienced surgical oncologists, radiation oncologists, medical oncologists, radiologists and nuclear medicine physicians, who are available round-the-clock for extensive patient service. All the facilities at the HCG APEX Cancer Centre are designed and executed as per the NABH Guidelines 2016. With the latest technology and expertise to treat cancer, HCG Apex Cancer Centre is emerging as a leading Cancer Hospital in Mumbai, India.
HCG NCHRI Cancer Centre, Nagpur: In June 2017, HCG launched a comprehensive cancer centre in Nagpur, Maharashtra. The HCG NCHRI Cancer Centre is a 115 bed dedicated comprehensive cancer hospital established in collaboration with the Nagpur Cancer Hospital and Research Institute Private Limited (NCHRI). HCG NCHRI Cancer Centre, Nagpur, is the first private, comprehensive cancer care hospital in central India with all oncology facilities under one roof. The hospital provides quality cancer care through surgical oncology, radiation oncology and medical oncology with a full range of diagnostics. The centre introduced TrueBeam STX for the first time in central India. This revolutionizes the cancer care industry by providing expertise and hope to hundreds of patients. The hospital treats all types of cancer with the latest advancement in radiotherapy system like image-guided radiotherapy and radio-surgery which is designed to treat tumors with speed and precision and has a clinical team comprising highly qualified, trained and experienced
surgical oncologists, radiation oncologists, medical oncologists, radiologists and nuclear medicine physicians, who are available round-the-clock for extensive patient service. The HCG NCHRI Cancer Centre is a perfect amalgamation of the latest technology available in the oncology space, with highly qualified clinicians.
HCG Manavata Cancer Centre, Nashik: The Company had established the first comprehensive cancer centre in Nashik in 2008. The centre has 65 beds offering advanced diagnostics, radiation, medical and surgical oncology. Last year, HCG expanded its operations in Nashik and has upgraded the centre in a new building and has an additional 90 beds featuring advanced radiation therapy, Tomotherapy H, the first in Maharashtra, multidisciplinary team of oncologists including sub specialists and a bone-marrow transplant unit. The new centre has commenced its operations in May 2018. Also, the centre which was operating under HCG, has been moved into a new legal entity, named HCG Manavata Oncology LLP, which is owned by HCG and Dr. Rajnish Nagarkar in the ratio of 51:49 respectively.
We plan to expand our network in India and in select geographies overseas by establishing new cancer centres and by expanding the capacity and service offering of the existing HCG cancer centres. We carry out a competitive assessment of the markets in which HCG plans to expand its network based on a number of factors, including the estimated incidence of cancer in the primary and secondary catchment population, the number of comprehensive cancer centres, if any, in the catchment; the average distance patients have to travel to avail such comprehensive cancer care; affordability of healthcare generally and cancer care in particular; and the available third party payer options, whether corporate, government or private insurance. HCG will continue to expand its network through green field projects, partnership arrangements and acquisitions; and that the past experiences will aid the Management in identifying potential opportunities in the future and assist HCG in integrating new cancer centres into the existing HCG network.
12

Somashekar, F/o Varsha - Cancer Winner
“A tumour in her eye. Impending loss of vision. And complete paralysis. Until we took an expert second opinion.”
13

MULTI-DISCIPLINARYTEAM
While cancer may be complex, its treatment requires a planned and integrated approach for the best possible outcomes.
MULTI-DISCIPLINARYTEAM
While cancer may be complex, its treatment requires a planned and integrated approach for the best possible outcomes.
14 14

15
At HCG, a team of experts (multidisciplinary team) meet to discuss and contribute their years of expertise to address critical and complex cases across the HCG network, which gives the patient not just one specialist to treat their disease, but a team of specialists who carry out an in depth exploration of all documents, medical history and then provide the patient a comprehensive holistic report on the best possible treatment plans and outcomes that suit the case.
The multidisciplinary team has a panel of specialists who are experts in their own field of expertise and bring this to
each case. This panel of experts work together to ensure that comprehensive, opinion is available to guide each patient through diagnosis, treatment and recovery, and that patients who need several different therapies to treat their cancer will receive advice on the ideal combination. This team approach means that patients benefit from the combined expertise of cancer rehabilitation coupled with shorter stay. Our multidisciplinary panel comprises medical oncologist, surgical oncologist, radiation oncologist, onco pathologist, onco radiologist, immuno therapist, nuclear medic ine exper t onco psycholog is t , nutritionist
Being at the forefront in the fight against cancer involves pioneering innovative treatments, methods and the introduction of industry-changing technologies that benefit both the medical expert and the patient. HCG has led the march against cancer and set benchmarks in the industry by introducing many new technologies like TrueBeam, CyberKnife and TomoTherapy.
Our comprehensive cancer care centres have all the facilities and departments under one roof - surgical, radiation, medical oncology and diagnostic facilities.
The surgical oncology department comprises a team of highly qualified, trained and experienced surgical oncologists. The group, though divided by sub-speciality, uses a team approach in the treatment of patients. Outcomes are on par with that of leading international cancer institutes. The focus is on offering a better quality of life to cancer patients with consideration for cosmesis and rehabilitation, coupled with shorter hospital stays.
Being at the forefront of cancer care involves pioneering innovative treatment methods as well as the introduction of technology that aids medical experts. HCG has led the pack on both counts by introducing TrueBeam, India’s first advanced radiation therapy system with multileaf. It delivers precise tumour targeting, while lowering toxicity and improving outcomes. For oncology thought leaders, it allows pioneering new treatment that goes beyond today’s clinical norms. For patients, it means the short road to life back as usual.
and physiotherapist.
15

QUALITY OF LIFE
16
An increasingly important issue in oncology is to evaluate QoL in cancer patients. The cancer-specific QoL is related to all stages of this disease. In fact, for all types of cancer patients, general QoL instruments can be used to assess the overall impact of patients’ health status on their QoL. However, hand cancer-specific instruments assess the impact of a specific cancer on QoL. In some cancer diseases (glioma for instance), QoL has become an important end point for treatments comparison in randomized controlled trials so that in these patients, clinical studies increasingly incorporate QoL as end point.
Cancer can produce many different symptoms, some subtle and some not at all subtle. Some symptoms of cancer affecting QoL in patients would be cancer type and stage, as some types of cancer do not present any symptoms until they are in advanced stages, time since diagnosis, patient acceptance, intensity of the disease and the level of psychological distress experienced by caregivers.
Having a potentially life-threatening disease like cancer often leads people to examine their lives and look for meaning. In fact, this search for meaning may be the aspect of cancer that most often has a positive influence on life. The fear of death that affects most people when they are diagnosed with cancer often leads us to think about what we leave behind and what we would like to do with the time we
have left. It can make you feel like it’s the quality of life, not just the quantity which matters most.
Quality of life means different things to different people. What’s most important is that you figure out what it means to you and overcome it.
It is not beyond us to meet the challenge if -
• The emotional and mental impacts of cancer are taken as seriously as the physical impacts
• Cancer patients are made aware of treatment-related symptoms and side effects so that they can be more informed in their choices
• Holistic, person-centred, multidisciplinary approaches to cancer care are accessible, which will improve cancer outcomes and maximise quality of life for people of all ages living with cancer, their families and caregivers
• Individuals feel empowered to talk about cancer and reach out for support
• Governments implement global commitments to ensure that palliative care is included in all national health policies and budgets and in the curricula for health professionals
• Healthcare providers are equipped with the skills and knowledge to ensure that all cancer patients have access to adequate pain relief and quality palliative care
The term Quality of Life (QoL) is used to evaluate the general well-being of individuals and societies. According to the World Health Organization (WHO), quality of life (QoL) is defined as individual perception of life, values, objectives, standards, and interests in the framework of culture. A number of illness-related factors exist that can affect QoL. The amount of symptoms of distress experienced by an individual has been related to QoL in a number of people with cancer. QoL is increasingly being used as a primary outcome measure in studies to evaluate the effectiveness of treatment. Patients generally, instead of measuring lipoprotein level, blood pressure, and the electrocardiogram, make decisions about their health care by means of QoL which estimates the effects on outcomes important to themselves.
17

CHAIRMAN’S LETTER
Our Company has played a crucial role in changing the ecosystem of the cancer burden, with outcomes to synchronize with our mission of adding life to years, where we ensure to improve the quality of life by managing the disease the right way.
18

Dear Shareholders,
Our growth story has been positive and it has been a fruitful experience and I am humbled to have each one of you to be a part of it.
The year that passed witnessed business expansion in newer geographies, application of advanced technologies and continued to deliver the right treatment and ensure accessible healthcare for all.
HCG has played a significant role in changing the cancer care scenario and creating social impact. One of the notable features is the business combination of our diagnostics division Triesta Sciences with Strands Life Sciences, where HCG is a major shareholder dealing with molecular diagnostics and bio-informatics. There is significant opportunity to tap the molecular diagnostic market and create bio-repository data bank, expected to take the company to the next level.
With the organisational ideology of winning over cancer and creating an ideal destination for cancer care, we have created success stories for not only the patients but also ourselves, as they emerged as cancer victors. Our presence in different geographies following the hub and spoke model with comprehensive facilities and expertise has allowed patients to avail cancer care closer to their homes and recuperate within the comfort of the closed ones.
In continuation of the HCG growth story we have ventured into key markets overseas and penetrated into regions which are in dire need of holistic cancer care. The leadership team has been strategically pursuing opportunities and partnerships, establishing strong foothold of the brand in the geographies like Kolkata, South Mumbai, Jaipur and Delhi.
Our fertility clinics under the brand Milann - The Fertility Centre are also growing, we expect to further consolidate and increase the network of fertility centres.
We continue to maintain a strong leadership position in India. We are proud to be the only cancer care group that has taken its business model successfully to tier 2 and tier 3 cities in India, and continue to do so. By 2020, we expect nearly 8 million people living with different kinds of cancer in India alone and while this is an obvious challenge, we are equipped with the right expertise and technology to deal with the epidemic.
With regard to the financial performance for the financial year ended March 31, 2018, the consolidated income from operations for FY18 was INR 8,306.9 million as compared to INR 7,001.1 million in the previous fiscal year, reflecting a growth of 18.7%. Operating EBITDA in FY18 was INR 1,188.2 million as compared to INR 1,050.0 million in FY17, reflecting a year-on-year increase of 13.2%. EBITDA margin for the year was 14.3% as compared to 15.0% in FY17, reflecting a decrease of 70 basis points primarily on account of new centres getting operational this fiscal year. EBITDA margin for existing centres was up by 110 basis points to 18.7% in FY18. PAT in the fiscal year was INR 205.2 million as compared to INR 221.7 million in FY17.
The revenue growth was driven by 19.1% growth from HCG Centres while the Milann centres grew at 13.5%. HCG Centres constituted 92% of the consolidated revenues for the Company and the remaining 8% was contributed by Milann centres.
The key takeaway from these financial results is that your Company has demonstrated strong growth in revenues, EBIDTA, a healthy PAT with overall margin improvements for the year.
Looking at the operations across centres in India, we continue to have a steady increas in the revenues from international patients. We also acquired a centre in Nairobi, Kenya to have our first operating cancer centre outside of India. HCG Vadodara, a
comprehensive cancer care hospital, which started in May, 2016 has achieved EBITDA break even in this fiscal year.
At the HCG annual clinical meeting - ATRO, we compared our outcomes to global data and were pleased to know that they were comparable to the best of the centres in the world. I am extremely proud that our data is promising and at par with global standards. In the coming time, HCG will work aggressively on data collection and focus on genes specific treatment approach, organ specific data, advanced and recurring cancer cases.
HCG stands apart in leadership role and continues to scale newer heights with amalgamation of innovation, technology and expertise. Using technology to understand and analyse the disease and deliver appropriate treatment is the key to quality of life.
We are a global company which believes in strengthening the research and development required to bring in global innovations, HCG is delighted to be presenting 12 paper presentations at the ASTRO conference this year. At HCG, the goal remains steady on delivering the right treatment at the right time with patient first approach. With this, I would like to conclude and wish us all the best for the coming year.
Regards,Dr. B. S. Ajaikumar Chairman & CEO
outside of India. HCG Vadodara, a have our first operating cancer centre outside of India. HCG Vadodara, a have our first operating cancer centre acquired a centre in Nairobi, Kenya to
outside of India. HCG Vadodara, a have our first operating cancer centre acquired a centre in Nairobi, Kenya to international patients. We also international patients. We also
19

Brief biographiesof Directors.
01. Dr. B. S. Ajaikumar is the Chairman and Chief Executive Officer of our Company. He has been a Director of our Company since March 7, 2000. He was re-appointed as the Chief Executive Officer with effect from July 1, 2015. He holds a Bachelor’s Degree in Medicine and Surgery from St. John’s Medical College, Bengaluru, India. He completed his Residency in Oncology from the University of Virginia Hospital, Charlottesville and his Residency in Radiotherapy from the University of Texas System Cancer Centre, MD Anderson Hospital and Tumour Institute, Texas, United States of America. He has been awarded the Ernst and Young Entrepreneur of the Year Award for
the start-up category in healthcare and the B. C. Roy Award by the Indian Science Monitor. He has also been awarded the CII Regional Emerging Entrepreneurs Award for the contribution made by our company in the field of healthcare.
02. Gangadhara Ganapati is a Non-Executive Director of our Company. He has been a Director of our Company since December 21, 2005. He holds a Bachelor’s Degree in Mechanical Engineering from the Indian Institute of Technology, Madras, and a Post Graduate Diploma in Management from the Indian Institute of Management, Ahmedabad. He also holds a Master’s Degree in Business
Administration from the Wharton School, University of Pennsylvania. In the past, he has worked as the Managing Director of Adamas India Pharmaceuticals Private Limited, and as Vice President, Corporate Development of NeuroMolecular Pharmaceuticals, Inc. He founded Triesta Sciences, Inc. and served as its Chief Executive Officer from 2002 until 2006. He served in the Tata Administrative Service at Tata Industries Limited from 1990 to 1994.
03. Sampath Thattai Ramesh is a Non-Executive, Independent Director of our Company. He has been a Director of our Company since May 29, 2015. He has also been awarded
a Doctor of Letters in Management from the University of Tumkur. He is a retired civil servant who served in the Karnataka Police Department and the Government of India. He was the former Director General and Inspector General of Police, Karnataka. He has also been the Chairman of the National Road Safety Committee on Enforcement. He has received the President’s Police Medal for Meritorious Service in 1995 and the President’s Police Medal for Distinguished Service in 2007.
04. Suresh Chandra Senapaty is a Non-Executive, Independent Director of our Company. He has been a Director of our Company since May 29, 2015. He holds a Bachelor’s Degree in Commerce from Utkal University and is a member of the Institute of Chartered Accountants of India. He has held several positions at Wipro Limited including that of the Chief Financial Officer. He has also been a Director of Wipro Corporation, Wipro GE Healthcare and Wipro Enterprises Limited.
05. Shanker Annaswamy is a Non-Executive, Independent Director of our Company. He has been a Director of our Company since February 25, 2015. He holds a Bachelor’s Degree in Electronics and Communication Engineering from Madras University and a Diploma in Management from the All India Management Association, New Delhi. He is experienced in the field of business management. In the past he has been the Managing Director of IBM India Private Limited, and the Regional General Manager of IBM in India/South Asia. He has also been the President and Chief Executive officer of GE Medical Systems, South Asia and the Managing Director of Wipro-GE Medical Systems. He was an elected member of NASSCOM’s Executive Council in the past and he has held the position of the Chairman of the National Committee of IP Owners (Confederation of IndianIndustry) in 2010 and co-chaired theConfederation of Indian Industry’s National Innovation Mission in 2007 In 2009, Business Week magazine listed him as one of India’s 50 Most Powerful People. In October 2011, Mr. Annaswamy received a leadership award at the Forbes India Leadership Awards.
06. Sudhakar Rao is a Non- Executive, Independent Director of our Company. He has been a Director of our Company since February 25, 2015. He holds a Master’s Degree in Arts from the Delhi University and a Master’s Degree in Public Administration from the Kennedy School of Government, Harvard University. He is a retired Indian Administrative Service Officer and he has held several posts in the government including the post of the Chief Secretary to the Government of Karnataka. He has previously been a Director on the boards of Indian Oil Corporation Limited and Binani Industries Limited. He has been awarded the Kannada Rajyotsava Award by the Government of Karnataka.
07. Bhushani Kumar is a Non- Executive, Independent Director of our Company. She has been a Director of our Company since May 29, 2015. She holds a Bachelor’s Degree in Science from the University of Mysore, a Bachelor’s Degree in Law from Bangalore University and a Master’s Degree in Law from Bangalore University. She is presently the Secretary at Women’s Peace League, Basavanagudi, Bengaluru.
08. Dr. Amit Varma is a Non-Executive Director of our Company. He has over 25 years of private equity, strategic & operational leadership and board level experience in healthcare organizations across USA, Asia and Australia. He is the co-founder and Managing Partner of Quadria Capital, one of Asia’s largest healthcare private equity firms, with assets under management exceeding USD 1.5 billion and focused on investing in the healthcare sector across South and Southeast Asia. Dr. Varma is also the sponsor of Healthquad, a healthcare focused Venture Capital firm investing in technology backed companies in India, and spearheaded India Build Out Fund, a USD 100 million Healthcare and Education focused domestic Private Equity Fund. He has co-led the deployment of RHC Principal, a USD 700 million principal pool of capital across various healthcare sub sectors in Asia. He is a renowned Critical Care Medicine Physician and continues to practice as a critical care physician
on a part-time basis. Previously, he was associated with Fortis Healthcare, Narayan Hrudayalaya and Manipal Heart Foundation. He has also served as an adjunct professor at the University of Pittsburgh and the Cleveland Clinic. He has completed his M.B.B.S., M.D. from the University of Delhi, India, and super-specialty medicine training from the University of New York and University of Pittsburgh, USA. He had attended MBA courses at the University of Chicago, USA.
09. Dr. B. S. Ramesh is an Executive Director of our Company. He is one of the promoters of the Company. He has completed his MBBS from Bangalore University, holds a degree of Doctor of Medicine (Radio Therapy), a post graduate diploma in Radio Diagnosis from Bangalore University and a Post Graduate Diploma in Medical Law and Ethics from the National Law School of India University, Bengaluru. He is experienced in the field of radiation oncology. He has worked as a consultant in the department of radio therapy at Sri Devaraj Urs Academy of Higher Education and Research as a professor of Radio Therapy at the MS Ramaiah Medical College, Bengaluru. He was the chairman of the Indian College of Radiation Oncology between 2010 and 2012 and the president of the Association of Radiation Oncologists of India between 2012 and 2014. He was also the secretary of the Bangalore branch of the Indian Medical Association between 1980 and 1981. He was awarded the IMA Community Service Award for Individuals by the Indian Medical Association in 2012. He is presently a Director on the boards of some of the subsidiaries of the Company.
20
01. Dr. B. S. Ajaikumar is the Chairman and Chief Executive Officer of our Company. He has been a Director of our Company since March 7, 2000. He was re-appointed as the Chief Executive Officer with effect from July 1, 2015. He holds a Bachelor’s Degree in Medicine and Surgery from St. John’s Medical College, Bengaluru, India. He completed his Residency in Oncology from the University of Virginia Hospital, Charlottesville and his Residency in Radiotherapy from the University of Texas System Cancer Centre, MD Anderson Hospital and Tumour Institute, Texas, United States of America. He has been awarded the Ernst and Young Entrepreneur of the Year Award for
the start-up category in healthcare and the B. C. Roy Award by the Indian Science Monitor. He has also been awarded the CII Regional Emerging Entrepreneurs Award for the contribution made by our company in the field of healthcare.
02. Gangadhara Ganapati is a Non-Executive Director of our Company. He has been a Director of our Company since December 21, 2005. He holds a Bachelor’s Degree in Mechanical Engineering from the Indian Institute of Technology, Madras, and a Post Graduate Diploma in Management from the Indian Institute of Management, Ahmedabad. He also holds a Master’s Degree in Business
Administration from the Wharton School, University of Pennsylvania. In the past, he has worked as the Managing Director of Adamas India Pharmaceuticals Private Limited, and as Vice President, Corporate Development of NeuroMolecular Pharmaceuticals, Inc. He founded Triesta Sciences, Inc. and served as its Chief Executive Officer from 2002 until 2006. He served in the Tata Administrative Service at Tata Industries Limited from 1990 to 1994.
03. Sampath Thattai Ramesh is a Non-Executive, Independent Director of our Company. He has been a Director of our Company since May 29, 2015. He has also been awarded
a Doctor of Letters in Management from the University of Tumkur. He is a retired civil servant who served in the Karnataka Police Department and the Government of India. He was the former Director General and Inspector General of Police, Karnataka. He has also been the Chairman of the National Road Safety Committee on Enforcement. He has received the President’s Police Medal for Meritorious Service in 1995 and the President’s Police Medal for Distinguished Service in 2007.
04. Suresh Chandra Senapaty is a Non-Executive, Independent Director of our Company. He has been a Director of our Company since May 29, 2015. He holds a Bachelor’s Degree in Commerce from Utkal University and is a member of the Institute of Chartered Accountants of India. He has held several positions at Wipro Limited including that of the Chief Financial Officer. He has also been a Director of Wipro Corporation, Wipro GE Healthcare and Wipro Enterprises Limited.
05. Shanker Annaswamy is a Non-Executive, Independent Director of our Company. He has been a Director of our Company since February 25, 2015. He holds a Bachelor’s Degree in Electronics and Communication Engineering from Madras University and a Diploma in Management from the All India Management Association, New Delhi. He is experienced in the field of business management. In the past he has been the Managing Director of IBM India Private Limited, and the Regional General Manager of IBM in India/South Asia. He has also been the President and Chief Executive officer of GE Medical Systems, South Asia and the Managing Director of Wipro-GE Medical Systems. He was an elected member of NASSCOM’s Executive Council in the past and he has held the position of the Chairman of the National Committee of IP Owners (Confederation of IndianIndustry) in 2010 and co-chaired theConfederation of Indian Industry’s National Innovation Mission in 2007 In 2009, Business Week magazine listed him as one of India’s 50 Most Powerful People. In October 2011, Mr. Annaswamy received a leadership award at the Forbes India Leadership Awards.
06. Sudhakar Rao is a Non- Executive, Independent Director of our Company. He has been a Director of our Company since February 25, 2015. He holds a Master’s Degree in Arts from the Delhi University and a Master’s Degree in Public Administration from the Kennedy School of Government, Harvard University. He is a retired Indian Administrative Service Officer and he has held several posts in the government including the post of the Chief Secretary to the Government of Karnataka. He has previously been a Director on the boards of Indian Oil Corporation Limited and Binani Industries Limited. He has been awarded the Kannada Rajyotsava Award by the Government of Karnataka.
07. Bhushani Kumar is a Non- Executive, Independent Director of our Company. She has been a Director of our Company since May 29, 2015. She holds a Bachelor’s Degree in Science from the University of Mysore, a Bachelor’s Degree in Law from Bangalore University and a Master’s Degree in Law from Bangalore University. She is presently the Secretary at Women’s Peace League, Basavanagudi, Bengaluru.
08. Dr. Amit Varma is a Non-Executive Director of our Company. He has over 25 years of private equity, strategic & operational leadership and board level experience in healthcare organizations across USA, Asia and Australia. He is the co-founder and Managing Partner of Quadria Capital, one of Asia’s largest healthcare private equity firms, with assets under management exceeding USD 1.5 billion and focused on investing in the healthcare sector across South and Southeast Asia. Dr. Varma is also the sponsor of Healthquad, a healthcare focused Venture Capital firm investing in technology backed companies in India, and spearheaded India Build Out Fund, a USD 100 million Healthcare and Education focused domestic Private Equity Fund. He has co-led the deployment of RHC Principal, a USD 700 million principal pool of capital across various healthcare sub sectors in Asia. He is a renowned Critical Care Medicine Physician and continues to practice as a critical care physician
on a part-time basis. Previously, he was associated with Fortis Healthcare, Narayan Hrudayalaya and Manipal Heart Foundation. He has also served as an adjunct professor at the University of Pittsburgh and the Cleveland Clinic. He has completed his M.B.B.S., M.D. from the University of Delhi, India, and super-specialty medicine training from the University of New York and University of Pittsburgh, USA. He had attended MBA courses at the University of Chicago, USA.
09. Dr. B. S. Ramesh is an Executive Director of our Company. He is one of the promoters of the Company. He has completed his MBBS from Bangalore University, holds a degree of Doctor of Medicine (Radio Therapy), a post graduate diploma in Radio Diagnosis from Bangalore University and a Post Graduate Diploma in Medical Law and Ethics from the National Law School of India University, Bengaluru. He is experienced in the field of radiation oncology. He has worked as a consultant in the department of radio therapy at Sri Devaraj Urs Academy of Higher Education and Research as a professor of Radio Therapy at the MS Ramaiah Medical College, Bengaluru. He was the chairman of the Indian College of Radiation Oncology between 2010 and 2012 and the president of the Association of Radiation Oncologists of India between 2012 and 2014. He was also the secretary of the Bangalore branch of the Indian Medical Association between 1980 and 1981. He was awarded the IMA Community Service Award for Individuals by the Indian Medical Association in 2012. He is presently a Director on the boards of some of the subsidiaries of the Company.
21

Director’s Report
Dear Members,
Your Directors are pleased to present the Twentieth Annual Report of your Company together with the Audited Standalone and Consolidated Financial Statements and the Auditors’ Report thereon for the financial year ended March 31, 2018.
1. Financial Results:
The highlights of Standalone and Consolidated financial results of your Company and its subsidiaries are as follows:
Consolidated 2017-18(` in millions)
2016-17 (` in millions)
Income from operations 8,306.9 7,001.1
Total Expenditure excluding Depreciation, Interest cost, tax and exceptional items 7,118.6 5,951.2
Profit before other income, Depreciation, Interest cost, tax and exceptional items 1,188.2 1,049.9
Other income 128.0 96.7
Depreciation, Finance Charges and exceptional items 1,030.4 798.2
Share of (loss) of equity accounted investees (14.0) -
Profit before tax 271.8 348.4
Profit after tax before share of profit of minority interest 169.4 230.4
Standalone
Income from operations 5,868.7 5,450.4
Total Expenditure excluding Depreciation, Interest cost, tax and exceptional items 4,981.4 4,623.6
Profit before other income, Depreciation, Interest cost, tax and exceptional items 887.3 826.7
Other income 159.3 67.2
Depreciation, Finance Charges and exceptional items 677.8 600.9
Profit/(Loss) before tax 368.6 293.0
Profit/(Loss) after tax 248.8 194.8
2. Performance Overview
Consolidated Operations:
The consolidated income from operations for FY 2017 - 18 was ` 8,306.9 million as compared to ̀ 7,001.1 million in the previous fiscal year, reflecting a growth of 18.7%. EBITDA in FY 2017-18 was ` 1,188.2 million as compared to ` 1,049.9 million in FY 2016-17, reflecting a year-on-year increase of 13.2%. EBITDA margin for the year was 14.3% as compared to 15.0% in FY 2016-17, reflecting a decrease of 70 basis points primarily due to the losses incurred by new centres. PAT in the fiscal year was ` 169.4 million as compared to ` 230.4 million in FY 2016-17.
The revenue growth was driven by 19.1% growth from HCG Centres (including the multi-specialty hospitals) while the Milann centres contributed growth of 13.5%. HCG Centres constituted 92% of the consolidated revenues for the Company and the
remaining 8% of the consolidated revenue was contributed by Milann Centres.
Standalone Operations:
The Company ended the year FY 2017-18 with income from operations of ` 5,868.7 million as compared to ` 5,450.4 million for the previous financial year, reflecting an increase of 7.7%. Our EBITDA before exceptional items for FY 2017-18 was ` 887.3 million with EBITDA margin of 15.1%.
3. Indian Accounting Standards
The Ministry of Corporate Affairs (MCA), vide its notification in the Official Gazette dated February 16, 2015, notified the Indian Accounting Standards (“Ind AS”) applicable to certain class of companies. Ind AS has replaced the existing GAAP prescribed under Section 133 of Companies Act, 2013, read with Rule 7 of
22

the Companies (Accounts) Rules, 2014. For HCG Group, Ind AS is applicable from April 01, 2016.
4. Business and Strategy:
4.1 Business:
The Company is a provider of speciality healthcare in India focused on cancer and fertility. Under the “HCG” brand, we operate the largest cancer care network in India in terms of the total number of private cancer treatment centres licensed by the AERB. Each of our comprehensive cancer centres offers, at a single location, comprehensive cancer diagnosis and treatment services (including radiation, medical oncology and surgical treatments).
In our HCG network, our specialist physicians adopt a technology-focused approach to diagnosis and treatment. For instance, we use advanced technologies, including molecular pathology and molecular imaging for accurate diagnosis and staging of cancer, which enable us to decide upon the appropriate course of treatment for each patient. We also utilise targeted nuclear medicine therapies as well as advanced radiation treatments to minimise side effects and improve the outcome of treatments. By ensuring that we adopt these diagnostic and treatment technologies throughout our HCG network, we are able to provide consistent quality of care to all patients.
Given the large number of patient cases treated across our HCG network, we believe that we are able to efficiently utilise our equipment, technologies and human resources, thereby deriving economies of scale. Furthermore, through the adoption of a centralised drug and consumables formulary, we are able to lower the overall cost of drugs and consumables. We believe that our business model is scalable and when combined with efficient utilisation of resources, it enables us to operate within a competitive cost structure.
As a group, we continue to deliver the highest standards of clinical outcomes across all our centres. Our standardised clinical protocols for diagnosis and treatment of cancer patients have allowed us to manage the large volume of patient cases across our HCG network with successful clinical outcomes. Mapping our own clinical outcomes and constantly evolving HCG treatment guidelines has paved way for standardization of clinical pathways and improvement in the functioning of the clinical departments. We believe that we are able to attract and retain highly skilled specialist physicians due to our reputation for clinical excellence, our technology-focused approach, the exposure and experience we provide in relation to clinical best practices and the training programmes we offer for their ongoing development. We believe that the abilities and expertise of our team of specialist physicians differentiate us relative to our competitors.
We also provide fertility treatment under our “Milann” brand. Our Milann fertility centres provide comprehensive reproductive medicine services, including assisted reproduction, gynaecological endoscopy and fertility preservation; and follow a multidisciplinary and technology-focused approach to diagnosis and treatment. Our Milann network also operates on a model similar to our HCG network, wherein the various Milann fertility centres aim to provide medical services following established protocols with a focus on quality medical care across diagnosis and treatment.
4.2 New Cancer Care Centres:
4.2.1 Cancer Care Kenya, Nairobi: Despite the growing incidence of cancer, there is a shortage of cancer centres in many countries in Africa. We believe that this growing demand presents us with an opportunity to establish a network of speciality cancer centres in Africa. The Company through its subsidiary HCG Kenya, has acquired majority stake in Cancer Care Kenya (CCK) a leading cancer care centre in Nairobi, Kenya. CDC, the development finance institution of UK Government, which has partnered with the Company for Africa investments, has partnered through HCG Kenya an off-shore subsidiary for the acquisition. MP Shah Hospital, a leading tertiary care hospital in Kenya, has also participated in the transaction. HCG Kenya has received necessary approvals from Competition Authority of Kenya (CAK) in May 2017, for the acquisition. CCK, which started operations in 2010, is the first private comprehensive cancer centre in Kenya. CCK treats over a thousand patients annually including over two hundred patients from other African nations. CCK’s team includes internationally trained radiation, medical and surgical oncologists, physicists, radiation technicians and oncology nurses. CCK is the first private cancer care centre in Kenya. The Centre was launched in July 2017 in association with Cancer Care Kenya and MP Shah Hospital.
4.2.2 HCG APEX Cancer Centre, Borivali: The Company in order to significantly strengthen its presence in western India, has launched the first dedicated comprehensive cancer hospital in Mumbai, in May 2017, in collaboration with Apex Criticare LLP, founded with the aim of providing consistently high quality and result oriented cancer treatment by adopting global innovations. HCG APEX Cancer Centre is a state-of-the-art comprising of 69 beds along with oncology facilities. The hospital provides quality cancer care through surgical oncology, radiation oncology and medical oncology, all under one roof with a complete range of diagnostics. The cancer centre introduced the 1st Elekta Versa HD Radiation Machine in the state of Maharashtra, which is equipped with the Agility™ for high-speed, high precision beam shaping to support exceptionally accurate tumor targeting and improved healthy tissue preservation. HCG APEX Cancer Centre, Mumbai, has a clinical team comprising of highly qualified, trained and experienced surgical oncologists, radiation oncologists, medical oncologists, radiologists and nuclear medicine physicians, who are available round-the-clock for extensive patient service. All the facilities at the HCG APEX Cancer Centre are designed and executed as per the NABH Guidelines 2016. With the latest technology and expertise to treat cancer, HCG Apex Cancer Centre is emerging as one of the Best Cancer Hospital in Mumbai, India.
4.2.3 HCG NCHRI Cancer Centre, Nagpur: There has been a lack of dedicated advanced cancer care facilities in central India. With the inauguration of HCG NCHRI Cancer Centre in June 2017, we have now created
23

access to the most advanced dedicated cancer centre in the region. HCG NCHRI Cancer Centre is a 115 bed dedicated comprehensive cancer hospital established in collaboration with the Nagpur Cancer Hospital and Research Institute Private Limited (“NCHRI”). HCG NCHRI Cancer Centre, Nagpur, is the first private, comprehensive cancer care hospital in central India with all oncology facilities under one roof. The hospital provides quality cancer care through surgical oncology, radiation oncology and medical oncology with a full range of diagnostics. The Centre introduced TrueBeam STX for the first time in central India. This revolutionizes the cancer care industry by providing expertise and hope to hundreds of patients. The hospital treats all types of cancer with latest advancement in radiotherapy system like image-guided radiotherapy and radio-surgery which is designed to treat tumors with speed and precision and has a clinical team comprising of highly qualified, trained and experienced surgical oncologists, radiation oncologists, medical oncologists, radiologists and nuclear medicine physicians, who are available round-the-clock for extensive patient service. All the facilities at the HCG NCHRI Cancer Centre are designed and executed as per the NABH guidelines, 2016, and are a perfect amalgamation of the latest technology available in the oncology space, with highly qualified clinicians.
4.2.4 HCG Manavata Cancer Centre, Nashik: The Company had established the first comprehensive cancer centre in Nashik in 2008. The centre has 65 beds offering advanced diagnostics, radiation, medical and surgical oncology. Last year, HCG has expanded its operations in Nashik and has upgraded the centre in a new building and has additional 90 beds featuring advanced radiation therapy, multidisciplinary team of oncologists including sub specialists, bone-marrow transplant unit. The new centre has commenced its operations in May 2018. Also, the centre which was operating under HCG, has been moved into a new legal entity, named HCG Manavata Oncology LLP, which is owned by HCG and Dr. Rajnish Nagarkar in the ratio of 51:49 respectively.
4.3 New Milann Centres:
We believe that there is significant potential for growth in the fertility segment of the Indian healthcare industry. Further, the fragmentation of the market presents us with an opportunity to leverage the expertise of building our HCG brand into a nationally recognised speciality healthcare brand and to build and establish our Milann brand across India. Milann, during the year, has launched IVF Centres at Mumbai, Ahmedabad and two additional centres at Bengaluru - Whitefield and Banaswadi. BACC, the subsidiary of HCG operates eight Milann fertility centers across Bengaluru, Delhi, Chandigarh, Mumbai and Ahmedabad as on March 31, 2018. Milann is the first to receive ICMR approval for Uterus Transplant and has been Ranked No. 1 in India and first in the South India region continuously for 3 years in the fertility segment in the Times Health All India Critical Care Hospital Ranking Survey.
4.4 Acquisition, Investment, Disinvestment, Mergers and Amalgamations:
4.4.1 Acquisition of City Cancer Centre, Vijayawada: The Company has been operating a cancer care centre in Vijayawada and Ongole and a PET CT centre in Vijayawada (“HCG Vijayawada”). In order to consolidate the existing business of HCG Vijayawada and that of City Cancer Centre under the Company, and for improving the performance, efficiency, brand visibility and leadership in Andhra Pradesh, the Company vide business transfer agreement entered into with Dr. M. Gopichand, one of the promoters of the Company, in February 2018, has acquired the business of City Cancer Centre, located at Vijayawada 520002, a sole proprietary concern, owned by Dr. M. Gopichand. He is a renowned Surgical Oncologist in Vijayawada, and has entered into a consultancy agreement with the Company to provide medical consultancy services on an exclusive basis. As per the business transfer agreement with Dr. Gopichand, the Company has to pay a consideration of ` 52 Crores, payable partly by way of issuance of shares of the Company, and by way of cash consideration, in tranches, and certain cash tranche payments are linked to the performance of the combined business. The Company has issued and allotted shares in April 2018 to Dr. Gopichand, in fulfilment of the payment of consideration payable by way of shares.
4.4.2 Suchirayu HealthCare Solutions Private Limited, Hubli: The Company, with an aim to make healthcare more accessible and affordable to the people of Hubli and North Karnataka, has entered into an operations and management arrangement with Suchirayu in August 2017. The Company has also acquired equity shares of Suchirayu to an extent of 17.72%. Suchirayu owns and operates an advanced multispecialty hospital in Hubli, having a capacity of 225 beds with most advanced technology in cathlab, CT, MRI and has best in class physicians.
4.4.3 Disinvestment of shares in HCG Regency Oncology Healthcare Private Limited: The Company has entered into a Share Purchase Agreement (“SPA”) with Regency Hospital Limited (“RHL”) and HCG Regency Oncology Healthcare Private Limited (“HCG Regency”) on March 28, 2018, relating to the sale/transfer of shareholding of the Company in HCG Regency to RHL. The Company pursuant to the SPA has transferred its entire shareholding in HCG Regency, representing 51% of the share capital of HCG Regency to RHL. In view of the sale/transfer of entire shareholding of the Company in HCG Regency to RHL, the Company has ceased to be a shareholder of HCG Regency, effective from the close of business hours of March 28, 2018; and accordingly, HCG Regency has ceased to be a subsidiary of the Company effective from March 29, 2018. This was a strategic decision driven by lower than estimated mix of cash patients, other priorities and business dynamics.
4.4.4 iCrest, Bengaluru: The developments in healthcare of late have established value of regenerative medicine, offering new found hope to patients. There is synergy with the Company in using adult stem cells in treating
24

several conditions including cancer. The Company in April 2018 has acquired equity shares of International Stemcell Services Limited (“ISSL” or “iCrest”) to an extent of 12.00% (Twelve Percent) from its existing shareholders. ISSL is a knowledge-centric Company in the space of stem cells and regenerative medicine. The research activities with respect to stem cells and regenerative medicine carried out by ISSL would support the Company in the development of targeted therapies for cancer treatment
4.4.5 Merger of HCG Pinnacle Oncology Private Limited, subsidiary Company with the Company: During the year, HCG Pinnacle Oncology Private Limited the wholly owned subsidiary of the Company (Transferor Company), has been merged with the Company (Transferee Company) in accordance with the terms of a Scheme of Amalgamation (the Scheme) as approved by the Regional Director, Ministry of Corporate Affairs, Hyderabad with an appointed date of April 01, 2016. The Scheme was approved by the Regional Director, MCA, Hyderabad on January 30, 2018. The consolidation of operations of HCG Pinnacle and the Company has led to a more efficient utilisation of capital and superior deployment of brand promotion, sales and distribution strategies and created a consolidated and diversified base for future growth of oncology segment.
4.4.6 Amalgamation of DKR with BACC: During the year, DKR HealthCare Private Limited (Transferor Company), the wholly owned subsidiary of BACC HealthCare Private Limited (Transferee Company) has been merged with the Transferee Company in accordance with the terms of a Scheme of Amalgamation (the Scheme) as approved by the Regional Director, Ministry of Corporate affairs, Hyderabad with an appointed date of 01st April 2017.The scheme was approved by Regional Director, MCA, Hyderabad on January 29, 2018. This amalgamation has led to administrative and operational rationalization and has promoted organisational efficiencies.
4.4.7 Business combination of Triesta Sciences with Strand Life Sciences: The Company has entered into a business transfer agreement, with Strand Life Sciences in January 2018, providing for a business combination of its Triesta Sciences business unit (“Triesta Sciences”), with Strand Life Sciences Private Limited, a Company incorporated under the Companies Act, 1956 and having its registered office at 5th Floor, Kirloskar Business Park, Bellary Road, Hebbal, Bengaluru 560024 (“Strand Life Sciences”). Pursuant to the business transfer agreement, the Company has transferred its Triesta unit on slump sale basis for a consideration aggregating to 38.2 % stake in Strand Life Sciences. Strand Life Sciences is renowned in the field of bioinformatics and genomics research and is engaged in the business of developing, implementing and deploying technology for data, image and text analysis, and for diagnostic testing in the fields of genomics, research, pharmaceutical research and development, biotechnology and healthcare. Triesta Sciences has strong capabilities
in molecular diagnostics and clinical research. The business combination of Triesta Business and Strand Life Sciences creates an entity which will have a leadership position in specialized diagnostics and genomics research.
4.5 Strategy:
a) Expand the reach of our cancer care network in India:
We plan to expand its network in India by establishing new cancer centres across India and by expanding the capacity and service offering of the existing HCG cancer centres. We carry out a competitive assessment of the markets in which HCG plans to expand the network based on a number of factors, including the estimated incidence of cancer in the primary and secondary catchment population, the number of comprehensive cancer centres, if any, in the catchment; the average distance patients have to travel to avail of such comprehensive cancer care; affordability of healthcare generally and cancer care in particular; and the available third party payer options, whether corporate, government or private insurance. HCG will continue to expand its network through green field projects, partnership arrangements and acquisitions; and that the past experiences will aid the Management in identifying potential opportunities in the future and assist HCG in integrating new cancer centres into the existing HCG network. We believe that our planned network will cater to the increasing unmet demand for cancer care in India.
b) Strengthen our HCG brand to reach more cancer patients
We believe that our HCG brand distinguishes us from our competitors. As we establish new comprehensive cancer centres across India, we plan to invest in building our brand, enhancing our market presence, brand image and visibility. We intend to strengthen our patient support groups comprising cancer survivors to further spread awareness of cancer screening and to educate patients regarding cancer treatment options and their relative outcomes and benefits. Through these initiatives, we seek to further strengthen our brand and our commitment to the community, cancer patients and their families.
c) Expand our cancer care network overseas
We believe that despite the growing incidence of cancer, there is a shortage of cancer centres in many countries in Africa. As a result, patients suffering from cancer often travel outside the region at a significant cost for availing quality cancer care, including to our comprehensive cancer centres in India. In the past, we have experienced an increase in the number of patients travelling from Africa and other regions to our centre of excellence in Bengaluru, as well as to our other comprehensive cancer centres in India for cancer treatment. We believe that this growing demand presents us with an opportunity to establish a network of speciality cancer centres in Africa. In addition, we periodically and selectively evaluate partnering opportunities in countries in the Middle East and South and Southeast Asia.
d) Upgrade and strengthen our information technology infrastructure
We are in the process of significantly upgrading our information technology infrastructure in order to enhance the
25
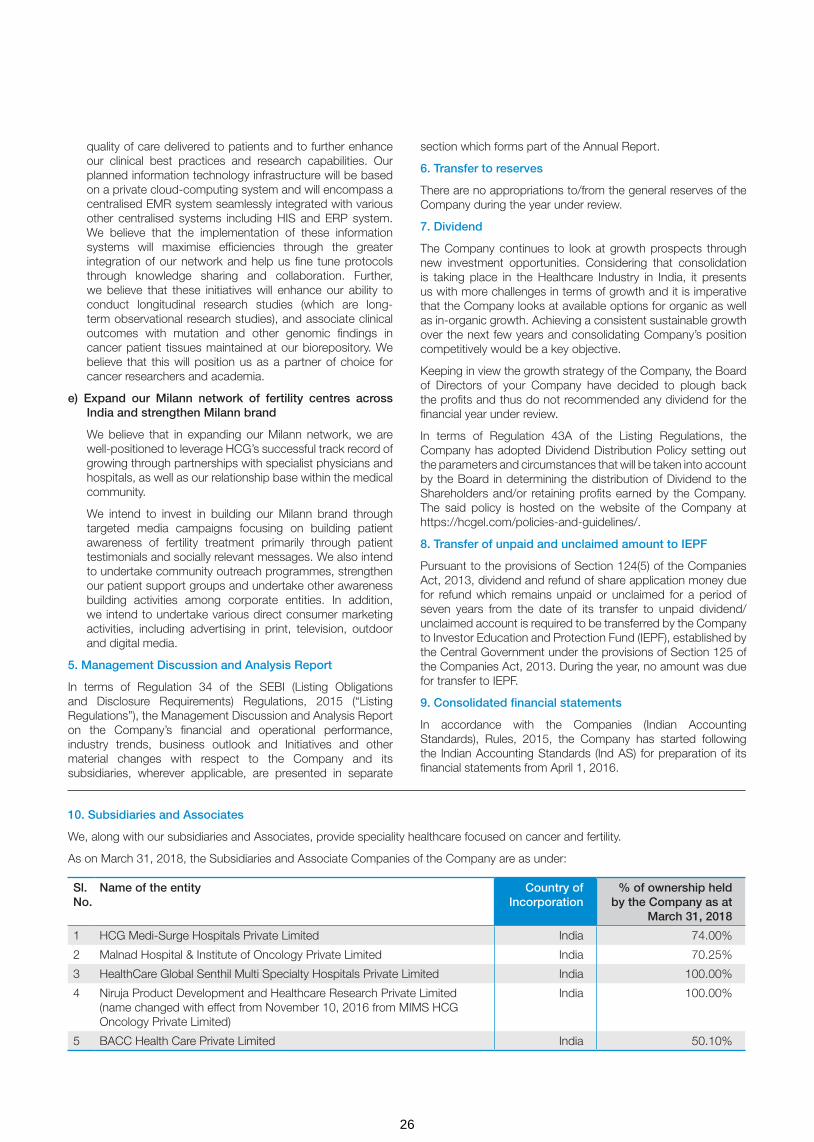
quality of care delivered to patients and to further enhance our clinical best practices and research capabilities. Our planned information technology infrastructure will be based on a private cloud-computing system and will encompass a centralised EMR system seamlessly integrated with various other centralised systems including HIS and ERP system. We believe that the implementation of these information systems will maximise efficiencies through the greater integration of our network and help us fine tune protocols through knowledge sharing and collaboration. Further, we believe that these initiatives will enhance our ability to conduct longitudinal research studies (which are long-term observational research studies), and associate clinical outcomes with mutation and other genomic findings in cancer patient tissues maintained at our biorepository. We believe that this will position us as a partner of choice for cancer researchers and academia.
e) Expand our Milann network of fertility centres across India and strengthen Milann brand
We believe that in expanding our Milann network, we are well-positioned to leverage HCG’s successful track record of growing through partnerships with specialist physicians and hospitals, as well as our relationship base within the medical community.
We intend to invest in building our Milann brand through targeted media campaigns focusing on building patient awareness of fertility treatment primarily through patient testimonials and socially relevant messages. We also intend to undertake community outreach programmes, strengthen our patient support groups and undertake other awareness building activities among corporate entities. In addition, we intend to undertake various direct consumer marketing activities, including advertising in print, television, outdoor and digital media.
5. Management Discussion and Analysis Report
In terms of Regulation 34 of the SEBI (Listing Obligations and Disclosure Requirements) Regulations, 2015 (“Listing Regulations”), the Management Discussion and Analysis Report on the Company’s financial and operational performance, industry trends, business outlook and Initiatives and other material changes with respect to the Company and its subsidiaries, wherever applicable, are presented in separate
section which forms part of the Annual Report.
6. Transfer to reserves
There are no appropriations to/from the general reserves of the Company during the year under review.
7. Dividend
The Company continues to look at growth prospects through new investment opportunities. Considering that consolidation is taking place in the Healthcare Industry in India, it presents us with more challenges in terms of growth and it is imperative that the Company looks at available options for organic as well as in-organic growth. Achieving a consistent sustainable growth over the next few years and consolidating Company’s position competitively would be a key objective.
Keeping in view the growth strategy of the Company, the Board of Directors of your Company have decided to plough back the profits and thus do not recommended any dividend for the financial year under review.
In terms of Regulation 43A of the Listing Regulations, the Company has adopted Dividend Distribution Policy setting out the parameters and circumstances that will be taken into account by the Board in determining the distribution of Dividend to the Shareholders and/or retaining profits earned by the Company. The said policy is hosted on the website of the Company at https://hcgel.com/policies-and-guidelines/.
8. Transfer of unpaid and unclaimed amount to IEPF
Pursuant to the provisions of Section 124(5) of the Companies Act, 2013, dividend and refund of share application money due for refund which remains unpaid or unclaimed for a period of seven years from the date of its transfer to unpaid dividend/ unclaimed account is required to be transferred by the Company to Investor Education and Protection Fund (IEPF), established by the Central Government under the provisions of Section 125 of the Companies Act, 2013. During the year, no amount was due for transfer to IEPF.
9. Consolidated financial statements
In accordance with the Companies (Indian Accounting Standards), Rules, 2015, the Company has started following the Indian Accounting Standards (Ind AS) for preparation of its financial statements from April 1, 2016.
Sl.No.
Name of the entity Country of Incorporation
% of ownership held by the Company as at
March 31, 2018
1 HCG Medi-Surge Hospitals Private Limited India 74.00%
2 Malnad Hospital & Institute of Oncology Private Limited India 70.25%
3 HealthCare Global Senthil Multi Specialty Hospitals Private Limited India 100.00%
4 Niruja Product Development and Healthcare Research Private Limited (name changed with effect from November 10, 2016 from MIMS HCG Oncology Private Limited)
India 100.00%
5 BACC Health Care Private Limited India 50.10%
10. Subsidiaries and Associates
We, along with our subsidiaries and Associates, provide speciality healthcare focused on cancer and fertility.
As on March 31, 2018, the Subsidiaries and Associate Companies of the Company are as under:
26

Sl.No.
Name of the entity Country of Incorporation
% of ownership held by the Company as at
March 31, 2018
6 HealthCare Diwan Chand Imaging LLP India 75.00%
7 APEX HCG Oncology Hospitals LLP India 50.10%
8 HCG NCHRI Oncology LLP India 76.00%
9 HCG Oncology LLP India 74.00%
10 Strand-Triesta Cancer Genomics LLP India 30.00%
11 HCG EKO Oncology LLP India 50.50%
12 HCG Manavata Oncology LLP India 51.00%
13 HCG (Mauritius) Pvt. Ltd. Mauritius 100.00%
14 Healthcare Global (Africa) Pvt. Ltd. Mauritius 76.73%
15 HealthCare Global (Uganda) Private Limited (Wholly Owned Subsidiary of Healthcare Global (Africa) Pvt. Ltd)
Uganda 76.73%
16 HealthCare Global (Kenya) Private Limited (Wholly Owned Subsidiary of Healthcare Global (Africa) Pvt. Ltd)
Kenya 76.73%
17 HealthCare Global (Tanzania) Private Limited (Wholly Owned Subsidiary of Healthcare Global (Africa) Pvt. Ltd)
Tanzania 76.73%
18 HCG SUN Hospitals LLP India 74.00%
19 Cancer Care Kenya Limited (Subsidiary of HealthCare Global (Kenya) Private Limited)
Kenya 59.47%
20 Strand Life Sciences Private Limited India 38.20%
During the year, the Board of Directors reviewed the affairs of the subsidiaries. In accordance with Section 129(3) of the Companies Act, 2013 read with Regulation 33 of the Listing Regulations, and applicable accounting standards, the consolidated financial statements of the Company, prepared in accordance with the relevant accounting standards specified under Section 133 of the Companies Act, 2013 read with the rules made there under, forms part of this Annual Report.
Further, pursuant to the provisions of Section 136 (1) of the Companies Act, 2013:
a) The Annual Report of the Company, containing therein its standalone and consolidated financial statements, is placed on the website of the Company, being www.hcgel.com.
b) The audited financial statements of subsidiary companies are posted on the website of the Company, being www.hcgel.com.
None of the above Companies is a Material Subsidiary within the meaning of Material Subsidiary as defined under the Listing Regulations.
Pursuant to Section 129 of the Companies Act, 2013, a statement containing the salient features of the financial statements of the subsidiary companies in Form AOC-1 is annexed herewith as Annexure 5 and forms part of the Report.
10.1 Subsidiaries incorporated during the Financial Year
HCG SUN Hospitals LLP: HCG SUN Hospitals LLP was incorporated on September 22, 2017, under the Limited Liability Partnership Act, 2008. The Partners of the LLP are HCG and SHIV-SUN Medical Services LLP, in the capital contribution ratio of 74:26, respectively. HCG and SHIV- SUN have agreed to join hands to set up a multispecialty
hospital with high end infrastructure in Rajkot, under the name “HCG Hospitals.
11. Public deposits
Your Company has not accepted any deposits from public in terms of Section 73 of the Companies Act, 2013 and as such, no amount on account of principal or interest on public deposits was outstanding as on the date of the balance sheet.
12. Particulars of loans, guarantees or investments under Section 186 of the Companies Act, 2013
Pursuant to Section 186 of the Companies Act, 2013 and Schedule V of the Listing Regulations, disclosure on particulars relating to Loans/advances given, guarantees provided and investments made are provided as part of the financial statements.
13. Related party transactions
In line with the requirements of the Companies Act, 2013 and Listing Regulations, your Company has formulated a Policy on Related Party Transactions which is also available on the Company’s website at https://hcgel.com/policies-and-guidelines/. The Policy intends to ensure that proper reporting, approval and disclosure processes are in place for all transactions between the Company and Related Parties.
All Related Party Transactions are placed before the Audit Committee for review and approval. Prior omnibus approval is obtained for Related Party Transactions on yearly basis for transactions which are of repetitive nature and / or entered in the ordinary course of business and are at arm’s length.
All Related Party Transactions entered during the year were in ordinary course of the business and at arm’s length basis. No Material Related Party Transactions, i.e. transactions exceeding
27

10% of the annual consolidated turnover as per the last audited financial statements, were entered into by your Company during the year.
A statement giving details of all related party transactions, entered pursuant to the omnibus approval so granted, is placed before the Audit Committee for their review, on a quarterly basis. The policy on Related Party Transactions has been hosted on the Company’s website https://hcgel.com/policies-and-guidelines/ in terms of the Listing Regulations relating to Corporate Governance.
Disclosures as required under Section 134(3) (h) read with Rule 8(2) of the Companies (Accounts) Rules, 2014, are given in Form AOC 2 as specified under Companies Act, 2013, which is annexed herewith as Annexure 6 and forms part of the report.
14. Initial Public Offer
During the year 2015-16, the Company had completed its Initial Public Offering of 29,800,000 equity shares of ` 10 each, comprising of Fresh Issue of 11,600,000 equity shares and Offer for Sale of 18,200,000 equity shares at a premium of ` 208 per equity share. The total issue size was ` 6496.4 million. The shares got listed on the National Stock Exchange of India Limited and BSE Limited on March 30, 2016.
The proceeds of the initial public offer are proposed to be utilized for the following purposes:
1. Purchase of medical equipment
2. Investment in IT software, services and hardware
3. Pre-payment of debt; and
4. General Corporate Purposes
During the year under review, the Company has not deviated in utilizing the proceeds of issue.
15. Share capital
a) Authorized Share Capital: HCG Pinnacle Oncology Private Limited, one of the wholly owned subsidiaries of the Company has been merged with the Company, vide order dated January 30, 2018 of the Regional Director, South East Region, Hyderabad, Ministry of Corporate Affairs. As a result of the said merger, the Authorized Share Capital of HCG Pinnacle Oncology Private Limited amounting to ` 50,000,000 has been added to the Authorized Share Capital of the Company. As on the date of this report, the authorized share capital of the Company is ` 1,320,000,000 consisting of 132,000,000 equity shares of ` 10 each. Prior to the order approving the said merger, the authorized capital was ` 1,270,000,000.
b) Issued, Subscribed and Paid-up Share Capital: The Issued, Subscribed and Paid-up Share Capital of the Company has been increased from ` 857,129,860 consisting of 85,712,986 equity shares of ` 10 each to ` 869,044,730 consisting of 86,904,473 equity shares of ` 10 each during the year.
Name of allottee No. of shares allotted Issue price (`) Date of allotment
Indgrowth Capital Fund I 1,166,667 300 28.12.2017
Employees (On exercise of ESOP) 24,820 10 08.02.2008
The increase in the Issued, Subscribed and Paid-up Share Capital was on account of allotment of shares as under:
16. Number of meetings of the Board
The Board met five times during the financial year 2017-18 viz., on, May 24, 2017, August 11, 2017, November 7, 2017, November 22, 2017 and February 8, 2018.
Detailed information regarding the meetings of the Board and meetings of the Committees of the Board is included in the report on Corporate Governance which forms a part of Directors’ Report.
17. Declaration by Independent Directors
The Company has received necessary declaration from each Independent Director, in accordance with Section 149(7) of the Companies Act, 2013, that he/she met the criteria of independence as laid out in sub-section (6) of Section 149 of the Companies Act, 2013 and the Regulation 16(1)(B) of the Listing Regulations, The Company has received and taken on record, the necessary declaration from each of the independent directors under Section 149 of the Companies Act, 2013 that they meet with the criteria of their independence.
18. Extract of Annual Return
The extract of the Annual Return of your Company as on March 31, 2018 as provided under sub-section (3) of Section 92 in the Form MGT 9 is annexed herewith as Annexure 1.
19. Director’s Responsibility Statement
Pursuant to Section 134 (3) (C) and 134 (5) of the Companies Act, 2013, the Board of Directors of the Company hereby state and confirm that:
a) in the preparation of the annual accounts, the applicable accounting standards had been followed along with proper explanation relating to material departures;
b) the Directors had selected such accounting policies and applied them consistently and made judgments and estimates that are reasonable and prudent so as to give a true and fair view of the state of affairs of the Company at the end of the financial year and of the profit of the Company for that period;
c) the Directors had taken proper and sufficient care for the maintenance of adequate accounting records in accordance with the provisions of this Act for safeguarding the assets of the Company and for preventing and detecting fraud and other irregularities;
d) the Directors had prepared the annual accounts on a going concern basis;
e) the Directors had laid down internal financial controls to be followed by the Company and that such internal financial controls are adequate and were operating effectively.
28

f) The Directors had devised proper systems to ensure compliance with the provisions of all applicable laws and such systems are adequate and operating effectively.
20. Appointment of Directors
During the year under review, there has been no change in the Directors of the Company. Dr. Amit Varma and Dr. Ramesh S. Bilimagga who were appointed as Additional Directors with effect from November 10, 2016, liable to retire by rotation, have been reappointed by the shareholders at the Annual General Meeting held on August 10, 2017.
Based on the recommendation of the Nomination and Remuneration Committee, the Board of Directors of the Company, on May 22, 2018, subject to the approval of the shareholders of the Company at the ensuing Annual General Meeting, has appointed Dr. B.S. Ramesh as a Whole Time Director, designated as “Executive Director”.
The Notice of twentieth Annual General Meeting of the Company contains the above proposal for the approval of the Members.
21. Reappointment of Directors
As per the provisions of the Companies Act, 2013, Dr. Amit Varma and Dr. B. S. Ramesh, Directors of the Company, retire at the forthcoming Annual General Meeting and have sought for reappointment.
22. Key Managerial personnel
The Key Managerial Personnel of the Company are:
a) Dr. B.S.Ajaikumar – Chairman & CEO
b) Mr. Yogesh Patel – Chief Financial Officer
c) Ms. Sunu Manuel – Company Secretary
During the year, there were no changes in Key Managerial Personnel of the Company.
23. Board of Directors and Committees of the Board and their constitution
Your Company’s Board of Directors comprises of Executive Directors, Non-Executive Directors and Independent Directors. The Composition of the Board along with relevant information pertaining to Directors are detailed in the Corporate Governance Report which forms a part of this Report.
The Board has formed the following five Committees:
1. Audit and Risk Management Committee
2. Nomination and Remuneration Committee
3. Stakeholders’ Relationship Committee
4. Corporate Social Responsibility Committee and
5. Strategy Committee.
Details of terms of reference of the Committees, attendance at meetings of the Committees are provided in the Corporate Governance report. The Company Secretary acts as the Secretary of all the Committees of the Board.
(a) Audit and Risk Management Committee
Pursuant to the requirements of Section 177 of the Companies Act, 2013 and Rule 6 of the Companies (Meetings of Board and its Powers), Rules 2014, the Company has an Audit and Risk Management Committee and the composition of the committee is as under:
1. Mr. Suresh Chandra Senapaty, Chairman
2. Dr. Sudhakar Rao
3. Mr. Shanker Annaswamy
The Audit committee was reconstituted and renamed as the “Audit and Risk Management Committee” by a meeting of the Board of Directors held on May 29, 2015.
(b) Nomination and Remuneration Committee
Pusuant to the requirements of Section 178 of the Companies Act, 2013 and Rule 6 of the Companies (Meetings of Board and its Powers), Rules 2014, the Board of Directors have reconstituted the Nomination and Remuneration Committee.
The members of the Nomination and Remuneration Committee are:
1. Mr. Shanker Annaswamy, Chairman
2. Dr. Sampath Thattai Ramesh
3. Mr. Gangadhara Ganapati
(c) Stakeholders’ Relationship Committee
The Stakeholders’ Relationship Committee was constituted by our Board of Directors at their meeting held on May 29, 2015. The scope and function of the Stakeholders’ Relationship Committee is in accordance with Section 178 of the Companies Act, 2013.
The members of the Stakeholders’ Relationship Committee are:
1. Mr. Gangadhara Ganapati, Chairman
2. Dr. B.S Ajaikumar
(d) Corporate Social Responsibility Committee
The Corporate Social Responsibility Committee was constituted by our Board of Directors at their meeting held on May 29, 2015. The terms of reference of the Corporate Social Responsibility Committee of our Company are as per Section 135 of the Companies Act, 2013 and the applicable rules thereunder.
The members of the Corporate Social Responsibility Committee are:
1. Mr. Sudhakar Rao, Chairman
2. Dr. Sampath Thattai Ramesh
3. Ms. Bhushani Kumar
4. Dr. B.S Ajaikumar
(e) Strategy Committee
The Committee was constituted by our Board of Directors at their Meeting held on May 26, 2016 with the scope of reviewing strategic initiatives; and for having an ooversight of the strategic direction of the Company.
The members of the Committee are:
1. Dr. B. S. Ajaikumar, Chairman
2. Mr. Gangadhara Ganapati
3. Mr. Suresh Senapaty
4. Mr. Shanker Annaswamy
5. Dr. Amit Varma
29
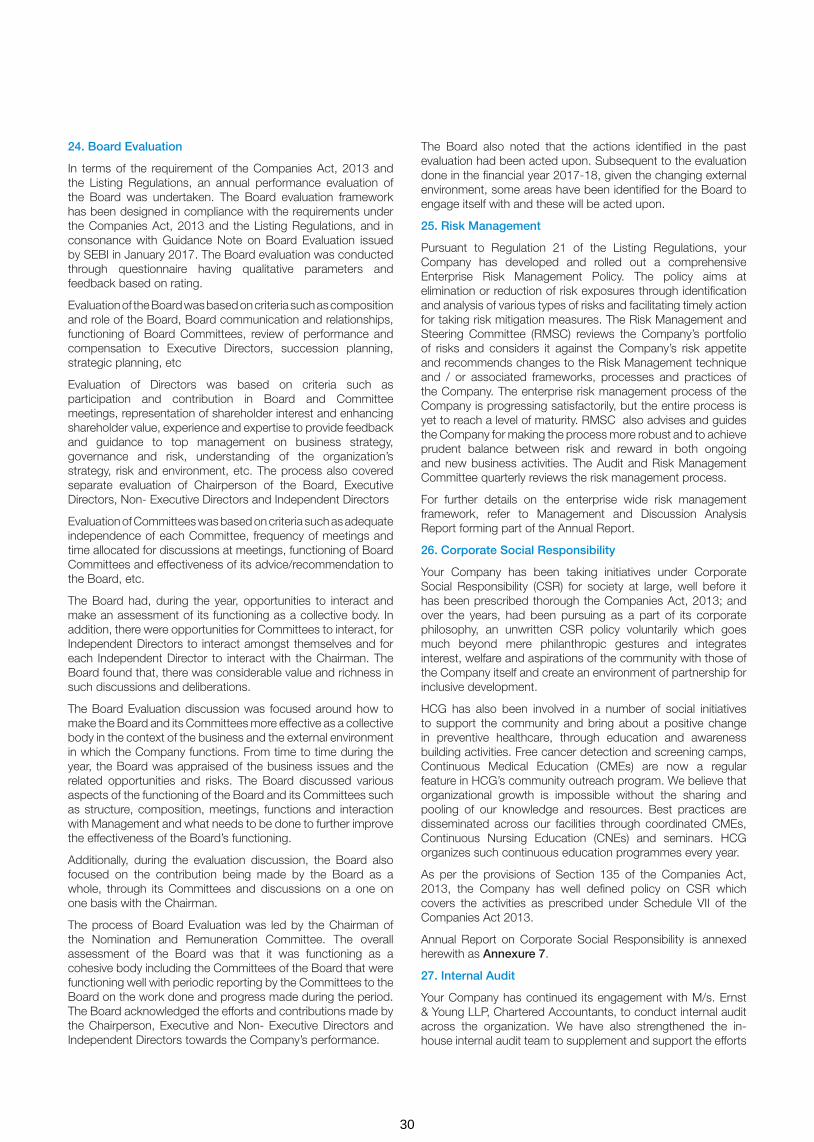
24. Board Evaluation
In terms of the requirement of the Companies Act, 2013 and the Listing Regulations, an annual performance evaluation of the Board was undertaken. The Board evaluation framework has been designed in compliance with the requirements under the Companies Act, 2013 and the Listing Regulations, and in consonance with Guidance Note on Board Evaluation issued by SEBI in January 2017. The Board evaluation was conducted through questionnaire having qualitative parameters and feedback based on rating.
Evaluation of the Board was based on criteria such as composition and role of the Board, Board communication and relationships, functioning of Board Committees, review of performance and compensation to Executive Directors, succession planning, strategic planning, etc
Evaluation of Directors was based on criteria such as participation and contribution in Board and Committee meetings, representation of shareholder interest and enhancing shareholder value, experience and expertise to provide feedback and guidance to top management on business strategy, governance and risk, understanding of the organization’s strategy, risk and environment, etc. The process also covered separate evaluation of Chairperson of the Board, Executive Directors, Non- Executive Directors and Independent Directors
Evaluation of Committees was based on criteria such as adequate independence of each Committee, frequency of meetings and time allocated for discussions at meetings, functioning of Board Committees and effectiveness of its advice/recommendation to the Board, etc.
The Board had, during the year, opportunities to interact and make an assessment of its functioning as a collective body. In addition, there were opportunities for Committees to interact, for Independent Directors to interact amongst themselves and for each Independent Director to interact with the Chairman. The Board found that, there was considerable value and richness in such discussions and deliberations.
The Board Evaluation discussion was focused around how to make the Board and its Committees more effective as a collective body in the context of the business and the external environment in which the Company functions. From time to time during the year, the Board was appraised of the business issues and the related opportunities and risks. The Board discussed various aspects of the functioning of the Board and its Committees such as structure, composition, meetings, functions and interaction with Management and what needs to be done to further improve the effectiveness of the Board’s functioning.
Additionally, during the evaluation discussion, the Board also focused on the contribution being made by the Board as a whole, through its Committees and discussions on a one on one basis with the Chairman.
The process of Board Evaluation was led by the Chairman of the Nomination and Remuneration Committee. The overall assessment of the Board was that it was functioning as a cohesive body including the Committees of the Board that were functioning well with periodic reporting by the Committees to the Board on the work done and progress made during the period. The Board acknowledged the efforts and contributions made by the Chairperson, Executive and Non- Executive Directors and Independent Directors towards the Company’s performance.
The Board also noted that the actions identified in the past evaluation had been acted upon. Subsequent to the evaluation done in the financial year 2017-18, given the changing external environment, some areas have been identified for the Board to engage itself with and these will be acted upon.
25. Risk Management
Pursuant to Regulation 21 of the Listing Regulations, your Company has developed and rolled out a comprehensive Enterprise Risk Management Policy. The policy aims at elimination or reduction of risk exposures through identification and analysis of various types of risks and facilitating timely action for taking risk mitigation measures. The Risk Management and Steering Committee (RMSC) reviews the Company’s portfolio of risks and considers it against the Company’s risk appetite and recommends changes to the Risk Management technique and / or associated frameworks, processes and practices of the Company. The enterprise risk management process of the Company is progressing satisfactorily, but the entire process is yet to reach a level of maturity. RMSC also advises and guides the Company for making the process more robust and to achieve prudent balance between risk and reward in both ongoing and new business activities. The Audit and Risk Management Committee quarterly reviews the risk management process.
For further details on the enterprise wide risk management framework, refer to Management and Discussion Analysis Report forming part of the Annual Report.
26. Corporate Social Responsibility
Your Company has been taking initiatives under Corporate Social Responsibility (CSR) for society at large, well before it has been prescribed thorough the Companies Act, 2013; and over the years, had been pursuing as a part of its corporate philosophy, an unwritten CSR policy voluntarily which goes much beyond mere philanthropic gestures and integrates interest, welfare and aspirations of the community with those of the Company itself and create an environment of partnership for inclusive development.
HCG has also been involved in a number of social initiatives to support the community and bring about a positive change in preventive healthcare, through education and awareness building activities. Free cancer detection and screening camps, Continuous Medical Education (CMEs) are now a regular feature in HCG’s community outreach program. We believe that organizational growth is impossible without the sharing and pooling of our knowledge and resources. Best practices are disseminated across our facilities through coordinated CMEs, Continuous Nursing Education (CNEs) and seminars. HCG organizes such continuous education programmes every year.
As per the provisions of Section 135 of the Companies Act, 2013, the Company has well defined policy on CSR which covers the activities as prescribed under Schedule VII of the Companies Act 2013.
Annual Report on Corporate Social Responsibility is annexed herewith as Annexure 7.
27. Internal Audit
Your Company has continued its engagement with M/s. Ernst & Young LLP, Chartered Accountants, to conduct internal audit across the organization. We have also strengthened the in-house internal audit team to supplement and support the efforts
30
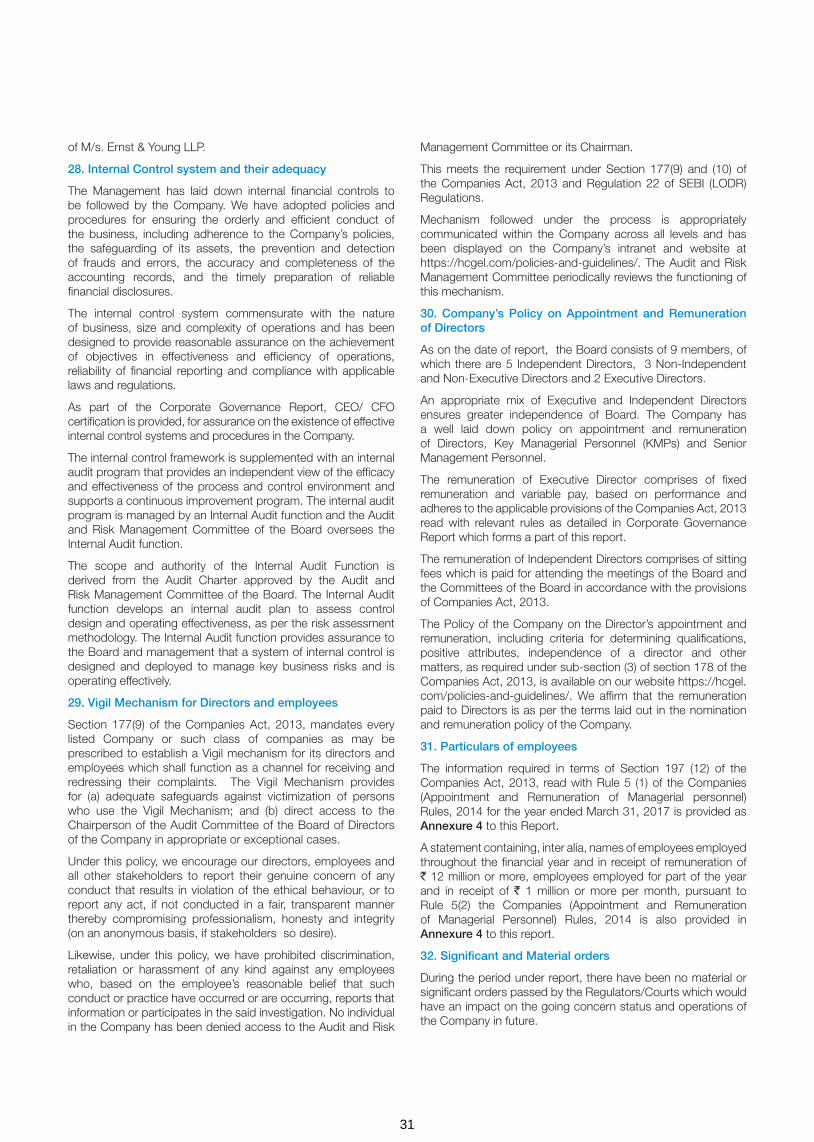
of M/s. Ernst & Young LLP.
28. Internal Control system and their adequacy
The Management has laid down internal financial controls to be followed by the Company. We have adopted policies and procedures for ensuring the orderly and efficient conduct of the business, including adherence to the Company’s policies, the safeguarding of its assets, the prevention and detection of frauds and errors, the accuracy and completeness of the accounting records, and the timely preparation of reliable financial disclosures.
The internal control system commensurate with the nature of business, size and complexity of operations and has been designed to provide reasonable assurance on the achievement of objectives in effectiveness and efficiency of operations, reliability of financial reporting and compliance with applicable laws and regulations.
As part of the Corporate Governance Report, CEO/ CFO certification is provided, for assurance on the existence of effective internal control systems and procedures in the Company.
The internal control framework is supplemented with an internal audit program that provides an independent view of the efficacy and effectiveness of the process and control environment and supports a continuous improvement program. The internal audit program is managed by an Internal Audit function and the Audit and Risk Management Committee of the Board oversees the Internal Audit function.
The scope and authority of the Internal Audit Function is derived from the Audit Charter approved by the Audit and Risk Management Committee of the Board. The Internal Audit function develops an internal audit plan to assess control design and operating effectiveness, as per the risk assessment methodology. The Internal Audit function provides assurance to the Board and management that a system of internal control is designed and deployed to manage key business risks and is operating effectively.
29. Vigil Mechanism for Directors and employees
Section 177(9) of the Companies Act, 2013, mandates every listed Company or such class of companies as may be prescribed to establish a Vigil mechanism for its directors and employees which shall function as a channel for receiving and redressing their complaints. The Vigil Mechanism provides for (a) adequate safeguards against victimization of persons who use the Vigil Mechanism; and (b) direct access to the Chairperson of the Audit Committee of the Board of Directors of the Company in appropriate or exceptional cases.
Under this policy, we encourage our directors, employees and all other stakeholders to report their genuine concern of any conduct that results in violation of the ethical behaviour, or to report any act, if not conducted in a fair, transparent manner thereby compromising professionalism, honesty and integrity (on an anonymous basis, if stakeholders so desire).
Likewise, under this policy, we have prohibited discrimination, retaliation or harassment of any kind against any employees who, based on the employee’s reasonable belief that such conduct or practice have occurred or are occurring, reports that information or participates in the said investigation. No individual in the Company has been denied access to the Audit and Risk
Management Committee or its Chairman.
This meets the requirement under Section 177(9) and (10) of the Companies Act, 2013 and Regulation 22 of SEBI (LODR) Regulations.
Mechanism followed under the process is appropriately communicated within the Company across all levels and has been displayed on the Company’s intranet and website at https://hcgel.com/policies-and-guidelines/. The Audit and Risk Management Committee periodically reviews the functioning of this mechanism.
30. Company’s Policy on Appointment and Remuneration of Directors
As on the date of report, the Board consists of 9 members, of which there are 5 Independent Directors, 3 Non-Independent and Non-Executive Directors and 2 Executive Directors.
An appropriate mix of Executive and Independent Directors ensures greater independence of Board. The Company has a well laid down policy on appointment and remuneration of Directors, Key Managerial Personnel (KMPs) and Senior Management Personnel.
The remuneration of Executive Director comprises of fixed remuneration and variable pay, based on performance and adheres to the applicable provisions of the Companies Act, 2013 read with relevant rules as detailed in Corporate Governance Report which forms a part of this report.
The remuneration of Independent Directors comprises of sitting fees which is paid for attending the meetings of the Board and the Committees of the Board in accordance with the provisions of Companies Act, 2013.
The Policy of the Company on the Director’s appointment and remuneration, including criteria for determining qualifications, positive attributes, independence of a director and other matters, as required under sub-section (3) of section 178 of the Companies Act, 2013, is available on our website https://hcgel.com/policies-and-guidelines/. We affirm that the remuneration paid to Directors is as per the terms laid out in the nomination and remuneration policy of the Company.
31. Particulars of employees
The information required in terms of Section 197 (12) of the Companies Act, 2013, read with Rule 5 (1) of the Companies (Appointment and Remuneration of Managerial personnel) Rules, 2014 for the year ended March 31, 2017 is provided as Annexure 4 to this Report.
A statement containing, inter alia, names of employees employed throughout the financial year and in receipt of remuneration of ` 12 million or more, employees employed for part of the year and in receipt of ` 1 million or more per month, pursuant to Rule 5(2) the Companies (Appointment and Remuneration of Managerial Personnel) Rules, 2014 is also provided in Annexure 4 to this report.
32. Significant and Material orders
During the period under report, there have been no material or significant orders passed by the Regulators/Courts which would have an impact on the going concern status and operations of the Company in future.
31

33. Statutory Auditors
Under Section 139 of the Indian Companies Act, 2013 and Rules made thereunder, it is mandatory to rotate the Statutory Auditors on completion of the maximum term permitted under the said section.
The tenure of M/s. Deloitte Haskins & Sells, as Statutory Auditors has come to an end at the last Annual General Meeting held on August 10, 2017; and accordingly the shareholders on the Annual General Meeting have approved the appointment of M/s. B S R & Co. LLP (Firm Registration No. 101248W/W-100022) as Statutory Auditors for a term of 5 years commencing from the conclusion of the Annual General Meeting of the Company held on August 10, 2017, till the conclusion of the Annual General Meeting to be held in the year 2022.
34. Auditors’ Report
There are no qualifications, reservations or adverse remarks made by M/s B S R & Co. LLP, Statutory Auditors, in their report for the financial year ended March 31, 2018; and hence, do not call for any further comments under Section 134 of the Companies Act, 2013.
Pursuant to provisions of Section 143(12) of the Companies Act, 2013, the Statutory Auditors have not reported any incident of fraud to the Audit and Risk Management Committee during the year under review.
35. Material changes and commitments, if any, affecting the financial position of the Company occurred between the end of the financial year to which these financial statements relate and the date of the report:
There are no other material changes affecting the financial position of the Company between the end of the financial year to which this financial statements relate and the date of the report.
There has been no change in the nature of business of the Company during the last financial year.
36. Secretarial Audit
Pursuant to the provisions of Section 204 of the Companies Act, 2013 and The Companies (Appointment and Remuneration of Managerial Personnel) Rules, 2014, your Company has appointed Mr. V Sreedharan, Partner, M/s V Sreedharan & Associates, a firm of Company Secretaries in Practice to undertake the Secretarial Audit of the Company for the financial year ended March, 31, 2018. The said Report of the Secretarial Audit in Form MR 3 is annexed herewith as Annexure 2 and forms part of the report.
There are no qualifications, reservations or adverse remarks made by the Secretarial Auditor of the Company, in their Secretarial Audit Report.
37. Cost Auditor
Pursuant to Section 148 of the Companies Act, 2013 read with The Companies (Cost Records and Audit) Amendment Rules, 2014, the cost records maintained by the Company in respect of its hospital activity is required to be audited. Your Directors had, on the recommendation of the Audit and Risk Management Committee, appointed M/s. M. Thimmarayaswamy & Co., Cost Accountants to audit the cost records of the Company for the Financial Year 2017-18.
Cost Audit Report for the financial year ended 31st March 2017 has been duly filed with the Registrar of Companies.
38. Particulars regarding Conservation of energy, Technology absorption and Foreign exchange earnings and outgo as per Section 134(3)(m) of the Companies Act, 2013.
The information on conservation of energy, technology absorption and foreign exchange earnings and outgo stipulated under Section 134(3)(m) of the Companies Act, 2013 read with Rule 8 of the Companies (Accounts) Rules, 2014 is detailed in Annexure 8.
39. Prevention of Sexual Harassment Policy
The Company has in place a Prevention of Sexual Harassment policy in line with the requirements of the Sexual Harassment of Women at the Workplace (Prevention, Prohibition and Redressal) Act, 2013. An Internal Complaints Committee has been set up to redress complaints received regarding sexual harassment. All employees (permanent, contractual, temporary, trainees) are covered under this policy.
During the year 2017-2018, three complaints were received at a group level and the same were investigated, out of which two resolved as per the provisions of the Act. One complaint was pending as on the date of this report.
In order to build awareness in this area, the Company has been conducting programmes in the organization on a continuous basis.
40. Green initiative
As a green initiative in corporate governance, Ministry of Corporate affairs have permitted companies to send electronic copies of Annual Report, notices, etc., to the e-mail IDs of shareholders. We are accordingly arranging to send soft copies of these documents to the e-mail IDs of shareholders available with us.
In case any of the shareholders would like to receive physical copies of these documents, the same shall be forwarded on request to the Company by post or an e-mail.
We are also in the process of starting a sustainability initiative with the aim of being carbon neutral and minimize our impact on the environment. Sustainability practices will be implemented and tracked diligently to ensure that we comply with the goals we set for ourselves.
41. Employee Stock Option Schemes
As required under Securities and Exchange Board of India (Share Based Employee Benefits) Regulation 2014, the applicable disclosures as on March 31, 2018 are annexed to this Report as Annexure 3.
During the financial year under review, pursuant to regulation 12(1) of the Securities and Exchange Board of India (Share Based Employee Benefits) Regulation 2014, the Company has obtained the approval of the members at the Annual General Meeting held on September 29, 2016, for ratifying Employee Stock Option Scheme of the Company (HCG ESOS 2014), the pre-IPO plan. HCG ESOS 2014 is in compliance with Securities and Exchange Board of India (Share Based Employee Benefits) Regulation 2014.
The Nomination and Remuneration Committee of the board evaluates the performance and other criteria of employees and approves the grant of options based on the recommendation
32

of the Management. These options vest with employees over a specified period subject to fulfilment of certain conditions. Upon vesting, employees are eligible to apply and secure allotment of Company’s shares at a price determined on the date of grant of options.
The stock compensation cost is computed under fair value method and accounted in line with graded vesting of options over the total vesting period of four years. For the year ended March 31, 2018, the Company has recorded stock compensation expense of ` 27,093,288 (2017: ` 9,450,182).
For further details on the Scheme refer Annexure 3 of the Director’s report.
42. Corporate Governance
The Company is committed to observe good corporate governance practices. The report on Corporate Governance for the financial year ended March 31, 2018, as per regulation 34(3) read with Schedule V of the SEBI (Listing Obligations and Disclosure Requirements) Regulations, 2015 forms a part of this Annual Report.
Certificate from Mr. V Sreedharan, Partner, M/s V Sreedharan & Associates, a firm of Company Secretaries in Practice confirming the compliance with the conditions of Corporate Governance as stipulated by Regulation 34 (3) of Listing Regulations is attached to this report.
43. Declaration on Code of Conduct
The Company has adopted the Code of Conduct for all its Senior Management Personnel and Directors and the same is affirmed by all the Board Members and Senior Management Personnel as required under Regulation 34 read with Part D of Schedule V of the Listing Regulations. A declaration signed by Dr. B.S. Ajaikumar, Chairman & CEO of the Company affirming the compliance with the Code of Conduct of the Company for the financial year 2017-18 has been annexed as part of this Report.
44. Acknowledgements and Appreciations
We stay committed to partnering for value creation and take this opportunity to thank one and all who have participated in our journey this far. Your Directors desire to place on record, its sincere appreciation to all employees at all levels, who with sustained dedicated effort and hard work, enabled the Company to deliver a good all-round performance. Your Directors also wish to place on record their appreciation and acknowledge with gratitude the support and co-operation extended by the vendors, business associates, consultants, bankers, regulatory and government authorities, shareholders and investors at large and look forward to their continued support. We also take this opportunity to express sincere thanks to the medical fraternity and patients for their continued co-operation, patronage and trust reposed in the Company and its healthcare services.
For and on behalf of the Board of Directors
Date: May 22, 2018 Dr. B. S. AjaikumarPlace: Bengaluru Chairman & CEO
DECLARATION ON CODE OF CONDUCT
To,
The Members of
HealthCare Global Enterprises Limited.
I, Dr. B.S. Ajaikumar, Chairman & CEO of the Company declare that all the Members of the Board of Directors and Senior Management Personnel have affirmed compliance with the Code of Conduct for the financial year ended March 31, 2018.
For and on behalf of the Board of Directors
Date: May 22, 2018 Dr. B. S. AjaikumarPlace: Bengaluru Chairman & CEO
33
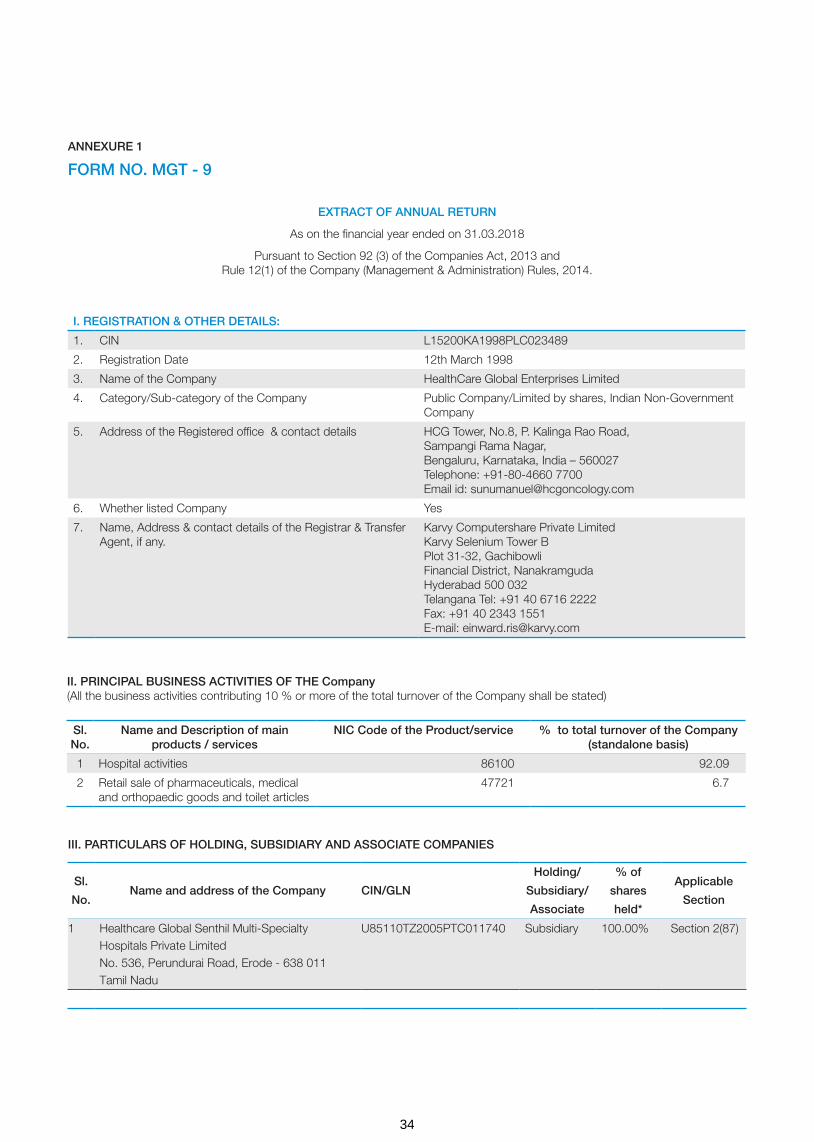
ANNEXURE 1
FORM NO. MGT - 9
EXTRACT OF ANNUAL RETURN
As on the financial year ended on 31.03.2018
Pursuant to Section 92 (3) of the Companies Act, 2013 and Rule 12(1) of the Company (Management & Administration) Rules, 2014.
I. REGISTRATION & OTHER DETAILS:
1. CIN L15200KA1998PLC023489
2. Registration Date 12th March 1998
3. Name of the Company HealthCare Global Enterprises Limited
4. Category/Sub-category of the Company Public Company/Limited by shares, Indian Non-Government Company
5. Address of the Registered office & contact details HCG Tower, No.8, P. Kalinga Rao Road, Sampangi Rama Nagar, Bengaluru, Karnataka, India – 560027 Telephone: +91-80-4660 7700 Email id: [email protected]
6. Whether listed Company Yes
7. Name, Address & contact details of the Registrar & Transfer Agent, if any.
Karvy Computershare Private Limited Karvy Selenium Tower B Plot 31-32, Gachibowli Financial District, Nanakramguda Hyderabad 500 032 Telangana Tel: +91 40 6716 2222 Fax: +91 40 2343 1551 E-mail: [email protected]
II. PRINCIPAL BUSINESS ACTIVITIES OF THE Company (All the business activities contributing 10 % or more of the total turnover of the Company shall be stated)
Sl. No.
Name and Description of main products / services
NIC Code of the Product/service % to total turnover of the Company (standalone basis)
1 Hospital activities 86100 92.09
2 Retail sale of pharmaceuticals, medical and orthopaedic goods and toilet articles
47721 6.7
III. PARTICULARS OF HOLDING, SUBSIDIARY AND ASSOCIATE COMPANIES
Sl.
No.Name and address of the Company CIN/GLN
Holding/
Subsidiary/
Associate
% of
shares
held*
Applicable
Section
1 Healthcare Global Senthil Multi-Specialty Hospitals Private Limited No. 536, Perundurai Road, Erode - 638 011 Tamil Nadu
U85110TZ2005PTC011740 Subsidiary 100.00% Section 2(87)
34

Sl. No.
Name and address of the Company CIN/GLNHolding/
Subsidiary/Associate
% of shares held*
Applicable Section
2 Niruja Product Development and Healthcare Research Private Limited (Formerly known as MIMS HCG Oncology Private Limited) HCG Tower, No. 8, P Kalinga Rao Road, Sampangi Rama Nagar, Bengaluru - 560 027 Karnataka
U73100KA2007PTC044658 Subsidiary 100.00% Section 2(87)
3 Malnad Hospital & Institute of Oncology Private Limited No. 600/601, Irwin Road, Mysore - 570 001, Karnataka
U85110KA1997PTC022149 Subsidiary 70.25% Section 2(87)
4 HCG Medi-Surge Hospitals Private Limited No. 1, Maharashtra Society, Mithakhali Cross Road, Ellisbridge, Ahmedabad - 380 006, Gujarat
U85110GJ2000PTC037474 Subsidiary 74.00% Section 2(87)
5 BACC Health Care Private LimitedNo. 7, East Park Road Basement, Kumara Park East, Bengaluru - 560 001, Karnataka
U74140KA2002PTC030098 Subsidiary 50.10% Section 2(87)
6 Apex HCG Oncology Hospitals LLPVaishali Heights, Wing “A”, Chandawarkar Road, Borivali West, Mumbai 400 092, Maharashtra
AAB- 5593 Subsidiary 50.10% Section 2(87)
7 Healthcare Diwan Chand Imaging LLP HCG Tower, No. 8, P Kalinga Rao Road, Sampangi Rama Nagar, Bengaluru - 560 027, Karnataka
AAA-0280 Subsidiary 75.00% Section 2(87)
8 HCG NCHRI Oncology LLP HCG Tower, No. 8, P Kalinga Rao Road, Sampangi Rama Nagar, Bengaluru - 560 027, Karnataka
AAA-6655 Subsidiary 76.00% Section 2(87)
9 HCG Oncology LLP No. 1, Maharashtra Society, Near Mithakhali Six Road, Ellisbridge, Ahmedabad - 380 006, Gujarat.
AAC-9917 Subsidiary 74.00% Section 2(87)
10 Strand-Triesta Cancer Genomics LLP 591/11, 3rd Main Road, Sadashivnagar, Bengaluru - 560080, Karnataka
AAC-8877 Associate 30.00% Section 2(6)
11 HCG EKO Oncology LLP HCG Tower, No. 8, P Kalinga Rao Road, Sampangi Rama Nagar, Bengaluru - 560 027, Karnataka
AAD-9508 Subsidiary 50.50% Section 2(87)
12 HCG Manavata Oncology LLP HCG Tower, No. 8, P Kalinga Rao Road, Sampangi Rama Nagar, Bengaluru - 560 027, Karnataka
AAH-1208 Subsidiary 51.00% Section 2(87)
13 HCG SUN Hospitals LLPHCG Tower, No. 8, P Kalinga Rao Road, Sampangi Rama Nagar, Bengaluru - 560 027, Karnataka
AAK-6700 Subsidiary 74.00% Section 2(87)
14 HCG (Mauritius) PVT. LTD.St. Louis Business Centre, CNR Desroches & St Louis Streets, Port Louis, Mauritius
N/A Subsidiary 100.00% Section 2(87)
15 Healthcare Global (Africa) Pvt. Ltd.St Louis Business Centre, CNR Desroches & St Louis Streets, Port Louis, Mauritius
N/A Subsidiary 76.73% Section 2(87)
35

IV. SHARE HOLDING PATTERN (Equity Share Capital Breakup as percentage of Total Equity)
(i) Category-wise Share Holding
Sl. No
Category Number of shares held at the beginning of the year
Number of shares held at the end of the year % of change during
the year
Demat Physical Total number
of shares
% of total
shares
Demat Physical Total number of
shares
% of total
shares
(A) Promoters
1 Indian
(a) Individuals/ Hindu Undivided Family
2,09,01,662 - 2,09,01,662 24.39 2,08,94,662 - 2,08,94,662 24.04 -0.35
(b) Central Government - - - - - - - - -
(c) State Government(s) - - - - - - - - -
(d) Bodies Corporate - - - - - - - - -
(e) Financial Institutions/ Banks
- - - - - - - - -
(f) Any Other (specify) - - - - - - - - -
Sub-Total (A)(1) 2,09,01,662 - 2,09,01,662 24.39 2,08,94,662 - 2,08,94,662 24.04 -0.35
2 Foreign
(a) NRIs- Individuals - - - - - - - - -
(b) Other- Individuals - - - - - - - - -
(c) Bodies Corporate - - - - - - - - -
(d) Banks/FI - - - - - - - - -
(e) Any Other (specify) - - - - - - - - -
Sub-Total (A)(2) - - - - - - - - -
Total Shareholding of Promoter (A)= (A)(1)+(A)(2)
2,09,01,662 - 2,09,01,662 24.39 2,08,94,662 - 2,08,94,662 24.04 -0.35
Sl.
No.Name and address of the Company CIN/GLN
Holding/
Subsidiary/
Associate
% of
shares
held*
Applicable
Section
16 HealthCare Global (Uganda) Private Limited Suite 13, 3rd Floor, Plot 2, Bombo Road City Apartments, PO Box 31176, Kampala, Uganda
N/A Subsidiary 76.73% Section 2(87)
17 HealthCare Global (Tanzania) Private Limited Regency Medical Centre, Alykhan Road, Upanga, PO Box 2029, Daar es Salaam, Tanzania
N/A Subsidiary 76.73% Section 2(87)
18 HealthCare Global (Kenya) Private Limited Jadala Place, Ngong Lane, Near Prestige Plaza, Post Office Box 6493-00200, Nairobi, Kenya
N/A Subsidiary 76.73% Section 2(87)
19 Cancer Care Kenya Limited P. O. Box 39173 - 00623, Nairobi, Kenya
N/A Subsidiary 59.47% Section 2(87)
20 Strand Life Sciences Private Limited5th Floor, Kirloskar Business Park, Bellary Road, Hebbal, Bengaluru, Karnataka - 560024
U85199KA2000PTC027913 Associate 38.20% Section 2(6)
*Representing aggregate % of the shares held by the Company and/or its subsidiaries
36

Sl. No
Category Number of shares held at the beginning of the year
Number of shares held at the end of the year % of change during
the year
Demat Physical Total number
of shares
% of total
shares
Demat Physical Total number of
shares
% of total
shares
B Public Share holding
1 Institutions
(a) Mutual Funds 1,58,95,730 - 1,58,95,730 18.55 1,02,40,627 - 1,02,40,627 11.78 -6.77
(b) Banks/Financial Institutions
1,460 - 1,460 0 8,064 - 8,064 0.01 0.01
(c) Central Government - - - - - - - - -
(d) State Government(s) - - - - - - - - -
(e) Venture Capital Funds - - - - - - - - -
(f) Insurance Companies - - - - - - - - -
(g) Foreign Institutional Investors
1,33,93,534 - 1,33,93,534 15.63 3,09,14,622 - 3,09,14,622 35.57 19.94
(h) Foreign Venture Capital Investors
- - - - - - - -
(i) Others (Specify) - - - - - - - -
Alternate Investment Funds
- - - - 11,66,667 - 11,66,667 1.34 1.34
Sub-Total (B)(1) 2,92,90,724 - 2,92,90,724 34.18 4,23,29,980 - 4,23,29,980 48.69 14.51
2 Non-institutions
(a) Bodies Corporate - - - - - - - -
(i) Indian 1,24,98,912 - 1,24,98,912 14.58 30,00,155 - 30,00,155 3.45 -11.13
(ii) Overseas 83,20,805 - 83,20,805 9.71 83,20,805 - 83,20,805 9.57 -0.14
(b) Individuals
(i) Individual shareholders holding nominal share capital up to `1 lakh.
23,90,258 3,48,156 27,38,414 3.19 20,64,097 2,47,603 23,11,700 2.66 -0.53
(ii) Individual shareholders holding nominal share capital in excess of ` 1 lakh.
49,59,739 23,51,116 73,10,855 8.53 48,13,701 11,60,823 59,74,524 6.87 -1.66
(d) Others (Specify)
(i) Trusts 23,18,150 - 23,18,150 2.7 23,06,917 - 23,06,917 2.65 -0.05
(ii) Non-Resident Indians 9,07,385 5,94,011 15,01,396 1.75 3,65,107 4,35,795 8,00,902 0.92 -0.83
(iii) NRI Non-Repatriation 7,32,486 0 7,32,486 0.85 9,23,257 0 9,23,257 1.06 0.21
(iv) Clearing Members 99,582 - 99,582 0.12 9,916 - 9,916 0.01 -0.11
(v) NBFCs Registered with RBI
- - - - 31,655 - 31,655 0.04 0.04
Sub-Total (B)(2) 3,22,27,317 32,93,283 3,55,20,600 41.44 2,18,35,610 18,44,221 2,36,79,831 27.24 -14.2
Total Public Shareholding(B)= (B)(1)+(B)(2)
6,15,18,041 32,93,283 6,48,11,324 75.61 6,41,65,590 32,93,283 6,60,09,811 75.96 0.35
(C) Shares held by Custodians for GDR and ADRs
- - - - - - - - -
GRAND TOTAL (A)+(B)+(C)
8,24,19,703 32,93,283 8,57,12,986 100 8,50,60,252 18,44,221 8,69,04,473 100
37
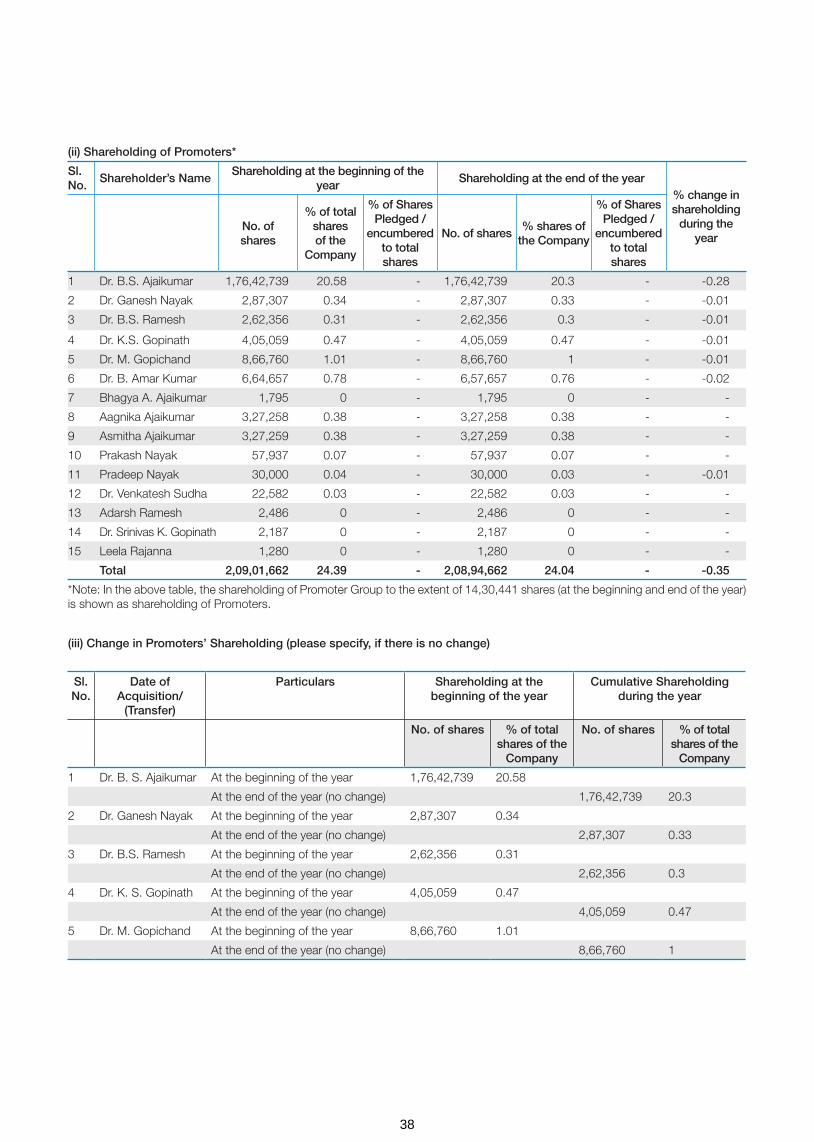
(ii) Shareholding of Promoters*
Sl. No.
Shareholder’s NameShareholding at the beginning of the
yearShareholding at the end of the year
% change in shareholding
during the year
No. of shares
% of total shares of the
Company
% of Shares Pledged /
encumbered to total shares
No. of shares% shares of
the Company
% of Shares Pledged /
encumbered to total shares
1 Dr. B.S. Ajaikumar 1,76,42,739 20.58 - 1,76,42,739 20.3 - -0.28
2 Dr. Ganesh Nayak 2,87,307 0.34 - 2,87,307 0.33 - -0.01
3 Dr. B.S. Ramesh 2,62,356 0.31 - 2,62,356 0.3 - -0.01
4 Dr. K.S. Gopinath 4,05,059 0.47 - 4,05,059 0.47 - -0.01
5 Dr. M. Gopichand 8,66,760 1.01 - 8,66,760 1 - -0.01
6 Dr. B. Amar Kumar 6,64,657 0.78 - 6,57,657 0.76 - -0.02
7 Bhagya A. Ajaikumar 1,795 0 - 1,795 0 - -
8 Aagnika Ajaikumar 3,27,258 0.38 - 3,27,258 0.38 - -
9 Asmitha Ajaikumar 3,27,259 0.38 - 3,27,259 0.38 - -
10 Prakash Nayak 57,937 0.07 - 57,937 0.07 - -
11 Pradeep Nayak 30,000 0.04 - 30,000 0.03 - -0.01
12 Dr. Venkatesh Sudha 22,582 0.03 - 22,582 0.03 - -
13 Adarsh Ramesh 2,486 0 - 2,486 0 - -
14 Dr. Srinivas K. Gopinath 2,187 0 - 2,187 0 - -
15 Leela Rajanna 1,280 0 - 1,280 0 - -
Total 2,09,01,662 24.39 - 2,08,94,662 24.04 - -0.35
*Note: In the above table, the shareholding of Promoter Group to the extent of 14,30,441 shares (at the beginning and end of the year) is shown as shareholding of Promoters.
(iii) Change in Promoters’ Shareholding (please specify, if there is no change)
Sl. No.
Date of Acquisition/
(Transfer)
Particulars Shareholding at the beginning of the year
Cumulative Shareholding during the year
No. of shares % of total shares of the
Company
No. of shares % of total shares of the
Company
1 Dr. B. S. Ajaikumar At the beginning of the year 1,76,42,739 20.58
At the end of the year (no change) 1,76,42,739 20.3
2 Dr. Ganesh Nayak At the beginning of the year 2,87,307 0.34
At the end of the year (no change) 2,87,307 0.33
3 Dr. B.S. Ramesh At the beginning of the year 2,62,356 0.31
At the end of the year (no change) 2,62,356 0.3
4 Dr. K. S. Gopinath At the beginning of the year 4,05,059 0.47
At the end of the year (no change) 4,05,059 0.47
5 Dr. M. Gopichand At the beginning of the year 8,66,760 1.01
At the end of the year (no change) 8,66,760 1
38

1 V-Sciences Investments Pte Ltd
At the beginning of the year 83,20,805 9.71
No change during the year - - - -
At the end of the year 83,20,805 9.57
2 Franklin India Smaller Companies Fund
At the beginning of the year 57,90,082 6.76
Purchase on 07.04.2017 5,052 0.01 57,95,134 6.76
Sale on 21.04.2017 53,837 0.06 57,41,297 6.7
Sale on 28.04.2017 13,141 0.02 57,28,156 6.68
Sale on 09.06.2017 62,133 0.07 56,66,023 6.61
Sale on 16.06.2017 3,769 0 56,62,254 6.61
Sale on 30.06.2017 39,515 0.05 56,22,739 6.56
Sale on 02.02.2018 8,33,645 0.96 47,89,094 5.51
Sale on 09.02.2018 5,00,000 0.58 42,89,094 4.94
Sale on 16.02.2018 5,00,000 0.58 37,89,094 4.36
At the end of the year 37,89,094 4.36
3 Buena Vista Asian Opportunities Master Fund Ltd
At the beginning of the year - -
Purchase on 30.06.2017 3,17,031 0.37 3,17,031 0.37
Purchase on 14.07.2017 16,29,364 1.9 19,46,395 2.27
Purchase on 21.07.2017 3,482 0 19,49,877 2.27
Purchase on 18.08.2017 3,840 0 19,53,717 2.28
Purchase on 15.09.2017 4,811 0.01 19,58,528 2.29
Purchase on 22.09.2017 28,335 0.03 19,86,863 2.32
Purchase on 29.09.2017 3,000 0 19,89,863 2.32
Purchase on 27.10.2017 3,50,000 0.41 23,39,863 2.73
Purchase on 31.10.2017 2,69,198 0.31 26,09,061 3.04
Purchase on 03.11.2017 7,50,000 0.87 33,59,061 3.92
Purchase on 22.12.2017 107 0 33,59,168 3.92
At the end of the year 33,59,168 3.92
4 Sundaram Mutual Fund A/C
At the beginning of the year 54,90,474 6.4
Purchase on 07.04.2017 23,805 0.03 55,14,279 6.43
Purchase on 19.05.2017 512 0 55,14,791 6.43
Purchase on 26.05.2017 3,157 0 55,17,948 6.44
Purchase on 02.06.2017 4,481 0 55,22,429 6.44
Sale on 03.11.2017 15,000 0.02 55,07,429 6.46
Purchase on 10.11.2017 2,190 0 55,09,619 6.46
Purchase on 10.11.2017 1,960 0 55,11,579 6.46
Sale on 22.12.2017 73,577 0.08 54,38,002 6.29
Purchase on 29.12.2017 73,577 0.08 55,11,579 6.39
Sale on 26.01.2018 10,000 0.01 55,01,579 6.37
Sl No
Name of the shareholder Shareholding at the beginning of the year
Cumulative shareholding during the year
Number of shares % of total shares of the Company
Number of shares % of total shares of the Company
iv) Shareholding Pattern of top ten Shareholders: (Other than Directors, Promoters and Holders of GDRs and ADRs):
39

Sale on 26.01.2018 50,556 0.06 54,51,023 6.31
Sale on 02.02.2018 5,657 0.01 54,45,366 6.3
Sale on 02.02.2018 8,000 0.01 54,37,366 6.26
Sale on 02.02.2018 3,547 0 54,33,819 6.25
Sale on 02.02.2018 1,73,021 0.2 52,60,798 6.05
Sale on 02.02.2018 1,000 0 52,59,798 6.05
Sale on 02.02.2018 879 0 52,58,919 6.05
Sale on 02.02.2018 624 0 52,58,295 6.05
Sale on 02.02.2018 559 0 52,57,736 6.05
Sale on 09.02.2018 53 0 52,57,683 6.05
Sale on 09.02.2018 7,00,480 0.81 45,57,203 5.24
Sale on 16.02.2018 5,679 0.01 45,51,524 5.24
At the end of the year 45,51,524 5.24
5 International Finance Corporation
At the beginning of the year 43,58,705 5.09
No change during the year - - - -
At the end of the year 43,58,705 5.02
6 HDFC Standard Life Insurance Company Limited
At the beginning of the year 27,29,336 3.18
Purchase on 07.04.2017 1,853 0 27,31,189 3.18
Sale on 21.04.2017 1,132 0 27,30,057 3.18
Sale on 05.05.2017 2,371 0 27,27,686 3.18
Sale on 26.05.2017 26,88,374 3.14 39,312 0.04
Sale on 26.05.2017 39,312 0.04 0 0
Purchase on 26.05.2017 39,312 0.04 39,312 0.04
Purchase on 26.05.2017 26,88,374 3.14 27,27,686 3.18
Sale on 30.06.2017 556 0 27,27,130 3.18
Purchase on 30.06.2017 286 0 27,27,416 3.18
Sale on 14.07.2017 906 0 27,26,510 3.18
Purchase on 21.07.2017 1,449 0 27,27,959 3.18
Sale on 21.07.2017 1,197 0 27,26,762 3.18
Purchase on 22.09.2017 1,169 0 27,27,931 3.18
Purchase on 06.10.2017 8,353 0.01 27,36,284 3.19
Sale on 03.11.2017 41,976 0.05 26,94,308 3.14
Purchase on 17.11.2017 651 0 26,94,959 3.14
Purchase on 24.11.2017 6,309 0.01 27,01,268 3.15
Sale on 01.12.2017 960 0 27,00,308 3.15
Sale on 08.12.2017 3,069 0 26,97,239 3.15
Purchase on 15.12.2017 2,353 0 26,99,592 3.15
Sale on 29.12.2017 7,188 0.01 26,92,404 3.1
Sale on 29.12.2017 1,996 0 26,90,408 3.1
Sale on 12.01.2018 1,575 0 26,88,833 3.1
Sale on 19.01.2018 5,952 0.01 26,82,881 3.09
Sl No
Name of the shareholder Shareholding at the beginning of the year
Cumulative shareholding during the year
Number of shares % of total shares of the Company
Number of shares % of total shares of the Company
40

Purchase on 26.01.2018 754 0 26,83,635 3.09
Sale on 02.02.2018 4,380 0.01 26,79,255 3.08
Sale on 23.02.2018 1,96,399 0.23 24,82,856 2.86
Sale on 02.03.2018 141 0 24,82,715 2.86
Purchase on 16.03.2018 30,000 0.03 25,12,715 2.89
Purchase on 23.03.2018 60,971 0.07 25,73,686 2.96
At the end of the year 25,73,686 2.96
7 First State Indian Subcontinent Fund
At the beginning of the year 10,80,258 1.26
Purchase on 28.04.2017 9,66,691 1.13 20,46,949 2.39
Purchase on 04.08.2017 2,54,474 0.3 23,01,423 2.69
Purchase on 18.08.2017 9,705 0.01 23,11,128 2.7
Purchase on 25.08.2017 1,65,781 0.19 24,76,909 2.89
Purchase on 08.09.2017 23,026 0.03 24,99,935 2.92
Purchase on 15.09.2017 69,778 0.08 25,69,713 3
Purchase on 22.09.2017 32,935 0.04 26,02,648 3.04
Purchase on 29.09.2017 1,11,926 0.13 27,14,574 3.17
Purchase on 06.10.2017 50,401 0.06 27,64,975 3.23
Purchase on 29.12.2017 3,15,915 0.36 30,80,890 3.54
At the end of the year 30,80,890 3.54
8 The Pabrai Investment Fund Ii, Lp
At the beginning of the year - -
Purchase on 02.02.2018 1,30,543 0.15 1,30,543 0.15
Purchase on 09.02.2018 6,51,372 0.75 7,81,915 0.9
Purchase on 23.02.2018 15,32,596 1.76 23,14,511 2.66
Purchase on 02.03.2018 1,67,265 0.19 24,81,776 2.85
Purchase on 09.03.2018 1,02,055 0.12 25,83,831 2.97
At the end of the year 25,83,831 2.97
9 The Scottish Oriental Smaller Companies Trustplc
At the beginning of the year 8,75,524 1.02
Purchase on 07.04.2018 2,50,000 0.29 11,25,524 1.31
Purchase on 28.04.2017 10,77,493 1.26 22,03,017 2.57
Purchase on 04.08.2017 2,56,107 0.3 24,59,124 2.87
Purchase on 18.08.2017 9,768 0.01 24,68,892 2.88
At the end of the year 24,68,892 2.88
10 Wellington Trust Company, National Association Mul
At the beginning of the year - -
Purchase on 30.06.2017 27 0 27 0
Purchase on 14.07.2017 5,852 0.01 5,879 0.01
Purchase on 21.07.2017 19,601 0.02 25,480 0.03
Purchase on 28.07.2017 3,57,631 0.42 3,83,111 0.45
Purchase on 04.08.2017 13,523 0.01 3,96,634 0.46
Purchase on 11.08.2017 755 0 3,97,389 0.46
Sl No
Name of the shareholder Shareholding at the beginning of the year
Cumulative shareholding during the year
Number of shares % of total shares of the Company
Number of shares % of total shares of the Company
41
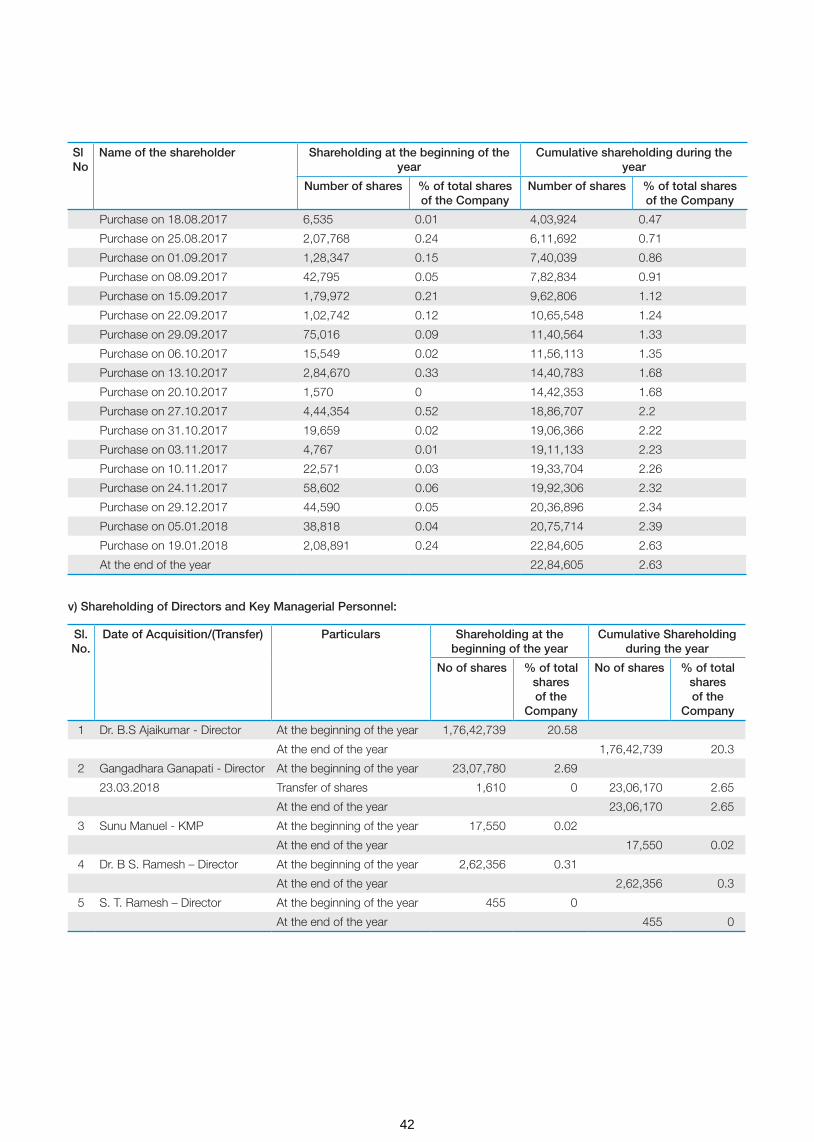
Purchase on 18.08.2017 6,535 0.01 4,03,924 0.47
Purchase on 25.08.2017 2,07,768 0.24 6,11,692 0.71
Purchase on 01.09.2017 1,28,347 0.15 7,40,039 0.86
Purchase on 08.09.2017 42,795 0.05 7,82,834 0.91
Purchase on 15.09.2017 1,79,972 0.21 9,62,806 1.12
Purchase on 22.09.2017 1,02,742 0.12 10,65,548 1.24
Purchase on 29.09.2017 75,016 0.09 11,40,564 1.33
Purchase on 06.10.2017 15,549 0.02 11,56,113 1.35
Purchase on 13.10.2017 2,84,670 0.33 14,40,783 1.68
Purchase on 20.10.2017 1,570 0 14,42,353 1.68
Purchase on 27.10.2017 4,44,354 0.52 18,86,707 2.2
Purchase on 31.10.2017 19,659 0.02 19,06,366 2.22
Purchase on 03.11.2017 4,767 0.01 19,11,133 2.23
Purchase on 10.11.2017 22,571 0.03 19,33,704 2.26
Purchase on 24.11.2017 58,602 0.06 19,92,306 2.32
Purchase on 29.12.2017 44,590 0.05 20,36,896 2.34
Purchase on 05.01.2018 38,818 0.04 20,75,714 2.39
Purchase on 19.01.2018 2,08,891 0.24 22,84,605 2.63
At the end of the year 22,84,605 2.63
Sl No
Name of the shareholder Shareholding at the beginning of the year
Cumulative shareholding during the year
Number of shares % of total shares of the Company
Number of shares % of total shares of the Company
Sl. No.
Date of Acquisition/(Transfer) Particulars Shareholding at the beginning of the year
Cumulative Shareholding during the year
No of shares % of total shares of the
Company
No of shares % of total shares of the
Company
1 Dr. B.S Ajaikumar - Director At the beginning of the year 1,76,42,739 20.58
At the end of the year 1,76,42,739 20.3
2 Gangadhara Ganapati - Director At the beginning of the year 23,07,780 2.69
23.03.2018 Transfer of shares 1,610 0 23,06,170 2.65
At the end of the year 23,06,170 2.65
3 Sunu Manuel - KMP At the beginning of the year 17,550 0.02
At the end of the year 17,550 0.02
4 Dr. B S. Ramesh – Director At the beginning of the year 2,62,356 0.31
At the end of the year 2,62,356 0.3
5 S. T. Ramesh – Director At the beginning of the year 455 0
At the end of the year 455 0
v) Shareholding of Directors and Key Managerial Personnel:
42

A. Remuneration to Managing Director, Whole-time Directors and/or Manager:
Sl. No.
Particulars of Remuneration Name of MD/WTD/ Manager Total Amount
Dr. B. S. Ajaikumar
1 Gross salary
(a) Salary as per provisions contained in section 17(1) of the Income-tax Act, 1961
1,90,00,000 1,90,00,000
(b) Value of perquisites u/s 17(2) Income-tax Act, 1961 Nil Nil
(c) Profits in lieu of salary under section 17(3) Income- tax Act, 1961 Nil Nil
2 Stock Option Nil Nil
3 Sweat Equity Nil Nil
4 Commission Nil Nil
- as % of profit
- others, specify…
5 Others, please specify – Variable remuneration # 64,46,695 # 64,46,695
Total (A) 2,54,46,695 2,54,46,695
Ceiling as per the Act ^2,45,18,812 ^2,45,18,812
VI. REMUNERATION OF DIRECTORS AND KEY MANAGERIAL PERSONNEL
# This includes remuneration to be paid, subject to the approval of the Central Government.
^ Managerial Remuneration in Case of Absence or Inadequacy of Profits in terms of Section 197 read with Schedule V to the Companies Act, 2013
Particulars Secured Loans excluding deposits
Unsecured Loans Deposit Total Indebtedness
Indebtedness at the beginning of the financial year
i) Principal Amount 186,16,16,642 234,04,43,430 - 420,20,60,072
ii) Interest due but not paid - - - -
iii) Interest accrued but not due 351,92,832 7,15,76,564 - 10,67,69,396
Total (i+ii+iii) 189,68,09,474 241,20,19,994 - 430,88,29,468
Change in Indebtedness during the financial year
* Addition 52,24,72,101 - 52,24,72,101
* Reduction -72,82,81,327 -136,13,92,070 - -208,96,73,397
Net Change -20,58,09,226 -136,13,92,070 - -156,72,01,296
Indebtedness at the end of the financial year
i) Principal Amount 165,58,07,416 97,90,51,360 - 263,48,58,776
ii) Interest due but not paid - - - -
iii) Interest accrued but not due 670,87,028 5,44,17,261 - 12,15,04,288
Total (i+ii+iii) 17228,94,444 10334,68,621 - 275,63,63,065
V) INDEBTEDNESS -Indebtedness of the Company including interest outstanding/accrued but not due for payment.
43

^ Managerial Remuneration in Case of Absence or Inadequacy of Profits in terms of Section 197 read with Schedule V to the Companies Act, 2013
* Excluding Tax
B. Remuneration to other directors
Sl. No.
Particulars of Remuneration Names of Directors Total Amount
Independent Directors Dr. Sudhakar Rao
Shanker Annaswamy
Suresh C. Senapaty
Dr. Sampath T. Ramesh
Bhushani Kumar
Fee for attending board/committee meeting*
850,000 1,500,000 1,500,000 850,000 600,000
Commission Nil Nil Nil Nil Nil
Others, please specify Nil Nil Nil Nil Nil
Total (1) 850,000 1,500,000 1,500,000 850,000 600,000 5,300,000
Other Non-Executive Directors
Gangadhara Ganapathi
Dr. B. S. Ramesh
Dr. Amit Varma
Fee for attending board/committee meetings
Nil Nil Nil
Commission Nil Nil Nil
Others Nil Nil Nil
Total (2) Nil Nil Nil
Total (B)=(1+2) Nil Nil Nil 5,300,000
Total Managerial Remuneration
3,07,46,695
Overall Ceiling as per the Act ^2,45,18,812
C. Remuneration to key managerial personnel other than MD/Manager/WTD
Sl. No.
Particulars of Remuneration Key Managerial Personnel
#CEO CS CFO Total
1 Gross salary
(a) Salary as per provisions contained in section 17(1) of the Income-tax Act, 1961
- 35,54,815 104,23,256 139,78,071
(b) Value of perquisites u/s 17(2) Income-tax Act, 1961
- 17,100 85,675 1,02,775
(c) Profits in lieu of salary under section 17(3) Income-tax Act, 1961
- Nil Nil Nil
2 Stock Option - Nil Nil Nil
3 Sweat Equity - Nil Nil Nil
4 Commission - Nil Nil Nil
- as % of profit - Nil Nil Nil
- others, specify… - Nil Nil Nil
5 Others, please specify - Employers contribution to Provident Fund
- 2,26,613 3,76,200 6,02,813
Total - 37,98,528 108,85,131 146,83,659
# In the above table, remuneration paid to Dr. B. S. Ajaikumar, Chairman & CEO is not included, since the said remuneration has already been included in remuneration paid to Whole-time Director under (A) above.
44

VII. PENALTIES / PUNISHMENT/ COMPOUNDING OF OFFENCES: NIL
Type Section of the Companies
Act
BriefDescription
Details of Penalty / Punishment/
Compounding fees imposed
Authority[RD / NCLT/COURT]
Appeal made,if any (give details)
A. Company
Penalty
NILPunishment
Compounding
B. DIRECTORS
Penalty
NILPunishment
Compounding
C. OTHER OFFICERS IN DEFAULT
Penalty
NILPunishment
Compounding
For HealthCare Global Enterprises Limited
Date : May 22, 2018 Dr. B. S. AjaikumarPlace: Bengaluru Chairman & CEO
45
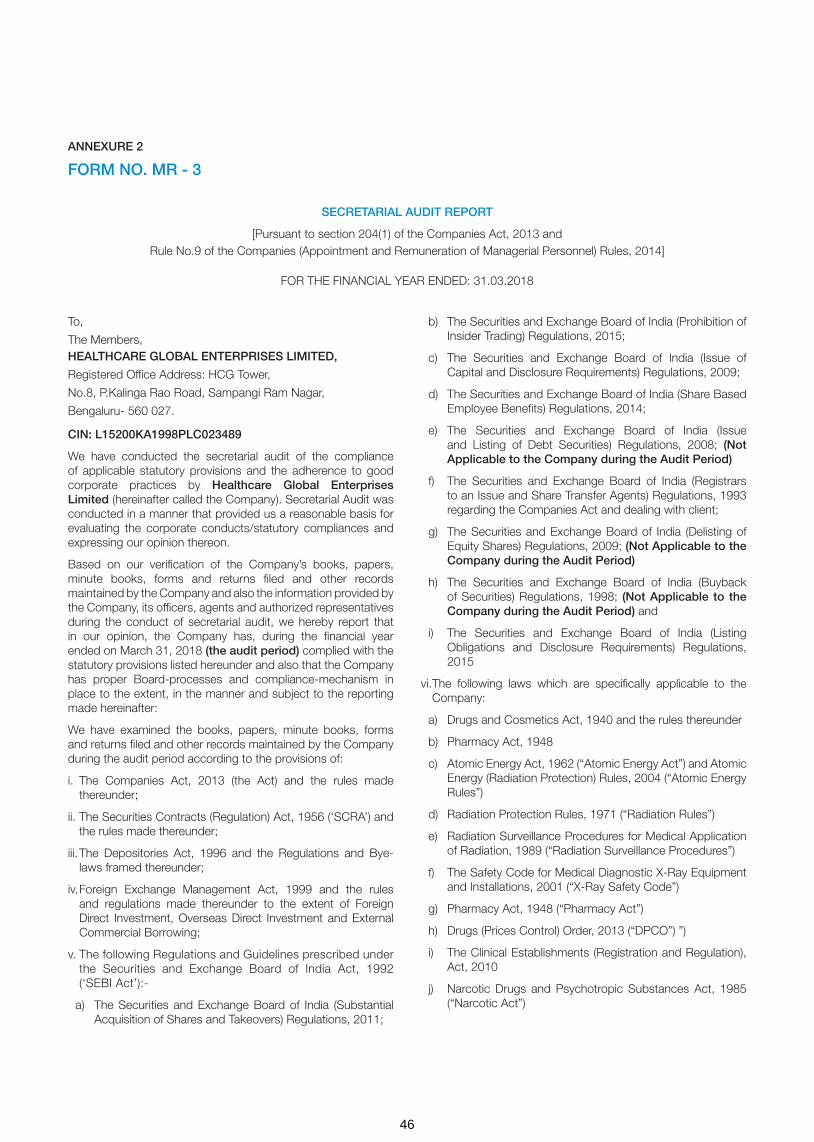
ANNEXURE 2
FORM NO. MR - 3
SECRETARIAL AUDIT REPORT
[Pursuant to section 204(1) of the Companies Act, 2013 and Rule No.9 of the Companies (Appointment and Remuneration of Managerial Personnel) Rules, 2014]
FOR THE FINANCIAL YEAR ENDED: 31.03.2018
To,
The Members, HEALTHCARE GLOBAL ENTERPRISES LIMITED,
Registered Office Address: HCG Tower,
No.8, P.Kalinga Rao Road, Sampangi Ram Nagar,
Bengaluru- 560 027.
CIN: L15200KA1998PLC023489
We have conducted the secretarial audit of the compliance of applicable statutory provisions and the adherence to good corporate practices by Healthcare Global Enterprises Limited (hereinafter called the Company). Secretarial Audit was conducted in a manner that provided us a reasonable basis for evaluating the corporate conducts/statutory compliances and expressing our opinion thereon.
Based on our verification of the Company’s books, papers, minute books, forms and returns filed and other records maintained by the Company and also the information provided by the Company, its officers, agents and authorized representatives during the conduct of secretarial audit, we hereby report that in our opinion, the Company has, during the financial year ended on March 31, 2018 (the audit period) complied with the statutory provisions listed hereunder and also that the Company has proper Board-processes and compliance-mechanism in place to the extent, in the manner and subject to the reporting made hereinafter:
We have examined the books, papers, minute books, forms and returns filed and other records maintained by the Company during the audit period according to the provisions of:
i. The Companies Act, 2013 (the Act) and the rules made thereunder;
ii. The Securities Contracts (Regulation) Act, 1956 (‘SCRA’) and the rules made thereunder;
iii. The Depositories Act, 1996 and the Regulations and Bye-laws framed thereunder;
iv. Foreign Exchange Management Act, 1999 and the rules and regulations made thereunder to the extent of Foreign Direct Investment, Overseas Direct Investment and External Commercial Borrowing;
v. The following Regulations and Guidelines prescribed under the Securities and Exchange Board of India Act, 1992 (‘SEBI Act’):-
a) The Securities and Exchange Board of India (Substantial Acquisition of Shares and Takeovers) Regulations, 2011;
b) The Securities and Exchange Board of India (Prohibition of Insider Trading) Regulations, 2015;
c) The Securities and Exchange Board of India (Issue of Capital and Disclosure Requirements) Regulations, 2009;
d) The Securities and Exchange Board of India (Share Based Employee Benefits) Regulations, 2014;
e) The Securities and Exchange Board of India (Issue and Listing of Debt Securities) Regulations, 2008; (Not Applicable to the Company during the Audit Period)
f) The Securities and Exchange Board of India (Registrars to an Issue and Share Transfer Agents) Regulations, 1993 regarding the Companies Act and dealing with client;
g) The Securities and Exchange Board of India (Delisting of Equity Shares) Regulations, 2009; (Not Applicable to the Company during the Audit Period)
h) The Securities and Exchange Board of India (Buyback of Securities) Regulations, 1998; (Not Applicable to the Company during the Audit Period) and
i) The Securities and Exchange Board of India (Listing Obligations and Disclosure Requirements) Regulations, 2015
vi. The following laws which are specifically applicable to the Company:
a) Drugs and Cosmetics Act, 1940 and the rules thereunder
b) Pharmacy Act, 1948
c) Atomic Energy Act, 1962 (“Atomic Energy Act”) and Atomic Energy (Radiation Protection) Rules, 2004 (“Atomic Energy Rules”)
d) Radiation Protection Rules, 1971 (“Radiation Rules”)
e) Radiation Surveillance Procedures for Medical Application of Radiation, 1989 (“Radiation Surveillance Procedures”)
f) The Safety Code for Medical Diagnostic X-Ray Equipment and Installations, 2001 (“X-Ray Safety Code”)
g) Pharmacy Act, 1948 (“Pharmacy Act”)
h) Drugs (Prices Control) Order, 2013 (“DPCO”) ”)
i) The Clinical Establishments (Registration and Regulation), Act, 2010
j) Narcotic Drugs and Psychotropic Substances Act, 1985 (“Narcotic Act”)
46

k) Pre-Conception and Pre-Natal Diagnostic Techniques (Prohibition of Sex Selection) Act, 1994 (“PNDT Act”) and the rules thereunder.
l) Medical Termination of Pregnancy Act, 1971 (“MTP Act”) and the rules and regulations thereunder.
m) Transplantation of Human Organs Act, 1994 (“Transplantation of Organs Act”)
n) Explosives Act, 1884 (“Explosives Act”)
o) Indian Boilers Act, 1923 (“Boilers Act”)
p) Ethical Guidelines for Biomedical Research on Human Participants, 2006 (“ICMR Guidelines”)
q) Legal Metrology Act, 2009 (“Legal Metrology Act”) and rules thereunder
r) Indian Medical Council Act, 1956 (“IMCA”)
s) Indian Medical Degree Act, 1916 (“IMDA”)
t) Indian Medical Council (Professional Conduct, Etiquette and Ethics) Regulations, 2002
u) Indian Nursing Council Act, 1947
v) Bio-Medical Waste (Management and Handling) Rules, 1998 (“BMW Rules”)
w) Hazardous Wastes (Management, Handling and Transboundary Movement) Rules, 2008 (“Hazardous Waste Rules”)
x) Batteries (Management and Handling) Rules, 2001 (“Batteries Rules”)
y) e-waste (Management and Handling) Rules, 2011 (“e-waste Rules”)
z) Poisons Act, 1919 and the Karnataka Poison Rules, 1966
aa) Static and Mobiles Pressure Vessels (Unfired) Rules, 1981
We have also examined the compliance with the applicable clauses of the Secretarial Standards issued by the Institute of Company Secretaries of India on Meetings of the Board of Directors and General Meetings.
During the period under review, the Company has complied with the provisions of the Act, Rules, Regulations, Guidelines, etc. mentioned above.
We further report that
The Board of Directors of the Company is duly constituted with proper balance of Executive Directors, Non-Executive Directors and Independent Directors. The changes in the composition of the Board of Directors that took place during the period under review were carried out in compliance with the provisions of the Act.
Adequate notice is given to all directors to schedule the Board Meetings, agenda and detailed notes on agenda were sent at least seven days in advance, and a system exists for seeking and obtaining further information and clarifications on the agenda items before the meeting and for meaningful participation at the meeting.
As per the minutes of the meetings duly recorded and signed by the Chairman, the decisions of the Board were unanimous and
no dissenting views have been recorded.
We further report that based on the compliance report furnished to the Board by the Company Secretary, there are adequate systems and processes in the Company commensurate with the size and operations of the Company to monitor and ensure compliance with applicable laws, rules, regulations and guidelines.
Except for the proposal for merger of HCG Pinnacle Oncology Private Limited, a Wholly Owned Subsidiary with the Company and preferential issue of shares aggregating to `35,00,00,100 to Indgrowth Capital Fund I , there was no event/action having a major bearing on the Company’s affairs in pursuance of the above referred laws, rules, regulations, guidelines, etc.
For V. SREEDHARAN & ASSOCIATES
(V. Sreedharan)
Bengaluru Partner
May 16, 2018 FCS: 2347; C.P. No: 833
47

(i) ESOP 2010
In the extraordinary general meeting held on 25 August, 2010, the shareholders had approved the issue of 1,800,000 options under the Scheme titled “Employee Stock Option Scheme 2010 (ESOP 2010). The ESOP 2010 allows the issue of options to employees of the Company and its subsidiaries. Each option comprises one underlying equity share.
As per the Scheme, the Remuneration committee grants the options to the employees deemed eligible. The exercise price of each option shall be at a price not less than the face value per share. The option holders may exercise those options vested based on passage of time commencing from the expiry of 4 years from the date of grant and those vested based on performance immediately after vesting, within the expiry of 10 years from the date of grant.
On 16 June, 2010, the Company granted options under said scheme for eligible personnel. In the extraordinary general meeting held on 31 March, 2015, the shareholders approved for accelerated vesting of options outstanding as at 31 March, 2015. Accordingly, all the options outstanding were vested in the hands of option holders as at 31 March, 2015. Further, the remaining options available for grant under ESOP 2010 were transferred to ESOP 2014 scheme.
(ii) ESOP 2014
Pursuant to the shareholders’ approval in the extraordinary general meeting held on 28 March, 2014 and 25 August, 2010, the Board of Directors formulated the Scheme titled “Employee Stock Option Scheme 2014” (ESOP 2014). The ESOP 2014 allows the issue of options to employees of the Company and its subsidiaries. Each option comprises one underlying equity share.
As per the Scheme, the Remuneration Committee grants the options to the employees deemed eligible. The Exercise Price shall be a price that is not less than the face value per share per option. Options Granted under ESOS 2014 would vest not less than one year and not more than five years from the date of Grant of such Options. Vesting of Options would be a function of continued employment with the Company (passage of time) and achievement of performance criteria as specified by the Nomination and Remuneration Committee as communicated at the time of grant of options. The option holders may exercise those options vested within a period as specified which may range upto 10 years from the date of grant.
Employee stock options will be settled by delivery of shares.
b) (i) The detail of fair market value and the exercise price is as given below:
Particulars ESOP 2010 ESOP 2014 ESOP 2014 ESOP 2014
Date of grant 16-Jun-10 24-Jun-14 10-Nov-16 10-Nov-16
Fair market value of option at grant date (`) 23.10 73.34 232.48 156.93
Fair market value of share at grant date (`) 29.18 78.95 240.15 240.15
Exercise price (`) 10 10 10 110.68
No. of options 12,94,800 1,10,100 1,65,400 30,000
Particulars ESOP 2014 ESOP 2014 ESOP 2014 ESOP 2014
Date of grant 01-Apr-17 01-Apr-17 11-Aug-17 06-Nov-17
Fair market value of option at grant date (`) 221.80 120.08 261.61 269.27
Fair market value of share at grant date (`) 229.45 229.45 269.35 276.95
Exercise price (`) 10.00 150.00 10.00 10.00
No. of options 25,000 35,000 1,01,000 53,000
(ii) The assumptions used in this model for calculating fair value of the ESOP granted during the current year and previous year are as below:
Grant Date:10 November 2016 (ESOP 2014)
Assumptions Vest 1 10-Nov-17
Vest 2 10-Nov-18
Vest 3 10-Nov-19
Vest 410-Nov-20
Variables 10% 20% 30% 40%
Risk free interest rate 6.52% 6.73% 6.73% 6.70%
Expected life (years) 2 3 4 5
Expected annual volatility of shares 28.98% 28.53% 30.45% 32.29%
Expected dividend yield 0.00% 0.00% 0.00% 0.00%
ANNEXURE 3
a) Employee share option plan of the Company
48
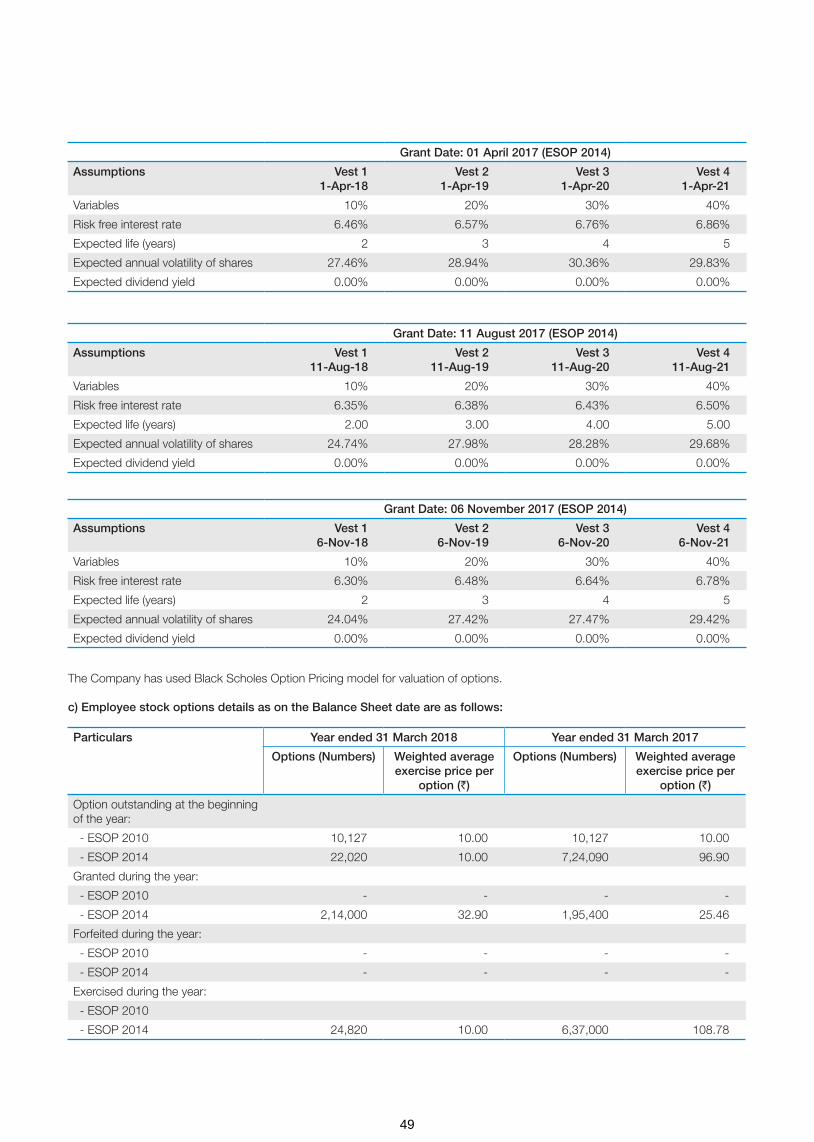
Grant Date: 01 April 2017 (ESOP 2014)
Assumptions Vest 11-Apr-18
Vest 21-Apr-19
Vest 31-Apr-20
Vest 41-Apr-21
Variables 10% 20% 30% 40%
Risk free interest rate 6.46% 6.57% 6.76% 6.86%
Expected life (years) 2 3 4 5
Expected annual volatility of shares 27.46% 28.94% 30.36% 29.83%
Expected dividend yield 0.00% 0.00% 0.00% 0.00%
Grant Date: 11 August 2017 (ESOP 2014)
Assumptions Vest 111-Aug-18
Vest 211-Aug-19
Vest 311-Aug-20
Vest 411-Aug-21
Variables 10% 20% 30% 40%
Risk free interest rate 6.35% 6.38% 6.43% 6.50%
Expected life (years) 2.00 3.00 4.00 5.00
Expected annual volatility of shares 24.74% 27.98% 28.28% 29.68%
Expected dividend yield 0.00% 0.00% 0.00% 0.00%
Grant Date: 06 November 2017 (ESOP 2014)
Assumptions Vest 16-Nov-18
Vest 26-Nov-19
Vest 36-Nov-20
Vest 46-Nov-21
Variables 10% 20% 30% 40%
Risk free interest rate 6.30% 6.48% 6.64% 6.78%
Expected life (years) 2 3 4 5
Expected annual volatility of shares 24.04% 27.42% 27.47% 29.42%
Expected dividend yield 0.00% 0.00% 0.00% 0.00%
The Company has used Black Scholes Option Pricing model for valuation of options.
c) Employee stock options details as on the Balance Sheet date are as follows:
Particulars Year ended 31 March 2018 Year ended 31 March 2017
Options (Numbers) Weighted average exercise price per
option (`)
Options (Numbers) Weighted average exercise price per
option (`)
Option outstanding at the beginning of the year:
- ESOP 2010 10,127 10.00 10,127 10.00
- ESOP 2014 22,020 10.00 7,24,090 96.90
Granted during the year:
- ESOP 2010 - - - -
- ESOP 2014 2,14,000 32.90 1,95,400 25.46
Forfeited during the year:
- ESOP 2010 - - - -
- ESOP 2014 - - - -
Exercised during the year:
- ESOP 2010
- ESOP 2014 24,820 10.00 6,37,000 108.78
49

Particulars Year ended 31 March 2018 Year ended 31 March 2017
Options (Numbers) Weighted average exercise price per
option (`)
Options (Numbers) Weighted average exercise price per
option (`)
- ESOP 2010 - - - -
- ESOP 2014 - - - -
Options outstanding at the end of the year:
- ESOP 2010 10,127 10.00 10,127 10.00
- ESOP 2014 4,71,670 20.17 2,82,490 20.69
Options exercisable at the end of the year:
- ESOP 2010 10,127 10.00 10,127 10.00
- ESOP 2014 37,770 18.00 22,020 10.0
Options available for grant under ESOP 2014 Scheme are 2,461,306 (previous year 2,675,306)
d) The weighted average share price at the date of exercise for share options exercised during the year ended 31 March 2018 is ` 318.65 (previous year ` 237.50).
e) The options outstanding at the end of the reporting period has exercise price in the range of ` 10 to ` 150 (Previous year ` 10 to ` 110.68) and weighted average remaining contractual life of 7.54 years (Previous year 6.75 years).
f) Please refer to Note 36 (Standalone Ind AS financial statement) on share based payments. For details of expense recognised in statement of profit and loss please refer note 24 and for details of movement in share options outstanding account refer note 15.2.
g) Fully diluted EPS pursuant to issue of Equity Shares on exercise of options in accordance with the relevant accounting standard
Year ended 31-Mar-18 Year ended 31-Mar-17 Year ended 31-Mar-16
2.89 2.38 (0.39)
Year ended 31-Mar-18 Year ended 31-Mar-17 Year ended 31-Mar-16
None None None
h) Variation in terms of options
i) Where the Company has calculated the employee compensation cost using the intrinsic value of stock options, difference, if any, between employee compensation cost calculated according using the intrinsic value of stock options and the employee compensation cost calculated on the basis of fair value of stock options
The Company follows the Fair Value (Black-Scholes Option Pricing Model) of the stock options for calculating employee compensation cost.
j) Impact on profit and EPS of the last three years if the accounting policies prescribed in the Securities and Exchange Board of India (Share Based Employee Benefits) Regulations, 2014 had been followed
For Financial Year 2018: The total accounting charge taken on account of ESOP 2010 and 2014 is ` 2,70,93,288
For Financial Year 2017: The total accounting charge taken on account of ESOP 2010 and 2014 is ` 94,50,182
For Financial Year 2016: The total accounting charge taken on account of ESOP 2010 and 2014 is ` 53,92,740
k) Money realized by exercise of options (INR), if scheme is implemented directly by the Company
2017-18: ` 2,48,200
2016-17: ` 6,92,95,000
2015-16: ` 7,98,75,770
l) Loan repaid by the Trust during the year from exercise price received
Not Applicable
50
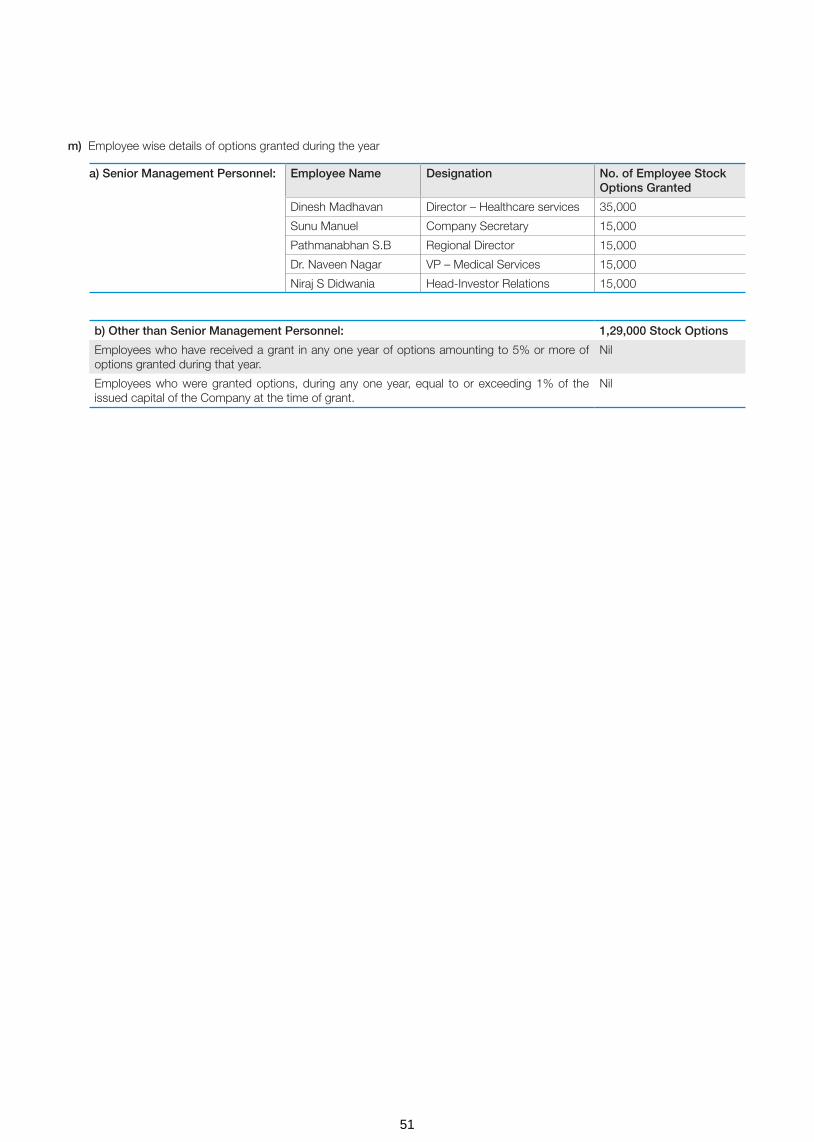
a) Senior Management Personnel: Employee Name Designation No. of Employee Stock Options Granted
Dinesh Madhavan Director – Healthcare services 35,000
Sunu Manuel Company Secretary 15,000
Pathmanabhan S.B Regional Director 15,000
Dr. Naveen Nagar VP – Medical Services 15,000
Niraj S Didwania Head-Investor Relations 15,000
m) Employee wise details of options granted during the year
b) Other than Senior Management Personnel: 1,29,000 Stock Options
Employees who have received a grant in any one year of options amounting to 5% or more of options granted during that year.
Nil
Employees who were granted options, during any one year, equal to or exceeding 1% of the issued capital of the Company at the time of grant.
Nil
51

ANNEXURE 4
Information pursuant to Section 197 (12) of the Companies Act, 2013, read with Rule 5 (1) of the Companies (Appointment and Remuneration of Managerial personnel) Rules, 2014 in respect of employees of the Company is detailed as under:
(a) Comparison and ratio of the remuneration of each director to the median remuneration of the employees of the Company for the Financial Year 2017-18
Name of the Executive Director Remuneration ofDirector (`in Mn.)
Median Remunerationof employees (`in Mn.)
Ratio
Dr. B. S. Ajaikumar 25.45 0.19 134:1
(b) The percentage increase in remuneration of each Director, Chief Financial Officer, Chief Executive Officer, Company Secretary or Manager, if any, during the financial year 2017-18
Name of Director/ KMP Designation % increase in Remuneration
Dr. B. S. Ajaikumar Chairman & CEO NIL
Mr. Yogesh Patel Chief Financial Officer NIL
Ms. Sunu Manuel Company Secretary 5.31
(c) The percentage increase in the median remuneration of employees during the financial year 2017-18 is 6.66%;
(d) The number of permanent employees on the rolls of Company is 3245 as on March 31, 2018.
(e) Average percentile increase already made in the salaries of employees of the Company other than the managerial personnel in the last financial year and its comparison with the percentile increase in the managerial remuneration and justification thereof and any exceptional circumstances for increase in the managerial remuneration
Particulars For the Financial Year 2017-18
(A) Average percentile increase already made in the salaries of employees other than the managerial personnel
11.67%
(B) Percentile increase in the managerial remuneration 1.39%
Comparison of (A) and (B) Percentile increase in Salaries of employees is more over average percentile increase in Remuneration of Managerial Personal by 10.28%
Justification -
Any exceptional circumstances for increase in the managerial remuneration
None
(f) Affirmation that the remuneration is as per the Remuneration Policy of the Company.
It is hereby confirmed that the remuneration is as per the Remuneration Policy of the Company.
Statement pursuant to Rule 5(2) of The Companies (Appointment and Remuneration of Managerial Personnel) Rules, 2014
Sl No
Name of the Employee
Designation Qualification Previous employment
Date of joining
Date of Birth
Age (in
Years)
Experience (in Years)
Remuneration including
Performance Based Variable
Pay (` in Million)
No of Equity Shares held
1 Dr. B.S. Ajaikumar
Chairman & CEO
MD Promoter 07/03/2000 22/05/1951 67 40 25.45 176,42,739
For HealthCare Global Enterprises Limited
Date : May 22, 2018 Dr. B. S. AjaikumarPlace: Bengaluru Chairman & CEO
52

Nam
e o
f th
e su
bsi
dia
ryF
inan
cial
p
erio
d
end
ed
Rep
ort
ing
C
urre
ncy
% o
f sh
are
hold
ing
Sha
re c
apita
l R
eser
ve
& s
urp
lus
Tota
l ass
ets
Tota
l lia
bili
ties
(exc
lud
ing
sh
are
cap
ital
and
res
erve
&
sur
plu
s)
Inve
stm
ents
Turn
ove
rP
rofit
/
(Lo
ss) b
efo
re
taxa
tion
Pro
visi
on
for
taxa
tion
Pro
fit /
(L
oss
) aft
er
taxa
tion
BA
CC
Hea
lthca
re P
rivat
e Li
mite
d3/
31/2
018
INR
50.1
0%93
5,78
0 40
0,36
0,95
5 55
4,47
6,05
0 15
3,17
9,31
5 -
669,
032,
002
66,1
07,2
03
21,5
73,6
97
44,5
33,5
06
HC
G R
egen
cy O
ncol
ogy
Hea
lthca
re P
rivat
e Li
mite
d *
3/28
/201
8IN
R51
.00%
302,
524,
750
(48,
263,
157)
1,11
1,68
5,02
9 85
7,42
3,43
6 -
99,6
90,5
05
(74,
883,
905)
2,29
6,93
9 (7
7,18
0,84
4)
HC
G M
edi-S
urge
Hos
pita
ls
Priv
ate
Lim
ited
3/31
/201
8IN
R74
.00%
55,6
87,0
40
135,
232,
513
942,
148,
852
751,
229,
299
-93
8,17
0,50
7 19
,810
,287
5,
166,
130
14,6
44,1
57
Mal
nad
Hos
pita
l & In
stitu
te o
f O
ncol
ogy
Priv
ate
Lim
ited
3/31
/201
8IN
R70
.25%
9,49
5,60
0 1,
154,
646
41,4
66,1
65
30,8
15,9
19
-39
,131
,489
35
0,30
1 (8
74,6
49)
1,22
4,95
0
Niru
ja P
rodu
ct D
evel
opm
ent
and
Hea
lthca
re R
esea
rch
Priv
ate
Lim
ited
3/31
/201
8IN
R10
0%50
0,00
0 (1
9,34
3,83
0)22
4,72
4,36
4 24
3,56
8,19
5 22
4,14
6,47
5 -
(1
7,57
6,00
8) -
(1
7,57
6,00
8)
Hea
lthC
are
Glo
bal S
enth
il M
ulti-
Spe
cial
ty H
ospi
tals
P
rivat
e Li
mite
d
3/31
/201
8IN
R10
0%9,
298,
000
(38,
668,
797)
1,03
8,89
9 30
,409
,695
-
-
(61,
482)
-
(61,
482)
Hea
lthC
are
Diw
an C
hand
Im
agin
g LL
P3/
31/2
018
INR
75.0
0%32
,722
,436
(8
,866
,044
)24
,795
,276
93
8,88
4 -
1,20
0,00
0 (5
,220
,158
)(2
,096
,635
)(3
,123
,524
)
HC
G O
ncol
ogy
LLP
3/31
/201
8IN
R74
.00%
113,
428,
617
(88,
275,
326)
532,
524,
568
507,
371,
277
-33
1,87
0,79
7 (5
4,90
5,81
3)(1
6,67
5,95
3)(3
8,22
9,86
0)
HC
G (M
aurit
ius)
PV
T. L
TD.
3/31
/201
8IN
R10
0.00
%24
8,31
3,05
5 (1
0,51
2,87
2)23
9,51
4,77
2 1,
714,
589
238,
140,
071
- (1
,679
,863
)-
(1,6
79,8
63)
US
D10
0.00
%3,
817,
611
(161
,627
)3,
682,
344
26,3
60
3,66
1,20
9 -
(25,
827)
- (2
5,82
7)
AP
EX
HC
G O
ncol
ogy
Hos
pita
ls L
LP3/
31/2
018
INR
50.0
1%35
0,60
9,83
0 (7
7,10
5,21
6)75
6,19
0,20
9 48
2,68
5,59
6 -
93
,088
,909
(1
36,5
67,8
66)
(45,
556,
883)
(91,
010,
983)
HC
G N
CH
RI O
ncol
ogy
LLP
3/31
/201
8IN
R76
.00%
201,
064,
484
(38,
685,
562)
529,
581,
679
367,
202,
758
-
77,5
77,4
52
(80,
538,
269)
(26,
604,
116)
(53,
934,
153)
HC
G M
anav
ata
Onc
olog
y LL
P3/
31/2
018
INR
51.0
0%47
8,15
1,38
3 11
0,16
8,51
1 1,
003,
713,
959
415,
394,
064
-
492,
912,
507
145,
024,
982
51,3
06,0
14
93,7
18,9
68
HC
G E
KO
Onc
olog
y LL
P3/
31/2
018
INR
50.5
0%81
,632
,868
6,
531,
442
338,
977,
463
250,
813,
153
-
-
(2,1
12,2
42)
-
(2,1
12,2
42)
HC
G S
UN
Hos
pita
ls L
LP3/
31/2
018
INR
74.0
0%51
,243
,268
(8
86,4
18)
50,3
92,2
49
35,4
00
-
-
(1,1
70,0
91)
(283
,673
)(8
86,4
18)
As
on 3
1.03
.18:
1 U
S$
= `
65.0
441,
* D
urin
g th
e ye
ar, t
he C
ompa
ny s
old
its in
vest
men
t in
equi
ty s
hare
s of
HC
G R
egen
cy O
ncol
ogy
Hea
lthca
re P
rivat
e Li
mite
d to
Reg
ency
Hos
pita
l Lim
ited
purs
uant
to w
hich
HC
G R
egen
cy O
ncol
ogy
Hea
lthca
re P
rivat
e Li
mite
d ce
ased
to b
e a
subs
idia
ry o
f the
Com
pany
effe
ctiv
e 28
Mar
ch 2
018
AN
NE
XU
RE
5
FO
RM
NO
. AO
C-1
Sta
tem
ent
pur
suan
t to
firs
t p
rovi
so t
o S
ub-S
ectio
n (3
) of
Sec
tion
129
read
with
Rul
e 5
of
Co
mp
anie
s (A
cco
unts
) Rul
es, 2
014
Sta
tem
ent
cont
aini
ng s
alie
nt f
eatu
res
of
the
finan
cial
sta
tem
ents
of
sub
sid
iari
es/a
sso
ciat
e co
mp
anie
s/jo
int
vent
ures
Par
t A -
Sub
sidi
arie
s
53

S.
No
.N
ame
of
asso
ciat
e/jo
int
vent
ure
Last
aud
ited
b
alan
ce
shee
t d
ate
Dat
e o
n w
hich
th
e as
soci
ate
or
join
t ve
ntur
e w
as a
sso
ciat
ed
or
acq
uire
d
No
of
shar
es h
eld
by
the
Co
mp
any
in A
sso
ciat
e/Jo
int
vent
ure
on
year
end
Am
oun
t o
f in
vest
men
t in
Ass
oci
ate/
Join
t ve
ntur
e
Ext
ent
of
hold
ing
(%
)
Des
crip
tion
of
how
the
re
is s
igni
fican
t in
fluen
ce
Rea
son
why
as
soci
ate/
join
t ve
ntur
e is
no
t co
nso
lidat
ed
Net
wo
rth
attr
ibut
able
to
sh
areh
old
ing
as
per
late
st a
udite
d
bal
ance
she
et
Pro
fit o
r (lo
ss) f
or
the
year
Co
nsid
ered
in
cons
olid
atio
n
No
t co
nsid
ered
in
cons
olid
atio
n
1S
tran
d Li
fe S
cien
ces
Priv
ate
Lim
ited
31 M
arch
20
1807
Feb
ruar
y 20
189,
140,
342
equi
ty
shar
es a
nd 1
01,1
93
com
puls
orily
con
vert
ible
pr
efer
ence
sha
res
24
0,00
0,00
0 38
.20%
Mor
e th
an 2
0%
shar
ehol
ding
Join
t con
trol
240
,037
,340
-
7,43
5,35
0 -
12,0
28,9
17
2H
ealth
Car
e G
loba
l (A
frica
) Pvt
. Ltd
.*31
Mar
ch
2018
01 J
uly
2017
160,
659
ordi
nary
sha
res
and
115,
820
pref
errr
ed
A s
hare
s
23
8,13
4,85
9 76
.73%
Mor
e th
an 2
0%
shar
ehol
ding
No
cont
rol
292
,640
,604
7
,538
,036
-
26,7
20,8
87
3H
ealth
Car
e G
loba
l (U
gand
a) P
rivat
e Li
mite
d #
31 M
arch
20
1801
Jul
y 20
1772
,500
ord
inar
y sh
ares
2,8
19,8
01
76.7
3%M
ore
than
20%
sh
areh
oldi
ng
No
cont
rol
1,4
65,5
87
-13
7,45
3 -
64,5
94
4H
ealth
Car
e G
loba
l (K
enya
) Priv
ate
Lim
ited
#
31 M
arch
20
1801
Jul
y 20
1755
3,55
4 or
dina
ry s
hare
s
359,
371,
128
76.7
3%M
ore
than
20%
sh
areh
oldi
ng
No
cont
rol
-22
,674
,177
-
12,9
69,7
22
-8,
672,
149
5H
ealth
Car
e G
loba
l (T
anza
nia)
Priv
ate
Lim
ited
#
31 M
arch
20
1801
Jul
y 20
1718
,000
ord
inar
y sh
ares
73,
898
76.7
3%M
ore
than
20%
sh
areh
oldi
ng
No
cont
rol
44,
903
-47
9,72
8 2
15,7
45
6C
ance
r C
are
Ken
ya
Lim
ited
@31
Mar
ch
2018
01 J
uly
2017
931,
470
ordi
nary
sha
res
298,
089,
927
59.4
7%M
ore
than
20%
sh
areh
oldi
ng
No
cont
rol
-75
,254
,683
-
550,
844
-37
5,47
7
* H
ealth
Car
e G
loba
l (A
frica
) Pvt
. Ltd
. bec
ame
an A
ssoc
iate
of H
CG
(Mau
ritiu
s) P
rivat
e Li
mite
d w
ith e
ffect
from
01
July
201
7.
# H
ealth
Car
e G
loba
l (U
gand
a) P
rivat
e Li
mite
d, H
ealth
Car
e G
loba
l (K
enya
) Priv
ate
Lim
ited
and
Hea
lthC
are
Glo
bal (
Tanz
ania
) Priv
ate
Lim
ited
are
who
lly o
wne
d su
bsid
iarie
s of
Hea
lthC
are
Glo
bal (
Afri
ca) P
vt. L
td. a
nd
acco
rdin
gly
all t
hese
com
pani
es w
ould
bec
ome
an A
ssoc
iate
of t
he u
ltim
ate
pare
nt C
ompa
ny.
@ C
ance
r C
are
Ken
ya L
imite
d is
a s
ubsi
diar
y of
Hea
lthC
are
Glo
bal (
Ken
ya) P
rivat
e Li
mite
d an
d w
as a
cqui
red
on 0
1 Ju
ly 2
017.
AN
NE
XU
RE
5
FO
RM
NO
. AO
C-1
Sta
tem
ent
pur
suan
t to
firs
t p
rovi
so t
o S
ub-S
ectio
n (3
) of
Sec
tion
129
read
with
Rul
e 5
of
Co
mp
anie
s (A
cco
unts
) Rul
es, 2
014
Sta
tem
ent
cont
aini
ng s
alie
nt f
eatu
res
of
the
finan
cial
sta
tem
ents
of
sub
sid
iari
es/a
sso
ciat
e co
mp
anie
s/jo
int
vent
ures
Par
t B -
Ass
ocia
tes
and
Join
t ven
ture
Dr.
B.S
. Aja
ikum
arC
hairm
an a
nd C
EO
DIN
: 007
1377
9
Dr.
Ram
esh
B.S
.D
irect
orD
IN: 0
0518
434
Yog
esh
Pat
elC
hief
Fin
anci
al O
ffice
rS
unu
Man
uel
Com
pan
y S
ecre
tary
for
and
on
beh
alf
of
the
Bo
ard
of
Dire
cto
rs o
f
Hea
lthC
are
Glo
bal E
nter
pris
es L
imite
d
Pla
ce :
Ben
galu
ruD
ate
: 22
May
201
8
54

ANNEXURE 6
FORM NO. AOC-2
(Pursuant to clause (h) of sub-section (3) of Section 134 of the Act and Rule 8 (2) of the Companies (Accounts) Rules, 2014)
Form for disclosure of particulars of Contracts/arrangements entered into by the Company with related parties referred to in sub-section (1) of section 188 of the Companies Act, 2013 including certain arm’s length transactions under third proviso thereto.
1. Details of contracts or arrangements or transactions not at arm’s length basis : There are no contracts/arrangements/transactions which are not at arm’s length basis.
2. Details of contracts or arrangements or transactions at arm’s length basis :
Name of related party Nature of relationship Nature of contracts/
arrangements/transactions
Duration of the Contracts/arrangements/
transactions
Salient terms of the Contracts or
arrangements or transactions
including the Value (` in
million) if any
Date of approval
by the Board, if
any
Amount paid as
advances, if any
Malnad Hospital and Institute of Oncology Private Limited
Subsidiary Company/ Common Director
Sale of goods
01.04.2017 - 31.03.2018
6.76
Not applicable
NIL
HCG Medi-surge Hospitals Private Limited
Subsidiary Company/ Common Director
149.50
Sada Sarada Tumor & Research Institute
Company with Common Director
42.71
HCG Oncology LLP LLP/Director is a partner 55.83
HCG Regency Oncology Healthcare Private Limited(Till 28th March, 2018)
Subsidiary Company/ Common Director
13.59
HCG NCHRI Oncology LLP LLP/Subsidiary 14.65
Apex HCG Oncology Hospitals LLP
LLP/Subsidiary 12.53
JSS Bharath Charitable Trust Trust/Director of the Company is a trustee
Providing of services
14.5
HCG Foundation Trust/Director of the Company is a trustee
8.24
HCG Medi-surge Hospitals Private Limited
Subsidiary Company/ Common Director
41.97
Malnad Hospital and Institute of Oncology Private Limited
Subsidiary Company/ Common Director
0.44
BACC Healthcare Private Limited
Subsidiary Company/ Common Director
0.31
Sada Sarada Tumor & Research Institute
Company with common Director
7.44
HCG Oncology LLP LLP/Director is a partner 0.16
HCG Regency Oncology Healthcare Private Limited(Till 28th March, 2018)
Subsidiary Company/ Common Director
0.38
HCG NCHRI Oncology LLP LLP/Subsidiary 2.48
Apex HCG Oncology Hospitals LLP
LLP/Subsidiary 1.16
HCG Manavata Oncology LLP LLP/Subsidiary 5.2
Sada Sarada Tumor & Research Institute
Company with common Director
Rent expenses 0.54
55

Name of related party Nature of relationship Nature of contracts/
arrangements/transactions
Duration of the Contracts/arrangements/
transactions
Salient terms of the Contracts or
arrangements or transactions
including the Value (` in
million) if any
Date of approval
by the Board, if
any
Amount paid as
advances, if any
HCG Medi-surge Hospitals Private Limited
"Subsidiary Company/ Common Director"
Corporate Guarantee
Commission Income
01.04.2017 - 31.03.2018
8.26
Not applicable
NIL
HCG Oncology LLP LLP/Director is a partner 5.79
HCG NCHRI Oncology LLP LLP/Subsidiary 1.29
HCG Manavata Oncology LLP LLP/Subsidiary 0.49
BACC Healthcare Private Limited
"Subsidiary Company/ Common Director"
0.37
Apex HCG Oncology Hospitals LLP
LLP/Subsidiary 2.16
HCG EKO Oncology LLP LLP/Subsidiary 1.08
Dr. B.S. Ajaikumar DirectorRemuneration
25.45
Ms. Anjali Ajaikumar Relative of a Director 3.95
Dr. B.S.Ramesh Director Professional Charges Paid
8.14
For HealthCare Global Enterprises Limited
Date : May 22, 2018 Dr. B. S. AjaikumarPlace: Bengaluru Chairman & CEO
56

ANNEXURE 7
ANNUAL REPORT ON CORPORATE SOCIAL RESPONSIBILITY (CSR) ACTIVITIES(As prescribed under Section 135 of the Companies Act, 2013 and Companies (Corporate Social Responsibility Policy) Rules, 2014)
1. Brief outline of the Company’s CSR policy, including overview of projects or programs proposed to be undertaken
The CSR activities of HCG are guided by its Corporate Social Responsibility (CSR) Policy which has been formulated and adopted by HCG in compliance with the provisions of Section 135 of the Companies Act, 2013 and is hosted on the Company’s website www.hcgel.com.
The main objective of HCG’s CSR Policy is to lay down guidelines for HCG and its subsidiary companies to make CSR a key business process for sustainable development of the Society. It aims at staying committed for ensuring socio-economic development of the community through different participatory and need- based initiatives in the best interest of the poor and deprived sections of the society, so as to help them to become self-reliant and build a better tomorrow for themselves. This in turn would lead to sustainable growth of the enterprises they are engaged with, the society and the country at large.
In alignment with the above, HCG, through the CSR Activities, will conduct and initiate programmes focusing on areas covered in the Policy so as to promote sustained growth for the society and community, in fulfillment of its role as a socially responsible corporate.
HCG’s CSR activities, amongst others, will focus on:
• Hunger, Poverty, Malnutrition and Health: Eradicating extreme hunger, poverty and malnutrition, promoting preventive healthcare and sanitation and making available safe drinking water.
• Education: Promoting education, including special education and employment-enhancing vocational skills especially among children, women, elderly and the differently-abled and livelihood enhancement projects; monetary contributions to academic institutions for establishing endowment funds, chairs, laboratories, etc., with the objective of assisting student in their studies.
• Gender Equality and Women Empowerment: Promoting gender equality and empowering women; setting up homes and hostels for women and orphans; setting up of old age homes, day care centres and such other facilities for senior citizens; and adopting measures for reducing inequalities faced by socially and economically backward groups.
• Environmental Sustainability: Ensuring environmental sustainability, ecological balance, animal welfare, agro-forestry, conservation of natural resources and maintaining quality of soil, air & water.
• National Heritage, Art and Culture: Protecting national heritage, art & culture promoting and developing traditional arts and handicrafts.
2. The Composition of the CSR Committee: The CSR committee consists of Dr. Sudhakar Rao (Chairman), Dr. B S Ajaikumar, Dr. Sampath Thattai Ramesh and Ms Bhushani Kumar, being the members of the Committee.
3. Average net profit of the Company for last three financial years: ` 7,24,16,214.
4. Prescribed CSR Expenditure (two per cent of the amount as in item 3 above): ` 14,48,324.
5. Details of CSR spent during the financial year:
HCG has made a provision for CSR spend in FY 2017-18 aggregating to ` 14,48,324.
Of the provision made, no expenditure has been made so far.
6. In case the Company has failed to spend the two per cent of the average net profit of the last three financial years or any part thereof, the Company shall provide the reasons for not spending the amount in its Board report:
The provisions of Corporate Social Responsibility (“CSR”) under the Companies Act, 2013 were not applicable to the Company till the financial year 2016-17. However, your Company has been, over the years, pursuing as a part of its corporate philosophy, an unwritten CSR policy voluntarily which goes much beyond mere philanthropic gestures and integrates interest, welfare and aspirations of the community with those of the Company itself and create an environment of partnership for inclusive development.
For the first time, HCG has made a provision for CSR spend in FY 2017-18 aggregating to ` 14,48,324 and is presently considering various projects/areas for which the expenditure shall be incurred.
HCG remains committed to continually explore opportunities which align to its CSR philosophy and create maximum impact and incrementally invest in CSR activities to spend the prescribed CSR amount in the subsequent years.
7. CSR Committee Responsibility Statement
The CSR Committee of the Board of Directors hereby confirms that the implementation and monitoring of CSR Policy, is in compliance with CSR objectives of the Company.
Place: Bengaluru Dr. B.S. Ajaikumar Date: May 22, 2018 Chairman & CEO
Dr. Sudhakar RaoChairman – CSR Committee
57
Annexure 8
CONSERVATION OF ENERGY, TECHNOLOGY ABSORPTION AND FOREIGN EXCHANGE EARNINGS AND OUTGO
The information on conservation of energy, technology absorption and foreign exchange earnings and outgo stipulated under Section 134(3)(m) of the Companies Act, 2013 read with Rule 8 of the Companies (Accounts) Rules, 2014 is given below:
A) Conservation of energy: The operations of your Company are not energy-intensive. However, significant measures are being taken to reduce energy consumption by using energy efficient equipment. The Company has taken initiatives to conserve energy and consume less energy.
The Company has reduced the internal energy consumption through the following:
• Phase out of CFL lamps to LED lights in the utility areas.
• Introduction of timer based operation of Air Handling Units to reduce power consumption.
• Introduction of micro processing energy saver for AHU Motors, in case of new units.
• Implementation of energy optimization practices in Transformer operation in existing as well as new units.
• VFD installation for AHU motor in a phased manner.
• Operation of all Lifts and OT AHUs with VFD panels.
Your Company constantly evaluates and invests in new technology to make the infrastructure more energy efficient. As the cost of energy forms a very small portion of the total costs, the financial implications of these measures are not material.
B) Technology absorption:
HCG has, for long, been at the forefront of the fight against cancer. An area of such intensity requires innovative treatments and methods, and the introduction of industry-changing technologies, for the overall benefit of both the medical expert and the patient. Cancer research is an area that requires more serious work and HCG aims to rise up to that challenge. In all its years of working in this field, HCG has led the march against cancer and set benchmarks in the industry, by introducing many new technologies, highly useful in increasing the accuracy and saving time. Cancer surgery is an important area of medicine and we aim to lead with our strong framework and technology infrastructure.
Some of the best and the world class equipments the Company has for the treatment of cancer are as under:
(i) Versa HD™: Versa HD™ is a Versatile, all-in-one system which offers classic radiotherapy to advanced stereotactic precision. Equipped with sophisticated conformal beam-shaping technology and High Dose rate mode delivery, Versa HD™ is designed to provide the precision and speed necessary to deliver advanced stereotactic radiotherapy (SRT) and stereotactic radiosurgery (SRS), techniques that demand the maximum accuracy in tumor targeting and protection of critical structures. Versa HD™ the unique combination of ground-breaking MLC leaf speeds with High Dose Rate mode means clinicians
can, for the first time, explore the full capabilities of high dose rate delivery and take advanced therapies to new levels. The equipment was imported in 2016 and the technology has been fully absorbed.
(ii) TomoTherapy® H™: This is one of the most innovative and precise radiation therapy for the first time in India. TomoTherapy is an advanced form of cancer treatment that combines Intensity Modulated Radiation Therapy (IMRT) with the accuracy of Computed Tomography (CT) scanning technology (IGRT- Image Guided Radiotherapy), all in one machine. With this advanced treatment modality, we can modulate powerful radiation beams to treat tumours with precision. Using the built-in CT scanning to confirm the shape and position of the tumour before each treatment, TomoTherapy reduces radiation exposure to healthy tissues and organs thereby minimising the side effects. This technology is very helpful in treating tumours in hard-to-reach sites, tumours that are advanced stage (locally and metastatic) and recurrent tumours which have been previously treated with other radiotherapy techniques. On each treatment day, the scanning technology provides a 3D image of the treatment area, so the radiation beams can be targeted according to the size, shape and location of the tumour(s) on that specific day. Hence there is no chance of missing the target. This minimizes the radiation that reaches the healthy tissues and organs, thereby, reducing the side effects. The TomoTherapy is a radiation therapy which efficiently treats cancer at any site on the body. Designed like a CT scanner, the TomoTherapy uses its integrated imaging to enhance treatment accuracy and a unique beam to improve treatment precision. The TomoTherapy can be used for any case which may need radiation therapy, including those involving large tumors or multiple tumors throughout the body. The TomoTherapy System may be used as the only treatment, or in combination with surgery and/or chemotherapy. The equipment was imported in 2017 and the technology has been fully absorbed.
(iii) TrueBeam™: TrueBeam system is the latest in cutting-edge technology in the fight against cancer. Aiding practitioners with its numerous lifesaving tools, this radical system enhances levels of clinical excellence with greater image clarity and pinpoint accuracy. Superior features like one-button image acquisition and full automation of beam delivery makes treatment 50% faster and much more effective. TrueBeam offers improved image quality, millimetre accuracy for increased precision and reduced human errors, thanks to its automated technology. It is highly accurate in tumour detection, has non-toxic elements and offers quicker treatment and delivery. The equipment was imported in 2016 and the technology has been fully absorbed.
58

(iv) Skyra 3 Tesla: This piece of cutting-edge technology allows clinicians to get an enhanced diagnosis which aids in deciding an optimal course of treatment and results in better outcomes. The Skyra 3 Tesla MRI incorporates Tim (Total imaging matrix) and Dot (Day optimising throughput) technology. In simple terms, this allows uniquely tailored and optimised scans that can be configured to the patient’s condition or a clinical question. It also allows higher spatial and temporal resolution without having to reposition the patient. The Skyra 3T MRI is used in neuro-surgery (surgical planning), tractography, functional MRI and high resolution anatomical data. The Skyra 3T MRI offers high signal to noise ratio which translates into better quality images. It has faster scan times and 3-dimensional data in every body region, for every contrast available. Better exploitation of the magnetic properties of blood and other tissues allows diagnostic imaging of superior quality. For the patients there is no sedation required, there’s more space to put claustrophobic patients at ease and motion correction for uncooperative patients. It can accommodate patients with special needs - pain and mobility issues, obesity, respiratory problems etc. The equipment was imported in 2010 and the technology has been fully absorbed.
(v) CyberKnife: This is the world’s first robotic radiosurgery system that offers the patients a new ray of hope in the treatment of tumours and lesions (previously diagnosed as inoperable or untreatable) anywhere in the body with sub-millimetre accuracy. It is considered to be an innovation in the treatment of cancer. CyberKnife offers a non-invasive alternative to surgery with state-of-the-art, real-time image guidance that precisely targets tumours anywhere in the body with pinpoint accuracy and delivers intense doses of radiation. As CyberKnife removes the need for invasive surgery, it also allows the patient to go home immediately after the treatment. Cyberknife offers several advantages to patients as it treats inoperable tumours, with stereotactic bloodless radiosurgery anywhere in the body. It also has high levels of comfort, as it is a relatively pain-free treatment procedure and requires no anaesthesia. CyberKnife also significantly reduces treatment time as it treats only the affected areas and offers minimal side effects allowing the patient to go back to leading a routine life. The equipment was imported in 2009 and the technology has been fully absorbed.
(vi) The Da Vinci Surgical System: Robotic surgery, or robot-assisted surgery, allows doctors to perform many types of complex procedures with more precision, flexibility and control than possible with conventional techniques. Robotic surgery is usually associated with minimally invasive surgery — procedures performed through tiny incisions. It is also, sometimes, used in certain traditional open surgical procedures. The Da Vinci Surgical System enables surgeons to perform delicate and complex operations through a few small incisions. The Da Vinci System consists of several key components, including an ergonomically designed console where the surgeon sits while operating, a patient-side cart where the patient is positioned during surgery, interactive robotic arms, a 3DHD vision system, and proprietary EndoWrist instruments. Da Vinci is powered by robotic technology
that allows the surgeon’s hand movements to be scaled, filtered and translated into precise movements of the EndoWrist instruments, working inside the patient’s body. The advantages are minimal blood loss, minimal pain, minimal scarring, minimal complications, shorter hospital stay and faster recovery and return to normal life. The equipment was imported in 2016 and the technology has been fully absorbed.
The Company has a dedicated team of technically competent personnel who relentlessly work on technology upgradation and development related fields. Your Company also deploys its resources from time to time and imparts necessary training to keep abreast of the continuously changing technology.
C) Research and Development:
The Research and Development is intellectual property driven accelerated bridge between basic research and clinical implementation through high quality translational research to understand disease pathogenesis, translate such knowledge into improvements in patient care and set new paradigm in personalized medicine era through biospecimen banking. Putting a step forward for comprehensive cancer care, the R&D focusses on high end molecular diagnostics, genomics and other high end technologies and platform to identify and utilize genetic variability in cancer and genetic make-up of the individual to formulate personalized therapeutic approaches that would enable maximum efficacy with a concomitant improvement in patient quality of life.
As a comprehensive cancer hospital dedicated to transforming cancer care, HCG is at the forefront of cancer research, ensuring our patients have access to cutting edge treatments that deliver the best possible outcomes. We are focused on delivering patient-centred care through clinical, academic and research excellence. Medicine is constantly evolving. To ensure we remain at the forefront of the latest approaches to cancer care and treatment, we have dedicated research teams onsite that focus on medical physics, radiation oncology, radiotherapy, medical oncology, as well as an integrated clinical trials department. This provides the opportunity for our patients and team members to get involved in vital research, including the trial of new drugs, devices and other treatment techniques.
Strand Life Sciences, associate of HCG offers the following range of services for Pharma, biotech, CRO and diagnostic companies engaged in drug discovery, drug development, biomarker discovery and companion diagnostics development:
• Targeted Gene sequencing
• Exome sequencing services
• Tumor profiling services
• Enriched Clinical trial
• Pharmacogenomics - Enable pharma in drug development
• Biomarker Validation
• Companion diagnostics
59

Our research is focused on the discovery of clinically relevant gene signatures to bring novel biomarkers of diagnostic, prognostic and predictive value in cancer patients. We also carry out research on areas where an understanding of intracellular signalling mechanisms has the potential to yield breakthrough-targeted therapeutics. R&D team has successfully written Investigator Initiated Research (IIR) projects for extramural grants.
The Company actively publishes research papers, case studies, abstracts in international & national forums like
ASCO, AACR and Indian Cancer Congress. Having access to well annotated and high quality clinical samples of various cancer types, Strand is the preferred partner for global pharma companies, academia, diagnostic companies, venture & technology groups for oncology research and clinical projects.
D) Foreign exchange earnings and outgo: The details of Foreign Exchange Earnings and Outgo during the year ended March 31, 2018 vis a vis during the year ended March 31, 2017 is as under:
Particulars For the year ended (`)
31-Mar-18 31-Mar-17
Expenditure in Foreign Exchange
Interest 1,492,871 2,841,133
Travel expenses 10,100,620 10,833,830
Repairs and maintenance :Machinery - 23,205,150
Professional charges 21,998,301 24,600,351
Business promotion expenses 8,062,107 1,927,913
Rent 1,873,533 -
Total 43,527,432 63,408,377
Imports
Capital Goods 323,243,296 20,978,447
Hospital Consumables 6,520,552 15,495,448
Earnings in foreign exchange
Medical service income 345,935,979 361,565,939
60

Corporate Governance Report
I. Company’s philosophy on code of governance
We at HealthCare Global Enterprises Limited (“HCG” or “the Company”) believe that effective governance is achieved through a culture of transparency and openness between management and the Board and across the stakeholders. This report, while detailing the required governance and regulatory assurances and disclosures, also provides an insight into how governance operates at HealthCare Global Enterprises Limited and how effective governance supports and guides our culture and behaviours.
The Board discharges some of its responsibilities directly and delegates certain other responsibilities to its committees to assist it in carrying out its function of ensuring independent oversight. The Board also delegates authority for the operational management of the business to the Chairman and CEO for further delegation by him in respect of matters that are necessary for the effective day-to-day running and management of the business.
A report on Corporate Governance, in accordance with Securities and Exchange Board of India (Listing Obligations and Disclosure Requirements) Regulations, 2015 (“Listing Regulations”) as applicable is outlined below.
II. Board of Directors
A. Composition of Board
Our Board comprises of directors with a broad range of skills, experience, backgrounds and perspectives. This mix of skills, knowledge and experience enriches the Board discussion and contributes towards a high performing and effective Board.
As of March 31, 2018, our Board had five Independent Non-Executive Directors, three Non-Executive Non-Independent Directors and one Executive Director who is Chairman of our Board. All 5 Independent Directors are free from any business or other relationship that could materially influence their judgment and satisfy the criteria of independence as defined under the Companies Act, 2013, and the Listing Regulations. The Company has a woman Director on the Board, who is Independent and Non-Executive Director. The profiles of our Directors forms part of the Annual Report.
B. Information flow to the Board Members
Information is provided to the Board members on a continuous basis for their review, inputs and approval from time to time. More specifically, we present our annual Strategic Plan and Operating Plans of our business to the Board for their review, inputs and
approval. Likewise, our quarterly financial statements and annual financial statements are first presented to the Audit Committee for their review and recommendations and subsequently to the Board of Directors for their approval. In addition, specific cases of acquisitions, important managerial decisions, material positive/negative developments and statutory matters are presented to the Committees of the Board and later with the recommendation of Committee to the Board of Directors for their approval.
A detailed agenda and notes thereon are sent to each Director in advance of Board and Committee Meetings. All material information is incorporated in the agenda for facilitating meaningful and focused discussions at the meeting. Where it is not practicable to attach any documents with the agenda, it is tabled before the meeting with specific reference to this effect in the agenda. To enable the Board to discharge its responsibilities effectively, the Board is kept abreast at every meeting on the overall performance of the Company. All the relevant reports are also presented at the Board Meetings.
The Chairman of the Board decides the agenda in consultation with other members of the Board for the Board meetings.
C. Board Meetings
To enable the Board to use its time most effectively, it maintains a scheduled forward programme of meetings and a rolling agenda. There is sufficient flexibility in the programme for specific items to be added to any particular agenda to ensure that the Board can focus on the key matters at the appropriate time. The Board also schedules a number of informal sessions and interactions, which allows Board members to discuss areas of the business, strategy and the external environment with members of the Management Team. Generally, members of the Management Team and other senior executives are invited to attend part of the meetings to ensure effective interaction with the Board.
Our Board meetings are normally scheduled for a day. The gap between two meetings did not exceed 120 days. The necessary quorum was present for all the meetings. In addition, Independent Directors meet amongst themselves exclusively, before the Board Meeting.
The Board met five times during the financial year 2017-18 viz., on, May 24, 2017, August 11, 2017, November 7, 2017, November 22, 2017 and February 8, 2018.
61

The attendance of the Directors at the Board Meetings for the year ended March 31, 2018 is provided in the below table:
There was no change in composition of the Board during the year.
Sl. No. Name Position Number of Board Meetings attended
1. Dr. B. S. Ajaikumar Chairman 5
2. Mr. Gangadhara Ganapati Member 5
3. Dr. Sudhakar Rao Member 5
4. Mr. Shanker Annaswamy Member 5
5. Mr. Suresh C. Senapaty Member 5
6. Dr. Sampath T. Ramesh Member 5
7. Mrs. Bhushani Kumar Member 5
8. Dr. Ramesh S. Bilimagga Member 3
9. Dr. Amit Varma Member 5
D. Lead Independent Director
The Board of Directors of the Company has designated Dr. Sudhakar Rao as the Lead Independent Director.
E. Appointment of Directors
In terms of Section 149 of the Companies Act, 2013, the Independent Directors shall be appointed for not more than two terms of maximum of five years each and shall not be liable to retire by rotation at the Annual General Meeting. The Board of Directors of the Company adopted the provisions with respect to appointment and tenure of Independent Directors which is consistent with the Companies Act, 2013 and Listing Regulations. Details of Directors proposed for re-appointment/appointment at the ensuing Annual General Meeting is provided in the Notice convening the Annual General Meeting.
F. Policy for Selection and Appointment of Directors and their Remuneration
The Policy of the Company on the Director’s appointment and remuneration, including criteria for determining qualifications, positive attributes, independence of a director and other matters, as required under sub-section (3) of section 178 of the Companies Act, 2013, is available on our website https://hcgel.com/policies-and-guidelines/. We affirm that the remuneration paid to Directors is as per the terms laid out in the nomination and remuneration policy of the Company.
Nomination and Remuneration Committee have adopted a Charter which, inter alia, deals with the manner of selection of Board of Directors and payment of their remuneration. The Policy is accordingly derived from the said Charter.
G. Criteria of selection of Independent Directors
Nomination and Remuneration Committee considers the following attributes/criteria, whilst recommending to the Board the candidature for appointment as Independent Director.
i. Qualification, expertise and experience of the Directors in their respective fields such as expertise or experience in Healthcare Industry, Scientific Research & Development, International Markets, Leadership, Finance, Risk Management and Strategic Planning, Law, Administration etc.
ii. Personal, Professional or business standing;
iii. Diversity of the Board.
In case of appointment of Independent Directors, Nomination and Remuneration Committee shall, apart from obtaining a declaration to that effect, satisfy itself with regard to the independent nature of the Directors vis-à-vis the Company, so as to enable the Board to discharge its function and duties effectively.
The Nomination and Remuneration Committee shall also ensure that the candidate identified for appointment as a Director is not disqualified for appointment under Section 164 of the Companies Act, 2013, simultaneously obtaining a declaration in that respect. In case of re-appointment of Independent Directors, the Board shall take into consideration the performance evaluation of the Independent Directors and their engagement level.
H. Meeting of Independent Directors
The Company’s Independent Directors are required to meet at least once in every Financial Year in compliance with the provisions of the Companies Act, 2013. Such meetings are conducted to enable Independent Directors to discuss the matters pertaining to the Company’s affairs and put forth their views. Further, Independent Directors also review the performance of the Non-Independent Directors, Chairperson (after considering the views of Executive and Non-Executive Directors of the Company) and the Board as a whole. During the Financial Year under review, the Independent Directors met on May 24, 2017, August 11, 2017, November 7, 2017, and February 8, 2018.
I. Familiarization programme of Directors
All new Board of Directors receive an induction programme to enable them to function effectively as quickly as possible, while building a deep understanding of our business and markets. Each induction typically consists of a combination of meetings with both executive and independent directors, briefings from senior managers across the Company.
Periodic presentations are made at the Board and Committee Meetings, on business and performance updates of the Company, operations review, quarterly and annual results, budgets, review of internal audit reports and action taken reports, statutory compliances, risk management, operations of subsidiaries and business strategy and risks involved. Such presentations and documents provide an opportunity to the Independent Directors to interact with the Senior Management Team of the Company and help them understand the Company’s strategy, operations, services, organization structure, finance,
62
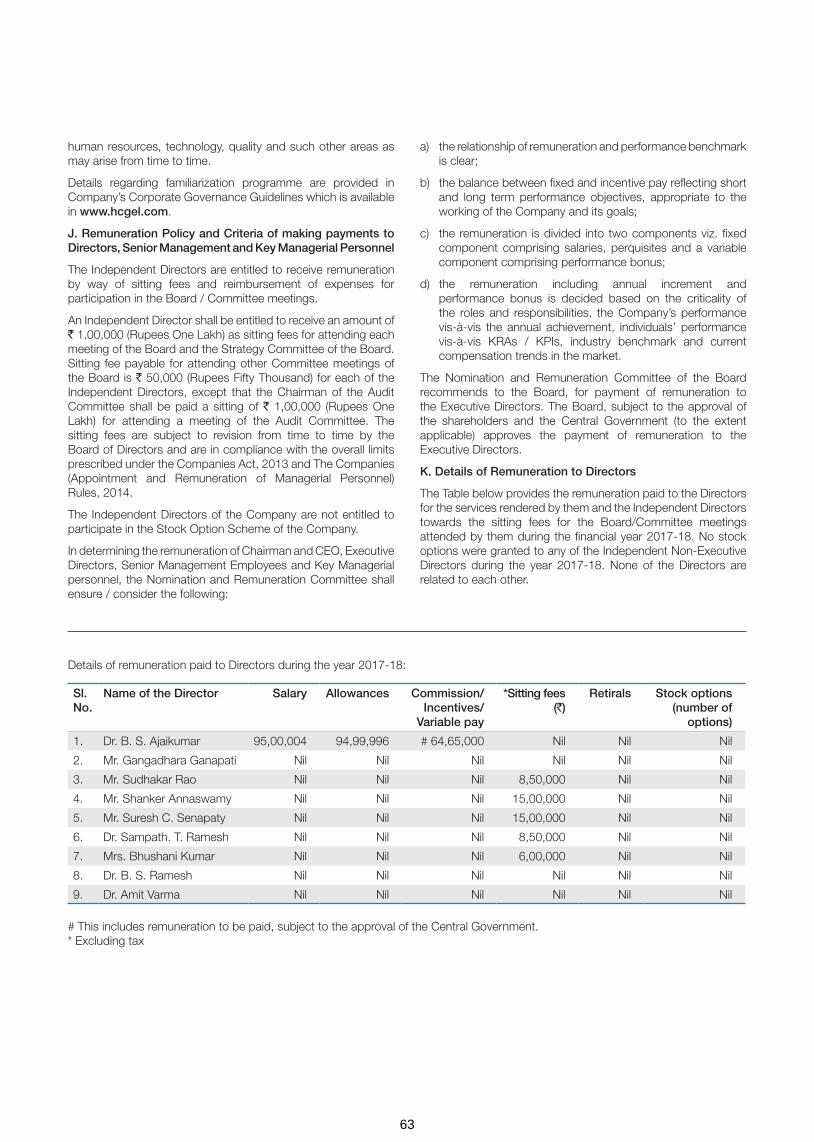
human resources, technology, quality and such other areas as may arise from time to time.
Details regarding familiarization programme are provided in Company’s Corporate Governance Guidelines which is available in www.hcgel.com.
J. Remuneration Policy and Criteria of making payments to Directors, Senior Management and Key Managerial Personnel
The Independent Directors are entitled to receive remuneration by way of sitting fees and reimbursement of expenses for participation in the Board / Committee meetings.
An Independent Director shall be entitled to receive an amount of ` 1,00,000 (Rupees One Lakh) as sitting fees for attending each meeting of the Board and the Strategy Committee of the Board. Sitting fee payable for attending other Committee meetings of the Board is ` 50,000 (Rupees Fifty Thousand) for each of the Independent Directors, except that the Chairman of the Audit Committee shall be paid a sitting of ` 1,00,000 (Rupees One Lakh) for attending a meeting of the Audit Committee. The sitting fees are subject to revision from time to time by the Board of Directors and are in compliance with the overall limits prescribed under the Companies Act, 2013 and The Companies (Appointment and Remuneration of Managerial Personnel) Rules, 2014.
The Independent Directors of the Company are not entitled to participate in the Stock Option Scheme of the Company.
In determining the remuneration of Chairman and CEO, Executive Directors, Senior Management Employees and Key Managerial personnel, the Nomination and Remuneration Committee shall ensure / consider the following:
a) the relationship of remuneration and performance benchmark is clear;
b) the balance between fixed and incentive pay reflecting short and long term performance objectives, appropriate to the working of the Company and its goals;
c) the remuneration is divided into two components viz. fixed component comprising salaries, perquisites and a variable component comprising performance bonus;
d) the remuneration including annual increment and performance bonus is decided based on the criticality of the roles and responsibilities, the Company’s performance vis-à-vis the annual achievement, individuals’ performance vis-à-vis KRAs / KPIs, industry benchmark and current compensation trends in the market.
The Nomination and Remuneration Committee of the Board recommends to the Board, for payment of remuneration to the Executive Directors. The Board, subject to the approval of the shareholders and the Central Government (to the extent applicable) approves the payment of remuneration to the Executive Directors.
K. Details of Remuneration to Directors
The Table below provides the remuneration paid to the Directors for the services rendered by them and the Independent Directors towards the sitting fees for the Board/Committee meetings attended by them during the financial year 2017-18. No stock options were granted to any of the Independent Non-Executive Directors during the year 2017-18. None of the Directors are related to each other.
Details of remuneration paid to Directors during the year 2017-18:
Sl. No.
Name of the Director Salary Allowances Commission/ Incentives/
Variable pay
*Sitting fees (`)
Retirals Stock options (number of
options)
1. Dr. B. S. Ajaikumar 95,00,004 94,99,996 # 64,65,000 Nil Nil Nil
2. Mr. Gangadhara Ganapati Nil Nil Nil Nil Nil Nil
3. Mr. Sudhakar Rao Nil Nil Nil 8,50,000 Nil Nil
4. Mr. Shanker Annaswamy Nil Nil Nil 15,00,000 Nil Nil
5. Mr. Suresh C. Senapaty Nil Nil Nil 15,00,000 Nil Nil
6. Dr. Sampath. T. Ramesh Nil Nil Nil 8,50,000 Nil Nil
7. Mrs. Bhushani Kumar Nil Nil Nil 6,00,000 Nil Nil
8. Dr. B. S. Ramesh Nil Nil Nil Nil Nil Nil
9. Dr. Amit Varma Nil Nil Nil Nil Nil Nil
# This includes remuneration to be paid, subject to the approval of the Central Government. * Excluding tax
63
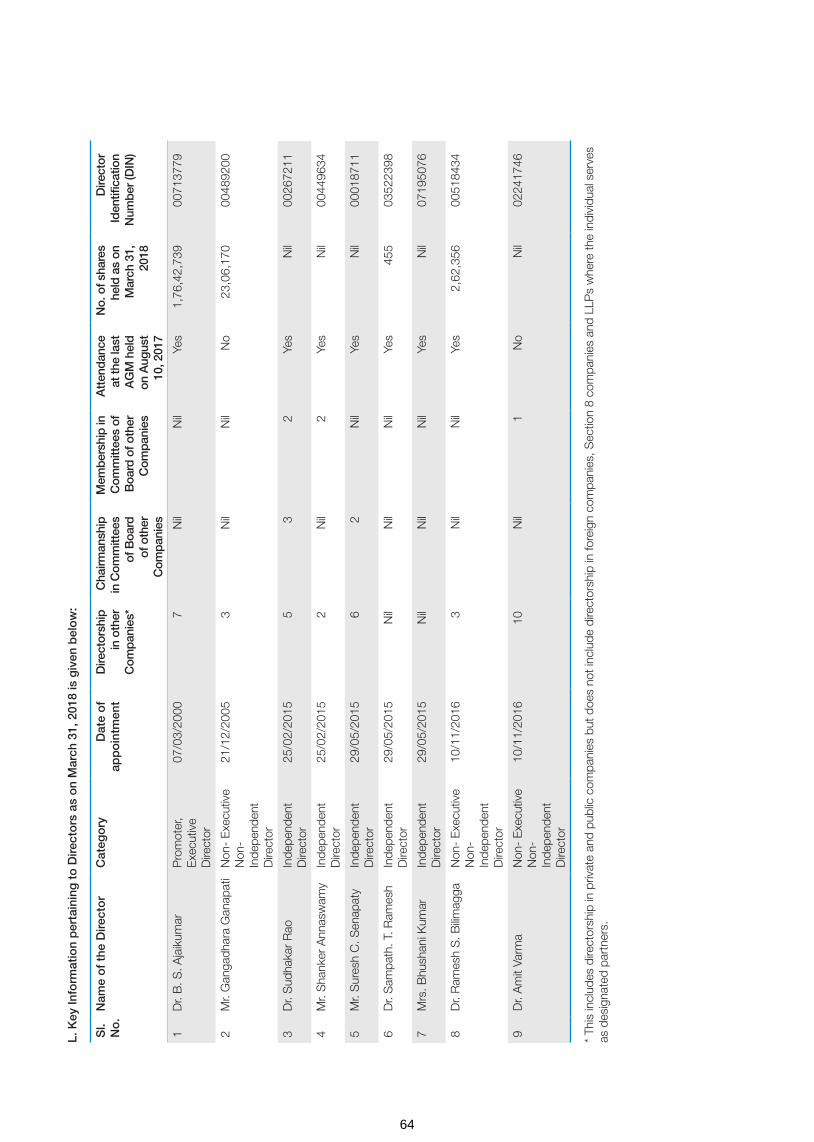
Sl.
No
.N
ame
of
the
Dire
cto
rC
ateg
ory
Dat
e o
f ap
po
intm
ent
Dire
ctor
ship
in
oth
er
Com
pan
ies*
Cha
irman
ship
in
Com
mitt
ees
of B
oard
of
oth
er
Com
pan
ies
Mem
ber
ship
in
Com
mitt
ees
of
Boa
rd o
f oth
er
Com
pan
ies
Att
end
ance
at
the
last
A
GM
hel
d
on A
ugus
t 10
, 201
7
No.
of s
hare
s he
ld a
s on
M
arch
31,
20
18
Dire
ctor
Id
entifi
catio
n N
umb
er (D
IN)
1D
r. B
. S. A
jaik
umar
Pro
mot
er,
Exe
cutiv
e D
irect
or
07/0
3/20
007
Nil
Nil
Yes
1,76
,42,
739
0071
3779
2M
r. G
anga
dhar
a G
anap
ati
Non
- E
xecu
tive
Non
- In
depe
nden
t D
irect
or
21/1
2/20
053
Nil
Nil
No
23,0
6,17
000
4892
00
3D
r. S
udha
kar
Rao
Inde
pend
ent
Dire
ctor
25/0
2/20
155
32
Yes
Nil
0026
7211
4M
r. S
hank
er A
nnas
wam
yIn
depe
nden
t D
irect
or25
/02/
2015
2N
il2
Yes
Nil
0044
9634
5M
r. S
ures
h C
. Sen
apat
yIn
depe
nden
t D
irect
or29
/05/
2015
62
Nil
Yes
Nil
0001
8711
6D
r. S
ampa
th. T
. Ram
esh
Inde
pend
ent
Dire
ctor
29/0
5/20
15N
ilN
ilN
ilYe
s45
503
5223
98
7M
rs. B
hush
ani K
umar
Inde
pend
ent
Dire
ctor
29/0
5/20
15N
ilN
ilN
ilYe
sN
il07
1950
76
8D
r. R
ames
h S
. Bilim
agga
Non
- E
xecu
tive
Non
- In
depe
nden
t D
irect
or
10/1
1/20
163
Nil
Nil
Yes
2,62
,356
0051
8434
9D
r. A
mit
Varm
aN
on-
Exe
cutiv
e N
on-
Inde
pend
ent
Dire
ctor
10/1
1/20
1610
Nil
1N
oN
il02
2417
46
* Th
is in
clud
es d
irect
orsh
ip in
priv
ate
and
publ
ic c
ompa
nies
but
doe
s no
t inc
lude
dire
ctor
ship
in fo
reig
n co
mpa
nies
, Sec
tion
8 co
mpa
nies
and
LLP
s w
here
the
indi
vidu
al s
erve
s as
des
igna
ted
part
ners
.
L. K
ey In
form
atio
n p
erta
inin
g t
o D
irect
ors
as
on
Mar
ch 3
1, 2
018
is g
iven
bel
ow
:
64

None of our Directors were members in more than 10 committees and has not acted as Chairman of more than five committees across all companies in which they were Directors. The Committee membership and Committee chairmanship shown above includes Audit Committee and Stakeholders Relationship Committee.
III. GOVERNANCE BY THE SUB-COMMITTEE OF THE BOARD OF DIRECTORS
The Board places significant reliance on its Committees by delegating a broad range of responsibilities and issues to them. It therefore remains crucial that effective linkages are in place between the Committees and the Board as a whole, not least as it is impracticable for all independent non-executive Directors to be members of all of the committees. Mechanisms are in place to facilitate these linkages. Alongside interconnected committee membership, the Board receives minutes of each of the committee’s meetings.
The Board has five sub-committees of the Board as of March 31, 2018.
A. Audit and Risk Management Committee
B. Nomination and Remuneration Committee
C. Stakeholders’ Relationship Committee
D. Corporate Social Responsibility Committee
E. Strategy Committee
A. Audit and Risk Management Committee
The Audit and Risk Management Committee of the Board reviews, acts on and reports to our Board with respect to various auditing and accounting matters. The scope and function of the Audit and Risk Management Committee is in accordance with Section 177 of the Companies Act, 2013, Regulation 18 of the Listing Regulations and its terms of reference inter-alia, include the following:
a) Overseeing our Company’s financial reporting process and disclosure of its financial information to ensure that the financial statement is correct, sufficient and credible;
b) Recommending to the Board, the appointment, re-appointment, replacement, remuneration and terms of appointment of the statutory auditor and the fixation of audit fee;
c) Review and monitor the auditor’s independence and performance and effectiveness of audit process;
d) Approval of payments to the statutory auditors for any other services rendered by statutory auditors;
e) Reviewing with the management, the annual financial statements and auditor’s report thereon before submission to the Board for approval, with particular reference to:
i) Matters required to be stated in the Director’s responsibility statement to be included in the Board’s report in terms of Section 134(3)(c) of the Companies Act, 2013;
ii) Changes, if any, in accounting policies and practices and reasons for the same;
iii) Major accounting entries involving estimates based on the exercise of judgment by management;
iv) Significant adjustments made in the financial statements arising out of audit findings;
v) Compliance with listing and other legal requirements relating to financial statements;
vi) Disclosure of any related party transactions; and
vii) Qualifications and modified opinions in the draft audit report.
f) Reviewing with the management, the quarterly, half-yearly and annual financial statements before submission to the Board for approval;
g) Review of inter-corporate loans and investments;
h) Review of valuation of undertakings or assets of our Company, wherever it is necessary;
i) Evaluation of internal financial controls and risk management systems;
j) Approval or any subsequent modification of transactions of our Company with related parties;
k) Reviewing with the management, the statement of uses/application of funds raised through an issue (public issue, rights issue, preferential issue, etc.), the statement of funds utilized for purposes other than those stated in the offer document/prospectus/notice and the report submitted by the monitoring agency monitoring the utilization of proceeds of a public or rights issue, and making appropriate recommendations to the Board to take up steps in this matter;
l) Overseeing the vigil mechanism for directors and employees to report their genuine concerns or grievances;
m) Reviewing, with the management, the performance of statutory and internal auditors and adequacy of the internal control systems;
n) Reviewing the adequacy of internal audit function and discussion with internal auditors on any significant findings and follow up thereon;
o) Reviewing the findings of any internal investigations by the internal auditors into matters where there is suspected fraud or irregularity or a failure of internal control systems of a material nature and reporting the matter to the Board;
p) Discussion with statutory auditors before the audit commences, about the nature and scope of audit as well as post-audit discussion to ascertain any area of concern;
q) Looking into the reasons for substantial defaults in the payment to the depositors, debenture holders, shareholders (in case of non-payment of declared dividends) and creditors;
r) To recommend the appointment of the chief financial officer (i.e., the whole-time finance Director or any other person heading the finance function or discharging the function) after assessing the qualifications, experience and background, etc. of the candidate;
s) Carrying out any other functions as is mentioned in the terms of reference of the Audit and Risk Management Committee; and
t) To formulate, review and make recommendations to the Board to amend the Audit and Risk Management Committee charter from time to time.
65
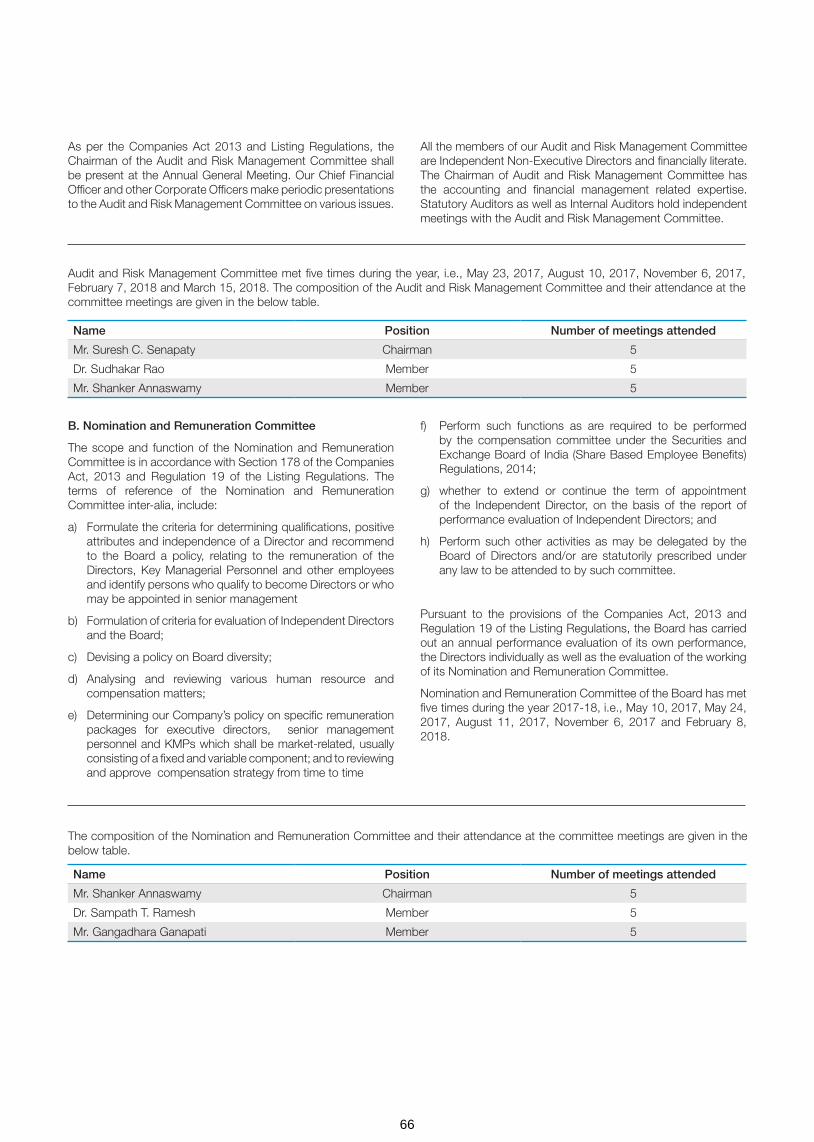
As per the Companies Act 2013 and Listing Regulations, the Chairman of the Audit and Risk Management Committee shall be present at the Annual General Meeting. Our Chief Financial Officer and other Corporate Officers make periodic presentations to the Audit and Risk Management Committee on various issues.
All the members of our Audit and Risk Management Committee are Independent Non-Executive Directors and financially literate. The Chairman of Audit and Risk Management Committee has the accounting and financial management related expertise. Statutory Auditors as well as Internal Auditors hold independent meetings with the Audit and Risk Management Committee.
Audit and Risk Management Committee met five times during the year, i.e., May 23, 2017, August 10, 2017, November 6, 2017, February 7, 2018 and March 15, 2018. The composition of the Audit and Risk Management Committee and their attendance at the committee meetings are given in the below table.
Name Position Number of meetings attended
Mr. Suresh C. Senapaty Chairman 5
Dr. Sudhakar Rao Member 5
Mr. Shanker Annaswamy Member 5
Name Position Number of meetings attended
Mr. Shanker Annaswamy Chairman 5
Dr. Sampath T. Ramesh Member 5
Mr. Gangadhara Ganapati Member 5
B. Nomination and Remuneration Committee
The scope and function of the Nomination and Remuneration Committee is in accordance with Section 178 of the Companies Act, 2013 and Regulation 19 of the Listing Regulations. The terms of reference of the Nomination and Remuneration Committee inter-alia, include:
a) Formulate the criteria for determining qualifications, positive attributes and independence of a Director and recommend to the Board a policy, relating to the remuneration of the Directors, Key Managerial Personnel and other employees and identify persons who qualify to become Directors or who may be appointed in senior management
b) Formulation of criteria for evaluation of Independent Directors and the Board;
c) Devising a policy on Board diversity;
d) Analysing and reviewing various human resource and compensation matters;
e) Determining our Company’s policy on specific remuneration packages for executive directors, senior management personnel and KMPs which shall be market-related, usually consisting of a fixed and variable component; and to reviewing and approve compensation strategy from time to time
f) Perform such functions as are required to be performed by the compensation committee under the Securities and Exchange Board of India (Share Based Employee Benefits) Regulations, 2014;
g) whether to extend or continue the term of appointment of the Independent Director, on the basis of the report of performance evaluation of Independent Directors; and
h) Perform such other activities as may be delegated by the Board of Directors and/or are statutorily prescribed under any law to be attended to by such committee.
Pursuant to the provisions of the Companies Act, 2013 and Regulation 19 of the Listing Regulations, the Board has carried out an annual performance evaluation of its own performance, the Directors individually as well as the evaluation of the working of its Nomination and Remuneration Committee.
Nomination and Remuneration Committee of the Board has met five times during the year 2017-18, i.e., May 10, 2017, May 24, 2017, August 11, 2017, November 6, 2017 and February 8, 2018.
The composition of the Nomination and Remuneration Committee and their attendance at the committee meetings are given in the below table.
66

C. Stakeholders’ Relationship Committee
This Committee is constituted in compliance with Section 178 of the Companies Act, 2013 and the Listing Regulations as Stakeholders’ Relationship Committee.
The terms of reference of the Stakeholders’ Relationship Committee inter-alia, include the following:
a) Redressal of shareholders’/investors’ grievances;
b) Allotment of shares, approval of transfer or transmission of
shares, debentures or any other securities;
c) Issue of duplicate certificates and new certificates on split/consolidation/renewal;
d) Non-receipt of declared dividends, balance sheets of the Company or any other documents or information to be sent by our Company to its shareholders; and
e) Carrying out any other function as prescribed under the Equity Listing Agreement.
The composition of the Stakeholders Relationship Committee and their attendance at the committee meetings are given in the below table.
The Committee has met twice during the financial year 2017-18 i.e., on August 11, 2017 and November 6, 2017.
E. Strategy Committee
The Committee was constituted by our Board of Directors at their Meeting held on May 26, 2016 with the scope of reviewing strategic initiatives; and for having an ooversight of the strategic direction of the Company.
The Committee shall, at all times, be composed of at least 4 members of the Board; and the Chairperson of the Committee shall be the Chairman and CEO of the Company. The members of the Committee shall be nominated by the Board of Directors with a right to appoint, replace the members from time to time. The Company Secretary shall act as the Secretary of the Committee. CFO shall be an invitee to the Committee Meetings and would provide support to the Committee in terms of financial analysis and planning.
The members of the Committee and their attendance at the committee meetings are given in the below table:
The Chairman of the Committee, Mr. Gangadhara Ganapati is a non-executive director. The Committee met once during the year 2017-18 i.e., May 25, 2017.
Details of Shareholders Complaints
The details of shareholders complaints received and resolved till March 31, 2018 are as under:
D. Corporate Social Responsibility Committee
The Corporate Social Responsibility Committee was constituted by our Board of Directors at their meeting held on May 29, 2015. The terms of reference of the Corporate Social Responsibility Committee of our Company are as per Section 135 of the Companies Act, 2013 and the applicable rules thereunder.
The members of the Corporate Social Responsibility Committee and their attendance at the committee meetings are given in the below table:
Name Position Number of meetings attended
Mr. Gangadhara Ganapati Chairman 1
Dr. B. S. Ajaikumar Member 1
No. of complaints remaining pending at the beginning of the year
Complaints received during the year
Complaints resolved during the year
No. of complaints remaining pending at the end of the year
- - - -
Name Position Number of meetings attended
Dr. Sudhakar Rao Chairman 2
Dr. B. S. Ajaikumar Member 2
Dr. Sampath T. Ramesh Member 2
Mrs. Bhushani Kumar Member 2
Name Position Number of meetings attended
Dr. B. S. Ajaikumar Chairperson 5
Mr. Gangadhara Ganapati Member 4
Mr. Suresh Senapaty Member 5
Mr. Shanker Annaswamy Member 5
Dr. Amit Varma Member 3
67

Primary responsibilities of the Committee, inter alia, are:
a) Oversight of the strategic direction of the Company
b) Making recommendations to the Board, related to the organization’s mission, vision, strategic initiatives, major programs and services and periodic review of the same.
c) Helping management identify critical strategic issues facing the organization, assisting in analysis of alternative strategic options.
d) Ensuring management has established an effective strategic planning process, including development of a three to five year Strategic Plan with measurable goals and time targets.
e) Annually reviewing the Company’s Strategic Plan and recommending updates as needed based on changes in the market, community needs and other factors.
f) Debate and discuss the outside-in-perspective (from a macro economic and technology trends) and see how this could possibly influence our choices as well as potential risks we may have to overcome.
g) Evaluate new investment proposals and expansions of existing business and make suitable recommendation to the Board for adoption.
h) Discuss thoughts on Mergers and Acquisitions and Strategic alliances and leverage Strategy Committee to suggest ideas and potentially open up sole sourced transactions.
i) Development of plans to implement the Company strategy.
j) Review of the Company’s progress with respect to implementation of its strategy. The Committee will regularly review, discuss, and, where appropriate, make recommendations to management on the Company’s vision as well as share with management the Board’s expectations for the strategic planning process.
k) Delegation of power to the Chairman of the Company to approve investments up to specified limits.
l) Examine specific proposals such as acquisition or divestment of companies or similar such proposals requiring the approval of the Board and make appropriate recommendations to the Board.
m) Advising and guiding CFO organization for developing formats for financial analysis of new projects, mergers and acquisitions etc., and for presenting financial information for evaluating investment opportunities.
The Committee has met five times i.e., on April 26, 2017, August 3, 2017, November 06, 2017, February 5, 2018 and March 23, 2018 during the financial year 2017-18.
IV. Governance Through Management process
A. Code for Prevention of Insider Trading:
The Company has adopted a Code of Conduct to regulate, monitor and report trading by insiders under the SEBI (Prohibition of Insider Trading) Regulations, 2015. This Code of Conduct also includes code for practices and procedures for fair disclosure of unpublished price sensitive information and has been made available on the Company’s website at www.hcgel.com
B. Disclosure Policy:
In line with requirements under Regulation 30 of the Listing Regulations, the Company has framed a policy on disclosure of material events and information as per the Listing Regulations, which is available on our website at www.hcgel.com. The objective of this policy is to have uniform disclosure practices and ensure timely, adequate and accurate disclosure of information on an on-going basis. The Company has constituted a Disclosure Committee consisting of senior officials, which approves all disclosures required to be made by the Company. The Company Secretary acts as Secretary to the Disclosure Committee.
C. Whistle Blower Policy:
The Company has adopted the Whistle Blower Policy which provides for a channel for receiving and redressing complaints from employees and directors. Under this policy, we encourage our employees to report any fraudulent, financial or other, information to the stakeholders, any conduct that results in violation of the Company’s Code of Business Conduct, to management (on an anonymous basis, if employees so desire). Likewise, under this policy, we have prohibited discrimination, retaliation or harassment of any kind against any employees who, based on the employee’s reasonable belief that such conduct or practice have occurred or are occurring, reports that information or participates in the investigation. Mechanism followed under policy is appropriately communicated within the Company across all levels and has been displayed on the Company’s intranet and website at www.hcgel.com.
D. Policy for Preservation of Documents:
Pursuant to the requirements under Regulation 9 of the Listing Regulations, the Board has formulated and approved a Document Retention Policy prescribing the manner of retaining the Company’s documents and the time period up to certain documents are to be retained.
E. Policy for Prevention, Prohibition & Redressal Sexual Harassment of Women at Workplace:
Pursuant to the requirements of Sexual Harassment of Women at Workplace (Prevention, Prohibition & Redressal) Act, 2014, your Company has a policy and framework for employees to report sexual harassment cases at workplace and our process ensures complete anonymity and confidentiality of information. Adequate workshops and awareness programmes against sexual harassment are conducted across the organization.
V. Other Disclosures
A. Disclosure of materially significant related party transactions
All transactions entered into with the related parties as defined under the Companies Act, 2013, during the financial year were in the ordinary course of business and on an arm’s length basis and do not attract the provisions of Section 188 of the Companies Act, 2013. There are no materially significant related party transactions made by the Company with Promoters, Directors, Key Managerial Personnel or other designated persons which may have a potential conflict with the interest of the Company at large.
In terms of Regulation 23 of the Listing Regulations, the Company has adopted a policy on Related Party Transactions, Framework document around the Policy and certification process for purpose of identification, monitoring and reporting of such
68

transactions. The abridged policy on Related Party Transactions as approved by the Audit Committee and the Board is available on the Company’s website at www.hcgel.com.
None of the Directors has any pecuniary relationships or transactions vis-à-vis the Company, other than the managerial remuneration paid/payable to the Executive Directors and sitting fee paid to the Independent Directors. During the year 2017-18, no transactions of material nature had been entered into by the Company with the Management or their relatives that may have a potential conflict with interest of the Company and the concerned officials have given undertakings to that effect as per the provisions of the Listing Regulations. Register of Contracts or arrangements in which Directors are interested in terms of Section 189 of the Companies Act, 2013 is maintained and particulars of transactions are entered in the Register, wherever applicable.
B. Details of non-compliance by the Company, penalties, and strictures imposed on the Company by Stock Exchange or SEBI or any statutory authority, on any matter related to capital markets, during the last three years.
The Company listed its shares with National Stock Exchange of India Limited and BSE Limited with effect from March 30, 2016. During the period, the Company has complied with all the requirements of the Stock Exchange or SEBI or any other statutory authority on matters related to Capital Markets, as applicable, since listing on the stock exchanges. The Company has not been imposed with any penalty/fines in respect of non-compliance with regulations by Stock Exchange or SEBI or any statutory authority related to capital markets during the period.
C. Whistle Blower Policy and affirmation that no personnel have been denied access to the Audit Committee
The Company has adopted a Whistle Blower Policy which is a channel for receiving and redressing of employees’ complaints. No personnel in the Company has been denied access to the Audit and Risk Management Committee or its Chairman.
D. Policy for determining material subsidiary
The Company does not have any material subsidiary whose net worth exceeds 20% of the consolidated net worth of the holding Company in the immediately preceding accounting year or has generated 20% of the consolidated income of the Company during the previous financial year. Accordingly, a policy on material subsidiaries has not been formulated.
E. Framework to Monitor Subsidiary companies
All the subsidiary companies of the Company are managed with their Boards having the rights and obligations to manage these companies in the best interest of their stakeholders. The Company nominates its representatives on the Board of subsidiary companies and monitors performance of such companies, inter alia, by reviewing:
a. financial statements, statement containing all significant transactions and arrangements entered into by the unlisted subsidiary companies forming part of the financials.
b. Minutes of the meetings of the unlisted subsidiary companies, if any, are placed before the Company’s Board regularly.
F. Certificate on Compliance with norms of Corporate Governance
The certificate in terms of Listing Regulations obtained from Practicing Company Secretary is annexed herewith and forms part of the Annual Report.
G. Unclaimed Shares
There are no shares in the DEMAT suspense account or the unclaimed suspense account.
The disclosure as required under Listing Regulations is given below:
• Aggregate number of shareholders and the outstanding shares lying in the Unclaimed Suspense Account at the beginning of the year: Nil
• Number of shareholders who approached the issuer for transfer of shares from the Unclaimed Suspense Account during the year: Nil
• Number of shareholders to whom shares were transferred from the Unclaimed Suspense Account during the year: Nil
• Aggregate number of shareholders and the outstanding shares lying in the Unclaimed Suspense Account at the end of the year: Nil
• Voting rights on these shares shall remain frozen till the rightful owner of such shares claims the shares: NA
H. Compliance with mandatory requirements and adoption of non-mandatory requirements
Your Company has complied with all mandatory requirements of Listing Regulations with respect to Corporate Governance to the extent applicable to the Company.
Your Company has complied with the discretionary requirement of Listing Regulations with respect to the Audit Report since there were no audit qualification/observation on your Company’s financial statements, during the year under review.
I. Code of Conduct for the Board Members and Senior Management
The Board of Directors and all Senior Management of the Company have a responsibility to understand and follow the Code of Conduct. They are expected to perform their work with honesty and integrity. The Code reflects general principles to guide employees in making ethical decisions. The Code outlines standards for fair dealing, honesty and integrity, health, safety and environment that need to be maintained for professional conduct. This Code has been displayed on the Company’s website www.hcgel.com.
J. Declaration as required under Regulation 34 (3) and Schedule V of the Listing Regulations
All Directors and Senior Management personnel of the Company have affirmed compliance with the Code of Conduct for the financial year ended March 31, 2018.
Bengaluru Dr. B. S. Ajaikumar May 22, 2018 Chairman & CEO
69

GENERAL SHAREHOLDER INFORMATIONA. Corporate Identity Number (CIN)
Our Corporate Identity Number (CIN), allotted by Ministry of Corporate Affairs, Government of India is L15200KA1998PLC023489 and our Company Registration Number is 23489.
B. Annual General Meeting
The Twentieth Annual General Meeting of the Company is scheduled to be held as under:
The Day, date and time : Wednesday, the 26th day of September 2018 at 3.00 P.M.
Venue: M. S. Ramaiah Memorial Hospital Auditorium, M. S. Ramaiah Memorial Hospital, MSR Nagar, MSRIT Post, Bengaluru – 560054.
General Body Meetings
i. Details of last three Annual General Meetings
Particulars Date & Time Venue Special Resolutions passed
For the Financial year ended March 31, 2017 - Nineteenth AGM
August 10, 2017 at 4.00 p.m. M. S. Ramaiah Memorial Hospital Auditorium, M. S. Ramaiah Memorial Hospital, MSR Nagar, MSRIT Post, Bengaluru – 560054
1. Increase in remuneration of Ms. Anjali Ajaikumar, Vice-President – Strategy & Quality, relative of Dr. B. S. Ajaikumar, Whole-time Director, designated as Chairman & CEO
2. To approve borrowings in excess of the limits prescribed under Section 180 (1) (c) of the Companies Act, 2013
For the Financial year ended March 31, 2016 - Eighteenth AGM
September 29, 2016 at 3.00 p.m.
No. 9/1, P. Kalinga Rao Road, Sampangi Rama Nagar, Bengaluru – 560027, Karnataka, India
1. Increase in remuneration of Dr. B. S. Ajaikumar, Whole-time Director, designated as Chairman & CEO
2. To permit Foreign Institutional Investors (FIIs), Foreign Portfolio Investors (FPI) and Qualified Foreign Investors (QFI) to acquire and to make investment in the equity shares of the Company
3. Issue of further shares to employees under a Scheme of Employees’ Stock Option
For the Financial year ended March 31, 2015 - Seventeenth AGM
September 28, 2015 at 11.00 a.m.
No. 3, Ground Floor, Tower Block, Unity Building Complex, Mission Road, Bengaluru – 560027, Karnataka, India
None
ii. Details of Special Resolutions passed in Extraordinary General Meetings
At the Extraordinary General Meeting held on June 15, 2015, the shareholders have passed Special Resolutions as listed below:
1. Approve Initial Public Offer of the Company under Section 62 of the Companies, Act, 2013 for issue of up to 1,40,00,000 Equity shares (fresh issue) to the public and took note of the offer for sale of up to 2,30,00,000 Equity shares by existing members of the Company
2. Adoption of new set of Articles of Association
At the Extraordinary General Meeting held on July 13, 2015, the shareholders have passed Special Resolutions as listed below:
1. Re-appointment of Dr. B. S. Ajaikumar as whole time Director of the Company designated as Chairman & CEO for a period of 4 years
2. Maintenance of Register of Members and other related books at a place other than the Registered Office of the Company
3. Approve Employee Stock Option Scheme 2014
70

At the Extraordinary General Meeting held on December 1, 2017, the shareholders have passed Resolution with requisite majority as listed below:
1. Approve, with or without modification, the Scheme of Amalgamation of HCG Pinnacle Oncology Private Limited with HealthCare Global Enterprises Limited
At the Extraordinary General Meeting held on December 22, 2017, the shareholders have passed Special Resolution as listed below:
1. Issue of Equity Shares on a Preferential Allotment / Private Placement Basis
At the Extraordinary General Meeting held on March 29, 2018, the shareholders have passed Special Resolution as listed below:
1. Issue of equity shares to Dr. M. Gopichand, one of the Promoters, for consideration other than cash
iii. Details of Postal Ballot
The Company did not conduct any postal ballots during the year.
C. Means of Communication
i. Means of Communication with Shareholders / Analysts
We have established procedures to disseminate, in a planned manner, relevant information to our shareholders, analysts, employees and the people at large.
All our news releases and presentations made at investor conferences and to analysts are posted on the Company’s website at www.hcgel.com.
Our quarterly results are published in widely circulated newspapers such as The Business Standard (English) and the Vijayawani (Kannada)
ii. Website: The Company’s website contains a separate dedicated section “Investors” where information sought by shareholders is available. The Annual report of the Company, press releases, quarterly reports of the Company apart from the details about the Company, Board of directors and Management, are also available on the website in a user friendly and downloadable form at www.hcgel.com.
iii. Annual Report: Annual Report containing audited standalone accounts, consolidated financial statements together with
Directors’ report, Auditors report and other important information are circulated to members entitled thereto.
D. Financial year of the Company
The Financial year of the Company starts from 1st April of every year and ends on 31st March of succeeding year and the current financial year is from April 01, 2017 to March 31, 2018. The Company got its securities listed on BSE Limited and National Stock Exchange of India Limited on March 30, 2016.
E. Dividend
Keeping in view the growth strategy of the Company, the Board of Directors of your Company have decided to plough back the profits and thus, not recommended any dividend for the financial year under review.
F. Unclaimed Dividends
The Company has not declared dividend in the previous years and hence there in no requirement to transfer the unpaid or unclaimed dividend on due date to the Investor Education and Protection Fund administered by the Central Government pursuant to Section 124 and 125 of Companies Act, 2013.
G. Listing on Stock Exchanges
As on date, the Company’s Equity Shares are listed on the following Stock Exchanges
• National Stock Exchange of India Limited (NSE), Exchange Plaza, Bandra-Kurla Complex, Bandra (E), Mumbai-400051. Website: www.nseindia.com
• BSE Limited, Phiroze Jheejheebhoy Towers, Dalal Street, Fort, Mumbai-400001. Website: www.bseindia.com The Company has paid the Annual Listing Fees to both NSE and BSE and there are no outstanding payments as on date.
H. International Securities Identification Number (ISIN)
ISIN is an identification number for traded shares. This number needs to be quoted in each transaction relating to the dematerialized equity shares of the Company. Our ISIN number for equity shares of the Company is INE075I01017.
I. Stock Code
Equity shares Stock codes
BSE Limited 539787
National Stock Exchange of India Limited HCG
71
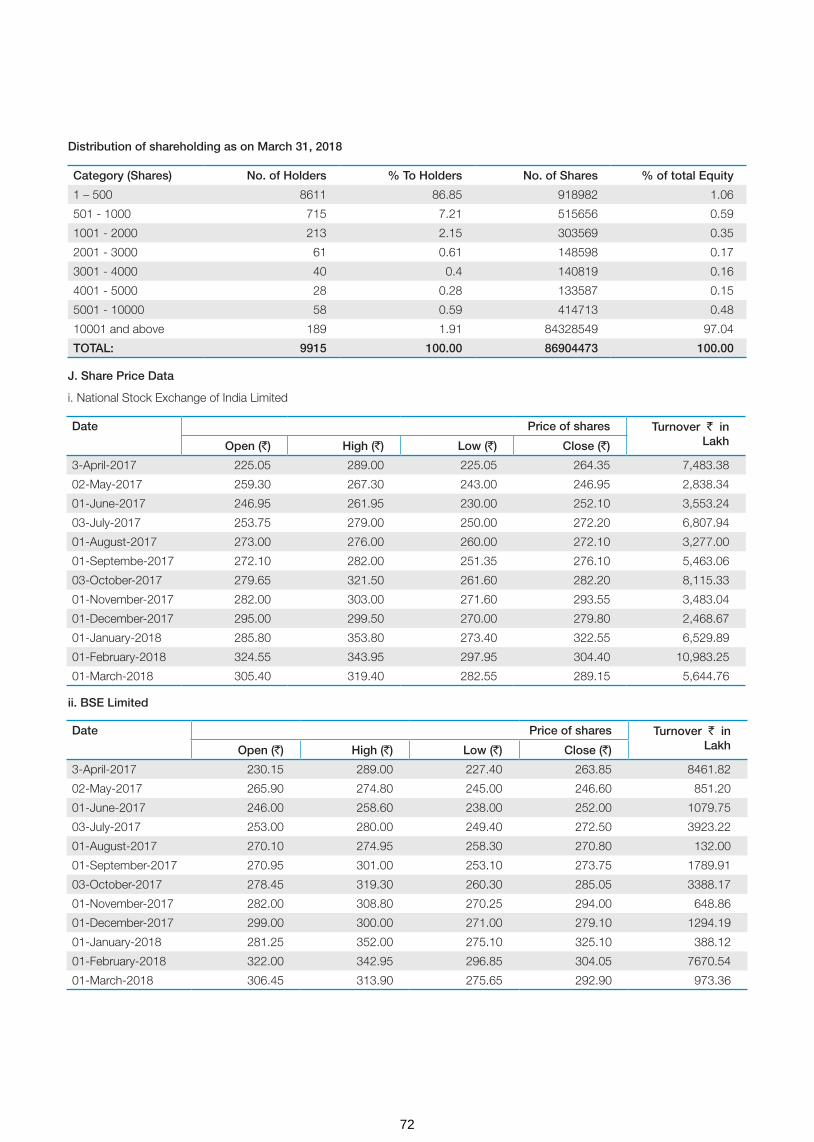
Distribution of shareholding as on March 31, 2018
J. Share Price Data
i. National Stock Exchange of India Limited
ii. BSE Limited
Category (Shares) No. of Holders % To Holders No. of Shares % of total Equity
1 – 500 8611 86.85 918982 1.06
501 - 1000 715 7.21 515656 0.59
1001 - 2000 213 2.15 303569 0.35
2001 - 3000 61 0.61 148598 0.17
3001 - 4000 40 0.4 140819 0.16
4001 - 5000 28 0.28 133587 0.15
5001 - 10000 58 0.59 414713 0.48
10001 and above 189 1.91 84328549 97.04
TOTAL: 9915 100.00 86904473 100.00
Date Price of shares Turnover ` in LakhOpen (`) High (`) Low (`) Close (`)
3-April-2017 225.05 289.00 225.05 264.35 7,483.38
02-May-2017 259.30 267.30 243.00 246.95 2,838.34
01-June-2017 246.95 261.95 230.00 252.10 3,553.24
03-July-2017 253.75 279.00 250.00 272.20 6,807.94
01-August-2017 273.00 276.00 260.00 272.10 3,277.00
01-Septembe-2017 272.10 282.00 251.35 276.10 5,463.06
03-October-2017 279.65 321.50 261.60 282.20 8,115.33
01-November-2017 282.00 303.00 271.60 293.55 3,483.04
01-December-2017 295.00 299.50 270.00 279.80 2,468.67
01-January-2018 285.80 353.80 273.40 322.55 6,529.89
01-February-2018 324.55 343.95 297.95 304.40 10,983.25
01-March-2018 305.40 319.40 282.55 289.15 5,644.76
Date Price of shares Turnover ` in LakhOpen (`) High (`) Low (`) Close (`)
3-April-2017 230.15 289.00 227.40 263.85 8461.82
02-May-2017 265.90 274.80 245.00 246.60 851.20
01-June-2017 246.00 258.60 238.00 252.00 1079.75
03-July-2017 253.00 280.00 249.40 272.50 3923.22
01-August-2017 270.10 274.95 258.30 270.80 132.00
01-September-2017 270.95 301.00 253.10 273.75 1789.91
03-October-2017 278.45 319.30 260.30 285.05 3388.17
01-November-2017 282.00 308.80 270.25 294.00 648.86
01-December-2017 299.00 300.00 271.00 279.10 1294.19
01-January-2018 281.25 352.00 275.10 325.10 388.12
01-February-2018 322.00 342.95 296.85 304.05 7670.54
01-March-2018 306.45 313.90 275.65 292.90 973.36
72
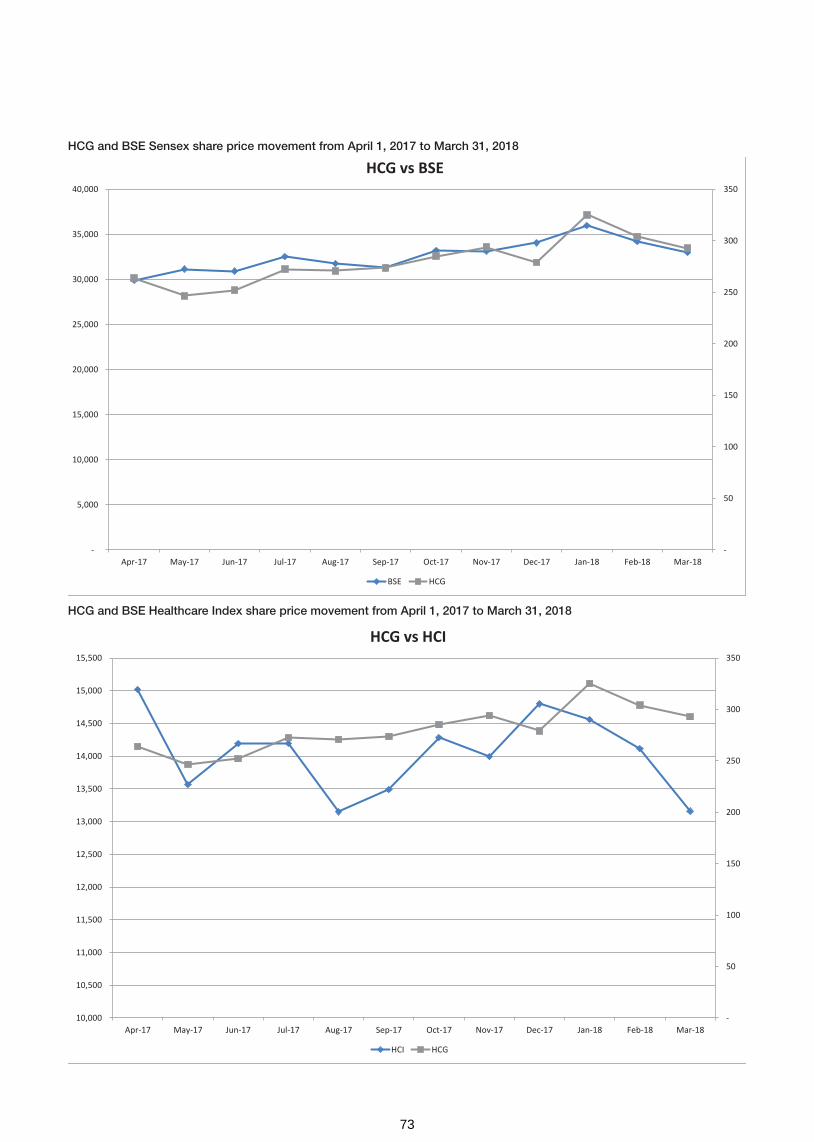
-
50
100
150
200
250
300
350
10,000
10,500
11,000
11,500
12,000
12,500
13,000
13,500
14,000
14,500
15,000
15,500
Apr-17 May-17 Jun-17 Jul-17 Aug-17 Sep-17 Oct-17 Nov-17 Dec-17 Jan-18 Feb-18 Mar-18
HCG vs HCI
HCI HCG
-
50
100
150
200
250
300
350
-
5,000
10,000
15,000
20,000
25,000
30,000
35,000
40,000
Apr-17 May-17 Jun-17 Jul-17 Aug-17 Sep-17 Oct-17 Nov-17 Dec-17 Jan-18 Feb-18 Mar-18
HCG vs BSE
BSE HCG
HCG and BSE Sensex share price movement from April 1, 2017 to March 31, 2018
HCG and BSE Healthcare Index share price movement from April 1, 2017 to March 31, 2018
73

K. Shareholding pattern – Physical Vs DEMAT
The pattern of shareholding in physical as against in DEMAT mode as on March 31, 2018 is as under:
Out of total 9,915 shareholders, 173 shareholders hold 18,44,221 shares, aggregating to 2.12% of total shares, in physical mode as on March 31, 2018.
Shareholders can also send their correspondence to the Company with respect to their shares, dividend, request for annual reports and shareholder grievance. The contact details are provided below:
Sl. No Description Cases Shares % Equity
1 PHYSICAL 173 18,44,221 2.12
2 NSDL 6,281 8,28,66,161 95.35
3 CDSL 3,461 21,94,091 2.53
Total: 9,915 8,69,04,473 100.00
L. Registrar and Transfer Agents
The Company’s Registrar and Share Transfer Agent is M/s. Karvy Computershare Private Limited for handling the shares held in physical as well as dematerialised mode. The shareholders may address all their correspondence directly to the RTA.
Address for correspondence
The address of our Registrar and Share Transfer Agents is given below.
M/s. Karvy Computershare Private Limited
Unit: HealthCare Global Enterprises Limited
Karvy Selenium Tower B, Plot 31-32, Gachibowli,
Financial District, Nanakramguda
Hyderabad – 500 032
Phone: 040-67162222
Fax: 040-23001153
Contact person name, designation, e-mail id:Mr. K. S. Reddy, Asst. General Manager - [email protected]
M. Share Transfer System and Reconciliation of Share Capital Audit
Share transfer requests for shares held in physical form received by the Company are processed and share certificates are issued/returned within the time stipulated under the Companies Act and the relevant rules/regulations, where the documents provided are in order and complete in all respects.
The Reconciliation of Share Capital Audit as stipulated under Regulation 55A of SEBI (Depositories and Participants) Regulations, 1996 is carried out by a Practicing Company Secretary for every quarter to reconcile the total admitted
capital with National Securities Depository Limited and Central Depository Services (India) Limited and total issued and listed capital. The Reconciliation of Share Capital Audit Reports confirms that the total issued/paid up capital is same as the total number of shares in physical form and the total number of dematerialized shares held with the depositories. The reports for all the quarters have been filed with the stock Exchanges within the time stipulated under Listing Regulations.
N. Dematerialisation of shares and liquidity
The requests for dematerialization of shares are processed by RTA expeditiously and the confirmation in respect of dematerialization is entered by RTA in the depository system of the respective depositories, by way of electronic entries for dematerialization of shares generally on weekly basis. In case of rejections, the documents are returned under objection to the Depository Participant with a copy to the shareholder and electronic entry for rejection is made by RTA in the Depository System. The rejected requests may be resubmitted with necessary documents, which are processed in the normal course once again.
O. Web-based Query Redressal System
Members may utilize this facility extended by the Registrar & Transfer Agents for redressal of their queries. Please visit https://kcpl.karvy.com and click on “investors” option for query registration through free identity registration to log on. Investor can submit the query in the “QUERIES” option provided on the web-site, which would give the grievance registration number. For accessing the status/response to your query, please use the same number at the option “VIEW REPLY” after 24 hours. The investors can continue to put additional queries relating to the case till they are satisfied.
For Shareholder Grievance RedressalMs. Sunu ManuelCompany Secretary and Compliance OfficerHealthCare Global Enterprises LimitedHCG Towers, No. 8, P. Kalinga Rao RoadSampangi Rama NagarBengaluru - 560027Phone: 080-46607700Fax: 080-46607748e-mail: [email protected]
For Investor RelationsMr. Niraj DidwaniaHead – Investor RelationsHCG, Unity Building ComplexNo. 3, Tower BlockUnity Building Complex, Mission RoadBengaluru – 560027Phone: 080-46607700Fax: 080-46607748e-mail: [email protected]
74

P. Chairman and Managing Director / CFO Certification
The Chairman and CEO, CFO have issued certificate pursuant to the provisions of Regulation 17 (8) of Listing Regulations, 2015 certifying that the financial statements do not contain any untrue statement and these statements represent a true and fair view of the Company’s affairs. The said certificate is annexed and forms part of the Annual Report.
Q. Hospital units/locations
Your Company, with its subsidiaries provides healthcare services across India and Africa. Details of locations of units are available on our website https://www.hcgoncology.com/our-hospitals.
75

Chief Executive Officer (CEO) / Chief Financial Officer (CFO) Certification under Regulation 17 (8) of the SEBI (LODR) Regulations, 2015
The Board of Directors
HealthCare Global Enterprises Limited
Bengaluru
Dear members of the Board,
1. We have reviewed the financial statements and the cash flow statement of HealthCare Global Enterprises Limited for the year ended March 31, 2018 and to the best of our knowledge and belief:
a. these statements do not contain any materially untrue statement or omit any material fact or contain statements that might be misleading;
b. these statements together present a true and fair view of the Company’s affairs and are in compliance with existing accounting standards, applicable laws and regulations.
2. There are, to the best of our knowledge and belief, no transactions entered into by the Company during the year which are fraudulent, illegal or violate the Company’s Code of Conduct.
3. We accept responsibility for establishing and maintaining internal controls for financial reporting and we have evaluated the effectiveness of Company’s internal control systems pertaining to financial reporting. We have not come across any reportable deficiencies in the design or operation of such internal controls.
4. We have indicated to the Auditors and the Audit Committee:
a. that there are no significant changes in internal control over financial reporting during the year;
b. that there are no significant changes in accounting policies during the year; and
c. that there are no instances of significant fraud of which we have become aware.
Bengaluru Dr. B. S. Ajaikumar Yogesh Patel
May 22, 2018 Chairman & CEO Chief Financial Officer
76
CORPORATE GOVERNANCE COMPLIANCE CERTIFICATE
Corporate Identity No : L15200KA1998PLC023489
Nominal Capital : ` 132 Crores
To
The Members of HEALTHCARE GLOBAL ENTERPRISES LIMITED,
We have examined all the relevant records of HEALTHCARE GLOBAL ENTERPRISES LIMITED for the purpose of certifying compliance of the conditions of the Corporate Governance under the SEBI (Listing Obligations and Disclosure Requirements) Regulations, 2015 for the financial year ended March 31, 2018. We have obtained all the information and explanations which to the best of our knowledge and belief were necessary for the purposes of certification.
The compliance of conditions of corporate governance is the responsibility of the Management. Our examination was limited to the procedure and implementation process adopted by the Company for ensuring the compliance of the conditions of the corporate governance.
This certificate neither an assurance as to the future viability of the Company nor of the efficacy or effectiveness with which the management has conducted the affairs of the Company.
In our opinion and to the best of our information and according to the explanations and information furnished to us, we certify that the Company has complied with all the mandatory conditions of Corporate Governance as stipulated in the said Regulations. As regards Discretionary Requirements specified in Part E of Schedule II of the SEBI (Listing Obligations and Disclosure Requirements) Regulations, 2015 the Company has complied with items C and E.
For V. Sreedharan & Associates Company Secretaries
V. SreedharanBengaluru PartnerMay 15, 2018 FCS: 2347; CP No. 833
77

Management Discussion and Analysis
The following discussion of our financial performance and results of operations should be read together with the Audited Financial Statements, the notes and significant accounting policies thereto and the reports thereon, on the Financial Statements.
Our Management accepts responsibility for the integrity and objectivity of these financial statements, as well as for various estimates and judgments used therein. The estimates and judgments relating to the financial statements have been made on a prudent and reasonable basis, so that the financial statements reflect in a true and fair manner, the form and substance of transactions, and reasonably present our state of affairs, profits/loss and cash flows for the year. Investors are also requested to note that this discussion is based on the consolidated financial results of the Company.
Healthcare Market
Indian healthcare market is expected to rank amongst the top three in terms of incremental growth by 2020. India was the sixth largest market globally in terms of size in 2014. The industry is expected to advance at a CAGR of 22.87 per cent during 2015–2020 to reach USD 280 billion. Rising income levels, ageing population, growing health awareness and changing attitude towards preventive healthcare is expected to boost healthcare services demand in future. The low cost of medical services has resulted in a rise in the country’s medical tourism, attracting patients from across the world. Moreover, India has emerged as a hub for R&D activities for international players due to its relatively low cost of clinical research. Conducive policies for encouraging FDI, tax benefits, favourable government
policies coupled with promising growth prospects have helped the industry attract private equity, venture capitals and foreign players.
Overall, the growth in the Indian healthcare industry will be primarily driven by socio-economic changes such as growing health awareness, increasing per-capita income, increasing penetration of health insurance, increasing instances of lifestyle diseases and an ageing population; technological advancements such as continuing development of mobile technology which will enhance the delivery of healthcare through telemedicine; affordability of healthcare in India, which will attract more patients as the treatment for major surgeries in India costs less than the cost in a developed country; and government policies in India that support the growth in the healthcare industry such as tax reliefs on hospitals in tier II and tier III cities, which will attract healthcare investment in these areas.
The private sector has emerged as a vibrant force in India’s healthcare industry, lending it both national and international repute. Large investments by private sector players are likely to contribute significantly to the development of India’s hospital industry, which comprises around 80 per cent of the total market. Private sector’s share in hospitals and hospital beds is estimated at 74 per cent and 40 per cent, respectively.
A major portion of secondary, tertiary and quaternary healthcare institutions comes from private sector. Large investments by private sector players are likely to contribute significantly to the development of India’s hospital industry with the sector poised to grow to USD280 billion by 2020.
“Indian Hospital Services Outlook”
(Source: Report by consultancy RNCOS, Grand Thornton, LSI Financial Services, OECD, Techsri Research)
“Indian Hospital Services Outlook”(Source: Report by consultancy RNCOS, Grand Thornton, LSI Financial Services, OECD, Techsri Research)
Government Hospitals
Top Tier Hospitals
Mid-Tier Hospitals
Nursing Homes
Healthcare spending in India, 2005
Healthcare spending in India, 2015
19
4011
3034
26
14
26
78
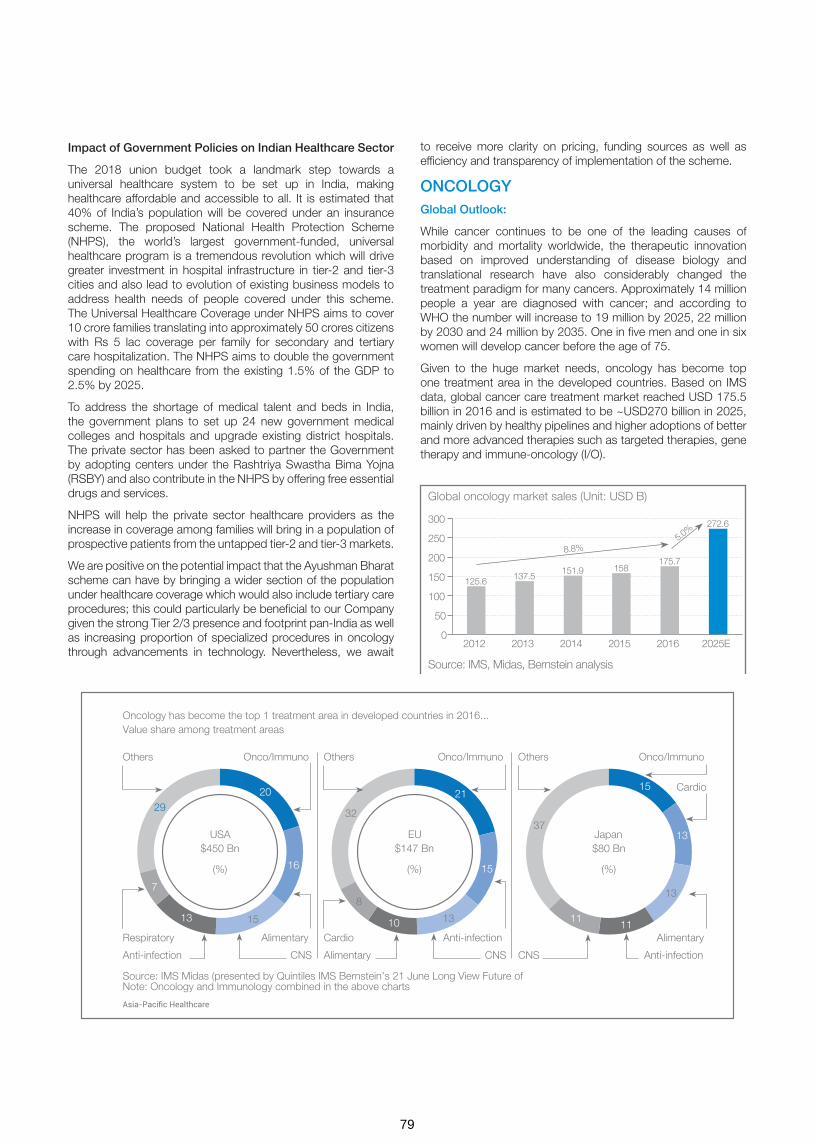
Impact of Government Policies on Indian Healthcare Sector
The 2018 union budget took a landmark step towards a universal healthcare system to be set up in India, making healthcare affordable and accessible to all. It is estimated that 40% of India’s population will be covered under an insurance scheme. The proposed National Health Protection Scheme (NHPS), the world’s largest government-funded, universal healthcare program is a tremendous revolution which will drive greater investment in hospital infrastructure in tier-2 and tier-3 cities and also lead to evolution of existing business models to address health needs of people covered under this scheme. The Universal Healthcare Coverage under NHPS aims to cover 10 crore families translating into approximately 50 crores citizens with Rs 5 lac coverage per family for secondary and tertiary care hospitalization. The NHPS aims to double the government spending on healthcare from the existing 1.5% of the GDP to 2.5% by 2025.
To address the shortage of medical talent and beds in India, the government plans to set up 24 new government medical colleges and hospitals and upgrade existing district hospitals. The private sector has been asked to partner the Government by adopting centers under the Rashtriya Swastha Bima Yojna (RSBY) and also contribute in the NHPS by offering free essential drugs and services.
NHPS will help the private sector healthcare providers as the increase in coverage among families will bring in a population of prospective patients from the untapped tier-2 and tier-3 markets.
We are positive on the potential impact that the Ayushman Bharat scheme can have by bringing a wider section of the population under healthcare coverage which would also include tertiary care procedures; this could particularly be beneficial to our Company given the strong Tier 2/3 presence and footprint pan-India as well as increasing proportion of specialized procedures in oncology through advancements in technology. Nevertheless, we await
to receive more clarity on pricing, funding sources as well as efficiency and transparency of implementation of the scheme.
ONCOLOGY Global Outlook:
While cancer continues to be one of the leading causes of morbidity and mortality worldwide, the therapeutic innovation based on improved understanding of disease biology and translational research have also considerably changed the treatment paradigm for many cancers. Approximately 14 million people a year are diagnosed with cancer; and according to WHO the number will increase to 19 million by 2025, 22 million by 2030 and 24 million by 2035. One in five men and one in six women will develop cancer before the age of 75.
Given to the huge market needs, oncology has become top one treatment area in the developed countries. Based on IMS data, global cancer care treatment market reached USD 175.5 billion in 2016 and is estimated to be ~USD270 billion in 2025, mainly driven by healthy pipelines and higher adoptions of better and more advanced therapies such as targeted therapies, gene therapy and immune-oncology (I/O).
Oncology has become the top 1 treatment area in developed countries in 2016...Value share among treatment areas
Source: IMS Midas (presented by Quintiles IMS Bernstein’s 21 June Long View Future of Note: Oncology and Immunology combined in the above charts
20
16
1513
7
29
USA$450 Bn
(%)
21
15
1310
8
32
EU$147 Bn
(%)
15
13
13
1111
37Japan$80 Bn
(%)
Onco/Immuno Onco/ImmunoOnco/Immuno
Alimentary Alimentary
Alimentary
Cardio
Anti-infection
Cardio
CNSAnti-infection
Anti-infectionRespiratory
Others Others Others
CNS CNS
Global oncology market sales (Unit: USD B)
300
250
200
150
100
50
02012
125.6
2015
158
2013
137.5
2016
175.7
2014
151.9
8.8%5.0
%
2025E
272.6
Source: IMS, Midas, Bernstein analysis
79

India Outlook:
The Indian Council of Medical Research (ICMR) reported in their study that in 2016 the total number of new cancer cases was estimated to be around 14.5 lakh and the figure is likely to reach nearly 17.3 lakh new cases in 2020. The real incidence of cancer in India could be significantly higher than the reported figure, especially if comparisons are drawn with China which has approximately 10% more population but new cancer incidences are 4 times that of India as reported. Data from large randomised screening trials undertaken in India suggest that the
The reported incidence of cancer in India is based on data collected from the cancer registries, which cover less than 10% of the population, resulting in a significant margin of error in estimation. The gap between reported and real cancer incidence can primarily be attributed to under-diagnosis of cancer in India. The under-diagnosis of cancer is represented in the relatively late stage of presentation of cancer cases in India relative to China, the United Kingdom and the United States. Data collected between 2009 and 2011 show that only 43% of breast cancer cases were diagnosed at early stages (i.e., stage I or stage II) of the disease in India while it is 62% in the United States, 81% in
real incidence of cancer could be at least 1.5 to 2 times higher than the reported incidence.
With incidence rising at a rapid pace, cancer is ranked as the sixth leading cause of death in India. Of the new cases of cancer projected to have been diagnosed in India each year, breast and cervical rank among the top two cancers in terms of both incidence and mortality. The cancer mortality rate in India is high, at 68% of the annual incidence. This ratio indicates that fewer than 30% of Indian patients with cancer survive five years or longer after diagnosis.
the United Kingdom and 72% in China. While this varies with the type of cancer, the rate of diagnosis in India is generally more delayed compared to other countries. (Source: Call for Action: Expanding cancer care in India dated July 2015, page number 3, published by Ernst & Young)
The following graph sets out the comparison of early stage (i.e., stage I or stage II) cancer diagnosis during the period from 2009 to 2011 in India, and in the United States, the United Kingdom and China during the period from 2009 to 2013, by different cancer types:
Cancer Diagnosis at Early Stages (Stage I or Stage II)
(Source: Call for Action: Expanding cancer care in India dated July 2015, page number 14, published by Ernst & Young)
1,800
1,600
1,400
1,200
1,000
800
600
400
200
02015 2025 20352020 2030
Male
Female
Estimated number of new cancer incidences (‘000)
1,200
1,000
800
600
400
200
02015 2025 20352020 2030
Male
Female
Estimated number of cancer deaths (‘000)
(Source: Call for Action: Expanding cancer care in India dated July 2015, page number 14, published by Ernst & Young)
Cancer Diagnosis at Early Stages (Stage I or Stage II)
USA UK China India
Breast Cancer
62%
81%
72%
43%
Cervical Cancer
71% 70%
91%
10%
Head and Neck Cancer
31% 30%
19%
8%
80

Lack of awareness of cancer and the lack of participation in screening programs in India are significant contributory factors for the relatively late stage of the disease presentation and consequently low reported cancer incidences in India. Fewer than 1% of women in India aged between 40 and 69 years participated in recommended breast screening mammograms once in 24 months, as compared to 30% in China and 65% in the United States in 2014.
The annual expenditure in India for the diagnosis and treatment of cancer was estimated to be between US$ 1.7 and US$ 2.0 billion. Even at for-profit hospitals in India, the cost of cancer care, including treatment with the most advanced technologies (such as PET-CT and LINAC based radiation therapy) is one
Even though the cost of cancer treatment in India is significantly lower than other countries, high quality cancer care is still inaccessible to a large proportion of the Indian population with patients having to travel outside their towns to avail of cancer treatment.
The profile of cancers in India is also changing, and is becoming more similar to that seen in more urbanised and higher income societies. For instance, in 2000, the most prevalent cancers in India were head and neck cancers in men (associated with all forms of tobacco use) and cervical cancer in women (associated with human papillomavirus infection and poor female sanitation). Breast cancer has currently surpassed cervical cancer as the most prevalent cancer in women. The incidence rates of gastrointestinal cancers, which have traditionally been low in India in comparison to developed nations and China, have also shown an increasing trend.
FERTILITY
An estimated 220 million women in India are of reproductive age (between 20 and 44 years of age) and about 27.5 million couples in this group are estimated to be suffering from infertility. The number of infertile couples in India is expected to increase from 27.5 million in 2015 to between 29 and 32 million by 2020.
Key Drivers of Cancer Incidence
High incidence of cancer in India is attributed to factors such as, poor immune conditions, genetic pre-disposition and hormonal conditions, industrialization, over growth of population, ageing population, lifestyle and food habits. Demographic factors alone are expected to result in an increase in cancer incidences of 100,000 to 350,000 cases a year.
of the lowest in the world and represents only a fraction of the cost of treatment in the United States and Europe even after adjusting for purchasing power parity. The table below sets out the cost of cancer treatment in India and the United States by service offerings, during 2014 and 2012, respectively:
The total fertility rate (defined as the average number of children that would be born to a woman if she experiences the current fertility pattern throughout her reproductive span (15 to 49 years)) in India has witnessed a rapid decline over the last few decades, from 3.9 in 1990 to 2.3 in 2013.
The prevalence of infertility in India has been rising owing to (i) demographic changes with an increase in the number of women of reproductive age; (ii) lifestyle changes; (iii) prevalence of several known clinical factors; and (iv) ethnicity. Awareness of infertility and fertility treatment options in India are among the lowest in the world.
The primary assisted reproduction treatment options for infertility include intrauterine insemination (“IUI”) and in-vitro fertilization (“IVF”). The IVF market in India is significantly underpenetrated relative to the potential demand. India recorded 2,786 IVF cycles per million infertile women aged between 20 years and 44 years in 2015, compared to 46,042 IVF cycles in the United States in 2013, and 6,494 IVF cycles in China in 2014.
As of 2015, around 1% of the 27.5 million couples suffering from infertility in India presented for fertility assessment. It is estimated that the potential demand for IVF cycles in Bengaluru, Delhi and Mumbai is nine to twelve times higher than the current actual demand.
Cost of Cancer Treatment (Amounts in `)
Type of treatment India United States United States (purchasing power parity adjusted)
Chemotherapy 150,000 - 240,000 1.3 - 1.8 million 510,000 - 720,000
Surgery 60,000 - 100,000 1.5 - 1.8 million 600,000 - 720,000
Radiation Therapy 60,000 - 100,000 1.1 - 1.4 million 420,000 - 540,000
KEY GROWTH DRIVERS
Increasing life expectancy
Growing tobacco consumption
Increasing healthcare awareness
Improved access to diagnosis and
treatment facilities
Changing diet/lifestyle habits
81

The following graph sets out a comparison of (i) the need for parenthood, (ii) the importance of social status associated with parenthood, and (iii) the relative awareness of infertility problems
The number of IVF cycles performed in India has grown at a compound annual growth rate of 18.1% over the last 10 years. This growth in fertility treatment in India mirrors similar trends witnessed in most developed countries as infertility prevalence has increased.
The number of couples presenting for infertility treatment and evaluation in India is expected to increase from 270,000 in 2015 to around 650,000 to 700,000 annually in 2020. The number of IVF cycles performed in India is forecast to increase from 100,000 in 2015 to an estimated 260,000 in 2020.
The fertility treatment market in India is highly fragmented and unregulated. An estimated 75% of the IVF cycles in India are done by about 500 clinics, comprising a few corporate chains and private clinics of leading physicians. There is no requirement
in India, the United States, the United Kingdom, China, Japan and Germany:
to obtain any permission or have any specific qualifications to open infertility or assisted reproductive technology clinics in India. As a result, in the last 20 years, there has been an increase in the number of fertility clinics that use techniques requiring handling of spermatozoa or oocyte outside the body or the use of a surrogate mother. (Source: Call for Action: Expanding IVF treatment India dated July 2015, published by Ernst & Young)
COMPANY OVERVIEW
HCG is a leading provider of tertiary and quaternary healthcare services focused on cancer and fertility specialties. Under the “HCG” brand, we operate the largest cancer care network in India in terms of the total number of cancer treatment centers licensed by the AERB as of May 31, 2015 (Government of India, Atomic Energy Regulatory Board)
Factors Influencing Infertility Treatment
Japan
China
India
Germany
UK
USA
Japan
China
India
Germany
UK
USA
Japan
China
India
Germany
UK
USA
Need for Parenthood Importance of Social Status of Parenthood
Awareness of Fertility problems
Hospitals
Today
19892005
2005
20071
st cancer centre in the
HCG network was set up
Entry into the clinical laboratory businessthrough acquisition
of Triesta
Acquired HCG Medi -Surge which operates a multi-speciality hospital in
AhmedabadOperated 3 cancer centers; began expansion of the
HCG network
Awarded Oncology Leader of the Year by Frost &
Sullivan
Entry into fertility business through the acquisition of
50.1% in BACC Healthcare Pvt. Ltd.*
• India’s largest provider of cancer care• Milann- ranked #1 nationally• IPO completed in March 2016• Acquired cancer center in Nairobi, Kenya• Consummated business combination with Strand Lifesciences
2011
2013
Evolution of HCG as a Provider of Speciality Healthcare and India’s Largest Provider of Cancer Care
82

MS Ramaiah Nagar
Kalinga Rao Road
Double Road
Bengaluru
Jaipur
Nagpur
Freestanding Diagnostic Center (3)2
Cancer Centers Under Development (6)
Centre of Excellence (CoE)1
Comprehensive Cancer Center (19)2
Day Care Chemotherapy Center (1)
Koramangala
OUR BUSINESS
ONCOLOGY:
The Company is the largest provider of cancer care in India under the “HCG” brand. It owns and operates comprehensive cancer diagnosis and treatment services (through radiation therapy, medical oncology and surgery).
As of March 31, 2018, our HCG network consisted of 19 comprehensive cancer centers, including our center of excellence in Bengaluru, 3 freestanding diagnostic centers and
1 day care chemotherapy center across India and 1 center in Africa. Each of our comprehensive cancer centers offers, at a single location, comprehensive cancer diagnosis and treatment services (including radiation, medical oncology and surgical treatments). Our freestanding diagnostic centers and our day care chemotherapy center offer diagnosis and medical oncology services, respectively.
HCG’s Cancer Care Network in India
Network of Existing and Under Development Cancer Care Centers
83

MS Ramaiah Nagar
Kalinga Rao Road
Double Road
Bengaluru
Jaipur
Nagpur
Freestanding Diagnostic Center (3)2
Cancer Centers Under Development (6)
Centre of Excellence (CoE)1
Comprehensive Cancer Center (19)2
Day Care Chemotherapy Center (1)
Koramangala
We follow a multidisciplinary approach to cancer care across our HCG network, wherein specialist physicians from various disciplines collaborate to provide the best course of treatment for each patient. This allows us to share and develop best practices, build clinical expertise and adopt standardised protocols for diagnosis and treatment, thereby improving the quality of our cancer care services. We believe that as a result, we are able to better serve our patients and ensure consistent clinical outcomes.
In our HCG network, our specialist physicians adopt a technology-focused approach to diagnosis and treatment. For instance, we use advanced technologies, including molecular pathology and molecular imaging for accurate diagnosis and staging of cancer, which enable us to decide upon the appropriate course of treatment for each patient. We believe that owing to the relationships we enjoy with such medical technology vendors and pharmaceutical and biotechnology companies and our involvement with them in the areas of research and development, we have been able to introduce in India and adopt across our HCG network the latest advances in technology relatively early. For instance, we were among the first healthcare providers in India to standardise molecular diagnostics technologies, including genomic testing and molecular imaging, including 128 slice PET-CT scans in the diagnosis and staging of cancer, as well as to introduce high intensity flattening filter free mode radiotherapy, stereotactic radiosurgery and robotic radiosurgery, in the treatment of cancer in India. We were also the first healthcare provider in India to perform computer assisted tumour navigation surgery. We believe this gives us a distinct advantage relative to our competitors in delivering high quality and standardised cancer care to our patients. We also utilise targeted nuclear medicine therapies as well as advanced radiation treatments to minimise side effects and improve the outcome of treatments. By ensuring that we adopt these diagnostic and treatment technologies throughout our HCG network, we are able to provide consistent quality of care to all patients.
Given the large number of patient cases treated across our HCG network, we believe that we are able to efficiently utilise our equipment, technologies and human resources, thereby deriving economies of scale. Furthermore, through the adoption of a centralised drug and consumables formulary, we are able to lower the overall cost of drugs and consumables. We believe that our business model is scalable and when combined with efficient utilisation of resources, it enables us to operate within a
FERTILITY:
Milann is the leading provider of fertility treatment under the brand “Milann”. It owns and operates comprehensive reproductive medicine services including assisted reproduction, gynaecological endoscopy and fertility preservation. Milann has been Ranked No. 1 in India and first in the South India region continuously for 3 years in the fertility segment in the Times Health All India Critical Care Hospital Ranking Survey 2018. (Source: All India Critical Care Hospital Ranking Survey 2017, All India Critical Care Hospital Ranking Survey 2017, published on Times Health, Times of India on December 16, 2016)
competitive cost structure.
We believe that our current model of providing speciality healthcare in India can be replicated in other underserved healthcare markets internationally. We have partnered with CDC to establish a network of speciality cancer centres in Africa, similar to our cancer care network in India. Pursuant to this partnership with CDC, we completed acquis ition of Cancer Care Kenya, a leading dedicated cancer care center located in Nairobi in July’2017, We believe that our planned network will cater to the increasing unmet demand for cancer care in Africa due to which, a large number of cancer patients travel outside the region to avail quality cancer care, including to our comprehensive cancer centers in India.
We acquired a majority stake in Cancer Care Kenya Limited (CCK) a leading cancer centre in Nairobi, Kenya. CCK, which started operation in 2010 is the first private comprehensive cancer centre in the country. CCK treats over a thousand patients annually including over two hundred patients from other African nations. CCK’s team includes internationally trained radiation, medical and surgical oncologists, physicists, radiation technicians and oncology nurses. There are over 250,000 new cancer incidences each year in Eastern Africa – resulting in a huge and growing unmet need for advanced cancer care. Thousands of patients travel overseas for treatment, due to the lack of access to advanced cancer care. HCG has been treating patients from Africa in India for several years now, and have been enthused by the positive results and the strong response from the medical community in these countries. To ensure the best clinical outcomes, we have been seeking to find the right opportunities to establish advanced treatment options in the region. We are thus excited by the opportunity to partner with a highly regarded group like CCK and look forward to working closely with our partners, Dr. Adamali, CDC and MP Shah Hospital to bring in the highest standards of excellence in cancer care in Africa and further out mission to make high quality cancer care accessible to all.
HCG acquired 50.10% equity interest in BACC Healthcare Pvt Ltd in 2013 which operates fertility centers under the Milann brand. Pursuant to this acquisition, we operate eight Milann fertility centers across Bengaluru, Delhi, Chandigarh,Mumbai and Ahmedabad as on March 31, 2018.
BACC Healthcare Pvt Ltd. is led by a team of qualified and experienced fertility specialists. Its founder, Dr. Kamini Rao has a successful track record of over 25 years of providing fertility treatments. Our Milann fertility centers provide comprehensive reproductive medicine services, including assisted reproduction, gynaecological endoscopy and fertility preservation; and follow a multidisciplinary and technology-focused approach to diagnosis and treatment. Our Milann network also operates on a model similar to our HCG network, wherein the various Milann fertility centers aim to provide medical services following established protocols with a focus on quality medical care across diagnosis
84
and treatment. During Fiscal Years 2018 and 2017, our Milann fertility centers registered 5,083 and 4,273 new patients and performed 2,178 and 1,823 IVF procedures, respectively. Our
SPECIALITY DIAGNOSTICS:
Strand Life Sciences private Limited is an integrated speciality diagnostics company with end to end capabilities in precision medicine through proprietary analytics, clinical research, access to the HCG biorepository, genomic technologies, assay development and validation and a network of laboratories offering a broad menu of tests.
HCG entered into a business transfer agreement, with Strand Life Sciences in January 2018, providing for a business combination of its Triesta Sciences business unit (“Triesta Sciences”), with Strand Life Sciences. Pursuant to the business transfer agreement, the Company has transferred its Triesta unit on slump sale basis for a consideration aggregating to 38.2 % stake in Strand Life Sciences. Strand is an Associate Company of the Company.
Strand, established in 2000 as a spin-off from the Indian Institute of Science, is one of the pioneers in the bioinformatics space and leader in genomic testing for cancer and inherited diseases in India. Strand has over 200 engineers and scientists and provides cutting-edge diagnostic solutions and its customers include leading global life science and technology companies, research labs, as well as oncologists, pediatric specialists, geneticists and hospitals.
Triesta Sciences, which, prior to the business transfer, operated as the diagnostic unit of the Company and offers a one- stop solution for oncology diagnostics, Genomics (Next Generation sequencing based diagnostics), biomarker and translational research, laboratory services, and clinical research services for several hospitals across India. with a focus on innovation, quality and accuracy for better diagnosis and prognosis of Cancer.
Strand is a leader in offering bioinformatics solutions and offers proprietary data analytical engines for research and
MULTISPECIALITY:
HCG operates three multi-speciality hospitals, two under “HCG” brand in Ahmedabad and Bhavnagar, both in the state of Gujarat and one under Operations and Management contract in Hubli in state of Karnataka.
HCG Multispecialty in Ahmedabad and Bhavnagar are tertiary care hospitals with 118 and 39 available operational beds, respectively, as of March 31, 2018. It provides comprehensive inpatient and outpatient treatments. Its key specialties include cardiology, neurology, orthopedics, gastroenterology, urology, internal medicine and pulmonary and critical care.
Milann fertility centers also offer training programmes for fertility specialists and embryologists.
clinical applications for genomic testing. Strand also provides hospital laboratory management services by way of establishing and operating laboratory within the hospital premises. We also provide clinical reference laboratory services in India with specialization in oncology, rare diseases and reproductive health and its offerings include molecular diagnostic services and genomic testing. Strand central reference laboratory is located in in Bengaluru and is accredited by NABL in India, as well as by CAP for quality assurance of laboratory tests performed. Additionally, Strand offers research and development services to pharmaceutical and biotechnology companies in the areas of clinical trial management and biomarker discovery and validation and is led by a team of specialist oncopathologists, molecular biologists and clinical researchers.
The bioinformatics vertical of Strand covers the entire range of high-throughput data, including Microarrays, Mass Spectrometry, Next-Generation Sequencing, Microscopy etc. and has over ~24,000 citations in research publications for tools built by Strand.
As part of clinical diagnostics, Strand offers precision tests like Rare disease Diagnosis, Inherited Cancer Risk Analysis, Tumor Mutation Analysis for Precision Treatment, Liquid Biopsy Analysis for Precision Treatment, Response Monitoring, and Early Detection of Relapse, in addition to an entire gambit of traditional tests. The Precision Medicine Laboratory is the first NGS CAP Lab in South Asia and scored 100% in Proficiency Testing for both Germline cancer risk and Somatic tumor profiling while other labs, most in the US and Europe, ranged from 85-100%.
The specialised diagnostics market is one of the fastest growing segments within the Indian diagnostic industry and is expected to be over US$ 700 million by 2020. We believe that Strand is well- positioned to leverage the opportunities in bioinformatics, clinical reference laboratory services and research services on account of its strong capabilities and business strengths.
Suchirayu Health Care Solutions Limited, in Hubli, managed by us, is a multi-specialty tertiary hospital. With 110 operational beds and capacity to go to 250 beds, the hospital offers state of the art facilities and infrastructure in the region. We also acquired 18% stake in Suchirayu Health Care Solutions as part of its strategy to grow multispecialty business in niche specialties and regions of strategic interest for the Company. Going forward, we intend to pursue selective organic and inorganic opportunities in this space to scale this business with a focused strategy concentrated on niche specialities towards creating leadership over long-term.
85
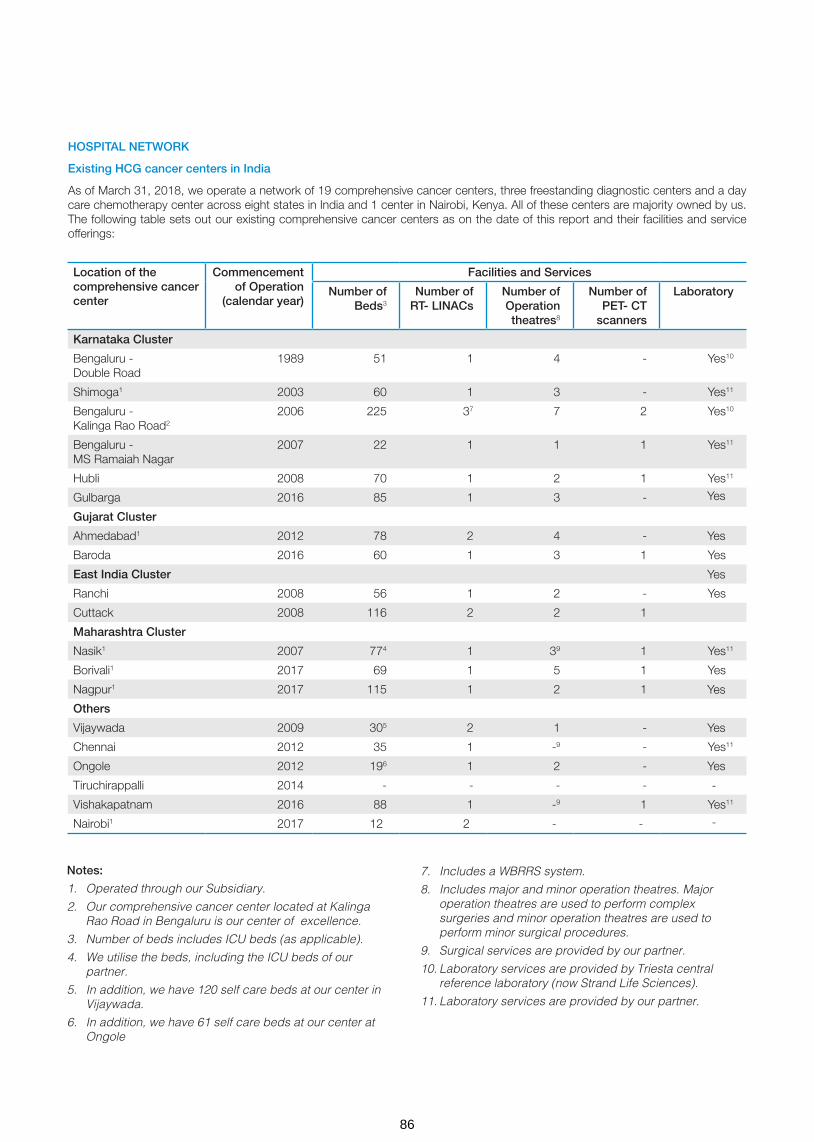
HOSPITAL NETWORK
Existing HCG cancer centers in India
As of March 31, 2018, we operate a network of 19 comprehensive cancer centers, three freestanding diagnostic centers and a day care chemotherapy center across eight states in India and 1 center in Nairobi, Kenya. All of these centers are majority owned by us. The following table sets out our existing comprehensive cancer centers as on the date of this report and their facilities and service offerings:
Location of the comprehensive cancer center
Commencement of Operation
(calendar year)
Facilities and Services
Number of Beds3
Number of RT- LINACs
Number of Operation theatres8
Number of PET- CT
scanners
Laboratory
Karnataka Cluster
Bengaluru - Double Road
1989 51 1 4 - Yes10
Shimoga1 2003 60 1 3 - Yes11
Bengaluru - Kalinga Rao Road2
2006 225 37 7 2 Yes10
Bengaluru - MS Ramaiah Nagar
2007 22 1 1 1 Yes11
Hubli 2008 70 1 2 1 Yes11
Gulbarga 2016 85 1 3 -
Gujarat Cluster
Ahmedabad1 2012 78 2 4 -
Baroda 2016 60 1 3 1 Yes11
East India Cluster
Ranchi 2008 56 1 2 - Yes11
Cuttack 2008 116 2 2 1
Maharashtra Cluster
Nasik1 2007 774 1 39 1 Yes11
Borivali1 2017 69 1 5 1 Yes11
Nagpur1 2017 115 1 2 1
Others
Vijaywada 2009 305 2 1 -
Chennai 2012 35 1 -9 - Yes11
Ongole 2012 196 1 2 -
Tiruchirappalli 2014 - - - -
Vishakapatnam 2016 88 1 -9 1 Yes11
Nairobi1 2017 12 2 - -
Notes:
1. Operated through our Subsidiary.
2. Our comprehensive cancer center located at Kalinga Rao Road in Bengaluru is our center of excellence.
3. Number of beds includes ICU beds (as applicable).
4. We utilise the beds, including the ICU beds of our partner.
5. In addition, we have 120 self care beds at our center in Vijaywada.
6. In addition, we have 61 self care beds at our center at Ongole
7. Includes a WBRRS system.
8. Includes major and minor operation theatres. Major operation theatres are used to perform complex surgeries and minor operation theatres are used to perform minor surgical procedures.
9. Surgical services are provided by our partner.
10. Laboratory services are provided by Triesta central reference laboratory (now Strand Life Sciences).
11. Laboratory services are provided by our partner.
Yes
Yes
Yes
Yes
Yes
Yes
-
-
86

Location of the comprehensive cancer center
Facilities and Services
Number of Beds
Number of RT- LINACs
Number of Operation Theatres3
Number of PET-CT Scanners
Laboratory
Kochi 100 1 5 1 Yes
Gurgaon 85 1 3 1 Yes5
Jaipur 50 1 3 1 Yes
Kolkata1 50 1 3 -4 Yes5
Mumbai – Cooperage 32 1 2 1 Yes
Bhavnagar2 90 1 3 - Yes
Nashik Phase II 92 1 5 - Yes
Notes:
1. Set up through limited liability partnership with our partner(s).
2. Our existing multi-speciality hospital at Bhavnagar will be upgraded into a comprehensive cancer center through the addition of radiation and medical oncology capabilities.
3. Including major and minor operation theatres. Major operation theatres are used to perform complex surgeries and minor operation theatres are used to perform minor surgical procedures.
4. PET-CT procedures will be performed by our partner.
5. Laboratory services will be provided by our partner.
As of March 31, 2018 we also had three freestanding diagnostic centers, of which one is located in Chennai and one each in Mangalore and Vijaywada, respectively. Our freestanding diagnostic centers are equipped with PET-CT scanners and provide radiology and diagnostic services. We established some of these centers under partnership arrangements.
HCG Center in Tiruchi has been restructured in FY 2018, where HCG does not operate the centers as part of HCG Network. HCG however continues to provide services across treatment planning and allow usage of its installed equipments at the hospital and receive fee incomes for the same.
As of March’2018, HCG sold its 51% stake in cancer center in Kanpur to its partner, Regency Healthcare. This was a strategic decision driven by lower than estimated mix of cash patients, other priorities as well as other business dynamics.
Also, HCG acquired the surgical practice of its partner, Dr.Gopichand, in Vijaywada to consolidate its position as leader in the region.
As of March 31, 2018, we also had a day care chemotherapy center in Bengaluru. Our day care chemotherapy center provides medical oncology services and carries out minor surgical procedures.
HCG cancer centers under development in India
New Centers
As on the date of this report, we were in the process of establishing 6 new comprehensive cancer centers in India, all of which are under various stages of development. We expect these centers to commence operation by end of FY 2020. All of these centers are majority-owned by us.
The table below sets out details of our comprehensive cancer centers under development in India as on the date of this report and their facilities and service offerings:
Milann Centers
The following table sets out our existing Milann fertility centers as of March 31, 2018 and their facilities and service offerings:
Location Year Number of Beds IVF Endoscopy Operation Theatre
Embryology Laboratory
Neonatal ICU
Shivananda Circle, Bengaluru
1989 38 √ √ √ √
Jayanagar, Bengaluru 2010 26 √ √ √ √
Indiranagar, Bengaluru 2012 6 √ √ √ -
MSR Nagar, Bengaluru 2015 6 √ √ √ -
Delhi 2016 4 √ √ √ -
Chandigarh 2016 3 √ √ √ -
Mumbai 2017 6 √ - √ -
Ahmedabad 2018 6 √ √ √ -
87

FINANCIAL AND OPERATING HIGHLIGHTS
Overview of Key Regions
Karnataka Cluster
Number of centers in Karnataka cluster increased to 7 with the addition of Suchirayu Hospital in Hubli, a Multispecialty hospital being managed by HCG on Operations and Management basis. Strong adoption of daVinci technology continues at our center of excellence in Bengaluru, with over 234 robotic surgeries completed in the year. The number of beds operated in the Karnataka cluster at end of FY 18 were 632 as compared to 522 beds in FY 17.
Karnataka cluster strategy of focusing on procedure and payer mix enhancement has resulted in Revenues increased from INR 2,898.8 million in FY 17 to 3,247.1 million in FY 18. EBITDA margins were stable at 24.4%, ARPOB increased by 3.7% to INR 34,116/day on the back of change in payer mix in the current year. With continuing expansion on pan-India basis as well as improving performance in other geographies, share of Karnataka region as a percentage of total revenues for HCG Centers (excluding Fertility) continues to reduce, and was at 42% in FY 18 as compared to 45% in FY 17.
Gujarat Cluster
During the year under review, Gujarat cluster had 4 operational centers and operated 304 beds. The Bhavnagar center which started in May 2015 has achieved break-even and is ramping up well and will be adding cancer infrastructure shortly. Baroda center, launched in May’2016 has grown well and achieved break-even during the year. While the revenue of the cluster have shown an increase of 19.7% to INR 2,220.3 million, the ARPOB has also improved by 8.9% to INR 34,987 INR/day when compared to FY17. The EBITDA margins are at 18.0% excluding the losses from the new centers. We continue to strengthen our position in state of Gujarat with share of revenues of HCG Centers from this cluster remaining constant at 29% in FY 18 as in FY 17 and remain positive about this region.
Maharashtra Cluster:
We had consolidated the operations with our partner at Nashik center in FY17 and have plans to expand the operations with launch of Phase II with addition of over 92 beds in forthcoming fiscal.
Additionally, 2 new comprehensive cancer centers were opened in Maharashtra during FY18, one center in Borivali in Mumbai and another one in Nagpur. While Borivali is operational with 69 beds and capacity for 105 beds, Nagpur center is a 115 bed hospital. Both the centers are ramping up well, with growth in volumes and revenue.
Overall Maharashtra cluster clocked revenue of INR 671.5 million during FY18 as against revenue of INR 244.2 million in FY17.
Existing EBITDA% was at 36.1% as against 26.2% in FY17.
We are on track to launch our new center in Mumbai city located at South Mumbai, in the forthcoming fiscal with addition of 32 beds. Going forward, we would have strength of about 400 operational beds across 4 centers in this region. We continue to strengthen our position in state of Maharashtra with share of revenues of HCG Centers from this cluster increasing from 4% in FY 17 to 9% in FY 18 and remain positive about this region.
East India Cluster
Currently we have Cuttack and Ranchi as the two mature centers in the East India cluster. These centers have seen good traction and we closed the year with revenues of INR 586.9 million in FY 18 as compared to INR 491.1 million in FY 17 which is an increase of 19.5% over the last fiscal. EBITDA margins at 25.5% showed a marginal decrease of 68 bps over last year’s margin of 26.1%. This was primarily on account of increase in the clinical team and increased business promotion expenses to strengthen our position further in the Geography. The expansion at the Cuttack center with addition of new technologies was adopted well with ARPOB improving by 18.4% to INR 14,535.
Andhra Pradesh Cluster
During the year under review, Andhra Pradesh cluster had 3 operational centers and operated 137 beds. The Vishakhapatnam center which started in Q1 FY 17 has achieved break-even and is ramping up well. The revenues of the cluster have shown an increase of 32.7% to INR 497.1 million, whereas the EBITDA margins were at 19.5% as compared to 10.1% in FY17. With positive experience from our long term presence in Vijayawada, we have consolidated the operations with our partner. We continue to strengthen our position in state of Andhra Pradesh, with share of revenues of HCG Centers from this cluster remaining constant at 6% in FY 18 as in FY 17 and remain positive about this region.
Milann Centers
The current fiscal was a good year for Milann with new registrations increasing 19.0% to 5,083. The number of IVF cycles increased by 19.5% to 2,178 compared to the 1,823 cycles in the last fiscal. Consequently, revenues increased to INR 669.0 million compared to INR 589.5 million in last year which was an increase of 13.5%.
FINANCIAL PERFORMANCE
The financial statements of HealthCare Global Enterprises Limited and its subsidiaries, joint ventures and associates (collectively referred to as “HCG” or the Company) are prepared in compliance with the Companies (Indian Accounting Standards), Rules, 2015 of the Companies Act, 2013 and Indian Accounting Standards (Ind AS).
The discussions herein below relate to consolidated statement of profit and loss for the year ended March 31, 2018, consolidated balance sheet as at March 31, 2018 and the consolidated cash flow statement for the year ended March 31, 2018. The consolidated results are more relevant for understanding the performance of HCG.
In accordance with the Companies (Indian Accounting Standards), Rules, 2015 of the Companies Act, 2013, HCG started following the Indian Accounting Standards (Ind AS) for preparation of its financial statements from April 1, 2016.
Significant accounting policies used for the preparation of the financial statements are disclosed in the notes to the consolidated financial statements.
88

Key Metrics
Operating Revenue (INR Mn)
Operating EBITDA (INR Mn)
PAT (INR Mn)
FY16
5,842
FY17 FY18 FY18 FY18
7,00119.8%
8,307
FY16
848
FY17
1,050
1,188
FY16
-15
FY17
222205
18.7%
23.9%13.2%
Results of Operations
Particulars Fiscal Year 2018 Growth vis a vis FY 2017
Fiscal Year 2017
REVENUE (in millions) % of revenue % (in millions) % of revenue
Revenue from operations
Income from medical services 7,498.4 88.9 18.4 6,333.2 89.2
Income from pharmacy 684.1 8.1 11.4 614.3 8.7
Other operating revenues 124.3 1.5 131.9 53.6 0.8
Total Revenue from Operations 8,306.9 18.7 7,001.1
Other income 128.0 1.5 32.4 96.7 1.4
Total Revenue 8,434.9 100.0 18.8 7,097.8 100.0
EXPENSES
Purchases of stock-in-trade 1,966.4 23.3 11.8 1,759.2 24.8
(Increase)/ decrease in stock-in-trade -69.3 -0.8 38.3 -50.1 -0.7
Employee benefits expense 1,577.1 18.7 29.3 1,219.3 17.2
Finance costs 423.5 5.0 84.1 230.0 3.2
Depreciation and amortisation expense
714.6 8.5 25.8 568.3 8.0
Other expenses 3,644.5 43.2 20.6 3,022.8 42.6
Share of profit of minority interest -35.9 -0.4 NM 8.7 0.1
Total Expenses 8,256.8 97.9 22.3 6,749.4 95.1
Profit/ (Loss) before tax and exceptional items
178.1 2.1 -48.9 348.4 4.9
Share of (loss) of equity accounted investees
-14.0 -0.2 NM 0 0
Profit/ (Loss) before tax 271.8 3.2
2.4
-22.0 348.4 4.9
Profit/ (Loss) after tax before share of profit/ (loss) of minority interest
169.4 2.0 -26.5 230.4 3.2
Net tax expense 102.4 1.2 -13.2 118.0 1.7
Exceptional Items 107.7 1.3 NM 0 0
Net Profit/ (Loss) for the period 205.2 -7.4 221.7 3.1
89

REVENUE BREAKUP
RevenueOur total revenue increased by ` 1,337.1 million (18.8%) as compared to Fiscal Year 2017 to ` 8,434.9 million in Fiscal Year 2018. This increase was primarily due to an increase in revenue from operations.
Revenue from operationsThe revenue from operations increased by ` 1,305.8 million, or by 18.7%, from ̀ 7,001.1 million in Fiscal Year 2017 to ̀ 8,306.9 million in Fiscal Year 2018. This was primarily contributed by an increase in ARPOB, revenue from additional facilities in existing
Other operating revenues
Our other operating revenues increased by ` 70.7 million, or by 131.9%, from ̀ 53.6 million in Fiscal Year 2017 to ̀ 124.3 million in Fiscal Year 2018 primarily on account of higher export incentive revenue in the year and other operational arrangements.
Other income
Our other income increased by ` 31.3 million, or by 32.4%, from ` 96.7 million in Fiscal Year 2017 to ` 128.0 million in Fiscal Year 2018. This was primarily contributed by higher interest received in the year on IT refund and other investments made.
Expenses
Our total expenses increased by ` 1,507.4 million, or by 22.3%, from ` 6,749.4 million in Fiscal Year 2017 to ` 8,256.8 million in Fiscal Year 2018. The increase in expenses is in line with the business growth and primarily contributed by increase in employee benefits expense and other expenses.
Cost of consumption
Cost of consumption comprises of our expenses related to purchases of stock-in-trade and changes in inventories of stock-in-trade. Cost of consumption related to usage of drugs, medical and non-medical consumable items increased by ` 188.0 million, or by 11.0%, from ` 1,709.1 million in Fiscal Year 2017 to ` 1,897.1 million in Fiscal Year 2018.
Cost of consumption as a percentage of our total revenue decreased from 24.1% in Fiscal Year 2017 to 22.5% in Fiscal
centers and from new centers commenced. During the Fiscal Year 2018, our Maharashtra, Gujarat and Karnataka clusters contributed additional revenues of ` 427.3 million, ` 365.1 million and ` 348.3 million respectively compared to Fiscal Year 2017. Our new centers, Baroda in Gujarat, Visakhapatnam in Andhra Pradesh, Borivali and Nagpur in Maharashtra, contributed additional revenue of ` 410.1 million combined. Our fertility centers contributed additional revenue of ` 79.5 million, contributed by increase in patients in existing clinics and ramp-up in the new centers.
Year 2018. This was primarily due to savings generated on account of centralisation of our procurement functions and our efforts in implementing a centralised formulary of drugs and consumables.
Employee benefits expense
Our employee benefits expense increased by ` 357.8 million, or by 29.3%, from ` 1,219.3 million in Fiscal Year 2017 to ` 1,577.1 million in Fiscal Year 2018. The increase was primarily due to additions of new centers - comprehensive cancer centers at Borivali and Nagpur, as well as new center being managed by HCG at Suchirayu, Hubli.
Finance costs
Our finance costs increased by ` 193.5 million, or by 84.1%, from ` 230.0 million in Fiscal Year 2017 to ` 423.5 million in Fiscal Year 2018 primarily on account of increase in loans availed for investments at new centers.
Depreciation and amortisation expense
Our depreciation and amortisation expense increased by ` 146.4 million, or by 25.8%, from ` 568.3 million in Fiscal Year 2017 to ` 714.6 million in Fiscal Year 2018. This was primarily due to increase in our fixed assets on account of purchase of new equipments, including purchase at new centers.
As a percentage of revenue, this group of expense was at 8.5% in FY2018 as compared to 8.0% in FY2017.
(1) 19 comprehensive cancer centres (including center in Kenya), 2 multispecialty hospitals, 3 diagnostic centers and 1 day care chemotherapy center operated under “HCG” brand and 1 multispecialty hospital managed by HCG, as at March 31, 2018
(2) 8 fertility centers operated under “Milann” brand
Note: The percent in brackets represents FY 17
(45%)1HCG Centers
90
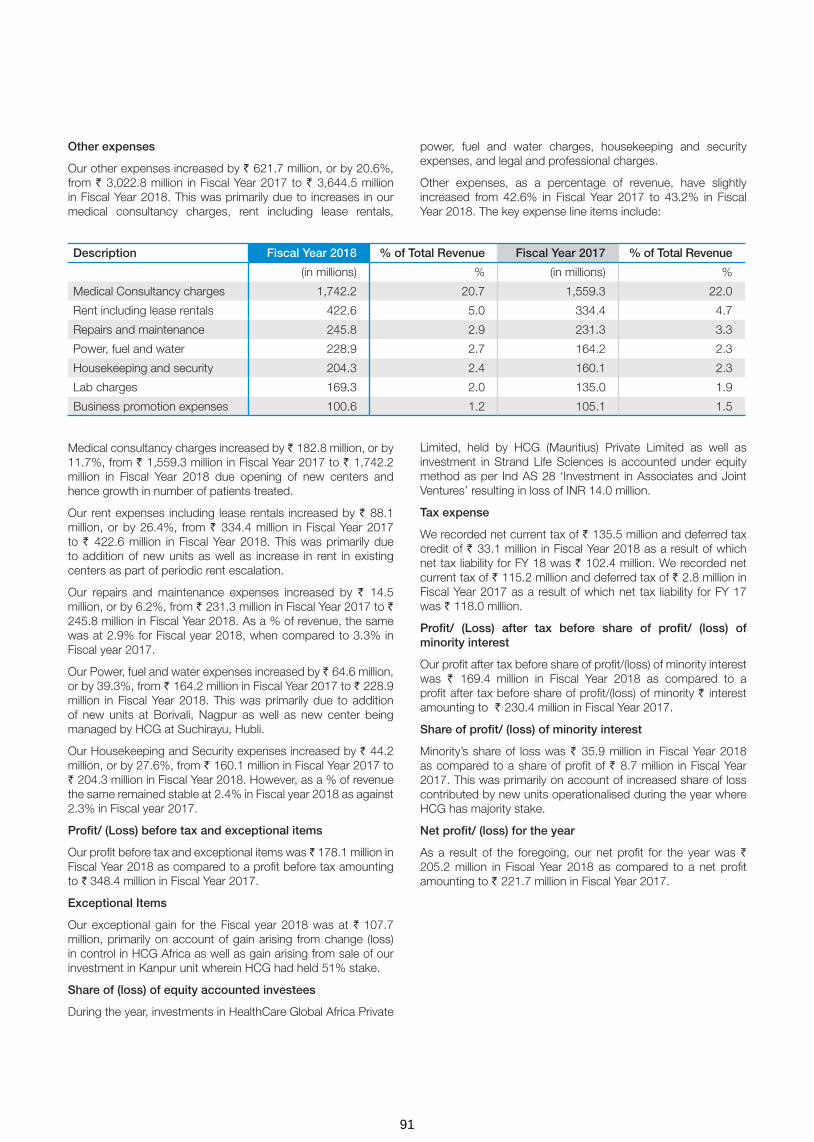
Other expenses
Our other expenses increased by ` 621.7 million, or by 20.6%, from ` 3,022.8 million in Fiscal Year 2017 to ` 3,644.5 million in Fiscal Year 2018. This was primarily due to increases in our medical consultancy charges, rent including lease rentals,
Medical consultancy charges increased by ` 182.8 million, or by 11.7%, from ` 1,559.3 million in Fiscal Year 2017 to ` 1,742.2 million in Fiscal Year 2018 due opening of new centers and hence growth in number of patients treated.
Our rent expenses including lease rentals increased by ` 88.1 million, or by 26.4%, from ` 334.4 million in Fiscal Year 2017 to ` 422.6 million in Fiscal Year 2018. This was primarily due to addition of new units as well as increase in rent in existing centers as part of periodic rent escalation.
Our repairs and maintenance expenses increased by ` 14.5 million, or by 6.2%, from ` 231.3 million in Fiscal Year 2017 to ` 245.8 million in Fiscal Year 2018. As a % of revenue, the same was at 2.9% for Fiscal year 2018, when compared to 3.3% in Fiscal year 2017.
Our Power, fuel and water expenses increased by ` 64.6 million, or by 39.3%, from ` 164.2 million in Fiscal Year 2017 to ` 228.9 million in Fiscal Year 2018. This was primarily due to addition of new units at Borivali, Nagpur as well as new center being managed by HCG at Suchirayu, Hubli.
Our Housekeeping and Security expenses increased by ` 44.2 million, or by 27.6%, from ` 160.1 million in Fiscal Year 2017 to ` 204.3 million in Fiscal Year 2018. However, as a % of revenue the same remained stable at 2.4% in Fiscal year 2018 as against 2.3% in Fiscal year 2017.
Profit/ (Loss) before tax and exceptional items
Our profit before tax and exceptional items was ̀ 178.1 million in Fiscal Year 2018 as compared to a profit before tax amounting to ` 348.4 million in Fiscal Year 2017.
Exceptional Items
Our exceptional gain for the Fiscal year 2018 was at ` 107.7 million, primarily on account of gain arising from change (loss) in control in HCG Africa as well as gain arising from sale of our investment in Kanpur unit wherein HCG had held 51% stake.
Share of (loss) of equity accounted investees
During the year, investments in HealthCare Global Africa Private
Description Fiscal Year 2018 % of Total Revenue Fiscal Year 2017 % of Total Revenue
(in millions) % (in millions) %
Medical Consultancy charges 1,742.2 20.7 1,559.3 22.0
Rent including lease rentals 422.6 5.0 334.4 4.7
Repairs and maintenance 245.8 2.9 231.3 3.3
Power, fuel and water 228.9 2.7 164.2 2.3
Housekeeping and security 204.3 2.4 160.1 2.3
Lab charges 169.3 2.0 135.0 1.9
Business promotion expenses 100.6 1.2 105.1 1.5
power, fuel and water charges, housekeeping and security expenses, and legal and professional charges.
Other expenses, as a percentage of revenue, have slightly increased from 42.6% in Fiscal Year 2017 to 43.2% in Fiscal Year 2018. The key expense line items include:
Limited, held by HCG (Mauritius) Private Limited as well as investment in Strand Life Sciences is accounted under equity method as per Ind AS 28 ‘Investment in Associates and Joint Ventures’ resulting in loss of INR 14.0 million.
Tax expense
We recorded net current tax of ` 135.5 million and deferred tax credit of ` 33.1 million in Fiscal Year 2018 as a result of which net tax liability for FY 18 was ` 102.4 million. We recorded net current tax of ` 115.2 million and deferred tax of ` 2.8 million in Fiscal Year 2017 as a result of which net tax liability for FY 17 was ` 118.0 million.
Profit/ (Loss) after tax before share of profit/ (loss) of minority interest
Our profit after tax before share of profit/(loss) of minority interest was ` 169.4 million in Fiscal Year 2018 as compared to a profit after tax before share of profit/(loss) of minority ` interest amounting to ` 230.4 million in Fiscal Year 2017.
Share of profit/ (loss) of minority interest
Minority’s share of loss was ` 35.9 million in Fiscal Year 2018 as compared to a share of profit of ` 8.7 million in Fiscal Year 2017. This was primarily on account of increased share of loss contributed by new units operationalised during the year where HCG has majority stake.
Net profit/ (loss) for the year
As a result of the foregoing, our net profit for the year was ` 205.2 million in Fiscal Year 2018 as compared to a net profit amounting to ` 221.7 million in Fiscal Year 2017.
91
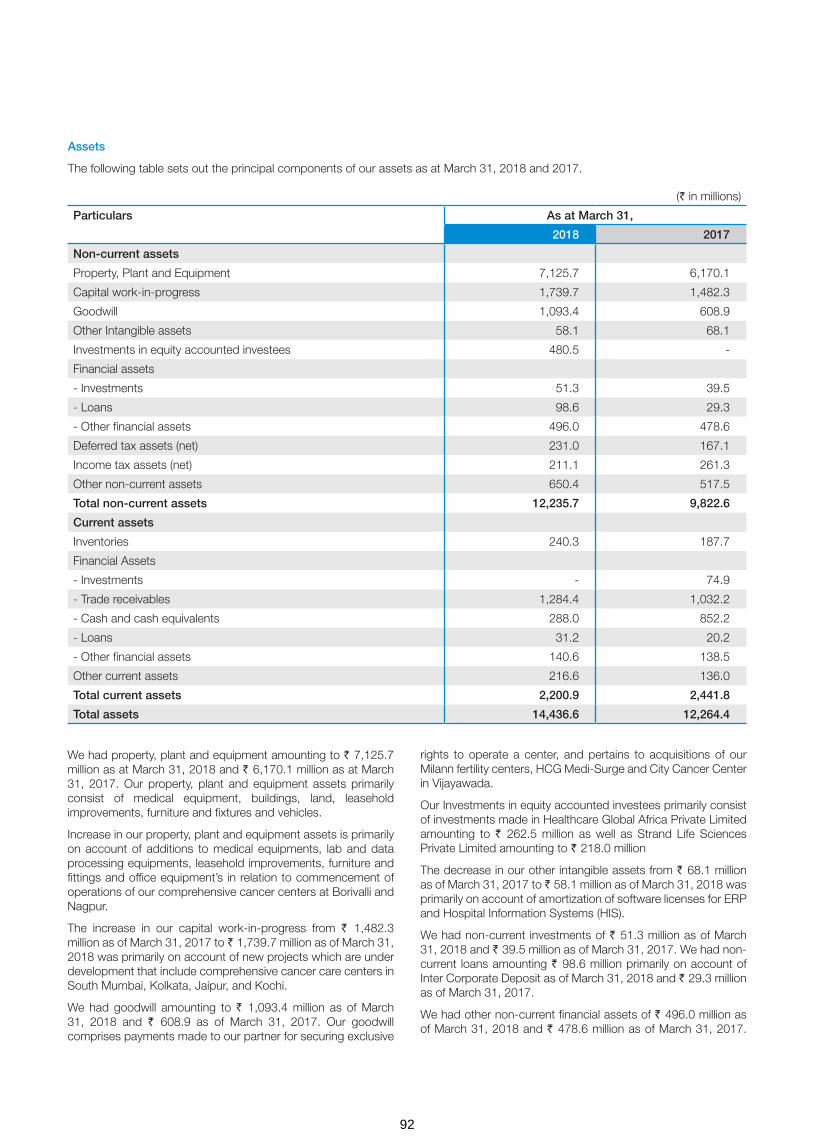
We had property, plant and equipment amounting to ` 7,125.7 million as at March 31, 2018 and ` 6,170.1 million as at March 31, 2017. Our property, plant and equipment assets primarily consist of medical equipment, buildings, land, leasehold improvements, furniture and fixtures and vehicles.
Increase in our property, plant and equipment assets is primarily on account of additions to medical equipments, lab and data processing equipments, leasehold improvements, furniture and fittings and office equipment’s in relation to commencement of operations of our comprehensive cancer centers at Borivalli and Nagpur.
The increase in our capital work-in-progress from ` 1,482.3 million as of March 31, 2017 to ` 1,739.7 million as of March 31, 2018 was primarily on account of new projects which are under development that include comprehensive cancer care centers in South Mumbai, Kolkata, Jaipur, and Kochi.
We had goodwill amounting to ` 1,093.4 million as of March 31, 2018 and ` 608.9 as of March 31, 2017. Our goodwill comprises payments made to our partner for securing exclusive
rights to operate a center, and pertains to acquisitions of our Milann fertility centers, HCG Medi-Surge and City Cancer Center in Vijayawada.
Our Investments in equity accounted investees primarily consist of investments made in Healthcare Global Africa Private Limited amounting to ` 262.5 million as well as Strand Life Sciences Private Limited amounting to ` 218.0 million
The decrease in our other intangible assets from ` 68.1 million as of March 31, 2017 to ̀ 58.1 million as of March 31, 2018 was primarily on account of amortization of software licenses for ERP and Hospital Information Systems (HIS).
We had non-current investments of ` 51.3 million as of March 31, 2018 and ` 39.5 million as of March 31, 2017. We had non-current loans amounting ` 98.6 million primarily on account of Inter Corporate Deposit as of March 31, 2018 and ` 29.3 million as of March 31, 2017.
We had other non-current financial assets of ` 496.0 million as of March 31, 2018 and ` 478.6 million as of March 31, 2017.
Assets
The following table sets out the principal components of our assets as at March 31, 2018 and 2017.
(` in millions)
Particulars As at March 31,
2018 2017
Non-current assets
Property, Plant and Equipment 7,125.7 6,170.1
Capital work-in-progress 1,739.7 1,482.3
Goodwill 1,093.4 608.9
Other Intangible assets 58.1 68.1
Investments in equity accounted investees 480.5 -
Financial assets
- Investments 51.3 39.5
- Loans 98.6 29.3
- Other financial assets 496.0 478.6
Deferred tax assets (net) 231.0 167.1
Income tax assets (net) 211.1 261.3
Other non-current assets 650.4 517.5
Total non-current assets 12,235.7 9,822.6
Current assets
Inventories 240.3 187.7
Financial Assets
- Investments - 74.9
- Trade receivables 1,284.4 1,032.2
- Cash and cash equivalents 288.0 852.2
- Loans 31.2 20.2
- Other financial assets 140.6 138.5
Other current assets 216.6 136.0
Total current assets 2,200.9 2,441.8
Total assets 14,436.6 12,264.4
92

This primarily comprises of Security Deposits amounting to ` 327.7 million and Term Deposits amounting to ` 142.0 million as on March 31, 2018.
Our Deferred Tax Assets increased to ` 231.0 million as of 31 March 2018 from ` 167.1 million as of 31 March 2017. Our income tax assets decreased to ` 211.1 million as of 31 March 2018 from ̀ 261.3 million as of 31 March 2017 which is primarily on account of tax refunds in our holding Company and our subsidiaries.
We had other non-current assets amounting to ` 650.4 million and ` 517.5 million as at March 31, 2018 and 2017 respectively and the increase is on account of prepaid expenses by ` 34.7 million and our capital advances by ̀ 99.6 million, which primarily pertaining to projects under development.
A significant portion of our liabilities comprise of non-current borrowings. We had non-current borrowings amounting to ` 3,724.3 million and ` 2,833.8 million as at March 31, 2018 and 2017 respectively.
Our other non-current financial liabilities as at March 31, 2018 was ` 915.7 million from ` 801.2 million as at March 31, 2017. This was primarily composed of gross obligation under written put option.
We had outstanding net trade receivables amounting to ` 1,284.4 million and ` 1,032.2 million as at March 31, 2018 and 2017 respectively. We made provisions for doubtful trade receivables amounting to ` 340.1 million and ` 385.9 million as at the end of March 31, 2018 and 2017 respectively. Our trade receivables comprise receivables from government payors, corporate bodies, insurers and patients who pay directly to us.
We had other current financial assets of ` 140.6 million as of March 31, 2018 as against ` 138.5 million as of March 31, 2017 and other current assets of ` 216.6 million as of March 31, 2018 as against ` 136.0 million as of March 31, 2017. Our other current financial assets primarily comprises of unbilled receivables amounting to ` 126.8 million and Term Deposits amounting to ` 9.1 million, while other current assets consist of advance to vendors amounting to ` 101.3 million, prepaid expenses of ` 66.2 million, and rental advance of ` 15.3 million as on March 31, 2018.
Our other non current liabilities primarily comprise of Deferred Government grant ` 305.1 million as of March 31, 2018.
We had outstanding trade payables amounting to ` 1,424.7 million and ` 1,273.6 million as at March 31, 2018 and 2017 respectively. These primarily comprised payables towards purchase of drugs, consumables, various services including medical consultancy charges, legal and professional fees, housekeeping charges and security charges.
LABILITIES AND INDEBTEDNESS
Liabilities
The following table sets forth the principal components of our liabilities as at March 31, 2018 and 2017.
(` in millions)
Particulars As at March 31,
2018 2017
Non-current liabilities
Financial liabilities:
- Borrowings 3,724.3 2,833.8
- Other financial liabilities 915.7 801.2
Provisions 51.0 30.5
Deferred tax liabilities 37.7 11.7
Other non-current liabilities 330.1 30.7
Total non-current liabilities 5,058.8 3,707.9
Current liabilities
Financial liabilities:
- Borrowings 17.4 416.3
- Trade payables 1,424.7 1,273.6
- Other financial liabilities 1,764.4 1,673.4
Provisions 56.0 49.4
Income tax liabilities (net) 39.8 13.9
Other current liabilities 285.3 228.7
Total current liabilities 3,587.6 3,655.3
Total liabilities 8,646.4 7,363.2
93

Indebtedness
(` in millions)
Particulars As at March 31,
2018 2017
Secured loans
- Term loans from banks 2,518.5 1,385.8
- Term loans from other parties 34.3 57.4
- Vehicle Loans 8.0 2.2
- Working capital loans 17.4 416.3
Total secured loans 2,578.1 1,861.6
Unsecured loans
- Deferred payment obligations 1,489.3 1,834.5
- Long term maturities of Finance Lease obligations 555.2 490.6
- From other parties 6.4 15.4
Total unsecured loans 2,050.9 2,340.4
Total borrowings 4,629.0 4,202.1
Total borrowings represented by:
Long-term borrowings 3,724.3 2833.8
Short-term borrowings 17.4 416.3
Current maturities of long-term borrowings 887.3 951.9
Total 4,629.0 4202.1
Summary of cash flow statement:
Particulars Fiscal Year 2018 Fiscal Year 2017
Net cash flow generated from/(used in) operating activities 978.1 912.8
Net cash flow generated from/(used in) investing activities (2,817.0) (2,098.0)
Net cash flow generated from/(used in) financing activities 1,612.9 891.5
Net cash flows generated for the year (226.0) (293.7)
We had other current financial liabilities amounting to ` 1,764.4 million and ` 1,673.4 million as at March 31, 2018 and 2017 respectively. These primarily comprised current maturities of long-term debts amounting to ` 887.3 million and ` 951.9 million, current liability on written put option of ` 417.6 million and ` 380.9 million; and payable on purchase of fixed assets amounting to ` 217.7 million and ` 127.7 million as at March 31, 2018 and 2017 respectively.
To fund our working capital and capital expenditure requirements, we have entered into various loans and facility agreements with various financial institutions. As at March 31, 2018, we had ` 4,629.0 million of indebtedness outstanding.
Cash flow generated from/ (used in) operating activities
For the fiscal year ended March 31 2018, we had profit before tax of ` 271.8 million and our operating profit before working capital changes was ` 1,289.9 million. Our cash generated from operations after adjusting for changes in working capital was ` 1,020.2 million. This reflected cash inflow on account of an increase in trade and other payable by ` 428.2 million; and
Our other current liabilities amounted to ` 285.3 million and ` 228.7 million as at March 31, 2018 and 2017 respectively. This was primarily comprised of advance from customers amounting to ` 204.4 million and ` 163.9 million, and Statutory remittances amounting to ` 60.9 million and ` 64.8 million as at March 31, 2018 and 2017 respectively.
All of our indebtedness outstanding as at March 31, 2018 was denominated in Indian Rupees except for U.S.$ 27.6 million in outstanding loans taken from various equipment vendors.
cash outflow on account of an increase in trade receivables by ` 397.9 million and an increase in inventories by ` 79.3 million. After adjusting for changes in working capital and a net income tax payment amounting to ` 42.0 million, our net cash flow generated from operating activities was ` 978.1 million for the fiscal year ended March 31 2018.
94

Cash flow generated from/ (used in) investing activities
For the fiscal year ended March 31, 2018, our net cash flow used in investing activities was ` 2,817.0 million. This reflected payments for property, plant and equipment including margin money deposits amounting to ` 2,710.0 million primarily relating to recently completed projects like Borivali and Nagpur as well as projects under development which include our upcoming comprehensive cancer care centers in Nashik Phase II, Jaipur and Kolkata.
Notes
1. Return on Equity: PAT/Average Shareholder Equity2. RoCE- EBIT/Average Capital Employed3. Inventory Turnover Ratio: EBIT/Average Inventory of FY 17
and FY 18
CREDIT RATING
The long term credit rating of HCG for FY18 has been maintained at A(-) by ICRA (associate of Moody’s Investor Services). ‘A’ Rating for instruments signifies adequate degree of safety regarding timely servicing of financial obligations. We moved from category of having moderate degree of safety to adequate degree of safety. The outlook on the long term rating has been revised to Stable from Positive.
INTERNAL CONTROL SYSTEM AND THEIR ADEQUACY
At HCG, management has the overall responsibility to design, implement and monitor an effective process and control environment that is aligned to the inherent risk profile of the organization. Management is responsible for the identification, evaluation and management of significant risks. The Company has institutionalized a framework to focus on key risks that might
Cash flow generated from/ (used in) financing activities
For the fiscal year ended March 31, 2018, our net cash flow generated from financing activities was ` 1,612.9 million. This primarily reflected proceeds from borrowings amounting to ` 3,464.5 million, proceeds from preferential equity share issue (net of expenses) amounting to ` 348.1 million and proceeds from minority shareholders in subsidiaries amounting to ` 123.4 million, which were partially offset by repayment of borrowings amounting to ` 1,972.1 million and interest paid amounting to ` 351.1 million
impact achievement of business objectives. The framework entails a structured process to identify, assess and monitor the risks and initiate suitable mitigation strategies for effective risk management. The Board monitors exposure to these risks with the assistance of various committees and senior management.
The internal control framework is designed to manage and mitigate the risks faced by the Company. The Company has designed and implemented an entity level control framework setting the control philosophy and principles which guide the organization policy and operating process framework.
The organizational role, responsibility and accountability structures with appropriate performance oversight processes are defined and aligned to provide an enabling environment to the business units and functions to operate as per the design control environment. Review and oversight procedures are designed to monitor effective adherence as per design.
RATIO ANALYSIS: Snapshot of 2018 and 2017
Key Ratios For the fiscal year ended March 31, 2018
For the fiscal year ended March 31, 2017
Ratios – Leverage
Debt/Equity 0.80 0.86
EBITDA/Interest 3.11 4.99
Ratios – Profitability
Operating Profit Margin 15.6% 16.2%
Net Profit Margin 2.4% 3.1%
Return on Equity 4.3% 5.2%
RoCE 8.3% 9.9%
Ratios – Operations
Inventory Turnover ratio 8.8 10.6
Current ratio 0.5 0.6
Ratios – Per Share
EPS 2.3 2.6
P/E* 122.9 85.7
Market Capitalisation/Total Revenue* 3.0 2.7
* Based on closing share price as on March 31, 2018 on BSE.
4. Current Ratio: Current Assets/Current Liabilities5. EPS: PAT post Minority Interest/No of diluted shares
outstanding6. P/E: Closing share price as on March 31, 2018 on BSE/ EPS
95

The internal control system is commensurate with the nature of business, size and complexity of operations and has been designed to provide reasonable assurance on the achievement of objectives in effectiveness and efficiency of operations, reliability of financial reporting and compliance with applicable laws and regulations.
As a part of overall governance mechanism around financial reporting and as stipulated under the Companies Act, 2013, Internal Controls over Financial Reporting (ICoFR) framework have been institutionalized. The adequacy and operating effectiveness of the internal controls affecting financial reporting is assessed by the management.
The internal control framework is supplemented with an internal audit program that provides an independent view of the efficacy and effectiveness of the process and control environment and supports a continuous improvement program. The internal audit program is managed by an Internal Audit function with direct reporting to the Audit and Risk Management Committee of the Board.
The scope and authority of the Internal Audit Function is derived from the Audit Charter approved by the Audit and Risk Management Committee of the Board. The Internal Audit function develops an internal audit plan to assess control design and operating effectiveness, as per the risk assessment methodology.
The Internal Audit function provides assurance to the Board and management that a system of internal control is designed and deployed to manage key business risks and is operating effectively.
Management provides action plans to address the observations noted from the internal audit reviews and action plans are
monitored towards resolution under the supervision and guidance of the Audit and Risk Management Committee.
The Audit and Risk Management Committee reviews the adequacy and effectiveness of the Company’s internal control environment and monitors the implementation of internal audit observations.
ENTERPRISE RISK MANAGEMENT
HCG operates in a business environment that is characterized by increasing competition and market uncertainties. It is exposed to a number of risks in ordinary course of business. This is inevitable, as there can be no entrepreneurial activity without the acceptance of risks and associated profit opportunities.
Accordingly, risk management activities at HCG are not aimed at eliminating all risks in their entirety, but rather at helping to identify and assess the risks the Company encounters in its daily business. This allows the Company to manage the risks in an efficient manner to take informed decisions, to exploit the opportunities available and thereby enhance the value of the Company and its stake holders.
Risk Management Framework:
The Risk Management framework has been developed and approved by senior management in accordance with the business strategy.
The key elements of the framework include Risk Strategy, Risk Structure, Risk Portfolio, Risk Measuring & Monitoring and Risk Optimizing. The implementation of the framework is supported through criteria for risk assessment and categorization, risk escalation matrix, Risk forms & MIS.
The overall objective of risk management process is to optimize the risk-reward relationship.
Risk Categorization:
Risk Categorization into different buckets help to prioritize risks, within an entity. It assists management in ensuring that they have captured all categories of organizational risks, not just traditional, financial hazards.
HCG identifies and categorizes risks into
• Financial Risk
• Reputation Risk
• Regulatory/Legal Risk
• Employee Risk
• Patient/Customer Risk
The Board of Directors considers a number of factors for risk categorization during risk identification and assessment.
Risk Measuring and Monitoring:
A risk review involves the re-examination of all risks recorded on the risk assessment repository to ensure that the current assessments remain valid and review the progress of risk reduction actions.
Risk Communication and Escalation need to be embedded in the culture of an organization to make it effective. At HCG, the Board of Directors drive the Risk Management Process through its Audit and Risk Management Committee by adopting the following communication and escalation procedure:
• Employees continuously identify needs to update / modify the risks and escalate them to their respective Unit / Functional Head.
• The respective Unit/ Functional Head or designated personnel collate the identified risks/ modifications and
RISK MANAGEMENT FRAMEWORK
Risk Structure Risk PortfolioRisk Measuringand Monitoring
Risk Optimizing Risk Category
96
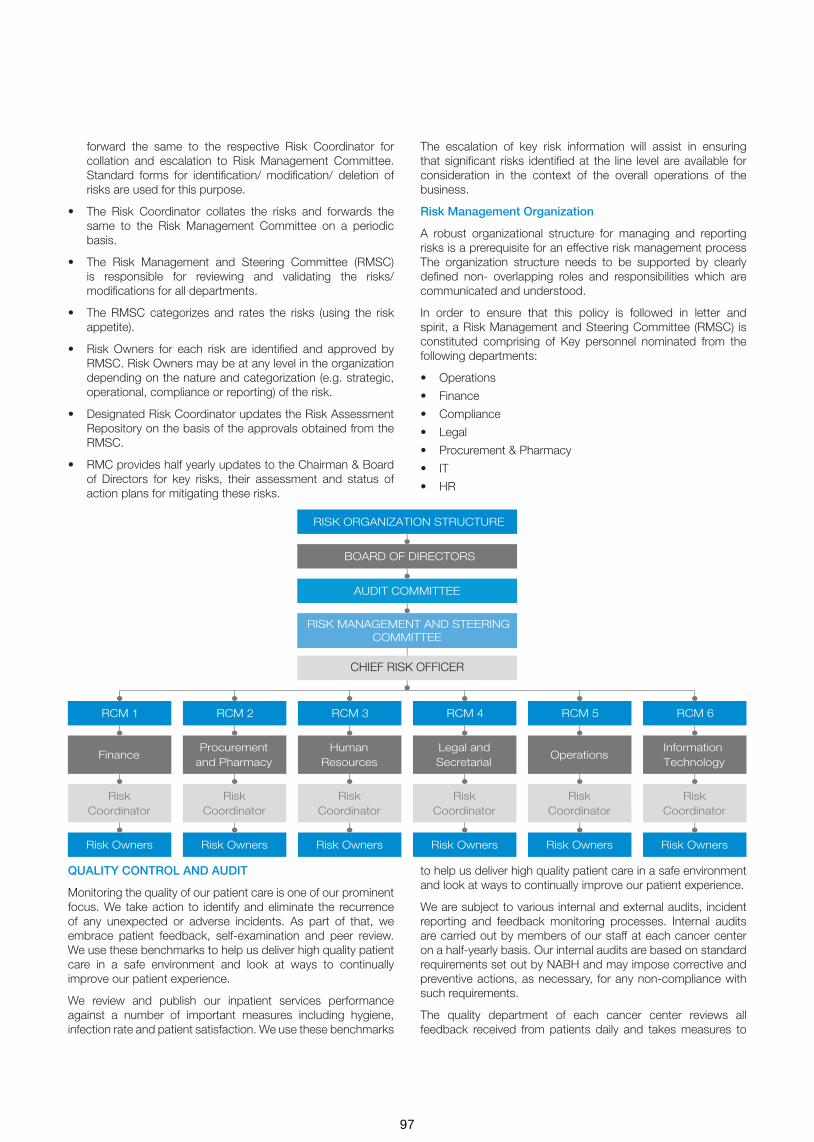
forward the same to the respective Risk Coordinator for collation and escalation to Risk Management Committee. Standard forms for identification/ modification/ deletion of risks are used for this purpose.
• The Risk Coordinator collates the risks and forwards the same to the Risk Management Committee on a periodic basis.
• The Risk Management and Steering Committee (RMSC) is responsible for reviewing and validating the risks/ modifications for all departments.
• The RMSC categorizes and rates the risks (using the risk appetite).
• Risk Owners for each risk are identified and approved by RMSC. Risk Owners may be at any level in the organization depending on the nature and categorization (e.g. strategic, operational, compliance or reporting) of the risk.
• Designated Risk Coordinator updates the Risk Assessment Repository on the basis of the approvals obtained from the RMSC.
• RMC provides half yearly updates to the Chairman & Board of Directors for key risks, their assessment and status of action plans for mitigating these risks.
The escalation of key risk information will assist in ensuring that significant risks identified at the line level are available for consideration in the context of the overall operations of the business.
Risk Management Organization
A robust organizational structure for managing and reporting risks is a prerequisite for an effective risk management process The organization structure needs to be supported by clearly defined non- overlapping roles and responsibilities which are communicated and understood.
In order to ensure that this policy is followed in letter and spirit, a Risk Management and Steering Committee (RMSC) is constituted comprising of Key personnel nominated from the following departments:
• Operations
• Finance
• Compliance
• Legal
• Procurement & Pharmacy
• IT
• HR
QUALITY CONTROL AND AUDIT
Monitoring the quality of our patient care is one of our prominent focus. We take action to identify and eliminate the recurrence of any unexpected or adverse incidents. As part of that, we embrace patient feedback, self-examination and peer review. We use these benchmarks to help us deliver high quality patient care in a safe environment and look at ways to continually improve our patient experience.
We review and publish our inpatient services performance against a number of important measures including hygiene, infection rate and patient satisfaction. We use these benchmarks
to help us deliver high quality patient care in a safe environment and look at ways to continually improve our patient experience.
We are subject to various internal and external audits, incident reporting and feedback monitoring processes. Internal audits are carried out by members of our staff at each cancer center on a half-yearly basis. Our internal audits are based on standard requirements set out by NABH and may impose corrective and preventive actions, as necessary, for any non-compliance with such requirements.
The quality department of each cancer center reviews all feedback received from patients daily and takes measures to
CHIEF RISK OFFICER
97

appropriately address such feedback. Incident reports are collected and analysed by the quality departments weekly and appropriate remedial measures are undertaken.
External audits are carried out by NABH at our center of excellence in Bengaluru and at HMS. External audits by NABL and CAP had been carried out at Triesta central reference laboratory. External audits by NABH, NABL and CAP are based on the standards set out by these bodies and are voluntary. The external accrediting bodies also set out certain quality standards, which are monitored by our internal quality departments and a monthly report of quality indicators is presented to our corporate quality team, which oversees the quality functions of our Company. Further, our internal quality teams document the policies and procedures mandated by the accrediting bodies. The accrediting bodies verify these policies and procedures. Our corporate quality team also develops specific quality indicators to monitor clinical outcomes based on documented clinical procedures.
In addition to the above, HCG has also developed case specific clinical protocols for the majority of the oncology cases that we see in the HCG Network. This standardization has helped us in achieving optimum level of care in all units without having to compromise.
Each cancer center also has other committees which are responsible for quality control, such as hospital infection control committees, pharmacy and therapeutics committees, employee grievances committees and ethics committees.
From time to time, AERB also conducts audits at our cancer centers relating to quality assurance of radiation equipment, radiation safety measures taken by our cancer centers, any changes in the representations made by our cancer centers while obtaining the AERB approval and the adequacy of the skills and number of manpower and resources at each cancer center.
We also have a quality management system structured as per the ISO9001:2008 guidelines for quality management systems across our Milann fertility centers. The key quality assurance practices at our Milann fertility centers include standardised treatment and management protocols, service delivery by experts in reproductive medicine, globally accepted medical equipment, regular calibration and maintenance of key equipment, quality control processes such as standardised processes for tests and audits.
Our Milann fertility centers undertake weekly clinical audits aimed at enhancing clinical outcomes, patient safety and care. The clinical audit process reviews and evaluates medical management in line with clinical and scientific best practice standards, clinical success rates, possible causes and courses of action for unsuccessful outcomes, quality metrics for clinical, embryology and laboratory outcomes and policies and action plans for continuous quality improvement.
Employee surveys are carried out twice a year by the human resource departments of each cancer center and the results of such surveys are shared with the quality departments and the management team of each cancer center for remedial measures.
CLINICAL EXCELLENCE
Clinical excellence is the core premise around which our healthcare operations are structured. Our Group continues to deliver the highest standards of clinical outcomes across all our business verticals. Our standardised clinical protocols for diagnosis and treatment of cancer patients have allowed us to manage the large volume of patient cases across our HCG network with successful clinical outcomes. The five-year survival rate for breast cancer patients at our HCG network is comparable to U.S. benchmarks. (Source: Delivering World-Class Health Care, Affordably, published on Harvard Business Review by Vijay Govindarajan and Ravi Ramamurti, dated November 2013). We believe that we are able to attract and retain highly skilled specialist physicians due to our reputation for clinical excellence, our technology-focused approach, the exposure and experience we provide in relation to clinical best practices and the training programmes we offer for their ongoing development. We believe that the abilities and expertise of our team of specialist physicians differentiate us relative to our competitors.
Department of Clinical excellence at HCG has been instrumental in synergizing the clinical functions at all HCG hospitals. This department under quality and strategy aims to improve the quality of clinical care and usher in uniform standards of care across all HCG centers. This has been facilitated through a systematic change in people, process, and function. Credentialing and privileging have been synergized with the functions and quality indicators of each department thereby ushering a sense of accountability. Identifying training needs and skill development has ensured improvement at the people level. At the process level upgradation of medical record departments, registry, implementation of uniform documentation practices across centers, clinical audits and deficiency monitoring has helped set high standards of clinical practice. Mapping our own clinical outcomes and constantly evolving HCG treatment guidelines has paved way for standardization of clinical pathways and improvement in the functioning of the departments. Research leveraged with genomics has ushered in an era of precision medicine at HCG. Biorepository specimens and the acCompanying clinical repository is a treasure trove for novel drug targets and discovery. The department of clinical excellence strives towards an improvement in clinical care and health of the patients transcending beyond oncology. The vision is to make people’s lives better than what they had before a cancer diagnosis using caring hands, clinical expertise, and high-end technology.
The Department of Clinical Excellence facilitates:
• Implementation of Uniform documentation standards
• Implementation of Uniform treatment protocols and clinical pathways
• Centralized Cancer registry
• Centralized Clinical repository
• Centralized Biorepository
• R&D activities and Investigator Initiated Trials
• Documentation of outcomes
• Development of clinical audit standards across departments
• Developments of clinical forms
98

HCG was the host institution to the Second International Cancer Congress (ICC-2017), the largest conglomeration of oncologists in the country. The second chapter of the Indian Cancer Congress (ICC) 2017 at the Clarks Convention Centre in Bengaluru. The aim of the conference, jointly organized by its four major national oncology partners and the Government of Karnataka, was to provide a platform and spread cancer awareness through various initiatives. The theme of the conference was Insight, Innovation, and Integration. The conference also saw active participation from Ministry of AYUSH in launching the National Integrative Cancer program (ICAP). The conference was a scientific treat with around 5000 delegates and several hundred international speakers, discussing and sharing advances in various aspects of cancer Care. The conference saw an active participation from HCG Oncologists in coordinating various specialty symposia and presenting several research publications.
HUMAN RESOURCES MANAGEMENT – EMPLOYEE RELATIONS AND DEVELOPMENT
The Human Resources (HR) department at HCG is driven by the mission to help HCGians realize their potential – to develop, grow and achieve their purpose, build the right culture and capabilities to enable us to serve our patients and to make HCG the best place to work for passionate, innovative people who want to make a difference.
We believe that we are able to attract and retain highly skilled specialist physicians due to our reputation for clinical excellence, our technology-focused approach, the exposure and experience we provide in relation to clinical best practices and the training programmes we offer for their ongoing development. We believe that the abilities and expertise of our team of specialist physicians differentiate us relative to our competitors. Several of our specialist physicians have received accolades and awards in recognition of their contribution to their respective fields of medicine.
Our senior management team has extensive experience in the management of healthcare businesses. We believe the experience, depth and diversity of our management team, complemented by the clinical expertise and relationship base of our physician Promoters, is a distinct competitive advantage in the complex and rapidly evolving healthcare industry in which we operate.
In order to maintain the quality of care we offer to our patients, our physicians and other medical staff must pursue a rigorous programme of continuing education. We offer a wide range of health education sessions and seminars on-site at our centers and hospitals to our physicians and medical staff, as well as to healthcare professionals outside our network of centers and hospitals. The sessions are led by expert physicians and other healthcare professionals from our network of centers and hospitals, who have first-hand knowledge of the latest clinical developments and research. We believe that these sessions provide an important forum to discuss recent developments to improve patient care and teach our physicians and medical staff new skills. In addition, we believe that they also provide an important opportunity for us to showcase the capabilities of our centers, hospitals and physicians and allow our physicians to grow their referral networks.
We also offer physicians the opportunity to consult with each other on challenging cases and treatments. For example, at our
weekly tumour board discussions, we discuss selected complex cases from across our HCG network. This allows knowledge sharing and enables us to develop best practices and protocols which are implemented across our HCG network. We also evaluate the clinical activities of each center and hospital as part of our annual evaluations to ensure that high quality treatments or services are provided to patients.
Furthermore, we have a dedicated learning and development department, which continuously monitors the learning and development activities and ensures that a high quality of service is provided to our patients, thereby improving patient satisfaction. Our learning and development department provides continuing education for quality improvement to our employees. It identifies areas in which training is required, and develops an employee development plan for each employee, pursuant to which employees are provided various skill enhancement trainings.
At our center of excellence in Bengaluru, we offer a Diplomate of National Board medical residency programme for radiation oncology, medical oncology and pathology, in affiliation with the National Board of Examination.
In addition, we offer various certificate medical and nursing courses on oncology, a paramedical course on advanced radiotherapy technology, a laboratory research course and various other medical and non-medical courses for our employees.
Our Milann fertility centers also offer a post-graduate fellowship programme in reproductive medicine services to fertility specialists, in affiliation with the National Board of Examination. Additionally, our Milann fertility centers offer training programmes in IVF for fertility specialists and embryologists. We believe that these education and training programmes are critical capabilities that we have and these enable us to develop an in house trained team of specialist physicians.
FORWARD LOOKING STATEMENT
Except for the historical information contained herein, statements in this discussion contain contains certain “forward-looking statements”. These forward-looking statements generally can be identified by words or phrases such as “aim”, “anticipate”, “believe”, “expect”, “estimate”, “intend”, “objective”, “plan”, “project”, “will”, “will continue”, “will pursue” or other words or phrases of similar import. Similarly, statements that describe our Company’s strategies, objectives, plans or goals are also forward-looking statements. These forward looking statements involve a number of risks, uncertainties and other factors that could cause actual results to differ materially from those suggested by the forward-looking statements. These risks and uncertainties include, but are not limited to, our ability to successfully implement our strategy, future business plans, our growth and expansion in business, the impact of any acquisitions, our financial capabilities, technological implementation and changes, the actual growth in demand for our services, cash flow projections, our exposure to market risks as well as other general risks applicable to the business or industry.
The Company undertakes no obligation to update forward looking statements to reflect events or circumstances after the date thereof. These discussions and analysis should be read in conjunction with the Company’s financial Statements included herein and the notes thereto.
99

To the Members of HealthCare Global Enterprises Limited
Report on the Audit of the Standalone Ind AS Financial Statements
We have audited the accompanying standalone Ind AS financial statements of HealthCare Global Enterprises Limited (“the Company”), which comprise the Balance Sheet as at 31 March 2018, the Statement of Profit and Loss, the Statement of Changes in Equity and the Statement of Cash Flows for the year then ended, and summary of the significant accounting policies and other explanatory information.
Management’s Responsibility for the Standalone Ind AS Financial Statements
The Company’s Board of Directors is responsible for the matters stated in Section 134(5) of the Companies Act, 2013 (“the Act”) with respect to the preparation of these standalone Ind AS financial statements that give a true and fair view of the state of affairs, profit/loss and other comprehensive income, changes in equity and cash flows of the Company in accordance with the accounting principles generally accepted in India, including the Indian Accounting Standards (Ind AS) prescribed under section 133 of the Act.
This responsibility also includes maintenance of adequate accounting records in accordance with the provisions of the Act for safeguarding the assets of the Company and for preventing and detecting frauds and other irregularities; selection and application of appropriate accounting policies; making judgments and estimates that are reasonable and prudent; and design, implementation and maintenance of adequate internal financial controls that were operating effectively for ensuring the accuracy and completeness of the accounting records, relevant to the preparation and presentation of the standalone Ind AS financial statements that give a true and fair view and are free from material misstatement, whether due to fraud or error.
In preparing the financial statements, management is responsible for assessing the Company’s ability to continue as a going concern, disclosing, as applicable, matters related to going concern and using the going concern basis of accounting unless management either intends to liquidate the Company or to cease operations, or has no realistic alternative but to do so.
Auditor’s Responsibility
Our responsibility is to express an opinion on these standalone Ind AS financial statements based on our audit.
We have taken into account the provisions of the Act, the accounting and auditing standards and matters which are required to be included in the audit report under the provisions of the Act and the Rules made thereunder.
We conducted our audit of the standalone Ind AS financial statements in accordance with the Standards on Auditing specified under Section 143(10) of the Act. Those Standards require that we comply with ethical requirements and plan and perform the audit to obtain reasonable assurance about whether the standalone Ind AS financial statements are free from material misstatement.
An audit involves performing procedures to obtain audit evidence about the amounts and the disclosures in the standalone Ind AS financial statements. The procedures selected depend on the auditor’s judgment, including the assessment of the risks of material misstatement of the standalone Ind AS financial statements, whether due to fraud or error. In making those risk assessments, the auditor considers internal financial control relevant to the Company’s preparation of the standalone Ind AS financial statements that give a true and fair view in order to design audit procedures that are appropriate in the circumstances. An audit also includes evaluating the appropriateness of the accounting policies used and the reasonableness of the accounting estimates made by the Company’s Directors, as well as evaluating the overall presentation of the standalone Ind AS financial statements.
We are also responsible to conclude on the appropriateness of management’s use of the going concern basis of accounting and, based on the audit evidence obtained, whether a material uncertainty exists related to events or conditions that may cast significant doubt on the entity’s ability to continue as a going concern. If we conclude that a material uncertainty exists, we are required to draw attention in the auditor’s report to the related disclosures in the financial statements or, if such disclosures are inadequate, to modify the opinion. Our conclusions are based on the audit evidence obtained up to the date of the auditor’s report. However, future events or conditions may cause an entity to cease to continue as a going concern.
We believe that the audit evidence we have obtained is sufficient and appropriate to provide a basis for our audit opinion on the standalone Ind AS financial statements.
Opinion
In our opinion and to the best of our information and according to the explanations given to us, the aforesaid standalone Ind AS financial statements give the information required by the Act in the manner so required and give a true and fair view in conformity with the accounting principles generally accepted in India of the state of affairs of the Company as at 31 March 2018, its profit and other comprehensive income, changes in equity and its cash flows for the year ended on that date.
Other Matters
As fully explained in note 48 to the standalone Ind AS financial statements, the Company has given effect to the Scheme of Arrangement (‘Scheme’) approved by Regional Director, Ministry of Corporate Affairs, Hyderabad vide its order dated 30 January 2018. The Company has given effect to the Scheme which is merger of HCG Pinnacle Oncology Private Limited (‘HCG Pinnacle’) with the Company from the appointed date specified in the Scheme, i.e. 1 April 2016. The accounting treatment is in accordance with Appendix C of Ind AS 103, Business Combination as these transactions were between the common control entities.
Corresponding figures for the year ended 31 March 2017 of the standalone Ind AS financial statements of the Company have been audited by predecessor auditor who expressed an unmodified opinion dated 24 May 2017. The figures for year
INDEPENDENT AUDITOR’S REPORT
100
ended 31 March 2017 of HCG Pinnacle were audited by the predecessor auditor who expressed an unmodified opinion dated 19 May 2017.
Our opinion on the standalone Ind AS financial statements is not modified in respect of the above matters.
Report on Other Legal and Regulatory Requirements
1. As required by the Companies (Auditor’s Report) Order, 2016 (“the Order”) issued by the Central Government in terms of Section 143(11) of the Act, we give in “Annexure A” a statement on the matters specified in paragraphs 3 and 4 of the Order.
2. As required by Section 143(3) of the Act, we report that:
a) We have sought and obtained all the information and explanations which to the best of our knowledge and belief were necessary for the purposes of our audit.
b) In our opinion, proper books of account as required by law have been kept by the Company so far as it appears from our examination of those books.
c) The Balance Sheet, the Statement of Profit and Loss, the Cash Flow Statement and Statement of Changes in Equity dealt with by this Report are in agreement with the books of account.
d) In our opinion, the aforesaid standalone Ind AS financial statements comply with the Indian Accounting Standards prescribed under section 133 of the Act.
e) On the basis of the written representations received from the directors as on 31 March 2018 taken on record by the Board of Directors, none of the directors is disqualified as on 31 March 2018 from being appointed as a director in terms of Section 164(2) of the Act.
f) With respect to the adequacy of the internal financial controls with reference to financial statements of the Company and the operating effectiveness of such controls, refer to our separate Report in “Annexure B”.
for B S R & Co. LLP Chartered Accountants
Firm’s registration number: 101248W/W-100022
Amit SomaniPlace: Bengaluru PartnerDate: 22 May 2018 Membership number: 060154
g) With respect to the other matters to be included in the Auditor’s Report in accordance with Rule 11 of the Companies (Audit and Auditors) Rules, 2014, in our opinion and to the best of our information and according to the explanations given to us:
i. The Company has disclosed the impact of pending litigations on its financial position in its standalone Ind AS financial statements; - Refer Note 30 to the standalone Ind AS financial statements.
ii. The Company did not have any long-term contracts including derivative contracts for which there were any material foreseeable losses.
iii. There were no amounts which were required to be transferred to the Investor Education and Protection Fund by the Company.
iv. The disclosures in the standalone Ind AS financial statements regarding holdings as well as dealings in specified bank notes during the period from 8 November 2016 to 30 December 2016 have not been made since they do not pertain to the financial year ended 31 March 2018. However amounts as appearing in the audited Standalone Ind AS financial statements for the period ended 31 March 2017 have been disclosed.
101

With reference to the Annexure A referred to in the Independent Auditor’s Report to the members of the Company on the standalone Ind AS financial statements for the year ended 31 March 2018, we report the following:
(i) (a) The Company has maintained proper records showing full particulars, including quantitative details and situation of fixed assets.
(b) The Company has a regular programme of physical verification of its fixed assets by which all fixed assets are verified in a phased manner over a period of 3 years. In our opinion, this periodicity of physical verification is reasonable having regard to the size of the Company and the nature of its assets. Pursuant to the programme, certain fixed assets were physically verified during the year. No material discrepancies were noticed on such verification.
(c) In our opinion and according to the information and explanations given to us and on the basis of our examination of the records of the Company, the title deeds of immovable properties included in property, plant and equipment are held in the name of the Company except the following immoveable properties for which the Company is in the process of obtaining it:
Total number of cases
Gross block
Net Block
Remarks, if any
Freehold land - 3 cases
132.08 132.08
Building – 3 cases
440.94 351.35 The buildings referred to here are on the freehold land referred above.
(ii) The inventory has been physically verified by the management during the year. In our opinion, the frequency of such verification is reasonable. The discrepancies noticed on verification between the physical stock and the book records were not material.
(iii) The Company has granted loans to two companies and a Limited Liability Partnership (‘LLP’) covered in the register maintained under section 189 of the Companies Act, 2013 (“the Act”).
(a) In our opinion and according to the information and explanations given to us, the terms and conditions on which the loans had been granted to the company and a LLP listed in the Register maintained under Section 189 of the Act are not prejudicial to the Company’s interest.
(b) According to the information and explanations given to us, for the loans granted, terms and conditions with respect to repayment of principal and payment of interest are not stipulated. We are therefore unable to make specific comment on the regularity of repayment of principal and payment of interest.
(c) There are no amounts of loans granted to companies and LLP listed in the register maintained under section 189 of the Act which are overdue for more than ninety days. During the earlier years, due to the adverse business performance of a subsidiary company, the outstanding loan was fully provided for.
(iv) In our opinion and according to the information and explanations given to us, the Company has complied with the provisions of Sections 185 and 186 of the Act, with respect to the loans given, investments made and guarantees given. Further, there are no security given in respect of which provisions of section 185 and 186 of the Act are applicable.
(v) The Company has not accepted any deposits from the public within the meaning the directives issued by the Reserve Bank of India, provisions of Section 73 to 76 of the Act, any other relevant provisions of the Act and the relevant rules framed thereunder.
(vi) We have broadly reviewed the books of account maintained by the Company pursuant to the rules prescribed by the Central Government for maintenance of cost records under Section 148 of the Act and are of the opinion that prima facie, the prescribed accounts and records have been made and maintained. However, we have not made a detailed examination of such records.
(vii) (a) According to the information and explanations given to us and on the basis of our examination of
the records of the Company, amounts deducted/ accrued in the books of account in respect of undisputed statutory dues including Provident fund, Employees’ State Insurance, Income-tax, Sales tax, Service Tax, Goods and Services tax, duty of Customs, Value added tax, and other material statutory dues have generally been regularly deposited during the year by the Company with the appropriate authorities.
According to the information and explanations given to us, no undisputed amounts payable in respect of Provident fund, Employees’ State Insurance, Income-tax, Sales tax, Service tax, Goods and Services tax, duty of Customs, Value added tax, and other material statutory dues were in arrears as at 31 March 2018, for a period of more than six months from the date they became payable.
Annexure- A to the Independent Auditor’s Report of even date on the standalone Ind AS financial statements of HealthCare Global Enterprises Limited
102

Name of the statute Nature of the dues Amount (` in Millions)#
Period to which the amount relates
Forum where dispute is pending
Andhra Pradesh Value Added Tax Act, 2005
Value Added Tax 2.5 (0.4 million)*
Financial year 2011-12 to financial year 2014-15
High Court of Judicature at Hyderabad, for the state of Telangana and the state of Andhra Pradesh
The Central Excise Act, 1944
Excise duty 15.23 (0.6 million)*
April 2009 to March 2014
Central Excise, Customs and Service Tax Appellate Tribunal (CESTAT)
The Central Excise Act, 1944
Excise duty 13.14 March 2013 to June 2015
Commissioner( Appeals) of Central Excise
(b) According to the information and explanations given to us, there are no dues of income Tax or sales Tax or service Tax or duty of customs or duty of excise or value added tax which have not been deposited by the Company on account of disputes, except for the following:
* represents amount paid under protest # the amounts disclosed above includes interest and penalties, wherever applicable.
Annexure- A to the Independent Auditor’s Report of even date on the standalone Ind AS financial statements of HealthCare Global Enterprises Limited (continued)
(viii) In our opinion and according to the information and explanations given to us, the Company has not defaulted in repayment of loans or borrowings to financial institutions and banks. The Company did not have any outstanding loans or borrowings from government and there are no dues to debenture holders during the year.
(ix) According to the information and explanations given to us and based on examination of the records of the Company, the term loans obtained during the year were applied for the purpose for which they were obtained. The Company has not raised any money by way of initial public offer or further public offer (including debt instruments) during the year.
(x) According to the information and explanations given to us, no material fraud on the Company by its officers and employees or fraud by the Company has been noticed or reported during the course of our audit.
(xi) As stated in Note 45 to the financial statements and according to the information and explanations given to us, the Managerial remuneration for the year ended 31 March 2018 aggregated Rs 25.45million towards remuneration of the Managing Director. The aforesaid remuneration is in excess of the limits prescribed under the provisions of Section 197 read with Schedule V to the Act. We have been informed by the Management that the Company is in the process of obtaining the requisite approvals from the Central Government for the excess remuneration provided.
(xii) According to the information and explanations given to us, in our opinion, the Company is not a Nidhi Company as prescribed under Section 406 of the Act.
(xiii) According to the information and explanations given to us and based on our examination of the records of the Company,
all transactions with the related parties are in compliance with Sections 177 and 188 of the Act, where applicable, and details of such transactions have been disclosed in the standalone Ind AS financial statements as required by the applicable accounting standards
(xiv) According to the information and explanations given to us and based on our examination of the records of the Company, the Company has complied with the provisions of Section 42 of the Act in respect of preferential allotment of shares during the year. Further, according to the information and explanations given to us and based on our examination of the records of the Company, we report that the amounts raised have been used for the purpose for which the funds were raised.
(xv) According to the information and explanations given to us and based on our examination of the records of the Company, the Company has not entered into non-cash transactions with directors or persons connected with him.
(xvi) According to the information and explanations given to us, the Company is not required to be registered under section 45-IA of the Reserve Bank of India Act, 1934.
for B S R & Co. LLP Chartered Accountants
Firm’s registration number: 101248W/W-100022
Amit SomaniPlace: Bengaluru PartnerDate: 22 May 2018 Membership number: 060154
103
Report on the Internal Financial Controls Over Financial Reporting under Clause (i) of Sub-section 3 of Section 143 of the Companies Act, 2013 (“the Act”)
We have audited the internal financial controls over financial reporting with reference to Standalone Ind AS financial statements of HealthCare Global Enterprises Limited (“the Company”) as of 31 March 2018 in conjunction with our audit of the standalone Ind AS financial statements of the Company for the year ended on that date.
Management’s Responsibility for Internal Financial Controls
The Company’s management is responsible for establishing and maintaining internal financial controls based on the internal control over financial reporting criteria established by the Company considering the essential components of internal control stated in the Guidance Note on Audit of Internal Financial Controls Over Financial Reporting (‘Guidance Note’) issued by the Institute of Chartered Accountants of India (‘ICAI’). These responsibilities include the design, implementation and maintenance of adequate internal financial controls that were operating effectively for ensuring the orderly and efficient conduct of its business, including adherence to company’s policies, the safeguarding of its assets, the prevention and detection of frauds and errors, the accuracy and completeness of the accounting records, and the timely preparation of reliable financial information, as required under the Act.
Auditor’s Responsibility
Our responsibility is to express an opinion on the Company’s internal financial controls over financial reporting based on our audit. We conducted our audit in accordance with the Guidance Note and the Standards on Auditing, issued by ICAI and deemed to be prescribed under section 143(10) of the Act, to the extent applicable to an audit of internal financial controls, both applicable to an audit of Internal Financial Controls and, both issued by the Institute of Chartered Accountants of India. Those Standards and the Guidance Note require that we comply with ethical requirements and plan and perform the audit to obtain reasonable assurance about whether adequate internal financial controls over financial reporting was established and maintained and if such controls operated effectively in all material respects.
Our audit involves performing procedures to obtain audit evidence about the adequacy of the internal financial controls system over financial reporting and their operating effectiveness. Our audit of internal financial controls over financial reporting included obtaining an understanding of internal financial controls over financial reporting, assessing the risk that a material weakness exists, and testing and evaluating the design and operating effectiveness of internal control based on the assessed risk. The procedures selected depend on the auditor’s judgment, including the assessment of the risks of material misstatement of the standalone Ind AS financial statements, whether due to fraud or error.
We believe that the audit evidence we have obtained is sufficient and appropriate to provide a basis for our audit opinion on the Company’s internal financial controls system over financial reporting.
Annexure B to the Independent Auditor’s Report of even date on the standalone Ind AS financial statements of HealthCare Global Enterprises Limited
Meaning of Internal Financial Controls Over Financial Reporting
A company’s internal financial control over financial reporting is a process designed to provide reasonable assurance regarding the reliability of financial reporting and the preparation of financial statements for external purposes in accordance with generally accepted accounting principles. A company’s internal financial control over financial reporting includes those policies and procedures that:
1. pertain to the maintenance of records that, in reasonable detail, accurately and fairly reflect the transactions and dispositions of the assets of the company;
2. provide reasonable assurance that transactions are recorded as necessary to permit preparation of the financial statements in accordance with generally accepted accounting principles, and that receipts and expenditures of the company are being made only in accordance with authorisations of management and directors of the company; and
3. provide reasonable assurance regarding prevention or timely detection of unauthorised acquisition, use, or disposition of the company’s assets that could have a material effect on the financial statements.
Inherent Limitations of Internal Financial Controls Over Financial Reporting
Because of the inherent limitations of internal financial controls over financial reporting, including the possibility of collusion or improper management override of controls, material misstatements due to error or fraud may occur and not be detected. Also, projections of any evaluation of the internal financial controls over financial reporting to future periods are subject to the risk that the internal financial control over financial reporting may become inadequate because of changes in conditions, or that the degree of compliance with the policies or procedures may deteriorate.
Opinion
In our opinion, the Company has, in all material respects, an adequate internal financial controls system over financial reporting with reference to Standalone Ind AS financial statements and such internal financial controls over financial reporting were operating effectively as at 31 March 2018, based on the internal control over financial reporting criteria established by the Company considering the essential components of internal control stated in the Guidance Note issued by the ICAI.
for B S R & Co. LLP Chartered Accountants
Firm’s registration number: 101248W/W-100022
Amit SomaniPlace: Bengaluru PartnerDate: 22 May 2018 Membership number: 060154
104

HealthCare Global Enterprises Limited
Balance Sheet
Balance Sheet as at Note No. 31 March 2018 31 March 2017(Restated)*
ASSETS
Non-current assets
(a) Property, plant and equipment 5 4,390.74 4,360.80
(b) Capital work-in-progress 5 791.11 334.14
(c) Goodwill 6 484.52 -
(d) Other intangible assets 6 44.75 60.41
(e) Financial assets
(i) Investments 7 2,188.45 1,339.29
(ii) Loans 8 338.29 30.36
(iii) Other financial assets 9 293.47 253.27
(f) Deferred tax assets (net) 29.3 91.02 120.49
(g) Income tax assets (net) 29.4 174.65 253.93
(h) Other non-current assets 10 349.28 192.31
Total non current assets 9,146.28 6,945.00
Current assets
(a) Inventories 11 171.03 149.01
(b) Financial assets
(i) Investments 7 - 74.91
(ii) Trade receivables 12 1,262.13 1,006.01
(iii) Cash and cash equivalents 13 153.11 745.81
(iv) Loans 8 29.21 18.41
(v) Other financial assets 9 181.40 191.71
(c) Other current assets 10 179.51 94.45
Total current assets 1976.39 2,280.31
TOTAL ASSETS 11,122.67 9,225.31
EQUITY AND LIABILITIES
Equity
(a) Equity share capital 14 869.04 857.13
(b) Share pending issuance 14.6 299.75 -
(c) Other equity 15 5,215.61 4,594.76
Total equity 6,384.40 5,451.89
Liabilities
Non-current liabilities
(a) Financial liabilities
(i) Borrowings 16 2,172.43 1,235.74
(ii) Other financial liabilities 17 221.13 15.43
(b) Provisions 19 37.29 24.36
(c) Other non-current liabilities 18 100.21 11.60
Total non current liabilities 2,531.06 1,287.13
(` in million)
105

HealthCare Global Enterprises Limited
Balance Sheet
Balance Sheet as at Note No. 31 March 2018 31 March 2017(Restated)*
Current liabilities
(a) Financial liabilities
(i) Borrowings 16 17.35 412.65
(ii) Trade payables 20 1,144.24 1,053.72
(iii) Other financial liabilities 17 781.27 809.99
(b) Provisions 19 51.97 45.35
(c) Other current liabilities 18 212.38 164.58
Total current liabilities 2,207.21 2,486.29
TOTAL EQUITY AND LIABILITIES 11,122.67 9,225.31
Significant accounting policies 3
* Refer note 48
The accompanying notes are an integral part of these Standalone Ind AS financial statements
As per our reports of even date attached
for B S R & Co. LLPChartered AccountantsFirm’s registration number: 101248W/W -100022
for and on behalf of the Board of Directors of
HealthCare Global Enterprises Limited
Amit SomaniPartnerMembership number: 060154
Dr. B.S. AjaikumarChairman and CEODIN: 00713779
Dr. Ramesh B.S.DirectorDIN: 00518434
Yogesh PatelChief Financial Officer
Sunu ManuelCompany Secretary
Place : BengaluruDate : 22 May 2018
Place : BengaluruDate : 22 May 2018
Place : BengaluruDate : 22 May 2018
106

HealthCare Global Enterprises Limited
Statement of profit and loss
Statement of profit and loss for the years ended Note No.
31 March 2018 31 March 2017(Restated)*
I Income
Revenue from operations 21 5,868.66 5,450.35
Other income 22 159.26 67.16
Total income (I) 6,027.92 5,517.51
II Expenses
Purchases of medical and non-medical items 1,578.23 1,529.42
Changes in inventories 23 (26.65) (35.50)
Employee benefits expense 24 1,155.84 980.60
Finance costs 25 267.96 159.28
Depreciation and amortisation expense 26 439.20 441.58
Other expenses 27 2,273.97 2,149.12
Total expenses (II) 5,688.55 5,224.50
III Profit before exceptional items and tax (I- II) 339.37 293.01
IV Exceptional items 28 29.35 -
V Profit before tax (III+IV) 368.72 293.01
VI Tax expense
(1) Current tax: Minimum Alternative tax (MAT for the year) 29.1 86.30 75.40
(2) Deferred tax 29.1 33.52 22.77
Total tax expense 119.82 98.17
VII Profit for the year (V-VI) 248.90 194.84
VIII Other comprehensive income / expense
Items that will not be reclassified to Subsequnetly to profit and loss
(a) Remeasurements of the defined benefit plan (2.99) (1.61)
(b) Income tax effect 29.2 1.03 0.62
Other comprehensive income / expenses for the year, net of income tax
(1.96) (0.99)
IX Total comprehensive income for the year (VII+VIII) 246.94 193.85
Earnings per share:
Basic (in `) 32.1 2.89 2.38
Diluted (in `) 32.2 2.89 2.38
Significant accounting policies 3
* Refer note 48The accompanying notes are an integral part of these Standalone Ind AS financial statements
As per our reports of even date attached
for B S R & Co. LLPChartered AccountantsFirm’s registration number: 101248W/W -100022
for and on behalf of the Board of Directors of
HealthCare Global Enterprises Limited
Amit SomaniPartnerMembership number: 060154
Dr. B.S. AjaikumarChairman and CEODIN: 00713779
Dr. Ramesh B.S.DirectorDIN: 00518434
Yogesh PatelChief Financial Officer
Sunu ManuelCompany Secretary
Place : BengaluruDate : 22 May 2018
Place : BengaluruDate : 22 May 2018
Place : BengaluruDate : 22 May 2018
(` in million)
107
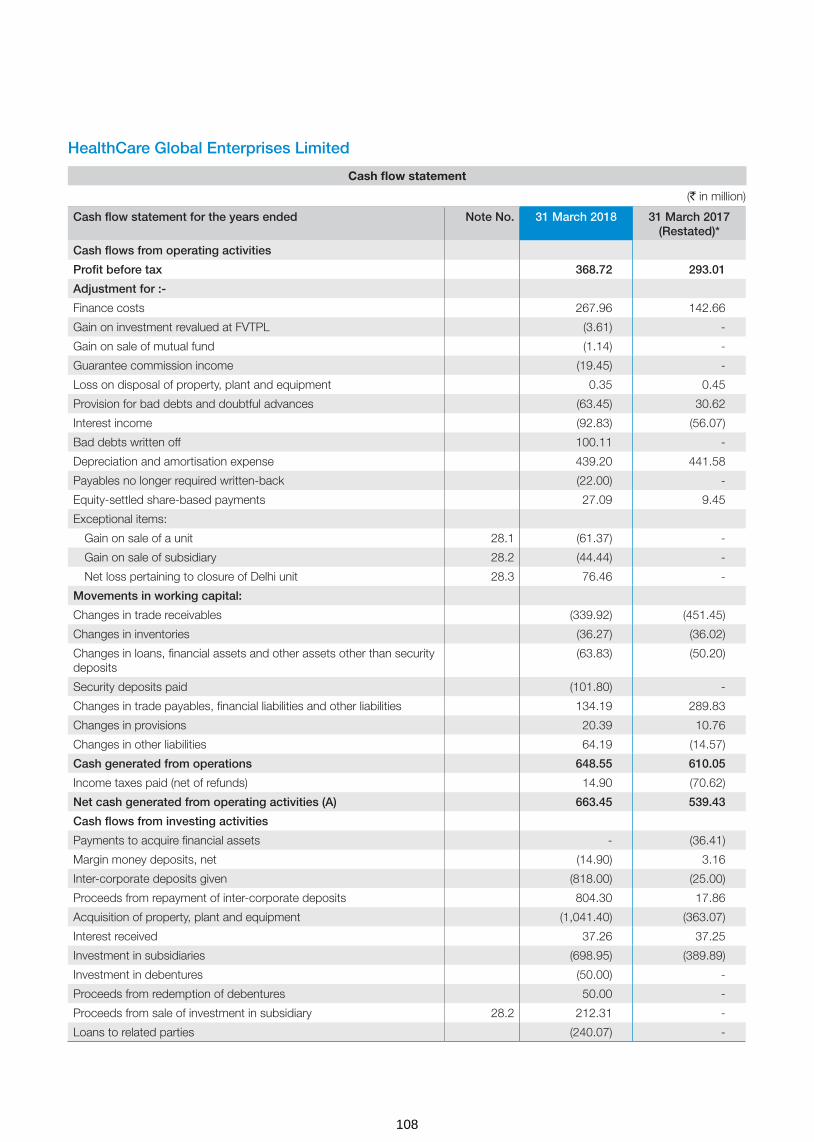
HealthCare Global Enterprises Limited
Cash flow statement
Cash flow statement for the years ended Note No. 31 March 2018 31 March 2017(Restated)*
Cash flows from operating activities
Profit before tax 368.72 293.01
Adjustment for :-
Finance costs 267.96 142.66
Gain on investment revalued at FVTPL (3.61) -
Gain on sale of mutual fund (1.14) -
Guarantee commission income (19.45) -
Loss on disposal of property, plant and equipment 0.35 0.45
Provision for bad debts and doubtful advances (63.45) 30.62
Interest income (92.83) (56.07)
Bad debts written off 100.11 -
Depreciation and amortisation expense 439.20 441.58
Payables no longer required written-back (22.00) -
Equity-settled share-based payments 27.09 9.45
Exceptional items:
Gain on sale of a unit 28.1 (61.37) -
Gain on sale of subsidiary 28.2 (44.44) -
Net loss pertaining to closure of Delhi unit 28.3 76.46 -
Movements in working capital:
Changes in trade receivables (339.92) (451.45)
Changes in inventories (36.27) (36.02)
Changes in loans, financial assets and other assets other than security deposits
(63.83) (50.20)
Security deposits paid (101.80) -
Changes in trade payables, financial liabilities and other liabilities 134.19 289.83
Changes in provisions 20.39 10.76
Changes in other liabilities 64.19 (14.57)
Cash generated from operations 648.55 610.05
Income taxes paid (net of refunds) 14.90 (70.62)
Net cash generated from operating activities (A) 663.45 539.43
Cash flows from investing activities
Payments to acquire financial assets - (36.41)
Margin money deposits, net (14.90) 3.16
Inter-corporate deposits given (818.00) (25.00)
Proceeds from repayment of inter-corporate deposits 804.30 17.86
Acquisition of property, plant and equipment (1,041.40) (363.07)
Interest received 37.26 37.25
Investment in subsidiaries (698.95) (389.89)
Investment in debentures (50.00) -
Proceeds from redemption of debentures 50.00 -
Proceeds from sale of investment in subsidiary 28.2 212.31 -
Loans to related parties (240.07) -
(` in million)
108
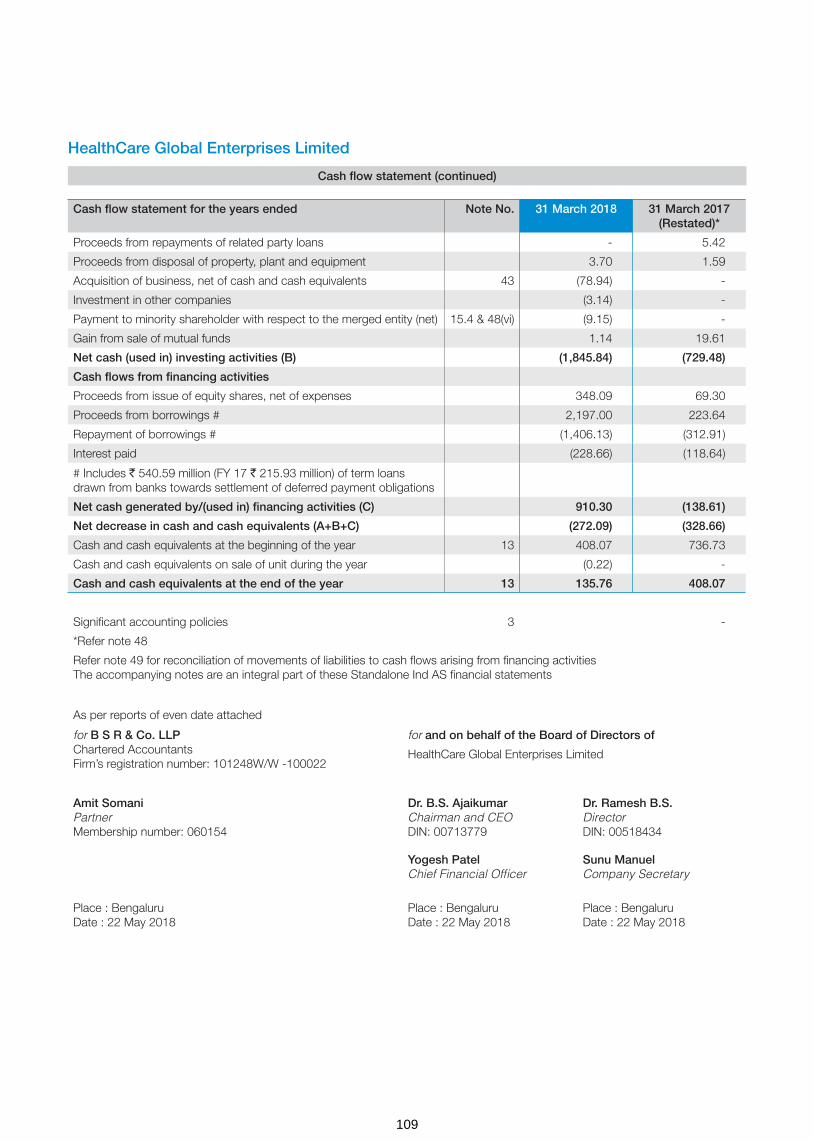
HealthCare Global Enterprises Limited
Cash flow statement (continued)
Cash flow statement for the years ended Note No. 31 March 2018 31 March 2017(Restated)*
Proceeds from repayments of related party loans - 5.42
Proceeds from disposal of property, plant and equipment 3.70 1.59
Acquisition of business, net of cash and cash equivalents 43 (78.94) -
Investment in other companies (3.14) -
Payment to minority shareholder with respect to the merged entity (net) 15.4 & 48(vi) (9.15) -
Gain from sale of mutual funds 1.14 19.61
Net cash (used in) investing activities (B) (1,845.84) (729.48)
Cash flows from financing activities
Proceeds from issue of equity shares, net of expenses 348.09 69.30
Proceeds from borrowings # 2,197.00 223.64
Repayment of borrowings # (1,406.13) (312.91)
Interest paid (228.66) (118.64)
# Includes ` 540.59 million (FY 17 ` 215.93 million) of term loans drawn from banks towards settlement of deferred payment obligations
Net cash generated by/(used in) financing activities (C) 910.30 (138.61)
Net decrease in cash and cash equivalents (A+B+C) (272.09) (328.66)
Cash and cash equivalents at the beginning of the year 13 408.07 736.73
Cash and cash equivalents on sale of unit during the year (0.22) -
Cash and cash equivalents at the end of the year 13 135.76 408.07
Significant accounting policies 3 -
*Refer note 48
Refer note 49 for reconciliation of movements of liabilities to cash flows arising from financing activitiesThe accompanying notes are an integral part of these Standalone Ind AS financial statements
As per reports of even date attached
for B S R & Co. LLPChartered AccountantsFirm’s registration number: 101248W/W -100022
for and on behalf of the Board of Directors of
HealthCare Global Enterprises Limited
Amit SomaniPartnerMembership number: 060154
Dr. B.S. AjaikumarChairman and CEODIN: 00713779
Dr. Ramesh B.S.DirectorDIN: 00518434
Yogesh PatelChief Financial Officer
Sunu ManuelCompany Secretary
Place : BengaluruDate : 22 May 2018
Place : BengaluruDate : 22 May 2018
Place : BengaluruDate : 22 May 2018
109

Hea
lthC
are
Glo
bal
Ent
erp
rise
s Li
mite
d
Sta
tem
ent
of
chan
ges
in e
qui
ty f
or
the
year
s en
ded
31
Mar
ch 2
018
and
31
Mar
ch 2
017
a. E
qui
ty s
hare
cap
ital
No
of
Sha
res
(` in
mill
ion)
Bal
ance
as
at 0
1 A
pri
l 201
6 8
5,07
5,98
6 8
50.7
6
(a) I
ssue
of e
quity
sha
res
purs
uant
to e
xerc
ise
of e
mpl
oyee
sha
re o
ptio
ns u
nder
em
ploy
ee s
hare
opt
ion
plan
201
4(re
fer
note
36(
c))
637
,000
6
.37
Bal
ance
as
at 3
1 M
arch
201
7 8
5,71
2,98
6 8
57.1
3
(a) I
ssue
of e
quity
sha
res
purs
uant
to p
refe
rent
ial a
llotm
ent (
refe
r no
te 1
4.1)
1,1
66,6
67
11.
66
(b) I
ssue
of e
quity
sha
res
purs
uant
to e
xerc
ise
of e
mpl
oyee
sha
re o
ptio
ns u
nder
em
ploy
ee s
hare
opt
ion
plan
201
4 (re
fer n
ote
36(c
)) 2
4,82
0 0
.25
Bal
ance
as
at 3
1 M
arch
201
8 8
6,90
4,47
3 8
69.0
4
b. S
hare
pen
din
g is
suan
ce (`
in m
illio
n)
Bal
ance
as
at 0
1 A
pri
l 201
6 -
Add
: Dur
ing
the
year
-
Bal
ance
as
at 3
1 M
arch
201
7 -
Ad
d: D
urin
g t
he y
ear
(ref
er n
ote
43)
299
.75
Bal
ance
as
at 3
1 M
arch
201
8 2
99.7
5
c. O
ther
eq
uity
( ` in
mill
ion)
Par
ticul
ars
No
te N
o.
Res
erve
s an
d s
urp
lus
Item
s o
f o
ther
co
mp
rehe
nsiv
e in
com
e
Sec
uriti
es
pre
miu
mS
hare
op
tions
o
utst
and
ing
ac
coun
t
Ret
aine
d
earn
ing
s (R
esta
ted
) (r
efer
no
te 4
8)
Am
alg
amat
ion
adju
stm
ent
defi
cit
acco
unt
(Res
tate
d)
(ref
er n
ote
48)
Rem
easu
rem
ents
of
the
defi
ned
ben
efit
pla
n (R
esta
ted
) (r
efer
no
te 4
8)
Tota
l oth
er
equi
ty
Bal
ance
as
at 0
1Ap
ril 2
016
(Res
tate
d, r
efer
no
te 4
8) 4
,867
.85
9.0
4 (5
34.3
3) (2
3.47
) 1
.10
4,3
20.1
9
Pro
fit fo
r th
e ye
ar -
-
1
94.8
4 -
-
1
94.8
4
Oth
er c
ompr
ehen
sive
inco
me
for
the
year
(net
of t
ax)
-
-
-
-
(0.9
9) (0
.99)
Tota
l co
mp
rehe
nsiv
e in
com
e -
-
1
94.8
4 -
(0
.99)
193
.85
Tran
sact
ions
rec
ord
ed d
irect
ly in
eq
uity
Pre
miu
m re
ceiv
ed o
n sh
ares
issu
ed d
urin
g th
e ye
ar 6
2.93
-
-
-
-
6
2.93
Uns
pent
am
ount
of s
hare
issu
e ex
pens
es c
redi
ted
durin
g th
e ye
ar15
.1 8
.34
-
-
-
-
8.3
4
Tran
sfer
red
to S
ecur
ities
pre
miu
m a
ccou
nt o
n ex
erci
se o
f E
SO
Ps
15.2
6.3
2 (6
.32)
-
-
-
-
Def
erre
d st
ock
com
pens
atio
n ex
pens
e fo
r th
e ye
ar -
9
.45
-
-
-
9.4
5
Bal
ance
as
at 3
1 M
arch
201
7 (R
esta
ted
, ref
er n
ote
48)
4,9
45.4
4 1
2.17
(3
39.4
9) (2
3.47
) 0
.11
4,5
94.7
6
110

Hea
lthC
are
Glo
bal
Ent
erp
rise
s Li
mite
d
Sta
tem
ent
of
chan
ges
in e
qui
ty f
or
the
year
s en
ded
31
Mar
ch 2
018
and
31
Mar
ch 2
017
(co
ntin
ued
)
Pro
fit fo
r th
e ye
ar -
-
2
48.9
0 -
-
2
48.9
0
Oth
er c
ompr
ehen
sive
inco
me
for
the
year
(net
of t
ax)
-
-
-
-
(1.9
6) (1
.96)
Adj
ustm
ent t
owar
ds c
omm
on c
ontr
ol tr
ansa
ctio
n (re
fer
note
48)
-
-
-
9.5
6 -
9
.56
Tota
l co
mp
rehe
nsiv
e in
com
e -
-
2
48.9
0 9
.56
(1.9
6) 2
56.5
0
Tran
sact
ions
rec
ord
ed d
irect
ly in
eq
uity
Pre
miu
m re
ceiv
ed o
n sh
ares
issu
ed d
urin
g ye
ar15
.1 3
38.3
4 -
-
-
-
3
38.3
4
Sha
re is
sue
expe
nses
incu
rred
dur
ing
the
year
15
.1 (1
.08)
-
-
-
-
(1.0
8)
Tran
sfer
red
to s
ecur
ities
pre
miu
m a
ccou
nt o
n ex
erci
se o
f E
SO
Ps
15.2
2.1
8 (2
.18)
-
-
-
-
Def
erre
d st
ock
com
pens
atio
n ex
pens
e fo
r th
e ye
ar -
2
7.09
-
-
-
2
7.09
Bal
ance
as
at 3
1 M
arch
201
8 5
,284
.88
37.
08
(90.
59)
(13.
91)
(1.8
5) 5
,215
.61
Sec
uriti
es p
rem
ium
Sec
uriti
es p
rem
ium
is u
sed
to re
cord
the
prem
ium
on
issu
e of
equ
ity s
hare
s. T
he re
serv
e is
util
ised
in a
ccor
danc
e w
ith th
e pr
ovis
ions
of t
he C
ompa
nies
Act
,201
3.
Sha
re o
ptio
n o
utst
and
ing
acc
oun
t
The
Com
pany
has
em
ploy
ee s
tock
opt
ion
plan
s fo
r el
igib
le e
mpl
oyee
s of
the
Com
pany
and
its
grou
p co
mpa
nies
. Ref
er n
ote
36 fo
r fu
rthe
r de
tails
on
thes
e pl
ans
Am
alg
amat
ion
adju
stm
ent
defi
cit
acco
unt
It re
pres
ents
exc
ess
of c
onsi
dera
tion
over
car
ryin
g va
lue
of n
et a
sset
s (in
clud
ing
rese
rves
) in
case
of c
omm
on c
ontr
ol b
usin
ess
com
bina
tion.
Thi
s am
ount
will
be a
djus
ted
in d
eter
min
ing
the
surp
lus
avai
labl
e fo
r di
vide
nd d
istr
ibut
ion.
Sig
nific
ant a
ccou
ntin
g po
licie
s (re
fer
note
3)
The
acco
mpa
nyin
g no
tes
are
an in
tegr
al p
art o
f the
se S
tand
alon
e In
d A
S fi
nanc
ial s
tate
men
ts
As
per
repo
rts
of e
ven
date
att
ache
d
for
B S
R &
Co
. LLP
Cha
rter
ed A
ccou
ntan
tsFi
rm’s
regi
stra
tion
num
ber:
101
248W
/W -
1000
22
for
and
on
beh
alf
of
the
Bo
ard
of
Dire
cto
rs o
f
Hea
lthC
are
Glo
bal E
nter
pris
es L
imite
d
Am
it S
om
ani
Par
tner
Mem
bers
hip
num
ber:
060
154
Dr.
B.S
. Aja
ikum
arC
hairm
an a
nd C
EO
DIN
: 007
1377
9
Dr.
Ram
esh
B.S
.D
irect
orD
IN: 0
0518
434
Yog
esh
Pat
elC
hief
Fin
anci
al O
ffice
rS
unu
Man
uel
Com
pan
y S
ecre
tary
Pla
ce :
Ben
galu
ruD
ate
: 22
May
201
8P
lace
: B
enga
luru
Dat
e : 2
2 M
ay 2
018
Pla
ce :
Ben
galu
ruD
ate
: 22
May
201
8
111
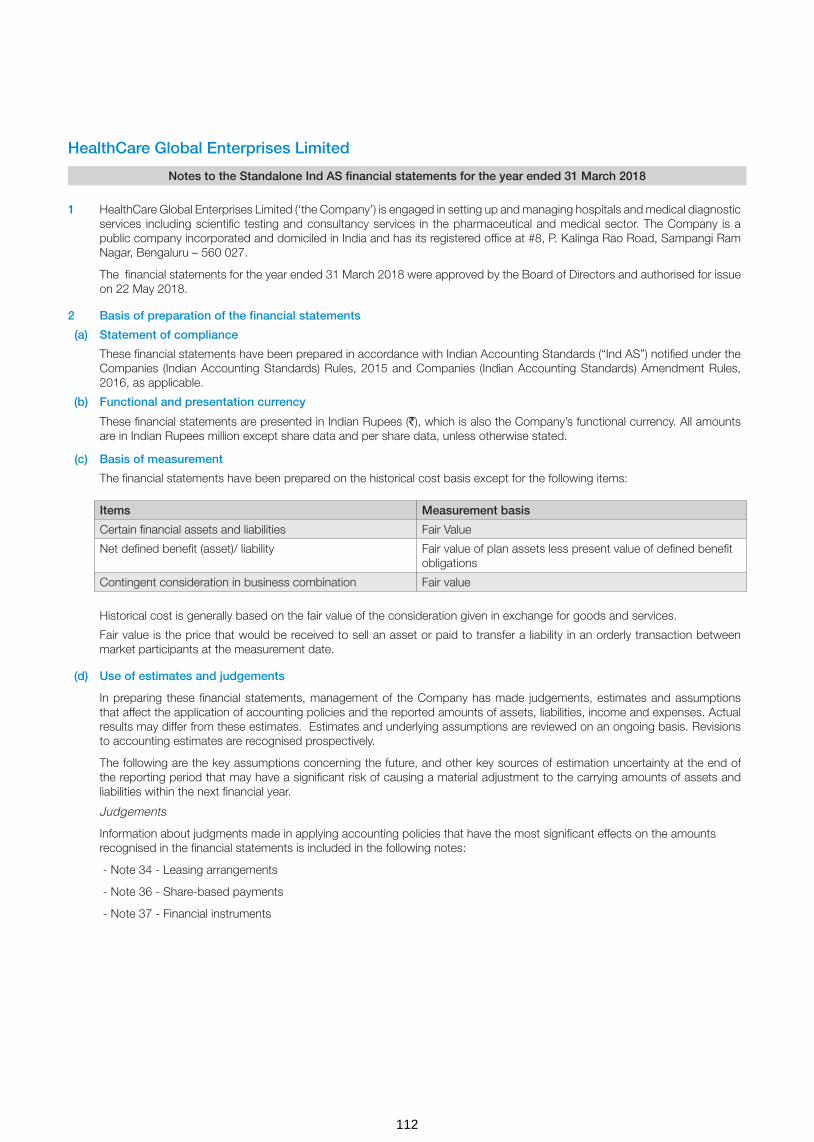
HealthCare Global Enterprises Limited
Notes to the Standalone Ind AS financial statements for the year ended 31 March 2018
1 HealthCare Global Enterprises Limited (‘the Company’) is engaged in setting up and managing hospitals and medical diagnostic services including scientific testing and consultancy services in the pharmaceutical and medical sector. The Company is a public company incorporated and domiciled in India and has its registered office at #8, P. Kalinga Rao Road, Sampangi Ram Nagar, Bengaluru – 560 027.
The financial statements for the year ended 31 March 2018 were approved by the Board of Directors and authorised for issue on 22 May 2018.
2 Basis of preparation of the financial statements
(a) Statement of compliance
These financial statements have been prepared in accordance with Indian Accounting Standards (“Ind AS”) notified under the Companies (Indian Accounting Standards) Rules, 2015 and Companies (Indian Accounting Standards) Amendment Rules, 2016, as applicable.
(b) Functional and presentation currency
These financial statements are presented in Indian Rupees (`), which is also the Company’s functional currency. All amounts are in Indian Rupees million except share data and per share data, unless otherwise stated.
(c) Basis of measurement
The financial statements have been prepared on the historical cost basis except for the following items:
Historical cost is generally based on the fair value of the consideration given in exchange for goods and services.
Fair value is the price that would be received to sell an asset or paid to transfer a liability in an orderly transaction between market participants at the measurement date.
(d) Use of estimates and judgements
In preparing these financial statements, management of the Company has made judgements, estimates and assumptions that affect the application of accounting policies and the reported amounts of assets, liabilities, income and expenses. Actual results may differ from these estimates. Estimates and underlying assumptions are reviewed on an ongoing basis. Revisions to accounting estimates are recognised prospectively.
The following are the key assumptions concerning the future, and other key sources of estimation uncertainty at the end of the reporting period that may have a significant risk of causing a material adjustment to the carrying amounts of assets and liabilities within the next financial year.
Judgements
Information about judgments made in applying accounting policies that have the most significant effects on the amounts recognised in the financial statements is included in the following notes:
- Note 34 - Leasing arrangements
- Note 36 - Share-based payments
- Note 37 - Financial instruments
Items Measurement basis
Certain financial assets and liabilities Fair Value
Net defined benefit (asset)/ liability Fair value of plan assets less present value of defined benefit obligations
Contingent consideration in business combination Fair value
112

HealthCare Global Enterprises Limited
Notes to the Standalone Ind AS financial statements for the year ended 31 March 2018 (continued)
Assumptions and estimation uncertainties
Information about assumptions and estimation uncertainties that have a significant risk of resulting in a material adjustment in the year ending 31 March 2018 is included in the following notes:
- Note 5 - Estimation of useful life of property, plant and equipment
- Note 43 - Acquisition of business: fair value of the consideration transferred (including contingent consideration) and fair value of the assets acquired and liabilities assumed, measured on provisional basis;
- Note 28.3 - Impairment of financial assets.
- Note 29.3 - Deferred tax balances (net)
- Note 30 - Recognition and measurement of provisions and contingencies: key assumptions about the likelihood and magnitude of an outflow of resources;
- Note 35 - Employee benefit plans: key actuarial assumptions;
(e) Measurement of fair values
The Company’s accounting policies and disclosures require the measurement of fair values, for both financial and non-financial assets and liabilities. The Company has an established control framework with respect to the measurement of fair values. This includes a valuation team that has overall responsibility for overseeing all significant fair value measurement, including level 3 fair values, and reports directly to the chief financial officer.
Fair values are categorised into different levels in a fair value hierarchy based on the inputs used in the valuation techniques as follows:
– Level 1: quoted prices (unadjusted) in active markets for identical assets or liabilities. – Level 2: inputs other than quoted prices included in Level 1 that are observable for the asset or liability, either directly (i.e. as prices) or indirectly (i.e. derived from prices). – Level 3: inputs for the asset or liability that are not based on observable market data (unobservable inputs).
When measuring the fair value of an asset or a liability, the Company uses observable market data as far as possible. If the inputs used to measure the fair value of an asset or a liability fall into different levels of the fair value hierarchy, then the fair value measurement is categorised in its entirety in the same level of the fair value hierarchy as the lowest level input that is significant to the entire measurement. The Company recognises transfers between levels of the fair value hierarchy at the end of the reporting period during which the change has occurred.
(f) Business combinations
In accordance with Ind AS 103, “Business combinations” the Company accounts for the business combinations using the acquisition method when control is transferred to the Company. The consideration transferred for the business combination is generally measured at fair value as at the date the control is acquired (acquisition date), as are the net identifiable assets acquired. Any goodwill that arises is tested annually for impairment. Any gain on a bargain purchase is recognised in Other comprehensive income (OCI) and accumulated in equity as capital reserve if there exists clear evidence of the underlying reasons for classifying the business combination as resulting in a bargain purchase; otherwise the gain is recognised directly in equity as capital reserve. Transaction costs are expensed as incurred, except to the extent related to the issue of debt or equity securities.
The consideration transferred does not include amounts related to the settlement of pre-existing relationships with the acquiree. Such amounts are generally recognised in the Statement of Profit or Loss.
Any contingent consideration is measured at fair value at the date of acquisition. If an obligation to pay contingent consideration that meets the definition of financial instrument is classified as equity, then its not remeasured subsequently and settlement is accounted for within equity. Other contingent consideration is remeasured at fair value at each reporting date and changes in the fair value of the contingent consideration are recognised in profit or loss
113

HealthCare Global Enterprises Limited
Notes to the Standalone Ind AS financial statements for the year ended 31 March 2018 (continued)
3 Summary of significant accounting policies
(a) Revenue recognition
Medical services
Revenue primarily comprises fees charged for inpatient and outpatient hospital services. Services include charges for accommodation, medical professional services, equipment, radiology, laboratory and pharmaceutical goods used in treatments given to Patients. Revenue is recorded net of discount given to patients recognised during the period in which the hospital service is provided, based upon the estimated amounts due from patients and/or medical funding entities. Unbilled revenue is recorded for the service where the patients are not discharged and invoice is not raised for the service.
Sale of medical and non-medical items
Pharmacy Sales are recognised when the significant risks and rewards of ownership is transferred to the customer. Revenue is measured at the fair value of the consideration received or receivable, taking into account contractually defined terms of payment and excluding taxes or duties collected on behalf of the government.
Other operating revenue
Other operating revenue comprises revenue from various ancillary revenue generating activities like operations and maintenance arrangements as per the management agreement with other entities. The service income is recognised on the basis of services rendered and as per the terms of agreement.
Dividend and interest income
Interest income from a financial asset is recognised when it is probable that the economic benefits will flow to the Company and the amount of income can be measured reliably. Interest income is accrued on a time basis, by reference to the principal outstanding and at the effective interest rate applicable, which is the rate that exactly discounts estimated future cash receipts through the expected life of the financial asset to that asset’s net carrying amount on initial recognition.
Dividend income is recognised when the Company’s right to receive dividend is established.
(b) Leases
Leases are classified as finance leases whenever the terms of the lease transfer substantially all the risks and rewards of ownership to the lessee. All other leases are classified as operating leases.
Assets held under finance leases are initially capitalised as assets of the Company at their fair value at the inception of the lease or, if lower, at the present value of the minimum lease payments. The corresponding liability to the lessor is included in the balance sheet as a finance lease obligation. Lease payments are apportioned between finance expenses and reduction of the lease obligation so as to achieve a constant rate of interest on the remaining balance of the liability.
Rental expense from operating leases is generally recognised on a straight-line basis over the term of the relevant lease. Where the rentals are structured solely to increase in line with expected general inflation to compensate for the lessor’s expected inflationary cost increases, such increases are recognised in the year in which such benefits accrue. Contingent rentals arising under operating leases are recognised as an expense in the period in which they are incurred.
(c) Foreign currency transactions
Transactions in foreign currencies are translated into the respective functional currencies of company at the exchange rates at the dates of the transactions or an average rate approximates the actual rate at the date of the transaction.
Monetary assets and liabilities denominated in foreign currencies are translated into the functional currency at the exchange rate at the reporting date.
Exchange differences on monetary items are recognised in the Statement of profit and loss in the period in which they arise except for exchange differences arising from translation of long-term foreign currency monetary items recognised in the financial statements of the Company for the period immediately before the beginning of the first Ind AS financial reporting period (prior to 01 April 2016), as per the previous GAAP, pursuant to the Company’s choice of availing the exemption as permitted by Ind AS 101.
Non-monetary assets and liabilities that are measured in terms of historical cost in foreign currencies are not retranslated.
Income and expense items in foreign currency are translated at the average exchange rates for the period, unless exchange rates fluctuate significantly during that period, in which case the exchange rates at the dates of the transactions are used.
114

HealthCare Global Enterprises Limited
Notes to the Standalone Ind AS financial statements for the year ended 31 March 2018 (continued)
(d ) Borrowing costs
Borrowing costs include: (i) interest expense calculated using the effective interest rate method, (ii) finance charges in respect of finance leases, and (iii) exchange differences arising from foreign currency borrowings to the extent that they are regarded as an adjustment to interest costs.
Borrowing costs directly attributable to the acquisition, construction or production of qualifying assets, which are assets that necessarily take a substantial period of time to get ready for their intended use or sale, are added to the cost of those assets, until such time as the assets are substantially ready for their intended use or sale.
Interest income earned on the temporary investment of specific borrowings pending their expenditure on qualifying assets is deducted from the borrowing costs eligible for capitalisation.
All other borrowing costs are recognised in the statement of profit and loss in the period in which they are incurred.
(e) Employee benefits
Defined benefit plan
Payments to defined contribution retirement benefit plans are recognised as an expense when employees have rendered service entitling them to the contributions.
For defined benefit plans, the cost of providing benefits is determined using the projected unit credit method, with actuarial valuations being carried out at the end of each annual reporting period. Remeasurement, comprising actuarial gains and losses, the effect of the changes to the asset ceiling (if applicable) and the return on plan assets (excluding net interest), is reflected in the balance sheet with a charge or credit recognised in other comprehensive income in the period in which they occur. The service cost (including current service cost, past service cost, as well as gains and losses on curtailments and settlements) is recognised in the Statement of profit and loss in the line item ‘Employee benefits expense’. Net interest is calculated by applying the discount rate at the beginning of the period to the net defined benefit liability or asset. The net interest expense is recognised in the line item ‘Finance costs’.
Defined contribution plan
A defined contribution plan is post-employment benefit plan of Employee State Insurance (ESI) under which an entity pays specified contributions to separate entity and has no obligation to pay any further amounts. The Company makes specified obligations towards employee provident fund and employee state insurance to Government administered provident fund scheme and Employee State Insurance scheme which is a defined contribution plan. The Company’s contributions are recognized as an expense in the statement of profit and loss during the period in which the employee renders the related service
Compensated absences
The employees can carry-forward a portion of the unutilized accrued compensated absences and utilize it in future service periods or receive cash compensation on termination of employment. Since the employee has unconditional right to avail the leave, the benefit is classified as a short term employee benefit. The Company records an obligation for such compensated absences in the period in which the employee renders the services that increase this entitlement. The obligation is measured on the basis of independent actuarial valuation using the projected unit credit method.
Share-based payment transactions
The cost of equity-settled transactions is determined by the fair value at the date when the grant is made using an appropriate valuation model and Company’s estimate of equity instruments that will vest. That cost is recognised, together with a corresponding increase in share-options together with a corresponding increase in share-options outstanding account in equity, over the period in which the performance and/or service conditions are fulfilled in employee benefits expense.
(f) Taxation
Income tax expense represents the sum of the tax currently payable and deferred tax.
115

HealthCare Global Enterprises Limited
Notes to the Standalone Ind AS financial statements for the year ended 31 March 2018 (continued)
(i) Current tax
The tax currently payable is based on taxable profit for the year. Taxable profit differs from ‘profit before tax’ as reported in the statement of profit and loss because of items of income or expense that are taxable or deductible in other years and items that are never taxable or deductible. The amount of current tax reflects the best estimate of the tax to be paid after considering the uncertainty and is calculated by using tax rates that have been enacted or substantively enacted by the end of the reporting period.
Current tax assets and current tax liabilities are offset only if there is a legally enforceable right to set off the recognised amounts, and it is intended to realize the assets and settle the liability on a net basis or simultaneously.
(ii) Deferred tax
Deferred tax is recognised on temporary differences between the carrying amounts of assets and liabilities in the financial statements and the corresponding tax bases used in the computation of taxable profit. Deferred tax liabilities are generally recognised for all taxable temporary differences. Deferred tax assets are generally recognised for all deductible temporary differences to the extent that it is probable that taxable profits will be available against which those deductible temporary differences can be utilised. Such deferred tax assets and liabilities are not recognised if the temporary difference arises from the initial recognition of assets and liabilities in a transaction that affects neither the taxable profit nor the accounting profit.
The carrying amount of deferred tax assets is reviewed at the end of each reporting period and reduced to the extent that it is no longer probable that sufficient taxable profits will be available to allow all or part of the asset to be recovered.
Deferred tax liabilities and assets are measured at the tax rates that are expected to apply in the period in which the liability is settled or the asset realised, based on tax rates (and tax laws) that have been enacted or substantively enacted by the end of the reporting period.
The measurement of deferred tax liabilities and assets reflects the tax consequences that would follow from the manner in which the Company expects, at the end of the reporting period, to recover or settle the carrying amount of its assets and liabilities.
Deferred tax assets and liabilities are offset if there is a legally enforceable right to offset current tax liabilities and assets, and they relate to income taxes levied by the same tax authority on the same taxable entity, or on different tax entities, but they intend to settle current tax liabilities and assets on a net basis or their tax assets and liabilities will be realised simultaneously.
Minimum alternative tax (‘MAT’) paid in accordance with the tax laws, which gives rise to future economic benefits in the form of adjustment of future tax liability, is considered as an asset if there is convincing evidence that the Company will pay normal income tax in future years. Ind AS 12, Income Taxes defines deferred tax to include carry forward of unused tax credits that are carried forward by the entity for a specified period of time. Accordingly, MAT credit entitlement is grouped with deferred tax assets (net) in the balance sheet.
(g) Property, plant and equipment
Property, plant and equipment are measured at cost which includes capitalized borrowing costs, less accumulated depreciation and impairment losses, if any. The cost of an item of Property, Plant and Equipment comprises its purchase price, including import duties and other non-refundable taxes or levies, freight, any directly attributable cost of bringing the asset to its working condition for its intended use and estimated cost of dismantling and restoring onsite; any trade discounts and rebates are deducted in arriving at the purchase price. Subsequent expenditures related to an item of tangible fixed asset are added to its book value only if they increase the future benefits from the existing asset beyond its previously assessed standard of performance. Cost includes expenditures directly attributable to the acquisition of the asset.
The Company depreciates property, plant and equipment over the estimated useful life on a straight-line basis from the date the assets are ready for intended use. The estimated useful lives of assets for the current and comparative period of significant items of property, plant and equipment are as follows:
Asset category Useful life as per the management As per schedule II of Companies Act, 2013
Buildings 60 years 60 years
Plant and Medical Equipment 10-15 years 10-15 years
Data processing equipment 3-6 years 3-6 years
Electrical installations 10 years 10 years
Furniture and fixtures 10 years 10 years
Office equipment 5 years 5 years
Vehicles 8 years 8 years
116
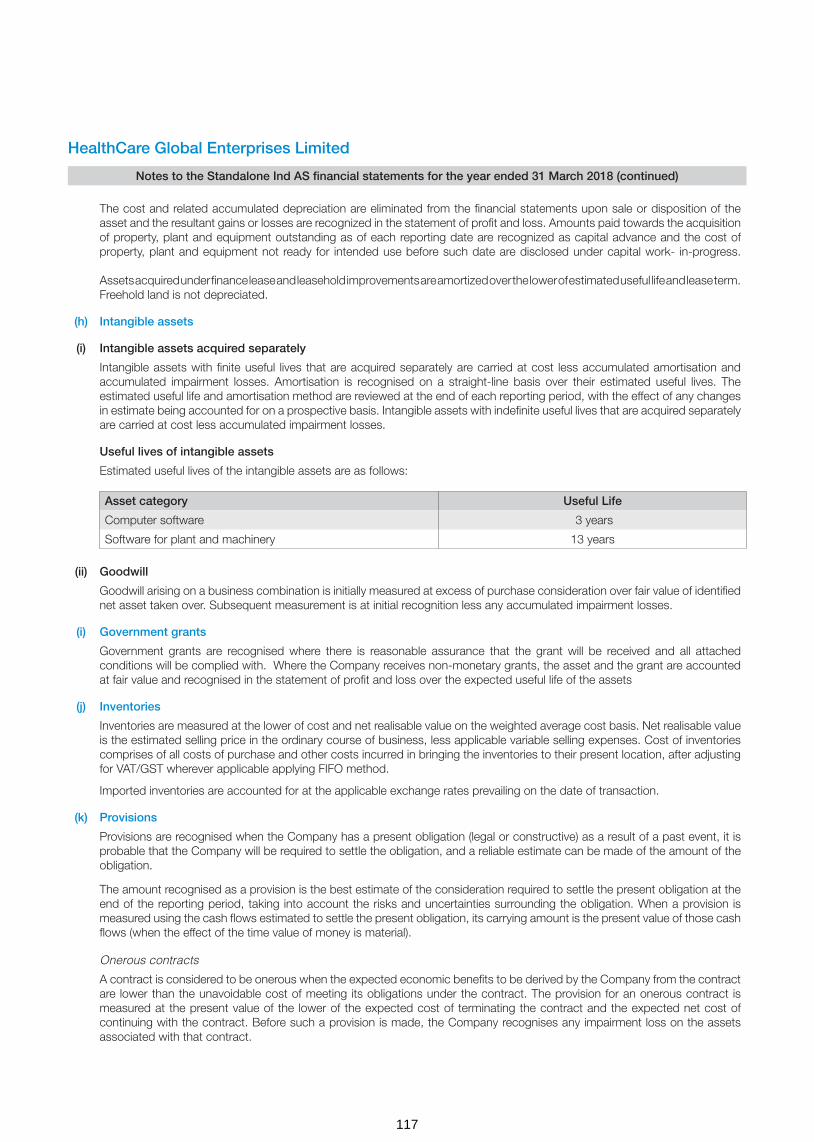
HealthCare Global Enterprises Limited
Notes to the Standalone Ind AS financial statements for the year ended 31 March 2018 (continued)
The cost and related accumulated depreciation are eliminated from the financial statements upon sale or disposition of the asset and the resultant gains or losses are recognized in the statement of profit and loss. Amounts paid towards the acquisition of property, plant and equipment outstanding as of each reporting date are recognized as capital advance and the cost of property, plant and equipment not ready for intended use before such date are disclosed under capital work- in-progress. Assets acquired under finance lease and leasehold improvements are amortized over the lower of estimated useful life and lease term. Freehold land is not depreciated.
(h) Intangible assets
(i) Intangible assets acquired separately
Intangible assets with finite useful lives that are acquired separately are carried at cost less accumulated amortisation and accumulated impairment losses. Amortisation is recognised on a straight-line basis over their estimated useful lives. The estimated useful life and amortisation method are reviewed at the end of each reporting period, with the effect of any changes in estimate being accounted for on a prospective basis. Intangible assets with indefinite useful lives that are acquired separately are carried at cost less accumulated impairment losses.
Useful lives of intangible assets
Estimated useful lives of the intangible assets are as follows:
(ii) Goodwill
Goodwill arising on a business combination is initially measured at excess of purchase consideration over fair value of identified net asset taken over. Subsequent measurement is at initial recognition less any accumulated impairment losses.
(i) Government grants
Government grants are recognised where there is reasonable assurance that the grant will be received and all attached conditions will be complied with. Where the Company receives non-monetary grants, the asset and the grant are accounted at fair value and recognised in the statement of profit and loss over the expected useful life of the assets
(j) Inventories
Inventories are measured at the lower of cost and net realisable value on the weighted average cost basis. Net realisable value is the estimated selling price in the ordinary course of business, less applicable variable selling expenses. Cost of inventories comprises of all costs of purchase and other costs incurred in bringing the inventories to their present location, after adjusting for VAT/GST wherever applicable applying FIFO method.
Imported inventories are accounted for at the applicable exchange rates prevailing on the date of transaction.
(k) Provisions
Provisions are recognised when the Company has a present obligation (legal or constructive) as a result of a past event, it is probable that the Company will be required to settle the obligation, and a reliable estimate can be made of the amount of the obligation.
The amount recognised as a provision is the best estimate of the consideration required to settle the present obligation at the end of the reporting period, taking into account the risks and uncertainties surrounding the obligation. When a provision is measured using the cash flows estimated to settle the present obligation, its carrying amount is the present value of those cash flows (when the effect of the time value of money is material).
Onerous contracts
A contract is considered to be onerous when the expected economic benefits to be derived by the Company from the contract are lower than the unavoidable cost of meeting its obligations under the contract. The provision for an onerous contract is measured at the present value of the lower of the expected cost of terminating the contract and the expected net cost of continuing with the contract. Before such a provision is made, the Company recognises any impairment loss on the assets associated with that contract.
Asset category Useful Life
Computer software 3 years
Software for plant and machinery 13 years
117

HealthCare Global Enterprises Limited
Notes to the Standalone Ind AS financial statements for the year ended 31 March 2018 (continued)
(l) Financial instruments
i. Recognition and initial measurement
Trade receivables and debt securities issued are initially recognised when they are originated. All other financial assets and financial liabilities are initially recognised when the Company becomes a party to the contractual provisions of the instrument. A financial asset or financial liability is initially measured at fair value plus, for an item not at fair value through profit and loss (FVTPL), transaction costs that are directly attributable to its acquisition or issue.
ii. Classification and subsequent measurement
Financial assets
On initial recognition, a financial asset is classified as measured at
- amortised cost;
- FVTPL
Financial assets are not reclassified subsequent to their initial recognition, except if and in the period the Company changes its business model for managing financial assets.
A financial asset is measured at amortised cost if it meets both of the following conditions and is not designated as at FVTPL:
− the asset is held within a business model whose objective is to hold assets to collect contractual cash flows; and
− the contractual terms of the financial asset give rise on specified dates to cash flows that are solely payments of principal and interest on the principal amount outstanding.
All financial assets not classified as measured at amortised cost as described above are measured at FVTPL. On initial recognition, the Company may irrevocably designate a financial asset that otherwise meets the requirements to be measured at amortised cost at FVTPL if doing so eliminates or significantly reduces an accounting mismatch that would otherwise arise.
Financial assets: Business model assessment
The Company makes an assessment of the objective of the business model in which a financial asset is held at a portfolio level because this best reflects the way the business is managed and information is provided to management. The information considered includes:
- the stated policies and objectives for the portfolio and the operation of those policies in practice. These include whether management’s strategy focuses on earning contractual interest income, maintaining a particular interest rate profile, matching the duration of the financial assets to the duration of any related liabilities or expected cash outflows or realising cash flows through the sale of the assets;
- how the performance of the portfolio is evaluated and reported to the Company’s management;- the risks that affect the performance of the business model (and the financial assets held within that business model) and
how those risks are managed;- how managers of the business are compensated – e.g. whether compensation is based on the fair value of the assets
managed or the contractual cash flows collected; and- the frequency, volume and timing of sales of financial assets in prior periods, the reasons for such sales and expectations
about future sales activity.
Transfers of financial assets to third parties in transactions that do not qualify for derecognition are not considered sales for this purpose, consistent with the Company’s continuing recognition of the assets.
Financial assets that are held for trading or are managed and whose performance is evaluated on a fair value basis are measured at FVTPL.
118

HealthCare Global Enterprises Limited
Notes to the Standalone Ind AS financial statements for the year ended 31 March 2018 (continued)
Financial assets: Assessment whether contractual cash flows are solely payments of principal and interest
For the purposes of this assessment, ‘principal’ is defined as the fair value of the financial asset on initial recognition. ‘Interest’ is defined as consideration for the time value of money and for the credit risk associated with the principal amount outstanding during a particular period of time and for other basic lending risks and costs (e.g. liquidity risk and administrative costs), as well as a profit margin.
In assessing whether the contractual cash flows are solely payments of principal and interest, the Company considers the contractual terms of the instrument. This includes assessing whether the financial asset contains a contractual term that could change the timing or amount of contractual cash flows such that it would not meet this condition. In making this assessment, the Company considers:
− contingent events that would change the amount or timing of cash flows; − terms that may adjust the contractual coupon rate, including variable interest rate features; − prepayment and extension features; and − terms that limit the Company’s claim to cash flows from specified assets (e.g. non- recourse features).
A prepayment feature is consistent with the solely payments of principal and interest criterion if the prepayment amount substantially represents unpaid amounts of principal and interest on the principal amount outstanding, which may include reasonable additional compensation for early termination of the contract. Additionally, for a financial asset acquired at a significant discount or premium to its contractual par amount, a feature that permits or requires prepayment at an amount that substantially represents the contractual par amount plus accrued (but unpaid) contractual interest (which may also include reasonable additional compensation for early termination) is treated as consistent with this criterion if the fair value of the prepayment feature is insignificant at initial recognition.
Financial assets: Subsequent measurement and gains and losses
Financial liabilities: Classification, subsequent measurement and gains and losses
Financial liabilities are classified as measured at amortised cost or FVTPL. A financial liability is classified as at FVTPL if it is classified as held- for- trading, or it is a derivative or it is designated as such on initial recognition. Financial liabilities at FVTPL are measured at fair value and net gains and losses, including any interest expense, are recognised in profit or loss. Other financial liabilities are subsequently measured at amortised cost using the effective interest method. Interest expense and foreign exchange gains and losses are recognised in profit or loss. Any gain or loss on derecognition is also recognised in profit or loss.
iii. Derecognition
Financial assets
The Company derecognises a financial asset when the contractual rights to the cash flows from the financial asset expire, or it transfers the rights to receive the contractual cash flows in a transaction in which substantially all of the risks and rewards of ownership of the financial asset are transferred or in which the Company neither transfers nor retains substantially all of the risks and rewards of ownership and does not retain control of the financial asset.
If the Company enters into transactions whereby it transfers assets recognised on its balance sheet, but retains either all or substantially all of the risks and rewards of the transferred assets, the transferred assets are not derecognised.
Financial liabilities
The Company derecognises a financial liability when its contractual obligations are discharged or cancelled, or expire.
The Company also derecognises a financial liability when its terms are modified and the cash flows under the modified terms are substantially different. In this case, a new financial liability based on the modified terms is recognised at fair value. The difference between the carrying amount of the financial liability extinguished and the new financial liability with modified terms is recognised in profit or loss.
Financial assets at FVTPL These assets are subsequently measured at fair value. Net gains and losses, including any interest or dividend income, are recognised in profit or loss.
Financial assets at amortised cost These assets are subsequently measured at amortised cost using the effective interest method. The amortised cost is reduced by impairment losses. Interest income, foreign exchange gains and losses and impairment are recognised in profit or loss. Any gain or loss on derecognition is recognised in profit or loss.
119
HealthCare Global Enterprises Limited
Notes to the Standalone Ind AS financial statements for the year ended 31 March 2018 (continued)
iv. Offsetting
Financial assets and financial liabilities are offset and the net amount presented in the balance sheet when, and only when, the Company currently has a legally enforceable right to set off the amounts and it intends either to settle them on a net basis or to realise the asset and settle the liability simultaneously.
v. Derivative financial instruments
The Company holds derivative financial instruments to hedge its foreign currency exposures. Embedded derivatives are separated from the host contract and accounted for separately if the host contract is not a financial asset and certain criteria are met. Derivatives are initially measured at fair value. Subsequent to initial recognition, derivatives are measured at fair value, and changes therein are generally recognised in profit or loss.
(m) Impairment
(i) Financial assets (other than at fair value)
The Company assesses at each date of balance sheet, whether a financial asset or a group of financial assets is impaired. Ind AS 109 - Financial instruments, requires expected credit losses to be measured though a loss allowance. The Company recognises lifetime expected losses for all contract assets and / or all trade receivables that do not constitute a financing transaction. For all other financial assets, expected credit losses are measured at an amount equal to the twelve-month expected credit losses or at an amount equal to the life time expected credit losses if the credit risk on the financial asset has increased significantly, since initial recognition.
(ii) Non-financial assets
(a) Tangible and Intangible assets
Property, Plant and equipment and intangible assets with finite life are evaluated for recoverability whenever there is an indication that their carrying amounts may not be recoverable. If any such indication exists, the recoverable amount (i.e. higher of the fair value less cost to sell and the value-in-use) is determined on an individual asset basis unless the asset does not generate cash flows that are largely independent of those from other assets. In such cases, the recoverable amount is determined for cash generating unit (CGU) to which the asset belongs.
If the recoverable amount of an asset (or CGU) is estimated to be less than its carrying amount, the carrying amount of the asset (or CGU) is reduced to it’s recoverable amount. An impairment loss is recognised in the statement of profit and loss.
(n) Earnings per share
Basic earnings per share are computed by dividing profit attributable to equity shareholders of the Company by the weighted average number of equity shares outstanding during the year.
Diluted earnings per share is computed by dividing the profit after tax by the weighted average number of equity shares considered for deriving basic EPS and also weighted average number of equity shares that could have been issued upon conversion of all dilutive potential equity shares. Dilutive potential equity shares are deemed converted as of the beginning of the period, unless issued at a later date. Dilutive potential equity shares are determined independently for each period presented.
(o) Contingent liabilities
A contingent liability is a possible obligation that arises from past events whose existence will be confirmed by the occurrence or non-occurrence of one or more uncertain future events beyond the control of the Company or a present obligation that is not recognized because it is not probable that an outflow of resources will be required to settle the obligation. A contingent liability also arises in extremely rare cases where there is a liability that cannot be recognized because it cannot be measured reliably. The Company does not recognize a contingent liability but discloses its existence in the financial statements unless the possibility of an outflow of resources embodying economic benefits is remote.
Contingent liabilities and commitments are reviewed by the management at each balance sheet date.
(p) Cash flow statement
Cash flows are reported using the indirect method, whereby net profit before tax is adjusted for the effects of transactions of a non-cash nature and any deferrals or accruals of past or future cash receipts or payments. The cash flows from operating, investing and financing activities of the Company are segregate. Bank overdrafts and investment in liquid mutual funds are classified as cash and cash equivalents for the purpose of cash flow statement, as they form an integral part of an entity’s cash management.
120
(q) Cash and cash equivalents
Cash and cash equivalents include cash in hand, demand deposits with banks and other short-term highly liquid investments with original maturities of three months or less.
For the purpose of cash flow statement, cash and cash equivalent includes cash in hand, in banks, demand deposits with banks and other short-term highly liquid investments with original maturities of three months or less, net of outstanding bank overdrafts that are repayable on demand and are considered part of the cash management system.
(i) Initial recognition
The acquired investments in subsidiaries and joint ventures are measured at acquisition date fair value.
(ii) Subsequent measurement
Investments in equity shares of subsidiaries and joint ventures are accounted either.
(a) at cost, or
(b) in accordance with Ind AS 109, Financial Instruments
The Company has elected to account its investments in subsidiaries and joint ventures at cost.
4 New accounting standards not yet adopted
Ministry of Corporate Affairs (“MCA”) through Companies (Indian Accounting Standards) Amendment Rules, 2018 has notified the following new amendments to Ind ASs which the Company has not applied as they are effective for annual periods beginning on or after 01 April 2018:
(a) Ind AS 115 - Revenue from Contracts with Customers
On 28 March 2018, the MCA notified the Ind AS 115 Revenue from contract with customers. The core principle of the new standard is that an entity should recognise revenue to depict the transfer of promised goods or services to customers in an amount that reflects the consideration to which the entity expects to be entitled in exchange for those goods and service. Further, the new standard requires enhanced disclosure about the nature, amount, timing and uncertainty of revenue and cash flow arising from the entity’s contract with customers. The effective date for adoption of Ind AS 115 is financial period beginning on or after 01 April 2018.
There is no material impact on account of adoption of Ind AS 115 to the Company’s current policy of revenue recognition.
(b) Ind AS 21 – The effect of changes in foreign Exchange rates
The amendment clarifies on the accounting of transactions that include the receipt or payment of advance consideration in a foreign currency. The appendix explains that the date of the transaction, for the purpose of determining the exchange rate, is the date of initial recognition of the non-monetary prepayment asset or deferred income liability. If there are multiple payments or receipts in advance, a date of transaction is established for each payment or receipt. The Company is evaluating the impact of this amendment on its financial statements.
HealthCare Global Enterprises Limited
Notes to the Standalone Ind AS financial statements for the year ended 31 March 2018 (continued)
(r) Investments in subsidiaries and joint ventures
121

5 P
rop
erty
, pla
nt a
nd e
qui
pm
ent
and
cap
ital w
ork
-in-
pro
gre
ss
Des
crip
tion
of
asse
tsF
ree-
hold
la
nd
Bui
ld-
ing
s -
ow
ned
Bui
ld-
ing
s -
leas
ed
Leas
eho
ld
imp
rove
-m
ents
Pla
nt a
nd
med
ical
eq
uip
men
t -
ow
ned
Pla
nt
and
eq
uip
-m
ent
- le
ased
Offi
ce
equi
p-
men
t
Fur
ni-
ture
and
fix
ture
s
Dat
a p
ro-
cess
ing
eq
uip
-m
ents
Ele
ctri
cal
inst
alla
-tio
n
Vehi
cles
Tota
lC
apita
l w
ork
in
pro
gre
ss
I. G
ross
blo
ck
Bal
ance
as
at 0
1 A
pri
l 201
6 4
02.8
6 6
08.3
0 3
97.2
7 3
71.3
0 2
,620
.81
53.
82
50.
48
69.
57
31.
99
19.
54
10.
58
4,6
36.5
2 5
33.2
5
Add
ition
s *
-
28.
96
-
23.
59
491
.91
-
12.
63
10.
61
15.
23
7.3
5 9
.41
599
.69
336
.01
Dis
posa
ls -
-
-
(1
.05)
(56.
64)
-
(0.1
1) (0
.16)
-
-
-
(57.
96)
(11.
12)
Exc
hang
e flu
ctua
tion
-
-
-
-
(8.1
3) -
-
-
-
-
-
(8
.13)
-
Cap
italis
ed d
urin
g th
e ye
ar -
-
-
-
-
-
-
-
-
-
-
-
(5
24.0
0)
Dis
posa
l of b
usin
ess
to s
ubsi
diar
y (re
fer n
ote
47)
-
-
-
-
(134
.44)
-
(0.9
4) (0
.82)
(0.8
2) -
(0
.28)
(137
.30)
-
Bal
ance
as
at 3
1 M
arch
201
7 4
02.8
6 6
37.2
6 3
97.2
7 3
93.8
4 2
,913
.51
53.
82
62.
06
79.
20
46.
40
26.
89
19.
71
5,0
32.8
2 3
34.1
4
Add
ition
s* $
(ref
er n
ote
18)
39.
44
79.
55
45.
84
399
.36
-
8.8
9 1
0.10
2
5.89
4
.93
10.
42
624
.42
798
.78
Dis
posa
ls (4
3.32
) (1
03.9
7) -
(1
.60)
(3.1
7) (2
.16)
-
(3.0
7) (1
57.2
9) (1
00.3
0)
Sal
e of
Trie
sta
unit
durin
g th
e ye
ar (r
efer
not
e:28
.1)
(16.
28)
(129
.91)
-
(6.8
9) (3
.88)
(7.5
6) (0
.06)
-
(164
.58)
(36.
31)
Exc
hang
e flu
ctua
tion
-
-
-
-
(2.9
6) -
-
-
-
-
-
(2
.96)
-
Cap
italis
ed d
urin
g th
e ye
ar -
-
-
-
-
-
-
-
-
-
-
-
(2
05.2
0)
Acq
uire
d th
roug
h bu
sine
ss c
ombi
natio
n (re
fer
note
43)
-
-
-
-
9.1
7 -
1
.60
1.3
7 0
.41
0.0
5 0
.20
12.
80
-
Adj
ustm
ent *
* -
-
-
-
5
3.82
(5
3.82
) -
-
-
-
-
-
-
Bal
ance
as
at 3
1 M
arch
201
8 4
02.8
6 6
76.7
0 4
76.8
2 3
80.0
8 3
,139
.02
-
64.
06
83.
62
62.
98
31.
81
27.
26
5,3
45.2
1 7
91.1
1
Hea
lthC
are
Glo
bal
Ent
erp
rise
s Li
mite
d
No
tes
to t
he S
tand
alo
ne In
d A
S fi
nanc
ial s
tate
men
ts (c
ont
inue
d)
(` in
mill
ion)
(q) Cash and cash equivalents
Cash and cash equivalents include cash in hand, demand deposits with banks and other short-term highly liquid investments with original maturities of three months or less.
For the purpose of cash flow statement, cash and cash equivalent includes cash in hand, in banks, demand deposits with banks and other short-term highly liquid investments with original maturities of three months or less, net of outstanding bank overdrafts that are repayable on demand and are considered part of the cash management system.
(i) Initial recognition
The acquired investments in subsidiaries and joint ventures are measured at acquisition date fair value.
(ii) Subsequent measurement
Investments in equity shares of subsidiaries and joint ventures are accounted either.
(a) at cost, or
(b) in accordance with Ind AS 109, Financial Instruments
The Company has elected to account its investments in subsidiaries and joint ventures at cost.
4 New accounting standards not yet adopted
Ministry of Corporate Affairs (“MCA”) through Companies (Indian Accounting Standards) Amendment Rules, 2018 has notified the following new amendments to Ind ASs which the Company has not applied as they are effective for annual periods beginning on or after 01 April 2018:
(a) Ind AS 115 - Revenue from Contracts with Customers
On 28 March 2018, the MCA notified the Ind AS 115 Revenue from contract with customers. The core principle of the new standard is that an entity should recognise revenue to depict the transfer of promised goods or services to customers in an amount that reflects the consideration to which the entity expects to be entitled in exchange for those goods and service. Further, the new standard requires enhanced disclosure about the nature, amount, timing and uncertainty of revenue and cash flow arising from the entity’s contract with customers. The effective date for adoption of Ind AS 115 is financial period beginning on or after 01 April 2018.
There is no material impact on account of adoption of Ind AS 115 to the Company’s current policy of revenue recognition.
(b) Ind AS 21 – The effect of changes in foreign Exchange rates
The amendment clarifies on the accounting of transactions that include the receipt or payment of advance consideration in a foreign currency. The appendix explains that the date of the transaction, for the purpose of determining the exchange rate, is the date of initial recognition of the non-monetary prepayment asset or deferred income liability. If there are multiple payments or receipts in advance, a date of transaction is established for each payment or receipt. The Company is evaluating the impact of this amendment on its financial statements.
122

Pro
per
ty, p
lant
and
eq
uip
men
t an
d c
apita
l wo
rk-i
n-p
rog
ress
(co
ntin
ued
)
Des
crip
tion
of
asse
tsF
ree-
hold
la
nd
Bui
ld-
ing
s -
ow
ned
Bui
ld-
ing
s -
leas
ed
Leas
eho
ld
imp
rove
-m
ents
Pla
nt a
nd
med
ical
eq
uip
men
t -
ow
ned
Pla
nt
and
eq
uip
-m
ent
- le
ased
Offi
ce
equi
p-
men
t
Fur
ni-
ture
and
fix
ture
s
Dat
a p
ro-
cess
ing
eq
uip
-m
ents
Ele
ctri
cal
inst
alla
-tio
n
Vehi
cles
Tota
lC
apita
l w
ork
in
pro
gre
ss
II. A
ccum
ulat
ed d
epre
ciat
ion
and
im
pai
rmen
t
Bal
ance
as
at 0
1 A
pri
l 201
6 -
1
3.25
1
8.93
2
7.17
2
49.3
4 8
.21
7.7
5 1
1.30
7
.19
7.0
7 0
.72
350
.93
-
Elim
inat
ed o
n di
spos
al o
f ass
ets
-
-
-
(0.7
3) (5
5.01
) -
(0
.07)
(0.1
1) -
-
-
(5
5.92
) -
Dep
reci
atio
n ex
pens
e -
1
6.82
1
4.20
3
4.60
3
17.8
5 4
.47
11.
32
13.
37
14.
81
5.7
3 2
.25
435
.42
-
Dis
posa
l of b
usin
ess
to s
ubsi
diar
y (re
fer n
ote
47)
-
-
-
-
(55.
78)
-
(0.9
1) (0
.69)
(0.7
5) -
(0
.28)
(58.
41)
-
Bal
ance
as
at 3
1 M
arch
201
7 -
3
0.07
3
3.13
6
1.04
4
56.4
0 1
2.68
1
8.09
2
3.87
2
1.25
1
2.80
2
.69
672
.02
-
Elim
inat
ed o
n di
spos
al o
f ass
ets
(refe
r not
e 28
.3)
-
-
-
(21.
24)
(71.
45)
-
(1.1
9) (2
.84)
(1.6
3) -
(1
.57)
(99.
92)
-
Sal
e of
Trie
sta
unit
durin
g th
e ye
ar (r
efer
not
e 28
.1)
-
-
-
(4.0
1) (2
3.74
) -
(2
.86)
(1.8
5) (4
.14)
-
-
(36.
60)
-
Adj
ustm
ent
-
-
-
-
20.
89
(2
0.89
) -
-
-
-
-
-
-
Dep
reci
atio
n ex
pens
e -
1
4.50
1
7.84
3
5.67
3
00.4
1 8
.21
8.2
2 1
2.54
1
4.59
3
.29
3.7
0 4
18.9
7 -
Bal
ance
as
at 3
1 M
arch
201
8 -
4
4.57
5
0.97
7
1.46
6
82.5
1 -
2
2.26
3
1.72
3
0.07
1
6.09
4
.82
954
.47
-
Net
blo
ck a
s at
31
Mar
ch 2
017
40
2.86
6
07.1
9
364.
14
332
.80
2,4
57.1
1 4
1.14
4
3.97
5
5.33
2
5.15
1
4.09
1
7.02
4,36
0.80
3
34.1
4
Net
blo
ck a
s at
31
Mar
ch 2
018
402.
86
632
.13
425.
85
308
.62
2,4
56.5
1 -
4
1.80
5
1.90
3
2.91
1
5.72
2
2.44
4,
390.
74
791
.11
Ref
er n
ote
16 fo
r de
tails
of c
harg
e cr
eate
d on
fixe
d as
sets
* In
clud
es e
xpen
ses
capi
talis
ed o
f ` 3
10.2
5 m
illion
(PY
17.
` 1
56.1
9 m
illion
) of w
hich
bor
row
ing
cost
cap
italis
ed is
` 0
.82
milli
on ,
(PY
17
Nil)
** P
erta
in to
ass
ets
clas
sifie
d as
fina
nce
leas
e til
l pre
viou
s ye
ar. D
urin
g th
e ye
ar, o
n ac
coun
t of s
ettle
men
t of l
ease
obl
igat
ion
this
has
bee
n tr
ansf
erre
d to
ow
ned
asse
ts.
$ A
dditi
ons
incl
udes
gov
ernm
ent g
rant
reco
gnis
ed a
t fai
r va
lue.
(refe
r no
te 1
8)
Hea
lthC
are
Glo
bal
Ent
erp
rise
s Li
mite
d
No
tes
to t
he S
tand
alo
ne In
d A
S fi
nanc
ial s
tate
men
ts (c
ont
inue
d)
5(`
in m
illio
n)
123

HealthCare Global Enterprises Limited
Notes to the Standalone Ind AS financial statements (continued)
6 Goodwill and other intangible assets
Description of assets
Other intangible assets
Goodwill (refer note (i)
below)
Computer software and
software for plant and machinery
Total
I. Gross block
Balance as at 01 April 2016 - 33.98 33.98
Additions - 41.43 41.43
Balance as at 31 March 2017 - 75.41 75.41
Additions - 5.81 5.81
Acquired through business combination (refer note 43) 484.52 - -
Sale of Triesta unit during the year (refer note 28.1) - (2.84) (2.84)
Balance as at 31 March 2018 484.52 78.38 78.38
II. Accumulated amortisation and impairment losses
Balance as at 01 April 2016 - 8.84 8.84
Amortisation expense for the year - 6.16 6.16
Balance as at 31 March 2017 - 15.00 15.00
Sale of unit - (1.60) (1.60)
Amortisation expense for the year - 20.23 20.23
Balance as at 31 March 2018 - 33.63 33.63
Net block as at 31 March 2017 - 60.41 60.41
Net block as at 31 March 2018 484.52 44.75 44.75
(i) The key assumptions used in the estimation of the recoverable amount of Goodwill are set out below:
Assumptions Values in %
Annual growth rate 20% to 22%
Terminal growth rate 5%
Discount rate 19.94%
The values assigned to the key assumptions represent management’s assessment of future trends and based on historical data from both external and internal sources. Discount rate reflects the current market assessment of the risks specific to the Cash Generating Unit (CGU). The discount rate is estimated based on the capital asset pricing method for the CGU. The cash flow projections included specific estimates developed using internal forecasts. The planning horizon reflects the assumptions for short-to-midterm market developments. The Company believes that any reasonably possible change in the key assumptions on which the recoverable amount is based would not cause the aggregate carrying amount to exceed the aggregate recoverable amount of the CGU.
The estimated recoverable amount of the CGU exceeded its carrying amount, hence impairment is not triggered.
(` in million)
124
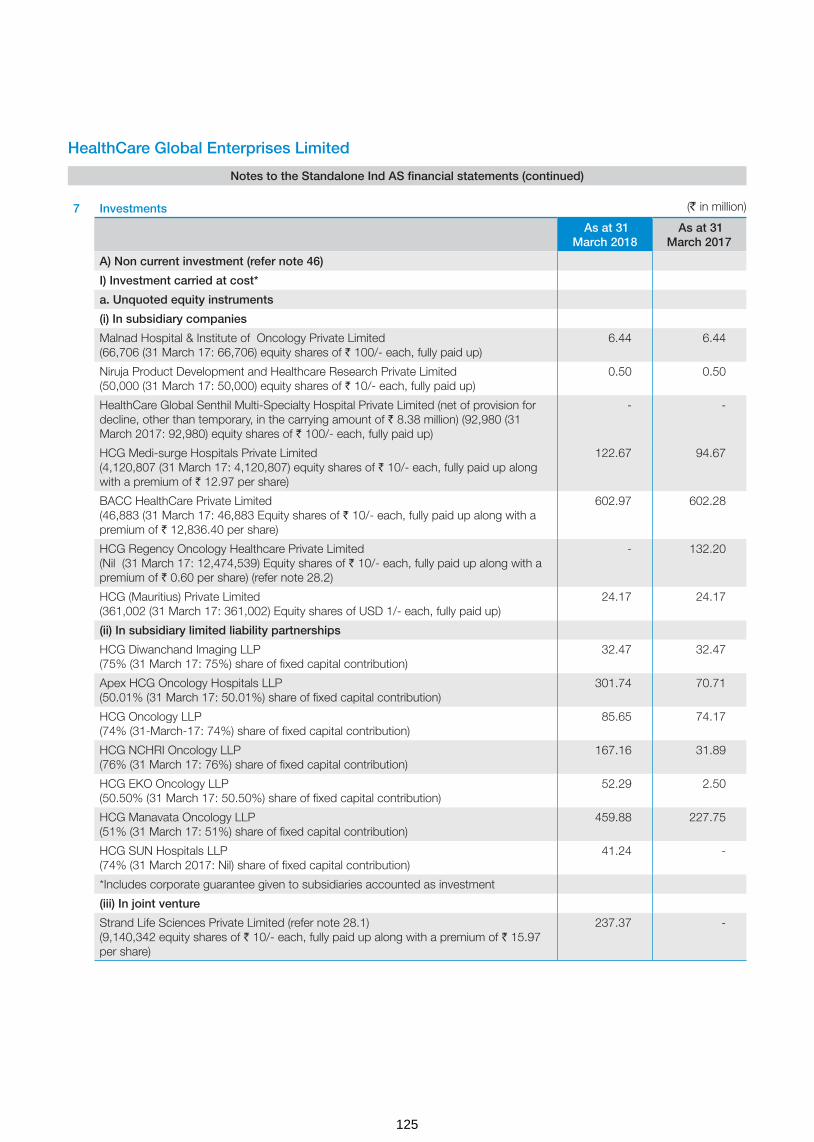
HealthCare Global Enterprises Limited
Notes to the Standalone Ind AS financial statements (continued)
7 Investments
As at 31 March 2018
As at 31 March 2017
A) Non current investment (refer note 46)
I) Investment carried at cost*
a. Unquoted equity instruments
(i) In subsidiary companies
Malnad Hospital & Institute of Oncology Private Limited (66,706 (31 March 17: 66,706) equity shares of ` 100/- each, fully paid up)
6.44 6.44
Niruja Product Development and Healthcare Research Private Limited (50,000 (31 March 17: 50,000) equity shares of ` 10/- each, fully paid up)
0.50 0.50
HealthCare Global Senthil Multi-Specialty Hospital Private Limited (net of provision for decline, other than temporary, in the carrying amount of ` 8.38 million) (92,980 (31 March 2017: 92,980) equity shares of ` 100/- each, fully paid up)
- -
HCG Medi-surge Hospitals Private Limited (4,120,807 (31 March 17: 4,120,807) equity shares of ` 10/- each, fully paid up along with a premium of ` 12.97 per share)
122.67 94.67
BACC HealthCare Private Limited (46,883 (31 March 17: 46,883 Equity shares of ` 10/- each, fully paid up along with a premium of ` 12,836.40 per share)
602.97 602.28
HCG Regency Oncology Healthcare Private Limited (Nil (31 March 17: 12,474,539) Equity shares of ` 10/- each, fully paid up along with a premium of ` 0.60 per share) (refer note 28.2)
- 132.20
HCG (Mauritius) Private Limited (361,002 (31 March 17: 361,002) Equity shares of USD 1/- each, fully paid up)
24.17 24.17
(ii) In subsidiary limited liability partnerships
HCG Diwanchand Imaging LLP (75% (31 March 17: 75%) share of fixed capital contribution)
32.47 32.47
Apex HCG Oncology Hospitals LLP (50.01% (31 March 17: 50.01%) share of fixed capital contribution)
301.74 70.71
HCG Oncology LLP (74% (31-March-17: 74%) share of fixed capital contribution)
85.65 74.17
HCG NCHRI Oncology LLP (76% (31 March 17: 76%) share of fixed capital contribution)
167.16 31.89
HCG EKO Oncology LLP (50.50% (31 March 17: 50.50%) share of fixed capital contribution)
52.29 2.50
HCG Manavata Oncology LLP (51% (31 March 17: 51%) share of fixed capital contribution)
459.88 227.75
HCG SUN Hospitals LLP (74% (31 March 2017: Nil) share of fixed capital contribution)
41.24 -
*Includes corporate guarantee given to subsidiaries accounted as investment
(iii) In joint venture
Strand Life Sciences Private Limited (refer note 28.1) (9,140,342 equity shares of ` 10/- each, fully paid up along with a premium of ` 15.97 per share)
237.37 -
(` in million)
125

HealthCare Global Enterprises Limited
Notes to the Standalone Ind AS financial statements (continued)
b.Unquoted compulsorily convertible preference shares
(i) In joint venture
Strand Life Sciences Private Limited (refer note 28.1) (101,193 Series 1 preference shares of ` 10/- each, fully paid up along with a premium of ` 15.97 per share)
2.63 -
II) Investment carried at fair value through profit and loss (FVTPL)
(a) In other companies
Zoctr Health Private Limited (299 equity shares of ` 10/- each, fully paid along with a premium of ` 17,097.25 per share and 153 equity shares of ` 10/- each, fully paid up along with a premium of ` 16,498 per share ; 31 March 2017: Nil)
7.64 -
Suchirayu Healthcare Solutions Limited (2,055,000 equity shares of ` 10/- each, fully paid up; 31 March 2017 : Nil ) Refer note below
0.50 -
Note: The Company has entered into a non-disposal undertaking of the its investment in Suchirayu Healthcare Solutions Limited (Suchirayu) until the closure of the loan by Suchirayu.
(b) Investments in mutual fund (quoted)
Religare Invesco Short Term Fund- 17,112.198 units @ ` 2,520.36 (31 March17: 17,112.198 units @ ` 2,310.36)
43.13 39.54
Total non current investments 2,188.45 1,339.29
As at 31 March 2018 As at 31 March 2017
Units Amount Units Amount
B) Current
Investments carried at fair value through profit and loss (FVTPL)
Mutual funds and other funds (Quoted)
- Unit Trust of India - Money Market Fund - - 24,060.61 53.93
- Birla Sun life - - 65,845.71 20.98
Total current investments - - 74.91
Aggregate amount of quoted investments 43.13 114.45
Aggregate amount of Market value of investments 43.13 114.45
Aggregate amount of unquoted investments (gross) 2,153.70 1,308.13
Aggregate amount of impairment in value of investments
8.38 8.38
8 Loans (unsecured)
As at 31 March 2018 As at 31 March 2017
Non Current Current Non Current Current
Considered good
a)Loans to related parties (refer note 44) 241.13 - 1.06 -
b)Advances to employees - 29.21 - 18.41
c)Inter-corporate deposits 68.00 - 29.30 -
d) Other advances to related parties (refer note 44) 29.16 - - -
Considered doubtful
Loans to related parties (refer note 44) 30.38 - 30.38 -
Less : Allowance for bad and doubtful loans (30.38) - (30.38) -
Total 338.29 29.21 30.36 18.41
(` in million)
126

HealthCare Global Enterprises Limited
Notes to the Standalone Ind AS financial statements (continued)
9 Other financial assets
As at 31 March 2018 As at 31 March 2017
Non Current Current Non Current Current
Security deposits 189.13 - 194.35 -
Advances to related parties (refer note 44) - 68.70 - 82.38
Unbilled revenue - 84.30 - 79.67
Term deposits (more than 12 months maturity from the reporting date) ¹
85.08 - 48.27 22.24
Interest accrued but not due on fixed deposits 10.13 - 9.70 -
Interest accrued on inter corporate deposit 9.13 - 0.95 -
Interest accrued on loan to subsidiaries (refer note 44) - 28.40 - 7.42
Total 293.47 181.40 253.27 191.71
Note:
1 Term deposits include margin money deposits with banks and deposits given as security for obtaining bank guarantees
2 Details of advances to directors and private companies in which any director is a director or a member
As at 31 March 2018
As at 31 March 2017
i Advances to director
- Dr. B S Ajaikumar 0.93 -
ii Private companies in which any director is a director or member
- HCG Medi-Surge Hospitals Private Limited 9.44 6.31
- Malnad Hospital and Institute of Oncology Private Limited 12.50 22.87
- BACC HealthCare Private Limited 5.50 3.65
10 Other assets
As at 31 March 2018 As at 31 March 2017
Non Current Current Non Current Current
Considered good
Capital advances 216.25 - 53.18 -
Prepaid expenses 133.03 36.54 139.13 31.56
Rental advance - 15.31 - 22.30
Advance to vendors - 93.96 - 40.59
Balance with revenue authorities - 33.70 - -
Considered doubtful
Advance to vendors - 27.13 - 27.93
Less : Allowance for bad and doubtful advances - (27.13) - (27.93)
Total 349.28 179.51 192.31 94.45
11 Inventories (lower of cost and net realisable value)*
As at 31 March 2018
As at 31 March 2017
Medical and non-medical items 171.03 149.01
171.03 149.01
*Inventories are subject to charge to secure bank loans. There are nil provision for written down to net realisable value.
(` in million)
127

HealthCare Global Enterprises Limited
Notes to the Standalone Ind AS financial statements (continued)
12 Trade receivables*
As at 31 March 2018
As at 31 March 2017
Trade receivables (unsecured) consist of following
a) considered good 1,262.13 1,006.01
b) considered doubtful 302.17 365.62
Allowance for doubtful debts (expected credit loss allowance - refer note 39 ) (302.17) (365.62)
1,262.13 1,006.01
*Trade receivables are subject to charge to secure bank loans
Note: Trade receivables include due from companies in which any director is a director or member
Refer note 44 for related party balances As at31 March 2018
As at31 March 2017
Private companies in which any director is a director or member
- HealthCare Global Senthil Multi-Specialty Hospitals Private Limited 0.13 0.32
- HCG Medi-surge Hospitals Private Limited 42.20 64.78
- Malnad Hospital and Institute of Oncology Private Limited 4.38 7.14
- BACC Healthcare Private Limited 0.08 0.13
- Health Care Process Solutions (India) Private Limited 0.06 -
Total 46.85 72.37
13 Cash and bank balances
As at31 March 2018
As at31 March 2017Cash and cash equivalents
(a) Cash on hand 4.41 6.86
(b) Cheques, drafts on hand 0.83 0.72
(c) Balance with bank
In current accounts 99.09 11.59
In Exchange Earners Foreign Currency Account (EEFC) accounts 7.06 5.07
(d) Other deposit* 41.72 382.90
(e) Earmarked balances with banks - 338.67
153.11 745.81
*Other deposits include margin money deposits with banks and deposits given as security for obtaining bank guarantees. These deposits are restrictive.
(` in million)
128

HealthCare Global Enterprises Limited
Notes to the Standalone Ind AS financial statements (continued)
For the purpose of the statement of cash flows, cash and cash equivalent comprise the following:
As at 31 March 2018
As at 31 March 2017
(a) Cash on hand 4.41 6.86
(b) Cheques, drafts on hand 0.83 0.72
(c) Balance with bank
In current accounts 99.09 11.59
In EEFC accounts 7.06 5.07
(d) Other deposit* 41.72 382.90
(e) Earmarked balances with banks - 338.67
153.11 745.81
Less : Bank overdrafts (refer note 16) (17.35) (412.65)
Add: Investments in liquid mutual funds in the nature of “Cash and cash equivalents” [refer note 7]
- 74.91
Cash and cash equivalents as per statement of cash flows 135.76 408.07
14 Equity share capital
As at31 March 2018
As at31 March 2017
Authorised share capital :
132,000,000 equity shares of ` 10 each (as at 31 March 2017: 132,000,000) 1,320.00 1,320.00
Issued, subscribed and paid up capital comprises:
86,904,473 (as at 31 March 2017: 85,712,986) fully paid equity shares of ` 10 each 869.05 857.13
14.1 Reconciliation of the equity shares outstanding at the beginning and at the end of the year
Number of shares
Amount
Balance as at 01 April 2016 85,075,986 850.76
Increase during the year
(a) Issue of equity shares pursuant to exercise of employee share options under employee share option plan 2014(refer note 36(C))
637,000 6.37
Balance as at 31 March 2017 85,712,986 857.13
(a) Issue of equity shares pursuant to preferential allotment* 1,166,667 11.66
(b) Issue of equity shares pursuant to exercise of employee share options under employee share option plan 2014(refer note 36(C))
24,820 0.25
Balance as at 31 March 2018 86,904,473 869.04
*The shareholders of the Company, vide resolution passed in Extra Ordinary General meeting, held on 28 December 2017, approved the allotment of 1,166,667 (Eleven Lakh Sixty Six Thousand Six Hundred Sixty Seven) equity shares of ` 10 each of the Company, at a price of ` 300 per share (including share premium of ` 290 per share), on Preferential basis, to Indgrowth Capital Fund 1, a SEBI registered Category III, Alternative Investment Fund (‘Allottee’).
(` in million)
129

HealthCare Global Enterprises Limited
Notes to the Standalone Ind AS financial statements (continued)
14.2 Rights, preferences and restrictions attached to equity shares
Fully paid equity shares, which have a par value of ` 10, carry one vote per share and carry a right to dividends The Company has only one class of equity share having a par value of ` 10/- each. Holder of equity shares is entitled to one vote per share. In the event of liquidation of the Company, the holders of the equity shares will be entitled to receive any of the remaining assets of the Company, after distribution of all preferential amount. The distribution will be in proportion to number of equity shares held by the shareholders.
14.3 Details of shareholder holding more than 5% shares of equity shares
As at 31 March 2018 As at 31 March 2017
Number of Shares held
% holding of equity shares
Number of Shares held
% holding of equity shares
Fully paid equity shares
Dr B.S Ajaikumar 17,642,739 20.30% 17,642,739 20.58%
Sundaram Mutual Fund 4,551,524 5.24% 5,490,474 6.41%
V Sciences Investments Pte. Limited 8,320,805 9.57% 8,320,805 9.71%
International Finance Corporation 4,358,705 5.02% 4,358,705 5.09%
Franklin Templeton Mutual Fund - - 5,790,082 6.76%
Prazim Trading and Investment Co Private Limited - - 6,654,723 7.76%
14.4 Aggregate number of equity shares allotted as fully paid-up without payment being received in cash for a period of five years immediately preceding the year ended 31 March 2018 (refer note 14.6)
Particulars Aggregate number of shares
as at
31 March 2018 31 March 2017
(a) Issue of shares pursuant to mergers 1,531,562 1,531,562
14.5 Number of equity shares of ` 10/- each reserved for issuance
Particulars As at31 March 2018
As at31 March 2017
a) to eligible employees under Employee Stock Option Scheme 2,943,103 2,967,923
14.6 Share pending issuance (refer note 43)
ParticularsAs at
31 March 2018As at
31 March 2017
Share pending issuance for the year 299.75 -
Total 299.75 -
15 Other equity
Note No.As at
31 March 2018As at
31 March 2017
Securities premium 15.1 5,284.88 4,945.44
Share options outstanding account 15.2 37.08 12.17
Retained earnings 15.3 (90.59) (339.49)
Amalgamation adjustment deficit account 15.4 (13.91) (23.47)
Remeasurements of the defined benefit plan 15.5 (1.85) 0.11
5,215.61 4,594.76
130

HealthCare Global Enterprises Limited
Notes to the Standalone Ind AS financial statements (continued)
15.1 Securities premium
As at31 March 2018
As at31 March 2017
Balance at beginning of year 4,945.44 4,867.85
Premium on shares issued during year 340.52 69.25
Share issue expenses * (1.08) 8.34
Balance at end of year 5,284.88 4,945.44
* Share issue expenses of ` 1.08 million towards preferential allotment of 1,166,667 equity shares during the year has been debited to securities premium.
Share issue expenses of ` 163.33 million towards Initial Public Offer of 11,600,000 shares had been debited to securities premium in financial year ended 31 March 2016. Unspent amount of ` 8.34 million out of the same has been credited to securities premium during the financial year ended 31 March 2017.
15.2 Share options outstanding account
As at31 March 2018
As at31 March 2017
Balance at the beginning of the year 12.17 9.04
Transferred to securities premium account on exercise of ESOPs
(2.18) (6.32)
Deferred stock compensation expense for the year 27.09 9.45
Balance at end of year 37.08 12.17
The above reserve relates to share options granted by the Company to its employees under its employee share option plan. Further information about share-based payments to employees is set out in note 36
15.3 Retained earnings
As at31 March 2018
As at31 March 2017
Balance at beginning of year (339.49) (534.33)
Profit/ (loss) attributable to owners of the Company 248.90 194.84
Balance at end of year (90.59) (339.49)
15.4 Amalgamation adjustment deficit account (refer note 48)
As at31 March 2018
As at31 March 2017
Balance at beginning of year (23.47) (23.47)
Adjustment towards common control transaction 9.56 -
Balance at end of year (13.91) (23.47)
15.5 Remeasurements of the defined benefit plan
As at31 March 2018
As at31 March 2017
Balance at beginning of year 0.11 1.10
Other comprehensive income arising from remeasurement of defined benefit obligation (net of income tax)
(1.96) (0.99)
Balance at end of year (1.85) 0.11
(` in million)
131
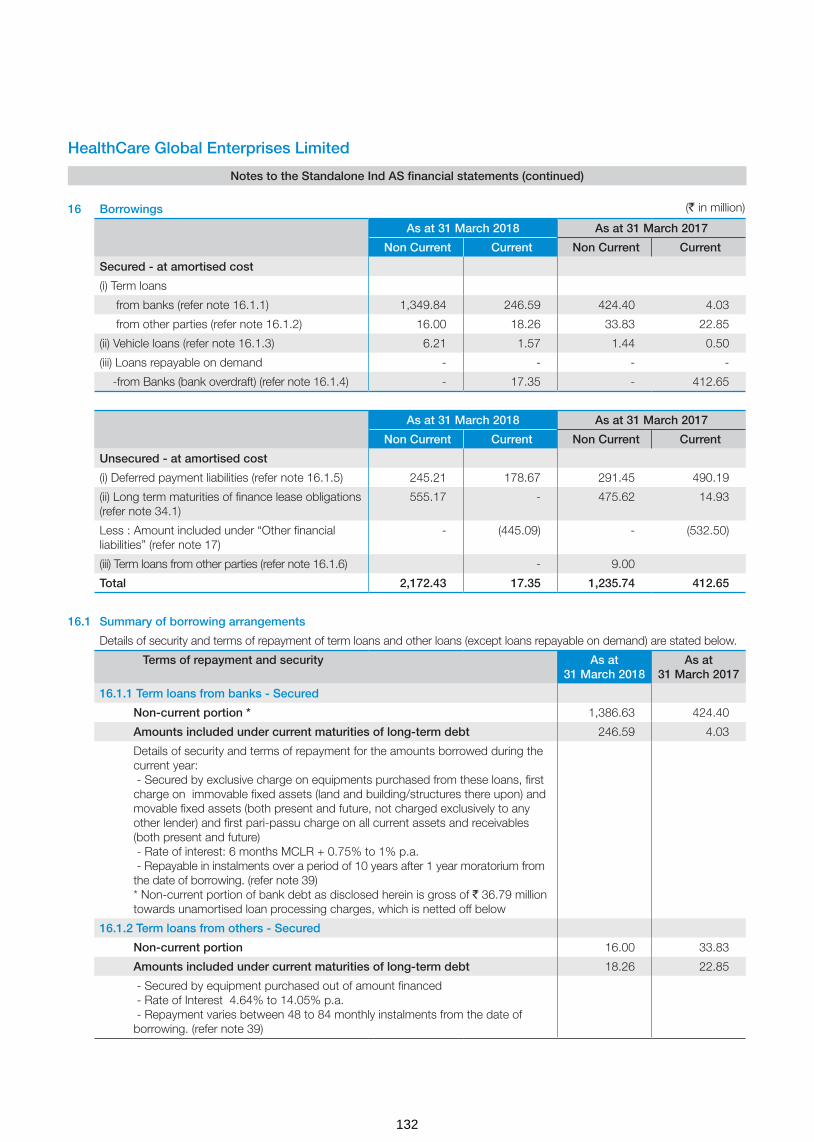
HealthCare Global Enterprises Limited
Notes to the Standalone Ind AS financial statements (continued)
16 Borrowings
As at 31 March 2018 As at 31 March 2017
Non Current Current Non Current Current
Secured - at amortised cost
(i) Term loans
from banks (refer note 16.1.1) 1,349.84 246.59 424.40 4.03
from other parties (refer note 16.1.2) 16.00 18.26 33.83 22.85
(ii) Vehicle loans (refer note 16.1.3) 6.21 1.57 1.44 0.50
(iii) Loans repayable on demand - - - -
-from Banks (bank overdraft) (refer note 16.1.4) - 17.35 - 412.65
As at 31 March 2018 As at 31 March 2017
Non Current Current Non Current Current
Unsecured - at amortised cost
(i) Deferred payment liabilities (refer note 16.1.5) 245.21 178.67 291.45 490.19
(ii) Long term maturities of finance lease obligations (refer note 34.1)
555.17 - 475.62 14.93
Less : Amount included under “Other financial liabilities” (refer note 17)
- (445.09) - (532.50)
(iii) Term loans from other parties (refer note 16.1.6) - 9.00
Total 2,172.43 17.35 1,235.74 412.65
16.1 Summary of borrowing arrangements
Details of security and terms of repayment of term loans and other loans (except loans repayable on demand) are stated below.
Terms of repayment and security As at 31 March 2018
As at 31 March 2017
16.1.1 Term loans from banks - Secured
Non-current portion * 1,386.63 424.40
Amounts included under current maturities of long-term debt 246.59 4.03
Details of security and terms of repayment for the amounts borrowed during the current year: - Secured by exclusive charge on equipments purchased from these loans, first charge on immovable fixed assets (land and building/structures there upon) and movable fixed assets (both present and future, not charged exclusively to any other lender) and first pari-passu charge on all current assets and receivables (both present and future) - Rate of interest: 6 months MCLR + 0.75% to 1% p.a. - Repayable in instalments over a period of 10 years after 1 year moratorium from the date of borrowing. (refer note 39) * Non-current portion of bank debt as disclosed herein is gross of ` 36.79 million towards unamortised loan processing charges, which is netted off below
16.1.2 Term loans from others - Secured
Non-current portion 16.00 33.83
Amounts included under current maturities of long-term debt 18.26 22.85
- Secured by equipment purchased out of amount financed - Rate of Interest 4.64% to 14.05% p.a. - Repayment varies between 48 to 84 monthly instalments from the date of borrowing. (refer note 39)
(` in million)
132
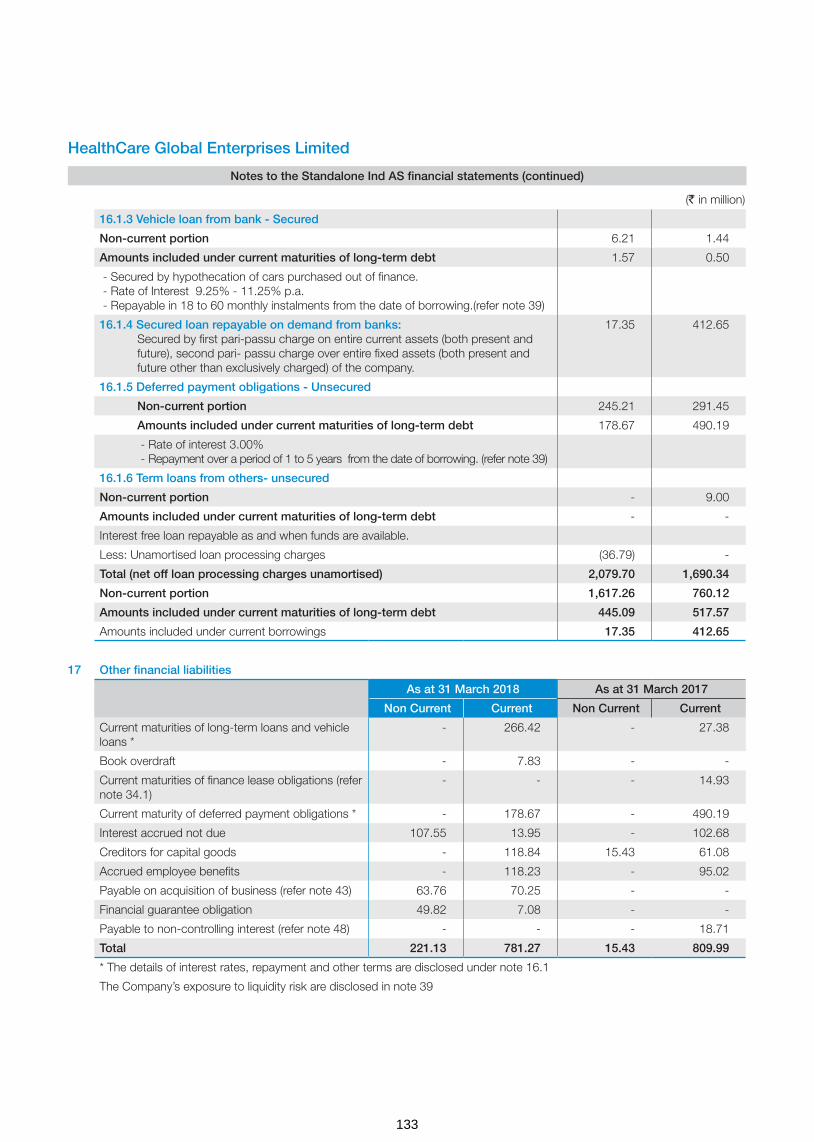
HealthCare Global Enterprises Limited
Notes to the Standalone Ind AS financial statements (continued)
16.1.3 Vehicle loan from bank - Secured
Non-current portion 6.21 1.44
Amounts included under current maturities of long-term debt 1.57 0.50
- Secured by hypothecation of cars purchased out of finance. - Rate of Interest 9.25% - 11.25% p.a. - Repayable in 18 to 60 monthly instalments from the date of borrowing.(refer note 39)
16.1.4 Secured loan repayable on demand from banks: Secured by first pari-passu charge on entire current assets (both present and future), second pari- passu charge over entire fixed assets (both present and future other than exclusively charged) of the company.
17.35 412.65
16.1.5 Deferred payment obligations - Unsecured
Non-current portion 245.21 291.45
Amounts included under current maturities of long-term debt 178.67 490.19
- Rate of interest 3.00% - Repayment over a period of 1 to 5 years from the date of borrowing. (refer note 39)
16.1.6 Term loans from others- unsecured
Non-current portion - 9.00
Amounts included under current maturities of long-term debt - -
Interest free loan repayable as and when funds are available.
Less: Unamortised loan processing charges (36.79) -
Total (net off loan processing charges unamortised) 2,079.70 1,690.34
Non-current portion 1,617.26 760.12
Amounts included under current maturities of long-term debt 445.09 517.57
Amounts included under current borrowings 17.35 412.65
17 Other financial liabilities
As at 31 March 2018 As at 31 March 2017
Non Current Current Non Current Current
Current maturities of long-term loans and vehicle loans *
- 266.42 - 27.38
Book overdraft - 7.83 - -
Current maturities of finance lease obligations (refer note 34.1)
- - - 14.93
Current maturity of deferred payment obligations * - 178.67 - 490.19
Interest accrued not due 107.55 13.95 - 102.68
Creditors for capital goods - 118.84 15.43 61.08
Accrued employee benefits - 118.23 - 95.02
Payable on acquisition of business (refer note 43) 63.76 70.25 - -
Financial guarantee obligation 49.82 7.08 - -
Payable to non-controlling interest (refer note 48) - - - 18.71
Total 221.13 781.27 15.43 809.99
* The details of interest rates, repayment and other terms are disclosed under note 16.1
The Company’s exposure to liquidity risk are disclosed in note 39
(` in million)
133
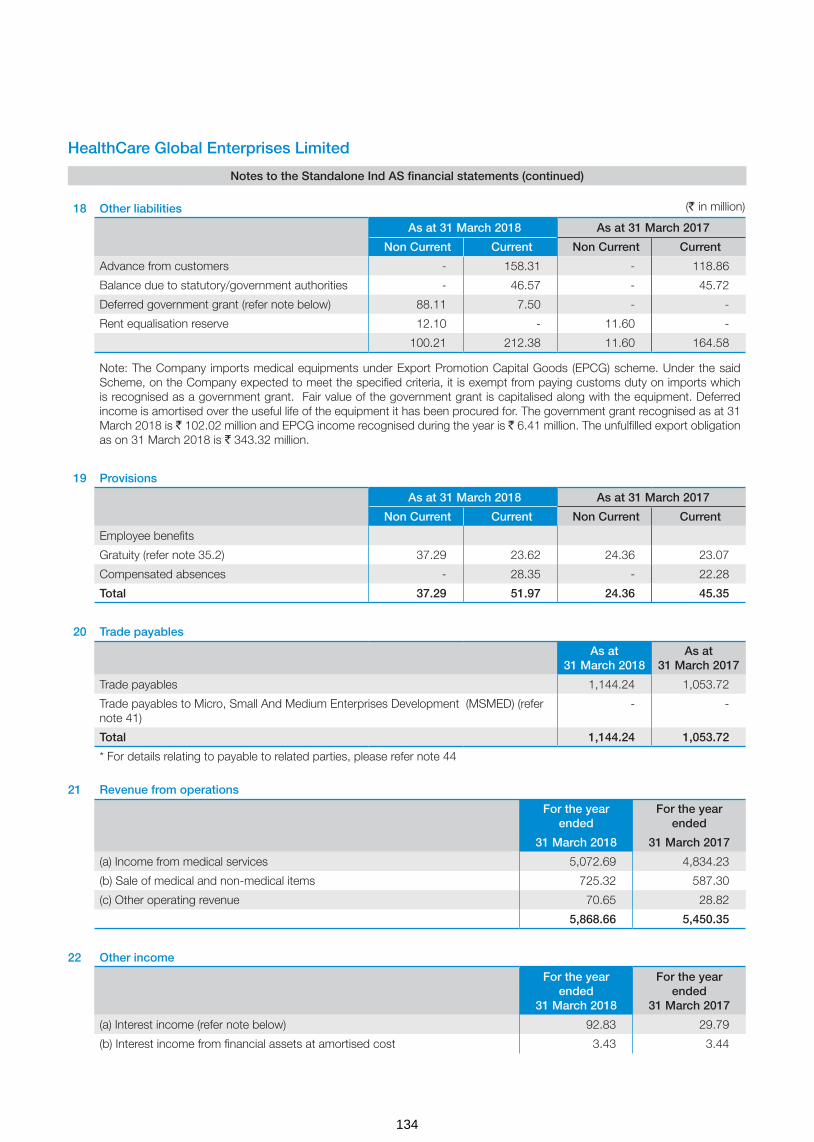
HealthCare Global Enterprises Limited
Notes to the Standalone Ind AS financial statements (continued)
18 Other liabilities
As at 31 March 2018 As at 31 March 2017
Non Current Current Non Current Current
Advance from customers - 158.31 - 118.86
Balance due to statutory/government authorities - 46.57 - 45.72
Deferred government grant (refer note below) 88.11 7.50 - -
Rent equalisation reserve 12.10 - 11.60 -
100.21 212.38 11.60 164.58
Note: The Company imports medical equipments under Export Promotion Capital Goods (EPCG) scheme. Under the said Scheme, on the Company expected to meet the specified criteria, it is exempt from paying customs duty on imports which is recognised as a government grant. Fair value of the government grant is capitalised along with the equipment. Deferred income is amortised over the useful life of the equipment it has been procured for. The government grant recognised as at 31 March 2018 is ` 102.02 million and EPCG income recognised during the year is ` 6.41 million. The unfulfilled export obligation as on 31 March 2018 is ` 343.32 million.
19 Provisions
As at 31 March 2018 As at 31 March 2017
Non Current Current Non Current Current
Employee benefits
Gratuity (refer note 35.2) 37.29 23.62 24.36 23.07
Compensated absences - 28.35 - 22.28
Total 37.29 51.97 24.36 45.35
20 Trade payables
As at 31 March 2018
As at 31 March 2017
Trade payables 1,144.24 1,053.72
Trade payables to Micro, Small And Medium Enterprises Development (MSMED) (refer note 41)
- -
Total 1,144.24 1,053.72
* For details relating to payable to related parties, please refer note 44
21 Revenue from operations
For the year ended
For the year ended
31 March 2018 31 March 2017
(a) Income from medical services 5,072.69 4,834.23
(b) Sale of medical and non-medical items 725.32 587.30
(c) Other operating revenue 70.65 28.82
5,868.66 5,450.35
22 Other income
For the year ended
31 March 2018
For the year ended
31 March 2017
(a) Interest income (refer note below) 92.83 29.79
(b) Interest income from financial assets at amortised cost 3.43 3.44
(` in million)
134

HealthCare Global Enterprises Limited
Notes to the Standalone Ind AS financial statements (continued)
(c) Net foreign exchange gains 1.82 3.31
(d) Net gain on sale of investments in mutual funds 1.14 22.84
(e) Net gain on financial assets designated at fair value through profit and loss 3.61 0.39
(f) Payables no longer required written-back 22.00 0.29
(g) Miscellaneous income 14.98 7.10
(h) Guarantee commission 19.45 -
159.26 67.16
Interest income comprise:
Interest on bank deposits 31.15 22.87
Interest on income tax refund 25.97 3.89
Interest on unsecured loans given to subsidiaries (refer note 44) 21.34 1.42
Interest on inter-corporate deposits 10.16 1.61
Interest on debentures 4.21 -
92.83 29.79
23 Changes in inventories
For the year ended
For the year ended
31 March 2018 31 March 2017
Inventories at the beginning of the year 149.01 112.99
Inventories at the end of the year 171.03 149.01
Changes in inventories (22.02) (36.02)
Opening stock of unit sold during the year (refer note 28.1) (8.53) -
Opening stock on acquisition of business (refer note 43) 3.90 -
Adjustments - 0.52
Net (decrease) (26.65) (35.50)
24 Employee benefits expense
For the year ended
31 March 2018
For the year ended
31 March 2017
Salaries and wages (refer note 5) 1,020.16 885.86
Contribution to provident and other funds (refer note 35.1) 66.15 48.20
Expense on employee stock option scheme (refer note 36) 27.09 9.45
Staff welfare expenses 42.44 37.09
1,155.84 980.60
25 Finance costs
For the year ended
31 March 2018
For the year ended
31 March 2017
(a) Interest costs :-
Interest on term loan from banks and others 121.06 28.71
Interest on bank overdraft 32.74 6.29
Interest on deferred payment obligations 19.47 33.79
(` in million)
135
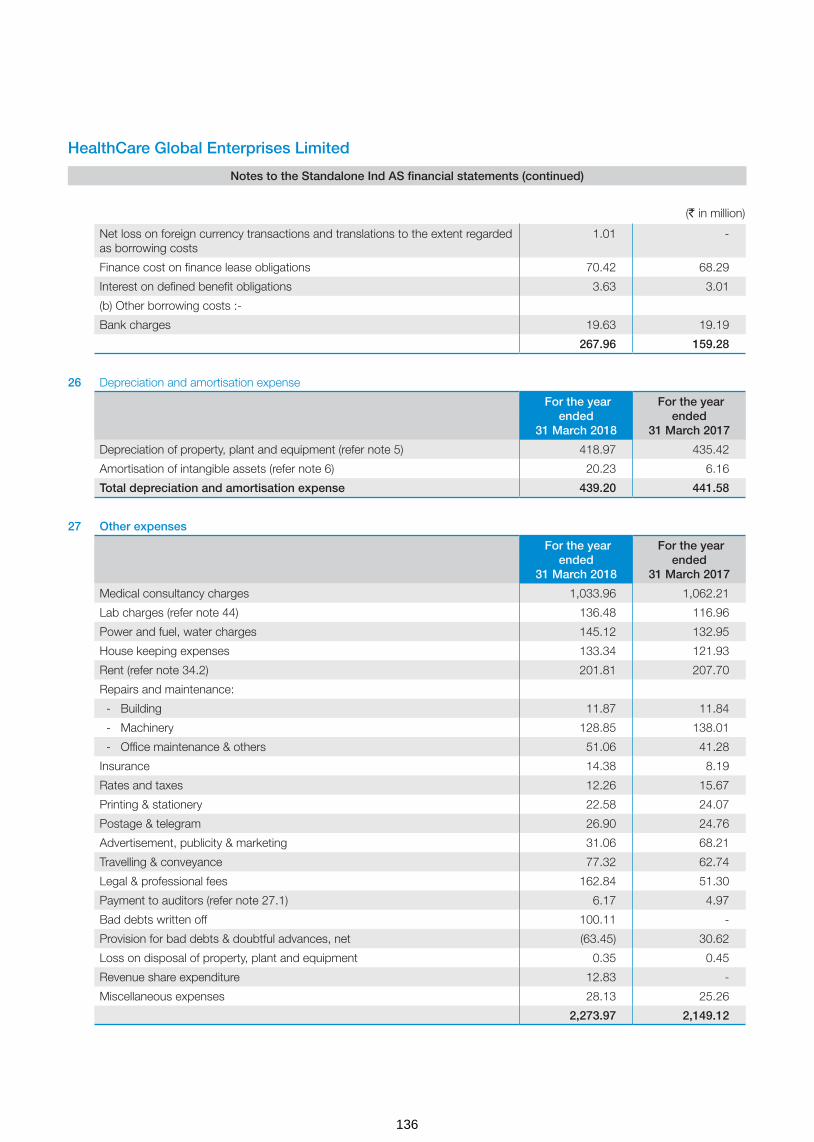
HealthCare Global Enterprises Limited
Notes to the Standalone Ind AS financial statements (continued)
Net loss on foreign currency transactions and translations to the extent regarded as borrowing costs
1.01 -
Finance cost on finance lease obligations 70.42 68.29
Interest on defined benefit obligations 3.63 3.01
(b) Other borrowing costs :-
Bank charges 19.63 19.19
267.96 159.28
26 Depreciation and amortisation expense
For the year ended
31 March 2018
For the year ended
31 March 2017
Depreciation of property, plant and equipment (refer note 5) 418.97 435.42
Amortisation of intangible assets (refer note 6) 20.23 6.16
Total depreciation and amortisation expense 439.20 441.58
27 Other expenses
For the year ended
31 March 2018
For the year ended
31 March 2017
Medical consultancy charges 1,033.96 1,062.21
Lab charges (refer note 44) 136.48 116.96
Power and fuel, water charges 145.12 132.95
House keeping expenses 133.34 121.93
Rent (refer note 34.2) 201.81 207.70
Repairs and maintenance:
- Building 11.87 11.84
- Machinery 128.85 138.01
- Office maintenance & others 51.06 41.28
Insurance 14.38 8.19
Rates and taxes 12.26 15.67
Printing & stationery 22.58 24.07
Postage & telegram 26.90 24.76
Advertisement, publicity & marketing 31.06 68.21
Travelling & conveyance 77.32 62.74
Legal & professional fees 162.84 51.30
Payment to auditors (refer note 27.1) 6.17 4.97
Bad debts written off 100.11 -
Provision for bad debts & doubtful advances, net (63.45) 30.62
Loss on disposal of property, plant and equipment 0.35 0.45
Revenue share expenditure 12.83 -
Miscellaneous expenses 28.13 25.26
2,273.97 2,149.12
(` in million)
136
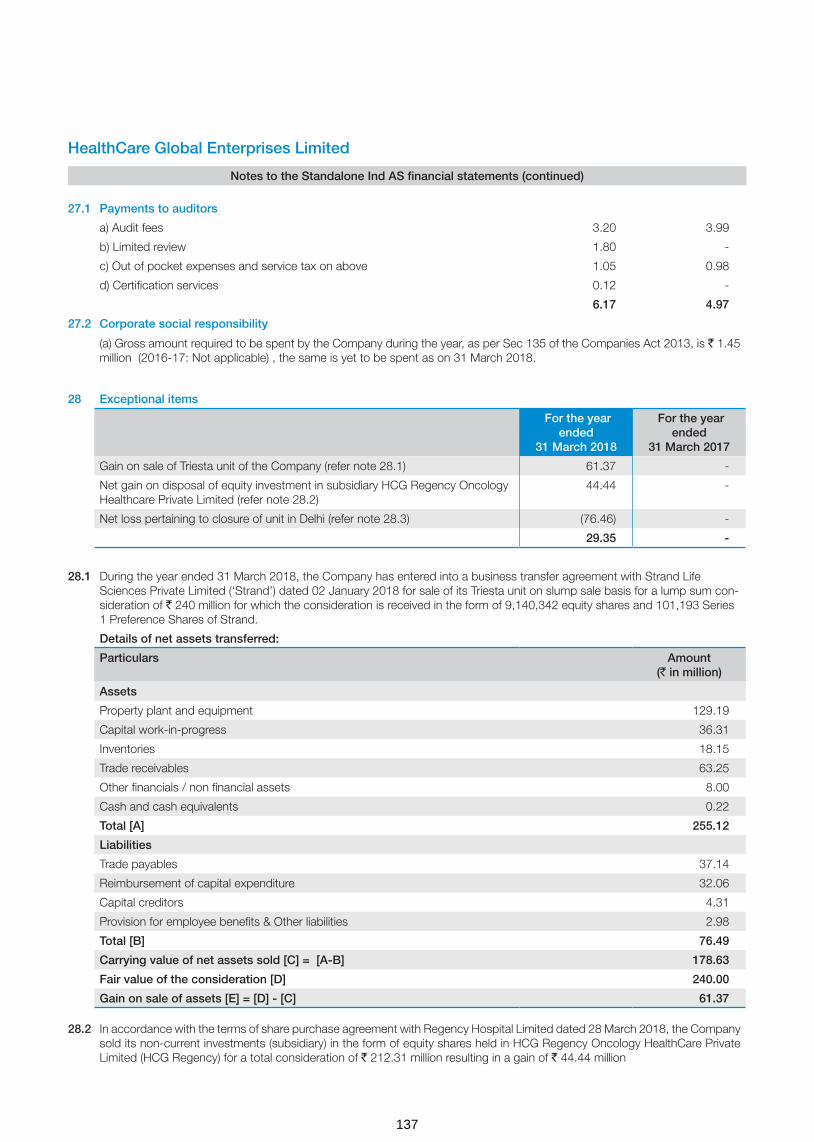
HealthCare Global Enterprises Limited
Notes to the Standalone Ind AS financial statements (continued)
27.1 Payments to auditors
a) Audit fees 3.20 3.99
b) Limited review 1.80 -
c) Out of pocket expenses and service tax on above 1.05 0.98
d) Certification services 0.12 -
6.17 4.97
27.2 Corporate social responsibility
(a) Gross amount required to be spent by the Company during the year, as per Sec 135 of the Companies Act 2013, is ` 1.45 million (2016-17: Not applicable) , the same is yet to be spent as on 31 March 2018.
28 Exceptional items
For the year ended
31 March 2018
For the year ended
31 March 2017
Gain on sale of Triesta unit of the Company (refer note 28.1) 61.37 -
Net gain on disposal of equity investment in subsidiary HCG Regency Oncology Healthcare Private Limited (refer note 28.2)
44.44 -
Net loss pertaining to closure of unit in Delhi (refer note 28.3) (76.46) -
29.35 -
28.1 During the year ended 31 March 2018, the Company has entered into a business transfer agreement with Strand Life Sciences Private Limited (‘Strand’) dated 02 January 2018 for sale of its Triesta unit on slump sale basis for a lump sum con-sideration of ` 240 million for which the consideration is received in the form of 9,140,342 equity shares and 101,193 Series 1 Preference Shares of Strand.
Details of net assets transferred:
Particulars Amount(` in million)
Assets
Property plant and equipment 129.19
Capital work-in-progress 36.31
Inventories 18.15
Trade receivables 63.25
Other financials / non financial assets 8.00
Cash and cash equivalents 0.22
Total [A] 255.12
Liabilities
Trade payables 37.14
Reimbursement of capital expenditure 32.06
Capital creditors 4.31
Provision for employee benefits & Other liabilities 2.98
Total [B] 76.49
Carrying value of net assets sold [C] = [A-B] 178.63
Fair value of the consideration [D] 240.00
Gain on sale of assets [E] = [D] - [C] 61.37
28.2 In accordance with the terms of share purchase agreement with Regency Hospital Limited dated 28 March 2018, the Company sold its non-current investments (subsidiary) in the form of equity shares held in HCG Regency Oncology HealthCare Private Limited (HCG Regency) for a total consideration of ` 212.31 million resulting in a gain of ` 44.44 million
137

HealthCare Global Enterprises Limited
Notes to the Standalone Ind AS financial statements (continued)
28.3 During the year ended 31 March 2018, the Company decided to close the operations of Delhi unit. Net charge on account of write off of receivables is ` 21.90 million and the charge due to write off of net fixed assets is ` 54.56 million. The total charge due to unit closure is ` 76.46 million.
(` in million)
Particulars Amount Amount
(a) Trade receivables written off 100.11
Less: Provided earlier 78.21
Net impact on account of write off of trade receivables 21.90
(b) Assets written off
Gross block 150.87
Less: Accumulated depreciation 96.31
Net impact on account of write off of tangible assets 54.56
Total 76.46
29 Income tax expense
29.1 Income tax recognised in the Statement of profit and loss
For the year ended
31 March 2018
For the year ended
31 March 2017
Current tax
Current tax 86.30 75.40
86.30 75.40
Deferred tax
- MAT (86.30) (75.40)
- Others 119.82 98.17
33.52 22.77
Total income tax expense recognised in the Statement of profit and loss 119.82 98.17
The reconciliation between the income tax expense and amounts computed by applying the Indian statutory income tax rate to profit before taxes is as follows:
Profit before tax 368.72 293.01
Enacted income tax rate in India 34.608% 34.608%
Computed expected tax expense 127.61 101.40
Effect of:
Income not taxable (6.73) -
Others (1.06) (3.23)
119.82 98.17
29.2 Income tax recognised in other comprehensive income
31 March 2018 31 March 2017
Remeasurement of defined benefit plan 1.03 0.62
Total income tax recognised in other comprehensive income on items that will not be reclassified to profit or loss
1.03 0.62
138

HealthCare Global Enterprises Limited
Notes to the Standalone Ind AS financial statements (continued)
Significant components of net deferred tax assets and liabilities for the year ended 31 March 2018 are as follows:
Deferred tax assets / (liabilities) in relation to Opening Balance
Recognised in Statement of
Profit and Loss
Recognised in other
comprehensive income
Closing Balance
Property, plant and equipment (503.56) 41.54 - (462.02)
Intangible assets (10.70) (10.60) - (21.30)
Financial liabilities at amortised cost 4.86 (4.86) - -
MAT credit entitlement 108.68 86.30 - 194.98
Provision for doubtful debts/advances 139.14 (24.05) - 115.09
Sec 43B items 34.09 11.74 1.03 46.86
Tax losses 347.98 (133.59) - 214.39
Others - 3.02 - 3.02
120.49 (30.50) 1.03 91.02
Significant components of net deferred tax assets and liabilities for the year ended 31 March 2017 are as follows:
Deferred tax assets / (liabilities) in relation to Opening Balance
Recognised in Profit or Loss
Recognised in other
comprehensive income
Closing Balance
Property, plant and equipment (468.59) (34.97) - (503.56)
Intangible assets (3.54) (7.16) - (10.70)
Financial liabilities at amortised cost (1.53) 6.39 - 4.86
MAT credit entitlement 33.28 75.40 - 108.68
Provision for doubtful debts/advances 130.58 8.56 - 139.14
Sec 43B items 29.62 3.85 0.62 34.09
Tax losses 422.82 (74.84) - 347.98
142.64 (22.77) 0.62 120.49
Under the Income Tax Act, 1961, unabsorbed business losses expire 8 years after the year in which they originate. Further, the Company carry tax credit entitlement in respect of Minimum Alternate Tax (MAT) paid, which can be carried forward for certain period and can be set-off for 15 years (from AY 18 -19) against future tax liabilities to the extent income tax under normal tax provisions exceed the MAT for those years. Tax benefits on unabsorbed business losses and MAT credit entitlement have been recognised as deferred tax asset as it is more probable than not that the future economic benefits associated with the asset will be realised.
29.4 Current tax assets
As at31 March 2018
As at31 March 2017
Tax deducted at source, advance tax (net of provision) 174.65 253.93
174.65 253.93
29.3 Deferred tax balances (net)
As at31 March 2018
As at31 March 2017
Deferred tax assets (483.32) (514.26)
Deferred tax liabilities 574.34 634.75
Total 91.02 120.49
(` in million)
139

HealthCare Global Enterprises Limited
Notes to the Standalone Ind AS financial statements (continued)
1. Excise Commissionerate-III, Bengaluru has passed Order against the Company adjudicating that the product Fluro-deoxy-glucose (‘FDG’) is excisable and levied excise duty for the period under scrutiny from April 2009 to March 2014 of ` 6.80 million, interest on duty amount, penalty of ` 6.80 million, redemption fine of ` 0.6 million in lieu of confiscation of goods not available. The order also imposed a penalty of ` 1 million on Dr. B.S.Ajaikumar, Chairman & CEO of the Company. The Company has filed an appeal before CESTAT by paying Central Excise Duty of Rs.0.6 million.
Additional Commissionerate of Central Excise, Chennai, has passed the Order confirming the excisability on sale of FDG for the period March 2013 to June 2015 levying excise duty of ` 6.57 million, interest on duty amount and penalty of ` 6.57 million.
The Company is positive of winning the case on the ground that FDG is not excisable as there is no specific entry in the Central Excise Tariff Act 1985. Further, even if it is excisable the same has to be classified under Chapter 30 which attracts excise duty at 6% and valuation of captively consumed FDG will reduce the demand.
2. HealthCare Global Vijay Oncology Private Limited which got merged with HCG effective from April 1, 2015, has undergone Departmental VAT audit for the period from 2011-12 to 2014-15 and noted that the Company has not charged & paid VAT on supply of food to patients and raised a AP-VAT demand of ` 2 million. Further, the Deputy Commercial Tax Officer, Vijayawada has passed the Penalty Order for ` 0.5 million against the above AP-VAT Audit Order. The Company has filed an writ petition before Andhra Pradesh High Court by paying ` 0.4 million VAT amount to department. The Company is positive of winning the case on the ground that various High Courts in India have ruled that the supply of food to patient is pursuant to provision of medical service and is not a sale of goods.
3. The Payment of Bonus (Amendment) Act, 2015 (hereinafter referred to as the Amendment Act, 2015) has been enacted on 31 December 2015, according to which the eligibility criteria of salary or wages has been increased from ` 10,000 per month to ` 21,000 per month (Section 2(13)) and the ceiling for computation of such salary or wages has been increased from ` 3,500 per month to ` 7,000 per month or the minimum wage for the scheduled employment, as fixed by the appropriate government, whichever is higher. The reference to scheduled employment has been linked to the provisions of the Minimum Wages Act, 1948. The Amendment Act, 2015 is effective retrospectively from 1 April 2014. Based on the same, the Company has computed the bonus for the year ended 31 March 2015 which amounts to ` 9.98 million.
The Company has taken a position that the stay granted by the two High Courts of India on the retrospective application of the amendment would have a persuasive effect even outside the boundaries of the relevant states and accordingly no provision is currently required.
4. The Company is involved in other disputes, law suits and other claims including commercial matters which arise from time to time in the ordinary course of business. The Company believes that there are no such pending matters that are expected to have any material adverse effect on the financial statements.
5. The Company has given letter of support to its subsidiary companies, namely HealthCare Global Senthil-Multi Specialty Hospital Private Limited, Niruja Product Development and Healthcare Research Private Limited, HCG Oncology LLP and APEX HCG Oncology Hospitals LLP . Under the letter of support, the Company is committed to provide operational and financial assistance as is necessary for the subsidiary companies to enable them to operate as going concern for a period of at least one year from the balance sheet date i.e. till 31 March, 2019
30 Contingent liabilities
Particulars As at31 March 2018
As at31 March 2017
a) Corporate guarantee given on behalf of subsidiaries and other parties 1,357.81 1,274.79
i) Other money for which the company is contingently liable
Excise and service tax (Refer note 1) 28.35 15.72
Value added tax (Refer note 2) 2.50 2.94
b) Bonus to employees pursuant to retrospective amendment to the Payment of Bonus Act, 1965 (Refer note 3)
9.98 9.98
(` in million)
140

32 Earnings per share (` in million unless otherwise stated)
32.1 Basic earnings per share
The calculations of profit attributable to equity shareholders and weighted average number of equity shares outstanding for purposes of basic earnings and diluted earnings per share calculations are as follows:
For the year ending
31 March 2018
For the year ending 31
March 2017
a. Profit after tax 248.90 194.84
Adjustment in respect of share issue expenses charged-off to securities premium account which is otherwise required to be recognised in the Statement of profit and loss in accordance with Ind AS
8.34
The earnings used in the calculation of basic earnings per share 248.90 203.18
b. Weighted average number of equity shares for the year
Weighted average number of equity shares for the purposes of basic earnings per share
86,046,366 85,163,315
Basic earnings per equity share ` per share (a/b) 2.89 2.38
32.2 Diluted earnings per share
The earnings used in the calculation of diluted earnings per share are as follows.
a. Earnings used in the calculation of basic earnings per share 248.90 203.18
b. Earnings used in the calculation of diluted earnings per share 248.90 203.18
c. Weighted average number of equity shares used in the calculation of diluted earnings per share
86,204,138 85,173,020
Diluted earnings per equity share ` per share (a/c) 2.89 2.38
The weighted average number of equity shares for the purpose of diluted earnings per share reconciles to the weighted average number of equity shares used in the calculation of basic earnings per share as follows:
Weighted average number of equity shares used in the calculation of basic earnings per share
86,046,366 85,163,315
Shares deemed to be issued for no consideration in respect of employee options 157,772 9,705
Weighted average number of equity shares used in the calculation of diluted earnings per share
86,204,138 85,173,020
33 Segment information
Ind AS 108 “Operating Segment” (“Ind AS 108”) establishes standards for the way that public business enterprises report information about operating segments and related disclosures about products and services, geographic areas, and major customers. Based on the “management approach” as defined in Ind AS 108, Operating segments are to be reported in a manner consistent with the internal reporting provided to the Chief Operating Decision Maker (CODM).The CODM evaluates the Company’s performance and allocates resources on overall basis. The Company’s sole operating segment is therefore ‘Medical services’. Accordingly, there are no additional disclosure to be provided under Ind AS 108, other than those already provided in the financial statements.
HealthCare Global Enterprises Limited
Notes to the Standalone Ind AS financial statements (continued)
31 Commitments
Particulars As at31 March 2018
As at31 March 2017
(a) Estimated amount of contracts remaining to be executed on capital account and not provided for
676.33 744.99
(b) Written put options issued by the Company to the non-controlling interests of its subsidiaries
1,111.64 1,166.65
(` in million)
141

HealthCare Global Enterprises Limited
Notes to the Standalone Ind AS financial statements (continued)
Geographical information
Geographical information analyses the company’s revenue and non-current assets by the Company’s country of domicile (i.e. India) and other countries. In presenting the geographical information, segment revenue has been presented based on the geographical location of the customers and segment assets has been presented based on the geographical location of the assets.
(i) Revenue from operations (` in million)
Particulars For the year ended
31 March 2018
For the year ended
31 March 2017
India 5,868.66 5,450.35
Total 5,868.66 5,450.35
(ii) Non current assets*
Particulars As at 31 March 2018
As at 31 March 2017
India 6,235.05 5,201.59
Total 6,235.05 5,201.59
*Non-current assets exclude financial assets and deferred tax assets
34 Leasing arrangements: The Company being a lessee
34.1 Finance lease arrangements
Finance leasing arrangements of the Company include lease of Hospital buildings for duration of 24 to 30 years and medical equipments for 6 years. Interest rates underlying all obligations under finance leases range between 10% to 12% p.a. The details of future minimum lease payment and reconciliation of gross investment in the lease and payment value of minimum lease payments are given below:
Finance lease liabilities
Particulars Minimum Lease Payments Present Value of Minimum Lease Payments
31 March 2018 31 March 2017 31 March 2018 31 March 2017
Not later than one year 66.31 71.12 - 14.93
Later than one year and not later than five years 301.30 253.74 - -
Later than five years 1,586.79 1,435.70 555.17 475.62
1,954.40 1,760.56 555.17 490.55
Less: future finance charges (1,399.23) (1,270.01) - -
Present value of minimum lease payments 555.17 490.55 555.17 490.55
31 March 2018 31 March 2017
Included in the financial statements as:
- Current maturities of finance lease obligations (refer note 16) - 14.93
- Non-current borrowings (refer note 16) 555.17 475.62
555.17 490.55
34.2 Operating lease arrangements
The Company has entered into cancellable and non cancellable lease arrangements for certain facilities and office premises. Non-cancellable lease arrangements are for a period of 5 to 30 years and may be renewed for a further period, based on mutual agreement of the parties. The escalation clause in these arrangements ranges from nil to 10%.
142

HealthCare Global Enterprises Limited
Notes to the Standalone Ind AS financial statements (continued)
Payments recognised as an expense in note 27 Year ended31 March 2018
Year ended31 March 2017Particulars
Minimum lease payments 201.81 207.70
201.81 207.70
Future non-cancellable operating lease commitments
Particulars 31 March 2018 31 March 2017
Not later than 1 year 170.10 105.66
Later than 1 year and not later than 5 years 686.14 398.44
Later than 5 years 1046.72 731.70
1,902.96 1,235.80
35 Employee benefit plans
35.1 Defined contribution plans
The Company has defined contribution plan in form of Provident Fund and Employee State Insurance Scheme for qualifying employees. Under the Schemes, the Company is required to contribute a specified percentage of the payroll costs to fund the benefits. The total expense recognised in the Statement of profit and loss under employee benefit expenses in respect of such schemes are given below:
Particulars Year ended31 March 2018
Year ended31 March 2017
Contribution to Provident Fund included under contribution to provident and other funds. 54.93 39.11
Contribution to Employee State Insurance Scheme 12.62 10.54
67.55 49.65
35.2 Defined benefit plans
The Company offers gratuity plan for its qualified employees which is payable as per the requirements of Payment of Gratuity Act, 1972. The benefit vests upon completion of five years of continuous service and once vested it is payable to employees on retirement or on termination of employment. In case of death while in service, gratuity is payable irrespective of vesting.
Amounts recognised in statement of profit and loss in respect of this defined benefit plan are as follows.
Year ended 31 March
2018
Year ended 31 March
2017
Current service cost 7.75 8.88
Past service cost and (gain)/loss from settlements 3.47 0.00
Net interest expense 3.64 3.01
Components of defined benefit costs recognised in the Statement of profit and loss
14.86 11.89
Service cost recognised in employee benefits expense in note 24 11.22 8.88
Net interest expense recognised in finance costs in note 25 3.64 3.01
Remeasurement of the net defined benefit liability:
Return on plan assets (excluding amounts included in net interest expense) 0.62 -
Actuarial (gains) / losses arising from changes in demographic assumptions (0.34) -
Actuarial (gains) / losses arising from changes in financial assumptions 2.71 1.40
(` in million)
143

HealthCare Global Enterprises Limited
Notes to the Standalone Ind AS financial statements (continued)
Actuarial (gains) / losses arising from experience adjustments - 0.22
Remeasurement of plan assets - (0.01)
Adjustments for restrictions on the defined benefit asset -
Remeasurement of the net defined benefit liability recognised in other comprehensive income
2.99 1.61
The amount included in the balance sheet arising from the entity’s obligation in respect of its defined benefit plans is as follows:
Year ended 31 March 2018
Year ended 31 March 2017
Present value of funded defined benefit obligation 61.73 47.88
Fair value of plan assets 0.82 0.77
Unfunded status 60.91 47.11
Restrictions on asset recognised - -
Net liability arising from defined benefit obligation 60.91 47.11
Non-current 37.29 24.36
Current 23.62 23.07
Movements in the present value of the defined benefit obligation are as follows. Year ended 31 March 2018
Year ended 31 March 2017
Opening defined benefit obligation 47.88 40.35
Current service cost 11.22 8.88
Interest cost 3.64 3.06
Remeasurement (gains)/losses:
Actuarial gains and losses arising from changes in demographic assumptions 0.62 -
Actuarial gains and losses arising from changes in financial assumptions (0.34) 1.58
Actuarial gains and losses arising from experience adjustments 2.71 0.22
Benefits paid (4.10) (6.21)
Others 0.10
Closing defined benefit obligation 61.73 47.88
Movements in the fair value of the plan assets are as follows. As at31 March 2018
As at31 March 2017
Opening fair value of plan assets 0.77 0.71
Interest income 0.05 0.05
Remeasurements of plan assets - 0.01
Contributions from the employer * - -
Closing fair value of plan assets 0.82 0.77
*Expected future contribution to the plan - Nil ( FY 17 - Nil )
The fair value of the plan assets at the end of the reporting period for each category, are as follows
Fair value of plan assets as at
31 March 2018 31 March 2017
Insurer-managed funds 0.82 0.77
Total 0.82 0.77
144

HealthCare Global Enterprises Limited
Notes to the Standalone Ind AS financial statements (continued)
Defined plan asset
Plan assets consist of assets held in a 'long-term benefit fund' for the sole purpose making future benefit payments when they fall due. Plan assets include qualifying insurance policies and not quoted in the market.
The actual return on plan assets was ` 0.05 Million (for the year ended 31 March 2017: ` 0.07 Million).
Significant actuarial assumptions for the determination of the defined obligation are discount rate, expected salary increase and mortality. The sensitivity analyses below have been determined based on reasonably possible changes of the respective assumptions occurring at the end of the reporting period, while holding all other assumptions constant.
The sensitivity of the defined benefit obligation to changes in the weighted principal assumptions is:
Particulars As at 31 March 2018 As at 31 March 2017
Increase Decrease Increase Decrease
Discount rate (1% movement) (1.18) 1.23 (0.71) 0.74
Future salary increase (1% movement) 2.73 (2.57) 0.90 (0.90)
Attrition rate (10% movement) (0.71) 0.74 (1.44) 1.80
The sensitivity analysis presented above may not be representative of the actual change in the defined benefit obligation as it is unlikely that the change in assumptions would occur in isolation of one another as some of the assumptions may be correlated.
Furthermore, in presenting the above sensitivity analysis, the present value of the defined benefit obligation has been calcu-lated using the projected unit credit method at the end of the reporting period, which is the same as that applied in calculat-ing the defined benefit obligation liability recognised in the balance sheet.
There was no change in the methods and assumptions used in preparing the sensitivity analysis from prior years.
The average duration of the defined benefit obligation as at 31 March 2018 is 4.66 years (as at 31 March 2017 1.44 years)
The principal assumptions used for the purposes of the actuarial valuations were as follows.
Valuation as at
31 March 2018 31 March 2017
Discount rate(s) 6.50% 6.20%
Expected rate(s) of salary increase 5% 5%
Rate of return on plan assets 6.5% 6%
Mortality table IALM 2006-08 IALM 2006-08
Employee turnover rate 40.00% 48.95%
Maturity profile of defined benefit obligation:
Particulars As at
31 March 2018 31 March 2017
Within 1 year 24.44 23.44
1-2 years 15.43 13.78
2-3 years 10.72 8.10
3-4 years 7.26 4.80
4-5 years 4.87 2.73
6-10 year 7.53 2.98
>10 years 0.74 0.13
145
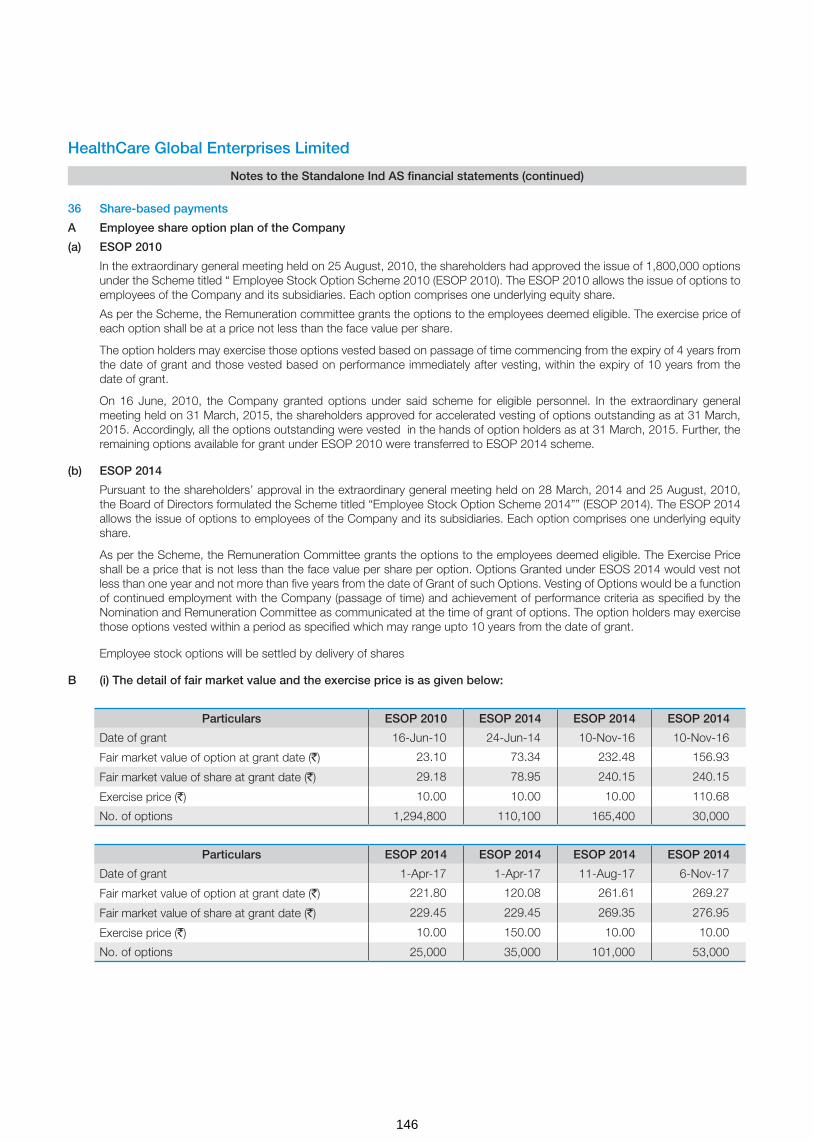
HealthCare Global Enterprises Limited
Notes to the Standalone Ind AS financial statements (continued)
36 Share-based payments
A Employee share option plan of the Company
(a) ESOP 2010
In the extraordinary general meeting held on 25 August, 2010, the shareholders had approved the issue of 1,800,000 options under the Scheme titled “ Employee Stock Option Scheme 2010 (ESOP 2010). The ESOP 2010 allows the issue of options to employees of the Company and its subsidiaries. Each option comprises one underlying equity share.
As per the Scheme, the Remuneration committee grants the options to the employees deemed eligible. The exercise price of each option shall be at a price not less than the face value per share.
The option holders may exercise those options vested based on passage of time commencing from the expiry of 4 years from the date of grant and those vested based on performance immediately after vesting, within the expiry of 10 years from the date of grant.
On 16 June, 2010, the Company granted options under said scheme for eligible personnel. In the extraordinary general meeting held on 31 March, 2015, the shareholders approved for accelerated vesting of options outstanding as at 31 March, 2015. Accordingly, all the options outstanding were vested in the hands of option holders as at 31 March, 2015. Further, the remaining options available for grant under ESOP 2010 were transferred to ESOP 2014 scheme.
(b) ESOP 2014
Pursuant to the shareholders’ approval in the extraordinary general meeting held on 28 March, 2014 and 25 August, 2010, the Board of Directors formulated the Scheme titled “Employee Stock Option Scheme 2014”” (ESOP 2014). The ESOP 2014 allows the issue of options to employees of the Company and its subsidiaries. Each option comprises one underlying equity share.
As per the Scheme, the Remuneration Committee grants the options to the employees deemed eligible. The Exercise Price shall be a price that is not less than the face value per share per option. Options Granted under ESOS 2014 would vest not less than one year and not more than five years from the date of Grant of such Options. Vesting of Options would be a function of continued employment with the Company (passage of time) and achievement of performance criteria as specified by the Nomination and Remuneration Committee as communicated at the time of grant of options. The option holders may exercise those options vested within a period as specified which may range upto 10 years from the date of grant.
Employee stock options will be settled by delivery of shares
B (i) The detail of fair market value and the exercise price is as given below:
Particulars ESOP 2010 ESOP 2014 ESOP 2014 ESOP 2014
Date of grant 16-Jun-10 24-Jun-14 10-Nov-16 10-Nov-16
Fair market value of option at grant date (`) 23.10 73.34 232.48 156.93
Fair market value of share at grant date (`) 29.18 78.95 240.15 240.15
Exercise price (`) 10.00 10.00 10.00 110.68
No. of options 1,294,800 110,100 165,400 30,000
Particulars ESOP 2014 ESOP 2014 ESOP 2014 ESOP 2014
Date of grant 1-Apr-17 1-Apr-17 11-Aug-17 6-Nov-17
Fair market value of option at grant date (`) 221.80 120.08 261.61 269.27
Fair market value of share at grant date (`) 229.45 229.45 269.35 276.95
Exercise price (`) 10.00 150.00 10.00 10.00
No. of options 25,000 35,000 101,000 53,000
146

HealthCare Global Enterprises Limited
Notes to the Standalone Ind AS financial statements (continued)
(ii) The assumptions used in this model for calculating fair value of the ESOP granted during the current year and previous year are as below:
Grant Date:10 November 2016 (ESOP 2014)
Assumptions Vest 1 10 Nov 17
Vest 2 10 Nov 18
Vest 3 10 Nov 19
Vest 4 10 Nov 20
Variables 10% 20% 30% 40%
Risk free interest rate 6.52% 6.73% 6.73% 6.70%
Expected life 2.00 3.00 4.00 5.00
Expected annual volatility of shares 28.98% 28.53% 30.45% 32.29%
Expected dividend yield 0.00% 0.00% 0.00% 0.00%
Grant Date: 01 April 2017 (ESOP 2014)
Assumptions Vest 1 01 Apr 18
Vest 2 01 Apr 19
Vest 3 01 Apr 20
Vest 4 01 Apr 21
Variables 10% 20% 30% 40%
Risk free interest rate 6.46% 6.57% 6.76% 6.86%
Expected life 2.00 3.00 4.00 5.00
Expected annual volatility of shares 27.46% 28.94% 30.36% 29.83%
Expected dividend yield 0.00% 0.00% 0.00% 0.00%
Grant Date: 11 August 2017 (ESOP 2014)
Assumptions Vest 1 11 Aug 18
Vest 2 11 Aug 19
Vest 3 11 Aug 20
Vest 4 11 Aug 21
Variables 10% 20% 30% 40%
Risk free interest rate 6.35% 6.38% 6.43% 6.50%
Expected life 2.00 3.00 4.00 5.00
Expected annual volatility of shares 24.74% 27.98% 28.28% 29.68%
Expected dividend yield 0.00% 0.00% 0.00% 0.00%
Grant Date: 06 November 2017 (ESOP 2014)
Assumptions Vest 1 06 Nov 18
Vest 2 06 Nov 19
Vest 3 06 Nov 20
Vest 4 06 Nov 21
Variables 10% 20% 30% 40%
Risk free interest rate 6.30% 6.48% 6.64% 6.78%
Expected life 2.00 3.00 4.00 5.00
Expected annual volatility of shares 24.04% 27.42% 27.47% 29.42%
Expected dividend yield 0.00% 0.00% 0.00% 0.00%
147
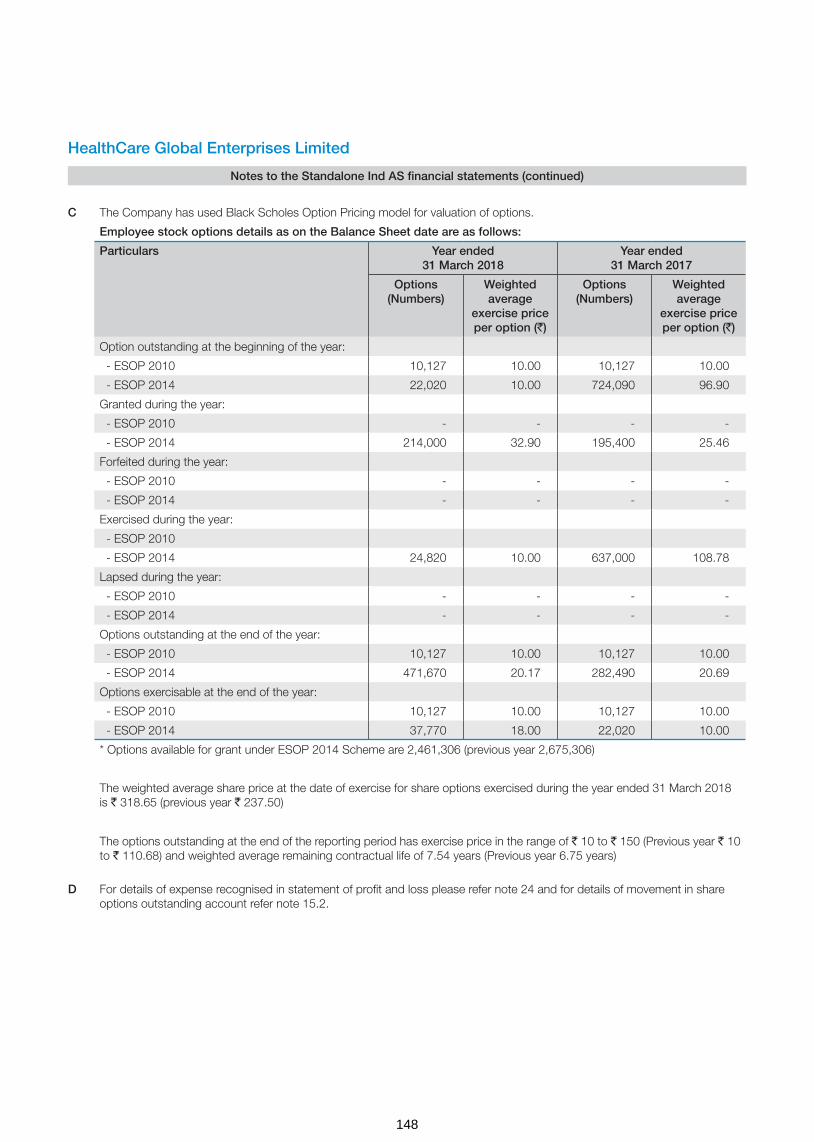
HealthCare Global Enterprises Limited
Notes to the Standalone Ind AS financial statements (continued)
C The Company has used Black Scholes Option Pricing model for valuation of options.
Employee stock options details as on the Balance Sheet date are as follows:
Particulars Year ended 31 March 2018
Year ended 31 March 2017
Options (Numbers)
Weighted average
exercise price per option (`)
Options (Numbers)
Weighted average
exercise price per option (`)
Option outstanding at the beginning of the year:
- ESOP 2010 10,127 10.00 10,127 10.00
- ESOP 2014 22,020 10.00 724,090 96.90
Granted during the year:
- ESOP 2010 - - - -
- ESOP 2014 214,000 32.90 195,400 25.46
Forfeited during the year:
- ESOP 2010 - - - -
- ESOP 2014 - - - -
Exercised during the year:
- ESOP 2010
- ESOP 2014 24,820 10.00 637,000 108.78
Lapsed during the year:
- ESOP 2010 - - - -
- ESOP 2014 - - - -
Options outstanding at the end of the year:
- ESOP 2010 10,127 10.00 10,127 10.00
- ESOP 2014 471,670 20.17 282,490 20.69
Options exercisable at the end of the year:
- ESOP 2010 10,127 10.00 10,127 10.00
- ESOP 2014 37,770 18.00 22,020 10.00
* Options available for grant under ESOP 2014 Scheme are 2,461,306 (previous year 2,675,306)
The weighted average share price at the date of exercise for share options exercised during the year ended 31 March 2018 is ` 318.65 (previous year ` 237.50)
The options outstanding at the end of the reporting period has exercise price in the range of ` 10 to ` 150 (Previous year ` 10 to ` 110.68) and weighted average remaining contractual life of 7.54 years (Previous year 6.75 years)
D For details of expense recognised in statement of profit and loss please refer note 24 and for details of movement in share options outstanding account refer note 15.2.
148

HealthCare Global Enterprises Limited
Notes to the Standalone Ind AS financial statements (continued)
37 Financial instruments
The carrying value and fair value of financial instruments by categories as at 31 March 2018 and 31 March 2017 are as follows:
Particulars Carrying value as at Carrying value as at
31 March 2018 31 March 2017
Financial assets
Amortised cost
Loans (includes current and non-current) 367.50 48.77
Trade receivables 1,262.13 1,006.01
Cash and bank balances 153.11 745.81
Other financial assets (includes current and non-current) 474.87 444.98
FVTPL
Investments in unquoted equity instruments 8.14 -
Investments in mutual fund (quoted) 43.13 114.45
Total assets 2,308.88 2,360.02
Financial liabilities
Amortised cost
Borrowings (including current maturities and short-term borrowings) 2,634.87 2,180.89
Trade payables 1,144.24 1,053.72
Other financial liabilities (includes current and non-current) 436.65 292.92
FVTPL
Financial guarantee obligation (current and non current) 56.90 -
Payable on acquisition of business (Contingent consideration) 63.76 -
Total liabilities 4,336.42 3,527.53
The management assessed that carrying value of above financial assets and liabilities approximates the fair value.
Refer note 16 for details related to charge on financial assets.
38 Fair value hierarchy
Level 1 - Quoted prices (unadjusted) in active markets for identical assets or liabilities.
Level 2 – Inputs other than quoted prices included within Level 1 that are observable for the asset or liability, either directly (i.e. as prices) or indirectly (i.e. derived from prices).
Level 3 - Inputs for the assets or liabilities that are not based on observable market data (unobservable inputs).
The following table presents the fair value measurement hierarchy of financial assets and liabilities measured at fair value on recurring basis as at 31 March 2018 and 31 March 2017.
Fair value measurement using
Quantitative disclosures fair value measurement hierarchy
Total Quoted prices in active markets
(Level 1)
Significant observable
inputs (Level 2)
Significant unobservable
inputs (Level 3)
Financial assets measured at fair value as at 31 March 2018
Investment in mutual funds (quoted) 43.13 43.13 - -
Investments in unquoted equity instruments 8.14 - - 8.14
(` in million)
149
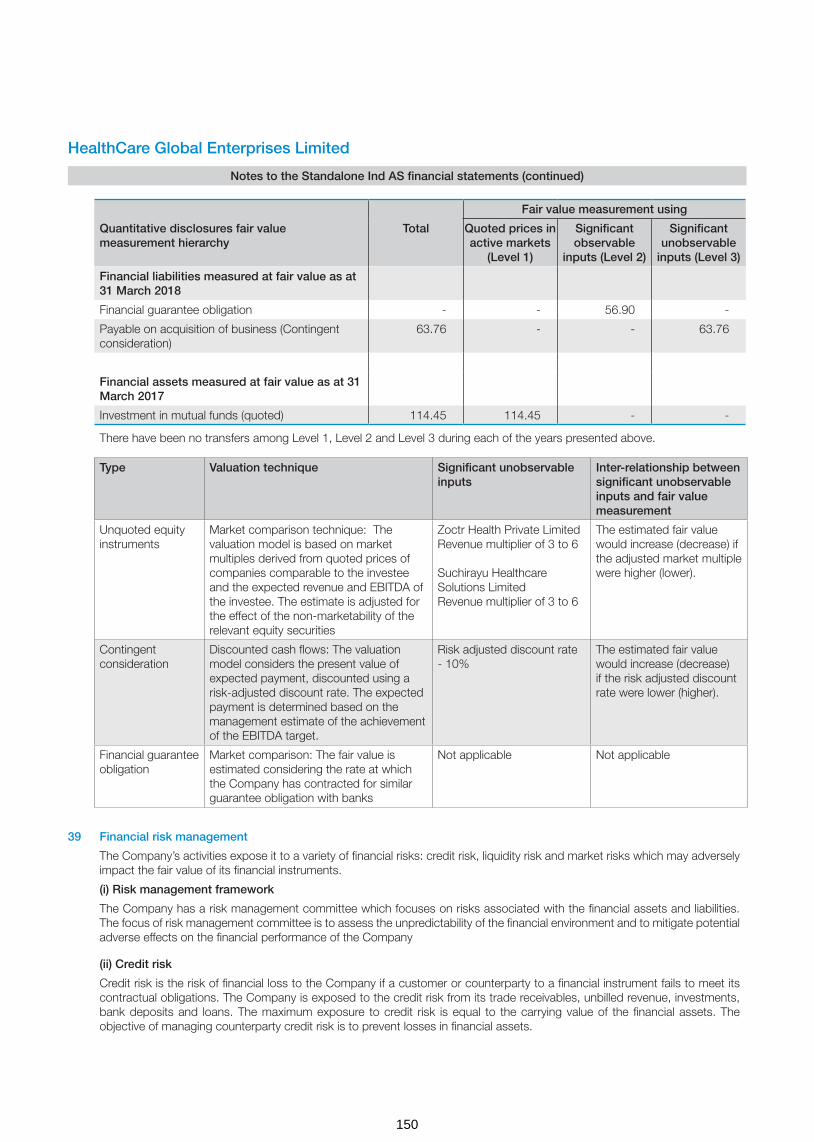
HealthCare Global Enterprises Limited
Notes to the Standalone Ind AS financial statements (continued)
Fair value measurement using
Quantitative disclosures fair value measurement hierarchy
Total Quoted prices in active markets
(Level 1)
Significant observable
inputs (Level 2)
Significant unobservable
inputs (Level 3)
Financial liabilities measured at fair value as at 31 March 2018
Financial guarantee obligation - - 56.90 -
Payable on acquisition of business (Contingent consideration)
63.76 - - 63.76
Financial assets measured at fair value as at 31 March 2017
Investment in mutual funds (quoted) 114.45 114.45 - -
There have been no transfers among Level 1, Level 2 and Level 3 during each of the years presented above.
Type Valuation technique Significant unobservable inputs
Inter-relationship between significant unobservable inputs and fair value measurement
Unquoted equity instruments
Market comparison technique: The valuation model is based on market multiples derived from quoted prices of companies comparable to the investee and the expected revenue and EBITDA of the investee. The estimate is adjusted for the effect of the non-marketability of the relevant equity securities
Zoctr Health Private Limited Revenue multiplier of 3 to 6 Suchirayu Healthcare Solutions Limited Revenue multiplier of 3 to 6
The estimated fair value would increase (decrease) if the adjusted market multiple were higher (lower).
Contingent consideration
Discounted cash flows: The valuation model considers the present value of expected payment, discounted using a risk-adjusted discount rate. The expected payment is determined based on the management estimate of the achievement of the EBITDA target.
Risk adjusted discount rate - 10%
The estimated fair value would increase (decrease) if the risk adjusted discount rate were lower (higher).
Financial guarantee obligation
Market comparison: The fair value is estimated considering the rate at which the Company has contracted for similar guarantee obligation with banks
Not applicable Not applicable
39 Financial risk management
The Company’s activities expose it to a variety of financial risks: credit risk, liquidity risk and market risks which may adversely impact the fair value of its financial instruments.
(i) Risk management framework
The Company has a risk management committee which focuses on risks associated with the financial assets and liabilities. The focus of risk management committee is to assess the unpredictability of the financial environment and to mitigate potential adverse effects on the financial performance of the Company
(ii) Credit risk
Credit risk is the risk of financial loss to the Company if a customer or counterparty to a financial instrument fails to meet its contractual obligations. The Company is exposed to the credit risk from its trade receivables, unbilled revenue, investments, bank deposits and loans. The maximum exposure to credit risk is equal to the carrying value of the financial assets. The objective of managing counterparty credit risk is to prevent losses in financial assets.
150

HealthCare Global Enterprises Limited
Notes to the Standalone Ind AS financial statements (continued)
a) Trade and other receivables
Trade receivables comprise a widespread customer base. Management evaluate credit risk relating to customers on an ongoing basis. If customers are independently rated, these ratings are used. Otherwise, if there is no independent rating, risk control assesses the credit quality of the customer, taking into account its financial position, past experience and other factors. Individual risk limits are set for patients without medical aid insurance. Services to customers without medical aid insurance are settled in cash or using major credit cards on discharge date as far as possible. Credit Guarantees insurance is not purchased. The receivables are mainly unsecured, the Company does not hold any collateral or a guarantee as security.
The Company has used a practical expedient by computing the expected credit loss allowance for trade receivables based on a provision matrix. The provision matrix takes into account historical credit loss experience and adjusted for forward looking information. The expected credit loss allowance is based on the ageing of the days the receivables are due and the rates as derived as per the trend of trade receivable ageing of previous years.
1. The Provision matrix at the end of the reporting period is as follows:-
Category Ageing
Less than 1 year
1-2 year 2-3 year More than 3 year
Government Schemes (other than ESI) 10% 40% 64% 100%
Government ESI schemes 10% 45% 73% 100%
Others 12.50% 57% 100% 100%
2. The provision details of the trade receivable is given below.
Movement in the expected credit loss allowance
For the year ended
31 March 2018
For the year ended
31 March 2017
Balance at beginning of the year 365.62 335.00
Additional provision during the year 36.66 30.62
Written-off during the year (100.11) -
Balance at end of the year 302.17 365.62
No single customer accounted for more than 10% of the revenue as of 31 March 2018 and 31 March 2017. There is no significant concentration of credit risk
Details of geographic concentration of revenue is included in note 33 to the financial statements
b) Investments and cash deposits
The Company limits its exposure to credit risk by generally investing in liquid securities and only with counterparties that have a good credit rating. The Company does not expect any losses from non-performance by these counter-parties, and does not have any significant concentration of exposures to specific industry sectors.
(iii) Liquidity risk
Liquidity risk is the risk that the Company will not be able to meet its financial obligations as they become due. The Company manages its liquidity risk by ensuring, as far as possible, that it will always have sufficient liquidity to meet its liabilities when due. Also, the Company has unutilized credit limits with banks.
The Company’s corporate treasury department is responsible for liquidity, funding as well as settlement management. In addition, processes and policies related to such risks are overseen by senior management.
151

HealthCare Global Enterprises Limited
Notes to the Standalone Ind AS financial statements (continued)
The table below provides details regarding the contractual maturities of significant financial liabilities as at 31 March 2018 and 31 March 2017
Particulars As at 31 March 2018
Total Less than 1 year
1-2 years 2-3 years 3-4 years 4 years and above
Borrowings 2,634.87 462.44 194.81 343.16 144.41 1,490.05
Trade payables 1,144.24 1,144.24 - - - -
Other financial liabilities 423.30 265.93 8.99 8.30 7.55 132.53
Payable on acquisition of business 134.01 70.25 63.76 - - -
Particulars As at 31 March 2017
Total Less than 1 year
1-2 years 2-3 years 3-4 years 4 years and above
Borrowings 2,180.89 945.15 114.66 33.84 27.62 1,059.62
Trade payables 1,053.72 1,053.72 - - - -
Other financial liabilities 292.92 277.49 5.58 5.58 4.27 -
(iv) Market risk:
Market risk is the risk that the fair value of future cash flows of a financial instrument will fluctuate because of changes in market prices, such as foreign exchange rates, interest rates and equity prices.
(a) Foreign currency risk
The Company’s exchange risk arises mainly from its foreign currency borrowings. As a result, depreciation of Indian rupee relative to these foreign currencies will have a significant impact on the financial performance of the Company. The exchange rate between the Indian rupee and these foreign currencies has changed substantially in recent periods and may continue to fluctuate substantially in the future.
(i) The following table presents unhedged foreign currency risk from financial instruments as of 31 March 2018 and 31 March 2017.
As at 31 March 2018
Particulars US $ Euro Pound sterling Total
Assets
Cash and cash equivalents 7.06 - - 7.06
Liabilities
Borrowings 423.88 - - 423.88
Creditors for capital goods - 7.26 - 7.26
Trade payables 34.29 0.48 34.77
Net assets/(liabilities) (451.11) (7.74) - (458.85)
As at 31 March 2017
Particulars US $ Euro Pound Sterling Total
Assets
Cash and cash equivalents 5.07 - - 5.07
Liabilities
Borrowings 781.64 - - 781.64
Creditors for capital goods - - 4.63 4.63
Net assets/(liabilities) (776.57) - (4.63) (781.20)
(` in million)
Rupee equivalent of foreign currency amounts
Rupee equivalent of foreign currency amounts
152

HealthCare Global Enterprises Limited
Notes to the Standalone Ind AS financial statements (continued)
(ii) Sensitivity analysis
The sensitivity of profit or loss to changes in exchange rates arises mainly from foreign currency denominated financial instruments
Particulars Impact on profit or (loss) before tax
As at 31 March 2018
As at 31 March 2017
USD Sensitivity
`/USD - Increase by 1% 2.90 -
`/USD - Decrease by 1% (2.90) -
(b) Cash flow and fair value interest rate risk
Interest rate risk is the risk that the fair value or future cash flows of a financial instrument will fluctuate because of changes in market interest rates. The Company’s exposure to the risk of changes in market interest rates relates primarily to the Company’s debt obligations with floating interest rates and investments. Such risks are overseen by the Company’s corporate treasury department as well as senior management.
(i) Interest rate risk exposure
The exposure of the Company’s borrowing to interest rate changes at the end of the reporting period are as follows:
Particulars As at 31 March 2018
As at 31 March 2017
Variable rate long term borrowings including current maturities 1,633.22 428.42
Total borrowings 1,633.22 428.42
(ii) Sensitivity analysis
Particulars Impact on profit or (loss) before tax
As at 31 March 2018
As at 31 March 2017
Sensitivity
1% increase in MCLR rate 16.33 4.28
1% decrease in MCLR rate (16.33) (4.28)
40 Capital management
The Company manages its capital to ensure that entities in the Company will be able to continue as going concerns while maximising the return to stakeholders through the optimisation of the debt and equity balance. The capital structure of the Company consists of net debt (borrowings offset by cash and bank balances) and total equity of the Company.
The capital structure is as follows:
Particulars As at31 March 2018
As at31 March 2017
Total equity attributable to the equity share holders of the Company 6,384.40 5,451.89
As percentage of total capital 72% 79%
Total borrowings 2,634.87 2,180.89
Cash and cash equivalents 153.11 745.81
Net borrowings including current maturities 2,481.76 1,435.08
As a percentage of total capital 28% 21%
Total capital (loans and borrowings and equity) 8,866.16 6,886.97
(` in million)
153

HealthCare Global Enterprises Limited
Notes to the Standalone Ind AS financial statements (continued)
41 Due to Micro, Small and Medium Enterprises
The Ministry of Micro, Small and Medium Enterprises has issued an office memorandum dated 26 August 2008 which recommends that the Micro and Small Enterprises should mention in their correspondence with its customers the Entrepreneurs Memorandum Number as allocated after filing of the Memorandum. Accordingly, the disclosure in respect of the amounts payable to such enterprises as at 31 March 2018 has been made in the financial statements based on information received and available with the Company. Further in view of the management, the impact of interest, if any, that may be payable in accordance with the provisions of the Micro, Small and Medium Enterprises Development Act, 2006 (‘The MSMED Act’) is not expected to be material. The Company has not received any claim for interest from any supplier
Particulars As at31 March 2018
As at 31 March 2017
The amounts remaining unpaid to micro and small suppliers as at the end of the year - -
Principal - -
Interest - -
The amount of interest paid by the buyer under MSMED Act - -
The amount of payments made to micro and small suppliers beyond the appointed day during the accounting year
- -
The amount of interest due and payable for the period of delay in making payment (which have been paid but beyond the appointed day during the year) but without adding the interest specified under the MSMED Act;
- -
The amount of interest accrued and remaining unpaid at the end of each accounting year
- -
The amount of further interest remaining due and payable even in the succeeding years, until such date when the interest dues as above are actually paid to the small enterprise for the purpose of disallowance as a deductible expenditure under the MSMED Act
- -
All trade payables are ‘current.’ The Company’s exposure to currency and liquidity risks related to trade payable is disclosed in note 39
42 Pursuant to the MCA notification G.S.R. 308(E) dated 30 March 2017, the details of Specified Bank Notes (SBN)* held and transacted during the period from 8 November 2016 to 30 December 2016 are provided in the table below:
Particulars SBNs Other denomination
notes
Total
Closing cash in hand as on 8 November 2016 7.35 1.30 8.65
(+) Permitted receipts 7.30 99.13 106.43
(-) Permitted payments (0.02) (9.00) (9.02)
(-) Amount deposited in Banks (14.63) (88.38) (103.01)
Closing cash in hand as on 30 December 2016 - 3.05 3.05
* The term ‘Specified Bank Notes’ have the same meaning provided in the notification of the Government of India, in the Ministry of Finance, Department of Economic Affairs number S.O. 3407(E), dated the November 8, 2016
(` in million)
154

HealthCare Global Enterprises Limited
Notes to the Standalone Ind AS financial statements (continued)
43 Goodwill on acquisition of City Cancer Centre (CCC) (refer note 6)
Acquisition
The Company entered into a business transfer agreement with Dr.Gopichand (‘Seller’) dated 28 February 2018 for purchase of business owned and operated by the Seller in the name of CCC located in Vijayawada. The Company has agreed to purchase the business on a slump sale basis for a lump sum consideration of ` 520 million without values being assigned to individual assets and liabilities.
Consideration is payable in tranches as follows:
i) Issue of equity shares of the Company at ` 321 per equity share for a value of ` 299.75 million subject to shareholders approval
ii) First tranche cash payment of ` 150.25 million
iii) Contingent consideration of ` 70 million on achievement of the agreed Earnings Before Interest Taxes Depreciation and Amortisation (EBITDA) target.
As at the end of the year, the Company has obtained the approval of the shareholders for preferential allotment and on receipt of regulatory approvals subsequent to year end, equity shares for ` 299.75 million have been allotted to Dr.Gopichand and the balance amount of cash consideration (after the payment of ` 70 million during the year) including contingent consideration has been disclosed under other financial liabilities. As of the date of approval of financial statements, based on estimates available, the Seller is expected to achieve the agreed EBITDA target and the contingent consideration is fair valued.
Date of business combination - Considering the fact that the business transfer agreement has been entered into on 28 February 2018 and shareholders approval has been received on 29 March 2018, date of the business combination has been considered as 01 March 2018.
The acquisition is expected to provide the Company with an increased market share and also expects to reduce costs through economies of scale. Revenues included in the statement of profit and loss of this acquisition for the financial year ended 31 March 2018 is ` 17.78 million and profit after tax is ` 3.45 million. Had the business combination occurred on 01 April 2017, per management estimate, revenues for the financial year ended 31 March 2018 would have been higher by ` 195.58 million and profit after tax would have been higher by ` 37.96 million.
The Company’s share of costs incurred for this business combination has been charged off to statement of profit and loss.
a) Business combination
The above transaction qualifies as a business combination as per Ind AS 103 - “Business Combinations” and has been accounted by applying the acquisition method wherein identifiable assets acquired, liabilities assumed are fair valued against the fair value of the consideration transferred and the resultant goodwill recognised.
b) Measurement of fair values
Particulars Valuation methodology Notes
Tangible assets Historical costs Tangible assets include property, plant & equipment, trade receivables & inventories. Historical cost is considered for valuation of tangible assets based on the management representation that tangible assets will be realised at book value, after acquisition of business.
Tangible liabilities Book value as on acquisition date Tangible liabilities include trade payables / provision for expenses, and statutory liabilities. Book value as on the Valuation date is considered based on the management representation that, after acquisition of Business, such tangible liabilities are settled at book value as on acquisition date.
Goodwill Residual method Difference between fair value of identified assets and liabilities and purchase price.
155

HealthCare Global Enterprises Limited
Notes to the Standalone Ind AS financial statements (continued)
c) Identifiable assets and liabilities assumed
Particulars Amt (` in million)
Fair value of consideration transferred
Equity shares * 299.75
Cash consideration 150.25
Contingent consideration 63.76
Total (A) 513.76
Assets acquired
Property, plant and equipment (Refer note 5) 12.80
Trade receivables, net 37.98
Cash and cash equivalents 1.06
Inventories 3.90
Total assets acquired (B) 55.74
Liabilities assumed
Trade payables and statutory liabilities (C) 26.50
Net assets acquired [D = (B-C)] 29.24
Goodwill (A-D) # 484.52
* The equity shares to be issued to the seller is pursuant to the preferential allotment of shares as per the relevant regulations. Had the equity shares been accounted at its value as on the date of the approval by the shareholders, value of shares would have been lower by ` 29.40 million.
# Goodwill is attributable to the increased market share and the synergies expected to be achieved from acquisition of CCC into the Company. Goodwill is tax deductible.
156

HealthCare Global Enterprises Limited
Notes to the Standalone Ind AS financial statements (continued)
44 Related Party Disclosures
A. Details of related parties:
Description of relationship Names of related parties
Subsidiary companies, LLPs and step down subsidiaries
Malnad Hospital & Institute of Oncology Private Limited
HealthCare Global Senthil-Multi Specialty Hospital Private Limited
HCG Medi-Surge Hospitals Private Limited
Niruja Product Development and Healthcare Research Private Limited (formerly MIMS HCG Oncology Private Limited)
BACC HealthCare Private Limited
HCG Regency Oncology Healthcare Private Limited (Till 28 March 2018)
Healthcare Diwanchand Imaging LLP
APEX HCG Oncology Hospitals LLP
HCG Oncology LLP
HCG Manavata Oncology LLP
HCG NCHRI Oncology LLP
HCG (Mauritius) Private Limited
HCG EKO Oncology LLP
Healthcare Global (Kenya) Private Limited (Step down subsidiary till 1st quarter of FY 18)
Healthcare Global (Tanzania) Private Limited (Step down subsidiary till 1st quarter of FY 18)
Healthcare Global (Uganda) Private Limited (Step down subsidiary till 1st quarter of FY 18)
HCG SUN Hospitals LLP (with effect from 15 February 2018)
Description of relationship Names of related parties
Associate company of the subsidiary HealthCare Global (Africa) Private Limited (Step down subsidiary till 1st quarter of FY 18)
Joint venture Strand Lifesciences Private Limited (with effect from 07 February 2018)
Key Management Personnel (KMP) Whole-time director
Dr. B S Ajaikumar, Chairman
Non-executive directors
Gangadhara Ganapati
Shanker Annaswamy
Sampath T Ramesh
Sudhakar Rao
Suresh C Senapaty
Bhushani Kumar
Dr. B S Ramesh (From 10 November 2016)
Dr. Amit Varma (From 10 November 2016)
Relatives of KMP Ms. Anjali Ajaikumar (Daughter of Dr. B S Ajaikumar)
Company in which KMP / Relatives of KMP can exercise significant influence
JSS Bharath Charitable Trust
Sada Sarada Tumor & Research Institute
B.C.C.H.I Trust
HCG Foundation
Gutti Malnad LLP
Health Care Process Solutions (India) Private Limited
157
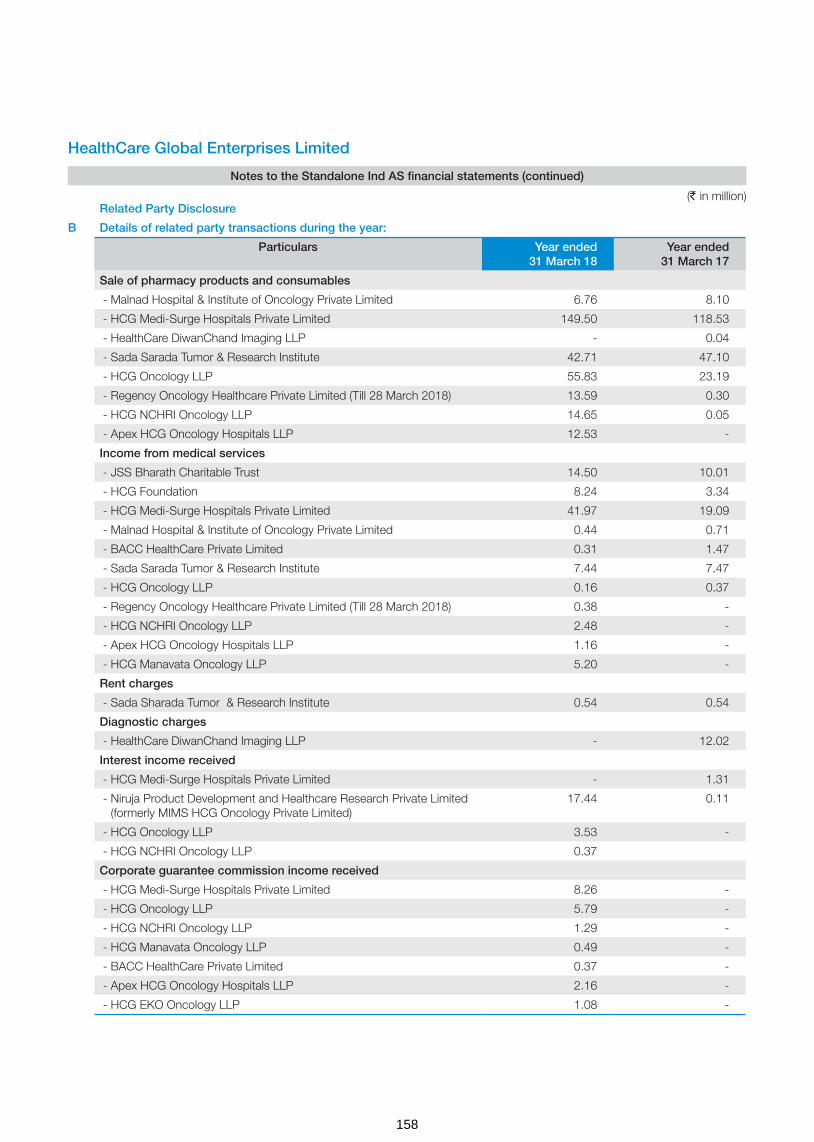
HealthCare Global Enterprises Limited
Notes to the Standalone Ind AS financial statements (continued)
Related Party Disclosure
B Details of related party transactions during the year:
Particulars Year ended 31 March 18
Year ended 31 March 17
Sale of pharmacy products and consumables
- Malnad Hospital & Institute of Oncology Private Limited 6.76 8.10
- HCG Medi-Surge Hospitals Private Limited 149.50 118.53
- HealthCare DiwanChand Imaging LLP - 0.04
- Sada Sarada Tumor & Research Institute 42.71 47.10
- HCG Oncology LLP 55.83 23.19
- Regency Oncology Healthcare Private Limited (Till 28 March 2018) 13.59 0.30
- HCG NCHRI Oncology LLP 14.65 0.05
- Apex HCG Oncology Hospitals LLP 12.53 -
Income from medical services
- JSS Bharath Charitable Trust 14.50 10.01
- HCG Foundation 8.24 3.34
- HCG Medi-Surge Hospitals Private Limited 41.97 19.09
- Malnad Hospital & Institute of Oncology Private Limited 0.44 0.71
- BACC HealthCare Private Limited 0.31 1.47
- Sada Sarada Tumor & Research Institute 7.44 7.47
- HCG Oncology LLP 0.16 0.37
- Regency Oncology Healthcare Private Limited (Till 28 March 2018) 0.38 -
- HCG NCHRI Oncology LLP 2.48 -
- Apex HCG Oncology Hospitals LLP 1.16 -
- HCG Manavata Oncology LLP 5.20 -
Rent charges
- Sada Sharada Tumor & Research Institute 0.54 0.54
Diagnostic charges
- HealthCare DiwanChand Imaging LLP - 12.02
Interest income received
- HCG Medi-Surge Hospitals Private Limited - 1.31
- Niruja Product Development and Healthcare Research Private Limited (formerly MIMS HCG Oncology Private Limited)
17.44 0.11
- HCG Oncology LLP 3.53 -
- HCG NCHRI Oncology LLP 0.37
Corporate guarantee commission income received
- HCG Medi-Surge Hospitals Private Limited 8.26 -
- HCG Oncology LLP 5.79 -
- HCG NCHRI Oncology LLP 1.29 -
- HCG Manavata Oncology LLP 0.49 -
- BACC HealthCare Private Limited 0.37 -
- Apex HCG Oncology Hospitals LLP 2.16 -
- HCG EKO Oncology LLP 1.08 -
(` in million)
158

HealthCare Global Enterprises Limited
Notes to the Standalone Ind AS financial statements (continued)
Related Party Disclosure
B Details of related party transactions during the year:
Particulars Year ended 31 March 18
Year ended 31 March 17
Other advances given
- Strand Life Sciences Private Limited 29.16 -
Loans given
- Niruja Product Development and Healthcare Research Private Limited (formerly MIMS HCG Oncology Private Limited)
224.67 0.15
- HCG Oncology LLP 15.40 -
Loans given repaid
- HCG Medi-Surge Hospitals Private Limited - 18.52
- HealthCare Global Senthil-Multi Specialty Hospital Private Limited - 4.50
Reimbursement of capital expenditure/ revenue expenditure
- HCG Medi-Surge Hospitals Private Limited 3.10 10.77
- HCG Oncology LLP 0.55 16.87
- Healthcare Global (Kenya) Private Limited 0.66 1.37
- Healthcare Global (Africa) Private Limited 17.70 0.37
- HCG NCHRI Oncology LLP - 0.16
- BACC HealthCare Private Limited 1.84 2.88
- HealthCare DiwanChand Imaging LLP 1.06 1.77
Security deposit received
- Sada Sarada Tumor & Research Institute 0.50 1.10
Investment made during the year in (including corporate guarantee)
- Healthcare DiwanChand Imaging LLP - 0.57
- APEX HCG Oncology Hospitals LLP 231.03 37.82
- Regency Oncology Healthcare Private Limited (Till 28 March 2018) 35.70 57.50
- HCG (Mauritius) Private Limited - 13.01
- HCG Oncology LLP 11.48 18.86
- HCG EKO Oncology LLP 49.79 2.50
- HCG Manavata Oncology LLP 232.13 227.75
- HCG NCHRI Oncology LLP 135.26 31.89
- HCG SUN Hospitals LLP 41.24 -
- Strand Life Sciences Private Limited 240.00 -
- BACC HealthCare Private Limited 0.69 -
- HCG Medi-surge Hospitals Private Limited 28.00 -
Investment sold during the year in
- HCG Regency Oncology Healthcare Private Limited (Till 28 March 2018) 167.90 -
(` in million)
159
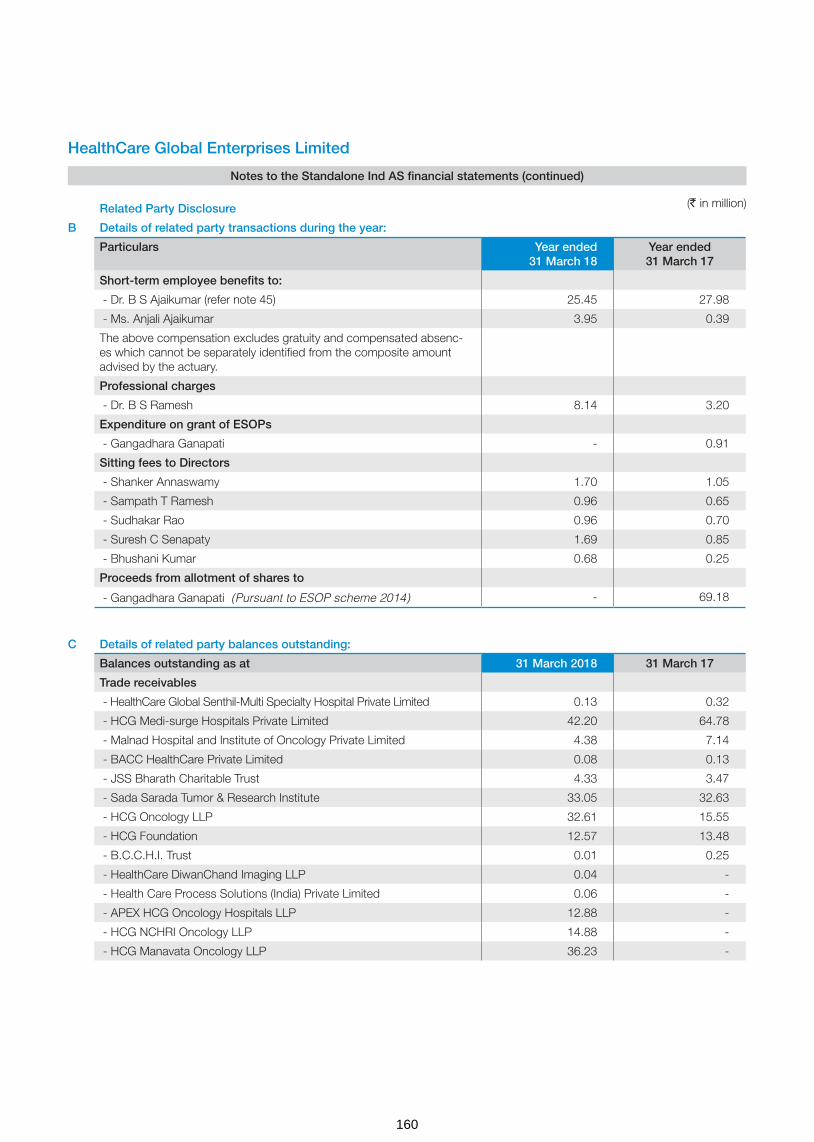
HealthCare Global Enterprises Limited
Notes to the Standalone Ind AS financial statements (continued)
Related Party Disclosure
B Details of related party transactions during the year:
Particulars Year ended 31 March 18
Year ended 31 March 17
Short-term employee benefits to:
- Dr. B S Ajaikumar (refer note 45) 25.45 27.98
- Ms. Anjali Ajaikumar 3.95 0.39
The above compensation excludes gratuity and compensated absenc-es which cannot be separately identified from the composite amount advised by the actuary.
Professional charges
- Dr. B S Ramesh 8.14 3.20
Expenditure on grant of ESOPs
- Gangadhara Ganapati - 0.91
Sitting fees to Directors
- Shanker Annaswamy 1.70 1.05
- Sampath T Ramesh 0.96 0.65
- Sudhakar Rao 0.96 0.70
- Suresh C Senapaty 1.69 0.85
- Bhushani Kumar 0.68 0.25
Proceeds from allotment of shares to
- Gangadhara Ganapati (Pursuant to ESOP scheme 2014) - 69.18
C Details of related party balances outstanding:
Balances outstanding as at 31 March 2018 31 March 17
Trade receivables
- HealthCare Global Senthil-Multi Specialty Hospital Private Limited 0.13 0.32
- HCG Medi-surge Hospitals Private Limited 42.20 64.78
- Malnad Hospital and Institute of Oncology Private Limited 4.38 7.14
- BACC HealthCare Private Limited 0.08 0.13
- JSS Bharath Charitable Trust 4.33 3.47
- Sada Sarada Tumor & Research Institute 33.05 32.63
- HCG Oncology LLP 32.61 15.55
- HCG Foundation 12.57 13.48
- B.C.C.H.I. Trust 0.01 0.25
- HealthCare DiwanChand Imaging LLP 0.04 -
- Health Care Process Solutions (India) Private Limited 0.06 -
- APEX HCG Oncology Hospitals LLP 12.88 -
- HCG NCHRI Oncology LLP 14.88 -
- HCG Manavata Oncology LLP 36.23 -
(` in million)
160

HealthCare Global Enterprises Limited
Notes to the Standalone Ind AS financial statements (continued)
C Details of related party balances outstanding: (continued)
Balances outstanding as at 31 March 2018 31 March 17
Interest accrued on loan to subsidiaries
- Malnad Hospital and Institute of Oncology Private Limited 0.30 0.30
- HCG Medi-Surge Hospitals Private Limited 6.83 6.83
- Niruja Product Development and Healthcare Research Private Limited (formerly MIMS HCG Oncology Private Limited)
17.73 0.29
- HCG NCHRI Oncology LLP 0.36 -
- HCG Oncology LLP 3.25 -
Other financial assets
- HCG Medi-Surge Hospitals Private Limited 9.44 6.31
- Malnad Hospital and Institute of Oncology Private Limited 12.50 22.87
- BACC HealthCare Private Limited 5.50 3.65
- HCG Oncology LLP 37.71 37.16
- HCG NCHRI Oncology LLP - 0.16
- HCG (Mauritius) Private Limited - 0.59
- HealthCare DiwanChand Imaging LLP 3.55 2.49
- Healthcare Global (Africa) Private Limited - 1.04
- Healthcare Global (Kenya) Private Limited - 5.86
- Healthcare Global (Tanzania) Private Limited - 1.77
- Healthcare Global (Uganda) Private Limited - 0.44
- HCG Foundation - 0.04
Other advances
- Strand Life Sciences Private Limited 29.16 -
Loans
- HealthCare Global Senthil-Multi Specialty Hospital Private Limited - -
(net of provision for doubtful loans ` 30.38 million)
- Niruja Product Development and Healthcare Research Private Limited (formerly MIMS HCG Oncology Private Limited)
225.73 1.06
- HCG Medi-Surge Hospitals Private Limited - -
- HCG Oncology LLP 15.40 -
Security deposits (refundable) with
- Sada Sarada Tumor & Research Institute - 0.50
Accrued employee benefits
- Dr. B S Ajaikumar 7.09 10.56
Advances to employees
- Dr. B S Ajaikumar (Refer note 45) 0.93 - Trade Payables
- Healthcare Global Senthil Multi-Specialty Hospitals Private Limited - -
- BACC HealthCare Private Limited 0.10 0.10
- HealthCare DiwanChand Imaging LLP 9.99 10.82
- Malnad Hospital and Institute of Oncology Private Limited 0.04 0.04
- HCG Foundation 0.16 -
- HCG Manavata Oncology LLP 3.77 -
(` in million)
161

HealthCare Global Enterprises Limited
Notes to the Standalone Ind AS financial statements (continued)
C Details of related party balances outstanding: (continued)
Balances outstanding as at 31 March 2018 31 March 17
Corporate guarantees given on behalf of:
- HCG Medi-Surge Hospitals Private Limited 303.50 303.50
- BACC HealthCare Private Limited 49.63 46.77
- HCG Oncology LLP 263.34 124.00
- Regency Oncology Healthcare Private Limited (Till 28 March 2018) - 345.37
- HCG NCHRI Oncology LLP 76.96 49.90
- HCG Manavata Oncology LLP 5.96 -
- HCG EKO Oncology LLP 73.81 -
- Apex HCG Oncology Hospitals LLP 169.86 85.50
Note:
All transactions with the related parties are priced at arm's length basis and resulting outstanding balances are to be settled as per the terms agreed. None of the above balances are secured.
45 Managerial remuneration:
Dr. B.S. Ajaikumar was re-appointed as the Chairman & CEO of the Company for a period of 4 years with effect from 1 July 2015.
For the financial year ended 31 March 2018
In terms of the limits prescribed under Section 197 read with Schedule V to the Companies Act, 2013, the maximum amount of remuneration payable to the Chairman & CEO of the Company for the year ended March 31, 2018 amounts to ` 24.52 Million. Based on the approval of the Nomination and Remuneration Committee of the Company, the Board of Directors have proposed and accrued an additional remuneration of ` 0.93 Million to the Chairman & CEO of the Company in excess of the limits specified under the Companies Act, 2013, which is subject to the approval of the Central Government, for which the Company is in the process of filing the necessary application. This additional remuneration will be paid on receipt of the approval from the Central Government. Pending Central Government approval, such amount has not been paid and the corresponding amount has been disclosed as “advance”.
For the financial year ended 31 March 2017
In terms of the limits prescribed under Section 197 read with Schedule V to the Companies Act, 2013, the maximum amount of remuneration payable to the Chairman & CEO of the Company for the year ended March 31, 2017 amounts to ` 24.37 Million . Based on the approval of the Nomination and Remuneration Committee of the Company, the Board of Directors have proposed and accrued an additional remuneration of ` 3.61 Million to the Chairman & CEO of the Company in excess of the limits specified under the Companies Act, 2013, which is subject to the approval of the Central Government, for which the Company is in the process of filing the necessary application. This additional remuneration will be paid on receipt of the approval from the Central Government.
(` in million)
162

HealthCare Global Enterprises Limited
Notes to the Standalone Ind AS financial statements (continued)
46 Investments, loans, guarantees and security
(a) The Company has made investment in the following companies
Investment in equity instruments * As at 31 March 2017
Invested during the year
Sold during the year
As at 31 March 2018
Malnad Hospital & Institute of Oncology Private Limited
6.44 - - 6.44
Niruja Product Development and Healthcare Research Private Limited (formerly MIMS HCG Oncology Private Limited)
0.50 - - 0.50
HCG Medi-Surge Hospitals Private Limited 94.67 28.00 - 122.67
BACC HealthCare Private Limited 602.28 0.69 - 602.97
HCG Regency Oncology Healthcare Private Limited (Till 28 March 2018)
132.20 35.70 (167.90) -
HCG (Mauritius) Private Limited 24.17 - - 24.17
HealthCare Global Senthil Multi-Specialty Hospital Private Limited**
8.38 - - 8.38
Investment in limited liability partnership
HealthCare DiwanChand Imaging LLP 32.47 - - 32.47
APEX HCG Oncology Hospitals LLP 70.71 231.03 - 301.74
HCG NCHRI Oncology LLP 31.89 135.26 - 167.15
HCG EKO Oncology LLP 2.50 49.79 - 52.29
HCG Manavata Oncology LLP 227.75 232.13 - 459.88
HCG Oncology LLP 74.17 11.48 - 85.65
HCG SUN Hospitals LLP - 41.24 - 41.24
Investment in other companies
Zoctr Health Private Limited - 7.64 - 7.64
Suchirayu Healthcare Solutions Limited - 0.50 - 0.50
Investment in joint venture (Equity & preference shares)
Strand Life Sciences Private Limited - 240.00 - 240.00
* This includes fair value of corporate guarantee given to subsidiaries accounted as investment in subsidiaries as per Ind AS 109
** The Company has provided for permanent diminution in investment of ` 8.38 million
(b) The Company has given inter-corporate deposits to its following companies
Entity As at 31 March 2017
Movement As at 31 March 2018
Purpose of the loan
Niruja Product Development and Healthcare Research Private Limited (formerly MIMS HCG Oncology Private Limited)
1.06 224.67 225.73 The loan has been given for the purpose
of investing in HCG (Mauritius) Private Limited
HCG Oncology LLP - 15.40 15.40 These loans have been given for operational requirements of the respective
entities
(` in million)
163

HealthCare Global Enterprises Limited
Notes to the Standalone Ind AS financial statements (continued)
(b) The Company has given inter-corporate deposits to its following companies (continued)
Entity As at 31 March 2017
Movement As at 31 March 2018
Purpose of the loan
Apex Super Speciality Hospitals Private Limited 20.00 - 20.00
HealthCare Global Senthil Multi-Specialty Hospitals Private Limited*
30.38 - 30.38
Suchirayu Healthcare Solutions Limited # 30.00 18.00 48.00
NCHRI Private Limited 4.30 (4.30) -
Zoctr Health Private Limited 5.00 (5.00) -
* The Company has provided for non recoverability of the loan given of ` 30.38 million.
# Security deposit given to Suchirayu Healthcare Solutions Limited in FY 17 has been converted into inter-corporate deposit in FY 18.(refer cash flow statement)
(c) The Company has provided the guarantees to the following entities
Entity As at 31 March
2017
Movement As at 31 March
2018
Purpose of the guarantee
HCG Medi-Surge Hospitals Private Limited
303.50 - 303.50 Corporate guarantee given to Yes Bank for giving term loan / working capital loan for HCG Medisurge Hospitals Private Limited
HCG Regency Oncology Healthcare Private Limited (Till 28 March 2018)
345.37 (345.37) -
BACC HealthCare Private Limited 46.77 2.86 49.63 Corporate guarantee given to Axis Bank for giving term loan / working capital loan for BACC healthcare Private Limited
HCG Oncology LLP 124.00 139.34 263.34 Corporate guarantee given to Yes Bank for giving term loan / working capital loan for HCG Oncology LLP
HCG NCHRI Oncology LLP 49.90 27.06 76.96 Corporate guarantee given to Yes Bank for giving term loan / working capital loan for HCG NCHRI Oncology LLP
HCG Manavata Oncology LLP - 5.96 5.96 Corporate guarantee given to Yes Bank for giving term loan / working capital loan for HCG EKO Oncology LLP
HCG EKO Oncology LLP - 73.81 73.81 Corporate guarantee given to Yes Bank for giving term loan / working capital loan for HCG EKO Oncology LLP
APEX HCG Oncology Hospitals LLP 85.50 84.36 169.86 Corporate guarantee given to Yes Bank for giving term loan / working capital loan for APEX HCG Oncology Hospitals LLP
NCHRI Private Limited 319.75 138.25 458.00 Corporate guarantee given to Yes Bank for giving term loan / working capital loan for NCHRI Private Limited
Total 1,274.79 126.27 1,401.06
Note: The above does not include corporate guarantee given by the Company for bank guarantee and cash credit facility. This represents only corporate guarantee given for the term loan facility of the respective entities.
(` in million)
164

HealthCare Global Enterprises Limited
Notes to the Standalone Ind AS financial statements (continued)
(d) The Company has made investment in the following companies
Investment in equity instruments # As at 01 April 2016
Invested during the year
Sold during the year
As at 31 March 2017
Malnad Hospital & Institute of Oncology Private Limited
6.44 - - 6.44
Niruja Product Development and Healthcare Research Private Limited (formerly MIMS HCG Oncology Private Limited)
0.50 - - 0.50
HCG Medi-Surge Hospitals Private Limited 94.67 - - 94.67
BACC HealthCare Private Limited 602.28 - - 602.28
HCG Regency Oncology Healthcare Private Limited (Till 28 March 2018)
74.70 57.50 - 132.20
HCG (Mauritius) Private Limited 11.16 13.01 - 24.17
HealthCare Global Senthil Multi-Specialty Hospital Private Limited ##
8.38 - - 8.38
Investment in limited liability partnership
HealthCare DiwanChand Imaging LLP 31.90 0.57 - 32.47
APEX HCG Oncology Hospitals LLP 32.89 37.82 - 70.71
HCG NCHRI Oncology LLP - 31.89 - 31.89
HCG EKO Oncology LLP - 2.50 - 2.50
HCG Manavata Oncology LLP - 227.75 - 227.75
HCG Oncology LLP 55.31 18.86 - 74.17
# This does not include fair value of corporate guarantee given to subsidiaries accounted as investment in subsidiaries as per Ind AS 109
## The Company has provided for permanent diminution in investment of ` 8.38 million
(e) The Company has given inter-corporate deposits to its following companies
Entity As at 01 April 2016
Movement As at 31 March 2017
Purpose of loans
Niruja Product Development and Healthcare Research Private Limited (formerly MIMS HCG Oncology Private Limited)
0.91 0.15 1.06 These loans have been given for operational requirements of the respective
entities
HCG Medi-Surge Hospitals Private Limited 18.52 (18.52) -
HealthCare Global Senthil Multi-Specialty Hospital Private Limited *
34.88 (4.50) 30.38
Apex Super Speciality Hospitals Private Limited - 20.00 20.00
NCHRI Private Limited 4.30 4.30
Zoctr Health Private Limited 5.00 5.00
* The Company has provided for non recoverability of the loan given of ` 30.38 million
(` in million)
165

HealthCare Global Enterprises Limited
Notes to the Standalone Ind AS financial statements (continued)
(f) The Company has provided the guarantees to the following entities
Entity As at 01 April 2016
Movement As at 31 March 2017
Purpose of the guarantee
HCG Medi-Surge Hospitals Private Limited 292.00 11.50 303.50 Corporate guarantee given to Yes Bank
for giving term loan / working capital loan for
HCG Oncology LLP
BACC HealthCare Private Limited 18.10 28.67 46.77 Corporate guarantee given to Axis Bank
for giving term loan / working capital loan for BACC healthcare Pvt
Ltd
HCG Oncology LLP 66.50 57.50 124.00 Corporate guarantee given to Yes Bank
for giving term loan / working capital loan for
HCG Oncology LLP
HCG Regency Oncology Healthcare Private Limited (Till 28 March 2018)
- 345.37 345.37 Corporate guarantee given to Yes Bank
for giving term loan / working capital loan for HCG Regency
Oncology Healthcare Private Limited
HCG NCHRI Oncology LLP - 49.90 49.90 Corporate guarantee given to Yes Bank
for giving term loan / working capital loan for HCG NCHRI Oncology
LLP
Apex HCG Oncology Hospitals LLP - 85.50 85.50 Corporate guarantee given to Yes Bank
for giving term loan / working capital loan for
HCG EKO Oncology LLP
NCHRI Private Limited 87.75 232.00 319.75 Corporate guarantee given to Yes Bank
for giving term loan / working capital loan for NCHRI Private Limited
Total 464.35 810.44 1,274.79
Note: The above does not include corporate guarantee given by the Company for bank guarantee and cash credit facility. This represents only corporate guarantee given for the term loan facility of the respective entities.
(` in million)
166
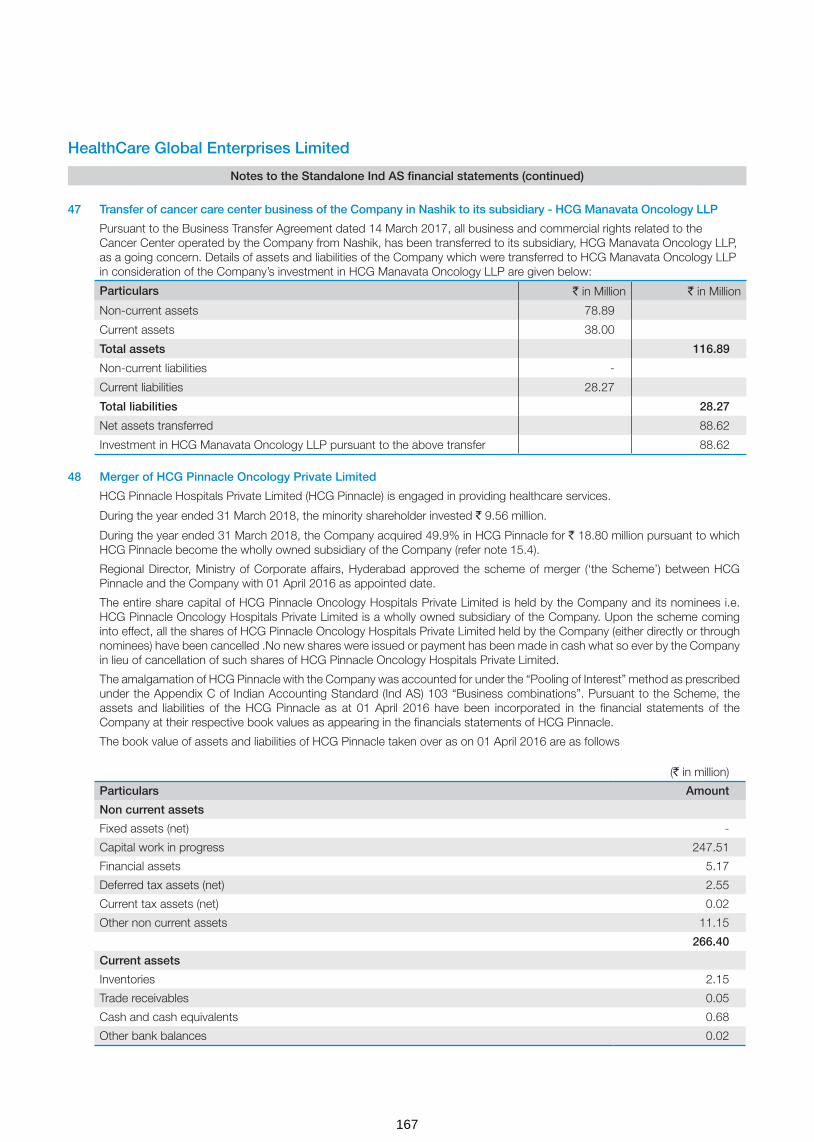
(` in million)
Particulars Amount
Non current assets
Fixed assets (net) -
Capital work in progress 247.51
Financial assets 5.17
Deferred tax assets (net) 2.55
Current tax assets (net) 0.02
Other non current assets 11.15
266.40
Current assets
Inventories 2.15
Trade receivables 0.05
Cash and cash equivalents 0.68
Other bank balances 0.02
HealthCare Global Enterprises Limited
Notes to the Standalone Ind AS financial statements (continued)
47 Transfer of cancer care center business of the Company in Nashik to its subsidiary - HCG Manavata Oncology LLP
Pursuant to the Business Transfer Agreement dated 14 March 2017, all business and commercial rights related to the Cancer Center operated by the Company from Nashik, has been transferred to its subsidiary, HCG Manavata Oncology LLP, as a going concern. Details of assets and liabilities of the Company which were transferred to HCG Manavata Oncology LLP in consideration of the Company’s investment in HCG Manavata Oncology LLP are given below:
Particulars ` in Million ` in Million
Non-current assets 78.89
Current assets 38.00
Total assets 116.89
Non-current liabilities -
Current liabilities 28.27
Total liabilities 28.27
Net assets transferred 88.62
Investment in HCG Manavata Oncology LLP pursuant to the above transfer 88.62
48 Merger of HCG Pinnacle Oncology Private Limited
HCG Pinnacle Hospitals Private Limited (HCG Pinnacle) is engaged in providing healthcare services.
During the year ended 31 March 2018, the minority shareholder invested ` 9.56 million.
During the year ended 31 March 2018, the Company acquired 49.9% in HCG Pinnacle for ` 18.80 million pursuant to which HCG Pinnacle become the wholly owned subsidiary of the Company (refer note 15.4).
Regional Director, Ministry of Corporate affairs, Hyderabad approved the scheme of merger (‘the Scheme’) between HCG Pinnacle and the Company with 01 April 2016 as appointed date.
The entire share capital of HCG Pinnacle Oncology Hospitals Private Limited is held by the Company and its nominees i.e. HCG Pinnacle Oncology Hospitals Private Limited is a wholly owned subsidiary of the Company. Upon the scheme coming into effect, all the shares of HCG Pinnacle Oncology Hospitals Private Limited held by the Company (either directly or through nominees) have been cancelled .No new shares were issued or payment has been made in cash what so ever by the Company in lieu of cancellation of such shares of HCG Pinnacle Oncology Hospitals Private Limited.
The amalgamation of HCG Pinnacle with the Company was accounted for under the “Pooling of Interest” method as prescribed under the Appendix C of Indian Accounting Standard (Ind AS) 103 “Business combinations”. Pursuant to the Scheme, the assets and liabilities of the HCG Pinnacle as at 01 April 2016 have been incorporated in the financial statements of the Company at their respective book values as appearing in the financials statements of HCG Pinnacle.
The book value of assets and liabilities of HCG Pinnacle taken over as on 01 April 2016 are as follows
167
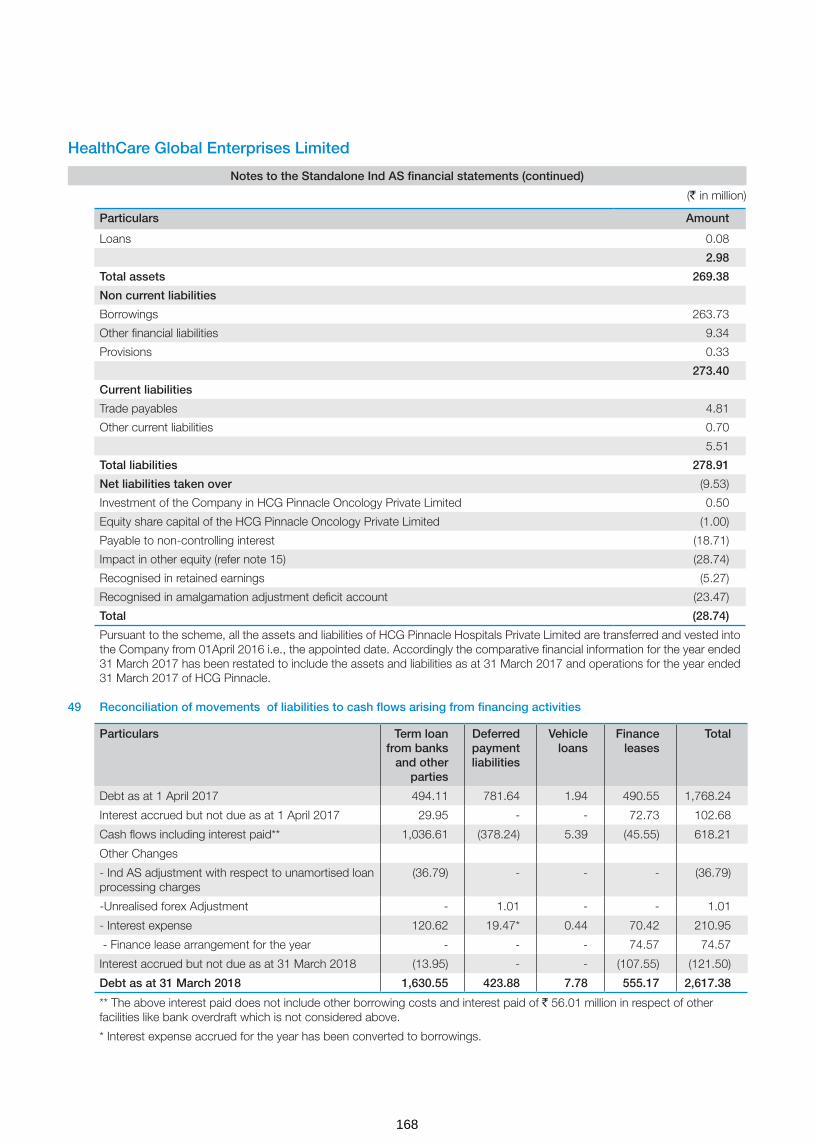
HealthCare Global Enterprises Limited
Notes to the Standalone Ind AS financial statements (continued)
Particulars Amount
Loans 0.08
2.98
Total assets 269.38
Non current liabilities
Borrowings 263.73
Other financial liabilities 9.34
Provisions 0.33
273.40
Current liabilities
Trade payables 4.81
Other current liabilities 0.70
5.51
Total liabilities 278.91
Net liabilities taken over (9.53)
Investment of the Company in HCG Pinnacle Oncology Private Limited 0.50
Equity share capital of the HCG Pinnacle Oncology Private Limited (1.00)
Payable to non-controlling interest (18.71)
Impact in other equity (refer note 15) (28.74)
Recognised in retained earnings (5.27)
Recognised in amalgamation adjustment deficit account (23.47)
Total (28.74)
Pursuant to the scheme, all the assets and liabilities of HCG Pinnacle Hospitals Private Limited are transferred and vested into the Company from 01April 2016 i.e., the appointed date. Accordingly the comparative financial information for the year ended 31 March 2017 has been restated to include the assets and liabilities as at 31 March 2017 and operations for the year ended 31 March 2017 of HCG Pinnacle.
49 Reconciliation of movements of liabilities to cash flows arising from financing activities
Particulars Term loan from banks
and other parties
Deferred payment liabilities
Vehicle loans
Finance leases
Total
Debt as at 1 April 2017 494.11 781.64 1.94 490.55 1,768.24
Interest accrued but not due as at 1 April 2017 29.95 - - 72.73 102.68
Cash flows including interest paid** 1,036.61 (378.24) 5.39 (45.55) 618.21
Other Changes
- Ind AS adjustment with respect to unamortised loan processing charges
(36.79) - - - (36.79)
-Unrealised forex Adjustment - 1.01 - - 1.01
- Interest expense 120.62 19.47* 0.44 70.42 210.95
- Finance lease arrangement for the year - - - 74.57 74.57
Interest accrued but not due as at 31 March 2018 (13.95) - - (107.55) (121.50)
Debt as at 31 March 2018 1,630.55 423.88 7.78 555.17 2,617.38
** The above interest paid does not include other borrowing costs and interest paid of ` 56.01 million in respect of other facilities like bank overdraft which is not considered above.
* Interest expense accrued for the year has been converted to borrowings.
(` in million)
168
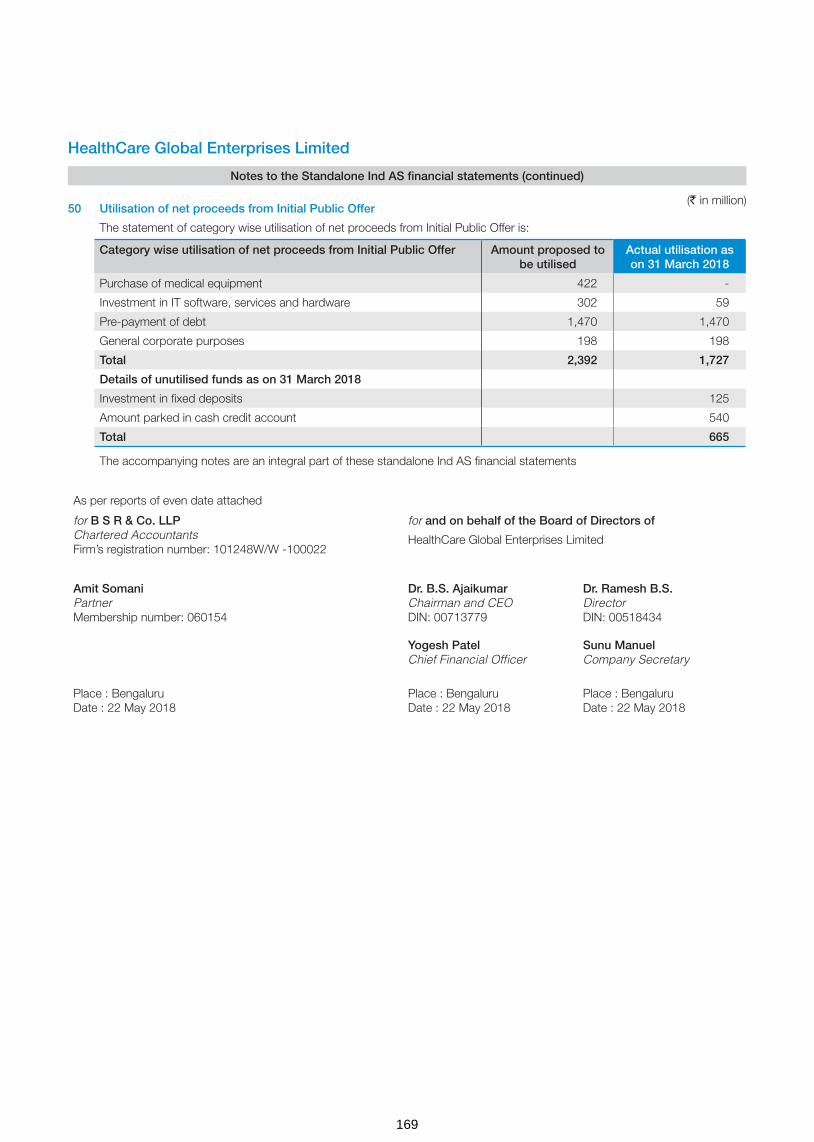
HealthCare Global Enterprises Limited
Notes to the Standalone Ind AS financial statements (continued)
50 Utilisation of net proceeds from Initial Public Offer
The statement of category wise utilisation of net proceeds from Initial Public Offer is:
Category wise utilisation of net proceeds from Initial Public Offer Amount proposed to be utilised
Actual utilisation as on 31 March 2018
Purchase of medical equipment 422 -
Investment in IT software, services and hardware 302 59
Pre-payment of debt 1,470 1,470
General corporate purposes 198 198
Total 2,392 1,727
Details of unutilised funds as on 31 March 2018
Investment in fixed deposits 125
Amount parked in cash credit account 540
Total 665
The accompanying notes are an integral part of these standalone Ind AS financial statements
As per reports of even date attached
for B S R & Co. LLPChartered AccountantsFirm’s registration number: 101248W/W -100022
for and on behalf of the Board of Directors of
HealthCare Global Enterprises Limited
Amit SomaniPartnerMembership number: 060154
Dr. B.S. AjaikumarChairman and CEODIN: 00713779
Dr. Ramesh B.S.DirectorDIN: 00518434
Yogesh PatelChief Financial Officer
Sunu ManuelCompany Secretary
Place : BengaluruDate : 22 May 2018
Place : BengaluruDate : 22 May 2018
Place : BengaluruDate : 22 May 2018
(` in million)
169

INDEPENDENT AUDITOR’S REPORTTo the Members of HealthCare Global Enterprises Limited
Report on the Audit of Consolidated Ind AS Financial Statements
We have audited the accompanying consolidated Ind AS financial statements of HealthCare Global Enterprises Limited (hereinafter referred to as “the Holding Company”) and its subsidiaries (the Holding Company and its subsidiaries together referred to as “the Group”), its associate and its joint venture ( as listed in note 46 to the consolidated Ind AS financial statements) which comprise the Consolidated Balance Sheet as at 31 March 2018, the Consolidated Statement of Profit and Loss, Consolidated Statement of Changes in Equity and the Consolidated Cash Flow Statement, for the year then ended, including a summary of significant accounting policies and other explanatory information (hereinafter referred to as “the consolidated Ind AS financial statements”).
Management’s Responsibility for the Consolidated Ind AS Financial Statements
The Holding Company’s Board of Directors is responsible for the preparation of these consolidated Ind AS financial statements in terms of the requirements of the Companies Act, 2013 (hereinafter referred to as “the Act”) that give a true and fair view of the consolidated state of affairs, consolidated profit/ loss (including other comprehensive income), consolidated statement of changes in equity and consolidated cash flows of the Group including its associate and a joint venture in accordance with the accounting principles generally accepted in India, including the Indian Accounting Standards (Ind AS) specified under section 133 of the Act. The respective Board of Directors of the companies included in the Group and of its associate and a joint venture are responsible for maintenance of adequate accounting records in accordance with the provisions of the Act for safeguarding the assets of the Group and its associate and its joint venture and for preventing and detecting frauds and other irregularities; the selection and application of appropriate accounting policies; making judgments and estimates that are reasonable and prudent; and the design, implementation and maintenance of adequate internal financial controls that were operating effectively for ensuring the accuracy and completeness of the accounting records, relevant to the preparation and presentation of the consolidated Ind AS financial statements that give a true and fair view and are free from material misstatement, whether due to fraud or error, which have been used for the purpose of preparation of the consolidated Ind AS financial statements by the Directors of the Holding Company, as aforesaid.
In preparing the consolidated Ind AS financial statements, the respective Board of Directors of the companies included in the Group and of its associate and a joint venture are responsible for assessing the ability of the Group and of its associate and a joint venture to continue as a going concern, disclosing, as applicable, matters related to going concern and using the going concern basis of accounting unless management either intends to liquidate the Group or to cease operations, or has no realistic alternative but to do so.
Auditor’s Responsibility
Our responsibility is to express an opinion on these consolidated Ind AS financial statements based on our audit. While conducting
the audit, we have taken into account the provisions of the Act, the accounting and auditing standards and matters which are required to be included in the audit report under the provisions of the Act and the Rules made thereunder.
We conducted our audit in accordance with the Standards on Auditing specified under Section 143(10) of the Act. Those Standards require that we comply with ethical requirements and plan and perform the audit to obtain reasonable assurance about whether the consolidated Ind AS financial statements are free from material misstatement.
An audit involves performing procedures to obtain audit evidence about the amounts and the disclosures in the consolidated Ind AS financial statements. The procedures selected depend on the auditor’s judgment, including the assessment of the risks of material misstatement of the consolidated Ind AS financial statements, whether due to fraud or error. In making those risk assessments, the auditor considers internal financial control relevant to the Holding Company’s preparation of the consolidated Ind AS financial statements that give a true and fair view in order to design audit procedures that are appropriate in the circumstances. An audit also includes evaluating the appropriateness of the accounting policies used and the reasonableness of the accounting estimates made, as well as evaluating the overall presentation of the consolidated Ind AS financial statements.
We are also responsible to conclude on the appropriateness of management’s use of the going concern basis of accounting and, based on the audit evidence obtained, whether a material uncertainty exists related to events or conditions that may cast significant doubt on the ability of Group and of its associate and a joint venture to continue as a going concern. If we conclude that a material uncertainty exists, we are required to draw attention in the auditor’s report to the related disclosures in the consolidated Ind AS financial statements or, if such disclosures are inadequate, to modify our opinion. Our conclusions are based on the audit evidence obtained up to the date of our auditor’s report. However, future events or conditions may cause Group and its associate and a joint venture to cease to continue as a going concern.
We believe that the audit evidence obtained by us and the audit evidence obtained by the other auditors in terms of their reports referred to in Other Matters paragraph below, is sufficient and appropriate to provide a basis for our audit opinion on the consolidated Ind AS financial statements.
Opinion
In our opinion and to the best of our information and according to the explanations given to us and based on the consideration of reports of other auditors on separate financial statements and on the other financial information of the subsidiaries, an associate and a joint venture, the aforesaid consolidated Ind AS financial statements give the information required by the Act in the manner so required and give a true and fair view in conformity with the accounting principles generally accepted in India, of the consolidated state of affairs of the Group, its associate and a joint venture as at 31 March 2018, and their consolidated profit (including other comprehensive income), consolidated statement of changes in equity and consolidated cash flows for the year ended on that date.
170
Other Matters
Corresponding figures of the Group, its associate and a joint venture for the year ended 31 March 2017 have been audited by another auditor who expressed an unmodified opinion dated 24 May 2017 on the consolidated Ind AS financial statements for the year ended 31 March 2017.
We did not audit the financial statements/ financial information of four subsidiaries and one step down subsidiary, whose financial statements/ financial information reflect total assets of Rs.1,221 million as at 31 March 2018, total revenues (including other income) of Rs. 81 million and net cash inflows amounting to Rs. 5.63 million for the year ended on that date, as considered in the consolidated Ind AS financial statements. The consolidated Ind AS financial statements also include the Group’s share of net loss of Rs. 14 million for the year ended 31 March 2018, as considered in the consolidated Ind AS financial statements, in respect of an associate and a joint venture, whose financial statements / financial information have not been audited by us. These financial statements / financial information have been audited by other auditors whose reports have been furnished to us by the Management and our opinion on the consolidated Ind AS financial statements, in so far as it relates to the amounts and disclosures included in respect of these subsidiaries, a joint venture and an associate and our report in terms of sub-section (3) of Section 143 of the Act, insofar as it relates to the aforesaid subsidiaries, a joint venture and an associate is based solely on the reports of the other auditors.
Our opinion above on the consolidated Ind AS financial statements, and our report on Other Legal and Regulatory Requirements below, is not modified in respect of the above matters with respect to our reliance on the work done and the reports of the other auditors.
Report on Other Legal and Regulatory Requirements
1. As required by Section 143(3) of the Act, based on our audit and on the consideration of report of the other auditors on separate financial statements and the other financial information of subsidiaries, a joint venture and an associate, as noted in the ‘other matter’ paragraph, we report, to the extent applicable, that:
a) We have sought and obtained all the information and explanations which to the best of our knowledge and belief were necessary for the purposes of our audit of the aforesaid consolidated Ind AS financial statements.
b) In our opinion, proper books of account as required by law relating to preparation of the aforesaid consolidated Ind AS financial statements have been kept so far as it appears from our examination of those books and the reports of the other auditors.
c) The Consolidated Balance Sheet, the Consolidated Statement of Profit and Loss, the Consolidated Cash Flow Statement and Consolidated Statement of Changes in Equity dealt with by this Report are in agreement with the relevant books of account maintained for the purpose of preparation of the consolidated Ind AS financial statements.
d) In our opinion, the aforesaid consolidated Ind AS financial statements comply with the Indian Accounting Standards specified under section 133 of the Act.
e) On the basis of the written representations received from the directors of the Holding Company as on 31 March 2018 taken on record by the Board of Directors of the Holding Company and the reports of the statutory auditors of its subsidiary companies and a joint venture incorporated in India, none of the directors of the Group companies and a joint venture incorporated in India is disqualified as on 31 March 2018 from being appointed as a director in terms of Section 164(2) of the Act.
f) With respect to the adequacy of the internal financial controls with reference to financial statements of the Holding Company, its subsidiary companies and a joint venture incorporated in India and the operating effectiveness of such controls, refer to our separate Report in “Annexure A”.
g) With respect to the other matters to be included in the Auditor’s Report in accordance with Rule 11 of the Companies (Audit and Auditor’s) Rules, 2014, in our opinion and to the best of our information and according to the explanations given to us and based on the consideration of the report of the other auditors on separate financial statements and also the other financial information of the subsidiaries, an associate and a joint venture as noted in the ‘Other matter’ paragraph:
i. The consolidated Ind AS financial statements disclose the impact of pending litigations on the consolidated financial position of the Group, its associate and a joint venture. Refer Note 31 to the consolidated Ind AS financial statements.
ii. The Group, its associate and a joint venture did not have any material foreseeable losses on long-term contracts including derivative contracts during the year ended 31 March 2018.
iii. There are no amounts which are required to be transferred to the Investor Education and Protection Fund by the Holding Company, its subsidiary companies and a joint venture incorporated in India during the year ended 31 March 2018.
iv. The disclosures in the consolidated Ind AS financial statements regarding holdings as well as dealings in specified bank notes during the period from 8 November 2016 to 30 December 2016 have not been made since they do not pertain to the financial year ended 31 March 2018. However amounts as appearing in the audited consolidated Ind AS financial statements for the period ended 31 March 2017 have been disclosed.
for B S R & Co. LLP Chartered Accountants
Firm’s registration number: 101248W/W-100022
Amit SomaniPlace: Bengaluru PartnerDate: 22 May 2018 Membership number: 060154
171
Report on the Internal Financial Controls with reference to financial statements under Clause (i) of Sub-section 3 of Section 143 of the Companies Act, 2013 (“the Act”)
In conjunction with our audit of the consolidated Ind AS financial statements of HealthCare Global Enterprises Limited (“the Holding Company”), its subsidiaries (collectively referred to as “the Company” or “the Group”), its associate and a joint venture as of and for the year ended 31 March 2018, we have audited the internal financial controls with reference to the financial statements of HealthCare Global Enterprises Limited and its subsidiary companies which are companies incorporated in India, as of that date.
Management’s Responsibility for Internal Financial Controls
The respective Board of Directors of the Holding Company and its subsidiary companies which are companies incorporated in India, are responsible for establishing and maintaining internal financial controls based on the internal control with reference to the financial statements criteria established by the respective companies considering the essential components of internal control stated in the Guidance Note on Audit of Internal Financial Controls over Financial Reporting (‘Guidance Note’) issued by the Institute of Chartered Accountants of India (‘ICAI’). These responsibilities include the design, implementation and maintenance of adequate internal financial controls that were operating effectively for ensuring the orderly and efficient conduct of its business, including adherence to the respective company’s policies, the safeguarding of its assets, the prevention and detection of frauds and errors, the accuracy and completeness of the accounting records, and the timely preparation of reliable financial information, as required under the Act.
Auditors’ Responsibility
Our responsibility is to express an opinion on the internal financial controls with reference to the financial statements of the Holding Company and its subsidiary companies incorporated in India, based on our audit. We conducted our audit in accordance with the Guidance Note and the Standards on Auditing, issued by ICAI and deemed to be prescribed under Section 143(10) of the Act, to the extent applicable to an audit of internal financial controls, both issued by the ICAI. Those Standards and the Guidance Note require that we comply with ethical requirements and plan and perform the audit to obtain reasonable assurance about whether adequate internal financial controls with reference to the financial statements was established and maintained and if such controls operated effectively in all material respects.
Our audit involves performing procedures to obtain audit evidence about the adequacy of the internal financial controls system with reference to the financial statements and their operating effectiveness. Our audit of internal financial controls with reference to the financial statements included obtaining an understanding of internal financial controls with reference to the financial statements, assessing the risk that a material weakness exists, and testing and evaluating the design and operating effectiveness of internal control based on the assessed risk. The procedures selected depend on the Auditor’s judgement, including the assessment of the risks of material misstatement of the financial statements, whether due to fraud or error.
We believe that the audit evidence we have obtained is sufficient and appropriate to provide a basis for our audit opinion on the internal financial controls system with reference to the financial statements of the Holding Company and its subsidiary companies incorporated in India.
Meaning of Internal Financial Controls with reference to the financial statements
A company’s internal financial control with reference to the financial statements is a process designed to provide reasonable assurance regarding the reliability of financial reporting and the preparation of financial statements for external purposes in accordance with generally accepted accounting principles. A company’s internal financial control with reference to the financial statements includes those policies and procedures that (1) pertain to the maintenance of records that, in reasonable detail, accurately and fairly reflect the transactions and dispositions of the assets of the Company; (2) provide reasonable assurance that transactions are recorded as necessary to permit preparation of financial statements in accordance with generally accepted accounting principles, and that receipts and expenditures of the company are being made only in accordance with authorisations of Management and Directors of the Company; and (3) provide reasonable assurance regarding prevention or timely detection of unauthorised acquisition, use, or disposition of the Company’s assets that could have a material effect on the financial statements.
Inherent Limitations of Internal Financial Controls with reference to the financial statements
Because of the inherent limitations of internal financial controls with reference to the financial statements, including the possibility of collusion or improper management override of controls, material misstatements due to error or fraud may occur and not be detected. Also, projections of any evaluation of the internal financial controls with reference to the financial statements to future periods are subject to the risk that the internal financial control with reference to the financial statements may become inadequate because of changes in conditions, or that the degree of compliance with the policies or procedures may deteriorate.
Opinion
In our opinion the Holding Company and its subsidiary companies incorporated in India, have, in all material respects, an adequate internal financial controls system with reference to the financial statements and such internal financial controls with reference to the financial statements were operating effectively as at 31 March 2018, based on the internal control with reference to the financial statements criteria established by the respective companies considering the essential components of internal control stated in the Guidance Note issued by the ICAI.
for B S R & Co. LLP Chartered Accountants
Firm’s registration number: 101248W/W-100022
Amit SomaniPlace: Bengaluru PartnerDate: 22 May 2018 Membership number: 060154
Annexure - A to the Independent Auditor’s Report of even date on the consolidated Ind AS financial statements of HealthCare Global Enterprises Limited
172

Consolidated Balance Sheet(` in million)
Consolidated Balance Sheet as at Note No. 31 March 2018 31 March 2017
ASSETS
Non-current assets
(a) Property, plant and equipment 5 7,125.67 6,170.07
(b) Capital work-in-progress 5 1,739.72 1,482.26
(c) Goodwill 6 1,093.40 608.88
(d) Other intangible assets 6 58.11 68.07
(e) Investments in equity accounted investees 7 480.45 -
(f) Financial assets
(i) Investments 7 51.27 39.54
(ii) Loans 8 98.55 29.30
(iii) Other financial assets 9 496.00 478.57
(g) Deferred tax assets (net) 30.3 231.01 167.09
(h) Income tax assets (net) 30.4 211.07 261.33
(i) Other non-current assets 10 650.42 517.53
Total non current assets 12,235.67 9,822.64
Current assets
(a) Inventories 11 240.26 187.69
(b) Financial assets
(i) Investments 7 - 74.91
(ii) Trade receivables 12 1,284.40 1,032.20
(iii) Cash and cash equivalents 13 287.96 852.22
(iv) Loans 8 31.19 20.20
(v) Other financial assets 9 140.55 138.52
(c) Other current assets 10 216.57 136.03
Total current assets 2,200.93 2,441.77
TOTAL ASSETS 14,436.60 12,264.41
EQUITY AND LIABILITIES
Equity
(a) Equity share capital 14 869.04 857.13
(b) Shares pending issuance 14.6 299.75 -
(c) Other equity 15 3,982.24 3,469.47
Equity attributable to owners of the Company 5,151.03 4,326.60
Non-controlling interests 16 639.21 574.62
Total equity 5,790.24 4,901.22
Liabilities
Non-current liabilities
(a) Financial liabilities
(i) Borrowings 17 3,724.29 2,833.82
(ii) Other financial liabilities 18 915.69 801.18
(b) Provisions 19 50.99 30.46
(c) Deferred tax liabilities (net) 30.3 37.70 11.70
(d) Other non-current liabilities 20 330.12 30.74
Total non-current liabilities 5,058.79 3,707.90
173

As per our reports of even date attached
for B S R & Co. LLPChartered AccountantsFirm’s registration number: 101248W/W -100022
for and on behalf of the Board of Directors of
HealthCare Global Enterprises Limited
Amit SomaniPartnerMembership number: 060154
Dr. B.S. AjaikumarChairman and CEODIN: 00713779
Dr. Ramesh B.S.DirectorDIN: 00518434
Yogesh PatelChief Financial Officer
Sunu ManuelCompany Secretary
Place : BengaluruDate : 22 May 2018
Place : BengaluruDate : 22 May 2018
Place : BengaluruDate : 22 May 2018
Consolidated Balance Sheet(` in million)
Consolidated Balance Sheet as at Note No. 31 March 2018 31 March 2017
Current liabilities
(a) Financial Liabilities
(i) Borrowings 17 17.35 416.29
(ii) Trade payables 21 1,424.74 1,273.63
(iii) Other financial liabilities 18 1,764.38 1,673.40
(b) Provisions 19 56.00 49.40
(c) Income tax liabilities (net) 30.5 39.83 13.91
(d) Other current liabilities 20 285.27 228.66
Total current liabilities 3,587.57 3,655.29
TOTAL EQUITY AND LIABILITIES 14,436.60 12,264.41
Significant accounting policies 3
The accompanying notes are an integral part of these consolidated Ind AS financial statements
174

Consolidated Statement of Profit and Loss(` in million)
Consolidated Statement of Profit and Loss for the years ended Note No. 31 March 2018 31 March 2017
I Income
Revenue from operations 22 8,306.88 7,001.11
Other income 23 128.02 96.71
Total income (I) 8,434.90 7,097.82
II Expenses
Purchases of medical and non-medical items 1,966.38 1,759.17
Changes in inventories 24 (69.25) (50.06)
Employee benefits expense 25 1,577.06 1,219.25
Finance costs 26 423.50 229.98
Depreciation and amortisation expense 27 714.60 568.25
Other expenses 28 3,644.51 3,022.80
Total expenses (II) 8,256.80 6,749.39
III Profit before share of loss of an associate / joint venture, excep-tional items and tax (I-II)
178.10 348.43
IV Share of loss of an associate / joint venture 14.02 -
V Profit before exceptional items and tax (III - IV) 164.08 348.43
VI Exceptional items 29 107.68 -
VII Profit before tax (V+VI) 271.76 348.43
VII Tax expense
(1) Current tax 30.1 135.50 115.23
(2) Deferred tax 30.1 (33.12) 2.77
102.38 118.00
VIII Profit for the year (VI-VII) 169.38 230.43
IX Other comprehensive income / expense
(i) Items that will not be reclassified subsquently to profit or loss -
(a) Remeasurements of the defined benefit plans 36.2 (2.46) (1.03)
(b) Income tax effect 30.2 1.03 0.39
(ii) Items that will be reclassified to Statement of profit or loss
(a) Exchange differences on translation of foreign operations - 0.32
Other comprehensive income / expense for the year, net of income tax
(1.43) (0.32)
X Total comprehensive income for the year (IX+X) 167.95 230.11
Profit for the year attributable to:
Owners of the Company 205.23 221.73
Non-controlling interests (35.85) 8.70
169.38 230.43
Other comprehensive income / (losses) for the year attributable to:
Owners of the Company (1.77) (0.41)
Non-controlling interests 0.34 0.09
(1.43) (0.32)
Total comprehensive income for the year attributable to:
Owners of the Company 203.46 221.32
Non-controlling interests (35.51) 8.79
167.95 230.11
175

As per our reports of even date attached
for B S R & Co. LLPChartered AccountantsFirm’s registration number: 101248W/W -100022
for and on behalf of the Board of Directors of
HealthCare Global Enterprises Limited
Amit SomaniPartnerMembership number: 060154
Dr. B.S. AjaikumarChairman and CEODIN: 00713779
Dr. Ramesh B.S.DirectorDIN: 00518434
Yogesh PatelChief Financial Officer
Sunu ManuelCompany Secretary
Place : BengaluruDate : 22 May 2018
Place : BengaluruDate : 22 May 2018
Place : BengaluruDate : 22 May 2018
Consolidated Statement of Profit and Loss(` in million)
Consolidated Statement of Profit and Loss for the years ended Note No. 31 March 2018 31 March 2017
Earnings per share :
Basic (in `) 33.1 2.38 2.69
Diluted (in `) 33.2 2.38 2.69
Significant accounting policies 3
The accompanying notes are an integral part of these consolidated Ind AS financial statements
176

Consolidated Cash Flow Statement
(` in million)
Consolidated Cash Flow Statement for the years ended Note No. 31 March 2018 31 March 2017
Cash flows from operating activities
Profit before tax 271.76 348.43
Adjustments for:
Finance costs 423.50 200.11
Gain on investment revalued at FVTPL (3.61) -
Gain on sale of mutual fund (1.14) -
Loss on disposal of property, plant and equipment 0.43 0.60
Provision for bad debts and doubtful advances (45.74) 33.18
Interest income (81.22) (65.57)
Bad debts written off 100.11 -
Depreciation and amortisation expense 714.60 568.25
Payables no longer required written back (22.20) (0.29)
Equity-settled share-based payments 27.09 9.45
Exceptional items:
Gain on sale of a unit 29.1 (37.97) -
Gain on sale of subsidiary 29.2 (82.20) -
Net loss pertaining to closure of Delhi unit 29.3 76.46 -
Gain on loss of control on subsidiary 29.4 (63.97) -
Share of loss of equity accounted investees 14.02 -
Movements in working capital:
Changes in trade receivables (397.93) (369.96)
Changes in inventories (79.30) (54.19)
Changes in loans, financial assets and other assets other than security deposits
(148.65) (56.06)
Security deposits paid (135.80) -
Changes in trade payables, financial liabilities and other liabilities 428.22 334.85
Changes in provisions 29.04 12.79
Changes in other liabilities 34.67 11.94
Cash generated from operations 1,020.17 973.53
Income taxes paid (net of refunds) (42.04) (60.74)
Net cash generated from operating activities (A) 978.13 912.79
Cash flows from investing activities
Payments to acquire financial assets - (158.50)
Margin money deposits, net (148.42) (65.63)
Inter-corporate deposits given (818.00) (25.00)
Proceeds from repayment of inter-corporate deposits 804.30 17.86
Proceeds from disposal of property, plant and equipment 1.71 3.26
Acquisition of property, plant and equipment (2,561.63) (1,926.63)
Acquisition of business, net of cash and cash equivalents 49 & 50 (92.29) -
Interest received 38.83 36.77
Proceeds from sale of mutual fund - 19.62
Proceeds from repayment of related party loans - 0.96
Investment in Associate (233.12) -
Investment in debentures (50.00) -
177
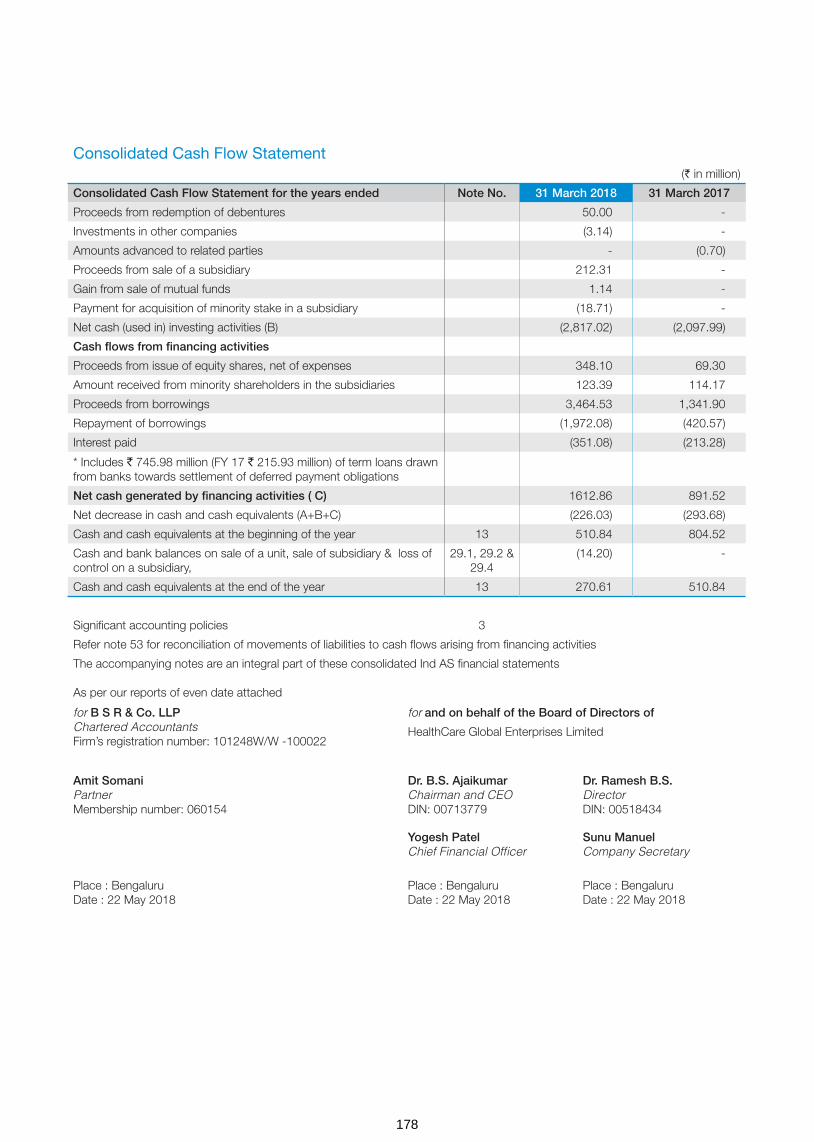
As per our reports of even date attached
for B S R & Co. LLPChartered AccountantsFirm’s registration number: 101248W/W -100022
for and on behalf of the Board of Directors of
HealthCare Global Enterprises Limited
Amit SomaniPartnerMembership number: 060154
Dr. B.S. AjaikumarChairman and CEODIN: 00713779
Dr. Ramesh B.S.DirectorDIN: 00518434
Yogesh PatelChief Financial Officer
Sunu ManuelCompany Secretary
Place : BengaluruDate : 22 May 2018
Place : BengaluruDate : 22 May 2018
Place : BengaluruDate : 22 May 2018
Consolidated Cash Flow Statement
(` in million)
Consolidated Cash Flow Statement for the years ended Note No. 31 March 2018 31 March 2017
Proceeds from redemption of debentures 50.00 -
Investments in other companies (3.14) -
Amounts advanced to related parties - (0.70)
Proceeds from sale of a subsidiary 212.31 -
Gain from sale of mutual funds 1.14 -
Payment for acquisition of minority stake in a subsidiary (18.71) -
Net cash (used in) investing activities (B) (2,817.02) (2,097.99)
Cash flows from financing activities
Proceeds from issue of equity shares, net of expenses 348.10 69.30
Amount received from minority shareholders in the subsidiaries 123.39 114.17
Proceeds from borrowings 3,464.53 1,341.90
Repayment of borrowings (1,972.08) (420.57)
Interest paid (351.08) (213.28)
* Includes ` 745.98 million (FY 17 ` 215.93 million) of term loans drawn from banks towards settlement of deferred payment obligations
Net cash generated by financing activities ( C) 1612.86 891.52
Net decrease in cash and cash equivalents (A+B+C) (226.03) (293.68)
Cash and cash equivalents at the beginning of the year 13 510.84 804.52
Cash and bank balances on sale of a unit, sale of subsidiary & loss of control on a subsidiary,
29.1, 29.2 & 29.4
(14.20) -
Cash and cash equivalents at the end of the year 13 270.61 510.84
Significant accounting policies 3
Refer note 53 for reconciliation of movements of liabilities to cash flows arising from financing activities
The accompanying notes are an integral part of these consolidated Ind AS financial statements
178
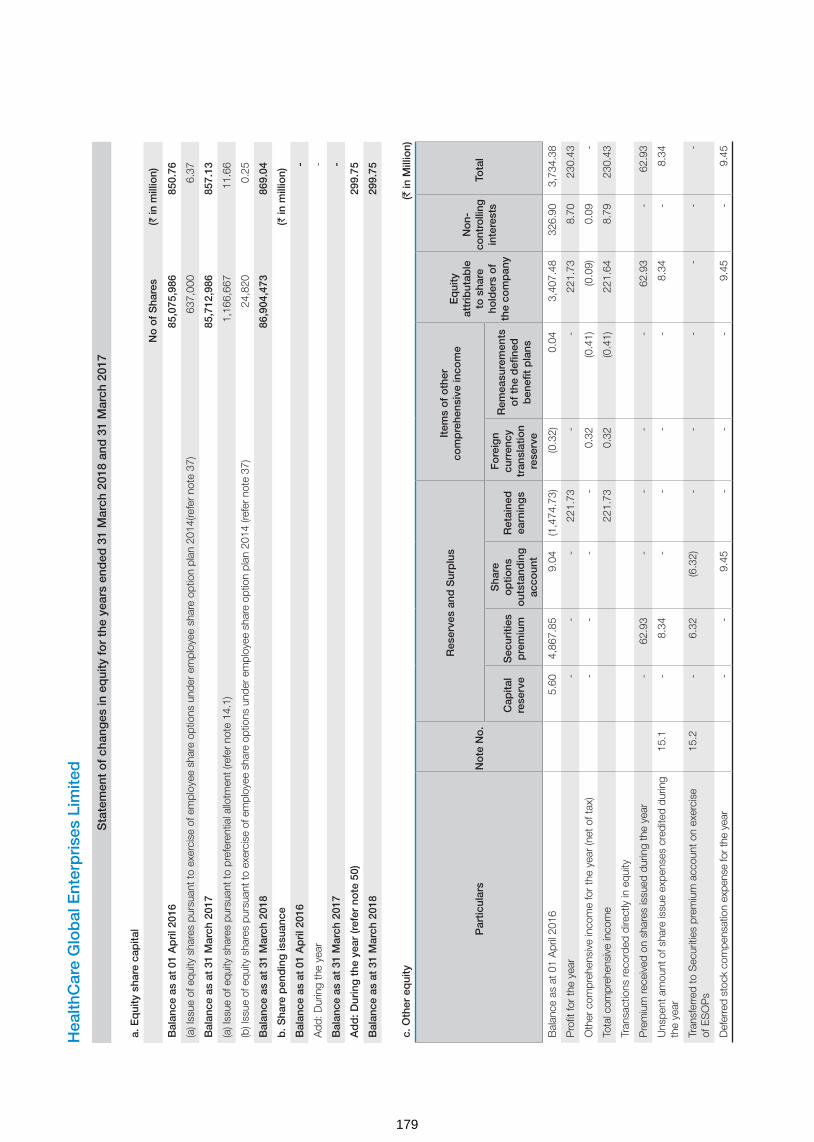
Hea
lthC
are
Glo
bal
Ent
erp
rise
s Li
mite
d
Sta
tem
ent
of
chan
ges
in e
qui
ty f
or
the
year
s en
ded
31
Mar
ch 2
018
and
31
Mar
ch 2
017
a. E
qui
ty s
hare
cap
ital
No
of
Sha
res
(` in
mill
ion)
Bal
ance
as
at 0
1 A
pri
l 201
6 8
5,07
5,98
6 8
50.7
6
(a) I
ssue
of e
quity
sha
res
purs
uant
to e
xerc
ise
of e
mpl
oyee
sha
re o
ptio
ns u
nder
em
ploy
ee s
hare
opt
ion
plan
201
4(re
fer
note
37)
637
,000
6
.37
Bal
ance
as
at 3
1 M
arch
201
7 8
5,71
2,98
6 8
57.1
3
(a) I
ssue
of e
quity
sha
res
purs
uant
to p
refe
rent
ial a
llotm
ent (
refe
r no
te 1
4.1)
1,1
66,6
67
11.
66
(b) I
ssue
of e
quity
sha
res
purs
uant
to e
xerc
ise
of e
mpl
oyee
sha
re o
ptio
ns u
nder
em
ploy
ee s
hare
opt
ion
plan
201
4 (re
fer n
ote
37)
24,
820
0.2
5
Bal
ance
as
at 3
1 M
arch
201
8 8
6,90
4,47
3 8
69.0
4
b. S
hare
pen
din
g is
suan
ce (`
in m
illio
n)
Bal
ance
as
at 0
1 A
pri
l 201
6 -
Add
: Dur
ing
the
year
-
Bal
ance
as
at 3
1 M
arch
201
7 -
Ad
d: D
urin
g t
he y
ear
(ref
er n
ote
50)
299
.75
Bal
ance
as
at 3
1 M
arch
201
8 2
99.7
5
c. O
ther
eq
uity
(` in
Mill
ion)
Par
ticul
ars
No
te N
o.
Res
erve
s an
d S
urp
lus
Item
s o
f o
ther
co
mp
rehe
nsiv
e in
com
eE
qui
ty
attr
ibut
able
to
sha
re
hold
ers
of
the
com
pan
y
Non
-co
ntro
lling
in
tere
sts
Tota
l
Cap
ital
rese
rve
Sec
uriti
es
pre
miu
m
Sha
re
op
tions
o
utst
and
ing
ac
coun
t
Ret
aine
d
earn
ing
s
Fo
reig
n cu
rren
cy
tran
slat
ion
rese
rve
Rem
easu
rem
ents
o
f th
e d
efine
d
ben
efit
pla
ns
Bal
ance
as
at 0
1 A
pril
2016
5.60
4,
867.
85
9.04
(1
,474
.73)
(0.3
2) 0
.04
3,4
07.4
8 3
26.9
0 3,
734.
38
Pro
fit fo
r th
e ye
ar -
-
-
2
21.7
3 -
-
2
21.7
3 8
.70
230
.43
Oth
er c
ompr
ehen
sive
inco
me
for
the
year
(net
of t
ax)
-
-
-
-
0.3
2 (0
.41)
(0.0
9) 0
.09
-
Tota
l com
preh
ensi
ve in
com
e 2
21.7
3 0
.32
(0.4
1) 2
21.6
4 8
.79
230
.43
Tran
sact
ions
reco
rded
dire
ctly
in e
quity
Pre
miu
m re
ceiv
ed o
n sh
ares
issu
ed d
urin
g th
e ye
ar -
62
.93
-
-
-
-
62.
93
-
62.
93
Uns
pent
am
ount
of s
hare
issu
e ex
pens
es c
redi
ted
durin
g th
e ye
ar15
.1 -
8.
34
-
-
-
-
8.3
4 -
8
.34
Tran
sfer
red
to S
ecur
ities
pre
miu
m a
ccou
nt o
n ex
erci
se
of E
SO
Ps
15.2
-
6.32
(6
.32)
-
-
-
-
-
-
Def
erre
d st
ock
com
pens
atio
n ex
pens
e fo
r the
yea
r -
-
9.
45
-
-
-
9.4
5 -
9
.45
179

Hea
lthC
are
Glo
bal
Ent
erp
rise
s Li
mite
d
Sta
tem
ent
of
chan
ges
in e
qui
ty f
or
the
year
s en
ded
31
Mar
ch 2
018
and
31
Mar
ch 2
017
(co
ntin
ued
)
Par
ticul
ars
No
te N
o.
Res
erve
s an
d S
urp
lus
Item
s o
f o
ther
co
mp
rehe
nsiv
e in
com
eE
qui
ty
attr
ibut
able
to
sha
re
hold
ers
of
the
com
pan
y
Non
-co
ntro
lling
in
tere
sts
Tota
lC
apita
l re
serv
eS
ecur
ities
p
rem
ium
Sha
re
op
tions
o
utst
and
ing
ac
coun
t
Ret
aine
d
earn
ing
s
Fo
reig
n cu
rren
cy
tran
slat
ion
rese
rve
Rem
easu
rem
ents
o
f th
e d
efine
d
ben
efit
pla
ns
Cha
nge
in fa
ir va
lue
of g
ross
obl
igat
ions
ove
r writ
ten
put
optio
ns is
sued
to th
e no
n-co
ntro
lling
inte
rest
s15
.6 -
-
-
(1
15.6
1) -
-
(1
15.6
1) -
(1
15.6
1)
Add
ition
al in
vest
men
ts b
y no
n-co
ntro
lling
inte
rest
s16
-
-
-
-
-
-
-
123
.69
123
.69
Adj
ustm
ent o
n ac
coun
t of c
hang
e in
hol
ding
with
out
chan
ge in
con
trol
(124
.76)
-
-
(124
.76)
115
.24
(9.5
2)
Bal
ance
as
at 3
1 M
arch
201
7 5
.60
4,94
5.44
1
2.17
(1
,493
.37)
-
(0.3
7) 3
,469
.47
574
.62
4,04
4.09
Pro
fit fo
r the
yea
r -
-
-
20
5.23
-
-
2
05.2
3 (3
5.85
) 1
69.3
8
Oth
er c
ompr
ehen
sive
inco
me
for t
he y
ear (
net o
f tax
) -
-
-
-
-
(1
.77)
(1.7
7) 0
.34
(1.4
3)
Tota
l com
preh
ensi
ve in
com
e -
-
-
2
05.2
3 -
(1
.77)
203
.46
(35.
51)
167
.95
Tran
sact
ions
reco
rded
dire
ctly
in e
quity
Pre
miu
m re
ceiv
ed o
n sh
ares
issu
ed d
urin
g ye
ar
-
338.
34
-
-
-
-
338
.34
-
338
.34
Sha
re is
sue
expe
nses
15
.1 -
(1
.08)
-
-
-
-
(1.0
8) -
(1
.08)
Tran
sfer
red
to S
ecur
ities
pre
miu
m a
ccou
nt o
n ex
erci
se o
f ES
OP
s 15
.2 -
2
.18
(2.1
8) -
-
-
-
-
-
Def
erre
d st
ock
com
pens
atio
n ex
pens
e fo
r the
yea
r -
-
2
7.09
-
-
-
2
7.09
-
2
7.09
Cha
nge
in fa
ir va
lue
of g
ross
obl
igat
ions
ove
r writ
ten
put
optio
ns is
sued
to th
e no
n-co
ntro
lling
inte
rest
s15
.6 -
-
-
5
5.01
-
-
5
5.01
5
5.01
On
acqu
isiti
on o
f bus
ines
s 49
1.1
7 -
-
-
-
-
1
.17
-
1.1
7
On
equi
ty a
ccou
nted
inve
stee
29
.1(a
) 8
.90
-
-
-
-
-
8.9
0 -
8
.90
Add
ition
al in
vest
men
ts b
y no
n-co
ntro
lling
inte
rest
s16
-
-
-
-
-
-
-
123
.39
123
.39
Adj
ustm
ent o
n ac
coun
t of c
hang
e in
hol
ding
with
out
chan
ge in
con
trol
16 -
-
-
(1
20.1
2) -
-
(1
20.1
2) 1
01.3
0 (1
8.82
)
Red
uctio
n in
non
-con
trollin
g in
tere
st o
n ac
coun
t of s
ale
of
equi
ty in
vest
men
t in
subs
idia
ry H
CG
Reg
ency
Onc
olog
y P
rivat
e Li
mite
d (R
efer
not
e 29
.2)
16 -
-
-
-
-
-
-
(1
24.5
9) (1
24.5
9)
Bal
ance
as
at 3
1 M
arch
201
8 1
5.67
5,
284.
88
37.
08
(1,3
53.2
5) -
(2
.14)
3,9
82.2
4 6
39.2
1 4,
621.
45
(` in
mill
ion)
180
Sec
uriti
es p
rem
ium
Sec
uriti
es p
rem
ium
is u
sed
to re
cord
the
prem
ium
on
issu
e of
equ
ity s
hare
s. T
he re
serv
e is
util
ised
in a
ccor
danc
e w
ith th
e pr
ovis
ions
of t
he C
ompa
nies
Act
,201
3.
Sha
re o
ptio
n o
utst
and
ing
acc
oun
t
The
Com
pany
has
em
ploy
ee s
tock
opt
ion
plan
s fo
r el
igib
le e
mpl
oyee
s of
the
Com
pany
and
its
grou
p co
mpa
nies
. Ref
er n
ote
37 fo
r fu
rthe
r de
tails
on
thes
e pl
ans
Cap
ital r
eser
ve
Cap
ital r
eser
ve is
cre
ated
on
acqu
isiti
on o
f bus
ines
s of
Cen
tral
Indi
a C
ance
r R
esea
rch
Inst
itute
(CIC
RI)
and
tran
sact
ion
with
Str
and
Life
Sci
ence
s P
vt. L
td b
y th
e C
ompa
ny d
urin
g th
e ye
ar. (
refe
r no
te 4
9 &
29.
1(a)
)
Sig
nific
ant a
ccou
ntin
g po
licie
s (re
fer
note
3)
The
acco
mpa
nyin
g no
tes
are
an in
tegr
al p
art o
f the
se C
onso
lidat
ed In
d A
S fi
nanc
ial s
tate
men
ts
As
per
repo
rts
of e
ven
date
att
ache
d
for
B S
R &
Co
. LLP
Cha
rter
ed A
ccou
ntan
tsFi
rm’s
regi
stra
tion
num
ber:
101
248W
/W -
1000
22
for
and
on
beh
alf
of
the
Bo
ard
of
Dire
cto
rs o
f
Hea
lthC
are
Glo
bal E
nter
pris
es L
imite
d
Am
it S
om
ani
Par
tner
Mem
bers
hip
num
ber:
060
154
Dr.
B.S
. Aja
ikum
arC
hairm
an a
nd C
EO
DIN
: 007
1377
9
Dr.
Ram
esh
B.S
.D
irect
orD
IN: 0
0518
434
Yog
esh
Pat
elC
hief
Fin
anci
al O
ffice
rS
unu
Man
uel
Com
pan
y S
ecre
tary
Pla
ce :
Ben
galu
ruD
ate
: 22
May
201
8P
lace
: B
enga
luru
Dat
e : 2
2 M
ay 2
018
Pla
ce :
Ben
galu
ruD
ate
: 22
May
201
8
Hea
lthC
are
Glo
bal
Ent
erp
rise
s Li
mite
d
Sta
tem
ent
of
chan
ges
in e
qui
ty f
or
the
year
s en
ded
31
Mar
ch 2
018
and
31
Mar
ch 2
017
181

1 HealthCare Global Enterprises Limited (‘the Company’) and its subsidiaries (collectively referred to as “the Group”) its associates / joint ventures is engaged in setting up and managing hospitals and medical diagnostic services including scientific testing and consultancy services in the pharmaceutical and medical sector. The Company is a public company incorporated and domiciled in India and has its registered office at #8, P. Kalinga Rao Road, Sampangi Ram Nagar, Bengaluru – 560 027.
The financial statements for the year ended 31 March 2018 were approved by the Board of Directors and authorised for issue on 22 May 2018.
2.1 Basis of preparation of the financial statements
(a) Statement of compliance
These consolidated financial statements have been prepared in accordance with Indian Accounting Standards (“Ind AS”) notified under the Companies (Indian Accounting Standards) Rules, 2015 and Companies (Indian Accounting Standards) Amendment Rules, 2016, as applicable.
(b) Functional and presentation currency
These consolidated financial statements are presented in Indian Rupees (`), which is also the Group’s functional currency. All amounts are in Indian Rupees million except share data and per share data, unless otherwise stated.
(c) Basis of measurement
The consolidated financial statements have been prepared on the historical cost basis except for the following items:
Items Measurement basis
Certain financial assets and liabilities Fair Value
Net defined benefit (asset)/ liability Fair value of plan assets less present value of defined benefit obligations
Contingent consideration in business combination Fair value Historical cost is generally based on the fair value of the consideration given in exchange for goods and services.
Fair value is the price that would be received to sell an asset or paid to transfer a liability in an orderly transaction between market participants at the measurement date.
(d) Use of estimates and judgements
In preparing these consolidated financial statements, management of the Group has made judgements, estimates and assumptions that affect the application of accounting policies and the reported amounts of assets, liabilities, income and expenses. Actual results may differ from these estimates. Estimates and underlying assumptions are reviewed on an ongoing basis. Revisions to accounting estimates are recognised prospectively.
The following are the key assumptions concerning the future, and other key sources of estimation uncertainty at the end of the reporting period that may have a significant risk of causing a material adjustment to the carrying amounts of assets and liabilities within the next financial year.
Judgements Information about judgments made in applying accounting policies that have the most significant effects on the amounts
recognised in the consolidated financial statements is included in the following notes: - Note 18 - Liability on written put options.
- Note 35 - Leasing arrangements. - Note 36 - Share based payments. - Note 38 - Financial instruments. - Note 46 - Consolidation, whether the Group has control over an investee.
Assumptions and estimation uncertainties Information about assumptions and estimation uncertainties that have a significant risk of resulting in a material adjustment in the
year ending 31 March 2018 is included in the following notes: - Note 5 - Estimation of useful life of property, plant and equipment - Note 49 & 50 - Acquisition of business: fair value of the consideration transferred (including contingent consideration) and fair
value of the assets acquired and liabilities assumed, measured on provisional basis; - Note 29.3 - Impairment of financial assets. - Note 30.3 - Deferred tax balances (net) - Note 31 - Recognition and measurement of provisions and contingencies: key assumptions about the likelihood and
magnitude of an outflow of resources; - Note 36 - Employee benefit plans: key actuarial assumptions;
HealthCare Global Enterprises Limited
Notes to the Ind AS consolidated financial statements for the year ended 31 March 2018
182

(e) Measurement of fair values
The Group’s accounting policies and disclosures require the measurement of fair values, for both financial and non-financial assets and liabilities. The Group has an established control framework with respect to the measurement of fair values. This includes a valuation team that has overall responsibility for overseeing all significant fair value measurement, including level 3 fair values, and reports directly to the chief financial officer.
Fair values are categorised into different levels in a fair value hierarchy based on the inputs used in the valuation techniques as follows:
– Level 1: quoted prices (unadjusted) in active markets for identical assets or liabilities. – Level 2: inputs other than quoted prices included in Level 1 that are observable for the asset or liability, either directly (i.e.as prices) or indirectly (i.e. derived from prices). – Level 3: inputs for the asset or liability that are not based on observable market data (unobservable inputs)
When measuring the fair value of an asset or a liability, the Group uses observable market data as far as possible. If the inputs used to measure the fair value of an asset or a liability fall into different levels of the fair value hierarchy, then the fair value measurement is categorised in its entirety in the same level of the fair value hierarchy as the lowest level input that is significant to the entire measurement. The Group recognises transfers between levels of the fair value hierarchy at the end of the reporting period during which the change has occurred.
2.2 Basis of consolidation
(a) Subsidiaries Subsidiaries are entities controlled by the Group. The Group controls an entity when it is exposed to, or has rights to, variable
returns from its involvement with the entity and has the ability to affect those returns through its power over the entity. The financial statements of subsidiaries are included in the consolidated financial statements from the date on which control commences until the date on which control ceases
(b) Non-controlling interests (NCI) NCI are measured at their proportionate share of the acquiree’s net identifiable assets at the date of acquisition.Changes in the
Group’s equity interest in a subsidiary that do not result in a loss of control are accounted for as equity transactions.
(c) Loss of control When the Group loses control over a subsidiary, it derecognises the assets and liabilities of the subsidiary, and any related NCI and
other components of equity. Any interest retained in the former subsidiary is measured at fair value at the date the control is lost. Any resulting gain or loss is recognised in profit or loss.
(d) Equity accounted investees
The Group’s interests in equity accounted investees comprise interest in an associate and a joint venture.
An associate is an entity in which the Group has significant influence, but not control or joint control, over the financial and operating policies. A joint venture is an arrangement in which the Group has joint control and has rights to the net assets of the arrangement, rather than the rights to its assets and obligations for its liabilities.
Interests in associate and joint venture are accounted for using the equity method. They are initially recognised at cost which includes transaction costs. Subsequent to initial recognition, the consolidated financial statements include the Group’s share of profit or loss and other comprehensive income of equity-accounted investees until the date on which significant influence or joint control ceases.
(e) Transactions eliminated on consolidation Intra-group balances and transactions, and any unrealised income and expenses arising from intragroup transactions, are
eliminated. Unrealised gains arising from transactions with equity accounted investees are eliminated against the investment to the extent of the Group’s interest in the investee. Unrealised losses are eliminated in the same way as unrealised gains, but only to the extent that there is no evidence of impairment.
(f) Business combinations In accordance with Ind AS 103, ”Business combinations” the Group accounts for these business combinations using the
acquisition method when control is transferred to the Group. The consideration transferred for the business combination is generally measured at fair value as at the date the control is acquired (acquisition date), as are the net identifiable assets acquired. Any goodwill that arises is tested annually for impairment. Any gain on a bargain purchase is recognised in OCI and accumulated in equity as capital reserve if there exists clear evidence of the underlying reasons for classifying the business combination as resulting in a bargain purchase; otherwise the gain is recognised directly in equity as capital reserve. Transaction costs are expensed as incurred, except to the extent related to the issue of debt or equity securities.
HealthCare Global Enterprises Limited
Notes to the Ind AS consolidated financial statements for the year ended 31 March 2018 (continued)
183

The consideration transferred does not include amounts related to the settlement of pre-existing relationships with the acquiree. Such amounts are generally recognised in the Statement of Profit or Loss.
Any contingent consideration is measured at fair value at the date of acquistaion. If an obligation to pay contingent consideration that meets the definition of financial instrument is classified as equity, then its not remeasured subsquently and settlement is accounted for within equity. Other contingent consideration is remeasured at fair value at each reporting date and changes in the fair value of the contingent consideration are recognised in profit or loss
3 Summary of significant accounting policies
(a) Revenue recognition
Medical services Revenue primarily comprises fees charged for inpatient and outpatient hospital services. Services include charges for
accommodation, medical professional services, equipment, radiology, laboratory and pharmaceutical goods used in treatments given to patients. Revenue is recorded net of discount given to patients recognised during the period in which the hospital service is provided, based upon the estimated amounts due from patients and/or medical funding entities. Unbilled revenue is recorded for the service where the patients are not discharged and invoice is not raised for the service.
Sale of medical and non-medical items Pharmacy Sales are recognised when the significant risks and rewards of ownership is transferred to the customer. Revenue is
measured at the fair value of the consideration received or receivable, taking into account contractually defined terms of payment and excluding taxes or duties collected on behalf of the government.
Other operating revenue Other operating revenue comprises revenue from various ancilliary revenue generating activities like operations and maintainence
arrangements as per the management agreement with other entities.The service income is recognised on the basis of services rendered and as per the terms of agreement.
Dividend and interest income Interest income from a financial asset is recognised when it is probable that the economic benefits will flow to the Group
and the amount of income can be measured reliably. Interest income is accrued on a time basis, by reference to the principal outstanding and at the effective interest rate applicable, which is the rate that exactly discounts estimated future cash receipts through the expected life of the financial asset to that asset’s net carrying amount on initial recognition. Dividend income is recognised when the Group’s right to receive dividend is established.
(b) Leases Leases are classified as finance leases whenever the terms of the lease transfer substantially all the risks and rewards of ownership
to the lessee. All other leases are classified as operating leases.
Assets held under finance leases are initially capitalised as assets of the Group at their fair value at the inception of the lease or, if lower, at the present value of the minimum lease payments. The corresponding liability to the lessor is included in the balance sheet as a finance lease obligation. Lease payments are apportioned between finance expenses and reduction of the lease obligation so as to achieve a constant rate of interest on the remaining balance of the liability.
Rental expense from operating leases is generally recognised on a straight-line basis over the term of the relevant lease. Where the rentals are structured solely to increase in line with expected general inflation to compensate for the lessor’s expected inflationary cost increases, such increases are recognised in the year in which such benefits accrue. Contingent rentals arising under operating leases are recognised as an expense in the period in which they are incurred.
(c) Foreign currency transactions Transactions in foreign currencies are translated into the respective functional currencies of Group at the exchange rates at the
dates of the transactions or an average rate approximates the actual rate at the date of the transaction.
Monetary assets and liabilities denominated in foreign currencies are translated into the functional currency at the exchange rate at the reporting date.
Exchange differences on monetary items are recognised in the Statement of profit and loss in the period in which they arise except for exchange differences arising from translation of long-term foreign currency monetary items recognised in the consolidated financial statements of the Group for the period immediately before the beginning of the first Ind AS financial reporting period (prior to 01 April 2016), as per the previous GAAP, pursuant to the Group’s choice of availing the exemption as permitted by Ind AS 101.
Non-monetary assets and liabilities that are measured in terms of historical cost in foreign currencies are not retranslated. Income and expense items in foreign currency are translated at the average exchange rates for the period, unless exchange rates fluctuate significantly during that period, in which case the exchange rates at the dates of the transactions are used.
HealthCare Global Enterprises Limited
Notes to the Ind AS consolidated financial statements for the year ended 31 March 2018 (continued)
184

(d ) Borrowing costs
Borrowing costs include: (i) interest expense calculated using the effective interest rate method, (ii) finance charges in respect of finance leases, and (iii) exchange differences arising from foreign currency borrowings to the extent that they are regarded as an adjustment to interest costs.
Borrowing costs directly attributable to the acquisition, construction or production of qualifying assets, which are assets that necessarily take a substantial period of time to get ready for their intended use or sale, are added to the cost of those assets, until such time as the assets are substantially ready for their intended use or sale.
Interest income earned on the temporary investment of specific borrowings pending their expenditure on qualifying assets is deducted from the borrowing costs eligible for capitalisation.
All other borrowing costs are recognised in the statement of profit and loss in the period in which they are incurred.
(e) Employee benefits
Defined benefit plan Payments to defined contribution retirement benefit plans are recognised as an expense when employees have rendered service
entitling them to the contributions.
For defined benefit plans, the cost of providing benefits is determined using the projected unit credit method, with actuarial valuations being carried out at the end of each annual reporting period. Remeasurement, comprising actuarial gains and losses, the effect of the changes to the asset ceiling (if applicable) and the return on plan assets (excluding net interest), is reflected in the balance sheet with a charge or credit recognised in other comprehensive income in the period in which they occur. The service cost (including current service cost, past service cost, as well as gains and losses on curtailments and settlements) is recognised in the Statement of profit and loss in the line item ‘Employee benefits expense’. Net interest is calculated by applying the discount rate at the beginning of the period to the net defined benefit liability or asset. The net interest expense is recognised in the line item ‘Finance costs’.
Defined contribution plan A defined contribution plan is post-employment benefit plan of Employee State Insurance (ESI) under which an entity pays specified
contributions to separate entity and has no obligation to pay any further amounts. The Group makes specified obligations towards employee provident fund and employee state insurance to Government administered provident fund scheme and Employee State Insurance scheme which is a defined contribution plan. The Group’s contributions are recognized as an expense in the statement of profit and loss during the period in which the employee renders the related service
Compensated absences The employees can carry-forward a portion of the unutilized accrued compensated absences and utilize it in future service periods
or receive cash compensation on termination of employment. Since the employee has unconditional right to avail the leave, the benefit is classified as a short term employee benefit. The Group records an obligation for such compensated absences in the period in which the employee renders the services that increase this entitlement. The obligation is measured on the basis of independent actuarial valuation using the projected unit credit method.
(e) Employee benefits (continued)
Share-based payment transactions The cost of equity-settled transactions is determined by the fair value at the date when the grant is made using an appropriate
valuation model and Group’s estimate of equity instruments that will vest. That cost is recognised, together with a corresponding increase in share-options together with a corresponding increase in share-options outstanding account in equity, over the period in which the performance and/or service conditions are fulfilled in employee benefits expense.
(f) Taxation
Income tax expense represents the sum of the tax currently payable and deferred tax.
(i) Current tax
The tax currently payable is based on taxable profit for the year. Taxable profit differs from ‘profit before tax’ as reported in the statement of profit and loss because of items of income or expense that are taxable or deductible in other years and items that are never taxable or deductible. The amount of current tax reflects the best estimate of the tax to be paid after considering the uncertainty and is calculated by using tax rates that have been enacted or substantively enacted by the end of the reporting period.
Current tax assets and current tax liabilities are offset only if there is a legally enforceable right to set off the recognised amounts, and it is intended to realize the assets and settle the liability on a net basis or simultaneously.
HealthCare Global Enterprises Limited
Notes to the Ind AS consolidated financial statements for the year ended 31 March 2018 (continued)
185
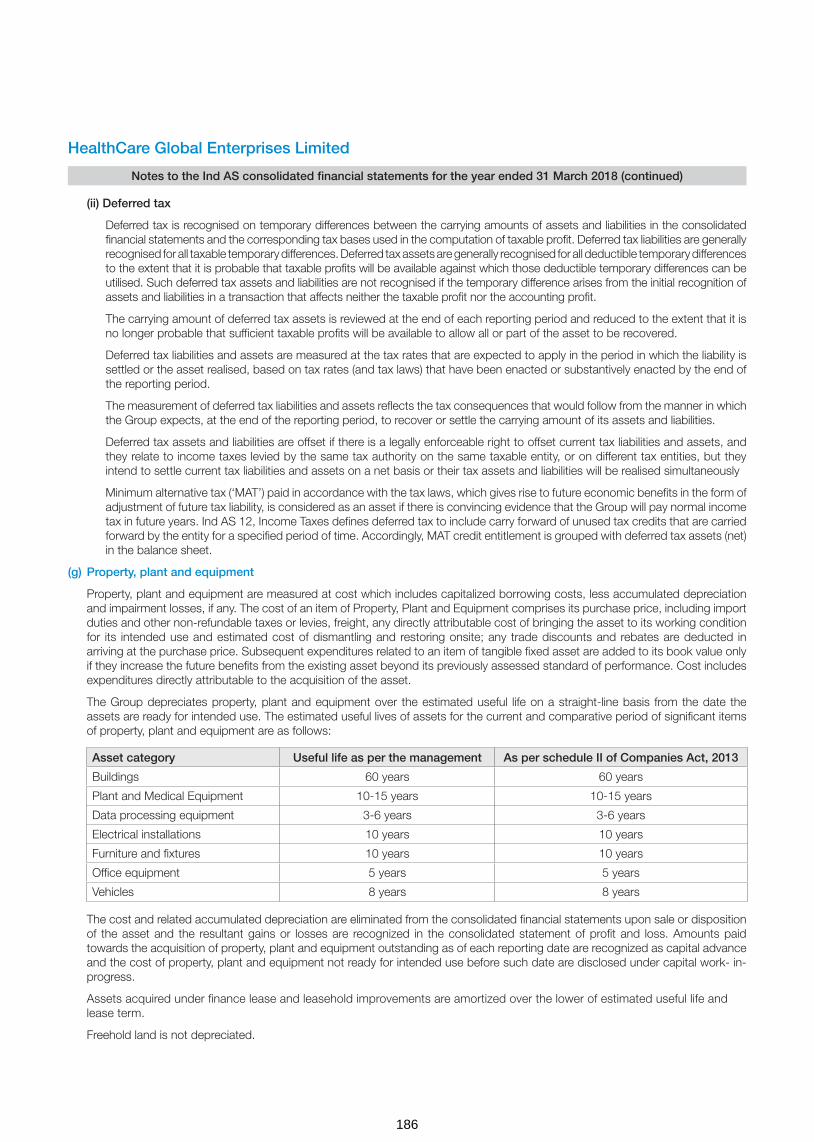
(ii) Deferred tax
Deferred tax is recognised on temporary differences between the carrying amounts of assets and liabilities in the consolidated financial statements and the corresponding tax bases used in the computation of taxable profit. Deferred tax liabilities are generally recognised for all taxable temporary differences. Deferred tax assets are generally recognised for all deductible temporary differences to the extent that it is probable that taxable profits will be available against which those deductible temporary differences can be utilised. Such deferred tax assets and liabilities are not recognised if the temporary difference arises from the initial recognition of assets and liabilities in a transaction that affects neither the taxable profit nor the accounting profit.
The carrying amount of deferred tax assets is reviewed at the end of each reporting period and reduced to the extent that it is no longer probable that sufficient taxable profits will be available to allow all or part of the asset to be recovered.
Deferred tax liabilities and assets are measured at the tax rates that are expected to apply in the period in which the liability is settled or the asset realised, based on tax rates (and tax laws) that have been enacted or substantively enacted by the end of the reporting period.
The measurement of deferred tax liabilities and assets reflects the tax consequences that would follow from the manner in which the Group expects, at the end of the reporting period, to recover or settle the carrying amount of its assets and liabilities.
Deferred tax assets and liabilities are offset if there is a legally enforceable right to offset current tax liabilities and assets, and they relate to income taxes levied by the same tax authority on the same taxable entity, or on different tax entities, but they intend to settle current tax liabilities and assets on a net basis or their tax assets and liabilities will be realised simultaneously
Minimum alternative tax (‘MAT’) paid in accordance with the tax laws, which gives rise to future economic benefits in the form of adjustment of future tax liability, is considered as an asset if there is convincing evidence that the Group will pay normal income tax in future years. Ind AS 12, Income Taxes defines deferred tax to include carry forward of unused tax credits that are carried forward by the entity for a specified period of time. Accordingly, MAT credit entitlement is grouped with deferred tax assets (net) in the balance sheet.
(g) Property, plant and equipment
Property, plant and equipment are measured at cost which includes capitalized borrowing costs, less accumulated depreciation and impairment losses, if any. The cost of an item of Property, Plant and Equipment comprises its purchase price, including import duties and other non-refundable taxes or levies, freight, any directly attributable cost of bringing the asset to its working condition for its intended use and estimated cost of dismantling and restoring onsite; any trade discounts and rebates are deducted in arriving at the purchase price. Subsequent expenditures related to an item of tangible fixed asset are added to its book value only if they increase the future benefits from the existing asset beyond its previously assessed standard of performance. Cost includes expenditures directly attributable to the acquisition of the asset.
The Group depreciates property, plant and equipment over the estimated useful life on a straight-line basis from the date the assets are ready for intended use. The estimated useful lives of assets for the current and comparative period of significant items of property, plant and equipment are as follows:
Asset category Useful life as per the management As per schedule II of Companies Act, 2013
Buildings 60 years 60 years
Plant and Medical Equipment 10-15 years 10-15 years
Data processing equipment 3-6 years 3-6 years
Electrical installations 10 years 10 years
Furniture and fixtures 10 years 10 years
Office equipment 5 years 5 years
Vehicles 8 years 8 years
The cost and related accumulated depreciation are eliminated from the consolidated financial statements upon sale or disposition of the asset and the resultant gains or losses are recognized in the consolidated statement of profit and loss. Amounts paid towards the acquisition of property, plant and equipment outstanding as of each reporting date are recognized as capital advance and the cost of property, plant and equipment not ready for intended use before such date are disclosed under capital work- in-progress.
Assets acquired under finance lease and leasehold improvements are amortized over the lower of estimated useful life and lease term.
Freehold land is not depreciated.
HealthCare Global Enterprises Limited
Notes to the Ind AS consolidated financial statements for the year ended 31 March 2018 (continued)
186

(h) Intangible assets
(i) Intangible assets acquired separately
Intangible assets with finite useful lives that are acquired separately are carried at cost less accumulated amortisation and accumulated impairment losses. Amortisation is recognised on a straight-line basis over their estimated useful lives. The estimated useful life and amortisation method are reviewed at the end of each reporting period, with the effect of any changes in estimate being accounted for on a prospective basis. Intangible assets with indefinite useful lives that are acquired separately are carried at cost less accumulated impairment losses.
Useful lives of intangible assets
Estimated useful lives of the intangible assets are as follows:
Asset category Useful Life
Computer software 3 years
Software for plant and machinery 13 years
(ii) Goodwill
Goodwill arising on a business combination is initially measured at excess of purchase consideration over fair value of identified net asset taken over. Subsequent measurement is at initial recognition less any accumulated impairment losses.
(i) Government grants
Government grants are recognised where there is reasonable assurance that the grant will be received and all attached conditions will be complied with. Where the Group receives non-monetary grants, the asset and the grant are accounted at fair value and recognised in the statement of profit and loss over the expected useful life of the assets
(j) Inventories
Inventories are measured at the lower of cost and net realisable value on the weighted average cost basis. Net realisable value is the estimated selling price in the ordinary course of business, less applicable variable selling expenses. Cost of inventories comprises of all costs of purchase and other costs incurred in bringing the inventories to their present location, after adjusting for VAT/GST wherever applicable applying FIFO method.
Imported inventories are accounted for at the applicable exchange rates prevailing on the date of transaction.
(k) Provisions
Provisions are recognised when the Group has a present obligation (legal or constructive) as a result of a past event, it is probable that the Group will be required to settle the obligation, and a reliable estimate can be made of the amount of the obligation.
The amount recognised as a provision is the best estimate of the consideration required to settle the present obligation at the end of the reporting period, taking into account the risks and uncertainties surrounding the obligation. When a provision is measured using the cash flows estimated to settle the present obligation, its carrying amount is the present value of those cash flows (when the effect of the time value of money is material).
Onerous contracts
A contract is considered to be onerous when the expected economic benefits to be derived by the Group from the contract are lower than the unavoidable cost of meeting its obligations under the contract. The provision for an onerous contract is measured at the present value of the lower of the expected cost of terminating the contract and the expected net cost of continuing with the contract. Before such a provision is made, the Group recognises any impairment loss on the assets associated with that contract.
(l) Financial instruments
a. Recognition and initial measurement
Trade receivables and debt securities issued are initially recognised when they are originated. All other financial assets and financial liabilities are initially recognised when the Group becomes a party to the contractual provisions of the instrument. A financial asset or financial liability is initially measured at fair value plus, for an item not at fair value through profit and loss (FVTPL), transaction costs that are directly attributable to its acquisition or issue.
HealthCare Global Enterprises Limited
Notes to the Ind AS consolidated financial statements for the year ended 31 March 2018 (continued)
187
b. Classification and subsequent measurement
Financial assets
On initial recognition, a financial asset is classified as measured at
- amortised cost;
- FVTPL
Financial assets are not reclassified subsequent to their initial recognition, except if and in the period the Group changes its business model for managing financial assets.
A financial asset is measured at amortised cost if it meets both of the following conditions and is not designated as at FVTPL:
− the asset is held within a business model whose objective is to hold assets to collect contractual cash flows; and
− the contractual terms of the financial asset give rise on specified dates to cash flows that are solely payments of principal and interest on the principal amount outstanding.
All financial assets not classified as measured at amortised cost as described above are measured at FVTPL. On initial recognition, the Group may irrevocably designate a financial asset that otherwise meets the requirements to be measured at amortised cost at FVTPL if doing so eliminates or significantly reduces an accounting mismatch that would otherwise arise.
Financial assets: Business model assessment
The Group makes an assessment of the objective of the business model in which a financial asset is held at a portfolio level because this best reflects the way the business is managed and information is provided to management. The information considered includes:
- the stated policies and objectives for the portfolio and the operation of those policies in practice. These include whether management’s strategy focuses on earning contractual interest income, maintaining a particular interest rate profile, matching the duration of the financial assets to the duration of any related liabilities or expected cash outflows or realising cash flows through the sale of the assets;
- how the performance of the portfolio is evaluated and reported to the Group’s management;
- the risks that affect the performance of the business model (and the financial assets held within that business model) and how those risks are managed;
- how managers of the business are compensated – e.g. whether compensation is based on the fair value of the assets managed or the contractual cash flows collected; and
- the frequency, volume and timing of sales of financial assets in prior periods, the reasons for such sales and expectations about future sales activity.
Transfers of financial assets to third parties in transactions that do not qualify for derecognition are not considered sales for this purpose, consistent with the Group’s continuing recognition of the assets.
Financial assets that are held for trading or are managed and whose performance is evaluated on a fair value basis are measured at FVTPL.
Financial assets: Assessment whether contractual cash flows are solely payments of principal and interest
For the purposes of this assessment, ‘principal’ is defined as the fair value of the financial asset on initial recognition. ‘Interest’ is defined as consideration for the time value of money and for the credit risk associated with the principal amount outstanding during a particular period of time and for other basic lending risks and costs (e.g. liquidity risk and administrative costs), as well as a profit margin.
In assessing whether the contractual cash flows are solely payments of principal and interest, the Group considers the contractual terms of the instrument. This includes assessing whether the financial asset contains a contractual term that could change the timing or amount of contractual cash flows such that it would not meet this condition. In making this assessment, the Group considers:
− contingent events that would change the amount or timing of cash flows; − terms that may adjust the contractual coupon rate, including variable interest rate features; − prepayment and extension features; and − terms that limit the Group’s claim to cash flows from specified assets (e.g. non- recourse features).
A prepayment feature is consistent with the solely payments of principal and interest criterion if the prepayment amount substantially represents unpaid amounts of principal and interest on the principal amount outstanding, which may include reasonable additional
HealthCare Global Enterprises Limited
Notes to the Ind AS consolidated financial statements for the year ended 31 March 2018 (continued)
188
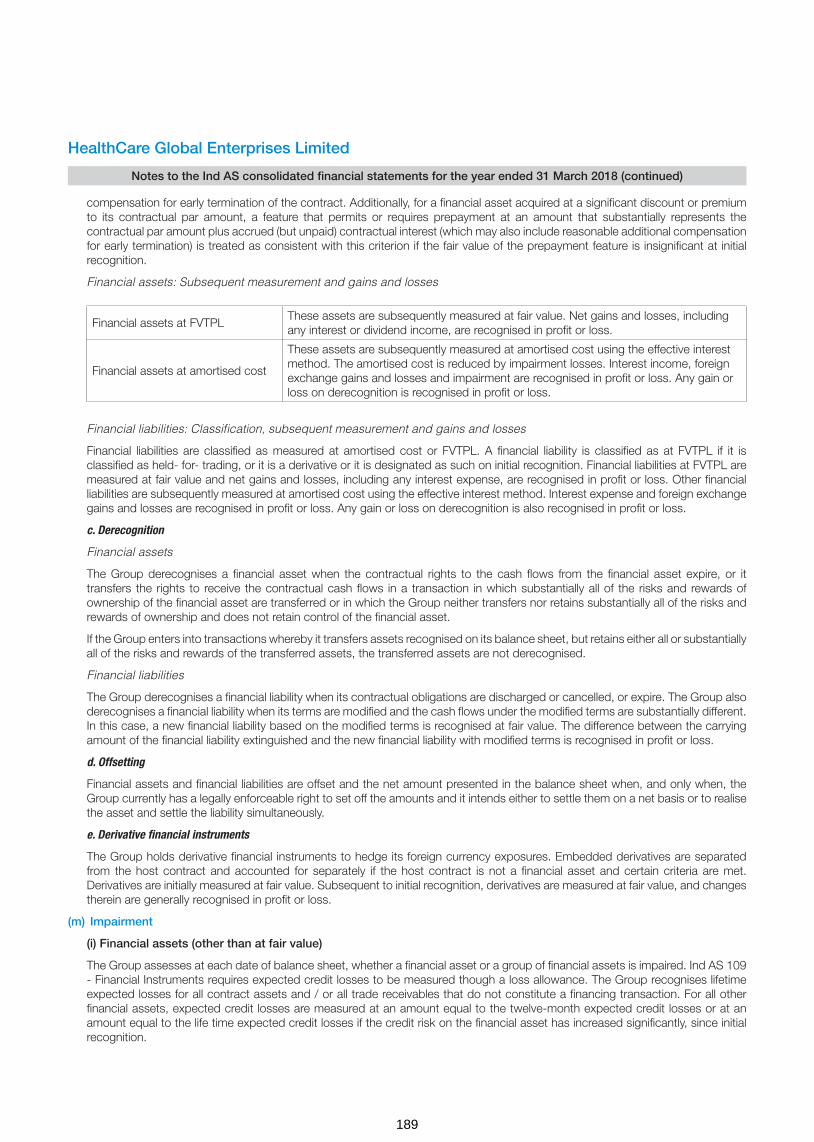
compensation for early termination of the contract. Additionally, for a financial asset acquired at a significant discount or premium to its contractual par amount, a feature that permits or requires prepayment at an amount that substantially represents the contractual par amount plus accrued (but unpaid) contractual interest (which may also include reasonable additional compensation for early termination) is treated as consistent with this criterion if the fair value of the prepayment feature is insignificant at initial recognition.
Financial assets: Subsequent measurement and gains and losses
Financial assets at FVTPLThese assets are subsequently measured at fair value. Net gains and losses, including any interest or dividend income, are recognised in profit or loss.
Financial assets at amortised cost
These assets are subsequently measured at amortised cost using the effective interest method. The amortised cost is reduced by impairment losses. Interest income, foreign exchange gains and losses and impairment are recognised in profit or loss. Any gain or loss on derecognition is recognised in profit or loss.
Financial liabilities: Classification, subsequent measurement and gains and losses
Financial liabilities are classified as measured at amortised cost or FVTPL. A financial liability is classified as at FVTPL if it is classified as held- for- trading, or it is a derivative or it is designated as such on initial recognition. Financial liabilities at FVTPL are measured at fair value and net gains and losses, including any interest expense, are recognised in profit or loss. Other financial liabilities are subsequently measured at amortised cost using the effective interest method. Interest expense and foreign exchange gains and losses are recognised in profit or loss. Any gain or loss on derecognition is also recognised in profit or loss.
c. Derecognition
Financial assets
The Group derecognises a financial asset when the contractual rights to the cash flows from the financial asset expire, or it transfers the rights to receive the contractual cash flows in a transaction in which substantially all of the risks and rewards of ownership of the financial asset are transferred or in which the Group neither transfers nor retains substantially all of the risks and rewards of ownership and does not retain control of the financial asset.
If the Group enters into transactions whereby it transfers assets recognised on its balance sheet, but retains either all or substantially all of the risks and rewards of the transferred assets, the transferred assets are not derecognised.
Financial liabilities
The Group derecognises a financial liability when its contractual obligations are discharged or cancelled, or expire. The Group also derecognises a financial liability when its terms are modified and the cash flows under the modified terms are substantially different. In this case, a new financial liability based on the modified terms is recognised at fair value. The difference between the carrying amount of the financial liability extinguished and the new financial liability with modified terms is recognised in profit or loss.
d. Offsetting
Financial assets and financial liabilities are offset and the net amount presented in the balance sheet when, and only when, the Group currently has a legally enforceable right to set off the amounts and it intends either to settle them on a net basis or to realise the asset and settle the liability simultaneously.
e. Derivative financial instruments
The Group holds derivative financial instruments to hedge its foreign currency exposures. Embedded derivatives are separated from the host contract and accounted for separately if the host contract is not a financial asset and certain criteria are met. Derivatives are initially measured at fair value. Subsequent to initial recognition, derivatives are measured at fair value, and changes therein are generally recognised in profit or loss.
(m) Impairment
(i) Financial assets (other than at fair value)
The Group assesses at each date of balance sheet, whether a financial asset or a group of financial assets is impaired. Ind AS 109 - Financial Instruments requires expected credit losses to be measured though a loss allowance. The Group recognises lifetime expected losses for all contract assets and / or all trade receivables that do not constitute a financing transaction. For all other financial assets, expected credit losses are measured at an amount equal to the twelve-month expected credit losses or at an amount equal to the life time expected credit losses if the credit risk on the financial asset has increased significantly, since initial recognition.
HealthCare Global Enterprises Limited
Notes to the Ind AS consolidated financial statements for the year ended 31 March 2018 (continued)
189

(ii) Non-financial assets
Tangible and Intangible assets
Property, Plant and equipment and intangible assets with finite life are evaluated for recoverability whenever there is an indication that their carrying amounts may not be recoverable. If any such indication exists, the recoverable amount (i.e. higher of the fair value less cost to sell and the value-in-use) is determined on an individual asset basis unless the asset does not generate cash flows that are largely independent of those from other assets. In such cases, the recoverable amount is determined for cash generating unit (CGU) to which the asset belongs.
If the recoverable amount of an asset (or CGU) is estimated to be less than its carrying amount, the carrying amount of the asset (or CGU) is reduced to it’s recoverable amount. An impairment loss is recognised in the statement of profit and loss.
(n) Earnings per share
Basic earnings per share are computed by dividing profit attributable to equity shareholders of the Group by the weighted average number of equity shares outstanding during the year.
Diluted earnings per share is computed by dividing the profit after tax by the weighted average number of equity shares considered for deriving basic EPS and also weighted average number of equity shares that could have been issued upon conversion of all dilutive potential equity shares. Dilutive potential equity shares are deemed converted as of the beginning of the period, unless issued at a later date. Dilutive potential equity shares are determined independently for each period presented.
(o) Contingent liabilities
A contingent liability is a possible obligation that arises from past events whose existence will be confirmed by the occurrence or non-occurrence of one or more uncertain future events beyond the control of the Group or a present obligation that is not recognized because it is not probable that an outflow of resources will be required to settle the obligation. A contingent liability also arises in extremely rare cases where there is a liability that cannot be recognized because it cannot be measured reliably. The Group does not recognize a contingent liability but discloses its existence in the consolidated financial statements unless the possibility of an outflow of resources embodying economic benefits is remote.
Contingent liabilities and commitments are reviewed by the management at each balance sheet date.
(p) Cash flow statement
Cash flows are reported using the indirect method, whereby net profit before tax is adjusted for the effects of transactions of a non-cash nature and any deferrals or accruals of past or future cash receipts or payments. The cash flows from operating, investing and financing activities of the Group are segregate. Bank overdrafts and investment in liquid mutual funds are classified as cash and cash equivalents for the purpose of cash flow statement, as they form an integral part of an entity’s cash management.
(q) Cash and cash equivalents
Cash and cash equivalents include cash in hand, demand deposits with banks and other short-term highly liquid investments with original maturities of three months or less.
For the purpose of cash flow statement, cash and cash equivalent includes cash in hand, in banks, demand deposits with banks and other short-term highly liquid investments with original maturities of three months or less, net of outstanding bank overdrafts that are repayable on demand and are considered part of the cash management system.
(r) Gross obligations over written put options issued to non-controlling interests
The Company has written put option to non-controlling interests in its subsidiaries.
The amount that may become payable under the option on exercise is recognised as a financial liability at its present value with a corresponding charge directly to the shareholders’ equity.
In the absence of any mandatorily applicable accounting guidance, the Group has elected an accounting policy choice to recognise changes on subsequent measurement of the liability in shareholders’ equity.
HealthCare Global Enterprises Limited
Notes to the Ind AS consolidated financial statements for the year ended 31 March 2018 (continued)
190

4 New accounting standards not yet adopted
Ministry of Corporate Affairs (“MCA”) through Companies (Indian Accounting Standards) Amendment Rules, 2018 has notified the following new amendments to Ind ASs which the Group has not applied as they are effective for annual periods beginning on or after 01 April 2018:
(a) Ind AS 115 - Revenue from Contracts with Customers
On 28 March 2018, the MCA notified the Ind AS 115 Revenue from contract with customers. The core principle of the new standard is that an entity should recognise revenue to depict the transfer of promised goods or services to customers in an amount that reflects the consideration to which the entity expects to be entitled in exchange for those goods and service. Further, the new standard requires enhanced disclosure about the nature,amount, timing and uncertainty of revenue and cash flow arising from the entity’s contract with customers. The effective date for adoption of Ind AS 115 is financial period beginning on or after 01 April 2018.
There is no material impact on account of adoption of Ind AS 115 to the Group’s current policy of revenue recognition.
(b) Ind AS 21 – The effect of changes in foreign Exchange rates
The amendment clarifies on the accounting of transactions that include the receipt or payment of advance consideration in a foreign currency. The appendix explains that the date of the transaction, for the purpose of determining the exchange rate, is the date of initial recognition of the non-monetary prepayment asset or deferred income liability. If there are multiple payments or receipts in advance, a date of transaction is established for each payment or receipt. The Group is evaluating the impact of this amendment on its consolidated financial statements.
HealthCare Global Enterprises Limited
Notes to the Ind AS consolidated financial statements for the year ended 31 March 2018 (continued)
191
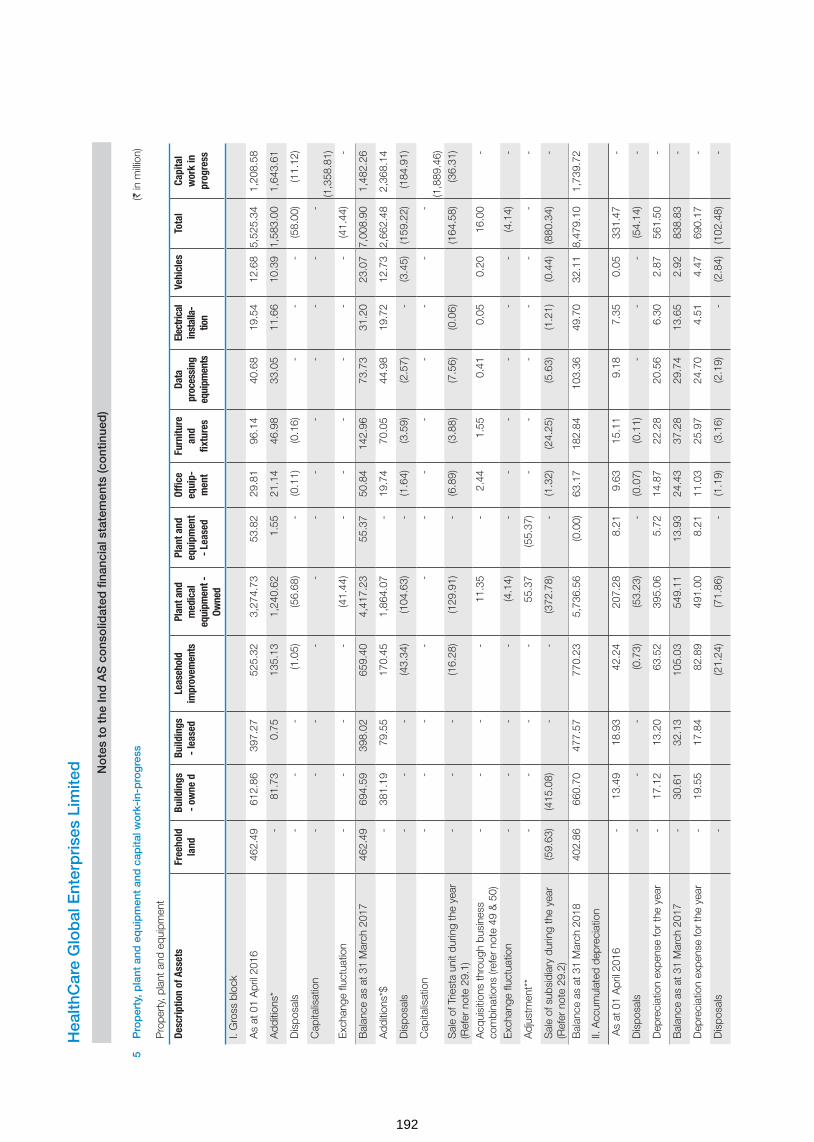
5P
rop
erty
, pla
nt a
nd e
qui
pm
ent
and
cap
ital w
ork
-in-
pro
gre
ss(`
in m
illion
)
Pro
pert
y, p
lant
and
equ
ipm
ent
Desc
riptio
n of
Ass
ets
Free
hold
la
ndBu
ildin
gs
- ow
ne d
Build
ings
-
leas
edLe
aseh
old
impr
ovem
ents
Plan
t and
m
edic
al
equi
pmen
t -
Owne
d
Plan
t and
eq
uipm
ent
- Le
ased
Offic
e eq
uip-
men
t
Furn
iture
an
d fix
ture
s
Data
pr
oces
sing
eq
uipm
ents
Elec
trica
l in
stal
la-
tion
Vehi
cles
Tota
lCa
pita
l w
ork
in
prog
ress
I. G
ross
blo
ck
As
at 0
1 A
pril
2016
462
.49
612
.86
397
.27
525
.32
3,2
74.7
3 5
3.82
2
9.81
9
6.14
4
0.68
1
9.54
1
2.68
5,
525.
34
1,2
08.5
8
Add
ition
s*
-
81.
73
0.7
5 1
35.1
3 1
,240
.62
1.5
5 2
1.14
4
6.98
3
3.05
1
1.66
1
0.39
1,
583.
00
1,6
43.6
1
Dis
posa
ls -
-
-
(1
.05)
(56.
68)
-
(0.1
1) (0
.16)
-
-
-
(58.
00)
(11.
12)
Cap
italis
atio
n -
-
-
-
-
-
-
-
-
-
-
-
(1,3
58.8
1)E
xcha
nge
fluct
uatio
n -
-
-
-
(4
1.44
) -
-
-
-
-
-
(4
1.44
) -
Bal
ance
as
at 3
1 M
arch
201
7 4
62.4
9 6
94.5
9 3
98.0
2 6
59.4
0 4
,417
.23
55.
37
50.
84
142
.96
73.
73
31.
20
23.
07
7,00
8.90
1
,482
.26
Add
ition
s*$
-
381
.19
79.
55
170
.45
1,8
64.0
7 -
1
9.74
7
0.05
4
4.98
1
9.72
1
2.73
2,
662.
48
2,3
68.1
4
Dis
posa
ls -
-
-
(4
3.34
) (1
04.6
3) -
(1
.64)
(3.5
9) (2
.57)
-
(3.4
5)(1
59.2
2) (1
84.9
1)
Cap
italis
atio
n -
-
-
-
-
-
-
-
-
-
-
-
(1,8
89.4
6)S
ale
of T
riest
a un
it du
ring
the
year
(R
efer
not
e 29
.1)
-
-
-
(16.
28)
(129
.91)
-
(6.8
9) (3
.88)
(7.5
6) (0
.06)
(164
.58)
(36.
31)
Acq
uisi
tions
thro
ugh
busi
ness
co
mbi
natio
ns (r
efer
not
e 49
& 5
0) -
-
-
-
1
1.35
-
2
.44
1.5
5 0
.41
0.0
5 0
.20
16.
00
-
Exc
hang
e flu
ctua
tion
-
-
-
-
(4.1
4) -
-
-
-
-
-
(4
.14)
-
Adj
ustm
ent*
* -
-
-
-
5
5.37
(5
5.37
) -
-
-
-
-
-
-
Sal
e of
sub
sidi
ary
durin
g th
e ye
ar
(Ref
er n
ote
29.2
) (5
9.63
) (4
15.0
8) -
-
(3
72.7
8) -
(1
.32)
(24.
25)
(5.6
3) (1
.21)
(0.4
4)(8
80.3
4) -
Bal
ance
as
at 3
1 M
arch
201
8 4
02.8
6 6
60.7
0 4
77.5
7 7
70.2
3 5
,736
.56
(0.0
0) 6
3.17
1
82.8
4 1
03.3
6 4
9.70
3
2.11
8,
479.
10
1,7
39.7
2
II. A
ccum
ulat
ed d
epre
ciat
ion
As
at 0
1 A
pril
2016
-
13.
49
18.
93
42.
24
207
.28
8.2
1 9
.63
15.
11
9.1
8 7
.35
0.0
5 3
31.4
7 -
Dis
posa
ls -
-
-
(0
.73)
(53.
23)
-
(0.0
7) (0
.11)
-
-
-
(54.
14)
-
Dep
reci
atio
n ex
pens
e fo
r th
e ye
ar -
1
7.12
1
3.20
6
3.52
3
95.0
6 5
.72
14.
87
22.
28
20.
56
6.3
0 2
.87
561
.50
-
Bal
ance
as
at 3
1 M
arch
201
7 -
3
0.61
3
2.13
1
05.0
3 5
49.1
1 1
3.93
2
4.43
3
7.28
2
9.74
1
3.65
2
.92
838
.83
-
Dep
reci
atio
n ex
pens
e fo
r th
e ye
ar -
1
9.55
1
7.84
8
2.89
4
91.0
0 8
.21
11.
03
25.
97
24.
70
4.5
1 4
.47
690
.17
-
Dis
posa
ls -
(2
1.24
) (7
1.86
) -
(1
.19)
(3.1
6) (2
.19)
-
(2.8
4) (1
02.4
8) -
Hea
lthC
are
Glo
bal
Ent
erp
rise
s Li
mite
d
No
tes
to t
he In
d A
S c
ons
olid
ated
fina
ncia
l sta
tem
ents
(co
ntin
ued
)
192

Sal
e of
Trie
sta
unit
durin
g th
e ye
ar
(Ref
er n
ote
29.1
) (4
.01)
(23.
77)
-
(2.8
6) (1
.85)
(4.1
4) -
-
(3
6.63
) -
Adj
ustm
ent
-
-
-
-
22.
14
(22.
14)
-
-
-
-
-
-
-
Sal
e of
sub
sidi
ary
durin
g th
e ye
ar
(Ref
er n
ote
29.2
) -
(5
.35)
-
-
(27.
34)
-
(0.2
9) (1
.60)
(1.7
3) (0
.10)
(0.0
5) (3
6.46
) -
Bal
ance
as
at 3
1 M
arch
201
8 -
4
4.81
4
9.97
1
62.6
7 9
39.2
8 -
3
1.12
5
6.64
4
6.38
1
8.06
4
.50
1,35
3.43
-
Net
blo
ck a
s at
31
Mar
ch 2
017
462
.49
663
.98
365
.89
554
.37
3,8
68.1
2 4
1.44
2
6.41
1
05.6
8 4
3.99
1
7.55
2
0.15
6,
170.
07
1,4
82.2
6
Net
blo
ck a
s at
31
Mar
ch 2
018
402
.86
615
.89
427
.60
607
.56
4,7
97.2
8 (0
.00)
32.
05
126
.20
56.
98
31.
64
27.
61
7,12
5.67
1
,739
.72
Ref
er n
ote
17 fo
r de
tails
of c
harg
e cr
eate
d on
xed
ass
ets
* In
clud
es e
xpen
ses
capi
talis
ed o
f ` 3
46.1
2 m
illion
(FY
17.
` 1
74.5
0 m
illion
) of w
hich
bor
row
ing
cost
cap
italis
ed is
` 0
.82
milli
on ,
(PY
17
Nil)
** P
erta
in to
ass
ets
clas
sifie
d as
fina
nce
leas
e til
l pre
viou
s ye
ar. D
urin
g th
e ye
ar, o
n ac
coun
t of s
ettle
men
t of l
ease
obl
igat
ion
this
has
bee
n tr
ansf
erre
d to
ow
ned
asse
ts.
$ A
dditi
ons
incl
udes
gov
ernm
ent g
rant
reco
gnis
ed a
t fai
r va
lue.
(refe
r no
te 2
0)
Hea
lthC
are
Glo
bal
Ent
erp
rise
s Li
mite
d
No
tes
to t
he In
d A
S c
ons
olid
ated
fina
ncia
l sta
tem
ents
(co
ntin
ued
)
193

6 Goodwill and other intangible assets
Description of assets Goodwill (refer note (i)
below)
Computer software and software for
plant and machinery
Tenancy rights
Total
I. Gross block
As at 01 April 2016 608.88 67.89 - 67.89
Additions - 47.94 - 47.94
Balance as at 31 March 2017 608.88 115.83 - 115.83
Additions - 10.26 - 10.26
Acquired through business combination (refer note 49 & 50)
484.52 - 11.00 11.00
Sale of Triesta unit during the year (refer note 29.1) - (2.84) - (2.84)
Sale of subsidiary during the year (refer note 29.2) - (5.61) - (5.61)
Balance as at 31 March 2018 1,093.40 117.64 11.00 128.64
II. Accumulated amortisation
As at 01 April 2016 - 41.01 - 41.01
Amortisation expense for the year - 6.75 - 6.75
Balance as at 31 March 2017 - 47.76 - 47.76
Sale of Triesta unit during the year (refer note 29.1) - (1.60) - (1.60)
Sale of subsidiary during the year (refer note 29.2) - (0.06) - (0.06)
Amortisation expense for the year - 22.23 2.20 24.43
Balance as at 31 March 2018 - 68.33 2.20 70.53
Net block as at 31 March 2017 608.88 68.07 - 68.07
Net block as at 31 March 2018 1,093.40 49.31 8.80 58.11
(i) Goodwill
For the purposes of impairment testing, goodwill from business acquisition has been allocated to the Cash Generating Units (CGU) as given below:
Particulars As at 31 March 2018
As at 31 March 2017
BACC Healthcare Private Limited (refer note a) 554.30 554.30
HCG Medi-Surge Hospitals Private Limited (refer note a) 53.46 53.46
Niruja Product Development and Healthcare Research Private Limited 0.25 0.25
Malnad Hospital and Institute of Oncology Private Limited 0.87 0.87
City Cancer Center (CCC) (refer note 50) 484.52 -
Total 1,093.40 608.88
(a) The key assumptions used in the estimation of the recoverable amount are set out below:
HealthCare Global Enterprises Limited
Notes to the Ind AS consolidated financial statements (continued)
Assumptions Values
Annual growth rate 10% to 22%
Terminal growth rate 4% to 5%
Discount rate 12% to 20%
(` in million)
194

HealthCare Global Enterprises Limited
Notes to the Ind AS consolidated financial statements (continued)
The values assigned to the key assumptions represent management’s assessment of future trends and based on historical data from both external and internal sources. Discount rate reflects the current market assessment of the risks specific to a Cash Generating Unit (CGU) or group of CGUs. The discount rate is estimated based on the capital asset pricing method for respective CGU. The cash flow projections included specific estimates developed using internal forecasts. The planning horizon reflects the assumptions for short-to-midterm market developments. The Group believes that any reasonably possible change in the key assumptions on which a recoverable amount is based would not cause the aggregate carrying amount to exceed the aggregate recoverable amount of the cash generating unit.
The estimated recoverable amount of the CGU exceeded its carrying amount, hence impairment is not triggered.
7 Investment in equity accounted investees
As at 31 March 2018 As at 31 March 2017
Unquoted equity instruments & preference instruments
In Associate
Healthcare Global (Africa) Private Limited 262.45 -
(160,659 ordinary shares of USD 1 each fully paid up & 115,820 Preferred A shares of USD 1 each along with premium of USD 30.12 per share. (refer note 29.4 for loss of control in subsidiary for 31 March 2017
In Joint Venture
Strand Life Sciences Private Limited 218.00 -
(9,140,342 equity shares of ` 10 each & 101,193 Series 1 preference shares of ` 10 each, fully paid up along with a premium of ` 15.97 per share (31 March 2017 - Nil) (Refer note 29.1)
480.45 -
7 Investments
As at 31 March 2018 As at 31 March 2017
A) Non-current
Investments carried at fair value through profit and loss (FVTPL)
(i) Unquoted equity instruments
Zoctr Health Private Limited (299 equity shares of ` 10/- each, fully paid along with a premium of ` 17,097.25 per share and 153 equity shares of ` 10/- each, fully paid up along with a pre-mium of ` 16,498 per share ; 31 March 2017: Nil)
7.64 -
Suchirayu Healthcare Solutions Limited (2,055,000 equity shares of ` 10/- each, fully paid up; 31 March 2017 : Nil ) Refer note below
0.50 -
Note: The Company has entered into a non-disposal under-taking of the its investment in Suchirayu Healthcare Solutions Limited (Suchirayu) until the closure of the loan by Suchirayu.
(ii) Mutual funds (Quoted)
Religare Invesco Short Term Fund- 17,112.198 units @ ` 2,520.36 (31 March 17: 17,112.198 units @ ` 2,310.36)
43.13 39.54
(iii) Mutual funds and other funds (unquoted)
Total non-current investments 51.27 39.54
(` in million)
195

HealthCare Global Enterprises Limited
Notes to the Ind AS consolidated financial statements (continued)
B) Current
As at 31 March 2018 As at 31 March 2017
Investments carried at fair value through profit and loss (FVTPL)
Units Amount Units Amount
Mutual funds and other funds (Quoted)
- Unit Trust of India - Money Market Fund - - 24,060.61 53.93
- Birla Sun life - - 65,845.71 20.98
Total current investments - 74.91
Aggregate amount of quoted investments 43.13 114.45
Aggregate amount of market value of investments 43.13 114.45
Aggregate amount of unquoted investments 8.14 -
8 Loans (Unsecured)
As at 31 March 2018 As at 31 March 2017
Non Current Current Non Current Current
Considered good
a) Others 1.39 - - -
b) Advances to employees - 31.19 - 20.20
c) Inter-corporate deposits 68.00 - 29.30 -
d) Other advances to related parties (refer note 44) 29.16 - - -
Total 98.55 31.19 29.30 20.20
9 Other financial assets
As at 31 March 2018 As at 31 March 2017
Non Current Current Non Current Current
Security deposits (refer note 44) 327.68 0.57 312.41 -
Unbilled revenue - 126.80 - 112.92
Advances to related parties (Refer note 44) 2.87 - 2.72 -
Term deposits (more than 12 months maturity from the reporting date)
142.02 9.10 145.33 25.60
Interest accrued on deposit 14.30 4.08 17.16 -
Interest accrued on inter corporate deposit 9.13 - 0.95 -
496.00 140.55 478.57 138.52
Note
1 Term deposits include margin money deposits with banks and deposits given as security for obtaining bank guarantees
2 Details of advances to directors As at 31 March 2018 As at 31 March 2017
i Advances to director 0.93 -
- Dr. B S Ajaikumar
(` in million)
196

HealthCare Global Enterprises Limited
Notes to the Ind AS consolidated financial statements (continued)
10 Other assets
As at 31 March 2018 As at 31 March 2017
Non Current Current Non Current Current
Considered good
Capital advances 314.79 - 215.22 -
Prepaid expenses 335.63 66.20 300.91 44.30
Rental advance - 15.33 - 24.91
Advance to vendors - 101.34 - 66.82
Indirect taxes paid under protest - - 1.40 -
Balance with revenue authorities - 33.70 - -
Considered doubtful
Advance to vendors - 29.03 - 29.83
Less : Allowance for bad and doubtful advances - (29.03) - (29.83)
650.42 216.57 517.53 136.03
11 Inventories (lower of cost and net realisable value)*
As at 31 March
2018
As at 31 March
2017
Medical and non medical items 240.26 187.69
240.26 187.69
*Inventories are subject to charge to secure bank loans. There are nil provisions for written down to net realisable value.
12 Trade receivables*
As at As at
31 March 2018
31 March 2017
Trade receivables (unsecured) consist of following
a) Considered good 1,284.40 1,032.20
b) Considered doubtful 340.14 385.88
Less: Allowance for bad and doubtful debts (expected credit loss allowance - Refer note 40)
(340.14) (385.88)
1,284.40 1,032.20
Refer note 44 for trade receivables from related parties
*Trade receivables are subject to charge to secure bank loans
Note: Trade receivables include due from companies in which any director is a director or member
As at 31 March
2018
As at 31 March
2017
Private companies in which any director is a director or member
- Health Care Process Solutions (India) Private Limited 0.06 -
(` in million)
197

HealthCare Global Enterprises Limited
Notes to the Ind AS consolidated financial statements (continued)
13 Cash and bank balances
As at 31 March
2018
As at 31 March
2017
A. (a) Cash on hand 7.62 15.36
(b) Cheques, drafts on hand 1.60 3.96
(c) Balance with bank
In current accounts 182.33 74.67
In Exchange Earners Foreign Currency Account (EEFC) accounts 17.11 11.04
(d) Other deposit* 79.30 408.52
(e) Earmarked balances with banks - 338.67
287.96 852.22
*Other deposits include margin money deposits with banks and deposits given as security for obtaining bank guarantees.These deposits are restrictive.
For the purpose of the statement of cash flows, cash and cash equivalent comprise the following:
As at 31 March
2018
As at 31 March
2017
(a) Cash on hand 7.62 15.36
(b) Cheques, drafts on hand 1.60 3.96
(c) Balance with bank
In current accounts 182.33 74.67
In EEFC accounts 17.11 11.04
(d) Other deposit* 79.30 408.52
(e) Earmarked balances with banks 338.67
287.96 852.22
Less: Bank overdrafts (Refer Note 17) (17.35) (416.29)
Add: Investments in liquid mutual funds in the nature of “Cash and cash equivalents” [Refer Note 7]
- 74.91
Cash and cash equivalents as per consolidated statement of cash flows 270.61 510.84
14 Equity share capital
As at31 March
2018
As at31 March
2017
Authorised share capital :
132,000,000 equity shares of ` 10 each (as at 31 March 2017: 132,000,000 equity shares)
1,320.00 1,320.00
Issued, subscribed and paid up capital comprises:
86,904,473 fully paid equity shares of ` 10 each (as at 31 March 31 2017: 85,712,986 fully paid equity shares of ` 10 each)
869.04 857.13
(` in million)
198

HealthCare Global Enterprises Limited
Notes to the Ind AS consolidated financial statements (continued)
14.1 Reconciliation of the equity shares outstanding at the beginning and at the end of the year:
Number of shares
Amount
Balance as at 01 April 2016 85,075,986 850.76
Increase during the year
(a) Issue of equity shares pursuant to exercise of employee share options under employee share option plan 2014 (refer note 37)
637,000 6.37
Balance as at 31 March 2017 85,712,986 857.13
Increase during the year
(a) Issue of equity shares pursuant to preferential allotment* 1,166,667 11.66
(b) Issue of equity shares pursuant to exercise of employee share options under employee share option plan 2014 (refer note 37)
24,820 0.25
Balance as at 31 March 2018 86,904,473 869.04
*The sharehoders of the Company, vide resolution passed Extraordinary General Meeting, held on 28 December 2017, has approved the allotment of 1,166,667 (Eleven Lakh Sixty Six Thousand Six Hundred Sixty Seven) equity shares of ` 10 each of the Company, at a price of ` 300 per share (including share premium of ` 290 per share), on Preferential basis, to Indgrowth Capital Fund 1, a SEBI registered Category III, Alternative Investment Fund (‘Allottee’).
14.2 Rights, preferences and restrictions attached to equity shares
Fully paid equity shares, which have a par value of ` 10, carry one vote per share and carry a right to dividends The Company has only one class of equity share having a par value of ` 10/- each. Holder of equity shares is entitled to one vote per share. In the event of liquidation of the Company, the holders of the equity shares will be entitled to receive any of the remaining assets of the Company, after distribution of all preferential amount. However, as on date no such preferential amount exists. The distribution will be in proportion to number of equity shares held by the shareholders.
14.3 Details of shareholder holding more than 5% shares of equity shares
As at 31 March 2018 As at 31 March 2017
Number of Shares held
% holding of equity shares
Number of Shares held
% holding of equity shares
Dr B.S Ajaikumar 17,642,739 20.30% 17,642,739 20.58%
V Sciences Investments Pte. Limited 8,320,805 9.57% 8,320,805 9.71%
Sundaram Mutual Fund 4,551,524 5.24% 5,490,474 6.41%
International Finance Corporation 4,358,705 5.02% 4,358,705 5.09%
Franklin Templeton Mutual Fund - - 5,790,082 6.76%
Prazim Trading and Investment Co Private Limited - - 6,654,723 7.76%
14.4 Aggregate number of equity shares allotted as fully paid-up without payment being received in cash for a period of five years immediately preceding the years ended 31 March 2018 and 31 March 2017 (refer note 14.6)
Particulars Aggregate number of shares as at
31 March 2018
31 March 2017
(a) Issue of shares pursuant to mergers 1,531,562 1,531,562
199
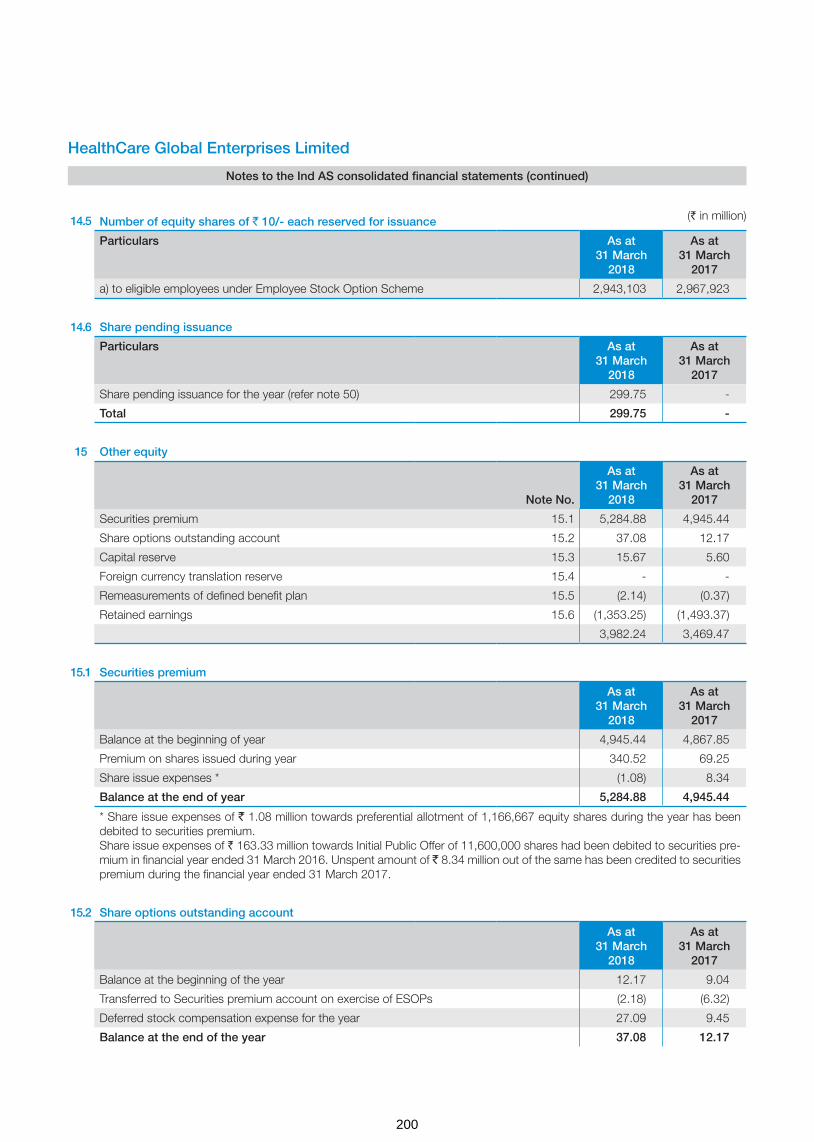
HealthCare Global Enterprises Limited
Notes to the Ind AS consolidated financial statements (continued)
14.5 Number of equity shares of ` 10/- each reserved for issuance
Particulars As at31 March
2018
As at31 March
2017
a) to eligible employees under Employee Stock Option Scheme 2,943,103 2,967,923
14.6 Share pending issuance
Particulars As at31 March
2018
As at31 March
2017
Share pending issuance for the year (refer note 50) 299.75 -
Total 299.75 -
15 Other equity
Note No.
As at31 March
2018
As at31 March
2017
Securities premium 15.1 5,284.88 4,945.44
Share options outstanding account 15.2 37.08 12.17
Capital reserve 15.3 15.67 5.60
Foreign currency translation reserve 15.4 - -
Remeasurements of defined benefit plan 15.5 (2.14) (0.37)
Retained earnings 15.6 (1,353.25) (1,493.37)
3,982.24 3,469.47
15.1 Securities premium
As at31 March
2018
As at31 March
2017
Balance at the beginning of year 4,945.44 4,867.85
Premium on shares issued during year 340.52 69.25
Share issue expenses * (1.08) 8.34
Balance at the end of year 5,284.88 4,945.44
* Share issue expenses of ` 1.08 million towards preferential allotment of 1,166,667 equity shares during the year has been debited to securities premium.Share issue expenses of ` 163.33 million towards Initial Public Offer of 11,600,000 shares had been debited to securities pre-mium in financial year ended 31 March 2016. Unspent amount of ` 8.34 million out of the same has been credited to securities premium during the financial year ended 31 March 2017.
15.2 Share options outstanding account
As at31 March
2018
As at31 March
2017
Balance at the beginning of the year 12.17 9.04
Transferred to Securities premium account on exercise of ESOPs (2.18) (6.32)
Deferred stock compensation expense for the year 27.09 9.45
Balance at the end of the year 37.08 12.17
(` in million)
200

HealthCare Global Enterprises Limited
Notes to the Ind AS consolidated financial statements (continued)
The above reserve relates to share options granted by the Company to its employees under its employee share option plan. Further information about share-based payments to employees is set out in note 37
15.3 Capital reserve
As at31 March
2018
As at31 March
2017
Balance at the beginning of the year 5.60 5.60
On acquisition of business (Refer note 49) 1.17 -
On equity accounted investee (Refer note 29.1(a)) 8.90 -
Balance at the end of the year 15.67 5.60
15.4 Foreign currency translation reserve
As at31 March
2018
As at31 March
2017
Balance at the beginning of the year - (0.32)
Other comprehensive income arising from exchange differences on translating the foreign operations
- 0.32
Balance at the end of the year - -
15.5 Remeasurements of the defined benefit plan
As at31 March
2018
As at31 March
2017
Balance at the beginning of the year (0.37) 0.04
Other comprehensive income arising from remeasurement of defined benefit plan (net of income tax)
(1.77) (0.41)
Balance at the end of the year (2.14) (0.37)
15.6 Retained earnings
As at31 March
2018
As at31 March
2017
Balance at the beginning of the year (1,493.37) (1,474.73)
Profit attributable to owners of the Company 205.23 221.73
Change in fair value of gross obligations over written put options issued to the non-controlling interests (refer note (i) below)
55.01 (115.61)
Change in ownership in subsidiaries (without loss of control) - (124.76)
Balance at the end of the year (1,233.13) (1,493.37)
(` in million)
201

HealthCare Global Enterprises Limited
Notes to the Ind AS consolidated financial statements (continued)
(i). The Company has issued written put option to non-controlling interests in BACC Healthcare Private Limited and HCG Medi-surge Hospitals Private Limited. In accordance with the terms of underlying shareholders agreement, should the option be exercised by non-controlling interests, the Company has to settle such liability by payment of cash.
16 Non-controlling interests
As at31 March
2018
As at31 March
2017
Balance at the beginning of the year 574.62 326.90
Profit for the year (35.85) 8.70
Other comprehensive income / (losses) for the year (net of tax) 0.34 0.09
Additional investments by non-controlling interests 123.39 123.69
Adjustment on account of change in holding without change in control 101.30 115.24
Reduction in non-controlling interest on account of sale of equity investment in subsidiary HCG Regency Oncology Private Limited (Refer note 29.2)
(124.59) -
Balance at the end of the year 639.21 574.62
(i) Details of non-wholly owned subsidiaries that have material non-controlling interests
There are no non-wholly owned subsidiaries that have material non-controlling interests. The management has set materiality at ten percent of the annual consolidated turnover, as per the last audited financial statements of the Company.
17 Borrowings
As at 31 March 2018 As at 31 March 2017
Non Current Current Non Current Current
Secured - at amortised cost
(i) Term loans
from banks (refer note 17.1.1) 2,221.41 297.13 1,331.71 54.05
from other parties (refer note 17.1.2) 16.00 18.26 34.54 22.85
(ii) Vehicle loans (refer note 17.1.3 ) 6.34 1.63 1.63 0.54
(iii) Loans repayable on demand
-from Banks (bank overdraft) (refer note 17.1.4) - 17.35 - 416.29
Unsecured - at amortised cost
(i) Deferred payment liabilities (refer note 17.1.5) 918.95 570.31 974.91 859.57
(ii) Long term maturities of finance lease obligations (refer note 35.1)
555.17 - 475.62 14.93
(` in million)
202

HealthCare Global Enterprises Limited
Notes to the Ind AS consolidated financial statements (continued)
(iii) Loans from others (refer note 17.1.6) 6.42 - 15.41 -
Less : Amount included under “Other financial liabilities” (refer note 18)
- (887.33) - (951.94)
Total 3,724.29 17.35 2,833.82 416.29
17.1 Summary of borrowing arrangements
Details of security and terms of repayment of term loans and other loans (except loans repayable on demand) are stated below.
Terms of repayment and securityAs at
31 March 2018
As at 31 March
2017
17.1.1 Term loans from banks - Secured
Facility-1
Non-current portion 2,262.20 985.91
Amounts included under current maturities of long-term debt 265.12 5.41
- Secured by exclusive charge on equipments purchased from these loans, first charge on immovable fixed assets (land and building / structures there upon) and movable fixed assets (both present and future, not charged exclusively to any other lender) and second pari-passu charge on all current assets and receivables (both present and future) of the Company, HCG Medi-Surge Hospitals Private Limited, HCG Oncology LLP, APEX HCG Oncology Hospitals LLP and HCG NCHRI Oncology LLP, HCG EKO Oncology LLP, HCG Manavata Oncology LLP - Rate of interest: 6 months MCLR (+ 0.70% to 1.25% p.a.) - Repayable in instalments over a period of 6 to 9 years after 1 to 3 year moratorium from the date of borrowing. (Refer note 40) * Non-current portion of bank debt as disclosed herein is gross of ` 58.58 million towards unamortised loan processing charges, which is netted below.”
Facility-2
Non-current portion 0.29 0.57
Amounts included under current maturities of long-term debt 0.25 0.21
- Security: Term loan is secured by hypothecation against medical equipment of Malnad Hospital and Institute of Oncology Private Limited.
- Rate of interest: Bank’s base rate + 2.75% p.a
- Payable in 84 monthly instalments commencing from the date of borrowing. (Refer note 40)
Facility-3
Non-current portion 17.00 15.57
Amounts included under current maturities of long-term debt 31.20 31.20
- Secured by pari-passu charge on all assets of BACC Healthcare Private Limited except those assets specifically funded out of any other bank. - Rate of interest: Bank’s base rate plus 1.65% p.a - Payable in 25 quarterly instalments after moratorium period of 1 year. (Refer note 40) * Non-current portion of bank debt as disclosed is net of ` 1.42 million towards unamortised loan processing charges.
Facility-4
Non-current portion 0.50 1.03
Amounts included under current maturities of long-term debt 0.56 0.49
- Security: Term loan is secured by hypothecation against medical equipment of Malnad Hospital and Institute of Oncology Private Limited.
(` in million)
203

HealthCare Global Enterprises Limited
Notes to the Ind AS consolidated financial statements (continued)
- Rate of interest: Bank’s base rate + 2.85% p.a
- Payable in 57 monthly instalments commencing from the date of borrowing after moratorium period of 3 months. (Refer note 40)
Term loans from banks - Secured
Facility-5
Non-current portion - 328.63
Amounts included under current maturities of long-term debt - 16.74
- Secured against movable and immovable fixed assets of the company, Corporate Guarantee of the Company and Regency Hospitals Limited. - Rate of interest: Bank’s base rate plus 2.25% p.a - Payable in 96 monthly instalments commencing from July 2017.
Less: Unamortised loan processing charges (58.58) -
Total of term loans from bank - secured (net off loan processing charges unamortised ) 2,518.54 1,385.76
Less: Amounts included under current maturities of long-term debt (297.13) (54.05)
Non-current portion of bank borrowings 2,221.41 1,331.71
Terms of repayment and security As at 31 March
2018
As at 31 March
2017
17.1.2 Term loans from other parties - Secured
Non-current portion 16.00 34.54
Amounts included under current maturities of long-term debt 18.26 22.85
- Secured by equipment of the Company purchased out of amount financed - Rate of interest 4.64% to 14.05% p.a. - Repayment varies between 48 to 84 monthly instalments. (Refer note 40)
17.1.3 Terms of repayment and securityAs at
31 March 2018
As at 31 March
2017
Vehicle loan from bank - Secured
Facility-1
Non-current portion 6.21 1.44
Amounts included under current maturities of long-term debt 1.57 0.50
- Secured by hypothecation of vehicles of the parent company - Rate of Interest 8% - 11.25% p.a. - Repayable in 18 to 60 monthly instalments from the date of borrowing. (Refer note 40)
17.1.3 Facility-2
Non-current portion 0.13 0.19
Amounts included under current maturities of long-term debt 0.06 0.04
- Secured by hypothecation of vehicle of Malnad Hospital & Institute of Oncology Private Limited - Rate of interest 10.75% p.a. - Repayable in 84 monthly instalments from commencing from the October 2014. (Refer note 40)
(` in million)
(` in million)
204

HealthCare Global Enterprises Limited
Notes to the Ind AS consolidated financial statements (continued)
Total of vehicle loans from bank - secured 7.97 2.17
Non-current portion 6.34 1.63
Amounts included under current maturities of long-term debt 1.63 0.54
Details of security and terms of repayment for the short-term borrowings:
Terms of repayment and securityAs at
31 March 2018
As at 31 March
2017
17.1.4 Secured loan repayable on demand from banks: Secured by first pari-passu charge on entire current assets (both present and future), second pari- passu charge over entire fixed assets (both present and future other than exclusively charged) of the parent company
17.35 416.29
Terms of repaymentAs at
31 March 2018
As at 31 March
2017
17.1.5 Deferred payment liabilities - Unsecured
Non-current portion 918.95 974.91
Amounts included under current maturities of long-term debt 570.31 859.57
- Rate of interest 3.00% - Repayment over a period of 1 to 5 years from the date of borrowing. (refer note 40)
Terms of repaymentAs at
31 March 2018
As at 31 March
2017
17.1.6 Term loans from others - Unsecured
Non-current portion 6.42 15.41
Amounts included under current maturities of long-term debt
- Interest free loan repayable as and when funds are available.
18 Other financial liabilities
As at 31 March 2018 As at 31 March 2017
Non Current Current Non Current Current
Current maturities of long-term loans and vehicle loans * - 317.02 - 77.44
Book overdraft - 7.83 - -
Current maturity of deferred payment obligations * - 570.31 - 859.57
Current maturities of finance lease obligations (Refer note 35.1) - - - 14.93
Liability on written put options# (refer note 15.6) 694.00 417.64 785.75 380.90
Interest accrued not due * 108.11 19.80 - 106.77
Creditors for capital goods - 217.71 15.43 127.72
Payable on acquisition of business (refer note 50) 63.76 70.25 - -
Accrued employee benefits - 136.74 - 106.07
Others 49.82 7.08 - -
Total 915.69 1,764.38 801.18 1,673.40
* The details of interest rates, repayment and other terms are disclosed under note 17
The Company’s exposure to liquidity risk are disclosed in note 40
(` in million)
(` in million)
205

HealthCare Global Enterprises Limited
Notes to the Ind AS consolidated financial statements (continued)
#. The Company has issued written put option to non-controlling interests in BACC Healthcare Private Limited and HCG Medi-surge Hospitals Private Limited. In accordance with the terms of underlying shareholders agreement, should the option be exercised by non-controlling interests, the Company has to settle such liability by payment of cash.
19 Provisions
As at 31 March 2018 As at 31 March 2017
Non Current Current Non Current Current
Employee benefits
Gratuity (refer note 36.2) 50.99 22.25 30.46 25.44
Compensated absences - 33.75 - 23.96
Total 50.99 56.00 30.46 49.40
20 Other liabilities
As at 31 March 2018 As at 31 March 2017
Non Current Current Non Current Current
Advance from customers - 204.42 - 163.85
Balance due to statutory/government authorities - 60.85 - 64.81
Deferred government grant (refer note below) 305.07 20.00 - -
Rent equalisation reserve 25.05 - 30.74 -
330.12 285.27 30.74 228.66
Note: The Group imports medical equipments under Export Promotion Capital Goods (EPCG) scheme. Under the said Scheme, on the Group expected to meet the specified criteria, it is exempt from paying customs duty on imports which is recognised as a government grant. Fair value of the government grant is capitalised along with the equipment. Deferred income is amortised over the useful life of the equipment it has been procured for. The government grant recognised as at 31 March 2018 is ` 346.26 million. EPCG income recognised during the year is ` 21.19 million. The unfulfilled export obligation as on 31 March 2018 is ` 1,799.23 million.
21 Trade payables
As at31 March
2018
As at31 March
2017
Trade payables 1,424.74 1,273.63
Trade payables to Micro, Small And Medium Enterprises Development (MSMED) (refer note 42)
- -
Total 1,424.74 1,273.63
* For details relating to payable to related parties, please refer note 44
22 Revenue from operations
For the year ended
31 March 2018
For the year ended
31 March 2017
(a) Income from medical services 7,498.42 6,333.21
(b) Sale of medical and non-medical items 684.14 614.29
(c) Other operating revenue 124.32 53.61
8,306.88 7,001.11
(` in million)
206

HealthCare Global Enterprises Limited
Notes to the Ind AS consolidated financial statements (continued)
23 Other income
For the year ended
31 March 2018
For the year ended
31 March 2017
Interest income (refer note below) 81.22 37.36
Interest on financial assets at amortised cost 6.86 5.37
Net foreign exchange gain 1.89 21.15
Net gain on sale of investments in mutual funds 1.14 22.84
Net gain on financial assets designated at fair value through profit and loss 3.61 0.39
Payables no longer required written-back 22.20 0.29
Miscellaneous income 11.10 9.31
128.02 96.71
Note:
Interest income comprise:
Interest on bank deposits 40.41 29.34
Interest on income tax refund 26.44 6.41
Interest on inter-corporate deposit 10.16 1.61
Interest on debentures 4.21 -
81.22 37.36
24 Changes in inventories
For the year ended
31 March 2018
For the year ended
31 March 2017
Inventories at the beginning of the year 187.69 133.50
Inventories at the end of the year 240.26 187.69
Net (decrease) (52.57) (54.19)
Adjustments on account of business transfer arrangements, sale of units, subsidiaries, etc. (16.68) 4.13
Net (decrease) (69.25) (50.06)
25 Employee benefits expense
For the year ended
31 March 2018
For the year ended
31 March 2017
Salaries and wages (Refer note 5) 1,408.33 1,104.94
Contribution to provident and other funds (Refer note 36.2) 88.02 59.98
Expense on employee stock option scheme (Refer note 37) 27.09 9.45
Staff welfare expenses 53.62 44.88
1,577.06 1,219.25
(` in million)
207
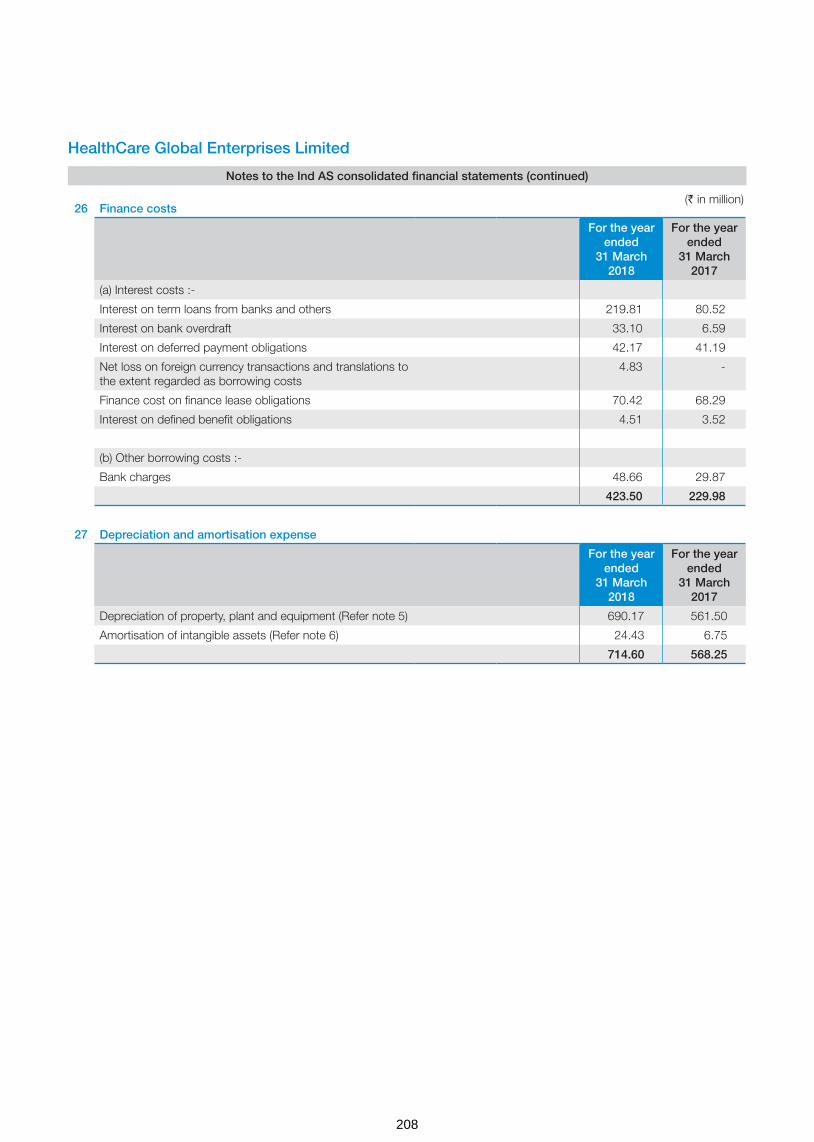
HealthCare Global Enterprises Limited
Notes to the Ind AS consolidated financial statements (continued)
26 Finance costs
For the year ended
31 March 2018
For the year ended
31 March 2017
(a) Interest costs :-
Interest on term loans from banks and others 219.81 80.52
Interest on bank overdraft 33.10 6.59
Interest on deferred payment obligations 42.17 41.19
Net loss on foreign currency transactions and translations to the extent regarded as borrowing costs
4.83 -
Finance cost on finance lease obligations 70.42 68.29
Interest on defined benefit obligations 4.51 3.52
(b) Other borrowing costs :-
Bank charges 48.66 29.87
423.50 229.98
27 Depreciation and amortisation expense
For the year ended
31 March 2018
For the year ended
31 March 2017
Depreciation of property, plant and equipment (Refer note 5) 690.17 561.50
Amortisation of intangible assets (Refer note 6) 24.43 6.75
714.60 568.25
(` in million)
208

HealthCare Global Enterprises Limited
Notes to the Ind AS consolidated financial statements (continued)
28 Other expenses
For the year ended
31 March 2018
For the year ended
31 March 2017
Medical consultancy charges 1,742.15 1,559.32
Lab charges 169.25 134.97
Power and fuel & water charges 228.86 164.24
House keeping expenses 204.27 160.10
Rent (refer note 35.2) 422.57 334.43
Repairs and maintenance
- Buildings 20.27 16.26
- Machinery 163.80 165.48
- Office maintenance & others 61.69 49.57
Insurance 19.47 10.22
Rates and taxes, excluding taxes on income 25.19 22.03
Printing & stationery 35.31 34.07
Advertisement, publicity & marketing 100.61 105.07
Travelling & conveyance 94.90 70.75
Legal & professional fees 185.81 80.26
Payment to auditors 9.55 7.00
Telephone expenses 36.67 31.24
Bad debts written off 100.11 -
Provision for bad debts & doubtful advances (45.74) 33.18
Loss on disposal of property, plant and equipment 0.43 0.60
Revenue share expenditure 12.83 -
Miscellaneous expenses 56.51 44.01
3,644.51 3,022.80
28.1 Corporate social responsibility
(a) Gross amount required to be spent by the Group during the year as per Sec 135 of the Companies Act, 2013 is ` 2.16 million (2016-17: ` 1.81 million), the same is yet to be spent as on 31 March 2018.
29 Exceptional items
For the year ended
31 March 2018
For the year ended
31 March 2017
Gain on sale of Triesta unit of the Company (refer note 29.1) 37.97 -
Net gain on disposal of equity investment in subsidiary HCG Regency Oncology Healthcare Private Limited (refer note 29.2)
82.20 -
Net loss pertaining to closure of unit in Delhi (refer note 29.3) (76.46) -
Gain on change in control in a subsidiary (refer note 29.4) 63.97 -
107.68 -
(` in million)
209

HealthCare Global Enterprises Limited
Notes to the Ind AS consolidated financial statements (continued)
29.1 During the year ended 31 March 2018, the Company has entered into a business transfer agreement with Strand Life Sciences Private Limited (‘Strand’) dated 02 January 2018 for sale of its Triesta unit on slump sale basis for a lump sum consideration of ` 240 million for which the consideration is received in the form of 9,140,342 equity shares and 101,193 Series 1 Preference Shares of Strand. Pursuant to the same, the Company acquired 38.2 % stake in Strand and accounted the initial investment in joint venture at fair value of consideration of ` 240 million.
(` in million)
Details of net assets transferred: Amount
Particulars
Assets
Property plant and equipment 129.19
Capital work-in-progress 36.31
Inventories 18.15
Trade receivables 63.25
Other financial and non-financial assets 8.00
Cash and cash equivalents 0.22
Total [A] 255.12
Liabilities
Trade payables 37.14
Reimbursement of capital expenditure 32.06
Capital creditors 4.31
Provision for employee benefits 2.98
Total [B] 76.49
Carrying value of net assets sold [C] = [A-B] 178.63
Fair value of the consideration [D] 240.00
Gain on sale of assets [E] = [D] - [C] 61.37
Elimination of Company’s share of gain on such transaction as per Ind AS 28 Investments in Associate and Joint venture [F]
23.40
Net gain recognised in exceptional items [G] = [E]-[F] 37.97
29.1 (a) Capital reserve on investment accounted for using equity method
Particulars Amount
Net assets of Strand post acquisition of net assets of Triesta unit 655.00
HCG’s share on the above at 38% 248.90
Initial recognition of investment 240.00
Capital reserve# 8.90
# In excess of the entity’s share of the net fair value of the investee’s identifiable assets and liabilities over the cost of the investment is being recognised directly in equity as capital reserve in the period in which the investment is acquired.
210

HealthCare Global Enterprises Limited
Notes to the Ind AS consolidated financial statements (continued)
29.2 In accordance with the terms of share purchase agreement with Regency Hospital Limited dated 28 March 2018, the Company sold its non-current investment (subsidiary) in the form of equity shares held in HCG Regency Oncology HealthCare Private Limited (HCG Regency) for a total consideration of ` 212.31 million. Details of net assets disposed-off and the resulting gain is given below:
(` in million)
ParticularsAs at
28 March 2018
As at 28 March
2018
Assets
Property, plant & equipment and intangible assets 849.43
Inventories 12.05
Trade receivables 42.62
Other financial and non-financial assets 193.30
Current tax assets 5.86
Cash and bank balances 5.33
Total [A] 1,108.59
Non-controlling interests 124.59
Liabilities
Borrowings including current maturities 738.70
Trade payables 86.28
Provision for employee benefits 0.51
Other financial and non-financial liabilities 28.40
Total [B] 978.48
Carrying value of net assets disposed off [C) = (A) - (B) 130.11
Less: Cash consideration received [D] 212.31
Profit on sale of investments (classified under exceptional items) [E] = (D) - (C)
82.20
29.3 During the year ended 31 March 2018, the Company decided to close the operations of Delhi unit. Net charge on account of write off of receivables is ` 21.90 million and the charge due to write off of net fixed assets is ` 54.56 million. The total charge due to unit closure is ` 76.46 million.
(` in million)
Particulars Amount Amount
(a) Trade receivables written off 100.11
Less: Provided earlier 78.21
Net impact on account of write off of trade receivables 21.90
(b) Assets written off
Gross block 150.87
Less: Accumulated depreciation 96.31
Net impact on account of write off of tangible assets 54.56
Total 76.46
211
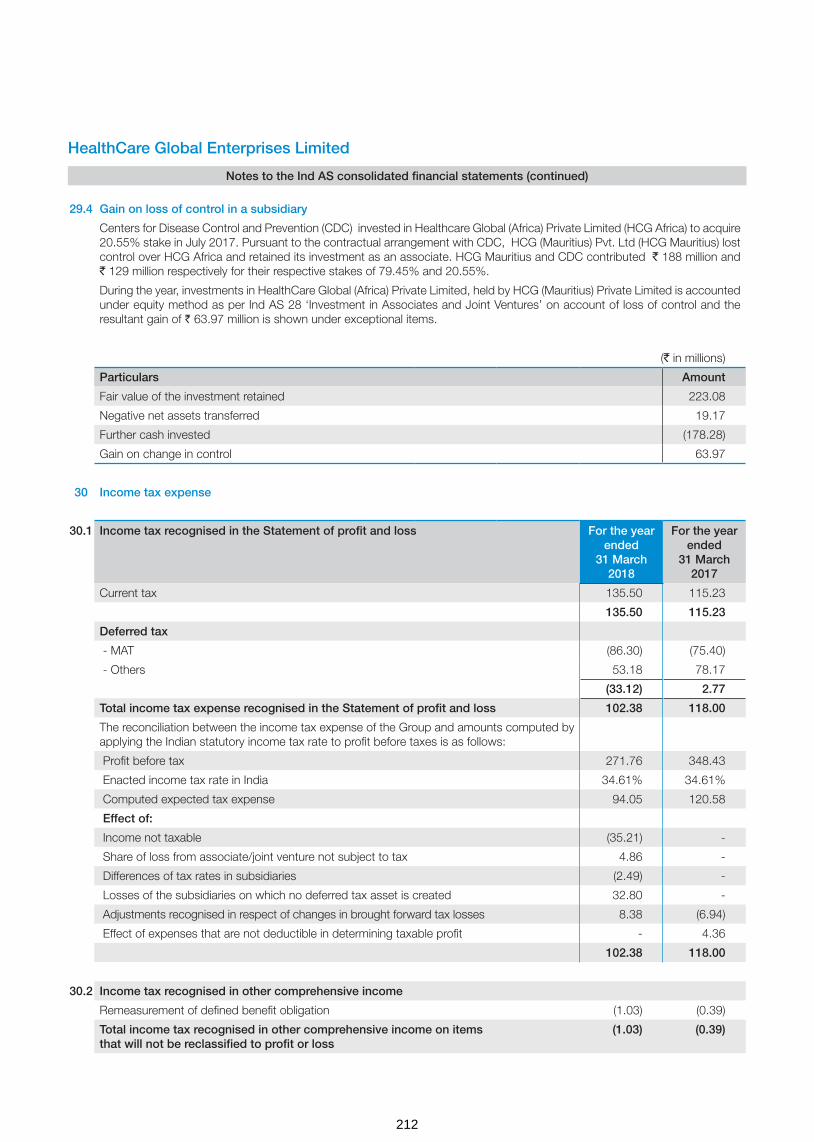
HealthCare Global Enterprises Limited
Notes to the Ind AS consolidated financial statements (continued)
29.4 Gain on loss of control in a subsidiary
Centers for Disease Control and Prevention (CDC) invested in Healthcare Global (Africa) Private Limited (HCG Africa) to acquire 20.55% stake in July 2017. Pursuant to the contractual arrangement with CDC, HCG (Mauritius) Pvt. Ltd (HCG Mauritius) lost control over HCG Africa and retained its investment as an associate. HCG Mauritius and CDC contributed ` 188 million and ` 129 million respectively for their respective stakes of 79.45% and 20.55%.
During the year, investments in HealthCare Global (Africa) Private Limited, held by HCG (Mauritius) Private Limited is accounted under equity method as per Ind AS 28 ‘Investment in Associates and Joint Ventures’ on account of loss of control and the resultant gain of ` 63.97 million is shown under exceptional items.
(` in millions)
Particulars Amount
Fair value of the investment retained 223.08
Negative net assets transferred 19.17
Further cash invested (178.28)
Gain on change in control 63.97
30 Income tax expense
30.1 Income tax recognised in the Statement of profit and loss For the year ended
31 March 2018
For the year ended
31 March 2017
Current tax 135.50 115.23
135.50 115.23
Deferred tax
- MAT (86.30) (75.40)
- Others 53.18 78.17
(33.12) 2.77
Total income tax expense recognised in the Statement of profit and loss 102.38 118.00
The reconciliation between the income tax expense of the Group and amounts computed by applying the Indian statutory income tax rate to profit before taxes is as follows:
Profit before tax 271.76 348.43
Enacted income tax rate in India 34.61% 34.61%
Computed expected tax expense 94.05 120.58
Effect of:
Income not taxable (35.21) -
Share of loss from associate/joint venture not subject to tax 4.86 -
Differences of tax rates in subsidiaries (2.49) -
Losses of the subsidiaries on which no deferred tax asset is created 32.80 -
Adjustments recognised in respect of changes in brought forward tax losses 8.38 (6.94)
Effect of expenses that are not deductible in determining taxable profit - 4.36
102.38 118.00
30.2 Income tax recognised in other comprehensive income
Remeasurement of defined benefit obligation (1.03) (0.39)
Total income tax recognised in other comprehensive income on items that will not be reclassified to profit or loss
(1.03) (0.39)
212

HealthCare Global Enterprises Limited
Notes to the Ind AS consolidated financial statements (continued)
30.3 Net deferred tax assets and liabilities
Deferred tax balances
As at31 March
2018
As at31 March
2017
Deferred tax assets 231.01 167.09
Deferred tax liabilities 37.07 11.70
Net 193.31 155.39
Significant components of net deferred tax assets and liabilities for the year ended 31 March 2018 are as follows:
Deferred tax assets / (liabilities) in relation to Opening Balance
Recognised in statement of profit and
loss
Recognised in other
comprehen-sive income
Closing Balance
Property, plant and equipment (583.73) (54.31) - (638.04)
Intangible assets (15.19) (9.47) - (24.66)
Financial liabilities at amortised cost 4.86 (5.23) - (0.37)
MAT credit entitlement 118.00 86.30 - 204.30
Sec 43B items 36.06 10.05 1.03 47.14
Provision for doubtful debts/advances 149.54 39.36 - 188.90
Other items 3.51 (1.16) - 2.35
Tax losses 442.34 (32.42) - 409.92
others - 3.77 - 3.77
Total 155.39 36.89 1.03 193.31
Significant components of net deferred tax assets and liabilities for the year ended 31 March 2017 are As follows:
Deferred tax assets / (liabilities) in relation to Opening balance
Recognised in statement of profit and
loss
Recognised in other
comprehen-sive income
Closing balance
Property, plant and equipment (479.66) (103.97) (0.10) (583.73)
Intangible assets (4.40) (10.79) - (15.19)
Financial liabilities at amortised cost (1.53) 6.39 - 4.86
MAT credit entitlement 42.60 75.40 - 118.00
Sec 43B items 34.03 1.64 0.39 36.06
Provision for doubtful debts/advances 135.69 13.85 - 149.54
Other items 1.47 2.04 - 3.51
Tax losses 429.67 12.67 - 442.34
Total 157.87 (2.77) 0.29 155.39
Under the Income Tax Act, 1961, unabsorbed business losses expire 8 years after the year in which they originate. Further, the Company and its certain subsidiaries carry tax credit entitlement in respect of Minimum Alternate Tax (MAT) paid, which can be carried forward for certain period and can be set-off against future tax liabilities to the extent income tax under normal tax provisions exceed the MAT for those years. Tax benefits on unabsorbed business losses and MAT credit entitlement have been recognised as deferred tax asset as it is more probable than not that the future economic benefits associated with the asset will be realised.
(` in million)
213

HealthCare Global Enterprises Limited
Notes to the Ind AS consolidated financial statements (continued)
30.4 Current tax Assets, (Net)
As at31 March
2018
As at31 March
2017
Advance tax (net of provision) 211.07 261.33
211.07 261.33
30.5 Current tax liabilities
As at 31 March
2018
As at 31 March
2017
Provision for tax (net of advance tax) 39.83 13.91
39.83 13.91
31 Contingent liabilities
As at 31 March
2018
As at 31 March
2017
a) Corporate guarantees given 414.75 319.75
b) Other money for which the company is contingently liable
Customs duty (Refer note 1) 4.49 4.49
Excise and service tax (Refer note 2) 31.72 19.10
Value added tax (Refer note 3) 18.19 18.62
Income tax (Refer note 4) 2.74 13.64
c) Bonus to employees pursuant to retrospective Amendment to the Payment of Bonus Act, 1965 (Refer note 5)
9.98 9.98
Notes:
1. HCG Medisurge Hospitals Private Limited imported (HCG Medisurge) radiation equipment, Linear Accelerator-True Beam with standard accessories in two consignments. First consignment with main Linear Accelerator equipment was cleared by paying CVD @5% and second consignment was cleared as accessories of the medical equipment with Nil rate of CVD by claiming benefit under Notification No.06/2006 dated01.03.2006. The Commissioner of Customs has passed the order against the import of the second consignment as “Accessories/spare parts of Linear Accelerator” which attracts CVD @ 5% and declined the benefit of Notification No. 06/2006 and levied duty of Rs. 2.244 million and penalty of Rs. 2.244 million along with applicable interest.
The HCG Medisurge has appealed before Customs, Excise & Service Tax Appellate Tribunal, Mumbai and is positive of claiming benefit under said notification.
2.(a) Excise Commissionerate-III, Bengaluru has passed Order against the Company adjudicating that the product Fluro-deoxy-glucose ('FDG') is excisable and levied excise duty for the period under scrutiny from April 2009 o March 2014 of ` 6.80 million, interest on duty amount, penalty of ` 6.80 million, redemption fine of ` 0.6 million in lieu of confiscation of goods not available. The order also imposed a penalty of ` 1 million on Dr. B.S.Ajaikumar, Chairman & CEO of the Company. The Company has filed an appeal before CESTAT by paying Central Excise Duty of ` 0.6 million.
Additional Commissionerate of Central Excise, Chennai, has passed the Order confirming the excisability on sale of FDG for the period March 2013 to June 2015 levying excise duty of Rs. 6.57 million, interest on duty amount and penalty of Rs. 6.57 million.
The Company is positive of winning the case on the ground that FDG is not excisable as there is no specific entry in the Central Excise Tariff Act 1985. Further, even if it is excisable the same has to be classified under Chapter 30 which attracts excise duty at 6% and valuation of captively consumed FDG will reduce the demand.
(` in million)
214

HealthCare Global Enterprises Limited
Notes to the Ind AS consolidated financial statements (continued)
2 (b) HealthCare Global Senthil Multispecialty Hospitals Private Limited (HCG-Senthil), has undergone service tax audit for the period 2008-09 to 2012-13 and noted that during the period Jul 2010 to April 2011, medical services provided to TPA are chargeable to service tax for which a demand of Rs. 2.09 million is raised for short payment of service tax. Also purchase volume discount has been classified as business auxiliary services for which a demand of Rs. 1.29 million has been raised by Joint Commissioner, Salem. HCG-Senthil appealed before Commissioner of Central Excise (Appeals) where the order was passed in favour of Revenue. Subsequently, the Company has filed an appeal before CESTAT, Chennai.
The HCG-Senthil has served to the patients under Tamil Nadu Government Scheme and the settlement is done by TPA, which is exempt from Service tax and purchase volume discount has been wrongly categorised as business auxiliary service which is out of the ambit of Service tax. Hence the HCG-Senthil believes there would be no service tax liability.
3 (a) HealthCare Global Vijay Oncology Private Limited which got merged with the Company effective from April 1, 2015, has undergone departmental VAT audit for the period from 2011-12 to 2014-15 and noted that the Company has not charged and paid VAT on supply of food to patients and raised a AP-VAT demand of Rs. 2 million. Further, the Deputy Commercial Tax Officer, Vijayawada has passed the penalty order for Rs. 0.5 million against the above AP-VAT audit order. The Company has filed an writ petition before Andhra Pradesh High Court by paying Rs.0.4 million VAT amount to department.
The Company is positive of winning the case on the ground that various High Courts in India have ruled that the supply of food to patient is pursuant to provision of medical service and is not sale of goods.
3 (b) HCG Medisurge Hospitals Private Limited’s (HCG Medisurge) VAT Assessment has been done for FY 2011-12 and noted that the HCG Medisurge has not paid VAT totalling Rs.9.49 million on goods which the Company claimed as Exempted goods. The AO has levied interest of Rs. 4.56 million and penalty of Rs. 1.64 million by wrongly assessing service income as a taxable item and levying VAT on cafeteria which was offered by the Company to VAT under different VAT registration.
The HCG Medisurge has filed an appeal before the Joint Commissioner of Commercial Taxes producing the relevant supporting documents for supply of exempted goods, provision of medical Services and offering of cafeteria sales under different VAT registration number. The Company believes that the VAT demand will be dropped.
4. During the Financial Year 2011-12, HCG Medisurge Hospitals Private Limited (HCG Medisurge) had made payment to Aastha Oncology Private Limited towards their medical/professional consultancy services after deducting TDS @ 2% (Sec 197 certificate issued for Rs. 31 Million) and there after @ 10% under Section 194J. However, the AO has erred in arriving at the total amount paid/payable to Aastha Oncology Private Limited due to not considering the revised quarterly e-TDS return amount while making TDS assessment and has levied short payment of TDS of Rs. 1.51 million and interest of Rs. 1.23 million.
The HCG Medisurge has produced the supporting documents during appeal and also accepted a short payment of TDS after considering all transactions with Aastha Oncology Private Limited during the year amounts to for Rs. 24,722
5. The Payment of Bonus (Amendment) Act, 2015 (hereinafter referred to as the Amendment Act, 2015) has been enacted on 31 December 2015, according to which the eligibility criteria of salary or wages has been increased from Rs.10,000 per month to Rs.21,000 per month (Section 2(13)) and the ceiling for computation of such salary or wages has been increased from Rs.3,500 per month to Rs.7,000 per month or the minimum wage for the scheduled employment, as fixed by the appropriate government, whichever is higher. The reference to scheduled employment has been linked to the provisions of the Minimum Wages Act, 1948. The Amendment Act, 2015 is effective retrospectively from 1 April 2014. Based on the same, the Company has computed the bonus for the year ended 31 March 2015 which amounts to Rs.9.98 million.
The Company has taken a position that the stay granted by the two High Courts of India on the retrospective application of the amendment would have a persuasive effect even outside the boundaries of the relevant states and accordingly no provision is currently required.
6. The Group is involved in other disputes, law suits and other claims including commercial matters which arise from time to time in the ordinary course of business. The Group believes that there are no such pending matters that are expected to have any material adverse effect on the financial statements
215

HealthCare Global Enterprises Limited
Notes to the Ind AS consolidated financial statements (continued)
32 Commitments
ParticularsAs at
31 March 2018
As at 31 March
2017
Estimated amount of contracts remaining to be executed on capital account and not provided for
710.18 1,221.23
33 Earnings per share (` in million unless otherwise stated)
The calculations of profit attributable to equity shareholders and weighted average number of equity shares outstanding for purposes of basic earnings and diluted earnings per share calculations are as follows:
33.1 Basic earnings per share
For the year ended
31 March 2018
For the year ended
31 March 2017
Profit for the year attributable to owners of the Company 205.23 221.73
Adjustment in respect of share issue expenses charged-off to securities premium account which is otherwise required to be recognised in the Statement of profit and loss in accordance with Ind AS (Refer Note 15.1)
8.34
a. The earnings used in the calculation of basic earnings per share 205.23 230.07
b. Weighted average number of equity shares for year
Weighted average number of equity shares for the purpose of basic earnings per share 86,046,366 85,163,315
Basic earnings per equity share ` Per share (a/b) 2.38 2.69
33.2 Diluted earnings per share
a. The earnings used in the calculation of basic earnings per share 205.23 230.07
b. Weighted average number of equity shares for year 86,204,138 85,173,020
Weighted average number of equity shares for the purpose of diluted earnings per share
Diluted earnings per equity share ` Per share (a/b) 2.38 2.69
The weighted average number of equity shares for the purpose of diluted earnings per share reconciles to the weighted average number of equity shares used in the calculation of basic earnings per share as follows:
Weighted average number of equity shares used in the calculation of basic earnings per share 86,046,366 85,163,315
Shares deemed to be issued for no consideration in respect of employee options 157,772 9,705
Weighted average number of equity shares used in the calculation of diluted earnings per share
86,204,138 85,173,020
34 Segment information
Ind AS 108 “Operating Segment” (“Ind AS 108”) establishes standards for the way that public business enterprises report information about operating segments and related disclosures about products and services, geographic areas, and major customers. Based on the “management approach” as defined in Ind AS 108, Operating segments are to be reported in a manner consistent with the internal reporting provided to the Chief Operating Decision Maker (CODM).The CODM evaluates the Company’s performance and allocates resources on overall basis. The Company’s sole operating segment is therefore ‘Medical and Healthcare Services’. Accordingly, there are no additional disclosure to be provided under Ind AS 108, other than those already provided in the financial statements.
(` in million)
216

HealthCare Global Enterprises Limited
Notes to the Ind AS consolidated financial statements (continued)
Geographical information
Geographical information analyses the group’s revenue and non-current assets by the group’s country of domicile (i.e. India) and other countries. In presenting the geographical information, segment revenue has been presented based on the geographical location of the customers and segment assets has been presented based on the geographical location of the assets.
(i) Revenue from operations (` in million)
Particulars For the year ended
31 March 2018
For the year ended
31 March 2017
India 8,306.33 7,000.02
Outside India 0.55 1.09
Total 8,306.88 7,001.11
(ii) Non current assets* (` in million)
ParticularsAs at
31 March 2018
As at 31 March
2017
India 11,358.84 9,108.14
Total 11,358.84 9,108.14
*Non-current assets exclude financial assets and deferred tax assets
35 Leasing arrangements: The group being a lessee
35.1 Finance lease arrangements
Finance leasing arrangements of the Group include lease of Hospital buildings for duration of 24 to 30 years and medical equipments for 6 years. Interest rates underlying all obligations under finance leases range between 10% to 12% p.a. The details of future minimum lease payment and reconciliation of gross investment in the lease and payment value of minimum lease payments are given below:
Finance lease liabilities
Particulars
Minimum Lease Payments Present value of minimum lease payments
As at 31 March
2018
As at 31 March
2017
As at 31 March
2018
As at 31 March
2017
Not later than one year 66.31 71.12 - 14.93
Later than one year and not later than five years 301.30 253.74 - -
Later than five years 1,586.79 1,435.70 555.17 475.62
1,954.40 1,760.56 555.17 490.55
Less: future finance charges (1,399.23) (1,270.01) - -
Present value of minimum lease payments
555.17 490.55 555.17 490.55
217
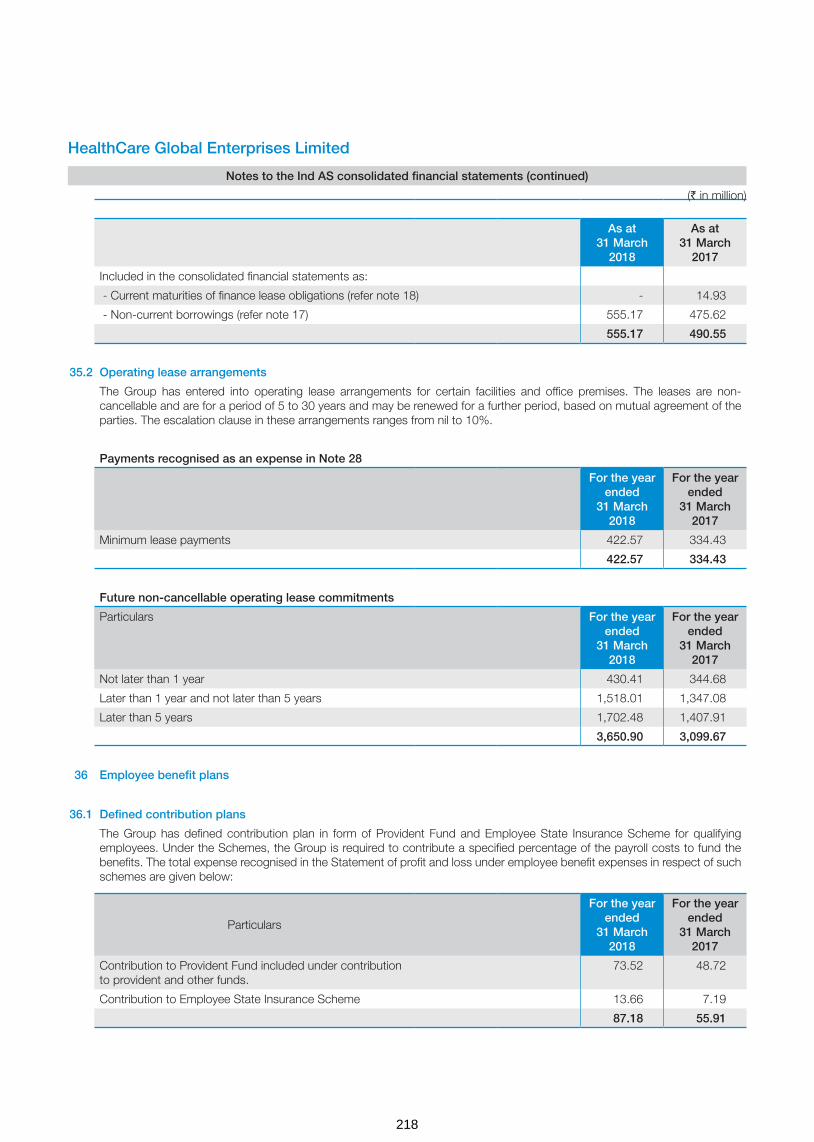
HealthCare Global Enterprises Limited
Notes to the Ind AS consolidated financial statements (continued)
As at 31 March
2018
As at 31 March
2017
Included in the consolidated financial statements as:
- Current maturities of finance lease obligations (refer note 18) - 14.93
- Non-current borrowings (refer note 17) 555.17 475.62
555.17 490.55
35.2 Operating lease arrangements
The Group has entered into operating lease arrangements for certain facilities and office premises. The leases are non-cancellable and are for a period of 5 to 30 years and may be renewed for a further period, based on mutual agreement of the parties. The escalation clause in these arrangements ranges from nil to 10%.
Payments recognised as an expense in Note 28
For the year ended
31 March 2018
For the year ended
31 March 2017
Minimum lease payments 422.57 334.43
422.57 334.43
Future non-cancellable operating lease commitments
Particulars For the year ended
31 March 2018
For the year ended
31 March 2017
Not later than 1 year 430.41 344.68
Later than 1 year and not later than 5 years 1,518.01 1,347.08
Later than 5 years 1,702.48 1,407.91
3,650.90 3,099.67
36 Employee benefit plans
36.1 Defined contribution plans
The Group has defined contribution plan in form of Provident Fund and Employee State Insurance Scheme for qualifying employees. Under the Schemes, the Group is required to contribute a specified percentage of the payroll costs to fund the benefits. The total expense recognised in the Statement of profit and loss under employee benefit expenses in respect of such schemes are given below:
Particulars
For the year ended
31 March 2018
For the year ended
31 March 2017
Contribution to Provident Fund included under contribution to provident and other funds.
73.52 48.72
Contribution to Employee State Insurance Scheme 13.66 7.19
87.18 55.91
(` in million)
218

HealthCare Global Enterprises Limited
Notes to the Ind AS consolidated financial statements (continued)
36.2 Defined benefit plans
The Group offers gratuity plan for its qualified employees which is payable as per the requirements of Payment of Gratuity Act, 1972. The benefit vests upon completion of five years of continuous service and once vested it is payable to employees on retirement or on termination of employment. In case of death while in service, the gratuity is payable irrespective of vesting.
Amounts recognised in consolidated statement of profit and loss in respect of this defined benefit plan are as follows.
For the year ended
31 March 2018
For the year ended
31 March 2017
Service cost recognised in employee benefits expense in note 25 14.50 11.26
Net interest expense recognised in finance costs in note 26 4.51 3.52
Components of defined benefit costs recognised in the Statement of profit and loss 19.01 14.78
Service cost recognised in employee benefits expense in note 25 14.50 11.26
Net interest expense recognised in finance costs in note 26 4.51 3.52
Remeasurement of the net defined benefit plan:
Return on plan assets (excluding amounts included in net interest expense) -
Actuarial (gains) / losses arising from changes in demographic assumptions 0.41 -
Actuarial (gains) / losses arising from changes in financial assumptions (0.56) 1.30
Actuarial (gains) / losses arising from experience adjustments 2.61 (0.26)
Remeasurement of plan assets - 0.01
Remeasurement of the net defined benefit plan recognised in other comprehensive income
2.46 1.03
The amount included in the consolidated balance sheet arising from the entity’s obligation in respect of its defined benefit plans is as follows:
31 March 2018
31 March 2017
Present value of funded defined benefit obligation 74.34 58.54
Fair value of plan assets 1.08 2.64
Unfunded status 73.26 55.90
Net liability arising from defined benefit obligation 73.26 55.90
Movements in the present value of the defined benefit obligation are as follows.
31 March 2018
31 March 2017
Opening defined benefit obligation 58.54 48.68
Current service cost 14.50 11.26
Interest cost 4.51 3.71
Remeasurement (gains)/losses: -
Actuarial (gains) / losses arising from changes in demographic assumptions 0.41
Actuarial gains and losses arising from changes in financial assumptions (0.56) 1.30
Actuarial gains and losses arising from experience adjustments 2.61 (0.26)
Benefits paid (5.67) (6.15)
Closing defined benefit obligation 74.34 58.54
(` in million)
219

HealthCare Global Enterprises Limited
Notes to the Ind AS consolidated financial statements (continued)
Movements in the fair value of the plan assets are as follows.
31 March 2018
31 March 2017
Opening fair value of plan assets 2.64 0.90
Interest income 0.07 0.18
Acquisitions - 1.56
Assets distributed on settlements (1.18) -
Contributions from the employer *
Benefits paid (0.45) -
Closing fair value of plan assets 1.08 2.64
* Expected future contribution to the plan - Nil (FY 17 - Nil)
The fair value of the plan assets at the end of the reporting period for each category, are as follows
Fair value of plan assets as at
31 March 2018
31 March 2017
Insurer-managed funds 1.08 2.64
Total 1.08 2.64
Defined plan asset
Plan assets consists of assets held in a ‘long-term benefit fund’ for the sole purpose of making future benefit payments when they fall due. Plan assets include qualifying insurance policies and are not quoted in the market.
The actual return on plan assets was ` 0.07 Million (for the year ended 31 March 2017: ` 0.17 Million).
Significant actuarial assumptions for the determination of the defined obligation are discount rate, expected salary increase and mortality. The sensitivity analyses below have been determined based on reasonably possible changes of the respective assumptions occurring at the end of the reporting period, while holding all other assumptions constant.
The sensitivity of the defined benefit obligation to changes in the weighted principal assumptions is:
Particulars As at 31 March 2018 As at 31 March 2017
Increase Decrease Increase Decrease
Discount rate (1% movement) (1.86) 2.00 (1.20) 1.12
Future salary increase (1% movement) 3.68 (3.37) 1.42 (1.35)
Attrition rate (10% movement) (0.87) 0.93 (1.83) 2.53
The sensitivity analysis presented above may not be representative of the actual change in the defined benefit obligation as it is unlikely that the change in assumptions would occur in isolation of one another as some of the assumptions may be correlated.
Furthermore, in presenting the above sensitivity analysis, the present value of the defined benefit obligation has been calculated using the projected unit credit method at the end of the reporting period, which is the same as that applied in calculating the defined benefit obligation liability recognised in the balance sheet.
There was no change in the methods and assumptions used in preparing the sensitivity analysis from prior years.
The average duration of the benefit obligation at 31 March 2018 is 8.30 years (as at 31 March 2017 is 4.27 years).
(` in million)
220

HealthCare Global Enterprises Limited
Notes to the Ind AS consolidated financial statements (continued)
The principal assumptions used for the purposes of the actuarial valuations were as follows.
Valuation as at
31 March 2018
31 March 2017
Discount rate(s) 6.40% to 7.70 %
6.20% to 7.25%
Expected rate(s) of salary increase 5.00% to 6.00%
5.00% to 6.00%
Rate of return on plan assets 6.00% to 6.50%
6.20% to 7.25%
Mortality table IALM 2006-08
IALM 2006-08
Employee turnover rate 25.00% to 55.00%
15.15% to 55.00%
Maturity profile of defined benefit obligation:
ParticularsAs at
31 March 2018
As at 31 March
2017
Within 1 year 26.59 26.15
1-2 year 17.17 14.74
2-3 year 12.21 8.88
3-4 year 8.71 5.55
4-5 year 6.40 3.40
5-10 year 12.67 4.75
> 10 years 9.44 5.49
37 Share-based payments
A Employee share option plan of the Company
(i) ESOP 2010
In the extraordinary general meeting held on 25 August, 2010, the shareholders had approved the issue of 1,800,000 options under the Scheme titled “ Employee Stock Option Scheme 2010 (ESOP 2010). The ESOP 2010 allows the issue of options to employees of the Company and its subsidiaries. Each option comprises one underlying equity share.
As per the Scheme, the Remuneration committee grants the options to the employees deemed eligible. The exercise price of each option shall be at a price not less than the face value per share. The option holders may exercise those options vested based on passage of time commencing from the expiry of 4 years from the date of grant and those vested based on performance immediately after vesting, within the expiry of 10 years from the date of grant. On 16 June, 2010, the Company granted options under said scheme for eligible personnel. In the extraordinary general meeting held on 31 March, 2015, the shareholders approved for accelerated vesting of options outstanding as at 31 March, 2015. Accordingly, all the options outstanding were vested in the hands of option holders as at 31 March, 2015. Further, the remaining options available for grant under ESOP 2010 were transferred to ESOP 2014 scheme.
(ii) ESOP 2014
Pursuant to the shareholders’ approval in the extraordinary general meeting held on 28 March, 2014 and 25 August, 2010, the Board of Directors formulated the Scheme titled “Employee Stock Option Scheme 2014” (ESOP 2014). The ESOP 2014 allows the issue of options to employees of the Company and its subsidiaries. Each option comprises one underlying equity share.
(` in million)
221

HealthCare Global Enterprises Limited
Notes to the Ind AS consolidated financial statements (continued)
As per the Scheme, the Remuneration Committee grants the options to the employees deemed eligible. The Exercise Price shall be a price that is not less than the face value per share per option. Options Granted under ESOS 2014 would vest not less than one year and not more than five years from the date of Grant of such Options. Vesting of Options would be a function of continued employment with the Company (passage of time) and achievement of performance criteria as specified by the Nomination and Remuneration Committee as communicated at the time of grant of options. The option holders may exercise those options vested within a period as specified which may range upto 10 years from the date of grant.
Employee stock options will be settled by delivery of shares
B (i) The detail of fair market value and the exercise price is as given below:
Particulars ESOP 2010 ESOP 2014 ESOP 2014 ESOP 2014
Date of grant 16-Jun-10 24-Jun-14 10-Nov-16 10-Nov-16
Fair market value of option at grant date (`) 23.10 73.34 232.48 156.93
Fair market value of share at grant date (`) 29.18 78.95 240.15 240.15
Exercise price (`) 10.00 10.00 10.00 110.68
No. of options 1,294,800 110,100 165,400 30,000
Particulars ESOP 2014 ESOP 2014 ESOP 2014 ESOP 2014
Date of grant 1-Apr-17 1-Apr-17 11-Aug-17 6-Nov-17
Fair market value of option at grant date (`) 221.80 120.08 261.61 269.27
Fair market value of share at grant date (`) 229.45 229.45 269.35 276.95
Exercise price (`) 10.00 150.00 10.00 10.00
No. of options 25,000 35,000 101,000 53,000
(ii) The assumptions used in this model for calculating fair value of the ESOP granted during the current year and previous year are as below:
Grant Date:10 November 2016 (ESOP 2014)
Assumptions Vest 1 10 Nov 17
Vest 2 10 Nov 18
Vest 3 10 Nov 19
Vest 4 10 Nov 20
Variables 10% 20% 30% 40%
Risk free interest rate 6.52% 6.73% 6.73% 6.70%
Expected life 2.00 3.00 4.00 5.00
Expected annual volatility of shares 28.98% 28.53% 30.45% 32.29%
Expected dividend yield 0.00% 0.00% 0.00% 0.00%
Grant Date: 01 April 2017 (ESOP 2014)
Assumptions Vest 1 01 Apr 18
Vest 2 01 Apr 19
Vest 3 01 Apr 20
Vest 4 01 Apr 21
Variables 10% 20% 30% 40%
Risk free interest rate 6.46% 6.57% 6.76% 6.86%
Expected life 2.00 3.00 4.00 5.00
Expected annual volatility of shares 27.46% 28.94% 30.36% 29.83%
Expected dividend yield 0.00% 0.00% 0.00% 0.00%
(` in million)
222

HealthCare Global Enterprises Limited
Notes to the Ind AS consolidated financial statements (continued)
Grant Date: 11 August 2017 (ESOP 2014)
Assumptions Vest 1 11 Aug 18
Vest 2 11 Aug 19
Vest 3 11 Aug 20
Vest 4 11 Aug 21
Variables 10% 20% 30% 40%
Risk free interest rate 6.35% 6.38% 6.43% 6.50%
Expected life 2.00 3.00 4.00 5.00
Expected annual volatility of shares 24.74% 27.98% 28.28% 29.68%
Expected dividend yield 0.00% 0.00% 0.00% 0.00%
Grant Date: 06 November 2017 (ESOP 2014)
Assumptions Vest 1 06 Nov 18
Vest 2 06 Nov 19
Vest 3 06 Nov 20
Vest 4 06 Nov 21
Variables 10% 20% 30% 40%
Risk free interest rate 6.30% 6.48% 6.64% 6.78%
Expected life 2.00 3.00 4.00 5.00
Expected annual volatility of shares 24.04% 27.42% 27.47% 29.42%
Expected dividend yield 0.00% 0.00% 0.00% 0.00%
C The Company has used Black Scholes Option Pricing model for valuation of options.
Employee stock options details as on the Balance Sheet date are as follows:
Particulars Year ended 31 March 2018
Year ended 31 March 2017
Options (Numbers)
Weighted average exercise price per option (`)
Options (Numbers)
Weighted average exercise price per option (`)
Option outstanding at the beginning of the year:
- ESOP 2010 10,127 10.00 10,127 10.00
- ESOP 2014 22,020 10.00 724,090 96.90
Granted during the year:
- ESOP 2010 - - - -
- ESOP 2014 214,000 32.90 195,400 25.46
Forfeited during the year:
- ESOP 2010 - - - -
- ESOP 2014 - - - -
Exercised during the year:
- ESOP 2010
- ESOP 2014 24,820 10.00 637,000 108.78
Lapsed during the year:
- ESOP 2010 - - - -
- ESOP 2014 - - - -
Options outstanding at the end of the year:
- ESOP 2010 10,127 10.00 10,127 10.00
- ESOP 2014 471,670 20.17 282,490 20.69
(` in million)
223
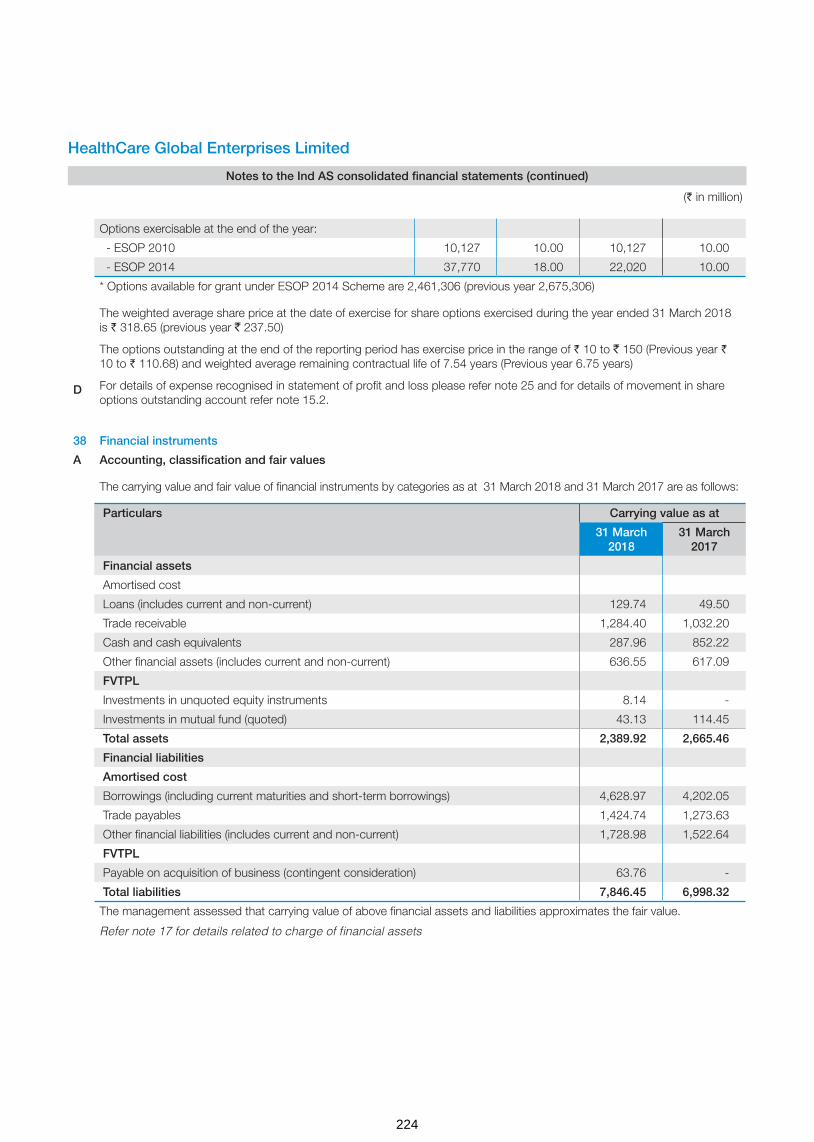
HealthCare Global Enterprises Limited
Notes to the Ind AS consolidated financial statements (continued)
Options exercisable at the end of the year:
- ESOP 2010 10,127 10.00 10,127 10.00
- ESOP 2014 37,770 18.00 22,020 10.00
* Options available for grant under ESOP 2014 Scheme are 2,461,306 (previous year 2,675,306)
The weighted average share price at the date of exercise for share options exercised during the year ended 31 March 2018 is ` 318.65 (previous year ` 237.50)
The options outstanding at the end of the reporting period has exercise price in the range of ` 10 to ` 150 (Previous year ` 10 to ` 110.68) and weighted average remaining contractual life of 7.54 years (Previous year 6.75 years)
For details of expense recognised in statement of profit and loss please refer note 25 and for details of movement in share options outstanding account refer note 15.2.
D
38 Financial instruments
A Accounting, classification and fair values
The carrying value and fair value of financial instruments by categories as at 31 March 2018 and 31 March 2017 are as follows:
Particulars Carrying value as at
31 March 2018
31 March 2017
Financial assets
Amortised cost
Loans (includes current and non-current) 129.74 49.50
Trade receivable 1,284.40 1,032.20
Cash and cash equivalents 287.96 852.22
Other financial assets (includes current and non-current) 636.55 617.09
FVTPL
Investments in unquoted equity instruments 8.14 -
Investments in mutual fund (quoted) 43.13 114.45
Total assets 2,389.92 2,665.46
Financial liabilities
Amortised cost
Borrowings (including current maturities and short-term borrowings) 4,628.97 4,202.05
Trade payables 1,424.74 1,273.63
Other financial liabilities (includes current and non-current) 1,728.98 1,522.64
FVTPL
Payable on acquisition of business (contingent consideration) 63.76 -
Total liabilities 7,846.45 6,998.32
The management assessed that carrying value of above financial assets and liabilities approximates the fair value.
Refer note 17 for details related to charge of financial assets
(` in million)
224

HealthCare Global Enterprises Limited
Notes to the Ind AS consolidated financial statements (continued)
39 Fair value hierarchy - Measurement of fair values
Level 1 - Quoted prices (unadjusted) in active markets for identical assets or liabilities.
Level 2 – Inputs other than quoted prices included within Level 1 that are observable for the asset or liability, either directly (i.e. as prices) or indirectly (i.e. derived from prices).
Level 3 - Inputs for the assets or liabilities that are not based on observable market data (unobservable inputs).
The following table presents the fair value measurement hierarchy of financial assets and liabilities measured at fair value on recurring basis as at 31 March 2018 and 31 March 2017.
Quantitative disclosures fair value measurement hierarchy Fair value measurement using
Total Quoted prices
in active markets (Level 1)
Significant observable
inputs (Level 2)
Significant unobser able
inputs (Level 3)
Financial assets measured at fair value as at 31 March 2018
Investment in mutual funds (quoted) 43.13 43.13 - -
Investments in unquoted equity instruments 8.14 - - 8.14
Financial liabilities measured at fair value as at 31 March 2018
Financial guarantee obligation 63.76 - - 63.76
Payable on acquisition of business (Contingent consideration)
Financial assets measured at fair value as at 31 March 2017 114.45 114.45 - -
There have been no transfers among Level 1, Level 2 and Level 3 during each of the years presented above.
Type Valuation technique Significant unobservable inputs Inter-relationship between significant unobservable inputs
and fair value measurement
Unquoted equity instruments
Market comparison technique: The valuation model is based on market multiples derived from quoted prices of companies comparable to the investee and the expected revenue and EBITDA of the investee. The estimate is adjusted for the effect of the non-marketability of the relevant equity securities
Zoctr Health Private Limited Revenue multiplier of 3 to 6 Suchirayu Healthcare Solutions Limited Revenue multiplier of 3 to 6
The estimated fair value would increase (decrease) if the adjusted market multiple were higher (lower).
Contingent consideration
Discounted cashflows: The valuation model considers the present value of expected payment, discounted using a risk-adjusted discount rate. The expected payment is determined based on the management estimate of the achievement of the EBITDA target.
Risk adjusted discount rate - 10%
The estimated fair value would increase (decrease) if the risk adjusted discount rate were lower (higher.
(` in million)
225
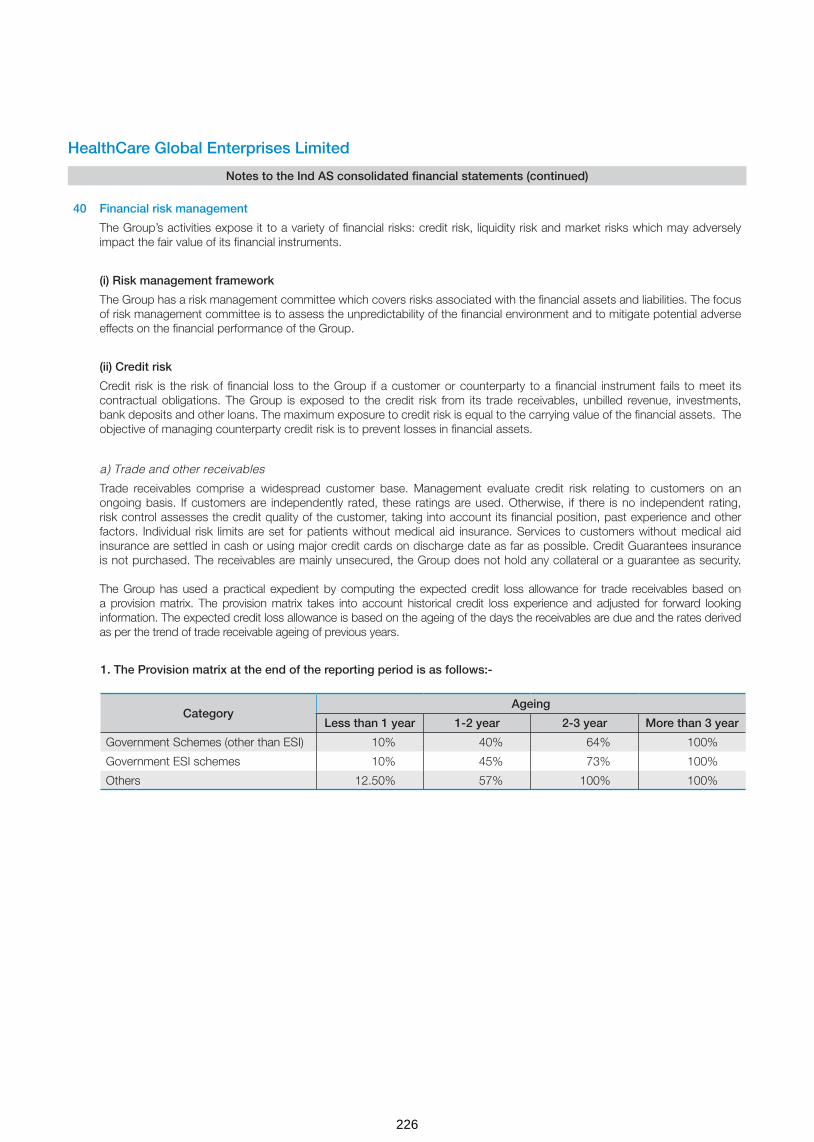
HealthCare Global Enterprises Limited
Notes to the Ind AS consolidated financial statements (continued)
40 Financial risk management
The Group’s activities expose it to a variety of financial risks: credit risk, liquidity risk and market risks which may adversely impact the fair value of its financial instruments.
(i) Risk management framework
The Group has a risk management committee which covers risks associated with the financial assets and liabilities. The focus of risk management committee is to assess the unpredictability of the financial environment and to mitigate potential adverse effects on the financial performance of the Group.
(ii) Credit risk
Credit risk is the risk of financial loss to the Group if a customer or counterparty to a financial instrument fails to meet its contractual obligations. The Group is exposed to the credit risk from its trade receivables, unbilled revenue, investments, bank deposits and other loans. The maximum exposure to credit risk is equal to the carrying value of the financial assets. The objective of managing counterparty credit risk is to prevent losses in financial assets.
a) Trade and other receivables
Trade receivables comprise a widespread customer base. Management evaluate credit risk relating to customers on an ongoing basis. If customers are independently rated, these ratings are used. Otherwise, if there is no independent rating, risk control assesses the credit quality of the customer, taking into account its financial position, past experience and other factors. Individual risk limits are set for patients without medical aid insurance. Services to customers without medical aid insurance are settled in cash or using major credit cards on discharge date as far as possible. Credit Guarantees insurance is not purchased. The receivables are mainly unsecured, the Group does not hold any collateral or a guarantee as security. The Group has used a practical expedient by computing the expected credit loss allowance for trade receivables based on a provision matrix. The provision matrix takes into account historical credit loss experience and adjusted for forward looking information. The expected credit loss allowance is based on the ageing of the days the receivables are due and the rates derived as per the trend of trade receivable ageing of previous years.
1. The Provision matrix at the end of the reporting period is as follows:-
CategoryAgeing
Less than 1 year 1-2 year 2-3 year More than 3 year
Government Schemes (other than ESI) 10% 40% 64% 100%
Government ESI schemes 10% 45% 73% 100%
Others 12.50% 57% 100% 100%
226

HealthCare Global Enterprises Limited
Notes to the Ind AS consolidated financial statements (continued)
2. The provision details of the trade receivable is given below.
Movement in the expected credit loss allowance
For the year ended
31 March 2018
For the year ended
31 March 2017
Balance at beginning of the year 385.88 352.70
Additional provision during the year 54.36 33.18
Written-off during the year (100.10) -
Balance at end of the year 340.14 385.88
No single customer accounted for more than 10% of the revenue as of 31 March 2018 and 31 March 2017. There is no sig-nificant concentration of credit risk
Details of geographic concentration of revenue is included in note 34 to the financial statements
b) Investments and cash deposits
The Group limits its exposure to credit risk by generally investing in liquid securities and only with counterparties that have a good credit rating. The Group does not expect any losses from non- performance by these counter-parties, and does not have any significant concentration of exposures to specific industry sectors.
(iii) Liquidity risk
Liquidity risk is the risk that the Group will not be able to meet its financial obligations as they become due. The Group manages its liquidity risk by ensuring, as far as possible, that it will always have sufficient liquidity to meet its liabilities when due. Also, the Group has unutilized credit limits with banks.
The Group’s corporate treasury department is responsible for liquidity, funding as well as settlement management. In addition, processes and policies related to such risks are overseen by senior management.
The table below provides details regarding the contractual maturities of significant financial liabilities as at 31 March 2018 & 31 March 2017
Particulars As at 31 March 2018
Total Less than 1 year
1-2 years 2-3 years 3-4 years 4 years and above
Borrowings 4,628.97 904.68 830.02 543.46 255.38 2,095.43
Trade payables 1,424.74 1,424.74 - - - -
Other financial liabilities 1,658.73 806.80 702.99 8.30 7.55 133.09
Payable on acquisition of business
134.01 70.25 63.76 - - -
Particulars As at 31 March 2017
Total Less than 1 year
1-2 years 2-3 years 3-4 years 4 years and above
Borrowings 4,202.05 1,368.23 724.63 447.68 124.45 1,537.06
Trade payables 1,273.63 1,273.63 - - - -
Other financial liabilities 1,522.64 721.46 796.91 - 4.27 -
(iv) Market risk:
Market risk is the risk that the fair value of future cash flows of a financial instrument will fluctuate because of changes in market prices, such as foreign exchange rates, interest rates and equity prices.
(` in million)
227
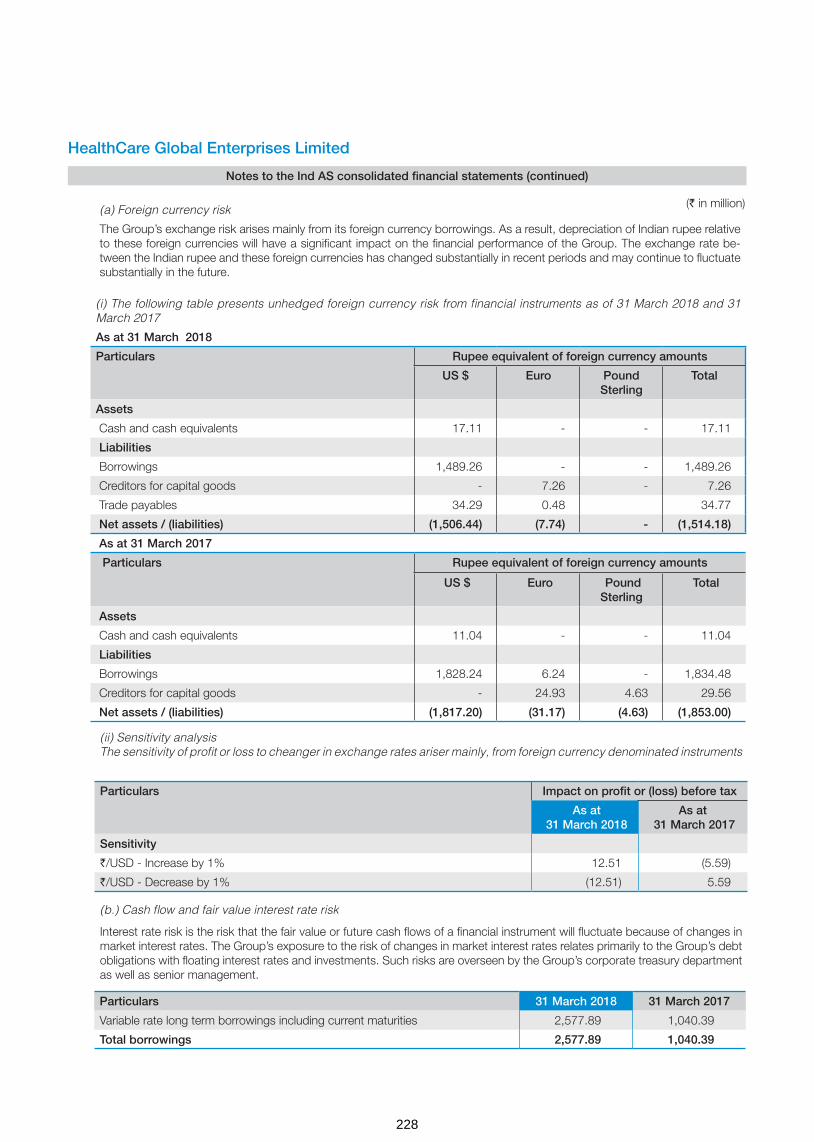
HealthCare Global Enterprises Limited
Notes to the Ind AS consolidated financial statements (continued)
(a) Foreign currency risk
The Group’s exchange risk arises mainly from its foreign currency borrowings. As a result, depreciation of Indian rupee relative to these foreign currencies will have a significant impact on the financial performance of the Group. The exchange rate be-tween the Indian rupee and these foreign currencies has changed substantially in recent periods and may continue to fluctuate substantially in the future.
(i) The following table presents unhedged foreign currency risk from financial instruments as of 31 March 2018 and 31 March 2017
As at 31 March 2018
Particulars Rupee equivalent of foreign currency amounts
US $ Euro Pound Sterling
Total
Assets
Cash and cash equivalents 17.11 - - 17.11
Liabilities
Borrowings 1,489.26 - - 1,489.26
Creditors for capital goods - 7.26 - 7.26
Trade payables 34.29 0.48 34.77
Net assets / (liabilities) (1,506.44) (7.74) - (1,514.18)
As at 31 March 2017
Particulars Rupee equivalent of foreign currency amounts
US $ Euro Pound Sterling
Total
Assets
Cash and cash equivalents 11.04 - - 11.04
Liabilities
Borrowings 1,828.24 6.24 - 1,834.48
Creditors for capital goods - 24.93 4.63 29.56
Net assets / (liabilities) (1,817.20) (31.17) (4.63) (1,853.00)
(ii) Sensitivity analysisThe sensitivity of profit or loss to cheanger in exchange rates ariser mainly, from foreign currency denominated instruments
Particulars Impact on profit or (loss) before tax
As at 31 March 2018
As at 31 March 2017
Sensitivity
`/USD - Increase by 1% 12.51 (5.59)
`/USD - Decrease by 1% (12.51) 5.59
(b.) Cash flow and fair value interest rate risk
Interest rate risk is the risk that the fair value or future cash flows of a financial instrument will fluctuate because of changes in market interest rates. The Group’s exposure to the risk of changes in market interest rates relates primarily to the Group’s debt obligations with floating interest rates and investments. Such risks are overseen by the Group’s corporate treasury department as well as senior management.
Particulars 31 March 2018 31 March 2017
Variable rate long term borrowings including current maturities 2,577.89 1,040.39
Total borrowings 2,577.89 1,040.39
(` in million)
228
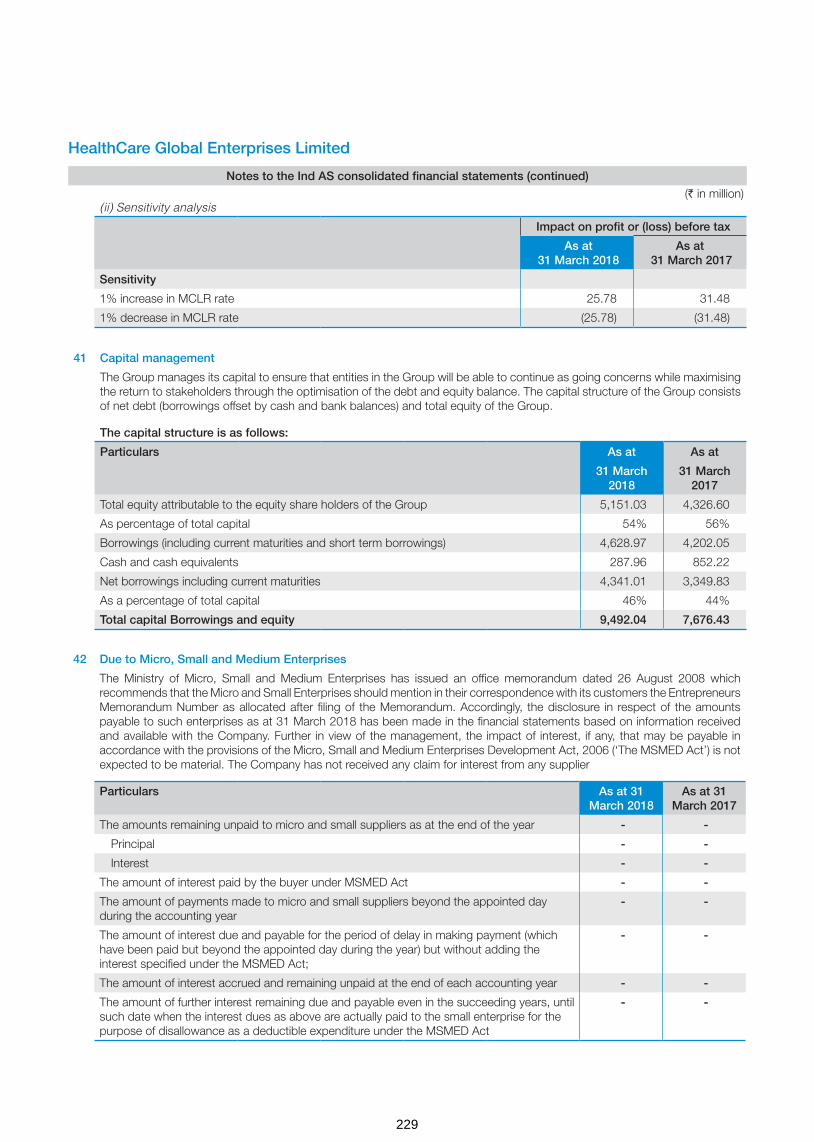
HealthCare Global Enterprises Limited
Notes to the Ind AS consolidated financial statements (continued)
41 Capital management
The Group manages its capital to ensure that entities in the Group will be able to continue as going concerns while maximising the return to stakeholders through the optimisation of the debt and equity balance. The capital structure of the Group consists of net debt (borrowings offset by cash and bank balances) and total equity of the Group.
The capital structure is as follows:
Particulars As at As at
31 March 2018
31 March 2017
Total equity attributable to the equity share holders of the Group 5,151.03 4,326.60
As percentage of total capital 54% 56%
Borrowings (including current maturities and short term borrowings) 4,628.97 4,202.05
Cash and cash equivalents 287.96 852.22
Net borrowings including current maturities 4,341.01 3,349.83
As a percentage of total capital 46% 44%
Total capital Borrowings and equity 9,492.04 7,676.43
(ii) Sensitivity analysis
Impact on profit or (loss) before tax
As at 31 March 2018
As at 31 March 2017
Sensitivity
1% increase in MCLR rate 25.78 31.48
1% decrease in MCLR rate (25.78) (31.48)
42 Due to Micro, Small and Medium Enterprises
The Ministry of Micro, Small and Medium Enterprises has issued an office memorandum dated 26 August 2008 which recommends that the Micro and Small Enterprises should mention in their correspondence with its customers the Entrepreneurs Memorandum Number as allocated after filing of the Memorandum. Accordingly, the disclosure in respect of the amounts payable to such enterprises as at 31 March 2018 has been made in the financial statements based on information received and available with the Company. Further in view of the management, the impact of interest, if any, that may be payable in accordance with the provisions of the Micro, Small and Medium Enterprises Development Act, 2006 (‘The MSMED Act’) is not expected to be material. The Company has not received any claim for interest from any supplier
Particulars As at 31 March 2018
As at 31 March 2017
The amounts remaining unpaid to micro and small suppliers as at the end of the year - -
Principal - -
Interest - -
The amount of interest paid by the buyer under MSMED Act - -
The amount of payments made to micro and small suppliers beyond the appointed day during the accounting year
- -
The amount of interest due and payable for the period of delay in making payment (which have been paid but beyond the appointed day during the year) but without adding the interest specified under the MSMED Act;
- -
The amount of interest accrued and remaining unpaid at the end of each accounting year - -
The amount of further interest remaining due and payable even in the succeeding years, until such date when the interest dues as above are actually paid to the small enterprise for the purpose of disallowance as a deductible expenditure under the MSMED Act
- -
(` in million)
229
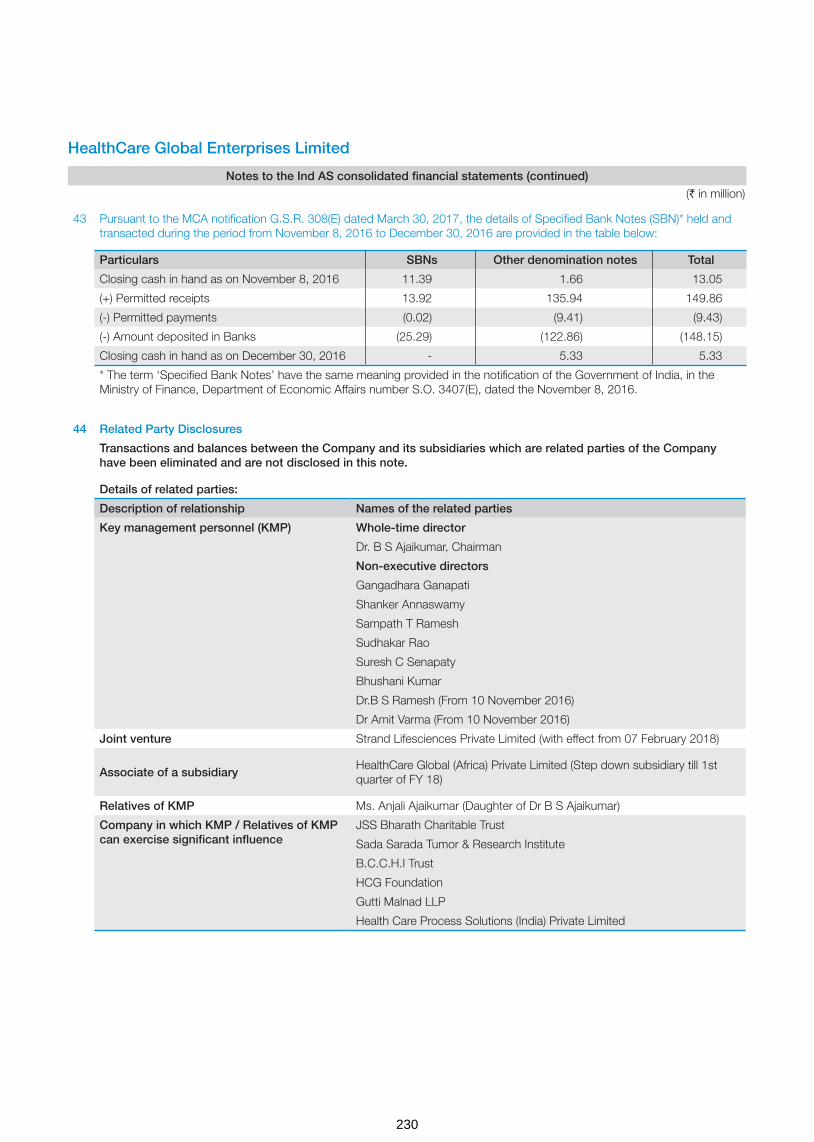
HealthCare Global Enterprises Limited
Notes to the Ind AS consolidated financial statements (continued)
43 Pursuant to the MCA notification G.S.R. 308(E) dated March 30, 2017, the details of Specified Bank Notes (SBN)* held and transacted during the period from November 8, 2016 to December 30, 2016 are provided in the table below:
Particulars SBNs Other denomination notes Total
Closing cash in hand as on November 8, 2016 11.39 1.66 13.05
(+) Permitted receipts 13.92 135.94 149.86
(-) Permitted payments (0.02) (9.41) (9.43)
(-) Amount deposited in Banks (25.29) (122.86) (148.15)
Closing cash in hand as on December 30, 2016 - 5.33 5.33
* The term ‘Specified Bank Notes’ have the same meaning provided in the notification of the Government of India, in the Ministry of Finance, Department of Economic Affairs number S.O. 3407(E), dated the November 8, 2016.
44 Related Party Disclosures
Transactions and balances between the Company and its subsidiaries which are related parties of the Company have been eliminated and are not disclosed in this note.
Details of related parties:
Description of relationship Names of the related parties
Key management personnel (KMP) Whole-time director
Dr. B S Ajaikumar, Chairman
Non-executive directors
Gangadhara Ganapati
Shanker Annaswamy
Sampath T Ramesh
Sudhakar Rao
Suresh C Senapaty
Bhushani Kumar
Dr.B S Ramesh (From 10 November 2016)
Dr Amit Varma (From 10 November 2016)
Joint venture Strand Lifesciences Private Limited (with effect from 07 February 2018)
Associate of a subsidiaryHealthCare Global (Africa) Private Limited (Step down subsidiary till 1st quarter of FY 18)
Relatives of KMP Ms. Anjali Ajaikumar (Daughter of Dr B S Ajaikumar)
Company in which KMP / Relatives of KMP can exercise significant influence
JSS Bharath Charitable Trust
Sada Sarada Tumor & Research Institute
B.C.C.H.I Trust
HCG Foundation
Gutti Malnad LLP
Health Care Process Solutions (India) Private Limited
(` in million)
230
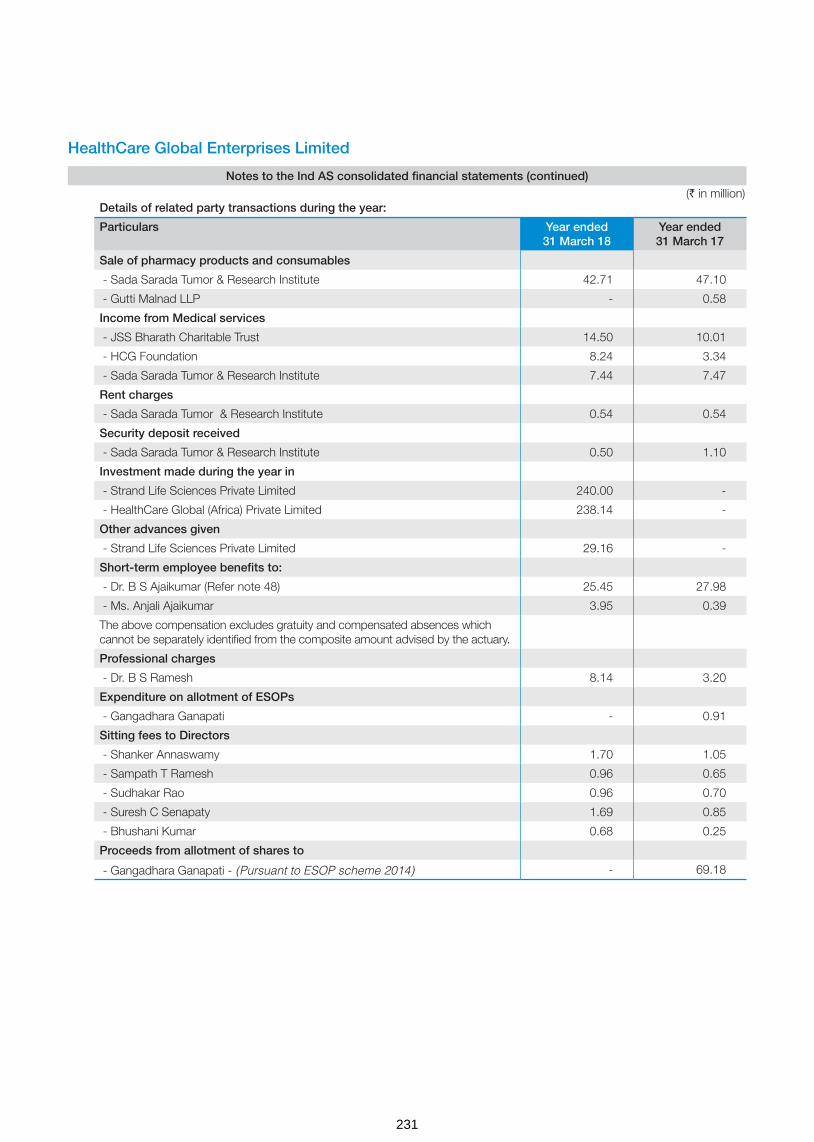
HealthCare Global Enterprises Limited
Notes to the Ind AS consolidated financial statements (continued)
Details of related party transactions during the year:
Particulars Year ended 31 March 18
Year ended 31 March 17
Sale of pharmacy products and consumables
- Sada Sarada Tumor & Research Institute 42.71 47.10
- Gutti Malnad LLP - 0.58
Income from Medical services
- JSS Bharath Charitable Trust 14.50 10.01
- HCG Foundation 8.24 3.34
- Sada Sarada Tumor & Research Institute 7.44 7.47
Rent charges
- Sada Sarada Tumor & Research Institute 0.54 0.54
Security deposit received
- Sada Sarada Tumor & Research Institute 0.50 1.10
Investment made during the year in
- Strand Life Sciences Private Limited 240.00 -
- HealthCare Global (Africa) Private Limited 238.14 -
Other advances given
- Strand Life Sciences Private Limited 29.16 -
Short-term employee benefits to:
- Dr. B S Ajaikumar (Refer note 48) 25.45 27.98
- Ms. Anjali Ajaikumar 3.95 0.39
The above compensation excludes gratuity and compensated absences which cannot be separately identified from the composite amount advised by the actuary.
Professional charges
- Dr. B S Ramesh 8.14 3.20
Expenditure on allotment of ESOPs
- Gangadhara Ganapati - 0.91
Sitting fees to Directors
- Shanker Annaswamy 1.70 1.05
- Sampath T Ramesh 0.96 0.65
- Sudhakar Rao 0.96 0.70
- Suresh C Senapaty 1.69 0.85
- Bhushani Kumar 0.68 0.25
Proceeds from allotment of shares to
- Gangadhara Ganapati - (Pursuant to ESOP scheme 2014) - 69.18
(` in million)
231

HealthCare Global Enterprises Limited
Notes to the Ind AS consolidated financial statements (continued)
Details of related party balances outstanding:
Balances outstanding as at As at 31 March 18
As at 31 March 17
Trade receivables
- JSS Bharath Charitable Trust 4.33 3.47
- Sada Sarada Tumor & Research Institute 33.05 32.63
- B.C.C.H.I. Trust 0.01 0.25
- HCG Foundation 12.65 14.02
- Gutti Malnad LLP 1.73 1.15
- Health Care Process Solutions (India) Private Limited 0.06 -
Other Financial Assets - Current
- Sada Sarada Tumor & Research Institute 2.80 2.60
- B.C.C.H.I. Trust 0.07 0.08
- HCG Foundation - 0.04
Advance
Other advances to related part
- Strand Life Sciences Private Limited 29.16 -
Security deposits (refundable) with
- Sada Sarada Tumor & Research Institute - 0.50
- Gutti Malnad LLP 3.50 3.50
Accrued employee benefits
- Dr. B S Ajaikumar 7.09 10.56
Advances to employees
- Dr. B S Ajaikumar (Refer note 45) 0.93 -
Trade payables
- Sada Sarada Tumor & Research Institute 0.01 0.01
- HCG Foundation 0.16 0.02
Note: All transactions with the related parties are priced at arm's length basis and resulting outstanding balances are to be settled as per the terms agreed. None of the balances are secured.
45 Managerial remuneration:
Dr. B.S. Ajaikumar was re-appointed as the Chairman & CEO of the Company for a period of 4 years with effect from 1 July 2015.
For the financial year ended 31 March 2018
In terms of the limits prescribed under Section 197 read with Schedule V to the Companies Act, 2013, the maximum amount of remuneration payable to the Chairman & CEO of the Company for the year ended March 31, 2018 amounts to ` 24.52 Million. Based on the approval of the Nomination and Remuneration Committee of the Company, the Board of Directors have proposed and accrued an additional remuneration of ` 0.93 Million to the Chairman & CEO of the Company in excess of the limits specified under the Companies Act, 2013, which is subject to the approval of the Central Government, for which the Company is in the process of filing the necessary application. This additional remuneration will be paid on receipt of the approval from the Central Government. Pending Central Government approval, such amount has not been paid and the corresponding amount recoverable has been disclosed as “advance”.
For the financial year ended 31 March 2017
In terms of the limits prescribed under Section 197 read with Schedule V to the Companies Act, 2013, the maximum amount of remuneration payable to the Chairman & CEO of the Company for the year ended March 31, 2017 amounts to ` 24.37 Million . Based on the approval of the Nomination and Remuneration Committee of the Company, the Board of Directors have proposed and accrued an additional remuneration of ` 3.61 Million to the Chairman & CEO of the Company in excess of the limits specified under the Companies Act, 2013, which is subject to the approval of the Central Government, for which the Company is in the process of filing the necessary application. This additional remuneration will be paid on receipt of the approval from the Central Government.
(` in million)
232

Hea
lthC
are
Glo
bal
Ent
erp
rise
s Li
mite
d
No
tes
to t
he In
d A
S c
ons
olid
ated
fina
ncia
l sta
tem
ents
(co
ntin
ued
)
46S
ubsi
dia
ries
, Ass
oci
ate
& J
oin
t ve
ntur
e
Det
ails
of t
he G
roup
’s s
ubsi
dia
ries
at th
e en
d o
f the
rep
ortin
g p
erio
d a
re a
s fo
llow
s
Nam
e o
f th
e su
bsi
dia
ryP
lace
of
Inco
rpo
ratio
n an
d O
per
atio
n P
rop
ort
ion
of
ow
ners
hip
inte
rest
and
vo
ting
p
ow
er h
eld
by
the
Gro
up
As
at
31 M
arch
201
8A
s at
31
Mar
ch 2
017
HC
G M
edi-S
urge
Hos
pita
ls P
rivat
e Li
mite
dIn
dia
74.0
0%74
.00%
Mal
nad
Hos
pita
l & In
stitu
te o
f Onc
olog
y P
rivat
e Li
mite
dIn
dia
70.2
5%70
.25%
Hea
lthC
are
Glo
bal S
enth
il M
ulti
Spe
cial
ty H
ospi
tal P
rivat
e Li
mite
dIn
dia
100.
00%
100.
00%
Niru
ja P
rodu
ct D
evel
opm
ent a
nd R
esea
rch
Priv
ate
Lim
ited
(f
orm
erly
kno
wn
as M
IMS
HC
G O
ncol
ogy
Priv
ate
Lim
ited
)In
dia
100.
00%
100.
00%
BA
CC
Hea
lthca
re P
rivat
e Li
mite
d*In
dia
50.1
0%50
.10%
Hea
lthC
are
Diw
an C
hand
Imag
ing
LLP
Indi
a75
.00%
75.0
0%
HC
G P
inna
cle
Onc
olog
y P
rivat
e Li
mite
d In
dia
Ref
er n
ote
a50
.10%
Hea
lthC
are
Glo
bal (
Uga
nda)
Priv
ate
Lim
ited
Uga
nda
Ref
er n
ote
b10
0.00
%
Hea
lthC
are
Glo
bal (
Ken
ya) P
rivat
e Li
mite
dK
enya
Ref
er n
ote
b10
0.00
%
Hea
lthC
are
Glo
bal (
Tanz
ania
) Priv
ate
Lim
ited
Tanz
ania
Ref
er n
ote
b10
0.00
%
Ape
x H
CG
Onc
olog
y H
ospi
tals
LLP
*In
dia
50.0
1%50
.01%
HC
G R
egen
cy O
ncol
ogy
Hea
lthca
re P
rivat
e Li
mite
dIn
dia
Ref
er n
ote
c51
.00%
HC
G O
ncol
ogy
LLP
Indi
a74
.00%
74.0
0%
DK
R H
ealth
care
Priv
ate
Lim
ited
(f
orm
erly
kno
wn
as P
aren
thoo
d H
ealth
care
Priv
ate
Lim
ited
)In
dia
Ref
er n
ote
d50
.10%
HC
G N
CH
RI O
ncol
ogy
LLP
Indi
a76
.00%
76.0
0%
HC
G M
anav
ata
Onc
olog
y LL
P *
Indi
a51
.00%
51.0
0%
HC
G E
KO
Onc
olog
y LL
P*
Indi
a50
.50%
50.5
0%
HC
G (M
aurit
ius)
Priv
ate
Lim
ited
Mau
ritiu
s10
0.00
%10
0.00
%
Hea
lthC
are
Glo
bal (
Afri
ca) P
rivat
e Li
mite
dM
aurit
ius
Ref
er n
ote
b10
0.00
%
HC
G S
UN
Hos
pita
ls L
LPIn
dia
74.0
0%N
A
The
prin
cipa
l act
ivity
of a
ll th
e ab
ove
men
tione
d su
bsid
iarie
s is
pro
vidi
ng H
ealth
care
ser
vice
s.
233

Not
e a:
Dur
ing
the
year
, H
CG
Pin
nacl
e O
ncol
ogy
Priv
ate
Lim
ited
the
who
lly o
wne
d su
bsid
iary
of t
he C
ompa
ny (T
rans
fero
r C
ompa
ny),
has
been
mer
ged
with
the
Com
pany
(Tra
nsfe
ree
Com
pany
) in
acco
rdan
ce w
ith th
e te
rms
of a
Sch
eme
of A
mal
gam
atio
n (th
e S
chem
e) a
s ap
prov
ed b
y th
e R
egio
nal D
irect
or, M
inis
try
of C
orpo
rate
affa
irs, H
yder
abad
with
an
appo
inte
d da
te o
f 01
Apr
il 20
16.
Not
e b:
Dur
ing
the
year
, H
CG
(Mau
ritiu
s) P
rivat
e Li
mite
d lo
st c
ontr
ol o
n ac
coun
t of
con
trac
tual
arr
ange
men
t ov
er H
ealth
Car
e G
loba
l (A
frica
) Priv
ate
Lim
ited
cons
eque
nt t
o w
hich
Hea
lthC
are
Glo
bal
(Afri
ca) P
rivat
e Li
mite
d an
d its
sub
sidi
arie
s H
ealth
Car
e G
loba
l (U
gand
a) P
rivat
e Li
mite
d, H
ealth
Car
e G
loba
l (K
enya
) Priv
ate
Lim
ited
& H
ealth
Car
e G
loba
l (Ta
nzan
ia) P
rivat
e Li
mite
d be
cam
e A
ssoc
iate
of
HC
G (M
aurit
ius)
Priv
ate
Lim
ited
(refe
r no
te 2
9.4)
Not
e c:
Dur
ing
the
year
, the
Com
pany
sol
d its
inve
stm
ent i
n eq
uity
sha
res
of H
CG
Reg
ency
Onc
olog
y H
ealth
care
Priv
ate
Lim
ited
to R
egen
cy H
ospi
tal L
imite
d pu
rsua
nt to
whi
ch H
CG
Reg
ency
Onc
olog
y H
ealth
care
Priv
ate
Lim
ited
ceas
es to
be
a su
bsid
iary
of t
he C
ompa
ny. R
efer
not
e 29
.2.
Not
e d:
Dur
ing
the
year
, D
KR
Hea
lthC
are
Priv
ate
Lim
ited
(Tra
nsfe
ror
com
pany
), th
e w
holly
ow
ned
subs
idia
ry o
f B
AC
C H
ealth
Car
e P
rivat
e Li
mite
d (T
rans
fere
e co
mpa
ny) h
as b
een
mer
ged
with
the
Tr
ansf
eree
Com
pany
in a
ccor
danc
e w
ith th
e te
rms
of a
Sch
eme
of A
mal
gam
atio
n (th
e S
chem
e) a
s ap
prov
ed b
y th
e R
egio
nal D
irect
or, M
inis
try
of C
orpo
rate
affa
irs, H
yder
abad
with
an
appo
inte
d da
te
of 0
1 A
pril
2017
.
*
The
dire
ctor
s of
the
Com
pany
ass
esse
d w
heth
er o
r not
the
Gro
up h
as c
ontr
ol o
ver t
he a
bove
men
tione
d en
titie
s ba
sed
on w
heth
er th
e G
roup
has
the
prac
tical
abi
lity
to d
irect
the
rele
vant
act
iviti
es o
f su
ch e
ntiti
es u
nila
tera
lly. B
ased
on
such
ass
essm
ent,
the
dire
ctor
s co
nclu
ded
that
the
Gro
up h
as s
uffic
ient
man
agem
ent r
ight
s to
uni
late
rally
dire
ct th
e re
leva
nt a
ctiv
ities
of s
uch
entit
ies
and
ther
efor
e th
e G
roup
has
con
trol
.
Hea
lthC
are
Glo
bal
Ent
erp
rise
s Li
mite
d
No
tes
to t
he In
d A
S c
ons
olid
ated
fina
ncia
l sta
tem
ents
(co
ntin
ued
)
Det
ails
of A
ssoc
iate
com
pany
at t
he e
nd o
f the
repo
rtin
g pe
riod
are
as fo
llow
s:
Nam
e o
f th
e A
sso
ciat
eP
lace
of
Inco
rpo
ratio
n P
rop
ort
ion
of
ow
ners
hip
inte
rest
and
vo
ting
p
ow
er h
eld
by
the
Gro
up
As
at
31 M
arch
201
8A
s at
31
Mar
ch 2
017
Hea
lthca
re G
loba
l (A
frica
) Priv
ate
Lim
ited
(Ref
er n
ote
b ab
ove)
Mau
ritiu
s76
.73%
-
Not
e: In
vest
men
ts in
Hea
lthca
re G
loba
l (A
frica
) Priv
ate
Lim
ited
is h
eld
by a
sub
sidi
ary
HC
G (M
aurit
ius)
Priv
ate
Lim
ited
whi
ch is
inco
rpor
ated
in M
aurit
ius.
The
prin
cipa
l act
ivity
of t
he A
ssoc
iate
is to
pro
vide
Hea
lthca
re s
ervi
ces
in A
frica
n re
gion
.
Det
ails
of t
he J
oint
Ven
ture
at t
he e
nd o
f the
repo
rtin
g pe
riod
are
as fo
llow
s:
Nam
e o
f th
e Jo
int
Vent
ure
Pla
ce o
f In
corp
ora
tion
Pro
po
rtio
n o
f o
wne
rshi
p in
tere
st a
nd v
otin
g
po
wer
hel
d b
y th
e G
roup
As
at
31 M
arch
201
8A
s at
31
Mar
ch 2
017
Str
and
Life
Sci
ence
s P
rivat
e Li
mite
d (J
oint
Ven
ture
)In
dia
38.2
0%-
The
prin
cipa
l act
ivity
of t
he J
oint
Ven
ture
is to
pro
vide
Hea
lthca
re s
ervi
ces.
The
man
agem
ent h
as s
et m
ater
ialit
y at
ten
perc
ent o
f the
ann
ual c
onso
lidat
ed tu
rnov
er, a
s pe
r th
e la
st a
udite
d fin
anci
al s
tate
men
ts o
f the
Com
pany
. Bas
ed o
n th
e m
ater
ialit
y, s
et b
y th
e m
an-
agem
ent,
none
of t
he e
quity
acc
ount
ed in
vest
ees
cros
s th
e m
ater
ialit
y an
d he
nce
sum
mar
ised
fina
ncia
l inf
orm
atio
n of
equ
ity a
ccou
nted
inve
stee
s ar
e no
t pre
sent
ed.
234
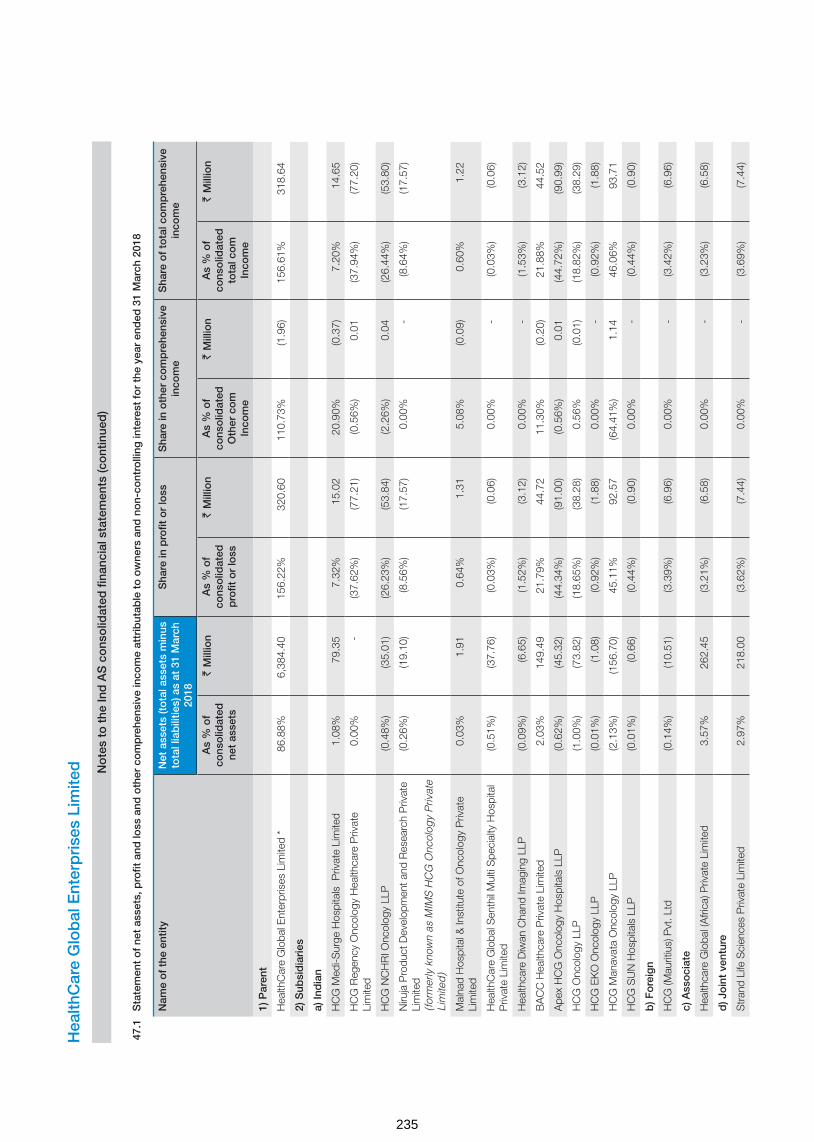
Hea
lthC
are
Glo
bal
Ent
erp
rise
s Li
mite
d
No
tes
to t
he In
d A
S c
ons
olid
ated
fina
ncia
l sta
tem
ents
(co
ntin
ued
)
47.1
Sta
tem
ent
of
net
asse
ts, p
rofit
and
loss
and
oth
er c
om
pre
hens
ive
inco
me
attr
ibut
able
to
ow
ners
and
no
n-co
ntro
lling
inte
rest
fo
r th
e ye
ar e
nded
31
Mar
ch 2
018
Nam
e o
f th
e en
tity
Net
ass
ets
(to
tal a
sset
s m
inus
to
tal l
iab
ilitie
s) a
s at
31
Mar
ch
2018
Sha
re in
pro
fit o
r lo
ss
Sha
re in
oth
er c
om
pre
hens
ive
inco
me
Sha
re o
f to
tal c
om
pre
hens
ive
inco
me
As
% o
f co
nso
lidat
ed
net
asse
ts
` M
illio
nA
s %
of
cons
olid
ated
p
rofit
or
loss
` M
illio
nA
s %
of
cons
olid
ated
O
ther
co
m
Inco
me
` M
illio
nA
s %
of
cons
olid
ated
to
tal c
om
In
com
e
` M
illio
n
1) P
aren
t
Hea
lthC
are
Glo
bal E
nter
pris
es L
imite
d *
86.8
8% 6
,384
.40
156.
22%
320
.60
110.
73%
(1.9
6)15
6.61
% 3
18.6
4
2) S
ubsi
dia
ries
a) In
dia
n
HC
G M
edi-S
urge
Hos
pita
ls P
rivat
e Li
mite
d1.
08%
79.
35
7.32
% 1
5.02
20
.90%
(0.3
7)7.
20%
14.
65
HC
G R
egen
cy O
ncol
ogy
Hea
lthca
re P
rivat
e Li
mite
d0.
00%
-
(37.
62%
) (7
7.21
) (0
.56%
) 0
.01
(37.
94%
) (7
7.20
)
HC
G N
CH
RI O
ncol
ogy
LLP
(0.4
8%)
(35.
01)
(26.
23%
) (5
3.84
) (2
.26%
) 0
.04
(26.
44%
) (5
3.80
)
Niru
ja P
rodu
ct D
evel
opm
ent a
nd R
esea
rch
Priv
ate
Lim
ited
(f
orm
erly
kno
wn
as M
IMS
HC
G O
ncol
ogy
Priv
ate
Lim
ited
)
(0.2
6%)
(19.
10)
(8.5
6%)
(17.
57)
0.00
% -
(8
.64%
) (1
7.57
)
Mal
nad
Hos
pita
l & In
stitu
te o
f Onc
olog
y P
rivat
e Li
mite
d0.
03%
1.9
1 0.
64%
1.3
1 5.
08%
(0.0
9)0.
60%
1.2
2
Hea
lthC
are
Glo
bal S
enth
il M
ulti
Spe
cial
ty H
ospi
tal
Priv
ate
Lim
ited
(0.5
1%)
(37.
76)
(0.0
3%)
(0.0
6)0.
00%
-
(0.0
3%)
(0.0
6)
Hea
lthca
re D
iwan
Cha
nd Im
agin
g LL
P (0
.09%
) (6
.65)
(1.5
2%)
(3.1
2)0.
00%
-
(1.5
3%)
(3.1
2)
BA
CC
Hea
lthca
re P
rivat
e Li
mite
d2.
03%
149
.49
21.7
9% 4
4.72
11
.30%
(0.2
0)21
.88%
44.
52
Ape
x H
CG
Onc
olog
y H
ospi
tals
LLP
(0.6
2%)
(45.
32)
(44.
34%
) (9
1.00
) (0
.56%
) 0
.01
(44.
72%
) (9
0.99
)
HC
G O
ncol
ogy
LLP
(1.0
0%)
(73.
82)
(18.
65%
) (3
8.28
)0.
56%
(0.0
1) (1
8.82
%)
(38.
29)
HC
G E
KO
Onc
olog
y LL
P (0
.01%
) (1
.08)
(0.9
2%)
(1.8
8)0.
00%
-
(0.9
2%)
(1.8
8)
HC
G M
anav
ata
Onc
olog
y LL
P (2
.13%
) (1
56.7
0)45
.11%
92.
57
(64.
41%
) 1
.14
46.0
6% 9
3.71
HC
G S
UN
Hos
pita
ls L
LP (0
.01%
) (0
.66)
(0.4
4%)
(0.9
0)0.
00%
-
(0.4
4%)
(0.9
0)
b) F
ore
ign
HC
G (M
aurit
ius)
Pvt
. Ltd
(0.1
4%)
(10.
51)
(3.3
9%)
(6.9
6)0.
00%
-
(3.4
2%)
(6.9
6)
c) A
sso
ciat
e
Hea
lthca
re G
loba
l (A
frica
) Priv
ate
Lim
ited
3.57
% 2
62.4
5 (3
.21%
) (6
.58)
0.00
% -
(3
.23%
) (6
.58)
d) J
oin
t ve
ntur
e
Str
and
Life
Sci
ence
s P
rivat
e Li
mite
d2.
97%
218
.00
(3.6
2%)
(7.4
4)0.
00%
-
(3.6
9%)
(7.4
4)
235
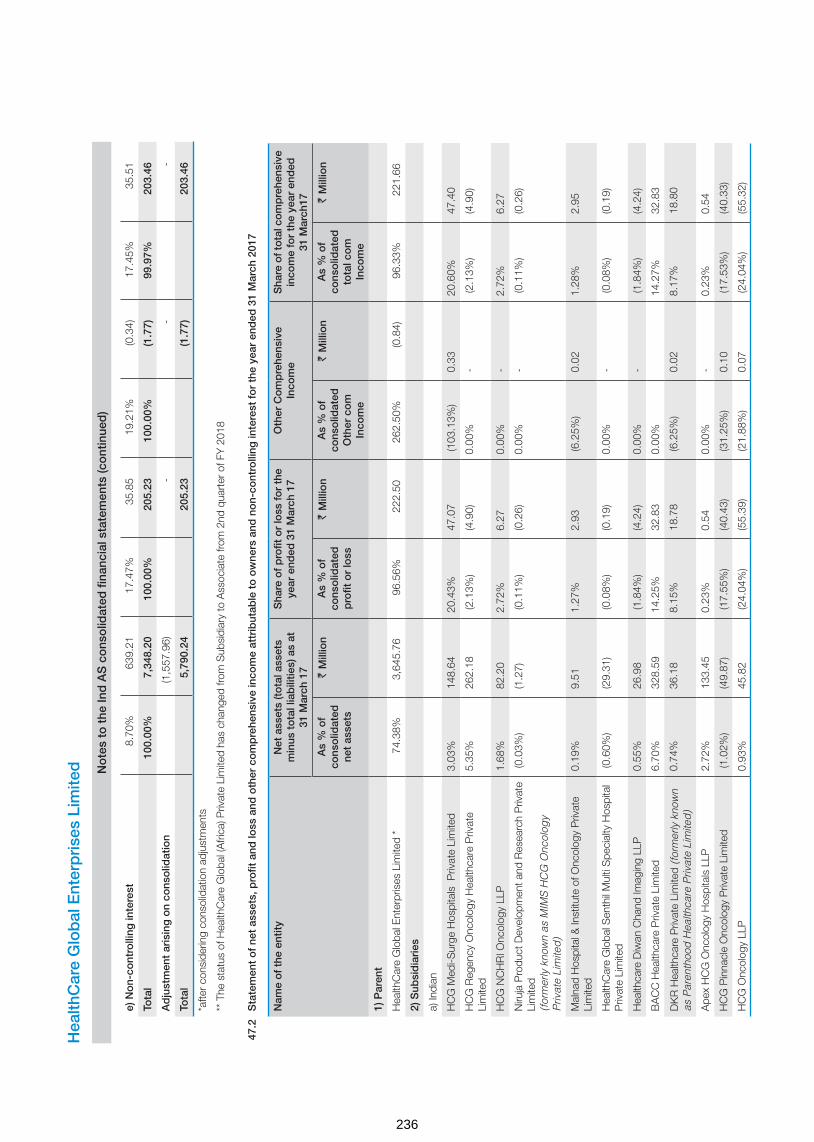
Hea
lthC
are
Glo
bal
Ent
erp
rise
s Li
mite
d
No
tes
to t
he In
d A
S c
ons
olid
ated
fina
ncia
l sta
tem
ents
(co
ntin
ued
)
e) N
on-
cont
rolli
ng in
tere
st8.
70%
639
.21
17.4
7% 3
5.85
19
.21%
(0.3
4)17
.45%
35.
51
Tota
l10
0.00
% 7
,348
.20
100.
00%
205
.23
100.
00%
(1.7
7)99
.97%
203
.46
Ad
just
men
t ar
isin
g o
n co
nso
lidat
ion
(1,5
57.9
6) -
-
-
Tota
l 5
,790
.24
205
.23
(1.7
7) 2
03.4
6
*afte
r co
nsid
erin
g co
nsol
idat
ion
adju
stm
ents
** T
he s
tatu
s of
Hea
lthC
are
Glo
bal (
Afri
ca) P
rivat
e Li
mite
d ha
s ch
ange
d fro
m S
ubsi
diar
y to
Ass
ocia
te fr
om 2
nd q
uart
er o
f FY
201
8
47.2
Sta
tem
ent
of
net
asse
ts, p
rofit
and
loss
and
oth
er c
om
pre
hens
ive
inco
me
attr
ibut
able
to
ow
ners
and
no
n-co
ntro
lling
inte
rest
fo
r th
e ye
ar e
nded
31
Mar
ch 2
017
Nam
e o
f th
e en
tity
Net
ass
ets
(to
tal a
sset
s m
inus
to
tal l
iab
ilitie
s) a
s at
31
Mar
ch 1
7
Sha
re o
f p
rofit
or
loss
fo
r th
e ye
ar e
nded
31
Mar
ch 1
7O
ther
Co
mp
rehe
nsiv
e In
com
eS
hare
of t
ota
l co
mp
rehe
nsiv
e in
com
e fo
r th
e ye
ar e
nded
31
Mar
ch17
As
% o
f co
nso
lidat
ed
net
asse
ts
` M
illio
nA
s %
of
cons
olid
ated
p
rofit
or
loss
` M
illio
nA
s %
of
cons
olid
ated
O
ther
co
m
Inco
me
` M
illio
nA
s %
of
cons
olid
ated
to
tal c
om
In
com
e
` M
illio
n
1) P
aren
t
Hea
lthC
are
Glo
bal E
nter
pris
es L
imite
d *
74.3
8% 3
,645
.76
96.5
6%22
2.50
26
2.50
% (0
.84)
96.3
3% 2
21.6
6
2) S
ubsi
dia
ries
a) In
dian
HC
G M
edi-S
urge
Hos
pita
ls P
rivat
e Li
mite
d3.
03%
148
.64
20.4
3% 4
7.07
(1
03.1
3%)
0.3
3 20
.60%
47.
40
HC
G R
egen
cy O
ncol
ogy
Hea
lthca
re P
rivat
e Li
mite
d5.
35%
262
.18
(2.1
3%)
(4.9
0)0.
00%
-
(2.1
3%)
(4.9
0)
HC
G N
CH
RI O
ncol
ogy
LLP
1.68
% 8
2.20
2.
72%
6.2
7 0.
00%
-
2.72
% 6
.27
Niru
ja P
rodu
ct D
evel
opm
ent a
nd R
esea
rch
Priv
ate
Lim
ited
(f
orm
erly
kno
wn
as M
IMS
HC
G O
ncol
ogy
Priv
ate
Lim
ited
)
(0.0
3%)
(1.2
7) (0
.11%
) (0
.26)
0.00
% -
(0
.11%
) (0
.26)
Mal
nad
Hos
pita
l & In
stitu
te o
f Onc
olog
y P
rivat
e Li
mite
d0.
19%
9.5
1 1.
27%
2.9
3 (6
.25%
) 0
.02
1.28
% 2
.95
Hea
lthC
are
Glo
bal S
enth
il M
ulti
Spe
cial
ty H
ospi
tal
Priv
ate
Lim
ited
(0.6
0%)
(29.
31)
(0.0
8%)
(0.1
9)0.
00%
-
(0.0
8%)
(0.1
9)
Hea
lthca
re D
iwan
Cha
nd Im
agin
g LL
P0.
55%
26.
98
(1.8
4%)
(4.2
4)0.
00%
-
(1.8
4%)
(4.2
4)
BA
CC
Hea
lthca
re P
rivat
e Li
mite
d6.
70%
328
.59
14.2
5% 3
2.83
0.
00%
14.2
7% 3
2.83
DK
R H
ealth
care
Priv
ate
Lim
ited
(for
mer
ly k
now
n as
Par
enth
ood
Hea
lthca
re P
rivat
e Li
mite
d)
0.74
% 3
6.18
8.
15%
18.
78
(6.2
5%)
0.0
2 8.
17%
18.
80
Ape
x H
CG
Onc
olog
y H
ospi
tals
LLP
2.72
% 1
33.4
5 0.
23%
0.5
4 0.
00%
-
0.23
% 0
.54
HC
G P
inna
cle
Onc
olog
y P
rivat
e Li
mite
d (1
.02%
) (4
9.87
) (1
7.55
%)
(40.
43)
(31.
25%
) 0
.10
(17.
53%
) (4
0.33
)
HC
G O
ncol
ogy
LLP
0.93
% 4
5.82
(2
4.04
%)
(55.
39)
(21.
88%
) 0
.07
(24.
04%
) (5
5.32
)
236

Hea
lthC
are
Glo
bal
Ent
erp
rise
s Li
mite
d
No
tes
to t
he In
d A
S c
ons
olid
ated
fina
ncia
l sta
tem
ents
(co
ntin
ued
)
Nam
e o
f th
e en
tity
Net
ass
ets
(to
tal a
sset
s m
inus
to
tal l
iab
ilitie
s) a
s at
31
Mar
ch 1
7
Sha
re o
f p
rofit
or
loss
fo
r th
e ye
ar e
nded
31
Mar
ch 1
7O
ther
Co
mp
rehe
nsiv
e In
com
eS
hare
of t
ota
l co
mp
rehe
nsiv
e in
com
e fo
r th
e ye
ar e
nded
31
Mar
ch17
As
% o
f co
nso
lidat
ed
net
asse
ts
` M
illio
nA
s %
of
cons
olid
ated
p
rofit
or
loss
` M
illio
nA
s %
of
cons
olid
ated
O
ther
co
m
Inco
me
` M
illio
nA
s %
of
cons
olid
ated
to
tal c
om
In
com
e
` M
illio
n
HC
G M
anav
ata
Onc
olog
y LL
P4.
61%
225
.77
3.88
% 8
.95
6.25
% (0
.02)
3.88
% 8
.93
b) F
orei
gn -
Hea
lthC
are
Glo
bal (
Uga
nda)
Priv
ate
Lim
ited
0.04
% 1
.91
(0.1
2%)
(0.2
8)0.
00%
-
(0.1
2%)
(0.2
8)
Hea
lthC
are
Glo
bal (
Ken
ya) P
rivat
e Li
mite
d (0
.16%
) (7
.92)
(3.7
2%)
(8.5
7)0.
00%
-
(3.7
2%)
(8.5
7)
Hea
lthC
are
Glo
bal (
Tanz
ania
) Priv
ate
Lim
ited
0.01
% 0
.32
0.05
% 0
.12
0.00
% -
0.
05%
0.1
2
HC
G (M
aurit
ius)
Pvt
. Ltd
0.42
% 2
0.39
0.
49%
1.1
3 0.
00%
-
0.49
% 1
.13
Hea
lthca
re G
loba
l (A
frica
) Pvt
. Ltd
0.34
% 1
6.89
1.
55%
3.5
7 0.
00%
-
1.55
% 3
.57
Tota
l10
0.00
% 4
,901
.22
100.
00%
230
.43
100.
00%
(0.3
2)10
0.00
% 2
30.1
1
3) N
on-
cont
rolli
ng in
tere
st (5
74.6
2) (8
.70)
(0.0
9) (8
.79)
Tota
l 4
,326
.60
221
.73
(0.4
1) 2
21.3
2
*aft
er c
ons
ider
ing
co
nso
lidat
ion
adju
stm
ents
48C
om
mo
n co
ntro
l tra
nsac
tions
Tran
sfer
of
canc
er c
are
cent
er b
usin
ess
of
the
Co
mp
any
in N
ashi
k to
its
sub
sid
iary
- H
CG
Man
avat
a O
nco
log
y LL
P
Pur
suan
t to
the
Bus
ines
s Tr
ansf
er A
gree
men
t da
ted
14 M
arch
201
7, a
ll bu
sine
ss a
nd c
omm
erci
al r
ight
s re
late
d to
the
Can
cer
Cen
ter
oper
ated
by
the
Com
pany
fro
m N
ashi
k, h
as b
een
tran
sfer
red
to it
s su
bsid
iary
, H
CG
Man
avat
a O
ncol
ogy
LLP,
as
a go
ing
conc
ern.
The
Com
pany
has
51%
sta
ke in
HC
G M
anav
ata
Onc
olog
y L
LP.
As
per
the
asse
ssm
ent
carr
ied
out
by t
he
dire
ctor
s of
the
Com
pany
, th
e G
roup
has
suf
ficie
nt m
anag
emen
t rig
hts
to u
nila
tera
lly d
irect
the
rel
evan
t ac
tiviti
es o
f su
ch e
ntiti
es a
nd t
here
fore
the
Gro
up h
as c
ontr
ol o
ver
HC
G M
anav
ata
Onc
olog
y LL
P. A
s th
e af
ores
aid
tran
sfer
of
busi
ness
is t
o an
ent
ity w
ith c
omm
on c
ontr
ol,
the
asse
ts a
nd li
abilit
ies
in t
he c
onso
lidat
ed fi
nanc
ial s
tate
men
ts c
ontin
ue t
o be
refl
ecte
d at
the
ir ca
rryi
ng a
mou
nts.
Con
sequ
entia
l cha
nges
in n
on-c
ontr
ollin
g in
tere
st o
f HC
G M
anav
ata
Onc
olog
y LL
P o
n tr
ansf
er o
f afo
resa
id b
usin
ess
and
furt
her i
nves
tmen
ts b
y th
e C
ompa
ny is
reco
gnis
ed
in th
e eq
uity
.
237

HealthCare Global Enterprises Limited
Notes to the Ind AS consolidated financial statements (continued)
49 Acquisition of CICRI
Acquisition
HCG NCHRI Oncology LLP (Purchaser), being the subsidiary of the Company, entered into a business transfer agreement dated 20 March 2017 with Dr.Ajay Mehta and Dr.Suchitra Mehta (Sellers) for purchase of business on a going concern basis effective 01 April 2017. Sellers own and operate a business in the name of Central India Cancer Research Institute (CICRI) in Nagpur which primarily comprises of an oncology hospital . The purchaser agreed to purchase the business on a slump sale basis for a lump sum consideration of ` 14 million without values being assigned to individual assets and liabilities.
Date of business combination and valuation date : 01 April 2017
The acquisition is expected to provide the Group with an increased market share which is driven by location advantage and also expects to reduce costs through economies of scale. Revenues included in the consolidated statement of profit and loss of this acquisition for the financial year ended 31 March 2018 is ` 12.32 million and profit after tax is ` 2.49 million. The Group has not incurred any costs related to this acquisition.
a) Business combination
The above transaction qualifies as a business combination as per IND AS 103 - “Business Combinations” and has been accounted by applying the acquisition method wherein identifiable assets acquired, liabilities assumed are fair valued against the fair value of the consideration transferred and the resultant bargain purchase is recognised as capital reserve.
b) Measurement of fair values
Particulars Valuation methodology Notes
Tangible assets Historical costs Tangible assets include property, plant & equipment, trade receivables. Historical cost is considered for valuation of tangible assets based on the management representation that tangible assets will be realised at book value, after acquisition of business.
Tangible liabilities Book value as on acquisition date
Tangible liabilities include trade payables and statutory liabilities. Book value as on the Valuation date is considered based on the management representation that, after acquisition of Business, such tangible liabilities are settled at book value as on acquisition date.
Tenancy rights Market approach Market approach valuation are those that determine the value of assets based on the prices of similar assets bought / leased and sold in the market.
Capital reserve Residual method Difference between purchase consideration and fair value of identified net asset values.
c) Identifiable assets and liabilities assumed
Particulars Amt (` Mn)
Cash consideration transferred (A) 14.00
Assets acquired
Property, plant and equipment (Refer note 5) 3.20
Trade receivables 0.06
Loans and advances 0.11
Cash and cash equivalents 1.82
Tenancy rights (Refer note 6) * 11.00
Total assets acquired (B) 16.19
Liabilities assumed
Trade payables and statutory liabilities (C) 1.02
Net assets acquired [D = (B-C)] 15.17
Capital reserve (D-A) 1.17
As explained above, acquisition of tenancy rights to occupy the premises for a nominal rent of ` 1 has resulted in a gain (bargain purchase) on this business combination
* Cash consideration paid to the extent of ` 9.83 million towards acquisition of the intangible asset, (tenancy rights) is tax deductible.
238
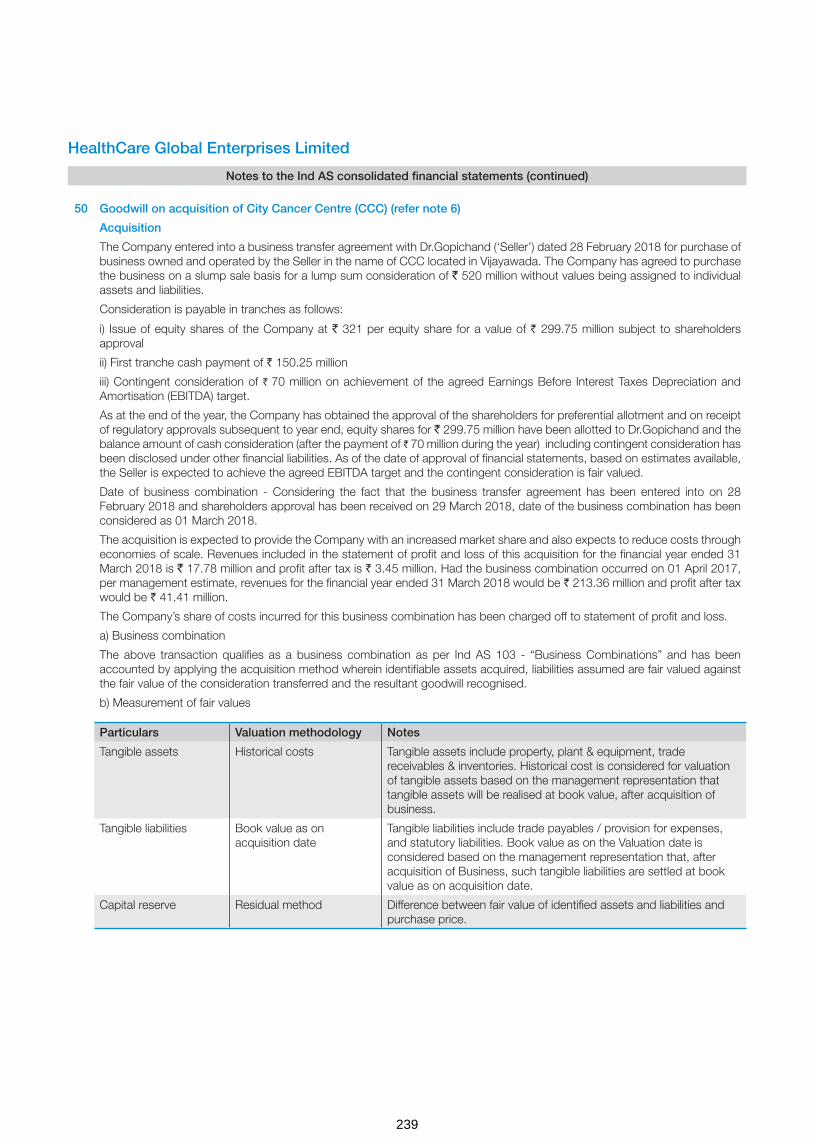
HealthCare Global Enterprises Limited
Notes to the Ind AS consolidated financial statements (continued)
50 Goodwill on acquisition of City Cancer Centre (CCC) (refer note 6)
Acquisition
The Company entered into a business transfer agreement with Dr.Gopichand (‘Seller’) dated 28 February 2018 for purchase of business owned and operated by the Seller in the name of CCC located in Vijayawada. The Company has agreed to purchase the business on a slump sale basis for a lump sum consideration of ` 520 million without values being assigned to individual assets and liabilities.
Consideration is payable in tranches as follows:
i) Issue of equity shares of the Company at ` 321 per equity share for a value of ` 299.75 million subject to shareholders approval
ii) First tranche cash payment of ` 150.25 million
iii) Contingent consideration of ` 70 million on achievement of the agreed Earnings Before Interest Taxes Depreciation and Amortisation (EBITDA) target.
As at the end of the year, the Company has obtained the approval of the shareholders for preferential allotment and on receipt of regulatory approvals subsequent to year end, equity shares for ` 299.75 million have been allotted to Dr.Gopichand and the balance amount of cash consideration (after the payment of ̀ 70 million during the year) including contingent consideration has been disclosed under other financial liabilities. As of the date of approval of financial statements, based on estimates available, the Seller is expected to achieve the agreed EBITDA target and the contingent consideration is fair valued.
Date of business combination - Considering the fact that the business transfer agreement has been entered into on 28 February 2018 and shareholders approval has been received on 29 March 2018, date of the business combination has been considered as 01 March 2018.
The acquisition is expected to provide the Company with an increased market share and also expects to reduce costs through economies of scale. Revenues included in the statement of profit and loss of this acquisition for the financial year ended 31 March 2018 is ` 17.78 million and profit after tax is ` 3.45 million. Had the business combination occurred on 01 April 2017, per management estimate, revenues for the financial year ended 31 March 2018 would be ` 213.36 million and profit after tax would be ` 41.41 million.
The Company’s share of costs incurred for this business combination has been charged off to statement of profit and loss.
a) Business combination
The above transaction qualifies as a business combination as per Ind AS 103 - “Business Combinations” and has been accounted by applying the acquisition method wherein identifiable assets acquired, liabilities assumed are fair valued against the fair value of the consideration transferred and the resultant goodwill recognised.
b) Measurement of fair values
Particulars Valuation methodology Notes
Tangible assets Historical costs Tangible assets include property, plant & equipment, trade receivables & inventories. Historical cost is considered for valuation of tangible assets based on the management representation that tangible assets will be realised at book value, after acquisition of business.
Tangible liabilities Book value as on acquisition date
Tangible liabilities include trade payables / provision for expenses, and statutory liabilities. Book value as on the Valuation date is considered based on the management representation that, after acquisition of Business, such tangible liabilities are settled at book value as on acquisition date.
Capital reserve Residual method Difference between fair value of identified assets and liabilities and purchase price.
239

HealthCare Global Enterprises Limited
Notes to the Ind AS consolidated financial statements (continued)
c) Identifiable assets and liabilities assumed
Particulars Amt (` Mn)
Fair value of consideration transferred
Equity shares * 299.75
Cash consideration 150.25
Contingent consideration 63.76
Total (A) 513.76
Assets acquired
Property, plant and equipment (Refer note 5) 12.80
Trade receivables, net 37.98
Cash and cash equivalents 1.06
Inventories 3.90
Total assets acquired (B) 55.74
Liabilities assumed
Trade payables and statutory liabilities (C) 26.50
Net assets acquired [D = (B-C)] 29.24
Goodwill (A-D) # 484.52
* The equity shares to be issued to the seller is pursuant to the preferential allotment of shares as per the relevant regulations. Had the equity shares been accounted at its value as on the date of the approval by the shareholders, value of shares would have been lower by ` 29.40 million.
# Goodwill is attributable to the increased market share and the synergies expected to be achieved from acquisition of CCC into the Company. Goodwill is tax deductible.
240
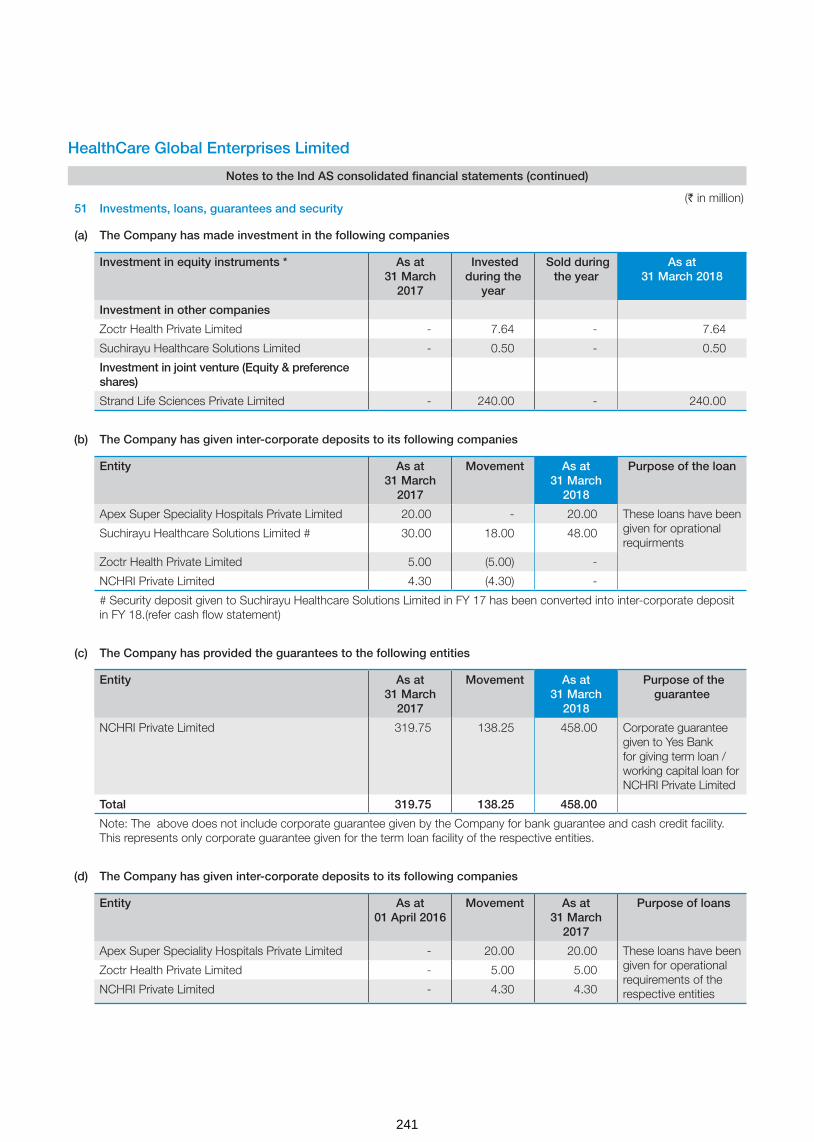
HealthCare Global Enterprises Limited
Notes to the Ind AS consolidated financial statements (continued)
51 Investments, loans, guarantees and security
(a) The Company has made investment in the following companies
Investment in equity instruments * As at 31 March
2017
Invested during the
year
Sold during the year
As at 31 March 2018
Investment in other companies
Zoctr Health Private Limited - 7.64 - 7.64
Suchirayu Healthcare Solutions Limited - 0.50 - 0.50
Investment in joint venture (Equity & preference shares)
Strand Life Sciences Private Limited - 240.00 - 240.00
(b) The Company has given inter-corporate deposits to its following companies
Entity As at 31 March
2017
Movement As at 31 March
2018
Purpose of the loan
Apex Super Speciality Hospitals Private Limited 20.00 - 20.00 These loans have been given for oprational requirments
Suchirayu Healthcare Solutions Limited # 30.00 18.00 48.00
Zoctr Health Private Limited 5.00 (5.00) -
NCHRI Private Limited 4.30 (4.30) -
# Security deposit given to Suchirayu Healthcare Solutions Limited in FY 17 has been converted into inter-corporate deposit in FY 18.(refer cash flow statement)
(c) The Company has provided the guarantees to the following entities
Entity As at 31 March
2017
Movement As at 31 March
2018
Purpose of the guarantee
NCHRI Private Limited 319.75 138.25 458.00 Corporate guarantee given to Yes Bank for giving term loan / working capital loan for NCHRI Private Limited
Total 319.75 138.25 458.00
Note: The above does not include corporate guarantee given by the Company for bank guarantee and cash credit facility. This represents only corporate guarantee given for the term loan facility of the respective entities.
(d) The Company has given inter-corporate deposits to its following companies
Entity As at 01 April 2016
Movement As at 31 March
2017
Purpose of loans
Apex Super Speciality Hospitals Private Limited - 20.00 20.00 These loans have been given for operational requirements of the respective entities
Zoctr Health Private Limited - 5.00 5.00
NCHRI Private Limited - 4.30 4.30
(` in million)
241

HealthCare Global Enterprises Limited
Notes to the Ind AS consolidated financial statements (continued)
(e) The Company has provided the guarantees to the following entities
Entity As at 01 April 2016
Movement As at 31 March
2017
Purpose of the guarantee
NCHRI Private Limited 87.75 232.00 319.75 Corporate guarantee given to Yes Bank for giving term loan / working capital loan for NCHRI Private Limited
Total 87.75 232.00 319.75
Note: The above does not include corporate guarantee given by the Company for bank guarantee and cash credit facility. This represents only corporate guarantee given for the term loan facility of the respective entities.
52 Reconciliation of movements of liabilities to cash flows arising from financing activities
Particulars
Term loan from
banks and other
parties
Deferred payment liabilities
Vehicle loans
Finance leases
Total
Debt as at 1April 2017 1,458.56 1,834.48 2.17 490.55 3,785.76
Interest accrued but not due as at 1 April 2017 34.04 - - 72.73 106.77
Cash flows including interest paid** 1,496.53 (223.83) 5.32 (45.55) 1,232.47
Other changes
- Ind AS adjustment with respect to unamortised loan processing charges
(58.58) - - - (58.58)
- Change on sale of subsidiary (refer note 29.2) (570.30) (168.40) - - (738.70)
- Unrealised forex adjustment - 4.83 - - 4.83
- Interest expense 219.33 42.18* 0.48 70.42 332.41
- Finance lease arrangement for the year - - - 74.57 74.57
Interest accrued but not due as at 31 March 2018 (20.36) - - (107.55) (127.91)
Debt as at 31 March 2018 2,559.22 1,489.26 7.97 555.17 4,611.62
** The above interest paid does not include other borrowing costs and interest paid of ` 91.10 million in respect of other facilities like bank overdraft which is not considered above * Interest expense accrued for the year has been converted to borrowings. # for movement of non-controlling interest refer note 16
(` in million)
242

As per our reports of even date attached
for B S R & Co. LLPChartered AccountantsFirm’s registration number: 101248W/W -100022
for and on behalf of the Board of Directors of
HealthCare Global Enterprises Limited
Amit SomaniPartnerMembership number: 060154
Dr. B.S. AjaikumarChairman and CEODIN: 00713779
Dr. Ramesh B.S.DirectorDIN: 00518434
Yogesh PatelChief Financial Officer
Sunu ManuelCompany Secretary
Place : BengaluruDate : 22 May 2018
Place : BengaluruDate : 22 May 2018
Place : BengaluruDate : 22 May 2018
53 Utilisation of net proceeds from Initial Public Offer
The statement of category wise utilisation of net proceeds from Initial Public Offer is:
Category wise utilisation of net proceeds from Initial Public Offer Amount proposed to be utilised
Actual utilisation as on
31 March 2018
Purchase of medical equipment 422 -
Investment in IT software, services and hardware 302 59
Pre-payment of debt 1,470 1,470
General corporate purposes 198 198
Total 2,392 1,727
Details of unutilised funds as on 31 March 2018
Investment in fixed deposits 125
Amount parked in cash credit account 540
Total 665
The accompanying notes are an integral part of these consolidated Ind AS financial statements
(` in million)
243

N O T E S

C O R P O R A T E I N F O R M A T I O N
Board of Directors
Dr. B. S. Ajaikumar - Chairman
Mr. Gangadhara Ganapati
Dr. Sudhakar Rao
Mr. Shanker Annaswamy
Dr. Sampath. T. Ramesh
Mr. Suresh C. Senapaty
Mrs. Bhushani Kumar
Dr. Amit Varma
Dr. B. S. Ramesh
Chief Financial Officer
Mr. Yogesh Patel
Company Secretary
Ms. Sunu Manuel
Statutory Auditors
B S R & Co. LLP
Maruthi Info-Tech Centre
11-12/1 Inner Ring Road
Koramangala Bengaluru 560 071
Karnataka
Registrar and Share Transfer Agents
Karvy Computershare Private Limited
Karvy Selenium Tower B, Plot 31-32
Gacchibowli, Financial District
Nanakramguda, Hyderabad - 500 032
Registered Office:
HCG Tower, No. 8, P Kalinga Rao Road,
Sampangi Rama Nagar, Bengaluru - 560 027,
Karnataka, India
Corporate Office:
Tower Block, Unity Building Complex, No. 3,
Mission Road, Bengaluru - 560 027,
Karnataka, India
E-mail: [email protected]
Website: www.hcgel.com
CIN
L15200KA1998PLC023489

+91 – 80 – 4660 7700
Registered Off: HCG Towers, # 8, P. Kalinga Rao Road, Sampangi Rama Nagar, Bengaluru – 560027, Karnataka, India.Corporate Off: Tower Block, Unity Building Complex, No. 3, Mission Road, Bengaluru - 560027, Karnataka, India.
HealthCare Global Enterprises Limited