annual report - australian securities exchange - · pdf fileannual report 30 june 2015 ......
TRANSCRIPT

Elixir Petroleum Limited
and controlled entitiesABN 51 108 230 995
Annual Report30 June 2015
For
per
sona
l use
onl
y

2015 Annual Report
Corporate Directory .................................................................................................................1
Chairman’s Letter .....................................................................................................................2
Review of Operations ...............................................................................................................3
Corporate Governance ............................................................................................................8
Directors’ Report ......................................................................................................................9
Auditors’ Independence Declaration ....................................................................................23
Independent Audit Report .....................................................................................................24
Directors’ Declaration ............................................................................................................26
Consolidated Statement of Profit or Loss and Other Comprehensive Income ................27
Consolidated Statement of Financial Position ....................................................................28
Consolidated Statement of Changes in Equity ....................................................................29
Consolidated Statement of Cash Flows ...............................................................................30
Notes to the Consolidated Financial Statements ................................................................31
Additional Securities Exchange Information .......................................................................76
ContentsF
or p
erso
nal u
se o
nly

1Elixir Petroleum Limited
Auditors - Australia
BDO Audit (WA) Pty Ltd
38 Station Street
Subiaco 6008
Western Australia
Auditors - UK
KSI (WA)
1304 Hay Street
West Perth 6005
Western Australia
Stock Exchange Listing
Australian Securities Exchange
Home Exchange: Perth
Western Australia
Code: EXR
Website and Email
www.elixirpetroleum.com
Directors
Mr Ray Barnes Non-Executive Chairman
Mr Dougal Ferguson Managing Director
Mr Sam Willis Non-Executive Director
Mr Mark O’Clery Non-Executive Director
Company Secretary
Mr Nicholas Ong
Registered Office
Level 2, 41-47 Colin Street
West Perth 6005
Western Australia
Telephone: (+61) 8 9226 2111
Share Registry
Security Transfer Registrars Pty Ltd
PO Box 535
Applecross 6953
Western Australia
Telephone (+61) 8 9315 2333
Bankers
National Australia Bank Limited
Ground Floor, 100 St Georges Terrace
Perth 6000
Western Australia
Corporate DirectoryF
or p
erso
nal u
se o
nly

2 2015 Annual Report
On the positive side, Elixir has been able to advance the Petra Project in Colorado to the point where we can report substantial, independently confirmed Prospective Oil Resources for the Rodwell Prospect, drilling permits in place and that the JV partners are positioned and ready to proceed with the first exploration well. The initial exploration well is expected to cost less than US$700,000 (dry hole basis) and has the potential to transform the Company if successful in proving up productive hydrocarbons.
Acquired in September 2014, the Petra Project illustrates the benefits of the US onshore business environment, where an active and cost efficient local oil and gas services sector yields rapid turn around and low costs compared to most international jurisdictions. In combination with a competent Operator, Elixir has moved forward with speed and efficiency. Within less than 12 months, Elixir has acquired a technical data base, shot two 2D seismic surveys, integrated and interpreted all the data and matured a drill ready prospect which has the ability to transform the Company and deliver the value that shareholders are seeking.
The current oil price environment has seen a reduction in investor appetite for oil and gas projects, however the Petra Project can potentially deliver a low cost oil development with an early and substantial return on investment even at current oil price levels through the combination of low cost wells, conventional reservoirs (fracking is not required) and lower decline rate production curves. We believe that projects which are economic at current prices are likely to attract far more investment capital than many of the resource plays which have been developed over recent years.
Our Moselle Permit renewal application in France continues to be delayed since the French Government has yet to confirm the renewal, despite having passed through all the necessary administrative approvals. Many companies with French exploration permits are in the same position which is extremely frustrating for both
the local French oil and gas industry and our investors. The financial results this year reflect a further non-cash impairment of the Moselle asset reducing the carrying value to zero. This in no way reflects the reduced prospectivity of the area, but recognises that the French Government has not demonstrated any willingness to expedite the long winded renewal process.
During the financial year, Elixir continued to reduce its cost base with a reduction of 20-25% in non-executive director fees in addition to a significant reduction in other general and administration costs. Cost control remains a key focus moving forward and your Board has agreed (subject to shareholder approval) to take 50% of their already reduced fees in shares for a six month period commencing 1 October 2015 through to 31 March 2016. Your Board recognises the need to conserve cash in a small exploration company such as Elixir in the current environment, but at the same time, retain the expertise at both management and Board level. By agreeing to take 50% of already reduced fees in equity, the Board’s alignment to shareholder wealth has never been stronger.
I would like to thank the management and previous and current directors of Elixir for their efforts during this challenging year. I would particularly like to express my appreciation to our shareholders for their ongoing support in difficult times. The Board is confident that with access to additional capital, there is opportunity to expand the asset base in this weak oil price environment and with the ongoing commitment of management and the Board, the Company can deliver the value that shareholders are seeking.
Yours sincerely
Ray BarnesNon-Executive Chairman
Chairman’s Letter
Dear Shareholder
I write to you in this my first year as Chairman of Elixir Petroleum in a challenging time for small oil and gas exploration companies. Lower energy prices have flowed through to the capital markets and share prices have suffered. I recognise the challenges that lie ahead of us, but I am also very pleased with the progress that Elixir has made in the short time I have been with the Company.
For
per
sona
l use
onl
y

3Elixir Petroleum Limited
formation in the Denver Julesburg Basin in north eastern Colorado. In more recent times, production has been declining due to the significant reduction in activity in the unconventional Niobrara resource play. The rig count in the Niobrara region has more than halved since late 2014 where it peaked at over 100 drilling rigs.
Colorado also produces hydrocarbons from conventional reservoirs in a number of areas, including south east of Denver in Lincoln and Washington counties. Several private companies, together with AIM listed Nighthawk Energy plc (LSE:HAWK) have had success in recent years chasing the conventional Mississippian and Pennsylvanian reservoirs. These are the same conventional reservoirs that Elixir is pursuing at its Petra Project.
Petra Project (Elixir 50% Working Interest)
On 4 September 2014, Elixir acquired a 50% Working Interest in over 14,400 net acres in Washington County, Colorado, for an initial payment of approximately US$700,000. Pursuant to the original agreement entered into when oil prices were in excess of US$100 per barrel, Elixir agreed to pay the first US$1.5M of exploration costs on behalf of the joint venture. The agreed work program included the acquisition of new and existing seismic data and the drilling of at least two exploration wells. The date for completion of the
STRATEGY
Elixir Petroleum Limited (“Elixir” or “Company”) is an international oil and gas exploration company with operations in the United States and France.
Elixir’s previously stated strategy is to pursue oil and gas opportunities in predominantly OECD countries which met the following key criteria:
• Onshore, early stage, low cost exploration opportunities with moderate geological risk;
• Conventional oil and gas projects with near term cash flow possibilities;
• A portfolio which exposes shareholders to multiple well drilling programs;
• Farm-in or farm-out potential to grow the portfolio and manage risk;
• Offer strategic partnerships for development projects to leverage opportunities; and
• Applying a combination of technical excellence, commercial innovation, speed and flexibility to grow the Company’s portfolio and access new opportunities.
With the recent significant change in the oil price environment, the Board is continually reviewing its strategy with respect to its asset portfolio. The premise for any revision of the strategy is to focus on new lower risk opportunities within the oil and gas sector, or if compelling, opportunities which may fall outside of the oil and gas sector.
OPERATIONS REVIEW
Colorado, USA
Colorado’s crude oil production rose steadily between the years of 2007 and 2014 principally due to increased exploitation of vast unconventional oil resources which are estimated to be as high as 2 billion barrels. The advent of horizontal drilling and hydraulic fracturing technology is unlocking the prolific resources of the Niobrara shale
Review of Operations
Washington and Lincoln Counties – Colorado, USA
For
per
sona
l use
onl
y

4 2015 Annual Report
production curves generated from publicly available analogue field data from surrounding fields. The valuations demonstrate the economic robustness of the conventional prospects being targeted by Elixir, even in the current low price environment. The detailed analysis has showed that at US$70/bbl WTI, the valuation more than doubles and at US$80/bbl WTI, the valuation almost triples making any success in this play highly leveraged to oil prices.
exploration program has recently been extended six months to 31 December 2016. Following completion of the committed expenditure, Elixir would retain a 50% interest in the leases which have no drilling or seismic commitments and long lease tenure.
Since completing the acquisition, Elixir has spent approximately US$680,000 of the initial US$1.5M acquiring a significant amount of 2D regional seismic data, followed by the acquisition of two proprietary seismic surveys being named the Bradman 2D and Simpson 2D. The seismic surveys confirmed a large geological feature which was mapped and matured into a drill ready prospect named the Rodwell Prospect. This prospect covers around 30% of the total acreage position within Elixir’s leased acreage, which now stands at 50% of approximately 30,000 net acres.
Elixir recently completed an independent Prospective Resources report (Table 1) which was announced to ASX on 13 August 2015 for the Rodwell Prospect.
Based on the above numbers and using the Mean Prospective Resource shown above, the independent assessment estimated an un-risked net present value of US$41.8MM net to Elixir (A$55MM at USD/AUD: 0.75 exchange rate) for the Mississippian and the Cherokee A formations. These valuations are based on West Texas Intermediate (WTI) oil price of US$50/bbl (less a US$9/bbl deduct for transport and marketing fees) and
Review of Operations
Table 1: Independent Prospective Resources net to Elixir – Rodwell Prospect
Reservoir IntervalLow
(MBO)Best
(MBO)High
(MBO)Mean (MBO)
Probability of Geological Success
Mississippian1 275 1,196 5,216 2,076 24%
Cherokee A2 110 320 950 434 19%
Aggregate3 2,511
1 Probabilistic outcome for entire structure2 Probabilistic outcome for mapped Cherokee closures3 Arithmetic summation of probabilistic estimates produces invalid results except for the mean estimate
General location of 50% Working Interest in approximately 30,000 net acres
For
per
sona
l use
onl
y

5Elixir Petroleum Limited
Geological and Geophysical Activities (100% carried by Elixir)
During the last year, Elixir purchased approximately 250kms of 2D seismic data and acquired approximately 60kms of proprietary seismic data, being the Bradman 2D and Simpson 2D seismic surveys. The purchased data was reprocessed and fully interpreted together with the newly acquired 2D seismic data resulting in the maturation of the Rodwell Prospect into a drill ready target. Elixir and its joint venture partner have subsequently permitted two wells over the main Rodwell Prospect and have entered into the planning stage for the first well on the strong geological feature that has been identified.
Leasing Activities (50% cost to Elixir)
During the last financial year, the Company increased its net acreage position by more than double to end the financial year with a 50% Working Interest in approximately 30,000 net acres. The land acquisition has been focussed around the core area to the north east of the producing Arikaree Creek oil field. The leases acquired were generally for tenures of between three and five years and have no seismic or drilling commitments associated with them. The leases acquired built up a material land position over the heart of the Rodwell Prospect and were purchased for approximately US$50/acre.
Review of Operations
Simpson 2D Seismic Survey being acquired over Rodwell Prospect
Location of the Moselle Permit
France
Moselle Permit (EXR 100%, Operator)
The renewal application for the Moselle Permit was lodged in September 2013 with the relevant French authorities. Elixir has committed to a second five year exploration period and with all obligations relating to the first exploration period previously being met, the Company awaits notification that the extension into a second exploration period has been granted. The Company does not intend to incur any significant expenditure on Moselle until the renewal is granted.
The Moselle Permit, acquired by Elixir in April 2010, is located in north-eastern France in the Saar-Lorraine Basin. The permit post renewal will be approximately 2,680 km2 in area, or over 500,000 acres.F
or p
erso
nal u
se o
nly

6 2015 Annual Report
Conventional Prospectivity
Elixir has identified significant prospective resource potential across the conventional prospects at Moselle, which is located largely in the south-western portion of the permit, and which has been retained in full (together with the most prospective areas for unconventional exploration) under the current permit renewal application.
In order to verify the technical studies undertaken by Elixir, RPS Energy Services Pty Ltd (“RPS”) was engaged in April 2013 to provide an Independent Resources Report in relation to three of the conventional prospects identified within the Moselle Permit. The RPS Independent Resources Report was completed in June 2013 and largely confirmed Elixir’s technical work, verifying the potential for significant conventional prospective resources in each of the three prospects analysed. RPS determined the following prospective recoverable resource estimates with respect to the three prospects.
Table 2: Prospective Recoverable Gas Resources (Bcf) – Mean Estimate
ProspectUnrisked Total (if all
sequences are successful) 1
Probabilistic Total (given at least one success) 2
Nancy East (4 sequences) 626 Bcf 235 Bcf
(GPoS3 37%)
Bullseye4
(6 sequences) 208 Bcf 55 Bcf (GPoS 50%)
West Chaumont4
(1 sequence) 25 Bcf 25 Bcf (GPoS 25%)
Total: Nancy East, Bullseye and West Chaumont 861 Bcf 5 157 Bcf 6
(GPoS 80%)
1 Statistical aggregation assuming that all sequences are successful. The probability of this occurring is the product of all risks and is
likely to be extremely small.2 Statistical aggregation assuming that at least one sequence is successful. The total takes into account all possible successful
outcomes and the mean value of this distribution represents the true expectation of success.3 GPoS means Geological Probability of Success.4 An alternate realisation for the Lower Triassic sequence in Bullseye and West Chaumont is oil rather than gas – please see oil case
table below.5 Summation is subject to rounding differences.5 This is a probabilistic total rather than an arithmetic addition.
Review of Operations
Moselle Permit following 50% relinquishment on renewal
For
per
sona
l use
onl
y
7Elixir Petroleum Limited
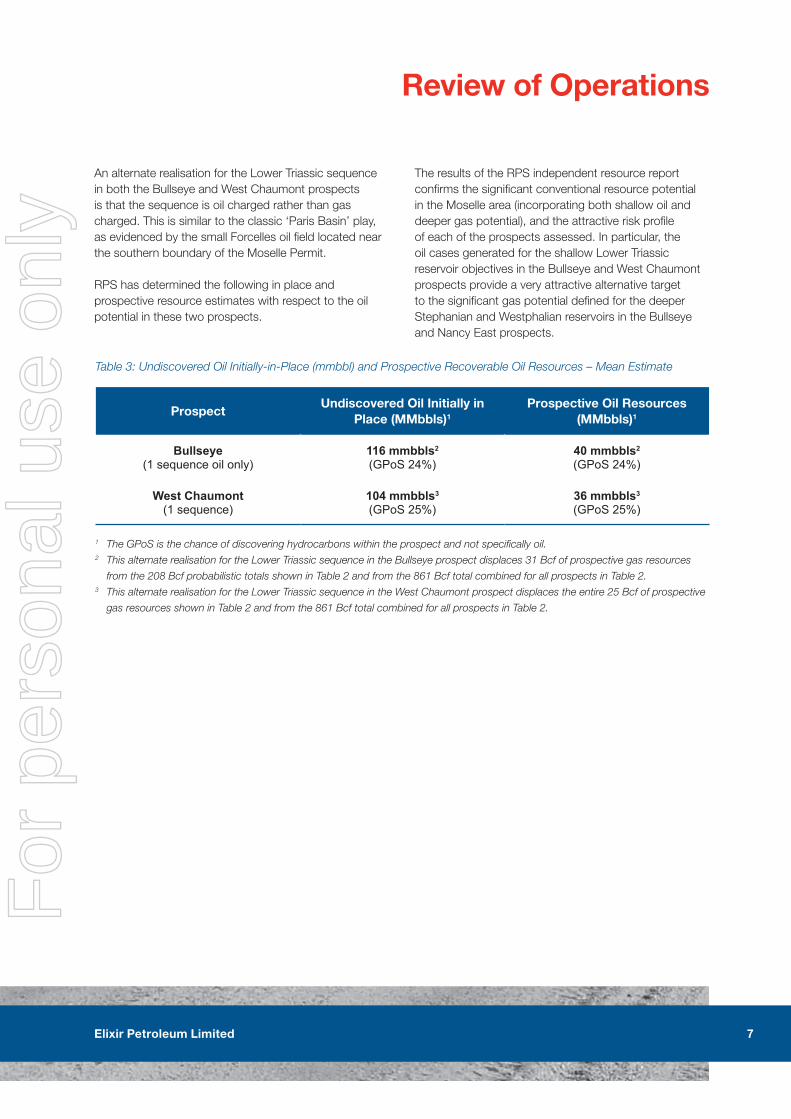
Table 3: Undiscovered Oil Initially-in-Place (mmbbl) and Prospective Recoverable Oil Resources – Mean Estimate
ProspectUndiscovered Oil Initially in
Place (MMbbls)1
Prospective Oil Resources (MMbbls)1
Bullseye (1 sequence oil only)
116 mmbbls2
(GPoS 24%)40 mmbbls2
(GPoS 24%)
West Chaumont (1 sequence)
104 mmbbls3
(GPoS 25%)36 mmbbls3
(GPoS 25%)
1 The GPoS is the chance of discovering hydrocarbons within the prospect and not specifically oil.2 This alternate realisation for the Lower Triassic sequence in the Bullseye prospect displaces 31 Bcf of prospective gas resources
from the 208 Bcf probabilistic totals shown in Table 2 and from the 861 Bcf total combined for all prospects in Table 2.3 This alternate realisation for the Lower Triassic sequence in the West Chaumont prospect displaces the entire 25 Bcf of prospective
gas resources shown in Table 2 and from the 861 Bcf total combined for all prospects in Table 2.
Review of Operations
An alternate realisation for the Lower Triassic sequence in both the Bullseye and West Chaumont prospects is that the sequence is oil charged rather than gas charged. This is similar to the classic ‘Paris Basin’ play, as evidenced by the small Forcelles oil field located near the southern boundary of the Moselle Permit.
RPS has determined the following in place and prospective resource estimates with respect to the oil potential in these two prospects.
The results of the RPS independent resource report confirms the significant conventional resource potential in the Moselle area (incorporating both shallow oil and deeper gas potential), and the attractive risk profile of each of the prospects assessed. In particular, the oil cases generated for the shallow Lower Triassic reservoir objectives in the Bullseye and West Chaumont prospects provide a very attractive alternative target to the significant gas potential defined for the deeper Stephanian and Westphalian reservoirs in the Bullseye and Nancy East prospects.
For
per
sona
l use
onl
y

8 2015 Annual Report
Shareholders approved the issue of 12,000,000 Options to the Non-Executive Directors exercisable at $0.015 on or before 15 October 2016. Of these, 4,000,000 have been cancelled following the resignation of Mr Michael Price. Mr Barnes has not been issued any Options in the Company. Following his appointment as Managing Director, Mr Ferguson was issued 30,000,000 Performance Rights pursuant to the Elixir Petroleum Executive Incentive Plan. The rights were to vest over two years upon attainment of certain share price related hurdles. Effective 31 July 2015, 15,000,000 of these Performance Rights did not vest due to non-attainment of the price hurdles set and have been subsequently forfeited.
CORPORATE GOVERNANCE STATEMENT
The directors of the Group support and adhere to the principles of corporate governance, recognising the need for the highest standard of corporate behaviour and accountability. Please refer to the corporate governance statement released to ASX and posted on the Company website at www.elixirpetroleum.com/corporate-governance.
CORPORATE
Board and Management Changes
On 4 September 2014, the Company appointed Mr Dougal Ferguson as Managing Director. Mr Ferguson originally joined the Company in early 2014 initially as a consultant, then as Chief Executive before being appointed Managing Director following the completion of the acquisition of the Colorado assets and the recapitalisation of the Company.
On 4 December 2014, the Board appointed Mr Ray Barnes as Non-Executive Chairman. Mr Barnes is a highly experienced geologist and company director who has served on ASX and AIM listed junior oil and gas exploration company boards since 2002.
On 31 December 2014, Mr Michael Price resigned from the Board. Mr Price had been a member of the Elixir Board for four years and served the Company well during his tenure.
Changes in Capital Structure
In September 2014, the Company successfully raised approximately $3 million before costs via a placement (“Placement”) and a fully subscribed Share Purchase Plan (“SPP”). The Placement resulted in the issue of 442,000,000 fully paid ordinary shares in the Company at $0.005 each and 221,000,000 Options exercisable at $0.015 on or before 30 September 2016. The Share Purchase plan resulted in the issue of 160,000,000 shares and 80,000,000 Options on the same terms as the Placement pursuant to a prospectus dated 4 August 2014. A further 20,000,000 Options exercisable at $0.015 on or before 30 September 2016 were issued to Hartleys Limited as part consideration for corporate advisory services in relation to the Placement.
Review of OperationsF
or p
erso
nal u
se o
nly

9Elixir Petroleum Limited
Directors’ Report
DIRECTORS
The names of the Directors of the Company in office during the financial year and at the date of this report are:
Mr Ray Barnes (appointed 10 December 2014)Mr Dougal Ferguson (appointed 4 September 2014)Mr Sam Willis Mr Mark O’Clery Mr Michael Price (resigned 31 December 2014)
Other than as stated above, each Director held office from 1 July 2014 until the date of this report.
PRINCIPAL ACTIVITIES
Elixir is an oil and gas exploration company focussed on conventional oil and gas exploration in the United States and Europe. There was no significant change in the nature of these activities during the year.
DIVIDENDS
No dividends have been declared, provided for or paid in respect of the financial year ended 30 June 2015 (2014: Nil).
REVIEW OF OPERATIONS
Operating Results
For the financial year ended 30 June 2015, the Group recorded a net loss from continuing operations after tax of $2,124,605 (2014: $4,369,626) after charging as expenses impairment of oil and gas assets of $1,051,494 (2014: $3,424,067), administration costs of $949,558 (2014: $877,308) and lease operating costs of $28,733 (2014: $78,649).
The Group’s primary focus has been the maturation of a drillable prospect within the Petra Project in Colorado. The Group initially acquired in September 2014 a 50% Working Interest in over 14,000 net acres over this new productive exploration trend in Washington County, Colorado. The Group has since acquired a 50% Working Interest in a further 16,000 net acres, purchased over 250 kilometres of pre-existing 2D seismic data and acquired over 60 kilometres of new proprietary 2D seismic data. The data set has been fully interpreted and has resulted in the identification of the Rodwell Prospect for which a Prospective Resources report has been completed.
The Group has continued to pursue the renewal of the Moselle Permit in France through lobbying of the relevant ministers. The renewal process has taken significantly longer than anticipated and the Board has determined that it is prudent to now fully impair the value of the Moselle Permit on the balance sheet, resulting in the impairment of oil and gas properties noted above.
The Board has continued to focus efforts on cost reduction across the business with all non-essential expenditure being eliminated from the business. The majority of the exploration expenditure incurred in the year ended 30 June 2015 has been expended advancing the Petra Project in Colorado. General and administration cash costs have been significantly reduced including non-executive director fees being reduced by 20-25% from 1 January 2015.
The Group evaluated a number of new venture opportunities during the financial year ended 30 June 2015, but none of these opportunities were concluded either due to excessive price expectations of the sellers or the project not meeting the technical screening criteria of the Company. The Group is focussing on new venture opportunities primarily within the oil and gas sector, but remains open to considering the merits of other opportunities should a compelling transaction be presented.
For
per
sona
l use
onl
y

10 2015 Annual Report
Directors’ Report
Corporate and Financial
In September 2014, the Company undertook a placement and closed a fully subscribed SPP which raised $3.01 million (pre costs). Expenditure for the financial year ended 30 June 2015 was primarily incurred on advancing the Petra Project.
At 30 June 2015, the Group held cash totalling $568,500 (2014: $783,889).
SIGNIFICANT CHANGES IN STATE OF AFFAIRS
Other than those events noted above, there were no other significant changes in the state of affairs of the Group during the year that requires separate disclosure.
EVENTS SINCE THE END OF THE FINANCIAL YEAR
No events have occurred since 30 June 2015 that would materially affect the operations of the Group, the results of the Group or the state of affairs of the Group that are not otherwise disclosed in the Group’s financial statements.
LIKELY DEVELOPMENTS AND EXPECTED RESULTS OF OPERATIONS
Refer to Review of Operations on likely developments and future prospects of the Group.
ENVIRONMENTAL REGULATIONS
The Group’s operations are subject to significant environmental regulation in relation to exploration and production activities conducted by the Group in the countries in which it operates. The Group has a policy of exceeding or at least complying with its environmental performance obligations. During the financial year, the Group was not aware of any material breach of any particular environmental law or any other particular regulation in respect to its operating activities.
INFORMATION ON DIRECTORS
Mr. Ray Barnes – Non-Executive Chairman (appointed 10 December 2014) Qualifications: B.Sc(Hons)Board Committees: Member of Remuneration Committee and Audit Committee
Mr Barnes is a Geoscientist with over 40 years of involvement in the oil and gas industry in Australasia, North Africa, India, North and South America, South East Asia and Europe. Mr Barnes has held geo-technical and management roles in a range of international and Australian companies while based in Australia and overseas. These companies include Delhi, Amax Petroleum, Union Texas, Ampolex / Mobile and Apache. Since 2002, Mr Barnes has served on the boards of Australian listed Voyager Energy and dual listed Oilex Limited as Technical Director. Mr Barnes has ongoing advisory roles with companies in Australia and South East Asia.
Other current Directorships of Australian listed public companies: Nil
Former Directorships of Australian listed public companies in last three years: Oilex Limited
Interests in shares and Options over shares in Group companies at the date of this report: 4,000,000 fully paid ordinary shares 2,000,000 Listed Options exercisable at $0.015 and expiring on 30 September 2016
For
per
sona
l use
onl
y

11Elixir Petroleum Limited
Directors’ Report
Mr Dougal Ferguson – Managing Director (appointed 4 September 2014); previously Chief Executive Officer (appointed 1 May 2014)Qualifications: B.Bus, GAICD
Mr Ferguson has over 22 years of experience in senior management positions in listed upstream oil and gas for both domestic and international companies. Mr Ferguson has held senior positions with Salinas Energy Limited, ARC Energy Limited, Adelphi Energy Limited and Discovery Petroleum Limited, whilst also spending seven years in London with Premier Oil plc and Hess Corporation. He has gained broad commercial and technical experience working in business development and commercial roles in small to medium exploration and production companies.
Mr Ferguson has a commercial and business development background and has been responsible for sourcing, negotiating and closing the recent acquisition in Colorado together with the associated recapitalisation of the Company.
Other current Directorships of Australian listed public companies: Nil
Former Directorships of Australian listed public companies in last three years: Sirocco Energy Limited (resigned 23 December 2013)
Interests in shares and Options over shares in Group companies at the date of this report: 21,350,000 fully paid ordinary shares 7,500,000 listed Options exercisable at $0.015, expiring on 30 September 2016 15,000,000 incentive Options exercisable at $0.01, 50% vesting after 2 May 2015 and 50% vesting after
02 May 2016, expiring 30 April 2017 15,000,000 Performance Rights, vesting on certain share price hurdles, expiring 31 July 2016.
Mr. Sam Willis – Non-Executive Director Qualifications: B.ComBoard Committees: Member of Remuneration Committee and Chair of Audit Committee
Mr Willis has over 10 years’ experience in upstream oil and gas and is currently Non-Executive Director at New Standard Energy (ASX: NSE) after holding the role as Managing Director there from 2007 to early 2013. Mr Willis is also currently a Non-Executive Director at minerals sands producer Base Resources Limited (ASX: BSE).
More broadly Sam brings over 14 years of experience in senior executive and board positions on small and micro-cap ASX listed companies combined with an additional 10 years of corporate finance and financial advisory work including as a private client advisor with stockbroker Hartley Poynton and a financial analyst with both Deutsche Bank and Schroders Investment Management in London. Sam brings extensive experience in all corporate and business development aspects of business as well as strategic direction at board level. He brings strong expertise in opportunity evaluation, deal negotiation and structuring, transaction execution and completion, investment analysis, capital raising and a strong interface with the financial markets and broking community.
Sam holds a Bachelor of Commerce from the University of Western Australia where he majored in Accounting and Finance (Marketing minor).
For
per
sona
l use
onl
y

12 2015 Annual Report
Directors’ Report
Other current Directorships of Australian listed public companies:• Base Resources Limited (ASX: BSE); and• New Standard Energy Limited (ASX:NSE)
Former Directorships of Australian listed public companies in last three years: Nil
Interests in shares and Options over shares in Group companies at the date of this report: 16,500,000 fully paid ordinary shares 7,500,000 Listed Options exercisable at $0.015 and expiring on 30 September 2016 2,000,000 Class A Director Options vesting on 31 August 2015 and expiring on 15 October 2016 2,000,000 Class B Director Options vesting on 31 August 2016 and expiring on 15 October 2016
Mr Mark O’Clery – Non-Executive Director Qualifications: B.Sc (Hons.)Board Committees: Chair of Remuneration Committee and Member of Audit Committee
Mr O’Clery is a Petroleum Geologist with over 25 years of experience in the international, upstream oil and gas business. During his career Mr. O’Clery has held senior technical, commercial, operational and managerial roles with a number of larger international petroleum companies, including Western Mining Corporation, British Gas Plc, Ampolex Limited, Mobil Corporation and OMV AG. Over the past 10 years, Mr O’Clery has been involved in the management of a number of public and private oil and gas, exploration and production companies, and is currently a technical advisor to Alcoa Australia and APA Group. Mark’s broad technical and commercial experience spans a variety of jurisdictions, including Australia, New Zealand, Indonesia, the USA, the UK and a number of East and West African Countries.
Other current Directorships of Australian listed public companies: Nil
Former directorships of Australian listed public companies in last three years: Nil
Interests in shares and Options over shares in Group companies at the date of this report: 6,306,940 fully paid ordinary shares 3,000,000 Listed Options exercisable at $0.015 and expiring on 30 September 2016 2,000,000 Class A Director Options vesting on 31 August 2015 and expiring on 15 October 2016 2,000,000 Class B Director Options vesting on 31 August 2016 and expiring on 15 October 2016
COMPANY SECRETARY
Mr Nicholas Ong Qualifications: BCom, GradDipAppFin, ACIS, MBA
Mr Ong is a Chartered Secretary and is a founding Director of Minerva Corporate, a corporate advisory firm that specialises in providing transaction advisory, financial reporting and company secretarial services.
For
per
sona
l use
onl
y
13Elixir Petroleum Limited
Directors’ Report
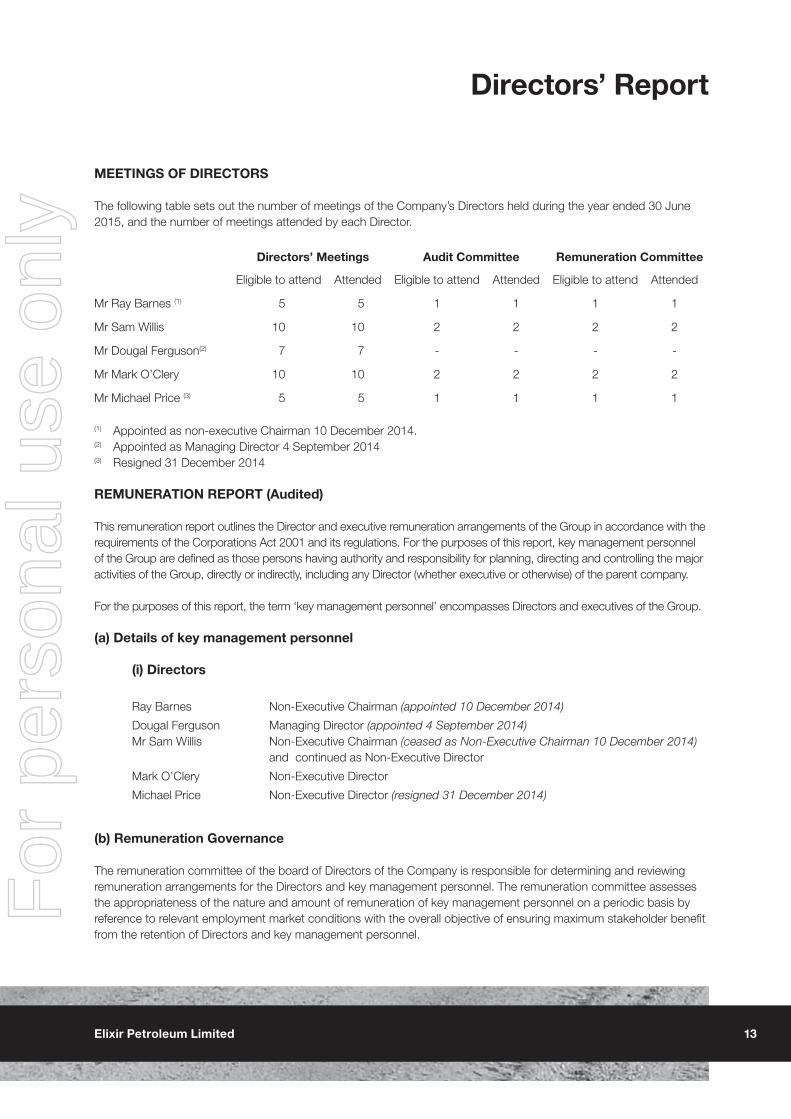
MEETINGS OF DIRECTORS
The following table sets out the number of meetings of the Company’s Directors held during the year ended 30 June 2015, and the number of meetings attended by each Director.
Directors’ Meetings Audit Committee Remuneration Committee
Eligible to attend Attended Eligible to attend Attended Eligible to attend Attended
Mr Ray Barnes (1) 5 5 1 1 1 1
Mr Sam Willis 10 10 2 2 2 2
Mr Dougal Ferguson(2) 7 7 - - - -
Mr Mark O’Clery 10 10 2 2 2 2
Mr Michael Price (3) 5 5 1 1 1 1
(1) Appointed as non-executive Chairman 10 December 2014.(2) Appointed as Managing Director 4 September 2014(3) Resigned 31 December 2014
REMUNERATION REPORT (Audited)
This remuneration report outlines the Director and executive remuneration arrangements of the Group in accordance with the requirements of the Corporations Act 2001 and its regulations. For the purposes of this report, key management personnel of the Group are defined as those persons having authority and responsibility for planning, directing and controlling the major activities of the Group, directly or indirectly, including any Director (whether executive or otherwise) of the parent company.
For the purposes of this report, the term ‘key management personnel’ encompasses Directors and executives of the Group.
(a) Details of key management personnel
(i) Directors
Ray Barnes Non-Executive Chairman (appointed 10 December 2014)
Dougal Ferguson Managing Director (appointed 4 September 2014)Mr Sam Willis Non-Executive Chairman (ceased as Non-Executive Chairman 10 December 2014)
and continued as Non-Executive Director
Mark O’Clery Non-Executive Director
Michael Price Non-Executive Director (resigned 31 December 2014)
(b) Remuneration Governance
The remuneration committee of the board of Directors of the Company is responsible for determining and reviewing remuneration arrangements for the Directors and key management personnel. The remuneration committee assesses the appropriateness of the nature and amount of remuneration of key management personnel on a periodic basis by reference to relevant employment market conditions with the overall objective of ensuring maximum stakeholder benefit from the retention of Directors and key management personnel.
For
per
sona
l use
onl
y

14 2015 Annual Report
Directors’ Report
(c) Remuneration philosophy
The performance of the Company, among other things, depends upon the quality of its Directors and management. To prosper, the Company must attract, motivate and retain highly skilled Directors and key management personnel. To this end, the charter adopted by the remuneration committee aims to align rewards with achievement of strategic objectives. The remuneration framework applied provides for a mixture of fixed and variable pay and a blend of short and long term incentives as appropriate.
Currently no remuneration consultants are used by the Group in formulating remuneration policies.
(d) Remuneration structure
In accordance with best practice corporate governance, the structure of Non-Executive Director and key management personnel remuneration is separate and distinct.
Non-Executive Directors
Non-executive Directors FeesThe maximum aggregate amount of fees that can be paid to Non-Executive Directors is subject to approval by shareholders in a general meeting. At the Company’s Annual General Meeting held on the 29 November 2011, the shareholders of the Company approved that the aggregate amount of Director fees payable to Non-Executive Directors of the Company be set at $500,000 per annum in total. Current Non-Executive director fees are set at $36,000 per annum with the Non-Executive Chairman fees at $45,000 per annum.
The Group’s policy is to remunerate Non-Executive Directors at market rates (for comparable companies) for time, commitment and responsibilities. Cash fees for Non-Executive Directors are not linked to the performance of the Group. However to align Directors’ interests with shareholders’ interests, Directors are encouraged to hold shares in the Company.
Retirement benefits and allowancesNo retirement benefits or allowances are paid or payable to Directors of the Company (other than statutory or mandatory superannuation contributions, where applicable).
Key Management Personnel
Base payKey management personnel are offered a competitive level of base pay which comprises the fixed (unrisked) component of their pay and rewards. Base pay for senior key management personnel is reviewed annually to ensure market competitiveness. There is no guaranteed base pay increases included in any senior key management personnel contracts.
Short term incentivesPayment of short term incentives is at the sole and absolute discretion of the remuneration committee. The remuneration committee assess the achievement of key performance milestones to determine bonus payments. These milestones require performance in relation to key strategic, non-financial measures linked to drivers of performance in future reporting periods.
Short-term bonus payments may be adjusted up or down in line with under or over achievement relative to target performance levels at the discretion of the remuneration committee. For the year ended 30 June 2015 a bonus payment was awarded to Mr Ferguson of $26,000 which represented 10% of his remuneration package and was earned following the introduction of the Petra Project and associated $3 million capital raise. No other short-term bonus payments were made to key management personnel of the Group (2014: Nil):
For
per
sona
l use
onl
y

15Elixir Petroleum Limited
Directors’ Report
There have been no forfeitures of bonuses by key management personnel during the current or prior periods and no cash bonuses remained unvested at year end.
Long term Incentive - Share-based compensationOptions over shares in the Company and Performance Rights are granted under the Elixir Petroleum Executive Incentive Plan (‘Incentive Plan”) which was approved by shareholders at a general meeting on 12 November 2013. The Incentive Plan is designed to provide long-term incentives to the Company’s employees and consultants to deliver long-term shareholder returns. Pursuant to the Incentive Plan, participants are granted Options or Performance Rights subject to vesting conditions set by the Board. The terms may be related to periods of service or achievement of certain performance standards. Participation in the Incentive Plan is at the board’s discretion and no individual has a contractual right to participate in the Incentive Plan or to receive any guaranteed benefits. Options or Performance Rights granted under the Incentive Plan carry no dividend or voting rights.
The Incentive Plan includes rules to prevent participants entering into transactions to remove the “at risk” aspect of the unvested Options or Performance Rights without the approval of the board.
(e) Options and performance rights granted as part of remuneration
Details of Options or Performance Rights over ordinary shares in the Company provided as remuneration to each Director and each of the key management personnel of the Group in the current and prior years are set out below.
Grant Date NumberVesting
ConditionsExercise
PriceExpiry Date
Value per option at grant date
Share Options
Non-Executive Directors3 September 2014(1)
3 September 2014(1)
6,000,0006,000,000
31-August-1531-August-16
$0.015$0.015
15-Oct-1615-Oct-16
$0.001$0.001
Executive Director2 May 20142 May 2014
7,500,0007,500,000
2 May 20152 May 2016
$0.010$0.010
30-Apr-1730-Apr-17
$0.004$0.004
Performance Rights
Executive Director4 September 20144 September 2014
15,000,00015,000,000
Share Price Hurdles (2)
Share Price Hurdles (2)
NoneNone
31-Jul-1531-Jul-16
(1) 2,000,000 of each class of options issued to Michael Price were cancelled following Mr Price’s resignation on 31 December 2014.
(2) The Performance Rights are to vest over two years upon the attainment of certain share price related hurdles. No Performance Rights will be issued if the share price does not exceed $0.01, with 50% vesting if the share price is equal to or greater than $0.01 and 100% vesting if the share price is equal to or greater than $0.014, with pro rata adjustment for a share price between $0.01 and $0.014. 50% of the Performance Rights were measured on 31 July 2015 and none vested and were subsequently forfeited, with the balancing being measured against the share price hurdles on 31 July 2016.
When exercisable, each Option or Performance Right is convertible into one ordinary share of the Company. Further information on the Options and Performance Rights are set out in Note 25 of the Financial Statements.
For
per
sona
l use
onl
y
16 2015 Annual Report
Directors’ Report
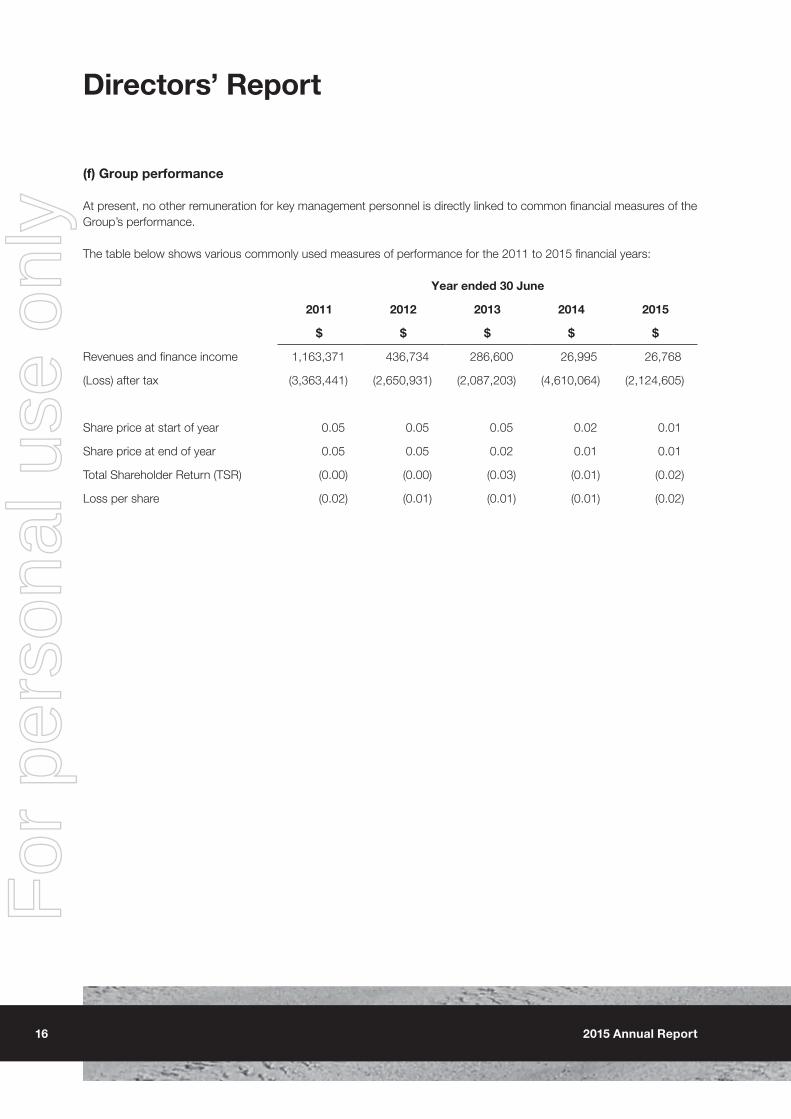
(f) Group performance
At present, no other remuneration for key management personnel is directly linked to common financial measures of the Group’s performance.
The table below shows various commonly used measures of performance for the 2011 to 2015 financial years:
Year ended 30 June
2011 2012 2013 2014 2015
$ $ $ $ $
Revenues and finance income 1,163,371 436,734 286,600 26,995 26,768
(Loss) after tax (3,363,441) (2,650,931) (2,087,203) (4,610,064) (2,124,605)
Share price at start of year 0.05 0.05 0.05 0.02 0.01
Share price at end of year 0.05 0.05 0.02 0.01 0.01
Total Shareholder Return (TSR) (0.00) (0.00) (0.03) (0.01) (0.02)
Loss per share (0.02) (0.01) (0.01) (0.01) (0.02)
For
per
sona
l use
onl
y

17Elixir Petroleum Limited
Directors’ Report
(g) Remuneration of directors and key management personnel of the group for the current and previous financial year
The following tables show details of the remuneration received by the Group’s key management personnel for the current and previous years:
2015 Short-term benefits
Post-employment
benefitsShare-based
payment
Cash salary
and fees Bonus
Other Super-
annuation Options
Perform-ance
Rights Total
Perform-ance
Related
$ $ $ $ $ $ $ %
Non-Executive Directors
Ray Barnes(1) 22,500 - - - - - 22,500 -
Sam Willis 40,500 - - - 2,476 - 42,976 5.8%
Mark O’Clery(2) 40,500 - 8,000 - 2,476 - 50,976 5.8%
Michael Price(3) 22,883 - - 2,117 - - 25,000 -
Subtotal Non-Executive Directors 126,383 - 8,000 2,117 4,952 - 141,452 3.7%
Executive Director
Dougal Ferguson(4) (5) 237,775 26,000 23,757 22,583 40,150 25,341 375,606 24.4%
Subtotal other executives 237,775 26,000 23,757 22,583 40,150 25,341 375,606 24.4%
Total Key Management Personnel 364,158 26,000 31,757 24,700 45,102 25,341 517,058 18.7%
(1) Mr Barnes was appointed as Non-Executive Chairman on 10 December 2014.(2) Mr O’Clery charged $8,000 for technical work done on the Petra Project acquisition on normal commercial terms(3) Mr Price resigned as a Non-Executive Director on 31 December 2014(4) Mr Ferguson was appointed Managing Director on 4 September 2014(5) Mr Ferguson accrued $23,757 of annual leave during the year.
For
per
sona
l use
onl
y

18 2015 Annual Report
Directors’ Report
2014 Short-term benefits
Post-employment
benefitsShare-based
payment
Cash salary
and fees Bonus
Other (5)
Super-annuation Options
Perform-ance
Rights Total
Perform-ance
Related
$ $ $ $ $ $ $ %
Non-Executive Directors
Sam Willis (1) 37,500 - - - - - 37,500 -
Michael Price 45,767 - - 4,233 - - 50,000 -
Mark O’Clery (2) 45,000 - 35,383 - - - 80,383 -
Alan Watson (3) 47,690 - - 4,420 - - 52,110 -
John Robertson (4) 18,333 - - - - - 18,333 -
Subtotal Non-Executive Directors 194,290 - 35,383 8,653 - - 238,326 -
Key Management Personnel
Dougal Ferguson (5) 39,664 - 59,788 3,669 7,274 - 110,395 6.5%
Matthew Szwedzicki (6,7) 105,170 - 2,850 9,729 - (18,513) 99,236 -
Subtotal other executives 144,834 - 62,638 13,398 7,274 (18,513) 209,631 3.4%
Total Key Management Personnel 339,124 - 98,021 22,051 7,274 (18,513) 447,957 1.6%
(1) Mr Willis was appointed as Non-Executive Director on 30 August 2013.(2) Mr O’Clery charged $35,383 for technical work done on the Moselle Project on normal commercial terms. (3) Mr Watson resigned as Non-Executive Chairman on 13 May 2014.(4) Dr Robertson retired on 12 November 2013.(5) Mr Ferguson provided consultancy services from 15 January 2014 to 30 April 2014 totalling $59,788. Mr Ferguson
was appointed Chief Executive Officer on 1 May 2014.(6) Mr Szwedzicki resigned 31st December 2013. Mr Szwedzicki provided consultancy services after the end of his
employment totalling $2,850.(7) Remuneration in the form of Options and Performance Rights includes negative amounts for Options and
Performance Rights forfeited during the year. The performance related percentage is not disclosed where the total amount of short term incentive and / or long term incentive remuneration expense is negative for the relevant period.
For
per
sona
l use
onl
y

19Elixir Petroleum Limited
Directors’ Report
(h) Service agreements
Remuneration and other terms of employment for the executives are formalised in service agreements. These agreements specify the components of remuneration, benefits and notice periods. The material terms of service agreements with key management personnel are noted as follows:
NameTerm of agreement and
notice periodBase salary including
superannuationTermination payment
Mr Dougal Ferguson(1) No fixed term; 3 months(2) $260,000 3 months(3)
(1) Mr Ferguson service agreement commenced 1 May 2014. The contract includes a provision for a cash performance based bonus of up to 40% of the employment contract to be paid for the period ending 30 June 2015 of which 10% was earned.
(2) The notice period applies only to the Company(3) Notice period or termination benefit in lieu of notice (on behalf of the employer), other than for gross misconduct.
(i) Equity instruments held by key management personnel
Options and Performance Rights holdings
The number of Options over ordinary shares and Performance Rights held by Key Management Personnel during the financial year is as follows:
30 June 2015
Balance at beginning
of year
Granted as compen-
sationOther
Purchases(3)
Lapsed/Expired/Forfeited Other (4)
Balance at the end of the year
Vested and
exercisable
Vested and un-ex-
ercisable
Options
Ray Barnes - - - - 2,000,000 2,000,000 2,000,000 -
Sam Willis - 4,000,000 7,500,000 - - 11,500,000 7,500,000 4,000,000
Michael Price (2) - 4,000,000 2,500,000 (4,000,000) (2,500,000) - - -
Mark O’Clery - 4,000,000 3,000,000 - - 7,000,000 3,000,000 4,000,000
Dougal Ferguson 15,000,000 - 7,500,000 - - 22,500,000 15,000,000 7,500,000
15,000,000 12,000,000 20,500,000 (4,000,000) (500,000) 43,000,000 27,500,000 15,500,000
Performance Rights(1)
Dougal Ferguson(5) - 30,000,000 - - - 30,000,000 - -
- 30,000,000 - - - 30,000,000 - -
(1) Non-Executive Directors are not entitled to receive Performance Rights(2) Upon Mr Price’s resignation all remuneration Options issued to Mr Michael Price were forfeited.(3) “Other Purchases” includes listed options issued as part of the placement and SPP completed in September 2014.(4) “Other” includes options held upon appointment, resignation or retirement during the financial year.(5) 15,000,000 performance rights expired after year end.
For
per
sona
l use
onl
y

20 2015 Annual Report
Directors’ Report
Shareholdings
The number of ordinary shares in Elixir Petroleum Limited held by each KMP of the Group during the financial year is as follows:
30 June 2015Balance at
beginning of year
Granted as remuneration
during the year
Issued on exercise of
options during the year
OtherPurchases/
(Sales) (1)
Other changes during the
year (2)
Balance at end of year
Ray Barnes - - - - 4,000,000 4,000,000
Sam Willis 1,500,000 - - 15,000,000 - 16,500,000
Michael Price 999,999 - - 5,000,000 (5,999,999) -
Mark O’Clery 306,940 - - 6,000,000 - 6,306,940
Dougal Ferguson - - - 21,350,000 - 21,350,000
2,806,939 - - 47,350,000 (1,999,999) 48,156,940
(1) Other purchases or sales include on-market purchases and/or sales of shareholdings during the year.(2) Other changes include the shareholding of KMP at the time of appointment, resignation or retirement.
(j) Loans to key management personnel
No loans were provided to the key management personnel or to any of their associates.
(k) Other transactions with key management personnel
There were no other transactions with key management personnel during the financial year.
Voting of Shareholders at Last Year’s Annual General Meeting
The adoption of the remuneration report for the financial year ended 30 June 2014 was put to shareholders of the Company at the Annual General Meeting (AGM) held on 28 November 2014. The resolution was passed by a show of hands. The Company did not receive any specific feedback at the AGM or throughout the year on its remuneration practices.
This is the end of the audited remuneration report.
For
per
sona
l use
onl
y
21Elixir Petroleum Limited
Directors’ Report
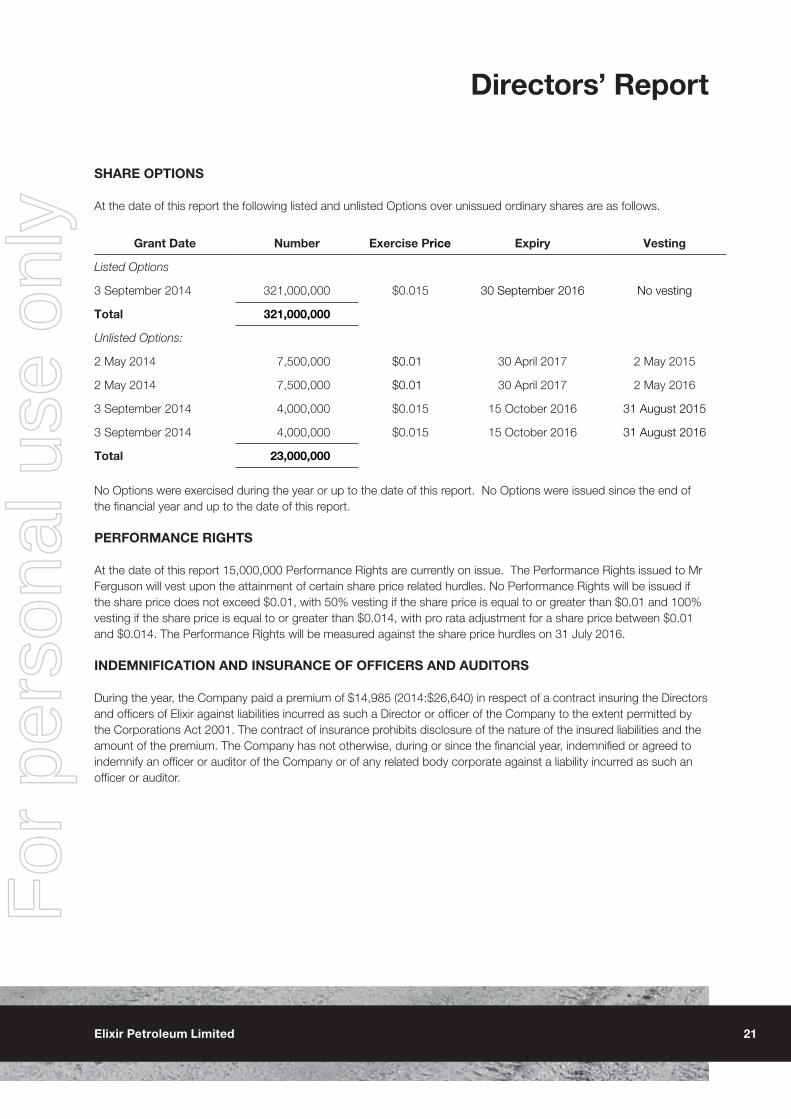
SHARE OPTIONS
At the date of this report the following listed and unlisted Options over unissued ordinary shares are as follows.
Grant Date Number Exercise Price Expiry Vesting
Listed Options
3 September 2014 321,000,000 $0.015 30 September 2016 No vesting
Total 321,000,000
Unlisted Options:
2 May 2014 7,500,000 $0.01 30 April 2017 2 May 2015
2 May 2014 7,500,000 $0.01 30 April 2017 2 May 2016
3 September 2014 4,000,000 $0.015 15 October 2016 31 August 2015
3 September 2014 4,000,000 $0.015 15 October 2016 31 August 2016
Total 23,000,000
No Options were exercised during the year or up to the date of this report. No Options were issued since the end of the financial year and up to the date of this report.
PERFORMANCE RIGHTS
At the date of this report 15,000,000 Performance Rights are currently on issue. The Performance Rights issued to Mr Ferguson will vest upon the attainment of certain share price related hurdles. No Performance Rights will be issued if the share price does not exceed $0.01, with 50% vesting if the share price is equal to or greater than $0.01 and 100% vesting if the share price is equal to or greater than $0.014, with pro rata adjustment for a share price between $0.01 and $0.014. The Performance Rights will be measured against the share price hurdles on 31 July 2016.
INDEMNIFICATION AND INSURANCE OF OFFICERS AND AUDITORS
During the year, the Company paid a premium of $14,985 (2014:$26,640) in respect of a contract insuring the Directors and officers of Elixir against liabilities incurred as such a Director or officer of the Company to the extent permitted by the Corporations Act 2001. The contract of insurance prohibits disclosure of the nature of the insured liabilities and the amount of the premium. The Company has not otherwise, during or since the financial year, indemnified or agreed to indemnify an officer or auditor of the Company or of any related body corporate against a liability incurred as such an officer or auditor.
For
per
sona
l use
onl
y

22 2015 Annual Report
Directors’ Report
PROCEEDINGS ON BEHALF OF THE COMPANY
No person has applied for leave of the court under section 5237 of the Corporations Act 2001 to bring proceedings on behalf of the Company or to intervene in any proceeding to which the Company is a party for the purpose of taking responsibility on behalf of the Company for all or any part of those proceedings.
The Group was not a party to any such proceedings during the year.
NON-AUDIT SERVICES
No non-audit services were provided by the Group’s auditors during the year (or by any other person or firm on the auditors’ behalf) and accordingly the Directors are satisfied that the auditor has complied with the general standard of independence for auditors imposed by the Corporations Act 2001.
AUDITOR’S INDEPENDENCE DECLARATION
The Auditor’s independence declaration is included on page 23 of the financial report.Signed in accordance with a resolution of the Directors made pursuant to s.298 (2) of the Corporations Act 2001
Dougal FergusonManaging DirectorPerth, Western Australia8 September 2015
For
per
sona
l use
onl
y

23Elixir Petroleum Limited
Auditors’ Independence Declaration
BDO Audit (WA) Pty Ltd ABN 79 112 284 787 is a member of a national association of independent entities which are all members of BDO Australia Ltd ABN 77 050 110 275, anAustralian company limited by guarantee. BDO Audit (WA) Pty Ltd and BDO Australia Ltd are members of BDO International Ltd, a UK company limited by guarantee, and formpart of the international BDO network of independent member firms. Liability limited by a scheme approved under Professional Standards Legislation other than for the acts oromissions of financial services licensees
38 Station StreetSubiaco, WA 6008PO Box 700 West Perth WA 6872Australia
Tel: +61 8 6382 4600Fax: +61 8 6382 4601www.bdo.com.au
DECLARATION OF INDEPENDENCE BY JARRAD PRUE TO THE DIRECTORS OF ELIXIR PETROLEUM LIMITED
As lead auditor of Elixir Petroleum Limited for the year ended 30 June 2015, I declare that, to the best ofmy knowledge and belief, there have been:
1. No contraventions of the auditor independence requirements of the Corporations Act 2001 in relationto the audit; and
2. No contraventions of any applicable code of professional conduct in relation to the audit.
This declaration is in respect of Elixir Petroleum Limited and the entities it controlled during the period.
Jarrad Prue
Director
BDO Audit (WA) Pty Ltd
Perth, 8 September 2015
For
per
sona
l use
onl
y

24 2015 Annual Report
Independent Audit Report
38 Station StreetSubiaco, WA 6008PO Box 700 West Perth WA 6872Australia
Tel: +61 8 6382 4600Fax: +61 8 6382 4601www.bdo.com.au
BDO Audit (WA) Pty Ltd ABN 79 112 284 787 is a member of a national association of independent entities which are all members of BDO Australia Ltd ABN77 050 110 275, an Australian company limited by guarantee. BDO Audit (WA) Pty Ltd and BDO Australia Ltd are members of BDO International Ltd, a UKcompany limited by guarantee, and form part of the international BDO network of independent member firms. Liability limited by a scheme approved underProfessional Standards Legislation, other than for the acts or omissions of financial services licensees.
INDEPENDENT AUDITOR’S REPORT
To the members of Elixir Petroleum Limited
Report on the Financial Report
We have audited the accompanying financial report of Elixir Petroleum Limited, which comprises theconsolidated statement of financial position as at 30 June 2015, the consolidated statement of profit orloss and other comprehensive income, the consolidated statement of changes in equity and theconsolidated statement of cash flows for the year then ended, notes comprising a summary ofsignificant accounting policies and other explanatory information, and the directors’ declaration of theconsolidated entity comprising the company and the entities it controlled at the year’s end or fromtime to time during the financial year.
Directors’ Responsibility for the Financial Report
The directors of the company are responsible for the preparation of the financial report that gives atrue and fair view in accordance with Australian Accounting Standards and the Corporations Act 2001and for such internal control as the directors determine is necessary to enable the preparation of thefinancial report that gives a true and fair view and is free from material misstatement, whether due tofraud or error. In Note 1, the directors also state, in accordance with Accounting Standard AASB 101Presentation of Financial Statements, that the financial statements comply with InternationalFinancial Reporting Standards.
Auditor’s Responsibility
Our responsibility is to express an opinion on the financial report based on our audit. We conducted ouraudit in accordance with Australian Auditing Standards. Those standards require that we comply withrelevant ethical requirements relating to audit engagements and plan and perform the audit to obtainreasonable assurance about whether the financial report is free from material misstatement.
An audit involves performing procedures to obtain audit evidence about the amounts and disclosures inthe financial report. The procedures selected depend on the auditor’s judgement, including theassessment of the risks of material misstatement of the financial report, whether due to fraud or error.In making those risk assessments, the auditor considers internal control relevant to the company’spreparation of the financial report that gives a true and fair view in order to design audit proceduresthat are appropriate in the circumstances, but not for the purpose of expressing an opinion on theeffectiveness of the company’s internal control. An audit also includes evaluating the appropriatenessof accounting policies used and the reasonableness of accounting estimates made by the directors, aswell as evaluating the overall presentation of the financial report.
We believe that the audit evidence we have obtained is sufficient and appropriate to provide a basisfor our audit opinion.
Independence
In conducting our audit, we have complied with the independence requirements of the CorporationsAct 2001. We confirm that the independence declaration required by the Corporations Act 2001, whichhas been given to the directors of Elixir Petroleum Limited, would be in the same terms if given to thedirectors as at the time of this auditor’s report.
38 Station StreetSubiaco, WA 6008PO Box 700 West Perth WA 6872Australia
Tel: +61 8 6382 4600Fax: +61 8 6382 4601www.bdo.com.au
BDO Audit (WA) Pty Ltd ABN 79 112 284 787 is a member of a national association of independent entities which are all members of BDO Australia Ltd ABN77 050 110 275, an Australian company limited by guarantee. BDO Audit (WA) Pty Ltd and BDO Australia Ltd are members of BDO International Ltd, a UKcompany limited by guarantee, and form part of the international BDO network of independent member firms. Liability limited by a scheme approved underProfessional Standards Legislation, other than for the acts or omissions of financial services licensees.
INDEPENDENT AUDITOR’S REPORT
To the members of Elixir Petroleum Limited
Report on the Financial Report
We have audited the accompanying financial report of Elixir Petroleum Limited, which comprises theconsolidated statement of financial position as at 30 June 2015, the consolidated statement of profit orloss and other comprehensive income, the consolidated statement of changes in equity and theconsolidated statement of cash flows for the year then ended, notes comprising a summary ofsignificant accounting policies and other explanatory information, and the directors’ declaration of theconsolidated entity comprising the company and the entities it controlled at the year’s end or fromtime to time during the financial year.
Directors’ Responsibility for the Financial Report
The directors of the company are responsible for the preparation of the financial report that gives atrue and fair view in accordance with Australian Accounting Standards and the Corporations Act 2001and for such internal control as the directors determine is necessary to enable the preparation of thefinancial report that gives a true and fair view and is free from material misstatement, whether due tofraud or error. In Note 1, the directors also state, in accordance with Accounting Standard AASB 101Presentation of Financial Statements, that the financial statements comply with InternationalFinancial Reporting Standards.
Auditor’s Responsibility
Our responsibility is to express an opinion on the financial report based on our audit. We conducted ouraudit in accordance with Australian Auditing Standards. Those standards require that we comply withrelevant ethical requirements relating to audit engagements and plan and perform the audit to obtainreasonable assurance about whether the financial report is free from material misstatement.
An audit involves performing procedures to obtain audit evidence about the amounts and disclosures inthe financial report. The procedures selected depend on the auditor’s judgement, including theassessment of the risks of material misstatement of the financial report, whether due to fraud or error.In making those risk assessments, the auditor considers internal control relevant to the company’spreparation of the financial report that gives a true and fair view in order to design audit proceduresthat are appropriate in the circumstances, but not for the purpose of expressing an opinion on theeffectiveness of the company’s internal control. An audit also includes evaluating the appropriatenessof accounting policies used and the reasonableness of accounting estimates made by the directors, aswell as evaluating the overall presentation of the financial report.
We believe that the audit evidence we have obtained is sufficient and appropriate to provide a basisfor our audit opinion.
Independence
In conducting our audit, we have complied with the independence requirements of the CorporationsAct 2001. We confirm that the independence declaration required by the Corporations Act 2001, whichhas been given to the directors of Elixir Petroleum Limited, would be in the same terms if given to thedirectors as at the time of this auditor’s report.F
or p
erso
nal u
se o
nly

25Elixir Petroleum Limited
Independent Audit Report
Opinion
In our opinion:
(a) the financial report of Elixir Petroleum Limited is in accordance with the Corporations Act 2001,including:
(i) giving a true and fair view of the consolidated entity’s financial position as at 30 June 2015and of its performance for the year ended on that date; and
(ii) complying with Australian Accounting Standards and the Corporations Regulations 2001; and
(b) the financial report also complies with International Financial Reporting Standards as disclosed inNote 1.
Emphasis of matter
Without modifying our opinion, we draw attention to Note 1(b) in the financial report, which indicatesthat the ability of the consolidated entity to continue as a going concern is dependent upon futureasset transactions, capital raising or other corporate activity. These conditions, along with othermatters as set out in Note 1(b), indicate the existence of a material uncertainty that may castsignificant doubt about the consolidated entity’s ability to continue as a going concern and therefore,the consolidated entity may be unable to realise its assets and discharge its liabilities in the normalcourse of business.
Report on the Remuneration Report
We have audited the Remuneration Report included in the directors’ report for the year ended 30 June2015. The directors of the company are responsible for the preparation and presentation of theRemuneration Report in accordance with section 300A of the Corporations Act 2001. Our responsibilityis to express an opinion on the Remuneration Report, based on our audit conducted in accordance withAustralian Auditing Standards.
Opinion
In our opinion, the Remuneration Report of Elixir Petroleum Limited for the year ended 30 June 2015complies with section 300A of the Corporations Act 2001.
BDO Audit (WA) Pty Ltd
Jarrad Prue
Director
Perth, 8 September 2015For
per
sona
l use
onl
y
26 2015 Annual Report
Directors’ Declaration
In the Directors’ opinion:
1. the financial statements and accompanying notes set out on pages 27 to 75, are in accordance with the Corporations Act 2001, including:
a. complying with Accounting Standards, the Corporations Regulations 2001 and other mandatory professional reporting requirements; and
b. giving a true and fair view of the Group’s financial position as at 30 June 2015 and of its performance for the financial year ended on that date; and
2. there are reasonable grounds to believe that the Company will be able to pay its debts as and when they become due and payable, and
3. the financial statements and accompanying notes are presented in compliance with IFRS and interpretations adopted by the International Accounting Standards Board.
4. the remuneration disclosures set out in the Directors’ report (as part of the audited remuneration report) for the year ended 30 June 2015 comply with section 300A of the Corporations Act 2001; and
5. at the date of this declaration, there are reasonable grounds to believe that the members of the Extended Closed Group identified in note 11 will be able to meet any obligations or liabilities to which they are, or may become, subject by virtue of the deed of cross guarantee described in note 11.
The Directors have been given the declarations by the chief operating officer required by section 295A of the Corporations Act 2001.
Signed in accordance with a resolution of the Directors made pursuant to section 295(5) of the Corporations Act 2001.
On behalf of the Directors.
Dougal FergusonManaging DirectorPerth, Western Australia
8 September 2015
For
per
sona
l use
onl
y

27Elixir Petroleum Limited
Consolidated Statement of Profit or Loss and Other Comprehensive Income
For the year ended 30 June 2015
Consolidated
Note 2015 2014
$ $
Continuing operations
Revenue and other Income (3) 26,768 26,995
Depreciation and amortisation expense (4) (593) (1,505)
Impairment of Exploration & Evaluation Expenditure (15) (1,051,494) (3,424,067)
Abandonment expense (17) (140,935) -
Lease operating costs (28,733) (78,649)
Loss on disposal of asset - (9,480)
Foreign exchange gain/(loss) 19,940 (5,612)
Administration and office costs (4) (949,558) (877,308)
Loss from continuing operations before income tax (2,124,605) (4,369,626)
Tax expense (5) - -
Net Loss from continuing operations after income tax expense (2,124,605) (4,369,626)
Loss from discontinued operations (24) - (240,438)
Loss after tax (2,124,605) (4,610,064)
Other comprehensive income:
Items that may not be reclassified to profit or loss:
Foreign currency translation differences 366,844 262,068
Other comprehensive income for the year 366,844 262,068
Total comprehensive loss for the year (1,757,761) (4,347,996)
Net loss attributable to:
Members of the parent entity (2,124,605) (4,610,064)
(2,124,605) (4,610,064)
Total comprehensive loss attributable to:
Members of the parent entity (1,757,761) (4,347,996)
(1,757,761) (4,347,996)
Loss per share for the year attributable to the members of Elixir Petroleum Ltd
From continuing and discontinued operations
Basic and diluted (loss) per share (cents) (7) (0.23) (1.12)
The above consolidated statement of profit or loss and other comprehensive income should be read in conjunction with the accompanying notes.
For
per
sona
l use
onl
y

28 2015 Annual Report
Consolidated Statement ofFinancial PositionAs at 30 June 2015
Consolidated
2015 2014
Note $ $
Assets
Current assets
Cash and cash equivalents (8) 568,500 783,889
Trade and other receivables (9) 910 11,392
Other assets (12) 19,710 21,782
Total current assets 589,120 817,063
Non-current assets
Trade and other receivables (9) 750,893 609,155
Property, plant and equipment (13) 3,813 1,906
Oil and gas properties (14) - -
Deferred exploration and evaluation expenditure (15) 2,484,762 1,000,000
Total non-current assets 3,239,468 1,611,061
Total assets 3,828,588 2,428,124
Liabilities
Current liabilities
Trade and other payables (16) 215,149 242,219
Provisions (17) 774,649 484,816
Total current liabilities 989,798 727,035
Total liabilities 989,798 727,035
Net Assets 2,838,790 1,701,089
Equity
Issued capital (18) 69,510,232 66,721,736
Reserves (28) 174,598 (298,308)
Accumulated Losses (28) (66,846,040) (64,722,339)
Total equity 2,838,790 1,701,089
The above consolidated statement of financial position should be read in conjunction with the accompanying notes.For
per
sona
l use
onl
y

29Elixir Petroleum Limited
Consolidated Statement of Changes in Equity
For the year ended 30 June 2015
Share Capital Reserves
OrdinaryAccumulated
Losses
Option Premium Reserve
Share Based
Payment Reserve
Foreign Currency
Translation Reserve Total
$ $ $ $ $ $Consolidated Group Balance at 1 July 2013 64,972,576 (61,889,466) 1,773,184 10,932 (568,554) 4,298,672
Comprehensive income
(Loss) for the year - (4,610,064) - - - (4,610,064)Exchange differences on translation of foreign operations - - - - 262,068 262,068
Total comprehensive income/(loss) for the year - (4,610,064) - - 262,068 (4,347,996)
Transactions with owners, in their capacity as owners, and other transfers
Lapse of Performance Rights - 4,007 - (10,932) - (6,925)
Lapse of Options - 1,773,184 (1,773,184) - - -
Options issued during the year - - - 7,274 - 7,274Performance Rights issued during the year - - - 904 - 904
Shares issued during the year 1,848,338 - - - - 1,848,338
Share issue costs (99,178) - - - - (99,178)Total transactions with owners and other transfers 1,749,160 1,777,191 (1,773,184) (2,754) - 1,750,413
Balance at 30 June 2014 66,721,736 (64,722,339) - 8,178 (306,486) 1,701,089
Comprehensive income
Loss for the year - (2,124,605) - - - (2,124,605)Exchange differences on translation of foreign operations - - - - 366,844 366,844Total comprehensive income/(loss) for the year - (2,124,605) - - 366,844 (1,757,761)
Transactions with owners, in their capacity as owners, and other transfers
Lapse of Performance Rights - 904 - (6,000) - (5,096)
Forfeit of Options - - - (971) - (971)
Options issued during the year - - - 66,075 - 66,075Performance rights issued during the year - - - 46,958 - 46,958
Shares issued during the year 3,010,000 - - - - 3,010,000
Share issue costs (221,504) - - - - (221,504)
Total transactions with owners and other transfers 2,788,496 904 - 106,062 - 2,895,462
Balance at 30 June 2015 69,510,232 (66,846,040) - 114,240 60,358 2,838,790
The above consolidated statement of changes in equity should be read in conjunction with the accompanying notes.
For
per
sona
l use
onl
y

30 2015 Annual Report
Consolidated Statement of Cash FlowsFor the year ended 30 June 2015
Consolidated
Note 2015 2014
$ $
Cash flows from operating activities
Receipts from customers - 61,543
Payments to suppliers and employees (845,367) (1,057,934)
Net cash (used in) operating activities (22a) (845,367) (996,391)
Cash flows from investing activities
Payments for capitalised exploration, evaluation and development (2,206,817) (216,216)
Interest received 30,863 22,900
Proceeds from sale of assets (payment to exit) (24) - (764,947)
Proceeds from sale of plant and equipment - 10,000
Purchase of property, plant and equipment (2,500) -
Net cash (used in) investing activities (2,178,454) (948,263)
Cash flows from financing activities
Proceeds from issues of shares 3,010,000 1,848,338
Payments for share issue costs (221,504) (99,178)
Net cash provided by financing activities 2,788,496 1,749,160
Net decrease in cash held (235,325) (195,494)
Cash and cash equivalents at beginning of financial year (8) 783,889 984,995
Effect of exchange rates on cash holdings in foreign currencies 19,936 (5,612)
Cash and cash equivalents at end of financial year (8) 568,500 783,889
The above consolidated statement of cash flows should be read in conjunction with the accompanying notes.
For
per
sona
l use
onl
y

31Elixir Petroleum Limited
Notes to the Financial Statements
1. Notes to the Consolidated Financial Statements
Basis of preparation
The financial statements are general purpose financial statements that have been prepared in accordance with Australian Accounting Standards, Australian Accounting Interpretations, other authoritative pronouncements of the Australian Accounting Standards Board and the Corporations Act 2001. The Group is a for-profit entity for financial reporting purposes under the Australian Accounting Standards.
The financial statements have been prepared on the going concern basis, which contemplates the continuity of normal business activity and the realisation of assets and the settlement of liabilities in the normal course of business.
Australian Accounting Standards set out accounting policies that the Australian Accounting Standards Board has concluded would result in financial statements containing relevant and reliable information about transactions, events and conditions. The financial statements and notes also comply with International Financial Reporting Standards as issued by the IASB. Material accounting policies adopted in the preparation of the financial statements are presented below and have been consistently applied unless stated otherwise. Material accounting policies adopted in the preparation of these financial statements are presented below and have been consistently applied unless stated otherwise.
Except for cash flow information, the financial statements have been prepared on an accruals basis and are based on historical costs, modified, where applicable, by the measurement at fair value of selected non-current assets, financial assets and financial liabilities.
(a) Principles of consolidation
The consolidated financial statements incorporate the assets, liabilities and results of entities controlled by Elixir Petroleum Limited at the end of the reporting period. A controlled entity is any entity over which Elixir Petroleum Limited has the ability and right to govern the financial and operating policies so as to obtain benefits from the entity’s activities.
Where controlled entities have entered or left the Group during the year, the financial performance of those entities is included only for the period of the year that they were controlled. A list of controlled entities is contained in Note 11 to the financial statements.
In preparing the consolidated financial statements, all intragroup balances and transactions between entities in the consolidated group have been eliminated in full on consolidation.
Non-controlling interests, being the equity in a subsidiary not attributable, directly or indirectly, to a parent, are reported separately within the equity section of the consolidated statement of financial position and statements showing profit or loss and other comprehensive income. The non-controlling interests in the net assets comprise their interests at the date of the original business combination and their share of changes in equity since that date.
(b) Going concern
The financial statements have been prepared on the going concern basis, which contemplates the continuity of normal business activity and the realisation of assets and the settlement of liabilities in the normal course of business.
For
per
sona
l use
onl
y

32 2015 Annual Report
Notes to the Financial Statements
1. Notes to the Consolidated Financial Statements (continued)
(b) Going concern (continued)
The ability of the consolidated entity to continue as a going concern is dependent upon future asset transactions, capital raising or other corporate activity. Elixir has been able to successfully execute such transactions and raise capital in the past and may be required to do so again in the future to supplement working capital requirements.
The Directors of the consolidated entity continually review funding requirements of the Group and have the ability to supplement existing working capital if required. However, current market conditions indicate the existence of a material uncertainty that may cast significant doubt about the consolidated entity’s ability to continue as a going concern and therefore be unable to realise its assets and discharge its liabilities in the normal course of business.
(c) Asset acquisition
On 4 September 2014, the Company acquired a 50% Working Interest in 14,322 net acres for cash consideration of US$699,583 (A$757,756) from Apollo Operating LLC, pursuant to a Sale and Purchase Agreement. As the acquisition is not deemed a business acquisition, the transaction has been accounted for as an asset acquisition.
When an asset acquisition does not constitute a business combination, the assets and liabilities are assigned a carrying amount based on their relative fair values in an asset purchase transaction and no deferred tax will arise in relation to the acquired assets and assumed liabilities as the initial recognition exemption for deferred tax under AASB 112 applies. No goodwill will arise on the acquisition and transaction costs of the acquisition will be included in the capitalised cost of the asset.
(d) Income Tax
The income tax expense / (income) for the year comprises current income tax expense / (income) and deferred tax expense / (income).
Current income tax expense charged to profit or loss is the tax payable on taxable income. Current tax liabilities / (assets) are measured at the amounts expected to be paid to / (recovered from) the relevant taxation authority.
Deferred income tax expense reflects movements in deferred tax asset and deferred tax liability balances during the year as well as unused tax losses.
Current and deferred income tax expense / (income) is charged or credited outside profit or loss when the tax relates to items that are recognised outside profit or loss.
Except for business combinations, no deferred income tax is recognised from the initial recognition of an asset or liability, where there is no effect on accounting or taxable profit or loss.
Deferred tax assets and liabilities are calculated at the tax rates that are expected to apply to the period when the asset is realised or the liability is settled and their measurement also reflects the manner in which management expects to recover or settle the carrying amount of the related asset or liability. With respect to non-depreciable items of property, plant and equipment measured at fair value and items of investment property measured at fair value, the related deferred tax liability or deferred tax asset is measured on the basis that the carrying amount of the asset will be recovered entirely through sale.
For
per
sona
l use
onl
y

33Elixir Petroleum Limited
Notes to the Financial Statements
1. Notes to the Consolidated Financial Statements (continued)
(d) Income Tax (continued)
Deferred tax assets relating to temporary differences and unused tax losses are recognised only to the extent that it is probable that future taxable profit will be available against which the benefits of the deferred tax asset can be utilised.
Where temporary differences exist in relation to investments in subsidiaries, branches, associates, and joint ventures, deferred tax assets and liabilities are not recognised where the timing of the reversal of the temporary difference can be controlled and it is not probable that the reversal will occur in the foreseeable future.
Current tax assets and liabilities are offset where a legally enforceable right of set-off exists and it is intended that net settlement or simultaneous realisation and settlement of the respective asset and liability will occur. Deferred tax assets and liabilities are offset where: (a) a legally enforceable right of set-off exists; and (b) the deferred tax assets and liabilities relate to income taxes levied by the same taxation authority on either the same taxable entity or different taxable entities where it is intended that net settlement or simultaneous realisation and settlement of the respective asset and liability will occur in future periods in which significant amounts of deferred tax assets or liabilities are expected to be recovered or settled.
(e) Segment Reporting
The Group has identified its operating segments based on the internal reports that are reviewed and used by the board of Directors (chief operating decision makers) in assessing performance and in determining the allocation of resources.
Management has determined, based on the reports reviewed by the Board of Directors that are used to make strategic decision, that the Group had three reportable segments being oil and gas exploration in the United Kingdom (UK), oil and gas exploration in France and oil and gas exploration in the United States of America (USA). The group’s management and administration office is located in Australia.
Basis of accounting for purposes of reporting by operating segments
(i) Accounting policies adoptedUnless stated otherwise, all amounts reported to the Board of Directors, being the chief operating decision makers with respect to operating segments, are determined in accordance with accounting policies that are consistent with those adopted in the annual financial statements of the Group.
(ii) Inter-segment transactionsAn internally determined transfer price is set for all inter-segment sales. This price is re-set quarterly and is based on what would be realised in the event the sale was made to an external party at arm’s length. All such transactions are eliminated on consolidation of the Group’s financial statements.
Corporate charges are allocated to reporting segments based on the segment’s overall proportion of revenue generation within the Group. The Board of Directors believes this is representative of likely consumption of head office expenditure that should be used in assessing segment performance and cost recoveries.
For
per
sona
l use
onl
y

34 2015 Annual Report
Notes to the Financial Statements
1. Notes to the Consolidated Financial Statements (continued)
(e) Segment Reporting (continued)
Inter-segment loans payable and receivable are initially recognised at the consideration received / to be received net of transaction costs. If intersegment loans receivable and payable are not on commercial terms, these are not adjusted to fair value based on market interest rates. This policy represents a departure from that applied to the statutory financial statements.
(iii) Segment assetsWhere an asset is used across multiple segments, the asset is allocated to the segment that receives the majority of the economic value from the asset. In most instances, segment assets are clearly identifiable on the basis of their nature and physical location.
(iv) Segment liabilitiesLiabilities are allocated to segments where there is direct nexus between the incurrence of the liability and the operations of the segment. Borrowings and tax liabilities are generally considered to relate to the Group as a whole and are not allocated. Segment liabilities include trade and other payables and certain direct borrowings.
(v) Unallocated itemsThe following items of revenue, expense, assets and liabilities are not allocated to operating segments as they are not considered part of the core operations of any segment:• Derivatives• Net gains on disposal of available-for-sale investments• Income tax expense• Deferred tax assets and liabilities• Current tax liabilities• Other financial liabilities• Discontinued operations• Retirement benefit obligations
(f) Property, Plant and Equipment
Each class of property, plant and equipment is carried at cost or fair value as indicated less, where applicable, any accumulated depreciation and impairment losses.
Plant and equipmentPlant and equipment are measured on the cost basis and therefore carried at cost less accumulated depreciation and any accumulated impairment. In the event the carrying amount of plant and equipment is greater than the estimated recoverable amount, the carrying amount is written down immediately to the estimated recoverable amount and impairment losses are recognised either in profit or loss or as a revaluation decrease if the impairment losses relate to a revalued asset. A formal assessment of recoverable amount is made when impairment indicators are present (refer to Note 1(g) for details of impairment).
The carrying amount of plant and equipment is reviewed annually by Directors to ensure it is not in excess of the recoverable amount from these assets. The recoverable amount is assessed on the basis of the expected net cash flows that will be received from the asset’s employment and subsequent disposal. The expected net cash flows have been discounted to their present values in determining recoverable amounts.
For
per
sona
l use
onl
y

35Elixir Petroleum Limited
Notes to the Financial Statements
1. Notes to the Consolidated Financial Statements (continued)
(f) Property, Plant and Equipment (continued)
The cost of fixed assets constructed within the consolidated group includes the cost of materials, direct labour, borrowing costs and an appropriate proportion of fixed and variable overheads.
Subsequent costs are included in the asset’s carrying amount or recognised as a separate asset, as appropriate, only when it is probable that future economic benefits associated with the item will flow to the Group and the cost of the item can be measured reliably. All other repairs and maintenance are recognised as expenses in profit or loss during the financial period in which they are incurred.
DepreciationThe depreciable amount of all fixed assets including buildings and capitalised lease assets, but excluding freehold land, is depreciated on a straight-line basis over the asset’s useful life to the company commencing from the time the asset is held ready for use. Leasehold improvements are depreciated over the shorter of either the unexpired period of the lease or the estimated useful lives of the improvements.
The depreciation rates used for each class of depreciable assets are:
Class of Fixed Asset Depreciation Rate
Plant and equipment 25%
The assets’ residual values and useful lives are reviewed, and adjusted if appropriate, at the end of each reporting period.
An asset’s carrying amount is written down immediately to its recoverable amount if the asset’s carrying amount is greater than its estimated recoverable amount.
Gains and losses on disposals are determined by comparing proceeds with the carrying amount. These gains and losses are recognised in profit or loss in the period in which they arise. When revalued assets are sold, amounts included in the revaluation surplus relating to that asset are transferred to retained earnings.
(g) Interests in oil and gas properties
Exploration & evaluation expenditureThe Group’s accounting policy for expenditure on exploration and of evaluation is accounted for in accordance with the area of interest method.
This approach is strongly linked to the Group’s oil and gas reserves determination and reporting process and is considered to most fairly reflect the results of the Group’s exploration and evaluation activity because only assets with demonstrable value are carried on the statement of financial position.
Once a decision has been made to develop an oil or gas prospect, accumulated exploration and evaluation costs for that prospect are transferred from Deferred Exploration, Evaluation to Development Projects. Once production commences capitalised costs associated with the producing well are transferred to Oil and Gas Properties and are amortised or depreciated over the useful life of the asset.F
or p
erso
nal u
se o
nly

36 2015 Annual Report
Notes to the Financial Statements
1. Notes to the Consolidated Financial Statements (continued)
(g) Interests in oil and gas properties (continued)
This method allows the costs of discovery, evaluation and development of a prospect to be aggregated on the statement of financial position and matched against the benefits derived from production once this commences.
CostsExploration licence acquisition costs relating to Greenfields oil and gas exploration provinces are expensed as incurred while the costs incurred in relation to established or recognised oil and gas exploration provinces are initially capitalised and then amortised over the shorter term of the licence or the expected life of the project.
All other exploration and evaluation costs, including general permit activity, geological and geophysical costs and new venture activity costs are charged as expenses as incurred except where:
• the expenditure relates to an area of interest that, at reporting date, no assessment of the existence of economically recoverable reserves has been made; or
• where there exists an economically recoverable reserve and it is expected that the capitalised expenditure will be recouped through successful exploitation of the area of interest, or alternatively, by its sale.
Areas of interest are recognised at the field level. Subsequent to the recognition of an area of interest, all further costs relating to the area of interest are initially capitalised. Each area of interest is reviewed at least bi-annually to determine whether economic quantities of reserves exist or whether further exploration and evaluation work is required to support the continued carry forward of capitalised costs.
The costs of drilling exploration wells are initially capitalised pending the results of the well. Costs are expensed where the well does not result in the successful discovery of economically recoverable hydrocarbons. To the extent it is considered that the relevant expenditure will not be recovered, it is immediately expensed.
Transfer to development projectsUpon a decision being made to commercially develop an area of interest, accumulated expenditure for the area of interest is transferred to Oil and Gas Properties and amortised or depreciated over the useful life of the project.
Producing projectsExploration, evaluation and development costs are initially capitalised as deferred exploration, evaluation and development expenditure and upon commencement of commercial operations are transferred to Oil and Gas Properties. Operating costs of projects in commercial production are expensed as incurred.
Prepaid drilling and completion costsWhere the Group has a non-operator interest in an oil or gas property, it may periodically be required to make a cash contribution for its share of the operator’s drilling and / or completion costs, in advance of these operations taking place.
Where these contributions relate to a prepayment for exploratory or early stage drilling activity, prior to a decision on the commerciality of a well having been made, the costs are capitalised as prepaid drilling costs within Deferred Exploration, Evaluation and Development Expenditure.
Where these contributions relate to a prepayment for well completion, these costs are capitalised as prepaid completion costs within Deferred Exploration, Evaluation and Development Expenditure.
For
per
sona
l use
onl
y

37Elixir Petroleum Limited
Notes to the Financial Statements
1. Notes to the Consolidated Financial Statements (continued)
(g) Interests in oil and gas properties (continued)
As the operator notifies the Company as to how funds have been expended, the costs are reclassified from prepaid costs to the appropriate expenditure category.
Once a decision has been made to proceed with completion of a well, all costs are transferred from Exploration and Evaluation to Oil and Gas Properties, including any prepaid amounts.
Amortisation of producing projectsUpon commencement of production, the Group amortises the accumulated costs for the relevant area of interest over the life of the area according to the rate of depletion of the economically recoverable quantities of reserves. Estimates of recoverable reserve quantities include judgemental assumptions regarding commodity prices, exchange rates, discount rates, and production and transportation costs for future cash flows. It also requires interpretation of complex and difficult geological and geophysical models in order to make an assessment of the size, shape, depth and quality of reservoirs, and their anticipated recoveries. The economic, geological and technical factors used to estimate reserves may change from period to period.
(h) Financial Instruments
Recognition and Initial MeasurementFinancial assets and financial liabilities are recognised when the entity becomes a party to the contractual provisions to the instrument. For financial assets, this is equivalent to the date that the company commits itself to either the purchase or sale of the asset (i.e. trade date accounting is adopted).
Financial instruments are initially measured at fair value plus transactions costs except where the instrument is classified ‘at fair value through profit or loss’ in which case transaction costs are expensed to profit or loss immediately.
Classification and Subsequent MeasurementFinancial instruments are subsequently measured at fair value, amortised cost using the effective interest method, or cost.
Amortised cost is calculated as the amount at which the financial asset or financial liability is measured at initial recognition less principal repayments and any reduction for impairment, and adjusted for any cumulative amortisation of the difference between that initial amount and the maturity amount calculated using the effective interest method.
Fair value is determined based on current bid prices for all quoted investments. Valuation techniques are applied to determine the fair value for all unlisted securities, including recent arm’s length transactions, reference to similar instruments and option pricing models.
The effective interest method is used to allocate interest income or interest expense over the relevant period and is equivalent to the rate that discounts estimated future cash payments or receipts (including fees, transaction costs and other premiums or discounts) over the expected life (or when this cannot be reliably predicted, the contractual term) of the financial instrument to the net carrying amount of the financial asset or financial liability. Revisions to expected future net cash flows will necessitate an adjustment to the carrying amount with a consequential recognition of an income or expense item in profit or loss.
For
per
sona
l use
onl
y

38 2015 Annual Report
Notes to the Financial Statements
1. Notes to the Consolidated Financial Statements (continued)
(h) Financial Instruments (continued)
The Group does not designate any interests in subsidiaries, associates or joint venture entities as being subject to the requirements of accounting standards specifically applicable to financial instruments.
(i) Loans and receivables Loans and receivables are non-derivative financial assets with fixed or determinable payments that are not
quoted in an active market and are subsequently measured at amortised cost.
Gains or losses are recognised in profit or loss through the amortisation process and when the financial asset is derecognised.
(ii) Held-to-maturity investments Held-to-maturity investments are non-derivative financial assets that have fixed maturities and fixed or
determinable payments, and it is the Group’s intention to hold these investments to maturity. They are subsequently measured at amortised cost.
Gains or losses are recognised in profit or loss through the amortisation process and when the financial asset is derecognised.
(iii) Financial Liabilities Non-derivative financial liabilities other than financial guarantees are subsequently measured at amortised
cost. Gains or losses are recognised in profit or loss through the amortisation process and when the financial liability is derecognised.
ImpairmentAt the end of each reporting period, the Group assesses whether there is objective evidence that a financial asset has been impaired. A financial asset (or a group of financial assets) is deemed to be impaired if, and only if, there is objective evidence of impairment as a result of one or more events (a “loss event”) having occurred, which has an impact on the estimated future cash flows of the financial asset(s).
In the case of available-for-sale financial assets, a significant or prolonged decline in the market value of the instrument is considered to constitute a loss event. Impairment losses are recognised in profit or loss immediately. Also, any cumulative decline in fair value previously recognised in other comprehensive income is reclassified to profit or loss at this point.
In the case of financial assets carried at amortised cost, loss events may include: indications that the debtors or a group of debtors are experiencing significant financial difficulty, default or delinquency in interest or principal payments; indications that they will enter bankruptcy or other financial reorganisation; and changes in arrears or economic conditions that correlate with defaults.
For financial assets carried at amortised cost (including loans and receivables), a separate allowance account is used to reduce the carrying amount of financial assets impaired by credit losses. After having taken all possible measures of recovery, if management establishes that the carrying amount cannot be recovered by any means, at that point the written-off amounts are charged to the allowance account or the carrying amount of impaired financial assets is reduced directly if no impairment amount was previously recognised in the allowance account.
For
per
sona
l use
onl
y

39Elixir Petroleum Limited
Notes to the Financial Statements
1. Notes to the Consolidated Financial Statements (continued)
(h) Financial Instruments (continued)
When the terms of financial assets that would otherwise have been past due or impaired have been renegotiated, the Group recognises the impairment for such financial assets by taking into account the original terms as if the terms have not been renegotiated so that the loss events that have occurred are duly considered.
Financial GuaranteesWhere material, financial guarantees issued that require the issuer to make specified payments to reimburse the holder for a loss it incurs because a specified debtor fails to make payment when due are recognised as a financial liability at fair value on initial recognition.
The fair value of financial guarantee contracts has been assessed using a probability-weighted discounted cash flow approach. The probability has been based on:
• the likelihood of the guaranteed party defaulting during the next reporting period;• the proportion of the exposure that is not expected to be recovered due to the guaranteed party defaulting; and• the maximum loss exposure if the guaranteed party were to default.
Financial guarantees are subsequently measured at the higher of the best estimate of the obligation in accordance with AASB 137: Provisions, Contingent Liabilities and Contingent Assets and the amount initially recognised less, when appropriate, cumulative amortisation in accordance with AASB 118: Revenue. Where the entity gives guarantees in exchange for a fee, revenue is recognised in accordance with AASB 118.
DerecognitionFinancial assets are derecognised when the contractual rights to receipt of cash flows expire or the asset is transferred to another party whereby the entity no longer has any significant continuing involvement in the risks and benefits associated with the asset. Financial liabilities are derecognised when the related obligations are discharged, cancelled or have expired. The difference between the carrying amount of the financial liability extinguished or transferred to another party and the fair value of consideration paid, including the transfer of non-cash assets or liabilities assumed, is recognised in profit or loss.
(i) Impairment of Assets
At the end of each reporting period, the Group assesses whether there is any indication that an asset may be impaired. The assessment will include the consideration of external and internal sources of information including dividends received from subsidiaries, associates or jointly controlled entities deemed to be out of pre-acquisition profits. If such an indication exists, an impairment test is carried out on the asset by comparing the recoverable amount of the asset, being the higher of the asset’s fair value less costs to sell and value in use, to the asset’s carrying amount. Any excess of the asset’s carrying amount over its recoverable amount is recognised immediately in profit or loss, unless the asset is carried at a revalued amount in accordance with another Standard (e.g. in accordance with the revaluation model in AASB 116). Any impairment loss of a revalued asset is treated as a revaluation decrease in accordance with that other Standard.
Where it is not possible to estimate the recoverable amount of an individual asset, the Group estimates the recoverable amount of the cash-generating unit to which the asset belongs.
Impairment testing is performed annually for goodwill, intangible assets with indefinite lives and intangible assets not yet available for use.
For
per
sona
l use
onl
y

40 2015 Annual Report
Notes to the Financial Statements
1. Notes to the Consolidated Financial Statements (continued)
(j) Interests in Joint Operations
The Group recognises its direct right to the assets, liabilities, revenue and expenses of joint operations and its share of any jointly held or incurred assets, liabilities, revenues and expenses. These have been included in the appropriate line items of the consolidated financial statements. Details of the Group’s interests are provided in Note 10.
(k) Contributed Equity
Ordinary shares are classified as equity.
Incremental costs directly attributable to the issue of new shares or options are shown in equity as a deduction, net of tax, from the proceeds. Incremental costs directly attributable to the issue of new shares or options for the acquisition of a business are not included in the costs of the acquisition as part of the purchase consideration.
If the Company reacquires its own equity instruments, e.g. as the result of share buy-back, those instruments are deducted from equity and the associated shares are cancelled. No gain or loss is recognised in the profit or loss and the consideration paid including any directly attributable incremental costs (net of income taxes) is recognised directly in equity.
(l) Foreign Currency Transactions and Balances
Functional and presentation currencyThe functional currency of each of the Group’s entities is measured using the currency of the primary economic environment in which that entity operates. The consolidated financial statements are presented in Australian dollars which is the parent entity’s functional currency.
Transaction and balancesForeign currency transactions are translated into functional currency using the exchange rates prevailing at the date of the transaction. Foreign currency monetary items are translated at the year-end exchange rate. Non-monetary items measured at historical cost continue to be carried at the exchange rate at the date of the transaction. Non-monetary items measured at fair value are reported at the exchange rate at the date when fair values were determined.
Exchange differences arising on the translation of monetary items are recognised in profit or loss, except where deferred in equity as a qualifying cash flow or net investment hedge.
Exchange differences arising on the translation of non-monetary items are recognised directly in other comprehensive income to the extent that the underlying gain or loss is recognised in other comprehensive income; otherwise the exchange difference is recognised in the profit or loss.
Group companiesThe financial results and position of foreign operations whose functional currency is different from the group’s presentation currency are translated as follows:• assets and liabilities are translated at exchange rates prevailing at the end of the reporting period;• income and expenses are translated at average exchange rates for the period; and• retained earnings are translated at the exchange rates prevailing at the date of the transaction.
For
per
sona
l use
onl
y
41Elixir Petroleum Limited
Notes to the Financial Statements
1. Notes to the Consolidated Financial Statements (continued)
(l) Foreign Currency Transactions and Balances (continued)
Exchange differences arising on translation of foreign operations with functional currencies other than Australian dollars are recognised in other comprehensive income and included in the foreign currency translation reserve in the statement of financial position. The cumulative amount of these differences is reclassified into profit or loss in the period in which the operation is disposed of.
(m) Employee Benefits
Provision is made for the Group’s liability for employee benefits arising from services rendered by employees to the end of the reporting period. Employee benefits that are expected to be settled within one year have been measured at the amounts expected to be paid when the liability is settled.
Employee benefits payable later than one year have been measured at the present value of the estimated future cash outflows to be made for those benefits. In determining the liability, consideration is given to employee wage increases and the probability that the employee may satisfy any vesting requirements. Those cash flows are discounted using market yields on national government bonds with terms to maturity that match the expected timing of cash flows attributable to employee benefits.
Share-based paymentsThe Group operates an employee share, option and Performance Rights plan. Share-based payments to employees are measured at the fair value of the instruments issued and amortised over the vesting periods. Share-based payments to non-employees are measured at the fair value of goods or services received or the fair value of the equity instruments issued, if it is determined the fair value of the goods or services cannot be reliably measured, and are recorded at the date the goods or services are received. The corresponding amount is recorded to the share-based payment reserve. The fair value of Options is determined using the Black–Scholes pricing model. The number of shares, Options and rights expected to vest is reviewed and adjusted at the end of each reporting period such that the amount recognised for services received as consideration for the equity instruments granted is based on the number of equity instruments that eventually vest.
(n) Provisions
Provisions are recognised when the Group has a present obligation as a result of a past event, the future sacrifice of economic benefits is probable and the amount of the obligation can be reliably estimated.
When some or all of the economic benefits required to settle a provision are expected to be recovered from a third party, the receivable is recognised as an asset if it is virtually certain that recovery will be received and the amount of the receivable can be measured reliably.
For
per
sona
l use
onl
y

42 2015 Annual Report
Notes to the Financial Statements
1. Notes to the Consolidated Financial Statements (continued)
(n) Provisions (continued)
The amount recognised as a provision is the best estimate of the consideration required to settle the present obligation at reporting date, taking into account the risks and uncertainties surrounding the obligation. Where a provision is measured using the cash flows estimated to settle the present obligation, its carrying amount is the present value of those cash flows.
An onerous contract is considered to exist where the Group has a contract under which the unavoidable cost of meeting the contractual obligations exceed the economic benefits estimated to be received. Present obligations arising under onerous contracts are recognised as a provision to the extent that the present obligation exceeds the economic benefits estimated to be received.
Provision for restoration and rehabilitationProvision is made in the statement of financial position for restoration of operating locations. The estimated restoration and rehabilitation costs are initially recognised as part of the capitalised cost of the relevant project which gave rise to the future obligation. During the production phase of the project the capitalised restoration costs is amortised using the units of production method. Any actual costs incurred by the Group are allocated against the provision.
The provision for restoration and rehabilitation are based on the latest estimated future costs, determined on a discounted basis, which are re-assessed regularly and exclude any allowance for potential changes in technology or material changes in legislative requirements.
(o) Earnings per share
(i) Basic earnings per share Basic earnings per share is calculated by dividing the profit / (loss) attributable to equity holders of the Company,
excluding any costs of servicing equity other than ordinary shares, by the weighted average number of ordinary shares on issue during the financial year, adjusted for bonus elements in ordinary shares issued during the year.
(ii) Diluted earnings per share Diluted earnings per share adjusts the figures used in the determination of basic earnings per share to
take into account the after income tax effect of interest and other financing costs associated with dilutive potential ordinary shares and the weighted average number of shares assumed to have been issued for no consideration in relation to dilutive potential ordinary shares.
(p) Cash and Cash Equivalents
Cash and cash equivalents include cash on hand, deposits available on demand with banks, other short-term highly liquid investments, and bank overdrafts. Bank overdrafts are reported within short-term borrowings in current liabilities in the statement of financial position.
(q) Revenue recognition
Revenue is measured at the fair value of the consideration received or receivable after taking into account any trade discounts and volume rebates allowed. When the inflow of consideration is deferred it is treated as the provision of financing and is discounted at a rate of interest that is generally accepted in the market for similar arrangements. The difference between the amount initially recognised and the amount ultimately received is interest revenue.
For
per
sona
l use
onl
y

43Elixir Petroleum Limited
Notes to the Financial Statements
1. Notes to the Consolidated Financial Statements (continued)
(q) Revenue recognition (continued)
Revenue from the sale of goods is recognised at the point of delivery as this corresponds to the transfer of significant risks and rewards of ownership of the goods and the cessation of all involvement in those goods.
Interest revenue is recognised using the effective interest method.
All revenue is stated net of the amount of goods and services tax or value added tax.
(r) Trade and Other Receivables
Trade and other receivables include amounts due from customers for goods sold and services performed in the ordinary course of business. Receivables expected to be collected within 12 months of the end of the reporting period are classified as current assets. All other receivables are classified as non-current assets.
Trade and other receivables are initially recognised at fair value and subsequently measured at amortised cost using the effective interest method, less any provision for impairment. Refer to Note 1(g) for further discussion on the determination of impairment losses.
(s) Trade and Other Payables
Trade and other payables represent the liabilities for goods and services received by the entity that remain unpaid at the end of the reporting period. The balance is recognised as a current liability with the amounts normally paid within 30 days of recognition of the liability.
(t) Goods and Services Tax (GST) and Value Added Tax (VAT)
Revenues, expenses and assets are recognised net of the amount of GST or value added tax (VAT), except where the amount of GST or VAT incurred is not recoverable from the taxation authority.
Receivables and payables are stated inclusive of the amount of GST or VAT receivable or payable. The net amount of GST or VAT recoverable from, or payable to, the taxation authority is included with other receivables or payables in the statement of financial position.
Cash flows are presented on a gross basis. The GST or VAT components of cash flows arising from investing or financing activities which are recoverable from, or payable to, the taxation authority are presented as operating cash flows included in receipts from customers or payments to suppliers.
(u) Comparative Figures
When required by Accounting Standards, comparative figures have been adjusted to conform to changes in presentation for the current financial year.
Where the Group has retrospectively applied an accounting policy, made a retrospective restatement or reclassified items in its financial statements, an additional statement of financial position as at the beginning of the earliest comparative period will be disclosed.
For
per
sona
l use
onl
y
44 2015 Annual Report
Notes to the Financial Statements
1. Notes to the Consolidated Financial Statements (continued)
(v) Critical Accounting Estimates and Judgments
The Directors evaluate estimates and judgments incorporated into the financial statements based on historical knowledge and best available current information. Estimates assume a reasonable expectation of future events and are based on current trends and economic data, obtained both externally and within the Group.
Key EstimatesThe carrying amounts of certain assets and liabilities are often determined based on estimates and assumptions of future events. The key estimates and assumptions that have a significant risk of causing a material adjustment to the carrying amounts of certain assets and liabilities within the next annual reporting period are:
(i) Amortisation Upon commencement of production, the Group amortises the accumulated costs for the relevant area of
interest over the life of the area according to the rate of depletion of the economically recoverable quantities of reserves. Estimates of recoverable reserve quantities include judgemental assumptions regarding commodity prices, exchange rates, discount rates, and production and transportation costs for future cash flows. It also requires interpretation of the quality of reservoirs, and their anticipated recoveries. The economic, geological and technical factors used to estimate reserves may change from period to period.
(ii) Share-based payment transactions The Group measures the cost of equity-settled transactions with employees and consultants by reference
to the fair value of the equity instruments at the date at which they are granted. The fair value is determined using a Black-Scholes valuation model, using the assumptions detailed in Note 25.
(iii) Rehabilitation obligations The Group estimates its share of the future removal and remediation costs of oil and gas platforms,
production facilities, wells and pipelines at the time of acquisition or installation of the assets. In most instances, removal of assets occurs many years into the future. This requires judgemental assumptions regarding removal date, future environmental legislation, the extent of remediation activities required, the engineering methodology for estimating cost, future removal technologies in determining the removal cost, and asset specific discount rates to determine the present value of these cash flows. For more detail regarding the policy in respect of provision for rehabilitation refer to Note 1(l).
(iv) Impairment of assets In the absence of readily available market prices, the recoverable amounts of assets are determined using
estimates of the present value of future cash flows using asset-specific discount rates. For oil & gas properties, these estimates are based on assumptions concerning reserves, future production profiles and costs. When the carrying amount exceeds the present value of the future cash flows then the asset is impaired to its fair value.
Key JudgmentsIn the process of applying the Group’s accounting policies, management has made the following judgements, apart from those involving estimations, which have the most significant effect on the amounts recognised in the financial statements:F
or p
erso
nal u
se o
nly

45Elixir Petroleum Limited
Notes to the Financial Statements
1. Notes to the Consolidated Financial Statements (continued)
(v) Critical Accounting Estimates and Judgments (continued)
(i) Exploration and Evaluation Expenditure The Group’s accounting policy for exploration, evaluation and development is set out at Note 1(g).
Application of this policy necessarily requires management to make certain estimates and assumptions as to future events and circumstances, in particular, the assessment of whether economic quantities of reserves exist. Any such estimates and assumptions may change as new information becomes available. If, after having capitalised expenditure under our policy, management conclude that it is unlikely that capitalised expenditure will be recovered by future exploitation or sale, the relevant capitalised amount will be written off to the statement of profit or loss and other comprehensive income.
(ii) Oil & Gas Properties The Group’s accounting policy for oil & gas properties is set out at Note 1(g). Application of this policy necessarily
requires management to make certain estimates and assumptions as to future events and circumstances, in particular, the assessment of whether economic quantities of reserves exist. Any such estimates and assumptions may change as new information becomes available. If, after having capitalised expenditure under our policy, management conclude that it is unlikely that capitalised expenditure will be recovered by future exploitation or sale, the relevant capitalised amount will be written off to the statement of profit or loss and other comprehensive income.
(iii) Deferred Tax Assets The Group has carried forward tax losses which have not been recognised as deferred tax assets as it is not
considered sufficiently probable that these losses will be recouped by means of future profits taxable in the appropriate jurisdictions.
Taxation of oil and gas activities in the US allows a number of alternative treatments which are not available under Australian taxation legislation. In particular, companies may elect to:
• claim an immediate deduction for Intangible Drilling Costs (“IDC”); and• must use either the cost or percentage depletion method, whichever yields the largest tax deduction, when
calculating applicable tax deductions in relation to the entities economic interest in its oil and gas properties.
The election to expense IDC applies to all expenditures incident to and necessary for the drilling of wells and the preparation of wells for the production of oil or gas. Once the election to expense IDC is made, the election is binding upon the taxpayer for the first taxable year for which it is effective and for all subsequent taxable years.
At reporting date a determination had not been made as to whether the cost or percentage depletion method would apply for the current years US income tax calculation. The directors have not recognised a deferred tax asset or liability in respect of this potential difference in the tax base of these properties as they do not believe it is capable of being reliably estimated at reporting date.
(w) Discontinued operations
A discontinued operation is a component of the entity that has been disposed of or is classified as held for sale and that represents a separate major line of business or geological area of operations, is part of a single co-ordinated plan to dispose of such a line of business or area of operations, or is a subsidiary acquired exclusively with a view to resale. The results of discontinued operations are presented separately in the Consolidated Statement of profit or loss and other comprehensive income.
For
per
sona
l use
onl
y

46 2015 Annual Report
Notes to the Financial Statements
1. Notes to the Consolidated Financial Statements (continued)
(x) New standard and interpretations
Certain new accounting standards and interpretations have been published that are not mandatory for ended 30 June 2015 reporting periods and have not been early adopted by the Company. The Company’s assessment of the impact of these new standards and interpretations is set out below.
Title of standard Nature of Change Nature of Change
Application Date/Date adopted by company
AASB 9 Financial Instruments
AASB 9 addresses the classification, measurement and derecognition of financial assets and financial liabilities. Since December 2013, it also sets out new rules for hedge accounting.
There will be no impact on the company’s accounting for financial assets and financial liabilities, as the new requirements only effect the accounting for available-for-sale financial assets and the accounting for financial liabilities that are designated at fair value through profit and loss and the company does not have any such financial assets or financial liabilities.
The new hedging rules align hedge accounting more closely with the company’s risk management practices. As a general rule it will be easier to apply hedge accounting going forward. The new standard also introduces expanded disclosure requirements and changes in presentation.
Must be applied for financial years commencing on or after 1 January 2017. Therefore application date for the company will be 30 June 2018.
The company does not currently have any hedging arrangements in place.
IFRS 15 (issued June 2014)
Revenue from contracts with customers
An entity will recognise revenue to depict the transfer of promised goods or services to customers in an amount that reflects the consideration to which the entity expects to be entitled in exchange for those goods or services. This means that revenue will be recognised when control of goods or services is transferred, rather than on transfer of risks and rewards as is currently the case under IAS 18 Revenue.
Due to the recent release of this standard the company has not yet made an assessment of the impact of this standard.
Must be applied for annual reporting periods beginning on or after 1 January 2017. Therefore application date for the company will be 30 June 2018.
For
per
sona
l use
onl
y
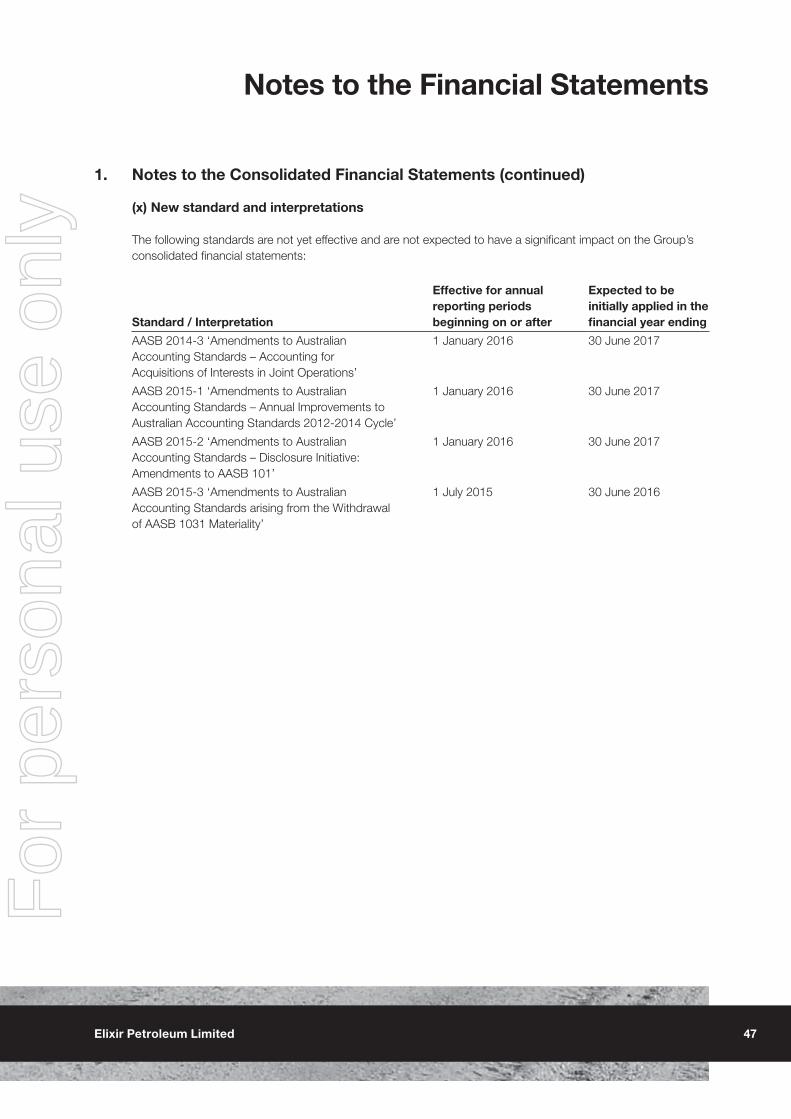
47Elixir Petroleum Limited
Notes to the Financial Statements
1. Notes to the Consolidated Financial Statements (continued)
(x) New standard and interpretations
The following standards are not yet effective and are not expected to have a significant impact on the Group’s consolidated financial statements:
Standard / Interpretation
Effective for annual reporting periods beginning on or after
Expected to be initially applied in the financial year ending
AASB 2014-3 ‘Amendments to Australian Accounting Standards – Accounting for Acquisitions of Interests in Joint Operations’
1 January 2016 30 June 2017
AASB 2015-1 ‘Amendments to Australian Accounting Standards – Annual Improvements to Australian Accounting Standards 2012-2014 Cycle’
1 January 2016 30 June 2017
AASB 2015-2 ‘Amendments to Australian Accounting Standards – Disclosure Initiative: Amendments to AASB 101’
1 January 2016 30 June 2017
AASB 2015-3 ‘Amendments to Australian Accounting Standards arising from the Withdrawal of AASB 1031 Materiality’
1 July 2015 30 June 2016
For
per
sona
l use
onl
y

48 2015 Annual Report
Notes to the Financial Statements
2. Parent Entity Information
The following information has been extracted from the books and records of the parents and has been prepared in accordance with Australian Accounting standards.
2015 2014
$ $
Statement of Financial Position
Assets
Current Assets 537,810 752,216
Non-current Assets 2,428,132 1,098,691
Total assets 2,965,942 1,850,907
Liabilities
Current Liabilities 127,242 149,818
Total Liabilities 127,242 149,818
Net assets 2,838,700 1,701,089
Equity
Issued Capital 69,510,232 66,721,737
Accumulated Losses (66,785,772) (65,028,826)
Option Premium Reserve - -
Share-based Payment Reserve 114,240 8,178
Total Equity 2,838,700 1,701,089
Statement of Profit or Loss and other Comprehensive Income
Total loss (1,757,850) (4,347,997)
Total comprehensive loss (1,757,850) (4,347,997)
At reporting date amounts receivable from controlled entities at cost totalled $20,345,662 (2014: $15,665,970). An impairment offsetting the amounts receivable was increased during the year ended 30 June 2015 by $3,352,157 (reduced in 2014 by $1,464,604) resulting in a net carrying value of amounts receivable from controlled entities of $1,327,740 (2014: $1,096,786). F
or p
erso
nal u
se o
nly

49Elixir Petroleum Limited
Notes to the Financial Statements
2. Parent Entity Information (continued)
GuaranteesElixir Petroleum Limited has entered into a cross guarantee with Elixir Petroleum (Australia) Pty Ltd, a wholly owned subsidiary with the full details being disclosed at Note 11.
Wholly-owned groupDetails of interests in wholly-owned controlled entities are set out at Note 11. Details of dealings with controlled entities are as follows:
Inter-company AccountElixir Petroleum Limited provides working capital to its controlled entities. Transactions between Elixir Petroleum Limited and other controlled entities in the Group during the year ended 30 June 2015 consisted of:
• Working capital advanced by Elixir Petroleum Limited.• Provision of services by Elixir Petroleum Limited.• Expenses paid by Elixir Petroleum Limited on behalf of its controlled entities.
The above transactions were made interest free with no fixed terms for the repayment of amounts advanced by Elixir Petroleum Limited.
3. Revenue and Other Income
Consolidated Group
2015 2014
$ $
Revenue from continuing operations
Other revenue
Interest received 26,768 26,995
Total revenue 26,768 26,995
For
per
sona
l use
onl
y

50 2015 Annual Report
Notes to the Financial Statements
4. Loss for the Year
Consolidated Group
2015 2014
$ $
Loss before income tax from continuing operations includes the following specific expenses:
Depreciation
Depreciation of plant and equipment 593 1,505
593 1,505
Administration and office costs
Corporate compliance 123,943 195,046
Corporate management costs 485,098 515,498
Consultants 110,478 10,855
Rent of Office space 27,421 38,325
General administration 98,987 116,332
Share based payments 103,631 1,252
949,558 877,308
During the current year, the Group has continued efforts to reduce corporate compliance costs, corporate management cost and other general and administrative expenses, including all non-executive directors agreeing to a reduction in their fees. Non-cash share based payments expense increased and is a function of valuation of Performance Rights and Options. None of these Performance Rights or Options had been converted into shares as at the end of the financial year. Consultants’ expense increased due in part to some of these costs being previously capitalised to deferred exploration and evaluation expenditure in the balance sheet.
For
per
sona
l use
onl
y

51Elixir Petroleum Limited
Notes to the Financial Statements
5. Tax Expense
Consolidated Group
2015 2014
$ $
The prima facie tax on loss from ordinary activities before income tax is reconciled to the income tax as follows:
Prima facie tax benefit on loss from ordinary activities before income tax at 30% (2014: 30%)
— Consolidated group (637,381) (1,383,019)
Add/less tax effect of:
— Foreign tax losses not recognised 46,655 -
— Tax losses and other timing differences for which no deferred tax asset has been recognised 652,375 (1,004,323)
— Permanent differences arising from non-allowable items (230,652) 2,434,393
— Effect of foreign tax differential 169,003 (47,051)
Income tax attributable to entity - -
The following deferred tax balances have not been recognised
Deferred tax assets
Tax losses 7,122,574 6,634,211
Unrealised foreign exchange gains / losses 18,108 -
Capital Raising Costs 31,278 14,952
Provisions and accruals 45,932 179,964
Total deferred tax assets 7,217,892 6,829,127
Deferred tax liability
Unrealised foreign exchange gains - (91,946)
Oil and gas properties (245,317) (979,452)
Total deferred tax liability (245,317) (1,071,398)
Net deferred asset not recognised 6,972,575 5,757,729
The tax benefits of the above deferred tax assets will only be obtained if:(a) the Group derives future assessable income of a nature and amount sufficient to enable the benefits to be utilised;(b) the Group continues to comply with the conditions for deductibility imposed by law; and(c) no changes in income tax legislation adversely affect the company utilising the benefits.F
or p
erso
nal u
se o
nly

52 2015 Annual Report
Notes to the Financial Statements
6. Auditors’ Remuneration
Consolidated Group
2015 2014
$ $
BDO (WA) Pty Ltd
Remuneration of the auditor for:
— auditing or reviewing the financial report 35,980 40,981
35,980 40,981
KSI (WA) Pty Ltd
Remuneration of the auditor for:
— auditing or reviewing the financial statement of subsidiaries 13,500 16,236
13,500 16,236
7. Loss per Share
(a) Reconciliation of earnings used in calculating earnings per share:
Loss attributable to the ordinary equity holders of the company:
Loss from continuing operations (2,124,605) (4,369,626)
Loss from discontinuing operations - (240,438)
(2,124,605) (4,610,064)
Shares Shares
(b) Weighted average number of ordinary shares outstanding during the year used in calculating basic EPS 926,072,877 412,710,631
Cents Cents
(c) Basic and diluted loss per share
From continuing operations attributable to the ordinary equity holders of the Company (0.23) (1.06)
From discontinued operations - (0.06)
Total basic earnings per share attributable to the ordinary equity holders of the Company (0.23) (1.12)F
or p
erso
nal u
se o
nly

53Elixir Petroleum Limited
Notes to the Financial Statements
8. Cash and Cash EquivalentsConsolidated Group
2015 2014
$ $
Cash at bank and on hand 568,500 183,889
Short-term bank deposits - 600,000
(27) 568,500 783,889
Information about the Group’s exposure to foreign exchange risk and interest rate risk in relation to cash and cash equivalents is provided in Note 27.
9. Trade and Other Receivables
Current
Trade receivables 910 11,392
Non-Current
Other receivables (Performance Bond) 750,893 609,155
Credit risk
The Group has no significant concentration of credit risk with respect to any single counter party or group of counter parties other than those receivables specifically provided for and mentioned within Note 11. The class of assets described as Other Receivables is considered to be the main source of credit risk related to the Group. Due to the nature of these receivables (cash backed bond), their carrying value is assumed to approximate their fair value.
Impaired trade receivables
No Group trade receivables were past due or impaired as at 30 June 2015 (2014: nil) and there is no indication that amounts recognised as trade and other receivables will not be recovered in the normal course of business.
10. Joint Arrangements
At the reporting date, the Group had working interests in joint arrangements for the following projects;
Project Blocks Activity Location Working Interest
2015 2014
Petra Project(1) Oil & Gas field, exploration project USA 50% -
Pompano Project(2) 446-L SE/4 Oil & Gas field, production project USA 25% 25%
(1) On 4 September 2014, Elixir, through its wholly owned subsidiary, Elixir Petroleum Petra Pty Ltd, acquired a 50% working interest in over 30,000 net acres in Washington County, Colorado, USA.
(2) Cottesloe Oil and Gas LLC (“Cottesloe”), a wholly owned subsidiary of the Group, was a party to a Joint Operating Agreement with respect to the Pompano project. It is unclear whether Cottesloe remains a party to this Agreement. Refer Note 20.
For
per
sona
l use
onl
y
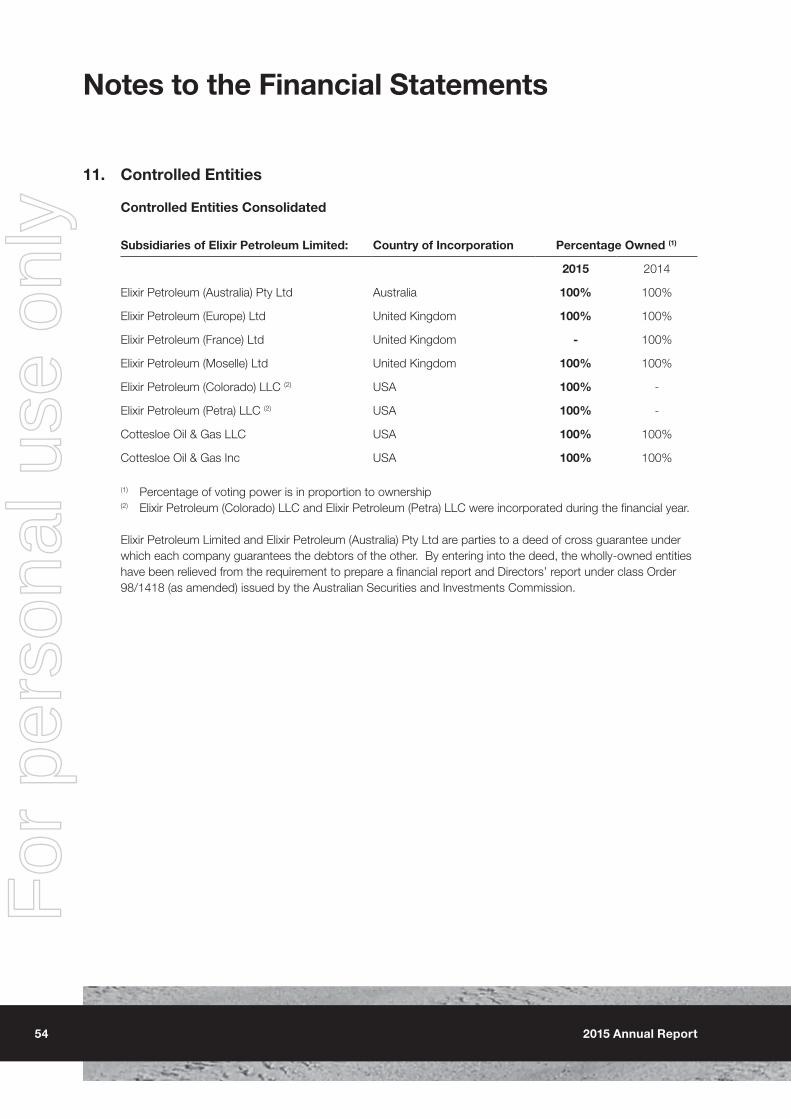
54 2015 Annual Report
Notes to the Financial Statements
11. Controlled Entities
Controlled Entities Consolidated
Subsidiaries of Elixir Petroleum Limited: Country of Incorporation Percentage Owned (1)
2015 2014
Elixir Petroleum (Australia) Pty Ltd Australia 100% 100%
Elixir Petroleum (Europe) Ltd United Kingdom 100% 100%
Elixir Petroleum (France) Ltd United Kingdom - 100%
Elixir Petroleum (Moselle) Ltd United Kingdom 100% 100%
Elixir Petroleum (Colorado) LLC (2) USA 100% -
Elixir Petroleum (Petra) LLC (2) USA 100% -
Cottesloe Oil & Gas LLC USA 100% 100%
Cottesloe Oil & Gas Inc USA 100% 100%
(1) Percentage of voting power is in proportion to ownership(2) Elixir Petroleum (Colorado) LLC and Elixir Petroleum (Petra) LLC were incorporated during the financial year.
Elixir Petroleum Limited and Elixir Petroleum (Australia) Pty Ltd are parties to a deed of cross guarantee under which each company guarantees the debtors of the other. By entering into the deed, the wholly-owned entities have been relieved from the requirement to prepare a financial report and Directors’ report under class Order 98/1418 (as amended) issued by the Australian Securities and Investments Commission.
For
per
sona
l use
onl
y

55Elixir Petroleum Limited
Notes to the Financial Statements
11. Controlled Entities (continued)
Closed Group2015
Closed Group2014
$ $
Financial information in relation to:
(i) Statement of Profit or Loss and Other Comprehensive Income:
Loss before income tax (9,686,760) (704,535)
Income tax expense - -
Loss after income tax (9,686,760) (704,535)
Loss attributable to members of the parent entity (9,686,760) (704,535)
(ii) Accumulated losses:
Accumulated losses at the beginning of the year (58,186,321) (59,258,977)
Value of options lapsed during the year 904 1,777,190
Loss after income tax (9,686,760) (704,535)
Accumulated losses at the end of the year (67,872,177) (58,186,322)
(iii) Statement of Financial Position:
Current Assets
Cash and cash equivalents 528,570 727,309
Trade and other receivables 910 11,393
Other current assets 8,330 13,514
Total current assets 537,810 752,216
Non-current Assets
Receivables 1,321,116 7,922,304
Investment in subsidiaries 16,796 16,798
Other plant and equipment 3,812 1,906
Total non-current assets 1,341,724 7,941,008
Total assets 1,879,534 8,693,224
Current Liabilities
Trade and other payables 127,239 149,632
Total current liabilities 127,239 149,632
Total liabilities 127,239 149,632
Net assets 1,752,295 8,543,592
For
per
sona
l use
onl
y
56 2015 Annual Report
Notes to the Financial Statements
11. Controlled Entities (continued)
Closed Group2015
Closed Group2014
$ $
Equity
Issued capital 69,510,232 66,721,736
Reserves 114,240 8,178
Accumulated losses (67,872,177) (58,186,322)
1,752,295 8,543,592
During the current year the investment in subsidiaries was adjusted to its fair value by recording an impairment of $nil (2014: $3,643,462). The fair value adjustment recognises the impairment in subsidiaries over a number of years, to bring the closed group to a value consistent with the consolidated group.
12. Other Assets
Consolidated Group
2015 2014
$ $
Prepayments 19,710 18,001
Other current assets - 3,781
19,710 21,782
13. Property, Plant and Equipment
Property, Plant and Equipment
Opening balance 1,906 22,891
Additions 2,500 -
Disposals - (19,480)
Depreciation (593) (1,505)
Net Carrying value 3,813 1,906
For
per
sona
l use
onl
y
57Elixir Petroleum Limited
Notes to the Financial Statements
14. Oil & Gas Properties
Consolidated Group
2015 2014
$ $
Property, Plant and Equipment
Opening balance - 84,603
Disposals (1) - (22,634,766)
Accumulated amortisation of assets disposed (1) - 11,102,781
Reverse accumulated Impairment of asset disposed (1) - 11,284,984
Fair value adjustment of asset disposed (1) - 162,398
Net Carrying Value - -
(1) During the prior year, Elixir Petroleum Limited disposed of its interest in the High Island project. Refer Note 24.
15. Deferred exploration & evaluation expenditure
Balance at 1 July 1,000,000 3,979,316
Amount Capitalised during the year 2,490,972 216,216
Impairment (1,051,494) (3,424,067)
Foreign Exchange Movements 45,284 228,535
Balance at 30 June 2,484,762 1,000,000
The ultimate recoupment of exploration expenditure carried forward is dependent on successful development and exploitation, or alternatively sale, of the respective area of interest. To determine the asset’s fair value the capitalised expenditure on the asset has been compared to the market capitalisation and net assets of the consolidated group. The excess of the asset’s carrying value (including capitalised expenditure) over the market capitalisation and net assets of the consolidated group has been expensed to the profit and loss. The impairment charge for 2015 relates solely to the Moselle Permit in France.
16. Trade and Other Payables
Current
Unsecured liabilities
Trade payables 197,627 239,834
Sundry payables and accrued expenses 17,522 2,385
215,149 242,219
Trade payables are unsecured and are usually paid within 30 days of recognition. Due to the short term nature of these payables, their carrying value is assumed to approximate their fair value. All amounts are expected to be settled within 12 months.
For
per
sona
l use
onl
y

58 2015 Annual Report
Notes to the Financial Statements
17. Provisions
Consolidated Group
2015 2014
$ $
Current
Oil Well Restoration
Opening balance at 1 July 484,816 1,342,935
Additional Provisions (1) 140,935 -
Amounts used(2) - (842,559)
Foreign currency movement 125,141 (15,560)
Balance at 30 June 750,892 484,816
Short-term Employee Benefits
Opening balance at 1 July - 10,921
Amounts used 23,757 (10,921)
Balance at 30 June 23,757 -
Total Current 774,649 484,816
(1) The provision for abandonment of the Pompano Project was increased to US$575,000 (A$750,892) during the current year to reflect the full value of the Performance Bond in place to cover abandonment liabilities. Refer to Note 20 for more details.
(2) During the prior reporting period Elixir Petroleum Limited disposed of its interests in the High Island Project. As part of the agreement for the disposal, Elixir Petroleum Limited was released from its liability for restoration costs and accordingly the provision for restoration costs has been reversed.
For
per
sona
l use
onl
y

59Elixir Petroleum Limited
Notes to the Financial Statements
18. Issued Capital
Consolidated Group
2015 2014
$ $
Fully paid ordinary shares 69,510,232 66,721,736
69,510,232 66,721,736
2015 2014
(a) Movement in ordinary share capital No. No.
At the beginning of the reporting period 431,278,356 277,250,637
Shares issued during the year
-13 August 2013 - 154,027,719
- 4 September 2014 602,000,000 -
At the end of the reporting period 1,033,278,356 431,278,356
Ordinary shares participate in dividends and the proceeds on winding up of the parent entity in proportion to the number of shares held. At the shareholders meetings each ordinary share is entitled to one vote when a poll is called, otherwise each shareholder has one vote on a show of hands.
(b) Options (i) For information relating to the details of Options issued, exercised and lapsed during the financial year and
the Options outstanding at year-end refer to Note 25: Share-based Payments. (ii) For information relating to share Options issued to key management personnel during the financial year refer
to Note 25: Share-based Payments.
(c) Capital Risk Management
Management controls the capital of the Group in order to maintain a sustainable debt to equity ratio, generate long-term shareholder value and ensure that the Group can fund its operations and continue as a going concern.
The Group is not subject to any externally imposed capital requirements.
Management effectively manages the Group’s capital by assessing the Group’s financial risks and adjusting its capital structure in response to changes in these risks and in the market. These responses include the management of debt levels, distributions to shareholders and share issues. F
or p
erso
nal u
se o
nly

60 2015 Annual Report
Notes to the Financial Statements
19. Capital and Leasing Commitments
Consolidated Group
2015 2014
$ $
Operating Lease Commitments
Non-cancellable operating leases contracted for but not recognised in the financial statements
Payable—minimum lease payments
not later than 12 months 5,000 17,500
between 12 months and 5 years - -
5,000 17,500
20. Contingent Liabilities
Cottesloe Oil and Gas LLC (“Cottesloe”), a wholly owned subsidiary of the Group, was a party to a Joint Operating Agreement (“JOA”) with amongst others, Buccaneer Resources LLC (“Buccaneer”), a wholly owned subsidiary of Buccaneer Energy Limited on the Pompano Project (“Pompano”). During 2011 the Operator proposed activities at Pompano which Cottesloe declined to participate in thus impacting our status and future rights and obligations under the JOA. The remaining JV partners ultimately elected to shut in the wells and relinquish the two associated leases during 2012 with abandonment obligations remaining outstanding. The Company has become aware that Buccaneer has applied for and been granted Chapter 11 protection in the United States and Australia post the end of the 2014 financial year. It is unclear whether Cottesloe is still a party to the JOA, but if this is the case, there is the possibility that in the event of a default by Buccaneer on its share of the abandonment cost of the platform, associated infrastructure and the wells, then Cottesloe will potentially be liable for its increased proportionate share of the cost. Buccaneer states in its latest annual report that it has a 65% working interest in the Pompano project. Cottesloe’s only significant asset is a cash backed bond of US$575,000 in favour of the previous owner of the platform and associated infrastructure which can be called upon in the event Cottesloe defaults on its share of the abandonment costs of this infrastructure. The cash backed bond provided by Cottesloe does not extend to any costs of abandoning the wells. There is no parent company guarantee in place between the Company and any of the other co-venturers in the Pompano project and therefore there is limited recourse to the Company or any other subsidiary of the Group should a claim be made on Cottesloe for an amount in excess of its assets.
For
per
sona
l use
onl
y

61Elixir Petroleum Limited
Notes to the Financial Statements
21. Operating Segments
General Information
Identification of reportable segments
The Group has identified its operating segments based on the internal reports that are reviewed and used by the board of Directors (chief operating decision makers) in assessing performance and in determining the allocation of resources.
Management has determined, based on the reports reviewed by the Board of Directors that are used to make strategic decision, that the Group had three reportable segments being oil and gas exploration in the United Kingdom (UK), oil and as exploration in France and oil and gas exploration in the United States of America (USA). The Group’s management and administration office is located in Australia.
(i) Segment Performance
Oil & Gas Production
(USA)
Oil & Gas Exploration
(UK)
Oil & Gas Exploration
(France)
Other Corporate Activities Total
30 June 2015 $ $ $ $ $
Revenue from external sources - - - 26,768 26,768
Reportable segment profit/(loss) (222,449) 5,462 (1,102,279) (805,339) (2,124,605)
Reportable segment assets 3,247,034 13,585 26,346 541,623 3,828,588
Reportable segment liabilities 836,820 - 25,736 127,242 989,798
30 June 2014
Revenue from external sources - - - 26,995 26,995
Reportable segment profit/(loss) (330,421) (89,585) (3,401,216) (788,842) (4,610,064)
Reportable segment assets 651,591 11,988 1,010,424 754,121 2,428,124
Reportable segment liabilities 528,502 11,852 37,050 149,631 727,035
No reconciliation is required of segment information as the information as presented is used by the Board to make strategic decisions.
For
per
sona
l use
onl
y

62 2015 Annual Report
Notes to the Financial Statements
22. Cash Flow Information
Consolidated Group
2015 2014
$ $
(a) Reconciliation of Cash Flow from Operations with Profit after Income Tax
Loss after income tax (2,124,605) (4,610,064)
Non-operating cash flows
Interest Income (26,768) (22,900)
Non-cash flows in profit
Impairment write down of oil and gas properties 1,051,494 3,424,067
Provision for abandonment 140,935 -
Depreciation, depletion & amortisation 593 1,505
Share-based payment 103,631 1,252
Net exchange rate differences 86,798 30,575
Net (gain)/loss on disposal of capitalised asset - 9,480
(Increase)/decrease in current assets 11,798 156,500
Increase/(decrease) in current liabilities (113,000) 13,194
Increase/(decrease) in provisions 23,757 -
Cash flow from operations (845,367) (996,391)
(b) Non-cash financing and investing activities
During the year ended 30 June 2015, the Group incurred share based payments expense of $103,631 net of the effect of forfeited options and lapsed Performance Rights (2014: $1,252). The company also issued options to a third party for corporate advisory services. There were no other non-cash financing and investing activities.
For
per
sona
l use
onl
y

63Elixir Petroleum Limited
Notes to the Financial Statements
23. Asset Acquisition
On 4 September 2014, the Group acquired a 50% Working Interest in 14,322 net acres for cash consideration of US$699,583 (A$757,756) from Apollo Operating LLC (“Apollo”), pursuant to a Sale and Purchase Agreement. Acquisition costs of US$14,453 were also incurred resulting in total costs of US$714,036. Details of the fair value of the assets acquired as at 4 September (in Australian dollars) as at the date of purchase are as follows:
4-Sept-2014
$
Purchase Consideration
Cash 774,340
Net Assets Acquired
Deferred exploration and evaluation (petroleum leases) 774,340
The Sale and Purchase Agreement with Apollo anticipates the Group will fund, in accordance with an agreed work program and budget, 100% of the first US$1,500,000 of exploration expenditures. The date to complete the agreed work program was recently extended from the original date of 30 June 2016 to 31 December 2016. As at the date of this report, the Group has incurred approximately US$680,000 of the US$1,500,000 and has completed the first year’s agreed work program to 30 June 2015 in accordance with the Sale and Purchase Agreement.
In the event that the Group elects not to proceed with any further expenditure due to technical, commercial or other reasons, 50% of the share of the leases purchased by the Group pursuant to the Sale and Purchase Agreement will be re-assigned to Apollo resulting in Elixir being released from any further expenditure obligations whilst retaining a 25% ownership in those leases.
For
per
sona
l use
onl
y

64 2015 Annual Report
Notes to the Financial Statements
24. Discontinued operations
On 12 November 2013 Elixir Petroleum Limited entered into a Purchase and Sale Agreement to dispose of its interest in the High Island Project. Financial information relating to the High Island Project from 1 July 2013 to 12 November 2013 is set out below:
Consolidated Group
From 1 July 2013 to 12 November
2013
$
(a) Financial Performance
Revenue - 30,345
Total expenses - 263,792
Gross loss - (233,447)
Income tax expense - -
Net loss attributable to discontinued operations - (233,447)
Loss on disposal of High Island Project - (6,991)
Income tax expense - -
Loss on disposal of after income tax - (6,991)
Loss from discontinued operation - (240,438)
Information relating to the financial position of the High Island Project on disposal date (12 November 2013) is set out below:
(b) Carrying amounts of assets and liabilities:
Oil and Gas Properties - 84,603
Trade debtors - -
Total assets - 84,603
Trade Creditors - -
Provision for restoration - 842,559
Total liabilities - 842,559
Net assets - (757,956)For
per
sona
l use
onl
y

65Elixir Petroleum Limited
Notes to the Financial Statements
24. Discontinued operations (continued)
Consolidated Group
From 1 July 2013 to 12 November
2013
$
(c) Cash flow information for the period 1 July 2013 to 12 November 2013:
Net cash outflow from operating activities - (183,158)
Net cash inflow from investing activities - -
Net cash inflow from financing activities - -
Net decrease in cash generated by the oil platform - (183,158)
Detail of the disposal of the oil platform:
Consideration paid - (764,947)
Carrying amount of net liabilities sold - 757,956
Loss on disposal before income tax - (6,991)
Income tax expense - -
Loss on disposal after income tax - (6,991)
.
For
per
sona
l use
onl
y

66 2015 Annual Report
Notes to the Financial Statements
25. Share Based Payments
Share based payments issued to key management personnelDetails of share based payment issued to key management personnel are provided in the remuneration report.
Share based payments issued to third parties:On 5 September 2014, 20,000,000 options were granted to the Company’s corporate advisors for services to be provided over the next 12 months. The options vested immediately and are exercisable at a price of $0.015 on or before 30 September 2016. 1,000,000 Performance Rights granted to a third party in the prior year lapsed on 6 May 2015.
A summary of the movements of all company Options and Performance Rights issued is as follows:
Consolidated Group
2015 2014
Movement in Options Number
Weighted average
exercise price Number
Weighted average
exercise price
Opening balance 15,000,000 $0.010 - -
Options Granted 32,000,000 $0.015 15,000,000 $0.010
Options Forfeited (1) (4,000,000) $0.015 - -
Closing balance 43,000,000 $0.013 15,000,000 $0.010
Options exercisable at year end 7,500,000 15,000,000
Movement in Performance rights
Opening balance 1,000,000 -
Performance Rights Granted(2) 30,000,000 1,000,000
Rights Lapsed (1,000,000) -
Closing balance 30,000,000 1,000,000
(1) 4,000,000 options issued to Michael Price were cancelled following Mr Price’s resignation on 31 December 2014.
(2) The Performance Rights are to vest over two years upon the attainment of certain share price related hurdles. No Performance Rights will be issued if the share price does not exceed $0.01, with 50% vesting if the share price is equal to or greater than $0.01 and 100% vesting if the share price is equal to or greater than $0.014, with pro rata adjustment for a share price between $0.01 and $0.014. 50% of the Performance Rights were measured on 31 July 2015 and none vested and were subsequently forfeited, with the balancing being measured against the share price hurdles on 31 July 2016.
The fair value of the Options and Performance Rights granted is deemed to represent the value of the services received over the vesting period. These values were calculated using the Black Scholes option pricing model and the Hoadley’s Multiple Barrier share option pricing model applying the following inputs:
For
per
sona
l use
onl
y

67Elixir Petroleum Limited
Notes to the Financial Statements
25. Share Based Payments (continued)
Non-Executive Directors
Non-Executive Directors
Financial Advisors
Key Management
Personnel
Key Management
Personnel
Number of options issued 6,000,000 6,000,000 20,000,000 15,000,000 15,000,000
Fair Value of Security at measurement date $0.001 $0.001 $0.001 $0.0018 $0.0027
Share Price at Grant Date $0.005 $0.005 $0.005 $0.005 $0.005
Exercise Price $0.015 $0.015 $0.015 Nil Nil
Expected Volatility 100% 100% n/a 100% 100%
Option Life 2.12 years 2.12 years 2.07 years 0.90 years 1.90 years
Expected Dividends Nil Nil Nil Nil Nil
Risk Free interest rate 2.51% 2.51% n/a 2.64% 2.64%
The weighted average fair value of all Options granted during the year was $32,000. The financial advisor Options were valued based on the value of the corporate advice to be received in lieu of cash fees, being $20,000 or $0.001 per Option.
Consolidated Group
2015 2014
$ $
Total share based payments expense is made up of the following;
Share based payments expense 86,966 1,252
Corporate advisory fee expense 16,665 -
103,631 1,252
For
per
sona
l use
onl
y

68 2015 Annual Report
Notes to the Financial Statements
26. Related Party Transactions
The Group’s main related parties are as follows
(i) Entities exercising control over the Group:The ultimate parent entity that exercises control over the Group is Elixir Petroleum Limited, which is incorporated in Australia.
(ii) Key Management Personnel Compensation:Refer to the Remuneration Report contained in the Directors’ Report for detailed remunerations disclosures of payments to each member of the Group’s key management personnel (KMP) for the year ended 30 June 2015.
The totals of remuneration paid to KMP of the company and the Group during the year are as follows:
Consolidated Group
2015 2014
$ $
Short-term employee benefits 421,915 437,145
Post-employment benefits 24,700 22,051
Share-based payments 70,443 (11,239)
Total KMP compensation 517,058 447,957
(iii) Entities subject to significant influence by the Group:An entity which has the power to participate in the financial and operating policy decisions of an entity, but does not have control over those policies is an entity which holds significant influence. Significant influence may be gained by share ownership, statute or agreement.
(iv) Transactions with other related parties:New Standard Energy Limited (“NSE”), a director related entity, provided office space and accounting services from 1 February 2014. The contract was based on normal commercial terms and conditions and ceased on 30 June 2015. NSE also sold computer equipment to Elixir at market value.
Aggregate amounts charges during the reporting period are as follows:
Consolidated Group
2015 2014
$ $
Rent of office building 25,000 15,000
Accounting services 2,000 2,000
Purchase of computer equipment 2,500 -
29,500 17,000
There were no other transactions with related parties during the year.
For
per
sona
l use
onl
y

69Elixir Petroleum Limited
Notes to the Financial Statements
26. Related Party Transactions (continued)
(iv) Outstanding balances arising from sales/purchases of goods and services:There are no outstanding balances arising from sale/purchases of goods and services (30 June 2014: Nil).
(v) Loan to / from related parties:There were no loans to or from related parties during the year (30 June 2014: Nil).
27. Financial Risk Management
The Group’s financial instruments consist mainly of deposits with banks, accounts receivable and payable and loans to and from subsidiaries.
The totals for each category of financial instruments, measured in accordance with AASB 139 “Financial Instruments: Recognition and Measurement” as detailed in the accounting policies to these financial statements, are as follows:
Consolidated Group
2015 2014
Note $ $
Financial Assets
Cash and cash equivalents (8) 568,500 783,889
Loans and receivables (9) 751,803 620,547
Total Financial Assets 1,320,303 1,404,436
Financial Liabilities
Financial liabilities at amortised cost
Trade and other payables (16) 215,149 242,219
Total Financial Liabilities 215,149 242,219
Financial Risk Management Policies
Company Management along with the Audit Committee have been delegated responsibility by the Board of Directors for, among other issues, managing financial risk exposures of the Group. The Board monitors the Group’s financial risk management policies and exposures and approves financial transactions within the scope of its authority. It also reviews the effectiveness of internal controls relating to commodity price risk, counterparty credit risk, currency risk, liquidity risk and interest rate risk.
The overall risk management strategy seeks to assist the consolidated group in meeting its financial targets, while minimising potential adverse effects on financial performance. Its functions include the review of the use of hedging derivative instruments, credit risk policies and future cash flow requirements.F
or p
erso
nal u
se o
nly

70 2015 Annual Report
Notes to the Financial Statements
27. Financial Risk Management (continued)
Specific Financial Risk Exposures and Management
The main risks the Group is exposed to through its financial instruments are credit risk, liquidity risk and market risk consisting of interest rate risk, foreign currency risk and other price risk (commodity and equity price risk). There have been no substantive changes in the types of risks the Group is exposed to, how these risks arise, or the Board’s objectives, policies and processes for managing or measuring the risks from the previous period.
(a) Credit risk
Exposure to credit risk relating to financial assets arises from the potential non-performance by counterparties of contract obligations that could lead to a financial loss to the Group.
Credit risk is managed through the maintenance of procedures (such procedures include the utilisation of systems for the approval, granting and renewal of credit limits, regular monitoring of exposures against such limits and monitoring of the financial stability of significant customers and counterparties), ensuring to the extent possible, that customers and counterparties to transactions are of sound credit worthiness. Such monitoring is used in assessing receivables for impairment.
Risk is also minimised through investing surplus funds in financial institutions that maintain a high credit rating or in entities that have otherwise been assessed as being financially sound.
Credit Risk ExposuresThe maximum exposure to credit risk by class of recognised financial assets at the end of the reporting period, excluding the value of any collateral or other security held is equivalent to the carrying amount and classification of those financial assets (net of any provisions) as presented in the statement of financial position. Credit risk also arises through the provision of financial guarantees, as approved at Board level, given to parties securing the liabilities of certain subsidiaries (refer Note 11 for details).
The Group has no significant concentration of credit risk with any single counterparty or group of counterparties. However, on a geographic basis, the Group had credit risk exposures to Australia, the USA, France and the United Kingdom given the operations in those regions. Details with respect to credit risk of Trade and Other Receivables is provided in Note 9.
Credit risk related to balances with banks and other financial institutions is managed in accordance with approved board policy. Such policy requires that surplus funds are only invested with counterparties with a Standard and Poor’s rating of at least AA-. The following table provides information regarding the credit risk relating to cash and money market securities based on Standard and Poor’s counterparty credit ratings.
Consolidated group
2015 2014
Note $ $
Cash and cash equivalents
AA Rated 528,589 749,724
A Rated 39,911 34,165
(8) 568,500 783,889
For
per
sona
l use
onl
y

71Elixir Petroleum Limited
Notes to the Financial Statements
27. Financial Risk Management (continued)
(b) Liquidity risk
Liquidity risk arises from the possibility that the Group might encounter difficulty in settling its debts or otherwise meeting its obligations related to financial liabilities. The Group manages this risk through the following mechanisms:
• preparing forward-looking cash flow analyses in relation to its operational, investing and financing activities• using derivatives that are only traded in highly liquid markets• monitoring undrawn credit facilities• obtaining funding from a variety of sources• maintaining a reputable credit profile• managing credit risk related to financial assets• only investing surplus cash with major financial institutions• comparing the maturity profile of financial liabilities with the realisation profile of financial assets
The tables below reflect an undiscounted contractual maturity analysis for financial liabilities. Financial guarantee liabilities are treated as payable on demand since the Group has no control over the timing of any potential settlement of the liabilities.
Cash flows realised from financial assets reflect management’s expectation as to the timing of realisation. Actual timing may therefore differ from that disclosed. The timing of cash flows presented in the table to settle financial liabilities reflect the earliest contractual settlement dates and do not reflect management’s expectations that banking facilities will be rolled forward.
Financial liability and financial asset maturity analysis
Within 1 Year 1 to 5 years Over 5 years Total
Consolidated Group2015
$2014
$2015
$2014
$2015
$2014
$2015
$2014
$
Financial liabilities due for payment
Trade and other payables 215,149 242,219 - - - - 215,149 242,219
Total expected outflows 215,149 242,219 - - - - 215,149 242,219
Financial Assets - cash flows realisable
Cash and cash equivalents 568,500 783,889 - - - - 568,500 783,889
Trade, term and loans receivables 911 11,392 750,892 609,155 - - 751,803 620,547
Total anticipated inflows 569,411 795,281 750,892 609,155 - - 1,320,303 1,404,436
Net (outflow) / inflow on financial instruments 354,262 553,062 750,892 609,155 - - 1,105,154 1,162,217
For
per
sona
l use
onl
y

72 2015 Annual Report
Notes to the Financial Statements
27. Financial Risk Management (continued)
(c) Market Risk
(i) Interest rate riskAs at, and during the year ended on the reporting date, the Group had no significant interest-bearing assets or liabilities other than liquid funds on deposit. As such, the Group’s income and operating cash flows (other than interest income from funds on deposit) are substantially independent of changes in market interest rates.
(ii) Foreign exchange riskExposure to foreign exchange risk may result in the fair value or future cash flows of a financial instrument fluctuating due to movement in foreign exchange rates of currencies in which the Group holds financial instruments which are other than the AUD functional currency of the Group.
With instruments being held by overseas operations, fluctuations in the US Dollar and the UK Pound Sterling may impact on the Group’s financial results unless those exposures are appropriately hedged.
During the year the Board decided that it would not be beneficial for the Group to purchase forward contracts or other derivative financial instruments to hedge its foreign exchange risk. Factors which the board considered in arriving at this position included, the expense of purchasing such instruments, the inherent difficulties associated with forecasting the timing and quantum of the USD and GBP outflows and the Group’s foreign exchange holdings. The Board regularly monitors the Group’s foreign exchange requirements and its foreign exchange risk. The board may in future period enter into transaction to hedge its foreign exchange risk if it is beneficial to do so.
The Group’s exposure to foreign currency risk at the reporting date was as follows:
2015 2014
USD GBP USD GBP
Cash - 39,931 34,165 22,411
Trade and other receivables - - 8,271 -
Non-current receivables 750,892 - 609,155 -
Trade Payables (85,927) (25,756) (43,685) (48,901)
664,965 14,175 607,906 (26,490)
(iii) Other price riskOther price risk relates to the risk that the fair value or future cash flows of a financial instrument will fluctuate because of changes in market prices largely due to demand and supply factors (other than those arising from interest rate risk or currency risk) for commodities.
For
per
sona
l use
onl
y
73Elixir Petroleum Limited
Notes to the Financial Statements
27. Financial Risk Management (continued)
Sensitivity AnalysisThe following table illustrates sensitivities to the Group’s exposures to changes in interest rates and exchange rates. The table indicates the impact on how profit and equity values reported at the end of the reporting period would have been affected by changes in the relevant risk variable that management considers to be reasonably possible. These sensitivities assume that the movement in a particular variable is independent of other variables.
Consolidated Group
Year ended 30 June 2015Profit
$Equity
$
+/- 0.9% in interest rates 6,085 6,085
+/- 20% in AUD relative to USD & GBP 568,958 568,958
Consolidated Group
Year ended 30 June 2014Profit
$Equity
$
+/- 0.9% in interest rates 7,960 7,960
+/- 20% in AUD relative to USD & GBP 340,218 340,218
There have been no changes in any of the methods or assumptions used to prepare the above sensitivity analysis from the prior year.
(iv) Fair values
Recurring fair value measurementsThe Group does not have any financial instruments that are subject to recurring or non-recurring fair value measurements.
Fair values of financial instruments not measured at fair valueDue to their short-term nature, the carrying amounts of current receivables and current trade and other payables is assumed to equal their fair value.
The following methods and assumptions are used to determine the net fair value of financial assets and liabilities:
• Cash assets, borrowings and financial assets are carried at amounts approximating fair value because of their short term nature to maturity.
• Receivables and payables are carried at amounts approximating fair value.
For
per
sona
l use
onl
y

74 2015 Annual Report
Notes to the Financial Statements
28. Reserves and Accumulated Losses
Consolidated Group
2015
$
2014
$
Foreign currency translation reserve
Opening Balance (306,486) (568,554)
Currency translation differences arising during the year 366,844 262,068
Closing Balance 60,358 (306,486)
Option Premium Reserve
Opening Balance - 1,773,184
Lapsed Options written to accumulated losses - (1,773,184)
Closing Balance - -
Share-based payment reserve
Opening Balance 8,178 10,932
Options/Performance Rights granted during the year 113,033 8,178
Lapse of Options/Performance Rights (6,971) (10,932)
Closing Balance 114,240 8,178
Accumulated losses
Opening balance (64,722,339) (61,889,466)
Net loss for the year (2,124,605) (4,610,064)
Forfeit/Lapse of Options 904 1,777,191
Closing balance (66,846,040) (64,722,339)
For
per
sona
l use
onl
y

75Elixir Petroleum Limited
Notes to the Financial Statements
28. Reserves and Accumulated Losses (continued)
The option premium reserve is used to record any premium received upon grant of Options. During the prior year a balance of $1,773,184 was transferred to accumulated losses to reflect expired or forfeited options from prior years (pre 2010).
The share-based payment reserve is used to record the deferred expense in relation to share based payments. During the current year 1,000,000 performance rights issued to a third party lapsed resulting in a de-recognition of $6,000. Options issued to Mr Michael Price during the year valued at $972 were forfeited upon his resignation as a director. During the prior year, 500,000 Performance Rights that had vested and lapsed during the year resulted in a de-recognition of $4,007.
The foreign currency translation reserve is used to record exchange differences arising on consolidation of subsidiaries with different functional currencies from the Company.
With respect to the payment of dividends (if any) by the Company in subsequent financial years, no franking credits are currently available, or are likely to become available in the next 12 months. No dividends were paid or declared during the current financial year.
29. Events After the Reporting Period
No events have occurred since 30 June 2015 that would materially affect the operations of the Group, the results of the Group or the state of affairs of the Group not otherwise disclosed in the Group’s financial statements.
For
per
sona
l use
onl
y

76 2015 Annual Report
Additional SecuritiesExchange Information
The shareholder information set out below was applicable as at 31 August 2015.1. Twenty largest shareholders
Ordinary shares Number Percentage
1 SUNDANCE ENERGY LIMITED 121,734,102 11.78
2 RICHARD J + S E HARRIS 35,300,000 3.42
3 AURORA OIL & GAS LIMITED 33,833,334 3.27
4 HENRY JOHN DEBURGH 32,333,337 3.13
5 DARREN JOHN HALL 25,986,297 2.51
6 DOUGAL FERGUSON 21,350,000 2.07
7 SCINTILLA STRATEGIC INVESTMENTS 20,000,000 1.94
8 TAN CHING KHOON 20,000,000 1.94
9 SAMUEL WILLIS 16,500,000 1.60
10 ARGONAUT EQUITY PARTNERS PTY LIMITED 15,000,000 1.45
11 DAVID SAMUEL NOUR 15,000,000 1.45
12 CITICORP NOM PL 14,793,029 1.43
13 REEF INV PL 14,551,851 1.41
14 WALLOON SEC PL 13,650,000 1.32
15 HSBC CUSTODY NOM AUST LTD 13,311,160 1.29
16 JP MORGAN NOM AUST LTD 12,398,430 1.16
17 PHILIP ANDREW THICK 10,997,556 1.06
18 MAXIMILIAN HOLZNER 10,313,001 1.00
19 DRAGOSLAV JETVIC 10,000,000 0.97
20 YOGI PL 10,000,000 0.97
Total top 20 466,962,097 45.19
Other 566,316,259 54.81
Total ordinary shares on issue 1,033,278,356 100.00
2. Substantial shareholdersSet out below are the names of the substantial holders and the number of equity securities held by those substantial holders (including those equity securities held by their associates), as disclosed in the substantial holding notices given to the company:
Shareholder Number Percentage
SUNDANCE ENERGY LIMITED 121,734,102 11.78For
per
sona
l use
onl
y
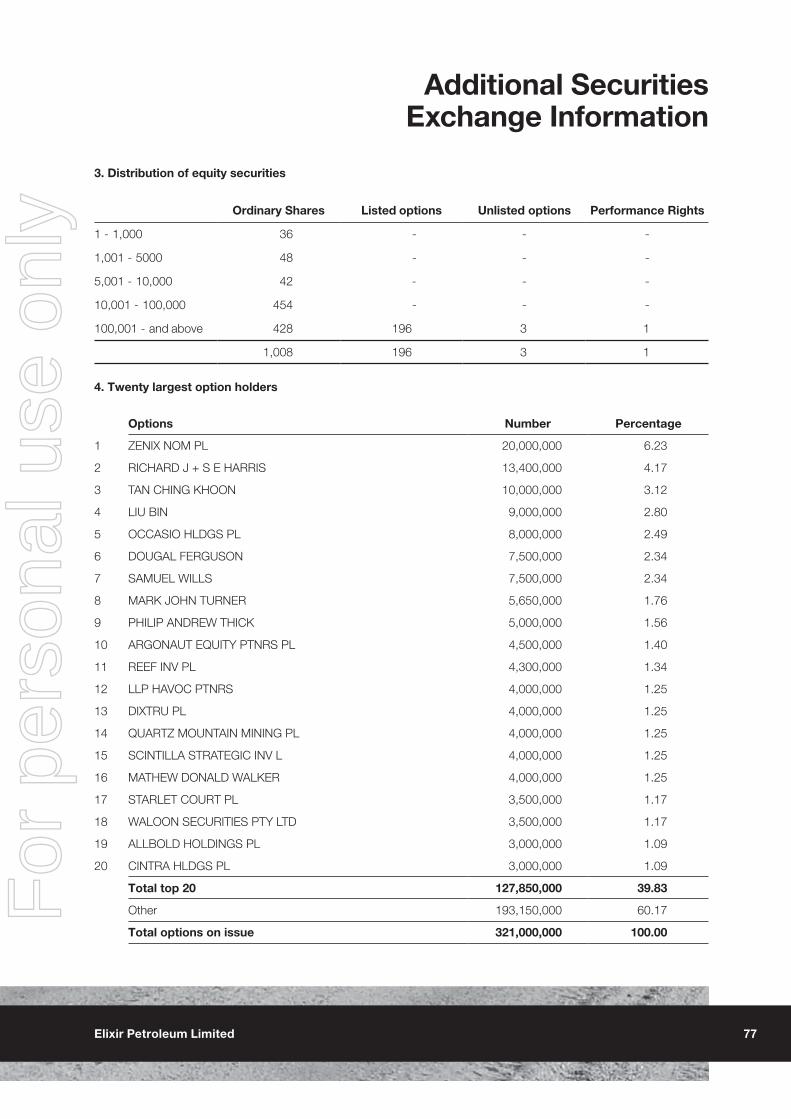
77Elixir Petroleum Limited
Additional SecuritiesExchange Information
3. Distribution of equity securities
Ordinary Shares Listed options Unlisted options Performance Rights
1 - 1,000 36 - - -
1,001 - 5000 48 - - -
5,001 - 10,000 42 - - -
10,001 - 100,000 454 - - -
100,001 - and above 428 196 3 1
1,008 196 3 1
4. Twenty largest option holders
Options Number Percentage
1 ZENIX NOM PL 20,000,000 6.23
2 RICHARD J + S E HARRIS 13,400,000 4.17
3 TAN CHING KHOON 10,000,000 3.12
4 LIU BIN 9,000,000 2.80
5 OCCASIO HLDGS PL 8,000,000 2.49
6 DOUGAL FERGUSON 7,500,000 2.34
7 SAMUEL WILLS 7,500,000 2.34
8 MARK JOHN TURNER 5,650,000 1.76
9 PHILIP ANDREW THICK 5,000,000 1.56
10 ARGONAUT EQUITY PTNRS PL 4,500,000 1.40
11 REEF INV PL 4,300,000 1.34
12 LLP HAVOC PTNRS 4,000,000 1.25
13 DIXTRU PL 4,000,000 1.25
14 QUARTZ MOUNTAIN MINING PL 4,000,000 1.25
15 SCINTILLA STRATEGIC INV L 4,000,000 1.25
16 MATHEW DONALD WALKER 4,000,000 1.25
17 STARLET COURT PL 3,500,000 1.17
18 WALOON SECURITIES PTY LTD 3,500,000 1.17
19 ALLBOLD HOLDINGS PL 3,000,000 1.09
20 CINTRA HLDGS PL 3,000,000 1.09
Total top 20 127,850,000 39.83
Other 193,150,000 60.17
Total options on issue 321,000,000 100.00
For
per
sona
l use
onl
y

78 2015 Annual Report
Additional SecuritiesExchange Information
5. Unquoted securitiesThe total number of unquoted securities on issue and the number of holders for each class of unquoted securities are set out below. Excepting holders that were issued or acquired unquoted securities under an employee incentive scheme, individuals holding more than 20% of any class of unquoted security are listed below.
Class of unquoted security Number on Issue Number of Holders
Unlisted executive incentive optionsUnlisted Director options(1)
Performance Rights
15,000,000 8,000,00015,000,000
121
(1) Holders of Unlisted Director options Number Held % Held
SJC & CM Willis <Willis Family Super Fund A/C>Mark O’Clery
4,000,0004,000,000
50.00%50.00%
6. Voting rightsRefer Note 18(a) of the Financial Statements for voting rights of ordinary shares. Listed and unlisted option holders and performance rights holders have no voting rights until the options or performance rights are converted into ordinary shares.
7. On-market buy backThere is currently no on-market buy-back program for any of Elixir’s listed securities.
8. Company secretary, registered and principal administrative office and share registryDetails can be found in the Corporate Directory at the beginning of the Annual Report.
9. List of interests in petroleum projectsDetails of the Company’s interests in petroleum projects can be found in the Review of Operations.
For
per
sona
l use
onl
y
