antofagasta plc annual report and financial statements · pdf fileannual report and financial...
TRANSCRIPT

Antofagasta plcAnnual report and financial statements 2015
An
tofag
asta plc A
nnual report and financial statements 2015

Antofagasta is a Chilean copper mining group with significant by-product production and interests in transport. The Group creates value for its stakeholders through the discovery, development and operation of copper mining assets. The Group is committed to generating value in a safe and sustainable way throughout the commodity cycle.
For further information on the mining lifecycle, please see pages 12 to 18.
Inside this report
01Overview
11Strategic report
69Governance
117Financial statements
183Other information
2015 Highlights 01
The business 02
Performance highlights 04
Letter from the Chairman 05
Statement from the CEO 08
Business model 12
Creating value through the mining lifecycle 12
Key inputs and cost base 19
Key relationships 22
The marketplace 25
Strategy for the mining business 28
Key performance indicators 30
Risk management 32
Long-term viability statement 38
Operational review 39
Mining division 39
The existing core business 40
Growth projects and opportunities 48
Transport 52
Managing a sustainable business 53
Financial review 64
Results 64
Revenue 65
Cash flows 67
Financial position 68
Cautionary statement about forward-looking statements 68
Corporate Governance Report 70
Leadership 72
How the Board and its Committees operate 72
Board of Directors 74
Executive Committee 77
Effectiveness 79
The Board in more detail 79
Information and professional development 82
Performance evaluation 84
Accountability 85
Board Committees 85
Audit and Risk Committee 86
Nomination and Governance Committee 90
Sustainability and Stakeholder Management Committee 93
Projects Committee 95
Remuneration 96
Annual Statement by the Chairman of the Remuneration and Talent Management Committee 96
Summary of Directors’ Remuneration Policy 98
Annual Report on Remuneration 2015 99
Relations with shareholders 112
Directors’ Report 114
Statement of Directors’ Responsibilities 116
Independent auditors’ report 118
Consolidated income statement 122
Consolidated statement of comprehensive income 123
Consolidated statement of changes in equity 123
Consolidated balance sheet 124
Consolidated cash flow statement 125
Notes to the financial statements 126
Parent Company financial statements 179
Five-year summary 184
Ore reserves and mineral resources estimates 186
Mining production and sales, cash cost reconciliation, transport and water statistics 194
Glossary and definitions 197
Shareholder information 200
Directors and advisors ibc
Introduction
EVALUATION EXTRACTION PROCESSING RESTORATIONMARKETINGEXPLORATIONINPUTS OUTPUTSCONSTRUCTION
Throughout this report our business model diagram below will indicate which area of our value chain is related to the narrative.

1 Restated.2 From continuing operations.
Copper production of 630,300 tonnes, a 10.6% decrease on 2014.
For more information go to Financial review.
11 12 13 14 15
640.
5
709.
6
721.
2
704.
8
630.
3
Copper production630,300 tonnes
Revenue of $3,394.6 million, 34.0% lower than 2014 due to fall in realised prices and lower production.
For more information go to Financial review.
11 12 13 141 15
6,07
6.0
6,74
0.1
5,97
1.6
5,14
5.6
3,39
4.6
Revenue$3,394.6m
Earnings per share fell 98.6% to 0.6 cents per share due to lower realised prices, sales volumes and higher unit operating costs.
For more information go to Financial review.
11 12 142
125.
4
105.
2
66.9
42.8
13 152
0.6
Earnings per share0.6 cents
Net cash costs for the year, 4.9% higher than 2014 as cost savings and lower input prices were more than offset by lower production.
For more information go to Financial review.
Net cash costs
11 12 13 14 15
1.02
1.03
1.36 1.43 1.
50
$1.50/lb
Antofagasta plc 01
OV
ER
VIE
WS
TR
AT
EG
IC R
EP
OR
TG
OV
ER
NA
NC
EF
INA
NC
IAL S
TAT
EM
EN
TS
OT
HE
R IN
FO
RM
AT
ION
2015 Highlights

The business
Mining is the Group’s core business, representing over 90% of Group revenue and EBITDA. The Group operates four copper mines in Chile, two of which also produce significant by-products. The Group has a significant portfolio of growth opportunities located predominantly in Chile and in the United States.
Further information on pages 39 to 51.
Group strategyThe strategy for growing the Group’s mining business is based around three pillars:
Further information on pages 28 and 29.
Los Pelambres Centinela60% owned 70% owned
The Group’s flagship mine is in central Chile, generating over 57% of overall production and approximately 65% of EBITDA. It produces copper concentrates containing gold and silver and a separate molybdenum concentrate.
Further information on pages 40 to 42.
The Group’s second largest operation is located in a world-class mining district in northern Chile. Centinela produces copper concentrates containing gold and silver, and copper cathodes.
Further information on pages 43 and 44.
Antucoya Zaldívar 70% owned 50% owned
Antucoya started production during 2015 and is expected to achieve its design capacity of 85,000 tonnes of copper cathodes per annum during the first half of 2016.
Further information on page 46.
The Group acquired a 50% interest and assumed operatorship of Zaldívar in December 2015. Zaldívar is an operating mine in northern Chile producing copper cathodes.
Further information on page 47.
Production Copper (tonnes) Molybdenum (tonnes) Gold (ounces)
2015 2016 forecast 2015 2016 forecast 2015 2016 forecast
Los Pelambres 363,200 355–365,000 10,100 8–9,000 51,400 45–55,000
Centinela Concentrates 145,200 175–185,000 162,500 200–220,000
Centinela Cathodes 75,900 60–65,000
Michilla1 29,400 –
Antucoya 12,200 65–70,000
Zaldívar2 4,400 50–55,000
Total 630,300 710–740,000 10,100 8–9,000 213,900 245–275,000
1 Put on care and maintenance at the end of December 2015.2 Attributable production, the Group became the operator of the mine in December 2015.
The existing core business 1
Mining
1 The existing core business
• Constant focus on cost management and compliance
• Delivery of production and cash cost guidance• Continue to get the best possible performance
from existing assets• Proactive new approach with community and
other stakeholders
2 Organic and sustainable growth of the core business
• Complete Antucoya ramp up to design capacity• Complete Centinela 105 ktpd expansion• Progress Encuentro Oxides and Centinela
Molybdenum Plant projects• Advance Centinela Second Concentrator and
Los Pelambres Incremental Expansion feasibility studies and permitting
3 Growth beyond the core business
• Progress international exploration activities• Continue optimisation of Twin Metals Minnesota
pre-feasibility study• Monitor and assess attractive
acquisition opportunities
2
3
1
02 Antofagasta plc Annual report and financial statements 2015
Under construction
CentinelaA debottlenecking project to increase daily ore throughput in the concentrator to 105,000 tonnes is underway and is expected to be completed in the first half of 2016.
Further information on page 48.
Encuentro OxidesConstruction of this project to provide additional feed for the Centinela SX-EW plant continued during 2015. This project will allow Centinela Cathodes to increase copper cathode production to 100,000 tonnes per annum until 2023 while at the same time opening up the larger Encuentro Sulphide deposit below the oxides.
Further information on page 48.
Molybdenum Plant This project to produce some 2,400 tonnes of molybdenum at Centinela Concentrates, is expected to be completed in 2017.
Further information on page 48.
Growth projects
Los Pelambres Incremental ExpansionDuring the year the Group revised the approach to the incremental expansion of Los Pelambres and decided to split the project into two phases to ease the development of the project and conserve development capital in light of lower commodity prices. This two-phase strategy was approved by the Board during the year and the feasibility study is now underway.
Further information on page 49.
Centinela Second ConcentratorThe Centinela Second Concentrator is expected to have annual production of 140,000 tonnes of copper, 150,000 ounces of gold and 3,000 tonnes of molybdenum. An environmental impact assessment has been submitted and the pre-feasibility study is expected to be completed in 2017.
Further information on pages 49 and 50.
Los PelambresThe current resource base is triple the size of the current mine plan and has potential for a further expansion in the longer term.
Further information on page 50.
Organic and sustainable growth of the core business
Growth beyond the core business
Greenfield
Twin MetalsA copper, nickel and platinum group metals underground mining project located in north-east Minnesota. The Group acquired the balance of the project in January 2015 and is now conducting optimisations of the pre-feasibility study while advancing the permitting process.
Further information on page 50.
ExplorationActive exploration programme internationally and in Chile. Continue to advance a portfolio of early-stage exploration activities.
Further information on pages 50 and 51.
EnergyThe Group has a number of investments in energy assets in Chile, with particular focus on renewable energy.
Further information on page 51.
3
2
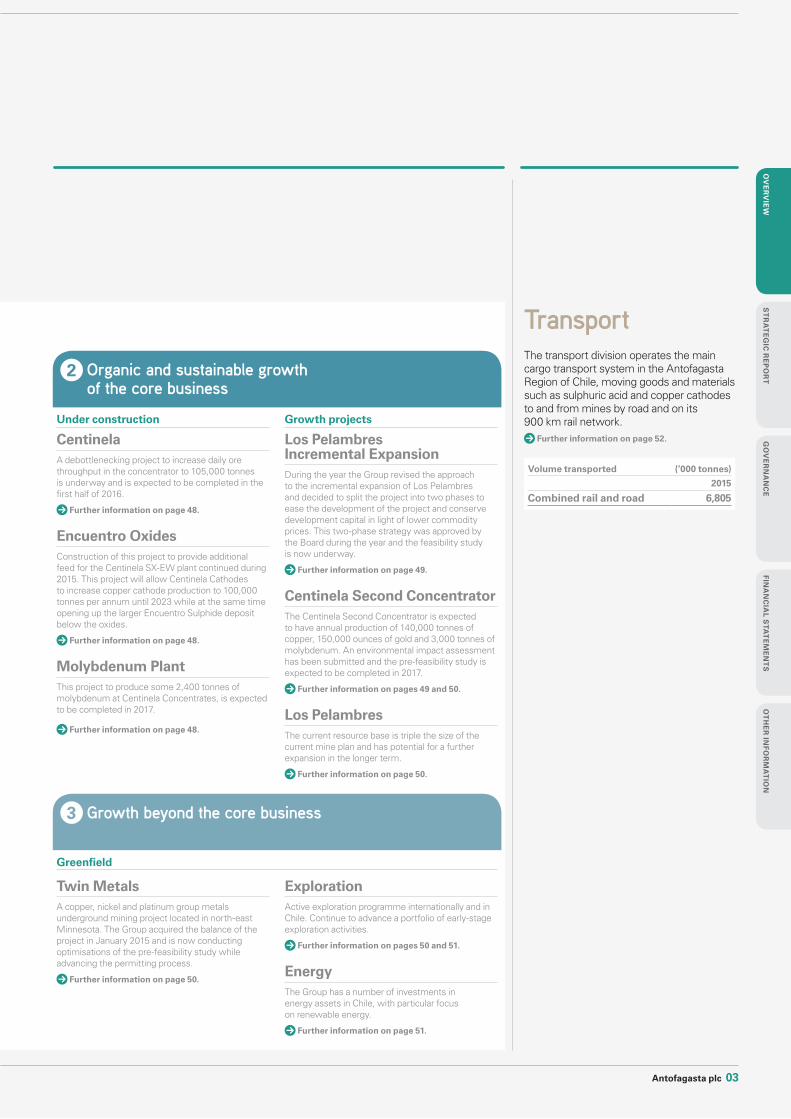
TransportThe transport division operates the main cargo transport system in the Antofagasta Region of Chile, moving goods and materials such as sulphuric acid and copper cathodes to and from mines by road and on its 900 km rail network.
Further information on page 52.
Volume transported (’000 tonnes)
2015
Combined rail and road 6,805
Antofagasta plc 03
OV
ER
VIE
WS
TR
AT
EG
IC R
EP
OR
TG
OV
ER
NA
NC
EF
INA
NC
IAL S
TAT
EM
EN
TS
OT
HE
R IN
FO
RM
AT
ION

A Los Pelambres 6,104 Mt @ 0.51% Cu
G Encuentro 1,212 Mt @ 0.42% Cu
B Centinela 3,553 Mt @ 0.39% Cu
H Zaldívar 582 Mt @ 0.53% Cu
C Twin Metals 2,372 Mt @ 0.45% Cu
I Penancho Blanco 293 Mt @ 0.41% Cu
D Los Volcanes 1,904 Mt @ 0.50% Cu
J Michilla 60 Mt @ 1.64% Cu
E Polo Sur 1,544 Mt @ 0.34% Cu
K Mirador 51 Mt @ 0.34% Cu
F Antucoya 1,255 Mt @ 0.31% Cu
L Llano-Paleocanal 46 Mt @ 0.50% Cu
E
A
C
D
F
G
B
H
J-L
11 12 13 14 15
13.7 15
.2 16.2 17
.9 18.7
Mineral resources by operation and deposit2
Mineral resources2
(including ore reserves)
Mineral resources increased mainly due to acquisition of Zaldívar and increase in resources at Los Volcanes during the year.
18.7bn tonnes
AB
$890.7mA Mining 832.3B Transport 58.4
B A
1
2
3
$3,394.6mEBITDA by division1Revenue by division1
A Mining 3,242.21 Los Pelambres 1,807.22 Centinela 1,266.13 Michilla 168.9B Transport 152.4
1 From continuing operations.2 Mineral resources relating to the Group’s subsidiaries on a 100% basis, and Zaldívar on a 50% basis.
Throughout this period of lower copper prices Antofagasta has had a rigorous approach to cost control at the operations and at the corporate office, achieving operating cost savings of $245 million in 2015. Good-quality assets and tight capital discipline mean the Group can weather the current downturn and maintain a competitive position in this challenging environment and when the copper cycle begins to recover, the Group will enjoy healthy margin growth.
Further information on pages 30 and 31.
04 Antofagasta plc Annual report and financial statements 2015
Performance highlights

Dear Shareholders,There is no doubt that 2015 has been a difficult year, and one in which the challenges facing our industry have been brought into sharp focus. Continued falls in commodity prices have highlighted the worst effects of more than a decade of bullish markets, a time when the industry appeared to have forgotten that the mining business is cyclical and cost control came a distant second to production growth. This over-exuberance led to over-investment in new mining capacity across the globe and a resultant decline in productivity. Industry lead times have meant that just as global demand growth slowed, much of this new production came online at what are now unsustainable costs. Now is the time to remove the consequences of these excesses.
Against this backdrop it has not been ‘business as usual’ for Antofagasta this year. Alongside our peers we have suffered from the worsening macro-environment and deteriorating market conditions. The commissioning of Antucoya took longer than planned despite the project’s construction cost being on budget. At an operational level, heavy rains early in the year led to delays in the commissioning of our expansion of Centinela, while community action at the Los Pelambres mine saw interruptions to production. As a result our production performance for 2015 fell short of our original expectations.
We took a cautious approach to developing our business at the peak of the market, and as a result we entered the current downturn with a strong balance sheet. As we continue to respond to low commodity prices, we are taking the steps needed to ensure our continued financial resilience in the future by working hard and focusing our efforts on being disciplined in our allocation of capital, reducing costs, improving operational efficiencies and lowering our overheads. We remain focused on cash flow generation and margin improvements through sustainable cost reductions and productivity improvements that help compensate the impact of lower commodity prices.
Managing these challenges is important, but I believe that every downturn also offers opportunities and during 2015 Antofagasta acquired a 50% stake in the high-quality Zaldívar copper mine in northern Chile with minimal impact to the balance sheet as it followed the sale of our water division. The acquisition was carefully considered and represents a rare opportunity to advance our long-term objectives, building on our existing portfolio of operations.
Antofagasta has weathered another difficult year, but remains on a solid and sustainable footing for the long term.
Chile – finding solutions together
Mining is an important part of Chile’s economy, contributing 11.2% to its GDP in 2014. With our history in the country, and our status as the largest non-state mining Group, Antofagasta is well positioned to help realise the full potential of the country’s world-class copper resources. We believe that Chile’s political and fiscal stability, and its skilled mining workforce make it an attractive place for our capital, as demonstrated by our investments in Zaldívar and Antucoya.
We took a cautious approach to developing our business at the peak of the market.
Antofagasta plc 05
OV
ER
VIE
WS
TR
AT
EG
IC R
EP
OR
TG
OV
ER
NA
NC
EF
INA
NC
IAL S
TAT
EM
EN
TS
OT
HE
R IN
FO
RM
AT
ION
Letter from the ChairmanJean-Paul Luksic

Our approach to allocating capital with an appropriate balance between investment, growth and dividends has allowed the Company to retain a strong position and our financial strength gave us the capacity to take advantage of opportunities over the year.
The impact of lower commodity prices on jobs and revenue generated by the mining sector to Chile is substantial, and to ensure the long-term sustainability of mining, the response must be a collective one – companies, employees, communities and government must unite to find solutions to complex problems. We must co-operate to reverse the decline in productivity and continue to work with our communities to reduce our social and environmental impact. Only by doing this can we ensure our industry has a long-term future in Chile.
Managing current challenges
Early in 2015 we were faced with disruptions at our Los Pelambres operations as a result of a blockade by the local community, who were protesting about the perceived impact of the mining operations on the local water supply. We realised that we must change the way that we engage with our communities in order to strengthen our relationships and find solutions that work for all sides. We are only at the beginning of this journey but I am confident that the actions we have taken over the course of 2015 have taken the depth of our engagement with the local communities to a new level and will provide us with a strong foundation for the future.
Turning to our financials, while lower metal prices impacted revenue and profit, we remained focused on maintaining a strong balance sheet, improving operational efficiencies and managing costs all with a keen focus on cash flow and margins. Our approach to allocating capital with an appropriate balance between investment, growth and dividends has allowed the Company to retain a strong position and our financial strength gave us the capacity to take advantage of opportunities over the year.
The sale of the ADASA water business effectively funded our acquisition from Barrick Gold in December of a 50% stake in the Zaldívar copper mine. We take a rigorous approach to acquisitions, and over the last three years the team screened 20–30 potential projects with only Zaldívar meeting our long-term objectives and passing our hurdle rates for this type of investment.
The closing of an extraordinary mine – Michilla
The year saw the closure of the Group’s very first mine, Michilla, after 50 years of copper production. Michilla played a very important role in Antofagasta’s history and in my personal life. When I was 18 years old I did a summer internship at Michilla as a rock drill operator’s assistant in the underground mine. This was my first job and it was hard, but one I will never forget as I learned valuable life experiences. For me and many others, not only just in the Group, but in the Chilean mining industry as a whole, Michilla has been a great school for learning about mining. With both oxide and sulphide deposits, and underground and open pit operations, Michilla was a microcosm of the country’s copper mining industry.
For those who have worked at this mine, I would like to say thank you. To the communities, suppliers and our other partners over the past half century as well as the local, national and federal authorities, thank you as well for being part of the spirit of Michilla.
06 Antofagasta plc Annual report and financial statements 2015
Letter from the Chairman

It is vital that we continue to focus on improving our operational performance and our ability to deliver on our commitments.
Safety
The safety of our employees, communities and operations always comes first in everything that we do and we continue to work hard to achieve our target of zero fatalities. However, I am saddened to report that during the course of 2015 Antofagasta had one fatality, and I would like to express on my own behalf – as well as that of the Board – my sincere condolences to the family of our colleague.
Governance and the Board
Over the course of the year we undertook a number of changes to the Board to enhance our corporate governance. The introduction of a new Projects Committee will allow greater Board oversight of Antofagasta’s major projects. The development of new projects is critical to the future of the Company and this Committee will allow more detailed scrutiny of our projects than is possible at full Board meetings. All matters that are brought to the Board for approval will first be reviewed by the Committee to highlight matters for the Board’s consideration and to make recommendations to the Board. This Committee is already making an important contribution to providing Board-level input into the advancement of our projects.
I would also like to take this opportunity to thank Miguel Sepulveda for his 29 years of service at Antofagasta, the last 22 years of which have been as General Manager for our railways business, the historical heart of the Group. Miguel stepped down in October and I thank him for his service and loyalty to Antofagasta and wish him the very best for his retirement.
Outlook
The year 2015 was a time for managing the challenges that faced Antofagasta and the wider industry as a whole in what has been another year of brutal markets and operating conditions. But, as was the case with Zaldívar, this has also been a time for taking advantage of opportunities when they appear.
As we look forward to 2016 we are under no illusion that the macroeconomic environment will improve in the near term. We are expecting another year of low copper prices. Consequently, it is vital that we continue to focus on improving our operational performance and our ability to deliver on our commitments.
We will not be afraid to make difficult decisions. Our internal business functions have been strengthened, our costs reduced, our balance sheet strength maintained and, operationally, in the final quarter we have seen a good end to the year. All of this leaves us well placed to weather the current downturn.
As a final note, I would like to thank all of our employees and management for all of their hard work over the last year and I look forward to the year ahead.
Antofagasta plc 07
OV
ER
VIE
WS
TR
AT
EG
IC R
EP
OR
TG
OV
ER
NA
NC
EF
INA
NC
IAL S
TAT
EM
EN
TS
OT
HE
R IN
FO
RM
AT
ION

We are in the sixth year of the downturn in the copper market. While I entered 2015 with a degree of optimism that the year would see the low of the cycle, continued deterioration in the macro-environment has instead created further downward pressure on prices. However, we have used 2015 to reset our costs back to levels that we have not seen for some time. We have made significant progress in this respect and I believe we will be able to reduce our costs further in the coming year. We are extending our cost reduction programmes which, together with the smooth start-up and integration of Antucoya and Zaldívar, will be an important focus of 2016 and beyond.
With our healthy balance sheet and low cost operations we are in a good position to weather the current market conditions. While we cut costs and free-up cash flow we are also in a position to consider taking advantage of any acquisition opportunities that arise, although we would only do so if we felt confident in our continued financial condition. We know that copper is a cyclical industry and as a result of the actions that we have taken over the past year we will be better positioned to benefit from the recovery when it comes.
Safety and health
We sadly had a fatality in 2015 as a result of a rockfall in our underground mine at Michilla. This is a great tragedy, especially as the mine was in its last few months of operation. I offer my sincerest condolences, together with all those of the senior management team, to Sergio Bruna’s family. It is not acceptable that we still have fatalities and we are determined to achieve our target of zero fatalities.
We have introduced a new safety management system based on risk prevention that has shown real improvements in safety awareness by employees and contractors. In 2015, there was a significant increase in the reporting of high-potential near misses, which is a fundamental preventative measure and is improving our understanding of the key risk areas.
Our executive team visit each of the Group’s mining operations periodically as part of a special safety leadership programme, demonstrating the importance of safety and empowering everyone to ensure safety comes first in everything we do.
2015 business performance
The focus of the year has been on optimising our operations to ensure we remain competitive in a low-price environment. We have also made several structural changes during the year as we strengthen our position as a focused copper miner. Major highlights include the start of production at our new Antucoya mine, the sale of our water division and the purchase of a 50% interest in the Zaldívar copper mine from Barrick Gold. At the same time we also took the decision to close the Michilla mine, which after a long history as part of the Group has come to the end of its economic life. These changes have meant that we have tightened the mining focus of the Group and increased our production capacity.
Against the backdrop of a weak macro- environment, prices fell for all our products. Our average realised copper price was 24% lower than in 2014 and gold and molybdenum were down 8% and 49% respectively.
We have made several structural changes during the year including starting up our new Antucoya mine, selling our water division, purchasing a 50% interest in the Zaldívar copper mine and closing Michilla.
08 Antofagasta plc Annual report and financial statements 2015
Statement from the CEO Diego Hernández

Areas of focus
1Position
2Optimise
3Discipline
Copper production was down by 74,500 tonnes to 630,300 tonnes, with lower throughput at Los Pelambres as we mined harder ore, and a significant fall in grade at Centinela. This, together with delays to the start of the commissioning of Antucoya and the expansion of Centinela Concentrates, the closure of the Michilla mine, heavy rains at Centinela and protests at Los Pelambres, all had an impact in lowering production compared to 2014. The lower prices and lower production led to Group revenues falling by 34% to $3.4 billion compared with 2014 and EBITDA decreasing by 58% to $891 million, some $1.25 billion lower than last year.
Despite the significant fall in production, cash costs before by-product credits for the year fell by 1.1% to $1.81/lb. A weaker Chilean peso against the US dollar (net of inflation) reduced costs by 6c/lb, and falls in the oil price, together with lower power costs at Los Pelambres and other lower consumables’ prices, reduced costs by a further 9c/lb. Net cash costs were further impacted by weak by-product prices and lower gold production, and increased by 4.9% to $1.50/lb compared with 2014. Offsetting the savings was an increase of 18c/lb arising from the lower production during the year.
The sale of the water division for $963 million in June generated a profit of $616 million, which has been recorded as a profit from discontinued operations. Excluding this amount, net earnings from continuing operations for the year were $5.5 million or 0.6 cents per share, a 98.7% decrease from 2014. Net earnings including discontinued operations increased by 32.2% to $608.2 million.
The total dividend for the year is 3.1 cents per share, or $30.6 million, which was paid as the interim dividend, and as a result exceeds the minimum payout ratio set in the Group’s dividend policy. No final dividend has been recommended by the Board.
Total operating costs in the mining division were reduced by some $245 million, or 8%, during the year. Our Cost and Competitiveness Programme achieved $150 million of mine site savings, or 11c/lb, and approximately another $95 million was saved through reductions in exploration and evaluation, and corporate costs. The cost reductions we achieved followed an intense review of our cost structures and productivity.
Maintain our discipline and flexibility
• Cost control without increasing risk• Reduce development capital
expenditure without compromising future growth
Optimise our portfolio
• Sale of water division• Bring Antucoya to full production• Purchase of TMM and stake
in Zaldívar• Closure of Michilla
The Group’s position in a challenging environment
• Strong balance sheet• Competitive operating cost position• Re-setting community engagement• Preserving growth projects
Antofagasta plc 09
OV
ER
VIE
WS
TR
AT
EG
IC R
EP
OR
TG
OV
ER
NA
NC
EF
INA
NC
IAL S
TAT
EM
EN
TS
OT
HE
R IN
FO
RM
AT
ION

This involved overhauling how we structured our service contracts, increasing operational efficiencies, extracting further synergies from the Centinela merger, and reducing employee numbers. Looking forward to 2016, we expect to make further mine site cost reductions of $160 million.
Zaldívar acquisition
Towards the end of the year, we acquired a 50% interest in the Zaldívar copper mine and took over as operators. The opportunity to purchase an interest in a mine of this quality rarely occurs and it is a reflection of the state of the market that it was offered for sale. The acquisition was keenly contested as copper remains widely regarded as one of the metals with the best outlook in the medium and long term. The acquisition was carefully considered and represented a unique opportunity to advance the Group’s long-term objectives, building on its existing portfolio of operations.
We have taken over as operators of the mine, which is expected to achieve savings of some $15–20 million from synergies with our existing corporate functions and a programme of cost reductions during the year. We expect our attributable production in 2016 to be 50–55,000 tonnes of copper and then to rise as mining moves into higher grade areas of the pit. The Group is also investigating increasing leach recoveries at the operation.
Managing our position through the downturn
Over the course of 2015, we have prepared for a period of prolonged weak markets and have contingency plans should prices deteriorate further. Beyond the actions I have mentioned regarding reducing operating costs, we are also taking steps to improve our free cash flow through a tighter control of inventory and a reduction in both development and sustaining capital expenditure. No expenditure is made without careful consideration.
Total capital expenditure in 2015 was approximately $1.05 billion and in 2016 is expected to drop slightly to some $1.0 billion including mine development, which increases by some $200 million.
We currently have two development projects underway, Encuentro Oxides and the new molybdenum plant at Centinela. Both of these projects were started in early 2015 and were scheduled to be completed by the end of 2016 and early 2017, respectively. Although stopping these projects would be disproportionately expensive considering their state of advancement, their development is now being slowed with no impact on their net present value and will now not be completed until the second half of 2017. This will help preserve cash in 2016 and, once these projects are commissioned, we will not need to commit to any new projects until the market outlook improves.
Future growth
The next stage of growth will come from our Los Pelambres Incremental Expansion project and building a second concentrator at Centinela, which will add up to 200,000 tonnes of annual copper production. Both of these projects completed their pre-feasibility studies in 2015 and are currently at the feasibility study stage. These studies are being undertaken at minimum cost and can be accelerated if conditions improve, but are currently not planned to be completed before late 2017.
The development of the Los Pelambres Incremental Expansion will be split into two phases. The first will maximise throughput under the mine’s existing environmental and water permits. The second will increase throughput to 205,000 tonnes per day. This phasing will simplify the permit application process and spread the costs of the expansion over a longer period.
At Centinela the Environmental Impact Assessment for the second concentrator was submitted in May and is expected to be approved in 2016. The feasibility study is underway and will focus on the first phase of expansion to add some 140,000 tonnes of copper, 150,000 ounces of gold and 3,000 tonnes of molybdenum annually.
Sustainability
In 2014, we announced that we had secured several new Power Purchase Agreements at Los Pelambres which will mean that by 2019 some 80% of energy used at the mine will come from renewable sources. This is a major step forward that will limit our impact on the environment and also help us to manage our costs.
In 2014, the El Arrayán wind farm was commissioned, followed by the Javiera solar plant last year and then the Conejo solar plant this year, which in total will provide Los Pelambres with 90MW of power.
During 2015, at Los Pelambres we made considerable progress in informing our local communities about our use of water and the impact of the Mauro tailings dam. We have engaged in a consultation process with all of the affected communities in a variety of different forums.
Through these forums we are working together to identify future water supply solutions and to agree compensation for the impact of the Mauro dam on those who live nearest to it in Caimanes. Considerable progress has been made and we expect that 2016 will see agreement on lasting solutions for those affected.
This is part of our ongoing commitment to ensure that the impact we have on the communities and environments in which we work is limited as much as possible.
Outlook
In 2016, we expect to produce 710–740,000 tonnes of copper, 245–275,000 ounces of gold and 8–9,000 tonnes of molybdenum, as Antucoya ramps up to full production and Zaldívar contributes its first full year of production. If we achieve the top end of our copper target we will have had our highest year of production ever and we expect this, together with savings and productivity programmes, will see our cash costs before by-products fall to 2012 levels of $1.65/lb and our net cash costs to $1.35/lb.
World markets at the beginning of 2016 have been dominated by uncertainty and negative sentiment even though the fundamentals are little changed. This has not been good for the mining industry and the copper price dropped below $2.00/lb in January. However, if the fundamentals prevail as we expect, the price should stabilise during a period of small supply surpluses before recovering in late 2017, early 2018. These years are going to be difficult for both Antofagasta and the wider industry and will require perseverance and discipline. We will continue to work hard to protect our margins and manage our cash flow, while remaining open to opportunities in the market. The actions that we are taking now will allow us to emerge from this downturn in a stronger position than we entered it.
10 Antofagasta plc Annual report and financial statements 2015
Statement from the CEO

Strategic report
Business model 12
Creating value through the mining lifecycle 12
Key inputs and cost base 19
Key relationships 22
The marketplace 25
Strategy for the mining business 28
Key performance indicators 30
Risk management 32
Long-term viability statement 38
Operational review
Mining division 39
The existing core business 40
Growth projects and opportunities 48
Transport 52
Managing a sustainable business 53
Financial review
Results 64
Revenue 65
Cash flows 67
Financial position 68
Cautionary statement about forward-looking statements 68
ST
RA
TE
GIC
RE
PO
RT
ST
RA
TE
GIC
RE
PO
RT
OV
ER
VIE
WG
OV
ER
NA
NC
EF
INA
NC
IAL S
TAT
EM
EN
TS
OT
HE
R IN
FO
RM
AT
ION
Antofagasta plc 11

Creating value through the mining lifecycle
1. Inputs
Mining is a long-term business and timescales can run into decades. The period from initial exploration to the start of production often exceeds ten years and then, depending on the nature of the project and market conditions, it may take more than five years of operation to recoup the initial investment. If possible, mines usually plan to exploit higher-grade areas towards the start of the mine life in order to maximise returns from the operation. As a result, average ore grades may decline over time, with production volumes decreasing along with revenues.
2. Exploration 4. Construction3. Evaluation
ResourcesRelationships
ChileInternational
Los Pelambres Incremental ExpansionCentinela Second ConcentratorTwin Metals
Encuentro OxidesCentinela Molybdenum Plant
Sustainable development is an integral and innovative component of Antofagasta’s decision-making process, firmly embedded in the business model and strategy of the Group. Antofagasta is committed to operational excellence, safety, talent management, environmental management and co-operation with employees and local communities.
Further information on page 15.
Further information on page 15.
Further information on page 14.
Further information on page 14.
5 YEARS3–5 YEARS 3–5 YEARS
Income
Investment
Innovative sustainability
Investment versus income
12 Antofagasta plc Annual report and financial statements 2015
Business model

Ongoing value chainThe copper and by‑products from the Group’s mines go on to be further processed for use in end markets, including property, power, electronics, transport and consumer products.
9. Outputs
Revenues, however, depend on commodity prices. These tend to be cyclical, so even as production volumes decline revenues can increase, and vice versa. Long-life and low-cost operations increase the chances of a mine benefiting from the peaks in the commodity price cycle while withstanding the troughs. Also, during the life of a mine there will often be expansions that help it to keep down its unit costs of production – the most important financial KPI on a mine.
Sustainability drives business success and without it the Group would not operate as efficiently as it does.
For more information on the Group’s commitment to sustainability see pages 53 to 63.
6. Processing5. Extraction 7. Marketing 8. Restoration
Further information on pages 16 and 17.
Further information on page 18.
Further information on page 18.
Further information on pages 16 and 17.
Further information on pages 16 and 17.
+20 YEARS
Income
Investment
Core operations
Los Pelambres CentinelaAntucoyaZaldívar
Antofagasta plc 13
ST
RA
TE
GIC
RE
PO
RT
ST
RA
TE
GIC
RE
PO
RT
OV
ER
VIE
WG
OV
ER
NA
NC
EF
INA
NC
IAL S
TAT
EM
EN
TS
OT
HE
R IN
FO
RM
AT
ION

To secure the future of the business in the long term, the Group must grow its mineral resource base. It undertakes in-house exploration activities in Chile. Exploration programmes further afield are carried out in partnership with other companies in order to benefit from their local knowledge and experience.Growing
resources
The Group’s mining operations depend on a range of key inputs, such as energy, water, labour and fuel. The management of these inputs has a significant impact on operating costs, so ensuring the long-term availability of key resources is a vital part of supply management.
Resources• Labour• Financial capital • Mineral resource-rich land
• Energy• Water• Reagents
• Plant and equipment• Services and supplies• Fuel
Relationships with• Employees and contractors• Customers• Suppliers
• Neighbouring communities• Environment
• Government and public authorities
• Infrastructure providers
More on key inputs and cost base on pages 19 to 21.
1. Inputs
Balanced inputs
Exploration programmes throughout Chile
More on pages 50 and 51.
Earn-in agreements in North America, Latin America, Europe, Africa and Australia
More on pages 50 and 51.
2. Exploration
Exp
loratio
n – 3–5 years
Increased mineral resources by 831.3 million tonnes in 2015 at Los Volcanes and Polo Sur deposits.
14 Antofagasta plc Annual report and financial statements 2015
Business model Creating value through the mining lifecycle
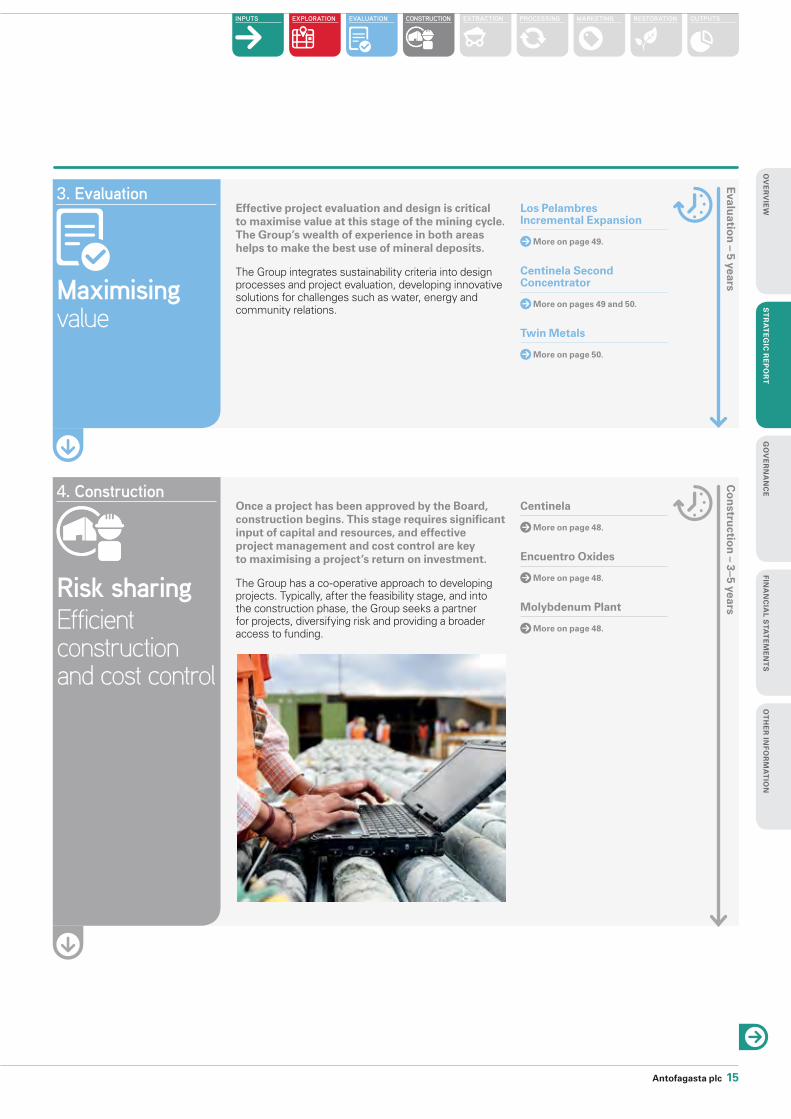
Effective project evaluation and design is critical to maximise value at this stage of the mining cycle. The Group’s wealth of experience in both areas helps to make the best use of mineral deposits.
The Group integrates sustainability criteria into design processes and project evaluation, developing innovative solutions for challenges such as water, energy and community relations.
Maximising value
Once a project has been approved by the Board, construction begins. This stage requires significant input of capital and resources, and effective project management and cost control are key to maximising a project’s return on investment.
The Group has a co-operative approach to developing projects. Typically, after the feasibility stage, and into the construction phase, the Group seeks a partner for projects, diversifying risk and providing a broader access to funding.
Risk sharingEfficient construction and cost control
3. EvaluationLos Pelambres Incremental Expansion
More on page 49.
Centinela Second Concentrator
More on pages 49 and 50.
Twin Metals
More on page 50.
4. ConstructionCentinela
More on page 48.
Encuentro Oxides
More on page 48.
Molybdenum Plant
More on page 48.
Evaluatio
n – 5 yearsC
on
structio
n – 3–5 years
EXTRACTION PROCESSINGEVALUATIONEXPLORATIONINPUTS CONSTRUCTION RESTORATIONMARKETING OUTPUTS
Antofagasta plc 15
ST
RA
TE
GIC
RE
PO
RT
ST
RA
TE
GIC
RE
PO
RT
OV
ER
VIE
WG
OV
ER
NA
NC
EF
INA
NC
IAL S
TAT
EM
EN
TS
OT
HE
R IN
FO
RM
AT
ION

5. ExtractionThe Group’s four operations in Chile are: Los Pelambres, Centinela, Antucoya and Zaldívar.
The world-class Los Pelambres and Centinela districts have long-life operations with large mineral resources and produce significant by-products: gold, silver and molybdenum. Within these operations are four open pit mines. In 2015, the Group completed the construction of Antucoya, the only new mine opened in Chile during the year.
In December 2015, the Group acquired a 50% interest in the Zaldívar copper mine and became the operator.
Safety and health are key elements of operational efficiency and remain a top priority for the Board and management team.
Operating efficiency
Op
eration
s – 20+ years
6. ProcessingThe Group mines both copper sulphide and copper oxide ores which require different processing routes:
• Los Pelambres and Centinela Concentrates Mined sulphide ore is milled to reduce its size before passing to flotation cells where it is upgraded to a concentrate containing some 25-35% copper. This concentrate is then shipped to a smelter operated by a third party and converted to copper metal.
• Centinela Cathodes, Antucoya and Zaldívar Mined oxide ore, combined with leachable sulphide or at Zaldívar, is crushed, piled into heaps and then leached with sulphuric acid, producing a copper sulphate solution. This solution is then put through a solvent extraction and electrowinning (“SX-EW”) plant to produce copper cathodes, which are sold to fabricators around the world.
Quality output
Op
eration
s – 20+ years
7. MarketingThe marketing team builds long-term relationships with smelters and fabricators who purchase the Group’s products, with approximately 76% of output going to Asian markets.
As well as copper, a number of the Group’s mines produce significant volumes of metal by-products: gold, molybdenum and silver.
Gold is sold for use in industrial and electronic applications and in jewellery making. Molybdenum is used in industrial applications, mainly in steel alloys. Silver is used for electrical and electronic applications and for jewellery.
Most copper and molybdenum sales are made under annual contracts or longer-term framework agreements, with sales volumes agreed each year, which guarantees offtake.
For more information on the structure of the Group’s sales contracts, please see page 22.
Long-term relationships
Op
eration
s – 20+ years
16 Antofagasta plc Annual report and financial statements 2015
Business model Creating value through the mining lifecycle

EXTRACTION PROCESSINGEVALUATIONEXPLORATIONINPUTS RESTORATIONMARKETING OUTPUTS
Los Pelambres More on pages 40 to 42.
Start of operation: 2000 Estimated output in 2016:
355–365,000 tonnes
Centinela Concentrates More on pages 43 and 44.
Start of operation: 2011 Estimated output in 2016:
175–185,000 tonnes
Centinela Cathodes More on pages 43 and 44.
Start of operation: 2001 Estimated output in 2016:
60–65,000 tonnes
Antucoya More on page 46.
Start of operation: 2015 Estimated output in 2016:
65–70,000 tonnes
Zaldívar More on page 47.
Start of operation: 1995 Estimated output in 2016 (50%):
50–55,000 tonnes
Sulphide OreOxide Ore
ConcentratorHeap-leaching and SX-EW
ConcentratesCathodes
Antofagasta plc 17
ST
RA
TE
GIC
RE
PO
RT
ST
RA
TE
GIC
RE
PO
RT
OV
ER
VIE
WG
OV
ER
NA
NC
EF
INA
NC
IAL S
TAT
EM
EN
TS
OT
HE
R IN
FO
RM
AT
ION
CONSTRUCTION

8. Restoration
9. Outputs
During the operation of a mine, its impact on the environment and the neighbouring communities is carefully managed. At the end of its life, a mine must be closed and the surrounding habitats restored to their original state.
A closure plan for each mine is maintained and updated throughout its life to ensure compliance with the latest regulations and sustainable closure.
Managing our impact
The Group’s mining operations create significant economic and social value for a wide range of stakeholders – local communities benefit from job creation and improved infrastructure, while the Chilean government and local municipalities receive tax payments and royalties. There are also benefits to society in general – the copper the Group produces is used in a wide range of sectors, from industrial to medical.
Outputs• Copper
• By-products: gold, molybdenum and silver
Outcomes• Financial (reinvested profits, dividends
to shareholders, taxes to government)
• Improved local infrastructure
• Impact on environment (minimised as far as possible, see page 55)
• Social and economic benefit to local communities (jobs and opportunities for partnerships with local business)
• Benefit to wider society and industry (products used in a wide range of sectors)
More on KPIs on pages 30 and 31.
Economic and social value
Exp
loratio
n – 20+ years
Sustainable development is an essential component of the Group’s decision-making process and business model.
More on Managing a sustainable business on pages 53 to 63.
18 Antofagasta plc Annual report and financial statements 2015
Business model Creating value through the mining lifecycle

EXTRACTION PROCESSINGEVALUATIONEXPLORATIONINPUTS CONSTRUCTION RESTORATIONMARKETING OUTPUTS
Dec 2014Jun 2014Dec 2013 Jun 2015 Dec 2015
250
200
150
100
50
0
Chilean central and northern grid spot energy prices $/MWh
H1 2014Average $88
H2 2014Average $63
H1 2015Average $54 H2 2015
Average $48
H1 2014Average $155
H2 2014Average $107
H1 2015Average $133
H2 2015Average $58
Central grid (”SIC”) Northern grid (”SING”)
Dec 2014Jun 2014Dec 2013 Jun 2015 Dec 2015
Exchange rate Ch$/$
H1 2014Average 553 H2 2014
Average 587H1 2015
Average 621
H2 2015Average 687
500
450
550
600
650
700
750
Key inputs and cost baseThe Group’s mining operations depend on key inputs, such as energy, water, labour and fuel. For cathode producers such as Centinela, Antucoya and Zaldívar, which use the SX-EW process, sulphuric acid is also a key input. The availability and cost of such inputs lie at the heart of the Group’s cost management strategy, which focuses on cost control and security of supply.
The Group’s two largest operations, Los Pelambres and Centinela, are competitively positioned on the copper industry cost curve. This reflects low operating costs and significant by-product credits. The Group cash cost guidance for 2016, before by-product credits, is $1.65/lb, some 9% lower than achieved in 2015. The initiatives below, implemented by the Group’s procurement department contribute to the reductions required to lower unit costs, even while mine grades are declining.
Cost and Competitiveness Programme
The Group introduced the Cost and Competitive Programme in 2014, with the aim of reducing the cost base and improving the Group’s competitiveness within the industry.
During 2015, the Group continued to focus on reducing its operating costs through its integrated Cost and Competitiveness Programme. The Group achieved cost savings of approximately $150 million. The target for 2016 is set at an incremental $160 million.
The programme focuses on four areas:
Services productivity: Improving productivity and quality of contracts while reducing costs
Actions:
• Negotiated corporate level agreements and associated price reductions for key consumables such as tyres, fuel, lubricants, grinding media, mining equipment and spare parts as well as solvents and reagents
• Undertook rationalisation and negotiation of smaller contracts
• Implemented a new contractor management system to measure contractors’ efficiency in providing services
Source: SIC and SING
Antofagasta plc 19
ST
RA
TE
GIC
RE
PO
RT
ST
RA
TE
GIC
RE
PO
RT
GO
VE
RN
AN
CE
FIN
AN
CIA
L STA
TE
ME
NT
SO
TH
ER
INF
OR
MA
TIO
NO
VE
RV
IEW
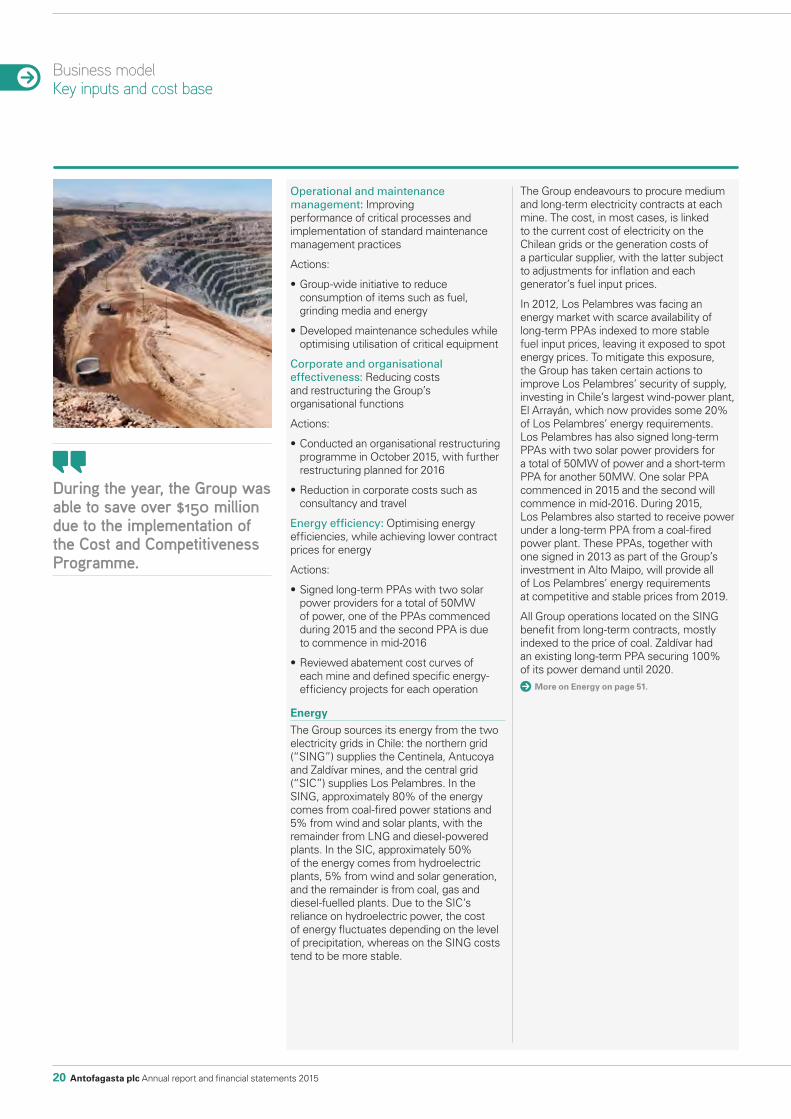
During the year, the Group was able to save over $150 million due to the implementation of the Cost and Competitiveness Programme.
Operational and maintenance management: Improving performance of critical processes and implementation of standard maintenance management practices
Actions:
• Group-wide initiative to reduce consumption of items such as fuel, grinding media and energy
• Developed maintenance schedules while optimising utilisation of critical equipment
Corporate and organisational effectiveness: Reducing costs and restructuring the Group’s organisational functions
Actions:
• Conducted an organisational restructuring programme in October 2015, with further restructuring planned for 2016
• Reduction in corporate costs such as consultancy and travel
Energy efficiency: Optimising energy efficiencies, while achieving lower contract prices for energy
Actions:
• Signed long-term PPAs with two solar power providers for a total of 50MW of power, one of the PPAs commenced during 2015 and the second PPA is due to commence in mid-2016
• Reviewed abatement cost curves of each mine and defined specific energy-efficiency projects for each operation
Energy
The Group sources its energy from the two electricity grids in Chile: the northern grid (“SING”) supplies the Centinela, Antucoya and Zaldívar mines, and the central grid (“SIC”) supplies Los Pelambres. In the SING, approximately 80% of the energy comes from coal-fired power stations and 5% from wind and solar plants, with the remainder from LNG and diesel-powered plants. In the SIC, approximately 50% of the energy comes from hydroelectric plants, 5% from wind and solar generation, and the remainder is from coal, gas and diesel-fuelled plants. Due to the SIC’s reliance on hydroelectric power, the cost of energy fluctuates depending on the level of precipitation, whereas on the SING costs tend to be more stable.
The Group endeavours to procure medium and long-term electricity contracts at each mine. The cost, in most cases, is linked to the current cost of electricity on the Chilean grids or the generation costs of a particular supplier, with the latter subject to adjustments for inflation and each generator’s fuel input prices.
In 2012, Los Pelambres was facing an energy market with scarce availability of long-term PPAs indexed to more stable fuel input prices, leaving it exposed to spot energy prices. To mitigate this exposure, the Group has taken certain actions to improve Los Pelambres’ security of supply, investing in Chile’s largest wind-power plant, El Arrayán, which now provides some 20% of Los Pelambres’ energy requirements. Los Pelambres has also signed long-term PPAs with two solar power providers for a total of 50MW of power and a short-term PPA for another 50MW. One solar PPA commenced in 2015 and the second will commence in mid-2016. During 2015, Los Pelambres also started to receive power under a long-term PPA from a coal-fired power plant. These PPAs, together with one signed in 2013 as part of the Group’s investment in Alto Maipo, will provide all of Los Pelambres’ energy requirements at competitive and stable prices from 2019.
All Group operations located on the SING benefit from long-term contracts, mostly indexed to the price of coal. Zaldívar had an existing long-term PPA securing 100% of its power demand until 2020.
More on Energy on page 51.
20 Antofagasta plc Annual report and financial statements 2015
Business model Key inputs and cost base

EXTRACTION PROCESSINGEVALUATIONEXPLORATIONINPUTS CONSTRUCTION RESTORATIONMARKETING OUTPUTS
Water
Water is a precious commodity in the regions where the Group’s mines operate, so the recycling of water is of great importance.
Water for each operation is sourced either from the sea or from surface and underground sources. Each operation has the necessary permits for the long-term supply of water at current production levels.
The Group optimises water efficiency by using desalinated sea water, reducing demand and encouraging recycling across the operations. Water reuse rates depend on a range of factors and the Group seeks to achieve between 70–85% depending on the characteristics of each operation.
The Group has pioneered the use of untreated sea water at its Chilean operations, with both Centinela and Antucoya using this process. In 2015, sea water accounted for 45.5% of total Group water use.
More on Managing a sustainable business on pages 53 to 63.
Labour
Secure labour supply is key to the Group’s success. Labour agreements with unions are in place at all of the Group’s mining operations, generally covering periods of four years. In 2014, new labour agreements were negotiated at all operations, except Zaldívar, securing terms of employment for all employees until 2018 and at Zaldívar until 2017. The Group continues to foster good working relationships with its employees and labour unions and to date there has been no industrial action.
Contractors make up approximately 72% of the total workforce across all Group operations. Labour negotiations for the contractors’ workforce are the responsibility of contractors. The Group maintains strong relations with all contractors to ensure operational continuity.
Sulphuric acid
The sulphuric acid market weakened during 2015, mainly due to lower consumption in the fertiliser industry. In Chile, acid consumption at mine operations decreased as lower copper prices affected production, lowering the regional deficit and causing prices to drop by the end of the year.
The Group secures most of its sulphuric acid requirements for a year or longer at specified rates, normally agreed in the latter part of the previous year. Therefore, the decline in demand is likely to benefit the acid procurement programme in 2016.
Service contracts and key supplies
The Central Procurement Department is repositioning the Group as a single entity rather than several separate operations. Procurement policies and procedures have been standardised. A central group of subject matter experts now defines categories of products and services. There are new corporate level agreements with price reductions and discounts in high spend categories such as tyres, fuel, lubricants, pick-up trucks, explosives and blasting, grinding media, mining equipment and spare parts as well as solvents and reagents. This will save over $150 million over the coming five years.
In 2015, the procurement team analysed the top 20 contractors across each operation in order to standardise procurement practices, re-scope major service contracts and seek price reductions with suppliers in exchange for centralised agreements. The Group continually reviews its procurement processes and existing agreements and has identified additional cost-saving opportunities to be taken in the coming years as part of the Cost and Competitiveness Programme.
In total, the Group has over 1,000 contracts for goods and services. All key contracts, such as for tyres, grinding media, mining and mobile equipment, chemicals, explosives, camp administration and maintenance, are under long-term agreements. Price adjustment formulas reflect current market downturns of key cost elements, such as steel, petrol, coal, etc. Contracts are normally between the operation and the supplier, but tender and negotiation processes are mostly co-ordinated or even led centrally by the Central Procurement Department to maximise leverage and benefits.
The Group’s corporate procurement team uses a variety of strategies, from full price competition, price auctions or sourcing in China, to working with strategic suppliers to reduce the costs to each party and achieve a sustainable, longer-term lower cost base for future growth. To foster this co-operative approach, the Group has engaged productivity experts to map the operations and understand value streams and opportunities for the Group to increase efficiency and reduce costs.
The Central Procurement Department continually seeks to increase productivity, optimise service contracts, reduce relevant supply costs and better manage inventory levels, as well as consolidating minor suppliers for non-critical goods and services.
Over the last two years, the Group’s material stocks have been reduced by a third, equivalent to $75 million, without compromising service levels.
The Group has recently upgraded its financial and management systems implementing SAP, an enterprise resource planning system that centrally manages all stock codes, inventories and supply contracts.
The procurement of supplies for the Zaldívar operation has been fully integrated into the Group´s centralised procurement system and will benefit from existing Group supply contracts.
Oil price
Fuel represents a small proportion of total costs and is used in trucks transporting ore and waste at the mine sites. Nevertheless, improving fuel efficiency is a priority, with the litres of fuel consumed per tonne of material extracted being a key measure. Fuel is supplied by Chile’s two largest suppliers to avoid sole supplier risk.
The oil price also affects the spot price of energy, shipping rates for supplies and products and the cost of items such as tyres and conveyor belts which contain oil-based products. The oil price fell by approximately 30% during 2015 and this weakness has continued in early 2016. This will affect the Group’s costs, but the impact will not be significant.
Exchange rate
Costs are affected by the Chilean peso to US dollar exchange rate, as approximately 35-40% of the mining division’s operating costs are in Chilean pesos. However, the exchange rate often acts as a natural hedge as over half of Chile’s foreign exchange is generated from copper sales and so movements in the copper price tend to affect the exchange rate. During 2015, the peso weakened by 14% from Ch$570/$1 in 2014 to Ch$654/$1 in 2015. During the first two months of 2016, the peso averaged Ch$712/$1.
Antofagasta plc 21
ST
RA
TE
GIC
RE
PO
RT
ST
RA
TE
GIC
RE
PO
RT
GO
VE
RN
AN
CE
FIN
AN
CIA
L STA
TE
ME
NT
SO
TH
ER
INF
OR
MA
TIO
NO
VE
RV
IEW

Key relationshipsThe Group cannot run its business in isolation. The business model is underpinned by a series of relationships with stakeholders at local, regional, national and international level, which contribute to the long-term success of the Group.
The Group forms long-term partnerships with some suppliers, while others are managed with a more short-term focus based on market competition.
The Group’s marketing team builds long-term relationships with core customers, while maintaining relationships with trading companies that participate in shorter-term sales.
Customers
Most of the copper and molybdenum sales are made under annual contracts or longer-term framework agreements, with sales volumes agreed for the coming year.
The majority of sales are to industrial customers who refine or further process the copper – smelters, in the case of copper concentrate production, and copper fabricators in the case of cathode production. The Group’s marketing team builds long-term relationships with these core customers, while maintaining relationships with trading companies that participate in shorter-term sales.
Over 80% of the Group’s mining sales are under contracts of a year or longer and metals sales pricing is generally based on prevailing market prices.
Structure of the Group’s sales contracts
The Group’s sales contracts typically set out the annual volumes to be supplied and the main terms for the sale of each payable metal, with the pricing of the contained copper in line with LME prices. In the case of concentrate, a deduction is made from LME prices to reflect TC/RCs – the smelting and refining costs necessary to process the concentrate into copper cathodes. These TC/RCs are typically determined annually and in line with terms negotiated across the concentrate market.
A significant proportion of the Group’s copper cathode sales are made under annual contracts, priced in line with LME prices. In copper cathode transactions, a premium, or in some cases a discount, on the LME price is negotiated to reflect differences in quality, logistics and financing compared with the metal exchanges’ standard copper contract specifications.
Similarly, the Group’s molybdenum contracts are made under long-term framework agreements, with pricing usually based on Platts’ average prices.
Across the industry neither copper producers nor consumers tend to make annual commitments for 100% of their respective production or needs. Therefore, producers normally retain a portion to be sold on the spot market throughout the year.
The prices realised by the Group during a specific period will differ from the average market price for that period. This is because, in line with industry practice, sales agreements generally provide for provisional pricing at the time of shipment, with final pricing based on the average market price for the month in which settlement takes place.
For copper concentrate, sales remain open until settlement occurs, on average three to five months from the shipment date. Settlement for the gold and silver content in copper concentrate sales occurs approximately one month from shipment. Copper cathode sales remain open for an average of one month from shipment. Settlement for copper in concentrate sales is later than for copper cathode sales since further refinement of copper in concentrate is needed before sale. Molybdenum sales generally remain open for two or three months from shipment.
22 Antofagasta plc Annual report and financial statements 2015
Business model

EXTRACTION PROCESSINGEVALUATIONEXPLORATIONINPUTS CONSTRUCTION RESTORATIONMARKETING OUTPUTS
Contractors are vitally important to mining operations and the Group aims to build long-term relationships with contractor companies based on the highest standards.
Suppliers
Suppliers play a critical role in the Group’s ability to operate, supplying a large range of products and services from grinding media to catering at the mine sites.
More information on key inputs is included on pages 19 to 21.
The Group currently conducts business with over 5,000 suppliers and is working with the top suppliers in each category to ensure the most cost-effective and efficient solutions are employed across all operations. The corporate procurement team has consolidated all procurement practices across the operations and projects. In addition, the team has reduced the number of suppliers to extract greater benefits from elected suppliers over a long period of time. The Group has identified 300 categories across all its mining operations and construction projects and is negotiating with its suppliers on each of these. This strategic approach will allow the Group to extract greater benefits from its suppliers over a long period of time. For example, the Group may develop long-term partnerships with some suppliers, while others are managed with a more short-term focus based on market competition.
The Group has an open-door policy that encourages suppliers to raise any issues or concerns. Suppliers are audited regularly to ensure compliance with the law and Company standards, particularly concerning safety and health and the environment.
Given the sensitive market conditions for suppliers, emphasis has been placed on monitoring the suppliers’ financial health and ensuring bank guarantees are in place when deemed necessary.
Employees
The Group employs approximately 5,300 people, who work alongside approximately 13,900 contractors at its corporate offices, operations and projects. Mining is inherently risky and ensuring the safety and health of every employee is an absolute priority. It is an ethical obligation and is central to the Group’s strategic objectives.
The Group has created a variety of initiatives over the last few years to secure and develop talent. In particular, the Group seeks to attract young professionals into the mining industry and complement their work experience with workshops and seminars across different functional areas.
Relationships with trade unions are based on mutual respect and transparency. This helps the Group to retain employees and avoid labour disputes, contributing to greater productivity and business efficiency. During 2014, the Group renewed labour agreements at all of its then mining operations, except Zaldívar, ensuring stability until 2018.
The Group undertakes an annual survey to assess employee satisfaction. Based on the results, action is taken to improve the work environment.
More on Employees on pages 61 to 63.
Contractors
The number of contractors working for Antofagasta varies according to business needs and the level of construction activity.
As at 31 December 2015, there were approximately 13,900 contractors working at the Group’s operations and projects. This was some 30% lower than the same time last year, principally due to the completion of construction of the Antucoya project.
Contractors are vitally important to mining operations and the Group aims to build long-term relationships with contractor companies based on the highest standards. Safety and health targets are included in performance contracts and compliance with safety and human rights laws and labour regulations are assessed regularly by internal and external audits.
The minimum wage paid by Antofagasta Minerals to contractor employees is 70% higher than that required by Chilean law, and contractor staff have access to the same facilities as the Group’s own employees at the mine camps.
Antofagasta plc 23
ST
RA
TE
GIC
RE
PO
RT
ST
RA
TE
GIC
RE
PO
RT
GO
VE
RN
AN
CE
FIN
AN
CIA
L STA
TE
ME
NT
SO
TH
ER
INF
OR
MA
TIO
NO
VE
RV
IEW

19,2001
The number of employees and contractors working across the Group’s operations.
Having clear social policies and regular contact with community members helps to manage potential conflicts and maintains the Group’s social licence to operate.
Local communities
It is crucial to have strong relationships built on trust and mutual understanding with local communities in the areas where the Group operates as it is not possible to run a mine successfully without their co-operation and agreement.
Having clear social policies and regular contact with community members helps to manage potential conflicts and maintains the Group’s social licence to operate. During 2014, Los Pelambres adopted a new approach to engagement with communities. The initiative is called “Somos Choapa” (We Are Choapa), the region in which Los Pelambres is located). In 2015, the Group signed a framework agreement with three municipalities under the Somos Choapas initiative, and has begun assessing a portfolio of projects for sustainable development in the region.
More information on this is provided on pages 59 and 60.
Other local stakeholders
Positive relationships with all local stakeholders near the Group’s operations and projects are fundamental to the smooth operation of the business and its future growth.
All of the Group’s operations appoint a manager to oversee relationships with external stakeholders such as the local authorities, local media and others.
Government and public authorities
Political developments and changes to legislation or regulations can affect business, whether in Chile, the UK, or other countries where the Group has operations, development projects or exploration activities.
New and proposed legislation is monitored to enable the Group to anticipate, mitigate or reduce possible effects, and to ensure it complies with all legal and regulatory obligations. The Group works with industry bodies to engage with governments on public policy, laws, regulations and procedures that may affect its business, including such issues as climate change and energy security.
The Group assesses political risk as part of its evaluation of potential projects, including the nature of existing foreign investment agreements. It also monitors political, legal and regulatory developments affecting its operations and projects, and utilises internal and external legal expertise to ensure its rights are protected.
1 Excludes employees and contractors at joint ventures.
24 Antofagasta plc Annual report and financial statements 2015
Business model Key relationships

The Group’s mining operations produce copper with by-products of gold, molybdenum and silver. Los Pelambres and Centinela produce copper concentrate containing gold and silver, which is sold to smelters for further processing and refining into copper cathodes, as well as the production of gold and silver. Copper contained in concentrates made up over 80% of the Group’s copper sales in 2015. Centinela, Antucoya and Zaldívar produce copper cathodes which are sold directly to fabricators and trading companies. Cathode production is set to increase during 2016 with Antucoya’s ramp-up to full production and the recent acquisition of 50% of the Zaldívar mine. Los Pelambres produces molybdenum concentrate, which is sold to roasters for further processing.
For more information on the structure of the Group’s sales contracts, please see page 22.
$m
Los Pelambres 1,606.7
Centinela 1,058.9
Michilla 168.9
Total copper 2,834.5
$m
Gold Los Pelambres/Centinela 252.0
Molybdenum Los Pelambres 105.3
Silver Los Pelambres/Centinela 50.4
Products
Mining division revenue by-product ($3,242.2m)
$1,606.7m
$1,058.9m
$168.9m$252.0m $105.3m $50.4m
%
A Construction 29.3
B Consumer products 28.6
C Electrical and electronic products 19.2
D Transport 12.3
E Industrial machinery 10.6
1 Source: Wood Mackenzie’s Q4 2015 Copper Outlook – December 2015.
Global copper consumption by sector1
A
C
D
E
B
Los Pelambres Centinela Michilla GoldMolybdenum
Silver
Antofagasta plc 25
ST
RA
TE
GIC
RE
PO
RT
ST
RA
TE
GIC
RE
PO
RT
GO
VE
RN
AN
CE
FIN
AN
CIA
L STA
TE
ME
NT
SO
TH
ER
INF
OR
MA
TIO
NO
VE
RV
IEW
The marketplace

Copper
Refined copper is used principally in electrical and thermal applications, as it is a very good conductor of electricity and heat, and in a number of metal alloys such as brass and bronze. The main consumption areas are construction and consumer products, which account for approximately 58% of global copper demand. Electrical and electronic products, transport and industrial machinery account for the balance.
The price of copper is typically determined by the major metals exchanges – the London Metal Exchange (“LME”), the Commodity Exchange, Inc. (“COMEX”) and the Shanghai Futures Exchange (“SHFE”). The price of copper is affected by supply-demand fundamentals as well as by financial investors who take positions on the future value of the metal. This can lead to volatile and cyclical movements, as has been seen during the course of 2015.
Gold
Gold is used as an investment asset, in jewellery and for industrial and electronic applications. It can be readily sold on numerous markets throughout the world and benchmark prices are generally based on London Bullion Market Association (“LBMA”) quotations.
Molybdenum
The main use of molybdenum is as a key alloying element in steel, although it is also used in other products such as catalysts. Contract prices are typically based on price benchmarks such as those reported by Platts.
The price of copper is affected by supply-demand fundamentals as well as by financial investors who take positions on the future value of the metal.
26 Antofagasta plc Annual report and financial statements 2015
The marketplace
Market environment
Refined copper
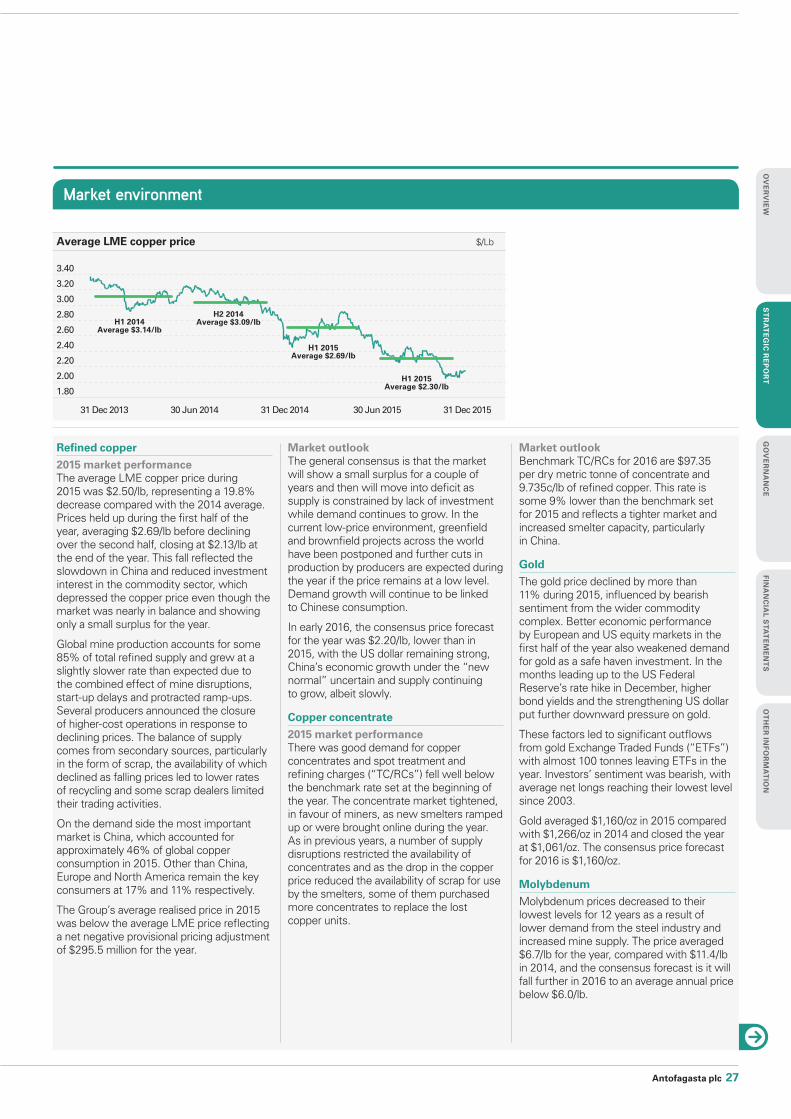
2015 market performanceThe average LME copper price during 2015 was $2.50/lb, representing a 19.8% decrease compared with the 2014 average. Prices held up during the first half of the year, averaging $2.69/lb before declining over the second half, closing at $2.13/lb at the end of the year. This fall reflected the slowdown in China and reduced investment interest in the commodity sector, which depressed the copper price even though the market was nearly in balance and showing only a small surplus for the year.
Global mine production accounts for some 85% of total refined supply and grew at a slightly slower rate than expected due to the combined effect of mine disruptions, start-up delays and protracted ramp-ups. Several producers announced the closure of higher-cost operations in response to declining prices. The balance of supply comes from secondary sources, particularly in the form of scrap, the availability of which declined as falling prices led to lower rates of recycling and some scrap dealers limited their trading activities.
On the demand side the most important market is China, which accounted for approximately 46% of global copper consumption in 2015. Other than China, Europe and North America remain the key consumers at 17% and 11% respectively.
The Group’s average realised price in 2015 was below the average LME price reflecting a net negative provisional pricing adjustment of $295.5 million for the year.
Market outlookThe general consensus is that the market will show a small surplus for a couple of years and then will move into deficit as supply is constrained by lack of investment while demand continues to grow. In the current low-price environment, greenfield and brownfield projects across the world have been postponed and further cuts in production by producers are expected during the year if the price remains at a low level. Demand growth will continue to be linked to Chinese consumption.
In early 2016, the consensus price forecast for the year was $2.20/lb, lower than in 2015, with the US dollar remaining strong, China’s economic growth under the “new normal” uncertain and supply continuing to grow, albeit slowly.
Copper concentrate
2015 market performanceThere was good demand for copper concentrates and spot treatment and refining charges (“TC/RCs”) fell well below the benchmark rate set at the beginning of the year. The concentrate market tightened, in favour of miners, as new smelters ramped up or were brought online during the year. As in previous years, a number of supply disruptions restricted the availability of concentrates and as the drop in the copper price reduced the availability of scrap for use by the smelters, some of them purchased more concentrates to replace the lost copper units.
Market outlookBenchmark TC/RCs for 2016 are $97.35 per dry metric tonne of concentrate and 9.735c/lb of refined copper. This rate is some 9% lower than the benchmark set for 2015 and reflects a tighter market and increased smelter capacity, particularly in China.
Gold
The gold price declined by more than 11% during 2015, influenced by bearish sentiment from the wider commodity complex. Better economic performance by European and US equity markets in the first half of the year also weakened demand for gold as a safe haven investment. In the months leading up to the US Federal Reserve’s rate hike in December, higher bond yields and the strengthening US dollar put further downward pressure on gold.
These factors led to significant outflows from gold Exchange Traded Funds (“ETFs”) with almost 100 tonnes leaving ETFs in the year. Investors’ sentiment was bearish, with average net longs reaching their lowest level since 2003.
Gold averaged $1,160/oz in 2015 compared with $1,266/oz in 2014 and closed the year at $1,061/oz. The consensus price forecast for 2016 is $1,160/oz.
Molybdenum
Molybdenum prices decreased to their lowest levels for 12 years as a result of lower demand from the steel industry and increased mine supply. The price averaged $6.7/lb for the year, compared with $11.4/lb in 2014, and the consensus forecast is it will fall further in 2016 to an average annual price below $6.0/lb.
Antofagasta plc 27
ST
RA
TE
GIC
RE
PO
RT
ST
RA
TE
GIC
RE
PO
RT
GO
VE
RN
AN
CE
FIN
AN
CIA
L STA
TE
ME
NT
SO
TH
ER
INF
OR
MA
TIO
NO
VE
RV
IEW
31 Dec 2014 30 Jun 201530 Jun 201431 Dec 2013 31 Dec 2015
Average LME copper price $/Lb
H1 2014Average $3.14/lb
H2 2014Average $3.09/lb
H1 2015Average $2.69/lb
H1 2015Average $2.30/lb1.80
2.00
2.20
2.40
2.60
2.80
3.00
3.20
3.40

The existing core business1
Current strategic focus:
• Embed the Safety Model across all operations to achieve zero fatalities
• Implement the Cost and Competitiveness Programme (“CCP”) to improve performance and competitive position
• Integrate Zaldívar, focusing on capturing potential synergies
• Proactive and inclusive approach with communities and other stakeholders to strengthen sustainable development
Further information on pages 40 to 47.
Current strategic focus:
• Advance projects under construction: Encuentro Oxides and the molybdenum plant at Centinela
• Continue to advance the Group’s main brownfield projects: Los Pelambres Incremental Expansion and Centinela Second Concentrator
Further information on pages 48 to 51.
Mining division business strategyTo be an international mining company based in Chile, focused on copper and related by-products, and recognised for operational efficiency, value creation and as a preferred partner in the global mining industry.
1 The existing core business
The first pillar of the strategy for the mining division is to optimise and enhance its existing core business: Los Pelambres, Centinela, Antucoya and Zaldívar.
2 Organic and sustainable growth of the core business
The second pillar of the strategy is to achieve sustainable, organic growth from further developing the areas around the Group’s existing asset base in Chile: Encuentro Oxides, Centinela Molybdenum Plant, Los Pelambres Incremental Expansion and Centinela Second Concentrator.
3 Growth beyond the core business
The third pillar of the strategy is to seek growth beyond the Group’s existing operations – both in Chile and internationally. The focus is on potential acquisitions of high-quality operating assets and high-potential early-stage developments.
2
3
1
Organic and sustainable growth of the core business
2
Current strategic focus:
• Work to develop the long-term growth pipeline beyond our existing operations
• Monitor the current market environment to assess potential value accretive acquisitions or joint ventures
Further information on pages 48 to 51.
Growth beyond the core business3
28 Antofagasta plc Annual report and financial statements 2015
Strategy for the mining business

2015 in Review Objectives for 2016The Group regrets that there has been one fatality this year. The Group is convinced that the Safety Model introduced in 2014 is the right approach and will keep on working with employees, contractors and suppliers to ensure the effective implementation of the critical controls associated with this model
Zero fatalities
Improve safety standards through strengthening application of the Safety Model
Copper production of 630,300 tonnes is approximately 10% lower than guidance issued at the beginning of 2015
Copper production of 710–740,000 tonnes (including 50% of Zaldívar), while reducing cash costs before by-product credits to $1.65/lb from $1.81/lb in 2015
Group net cash costs for the full year 2015 of $1.50/lb, in line with initial guidance for the year
During 2015, the Group implemented a corporate initiative to improve its competitive position and to achieve structural cost savings. The Cost and Competitiveness Programme (“CCP”) has four areas of focus: services productivity, operational & maintenance management, corporate & organisational effectiveness and energy efficiency. In 2015, the CCP achieved $150 million in cost savings
Continue working on the capture of newly identified savings, aiming to add $160 million of cost reductions this year
Michilla put on care and maintenance at the end of 2015
2015 in Review Objectives for 2016Antucoya started production in September and ramp-up reached 58% of plant design capacity by the end of the year
Reach design capacity and stabilise all key performance indicators to achieve 2016 production plan
Advanced Encuentro Oxides pre-stripping and commenced construction of processing facility. Started construction of the molybdenum plant at Centinela
Advance construction of Encuentro Oxides and Molybdenum Plant, but at a slower rate than originally planned, to reduce expenditure in 2016. Completion expected in 2017
Completed environmental baseline study and advanced engineering and EIA studies for the use of sea water in the Los Pelambres Incremental Expansion project
Submission of Environmental Impact Assessment (“EIA”) for Los Pelambres Incremental Expansion project and advance feasibility study for completion in 2017
Completed the pre-feasibility study for the Centinela Second Concentrator and started the feasibility study. Submitted EIA for approval
Advance Centinela Second Concentrator feasibility study for completion in 2017. EIA approval expected in 2016
Completed installation of secondary and tertiary crushers at Centinela Concentrator
Reach throughput capacity of 105,000tpd
2015 in Review Objectives for 2016The acquisition of 50% of Zaldívar is a major milestone in the history of the Group and the first acquisition of an operating company since the acquisition of Michilla in 1980
Contribute 50–55,000 tonnes to Group production and increase thereafter
Fully integrate Zaldívar into the Group’s operating practices
Continued international exploration programme with existing and new joint venture partners
Continue current exploration programmes
Identify potential new growth opportunities in Chile and abroad
Consolidated full ownership of the Twin Metals project and advanced optimisation studies
Continue with optimisation of the Twin Metals project and advance the permitting process
Antofagasta plc 29
ST
RA
TE
GIC
RE
PO
RT
GO
VE
RN
AN
CE
FIN
AN
CIA
L STA
TE
ME
NT
SO
TH
ER
INF
OR
MA
TIO
NS
TR
AT
EG
IC R
EP
OR
TG
OV
ER
NA
NC
EF
INA
NC
IAL S
TAT
EM
EN
TS
OT
HE
R IN
FO
RM
AT
ION
OV
ER
VIE
W

The Group uses KPIs to assess performance in terms of meeting its strategic and operational objectives.
Performance is measured against the following financial, operational and sustainability objectives:
An analysis of Financial KPIs is included within the Financial review on pages 64 to 68.
1 Restated.2 From continuing operations.
Why it is important This is a measure of the Group’s underlying profitability.
Performance in 2015 EBITDA fell by over 58% in 2015 as a result of lower production, lower realised prices and slightly higher unit operating costs.
11 12 13 141 152
3,66
0.5
3,86
4.4
2,70
2.2
2,14
1.4
890.
7
Why it is important Revenue represents the income from sales, principally from the sale of copper as well as the gold, molybdenum and silver by-product credits.
Performance in 2015 Revenue fell 34.0% in 2015, mainly due to lower realised copper prices, lower copper sales volumes and reduced gold by-product revenues.
11 12 13 141 152
6,07
6.0
6,74
0.1
5,91
7.6
5,14
5.6
3,39
4.6
Why it is important This is a measure of the profit attributable to shareholders.
Performance in 2015 EPS was impacted by lower profitability as costs rose and realised prices fell.
11 12 142
125.
4
105.
2
66.9
42.8
0.6
13 152
Group revenue
$3,394.6m
EBITDA
$890.7m
Earnings per share1
0.6 cents
Financial KPIs
30 Antofagasta plc Annual report and financial statements 2015
Key performance indicators

EXTRACTION PROCESSINGEVALUATIONEXPLORATIONINPUTS CONSTRUCTION RESTORATIONMARKETING OUTPUTS
An analysis of the Group’s copper production and cash costs is included in the Operational review on pages 39 to 51 and within the Financial review on pages 64 to 68.
Mineral resources – a review of the Group’s exploration activities is set out in the Operational review on pages 39 to 51, and the ore reserves and mineral resources estimates, along with supporting explanations, are set out on pages 186 to 193.
Further information on safety and health, water consumption and carbon emissions is provided in the Managing a sustainable business section on pages 53 to 63.
Why it is important Expansion of the Group’s mineral resources base has supported its strong organic growth pipeline.
Performance in 2015 The mineral resource base grew by over 6%, reflecting the incorporation of additional resources at Los Volcanes and the acquisition of the Zaldívar mine.
11 12 13 14 15
13.7 15
.2 16.2 17
.9
18.7
Why it is important The Group recognises the risks and opportunities of climate change and the need to measure and mitigate its greenhouse gas (“GHG”) emissions. The Group is investing in renewable energy projects both to address rising costs and as part of its approach to mitigate climate change.
Performance in 2015 Carbon emission intensity rose from 2014 primarily due to lower copper production at the Group’s operations. 11 12 13 14 15
2.76 2.
92 3.09
2.98 3.
24
Why it is important Safety is a key priority for the Group with the LTIFR being one of the principal measures of performance.
Performance in 2015 The LTIFR of the Group in 2015 was 1.98 accidents with lost time per million hours worked. One fatality was reported in 2015 and is not acceptable: the Group continues to target zero fatalities across all operations.
11 12 13 14 15
3.2
2.6
2.1
1.9
1.98
Why it is important Water is a precious resource and the Group is focused on maximising efficient use and utilising the most sustainable sources as production grows.
Performance in 2015 Consumption of water decreased during 2015, in line with the Group’s efforts to maximise water efficiency.
Continental Sea
11 12 13 14 15
22.6
15.9
25.5
24.4
24.7
26.8
20.0
20.2
20.6
20.6
2 Net cash costs are an industry measure of the cost of production. 3 Mineral resources relating to the Group’s subsidiaries on a 100% basis, and Zaldívar
on a 50% basis.
4 The Lost Time Injury Frequency Rate is the number of accidents with lost time during the year per million hours worked.
5 Water consumption relates to the mining division only. 6 Total CO2 emissions per tonne of copper produced. Data relates to the mining division only.
Why it is important Copper is the Group’s main product and its production is a key operational parameter.
Performance in 2015 Copper production decreased by 10.6% in 2015, primarily due to lower production at Los Pelambres and Centinela. Attributable production for the year was 4,400 tonnes from Zaldívar.
11 12 13 14 15
640.
5
709.
6
721.
2
704.
8
630.
3
Why it is important This is a key indicator of operational efficiency and profitability.
Performance in 2015 Net cash costs rose 4.9% compared to 2014, as lower realised by-product prices and lower gold production outweighed the lower cash costs before by-product credits.
11 12 13 14 15
1.02
1.03
1.36 1.
43 1.50
Lost time injury frequency rate4
1.98Copper production
630,300 tonnes
Water consumption5
45.2m m3Net cash costs2
$1.50/lb
Mineral resources3
18.7bn tonnesEmissions6
3.24 tonnes
Operational KPIs Sustainability KPIs
Antofagasta plc 31
ST
RA
TE
GIC
RE
PO
RT
GO
VE
RN
AN
CE
FIN
AN
CIA
L STA
TE
ME
NT
SO
TH
ER
INF
OR
MA
TIO
NS
TR
AT
EG
IC R
EP
OR
TG
OV
ER
NA
NC
EF
INA
NC
IAL S
TAT
EM
EN
TS
OT
HE
R IN
FO
RM
AT
ION
OV
ER
VIE
W
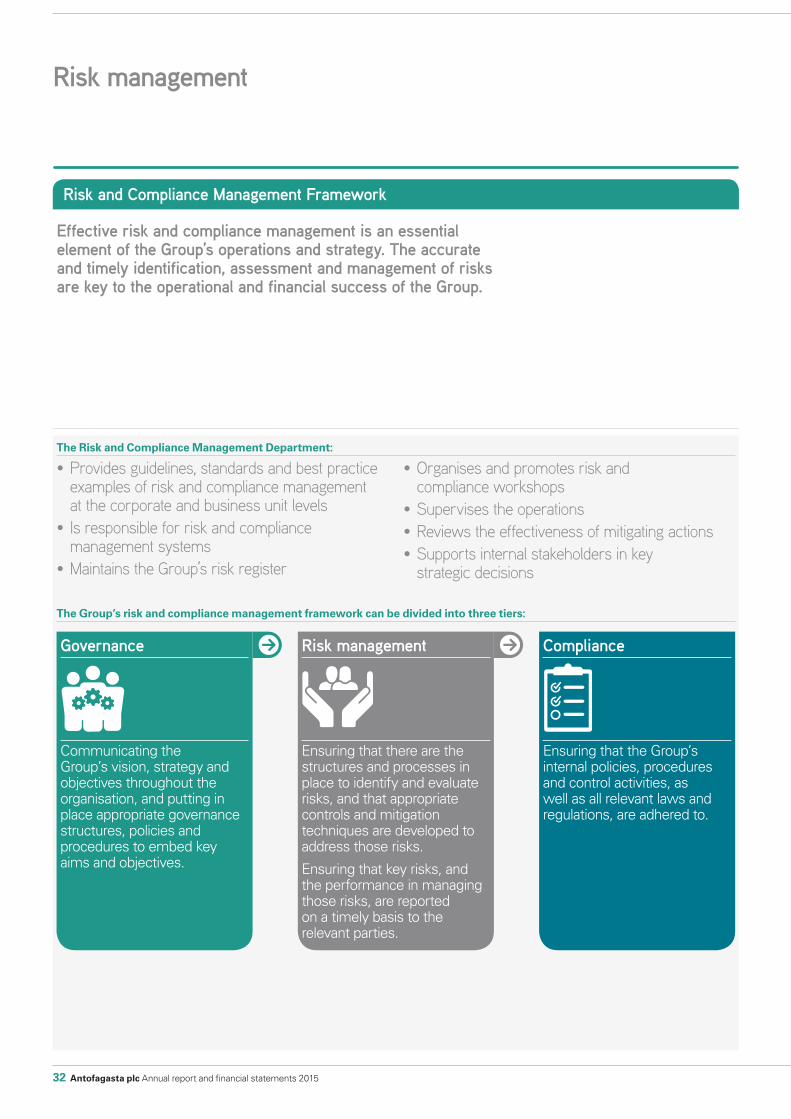
Effective risk and compliance management is an essential element of the Group’s operations and strategy. The accurate and timely identification, assessment and management of risks are key to the operational and financial success of the Group.
The Risk and Compliance Management Department:
• Provides guidelines, standards and best practice examples of risk and compliance management at the corporate and business unit levels
• Is responsible for risk and compliance management systems
• Maintains the Group’s risk register
• Organises and promotes risk and compliance workshops
• Supervises the operations• Reviews the effectiveness of mitigating actions• Supports internal stakeholders in key
strategic decisions
The Group’s risk and compliance management framework can be divided into three tiers:
Governance Compliance
Ensuring that the Group’s internal policies, procedures and control activities, as well as all relevant laws and regulations, are adhered to.
Communicating the Group’s vision, strategy and objectives throughout the organisation, and putting in place appropriate governance structures, policies and procedures to embed key aims and objectives.
Risk management
Ensuring that there are the structures and processes in place to identify and evaluate risks, and that appropriate controls and mitigation techniques are developed to address those risks.
Ensuring that key risks, and the performance in managing those risks, are reported on a timely basis to the relevant parties.
Risk and Compliance Management Framework
32 Antofagasta plc Annual report and financial statements 2015
Risk management

EXTRACTION PROCESSINGEVALUATIONEXPLORATIONINPUTS CONSTRUCTION RESTORATIONMARKETING OUTPUTS
Governance
The Board is responsible for determining the nature and extent of the significant risks that the Group will accept in order to achieve its strategic objectives, and for maintaining sound risk management and internal control systems. The Board receives detailed analysis of key matters for consideration in advance of Board meetings. This includes reports on the Group’s operational performance, including safety and health, financial, environmental, legal and social matters, key developments in the Group’s exploration and business development activities, information on the commodity markets, updates on talent management and analysis of financial investments. The regular provision of this information allows the early identification of potential issues and assessment of any necessary mitigating actions.
The Audit and Risk Committee assists the Board by reviewing the effectiveness of the risk management process and monitoring key risks and mitigation procedures. The Chairman of the Audit and Risk Committee reports to the Board following each Committee meeting, allowing the Board to understand and, if necessary, further discuss the matters considered in detail by the Committee.
These processes allow the Board to monitor effectively the Group’s major risks and related mitigation procedures, and assess the acceptable level of risk that arises from the Group’s operations and development activities. Quarterly risk management reports are sent to the Board.
The Code of Ethics sets out the Group’s commitment to undertake business in a responsible and transparent manner. The Code requires honesty, integrity and accountability from all employees and contractors and includes guidelines for identifying and managing potential conflicts of interest. An Ethics Committee comprising members of senior management is responsible for implementing, developing and updating the Code and monitoring compliance. The Code and other compliance matters form part of the induction programme for new employees.
Further information on the Board and its Committees is given in the Governance section on pages 69 to 116.
Risk management
The Risk and Compliance Management Department has responsibility for risk and compliance management systems across the Group. It maintains the Group’s risk register, which specifies the strategic risks that represent the most significant threats to the Group’s performance and achievement of its strategy, along with any necessary mitigation activities. The risk register is continuously updated and annual strategic risk workshops are held at which senior management from across the business review the Group’s key strategic risks and related mitigation activities. The Risk and Compliance Management Department reports quarterly to the Audit and Risk Committee on the overall risk management process, including a detailed update of key risks, mitigation activities and the actions being taken.
The General Managers of each of the operations have overall responsibility for leading and supporting risk management. Risk Champions within each operation have direct responsibility for risk management processes in their operations and for the continuous update of individual business risk registers, including relevant mitigation activities. The owners of the risks and controls at each business unit are identified, providing an effective and direct management of risk. As part of this process, each operation holds its own annual risk workshop in which the business unit’s risks and mitigation activities are reviewed in detail and updated if necessary. Workshops are also used to assess key risks that may affect relationships with stakeholders, limit resources, interrupt operations and/or negatively affect potential future growth. Mitigation techniques for the significant strategic and business unit risks are annually reviewed by the risk management department.
The Board regularly reviews Group compliance with all relevant laws and regulations, internal policies, procedures and control activities. A formal risk assessment is conducted at least once a year at all of the Group’s operations, and all risks are reported and reviewed quarterly by the Audit and Risk Committee.
Compliance Model
The Group’s Compliance Model applies to both employees and contractors. It is clearly defined and communicated regularly through internal communication channels, as well as being available on the Group’s website. All contracts with contractors include clauses relating to ethics and crime prevention to ensure adherence to the Group’s Compliance Model.
The Compliance Model comprises of five pillars:
1 The Code of Ethics This code sets out the Group’s values and provides guidelines on behaviour for all employees and contractors.
2 The Crime Prevention Model This model ensures compliance with the anti-bribery and anti-corruption laws in the United Kingdom and Chile. The Vice President of Finance and Administration is responsible for overseeing, defining and implementing the Model. As part of the Model, the Group regularly undertakes the following activities:
• Training on key risk areas (ethics, anti-corruption and anti-trust matters)
• Investigating all reports made by whistleblowers
• Conflict of interest assessment and due diligence on all business partners
• Updating and reviewing all employees’ conflict of interest statements
• Bolstering the compliance programme and systems
• Third party review of the Crime Prevention Model
Policies and processes are in place to ensure the proper management of any non-compliance exposure.
3 Whistleblowing Employees and external stakeholders can report concerns of irregular conduct or ethical issues through the Company’s intranet, or by email, letter or using a dedicated hotline. Every complaint is investigated, the findings are reported to the Ethics Committee and, if required, action is taken. Measures are taken to ensure the security and confidentiality of employees for the duration of the process, safeguarding employees and providing greater transparency.
Antofagasta plc 33
ST
RA
TE
GIC
RE
PO
RT
GO
VE
RN
AN
CE
FIN
AN
CIA
L STA
TE
ME
NT
SO
TH
ER
INF
OR
MA
TIO
NS
TR
AT
EG
IC R
EP
OR
TG
OV
ER
NA
NC
EF
INA
NC
IAL S
TAT
EM
EN
TS
OT
HE
R IN
FO
RM
AT
ION
OV
ER
VIE
W
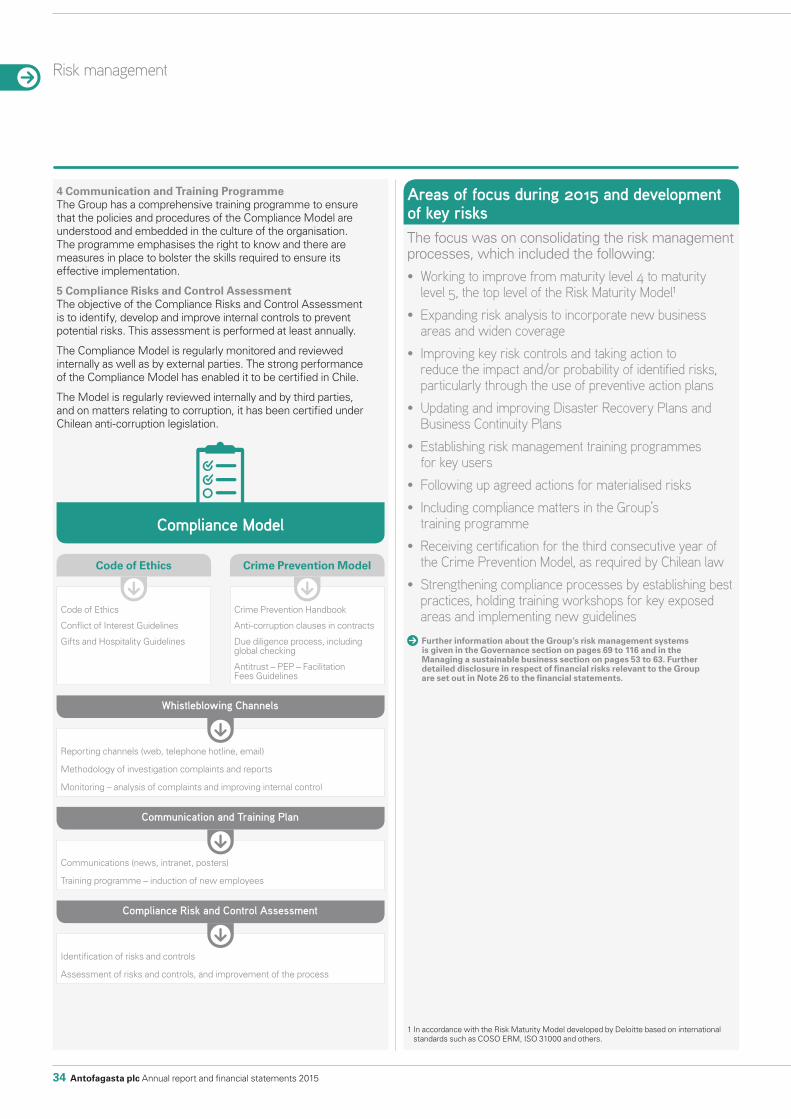
Areas of focus during 2015 and development of key risks
Code of Ethics
Conflict of Interest Guidelines
Gifts and Hospitality Guidelines
Code of Ethics
Crime Prevention Handbook
Anti-corruption clauses in contracts
Due diligence process, including global checking
Antitrust – PEP – Facilitation Fees Guidelines
Crime Prevention Model
Communications (news, intranet, posters)
Training programme – induction of new employees
Communication and Training Plan
Identification of risks and controls
Assessment of risks and controls, and improvement of the process
Compliance Risk and Control Assessment
Reporting channels (web, telephone hotline, email)
Methodology of investigation complaints and reports
Monitoring – analysis of complaints and improving internal control
Whistleblowing Channels
Compliance Model
4 Communication and Training Programme The Group has a comprehensive training programme to ensure that the policies and procedures of the Compliance Model are understood and embedded in the culture of the organisation. The programme emphasises the right to know and there are measures in place to bolster the skills required to ensure its effective implementation.
5 Compliance Risks and Control Assessment The objective of the Compliance Risks and Control Assessment is to identify, develop and improve internal controls to prevent potential risks. This assessment is performed at least annually.
The Compliance Model is regularly monitored and reviewed internally as well as by external parties. The strong performance of the Compliance Model has enabled it to be certified in Chile.
The Model is regularly reviewed internally and by third parties, and on matters relating to corruption, it has been certified under Chilean anti-corruption legislation.
1 In accordance with the Risk Maturity Model developed by Deloitte based on international standards such as COSO ERM, ISO 31000 and others.
The focus was on consolidating the risk management processes, which included the following:
• Working to improve from maturity level 4 to maturity level 5, the top level of the Risk Maturity Model¹
• Expanding risk analysis to incorporate new business areas and widen coverage
• Improving key risk controls and taking action to reduce the impact and/or probability of identified risks, particularly through the use of preventive action plans
• Updating and improving Disaster Recovery Plans and Business Continuity Plans
• Establishing risk management training programmes for key users
• Following up agreed actions for materialised risks
• Including compliance matters in the Group’s training programme
• Receiving certification for the third consecutive year of the Crime Prevention Model, as required by Chilean law
• Strengthening compliance processes by establishing best practices, holding training workshops for key exposed areas and implementing new guidelines
Further information about the Group’s risk management systems is given in the Governance section on pages 69 to 116 and in the Managing a sustainable business section on pages 53 to 63. Further detailed disclosure in respect of financial risks relevant to the Group are set out in Note 26 to the financial statements.
34 Antofagasta plc Annual report and financial statements 2015
Risk management

EXTRACTION PROCESSINGEVALUATIONEXPLORATIONINPUTS CONSTRUCTION RESTORATIONMARKETING OUTPUTS
Set out below are the Group’s principal risks and related mitigation techniques.
The Board has carried out a robust assessment of the principal risks set out below.
Risk Mitigation Application to strategy
Community relations
Failure to identify and manage local concerns and expectations can have a negative impact on the Group. Relations with local communities and stakeholders affect the Group’s reputation and social licence to operate and grow.
The Group has dedicated teams at its central office and at each of its operations. These establish and maintain relations with local communities based on trust and mutual benefit throughout the mining lifecycle, from exploration to final remediation. The Group seeks to identify any potentially negative operational impacts and minimise these through responsible behaviour. This means acting transparently and ethically, prioritising the safety and health of its employees and contractors, promoting dialogue, complying with commitments to stakeholders and establishing mechanisms to prevent or address a crisis. These steps are undertaken in the early stages of each project and continue throughout the life of each operation. The Group also contributes to the development of communities in the areas of influence in which it operates, particularly through human capital development – the education, training and employment of the local population. The Group endeavours to communicate clearly and transparently with local communities in line with the established Community Relations Plan, including the use of a grievance management process, local perception surveys, local media and community engagement.
Details of the Group’s community relations activities are included in the Managing a sustainable business section on pages 53 to 63.
2
3
1
Strategic resources
Disruption to the supply of any of the Group’s key strategic inputs such as electricity, water, fuel, sulphuric acid and mining equipment could have a negative impact on production. Longer term, any restrictions on the availability of key strategic resources such as water and electricity could affect the Group’s opportunities for growth.
A significant portion of the Group’s input costs are influenced by external market factors.
Contingency plans are in place to address any short-term disruptions to strategic resources. The Group commences early negotiations in supply contracts for key inputs to ensure supply continuity. Certain key supplies are purchased from several sources to mitigate potential disruption arising from exposure to a single supplier.
Technological and innovative solutions, such as using sea water in the Group’s mining operations, can help mitigate exposure to potential scarcity of resources.
Access to energy is a priority for the Group and during 2014 and 2015, it secured several sources of non-traditional energy such as wind and solar power.
Information on the Group’s arrangements for the supply of key inputs are included within the Key inputs section on pages 19 to 21, and details of significant operational or cost factors related to key inputs are included within the Operational review on pages 39 to 52.
2
3
1
Operational
Mining operations are subject to a number of circumstances not wholly within the Group’s control. These include damage to or breakdown of equipment or infrastructure, unexpected geological variations or technical issues, extreme weather conditions and natural disasters, any of which could adversely affect production and/or costs.
The key risks relating to each operation are identified as part of the regular risk review process undertaken by the individual operations. This process also identifies appropriate mitigation techniques for such risks. Monthly reports to the Board provide a variance analysis of operational and financial performance, allowing potential key issues to be identified in good time and any necessary actions, such as monitoring or control activities, to take place.
The Group has a Business Continuity Plan and Disaster Recovery Plan for all key processes within its operations in case of crisis or natural disaster. The Group also has insurance to provide protection from some, but not all, of the costs that may arise from such events.
Details of the performance of each of the Group’s operations are included within the Operational review on pages 39 to 52.
2
3
1
Principal risks and uncertainties
Antofagasta plc 35
ST
RA
TE
GIC
RE
PO
RT
GO
VE
RN
AN
CE
FIN
AN
CIA
L STA
TE
ME
NT
SO
TH
ER
INF
OR
MA
TIO
NS
TR
AT
EG
IC R
EP
OR
TG
OV
ER
NA
NC
EF
INA
NC
IAL S
TAT
EM
EN
TS
OT
HE
R IN
FO
RM
AT
ION
OV
ER
VIE
W

Risk Mitigation Application to strategy
Project management
Failure to effectively manage the Group’s development projects could result in delays in the start of production and cost overruns.
The Group has a project management system consisting of standards, manuals and procedures containing the best practices applicable and enforceable in all phases of project development. The project management system supports the decision-making process by balancing risk versus benefit, increasing the likelihood of success and providing a common defining language and standards. All geometallurgical models are reviewed by independent experts.
Additionally, during the project lifecycle, quality checks for each of the standards applied are carried out by a panel of experts from within the Group. This panel reviews each feasibility study to assess the technical and commercial viability of the project. Detailed progress reports on ongoing projects are regularly reviewed, including assessments of progress against key project milestones and performance against budget.
Details of the progress of the Group’s projects are included within the Operational review on pages 39 to 51.
2
3
1
Political, legal and regulatory
The Group may be affected by political instability and regulatory developments in the countries in which it is operating, pursuing projects or conducting exploration activities. Issues regarding the granting of permits or amendments to permits already granted, and changes to the legal environment or regulations, could adversely affect the Group’s operations and development projects.
The Group assesses political risk as part of its evaluation of potential projects, including the nature of any foreign investment agreements. Political, legal and regulatory developments affecting the Group’s operations and projects are monitored on a continuous basis. The Group operates in full compliance with the existing laws, regulations, licences, permits and rights in each country in which it operates.
The Group monitors proposed changes in government policies and regulations and belongs to several associations that consult with the government on these changes.
Details of any significant political, legal or regulatory issues that impact the Group’s operations are included within the Operational review on pages 39 to 52.
2
3
1
Safety and health
Safety and health incidents could result in harm to the Group’s employees, contractors or to local communities. Ensuring their safety and wellbeing is first and foremost an ethical obligation for the Group as stated in the Charter of Values.
Poor safety records or serious accidents could have a long-term impact on the Group’s morale, reputation and production.
Safety and health risk management procedures are being strengthened, with particular focus on preventing fatalities and the early identification of risks.
The corporate Safety and Health department provides a common strategy to the Group’s operations and co-ordinates all safety and health matters. The Group has a Significant Incident Report system which is an important part of the Group’s overall approach to safety.
This approach includes a goal of zero fatalities and minimising the number of accidents. This goal requires all contractors to comply with the Group’s Occupational Health and Safety Plan, which is monitored through monthly audits and supported by regular training and awareness campaigns for employees, contractors, and employees’ families and local communities, particularly with regard to road safety.
Further information about the Group’s activities in respect of safety and health is set out in the Managing a sustainable business section on pages 53 to 63.
2
3
1
Environmental management
An operational incident that damages the environment could affect the Group’s relationship with local stakeholders and its reputation, undermining its social licence to operate and to grow.
The Group operates in challenging environments, including the Atacama Desert where water scarcity is a key issue.
The Group has a comprehensive approach to incident prevention. Relevant risks are assessed, monitored and controlled. The Group works to raise awareness among employees and provide training to promote operational excellence. Potential environmental impacts are key considerations when assessing project viability and the integration of innovative technology in the project design to mitigate these effects is encouraged. The Group pioneered the use of sea water for mining operations in Chile and has installed capacity to produce thickened tailings at Centinela as it strives to ensure maximum efficiency in water use, achieving high rates of reuse and recovery.
Further information in respect of the Group’s environmental activities is set out in the Managing a sustainable business section on pages 53 to 63.
2
3
1
36 Antofagasta plc Annual report and financial statements 2015
Risk management

EXTRACTION PROCESSINGEVALUATIONEXPLORATIONINPUTS CONSTRUCTION RESTORATIONMARKETING OUTPUTS
Risk Mitigation Application to strategy
Growth opportunities
The Group may fail to identify attractive acquisition opportunities or may select inappropriate targets.
The long-term commodity price forecast and other assumptions used when assessing potential projects and other investment opportunities have a significant influence on the forecast return on investment and if incorrectly estimated could result in the wrong decisions being made.
The Group assesses a wide range of potential growth opportunities, both internal projects and external opportunities. A rigorous assessment process is followed to evaluate all potential business acquisitions, which are subjected to different stress test scenarios for sensitivity analysis and to determine the risks associated with the project or opportunity.
The Group’s Business Development Committee reviews potential growth opportunities and potential transactions, and approves or recommends them within authority levels set by the Board.
Details of the Group’s growth opportunities are set out in the Operational review on pages 39 to 51.
2
3
1
Commodity prices
The Group’s results are heavily dependent on commodity prices – principally copper and, to a lesser extent, gold and molybdenum. The prices of these commodities are strongly influenced by a variety of external factors, including world economic growth, inventory balances, industry demand and supply, possible substitution, etc.
The Group considers exposure to commodity price fluctuations to be an integral part of the business and its usual policy is to sell its products at prevailing market prices. The Group monitors the commodity markets closely to determine the effect of price fluctuations on earnings, capital expenditure and cash flows. Very occasionally the Group uses derivative instruments to manage its exposure to commodity price fluctuations when it feels it to be appropriate. The Group runs its business plans under various different commodity price scenarios and develops contingency plans as required.
As at the end of 2015, the Group held no open commodity hedging positions.
The sensitivity of the Group’s earnings to movements in commodity prices is set out in Note 26 to the financial statements.
2
3
1
Foreign currency
The Group’s sales are mainly denominated in US dollars and some of the Group’s operating costs are in Chilean pesos.
The strengthening of the Chilean peso may negatively affect the Group’s financial results.
As copper exports account for over 50% of Chile’s exports, there is a correlation between the copper price and the US dollar/Chilean peso exchange rate. This natural hedge partly mitigates the Group’s foreign exchange exposure. However, the Group closely monitors the foreign exchange markets and the macroeconomic variables that affect it and on occasion maintains a focused currency hedging programme to reduce short-term exposure to fluctuations in the US dollar against the Chilean peso.
Details of the Group’s currency hedging arrangements are shown in Note 26 to the financial statements.
2
3
1
Identification of new mineral resources
The Group needs to identify new mineral resources to ensure continued future growth and does so through exploration and acquisition. There is a risk that exploration activities may not identify sufficient viable mineral resources.
The Group conducts exploration programmes both in Chile and other countries. The Group has entered into early-stage exploration agreements and strategic alliances with third parties in a number of countries and has also acquired equity interests in companies with known geological potential. The Group focuses its exploration activities on stable and secure countries to reduce country risk exposure.
A review of the Group’s exploration activities is set out in the Operational review on pages 50 and 51.
2
3
1
Antofagasta plc 37
ST
RA
TE
GIC
RE
PO
RT
GO
VE
RN
AN
CE
FIN
AN
CIA
L STA
TE
ME
NT
SO
TH
ER
INF
OR
MA
TIO
NS
TR
AT
EG
IC R
EP
OR
TG
OV
ER
NA
NC
EF
INA
NC
IAL S
TAT
EM
EN
TS
OT
HE
R IN
FO
RM
AT
ION
OV
ER
VIE
W

Risk Mitigation Application to strategy
Ore reserves and mineral resources estimates
The Group’s ore reserves and mineral resources estimates are subject to a number of assumptions and estimates, including geological, metallurgical and technical factors, future commodity prices and production costs. Fluctuations in these variables may result in some reserves or resources being deemed uneconomic, which could lead to a reduction in reserves and/or resources.
The Group’s reserves and resources estimates are updated annually to reflect material extracted during the year, the results of drilling programmes and any revised assumptions. The Group follows the Australasian Joint Ore Reserves Committee (“JORC”) Code in reporting its ore reserves and mineral resources, which requires that the reserves and resources estimates are based on work undertaken by a Competent Person, as defined by the Code. In addition, the Group’s reserves and resources estimates are subject to a comprehensive programme of internal and external audits.
The ore reserves and mineral resources estimates, along with supporting explanations, are set out on pages 186 to 193.
2
3
1
Talent management and labour relations
The Group’s highly skilled workforce and experienced management team are critical to maintaining current operations, implementing development projects, achieving long-term growth and preserving current operations without major disruption. Managing talent and maintaining a high-quality labour force is a key priority for the Group and any failures in this respect could have a negative impact on the performance of the existing operations and future growth.
There are long-term labour agreements in place with employees at each of the Group’s mining operations, which help to ensure labour stability. These agreements were last renegotiated in 2014 for a period of up to four years for all of the Group’s operations, except for Zaldívar which was acquired during 2015 and whose labour agreement continues until 2017.
The Group seeks to identify and address labour issues that may arise throughout the period covered by existing labour agreements and to anticipate any potential issues in good time. Contractors are an important part of the Group’s workforce and under Chilean law are subject to the same duties and responsibilities as the Group’s own employees. The Group’s approach is to treat contractors as strategic associates and its goal is to build long-term mutually beneficial contractor relationships. The Group maintains constructive relationships with its employees and the unions that represent them through regular communication and consultation. Union representatives are regularly involved in discussions about the future of the workforce.
The Group develops the talents of its employees through training and development, invests in initiatives to widen the talent pool and focuses on maintaining good relationships with employees, unions and contractors.
The Group’s performance management system is designed to provide reward and remuneration structures and personal development opportunities to attract and retain key employees. The Group has in place a talent management system to identify and develop internal candidates for critical management positions, as well as processes to identify suitable external candidates where appropriate.
Details of the Group’s relations with its employees and contractors are set out within the Managing a sustainable business section on pages 53 to 63 and within the Operational review on pages 39 to 52.
2
3
1
To address the requirements of provision C.2.2 of the 2014 Corporate Governance Code, the Directors have assessed the prospects of the Group over a period of five years.
Mining is a long-term business and timescales can run into decades. The Group maintains life-of-mine plans covering the full remaining mine life for each of the mining operations. More detailed medium-term planning is performed for a five-year time horizon (as well as very detailed annual budgets). Accordingly, a period of five years has been selected as the appropriate period over which to assess the prospects of the Group.
When taking account of the impact of the Group’s current position on this viability assessment, the Directors have considered in particular its financial position, including its significant balance of cash, cash equivalents and liquid investments and the borrowing facilities in place, including their terms and remaining durations.
When assessing the prospects of the Group, the Directors have considered the Group’s copper price forecasts, the Group’s expected production levels, operating cost profile, capital expenditure and financing plans. The Directors have taken into consideration the Group’s key risks which could impact the prospects of the Group over this period, with the most relevant to this viability assessment considered to be risks to the copper price outlook. Robust down-side sensitivity analyses have been performed, assessing the impact of a significant deterioration in the copper price outlook over the five-year period. This analysis has focused on the
existing asset-base of the Group, without factoring in potential development projects, which is considered appropriate for an assessment of the Group’s ability to manage the impact of a depressed economic environment. These stress-tests all indicated results which could be managed in the normal course of business.
Based on their assessment of the Group’s prospects and viability, the Directors confirm that they have a reasonable expectation that the Group will be able to continue in operation and meet its liabilities as they fall due over the next five years.
Going concernThe Directors also considered it appropriate to prepare the financial statements on the going concern basis, as explained in the Basis of preparation paragraph in Note 1 to the financial statements.
The Strategic Report has been approved by the Board and signed on its behalf by:
Jean-Paul LuksicChairman14 March 2016
Long-term viability statement
38 Antofagasta plc Annual report and financial statements 2015
Risk management

EVALUATION EXTRACTION PROCESSING RESTORATIONMARKETINGEXPLORATIONINPUTS OUTPUTSCONSTRUCTION
All of the Group’s operations are located in the Antofagasta Region of northern Chile except for its flagship operation, Los Pelambres, which is in the Coquimbo Region of central Chile.
630,300Tonnes of copper produced in 2015.
$1.50/lbNet cash costs in 2015.
COQUIMBOREGION
ANTOFAGASTAREGION
LOS PELAMBRES
ILLAPEL
LA SERENA
Punta Chungo port
LOS VILOS
P E R U
A R G E N T I N A
B O L I V I A
P A C I F I CO C E A N
C H I L ESANTIAGO
CALAMA
CENTINELAMICHILLA
ANTUCOYA
ANTOFAGASTA
Mejillones
ZALDÍVAR
Esperanza port
Cities and town centres
Capital city
Antofagasta Minerals ports
Antofagasta operations and projects
ANTOFAGASTAREGION
COQUIMBOREGION
Antofagasta plc 39
ST
RA
TE
GIC
RE
PO
RT
ST
RA
TE
GIC
RE
PO
RT
GO
VE
RN
AN
CE
FIN
AN
CIA
L STA
TE
ME
NT
SO
TH
ER
INF
OR
MA
TIO
NO
VE
RV
IEW
Operational reviewMining division

Los Pelambres 60% owned
Los Pelambres is a sulphide deposit in Chile’s Coquimbo Region, 240 km north of Santiago. It produces copper concentrate (containing gold and silver) and molybdenum concentrate through a milling and flotation process.
Exploration Evaluation Construction Production
Start of operation: 2000Remaining mine life: 22 years
Molybdenum
Tonnes (2014 – 7,900)
27.8%10,100
Net cash costs
(2014 – $1.18/lb)
4.2%$1.23/lb
Operating profit
(2014 – $1,337.8m)
(58.5)%$555.0m
Copper
Tonnes (2014 – 391,300)
(7.2)%363,200
Copper production’000 tonnes
Gold
Ounces (2014 – 66,500)
(22.7)%51,400
403.
7
405.
3
391.
3
355-
365
363.
2
12 13 14 15 16E
Net cash costs
$/lb
0.86
1.16 1.18 1.25
1.23
12 13 14 15 16E
Gold
Ounces
45,000–55,000
Net cash costs
$/lb
1.25
Copper
Tonnes
355,000–365,000
Molybdenum
Tonnes
8,000–9,000
Mine lifecycle position
2015 Production 2015 Financials 2016 Forecast
40 Antofagasta plc Annual report and financial statements 2015
Operational review Mining divisionThe existing core business
3
2
1

EVALUATION EXTRACTION PROCESSING RESTORATIONMARKETINGEXPLORATIONINPUTS OUTPUTSCONSTRUCTION
2015 PerformanceOperating profit
Operating profit at Los Pelambres was $555.0 million in 2015, compared with $1,337.8 million in 2014, reflecting lower realised prices and lower production. Realised copper prices fell to $2.24/lb from $2.95/lb, significantly impacting operating profits, with unit cash costs slightly increasing.
Production
Copper production was 363,200 tonnes in 2015, which was slightly below the forecast for the year, and 7.2% below production in 2014 of 391,300 tonnes. The decrease in production was primarily due to lower throughput in the first quarter as a result of community protests as well as the higher proportion of harder ore being processed during 2015 which also affected recoveries.
Molybdenum production for the year of 10,100 tonnes was the highest since 2012 and a 27.8% increase on 2014 as a new, higher grade area of the pit was mined. Gold production was 22.7% lower in 2015 at 51,400 ounces, compared with 66,500 ounces in 2014.
Cash costs
Cash costs before by-product credits were $1.51/lb, 3.8% lower than in 2014, primarily due to targeted cost savings being achieved and lower input prices such as energy and diesel. For the full year, energy costs were $116/MWh (including transmission and other charges), compared with $149/MWh in 2014. Net cash costs for the full year 2015 were $1.23/lb compared with $1.18/lb in 2014. This increase is mainly due to lower gold production and lower realised molybdenum prices, which almost halved.
Total capital expenditure in 2015 was $203.1 million, which included the completion of the new mine facilities, a relocation of the water pumping system at the Mauro tailings dam and the replacement of a section of the tailings pipeline. Capital expenditure is expected to be approximately $185 million in 2016, reflecting slightly reduced sustaining investments in line with 2015.
More details on this project can be found on page 49.
Legal update El Mauro tailings dam
The Mauro tailings dam began operating in 2008. Since then there have been a series of civil claims filed by some members of the Caimanes community seeking to stop the operation of the dam. Two ongoing claims allege the dam interferes with the rights of the Caimanes community: one on the grounds that it affects the flow and quality of the Pupío stream; and the other claiming that the tailings dam wall would not withstand an extreme seismic event. These claims have been through various courts and stages of appeal. Los Pelambres has always complied with all applicable laws, regulations and controls and has successfully defended its right to continue operating the dam.
Claim that the dam affects the flow and quality of the Pupío stream
In October 2014, the Supreme Court, by split decision, upheld an appeal filed by a section of the Caimanes community, and ordered Los Pelambres to submit a plan of works to ensure the operation of the tailings dam does not affect the normal flow and quality of the Pupío stream. In November 2014, Los Pelambres submitted this plan to the Civil Court in Los Vilos. In March 2015, that Court found that the plan was not sufficient to address the requirements of the Supreme Court order and ordered the partial or total demolition of the tailings dam wall. Los Pelambres appealed that decision, and in December 2015, the Appeal Court of La Serena ordered that a court appointed engineer review the work plan submitted by Los Pelambres and to propose remedies should their opinion be that the work plan is deficient. A decision is expected in 2016.
Claim that the dam wall would not withstand extreme seismic events
In May 2015, the Court of Appeals of La Serena reversed a previous ruling by the trial Court of Los Vilos concluding that the design, construction and operation of the Mauro tailings dam had been properly undertaken according to best practices and that there was no evidence or indication that the dam constituted a threat to the Caimanes community. The decision of the Court of Appeal was then appealed by the Plaintiffs to the Supreme Court. The Supreme Court is expected to hear oral argument and issue a final decision during the first half of 2016.
Engagement with the Caimanes community
In April 2015, Los Pelambres initiated conversations with representatives of the Caimanes community and in September these were expanded to a formal consultation process with the whole community. The focus of the consultation was to discuss the community’s concerns regarding the Mauro dam, including the flow of a local stream and other topics of common interest, with the process being monitored by the Chilean branch of Transparency International. The community and the Company discussed the implementation of initiatives to improve the community’s access to water, address the concerns of some members of the community about the safety of the dam, improve the emergency communications plan and to set-up a development fund for the benefit of the community and local residents. Considerable progress has been made and agreement on a lasting solution to this long-standing issue is expected in 2016.
Antofagasta plc 41
ST
RA
TE
GIC
RE
PO
RT
ST
RA
TE
GIC
RE
PO
RT
GO
VE
RN
AN
CE
FIN
AN
CIA
L STA
TE
ME
NT
SO
TH
ER
INF
OR
MA
TIO
NO
VE
RV
IEW

Legal update – Cerro Amarillo waste dump
In 2004, Los Pelambres received all of the required authorisations from the Chilean government to deposit a waste-rock dump (“Cerro Amarillo Waste Dump”) in its current location which, according to the then official Chilean maps (1996), was located within Chile. In 2007, Chile modified the official maps in this area without making the changes public. Los Pelambres stopped using the relevant area of the Cerro Amarillo Waste Dump in 2011.
In February 2012, a binational border commission, established to clarify the exact position of the Chile/Argentina border, determined accurately the location of the border in the area of the Cerro Amarillo Waste Dump, which showed that part of the Cerro Amarillo Waste Dump was located in Argentina.
In May 2014, Xstrata Pachón S.A. (“Xstrata Pachón”), a subsidiary of Glencore and the holder of the mining properties on the Argentinian side of the border, filed a claim against Los Pelambres before the Federal Court of San Juan, Argentina, alleging that Los Pelambres had unlawfully deposited waste-rock on its property.
Xstrata Pachón has also filed a criminal complaint before a different Federal Court of San Juan alleging that Los Pelambres had violated several Argentinian laws relating to the misappropriation of land, unlawful appropriation of water bodies and that people’s health was in jeopardy from the alleged contamination that the Cerro Amarillo Waste Dump might generate.
In both cases, Los Pelambres submitted preliminary objections to the Argentinian courts. These objections are still pending in relation to the civil claim and each party may appeal any decision on these preliminary objections to higher courts. In the criminal proceeding, the first instance Court dismissed the preliminary objections made by Los Pelambres, but this decision has been appealed.
The Cerro Amarillo Waste Dump is a pile of inert waste-rock and any potential future environmental impact could be easily prevented with the implementation of an environmental closure plan, which is the accepted and recommended practice. Los Pelambres has offered to implement a closure plan in line with the requirements of the Provincial Authorities of San Juan, but Xstrata Pachón has rejected this proposal outright, even though this solution would address all of the alleged environmental concerns.
Los Pelambres will exercise all available legal avenues to defend its position and will continue to seek to reach an understanding with the relevant authorities in Argentina to allow the environmental closure of the Cerro Amarillo Waste Dump.
Additional details of these claims are set out in Note 37 to the financial statements.
Power Purchase Agreements (“PPAs”)
The El Arrayán wind farm, in which the Group has a 30% interest, supplies Los Pelambres with an average of 21MW of power under a 20-year PPA, which is around 20% of the mine’s total energy requirement.
During 2015, Los Pelambres started receiving power under two other PPAs, one from a solar power provider and the other from a coal-fired station, that together provide another 46% of the mine’s power needs.
In the second half of 2016, Los Pelambres will start to receive power from another solar power provider, bringing the total amount of power supplied from non-traditional renewable sources to 33%.
These PPAs, plus a new short-term PPA signed early in 2016, will reduce the variability and cost of Los Pelambres’ power over the coming years.
For more information on these PPAs, please see page 49.
OutlookProduction
The forecast production for 2016 is expected to be 355–365,000 tonnes of payable copper, similar to the 363,200 tonnes produced in 2015, 8–9,000 tonnes of molybdenum and 45–55,000 ounces of gold.
Cash costs
Cash costs before by-products credits for 2016 are forecast to be approximately $1.55/lb and net cash costs are forecast at approximately $1.25/lb. Lower throughput is expected due to a higher proportion of harder ore in the current phase and this in turn puts pressure on unit mining costs. Energy prices remain a key input cost for Los Pelambres and partly depend on precipitation levels in the region, where much of the power is generated by hydroelectricity. By the end of 2016, Los Pelambres will be receiving almost all of its power under long-term PPAs with wind, solar and coal-fired power generators, all of which are independent of precipitation levels.
More information on Los Pelambres’ sources of power is set out in Energy opportunities on page 51.
Innovative sustainability
Further information on pages 53 to 63.
42 Antofagasta plc Annual report and financial statements 2015
Operational review Mining divisionThe existing core business

EVALUATION EXTRACTION PROCESSING RESTORATIONMARKETINGEXPLORATIONINPUTS OUTPUTSCONSTRUCTION
Centinela 70% owned
Centinela was formed during 2014 from the merger of the Esperanza and El Tesoro mines. Centinela is located in Chile’s Antofagasta Region, 1,350 km north of Santiago, in an important mining region with sulphide and oxide deposits.
It produces copper concentrate (containing gold and silver) through a milling and flotation process at Centinela Concentrates and copper cathodes using a solvent extraction electrowinning process (“SX-EW”) at Centinela Cathodes.
Start of operation: 2001Remaining mine life: 43 years
Copper in concentrate
Copper cathodes
Gold
Ounces (2014 – 204,400)
(20.5)%162,500
Copper production
’000 tonnes
Copper cathode
Tonnes (2014 – 93,800)
(19.1)%75,900
Net cash costs
(2014 – $1.63/lb)
13.5%$1.85/lb
Copper in concentrateTonnes (2014 – 172,800)
(16.0)%145,200
Gold
Ounces
200,000–220,000
Net cash costs
$/lb
1.30
Copper
Tonnes
240,000–250,000
Operating profit/(loss)(2014 – $464.4m)
(128.2)%$(131.0)m
Mine lifecycle position
2015 Production 2015 Financials 2016 Forecast
3
2
1
Exploration Evaluation Construction Production
105.
1
102.
6
93.3
163.
2
174.
9
172.
8
60-6
517
5-18
575.9
145.
2
12 13 14 15 16E
Net cash costs
$/lb
0.99
1.40
1.63
1.30
1.85
12 13 14 15 16E
Antofagasta plc 43
ST
RA
TE
GIC
RE
PO
RT
GO
VE
RN
AN
CE
FIN
AN
CIA
L STA
TE
ME
NT
SO
TH
ER
INF
OR
MA
TIO
NS
TR
AT
EG
IC R
EP
OR
TG
OV
ER
NA
NC
EF
INA
NC
IAL S
TAT
EM
EN
TS
OT
HE
R IN
FO
RM
AT
ION
OV
ER
VIE
W

2015 PerformanceOperating profit
The operating loss at Centinela was $131.0 million, compared with a profit of $464.4 million in 2014, reflecting higher net cash costs and lower realised copper prices. The realised copper price fell by 24% from $3.02/lb in 2014 to $2.33/lb in 2015, as did the realised gold price, which fell from $1,261/oz in 2014 to $1,159/oz in 2015. The mine generated $290.7 million of operating cash flow during the year, compared with $841.6 million in 2014.
Production
Copper production decreased by 17.1% to 221,100 tonnes compared with 2014, due to lower production of copper in concentrate and lower cathode production.
Copper in concentrate production was 145,200 tonnes, a 16.0% decrease compared with 2014. Production decreased due to grades falling at Centinela Concentrates, as expected, from 0.65% to 0.58%, lower recoveries and, to a lesser extent, lower throughput. Gold production was 162,500 ounces compared with 204,400 ounces in 2014, primarily due to lower grades and throughput, compounded by slightly lower recoveries.
Copper cathode production for the year was 75,900 tonnes compared with the 93,800 tonnes produced in 2014. Compared with the same period last year, cathode production was 19.1% lower as grades declined as expected. Mining activity moved to the lower grade zones of the Tesoro Central and Tesoro Noreste (“TNE”) pits before stopping at TNE in November.
Cash costs
Cash costs before by-product credits increased by 7.1% to $2.27/lb compared with $2.12/lb in 2014 as copper production fell by 17.1%. This was offset by lower input prices, a weaker Chilean peso and a reduction in fixed costs. Net cash costs for 2015 were $1.85/lb compared with $1.63/lb in 2014. This increase is due to the higher cash costs before by-product credits as well as lower gold production and realised gold prices.
Capital expenditure was $559.4 million, including approximately $472 million in respect of optimisation and development projects. Total capital expenditure in 2016 is expected to be approximately $430 million, including $247 million related to the construction of the Encuentro Oxides and the molybdenum plant projects.
At Centinela in 2015, cash stripping costs of $63 million were capitalised, and in 2016 a further $265 million of stripping costs are expected to be capitalised.
More information on these projects can be found on pages 48 to 51.
OutlookProduction
The forecast for 2016 is for production of 240–250,000 tonnes of payable copper and 200–220,000 ounces of gold. This forecast includes 60,000–65,000 tonnes of copper cathodes and 175,000–185,000 tonnes of copper in concentrate. The Group expects to complete the construction of the Encuentro Oxides project during 2017, which will provide feed to the Centinela SX-EW plant allowing it to operate near its peak capacity of 100,000 tonnes per annum.
Cash costs
Cash costs before by-products for 2016 are forecast to be approximately $1.80/lb compared with $2.27/lb in 2015. Net cash costs are forecast at approximately $1.30/lb. Net cash costs are sensitive to the gold price, with each $100/oz movement in the realised gold price having a $0.04/lb impact on net cash costs in 2016.
In 2015, the Group commenced construction of a separate molybdenum plant that would produce approximately 3,500 tonnes per year of molybdenum over the remaining life of the mine. Production is expected to commence in 2017.
Innovative sustainability
Further information on pages 53 to 63.
The Group expects to complete the construction of the Encuentro Oxides project during 2017, which will provide feed to the Centinela SX-EW plant allowing it to operate near its peak capacity of 100,000 tonnes per annum.
44 Antofagasta plc Annual report and financial statements 2015
Operational review Mining divisionThe existing core business

EVALUATION EXTRACTION PROCESSING RESTORATIONMARKETINGEXPLORATIONINPUTS OUTPUTSCONSTRUCTION
2015 PerformanceOperating profit
Michilla had an operating profit of $15.4 million, compared to an operating loss of $29.0 million in 2014, which was its last full year of production. The mine was put on care and maintenance at the end of 2015.
Production
Total production was 29,400 tonnes of copper cathodes, a decrease of 37.4% on the 2014 production of 47,000 tonnes as operations were wound down in the lead up to the mine closure.
Cash costs
Cash costs decreased to $2.14/lb in 2015 compared with $2.38/lb in 2014. This decrease is due to the reduced activity at the mine.
Innovative sustainability
Further information on pages 53 to 63.
Michilla 99% owned
Michilla was placed on care and maintenance at the end of 2015. The mine produced copper cathodes from a leachable sulphide and oxide deposit located in Chile’s Antofagasta Region, 1,500 km north of Santiago.
Start of operation: 1959Remaining mine life: 0 years
Copper production’000 tonnes
Cash costs
$/lb
Cash costs
(2014 – $2.38/lb)
(10.1)%$2.14/lb
Operating profit/(loss)(2014 – $(29.0)m)
(153.1)%$15.4m
Copper
Tonnes (2014 – 47,000)
(37.4)%29,400
Mine lifecycle position
2015 Production 2015 Financials
3
2
1
Exploration Evaluation Construction Production
37.7
38.3
47.0
29.4
12 13 14 15
3.18
3.22
2.38
2.14
12 13 14 15
Antofagasta plc 45
ST
RA
TE
GIC
RE
PO
RT
GO
VE
RN
AN
CE
FIN
AN
CIA
L STA
TE
ME
NT
SO
TH
ER
INF
OR
MA
TIO
NS
TR
AT
EG
IC R
EP
OR
TG
OV
ER
NA
NC
EF
INA
NC
IAL S
TAT
EM
EN
TS
OT
HE
R IN
FO
RM
AT
ION
OV
ER
VIE
W

Antucoya 70% owned
Antucoya is an oxide deposit approximately 125 km north-east of the city of Antofagasta, in Chile’s Antofagasta Region. Construction of the project was completed in 2015 with full production expected to occur by the end of the first half of 2016. Antucoya will produce 85,000 tonnes of copper cathodes per year.
Start of operation: 2016Remaining mine life: 20 years
Copper production’000 tonnes
Copper
Tonnes
12,200
Mine lifecycle position
2015 Production
3
2
1
Exploration Evaluation Construction Production
Cash costs
$/lb
1.65
Copper
Tonnes
65,000–70,000
2016 Forecast
2015 PerformanceProduction
Total production in 2015 was 12,200 tonnes of copper cathodes, as production started in the third quarter of 2015. The mine is currently ramping up to full capacity of 85,000 tonnes per year in the first half of 2016.
Cash costs
Cash costs at Antucoya will be reported in unit costs once commercial production is achieved, which is expected to be in the first half of 2016.
Total capital expenditure on the project has been $1.9 billion of which $143.4 million was in 2015.
OutlookCathode production in 2016 is forecast to be approximately 65,000–70,000 tonnes.
The forecast cash costs for 2016 are expected to be $1.65/lb.
The final $59 million of project capital expenditure will be incurred in 2016.
Innovative sustainability
Further information on pages 53 to 63.
15 16E
12.2
65-7
0
46 Antofagasta plc Annual report and financial statements 2015
Operational review Mining divisionThe existing core business

EVALUATION EXTRACTION PROCESSING RESTORATIONMARKETINGEXPLORATIONINPUTS OUTPUTSCONSTRUCTION
Zaldívar 50% owned Joint Venture
Zaldívar is an open-pit, heap-leach copper oxide mine operating at an average elevation of 3,000 metres approximately 1,400 km north of Santiago and 175 km south-east of the city of Antofagasta. The Group completed the acquisition of a 50% interest in the mine from Barrick Gold Corporation on 1 December 2015 and is the operator of the mine.
Start of operation: 1995Remaining mine life: 14 years
Copper production’000 tonnes
Copper
Tonnes (2014 – 100,698)
4,400
2015 Production1
Mine lifecycle position
3
2
1
Exploration Evaluation Construction Production
Cash costs
$/lb
1.80
Copper
Tonnes
50,000–55,000
2016 Forecast
1 Represents attributable production since 1 December 2015.2 Capital expenditures represent Antofagasta’s share.
2015 PerformanceAcquisition
In December 2015, the Group completed the acquisition of a 50% interest of the Zaldívar mine from Barrick Gold Corporation. Total consideration for the transaction was $1,005 million, $980 million upon closing less working capital adjustments and five annual payments of $5 million each, starting in 2016. The final price will be determined once the working capital adjustments are finalised.
Production
Total attributable production in 2015 from the completion date was 4,400 tonnes of copper cathodes.
Cash costs
Cash costs at Zaldívar since completion in 2015 were $1.73/lb and capital expenditure was $6.6 million.
OutlookAttributable copper production in 2016 is forecast to be approximately 50,000–55,000 tonnes at a cash cost of $1.80/lb.
Capital expenditure2 in 2016 is expected to be approximately $55 million, of which $26 million will be spent on stripping.
Innovative sustainability
Further information on pages 53 to 63.
4.4
50-5
5
15 16E
Antofagasta plc 47
ST
RA
TE
GIC
RE
PO
RT
GO
VE
RN
AN
CE
FIN
AN
CIA
L STA
TE
ME
NT
SO
TH
ER
INF
OR
MA
TIO
NS
TR
AT
EG
IC R
EP
OR
TG
OV
ER
NA
NC
EF
INA
NC
IAL S
TAT
EM
EN
TS
OT
HE
R IN
FO
RM
AT
ION
OV
ER
VIE
W

The Group seeks to expand its copper production in Chile and abroad through the development of projects and other potential opportunities. Brownfield development within the Group’s Los Pelambres and Centinela mining districts in Chile remain the primary focus for maximising value while managing risks associated with execution.
The Group has a portfolio of longer-term growth options and continues to assess opportunities that come to market. Long-term growth options associated within the Group’s portfolio are currently under evaluation in pre-feasibility and feasibility studies. Given the early-stage nature of some of these projects, their potential and timing is inherently uncertain and the following outline is intended to provide only a high-level indication of potential opportunities. In the current uncertain market conditions, growth is not a priority but the Group seeks to keep its expansion options open for when conditions improve.
The Group’s exploration and evaluation expenditure decreased by 39% to $101.9 million in 2015 compared with $167.5 million in 2014. As commodity prices decline and there is greater emphasis on cost control, there is a natural decrease in exploration and evaluation expense reflecting a tighter focus on high-potential activities.
Projects under construction
2 Encuentro Oxides
The Encuentro Oxides deposit is within the Centinela Mining District. It is expected to produce an average of approximately 43,000 tonnes of copper cathode per year over an eight-year period, utilising the existing capacity at Centinela’s SX-EW plant. This will enable the plant to produce at full capacity of 100,000 tonnes per annum for a number of years once the project is complete, helping to offset a decline in production that would otherwise occur due to falling mined grades at Centinela’s existing oxide pits.
The construction budget for the project of $636 million was approved by the Board at the end of 2014.
The project entails the installation of new crushing and heap-leach facilities at the Encuentro Oxides deposit, a pipeline to take the leach solution for processing at the existing SX-EW plant some 17 km away, and the extension of the sea water pipeline from Centinela to Encuentro. Higher-grade ore will be crushed and sent to the new heap-leach facilities, while lower-grade ore will be processed later on a Run-of-Mine (“ROM”) leach pad.
This deposit is geologically important for the Group’s long-term development plan, as Encuentro Oxides sits on top of the much larger Encuentro Sulphide deposit. The Encuentro Oxides project will act as a funded pre-strip for the sulphide deposit below, opening it up for development as part of the Centinela Second Concentrator project.
Pre-stripping started in August 2014 and full-scale construction in early 2015. As of the end of December 2015, the project had achieved over 50% completion with first production originally expected in late 2016, but now delayed to the second half of 2017 to reduce expenditure during 2016.
As at the end of December, the project was on time and on budget with 53% total progress (including design, engineering, procurement and construction) with first production originally expected in late 2016, but now delayed to the second half of 2017 to preserve cash flow without impacting the return of the project.
2 Centinela
During 2015, work continued on optimising Centinela’s concentrator plant to bring the level of throughput to the original design capacity of 97,000 tonnes per day and later to 105,000 tonnes per day. The first stage, including the installation of two tailings thickeners, crushing equipment and flotation cells, was completed during the year. The second stage, carried out simultaneously, involves the installation of a sixth tailings thickener at the plant as well as the purchase of further mining equipment. This will allow throughput to increase to 105,000 tonnes per day while producing thickened tailings with a solids content of approximately 65%. As at the end of December 2015, throughput could be maintained at the increased rate, but not while producing tailings with the required moisture content. To do this will require the completion of the final thickener, which is expected in the first half of 2016.
2 Molybdenum Plant
This project will allow Centinela to produce 2,400 tonnes of molybdenum per year. The project is being delayed to preserve cash in 2016 and is now expected to be completed in 2017, and will lower Centinela’s unit net cash costs.
2
3
1
48 Antofagasta plc Annual report and financial statements 2015
Operational review Mining divisionGrowth projects and opportunities

EXTRACTION PROCESSINGEVALUATIONEXPLORATIONINPUTS CONSTRUCTION RESTORATIONMARKETING OUTPUTS
Brownfield growth projectsThe Group recognises the importance of capital cost control and optimising production from existing operations, and manages this by constantly monitoring the efficiency of its mines, plants and transport infrastructure. Where possible, it conducts debottlenecking and incremental plant expansions to increase throughput and improve overall efficiencies. However, in current market circumstances the Group seeks to defer these projects, minimising expenditure while keeping the project teams active and focusing on completion of key time-critical feasibility study work, such as the preparation of EIAs.
2 Los Pelambres Incremental Expansion
During the year, the Group revised the approach to the incremental expansion of Los Pelambres and decided to split the project into two phases to ease the development of the project and conserve development capital in light of lower commodity prices. This two-phase strategy was approved by the Board during the year and the feasibility study is now underway.
Phase 1
This phase is to optimise throughput at the operation within the limits set by the existing operating, environmental and water extraction permits, which will only need relatively simple updates. During this phase, Los Pelambres will operate at an average throughput of 190,000 tonnes per day with the addition of a new grinding and flotation circuit, to mitigate the hard ore currently being mined, together with a 400l/s desalination plant and pipeline. Desalinated water will be pumped to the tailing storage facility at Mauro where it will connect with the water recycling circuit that returns water from the tailings facility to the Los Pelambres processing plant. The feasibility study is underway and includes the preparation and submission of an updated EIA for this phase, which should be ready for submission in the first half of 2016.
Capital expenditure for this project is estimated at approximately $1.1 billion, with some $600 million allocated to the additional crushing and flotation circuits and the balance for the desalination plant and water pipeline. The Board will consider the feasibility study for this project for approval in late 2016 or in 2017, but a decision to proceed will only be made once market conditions are suitable and an approved EIA is in place. Production would commence in late 2019 at the earliest.
Phase 2
In this phase, the Group will seek to increase throughput to 205,000 tonnes per day and to extend the mine’s life beyond the currently approved 22 years. As part of the development of this phase, a new EIA must be submitted to increase the capacity of the mine’s Mauro tailings storage facility and its waste dumps.
Capital expenditure for this phase of the project is estimated at approximately $500 million, with the majority of the expenditure being on mining equipment, additional crushing and grinding capacity and flotation cells. The conveyors from the primary crusher to the concentrator plant will have to be repowered to support the additional throughput. The critical studies (tailings and waste storage capacity), is being conducted in parallel with the feasibility study for Phase 1 and should be completed by the end of 2017. However, it will only proceed following a decision on Phase 1 and will in addition require the preparation and submission of various permit applications, including an EIA. At the earliest, first production from this phase would be in 2022.
Greenfield growth projects
2 Centinela Second Concentrator
The Group continues to evaluate options for the development of the Centinela Mining District, a key area for longer-term growth.
The second concentrator will be built some 7 km from Centinela’s current concentrator. It is expected to have an ore throughput capacity of approximately 90,000 tonnes per day, with annual production of approximately 140,000 tonnes of copper, 150,000 ounces of gold and 3,000 tonnes of molybdenum. It is currently planned that ore will first be sourced from the Esperanza Sur deposit and, once mining at Encuentro Oxides is completed, ore will also be sourced from Encuentro Sulphides.
The pre-feasibility study for this $2.7 billion project was completed at the end of 2015 and the preparation of the feasibility study is now underway. The EIA was submitted in 2015, with the outcome expected during 2016. The feasibility study is expected to be completed by the middle of 2017 and will include pilot testing of a hydraulic roll crushing system which is being considered in preference to conventional SAG and ball mills. A decision to proceed with the project will only be made if it is supported by the market outlook at the time. If approval is granted in 2017, production would be expected to begin in 2020.
Antofagasta plc 49
ST
RA
TE
GIC
RE
PO
RT
GO
VE
RN
AN
CE
FIN
AN
CIA
L STA
TE
ME
NT
SO
TH
ER
INF
OR
MA
TIO
NS
TR
AT
EG
IC R
EP
OR
TG
OV
ER
NA
NC
EF
INA
NC
IAL S
TAT
EM
EN
TS
OT
HE
R IN
FO
RM
AT
ION
OV
ER
VIE
W

The project team continues to review options for reducing the capital cost of the project, including the use of existing infrastructure (power lines, pipelines, concentrate shipping and other facilities) as well as using a larger owner’s team, as opposed to an EPCM contractor, together with other initiatives.
Following the completion of the second concentrator, there is scope to increase the plant capacity further and the Group is considering the possibility and timing of such an expansion. This could bring throughput capacity to approximately 150,000 tonnes per day and would increase annual production to approximately 200,000 tonnes of copper, 170,000 ounces of gold and 1,100 tonnes of molybdenum. The Board has approved feasibility level studies to commence on critical activities and will review the project upon completion of those studies.
The Group continues to evaluate other opportunities in the Centinela Mining District, the most significant of which is Polo Sur. This deposit has a resource of 1.5 billion tonnes at 0.34% copper together with gold and molybdenum, and includes 125.5 million tonnes of copper oxides at 0.40% copper and some additional leachable supergene sulphides. The deposit is approximately 35 km from Centinela and the oxides may act as an additional source of feed for its SX-EW plant in the future.
2 Los Pelambres
Given the size of the resource, which at 6.1 billion tonnes is more than three times the quantity of processed ore expected under the existing mine plan, there is significant scope to increase the plant capacity beyond the 205,000 tonnes per day planned for Phase 2 of the incremental expansion project. Such an expansion will require extensive engineering works and permitting as well as the support of local communities and currently no significant evaluation work is planned.
3 United States – Twin Metals Minnesota
Twin Metals Minnesota LLC (“Twin Metals”) is a copper, nickel and platinum group metals (“PGM”) underground-mining project that holds the Maturi, Maturi Southwest, Birch Lake and Spruce Road copper-nickel-PGM deposits located in north-eastern Minnesota, USA.
The Group completed the acquisition of its project partner in January 2015, bringing Antofagasta’s ownership in the project to 100%.
During 2015, the Group has been undertaking evaluation and optimisation exercises on the pre-feasibility study that was completed in 2014 and has also progressed with geotechnical studies and hydrological fieldwork required to support future environmental reviews and permitting.
3 Other exploration and evaluation activities
The Group has an active early-stage exploration programme beyond the existing core locations of the Centinela and Los Pelambres mining districts. This is conducted through its in-house exploration team and through partnerships with third parties to build a portfolio of longer-term opportunities across Chile and the rest of the world.
Chile
The Group focuses its exploration activities on the main copper porphyry belts in northern and central Chile.
During the year, 45.6 million tonnes of mineral inventory relating to the Llano-Paleocanal project was upgraded to mineral resource, demonstrating the Group’s ability to continually expand and develop its resource base. The 2015 programme resulted in increasing mineral resources at the Los Volcanes project and the Polo Sur deposits by 831.3 million tonnes, through exploration and in-fill drilling and the completion of the geological and resource models.
The Group has land holdings throughout Chile and in some instances conducts exploration under agreements with the landowners or the state.
Further information regarding reserves and resources is included on pages 186 to 193.
The Group’s international exploration strategy is to rapidly and effectively identify, secure and evaluate high-quality copper exploration projects.
50 Antofagasta plc Annual report and financial statements 2015
Operational review Mining divisionGrowth projects and opportunities

EXTRACTION PROCESSINGEVALUATIONEXPLORATIONINPUTS CONSTRUCTION RESTORATIONMARKETING OUTPUTS
International
The Group’s international exploration strategy is to rapidly and effectively identify, secure and evaluate high-quality copper exploration projects in preferred jurisdictions in the Americas, Australia-Oceania and Africa.
During 2015, the Group refined its portfolio of early-stage exploration projects in key copper provinces across the globe. Working in partnership with selected companies, both public and private, the Group advanced projects in Argentina, Australia, Canada, Chile, Mexico and Zambia, while exiting from projects in Australia, Canada, Finland and Portugal.
The Group’s strategy is to partner with experienced junior exploration companies, funding their exploration programmes to earn an interest in the projects while benefiting from their local knowledge and expertise.
3 Energy assets
Over the last few years, the Group has acquired a series of minority interests in energy generators and projects as part of its strategy to support the power supply requirements of the mining operations. The strategy has a particular focus on renewable energy generation, supporting the Group’s broader aim of increasing the sustainability of its operations. Over the last five years, the Group has invested some $577 million in power-generating assets, with combined installed capacity of 880MW (100% basis), of which, at the end of 2015, 350MW (100% basis), were in operation.
Further information regarding the Chilean energy market is included in the Key inputs and cost base section on pages 19 to 21.
Energía Andina
The Group has a 50% interest in Energía Andina S.A., a joint venture with Origin Energy Limited of Australia, that has a minority position in the Javiera solar project in the Atacama Desert. This has been supplying Los Pelambres with some 20MW of power since June 2015.
For further information on Los Pelambres’ energy supply, please see page 42.
El Arrayán
Antofagasta has a 30% interest in Parque Eólico El Arrayán SpA, which operates the largest wind farm in Chile, about 400 km north of Santiago. The plant supplies 40MW of power to Los Pelambres, accounting for approximately 20% of its total power requirement, under a 20-year supply contract.
Inversiones Hornitos
The Group holds a 40% interest in Inversiones Hornitos S.A. (“Inversiones Hornitos”) through its transport division. Inversiones Hornitos operates a 165MW thermoelectric power plant in Mejillones, in Chile’s Antofagasta Region. Inversiones Hornitos supplies Centinela under long-term PPAs.
Alto Maipo
Los Pelambres holds a 40% interest in the 531MW Alto Maipo run-of-river hydroelectric project which is operated by the AES Gener group and is in the upper section of the Maipo river, approximately 50 km south-east of Santiago. Construction is underway and is expected to be completed in 2019. The Group is contributing its share of the expected $2.1 billion capital cost of which $1.2 billion is being funded by project financing. The Group has signed two 20-year PPAs that will secure the provision of energy to Los Pelambres for up to 160MW. The first PPA started in 2015 with power coming from a coal-fired station and the second will start on completion of the project in 2019.
Solar energy
Los Pelambres has long-term PPAs with two solar power providers for a total of 50MW of power, approximately 25% of its total energy requirement. The first of these PPAs came on stream in 2015 (see Energía Andina above) and the second should come on stream in the second half of 2016. These PPAs provide a secure renewable energy supply to Los Pelambres for a 20-year period at competitive prices.
Innovative sustainability
Further information on pages 53 to 63.
Antofagasta has a 30% interest in Parque Eólico El Arrayán SpA, which operates the largest wind farm in Chile.
Antofagasta plc 51
ST
RA
TE
GIC
RE
PO
RT
GO
VE
RN
AN
CE
FIN
AN
CIA
L STA
TE
ME
NT
SO
TH
ER
INF
OR
MA
TIO
NS
TR
AT
EG
IC R
EP
OR
TG
OV
ER
NA
NC
EF
INA
NC
IAL S
TAT
EM
EN
TS
OT
HE
R IN
FO
RM
AT
ION
OV
ER
VIE
W

The transport division provides rail and road cargo services in northern Chile. The main business during 2015 was the transport of copper cathodes, and increasingly concentrate and sulphuric acid, to and from mines in the Antofagasta Region.
The transport division typically provides services to customers, who are mostly major mining companies, under long-term contracts, often with agreed pricing levels. These are subject to adjustments for inflation and movements in fuel prices. The division offers domestic and international cargo transfer, shipment and storage services.
The transport division’s total volumes transported were lower in 2015, falling to 6.8 million tonnes, compared to 7.3 million tonnes in 2014. Shipments for the year were lower than had originally been expected due to the Sierra Gorda mine’s slower than planned ramp-up and the effects of the heavy rains in northern Chile during the first half of the year.
Revenue at the transport division was $152.4 million, a 5.3% decrease compared to $160.9 million in 2014, reflecting lower tonnage and a decrease in tariffs due to lower oil prices and the weaker Chilean peso (tariffs are set in pesos).
Operating profit fell to $42.0 million in 2015, mainly reflecting the decrease in tonnage and tariffs. Capital expenditure in 2015 was $32.0 million compared to $21.2 million in 2014.
During the year, the division adopted a new operating model based on sustainability, productivity and cost management. As commodity prices declined during the year, volumes being transported in northern Chile fell. The division introduced a new model to control costs and optimise the efficiency of its assets, particularly its rolling stock. During the year, the division also provided new services on a spot basis to the El Abra and Spence mines for the transport of sulphuric acid.
The division operates its own railway network, with access to neighbouring countries and to the two largest ports in the Antofagasta Region, Mejillones and Antofagasta. The Antofagasta port is managed by ATI, in which the Group holds a minority non-controlling interest.
The transport division also owns Forestal S.A., which manages the Group’s forestry assets. Forestal’s two properties, Releco-Puñir and Huilo-Huilo, comprise some 25,000 hectares of native forest near the Panguipulli and Neltume lakes, in Chile’s Region de Los Lagos. During 2015, Forestal continued its regular forestation, fertilisation and thinning programme.
Innovative sustainability
Sustainability is an important part of the ethos of the transport division, not only in terms of ensuring the safe transport of cargos and zero harm, but also from the perspective of minimising the impact of the division’s transport operations on the communities in which it operates.
The transport division provides rigorous safety and health training for all of its employees and contractors. The division has also established safety procedures and measures to prevent accidents and ensure public safety, such as installing traffic lights and clear signage at railway crossings, regular road maintenance and the regular clearance of rubbish from beside the railway lines.
Sustainability is one of the pillars of the division’s new operating model. This focus will not only benefit the environment and the communities in which the division operates, but will also enhance shareholder value as stronger relationships are developed with all stakeholders. During 2016, there will be increased interaction with the communities and increased transparency in what the division does. This greater level of engagement should lead to greater understanding between all stakeholders and provide benefits for all in the short, medium and long term.
Transported in 2015
6.8m tonnes
Operating profit $m (2014 – 51.0)
(17.7)%$42.0m
Combined rail and road tonnage ’000 tonnes (2014 – 7,302)
(6.8)%6,805
2016 Financials
2015 Tonnage transported
52 Antofagasta plc Annual report and financial statements 2015
Operational review Transport

Sustainability focus
The Group’s sustainability priorities are those issues of material risk to the business, its employees and contractors, to the environment in which it operates and to the Group’s national and international stakeholders. In 2015, the Group built upon the materiality assessment carried out in 2014 addressing high risk and high impact areas. Specifically, the Group focused on the following:
• implementing its new community engagement approach, strengthening its social licence to operate on the basis of regular dialogue and agreed contributions to the communities in which the Group operates;
• developing human capital – finding, developing and maintaining a high-quality and committed workforce to achieve the Group´s business strategy;
• auditing and assessing business operations to ensure safe work practices and strengthening leadership and operating procedures in higher risk areas;
• identifying opportunities to improve the efficient use of water, energy and other natural resources; and
• developing the first Group-wide response to climate change.
While there were significant highlights in 2015, regrettably the Group suffered the loss of a contractor at the Michilla mine. In addition, there were protests by the Salamanca community, close to Los Pelambres, concerning water shortages in the region.
Reporting on progress
This section of the Annual Report summarises the Group’s sustainability performance in 2015. The 2015 Sustainability Report is published separately and is available at www.antofagasta.co.uk.
The 2015 Sustainability Report is the Company’s ninth and has been prepared in accordance with the Global Reporting Initiative (“GRI”) G4 reporting standards and verified by PricewaterhouseCoopers. The Report also covers the mining division’s compliance with the ICMM’s ten sustainable development principles.
Los Pelambres and Centinela Cathodes are certified under the international standards ISO 14001, ISO 9001 and OHSAS 18001. Until its closure, Michilla was certified under ISO 9001 and OHSAS 18001 and had a management system in line with ISO 14001.
Sustainable development is an essential component of the Group’s decision-making process and business model.
To achieve this aim, the Group is committed to the continuous assessment and improvement of safety, health, environmental and social performance across all of its business operations.
The Group respects the rights of its employees and contractors, as well as those of everyone that comes into contact with the business.
Antofagasta plc 53
ST
RA
TE
GIC
RE
PO
RT
GO
VE
RN
AN
CE
FIN
AN
CIA
L STA
TE
ME
NT
SO
TH
ER
INF
OR
MA
TIO
NS
TR
AT
EG
IC R
EP
OR
TG
OV
ER
NA
NC
EF
INA
NC
IAL S
TAT
EM
EN
TS
OT
HE
R IN
FO
RM
AT
ION
OV
ER
VIE
W
Operational review Managing a sustainable business

The Board is supported by five committees including the Sustainability and Stakeholder Management Committee whose role is to oversee implementation of the Company’s safety, environmental and social policies and standards. This Committee met six times in 2015.
At the operational level, the transport division and each mining company has its own sustainability manager responsible for environmental, community, public affairs and communication issues.
Further information regarding the Sustainability and Stakeholder Management Committee is included on pages 93 and 94.
Upholding Ethical Standards and Values
The Group’s Code of Ethics and Crime Prevention Handbook set out the responsibilities of employees and contractors in relation to human rights, corruption and bribery, codes of conduct, complaints management and whistleblowing. The Code reflects the Group’s core values of:
• Respect
• Sustainability
• Excellence
• Safety and health
• Innovation
• Forward-thinking
Employees and contractors are trained in the Code and are encouraged to report any unethical conduct through established channels.
Respecting Human Rights
The Group respects the rights of its employees and contractors, as well as those of everyone that comes into contact with the business. This is reflected in the Group’s commitments to employees, contractors and local communities:
Employees and contractors• High safety and health standards
• Fair wages and good labour relations
• Prevention of discrimination, harassment and bullying
• Opportunities for training and development
• Provision of good-quality accommodation, services and facilities at the operations
Communities• Prevention of corruption and malpractices
• Prevention or mitigation of environmental and social impacts
• Respect for communities’ rights, culture and heritage
• Engagement in dialogue through the mining cycle from exploration to closure
• Listening and responding to grievances
• Support for community development
The Group is sensitive to the different cultures, ethnicity and diversity of the places in which we operate. None of the Group’s current operations or projects involve indigenous people, however, Antofagasta has had some very early-stage, short-term exploration activities which have required engagement with indigenous communities. The Group has been successful in maintaining a respectful and mutually beneficial relationship in accordance with ILO Convention 169 and ICMM recommendations.
Why it mattersAntofagasta is committed to high levels of corporate environmental and social governance, starting with leadership from the Board of Directors. The Board is responsible for ensuring that sustainability is embedded in all decisions throughout the mining cycle.
Antofagasta Minerals was accepted as a member of the International Council on Mining and Metals (“ICMM”) in May 2014. The ICMM was founded in 2001 to improve sustainable development in the mining and minerals industries. Member companies are required to improve their sustainability performance based on ten guiding principles and to report on their progress annually using the GRI G4 standard. In 2015, Antofagasta Minerals worked towards closing the gaps identified during its application to ICMM.
In June 2015, the Company was added as a constituent of the FTSE4Good Index. This index is made up of companies with strong Environmental, Social and Governance (“ESG”) practices as measured against 300 indicators, 14 themes and three pillars as assessed by FTSE International.
ICMM and FTSE4Good
Environmental and social governance
54 Antofagasta plc Annual report and financial statements 2015
Operational review Managing a sustainable business

Compliance
Environmental protection is highly regulated in Chile. Mining projects must undergo a stringent environmental impact assessment, including social and heritage aspects. If the project is approved by the National Agency for Environmental Assessment, its impact prevention, mitigation and compensation measures are included in the Environmental Approval Resolution (“RCA”). They become legally-binding and are subject to review by the Environmental Agency. Non-compliance with RCA commitments can result in fines and eventual revocation of the operational permit. In 2015, the Group submitted the EIA for the construction of the Centinela Second Concentrator project.
Optimising water resources
Water is a scarce and valuable commodity in the centre and north of Chile, particularly in the Choapa Valley near Los Pelambres, which is a key area for agricultural production. Water availability is increasingly affected by changes in the climate and the prolonged drought in central Chile is an ongoing concern.
The Group’s priority is to ensure that it has sufficient water to operate without compromising the quality or availability of water for the local community.
Antofagasta is always looking at ways to minimise the use of continental water resources through increased efficiency and the use of sea water as it does in its Michilla, Centinela and Antucoya operations.
The Group has achieved high water reuse rates of up to 72% at each operation. The remainder of the water either evaporates or remains in the tailings dam with no discharge to the environment. In 2015, the mining division consumed 45.2 million m3 of water and sea water accounted for 45.6% of it, up from 44.6 million m3 and 44% in 2014.
All of the Group’s mining operations have water management plans and water quality monitoring results are submitted to the Water Bureau and Health Service. Since 2012, the Choapa community has also been actively involved in water quality monitoring. In addition, Los Pelambres provides direct financial support to local farmers in the Choapa valley for water efficiency projects such as large-scale drip irrigation schemes and the lining of irrigation canals.
• Total water consumption
• % water supply from sea water
• Zero water discharged
• % water recirculated
Key Water Indicators
Why it mattersMining operations can have significant environmental impacts and concern for long-term environmental integrity, including climate change impacts, is high and of increasing public interest. Mining involves the alteration of habitats, the use of water and energy resources, the generation of noise and air emissions and of large quantities of waste-rock, spent ore and tailings. Legal permits, the social licence to operate and good community relations all depend on sound environmental stewardship.
Environmental protection
Antofagasta plc 55
ST
RA
TE
GIC
RE
PO
RT
GO
VE
RN
AN
CE
FIN
AN
CIA
L STA
TE
ME
NT
SO
TH
ER
INF
OR
MA
TIO
NS
TR
AT
EG
IC R
EP
OR
TG
OV
ER
NA
NC
EF
INA
NC
IAL S
TAT
EM
EN
TS
OT
HE
R IN
FO
RM
AT
ION
OV
ER
VIE
W

Managing waste
Large-scale mining operations generate waste rock, spent ore and tailings – the material left over after the process of separating the valuable portion of the ore from the uneconomic portion. Michilla, Antucoya and Centinela Cathodes, which use leaching to produce copper, have fully permitted spent ore dumps. Los Pelambres and Centinela Concentrates, which use flotation, deposit their waste in licensed tailings storage facilities.
Centinela is the first mine in the world to use thickened tailings technology on this scale. It provides many advantages including greater water efficiency and stability and better dust control.
Other solid (non-mining) wastes are segregated and stored prior to final disposal in compliance with Chilean regulations.
The Group has pioneered the use of thickened tailings deposits, which have a lower environmental impact.
Sustainable energy
In 2015, energy accounted for approximately 15% of the total operating costs of the mining division. Total energy demand is rising as production grows, transportation distances increase and ore grades decline as the Group’s operations get older. There is also greater use of sea water, which needs to be pumped to the mine sites.
Investment in new and clean energy sources has major commercial as well as environmental benefits.
To date, the Group has secured renewable energy from two principal sources:
• El Arrayán is the largest wind farm in Chile with an installed capacity of 115MW and is operated by Pattern Energy. El Arrayán provided approximately 20% of Los Pelambres’ energy in 2015 and operates under a long-term PPA; and
• Javiera solar (photovoltaic) farm in the Atacama Desert is operated by SunEdison. The farm has an installed capacity of 69.5MW covering a site of 180 hectares and supplies Los Pelambres with approximately 10% of its total energy requirement.
By the end of 2015, the Group´s biggest operation, Los Pelambres, was being supplied with 33% of its energy from renewable sources and this is expected to reach 80% by 2019.
With a core focus on resource efficiency, the Group seeks to further reduce energy consumption per unit of production and increase the percentage of total energy generated from renewable sources.
Los Pelambres has two tailings dams. Since 2008, its tailings have been deposited in the Mauro Dam, located in the Pupio Valley 13 km from Caimanes, the nearest community. With a capacity of 1.7 billion tonnes, it was designed to withstand extreme weather conditions and severe earthquakes. This was tested in September 2015, when a major earthquake of magnitude 8.3 on the Richter scale struck off the coast of Chile, some 100 km from El Mauro. The dam continued to operate as normal and there was no structural damage to the infrastructure. Immediately after the earthquake, Los Pelambres invited representatives from the local community to verify the structural integrity of the dam.
El Mauro tailings dam
HSE Indicators:
• Total energy demand MW • % energy supply from
renewable sources
56 Antofagasta plc Annual report and financial statements 2015
Operational review Managing a sustainable business

Mitigating climate change
Changes to the climate have a direct impact on the Group’s operations in relation to the availability of water, droughts and other extreme weather events. Chile is a country which is vulnerable to the effects of climate change, reflected in higher temperatures and reduced rainfall in the north and centre of the country. The Chilean government has recently committed to a 30% reduction in GHG emissions below 2007 levels by 2030, despite a global contribution of only 0.2%.
The Group’s approach is to limit contributions to climate change by controlling GHG emissions through improved energy efficiency and to source an increasing proportion of its energy needs from clean energy sources. The Group has reported its Scope 1 and 2 direct and indirect GHG emissions, as defined in the GHG Protocol, to the CDP since 2009. In 2015, it developed its first integrated climate change strategy, which was based on ICMM’s policy recommendations.
The main features of the standard are:
• identifying the risks and opportunities of climate change impacts on the Group’s operations;
• encouraging innovation to improve energy efficiency and the use of clean energy;
• mitigating GHG emissions; and
• measuring progress and reporting results, including CO2 emissions, in accordance with the Carbon Disclosure Project (“CDP”).
Growth in production will inevitably result in increased GHG emissions. However, the Company will seek to balance this through greater energy efficiency and increased energy supply from non-fossil fuel sources.
Antofagasta’s new climate change standard establishes a strategy to mitigate its carbon emissions, despite the Group’s increasing use of sea water. With 75% of its emissions associated with electricity consumption, the first priority was to diversify its energy sourcing and by the end of 2015, Los Pelambres was receiving 33% of its energy from clean sources. By 2019, this will increase to 80%.
The new standard guides the implementation of initiatives to mitigate CO2 emissions at current operations and future projects. To achieve this, the Group has identified the critical activities and designed projects to reduce emissions that are both technically and economically feasible according to the marginal abatement cost curve. This methodology allows for the comparison of the benefits of each project, measured in terms of potential reduction against cost savings per tonne of copper abated, which is particularly relevant in the current cost control environment.
In 2016, Antofagasta will start executing specific projects to increase energy efficiency in its operations which allow it to set goals for GHG reduction.
Climate change – Decoupling growth from CO2 emissions
CO2 emissions by location 2015 (tonnes of CO2 equivalent)
Scope 1 Direct emissions
Scope 2 Indirect emissions
Total emissions1
CO2 emissions intensity2
2015 2014 2015 2014 2015 2014 2015 2014
Mining divisionLos Pelambres 168,892 173,943 425,064 454,885 967,876 628,828 1.64 1.61Centinela Concentrates 233,384 225,013 734,493 713,253 967,876 938,266 6.67 5.43Centinela Cathodes 152,372 145,533 173,664 212,098 326,036 357,631 4.29 3.81Michilla 23,351 49,218 78,497 124,991 101,848 174,209 3.47 3.71Corporate Offices 120 208 1,042 770 1,161 978 – –Total for mining division 578,118 593,915 1,412,760 1,505,997 1,990,878 2,099,912 3.24 2.98Transport division 76,028 96,321 2,228 2,043 78,256 98,364 10.923 13.473
Total Antofagasta 654,146 693,180 1,414,988 1,533,904 2,069,134 2,227,084 609.544 420.974
1 Scope 1 + Scope 2. 2 Total CO2 emissions per tonne of fine copper produced (scopes 1 and 2). 3 Tonnes CO2 e/kiloton transported. 4 Antofagasta’s Intensity figure against revenue.
Antofagasta plc 57
ST
RA
TE
GIC
RE
PO
RT
GO
VE
RN
AN
CE
FIN
AN
CIA
L STA
TE
ME
NT
SO
TH
ER
INF
OR
MA
TIO
NS
TR
AT
EG
IC R
EP
OR
TG
OV
ER
NA
NC
EF
INA
NC
IAL S
TAT
EM
EN
TS
OT
HE
R IN
FO
RM
AT
ION
OV
ER
VIE
W

Protecting biodiversity
The Group’s targets are zero net loss of biodiversity and to add value to biodiversity wherever possible through direct support for conservation projects and effective private-public partnerships.
The greatest biodiversity challenges for the Group are at Los Pelambres which is located in an agricultural valley.
The Company has voluntarily restored the Laguna Conchali coastal wetlands, near its port facilities, to create a nature sanctuary that has been classified as a Wetland of International Importance under the Ramsar Convention. The Group has also put in place a programme to protect one of the few remaining Chilean palm forests at Monte Aranda and since 2014 has also been protecting Santa Inés, one of the rare relic forests in the region.
Los Pelambres and Centinela monitor their impact on the marine ecosystems at their port facilities in Los Vilos and Caleta Michilla to prevent impacts on the marine environment.
In 2015, the Group worked with the Wildlife Conservation Society to develop a biodiversity standard, aligned with ICMM’s principles, to achieve no net loss of biodiversity across the business through the application of the mitigation hierarchy.
Cultural heritage
The Group participates in various initiatives to protect and increase public knowledge about local heritage. In 2014, Los Pelambres opened an exhibition hall at Monte Aranda in the Choapa Province focusing on rural life and local customs. Some residents of Caimanes now work there as hosts. In 2016, the Group will open a 25-hectare rock art park, also at Monte Aranda, which will exhibit over 240 petroglyphs recovered from the area where the Mauro Dam was built.
In the Antofagasta Region, the Group is involved in conservation and the enhancement of cultural heritage, supporting local organisations such as the ProLoa and Fundación Chacabuco, which are dedicated to the preservation of regional heritage. It has sponsored a number of books on the archaeological heritage of the Antofagasta and Choapa regions.
Managing mine closure
Chilean legislation requires that mining operations have comprehensive closure plans approved by the national geology and mining agency SERNAGEOMIN, which defines measures to control risks and demonstrate appropriate funding to
implement the closure plans. These plans must be updated every five years and were last updated at Michilla, Los Pelambres and Centinela in 2014.
In November 2014, the Group announced the closure of the Michilla mine, which was acquired by the Company in 1980. The announcement was made 14 months in advance of closure and a comprehensive social closure plan was implemented, which included trying to transfer as many employees as possible from Michilla to other Group operations. For the remainder, generous severance terms, beyond those required by law, were agreed with the mine’s unions. This approach helped to minimise uncertainty and provided enough time for employees to plan ahead.
During the year, the Group began developing corporate closure standards that move beyond those required under Chilean law, and following ICMM best practice that provides guidance for environmental and social issues.
Air quality control
In addition to naturally occurring dust, mining operations generate particulate emissions from loading and hauling activities. Dust can affect health, particularly through the smaller, ingestible component and is of particular concern at Los Pelambres where the communities are closer to the mine than at some of the Group’s other operations. At Centinela, dust is also an issue as there are several other active mining operations around the town of Sierra Gorda.
Dust levels are monitored across all sites and at nearby communities to ensure compliance with Chilean government standards. The Group uses a preventative approach to manage air quality and limits dust emissions through operational controls like road wetting and covering of conveyors and stockpiles including crushed materials. Key innovations to limit dust include:
• introduction of a preventive warning system at Los Pelambres and Centinela based on mining operations and weather conditions – in conditions of strong winds, certain operational activities such as blasting may be rescheduled;
• introduction of a system of mist cannons at Los Pelambres; and
• working in conjunction with other mine operators, the local authorities and the regional environment agency to diagnose and plan a solution to control the dust in Sierra Gorda.
Antofagasta has no significant gaseous emissions other than GHGs, which are addressed under climate change.
Michilla is located in a remote coastal area of the Atacama Desert, close to Caleta Michilla, which has some 800 inhabitants. Following the completion of mining activities in 2015, the mine and processing plant were put on care and maintenance. The water extraction facilities at Caleta Michilla will continue to be used by Antucoya and Centinela.
Antofagasta created a dedicated committee to co-ordinate the actions associated with the closure, comprising representatives from the Human Resources, Environment, Safety, Risk and Public Affairs departments. The committee focused on the timely announcement of the closure (14 months in advance), a recruitment and re-employment plan for employees (around 25% of employees have been placed in positions in other parts of the mining division), and the management of the long-term and legacy environmental impacts.
Social closure of the Michilla mine
HSE Indicators:
• CO2 direct and indirect emissions • CO2 intensity per tonne of
copper produced
58 Antofagasta plc Annual report and financial statements 2015
Operational review Managing a sustainable business

In September, Los Pelambres began a consultation process with the Caimanes community to discuss their concerns regarding the Mauro Dam, including the flow of a local stream and other topics of common interest. The community and the Company discussed the implementation of initiatives to improve the community’s access to water, introduce additional safety measures at the dam, improve the emergency communications plan and to set-up a development fund for the benefit of the community and local residents. Considerable progress has been made and agreement on a lasting solution to this long-standing issue is expected in 2016.
Supporting regional development
The Group’s mining division has designed and implemented a social investment programme which aims to bring sustainable business and development opportunities to the communities in which the Group operates.
Over the years these have included the:
• development of sustainable agriculture schemes, including investment in a large-scale drip irrigation project and technical support to small farmers;
• support to artisanal fishermen at Los Vilos;
• investment in infrastructure projects to improve public areas in local communities such as in the town squares, sport facilities and schools;
• support for a number of education programmes and award of scholarships to top candidates at local schools to allow them to attend university or receive technical training;
• provision of vocational training opportunities;
Approach to community engagement
Each mining operation has a sustainability manager with overall responsibility for community relations including the implementation of the social investment and stakeholder engagement programmes. Engagement is through both formal and informal channels including holding regular open meetings, joint community-company task groups (for monitoring and discussing specific local development issues), use of social media and regular visits for members of the community to the mine sites.
In 2013, Los Pelambres developed a new model for community relations called “Somos Choapa” (We Are Choapa) which represented a major increase in the dialogue and involvement of the community with the Company. The Group’s operations in the Antofagasta Region also participate in local development alliances such as CREO Antofagasta.
Conflict management
Upset because of a long drought, in February 2015 some neighbours from Salamanca blocked the road leading to Los Pelambres demanding that the Company build a desalination plant and stop using water from the Choapa river. However, using the new engagement model, the crisis was managed by bringing together local government, members of congress and water consumer organisations, as well as the protesters and representatives from Los Pelambres. An agreement was reached after about ten days of negotiation that included undertakings by both public and private parties to address the core issue of finding short and long-term solutions to water shortages in the area.
More information in the 2015 Sustainability Report.
Why it mattersManaging the operations sustainably requires preventing and mitigating their impact throughout the mining cycle from exploration to closure, fulfilling their commitments and becoming a more visible and effective contributor to local development. Over the last couple of years, Antofagasta has been innovative in its community engagement approach to strengthen its social licence by becoming more active in regional long-term development, based on a long-term vision developed together with local stakeholders and close collaboration with the municipalities and the government.
Los Pelambres began a consultation process with the Caimanes community to discuss the implementation of initiatives concerning the Mauro dam. Considerable progress has been made.
Community relations
Antofagasta plc 59
ST
RA
TE
GIC
RE
PO
RT
GO
VE
RN
AN
CE
FIN
AN
CIA
L STA
TE
ME
NT
SO
TH
ER
INF
OR
MA
TIO
NS
TR
AT
EG
IC R
EP
OR
TG
OV
ER
NA
NC
EF
INA
NC
IAL S
TAT
EM
EN
TS
OT
HE
R IN
FO
RM
AT
ION
OV
ER
VIE
W

The Group’s new engagement model aims to strengthen its social licence to operate and grow. It is based on a methodology to sustain ongoing dialogue between the Company, local communities, authorities and other local stakeholders to enhance the Group’s contribution to local development and social capital. The model s key characteristics are:
1. Engaging with the communities, the local authority and other local stakeholders to:
• identify local challenges and opportunities (whether related to mining or not);
• build a shared vision for the region s development; and
• design a portfolio of projects and programmes to fulfil this vision.
2. Taking an integrated and long-term approach to the challenges faced by the Choapa province’s four municipalities, through the design and execution of a portfolio of projects instead of isolated contributions.
3. Working through alliances with national, regional and local government, using both private and public funding to implement the agreed projects.
4. Explicit commitment to transparency and accountability of decisions, management and results. Chile Transparente – the Chilean arm of Transparency International – has accepted the Group’s invitation to oversee Somos Choapa.
Somos Choapa has been accepted with growing enthusiasm by local stakeholders. By the end of 2015, some 49 discussion forums had been held in the province with the participation of 3,600 neighbours. From this process 18 strategies emerged, involving 57 specific initiatives. A dozen were already in their tendering stage by the end of the year.
Somos Choapa constitutes an integrated platform for the sustainable development of the Choapa province and a common charter for both public and private investment in the short, medium and long term.
• investment in healthcare facilities including completion of the first Primary Health Care facility at Alto Choapa (investment of $2.0 million);
• provision of clean drinking water through co-financing ($3 million) water towers and wastewater facilities for the towns of Sierra Gorda and Baquedano;
• provision of running drinking water for Caleta Michilla through co-financing a desalination plant run by the Mejillones municipality; and
• contribution of funds to a coastal bicycle path as part of the CREO Antofagasta master plan.
Responding to community complaints
Unethical behaviour can be reported through the Company’s website, via the internet or on the telephone. All complaints will be investigated and can be made anonymously if the complainant prefers. The Ethics Committee is responsible for investigating these complaints in a timely manner and their work is supervised by the Audit and Risk Committee of the Board.
The Group also has a grievance system at all of its operations for members of local communities to express their concerns to the Company. This system allows for consultation and feedback, with grievances from local communities generally handled by the operation’s community engagement team.
By providing these different means for complaints to be made about the Company and for them to be handled efficiently, the Board intends that any contentious issues can be raised early and resolved before they develop into potentially serious areas of contention.
Somos Choapa (We Are Choapa) – Our new approach to community engagement
60 Antofagasta plc Annual report and financial statements 2015
Operational review Managing a sustainable business

Supporting the businessIn 2013, the Group designed a corporate human resources strategy for all its companies. New programmes and tools were introduced in 2014 and consolidated in 2015, in line with the corporate Costs and Competitiveness Programme.
More information on Key inputs and cost base on pages 19 to 21.
The aim of Antofagasta’s Human Resources strategy is to develop and ensure it has the organisational capabilities to sustain its business strategy over the short, medium and long term. The strategic objectives are:
• developing a Group organisational model through the capture of best practices, promoting synergy and supporting competitiveness;
• strengthening Group culture through promoting shared values, principles and ethics while enhancing the leadership model;
• Talent Management including development programmes and tools, performance management and succession planning for key positions; and
• enhance employees engagement to the organisation.
Labour relations
Antofagasta is one of the largest mining operators in Chile. In 2015, the Group had a total workforce of approximately 19,200 of which some 27% were employees and the balance were contractors. The workforce declined compared with 26,151 in 2014 due to the completion of the construction of Antucoya and the departure of the contractors working there.
Why it mattersRetaining, developing and engaging employees is key to operating a successful business.
The Group ensures its own and its contractors’ compliance with all Chilean laws and regulations, and with the Group’s values and Code of Ethics, including the fundamental respect for human rights. Labour agreements which cover salaries, working hours, compensation and employment benefits, are negotiated with the unions at all of the Group’s operations. These agreements were last negotiated in the mining division in 2013 and 2014 and cover a period of up to four years. There are ten unions in total, three at Los Pelambres, three at Centinela, two at Zaldívar and one at each of Michilla and Antucoya. The Group recognises employees’ rights to union membership and collective bargaining, and promotes equal opportunities in the workforce.
Group employees receive a fair salary, commensurate with industry benchmarks. Training opportunities are available for all employees and job opportunities are advertised internally to promote internal mobility. The Group strives to offer a safe work environment, good quality accommodation, medical and other support. The maximum number of working hours is prescribed under Chilean law, which also forbids child and forced labour.
In 2015, women represented 10% of the mining division’s workforce and 8% of them are supervisors or above. There is one woman on the Executive Committee and one on the Board.
Contractors and suppliers
Contractors form some 72% of the mining division’s workforce and therefore the management of contractors and maintaining their high standards of performance is key to the Group’s success and reputation.
The Group’s Executive Committee, led by the CEO, made seven visits to the operations in 2015, to verify the critical controls for the key risks were being implemented effectively.
Employees
Antofagasta plc 61
ST
RA
TE
GIC
RE
PO
RT
GO
VE
RN
AN
CE
FIN
AN
CIA
L STA
TE
ME
NT
SO
TH
ER
INF
OR
MA
TIO
NS
TR
AT
EG
IC R
EP
OR
TG
OV
ER
NA
NC
EF
INA
NC
IAL S
TAT
EM
EN
TS
OT
HE
R IN
FO
RM
AT
ION
OV
ER
VIE
W

Training for employees enables the Group to keep improving the skills of the workforce in line with the current and future needs of the business. Providing personal development opportunities helps to motivate employees and keep them with the Company for the long term. The Company has a talent management programme to develop personnel within the Company, and a succession plan for key positions. Since 2010, the Group has a specific initiative to recruit young professionals.
Talent management and development
The Group audits its main contractors on a regular basis to ensure compliance with Chilean labour legislation and the Group’s labour and safety standards including monthly audits to ensure that all wages and associated social contributions are paid by the contractors’ employers, before the next invoice is paid. In addition, contractors’ employers are required to pay their employees a minimum salary that is approximately 70% above the lowest legal wage in Chile.
Contractors receive training on the Group’s safety and other standards and are required to uphold the same high level of safety practices as the Group’s own employees. Additionally, a new Group-wide procedure has been implemented on particular safety prevention techniques and actions to be executed by each relevant contractor under the supervision of the contractor’s employer.
Safety: risk-based preventative approach
In 2013, the Group adopted a new safety model in line with international best practices and ICMM recommendations. The pillars of this model are:
• identifying and understanding key fatality or serious injury risks;
• implementing critical controls;
• reporting and investigating near misses; and
• increasing on the ground senior leadership.
Analysis of the key risk areas identified that, between 2006 and 2015, 11 types of risk were responsible for all of the fatalities and 95% of the high-potential near misses. The Group concentrated on these risk areas increasing leadership and awareness, assigning responsibility for risks and auditing safety procedures.
In 2016, the focus will be to monitor and audit the safety performance and to extend all procedures to contractors to strengthen the performance of contractor companies.
The Group’s Executive Committee, led by the CEO, made seven visits to the operations in 2015, to verify the critical controls for the key risks were being implemented effectively.
Among other initiatives, on-site supervision of key safety risks, near-miss reporting, distribution of newsletters about the causes of severe accidents, extended site management meetings that focus on safety, and public recognition for employees that demonstrate the best safety conduct help raise safety awareness. The Group also trains and supervises employees and oversees safety standards and practices for all contractors.
During 2015, 3,904 people were trained in key aspects of the safety and health model such as incident reporting, investigation of high-potential near-misses and Antofagasta´s new safety and health guidance for contractors.
All employees complete a safety and health induction course before starting work. There are regular refresher workshops on safety policies and procedures, to discuss lessons learned from near-miss incidents and share examples of best practice.
Safety performance is reported weekly to the Executive Committee and monthly to the Board. Fatal and serious accidents are reviewed in detail by the Board’s Sustainability and Stakeholder Management Committee. Operational safety reviews are conducted by the Executive Committee across all operations.
Total number of employees in 2015
5,300Total number of contractors
13,900
HSE Indicators:
62 Antofagasta plc Annual report and financial statements 2015
Operational review Managing a sustainable business

Safety performance
While over the years the Group has steadily reduced the severity and frequency of accidents, fatalities have not been eliminated. In 2015, one contractor died at the Michilla operation. Fatalities are not acceptable and this incident has further heightened the Group’s awareness of its safety responsibilities. Important lessons have been learned and new measures are being implemented to strengthen the operational control of our contractors and to accelerate their adoption of the new safety and health model.
The Group’s objective is to achieve zero fatalities for employees and contractors in each and every year. All contractors are required to comply with the new safety and health procedures and, going forwards, this will be further strengthened through technical support audits and monitoring. Compliance with the safety and health model is audited twice a year at each of the Group’s operations and exploration projects. The results of these audits are reported to the Group CEO and the General Manager of each mining operation.
Health
The Group analysed the cause of health risks across the business and identified the six main risks as: exposure to airborne dust and particulates (including silica); exposure to acid mist; ionising radiation; solar radiation; exposure to elevated noise; and working at height. To prevent each of these risks, new critical controls were introduced in 2015 and these will be verified in the field during 2016 so as to reduce the risks to all members of the workforce.
A complete medical check-up to establish fitness to work is mandatory for new employees. Every year all employees have access to a preventive age-adapted medical check-up paid for by the Company and done in the best available clinics and in Company time.
Health service provision at each operation includes a fully operational medical centre providing full first aid emergency arrangements and paramedic support.
Lost Time Injury Frequency Rate (“LTIFR”) All Injury Frequency Rate (“AIFR”) Number of fatalities
2011 2012 2013 2014 2015 2011 2012 2013 2014 2015 2011 2012 2013 2014 2015
Chilean mining industry1 3.1 2.9 2.6 2.5 2.0 N/A N/A N/A N/A N/A 26 25 25 27 16Mining Division 2.1 1.3 1.1 1.1 1.1 9.1 5.4 3.9 5.0 6.9 – 1 2 5 1Transport Division 9.6 13.0 10.3 10.3 10.9 28.3 28.6 17.7 22.2 17.8 1 – – – –Group 3.0 2.5 1.9 1.7 2.0 11.4 7.8 5.1 6.1 7.8 1 1 2 5 1
The Group’s objective is to achieve zero fatalities for employees and contractors in each and every year.
1 Source: National Mining and Geology Service (Servicio Nacional de Geología y Minería, Sernageomin). N/A: Not available.
LTIFR: Number of accidents with lost time during the period per million hours worked.
AIFR: Number of accidents with and without lost time during the period per million hours worked.
Antofagasta plc 63
ST
RA
TE
GIC
RE
PO
RT
GO
VE
RN
AN
CE
FIN
AN
CIA
L STA
TE
ME
NT
SO
TH
ER
INF
OR
MA
TIO
NS
TR
AT
EG
IC R
EP
OR
TG
OV
ER
NA
NC
EF
INA
NC
IAL S
TAT
EM
EN
TS
OT
HE
R IN
FO
RM
AT
ION
OV
ER
VIE
W

ResultsYear ended 31.12.2015
$m
Year ended 31.12.2014
$mMovement
$m Movement
%
Revenue 3,394.6 5,145.6 (1,751.0) (34.0)EBITDA 890.7 2,141.4 (1,250.7) (58.4)Depreciation, amortisation and disposals (586.3) (557.8) (28.5) 5.1Net finance expense (39.2) (63.9) 24.7 (38.7)Profit before tax 259.4 1,515.6 (1,256.6) (82.9)Income tax expense (160.4) (702.3) (541.9) (77.2)Discontinued operations 602.7 37.4 565.3 1,511.5Profit for the year from continuing and discontinued operations 701.7 850.7 (149.0) (17.5)Earnings per share from continuing operations 0.6 42.8 (42.2) (98.6)Earnings per share from continuing and discontinued operations (US cents) 61.7 46.6 15.1 32.4Net debt (1,023.5) (1.6) (1,021.9) 63,868.8
As a result of the disposal of Aguas de Antofagasta S.A. (“ADASA”) and Empresa Ferroviaria Andina S.A. (“FCA”), their results have been classified as discontinued operations and excluded from the individual income statement lines, with the 2014 figures restated on a consistent basis.
A detailed segmental analysis of the components of the income statement is contained in Note 4 to the financial statements.
The following table reconciles between the 2014 and 2015 EBITDA:
$m
EBITDA in 2014 2,141.4Revenue Decrease in copper realised price (1,108.4)Decrease in copper volumes sold (411.8)Increase in tolling charges (35.1)Decrease in revenue from copper concentrate and cathodes (1,555.3)Decrease in gold revenues (84.7)Decrease in silver revenues (25.0)Decrease in molybdenum revenues (77.5)Decrease in revenue from by-products (187.2)Decrease in transport division revenue (8.5)Decrease in Group revenue (1,751.0)Operating costsDecrease in mining costs (432.8)Increase in charge for closure provisions 33.0Decrease in exploration and evaluation costs (65.6)Decrease in other mining division costs and corporate costs (31.6)Decrease in operating costs for mining division (497.0)Decrease in transport division operating costs (3.3)Decrease in Group operating costs (500.3)Decrease in EBITDA (1,250.7)EBITDA in 2015 890.7
64 Antofagasta plc Annual report and financial statements 2015
Financial reviewFor the year ended 31 December 2015
RevenueGroup revenue in 2015 was $3,394.6 million, 34.0% below the $5,145.6 million achieved in 2014. The decrease of $1,751.0 million mainly reflected a decrease in the realised copper price as well as lower copper sales volumes and by-product revenues.
Revenue from the mining division
Revenue from copper concentrate and copper cathodesRevenue from copper concentrate and copper cathode sales decreased by $1,555.2 million, or 36.1%, to $2,834.5 million, compared with $4,389.7 million in 2014. The decrease reflected the impact of lower realised prices, lower volumes and increased tolling charges.
(i) Realised copper pricesThe Group’s average realised copper price decreased by 24.0% to $2.28/lb in 2015 (2014 – $3.00/lb). The level of decrease was higher than the reduction in the average LME copper price, which decreased by 19.8% to $2.50/lb from $3.11 in 2014, due to a higher level of negative provisional pricing adjustments in the current year compared with the prior year. The decrease in average realised prices led to a $1,108.4 million reduction in revenue from copper concentrate and cathode sales.
Realised copper prices are determined by comparing revenue (gross of tolling charges for concentrate sales) with sales volumes in the year. Realised copper prices differ from market prices mainly because, in line with industry practice, concentrate and cathode sales agreements generally provide for provisional pricing at the time of shipment with final pricing based on the average market price for future years (normally about 30 days after delivery to the customer in the case of cathode sales and up to 150 days after delivery to the customer in the case of concentrate sales). Realised copper prices also reflect the impact of realised gain or losses of commodity derivative instruments hedge accounted for in accordance with IAS 39 “Financial Instruments: Recognition and Measurements”.
Provisional pricing adjustments decreased initially invoiced sales (before adjusting for tolling charges) by $295.6 million in 2015, compared with a decrease of $201.7 million in 2014. The negative adjustments in the current year mainly reflected the decrease in the copper price in 2015 and to a lesser extent a negative year end mark to market adjustment. Further details of provisional pricing adjustments are given in Note 5 to the financial statements.
(ii) Copper sales volumesCopper sales volumes decreased by 11.6% from 703,000 tonnes in 2014 to 621,200 tonnes in this year, reflecting lower production at Los Pelambres and Centinela. The decrease in sales volumes accounted for a decrease of $411.8 million in revenue from copper concentrate and cathode sales.
(iii) Tolling chargesTolling charges for copper concentrate increased by $35.1 million to $294.0 million in 2015 from $258.9 million in 2014. This reflected increased tolling charges at Los Pelambres and Centinela Concentrates, mainly due to an increase in average tolling charges during the year.
Tolling charges are deducted from concentrate sales in reporting revenue and hence the increase in these charges has had a negative impact on revenue.
Revenue from molybdenum, gold and other by-products
Revenue from by-products at Los Pelambres and Centinela relate mainly to molybdenum and gold, and a lesser extent silver. Revenue from by-products decreased by $187.3 million or 31.5% to $407.7 million in 2015, compared with $595.0 million in 2014.
Revenue from gold in concentrate (net of tolling charges) was $252.1 million (2014 – $336.8 million), a decrease of $84.7 million, which mainly reflected a decrease in volumes, as well as a lower realised gold price. Gold sales volumes decreased from 267,400 ounces in 2014 to 219,200 ounces in 2015, mainly due to the lower gold grades at Centinela in the second half of the year. The realised gold price was $1,155/oz in 2015 compared with $1,262/oz in 2014, with the decrease largely reflecting the general reduction in average market prices.
Revenue from molybdenum (net of roasting charges) was $105.3 million (2014 – $182.8 million), a decrease of $77.5 million. The decrease was mainly due to a lower realised price of $5.7 per pound (2014 – $11.0 per pound) partly offset by increased sales volumes of 9,900 tonnes (2014 – 8,200 tonnes).
Revenue from silver in concentrate decreased by $25.0 million to $50.4 million in 2015 (2014 – $75.4 million). The decrease was due to a decrease in the realised silver price from $18.7/oz in 2014 to $15.5/oz in 2015, as well as decreased sales volumes of 3.3 million ounces (2014 – 4.1 million ounces).
Revenue from the transport division
Revenue from the transport division (“FCAB”) decreased by $8.5 million or 5.3% to $152.4 million. This mainly reflected a decrease in tonnages transported and the impact of the weaker Chilean peso.
Operating costs (excluding depreciation, amortisation and disposals)
Operating costs (excluding depreciation, amortisation and disposals) amounted to $2,503.9 million (2014 – $3,004.2 million), a decrease of $500.3 million. This was mainly due to lower mining operating costs, exploration and evaluation costs and other mining costs, partly off-set by a higher charge in respect of closure provisions.
Operating costs (excluding depreciation, amortisation and disposals) at the mining division
Operating costs at the mining division decreased by $497.0 million to $2,409.9 million in 2015, a decrease of 17.1%.
Excluding by-product credits (which are reported as part of revenue) and tolling charges for concentrates (which are deducted from revenue), weighted average cash costs for the Group (comprising on-site and shipping costs in the case of Los Pelambres and Centinela and cash costs in the case of Centinela and Michilla) decreased by $0.07/lb to $1.58/lb.
Exploration and evaluation costs decreased by $65.6 million to $101.9 million (2014 – $167.5 million). This mainly reflected decreases in expenditure relating to exploration and studies in the Centinela district and international exploration.
The income statement had a charge relating to mine closure provisions of $25.8 million (2014 – credit of $7.2 million), mainly reflecting an increased charge at Los Pelambres.
Operating costs (excluding depreciation, amortisation and disposals) at the transport division decreased by $3.3 million to $94.0 million, mainly reflecting the weaker Chilean peso.
Antofagasta plc 65
ST
RA
TE
GIC
RE
PO
RT
GO
VE
RN
AN
CE
FIN
AN
CIA
L STA
TE
ME
NT
SO
TH
ER
INF
OR
MA
TIO
NS
TR
AT
EG
IC R
EP
OR
TG
OV
ER
NA
NC
EF
INA
NC
IAL S
TAT
EM
EN
TS
OT
HE
R IN
FO
RM
AT
ION
OV
ER
VIE
W

EBITDA and operating profit from subsidiaries and joint ventures
EBITDAEBITDA (earnings before interest, tax, depreciation, and amortisation) from subsidiaries and joint ventures decreased by $1,250.7 million or 58.4% to $890.7 million in 2015 (2014 – $2,141.4 million).
EBITDA at the mining division decreased by 59.9% from $2,077.8 million in 2014 to $832.3 million in 2015. As explained above, this was mainly due to the decrease in revenue as a result of the lower realised copper price and copper sales volumes, partly offset by lower operating costs.
EBITDA at the transport division decreased by $5.2 million to $58.4 million in 2015, reflecting the decreased revenue as explained above.
Depreciation, amortisation and disposalsThe depreciation, amortisation and disposals charge was higher at $586.3 million (2014 – $557.8 million). Increased depreciation at Centinela and Los Pelambres was partly offset by a decrease at Michilla.
Operating profit from subsidiariesAs a result of the above factors, operating profit from subsidiaries decreased by 80.8% to $304.4 million.
Share of results from associates and joint ventures
The Group’s share of results from its associates and joint ventures was a loss of $5.8 million (2014 – loss of $4.1 million). This mainly reflects losses at the Zaldívar joint venture partly offset by higher profits at the Inversiones Hornitos associate.
Net finance expense
Net finance expense in 2015 was $39.2 million, compared with a net finance expense of $63.9 million in 2014.
Year ended 31.12.15
$m
Year ended 31.12.14
$m
Investment income 18.1 16.8Interest expense (33.7) (44.4)Other finance items (23.6) (36.3)Net finance expense (39.2) (63.9)
Interest income increased from $16.8 million in 2014 to $18.1 million in 2015, mainly reflecting additional interest income in respect of a loan from Los Pelambres to the Alto Maipo associate.
Interest expense decreased from $44.4 million in 2014 to $33.7 million in 2015, mainly due to a decrease of interest payable at Centinela reflecting one-off costs incurred in 2014 as a consequence of a refinancing in that year.
Other finance items comprised a loss of $23.6 million (2014 – loss of $36.3 million). A gain of $0.1 million (2014 – loss of $5.1 million) has been recognised in respect of the time value element of changes in the fair value of commodity derivative options, which is excluded from the designated hedging relationship, and is therefore recognised directly in profit or loss. Foreign exchange losses included in finance items were $13.6 million in 2015, compared with a gain of $4.0 million in 2014. An expense of $9.1 million (2014 – $8.9 million) has been recognised in relation to the unwinding of the discount on provisions. An impairment charge of $26.3 million was recognised in 2014 in respect of Duluth Metals shares, with fair value losses previously recorded within the Consolidated Statement of Comprehensive Income being transferred to the income statement and recognised within this impairment loss, further details are given in Note 8 to the financial statements.
Profit before tax
As a result of the factors set out above, profit before tax decreased by $1,256.2 million or 82.9% to $259.4 million in 2015 compared with $1,515.6 million in 2014.
Income tax expense
The tax charge in 2015 was $160.4 million (2014 – $702.3 million) and the effective tax rate was 61.8% (2014 – 46.3%).
Year ended 31.12.2015
$m
Effective tax rate
%
Year ended 31.12.2014
$m
Effective tax rate
%
Profit before tax 259.4 1,515.6Taxes (current and deferred)Corporate tax (110.6) 42.6 (350.9) 21.8Adjustment to deferred tax attributable to changes in tax rates – – (215.1) 14.2Mining tax (34.0) 13.1 (79.1) 5.2Withholding tax (14.8) 5.7 (56.8) 3.7Exchange rate (1.0) 0.4 (0.4) –Total tax charge (160.4) 61.8 (702.3) 46.3
The tax charge for 2015 was $160.4 million and the effective tax rate was 61.8%. The statutory rate of Chilean corporate (first category) tax in 2015 was 22.5% (2014 – 20%). In 2015, the effective tax rate varied from the statutory rate principally due to tax losses which under Chilean tax carry-back rules generated a credit at historic tax rates below the current year statutory rate, as well as the effect of expenses not deductible for Chilean corporate tax purposes (principally the funding of expenses outside of Chile) and the effects of the mining tax which resulted in a charge of $34.0 million and a withholding tax charge of $14.8 million. In 2014, the effective tax rate varied from the standard rate (comprising corporate (first category) tax) principally due to the one-off deferred tax charge of $215.1 million reflecting the increase in tax rates as a result of the Chilean tax reform enacted in that year. Further details are given in Note 9 to the financial statements.
66 Antofagasta plc Annual report and financial statements 2015
Financial review

Discontinued operations
During the year the Group completed the disposal of its water division, Aguas de Antofagasta S.A. (“ADASA”) as well as part of its transport division. The results of these operations for the year prior to disposal as well as the profit on disposal have been presented on the “Profit for the year from discontinued operations” line in the income statement.
The profit for the year from discontinued operations was $602.7 million, compared with $37.4 million in 2014, reflecting a net profit on disposal of $595.2 million (2014 – nil) and a net profit from operations prior to disposal of $7.5 million (2014 – $37.4 million). Further details are given in Note 10 to the financial statements.
Non-controlling interests
Profit for the year attributable to non-controlling interests was $93.5 million, compared with $390.9 million in 2014, reflecting the lower profit attributable to the non-controlling interests as a consequence of the decrease in the earnings of the mining operations analysed above.
Earnings per shareYear ended
31.12.15 US cents
Year ended 31.12.14
US cents
Earnings per share from continuing operations 0.6 42.8Earnings per share from continuing and discontinued operations 61.7 46.6
Earnings per share calculations are based on 985,856,695 ordinary shares. As a result of the factors set out above, profit in 2015 attributable to equity shareholders of the Company was $608.2 million compared with $459.8 million in 2014. Accordingly, earnings per share were 61.7 cents in 2015 compared with 46.6 cents in 2014, an increase of 32.3%.
Dividends
Dividends per share proposed in relation to the year are as follows:
Year ended 31.12.15
US cents
Year ended 31.12.14
US cents
OrdinaryInterim 3.1 11.7Final – 9.8Total dividends to ordinary shareholders 3.1 21.5
The Board determines the appropriate dividend each year based on consideration of the Group’s cash balance, the level of free cash flow and earnings generated during the year and significant known or expected funding commitments. It is expected that the total annual dividend for each year would represent a payout ratio based on net earnings for that year of at least 35%.
The total dividend for the year is 3.1 cents per share, or $30.6 million, which was paid as the interim dividend, and exceeds the Group’s 35% minimum payout ratio dividend policy for the year. Therefore, no final dividend has been recommended by the Board.
Capital expenditure
Capital expenditure (including discontinued operations) decreased by $568.4 million from $1,581.0 million in 2014 to $1,012.6 million in 2015. This was mainly due to lower construction expenditure at the Antucoya project, where construction substantially completed during 2015. NB: capital expenditure figures quoted in other sections of this report are on a cash flow basis, unless stated otherwise.
Derivative financial instruments
The Group periodically uses derivative financial instruments to reduce exposure to commodity price movements. At 31 December 2015, the Group had commodity swaps for 300 tonnes of copper production covering a total year up to 31 January 2016. The Group´s exposure to the copper price was limited by the extent of these instruments.
The Group periodically uses foreign exchange derivatives to cover expected operational cash flow needs. At 31 December 2015, the Group had no foreign exchange derivatives.
The Group also periodically uses interest rate swaps to swap the floating rate interest for fixed rate interest. At 31 December 2015, the Group had entered into contracts in relation to the Centinela financing for a maximum notional amount of $105 million at a weighted average fixed rate of 3.372% fully maturing in August 2018. The Group had also entered into contracts in relation to a financing loan at FCAB for a maximum notional amount of $120 million at weighted average fixed rate of 1.634% fully maturing in August 2019.
Cash flowsThe key features of the Group cash flow statement are summarised in the following table.
Year ended 31.12.15
$m
Year ended 31.12.14
$m
Cash flows from operations 858.3 2,507.8Income tax paid (427.1) (641.5)Net interest paid (27.6) (28.9)Capital contribution and loan to associates (112.0) (125.2)Acquisition of joint venture (972.8) –Disposal of subsidiaries 942.9 –Acquisition of mining interests (78.0) –Purchases of property, plant and equipment (1,048.5) (1,646.3)Dividends paid to equity holders of the Company (127.2) (964.2)Dividends paid to non-controlling interests (80.0) (412.2)Dividends from associate 12.1 20.0Other items 74.4 5.2Changes in net cash relating to cash flows (985.5) (1,285.3)Exchange and other non-cash movements (36.4) (27.5)Movement in net cash in the year (1,021.9) (1,312.8)Net cash at the beginning of the year (1.6) 1,311.2Net cash at the end of the year (1,023.5) (1.6)
Cash flows from operations were $858.3 million in 2015 compared with $2,507.8 million in 2014. This reflected EBITDA for the year of $890.7 million (2014 – $ 2,141.4 million) adjusted for a net working capital increase of $32.4 million (2014 – decrease of $286.2 million).
Antofagasta plc 67
ST
RA
TE
GIC
RE
PO
RT
GO
VE
RN
AN
CE
FIN
AN
CIA
L STA
TE
ME
NT
SO
TH
ER
INF
OR
MA
TIO
NS
TR
AT
EG
IC R
EP
OR
TG
OV
ER
NA
NC
EF
INA
NC
IAL S
TAT
EM
EN
TS
OT
HE
R IN
FO
RM
AT
ION
OV
ER
VIE
W

Cash tax payments in 2015 year were $427.1 million (2014 – $641.5 million), comprising corporation tax of $249.7 million (2014 – $264.0 million), mining tax of $32.2 million (2014 – $98.2 million) and withholding tax of $145.2 million (2014 – $279.3 million). These amounts differ from the current tax charge in the consolidated income statement of $160.4 million (2014 – $702.3 million) mainly because cash tax payments for withholding tax includes $132.4 million related to the disposal of ADASA and therefore is disclosed within the results from discontinued operations. In addition, under the Chilean tax regime the Group has prepaid taxes at rates higher than the final effective tax rate. As a consequence, the Group has current tax receivables of $319.5 million at 31 December 2015.
Contributions and loans to associates and joint ventures of $112.0 million mainly relate to the Group’s share of the funding of the development of the Alto Maipo project.
Cash disbursements relating to capital expenditure (including discontinued operations) in 2015 were $1,048.5 million compared with $1,646.3 million in 2014. This included expenditure of $143.4 million at Antucoya (2014 – $734.6 million), $559.4 million relating to Centinela (2014 – $566.9 million) and $203.1 million relating to Los Pelambres (2014 – $230.0 million). NB: capital expenditure figures quoted in other sections of this report are on a cash flow basis, unless stated otherwise.
Dividends paid to ordinary shareholders of the Company in 2015 were $127.2 million (2014 – $964.2 million), which related to the final dividend declared in respect of the previous year and the 2015 interim dividend.
Dividends paid by subsidiaries to non-controlling shareholders were $80.0 million (2014 – $412.2 million), consisting of distributions by Los Pelambres.
Financial positionAt
31.12.15 $m
At 31.12.14
$m
Cash, cash equivalents and liquid investments 1,731.6 2,374.5Total borrowings (2,755.1) (2,376.1)Net cash at the end of the year (1,023.5) (1.6)
At 31 December 2015, the Group had combined cash, cash equivalents and liquid investments of $1,731.6 million (31 December 2014 – $2,374.5 million). Excluding the non-controlling interest share in each partly-owned operation, the Group’s attributable share of cash, cash equivalents and liquid investments was $1,410.8 million (31 December 2014 – $2,007.0 million).
New borrowings in 2015 were $725.9 million (2014 – $1,583.4 million), mainly due to new short-term borrowings at Los Pelambres of $312.0 million, Centinela of $200.0 million and Antucoya of $30.0 million. Repayments of borrowings and finance leasing obligations in 2015 were $288.3 million (2014 – £570.9 million), relating mainly to regular repayments on existing loans of $34.9 million and repayments on short-term loans at Los Pelambres of $205.9 million and regular repayments of existing loan of $30.0 million at Ferrocarril Antofagasta Bolivia.
Total Group borrowings at 31 December 2015 were $2,755.1 million (2014 – $2,376.1 million). Of this, $1,936.2 million (2014 – $1,691.6 million) is proportionally attributable to the Group after excluding the non-controlling interest shareholdings in partly-owned operations.
Cautionary statement about forward-looking statementsThis Annual Report contains certain forward-looking statements. All statements other than historical facts are forward-looking statements. Examples of forward-looking statements include those regarding the Group’s strategy, plans, objectives or future operating or financial performance; reserve and resource estimates; commodity demand and trends in commodity prices; growth opportunities; and any assumptions underlying or relating to any of the foregoing. Words such as “intend”, “aim”, “project”, “anticipate”, “estimate”, “plan”, “believe”, “expect”, “may”, “should”, “will”, “continue” and similar expressions identify forward-looking statements.
Forward-looking statements involve known and unknown risks, uncertainties, assumptions and other factors that are beyond the Group’s control. Given these risks, uncertainties and assumptions, actual results could differ materially from any future results expressed or implied by these forward-looking statements, which speak only as at the date of this report. Important factors that could cause actual results to differ from those in the forward-looking statements include: global economic conditions; demand, supply and prices for copper; long-term commodity price assumptions, as they materially affect the timing and feasibility of future projects and developments; trends in the copper mining industry and conditions of the international copper markets; the effect of currency exchange rates on commodity prices and operating costs; the availability and costs associated with mining inputs and labour; operating or technical difficulties in connection with mining or development activities; employee relations; litigation; and actions and activities of governmental authorities, including changes in laws, regulations or taxation. Except as required by applicable law, rule or regulation, the Group does not undertake any obligation to publicly update or revise any forward-looking statements, whether as a result of new information, future events or otherwise.
Past performance cannot be relied on as a guide to future performance.
68 Antofagasta plc Annual report and financial statements 2015
Financial review

Corporate Governance Report 70
Leadership 72
How the Board and its Committees operate 72
Board of Directors 74
Executive Committee 77
Effectiveness 79
The Board in more detail 79
Information and professional development 82
Performance evaluation 84
Accountability 85
Board Committees 85
Audit and Risk Committee 86
Nomination and Governance Committee 90
Sustainability and Stakeholder Management Committee
93
Projects Committee 95
Remuneration 96
Annual Statement by the Chairman of the Remuneration and Talent Management Committee 96
Summary of Directors’ Remuneration Policy 98
Annual Report on Remuneration 2015 99
Relations with shareholders 112
Directors’ Report 114
Statement of Directors’ Responsibilities 116
GO
VE
RN
AN
CE
GO
VE
RN
AN
CE
ST
RA
TE
GIC
RE
PO
RT
FIN
AN
CIA
L STA
TE
ME
NT
SO
TH
ER
INF
OR
MA
TIO
NO
VE
RV
IEW
Governance
Antofagasta plc 69
Further details on the Group’s talent management and succession planning initiatives are set out in the Remuneration Report on page 97.
We believe that good corporate governance is fundamental to our success and I believe that we are in a strong position not only to face the current challenges that I identified in my introductory letter on page 5 but to continue to refine and execute our strategy to secure long-term growth and profitability.
Engaging with our shareholders
During 2015 I met with a number of our shareholders to hear their views about our Company, its strategy, management and governance. During these meetings we discussed a wide range of topics. These included how they used proxy voting agencies’ recommendations, board composition and diversity, the categorisation of independence for a Director, talent management and succession planning, the application of the “comply and explain” principle and aligning executive remuneration with strategy. These meetings allowed me to explain the changes to the Board’s structure in 2014, to update shareholders on progress following these changes and to understand how corporate governance developments are likely to assist us in the years ahead.
Once again, our Senior Independent Director, William Hayes, met with a number of shareholders to develop a balanced understanding of their issues and concerns. Further details of these meetings are set out on page 113.
Remuneration
Following the recent wave of changes to Executive remuneration reporting legislation and guidance, the Remuneration and Talent Committee, led by its Chairman, Tim Baker, commissioned an internal review of the effectiveness of the Group’s Executive pay arrangements, including the impact of safety performance on Executive pay. As part of this review, Tim Baker met with a number of industry and other FTSE 100 Remuneration Committee Chairmen in London to share and learn from their experiences. The changes that we have made to Executive incentives as a consequence of this review are set out in the Remuneration Report on pages 96 to 111. We have once again voluntarily reported on the remuneration and incentive pay design for Diego Hernández as if he was a member of the Board.
Our first full year of Corporate Governance Code compliance
In 2014 we changed many of our internal control and governance structures, processes and procedures in order to benefit from what we perceived to be sensible and beneficial governance practice. As a result, we are delighted to report that for the first time we have complied with all the detailed provisions of the Corporate Governance Code during 20151.1 The UK Corporate Governance Code issued by the Financial Reporting Council in September
2014 (the “Code”) (available on the Financial Reporting Council website at www.frc.org.uk) sets out the governance principles and provisions that applied to the Company during the 2015 financial year.
Nomination and Governance Committee
As part of these changes we decided to improve our focus on governance and the Nomination Committee became the Nomination and Governance Committee, with responsibility for monitoring and recommending improvements to the Board’s governance arrangements. The Committee has been instrumental in helping the Board further develop its governance framework which includes a clear description of matters reserved for the Board, terms of reference for Board Committees and specific responsibilities of the Chairman, Group CEO and Senior Independent Director.
Dear Shareholder,I am pleased to present the Antofagasta plc Corporate Governance Report for the year ended 31 December 2015.
One of my key responsibilities as Chairman is to promote good corporate governance and we have taken great strides in recent years to enhance our internal control and governance structures, processes and procedures. We have worked hard to ensure that we have the right people performing the right roles to shape the Group’s strategy and to drive, probe and report on its implementation. We have invested in talent management and succession planning and now have a strong pipeline of talent at various stages of development to fill these roles in the future.
Leadership
How the Board and its committees operate. For more information see pages 72 to 78.
Effectiveness
How the Board is balanced, how and what information flows through it and performance in 2015.
For more information see pages 79 to 84.
Accountability
How the Board and its committees oversee the Company’s position and prospects and assess risk.
For more information see pages 85 to 96.
Remuneration
How the Board and its committees ensure that executive pay is aligned with performance, strategy and the interests of shareholders.
For more information see pages 96 to 111.
Relations with shareholders
How the Board, its committees and the Company engage with shareholders and potential investors.
For more information see pages 112 and 113.
70 Antofagasta plc Annual report and financial statements 2015
Corporate Governance Report

Leveraging this framework in 2015, the Committee reviewed policies and procedures relating to diversity, succession planning and UK market obligations. The Committee will continue to focus on succession planning at Board level to ensure that our Committees continue to be appropriately staffed and that we continue to maintain a strong and committed Board with broad and complementary skills and experiences. More detail on the activities of the Nomination and Governance Committee during the year can be found on pages 90 to 92.
Board performance evaluation
Improving performance is a continuous process. Last year, we reported on the steps taken since our first external evaluation of the Board in 2013 and demonstrated that steady and significant progress had been made to implement the recommendations. This improvement was supported by the results of a separate internal evaluation exercise in 2014, the findings of which were also used to prioritise areas for improvement in an action plan for 2015. In 2015, we focused on those priorities and improvement was once again supported by the results of a separate internal review.
Following the demonstrated improvements arising from the recommendations made in the 2013 external review, we have once again commissioned an external review in 2016. More details on the 2015 internal review and scope of the 2016 external review can be found on page 84.
Sustainability and community engagement
At the operations level, it is essential that we are, and continue to be, a good neighbour. As explained in the Managing a sustainable business section of the Strategic Report on page 59, Minera Los Pelambres is located in the Choapa River valley in the central region of Chile and our recently launched “Somos Choapa” (We Are Choapa) Programme sets up forums for the Company, communities and authorities to discuss social and other needs and transform them into plans for everyone’s benefit. This programme has demonstrated the power of constructive dialogue and offers fresh perspectives on working with our neighbours and jointly developing our communities. The implementation of this programme was overseen by the Sustainability and Stakeholder Management Committee and more detail is set out in the Sustainability and Stakeholder Management Report on pages 93 and 94.
Key objectives for 2016
One of the keys to good communication between management and the Board is an effective relationship between the Chairman and Chief Executive. This is something that Diego and I have achieved during our first full year as Non-Executive Chairman and Group CEO. In 2016 the Board and I plan to continue to focus on strengthening the interface between the Board and its Committees and management to ensure that the Group’s strategy continues to be implemented effectively.
Open to questions
In the following pages, we outline our approach to corporate governance and demonstrate how our governance practices support this approach. This year our reporting follows the order of the main principles of the Corporate Governance Code.
As always, I welcome questions or comments from shareholders either via our website www.antofagasta.co.uk or in person at the Annual General Meeting.
Jean-Paul LuksicChairman
Substantial shareholdingsAs at 31 December 2015 and 14 March 2016, the following significant holdings of voting rights in the share capital of the Company had been disclosed to the Company under Disclosure and Transparency Rule 5:
Substantial shareholdings
1
1
1
2
2
3
3
Ordinary share capital
%
Preference share capital
%
Total share capital
%
1 Metalinvest Establishment 50.72 94.12 58.042 Kupferberg Establishment 9.94 – 8.273 Aureberg Establishment 4.26 – 3.54
Metalinvest Establishment and Kupferberg Establishment are both controlled by the E. Abaroa Foundation (“Abaroa”), in which members of the Luksic family are interested. As explained in Note 38 to the financial statements, Metalinvest Establishment is the immediate Parent Company of the Group and the E. Abaroa Foundation is the ultimate Parent Company. Aureberg Establishment is controlled by the Severe Studere Foundation that, in turn, is controlled by Jean-Paul Luksic, the Chairman of the Company.
Relationship agreementAbaroa is a controlling shareholder of the Company under the Listing Rules and certain other shareholders of the Company (including Aureberg Establishment), are also treated as controlling shareholders.
In 2014 the Company entered into relationship agreements with each controlling shareholder, which contain the mandatory independence provisions required by the Listing Rules. The Company has complied and, so far as the Directors are aware, each controlling shareholder and its associates have complied with the mandatory independence provisions at all times during 2015.
The Group has had a controlling shareholder since 1980. As a practical matter, the Board agreed some years ago that any proposed transaction between the Company and any controlling shareholder or its associates that is not in the ordinary course of business must be presented to the Board regardless of its size. Although infrequent, these transactions are considered, and if appropriate, approved by a committee of Directors who are independent from the controlling shareholder.
Details of the Company’s capital structure and Directors’ authority to issue and buyback shares of the Company are set out in the Directors‘ Report on page 115.
Antofagasta plc 71
GO
VE
RN
AN
CE
GO
VE
RN
AN
CE
ST
RA
TE
GIC
RE
PO
RT
FIN
AN
CIA
L STA
TE
ME
NT
SO
TH
ER
INF
OR
MA
TIO
NO
VE
RV
IEW

The Board
The Board is collectively responsible for the long-term success of the Group. It is responsible for its leadership and strategic direction, and for the oversight of the Group’s performance, risk and internal control systems.
Key responsibilities include:
• responsibility for the overall strategic management of the Group;
• changes to the capital, corporate structure, senior management and control structure;
• approval of preliminary announcements, financial reports, dividend policy and proposals, and significant changes in accounting policies or practices;
• ensuring a sound system of internal control and risk management and determining the nature and extent of principal risks that the Group is willing to take in achieving its strategic objectives;
• approving material contracts and transactions;
• reviewing and approving changes to the Board’s structure, size and composition, ensuring adequate succession planning for the Board, approving appointments to the boards of key subsidiaries and the appointment or removal of the Company Secretary;
• recommending the appointment, re-appointment or removal of the external auditor to shareholders for approval, following the recommendation of the Audit and Risk Committee;
• submitting the Directors’ Remuneration Policy to shareholders for approval and approving the Directors’ remuneration;
• appointing and delegating authority to the Group CEO and ensuring that there is adequate succession planning for the Group CEO and senior management;
• reviewing the Group’s overall corporate governance arrangements, receiving reports of the views of the Company’s shareholders, undertaking a formal and rigorous annual review of its own performance, as well as that of the Committees and individual Directors, determining the independence of Directors, receiving declarations of interest from Directors and authorising any Director’s conflict of interest;
• approving key corporate policies and the schedule of matters reserved for the Board; and
• establishing Committees of the Board that provide assistance on any of the matters set out above.
Matters which are required to be decided by the Board are set out in the schedule of matters reserved for the Board which is available on the Company’s website at www.antofagasta.co.uk.
A summary of the activities of the Board during the year is set out on page 81.
Board committees
The Board is assisted in the fulfilment of its responsibilities by the five Board Committees above. The Board has delegated authority to the Committees to perform certain activities as set out in their terms of reference.
The Chairman of each committee reports to the Board following each Committee meeting, allowing the Board to understand and discuss matters considered in detail by the Committee and/or adopt recommendations.
Terms of reference of the Projects Committee were adopted in August 2015 and the terms of reference for each Committee were amended in 2015 and are available on the Company’s website at www.antofagasta.co.uk.
A summary of the activities of each of the committees during the year is set out on pages 85 to 96.
Group CEO and the Executive Committee
The Board has delegated responsibility for implementing the Group’s strategic and financial objectives to Diego Hernández. Mr Hernández leads the teams with executive responsibility for running the Group’s businesses.
Mr Hernández is not a Director of Antofagasta plc but is invited to attend Board, Audit and Risk, Sustainability and Stakeholder Management, Projects and Remuneration and Talent Management Committee meetings.
The mining division is managed by the Antofagasta Minerals Executive Committee under the leadership of Iván Arriagada, the CEO of Antofagasta Minerals.
Details of the members of the Executive Committee are set out on pages 77 and 78.
The Executive Committee reviews significant matters in respect of the mining division and approves capital expenditures by the mining operations and the corporate centre within designated authority levels, leads the annual budgeting and planning processes, monitors the performance of the mining operations, and promotes the sharing of best practices and policies across the operations.
The Executive Committee is assisted in the performance of its responsibilities by the Operational Performance Review Committee, the Business Development Committee and certain Steering Committees set up to oversee important projects. The responsibilities of these Committees is set out opposite. Members of the Executive Committee also sit on the boards of the Group’s operating companies and periodically report to Mr Hernández and the Executive Committee on the activities of those companies.
Committee roles at the executive level are set out in the Executive Committee biographies on pages 77 and 78.
Group CEO
Audit and Risk Committee
Projects Committee
Remuneration and Talent
Management Committee
Sustainability and
Stakeholder Management Committee
Nomination and
Governance Committee
72 Antofagasta plc Annual report and financial statements 2015
Corporate Governance ReportLeadershipHow the Board and its Committees operate
Antofagasta plc Board Board Committees

Mining
Antofagasta Minerals Executive Committee
Pages 77 and 78
Audit and Risk Committee
Pages 86 to 89
Projects CommitteePages 95 and 96
Remuneration and Talent
Management Committee
Pages 96 to 111
Sustainability and
Stakeholder Management CommitteePages 93 and 94
Nomination and
Governance Committee
Pages 90 to 92
Group CEO
The Operational Performance Review Committee monitors the Group’s operations, with a focus on budgets, operational risks and investments. It supports and validates technical and operational decisions and is responsible for approving operational expenditures within approved budgets and small capital expenditures up to a set amount.
The Business Development Committee focuses on the mining division’s growth opportunities, both in relation to internal projects and potential transactions. It also oversees the implementation of the strategic business development guidelines and reviews and approves decisions regarding the portfolio of development in light of those strategic guidelines and within the approved budget and designated authority levels.
Operational Performance
Review Committee
Business Development Committee
Steering Committees
The Executive Committee sets up Steering Committees to monitor the implementation of important projects undertaken by the Group, both in the execution and study phases. The Steering Committees are generally responsible for approving technical and strategic project decisions, as well as approving certain expenditures within approved budgets and up to a set amount.
OP BD S
Transport
Antofagasta plc 73
GO
VE
RN
AN
CE
GO
VE
RN
AN
CE
ST
RA
TE
GIC
RE
PO
RT
FIN
AN
CIA
L STA
TE
ME
NT
SO
TH
ER
INF
OR
MA
TIO
NO
VE
RV
IEW
Antofagasta plc Board

4
26
3
7
1810
11
5
9
1 Jean-Paul Luksic2 William Hayes3 Gonzalo Menéndez4 Ramón Jara5 Juan Claro6 Hugo Dryland7 Tim Baker8 Ollie Oliveira9 Andrónico Luksic
10 Vivianne Blanlot11 Jorge Bande Key areas of expertise
Mining
Financial
Industry
Legal
Sustainability
Government Relations
Energy
Key to Committees
Audit and Risk
Sustainability and Stakeholder Management
Remuneration and Talent Management
Nomination and Governance
Projects
74 Antofagasta plc Annual report and financial statements 2015
Corporate Governance ReportLeadershipBoard of Directors

1 Jean-Paul Luksic
Chairman
Chairman, 51
Independent: No The Company is controlled by foundations in which members of the Luksic family are interested. Brother of Andrónico Luksic. Non-Executive Director of Quiñenco and other companies in the Quiñenco group in common with Andrónico Luksic and Gonzalo Menéndez. Quiñenco is also controlled by foundations in which members of the Luksic family are interested.
Appointed to the Board 1990 Appointed Chairman 2004 (Non-Executive since September 2014).
Over 20 years’ experience with Antofagasta, including responsibility for overseeing development of the Los Pelambres and El Tesoro (Centinela Cathodes) mines.
Previous roles:• Chief Executive Officer of Antofagasta Minerals
Current positions:• Chairman of the Consejo Minero, the industry body representing the largest
mining companies operating in Chile• Non-Executive Director of Quiñenco S.A. and other listed companies in the
Quiñenco group: Banco de Chile and Sociedad Matriz SAAM S.A.
2 William Hayes
Chairman
Senior Independent Director, 71
Independent: Yes
Appointed to the Board 2006Extensive financial and operational experience in the copper and gold mining industries in Chile, Latin America, North America and South Africa.
Previous roles:• Senior executive with Placer Dome Inc.• Chairman of the Consejo Minero, the industry body representing the largest
mining companies operating in Chile• Chairman of the Gold Institute in Washington DC
Current positions:• Chairman of Royal Gold Inc
3 Gonzalo Menéndez
Non‑Executive Director, 67
Independent: NoNon-Executive Director of Quiñenco and other companies in the Quiñenco group in common with Jean-Paul Luksic and Andrónico Luksic. Quiñenco is also controlled by foundations in which the Luksic family are interested.
Appointed to the Board 1985Qualified accountant with extensive experience in commercial and financial businesses across Latin America.
Current positions:• Chairman of the Board of Directors of Banco Latinoamericano de Comercio
Exterior S.A. (Bladex)• Director of Quiñenco S.A. and other listed companies in the Quiñenco group,
including Banco de Chile
4 Ramón Jara
Chairman
Non‑Executive Director, 62
Independent: NoProvides advisory services to the Group.
Appointed to the Board 2003Lawyer with wide-ranging legal and commercial experience in Chile.
Current positions:• Chairman of the Fundación Minera Los Pelambres (charitable foundation)• Director of the Fundación Andrónico Luksic A. (charitable foundation)
5 Juan Claro
Non‑Executive Director, 65
Independent: NoServed on the Board for more than nine years concurrently with the Chairman when he was performing the role of Executive Chairman.
Appointed to the Board 2005Extensive industrial experience in Chile, including an active role representing Chilean industrial interests nationally and internationally.
Previous roles:• Chairman of the Sociedad de Fomento Fabril (Chilean Society of Industrialists)• Chairman of the Confederación de la Producción y del Comercio
(Confederation of Chilean Business)• Chairman of the Consejo Binacional de Negocios Chile-China
(Council for Bilateral Business Chile-China)
Current positions:• Chairman of Coca-Cola Andina S.A. and Energía Coyanco S.A.• Director of several other companies in Chile, including Entel Chile S.A.,
Empresas Cementos Melon and Agrosuper• Member of the governing board of Centro de Estudios Públicos, a Chilean
not-for-profit foundation
6 Hugo Dryland
Non‑Executive Director, 60
Independent: NoProvides advisory services to the Group in his capacity as a Vice-Chairman at Rothschild, which is a financial advisor to the Group.
Appointed to the Board 2011Lawyer with extensive expertise in corporate finance and M&A within the mining sector, with over 25 years of investment banking experience in natural resources with the Rothschild group.
Previous roles:• Practising lawyer in the United States, specialising in the natural resources
and infrastructure sectors• Lawyer assigned to the energy group at the World Bank
Current positions:• Executive Vice-Chairman of NM Rothschild & Sons• Global head of Rothschild’s investment banking activities in the mining
and metals sector
Antofagasta plc 75
GO
VE
RN
AN
CE
GO
VE
RN
AN
CE
ST
RA
TE
GIC
RE
PO
RT
FIN
AN
CIA
L STA
TE
ME
NT
SO
TH
ER
INF
OR
MA
TIO
NO
VE
RV
IEW

7 Tim Baker
Chairman
Non‑Executive Director, 63
Independent: Yes
Appointed to the Board 2011Geologist with significant mining operational experience across North and South America and Africa which has included managing mining operations in Chile, the United States, Tanzania and Venezuela and geological and operating roles in Kenya and Liberia.
Previous roles:• Vice President and Chief Operating Officer at Kinross Gold Corporation• General Manager of Placer Dome Chile
Current positions:• Chairman of Golden Star Resources• Director of Sherritt International Corporation
8 Manuel Lino Silva De Sousa-Oliveira (Ollie Oliveira)
Chairman
Non‑Executive Director, 64
Independent: Yes
Appointed to the Board 2011Chartered accountant, chartered management accountant and economist with over 35 years of strategic and operational experience in the mining industry and corporate finance.
Previous roles:• Senior executive positions within the Anglo American group, including Executive
Director – Corporate Finance and Head of Strategy and Business Development of De Beers S.A.
9 Andrónico Luksic
Non‑Executive Director, 61
Independent: NoThe Company is controlled by foundations in which the Luksic family are interested. Brother of Jean-Paul Luksic. Chairman of Quiñenco and Chairman or Director of other companies in the Quiñenco group, in common with Jean-Paul Luksic and Gonzalo Menéndez. Quiñenco is also controlled by foundations in which members of the Luksic family are interested.
Appointed to the Board 2013Extensive experience across a range of business sectors throughout Chile, Latin America and Europe.
Current positions:• Chairman of Quiñenco S.A. and Compañía Cervecerías Unidas S.A.,
Vice-Chairman of Banco de Chile and a director of Tech Pack S.A., all of which are listed companies in the Quiñenco group
• Director of Nexans S.A., a company listed on NYSE Euronext Paris
10 Vivianne Blanlot
Non‑Executive Director, 61
Independent: Yes
Appointed to the Board 2014An economist with extensive experience across the energy, mining, water and environmental sectors in the public and private sectors in Chile.
Previous roles:• Executive Director of the Comisión Nacional de Medio Ambiente
(Environmental Agency in Chile)• Undersecretary of Comisión Nacional de Energía
(National Energy Commission in Chile)• Minister of Defence
Current positions:• Director of Colbún S.A., an energy company listed in Chile• Director of ScotiaBank Chile• Member of the Consejo Para La Transparencia (Transparency Council),
the Chilean body responsible for enforcing transparency in the public sector
11 Jorge Bande
Non‑Executive Director, 63
Independent: Yes
Appointed to the Board 2014Economist with over 30 years’ experience in the mining industry.
Previous roles:• Co-founder and Executive Director of Copper and Mining Studies (“CESCO”),
an independent not-for-profit think tank focused on mining policy issues• Vice President of Development and later Director of Codelco• CEO of AMP Chile• Advisor to the World Bank• Member of the Global Agenda Council for Responsible Minerals Resource
Management at the World Economic Forum• Director of Edelnor S.A. and Electroandina S.A. (now E-CL S.A.)
Current positions:• Director of CESCO, Inversiones Aguas Metropolitanas S.A. and Bupa Chile S.A. • Professor of the International Post-Graduate Programme in Mineral Economics
at the University of Chile• Member of the Experts Committee for Copper Prices for the Chilean Ministry
of Finance
76 Antofagasta plc Annual report and financial statements 2015
Corporate Governance ReportLeadershipBoard of Directors

1 Diego HernándezBD
Chairman
Group CEO
Joined the Group in 2012 Mining engineer with over 40 years of senior management experience with major international mining companies with operations in Latin America.
Previous roles:• Chief Executive Officer of Antofagasta Minerals • Chief Executive Officer of Codelco• President of BHP Billiton Base Metals division• Executive Director of Vale do Rio Doce• Chief Executive Officer of Compañía Minera Doña Inés de Collahuasi S.C.M.• Chief Executive Officer of Empresa Minera de Mantos Blancos S.A.• Various senior positions within the Anglo American group in Chile and
with the Rio Tinto group in Brazil
Other information:Named 2010 Copper Man of the Year by the Copper Club, New York, and received a gold medal award from the Chilean Institute of Engineers in 2013 in recognition of his contribution to the development of engineering in Chile. Mr Hernández is also Vice President of SONAMI, the Chilean Mining Society.
2 Iván ArriagadaBD
CEO of Antofagasta Minerals
Joined the Group in 2015Commercial engineer and economist with over 20 years’ experience in the mining, metals and oil and gas sectors.
Previous roles:• Chief Financial Officer of Codelco• Various positions at BHP Billiton, including President of Pampa Norte
(Spence and Cerro Colorado), Vice President Operations and Chief Financial Officer of the Base Metals division
• Over 15 years of international experience with Shell, in Chile, the United Kingdom, Argentina and the United States
3 Alfredo AtuchaBD E
Vice President of Finance and Administration and CFO
Joined the Group in 2013Accountant and economist with over 30 years of financial experience in the mining, metals, energy and FMCG sectors.
Previous roles:• 10 years’ service at BHP Billiton as Vice President of Finance for
Minera Escondida and Senior Manager of Base Metals Major Projects• Finance and Administration Manager at Chilquinta Energía
(part of Sempra Energy and PSG Group)• CFO at Reckitt Benckiser in Spain, Brazil and Chile• Tax Planning and Treasury at British American Tobacco
1
2
4
6
5
9
7
8
3
OPOperational Performance Review Committee
BDBusiness Development Committee
E Ethics Committee
Key to Committees
Antofagasta plc 77
GO
VE
RN
AN
CE
GO
VE
RN
AN
CE
ST
RA
TE
GIC
RE
PO
RT
FIN
AN
CIA
L STA
TE
ME
NT
SO
TH
ER
INF
OR
MA
TIO
NO
VE
RV
IEW
Corporate Governance ReportLeadershipExecutive Committee

4 Patricio EneiE
Vice President of Legal
Joined the Group in 2014Lawyer with over 20 years’ experience in mining, including roles at some of the largest international copper companies operating in Chile.
Previous roles:• General Counsel at Codelco• Corporate Affairs Manager of Minera Escondida• Senior Lawyer at BHP Billiton in Chile• Chief Legal Counsel at Minera Doña Inés de Collahuasi• Lawyer at the Instituto de Normalización Previsional and in private practice
5 Andrónico Luksic L.BD
Vice President of Development
Joined the Group in 2006
Business administrator with broad mining experience in sales, exploration, development and general management.
Previous roles:• Corporate Manager at Antofagasta Minerals• Director, Antofagasta Minerals Toronto Office• Various positions at Banco de Chile
6 Hernán MenaresOP
Vice President of Operations
Joined the Group in 2008 Civil mining engineer and mineral economist, with 30 years’ experience in the mining and metals sectors.
Previous roles:• Project Development Manager for the Centinela District • Operational and business planning roles at Codelco• Various positions at Compañía Minera del Pacífico and Compañía Minera
Huasco S.A.
7 Ana María RabagliatiE
Vice President of Human Resources
Joined the Group in 2013Human resources specialist with more than 25 years’ experience in international companies across a range of sectors, including financial services, industrials and oil and gas.
Previous roles:• Corporate Human Resources Manager at Masisa• Country Human Resources Vice President at Citigroup• Human Resources Manager at the Lafarge Group in Chile• Various positions across several divisions and areas at Shell, including
Human Resources Manager at the Lubricants Business of Shell Oil Latin America
8 Gonzalo Sánchez
Vice President of Sales
Joined the Group in 1996 Civil engineer with over 25 years’ experience in the marketing and hedging of metals.
Previous roles:• Deputy Commercial Director, Antofagasta Minerals • Copper sales at Codelco
9 Francisco Veloso
Vice President of Corporate Affairs and Sustainability
Joined the Group in 1993 Lawyer with over 20 years’ experience with Antofagasta Minerals, including oversight of critical phases of development at Los Pelambres.
Previous roles:• Vice President of Legal and Corporate Affairs at Antofagasta Minerals• Vice President of Human Resources at Antofagasta Minerals• General Counsel at Los Pelambres• Legal Manager at VTR• Chief lawyer at Michilla
For full biographies of the management team visit: www.antofagasta.co.uk/about-us/leadership/senior-management/
78 Antofagasta plc Annual report and financial statements 2015
Corporate Governance ReportLeadershipExecutive Committee

Board balance
As at the date of this report the Board has 11 Directors, comprising a Non-Executive Chairman and ten Non-Executive Directors. The Board considers five of these Non-Executive Directors to be independent. The Board is satisfied that the balance of the Board, in terms of background, gender and independence, limits the scope for an individual or small group of individuals to dominate the Board’s decision-making. The Board considers that a board comprising exclusively of Non-Executive Directors is valuable both in terms of providing a range of outside perspectives to the Group and in encouraging robust debate with, and challenge of, the Group’s executive management.
The Directors’ biographies provide details of their Committee memberships as well as other principal directorships and external roles, and demonstrate a detailed knowledge of the mining industry, significant international business experience and a diversity of core skills and experience. All Directors have confirmed that their other commitments do not prevent them from devoting sufficient time to their role.
The Board carefully considered the independence of all Directors in 2015 and is satisfied that William Hayes continues to demonstrate the qualities of independent character and judgement in carrying out his role as a Non-Executive Director and Senior Independent Director, notwithstanding that the ninth anniversary of his appointment was in September 2015. In reaching this conclusion, the Board has taken into account:
• the entirely Non-Executive composition of the Board which is designed to promote independent oversight of, and constructive challenge of, management;
• that there are no relationships or circumstances that are likely to affect, or could appear to affect, Mr Hayes’ judgement; and
• that Mr Hayes’ character and the manner in which he performs his role clearly demonstrate independent thought and judgement.
Mr Hayes retains his role as Senior Independent Director and will offer himself for re-election at this year’s Annual General Meeting.
Board composition and roles
Chairman
Jean-Paul Luksic Non-Executive Chairman.
More information is provided in the Board biographies on pages 74 to 76.
• Leads the Board and ensures its effectiveness in all aspects of its duties.
• Promotes the highest standards of integrity, probity and corporate governance.
• Sets the agenda for Board meetings in consultation with the Secretary to the Board, other Directors and members of senior management.
• Chairs meetings and ensures that there is adequate time available for discussion of all agenda items with a focus on strategic, rather than routine, issues.
• Promotes a culture of openness and debate within the Board by facilitating the effective contribution of all Directors.
• Oversees Director development, induction, performance evaluation and relations with shareholders.
Senior Independent Director
William Hayes The Board is satisfied as to his independence.
More information is provided in the Board biographies on pages 74 to 76.
• Provides a sounding board for the Chairman and supports the Chairman in the delivery of his objectives as required.
• Where necessary, acts as an intermediary between the Chairman and the other members of the Board or Group CEO.
• Acts as an additional point of contact for shareholders focusing on the Group’s governance and strategy, and gives shareholders a means of raising concerns other than with the Chairman or senior management.
Non-Executive Directors
Ramón JaraHugo DrylandAndrónico LuksicGonzalo MenéndezJuan Claro
These Directors do not meet one or more of the independence criteria set out in the UK Corporate Governance Code.
More information is provided in the Board biographies on pages 74 to 76.
• Provide a range of outside perspectives to the Group and encourage robust debate with, and challenge of, the Group’s executive management.
• Ensure that no individual or small group of individuals can dominate the Board’s decision-making.
Independent Non-Executive Directors
Tim BakerOllie Oliveira Vivianne Blanlot Jorge Bande
These Directors meet the independence criteria set out in the UK Corporate Governance Code and the Board is satisfied as to their independence.
More information is provided in the Board biographies on pages 74 to 76.
• No connection with the Group or any other Director which could be seen to compromise independence.
• Provide a range of outside perspectives to the Group and encourage robust debate with, and challenge of, the Group’s executive management.
• Ensure that no individual or small group of individuals can dominate the Board’s decision-making.
Antofagasta plc 79
GO
VE
RN
AN
CE
GO
VE
RN
AN
CE
ST
RA
TE
GIC
RE
PO
RT
FIN
AN
CIA
L STA
TE
ME
NT
SO
TH
ER
INF
OR
MA
TIO
NO
VE
RV
IEW
Corporate Governance ReportEffectivenessThe Board in more detail
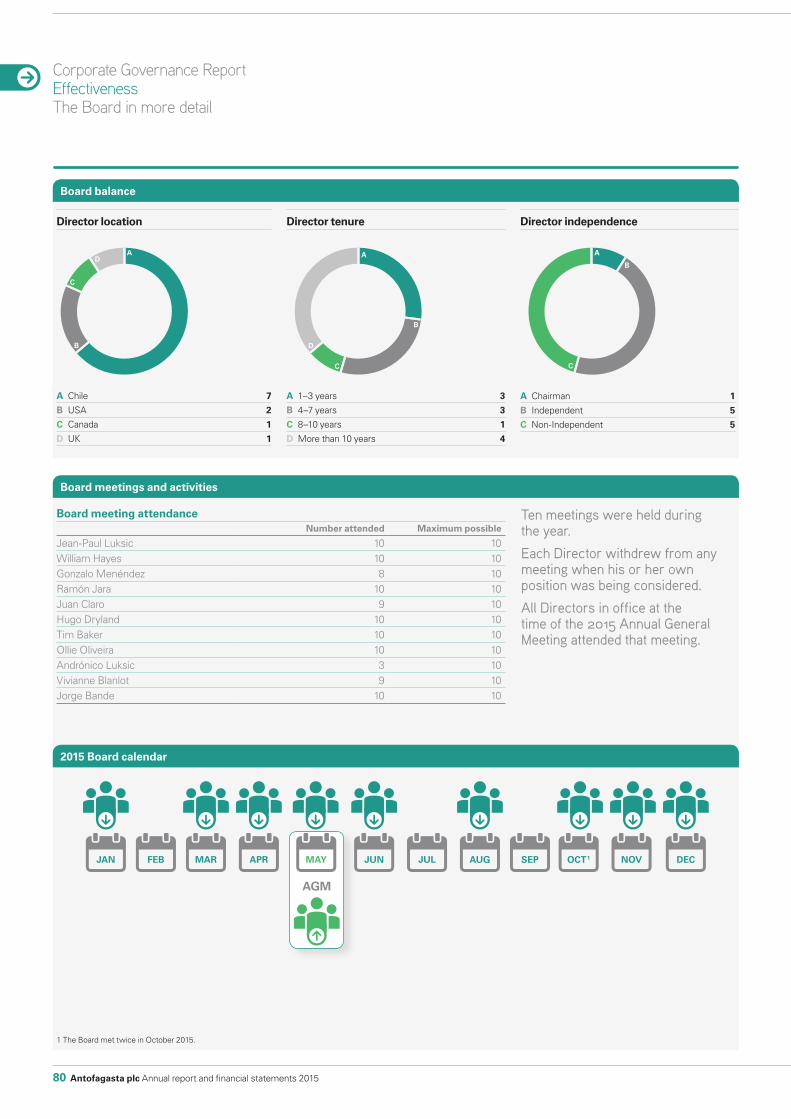
Board balance
2015 Board calendar
Board meetings and activities
Director location Director tenure Director independence
A
C
D
B
A
C
D
B
A
C
B
Board meeting attendanceNumber attended Maximum possible
Jean-Paul Luksic 10 10William Hayes 10 10Gonzalo Menéndez 8 10Ramón Jara 10 10Juan Claro 9 10Hugo Dryland 10 10Tim Baker 10 10Ollie Oliveira 10 10Andrónico Luksic 3 10Vivianne Blanlot 9 10Jorge Bande 10 10
Ten meetings were held during the year.
Each Director withdrew from any meeting when his or her own position was being considered.
All Directors in office at the time of the 2015 Annual General Meeting attended that meeting.
A Chile 7
B USA 2
C Canada 1
D UK 1
A 1–3 years 3
B 4–7 years 3
C 8–10 years 1
D More than 10 years 4
A Chairman 1
B Independent 5
C Non-Independent 5
1 The Board met twice in October 2015.
80 Antofagasta plc Annual report and financial statements 2015
Corporate Governance ReportEffectivenessThe Board in more detail
SEPMARJAN JUN AUG OCT1APR
AGM
MAYFEB JUL DECNOV

Board activities during the year
• held two stand-alone strategy days with particular focus on projects, business development and exploration, competitiveness and costs, human resources and talent and stakeholder management
• reviewed in detail the Group’s transport, energy and water strategies, including initiatives such as the need for a desalination plant at Los Pelambres
• reviewed and monitored the implementation of strategy and performance of each Executive Committee members’ team during the year
Strategy and management
• oversaw a review of the Group’s internal control and risk management systems and reported in accordance with these systems
• oversaw the implementation of the new Group enterprise resource planning (“ERP”) system
• reviewed the impact on the Group’s position of new tax legislation adopted in Chile
• adopted revised disclosure procedures and share dealing policies
Internal controls and risk management
• met with shareholders and proxy advisors to discuss corporate governance issues
• reviewed and updated Board policies
• conducted an internal evaluation of the Board’s effectiveness
Governance and shareholder engagement
• reviewed succession plans for all Directors and members of senior management
• oversaw the merger of the business development and exploration areas into a single Vice Presidency responsible for all development activities
• established a Projects Committee
• approved the Cost and Competitiveness Programme which is designed to mitigate the earnings reduction resulting from the drop in copper prices
Board and senior management structure
• approved key steps in the Group’s growth plans, executing the acquisition of 100% of Duluth Metals Limited and of 50% of Minera Zaldívar
• approved the divestment of the Group’s water division, Aguas de Antofagasta S.A., and the closure of Michilla
• approved the merger of wholly owned subsidiary, CCM Encuentro, into Centinela resulting in the contribution of Encuentro mining properties located in the Centinela Mining District to Centinela
• approved construction of a molybdenum plant and the pre-feasibility study for a second concentrator at Minera Centinela
Approval of material transactions
• approved the Group’s annual and half-year results
• reviewed the Group’s ongoing capital management and approved the final and interim dividends paid out to shareholders during 2015
• reviewed the Group’s performance against KPIs, including safety indicators
• reviewed and monitored the Group’s operational and project performance
• approved the Group’s 2016 budget, scorecard, commercial and financial parameters, and base case and development case production scenarios
Financial and performance reporting
Antofagasta plc 81
GO
VE
RN
AN
CE
GO
VE
RN
AN
CE
ST
RA
TE
GIC
RE
PO
RT
FIN
AN
CIA
L STA
TE
ME
NT
SO
TH
ER
INF
OR
MA
TIO
NO
VE
RV
IEW

The Company provides Directors with the necessary resources to develop and update their knowledge and capabilities. In particular, the Directors are regularly updated on the Group’s business, the competitive and regulatory environment in which it operates and other changes affecting the Group as a whole. In 2015, this included detailed presentations from management during the two Board strategy sessions, presentations from external commercial intelligence firms and briefings from external advisors on key changes to the regulatory and legal environment impacting the Group.
The Directors based outside Chile visit the country regularly to attend Board meetings and for other meetings with management. The Directors based outside the UK also regularly visit this country, normally at least once a year to attend the Company’s Annual General Meeting, which is held in London.
The Board and its Committees receive an analysis of the matters for consideration in advance of each Board or Committee meeting. They also receive regular reports including analysis of key metrics in respect of operational, financial, environmental and social performance, as well as key developments in the Group’s exploration and business development activities, information on the commodity markets, the Group’s talent management activities and analysis of the Group’s financial investments. The standing topics to be covered in Board meetings are agreed at the beginning of the year. The standing topics to be considered at the planned meetings in 2016 are set out opposite. Pre-reading materials are sent to Board and Committee members a week in advance and the Board and each Committee maintains an action list that is reviewed at the beginning of each meeting to ensure that the Board’s enquiries are clearly identified and responded to.
All Directors have access to management and to such further information as is needed to carry out their duties and responsibilities fully and effectively. Relevant management present to the Board and its Committees on the operational or development matters under consideration, allowing close interaction between the Board members and a wide range of executive management.
All Directors are entitled to seek independent professional advice concerning the affairs of the Group at the Company’s expense. The Company has appropriate insurance in place to cover the Directors against legal action against them.
All new Directors receive a thorough induction on joining the Board. This typically includes briefings on the Group’s operations and projects, meetings with the Chairman, other Directors and senior executives, briefings on the legal, regulatory and other duties and requirements of a director of a UK-listed company and visits to the Group’s key operations.
Information flow at Board meetings
Chairman agrees the meeting agenda
Board papers are circulated in advance of meetings
Board meeting
Action list prepared, monitored and updated
Key actions achieved
82 Antofagasta plc Annual report and financial statements 2015
Corporate Governance ReportEffectivenessInformation and professional development

Topics • Interim 2015 Q4 Results
• 2015 Performance Scorecard Results
• Compliance Report
• Insurance Strategy
• Interim 2015 Full-Year Results
• Risk Management Update
• Human Resources Strategy
• Competitiveness and Costs Programme – 2016
• Interim Q1 Results
• Projects Strategy
• Sustainability Strategy
• Sustainability Report
• Legal Strategy
• AGM Agenda
• Mining Operations Base Case
• Exploration Strategy
• Resources and Reserves
• Safety and Health Strategy
Topics • Group Strategy • Interim Q2 Results
• Half-Year Report
• 2016 Sales Strategy
• Commercial and Financial Parameters
• Sulphuric Acid Strategy
• Compliance Report
• Talent/Succession Plans
• Interim Q3 Results
• Energy Strategy
• 2017 Board Calendar and Agenda Topics
• Financing Strategy
• 2017 Budgets
• 2017 Performance Scorecard
• Conflicts of Interest Review
• Human Resources Update
JUN AUG NOVOCT
JAN MAR MAYAPR
Case Study: Information and Professional Development
It is essential for the Board continually to monitor and understand copper market fundamentals. In September 2015, the Board and senior executives were briefed by external commercial intelligence firms on the condition of the copper market which included an in-depth analysis of supply and consumption expectations and variables impacting on costs.
These sessions were held between the Board strategy sessions and played an important role in focusing the discussion topics at the strategy session held in November.
More information: www.antofagasta.co.uk
2016 Board calendar
Antofagasta plc 83
GO
VE
RN
AN
CE
GO
VE
RN
AN
CE
ST
RA
TE
GIC
RE
PO
RT
FIN
AN
CIA
L STA
TE
ME
NT
SO
TH
ER
INF
OR
MA
TIO
NO
VE
RV
IEW

2015 Internal evaluation
The Secretary to the Board also performed a separate internal evaluation of the performance of the Board and its Committees during the year. This was facilitated through a structured questionnaire completed by Directors. A summary of the results of the evaluation is as follows.
• understanding of roles and responsibilities and corporate governance responsibilities;
• the Board’s open and respectful work environment;
• the Board’s leadership in values, ethics, sustainability and diversity;
• the quality of Board documents including action lists and minutes; and
• technically strong, committed and productive Board Committees.
Strengths:
• focus on strategy;
• agenda ownership and decision-making;
• risk management;
• Board policies; and
• project evaluation, reviews, approvals, stewardship and learnings.
Areas where improvement has been made:
• the need to visit Operating Companies;
• learning from market and peers’ initiatives;
• improving time management during sessions;
• striking an appropriate balance between mining and transport division reporting;
• further strengthening the focus on Board succession planning, training and people issues; and
• continuing to consider strategic opportunities for overseas growth.
Opportunities for further improvement:
During the year, led by the Senior Independent Director, the Non-Executive Directors met without the Chairman present and evaluated the Chairman’s performance. The Senior Independent Director and the Secretary to the Board subsequently met with the Chairman to provide feedback. The Chairman used these comments further to develop the effective operation of the Board.
2016 External evaluation
Independent Audit Limited will again conduct an externally facilitated evaluation of the effectiveness of the Board and its Committees in 2016. The purpose of this review will be to review progress in closing the gaps that were identified in the 2013 review, evaluate how the Group has responded to changes in the UK Corporate Governance Code, analyse the Company’s response to the new FRC guidance on Internal Control and Risk Management and to compare the way the Board and its Committees operate versus other large publicly-listed companies in the UK.
This is being conducted in two phases: an initial stage in January has assessed positively the progress against the 2013 action plan; at the end of the year a follow-up will assess the further development of the Board’s work during 2016.
2013 2014 and 2015 2016
External evaluation completed by Independent Audit Limited
• Implementation of 2013 recommendations facilitated by the Company Secretary and the Secretary to the Board
• Internal reviews to identify areas and opportunities for improvement in the implementation of the recommendations made following the external review
• Annual evaluation of the Chairman by the Non-Executive Directors, led by the Senior Independent Director
• External evaluation commenced by Independent Audit Limited in January 2016
Performance Evaluation Cycle: Overview
During 2015, the Company Secretary and the Secretary to the Board worked with the Nomination and Governance Committee and the Board to implement the remaining recommendations made by Independent Audit Limited in its externally facilitated evaluation of the Board in 2013 with specific focus on the areas for improvements that were highlighted in the 2014 internal review. In particular, steps were taken:
• to restructure the Board’s agenda to enhance debate and facilitate constructive discussion where decision-making was required by the Board;
• to strengthen the Board’s focus on strategic issues by prioritising strategic decisions in the Board’s agenda and by setting aside two separate sessions outside the Boardroom to focus only on strategy;
• to establish a Projects Committee to work with management on the content and depth of project reviews; and
• to include succession planning and metrics relating to development plans and goals in the Human Resources Strategy and updates which are reviewed by the Board semi-annually.
84 Antofagasta plc Annual report and financial statements 2015
Corporate Governance ReportEffectivenessPerformance evaluation

Ollie OliveiraChairman of the Projects Committee
Tim BakerChairman of the Remuneration and Talent Management Committee
Audit and Risk Committee
Nomination and Governance Committee
Sustainability and Stakeholder Management Committee
Projects Committee
Remuneration and Talent Management Committee
Read more on pages 86 to 89.
Read more on pages 90 to 92.
Read more on pages 93 and 94.
Read more on pages 95 and 96.
Read more on pages 96 to 111.
William HayesChairman of the Audit and Risk Committee
Jean-Paul LuksicChairman of the Nomination and Governance Committee
Ramón JaraChairman of the Sustainability and Stakeholder Management Committee
Antofagasta plc 85
GO
VE
RN
AN
CE
GO
VE
RN
AN
CE
ST
RA
TE
GIC
RE
PO
RT
FIN
AN
CIA
L STA
TE
ME
NT
SO
TH
ER
INF
OR
MA
TIO
NO
VE
RV
IEW
Corporate Governance ReportAccountabilityBoard Committees
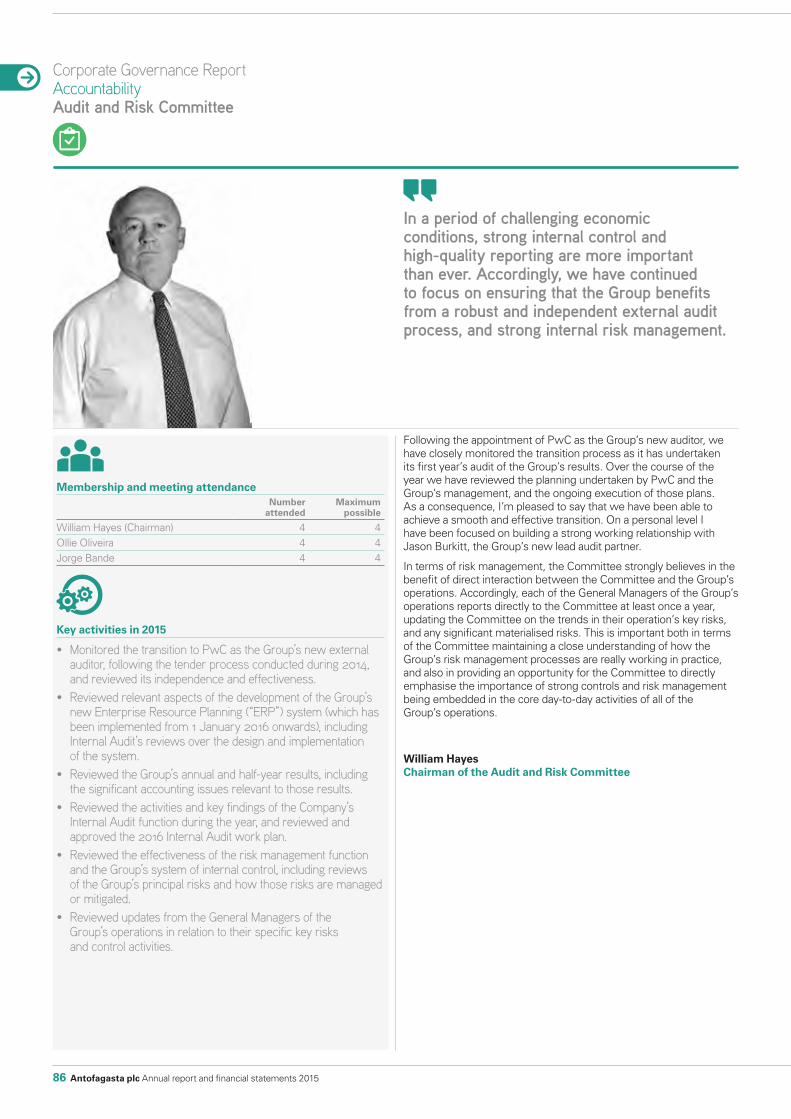
Following the appointment of PwC as the Group’s new auditor, we have closely monitored the transition process as it has undertaken its first year’s audit of the Group’s results. Over the course of the year we have reviewed the planning undertaken by PwC and the Group’s management, and the ongoing execution of those plans. As a consequence, I’m pleased to say that we have been able to achieve a smooth and effective transition. On a personal level I have been focused on building a strong working relationship with Jason Burkitt, the Group’s new lead audit partner.
In terms of risk management, the Committee strongly believes in the benefit of direct interaction between the Committee and the Group’s operations. Accordingly, each of the General Managers of the Group’s operations reports directly to the Committee at least once a year, updating the Committee on the trends in their operation’s key risks, and any significant materialised risks. This is important both in terms of the Committee maintaining a close understanding of how the Group’s risk management processes are really working in practice, and also in providing an opportunity for the Committee to directly emphasise the importance of strong controls and risk management being embedded in the core day-to-day activities of all of the Group’s operations.
William HayesChairman of the Audit and Risk Committee
In a period of challenging economic conditions, strong internal control and high-quality reporting are more important than ever. Accordingly, we have continued to focus on ensuring that the Group benefits from a robust and independent external audit process, and strong internal risk management.
Membership and meeting attendanceNumber
attendedMaximum
possible
William Hayes (Chairman) 4 4Ollie Oliveira 4 4Jorge Bande 4 4
Key activities in 2015
• Monitored the transition to PwC as the Group’s new external auditor, following the tender process conducted during 2014, and reviewed its independence and effectiveness.
• Reviewed relevant aspects of the development of the Group’s new Enterprise Resource Planning (“ERP”) system (which has been implemented from 1 January 2016 onwards), including Internal Audit’s reviews over the design and implementation of the system.
• Reviewed the Group’s annual and half-year results, including the significant accounting issues relevant to those results.
• Reviewed the activities and key findings of the Company’s Internal Audit function during the year, and reviewed and approved the 2016 Internal Audit work plan.
• Reviewed the effectiveness of the risk management function and the Group’s system of internal control, including reviews of the Group’s principal risks and how those risks are managed or mitigated.
• Reviewed updates from the General Managers of the Group’s operations in relation to their specific key risks and control activities.
86 Antofagasta plc Annual report and financial statements 2015
Corporate Governance ReportAccountabilityAudit and Risk Committee

Role and responsibilities of the Audit and Risk Committee
The purpose of the Audit and Risk Committee is to assist the Board in meeting its responsibilities relating to financial reporting and control. The Committee is responsible for overseeing the Group’s relationship with the external auditor and monitoring the effectiveness of the Group’s Internal Audit and risk management functions.
The Committee meets at least three times a year, with the external auditors in attendance. There is a rolling agenda that covers regular matters such as the review of the year end financial statements and half-yearly financial report, planning for the year end reporting and external audit processes, monitoring the Group’s tax strategy and processes, reviewing the Internal Audit work plan and reports from the risk management function, as well as providing time for ad-hoc matters requiring the Committee’s consideration. The Committee held four meetings during 2015.
Audit and Risk Committee membership
The members of the Committee and their attendance at meetings of the Committee during the year are shown in the table opposite. Biographical details of the members of the Committee, including relevant qualifications and experience, are set out on pages 74 to 76. All of the Committee members are considered by the Board to be independent Non-Executive Directors. William Hayes and Ollie Oliveira are considered to have recent and relevant financial experience. The Committee received briefings during the year on developments in financial reporting requirements and other relevant regulatory changes.
Financial reporting
The Committee monitors the integrity of the Group’s financial reporting. It reviews whether the Group’s accounting policies are appropriate, and whether management’s estimates and judgements applied in the financial statements are reasonable. The Committee reviews the year end financial statements and half-yearly financial report, as well as other relevant external financial reports. The Committee also reviews the going concern basis adopted in the year end financial statements and half-yearly financial report, prior to its endorsement by the Board.
The key internal controls over the financial reporting process include appropriate segregation of duties, ensuring adequate resources, technical expertise and experience in the operations’ and corporate centre’s accounting teams, application of consistent accounting policies as set out in the Group’s detailed accounting policies manual, robust review processes over the results, balances and key accounting judgements both within the individual operations and also by the corporate centre and effective financial reporting systems. A key area of focus for the Group during 2015 has been the completion of the development of a new unified ERP system for the Group, which has been implemented from 1 January 2016 onwards.
Fair, balanced and understandable
At the request of the Board, the Committee considered the 2015 Annual Report and Financial Statements and concluded that, taken as a whole, this was fair, balanced and understandable, and provided the necessary information to allow shareholders to assess the Group’s position and performance, business model and strategy.
Significant issues in relation to the financial statements considered by the Committee in 2015
1. Carrying value of assetsFollowing the significant deterioration in the commodity price environment in late 2015 and early 2016, reviews were undertaken of the carrying value of the Group’s assets, in particular in respect of Antucoya and Centinela. These reviews indicated the carrying value of those assets was fully recoverable, and accordingly no impairment was appropriate. Details of the impairment reviews are set out in Note 15 to the financial statements.
The Committee reviews the key assumptions used in the impairment reviews, including copper price forecasts and other relevant assumptions including future cost and production levels. The Committee reviews the disclosures in respect of the impairment reviews, including the sensitivities of the valuations to changes in key assumptions.
2. Zaldívar acquisitionReview of the accounting for the Group’s acquisition of its 50% stake in Minera Zaldívar SpA (“Zaldívar”), including the treatment of that investment as a joint venture, and the determination of the fair values of the assets and liabilities acquired.
The Committee reviewed the key factors relevant to the determination that the Group exercises joint control over Zaldívar, and the key assumptions and results of the fair value assessment.
3. Mine closure provisionsConsideration of the appropriateness of the provision balances in respect of future mine closure costs. The Group’s closure provisions are detailed in Note 30 to the financial statements.
The Committee reviews significant movements in the closure provision balances, and key assumptions used in the calculation of the provisions.
4. Capitalisation of costsConsideration of the appropriateness of the capitalisation of property, plant and equipment, in particular in respect of significant project expenditure. Details of additions to property, plant and equipment are set out in Note 14 to the financial statements.
The Committee reviews significant additional capitalised amounts, in particular in respect of major project expenditure, including consideration of the commercial viability of the relevant projects.
External audit
The Committee is responsible for overseeing the Group’s relationship with the external auditor. The Committee reviews and approves the scope of the external audit and the external auditor’s terms of engagement and fees. The Committee monitors the effectiveness of the external audit process and is responsible for ensuring the independence of the external auditor. The Committee is also responsible for making recommendations to the Board for the appointment, re-appointment or removal of the external auditor.
The Committee meets with the external auditor without management present at least once a year.
Antofagasta plc 87
GO
VE
RN
AN
CE
GO
VE
RN
AN
CE
ST
RA
TE
GIC
RE
PO
RT
FIN
AN
CIA
L STA
TE
ME
NT
SO
TH
ER
INF
OR
MA
TIO
NO
VE
RV
IEW

Audit tender process
A tender process was conducted during 2014 and resulted in the Committee recommending to the Board that PricewaterhouseCoopers LLP (“PwC”) be recommended to shareholders for appointment as the Group’s external auditor for the 2015 financial year onwards, replacing Deloitte LLP. Shareholders formally appointed PwC as the Group’s external auditor at the 2015 Annual General Meeting in May 2015.
Accordingly, 2015 is PwC’s first year as the Group’s external auditor.
In line with relevant regulatory guidance, the Committee expects to generally undertake a tender process in respect of the external audit at least every ten years.
The Statutory Audit Services for Large Companies Market Investigation (Mandatory Use of Competitive Tender Processes and Audit Committee Responsibilities) Order 2014 – statement of compliance
The Company confirms that it complied with the provisions of the Competition and Markets Authority’s Order for the financial year under review.
Independence and objectivity of the external auditor
The Committee monitors the external auditor’s independence and objectivity.
The Company has a policy in place that aims to safeguard the independence and objectivity of the external auditor. This includes measures in respect of the potential employment of former auditors, the types of non-audit services that the external auditor may and may not provide to the Group, and the approval process in respect of permitted non-audit services. Non-audit services that the external auditor is not permitted to provide under the policy include Internal Audit outsourcing, valuation services that would be used for financial accounting purposes, preparation of the Group’s accounting records or financial statements, and financial information systems’ design and implementation. Certain permitted non-audit services always require prior approval by the Committee, whereas certain other services require prior approval by the Committee when the related fees are above specified levels (currently $50,000 for a single engagement or a cumulative annual amount of $400,000). In addition to this approval process for specific non-audit services, the Audit and Risk Committee monitors the total level of non-audit services to ensure that neither the objectivity nor the independence of the external auditor is put at risk.
A breakdown of the audit and non-audit fees is disclosed in Note 6 to the financial statements. The Company’s external auditor for the 2015 financial year, PwC, has provided non-audit services (excluding audit-related services) which amounted to $0.2 million or 12% of the fee for audit and audit-related services. This mainly related to environmental consulting services. In general, where the external auditor is selected to provide non-audit services it is because they are considered to have specific expertise or experience in the relevant area which means they are the most suitable provider of those services. The Committee has reviewed the level of these services in the course of the year and is confident that the objectivity and independence of the auditor is not impaired by reason of such non-audit work.
The external auditor also provides a report to the Committee at least once a year, setting out its firm’s policies and procedures for maintaining its independence.
The Committee considers that PwC remained independent and objective throughout 2015.
Effectiveness of the external audit process
The Committee has reviewed the effectiveness of the external audit process during the year, including consideration of the following factors:
• the appropriateness of the proposed audit plan, the significant risk areas and areas of focus, and the effective performance of the audit in line with the agreed plan;
• the technical skills and industry experience of the audit engagement partner and the wider audit team;
• the quality of the external auditor’s reporting to the Committee;
• the effectiveness of the co-ordination between the UK and Chilean audit teams;
• the effectiveness of the interaction and relationship between the Group’s management and the external auditor;
• feedback from management, including questionnaires completed by the operations’ finance teams, in respect of the effectiveness of the audit processes for each business unit;
• consideration of the auditor’s management letter and, in particular, the view this provides of the auditor’s level of understanding and insight into the Group’s operations; and
• review of reports from the external auditor detailing its firm’s internal quality control procedures, as well as the auditor’s annual transparency report.
Internal Audit
The Committee monitors and reviews the effectiveness of the Group’s Internal Audit function. The Head of Internal Audit reports directly to the Committee and meets with the Committee without management present during the course of the year.
The Head of Internal Audit presents to the Committee several times during the year. The Committee reviews and approves Internal Audit’s plan of work for the coming year, including the department’s budget, head count and other resources. Internal Audit then reports to the Committee on the department’s performance of its work in comparison with the approved plan. Summaries of the audits undertaken during the year are presented to the Committee, as well as follow-up on management’s response to Internal Audit’s recommendations. All individual Internal Audit reports are distributed to the Committee members once they have been finalised.
During 2014, an independent review of the effectiveness of the Internal Audit function was undertaken by Independent Audit Limited. The Audit Committee reviewed that the implementation of the recommendations was completed as planned during 2015.
88 Antofagasta plc Annual report and financial statements 2015
Corporate Governance ReportAccountabilityAudit and Risk Committee

Risk and compliance management and internal control
The Board has ultimate responsibility for overseeing the Group’s key risks, as well as for maintaining sound risk management and internal control systems. The Group’s system of internal control is designed to manage rather than eliminate the risk of failure in order to achieve business objectives, and can only provide reasonable and not absolute assurance against material misstatement or loss.
The Committee plays a key role in assisting the Board with its responsibilities in respect of risk and related controls. The risk management function presents to the Committee several times during the year, and presentations include details of developments in the Group’s overall risk management processes and key Group-level strategic risks. The General Managers of the Group’s operations, including the transport and water divisions (until the date of its disposal), also present to the Committee, with each operation typically presenting at least once a year. The presentations include details of the operation’s most significant risks and related mitigating controls, and any significant control issues that have arisen.
The Committee ensures that appropriate compliance policies and procedures are observed throughout the Group. The Committee is responsible for making recommendations to the Board in respect of the appointment of the Group’s Crime Prevention Officer, and generally monitors and oversees the performance of the Crime Prevention Officer’s role. The Crime Prevention Officer is currently the Vice President of Finance and Administration. The Committee receives reports from the risk management function in respect of the Group’s Crime Prevention Model, in accordance with Chilean anti-corruption legislation.
The Committee is also responsible for reviewing the Group’s whistleblowing arrangements, which enable staff and contractors to raise concerns in confidence about possible improprieties or non-compliance with the Group’s Code of Ethics. The Committee receives quarterly reports on whistleblowing incidents. It remains satisfied that the procedures in place allow for the proportionate and independent investigation of matters raised and for appropriate follow-up action.
As discussed in the Risk management section on page 33, the Committee assists the Board with its assessment of the Group’s key risks and its review of the effectiveness of the risk management process. The Chairman of the Committee reports to the Board following each Committee meeting, allowing the Board to understand and, if necessary, discuss the matters considered in detail by the Committee. These processes have assisted the Board in carrying out a robust assessment of the principal risks facing the Company, including those that would threaten its business model, future performance, solvency or liquidity, and to assess the acceptability of the level of risks that arise from the Group’s operations and development activities. The Group’s principal risks, along with details of how those risks are managed or mitigated are set out in the Risk management section of the Strategic Report on pages 32 to 38.
Each year the Board, with the support of the Committee, reviews the effectiveness of the Group’s risk management and internal control systems. The review covers all material controls, including financial, operational and compliance controls. During 2015, a review of the risk management and internal control systems was performed by the Committee, with the Chairman of the Committee reporting back to the Board on its findings. No significant failures or weaknesses were identified as a result of this review.
Further information relating to the Group’s risk and management systems is given in the Risk management section of the Strategic Report on pages 32 to 38.
Risk management reporting process overview
Board
Audit and Risk Committee
Chairman reports to the Board after each meeting
Supports the Board in reviewing the effectiveness
of the Group’s risk management and internal
control systems
Risk Management Function
Present developments of the Group’s risk
management processes and Group-level strategic
risk at least twice per year
Report on Group’s Crime Prevention Model in
accordance with Chilean anti-corruption legislation
General Managers of the Operations
Present the operations most significant risks at
least once a year
Crime Prevention Officer
Appointment and activities overseen by the Audit and Risk Committee
Whistleblowing
Reports presented every quarter
Antofagasta plc 89
GO
VE
RN
AN
CE
GO
VE
RN
AN
CE
ST
RA
TE
GIC
RE
PO
RT
FIN
AN
CIA
L STA
TE
ME
NT
SO
TH
ER
INF
OR
MA
TIO
NO
VE
RV
IEW

This year has seen relative stability at Board and committee level following the appointments of two independent Non-Executive Directors and a change to the composition of the committees in 2014. Our focus therefore has shifted from making appointments and ensuring that new Directors or Committee members receive a full induction, appropriate training and experience, to succession planning for the medium term, both at Board and Senior Management level.
As noted in my introduction to the Corporate Governance Report, the Committee will continue to monitor the composition of the Board and its committees in 2016. This will ensure that they are appropriately staffed and that we continue to benefit from shared knowledge and experience as well as fresh ideas, so that we are in the best possible position to secure long-term growth and profitability. The Committee is also monitoring developments in connection with the FRC’s recent focus on UK Board Succession Planning.
The Board Committees are proactive and work hard to help the Board to challenge management constructively and ensure that matters that come to the Board for approval have been thoroughly analysed and well thought-out. With the creation of the Projects Committee, we have a broad and appropriate set of committees to ensure that Board meetings include significant focus on strategic issues without compromising the depth of knowledge required to support effective decision-making.
Below Board level, Diego Hernández has continued to work with the CEO of Antofagasta Minerals, Iván Arriagada, and the Executive Committee to rigorously implement our strategy of:
• strengthening the Group’s position in a challenging environment;
• optimising our business portfolio; and
• maintaining our discipline, austerity and ability to seize opportunities.
We have a strong and committed Board of Non-Executive Directors with a broad and complementary set of skills and experiences.
Membership and meeting attendanceNumber
attendedMaximum
possible
Jean-Paul Luksic (Chairman) 3 3William Hayes 3 3Tim Baker 3 3
Key activities in 2015
• Oversaw implementation of the remaining recommendations made in the 2013 externally facilitated Board evaluation and areas of specific focus highlighted in the 2014 internal evaluation.
• Reviewed and approved the scope of the Company’s second externally facilitated Board evaluation for 2016.
• Reviewed the composition and balance of the Board and its Committees, resulting in changes to the composition of the Audit and Risk and Sustainability and Stakeholder Management Committees.
• Recommended the creation of a Projects Committee to the Board for approval.
• Reviewed the Company’s corporate governance arrangements and recommended certain changes to the Board for approval.
• Reviewed Director independence, and succession plans for the Board.
• Recommended revised Board policies and procedures to the Board for approval.
• Recommended revised policies and procedures addressing the Group’s regulatory obligations in the UK to the Board for approval.
• Proactively engaged with shareholders on corporate governance issues.
90 Antofagasta plc Annual report and financial statements 2015
Corporate Governance ReportAccountabilityNomination and Governance Committee

Since joining the Group in 2012 as CEO of the mining division, Diego Hernández has led significant changes in the mining Group. These include restructuring the Executive Committee, as well as reporting lines from the mining operations and internal control and governance structures at the senior executive level. Following his appointment as Group CEO in 2014, Diego has overseen the sale of the Group’s water business, a restructuring of the internal control and governance structures within the railway business, and a further consolidation and simplification of reporting lines across the Group.
I touched on the impact of the Committee’s focus on corporate governance in my introduction to the Corporate Governance Report; evidence of the Group’s progress can be seen below and throughout the Annual Report.
Jean-Paul LuksicChairman of the Nomination and Governance Committee
Role and responsibilities of the Nomination and Governance Committee
The Nomination and Governance Committee is responsible for leading the process of identifying suitable candidates to fill vacancies on the Board and in Senior Management, for nominating such candidates for the approval of the Board and for ensuring that appointments are made on merit and against objective criteria. The Committee is responsible for evaluating and overseeing the balance of skills, knowledge and experience on the Board and its Committees, reviewing the independence of Directors from time to time and overseeing succession plans for the Board.
The Committee is also responsible for overseeing the Board’s governance arrangements, monitoring trends, initiatives and proposals in relation to governance matters, and reviewing the Company’s corporate governance framework at least annually and recommending any changes to the Board.
The Committee meets as necessary and at least twice per year.
Nomination and Governance Committee membership
The members of the Committee and their attendance at meetings of the Committee during the year are shown in the table opposite. Biographical details of the members of the Committee, including relevant qualifications and experience, are set out on pages 74 to 76. Except for the Chairman, all Committee members are considered by the Board to be independent.
Board evaluations
As explained on page 84, an internal Board evaluation was conducted during the year which demonstrated that significant progress has been made in implementing all the recommendations made following the 2013 external evaluation. The Committee reviewed and approved the scope of the external evaluation for 2016.
Appointments to the Board
In making appointments to the Board, the Committee considers the skills, experience and knowledge of the existing Directors and identifies potential candidates who would best contribute to maintaining a strong Board with broad and complementary skills and experiences. The Committee assesses the candidates based on a number of criteria, including relevant experience, skills, personality type, whether they would contribute to a diverse Board composition and whether they have sufficient time to devote to the role. Following the changes to the Chairman’s role and the appointment of two new independent Non-Executive Directors in 2014, there were no changes to the Board’s composition in 2015.
Antofagasta plc 91
GO
VE
RN
AN
CE
GO
VE
RN
AN
CE
ST
RA
TE
GIC
RE
PO
RT
FIN
AN
CIA
L STA
TE
ME
NT
SO
TH
ER
INF
OR
MA
TIO
NO
VE
RV
IEW

Succession planning
The Committee periodically reviews the composition of the Board and its Committees. The Committee regularly discusses relevant profiles for future appointments and when required, assists the Board to identify appropriate candidates for appointment to ensure that the Board remains balanced as regards skills, knowledge, experience and independence. The Committee reviewed succession plans for all of the Directors, including Committee roles, in 2015.
Corporate governance
The Committee is responsible for monitoring the Board’s corporate governance arrangements, reviewing the Company’s corporate governance framework at least annually and recommending changes to the Board. During the year, the Committee reviewed and revised a series of policies and procedures that apply to the Board, including in relation to succession planning, market disclosure procedures and share dealing.
As required, the Committee reviews and presents to the Board any updates to committees’ terms of reference, the schedule of matters reserved for the Board, and documents outlining the specific responsibilities of the Chairman, the Group CEO and the Senior Independent Director. These documents were thoroughly reviewed in 2014 and revised versions were adopted in March 2015. It is expected that some further refinements will be reviewed by the Committee during 2016.
Re-election
In accordance with the UK Corporate Governance Code, all Directors will stand for re-election at this year’s Annual General Meeting on 18 May 2016. As is required under the Listing Rules, independent Non-Executive Directors will be subject to a dual vote by shareholders, which means that each resolution to re-elect an independent Non-Executive Director must be approved by both a majority vote of all shareholders and a majority vote of the Company’s independent shareholders. Each year the Committee performs a thorough review of each Director’s independence during the year. Having taken into account the results of the performance evaluation of the Board (see page 84), the Board is satisfied that each of the Directors continues to be effective and demonstrates commitment to his or her role, and therefore recommends each of them for re-election.
Board induction and training
The Chairman is responsible for ensuring that any new Directors are provided with a full induction on joining the Board and the Secretary to the Board and the Company Secretary both assist the Chairman with this process. During the recruitment process, the Committee also advises potential candidates of the Company’s values, business culture and challenges, as well as expectations of time commitment to meet both Board and committee objectives.
Appointments to committees
As noted above, the Committee periodically reviews the composition of the committees and reviews and implements succession plans to ensure that vacancies can be appropriately filled while preserving an adequate balance of skills, knowledge, experience and independence.
During 2015, Tim Baker rotated off the Audit and Risk Committee and joined the Sustainability and Stakeholder Management Committee. There are now four Directors serving on the Sustainability and Stakeholder Management Committee. As explained on pages 93 and 94, engaging with the Group’s stakeholders to resolve long-term issues is a key objective for the Group and Mr Baker’s appointment to the Sustainability and Stakeholder Management Committee is intended to further support the Group in achieving this objective.
The Committee also recommended the creation of the Projects Committee during the year, comprising of Ollie Oliveira as Chairman and Jorge Bande and Tim Baker as members. One of the recommendations from the 2013 external Board evaluation was for the Board to focus greater attention on project reviews, approvals and execution. The Projects Committee has been tasked with assisting the Board with this responsibility. As explained on pages 74 to 76, all three Directors have significant mining experience and are well placed to carry out the Projects Committee’s objectives.
Boardroom diversity
The Board is comprised of highly capable and committed individuals with a diverse range of technical skills, backgrounds, expertise, nationalities and perspectives.
The Board benefits from the diversity of personal attributes among Board members. Diversity of views, attitudes, background and gender is important to ensure that the Board is not composed solely of like-minded individuals. As part of its annual evaluation, the Board assesses its effectiveness in meeting its diversity goals.
The Board believes in the benefits of diversity on the Board, including gender. The Board has the objective of continuing to have at least one female Director and will take advantage of opportunities to increase female representation while continuing to appoint Directors based on merit.
92 Antofagasta plc Annual report and financial statements 2015
Corporate Governance ReportAccountabilityNomination and Governance Committee

We were deeply saddened by the tragic fatal accident at Michilla in the first half of the year involving Sr Sergio Bruna Cortés, an employee of one of our contractors. This fatality followed the implementation of our new safety and health model in 2014, which has as one of its central aims stopping all fatalities in the Group. The Group remains committed to that aim and the Committee thoroughly reviewed the results of the independent investigation into this incident and the lessons learned, and these were extensively communicated throughout the Group. The Committee regularly reviews Group performance against the safety and health model to ensure that the objectives of the model are being achieved.
Earlier in the year, some members of one of the communities near Los Pelambres staged demonstrations and blocked access along the road leading to the mine. Through constructive dialogue this conflict was resolved.
The Group, with oversight from the Committee, has continued to implement the Group’s new community engagement model in 2015. The new model is based on promoting a wide engagement process with the local communities and with the provinces’ four municipalities, to jointly identify local challenges and opportunities. This model recognises that the future development of Los Pelambres and other areas within Los Pelambres’ zone of influence depends on committed and sustained collaboration between the community, the Government and the Group.
The Committee closely oversaw implementation of the engagement model during the year with a focus on ensuring that all activities, programmes and expenditures in the area were aligned. The new model includes community consultation to agree on a portfolio of projects, in line with the public policy for the area, which will be designed and executed with public support. The Committee believes that this community engagement model can be replicated, with appropriate modifications to the local environment, at our operations in the north of Chile and will continue to oversee this development in 2016.
The Committee was particularly active in 2015 as it oversaw the implementation of major steps to strengthen the Group’s safety, environmental and social performance, and evaluated the Group’s performance and strategies in these areas in light of the challenges that we faced during the year.
Membership and meeting attendanceNumber
attendedMaximum
possible
Ramón Jara (Chairman) 7 7Juan Claro 7 7Tim Baker (joined the Committee on 18 August 2015) 3 3Vivianne Blanlot 7 7
Key activities in 2015
• Reviewed personal accident and environmental incident reports and followed up on committed actions to prevent recurrence.
• Oversaw the development and implementation of a new community engagement programme at Los Pelambres.
• Evaluated environmental risks and mitigating actions, including water availability and possible initiatives such as the construction of a desalination plant for Los Pelambres.
• Analysed operational response to the earthquake which impacted Los Pelambres.
• Reviewed Michilla’s plan to put the site on care and maintenance.• Reviewed sustainability aspects of development projects at
Centinela, Los Pelambres and Alto Maipo including processes to obtain the required Environmental Impact Studies and Environmental Impact Declarations.
• Reviewed the mining division’s communications strategy and co-ordination with non-mining businesses.
• Evaluated expenditure related to social plans.• Reviewed environmental compliance at Los Pelambres
and the Antofagasta port.• Oversaw the process by which Antofagasta Minerals
is fulfilling its commitments made with the ICMM.• Reviewed and approved the 2015 Antofagasta Minerals
Sustainability Report.
Antofagasta plc 93
GO
VE
RN
AN
CE
GO
VE
RN
AN
CE
ST
RA
TE
GIC
RE
PO
RT
FIN
AN
CIA
L STA
TE
ME
NT
SO
TH
ER
INF
OR
MA
TIO
NO
VE
RV
IEW
Corporate Governance ReportAccountabilitySustainability and Stakeholder Management Committee

The discussion forums that have been set up as part of the new engagement model were particularly helpful for co-ordinating the assistance efforts following the extremely powerful September earthquake. This measured 8.4 on the Richter scale at the epicentre which was less than 100 km from the Mauro tailings dam. The earthquake did not damage the Mauro tailings dam and representatives from the local community and independent experts were invited to verify the structural integrity of the dam immediately following the earthquake.
The Committee continued to oversee the work being done by the Group to meet its commitments as a member of the International Council on Mining and Metals (“ICMM”), which included reviewing revised mine closure guidelines and procedures. Michilla is the Group’s only underground mine and over the course of the year
the Committee oversaw the successful process of putting the mine on care and maintenance. There was a special focus on safety, environmental and social aspects of the closure as well as on the implementation of the stakeholder management plan with employees, authorities and the local communities.
2016 will be another important year for the Group to ensure that it maintains its social licence to operate and continues to improve its performance against sustainability indicators.
Ramón JaraChairman of the Sustainability and Stakeholder Management Committee
Role and responsibilities of the Sustainability and Stakeholder Management Committee
The Board has ultimate responsibility for sustainability. The Committee assists the Board in the stewardship of the Group’s social responsibility programmes and makes recommendations to the Board to ensure that ethical, safety and health, environmental, social and community considerations are taken into account in the Board’s deliberations.
The Committee provides guidance to the Group in relation to sustainability matters generally, reviewing and updating the Group’s framework of policies and strategies, including safety and health, environmental, climate change, human rights, community and other stakeholder issues, and monitoring and reviewing the Group’s performance in respect of sustainability matters, indicators and targets. When necessary, the Committee escalates matters of concern to the Board.
For details on the Group’s sustainability performance in 2015, see the Managing a sustainable business section of the Strategic Report on pages 53 to 63.
Sustainability and Stakeholder Management Committee Membership
The members of the Committee and their attendance at meetings of the Committee during the year are shown in the table on page 93. Biographical details of the members of the Committee, including qualifications and experience, are set out on pages 74 to 76.
Safety and healthA core responsibility of the Committee is to monitor and report on the implementation of the Group safety and health model, to investigate any negative performance and to make recommendations to the Board. Details of the Group’s safety and health model are set out in the Managing a sustainable business section of the Strategic Report on pages 53 to 63.
The Group’s objective is to achieve zero fatalities for employees and contractors and the Committee will continue actively to monitor the Group’s performance in 2016.
Community relationsThe Committee is responsible for reviewing the Group’s community engagement strategies and in 2015, the Committee reviewed progress on the implementation of a new community relations programme at Los Pelambres, working with the community and the Government to create a shared vision of social and environmental priorities and corresponding projects to be developed over the coming years.
Consultation, commitment to regional development and responding to complaints are fundamental components of this strategy, as explained in more detail in the Managing a sustainable business section of the Strategic Report on pages 53 to 63.
EnvironmentAs part of the Committee’s responsibilities to make recommendations for developing and updating policies and standards, the Committee continued to oversee the work being done by the Group to meet its commitments as a member of the ICMM following its acceptance as a member in 2014. This included approving the development of:
• a climate change strategy to determine a feasible goal on reduction of greenhouse gas emissions;
• a biodiversity strategy, including a baseline for future projects and a biodiversity standard; and
• revised mine closure guidelines and procedures.
These will be ready for review in 2016. The Committee also reviewed the preparation, submission and review of the Environmental Impact Study for the Centinela Second Concentrator Project.
Further details are set out in the Managing a sustainable business section of the Strategic Report on pages 53 to 63.
The Antofagasta Minerals Sustainability Report provides further information on its social and environmental performance and is available on the Company’s website at www.antofagasta.co.uk.
94 Antofagasta plc Annual report and financial statements 2015
Corporate Governance ReportAccountabilitySustainability and Stakeholder Management Committee
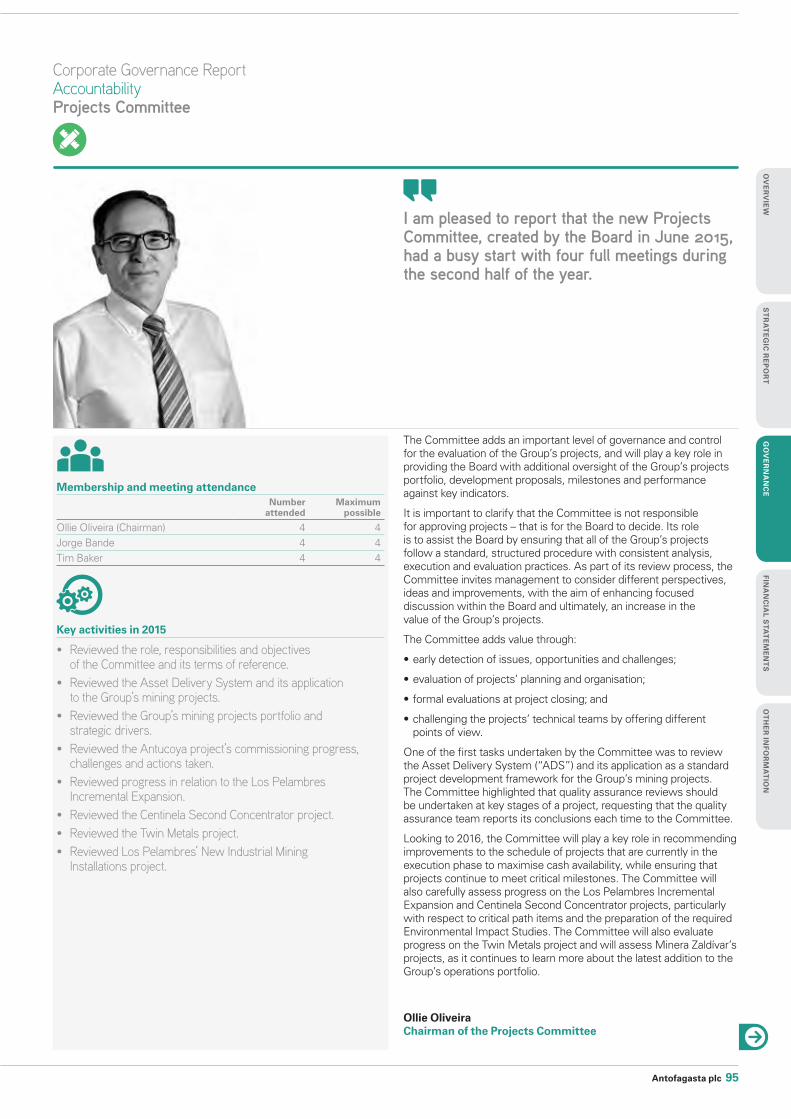
I am pleased to report that the new Projects Committee, created by the Board in June 2015, had a busy start with four full meetings during the second half of the year.
The Committee adds an important level of governance and control for the evaluation of the Group’s projects, and will play a key role in providing the Board with additional oversight of the Group’s projects portfolio, development proposals, milestones and performance against key indicators.
It is important to clarify that the Committee is not responsible for approving projects – that is for the Board to decide. Its role is to assist the Board by ensuring that all of the Group’s projects follow a standard, structured procedure with consistent analysis, execution and evaluation practices. As part of its review process, the Committee invites management to consider different perspectives, ideas and improvements, with the aim of enhancing focused discussion within the Board and ultimately, an increase in the value of the Group’s projects.
The Committee adds value through:
• early detection of issues, opportunities and challenges;
• evaluation of projects’ planning and organisation;
• formal evaluations at project closing; and
• challenging the projects’ technical teams by offering different points of view.
One of the first tasks undertaken by the Committee was to review the Asset Delivery System (“ADS”) and its application as a standard project development framework for the Group’s mining projects. The Committee highlighted that quality assurance reviews should be undertaken at key stages of a project, requesting that the quality assurance team reports its conclusions each time to the Committee.
Looking to 2016, the Committee will play a key role in recommending improvements to the schedule of projects that are currently in the execution phase to maximise cash availability, while ensuring that projects continue to meet critical milestones. The Committee will also carefully assess progress on the Los Pelambres Incremental Expansion and Centinela Second Concentrator projects, particularly with respect to critical path items and the preparation of the required Environmental Impact Studies. The Committee will also evaluate progress on the Twin Metals project and will assess Minera Zaldívar’s projects, as it continues to learn more about the latest addition to the Group’s operations portfolio.
Ollie OliveiraChairman of the Projects Committee
Membership and meeting attendanceNumber
attendedMaximum
possible
Ollie Oliveira (Chairman) 4 4Jorge Bande 4 4Tim Baker 4 4
Key activities in 2015
• Reviewed the role, responsibilities and objectives of the Committee and its terms of reference.
• Reviewed the Asset Delivery System and its application to the Group’s mining projects.
• Reviewed the Group’s mining projects portfolio and strategic drivers.
• Reviewed the Antucoya project’s commissioning progress, challenges and actions taken.
• Reviewed progress in relation to the Los Pelambres Incremental Expansion.
• Reviewed the Centinela Second Concentrator project.• Reviewed the Twin Metals project.• Reviewed Los Pelambres’ New Industrial Mining
Installations project.
Antofagasta plc 95
GO
VE
RN
AN
CE
GO
VE
RN
AN
CE
ST
RA
TE
GIC
RE
PO
RT
FIN
AN
CIA
L STA
TE
ME
NT
SO
TH
ER
INF
OR
MA
TIO
NO
VE
RV
IEW
Corporate Governance ReportAccountabilityProjects Committee

Role and responsibilities of the Projects Committee
Antofagasta is committed to growing its copper mining business, in Chile and beyond, in a sustainable and responsible manner that ensures it retains its social licence to operate.
The Projects Committee assists the Board in reviewing all aspects of projects that require Board approval. It highlights key matters for Board consideration and makes recommendations to the Board. The Board has ultimate responsibility for decisions relating to projects.
Projects Committee membershipThe members of the Committee and their attendance at meetings of the Committee during the year are shown in the table on page 95. Biographical details of the members, including qualifications and experience, are set out on pages 74 to 76.
Asset Delivery SystemThe Committee provides guidance to the Board from the early stages of project planning and organisation on the application of policies, strategies and the Group’s standard implementation framework to all projects. The use of the Group’s ADS framework is an essential component of this.
ADS uses processes and practices commonly used in the mining industry for project management. It defines standards and common criteria, considers governance by a steering committee, and includes functional quality assurance reviews and risk management.
Projects in study/execution phaseThe Committee is responsible for monitoring the Group’s projects portfolio at all stages of development and ensures their continued alignment with the Company’s strategic goals. The Committee reviews project proposals against flat-price sensitivities, execution milestones and key performance indicators, providing guidance when there is evidence of a deviation in costs or schedule from the plans approved by the Board.
In 2015, the Committee reviewed the Centinela Second Concentrator project’s pre-feasibility study results, quality assurance review, choice of technology, risks and mitigation actions, residual risk and 2016 budget. The Committee recommended to the Board that the project advance to the feasibility study phase. The Committee analysed the planned 2016 cash expenditures in detail, to ensure that critical path items and the Environmental Impact Study are adequately resourced.
The Committee also evaluated the Los Pelambres Incremental Expansion project and confirmed that it should proceed in two stages, with the first stage ensuring the sustainability of operations through the construction of a desalination plant to supply current and future water needs.
Project commissioningThe Committee also advises the Board on project transition from development to operation and reviews project close-out reports, including plans to share lessons learned. In 2015, the Committee reviewed progress in the Antucoya Project’s commissioning, its milestones, successes, challenges and opportunities. Special emphasis was placed on overseeing the resolution of the dust issue in the crushing process, analysing dust measurements in the camp site and confirming that they are within limits set by the authorities.
As a Committee, our objectives for 2016 are the same as for the rest of the Group – to focus on the Group’s strategic objectives, operational performance and ability to deliver.
Remuneration at a glance
The remuneration information is structured as follows:
Annual Statement by the Chairman of the Remuneration and Talent Management Committee 96
Summary of Directors’ Remuneration Policy 98
Annual Report on Remuneration 2015 99
Remuneration and Talent Management Committee 99
Statement of shareholder voting 100
Implementation of the Directors’ Remuneration Policy in 2015 100
Voluntary disclosures – executive remuneration 102
Comparison of overall performance and remuneration 110
Relative change in remuneration 111
Relative importance of remuneration spend 111
96 Antofagasta plc Annual report and financial statements 2015
Corporate Governance ReportAccountabilityProjects Committee
RemunerationAnnual Statement by the Chairman of the Remuneration and Talent Management Committee
Dear Shareholder,I am pleased to introduce Antofagasta plc’s Remuneration Report for the financial year to 31 December 2015.
We have not made any changes to the Directors’ Remuneration Policy approved by shareholders at the 2014 AGM and include a summary of the Remuneration Policy at the beginning of this Remuneration Report.
Our focus in 2015 was to ensure that the pay structures and incentives for the Group’s executives, who are currently outside the scope of the Directors’ Remuneration Policy, encourage teamwork and collaboration and appropriately incentivise and stretch management to achieve the Group’s strategic objectives.
This Remuneration Report has been prepared in accordance with Schedule 8 of the Large and Medium-sized Companies and Groups (Accounts and Reports) Regulations 2008 (as amended). It also describes how the Board has applied the principles of good governance as set out in the Corporate Governance Code.
We feel it is important to embrace the broad governance requirements of the UK while at the same time recognising that our Group CEO and all of the members of the Executive Committee are based in Chile. Consequently, we have continued voluntarily to report information on the remuneration and incentive pay design for our Group CEO as if he was a member of the Board and have also continued to provide detailed information in relation to the structure and components of the other Executive Committee members’ remuneration.
As reported by the Chairman in his introduction to this year’s Annual Report, 2015 has been a difficult year for the Group. As a consequence, the performance score for the purposes of calculating awards for the Group CEO and the Executive Committee under the 2015 Annual Bonus Plan was 95% (within a range from 90–110%).
The Committee reviewed and, with the support of the Board, fine-tuned the 2016 executive pay arrangements for the Group CEO and the Executive Committee to ensure that measurements fairly reflect performance and continue to be aligned with the Group’s strategic objectives and shareholders’ interests. Further information is set out on pages 108 and 109.
Talent management and succession planning are essential to our ability to ensure that the Group remains dynamic and adaptable and that there is sufficient continuity of knowledge to enable the Group to pursue its strategic objectives. 2015 was the second full year following the implementation of the Group’s new talent management strategy and succession planning policy for key positions within the Group as identified by the Committee.
As part of this policy, the Committee oversaw processes during 2015 to agree on the key positions and to identify the existing employees who are possible successors for these positions in the future. Under the agreed succession planning policy, whenever a key position becomes vacant, a replacement will first be sought from within the Group, taking into account the succession plan previously developed and agreed for that position.
During 2015, 68% of vacancies in key positions were filled by internal candidates, in accordance with the succession planning policy.
As part of the implementation of the Group’s talent management strategy in 2015, the Group launched a mentoring programme for 82 high-potential employees, formalised individual development plans and launched a trainee programme aimed at filling the talent pipeline in the longer term. 62% of the participants in the 2015 trainee programme were female. The Group’s focus on talent management and succession planning was supported by the performance criteria that applied to the Group CEO’s Recruitment Awards that vested in 2015, as set out on page 107.
Last year we reported that following the change in the role of the Chairman in 2014 and the Committee’s review of his remuneration, his total annual remuneration would be reduced by almost 70%. This year was the first full year that the Chairman performed in a non-executive role and the impact of this change on the Chairman’s pay arrangements can be seen in the single figure remuneration table on page 101.
Fee levels for the Non-Executive Directors, which are reviewed annually, have remained unchanged since 2012. Following the creation of the Projects Committee during the year, the Committee determined that additional fees for the Projects Committee members should be the same as for the Remuneration and Talent Management Committee and the Sustainability and Stakeholder Management Committee.
As a Committee, our objectives for 2016 are the same as for the rest of the Group – to focus on the Group’s strategic objectives, operational performance and ability to deliver. Specific areas where this will be applied in 2016 include the alignment of Zaldívar’s remuneration practices with those of the rest of the Group, and labour negotiations with four unions that represent employees and contractors in the Group’s transport division during the first quarter of 2016.
As required under UK legislation, we expect to submit the Directors’ Remuneration Policy to the 2017 AGM and will review its principles and application during 2016.
Shareholders are invited to vote on the Remuneration Report and I hope that you will continue to support the Group’s pay arrangements.
Tim BakerChairman of the Remuneration and Talent Management Committee
Antofagasta plc 97
GO
VE
RN
AN
CE
GO
VE
RN
AN
CE
ST
RA
TE
GIC
RE
PO
RT
FIN
AN
CIA
L STA
TE
ME
NT
SO
TH
ER
INF
OR
MA
TIO
NO
VE
RV
IEW
Purpose Operation Maximum opportunity
Fees To attract and retain high-calibre, experienced Non-Executive Directors by offering globally competitive fee levels.
Fees are reviewed annually and the competitiveness of total fees is assessed against companies of a similar nature, size and complexity.
Non-Executive Directors receive a base fee for services to Antofagasta plc’s Board, as well as additional fees for chairing or serving as a member of any of the Board’s committees.
Separate base fees are paid for services to the Antofagasta Minerals Board (all Non-Executive Directors are members of both boards), and for being directors of subsidiary companies and joint venture companies within the Group.
Ramón Jara also receives a base fee for services provided to Antofagasta Minerals (pursuant to a separate service contract).
Fee levels are denominated in US dollars. The Committee may determine fee levels and/or pay fees in any other currency if deemed necessary.
In normal circumstances, the maximum annual fee increase will be 7%. However, the Committee has discretion to exceed this in exceptional circumstances, for example:
• if there is a sustained period of high inflation;
• if fees are out of line with the market; and/or
• if fees for chairing or serving as a member of any of the Board’s committees are out of line with the market.
Any increases will take into account the factors described under “operation” and will not be excessive.
Fee levels for additional roles within the Antofagasta Group are based on the needs and time commitment expected and may be determined and/or paid in a combination of currencies, including US dollars and Chilean pesos.
Fees will also be increased to take account of Chilean inflation and may be reported as an increase or decrease as a result of the exchange rate impact of Chilean peso-denominated fees, given all amounts in this report are reported in US dollars.
Variable remuneration
Given the non-executive composition of the Board, there are no arrangements for Directors to acquire benefits through the acquisition of shares in the Company or any of its subsidiary undertakings, to benefit through performance-related pay or to participate in long-term incentive schemes.
The Corporate Governance Code states that remuneration for Non-Executive Directors should not include share options or other performance-related elements.
Benefits To provide appropriate benefits required in the performance of duties of the Non-Executive Directors.
Benefits include the provision of life, accident and health insurance.
The Committee retains the discretion to provide additional insurance benefits in accordance with Company policy, should this be deemed necessary.
In normal circumstances, the maximum value of benefits will be $22,000. However, the Committee has discretion to exceed this should the underlying cost of providing the pre-existing benefits increase, or if additional benefits are provided and are deemed appropriate.
Pension No Director receives pension contributions. The Corporate Governance Code considers that the participation by a Non-Executive Director in a company’s pension scheme could potentially affect the independence of that Non-Executive Director.
As Directors do not receive variable remuneration, there are no provisions in place to recover sums paid or withhold payments.
No Executive Directors were appointed, or served, on the Board in 2015.
The Directors’ Remuneration Policy was approved by shareholders at the AGM held on 21 May 2014 and took effect from that date. The summary policy table below is provided for reference, and covers elements of the policy that apply to all Directors. It does not formally form part of the Remuneration Report and has not been separated into elements relating to the role of Executive Chairman and Non-Executive Director following Jean-Paul Luksic’s re-designation as Non-Executive Chairman in September 2014.
The full Remuneration Policy approved by shareholders at the 2014 AGM can be found in the Remuneration and Talent Management section of the Company’s website at www.antofagasta.co.uk/investors/corporate-governance/board-committees.
The Company’s policy is to ensure that Directors are fairly rewarded with regard to their responsibilities, and to consider comparable pay levels and structures in the UK, Chile, and in the international mining industry. Remuneration levels for Directors are reviewed annually in comparison with companies of a similar nature, size and complexity and take into account the specific responsibilities undertaken and structure of the Board.
98 Antofagasta plc Annual report and financial statements 2015
Corporate Governance ReportRemunerationSummary of Directors’ Remuneration Policy

Remuneration and Talent Management Committee
Role and responsibilities of the Committee
The Remuneration and Talent Management Committee is responsible for ensuring that remuneration arrangements support the Group’s strategic objectives and enable the recruitment, motivation, retention and development of talent within the expectations of shareholders.
The Committee is responsible for preparing the Company’s Remuneration Policy and assessing its relevance and for reviewing the remuneration of any Executive Directors (although there are currently none). The Committee also reviews and approves the remuneration of both the Chairman and the Group CEO, determining the performance-related elements of the Group CEO’s compensation.
Remuneration for members of the Executive Committee, including awards granted under the LTIP and Annual Bonus Plan, and performance targets for each plan, are reviewed by the Group CEO and recommended to the Committee for approval.
Group performance is a significant component of the Annual Bonus Plan and the Committee reviews targets for the Group and each of its operations at the beginning of each year and recommends them to the Board for approval.
The Committee is also responsible for: monitoring the level and structure of remuneration of the Executive Committee; reviewing and approving performance-related compensation; reviewing succession plans for the Executive Committee; reviewing any major changes in compensation policies applied across the Group’s companies that have a significant long-term impact on labour costs; and reviewing compensation and talent management strategies.
The Committee works with remuneration consultants to review Non-Executive Directors’ remuneration against relevant markets and makes recommendations to the Board based on those results. The remuneration of Non-Executive Directors is determined by the Board as a whole and no Director participates in the determination of his or her own remuneration.
Remuneration and Talent Management Committee membership
The members of the Committee and their attendance at meetings of the Committee during the year are shown in the table above. Biographical details of the members of the Committee, including relevant qualifications and experience, are set out on pages 74 to 76. All of the Committee members are considered by the Board to be independent Non-Executive Directors.
Advisors to the Committee
During the year, the Committee re-appointed remuneration consultants Towers Watson to continue to provide advice on matters under its consideration. This included compensation benchmarking and updates on legislative requirements and market practice.
Towers Watson is a widely recognised independent global professional services firm that is signatory to, and adheres to, the Code of Conduct for Remuneration Committee Consultants, which can be found at www.remunerationconsultantsgroup.com.
The Committee is satisfied that the advice provided by Towers Watson in 2015 was objective and independent, that no conflict of interest arose as a result of these services and that Towers Watson has no other connection with the Company.
Membership and meeting attendanceNumber
attendedMaximum
possible
Tim Baker (Chairman) 6 6William Hayes 6 6Ollie Oliveira 6 6
Key activities in 2015
• Reviewed the structure of the Group’s Annual Bonus and long-term incentive plans and recommended changes to the Board for approval.
• Reviewed LTIP eligibility and participants.• Oversaw the continued implementation of the Group’s talent
management and succession planning policies.• Reviewed compensation across the Group to ensure that it
remains competitive, motivating and appropriately aligned with the Group’s performance and strategy.
• Reviewed fees for members of the Projects Committee and recommended them to the Board for approval.
• Reviewed the Company’s 2014 Remuneration Report prior to its approval by the Board and subsequent approval by shareholders at the 2015 AGM.
• Reviewed Group performance and approved the vesting of awards in connection with LTIP awards granted in 2012.
• Reviewed the 2016 Annual Bonus Plan and Group performance against the 2015 Annual Bonus Plan.
• Reviewed and approved the performance of the members of the Executive Committee under the 2014 Annual Bonus Plan.
• Reviewed the performance of the Group CEO for the purpose of determining variable compensation under the 2014 Annual Bonus Plan and Recruitment Award.
• Reviewed the performance-related elements of the Group CEO’s compensation and approved the grant of Strategic Awards.
• Reviewed Chairman, Director and Committee fees.
Antofagasta plc 99
GO
VE
RN
AN
CE
GO
VE
RN
AN
CE
ST
RA
TE
GIC
RE
PO
RT
FIN
AN
CIA
L STA
TE
ME
NT
SO
TH
ER
INF
OR
MA
TIO
NO
VE
RV
IEW
Corporate Governance ReportRemunerationAnnual Report on Remuneration 2015

Towers Watson’s fees for this work were charged in accordance with normal billing practices and amounted to £60,140.
The Company’s legal advisors, Clifford Chance LLP, were also re-appointed by the Committee to continue to provide advice on the operation of the Group’s LTIP and other legal issues during 2015.
The Committee Chairman has regular dialogue with advisers without management present. For that reason and the reasons above, the Committee considers that the advice that it receives is independent.
The Committee also received assistance from the Chairman, the Group CEO, the Vice President of Human Resources and the Company Secretary during 2015, none of whom participate in discussions relating to setting their own remuneration.
Statement of shareholder votingThe table below displays the voting results on the Remuneration Policy at the 2014 AGM and the Company’s 2014 Remuneration Report at the 2015 AGM:
Resolution to approve the Remuneration Policy Votes for 965,357,216 91.8%Votes against 86,053,542 8.2%Votes cast as a percentage of Issued Share Capital 88.7%Votes withheld 1,350,645
Resolution to approve the Company’s 2014 Remuneration Report Votes for 1,049,760,797 99.1%Votes against 9,754,030 0.9%Votes cast as a percentage of Issued Share Capital 89.4%Votes withheld 105,477
The considerable vote in favour of the Remuneration Policy and the Company’s 2014 Remuneration Report confirms the strong support the Group has received from shareholders regarding the remuneration arrangements and the performance of the Group over the past year.
Implementation of the Directors’ Remuneration Policy in 2015
Chairman
Mr Jean-Paul Luksic was appointed Executive Chairman in 2004 and was redesignated as Non-Executive Chairman on 1 September 2014. As a consequence of this, the contracts for services that Mr Luksic had with the Antofagasta Railway Company plc and Antofagasta Minerals were terminated with effect from that date and the fee payable for the role of Chairman of the Board was reduced.
From 6 October 2015, Mr Luksic resigned as a director of the Group’s transport division subsidiary and therefore, from that date, the only fees payable to Mr Luksic are for his services as Chairman of the Board, Chairman of the Nomination and Governance Committee and Chairman of the Antofagasta Minerals board.
Non-Executive Directors
There has been no change to the level of Antofagasta plc Board fees since 2012. The base Non-Executive Director’s annual fee in respect of the Board remained at $130,000. Given the core role which Antofagasta Minerals plays in the management of the mining operations and projects, and that Antofagasta Minerals represents the large majority of the Group’s business, all Antofagasta plc Directors also served as Directors of the Antofagasta Minerals board. The annual fee payable to Directors of Antofagasta Minerals remained at $130,000 for members of the Board. Therefore, the combined base fees payable to Non-Executive Directors of both Antofagasta plc and Antofagasta Minerals amounted to $260,000 per annum.
The Board remains satisfied that the current fee levels and structure are aligned with the Group’s international peers and the Board is not recommending any change this year, but will continue to review fee levels from time to time, in accordance with the Remuneration Policy.
In addition to Board fees, Directors also receive fees for their contributions to Board committees during the year. In 2015, with the assistance of Towers Watson, the Committee reviewed committee fee levels and it was decided that fees for the existing committees should remain unchanged, as they have since 2012. Following the creation of the Projects Committee in 2015, the Committee determined that additional fees for the Projects Committee Chairman and members should be the same as for the Remuneration and Talent Management Committee and the Sustainability and Stakeholder Management Committee. The table below summarises Antofagasta plc Board Committee fees payable in 2015.
RoleAdditional
fees ($000)
Audit and Risk Committee Chairman 20Audit and Risk Committee member 10Nomination and Governance Committee Chairman 10Nomination and Governance Committee member 4Projects Committee Chairman 16Projects Committee member 10Remuneration and Talent Management Committee Chairman 16Remuneration and Talent Management Committee member 10Sustainability and Stakeholder Management Committee Chairman 16Sustainability and Stakeholder Management Committee member 10
The Remuneration Policy does not allow for the payment of variable remuneration to the Chairman or Non-Executive Directors.
Implementation of Remuneration Policy in 2015 and 2016
The Committee does not anticipate any changes to the implementation of the Remuneration Policy during 2016.
Audited single figure remuneration table
The remuneration of the Directors and of Mr Diego Hernández, the Group CEO, for the year is set out below in US dollars. Unless otherwise noted, amounts paid in Chilean pesos have been translated at exchange rates at the time of payment.
Any additional fees payable for membership of subsidiary and joint venture company boards are included within the amounts attributable to the Directors within the table of Directors’ remuneration below.
As explained in the Remuneration Policy, Directors do not receive pensions or performance-related pay and are not eligible to participate in the LTIP.
100 Antofagasta plc Annual report and financial statements 2015
Corporate Governance ReportRemunerationAnnual Report on Remuneration 2015

Salary/Fees Benefits5 Annual Bonus LTIP6Recruitment
Award9 Total
2015 $000
2014 $000
2015 $000
2014 $000
2015 $000
2014 $000
20157
$00020148
$0002015 $000
2014 $000
2015 $000
2014 $000
Chairman Jean-Paul Luksic1 (non-executive since 1 September 2014) 1,098 2,590 18 20 – – – – – – 1,115 2,610Non-Executive Directors William Hayes 342 356 – – – – – – – – 342 356Gonzalo Menéndez 313 340 – – – – – – – – 313 340Ramón Jara2 876 960 3 3 – – – – – – 879 963Juan Claro 270 279 – – – – – – – – 270 279Hugo Dryland 260 260 – – – – – – – – 260 260Tim Baker 294 294 – – – – – – – – 294 294Ollie Oliveira3 288 273 – – – – – – – – 288 273Nelson Pizarro (resigned 1 September 2014) – 173 – – – – – – – – 0 173Andrónico Luksic 260 260 – – – – – – – – 260 260Vivianne Blanlot (appointed 27 March 2014) 270 200 – – – – – – – – 270 200Jorge Bande (appointed 17 December 2014) 275 10 – – – – – – – – 275 10Total Board 4,545 5,995 21 23 – – – – – – 4,566 6,018Group CEO (not on the Board)Diego Hernández4 (appointed Group CEO 1 September 2014) 847 303 11 5 321 220 621 158 734 – 2,534 688Grand total 5,392 6,298 32 28 321 220 621 158 734 – 7,100 6,706
1 On 1 September 2014, Jean-Paul Luksic became Non-Executive Chairman of Antofagasta plc. From this date, his service agreements with Antofagasta Minerals S.A. and Antofagasta Railway Company plc terminated and his annual fee as Chairman of the Antofagasta plc Board was reduced from $1,000,000 to $730,000. He continues to receive an annual fee of $260,000 as Chairman of Antofagasta Minerals S.A., an annual fee of $10,000 as Chairman of the Nomination and Governance Committee and received directors’ fees as a director of Ferrocarril de Antofagasta a Bolivia, the Chilean branch of Antofagasta Railway Company plc until 6 October 2015 and Aguas de Antofagasta S.A. until 3 June 2015, when the sale of the Group’s water division completed. The benefits expense represents the provision of life, accident and health insurance.
2 During 2015, remuneration of $524,000 (2014 – $573,000) for the provision of services by Ramón Jara was paid to Asesorías Ramón F Jara Ltda. This amount is included in the amounts attributable to Ramón Jara of $876,000 (2014 – $960,000). The benefits expense represents the provision of accident insurance to Ramón Jara.
3 Fees payable in respect of Ollie Oliveira’s service as a Director are paid to Greengrove Capital LLP, a partnership in which Ollie Oliveira is a partner.
4 Diego Hernández was appointed Group CEO on 1 September 2014 and amounts disclosed for 2014 relate to remuneration paid to him from that date, including base salary and benefits and the pro rata value of his annual bonus and LTIP Restricted Share Awards. No pension is payable to Diego Hernández.
5 All Directors are covered by the Directors’ and Officers’, Life and Travel insurance policies generally maintained by the Group. Diego Hernández is covered by Life and Health insurance policies generally maintained by the Group.
6 As explained on page 104, awards granted pursuant to the LTIP are split between Restricted Share Awards and Performance Share Awards. Because Restricted Share Awards do not have a performance element, they are reported in the year that they vest.
7 The 2015 amounts payable to Diego Hernández under the LTIP relate to Restricted Share Awards and Performance Share Awards granted in 2013 and to Restricted Share Awards granted in 2012 and 2014. The performance period for Performance Share Awards granted in 2013 concluded on 31 December 2015 and these awards will vest on 12 April 2016. Because the Performance Share Awards granted in 2013 have not yet vested, the amounts attributable to these awards have been estimated using the average closing share price for the last quarter of 2015 of 505.1p and the average exchange rate for the year of $1.528/£1.
8 The 2014 amounts payable to Diego Hernández under the LTIP relate to Restricted Share Awards and Performance Share Awards granted in 2012 and to Restricted Share Awards granted in 2013. The amounts attributable to the Restricted Share Awards are the pro rata value of amounts paid following vesting in 2014 following his appointment as Group CEO. The performance period for Performance Share Awards granted in 2012 concluded on 31 December 2014 and vested on 25 March 2015. This figure is the final amount paid for the entire performance period. In the 2014 Annual Report an estimate was used because the 2012 Performance Share Awards had not yet vested.
9 Diego Hernández was granted an exceptional, long-term Recruitment Award on 22 November 2012. The Recruitment Award was in the form of conditional rights to receive a cash payment by reference to the market value of 83,496 ordinary shares in the Company at vesting. The Recruitment Award was not granted over actual shares. Half of the Recruitment Award was subject both to performance conditions, which were measured over a three-year period ending on 1 August 2015 (the three-year anniversary of the effective date of Diego Hernández’s appointment), and to continued employment and the other half of the Recruitment Award was subject to continued employment. 100% of the Recruitment Award vested on 1 August 2015. The calculation of the award was made using the share price as at 1 August 2015 of 577.5p and an exchange rate of $1.577/£1. Details of the performance conditions attaching to the Recruitment Award and Diego Hernández’s performance are explained in more detail on page 107.
Antofagasta plc 101
GO
VE
RN
AN
CE
GO
VE
RN
AN
CE
ST
RA
TE
GIC
RE
PO
RT
FIN
AN
CIA
L STA
TE
ME
NT
SO
TH
ER
INF
OR
MA
TIO
NO
VE
RV
IEW

Directors’ interests (Audited)
The Directors who held office at 31 December 2015 had the following interests in the ordinary shares of the Company:
Ordinary shares of 5p each
31 December 2015 1 January 2015
Jean-Paul Luksic1 41,963,110 41,963,110Ramón Jara2 5,260 5,260
1 Jean-Paul Luksic’s interest relates to shares held by Aureberg Establishment, an entity that he ultimately controls.
2 Ramón Jara’s interest relates to shares held by a close family member.
There have been no changes to the Directors’ interests in the shares of the Company between 31 December 2015 and the date of this report.
The Directors had no interests in the shares of the Company during the year other than the interests set out in the table above. No Director had any material interest in any contract (other than a service contract) with the Company or its subsidiary undertakings during the year other than in the ordinary course of business.
The Group does not currently have shareholding guidelines or requirements for Directors – all of whom are non-executive. Executives, all of whom are below Board level, participate in the Group’s LTIP which entitles them to “phantom” share awards. Awards that have been granted to Diego Hernández under the LTIP with one or more outstanding components are set out on page 106. Further details on the LTIP are set out on page 104.
During the period, no Director was eligible for any short-term or long-term incentive awards and no Director owns any shares that have resulted from the achievement of performance conditions.
Letters of appointment
Each Director has a letter of appointment with the Company. The Company has a policy of putting all Directors forward for re-election at each Annual General Meeting, in accordance with the UK Corporate Governance Code. Under the terms of the letters, if a majority of shareholders do not confirm a Director’s appointment, the appointment will terminate with immediate effect. In other circumstances, the appointment may be terminated by either party on one month’s prior written notice.
There is a contract between Antofagasta Minerals S.A. and Asesorías Ramón F Jara Ltda (formerly E.I.R.L.) dated 2 November 2004 for the provision of advisory services by Ramón Jara. This contract does not have an expiry date but may be terminated by either party on one month’s notice. No other Director is party to a service contract with the Group.
Voluntary disclosures – executive remuneration Diego Hernández is responsible for leading the senior management team and for the executive management of the Group. The Executive Committee, led by the Antofagasta Minerals CEO, Iván Arriagada, is responsible for leading the day-to-day operation of the mining business. No member of the Executive Committee, nor the Group CEO, sits on the Board of Antofagasta plc. Consequently, the disclosures below relating to the variable pay mechanisms, Annual Bonus and LTIP, as well as information on the Group CEO’s remuneration arrangements above, are voluntary disclosures to provide shareholders with further information on the Group’s pay structure for senior executives.
Remuneration principles
The remuneration arrangements in place for Diego Hernández and the Executive Committee are structured to align remuneration with performance, the Group’s strategic objectives and shareholders’ interests. Diego Hernández and each Executive Committee member is eligible to receive a combination of base salary and other benefits, as well as variable remuneration in the form of an annual cash bonus and conditional cash awards based on the price of the ordinary shares of the Company granted pursuant to the Group’s LTIP.
The performance components of variable remuneration are selected to incentivise the delivery of the business strategy, to reward Group and individual performance and to motivate Diego Hernández and the Executive Committee.
As noted in the single figure table on page 101, except for the amount attributable to 2012 LTIP Performance Share Awards which relate to the entire performance period from 2012 until 31 December 2014, disclosures in relation to Diego Hernández’s 2014 remuneration relate only to the four-month period following his appointment as Group CEO and lead executive in the Group. 2015 disclosures are for the whole year. The table on page 110 shows the total remuneration for the Group’s lead executive over the last seven years. The total remuneration for Diego Hernandez in 2015 was 12% lower than the total remuneration for the lead executive position in 2014.
Salary and benefits
The total remuneration paid to Diego Hernández for 2015 was $2,534,000. Fixed remuneration comprises base salary and benefits, and in 2015 represented less than 35% of his total remuneration package.
Benefits payable to Diego Hernández reflect amounts paid to maintain Life and Health insurance policies.
According to Chilean law, all employees are required to pay their own pension and compulsory healthcare contributions. No additional contributions are made by the Group, including in relation to Diego Hernández.
Diego Hernández’s total remuneration package is determined by the Remuneration and Talent Management Committee, taking into account the performance of the Group and his personal performance. The Company also benchmarks each element of his remuneration and his total remuneration package by reference to FTSE 100, FTSE mining and comparable international mining companies.
Employment contract
Diego Hernández is employed under a contract of employment with Antofagasta Minerals S.A., a subsidiary of Antofagasta plc. His contract is governed by Chilean Labour Law. It does not have a fixed term and can be terminated by either party on 30 days’ notice in writing. Except in the case of termination for breach of contract or misconduct under the Chilean Labour Code, Diego Hernández is entitled to receive one month’s base salary for each year of service on termination, otherwise no other compensations or benefits are payable on termination of his employment. The salary payable to Diego Hernández under his employment contract as of 1 September 2014 was Ch$44,871,653 ($75,669) per month and his salary is adjusted for inflation in Chile every three months.
His total salary payments for 2015 were Ch$556,654,801 ($847,103) and other than adjustments for inflation, there were no other adjustments to his salary in 2015. Under his employment agreement, Diego Hernández is entitled to 22 working days’ paid holiday per year. Diego Hernández is entitled to Life and Health insurance. Because the Group CEO’s salary is paid in Chilean pesos, it is subject to annual exchange rate movements when reported in US dollars.
102 Antofagasta plc Annual report and financial statements 2015
Corporate Governance ReportRemunerationAnnual Report on Remuneration 2015

Annual bonus
Employees are eligible to receive cash awards under the Annual Bonus Plan based on Group and individual performance. The bonus plan focuses on the delivery of annual financial and non-financial targets designed to align remuneration with the Group’s strategy and create a platform for sustainable future performance. In 2015, the bonus payable to the Group CEO was attributable 70% to the performance of the Group and 30% to personal performance, according to metrics that were fixed at the beginning of the year.
• The bonus payable to the Group CEO for achieving the Group and personal performance targets in 2015 was 50% of annual base salary (six months’ base salary).
• The maximum bonus payable to the Group CEO for achieving stretch performance targets in 2015 was 100% of annual base salary (12 months’ base salary).
In 2015, the bonus payable to the CEO of Antofagasta Minerals was attributable 70% performance of the Group and 30% to personal performance, according to metrics that were fixed when he joined the Group in 2015. The bonus payable to each Vice President was attributable 50% to the performance of the Group and 50% to the performance of that Vice President, according to metrics that were fixed at the beginning of the year.
The Group performance criteria for the Annual Bonus Plan and the individual performance criteria for the Group CEO are set annually by the Committee. The individual performance criteria for the Executive Committee are set by the Group CEO and reviewed by the Committee. The average maximum available award for the Executive Committee members under the terms of the Annual Bonus Plan, which would reflect maximum individual and Group performance, is 67% of base salary. In 2015, the average award for the Executive Committee members was approximately 32% of base salary. Individual award levels are calibrated at the conclusion of each annual performance period to ensure that performance targets remain stretching and that high or maximum payments under each plan are received only for exceptional performance.
In 2015, Group performance under the Annual Bonus Plan was as follows:
Weighting Objective Measure2015
Minimum2015
Target2015
Maximum2015
Outcome2015
Result1 %
58% Core Business16% EBITDA2 $m 1,059 1,176 1,294 832 9015% Production3
Copper Production (13.6%) kt 668 710 732 626 90Gold Production (0.9%) koz 235 250 258 214 90Molybdenum Production (0.5%) kt 7.5 8.0 8.2 10.1 110
24% CostsCash Costs Before By-product Credits (22%) $/lb 1.86 1.75 1.70 1.81 94.5Corporate Expenditure (2%) $m 152 145 137 136 110
3% Operating Companies’ Capex Measured according to schedule and budget 104.221% Business Development13% Growth Projects’ Execution4 Measured according to schedule/budget/quality 98.63% Exploration and Development – Resources increase Mt CuF 6.5 6.8 7.2 7.9 1105% Business Development Growth – M&A Measured according to KPIs and milestones 11021% Sustainability and Organisational Capabilities10% Safety – KPIs, Reporting and Safety Model
Measured according to KPIs and milestones
96.32% People – Talent Management 108.42% Environmental Performance 102.75% Social Programmes 108.62% Transformational Initiatives – Nexo Project 107.6Total 97.1
1 Performance range is 90-110% where 90% = threshold, 100% = meets expectations/target, and 110% = outstanding performance/stretch.
2 Mining division only.
3 Excludes Zaldívar.
4 Split between the Antucoya Project (6%), Encuentro Oxides (4%), Los Pelambres Incremental Expansion (1%), Centinela Second Concentrator (1%) and Centinela Molybdenum Plant (1%).
The choice of these criteria, and their respective weightings, reflect the Committee’s belief that any incentive compensation should be tied both to the overall performance of the Group and to those areas of the business that the relevant individual can directly influence. The Committee reviewed the results for 2015 in November 2015 and January 2016 and decided to recommend that the Board use its discretion to lower the 2015 Group performance outcome as it applies to Diego Hernández and the Executive Committee from 97.1% to 95% to reflect that 2015 was a challenging year for the Group – in particular with production substantially missing budget and a fatality at Michilla.
Antofagasta plc 103
GO
VE
RN
AN
CE
GO
VE
RN
AN
CE
ST
RA
TE
GIC
RE
PO
RT
FIN
AN
CIA
L STA
TE
ME
NT
SO
TH
ER
INF
OR
MA
TIO
NO
VE
RV
IEW

The Committee, with input from the Board, assessed Diego Hernández’s performance against his individual objectives as 104% for his individual contribution to the business during the year.
Diego Hernández’s performance against his individual objectives is summarised below:
Category Performance
Results • Effective implementation of, and performance against, the Group’s safety and health model – with the exception of an unacceptable fatality at Michilla.
• Copper production below target.
• Unit costs higher than target due to lower than forecast production.
• Successful handling of the closure of mining operations at Michilla.
• Antucoya commenced production once construction issues were resolved.
• On budget progress at the Encuentro Oxides project.
• Centinela Molybdenum Plant project approved for construction.
• Strong progress on developing in-house construction management expertise for the Encuentro Oxides and Centinela Molybdenum Plant projects.
Leadership • Strong leadership demonstrated across the Group with good progress on safety, succession planning and talent management.
• Strong mentorship of the Executive Committee.
• Further progress on rolling out and strengthening the Group’s leadership values and behaviours model.
• Further progress developing synergies between the Group’s operations.Strategic development • Completed the sale of the water division.
• Acquisition of 50% of Zaldívar, with operatorship.Capital and cost reductions
• Significant and successful headcount reductions across all areas were carried out during the year.
• Cost reductions of $245 million during the year.
• Capital expenditure reduced by $598 million to $1,049 million (stated on a cash flow basis).
• Maintained a strong balance sheet with net debt of $1,024 million and low gearing.
Based on performance achieved against targets during the 2015 financial year, the Committee determined, based on the performance metrics, that Diego Hernández would receive a bonus payment of $321,000 for 2015.
Because the annual bonus is paid in Chilean pesos, it is subject to annual exchange rate movements when reported in US dollars.
Long-Term Incentive Plan
The Company introduced the LTIP at the end of 2011. Eligibility to participate in the LTIP is determined by the Committee each year on an individual basis and all members of the Executive Committee currently participate. The first awards under the LTIP were granted on 29 December 2011 and awards have since been granted annually. Under the rules of the LTIP, Directors are not eligible to participate.
Under the LTIP, participants are eligible to receive “phantom” share awards (conditional rights to receive cash payment by reference to a specified number of the Company’s ordinary shares), which are paid in cash upon vesting and are made to participants based on the price of the Company’s ordinary shares at the time of vesting.
Awards granted pursuant to the LTIP are split between Restricted Share Awards (“RSAs”) and Performance Share Awards (“PSAs”). The RSAs are conditional rights to receive cash payment by reference to a specified number of the Company’s ordinary shares subject to the relevant employee remaining employed by the Group when the RSAs vest. The PSAs are conditional rights to receive cash payment by reference to a specified number of the Company’s ordinary shares subject to both the satisfaction of performance conditions and the relevant employee remaining employed by the Group when the PSAs vest.
• PSAs reward performance over three years.
• RSAs vest one-third in each year over a three-year period following grant of the award.
The same performance criteria apply to all participants in the LTIP, which is designed to link business objectives, shareholder value and senior management rewards. The number of PSAs and RSAs awarded to each member of the Executive Committee is calculated as a percentage of salary up to a limit of 200% of base salary or 325% of base salary if the Committee determines that exceptional circumstances apply. The market value of shares in relation to which the award is to be granted is equal to the closing price on the dealing day before the grant or if the Committee so determines, the average of the closing price during a period determined by the Committee not exceeding five dealing days ending with the last dealing day before the grant.
In 2015, Diego Hernández received total payments of $481,000 in respect of the RSAs granted in 2012, 2013 and 2014. Using the average closing share price for the last quarter of 2015 of 505.1p and the average exchange rate for the year of $1.528/£1, Diego Hernández’s estimated payment for PSA awards granted under the 2013 programme and vesting on the conclusion of performance in 2015 is $140,000. Using these calculations, LTIP awards amounted to 73% of his base salary.
104 Antofagasta plc Annual report and financial statements 2015
Corporate Governance ReportRemunerationAnnual Report on Remuneration 2015

The performance criteria attaching to the PSAs granted in 2013 and anticipated performance based on estimates as at March 2016 is as follows:
Weighting Objective
MeasureAnticipated
performance1
Minimum Target Maximum
25% Relative Total Shareholder Return2
0% vesting at performance below the index during the three-year period
33% vesting at performance equal to the index during the three-year period
100% vesting at performance equal to or greater than the index plus 5% during the three-year period
100%
25% EBITDA3 0% vesting at 80% of maximum or below
75% vesting at 90% of maximum
100% vesting at $8,150 million 0%
5% Mineral Resources Increase
0% vesting at 66.481 MtCuF or below as at 31 December 2015, taking into account 1.050 MtCuF expected consumption over the performance period
50% vesting at 67.531 MtCuF, the expected level of contained resources as at 31 December 2015
100% vesting at 68.581 MtCuF contained resources as at 31 December 2015, including an additional 1.050 MtCuF increase in contained resources in Chile
100%
10% Mineral Reserves Increase
0% vesting at 11.817 MtCuF. This figure corresponds to 2012 reserves, less estimated consumption by the operating companies over the performance period
33% vesting at 14.063 MtCuF. This figure assumes that only Antucoya has been incorporated as reserves
100% vesting at 14.714 MtCuF. This figure corresponds to the level of contained copper reserves for the Group at the end of 2015 and assumes that the resources of Antucoya and Encuentro Oxides have been incorporated as reserves
100%
Minimum (0%) Target (50%) Maximum (100%)
35% Projects, Development and Sustainability
1. Encuentro Oxides and Centinela Second Concentrator (7%)
At least one of the four goals achieved
At least two of the four goals achieved
Four time-based goals for progressing Encuentro Oxides’ commissioning and the commencement of construction on completion of feasibility studies for various elements of the Centinela Second Concentrator Project
0%
2. Antucoya (7%) Full production at February 2016
Full production at January 2016
Full production at December 2015
0%
3. Los Pelambres energy cost (4%) $130/MWh $120/MWh $110/MWh 25%4. Safety (7%)Over the three-year period, zero fatalities and LTIFR less than an average of 1.3
Over the three-year period, zero fatalities and LTIFR less than an average of 1.1
Over the three-year period, zero fatalities and LTIFR less than an average of 1.0
0%
5. Los Pelambres expansion project (6%)Pre-feasibility study completed by 31 December 2015
Feasibility study completed by 31 December 2015 and EIA submitted
EIA approved and project approved by 31 December 2015
0%
6. Twin Metals project (4%)Pre-feasibility study completed by 31 December 2014
Pre-feasibility study and basic information for the mine plan of operation completed by 31 December 2014
Pre-feasibility study with definitive mine plan of operation completed and environmental review process ongoing by 31 December 2015
0%
Total 41%
1 Anticipated performance is based on estimates in March 2016. These awards will not vest until after the Group’s 2015 results have been released to the market.
2 Total shareholder return is calculated to show a theoretical change in the value of a shareholding over a specified period, assuming that dividends are reinvested to purchase additional shares at the closing price applicable on the ex-dividend date. Total shareholder return for the Euromoney Global Mining Index is calculated by aggregating the returns of all individual constituents of that index and, for the purposes of comparison with Antofagasta plc share performance, is calculated by taking an average of the index over three months before the beginning and the end of the period respectively.
3 Targets are calculated based on the Group’s accumulated EBITDA over the period from 2013-2015, versus the 2013 budget figure and the 2013, Group’s internal base case figures for 2014 and 2015. The final calculation will not be adjusted for commodity price or exchange rate fluctuations.
Antofagasta plc 105
GO
VE
RN
AN
CE
GO
VE
RN
AN
CE
ST
RA
TE
GIC
RE
PO
RT
FIN
AN
CIA
L STA
TE
ME
NT
SO
TH
ER
INF
OR
MA
TIO
NO
VE
RV
IEW

The following LTIP awards with one or more outstanding components have been granted to Diego Hernández:
Year of grant Award type
Number of shares over
which the grant relates Date of award Vesting dates
Face value of award (using
market price at grant) £’000
Market price at
grant £
End of performance
period
% of award receivable if
minimum performance
achieved
2013 Performance Share Awards
45,242 12 April 2013 12 April 2016 700 10.13 31 December 2015 0%
Restricted Share Awards
45,242 12 April 2013 12 April 2014 12 April 2015 12 April 2016
700 10.13 N/A 0%
2014 Performance Share Awards
53,896 19 March 2014 19 March 2017 750 7.85 31 December 2016 0%
Restricted Share Awards
53,896 19 March 2014 19 March 2015 19 March 2016 19 March 2017
750 7.85 N/A 0%
Note: Diego Hernández joined the Group on 1 August 2012 and was granted awards under the 2012 LTIP on 22 November 2012. The portion of RSAs that vested on 9 January 2013 was reduced pro rata to take into account the period before he joined the Group. The payment that he received in relation to the PSAs that vested in 2015 was also reduced pro rata to the time that he has been with the Group during the 2012 programme.
2015 Strategic Awards
Following his appointment as Group CEO, Diego Hernández received Strategic Awards in 2015 in lieu of awards that he may otherwise have received pursuant to the LTIP and to align his performance goals with the Group’s strategy, taking into account his transition into this new role and the associated responsibilities.
The 2015 Strategic Awards are cash awards and are not linked to the share price. The maximum performance by Diego Hernández would amount to a payment of $1,530,000 in 2016 and there is no guaranteed minimum payment under the terms of the 2015 Strategic Award.
Type of award Grant date
Face value of award
(% of base salary)
Face value of award
(‘000)1
% vesting at threshold
performance
End of performance period over which the performance
conditions have been fulfilled2
Cash Awards 21 May 2015 27% $230 100% 30 April 2016Cash Awards 21 May 2015 153% $1,300 62% 1 August 2016
1 The face value represents the maximum value of the award. The expected value of the award vesting on 1 August 2016 is 62% of the face value or $800,000.
2 Vesting of the 2015 Strategic Awards is subject to Diego Hernández remaining in employment with the Group and to performance criteria based on the Group’s growth strategy and leading and effectively managing the Group’s leadership team. These individual targets are considered by the Board to be commercially sensitive; however the specific targets and performance against them will be described retrospectively in the 2016 Annual Report.
106 Antofagasta plc Annual report and financial statements 2015
Corporate Governance ReportRemunerationAnnual Report on Remuneration 2015
Recruitment Award
As explained on page 101, as part of the remuneration arrangements agreed on his appointment, Diego Hernández was granted an exceptional, long-term Recruitment Award when he joined the Group.
Over and above the Annual Bonus Plan and the LTIP, which are both heavily weighted towards Group performance, Diego Hernández was tasked by the Board to build an organisation that could sustain itself in the long term in a very competitive labour market by building a depth of talent, ensuring that succession plans were in place for all key positions in the Group and to develop a successor for the role of CEO of Antofagasta Minerals. Over the three-year performance period, considerable work has been done and the Committee assessed that the targets were fully met. The specific performance criteria and weightings attaching to the Recruitment Award were as follows.
Weighting Measure
12.8% Increased leadership effectiveness of the Executive Committee evidenced by 360-degree feedback and measured against external benchmarking performed in 2012, and in fully closing any gaps agreed with the Remuneration and Talent Management Committee.
61.6% Implementation of a succession plan for each member of the Executive Committee and for the General Managers of each of the Group’s operations evidenced by the successful identification of at least one successor for each position that is deemed ready to assume the role at the vesting date.
12.8% Improvement of the organisational climate in the mining division, specifically regarding quality of life, recognition and development.12.8% Implementation of a development programme for “high-potential” employees.
Indicative total remuneration in 2016
The Group CEO’s total remuneration in 2016 will consist of the same elements as in 2015, including:
• Annual base salary of Ch$570,362,748 ($806,737) as at 1 January 2016, subject to adjustments for Chilean inflation, as described above;
• An annual bonus equivalent to 50% of base salary if target performance is achieved, with a maximum of 100% if stretch targets are met;
• The vesting of LTIP awards granted before 1 September 2014, which using the average closing share price for the last quarter of 2015 are equivalent to a maximum of 49% of base salary; and
• The vesting of 2015 Strategic Awards, which are equivalent to a maximum of 190% of base salary.
A significant proportion of the rewards available to Diego Hernández is dependent on the performance of the Group.
Antofagasta plc 107
GO
VE
RN
AN
CE
GO
VE
RN
AN
CE
ST
RA
TE
GIC
RE
PO
RT
FIN
AN
CIA
L STA
TE
ME
NT
SO
TH
ER
INF
OR
MA
TIO
NO
VE
RV
IEW

2016 Annual Bonus Plan
The Board has agreed Group performance criteria for the 2016 Annual Bonus Plan as follows.
Weighting Objective Measure Minimum Target Maximum
70% Core Business10% EBITDA $m ≤-10% The Group’s future metals price assumptions are
commercially sensitive and therefore the target for EBITDA will not be disclosed in advance. However, the Company plans to disclose the 2016 target and outcome in the 2016 Annual Report.
≥+10%
25% Copper Production tonnes ≤-6% 710-740,000 ≥+3%
30% CostsCash costs before by-product credits (24%)
$/lb ≥+6% 1.65 ≤-3%
Corporate Expenditure (6%) $m ≥+6% This is commercially sensitive and the Company plans to disclose the target and outcome in the 2016 Annual Report.
≤-3%
5% Sustaining Capital Expenditure Measured according to schedule and budget.5% Business Development –
Growth Projects Execution Measured according to KPIs and milestones.
25% Sustainability and Organisation Capabilities5% Safety
Measured according to KPIs and milestones.5% People 5% Environmental 10% Social
The weighting attributable to core business has increased from 58% of the total scorecard in 2015 to 70% in 2016, and the weighting attributable to sustainability (including safety) has been increased from 21% in 2015 to 25% in 2016. This reflects the challenges associated with low forecast copper prices and the Group’s goals of focusing on safety, costs and productivity.
Starting in 2016, the Board has determined that two stand-alone triggers will apply to the calculation of Group performance as follows:
1. If net profit adjusted for currency fluctuations, metals prices and exceptional items is negative, the score relating to core business will be 90%.
2. If there are one or more fatalities in a year, the final Group performance score will be reduced by 15% within the performance range. If there are no fatalities the score will be increased by 15% within the performance range.
In addition, the Board has the discretion to adjust the final Group performance score by up to 3%.
The Board has also agreed to adjust the ratios between Group and individual performance under the 2016 Annual Bonus Plan. In 2016, the performance of the Vice Presidents will be weighted 70% towards Group performance and 30% towards individual performance (previously the split was 50/50). This change is intended to more closely align the performance of the Group CEO and the members of the Executive Committee with the Group’s objectives of improving safety, costs and productivity in 2016.
108 Antofagasta plc Annual report and financial statements 2015
Corporate Governance ReportRemunerationAnnual Report on Remuneration 2015

2016 Long-Term Incentive Plan Awards
The Committee completed a thorough review of the LTIP in 2015. This included a review of the plan’s objectives, methodology, participants, performance KPIs and targets. As part of this process, the plan was benchmarked against peers both globally and in the UK, and participants were asked to give feedback on the programme, including whether or not the performance KPIs adequately reflect current business challenges. As a consequence, the LTIP has been amended so that participants will receive a greater proportion of PSAs (70%) and a lower proportion of RSAs (30%). In addition, total shareholder return will account for 40% of the performance criteria attaching to 2016 PSAs (increased from 25% in 2015).
The PSAs granted in 2016 will be measured over a three-year performance period. The specific targets are commercially sensitive, and will be described retrospectively after the conclusion of the performance period, and are based on the following performance conditions:
Weighting Objective Measure
40% Relative Total Shareholder Return
Comparison against Euromoney Global Mining Index with 33% vesting at performance equal to the index and 100% vesting at performance equal to or greater than the index plus 5% during the three-year period.
20% EBITDA The maximum figure corresponds to the accumulated EBITDA over the period 2016-2018. For 2016, this is calculated using the budget figure. For 2017 and 2018, the figures will be the ones resulting from the base case prepared during 2016. The final calculation will take into account price and exchange rate fluctuations.
5% Mineral Resources Increase
Performance metrics correspond to the contained resources at the end of 2018.
35% Projects, Development and Sustainability
These performance criteria relate to priority projects for the Group, environmental performance and community relations.
The LTIP was amended by the Committee in March 2015. As a consequence, any LTIP awards granted after 17 March 2015 are subject to malus provisions under the LTIP rules. These allow the Committee to, at its discretion, reduce the number of shares to which an award relates or to cancel an award as a result of:
• actions by a participant that, in the reasonable opinion of the Committee, amount to gross misconduct which has or may have a material affect on the value or reputation of the Company or any of its subsidiaries;
• a materially adverse error in the consolidated financial statements of the Group during the performance period; or
• any reasonable circumstance that the Committee determines in good faith to have resulted in an unfair benefit to the participant.
Illustrative application of the Remuneration Policy for the Group CEO in 2016
The following chart outlines the potential total remuneration of the Group CEO in 2016 under different performance scenarios. The chart is forward-looking and does not include information on the vesting of awards in 2015 shown in the single figure remuneration table on page 101.
Group CEO
$0 $1m $2m $4m$3m
Maximum 23% 23%
30%
54%
15% 55%
100%
$3.545m
$2.746m
$0.813mMinimum
Target
Fixed elements Annual variable elements
Long-term variable elements
Figures are based on the following assumptions:
• Minimum consists of base salary plus benefits only and excludes adjustments for inflation.
• Target consists of base salary, benefits and incentive awards at 50% of the maximum potential award.
• Maximum consists of base salary, benefits and incentive awards at 100% of the maximum potential award.
• No change in the share price is included in the calculation of the potential awards.
• Long-term variable elements awards are calculated using the average closing share price for the last quarter of 2015 of 505.1p and an exchange rate of $1.528/£1.
• Base salary, benefits and incentive awards are estimated in Chilean pesos and long-term variable awards are estimated by reference to the Company’s share price which is in pound sterling. These figures are therefore subject to exchange rate fluctuations.
Remuneration structure
The Committee is satisfied that the remuneration arrangements in place for Diego Hernández and the Executive Committee are linked to performance, appropriately stretching and aligned to the business strategy. Variable remuneration is a core component of Executive Committee remuneration and up to 61% of the Executive Committee’s total annual remuneration may be achieved under the Annual Bonus Plan and the LTIP.
Antofagasta plc 109
GO
VE
RN
AN
CE
GO
VE
RN
AN
CE
ST
RA
TE
GIC
RE
PO
RT
FIN
AN
CIA
L STA
TE
ME
NT
SO
TH
ER
INF
OR
MA
TIO
NO
VE
RV
IEW
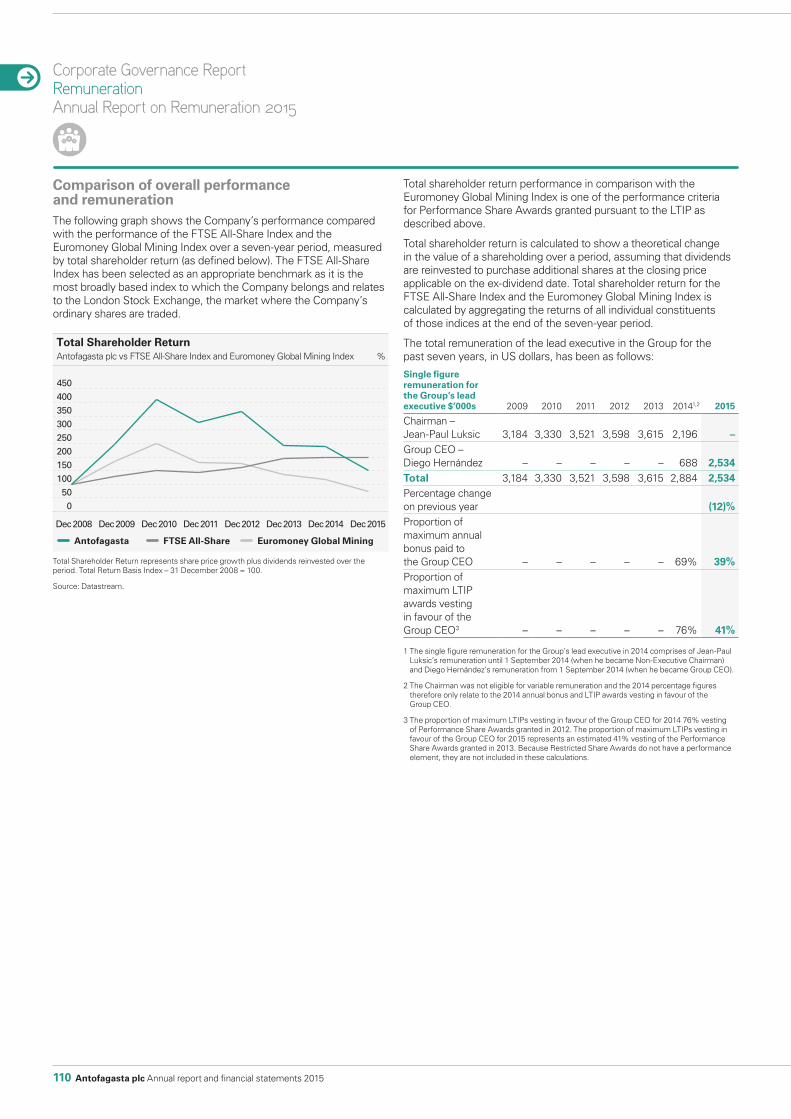
Comparison of overall performance and remunerationThe following graph shows the Company’s performance compared with the performance of the FTSE All-Share Index and the Euromoney Global Mining Index over a seven-year period, measured by total shareholder return (as defined below). The FTSE All-Share Index has been selected as an appropriate benchmark as it is the most broadly based index to which the Company belongs and relates to the London Stock Exchange, the market where the Company’s ordinary shares are traded.
050
100150200250300350400450
Dec 2008 Dec 2009 Dec 2010 Dec 2011 Dec 2012 Dec 2013 Dec 2014 Dec 2015
Total Shareholder ReturnAntofagasta plc vs FTSE All-Share Index and Euromoney Global Mining Index %
Antofagasta FTSE All-Share Euromoney Global Mining
Total Shareholder Return represents share price growth plus dividends reinvested over the period. Total Return Basis Index – 31 December 2008 = 100.
Source: Datastream.
Total shareholder return performance in comparison with the Euromoney Global Mining Index is one of the performance criteria for Performance Share Awards granted pursuant to the LTIP as described above.
Total shareholder return is calculated to show a theoretical change in the value of a shareholding over a period, assuming that dividends are reinvested to purchase additional shares at the closing price applicable on the ex-dividend date. Total shareholder return for the FTSE All-Share Index and the Euromoney Global Mining Index is calculated by aggregating the returns of all individual constituents of those indices at the end of the seven-year period.
The total remuneration of the lead executive in the Group for the past seven years, in US dollars, has been as follows:
Single figure remuneration for the Group’s lead executive $’000s 2009 2010 2011 2012 2013 20141,2 2015
Chairman – Jean-Paul Luksic 3,184 3,330 3,521 3,598 3,615 2,196 –Group CEO – Diego Hernández – – – – – 688 2,534Total 3,184 3,330 3,521 3,598 3,615 2,884 2,534Percentage change on previous year (12)%Proportion of maximum annual bonus paid to the Group CEO – – – – – 69% 39%Proportion of maximum LTIP awards vesting in favour of the Group CEO3 – – – – – 76% 41%
1 The single figure remuneration for the Group’s lead executive in 2014 comprises of Jean-Paul Luksic’s remuneration until 1 September 2014 (when he became Non-Executive Chairman) and Diego Hernández’s remuneration from 1 September 2014 (when he became Group CEO).
2 The Chairman was not eligible for variable remuneration and the 2014 percentage figures therefore only relate to the 2014 annual bonus and LTIP awards vesting in favour of the Group CEO.
3 The proportion of maximum LTIPs vesting in favour of the Group CEO for 2014 76% vesting of Performance Share Awards granted in 2012. The proportion of maximum LTIPs vesting in favour of the Group CEO for 2015 represents an estimated 41% vesting of the Performance Share Awards granted in 2013. Because Restricted Share Awards do not have a performance element, they are not included in these calculations.
110 Antofagasta plc Annual report and financial statements 2015
Corporate Governance ReportRemunerationAnnual Report on Remuneration 2015

Relative change in remunerationThe total remuneration paid to Diego Hernández for 2015 was 12% lower than the total remuneration paid to the lead executive in the Group. This included a 66% decrease in fees/base salary and a 35% decrease in benefits. These amounts are higher than the overall decrease in total remuneration because a large proportion of Diego Hernández’s total remuneration is made up of variable remuneration, whereas none of the Chairman’s remuneration was or is made up of variable remuneration.
The equivalent average percentage change for Group employees as a whole was an increase of 4.3%. This comprised a 4.3% increase in salaries and a 0% movement in benefits. It is common for employment contracts in Chile to include an annual adjustment for Chilean inflation and most Group employees’ base salaries in Chile are linked to inflation. In 2015, Chilean inflation was 4.4%.
The table below compares the changes from 2014 to 2015 in fees/base salary, benefits and annual bonus paid to the Group’s lead executive and Group employees as a whole. The underlying elements of the lead executives’ pay are calculated using the values reported in the single figure remuneration table on page 101.
Percentage change in
base salary
Percentage change in
benefits
Percentage change in
annual bonus
Executive Chairman/ Group CEO (66)% (35)% (51)%1
Group employees 4.3% 0% (10)%2
1 This figure relates to the percentage change in annual bonus for Diego Hernández only between 2014 and 2015 since Jean-Paul Luksic did not receive variable remuneration.
2 This figure relates to the percentage change in annual bonus for mining division employees and does not include a one-off bonus paid to employees as a result of the conclusion of collective bargaining agreements with labour unions in 2014. Mining division employees were chosen as the comparator group here because employees in the transport division did not participate in the Annual Bonus Plan in 2015.
Relative importance of remuneration spendThe table below shows the total expenditure on employee remuneration, the levels of distributions to shareholders and the taxation cost in 2014 and 2015.
C
B
A
A
B
C
2014 ($m)
2015 ($m)
Percentage change
A Employee remuneration1 502.8 422.3 (16)%B Distribution to shareholders2 212.0 30.6 (86)%C Taxation3 712.7 75.9 (89)%
1 The employee remuneration cost includes salaries and social security costs, as set out in Note 7 to the financial statements.
2 The distributions to shareholders represent the dividends proposed in relation to the year, as set out in Note 12 to the financial statements.
3 Taxation has been included because it provides an indication of the contribution of the Group’s operations in Chile to the Chilean State via its tax contributions. The taxation cost represents the current tax charge in respect of corporate tax, mining tax (royalty) and withholding tax, as set out in Note 9 to the financial statements.
Other informationThis report does not disclose information in relation to the following, which were not relevant for the 2015 financial year:
• payments for loss of office – no such events occurred in the year;
• further details on pension arrangements – Directors do not receive pension benefits; and
• payments to past Directors – no such payments were made in the year.
Should such events occur in the future, the necessary disclosures will be made at the appropriate time.
The Remuneration Report has been approved by the Board and signed on its behalf by
Tim BakerChairman of the Remuneration and Talent Management Committee14 March 2016
Antofagasta plc 111
GO
VE
RN
AN
CE
GO
VE
RN
AN
CE
ST
RA
TE
GIC
RE
PO
RT
FIN
AN
CIA
L STA
TE
ME
NT
SO
TH
ER
INF
OR
MA
TIO
NO
VE
RV
IEW
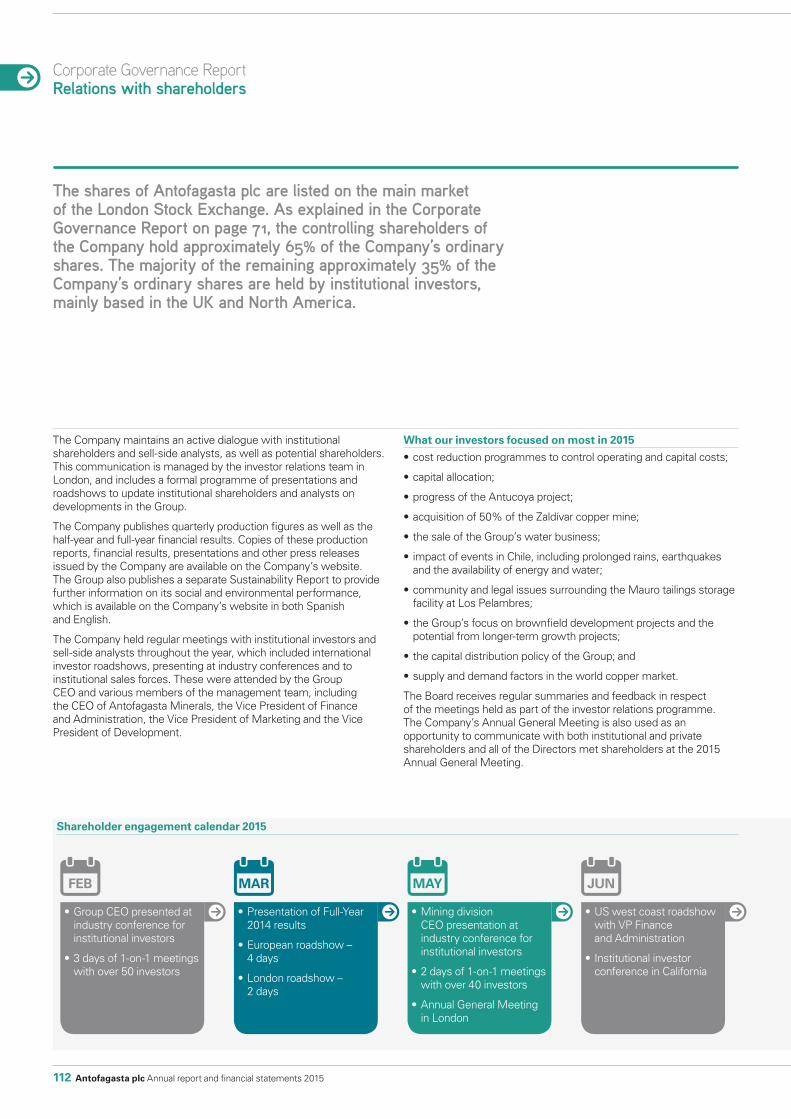
The Company maintains an active dialogue with institutional shareholders and sell-side analysts, as well as potential shareholders. This communication is managed by the investor relations team in London, and includes a formal programme of presentations and roadshows to update institutional shareholders and analysts on developments in the Group.
The Company publishes quarterly production figures as well as the half-year and full-year financial results. Copies of these production reports, financial results, presentations and other press releases issued by the Company are available on the Company’s website. The Group also publishes a separate Sustainability Report to provide further information on its social and environmental performance, which is available on the Company’s website in both Spanish and English.
The Company held regular meetings with institutional investors and sell-side analysts throughout the year, which included international investor roadshows, presenting at industry conferences and to institutional sales forces. These were attended by the Group CEO and various members of the management team, including the CEO of Antofagasta Minerals, the Vice President of Finance and Administration, the Vice President of Marketing and the Vice President of Development.
What our investors focused on most in 2015
• cost reduction programmes to control operating and capital costs;
• capital allocation;
• progress of the Antucoya project;
• acquisition of 50% of the Zaldívar copper mine;
• the sale of the Group’s water business;
• impact of events in Chile, including prolonged rains, earthquakes and the availability of energy and water;
• community and legal issues surrounding the Mauro tailings storage facility at Los Pelambres;
• the Group’s focus on brownfield development projects and the potential from longer-term growth projects;
• the capital distribution policy of the Group; and
• supply and demand factors in the world copper market.
The Board receives regular summaries and feedback in respect of the meetings held as part of the investor relations programme. The Company’s Annual General Meeting is also used as an opportunity to communicate with both institutional and private shareholders and all of the Directors met shareholders at the 2015 Annual General Meeting.
Shareholder engagement calendar 2015
The shares of Antofagasta plc are listed on the main market of the London Stock Exchange. As explained in the Corporate Governance Report on page 71, the controlling shareholders of the Company hold approximately 65% of the Company’s ordinary shares. The majority of the remaining approximately 35% of the Company’s ordinary shares are held by institutional investors, mainly based in the UK and North America.
• Group CEO presented at industry conference for institutional investors
• 3 days of 1-on-1 meetings with over 50 investors
• Presentation of Full-Year 2014 results
• European roadshow – 4 days
• London roadshow – 2 days
• Mining division CEO presentation at industry conference for institutional investors
• 2 days of 1-on-1 meetings with over 40 investors
• Annual General Meeting in London
• US west coast roadshow with VP Finance and Administration
• Institutional investor conference in California
FEB MAR MAY JUN
112 Antofagasta plc Annual report and financial statements 2015
Corporate Governance ReportRelations with shareholders
Shareholders also met with several Directors, including the Chairman, the Senior Independent Director and Chairman of the Audit and Risk Committee, the Chairman of the Projects Committee and members of the other Board Committees during the year.
The Chairman met with a number of the Group’s largest shareholders during the year to hear their views about the Company, its strategy, management and governance. During these meetings a wide range of topics were discussed, including:
• the use of proxy voting agency recommendations;
• Board composition and diversity;
• the determination of independence for a Director;
• the application of the “comply and explain” principle;
• talent development and succession planning;
• the structure of the Group’s LTIP;
• the link between Group pay structures and incentives and strategy; and
• progress in the court cases involving Los Pelambres.
The Chairman also used these meetings to explain the changes to the Board’s structure in 2014, to update shareholders on progress following these changes and to clarify how corporate governance developments are likely to assist the Group in the years ahead.
Senior Independent Director
Since his appointment as Senior Independent Director in 2011, William Hayes has met with a number of the Group’s largest shareholders and proxy voting agencies, allowing him to provide his perspective on the Group’s governance and strategy and to obtain their feedback on the Group.
In October 2015, William Hayes met with major shareholders and proxy voting agencies to focus on the issues that were most relevant to investors during the course of the year and to follow up on meetings that the Chairman had attended earlier in the year.
How our investors can find us
• Presentation of Half-Year 2015 results
• European roadshow – 4 days
• London roadshow – 2 days
• US east coast roadshow – 2 days
• Investor relations team attended three industry conferences in the UK and engaged with shareholders
• VP Marketing presented to investors during London Metals Week
• Investor relations team attended two industry conferences in the UK and engaged with shareholders
AUG SEP OCT NOV
Our Group website www.antofagasta.co.uk
Investor section www.antofagasta.co.uk/investors/
Antofagasta plc 113
GO
VE
RN
AN
CE
GO
VE
RN
AN
CE
ST
RA
TE
GIC
RE
PO
RT
FIN
AN
CIA
L STA
TE
ME
NT
SO
TH
ER
INF
OR
MA
TIO
NO
VE
RV
IEW

Directors
Directors that have served during the year and summaries of current Directors’ key skills and experience are set out in the Corporate Governance Report on pages 74 to 76.
Post balance sheet events
There have been no post balance sheet events.
Financial risk management
Details of the Company’s policies on financial risk management are set out in Note 26 to the financial statements.
Results and dividends
The consolidated profit before tax (from continuing operations) has decreased from $1,515.6 million in 2014 to $259.4 million in 2015.
An interim dividend of 3.1 cents was paid on 8 October 2015 (2014 interim dividend – 11.7 cents). No final dividend for the year ended 31 December 2015 is proposed to be paid. This gives total dividends per share proposed in relation to 2015 of 3.1 cents (2014 – 21.5 cents) and a total dividend amount in relation to 2015 of $30.6 million (2014 – $212.0 million).
Preference shares carry the right to a fixed cumulative dividend of 5% per annum. The preference shares are classified within borrowings and preference dividends are included within finance costs. The total cost of dividends paid on preference shares and recognised as an expense in the income statement was $0.2 million (2014 – $0.2 million). Further information relating to dividends is set out in the Financial review on page 67 and in Note 12 to the financial statements.
Political contributions
The Group did not make political donations during the year ended 31 December 2015 (2014 – nil).
Auditors
The auditors, PwC LLP have indicated their willingness to continue in office and a resolution seeking to re-appoint them will be proposed at the Annual General Meeting.
Disclosure of information to auditors
The Directors in office at the date of this report have each confirmed that:
(a) so far as he or she is aware, there is no relevant audit information of which the Group’s auditors are unaware; and
(b) he or she has taken all the steps that he or she ought to have taken as a Director in order to make himself aware of any relevant audit information and to establish that the Group’s auditors are aware of that information.
Capital structure
Details of the authorised and issued ordinary share capital, including details of any movements in the issued share capital during the year, are shown in Note 31 to the financial statements. The Company has one class of ordinary shares, which carry no right to fixed income. Each ordinary share carries one vote at any general meeting of the Company.
Details of the preference share capital are shown in Note 24 to the financial statements. The preference shares are non-redeemable and are entitled to a fixed cumulative dividend of 5% per annum. Each preference share carries 100 votes on a poll at any General Meeting of the Company.
The nominal value of the issued ordinary share capital is 96.1% of the total sterling nominal value of all issued share capital, and the nominal value of the issued preference share capital is 3.9% of the total sterling nominal value of all issued share capital.
There are no specific restrictions on the transfer of shares or on their voting rights beyond those standard provisions set out in the Company’s Articles of Association and other provisions of applicable law and regulation (including, in particular, following a failure to provide the Company with information about interests in shares as required by the Companies Act 2006). The Company is not aware of any agreements between holders of the Company’s shares that may result in restrictions on the transfer of securities or on voting rights.
The Company has the authority to purchase up to 98,585,669 of its own ordinary shares, representing 10% of the issued ordinary share capital. With regard to the appointment and replacement of Directors, the Company is governed by its Articles of Association, the UK Corporate Governance Code 2014, the Companies Act 2006 and related legislation. The Articles of Association may be amended by special resolution of the shareholders. There are no significant agreements in place that take effect, alter or terminate upon a change of control of the Company. There are no agreements in place between the Company and its Directors or employees that provide for compensation for loss of office resulting from a change of control of the Company.
114 Antofagasta plc Annual report and financial statements 2015
Directors’ Report

Authority to issue shares and authority to purchase own shares
At the 2015 AGM, held on 20 May 2015, authority was given to the Directors to allot unissued relevant securities in the Company up to a maximum amount equivalent to two-thirds of the shares in issue (of which one-third must be offered by way of rights issue). This authority expires on the date of this year’s AGM, to be held on 18 May 2016. No such shares have been issued. The Directors propose to renew this authority at this year’s AGM for the following year. A further special resolution passed at that meeting granted authority to the Directors to allot equity securities in the Company for cash, without regard to the pre-emption provisions of the Companies Act 2006. This authority also expires on the date of this year’s AGM and the Directors will seek to renew this authority for the following year.
The Company was also authorised by a shareholders’ resolution passed at the 2015 AGM to purchase up to 10% of its issued ordinary share capital. Any shares which have been bought back may be held as treasury shares or, if not so held, must be cancelled immediately upon completion of the purchase, thereby reducing the amount of the Company’s issued and authorised share capital. This authority will expire at this year’s AGM and a resolution to renew the authority for a further year will be proposed. No shares were purchased by the Company during the year.
Directors’ interests and indemnities
Details of Directors’ contracts and letters of appointment, remuneration and emoluments, and their interests in the shares of the Company as at 31 December 2015 are given in the Directors’ Remuneration Report. No Director had any material interest in a contract of significance (other than a service contract) with the Company or any subsidiary company during the year.
In accordance with the Company’s Articles of Association and to the extent permitted by the laws of England and Wales, Directors are granted an indemnity from the Company in respect of liabilities personally incurred as a result of their office. In respect of those matters for which the Directors may or may not be indemnified, the Company maintained a Directors’ and Officers’ liability insurance policy throughout the financial year. A new policy has been entered into for the current financial year.
Conflicts of interest
The Companies Act 2006 requires that a Director must avoid a situation where he has, or can have, a direct or indirect interest that conflicts, or possibly may conflict, with the Company’s interests. The Company has undertaken a process to identify and, where appropriate, authorise and manage potential and actual conflicts. Each Director has identified his or her interests that may constitute conflicts including, for example, directorships in other companies. The Board, with detailed assistance from the Nomination and Governance Committee, has considered the potential and actual conflict situations of each of the Directors and decided in relation to each situation whether to authorise it and the steps, if any, which need to be taken to manage it. The authorisation process is not regarded as a substitute for managing an actual conflict of interest if one arises. The monitoring and, if appropriate, authorisation of actual and potential conflicts of interest is an ongoing process. Directors are required to notify the Company of any material changes in those positions or situations that have already been considered, as well as to notify the Company of any other new positions or situations that may arise. In addition to considering any new situations as they arise, the Board usually considers the conflict position of all Directors formally each year.
Substantial shareholdings
Notifiable major share interests in which the Company has been made aware are set out in the Corporate Governance Report on page 71.
Other statutory disclosures
The Corporate Governance Report on pages 70 to 113, the Statement of Directors’ Responsibilities on page 116 of this Annual Report and Notes 26 to the financial statements are incorporated into the Directors’ Report by reference.
Other information can be found in the following sections of the Strategic Report:
Location in Strategic Report
Future developments in the business of the Group Pages 39 to 52Viability and going concern statement Page 38Subsidiaries, associates and joint ventures Pages 39 to 52Employee consultation Pages 61 to 63Greenhouse gas emissions Page 57
By order of the Board
Julian AndersonCompany Secretary14 March 2016
Antofagasta plc 115
GO
VE
RN
AN
CE
GO
VE
RN
AN
CE
ST
RA
TE
GIC
RE
PO
RT
FIN
AN
CIA
L STA
TE
ME
NT
SO
TH
ER
INF
OR
MA
TIO
NO
VE
RV
IEW

Statement of Directors’ Responsibilities in relation to the financial statements
The Directors are responsible for preparing the Annual Report, the Directors’ Remuneration Report and the financial statements in accordance with applicable law and regulations.
Company law requires the Directors to prepare financial statements for each financial year. Under that law the Directors have prepared the Group financial statements in accordance with International Financial Reporting Standards (“IFRSs”) as adopted by the European Union, and the Parent Company financial statements in accordance with United Kingdom Generally Accepted Accounting Practice (United Kingdom Accounting Standards and applicable law), including Financial Reporting Standard 101 Reduced Disclosure Framework (“FRS 101”). Under company law the Directors must not approve the financial statements unless they are satisfied that they give a true and fair view of the state of affairs of the Group and the Company and of the profit or loss of the Group for that period. In preparing these financial statements, the Directors are required to:
• select suitable accounting policies and then apply them consistently;
• make judgements and accounting estimates that are reasonable and prudent;
• state whether IFRSs as adopted by the European Union and applicable UK Accounting Standards, including FRS 101, have been followed, subject to any material departures disclosed and explained in the Group and Parent Company financial statements respectively; and
• prepare the financial statements on the going concern basis unless it is inappropriate to presume that the Company will continue in business.
The Directors are responsible for keeping adequate accounting records that are sufficient to show and explain the Company’s transactions and disclose with reasonable accuracy at any time the financial position of the Company and the Group and enable them to ensure that the financial statements and the Directors’ Remuneration Report comply with the Companies Act 2006 and, as regards the Group financial statements, Article 4 of the IAS Regulation. They are also responsible for safeguarding the assets of the Company and the Group and hence for taking reasonable steps for the prevention and detection of fraud and other irregularities.
The Directors are responsible for the maintenance and integrity of the Company’s website. Legislation in the United Kingdom governing the preparation and dissemination of financial statements may differ from legislation in other jurisdictions.
The Directors consider that the Annual Report and Financial Statements, taken as a whole, is fair, balanced and understandable and provides the information necessary for shareholders to assess the Company’s position and performance, business model and strategy.
Each of the Directors, whose names and functions are listed in the Corporate Governance Report confirm that, to the best of their knowledge:
• the Group financial statements, which have been prepared in accordance with IFRSs as adopted by the EU, give a true and fair view of the assets, liabilities, financial position and profit of the Group; and
• the Strategic Report and the Directors’ Report include a fair review of the development and performance of the business and the position of the Group, together with a description of the principal risks and uncertainties that it faces.
By order of the Board
Jean-Paul Luksic William HayesChairman Senior Independent Director and Chairman of the Audit and Risk Committee 14 March 2016
116 Antofagasta plc Annual report and financial statements 2015
Statement of Directors’ Responsibilities

Financial statements
Independent auditors’ report 118
Consolidated income statement 122
Consolidated statement of comprehensive income 123
Consolidated statement of changes in equity 123
Consolidated balance sheet 124
Consolidated cash flow statement 125
Notes to the financial statements 126
Parent Company financial statements 179
Antofagasta plc 117
OT
HE
R IN
FO
RM
AT
ION
GO
VE
RN
AN
CE
OV
ER
VIE
WF
INA
NC
IAL S
TAT
EM
EN
TS
ST
RA
TE
GIC
RE
PO
RT

Report on the financial statements
Our opinion
In our opinion:
Antofagasta plc’s group financial statements and Parent Company financial statements (the “financial statements”) give a true and fair view of the state of the Group’s and of the Parent Company’s affairs as at 31 December 2015 and of the Group’s profit and cash flows for the year then ended;
• the Group financial statements have been properly prepared in accordance with International Financial Reporting Standards (“IFRSs”) as adopted by the European Union;
• the parent company financial statements have been properly prepared in accordance with United Kingdom Generally Accepted Accounting Practice; and
• the financial statements have been prepared in accordance with the requirements of the Companies Act 2006 and, as regards the Group financial statements, Article 4 of the IAS Regulation.
What we have audited
The financial statements, included within the Annual Report, comprise:
• the Consolidated Balance Sheet as at 31 December 2015;
• the Balance Sheet of the Parent Company as at 31 December 2015;
• the Consolidated Income Statement and the Consolidated Statement of Comprehensive Income for the year then ended;
• the Consolidated Cash Flow Statement for the year then ended;
• the Consolidated Statement of Changes in Equity for the year then ended;
• the Statement of changes in equity of the Parent Company; and
• the notes to the financial statements, which include a summary of significant accounting policies and other explanatory information.
The financial reporting framework that has been applied in the preparation of the Group financial statements is applicable law and IFRSs as adopted by the European Union. The financial reporting framework that has been applied in the preparation of the Parent Company financial statements is United Kingdom Accounting Standards, comprising FRS 101 “Reduced Disclosure Framework”, and applicable law (United Kingdom Generally Accepted Accounting Practice).
Our audit approach
ContextThe context for our audit was set by Antofagasta’s major activities in 2015, against a backdrop of a significant fall in spot commodity prices, along with a number of changes in the composition of the Group. Antofagasta is one of the largest copper producers in the world, operating up to five mines in Chile, and its earnings were impacted by the fall in copper prices during the year. In the year, Antofagasta acquired a 50% interest in the Zaldívar mine and became the operator of this joint venture, in addition to acquiring 100% of Duluth Metals
and consequently the Twin Metals exploration project. The Michilla mine, which had reached the end of its mine life, was placed on care and maintenance in December. At year end, the Antucoya mine was still being commissioned, and commercial production is expected to commence in the first half of 2016. Away from its mining operations, the Group also exited the water business in May, selling its entire interest in Aguas de Antofagasta S.A. (“ADASA”), and completed the disposal of its transport operation in Bolivia, Empresa Ferroviaria Andina S.A. (“FCA”).
The scope of our audit and our areas of focus
We conducted our audit in accordance with International Standards on Auditing (UK and Ireland) (“ISAs (UK & Ireland)”).
We designed our audit by determining materiality and assessing the risks of material misstatement in the financial statements. In particular, we looked at where the directors made subjective judgements, for example in respect of significant accounting estimates that involved making assumptions and considering future events that are inherently uncertain. As in all of our audits, we also addressed the risk of management override of internal controls, including evaluating
whether there was evidence of bias by the directors that represented a risk of material misstatement due to fraud.
The risks of material misstatement that had the greatest effect on our audit, including the allocation of our resources and effort, are identified as “areas of focus” in the table below. We have also set out how we tailored our audit to address these specific areas in order to provide an opinion on the financial statements as a whole, and any comments we make on the results of our procedures should be read in this context. This is not a complete list of all risks identified by our audit.
• We identified the three mine sites, Los Pelambres, Centinela and Antucoya, which in our view, required an audit of their complete financial information.
• We conducted other audit procedures over the recently acquired Zaldívar mine and at the corporate offices in London and Chile.
• Taken together, the locations and functions where we performed our audit work accounted for 91% of revenue and approximately 76% of absolute adjusted profit before tax (ie the sum of the numerical values without regard to whether they were profits or losses for the relevant locations and functions).
• Overall group materiality: $65 million which represents 5% of three-year average of profit before tax adjusted for one-off items.
• Impairment assessments at Antucoya and Centinela.
• Accounting for the acquisition of Zaldívar.
Areas offocus
Audit scope
Materiality
Overview
118 Antofagasta plc Annual report and financial statements 2015
Independent auditors’ report to the members of Antofagasta plc

Area of focus How our audit addressed the area of focus
Impairment assessments at Antucoya and CentinelaIn accordance with IAS 16 “Property, plant and equipment” the Directors are required to perform a review for impairment of long-lived assets at any time an indicator of impairment exists.
The Directors’ identified that impairment indicators existed at Antucoya and Centinela, as both mines are heavily leveraged to movements in copper prices.
The Directors’ identified that the Antucoya and Centinela Cash Generating Units (“CGUs”) had a carrying value of $1,660 and $3,870 million respectively at 31 December 2015. The recoverable amounts calculated by the directors were in excess of the carrying values, and accordingly, no impairment was recorded.
The determination of recoverable amount was based on the higher of value-in-use and fair value less costs to dispose (“FVLCD”), which requires judgement on the part of the directors in valuing the relevant CGUs.
As a value-in-use methodology does not permit future expansion or optimisation plans to be included within the discounted cash flow model, the Directors have used a FVLCD valuation methodology to determine the recoverable amount, applying assumptions that a market participant would use to determine fair value.
We considered the Directors’ impairment trigger analysis and agree that impairment indicators existed at Antucoya and Centinela, and that these were the appropriate CGUs for impairment testing purposes.
We evaluated the Directors’ future cash flow forecasts, and the process by which they were drawn up, including verifying the mathematical accuracy of the cash flow models and agreeing future capital and operating expenditure to the latest Board approved budgets and the latest approved Life of Mine plans. We assessed the reasonableness of the Directors’ future capital and operating expenses in light of their historical accuracy and the current operational results and concluded the forecasts had been appropriately prepared, notwithstanding that Antucoya has no operational history and the operating parameters are based on the feasibility study adjusted for the latest expectations.
For each CGU, utilising our valuation experts, we evaluated the appropriateness of key market related assumptions in the Directors’ valuation models, including the copper prices, discount rates, foreign currency exchange rates and acid prices. We noted that the margin of recoverable amount above carrying value for both CGUs was particularly sensitive to changes in long-term copper price and discount rate assumptions.
We formed an independent view of the copper price that a market participant might use in a fair value less cost to dispose scenario. We found that the Directors’ long-term copper price assumption $3.00/lb was at the higher end of a reasonable range.
We independently calculated a weighted average cost of capital by making reference to market data, and considered the CGU specific risks. The discount rate used by the Directors’ of 8% fell at the lower end of what we calculated as a reasonable range.
We performed sensitivity analysis around the key assumptions within the cash flow forecasts using a range of higher discount rates and lower long term copper prices and there was no impairment. Having done so, whilst we agreed with the director’s conclusion, we found that a reasonably plausible downside scenario, within our reasonable range, would result in an impairment of both CGUs.
In light of the above, we reviewed the appropriateness of the related disclosures in Note 15 of the financial statements, including the sensitivities provided with respect to the relevant CGUs, and concluded they were appropriate.
Accounting for the acquisition of ZaldívarThe acquisition of Zaldívar presents a number of complex accounting judgements in respect of the assessment of whether the Group controls or jointly controls the business, along with whether the business is a joint venture or joint arrangement.
Business combinations accounted for under IFRS 3 “Business Combinations” are inherently complex, requiring the directors to perform a purchase price allocation exercise to fair value the assets and liabilities of the acquired business. In determining the purchase price allocation the Directors engaged an external expert. As Zaldívar was acquired on 1 December 2015, there was limited time to conduct this exercise and in particular, the working capital adjustment period remained open.
The Directors’ determined that based on the respective rights and obligations of each investor, Zaldívar was jointly controlled and should be equity accounted as a joint venture. We examined the terms of the sale and joint venture agreements and considered the substantive rights of the investors over the relevant activities of the investee and determined that equity accounting was appropriate.
The Group engaged an independent valuation expert to perform the purchase price allocation exercise and we assessed the competency and objectivity of the expert, and the scope of their work.
We read the expert’s report and discussed with the expert their valuation methodology for each category of asset and liability, along with the key judgements, including copper prices and discount rates, they made in determining the fair values. We determined that the methods used by the Directors’ expert were appropriate and the fair values appeared reasonable based on the judgements made.
The Group has disclosed that the purchase price allocation remains provisional as the final working capital true up has not been agreed with the vendor and further adjustment to the consideration, or the allocation to assets and liabilities, could result.
We concurred with the Directors’ expert’s assessment of the provisional purchase price allocation and the appropriateness of the related disclosures in Note 17 of the financial statements.
How we tailored the audit scopeWe tailored the scope of our audit to ensure that we performed enough work to be able to give an opinion on the financial statements as a whole, taking into account the geographic structure of the Group, the accounting processes and controls, and the industry in which the Group operates. As part of our planning for the audit, we reviewed the predecessor auditor’s working papers.
The core mining business consists of five assets: Los Pelambres and Centinela, which are the main operating assets; Antucoya, which is under construction; Michilla, which was placed on care and maintenance in December 2015; and Zaldívar, a joint venture with Barrick Gold Corporation. Centinela consists of the combined El Tesoro and Esperanza assets. The Group acquired its interest in Zaldívar in December 2015, and is now the operator of this asset.
The Group’s non-core divisions consist of: a transport operation, Ferrocarril Antofagasta a Bolivia and a water business, Aguas de Antofagasta. The water business was sold in May 2015 and as such its results for the period are presented as discontinued operations.
All of the above operations are located in Chile. In addition, the Group has corporate head offices located in both Santiago, Chile (Antofagasta Minerals) and London, UK (Antofagasta plc).
In establishing the overall approach to the Group audit, we determined the type of work that needed to be performed at each of the three mine sites and the corporate offices in Chile, by us, as the Group engagement team and by component auditors from PwC Chile operating under our instruction. Los Pelambres and Centinela were considered to be financially significant components of the Group, due to their contribution towards Group profit before tax, and so required audits of their complete financial information. Antucoya was also subject to an audit of its complete financial information, in response to the risk of impairment to its carrying value.
We also requested that component auditors perform specified procedures over the recently acquired Zaldívar mine, the corporate offices in Chile, and specific line items of other entities within the Group to ensure that we had sufficient coverage from our audit work for each line of the Group’s financial statements.
Antofagasta plc 119
ST
RA
TE
GIC
RE
PO
RT
GO
VE
RN
AN
CE
FIN
AN
CIA
L STA
TE
ME
NT
SO
TH
ER
INF
OR
MA
TIO
NS
TR
AT
EG
IC R
EP
OR
TF
INA
NC
IAL S
TAT
EM
EN
TS
FIN
AN
CIA
L STA
TE
ME
NT
SG
OV
ER
NA
NC
EO
TH
ER
INF
OR
MA
TIO
NO
VE
RV
IEW
ST
RA
TE
GIC
RE
PO
RT

Where work was performed by component auditors, we determined the level of involvement we needed to have in the audit work to be able to conclude whether sufficient appropriate audit evidence had been obtained as a basis for our opinion on the Group financial statements as a whole.
A UK senior manager was seconded to PwC Chile to be an integral part of the team. In addition the Senior Statutory Auditor visited Chile three times, including two mine sites, and attended key audit meetings with our component auditors and management. The Group team also reviewed the component auditor working papers, attended local audit clearance meetings, and reviewed other forms of communications dealing with significant accounting and auditing issues.
MaterialityThe scope of our audit was influenced by our application of materiality. We set certain quantitative thresholds for materiality. These, together with qualitative considerations, helped us to determine the scope of our audit and the nature, timing and extent of our audit procedures on the individual financial statement line items and disclosures and in evaluating the effect of misstatements, both individually and on the financial statements as a whole.
Based on our professional judgement, we determined materiality for the financial statements as a whole as follows:
Overall Group materiality
$65 million (2014 – $75 million).
How we determined it
5% of three-year average of profit before tax adjusted for one-off items, primarily the profit on disposal of ADASA.
Rationale for benchmark applied
We believe that profit before tax is the primary measure in assessing the performance of the Group, and is a generally accepted auditing benchmark. We used a three-year average due to the impact on profit before tax of the inherent volatility in copper commodity prices, and adjusted for one-off items to eliminate the volatility that they introduce.
Component materiality
For each component in our audit scope, we allocated a materiality that is less than our overall Group materiality. The range of materiality allocated across components was between $60 million and $40 million.
We agreed with the Audit and Risk Committee that we would report to them misstatements identified during our audit above $3 million (2014 – $1.25 million) as well as misstatements below that amount that, in our view, warranted reporting for qualitative reasons.
Going concernUnder the Listing Rules we are required to review the Directors’ Statement, set out on page 114, in relation to going concern. We have nothing to report having performed our review.
Under ISAs (UK & Ireland) we are required to report to you if we have anything material to add or to draw attention to in relation to the Directors’ Statement about whether they considered it appropriate to adopt the going concern basis in preparing the financial statements. We have nothing material to add or to draw attention to.
As noted in the Directors’ Statement, the Directors have concluded that it is appropriate to adopt the going concern basis in preparing the financial statements. The going concern basis presumes that the Group and Parent Company have adequate resources to remain in operation, and that the Directors intend them to do so, for at least one year from the date the financial statements were signed. As part of our audit we have concluded that the Directors’ use of the going concern basis is appropriate. However, because not all future events or conditions can be predicted, these statements are not a guarantee as to the Group’s and Parent Company’s ability to continue as a going concern.
Other required reporting
Consistency of other information
Companies Act 2006 opinionIn our opinion, the information given in the Strategic Report and the Directors’ Report for the financial year for which the financial statements are prepared is consistent with the financial statements.
ISAs (UK & Ireland) reportingUnder ISAs (UK & Ireland) we are required to report to you if, in our opinion:
• information in the Annual Report is:
• materially inconsistent with the information in the audited financial statements; or
• apparently materially incorrect based on, or materially inconsistent with, our knowledge of the Group and Parent Company acquired in the course of performing our audit; or
• otherwise misleading.
We have no exceptions to report.
• the statement given by the Directors’ on page 114, in accordance with provision C.1.1 of the UK Corporate Governance Code (the “Code”), that they consider the Annual Report taken as a whole to be fair, balanced and understandable and provides the information necessary for members to assess the Group’s and Parent Company’s position and performance, business model and strategy is materially inconsistent with our knowledge of the Group and Parent Company acquired in the course of performing our audit.
We have no exceptions to report.
• the section of the Annual Report on page 86, as required by provision C.3.8 of the Code, describing the work of the Audit and Risk Committee does not appropriately address matters communicated by us to the Audit and Risk Committee.
We have no exceptions to report.
120 Antofagasta plc Annual report and financial statements 2015
Independent auditors’ report to the members of Antofagasta plc

The Directors’ assessment of the prospects of the Group and of the principal risks that would threaten the solvency or liquidity of the Group
Under ISAs (UK & Ireland) we are required to report to you if we have anything material to add or to draw attention to in relation to:
• the Directors’ confirmation on page 35 of the Annual Report, in accordance with provision C.2.1 of the Code, that they have carried out a robust assessment of the principal risks facing the group, including those that would threaten its business model, future performance, solvency or liquidity.
We have nothing material to add or to draw attention to.
• the disclosures in the Annual Report that describe those risks and explain how they are being managed or mitigated.
We have nothing material to add or to draw attention to.
• the Directors’ explanation on page 116 of the Annual Report, in accordance with provision C.2.2 of the Code, as to how they have assessed the prospects of the Group, over what period they have done so and why they consider that period to be appropriate, and their statement as to whether they have a reasonable expectation that the Group will be able to continue in operation and meet its liabilities as they fall due over the period of their assessment, including any related disclosures drawing attention to any necessary qualifications or assumptions.
We have nothing material to add or to draw attention to.
Under the Listing Rules we are required to review the Directors’ statement that they have carried out a robust assessment of the principal risks facing the Group and the Directors’ statement in relation to the longer-term viability of the Group. Our review was substantially less in scope than an audit and only consisted of making inquiries and considering the Directors’ process supporting their statements; checking that the statements are in alignment with the relevant provisions of the Code; and considering whether the statements are consistent with the knowledge acquired by us in the course of performing our audit. We have nothing to report having performed our review.
Adequacy of accounting records and information and explanations received
Under the Companies Act 2006 we are required to report to you if, in our opinion:
• we have not received all the information and explanations we require for our audit; or
• adequate accounting records have not been kept by the parent company, or returns adequate for our audit have not been received from branches not visited by us; or
• the parent company financial statements and the part of the Directors’ Remuneration Report to be audited are not in agreement with the accounting records and returns.
We have no exceptions to report arising from this responsibility.
Directors’ remuneration
Directors’ Remuneration Report – Companies Act 2006 opinionIn our opinion, the part of the Directors’ Remuneration Report to be audited has been properly prepared in accordance with the Companies Act 2006.
Other Companies Act 2006 reportingUnder the Companies Act 2006 we are required to report to you if, in our opinion, certain disclosures of Directors’ remuneration specified by law are not made. We have no exceptions to report arising from this responsibility.
Corporate governance statement
Under the Listing Rules we are required to review the part of the Corporate Governance Statement relating to ten further provisions of the Code. We have nothing to report having performed our review.
Responsibilities for the financial statements and the audit
Our responsibilities and those of the Directors
As explained more fully in the Directors’ Responsibilities Statement set out on page 116, the Directors are responsible for the preparation of the financial statements and for being satisfied that they give a true and fair view.
Our responsibility is to audit and express an opinion on the financial statements in accordance with applicable law and ISAs (UK & Ireland). Those standards require us to comply with the Auditing Practices Board’s Ethical Standards for Auditors.
This report, including the opinions, has been prepared for and only for the Parent Company’s members as a body in accordance with Chapter 3 of Part 16 of the Companies Act 2006 and for no other purpose. We do not, in giving these opinions, accept or assume responsibility for any other purpose or to any other person to whom this report is shown or into whose hands it may come save where expressly agreed by our prior consent in writing.
What an audit of financial statements involves
An audit involves obtaining evidence about the amounts and disclosures in the financial statements sufficient to give reasonable assurance that the financial statements are free from material misstatement, whether caused by fraud or error. This includes an assessment of:
• whether the accounting policies are appropriate to the Group’s and the Parent Company’s circumstances and have been consistently applied and adequately disclosed;
• the reasonableness of significant accounting estimates made by the directors; and
• the overall presentation of the financial statements.
We primarily focus our work in these areas by assessing the Directors’ judgements against available evidence, forming our own judgements, and evaluating the disclosures in the financial statements.
We test and examine information, using sampling and other auditing techniques, to the extent we consider necessary to provide a reasonable basis for us to draw conclusions. We obtain audit evidence through testing the effectiveness of controls, substantive procedures or a combination of both.
In addition, we read all the financial and non-financial information in the Annual Report to identify material inconsistencies with the audited financial statements and to identify any information that is apparently materially incorrect based on, or materially inconsistent with, the knowledge acquired by us in the course of performing the audit. If we become aware of any apparent material misstatements or inconsistencies we consider the implications for our report.
Jason Burkitt (Senior Statutory Auditor)for and on behalf of PricewaterhouseCoopers LLPChartered Accountants and Statutory AuditorsLondon14 March 2016
Antofagasta plc 121
ST
RA
TE
GIC
RE
PO
RT
GO
VE
RN
AN
CE
FIN
AN
CIA
L STA
TE
ME
NT
SO
TH
ER
INF
OR
MA
TIO
NS
TR
AT
EG
IC R
EP
OR
TF
INA
NC
IAL S
TAT
EM
EN
TS
FIN
AN
CIA
L STA
TE
ME
NT
SG
OV
ER
NA
NC
EO
TH
ER
INF
OR
MA
TIO
NO
VE
RV
IEW
ST
RA
TE
GIC
RE
PO
RT

Notes2015
$m
2014(restated)
$m
Group revenue 4,5 3,394.6 5,145.6 Total operating costs (3,090.2) (3,562.0)Operating profit from subsidiaries 4,6 304.4 1,583.6 Share of results from associates and joint ventures 17,4 (5.8) (4.1)Total profit from operations, associates and joint ventures 4,6 298.6 1,579.5 Investment income 18.1 16.8 Interest expense (33.7) (44.4)Other finance items (23.6) (36.3)Net finance expense 8 (39.2) (63.9)Profit before tax 4 259.4 1,515.6 Income tax expense 9 (160.4) (702.3)Profit for the financial year from continuing operations 4 99.0 813.3 Discontinued operationsProfit for the financial year from discontinued operations 10 602.7 37.4 Profit for the year 701.7 850.7 Attributable to:Non-controlling interests 32 93.5 390.9 Owners of the parent 11 608.2 459.8
US cents US cents
Basic earnings per share 11From continuing operations 0.6 42.8 From discontinued operations 61.1 3.8 Total continuing and discontinued operations 61.7 46.6
122 Antofagasta plc Annual report and financial statements 2015
Consolidated income statementFor the year ended 31 December 2015

Notes2015
$m2014
$m
Profit for the year 4 701.7 850.7 Items that may be reclassified subsequently to profit or loss: Gains/(losses) in fair value of cash flow hedges deferred in reserves 26 1.7 (0.2)Share of other comprehensive losses of associates and joint ventures, net of tax 17 (16.0) (42.0)Losses in fair value of available-for-sale investments 18 (3.2) (6.1)Currency translation adjustment (1.8) (26.2)Deferred tax effects arising on cash flow hedges deferred in reserves 26 – 2.1 Losses/(gains) in fair value of cash flow hedges transferred to the income statement 26 5.8 (8.5)Losses in fair value of available-for-sale investments transferred to income statement 8 1.0 26.3 Deferred tax effects arising on amounts transferred to the income statement 26 (1.3) 1.8 Total items that may be reclassified subsequently to profit or loss (13.8) (52.8)
Items that will not be subsequently reclassified to profit or loss:Actuarial gains/(losses) on defined benefit plans 28 3.8 (17.4)Tax on items recognised directly in equity that will not be reclassified (1.2) 4.2 Total items that will not be subsequently reclassified to profit or loss 2.6 (13.2)Total other comprehensive expense (11.2) (66.0)Total comprehensive income for the year 690.5 784.7
Attributable to:Non-controlling interests 32 90.9 370.1 Owners of the parent 599.6 414.6
Share capital $m
Share premium
$m
Other reserves (Note 31)
$m
Retained earnings (Note 31)
$m
Net equity
$m
Non-controlling
interests $m
Total equity
$m
At 1 January 2014 89.8 199.2 (12.0) 6,447.5 6,724.5 1,939.1 8,663.6 Comprehensive income for the year – – – 459.8 459.8 390.9 850.7 Other comprehensive expense for the year – – (35.4) (9.8) (45.2) (20.8) (66.0)Change in ownership interest in subsidiaries – – – 1.5 1.5 (32.0) (30.5)Loss of control in subsidiaries – – – – – (56.7) (56.7)Capital increase in non-controlling interest – – – (2.7) (2.7) 2.7 – Capital contribution from non-controlling interest – – – – – 50.0 50.0 Dividends – – – (964.2) (964.2) (412.2) (1,376.4)At 31 December 2014 89.8 199.2 (47.4) 5,932.1 6,173.7 1,861.0 8,034.7 Comprehensive income for the year – – – 608.2 608.2 93.5 701.7 Other comprehensive (expense)/income for the year – – (11.9) 3.3 (8.6) (2.6) (11.2)Loss of control in subsidiaries – – – – – (13.3) (13.3)Capital contribution from non-controlling interest – – – – – 14.6 14.6 Dividends – – – (127.2) (127.2) (80.0) (207.2)At 31 December 2015 89.8 199.2 (59.3) 6,416.4 6,646.1 1,873.2 8,519.3
Antofagasta plc 123
ST
RA
TE
GIC
RE
PO
RT
GO
VE
RN
AN
CE
FIN
AN
CIA
L STA
TE
ME
NT
SO
TH
ER
INF
OR
MA
TIO
NS
TR
AT
EG
IC R
EP
OR
TF
INA
NC
IAL S
TAT
EM
EN
TS
FIN
AN
CIA
L STA
TE
ME
NT
SG
OV
ER
NA
NC
EO
TH
ER
INF
OR
MA
TIO
NO
VE
RV
IEW
ST
RA
TE
GIC
RE
PO
RT
Consolidated statement of changes in equityFor the year ended 31 December 2015
Consolidated statement of comprehensive incomeFor the year ended 31 December 2015

Notes2015
$m
2014 (Restated)
$m
Non-current assetsIntangible assets 13 150.1 118.6 Property, plant and equipment 14 8,601.1 8,213.9 Investment property 2.0 2.6 Inventories 21 263.9 247.8 Investment in associates and joint ventures 17 1,146.6 198.1 Trade and other receivables 22 292.9 239.5 Available-for-sale investments 18 2.7 15.6 Deferred tax assets 29 124.6 104.6
10,583.9 9,140.7 Current assetsInventories 21 297.1 382.5 Trade and other receivables 22 604.8 810.3 Current tax assets 319.5 106.9 Derivative financial instruments 26 0.2 0.2 Liquid investments 23 924.1 1,529.1 Cash and cash equivalents 23 807.5 845.4
2,953.2 3,674.4 Total assets 13,537.1 12,815.1 Current liabilitiesShort-term borrowings 24 (758.9) (284.5)Derivative financial instruments 26 (2.0) (7.5)Trade and other payables 25 (478.9) (793.8)Current tax liabilities (198.8) (77.6) (1,438.6) (1,163.4)Non-current liabilitiesMedium and long-term borrowings 24 (1,996.2) (2,091.6)Derivative financial instruments 26 (1.5) (3.5)Trade and other payables 25 (24.4) (4.8)Post-employment benefit obligations 28 (86.9) (103.0)Decommissioning and restoration and other long-term provisions 30 (394.0) (434.3)Deferred tax liabilities 30 (1,076.2) (979.8)
(3,579.2) (3,617.0)Total liabilities (5,017.8) (4,780.4)Net assets 8,519.3 8,034.7 EquityShare capital 31 89.8 89.8 Share premium 199.2 199.2 Other reserves 31 (59.3) (47.4)Retained earnings 31 6,416.4 5,932.1 Equity attributable to equity owners of the parent 6,646.1 6,173.7 Non-controlling interests 32 1,873.2 1,861.0 Total equity 8,519.3 8,034.7
The financial statements on pages 122 to 124 were approved by the Board of Directors on 14 March 2016 and signed on its behalf by
Jean-Paul Luksic William HayesChairman Director
124 Antofagasta plc Annual report and financial statements 2015
Consolidated balance sheetAs at 31 December 2015

Notes2015
$m2014
$m
Cash flows from operations 33 858.3 2,507.8 Interest paid (38.6) (45.4)Income tax paid (427.1) (641.5)Net cash from operating activities 392.6 1,820.9 Investing activitiesCapital contribution and loan to associates and joint ventures 17 (112.0) (125.2)Acquisition of joint ventures 20 (972.8) – Dividends from associate 17 12.1 20.0 Acquisition of available-for-sale investments 18 (0.2) (5.9)Disposal of subsidiary 8 942.9 – Acquisition of mining properties 19 (78.0) – Cash derecognised due to loss of control of subsidiary – (7.6)Proceeds from sale of property, plant and equipment 1.6 1.7 Purchases of property, plant and equipment (1,048.5) (1,646.3)Net decrease in liquid investments 23 605.0 542.3 Interest received 11.0 16.5 Net cash used in investing activities (638.9) (1,204.5)Financing activitiesDividends paid to equity holders of the Company 12 (127.2) (964.2)Dividends paid to preference shareholders of the Company 12 (0.2) (0.2)Dividends paid to non-controlling interests 32 (80.0) (412.2)Capital contribution from non-controlling interests 14.6 50.0 Change in ownership interest in subsidiaries – (30.9)Proceeds from issue of new borrowings 33 725.9 1,583.4 Repayments of borrowings 33 (276.4) (570.9)Repayments of obligations under finance leases 33 (11.9) (12.2)Net cash from/(used) in financing activities 244.8 (357.2)Net (decrease)/increase in cash and cash equivalents (1.5) 259.2 Cash and cash equivalents at beginning of the year 845.4 613.7 Net (decrease)/increase in cash and cash equivalents 33 (1.5) 259.2 Effect of foreign exchange rate changes 33 (36.4) (27.5)Cash and cash equivalents at end of the year 23,33 807.5 845.4
Antofagasta plc 125
ST
RA
TE
GIC
RE
PO
RT
GO
VE
RN
AN
CE
FIN
AN
CIA
L STA
TE
ME
NT
SO
TH
ER
INF
OR
MA
TIO
NS
TR
AT
EG
IC R
EP
OR
TF
INA
NC
IAL S
TAT
EM
EN
TS
FIN
AN
CIA
L STA
TE
ME
NT
SG
OV
ER
NA
NC
EO
TH
ER
INF
OR
MA
TIO
NO
VE
RV
IEW
ST
RA
TE
GIC
RE
PO
RT
Consolidated cash flow statementFor the year ended 31 December 2015

1 Basis of preparationThe financial statements have been prepared in accordance with International Financial Reporting Standards (“IFRS”) and with those parts of the Companies Act 2006 applicable to companies reporting under IFRS. For these purposes, IFRS comprise the standards issued by the International Accounting Standards Board (“IASB”) and IFRS Interpretations Committee (“IFRS IC”) that have been endorsed by the European Union (“EU”).
The financial statements have been prepared on the going concern basis. Details of the factors which have been taken into account in assessing the Group’s going concern status are set out within the Directors´ Report.
Significant events during 2015 and 2014
Construction of the Antucoya project was completed during 2015 and the project is currently in its initial start-up phase during which final commissioning activities are being performed to ensure that the operation’s assets are capable of operating in the manner intended by management. During this initial start-up period, all costs of the Antucoya operation, along with related revenues, are being capitalised.
On 1 December 2015, the Group completed the agreement with Barrick Gold Corporation (“Barrick”) under which Antofagasta acquired a 50% interest in Compañia Minera Zaldívar SpA (“Zaldívar”), and has accounted for its 50% interest in Zaldívar as a joint venture from that date.
The Group completed the sale of its water division, Aguas de Antofagasta S.A. to Empresas Publicas de Medellin, on 2 June, 2015 and the sale of its transport operation in Bolivia, Empresa Ferroviaria Andina (“FCA”), to Kimarcus Group Corp on 28 August, 2015. In these financial statements the net results of the water division for the five months to May 2015 and of the FCA for the eight months to August 2015, are shown in the income statement on the line for “Profit for the period from discontinued operations”. The comparative results for the prior year have been restated in order to present the comparative net result on the “Profit for the period from discontinued operations” line.
In January 2015, the Group completed its acquisition of Duluth Metals Limited (“Duluth”). As a result of the acquisition, the Group now has a 100% interest in Twin Metals Minnesota Limited (“Twin Metals”) and therefore it has been consolidated as a subsidiary of the Group from that date.
A reclassification between property, plant and equipment and current inventories has been made in the prior period comparative figures related to Ferrocarril Antofagasta Bolivia (“FCAB”). This has resulted in an increase in current inventories and a corresponding decrease in property, plant and equipment of $13.2 million as at 31 December 2014.
During 2014, the Group merged Minera Esperanza and Minera El Tesoro into a single entity – Minera Centinela. The production of copper concentrate, which was previously within Minera Esperanza, is now referred to as Centinela Concentrates, and the production of copper cathodes, which was previously within Minera El Tesoro, is referred to as Centinela Cathodes.
a) Adoption of new accounting standardsThe following accounting standards, amendments and interpretations became effective in the current reporting period:
Annual improvements 2011–2013 Cycle – improvements to four IFRSs
IFRIC 21 Levies
The application of these standards and interpretations, effective for the first time in the current year, has had no significant impact on the amounts reported in these financial statements.
b) Accounting standards issued but not yet effective At the date of authorisation of these financial statements, the following Standards and Interpretations which have not been applied in these financial statements were in issue but not yet effective:
• IFRS 9 Financial Instruments
• IFRS 14 Regulatory Deferral Accounts
• IFRS 15 Revenue from Contracts with Customers
• IFRS 16 Leases
• IAS 19 Defined Benefit Plans, Employee Contributions (Amendments to IAS 19)
• Annual improvements 2010–2012 Cycle – improvements to six IFRSs
• Accounting for Acquisitions of Interests in Joint Operations (Amendments to IFRS 11)
• Clarification of Acceptable Methods of Depreciation and Amortisation (Amendments to IAS 16 and IAS 38)
• Agriculture: Bearer Plants (Amendments to IAS 16 and IAS 41)
• Equity Method in Separate Financial Statements (Amendments to IAS 27)
• Sale or Contribution of Assets between an Investor and its Associate or Joint Venture (Amendments to IFRS 10 and IAS 28)
• Investment Entities: Applying the Consolidation Exception (Amendments to IFRS 10, IFRS 12 and IAS 28)
• Disclosure Initiative (Amendments to IAS 1)
• Annual improvements 2012–2014 Cycle – improvements to four IFRSs
• Recognition of Deferred Tax Assets for Unrealised Losses (Amendments to IAS 12)
• Disclosure Initiative (Amendments to IAS 7)
The Group is continuing to evaluate the impact of adopting these new standards and interpretations.
The Group is continuing to evaluate in detail the potential impact of IFRS 9 Financial Instruments and IFRS 15 Revenue from contracts with customers but does not currently expect these to have a material impact. In respect of IFRS 16 Leases the Group is not able to estimate the impact of the new rules on the Group´s financial statements. The Group will make more detailed assessments of the impact.
126 Antofagasta plc Annual report and financial statements 2015
Notes to the financial statements

2 Principal accounting policies
a) Accounting convention
These financial statements have been prepared under the historical cost convention as modified by the use of fair values to measure certain financial instruments, principally provisionally priced sales as explained in Note 2(f) and financial derivative contracts as explained in Note 2(x).
b) Basis of consolidation
The financial statements comprise the consolidated financial statements of Antofagasta plc (“the Company”) and its subsidiaries (collectively “the Group”).
(i) Subsidiaries – A subsidiary is an entity over which the Group has control, which is the case when the Group is exposed to, or has rights to, variable returns from its involvement with the entity and has the ability to affect those returns through its power over the entity. The consolidated financial statements include all the assets, liabilities, revenues, expenses and cash flows of the Company and its subsidiaries after eliminating inter-company balances and transactions. For partly-owned subsidiaries, the net assets and net earnings attributable to non-controlling shareholders are presented as “Non-controlling interests” in the consolidated balance sheet and consolidated income statement.
Non-controlling interests that are present ownership interests and entitle their holders to a proportionate share of the entity’s net assets in the event of liquidation, may be initially measured either at fair value or at the non-controlling interests’ proportionate share of the recognised amounts of the acquiree’s identifiable net assets. The choice of measurement basis is made on an acquisition-by-acquisition basis. Other types of non-controlling interests are measured at fair value or, when applicable, on the basis specified in another IFRS. Subsequent to acquisition, the carrying amount of non-controlling interests is the amount of those interests at initial recognition plus the non-controlling interests’ share of subsequent changes in equity. Total comprehensive income is attributed to non-controlling interests even if this results in the non-controlling interests having a deficit balance.
Changes in the Group’s ownership interests in subsidiaries that do not result in the Group losing control over the subsidiaries are accounted for as equity transactions. The carrying amounts of the Group’s interests and the non-controlling interests are adjusted to reflect the changes in their relative interests in the subsidiaries. Any difference between the amount by which the non-controlling interests are adjusted and the fair value of the consideration paid or received is recognised directly in equity and attributed to owners of the Company.
When the Group loses control of a subsidiary, a gain or loss is recognised in profit or loss and is calculated as the difference between (i) the aggregate of the fair value of the consideration received and the fair value of any retained interest and (ii) the previous carrying amount of the assets (including goodwill), and liabilities of the subsidiary and any non-controlling interests. When assets of the subsidiary are carried at revalued amounts or fair values and the related cumulative gain or loss has been recognised in other comprehensive income and accumulated in equity, the amounts previously recognised in other comprehensive income and accumulated in equity are accounted for as if the Group had directly disposed of the relevant assets (ie reclassified to profit or loss or transferred directly to retained earnings as specified by applicable IFRSs). The fair value of any investment retained in the former subsidiary at the date when control is lost is regarded as the fair value on initial recognition for subsequent accounting under IAS 39 Financial Instruments: Recognition and Measurement or, when applicable, the cost on initial recognition of an investment in an associate or a joint venture.
Acquisitions and disposals are treated as explained in Note 2(g) relating to business combinations and goodwill.
c) Investments in associates
An associate is an entity over which the Group is in a position to exercise significant influence, but not control or joint control, through the power to participate in the financial and operating policy decisions of that entity. The results and assets and liabilities of associates are incorporated in these consolidated financial statements using the equity method of accounting. This requires recording the investment initially at cost to the Group and then, in subsequent periods, adjusting the carrying amount of the investment to reflect the Group’s share of the associate’s results less any impairment and any other changes to the associate’s net assets such as dividends. When the Group loses control of a former subsidiary but retains an investment in associate in that entity, the initial carrying value of the investment in associate is recorded at its fair value at that point. When the Group’s share of losses of an associate exceeds the Group’s interest in that associate, the Group discontinues recognising its share of further losses. Additional losses are recognised only to the extent that the Group has incurred legal or constructive obligations or made payments on behalf of the associate.
Antofagasta plc 127
GO
VE
RN
AN
CE
FIN
AN
CIA
L STA
TE
ME
NT
SO
TH
ER
INF
OR
MA
TIO
NF
INA
NC
IAL S
TAT
EM
EN
TS
FIN
AN
CIA
L STA
TE
ME
NT
SG
OV
ER
NA
NC
EO
TH
ER
INF
OR
MA
TIO
NO
VE
RV
IEW
ST
RA
TE
GIC
RE
PO
RT

2 Principal accounting policies continued
d) Joint arrangements
A joint arrangement is an arrangement of which two or more parties have joint control. Joint arrangements are accounted depending on the nature of the arrangement.
(i) Joint ventures – are accounted for using equity method in accordance with IAS 28 Investment in Associates and Joint Ventures as described in Note 2(c).
(ii) Joint operations – are accounted for recognising directly the assets, obligations, revenues and expenses of the joint operator in the joint arrangement. The assets, liabilities, revenues and expenses are accounted for in accordance with the relevant IFRS.
When a Group entity transacts with its joint arrangements, profits and losses resulting from the transactions with the joint arrangements are recognised in the Group’s consolidated financial statements only to the extent of interests in the joint arrangements that are not related to the Group.
e) Currency translation
The functional currency for each entity in the Group is determined as the currency of the primary economic environment in which it operates. Transactions in currencies other than the functional currency of the entity are translated at the exchange rate ruling at the date of the transaction. Monetary assets and liabilities denominated in currencies other than the functional currency are retranslated at year end exchange rates. Gains and losses on retranslation are included in net profit or loss for the period within other finance items.
The presentational currency of the Group and the functional currency of the Company is the US dollar. On consolidation, income statement items for entities with a functional currency other than the US dollar are translated into US dollars at average rates of exchange. Balance sheet items are translated at period-end exchange rates. Exchange differences on translation of the net assets of such entities are taken to equity and recorded in a separate currency translation reserve. Cumulative translation differences arising after the transition date to IFRS are recognised as income or as expenses in the income statement in the period in which an operation is disposed of.
On consolidation, exchange gains and losses which arise on balances between Group entities are taken to reserves where that balance is, in substance, part of the net investment in a foreign operation, ie where settlement is neither planned nor likely to occur in the foreseeable future. All other exchange gains and losses on Group balances are dealt with in the income statement.
Fair value adjustments and any goodwill arising on the acquisition of a foreign entity are treated as assets of the foreign entity and translated at the period-end rate.
f) Revenue recognition
Revenue represents the value of goods and services supplied to third parties during the year. Revenue is measured at the fair value of consideration received or receivable, and excludes any applicable sales tax.
A sale is recognised when the significant risks and rewards of ownership have passed. This is generally when title and any insurance risk has passed to the customer, and the goods have been delivered to a contractually agreed location or when any services have been provided.
Revenue from mining activities is recorded at the invoiced amounts with an adjustment for provisional pricing at each reporting date, as explained below. For copper and molybdenum concentrates, which are sold to smelters and roasting plants for further processing, the invoiced amount is the market value of the metal payable by the customer, net of deductions for tolling charges. Revenue includes amounts from the sale of by-products.
Copper and molybdenum concentrate sale agreements and copper cathode sale agreements generally provide for provisional pricing of sales at the time of shipment, with final pricing based on the monthly average London Metal Exchange (“LME”) copper price or the monthly average market molybdenum price for specified future periods. This normally ranges from one to five months after delivery to the customer. Such a provisional sale contains an embedded derivative which is required to be separated from the host contract. The host contract is the sale of metals contained in the concentrate or cathode at the provisional invoice price less tolling charges deducted, and the embedded derivative is the forward contract for which the provisional sale is subsequently adjusted. At each reporting date, the provisionally priced metal sales together with any related tolling charges are marked-to-market, with adjustments (both gains and losses) being recorded in revenue in the consolidated income statement and in trade debtors in the balance sheet. Forward prices at the period end are used for copper concentrate and cathode sales, while period-end average prices are used for molybdenum concentrate sales due to the absence of a futures market.
Interest income is accrued on a time basis, by reference to the principal outstanding and the effective interest rate applicable, which is the rate that exactly discounts estimated future cash receipts through the expected life of the financial asset to that asset’s net carrying amount.
Dividend income from available-for-sale investments and associates is recognised when the shareholders’ right to receive payment has been established.
128 Antofagasta plc Annual report and financial statements 2015
Notes to the financial statements

g) Business combinations and goodwill
Acquisitions of businesses are accounted for using the acquisition method. The consideration transferred in a business combination is measured at fair value, which is calculated as the sum of the acquisition-date fair values of the assets transferred by the Group, liabilities incurred by the Group to the former owners of the acquiree and the equity interests issued by the Group in exchange for control of the acquiree. The results of businesses acquired during the year are brought into the consolidated financial statements from the effective date of acquisition. The identifiable assets, liabilities and contingent liabilities of a business which can be measured reliably are recorded at their provisional fair values at the date of acquisition. Provisional fair values are finalised within 12 months of the acquisition date. Acquisition-related costs are expensed as incurred.
When the consideration transferred by the Group in a business combination includes assets or liabilities resulting from a contingent consideration arrangement, the contingent consideration is measured at its acquisition-date fair value and included as part of the consideration transferred in a business combination. Changes in the fair value of the contingent consideration that qualify as measurement period adjustments are adjusted retrospectively, with corresponding adjustments against goodwill. Measurement period adjustments are adjustments that arise from additional information obtained during the “measurement period” (which cannot exceed one year from the acquisition date) about facts and circumstances that existed at the acquisition date.
The subsequent accounting for changes in the fair value of the contingent consideration that do not qualify as “measurement period” adjustments depends on how the contingent consideration is classified. Contingent consideration that is classified as equity is not remeasured at subsequent reporting dates and its subsequent settlement is accounted for within equity. Contingent consideration that is classified as an asset or a liability is remeasured at subsequent reporting dates in accordance with IAS 39, or IAS 37 Provisions, Contingent Liabilities and Contingent Assets, as appropriate.
When a business combination is achieved in stages, the Group’s previously held equity interest in the acquiree is remeasured to fair value at the acquisition date (ie the date when the Group obtains control) and the resulting gain or loss, if any, is recognised in profit or loss. Amounts arising from interests in the acquiree prior to the acquisition date that have previously been recognised in other comprehensive income are reclassified to profit or loss where such treatment would be appropriate if that interest were disposed of.
If the initial accounting for a business combination is incomplete by the end of the reporting period in which the combination occurs, the Group reports provisional amounts for the items for which the accounting is incomplete. Those provisional amounts are adjusted during the measurement period (see above), or additional assets or liabilities are recognised, to reflect new information obtained about facts and circumstances that existed at the acquisition date that, if known, would have affected the amounts recognised at that date.
Goodwill arising in a business combination is measured as the excess of the sum of the consideration transferred, the amount of any non-controlling interest in the acquiree and the fair value of the acquirer’s previously held equity interest in the acquiree (if any) over the next identifiable assets acquired and liabilities assumed. Any goodwill on the acquisition of subsidiaries is separately disclosed, while any goodwill on the acquisition of associates is included within investments in equity accounted entities. Internally generated goodwill is not recognised. Where the fair values of the identifiable net assets acquired exceed the sum of the consideration transferred, the surplus is credited to the profit or loss in the period of acquisition as a bargain purchase gain.
The Group often enters into earn-in arrangements whereby the Group acquires an interest in a project company in exchange for funding exploration and evaluation expenditure up to a specified level of expenditure or a specified stage in the life of the project. Funding is usually conditional on the achievement of key milestones by the partner. Typically there is no consideration transferred or funding liability on the effective date of acquisition of the interest in the project company and no goodwill is recognised on this type of business combination.
The results of businesses sold during the year are included in the consolidated financial statements for the period up to the effective date of disposal. Gains or losses on disposal are calculated as the difference between the sales´ proceeds (net of expenses) and the net assets attributable to the interest which has been sold. Where a disposal represents a separate major line of business or geographical area of operations, the net results attributable to the disposed entity are shown separately in the income statement.
h) Exploration and evaluation expenditure
Exploration and evaluation costs, other than those incurred in acquiring exploration licences, are expensed in the year in which they are incurred. When a mining project is considered to be commercially viable (normally when the project has completed a pre-feasibility study, and the start of a feasibility study has been approved) all further directly attributable pre-production expenditure is capitalised. Capitalisation of pre-production expenditure ceases when commercial levels of production are achieved.
Costs incurred in acquiring exploration licences are accounted for as mining properties included in property, plant and equipment in accordance with the policy in Note 2(k) and are stated at cost less accumulated amortisation.
Antofagasta plc 129
GO
VE
RN
AN
CE
FIN
AN
CIA
L STA
TE
ME
NT
SO
TH
ER
INF
OR
MA
TIO
NF
INA
NC
IAL S
TAT
EM
EN
TS
FIN
AN
CIA
L STA
TE
ME
NT
SG
OV
ER
NA
NC
EO
TH
ER
INF
OR
MA
TIO
NO
VE
RV
IEW
ST
RA
TE
GIC
RE
PO
RT
2 Principal accounting policies continued
i) Stripping costs
Pre-stripping and operational stripping costs are incurred in the course of the development and operation of open-pit mining operations.
Pre-stripping costs relate to the removal of waste material as part of the initial development of an open-pit, in order to allow access to the ore body. These costs are capitalised within mining properties within property, plant and equipment. The capitalised costs are depreciated once production commences on a unit of production basis, in proportion to the volume of ore extracted in the year compared with total proven and probable reserves for that pit at the beginning of the year.
Operational stripping costs relate to the costs of extracting waste material as part of the ongoing mining process. The ongoing mining and development of the Group’s open-pit mines is generally performed via a succession of individual phases. The costs of extracting material from an open-pit mine are generally allocated between ore and waste stripping in proportion to the tonnes of material extracted. The waste stripping costs are generally absorbed into inventory and expensed as that inventory is processed and sold. Where the stripping costs relate to a significant stripping campaign which is expected to provide improved access to an identifiable component of the ore body (typically an individual phase within the overall mine plan), the costs of removing waste in order to improve access to that part of the ore body will be capitalised within mining properties within property, plant and equipment. The capitalised costs will then be amortised on a unit of production basis, in proportion to the volume of ore extracted compared with the total ore contained in the component of the pit to which the stripping campaign relates.
j) Intangible assets
Intangible assets with finite useful lives that are acquired separately are carried at cost less accumulated amortisation and accumulated impairment losses. Intangible assets include the cost of acquiring exploration licences. Amortisation is recognised on a straight-line basis over their estimated useful lives. The estimated useful life and amortisation method are reviewed at the end of each reporting period, with the effect of any changes in estimate being accounted for on a prospective basis. Intangible assets with indefinite useful lives that are acquired separately are carried at cost less accumulated impairment losses.
Intangible assets acquired in a business combination and recognised separately from goodwill are initially recognised at their fair value at the acquisition date (which is regarded as their cost).
Subsequent to initial recognition, intangible assets acquired in a business combination are reported at cost less accumulated amortisation and accumulated impairment losses, on the same basis as intangible assets that are acquired separately.
An intangible asset is derecognised on disposal, or when no future economic benefits are expected from use or disposal. Gains or losses arising from derecognition of an intangible asset, measured as the difference between the net disposal proceeds and the carrying amount of the asset, are recognised in profit or loss when the asset is derecognised.
k) Property, plant and equipment
The costs of mining properties and leases, which include the costs of acquiring and developing mining properties and mineral rights, are capitalised as property, plant and equipment in the year in which they are incurred, when a mining project is considered to be commercially viable (normally when the project has completed a pre-feasibility study, and the start of a feasibility study has been approved). The cost of property, plant and equipment comprises the purchase price and any costs directly attributable to bringing the asset to the location and condition necessary for it to be capable of operating in the manner intended. Once a project has been established as commercially viable, related development expenditure is capitalised. This includes costs incurred in preparing the site for mining operations, including pre-stripping costs. Capitalisation ceases when the mine is capable of commercial production, with the exception of development costs which give rise to a future benefit.
Interest on borrowings related to construction or development of projects is capitalised, until such time as the assets are substantially ready for their intended use or sale which, in the case of mining properties, is when they are capable of commercial production.
l) Depreciation of property, plant and equipment and amortisation of intangible assets
Property, plant and equipment is depreciated over its useful life, or over the remaining life of the operation if shorter, to residual value. The major categories of property, plant and equipment are depreciated as follows:
(i) Land – freehold land is not depreciated unless the value of the land is considered to relate directly to a particular mining operation, in which case the land is depreciated on a straight-line basis over the expected mine life. Any leasehold land is depreciated on a straight-line basis over the life of the lease.
(ii) Mining properties – mining properties, including capitalised financing costs, are depreciated on a unit of production basis, in proportion to the volume of ore extracted in the year compared with total proven and probable reserves at the beginning of the year.
(iii) Buildings and infrastructure – straight-line basis over 10 to 25 years.
(iv) Railway track (including trackside equipment) – straight-line basis over 20 to 25 years.
(v) Wagons and rolling stock – straight-line basis over 10 to 20 years.
(vi) Machinery, equipment and other assets – are depreciated on a unit of production basis, in proportion to the volume of ore/material processed or straight-line basis over 5 to 20 years.
(vii) Assets under construction – no depreciation until asset is available for use.
(viii) Assets held under finance lease – are depreciated over the shorter of the lease term and their useful life.
Residual values and useful lives are reviewed, and adjusted if appropriate, at least annually, and changes to residual values and useful lives are accounted for prospectively.
The concession right is amortised on a straight-line basis over the life of the concession, or the useful life of any component part if less.
130 Antofagasta plc Annual report and financial statements 2015
Notes to the financial statements

m) Impairment of property, plant and equipment and intangible assets (excluding goodwill)
Property, plant and equipment and finite life intangible assets are reviewed for impairment if there is any indication that the carrying amount may not be recoverable. If any such indication exists, the recoverable amount of the asset is estimated in order to determine the extent of the impairment (if any). Where the asset does not generate cash flows that are independent from other assets, the Group estimates the recoverable amount of the cash-generating unit to which the asset belongs. Any intangible asset with an indefinite useful life is tested for impairment annually and whenever there is an indication that the asset may be impaired.
Recoverable amount is the higher of fair value less costs of disposal and value in use. Fair value less costs of disposal reflects the net amount the Group would receive from the sale of the asset in an orderly transaction between market participants. For mining assets this would generally be determined based on the present value of the estimated future cash flows arising from the continued use, further development or eventual disposal of the asset. The estimates used in determining the present value of those cash flows are those that an independent market participant would consider appropriate. Value in use reflects the present value of the future cash flows which the Group would expect to derive from continued use of the asset in its current condition, discounted using a pre-tax discount rate that reflects current market assessments of the time value of money and the risks specific to the asset for which estimates of future cash flows have not been adjusted.
If the recoverable amount of an asset or cash-generating unit is estimated to be less than its carrying amount, the carrying amount is reduced to the recoverable amount. An impairment charge is recognised in the income statement immediately. Where an impairment subsequently reverses, the carrying amount is increased to the revised estimate of recoverable amount, but so that the increased carrying amount does not exceed the carrying value that would have been determined if no impairment had previously been recognised. A reversal is recognised in the income statement immediately.
n) Investment property
Investment property is property held to earn rentals and/or for capital appreciation and includes land held for a currently undetermined future use. The Group has elected to adopt the cost model in IAS 40 “Investment Property”. Accordingly, investment property is measured initially at cost, which includes transaction costs for the acquisition of the property and, as detailed in Note 2(l) relating to property, plant and equipment, is not depreciated.
o) Inventory
Inventory consists of raw materials and consumables, work-in-progress and finished goods. Work-in-progress represents material that is in the process of being converted into finished goods. The conversion process for mining operations depends on the nature of the copper ore. For sulphide ores, processing includes milling and concentrating and results in the production of copper concentrate. For oxide ores, processing includes leaching of stockpiles, solution extraction and electrowinning and results in the production of copper cathodes. Finished goods consist of copper concentrate containing gold and silver at Los Pelambres and Centinela and copper cathodes at Centinela, Antucoya and Michilla. Los Pelambres also produces molybdenum as a by-product.
Inventory is valued at the lower of cost, on a weighted average basis, and net realisable value. Net realisable value represents estimated selling price less all estimated costs of completion and costs to be incurred in marketing, selling and distribution. Cost of finished goods and work-in-progress is production cost and for raw materials and consumables it is purchase price. Production cost includes:
• labour costs, raw material costs and other costs directly attributable to the extraction and processing of ore;
• depreciation of plant, equipment and mining properties directly involved in the production process; and
• an appropriate portion of production overheads.
Stockpiles represent ore that is extracted and is available for further processing. Costs directly attributable to the extraction of ore are generally allocated as part of production cost in proportion to the tonnes of material extracted. Operational stripping costs are generally absorbed into inventory, and therefore expensed as that inventory is processed and sold. If ore will not be processed within 12 months of the statement of financial position date, it is included within non-current assets. If there is significant uncertainty as to when any stockpiled ore will be processed, it is expensed as incurred.
p) Taxation
Tax expense comprises the charges or credits for the year relating to both current and deferred tax.
Current tax is based on taxable profit for the year. Taxable profit may differ from net profit as reported in the income statement because it excludes items of income or expense that are taxable and deductible in different years and also excludes items that are not taxable or deductible. The liability for current tax is calculated using tax rates for each entity in the consolidated financial statements which have been enacted or substantively enacted at the balance sheet date.
Deferred tax is the tax expected to be payable or recoverable on temporary differences (ie differences between the carrying amount of assets and liabilities in the financial statements and the corresponding tax basis used in the computation of taxable profit). Deferred tax is accounted for using the balance sheet liability method and is provided on all temporary differences with certain limited exceptions as follows:
(i) tax payable on undistributed earnings of subsidiaries, associates and joint ventures is provided except where the Group is able to control the remittance of profits and it is probable that there will be no remittance of past profits earned in the foreseeable future;
(ii) deferred tax is not provided on the initial recognition of an asset or liability in a transaction that does not affect accounting profit or taxable profit and is not a business combination; nor is deferred tax provided on subsequent changes in the carrying value of such assets and liabilities, for example where they are depreciated; and
(iii) the initial recognition of any goodwill.
Deferred tax assets are recognised only to the extent that it is probable that they will be recovered through sufficient future taxable profit. The carrying amount of deferred tax assets is reviewed at each balance sheet date.
Deferred tax is calculated at the tax rates that are expected to apply in the period when the liability is settled or the asset is realised. Deferred tax is charged or credited in the income statement, except when it relates to items charged or credited directly to equity, in which case the deferred tax is also taken directly to equity.
Antofagasta plc 131
GO
VE
RN
AN
CE
FIN
AN
CIA
L STA
TE
ME
NT
SO
TH
ER
INF
OR
MA
TIO
NF
INA
NC
IAL S
TAT
EM
EN
TS
FIN
AN
CIA
L STA
TE
ME
NT
SG
OV
ER
NA
NC
EO
TH
ER
INF
OR
MA
TIO
NO
VE
RV
IEW
ST
RA
TE
GIC
RE
PO
RT

2 Principal accounting policies continued
q) Provisions
Provisions are recognised when the Group has a present obligation (legal or constructive) as a result of a past event, it is probable that the Group will be required to settle the obligation, and a reliable estimate can be made of the amount of the obligation.
The amount recognised as a provision is the best estimate of the consideration required to settle the present obligation at the end of the reporting period, taking into account the risks and uncertainties surrounding the obligation. When a provision is measured using the cash flows estimated to settle the present obligation, its carrying amount is the present value of those cash flows (when the effect of the time value of money is material).
When some or all of the economic benefits required to settle a provision are expected to be recovered from a third party, a receivable is recognised as an asset if it is virtually certain that reimbursement will be received and the amount of the receivable can be measured reliably.
r) Provisions for decommissioning and restoration costs
An obligation to incur decommissioning and restoration costs occurs when environmental disturbance is caused by the development or ongoing production of a mining property. Costs are estimated on the basis of a formal closure plan and are subject to regular formal review.
Such costs arising from the installation of plant and other site preparation work, discounted to their net present value, are provided and capitalised at the start of each project, as soon as the obligation to incur such costs arises. These decommissioning costs are charged against profits over the life of the mine, through depreciation of the asset and unwinding or amortisation of the discount on the provision. Depreciation is included in operating costs while the unwinding of the discount is included as financing costs. Changes in the measurement of a liability relating to the decommissioning of plant or other site preparation work are added to, or deducted from, the cost of the related asset in the current year.
The costs for restoration of site damage, which is created on an ongoing basis during production, are provided for at their net present values and charged against operating profits as extraction progresses. Changes in the measurement of a liability relating to site damage created during production is charged against operating profit.
s) Share-based payments
For cash-settled share-based payments, a liability is recognised for the goods or services acquired, measured initially at the fair value of the liability. At the end of each reporting period until the liability is settled, and at the date of settlement, the fair value of the liability is remeasured, with any changes in fair value recognised in profit or loss for the year. The Group currently does not have any equity share-based payments to employees or third parties.
t) Post-employment benefits
The Group operates defined contribution schemes for a limited number of employees. For such schemes, the amount charged to the income statement is the contributions paid or payable in the year.
Employment terms may also provide for payment of a severance indemnity when an employment contract comes to an end. This is typically at the rate of one month for each year of service (subject in most cases to a cap as to the number of qualifying years of service) and based on final salary level. The severance indemnity obligation is treated as an unfunded defined benefit plan, and the calculation is based on valuations performed by an independent actuary using
the projected unit credit method, which are regularly updated. The obligation recognised in the balance sheet represents the present value of the severance indemnity obligation. Actuarial gains and losses are immediately recognised in other comprehensive income.
u) Cash and cash equivalents
Cash and cash equivalents comprise cash on hand, deposits held on call with banks, highly liquid investments that are readily convertible into known amounts of cash and which are subject to insignificant risk of changes in value, net of bank overdrafts which are repayable on demand. Cash and cash equivalents normally have a maturity period of 90 days or less.
v) Liquid investments
Liquid investments represent highly liquid current asset investments that do not meet the IAS 7 definition of cash and cash equivalents, normally because even if readily accessible, the underlying investments have an average maturity profile greater than 90 days from the date first entered into. These assets are designated as fair value through profit or loss.
w) Leases
Rental costs under operating leases are charged to the income statement account in equal annual amounts over the term of the lease.
Assets under finance leases are recognised as assets of the Group at inception of the lease at the lower of fair value or the present value of the minimum lease payments derived by discounting at the interest rate implicit in the lease. The interest element is charged within financing costs so as to produce a constant periodic rate of interest on the remaining balance of the liability.
x) Other financial instruments
Financial assets and financial liabilities are recognised on the Group’s balance sheet when the Group becomes a party to the contractual provisions of the instrument.
(i) Investments – Investments which are not subsidiaries, associates or joint ventures are initially measured at cost, including transaction costs.
Investments are classified as either held for trading or available-for-sale, and are normally measured at subsequent reporting dates at fair value. Fair value is determined in the manner described in Note 26(b). Investments in equity instruments that do not have a quoted market price in an active market and whose fair value cannot be reliably measured are measured at cost. Securities are classified as “held-for-trading” when they are acquired principally for the purpose of sale in the short term, and gains and losses arising from changes in fair value are included in profit or loss for the period. Other investments are classified as “available-for-sale”, and gains and losses arising from changes in fair value are recognised directly in equity, within the “Fair value reserve”, until the security is disposed of or is determined to be impaired, at which time the cumulative gain or loss previously recognised in equity is included in profit or loss for the period. Dividends on available-for-sale and held-for-trading equity investments are recognised in the income statement when the right to receive payment is established.
(ii) Trade and other receivables – Trade and other receivables do not generally carry any interest and are normally stated at their nominal value less any impairment. Impairment losses on trade receivables are recognised within an allowance account unless the Group considers that no recovery of the amount is possible, in which case the carrying value of the asset is reduced directly.
132 Antofagasta plc Annual report and financial statements 2015
Notes to the financial statements

(iii) Trade and other payables – Trade and other payables are generally not interest-bearing and are normally stated at their nominal value.
(iv) Borrowings (loans and preference shares) – Interest-bearing loans and bank overdrafts are initially recorded at the proceeds received, net of direct issue costs. They are subsequently measured at amortised cost using the effective interest method, with interest expense recognised on an effective yield basis. The effective interest method is a method of calculating the amortised cost of a financial liability and of allocating interest expense over the relevant period. The effective interest rate is the rate that exactly discounts estimated future cash payments through the expected life of the financial liability, or, where appropriate, a shorter period. Finance charges, including premiums payable on settlement or redemption and direct issue costs, are accounted for on an accruals basis using the effective interest rate method. Amounts are either recorded as financing costs in profit or loss or capitalised in accordance with the accounting policy set out in Note 2(k). Finance charges are added to the carrying amount of the instrument to the extent that they are not settled in the period in which they arise.
The sterling-denominated preference shares issued by the Company carry a fixed rate of return without the right to participate in any surplus. They are accordingly classified within borrowings and translated into US dollars at period-end rates of exchange. Preference share dividends are included within finance costs.
(v) Equity instruments – Equity instruments issued are recorded at the proceeds received, net of direct issue costs. Equity instruments of the Company comprise its sterling-denominated issued ordinary share capital and related share premium. As explained in Note 2(e), the presentational currency of the Group and the functional currency of the Company is US dollars, and ordinary share capital and share premium are translated into US dollars at historical rates of exchange based on dates of issue.
(vi) Derivative financial instruments – As explained in Note 26(d), the Group uses derivative financial instruments to reduce exposure to foreign exchange, interest rate and commodity price movements. The Group does not use such derivative instruments for trading purposes. The Group has applied the hedge accounting provisions of IAS 39 “Financial Instruments: Recognition and Measurement”. The effective portion of changes in the fair value of derivative financial instruments that are designated and qualify as hedges of future cash flows have been recognised directly in equity, with such amounts subsequently recognised in profit or loss in the period when the hedged item affects profit or loss. Any ineffective portion is recognised immediately in profit or loss. Realised gains and losses on commodity derivatives recognised in profit or loss are recorded within revenue. The time value element of changes in the fair value of derivative options is excluded from the designated hedging relationship, and is therefore recognised directly in profit or loss within other finance items. Derivatives embedded in other financial instruments or other host contracts are treated as separate derivatives when their risks and characteristics are not closely related to those of host contracts and the host contracts are not carried at fair value. Changes in fair value are reported in profit or loss for the year. The treatment of embedded derivatives arising from provisionally-priced commodity sales contracts is set out in further detail in Note 2(f) relating to revenue.
(vii) Impairment of financial assets – Financial assets, other than those at fair value through profit or loss, are assessed for indicators of impairment at each balance sheet date. Financial assets are impaired where there is objective evidence that as a result of one or more events that occurred after the initial recognition of the financial asset the estimated future cash flows of the investment have been impacted. For loans and receivables, the amount of the impairment is the difference between the asset’s carrying value and the present value of estimated future cash flows, discounted at the original effective interest rate. Any impairment loss is recognised in profit or loss immediately.
The carrying amount of the financial asset is reduced by the impairment loss directly for all financial assets with the exception of trade receivables.
With the exception of available-for-sale equity instruments, if, in a subsequent period, the amount of the impairment loss decreases and the decrease can be related objectively to an event occurring after the impairment was recognised, the previously recognised impairment loss is reversed through profit or loss immediately to the extent that the carrying amount of the investment at the date the impairment is reversed does not exceed what the amortised cost would have been had the impairment not been recognised. In respect of available-for-sale equity instruments, any increase in fair value subsequent to an impairment loss is recognised directly in equity.
y) Rounding
All amounts disclosed in the financial statements and notes have been rounded off to the nearest one hundred thousand dollars unless otherwise stated.
These policies have been consistently applied to all the years presented, unless otherwise stated.
3 Critical accounting judgements and key sources of estimation uncertaintyDetermining many of the amounts included in the financial statements involves the use of judgement and/or estimation. These judgements and estimates are based on management’s best knowledge of the relevant facts and circumstances having regard to prior experience, but actual results may differ from the amounts included in the financial statements. Information about such judgements and estimates is included in the principal accounting policies in Note 2 or the other notes to the financial statements, and the key areas are set out below.
a) Capitalisation of property, plant and equipment and of project costs
As explained in Note 2(k), the costs of developing mining properties are capitalised as property, plant and equipment in the year in which they are incurred, when the mining project is considered to be commercially viable. Management reviews amounts capitalised to ensure that the treatment of that expenditure as capital rather than operating expenditure is reasonable, in particular in respect of the commercial viability of the project. Commercial viability is normally considered to be demonstrable when the project has completed a pre-feasibility study, and the start of a feasibility study has been approved.
Antofagasta plc 133
GO
VE
RN
AN
CE
FIN
AN
CIA
L STA
TE
ME
NT
SO
TH
ER
INF
OR
MA
TIO
NF
INA
NC
IAL S
TAT
EM
EN
TS
FIN
AN
CIA
L STA
TE
ME
NT
SG
OV
ER
NA
NC
EO
TH
ER
INF
OR
MA
TIO
NO
VE
RV
IEW
ST
RA
TE
GIC
RE
PO
RT

3 Critical accounting judgements and key sources of estimation uncertainty continued
b) Useful economic lives of property, plant and equipment and ore reserves estimates
As explained in Note 2(l), mining properties, including capitalised financing costs, are depreciated in proportion to the volume of ore extracted in the year compared with total proven and probable reserves at the beginning of the year.
There are numerous uncertainties inherent in estimating ore reserves, and assumptions that were valid at the time of estimation may change when new information becomes available. These include assumptions as to grade estimates and cut-off grades, recovery rates, commodity prices, exchange rates, production costs, capital costs, processing and reclamation costs and discount rates. The actual volume of ore extracted and any changes in these assumptions could affect prospective depreciation rates and carrying values.
The majority of other items of property, plant and equipment are depreciated on a straight-line basis over their useful economic lives. Management reviews the appropriateness of useful economic lives at least annually and, again, any changes could affect prospective depreciation rates and asset carrying values.
c) Impairment of assets
As explained in Note 2(m), the Group reviews the carrying value of its intangible assets and property, plant and equipment to determine whether there is any indication that those assets are impaired. In making assessments for impairment, assets that do not generate independent cash flows are allocated to an appropriate cash-generating unit (“CGU”). The recoverable amount of those assets, or CGU, is measured at the higher of their fair value less costs to sell and value in use. Details of the impairment reviews undertaken as at 31 December 2015 are set out in Note 15.
Management necessarily applies its judgement in allocating assets to CGUs, in estimating the probability, timing and value of underlying cash flows and in selecting appropriate discount rates to be applied within the fair value less cost to dispose calculation. The key assumptions are set out in Note 2(m) and Note 15. Subsequent changes to CGU allocation, licensing status, reserves and resources, price assumptions or other estimates and assumptions in the fair value less cost to dispose calculation could impact the carrying value of the respective assets.
d) Provisions for decommissioning and site restoration costs
As explained in Note 2(r), provision is made, based on net present values, for decommissioning and site rehabilitation costs as soon as the obligation arises following the development or ongoing production of a mining property. The provision is based on a closure plan prepared with the assistance of external consultants.
Management uses its judgement and experience to provide for and (in the case of capitalised decommissioning costs) amortise these estimated costs over the life of the mine. The ultimate cost of decommissioning and site rehabilitation is uncertain and cost estimates can vary in response to many factors including changes to relevant legal requirements, the emergence of new restoration techniques or experience at other mine sites.
The expected timing and extent of expenditure can also change, for example in response to changes in ore reserves or processing levels. As a result, there could be significant adjustments to the provisions established which would affect future financial results.
e) Deferred taxation
As explained in Note 2(p), deferred tax is not provided for future tax payable on undistributed earnings where the Group is able to control the remittance of profits and it is probable that there will be no remittance of past profits earned in the foreseeable future.
Management uses its judgement in estimating the probability of such remittances. These are based on Group forecasts and include assumptions as to future profits and cash flows (which depend on several factors including commodity prices, operating costs, production levels, capital expenditures, interest costs, debt repayment and tax rates) and cash requirements (which may also depend on several factors including future dividend levels). A change in the assumptions used or in the estimate as to the probability that past profits will be remitted would impact the deferred tax charge and balance sheet provision.
4 Segment informationThe Group’s reportable segments are as follows:
• Los Pelambres
• Centinela
• Michilla
• Antucoya
• Zaldívar
• Exploration and evaluation
• Railway and other transport services
• Water concession
• Corporate and other items
For management purposes, the Group is organised into three business divisions based on their products – Mining, Railway and other transport services and the Water concession. The mining division is split further for management reporting purposes to show results by mine and exploration activity. Los Pelambres and Centinela are both operating mines, Michilla was placed on care and maintenance at the end of 2015, Antucoya is in its initial ramp-up stage and Zaldívar, in which the Group has acquired a 50% stake, was acquired in December 2015. Los Pelambres produces primarily copper concentrate and molybdenum as a by-product. Centinela produces primarily copper concentrate containing gold as a by-product and copper cathodes. Michilla, Antucoya and Zaldívar produce copper cathodes. The transport division provides rail cargo (based in Chile and formerly Bolivia) and road cargo (based in Chile) together with a number of ancillary services (based in Chile). The water division produced and distributed potable water to domestic customers and untreated water to industrial customers in Chile’s Antofagasta Region. The Exploration and evaluation segment incurs exploration and evaluation expenses. “Corporate and other items” comprises costs incurred by the Company, Antofagasta Minerals S.A., the Group’s mining corporate centre and other entities, that are not allocated to any individual business segment. Consistent with its internal management reporting, the Group’s corporate and other items are included within the mining division.
Management monitors the operating results of business segments separately for the purpose of making decisions about resources to be allocated and of assessing performance. Segment performance is evaluated based on the operating profit of each of the segments.
134 Antofagasta plc Annual report and financial statements 2015
Notes to the financial statements

a) Segment revenues and results
For the year ended 31 December 2015
Los Pelambres
$mCentinela
$mMichilla
$mAntucoya
$mZaldívar
$m
Exploration and
evaluation2
$m
Corporate and other
items $m
Mining $m
Railway and other transport
services $m
Water concession
$mTotal
$m
Revenue 1,807.2 1,266.1 168.9 – – – – 3,242.2 152.4 – 3,394.6 EBITDA1 749.3 238.4 14.1 – – (101.9) (67.6) 832.3 58.4 – 890.7 Depreciation and amortisation (191.6) (367.6) – – – – (3.1) (562.3) (13.8) – (576.1)(Loss)/gain on disposals (2.7) (1.8) 1.3 – – – (4.4) (7.6) (2.6) – (10.2)Operating profit/(loss) 555.0 (131.0) 15.4 – – (101.9) (75.1) 262.4 42.0 – 304.4 Share of results from associates and joint ventures (3.7) – – – (2.8) – (7.5) (14.0) 8.2 – (5.8)Investment income 10.2 4.3 0.6 – – – 2.2 17.3 0.8 – 18.1 Interest expense (1.8) (27.1) – – – – (1.8) (30.7) (3.0) – (33.7)Other finance items (4.6) (9.7) 0.6 (3.4) – – (7.5) (24.6) 1.0 – (23.6)Profit/(loss) before tax 555.1 (163.5) 16.6 (3.4) (2.8) (101.9) (89.7) 210.4 49.0 – 259.4 Tax (161.8) 49.6 (6.0) (21.8) – – 1.8 (138.2) (22.2) (160.4)Profit/(loss) for the year from continuing operations 393.3 (113.9) 10.6 (25.2) (2.8) (101.9) (87.9) 72.2 26.8 – 99.0
Profit for the year from discontinued operations – – – – – – – – (13.1) 615.8 602.7 Profit/(loss) for the year 393.3 (113.9) 10.6 (25.2) (2.8) (101.9) (87.9) 72.2 13.7 615.8 701.7 Non-controlling interests (151.8) 46.5 (0.2) 11.9 – – – (93.6) 0.1 – (93.5)Net earnings/(losses) 241.5 (67.4) 10.4 (13.3) (2.8) (101.9) (87.9) (21.4) 13.8 615.8 608.2 Additions to non-current assetsCapital expenditure 188.3 535.1 – 147.9 – – 111.0 982.3 13.9 16.4 1,012.6 Segment assets and liabilitiesSegment assets 3,753.3 5,013.0 122.7 1,974.4 – – 1,026.4 11,889.8 500.7 – 12,390.5 Investment in associates and joint ventures 33.5 – – – 998.9 – 31.0 1,063.4 83.2 – 1,146.6 Segment liabilities (1,205.9) (2,068.9) (46.0) (1,185.5) – – (151.6) (4,657.9) (359.9) – (5,017.8)
1 EBITDA refers to Earnings Before Interest, Tax, Depreciation and Amortisation. EBITDA is calculated by adding back depreciation, amortisation, profit or loss on disposals and impairment charges to operating profit from subsidiaries and joint ventures.
2 During the year, operating cash outflow from exploration and evaluation was $38.3 million.
Antofagasta plc 135
GO
VE
RN
AN
CE
FIN
AN
CIA
L STA
TE
ME
NT
SO
TH
ER
INF
OR
MA
TIO
NF
INA
NC
IAL S
TAT
EM
EN
TS
FIN
AN
CIA
L STA
TE
ME
NT
SG
OV
ER
NA
NC
EO
TH
ER
INF
OR
MA
TIO
NO
VE
RV
IEW
ST
RA
TE
GIC
RE
PO
RT

4 Segment information continuedFor the year ended 31 December 2014 (Restated)
Los Pelambres
$mCentinela
$mMichilla
$mAntucoya
$m
Exploration and
evaluation2
$m
Corporate and other
items $m
Mining $m
Railway and other
transport services
$m
Water concession
$mTotal
$m
Revenue 2,663.6 1,985.7 335.4 – – – 4,984.7 160.9 – 5,145.6 EBITDA1 1,518.6 767.2 58.7 – (167.5) (99.2) 2,077.8 63.6 – 2,141.4 Depreciation and amortisation (178.3) (301.5) (87.3) – – (2.6) (569.7) (12.0) – (581.7)(Loss)/gain on disposals (2.5) (1.3) (0.4) – – 28.7 24.5 (0.6) – 23.9 Operating profit/(loss) 1,337.8 464.4 (29.0) – (167.5) (73.1) 1,532.6 51.0 – 1,583.6 Share of results from associates and joint ventures (1.3) – – – – (9.3) (10.6) 6.5 – (4.1)Investment income 7.5 4.2 0.7 – – 3.9 16.3 0.5 – 16.8 Interest expense (3.8) (36.6) – – – (2.4) (42.8) (1.6) – (44.4)Other finance items (2.5) 2.9 (8.3) 3.3 – (31.4) (36.0) (0.3) – (36.3)Profit/(loss) before tax 1,337.7 434.9 (36.6) 3.3 (167.5) (112.3) 1,459.5 56.1 – 1,515.6 Tax (441.7) (214.9) 1.3 (9.7) – 25.0 (640.0) (62.3) – (702.3)Profit/(loss) for the year from continuing operations 896.0 220.0 (35.3) (6.4) (167.5) (87.3) 819.5 (6.2) – 813.3 Profit for the year from discontinued operations – – – – – – – (6.3) 43.7 37.4 Profit/(loss) for the year 896.0 220.0 (35.3) (6.4) (167.5) (87.3) 819.5 (12.5) 43.7 850.7 Non-controlling interests (352.3) (56.1) 0.3 3.8 – 12.3 (392.0) 1.1 – (390.9)Net earnings/(losses) 543.7 163.9 (35.0) (2.6) (167.5) (75.0) 427.5 (11.4) 43.7 459.8 Additions to non-current assetsCapital expenditure 229.6 535.6 11.1 707.1 – 51.4 1,534.8 21.2 25.0 1,581.0 Segment assets and liabilities – Segment assets 3,671.9 5,152.9 181.9 1,619.8 – 1,455.2 12,081.7 322.9 212.4 12,617.0 Investment in associates and joint ventures 8.3 – – – – 102.7 111.0 87.1 – 198.1 Segment liabilities (1,255.2) (2,014.6) (114.6) (994.7) – (138.2) (4,517.3) (212.1) (51.0) (4,780.4)
1 EBITDA refers to Earnings Before Interest, Tax, Depreciation and Amortisation. EBITDA is calculated by adding back depreciation, amortisation, profit or loss on disposals and impairment charges to operating profit from subsidiaries and joint ventures.
2 During the year, operating cash outflow from exploration and evaluation was $60.2 million.
136 Antofagasta plc Annual report and financial statements 2015
Notes to the financial statements

Notes to segment revenues and results(i) The accounting policies of the reportable segments are the same as the Group’s accounting policies. Operating profit excludes the share
of net loss from associates and joint venture of $5.8 million (year ended 31 December 2014 – net loss of $4.1 million).
(ii) Inter-segment revenues are eliminated on consolidation. Revenue from the Railway and other transport services is stated after eliminating inter-segmental sales to the mining division of $1.6 million (year ended 31 December 2014 – $0.4 million). Revenue from the Water concession is stated after eliminating inter-segmental sales to the mining division of $2.0 million (year ended 31 December 2014 – $7.3 million) and after eliminating sales to the Railway and other transport services of $0.1 million (year ended 31 December 2014 – $0.2 million).
(iii) Revenue includes the effect of both final pricing and mark-to-market adjustments to provisionally priced sales of copper and molybdenum concentrates and copper cathodes. Further details of such adjustments are given in Note 5.
(iv) Revenue includes a realised gain at Michilla of nil (year ended 31 December 2014 – gain of $18.3 million) and a realised loss at Centinela of $0.1 million (year ended 31 December 2014 – gain of $0.1 million) relating to commodity derivatives. Further details of such gains or losses are given in Note 26(d).
(v) The copper and molybdenum concentrate sales are stated net of deductions for tolling charges. Tolling charges for copper and molybdenum concentrates are detailed in Note 5.
(vi) The effects of tax and non-controlling interests on the expenses within the Exploration and evaluation segment are allocated to the mine that the exploration work relates to.
(vii) The assets of the Railway and transport services segment includes $75.1 million (year ended 31 December 2014 – $78.3 million) relating to the Group’s 40% interest in Inversiones Hornitos S.A. (“Inversiones Hornitos”), which owns the 165MW Hornitos thermoelectric power plant in Mejillones in Chile’s Antofagasta Region and $8.1 million (year ended 31 December 2014 – $8.8 million) relating to the Group’s 30% interest in Antofagasta Terminal International S.A. (“ATI”), which operates a concession to manage installations in the port of Antofagasta. The assets of the Corporate and other items segment includes $23.8 million (year ended 31 December 2014 – $24.5 million) relating to the Group´s 30% interest in Parque Eólico El Arrayán S.A., an energy company which operates a wind farm in Chile, and $10.2 million (year ended 31 December 2014 – $11.2 million) relating to the Group´s 50.1% interest in the Energía Andina joint venture. The assets of Los Pelambres includes $33.0 million (year ended 31 December 2014 – $8.3 million) relating to the Group´s 40% interest in Alto Maipo SpA, which is constructing a hydroelectric project in Chile. Further details of these investments are set out in Note 17.
(viii) As explained in Note 17, during 2014 the Group held a 40% interest in Twin Metals Minnesota Limited (“Twin Metals”), which until July 2014 was accounted for as a subsidiary as the Group exercised control over the company. In July 2014, the Group lost its ability to control Twin Metals and accordingly the company ceased to be a subsidiary of the Group, and was accounted for as an associate from that point. This disposal of the investment in a subsidiary and the recognition of an interest in an associate at fair value resulted in a gain of $28.6 million in 2014 (shown above within “Gains on disposals” within the “Corporate and other items” segment). An impairment charge of $26.3 million was recognised in 2014, in respect of Duluth Metals Limited (“Duluth”) shares as set out in Note 8. In January 2015, the Group completed its acquisition of 100% of Duluth, the company which held the remaining 60% of Twin Metals. This has resulted in the Group consolidating 100% of the assets and liabilities relating to Twin Metals with effect from January 2015.
b) Entity-wide disclosures
Revenue by product
2015 $m
2014 (Restated)
$m
Copper – Los Pelambres 1,606.7 2,348.6 – Centinela Concentrate 626.6 1,073.8 – Centinela Cathodes 432.3 631.9 – Michilla 168.9 335.4
Molybdenum – Los Pelambres 105.3 182.8
Gold – Los Pelambres 60.7 80.5 – Centinela 191.3 256.3
Silver – Los Pelambres 34.5 51.7 – Centinela 15.9 23.7
Total Mining 3,242.2 4,984.7 Railway and transport services 152.4 160.9
3,394.6 5,145.6
Antofagasta plc 137
GO
VE
RN
AN
CE
FIN
AN
CIA
L STA
TE
ME
NT
SO
TH
ER
INF
OR
MA
TIO
NF
INA
NC
IAL S
TAT
EM
EN
TS
FIN
AN
CIA
L STA
TE
ME
NT
SG
OV
ER
NA
NC
EO
TH
ER
INF
OR
MA
TIO
NO
VE
RV
IEW
ST
RA
TE
GIC
RE
PO
RT

4 Segment information continuedRevenue by location of customer
2015$m
2014(Restated)
$m
Europe – United Kingdom 19.1 8.2 – Switzerland 175.2 138.5 – Spain 54.1 160.6 – Germany 167.0 146.1 – Rest of Europe 70.6 137.7
Latin America – Chile 167.0 215.3 – Rest of Latin America 74.1 161.0
North America – United States 107.3 133.7
Asia – Japan 1,147.0 1,965.4 – China 782.4 1,253.1 – Rest of Asia 630.8 826.0
3,394.6 5,145.6
Information about major customersIn the year ended 31 December 2015, the Group’s mining revenues included $426.0 million related to one large customer that individually accounted for more than 10% of the Group’s revenues (year ended 31 December 2014 – one large customer representing $804.3 million).
Non-current assets by location of assets2015
$m2014 $m
Chile 10,284.6 8,934.8 Bolivia – 30.9 USA 171.2 67.4 Other 0.8 0.6
10,456.6 9,033.7
The above non-current assets disclosed by location of assets exclude available-for-sale investments and deferred tax assets.
138 Antofagasta plc Annual report and financial statements 2015
Notes to the financial statements

5 RevenuesAn analysis of the Group’s total revenue is as follows:
2015 $m
2014 (Restated)
$m
Sales of goods 3,265.9 5,005.2 Rendering of services 128.7 140.4 Group revenue 3,394.6 5,145.6 Other operating income (included within net operating costs) 37.6 20.8 Investment income 18.1 16.8 Total revenue 3,450.3 5,183.2
Copper and molybdenum concentrate sale agreements and copper cathode sale agreements generally provide for provisional pricing of sales at the time of shipment, with final pricing being based on the monthly average London Metal Exchange copper price or monthly average molybdenum price for specified future periods. This normally ranges from one to five months after shipment to the customer. The provisional pricing mechanism within the sale agreements is an embedded derivative under IFRS. Gains and losses from the marking-to-market of open sales are recognised through adjustments to revenue in the income statement and to trade debtors in the balance sheet. The Group determines mark-to-market prices using forward prices at each period end for copper concentrate and cathode sales, and period-end month average prices for molybdenum concentrate sales due to the absence of a futures market in the market price references for that commodity in the majority of the Group’s contracts.
In addition to mark-to-market and final pricing adjustments, revenue also includes realised gains and losses relating to derivative commodity instruments. Details of these realised gains or losses are shown in the tables below. Further details of derivative commodity instruments in place at the period end are given in Note 26.
Copper and molybdenum concentrate sales are stated net of deductions for tolling charges, as shown in the tables below.
For the year ended 31 December 2015
Los PelambresCopper
concentrate$m
Centinela Copper
concentrate$m
Centinela Copper
cathodes$m
MichillaCopper
cathodes$m
Los PelambresGold in
concentrate$m
Centinela Gold in
concentrate$m
Los PelambresMolybdenum
concentrate$m
Provisionally invoiced gross sales 2,001.6 805.8 443.4 173.3 63.0 200.7 147.0 Effects of pricing adjustments to previous year invoicesReversal of mark-to-market adjustments at the end of the previous year 45.5 19.6 1.4 0.4 – 1.8 2.0 Settlement of sales invoiced in the previous year (100.4) (49.8) (5.6) (2.3) – 3.6 (7.1)Total effect of adjustments to previous year invoices in the current year (54.9) (30.2) (4.2) (1.9) – 5.4 (5.1)Effects of pricing adjustments to current year invoicesSettlement of sales invoiced in the current year (126.7) (47.6) (7.1) (2.6) (2.1) (11.8) (19.8)Mark-to-market adjustments at the end of the current year (14.5) (6.2) 0.2 0.1 – (2.2) 1.0
Total effect of adjustments to current year invoices (141.2) (53.8) (6.9) (2.5) (2.1) (14.0) (18.8)Total pricing adjustments (196.1) (84.0) (11.1) (4.4) (2.1) (8.6) (23.9)Realised gains on commodity derivatives – – – – – – – Revenue before deducting tolling charges 1,805.5 721.8 432.3 168.9 60.9 192.1 123.1 Tolling charges (198.8) (95.2) – – (0.2) (0.8) (17.8)Revenue net of tolling charges 1,606.7 626.6 432.3 168.9 60.7 191.3 105.3
Antofagasta plc 139
GO
VE
RN
AN
CE
FIN
AN
CIA
L STA
TE
ME
NT
SO
TH
ER
INF
OR
MA
TIO
NF
INA
NC
IAL S
TAT
EM
EN
TS
FIN
AN
CIA
L STA
TE
ME
NT
SG
OV
ER
NA
NC
EO
TH
ER
INF
OR
MA
TIO
NO
VE
RV
IEW
ST
RA
TE
GIC
RE
PO
RT

5 Revenues continuedFor the year ended 31 December 2014
Los PelambresCopper
concentrate$m
Centinela Copper
concentrate$m
Centinela Copper
cathodes$m
MichillaCopper
cathodes$m
Los PelambresGold in
concentrate$m
Centinela Gold in
concentrate$m
Los PelambresMolybdenum
concentrate$m
Provisionally invoiced gross sales 2,642.5 1,226.8 640.6 322.0 80.4 267.8 213.7 Effects of pricing adjustments to previous year invoicesReversal of mark-to-market adjustments at the end of the previous year (27.1) (8.8) (1.0) 0.1 – 4.5 1.2 Settlement of sales invoiced in the previous year (27.7) (9.8) 1.2 (0.3) 0.4 (2.0) 0.2 Total effect of adjustments to previous year invoices in the current year (54.8) (18.6) 0.2 (0.2) 0.4 2.5 1.4 Effects of pricing adjustments to current year invoicesSettlement of sales invoiced in the current year (29.8) (19.7) (7.7) (4.3) – (11.7) (15.2)Mark-to-market adjustments at the end of the current year (45.5) (19.6) (1.3) (0.4) – (1.8) (2.0)
Total effect of adjustments to current year invoices (75.3) (39.3) (9.0) (4.7) – (13.5) (17.2)Total pricing adjustments (130.1) (57.9) (8.8) (4.9) 0.4 (11.0) (15.8)Realised gains on commodity derivatives – – 0.1 18.3 – – – Revenue before deducting tolling charges 2,512.4 1,168.9 631.9 335.4 80.8 256.8 197.9 Tolling charges (163.8) (95.1) – – (0.3) (0.5) (15.1)Revenue net of tolling charges 2,348.6 1,073.8 631.9 335.4 80.5 256.3 182.8
(i) Copper concentrate
The typical period for which sales of copper concentrate remain open until settlement occurs is a range of approximately three to five months from shipment date.
At 31 December 2015, sales totalling 184,400 tonnes remained open as to price, with an average mark-to-market price of $2.13/lb compared with an average provisional invoice price of $2.18/lb.
At 31 December 2014, sales totalling 199,200 tonnes remained open as to price, with an average mark-to-market price of $2.86/lb compared with an average provisional invoice price of $3.01/lb.
(ii) Copper cathodes
The typical period for which sales of copper cathodes remain open until settlement occurs is approximately one month from shipment date.
At 31 December 2015, sales totalling 7,700 tonnes remained open as to price, with an average mark-to-market price of $2.13/lb compared with an average provisional invoice price of $2.12/lb.
At 31 December 2014, sales totalling 13,800 tonnes remained open as to price, with an average mark-to-market price of $2.88/lb compared with an average provisional invoice price of $2.94/lb.
140 Antofagasta plc Annual report and financial statements 2015
Notes to the financial statements

(iii) Gold concentrates
The typical period for which sales of gold in concentrate remain open is approximately one month from shipment date.
At 31 December 2015, sales totalling 50,300 ounces remained open as to price, with an average mark-to-market price of $1,061/oz compared with an average provisional invoice price of $1,105/oz.
At 31 December 2014, sales totalling 81,600 ounces remained open as to price, with an average mark-to-market price of $1,186/oz compared with an average provisional invoice price of $1,209/oz.
(iv) Molybdenum concentrate
The typical period for which sales of molybdenum remain open is approximately two months from shipment date.
At 31 December 2015, sales totalling 1,900 tonnes remained open as to price, with an average mark-to-market price of $5.1/lb compared with an average provisional invoice price of $4.8/lb.
At 31 December 2014, sales totalling 1,900 tonnes remained open as to price, with an average mark-to-market price of $9.0/lb compared with an average provisional invoice price of $9.4/lb.
As detailed above, the effects of gains and losses from the marking-to-market of open sales are recognised through adjustments to revenue in the income statement and to trade debtors in the balance sheet. The effect of mark-to-market adjustments on the balance sheet at the end of each period are as follows:
Effect on debtors of year end mark-to-market adjustments
2015$m
2014$m
Los Pelambres – copper concentrate (14.5) (45.5)Los Pelambres – molybdenum concentrate 1.0 (2.0)Centinela – copper concentrate (6.2) (19.6)Centinela – Gold concentrate (2.2) (1.8)Centinela – copper cathodes 0.2 (1.3)Michilla – copper cathodes 0.1 (0.4)
(21.6) (70.6)
6 Profit before taxOperating profit from subsidiaries and total profit from operations and associates and joint ventures is derived from Group revenue by deducting operating costs as follows:
2015 $m
2014 (Restated)
$m
Group revenue 3,394.6 5,145.6 Cost of sales (2,478.9) (2,869.3)Gross profit 915.7 2,276.3 Administrative and distribution expenses (455.7) (457.2)Other operating income 37.6 20.8 Other operating expenses (193.2) (256.3)Operating profit from subsidiaries 304.4 1,583.6 Share of results from associates and joint ventures (5.8) (4.1)Total profit from operations, associates and joint ventures 298.6 1,579.5
Antofagasta plc 141
GO
VE
RN
AN
CE
FIN
AN
CIA
L STA
TE
ME
NT
SO
TH
ER
INF
OR
MA
TIO
NF
INA
NC
IAL S
TAT
EM
EN
TS
FIN
AN
CIA
L STA
TE
ME
NT
SG
OV
ER
NA
NC
EO
TH
ER
INF
OR
MA
TIO
NO
VE
RV
IEW
ST
RA
TE
GIC
RE
PO
RT

6 Profit before tax continuedProfit before tax is stated after (charging)/crediting:
2015 $m
2014 (Restated)
$m
Foreign exchange (losses)/gains – included in net finance costs (13.6) 4.0 – included in income tax expense (1.0) (0.4)
Amortisation of intangible asset included in cost of sales – – Depreciation of property, plant and equipment – owned assets (569.9) (575.6) – assets held under finance leases (6.2) (6.1)
Property and equipment written off (10.2) 23.9 Cost of inventories recognised as expense (1,762.1) (2,006.5)Employee benefit expense (380.0) (462.8)Closure provision (25.8) 7.2 Severance charges (16.6) (17.5)Exploration and evaluation cost (101.9) (167.5)Auditors´ remuneration (1.7) (1.4)
A more detailed analysis of auditor’s remuneration on a worldwide basis is provided below:
Group2015 $000
2014 $000
Fees payable to the Company´s auditor and its associates for the audit of parent company and consolidated financial statements 982 666Fees payable to Company´s auditor and its associates for other services: – The audit of Company’s subsidiaries 246 270 – Audit-related assurance services 235 301 – Tax advisory services 30 17 – Tax compliance services 15 – – Other assurance services 48 – – Other non-audit services 143 105
1,699 1,359
Details of the Company’s policy on the use of auditors for non-audit services, the reason why the auditor was used rather than another supplier and how the auditor’s independence and objectivity was safeguarded are set out in the Audit and Risk Committee report on page 86. No services were provided pursuant to contingent fee arrangements.
142 Antofagasta plc Annual report and financial statements 2015
Notes to the financial statements

7 Employees
a) Average monthly number of employees
2015 Number
2014 Number
Los Pelambres 928 925 Centinela 2,100 2,108 Michilla 395 688 Antucoya 698 463 Exploration and evaluation 58 52 Corporate and other employees – Chile 417 380 – United Kingdom 5 8 – Other 25 36
Mining 4,626 4,660 Railway and other transport services 1,324 1,575 Water concession – 374
5,950 6,609
(i) The average number of employees for the year includes all the employees of subsidiaries. The average number of employees does not include contractors who are not directly employed by the Group.
(ii) The average number of employees does not include employees from associates and joint ventures.
(iii) The average number of employees includes Non-Executive Directors.
b) Aggregated remuneration
The aggregated remuneration of the employees included in the table above was as follows:
2015 $m
2014 $m
Wages and salaries (407.7) (478.6)Social security costs (14.6) (24.2)
(422.3) (502.8)
During 2015, the amount relating to Minera Antucoya of $42.3 million (2014 – $39.9 million) on wages, salaries and social security cost has been capitalised.
c) Key management personnel
In accordance with IAS 24, key management personnel are those persons having authority and responsibility for planning, directing and controlling the activities of the Group, directly or indirectly, including any Directors (Executive and Non-Executive) of the Company. Key management personnel who are not Directors have been treated as responsible senior management at the Corporate Centre and for the running of the key business divisions of the Group.
Compensation for key management personnel (including Directors) was as follows:
2015 $m
2014 $m
Salaries and short-term employee benefits (19.2) (18.4) (19.2) (18.4)
Disclosures on Directors’ remuneration required by Schedule 8 of the Large and Medium-sized Companies and Group (Accounts and Reports) Regulations 2008 including those specified for audit by that Schedule are included in the Remuneration Report on page 96.
Antofagasta plc 143
GO
VE
RN
AN
CE
FIN
AN
CIA
L STA
TE
ME
NT
SO
TH
ER
INF
OR
MA
TIO
NF
INA
NC
IAL S
TAT
EM
EN
TS
FIN
AN
CIA
L STA
TE
ME
NT
SG
OV
ER
NA
NC
EO
TH
ER
INF
OR
MA
TIO
NO
VE
RV
IEW
ST
RA
TE
GIC
RE
PO
RT

8 Net finance expense
2015 $m
2014 (Restated)
$m
Investment incomeInterest income 16.7 14.2 Fair value through profit or loss 1.4 2.6
18.1 16.8 Interest expenseInterest expense (33.5) (44.2)Preference dividends (0.2) (0.2)
(33.7) (44.4)Other finance itemsTime value effect of derivatives 0.1 (5.1)Unwinding of discount on provisions (9.1) (8.9)Impairment of available-for-sale investments (1.0) (26.3)Foreign exchange (13.6) 4.0
(23.6) (36.3)Net finance expense (39.2) (63.9)
At 31 December 2015, an expense of $29.6 million relating to net interest expense and other finance items at Antucoya was capitalised (at 31 December 2014 – $27.4).
As at 31 December 2014, the Group held a 17.2% stake in Duluth Metals Limited (“Duluth”), accounted for as an available-for-sale investment. As at 31 December 2014, Duluth held a 60% interest in Twin Metals Minnesota Limited (“Twin Metals”), with the Group holding the remaining 40% interest in Twin Metals. As disclosed in Note 19, in November 2014 Antofagasta entered into a binding letter of agreement to acquire 100% of Duluth. The acquisition completed subsequent to the 2014 year end following approval from Duluth’s shareholders in January 2015. Movements in the fair value of the available-for-sale investment in Duluth had previously been recorded within the Consolidated Statement of Comprehensive Income. The agreed acquisition terms indicated a final fixed value for the Duluth shares, and that there had therefore been an impairment in the value of the Duluth shares to this amount. Accordingly, an impairment charge of $26.3 million was recognised in 2014 in respect of this available-for-sale investment, with fair value losses previously recorded within the Consolidated Statement of Comprehensive Income being transferred to the income statement and recognised within this impairment loss. This impairment change was largely offset by the related $28.6 million disposal gain recognised in 2014 in respect of the temporary loss of control of the Twin Metals project as set out in Note 17.
The fair value through profit or loss line represents the fair value gains relating to liquid investments.
9 Income tax expenseThe tax charge for the year comprised the following:
2015 $m
2014 (Restated)
$m
Current tax charge – Corporate tax (principally first category tax in Chile) (41.6) (360.9) – Mining tax (royalty) (20.4) (71.9) – Withholding tax (12.9) (279.3) – Exchange losses on corporate tax balances (1.0) (0.6)
(75.9) (712.7)Deferred tax charge – Corporate tax (principally first category tax in Chile) (69.0) 10.2 – Adjustment to deferred tax attributable to changes in tax rates – (215.1) – Mining tax (royalty) (13.6) (7.2) – Withholding tax provision (1.9) 222.5
(84.5) 10.4 Total tax charge (160.4) (702.3)
The rate of first category (ie corporate) tax in Chile is currently 22.5% (2014 – 21%). The rate will increase to 24% in 2016.
144 Antofagasta plc Annual report and financial statements 2015
Notes to the financial statements

In addition to first category tax, the Group incurs withholding taxes on any remittance of profits from Chile and deferred tax is provided on undistributed earnings to the extent that remittance is probable in the foreseeable future. Withholding tax is levied on remittances of profits from Chile at 35% less first category (ie corporate) tax already paid in respect of the profits to which the remittances relate.
On 29 September 2014, a significant reform of the Chilean system was enacted into law. This introduced two alternative future taxation systems – the partially-integrated system (the default system for the Group’s Chilean subsidiaries) or the attributable system. The Group has been accounting for deferred tax on the basis that it would apply the default partially-integrated system. On 1 February 2016, a Simplification of the Tax Reform was enacted into law. This specifies that for entities such as the Group’s Chilean subsidiaries, whose members are corporate entities and not individual persons, only the partially-integrated system can be applied. Given that the Group has already been accounting for deferred tax on the basis that it would apply the default partially-integrated system this has not resulted in any accounting impact for the Group.
Under the partially-integrated system the corporate tax rate will be 25.5% in 2017 and 27% from 2018 onwards. The immediate shareholders of the Chilean subsidiaries will pay withholding tax based on the cash distributions made by those subsidiary companies, as with the current tax system. If the subsidiary company’s shareholders are tax resident in countries with applicable tax treaties with Chile (as is the case for the Group) the withholding tax will be 35%, less first category tax at the rate it was paid, so if the Company distributes all of its earnings the total corporate and withholding tax burden will be 35%.
The Group’s mining operations are also subject to a mining tax (royalty). Production from Los Pelambres, the Tesoro Central and Mirador pits at Centinela Cathodes and Michilla are currently subject to a rate of 4% of taxable operating profit and Centinela Concentrates of 5%, and production from the Tesoro North East pit and the run-of-mine processing at Centinela Cathodes is subject to a rate of between 5–14%, depending on the level of operating profit margin.
20152014
(Restated)
$m % $m %
Profit before tax 259.4 1,515.6Tax at the Chilean corporate tax rate of 22.5% (2014 – 21%) (58.4) 22.5 (318.3) 21.0 Effect of increase in first category tax rates on deferred tax balances (8.9) 3.4 (215.1) 14.2 Items not subject to or deductible from first category tax (17.1) 6.6 (33.5) 2.2 Carry-back tax losses resulting in credits at historic tax rates (25.8) 9.9 – – Mining tax (royalty) (34.0) 13.1 (79.1) 5.2 Withholding taxes (14.8) 5.7 (56.8) 3.7 Tax effect of share of results of associates and joint ventures (0.5) 0.2 (0.9) 0.1 Net other items (0.9) 0.3 1.4 (0.1)Tax expense and effective tax rate for the year (160.4) 61.8 (702.3) 46.3
The tax charge for 2015 was $160.4 million and the effective tax rate was 61.8%. In 2015 the effective tax rate varied from the statutory rate principally due to tax losses which under Chilean tax carry-back rules generated a credit at historic tax rates below the current year statutory rate (impact of $25.8 million/9.9%), the effect of expenses not deductible for Chilean corporate tax purposes (principally the funding of expenses outside of Chile) (impact of $17.1 million/6.6%) and the mining tax (impact of $34.0 million/13.1%) and withholding tax charge (impact of $14.8 million/5.7%). In 2014, the effective tax rate varied from the standard rate (comprising corporate (first category) tax) principally due to the one-off deferred tax charge of $215.1 million reflecting the increase in tax rates as a result of the Chilean tax reform enacted in that year.
There are no significant tax uncertainties which would require critical judgements, estimates or potential provisions.
Antofagasta plc 145
GO
VE
RN
AN
CE
FIN
AN
CIA
L STA
TE
ME
NT
SO
TH
ER
INF
OR
MA
TIO
NF
INA
NC
IAL S
TAT
EM
EN
TS
FIN
AN
CIA
L STA
TE
ME
NT
SG
OV
ER
NA
NC
EO
TH
ER
INF
OR
MA
TIO
NO
VE
RV
IEW
ST
RA
TE
GIC
RE
PO
RT

10 Discontinued operations
(i) Asset disposals
On 2 June 2015, the Group completed the disposal of its Water division, of Aguas de Antofagasta S.A. (“ADASA”). On 28 August 2015, the Group completed the disposal of its transport operation in Bolivia, Empresa Ferroviaria Andina (“FCA”).
The results of ADASA and FCA for the period prior to disposal as well as the profit on disposal have been presented on the “Profit for the period from discontinued operations” line in the income statement, reflecting the following amounts:
FCA$m
ADASA$m
Year ended 31 December
2015$m
FCA$m
ADASA$m
Year ended 31 December
2014$m
Revenue 12.9 53.9 66.8 19.9 124.9 144.8 Total operating costs (20.2) (34.9) (55.1) (25.3) (63.4) (88.7)Net finance(expense)/income (0.2) (0.1) (0.3) (0.3) 2.1 1.8 (Loss)/profit before tax (7.5) 18.9 11.4 (5.7) 63.6 57.9 Attributable tax expense – (3.9) (3.9) (0.6) (19.9) (20.5)(Loss)/profit of discontinued operations (7.5) 15.0 7.5 (6.3) 43.7 37.4 (Loss)/profit on disposal of discontinued operations1 (5.6) 853.2 847.6 – – – Attributable tax expense2 – (252.4) (252.4) – – – Net profit attributable to discontinued operations (attributable to owners of the Company) (13.1) 615.8 602.7 (6.3) 43.7 37.4
1 Profit on disposal included a loss of $3.9 million and a profit of $2.1 million related to the accumulated currency translation adjustment relating to ADASA and FCA respectively, which has been reclassified from translation reserves in other comprehensive income to the income statement upon disposal.
2 Tax expense includes $57.2 million related to withholding tax.
The operating costs at ADASA related with amortisation of concession rights are $2.4 million at December 2015 (2014 – $10.9 million).
During the period, ADASA contributed $21.7 million (2014 – $63.6 million) to the Group´s net cash flow from operating activities, $19.2 million (2014 – $25.7 million) in respect to net cash used in investing activities and paid $2.0 million (2014 – $27.9 million) in net cash provided in financing activities.
During the period, FCA contributed $2.2 million (2014 – $4.8 million) to the Group´s net cash flow from operating activities, $2.1 million (2014 – $4.5 million) in respect to net cash used in investing activities and paid $0.1 million (2014 – $0.3 million) in net cash provided in financing activities.
146 Antofagasta plc Annual report and financial statements 2015
Notes to the financial statements
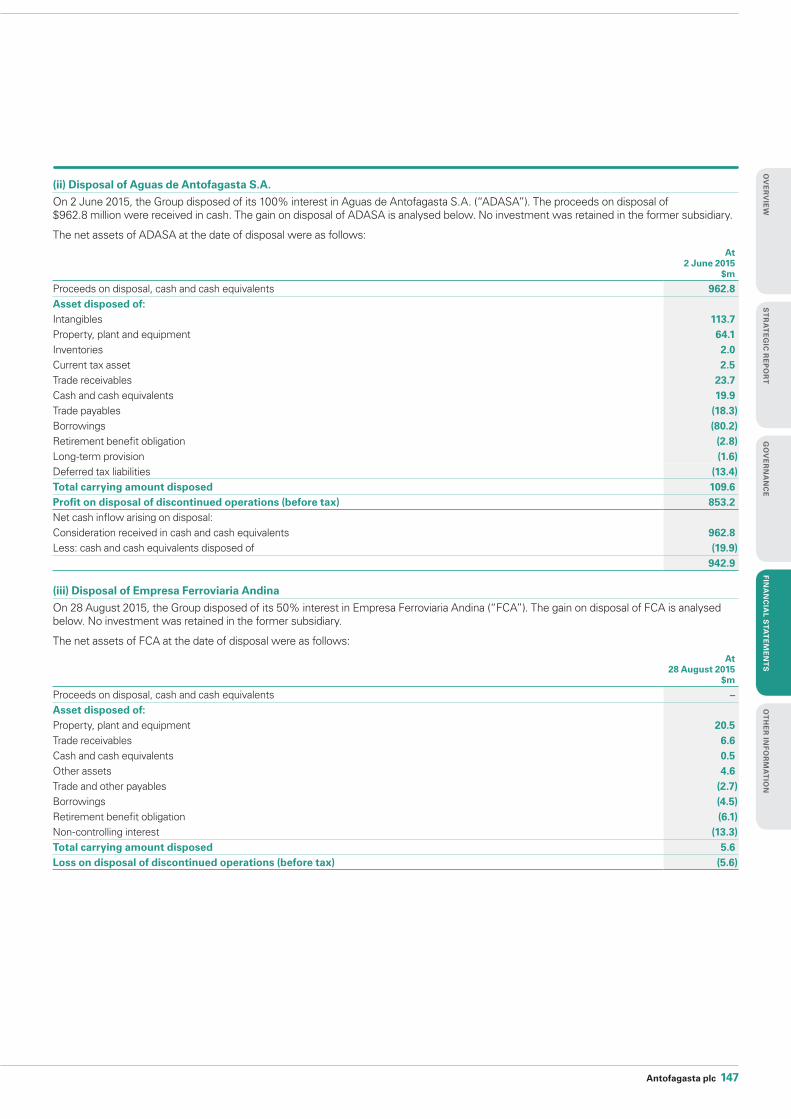
(ii) Disposal of Aguas de Antofagasta S.A.
On 2 June 2015, the Group disposed of its 100% interest in Aguas de Antofagasta S.A. (“ADASA”). The proceeds on disposal of $962.8 million were received in cash. The gain on disposal of ADASA is analysed below. No investment was retained in the former subsidiary.
The net assets of ADASA at the date of disposal were as follows:
At 2 June 2015
$m
Proceeds on disposal, cash and cash equivalents 962.8 Asset disposed of:Intangibles 113.7Property, plant and equipment 64.1Inventories 2.0Current tax asset 2.5Trade receivables 23.7Cash and cash equivalents 19.9Trade payables (18.3)Borrowings (80.2)Retirement benefit obligation (2.8)Long-term provision (1.6)Deferred tax liabilities (13.4)Total carrying amount disposed 109.6Profit on disposal of discontinued operations (before tax) 853.2Net cash inflow arising on disposal:Consideration received in cash and cash equivalents 962.8Less: cash and cash equivalents disposed of (19.9)
942.9
(iii) Disposal of Empresa Ferroviaria Andina
On 28 August 2015, the Group disposed of its 50% interest in Empresa Ferroviaria Andina (“FCA”). The gain on disposal of FCA is analysed below. No investment was retained in the former subsidiary.
The net assets of FCA at the date of disposal were as follows:
At 28 August 2015
$m
Proceeds on disposal, cash and cash equivalents – Asset disposed of:Property, plant and equipment 20.5 Trade receivables 6.6 Cash and cash equivalents 0.5 Other assets 4.6 Trade and other payables (2.7)Borrowings (4.5)Retirement benefit obligation (6.1)Non-controlling interest (13.3)Total carrying amount disposed 5.6 Loss on disposal of discontinued operations (before tax) (5.6)
Antofagasta plc 147
GO
VE
RN
AN
CE
FIN
AN
CIA
L STA
TE
ME
NT
SO
TH
ER
INF
OR
MA
TIO
NF
INA
NC
IAL S
TAT
EM
EN
TS
FIN
AN
CIA
L STA
TE
ME
NT
SG
OV
ER
NA
NC
EO
TH
ER
INF
OR
MA
TIO
NO
VE
RV
IEW
ST
RA
TE
GIC
RE
PO
RT

11 Earnings per share2015
$m2014
$m
Profit for the year attributable to equity holders of the Company (Net earnings) 608.2 459.8
2015 Number
2014 Number
Ordinary shares in issue throughout each year 985,856,695 985,856,695
2015 US cents
2014 US cents
Basic earnings per shareFrom continuing operations 0.6 42.8From discontinued operations 61.1 3.8Total continuing and discontinued operations 61.7 46.6
Basic earnings per share are calculated as profit after tax and non-controlling interests, based on 985,856,695 ordinary shares.
There was no potential dilution of earnings per share in either year set out above, and therefore diluted earnings per share did not differ from basic earnings per share as disclosed above.
12 DividendsAmounts recognised as distributions to equity holders in the year:
2015 $m
2014 $m
2015 US cents per share
2014 US cents per share
Final dividend paid in June (proposed in relation to the previous year) – ordinary 96.6 848.8 9.8 86.1
Interim dividend paid in October – ordinary 30.6 115.4 3.1 11.7
127.2 964.2 12.9 97.8
The proposed final dividend for each year, which is subject to approval by shareholders at the Annual General Meeting and has therefore not been included as a liability in these financial statements, is as follows:
2015 $m
2014 $m
2015 US cents per share
2014 US cents per share
Final dividend proposed in relation to the year– ordinary – 96.6 – 9.8
– 96.6 – 9.8
This gives total dividends proposed in relation to 2015 (including the interim dividend) of 3.1 cents per share or $30.6 million (2014 – 21.5 cents per share or $212.0 million).
In accordance with IAS 32, preference dividends have been included within interest expense (see Note 8) and amounted to $0.2 million (2014 – $0.2 million).
Further details of the currency election timing and process (including the default currency of payment) are available on the Antofagasta plc website (www.antofagasta.co.uk) or from the Company’s registrar, Computershare Investor Services PLC on +44 870 702 0159.
Further details relating to dividends for each year are given in the Directors’ Report.
148 Antofagasta plc Annual report and financial statements 2015
Notes to the financial statements

13 Intangible assets$m
CostAt 1 January 2014 243.7 Additions 14.1 Foreign currency exchange difference (24.4)At 31 December 2014 233.4 Additions through acquisition of Twin Metals 150.1 Disposals (228.6)Foreign currency exchange difference (4.8)At 31 December 2015 150.1 Accumulated amortisation and impairmentAt 1 January 2014 (110.7)Charge for the year (10.9)Foreign currency exchange difference 6.8 At 31 December 2014 (114.8)Charge for the year (2.4)Disposals 114.9 Foreign currency exchange difference 2.3 At 31 December 2015 –Net book valueAt 31 December 2015 150.1 At 31 December 2014 118.6
As disclosed in Note 19, in January 2015 the Group completed its acquisition of 100% of Duluth Metals Limited (“Duluth”). The principal asset of Duluth was its 60% stake in Twin Metals Minnesota Limited (“Twin Metals”), a company in which the Group held the remaining 40% stake as at December 2014. This transaction has resulted in the Group consolidating 100% of the assets and liabilities relating to Twin Metals with effect from January 2015, including the above $150.1 million intangible asset reflecting the value of Twin Metals’ mining property assets. The mining properties acquired will be amortised once production commences.
The prior year balance related to Aguas de Antofagasta S.A.’s (“ADASA”) 30-year concession to operate the water rights and facilities in the Antofagasta Region of Chile. This balance was disposed of as part of the sale of ADASA on 2 June 2015, as disclosed in Note 10.
Antofagasta plc 149
GO
VE
RN
AN
CE
FIN
AN
CIA
L STA
TE
ME
NT
SO
TH
ER
INF
OR
MA
TIO
NF
INA
NC
IAL S
TAT
EM
EN
TS
FIN
AN
CIA
L STA
TE
ME
NT
SG
OV
ER
NA
NC
EO
TH
ER
INF
OR
MA
TIO
NO
VE
RV
IEW
ST
RA
TE
GIC
RE
PO
RT

14 Property, plant and equipment
Land$m
Mining properties
$m
Buildings and infrastructure
$m
Railway track
$m
Wagons and rolling stock
$m
Machinery, equipment and others
$m
Assets under construction
$mTotal
$m
CostAt 1 January 2014 26.4 1,318.1 3,559.9 72.3 150.4 4,453.5 1,580.1 11,160.7 Additions – 73.8 1.7 – 7.3 52.5 1,445.7 1,581.0 Adjustment to capitalised decommissioning provisions – – (48.1) – – – – (48.1)Reclassifications – 25.4 260.8 4.8 8.0 227.6 (517.0) 9.6 Assets derecognised due to loss of control of subsidiary – (89.6) – – – (6.0) – (95.6)Asset disposals – (0.8) (0.9) (1.8) (2.6) (29.7) (3.3) (39.1)Foreign currency exchange difference – – (12.8) – – (2.9) (1.6) (17.3)At 31 December 2014 26.4 1,326.9 3,760.6 75.3 163.1 4,695.0 2,503.9 12,551.2 Additions – 81.1 0.2 – 1.8 93.9 835.6 1,012.6 Additions through acquisition of Twin Metals 0.6 9.9 0.1 – – 11.4 – 22.0 Adjustment to capitalised decommissioning provisions – – (35.7) – – – – (35.7)Reclassifications 12.0 95.5 590.9 4.6 6.4 1,227.9 (1,813.3) 124.0 Disposal of subsidiary (0.8) (29.7) (0.8) – (35.9) (55.4) (30.0) (152.6)Asset disposals – (4.1) – (1.5) (3.9) (14.1) (2.6) (26.2)Foreign currency exchange difference – – (5.1) – – (0.8) (0.5) (6.4)At 31 December 2015 38.2 1,479.6 4,310.2 78.4 131.5 5,957.9 1,493.1 13,488.9 Accumulated depreciation and impairmentAt 1 January 2014 – (604.5) (1,040.8) (18.4) (88.2) (1,549.6) (447.6) (3,749.1)Charge for the year – (121.5) (142.2) (2.3) (14.9) (314.2) – (595.1)Depreciation capitalised in inventories – – – – – (10.0) – (10.0)Depreciation capitalised in property, plant and equipment – – – – – (16.4) – (16.4)Assets derecognised due to loss of control of subsidiary – – – – – 1.2 1.2 Reclassifications – – – – (0.6) (9.8) – (10.4)Asset disposals – – 0.8 0.8 3.4 27.8 – 32.8 Foreign currency exchange difference – – 8.6 – – 1.1 9.7 At 31 December 2014 – (726.0) (1,173.6) (19.9) (100.3) (1,869.9) (447.6) (4,337.3)Charge for the year – (134.7) (149.0) (2.7) (18.1) (286.2) – (590.7)Additions through acquisition of Twin Metals – – – – – (1.2) – (1.2)Depreciation capitalised in inventories – – – – – (24.8) – (24.8)Depreciation capitalised in property, plant and equipment – – – – – (20.1) – (20.1)Disposal of subsidiary – – 3.5 – 38.1 26.4 – 68.0 Reclassifications – – (4.3) – – 4.1 – (0.2)Asset disposals – – – 0.6 3.0 10.3 – 13.9 Foreign currency exchange difference – – 3.6 – (0.1) 1.1 – 4.6 At 31 December 2015 – (860.7) (1,319.8) (22.0) (77.4) (2,160.3) (447.6) (4,887.8)Net book valueat 31 December 2015 38.2 618.9 2,990.4 56.4 54.1 3,797.6 1,045.5 8,601.1 At 31 December 2014 26.4 600.9 2,587.0 55.4 62.8 2,825.1 2,056.3 8,213.9 Assets under finance leases included in the totals aboveNet book valueat 31 December 2015 – – 26.5 – – 9.9 – 36.4 At 31 December 2014 – – 26.9 – 3.0 14.7 – 44.6
The charge for the year of depreciation included $2.8 million related to the charge of the period for Aguas de Antofagasta S.A (until May, 2015) and $12.1 Empresa Ferroviaria Andina (until August, 2015) and shown as discontinued operations in Note 4.
150 Antofagasta plc Annual report and financial statements 2015
Notes to the financial statements
The Group has pledged assets with a carrying value of $301.4 million (2014 – $169.3 million) as security against bank loans provided to the Group. The increase in the value of pledged assets compared with 2014 reflects the guarantees relating to the Antucoya project financing during 2015.
At 31 December 2015 the Group had entered into contractual commitments for the acquisition of property, plant and equipment amounting to $283.1 million (2014 – $253.2 million) of which $138.6 million was related to the development of the Encuentro Oxides project.
Compensation from insurance companies related to property, plant and equipment included in the consolidated income statement was $15.2 million in 2015 (2014 – $2.5 million).
At 31 December 2015 $44.9 million (2014 – $26.4 million) of depreciation in respect of assets relating to Los Pelambres, Centinela, Antucoya and Michilla has been capitalised within property, plant and equipment or inventory, and accordingly is excluded from the depreciation charge recorded in the income statement as shown in Note 4(a).
Additions include $20.8 million related to property, plant and equipment of Twin Metals as part of the acquisition of the Duluth group of assets (see Note 19).
Reclassification additions are mainly related to the capitalisation of interests and other expenses incurred during the commissioning of Antucoya.
15 Impairment reviewGiven the recent deterioration in commodity market conditions the Group has reviewed its assets for indicators of impairment, and has performed impairment reviews in respect of the Centinela and Antucoya operations.
In both cases fair value less costs of disposal (“FVLCD”) calculations have been used, based on discounted cash flow models incorporating estimates of assumptions that would be used by independent market participants in valuing the assets. The cash flow models are based on the operations’ detailed life-of-mine plans.
The key assumptions to which the value of the assets are most sensitive are future commodity prices, the discount rate used to determine the present value of the future cash flows, future operating costs, sustaining and development capital expenditure and ore reserve estimates. The commodity price forecasts (representing the Group’s estimates of the assumptions that would be used by independent market participants in valuing the assets) are based on consensus forecasts, information disclosed by other mining companies and prices implied by recent market transactions. A long-term copper price of $3.00/lb has been used in the FVLCD calculations. A real post-tax discount rate of 8% has been used in determining the present value of the forecast future cash flow from the assets.
For both Centinela and Antucoya, the recoverable amount indicated by the FVLCD calculations was greater than the carrying value of the assets, and accordingly no impairment charge has been recorded.
The assumptions used in the FVLCD calculations which are considered to be subject to the most estimation uncertainty are the long-term copper price and the discount rate. To illustrate the sensitivity of the valuations of Centinela and Antucoya to negative movements in these parameters, a 5% decrease in the forecast long-term copper price would result in an impairment of $375 million at Centinela and an impairment of $95 million at Antucoya, and an increase in the discount rate from 8% to 9% would result in an impairment of $190 million at Centinela and an impairment of $50 million at Antucoya. These are simple sensitivities, looking at illustrative movements in the long-term copper price and discount rate in isolation. In reality, a deterioration in the long-term copper price environment is likely to result in corresponding improvements in a range of input cost factors, as well as potential operational changes, which could partly mitigate the above estimated potential impairment charges.
Antofagasta plc 151
GO
VE
RN
AN
CE
FIN
AN
CIA
L STA
TE
ME
NT
SO
TH
ER
INF
OR
MA
TIO
NF
INA
NC
IAL S
TAT
EM
EN
TS
FIN
AN
CIA
L STA
TE
ME
NT
SG
OV
ER
NA
NC
EO
TH
ER
INF
OR
MA
TIO
NO
VE
RV
IEW
ST
RA
TE
GIC
RE
PO
RT

16 Investments in subsidiariesThe principal subsidiaries of the Group, the percentage of equity owned and the main country of operation are set out below. These interests are consolidated within these financial statements.
Country of incorporation Country of operations Nature of business Economic interest
Direct subsidiaries of the Parent CompanyAntofagasta Railway Company plc UK Chile Railway 100%Chilean Northern Mines Limited UK Chile Investment 100%Antofagasta Investment Company Limited Jersey Jersey Investment 100%Alfa Estates Limited Jersey Jersey Investment 100%Minprop Limited Jersey Jersey Mining 100%Andes Trust Limited (The) UK UK Investment 100%Indirect subsidiaries of the Parent CompanyAntofagasta Minerals S.A. Chile Chile Mining 100%Minera Los Pelambres SCM Chile Chile Mining 60%Minera Centinela SCM Chile Chile Mining 70%Minera Michilla S.A. Chile Chile Mining 99.9%Minera Antucoya Limitada Chile Chile Mining 70%Minera Encuentro SCM Chile Chile Mining 100%Minera Mulpun Limitada Chile Chile Mining 100%Equatorial Resources SpA Chile Chile Investment 100%Minera Santa Margarita de Astillas SCM Chile Chile Mining 100%Minera Penacho Blanco S.A. Chile Chile Mining 100%Duluth Metals Limited Canada Canada Investment 100%Twin Metals Minnesota LLC USA USA Mining 100%Inversiones Los Pelambres Chile Limitada. Chile Chile Investment 100%El Tesoro SPV Bermuda Limited Bermuda Bermuda Investment 100%Andes Investment Company (Jersey) Limited Jersey Jersey Investment 100%Antofagasta Minerals Canada Canada Canada Mining 100%Minera Anaconda Peru SA Peru Peru Mining 100%Antofagasta Minerals Australia Pty Limited Australia Australia Mining 100%Antofagasta Services Limited UK UK Group services 100%Ferrocarril Antofagasta a Bolivia (Agency) Chile Chile Railway 100%Servicios de Transportes Integrados Limitada Chile Chile Road transport 100%Inversiones Punta de Rieles Limitada Chile Chile Investment 100%Inversiones Chilean Northern Mines Limitada Chile Chile Investment 100%The Andes Trust Chile S.A. Chile Chile Investment 100%Transportes Integrados Limitada Chile Chile Transport 100%Inversiones Transportes Integrados Limitada Chile Chile Investment 100%Embarcadores Limitada Chile Chile Transport 100%FCAB Ingenieria y Servicios Limitada Chile Chile Transport 100%Emisa Antofagasta S.A. Chile Chile Transport 100%Servicios Logisticos Capricornio Limitada Chile Chile Transport 100%Forestal S.A. Chile Chile Forestry 100%Atacama Copper Company Pty Limited Australia Australia Investment 50%Tethyan Copper Company Limited Australia Australia Investment 50%Chagai Mineral Company Limited Pakistan Pakistan Investment 50%Tethyan Copper Company Pakistan (Private) Limited Pakistan Pakistan Mining 50%Paktui Exploration Limited Pakistan Pakistan Investment 50%Northern Minerals Investment (Jersey) Limited Jersey Jersey Investment 100%Northern Metals (UK) Limited UK UK Investment 100%Northern Minerals Holding Co USA USA Investment 100%Twin Metals (UK) Limited UK UK Investment 100%Twin Metals Inc. USA USA Investment 100%DMC LLC USA USA Investment 100%Duluth Metals Holdings Inc USA USA Investment 100%Duluth Exploration Inc USA USA Investment 100%
152 Antofagasta plc Annual report and financial statements 2015
Notes to the financial statements

Country of incorporation Country of operations Nature of business Economic interest
DMC (USA) LLC USA USA Investment 100%DMC (USA) Corporation USA USA Investment 100%Antofagasta Energy Jersey PCC Jersey Jersey Investment 100%Antomin 2 Limited BVI BVI Mining 100%Antomin Investors Limited BVI BVI Mining 100%Antofagasta Minerals Adelaide Pty Limited Australia Australia Mining 100%Antofagasta Minerals Perth Pty Limited Australia Australia Mining 100%Los Pelambres Holding Company Limited Jersey Jersey Investment 100%Los Pelambres Investment Company Limited Jersey Jersey Investment 100%Anaconda South America Inc USA USA Investment 100%Lamborn Land Co USA USA Investment 100%Helleborus Anstalt Liechtenstein Liechtenstein Investment 100%Morrisville Holdings Co BVI BVI Investment 100%Bolivian Rail Investors Co Inc USA USA Investment 100%Blue Ocean Overseas Inc BVI BVI Investment 100%Antofagasta Metals Limited UK UK Investment 100%Antofagasta Nickel Limited UK UK Investment 100%Antofagasta (Chili) and Bolivia Railway Company. Limited UK UK Investment 100%Antofagasta Holdings Limited UK UK Investment 100%Antofagasta Minerals Limited UK UK Investment 100%Antofagasta Gold Limited UK UK Investment 100%Antofagasta Mining Limited UK UK Investment 100%Antofagasta Copper Limited UK UK Investment 100%
With the exception of the Antofagasta Railway Company plc, all of the above Group companies have only one class of ordinary share capital in issue. The Antofagasta Railway Company plc has ordinary and preference share capital in issue, with the ordinary share capital representing 76% of the Company’s total share capital, and the preference share capital representing 24% of the Company’s total share capital, Antofagasta plc holds 100% of both the ordinary and preference share capital of the Antofagasta Railway Company plc.
The proportion of the voting rights is proportional with the economic interest under the companies listed above.
During 2015, the Group sold its 100% participation in the subsidiary Aguas de Antofagasta S.A. together with its investment in Atacama Aguas y Tecnología Limitada and the Group´s 50% share in Empresa Ferroviaria Andina. For more details of these transactions see Note 10.
17 Investment in associates and joint venturesInversiones
Hornitos 2015
$m
ATI 2015
$m
El Arrayán 2015
$m
Alto Maipo
2015 $m
Minera Zaldívar
2015 $m
Energía Andina
2015 $m
Tethyan Copper
2015 $m
Twin Metals
2015 $m
Total 2015
$m
Total 2014
$m
Balance at the beginning of the year 78.3 8.8 24.5 8.3 – 11.2 (0.4) 67.4 198.1 175.2 Capital contribution – – – 42.8 – 1.3 4.0 – 48.1 21.6 Acquisition – – – – 1,001.7 – – – 1,001.7 – Gains/(losses) in fair value of cash flow hedges deferred in reserves of associates – – (0.4) (13.9) – (1.7) – – (16.0) (42.0)Derecognition of investment in associate upon reclassification to subsidiary – – – – – – – (67.4) (67.4) 67.4 Share of net profit/(loss) before tax 12.3 (0.9) (0.4) (6.2) (2.4) (0.7) (6.1) – (4.4) (1.2)Share of tax (3.4) 0.2 (0.5) 2.5 (0.4) 0.2 – – (1.4) (2.9)Share of income/(loss) from associates 8.9 (0.7) (0.9) (3.7) (2.8) (0.5) (6.1) – (5.8) (4.1)Dividends received (12.1) – – – – – – – (12.1) (20.0)Balance at the end of the year 75.1 8.1 23.2 33.5 998.9 10.3 (2.5) – 1,146.6 198.1
The investments which are included in the $1,146.6 million balance at 31 December 2015 are set out below:
Investment in associates
(i) The Group’s 40% interest in Inversiones Hornitos S.A., which owns the 165MW Hornitos thermoelectric power plant operating in Mejillones, in Chile’s Antofagasta Region. The Group has a 16-year power purchase agreement with Hornitos for the provision of up to 40MW of electricity for Centinela.
(ii) The Group’s 30% interest in ATI, which operates a concession to manage installations in the port of Antofagasta.
Antofagasta plc 153
FIN
AN
CIA
L STA
TE
ME
NT
SF
INA
NC
IAL S
TAT
EM
EN
TS
GO
VE
RN
AN
CE
OT
HE
R IN
FO
RM
AT
ION
OV
ER
VIE
WS
TR
AT
EG
IC R
EP
OR
T

17 Investment in associates and joint ventures continued(iii) The Group´s 30% interest in Parque Eolico El Arrayán S.A., which operates an 115MW wind-farm project, which entered into operation
in June 2014. The Group has a 20-year power purchase agreement with Parque Eolico El Arrayán S.A. for the provision of up to 40MW of electricity for Los Pelambres. The Group did not make any capital contributions to Parque Eolico El Arrayán S.A. during the year (2014 – $2.6 million).
(iv) The Group’s interest in Alto Maipo SpA (“Alto Maipo”), which will develop, construct, own and operate two run-of-river hydroelectric power stations located in the upper section of the Maipo River, approximately 50 kilometres to the southeast of Santiago, with a total installed capacity of 531MW. In July 2013, the Group exercised an option to acquire a 40% interest in Alto Maipo for a consideration of $50.2 million, and is responsible for its share of development costs. Alto Maipo has used derivative financial instruments to reduce its exposure to interest rate movements in relation to the project financing and foreign exposure. A fair value loss of $13.9 million (2014 – $42.3 million loss) was recognised in relation to the mark-to-market of these derivative financial instruments with this amount deferred in reserves as it forms part of a designated cash flow hedging relationship. During 2015, the Group made capital contributions of $42.8 million (2014 – nil). During the year, the Group also provided $63.9 million of loan financing (2014 – $105.4 million) to Alto Maipo. The balance due from Alto Maipo to the Group at 31 December 2015 was $229.7 million (2014 – $152.4 million) representing loan financing with an interest rate of six-month LIBOR plus 4.25%.
(v) As at 31 December 2014, the Group had a 40% interest in Twin Metals Minnesota LLC (“Twin Metals”), which is seeking to develop a copper-nickel-PGM deposit in north-eastern Minnesota. The remaining 60% interest in Twin Metals was held by Duluth Metals Limited (“Duluth”). As detailed in Note 19, in January 2015 the Group completed its acquisition of 100% of Duluth, resulting in the Group holding a 100% interest in Twin Metals from that point. This has resulted in the Group consolidating 100% of the assets and liabilities relating to Twin Metals with effect from January 2015, and accordingly the investment in associate balance relating to Twin Metals was derecognised at that point.
Investment in joint ventures
(vi) The Group’s 50% interest in Compañia Minera Zaldívar SpA (“Zaldívar”), which was acquired on 1 December 2015 (see Note 20). Zaldívar is an open-pit, heap-leach copper mine located in Northern Chile, which produces approximately 100,000 tonnes of copper cathodes annually. The total provisional consideration for the acquisition of the Group’s 50% stake (including acquisition costs) was $1,001.7 million. The consideration is subject to adjustments based on the net debt and working capital levels of Zaldívar at the completion date, and it is currently expected that these adjustments will be finalised during the first half of 2016, allowing a final determination of the total consideration and the fair value of the share of assets and liabilities acquired.
(vii) The Group’s 50.1% (2014 – 50.1%) interest in Energía Andina, which is a joint venture with Origin Energy Geothermal Chile Limitada (“Origin”) for the evaluation and development of potential sources of geothermal and solar energy.
(viii) The Group’s 50% interest in Tethyan Copper Company Limited (“Tethyan”), which is a joint venture with Barrick Gold Corporation over Tethyan’s mineral interests in Pakistan, which is now subject to international arbitration as set out in Note 37 below.
Summarised financial information for the associates and joint ventures is as follows:
Inversiones Hornitos
2015 $m
ATI 2015
$m
El Arrayán 2015
$m
Alto Maipo
2015 $m
Minera Zaldívar
2015 $m
Energía Andina
2015 $m
Tethyan Copper
2015 $m
Total 2015
$m
Total 2014
$m
Cash and cash equivalent 23.4 1.0 2.7 121.6 17.5 1.2 2.1 169.5 75.0 Current assets 44.9 14.7 15.2 36.7 616.7 – 0.2 728.4 80.8 Non-current assets 310.6 148.9 271.4 841.3 1,589.8 19.6 0.3 3,181.9 1,476.3 Current liabilities (28.1) (23.2) (13.5) (102.4) (116.1) (0.6) (7.2) (291.1) (133.6)Non-current liabilities (163.2) (114.3) (198.7) (813.6) (97.1) – (0.2) (1,387.1) (993.6)Revenue 143.0 38.9 32.6 – 51.7 – – 266.2 212.9 Profit/(loss) after tax 22.4 (2.7) (3.0) (6.7) (5.5) (1.1) (12.2) (8.8) (14.0)Other comprehensive income – – (1.2) (35.0) – (3.2) – (39.4) (109.2)Total comprehensive income/(expense) 165.4 36.2 28.4 (41.7) 46.2 (4.3) (12.2) 218.0 (123.2)
Notes to the summarised financial information
(i) The summarised financial information is based on the amounts included in the IFRS financial statements of the associate or joint venture (ie 100% of the results or balances of the associate or joint venture, rather than the Group’s proportionate share), after the Group’s fair value adjustments.
(ii) The amounts shown above for Zaldívar reflect a provisional estimate of the fair value of the assets and liabilities acquired on 1 December 2015. The consideration payable for the Group’s 50% stake in Zaldívar is subject to adjustments based on the net debt and working capital levels of Zaldívar at the completion date (see Note 20) and it is currently expected that these adjustments will be finalised during the first half of 2016, allowing a final determination of the total consideration and the fair value of the share of assets and liabilities acquired.
(iii) Non-current liabilities at Alto Maipo include a loan related to the project finance and financial derivatives of $192.7 million and subordinated debt of $574.8.
154 Antofagasta plc Annual report and financial statements 2015
Notes to the financial statements

18 Available-for-sale investments2015
$m2014
$m
Balance at the beginning of the year 15.6 16.6 Additions 0.2 5.9 Movement in fair value (3.2) (6.1)Reclassification (9.4) – Disposal (0.2) – Foreign currency exchange differences (0.3) (0.8)Balance at the end of the year 2.7 15.6
Available-for-sale investments represent those investments which are not subsidiaries, associates or joint ventures and are not held for trading purposes. The fair value of all equity investments are based on quoted market prices.
The reclassification of $9.4 million is related to the acquisition of Duluth Metals Limited (“Duluth”). As at 31 December 2014, the Group held 17.2% of Duluth’s share capital, with a fair value of $9.4 million, accounted for as an available-for-sale investment. As explained in Note 19, in January 2015 the Group completed its acquisition of 100% of Duluth. Duluth held a 60% stake in Twin Metals Minnesota Limited (“Twin Metals”), a company in which the Group held a 40% stake as at December 2014. Accordingly, as a consequence of the acquisition of Duluth the Group had a 100% interest in Duluth and, as a result of this, a 100% interest in Twin Metals. The principal asset of Twin Metals is its copper-nickel-PGM deposit in north-eastern Minnesota, and the transaction has accordingly been accounted for as the acquisition by the Group of the remaining 60% interest in that asset, with this $9.4 million balance forming part of the total consideration of that acquisition. From January 2015, Twin Metals has therefore been consolidated as a 100% subsidiary of the Group, with this $9.4 million balance forming part of the total consideration reflected in the accounting for the acquisition of the subsidiary.
19 Duluth Metals Limited transactionIn January 2015, the Group completed its acquisition of 100% of Duluth Metals Limited (“Duluth”). The principal asset of Duluth was its 60% stake in Twin Metals Minnesota Limited (“Twin Metals”), a company in which the Group held the remaining 40% stake as at December 2014. The principal asset of Twin Metals is its copper-nickel-PGM deposit in north-eastern Minnesota, and the transaction has accordingly been accounted for as the acquisition by the Group of the remaining 60% interest in that asset.
Immediately prior to the completion of the transaction the Group held 17.2% of Duluth’s share capital. The fair value of the consideration transferred to acquire the remaining 82.8% of the share capital of Duluth in January 2015 was $44.3 million, reflecting the agreed acquisition price of C$0.45 per share. In addition, transaction costs of $6.3 million have been included as part of the cost of the asset acquisition. The carrying value of the Group’s existing investment in associate balance relating to its 40% interest in Twin Metals at the date of the transaction in January 2015 was $67.4 million, and the carrying value of the Group’s existing available-for-sale investment balance relating to its 17.2% holding of Duluth’s share capital at that date was $9.4 million. As part of the acquisition agreement the Group also agreed to redeem convertible debentures previously issued by Duluth at a cash cost of $31.7 million, and has also acquired the other sundry net liabilities of Duluth.
This has resulted in the Group consolidating 100% of the assets and liabilities relating to Twin Metals with effect from January 2015. The principal assets recognised at that date were an intangible asset balance of $150.1 million reflecting the value of the mining property assets, and a property, plant and equipment balance of $20.8 million relating to land and buildings. In addition, a liability of $31.7 million was recognised in respect of the Duluth convertible debentures, which were subsequently redeemed by the Group, along with $11.8 million of other sundry net liabilities of Duluth and Twin Metals.
20 Compañia Minera Zaldívar SpA transactionOn 1 December 2015, Antofagasta completed its acquisition of a 50% stake in Compañia Minera Zaldívar SpA (“Zaldívar”) from Barrick Gold Corporation (“Barrick”), pursuant to an agreement entered into on 30 July 2015. As a result, Antofagasta has become operator of the Zaldívar mine. Zaldívar is an open-pit, heap-leach copper mine located in northern Chile, which produces approximately 100,000 tonnes of copper cathodes annually.
Given that Antofagasta and Barrick have joint control over Zaldívar, Antofagasta is accounting for its 50% stake in Zaldívar as a joint venture.
Total consideration for the transaction was $1,005 million, subject to adjustments based on the net debt and working capital levels of Zaldívar at the completion date. The consideration was wholly in cash, with $980 million payable upon closing (subject to the net debt and working capital adjustments), and five annual payments of $5 million per year, starting in 2016. Provisional estimated adjustments in respect of the net debt and working capital levels of Zaldívar at 1 December 2015 resulted in a provisional reduction in the consideration of $10.3 million to $994.7 million. Including capitalised acquisition costs of $7.0 million the initial investment in joint venture balance is therefore $1,001.7 million.
It is currently expected that the net debt and working capital adjustments will be finalised during the first half of 2016, allowing a final determination of the total consideration and the fair value of the share of assets and liabilities acquired.
Antofagasta plc 155
FIN
AN
CIA
L STA
TE
ME
NT
SF
INA
NC
IAL S
TAT
EM
EN
TS
GO
VE
RN
AN
CE
OT
HE
R IN
FO
RM
AT
ION
OV
ER
VIE
WS
TR
AT
EG
IC R
EP
OR
T

21 Inventories2015
$m2014
$m
Current:Raw materials and consumables 162.0 177.9 Work-in-progress 97.7 136.7 Finished goods 37.4 67.9
297.1 382.5 Non-current:Work-in-progress 263.9 247.8
263.9 247.8 Total 561.0 630.3
The amount of write down of inventory related to Net Realisable Value (“NRV”) recognised as an expense was $17.7 million at 31 December 2015 (2014 – nil).
Non-current work-in-progress represents inventory expected to be processed more than 12 months after the balance sheet date.
22 Trade and other receivablesTrade and other receivables do not generally carry any interest, are principally short term in nature and are normally started at their nominal value less any impairment.
Due in one year Due after one year Total
2015 $m
2014 $m
2015 $m
2014 $m
2015 $m
2014 $m
Trade receivables 382.8 545.6 – 0.5 382.8 546.1 Other receivables 222.0 264.7 76.6 86.6 298.6 351.3 Loans provided to associates and joint ventures – – 216.3 152.4 216.3 152.4
604.8 810.3 292.9 239.5 897.7 1,049.8
The largest balances of trade receivables are held with equity participants in the key mining projects. Many other significant trade receivables are secured by letters of credit or other forms of security. The average credit period given on sale of goods and rendering of service is 41 days (2014 – 37 days). There is no material element which is interest-bearing. Trade receivables include mark-to-market adjustments in respect of provisionally priced sales of copper and molybdenum concentrates which remain open as to final pricing. Where these have resulted in credit balances, they have been reclassified to trade payables.
156 Antofagasta plc Annual report and financial statements 2015
Notes to the financial statements

Movements in the provision for doubtful debts were as follows:
2015 $m
2014 $m
Balance at the beginning of the year (4.9) (5.6)Charge for the year (0.1) (0.2)Amounts written off – – Disposal of subsidiaries 3.9 – Unused amounts reversed 0.1 0.4 Foreign currency exchange difference – 0.5 Balance at the end of the year (1.0) (4.9)
The ageing analysis of the trade receivables balance is as follows:
Past due but not impaired
Neither past due nor impaired
$m
Up to 3 months past due
$m
3–6 months past due
$m
More than 6 months past due
$mTotal
$m
2015 892.4 1.0 – 4.3 897.7 2014 1,035.4 7.5 1.1 5.8 1,049.8
With respect to the trade receivables that are neither past due nor impaired, there are no indications that the debtors will not meet their payment obligations. The carrying value of the trade receivables recorded in the financial statements represents the Group’s maximum exposure to credit risk. The Group does not hold any collateral as security.
At 31 December 2015, the other receivables include $35.3 million (2014 – $28.4 million) relating to prepayments.
23 Cash, cash equivalents and liquid investmentsThe fair value of cash, cash equivalents and liquid investments is not materially different from the carrying values presented. The credit risk on cash and cash equivalents is limited because the counterparties are banks with high credit ratings assigned by international credit-rating agencies.
Cash, cash equivalents and liquid investments was comprised of:
2015 $m
2014 $m
Cash and cash equivalents 807.5 845.4 Liquid investments 924.1 1,529.1
1,731.6 2,374.5
At 31 December 2015 and 2014, there is no cash which is subject to restriction.
The currency exposure of cash, cash equivalents and liquid investments was as follows:
2015 $m
2014 $m
US dollars 1,492.3 2,065.3 Chilean pesos 237.5 307.7 Australian dollars 0.2 0.3 Sterling 0.5 0.2 Other 1.1 1.0
1,731.6 2,374.5
Antofagasta plc 157
FIN
AN
CIA
L STA
TE
ME
NT
SF
INA
NC
IAL S
TAT
EM
EN
TS
GO
VE
RN
AN
CE
OT
HE
R IN
FO
RM
AT
ION
OV
ER
VIE
WS
TR
AT
EG
IC R
EP
OR
T

24 Borrowings
a) Analysis by type of borrowing
Borrowings may be analysed by business segment and type as follows:
Notes2015 $m
2014 $m
Los Pelambres Corporate loans (i) (52.3) (87.2)Short-term loan (ii) (312.1) (206.0)Finance leases (iii) (7.9) (12.5)Centinela Project financing (senior debt) (iv) (889.8) (884.1)Shareholder loan (subordinated debt) (v) (174.5) (167.0)Short-term loan (vi) (200.0) – Finance leases (vii) – (0.1)Antucoya Project financing (senior debt) (viii) (630.2) (572.7)Shareholder loan (subordinated debt) (ix) (308.7) (241.7)Short-term loan (30.0) – Finance leases (x) – (1.1)Corporate and other items Finance leases (xi) (24.6) (29.7)Railway and other transport services Long-term loans (xii) (119.1) (148.6)Finance leases (xiii) (2.9) (3.2)Water concession Long-term loan (xiv) – (14.6)Andino (xv)Bonds (xvi) – (3.0)Short-term loans (xvii) – (1.5)Preference shares (xviii) (3.0) (3.1)Total (2,755.1) (2,376.1)
(i) Corporate loans at Los Pelambres are unsecured and US dollar denominated. These loans have a remaining term of 2.5 years and have an interest rate of LIBOR six-month plus margins of between 0.9%–1.6%.
(ii) Short-term loan (PAE) is US dollar denominated, and comprises a working capital loan for an average period of one year and has an interest rate of LIBOR six-month rate plus margins of between 0.05%–0.16%.
(iii) Finance leases at Los Pelambres are US dollar denominated, comprising $10.1 million at a fixed rate of 0.47% with a remaining duration of 2.5 years.
(iv) Senior debt at Centinela is US dollar denominated, and comprises $887.3 million in respect of syndicated loans. These loans are for a remaining term of 4.5 years and have an interest rate of LIBOR six-month plus 1%. The loans are subject to financial covenants which require that specified net debt to EBITDA and EBITDA to finance expense ratios are maintained.
The Group has used interest rate swaps to swap the floating rate interest for fixed rate interest. At 31 December 2015, the current notional amount hedged of the senior debt at Centinela was $105.0 million.
(v) Long-term US dollar denominated subordinated debt provided to Centinela by Marubeni Corporation, with a duration of 6.5 years and a weighted average interest rate of LIBOR six-month plus 3.75%. Long-term subordinated debt provided by Group companies to Centinela has been eliminated on consolidation.
(vi) Short-term loan (PAE) is US dollar denominated, and comprises a working capital loan for an average period of one year and has an interest rate of LIBOR six-month plus margins of between 0.1%–0.3%.
(vii) Finance leases at Centinela are US dollar denominated, with a remaining duration of 0.5 years and with an average interest fixed rate at approximately 1.3%.
(viii) Senior debt at Antucoya is US dollar denominated, and comprises $623.3 million in respect of syndicated loans. These loans are for a remaining term of 11.5 years and have an interest rate of LIBOR 180 days plus 1.9%.
(ix) Long-term US dollar denominated subordinated debt provided to Antucoya by Marubeni Corporation, with a duration of 11.5 years and an interest rate of LIBOR six-month plus 3.65%. Long-term subordinated debt provided by Group companies to Antucoya has been eliminated on consolidation.
158 Antofagasta plc Annual report and financial statements 2015
Notes to the financial statements

(x) Short-term loan is US dollar denominated, and comprises a working capital loan for an average period of one year and has an interest rate of LIBOR six-month plus 0.9%.
(xi) Finance leases at Antucoya are US dollar denominated, with a maximum remaining duration of 0.5 years and with an average interest rate at approximately LIBOR three-month plus 2.89%.
(xii) Finance leases at Corporate and other items are denominated in Unidades de Fomento (ie inflation-linked Chilean pesos) and have a remaining duration of 12.5 years and are fixed rate with an average interest rate of 5.29%.
(xiii) Long-term loans at Railway and other transport services are US dollar denominated, and mainly comprise a loan for $148.6 million with a duration of 4.5 years and with an interest rate of LIBOR six-month plus 0.48%.The Group has used interest rate swaps to swap the floating rate interest for fixed rate interest. At 31 December 2015, the current notional amount hedged of the long-term debt at Railway and other transport services was $120.0 million.
(xiv) Finance leasing at Railway and other transport services are Chilean pesos denominated, with a maximum remaining duration of 2.5 years and with a fixed interest rate of 4.8%.
(xv) Long-term loan at ADASA denominated in Unidades de Fomento (ie inflation-linked Chilean pesos) was derecognised as part of the ADASA sale.
(xvi) Bond at Andino (FCA) was derecognised as part of the FCA sale.
(xvii) Short-term loans at Andino (FCA) were derecognised as part of the FCA sale.
(xviii) The preference shares are sterling-denominated and issued by the Company. There were two million shares of £1 each authorised, issued and fully paid at 31 December 2014. The preference shares are non-redeemable and are entitled to a fixed cumulative dividend of 5% per annum. On winding up they are entitled to repayment and any arrears of dividend in priority to ordinary shareholders, but are not entitled to participate further in any surplus. Each preference share carries 100 votes in any general meeting of the Company.
b) Analysis of borrowings by currency
The exposure of the Group’s borrowings to currency risk is as follows:
At 31 December 2015Pesos
$mSterling
$m Other
$mUS dollars
$m
2015 Total
$m
Corporate loans – – – (1,572.3) (1,572.3)Other loans (including short-term loans) – – – (1,144.4) (1,144.4)Finance leases (27.4) – – (8.0) (35.4)Preference shares – (3.0) – – (3.0)
(27.4) (3.0) – (2,724.7) (2,755.1)
At 31 December 2014Pesos
$mSterling
$m Other
$mUS dollars
$m
2014 Total
$m
Corporate loans – – – (1,544.0) (1,544.0)Other loans (including short-term loans) – – (16.1) (766.3) (782.4)Finance leases (33.3) – – (13.3) (46.6)Preference shares – (3.1) – – (3.1)
(33.3) (3.1) (16.1) (2,323.6) (2,376.1)
Antofagasta plc 159
FIN
AN
CIA
L STA
TE
ME
NT
SF
INA
NC
IAL S
TAT
EM
EN
TS
GO
VE
RN
AN
CE
OT
HE
R IN
FO
RM
AT
ION
OV
ER
VIE
WS
TR
AT
EG
IC R
EP
OR
T

24 Borrowings continued
c) Analysis of borrowings by type of interest rate
The exposure of the Group’s borrowings to interest rate risk is as follows:
At 31 December 2015 Fixed
$m Floating
$m
2015 Total
$m
Corporate loans – (1,572.3) (1,572.3)Other loans (including short-term loans) – (1,144.4) (1,144.4)Finance leases (27.5) (7.9) (35.4)Preference shares (3.0) – (3.0)
(30.5) (2,724.6) (2,755.1)
At 31 December 2014 Fixed
$m Floating
$m
2014 Total
$m
Corporate loans – (1,544.0) (1,544.0)Other loans (including short-term loans) (22.1) (760.3) (782.4)Finance leases (45.3) (1.3) (46.6)Preference shares (3.1) – (3.1)
(70.5) (2,305.6) (2,376.1)
The above floating rate corporate loans include the project financing at Centinela and long-term loans at the Railway and other transport services, where the Group has used interest rate swaps to swap the floating rate interest for fixed rate interest. At 31 December 2015, the current notional amount hedged of the senior debt at Centinela was $105.0 million (2014 – $140.0 million) and the current notional amount hedged of the long-term loans at Railway and other transport services was $120.0 million (2014 – $150.0 million).
d) Maturity profile
The maturity profile of the Group’s borrowings is as follows:
At 31 December 2015
Within 1 year
$m
Between 1–2 years
$m
Between 2–5 years
$m
After 5 years
$m
2015 Total
$m
Corporate loans (181.8) (315.9) (684.1) (390.5) (1,572.3)Other loans (571.6) (59.7) (29.9) (483.2) (1,144.4)Finance leases (5.5) (7.9) (22.0) – (35.4)Preference shares – – – (3.0) (3.0)
(758.9) (383.5) (736.0) (876.7) (2,755.1)
At 31 December 2014
Within 1 year
$m
Between 1–2 years
$m
Between 2–5 years
$m
After 5 years
$m
2014 Total
$m
Corporate loans (34.8) (209.5) (996.9) (302.8) (1,544.0)Other loans (241.2) (35.0) (97.0) (409.2) (782.4)Finance leases (8.5) (7.5) (10.3) (20.3) (46.6)Preference shares – – – (3.1) (3.1)
(284.5) (252.0) (1,104.2) (735.4) (2,376.1)
The amounts included above for finance leases are based on the present value of minimum lease payments.
160 Antofagasta plc Annual report and financial statements 2015
Notes to the financial statements

The total minimum lease payments for these finance leases may be analysed as follows:
2015 $m
2014 $m
Within 1 year (6.8) (10.4)Between 1–2 years (9.0) (8.2)Between 2–5 years (8.6) (14.2)After 5 years (19.6) (25.0)Total minimum lease payment (44.0) (57.8)Less amounts representing finance charges 8.6 11.3 Present value of minimum lease payment (35.4) (46.5)
All leases are on a fixed payment basis and no arrangements have been entered into for contingent rental payments.
e) Borrowings facilities
The undrawn committed borrowing facilities available at the end of each year, in respect of which all conditions precedent had been met at those dates, were as follows:
2015 $m
2014 $m
Expiring in one year or less 1,378.1 1,563.2 Expiring in more than one, but not more than two years – 53.1 Expiring in more than two years – 15.4
1,378.1 1,631.7
The available facilities comprise general working capital facilities at the Group’s operating subsidiaries all of which were undrawn at the end of each year. Of these facilities, $1,351.7 million (2014 – $1,548.6 million) are denominated in US dollars, $26.4 million (2014 – $24.3 million) in Unidades de Fomento (ie inflation-linked Chilean pesos), nil (2014 – nil) in Euro and nil (2014 – $58.8 million) in Chilean pesos.
25 Trade and other payables
Due in one year Due after one year Total
2015 $m
2014 $m
2015 $m
2014 $m
2015 $m
2014 $m
Trade payables (207.6) (406.5) – – (207.6) (406.5)Other payables and accruals (271.3) (387.3) (24.4) (4.8) (295.7) (392.1)
(478.9) (793.8) (24.4) (4.8) (503.3) (798.6)
Trade payables and accruals principally comprise amounts outstanding for trade purchases and ongoing costs.
The average credit period taken for trade purchases is 30 days (2014 – 48 days).
26 Financial instruments and financial risk management
a) Categories of financial instruments
The Group’s financial instruments, grouped according to the categories defined in IAS 39 “Financial instruments: Recognition and Measurement”, are as follows:
2015 $m
2014 $m
Financial assetsDerivatives in designated hedge accounting relationships 0.2 0.2 Available-for-sale investments 2.7 15.6 Loans and receivables at amortised cost (including cash and cash equivalents) 1,703.9 1,895.2 Fair value through profit and loss (liquid investments and mark-to-market debtors) 925.4 1,529.1 Financial liabilitiesDerivatives in designated hedge accounting relationships (3.5) (11.0)Financial liabilities measured at amortised cost (3,235.5) (3,104.1)Fair value through profit and loss (mark-to-market payables) (22.9) (70.6)
(629.7) 254.4
Antofagasta plc 161
FIN
AN
CIA
L STA
TE
ME
NT
SF
INA
NC
IAL S
TAT
EM
EN
TS
GO
VE
RN
AN
CE
OT
HE
R IN
FO
RM
AT
ION
OV
ER
VIE
WS
TR
AT
EG
IC R
EP
OR
T

26 Financial instruments and financial risk management continued
b) Fair value of financial instruments
The fair values of financial assets and financial liabilities are determined as follows:
• the fair values of financial assets and financial liabilities with standard terms and conditions and traded on active liquid markets are determined with reference to quoted market prices;
• the fair values of other financial assets and financial liabilities (excluding derivative instruments) are determined in accordance with generally accepted pricing models based on discounted cash flow analysis using prices from observable current market transactions; and
• the fair values of derivative instruments are calculated using quoted prices. Where such prices are not available, use is made of discounted cash flow analysis based on the applicable yield curve for the duration of the instruments for non-optional derivatives, and option pricing models for optional derivatives.
The fair value of each category of financial asset and liability is not materially different from the carrying values presented for either 2015 or 2014.
Financial assets and liabilities measurement as fair value through profit and loss are designated as such upon initial recognition.
The following table provides an analysis of the financial instruments that are measured subsequent to initial recognition at fair value, grouped into levels 1 to 3 based on the degree to which the fair value is observable:
• level 1 fair value measurements are those derived from quoted prices (unadjusted) in active markets for identical assets or liabilities;
• level 2 fair value measurements are those derived from inputs other than quoted prices included within level 1 that are observable for the asset or liability, either directly (ie as prices) or indirectly (ie derived from prices); and
• level 3 fair value measurements are those derived from valuation techniques that include inputs for the asset or liability that are not based on observable market data (unobservable inputs).
Level 1 $m
Level 2 $m
Level 3 $m
Total 2015
$m
Total 2014
$m
Financial assetsDerivatives in designated hedge accounting relationships – 0.2 – 0.2 0.2 Available-for-sale investments 2.7 – – 2.7 15.6 Debtors mark-to-market – 1.3 – 1.3 – Fair value through profit and loss 925.4 – – 925.4 1,529.1 Financial liabilitiesDerivatives in designated hedge accounting relationships – (3.5) – (3.5) (11.0)Creditors mark-to-market – (22.9) – (22.9) (70.6)
928.1 (24.9) – 903.2 1,463.3
There were no transfers between level 1 and 2 during the year.
c) Financial risk management
The Group’s activities expose it to a variety of financial risks: market risk (including commodity price risk, currency risk, interest rate risk and other price risk), credit risk and liquidity risk. The Group uses derivative financial instruments, in general to reduce exposure to commodity price, foreign exchange and interest rate movements. The Group does not use such derivative instruments for speculative trading purposes.
The Board of Directors is responsible for overseeing the Group’s risk management framework. The Audit and Risk Committee assists the Board with its review of the effectiveness of the risk management process, and monitoring of key risks and mitigations. Internal Audit undertakes both regular and ad-hoc reviews of risk management controls and procedures, the results of which are reported to the Audit and Risk Committee.
(i) Commodity price riskThe Group generally sells its copper and molybdenum concentrate and copper cathodes output at prevailing market prices, subject to final pricing adjustments which may range from one to five months after delivery to the customer, and it is therefore exposed to changes in market prices for copper and molybdenum both in respect of future sales and previous sales which remain open as to final pricing. In 2015, sales of copper and molybdenum concentrate and copper cathodes represented 90.7% of Group turnover and therefore revenues and earnings depend significantly on LME and realised copper prices.
The Group uses futures, min-max instruments and options to manage its exposure to copper prices. These instruments may give rise to accounting volatility due to fluctuations in their fair value prior to the maturity of the instruments. Details of those copper and molybdenum concentrate sales and copper cathode sales which remain open as to final pricing are given in Note 5. Details of commodity rate derivatives entered into by the Group are given in Note 26(d).
162 Antofagasta plc Annual report and financial statements 2015
Notes to the financial statements

Commodity price sensitivityThe sensitivity analysis below shows the impact of a movement in the copper price on the financial instruments held as at the reporting date. A movement in the copper forward price as at the reporting date will affect the final pricing adjustment to sales which remain open at that date, impacting the trade receivables balance and consequently the income statement. A movement in the copper forward price will also affect the valuation of commodity derivatives, impacting the hedging reserve in equity if the fair value movement relates to an effective designated cash flow hedge, and impacting the income statement if it does not. The calculation assumes that all other variables, such as currency rates, remain constant.
• If the copper forward price as at the reporting date had increased by 10 cents, net earnings would have increased by $18.5 million (2014 – increase by $16.5 million) and hedging reserves in equity would have decreased less than $0.4 million (2014 – decrease less than $0.1 million).
• If the copper forward price as at the reporting date had decreased by 10 cents, net earnings would have decreased by $17.2 million (2014 – decrease by $16.5 million) and hedging reserves in equity would have increased less than $0.4 million (2014 – increase less than $0.1 million).
In addition, a movement in the average copper price during the year would impact revenue and earnings. A 10 cents change in the average copper price during the year would have affected net earnings by $62.5 million (2014 – $64.7 million) and earnings per share by 6.3 cents (2014 – 6.6 cents), based on production volumes in 2015, without taking into account the effects of provisional pricing and hedging activity. A $1 change in the average molybdenum price for the year would have affected net earnings by $9.4 million (2014 – $7.0 million), and earnings per share by 1.0 cents (2014 – 0.7 cents), based on production volumes in 2015, and without taking into account the effects of provisional pricing. A $100 change in the average gold price for the year would have affected net earnings by $10.4 million (2014 – $9.7 million), and earnings per share by 1.1 cents (2014 – 1.0 cents), based on production volumes in 2015, and without taking into account the effects of provisional pricing.
(ii) Currency riskThe Group is exposed to a variety of currencies. The US dollar, however, is the currency in which the majority of the Group’s sales are denominated. Operating costs are influenced by the countries in which the Group’s operations are based (principally in Chile) as well as those currencies in which the costs of imported equipment and services are determined. After the US dollar, the Chilean peso is the most important currency influencing costs and to a lesser extent sales.
Given the significance of the US dollar to the Group’s operations, this is the presentational currency of the Group for internal and external reporting. The US dollar is also the currency for borrowing and holding surplus cash, although a portion of this may be held in other currencies, notably Chilean pesos and sterling, to meet short-term operational and capital commitments and dividend payments.
When considered appropriate, the Group uses forward exchange contracts and currency swaps to limit the effects of movements in exchange rates in foreign currency denominated assets and liabilities. The Group may also use these instruments to reduce currency exposure on future transactions and cash flows. Details of any exchange rate derivatives entered by the Group in the year are given in Note 26.(d).
The currency exposure of the Group’s cash, cash equivalents and liquid investments is given in Note 23, and the currency exposure of the Group’s borrowings is given in Note 26.b. The effects of exchange gains and losses included in the income statement are given in Note 5. Exchange differences on translation of the net assets of entities with a functional currency other than the US dollar (the most material of which is Aguas de Antofagasta S.A.) are taken to the currency translation reserve and are disclosed in the Consolidated statement of changes in equity on page 123.
Currency sensitivityThe sensitivity analysis below shows the impact of a movement in the US dollar/Chilean peso exchange rate on the financial instruments held as at the reporting date.
The impact on profit or loss is as a result of the retranslation of monetary financial instruments (including cash, cash equivalents, liquid investments, trade receivables, trade payables and borrowings). The impact on equity is as a result of changes in the fair value of derivative instruments which are effective designated cash flow hedges, and changes in the fair value of available-for-sale equity investments. The calculation assumes that all other variables, such as interest rates, remain constant.
If the US dollar had strengthened by 10% against the Chilean peso as at the reporting date, net earnings would have decreased by $2.9 million (2014 – decrease by $6.2 million); and hedging reserves in equity would have decreased by nil (2014 – decrease by $6.1 million). If the US dollar had weakened by 10% against the Chilean peso as at the reporting date, net earnings would have increased by $1.7 million (2014 – increased by $15.2 million); and hedging reserves in equity would have increased by nil (2014 – increase by $ 0.7 million).
(iii) Interest rate riskThe Group’s policy is generally to borrow and invest cash at floating rates. Fluctuations in interest rates may impact the Group’s net finance income or cost, and to a lesser extent on the value of financial assets and liabilities. The Group occasionally uses interest rate swaps and collars to manage interest rate exposures on a portion of its existing borrowings. Details of any interest rate derivatives entered into by the Group are given in Note 26(d)(i).
Interest rate exposure of the Group’s borrowings is given in Note 24.
Antofagasta plc 163
FIN
AN
CIA
L STA
TE
ME
NT
SF
INA
NC
IAL S
TAT
EM
EN
TS
GO
VE
RN
AN
CE
OT
HE
R IN
FO
RM
AT
ION
OV
ER
VIE
WS
TR
AT
EG
IC R
EP
OR
T

26 Financial instruments and financial risk management continuedInterest rate sensitivityThe sensitivity analysis below shows the impact of a movement in interest rates in relation to the financial instruments held as at the reporting date. The impact on profit or loss reflects the impact on annual interest expense in respect of the floating rate borrowings held as at the reporting date, and the impact on annual interest income in respect of cash and cash equivalents held as at the reporting date. The impact on equity is as a result of changes in the fair value of derivative instruments which are effective designated cash flow hedges. The calculation assumes that all other variables, such as currency rates, remain constant. If the interest rate increased by 1%, based on the financial instruments held as at the reporting date, net earnings would have increased by $4.4 million (2014 – increase by $2.5 million) and hedging reserves in equity would have increased by $0.7 million (2014 – increase by $0.3 million). This does not include the effect on the income statement of changes in the fair value of the Group’s liquid investments relating to the underlying investments in fixed income instruments.
(iv) Other price riskThe Group is exposed to equity price risk on its available-for-sale equity investments.
Equity price sensitivityThe sensitivity analysis below shows the impact of a movement in the equity values of the available-for-sale financial assets held as at the reporting date.
If the value of the available-for-sale investments had increased by 10% as at the reporting date, equity would have increased by $0.3 million (2014 – increase by $1.6 million). There would have been no impact on the income statement.
(v) Cash flow riskThe Group’s future cash flows depend on a number of factors, including commodity prices, production and sales levels, operating costs, capital expenditure levels and financial income and costs. Its cash flows are therefore subject to the exchange, interest rate and commodity price risks described above as well as operational factors and input costs. To reduce the risk of potential short-term disruptions to the supply of key inputs such as electricity and sulphuric acid, the Group enters into medium- and long-term supply contracts to help ensure continuity of supply. Long-term electricity supply contracts are in place at each of the Group’s mines, in most cases linking the cost of electricity under the contract to the current cost of electricity on the Chilean grids. The Group seeks to lock in supply of sulphuric acid for future periods of a year or longer, with contract prices agreed in the latter part of the year, to be applied to purchases of acid in the following year. Further information on production and sales levels and operating costs are given in the Operational review on page 39.
(vi) Credit riskCredit risk arises from trade and other receivables, cash, cash equivalents, liquid investments and derivative financial instruments. The Group’s credit risk is primarily to trade receivables. The credit risk on cash, cash equivalents and liquid investments and on derivative financial instruments is limited as the counterparties are financial institutions with high credit ratings assigned by international credit agencies.
All customers are subject to credit review procedures, including the use of external credit ratings where available. Credit is provided only within set limits, which are regularly reviewed. The main customers are recurrent with a good credit history during the years while they have been customers.
Outstanding receivable balances are monitored on an ongoing basis.
The carrying value of financial assets recorded in the financial statements represents the maximum exposure to credit risk. The amounts presented in the balance sheet are net of allowances for any doubtful receivables.
As detailed in Note 17, the Group has provided a total of $229.7 million of loan financing to its associated company Alto Maipo SpA (“Alto Maipo”). This loan financing forms part of the Group’s total funding of the Alto Maipo project, along with the capital contributions the Group has made to Alto Maipo, and the recovery of this balance will derive from the cash flows generated by the project once construction has completed and the project is operational.
(vii) Liquidity riskThe Group manages liquidity risk by maintaining adequate cash reserves and financing facilities, through the review of forecast and actual cash flows.
The Group typically holds surplus cash in demand or term deposits or highly liquid investments, which typically can be accessed or liquidated within 24 hours.
The majority of borrowings comprise corporate loans at Los Pelambres, repayable over periods of up to three years, corporate loans at Centinela Concentrates, repayable over approximately seven years and Antucoya long-term subordinated debt repayable over approximately 12 years.
At the end of 2015, the Group was in a net debt position (2014 – net debt position), as disclosed in Note 33.(c). Details of cash, cash equivalents and liquid investments are given in Note 23, while details of borrowings including the maturity profile are given in Note 24.(d). Details of undrawn committed borrowing facilities are also given in Note 24.(e).
164 Antofagasta plc Annual report and financial statements 2015
Notes to the financial statements
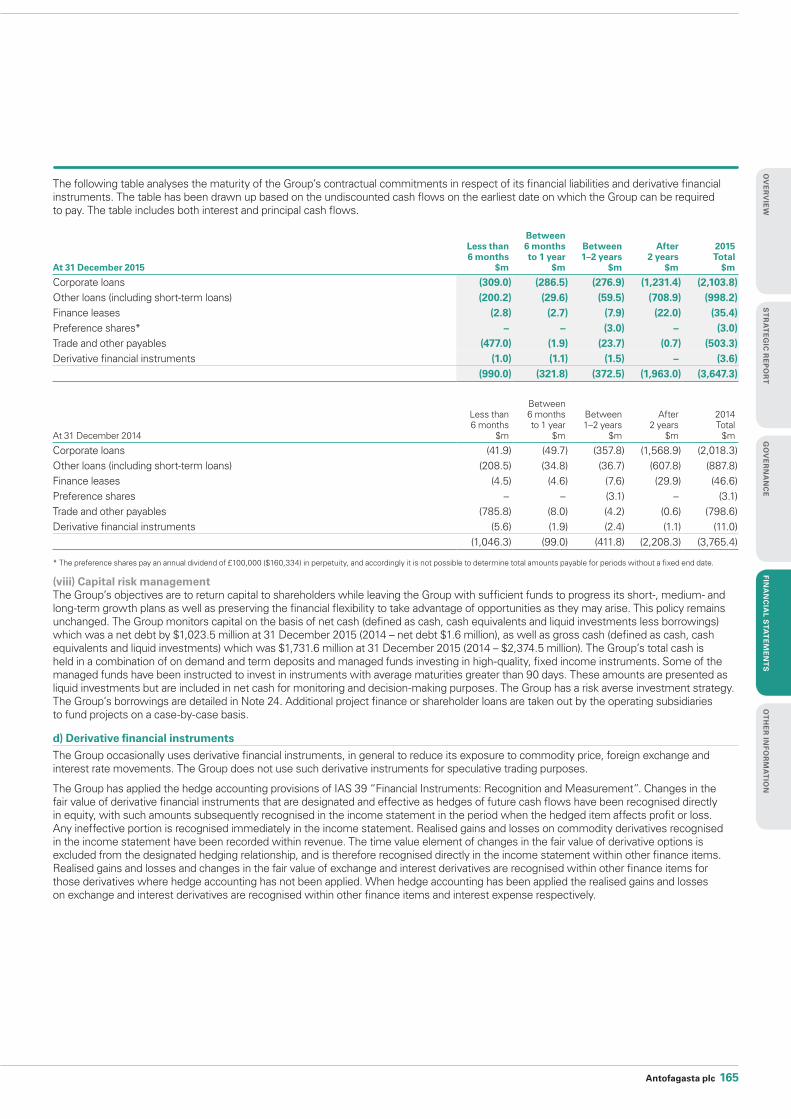
The following table analyses the maturity of the Group’s contractual commitments in respect of its financial liabilities and derivative financial instruments. The table has been drawn up based on the undiscounted cash flows on the earliest date on which the Group can be required to pay. The table includes both interest and principal cash flows.
At 31 December 2015
Less than 6 months
$m
Between 6 months to 1 year
$m
Between 1–2 years
$m
After 2 years
$m
2015 Total
$m
Corporate loans (309.0) (286.5) (276.9) (1,231.4) (2,103.8)Other loans (including short-term loans) (200.2) (29.6) (59.5) (708.9) (998.2)Finance leases (2.8) (2.7) (7.9) (22.0) (35.4)Preference shares* – – (3.0) – (3.0)Trade and other payables (477.0) (1.9) (23.7) (0.7) (503.3)Derivative financial instruments (1.0) (1.1) (1.5) – (3.6)
(990.0) (321.8) (372.5) (1,963.0) (3,647.3)
At 31 December 2014
Less than 6 months
$m
Between 6 months to 1 year
$m
Between 1–2 years
$m
After 2 years
$m
2014 Total
$m
Corporate loans (41.9) (49.7) (357.8) (1,568.9) (2,018.3)Other loans (including short-term loans) (208.5) (34.8) (36.7) (607.8) (887.8)Finance leases (4.5) (4.6) (7.6) (29.9) (46.6)Preference shares – – (3.1) – (3.1)Trade and other payables (785.8) (8.0) (4.2) (0.6) (798.6)Derivative financial instruments (5.6) (1.9) (2.4) (1.1) (11.0)
(1,046.3) (99.0) (411.8) (2,208.3) (3,765.4)
* The preference shares pay an annual dividend of £100,000 ($160,334) in perpetuity, and accordingly it is not possible to determine total amounts payable for periods without a fixed end date.
(viii) Capital risk managementThe Group’s objectives are to return capital to shareholders while leaving the Group with sufficient funds to progress its short-, medium- and long-term growth plans as well as preserving the financial flexibility to take advantage of opportunities as they may arise. This policy remains unchanged. The Group monitors capital on the basis of net cash (defined as cash, cash equivalents and liquid investments less borrowings) which was a net debt by $1,023.5 million at 31 December 2015 (2014 – net debt $1.6 million), as well as gross cash (defined as cash, cash equivalents and liquid investments) which was $1,731.6 million at 31 December 2015 (2014 – $2,374.5 million). The Group’s total cash is held in a combination of on demand and term deposits and managed funds investing in high-quality, fixed income instruments. Some of the managed funds have been instructed to invest in instruments with average maturities greater than 90 days. These amounts are presented as liquid investments but are included in net cash for monitoring and decision-making purposes. The Group has a risk averse investment strategy. The Group’s borrowings are detailed in Note 24. Additional project finance or shareholder loans are taken out by the operating subsidiaries to fund projects on a case-by-case basis.
d) Derivative financial instruments
The Group occasionally uses derivative financial instruments, in general to reduce its exposure to commodity price, foreign exchange and interest rate movements. The Group does not use such derivative instruments for speculative trading purposes.
The Group has applied the hedge accounting provisions of IAS 39 “Financial Instruments: Recognition and Measurement”. Changes in the fair value of derivative financial instruments that are designated and effective as hedges of future cash flows have been recognised directly in equity, with such amounts subsequently recognised in the income statement in the period when the hedged item affects profit or loss. Any ineffective portion is recognised immediately in the income statement. Realised gains and losses on commodity derivatives recognised in the income statement have been recorded within revenue. The time value element of changes in the fair value of derivative options is excluded from the designated hedging relationship, and is therefore recognised directly in the income statement within other finance items. Realised gains and losses and changes in the fair value of exchange and interest derivatives are recognised within other finance items for those derivatives where hedge accounting has not been applied. When hedge accounting has been applied the realised gains and losses on exchange and interest derivatives are recognised within other finance items and interest expense respectively.
Antofagasta plc 165
FIN
AN
CIA
L STA
TE
ME
NT
SF
INA
NC
IAL S
TAT
EM
EN
TS
GO
VE
RN
AN
CE
OT
HE
R IN
FO
RM
AT
ION
OV
ER
VIE
WS
TR
AT
EG
IC R
EP
OR
T

26 Financial instruments and financial risk management continued(i) Mark-to-market adjustments and income statement impactThe gains or losses recorded in the income statement or in reserves during the year, and the fair value recorded on the balance sheet at the end of the year in respect of derivatives are as follows:
For the year ended 31 December 2015
Impact on income statement Impact on reservesFair value recorded
on balance sheet
Realised gains/(losses)
2015 $m
Gains resulting from mark-to-market adjustments on
hedging instruments 2015
$m
Total net gain/(loss)
2015 $m
Gains/(Losses) resulting from
mark-to-market adjustments on
hedging instruments 2015
$m
Net financial asset/(liability)
31 December 2015
$m
Commodity derivativesCentinela (0.1) – (0.1) (0.1) 0.1 Exchange derivativesAntucoya 0.2 – 0.2 4.0 – Interest derivativesCentinela (3.6) – (3.6) 3.1 (2.9)Railway and other transport services (2.3) – (2.3) 0.5 (0.5)
(5.8) – (5.8) 7.5 (3.3)
For the year ended 31 December 2014
Impact on income statement Impact on reservesFair value recorded on
balance sheet
Realised gains/(losses)
2014 $m
Losses resulting from mark-to-market adjustments on
hedging instruments 2014
$m
Total net gain/(loss)
2014 $m
Gains/(losses) resulting from mark-to-market
adjustments on hedging instruments
2014 $m
Net financial asset/(liability)
31 December 2014 $m
Commodity derivativesCentinela 0.1 – 0.1 0.6 0.2 Michilla 18.3 (5.0) 13.3 (6.2) – Exchange derivativesMichilla (4.1) – (4.1) (1.7) – Antucoya – (0.1) (0.1) (3.8) (4.0)Interest derivativesCentinela (4.8) – (4.8) 3.4 (6.0)Railway and other transport services (1.0) – (1.0) (1.0) (1.0)
8.5 (5.1) 3.4 (8.7) (10.8)
The gains/(losses) recognised in reserves are disclosed before non-controlling interests and tax.
At December 2015, the credit risk implicit in the liability is $0.1 million (2014 – $0.1 million). The differences between the carrying amount and the amount the entity would be contractually required to pay at the maturity date are not material.
The net financial asset/(liability) resulting from the balance sheet mark-to-market adjustments are analysed as follows:
Analysed between:2015
$m2014
$m
Current assets 0.2 0.2 Current liabilities (2.0) (7.5)Non-current liabilities (1.5) (3.5)
(3.3) (10.8)
166 Antofagasta plc Annual report and financial statements 2015
Notes to the financial statements

(ii) Outstanding derivative financial instrumentsCommodity derivativesThe Group periodically uses commodity derivatives to reduce its exposure to fluctuation in the copper price.
a) Futures – arbitrageThe Group also has futures for copper production to swap COMEX price exposure for LME price exposure according to the Group’s pricing policy.
At 31 December 2015 For instruments held at 31 December 2015
Copper production hedged
Weighted average remaining period from 1 January 2016
Covering a period up to:
tonnes MonthsCentinela 300 0.1 31/1/2016
b) Interest derivativesThe Group periodically uses interest derivatives to reduce its exposure to interest rate movements.
Interest rate swapsThe Group has used interest rate swaps to swap the floating rate interest relating to the Centinela project financing and long-term loans at the Railway for fixed rate interest. At 31 December 2015, the Group had entered into the contracts outlined below.
Start date Maturity date
Maximum notional amount
$m
Weighted average fixed rate
%
Centinela Concentrates 15/2/2011 15/8/2018 105.0 3.372 Railway and other transport services 12/8/2014 12/8/2019 120.0 1.634
The actual notional amount hedged depends upon the amount of the related debt currently outstanding.
27 Long-term incentive planThe long-term incentive plan (the “Plan”) was introduced at the end of 2011. Awards granted pursuant to the Plan form part of the remuneration of senior managers in the Group. Directors are not eligible to participate in the Plan.
Details of the Awards
Under the Plan, the Group may grant awards based on the price of ordinary shares in the Company and cannot grant awards over actual shares.
• Restricted Awards: These awards are conditional rights to receive cash payment by reference to a specified number of the Company’s ordinary shares, subject to the relevant employee remaining employed by the Group when the Restricted Award vests; and
• Performance Awards: These awards are conditional rights to receive cash payment by reference to a specified number of the Company’s ordinary shares subject to both the satisfaction of a performance condition and the relevant employee remaining employed by the Group when the Performance Award vests.
When awards vest under the Plan, participants become entitled to receive a cash payment by reference to the number and portion of awards that have vested and the market value of the Company’s ordinary shares on the date of vesting. There is no exercise price payable by participants in respect of the awards.
Restricted Awards can only vest in full if participants remain employed by the Group for three years from the date that Restricted Awards are granted. In ordinary circumstances, the first one-third of a Restricted Award will vest after one year, the second one-third will vest after two years and the remaining one-third will vest after three years. There are no performance criteria attached to Restricted Awards. The fair value of Restricted Awards granted under the Plan is recorded as a compensation expense over the vesting periods, with a corresponding liability recognised for the fair value of the liability at the end of each period until settled.
Performance Awards only vest if certain performance criteria are met. The performance criteria reflect a number of factors including total shareholder return, earnings levels, growth in the Group’s reserves and resources and project delivery targets. The fair value of Performance Awards under the Plan is recorded as a compensation expense over the vesting period, with a corresponding liability at the end of each period until settled.
A One-off Award was granted to Diego Hernández, the Group CEO, following his appointment during 2012. This award was granted for the same purpose as the awards granted under the LTI Plan but by reference to metrics which are specific to the participant’s role as CEO. The award vested during 2015.
Antofagasta plc 167
FIN
AN
CIA
L STA
TE
ME
NT
SF
INA
NC
IAL S
TAT
EM
EN
TS
GO
VE
RN
AN
CE
OT
HE
R IN
FO
RM
AT
ION
OV
ER
VIE
WS
TR
AT
EG
IC R
EP
OR
T

27 Long-term incentive plan continued
Valuation process and accounting for the awards
The fair value of the awards is determined using a Monte Carlo simulation model. The inputs into the Monte Carlo simulation model are as follows:
2015 2014
Weighted average forecast share price at vesting date $10.07 $11.46Expected volatility 27.31% 28.32%Expected life of awards 3 years 3 yearsExpected dividend yields 1.90% 2.45%Risk free rate 0.13% 1.30%
Expected volatility was determined by calculating the historical volatility of the Group’s share price over the previous five years. The expected life of awards used in the model has been adjusted based on management’s best estimate for the effects of non-transferability and compliance of the objectives determined according to the characteristic of each plan.
The number of awards outstanding at the end of the year is as follows:
Restricted Awards
Performance Awards
One-off Award
Outstanding at 1 January 2015 577,319 787,222 83,496 Granted during the year 359,786 359,786 – Cancelled during the year (64,123) (127,692) – Payments during the year (203,118) – (83,496)Outstanding at 31 December 2015 669,864 1,019,316 – Number of awards that have vested 369,302 – –
The Group has recorded a liability for $8.9 million at 31 December 2015, of which $3.4 million is due after more than one year (31 December 2014 – $8.9 million, of which $4.9 million was due after more than one year) and total expenses of $4.0 million for the year (2014 – expense of $5.8 million). The intrinsic value is $8.9 million.
28 Post-employment benefit obligations
a) Defined contribution schemes
The Group operates defined contribution schemes for a limited number of employees. The amount charged to the income statement in 2015 was $0.1 million (2014 – $0.2 million), representing the amount paid in the year. There were no outstanding amounts which remain payable at the end of either year.
b) Severance provisions
Employment terms at some of the Group’s operations provide for payment of a severance indemnity when an employment contract comes to an end. This is typically at the rate of one month for each year of service (subject in most cases to a cap as to the number of qualifying years of service) and based on final salary level. The severance indemnity obligation is treated as an unfunded defined benefit plan, and the obligation recognised is based on valuations performed by an independent actuary using the projected unit credit method, which are regularly updated. The obligation recognised in the balance sheet represents the present value of the severance indemnity obligation. Actuarial gains and losses are immediately recognised in other comprehensive income.
The most recent valuation was carried out in 2015 by Ernst & Young, a qualified actuary in Chile who is not connected with the Group.
168 Antofagasta plc Annual report and financial statements 2015
Notes to the financial statements

The main assumptions used to determine the actuarial present value of benefit obligations were as follows:
2015 2014
Average nominal discount rate 4.8% 4.5%Average rate of increase in salaries 1.6% 2.6%Average staff turnover 8.6% 5.0%
Amounts included in the income statement in respect of severance provisions are as follows:
2015 $m
2014 $m
Current service cost (charge to operating profit) (16.6) (17.2)Interest cost (charge to interest expenses) (4.1) (3.5)Foreign exchange credit to other finance items 15.5 12.0 Total charge to income statement (5.2) (8.7)
Movement in the present value of severance provisions were as follows:
2015 $m
2014 $m
Balance at the beginning of the year (103.0) (91.2)Current service cost (16.6) (17.2)Actuarial gains/(losses) 2.3 (18.0)Charge capitalised (3.6) 0.1 Interest cost (4.1) (3.5)Reclassification (0.3) 1.1 Paid in the year 14.0 13.7 Disposals of subsidiaries 8.9 – Foreign currency exchange difference 15.5 12.0 Balance at the end of the year (86.9) (103.0)
Assumptions descriptionDiscount rate
31 December 2015 31 December 2014
Nominal discount rate 4.84% 4.53%Reference rate name 20-year Chilean Central Bank Bonds 20-year Chilean Central Bank BondsGovernmental or corporate rate Governmental GovernmentalReference rating AA-/AA+ AA-/AA+Corresponds to an Issuance market (primary) or secondary market Secondary SecondaryIssuance currency associated to the reference rate Chilean peso Chilean pesoDate of determination of the reference interest rate 3 December 2015 3 December 2014Source of the reference interest rate Bloomberg Bloomberg
The discount rate is the interest rate used to discount the estimated future severance payments to their present value. The table below shows the principal instruments and assumptions utilised in determining the discount rate:
Rate of increase in salariesThis represents the estimated average rates of future salary increases, reflecting likely future promotions and other changes. This has been based on historical information for the Group for the period from 2012 to 2015.
Turnover rateThis represents the estimated average level of future employee turnover. This has been based on historical information for the Group for the period from 2012 to 2015.
Antofagasta plc 169
FIN
AN
CIA
L STA
TE
ME
NT
SF
INA
NC
IAL S
TAT
EM
EN
TS
GO
VE
RN
AN
CE
OT
HE
R IN
FO
RM
AT
ION
OV
ER
VIE
WS
TR
AT
EG
IC R
EP
OR
T

28 Post-employment benefit obligations continuedSensitivity analysisSignificant actuarial assumptions for the determination of the defined obligation are discount rate, expected salary increase and staff turnover. The sensitive analysis below has been determined based on reasonably possible changes of the respective assumptions occurring at the end of the reporting period, while holding all other assumptions constant.
• If the discount rate is 100 basis points higher the defined benefit obligation would decrease by $7.0 million. If the discount rate is 100 basis points lower the defined benefit obligation would increase by $8.2 million.
• If the expected salary growth increases by 1% the defined benefit obligation would increase by $7.5 million. If the expected salary growth decreases by 1% the defined benefit obligation would decrease by $6.5 million.
• If the staff turnover increases by 1% the defined benefit obligation would decrease by $0.1 million. If the staff turnover decreases by 1% the defined benefit obligation would increase by $0.1 million.
29 Deferred tax and liabilitiesThe following are the major deferred tax liabilities and assets recognised by the Group and movements thereon during 2015 and 2014.
Accelerated capital
allowances $m
Temporary differences on
provisions $m
Withholding tax $m
Short-term differences
$m
Mining tax (Royalty)
$mTax losses
$mTotal
$m
At 1 January 2014 (720.0) 108.0 (232.0) (10.9) (35.0) 0.9 (889.0)(Charge)/credit to income (257.3) 50.5 222.5 0.2 (7.2) 0.6 9.3 Reclassification – – – 0.3 – – 0.3 Charge deferred in equity – – – 4.2 – – 4.2 At 1 January 2015 (977.3) 158.5 (9.5) (6.2) (42.2) 1.5 (875.2)(Charge)/credit to income (99.3) (24.1) (1.9) 56.0 (12.9) (0.8) (83.0)Charge capitalised – – – (0.8) – – (0.8)Disposal of subsidiary 8.8 – – – – – 8.8 Charge deferred in equity – (1.4) – – – – (1.4)At 31 December 2015 (1,067.8) 133.0 (11.4) 49.0 (55.1) 0.7 (951.6)
The credit to the income statement of $83.0 million (2014 – $9.3 million charge) includes a credit for foreign exchange differences of $1.1 million (2014 – includes a credit of $2.9 million).
Certain deferred tax assets and liabilities have been offset. Deferred tax assets and liabilities are offset where the Group has a legally enforceable right to do so. The following is the analysis of the deferred tax balance (after offset):
2015 $m
2014 $m
Deferred tax assets 124.6 104.6 Deferred tax liabilities (1,076.2) (979.8)Net deferred tax balances (951.6) (875.2)
At 31 December 2015, the Group had unused tax losses of $9.9 million (2014 – $14.3 million) available for offset against future profits. A deferred tax asset of $2.7 million has been recognised in respect of these losses in 2015 (2014 – $1.5 million). These losses may be carried forward indefinitely.
At 31 December 2015, the aggregate amount of temporary differences associated with undistributed earnings of subsidiaries for which deferred tax liabilities have not been recognised was $4,963.9 million (2014 – $4,520.4 million). No liability has been recognised in respect of these differences because the Group is in a position to control the timing of the reversal of the temporary differences and it is likely that such differences will not reverse in the foreseeable future.
Temporary differences arising in connection with interests in associates are insignificant.
The deferred tax balance of $951.6 million (2014 – $875.2 million) includes $965.0 million (2014 – $951.6 million) due in more than one year. All amounts are shown as non-current on the face of the balance sheet as required by IAS 12.
170 Antofagasta plc Annual report and financial statements 2015
Notes to the financial statements

30 Decommissioning and restoration and other long-term provisions2015
$m2014
$m
Balance at the beginning of the year (434.3) (494.3)(Charge)/credit to operating profit in the year (25.8) 7.4 Release of discount to net interest in the year (5.0) (5.6)Actuarial gain/(loss) – 0.6 Capitalised adjustment to provision 35.7 48.1 Reclassification – 0.9 Utilised in year 30.1 6.2 Disposal 1.5 – Foreign currency exchange difference 3.8 2.4 Balance at the end of the year (394.0) (434.3)
Analysed as follows:Decommissioning and restoration (394.0) (432.6)Termination of Water concession – (1.7)Balance at the end of the year (394.0) (434.3)
a) Decommissioning and restoration
Decommissioning and restoration costs relate to the Group’s mining operations. Costs are estimated on the basis of a formal closure plan and are subject to regular independent formal review. It is estimated that the provision will be utilised from 2024 until 2059 based on current mine plans.
During the year ended 31 December 2015, the decommissioning and restoration provisions at the Group’s mining operations decreased by a net total of $38.6 million.
The balance at the end of the year includes $31.7 million of provision related to Michilla. Following the cessation of production at Michilla the current expectation is that the majority of the closure costs will be incurred during the next three years.
31 Share capital and other reserves
(i) Share capital
The ordinary share capital of the Company is as follows:
2015 Number
2014 Number
2015 $m
2014 $m
Authorised Ordinary shares of 5p each 1,300,000,000 1,300,000,000 118.9 118.9
2015 Number
2014 Number
2015 $m
2014 $m
Issued and fully paid Ordinary shares of 5p each 985,856,695 985,856,695 89.8 89.8
The Company has one class of ordinary shares which carry no right to fixed income. Each ordinary share carries one vote at any general meeting.
There were no changes in the authorised or issued share capital of the Company in either 2014 or 2015. Details of the Company’s preference share capital, which is included within borrowings in accordance with IAS 32, are given in Note 24(a)(xviii).
Antofagasta plc 171
FIN
AN
CIA
L STA
TE
ME
NT
SF
INA
NC
IAL S
TAT
EM
EN
TS
GO
VE
RN
AN
CE
OT
HE
R IN
FO
RM
AT
ION
OV
ER
VIE
WS
TR
AT
EG
IC R
EP
OR
T

31 Share capital and other reserves continued
(ii) Other reserves and retained earnings
Details of the share premium account, hedging, fair value and translation reserves and retained earnings for both 2015 and 2014 are included within the Consolidated statement of changes in equity on page 123.
2015 $m
2014 $m
Hedging reserves1
At 1 January (36.2) (6.8)Parent and subsidiaries net cash flow hedge fair value gains/(losses) 0.1 (0.2)Parent and subsidiaries net cash flow hedge gains/(losses) transferred to the income statement 3.5 (8.5)Share of other comprehensive income/(losses) of equity accounted units, net of tax (10.2) (25.2)Tax on the above (1.3) 4.5 At 31 December (44.1) (36.2)Available-for-sale revaluation reserves2
At 1 January (10.7) (30.9)Gain/(losses) on available-for-sale investment (3.2) (6.1)(Losses)/gain on available-for-sale securities transferred to the income statement 1.0 26.3 Tax on the above – –At 31 December (12.9) (10.7)Foreign currency translation reserves3
At 1 January (0.5) 25.7 Parent and subsidiaries currency translation and exchange adjustments – (26.2)Currency translation reclassified on disposal (1.8) –Tax on the above – –At 31 December (2.3) (0.5)Total other reserves per balance sheet (59.3) (47.4)Retained earnings4
At 1 January 5,932.1 6,447.5 Parent and subsidiaries profit for the year 614.0 463.4 Equity accounted units’ loss after tax for the year (5.8) (3.6)Actuarial gains/(losses)5 4.5 (13.2)Tax relating to components of other comprehensive income (1.2) 3.4 Total comprehensive income for the year 6,543.6 6,897.5 Change in ownership interest in subsidiaries – 1.5 Capital increase in non-controlling interest – (2.7)Dividends paid (127.2) (964.2)At 31 December 6,416.4 5,932.1
1 The hedging reserve records gains or losses on cash flow hedges that are recognised initially in equity, as described in Note 26(d).
2 The available-for-sale revaluation reserves record fair value gains or losses relating to available-for-sale investment, as described in Note 18.
3 Exchange differences arising on the translation of the Group’s net investment in foreign controlled companies are taken to the foreign currency translation reserve. The cumulative differences relating to an investment are transferred to the income statement when the investment is disposed of.
4 Retained earnings and movements in reserves of subsidiaries include those arising from the Group’s share of joint operations.
5 Actuarial gains or losses relating to long-term employee benefits, as described in Note 28.
172 Antofagasta plc Annual report and financial statements 2015
Notes to the financial statements

32 Non-controlling interestsThe non-controlling interests of the Group during 2015 and 2014 are as follows:
Non-controlling
interest % Country
At 1 January
2015 $m
Share of profit/
(losses) for the
financial year $m
Share of dividends
$m
Capital contribution
on non-controlling
interest $m
Elimination of non-
controlling interest
$m
Hedging and actuarial
gains/losses $m
Exchange differences
$m
At 31 December
2015 $m
Los Pelambres 40.0 Chile 971.3 151.8 (80.0) – – (2.7) – 1,040.4 Centinela 30.0 Chile 861.1 (46.5) – – – (0.5) – 814.1 Michilla 0.1 Chile 0.7 0.2 – – – (0.8) – 0.1 Antucoya 30.0 Chile 14.5 (11.9) – 14.6 – 1.4 – 18.6 Railway and other transport services 50.0 Bolivia 13.4 (0.1) – – (13.3) – – – Total 1,861.0 93.5 (80.0) 14.6 (13.3) (2.6) – 1,873.2
Non-controlling
interest % Country
At 1 January
2014 $m
Share of profit/
(losses) for the financial
year $m
Share of dividends
$m
Capital contribution
on non- controlling
interest $m
Capital increase in
non-controlling
interest $m
Elimination of non-
controlling interest
$m
Hedging and actuarial
gains/losses $m
Exchange differences
$m
At 31 December
2014 $m
Los Pelambres 40.0 Chile 1,030.9 352.3 (392.0) – – – (19.9) – 971.3 Centinela 30.0 Chile 819.8 56.1 (15.0) – – – 0.2 – 861.1 Michilla 0.1 Chile 37.4 (0.3) (5.2) – – (32.0) 0.8 – 0.7 Antucoya 30.0 Chile (26.2) (3.8) – 46.2 – – (1.7) – 14.5 Twin Metals 60.0 USA 62.5 (12.3) – 3.8 2.7 (56.7) – – – Railway and other transport services 50.0 Bolivia 14.7 (1.1) – – – – – (0.2) 13.4 Total 1,939.1 390.9 (412.2) 50.0 2.7 (88.7) (20.6) (0.2) 1,861.0
The proportion of the voting rights is proportional with the economic interest under the companies listed above.
Antofagasta plc 173
FIN
AN
CIA
L STA
TE
ME
NT
SF
INA
NC
IAL S
TAT
EM
EN
TS
GO
VE
RN
AN
CE
OT
HE
R IN
FO
RM
AT
ION
OV
ER
VIE
WS
TR
AT
EG
IC R
EP
OR
T

32 Non-controlling interests continued
Summarised financial position and cash flow for the years ended 2015 and 2014Los Pelambres
2015 $m
Centinela 2015
$m
Michilla 2015
$m
Antucoya 2015
$m
Non-controlling interest (%) 40.0% 30.0% 0.1% 30.0%Cash and cash equivalent 248.8 598.8 96.4 138.6 Current assets 670.5 474.7 26.9 166.3 Non-current assets 2,853.6 4,195.7 0.0 1,747.0 Current liabilities (429.0) (561.5) (13.5) (136.1)Non-current liabilities (770.1) (1,517.6) (32.6) (1,068.8)Accumulated non-controlling interest 1,040.4 814.1 0.1 18.6 Net cash flow from operating activities 490.1 197.9 26.3 (104.5)Net cash flow from investing activities (333.4) (429.7) (36.8) (215.0)Net cash flow from financing activities (139.9) 199.9 – 287.0
Los Pelambres 2014
$m
Centinela 2014
$m
Michilla 2014
$m
Antucoya 2014
$m
Non-controlling interest (%) 40.0% 30.0% 0.1% 30.0%Cash and cash equivalent 219.5 760.2 68.8 171.1 Current assets 473.1 457.2 64.1 78.4 Non-current assets 2,968.2 4,295.1 47.8 1,458.4 Current liabilities (475.2) (869.7) (47.5) (796.0)Non-current liabilities (783.7) (1,681.2) (66.4) (867.4)Accumulated non-controlling interest (971.3) (861.1) (0.7) (14.5)Net cash flow from operating activities 1,376.1 744.5 65.2 (158.5)Net cash flow from investing activities (408.9) (838.9) (10.5) (676.6)Net cash flow from financing activities (914.9) (1.1) (20.0) 959.1
Notes to the summarised financial position and cash flow
(i) The amounts disclosed for each subsidiary are based on the amounts included in the consolidated financial statements (ie 100% of the results and balances of the subsidiary rather than the non-controlling interest proportionate share) before inter-company eliminations.
(ii) Summarised income statement information is shown in the segment information in Note 4.
33 Notes to the consolidated cash flow statement
a) Reconciliation of profit before tax to net cash inflow from operating activities
2015 $m
2014 $m
Profit before tax from continuing and discontinued operations 1,118.4 1,573.5 Depreciation and amortisation 576.1 606.0 Net (profit)/loss on disposals 10.2 (24.1)Profit on disposal of discontinued operations (859.0) (57.9)Net finance expense 39.2 62.1 Share of results from associates and joint ventures 5.8 4.1 (Increase)/decrease in inventories 60.5 32.1 Decrease in debtors 137.7 124.8 Increase in creditors and provisions (230.6) 187.2 Cash flow from operations from continuing and discontinued operations 858.3 2,507.8
174 Antofagasta plc Annual report and financial statements 2015
Notes to the financial statements

b) Analysis of changes in net debtAt 1 January 2015
$mCash flows
$mOther
$mExchange
$mAt 31 December 2015
$m
Cash and cash equivalents 845.4 (1.5) – (36.4) 807.5 Liquid investments 1,529.1 (605.0) – – 924.1 Total cash and cash equivalents and liquid investments 2,374.5 (606.5) – (36.4) 1,731.6 Bank borrowings due within one year (276.0) (306.9) (171.3) 0.8 (753.4)Bank borrowings due after one year (2,050.5) (139.2) 225.0 1.4 (1,963.3)Finance leases due within one year (8.5) 11.5 (8.5) – (5.5)Finance leases due after one year (38.0) 0.3 4.8 3.0 (29.9)Preference shares (3.1) – – 0.1 (3.0)Total borrowings (2,376.1) (434.3) 50.0 5.3 (2,755.1)Net (debt)/cash (1.6) (1,040.8) 50.0 (31.1) (1,023.5)
At 1 January 2014 $m
Cash flows $m
Other $m
Exchange $m
At 31 December 2014 $m
Cash and cash equivalents 613.7 259.2 – (27.5) 845.4 Liquid investments 2,071.4 (542.3) – – 1,529.1 Total cash and cash equivalents and liquid investments 2,685.1 (283.1) – (27.5) 2,374.5
Bank borrowings due within one year (329.4) 29.7 23.7 – (276.0)Bank borrowings due after one year (985.0) (1,042.2) (23.3) – (2,050.5)Finance leases due within one year (11.6) 12.2 (9.1) – (8.5)Finance leases due after one year (44.6) – 6.6 – (38.0)Preference shares (3.3) – – 0.2 (3.1)Total borrowings (1,373.9) (1,000.3) (2.1) 0.2 (2,376.1)Net cash 1,311.2 (1,283.4) (2.1) (27.3) (1.6)
c) Net debt2015
$m2014
$m
Cash, cash equivalents and liquid investments 1,731.6 2,374.5 Total borrowings (2,755.1) (2,376.1)
(1,023.5) (1.6)
34 Operating lease arrangements2015
$m2014
$m
Minimum lease payments under operating leases recognised in income for the year 27.8 36.6
At the balance sheet date, the Group had outstanding commitments for future minimum lease payments under non-cancellable operating leases, which fall due as follows:
2015 $m
2014 $m
Within one year 32.4 30.5In the second to fifth years inclusive 33.8 33.3After five years – 0.8
66.2 64.6
Operating lease payments relate mainly to rental of plant and equipment by operating subsidiaries of the Group.
Antofagasta plc 175
FIN
AN
CIA
L STA
TE
ME
NT
SF
INA
NC
IAL S
TAT
EM
EN
TS
GO
VE
RN
AN
CE
OT
HE
R IN
FO
RM
AT
ION
OV
ER
VIE
WS
TR
AT
EG
IC R
EP
OR
T

35 Exchange rates in US dollarsAssets and liabilities denominated in foreign currencies are translated into dollars and sterling at the period end rates of exchange.
Results denominated in foreign currencies have been translated into dollars at the average rate for each period.
2015 2014
Year end rates $1.4828 = £1; $1 = Ch$710.16
$1.6426 = £1; $1 = Ch$606.75
Average rates $1.5284 = £1; $1 = Ch$654.47
$1.6072 = £1; $1 = Ch$570.15
36 Related party transactionsTransactions between the Company and its subsidiaries, which are related parties, have been eliminated on consolidation and are not disclosed in this note. Transactions between the Group and its associates are disclosed below.
The transactions which Group companies entered into with related parties who are not members of the Group are set out below. There are not guarantees given or received and no provisions for doubtful debts related to the amount of outstanding balances.
a) Quiñenco S.A.
Quiñenco S.A. (“Quiñenco”) is a Chilean financial and industrial conglomerate, the shares of which are traded on the Santiago Stock Exchange. The Group and Quiñenco are both under the control of the Luksic family, and three Directors of the Company, Jean-Paul Luksic, Andronico Luksic and Gonzalo Menéndez, are also directors of Quiñenco.
The following material transactions took place between the Group and the Quiñenco group of companies, all of which were on normal commercial terms:
• the Group earned interest income of $0.6 million (2014 – $0.5 million) during the year on deposits with Banco de Chile S.A., a subsidiary of Quiñenco. Deposit balances at the end of the year were $110.4 million (2014 – $70.1 million);
• the Group earned interest income of $0.7 million (2014 – $1.5 million) during the year on investments with Banchile Corredores de Bolsa S.A., a subsidiary of Quiñenco. Investment balances at the end of the year were $12.1 million (2014 – $26.3 million);
• the Group bought fuel from ENEX S.A. a subsidiary of Quiñenco of $32.4 million (2014 – $54.3 million). The balance due to ENEX S.A. at the end of the year was nil (2014 – nil).
b) Michilla/Minera Cerro Centinela S.A.
In March 2014, the Group acquired an additional 25.7% interest in Michilla for $30.9 million, increasing the Group’s interest from 74.2% to 99.9%. This included the acquisition of the 7.973% stake held by Minera Cerro Centinela S.A., an entity ultimately controlled by the Luksic family, for $9.6 million. Prior to this transaction, Michilla paid dividends of $1.6 million to Minera Cerro Centinela S.A.
c) Compañía de Inversiones Adriático S.A.
In 2013, the Group leased office space on normal commercial terms from Compañía de Inversiones Adriático S.A., a company controlled by the Luksic family, at a cost of less than $0.5 million (2014 – $0.7 million).
d) Antofagasta Terminal Internacional S.A.
As explained in Note 17, the Group has a 30% interest in Antofagasta Terminal Internacional S.A. (“ATI”) which is accounted for as an associate. During 2015, the Group has not received dividends from ATI (2014 – nil).
e) Antomin Limited, Antomin 2 Limited and Antomin Investors Limited
The Group holds a 51% interest in Antomin 2 Limited (“Antomin 2”) and Antomin Investors Limited (“Antomin Investors”), which own a number of copper exploration properties. The Group originally acquired its 51% interest in these properties for a nominal consideration from Mineralinvest Establishment, a company controlled by the Luksic family, which continues to hold the remaining 49% of Antomin 2 and Antomin Investors. During the year ended 31 December 2015, the Group incurred $4.2 million (year ended 31 December 2014 – $17.0 million) of exploration work at these properties.
f) Tethyan Copper Company Limited
As explained in Note 17, the Group has a 50% interest in Tethyan Copper Company Limited (“Tethyan”), which is a joint venture with Barrick Gold Corporation over Tethyan’s mineral interests in Pakistan. During 2015, the Group contributed $4.0 million (2014 – $8.5 million) to Tethyan. The balance due from Tethyan to Group companies at the end of the year was nil (2014 – nil).
176 Antofagasta plc Annual report and financial statements 2015
Notes to the financial statements

g) Energía Andina S.A.
As explained in Note 17, the Group has a 50.1% interest in Energía Andina, which is a joint venture with Origin Energy Geothermal Chile Limitada for the evaluation and development of potential sources of geothermal and solar energy. The balance due from Energía Andina S.A. to the Group at 31 December 2015 was nil (2014 – less than $0.1 million). During the year ended 31 December 2015, the Group contributed $1.3 million to Energía Andina (2014 – $7.7 million).
h) Compañia Minera Zaldívar SpA
The Group´s 50% (2014 – 0%) interest in Minera Zaldívar was acquired on 1 December 2015 (see Note 17), which is a joint venture with Barrick Gold Corporation. Antofagasta is the operator of Zaldívar from 1 December 2015 onwards. The balance due from Zaldívar to Group companies at the end of the year was less than $0.1 million.
i) Directors and other key management personnel
Information relating to Directors’ remuneration and interests are given in the Remuneration Report on page 96. Information relating to the remuneration of key management personnel including the Directors is given in Note 8.
j) Inversiones Hornitos S.A.
As explained in Note 17, the Group has a 40% interest in Inversiones Hornitos S.A., which is accounted for as an associate. The Group paid $140.5 million (year ended 31 December 2014 – $175.3 million) to Inversiones Hornitos in relation to the energy supply contract at Centinela. During 2015, the Group has received dividends from Inversiones Hornitos S.A. for $12.1 million (2014 – $20.0 million).
k) Parque Eólico El Arrayán S.A.
As explained in Note 17, the Group has a 30% interest in Parque Eólico El Arrayán S.A. (“El Arrayán”), which is accounted for as an associate. The Group paid $42.0 million (year ended 31 December 2014 – $12.0 million) to El Arrayán in relation to the energy supply contract at Los Pelambres. During 2015, the Group has contributed nil to El Arrayán (2014 – $2.6 million).
l) Alto Maipo SpA
As explained in Note 17, the Group has a 40% interest in Alto Maipo SpA (“Alto Maipo”), which is accounted for as an associate. During 2014, the Group made capital contributions for $42.8 million to Alto Maipo (2014 – $nil). The balance due from Alto Maipo to the Group at 31 December 2015 was $229.7 (2014 – $152.4 million), representing loan financing with an interest rate of LIBOR six-month plus 4.25%.
37 Litigation and contingent liabilitiesAntofagasta plc or its subsidiaries are subject to various claims which arise in the ordinary course of business. No provision has been made in the financial statements and none of these claims are currently expected to result in any material loss to the Group. Details of the principal claims in existence either during, or at the end of, the period and the current status of these claims are set out below:
Los Pelambres – Mauro tailings dam
As previously announced, during 2008 Los Pelambres entered into binding settlements in respect of litigation relating to the Mauro tailings dam. Since then, there have been a series of civil claims filed by some members of the Caimanes community (which is located near the Mauro tailings dam) seeking to stop the operation of the dam. Many of these claims have been rejected by the relevant courts.
Two of these claims are currently ongoing and Los Pelambres is continuing to take necessary steps to protect its position.
In the first claim, the plaintiffs have argued that the tailings dam affects their alleged water rights and the environment. This allegation is based on assertions that the dam interferes with the flow and quality of the water in the Pupío stream, a stream that passes through the valley in which the dam is built down to the Caimanes community. This claim was rejected by the trial Court of Los Vilos in a judgement issued in November 2012, which was then affirmed by the Court of Appeals of La Serena in August 2013. In October 2014, the Supreme Court, by a 3–2 majority decision, upheld the appeal and ordered Los Pelambres to submit back to the trial Court of Los Vilos, within one month, an implementation plan for works that would ensure that the operation of the dam does not affect the normal flow and quality of the waters of the Pupío stream. Los Pelambres believes that the requirements of this order have already been met as Los Pelambres has undertaken significant works to ensure that the flow of the Pupío stream is not altered and that the operation of the tailings dam does not affect the quantity or quality of these waters – something that has been confirmed by accredited independent assessors and other public services in Chile and confirmed by the Supreme Court in a parallel decision. Nevertheless, on 21 November 2014, Los Pelambres submitted this plan to the trial Court of Los Vilos. On 6 March 2015, that Court found that the plan submitted by Los Pelambres was not sufficient to address the requirements of the Supreme Court order, and as a consequence Los Pelambres must demolish part, or all, of the tailings dam wall. Los Pelambres appealed the Court’s decision and in December 2015 the Court of Appeals ordered that, before it issues its decision, a Court appointed engineer must review the plan submitted by Los Pelambres and issue a report explaining whether or not the proposed works are enough to ensure that the flow of the Pupío stream to the Caimanes community is not altered by the operation of the tailings dam and, if the proposed works are not deemed to be sufficient to achieve this purpose, what additional or other works must be performed by Los Pelambres to achieve this goal. That report is currently pending.
Antofagasta plc 177
FIN
AN
CIA
L STA
TE
ME
NT
SF
INA
NC
IAL S
TAT
EM
EN
TS
GO
VE
RN
AN
CE
OT
HE
R IN
FO
RM
AT
ION
OV
ER
VIE
WS
TR
AT
EG
IC R
EP
OR
T

37 Litigation and contingent liabilities continuedIn the second claim, the plaintiffs are seeking demolition of the dam wall on the basis of the risk that its collapse would pose to the community. The Civil Court in Los Vilos issued a decision in May 2014 denying the demolition request but ordering Minera Los Pelambres to undertake some additional measures to ensure protection of the community, in the event of a major earthquake or similar natural event. These measures would need to be reviewed and agreed with the technically competent bodies responsible for supervision of the dam. The decision of the Court of Los Vilos was appealed by both the plaintiffs and Los Pelambres to the Court of Appeal of La Serena. In April 2015, the Court of Appeal of La Serena upheld Los Pelambres’s appeal, overturning the decision of the Court of Los Vilos and rejecting completely the plaintiff’s claim. The decision of the Court of Appeal has been appealed by the plaintiffs to the Supreme Court. The Supreme Court is expected to hear oral arguments and issue a final decision within the next few months.
Los Pelambres – Cerro Amarillo Waste Dump
In 2004, Los Pelambres received all of the required authorisations from the Chilean government to deposit a waste-rock dump (“Cerro Amarillo Waste Dump”) in its current location which, according to the then official Chilean maps (1996), was located within Chile. In 2007, Chile modified the official maps in this area without making the changes public. Los Pelambres stopped using the relevant area of the Cerro Amarillo Waste Dump in 2011.
In February 2012, a binational border commission, established to clarify the exact position of the Chile/Argentina border, determined accurately the location of the border in the area of the Cerro Amarillo Waste Dump, which showed that part of the Cerro Amarillo Waste Dump was located in Argentina.
In May 2014, Xstrata Pachón S.A. (“Xstrata Pachón”), a subsidiary of Glencore plc and the holder of the mining properties on the Argentinian side of the border, filed a claim against Los Pelambres before the Federal Court of San Juan, Argentina, alleging that Los Pelambres had unlawfully deposited waste-rock on its property.
Xstrata Pachón has also filed a criminal complaint before a different Federal Court of San Juan alleging that Los Pelambres had violated several Argentinian laws relating to the misappropriation of land, unlawful appropriation of water bodies and that people’s health was in jeopardy from the alleged contamination that the Cerro Amarillo Waste Dump might generate.
In both cases, Los Pelambres submitted preliminary objections to the Argentinian courts. These objections are still pending in relation to the civil claim. Each party may appeal any decision on these preliminary objections to higher courts.
In the criminal proceeding the first instance Court dismissed the preliminary objections made by Los Pelambres but this decision has been appealed.
The Cerro Amarillo Waste Dump is a pile of inert waste-rock and any potential future environmental impact could be easily prevented with the implementation of an environmental closure plan, which is the accepted and recommended practice.
Los Pelambres has offered to implement a closure plan in line with the requirements of the Provincial Authorities of San Juan, but Xstrata Pachón has rejected this proposal outright, even though this solution would address all of the alleged environmental concerns.
Los Pelambres will exercise all available legal avenues to defend its position and will continue to seek to reach an understanding with the relevant authorities in Argentina to allow the environmental closure of the Cerro Amarillo Waste Dump.
38 Ultimate Parent CompanyThe immediate parent of the Group is Metalinvest Establishment, which is controlled by E. Abaroa Foundation, in which members of the Luksic family are interested.
Both Metalinvest Establishment and the E. Abaroa Foundation are domiciled in Liechtenstein. Information relating to the interest of Metalinvest Establishment and the E. Abaroa Foundation are given in the Directors’ report.
178 Antofagasta plc Annual report and financial statements 2015
Notes to the financial statements

39 Antofagasta plc – balance sheet of the Parent Company and related notesAt 31 December 2015
Notes2015
$m2014
$m
Fixed assetsInvestment in subsidiaries 39D 535.6 600.5 Debtors – loans to group undertakings 500.0 – Tangible fixed assets 0.7 –
1,036.3 600.5 Current assetsDebtors – amounts falling due within one year – amounts owed by subsidiaries 39D 49.8 44.7
– other debtors 1.0 – Current asset investments (term deposits) 184.1 66.5 Cash at bank and in hand 3.4 2.3
238.3 113.5 Total assets 1,274.6 714.0 Creditors – amounts falling due within one yearOther creditors (6.8) – Amounts owed to subsidiaries (297.7) (296.6)Net current liabilities (66.2) (183.1)Total assets less current liabilities 970.1 417.4 Creditors – amounts falling due after more than one yearPreference shares 39E (3.0) (3.1)Total assets less total liabilities 967.1 414.3 Capital and reservesCalled up shares capital – Ordinary shares – equity 89.8 89.8
Reserves – Share premium account 199.2 199.2
– Profit and loss account 678.1 125.3 Shareholders’ funds (including non-equity interests) 967.1 414.3
Approved by the Board and signed on its behalf on 14 March 2016.
Jean-Paul Luksic William HayesChairman Senior Independent Director and Chairman Audit and Risk Committee
Antofagasta plc 179
FIN
AN
CIA
L STA
TE
ME
NT
SF
INA
NC
IAL S
TAT
EM
EN
TS
GO
VE
RN
AN
CE
OT
HE
R IN
FO
RM
AT
ION
OV
ER
VIE
WS
TR
AT
EG
IC R
EP
OR
T
Parent Company financial statements

39 Antofagasta plc – Balance sheet of the Parent Company and related notes continued
Statement of changes in equity of the Parent Company
Called up ordinary
share capital $m
Share premium
$m
Retained earnings
$mTotal
$m
At 1 January 2014 (equity) 89.8 199.2 141.3 430.3 Profit for the financial year – – 948.2 948.2Dividends paid – – (964.2) (964.2)At 31 December 2014 and 1 January 2015 89.8 199.2 125.3 414.3Profit for the financial year – – 680.0 680.0 Dividends paid – – (127.2) (127.2)31 December 2015 (equity) 89.8 199.2 678.1 967.1
The ordinary shares rank after the preference shares in entitlement to dividend and on a winding-up. Each ordinary share carries one vote at any general meeting.
Antofagasta plc is a company limited by shares, incorporated and domiciled in the United Kingdom at Cleveland House 33 King Street, London.
39A Basis of preparation of the balance sheet and related notes of the Parent Company
The Antofagasta plc Parent Company balance sheet and related notes have been prepared in accordance with FRS 101, which applies the recognition and measurement bases of IFRS with reduced disclosure requirements. The financial information has been prepared on a historical cost basis. The financial statements have been prepared on a going concern basis. The functional currency of the Company and the presentational currency adopted is US dollars.
The following exemptions from the requirements of IFRS have been applied in the preparation of these financial statements, in accordance with FRS 101:
• Paragraphs 45(b) and 46 to 52 of IFRS 2, “Share-based payment” (details of the number and weighted-average exercise prices of share options, and how the fair value of goods or services received was determined)
• IFRS 7 “Financial Instruments: Disclosures”
• Paragraphs 91 to 99 of IFRS 13 “Fair value measurement” (disclosure of valuation techniques and inputs used for fair value measurement of assets and liabilities)
• Paragraph 38 of IAS 1 “Presentation of financial statements” comparative information requirements in respect of:
(i) paragraph 79(a)(iv) of IAS 1;
(ii) paragraph 73(e) of IAS 16 Property, plant and equipment; and
(iii) paragraph 118(e) of IAS 38 Intangible assets (reconciliations between the carrying amount at the beginning and end of the period)
• The following paragraphs of IAS 1, “Presentation of financial statements”:
• 10(d), (statement of cash flows);
• 10(f) (a statement of financial position as at the beginning of the preceding period when an entity applies an accounting policy retrospectively or makes a retrospective restatement of items in its financial statements, or when it reclassifies items in its financial statements);
• 16 (statement of compliance with all IFRS);
• 38A (requirement for minimum of two primary statements, including cash flow statements);
• 38B-D (additional comparative information);
• 40A-D (requirements for a third statement of financial position;
• 111 (cash flow statement information); and
• 134–136 (capital management disclosures).
• IAS 7 “Statement of cash flows”
• Paragraph 30 and 31 of IAS 8 “Accounting policies, changes in accounting estimates and errors” (requirement for the disclosure of information when an entity has not applied a new IFRS that has been issued but is not yet effective)
• Paragraph 17 of IAS 24 “Related party disclosures” (key management compensation)
The requirements in IAS 24 “Related party disclosures” to disclose related party transactions entered into between two or more members of a group.
180 Antofagasta plc Annual report and financial statements 2015
Parent Company financial statements
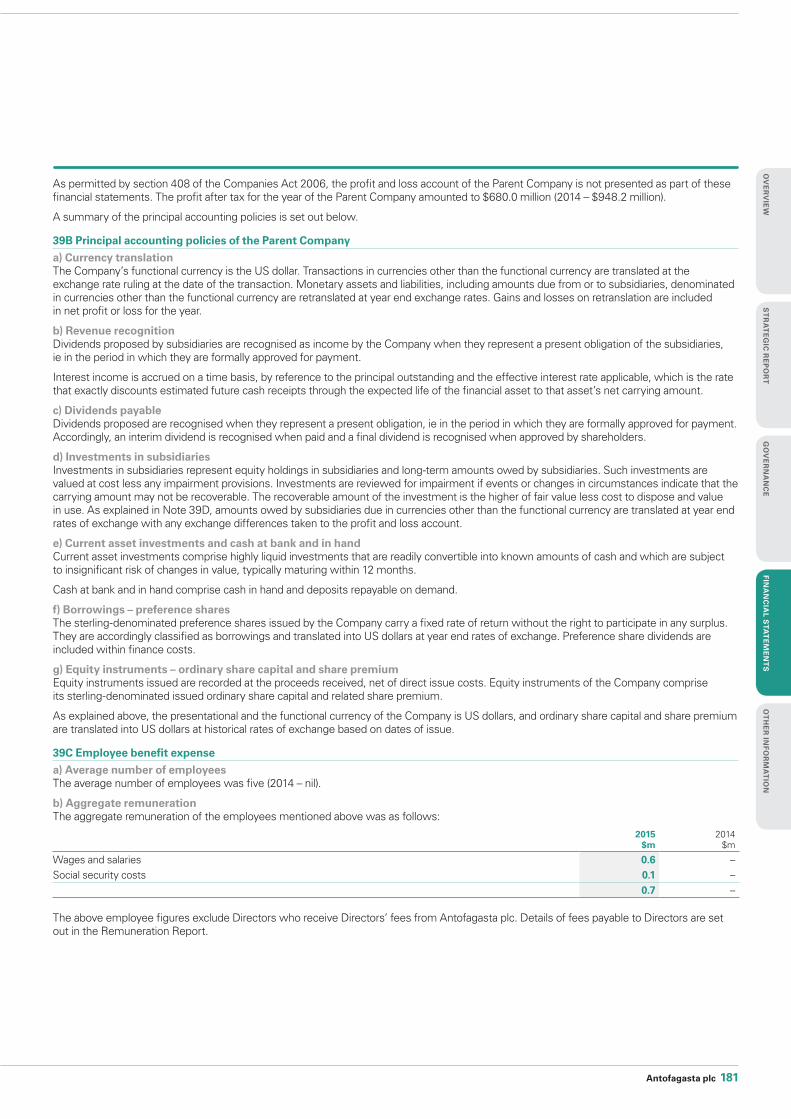
As permitted by section 408 of the Companies Act 2006, the profit and loss account of the Parent Company is not presented as part of these financial statements. The profit after tax for the year of the Parent Company amounted to $680.0 million (2014 – $948.2 million).
A summary of the principal accounting policies is set out below.
39B Principal accounting policies of the Parent Company
a) Currency translationThe Company’s functional currency is the US dollar. Transactions in currencies other than the functional currency are translated at the exchange rate ruling at the date of the transaction. Monetary assets and liabilities, including amounts due from or to subsidiaries, denominated in currencies other than the functional currency are retranslated at year end exchange rates. Gains and losses on retranslation are included in net profit or loss for the year.
b) Revenue recognitionDividends proposed by subsidiaries are recognised as income by the Company when they represent a present obligation of the subsidiaries, ie in the period in which they are formally approved for payment.
Interest income is accrued on a time basis, by reference to the principal outstanding and the effective interest rate applicable, which is the rate that exactly discounts estimated future cash receipts through the expected life of the financial asset to that asset’s net carrying amount.
c) Dividends payableDividends proposed are recognised when they represent a present obligation, ie in the period in which they are formally approved for payment. Accordingly, an interim dividend is recognised when paid and a final dividend is recognised when approved by shareholders.
d) Investments in subsidiariesInvestments in subsidiaries represent equity holdings in subsidiaries and long-term amounts owed by subsidiaries. Such investments are valued at cost less any impairment provisions. Investments are reviewed for impairment if events or changes in circumstances indicate that the carrying amount may not be recoverable. The recoverable amount of the investment is the higher of fair value less cost to dispose and value in use. As explained in Note 39D, amounts owed by subsidiaries due in currencies other than the functional currency are translated at year end rates of exchange with any exchange differences taken to the profit and loss account.
e) Current asset investments and cash at bank and in handCurrent asset investments comprise highly liquid investments that are readily convertible into known amounts of cash and which are subject to insignificant risk of changes in value, typically maturing within 12 months.
Cash at bank and in hand comprise cash in hand and deposits repayable on demand.
f) Borrowings – preference sharesThe sterling-denominated preference shares issued by the Company carry a fixed rate of return without the right to participate in any surplus. They are accordingly classified as borrowings and translated into US dollars at year end rates of exchange. Preference share dividends are included within finance costs.
g) Equity instruments – ordinary share capital and share premiumEquity instruments issued are recorded at the proceeds received, net of direct issue costs. Equity instruments of the Company comprise its sterling-denominated issued ordinary share capital and related share premium.
As explained above, the presentational and the functional currency of the Company is US dollars, and ordinary share capital and share premium are translated into US dollars at historical rates of exchange based on dates of issue.
39C Employee benefit expense
a) Average number of employeesThe average number of employees was five (2014 – nil).
b) Aggregate remunerationThe aggregate remuneration of the employees mentioned above was as follows:
2015 $m
2014 $m
Wages and salaries 0.6 – Social security costs 0.1 –
0.7 –
The above employee figures exclude Directors who receive Directors’ fees from Antofagasta plc. Details of fees payable to Directors are set out in the Remuneration Report.
Antofagasta plc 181
FIN
AN
CIA
L STA
TE
ME
NT
SF
INA
NC
IAL S
TAT
EM
EN
TS
GO
VE
RN
AN
CE
OT
HE
R IN
FO
RM
AT
ION
OV
ER
VIE
WS
TR
AT
EG
IC R
EP
OR
T

39 Antofagasta plc – balance sheet of the Parent Company and related notes continued
39D Subsidiaries
a) Investment in subsidiaries2015
$m2014
$m
Shares in subsidiaries at cost 57.6 57.6 Amounts owed by subsidiaries due after more than one year 478.0 542.9
535.6 600.6
Shares $m
Loans $m
Total $m
1 January 2015 57.6 542.9 600.5 Loans repaid – (64.9) (64.9)31 December 2015 57.6 478.0 535.6
The above amount of $478.0 million (2014 – $542.9 million) in respect of amounts owed by subsidiaries due after more than one year relates to long-term funding balances which form an integral part of the Company’s long-term investment in those subsidiary companies.
A one-off repayment of capital following the sale of Aguas de Antofagasta S.A. was made during 2015 and therefore it is still appropriate to consider the rest of the loans as part of the investment in subsidiary.
b) Trade and other receivables – amounts owed by subsidiaries due after one yearAt 31 December 2015, an amount of $500.0 million was owed to the Company by an indirect subsidiary, pursuant to a ten-year loan agreement.
c) Trade and other receivables – amounts owed by subsidiaries due within one year At 31 December 2015, amounts owed by subsidiaries due within one year were $49.8 million (2014 – $44.7 million).
39E Borrowings – preference shares
The authorised, issued and fully paid preference share capital of the Company comprised 2,000,000 5% cumulative preference shares of £1 each at both 31 December 2015 and 31 December 2014. As explained in Note 39B(f), the preference shares are measured in the balance sheet in US dollars at period-end rates of exchange.
The preference shares are non-redeemable and are entitled to a fixed 5% cumulative dividend, payable in equal instalments in June and December of each year. On a winding-up, the preference shares are entitled to repayment and any arrears of dividend in priority to ordinary shareholders, but are not entitled to participate further in any surplus. Each preference share carries 100 votes (see Note 24.(a).(xviii)) at any general meeting.
182 Antofagasta plc Annual report and financial statements 2015
Parent Company financial statements

OT
HE
R IN
FO
RM
AT
ION
ST
RA
TE
GIC
RE
PO
RT
GO
VE
RN
AN
CE
FIN
AN
CIA
L STA
TE
ME
NT
SO
VE
RV
IEW
Other information
Five-year summary 184
Ore reserves and mineral resources estimates 186
Mining production and sales, cash cost reconciliation, transport and water statistics 194
Glossary and definitions 197
Shareholder information 200
Directors and advisors ibc
Antofagasta plc 183
ST
RA
TE
GIC
RE
PO
RT
GO
VE
RN
AN
CE
OT
HE
R IN
FO
RM
AT
ION
FIN
AN
CIA
L STA
TE
ME
NT
SO
VE
RV
IEW
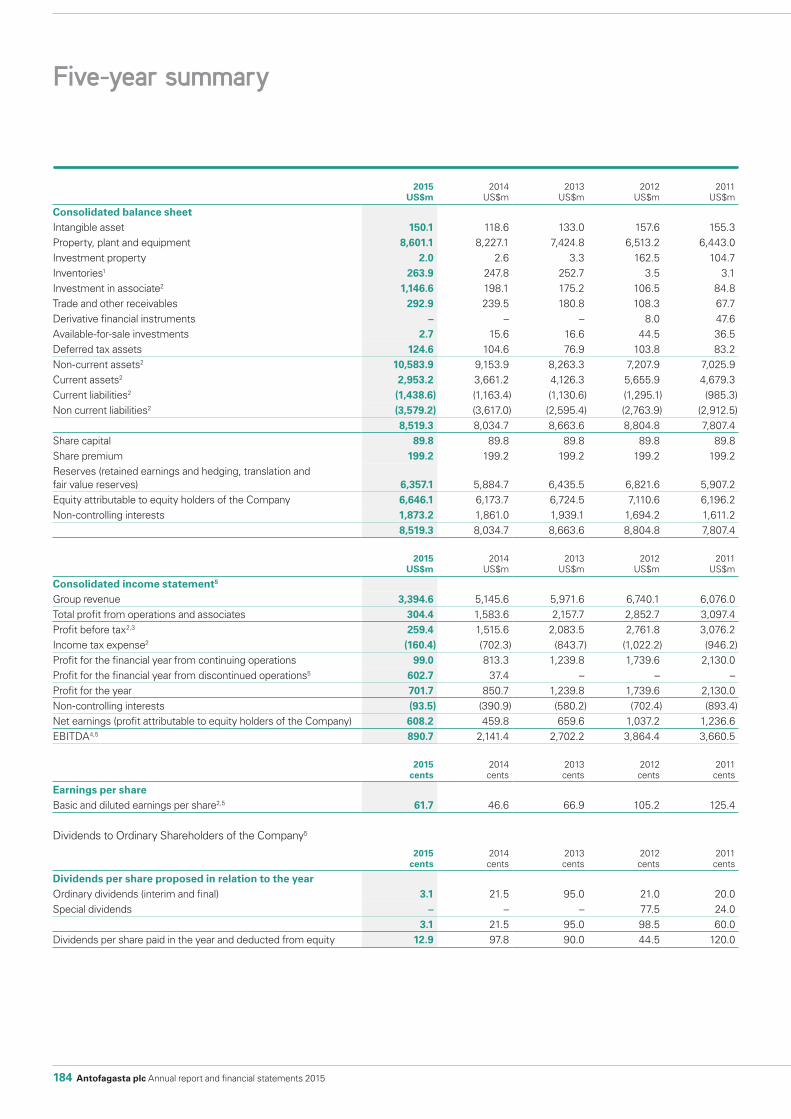
2015 US$m
2014 US$m
2013 US$m
2012 US$m
2011 US$m
Consolidated balance sheetIntangible asset 150.1 118.6 133.0 157.6 155.3 Property, plant and equipment 8,601.1 8,227.1 7,424.8 6,513.2 6,443.0 Investment property 2.0 2.6 3.3 162.5 104.7 Inventories1 263.9 247.8 252.7 3.5 3.1 Investment in associate2 1,146.6 198.1 175.2 106.5 84.8 Trade and other receivables 292.9 239.5 180.8 108.3 67.7 Derivative financial instruments – – – 8.0 47.6 Available-for-sale investments 2.7 15.6 16.6 44.5 36.5 Deferred tax assets 124.6 104.6 76.9 103.8 83.2 Non-current assets2 10,583.9 9,153.9 8,263.3 7,207.9 7,025.9 Current assets2 2,953.2 3,661.2 4,126.3 5,655.9 4,679.3 Current liabilities2 (1,438.6) (1,163.4) (1,130.6) (1,295.1) (985.3)Non current liabilities2 (3,579.2) (3,617.0) (2,595.4) (2,763.9) (2,912.5)
8,519.3 8,034.7 8,663.6 8,804.8 7,807.4 Share capital 89.8 89.8 89.8 89.8 89.8 Share premium 199.2 199.2 199.2 199.2 199.2 Reserves (retained earnings and hedging, translation and fair value reserves) 6,357.1 5,884.7 6,435.5 6,821.6 5,907.2 Equity attributable to equity holders of the Company 6,646.1 6,173.7 6,724.5 7,110.6 6,196.2 Non-controlling interests 1,873.2 1,861.0 1,939.1 1,694.2 1,611.2
8,519.3 8,034.7 8,663.6 8,804.8 7,807.4
2015 US$m
2014 US$m
2013 US$m
2012 US$m
2011 US$m
Consolidated income statement5
Group revenue 3,394.6 5,145.6 5,971.6 6,740.1 6,076.0 Total profit from operations and associates 304.4 1,583.6 2,157.7 2,852.7 3,097.4 Profit before tax2,3 259.4 1,515.6 2,083.5 2,761.8 3,076.2 Income tax expense2 (160.4) (702.3) (843.7) (1,022.2) (946.2)Profit for the financial year from continuing operations 99.0 813.3 1,239.8 1,739.6 2,130.0 Profit for the financial year from discontinued operations5 602.7 37.4 – – – Profit for the year 701.7 850.7 1,239.8 1,739.6 2,130.0 Non-controlling interests (93.5) (390.9) (580.2) (702.4) (893.4)Net earnings (profit attributable to equity holders of the Company) 608.2 459.8 659.6 1,037.2 1,236.6 EBITDA4,5 890.7 2,141.4 2,702.2 3,864.4 3,660.5
2015 cents
2014 cents
2013 cents
2012 cents
2011 cents
Earnings per shareBasic and diluted earnings per share2,5 61.7 46.6 66.9 105.2 125.4
Dividends to Ordinary Shareholders of the Company5
2015 cents
2014 cents
2013 cents
2012 cents
2011 cents
Dividends per share proposed in relation to the yearOrdinary dividends (interim and final) 3.1 21.5 95.0 21.0 20.0 Special dividends – – – 77.5 24.0
3.1 21.5 95.0 98.5 60.0 Dividends per share paid in the year and deducted from equity 12.9 97.8 90.0 44.5 120.0
184 Antofagasta plc Annual report and financial statements 2015
Five-year summary

2015 US$m
2014 US$m
2013 US$m
2012 US$m
2011 US$m
Consolidated cash flow statementCash flow from operations2,5 858.3 2,507.8 2,659.2 3,826.0 3,552.5 Interest paid (38.6) (45.4) (57.2) (88.1) (69.3)Income tax paid2 (427.1) (641.5) (896.5) (901.2) (1,018.1)Net cash from operating activities2 392.6 1,820.9 1,705.5 2,836.7 2,465.1 Investing activitiesAcquisition and disposal of subsidiaries, joint venture and associates (29.9) – – – – Dividends from associates 12.1 20.0 – 1.1 1.2 Available-for-sale investments, investing activities and recovery of VAT2 414.8 372.7 278.9 (496.0) (1,165.9)Purchases and disposals of intangible assets, property, plant and equipment (1,046.9) (1,613.7) (1,334.2) (868.1) (670.5)Interest received 11.0 16.5 14.0 24.8 21.7 Net cash used in investing activities2 (638.9) (1,204.5) (1,041.3) (1,338.2) (1,813.5)Financing activitiesDividends paid to equity holders of the Company (127.2) (964.2) (975.0) (438.7) (1,183.0)Dividends paid to preference holders and non-controlling interests (80.0) (412.4) (452.3) (702.7) (741.2)New borrowings less repayment of borrowings and finance leases 452.0 1,019.4 (418.2) 105.6 (114.5)Net cash used in financing activities 244.8 (357.2) (1,845.5) (1,035.8) (2,038.7)Net (decrease)/increase in cash and cash equivalents2 (1.5) 259.2 (1,181.3) 462.7 (1,387.1)
2015 US$m
2014 US$m
2013 US$m
2012 US$m
2011 US$m
Consolidated net cashCash, cash equivalents and liquid investments2 1,731.6 2,374.5 2,685.1 4,291.9 3,280.0 Short-term borrowings4 (758.9) (284.5) (341.0) (447.0) (301.9)Medium and long-term borrowings4 (1,996.2) (2,091.6) (1,032.9) (1,442.2) (1,838.4)
(2,755.1) (2,376.1) (1,373.9) (1,889.2) (2,140.3)Net cash at the year end2 (1,023.5) (1.6) 1,311.2 2,402.7 1,139.7
1 Non-current inventories refer to ore stockpiles that are expected to be processed more than 12 months after the statement of financial position date. The 2015, 2014, 2013 and 2012 balances have been prepared on this basis, and the 2011 balance has been restated to reflect this classification.
2 The 2012 figures have been restated as a result of the adoption of IFRS 11 Joint Arrangements and the application of the amendments to IAS 19 Employee Benefits in 2013. The 2011 balance have not been restated.
3 In 2012 the Consolidation income statement included $500.0 million as a provision against the carrying value of property, plant and equipment relating to the Antucoya project. Excluding this exceptional item profit before tax was $3,254.2 million.
4 EBITDA refers to Earnings Before Interest, Tax, Depreciation and Amortization. EBITDA is calculated by adding back depreciation, amortization, profit or loss on disposals and impairment charges to operating profit from subsidiaries and joint ventures.
5 The 2014 figures have been restated as results of IFRS 5 Non-current Assets Held for sale and Discontinued Operations related to ADASA and FCA sale during 2015.
Antofagasta plc 185
OT
HE
R IN
FO
RM
AT
ION
ST
RA
TE
GIC
RE
PO
RT
GO
VE
RN
AN
CE
FIN
AN
CIA
L STA
TE
ME
NT
SO
VE
RV
IEW

IntroductionThe ore reserves and mineral resources estimates presented in this report comply with the requirements of the Australasian Code for Reporting of Exploration Results, Mineral Resources and Ore Reserves 2012 edition (the JORC Code) which has been used by the Group as the minimum standard for the preparation and disclosure of the information contained herein. The definitions and categories of Ore Reserves and Mineral Resources are set out below.
The information on ore reserves and mineral resources was prepared by or under the supervision of Competent Persons as defined in the JORC Code. The Competent Persons have sufficient experience relevant to the style of mineralisation and type of deposit under consideration and to the activity which they are undertaking. The Competent Persons consent to the inclusion in this report of the matters based on their information in the form and context in which it appears. The Competent Person for Exploration Results and Mineral Resources is Aquiles Gonzalez (CP, Chile), Manager of Mineral Resource Evaluation for Antofagasta Minerals S.A. The Competent Person for Ore Reserves is Murray Canfield (P.Eng. Ontario), Technical Manager of Mining for Antofagasta Minerals S.A.
The Group’s operations and projects are subject to a comprehensive programme of audits aimed at providing assurance in respect of ore reserves and mineral resources estimates. The audits are conducted by suitably qualified Competent Persons from within a particular division, another division of the Company or from independent consultants.
The ore reserves and mineral resources estimates represent full reserves and resources, with the Group’s attributable share for each mine shown in the ‘Attributable tonnage’ column. The Group’s economic interest in each mine is disclosed in the notes following the estimates on pages 192 and 193. The totals in the table may include some small apparent differences as the specific individual figures have not been rounded.
Definitions and categories of ore reserves and mineral resourcesA “Mineral Resource” is a concentration or occurrence of material of intrinsic economic interest in or on the Earth’s crust in such form, quality and quantity that there are reasonable prospects for eventual economic extraction. The location, quantity, grade, geological characteristics and continuity of a Mineral Resource are known, estimated or interpreted from specific geological evidence and knowledge. Mineral Resources are sub-divided, in order of increasing geological confidence, into Inferred, Indicated and Measured categories.
An “Inferred Mineral Resource” is that part of a Mineral Resource for which tonnage, grade and mineral content can be estimated with a low level of confidence. It is inferred from geological evidence and assumed but not verified geological and/or grade continuity. It is based on information gathered through appropriate techniques from locations such as outcrops, trenches, pits, workings and drill holes which may be limited or of uncertain quality and reliability.
An “Indicated Mineral Resource” is that part of a Mineral Resource for which tonnage, densities, shape, physical characteristics, grade and mineral content can be estimated with a reasonable level of confidence. It is based on exploration, sampling and testing information gathered through appropriate techniques from locations such as outcrops, trenches, pits, workings and drill holes. The locations are too widely or inappropriately spaced to confirm geological and/or grade continuity but are spaced closely enough for continuity to be assumed.
A “Measured Mineral Resource” is that part of a Mineral Resource for which tonnage, densities, shape, physical characteristics, grade and mineral content can be estimated with a high level of confidence. It is based on detailed and reliable exploration, sampling and testing information gathered through appropriate techniques from locations such as outcrops, trenches, pits, workings and drill holes. The locations are spaced closely enough to confirm geological and grade continuity.
An “Ore Reserve” is the economically mineable part of a Measured and/or Indicated Mineral Resource. It includes diluting materials and allowances for losses, which may occur when the material is mined. Appropriate assessments and studies have been carried out, and include consideration of and modification by realistically assumed mining, metallurgical, economic, marketing, legal, environmental, social and governmental factors. These assessments demonstrate at the time of reporting that extraction could reasonably be justified. Ore Reserves are sub-divided in order of increasing confidence into Probable Ore Reserves and Proved Ore Reserves.
A “Probable Ore Reserve” is the economically mineable part of an Indicated, and in some circumstances, a Measured Mineral Resource. It includes diluting materials and allowances for losses which may occur when the material is mined. Appropriate assessments and studies have been carried out, and include consideration of and modification by realistically assumed mining, metallurgical, economic, marketing, legal, environmental, social and governmental factors. These assessments demonstrate at the time of reporting that extraction could reasonably be justified.
A “Proved Ore Reserve” is the economically mineable part of a Measured Mineral Resource. It includes diluting materials and allowances for losses which may occur when the material is mined. Appropriate assessments and studies have been carried out, and include consideration of and modification by realistically assumed mining, metallurgical, economic, marketing, legal, environmental, social and governmental factors. These assessments demonstrate at the time of reporting that extraction could reasonably be justified.
186 Antofagasta plc Annual report and financial statements 2015
Ore reserves and mineral resources estimates At 31 December 2015

Ore reserves estimatesAt 31 December 2015
Group subsidiaries
Tonnage (millions of tonnes)
Copper(%)
Molybdenum(%)
Gold (g/tonne)
Attributable tonnage
(millions of tonnes)
2015 2014 2015 2014 2015 2014 2015 2014 2015 2014
Ore reserves Los Pelambres (see Note (a)) Proved 704.4 727.9 0.61 0.61 0.022 0.022 0.05 0.05 422.6 436.7 Probable 604.3 640.0 0.60 0.57 0.015 0.015 0.04 0.04 362.6 384.0 Total 1,308.7 1,367.8 0.61 0.59 0.019 0.019 0.05 0.04 785.2 820.7 Centinela (see Note (b)) Centinela Concentrates Proved 577.0 616.2 0.50 0.50 0.012 0.011 0.20 0.20 403.9 431.3 Probable 1,263.4 1,266.3 0.41 0.42 0.012 0.012 0.13 0.13 884.4 886.4 Sub-total 1,840.4 1,882.5 0.44 0.44 0.012 0.012 0.15 0.16 1,288.3 1,317.7 El Tesoro Tesoro Central, Tesoro North-East, Mirador Proved 44.3 56.2 0.69 0.73 – – – – 31.0 39.3 Probable 39.1 43.2 0.54 0.57 – – – – 27.3 30.3 Sub-total 83.3 99.4 0.62 0.66 – – – – 58.3 69.6 El Tesoro ROM (Esperanza Oxides) Proved 1.3 7.9 0.31 0.31 – – – – 0.9 5.5 Probable 103.8 100.8 0.29 0.30 – – – – 72.7 70.6 Sub-total 105.2 108.7 0.29 0.30 – – – – 73.6 76.1 Total 188.5 208.1 0.44 0.47 – – – – 132.0 145.7 Centinela Cathodes Proved 45.6 64.1 0.68 0.67 – – – – 31.9 44.9 Probable 142.9 144.0 0.36 0.38 – – – – 100.0 100.8 Sub-total 188.5 208.1 0.44 0.47 – – – – 132.0 145.7 Centinela Total Proved 622.6 680.3 0.51 0.52 – – – – 435.8 476.2 Probable 1,406.3 1,410.3 0.41 0.41 – – – – 984.4 987.2 Total 2,028.9 2,090.6 0.44 0.45 – – – – 1,420.2 1,463.4 Antucoya (see Note (c)) Proved 374.0 384.1 0.36 0.36 – – – – 261.8 268.8 Probable 312.6 297.6 0.31 0.31 – – – – 218.8 208.3 Total 686.6 681.6 0.34 0.34 – – – – 480.6 477.2 Encuentro (see Note (d)) Proved 109.4 – 0.55 – – – – – 109.4 –Probable 6.2 – 0.42 – – – – – 6.2 –Total 115.6 – 0.54 – – – – – 115.6 –Michilla (see Note (e)) Proved – – – – – – – – – –Probable – 2.7 – 1.20 – – – – – 2.7 Total – 2.7 – 1.20 – – – – – 2.7 Group total 4,139.8 4,142.8 0.48 0.48 – – – – 2,801.7 2,764.0
Group joint ventures
Tonnage (millions of tonnes)
Copper(%)
Molybdenum(%)
Gold (g/tonne)
Attributable tonnage
(millions of tonnes)
2015 2014 2015 2014 2015 2014 2015 2014 2015 2014
Zaldívar (see Note (m)) Proved 374.1 – 0.55 – – – – – 187.1 –Probable 81.2 – 0.53 – – – – – 40.6 –Total 455.3 – 0.55 – – – – – 227.7 –Group total 4,595.1 4,142.8 0.49 0.48 – – – – 3,029.3 2,764.0
Antofagasta plc 187
OT
HE
R IN
FO
RM
AT
ION
ST
RA
TE
GIC
RE
PO
RT
GO
VE
RN
AN
CE
FIN
AN
CIA
L STA
TE
ME
NT
SO
VE
RV
IEW

Mineral resources estimates (including ore reserves)As at 31 December 2015
Tonnage (millions of tonnes)
Copper(%)
Molybdenum(%)
Gold (g/tonne)
Attributable tonnage
(millions of tonnes)
2015 2014 2015 2014 2015 2014 2015 2014 2015 2014
Mineral Resources (including ore reserves) Los Pelambres (see Note (a)) Sulphides Measured 1,151.2 1,064.8 0.59 0.60 0.022 0.023 0.05 0.05 690.7 638.9 Indicated 2,262.8 2,174.9 0.53 0.53 0.015 0.015 0.05 0.05 1,357.7 1,305.0 Measured + Indicated 3,414.0 3,239.7 0.55 0.55 0.018 0.018 0.05 0.05 2,048.4 1,943.8 Inferred 2,690.1 2,984.4 0.46 0.47 0.015 0.015 0.06 0.06 1,614.1 1,790.7 Total 6,104.1 6,224.1 0.51 0.51 0.016 0.017 0.06 0.06 3,662.5 3,734.5 Centinela (see Note (b)) Centinela Concentrates Measured 599.8 643.4 0.49 0.48 0.012 0.011 0.19 0.19 419.8 450.4 Indicated 1,650.2 1,660.3 0.39 0.38 0.012 0.012 0.12 0.12 1,155.1 1,162.2 Measured + Indicated 2,249.9 2,303.7 0.41 0.41 0.012 0.012 0.14 0.14 1,575.0 1,612.6 Inferred 965.7 1,028.5 0.32 0.31 0.011 0.011 0.09 0.09 676.0 719.9 Sub-total 3,215.7 3,332.2 0.38 0.38 0.012 0.011 0.13 0.12 2,251.0 2,332.5 Centinela Cathodes Measured 87.9 102.4 0.59 0.59 – – – – 61.5 71.7 Indicated 230.0 233.7 0.34 0.35 – – – – 161.0 163.6 Measured + Indicated 317.9 336.1 0.41 0.42 – – – – 222.5 235.3 Inferred 19.8 22.9 0.35 0.27 – – – – 13.9 16.0 Sub-total 337.7 358.9 0.41 0.41 – – – – 236.4 251.3 Centinela Total Measured 687.6 745.8 0.50 0.50 – – – – 481.3 522.1 Indicated 1,880.2 1,894.0 0.38 0.38 – – – – 1,316.1 1,325.8 Measured + Indicated 2,567.8 2,639.7 0.41 0.41 – – – – 1,797.5 1,847.8 Inferred 985.6 1,051.3 0.32 0.31 – – – – 689.9 735.9 Total 3,553.4 3,691.1 0.39 0.38 – – – – 2,487.4 2,583.8 Antucoya (see Note (c)) Oxides Measured 437.3 446.7 0.34 0.34 – – – – 306.1 312.7 Indicated 463.0 442.4 0.30 0.30 – – – – 324.1 309.6 Measured + Indicated 900.3 889.0 0.32 0.32 – – – – 630.2 622.3 Inferred 354.7 315.4 0.27 0.28 – – – – 248.3 220.8 Total 1,255.1 1,204.4 0.31 0.31 – – – – 878.6 843.1 Encuentro (see Note (d)) Oxides Measured 134.5 142.4 0.52 0.47 – – – – 134.5 142.4 Indicated 43.8 27.8 0.31 0.31 – – – – 43.8 27.8 Measured + Indicated 178.2 170.2 0.47 0.44 – – – – 178.2 170.2 Inferred 1.2 8.6 0.31 0.32 – – – – 1.2 8.6 Sub-total 179.4 178.8 0.46 0.44 – – – – 179.4 178.8 Sulphides Measured 407.9 424.0 0.53 0.53 0.015 – 0.21 – 407.9 424.0 Indicated 498.2 544.0 0.35 0.35 0.014 – 0.17 – 498.2 544.0 Measured + Indicated 906.1 967.9 0.43 0.43 0.015 – 0.19 – 906.1 967.9 Inferred 126.9 172.7 0.31 0.29 0.012 – 0.13 – 126.9 172.7 Sub-total 1,032.9 1,140.6 0.42 0.41 0.014 – 0.18 – 1,032.9 1,140.6 Total 1,212.4 1,319.4 0.42 0.41 – – – – 1,212.4 1,319.4
188 Antofagasta plc Annual report and financial statements 2015
Ore reserves and mineral resources estimates At 31 December 2015

Tonnage (millions of tonnes)
Copper(%)
Molybdenum(%)
Gold (g/tonne)
Attributable tonnage
(millions of tonnes)
2015 2014 2015 2014 2015 2014 2015 2014 2015 2014
Michilla (see Note (e)) Oxides Measured 22.0 23.2 1.72 1.70 – – – – 22.0 23.2 Indicated 23.2 23.6 1.51 1.50 – – – – 23.2 23.6 Measured + Indicated 45.2 46.8 1.61 1.60 – – – – 45.2 46.8 Inferred 15.1 15.4 1.72 1.69 – – – – 15.1 15.4 Total 60.3 62.2 1.64 1.62 – – – – 60.3 62.2 Polo Sur (see Note (f)) Oxides Measured – – – – – – – – – –Indicated 86.8 93.1 0.43 0.42 – – – – 86.8 93.1 Measured + Indicated 86.8 93.1 0.43 0.42 – – – – 86.8 93.1 Inferred 38.7 29.8 0.35 0.33 – – – – 38.7 29.8 Sub-total 125.5 122.8 0.40 0.40 – – – – 125.5 122.8 Sulphides Measured – – – – – – – – – –Indicated 706.1 690.6 0.37 0.37 0.007 – 0.06 – 706.1 690.6 Measured + Indicated 706.1 690.6 0.37 0.37 0.007 – 0.06 – 706.1 690.6 Inferred 712.2 521.8 0.30 0.30 0.007 – 0.05 – 712.2 521.8 Sub-total 1,418.2 1,212.4 0.34 0.34 0.007 – 0.05 – 1,418.2 1,212.4 Total 1,543.7 1,335.2 0.34 0.35 – – – – 1,543.7 1,335.2 Penacho Blanco (see Note (g)) Oxides Measured – – – – – – – – – –Indicated – – – – – – – – – –Measured + Indicated – – – – – – – – – –Inferred 11.0 17.5 0.30 0.30 – – – – 5.6 8.9 Sub-total 11.0 17.5 0.30 0.30 – – – – 5.6 8.9 Sulphides Measured – – – – – – – – – –Indicated – – – – – – – – – –Measured + Indicated – – – – – – – – – –Inferred 281.8 275.8 0.41 0.43 – – 0.05 – 143.7 140.7 Sub-total 281.8 275.8 0.41 0.43 – – 0.05 – 143.7 140.7 Total 292.8 293.3 0.41 0.42 – – – – 149.3 149.6 Mirador (see Note (h)) Oxides Measured 0.2 0.7 0.47 0.46 – – – – 0.2 0.7 Indicated 8.0 10.2 0.47 0.44 – – – – 8.0 10.2 Measured + Indicated 8.2 10.9 0.47 0.44 – – – – 8.2 10.9 Inferred 13.4 22.0 0.28 0.27 – – – – 13.4 22.0 Sub-total 21.6 32.9 0.35 0.33 – – – – 21.6 32.9 Sulphides Measured 1.1 1.5 0.41 0.38 – – 0.15 – 1.1 1.5 Indicated 17.7 35.3 0.36 0.34 – – 0.14 – 17.7 35.3 Measured + Indicated 18.8 36.8 0.37 0.34 – – 0.14 – 18.8 36.8 Inferred 10.2 30.7 0.29 0.27 – – 0.09 – 10.2 30.7 Sub-total 29.0 67.5 0.34 0.31 – – 0.12 – 29.0 67.5 Total 50.6 100.4 0.34 0.31 – – – – 50.6 100.4
Antofagasta plc 189
OT
HE
R IN
FO
RM
AT
ION
ST
RA
TE
GIC
RE
PO
RT
GO
VE
RN
AN
CE
FIN
AN
CIA
L STA
TE
ME
NT
SO
VE
RV
IEW

Mineral resources estimates (including ore reserves)As at 31 December 2015
Tonnage (millions of tonnes)
Copper(%)
Molybdenum(%)
Gold (g/tonne)
Attributable tonnage
(millions of tonnes)
2015 2014 2015 2014 2015 2014 2015 2014 2015 2014
Paleocanal (see Note (i)) Oxides Measured 10.3 – 0.52 – – – – – 9.1 –Indicated 3.4 – 0.41 – – – – – 3.0 –Measured + Indicated 13.7 – 0.49 – – – – – 12.2 –Inferred 0.5 – 0.33 – – – – – 0.5 –Sub-total 14.2 – 0.49 – – – – – 12.6 –Total 14.2 – 0.49 – – – – – 12.6 –Llano (see Note (j)) Oxides Measured 26.9 – 0.53 – – – – – 19.1 –Indicated 3.8 – 0.43 – – – – – 2.7 –Measured + Indicated 30.8 – 0.52 – – – – – 21.9 –Inferred 0.6 – 0.44 – – – – – 0.4 –Sub-total 31.4 – 0.51 – – – – – 22.3 –Total 31.4 – 0.51 – – – – – 22.3 –Los Volcanes (see Note (k)) Oxides Measured – – – – – – – – – –Indicated – – – – – – – – – –Measured + Indicated – – – – – – – – – –Inferred 30.4 40.8 0.31 0.39 – – – – 15.5 20.8 Sub-total 30.4 40.8 0.31 0.39 – – – – 15.5 20.8 Sulphides Measured – – – – – – – – – –Indicated – – – – – – – – – –Measured + Indicated – – – – – – – – – –Inferred 1,873.4 1,240.2 0.50 0.47 0.011 – – – 955.4 632.5 Sub-total 1,873.4 1,240.2 0.50 0.47 0.011 – – – 955.4 632.5 Total 1,903.8 1,281.0 0.50 0.47 – – – – 970.9 653.3
190 Antofagasta plc Annual report and financial statements 2015
Ore reserves and mineral resources estimates At 31 December 2015

Tonnage (millions of tonnes)
Copper(%)
Nickel(%)
TPM(g/tonne Au+Pt+Pd)
Attributable tonnage
(millions of tonnes)
2015 2014 2015 2014 2015 2014 2015 2014 2015 2014
Twin Metals (see Note (l)) Maturi Measured 279.5 279.5 0.63 0.63 0.20 0.20 0.57 0.57 215.3 86.1 Indicated 745.5 745.5 0.58 0.58 0.19 0.19 0.59 0.59 712.5 285.0 Measured + Indicated 1,025.0 1,025.0 0.59 0.59 0.19 0.19 0.58 0.58 927.7 371.1 Inferred 481.4 481.4 0.49 0.49 0.16 0.16 0.52 0.52 433.6 173.4 Sub-total 1,506.4 1,506.4 0.56 0.56 0.18 0.18 0.56 0.56 1,361.3 544.5 Birch Lake Measured – – – – – – – – – –Indicated 90.4 90.4 0.52 0.52 0.16 0.16 0.87 0.87 63.3 25.3 Measured + Indicated 90.4 90.4 0.52 0.52 0.16 0.16 0.87 0.87 63.3 25.3 Inferred 217.0 217.0 0.46 0.46 0.15 0.15 0.64 0.64 151.9 60.8 Sub-total 307.4 307.4 0.48 0.48 0.15 0.15 0.70 0.70 215.2 86.1 Spruce Road Measured – – – – – – – – – –Indicated – – – – – – – – – –Measured + Indicated – – – – – – – – – –Inferred 435.5 435.5 0.43 0.43 0.16 0.16 – – 304.8 121.9 Sub-total 435.5 435.5 0.43 0.43 0.16 0.16 – – 304.8 121.9 Maturi Southwest Measured – – – – – – – – – –Indicated 93.1 93.1 0.48 0.48 0.17 0.17 0.31 0.31 65.2 26.1 Measured + Indicated 93.1 93.1 0.48 0.48 0.17 0.17 0.31 0.31 65.2 26.1 Inferred 29.3 29.3 0.43 0.43 0.15 0.15 0.26 0.26 20.5 8.2 Sub-total 122.4 122.4 0.47 0.47 0.17 0.17 0.30 0.30 85.7 34.3 Total 2,371.7 2,371.7 0.52 0.52 0.17 0.17 0.46 0.46 1,967.0 786.8 Measured + Indicated 10,084.6 9,993.2 0.48 0.47 – – – – 7,515.8 6,852.7 Inferred 8,308.9 7,889.6 0.43 0.42 – – – – 5,501.8 4,715.6 Group subsidiaries total 18,393.5 17,882.9 0.45 0.45 – – – – 13,017.6 11,568.3
Group joint ventures
Tonnage (millions of tonnes)
Copper(%)
Nickel(%)
TPM(g/tonne Au+Pt+Pd)
Attributable tonnage
(millions of tonnes)
2015 2014 2015 2014 2015 2014 2015 2014 2015 2014
Zaldívar (see Note (m)) Measured 465.1 – 0.53 – – – – – 232.6 –Indicated 111.1 – 0.50 – – – – – 55.6 –Measured + Indicated 576.3 – 0.52 – – – – – 288.1 –Inferred 6.0 – 0.61 – – – – – 3.0 –Group joint ventures total 582.3 – 0.53 – – – – – 291.1 –
Total Group
Tonnage (millions of tonnes)
Copper(%)
Nickel(%)
TPM(g/tonne Au+Pt+Pd)
Attributable tonnage
(millions of tonnes)
2015 2014 2015 2014 2015 2014 2015 2014 2015 2014
Measured + Indicated 10,660.9 9,993.2 0.48 0.47 – – – – 7,803.9 6,852.7 Inferred 8,314.9 7,889.6 0.43 0.42 – – – – 5,504.8 4,715.6 Total 18,975.7 17,882.9 0.46 0.45 – – – – 13,308.7 11,568.3
Antofagasta plc 191
OT
HE
R IN
FO
RM
AT
ION
ST
RA
TE
GIC
RE
PO
RT
GO
VE
RN
AN
CE
FIN
AN
CIA
L STA
TE
ME
NT
SO
VE
RV
IEW

Notes to ore reserves and mineral resources estimatesThe ore reserves mentioned in this report were determined considering specific cut-off grades for each mine and using a long-term copper price of $3.10/lb (unchanged from 2014), $10.00/lb molybdenum ($11.00/lb in 2014) and $1,300/oz gold (unchanged from 2014), unless otherwise noted. These same values have been used for copper equivalent (CuEq) estimates, where appropriate.
In order to ensure that the stated resources represent mineralisation that has “reasonable prospects for eventual economic extraction” (JORC Code) the resources are enclosed within pit shells that were optimised based on measured, indicated and inferred resources and considering a copper price of $3.60/lb (unchanged from 2014). Mineralisation estimated outside these pit shells is not included in the resource figures unless they can expect to be exploited by underground methods.
a) Los Pelambres
Los Pelambres is 60% owned by the Group. The cut-off grade applied to the determination of ore reserves is 0.42% copper and for mineral resources is 0.35% copper. For 2015, the mineral resource model has been updated with 120 drill holes for a total of 36,073 metres.
The decrease of 70.6 million tonnes in ore reserves is due principally to depletion in the period and reflects the remaining capacity of the existing tailing dams, limiting the amount of mineral resource that can be converted into ore reserves.
Mineral resources in the measured plus indicated categories increased by 174 million tonnes while resources in the inferred category decreased by 294 million tonnes, reflecting increased information from new drill holes improving the confidence in the Mineral Resource categories.
b) Centinela (Concentrates & Cathodes)
Centinela is 70% owned by the Group and consists of Centinela Concentrates and Centinela Cathodes operations. The cut-off grade applied to the determination of ore reserves for Centinela Concentrates is 0.20% equivalent copper, with 0.15% copper used as a cut-off grade for mineral resources. The cut-off grade used for the Centinela Cathodes pits is as follows: Tesoro Central and Tesoro North-East deposits is 0.41% copper for ore reserves and 0.31% for mineral resources; the Mirador Oxides deposit is 0.30% copper for ore reserves and 0.15% for mineral resources. The cut-off grade applied to oxides contained in the Centinela Concentrates deposit (processed separately as Run-of-Mine leach, or ROM) is 0.20% copper for ore reserves and 0.15% copper for mineral resources. For 2015 the mineral resource model has not been updated, Centinela ore reserves decreased by a net 61.7 million tonnes after depletion of 55 million tonnes, and the mineral resources by a net 129 million tonnes. The decrease is mainly in Esperanza and Esperanza Sur due to updates to the economic parameters in the period. The Centinela Cathodes ore reserves are made up of 83.3 million tonnes at 0.62% copper of heap-leach and 105.2 million tonnes at 0.29% copper of ROM ore.
c) Antucoya
Antucoya is 70% owned by the Group. The cut-off grade applied to the determination of ore reserves is 0.16% copper, with 0.15% copper used as a cut-off grade for mineral resources.
During 2015, Antucoya began the operations ramp up, with 12 million tonnes ore depletion. Ore reserves have increased by 14 million tonnes mainly due to changes in the density
model. Mineral Resources have increased by 50 million tonnes due to changes in economic assumption and changes to the geo-metallurgical model.
d) Encuentro
Encuentro is 100% owned by the Group. The cut-off grade applied to the determination of mineral resources for both oxides and sulphides is 0.15% copper.
For 2015, the mineral resource model has been updated by refinement of the resource model without additional drill holes. The decrease of 106 million tonnes in Mineral Resources is mainly due to changes in economic assumptions.
During 2015, after a feasibility study, 115.6 million tonnes of oxide mineral resource were converted to ore reserves.
e) Michilla
During 2015, Michilla depleted 2.1 million tonnes and has initiated closure activities.
f) Polo Sur
Polo Sur is 100% owned by the Group. The cut-off grade applied to the determination of mineral resources for both oxides and sulphides is 0.20% copper. For 2015, the mineral resource geological model has been updated with 17 drill holes for a total of 5,354 metres. The increase of 208 million tonnes in resources is due mainly to improved continuity in the resource model, achieved by re-modelling the previously separated two main ore bodies into one continuous model.
g) Penacho Blanco
Penacho Blanco is 51% owned by the Group. The cut-off grade applied to the determination of mineral resources for both oxides and sulphides is 0.20% copper.
For 2015, the mineral resource geological model has been updated by refinement of resource model without addition drill holes. The resource model decreased slightly 0.4 million tonnes due principally to economic assumption.
h) Mirador
Mirador is 100% owned by the Group. A portion of the Mirador Oxides is subject to an agreement between the Group and Centinela, whereby Centinela purchased the rights to mine the oxide ore reserves within an identified area. The ore reserves and mineral resources for Mirador Oxides subject to the agreement with Centinela are included in the Centinela Cathodes section. The resources not subject to the agreement are reported in this section. The cut-off grade applied to the determination of mineral resources for oxides is 0.15% copper and for sulphides is 0.20% copper. For 2015, the resource model has not been updated.
i) Paleocanal
Paleocanal deposit is covered by AMSA and Centinela mining tenements shared in different proportions. Under these constraints the Group owns 88.7% of Paleocanal. The cut-off grade applied to the determination of mineral resources for oxides is 0.15% copper. For 2015 the resource model has been updated with 71 drill holes for a total of 6,258 metres. Paleocanal has been upgraded to Mineral Resources in 2015.
192 Antofagasta plc Annual report and financial statements 2015
Ore reserves and mineral resources estimates At 31 December 2015

j) Llano
Llano deposit is covered by AMSA and Centinela mining tenements shared in different proportions. Under these constraints the Group owns 71.1% of Llano. The cut-off grade applied to the determination of mineral resources for oxides is 0.15% copper. For 2015, the resource model has been updated with 47 drill holes for a total of 7,514 metres. Llano has been upgraded to Mineral Resources in 2015.
k) Los Volcanes
Los Volcanes is 51% owned by the Group. The cut-off grade applied to the determination of mineral resources for both oxides and sulphides is 0.20% copper.
For 2015, the mineral resource model has been updated with two extensions of previous drill holes, and additional assaying carried out to complete legacy data, for a total of 1,985 metres. The increase of 622 million tonnes in mineral resources is due principally to updated the resource model and updates to the economical parameters used in the resource pit shell.
l) Twin Metals Minnesota LLC
At year end the Group had an 82.9% interest in Twin Metals Minnesota LLC (“Twin Metals”), with the remaining percentage held by others. During 2015, Antofagasta acquired 100% of Duluth Metals and as a result of this a 100% interest in Twin Metals. Total Mineral Resources did not change from 2014 Statement; however for the Group, the attributable copper increased.
Twin Metals has a 70% interest in the Birch Lake Joint Venture (“BLJV”) which holds the Birch Lake, Spruce Road and Maturi Southwest deposits, as well as a portion of the main Maturi deposit. The prices used for the Twin Metals resource estimate remain unchanged from 2014.
The cut-off grade applied to the determination of mineral resources is 0.3% copper, which when combined with credits from nickel, platinum, palladium and gold, is deemed appropriate for an underground operation. In the resource table “TPM” (Total Precious Metals) refers to the sum of platinum, palladium and gold values in grammes per tonne. The TPM value of 0.57 for the Maturi resource estimate is made up of 0.15 g/tonne platinum, 0.34 g/tonne palladium and 0.08 g/tonne gold. The TPM value of 0.30 for the Maturi Southwest resource estimate is made up of 0.08 g/tonne platinum, 0.17 g/tonne palladium and 0.05 g/tonne gold. The TPM value of 0.70 g/tonne for the Birch Lake resource estimate is made up of 0.19 g/tonne platinum, 0.41 g/tonne palladium and 0.10 g/tonne gold. The Spruce Road resource estimate does not include TPM values as they were not assayed.
m) Zaldívar
Antofagasta acquired 50% of Minera Zaldívar Barrick Gold Corporation. The transaction was completed on 1 December 2015 and Antofagasta became the operator of the mine. Reserves included in reserves pit shell considered a copper price of 3.0 US$/lb while the Mineral Resource pit shell was 3.50 US$/lb.
n) Other mineral inventory
In addition to the Mineral Resources noted above, the Group has interests in other deposits located in the Antofagasta Region of Chile, some of them containing gold and/or molybdenum. At the moment they are in exploration or in the process of resource estimation. The potential quantity and grade of each of the deposits is conceptual in nature, there has been insufficient exploration to define these deposits as mineral resources, and it is uncertain if further exploration will result in the determination of a mineral resource. These include:
(i) In the Michilla DistrictThe Rencoret deposit, owned 100% by the Group.
Mineral deposit Tonnes range(million tonnes)
Grade range (% Cu)
Number drill
holesTotal
metres
Ownership interest
(%)
Rencoret 15 25 1.22 1.00 31 8,300 100.0Total 15 25 1.22 1.00 31 8,300
(ii) In the El Abra DistrictBrujulina is a mineral deposit within a few kilometres of the El Abra ore body, located near Calama in the Antofagasta Region of Chile. The Mineral Inventory of Brujulina deposit, owned 51% by the Group, is estimated to be in the range of 50 to 80 million tonnes with grades in the range of 0.65% to 0.53% copper.
Mineral deposit Tonnes range(million tonnes)
Grade range (% Cu)
Number drill
holesTotal
metres
Ownership interest
(%)
Brujulina 50 80 0.65 0.53 159 15,300 51.0Total 50 80 0.65 0.53 159 15,300
o) Antomin 2 and Antomin Investors
The Group has an approximately 51% interest in two indirect subsidiaries, Antomin 2 Limited (“Antomin 2”) and Antomin Investors Limited (“Antomin Investors”), which own a number of copper exploration properties in Chile’s Antofagasta Region and Coquimbo Region. These include, among others, Penacho Blanco, Los Volcanes (ex-Conchi) and Brujulina (see Note (k) above). The remaining approximately 49% of Antomin 2 and Antomin Investors is owned by Mineralinvest Establishment (“Mineralinvest”), a company controlled by the Luksic family.
Further details are set out in Note 36(e) to the financial statements.
Antofagasta plc 193
OT
HE
R IN
FO
RM
AT
ION
ST
RA
TE
GIC
RE
PO
RT
GO
VE
RN
AN
CE
FIN
AN
CIA
L STA
TE
ME
NT
SO
VE
RV
IEW
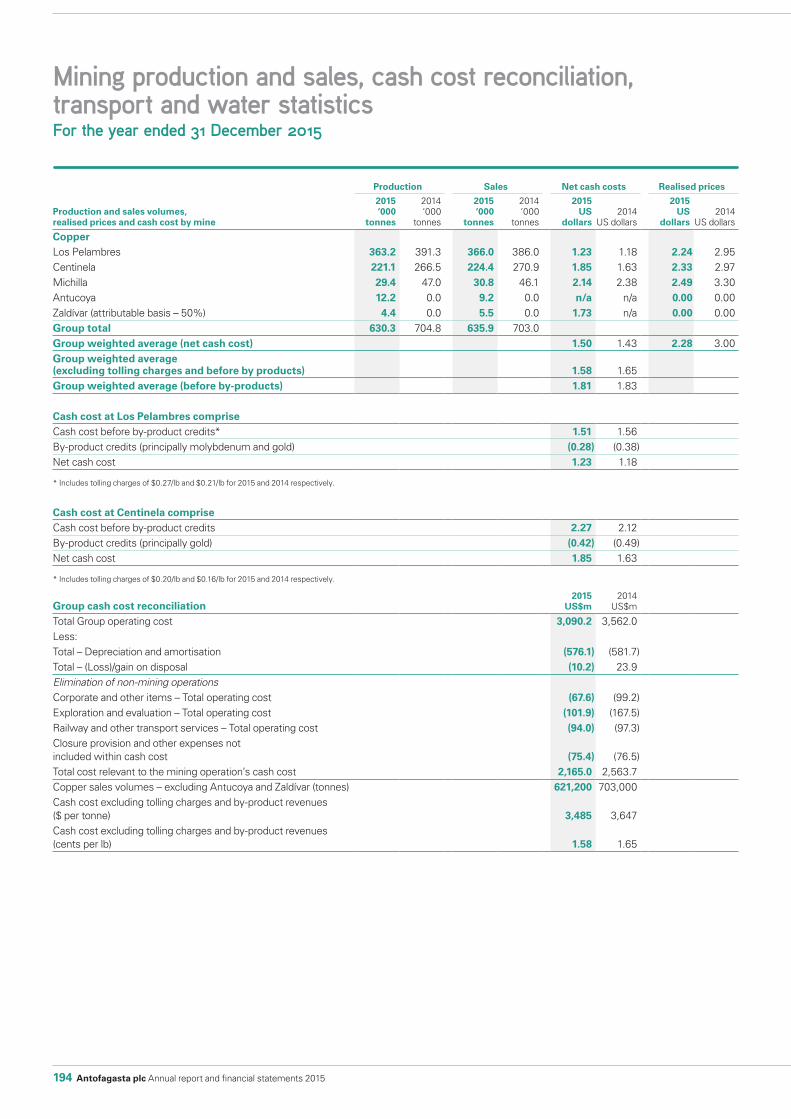
Production and sales volumes, realised prices and cash cost by mine
Production Sales Net cash costs Realised prices
2015 ‘000
tonnes
2014 ‘000
tonnes
2015 ‘000
tonnes
2014 ‘000
tonnes
2015 US
dollars2014
US dollars
2015 US
dollars2014
US dollars
CopperLos Pelambres 363.2 391.3 366.0 386.0 1.23 1.18 2.24 2.95 Centinela 221.1 266.5 224.4 270.9 1.85 1.63 2.33 2.97 Michilla 29.4 47.0 30.8 46.1 2.14 2.38 2.49 3.30 Antucoya 12.2 0.0 9.2 0.0 n/a n/a 0.00 0.00 Zaldívar (attributable basis – 50%) 4.4 0.0 5.5 0.0 1.73 n/a 0.00 0.00 Group total 630.3 704.8 635.9 703.0 Group weighted average (net cash cost) 1.50 1.43 2.28 3.00 Group weighted average (excluding tolling charges and before by products) 1.58 1.65 Group weighted average (before by-products) 1.81 1.83
Cash cost at Los Pelambres compriseCash cost before by-product credits* 1.51 1.56 By-product credits (principally molybdenum and gold) (0.28) (0.38)Net cash cost 1.23 1.18
* Includes tolling charges of $0.27/lb and $0.21/lb for 2015 and 2014 respectively.
Cash cost at Centinela compriseCash cost before by-product credits 2.27 2.12 By-product credits (principally gold) (0.42) (0.49)Net cash cost 1.85 1.63
* Includes tolling charges of $0.20/lb and $0.16/lb for 2015 and 2014 respectively.
Group cash cost reconciliation2015
US$m2014
US$m
Total Group operating cost 3,090.2 3,562.0 Less:Total – Depreciation and amortisation (576.1) (581.7)Total – (Loss)/gain on disposal (10.2) 23.9 Elimination of non-mining operationsCorporate and other items – Total operating cost (67.6) (99.2)Exploration and evaluation – Total operating cost (101.9) (167.5)Railway and other transport services – Total operating cost (94.0) (97.3)Closure provision and other expenses not included within cash cost (75.4) (76.5)Total cost relevant to the mining operation’s cash cost 2,165.0 2,563.7 Copper sales volumes – excluding Antucoya and Zaldívar (tonnes) 621,200 703,000 Cash cost excluding tolling charges and by-product revenues ($ per tonne) 3,485 3,647 Cash cost excluding tolling charges and by-product revenues (cents per lb) 1.58 1.65
194 Antofagasta plc Annual report and financial statements 2015
Mining production and sales, cash cost reconciliation, transport and water statisticsFor the year ended 31 December 2015
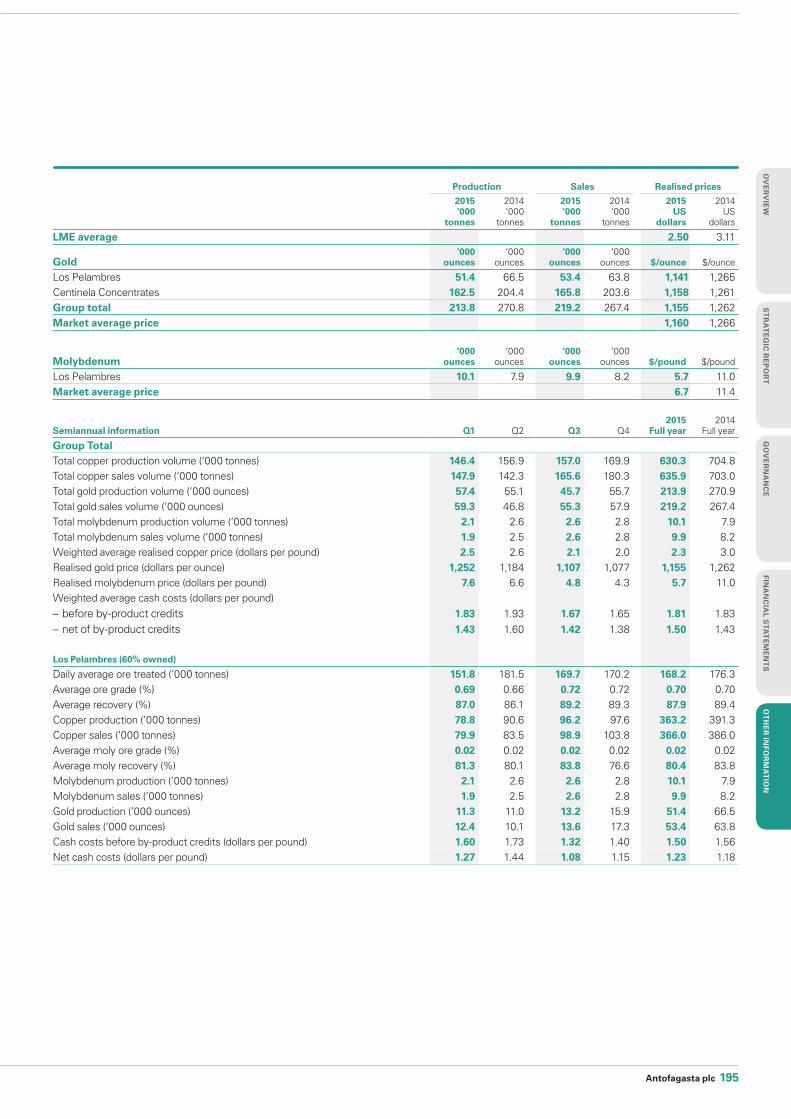
Production Sales Realised prices
2015 ‘000
tonnes
2014 ‘000
tonnes
2015 ‘000
tonnes
2014 ‘000
tonnes
2015 US
dollars
2014 US
dollars
LME average 2.50 3.11
Gold‘000
ounces‘000
ounces‘000
ounces‘000
ounces $/ounce $/ounce
Los Pelambres 51.4 66.5 53.4 63.8 1,141 1,265 Centinela Concentrates 162.5 204.4 165.8 203.6 1,158 1,261 Group total 213.8 270.8 219.2 267.4 1,155 1,262 Market average price 1,160 1,266
Molybdenum‘000
ounces‘000
ounces‘000
ounces‘000
ounces $/pound $/pound
Los Pelambres 10.1 7.9 9.9 8.2 5.7 11.0 Market average price 6.7 11.4
Semiannual information Q1 Q2 Q3 Q42015
Full year 2014
Full year
Group TotalTotal copper production volume (‘000 tonnes) 146.4 156.9 157.0 169.9 630.3 704.8 Total copper sales volume (‘000 tonnes) 147.9 142.3 165.6 180.3 635.9 703.0 Total gold production volume (‘000 ounces) 57.4 55.1 45.7 55.7 213.9 270.9 Total gold sales volume (‘000 ounces) 59.3 46.8 55.3 57.9 219.2 267.4 Total molybdenum production volume (‘000 tonnes) 2.1 2.6 2.6 2.8 10.1 7.9 Total molybdenum sales volume (‘000 tonnes) 1.9 2.5 2.6 2.8 9.9 8.2 Weighted average realised copper price (dollars per pound) 2.5 2.6 2.1 2.0 2.3 3.0 Realised gold price (dollars per ounce) 1,252 1,184 1,107 1,077 1,155 1,262 Realised molybdenum price (dollars per pound) 7.6 6.6 4.8 4.3 5.7 11.0 Weighted average cash costs (dollars per pound) – before by-product credits 1.83 1.93 1.67 1.65 1.81 1.83 – net of by-product credits 1.43 1.60 1.42 1.38 1.50 1.43
Los Pelambres (60% owned)
Daily average ore treated (’000 tonnes) 151.8 181.5 169.7 170.2 168.2 176.3 Average ore grade (%) 0.69 0.66 0.72 0.72 0.70 0.70 Average recovery (%) 87.0 86.1 89.2 89.3 87.9 89.4 Copper production (’000 tonnes) 78.8 90.6 96.2 97.6 363.2 391.3 Copper sales (’000 tonnes) 79.9 83.5 98.9 103.8 366.0 386.0 Average moly ore grade (%) 0.02 0.02 0.02 0.02 0.02 0.02 Average moly recovery (%) 81.3 80.1 83.8 76.6 80.4 83.8 Molybdenum production (’000 tonnes) 2.1 2.6 2.6 2.8 10.1 7.9 Molybdenum sales (’000 tonnes) 1.9 2.5 2.6 2.8 9.9 8.2 Gold production (’000 ounces) 11.3 11.0 13.2 15.9 51.4 66.5 Gold sales (’000 ounces) 12.4 10.1 13.6 17.3 53.4 63.8 Cash costs before by-product credits (dollars per pound) 1.60 1.73 1.32 1.40 1.50 1.56 Net cash costs (dollars per pound) 1.27 1.44 1.08 1.15 1.23 1.18
Antofagasta plc 195
OT
HE
R IN
FO
RM
AT
ION
ST
RA
TE
GIC
RE
PO
RT
GO
VE
RN
AN
CE
FIN
AN
CIA
L STA
TE
ME
NT
SO
VE
RV
IEW

Semiannual information Q1 Q2 Q3 Q42015
Full year 2014
Full year
Centinela Concentrate (70% owned)Daily average ore treated (’000 tonnes) 74.7 82.9 85.9 93.3 84.2 85.8 Average ore grade (%) 0.71 0.62 0.51 0.50 0.58 0.65 Average recovery (%) 88.0 86.6 84.2 83.0 85.5 88.2 Copper production (’000 tonnes) 38.4 39.9 31.9 34.9 145.2 172.8 Copper sales (’000 tonnes) 37.8 32.8 39.7 35.4 145.6 178.8 Average gold ore grade (g/tonne) 0.3 0.3 0.2 0.2 0.2 0.3 Average gold recovery (%) 78.8 71.6 69.8 68.0 72.3 74.7 Gold production (’000 ounces) 46.1 44.1 32.5 39.8 162.5 204.4 Gold sales (’000 ounces) 46.9 36.7 41.7 40.6 165.8 203.6
Centinela Cathodes (70% owned)Daily average ore treated (’000 tonnes) 25.4 26.2 25.0 25.0 25.4 25.2 Average ore grade (%) 1.17 0.96 0.97 0.85 0.98 1.31 Average recovery (%) 70.6 64.8 71.1 69.6 68.9 70.5 Copper production – heap-leach (’000 tonnes) 19.2 15.2 15.7 14.3 64.4 83.6 Copper production – total (’000 tonnes) 21.9 18.1 18.7 17.2 75.9 93.8 Copper sales (’000 tonnes) 21.8 18.2 19.0 19.8 78.8 92.1
Centinela (70% owned)Cash costs before by-product credits (dollars per pound) 2.06 2.22 2.36 2.47 2.27 2.12 Net cash costs (dollars per pound) 1.58 1.77 2.02 2.08 1.85 1.63
Michilla (99.9% owned)Daily average ore treated (’000 tonnes) 6.8 7.1 6.80 2.90 5.9 12.2 Average ore grade (%) 1.00 1.35 1.43 1.35 1.28 1.13 Average recovery (%) 78.1 79.3 78.9 74.0 78.2 79.5 Copper production – heap-leach (’000 tonnes) 5.6 6.0 6.1 4.4 22.1 40.1 Copper production – total (’000 tonnes) 7.3 8.3 8.0 5.8 29.4 47.0 Copper cathodes – sales volume (’000 tonnes) 8.4 7.8 8.0 6.7 30.8 46.1 Cash costs (dollars per pound) 2.48 2.04 2.06 1.97 2.14 2.38
Transport (100% owned)Total tonnage transported (’000 tonnes) 1,714 1,693 1,482 1,742 6,805 7,302
196 Antofagasta plc Annual report and financial statements 2015
Mining production and sales, cash cost reconciliation, transport and water statistics
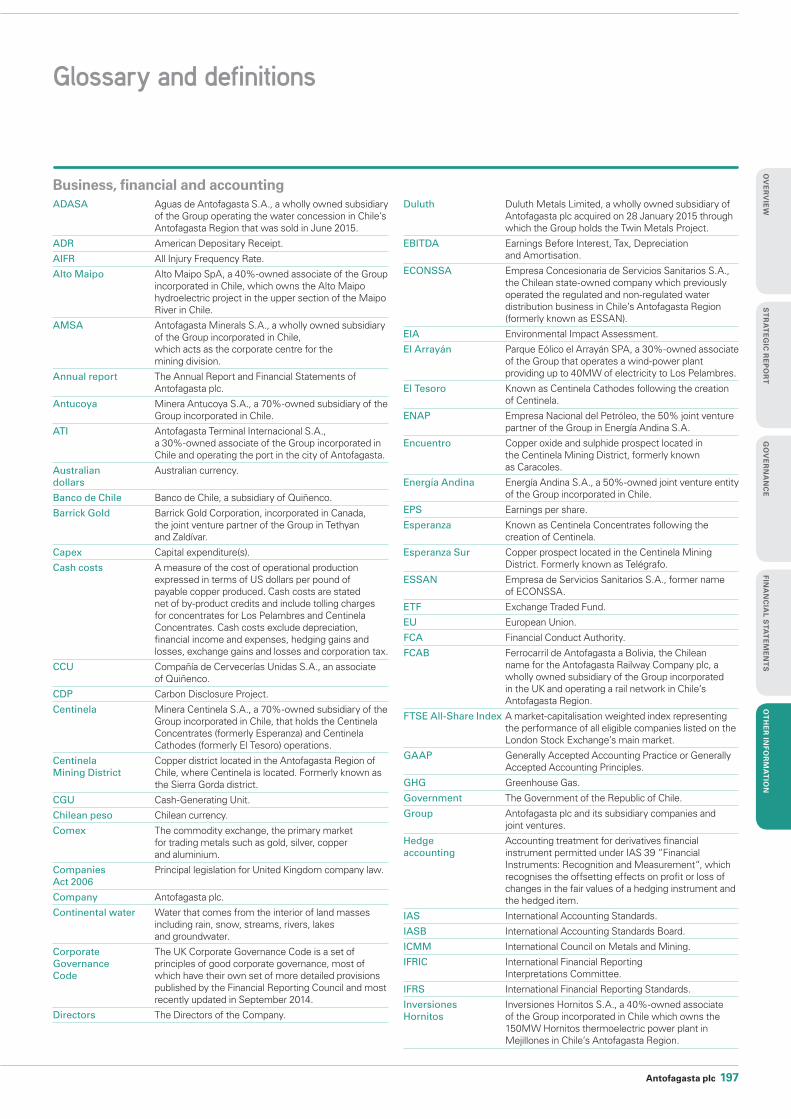
Business, financial and accountingADASA Aguas de Antofagasta S.A., a wholly owned subsidiary
of the Group operating the water concession in Chile’s Antofagasta Region that was sold in June 2015.
ADR American Depositary Receipt.
AIFR All Injury Frequency Rate.
Alto Maipo Alto Maipo SpA, a 40%-owned associate of the Group incorporated in Chile, which owns the Alto Maipo hydroelectric project in the upper section of the Maipo River in Chile.
AMSA Antofagasta Minerals S.A., a wholly owned subsidiary of the Group incorporated in Chile, which acts as the corporate centre for the mining division.
Annual report The Annual Report and Financial Statements of Antofagasta plc.
Antucoya Minera Antucoya S.A., a 70%-owned subsidiary of the Group incorporated in Chile.
ATI Antofagasta Terminal Internacional S.A., a 30%-owned associate of the Group incorporated in Chile and operating the port in the city of Antofagasta.
Australian dollars
Australian currency.
Banco de Chile Banco de Chile, a subsidiary of Quiñenco.
Barrick Gold Barrick Gold Corporation, incorporated in Canada, the joint venture partner of the Group in Tethyan and Zaldívar.
Capex Capital expenditure(s).
Cash costs A measure of the cost of operational production expressed in terms of US dollars per pound of payable copper produced. Cash costs are stated net of by-product credits and include tolling charges for concentrates for Los Pelambres and Centinela Concentrates. Cash costs exclude depreciation, financial income and expenses, hedging gains and losses, exchange gains and losses and corporation tax.
CCU Compañía de Cervecerías Unidas S.A., an associate of Quiñenco.
CDP Carbon Disclosure Project.
Centinela Minera Centinela S.A., a 70%-owned subsidiary of the Group incorporated in Chile, that holds the Centinela Concentrates (formerly Esperanza) and Centinela Cathodes (formerly El Tesoro) operations.
Centinela Mining District
Copper district located in the Antofagasta Region of Chile, where Centinela is located. Formerly known as the Sierra Gorda district.
CGU Cash-Generating Unit.
Chilean peso Chilean currency.
Comex The commodity exchange, the primary market for trading metals such as gold, silver, copper and aluminium.
Companies Act 2006
Principal legislation for United Kingdom company law.
Company Antofagasta plc.
Continental water Water that comes from the interior of land masses including rain, snow, streams, rivers, lakes and groundwater.
Corporate Governance Code
The UK Corporate Governance Code is a set of principles of good corporate governance, most of which have their own set of more detailed provisions published by the Financial Reporting Council and most recently updated in September 2014.
Directors The Directors of the Company.
Duluth Duluth Metals Limited, a wholly owned subsidiary of Antofagasta plc acquired on 28 January 2015 through which the Group holds the Twin Metals Project.
EBITDA Earnings Before Interest, Tax, Depreciation and Amortisation.
ECONSSA Empresa Concesionaria de Servicios Sanitarios S.A., the Chilean state-owned company which previously operated the regulated and non-regulated water distribution business in Chile’s Antofagasta Region (formerly known as ESSAN).
EIA Environmental Impact Assessment.
El Arrayán Parque Eólico el Arrayán SPA, a 30%-owned associate of the Group that operates a wind-power plant providing up to 40MW of electricity to Los Pelambres.
El Tesoro Known as Centinela Cathodes following the creation of Centinela.
ENAP Empresa Nacional del Petróleo, the 50% joint venture partner of the Group in Energía Andina S.A.
Encuentro Copper oxide and sulphide prospect located in the Centinela Mining District, formerly known as Caracoles.
Energía Andina Energía Andina S.A., a 50%-owned joint venture entity of the Group incorporated in Chile.
EPS Earnings per share.
Esperanza Known as Centinela Concentrates following the creation of Centinela.
Esperanza Sur Copper prospect located in the Centinela Mining District. Formerly known as Telégrafo.
ESSAN Empresa de Servicios Sanitarios S.A., former name of ECONSSA.
ETF Exchange Traded Fund.
EU European Union.
FCA Financial Conduct Authority.
FCAB Ferrocarril de Antofagasta a Bolivia, the Chilean name for the Antofagasta Railway Company plc, a wholly owned subsidiary of the Group incorporated in the UK and operating a rail network in Chile’s Antofagasta Region.
FTSE All‑Share Index A market-capitalisation weighted index representing the performance of all eligible companies listed on the London Stock Exchange’s main market.
GAAP Generally Accepted Accounting Practice or Generally Accepted Accounting Principles.
GHG Greenhouse Gas.
Government The Government of the Republic of Chile.
Group Antofagasta plc and its subsidiary companies and joint ventures.
Hedge accounting
Accounting treatment for derivatives financial instrument permitted under IAS 39 “Financial Instruments: Recognition and Measurement“, which recognises the offsetting effects on profit or loss of changes in the fair values of a hedging instrument and the hedged item.
IAS International Accounting Standards.
IASB International Accounting Standards Board.
ICMM International Council on Metals and Mining.
IFRIC International Financial Reporting Interpretations Committee.
IFRS International Financial Reporting Standards.
Inversiones Hornitos
Inversiones Hornitos S.A., a 40%-owned associate of the Group incorporated in Chile which owns the 150MW Hornitos thermoelectric power plant in Mejillones in Chile’s Antofagasta Region.
Antofagasta plc 197
OT
HE
R IN
FO
RM
AT
ION
ST
RA
TE
GIC
RE
PO
RT
GO
VE
RN
AN
CE
FIN
AN
CIA
L STA
TE
ME
NT
SO
VE
RV
IEW
Glossary and definitions

IVA Impuesto al Valor Agregado, or Chilean Value Added Tax (Chilean VAT).
Key Management Personnel
Persons with authority and responsibility for planning, directing and controlling the activities of the Group.
KPI Key performance indicator.
LBMA London Bullion Market Association.
LIBOR London Inter Bank Offer Rate.
LME London Metal Exchange.
Los Pelambres Minera Los Pelambres S.A., a 60%-owned subsidiary of the Group incorporated in Chile.
LSE London Stock Exchange.
LTIFR Lost Time Injury Frequency Rate.
LTIP Long Term Incentive Plan which the Group’s CEO, Executive Committee and the other senior managers participate in.
Madeco Madeco S.A., a subsidiary of Quiñenco.
Marubeni Marubeni Corporation, the Group’s 30% minority partner in Centinela and Antucoya.
Michilla Minera Michilla S.A., a 99.9%-owned subsidiary of the Group incorporated in Chile.
Mirador Copper oxide deposit that forms part of the Centinela operation.
Platts A provider of energy and metals information and source of benchmark price assessments.
PPA Power Purchase Agreement.
Provisional pricing
A sales term in several copper and molybdenum concentrate sale agreements and cathodes sale agreements that provides for provisional pricing of sales at the time of shipment, with final pricing being based on the monthly average LME copper price or monthly average molybdenum price for specific future periods, normally ranging from 30 to 180 days after delivery to the customer. For the purposes of IAS 39, the provisional sale is considered to contain an embedded derivative (ie the forward contract for which the provisional sale is subsequently adjusted) that is separated from the host contract (ie the sale of metals contained in the concentrate or cathode at the provisional invoice price less tolling charges deducted).
Quiñenco Quiñenco S.A., a Chilean financial and industrial conglomerate under the control of the Luksic family and listed on the Santiago Stock Exchange.
Ramsar Convention
International treaty for the conservation and sustainable utilisation of wetlands.
Realised prices Effective sale price achieved comparing revenues (grossed up for tolling charges for concentrate) with sales volumes.
Reko Diq Reko Diq is a substantial copper-gold porphyry district in south-west Pakistan. The Group’s interest was held through Tethyan.
Run‑of‑river A type of hydroelectric plant using the flow of a river as it occurs and having little or no reservoir capacity.
SERNAGEOMIN Servicio Nacional de Geología y Minería, a government agency that provides geological and technical advice and regulates the mining industry in Chile.
SHFE Shanghai Futures Exchange.
Sterling UK currency.
SVS Superintendencia de Valores y Seguros de Chile, the Chilean securities regulator.
Telégrafo The former name of Esperanza Sur.
Tesoro Central and Tesoro Noreste
Copper oxide deposits that form part of the Centinela operation.
Tethyan Tethyan Copper Company Limited, a 50-50 joint venture with Barrick Gold incorporated in Australia.
TSR Total Shareholder Return, being the movement in the Company’s share price plus reinvested dividends.
Twin Metals Minnesota Project
A copper, nickel and platinum group metals (strategic metals) underground-mining project located in north-eastern Minnesota.
UK United Kingdom.
UKLA United Kingdom Listing Authority.
US United States.
US dollars United States currency.
Zaldívar Compañia Minera Zaldívar SpA, a 50-50 joint venture with Barrick Gold Corporation, which operates the Zaldívar copper mine in Chile.
Mining industryBrownfield project A development or exploration project in the vicinity
of an existing operation.
By‑products (credits in copper concentrates)
Products obtained as a result of copper processing. Los Pelambres and Centinela Concentrates receive credit for the gold and silver content in the copper concentrate sold. Los Pelambres also produces molybdenum concentrate.
Concentrate The product of a physical concentration process, such as flotation or gravity concentration, which involves separating ore minerals from unwanted waste rock. Concentrates require subsequent processing (such as smelting or leaching) to break down or dissolve the ore minerals and obtain the desired elements, usually metals.
Contained copper The proportion or quantity of copper contained in a given quantity of ore or concentrate.
Copper cathode Refined copper produced by electrolytic refining of impure copper by electrowinning.
Cut‑off grade The lowest grade of mineralised material considered economic to process and used in the calculation of ore reserves and mineral resources.
Flotation A process of separation by which chemicals in solution are added to materials, some of which are attracted to bubbles and float, while others sink. This results in the production of concentrate.
Grade A copper cathode
Highest-quality copper cathode (LME registered and certified in the case of Centinela Cathodes and Michilla).
Greenfield project The development or exploration of a new project at a previously undeveloped site.
Heap‑leaching A process for the recovery of copper from ore. The crushed material is laid on a slightly sloping, impermeable pad and leached by uniformly trickling (gravity fed) chemical solution through the beds to ponds. The metal is then recovered from the solution through the SX-EW process.
JORC The Australasian Joint Ore Reserves Committee.
Leaching The process by which a soluble mineral can be economically recovered by dissolution.
Life‑of‑Mine (“LOM”) The remaining life of a mine expressed in years, calculated by reference to scheduled production rates (ie comparing the rate at which ore is expected to be extracted from the mine to current defined reserves).
198 Antofagasta plc Annual report and financial statements 2015
Glossary and definitions

Mineral resources Material of intrinsic economic interest occurring in such form and quantity that there are reasonable prospects for eventual economic extraction. Mineral resources are stated inclusive of ore reserves, as defined by JORC.
MW Megawatts (one million watts).
Net cash cost Gross cash cost plus by-product credits.
Open pit Mine working or excavation that is open to the surface.
Ore Rock from which metal(s) or mineral(s) can be economically and legally extracted.
Ore grade The relative quantity, or percentage, of metal content in an ore body or quantity of processed ore.
Ore reserves Part of Mineral Resources for which appropriate assessments have been carried out to demonstrate that at a given date extraction could be reasonably justified. These include consideration of and modification by realistically assumed mining, metallurgical, economic, marketing, legal, environmental, social and governmental factors.
Oxide and Sulphide ores
Different kinds of ore containing copper. Oxide ore occurs on the weathered surface of ore-rich lodes and normally results in the production of cathode copper through a heap-leaching process. Sulphide ore comes from an unweathered parent ores process and normally results in the production of concentrate through a flotation process which then requires smelting and refining to produce cathode copper.
Payable copper The proportion or quantity of contained copper for which payment is received after metallurgical deduction.
Porphyry A large body of rock which contains disseminated chalcopyrite and other sulphide minerals. Such a deposit is mined in bulk on a large scale, generally in open pits, for copper and its by-product molybdenum.
Run‑of‑Mine (“ROM”)
A process for the recovery of copper from ore, typically used for low-grade ores. The mined, uncrushed ore is leached with a chemical solution. The metal is then recovered from the solution through the SX-EW process.
Stockpile Material extracted and piled for future use.
SX‑EW Solvent extraction and electrowinning. A process for extracting metal from an ore and producing pure metal. First the metal is leached into solution; the resulting solution is then purified in the solvent-extraction process; the solution is then treated in an electrochemical process (electrowinning) to recover cathode copper.
Tailings dam Construction used to deposit the rock waste which remains as a result of the concentrating process after the recoverable minerals have been extracted in concentrate form.
TC/RCs Treatment and refining charges, being terms used to set the smelting and refining charge or margin for processing copper concentrate and normally set either on an annual or spot basis.
Tolling charges Charges or margins for converting concentrate into finished metal. These include TC/RCs, price participation and price sharing for copper concentrate and roasting charges for molybdenum concentrate.
tpd Tonnes per day, normally with reference to the quantity of ore processed over a given period of time expressed as a daily average.
Underground mine Natural or man-made excavation under the surface of the ground.
Currency abbreviations$ US dollar.
$’000 Thousand US dollars.
$m Million US dollars.
£ Pound sterling.
£’000 Thousand pounds sterling.
£m Million pounds sterling.
p Pence sterling.
C$ Canadian dollar.
C$m Million Canadian dollars.
Ch$ Chilean peso.
Ch$’000 Thousand Chilean pesos.
Ch$m Million Chilean pesos.
A$ Australian dollar.
A$’000 Thousand Australian dollars.
A$m Million Australian dollars.
Definitions and conversion of weights and measureslb Pound.
oz A troy ounce.
’000 m3 Thousand cubic metres.
’000 tonnes Thousand metric tonnes.
1 kilogramme = 2.2046 pounds.
1 metric tonne = 1,000 kilogrammes.
1 kilometre = 0.6214 miles.
1 troy ounce = 31.1 grammes.
Chemical symbolsCu Copper.
Mo Molybdenum.
Au Gold.
Ag Silver.
Antofagasta plc 199
OT
HE
R IN
FO
RM
AT
ION
ST
RA
TE
GIC
RE
PO
RT
GO
VE
RN
AN
CE
FIN
AN
CIA
L STA
TE
ME
NT
SO
VE
RV
IEW

Annual General MeetingThe Annual General Meeting will be held at Church House Conference Centre, Dean’s Yard, Westminster, London SW1P 3NZ at 10.00 am on Wednesday, 18 May 2016. The formal notice of the Annual General Meeting and resolutions to be proposed are set out in the Notice of Annual General Meeting.
London Stock Exchange listing and share priceThe Company’s shares are listed on the London Stock Exchange.
The Company’s American Depositary Receipts (“ADRs”) also trade on the over-the-counter market in the United States. Each ADR represents the right to receive two ordinary shares.
Share capitalDetails of the Company’s ordinary share capital are given in Note 31 to the financial statements.
RegistrarsComputershare Investor Services PLC The Pavilions Bridgwater Road Bristol BS99 6ZZ United Kingdom Tel: +44 (0)37 0702 0159 www.computershare.com
WebsiteAntofagasta plc’s annual and half-yearly financial reports, press releases and other presentations are available on the Group’s website at www.antofagasta.co.uk.
Registered officeCleveland House 33 King Street London SW1Y 6RJ United Kingdom Tel: +44 20 7808 0988
Santiago officeAntofagasta Minerals Av. Apoquindo 4001 – Piso 18 Santiago, Chile Tel: +562 2798 7000
Registered number1627889
Additional information can be found in the Shareholder Information section of the Notice of Annual General Meeting and on the Group’s website.
200 Antofagasta plc Annual report and financial statements 2015
Shareholder information
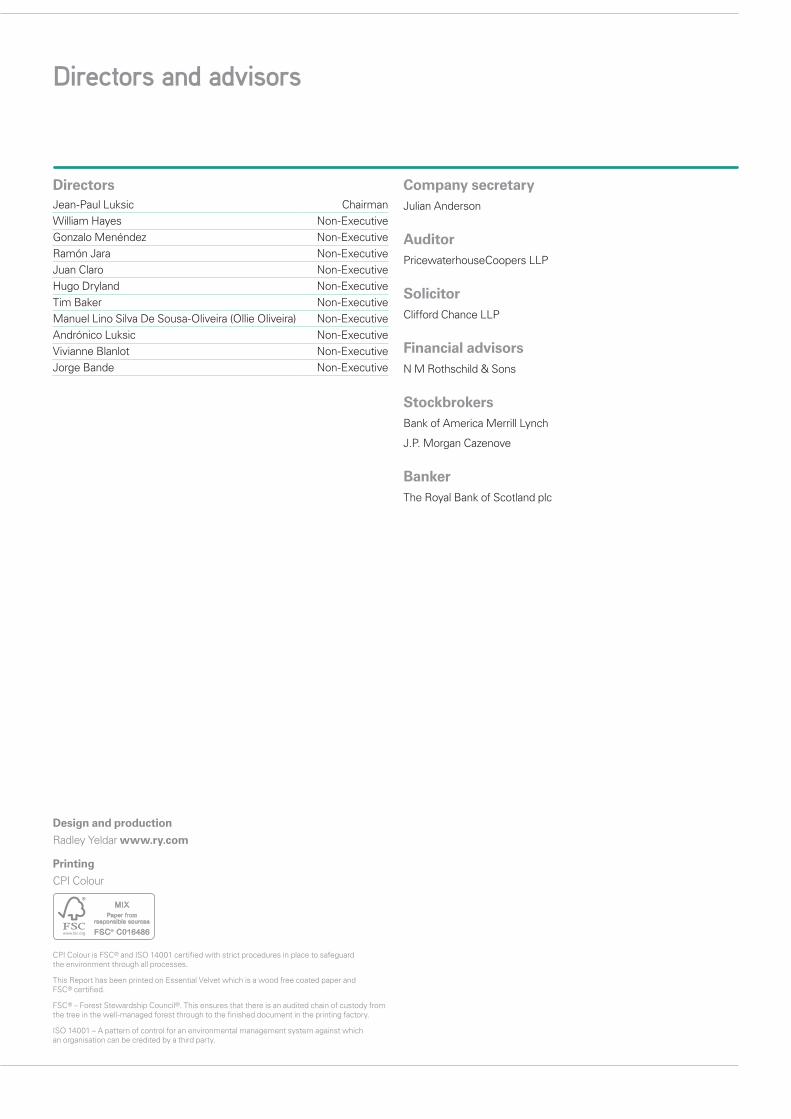
Design and production
Radley Yeldar www.ry.com
Printing
CPI Colour
CPI Colour is FSC® and ISO 14001 certified with strict procedures in place to safeguard the environment through all processes.
This Report has been printed on Essential Velvet which is a wood free coated paper and FSC® certified.
FSC® – Forest Stewardship Council®. This ensures that there is an audited chain of custody from the tree in the well-managed forest through to the finished document in the printing factory.
ISO 14001 – A pattern of control for an environmental management system against which an organisation can be credited by a third party.
DirectorsJean-Paul Luksic ChairmanWilliam Hayes Non-ExecutiveGonzalo Menéndez Non-ExecutiveRamón Jara Non-ExecutiveJuan Claro Non-ExecutiveHugo Dryland Non-ExecutiveTim Baker Non-ExecutiveManuel Lino Silva De Sousa-Oliveira (Ollie Oliveira) Non-ExecutiveAndrónico Luksic Non-ExecutiveVivianne Blanlot Non-ExecutiveJorge Bande Non-Executive
Company secretary Julian Anderson
Auditor PricewaterhouseCoopers LLP
Solicitor Clifford Chance LLP
Financial advisorsN M Rothschild & Sons
StockbrokersBank of America Merrill Lynch
J.P. Morgan Cazenove
BankerThe Royal Bank of Scotland plc
Directors and advisors

Visit www.antofagasta.co.uk for up-to-date investor information including our past financial results.
Antofagasta plcCleveland House 33 King Street London SW1Y 6RJ United Kingdom
An
tofag
asta plc A
nnual report and financial statements 2015