annual report and accounts 2014 - kambi · we know what it takes to win ... everything we do is...
TRANSCRIPT

Annual Report and Accounts 2014

Kambi at a glanceKambi Group plc is a B2B provider of premium sports betting services to licensed B2C gaming operators. Our services encompass a broad offering from front end user interface through to odds compiling, customer intelligence and risk management, built on an in-house developed software platform. We currently provide our services to 11 operators, and we have seen our revenue increase by 70% in 2014. We employ 364 staff across offices in Malta (headquarters), London, Manila and Stockholm.
We operate in a dynamic business with exciting growth prospects. This report will give you detailed information of our performance in 2014, our first year as a listed company, plus the way we view future growth. Kambi Group plc is listed on First North at NASDAQ Stockholm under the symbol "KAMBI".

We know what it takes to win
At Kambi, we live and breathe sports betting. It’s who we are. It’s ingrained in our DNA. We understand how the market works, what the growth drivers are and what the end user demands. A unique risk management approach gives us the possibility to present an unparalleled user experience for the players at the same time as optimising the return for our customers.
We pride ourselves in delivering a highly scalable solution that ensures we keep improving and innovating to be in the forefront in the future, too.
First and foremost, Kambi is about people who are passionate about sports betting. Our staff have built a solid foundation based on experience, structures and proprietary technology. We have created a service we want to use ourselves, both as an operator, as well as a player.
In our view, the future of sports betting demands a service where all the vital parts function together in perfect harmony. By understanding the odds, risk management is handled better. By understanding the customer activities, algorithms can be improved and player interfaces optimised. Most importantly, innovation and new features can be rolled out at an exceptional pace as the workstreams are synchronised.
As a premium brand, we are driven by the pursuit of perfection. Everything we do is geared towards excelling in our twin objectives: providing the ultimate user experience and delivering optimal margins for our operators, enabling them to execute their acquisition and retention strategies.
It is no coincidence that Kambi is the Japanese word for ‘perfection’. It is in everything we do. From delivering a premium service to our operators, to creating an entertaining experience for the end user. We are unwavering in our belief that there is only one way to do something and that’s to make it perfect. Every time.
Annual Report and Accounts 2014
Strategic Report 4
Chairman’s Statement 4
A view from the CEO 5
Overview and Highlights 6
FIFA World Cup 8
Always on Point 10
The Sports Betting Market 12
Kambi’s Focus and Customers 14
Share Performance 16
Risk Factors 18
Corporate Governance 21
Board of Directors 22
Senior Executives 2
Corporate Governance Report 24
Directors’ Report 25
Financial Report 27
Independent Auditor’s Report 28
Financial Review 29
Financial Statements 0
AGM and Company Information 57
Glossary 58
Introduction

Technological innovation and development is moving fast and affecting us all. People. Companies and organisations. Locally and globally. value chains and business models are being challenged in all sectors. New companies are disrupting established markets and existing companies must continuously improve to remain competitive. The dominant trends globally are mobile, digitalisation and business model innovation, with service and product development cycles continuously accelerating. User experience is the key driver in many industries.
These trends are also valid for the gaming industry – an industry which has been revolutionised through technology and IT, and is becoming more global. International competition and technological innovation are driving the whole betting industry to supply the very best user experience to attract players and reduce churn. 2014 contin-ued the growing trend towards betting via mobile devices, and the mobile channel now accounts for around 50% of turnover within Kambi’s customer base.
The increasing demand for online betting is a fact. Regulatory change is another ongoing global trend which will reshape the landscape in the whole gaming industry, creating new opportunities for Kambi.
Kambi is thriving in this world. We’re very pleased that our customers have, on several occasions, publicly commented on the effectiveness of the Kambi service and how it has helped them boost their revenues and gain market share.
Our strategy is to offer the best Sportsbook by driving innovation and exceptional user experience, in addition to cost savings for our customers. We deliver a highly compet-itive product, helping our customers to compete with the very best in the market. The proof of the business model is in their success. Kambi is well placed to gain market share and create value for them. We are in a strong financial position to drive further growth and our dynamic team is dedicated to delivering strong results both for Kambi and our customers.
We are optimistic and confident for 2015.
ChairmanLars Stugemo
Chairman’s Statement
“Kambi is thriving in this world. We’re
very pleased that our customers have, on several occasions,
publicly commented on the effectiveness of the Kambi service
and how it has helped them boost their
revenues and gain market share.”
4 Kambi Group plc
Strategic Report

If 2013 was a year of proving the business model and acquiring customers, 2014 has been a year of delivery for Kambi. Delivering to our customers, helping them grow. Delivering on our plans for global expansion. Delivering on our goal of being listed on First North at Nasdaq Stockholm.
Becoming listed on Nasdaq in June last year was a milestone in Kambi’s history. Personally speaking, ringing the bell on the first morning of trading was a very proud and emotional moment. At Kambi, we can only ever be as successful as our customers. We provide the product and service for them to leverage. It’s immensely gratifying that in 2014 our customers achieved great success, broadly outperforming the market, producing remarkable figures in the most competitive markets. Our customers’ sports betting revenues reached an all-time high.
Established customers Suertia, Luckia and Napoleon Games extended their contracts and we added three new customers, expanding our global presence: 32Red, Iveria-bet and NagaWorld. NagaWorld in Cambodia was an interesting strategic win for us. Opening our first foothold in Asia was an opportunity to launch our over-the-counter terminals, allowing us to showcase our Sportsbook in one of the world’s largest casino resorts. I’m very satisfied to see that we have established ourselves as a premium brand in the market. It speaks volumes for our service and is reflected in not just our custom-ers’ results, but also their positive feedback on how Kambi drives value for them.
The football World Cup was played over five weeks, thoroughly testing our systems and staff with flawless results, no downtime and a fantastic service delivery. There were a reasonable number of unanticipated results in the matches, which resulted in excellent profits for our customers and for Kambi. For more details, see the dedicated World Cup section on pages 8 – 9.
I’m continuously amazed and impressed by our dedicated and skilled staff: they epito-mise teamwork, working together to deliver the best end user experience and returns for our customers. We recently won an award for “The Best Sportsbook Supplier of the Year”, which gives us further proof and confidence in the quality of our services.
Kambi is a now a major player in sports betting. It’s our passion for sports and betting that enables us to know exactly what it takes to win.
CEOKristian Nylén
A view from the CEO
“It’s immensely gratifying that in 2014
our customers achieved great success, broadly
outperforming the market, producing
remarkable figures in the most competitive
markets. Our customers’ sports betting
revenues reached an all-time high.”
Annual Report and Accounts 2014
Strategic Report

Overview and HighlightsWinning by Outperforming
€8.6mEBITDA of
364Number ofemployees
+70% Revenue
growth of
Positive cash flow
Strong Balance Sheet
following financing initiatives
11Number ofcustomers
Kambi Group plc
Strategic Report

€2.2mOperating profit of
Continued growth in
operator turnover powered by
Kambi
Offices in Malta, London,
Manila and Stockholm
Operational Highlights
Listing in June on First North at
Nasdaq Stockholm
Launched 3 new customers: 32Red,
Iveriabet and NagaWorld
The FIFA World Cup in Brazil
888sport launched its Sportsbook
in Spain
Suertia, Luckia and Napoleon
Games extended their contracts
with Kambi
Ratified as Associate
Member of the World Lottery
Association, the European State Lotteries and
Toto Association, and CIBELAE, the Latin American Corporation of State Lottery and Betting
65 Sports covered
worldwide
10
12
100
7
0
2
0
10%
9.0%
8.0%
7.0%
.0%
.0%
4.0%
Operator Turnover and MarginQ
1 2013
Q2 2013
Q3 2013
Q4 2013
Q1 2014
Q2 2014
Q3 2014
Q4 2014
Turnover index Margin %
The Kambi Turnover Index illustrates the operators’ quarterly turnover and betting margin. The operator turnover of the first quarter of 2014, shown on the left-hand axis, is indexed at 100. The operator betting margin is shown on the right-hand axis. Kambi charges its customers a commission based on their result, which is calculated as the margin on their turnover. The level of operator turnover is a stronger indicator of performance than margin, which can fluctuate in the short-term due to the outcome of certain events.
11
7Annual Report and Accounts 2014
Kambi’s World Cup
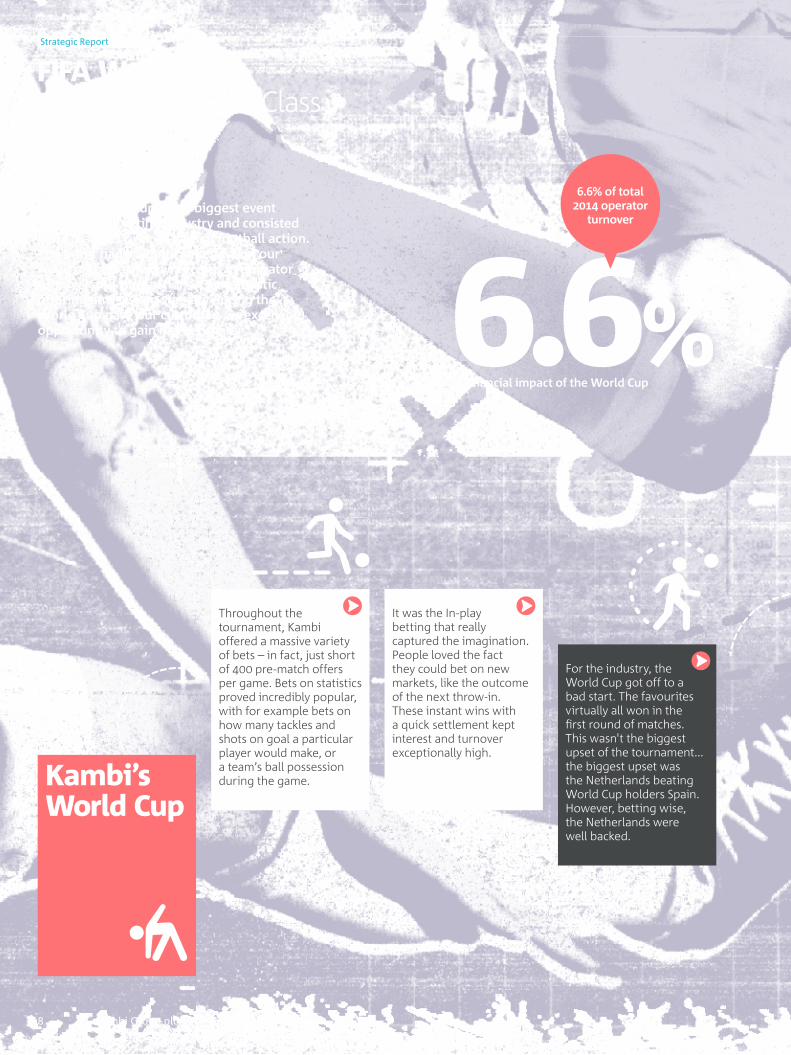
FIFA World CupWorld Cup. World Class
The FIFA World Cup is the biggest event in the sports betting industry and consisted of 64 matches over 25 days of football action. The event had a significant effect on our result and we saw new records in operator turnover and transactions. Our fantastic offering and system stability during the World Cup gave our customers an excellent opportunity to gain market share.
It was the In-play betting that really captured the imagination. People loved the fact they could bet on new markets, like the outcome of the next throw-in. These instant wins with a quick settlement kept interest and turnover exceptionally high.
For the industry, the World Cup got off to a bad start. The favourites virtually all won in the first round of matches. This wasn't the biggest upset of the tournament... the biggest upset was the Netherlands beating World Cup holders Spain. However, betting wise, the Netherlands were well backed.
Throughout the tournament, Kambi offered a massive variety of bets – in fact, just short of 400 pre-match offers per game. Bets on statistics proved incredibly popular, with for example bets on how many tackles and shots on goal a particular player would make, or a team’s ball possession during the game.
6.6% 6.6% of total
2014 operator turnover
Financial impact of the World Cup
8 Kambi Group plc
Strategic Report

The first major upset was tournament favourites Brazil only drawing 0 – 0 with Mexico. A disappointing result for Brazilian fans, but excellent for Kambi and its operators.
The 7 – 1 to Germany against Brazil was an extraordinary match. From a football perspective, it was all over after 25 minutes! Algorithms cannot handle this kind of outcome, but Kambi’s experienced traders continued to provide a high-quality offering, despite the match no longer being a contest after Germany went 4 – 0 ahead.
Out of all the matches, the final between Germany and Argentina provided the biggest turnover. Both sides were heavily backed to win, especially Germany, so the 0 – 0 result at 90 minutes saw it become the most profitable game.
In the last 16 matches, Germany’s extra time win against Algeria contributed to a very lucrative result for Kambi. Germany were runaway favourites and heavily backed. A surprising 0 – 0 scoreline at 90 minutes was the perfect result for us. The additional 30 minutes of extra time also allowed more In-play bets.
400 Kambi offered 400 pre-match
offers per game
11.4% 11.4% of total 2014 operator Gross Gaming
Revenue
Financial impact of the World Cup
Annual Report and Accounts 2014 9

Always on PointAs it Happens
In little more than a couple of years, sports betting has moved on from punts on an outcome that may have taken days to complete to ‘event-based’ betting, that happens in a moment. In 2014, Kambi accepted over 21 million bets on live tennis matches alone. To understand what that really takes to deliver, we need to take a closer look.
The
tenn
is p
laye
r
has
just
lost
the
thir
d po
int i
n a
row
.
He
seem
s ne
rvou
s
and
agit
ated
whi
lst
prep
arin
g to
ser
ve.
The
Kam
bi
trad
er s
pots
the
unch
arac
teri
stic
dip
in fo
rm a
nd c
onsi
ders
twea
king
the
algo
rith
m p
aram
eter
s
for t
he n
ext p
oint
.
200
0.1
It ta
kes
expe
rien
ced
spec
ialis
t
spor
t tra
ders
em
pow
ered
by
mod
els
from
a te
am o
f qua
nt
anal
ysts
and
mat
hem
atic
ians
to g
et th
e pr
obab
iliti
es s
pot o
n.A cu
stom
er
places
a lar
ge bet
on the w
inner o
f
the n
ext p
oint.
Our auto
mat
ed
custo
mer p
rofilin
g
syste
m p
icks u
p on
this
and id
entifies
the
custo
mer, a
sses
ses
their
history
and
behavio
ur and al
erts
the t
rader o
f the
‘new
’ conditi
ons. x%0.2
In an
insta
nt we n
eed
to se
parat
e the v
ario
us
player
cate
gories i
n order
to optim
ise m
argin
s and
max
imise
turn
over.
The player throws the
ball in the air. Until
just before striking
the ball, the bet offer
is still open.
95%Kambi stays ahead
of the game, allowing
bets right up until
the action takes
place. After all,
it’s in everyone’s
interest to maximise
the betting window.
0.3
The player breathes
out and starts
preparing for the
next point.A micro cycle in
Kambi’s ‘universe’
has passed and it all
starts over again.
0.5 The data from the
completed betting
cycle is fed back
to strengthen the
Kambi systems.
SecThe point is played to its exciting conclusion.
As soon as the umpire registers the point won, it’s automatically received in our system. Kambi settles and pays out the bet before the next point, enhancing the user experience and allowing us to turn that money over again.
0.4
10 Kambi Group plc
Strategic Report
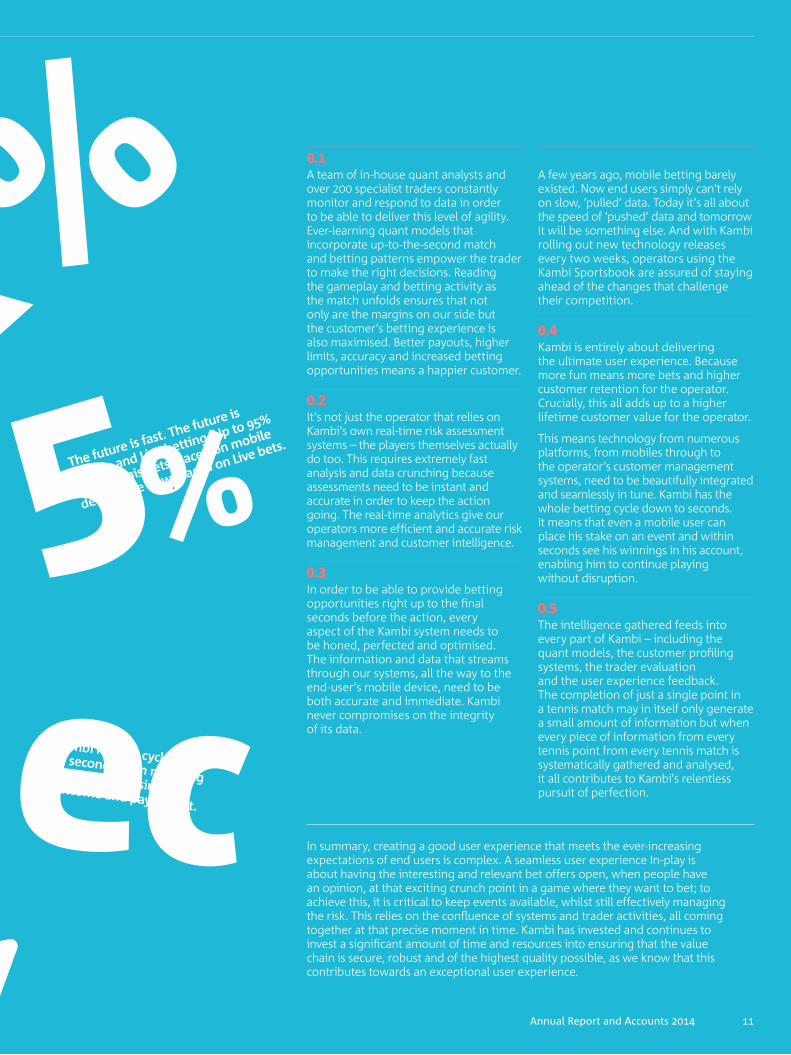
0.1A team of in-house quant analysts and over 200 specialist traders constantly monitor and respond to data in order to be able to deliver this level of agility. Ever-learning quant models that incorporate up-to-the-second match and betting patterns empower the trader to make the right decisions. Reading the gameplay and betting activity as the match unfolds ensures that not only are the margins on our side but the customer’s betting experience is also maximised. Better payouts, higher limits, accuracy and increased betting opportunities means a happier customer.
0.2It’s not just the operator that relies on Kambi’s own real-time risk assessment systems – the players themselves actually do too. This requires extremely fast analysis and data crunching because assessments need to be instant and accurate in order to keep the action going. The real-time analytics give our operators more efficient and accurate risk management and customer intelligence.
0.3In order to be able to provide betting opportunities right up to the final seconds before the action, every aspect of the Kambi system needs to be honed, perfected and optimised. The information and data that streams through our systems, all the way to the end-user’s mobile device, need to be both accurate and immediate. Kambi never compromises on the integrity of its data.
A few years ago, mobile betting barely existed. Now end users simply can’t rely on slow, ‘pulled’ data. Today it’s all about the speed of ‘pushed’ data and tomorrow it will be something else. And with Kambi rolling out new technology releases every two weeks, operators using the Kambi Sportsbook are assured of staying ahead of the changes that challenge their competition.
0.4Kambi is entirely about delivering the ultimate user experience. Because more fun means more bets and higher customer retention for the operator. Crucially, this all adds up to a higher lifetime customer value for the operator.
This means technology from numerous platforms, from mobiles through to the operator’s customer management systems, need to be beautifully integrated and seamlessly in tune. Kambi has the whole betting cycle down to seconds. It means that even a mobile user can place his stake on an event and within seconds see his winnings in his account, enabling him to continue playing without disruption.
0.5The intelligence gathered feeds into every part of Kambi – including the quant models, the customer profiling systems, the trader evaluation and the user experience feedback.The completion of just a single point in a tennis match may in itself only generate a small amount of information but when every piece of information from every tennis point from every tennis match is systematically gathered and analysed, it all contributes to Kambi's relentless pursuit of perfection.
In summary, creating a good user experience that meets the ever-increasing expectations of end users is complex. A seamless user experience In-play is about having the interesting and relevant bet offers open, when people have an opinion, at that exciting crunch point in a game where they want to bet; to achieve this, it is critical to keep events available, whilst still effectively managing the risk. This relies on the confluence of systems and trader activities, all coming together at that precise moment in time. Kambi has invested and continues to invest a significant amount of time and resources into ensuring that the value chain is secure, robust and of the highest quality possible, as we know that this contributes towards an exceptional user experience.
x%95%
The future is fast. The future is
mobile and Live betting. Up to 95%
of all tennis bets placed on mobile
devices are now placed on Live bets.
SecKambi has the cycle down to seconds from receiving the bet, processing the outcome and paying out.
Annual Report and Accounts 2014 11

The Sports Betting MarketMarket Figures
In 2014, the estimated value of the global sports betting market was approximately €40bn in Gross Gaming Revenue (GGR). Asia and Europe are the largest regions, valued at around €20bn and €15bn respectively. The market is estimated to have an annual growth rate of 10%.
Kambi currently operates less than 1% of this market and estimates that its addressable market is around 20 – 30% of the total. The rest of the market currently presents limited opportunities for Kambi due to a lack of regulations. However, there are macro trends of (re-)regulation in hitherto unregulated markets and a gradual shift in consumer demand from offline to online. These are creating a market dynamic that is increasing Kambi’s addressable market size as well as the need for Kambi’s services.
(Re-)regulation of sports betting is today on the agenda for many governments across the globe. Countries are starting to understand that untapped tax revenues are available. Furthermore, countries that have already re-regulated are also gradually improving regulatory models towards more end user and operator friendly regulations. These have been proven to be the best way to keep unregulated business out and optimise the tax income. Italy’s upcoming change from a tax based on Turnover to one based on GGR is a good example of this. This development further opens up the market for Kambi and creates a need for highly competitive solutions, such as Kambi’s.
There is a clear trend in end user behaviour from offline to online, along with increased mobile device usage. This transition comes with very low switching costs for the end users and therefore there is an increase in consumer demand for product quality and user experience. The mobile channel has taken this to the extreme and puts enormous pressure on operators to deliver a product that enables them to compete not only with other Sportsbooks but also with other mobile entertainment products.
Today the mobile channel represents around 40% of all online betting worldwide and it is growing rapidly. This trend will not replace the offline channel for sports betting. However, it does create demand for multi-channel solutions. The end users, and subsequently the operators to a certain extent, will be choosing their brand or product depending on the quality of the online solution. It is here that the biggest differences will become apparent.
The multi-channel solution was identified at an early stage as an enabler for Kambi to be able to maximise its addressable market. In Q3 2013, Kambi released its first multi-channel solution for desktop, mobile and retail, and today we have two customers operating on it. We see significant interest for this solution in the market.
Europe is ahead of the rest of the world when it comes to regulations and maturity in the online channel and therefore represents the largest addressable market for Kambi. We believe we will continue to see more regulatory change, which will have a positive impact on business-to-business opportunities in the sports betting industry, both from a market growth perspective as well as added acquisition opportunities. Regulatory changes in the Netherlands, Germany and Italy are the most likely opportunities shorter-term.
In Latin America, Mexico is currently finalising a new regulation and we expect other countries to follow.
The addressable online market in Asia is currently restricted due to limited licensing opportunities for operators.
Aside from Nevada, sports betting is illegal in the USA and restricted to the provisional lotteries in Canada.
In parts of Africa, sports betting is regulated, most notably in South Africa.
As for Australia, the market is regulated. It is a very mature market with a few large operators dominating the market. Live betting is not allowed online.
2%24%74%
Caribbean, Central and
South America€0.7bn
North America€4.0bn
13%
23%
64%
Strategic Report
12 Kambi Group plc

Source: H2GC
Key
• Onshore iBetting
• Offshore iBetting
• Total Land-based Betting
5%12%83%
Africa€0.6bn
Asia and the Middle East€20.6bn
20%
13%
67%
Oceania€2.8bn
32%
7%61%
Europe€14.9bn
22%
15%
63%
Total Global onshore online betting estimated for 2015
20%
Total Global offshore online betting estimated for 2015
15%
Total Land-based betting estimated for 2015
65%
1Annual Report and Accounts 2014

Kambi’s Focusand Customers
Europe is and will continue to be our core focus for future growth. Our belief is that there are good opportunities for new customer acquisitions in the region and that our existing customer base will continue to flourish. Having said that, Kambi has identified Latin America as the most suitable region for geographic expansion in the near future. Accordingly, Kambi set up a sales function in this region in 2014.
Due to limited regulated opportunities in Asia, our focus in the region during 2015 will be on building strategic relationships for the future.
Kambi is following developments in North America with interest, but the region is currently not prioritised due to legal restrictions. Africa and Oceania are regions that Kambi will treat on an opportunistic basis.
Retail is still the dominant distribution channel for sports betting and will continue to be for the foreseeable future. Kambi’s approach is to lead with its online service and attract multi-channel operators with a full suite multi-channel offering.
Unibet is one of the largest online gambling operators in the European market with over 9.7 million customers worldwide. In 2014, Unibet signed a contract with Kambi until the end of 2018. Unibet Group plc is listed on Nasdaq Stockholm. Its core markets are the Nordic region and Western Europe. Unibet is ranked number 9 in the 2014 eGaming Review Power 50.
888 is a leading online gaming provider. In 2013, 888 signed with Kambi to provide its sports betting service to the 888sport brand. 888 Holdings plc is UK listed. 888 is ranked number 6 in the 2014 eGaming Review Power 50.
Paf is an Åland (Finland) gaming company, controlled by the local Åland government. Its core markets are Finland and Sweden. Paf was Kambi’s first B2B customer, launched in 2011, and it recently extended its contract for the long-term. Paf is ranked number 23 in the 2014 eGaming Review Power 50.
Napoleon Games is a leading retail gaming group in Belgium. It went live with Kambi’s service for both online and retail in the Belgian market in early 2013 and recently extended its contract for the long-term.
14 Kambi Group plc
Strategic Report

Luckia is the gaming brand of Egasa, a large Spanish gaming group with a focus on the retail market. Egasa signed with Kambi in 2012 to address the online Spanish sports betting market. In 2014, it extended its contract with Kambi.
Premier Apuestas is the gaming brand of Mediaset España, the largest television and media network in Spain. It operates the commercial television channel Telecinco, which had the rights to the football World Cup in 2014. It signed with Kambi in 2012 to enter the online Spanish sports betting market.
Grupo Acrismatic is a Spanish land-based gaming operator, using the brand Juegging, which moved into the online Spanish sports betting market upon signing with Kambi in 2012.
Suertia is a Spanish gaming company, with a focus on specific regions. It originally signed with Kambi in early 2013 to address the online Spanish sports betting market, and recently extended its contract.
NagaWorld signed with Kambi in 2014 to provide a fully managed over-the-counter Sportsbook solution at its flagship hotel, casino and entertainment complex in Phnom Penh. It has subsequently extended its offering to include self-service terminals. NagaWorld is owned by NagaCorp Ltd, listed on the Hong Kong Stock Exchange.
Iveriabet is owned by Silk Road Group, one of the biggest investment companies in Georgia, specialising in the telecommunications, real estate, energy and gaming sectors. It signed with Kambi in 2014 to provide a fully managed Sportsbook solution, focusing on the Georgian market.
32Red plc is a UK listed group focusing on the UK market. It had an existing Sportsbook business under the 32RedSport brand, which has been powered by Kambi since signing in 2014. 32Red is ranked number 36 in the 2014 eGaming Review Power 50.
1Annual Report and Accounts 2014

Share PerformanceThe Kambi Share
The first day of trading of the Kambi shares was 2 June 2014. The opening price was SEK 29.30, the lowest price at which the stock traded during the year; the highest traded price during the year was SEK 82.50, on 30 December. The lowest closing price during 2014 was SEK 34.00 on 2 June and the highest closing price was SEK 76.50 on 6 November. The average daily volume traded post-listing during 2014 was 138,235 shares and the average price was SEK 55.38.
The closing price on the last trading day of the year, 30 December 2014, was SEK 76 with a market capitalisation of approximately €239 million.
Kambi Group plc is listed on First North at Nasdaq Stockholm with the ticker code: KAMBI and ISIN code: MT0000780107.
Share Price Development 2014 (the graph shows the closing price each trading day)
80
70
July August September October November December
60
50
40
30
SharePrice(SEK)
20
June
Strategic Report
1 Kambi Group plc

Shareholders on 31 December 2014
ShareholderNumber
of shares%
of Total
Anders Ström Core Holdings Ltd 5,082,464 17.09
Lannebo Fonder 2,347,003 7.89
Livförsäkringsbolaget Skandia Öms 2,232,056 7.50
Catella Fondförvaltning 1,928,000 6.48
Swedbank Robur Fonder 1,446,826 4.86
Fidelity Nordic Fund 1,443,044 4.85
Total 6 largest shareholders 14,479,393 48.67
Total other shareholders 15,261,804 51.33
Total 29,741,197 100
Ownership Distribution on 31 December 2014
HoldingsNumber of
shareholdersNumber of
shares(%)
of Total
1 – 500 3,522 409,106 1.38
501 – 1,000 316 271,224 0.91
1,001 – 5,000 297 686,205 2.31
5,001 – 10,000 55 408,546 1.37
10,001 – 15,000 34 437,850 1.47
15,001 – 20,000 19 350,155 1.18
20,001 + 89 27,178,111 91.38
Total 4,332 29,741,197 100
June July August September October November December
1.5
1.25
1
0.75
0.5
0.25
0
Volume of Kambi Shares Traded Daily in 2014volume in million shares
17Annual Report and Accounts 2014
Risk FactorsGeneral and Financial Risks
Set out below are some of the business and industry related risk factors that could have consequences for Kambi’s future development. The risk factors are not arranged in order of importance or potential economic impact.
Regulatory and Political EnvironmentThe Group’s core business is strictly regulated by law in the markets where Kambi and its customers operate. Accordingly, political decisions, court rulings or changes in laws in the countries where Kambi or its customers have licences or commercial interests could have a material adverse effect on Kambi’s business and operations. Regulatory changes can also have a positive impact, enabling us to access a market which becomes regulated or re-regulated.
Risks Related to ITKambi’s business is dependent on IT systems. System failures and other events that affect operations could have a material adverse effect on its business and results. The risk is mitigated by using continuous monitoring to detect any problems as early as possible. All critical servers are duplicated, i.e. if one server fails, another will immediately take over. Following any downtime, a detailed analysis is performed to ensure that the underlying reason for the downtime is understood and rectified.
Match FixingMatch fixing is defined as the manipulation of an event where the participants seek to fix the outcome for financial gain. To reduce the financial impact of this risk, Kambi has internal systems and alerts in place to highlight any indications of match fixing. We also collaborate with industry watchdogs and regulators. If match fixing were to lead to changes in regulatory environments, this could impact the results of operators and therefore Kambi’s financial performance.
Sport-specific IPR In certain jurisdictions, regulators have begun to impose charges on licence holders for the right to offer odds, access data and use trademarks on certain sports. Any future changes in these charges could impact Kambi’s financial position.
Dependency on Key Customers A majority of Kambi’s revenue is currently generated from a few large customers. The loss of business with Kambi’s major customers could have a material adverse effect on the Group’s business.
Strategic Report
18 Kambi Group plc

Foreign Currency RiskForeign exchange risks exist in the form of both transaction risks and translation risks. In the case of our customers handling transactions in a different currency to that which the invoice is issued in, currency movements can have an impact on the revenues generated by Kambi. Transaction risks occur in conjunction with purchases and sales of products and services in currencies other than the respective company's local currency. Translation risks occur in conjunction with the translation of the income statements and balance sheets of foreign subsidiaries into EUR. Sales are primarily made in EUR. The Group’s purchases of services and overhead costs, however, are primarily in GBP and SEK. Changes in the valuation of EUR in relation to other currencies can thus have both positive and negative effects on the Group’s profit and financial position. Currency risk is to some degree managed by means of holding funds on short-term deposit in the currencies of the Group’s principal cash outflows.
Tax RisksKambi conducts its business in accordance with its interpretation and understanding of the applicable tax laws and treaties, case law and the requirements of relevant tax authorities in the countries where it operates. Changes to regulatory, legislative and fiscal regimes in key markets could have an adverse effect on the Group’s results and additional costs may be incurred in order to comply with any new laws or regulations. In managing its taxation affairs, including estimating the amounts of taxation due, Kambi relies on the exercise of judgment concerning its understanding of, and compliance with, those laws assisted by professional advice.
Risk Related to Convertible BondPrior to listing, Kambi Group plc issued a €7.5m convertible bond to a wholly owned subsidiary of Unibet Group plc. According to the terms of the convertible bond, the Company is obliged to procure that certain events listed in the agreement do not take place unless with the prior consent of the lender. In case of a conversion, Unibet Group plc would obtain a controlling influence over the Company and would, consequently, have the power to control the outcome of most matters to be decided by vote at a shareholders’ meeting.
19Annual Report and Accounts 2014

20 Kambi Group plc

Corporate Governance
Corporate Governance Kambi Group plc
Board of Directors 22
Senior Executives 23
Corporate Governance Report 24
Directors’ Report 25
21Annual Report and Accounts 2014
Board of directorsKambi Group plc
Lars Stugemo (Swedish, born 1961)Lars has been CEO and President of HiQ International since 2000. HiQ is an IT and management consultancy firm, founded in 1995, with Lars as one of the co-founders. HiQ is listed on the NASDAQ OMX Stockholm midcap. Lars has been a member of IvA (Kungliga vetenskapsakademien) and vI since 2013. Lars holds a MSc Electronics Engineering from KTH Stockholm.
Lars Stugemo holds 20,880 shares in the Company.
Susan Ball (British, born 1961)Susan qualified at Ernst & Young and has extensive experience in private and listed online high-growth businesses across all markets. She is the ex-CFO of Unibet Group plc, and worked throughout its listing on NASDAQ OMX Stockholm. She has also worked for Cadbury Schweppes, Bookatable.com and MOO.com.
Susan Ball holds 14,980 shares in the Company.
Anders Ström (Swedish, born 1970)After studying Mathematics, Statistics and Economics at Karlstad University, Anders founded Trav- och Sporttjänst in 1993. Anders also founded Unibet Group plc in 1997. He has held various positions in Unibet, as Managing Director, CEO, Business Development Director, Chairman and Director. He was a partner and member of the Advisory Board of Hattrick 2008-2012 with a focus on the business development of www.hattrick.org and www.popmundo.com. Anders was co-founder of Kambi in 2010.
Anders Ström holds 5,082,464 shares in the Company.
Patrick Clase (Swedish, born 1968)Patrick is Chief Investment Officer and director of Anders Ström Investeringsaktiebolag. Amongst other positions held, Patrick has worked as a Financial Analyst with ABG Sundal Collier, Alfred Berg and is experienced in Swedish financial markets.
Patrick Clase holds 20,619 shares in the Company.
The Company’s Board of Directors consists of four ordinary members, including the Chairman of the Board. The members of the Board of Directors are listed in the table below:
Lars Stugemo Ordinary Board member (Chairman)
Anders Ström Ordinary Board member
Susan Ball Ordinary Board member
Patrick Clase Ordinary Board member
22 Kambi Group plc
Corporate Governance

Senior Executives Kambi Group plc
Kristian Nylén (Swedish, born 1970)Kristian joined Unibet in 2000. From 2003 Kristian was responsible for the Sportsbook operation and a part of the management team. Before Unibet, Kristian worked as a Real Estate analyst at Catella and Ernst & Young. Kristian has a BSc in Business Administration, Mathematics and Statistics from the University of Karlstad. Kristian was co-founder of Kambi in 2010.
Kristian Nylén holds 465,000 shares and 300,000 options in the Company.
David Kenyon (British, born 1975)David qualified at KPMG and joined Unibet in 2002 as Group FC where he worked on the Unibet NASDAQ OMX Stockholm listing. He then spent two years at the Capital Pub Company plc as CFO, where he floated the company on AIM, before moving to Kambi. David has a MA from Oxford University.
David Kenyon holds 43,330 shares and 60,000 options in the Company.
Erik Lögdberg (Swedish, born 1979)Erik started working for Unibet in 2005, straight after he had finished his degree in Electrical Engineering at the Royal Institute of Technology in Stockholm. His main responsibility was as Head of Live Betting from an operational as well as product development perspective.
Erik Lögdberg holds 90,000 shares and 60,000 options in the Company.
Jonas Jansson (Swedish, born 1969)Before joining Kambi, Jonas was Head of Trading for Unibet’s Sportsbook from 2003 onwards. Jonas holds a Bachelor degree in Financial Economics and Mathematics from the University of Karlstad. Jonas has also studied Data and System Development at the University of Stockholm.
Jonas Jansson holds 225,000 shares and 60,000 options in the Company.
Andreas Söneby (Swedish, born 1973)Before joining Kambi, Andreas held several different management positions within Unibet’s IT department from 2006 onwards: Head of Development, IT Director and finally CTO at Unibet. Andreas holds a degree in Computer Science from the Royal Institute of Technology in Stockholm.
Andreas Söneby holds 90,300 shares and 60,000 options in the Company.
Jonas Demnert (Swedish, born 1979)Jonas worked with the Unibet Sportsbook platform from 2007 onwards and has extensive knowledge in building secure, scalable and available systems. Prior to joining Unibet, Jonas worked as a consultant in the telecom and media industry. Jonas holds a Master of Science in Engineering and a Degree in Information and Communication Technology from the Royal Institute of Technology Sweden.
Jonas Demnert holds 90,000 shares and 60,000 options in the Company.
Ian Freeman (British, born 1970)Ian brings 15 years of B2B SaaS experience across a number of different market segments. Prior to joining Kambi, Ian spent five years as EMEA Head of Sales and Strategic accounts at Moxie Software, a leading organisation in Gartner’s E-Service magic quadrant. In his earlier career, Ian held a number of senior positions in high growth technology start-ups. Ian holds an MBA (Dist.) from Ashridge Business School.
Ian Freeman holds 6,620 shares and 60,000 options in the Company.
Senior executives and their positions are listed in the table below.
Kristian Nylén CEO
David Kenyon CFO
Erik Lögdberg Deputy CEO, CBDO
Jonas Jansson COO
Andreas Söneby CIO
Jonas Demnert CTO
Ian Freeman CCO
2Annual Report and Accounts 2014
Corporate Governance
Corporate Governance Report
Kambi Group plc is listed on First North at Nasdaq Stockholm and is not required to follow all the provisions of the Swedish and/or Maltese Corporate Governance Code (the Code). The Board however recognises the importance and value of good corporate governance practice and accordingly has selected those procedures and committees of the Code they consider relevant and appropriate to the Group, given its size and structure. Each of the committees meets regularly.
The BoardThe Board has four directors including the Chairman. The Board meets regularly to consider strategy, performance and the framework of internal controls.
The Board of Directors comprises a mix of the necessary skills, knowledge and experience required to provide leadership, control and oversight of the management of the Group and to contribute to the development and implementation of strategy. In particular, the Board combines a group of directors with diverse backgrounds within the technology, financial, gambling and other related sectors, which combine to provide the Board with the resources and expertise to drive the continuing development of the Group and advance its commercial objectives.
In addition to being on the Board of Kambi, Anders Ström is also Chairman of the Board of Directors in Unibet Group plc. To avoid any potential conflict of interest, Anders is not present at, nor does he participate in, any decision-making process which relates directly to the contract between Kambi and Unibet Group plc.
The Audit CommitteeThe Audit Committee is responsible for ensuring that the financial performance of the Group is properly reported on and monitored and for meeting the auditors and reviewing the reports from the auditors relating to accounts and internal control systems. It meets at least once a year with the auditors. The Audit Committee is comprised of Susan Ball and Patrick Clase and is chaired by Susan Ball.
The Remuneration CommitteeThe Remuneration Committee reviews the performance of the senior managers and sets and reviews the scale and structure of their remuneration, the basis of their remuneration and the terms of their service agreements with due regard to the interests of shareholders. The Remuneration Committee is comprised of Anders Ström and Stefan Lundborg and is chaired by Stefan Lundborg. Stefan was previously a member of the Kambi Advisory Committee and has many years of experience of Board work and financial advisory roles, in the gaming industry amongst others. Details of the remuneration of the Board of Directors and senior executives are set out below.
The Nomination CommitteeThe Nomination Committee is responsible for reviewing the size, structure and composition of the Board, succession planning, the appointment of replacement and/or additional directors and for making the appropriate recommendations to the Board. The Nomination Committee is comprised of the three largest shareholders and the Chairman of the Board. The members are: Anders Ström – Anders Ström Core Holdings Ltd, Lars Stugemo – Chairman of the Board, Johan Ståhl – Lannebo Fonder and Jimmy Bengtsson – Skandia Investment Management. It is chaired by Anders Ström.
DirectorsFees/Salary
€000Other€000
2014 Total€000
2013 Total€000
Anders Ström 30 – 30 –
Joseph Montebello * 3 – 3 7
Lars Stugemo 51 25 76 –
Patrick Clase 30 8 38 –
Susan Ball 30 10 40 –
Sub-total 144 43 187 7
Executive management 1,704 – 1,704 1,134
Total 1,848 43 1,891 1,141
* Resigned 25 April 201424 Kambi Group plc
Corporate Governance

directors’ ReportStatement of Directors’ Responsibilities
The directors present their report on the affairs of the Group, together with the audited consolidated financial statements and auditor’s report, for the year ended 31 December 2014.
Principal ActivitiesKambi Group plc is a B2B supplier of fully managed sports betting services on an in-house developed software platform, providing premium turnkey sports betting services to B2C gaming operators.
Results and Dividend The consolidated income statement is set out on page 30. The profit after tax was €1.0 (€-18.7) million.
The Board does not propose a dividend. As stated in the Company Description in 2014, dividends should not be expected for at least three years after the listing.
Going ConcernAs required by Listing Rule 5.62 issued by the Listing Authority, upon due consideration of the Company’s state of affairs, capital adequacy and solvency, the directors confirm the Company’s ability to continue in operational existence for the foreseeable future. For this reason, in preparing the financial statements, they continue to adopt the going concern basis.
Significant Events During 2014
Listed in June on First North at Nasdaq Stockholm
Equity issue and convertible bond strengthened the Balance Sheet
Launched 3 new customers: NagaWorld, 32Red and Iveriabet
Suertia, Luckia and Napoleon Games extended their contracts
Post-reporting Date EventsNo adjusting or significant non-adjusting events have occurred between the reporting date and the date of authorisation.
DirectorsThe following have served as directors during the year under review:
Lars Stugemo (Chairman)
Anders Ström
Susan Ball
Patrick Clase
Joseph Montebello
Joseph Montebello resigned as a director on 25 April 2014. Lars Stugemo, Anders Ström, Susan Ball and Patrick Clase will seek re-election at the forthcoming AGM.
Statement of Directors’ ResponsibilitiesThe Companies Act, Cap 386 requires the directors to prepare financial statements for each financial year which give a true and fair view of the state of affairs of the Company as at the end of the financial year and of the profit or loss of the Company for that year. In preparing these financial statements, the directors are required to:
– adopt the going concern basis unless it is inappropriate to presume that the Company will continue in business;
– select suitable accounting policies and then apply them consistently;
– make judgments and estimates that are reasonable and prudent;
– account for income and charges relating to the accounting period on the accruals basis;
– value separately the components of asset and liability items; and
– report comparative figures corresponding to those of the preceding accounting period.
The directors are responsible for keeping proper accounting records which disclose with reasonable accuracy at any time the financial position of the Company and to enable them to ensure that the financial statements have been properly prepared in accordance with the Companies Act, Cap 386. This responsibility includes designing, implementing and maintaining internal controls relevant to the preparation and fair presentation of financial statements that are free from material misstatement, whether due to fraud or error. They are also responsible for safeguarding the assets of the Company and for taking reasonable steps for the prevention and detection of fraud and other irregularities.
Disclosure of Information to the AuditorAt the date of making this report, the directors confirm the following:– As far as each director is aware, there
is no relevant information needed by the independent auditor in connection with preparing the audit report of which the independent auditor is unaware, and
– Each director has taken all steps that he/she ought to have taken as a director in order to make him/her-self aware of any relevant information needed by the independent auditor in connection with preparing the audit report and to establish that the independent auditor is aware of that information.
Independent AuditorThe auditor, Mazars, has indicated its willingness to continue in office and a resolution for its reappointment will be proposed at the Annual General Meeting.
On behalf of the Board Malta, 18 March 2015
Lars StugemoChairman
Susan BallMember of the Board
2Annual Report and Accounts 2014
Corporate Governance

Kambi Group plc

Financial Report Consolidated financial statements for the Year Ended 31 December 2014
Company Registration Number C 49768
Independent Auditor’s Report 28
Financial Review 29
Financial Statements 30
AGM and Company Information 57
Glossary 58
Annual Report and Accounts 014
Financial Report

Independent Auditor’s Report to the membersReport on the financial statements
We have audited the accompanying consolidated financial statements of Kambi Group plc set out on pages 30 to 56 which comprise the consolidated statement of financial position as at 31 December 2014, and the consolidated statement of profit or loss and other comprehensive income, consolidated statement of changes in equity and the consolidated statement of cash flows for the year then ended and a summary of significant accounting policies and other explanatory notes.
Directors’ Responsibility for the Financial StatementsAs described on page 25, the directors are responsible for the preparation and fair presentation of the consolidated financial statements in accordance with International financial Reporting standards as adopted by the EU, and for such internal control as the directors determine to be necessary to enable the preparation of the consolidated financial statements that are free from material misstatements, whether due to fraud or error.
Auditor’s ResponsibilityOur responsibility is to express an opinion on these consolidated financial statements based on our audit. We conducted our audit in accordance with International standards on Auditing. Those standards require that we comply with ethical requirements and plan and perform the audit to obtain reasonable assurance about whether the consolidated financial statements are free of material misstatement.
An audit involves performing procedures to obtain audit evidence about the amounts and disclosures in the financial statements. The procedures selected depend on the auditor’s judgment, including the assessment of the risks of material misstatement of the financial statements, whether due to fraud or error. In making those risk assessments, the auditor considers internal controls relevant to the Group’s preparation and fair presentation of the financial statements in order to design audit procedures that are appropriate in the circumstances, but not for the purpose of expressing an opinion on the effectiveness of the Group’s internal control. An audit also includes evaluating the appropriateness of accounting policies used and the reasonableness of accounting estimates made by the directors, as well as evaluating the overall presentation of the financial statements. We believe that the audit evidence obtained is sufficient and appropriate to provide a basis for our audit opinion.
In our opinion, these consolidated financial statements give a true and fair view of the state of the affairs of the Group as at 31 December 2014 and of its financial performance, cash flow and statement of changes in equity for the period then ended in accordance with International financial Reporting standards, as adopted by the EU.
Report on other legal and Regulatory RequirementsIn our opinion, the consolidated financial statements have been properly prepared in accordance with the Companies Act, 1995.
This copy of the audit report has been signed by Paul Giglio (Partner) for and on behalf of:
Mazars Malta Certified Public AccountantsAttard18 March 2015
Kambi Group plc
Financial Report

Financial Review
RevenueRevenue represents fees received for sports betting services rendered to Kambi’s operators. Kambi charges its operators a monthly fee, based on a number of variables, including fixed fees, commission based on the profits generated for operators and the number of live events offered.
Total revenue in 2014 increased to €36.0 (2013: €21.1) million. The increase of 70% year-on-year demonstrates Kambi’s continued growth, underpinned by the success of existing operators and the acquisition of new customers.
Administrative expensesOngoing administrative expenses for 2014 were €33.2 (2013: 28.4) million.
Excluding depreciation and amortisation, ongoing administrative expenses were €26.8 (2013: €22.1) million, of which €15.3 (2013: €12.4) million were salaries and associated costs. The increase in salaries can be attributed to the planned increase in full-time staff, as part of the continued development of the Kambi product, as well as salary increases in line with the market.
Note 5 in the financial statements on page 41 provides more analysis of operating costs, including items affecting comparability.
Items Affecting ComparabilityThe Group defines items affecting comparability as those which, by their size or nature in relation to the Group, should be separately disclosed in order to give a full understanding of the Group’s underlying financial performance, and aid comparison of the Group’s results between periods.
During 2014, Kambi Group plc listed on first North at Nasdaq stockholm and incurred one-off costs of €575,000 in relation to this listing.
In 2013, the remaining amortisation relating to certain previously acquired intangible assets was written off.
eBITDA and operating profitEarnings before interest, tax and depreciation and amortisation (EBITDA) for the full year 2014 were €8.6 (2013: €-0.9) million.
Profit from operations for the full year 2014 was €2.2 (2013: €-19.9) million.
profit After TaxProfit after tax for the full year 2014 was €1.0 (2013: €-18.7) million.
Development and Acquisition Costs of Intangible AssetsIn the full year 2014, development expenditure of €4.7 (2013: €5.1) million was capitalised. The key elements of capitalised development costs during 2014 were system automation, front end and retail product development.
Balance SheetKambi’s strong balance sheet reflects both the Group’s growth and its financing activities during the year.
There were two parts to the financing:
i) 9,766,697 new class B ordinary shares were issued by the Group, as part of an equity issue to existing shareholders. The total proceeds of the issue were €23,755,537. Costs of €192,000 relating to the equity issue were offset against the increase in share premium.
ii) A convertible bond of €7.5m was issued by Kambi Group plc; it is repayable on 1 January 2019.
Certain non-current assets of the Group relate to capitalised IT development costs. Other non-current assets include computer software, computer hardware, fixtures & fittings and deferred tax. The non-cash current assets on the balance sheet relate to trade receivables, other receivables and prepayments.
significant liabilities on the balance sheet include the convertible bond (see note 20 on page 47) and trade and other payables (see note 19 on page 47).
Cash FlowThe net cash inflow for 2014 was €20.1 (2013: €1.6) million, increasing the total cash balance at the end of 2014 to €23.2 (2013: €3.0) million.
In addition to the financing activities described above, the Group demonstrated the ability to generate positive operating cash flows. A total of €2.8 (2013: €-6.3) million in cash was generated from operating and investing activities (excluding working capital and financing activities) during 2014.
Annual Report and Accounts 2014
Financial Report

Statement of Consolidated profit or loss and other Comprehensive Income for the year ended 31 December 2014
Notes2014€000
2013€000
Revenue 4 36,017 21,147
Administrative expenses 5 (33,176) (28,445)
Other operating income 6 – 30
Other operating expenses 6 (52) –
finance costs 7 (315) (372)
Investment income 8 15 2
profit/(loss) before items affecting comparability 2,489 (7,638)
Items affecting comparability 5 (575) (12,610)
profit/(loss) before tax 9 1,914 (20,248)
Income tax expense 12 (947) 1,532
profit/(loss) for the year 967 (18,716)
other comprehensive income
Items that may be reclassified subsequently to profit or loss
foreign currency translation adjustments 26 (64) (117)
(64) (117)
Items that may not be reclassified subsequently to profit or loss
Actuarial loss on defined benefit scheme 21 (13) –
(13) –
other comprehensive income for the year (77) (117)
Total comprehensive income for the year 890 (18,833)
Earnings per share 27
Basic 0.037 (0.937)
Diluted 0.037 (0.937)
The notes on pages 34 to 56 form an integral part of these financial statements.
Financial Statements
0 Kambi Group plc
Financial Report
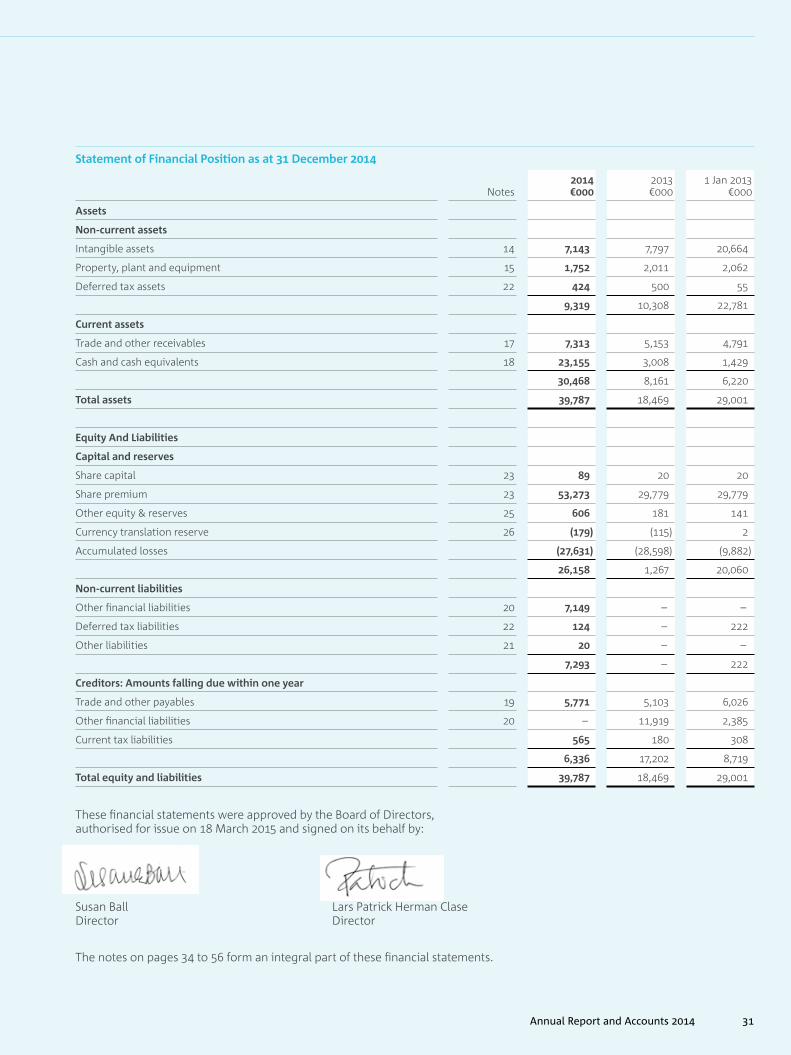
Statement of Financial position as at 31 December 2014
Notes2014 €000
2013 €000
1 Jan 2013€000
Assets
Non-current assets
Intangible assets 14 7,143 7,797 20,664
Property, plant and equipment 15 1,752 2,011 2,062
Deferred tax assets 22 424 500 55
9,319 10,308 22,781
Current assets
Trade and other receivables 17 7,313 5,153 4,791
Cash and cash equivalents 18 23,155 3,008 1,429
30,468 8,161 6,220
Total assets 39,787 18,469 29,001
equity And liabilities
Capital and reserves
share capital 23 89 20 20
share premium 23 53,273 29,779 29,779
Other equity & reserves 25 606 181 141
Currency translation reserve 26 (179) (115) 2
Accumulated losses (27,631) (28,598) (9,882)
26,158 1,267 20,060
Non-current liabilities
Other financial liabilities 20 7,149 – –
Deferred tax liabilities 22 124 – 222
Other liabilities 21 20 – –
7,293 – 222
Creditors: Amounts falling due within one year
Trade and other payables 19 5,771 5,103 6,026
Other financial liabilities 20 – 11,919 2,385
Current tax liabilities 565 180 308
6,336 17,202 8,719
Total equity and liabilities 39,787 18,469 29,001
These financial statements were approved by the Board of Directors, authorised for issue on 18 March 2015 and signed on its behalf by:
susan Ball Lars Patrick Herman ClaseDirector Director
The notes on pages 34 to 56 form an integral part of these financial statements.
1Annual Report and Accounts 2014

Statement of Changes in equity for the year ended 31 December 2014
sharecapital
€000
share premium
€000
Other reserves
€000
foreign currency
reserve€000
Accumulated losses€000
Total€000
Balance at 1 January 2013 as restated 20 29,779 141 2 (9,882) 20,060
Changes in equity for 2013
Value of employee share options – – 40 – – 40
Total comprehensive income for the year – – – (117) (18,716) (18,833)
Balance at 31 December 2013 20 29,779 181 (115) (28,598) 1,267
Changes in equity for 2014
Change in share capital 40 (40) – – – –
Proceeds of share issue 29 23,534 – – – 23,563
Other financial liabilities – – 399 – – 399
Value of employee share options – – 39 – – 39
Total comprehensive income for the year – – (13) (64) 967 890
Balance at 31 December 2014 89 53,273 606 (179) (27,631) 26,158
The notes on pages 34 to 56 form an integral part of these financial statements.
Financial StatementsContinued
Kambi Group plc
Financial Report
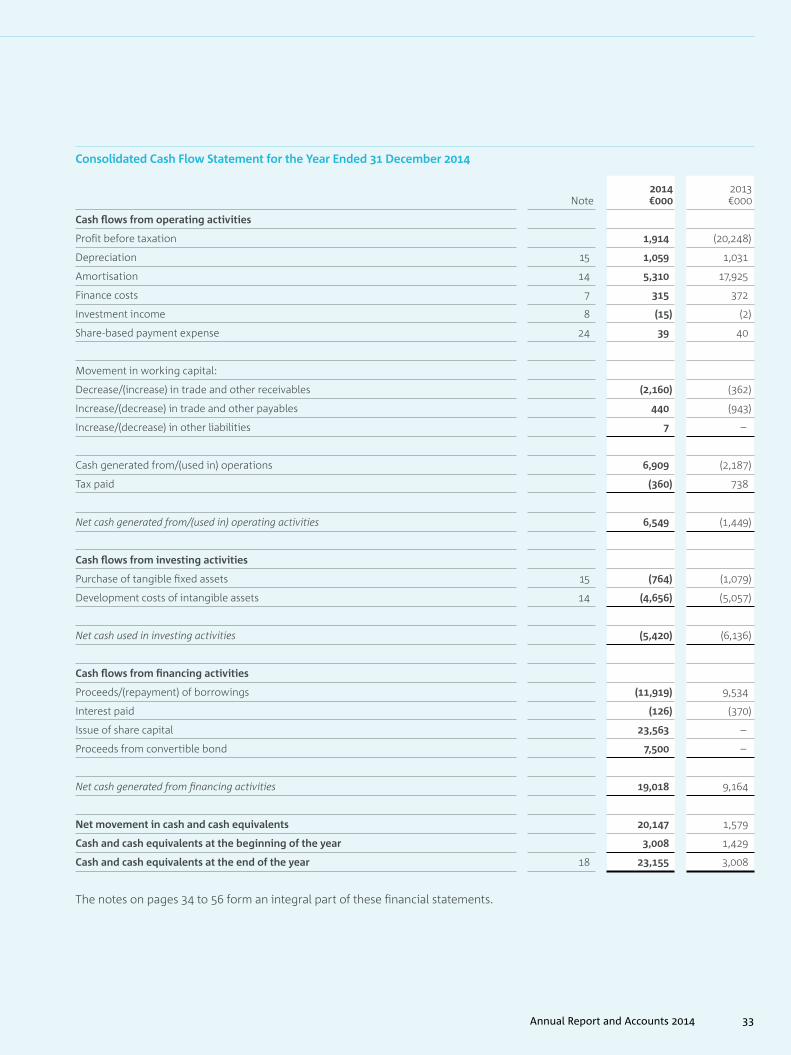
Consolidated Cash Flow Statement for the year ended 31 December 2014
Note2014€000
2013€000
Cash flows from operating activities
Profit before taxation 1,914 (20,248)
Depreciation 15 1,059 1,031
Amortisation 14 5,310 17,925
finance costs 7 315 372
Investment income 8 (15) (2)
share-based payment expense 24 39 40
Movement in working capital:
Decrease/(increase) in trade and other receivables (2,160) (362)
Increase/(decrease) in trade and other payables 440 (943)
Increase/(decrease) in other liabilities 7 –
Cash generated from/(used in) operations 6,909 (2,187)
Tax paid (360) 738
Net cash generated from/(used in) operating activities 6,549 (1,449)
Cash flows from investing activities
Purchase of tangible fixed assets 15 (764) (1,079)
Development costs of intangible assets 14 (4,656) (5,057)
Net cash used in investing activities (5,420) (6,136)
Cash flows from financing activities
Proceeds/(repayment) of borrowings (11,919) 9,534
Interest paid (126) (370)
Issue of share capital 23,563 –
Proceeds from convertible bond 7,500 –
Net cash generated from financing activities 19,018 9,164
Net movement in cash and cash equivalents 20,147 1,579
Cash and cash equivalents at the beginning of the year 3,008 1,429
Cash and cash equivalents at the end of the year 18 23,155 3,008
The notes on pages 34 to 56 form an integral part of these financial statements.
Annual Report and Accounts 2014

Notes to the Financial Statements for the year ended 31 December 2014
1 Basis of preparation & ConsolidationThe principal activity of Kambi Group plc and its subsidiaries (the Group) is the provision of managed sports betting services. Kambi Group plc is the Group’s ultimate parent company, incorporated and domiciled in Malta. Its registered office and principal place of business is 75, Quantum House, 3rd floor, Abate Rigord street, Ta’ Xbiex, XBX1120 Malta.
The Group financial statements consolidate those of the parent company and all of its subsidiaries as at 31 December 2014.
These financial statements have been prepared on the historical cost basis and in accordance with International financial Reporting standards, as adopted by the EU. All references to IAs, IfRs or sIC/IfRIC interpretations refer to those adopted by the EU.
These financial statements for the year ended 31 December 2014 are the first the Group has prepared in accordance with IfRs (see note 33 for a detailed explanation of the transition to IfRs). Accordingly, the Group has prepared financial statements which comply with IfRs applicable for periods ending on or after 31 December 2014, together with the comparative period data as at and for the year ended 31 December 2013, as described in the accounting policies. In preparing these financial statements, the Group’s opening statement of financial position was prepared as at 1 January 2013, the Group’s date of transition to IfRs.
The significant accounting policies set out below have been consistently applied to all periods presented and have been applied consistently by the Group’s entities.
The consolidated financial statements have been prepared under the historical cost convention, subject to modification where appropriate by the revaluation of financial assets and liabilities at fair value through profit or loss. The individual parent financial statements have been prepared separately.
The directors believe that the Group will continue with its current growth and therefore the financial statements have been prepared on a going concern basis.
The consolidated financial statements comprise the financial statements of the Group and its subsidiaries as at 31 December 2014. Control is achieved when the Group is exposed, or has rights, to variable returns from its involvement with the investee and has the ability to affect those returns through its power over the investee. The Group is considered to have power over an entity when it has existing rights that give it the current ability to direct the relevant activities. for the Group to have power over an entity, it must have the practical ability to exercise those rights. Where necessary, adjustments are made to the financial statements of subsidiaries to bring the accounting policies used in line with those used by other members of the Group.
Intra-group balances and income and expenses arising from intra-group transactions are eliminated in preparing the consolidated financial statements. Unrealised losses are eliminated in the same way as unrealised gains, but only to the extent that there is no evidence of impairment.
2 Significant Accounting policiesThe consolidated financial statements have been prepared using the significant accounting policies and measurement bases that are in effect at 31 December 2014, as summarised below. These were used throughout all periods presented, except where the Group has applied certain accounting policies and exemptions upon transition to IfRs (see note 33).
Changes in Accounting policies and DisclosuresThe accounting policies adopted are consistent with those of the previous financial period except as follows:
The Group has adopted the following new and amended IfRs and IfRIC interpretations as of 1 January 2013:
— IAs 19 (Revised) – Employee Benefits (effective for annual periods beginning on or after 1 January 2013). This represents the completion of the IAsB’s project to improve the accounting for pensions and other post-employment benefits under defined benefit schemes.
— IAs 32 Amendments and IfRs 7 Amendments – Disclosures – Offsetting financial Assets and financial Liabilities (effective for annual periods beginning on or after 1 January 2013). These amendments are intended to help intended investors and other financial statements users to better assess the effect or potential effect of offsetting arrangements on a company’s financial position. The disclosure requirements also improve transparency in the reporting of how companies mitigate credit risk, including disclosure of related collateral pledged or received.
— IfRs 13 – fair Value Measurement (effective for annual periods beginning on or after 1 January 2013). The standard defines fair value, sets out in a single IfRs framework for measuring fair value and requires disclosures about fair value measurements. The standard does not require fair value measurements in addition to those already required or permitted by other IfRss.
— Improvements to IfRss issued in May 2012 (effective for annual periods beginning on or after 1 January 2013). The improvements result in changes in IfRs 1 (permits repeated application of IfRs 1 and clarification of borrowing costs), IAs 1 (clarification of requirements for comparative information), IAs 16 (classification of servicing equipment), IAs 32 (tax effect of a distribution to holders of equity) and IAs 34 (clarification of interim reporting of segment information).
The adoption of the above new and amended standards and IfRIC interpretations did not have an impact on the financial position or performance of the Group.
Financial StatementsContinued
4 Kambi Group plc
Financial Report

The following standards, interpretations and amendments to published standards, as adopted by the EU, are not yet effective up to 31 December 2014:
Up to the financial position date, certain new standards, amendments and interpretations to existing standards have been published but are not yet effective for the current reporting period and which the Group has not yet adopted. None of the below-mentioned standards is expected to have a material impact on the Group’s financial position and performance. These are as follows:
— IfRs 10 – Consolidated financial statements (effective, at the latest, for annual periods beginning on or after 1 January 2014)
— IfRs 8 – Operating segments (effective, at the latest, for annual periods beginning on or after 1 January 2008)
— IfRs 11 – Joint Arrangements (effective, at the latest, for annual periods beginning on or after 1 January 2014)
— Transitional Guidance (amendments to IfRs 10 and IfRs 11) (effective on adoption of IfRs 10 and IfRs 11)
— IAs 27 – separate financial statements (effective, at the latest, for annual periods beginning on or after 1 January 2014)
— IAs 36 Amendments – Recoverable Amount Disclosures for Non-financial Assets (effective for annual periods beginning on or after 1 January 2014)
standards, interpretations and amendments issued by the International Accounting standards Board (IAsB) but not yet adopted by the European Union, that may apply to the Group:
— IfRs 9 – financial Instruments— IfRs 15 – Revenue from contracts with customers— Amendments to IAs 27 – Equity method in separate
financial statements— Amendments to IAs 16 and IAs 38 – Clarification of
acceptable methods of depreciation and amortisation— Amendments to IfRs 11 – Accounting for acquisitions
for interests in Joint Operations— Amendments to IfRs 11 - Defined benefit plans:
Employee contributions— Annual improvements to IfRss 2012–2014 cycle— Annual improvements to IfRss 2011-2013 cycle— Annual improvements to IfRss 2010-2012 cycle
property, plant and equipmentThe Group’s property, plant and equipment are classified into the following classes: leasehold improvements, fixtures & fittings and computer hardware.
Items of property, plant and equipment are initially measured at cost or manufacturing cost, including any costs directly attributable to bringing the assets to the location and in the condition necessary for these to be capable of being employed in the manner intended by the Group’s management. subsequently they are stated at cost less accumulated depreciation and any accumulated impairment losses. Material residual value estimates and estimates of useful lives are reviewed annually or earlier if required.
subsequent costs are included in the asset’s carrying amount when it is probable that future economic benefits associated with the item will flow to the Group and the cost of the item can be measured reliably. Expenditure on repairs and maintenance of property, plant and equipment are recognised as an expense when incurred.
Property, plant and equipment are derecognised on disposal or when no future economic benefits are expected from their use or disposal. Gains or losses arising from derecognition represent the difference between the net disposal proceeds, if any, and the carrying amount, and are included in profit or loss in the period of derecognition. Gains are not classified as revenue.
DepreciationDepreciation commences when the depreciable assets are available for use and is charged to profit or loss so as to write off the cost, less any estimated residual value, over their estimated useful lives, using the straight-line method. The estimated useful lives for the current and comparative period are as follows:
Leasehold improvements: 5 years
fixtures & fittings: 5 years
Computer hardware: 3 years
Depreciation methods, useful lives and residual values are reviewed at each reporting date and adjusted if deemed appropriate.
Annual Report and Accounts 2014

2 Significant Accounting policies Continued
Intangible AssetsAn intangible asset is recognised if it is probable that the expected future economic benefits that are attributable to the asset will flow to the Group and the cost of the asset can be measured reliably. Intangible assets are initially measured at cost and subsequently stated at cost less accumulated amortisation and any accumulated impairment losses.
The useful life of intangible assets is assessed to determine whether it is finite or indefinite. Intangible assets with a finite useful life are amortised over their useful life on a systematic basis. Amortisation is charged to profit or loss on a straight-line basis so as to write off the cost of intangible assets less any estimated residual value, over their estimated useful lives. The amortisation method applied, the useful lives and residual values are reviewed at each reporting date and adjusted if deemed appropriate.
Intangible assets with an indefinite useful life are not amortised and are carried at cost less any accumulated impairment losses. The useful life of an intangible asset that is not being amortised is reviewed at each year-end in order to determine whether events and circumstances continue to support an indefinite useful life assessment. If they do not, the change in the useful life assessment from indefinite to finite is accounted for as a change in an accounting estimate.
(i) Research and Development CostsExpenditure on research activities is recognised as an expense in the period in which it is incurred.
An internally-generated intangible asset arising from the Group’s development of a sportsbook product is recognised only if all of the following can be demonstrated by the Group:
— the technical feasibility of completing, and the intention to complete, the product so that it will be available for use or sale,
— how the product will generate probable future economic benefits,
— the availability of adequate technical, financial and other resources to complete the development and to use or sell the product, and
— the ability to measure reliably the expenditure attributable to the product during its development.
Where no internally-generated intangible asset can be recognised, development expenditure is recognised as an expense in the period in which it is incurred. After initial recognition, internally-generated intangible assets are carried at cost less any accumulated amortisation and any accumulated impairment losses. Internally-generated intangible assets are amortised on a straight-line basis over their estimated useful lives, which is generally assumed to be three years.
(ii) Computer SoftwareAcquired computer software licenses are capitalised on the basis of the costs incurred to acquire and install the specific software.
In determining the classification of an asset that incorporates both intangible and tangible elements, judgment is used in assessing which element is more significant. Computer software which is an integral part of the related hardware is classified as property, plant and equipment and accounted for in accordance with the Group’s accounting policy on property, plant and equipment. Where the software is not an integral part of the related hardware, this is classified as an intangible asset and carried at cost less any accumulated amortisation and any accumulated impairment losses. Computer software classified as an intangible asset is amortised on a straight-line basis over three years.
Financial Instrumentsfinancial assets and financial liabilities are recognised when the Group becomes a party to the contractual provisions of the instrument. financial assets and financial liabilities are initially recognised at their fair value plus or minus, in the case of a financial asset or financial liability not at fair value through profit or loss, transaction costs that are directly attributable to the acquisition or issue of the financial asset or financial liability.
financial assets are derecognised when the right to receive cash flows from the assets has expired or when the Group has transferred its contractual right to receive the cash flows of the financial assets, and either substantially all the risks and rewards of ownership have been transferred or substantially all the risks and rewards have neither been retained nor transferred but control is not retained.
financial liabilities are derecognised when they are extinguished, that is when the obligation is discharged, cancelled or expires.
financial assets and financial liabilities are offset and the net amount reported in the statement of financial position when there is a legally enforceable right to offset the recognised amounts and there is an intention to settle on a net basis, or to realise the asset and settle the liability simultaneously.
Financial StatementsContinued
Kambi Group plc
Financial Report

(i) Trade ReceivablesTrade receivables comprise amounts due from customers for services performed in the ordinary course of business. If collection is expected in one year or less (or in the normal operating cycle of the business if longer), they are classified as current assets. If not, they are presented as non-current assets. Trade receivables are classified as current assets and are stated at their nominal value unless the effect of discounting is material, in which case trade receivables are measured at amortised cost using the effective interest method. Appropriate allowances for estimated irrecoverable amounts are recognised in profit or loss when there is objective evidence that the asset is impaired.
Receivables are tested for impairment annually and when there is objective evidence that the Group will not be able to collect all amounts due in accordance with the original terms, an allowance is recognised in profit or loss. significant financial difficulties of the debtor, probability that the debtor will enter bankruptcy or financial reorganisation and default or delinquency in payments are considered indicators that the receivable is impaired. The amount of the allowance is the difference between the carrying amount of the receivable and the present value of estimated future cash flows discounted at the original effective interest rate.
Loans and receivables are non-derivative financial assets with fixed or determinable payments that are not quoted in an active market other than those that are held for trading or are designated upon initial recognition as at fair value through profit or loss or as available-for-sale financial assets or those for which the Group may not recover substantially all of its initial investment other than because of credit deterioration.
(ii) Trade payablesTrade payables are classified as current liabilities and are stated at their nominal value unless the effect of discounting is material, in which case trade payables are measured at amortised cost using the effective interest method.
(iii) Shares Issued by the GroupOrdinary shares issued by the Group are classified as equity instruments. Costs relating to an equity issue are offset against equity, as a deduction from the issue proceeds.
(iv) Convertible loans Convertible loans are regarded as compound instruments, consisting of a liability component and an equity component. such components are classified separately in accordance with the substance of the contractual arrangement and the definitions of a financial liability and an equity instrument. Upon initial recognition, the carrying amount of the liability component is determined by estimating the present value using the prevailing market interest rate for similar risk non-convertible debt. The difference between the fair value of the compound financial instrument as a whole and the present value of the financial liability represents the equity component.
The interest expense on the liability component is calculated by applying the prevailing market rate for similar risk non-convertible debt. The difference between this amount and the actual interest paid is added to the carrying amount of the liability.
Changes in the fair value of the equity component are not recognised. Redemptions or refinancings of the equity component are recognised as changes in equity whereas gains or losses associated with redemptions or refinancings of the liability component are recognised in profit or loss.
Revenue RecognitionRevenue arises from the provision of services and is measured at the fair value of the consideration received or receivable for services provided in the normal course of business, net of value added tax, rebates and discounts, where applicable. Revenue is recognised when it is probable that future economic benefits will flow to the Group and the amount of revenue and the associated costs can be measured reliably. The following specific recognition criteria must also be met before revenue is recognised:
(i) provision of ServicesRevenue from the provision of services is recognised in profit or loss in the period in which the services are rendered, by reference to completion of the specific transaction assessed on the basis of the actual service provided as a proportion of the total services to be provided. for practical purposes, when services are performed by an indeterminate number of acts over a specified period of time, revenue is recognised on a straight-line basis over the specified period unless there is evidence that some other method better represents the stage of completion.
(ii) Interest Income and expenseInterest income and expense is recognised on an accruals basis using the effective interest method which is a way of calculating the amortised cost of a financial asset or a financial liability (or a group of financial assets or financial liabilities) and of allocating the interest receivable or interest payable over the relevant period.
Annual Report and Accounts 2014

2 Significant Accounting policies Continued
Income TaxIncome tax expense comprises current and deferred tax and is recognised in profit or loss, except to the extent that it relates to items recognised in other comprehensive income or directly in equity, in which case the current and deferred tax is also dealt with in other comprehensive income or in equity, as appropriate.
Current tax is based on the taxable income for the period using tax rates enacted or substantively enacted at the reporting date and any adjustment to tax payable in respect of previous years. The taxable result for the period differs from the result as reported in profit or loss because it excludes items which are non-assessable or disallowed and it further excludes items that are taxable or deductible in other periods.
Deferred tax is recognised in respect of temporary differences between the carrying amounts of assets and liabilities for financial reporting purposes and the amounts used for taxation purposes. Deferred tax is measured at the tax rates that are expected to be applied to temporary differences when they reverse based on the laws that have been enacted or substantively enacted by the reporting date.
A deferred tax asset is recognised for unused tax losses and deductible temporary differences to the extent that it is probable that future taxable profits will be available against which they can be utilised. The carrying amount of deferred tax assets is reviewed at the end of each reporting period and reduced to the extent that it is no longer probable that sufficient taxable profit will be available to allow all or part of the asset to be utilised.
for the purposes of measuring deferred tax on investment properties that are measured using the fair value model, the carrying amounts of such properties are presumed to be recovered entirely through sale, unless the presumption is rebutted. The presumption is rebutted when the investment property is depreciable and is held within a business model whose objective is to consume substantially all of the economic benefits embodied in the investment property through use over time, rather than through sale.
Deferred tax assets and liabilities are offset when the Group has a legally enforceable right to set off its current tax assets and liabilities and the deferred tax assets and liabilities relate to income taxes levied by the same taxation authority on either the same taxable entity or different taxable entities which intend either to settle current tax liabilities and assets on a net basis, or to realise the assets and settle the liabilities simultaneously, in each future period in which significant amounts of deferred tax liabilities or assets are expected to be settled or recovered.
Foreign Currency TranslationThe financial statements of the Group are presented in its functional currency, the Euro, being the currency of the primary economic environment in which the Group operates.
foreign currency transactions are translated at the exchange rates ruling on the date of transaction. Monetary assets and liabilities denominated in currencies other than the functional currency are re-translated to the functional currency at the exchange rate ruling at year-end. Exchange differences arising on the settlement and on the re-translation of monetary items are recognised in profit or loss. Non-monetary assets and liabilities denominated in currencies other than the functional currency that are measured at fair value are re-translated using the exchange rate ruling on the date the fair value was determined. Non-monetary assets and liabilities denominated in currencies other than the functional currency that are measured in terms of historical cost are re-translated at the historical rate, being the rate ruling on the date of acquisition of the non-monetary asset or liability.
Exchange differences arising on the translation of non-monetary items carried at fair value are included in profit or loss for the period, except for differences arising on the re-translation of non-monetary items in respect of which gains and losses are recognised in other comprehensive income. for such non-monetary items, any exchange component of that gain or loss is also recognised in other comprehensive income.
foreign exchange gains and losses are included within Other Income and Expenses, except in the case of significant exchange differences arising on investing or financing activities, which are classified within investment income, investment losses or finance costs as appropriate.
foreign exchange gains and losses are reported on a net basis. such gains and losses are, however, reported separately if they are material.
Exchange differences are recognised in other comprehensive income and accumulated in a separate component of equity. such differences are reclassified from equity to profit or loss in the period in which the foreign operation is disposed of.
Cash and Cash equivalentsCash and cash equivalents comprise cash on hand and demand deposits, together with other short-term highly liquid investments that are readily convertible into known amounts of cash and which are subject to an insignificant risk of change in value. Cash and cash equivalents are carried in the statement of financial position at face value. In the statement of cash flows, cash and cash equivalents comprise cash at bank, including deposits accessible on demand.
Financial StatementsContinued
Kambi Group plc
Financial Report
provisionsProvisions are recognised when the Group has a present legal or constructive obligation as a result of a past event, it is probable that an outflow of resources embodying economic benefits will be required to settle the obligation and a reliable estimate can be made of the amount of the obligation. Provisions are measured at the directors’ best estimate of the expenditure required to settle the present obligation at the end of the reporting period. If the effect of the time value of money is material, provisions are recognised at their present value by discounting the expected future cash flows at a pre-tax rate that reflects current market assessments of the time value of money and, where appropriate, the risks specific to the liability. Provisions are not recognised for future operating losses.
Items Affecting Comparability The Group defines items affecting comparability as those items which, by their size or nature in relation to the Group, should be separately disclosed in order to give a full understanding of the Group’s underlying financial performance, and aid comparability of the Group’s results between periods.
leases The Group’s leases are all operating leases in which the Group is the lessee (leases in which a significant portion of the risks and rewards of ownership of the asset being leased are retained by the lessor). Rentals payable under operating leases are charged to the income statement on a straight-line basis over the term of the relevant lease (net of any incentive received from the lessor).
Share-based payments share-based payment arrangements in which the Group receives services as consideration for equity instruments are accounted for as equity settled share-based payment transactions by recognising in profit or loss the fair value of the awards with a corresponding increase in equity within other reserves.
The total amount to be expensed is measured by reference to the fair value at the grant date of the options granted, taking into account market performance conditions and the impact of any non-vesting conditions, and excluding the impact of any service or vesting conditions. Non-market performance and service conditions are included in assumptions about the number of options that are expected to vest. The total amount expensed is recognised over the vesting period of the options, which is usually three years. At each balance sheet date, the estimate of the number of options expected to vest is revised with the impact recognised in the consolidated income statement.
Impairment Assets that have an indefinite useful life are not subject to amortisation or depreciation but are tested annually for impairment. Assets with a definite useful life are tested for impairment when there is evidence of impairment, i.e. whenever events or changes in circumstances indicate that the carrying amount may not be recovered. for the purposes of assessing impairment, assets are grouped in cash generating units, i.e. the lowest levels for which there are separately identifiable cash flows.
An impairment loss is recognised if the carrying amount of an asset or its cash-generating unit exceeds its estimated recoverable amount. Impairment losses are recognised in profit or loss. The recoverable amount is the higher of an asset’s fair value less costs to sell and value in use. In assessing value in use the estimated future cash flows are discounted to their present value using a pre-tax discount rate that reflects current market assessments of the time value of money and the risks specific to the asset.
Impairment losses recognised in prior periods are assessed at each reporting date for any indications that the loss has decreased or no longer exists.
If in a subsequent period, the amount of the impairment loss decreases and the decrease can be related objectively to an event occurring after the impairment was recognised, the previously recognised impairment loss is reversed by adjusting the allowance account. The amount of the reversal is recognised in profit or loss.
Annual Report and Accounts 2014

2 Significant Accounting policies Continued
post-employment BenefitsThe Group contributes towards the state pension in accordance with local legislation where required. The only obligation of the Group is to make the required contributions. Costs related to such contributions are expensed in the period in which they are incurred.
The Group also provides for certain additional post-employment retirement benefits to employees in the Philippines. The cost of providing benefits under a defined benefit plan is recognised in profit or loss and includes the current service cost, any past service cost (and gain or loss on settlement) and net interest on the defined benefit liability or asset. The net defined benefit liability or asset includes actuarial gains and losses which are recognised in other comprehensive income in the period in which they arise.
Net interest is calculated by applying the discount rate to the net defined benefit liability or asset. The Group recognises the following changes in the net defined benefit obligation under Administrative Expenses in the Consolidated statement of Profit or Loss and Other Comprehensive Income:
— service costs comprising current service costs, past service costs, gains and losses on curtailments and non-routine settlements
— Net interest expense or income
The cost of the defined benefit retirement plan in the Philippines is dependent on actuarial valuations. An actuarial valuation involves making various assumptions that may differ from actual developments in the future. These include the determination of the discount rate, future salary increases, mortality rates and future pension increases. Due to the complexities involved in the valuation and its long-term nature, a defined benefit obligation is highly sensitive to changes in these assumptions. All assumptions are reviewed at each reporting date.
3 Judgments in Applying Accounting policies and key Sources of estimation uncertainty
The amounts recognised in the financial statements are sensitive to the accounting policies, assumptions and estimates that underlie the preparation of financial statements. The judgments made by management in applying the Group’s accounting policies that have the most significant effect on the amounts recognised in the financial statements, together with information about the key assumptions concerning the future, and other key sources of estimation uncertainty at the end of the reporting period, that have a significant risk of causing a material adjustment to the carrying amounts of assets and liabilities within the next financial year are disclosed herein.
Financial StatementsContinued
40 Kambi Group plc
Financial Report
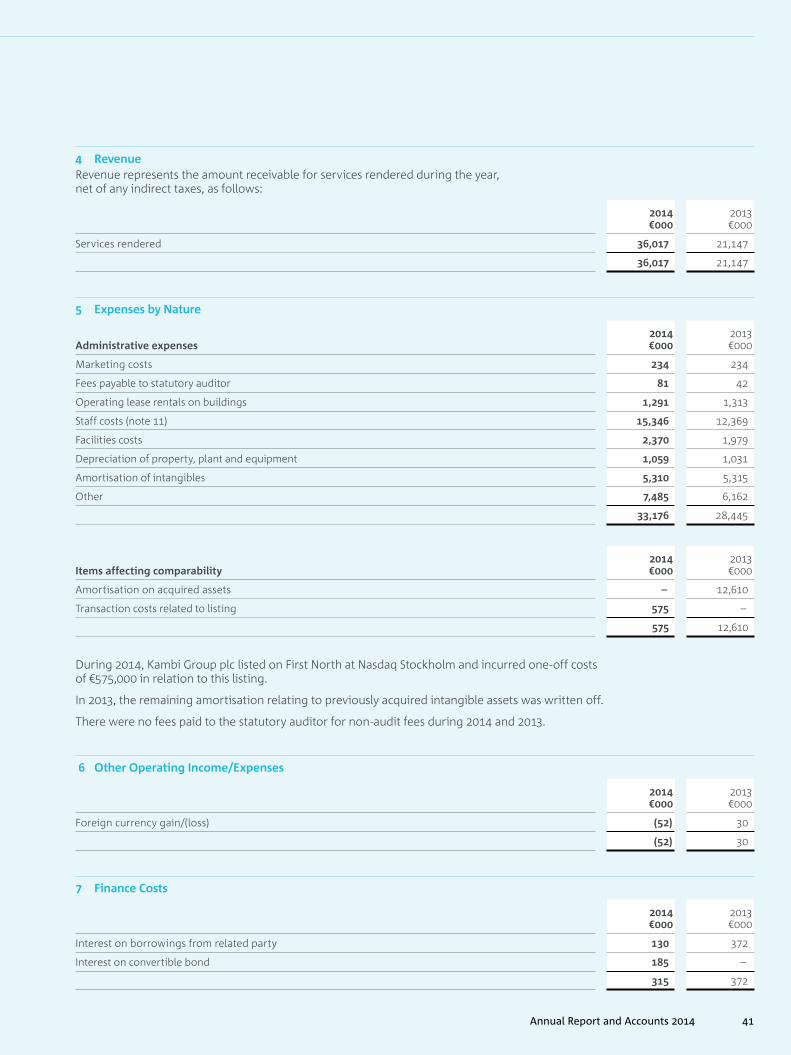
4 RevenueRevenue represents the amount receivable for services rendered during the year, net of any indirect taxes, as follows:
2014€000
2013€000
services rendered 36,017 21,147
36,017 21,147
5 expenses by Nature
Administrative expenses2014€000
2013€000
Marketing costs 234 234
fees payable to statutory auditor 81 42
Operating lease rentals on buildings 1,291 1,313
staff costs (note 11) 15,346 12,369
facilities costs 2,370 1,979
Depreciation of property, plant and equipment 1,059 1,031
Amortisation of intangibles 5,310 5,315
Other 7,485 6,162
33,176 28,445
Items affecting comparability2014€000
2013€000
Amortisation on acquired assets – 12,610
Transaction costs related to listing 575 –
575 12,610
During 2014, Kambi Group plc listed on first North at Nasdaq stockholm and incurred one-off costs of €575,000 in relation to this listing.
In 2013, the remaining amortisation relating to previously acquired intangible assets was written off.
There were no fees paid to the statutory auditor for non-audit fees during 2014 and 2013.
6 other operating Income/expenses
2014€000
2013€000
foreign currency gain/(loss) (52) 30
(52) 30
7 Finance Costs
2014€000
2013€000
Interest on borrowings from related party 130 372
Interest on convertible bond 185 –
315 372
41Annual Report and Accounts 2014

8 Investment Income
2014€000
2013€000
Interest income on bank deposits 15 2
15 2
9 profit/(loss) Before Tax
2014€000
2013€000
The profit/(loss) before tax is after charging:
Amortisation of intangible assets 1,059 1,031
Depreciation on property plant and equipment 5,310 17,925
Directors’ remuneration 185 7
Exchange differences 52 (30)
Listing costs 575 –
The amount that is payable to the auditors is as follows:
2014€000
2013€000
Total remuneration payable to the Group’s auditors for the audit of the Group’s financial statements 81 42
10 key Management personnel Compensation
2014€000
2013€000
Management remuneration 1,704 1,134
1,704 1,134
11 Staff Costs and employee Information
2014€000
2013€000
Wages and salaries 12,557 10,360
social security costs 2,033 1,626
Pension & retirement costs 717 343
share- based payments (note 24) 39 40
15,346 12,369
Financial StatementsContinued
4 Kambi Group plc
Financial Report

The average number of persons employed during the year was made up as follows:
2014Number
2013Number
Operations 209 179
IT 88 82
Other 50 36
347 297
12 Income Tax (expense)/CreditOn taxable profit subject to income tax at 35%:
2014€000
2013€000
Current tax (expense)/credit (744) 865
Deferred tax (expense)/credit (note 22) (203) 667
(947) 1,532
Income tax in Malta is calculated at a basic rate of 35% (2013: 35%) of the estimated assessable profit for the year. Taxation for other jurisdictions is calculated at the rates prevailing in the respective jurisdictions.
Tax applying the statutory domestic income tax rate and the tax charge for the year are reconciled as follows:
2014€000
2013€000
Profit/(loss) before tax 1,914 (20,248)
Tax (charge)/credit at the applicable rate of 35% (670) 7,087
Tax effect of:
Items of income/expenditure not taxable/deductible (678) 12
Prior year (under) provision/over provision of tax (18) –
Overseas tax rates 231 244
Deferred tax recognised on undistributed profits 179 –
Utilisation/(surrender) of tax losses – (6,303)
Other 9 492
Tax (charge)/credit for the year (947) 1,532
13 DividendsThere were no dividends paid during 2014 (2013: Nil).
4Annual Report and Accounts 2014
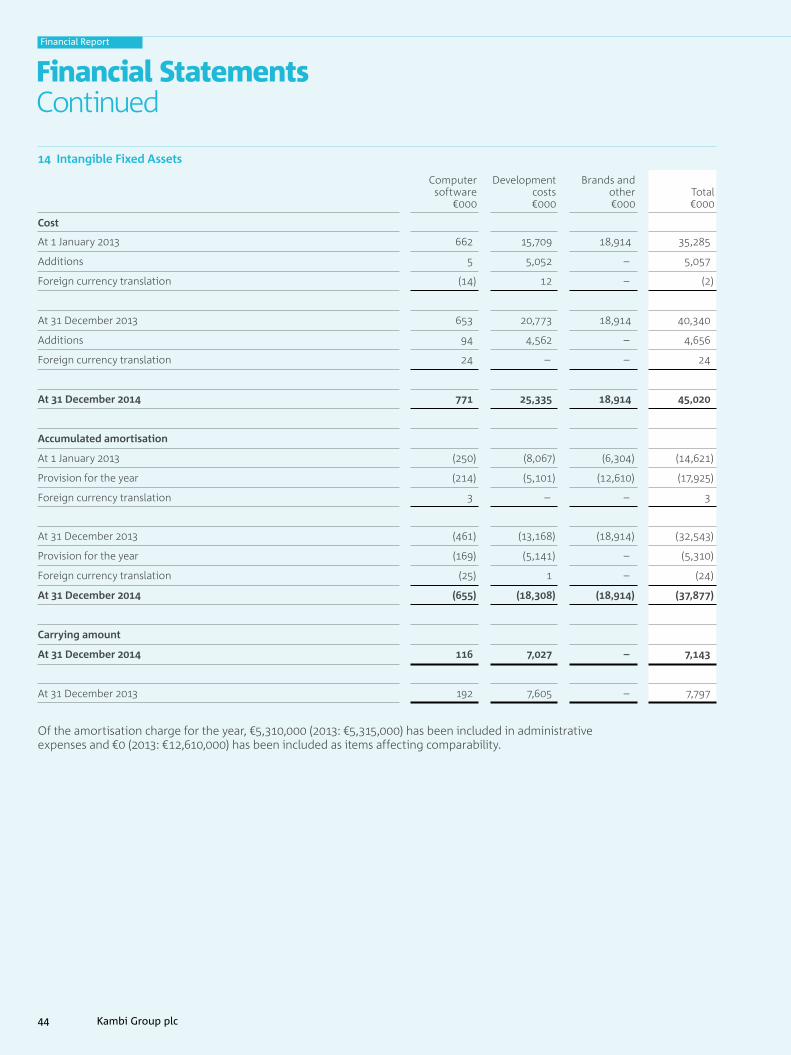
14 Intangible Fixed Assets
Computer software
€000
Development costs€000
Brands and other€000
Total€000
Cost
At 1 January 2013 662 15,709 18,914 35,285
Additions 5 5,052 – 5,057
foreign currency translation (14) 12 – (2)
At 31 December 2013 653 20,773 18,914 40,340
Additions 94 4,562 – 4,656
foreign currency translation 24 – – 24
At 31 December 2014 771 25,335 18,914 45,020
Accumulated amortisation
At 1 January 2013 (250) (8,067) (6,304) (14,621)
Provision for the year (214) (5,101) (12,610) (17,925)
foreign currency translation 3 – – 3
At 31 December 2013 (461) (13,168) (18,914) (32,543)
Provision for the year (169) (5,141) – (5,310)
foreign currency translation (25) 1 – (24)
At 31 December 2014 (655) (18,308) (18,914) (37,877)
Carrying amount
At 31 December 2014 116 7,027 – 7,143
At 31 December 2013 192 7,605 – 7,797
Of the amortisation charge for the year, €5,310,000 (2013: €5,315,000) has been included in administrative expenses and €0 (2013: €12,610,000) has been included as items affecting comparability.
Financial StatementsContinued
44 Kambi Group plc
Financial Report

15 property, plant and equipment
Plant & machinery
€000
fixtures & fittings
€000
Office equipment
€000
Computer hardware
€000
Leasehold improvements
€000Total€000
Cost
At 1 January 2013 10 333 181 2,100 735 3,359
Additions – 140 92 651 196 1,079
Disposals (10) (61) – – – (71)
foreign currency translation – (18) (9) (59) (47) (133)
At 31 December 2013 – 394 264 2,692 884 4,234
Additions – 14 36 682 32 764
foreign currency translation – (11) 15 6 58 68
At 31 December 2014 – 397 315 3,380 974 5,066
Depreciation and impairment
At 1 January 2013 (3) (214) (36) (948) (96) (1,297)
Provision for the year – (91) (41) (723) (176) (1,031)
Released on disposal 3 61 – – – 64
foreign currency translation – 8 2 25 6 41
At 31 December 2013 – (236) (75) (1,646) (266) (2,223)
Provisions for the year – (61) (51) (755) (192) (1,059)
foreign currency translation – 7 (8) (4) (27) (32)
At 31 December 2014 – (290) (134) (2,405) (485) (3,314)
Carrying amount
At 31 December 2014 – 107 181 975 489 1,752
At 31 December 2013 – 158 189 1,046 618 2,011
4Annual Report and Accounts 2014

16 Group Information
SubsidiariesThe subsidiaries of the Group at 31 December 2014 are shown below:
subsidiary
Country ofincorporation
Description of shares held
Percentage of shares held
%
Kambi Malta Limited Malta Ordinary shares 100
Kambi spain plc Malta Ordinary shares 100
sports Information services Limited Malta Ordinary shares 100
Kambi services Limited UK Ordinary shares 100
Kambi sweden AB sweden Ordinary shares 100
Global Technology & sports Limited British Virgin Islands Ordinary shares 100
Kambi Philippines Inc. Philippines Ordinary shares 100
Kambi sports solutions (Alderney) Limited Alderney Ordinary shares 100
Kambi Australia Pty Ltd (dormant) Australia Ordinary shares 100
17 Trade and other Receivables
2014€000
2013€000
Trade receivables 3,236 991
Other receivables 2,057 2,957
Prepayments and accrued income 2,020 1,205
7,313 5,153
18 Cash and Cash equivalentsCash and cash equivalents included in the statement of cash flows comprise the following amounts in the statement of financial position:
2014€000
2013€000
Cash at bank 23,155 3,008
Cash and cash equivalents in the statement of cash flows 23,155 3,008
Financial StatementsContinued
4 Kambi Group plc
Financial Report
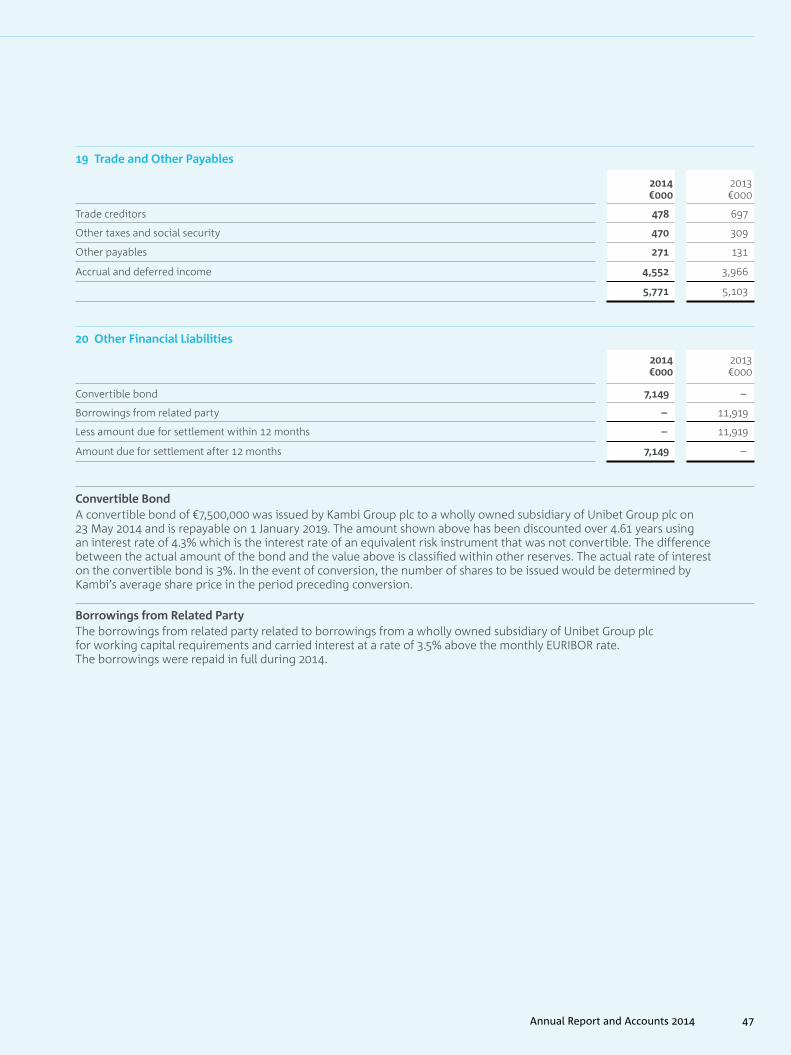
19 Trade and other payables
2014€000
2013€000
Trade creditors 478 697
Other taxes and social security 470 309
Other payables 271 131
Accrual and deferred income 4,552 3,966
5,771 5,103
20 other Financial liabilities
2014€000
2013€000
Convertible bond 7,149 –
Borrowings from related party – 11,919
Less amount due for settlement within 12 months – 11,919
Amount due for settlement after 12 months 7,149 –
Convertible BondA convertible bond of €7,500,000 was issued by Kambi Group plc to a wholly owned subsidiary of Unibet Group plc on 23 May 2014 and is repayable on 1 January 2019. The amount shown above has been discounted over 4.61 years using an interest rate of 4.3% which is the interest rate of an equivalent risk instrument that was not convertible. The difference between the actual amount of the bond and the value above is classified within other reserves. The actual rate of interest on the convertible bond is 3%. In the event of conversion, the number of shares to be issued would be determined by Kambi’s average share price in the period preceding conversion.
Borrowings from Related partyThe borrowings from related party related to borrowings from a wholly owned subsidiary of Unibet Group plc for working capital requirements and carried interest at a rate of 3.5% above the monthly EURIBOR rate. The borrowings were repaid in full during 2014.
4Annual Report and Accounts 2014

21 other liabilities
Net employee defined benefit liabilities2014€000
2013€000
Philippines post-employment retirement plan 20 –
Total 20 –
The Group provides for certain post-employment retirement benefits to employees in the Philippines. This plan is governed by the employment laws of the Philippines, which require retirement benefits to be provided. The level of benefits provided depends on the member’s length of service and salary at retirement age and is determined by an amount equivalent to one half of a month's salary for every year of service, with six months or more of service considered as one year.
The Group has used the actuary Institutional synergy, Inc. based in the Philippines to determine the current liability. The fee paid to the actuary for these services in 2014 was €1,000 (2013: Nil).
The following tables summarise the components of net benefit expense recognised in the statement of profit or loss and the funded status and amounts recognised in the statement of financial position for the plan:
Net benefit expense (recognised in profit or loss)2014€000
2013€000
Current service cost 6 –
Interest cost on benefit obligation 1 –
7 –
Movement in the present value of the obligation(pVo)
2014€000
2013€000
PVO at beginning of year – –
Current service cost 6 –
Interest cost 1 –
Actuarial loss due to:
Experience adjustments 6 –
Changes in financial assumptions 7 –
PVO at end of year 20 –
The principal assumptions used in determining retirement benefit obligations for the Group’s plans are shown below:
Actuarial assumptions 2014
Discount rate 4.61%
salary increase rate 3.00%
Mortality rate 1994 GAM
Turnover rate Scale
employees profile
Number of plan members 121
Total annual compensation €000 1,067
Average annual compensation €000 9
Average attained age 27.33
Average years of service 2.11
Average expected future service years 4.00
Financial StatementsContinued
4 Kambi Group plc
Financial Report

A quantitative sensitivity analysis for significant assumptions as at 31 December 2014 is as shown below:
Discount ratepresent
Value
5.61% 15
4.61% (Actual) 20
3.61% 25
Salary increase rate
present
Value
4% 25
3% (Actual) 20
2% 15
22 Deferred TaxDeferred income taxes are calculated on all temporary differences under the liability method using a principal tax rate of 35% (2013: 35%). The following are the deferred tax liabilities and assets (prior to offset) recognised by the Group and movements thereon during the current and prior reporting period:
2012€000
Movement for year
€0002013€000
Movement for year
€0002014€000
Unremitted earnings – – – 179 179
Tangible fixed assets 32 181 213 (67) 146
Unrealised exchange differences – 130 130 (189) (59)
Tax losses – 131 131 (131) –
Other (199) 225 26 8 34
(167) 667 500 (200) 300
Certain deferred tax assets and liabilities may have been offset when there is a legally enforceable right to offset current tax assets against current tax liabilities and when the deferred income taxes and liabilities relate to income taxes levied by the same taxation authority on either the same taxable entity or different taxable entities where there is an intention to settle the balances on a net basis.
The movement for the year is reconciled as follows:
2014 €000
2013€000
(Credit)/Charge to income for the year (203) 667
foreign currency translation 3 –
(200) 667
The following payments are expected contributions to the defined benefit plan in future years:
2014€000
Less than one year –
More than one year to five years –
More than five years to 10 years –
More than 10 years to 15 years –
More than 15 years to 20 years 11
More than 20 years 630
The average duration of the defined benefit obligation at the end of the reporting period is 27.07 years.
The following is the analysis of the deferred tax balances (after offset) for financial reporting purposes:
2014 €000
2013€000
Deferred tax assets 424 500
Deferred tax liabilities (124) –
300 500
4Annual Report and Accounts 2014

23 Share Capital and Share premium
2014€000
2013€000
Authorised
1,000,000,000 Ordinary shares of €0.001 each – 1,000
750,000,000 Ordinary ‘A’ shares of €0.003 each 2,250 –
250,000,000 Ordinary ‘B’ shares of €0.003 each 750 –
Issued and fully paid up
19,974,500 Ordinary shares of €0.001 each – 20
19,974,500 Ordinary ‘B’ shares of €0.003 each 60 –
9,766,697 Ordinary ‘B’ shares of €0.003 each 29 –
89 20
Share premium
share premium reserve 53,273 29,779
In April 2014, the following resolutions were passed with regard to the Company’s share capital:
i) To divide the authorised share capital of the Company and change the nominal value of the authorised share capital, from €1,000,000 divided into 1,000,000,000 Ordinary shares with a nominal value of €0.001 each, into 750,000,000 Ordinary ‘A’ shares with a nominal value of €0.003 each and 250,000,000 Ordinary ‘B’ shares with a nominal value of €0.003 each.
ii) To change the nominal value of all the shares currently in issue from €0.001 to €0.003 by capitalising the required amount of €39,949 from the share premium account.
iii) To redesignate as Ordinary ‘B’ shares all the 19,974,500 Ordinary shares having a nominal value of €0.003 in the Company currently in issue.
In May 2014, 9,766,697 new Ordinary 'B' shares were issued by the Group, as part of an equity issue to existing shareholders prior to the Group’s listing. The total issued share capital following the new equity issue consists of 29,741,197 Ordinary 'B' shares, each with a nominal value of €0.003 (2013: €0.001). No Ordinary 'A' shares have been issued.
The total proceeds of the issue were €23,755,537, of which €29,300 was an increase in issued share capital and €23,726,237 was an increase in share premium. Costs of €192,000 relating to the equity issue were offset against this increase in share premium.
Financial StatementsContinued
0 Kambi Group plc
Financial Report

24 Share-based payments
The Group operates a share-based payment scheme as set out within this note. No options within the scheme have been exercised. The total charge for the year relating to employee share-based payment schemes was €39,000 (2013: €40,000), all of which related to equity-settled share-based payment transactions.
The information provided below relates to the share option scheme operated by Kambi Group plc, for the benefit of employees of the Group.
kambi Group executive Share options planThe Kambi Group Executive share Option Plan (EsOP) was introduced in December 2013. Under the scheme, the Board can grant options over shares in the Group to employees of any entity within the Kambi Group.
Options are normally granted with a fixed exercise price equal to 130 per cent of the average share value, based on an external valuation. Awards under the scheme are generally made to employees at a senior level. Options will normally be exercisable in accordance with a vesting schedule set at the date of grant and will expire not later than the tenth anniversary of the date of grant. Options are exercisable only to the extent that certain performance conditions have been satisfied and are subject to continued employment.
Grants made under the EsOP are valued using the Black-scholes option-pricing model. The fair value per option granted and the assumptions used in the calculation are as follows. The exercise price of the options was set in GBP as this was the functional currency of Unibet Group plc, which was the owner of the Group at the date of grant.
Grant date14 Dec
2013
Exercise price GBP 1.23
Number of employees 53
shares under option 961,000
Vesting period (years) 3
Expected volatility % 21
Option life (years) 10
Expected life (years) 3.50
Risk-free rate % 1.23
Expected dividends expressed as dividend yield % 0
fair value per option GBP 0.08
The expected volatility is based on the standard deviation of Unibet Group’s share price over a year, prior to the grant date. During 2013, Kambi Group plc was not publicly traded and therefore Unibet Group’s share price was used to calculate the expected volatility. The risk-free rates of return applied to the EsOP grant is the approximate implicit risk-free interest rate for the options’ term to maturity, based on the three-year maturity rate offered by Riksbanken at the date of each grant.
1Annual Report and Accounts 2014
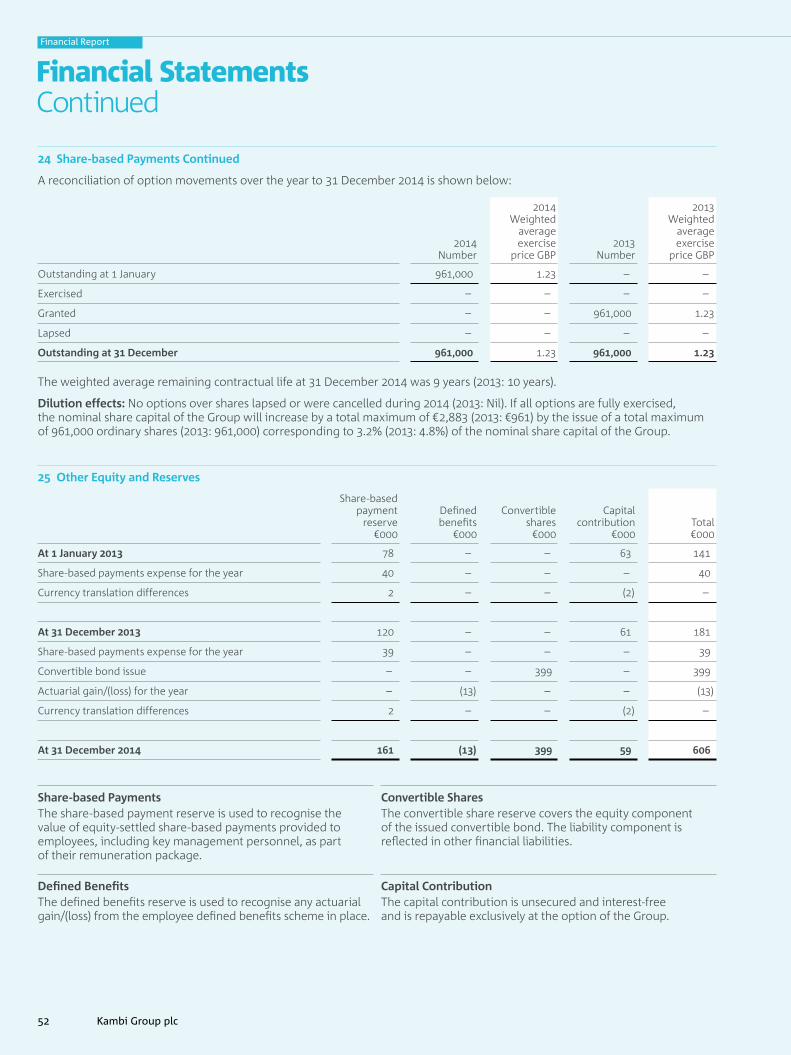
24 Share-based payments Continued
A reconciliation of option movements over the year to 31 December 2014 is shown below:
2014Number
2014Weighted
average exercise
price GBP2013
Number
2013Weighted
average exercise
price GBP
Outstanding at 1 January 961,000 1.23 – –
Exercised – – – –
Granted – – 961,000 1.23
Lapsed – – – –
outstanding at 31 December 961,000 1.23 961,000 1.23
The weighted average remaining contractual life at 31 December 2014 was 9 years (2013: 10 years).
Dilution effects: No options over shares lapsed or were cancelled during 2014 (2013: Nil). If all options are fully exercised, the nominal share capital of the Group will increase by a total maximum of €2,883 (2013: €961) by the issue of a total maximum of 961,000 ordinary shares (2013: 961,000) corresponding to 3.2% (2013: 4.8%) of the nominal share capital of the Group.
25 other equity and Reserves
share-based payment
reserve€000
Defined benefits
€000
Convertible shares
€000
Capital contribution
€000Total€000
At 1 January 2013 78 – – 63 141
share-based payments expense for the year 40 – – – 40
Currency translation differences 2 – – (2) –
At 31 December 2013 120 – – 61 181
share-based payments expense for the year 39 – – – 39
Convertible bond issue – – 399 – 399
Actuarial gain/(loss) for the year – (13) – – (13)
Currency translation differences 2 – – (2) –
At 31 December 2014 161 (13) 399 59 606
Share-based paymentsThe share-based payment reserve is used to recognise the value of equity-settled share-based payments provided to employees, including key management personnel, as part of their remuneration package.
Defined BenefitsThe defined benefits reserve is used to recognise any actuarial gain/(loss) from the employee defined benefits scheme in place.
Convertible SharesThe convertible share reserve covers the equity component of the issued convertible bond. The liability component is reflected in other financial liabilities.
Capital ContributionThe capital contribution is unsecured and interest-free and is repayable exclusively at the option of the Group.
Financial StatementsContinued
Kambi Group plc
Financial Report
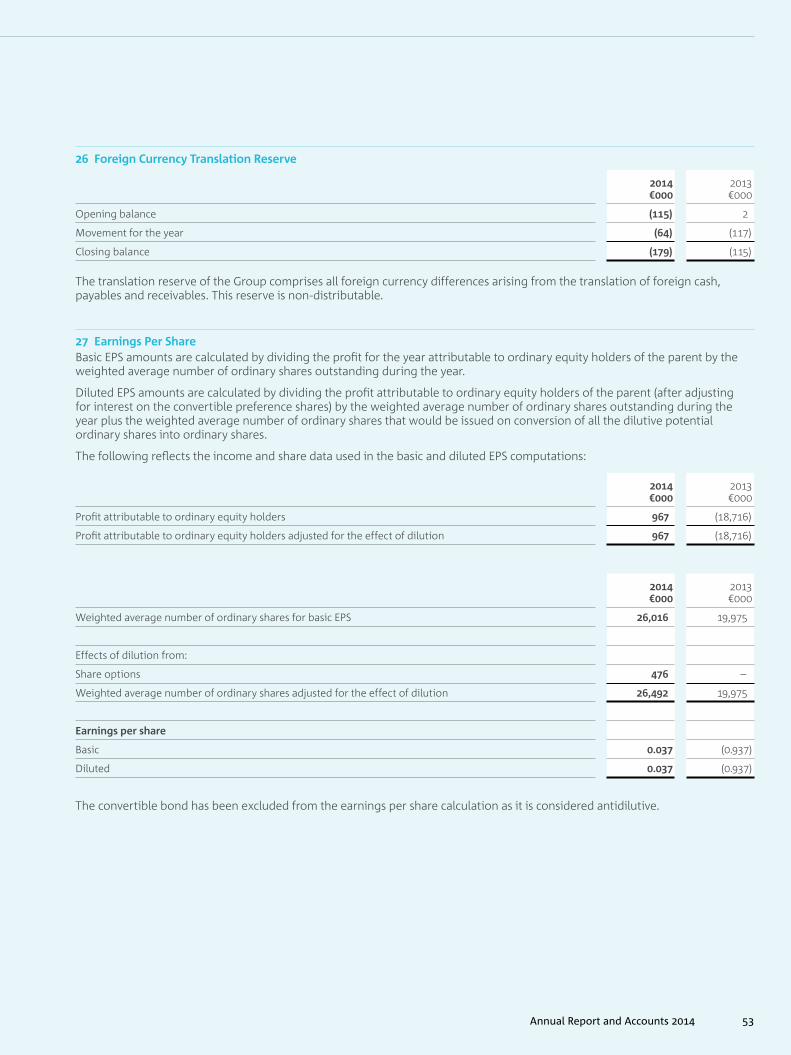
26 Foreign Currency Translation Reserve
2014€000
2013€000
Opening balance (115) 2
Movement for the year (64) (117)
Closing balance (179) (115)
The translation reserve of the Group comprises all foreign currency differences arising from the translation of foreign cash, payables and receivables. This reserve is non-distributable.
27 earnings per ShareBasic EPs amounts are calculated by dividing the profit for the year attributable to ordinary equity holders of the parent by the weighted average number of ordinary shares outstanding during the year.
Diluted EPs amounts are calculated by dividing the profit attributable to ordinary equity holders of the parent (after adjusting for interest on the convertible preference shares) by the weighted average number of ordinary shares outstanding during the year plus the weighted average number of ordinary shares that would be issued on conversion of all the dilutive potential ordinary shares into ordinary shares.
The following reflects the income and share data used in the basic and diluted EPs computations:
2014€000
2013€000
Profit attributable to ordinary equity holders 967 (18,716)
Profit attributable to ordinary equity holders adjusted for the effect of dilution 967 (18,716)
2014€000
2013€000
Weighted average number of ordinary shares for basic EPs 26,016 19,975
Effects of dilution from:
share options 476 –
Weighted average number of ordinary shares adjusted for the effect of dilution 26,492 19,975
earnings per share
Basic 0.037 (0.937)
Diluted 0.037 (0.937)
The convertible bond has been excluded from the earnings per share calculation as it is considered antidilutive.
Annual Report and Accounts 2014

28 Related party DisclosuresDuring the course of the year, the Group entered into transactions with related parties as set out below.
Until May 2014, the Group was part of Unibet Group plc and therefore all companies forming part of the Unibet Group are considered to be related parties up until this date as these companies are also ultimately owned by Unibet Group plc. Thereafter, Unibet Group plc is no longer a related party and any transactions are not included in this note.
Trading transactions with fellow subsidiaries of the Unibet Group were carried out at arm’s length and are shown below.
The amounts outstanding at the end of 2013 and due to a fellow subsidiary of the Unibet Group are disclosed within borrowings from related party in note 20.
for details of Directors’ and Key Management Remuneration, please refer to the report on page 24.
Related party
activity€000
2014Total
activity€000 %
Related party
activity€000
2013Total
activity€000 %
Revenue:
Related party transactions with:
Other related parties 8,678 16,996
8,678 36,017 24 16,996 21,147 80
Administrative expenses:
Related party transactions with:
Other related parties (357) (364)
(357) (33,176) 1 (364) (28,447) 1
Finance costs:
Related party transactions with:
Other related parties (130) (372)
(130) (315) 41 (372) (372) 100
Financial StatementsContinued
4 Kambi Group plc
Financial Report

30 Capital CommitmentsThere were no capital commitments at 31 December 2014 or 31 December 2013.
31 Contingent liabilitiesThere were no contingent liabilities at 31 December 2014 or 2013.
29 operating leases
2014€000
2013€000
Recognised as expense for the year 1,291 1,313
1,291 1,313
At the end of the reporting period, the Group had outstanding commitments under non-cancellable operating leases, which fall due as follows:
2014€000
2013€000
Within one year 1,303 1,259
Between one and five years 772 1,180
Over five years – –
2,075 2,439
Operating lease payments represent rentals payable by the Group for certain buildings. Leases are negotiated and rentals are fixed for an average term of two years. There are no future aggregate minimum lease payments under non-cancellable operating leases payable after five years.
Annual Report and Accounts 2014

32 Financialriskmanagement
FinancialriskFactorsThe Group’s activities potentially expose it to a variety of financial risks: market risk (including foreign currency exchange risk and interest rate risk), credit risk and liquidity risk. The Group’s overall risk management approach, covering risk exposures for all Group undertakings, focuses on the unpredictability of financial markets and seeks to minimise potential adverse effects on the Group’s financial performance.
The exposures to risk and the way risks arise, together with objectives, policies and processes for managing and measuring these risks are disclosed in more detail below. The objectives, policies and processes for managing financial risks and the methods used to measure such risks are subject to continual improvement and development.
(i)marketriskMarket risk is the risk that the Group loses money on its business due to unfavourable outcomes on the events where the Group offers odds. The Group has adopted specific risk management policies that control the maximum risk level for each sport or event on which the Group offers odds. The results of the most popular teams in major football leagues comprise the predominant market risk. Through diversification, which is a key element of the Group’s business, the risk is spread across a large number of events and sports. The Kambi Compliance Officer is responsible for day-to-day monitoring of market risk. It is also their responsibility to advise the odds compilers and risk managers on appropriate levels for certain events. The Kambi Compliance Officer assesses risk levels for individual events as well as from a longer term perspective. The Group continuously monitors its risk limits for each operator and end user.
The Group operates internationally and in addition to EUR is exposed to foreign exchange risk arising from various currency exposures, primarily with respect to the EUR. Foreign exchange risk arises from transactions and other events, and recognised assets and liabilities. The Group receives cash inflows from its customers in a range of currencies; additional currency risk is managed by means of holding funds on short-term deposit in the currencies of the Group’s principal cash outflows.
The Group is exposed to the risk that the fair value or future cash flows of a financial instrument will fluctuate because of changes in market interest rates. The Group has managed this risk through the negotiation of a fixed interest rate on its borrowings. In addition, a significant part of the Group’s liquid assets are held on short-term deposit in order to provide the necessary liquidity to fund the Group’s operations.
(ii)CreditriskCredit risk is the risk that one party to a financial instrument will cause a financial loss to the other party by failing to discharge an obligation.
Financial assets which potentially subject the Group to concentrations of credit risk consist principally of receivables and cash at bank. An allowance would be made for doubtful debts if there was an identified loss event which, based on previous experience, is evidence of a reduction in the recoverability of the cash flows. Credit risk with respect
to receivables is limited due to credit control procedures. Moreover, the debtor base comprises a number of customers, thus serving to mitigate concentration risk.
Cash at bank is placed with various reliable financial institutions.
(iii)LiquidityriskLiquidity risk is the risk that an entity will encounter difficulty in raising funds to meet commitments associated with financial instruments. The Group monitors and manages its risk to a shortage of funds by maintaining sufficient cash and by monitoring the availability of raising funds to meet commitments associated with financial instruments, and by maintaining adequate banking facilities.
CapitalriskmanagementThe Group’s objectives when managing capital are:
— to safeguard its ability to continue as a going concern; and— to maximise the return to stakeholders through the
optimisation of the debt and equity balance.
The primary objective of the Group’s capital management is to ensure that it maintains a strong credit rating and healthy capital ratios in order to support its business and maximise shareholder value.
The capital structure of the Group consists of debt, cash and cash equivalents and items presented within equity in the consolidated statement of financial position. The Group’s Directors manage the capital structure and make adjustments to it, in light of changes in economic conditions. The capital structure is reviewed on an ongoing basis. Based on recommendations of the Directors, the Group balances its overall capital structure through the payments of dividends, new share issues, the issue of new debt or the redemption of existing debt.
FairvaluesofFinancialinstrumentsThe carrying value of the Group’s financial assets and liabilities approximated to their fair values at the year-end.
33 First-timeadoptionofiFrSThe date of transition to IFRS is 1 January 2013. The Group applied IFRS 1 First-time Adoption of International Financial Reporting Standards in preparing these first IFRS consolidated financial statements. However, all companies within the Group were previously consolidated as part of Unibet Group plc, which already reports under IFRS, therefore the financial statements are already prepared on a like for like basis, apart from the exemptions listed below.
Upon transition, IFRS 1 permits certain exemptions from full retrospective application of IFRS. The Group has applied the following optional exemption:
i) The Group has deemed the cumulative translation differences for foreign operations at the date of transition to be zero. Adjustments to give effect to this are recorded against opening equity. After the date of transition, translation differences arising on translation of foreign operations are recognised in other comprehensive income and included in a separate translation reserve within equity (see note 26).
Financial StatementsContinued
Kambi Group plc
Financial ReportFinancial Report

AGm and Company Information
shareholders in Kambi Group plc are invited to participate in the AGM on Tuesday 19 May 2015 at 17.00 CET in the Phoenician suite at The Westin Dragonara Resort, Dragonara Road, st. Julian’s, sTJ 3143 Malta.
Rights to participateHolders of Kambi Group plc who wish to attend the AGM must be registered at Euroclear sweden AB on friday 8 May 2015 and notify the Company of their intention to attend the AGM no later than 17.00 CET on Thursday 14 May 2015.
In order to be entitled to participate in the proceedings at the AGM, shareholders who have their shares registered with a nominee account, must ensure their shares are temporarily registered in their own name by, at the latest, 8 May 2015.
you can notify your attendance:Via e-mail on: [email protected]
Or by mail to:Head of Investor RelationsAnna-Lena ÅströmKambi Group plcLevel 3, Quantum HouseAbate Rigord streetTa’ Xbiex XBX1120Malta
Financial Calendar 29 April 2015 Q1 Report19 May 2015 AGM5 August 2015 Q2 Report4 November 2015 Q3 Report10 february 2016 Q4 Report
Company Information Registered office: Level 3, Quantum HouseAbate Rigord streetTa’ Xbiex XBX1120Malta
Certified advisor:Redeye AB, stockholm
Company secretary: Maureen Ehlinger
Auditors:Mazars Maltasovereign Building, Zaghfran Road 32Attard ATD 9012Malta
Corporate website:kambigroupplc.com
Annual Report and Accounts 2014
Financial Report
A
Average number of employees Average number of employees based on headcount at each month end
B
B2BBusiness-to-Business
B2CBusiness-to-Consumer
C
Cash flow per share Net increase/(decrease) in cash and cash equivalents, divided by the number of ordinary shares at the balance sheet date
Customer B2C operator to whom Kambi provides services
E
Earnings per share, fully dilutedProfit after tax adjusted for any effects of dilutive potential ordinary shares divided by the fully diluted weighted average number of ordinary shares for the period
EBITEarnings before interest and taxation, equates to profit from operations
EBIT marginEBIT as a percentage of revenue
EBITDAProfit from operations before depreciation and amortisation charges
Equity/assets ratioTotal shareholders’ equity as a percentage of total assets
Equity per shareTotal shareholders’ equity divided by the number of ordinary shares at the balance sheet date
G
Gross Gaming Revenue (GGR) The amount wagered minus the winnings returned to players
L
Live betting Odds set and played during an event
N
Net cashTotal cash less debt at period end
O
Operating marginProfit from operations as a percentage of revenue
OperatorA B2C gambling operator
Operator Turnover and Margin Index This index shows Kambi’s operators’ turnover and margin based on the total stakes and payouts of their players
P
Pre-match oddsOdds set and played on prior to the start of the event
R
Return on total assets Profit after tax as a percentage of average total assets
Return on total capital Profit after tax as a percentage of total capital
Revenue Income from Kambi’s customers based on fixed and variable elements
S
SportsbookA platform where bets are placed and accepted on sporting and other events
T
Total capital Total capital is equal to equity as disclosed on the consolidated balance sheet, plus net debt (comprising total borrowings less cash and cash equivalents)
W
Weighted average number of shares Calculated as the weighted average number of ordinary shares outstanding during the year
Weighted average number of shares, fully dilutedCalculated as the weighted average number of ordinary shares outstanding and potentially outstanding (i.e. including the effect of exercising all share options) during the year
GlossaryDefinitions
Kambi Group plc
Financial Report

For more information, contact:
CEO Kristian Nylén Head of Investor Relations Anna-Lena Åström
Telephone +44 20 3617 7270 [email protected] kambigroupplc.com
——
Kambi Group plcLevel 3, Quantum HouseAbate Rigord StreetTa’ Xbiex XBX1120Malta
Designed and produced by mosaiccreates.co.ukIllustration by Alex WilliamsonIcons created by Juan Pablo Bravo, Jessica Lock, Björn Andersson and Iain Hector from the Noun Project