annual report & accounts 2014 - gmi...
TRANSCRIPT

ANNUAL REPORT & ACCOUNTS 2014

AT THE HEART OF THE HOME ACROSS THE
GENERATIONS
AGA RANGEMASTER IS A LEADING SPECIALIST MANUFACTURER AND
DISTRIBUTOR OF SOME OF THE BEST KNOWN AND LOVED KITCHEN APPLIANCES AND PRODUCTS.
WE PRIDE OURSELVES ON OUR BRITISH HERITAGE AND OVER THE DECADES WE
HAVE BUILT A REPUTATION FOR QUALITY, ICONIC DESIGN AND INNOVATION THAT
HAVE PLACED THE KITCHEN AT THE HEART OF HOMES IN BRITAIN AND ACROSS
THE WORLD.
INVESTING IN CRAFTED KITCHEN APPLIANCES USING BRITISH LED MANUFACTURING
EXPERTISE

THE RIGHT PRODUCTS, BRANDS AND ROUTES
TO MARKET TO ACHIEVE SUSTAINED GROWTH
AT A GLANCE
HEADQUARTERED IN LEAMINGTON SPA, THE GROUP SELLS OVER 100,000 DOMESTIC
COOKING RANGES AND REFRIGERATION APPLIANCES AROUND THE WORLD EACH YEAR, MANUFACTURING MOST OF THE PRODUCTS WE SELL. WE ALSO ARE THE
LARGEST MANUFACTURER OF SINKS IN THE UK AND SELL COMPLEMENTARY KITCHEN
APPLIANCES UNDER OUR KEY BRANDS.
WE EMPLOY OVER 2,500 PEOPLE IN OUR MANUFACTURING PLANTS IN THE UK, THE
USA, FRANCE, IRELAND AND ROMANIA, AND HAVE INTERNATIONAL WHOLESALE AND RETAIL DISTRIBUTION. WE HAVE A
MANUFACTURING TRADITION THAT PLACES US AT THE FOREFRONT OF MODERN
TECHNIQUES OF PROCESS CONTROL AND HAVE THE CAPACITY AVAILABLE TO MEET A
SIGNIFICANT GROWTH IN DEMAND.
BUILDING ON OUR 300 YEAR HERITAGE, THE GROUP INVESTS CONTINUALLY IN
RESEARCH AND DEVELOPMENT TO ENSURE THAT ITS PRODUCTS MEET
ENVIRONMENTAL STANDARDS, ENERGY EFFICIENCY REQUIREMENTS AND HAVE THE FUNCTIONALITY AND STYLE FOR
LIFE TODAY.

GROUP REVENUE
£261.1m(2013: £250.4m)
EBITDA BEFORE NON-RECURRING COSTS
£12.5m(2013: £11.7m)
OPERATING PROFIT
£9.6m(2013: £8.2m)
NET CASH
£9.2m(2013: £5.9m)
STRATEGIC AND OPERATIONAL HIGHLIGHTS
AGA heat storage cooker volumes grew 9%.
Rangemaster sales grew by 9% in the UK and by 6% overall.
Fired Earth and AGA Marvel in North America saw revenue increases of over 10% contrasting with revenue falls for Waterford Stanley in Ireland and for French-based Grange furniture lines.
Pursuing strategy to become a focused premium international appliance operation.
COOKING
Led by the iconic AGA heritage brand, the Group produces cast iron cookers in our manufacturing plants in Coalbrookdale and Telford in the UK with wood burning stoves and cooker boilers built under the Rayburn and Stanley brands in Waterford in Ireland. The Group dominates the range cooking segment with the Rangemaster/Falcon/Mercury brands manufactured in Leamington Spa in the UK. The premium range cooker brand, La Cornue is manufactured in Paris, France. The cooking ranges are supported by growing cookware businesses.
REFRIGERATION
The Group manufactures its Marvel range of refrigerators in an entirely purpose built facility in Greenville, Michigan USA. We also source a premium range of refrigerators and other kitchen appliances to our specification to complement our key cooker brands for all our markets.
LIFESTYLE
Fired Earth sells tiles, paints, bathroom and kitchen products through retail shops across the UK. Grange manufactures in France and Romania a broad range of high quality furniture, with traditional and contemporary ethos and has international distribution. Leisure sinks are manufactured at Long Eaton. Nottingham.

Group plc Annual Report & Accounts 2014 1
Strategic Report
2 Our portfolio of brands4 Market overview5 Business model6 Chairman’s statement8 Innovation – AGA10 Innovation – Rangemaster12 Innovation – Living with designs14 Business and strategic review18 Key risks and uncertainties20 Corporate social responsibility
Governance
24 Board of directors26 Corporate governance report33 Directors’ remuneration report48 Directors’ report50 Statement of directors’ responsibilities
Financial
51 Consolidated income statement52 Consolidated statement
of comprehensive income53 Consolidated balance sheet54 Consolidated cash flow statement55 Consolidated statement of
changes in equity56 Notes to the accounts84 Independent auditor’s report87 Five year financial history88 Parent company accounts under UK GAAP89 Notes to the parent company accounts93 Shareholder information
Image courtesy of Linden Homes
Group plc Annual Report & Accounts 20142
LA CORNUE La Cornue remains firmly at the forefront of style in the kitchen where it has been since 1908. It is a statement in itself. There is a new generation of products developed at our Paris factory to
be launched in spring 2015 and there are new styles which with a strengthened international dealer structure suggest that La Cornue can enter a new phase of growth.
The French styling and the vaulted oven cooking approach have made La Cornue internationally renowned and brings a high profile clientele.
RANGEMASTER Since we introduced the Rangemaster twenty years ago, we have sold 1,000,000 cookers around the world and have over 50% of the UK range cooking market.
We have introduced a new gas burner to adapt the range cooker into the lives of Chinese consumers. Our new 60cm wide cookers have been successfully launched through a major retailer in the UK. We made circa 65,000 range cookers in 2014.
Rangemaster is renowned for its build quality and the brand extends to cooker hoods, refrigerators, sinks, and dishwashers.
AGA The AGA creates an ambience in the home that puts it at the centre of family life.
With the new generation of AGA cookers launched since May 2011 – now including the smaller AGA City60 – bringing controllable electric and dual control products
into the AGA cooker family. It is attracting new and international customers.
Rayburn and Stanley cooker boilers and stoves provide a complementary variation to the core AGA. We made over 10,000 cast iron cookers in 2014.
AGA cooking is the best in the world – because of radiant heat from the cast iron oven walls. Cast iron AGA cookers have been at the heart of family kitchens in the UK since the early 1930s.
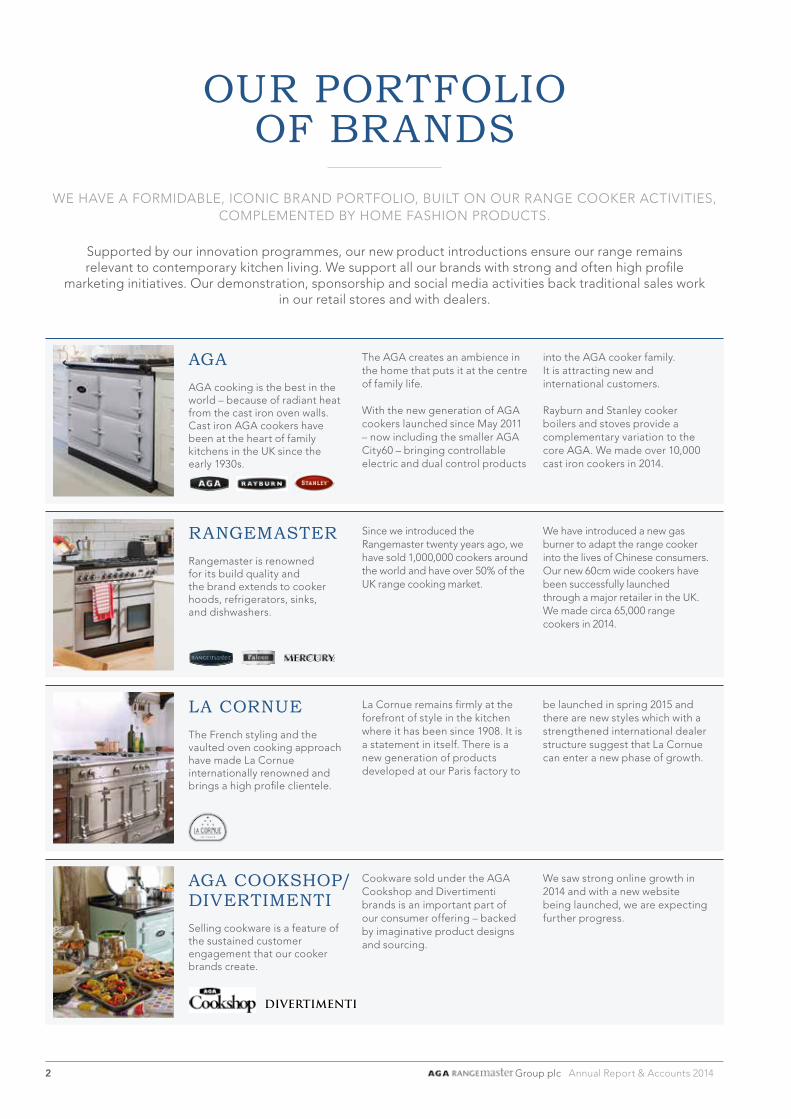
OUR PORTFOLIO OF BRANDS
WE HAVE A FORMIDABLE, ICONIC BRAND PORTFOLIO, BUILT ON OUR RANGE COOKER ACTIVITIES, COMPLEMENTED BY HOME FASHION PRODUCTS.
Supported by our innovation programmes, our new product introductions ensure our range remains relevant to contemporary kitchen living. We support all our brands with strong and often high profile
marketing initiatives. Our demonstration, sponsorship and social media activities back traditional sales work in our retail stores and with dealers.
AGA COOKSHOP/DIVERTIMENTI
Cookware sold under the AGA Cookshop and Divertimenti brands is an important part of our consumer offering – backed by imaginative product designs and sourcing.
We saw strong online growth in 2014 and with a new website being launched, we are expecting further progress.
Selling cookware is a feature of the sustained customer engagement that our cooker brands create.

Group plc Annual Report & Accounts 2014 3
MARVEL Marvel Refrigeration is steadily gathering market share and consumer recognition and as we respond to the new regulations introduced in 2014, our new
energy efficient products mean we are well set for North American growth. We made over 34,000 refrigerators in 2014.
The new generation of brilliantly thought through products are designed to open up new possibilities for the brand indoor and outdoors and in specialist user segments like the medical and scientific markets.
GRANGE
French style in classic and contemporary designs make Grange renowned in the furniture sector.
Grange has new designs and a rationalised production footprint as it seeks to benefit from a pick-up in consumers spending on furniture. Grange, based in Lyon, has seven owned retail stores and has dealers operating in forty countries. The ‘My Grange’ design and ordering
system continues to gain in functionality and is able to provide consumers with more input to have bespoke furniture. Multi-purpose furniture lines for small space living is now a major new feature of the business.
FIRED EARTH
We now successfully balance style and value in the growing market for wall and floor tiles.
Fired Earth in the UK is a major tile retailer and sets the style and taste trend lines. Our modern retail format is attuned to urban living and has driven our major performance improvement.
The core tile lines are backed by the well-established bathroom, kitchen and paint lines. Our design team are seeing consumer confidence reflected in interest in larger scale home projects. Fired Earth has just launched a new bathroom catalogue. Online sales are growing rapidly.
TYPICAL SELLING PRICES OF OUR RANGE
£5,000– £100,000
£5,000– £16,000
£4,000–£7,000
£2,400–£4,500
£1,300–£2,600
OTHER BRANDS
LEISURE Our sinks are available in stainless steel, composite and ceramic finishes and in designs that suit both modern and traditional homes. Sinks are sold under the Leisure and Rangemaster brands.
We also offer a vast selection of taps which combine style and engineering excellence – ranging from ultra-cool to the perfectly practical – an ideal match to go with the sink of your choice. We sold over 500,000 sinks in 2014.
With more than 80 years of experience, Leisure has built its reputation on quality, efficiency and consistency.

Group plc Annual Report & Accounts 20144
1,820
1,220
1,020
820
620
420
220
0
Sep- 0
7
Dec- 0
7
Mar-
08
Jun-
08
Sep- 0
8
Dec- 0
8
Mar-
09
Jun-
09
Sep- 0
9
Dec- 0
9
Mar-
10
Jun-
10
Sep-1
0
Dec-1
0
Mar-
11
Jun-
11
Sep-1
1
Dec-1
1
Mar-
12
Jun-
12
Sep-1
2
Dec-1
2
Mar-
13
Jun-
13
Dec-1
3
1,620
1,420
2,020
2,220
Sep-1
3
Mar-
14
Jun-
14
Dec-1
4
Sep-1
4
UK Mortgage Approvals (’000s)
HMRC Stamp Duty Data (’000s) Halifax HPI Index
Nationwide HPI Index
110
90
100
120
130
80
70
60
30
40
50
20
MARKET OVERVIEW
STRONG BRANDS LOVED AT HOME AND INTERNATIONALLY
KEY MARKET DRIVERS • The Group’s primary market is kitchen
appliances. The UK provides two thirds of revenue and there are established niche positions in Northern Europe and in North America. The Group is also established in the wider home fashion market.
• A key driver of the business is the housing market with the propensity of consumers to spend being linked to home moves. Mortgage approvals therefore provide a good lead indicator of likely volumes. Alongside other household goods categories the cooker market fell sharply after the financial crash of 2007 and has remained, until recently, subdued because of the squeeze on disposable incomes. Mortgage approvals assisted by the ‘Help to Buy’ scheme and checked by the Mortgage Market Review have risen to reach, at present, a new plateau.
TWELVE MONTH ROLLING UK MORTGAGE APPROVALS AND STAMP DUTY DATA VS HOUSE PRICE INDICES (SEP 2007 T0 DEC 2014)
The French and Irish markets in which the Group is well positioned both had difficult years. Consumer spending was held back by tax increases and pressures on household incomes. The German market is large and creating consumer awareness is the primary task for the Group in that market.
Consumer confidence in North America has rebounded well although it has taken time to feed into the housing market and so into appliance expenditure. Volumes were still up by over 10%. New regulations in the refrigeration market provided a new stimulus in our market segment. The Rest of the World accounted for £6.7 million of revenue.
The tide turned for the UK appliance market in the second half of 2013 and volumes rose in 2014 by 9%. Built-in cookers linked to new homes were up 17% compared with range cookers up 8%. The increase was less sharp than the increase in housing transactions.
£171.5mUK
£48.5mEUROPE
£34.4mNORTH AMERICA

Group plc Annual Report & Accounts 2014 5
BUSINESS MODEL
DELIVERING VALUE THROUGH PRODUCT INNOVATION
KEY STRENGTHS
• Established market positions with well-defined routes to market in substantial market segments.
• Strong product development programmes that have modernised the product offering.
• Consumer brands that have resonated with generations putting products at the heart of the home.
• A manufacturing and engineering culture that holds product quality as a paramount feature.
• Well-established sourcing and supply chain management capability.
Research into market trends/customer expectations
to enhance designand innovation
Product development and
market testing to assess
reaction to own and
sourced productspre
miu
m p
rod
ucts
distrib
utio
n fo
r se
lect
ed
thro
ugh na
rrow
tie
d
Pro
duct l
aunc
hed
cookers and refrigeration
structures for mainstream
through wider dealerProduct sold
or up
grading their homes
the process of m
oving
a�uent consum
ers in
Market to m
ore
Mai
ntai
n br
and
rep
utat
ion
and
loya
lty –
inte
rnat
iona
lly
STRATEGIC OBJECTIVES 2014 PROGRESS FUTURE PLANS
GROWTH To grow sales of our primary brands, AGA and Rangemaster.
AGA heat storage cooker sales grew by 9% boosted by the autumn launch of the AGA City60. The new generation of AGA cookers launched since 2011 now represent around 67% of AGA cooker sales. Rangemaster sales grew by 9% in the UK and 6% overall – it also launched a new 60cm wide cooker in the autumn.
Existing owners trading up is a growing part of the AGA business. We expect the continuing new product introductions to keep the brands’ profile high in existing and new markets. The 60cm cookers and new sourced products will widen the markets targeted.
INTERNATIONAL SALES To grow international sales to50% of revenue.
International sales in 2014 were 34% of revenue. This was down from 37% in 2013 as a result of challenging market conditions in Europe. Currency movements also reduced the sales numbers in sterling terms.
Marvel Refrigeration in the US continues to show solid growth with sales up over 10%. With its new product range launched there is significant capacity to support further expansion.
In 2014, our continental activities progressed further and we extended our distributor structures notably into Germany and Russia. We expect this to start to deliver real growth in 2015.
In March 2015, our range cookers will launch in China. It is the culmination of three years’ work to gain accreditation and can open up new markets in the region.
PROFITABILITYTo improve the returns ofFired Earth and Grange.
Fired Earth returned to profit in 2013 and has enjoyed a good year in 2014, a year in which revenues grew by over 15%.
Grange remains loss making. It completed its rationalisation programme, consolidating manufacturing facilities and downsizing its distribution structure in North America. It has contemporary styled new product and designs for small space living.
We expect growth at Fired Earth to continue as it gains full year benefit from its smaller urban stores and further new stores are to be opened. Online sales are growing. Fired Earth continues to set style standards with its new tiles and bathroom ranges.
Grange has a capable management team and with new product and an established dealer network it has every opportunity to recover. The board will monitor progress and is ready to take further action.
RETURN ON SALES To improve the return on salesto the 10% target.
In 2014, operating return on sales increased to 3.7% from 3.3% – on sales up 4.3%.
Prior to this economic downturn, the return on sales target was achieved by the major constituent parts of the Group across economic cycles.
All operations have considered when they will return to or achieve the 10% return on sales target. The Group’s 10% target remains a benchmark key performance indicator for all operations.
EFFICIENCY To manage costs through efficiency improvements, rationalisation and international sourcing.
The cost savings realised during the 2008 – 2014 downturn totalled £18 million.
Some further cost reduction measures have already been taken in 2015. Further plans to make best use of our facilities are under consideration.

Group plc Annual Report & Accounts 20146
JOHN COLEMANCHAIRMAN
TRADING PERFORMANCES I am pleased to report on a positive year for the Group. There was good progress underlying the increased Group revenue and operating profit, although trading performance of our operations continued to be mixed.
Our AGA and Rangemaster brands are the most significant contributors to Group revenue and operating profit, and they traded well with new products for both brands coming to the market. We introduced the new 60 centimetre cookers in the autumn which attracted encouraging levels of interest. While still operating well below 2007 levels, both brands are seeing sustained improvement in volumes. Marvel Refrigeration based in the United States gained traction with the introduction of a new generation of products and increased further market share. Overall, there was reasonable growth across our core appliance brands during 2014. We are confident that with the current product development phase nearing completion, 2015 will see further opportunities for growth for these brands.
Fired Earth performed strongly with revenue growth of over 15%. That fed through into a significantly improved profit performance. We are optimistic about the prospects for 2015. Trading for our European operations, however, continued to be more difficult with consumers remaining cautious in their spending. Waterford Stanley and Grange based in Ireland and France respectively have been particularly affected. We have invested significantly in recent years to improve the fundamentals of these operations. The issues for these businesses are about demand levels in their product categories which have been weakened by the prevailing economic environment.
STRATEGYOver the recent difficult years for trading, all levels of our operations have carefully managed cost and rationalisation programmes to reduce the number of sites we occupy and to deliver cost savings to improve efficiency and effectiveness. We are a leaner business and in a better position to deliver profits as our markets pick up and our operational gearing shows through. We have prepared for an upturn by continuing to invest in research and development and have thereby brought a wide range of new products to market, many of which will have international appeal. We are proud of our heritage and look to build on it creating new products focused on meeting the demands of today’s customers with designs for 21st century living.
The Group’s strategy is to focus on the expansion of its core cooker and refrigeration brands in the UK and international markets. During the year we considered offers for Fired Earth but felt the best option was to extend existing arrangements with management, acquire a portion of management’s shareholding and allow the benefit of work carried out to be clearer in its impact before looking at a comprehensive valorisation exercise. A value of £3.3 million – by extrapolation over £20 million for Fired Earth as a whole including an inter-company loan – was placed on the management’s shareholding which gave rise to a fair value movement.
The triennial actuarial valuation as at 31st December 2014 is in train and in due course we will provide further clarification on the future funding requirements of the pension scheme..
Overall, we are working to configure the business best to take the market opportunities that arise. Focusing our resources and potentially creating strategic and product alliances from within our segment would bring appreciable benefits. In January 2015 Rothschild was appointed corporate finance adviser to the Group to assist in bringing third party agreements to fruition.
BOARD CHANGES We welcomed Bob Ivell to the board in July 2014 and we are confident that his extensive commercial, general management and public limited company board experience will assist us with many of the forthcoming strategic initiatives. Paul Jackson will be standing down from the board after the Annual General Meeting after nine years. His contribution to our development and in particular his assistance with brand and marketing initiatives has been tremendous.
DIVIDEND As previously announced, the board agreed on completion of the 2011 triennial actuarial valuation of the Group’s main pension scheme and related recovery plan not to make dividend payments without pension scheme trustee agreement. The board is not proposing to make a dividend payment in respect of 2014.
CHAIRMAN’S STATEMENT
OUR NEW PRODUCT MIX BENEFITING FROM IMPROVED MARKET CONDITIONS

Group plc Annual Report & Accounts 2014 7

Group plc Annual Report & Accounts 20148
HOW AGA IS CONSTANTLY DEVELOPING, CHANGING
AND INNOVATING...
AGA 2011 TO 2014: THE REJUVENATION YEARS
Understanding design and fashion trends
In a little over three years we have seen a transformation in the range of AGA cookers
we sell. We now have factory finished, flexible products easy to install and maintain that match the needs of the consumer today. The glorious enamelled colours of the AGA cooker reflect contemporary choices and
its warmth to touch make it a magnet in the kitchen.
Engineering new solutions that customers really want
In 2011, our research and development team designed the AGA Total Control model that means the AGA cooker works for you; ready when you are. And for many customers who want their AGA cooker to provide constant background
warmth and to have a separate hob to use when needed, the AGA Dual Control model is proving to be the right choice.
Of sales in 2014, 66% were the factory finished controllable products launched since 2011, over 75% of
sales are now of electric products.

Group plc Annual Report & Accounts 2014 9
An AGA cooker for smaller spaces and our appetite for
change is getting bigger
In 2014, we targeted the more urban market with the AGA City60 – 60cm wide and perfectly adapted for smaller
properties wherever they are. The design skills behind the AGA City60 and the functionality of it are exceptional. The
new product has received critical acclaim.
Mike Wright, executive director of Jaguar Land Rover attended the launch and made the comparison of the
new AGA City60 with the Range Rover Evoque.
Daisy Lowe unveiled the new AGA City60 at a pre-launch event at the AGA London shop in Spital Square.

Group plc Annual Report & Accounts 201410
1,000,000 RANGES MADE IN LEAMINGTON SPA “THANKS A MILLION”
OUTSTANDING FOR THEIR BUILD QUALITY
Designing solutions for modern living
We have been building cookers on the same site in Leamington Spa since 1830 and have set standards for quality
product ever after. We re-interpreted the range for the modern world with the launch of the original Rangemaster 110 in 1995
shown here. The range is now available in 90cm, through to 100cm, 110cm and 120cm. All have the single piece base plate developed in-house that provides the datum point for our cooking products. There is also the single piece hob that lends itself to clean lines of
the Rangemaster products. Common to all our products is that they are ‘built from experience’. We continue to innovate with
induction hot plate and gas burner technologies. Our new product for the Chinese customer is likely to be globally attractive.
The same, only smaller
We have moved back into the 60cm slot-in market after 12 years away as there is now a market for the range style in 60cm. We designed and featured the products which we source like the
Rangemaster Kitchener 60 shown above. Initially it has been sold exclusively through Currys. It will be followed by a new range of
built-in appliances. The Kitchener cooking grate was patented by William Flavel in 1829 and a dual fuel (coal and gas) Kitchener made
in 1887 is on display in the foyer of the Leamington Spa factory.

Group plc Annual Report & Accounts 2014 11
The new Nexus
The Rangemaster Nexus 90 Dual Fuel is set to become a major line. Selected to be the millionth range cooker – the gold model will be
part of the display in the foyer of the Leamington Spa factory. The Rangemaster Nexus has a number on new features including a
bread proving drawer, improved grill and rotary controls. It is available in 90cm and 110cm, in slate, stainless steel, gloss black or white.
Re-inventing Rangemaster for an international market
We are widening our customer base. Our sales on the continent are under the Falcon brand and we have high hopes that we can
persuade more German consumers to try range cooking. Rangemaster has a new training academy in Leamington Spa
opened by our French and German distributors. In China, we will sell under the Redfyre brand – where the
challenge is large to develop our range cooker brand because the oven itself has not been part of the cookery culture. Wok cooking
certainly is and hence our work to develop the best and most controllable wok gas burner available.
One in a million
We have now built 1,000,000 of our modern range cookers in Leamington Spa. We celebrated it by ‘thanking a million’: the team that inspired Rangemaster in 1995; the workforce that provide the depth of product knowledge; the suppliers that support our lean
process engineering approach; our dealer base in the UK and internationally; and, finally our customers who can see that they indeed have a product with great heritage that meets today’s
families’ needs.

Group plc Annual Report & Accounts 201412
LIVING WITH DESIGNS THAT ARE COOL,
FRESH AND STYLISH...
Marvel Refrigeration developing rapidly and
building our profile
Offering the highest energy efficiency, best cooling precision and maximum storage versatility on the market – there has been a real transformation of
Marvel Refrigeration. We offer a range of products suitable for indoor and outdoor use, built-in
or freestanding.
Our professional range offers luxury grade quality with sleek, sophisticated and ultra-efficient performance.
We have recently launched a new website to raise Marvel Refrigeration’s profile and are developing
good social media following.
La Cornue – trend setting in carbon
La Cornue continues to set style standards. The Chateau 150 : Carbon Edition incorporates a new patented air flow management system in its vaulted ovens. It will be the centrepiece of a major project
relaunch around the world. The Chateau 150 is available in 30 colours and 12 finishes.
FROM OUR NEW GENERATION OF PORCELAIN TILES TO THE LATEST ICE MAKERS, OUR PRODUCTS COMBINE DESIGN
WITH FUNCTIONALITY

Group plc Annual Report & Accounts 2014 13
Fired Earth – a world of style at your fingertips
Fired Earth’s aim is to provide inspiration for your home – stylish ideas for the kitchen or bathroom, wall and floor tiles, wood flooring, paints
and wallpapers – carefully sourced by us to our exacting standards.
Friendly, knowledgeable, local service and increasingly fulfilling customers’ needs online. Our new bathroom brochure will stimulate
more of the larger home projects that are helping accelerate growth rates.
Grange – bespoke quality furniture to suit your needs
Skilled craftsman make Grange furniture with traditional or contemporary styling. Individual pieces can be personalised to create
timeless designs that fit beautifully with life in the modern family home. Grange remains best known for its large module bookcases
and wall cabinets. It also has the new Côté Design products which are ideal for small space living.

Group plc Annual Report & Accounts 201414
WILLIAM MCGRATHCHIEF EXECUTIVE
BUSINESS AND STRATEGIC REVIEW
2014 PROVIDES SOUND TRADING BACKCLOTH FOR STRATEGIC INITIATIVES
“2014 was another sound year achieved in easing market conditions. AGA, Rangemaster and Marvel Refrigeration were all strong performers and now have new product platforms established in their markets. We are seeking out
strategic links to accelerate the growth strategies for these brands.”
GROUP OVERVIEW2014 was a positive year for the Group. Revenues rose by 4.3% to £261.1 million, 5.7% at constant currency, with 66% of the revenue generated in the UK. Second half growth of 5.1% was higher than in the first half. Operating profits rose again to reach £9.6 million from £8.2 million – a 17.1% increase.
This success has come despite the challenging trading environment across our markets, where activity levels remain down on pre-2008 levels. UK mortgage approvals, which have been a good lead indicator of activity for us historically, actually ended the year with a fourth quarter down on the prior year, leaving rolling 12 month numbers only just ahead year-on-year. This was sharply below expectations set a year ago by the Bank of England. It was encouraging, therefore, that household goods expenditure and appliance expenditure increased after a long period in the doldrums. With real incomes now rising and with inflation low, the trend towards higher spending on the home can be expected to continue in 2015. Elsewhere our markets in North America showed sustained good growth in contrast to our European markets which were soft.
CURRENT TRADINGMarket conditions in our major business areas are expected to improve this year. Our order intake so far this year is back to 2014 levels after a slow start. Fired Earth and AGA Marvel have seen the strong trend lines of 2014 continue in 2015. There are some more encouraging signs in both Ireland and France. We are looking to our development work in wider markets to start to contribute additionally to our sales in Germany – where our distributor CoolGiants has been rapidly opening up new outlets – and China. In China, our distributor, Beijing Hi Seasons, is to have 30 displaying outlets and there will be the formal launch later this month in Beijing. Overall, with these developments providing additional impetus, we expect trading outcomes to be encouraging this year.
As the housing market continues to improve,
the focus of the business has to alter as we set out to ensure that we are ready to take the
opportunities that arise

Group plc Annual Report & Accounts 2014 15
BUSINESS REVIEW AND PERFORMANCEAGA : range modernisation completedAGA had an encouraging year in 2014 with sales of heat storage AGA cookers increasing by 9%. The launch of the AGA City60 in the autumn helped to create a widened market for us. Of the sales in 2014 66% were of factory finished controllable products launched since mid 2011. The AGA Dual Control where electric hobs and gas or electric ovens operate on one system was launched in 2012 and is already our best selling heat storage line. The additional flexibility offered by a product that provides radiant heat, cooked food – together with the wider lifestyle benefits of the AGA – within a readily installable, flueless, electric package, provides a powerful sales proposition. We have been generating materially higher numbers of leads and we are now offering greater flexibility in how we work with customers so that we are ready to talk about their needs whenever they wish – not only in shop hours. We are also launching an international programme of webinars aimed at ‘absolute beginners’. With the City60 we are also making sure that the transition from an old built-in or slot-in cooker to an AGA is made as straight forward as possible.
We now have the products in place for AGA for the coming years. Our strategy is to maximise sales in our main targeted markets from the new product.
We see the AGA cookware business – from cast iron pots to fashionable textiles – as an important adjunct to the sale of cookers. Revenues are now growing with online sales rising sharply to represent a third of the business. A new website launching this month introduces a ‘click and collect’ capability which will add to the momentum.
Cooker boiler sales under the Rayburn and Stanley brands have fallen substantially since 2008 and continue to decline. To reverse the trend we are putting greater emphasis on direct contact from our own Rayburn/Stanley sales teams with consumers
in supporting our dealers in ensuring the particular features and benefits of these products are recognised by consumers. That can apply to solid fuel/wood burning models, in particular, where how to make the most of cost efficiency and practicality of a cooker/boiler combination needs to be fully explained.
For a wide range of households in the UK and France, there is a strong case for having a wood burning product in the home. Such a tradition exists in Ireland where we are the market leader and we see our stove operation expanding beyond its Irish homeland to bring volumes that can much improve the economics of our Waterford Stanley factory – now our centre of excellence for wood burning products and their development.
Rangemaster : 1,000,000 cooker milestoneOur range cooker operations sold 64,000 units during 2014, up 6% in the year with the UK up 9%. Our ranges are the best made in the overall market – ‘built from experience’. The solidity is provided by the patented single piece base plate and single piece hob developed in-house. The quality of the ovens and air flow management then ensure that our ovens cook evenly and well. Our home economics team review these aspects continually.
The domestic cooker was invented in our Leamington Spa factory in 1830 which has always had a reputation for product excellence. We remodelled the range cooker in 1995 for the modern world. We have now made over 1,000,000 of these modern range cookers in the Leamington Spa factory which is testament to the strength of the business. In 2014 Currys added 25 new kitchen galleries in the UK which featured the breadth of Rangemaster products. We provided Currys with an exclusive six month launch period for certain 60cm products. The independent retailers – who had a good 2014 – also had an exclusive line. As the market for these 60cm products widens this year it will provide an important additional revenue source.
Celebrating the millionth
Rangemaster
William McGrath was joined
by Councillor John Knight,
elected mayor of
Leamington Spa, Councillor
Clare Sawdon, elected
chairman of Warwick District
Council and Chris White,
Member of Parliament for
Warwick and Leamington
Spa, who cut a range cooker
cake to celebrate the
millionth Rangemaster
cooker being made.
With our complementary brands, Rangemaster, Falcon and Mercury we lead the UK range market. Part of our strategy is to increase the size of the UK market by highlighting why a range provides a better option than a built-in layout for the kitchen. We are also putting this to house builders and to builders providing refitted kitchens for existing homes.
We expect to show progress again in 2015 as the market continues to strengthen. We also expect Rangemaster to expand onto the continent – a key strategic objective for the Group. Economic conditions in our established markets in France and Benelux remain tough but the growth structures are in place. There are now over 250 displays in Germany. At the Cologne Kitchen Show in January it was clear that opinion forming observers of the German kitchen scene, were expecting range cookers to make ground in a market that is completely dominated by built-in models.
We have developed a gas burner system for our hobs which is particularly relevant for consumers who use woks extensively. We offer great controllability and flexibility. We are looking to see this support our progress in the Far East and in particular in the Chinese market, for which we now have the accreditations and sales structure in place. We are launching our products at the end of March and will test how rapidly the range can gain a niche position in the Chinese market.
Our development work in 2014 saw us create a new generation of vaulted ovens for La Cornue to be launched this month. It brings a patented variant to air flow management in a vaulted oven ensuring La Cornue meets new European energy consumption standards. The international dealer structure for La Cornue has received great attention and we expect revenues to start to grow significantly this year.

Group plc Annual Report & Accounts 201416
BUSINESS AND STRATEGIC REVIEW
CONTINUED
AGA Marvel : returns starting to increaseOur Marvel Refrigeration operation in North America enjoyed a strong year as consumer confidence picked up. We strengthened our market position by launching a completely new product range in the autumn, compliant with regulatory requirements introduced from September 2014 – this was a key strategic objective for the business. It is the work of our highly technically adept engineering team who put their careers’ experience into producing this new product generation. We have had an excellent response to the launch. We expect the double-digit revenue growth achieved in the last two years to continue. As the production levels increase the operational gearing of our modern purpose built facility in Greenville, Michigan should, for the first time, show through in North America.
We hope to broaden our relationship with consumers by providing packages of hot and cold products. This is a key strategic objective for the business. Our European produced cookers have a small but well established presence and we have the platform to deepen consumer contact. Generating a consistent flow of leads to be managed closely by our own team alongside our dealers will ensure both our North American and European styled products find wider audiences.
Fired Earth : further growthHaving returned to profitability in 2013 Fired Earth enjoyed a good year in which revenues increased by over 15%. The tile business which provides over half of sales for the division, was at a record level with both floor and wall lines performing well. Strengths are in providing not only good value but the unusual products, like our porcelain tiles that look like wood. Sales online exceeded those achieved by any one retail store for the first time. The retail format devised of smaller neighbourhood stores has been part of a retail space evolution for Fired Earth and we believe that the new stores opened recently in Ascot, Beaconsfield and Barnes will add to the momentum being achieved. We are moving from Marylebone High Street to a new flagship showroom on Baker Street following the sale of our shop
lease. With a new brochure for bathrooms now available that sets style standards – as is expected of Fired Earth – we anticipate good growth to continue this year.
Grange : modernisation continuesIn 2014 the major project undertaken by Grange was the integration of factory sites in Saint Symphorien, near Lyon, into a single production and warehouse centre, the benefits of which will be seen in higher efficiencies from 2015. The project cost was £1 million and follows other factory rationalisation programmes in Europe and the closure of a number of design centre outlets and our warehouse in North America. We have also looked at the product offering and Grange has been introducing new contemporary styled products which are aimed at younger urban consumers. The Côté Design products which lend themselves to small space living and many of which have multi-functional and imaginative capabilities is one of the principal drivers that are expected to provide the additional 10% in revenues to take Grange back above the breakeven point – a key strategic requirement for the Group. It has been in North America where over a ten year period revenues have decreased from $18 million to less than $4.5 million where we are yet to create a viable model.
With a capable management team, new product and established, committed dealers in place we are examining what needs to be added to the commercial mix of Grange to provide the impetus the business needs to prosper again as markets improve.
Pension scheme funding31st December 2014 is the date of the triennial actuarial valuation of the Group’s main pension scheme. The scheme is large relative to the size of the Group’s operations. The scheme’s asset performance over the three years since the last triennial valuation has been good. The returns achieved on the assets have been well in excess of the payments made to meet current obligations to and in respect of the members of the scheme. The basis on which the future liabilities of the scheme are
assessed for scheme funding purposes is linked to yields on UK government bonds. As gilt yields are being maintained at extremely low levels, and fell markedly over the second half of 2014, the valuation of the liabilities on the gilts-related basis increased significantly over this period. In accounting terms the liabilities are valued by reference to yields on ‘AA’ corporate bonds – which at the year end were also particularly low by historical standards. As a result, against total pension scheme assets of £883.4 million, the accounting liabilities were £955.4 million as at 31st December 2014 – giving an accounting deficit of £72.0 million as at 31st December 2014, compared with a deficit of £35.8 million as at 31st December 2013. It is expected that the funding deficit as at 31st December 2014 will be substantially higher given that gilt yields fell even more sharply than ‘AA’ corporate bond yields over the second half of 2014.
In accordance with the deficit recovery plan put in place on completion of the triennial actuarial valuation undertaken as at 31st December 2011, the Group paid £16.0 million in deficit reduction contributions in 2012 and made no deficit recovery payments in 2013 and 2014. If this existing deficit recovery plan were to remain in place, the deficit reduction contributions would be £4.0 million in 2015 and £10.0 million per annum in and from 2016.
Given the current levels of profitability of the Group, the pension scheme is a major absorber of resources and likely to continue to be so if gilt yields remain at current levels. All parties are aware of the need to maintain a balance recognising the interests of all stakeholders. A strengthening corporate covenant and the delivery of higher growth rates for the Group’s principal operations would assist in achieving the necessary balance.

Group plc Annual Report & Accounts 2014 17
FINANCIAL REVIEWRevenueGroup revenues increased by 4.3% to £261.1 million from the £250.4 million reported in 2013 and were up 5.7% in constant currency. First half revenues of £123.5 million were 3.3% up compared with £119.5 million in the first half of 2013 while second half revenues of £137.6 million were 5.1% up (2013: £130.9 million) as we successfully introduced a new range of 60cm product in September. Of total revenues 34% were outside the UK (2013: 37%).
Operating profitThe operating profit for the year was £9.6 million, up from the operating profit of £8.2 million reported in 2013. The second half profit of £7.2 million followed on from a first half profit of £2.4 million as the Group benefited more fully from the operational efficiencies established during the economic downturn and the normal seasonality.
Net operating costs and non-recurring costsNet operating costs for the year included reorganisation costs of £0.9 million – shown separately in 2013. Income of £0.9 million in the first half related to a lease assignment of one of the Group’s London shops and followed a prior year property gain of £0.9 million.
In 2013 non-recurring costs of £2.2 million related to site rationalisation programmes involving Waterford Stanley in Ireland and Grange in France and the costs of closing certain design centre outlets and the warehouse at Grange in North America.
Fair value movementA fair value charge of £3.3 million arises from a provision for a ‘cash settled share based payment’ in respect of incentive arrangements with the management of Fired Earth. Of this, £1.1 million was paid in January 2015. The £3.3 million represented the value placed on management’s 19.9% holding at the balance sheet date. This values Fired Earth, including an inter-company loan, at over £20 million.
Finance costsNet finance costs for the year were £1.5 million (2013: £1.4 million) and related to the cost of the three year bank facilities put in place at the end of 2012, the cost of the £30.0 million of pension scheme guarantees provided and interest payable on the Group’s EUR and USD hedging loans.
Profit before taxProfit before tax in the year was £0.7 million (2013: £1.1 million).
TaxationThe Group had a tax charge of £0.6 million (2013: £0.4 million). The Group expects the underlying tax rate to be slightly above the UK standard rate of 20% from April 2015. The impact of the pension scheme deficit recovery contributions in previous years will continue to reduce significantly future cash tax payments, which totalled £0.3 million in 2014.
Earnings per shareBasic earnings per share was 0.1 pence (2013: 1.2 pence) based on an average number of shares in issue of 69.3 million (2013: 69.3 million). Adjusted underlying earnings per share (excluding the pension charge, non-recurring costs and fair value movement and based on a standard UK tax rate) were 9.4 pence (2013: 7.6 pence).
DividendsThe directors are not recommending a final dividend. This means no dividends are to be paid in relation to the 2014 results (2013: nil). Under the arrangements made on completion of the 2011 actuarial valuation of the Group’s main pension scheme, agreement with the scheme trustee would be required prior to a dividend payment being made and this was not sought in respect of 2014.
Cash flowCash management continues to be a focus of attention for the Group. Cash generated from operating activities of £14.4 million in the year was up on the £8.4 million generated in 2013 and resulted from a determined effort to manage working capital while supporting the international development of the business.
The net inflow from working capital in the year was £2.0 million (2013: £0.4 million).
Cash flows relating to discontinued operations amounted to £0.5 million (2013: £0.7 million).
Capital expenditure including intangibles in the year totalled £9.9 million compared to £8.5 million in 2013 and included additional investment during the year in the AGA manufacturing processes in Coalbrookdale. The charge for depreciation and amortisation of intangibles in 2014 was £7.0 million (2013: £7.0 million).
Proceeds of £1.1 million were received from the disposal of property, plant and equipment and assets held for sale (2013: £1.2 million) as we sold the former head office building during the year.
The resulting net cash position at 31st December 2014 increased to £9.2 million (2013: £5.9 million).
PensionsThe deficit in the Group’s pension schemes at the end of 2014 included in the financial statements was £72.0 million on an accounting basis compared with a deficit of £35.8 million a year earlier. The change over the year reflects the impact of a lower liability discount rate of 3.5% (2013: 4.5%) which increases the liabilities, which counters the increase in the value of the assets held and the lower inflation expectation assumptions. The pension charge in the year was £4.1 million (2013: £3.5 million), of which £1.5 million was net interest as calculated on the net deficit in the scheme, up £0.4 million on 2013.

Group plc Annual Report & Accounts 201418
KEY RISKS AND UNCERTAINTIES
THE GROUP HAS A STRONG RISK IDENTIFICATION, EVALUATION AND MANAGEMENT PROCESS. THE EFFECTIVENESS OF THIS PROCESS IS REGULARLY REVIEWED BY THE BOARD AS ARE THE RESULTANT RISKS AND RISK RESPONSE PLANS. THE GROUP’S INTERNAL CONTROL AND RISK
MANAGEMENT POLICIES ARE SET OUT ON PAGES 30 AND 31.
The following table sets out the principal risks and uncertainties that might impact on the Group’s long-term performance and could cause actual results to differ materially from the expected and historical results. As the Group seeks to exploit new opportunities the profile of these risks might change and new risks, or risks that are
currently deemed immaterial, may also impact the Group’s profitability and its ability to meet its targets.
RISK MITIGATION
COMPETITION/MARKET EROSION
£ �
£ �
£ �
£ �
The Group operates in a number of competitive markets and as such the activities of our competitors can adversely affect the Group.
Competition in the market place particularly from online retailers can create pricing pressures. Further, the heavy promotion of built-in cookers and new competitor products can impact demand.
A significant downwards pressure on pricing and or a reduction in demand might impact the Group’s ability to deliver its strategy and business plans.
• We have differentiated, high quality products and actively invest in new product development and design to maintain our position.
• Our ‘built from experience’ campaign for Rangemaster highlights the quality differentials.
• Constant monitoring of our market position and competitor strategies.
• Value engineering programmes assist with the maintenance and enhancement of margin and pricing strategies.
FINANCIAL COVENANTS AND FUNDING
£ �
£ �
£ �
The Group has bank facilities in place to support its operations and to provide guarantees to cover future contributions to the pension scheme.
A breach of banking covenants might result in additional financial operating restrictions being placed on the business and could have a wider impact including that with the trustee of the pension schemes.
• Our bank facilities are sufficient for our needs and do not mature until August 2016.
• The Group keeps its bankers regularly informed of its progress against its strategy, business plans and financial covenants.
• The Group focuses closely on cash management.
FINANCIAL INSTRUMENTS
£ �
£ �
£ �
The Group has a global customer base and an international supply chain. As such it is exposed to both foreign exchange and interest rate risks. Significant fluctuations can impact profitability and cash flow.
• The Group’s treasury policy sets the framework for hedging foreign exchange and interest rate risks.
• The Group offsets currency flows internally where possible and where appropriate puts in place foreign exchange contracts.
GENERAL ECONOMIC CONDITIONS
£ �
£ �
£ �
£ �
£ �
The Group’s operations are sensitive to global economic conditions particularly the consumer and housing markets. Our exposure is most notable in the UK, the USA and France. The UK is growing but consumer confidence requires a sustained period of rising household incomes to recover to pre-downturn levels.
Improved global economic conditions would bring benefits given the operational gearing of the Group whereas adverse conditions can result in reduced demand for our products.
• The Group tracks key economic metrics for the markets in which it operates. The data is used to identify early signs of change enabling the Group to adjust its strategic plans and modify its investment priorities on a timely basis.
• The Group seeks to increase international sales and to reduce individual market dependency.
Growth£ �International sales£ � Profitability£ � Return on sales£ � Efficiency£ �

Group plc Annual Report & Accounts 2014 19
RISK MITIGATION
HEALTH, SAFETY AND ENVIRONMENTAL
£ �
£ �
£ �
£ �
£ �
The safety of employees, customers and visitors to our premises is of critical importance. As a business with a range of activities including manufacturing, retail and off site services, the Group is exposed to a number of health and safety risks.
The Group is committed to adhering to environmental standards set by governments and other organisations. It recognises that an environmental incident could impact on the community in which we operate. Further, the environmental performance and reputation of our products may affect customer demand and the environmental performance of our operations impact profitability and efficiency.
• We are committed to achieving the highest standards. We conduct regular audits to ensure compliance with relevant laws and regulations. We review both incidents and ‘near misses’ to establish their root cause.
• We have a health and safety executive committee of the board with a focus on these aspects of the business.
• Accreditation to ISO 9001:2008, ISO 14001:2004 and BS OHSAS 18001:2007 ensures a framework is in place with clear policies, procedures and audits.
• Our product development and value engineering programmes help ensure product performance is continuously improved, taking advantage of new and emerging technologies.
LEGAL AND REGULATORY
£ �
£ �
£ �
Compliance with laws and regulations is fundamental to the Group’s success. Changes to laws and regulatory requirements remain a source of both risk and opportunity throughout the Group. In particular, changing regulations in the EU and the USA in respect of the energy efficiency of products.
• The Group is committed to compliance with relevant laws and regulations and sees this compliance as central to the operations.
• We monitor the legal and regulatory environment within the countries in which we operate and maintain dialogue with relevant regulatory bodies. We take specialist public policy advice, if required. Management are tasked with ensuring that employees are aware of and comply with regulations and laws specific to their roles.
• In respect of product regulations our design team maintains an ongoing development programme to ensure that our product range remains compliant. This programme produces ever improving products which are also a source of opportunity for the Group.
PENSION SCHEME FUNDING
£ �
£ �
£ �
The Group is the sponsor of a large and mature defined benefit pension scheme and can be called on to meet funding deficits and make payments under deficit recovery plans.
A formal actuarial valuation of the scheme is undertaken at least every three years. Such valuations can reveal an increased deficit that requires additional cash contributions or guarantees from the Group.
The actuarial valuations are heavily driven by prevailing gilt yields which can be subject to market distortions or affected by government action. As such, wide fluctuations in the appraised liabilities are possible which in turn could severely constrain the finances of the Group.
Deficit recovery plans need to be agreed with the trusteeof the pension scheme who has to take the views and powers of The Pensions Regulator into account.
• Following the triennial actuarial valuation undertaken as at 31st December 2011 a deficit recovery plan was agreed and in 2012 a £16 million contribution from cash held on deposit was made. Further deficit contributions of £4m in 2015 and rising to £10m in 2016 are due to be made by the Group.
• The 2014 triennial actuarial valuation is now in preparation and the Group will then discuss with the trustee of the pension scheme any required changes to the existing arrangements.
• The defined benefit scheme is closed to new entrants and pensionable salaries were frozen in 2009/10. The nature of current pension provision in the Group is kept under review.
• Cash flows within the defined benefit scheme are closely monitored to link the requirements to pay pensions with cash generated from the assets held.
• The Group monitors market conditions and discusses with the trustee steps to strengthen the corporate covenant.
• In 2014 the Group became subject to the UK pension auto-enrolment requirements and a new pensions vehicle has been put in place for this purpose.
PEOPLE
£ �
£ �
£ �
£ �
£ �
The Group requires skilled people to enable it to develop fully and exploit new opportunities both in the UK and overseas. A failure to recruit quality personnel in a competitive market and develop existing talent might in time erode our competitive advantage.
Further, a failure to plan adequately for succession could also damage the future prospects of the Group.
• The Group HR director oversees the Group’s people strategy. This includes an annual review of its succession and personal development plans. The board is kept updated on key issues.
• Remuneration packages including fixed, variable and long-term elements and compensation arrangements are regularly benchmarked to ensure the Group’s remuneration policy remains in line with market practice.
SUPPLY CHAIN
£ �
£ �
£ �
£ �
£ �
The Group’s manufacturing operations require the timely supply of quality parts and materials.
Supply chain disruptions can adversely impact the Group. Such disruptions include the failure of key suppliers and environmental or industrial accidents.
Quality issues in the supply chain can also adversely impact the Group as faulty or substandard parts are unacceptable.
• We closely monitor our supply chain and employ a range of strategies to reduce reliance on individual suppliers and minimise the impact of potential supplier failures.
• We conduct supplier audits to assess compliance with the terms of supply agreements including processes, product specifications and manufacturing conditions.

Group plc Annual Report & Accounts 201420
20102011201220132014
20102011201220132014
20102011201220132014
20102011201220132014
20102011201220132014
20102011201220132014
LTA frequency*LTAs/100k hours worked
Lost time% of total working time lost
Lost time per accidentDays lost per LTA
0.490.55
0.850.87
0.69 0.92
0.12%
0.08%0.08%
0.14%0.13%
20.617.6
17.419.6
23.0
CO2 intensity*Tonnes/£m revenue**
Waste intensity~
Tonnes/£m revenue**
Water intensitym3/£m revenue**
118114
116
113108
4549
3637
34
247234
221230
203
CORPORATE SOCIAL RESPONSIBILITY
A SUSTAINABLE BUSINESS – COMMITTED TO OUR PRINCIPLES
We have published an annual Corporate Social Responsibility (‘CSR’) report since 2002 and whilst the Group has evolved considerably since then, we maintain our commitment to the principles underpinning CSR and for communicating with our stakeholders about what we are doing.
This report includes a summary of our full 2014 CSR Report which will be published on the corporate website (www.agarangemaster.com) during April 2015. Our CSR programme includes responsible sourcing, our community activities, our environmental, health and safety (‘EHS’) programmes, our engagement with employees, customers and other stakeholders and our product stewardship.
MANAGEMENT OF CSRThe board has overall responsibility for CSR and reviews and approves our policies and monitors performance. The chief executive is responsible for ensuring the Group operates in accordance with these policies and procedures. He is supported by the Group HR director and the senior management team. The Group monitors its CSR related performance through rigorous management systems and uses a set of key performance indicators (‘KPIs’) to manage and benchmark performance, to leverage and promote best practice and to set objectives. The chief executive reports to the board on all CSR related matters.
As a minimum standard, the Group seeks to comply with the laws, regulations and best practice guidelines governing its activities in each of the markets in which it operates. In many areas we exceed the minimum compliance standards. The Group has a well-established programme of internal CSR/compliance audits which complement the implementation of ISO 9001:2008, ISO 14001:2004 and BS OHSAS 18001:2007. This internal audit process covers EHS issues and opportunities, and assists with the benchmarking of best practice across the Group. The system is also used to monitor other commercial, supplier and delivery related issues, and to implement
improvements. These audits are undertaken by functional specialists with support from external advisers, where appropriate.
Our policies are embedded in our culture and values. Our CSR policies are available on the corporate website and apply globally to every director, manager and employee. The policies also extend across our supply chain and we consider the commitment of each supplier to minimise the impact of their operations on the environment and, where possible, ensure that their commitment to CSR issues is consistent with our own.
The Group participates in the Carbon Disclosure Project and is a member of the FTSE4Good Index and uses these, in conjunction with stakeholder consultations and other benchmarks, to help identify key priorities and to drive progress.
ENVIRONMENTAL, HEALTH AND SAFETYThe Group is committed to the continuous improvement of its EHS performance and to enhancing the overall sustainability of its operations, products and services.
There were no environmental or health and safety related fines, penalties or prosecutions reported during the year.
Health and safety executive committeeWe have a health and safety executive committee of the board established to monitor the integrity of the systems used to meet our health and safety responsibilities, to help ensure that policies and related strategy are effective and to support our continued commitment to improvement in these areas.
This committee is chaired by Jon Carling and membership is at least three non-executive directors. Directors’ attendance at meetings is shown on page 27. In addition, the executive directors, senior management and the health and safety manager attend meetings, as appropriate.
Health and safety targets and performanceThe Group uses a consistent set of KPIs to monitor accident frequencies, accident causes and the amount of time lost at all operations and sets annual improvement targets. All our locations have health and safety management systems in place. As described in the case study on page 23, La Cornue in France achieved BS OHSAS 18001:2007 accreditation during 2014 and nine of our fourteen office, warehouse and manufacturing locations are now accredited to BS OHSAS 18001:2007, the occupational health and safety standard. This includes all manufacturing sites in the UK, Ireland and North America.
* Lost time accident (LTA): an accident which results in one or more days lost time.

Group plc Annual Report & Accounts 2014 21
Across the Group the frequency of lost time accidents (‘LTAs’) was up by 10% in 2014 to 0.55 LTAs per 100,000 hours worked. This was behind our target of a 10% reduction. However, the 2014 performance represented a 36% improvement on 2012. The lost time due to accidents as a proportion of working time was down by 5% at 0.08% but was higher than the target of 0.07%. The average lost time per LTA was down by 14% to 17.6 days which was ahead of the targeted 5% reduction.
The Group’s long-term aim is to have no accidents. We will maintain our target of reducing LTA frequency and the average lost time per LTA by 5% in 2015.
The most common causes of accidents across the Group are cuts and abrasions. We will continue to focus particularly on reducing accidents in this area, specifically targeting sites with below average performance. We continue to review the appropriate personal protective equipment aligned to risk assessment and ‘hand safe’ awareness programmes. For example, we have introduced new moveable platforms to assist the home delivery teams moving finished goods into customers’ homes, to help prevent musculo-skeletal incidents.
Environmental targets and performanceThe Group’s environmental impacts include the climate change related emissions due to the use of energy in our manufacturing and other facilities and for transport, water consumption and the waste and recycling arising from our manufacturing processes and general business operations. The environmental data in this report covers 100% of the Group’s revenue.
The Group’s objectives are to reduce its environmental impacts indexed to sales by 5% over the two-year period 2013-15, to increase the proportion of total waste which is recycled and to extend coverage of ISO 14001:2004. Thus the 2014 report is in an interim update against these targets.
* Includes CO2e emissions due to energy use and in-house transport operations.
** Constant currency basis with prior years restated and updated to reflect changes in reporting methodology.
~ Hazardous and non-hazardous waste. Includes recycled material.
All our office, warehouse and manufacturing locations have environmental management systems in place and nine sites are accredited to ISO 14001:2004 following the accreditation of La Cornue during 2014 (see case study on page 23). The proportion of manufacturing sites revenue (including intercompany sales) covered by ISO 14001:2004 was 93% (2013: 88%).
20102011201220132014
20102011201220132014
20102011201220132014
20102011201220132014
20102011201220132014
20102011201220132014
LTA frequency*LTAs/100k hours worked
Lost time% of total working time lost
Lost time per accidentDays lost per LTA
0.490.55
0.850.87
0.69 0.92
0.12%
0.08%0.08%
0.14%0.13%
20.617.6
17.419.6
23.0
CO2 intensity*Tonnes/£m revenue**
Waste intensity~
Tonnes/£m revenue**
Water intensitym3/£m revenue**
118114
116
113108
4549
3637
34
247234
221230
203
2014 GROUP HEALTH AND SAFETY CONFERENCECASE STUDY
In September 2014, we held a group health and safety conference, the first for several years. The event was attended by external advisers, health and safety specialists and senior managers from across the Group. The conference was opened by William McGrath with closing remarks from Jon Carling, non-executive director and chairman of the Group’s health and safety executive committee. The core of the conference focused on our journey to zero accidents through safety culture development linked to greater employee involvement in the work place.
Positive outcomes of the conference are expected to be seen across the Group. There is already greater visibility of line managers in promoting risk reduction and in employees raising concerns through our ‘hazard spot’ initiative. There are regular meetings of the tactical health and safety team members at operational level and a further health and safety conference is planned for 2015.

Group plc Annual Report & Accounts 201422
Business Objective AwarenessRole ‘fit’Role eExpectationsCapability
Line of Sight
Career ProgressionSuccession planning
Training/LearningCoaching/Mentoring
Development
Work EnvironmentCultural Elements
LeadershipCommunication
Health and Safety
Organisational ArchitectureOrganisational designRecognitionDecision RightsWork Values
Employee Survey2014
CORPORATE SOCIAL RESPONSIBILITY
CONTINUED
Total 2014 CO2 equivalent (‘CO2e’) emissions due to energy use and in-house transport were 30,200 tonnes, up 3.6% from 29,100 tonnes in 2013. Indexed to sales, the Group’s 2014 CO2e emissions intensity decreased by 2.1% to 116 tonnes per £million revenue from 118 tonnes per £million in 2013. Thus whilst performance improved, the Group was marginally behind the running rate required to achieve its target to reduce CO2e intensity by 5% over the two year period 2013-15.
Total waste disposed of in 2014 was 12,800 tonnes, up 15.6% from 11,100 tonnes in 2013. The increase in waste disposal in 2014 is due to the full year impact of the identification of a recycling route for additional waste streams at two of the Group’s sites during 2013. Indexed to sales, the Group’s waste intensity increased by 9.1% to 49 tonnes per £million revenue from 45 tonnes per £million in 2013. Thus the Group’s performance in 2014 was behind the rate required to achieve its target to reduce waste intensity by 5% over the two year period 2013-15. However, as in the previous year, the increase in the amount of waste recycled helped to increase the proportion of total waste which was recycled. In 2014 this was up by 4 percentage points to 79% which is ahead of the rate required to achieve the target to increase the proportion of waste recycled over the period 2013-15.
Water use in 2014 was 61,000m3, which was similar to the 60,900m3 reported in 2013. Relative to sales, water intensity was down by 5.4% to 234m3 per £million revenue from 247m3 per £million in 2013. Thus the Group’s performance in 2014 was ahead of the rate required to achieve its target to reduce water intensity by 5% over the two year period 2013-15 and the Group will be seeking to make further improvements in 2015 to help ensure it meets the target.
The Group will continue to target reductions in its CO2e emissions intensity, waste intensity and water intensity in order to achieve its targets for the two year period 2013-15. Performance and achievement of targets will be subject to ongoing review.
The Group is required under The Companies Act 2006 (Strategic Report and Directors’ Reports) Regulations 2013 to report its annual Greenhouse Gas (‘GHG’) emissions in the directors’ report and this disclosure, which includes additional sources of GHGs relative to those reported above, is set out on page 49.
STAKEHOLDER ENGAGEMENTThe Group engages in proactive two way dialogue with stakeholders. We have senior management representation on various trade associations and we actively engage in consultations regarding new regulations which impact on our business. Engagement also includes customer feedback, hall testing of products, market research, meetings with shareholders, investor relations communications and website briefings.
We review the impact of our operations on local communities, especially where we directly engage with neighbours and through our charitable and community activities.
In 2014, we invited employees to take part in an employee engagement survey. Further details are set out in the case study on this page ‘2014 employee engagement survey’.
Our peopleOur Code of Conduct for employees was introduced in 2001 and is regularly reviewed, most recently in 2013. The Code outlines the standards of integrity and honest conduct expected, and explains that breaches of Company policy can result in disciplinary action and dismissal. The Code includes the whistleblowing policy which enables employees and others to report any breaches of the Code, fraud or any other criminal acts in confidence and without fear of retribution. All employees worldwide may use the internal whistleblowing provisions or an independent external service made available to them via Expolink. Each call is investigated and actioned as appropriate, prior to closure. All reports are logged and monitored by the audit and risk committee.
The Group is committed to providing equality of opportunity to all employees without discrimination and applies fair and equitable employment policies throughout the recruitment process and during employment with the Group. Appointments are determined by application of job criteria and competency.
The Group encourages recruitment, training, career development and promotion on the basis of aptitude and ability, without regard to disability. Where appropriate it is also committed to retaining and retraining of employees who become disabled during the course of their employment. In total, over 2,800 days of ‘off-the-job’ training were recorded during the year (2013: 1,500 days).
2014 EMPLOYEE ENGAGEMENT SURVEYCASE STUDY
During 2014 we conducted our first employee survey. There were 25 questions grouped into four key areas centred on employee engagement. Twelve control groups were used to review responses at local and at Group level. Participation rates were strong at 53% of employees invited to complete the survey and the majority of responses were positive. A significant number of employees took the option to include additional comments when responding.
Overall feedback showed employees were clear about what their job entails, training provision and job satisfaction. They feel that they work in a healthy and safe environment. Most employees were proud to be associated with the Group and would recommend our products to friends and family.
At operational level employees indicated that we can improve communication across the organisation. They would like to have more employee/management interaction and more praise and feedback to help foster greater engagement. We have already commenced actions on the key topics raised. For example, we are generating greater involvement through health and safety initiatives and launching training in cross process improvements through our Lean Education and Development programme (a specialist government funded training provider).
Improving employee wellbeing will continue to be a focus for improvement. We are looking at a follow-up survey in 2015 to help monitor progress and to identify further opportunities to develop engagement.

Group plc Annual Report & Accounts 2014 23
LA CORNUE ACCREDITATION HAT-TRICKCASE STUDY
The whole team at La Cornue put in a tremendous amount of effort, supported by the Group’s business excellence team, to achieve the international standards for quality (ISO 9001:2008) and environmental management (ISO 14001:2004). It successfully completed the hat-trick in October 2014 by receiving recommendation from Lloyd’s Register Quality Assurance (‘LRQA’) auditors for accreditation to the occupational health and safety standard (OHSAS 18001:2007).
La Cornue now operates a common, integrated management system for each standard alongside other Group sites in the UK, the USA, Ireland and Hong Kong. These systems, as well as demonstrating our effectiveness and commitment to health and safety, the environment and quality, underpin the continuous development of all our businesses management systems and provide a framework supportive of embedding best practice across the Group.
La Cornue also received the Group’s Health and Safety award for the third quarter. Accepting the award are Benoît Favier (Deputy Managing Director); Julien Hurel (Quality Manager); Alain Savignat (Production Manager); Anna Kowalczyk (Development and Quality Engineer); Erick Pelamourgues (Operations Manager); Valérine Boulanger (Production Manager); Eric Menegazzi (Senior Product Design Engineer).
Voluntary staff turnover during the year was on average 13% across the Group (2013: 11%). Total staff turnover was 14% (2013: 12%). Lost time, including sickness and ill-health, as a proportion of working time was 2.9%, down from 3.2% in 2013. Health and safety-related lost working time was 0.08% of total working time in 2014 (2013: 0.08%). Some 73% of our employees are located at operations which have official union recognition (2013: 74%).
Gender diversityDuring the year, the Group employed an average of 2,553 people in seven countries. Some 73% of our staff are located in the UK, with 17% elsewhere in Europe and 10% in North America. 96% are permanent employees, 70% are male and 30% are female. Of those in management roles, including retail managers, 59% are male and 41% are female. Some 81% of our employees work at our manufacturing sites and office locations with 19% in our retail operations. Under the Companies Act 2006 (Strategic Report and Directors’ Report) Regulations 2013, we are required to disclose the gender breakdown of the Company’s directors, senior managers (defined as those having responsibility for planning, directing or controlling the activities of the company, or a strategically significant part of the company) and all employees. This is set out in the table below:
Male Female Total
Directors 6 1 7Senior managers 20 5 25All employees 1,780 773 2,553
CustomersThe Group’s customer service strategy is to respond rapidly to evolving customer demand, to identify and anticipate emerging needs and to improve continuously product availability, quality and value. Our quality management systems help to ensure that our products meet or exceed customer requirements with 93% of the Group’s manufacturing site revenues covered by ISO 9001:2008.
Evolving technology makes it now far easier for customers – actual and potential – to communicate with the Group and with each other. We have upgraded our transactional websites and we have established social media channels to which we actively respond. In the coming year we will further engage with our customers to reinforce our product stewardship and other customer related initiatives.
Product stewardshipThe Group continues to place great emphasis on consumer and environmental issues. We are committed to minimising the environmental impact of our products during manufacture, in use and at the end of life. We aim to offer our customers well-designed, quality products that have been sustainably sourced, are energy efficient and have a high degree of recyclability, which is an inherent benefit of the use of cast iron material. The AGA foundry and process behind creating the AGA cooker was recently featured on Discovery (UK) Channel’s ‘How do they do it?’.
We are also pursuing eco-friendly and sustainable energy solutions to help ensure that our products address increasing concerns over the use of energy and the related CO2 emissions.
Supply chain – ethical trading policyThe Group first introduced an ethical trading policy in 2002 and it is regularly reviewed and was updated in 2013. This policy encompasses a set of global sourcing principles covering fair terms of employment, human rights, health and safety, equal opportunities and good environmental practice. All operating companies are required to review supplier compliance with this policy, identify any areas of non-conformance and take action where appropriate. The Group monitors the quality, design and availability of all sourced components and products, to ensure high standards are maintained.
Community involvementEach of our operations and their employees are encouraged to become involved with and to support local community projects, educational establishments, charities and other causes. This support takes various forms including donations, fundraising, payroll giving or personal time and commitment. Our retail operations also organise events and allow charities to hold meetings in their outlets. Total charitable donations during the year were £17,933 (2013: £38,206).
The Strategic Report was approved by the board and signed on its behalf by
W B MCGRATHCHIEF EXECUTIVE6th March 2015

Group plc Annual Report & Accounts 201424
BOARD OF DIRECTORS
JOHN COLEMAN (B*,A,H,N*,R)
CHAIRMAN (INDEPENDENT)WILLIAM MCGRATH (B)
CHIEF EXECUTIVESHAUN SMITH (B)
FINANCE DIRECTOR
John Coleman was appointed an independent non-executive director in March 2008. John became chairman of the board and the nomination committee in May 2008. John is currently non-executive chairman of McColl’s Retail Group plc and a non-executive director of Bonmarché Holdings plc. He was chief executive of House of Fraser plc from 1996 to 2006. He is a chartered management accountant.
William McGrath was appointed chief executive in March 2001. William joined the Group as finance director in October 1997 from Aggregate Industries plc where he had been group development director and prior to that finance director of Bardon Group plc. He had previously worked in the investment banking and construction sectors. He is a qualified accountant and a history graduate. He has an honorary doctorate from Birmingham City University.
Shaun Smith was appointed to the board as finance director in March 2001. Shaun joined the Group from Marks and Spencer plc in 1989 and worked in treasury becoming the group treasurer in 1999. He is a Governor of Birmingham City University. He is a qualified treasurer and economics graduate.
JON CARLING (B,A,H*,N,R)
NON-EXECUTIVE DIRECTOR (INDEPENDENT)
REBECCA WORTHINGTON (B,A*,H,N,R)
NON-EXECUTIVE DIRECTOR (INDEPENDENT)
Jon Carling was appointed an independent non-executive director in October 2010 and became the chair of the health and safety executive committee in 2013. Jon is the chief operating officer – civil large engines for Rolls Royce. Prior to this he was the chief operating officer at Aston Martin Lagonda and held a number of senior engineering positions with Jaguar Cars. He is a graduate in mechanical engineering.
Rebecca Worthington joined the board in July 2013 and became chair of the audit and risk committee in December 2013. Rebecca is founder and chief executive of Lodestone Capital Partners LLP. Prior to this, she was finance director of Quintain Estates & Development plc, a position she held for 11 years from 2001 before being appointed as deputy chief executive in May 2012. Rebecca qualified as a chartered accountant with PricewaterhouseCoopers in 1997 and worked as financial controller of Britton Group plc prior to joining Quintain. She is a non-executive director of Hansteen Holdings PLC and The British Property Federation and an advisory board member of the Association of Corporate Treasurers.
B Board member
A Audit and risk committee member
H Health and safety executive committee member
N Nomination committee member
R Remuneration committee member
* Denotes chairman of the board or committee

Group plc Annual Report & Accounts 2014 25
PAUL JACKSON (B,A,H,N,R*)
NON-EXECUTIVE DIRECTOR (INDEPENDENT)
BOB IVELL (B,A,H,N,R)
NON-EXECUTIVE DIRECTOR (SENIOR INDEPENDENT DIRECTOR)
PAM SISSONSCOMPANY SECRETARY
Paul Jackson joined the board in December 2005 and chairs the remuneration committee. Paul has spent his career in advertising. He started with Saatchi & Saatchi and later became executive managing partner and vice chairman of Ammirati Puris Lintas. He joined Ogilvy & Mather, part of the WPP Group, in 1999. He was a director at Ogilvy Group and Chief Executive of Ogilvy & Mather until 2007.
Bob Ivell joined the board in July 2014 and is the Company’s senior independent director. Bob is currently non-executive chairman of Mitchells & Butlers plc and Carpetright plc and senior independent director of Britvic plc. He was previously chairman of David Lloyd Leisure Limited, Park Resorts Group Limited, Next Generation Clubs Pacific and a non-executive director of The Restaurant Group Plc. He has over 30 years experience in the food and beverage industry with a particular focus on food-led managed restaurants and pubs. He previously held executive roles with Regent Inns Plc, Scottish & Newcastle Plc and Whitbread Plc.
Pam Sissons joined the Group in 1999 and was appointed company secretary in October 2004. She is a Fellow of the Chartered Insurance Institute and an Associate of the Chartered Institute of Secretaries and Administrators.
* Calls cost 8 pence per minute plus additional network charges where applicable. Non-UK callers should dial +44 121 415 7047. Lines are open 8.30am to 5.30pm, Monday to Friday.
FINANCIAL ADVISER AND STOCKBROKER
AUDITOR REGISTRAR SOLICITORS
NUMIS SECURITIES LIMITEDThe London Stock Exchange Building10 Paternoster SquareLondon EC4M 7LT
ERNST & YOUNG LLPNo. 1 Colmore SquareBirmingham B4 6HQ
EQUINITI LIMITEDAspect HouseSpencer RoadLancing BN99 6DATelephone: 0871 384 2355*
ALLEN & OVERY LLPOne Bishops SquareLondon E1 6AD
DLA PIPER LLPVictoria Square HouseVictoria SquareBirmingham B2 4DL
CORPORATE FINANCE ADVISER
FINANCIAL PUBLIC RELATIONS
PRINCIPAL BANKERS
N M ROTHSCHILD & SONS LIMITEDNew Court, St. Swithin’s Lane London EC4N 8AL
BRUNSWICK GROUP LLP16 Lincoln’s Inn FieldsLondon WC2A 3ED
BARCLAYS BANK PLCHSBC BANK PLCLLOYDS BANK PLC
Advisers

Group plc Annual Report & Accounts 201426
CORPORATE GOVERNANCE REPORT
CORPORATE GOVERNANCEChairman’s introduction on corporate governanceI am pleased to present the board’s annual report on corporate governance. The board recognises the importance of good governance and its role in achieving sustainable growth and adding value to our business. As chairman, my role is to run the board, to ensure the Company operates effectively and to ensure the board has the right balance of skills and experience to assess, manage and mitigate risks. The board is committed to achieving high standards of corporate governance and supports the principles laid down in The UK Corporate Governance Code issued by the Financial Reporting Council (‘FRC’) in September 2012 (‘the Code’).
In accordance with the Code, the board delegates various matters to its board committees and from time to time, asks the committees’ to review specific areas and report back to the board. This corporate governance report includes separate reports from the chairs of the board committees which describe how we conduct our operations in line with the Code’s provisions and other accepted principles of good corporate governance.
There have been a number of changes to the board and senior management over the last couple of years, ensuring there is an appropriate balance of skills and experience at board level and strength in senior management to develop appropriate succession plans for the future. These changes have been overseen by the nomination committee whose report is on page 32.
The remuneration committee has undertaken a significant amount of work during the last two years to ensure that it complies with the new regulations and best practice. The focus in 2014 has been on ensuring there is a direct link between rewards and performance and ensuring we operate within the shareholder approved policy.The directors’ remuneration report is on pages 33 to 47.
Since the end of 2013, the audit and risk committee has been refreshed with the appointment of a new chair, new audit partner and new head of risk and internal audit. It has thoroughly reviewed its brief and in particular monitored the development and improvement of our risk management and internal control systems. The audit and risk committee report is on pages 29 to 31.
In addition, the board has a health and safety executive committee which was established in 2013. Details of its role and activities are set out in the CSR report on pages 20 and 21.
Compliance statementThe directors consider that the Company has been in compliance with the principles and provisions of the Code throughout the year ended 31st December 2014 and up to the date of publication of this report, with the exception of code provision A.4.1, as the Company did not have a designated senior independent director for the period 2nd May 2014 to 30th June 2014, prior to the appointment of Bob Ivell and following the retirement of Paul Dermody. Where the Code allows some flexibility for smaller companies, a clear explanation of how the principles have been applied has been provided in our disclosures.
LEADERSHIPRole of the boardThe board is collectively responsible to the shareholders for the long-term success of the Company. Its role includes reviewing and approving key policies and decisions of the Company, particularly in
relation to the Group’s strategy and operating plans, the annual budget, governance and compliance with laws and regulations; business development including acquisitions and disposals; and, through its committees, financial reporting and risk management.
The board has a schedule of matters reserved for board decision. The schedule details key aspects of the affairs of the Company which the board does not delegate, including key strategic, operational and financial issues.
The board met regularly throughout the year and meetings are scheduled to coincide with key events in the Company’s financial calendar, including the half year and full year results and the Annual General Meeting (‘AGM’). Other meetings during the year specifically review the Company’s strategy, the budget for the next financial year, key risks and internal controls.
Board members are given appropriate documentation in advance of each board or committee meeting. This normally includes a detailed report on the Group’s financial position, operational and commercial activities and comprehensive briefing papers on matters where the board will be required to reach a decision. The board reviews performance and any significant variances from plans. A forward rolling business agenda is updated after each meeting of the board and its committees to include specific topics to be reviewed at future meetings.
The basis on which the Group generates value and delivers its strategic objectives is described in the strategic report commentary on pages 2 to 23.
Roles and responsibilitiesThere is a clear division of responsibility between the role of chairman and the role of the chief executive which are set out in writing and agreed by the board.
The chairman is responsible for the effective operation, leadership and governance of the board. He ensures that each non-executive director makes an effective contribution through debate and discussion with the executive directors. With the assistance of the company secretary, the chairman ensures that the board receives accurate, timely and clear information ahead of each board meeting and that adequate time is available at meetings to consider all agenda items to assess, manage and mitigate risks. The chairman communicates frequently with the non-executive and executive directors. Directors are encouraged to discuss any issues or concerns with the chairman at any time throughout the year and to ensure that any unresolved issues are formally minuted.
The chief executive is responsible for the day-to-day running of the business, carrying out agreed strategy and the delivery of performance in line with objectives. The chief executive is supported by the finance director and they meet frequently with management to review performance and deal with the operational requirements of the business. Senior management are regularly invited to attend and present at board meetings.
Senior independent directorPaul Dermody was senior independent director until the 1st May 2014. Bob Ivell was appointed as a non-executive director on 1st July 2014 and has been the senior independent director since that date. The senior independent director is available to shareholders if they have any concerns which are not resolved through the normal

Group plc Annual Report & Accounts 2014 27
channels of chairman, chief executive or finance director; or in circumstances where the normal channels are inappropriate. He also leads the non-executive directors in their annual assessment of the chairman’s performance.
Non-executive directors and independenceThe chairman, who was independent on appointment, meets with the non-executive directors at least annually without the executive directors being present and the chairman meets each director individually as part of the annual evaluation process, where individual performance is discussed.
The non-executive directors have a wide range of skills and experience. All the non-executive directors are considered to be independent in character and judgement and satisfied the Code criteria on appointment. The non-executive directors are encouraged to constructively challenge and help develop proposals on strategy. Their role is to scrutinise the performance of management in meeting the agreed goals and objectives and monitor the reporting of performance. They satisfy themselves on the integrity of financial information and that financial controls and systems of risk management are robust and defensible.
Board committeesThere are a number of committees appointed by the board to which various matters are delegated. Each has formal terms of reference which have been approved by the board and comply with the Code. The terms of reference are available for inspection on the Company’s website (www.agarangemaster.com). All committees have the authority to investigate any matters within their terms of reference, to access resources, to call for information and to obtain external professional advice at the cost of the Company. Details of the committees and their activities are set out below.
Board and committee meeting attendanceThe attendance of directors at board and committee meetings during the year ended 31st December 2014 is set out in the table below.
Board
Auditand risk
committee
Health and safety
executivecommittee
Nominationcommittee
Remunerationcommittee
W B McGrath 9/9 – – – –S M Smith 9/9 – – – –J D Carling 8/9 2/3 2/2 2/2 2/3J Coleman 9/9 3/3 2/2 2/2 3/3P B Dermody* 4/4 1/1 1/1 0/0 1/1R Ivell** 3/4 1/2 1/1 1/1 1/2P E Jackson 9/9 3/3 2/2 2/2 3/3R J Worthington 9/9 3/3 2/2 2/2 3/3
* retired 1st May 2014. ** appointed 1st July 2014.
EFFECTIVENESSBoard compositionAt the date of this report, the board comprises seven directors. In addition to the chairman, there are four non-executive directors and two executive directors. As highlighted in last year’s report and accounts, the nomination committee undertook a review of the board’s long-term succession planning and identified the particular skills, knowledge and experience required for the role to be filled following the retirement of Paul Dermody. Korn Ferry International
were appointed to assist in the search for a suitable new non-executive director. The chairman worked with Korn Ferry International to identify a shortlist of suitable candidates and an opportunity was set up for the non-executive directors and the executive directors to meet with potential candidates prior to appointment. Subsequently, Bob Ivell was appointed as senior independent director on 1st July 2014. Bob has extensive commercial, general management and public limited company board experience which will assist the board with many of the forthcoming strategic initiatives and his skills complement the skills, experience and knowledge already present on the board. Paul Dermody retired from the board on 1st May 2014. Paul Jackson has announced his intention to retire from the board following the 2015 AGM having served nine years on the board.
CommitmentSignificant commitments of directors held outside the Company are disclosed prior to appointment and on an ongoing basis where there are actual changes to those commitments. Actual and potential conflicts of interest are regularly reviewed. The Company’s Articles of Association (‘the articles’) allow the board to authorise potential conflicts of interest and to impose limits or conditions as it sees fit. All directors are required to allocate sufficient time to the Company to discharge their responsibilities effectively and this is reviewed as part of the annual evaluation process.
Performance evaluationA formal evaluation of the performance of the board, its committees and the individual directors was undertaken during the year. This consisted of an internally run exercise led by the chairman with the assistance of the company secretary. The appraisal questionnaires used in connection with the process were wide-ranging and based on topics outlined in the Code, covering board, committee and personal performance. The schedule of matters reserved for the board, the roles of the chairman and chief executive, the terms of reference of the committees and other policy statements are reviewed annually as part of the evaluation process. Progress against prior year action points was also reviewed.
The board considered that an internally run exercise was most appropriate in the current year but agreed to keep under review whether an externally facilitated evaluation may be appropriate as recommended in B.6.2 of the Code. All the board committees review annually their terms of reference and their effectiveness and recommend to the board any changes required as a result of such a review.
The chairman summarised the feedback and results of the evaluation process and this was discussed by the board as a whole. The process concluded that the board and its committees were operating effectively. The evaluation process identified a number of specific action points. Topics were identified for future board presentations. In addition, the focus should continue on the execution of strategy, value drivers and managing underperforming operations; and, there will be further enhancement of the succession and development plans.
Individual performance was also appraised, through one-to-one interviews with the chairman and in the case of the chairman, by the senior independent director following consultation with the other non-executive directors. The expected time commitments and independence criteria were reviewed for each non-executive director.

Group plc Annual Report & Accounts 201428
The board is satisfied that all non-executive directors remain independent in character and judgement and that there are no relationships or circumstances likely to affect their character or judgement.
Training and developmentThe chairman has the responsibility for ensuring that directors continually update their skills, knowledge and familiarity with the Company. This is specifically considered in the annual evaluation process. Where necessary the Company provides resources to meet the development requirements of individual directors. All directors receive tailored induction training on joining the board.
During the year, meetings and events were held at various different locations and presentations received from senior management. The non-executive directors are encouraged to visit the Group’s manufacturing and retail locations to meet management and employees, to maintain and deepen their understanding of the business as a whole.
Independent professional adviceA procedure is in place for directors to take independent professional advice at the Company’s expense if necessary. No such advice was sought by any director during the year. In addition, the directors have direct access to the advice and services of the company secretary, who is responsible for ensuring that board procedures are followed and advises the board, through the chairman, on all governance matters.
Election and re-electionIn accordance with the articles, each director stands for election by shareholders at the first AGM following their appointment and for re-election at least every three years. The board has resolved that all directors who are willing to continue in office will stand for election and re-election by shareholders at the 2015 AGM to comply with the best practice provision B.7.1 of the Code.
The chairman has confirmed following a formal performance evaluation, that each director continues to make an effective and valuable contribution and demonstrates commitment to their role. Accordingly, the board unanimously recommends the election and re-election of all the directors. Paul Jackson has announced his intention to retire from the board following the 2015 AGM and therefore will not stand for re-election.
ACCOUNTABILITYThe board should present a fair, balanced and understandable assessment of the Company’s position and prospects; maintain sound risk management and internal control systems and manage an appropriate relationship with the Company’s auditor.Further information on how these principles have been applied is detailed in the audit and risk committee report on pages 29 to 31.
REMUNERATIONLevels of remuneration should be sufficient to attract, retain and motivate directors of the quality required to run the Company successfully, whilst avoiding paying more than necessary for this purpose. There should be a formal and transparent procedure for developing policy on executive remuneration, with the performance-related elements stretching and designed to promote the long-term success of the Company.
Further information on how these principles have been applied is provided in the directors’ remuneration report on pages 33 to 47. The report includes the current directors’ remuneration policy which was approved by shareholders at the 2014 AGM. It also includes the annual report on remuneration, which will be subject to an advisory vote at the 2015 AGM.
SHAREHOLDER RELATIONSThe board recognises that it is accountable to shareholders for the performance and activities of the Company and there is regular dialogue with shareholders based on mutual understanding of medium and long-term objectives. The Company formally updates the market on its financial performance and developments in the business with the half-year and full-year results. The content of these updates and associated presentations made to analysts and investors are posted on the Company’s website, together with general information about the Company, so as to be available to all shareholders. The requirement to issue interim management statements was dispensed with in November 2014, but the board will continue to update the market as appropriate.
The Company has a regular programme of meetings with its larger shareholders which provides an opportunity to discuss strategy, performance, management and governance, within the constraints of information already made publicly available. The chairman, chief executive and finance director regularly report to the board the views of larger shareholders about the Company. The chairman met with a number of the larger shareholders during the year, and whilst there were no specific requests for meetings with the senior independent director or non-executive directors, there are opportunities for institutional investors to meet with directors at Company events throughout the year. The chairman, senior independent director and non-executive directors are available to meet with shareholders on request.
The company secretary oversees communications with private shareholders on behalf of the board. The annual report and accounts is the principal means of communication with private shareholders, along with other information made available for investors on the Company’s website (www.agarangemaster.com).
The AGM provides all shareholders with the opportunity to communicate directly with the board of directors. The notice of AGM is sent to shareholders at least 20 working days prior to such meeting and it is the Company’s policy to propose a separate resolution on each substantially separate issue. Recent trading performance and developments in the business are explained prior to the formal business of the meeting. Shareholders are invited to ask questions during the meeting, which is followed by an opportunity to meet with the directors, management and the Company’s advisers on an informal basis. The Company issues a market announcement setting out the results of voting, including proxy votes, on each resolution and it is made available on the Company’s website following the meeting.
By order of the board
J COLEMANCHAIRMAN6th March 2015
CORPORATE GOVERNANCE REPORT
CONTINUED

Group plc Annual Report & Accounts 2014 29
AUDIT AND RISK COMMITTEE Statement from the chair of the audit and risk committeeI am pleased to report on the activities of the audit and risk committee (the ‘committee’) during the 2014 financial year and to be able to confirm, on behalf of the board, that the 2014 annual report and accounts, taken as a whole, is fair, balanced and understandable.
This report outlines the work undertaken by the committee during the year in relation to the key areas set out in the Code being: to address any significant financial statement reporting issues; to assess the effectiveness of the risk management and internal control systems; to appoint the external auditor and oversee safeguards on the provision of non-audit services; and to assess the effectiveness of the external audit.
All of the members of the committee contribute their own financial experience and business skills to provide oversight and governance in all aspects of the committee’s remit. During the year, the board has had opportunities to meet with management and the committee has received presentations on key topics to develop a greater awareness of the challenges faced by the business and the potential consequences of those challenges. We have been greatly assisted by clear, concise and comprehensive papers from the auditor, management and internal audit which have enabled us to better understand the risks and opportunities faced. We have used this information to ensure the significant risks are being monitored and managed and have reviewed the internal audit programme to ensure it is appropriate in reviewing the effectiveness of the internal controls and risk management processes.
We have safeguards in place to monitor the independence and objectivity of our relationship with the external auditor. I confirm that the committee members have met the auditor and internal audit without management being present and I have maintained direct contact with the auditor during the year.
Membership and roleThe committee is appointed by the board and membership comprises Rebecca Worthington, Jon Carling, John Coleman, Paul Dermody (until 1st May 2014), Bob Ivell (from 1st July 2014) and Paul Jackson. The committee has been chaired by Rebecca Worthington throughout the year. The board has determined that Rebecca Worthington has recent and relevant financial experience. Biographical details of all the directors are set out on pages 24 and 25. The board believes that it is appropriate for John Coleman, the board’s chairman, to serve as a member of the committee so long as he does not chair the committee in accordance with provision C.3.1 of the Code.
The principal duties of the committee are to:• review the integrity of the Company’s financial statements
including the half-year and full-year results and the annual report and accounts, and any significant financial reporting issues and any judgements which they contain;
• ensure compliance with applicable accounting standards and review the appropriateness of accounting policies and practices in place;
• advise the board on whether the annual report and accounts taken as a whole, is fair, balanced and understandable and provides the information necessary for shareholders to assess the Company’s performance, business model and strategy as set out in the strategic report;
• assess the adequacy of the internal control environment and the processes in place to monitor this;
• review the effectiveness of risk management processes and consider the adequacy of actions taken to identify, mitigate and reduce the risk exposure of the Group;
• review the Company’s systems for detecting fraud, preventing bribery and allowing employees to raise concerns in a safe and confidential manner;
• review the effectiveness of the internal audit function; • monitor the Group’s policy and safeguards on the provision of
non-audit services; and • oversee the relationship with the external auditor, review the
auditor’s effectiveness and make recommendations to the board regarding the appointment and re-appointment of the auditor; specifically reviewing and approving the auditor’s remuneration, terms of engagement and the auditor’s objectivity and independence on an annual basis.
ActivitiesThe committee met three times during the year and attendance at meetings is shown on page 27. On each occasion the chief executive, finance director, head of risk and internal audit and the Company’s external auditor attended the meetings by invitation. Other senior executives of the Company are invited to attend, as appropriate. The external auditor met with the committee without management being present and the chair and members of the committee have direct contact with the audit partner and head of risk and internal audit, as required. The committee has an agenda linked to the events in the Group’s financial calendar. During the year the committee:• reviewed the half-year and full-year results, the preliminary
announcement and other announcements with financial implications;
• received and considered as part of the review of the interim and annual financial statements, reports from the external auditor in respect of the auditor’s review of the interim results, the audit plan for the year and the results of the annual audit. These reports included the scope of the interim review and the annual audit, the approach adopted by the auditor to address and conclude upon key estimates and other key audit areas, the basis on which the auditor assesses materiality, the terms of engagement for the auditor and an ongoing assessment of the impact of future accounting developments on the Group;
• considered whether the annual report and accounts is fair, balanced and understandable and reviewed a briefing paper provided by management with regard to this principle in relation to the 2014 annual report and accounts. This provided the committee with a framework to consider and make an assessment. Following detailed discussions, the committee was in a position to report to the board that the 2014 annual report and accounts taken as a whole is fair, balanced and understandable on the basis that the business description, business model and strategy agreed with its own understanding of the Group; the balance in the reporting of performance reflecting both positive and negative issues and the discussion reflecting the Group’s activities during the year;
• considered the effectiveness and independence of the external auditor and made a recommendation to the board regarding the re-appointment of Ernst & Young LLP as external auditor;

Group plc Annual Report & Accounts 201430
• considered and agreed the internal audit work programme; received regular reports on the key issues arising from its work during the year; and, reviewed the effectiveness of internal audit’s activities;
• reviewed the effectiveness of the Group’s whistleblowing provisions, including approving a new policy and third party service provider where employees may raise concerns in confidence about possible improprieties. The committee receives updates on any calls received;
• reviewed reports on the key business risks, including a review of the internal control processes used to identify, monitor and mitigate the principal risks and uncertainties; and
• received regular updates from management concerning various taxation, treasury, pensions and litigation issues; and reviewed the Company’s policy on non-audit fees.
Significant issues related to the financial statementsDuring the year, the committee, management and the external auditor considered and concluded what the significant risks and issues were in relation to the financial statements. These were examined and challenged and the committee concluded it was satisfied with the treatment of each item prior to recommending the financial statements to the board for approval. The significant issues reviewed during the year were as follows:• pensions related matters including the valuation of pension
scheme assets and liabilities on both an accounting and actuarial basis; the methodology used to derive the assumptions used in the IAS 19 pensions accounting; and their impact on the financial statements. The committee also sought and received management updates from meetings held during the year with the trustee of the Group’s pension schemes and their advisers;
• revenue recognition processes have been reviewed to ensure revenue has been recognised appropriately and consistency of policy has been achieved across the Group;
• non-recurring costs and fair value movements. The committee reviewed board approved plans pre and post implementation, including the fair value movement and liability for the cash settled share based payment in respect of the Fired Earth incentive scheme;
• impairment tests. The assumptions used in the impairment tests including sensitivity analysis were subject to thorough review;
• taxation provisions. Outstanding tax positions where recognition in the financial statements is judgemental given the uncertainty of settlement were reviewed. Positions had been fully provided for and potential benefit has not been recognised;
• contingent liabilities have been reviewed in view of legacy matters. The board and the committee received regular updates on these matters throughout the year; and
• the going concern assessment. This included the review of potential scenarios and sensitivities to consider how these may impact on the assessment.
External auditorErnst & Young LLP were appointed on the recommendation of the committee following a formal tender process in 2006. The current audit partner has been in office since 2014. The potential for re-tendering of the external audit services is kept under review and in accordance with the committee’s terms of reference the audit services contract is expected to be put out to tender by 2016. The committee is responsible for ensuring that an appropriate relationship is maintained between the Group and its auditor and assesses the auditor’s performance, effectiveness, objectivity and
independence. The committee agrees the scope of the audit work and discusses the results of the full-year audit and interim review each year and monitors the provision of non-audit services by the external auditor in order to maintain and ensure that their objectivity and independence is not compromised.
The committee revised the non-audit service pre-approval policy in 2013 so that the fees payable to the auditor for non-audit related work in any financial year should not normally be more than 100% of the total fees payable in respect of audit and compliance services. Any proposed spend over the limit set for each financial year must be approved by the committee. The policy sets out a list of prohibited services which must not be carried out by the auditor and an alternative firm must be used. Pre-approved services, that are routine in nature and where the fee is not significant may be authorised by the Group finance director. Where fees are expected to be in excess of a specified limit, prior approval of the chair of the committee is required. In each case, consideration is to be given to the need for value for money, experience and objectivity required in the particular circumstances. A breakdown of the audit and non-audit fees is set out in note 4 to the accounts. The fees paid to the auditor for non-audit services (including the interim review) in 2014 represented 54% of the audit fee, which was within the limit set in the policy.
The external auditor conducts an annual review of its independence, identifying all services provided to the Group and assessing whether the content and scale of such work is a threat to its independence. Following this year’s review the auditor concluded that there are no factors which would impair their objectivity and independence. In assessing the work of the external auditor, the committee found itself satisfied with the scope of the auditor’s work, its effectiveness and fee proposal. and recommended to the board the re-appointment of the auditor.
Internal auditThe internal audit function has a Group-wide remit and is independent of the business operations. It undertakes an on-going programme to provide assurance on the adequacy of the internal controls and risk management processes across the Group’s operations. It is responsible for reviewing and reporting on the effectiveness of the internal controls and risk management systems to the committee and ultimately to the board. The committee approves the internal audit plan at the start of each year and receives regular updates on internal audit’s performance throughout the year. The committee monitors and reviews the effectiveness of internal audit’s activities. During the year the committee has overseen the introduction of a new controls self-assessment questionnaire; the deployment of computer assisted techniques; an IT security review; and, a revised anti-bribery procedure and test programme. The committee has approved a new Group investigations policy, revised whistleblowing policy and changes to the externally provided confidential whistleblowing service.
Risk management and internal controlThe board has overall accountability for running the business effectively, which includes making sure risks are managed and that there is a sound system of internal control and risk management, including health and safety procedures and risk controls that are designed to reduce the chance of a failure to meet the Group’s objectives.
CORPORATE GOVERNANCE REPORT
CONTINUED

Group plc Annual Report & Accounts 2014 31
The board is responsible for the overall system of internal control for the Group and for reviewing its effectiveness. It carries out such a review at least annually covering all material controls including financial, operational, compliance and risk management systems.
Operating policies and controls are in place to cover a wide range of issues including financial reporting, capital expenditure, information technology, business continuity and management of employees. Detailed policies ensure the accuracy and reliability of the Group’s financial reporting and the Group’s process for preparing the consolidated accounts and financial statements.
The key elements of the Group’s processes for the provision of effective internal control and risk management include:• regular board meetings to consider a schedule of matters
reserved for directors’ consideration;• an annual review of corporate strategy carried out by the board,
which includes a review of risks and uncertainties facing the Group, and how these risks and uncertainties are monitored and managed on an ongoing basis throughout the Group;
• an established organisational structure with clearly defined lines of responsibility and delegation of authority;
• an internal audit function which implements the annual internal audit plan as agreed by the committee;
• documented and enforced policies and procedures used by all finance teams across the Group;
• appointment of staff of the necessary calibre to fulfil their allotted responsibilities;
• comprehensive budgets and forecasts, approved by the board, reviewed and revised on a regular basis, with performance monitored against them and explanations obtained for material variances; and
• a detailed investment approval process, requiring board approval for major capital expenditure projects, acquisitions and disposals of assets. Post-investment appraisals are conducted from time to time.
In respect of Group financial reporting, executive management, with the assistance of the finance function, is responsible for ensuring the appropriate maintenance of financial records and processes that ensure all financial information is relevant, reliable, in accordance with the applicable laws and regulations, and distributed both internally and externally in a timely manner. A review of the consolidation and financial statements is completed by executive management to ensure that the financial position and results of the Group are appropriately recorded in accordance with the applicable accounting standards, and these are circulated to members of the board and published, where appropriate. All financial information published by the Group is subject to the approval of the board, on the recommendation of the committee.
During the year no change has occurred that has materially affected, or is reasonably likely to affect materially, the Company’s internal controls over financial reporting.
There is in place an ongoing process of internal controls, reviewed by management and internal audit, which has been established for identifying, evaluating and managing the significant risks, both financial and non-financial, faced by the Group. The adoption of these processes and controls throughout the Group enables a consistent approach to the management of risk at both Group and operational level. The risk assessment programme has been
upgraded during the year to improve the identification, assessment of risks and aggregation of risks and to provide greater clarity on the management and mitigation of risks and opportunities.
The internal audit function meets regularly with operational management to monitor and ensure consistent deployment of internal control and risk management systems in compliance with the Group’s policies. The process is reviewed regularly by the board and, with advice from the committee; it is satisfied that this meets the requirements of the Turnbull Guidance. The risk management process and system of internal control are designed to manage rather than eliminate the risk of failure to achieve the Group’s strategic objectives. The Company’s system of internal control is designed to meet the Company’s particular needs and the risks to which it is exposed and by their nature, can only provide reasonable, but not absolute assurance against material misstatement or loss. In that context, the review, in the opinion of the board, did not indicate that the system was ineffective or unsatisfactory and the board is not aware of any change to this status. The process has been in place since the start of the financial year and up to the date of approval of the annual report and accounts. Further details of the key risks and uncertainties facing the business can be found on pages 18 and 19 of the strategic report.
AccountabilityThe board is required to present a fair, balanced and understandable assessment of the Company’s financial position and prospects. The responsibilities of the directors are set out on page 50 and the responsibilities of the external auditor are set out on pages 84 to 86. As set out on page 49 of the directors’ report, the directors’ consider the Company’s business is a going concern.
By order of the board
R J WORTHINGTONCHAIR OF THE AUDIT AND RISK COMMITTEE6th March 2015

Group plc Annual Report & Accounts 201432
NOMINATION COMMITTEEStatement from the chair of the nomination committeeOver the last two years the nomination committee (‘the committee’) has refreshed the membership of the board and its committees to ensure the structure, size, diversity and composition remain effective. The board has also overseen succession plans at senior management level, ensuring the Group has strong development plans and talent management below board level for future succession and to ensure our strategy has the best prospects of success. The committee will ensure further work is undertaken in this area over the year ahead.
ActivitiesThe committee is appointed by the board and membership comprises John Coleman (chairman), Jon Carling, Paul Dermody (until 1st May 2014), Bob Ivell (from 1st July 2014), Paul Jackson and Rebecca Worthington. The committee ensures there is a formal, rigorous and transparent procedure for the appointment of new directors, which are made on merit and against objective criteria, having due regard for the benefits of diversity. The principal duties of the committee are to:• keep under review the structure, size and composition of the board
and its committees and to recommend changes deemed necessary; • identify, evaluate and nominate candidates to fill executive and
non-executive vacancies taking into account the balance of skills, knowledge and experience on the board; and
• make recommendations to the board regarding the continuation in office of a director upon the expiry of any specified term(s) of appointment.
The committee, in conjunction with the board, receives updates from the chief executive, the Group HR director and other advisers, as appropriate.
The committee met twice during the year and attendance at meetings is shown on page 27. Paul Dermody, who had been chair of the audit and risk committee and senior independent director, announced his intention to retire from the board following the 2014 AGM. In 2013, Rebecca Worthington was appointed a non-executive director and subsequently became chair of the audit and risk committee. Following a further review of skills and experience and to assist with orderly succession planning, bearing in mind Paul Jackson was close to completing nine years in office, the Company engaged Korn Ferry International to assist with the search for a further non-executive director, able to take on the role of senior independent director and in due course assume the role of chair of the remuneration committee. Korn Ferry International also advised the Company on non-executive directors’ fees at the beginning of 2014. Korn Ferry International does not have any other connection with the Company.
The chairman worked with Korn Ferry International to identify a shortlist of candidates with suitable skills and experience. An opportunity was set up for the non-executive directors and the executive directors to meet with potential candidates prior to appointment. Bob Ivell was appointed as senior independent director on 1st July 2014. Bob has extensive commercial, general management and public limited company board experience which will assist the board with implementing its strategy. The committee is not looking to make any further changes to the composition of the board following the retirement of Paul Jackson after the 2015 AGM.
The committee keeps under regular review non-executive directors’ terms of office, although none will reach the end of any three year term prior to the 2015 AGM as outlined in the table below.
DirectorDate of appointment
First elected at an AGM
Date of last election/ re-electionat an AGM
W B McGrath October 1997 May 1998 1st May 2014S M Smith March 2001 May 2001 1st May 2014J D Carling October 2010 May 2011 1st May 2014J Coleman March 2008 May 2008 1st May 2014R Ivell* July 2014 n/a n/aP E Jackson December 2005 May 2006 1st May 2014R J Worthington July 2013 May 2014 1st May 2014
* Bob Ivell will stand for election at the 2015 AGM.
As part of the annual performance evaluation process, the board considered the effectiveness of each director standing for election and re-election at the 2015 AGM. The committee reviewed the necessary time commitments and confirmed to the board that all directors were spending sufficient time on fulfilling their duties. Having concluded that each director’s performance continues to be effective, the board has recommended the election and re-election of each director to shareholders.
DiversitySuccession planning at board level is informed by guidance provided by the Financial Reporting Council and the Department of Business, Innovation and Skills on both Board Effectiveness and Gender Diversity. The Company supports the provision that boards should consider the benefits of diversity, including gender, when making appointments and is committed to ensuring diversity not just at board level, but also throughout the workforce. The board believes that business benefits from the widest range of perspectives and backgrounds. The Company’s aim as regards composition of the board is that it should have a balance of experience, skills and knowledge to enable each director and the board as a whole to discharge their duties effectively. Whilst the Company agrees that it is entirely appropriate that it should seek to have diversity on its board, it does not consider that this can be best achieved by establishing specific quotas and targets and appointments will continue to be made based on merit. Further details on the gender diversity of the workforce are set out on pages 22 and 23 of the CSR report under ‘Our people’.
By order of the board
J COLEMANCHAIRMAN OF THE NOMINATION COMMITTEE6th March 2015
CORPORATE GOVERNANCE REPORT
CONTINUED

Group plc Annual Report & Accounts 2014 33
DIRECTORS’ REMUNERATION REPORT
REMUNERATION COMMITTEE CHAIRMAN’S ANNUAL STATEMENTOn behalf of the board, I am pleased to present the directors’ remuneration report for the year ended 31st December 2014 which sets out the remuneration policy for the directors and the amounts earned during the year.
Remuneration philosophyThe aim of the Group’s remuneration policy is to produce an outcome which is fair and appropriate to the Company, shareholders and senior executives. The policy is designed to ensure that the remuneration of executive directors and senior management is sufficiently competitive to retain and motivate the existing directors and to attract high calibre candidates to ensure the continued long-term success of the business. We have tried to maintain clear, simple and understandable components to the overall remuneration package, with both short and longer term elements linked to performance and aligned to the Group’s stated strategic KPIs. Where, for historical reasons, one element of the overall package may be out of line, we have adjusted the other elements to achieve an appropriate balance between the fixed and variable elements of the total package.
Stakeholder engagementThe remuneration committee considers feedback received on the directors’ remuneration report each year and guidance from representative bodies more generally. I am pleased to report on the strong level of support from shareholders as evidenced by the voting outcomes at the 2014 Annual General Meeting. The resolutions seeking approval of the directors’ remuneration report and the directors’ remuneration policy were supported by over 95% of the votes cast. We have engaged directly with institutional shareholders who have raised issues with us during the year.
2014 key decisionsThe remuneration committee remains committed to a responsible approach to executive pay and during the year has operated within the policy approved by shareholders. Key decisions on executive pay have taken into account pay and employment conditions elsewhere in the Group, which is particularly important given the continuing challenges of the economic environment.
Base salaries of the executive directors’ were not increased in 2014 or 2015. Thus the executive directors’ salaries have been frozen for five out of the last seven years.
In relation to variable pay, the remuneration committee retains the discretion to adjust performance metrics impacting on the annual incentive and options granted under the Company Share Option Plan (‘CSOP’) where it considers it appropriate to do so, to reflect changes in strategy, financial objectives or to reflect changes to the structure of the business. However in agreeing the 2014 annual incentive and decisions on share options which reached the end of their performance period during the year, the remuneration committee did not use any discretion or adjust the performance metrics.
An annual incentive of 6.6% of base salary was paid to each executive director for the 2014 financial year.
Share options awarded under the CSOP in 2011 reached the end of the performance period and were subject to achieving absolute earnings per share (‘EPS’) growth on a set scale. The target was not met and the options lapsed.
To assist with delivery of the long-term strategy and to maintain the balance between fixed and variable elements of the package, the remuneration committee decided to make a further grant of options under the CSOP in April 2014 to the executive directors and key senior management. A revised and stretching EPS absolute growth scale and Total Shareholder Return (‘TSR’) targets were set, where 25% of the award will vest for median level performance.
2015 frameworkThe performance metrics under the annual incentive plan have been reviewed and whilst consistent with the prior year have been revised to reflect the 2015 budget approved by the board and consensus expectations on operating profit.
The remuneration committee notes the 2014 edition of The UK Corporate Governance Code (‘2014 Code’) and specifically the new provision in relation to variable pay schemes to enable the Company to recover sums paid or withhold payments of any sum in specific circumstances in which it would be appropriate to do so. The remuneration committee is reviewing emerging best practice and the adjustments required to amend the annual incentive plan and the CSOP to include both malus and clawback provisions and will report back next year.
The remuneration committee welcomes any feedback and is keen to engage with shareholders on any specific issues.
By order of the board
P E JACKSONCHAIRMAN OF THE REMUNERATION COMMITTEE 6th March 2015

Group plc Annual Report & Accounts 201434
DIRECTORS’ REMUNERATION REPORT
CONTINUED
INTRODUCTIONThis report addresses the activities of the remuneration committee (‘the committee’) for the year ended 31st December 2014. It sets out the remuneration policy and remuneration details of the executive and non-executive directors of the Company. It has been prepared in accordance with Schedule 8 to the Large and Medium-sized Companies and Groups (Accounts & Reports) (Amendment) Regulations 2013 (‘the Regulations’), The UK Corporate Governance Code (2012) (‘the Code’) and the relevant requirements of the Listing Rules of the Financial Conduct Authority.
The report is split into three main areas - the Remuneration Committee Chairman’s Annual Statement (‘Statement’), the Annual Report on Remuneration and the Directors’ Remuneration Policy. The Companies Act 2006 requires the auditor to report to shareholders on certain parts of the report and to state whether, in their opinion, those parts of the report have been properly prepared in accordance with the Regulations. The parts of the Annual Report on Remuneration that are subject to audit are indicated in that report. The Statement and the Directors’ Remuneration Policy are not subject to audit.
ANNUAL REPORT ON REMUNERATION (SUBJECT TO AUDIT)Remuneration overviewAs outlined in the Statement, the Company aims to provide remuneration that is aligned with shareholder interests and designed to be competitive in the marketplace. Performance related components of the remuneration package can form a significant portion of the overall available remuneration package with maximum total potential awards being earned through the achievement of the Group’s stated strategic objectives and challenging performance targets designed to promote the long-term success of the Company.
Single total figure of remunerationThe tables below report the total remuneration for each person who served as a director of the Company during the financial years ended 31st December 2014 and 31st December 2013.
Year ended 31st December 2014
Salary/fees £Taxable
benefits £Annual
incentive £Long-term
incentives £
Salary in lieu of pension above the
earnings cap £
Valuation of benefits under
pension schemes and
life assurance arrangements £ Total £
W B McGrath 507,108 30,266 33,469 – 84,372 47,982 703,197S M Smith 291,297 22,567 19,226 – 36,900 19,288 389,278J D Carling 40,000 – – – – – 40,000J Coleman 125,000 – – – – – 125,000P B Dermody (retired 1.5.2014) 15,173 – – – – – 15,173R Ivell (appointed 1.7.2014) 22,500 – – – – – 22,500P E Jackson 45,000 – – – – – 45,000R J Worthington 45,000 – – – – – 45,000
Total 1,091,078 52,833 52,695 – 121,272 67,270 1,385,148
Year ended 31st December 2013
Salary/fees £Taxable
benefits £Annual
incentive £Long-term
incentives £
Salary in lieu of pension above the
earnings cap £
Valuation of benefits under
pension schemes and
life assurance arrangements £ Total £
W B McGrath 507,108 29,157 103,704 – 84,372 55,641 779,982S M Smith 291,297 22,567 59,570 – 36,900 26,804 437,138J D Carling 35,000 – – – – – 35,000J Coleman 125,000 – – – – – 125,000P B Dermody 40,000 – – – – – 40,000P E Jackson 40,000 – – – – – 40,000R J Worthington (appointed 1.7.2013) 17,917 – – – – – 17,917
Total 1,056,322 51,724 163,274 – 121,272 82,445 1,475,037

Group plc Annual Report & Accounts 2014 35
The figures in the single figure table are derived as follows:
Salary/fees – The amount of salary/fees received in the year.
Taxable benefits – The taxable value of benefits received during the year. These include car or car allowance, fuel or equivalent cash allowance and private medical insurance.
Annual incentive – An annual incentive of 6.6% of base salary was earned for the year ended 31st December 2014 (2013: 20.45%). A description of performance against targets is set out under the heading ‘Annual incentive 2014’ on page 36. The directors will reinvest over 50% of the 2014 net annual incentive into shares.
Long-term incentives – The value of CSOP awards that vest based on performance conditions during the financial year and the value of Sharesave Plan options granted during the financial year based on the fair value of the options at the date of grant. No CSOP options vested during the financial year and no Sharesave Plan options were granted during the financial year.
Salary in lieu – The salary supplement received by the executive directors in lieu of pension on remuneration above the pre-6th April 2006 statutory earnings cap projected forward to 2009 and frozen at that level at the end of 2009.
Valuation of benefits under pension schemes – The pension figures represent the value of all pensions and life assurance related benefits and alternatives thereto earned by or provided for the executive directors in the financial year. Under the defined benefit pension scheme provided to the current executive directors, the net value of pension benefits earned in the financial year calculated using the HMRC method (using a multiplier of 20); and the life assurance premiums paid on behalf of the executive directors during the year (non-taxable). Further details on pension benefits are set out on page 37.
Implementation statementA summary of remuneration arrangements in 2014 and how the Policy will be applied during 2015 is set out below.
Base salaryThe committee agreed to freeze executive base salary levels between 2012 and 2014 based on the benchmarking exercise undertaken by external remuneration advisers, MM&K Limited (‘MM&K’) in 2012, with the objective of reducing the fixed proportion of the total remuneration package. The committee has re-considered base salaries for 2015. The Group’s employees are, in general, receiving pay rises ranging from 0% to 2.5% depending on individual and operational performance (excluding increases relating to change of role and responsibilities, such as promotions etc.). The committee agreed that there would be no increase to executive directors’ salaries effective from 1st January 2015.
2015 £ 2014 £ % increase
W B McGrath 507,108 507,108 0%S M Smith 291,297 291,297 0%
FeesThe remuneration of non-executive directors (excluding the chairman of the board) is determined by the board as a whole on the recommendation of the executive directors. Based on publicly available data on fees paid to non-executive directors of FTSE SmallCap Index companies, non-executive directors’ base fees were reviewed and amended in January 2014. Prior to this, non-executive directors’ fees had not been revised since 2007. There was no change to the chairman’s fee. Non-executive directors’ fees are reviewed biennially, other than in the case of a significant change to an individual’s role, responsibilities and/or time commitments or when considering a new appointment. Fees were not amended effective from 1st January 2015.
Role 2015 £ 2014 £
Chairman 125,000 125,000Non-executive director 40,000 40,000Committee chair/senior independent director 5,000 5,000
No additional fees are paid for attendance or being a member of a board committee. A fee of £5,000 is paid for chairing the audit and risk committee, the nomination committee and the remuneration committee. John Coleman currently chairs the nomination committee and the separate fee for this has been included in his base fee since appointment. A fee of £5,000 may also be paid for fulfilling the role of the senior independent director.

Group plc Annual Report & Accounts 201436
Annual incentive 2014The maximum annual incentive payable is 75% of base salary subject to the achievement of challenging performance targets set by the committee at the beginning of each financial year. Performance is monitored against the targets set throughout the year. Following completion of the audit, the committee considered the performance and outcome against the pre-set financial targets and the agreed strategic/personal objectives.
The directors consider that the financial and strategic targets set are commercially sensitive and do not wish to disclose these to competitors. The committee will continue to disclose retrospectively the incentive earned each year and how the incentive paid relates to the financial targets and strategic/personal objectives set, where it considers it appropriate to do so. However, the committee may decide that some targets and objectives must remain confidential to the Company. The table below sets out the weighting and targets for the 2014 annual incentive plan.
Group operating profit
Operating cash flow
Range cooker units sold
Strategic objectives
Weighting 50% 8.3% 16.7% 25%Maximum % base salary 37.5% 6.25% 12.5% 18.75%In line with expectations £12.5m £13.2m Commercially sensitiveEarned nil nil 6.6% nil
For the financial objectives, for performance in line with expectations 50% of maximum award is earned with a sliding scale operating from threshold to maximum level. Performance against the strategic/personal objectives set is considered by the committee and they determine whether sufficient progress has been made against the objectives to justify an incentive payment.
For 2014, an incentive of 6.6% of base salary was earned by each of the executive directors based on the achievement of the target set for Rangemaster cookers and the threshold target for AGA cookers. The other financial targets were not achieved. The three strategic objectives were based on the development of sales in China, development of other strategic partnerships and opportunities to create value from the Group’s assets. Whilst appreciable progress was made, the committee having objectively reviewed performance decided that the threshold level had not been achieved and therefore no incentive was earned in relation to the strategic/personal objectives.
Having taken into account the sustained improvement in the performance of the business and following due consideration, the committee recommended to the board that an incentive award of 6.6% of base salary be paid for the 2014 year. No discretion was applied by the committee in arriving at this decision. The executive directors will reinvest a minimum of 50% of the net incentive paid in shares.
Annual incentive 2015No changes are proposed to the structure of the annual incentive plan for 2015. The maximum award under the plan will remain at 75% of base salary. Up to three quarters of the total incentive may be earned for on target performance against the financial targets set (Group operating profit, operating cash flow and product sales targets). A sliding scale operates for the financial targets with half the incentive being earned for delivery in line with the Company’s expectations. Up to one quarter of the total incentive may be earned for the achievement of strategic/personal objectives where the committee determines at the end of the financial year whether the objectives have been satisfactorily achieved. For the reasons set out above, the committee considers that the financial and strategic targets are commercially sensitive and should remain confidential to the Company. The committee will continue to disclose how the incentive earned relates to the performance against the targets on a retrospective basis.
Scheme interests awarded during the financial yearThe committee considered whether it was appropriate to make further awards of options under the CSOP or to make a further invitation under the Sharesave Plan during 2014. Following due consideration, it was agreed that no invitations would be made under the Sharesave Plan in 2014. However, in line with the advice from MM&K in 2012, the committee considered it was appropriate to make a further award of options to the executive directors and senior management under the CSOP in 2014.
The committee reviewed the performance criteria and agreed that it was appropriate to maintain an EPS absolute growth scale and set revised and stretching scales. In addition, the committee retained the TSR performance target to monitor the Company’s performance versus the FTSE Small Cap Index. The committee approved the level of award and the key senior management invited to participate. The award is a performance share award for which no exercise price is expected and a share option within the meaning of the Regulations.
As set out in the Policy, it is not the board’s current intention (on recommendation of the committee) to issue more than the equivalent of 100% of base salary in nil-cost options over a rolling three year period. If a further award is granted in 2015, it is the intention that 50% of an award will be measured against relative TSR and 50% of an award measured against EPS growth targets as set out in the Policy.
DIRECTORS’ REMUNERATION REPORT
CONTINUED

Group plc Annual Report & Accounts 2014 37
Type of award Basis of award
Percentage of base
salary
Face value at date of
grant £Number of
options*
% of award vesting at threshold
performanceLength of vesting period
Summary of performance measures and targets
W B McGrath CSOP Unapproved nil cost option 30 152,132 87,181 25 Three financial years 2014 to 2016, with earliest vesting date 17th April 2017.
50% linked to relative TSR performance versus the FTSE Small Cap Index. 50% linked to absolute EPS target. The full scale is set out in note 23 to the accounts.
S M Smith CSOP Unapproved nil cost option 30 87,389 50,079 25
* using the average mid-market price in the three days prior to grant (17th April 2014) of 174.5 pence per share.
Awards vesting in respect of the financial yearThe CSOP awards granted in 2011 were subject to the achievement of an EPS growth performance condition measured at the end of three consecutive financial years. All of the options lapsed as the performance condition was not met. (100% of the award would vest if EPS was 20 pence per share and none of the award vests if the EPS was less than 13 pence per share).
Awards under the Sharesave Plan were granted in 2008 at an option price of 209 pence per share and no discount was granted on market value. For those participants saving for five years, the options remained underwater and the options lapsed on 31st May 2014.
Total pension entitlementsThe Company closed the pre-existing Group UK pension scheme operated for executive directors and other senior employees in 1998, and thereafter such employees join the current Group UK pension scheme on the same basis as applies to all other new employees from time to time. Subsequently, the Company closed the current Group UK pension scheme to new members on a defined benefit basis of pension provision in 2001 and froze the pensionable salaries of current active defined benefit members of the scheme at the end of 2009 for higher earners and in January 2010 for all other active defined benefit members. From 2002, new members of the scheme join on a defined contribution basis of pension provision. The Group became subject to the pensions auto-enrolment requirements in the UK in 2014, and a new defined contribution pension vehicle was put in place from 1st January 2014 for new contributors employed by Aga Rangemaster Limited and became available from 1st May 2014 for new contributors employed by Fired Earth Limited.
The current executive directors were members of the pre-existing Group UK pension scheme which closed in 1998, and are current members of the Group’s current UK pension scheme on a defined benefit basis of pension provision.
Details of the pensions accrued in the defined benefit scheme for the current executive directors are shown in the table below.
Accrued pension at 31st December 2014
Changes in accrued pension over the year (net of
inflation) Normal retirement date
W B McGrath 67,400 2,200 60 yearsS M Smith 65,900 1,000 60 years
On their retirement from service at their normal retirement age of 60, the arrangements provide for a pension of two-thirds of final pensionable salary. William McGrath’s pension accrues annually at a rate of around one thirty-first of pensionable remuneration, while Shaun Smith’s pension effectively accrues annually at a rate of around one forty-fifth of pensionable remuneration (compared with the predominant accrual rate of one sixtieth of pensionable salary under the current scheme).
Early retirement can be taken from the age of 55 years provided the Company gives its consent. The accrued pension will then be reduced to take into account its early payment.
William McGrath and Shaun Smith each commenced pensionable service with the Group at a time when higher earners’ pensionable remuneration was subject to the statutory earnings cap. Therefore only part of their remuneration is pensionable; the equivalent of the statutory cap projected forward to 2009 was £123,600, and as a consequence of an amendment made to the pension scheme at the end of 2009 for higher earners, their pensionable remuneration has now been frozen at this level. No other payments are pensionable and there are no unfunded pension promises or similar arrangements for directors. William McGrath and Shaun Smith receive additional salary in lieu of pension on remuneration above the statutory cap as detailed in the single total figure of remuneration table on page 34.
Life assurance on death in service cover (equal to four times base salary) is arranged for the current executive directors; this is not a taxable benefit.

Group plc Annual Report & Accounts 201438
Payment to past directorsThere were no other payments to past directors during the period in respect of services provided to the Company as a director.
Payments for loss of officeThere were no payments made to directors during the period in respect of loss of office.
Statement of directors’ shareholding and share interests The table below sets out the interests in shares in the Company of the directors including interests of connected persons, the total number of scheme interests differentiating between those with and without performance conditions, and unvested and those vested or exercised during the year. This information is correct at 31st December 2014 and at the time of signing the balance sheet on 6th March 2015.
Unvested
Director Type
Shares owned
outright
Options exercised
during the year
Options vested but
unexercised
Subject to performance
conditions
Not subject to
performance conditions
Total as at 31st
December 2014
Executive directors
W B McGrath Shares 247,696 n/a n/a n/a n/a 247,696CSOP n/a – – 449,747 n/a 449,747Sharesave n/a – n/a n/a n/a –
S M Smith Shares 171,843 n/a n/a n/a n/a 171,843CSOP n/a – – 258,348 n/a 258,348Sharesave n/a – n/a n/a n/a –
Non-executive directors
J D Carling Shares 5,000 n/a n/a n/a n/a 5,000J Coleman Shares 16,510 n/a n/a n/a n/a 16,510P Dermody* Shares – n/a n/a n/a n/a –R Ivell Shares – n/a n/a n/a n/a –P E Jackson Shares 7,000 n/a n/a n/a n/a 7,000R J Worthington Shares – n/a n/a n/a n/a –
* Paul Dermody retired on 1st May 2014 and held 60,591 ordinary shares at that date.
No options were exercised by the directors during the year and therefore no gains were made (2013: nil).
The mid-market price of ordinary shares on 31st December 2014 was 118.0 pence and the lowest and highest mid-market prices during the financial year were 110.0 pence and 188.0 pence respectively.
The executive directors are expected to build a significant shareholding in the Company. The committee has not set a specific minimum shareholding requirement, although it has introduced a policy whereby executive directors invest at least 50% of their net annual incentive earned in shares, with a minimum holding period of three years. The executive directors’ shareholdings primarily result from market purchases. To date William McGrath has invested £419k and Shaun Smith has invested £387k in shares in the Company. The executive directors have not sold any shares during the last five years.
DIRECTORS’ REMUNERATION REPORT
CONTINUED

Group plc Annual Report & Accounts 2014 39
THE REMAINDER OF THE ANNUAL REPORT ON REMUNERATION IS NOT SUBJECT TO AUDIT
Performance graph and chief executive remuneration tableThe graph below shows the value, at 31st December 2014, of £100 invested in the Company on 1st January 2009 compared to the value of £100 invested in the FTSE All-Share Index. The FTSE All-Share Index has been selected as a relevant comparator index because the Company is a constituent member of that index.
£80
£100
£120
£140
£160
£180
£200
£220
£240
£260
Dec 14Dec 13Dec 12Dec 11Dec 10Dec 09Jan 09
FTSE All-Share AGA Rangemaster Group plc
The table below sets out details of the remuneration of the director undertaking the role of chief executive for the previous six years as required by the Regulations:
Year ended 31st December Total remunerationAnnual incentive paid
(% of maximum opportunity)
Long-term incentive % vesting against the
maximum opportunity
2014 703,197 8.8% 0%2013 779,982 27.3% 0%2012 736,034 25.0% 0%2011 714,301 13.3% 0%2010 835,183 44.0% 0%2009 765,194 26.7% 0%
During the six year period under review the directors have implemented a series of cost saving initiatives, managed various pension fund issues, put in place new banking lines, overseen the development of new products and established new market development opportunities. The Group is in a stronger position to be able to benefit from operational gearing and development opportunities as the market improves.
Percentage change in chief executive’s remunerationThe table below sets out the percentage change in remuneration of the chief executive and the wider workforce between the years 2013 and 2014. For these purposes, the wider workforce is based on all of the Group’s employees excluding the Company’s directors.
ComponentChief
ExecutiveWider
workforce
Salary 0% 2.9%Taxable benefits 3.8% (1.6)%Annual incentive/bonus (67.7)% 13.0%Total (10.8)% 3.1%
Relative importance of spend on payThe table below sets out the percentage change in overall expenditure on pay as a whole across the Group, retained earnings/losses and dividends. There were no dividends payable in respect of the years ended 2013 and 2014.
Measure 2014 2013 % change
Total staff costs* £87.0m £80.3m 8.3%Retained earnings/(losses) (£51.9) (£23.6) (119.9)%Dividends nil nil 0%
* 2014 includes £3.3m relating to a provision for a cash settled share based payment transaction in respect of the Fired Earth incentive scheme. In addition, the total number of employees increased by 2.1% in 2014.

Group plc Annual Report & Accounts 201440
DIRECTORS’ REMUNERATION REPORT
CONTINUED
Statement of voting at the last AGMThe Company remains committed to ongoing shareholder dialogue and takes an active interest in voting outcomes. The following table sets out actual voting in respect of the resolution to approve the directors’ remuneration report and the directors’ remuneration policy at the Company’s last AGM which was held on 1st May 2014:
Resolution Votes for % of voteVotes
against % of voteVotes
withheld
To approve the directors’ remuneration report 35,261,436 98.31 606,730 1.69 15,250To approve the directors’ remuneration policy 29,359,837 95.16 1,493,180 4.84 5,030,399
One significant institutional shareholder withheld their vote on the directors’ remuneration policy resolution . We entered into dialogue with the institution to establish whether they had any particular concerns with the policy or any issues they wished to raise with the remuneration committee. There were no matters arising that required to be follow up, but dialogue has been maintained. Remuneration committee The committee is appointed by the board and membership comprises Paul Jackson (chairman), Jon Carling, John Coleman, Paul Dermody (until 1st May 2014), Bob Ivell (from 1st July 2014) and Rebecca Worthington. The board believes that it is appropriate for John Coleman, the board’s chairman, to serve as a member of the committee so long as he does not chair the committee in accordance with provision D.2.1 of the Code. No committee member has any personal financial interest (other than as a shareholder) or other conflicts of interest in relation to matters to be decided by the committee. The committee met three times during the year and attendance at meetings is set out on page 27.
Role of the committeeThe committee’s terms of reference, which are available on the Company’s website (www.agarangemaster.com), set out its responsibilities which include:• determining and agreeing with the board the remuneration policy for the remuneration of the executive directors, other senior
executives and the chairman of the board and in respect of any new appointments;• determining the fixed and variable components of the executive directors’ and senior management’s remuneration, their contractual
terms and compensation arrangements;• approving the design of, and determining targets for, any performance related pay schemes operated by the Company and approving
the total annual payments made under such schemes;• determining the policy for and scope of pension arrangements for executive directors and senior management; and• overseeing any major changes in employee benefit structures throughout the Group.
The remuneration of the non-executive directors is decided by the board, within the limit set by the articles. During the year, the committee reviewed its composition to ensure there is sufficient expertise and resource for the committee to fulfil its responsibilities effectively. The committee also reviewed its terms of reference and carried out an annual review of its own performance.
AdvisersThe committee engaged MM&K in October 2011 as its independent remuneration adviser. MM&K do not provide any other service to the Company. MM&K undertook a full review of the Company’s remuneration policy for the executive directors, senior management and the non-executive directors and their recommendations were implemented in 2012. During 2014, the committee considered whether it was appropriate or necessary to take further Independent external advice on executive/senior management remuneration. The broad framework has been in place for a number of years and the committee do not expect to make any significant changes to the remuneration policy at present.
Deloitte LLP were engaged in February 2014 to perform a compliance check in respect of disclosures under the Regulations. The committee has continued to receive briefing notes from Deloitte and guidance from representative bodies throughout the year. Deloitte have been engaged to advise the committee on emerging best practice in relation to the 2014 Code provision in relation to variable pay schemes to enable the Company to recover sums paid or withhold the payment of any sum in specific circumstances in which it would be appropriate to do so. The committee is satisfied that the advice provided by Deloitte is independent. Deloitte do not provide any other services to the Group. Deloitte is a member of the Remuneration Consultants Group and, as such, voluntarily operates under a code of conduct in relation to executive remuneration consulting in the UK. Deloitte’s fees for providing advice to the committee during 2014 amounted to £2,500 (2013: nil).
The chief executive provided advice in respect of the remuneration of the executive management with the assistance of the Group HR director and the company secretary. External advisers may be invited to attend meetings. No director participates in discussions when his/her own remuneration is under consideration.

Group plc Annual Report & Accounts 2014 41
DIRECTORS’ REMUNERATION POLICYThis part of the report sets out the Company’s Directors’ Remuneration Policy (the ‘Policy’) which was approved by shareholders at the 2014 AGM. The Policy came into effect on 1st May 2014. The Policy was determined by the committee and recommended to the board for approval. The Policy is due to be reviewed by shareholders at the 2017 AGM.
The table below summarises each of the components of the remuneration package for directors of the Company which comprise the Policy. The committee may make minor changes to the Policy, which do not have a material advantage to the directors, to aid its operation or implementation, taking into account the interests of shareholders but without needing to seek shareholder approval.
Base salary
Purpose and link to strategy
Provides a sound basis on which to attract and retain directors of the calibre required by the business.
Core element of fixed remuneration reflecting size and scope of the role.
Operation Reviewed annually and usually fixed for 12 months from 1st January. There is no entitlement to an annual increase.
Takes into consideration the director’s role, skills, knowledge and experience and performance against the business objectives.
Takes into account prevailing market conditions and is aligned with workforce pay reviews.
Externally benchmarked by independent remuneration consultants from time to time against companies of similar size and complexity.
Maximum potential value
There is no prescribed maximum annual increase in base salary.
Base salaries are reviewed taking into consideration salary/wage increases across the Group.
Increases out of line with the workforce are very carefully considered but may be awarded taking all relevant factors into account. These may include increases on promotion of an individual to executive status; increase in the scope of responsibilities of a role; where external advice indicates base salary has fallen significantly below market rate.
Base salary takes into account pay levels in the relevant pay peer group.
Performance metrics
Not applicable, but the individual’s contribution and overall performance is reviewed annually and is one of the considerations when reviewing salary increases.
Benefits
Purpose and link to strategy
Provides benefits to ensure overall remuneration package is competitive.
Provides a sound basis on which to attract and retain directors of the calibre required by the business.
Operation Executive directors receive benefits in line with market practice which include car, fuel or car/fuel allowance, private medical insurance and life assurance.
Reasonable relocation, travel and subsistence allowances and other benefits may be provided based on individual circumstances (anticipated in cases of recruitment or promotion).
Maximum potential value
There is no overall maximum value set on benefits. They are set at a level which is comparable to market practice.
The Company may periodically amend the benefits available to employees/staff and the executive directors would normally be eligible to receive such amended benefits on similar terms to senior management. Values are shown in the single figure remuneration table on page 34. These may fluctuate without the committee taking action e.g. changes to prevailing tax legislation.
Performance metrics
Not applicable.

Group plc Annual Report & Accounts 201442
DIRECTORS’ REMUNERATION REPORT
CONTINUED
Annual incentive and deferral into shares
Purpose and link to strategy
Rewards performance against annual financial targets and strategic or personal objectives which are consistent with the short to medium-term strategic direction of the business.
To align performance and incentives with shareholder value creation linked to the sustained improvement in performance.
Deferral into shares aligns the interests of the executive directors and shareholders by increasing the directors’ long-term shareholding in the Company.
Operation Targets are reviewed and set annually with the committee setting financial and other qualitative targets aligned to strategy and business priorities.
The committee will monitor performance against the targets set throughout the year and make a recommendation to the board regarding the incentive earned based on full year audited data. If the outcome based on simple arithmetic targets leads to anomalies, the committee has the discretion to adjust awards, either upwards or downwards, with a view to ensuring any award is in line with investors reasonable expectations based on Company performance.
Annual incentives earned are paid in cash.
Deferral was introduced in 2012 with the executive directors reinvesting a minimum of 50% of any net annual incentive into shares. Subject to a minimum retention period of three years (subject to terms and conditions which the committee has the discretion to waive taking into account the specific personal circumstances of an individual director).
Maximum potential value
Maximum 75% of salary.
Performance metrics
The annual incentive payment can range from 0% to 75% of base salary.
50% of the award will be based on the achievement of Group operating profit.
25% of the award will be based on other key financial measures (currently operating cash flow and specific product sales).
25% of the award will be based on specific strategic or personal targets.
A threshold level has to be achieved delivering an improvement on the prior year before any award is made.
For the financial targets above, 50% of the maximum entitlement is payable for performance in line with the Company’s expectations.
A stretch scale applies from in line with expectations to the maximum performance level, with straight-line vesting between threshold, in line and maximum performance levels.
Up to 100% of the maximum entitlement is payable for achieving the strategic or personal targets. The committee determines whether the strategic or personal targets have been met at the end of the year.
See ‘Explanation of the performance metrics chosen’ on page 44.
Company Share Option Plan (‘CSOP’)
Purpose and link to strategy
To incentivise executive directors and senior employees to deliver sustained improvement in the longer term performance of the Company and creation of shareholder value.
Operation HMRC approved plan with an unapproved addendum together governing the operation of the plan.
Approved or unapproved options can be awarded. Approved options are granted at no less than market value. Unapproved options may be granted at nil-cost, market value or other value.
The committee retains the ability to adjust/or set different performance measures if events occur (such as a change in strategy, a material acquisition and/or a divestment of a Group business or a change in prevailing market conditions) which cause the committee to determine that the measures are no longer appropriate and that amendment is required so that they achieve their original purpose.
Maximum potential value
Maximum grant up to 100% of base salary per financial year. It is not the board’s current intention (on recommendation of the committee) to issue more than the equivalent of 100% of base salary in nil-cost options over a rolling three year period.
Performance metrics
Subject to performance conditions normally over a three year performance period.
The relevant metrics and weightings may vary each year based upon the Company’s strategic priorities.
For 2014, the performance measures and weightings for grants awarded were 50% on relative TSR compared to the FTSE SmallCap Index and 50% on EPS growth using an absolute scale to be achieved at the end of the performance period.
For each element on the achievement of threshold performance 25% of the award will vest. For the achievement of maximum performance 100% will vest.
TSR – 25% vests for ranking at the median. 100% vests at or above upper quartile.
EPS – At present, in view of the modest level of EPS, it is not appropriate to use an EPS growth above RPI scale. The committee will set an absolute EPS growth scale where 25% vests for performance in line with the markets reasonable expectations. 100% vests at a stretch maximum target.
There will be straight line vesting between the threshold and the maximum performance.
See ‘Explanation of the performance metrics chosen’ on page 44.

Group plc Annual Report & Accounts 2014 43
Sharesave Plan
Purpose and link to strategy
To encourage share ownership by employees, allowing them to participate in the long-term success of the Group and to align interests with those of shareholders.
Operation Sharesave is an HMRC approved monthly savings scheme facilitating the purchase of shares which can be at a discount to market price at the date of grant if agreed by the committee.
Maximum potential value
Sharesave contributions are as permitted in accordance with prevailing tax legislation.
Executive directors are able to participate in Sharesave on the same basis as employees.
Performance metrics
No performance conditions are attached to awards in line with HMRC practice.
Pension benefits
Purpose and link to strategy
Provides benefits to ensure overall remuneration package is competitive.
Provides a sound basis on which to attract and retain directors of the calibre required by the business.
Operation The current executive directors are members of the Group’s UK defined benefit pension scheme and receive a salary supplement in lieu of pension on remuneration above the pre-6th April 2006 statutory earnings cap, projected forward to 2009 and frozen at that level at the end of 2009.
A new internal executive director appointee who was already a member of the Group’s UK defined benefit pension scheme would be eligible to continue as a member of that scheme.
Any new external or other appointee (not currently a defined benefit pension scheme member) would be eligible to participate in the Group’s UK defined contribution pension scheme (or such other replacement scheme as may be deemed appropriate at the time of appointment) and/or receive a salary supplement in lieu of pension provision.
Maximum potential value
Current executive directors’ pension benefits and the benefits of any new internal appointee who was already a member of the Group’s defined benefit pension scheme, will not exceed the maximum benefits as permitted under HMRC’s pre-6th April 2006 benefits regime applicable to their period of employment with the Group.
Other new executive directors may receive contributions of up to 25% of base salary under the Group’s defined benefit contribution scheme, an equivalent salary supplement, or a combination of the two (up to 25% of base salary).
Life assurance cover is provided to four times base salary.
Performance metrics
Not applicable.
Non-executive directors fees
Purpose and link to strategy
Sole element of non-executive director remuneration. Set at a level that reflects market conditions and at a level to attract individuals with appropriate skills, knowledge and experience.
Operation Fees were reviewed by the board effective from 1st January 2014. Going forward, fees will be reviewed biennially, other than in the case of a significant change to an individual’s role, responsibilities and/or time commitments or when considering a new appointment.
There is no entitlement to a biennial increase. Fees are paid in cash.
Reviews take into account publicly available comparator data. Fees are externally benchmarked by independent remuneration consultants from time to time against companies of similar size and complexity.
Non-executive directors are entitled to claim reasonable out of pocket expenses in connection with the performance of their duties.
Maximum potential value
The maximum level of fees take into account a number of factors including skills, knowledge and experience and having regard to fees paid to non-executive directors serving on boards of listed companies of a similar size and complexity.
Non-executive directors receive a basic fee and an additional fee for further duties, e.g. chairing committees of the board or taking on the responsibilities of the senior independent director.
Performance metrics
Not applicable, although the individual’s contribution, availability and having sufficient time to commit to the role are reviewed annually as part of the performance evaluation.

Group plc Annual Report & Accounts 201444
Explanation of the performance metrics chosenThe performance measures selected are aligned with the Company’s strategy and business objectives. For the annual incentive, performance targets are set by the committee each year. For awards under the CSOP, the performance targets are reviewed by the committee and reset as necessary on or before the date of grant in accordance with the CSOP rules approved by shareholders on 7th May 2010.
In setting stretching performance targets, the committee will take into account a number of criteria which include the Company’s business plans and strategy, the financial and economic environment, market conditions, specific initiatives and other matters the committee deem to be relevant. The relevant metrics and weightings may vary each year based upon the Company’s strategic priorities.
With the Group having operated during a severe economic downturn in recent years, it has had to consider the interests of different stakeholder groups including shareholders, bankers, employees and the Group’s pension scheme members. The Group is now focused on delivering growth from the new product investment and the operational gearing potential available because of the significant restructuring of the business since 2008. The metrics below cover sales targets for our major brands which can deliver the most immediate improvement in operating profit and cash flow. Delivery on these targets will create value for all stakeholders.
Metric Component Link to strategy
Group operating profit Annual incentive plan Group operating profit is a measure of the Company’s financial performance and, in particular, how successful the Company has been in accelerating profitability from the various strategic initiatives in place and in moving closer to its 10% return on sales target.
Operating unit cash flow Annual incentive plan Operating unit cash flow is a good indicator of the Company’s financial health, which links to the key corporate objective of improving cash conversion and is important in ensuring our ability to fund key international plans, brand investment and highlights the Company’s discipline to key stakeholders.
AGA branded cooker sales Annual incentive plan Drives sales of a key brand in both the UK and international markets to move closer to our stated KPIs.
Rangemaster branded cooker sales Annual incentive plan Drives sales of a key brand in both the UK and international markets to move closer to our stated KPIs.
Strategic and/or personal objectives Annual incentive plan Reflects core strategic objectives of increasing sales in international markets and developing strategic partnerships to assist in revenue growth.
Three year EPS growth CSOP EPS is an important long-term financial metric linked to value creation for our shareholders and provides an appropriate underpin for awards to vest under the CSOP. The committee reserves the right to exclude items of a non-recurring nature from the EPS calculation.
Three year relative TSR growth CSOP TSR reflects the growth in value of the Company’s share price and dividends relative to a broad sector of peers, thereby ensuring that participants only receive rewards if they outperform the comparator group’s performance.
The committee retains the discretion to adjust performance targets and measures where it considers it appropriate to do so, where it is appropriate to reflect changes to the strategy and financial objectives or to reflect changes to the structure of the business. The committee must ensure that the adjusted performance targets and measures are no more or less difficult to satisfy.
Illustration of application of the PolicyThe charts below provide estimates of the potential future reward opportunities for each executive director and the potential split of remuneration between fixed pay (base salary, benefits, pension and life assurance) and variable pay (annual incentive and CSOP) on the basis of minimum remuneration; remuneration receivable for performance in line with the Company’s expectations; and maximum remuneration (not allowing for any share price appreciation). This is further explained in the table under the charts. It assumes that nil-cost options are granted under the CSOP equating to 100% of base salary per financial year and this is shown in the illustration. This would normally only be the case in exceptional circumstances. It is the not the board’s current intention (on recommendation from the committee) to issue more than the equivalent of 100% of base salary in nil-cost options over a rolling three year period. This is represented by the line in the CSOP component in the illustration.
0
450
900
1,350
1,800
Tota
l rem
uner
atio
n (£
000s
)
£670
£987
£1,557
100% 68%
19%13%
43%
24%
33%
0
250
500
750
1,000
Minimum In line with expectations
Maximum
£370
£552
£880
100% 67%
20%
42%
25%
33%
Shaun Smith
CSOP
Annual Incentive
Fixed Pay
13%
William McGrath
CSOP
Annual Incentive
Fixed Pay
Minimum In line with expectations
Maximum
DIRECTORS’ REMUNERATION REPORT
CONTINUED

Group plc Annual Report & Accounts 2014 45
Minimum In line with expectations Maximum
Fixed pay Fixed elements of remuneration are base salary, benefits and pension. Base salary is salary at 1st January 2015 and the value of benefits has been assumed to be the equivalent of that included in the single figure remuneration table on page 34.
As per minimum. As per minimum.
Annual incentive No incentive. 37.5% of salary for achieving on target performance and successfully achieving half the specific strategic targets set.
75% of salary awarded for delivering at/or above highest performance in respect of the annual incentive measures and successfully achieving the specific strategic targets set.
CSOP No CSOP vesting. 25% of maximum awards vesting for achieving threshold performance across all performance measures.
100% of award vesting for achieving the most stretching level of performance across all performance measures.
Approach to recruitment remunerationWhen setting the remuneration package for a new executive director, the committee would seek to apply the same principles and implement the Policy framework set out in the tables above.
Base salary will be set at a level appropriate to the role and the experience of the director being appointed. This may include an agreement on future increases up to a market rate, in line with increased experience and/or responsibilities, subject to performance progressing as anticipated in the intervening period, where it is considered appropriate.
For an external appointment, the committee may structure the package on appointment to recognise annual incentives, option awards or other benefits that would have to be forfeited on resignation from a previous position of employment. The committee will take into account time-horizons, performance conditions, vesting periods and such other specific matters as it considers relevant. The committee would only consider making such an award if necessary to secure an appointment. Such an award may take the form of cash and/or shares and/or share options. Where possible, these will be delivered under the Policy framework. The maximum payment under any such arrangements (which may be in addition to the normal variable remuneration) should be no more than the committee considers is required to provide reasonable compensation to the incoming director. The maximum level of recruitment award which may be granted (excluding buy-out arrangements) is 1.75 times base salary. The committee will ensure that such variable awards are linked to the achievement of appropriate and challenging targets and will be forfeited if performance targets are not met or if employment is terminated within 2 years of appointment. The committee does not intend to use its discretion to make non-performance related incentive payments i.e. ‘golden hellos’.
Any share awards referred to in this section will be granted as far as possible under the Company’s existing share plans. If necessary, and subject to the limits referred to above, recruitment awards may be granted outside of these plans as currently permitted under the Listing Rules which allow for the grant of awards to facilitate, in exceptional circumstances, the recruitment of an executive director.
In the case of an internal appointment where an employee is promoted to an executive director, the Company will honour pre-existing award commitments in accordance with their original terms/time-horizons.
If the new executive director is required to relocate in order to take up the position, it is the Company’s practice to allow reasonable relocation, travel, subsistence payments and any other related benefits. Any such payments will be at the discretion of the committee.
Non-executive director fees will be set at a competitive market level, reflecting the skills, knowledge, experience, responsibilities and time commitment.

Group plc Annual Report & Accounts 201446
DIRECTORS’ REMUNERATION REPORT
CONTINUED
Directors’ service contracts and letters of appointmentExecutive directors’ service contracts are on a rolling 12 month basis and are subject to 12 months’ notice when terminated by the Company or the director. In accordance with the best practice and as set out in Code provision D.1.5, notice periods in new service contracts will be set at one year or less. If it is necessary to offer longer notice or contract periods to new directors recruited externally, such periods should reduce to one year or less after the initial period.
The current non-executive directors, including the chairman, do not have service contracts and their appointments, whilst for a term of three years, may be terminated without compensation at any time. All non-executive directors have letters of appointment, subject to election and re-election by the Company’s shareholders in accordance with the Company’s articles and the Code.
Policy on payment for loss of officeIf an executive director’s employment is to be terminated, the committee’s policy in respect of the service agreement, in the absence of a breach of the service agreement by the director, is to agree a termination payment based on the value of base salary and contractual pension and other benefits that would have accrued to the director during the contractual notice period. Depending on the particular circumstances, a director may work the notice period, be placed on garden leave for some or all of the notice period or receive a payment in lieu of notice in accordance with the service agreement. The committee will consider mitigation to reduce the termination payment to a leaving director when appropriate to do so, having regard to the specific circumstances.
In addition, where a director may be entitled to pursue a claim against the Company in respect of statutory employment rights or any claim arising from the employment or its termination, the Company will be entitled to negotiate settlement terms (financial or otherwise) with the director that the committee considers to be reasonable in the specific circumstances and in the best interests of the Company and shareholders. This includes but is not limited to entering into a settlement agreement with the director to effect both the terms agreed under the service agreement and any additional statutory or other claims, including incentive payments and to record any agreement in relation to the incentives and/or share options in line with the policies described above.
The committee will consider whether a departing director should receive an annual incentive in respect of the financial year in which the termination occurs. This will be at the discretion of the committee on an individual basis and the decision as to whether or not to make an award under the annual incentive plan in full or in part will be dependent upon a number of factors, including the circumstances of the individual’s departure and their contribution to the business during the performance period in question. Any annual incentive amounts paid will typically be pro-rated for time in service to termination and will, subject to performance, usually be paid at the end of the relevant performance period. Following termination the requirement to defer a minimum of 50% of the net incentive into shares and retain those shares for a minimum period of three years falls away. It is the committee’s policy to avoid payments for underperformance.
The committee will consider whether share options held by the director under the CSOP should lapse or vest. Any determination by the committee will be in accordance with the plan rules, which have been approved by shareholders. The plan rules provide that options will vest if employment ends on the death of a participant or by reasons of ill health, disability, redundancy, retirement or employment being transferred outside the Group. In these circumstances the committee has the discretion to pro-rate according to time served and the extent to which the performance conditions have been satisfied during the curtailed period. If employment ends for any other reason the plan rules permit the committee to exercise its discretion and acting fairly and reasonably determine within 30 days of cessation of employment the terms on which an option may be exercised or the options will lapse. The plan rules provide that options may become exercisable as a result of change of control or voluntary winding-up.
Where the director participates in the Sharesave Plan, awards may vest or become exercisable on or following termination in accordance with the plan rules.
Pension benefits provided for the period of employment with the Group up to and including the termination date will be as set out in the rules of the pension scheme of which the executive director is a member, and no enhancement is payable except to the extent that the cost of any enhancement, if implemented, is deducted from the executive director’s termination payment as determined above.
Non-executive directors’ letters of appointment may be terminated without notice or compensation.
External appointmentsThe board recognises the benefit which the Group can obtain if the executive directors serve as non-executive directors of other companies. Subject to review in each case, the board’s general policy is that each executive director may accept one non-executive directorship with another company from which any fees received may be retained. At present neither of the executive directors hold any outside directorships.

Group plc Annual Report & Accounts 2014 47
Legacy mattersThe committee reserves the right to make any remuneration payments and payments for loss of office notwithstanding they are not in line with the Policy set out above where the terms of payment were agreed before the Policy came into effect or at a time when the relevant individual was not a director of the Company and, in the opinion of the committee, the payment was not in consideration for the individual becoming a director of the Company.
For these purposes the term payments includes the committee satisfying awards of variable remuneration and, in relation to an award over shares, the terms of payment are agreed at the time the award is granted.
Statement of consideration of employment conditions elsewhere in the GroupThe Group aims to provide a remuneration package to all employees that is market competitive, complies with any statutory requirements and is applied fairly and equitably across the employee population, taking into account local employment market conditions.
All employees receive a base salary/wage, may join a pension scheme when eligible or have equivalent state provided pension benefits. UK based employees are eligible to participate in the Sharesave Plan (subject to a minimum service requirement) when an invitation is offered.
Senior management’s remuneration has the same core components as set out in the Policy, i.e. base salary, annual incentive/bonus, taxable benefits, pension provision, life assurance and UK based employees are eligible to participate in the Sharesave Plan and CSOP. Annual incentive/bonus arrangements have the same core structure and payout mechanism, but are based on operational budgets and KPIs specific to each operation. The maximum annual incentive/bonus award varies according to seniority.
At present senior management are not required to reinvest part of their annual incentive/bonus into shares or retain shares exercised under the CSOP for a minimum period. This policy will be subject to further consideration during the year.
The committee takes into account the general basic salary increase being offered to employees elsewhere in the Group when annually reviewing the salary increases and remuneration for the executive directors. Employees have not been consulted in respect of the design of the Company’s senior executive remuneration policy to date, although the committee will keep this under review.
Statement of consideration of shareholder viewsThe committee takes into account shareholder feedback received on remuneration matters, including comments made in relation to the AGM, plus any additional comments received during any meetings with shareholders or in correspondence direct with the Company. The committee will seek to engage directly with major shareholders and their representative bodies should any material changes be made to the Policy.
Details of votes cast for and against the resolution to approve last year’s directors’ remuneration report and any matters discussed with shareholders are set out under ‘Statement of voting at the last AGM’ on page 40.
This report was approved by the board and signed on its behalf by
P E JACKSONCHAIRMAN OF THE REMUNERATION COMMITTEE 6th March 2015

Group plc Annual Report & Accounts 201448
DIRECTORS’ REPORT
THE DIRECTORS’ PRESENT THEIR REPORT AND AUDITED FINANCIAL STATEMENTS OF THE GROUP FOR THE YEAR ENDED 31ST DECEMBER 2014
This report contains additional information which the directors are required by law and regulation to include in the annual report and accounts.
STRATEGIC REPORTThe Company is required by the Companies Act 2006 to include a strategic report in the annual report and accounts. The information that fulfils the requirements of the strategic report can be found on pages 2 to 23.
CORPORATE GOVERNANCE STATEMENTThe corporate governance statement as required by the Disclosure and Transparency Rule 7.2.1 is set out on pages 26 to 32 and is incorporated into this report by reference.
DIRECTORS’ REMUNERATION DISCLOSURESDisclosures required under the Listing Rules 9.8.6R can be found on pages 33 to 47 which are incorporated into this report by reference.
CAPITAL STRUCTUREAt 6th March 2015, the issued share capital of the Company is £32,467,604 divided into 69,264,223 ordinary shares of 467/8pence each. Details of the share capital and share based payment arrangements can be found in notes 22 and 23 to the accounts. The Company has one class of ordinary share which rank equally with respect to voting rights and rights to receive dividends. On a show of hands at a general meeting every holder of ordinary shares present in person or by proxy and entitled to vote shall have one vote. On a poll each share carries the right to one vote. Deadlines on exercising voting rights are set out in the Notice of Annual General Meeting and in the Form of Proxy.
There are no specific restrictions on the size of a holding nor on the transfer of shares, which are both governed by the general provisions of the Company’s Articles of Association (‘the articles’) and prevailing legislation. The directors are not aware of any agreements between holders of the Company’s shares that might result in restrictions on the transfer of securities or on voting rights. No person has any special rights of control over the Company’s share capital and all issued shares are fully paid.
Under the articles, the directors have authority to issue ordinary shares up to the aggregate amount set at the Annual General Meeting (‘AGM’).
SUBSTANTIAL SHAREHOLDINGSNotification of the following voting interests in the Company’s ordinary share capital had been received by the Company in accordance with chapter 5 of the Disclosure and Transparency Rules and section 793 of the Companies Act 2006 as at 6th March 2015.
Notifying person(s)
% of votingrights and
issued share
capital
Ordinaryshares of
467/8 p each
J O Hambro Capital Management Group Ltd 10.93 7,573,640River & Mercantile Asset Management LLP 8.22 5,693,920Hargreave Hale Limited 6.19 4,289,653Dimensional Fund Advisors 4.38 3,030,559
CHANGE OF CONTROLThere are a number of agreements that take effect after, or terminate upon, a change of control of the Company, such as commercial contracts, bank facility agreements, guarantees, property agreements and employee share plans. None of these are considered to be significant in terms of their likely impact on the business of the Group as a whole. Furthermore, the directors are not aware of any agreements between the Company and its directors or employees that provide for compensation for loss of office or employment that occurs because of a takeover.
ARTICLES OF ASSOCIATIONThe board of directors may exercise all the powers of the Company, subject to the provisions of relevant statutes, the articles and any directions given by special resolution.
The articles, for instance, contain certain specific provisions and restrictions regarding the Company’s power to borrow money. Powers relating to the issuing and buying back of shares are included in the articles and are subject to such authorities being approved annually by shareholders at the AGM, should the directors recommend that it remains appropriate to retain such flexibility. The rules for the appointment and replacement of directors are set out in the articles, The UK Corporate Governance Code (‘the Code’), the Companies Act 2006 and related legislation. The articles can only be changed by a special resolution passed in a general meeting of shareholders.
DIRECTORS AND THEIR INTERESTSBiographical details of the directors currently serving on the board are set out on pages 24 and 25. Changes to the board composition during the year are set out in the corporate governance report on page 27. Details of directors’ service agreements or letters of appointment are set out in the remuneration report on page 46. The interests of directors in shares in the Company and share options are set out in the remuneration report on page 38.
In accordance with the Code all directors, with the exception of Paul Jackson, will offer themselves for election or re-election at the AGM on Thursday 30th April 2015. Paul Jackson has confirmed he will retire from the board following the AGM and so will not stand for re-election.
DIRECTORS’ INDEMNITIESAs permitted by the articles, the directors have the benefit of an indemnity which is a qualifying third party indemnity provision as defined by section 234 of the Companies Act 2006. The indemnity was in force throughout the financial year and remains in force. The Company has also purchased and maintained throughout the same period appropriate directors’ and officers’ liability insurance coverage in respect of the Company, its subsidiaries, its directors and officers.
The Trust Deeds to the Company’s principal UK pension schemes include the provision of an indemnity from the Company to the scheme trustee’s directors, to the extent permitted by the law.
There are no indemnities in place for the benefit of the auditor.
EMPLOYEESThe average number of employees within the Group is shown in note 5 to the accounts. Details of the arrangements relating to employees is described in the CSR report under the heading ‘Our people’ on pages 22 and 23.

Group plc Annual Report & Accounts 2014 49
GREENHOUSE GAS EMISSIONS REPORTINGUnder The Companies Act 2006 (Strategic and Directors’ Reports) Regulations 2013, the Group is required to report its annual Greenhouse Gas (‘GHG’) emissions in its directors’ report as tonnes of CO2 equivalent (‘CO2e’). The Group has published information on its CO2 emissions due to the combustion of fossil fuels and the electricity purchased by the Company for its own use in its annual report since 2006. The Group is also a long-term participant in the Carbon Disclosure Project.
The regulations require the Group to disclose its emissions due to the combustion of biomass and other emissions sources which are not included in the emissions reported on pages 21 and 22 of the CSR report.
2014 tonnes CO2e
2013 tonnes CO2e
Emissions from combustion of fuels and operation of facilities:Combustion of fossil fuels*+ 14,900 14,500Operation of facilities, including process and fugitive emissions 500 700Electricity purchased for own consumption:Purchased electricity~ 15,300 14,600Intensity measurement:CO2e due to fossil fuels and purchased electricity per £m revenue** 116 118GHGs per £m revenue** 118 121
Data is rounded to the nearest 100 tonnes of CO2e.* Includes emissions of 4,000 tonnes (2013: 3,300 tonnes) relating to fuel use in company
commercial vehicles.+ Excludes emissions due to the use of company cars estimated to be approximately 1%
of total emissions.~ Electricity-related emissions are reported as CO2 because CO2e factors are not
available in all countries.** Constant currency basis and updated to reflect changes in reporting methodology.
As required under the regulations, the above report includes the material emission sources from the operations and activities covered by the Group’s financial statements. As noted, the report excludes the emissions relating to the fuel used in company cars which are estimated to account for approximately 1% of total emissions. The directors consider that this source of emissions is not material to the total of the Group’s GHG emissions.
The Group uses the Greenhouse Gas Protocol with emission factors for standard grid electricity by country from the International Energy Agency and other factors as published by the UK Department of Environment, Food and Rural Affairs in order to calculate the CO2e emissions included in this report.
RESEARCH AND DEVELOPMENTResearch and development plays an important role in the development of the Group. Product innovation has been a key feature of our strategy. Development departments across the Group work together to develop products to meet our strategy to increase Group revenues internationally. The Group capitalises certain development spend under IAS 38. During the year, the Group capitalised development expenditure of £3.0million (2013: £2.8 million). The aggregate capitalised expenditure in the last five years has been £12.2 million.
POLITICAL DONATIONSThe Group’s policy is not to make any donations for political purposes in the UK or to donate to EU political parties or incur EU political expenditure.
FINANCIAL RISK MANAGEMENTThe disclosures required in relation to the use of financial instruments by the Company together with details of our treasury policy and management are set out in note 19 to the accounts. Key risks and uncertainties are set out on pages 18 and 19.
AUDITORErnst & Young LLP have expressed their willingness to continue in office as independent auditor and their re-appointment has been approved by the audit and risk committee. Resolutions to re-appoint the auditor and to authorise the directors to determine the auditor’s remuneration will be proposed at the 2015 AGM.
DISCLOSURE OF INFORMATION TO THE AUDITOREach of the directors at the date of approval of this annual report confirm that:• so far as they are aware, there is no relevant audit information of
which the Company’s auditor is unaware; and • they have taken all steps that they ought to have taken as a
director in order to make themselves aware of any relevant audit information and to establish that the Company’s auditor is aware of that information.
This confirmation is given and should be interpreted in accordance with the provisions of section 418 of the Companies Act 2006.
GOING CONCERNIn presenting the financial statements on a going concern basis, the directors have considered both the business activities and key risks and uncertainties as set out in the strategic report on pages 2 to 23. In addition, the directors have considered the following factors: the Group’s ability to generate cash flows, the financial resources available to it, headroom under bank covenants and exposure to credit risk. Based on the Group’s cash flow forecasts and projections and taking into consideration a range of potential scenarios and sensitivities and how these may impact on cash flows, facility headroom and bank covenants, the board is satisfied that the Group will be able to operate within the level of its facilities for the forseeable future. For this reason the Group continues to apply the going concern basis in preparing its financial statements.
ANNUAL GENERAL MEETINGThe AGM of the Company will be held at Mallory Court Hotel, Harbury Lane, Leamington Spa, Warwickshire, CV33 9QB at 11.00 a.m. on Thursday 30th April 2015. The notice convening the meeting, together with the special business to be considered and explanatory notes for each resolution, is distributed separately to shareholders. It is also available on the Company’s website: www.agarangemaster.com, where a copy can be viewed or downloaded.
By order of the board
P M SISSONSCOMPANY SECRETARY6th March 2015
AGA Rangemaster Group plcRegistered in England and Wales no. 00354715

Group plc Annual Report & Accounts 201450
The directors are responsible for preparing the annual report and accounts in accordance with applicable laws and regulations.
Company law requires the directors to prepare financial statements for each financial year. The directors have prepared the Group financial statements in accordance with International Financial Reporting Standards (‘IFRS’) as adopted by the European Union (‘EU’) and Article 4 of the International Accounting Standard (‘IAS’) Regulation and have chosen to prepare the parent Company financial statements in accordance with United Kingdom Generally Accepted Accounting Practice (United Kingdom Accounting Standards and applicable law).
In preparing the parent Company financial statements it is the directors’ responsibility to prepare financial statements for each financial period, which give a true and fair view of the state of affairs of the Company as at the end of the financial period and of the profit and loss of the Company for that period; the directors are required to:• select suitable accounting policies and apply them consistently;• make judgements and estimates that are reasonable;• state whether applicable UK Accounting Standards have been
followed, subject to any material departures disclosed and explained in the financial statements; and
• prepare the financial statements on the going concern basis unless it is inappropriate to presume that the Company will continue in business.
In preparing the Group financial statements, the directors are required to:• present fairly the financial position, financial performance and
cash flows of the Group;• properly select and apply accounting policies consistently;• present information including accounting policies, in a manner
that provides relevant, reliable, comparable and understandable information;
• provide additional disclosures when compliance with the specific requirements in IFRSs are insufficient to enable users to understand the impact of particular transactions, other events and conditions on the Group’s financial position and financial performance; and
• state that the Group has complied with IFRS.
The directors are responsible for keeping adequate accounting records that are sufficient to show and explain the Group’s transactions and disclose with reasonable accuracy at any time the financial position of the Group and to enable them to ensure that the financial statements comply with the Companies Act 2006 and Article 4 of the IAS Regulation. They are also responsible for safeguarding the assets of the Group and hence for taking reasonable steps for the prevention and detection of fraud and other irregularities.
The directors are responsible for the maintenance and integrity of the Company website. The work carried out by the auditor does not involve consideration of these matters and, accordingly the auditor accepts no responsibility for any changes that may have occurred to the financial statements since they were initially presented on the website. Legislation in the United Kingdom governing the preparation and dissemination of financial statements may differ from legislation in other jurisdictions.
RESPONSIBILITY STATEMENTThe directors confirm that, to the best of their knowledge:• the financial statements, prepared in accordance with IFRS, give
a true and fair view of the assets, liabilities, financial position and profit of the Company and the undertakings included in the consolidation taken as a whole; and
• the strategic report includes a fair review of the development and performance of the business and the position of the Company and the undertakings included in the consolidation as a whole, together with a description of the principal risks and uncertainties they face.
The directors consider that the annual report and accounts, taken as a whole, having taken advice from the audit and risk committee, are fair, balanced and understandable and provides the information necessary for shareholders to assess the Group’s performance, business model and strategy.
By order of the board
W B MCGRATH S M SMITHCHIEF EXECUTIVE FINANCE DIRECTOR6th March 2015
STATEMENT OF DIRECTORS’ RESPONSIBILITIES

Group plc Annual Report & Accounts 2014 51
CONSOLIDATED INCOME STATEMENT
FOR THE YEAR ENDED 31ST DECEMBER
Notes2014
£m2013
£m
Revenue 3 261.1 250.4Net operating costs 4 (251.5) (242.2)
Group operating profit 9.6 8.2
Pension charge 6 (4.1) (3.5)Non-recurring costs 4 – (2.2)Fair value movement 4 (3.3) –
Profit before finance income/(costs) and tax 2.2 2.5Finance income 7 – 0.1Finance costs 7 (1.5) (1.5)
Profit before tax 0.7 1.1Tax expense 8 (0.6) (0.4)
Profit for the year 0.1 0.7
Profit attributable to:Equity holders of the parent 0.1 0.8Non-controlling interests – (0.1)
Profit for the year 0.1 0.7
Earnings per share attributable to equity holders of the parent 11 p pBasic 0.1 1.2Diluted 0.1 1.1
All operations are continuing.
Notes to the accounts are on pages 56 to 83.

Group plc Annual Report & Accounts 201452
CONSOLIDATED STATEMENT OF COMPREHENSIVE INCOME
FOR THE YEAR ENDED 31ST DECEMBER
Notes2014
£m2013
£m
Profit for the year 0.1 0.7
Other comprehensive income/(losses) to be reclassified to profit or loss in subsequent periods:Exchange adjustments on hedge of net investments 19 (0.1) –Exchange differences on translation of foreign operations (1.6) 0.4Tax on items taken to reserves 0.4 (0.4)
Net other comprehensive losses to be reclassified to profit or loss in subsequent periods (1.3) –
Items not to be reclassified to profit or loss in subsequent periods:Actuarial (losses)/gains on defined benefit pension schemes 6 (36.0) 2.3Tax on defined benefit pension schemes and losses 8 7.2 (2.3)
Net other comprehensive losses not to be reclassified to profit or loss in subsequent periods (28.8) –
Other comprehensive losses for the year (30.1) –
Total comprehensive (losses)/income for the year (30.0) 0.7
Attributable to:Equity holders of the parent (30.0) 0.8Non-controlling interests – (0.1)
Total comprehensive (losses)/income for the year (30.0) 0.7
Notes to the accounts are on pages 56 to 83.

Group plc Annual Report & Accounts 2014 53
CONSOLIDATED BALANCE SHEET
AS AT 31ST DECEMBER
Notes2014
£m2013
£m
Non-current assetsGoodwill 12 65.1 65.4Intangible assets 13 25.4 25.5Property, plant and equipment 14 42.5 38.6Other receivables 16 0.2 0.2Deferred tax assets 21 17.9 11.4
151.1 141.1
Current assetsInventories 15 49.0 45.1Trade and other receivables 16 33.0 35.2Cash and cash equivalents 18a 24.2 21.2
106.2 101.5
Assets held for sale 14 – 2.2
Total assets 257.3 244.8
Current liabilitiesBorrowings 18b (0.6) (1.0)Trade and other payables 17 (68.9) (63.9)Current tax liabilities (3.8) (4.0)Provisions and share based payments 20 (3.7) (2.8)
(77.0) (71.7)
Net current assets 29.2 29.8
Non-current liabilitiesBorrowings 18b (14.4) (14.3)Retirement benefit obligation 6 (72.0) (35.8)Deferred tax liabilities 21 – (0.8)Provisions and share based payments 20 (3.2) (1.5)
(89.6) (52.4)
Total liabilities (166.6) (124.1)
Net assets 90.7 120.7
EquityShare capital 22 32.5 32.5Share premium account 29.6 29.6Other reserves 24 80.5 82.2Retained losses (51.9) (23.6)
Total equity 90.7 120.7
The accounts were approved by the board of directors on 6th March 2015 and were signed on its behalf by:
W B McGrath S M SmithChief Executive Finance Director
Notes to the accounts are on pages 56 to 83.

Group plc Annual Report & Accounts 201454
CONSOLIDATED CASH FLOW STATEMENT
FOR THE YEAR ENDED 31ST DECEMBER
Notes2014
£m2013
£m
Operating activitiesProfit before tax: 0.7 1.1
Reconciliation of profit before tax to net cash flows:Net finance costs 1.5 1.4Depreciation of property, plant and equipment 14 4.7 4.7Amortisation of intangible assets 13 2.3 2.3Net loss/(profit) on disposal of property, plant and equipment and assets held for sale 0.1 (1.0)Share based payments expense 3.3 0.1Other non-cash item (0.2) –(Increase)/decrease in inventories (4.1) 0.8Decrease/(increase) in receivables 1.6 (3.7)Increase in payables 4.5 3.3Pension charge 6 4.1 3.5Pension contributions (4.1) (4.1)
Cash generated from operating activities 14.4 8.4
Cash flows related to discontinued operations 9 (0.5) (0.7)Finance income – 0.1Finance costs (1.3) (1.4)Tax (payment)/receipt (0.3) 1.7
Net cash flows generated from operating activities 12.3 8.1
Investing activitiesPurchase of property, plant and equipment (6.7) (5.5)Expenditure on intangibles 13 (3.2) (3.0)Proceeds from disposal of property, plant and equipment and assets held for sale 1.1 1.2
Net cash used in investing activities (8.8) (7.3)
Financing activitiesBorrowing costs (0.1) (0.3)Repayment of borrowings (0.4) (0.3)
Net cash used in financing activities (0.5) (0.6)
Net increase in cash and cash equivalents 3.0 0.2Cash and cash equivalents at beginning of year 21.2 21.0
Cash and cash equivalents at end of year 18a 24.2 21.2
Notes to the accounts are on pages 56 to 83.

Group plc Annual Report & Accounts 2014 55
CONSOLIDATED STATEMENT OF CHANGES IN EQUITY
Equity attributable to equity holders of the parent
Sharecapital
(note 22)£m
Sharepremium
£m
Otherreserves(note 24)
£m
Retainedearnings
£mTotal
£m
Non-controlling
interests£m
Totalequity
£m
At 1st January 2013 32.5 29.6 81.8 (24.1) 119.8 0.1 119.9
Comprehensive incomeProfit/(loss) for the year – – – 0.8 0.8 (0.1) 0.7Other comprehensive income/(losses):Exchange differences on translation of foreign operations – – 0.4 – 0.4 – 0.4Actuarial gains on defined benefit pension schemes – – – 2.3 2.3 – 2.3Tax on items taken to reserves – – – (2.7) (2.7) – (2.7)
Total comprehensive gains/(losses) for the year to 31st December 2013 – – 0.4 0.4 0.8 (0.1) 0.7Share based payments – – – 0.1 0.1 – 0.1
At 1st January 2014 32.5 29.6 82.2 (23.6) 120.7 – 120.7
Comprehensive incomeProfit for the year – – – 0.1 0.1 – 0.1Other comprehensive income/(losses):Exchange adjustments on hedge of net investments – – (0.1) – (0.1) – (0.1)Exchange differences on translation of foreign operations – – (1.6) – (1.6) – (1.6)Actuarial losses on defined benefit pension schemes – – – (36.0) (36.0) – (36.0)Tax on items taken to reserves – – – 7.6 7.6 – 7.6
Total comprehensive losses for the year to 31st December 2014 – – (1.7) (28.3) (30.0) – (30.0)
At 31st December 2014 32.5 29.6 80.5 (51.9) 90.7 – 90.7
The cumulative amount of goodwill taken direct to reserves since 1985 in respect of businesses that were members of the Group at 31st December 2014 is £6.3m (2013: £6.3m).
Notes to the accounts are on pages 56 to 83.

Group plc Annual Report & Accounts 201456
NOTES TO THE ACCOUNTS
1. CORPORATE INFORMATION
The consolidated financial statements of the Group, which incorporates the financial statements of AGA Rangemaster Group plc and its subsidiaries, for the year ended 31st December 2014 were authorised for issue in accordance with a resolution of the directors on 6th March 2015.
The Company is a public limited company incorporated and domiciled in the UK whose shares are publicly traded on the London Stock Exchange.
The principal activities of the Group are the manufacture and sale of range cookers and kitchen and related home fashions products.
2. ACCOUNTING POLICIES
Basis of accountingThe Group financial statements presented in this document have been prepared in accordance with International Financial Reporting Standards (‘IFRS’), as adopted by the European Union, in accordance with the Companies Act 2006.
Critical accounting estimates and judgementsThe preparation of financial statements requires management to make estimates and judgements that affect the reported amounts of assets and liabilities, disclosure of contingent assets and liabilities at the date of the financial statements and the reported amounts of revenues and expenses during the reporting period. Actual results may differ from these estimates under different assumptions and conditions. Estimates and judgements are continually evaluated and are based on historical experience and other factors, including expectations of future events that are believed to be reasonable under the circumstances. It also requires management to exercise its judgement in the process of applying the Group’s accounting policies.
Impairment – the Group determines whether goodwill and intangible assets are impaired on an annual basis or more frequently if there are indicators of impairment. Other non-current assets, including property, plant and equipment, are tested for impairment if there are indicators of impairment. Impairment testing requires an estimate of future cash flows and the choice of a suitable discount rate (note 13).
Retirement benefits and other post-employment benefits – the valuation of the defined benefit pension plans and other post-employment benefits are determined using actuarial valuations. The actuarial valuation involves making assumptions about discount rates, expected rates of return on assets, future salary increases, mortality rates and future pension increases. In determining the appropriate discount rate, the directors consider the interest rates of corporate bonds with an ‘AA’ rating or above, as set by an internationally acknowledged rating agency, and extrapolated as needed along the yield curve to correspond with the expected term of the defined benefit obligation. Due to the complexity of the valuation, the underlying assumptions and the long-term nature of these plans, such estimates are subject to significant uncertainty (note 6).
Tax – provisions for tax accruals require judgements on the interpretation of tax legislation, developments in tax case law and the potential outcomes of tax audits and appeals. In addition, deferred tax assets are recognised for unused tax losses to the extent that it is probable that taxable profit will be available against which they can be utilised. Judgement is required as to the amount that can be recognised based on the likely amount and timing of future taxable profits together with future tax planning strategies. Deferred tax balances are dependent on management’s expectations regarding the manner and timing of recovery of the related assets (note 21).
Cash settled share based payment transactions – provision is made in relation to their fair value at the balance sheet date. The liability is remeasured to fair value at each reporting date. External advisors value the equity using a market based capitalised earnings method, which utilises a benchmarked multiple of earnings in order to arrive at a fair value, this inherently involves an element of judgement.
Accounting changes in the yearThe Group applies, for the first time, certain standards/amendments and the nature and the impact of each new standard/amendment is described below:
Consolidated Financial Statements IFRS 10This standard establishes the requirement for the consolidation of entities that a company controls.
Joint Arrangements IFRS 11This standard outlines the accounting requirement for entities that are subject to joint control.
Disclosure of Interests in Other Entities IFRS 12This standard outlines disclosure requirements for interests in subsidiaries, joint arrangements, associates and structured entities.
These new standards have no material impact on the Group.

Group plc Annual Report & Accounts 2014 57
Offsetting Financial Assets and Financial Liabilities (Amendments to IFRS 7)These amendments clarify the meaning of ‘currently has a legally enforceable right to set-off’ and the criteria for non-simultaneous settlement mechanisms of clearing houses to qualify for offsetting.
Recoverable Amount Disclosures for Non-Financial Assets (Amendments to IAS 36)These amendments remove the unintended consequences of IFRS 13 Fair Value Measurement on the disclosures required under IAS 36 Impairment of Assets. In addition, these amendments require disclosure of the recoverable amounts for the assets or cash-generating units (CGUs) for which an impairment loss has been recognised or reversed during the period.
These amendments have no material impact on the Group.
The Group has not early adopted any other standard, interpretation or amendment that has been issued but is not yet effective. The relevant standards, interpretations and amendments that are issued, but not yet effective, up to the date of issuance of the Group’s financial statements are disclosed below. The Group intends to adopt these standards, if applicable, when they become effective.
IFRS 9 Financial InstrumentsIn July 2014, the IASB issued the final version of IFRS 9 Financial Instruments which reflects all phases of the financial instruments project and replaces IAS 39 Financial Instruments: Recognition and Measurement and all previous versions of IFRS 9. The standard introduces new requirements for classification and measurement, impairment and hedge accounting. IFRS 9 is effective for annual periods beginning on or after 1st January 2018, with early application permitted. The adoption of IFRS 9 should not have an effect on the classification and measurement of the Group’s financial assets or on the classification and measurement of the Group’s financial liabilities.
Amendments to IAS 19 Defined Benefit Plans: Employee ContributionsIAS 19 requires an entity to consider contributions from employees or third parties when accounting for defined benefit plans. Where the contributions are linked to service, they should be attributed to periods of service as a negative benefit. These amendments clarify that, if the amount of the contributions is independent of the number of years of service, an entity is permitted to recognise such contributions as a reduction in the service cost in the period in which the service is rendered, instead of allocating the contributions to the periods of service. This amendment is effective for annual periods beginning on or after 1st July 2014. It is not expected that this amendment will have a material impact on the Group.
Annual improvements 2010-2012 CycleThese improvements are effective from 1st July 2014 and are not expected to have a material impact on the Group. They include:
IFRS 2 Share-based PaymentThis improvement is applied prospectively and clarifies various issues relating to the definitions of performance and service conditions which are vesting conditions, including:• A performance condition must contain a service condition;• A performance target must be met while the counterparty is rendering service;• A performance target may relate to the operations or activities of an entity, or to those of another entity in the same group; • A performance condition may be a market or non-market condition; and• If the counterparty, regardless of the reason, ceases to provide service during the vesting period, the service condition is not satisfied.
IFRS 3 Business CombinationsThe amendment is applied prospectively and clarifies that all contingent consideration arrangements classified as liabilities (or assets) arising from a business combination should be subsequently measured at fair value through profit or loss whether or not they fall within the scope of IFRS 9 (or IAS 39, as applicable).
IFRS 8 Operating SegmentsThe amendments are applied retrospectively and clarify that:• An entity must disclose the judgements made by management in applying the aggregation criteria in paragraph 12 of IFRS 8, including a
brief description of operating segments that have been aggregated and the economic characteristics (e.g., sales and gross margins) used to assess whether the segments are ‘similar;’ and
• The reconciliation of segment assets to total assets is only required to be disclosed if the reconciliation is reported to the chief operating decision maker, similar to the required disclosure for segment liabilities.
IAS 16 Property, Plant and Equipment and IAS 38 Intangible AssetsThe amendment is applied retrospectively and clarifies in IAS 16 and IAS 38 that the asset may be revalued by reference to observable data on either the gross or the net carrying amount. In addition, the accumulated depreciation or amortisation is the difference between the gross and carrying amounts of the asset.

Group plc Annual Report & Accounts 201458
2. ACCOUNTING POLICIES CONTINUED
IAS 24 Related Party DisclosuresThe amendment is applied retrospectively and clarifies that a management entity (an entity that provides key management personnel services) is a related party subject to the related party disclosures. In addition, an entity that uses a management entity is required to disclose the expenses incurred for management services.
Annual improvements 2011-2013 CycleThese improvements are effective from 1st July 2014 and are not expected to have a material impact on the Group. They include:
IFRS 3 Business CombinationsThe amendment is applied prospectively and clarifies for the scope exceptions within IFRS 3 that joint arrangements, not just joint ventures, are outside the scope of IFRS 3 and this scope exception applies only to the accounting in the financial statements of the joint arrangement itself.
IFRS 13 Fair Value MeasurementThe amendment is applied prospectively and clarifies that the portfolio exception in IFRS 13 can be applied not only to financial assets and financial liabilities, but also to other contracts within the scope of IFRS 9 (or IAS 39, as applicable).
Amendments to IAS 16 and IAS 38: Clarification of Acceptable Methods of Depreciation and AmortisationThe amendments clarify the principle in IAS 16 and IAS 38 that revenue reflects a pattern of economic benefits that are generated from operating a business (of which the asset is part) rather than the economic benefits that are consumed through use of the asset. As a result, a revenue-based method cannot be used to depreciate property, plant and equipment and may only be used in very limited circumstances to amortise intangible assets. The amendments are effective prospectively for annual periods beginning on or after 1st January 2016, with early adoption permitted. These amendments are not expected to have any impact to the Group given that the Group has not used a revenue-based method to depreciate its non-current assets.
IFRS 15 Revenue from Contracts with CustomersIFRS 15 was issued in May 2014 and establishes a new five-step model that will apply to revenue arising from contracts with customers. Under IFRS 15 revenue is recognised at an amount that reflects the consideration to which an entity expects to be entitled in exchange for transferring goods or services to a customer. The principles in IFRS 15 provide a more structured approach to measuring and recognising revenue. The new revenue standard is applicable to all entities and will supersede all current revenue recognition requirements under IFRS. Either a full or modified retrospective application is required for annual periods beginning on or after 1st January 2017 with early adoption permitted. The Group is currently assessing the impact of IFRS 15 and plans to adopt the new standard on the required effective date.
Principal accounting policiesA summary of the Group’s principal IFRS accounting policies is set out below:
Basis of consolidationThe consolidated income statement and balance sheet include the accounts of the Parent Company and all its subsidiaries made up to the end of the financial year and include the results of subsidiaries and businesses acquired and sold during the year from or up to their effective date of acquisition or sale. The Group defines a subsidiary as an entity that the Group has the power to control. All intra-group balances and transactions, including unrealised profits arising from intra-group transactions, are eliminated in full. Unrealised losses are eliminated unless the transaction provides evidence of an impairment of the asset transferred.
Non-controlling interests represent the proportion of profit or loss and net assets that are not held by the Group and are presented separately in the consolidated income statement and within equity in the consolidated balance sheet, separately from the equity attributable to equity holders of the parent.
Business combinations and goodwillBusiness combinations are accounted for using the acquisition method. The cost of an acquisition is measured as the aggregate of the consideration transferred, measured at acquisition date fair value and the amount of any non-controlling interest in the acquiree. The choice of measurement of non-controlling interest, either at fair value or at the proportionate share of the acquiree’s identifiable net assets is determined on a transaction by transaction basis.
Acquisition costs incurred are expensed and are included within administrative expenses.
When the Group acquires a business, it assesses the financial assets and liabilities assumed for appropriate classification and designation in accordance with the contractual terms, economic circumstances and pertinent conditions as at the acquisition date. This includes the separation of embedded derivatives in host contracts by the acquiree.
NOTES TO THE ACCOUNTS
CONTINUED

Group plc Annual Report & Accounts 2014 59
Goodwill is initially measured at cost being the excess of the aggregate of the acquisition date fair value of the consideration transferred and the amount recognised for the non-controlling interest (where the business combination is achieved in stages, the acquisition date fair value of the acquirer’s previously held equity interest in the acquiree) over the net identifiable amounts of the net assets acquired and the liabilities assumed in exchange for the business combination. Assets acquired and liabilities assumed in transactions separate to the business combinations, such as the settlement of pre-existing relationships or post-acquisition remuneration arrangements are accounted for separately from the business combination in accordance with their nature and applicable IFRSs. Identifiable intangible assets, meeting either the contractual legal or separability criterion are recognised separately from goodwill. Contingent liabilities representing a present obligation are recognised if the acquisition date fair value can be measured reliably.
If the aggregate of the acquisition date fair value of the consideration transferred and the amount recognised for the non-controlling interest (and where the business combination is achieved in stages, the acquisition date fair value of the acquirer’s previously held equity interest in the acquiree) is lower than the fair value of the assets, liabilities and contingent liabilities and the fair value of any pre-existing interest held in the business acquired, the difference is recognised in the consolidated income statement.
Goodwill arising on acquisitions prior to 1998 was written off to reserves.
Revenue recognitionRevenue, which excludes value added tax and intra-group revenue, principally represents the invoiced value of goods sold, services rendered and short-term maintenance contracts. Appropriate provisions for returns, trade discounts and other allowances are deducted from revenue. The Group has no barter transactions. Revenue is recognised from the sale of goods when the significant risks and rewards of ownership of the goods have passed to the buyer and can be readily measured. This is deemed to be when the goods have been dispatched or are available for delivery, the customer has paid and the title has passed to the customer.
Revenue from services rendered is recognised in the accounting period in which the services are rendered, by reference to the stage of completion of the specific transaction and are assessed on the basis of the fair value of the actual service provided as a proportion of the fair value of the total services to be provided.
Post retirement benefitsThe Group operates both defined benefit and defined contribution pension schemes.
Defined benefit pension schemes – the employer’s portion of the current service costs, settlement gains and curtailment gains are charged to the consolidated income statement for these schemes, with the net interest cost also being charged to the consolidated income statement. Net interest is determined by multiplying the net defined benefit liability by the discount rate, both as determined at the start of the annual reporting period, taking into account any changes in the net defined liability during the period as a result of contributions and benefit payments. When a settlement or a curtailment occurs the obligation and scheme assets are re-measured using current actuarial assumptions and the resultant gain or loss is recognised in the consolidated income statement during the year in which the settlement or curtailment occurs. Actuarial gains and losses are recognised in the consolidated statement of comprehensive income, and the consolidated balance sheet reflects the schemes’ surplus or deficit at the balance sheet date. The determination of the present value of obligations and the fair value of scheme assets is carried out with sufficient regularity that the amounts recognised in the financial statements can be determined at the end of the reporting period. A full valuation on an actuarial basis is carried out triennially using the projected unit credit method. The defined benefit pension asset or liability in the consolidated balance sheet comprises the total for each scheme of the present value of the defined benefit obligation, using a discount rate based on high quality corporate bonds and less the fair value of scheme assets out of which the obligations are to be settled directly. Fair value is based on market price information and in the case of quoted securities is the published bid price. Measurement of defined benefit obligations requires an estimation of future changes in salaries and inflation, as well as mortality rates, and the selection of a suitable discount rate.
An asset is recognised when the employer has an unconditional right to use the surplus at some point during the life of the scheme or on its winding up. To the extent that future funding commitments payable will not be available after they are paid into the scheme the Group recognises a liability when the obligation arises.
Costs of managing the plan assets are deducted as incurred in determining the return on plan assets which are recognised in OCI and the present value of projected future general administration expenses that are a direct consequence of past service are included as part of the retirement benefit obligation.
Defined contribution schemes – payments to defined contribution schemes are charged to the consolidated income statement as they become payable.

Group plc Annual Report & Accounts 201460
2. ACCOUNTING POLICIES CONTINUED
Intangible assetsResearch costs are expensed as incurred. Development expenditure on an individual project is recognised as an intangible asset when the Group can demonstrate:• the technical feasibility of completing the intangible asset so that it will be available for use or sale;• its intention to complete and its ability to use or sell the asset;• how the asset will generate future economic benefits;• the availability of resources to complete the asset; and• the ability to measure reliably the expenditure during development.
Following initial recognition of the development expenditure as an asset, the asset is carried at cost less any accumulated amortisation and accumulated impairment losses. Amortisation of the asset begins when development is complete and the asset is available for use. It is amortised evenly over its useful life, the period of expected future benefit, which in all cases does not exceed seven and a half years. During the period of development, the asset is tested for impairment annually.
Computer software licences acquired, costs associated with the development of software products and software that is not integral to a related item of hardware, are recognised as intangible assets and are amortised evenly over their useful lives, up to a maximum of five years. Development costs mainly arise from internal development. Brands have been acquired separately.
Impairment of goodwill and intangiblesGoodwill is subject to an impairment review annually or when there are indications that the carrying value may not be recoverable. An impairment loss is recognised in the consolidated income statement for the amount by which the asset’s carrying value exceeds its recoverable amount. The recoverable amount is the higher of an asset’s fair value less costs to sell and its discounted value in use. For the purpose of assessing impairment, assets are grouped at the lowest levels for which there are separately identifiable cash inflows. The carrying amount of goodwill allocated to a cash-generating unit (‘CGU’) is taken into account when determining the gain or loss on disposal of a unit.
Separable intangible assets, such as trademarks, licences and brands, are recognised separately from goodwill on all acquisitions after 1st January 2004, the date of transition to IFRS and they are carried at cost less accumulated amortisation and are amortised over their estimated useful life. Brands identified in certain business combinations have been assessed as having an indefinite useful life. In reaching this assessment, account was made of their market-leading position in niche markets, premium image, length of history and fashion. These factors are coupled with continuing marketing spend to maintain the brand. These brands are assessed for impairment on an annual basis or sooner where there is indication of impairment. The carrying values are assessed by reference to the net present values of forecast future cash flows. For brands, the Royalty Relief Methodology is used. This is based on the notion of what an independent third party would need to pay a brand owner in order to use that brand name in a particular marketplace or defined territory.
Assets held for saleAssets held for sale are valued at the lower of carrying amount and fair value less costs to sell. The assets are classified as held for sale if their carrying amounts will be recovered principally through a sale transaction rather than through continuing use. This condition is regarded as met only when the sale is highly probable and the asset is available for immediate sale in its present condition. Management must be committed to the sale, which should be expected to qualify for recognition as a completed sale within one year from the date of classification.
Property, plant and equipmentProperty, plant and equipment is held at cost less accumulated depreciation. Depreciation is provided on property, plant and equipment, other than freehold land and assets in the course of construction, at rates calculated to write off the cost of each asset on a straight line basis down to its residual value as follows:• Freehold buildings over 50 years.• Leasehold buildings over 50 years or the period of the lease whichever is less.• Plant and equipment over a period of 3 to 121/2 years.
The Group annually reviews the assessment of residual values and useful lives in accordance with IAS 16. The carrying value of property, plant and equipment is reviewed for impairment if there are indicators that the carrying value may not be recoverable.
The gain or loss arising on the disposal of an asset is determined as the difference between the net sales proceeds and the carrying value of the asset and is recognised in the consolidated income statement.
NOTES TO THE ACCOUNTS
CONTINUED

Group plc Annual Report & Accounts 2014 61
LeasesAssets held under leases and hire purchase contracts, where the Group has substantially all the risks and rewards of ownership, are capitalised as owned property, plant and equipment and the obligations relating thereto, excluding finance charges, are included in borrowings. Finance costs are charged to the consolidated income statement over the contract term to give a constant rate of interest on the outstanding balance. Finance lease assets held as property, plant and equipment are depreciated over the shorter of the asset’s expected useful life and the lease term.
Payments in respect of operating leases, net of any incentives received, are charged in arriving at the operating profit on a straight line basis over the period of the lease.
InventoriesThe Group’s inventories are valued at the lower of cost on a first in first out basis and net realisable value. Cost includes a proportion of production overheads based on normal levels of activity. Provision is made for any obsolete or slow moving items.
BorrowingsObligations for loans and borrowings are recognised when the Group becomes party to the related contracts and are measured initially at fair value less directly attributable transaction costs. After initial recognition, interest-bearing loans and borrowings are subsequently measured at amortised cost using the effective rate interest method. Gains and losses arising on the repurchase, settlement or cancellation of liabilities are recognised respectively in finance income and finance cost.
Borrowings are classified as current liabilities unless the Group has an unconditional right to defer settlement of the liability at the balance sheet date.
Cash and cash equivalentsCash and short-term deposits in the balance sheet comprise cash at bank and in hand and short-term deposits with a maturity of three months or less. For the purpose of the consolidated cash flow statement, cash and cash equivalents consist of cash and cash equivalents as defined above, net of outstanding bank overdrafts.
Foreign currency translationTransactions in foreign currencies are initially recorded in the functional currency by applying the spot exchange rate ruling at the date of the transaction. Monetary assets and liabilities denominated in foreign currencies are retranslated at the functional currency rate of exchange ruling at the balance sheet date. All differences are taken to the consolidated income statement, except when hedge accounting is applied and for differences on monetary assets and liabilities that form part of the Group’s net investment in a foreign operation. These differences are taken directly to the consolidated statement of comprehensive income until the disposal of the net investment when the deferred cumulative amount recognised in the consolidated statement of comprehensive income relating to that particular foreign operation is recognised in the consolidated income statement.
For each currency, exchange differences arising from the translation of foreign currency borrowings used to finance foreign currency investments have been offset as reserves movements against exchange differences arising on the retranslation of the net investment in that currency.
The assets and liabilities of foreign operations are translated into sterling at the rate of exchange ruling at the balance sheet date. Income and expenses are translated at the average exchange rate for the month in which they arise. The main foreign currencies used are US Dollars and Euros. The year end rate of exchange used for the Euro was 1.29 (2013: 1.20) and for the US Dollar was 1.56 (2013: 1.66) and the average rates were 1.24 (2013: 1.18) and 1.65 (2013: 1.57), respectively. The resulting exchange differences are taken directly to the consolidated statement of comprehensive income.
Non-monetary items that are measured in terms of historical cost in a foreign currency are translated using the exchange rates as at the dates of the initial transactions. Non-monetary items measured at fair value in foreign currency are translated using the exchange rates at the date when the fair value was determined.
Financial assetsFinancial assets include cash and short-term deposits, trade and other receivables, loan notes, quoted and unquoted financial instruments and derivative financial instruments.
Financial assets within the scope of IAS 39 ‘Financial Instruments’ are classified as financial assets at fair value through profit or loss, loans and receivables, held-to-maturity investments, available-for-sale financial assets, or as derivatives designated as hedging instruments in an effective hedge, as appropriate. The Group determines the classification of its financial assets at initial recognition.

Group plc Annual Report & Accounts 201462
2. ACCOUNTING POLICIES CONTINUED
All financial assets are recognised initially at fair value plus, in the case of investments not at fair value through profit or loss, directly attributable transaction costs.
Trade receivables are recognised and carried at the lower of their original invoiced value and recoverable amount. A provision is made when there is objective evidence that the Group will not be able to recover balances in full.
DividendsFinal dividends are only recognised at the point when they are declared and approved by the shareholders at the AGM. Interim dividends are recognised on payment.
Derivative financial instruments and hedgingDerivative financial instruments are classified as held for trading unless they are designated as hedging instruments. Assets and liabilities are carried in the consolidated balance sheet at fair value with gains or losses recognised in the consolidated income statement.
Where appropriate, the Group uses derivative financial instruments such as forward foreign exchange contracts and interest rate swaps to hedge its risks associated with foreign currency and interest rate fluctuations. The Group does not hold or issue derivative financial instruments for speculative purposes.
Derivative financial instruments are initially recognised at fair value on the date on which a derivative contract is entered into and are subsequently remeasured at fair value. Derivatives are carried as assets when the fair value is positive and as liabilities when the fair value is negative.
The fair value of forward foreign exchange contracts is calculated by reference to current forward exchange rates for contracts with similar maturity profiles. The fair value of interest rate swap contracts is determined by reference to market values for similar instruments.
Where the criteria are met for hedge accounting, it is applied to the forward foreign exchange contracts put in place to reduce exposure to currency denominated sales and purchases.
Where the criteria for hedge accounting are not met, or the Group elects not to hedge account, gains and losses on the fair value of forward contracts are taken to the consolidated income statement as they arise.
For those derivatives designated as hedges and for which hedge accounting is desired, the hedging relationship is documented at its inception. This documentation identifies the hedging instrument, the hedged item or transaction, the nature of the risk being hedged and how the effectiveness will be measured throughout its duration. Such hedges are expected to be highly effective at inception.
For the purpose of hedge accounting, a hedge is classified as:• a fair value hedge, i.e. a hedge of the fair value of an asset or a liability. Changes in the fair value of derivative instruments that are
designated and qualify as fair value hedges are recorded in the consolidated income statement, together with any changes in the fair value of the hedged asset or liability that are attributable to the hedged risk;
• a cash flow hedge, i.e. a hedge of the variability in cash flows of a recognised asset or liability or a highly probable forecast transaction. Changes in the fair value of derivative instruments designated as cash flow hedges such as forward foreign exchange contracts are recognised as other comprehensive income to the extent that the hedges are effective. Any ineffective portion is recognised in the consolidated income statement. Amounts deferred in equity are released when the forecast hedged transaction impacts the consolidated income statement; and
• a hedge of a net investment in a foreign entity. The Group hedges net investments in foreign entities primarily through currency borrowings. Any gains or losses on the translation of the borrowings are recognised as other comprehensive income. As the hedge relationship is expected to remain highly effective, the accounting treatment will be applied on an ongoing basis until the Group revokes the designation or the investment is disposed of.
Current and deferred taxCurrent tax assets and liabilities are measured at the amounts expected to be recovered from or paid to the relevant tax authorities, based on tax rates and laws that are enacted or substantively enacted, by the reporting date, in the countries where the Group operates and generates taxable income.
Deferred tax is provided in full, using the balance sheet liability method, on temporary differences arising between the tax bases of assets and liabilities and their carrying amounts in the consolidated financial statements. However, the deferred tax is not accounted for, if it arises from initial recognition of an asset or liability in a transaction other than a business combination that at the time of the transaction affects neither accounting nor taxable profit or loss. Deferred tax is determined using tax rates and laws that have been enacted or substantively enacted by the balance sheet date and are expected to apply when the related deferred tax asset is realised or the deferred tax liability is settled.
NOTES TO THE ACCOUNTS
CONTINUED

Group plc Annual Report & Accounts 2014 63
Deferred tax assets are recognised to the extent that it is probable that future taxable profit will be available against which the temporary differences can be utilised.
Deferred tax is provided on temporary differences arising on investments in subsidiaries and associates, except where the timing of the reversal of the temporary difference is controlled by the Group and it is probable that the temporary difference will not reverse in the foreseeable future.
The Group has not provided for deferred tax in relation to temporary differences associated with undistributed earnings of subsidiaries. However, based on current enacted law and on the basis that the Group is in a position to control the timing and realisation of these temporary differences, no material tax consequences are expected to arise.
Employee share optionsIFRS 2 ‘Share-based Payment’ requires that the cost of equity-settled transactions with employees is measured by reference to the fair value at the date on which they are granted and is recognised as an expense over the vesting period, which ends on the date on which the relevant employees become fully entitled to the award. Fair value is determined by external valuation using an appropriate pricing model. In valuing equity-settled transactions, no account is taken of any service or performance conditions (vesting conditions), other than performance conditions linked to the price of the shares of the Company (market conditions). Any other conditions which are required to be met in order for an employee to become fully entitled to an award are considered to be non-vesting conditions. Market performance conditions and non-vesting conditions are taken into account in determining the grant date fair value. Further details are given in note 23.
No expense is recognised for awards that do not ultimately vest, except for awards where vesting is conditional upon a market vesting condition or a non-vesting condition, which are treated as vesting irrespective of whether or not the market condition or non-vesting condition is satisfied, provided that all other non-market vesting conditions are satisfied.
Where an equity-settled award is cancelled, it is treated as if it had vested on the date of cancellation, and any cost not yet recognised in the consolidated income statement for the award is expensed immediately. Any compensation paid up to the fair value of the award at the cancellation or settlement date is deducted from equity, with any excess over fair value being treated as an expense in the consolidated income statement.
Provision is made for cash settled options in relation to their fair value at the balance sheet date. The liability is remeasured to fair value at each reporting date up to, and including the settlement date, with changes in fair value recognised in the consolidated income statement.
ProvisionsA provision is recognised when the Group has a legal or constructive obligation as a result of a past event; it is probable that an outflow of economic benefits will be required to settle the obligation; and a reliable estimate can be made of the amount of the obligation. If the effect is material, expected future cash flows are discounted using a current pre-tax rate that reflects, where appropriate, the risks specific to the liability. Where the Group expects some or all of a provision to be reimbursed, the reimbursement is recognised as a separate asset but only when recovery is virtually certain. The expense relating to any provision is recognised in the consolidated income statement net of any reimbursement.
Non-recurring costsThe Group presents as non-recurring items on the face of the consolidated income statement, those material items of income and expense which, because of the non-recurring nature and expected infrequency of the events giving rise to them, merit separate presentation to allow shareholders to understand better the elements of financial performance in the year, so as to facilitate comparison with prior periods and to better assess trends in financial performance.
3. SEGMENTAL ANALYSIS
An operating segment is described in IFRS 8 ‘Operating Segments’ as a component of an entity that engages in business activities from which it may earn revenues and incur expenses, whose operating results are regularly reviewed by the chief operating decision maker (‘CODM’) to make decisions about the resources to be allocated to the segment and assess its performance and for which discrete financial information is available. The directors consider that there are two operating segments, namely AGA (which comprises the brands and operations of AGA, Fired Earth, Grange, Rayburn, Redfyre and Waterford Stanley) and Rangemaster (which comprises the brands and operations of AGA Marvel, Divertimenti, Heartland, La Cornue and Rangemaster). Two areas of the business were identified over which the directors allocate resource, plan purchasing and manufacturing, have combined sales targets, incentives and marketing programmes. These areas were determined to be the level at which the CODM makes decisions and were deemed to be the operating segments of ‘AGA’ and ‘Rangemaster’. The strategy as set by the board is for the Group to be seen as a global consumer brand which sells range cookers, kitchen and related home fashions products internationally with cross-selling opportunities creating appreciable competitive advantage for all our individual brands.

Group plc Annual Report & Accounts 201464
3. SEGMENTAL ANALYSIS CONTINUED
The operating results of the operating segments, for which discrete information is available, are regularly reviewed by the CODM, which consists of the chief executive and his senior management team, to make decisions about the resources to be allocated to the segments and assess their performance. Management’s focus is on the cross-selling of all consumer products to our customers – e.g. AGA Marvel is responsible for distributing product manufactured in the UK at our Leamington Spa (range cookers) and Telford (cast iron cookers) factories, which are then sold in North America under the AGA brand. Waterford Stanley is the distributor for Rangemaster and Rayburn products into Ireland and Grange has developed products that are sold under its own brand and the Fired Earth brand.
Our customers are substantially of the same demographic. At the heart of our sales strategy we look to sell packages of products to our customer base which, for example, may include AGA, Fired Earth, Rangemaster or AGA Marvel branded products and, in addition, this is how our senior management are now incentivised to achieve Group targets.
The two operating segments are considered to meet the aggregation criteria of IFRS 8 in full and so the directors consider that there is only one aggregated reportable segment as the two segments have similar economic characteristics, products and services, production processes, types and classes of customer and methods of distribution. The directors consider the aggregated reportable segment to be the manufacture and sale of range cookers, kitchen and related home fashions product, from which the Group derives most of its revenue. All Group companies are subject to similar economic forces and comparable regulatory environments.
Disclosures in respect of revenues from external customers and non-current assets are provided below:
2014 2013
Revenue£m
Non-currentassets
£mRevenue
£m
Non-currentassets
£m
United Kingdom 171.5 60.7 158.0 58.8North America 34.4 31.3 32.1 28.3Europe 48.5 41.2 54.0 42.6Rest of World 6.7 – 6.3 –
Total operations 261.1 133.2 250.4 129.7Tax – 17.9 – 11.4
Total 261.1 151.1 250.4 141.1
4. NET OPERATING COSTS
2014£m
Restated2013
£m
Raw materials, consumables and changes in inventories of finished goods and work in progress 106.3 102.6Staff costs (note 5) 79.6 76.8Other operating charges 60.0 57.0Other operating income (1.4) (1.2)Amortisation of intangibles (note 13) 2.3 2.3Depreciation of property, plant and equipment (note 14) 4.7 4.7
Total net operating costs 251.5 242.2
Net operating costs include reorganisation costs of £0.9m (2013: £nil) and income of £0.9m relating to a lease assignment of one of the Group’s London shops.
The 2013 classification of other operating income has been restated to be consistent with the 2014 presentation.
NOTES TO THE ACCOUNTS
CONTINUED

Group plc Annual Report & Accounts 2014 65
2014£m
2013£m
Group operating profit for the year is stated after charging/(crediting):Net loss/(profit) on disposal of property, plant and equipment and assets held for sale 0.1 (1.0)Trade receivables impairment (note 16) (0.3) 0.6Raw materials, consumables and changes in inventories of finished goods and work in progress include:– Inventory provision charged/(credited) in the year (note 15) 0.1 (0.2)Research and development expenditure 0.9 1.0Depreciation of property, plant and equipment (note 14) 4.7 4.7Amortisation of intangibles (note 13) 2.3 2.3Operating lease rentals payable:– Plant and machinery 2.2 2.5– Land and buildings 6.7 7.0Net exchange differences (0.3) (0.3)Auditor’s remuneration:– Fees payable to Company’s auditor for the audit of the Company’s annual accounts 0.1 0.1– The audit of the Company’s subsidiaries 0.2 0.2Other fees to auditor:– Taxation advisory services 0.1 0.1– Other services – 0.1
Fair value movementsThe fair value movement amounted to £3.3m relating to a provision for a cash settled share based payment transaction in respect of the Fired Earth Incentive Scheme (note 23).
Non-recurring costsIn 2013 the non-recurring costs amounted to £2.2m which related to site rationalisation programmes involving Waterford Stanley in Ireland and Grange in France and the costs of closing certain retailing outlets and the warehouse of Grange in North America.
5. EMPLOYEE INFORMATION
Average number of employees (including directors) 2014Restated
2013
Production 1,364 1,325Selling and distribution 712 719Administration and support services 477 474
Total average number of employees 2,553 2,518
Total staff costs (including directors)2014
£m2013
£m
Wages and salaries 69.7 66.7Social security costs 8.7 8.8Share based payments – 0.1Other pensions costs (note 6) 1.2 1.2
Staff costs (note 4) 79.6 76.8Cash settled share based payment (note 23) 3.3 –Pension charge (note 6) 4.1 3.5
Total staff costs 87.0 80.3

Group plc Annual Report & Accounts 201466
5. EMPLOYEE INFORMATION CONTINUED
Other pension costs relate to contributions under defined contribution schemes and are included within Group operating profit. The pension charge relates to the defined benefit schemes and is separately presented on the face of the consolidated income statement.
Directors’ remuneration2014
£m2013
£m
Salaries and benefits in kind 1.4 1.6
Total directors’ remuneration 1.4 1.6
There are no amounts receivable under the Group’s LTIP scheme (2013: £nil).
There are two directors who accrued benefits under the defined benefit pension scheme (2013: two).
6. PENSIONS
The Group operates several pension schemes, the main one is the AGA Rangemaster Group Pension Scheme, which covers the majority of UK employees. Membership on a defined benefit basis was closed to new entrants in 2001. The scheme became open to new entrants on a defined contribution basis in 2002, but was generally closed to new entrants on this basis during 2014. The other defined benefit schemes operating within the Group are the Amari plc Pension and Life Assurance Plan in the UK, the Northland Corporation U.A.W. Retirement Income Plan in the US, the Grange Pension Scheme and the La Cornue Scheme in France and the Waterford Stanley Limited Retirement Benefits Scheme in Ireland. The assets are held in trust funds separate from the Group’s assets although they are included in the Group’s consolidated balance sheet. Various defined contribution schemes exist across the Group and the total contributions in the year were £1.2m (2013: £1.2m) which are included under staff costs in note 5.
The latest full triennial actuarial valuation of the main UK scheme was carried out by Towers Watson Limited, independent consulting actuaries, as at 31st December 2011 using the projected unit credit method which showed an actuarial deficit of £228m. An actuarial report as at 31st December 2012 showed an actuarial deficit of £169m and as at 31st December 2013 showed an actuarial deficit of £104m. The actuarial valuation as at 31st December 2008 showed an actuarial deficit of £161m, reducing to £76m as at 31st December 2009 and an actuarial report as at 31st December 2010 showed an actuarial deficit of £62m.
Defined benefit scheme contributions of £3.2m (2013: £3.3m) based on pensionable salaries and other payments of £0.9m (2013: £0.8m) were made by the Group during the year ended 31st December 2014. Contributions of £0.2m (2013: £0.2m) were owed to the scheme at 31st December 2014.
Normal company contributions for 2015 under the main UK scheme will be at the rate of 19.1% (2014: 18.6%) of pensionable salaries for all members accruing benefits on a defined benefit basis with the exception of three members of the former 1970 scheme in respect of whom contributions will be at the rate of 40.2% (2014: 39.2%) of capped basic salaries. Normal contributions of around £3m and other payments of around £1.5m are set to be paid by the Group during 2015. Under the deficit recovery plan put in place on completion of the last full triennial actuarial valuation of the main UK scheme as at 31st December 2011, the following deficiency contributions are payable into the scheme: £4.0m in 2015, £10.0m a year from 2016 to 2021 inclusive and an additional payment of £30.0m on 31st December 2020, see note 27. These arrangements may be reviewed with the completion of the next full triennial actuarial valuation being undertaken as at 31st December 2014.
The financial assumptions used to calculate the defined benefit schemes’ liabilities under IAS 19 were:
2014 2013
UKschemes
%
WaterfordStanleyscheme
%
UKschemes
%
WaterfordStanleyscheme
%
Rate of increase in pensionable salaries 0.0 1.5 0.0 2.4Rate of increase of pensions in payment 2.5-3.2 1.5 2.5-3.4 1.9Discount rate 3.5 2.2 4.5 3.9Inflation rate – in payment 2.9 1.5 3.4 1.9Inflation rate – in deferment 1.7 1.5 2.4 1.9
NOTES TO THE ACCOUNTS
CONTINUED

Group plc Annual Report & Accounts 2014 67
In determining the appropriate discount rate, management considers the interest rates of corporate bonds in the respective currency with at least an ‘AA’ rating, with extrapolated maturities corresponding to the expected duration of the defined benefit obligation. Future salary increases and pension increases are based on expected future inflation rates for the respective country. The mortality rate is based on publicly available mortality tables for the specific country.
The demographic assumptions used include rates for mortality which, for example, lead to an average projected life expectancy of 19.5 (2013: 19.4) years for male members and 21.7 (2013: 21.6) years for female members currently aged 65 and of 21.0 (2013: 20.9) years from age 65 for male members and 23.2 (2013: 23.1) years from age 65 for female members currently aged 50. This data has been provided by Towers Watson Limited.
SensitivitiesThe value of scheme assets is sensitive to market conditions. Changes in assumptions used for determining retirement benefit costs and obligations may have a material impact on the consolidated income statement and the consolidated balance sheet. The main assumptions are the discount rate, the rate of inflation and the assumed mortality rate. The following table provides an estimate of the potential impact on the Group pension schemes of changing each of these variables.
In calculating these sensitivities the assumptions have been considered in isolation and do not consider the potential implications should more than one assumption change.
Increase/(decrease) in liabilities
2014£m
Discount rate – 0.5% decrease 73.4– 0.5% increase (65.0)
Inflation rate – 0.5% decrease (29.1)– 0.5% increase 39.3
Mortality rate – one year increase in life expectancy 49.6
The assets and obligations of the aggregated schemes:2014 2013
% £m % £m
UK equities securities 5.0 44.1 6.7 55.2Overseas equity securities 9.4 83.4 10.1 83.7Debt securities 30.2 266.4 40.1 332.1Real estate/property 10.4 92.1 10.3 85.7Cash and cash equivalents 2.3 20.2 4.0 33.3Other 42.7 377.2 28.8 238.9
Fair value of schemes’ assets 100.0 883.4 100.0 828.9Present value of funded obligation (955.4) (864.7)
Net deficit in the schemes (72.0) (35.8)
Investments of the defined benefit schemes are diversified, such that the failure of any single investment would not have a material impact on the overall level of assets. The largest proportion of assets are invested in ‘other‘ which include return-seeking assets including absolute return bond funds, diversified growth funds and funds of hedge funds, although the schemes also invest in debt and equities securities, real estate/property and in cash.

Group plc Annual Report & Accounts 201468
6. PENSIONS CONTINUED
The non-cash and cash equivalents assets at 31st December 2014 are held either in segregated portfolios of listed UK equities securities, UK fixed interest and index-linked government debt securities, and non-government debt securities (32.6% 2013: 27.8%) and unlisted real estate/property and non-government debt securities (11.6% 2013: 12.7%), or in a number of pooled funds encompassing diversified investment strategies (53.5% 2013: 55.5%). The pooled funds’ investment strategies include investing from time to time in a wide range of the asset categories listed above, including both listed and unlisted assets, and on a global basis. The absolute return bond funds, the diversified growth funds, and the funds of hedge funds generally target a consistently positive investment return, substantially in excess of UK one month LIBOR or similar, with reduced volatility in the range of investment return outcomes.
Included above are assets with a market value of £4.0m (2013: £3.6m) and a deficit of £1.4m (2013: £0.9m) in respect of overseas schemes. The foreign exchange impact on the overseas schemes is £nil.
The amounts recognised in the consolidated income statement are as follows:2014
£m2013
£m
Current service cost – defined benefit 2.6 2.4Net interest cost on net defined benefit obligation 1.5 1.1
Pension charge included in the consolidated income statement 4.1 3.5
Taken to comprehensive income:2014
£m2013
£m
Actuarial gain – experience (3.3) (0.4)Actuarial loss – financial assumptions 98.7 23.4Return on scheme assets greater than discount rate (59.4) (25.3)
Recognised in the statement of comprehensive income 36.0 (2.3)
Movement in net deficit of the aggregated schemes during the year:2014
£m2013
£m
Net deficit of the schemes at 1st January (35.8) (38.7)Net pension charge (4.1) (3.5)Company contributions 4.1 4.1Other movement (0.2) –Actuarial (loss)/gain (36.0) 2.3
Net deficit of the schemes at 31st December (72.0) (35.8)
The cumulative amount recognised in the consolidated statement of comprehensive income since 1st January 2004 is £122.1m loss (2013: £86.1m loss).
Changes in the present value of the defined benefit obligation are as follows:2014
£m2013
£m
Present value of obligation at 1st January 864.7 847.8Current service cost 2.6 2.4Interest costs on defined benefit obligation 37.9 36.7Member contributions 0.5 0.5Actuarial gain – experience (3.3) (0.4)Actuarial loss – financial assumptions 98.7 23.4Benefit payments from scheme assets (43.2) (43.0)Administration costs paid (2.5) (2.5)Other adjustments – (0.2)
Present value of obligation at 31st December 955.4 864.7
NOTES TO THE ACCOUNTS
CONTINUED

Group plc Annual Report & Accounts 2014 69
Changes in the fair value of the schemes’ assets are as follows:2014
£m2013
£m
Fair value of schemes’ assets at 1st January 828.9 809.1Interest income on schemes’ assets 36.4 35.6Return on scheme assets greater than discount rate 59.4 25.3Company contributions 4.1 4.1Member contributions 0.5 0.5Benefit payments (including lump sums on retirement) (43.2) (43.0)Administration costs paid (2.5) (2.5)Other adjustments (0.2) (0.2)
Fair value of schemes’ assets at 31st December 883.4 828.9
The actual gain on the schemes’ assets was £95.8m (2013: £60.9m).
Analysis of defined benefit obligation by participant category(AGA Rangemaster Group Pension Scheme only):
2014£m
2013£m
Active participants 91.7 73.4Deferred participants 355.2 302.6Pensioners 489.4 472.2
Total 936.3 848.2
The weighted average duration of the defined benefit obligation of the AGA Rangemaster Group Pension Scheme is 14 – 15 years (2013: 14 – 15).
Maturity profile of defined benefit obligation(AGA Rangemaster Group Pension Scheme only):
2014£m
Expected benefit payments during fiscal year ending 31st December:2015 42.62016 43.12017 44.22018 44.62019 45.62020-24 233.1
The maturity profile shown above is not the full maturity profile but that of the next ten years, based on an analysis of the present value of the defined benefit obligation.
7. FINANCE (COSTS)/INCOME
Finance income:2014
£m2013
£m
Bank interest – 0.1
Total finance income – 0.1
Finance costs:Bank borrowings (1.3) (1.3)Other borrowings (0.2) (0.2)
Total finance costs (1.5) (1.5)
Net finance costs (1.5) (1.4)

Group plc Annual Report & Accounts 201470
8. TAX ON PROFIT FOR THE YEAR2014
£m2013
£m
Current tax on income for year 1.2 0.9Adjustments in respect of prior years – 0.2
United Kingdom corporation tax 1.2 1.1
Overseas current tax on income for year 0.2 0.2Adjustments in respect of prior years 0.1 (0.3)
Overseas corporation tax 0.3 (0.1)
Total current tax charge 1.5 1.0
United Kingdom deferred tax credit:– change in rate of corporation tax – (0.2)– current year (0.1) (0.1)Overseas deferred tax credit in year (0.5) (0.2)Overseas deferred tax credit in respect of prior years (0.3) (0.1)
Total deferred tax credit (0.9) (0.6)
Total United Kingdom tax 1.1 0.8Total overseas tax (0.5) (0.4)
Tax charge 0.6 0.4
Other comprehensive income:2014
£m2013
£m
Corporation tax credit on defined benefit pension schemes (0.8) (0.9)Deferred tax (credit)/charge on defined benefit pension schemes and losses (note 21) (6.4) 3.2
Total tax on defined benefit pension schemes and losses (7.2) 2.3Corporation tax on items taken to reserves (0.4) 0.4
Total tax on other comprehensive income (7.6) 2.7
Tax on comprehensive income:2014
£m2013
£m
Current tax charge 0.3 0.5Deferred tax (credit)/charge (7.3) 2.6
Total (credit)/charge (7.0) 3.1
Factors affecting the future tax chargeReductions in the UK corporation tax rate to 21% from 1st April 2014 and to 20% from 1st April 2015, were substantively enacted in July 2013. Accordingly, the substantively enacted rates have been applied in the measurement of the Group’s deferred tax assets and liabilities as at 31st December 2014.
The total tax assessed for the year is higher than the standard rate of corporation tax in the UK as explained below:2014
£m2013
£m
Profit before tax 0.7 1.1
Profit multiplied by the standard rate of corporation tax in the UK of 21.5% (2013: 23.25%) 0.1 0.3Effects of:– overseas tax rates (0.2) (0.1)– lower rates of future tax – (0.2)– non-allowable expenditure (fair value movement) 0.7 0.1– research credits – (0.3)– losses not recognised 0.8 1.2– non-taxable income (0.2) –– utilisation of tax losses not previously recognised (0.6) (0.4)– adjustment to tax charge in respect of prior years (0.2) (0.2)– other 0.2 –
Total tax charge 0.6 0.4
NOTES TO THE ACCOUNTS
CONTINUED

Group plc Annual Report & Accounts 2014 71
9. DISCONTINUED OPERATIONS
The net cash outflow relating to discontinued operations was £0.5m (2013: £0.7m).
10. DIVIDENDS
The directors are not recommending a final dividend in respect of the financial year ended 31st December 2014 (2013: £nil). No interim dividend was paid in the year (2013: £nil).
11. EARNINGS PER SHARE
The basic earnings per share (‘EPS’) is calculated by dividing the earnings attributable to equity shareholders of the parent by the weighted average number of ordinary shares outstanding during the year.
For diluted EPS, the weighted average number of ordinary shares in issue is adjusted to assume conversion of all potential dilutive ordinary shares. Share options granted to employees represent the potential dilutive shares. Share options which are either contingently issuable and for which performance criteria have not been met, or options which are anti-dilutive have been excluded from the calculation of the diluted EPS.
The earnings and weighted average number of shares are set out below:
Earnings for the purpose of the basic and diluted EPS2014
£m2013
£m
Profit after tax 0.1 0.7Non-controlling interests – 0.1
Profit attributable to equity holders of the parent 0.1 0.8
Weighted average number of shares in issue2014
m2013
m
For basic EPS calculation 69.3 69.3Dilutive effect of share options 0.3 0.3
For diluted EPS calculation 69.6 69.6
EPS attributable to equity holders of the parent2014
p2013
p
Basic 0.1 1.2Diluted 0.1 1.1
12. GOODWILL
Cost2014
£m2013
£m
At 1st January 65.4 65.3Exchange adjustment (0.3) 0.1
At 31st December 65.1 65.4
Impairment testingThe recoverable amount of goodwill allocated to the cash-generating units (‘CGUs’) has been determined based on a value in use calculation.
Cash generating unitsAGA, Fired Earth, Grange, Rayburn, Redfyre and Waterford Stanley form the AGA CGU with AGA Marvel, Divertimenti, Heartland, La Cornue and Rangemaster forming the Rangemaster CGU. Given the shared resource and integration within these two CGUs they are deemed to be the smallest identifiable group of assets that generate cash inflows that are largely independent of each other. Goodwill at 31st December 2014 is allocated over the two CGUs as follows: AGA £37.7m (2013: £37.9m) and Rangemaster £27.4m (2013: £27.5m).

Group plc Annual Report & Accounts 201472
NOTES TO THE ACCOUNTS
CONTINUED
12. GOODWILL CONTINUED
Key assumptions used in the value in use calculationCash flows – for goodwill impairment testing, future cash flows are based on the board approved, budgeted cash flows for both of the relevant CGUs for 2015. The operating cash flows reflect management’s current expectations of future performance incorporating judgements around the current economic climate and reflecting cost savings made. Management’s expectations are also formed in line with performance to date and experience, as well as available external market data.
Growth rates – a 2% (2013: 2%) growth rate in cash flows is assumed for the four years following the budget year. A terminal value is then calculated using this rate. The growth rate is based on the current GDP forecasts for the medium-term.
Discount rate – the future cash flows are discounted, at the pre tax cost of capital applicable to that particular CGU. The pre tax discount rate for both CGUs is 9.2% (2013: 9.1%). The discount rate has been risk adjusted by utilising an equity risk premium and a company specific beta. Discount rates represent the current market assessment of the risks specific to each CGU, taking into consideration the time value of money and individual risks of the underlying assets that have not been incorporated into the cash flow estimates. The discount rate calculation is based on the specific circumstances of the Group and is derived from its weighted average cost of capital (‘WACC’).
Sensitivities – a reasonable change in key assumptions, on which management has based its determination of the recoverable amount, does not cause the carrying amount to exceed its recoverable amount.
13. INTANGIBLE ASSETSComputersoftware
£mBrands
£m
Developmentcosts
£mOther
£mTotal
£m
CostAt 1st January 2014 6.0 13.3 21.4 0.5 41.2Exchange adjustment – (0.9) (0.1) – (1.0)Additions – internally generated 0.1 – 2.8 – 2.9Additions – externally acquired 0.1 – 0.2 – 0.3Disposals (0.7) – (0.8) – (1.5)
At 31st December 2014 5.5 12.4 23.5 0.5 41.9
AmortisationAt 1st January 2014 4.6 – 11.1 – 15.7Charge for the year 0.3 – 2.0 – 2.3Disposals (0.7) – (0.8) – (1.5)
At 31st December 2014 4.2 – 12.3 – 16.5
Net book value at 31st December 2014 1.3 12.4 11.2 0.5 25.4
Computersoftware
£mBrands
£m
Developmentcosts
£mOther
£mTotal
£m
CostAt 1st January 2013 5.8 13.0 19.1 0.5 38.4Exchange adjustment – 0.3 – – 0.3Additions – internally generated 0.1 – 2.6 – 2.7Additions – externally acquired 0.1 – 0.2 – 0.3Disposals – – (0.5) – (0.5)
At 31st December 2013 6.0 13.3 21.4 0.5 41.2
AmortisationAt 1st January 2013 4.3 – 9.6 – 13.9Charge for the year 0.3 – 2.0 – 2.3Disposals – – (0.5) – (0.5)
At 31st December 2013 4.6 – 11.1 – 15.7
Net book value at 31st December 2013 1.4 13.3 10.3 0.5 25.5

Group plc Annual Report & Accounts 2014 73
Computer software and development costsComputer software and development costs are amortised and the amortisation is charged directly to the consolidated income statement where the project has commenced, otherwise costs will be subject to a mandatory impairment test. Development costs are tested for impairment annually using future cash flows for each project and an appropriate discount rate.
Brands and brands impairment testingBrands are considered to have an indefinite life and are subject to annual impairment testing. It is expected that the brands will be held and supported for an indefinite period of time and are expected to generate economic benefits. The Group is committed to supporting its brands and invests in consumer marketing promotional spend.
To test the impairment of brands the Royalty Relief Methodology is used to forecast future cash flows. Cash flows are estimated using an imputed royalty rate applied to board approved, budgeted revenues for 2015.
Growth rate – a revenue growth rate of 2.0% (2013: 2.0%) is assumed for the four years following the budget year. A terminal value is then calculated. This growth rate is based on the current GDP forecasts for the medium-term.
Discount rates – future cash flows are discounted at the pre tax discount rate applicable to that particular brand. The appropriate discount rate for each brand has been adjusted to reflect an independent capital structure. The Group has risk adjusted the discount rates by utilising a company specific beta and equity risk premium. For 2014 testing, a pre tax rate of 9.1% was used for the Grange brand and a pre tax rate of 9.2% for the Group’s other significant brands (2013: 8.8% and 9.1%, respectively).
Royalty rates – imputed royalty rates used are in the range 2.5% to 4.0%. Management considers the appropriateness of the royalty rates used on an annual basis.
Sensitivities – for most of the brands a reasonable change in key assumptions, on which management has based its determination of the recoverable amount, does not cause the carrying amount to exceed their recoverable amounts. In the case of £0.5m of the brands and other intangibles a 1% increase in the discount rate may lead to an impairment of less than £0.1m, if the other variables remained unchanged.
OtherItems included in the ‘other’ category include patents and trademarks acquired. Other intangibles are considered to have an indefinite life and are subject to impairment testing. No impairment has been identified.
14. PROPERTY, PLANT AND EQUIPMENTFreeholdand long
leaseholdland andbuildings
£m
Plant, machinery
andequipment
£m
Assets in course of
construction£m
Total£m
CostAt 1st January 2014 20.1 95.5 0.8 116.4Exchange adjustment 0.1 (0.6) – (0.5)Capital expenditure 1.2 5.9 0.4 7.5Transferred from assets held for sale 1.4 – – 1.4Disposals (0.6) (0.9) – (1.5)Reclassification 0.3 0.5 (0.8) –
At 31st December 2014 22.5 100.4 0.4 123.3
DepreciationAt 1st January 2014 7.0 70.8 – 77.8Exchange adjustment (0.2) (0.4) – (0.6)Charge for the year 0.3 4.4 – 4.7Disposals (0.5) (0.9) – (1.4)Transferred from assets held for sale 0.3 – – 0.3
At 31st December 2014 6.9 73.9 – 80.8
Net book value at 31st December 2014 15.6 26.5 0.4 42.5
The cost of property, plant and equipment includes £nil (2013: £0.2m) of assets held under finance leases. The net book value of these assets was £nil (2013: £nil). All leases are reviewed and are capitalised where appropriate.

Group plc Annual Report & Accounts 201474
NOTES TO THE ACCOUNTS
CONTINUED
14. PROPERTY, PLANT AND EQUIPMENT CONTINUED
Freeholdand long
leaseholdland and
buildings£m
Plant, machinery
andequipment
£m
Assets incourse of
construction£m
Total£m
CostAt 1st January 2013 22.5 91.7 0.4 114.6Exchange adjustment – 0.2 – 0.2Capital expenditure – 4.4 0.8 5.2Disposals (2.4) (1.2) – (3.6)Reclassification – 0.4 (0.4) –
At 31st December 2013 20.1 95.5 0.8 116.4
DepreciationAt 1st January 2013 8.9 67.4 – 76.3Exchange adjustment – 0.2 – 0.2Charge for the year 0.4 4.3 – 4.7Disposals (2.3) (1.1) – (3.4)
At 31st December 2013 7.0 70.8 – 77.8
Net book value at 31st December 2013 13.1 24.7 0.8 38.6
Assets held for saleOf the £2.2m assets held for sale in 2013, one was sold during the year and the other was transferred back into property, plant and equipment at its recoverable amount as it no longer meets the criteria of an asset held for sale.
15. INVENTORIES2014
£m2013
£m
Raw materials and consumables 12.2 10.7Work in progress 4.7 4.6Finished goods 32.1 29.8
Total inventories at the lower of cost and net realisable value 49.0 45.1
The Group expensed £106.3m of inventories during the year (2013: £102.6m). The Group charged £0.1m to inventory provisions in the year (2013: £0.2m credited). The Group did not hold any inventories pledged as security for liabilities (2013: £nil).
16. TRADE AND OTHER RECEIVABLES
Amounts falling due within one year2014
£m2013
£m
Trade receivables 24.8 26.8Less provision for impairment of receivables (1.0) (1.4)
Net trade receivables 23.8 25.4Other receivables 2.8 3.4Prepayments and accrued income 6.4 6.4
Total receivables falling due within one year 33.0 35.2
Amounts falling due after one year
Other receivables 0.2 0.2
Total receivables 33.2 35.4
The Group provides for trade receivables on estimated irrecoverable amounts from the sale of goods based on the age of debt, past default experience and any other information which comes to light which suggests that the recoverable amount may be impaired. There is a Group-wide credit insurance policy in the UK. This covers 90% of individual debts in these units up to specific insured limits.

Group plc Annual Report & Accounts 2014 75
The Group uses external agencies to credit score new customers where appropriate to assess their credit quality and define an initial credit limit. Limits and credit scoring are reviewed as necessary. Aged debt reports are reviewed by local management on a regular basis with ‘debt at risk’ forms being formally submitted to Group on a monthly basis. £0.6m (2013: £1.0m) of trade receivables are factored. The Group retains the risks and rewards of these amounts, therefore, these are not derecognised.
In determining the recoverability of a trade receivable the Group considers any change in the credit quality of the trade receivable from the date the Group first traded with that company. Credit risk is mitigated by the relatively large customer base.
Included in trade receivables are balances of £3.0m (2013: £3.3m) which are past due at the reporting date for which the Group has not provided for as there has not been a significant change in the credit quality and the amounts are still considered recoverable.
Ageing of past due but not impaired receivables2014
£m2013
£m
30-60 days 1.4 1.660-90 days 0.8 0.690-120 days 0.1 0.3120+ days 0.7 0.8
Total receivables past due but not impaired 3.0 3.3
Movement in the provision for impairment of receivables2014
£m2013
£m
At 1st January 1.4 0.9Impairment losses (recovered)/recognised (0.3) 0.6Amounts written off (0.1) (0.1)
At 31st December 1.0 1.4
17. TRADE AND OTHER PAYABLES
Current trade and other payables2014
£m2013
£m
Trade payables 44.9 41.7Payments on account 0.3 0.3Social security 3.5 3.5Accruals and deferred income 11.2 10.5Other payables 9.0 7.9
Total current trade and other payables 68.9 63.9
18. CASH AND BORROWINGS
a) Cash and cash equivalents2014
£m2013
£m
Short-term bank deposits 24.2 21.2
Cash and cash equivalents 24.2 21.2
The short-term bank deposits have a weighted average maturity of under one month (2013: under one month) with an effective interest rate of 0.3% (2013: 0.3%). The fair value of cash and short-term deposits is £24.2m (2013: £21.4m).
b) Financial liabilities – borrowings
Borrowings2014
£m2013
£m
Current borrowings 0.6 1.0Non-current borrowings 14.4 14.3
Total borrowings 15.0 15.3

Group plc Annual Report & Accounts 201476
NOTES TO THE ACCOUNTS
CONTINUED
18. CASH AND BORROWINGS CONTINUED
The Group’s borrowings are primarily loan advances denominated in a number of currencies and interest is based on LIBOR or foreign equivalents. Borrowings have been classified as current and non-current liabilities with reference to the final maturity date of the facility agreements.
Bank borrowings comprise the following:Interest rate
basis2014
£m2013
£m
Bank factoring of trade receivables – current (note 16) Floating 0.6 1.0Unsecured bank loans – non-current Floating 14.3 14.0Other secured loans 2018 Floating 0.1 0.3
Total bank borrowings 15.0 15.3
The £14.3m of non-current unsecured bank loans are currency denominated loan advances from committed revolving credit facilities, which bear interest rates based on LIBOR and margins with a weighted average of circa 175 basis points.
19. FINANCIAL INSTRUMENTS
Capital managementThe Group’s capital comprises the equity attributable to the equity holders of the parent. The Group’s policy is to maintain a strong capital base so as to maintain investor, creditor and market confidence and to sustain the future development of the business. The Group monitors the nature and spread of its shareholders. Employees are encouraged to hold shares in the Company. The Group manages its capital structure and makes adjustments to it, in light of changes in economic conditions. To maintain or adjust the capital structure, the Group may adjust the dividend payment to shareholders, return capital to shareholders or issue new shares. The Group also has bank facilities in place to fund the business. These are discussed in more detail under liquidity risk.
The central treasury function sets out the treasury policy including guidelines for managing interest rate and cash flow risk, credit and price risk, foreign currency risk and liquidity risk as discussed below. The objective of the treasury policy is to manage the Group’s financial risk and to ensure that adequate financial resources are available for the development of the Group.
Interest rate and cash flow riskThe Group is exposed to a number of global interest rates – notably the UK, Euro and US rates. Borrowings issued at variable rates expose the Group to cash flow interest rate risk which is partially offset by cash held at variable rates. The Group analyses its interest rate exposure on a regular basis. Based on various scenarios the Group calculates the impact on profit and loss for a defined interest rate shift.
The following table demonstrates the sensitivity to a change in interest rates, with all other variables held constant on the Group’s profit before tax and equity. There were no interest rate swap agreements in place throughout 2014 (2013: nil).
Increase/(decrease)
in basis points
Effect onprofit before
tax/equity£m
2014 Cash +50/(50) 0.1/(0.1)Borrowings +50/(50) (0.1)/0.1
2013 Cash +50/(50) 0.1/(0.1)Borrowings +50/(50) (0.1)/0.1
Credit and price riskThe Group monitors closely the availability of trade finance to its customers and suppliers. The ability for the Group and its principal operations to maintain trade credit insurance on our customers is monitored on an ongoing basis. Where insurers inform us it is their intention to withdraw or reduce trade credit insurance cover on our customers we undertake detailed analysis on the commercial and financial information available and actively manage the terms of trade with any such customers as appropriate. In addition, the ability of our suppliers to maintain credit insurance on the Group and its principal operations is an important issue. We have excellent relationships with our suppliers and we continue to work closely with them on a normal commercial basis. There are no significant concentrations of credit risk within the Group. The maximum credit risk exposure relating to financial assets is represented by their carrying value as at the balance sheet date. The Group’s policy on minimising credit risk with respect to its trade and other receivables is stated in note 16.
The Group is exposed to risk in the price movement of key raw materials and energy. The Group manages these risks and has a combination of a two year fixed price gas contract and a one year fixed price electricity contract together with a one year partially fixed steel supply contract for its main activities. The Group continually reviews its exposure to any remaining commodity risk to ensure that commercial opportunities are fully maximised and risks mitigated wherever possible.

Group plc Annual Report & Accounts 2014 77
Foreign currency riskThe Group’s main transaction exposures are in respect of products manufactured in one currency region and sold in another currency and exposure through the movement in exchange rates on purchases of raw materials and other goods that are not denominated in sterling. These are mainly imports from Asia and the United States of America (‘USA’) which are denominated in US Dollars and imports of component parts from Europe which are denominated in Euros. These currency outflows are offset by inflows of US Dollars relating to UK exports to US markets and inflows of Euros in respect of UK exports to the eurozone respectively. The main translation risk is that the results of non-UK businesses will translate into differing sterling values depending on the exchange rates used.
a) Forward foreign exchange contractsAs a result of the Group’s geographical presence and operations, forward foreign exchange contracts are put in place.
As at 31st December 2014, the notional amounts of outstanding forward foreign exchange contracts that the Group was committed to were £0.2m (2013: £0.2m), CHF 0.3m (2013: CHF 0.3m), USD 1.0m (2013: nil) and CAD 2.2m (2013: nil). The fair value of these open forward foreign exchange contracts is not material. The contracts have been put in place to mitigate the foreign currency risk of anticipated future sales and purchase commitments and mature over the next twelve months.
There were no forward foreign exchange contracts designated as cash flow hedges at the balance sheet date (2013: nil).
b) Hedge of net investment in foreign entitiesThe Group has Euro and US Dollar denominated borrowings, which it has designated as a hedge of a proportion of its investment in its subsidiaries in Europe and the US. The carrying value, gross of borrowing costs, of such Euro borrowings at 31st December 2014 was £5.8m (2013: £6.3m) and the carrying value of the US Dollar borrowings was £8.8m (2013: £8.2m). The exchange differences on the translation of these borrowings into sterling have been recognised in translation reserves; in 2014 these amounted to £0.1m (2013: £nil).
Liquidity riskThe Group’s funding objective is to have sufficient long-term committed facilities, in addition to uncommitted facilities and finance lease agreements, to meet its funding needs. The Group has sound and long established arrangements in place with its relationship banks who offer committed and uncommitted facilities, which together with cash flow monitoring and cash surpluses, provide adequate funding for the Group’s operations. Committed facilities totalling £60.0m were put in place towards the end of 2012 - during the course of 2014 these facilities have been extended and now have a maturity date of 31st August 2016. The Group maintains relationships with several large financial institutions. The Group’s committed loan facilities have three principal financial covenants: interest cover, net debt/earnings before interest, tax, depreciation and amortisation and a minimum level of earnings before interest, tax, depreciation and amortisation excluding pension costs. The Group complied with all covenants at the year end.
The Group maintains a mixture of short-term uncommitted and medium-term committed facilities to ensure a sufficient level of funds and guarantee facilities are available for its business operations. The £60.0m committed facilities have been arranged to help finance the Group’s activities. These facilities incur commitment fees at market rates.
The following table analyses utilisation of the Group’s principal committed facilities at the year end:
2014£m
2013£m
Expiring between 1 and 2 years 15.7 16.0
Total undrawn committed facilities 15.7 16.0
Non-current borrowings used to hedge investments in foreign operations 14.3 14.0Guarantees provided (note 27) 30.0 30.0
Total committed facilities 60.0 60.0
In addition to the committed facilities detailed above, the Group also has uncommitted facilities totalling £20.6m (2013: £17.1m) having increased the available facilities during the year to match the current ongoing requirements.

Group plc Annual Report & Accounts 201478
NOTES TO THE ACCOUNTS
CONTINUED
19. FINANCIAL INSTRUMENTS CONTINUED
Maturity profile of financial liabilitiesThe table below summarises the maturity profile of the Group’s financial liabilities at 31st December 2014 and 2013 based on contractual undiscounted payments. Floating rate borrowings are re-priced within six months from the balance sheet date.
2014Interest rate
basis
Within1 year
£m1-2 years
£m2-3 years
£m3-4 years
£m4-5 years
£m
5 yearsand over
£mTotal
£m
Borrowings Floating 0.9 14.3 0.1 0.1 – – 15.4Trade payables 44.9 – – – – – 44.9Other payables 9.0 – – – – – 9.0
Total 54.8 14.3 0.1 0.1 – – 69.3
2013Interest rate
basis
Within1 year
£m1-2 years
£m2-3 years
£m3-4 years
£m4-5 years
£m
5 yearsand over
£mTotal
£m
Borrowings Floating 1.4 14.2 0.1 0.1 – – 15.8Trade payables 41.7 – – – – – 41.7Other payables 7.9 – – – – – 7.9
Total 51.0 14.2 0.1 0.1 – – 65.4
Carrying valueThe carrying value of the Group’s financial assets, including trade and other receivables and cash, and financial liabilities, including trade and other payables and borrowings, as disclosed in the consolidated balance sheet, are equivalent to their fair value at the balance sheet date.
20. PROVISIONS AND SHARE BASED PAYMENTSShare based
payment £m
Productwarranties
£mReorganisation
£mDiscontinued
£mTotal
£m
At 1st January 2014 – 2.8 0.1 1.4 4.3Charged in the year 3.3 1.5 – (0.1) 4.7Utilised in year – (1.3) (0.1) (0.7) (2.1)
At 31st December 2014 3.3 3.0 – 0.6 6.9
Provisions have been split between current and non-current as follows:
2014£m
2013£m
Current 3.7 2.8Non-current 3.2 1.5
At 31st December 6.9 4.3
Product warrantiesProvision is made for the estimated liability on all products still under warranty. Product warranties of between one and three years are given for the Group’s main products.
ReorganisationThe reorganisation provision includes provision for the remaining costs associated with previously announced reorganisations within the Group.
DiscontinuedThe discontinued provision mainly relates to the remaining costs in respect of the disposal of Pipe Systems in 2001 and Foodservice in 2007, including possible warranty and indemnity claims, other claims and other costs from third parties in relation to these divested businesses. Although the majority of these provisions may be realised in the next accounting period, the exact timing is unclear. The provision held reflects the remaining settlements and claims in relation to divested businesses.
Share based paymentThis relates to a cash settled share based payment transaction in respect of the Fired Earth Incentive Scheme (note 23).

Group plc Annual Report & Accounts 2014 79
21. DEFERRED TAX
Deferred tax is calculated on temporary differences under the balance sheet liability method using the substantively enacted rates. The movement on the deferred tax account is shown below:
Net deferred tax2014
£m2013
£m
At 1st January 10.6 13.3Exchange adjustment – (0.1)Taken to other comprehensive income (note 8) 6.4 (3.2)Credited to consolidated income statement (note 8) 0.9 0.6
At 31st December 17.9 10.6
Deferred tax assets have been recognised in respect of all tax losses and other temporary differences giving rise to deferred tax assets where it is probable that these assets will be recovered. The movement in deferred tax assets and liabilities during the year is shown below:
Deferred tax assetsIntangibles
£mPensions
£mTax losses
£mOther
£mTotal
£m
At 1st January 2014 (1.1) 8.8 2.4 1.3 11.4Transferred from deferred tax liabilities (1.3) – – 0.5 (0.8)Taken to other comprehensive income (note 8) – 6.4 – – 6.4Credited to consolidated income statement 0.2 0.3 (0.1) 0.5 0.9
At 31st December 2014 (2.2) 15.5 2.3 2.3 17.9
Deferred tax liabilitiesIntangibles
£mOther
£mTotal
£m
At 1st January 2014 1.3 (0.5) 0.8Transferred to deferred tax assets (1.3) 0.5 (0.8)
At 31st December 2014 – – –
Deferred tax liabilities have been offset against deferred tax assets in the same tax groups and jurisdictions to the extent that they can be set off for corporation tax. The Group has unprovided deferred tax assets of £12.0m (2013: £11.0m) relating to losses and other temporary differences and £0.4m relating to capital losses.
A deferred tax asset has not been recognised where the future recovery of the assets is uncertain.
22. SHARE CAPITAL2014 2013
Allotted, called up and fully paid m £m m £m
Ordinary shares of 467/8p each as at 31st December 69.3 32.5 69.3 32.5
23. SHARE BASED PAYMENT ARRANGEMENTS
The Group has the following share option schemes in place:
The Senior Executive Share Option SchemeDuring 2013, the 105,500 Senior Executive Share options granted in 2003 lapsed. No options under this scheme remain outstanding.
The Company Share Option Plan (‘CSOP’)The CSOP was introduced during 2010. The CSOP options granted in April 2011 lapsed in 2014 as the performance condition was not met. The CSOP options granted in April 2012 will only become exercisable on the achievement of EPS growth above RPI and Total Shareholder Return (‘TSR’) targets. Half of the options granted are linked to TSR performance compared to the performance of the FTSE Small Cap Index (‘comparator group’). The options subject to the TSR condition shall only vest if the Company’s TSR shall place it at least at the median of the constituents of the comparator group ranked in descending order by TSR for the performance period. Half of the options granted are linked to EPS performance. The options subject to the EPS condition shall only vest if the Company’s EPS growth above RPI is at least 3% compound per annum. The performance condition is tested at the end of the performance period on the scale set out below:

Group plc Annual Report & Accounts 201480
NOTES TO THE ACCOUNTS
CONTINUED
23. SHARE BASED PAYMENT ARRANGEMENTS CONTINUED
Company’s TSR ranking versus the FTSE Small Cap Index
% of totaloption
exercisable
Below median 0%Median 25%Upper quartile 100%
EPS growth above RPI
% of totaloption
exercisable
Less than 3% compound p.a. 0%3% compound p.a. 25%10% compound p.a. or more 100%
Straight line vesting will occur if the Company’s TSR is between the median and upper quartile and the EPS between 3% and 10% compound per annum. The performance period is three years from 31st December 2011 to 31st December 2014. The EPS performance condition has not been achieved but part of the TSR performance condition has been met. The option holder will be able to exercise the option from 16th April 2015 to 15th April 2022. The binomial model was used for the valuations.
For the CSOP options granted in April 2014, half of the option subject to the TSR condition shall only be capable of being exercised (or vest) if the Company’s TSR shall have been such as would place it on the last day of the performance period at least at the median of the constituents of the comparator group ranked in descending order by TSR for the performance period, in which case the option shall become exercisable as follows and on a straight line basis for intermediate positions between each of the percentiles:
Position at which the Company is ranked
% of total option
exercisable
Lower than 50th percentile 050th percentile 2555th percentile 4060th percentile 5565th percentile 7070th percentile 8575th percentile 100
The part of the option subject to the EPS condition shall only be capable of being exercised (or vest) if the Company’s EPS shall have been such as would place it on the last day of the performance period at least the minimum threshold in which case the option shall become exercisable as follows and on a straight line basis for intermediate positions up to the maximum calculated as follows:
Basic EPS at end of performance period
% of total option
vesting
22.5p 100%20.0p 75%17.5p 50%15.0p 25%Below 15.0p No vesting
The Sharesave PlanThe Sharesave Plan was introduced in 2008 to encourage eligible UK employees to have an involvement in the Group’s performance. Savings contracts are of three or five year terms. The vesting period was 38 months or 62 months and options may be exercised up to six months after the vesting date. During 2014 the options under this plan lapsed.
Fired Earth Incentive SchemeThe management of Fired Earth had an option to acquire 25.5% of the share capital of Fired Earth Limited under an agreement commencing May 2011. The agreement is treated as a cash settled share based payment arrangement due to a put option within the agreement whereby management can put the shares back to the Group for cash representing market value. As at 31st December 2014 management had acquired 19.9% of the shares and the option for the remaining 5.6% share capital had lapsed. The charge for the year reflects the movement in the fair value of the cash settled arrangement and is £3.3m based on 18,500 shares at a fair value of £180 each.

Group plc Annual Report & Accounts 2014 81
Share options outstandingOptions outstanding at 31st December 2014 under the Group schemes were as follows:
Sharesave Plan CSOP
Grant dateNumber of
sharesExercisable
in 6 months toExercise price
p per share Grant dateNumber of
sharesExercisable in
7 years toExercise price
p per share
April 2014 223,219 April 2024 NilSeptember 2008 – May 2014 209 April 2012 698,456 April 2022 Nil
Total – Total 921,675
The total charge for the year relating to employee share based payment plans was £nil (2013: £0.1m) before tax and £nil (2013: £0.1m) post tax.
The fair value per option of the CSOP granted in 2014 and the assumptions used in the calculation were as follows:
2014
Grant date 17th AprilClosing share price at valuation date 173pExercise price NilNumber of employees 5Shares under option 223,219Vesting period (years) 3Expected volatility 38.4%Option life (years) 10Expected life (years) 3Risk-free rate 1.093%Expected dividend yield 0%Fair value per option (EPS/TSR) 173p/128p
There are no options exercisable under the CSOP as at 31st December 2014. The weighted average remaining contractual life is eight years.
A reconciliation of the movements in the Senior Executive Share Option Scheme is shown below:
2014 2013
Number’000
Weightedaverageexercise
pricep
Number’000
Weightedaverageexercise
price p
Outstanding at 1st January – – 106 235Lapsed – expired – – (106) 235
Outstanding at 31st December – – – –
Exercisable at 31st December – – – –
A reconciliation of the movements in the CSOP and Sharesave Plan are shown below:
CSOP Sharesave Plan
2014Number of
shares’000
2013Number of
shares’000
2014Number of
shares’000
2013Number of
shares’000
Outstanding at 1st January 857 1,017 205 207Granted 223 – – –Lapsed – expired – (1) (205) –Lapsed – forfeited (158) (159) – (2)
Outstanding at 31st December 922 857 – 205
Exercisable at 31st December – – – 205

Group plc Annual Report & Accounts 201482
NOTES TO THE ACCOUNTS
CONTINUED
23. SHARE BASED PAYMENT ARRANGEMENTS CONTINUED
Under the CSOP and Sharesave Plan the share options outstanding as at 31st December are as follows:
CSOP2014 2013
Exerciseprice
p
Number ofshares
’000
Contractual remaining life
years
Exerciseprice
p
Number ofshares
’000
Contractualremaining life
years
123 – – 123 159 7.3
Nil 698 7.3 Nil 698 8.3
Nil 223 9.3 Nil – –
Sharesave Plan2014 2013
Exerciseprice
p
Number ofshares
’000
Contractualremaining life
years
Exerciseprice
p
Number ofshares
’000
Contractualremaining life
years
209 – – 209 205 0.4
Further details relating to the directors’ Sharesave Plan and CSOP interests are shown in the audited section of the remuneration report on pages 33 to 47.
24. OTHER RESERVESFair value
revaluationreserve
£m
Translationreserve
£m
Capitalredemption
reserve£m
Total£m
At 1st January 2014 1.5 5.7 75.0 82.2Exchange adjustments on hedge of net investments – (0.1) – (0.1)Exchange differences on translation of foreign operations – (1.6) – (1.6)
At 31st December 2014 1.5 4.0 75.0 80.5
Fair valuerevaluation
reserve£m
Translationreserve
£m
Capitalredemption
reserve£m
Total£m
At 1st January 2013 1.5 5.3 75.0 81.8Exchange differences on translation of foreign operations – 0.4 – 0.4
At 31st December 2013 1.5 5.7 75.0 82.2
The fair value revaluation reserve relates to the 2005 acquisition of an additional stake in Grange, by AGA Home SAS, which gave the Group a controlling interest. The translation reserve includes all exchange adjustments in respect of overseas operations. The capital redemption reserve has arisen through share buy-backs and share consolidations in previous years.
25. COMMITMENTS2014
£m2013
£m
Capital commitments contracted for by the Group for property, plantand equipment but not provided for in the accounts 0.3 1.7
26. OPERATING LEASE COMMITMENTSLand and buildings Other operating leases
Future minimum lease payments under non-cancellable leases2014
£m2013
£m2014
£m2013
£m
– within 1 year 5.8 6.1 1.3 1.5– between 1 and 5 years 15.1 16.8 2.9 3.0– after more than 5 years 7.7 10.8 0.1 0.1
Total operating lease commitments 28.6 33.7 4.3 4.6
The operating lease commitments relate to properties, motor vehicles and plant and machinery. The leases have various terms, escalation clauses and renewal rights.

Group plc Annual Report & Accounts 2014 83
27. CONTINGENT LIABILITIES
The Group has contingent liabilities for certain potential claims from third parties in relation to divested businesses. On the basis of information presently available to them, the directors believe that no material claims are likely to arise for which provision has not been made in these accounts.
The Group has arranged £30.0m (2013: £30.0m) of bank guarantees, to guarantee obligations of the Group to the AGA Rangemaster Group Pension Scheme which may arise in the period up to 31st December 2020.
The Group has no other material contingent liabilities arising in the normal course of business at 31st December 2014 (2013: £nil).
28. RELATED PARTY TRANSACTIONS
The Group recharges the Group pension scheme with part of the cost of administration. The total amount recharged in the year to 31st December 2014 was £0.1m (2013: £0.1m) and this was included in the amount outstanding at the year end of £0.2m (2013: £0.1m).
Key management’s compensationThe compensation of the key management team, including executive directors, at the balance sheet date is set out below:
2014£m
2013£m
Salaries and short-term benefits 1.4 1.6Post employment benefits 0.1 0.1Share based payments – 0.1
Total emoluments to key management 1.5 1.8
29. TRADING SUBSIDIARIES
The following is a list of the Group’s principal trading subsidiaries at 31st December 2014. A description of their activities is given in the strategic report. The share capital in each case consists, unless otherwise stated, wholly of ordinary shares, preference shares or common stock. All companies are held by subsidiary undertakings, except for those marked • in which case it is held directly by AGA Rangemaster Group plc.
Where subsidiaries are not wholly owned the percentage of owned capital is stated. Unless otherwise stated the companies are registered in England and operate in the United Kingdom. All subsidiaries included in the consolidation have coterminous year-ends.
AGA Rangemaster Limited trades in the UK principally under the trade and business names of:
Website addresses:
AGA www.agaliving.comAGA Cookshop www.agacookshop.co.ukDivertimenti www.divertimenti.co.ukFalcon www.falconappliances.comLeisure Sinks www.leisuresinks.co.ukMercury www.mercuryappliances.co.ukRangemaster www.rangemaster.co.ukRayburn www.rayburn-web.co.ukRedfyre www.redfyrecookers.co.uk
Principal overseas trade and business names:AGA Marvel (USA) www.agamarvel.com
www.aga-ranges.comwww.marvelrefrigeration.com
AGA Rangemaster France (branch) www.falconfrance.comGrange SAS (France) 98.5% www.grange.frHeartland Appliances Inc (Canada) www.heartlandapp.comLa Cornue SAS (France) www.lacornue.comNorthland Corporation (USA) www.northlandnka.comWaterford Stanley Limited (Ireland) www.waterfordstanley.com
Other UK:ARG Corporate Services Limited •Fired Earth Limited 80.1% • www.firedearth.com

Group plc Annual Report & Accounts 201484
INDEPENDENT AUDITOR’S REPORT
TO THE MEMBERS OF AGA RANGEMASTER GROUP PLC
Our opinion on the financial statements is unmodifiedWe have audited the financial statements of AGA Rangemaster Group plc for the year ended 31st December 2014 which comprise the consolidated income statement, the consolidated statement of comprehensive income, the consolidated and Parent Company balance sheets, the consolidated cash flow statement, the consolidated statement of changes in equity and the related notes. The financial reporting framework that has been applied in the preparation of the Group financial statements is applicable law and International Financial Reporting Standards (IFRSs) as adopted by the European Union. The financial reporting framework that has been applied in the preparation of the Parent Company financial statements is applicable law and United Kingdom Accounting Standards (United Kingdom Generally Accepted Accounting Practice).
This report is made solely to the Company’s members, as a body, in accordance with Chapter 3 of Part 16 of the Companies Act 2006. Our audit work has been undertaken so that we might state to the Company’s members those matters we are required to state to them in an auditor’s report and for no other purpose. To the fullest extent permitted by law, we do not accept or assume responsibility to anyone other than the Company and the Company’s members as a body, for our audit work, for this report, or for the opinions we have formed.
In our opinion:• the financial statements give a true and fair view of the state of the Group’s and of the Parent Company’s affairs as at 31st December 2014
and of the Group’s profit for the year then ended;• the Group financial statements have been properly prepared in accordance with International Financial Reporting Standards (IFRSs) as
adopted by the European Union;• the Parent Company financial statements have been properly prepared in accordance with United Kingdom Generally Accepted
Accounting Practice; and• the financial statements have been prepared in accordance with the requirements of the Companies Act 2006 and, as regards the Group
financial statements, Article 4 of the IAS Regulation.
Overview of our audit approach:
Materiality • Materiality of £1.3m representing 0.5% of revenue.• Audit differences in excess of £67k are reported to the audit committee.
Audit scope • AGA Rangemaster Group plc, the Parent Company, and AGA Rangemaster Limited were subject to full scope audits with the remaining entities and eliminations subject to specific audit testing based on our judgement of risk and materiality.
• Our scoping approach ensured we audited locations totalling 94% of the Group’s revenue. Principal risk areas • The accounting for the defined benefit pension scheme; and
• Revenue recognition – in particular the timing of revenue recognition.
Respective responsibilities of directors and auditorAs explained more fully in the directors’ responsibilities statement set out on page 50, the directors are responsible for the preparation of the Group financial statements and for being satisfied that they give a true and fair view. Our responsibility is to audit and express an opinion on the Group financial statements in accordance with applicable law and International Standards on Auditing (UK and Ireland). Those standards require us to comply with the Auditing Practices Board’s Ethical Standards for Auditors.
Our audit of the financial statementsAn audit involves obtaining evidence about the amounts and disclosures in the financial statements sufficient to give reasonable assurance that the financial statements are free from material misstatement, whether caused by fraud or error. This includes an assessment of: whether the accounting policies are appropriate to the Group’s and Parent Company’s circumstances and have been consistently applied and adequately disclosed; the reasonableness of significant accounting estimates made by the directors; and the overall presentation of the financial statements. In addition, we read all the financial and non-financial information in the annual report to identify material inconsistencies with the audited financial statements and to identify any information that is apparently materially incorrect based on, or materially inconsistent with, the knowledge acquired by us in the course of performing the audit. If we become aware of any apparent material misstatements or inconsistencies we consider the implications for our report.
Our application of materialityWe apply the concept of materiality both in planning and performing our audit, and in evaluating the effect of misstatements on our audit and on the financial statements. For the purposes of determining whether the financial statements are free from material misstatement we define materiality as the magnitude of misstatement that makes it probable that the economic decisions of a reasonably knowledgeable person, relying on the financial statements, would be changed or influenced.
We also determine a lower level of performance materiality (i.e. our tolerance for misstatement in an individual account or balance) which we use to determine the extent of testing needed to reduce to an appropriately low level the probability that the aggregate of any undetected misstatements added to uncorrected misstatements exceeds materiality for the financial statements as a whole.

Group plc Annual Report & Accounts 2014 85
When establishing our overall audit strategy, we determined a magnitude of uncorrected misstatements that we judged would be material for the financial statements as a whole. We determined materiality for the Group to be £1.3m (2013: £1.0m), which is approximately 0.5% of revenue (2013: 0.4% of revenue). Revenue was determined to be the most appropriate basis upon which to assess materiality due to the level of pension contribution and fair value charges affecting profit before tax. This provided the basis for determining the nature, timing and extent of our audit procedures, and identifying and assessing the risk of material misstatement.
We have increased our materiality basis from 0.4% to a generally used benchmark of 0.5% of revenue, but we have decreased our assessment of performance materiality from 75% to 50% during the year to ensure our testing thresholds continue to reflect our assessment of risk in the business and to focus on key judgements and estimates. Our objective in adopting this approach was to ensure that the total uncorrected and undetected audit differences did not exceed our planning materiality of £1.3m for the financial statements as a whole.We agreed that we would report to the Audit Committee all audit differences in excess of £67k, as well as differences below that threshold that, in our view warranted reporting on qualitative grounds. We evaluated any uncorrected misstatements against both the quantitive measures of materiality discussed above and in light of other relevant qualitative considerations.
An overview of the scope of our auditIn assessing the risk of material misstatement to the Group financial statements, our audit scope focused on five divisions, of which one was subject to a full scope audit for the year ended 31st December 2014. Three operating divisions were subject to a specific scope audit and one to a limited scope audit, where the extent of the audit work was based on our assessment of the risk of material misstatement and the materiality of the Group’s business operations at those locations. The audit of these five locations was performed at a materiality level calculated by reference to a proportion of Group materiality appropriate to the relevant scale of the individual business unit, ranging from £175k to £520k. Together with the Group Functions, which were also subject to a full scope audit these locations represent the principal business units of the Group and account for 94% of the Group’s revenue (2013: 78%), 92% of the Group’s operating profit (2013: 89%) and 68% of the Group’s total assets (2013: 78%). For specific scope operating divisions we have only included the revenue, operating profit and assets which were subject to detailed audit procedures in calculating this coverage. For the remaining components, we performed other procedures including analytical review, discussion with management and other audit procedures as appropriate, to confirm there were no significant risks of material misstatement in the Group financial statements. The senior statutory auditor has visited the full scope locations, one of the specific scope locations and one of the other locations during the year. In addition to the locations visited, the Group audit team remained in continual contact with component teams and reviewed the work on key audit areas.
Our assessment of risks of material misstatementWe identified the following risks of material misstatement which had the greatest effect on the overall audit strategy; the allocation of resources in the audit; and directing the efforts of the engagement team. Our response to these risks included the following procedures:
Principal risk area and rationale Audit response
Accounting for the defined benefit pension scheme
The UK defined benefit pension scheme is significant in size when compared to the operations of the Group. A high level of judgement is required to value the obligation under the scheme.
• we challenged the assumptions used by management in the pension liability valuations and we used a pensions specialist to assist us with validating the assumptions based on expectations and market practices;
• the work performed by the actuarial expert engaged by management was assessed through understanding and challenging the scope of their work and expertise;
• we tested a sample of the pension asset valuations to ensure they had been valued appropriately and obtained third party confirmations for these;
• the methodology and base data for the calculation of the pension obligation were reviewed and tested to underlying information to ensure they were appropriate and accurate in accordance with the accounting standards; and
• we ensured that the financial statement disclosures were in accordance with accounting standards.
Revenue recognition
The nature of the AGA business results in revenue being a significant area of audit focus, with particular emphasis on cut-off and revenue recognition policies.
• we compared the stated trading terms and conditions for each of the significant business units to the Group’s revenue recognition policy, and tested a sample of transactions to gain assurance that revenue was recognised in accordance with IFRS;
• we tested a sample of rebate agreements to ensure these discounts were accounted for in accordance with IFRS in the appropriate period;
• we carried out testing relating to controls over recognition of revenue, including confirming revenue recognition was in the correct period;
• we performed analytical procedures, cut-off testing on customer delivery notes, and sales available for delivery, around the year end and testing of journals affecting revenue; and
• we ensured that the financial statement disclosures were in accordance with accounting standards.
The above risks are consistent with the prior year.

Group plc Annual Report & Accounts 201486
Opinion on other matter prescribed by the Companies Act 2006In our opinion:• the part of the directors’ remuneration report to be audited has been properly prepared in accordance with the Companies Act 2006; and• the information given in the strategic report and the directors’ report for the financial year for which the Group financial statements are
prepared is consistent with the Group financial statements.
Matters on which we are required to report by exception
ISAs (UK and Ireland) reporting
We are required to report to you if, in our opinion, information in the annual report is:• materially inconsistent with the information in the audited financial statements; or• apparently materially incorrect based on, or materially inconsistent with, our
knowledge of the Group acquired in the course of performing our audit; or• is otherwise misleading.
In particular, we are required to consider whether we have identified any inconsistencies between our knowledge acquired during the audit and the directors’ statement that they consider the annual report is fair, balanced and understandable, and whether the annual report appropriately discloses those matters that we communicated to the audit committee which we consider should be disclosed.
We have no exceptions to report.
Companies Act 2006 reporting
We are required to report to you if, in our opinion:• adequate accounting records have not been kept by the Parent Company, or
returns adequate for our audit have not been received from branches not visited by us; or
• the Parent Company financial statements and the part of the directors’ remuneration report to be audited are not in agreement with the accounting records and returns; or
• certain disclosures of directors’ remuneration specified by law are not made; or• we have not received all the information and explanations we require for our audit.
We have no exceptions to report.
Listing Rules review requirements
We are required to review:• the directors’ statement, set out on page 49, in relation to going concern; and• the part of the Corporate Governance Statement relating to the Company’s
compliance with the nine provisions of the UK Corporate Governance Code specified for our review.
We have no exceptions to report.
Nigel Meredith (Senior statutory auditor)for and on behalf of Ernst & Young LLP, Statutory AuditorBirmingham6th March 2015
INDEPENDENT AUDITOR’S REPORT
CONTINUED

Group plc Annual Report & Accounts 2014 87
FIVE YEAR FINANCIAL HISTORY
Trading results2014
£m2013
£m2012
£m2011
£m2010
£m
Revenue 261.1 250.4 244.6 250.9 259.1Group operating profit 9.6 8.2 6.5 6.1 5.1Pension (charge)/credit (4.1) (3.5) (2.9) 3.1 16.4Non-recurring costs – (2.2) (1.7) (2.1) (1.4)Fair value movement (3.3) – – – –
Profit before finance cost and tax 2.2 2.5 1.9 7.1 20.1Net finance (cost)/income (1.5) (1.4) (0.2) 0.4 (0.2)
Profit before tax 0.7 1.1 1.7 7.5 19.9Tax (expense)/credit (0.6) (0.4) (0.2) 5.4 (5.8)
Profit for the year – continuing operations 0.1 0.7 1.5 12.9 14.1Post tax profit from discontinued operations – – – 2.7 –
Profit for the year 0.1 0.7 1.5 15.6 14.1
StatisticsOperating profit to revenue % 3.7 3.3 2.7 2.4 2.0Dividend per ordinary share p – – – 1.9 1.7
Earnings per share – continuingBasic p 0.1 1.2 2.3 18.8 20.5Diluted p 0.1 1.1 2.3 18.8 20.5
Balance sheet summary2014
£m2013
£m2012
£m2011
£m2010
£m
Net operating assetsProperty, plant and equipment 42.5 38.6 38.3 40.8 40.8Inventories 49.0 45.1 45.9 45.5 42.8Operating receivables less payables and provisions (42.6) (32.8) (34.5) (45.6) (47.2)
Total net operating assets before retirement benefit (obligation)/surplus and intangibles 48.9 50.9 49.7 40.7 36.4Assets held for sale – 2.2 2.2 2.6 10.2Retirement benefit (obligation)/surplus (72.0) (35.8) (38.7) (22.6) 7.1Goodwill and intangible assets 90.5 90.9 89.8 90.6 89.6
Total net operating assets 67.4 108.2 103.0 111.3 143.3Tax 14.1 6.6 11.4 3.9 (15.6)Total net cash 9.2 5.9 5.5 31.3 34.6
Total net assets 90.7 120.7 119.9 146.5 162.3
Financed byOrdinary shares 32.5 32.5 32.5 32.5 32.5Reserves 58.2 88.2 87.3 113.8 129.4
Equity attributable to equity holders of the parent 90.7 120.7 119.8 146.3 161.9Non-controlling interests – – 0.1 0.2 0.4
Total equity 90.7 120.7 119.9 146.5 162.3

Group plc Annual Report & Accounts 201488
The Company has elected to prepare its financial statements under UK GAAP.
Notes2014
£m2013
£m
Fixed assetsInvestments 5 389.5 399.1
Total fixed assets 389.5 399.1
Current assetsDebtors – amounts falling due within one year 6 660.4 657.5Cash at bank and in hand 7 10.8 9.8
Total current assets 671.2 667.3
Creditors – amounts falling due within one yearCreditors 8 (639.9) (630.4)Provision for liabilities and charges 9 (3.8) (1.0)
Total amounts falling due within one year (643.7) (631.4)
Net current assets 27.5 35.9
Total assets less current liabilities 417.0 435.0
Creditors – amounts falling due after more than one yearBorrowings 7 (14.2) (14.0)
Total net assets employed 402.8 421.0
Shareholders’ equityShare capital 10 32.5 32.5Share premium account 11 29.6 29.6Capital redemption reserve 11 75.0 75.0Profit and loss account 11 265.7 283.9
Total shareholders’ funds 402.8 421.0
The accounts were approved by the board of directors on 6th March 2015 and were signed on its behalf by:
W B McGrath S M SmithChief Executive Finance Director
Notes to the accounts are on pages 89 to 92.
PARENT COMPANY ACCOUNTS UNDER UK GAAP
COMPANY BALANCE SHEET AS AT 31ST DECEMBER

Group plc Annual Report & Accounts 2014 89
NOTES TO THE PARENT COMPANY ACCOUNTS
The directors’ report is on pages 48 to 49 and the strategic report on pages 2 to 23 of the annual report and accounts.
1. ACCOUNTING POLICIES
Basis of accountingThe accounts are prepared under the historical cost convention and in accordance with applicable Accounting Standards and the Companies Act 2006.
A consolidated Group cash flow statement has been included in the AGA Rangemaster Group plc consolidated accounts; the Company has therefore taken advantage of the exemption under FRS 1 not to produce a cash flow statement. The Company has taken advantage of the exemption under FRS 29 from financial instrument disclosures.
CashCash and short-term deposits in the balance sheet comprise cash at bank and in hand and short-term deposits with an original maturity of three months or less.
Interest bearing loans and borrowingsObligations for loans and borrowings are recognised when the Company becomes party to the related contracts and are measured initially at fair value less directly attributable transaction costs. After initial recognition, interest bearing loans and borrowings are subsequently measured at amortised cost using the effective interest method. Gains and losses arising on the repurchase, settlement or cancellation of liabilities are recognised respectively in interest receivable and payable.
Borrowings are classified as current liabilities unless the Company has an unconditional right to defer settlement of the liability at the balance sheet date.
Foreign currenciesThe Company’s functional currency and the presentation currency is pounds sterling. Transactions in foreign currencies are initially recorded in the functional currency by applying the spot exchange rate ruling at the date of the transaction. Monetary assets and liabilities denominated in foreign currencies are retranslated at the functional currency rate of exchange ruling at the balance sheet date. All differences are taken to the profit and loss account, except when hedge accounting is applied. These are taken directly to reserves until the hedged transaction affects profit or loss, at which time they are recognised in the profit and loss account.
Non-monetary items that are measured in terms of historical cost in a foreign currency are translated using the exchange rates as at the dates of the initial transactions. Non-monetary items measured at fair value in a foreign currency are translated using the exchange rates at the date when the fair value was determined.
Deferred taxDeferred tax is provided in respect of all timing differences, using the balance sheet liability method. Deferred tax assets are recognised to the extent that it is probable that future taxable profit will be available against which the timing differences can be utilised.
Deferred tax is measured at the tax rates that are expected to apply in the periods in which the timing differences are expected to reverse based on tax rates and laws that have been enacted or substantively enacted by the balance sheet date.
InvestmentsInvestments in subsidiaries are held at cost and reviewed for impairment annually where there are indicators that suggest the amount might not be recoverable.
ProvisionsA provision is recognised when the Group has a legal or constructive obligation as a result of a past event; it is probable that an outflow of economic benefits will be required to settle the obligation; and a reliable estimate can be made of the amount of the obligation. If the effect is material, expected future cash flows are discounted using a current pre-tax rate that reflects, where appropriate, the risks specific to the liability. Where the Group expects some or all of a provision to be reimbursed, the reimbursement is recognised as a separate asset but only when recovery is virtually certain.
Employee share optionsThe cost of equity-settled transactions with employees is measured by reference to the fair value at the date on which they are granted and is recognised as an expense over the vesting period, which ends on the date on which the relevant employees become fully entitled to the award. Fair value is determined by external valuation using an appropriate pricing model. In valuing equity-settled transactions, no account is taken of any service or performance conditions (vesting conditions), other than performance conditions linked to the price of the shares of the Company (market conditions). Any other conditions which are required to be met in order for an employee to become fully entitled to an award are considered to be non-vesting conditions. Market performance conditions and non-vesting conditions are taken into account in determining the grant date fair value.

Group plc Annual Report & Accounts 201490
NOTES TO THE PARENT COMPANY ACCOUNTS
CONTINUED
1. ACCOUNTING POLICIES CONTINUED
No expense is recognised for awards that do not ultimately vest, except for awards where vesting is conditional upon a market vesting condition or a non-vesting condition, which are treated as vesting irrespective of whether or not the market condition or non-vesting condition is satisfied, provided that all other non-market vesting conditions are satisfied.
Where an equity-settled award is cancelled, it is treated as if it had vested on the date of cancellation, and any cost not yet recognised in the profit and loss account for the award is expensed immediately. Any compensation paid up to the fair value of the award at the cancellation or settlement date is deducted from equity, with any excess over fair value being treated as an expense in the profit and loss account.
The majority of share options are granted to directors of the Company. When the Company awards share options to subsidiary companies an addition to their cost of investment is made in order to recognise the capital contribution.
Provision is made for cash settled options in relation to their fair value at the balance sheet date. The liability is remeasured to fair value at each reporting date up to, and including the settlement date, with changes in fair value recognised in the profit and loss account.
2. COMPANY PROFIT AND LOSS ACCOUNT
AGA Rangemaster Group plc has taken advantage of section 408(4) of the Companies Act 2006 and has not included its own profit and loss account in these accounts. The Company’s loss after tax was £18.2m (2013 profit: £121.3m).
Fees paid to Ernst & Young LLP and its associates for non-audit services to the Company itself are not disclosed in the individual accounts of AGA Rangemaster Group plc because Group financial statements are prepared which are required to disclose such fees on a group basis.
3. DIVIDENDS
The directors are not recommending a final dividend in respect of the financial year ended 31st December 2014 (2013: £nil). No interim dividend was paid in the year (2013: £nil).
4. DIRECTORS’ COMPENSATION
The compensation of the directors is disclosed in note 5 of the consolidated annual report and accounts.
5. INVESTMENTS
Interest in subsidiaries
Cost ofshares
£mProvisions
£m
Net bookvalue
£m
At 1st January 2014 470.7 (71.6) 399.1Movement in year – (9.6) (9.6)
At 31st December 2014 470.7 (81.2) 389.5
The movement in provisions in the year related to AGA Home SAS.
6. TRADE AND OTHER DEBTORS
Amounts falling due within one year2014
£m2013
£m
Amounts owed by Group undertakings 659.0 656.4Deferred tax asset 0.4 0.3Corporation tax recoverable 0.9 0.5Prepayments and accrued income – 0.2Other receivables 0.1 0.1
Debtors falling due within one year 660.4 657.5

Group plc Annual Report & Accounts 2014 91
7. CASH AND BORROWINGS
a) Cash2014
£m2013
£m
Short-term bank deposits 10.8 9.8
Cash 10.8 9.8
b) Financial liabilities – net borrowings2014
£m2013
£m
Bank borrowings 14.2 14.0
Borrowings falling due after one year 14.2 14.0
Short-term bank deposits (10.8) (9.8)
Total net borrowings 3.4 4.2
The Company’s borrowings are primarily loan advances denominated in a number of currencies and interest is based on LIBOR or foreign equivalents.
The loans are unsecured. The amounts falling due after one year are due for repayment in 2016.
8. CREDITORS
Amounts falling due within one year2014
£m2013
£m
Amounts owed to Group undertakings 636.7 627.8Defined benefit liability 1.9 1.6Accruals and deferred income 1.0 0.7Other payables 0.3 0.3
Total creditors falling due within one year 639.9 630.4
See note 6 of the consolidated annual report and accounts for pension’s disclosures.
9. PROVISIONS FOR LIABILITIES AND CHARGESShare based
payments£m
Discontinued£m
Total£m
At 1st January 2014 – 1.0 1.0Charge in year 3.3 – 3.3Utilised in the year – (0.5) (0.5)
At 31st December 2014 3.3 0.5 3.8
The discontinued provision mainly relates to the remaining costs in respect of the disposal of Pipe Systems in 2001 and Foodservice in 2007, including possible warranty and indemnity claims, other claims and other costs from third parties in relation to these divested businesses. Although the majority of these provisions may be realised in the next accounting period, the exact timing is unclear. The provision held reflects the remaining settlements and claims in relation to divested businesses.
The share based payment liability relates to a cash settled share based payment transaction in respect of the Fired Earth Incentive Scheme (see note 23 of the consolidated annual report and accounts).
10. SHARE CAPITAL
Allotted, called up and fully paid
2014 2013
m £m m £m
Ordinary shares of 467/8p each as at 31st December 69.3 32.5 69.3 32.5
During the year no ordinary shares were issued in connection with the Company’s share option schemes (2013: nil). All of the ordinary shares rank equally with respect to voting rights and rights to receive ordinary and special dividends. There are no restrictions on the rights to transfer shares.

Group plc Annual Report & Accounts 201492
10. SHARE CAPITAL CONTINUED
Share based paymentsOptions outstanding at 31st December 2014 and share based payments disclosures are shown in note 23 of the consolidated annual report and accounts.
11. RESERVES
Sharecapital
£m
Sharepremium
£m
Capitalredemption
reserve£m
Profit andloss
account£m
Totalequity
£m
At 1st January 2014 32.5 29.6 75.0 283.9 421.0Loss for the year – – – (18.2) (18.2)
At 31st December 2014 32.5 29.6 75.0 265.7 402.8
12. COMMITMENTS
The Company had no capital commitments (2013: £nil).
13. CONTINGENT LIABILITIES
The Company has contingent liabilities for certain potential claims from third parties in relation to divested businesses. On the basis of information presently available to them, the directors believe that no material claims are likely to arise for which provision has not been made in these accounts. The Company has given a number of financial and performance guarantees on behalf of its subsidiaries and the relevant liabilities are included in the balance sheet.
The Company has arranged £30.0m (2013: £30.0m) of bank guarantees, to guarantee obligations of the Company to the AGA Rangemaster Group Pension Scheme.
The Company has no other material contingent liabilities arising in the normal course of business at 31st December 2014 (2013: £nil).
14. RELATED PARTY TRANSACTIONS
The Company has taken advantage of the exemption permitted by FRS 8 not to disclose any transactions or balances with entities that are 100% controlled by the AGA Rangemaster Group plc.
The Company was owed an amount by its indirectly owned 98.5% subsidiary, Grange SAS. The balance at 31st December 2014 was £12.1m (2013: £8.9m) and is repayable on demand. The maximum balance during the year was £12.1m.
15. TRADING SUBSIDIARIES
The Company’s principal trading subsidiaries at 31st December 2014 are listed in note 29 of the consolidated annual report and accounts.
NOTES TO THE PARENT COMPANY ACCOUNTS
CONTINUED

Group plc Annual Report & Accounts 2014 93
SHAREHOLDER INFORMATION
HEAD OFFICE AND REGISTERED OFFICEAGA Rangemaster Group plcJuno DriveLeamington SpaWarwickshireCV31 3RGTelephone: +44 (0) 1926 455755Facsimile: +44 (0) 1926 455749E-mail: [email protected]: www.agarangemaster.comRegistered in England and Wales no. 00354715
2015 FINANCIAL CALENDARAnnual General Meeting 30th April 20152015 half year close 30th June 2015
At 31st December 2014, the Company had 5,003 ordinary shareholders (2013: 5,226). Their holdings are analysed as follows:
Number of 467/8p ordinary sharesNumber of
shareholders% of total
shareholdersNumber ofshares held
% of totalshares held
Up to 5,000 4,660 93.14 3,180,804 4.595,001–50,000 243 4.86 3,678,580 5.3150,001–500,000 74 1.48 14,004,344 20.22Over 500,001 26 0.52 48,400,495 69.88
Total 5,003 100.0 69,264,223 100.0
SHARE FRAUD WARNINGShareholders are advised to be very wary of any unsolicited investment advice or offers of free company reports. Keep in mind that firms authorised by the Financial Conduct Authority (‘FCA’) are unlikely to contact you in this way. Fraudsters use persuasive and high-pressure tactics to lure investors into scams, commonly by offering to sell shares that are worthless or non-existent, or to buy shares at an inflated price in return for an upfront payment. The FCA estimate £200 million is lost in the UK each year to share fraud, with most victims being experienced investors.
The FCA provides the following guidance should you be contacted in this manner:• Obtain the name of the person calling and the firm they represent;• Check the Financial Services Register at www.fca.org.uk/register to ensure they are authorised by the FCA;• Use the firm’s contact details listed on the Register if you want to call it back;• If you deal with an unauthorised firm you will not have access to the Financial Ombudsman Service and will not be eligible to receive
payment under the Financial Services Compensation Scheme;• Search the list of unauthorised firms to avoid at www.fca.org.uk/scams;• If you are approached by an unauthorised firm, or you are told details on the Register are out of date, please call the FCA on 0800 111
6768 or use the share fraud reporting form at www.fca.org.uk/scams. Please also inform our registrars, Equiniti, by calling 0871 384 2355;• If you have already paid money to share fraudsters you should contact Action Fraud on 0300 123 2040.
SHARE DEALING SERVICESThe Company’s registrar, Equiniti Financial Services Limited, offers UK and European Economic Area (‘EEA’) resident shareholders a telephone and internet dealing service, Shareview, which provides a simple and convenient way to buy and sell shares. For telephone purchases and sales call 0845 603 7037 between 8.00a.m. and 4.30p.m., Monday to Friday, and for internet dealings log on to www.shareview.co.uk/dealing. For the sale of shares, you will need your shareholder reference number as shown on your share certificate.
CAUTIONARY NOTE REGARDING FORWARD-LOOKING STATEMENTSThis annual report and accounts includes statements that are forward-looking in nature. Forward-looking statements involve known and unknown risks, assumptions and uncertainties that could cause actual results or outcomes to be materially different from those expressed or implied by such forward-looking statements. All forward-looking statements in this annual report and accounts are based upon information known to the Company on the date of this annual report and accounts. No assurance is given that any particular expectation will be met and you are cautioned not to place undue reliance on forward-looking statements. Except as required by the Listing Rules and applicable law, the Company does not undertake to update or revise any forward-looking statement, whether as a result of new information, future events or otherwise.

Juno Drive, Leamington Spa,Warwickshire, CV31 3RGTelephone: +44 (0)1926 455755Facsimile: +44 (0)1926 455749E-mail: [email protected]: www.agarangemaster.com
Group plc