annual report 2020 - shakarganj limited
TRANSCRIPT
ANNUAL REPORT 2020

01
Financial Statements (Unconsolidated)26 Independent Auditor’s Report
30 Statement of Financial Position
32 Statement of Profit Or Loss
33 Statement of Comprehensive Income
34 Statement of Changes in Equity
35 Statement of Cash Flows
36 Notes to the Financial Statements
Financial Statements (Consolidated)95 Consolidated Directors’ Report
96 Independent Auditor’s Report
100 Consolidated Statement of Financial Position
102 Consolidated Statement of Profit Or Loss
103 Consolidated Statement of Other Comprehensive Income
104 Consolidated Statement of Changes in Equity
105 Consolidated Statement of Cash Flows
106 Notes to the Consolidated Financial Statements
173 Pattern of Shareholding
176 Notice of 53rd Annual General Meeting
179 Notice of 53rd Annual General Meeting (Urdu)
180 Consolidated Directors’ Report (Urdu )
188 Directors’ Report (Urdu )
190 Review Report by the Chairman (Urdu )
191 Form of Proxy
191 Form of Proxy (Urdu)
193 Consent Form for Electronic Transmission of
Annual Report and Notice of AGM
194 Consent Form for Electronic Transmission of
Annual Report and Notice of AGM (Urdu)
195 Standard Request Form for Hard Copies of
Annual Audited Accounts
196 Standard Request Form for Hard Copies of
Annual Audited Accounts (Urdu)
197 E-Dividend Form
198 E-Dividend Form (Urdu)
199 Form for Video Conference Facility
200 Form for Video Conference Facility (Urdu)
CONTENTSOrganization Overview and Governance 02 Vision, Mission & Core Values
03 Quality Policy
04 Geographical Presence
05 Company Information
06 Shareholders Information
07 Company Profile and Group Structure
10 Management Committees
11 Organizational Chart
12 Review Report by the Chairman
13 Directors’ Report
Performance 19 Financial Highlights
20 Production Data
22 Statement of Compliance with Code of
Corporate Governance
24 Review Report to the Members on Statement of
Compliance with Code of Corporate Governance

02
MISSION
VISION
CORE VALUES
To gain and maintain leadership in our relevant sectors by producing the best quality products at the lowest possible cost
To give the best returns to our shareholders by optimal allocation of resources to the products and markets we compete in
To provide the best value products and services to our customers through investment in technology, human resources, operational systems, and processes
To provide the best working environment to our employees and provide them opportunities to enhance their skills
To work with our farmers, suppliers, and distributors as partners in developing their expertise and profitability
To pursue environment friendly policies, and effectively and efficiently use all energy resources aiming for zero waste and a clean healthy environment
To be a socially responsible corporate citizen supporting education, health, environment, and socio economic development of its community

03
QUALITY POLICY
Our quality policy, stemming from our vision, is to maintain industry leadership
and customer satisfaction through production of high quality sugar, biofuel,
yarn, and other allied products at lowest cost, using environment friendly technology in safe working conditions.
We run our businesses with integrity and professionalism, and believe in continual
improvements and a fair deal for our investors, customers, suppliers and above
all our employees.

04
Quetta
Lahore
Peshawar
Islamabad
Gilgit Baltistan
Karachi
Pakistan
Prod
ucts
Lim
ited
A.J & K
GEOGRAPHICAL PRESENCE

05
COMPANY INFORMATION
BOARD OF DIRECTORSFrom Left to Right
1. Chairman (Non-Executive) Mian Muhammad Anwar2. Chief Executive Officer Anjum Muhammad SaleemIn alphabetic order:3. Executive Director Ali Altaf Saleem4. Non-Executive Director Javed Anjum 5. Non-Executive Director (Independent) Jawad Amjad6. Non-Executive Director Khalid Bashir7. Non-Executive Director (Independent) Sheikh Asim Rafiq 8. Non-Executive Director (Independent) Zahra Ahsan Saleem
Chief Financial OfficerMuhammad Asif
Company SecretaryAsif Ali
Human Resource & Remuneration CommitteeChairpersonZahra Ahsan Saleem (Independent)
MemberJaved Anjum Khalid BashirZahra Ahsan Saleem (Independent)
MemberAnjum Muhammad SaleemKhalid BashirMian Muhammad Anwar
Audit CommitteeChairmanSheikh Asim Rafiq (Independent)
06
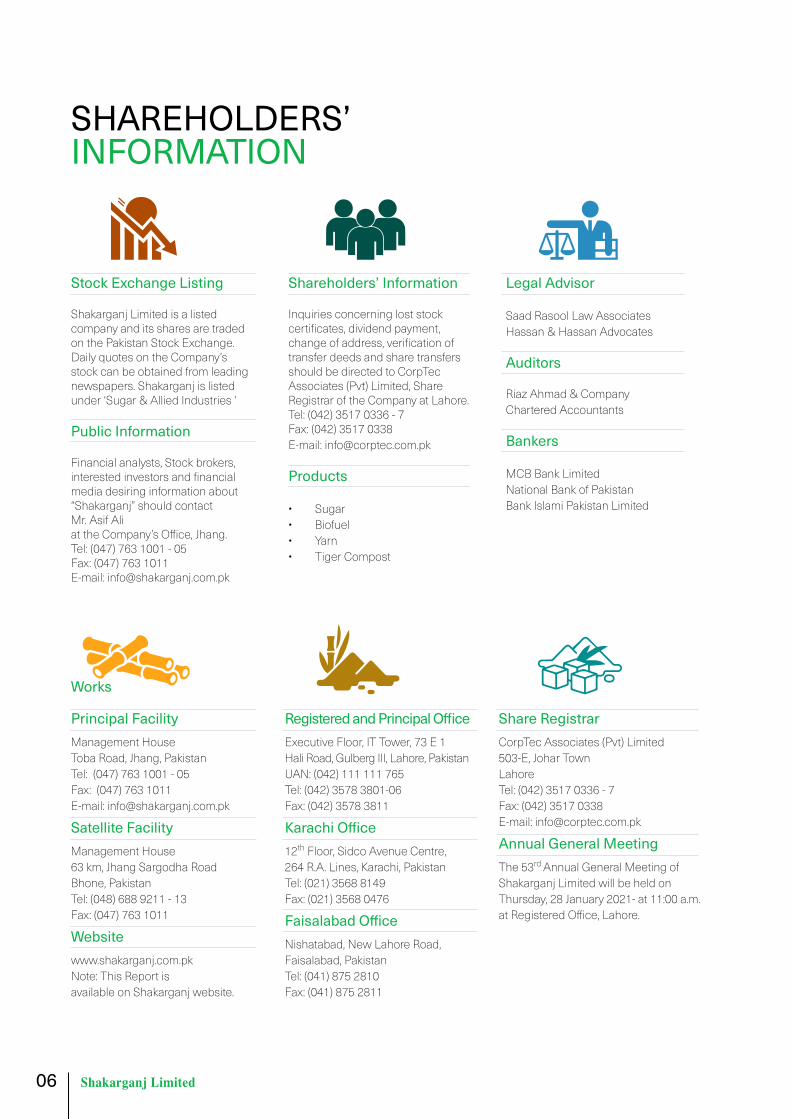
SHAREHOLDERS’ INFORMATION
Stock Exchange Listing Shakarganj Limited is a listed company and its shares are traded on the Pakistan Stock Exchange. Daily quotes on the Company’s stock can be obtained from leading newspapers. Shakarganj is listed under ‘Sugar & Allied Industries ’
Public Information
Financial analysts, Stock brokers,interested investors and financialmedia desiring information about“Shakarganj” should contact Mr. Asif Ali at the Company’s Office, Jhang.Tel: (047) 763 1001 - 05Fax: (047) 763 1011E-mail: [email protected]
Shareholders’ Information
Inquiries concerning lost stockcertificates, dividend payment,change of address, verification oftransfer deeds and share transfersshould be directed to CorpTec Associates (Pvt) Limited, Share Registrar of the Company at Lahore.Tel: (042) 3517 0336 - 7Fax: (042) 3517 0338E-mail: [email protected]
Products
• Sugar• Biofuel• Yarn• Tiger Compost
Legal Advisor
Saad Rasool Law AssociatesHassan & Hassan Advocates
Auditors
Riaz Ahmad & CompanyChartered Accountants
Bankers
MCB Bank LimitedNational Bank of PakistanBank Islami Pakistan Limited
Works
Principal FacilityManagement House Toba Road, Jhang, PakistanTel: (047) 763 1001 - 05Fax: (047) 763 1011E-mail: [email protected]
Satellite Facility Management House 63 km, Jhang Sargodha RoadBhone, PakistanTel: (048) 688 9211 - 13Fax: (047) 763 1011
Websitewww.shakarganj.com.pkNote: This Report isavailable on Shakarganj website.
Registered and Principal OfficeExecutive Floor, IT Tower, 73 E 1 Hali Road, Gulberg III, Lahore, PakistanUAN: (042) 111 111 765Tel: (042) 3578 3801-06Fax: (042) 3578 3811
Karachi Office12th Floor, Sidco Avenue Centre,264 R.A. Lines, Karachi, PakistanTel: (021) 3568 8149Fax: (021) 3568 0476
Faisalabad OfficeNishatabad, New Lahore Road,Faisalabad, PakistanTel: (041) 875 2810Fax: (041) 875 2811
Share Registrar CorpTec Associates (Pvt) Limited503-E, Johar TownLahoreTel: (042) 3517 0336 - 7Fax: (042) 3517 0338E-mail: [email protected]
Annual General MeetingThe 53rd Annual General Meeting of Shakarganj Limited will be held on Thursday, 28 January 2021- at 11:00 a.m. at Registered Office, Lahore.
07
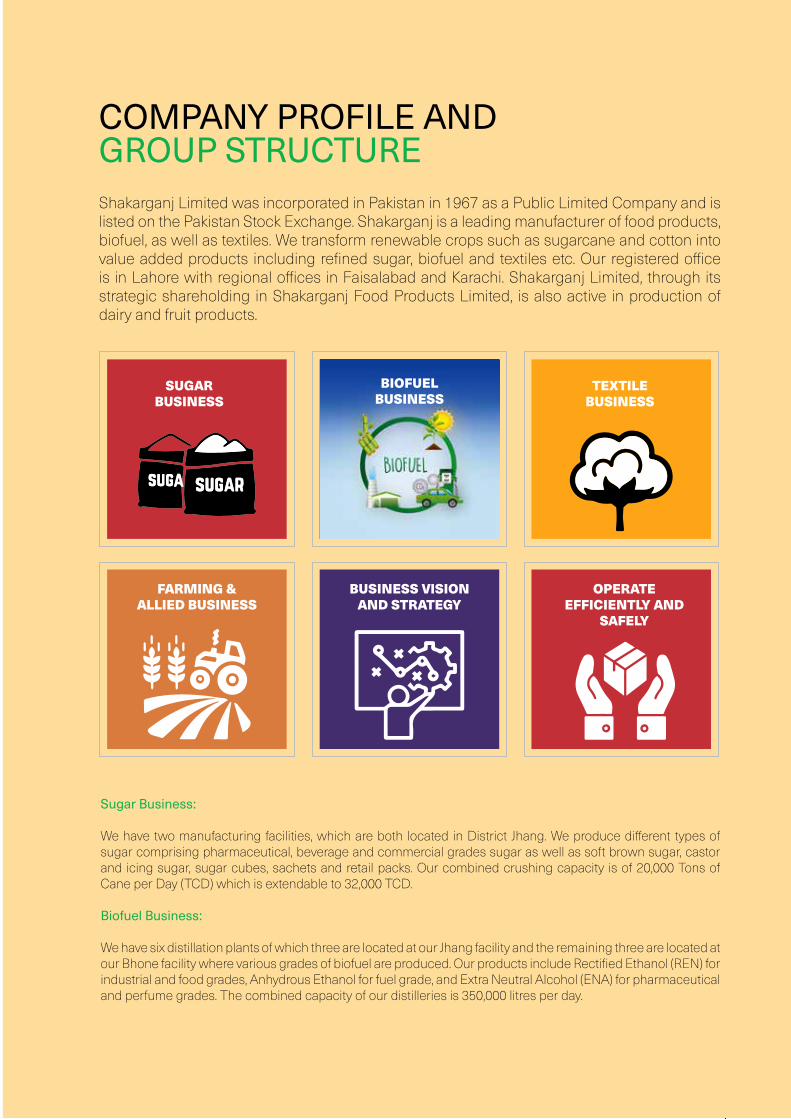
Shakarganj Limited was incorporated in Pakistan in 1967 as a Public Limited Company and is listed on the Pakistan Stock Exchange. Shakarganj is a leading manufacturer of food products, biofuel, as well as textiles. We transform renewable crops such as sugarcane and cotton into value added products including refined sugar, biofuel and textiles etc. Our registered office is in Lahore with regional offices in Faisalabad and Karachi. Shakarganj Limited, through its strategic shareholding in Shakarganj Food Products Limited, is also active in production of dairy and fruit products.
COMPANY PROFILE AND GROUP STRUCTURE
Sugar Business:
We have two manufacturing facilities, which are both located in District Jhang. We produce different types of sugar comprising pharmaceutical, beverage and commercial grades sugar as well as soft brown sugar, castor and icing sugar, sugar cubes, sachets and retail packs. Our combined crushing capacity is of 20,000 Tons of Cane per Day (TCD) which is extendable to 32,000 TCD.
Biofuel Business:
We have six distillation plants of which three are located at our Jhang facility and the remaining three are located at our Bhone facility where various grades of biofuel are produced. Our products include Rectified Ethanol (REN) for industrial and food grades, Anhydrous Ethanol for fuel grade, and Extra Neutral Alcohol (ENA) for pharmaceutical and perfume grades. The combined capacity of our distilleries is 350,000 litres per day.
SUGAR BUSINESS
BUSINESS VISION AND STRATEGY
FARMING & ALLIED BUSINESS
OPERATE EFFICIENTLY AND
SAFELY
TEXTILE BUSINESS
BIOFUEL BUSINESS

08
Textile Business:
This cotton spinning unit produces carded cotton and PC yarn ranging from 10/s to 33/s and doubled cotton yarn ranging from 8 to 40 TPI. The installed capacity is 24,960 spindles for cotton spinning and 2,304 spindles for doubling.
Farming & Allied Business:
This comprises different parcels of land mainly located in Jhang District near our manufacturing facilities. Total area under cultivation is 1,285 acres which is our owned land. The main crops include sugarcane, wheat, gram, maize, fodder and seasonal vegetables. A dairy farm located at Jhang has been developed, with a herd of around 200 milking and fattening cattle. A small herd of rams and bucks for fattening purpose has also been developed. Shakarganj has also launched a new product in the area of non chemicals fertilizers under the brand name of “Shakarganj Tiger Compost”. The product as organic fertilizer has been developed using aerobic decomposition process with addition of standardised microbial culture in filter cake. The compost is a rich source of organic matter, with macro and micro nutrients to help improve soil and it is very useful for better growth, yield and quality of all field crops in general and specifically for sugarcane. This is at its initial stage and would grow up in the farmer’s community with the practical exposures.
Business Vision and Strategy:
Shakarganj’s vision is to create the country’s leading renewable ingredients business. We aim to achieve this by building a consistent portfolio of distinctive, profitable, high-value solutions in products and services for our customers. Shakarganj is committed to providing long-term value for our shareholders. Our strategy is to build a stronger value added business with a low-cost commodity base.
We focus on five key business objectives to deliver consistent growth.
- Serve our Customers:
Delivering excellent customer service is at the core of everything we do. Our aim is to be the partner of choice in our customers’ processes and to help them develop more successful consumer products.
- Operate Efficiently and Safely:
We aim to be the lowest-cost and most efficient producer in all our markets. Through our expertise in high-volume process management, our focus is on technical and manufacturing excellence and the efficient use of services such as logistics and utilities. We are continually working to improve operational efficiency and strive to ensure safe and healthy conditions for everyone at our sites.
- Invest in Long Term Assets and Partnerships:
We continually evaluate investment opportunities that would add strategic value by enabling us to enter new markets or add products, technologies and knowledge more efficiently than we could originally. We also aim to grow our business by forming joint ventures and partnerships to enhance the capabilities of our existing product portfolio. Using alliances and joint ventures can be an efficient way to lower our cost of investing in new areas and markets, and will help secure access to new and complementary technology and expertise.
- Invest in Technology and People:
We are investing in our research and development capabilities to help us in developing innovative solutions that meet our customers’ product challenges. We are also complementing our own capabilities through business and technology partnerships, and university collaborations. To develop talent, improve leadership and help our employees succeed, we operate various Programmes designed to ensure the right skills at all levels to grow our business.
- Grow the Contribution from Value Added Products:
We are committed to grow the contribution from our value added products. Value added products utilise technology and intellectual property enabling us to obtain a price premium along with sustainable and/or higher margins.
09
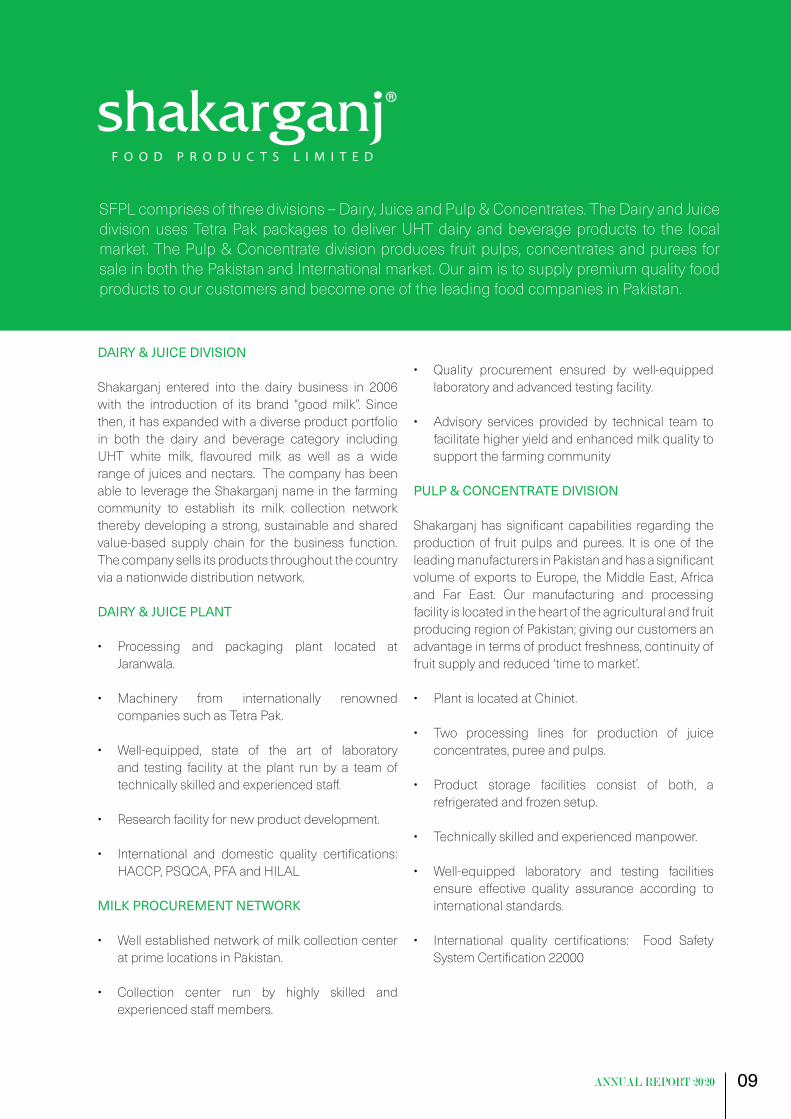
DAIRY & JUICE DIVISION
Shakarganj entered into the dairy business in 2006 with the introduction of its brand “good milk”. Since then, it has expanded with a diverse product portfolio in both the dairy and beverage category including UHT white milk, flavoured milk as well as a wide range of juices and nectars. The company has been able to leverage the Shakarganj name in the farming community to establish its milk collection network thereby developing a strong, sustainable and shared value-based supply chain for the business function. The company sells its products throughout the country via a nationwide distribution network.
DAIRY & JUICE PLANT
• Processing and packaging plant located at Jaranwala.
• Machinery from internationally renowned companies such as Tetra Pak.
• Well-equipped, state of the art of laboratory and testing facility at the plant run by a team of technically skilled and experienced staff.
• Research facility for new product development.
• International and domestic quality certifications: HACCP, PSQCA, PFA and HILAL
MILK PROCUREMENT NETWORK
• Well established network of milk collection center at prime locations in Pakistan.
• Collection center run by highly skilled and experienced staff members.
• Quality procurement ensured by well-equipped laboratory and advanced testing facility.
• Advisory services provided by technical team to facilitate higher yield and enhanced milk quality to support the farming community
PULP & CONCENTRATE DIVISION
Shakarganj has significant capabilities regarding the production of fruit pulps and purees. It is one of the leading manufacturers in Pakistan and has a significant volume of exports to Europe, the Middle East, Africa and Far East. Our manufacturing and processing facility is located in the heart of the agricultural and fruit producing region of Pakistan; giving our customers an advantage in terms of product freshness, continuity of fruit supply and reduced ‘time to market’.
• Plant is located at Chiniot.
• Two processing lines for production of juice concentrates, puree and pulps.
• Product storage facilities consist of both, a refrigerated and frozen setup.
• Technically skilled and experienced manpower.
• Well-equipped laboratory and testing facilities ensure effective quality assurance according to international standards.
• International quality certifications: Food Safety System Certification 22000
SFPL comprises of three divisions – Dairy, Juice and Pulp & Concentrates. The Dairy and Juice division uses Tetra Pak packages to deliver UHT dairy and beverage products to the local market. The Pulp & Concentrate division produces fruit pulps, concentrates and purees for sale in both the Pakistan and International market. Our aim is to supply premium quality food products to our customers and become one of the leading food companies in Pakistan.

10
System and Technology Committee
Muhammad Pervez Akhtar
ChairmanMuhammad Asif
Ibrahim Ahmad Cheema
This committee is responsible for devising the I.T. Strategy within the organization to keep all information systems of the Company updated in a fast changing environment.
Executive Committee
Anjum Muhammad SaleemChairman
Ali Altaf Saleem Muhammad Pervez Akhtar
Business Strategy Committee
Anjum Muhammad Saleem
ChairmanAli Altaf Saleem
Muhammad Pervez AkhtarMuhammad Asif
Manzoor Hussain Malik
This committee devises long term policies and visions for the Company with the sole objective for providing the best returns to shareholders by optimum allocation of existing resources. The Committee is also responsible for review of Company’s operation on ongoing basis, establishing and ensuring adequacy of internal controls and monitoring compliance of key policies.
This Committee is responsible for formulation of business strategy, review of risks and their mitigation plan. Further, the Committee is also responsible for staying abreast of developments and trends in the Industry to assist the Board in planning for future capital intensive investments and growth of the Company.
MANAGEMENT COMMITTEES
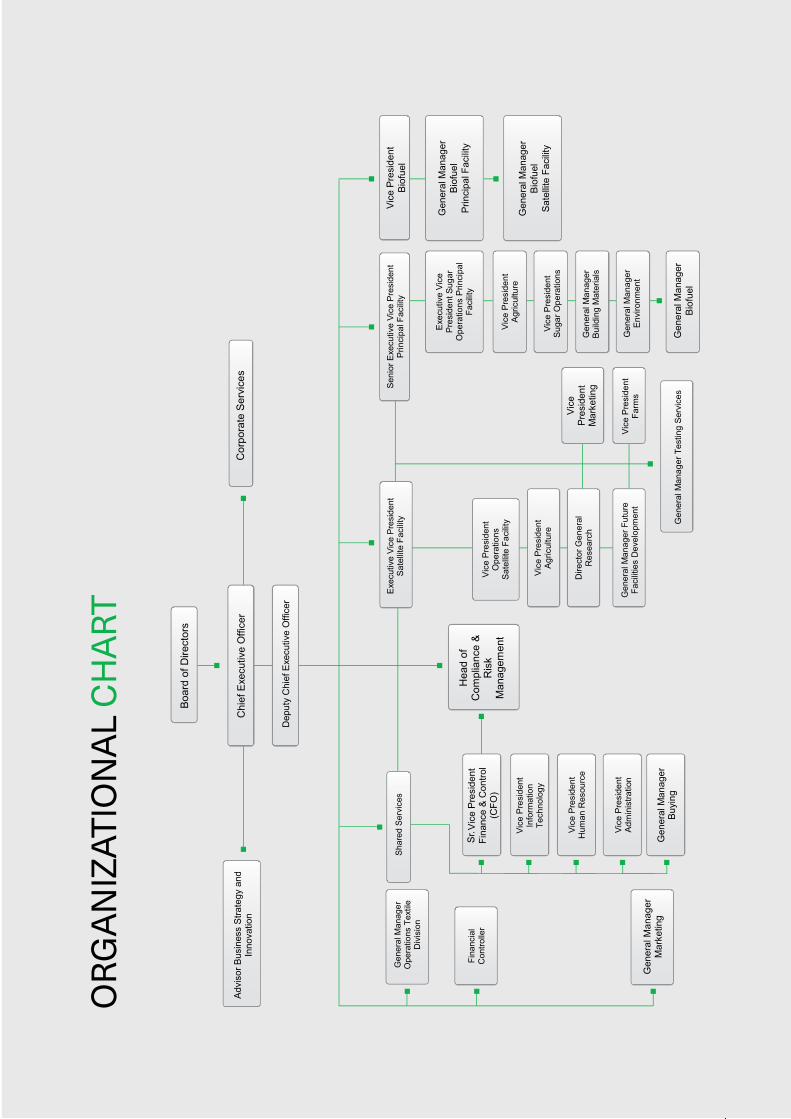
11
ORG
ANIZ
ATIO
NAL
CH
ART
Vice
Pre
side
ntB
iofu
el
Gen
eral
Man
ager
Bio
fuel
Prin
cipa
l Fac
ility
Gen
eral
Man
ager
Bio
fuel
Sat
ellit
e Fa
cilit
y
Gen
eral
Man
ager
Bio
fuel
Sr.

12
It gives me immense pleasure to present this report to the shareholders of Shakarganj Limited pertaining to the overall performance of the Board and the effectiveness of its role in attaining the Company’s aims and objectives.
Shakarganj Limited has implemented a strong governance framework supportive of an effective and prudent management of business matters which is regarded as instrumental in achieving long-term success of the Company.
During the year, the Board Committees continued to work with a great measure of proficiency. The Audit Committee has focused in particular on the management and control of risks associated with the business. At the same time, the Human Resource and Remuneration Committee has ensured that the HR policies regarding performance management, HR staffing, compensation and benefits are market driven, and are properly aligned not only with the Company’s performance and shareholders’ interests but also with the long-term success of the Company.
The Board as a whole has reviewed the Annual Report and Financial Statements, and is pleased to confirm that in its view the report and financial statements, taken as a whole, are fair, balanced, and understandable.
The Board carries out a review of its effectiveness and performance each year after the closure of the fiscal year, on a self-assessment basis. The last such review was carried out in July 2019 for the fiscal year 2020. The overall effectiveness of the Board was assessed as satisfactory and areas that required improvement were duly considered and suitable action plans were framed.
The overall assessment was based on an evaluation of the following integral components:
1. Vision, Mission, and Core Values: The Board members are familiar with the current vision, mission, and core values and found them appropriate for the organization.
2. Engagement in strategic planning: The Board has a clear understanding of the stakeholders whom the organization is meant to serve i.e. its shareholders, farmers, customers, employees, vendors, and the community. The Board has the strategic vision of how the organization should be evolving over the next three to five years and has identified key indicators for tracking its progress.
3. Formulation of policies: The Board has established policies that cover all essential areas of board responsibility and operations of the Company.
4. Monitoring the organization’s business activities: The Board is knowledgeable about the organization’s current business activities including strengths and weaknesses of each major
activity, and has an effective process for tracking performance activity-wise as well as area-wise.
5. Adequacy of financial resources management: The Board is knowledgeable about key aspects relating to managing the financial resources of the Company and provides appropriate direction and oversight on a timely basis.
6. Provide effective fiscal oversight: The Board ensures that the budget reflects the priorities established in the annual strategic plan and it complies with regulations governing the audit or independent examination of accounts and considers all recommendations made in the independent auditors’ report.
7. Act as a responsible employer: The Board has created necessary policies which ensure that the organization behaves in an equitable and legal manner towards staff, contractors, vendors, and any other individual working on its behalf.
8. Relationship between Board and Staff: Roles and Responsibilities of Board and management staff are clearly defined and understood and climate of mutual trust and respect exists between Board and management.
9. Organization’s Public Image: Board members promote a positive image of the organization in the community.
10. Review of CEO performance: The Board assesses the performance of the Chief Executive Officer in a fair and systematic manner and ensures that CEO’s pay is properly aligned with the Company’s performance, shareholders’ interests and the long-term success of the Company.
11. Board Structure and Dynamics: Size and composition of the Board is adequate to govern the Board procedures and the members are actively engaged in the work of the Board. The Board meets frequently enough to adequately discharge its responsibilities.
On an overall basis, I believe that the strategic direction of the Company for the next three years is clear and appropriate despite of the tough macroeconomic situation. Further, the processes adopted in developing and reviewing the overall corporate strategy and achievement of Company’s objectives are comprehensive.
Mian Muhammad AnwarChairman
04 January 2021
REVIEW REPORT BY THE CHAIRMAN
13
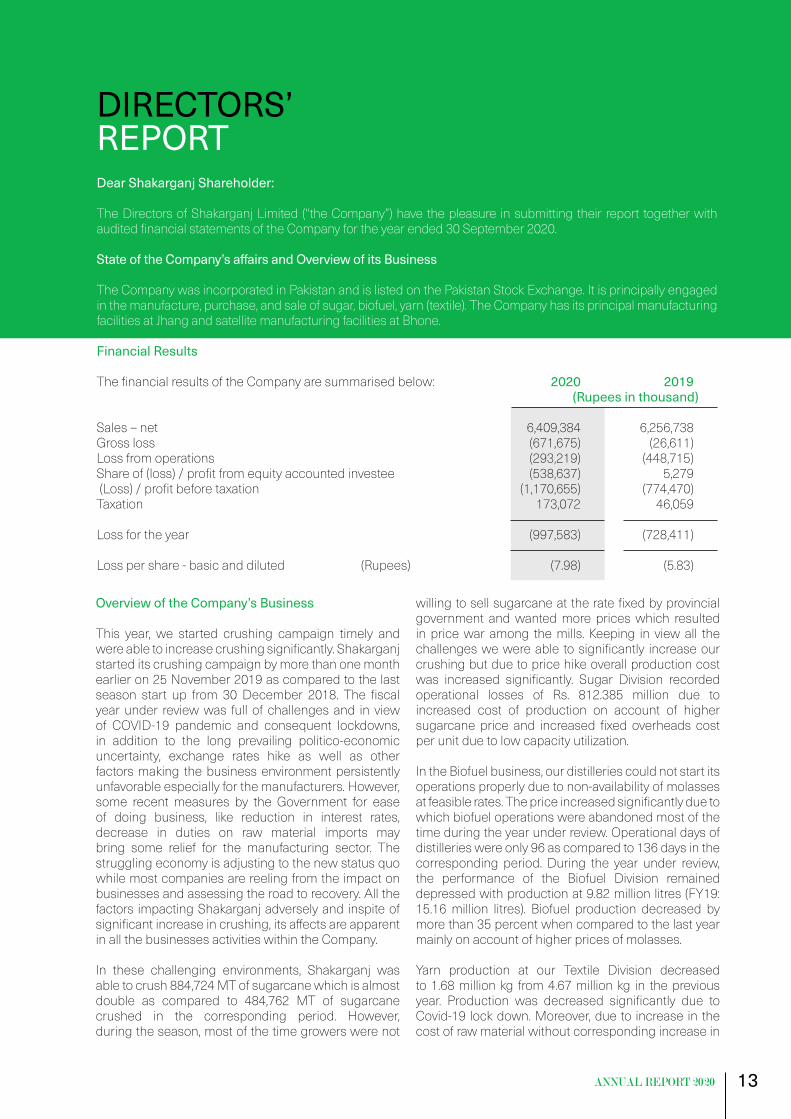
Dear Shakarganj Shareholder:
The Directors of Shakarganj Limited (“the Company”) have the pleasure in submitting their report together with audited financial statements of the Company for the year ended 30 September 2020.
State of the Company’s affairs and Overview of its Business
The Company was incorporated in Pakistan and is listed on the Pakistan Stock Exchange. It is principally engaged in the manufacture, purchase, and sale of sugar, biofuel, yarn (textile). The Company has its principal manufacturing facilities at Jhang and satellite manufacturing facilities at Bhone.
Financial Results
The financial results of the Company are summarised below: 2020 2019 (Rupees in thousand)
Sales – net 6,409,384 6,256,738Gross loss (671,675) (26,611)Loss from operations (293,219) (448,715)Share of (loss) / profit from equity accounted investee (538,637) 5,279 (Loss) / profit before taxation (1,170,655) (774,470)Taxation 173,072 46,059
Loss for the year (997,583) (728,411) Loss per share - basic and diluted (Rupees) (7.98) (5.83)
DIRECTORS’REPORT
Overview of the Company’s Business
This year, we started crushing campaign timely and were able to increase crushing significantly. Shakarganj started its crushing campaign by more than one month earlier on 25 November 2019 as compared to the last season start up from 30 December 2018. The fiscal year under review was full of challenges and in view of COVID-19 pandemic and consequent lockdowns, in addition to the long prevailing politico-economic uncertainty, exchange rates hike as well as other factors making the business environment persistently unfavorable especially for the manufacturers. However, some recent measures by the Government for ease of doing business, like reduction in interest rates, decrease in duties on raw material imports may bring some relief for the manufacturing sector. The struggling economy is adjusting to the new status quo while most companies are reeling from the impact on businesses and assessing the road to recovery. All the factors impacting Shakarganj adversely and inspite of significant increase in crushing, its affects are apparent in all the businesses activities within the Company.
In these challenging environments, Shakarganj was able to crush 884,724 MT of sugarcane which is almost double as compared to 484,762 MT of sugarcane crushed in the corresponding period. However, during the season, most of the time growers were not
willing to sell sugarcane at the rate fixed by provincial government and wanted more prices which resulted in price war among the mills. Keeping in view all the challenges we were able to significantly increase our crushing but due to price hike overall production cost was increased significantly. Sugar Division recorded operational losses of Rs. 812.385 million due to increased cost of production on account of higher sugarcane price and increased fixed overheads cost per unit due to low capacity utilization.
In the Biofuel business, our distilleries could not start its operations properly due to non-availability of molasses at feasible rates. The price increased significantly due to which biofuel operations were abandoned most of the time during the year under review. Operational days of distilleries were only 96 as compared to 136 days in the corresponding period. During the year under review, the performance of the Biofuel Division remained depressed with production at 9.82 million litres (FY19: 15.16 million litres). Biofuel production decreased by more than 35 percent when compared to the last year mainly on account of higher prices of molasses.
Yarn production at our Textile Division decreased to 1.68 million kg from 4.67 million kg in the previous year. Production was decreased significantly due to Covid-19 lock down. Moreover, due to increase in the cost of raw material without corresponding increase in
14
the sale price, bottom line was remained negative.
Due to aforesaid factors, Company’s after tax loss for the year under review was Rs. 997.58 million as compared to after tax loss of Rs. 728.41 million in the last year.
Principal Risks and Uncertainties Facing
Following are the principal risks and uncertainties currently faced by the Company:
• Higher purchase price of sugarcane as compared to sugar sale price
• Heavy taxation, sales tax rates on finished products
• Lack of irrigation water, reducing the yield of crop & low capacity utilizations
• Vulnerable to political interests
• Being an agro based industry, inherent risks of natural calamities / conditions
• Increasing cost of production and labour
• Overall inflationary increase in operational expenses
• Environmental concerns and sugar free products
• Further Rupee devaluation will be resulting in cost escalation
Adequacy of Internal Control
The system of internal control of the Company is sound in design and has been effectively implemented and monitored. The Board of Directors is aware of its responsibility with respect to internal controls environment and accordingly has established an efficient system of internal financial controls, for ensuring effective and efficient conduct of operations, safeguarding of Company’s assets, compliance with applicable laws and regulations and has a reliable financial reporting system. The outsourced independent internal audit function is in operation and such function regularly appraises and monitors the implementation of financial controls. Audit Committee of the Board, reviews the effectiveness of the internal control framework and financial statements regularly on quarterly basis.
Auditors
The auditors Riaz Ahmad & Co, Chartered Accountants will retire and are eligible for re-appointment as auditors of the Company for the next year. The Board, on recommendation of the Audit Committee, has recommended the re-appointment of Riaz Ahmad & Co, Chartered Accountants as auditors for consideration of members at the forthcoming Annual General Meeting.
Corporate Social Responsibility
We actively seek opportunities to contribute to the communities in which we operate and to improve the environments that sustain us all. Our areas of primary focus are education, health and safety, energy conservation, waste reduction, and community building. During the year Shakarganj contributed around Rs. 8.47 million toward these activities. As a responsible member of the corporate community, Shakarganj always contributes substantially towards the national economy on account of taxes and other government levies. Company’s contribution toward federal, provincial and local taxes was in excess of Rs. 1,129 million during the year under review.
At Shakarganj, Corporate Social Responsibility (CSR) is a strategic management driven initiative that incorporates our business, environmental, and citizenship activities in a manner that supports our vision and upholds our values. We aim to play a positive role in the communities in which we operate. Our community involvement policy is one of the core components underpinning our ethical behaviour. Our programmes involve building long term relationships with local communities to deliver our shared objective: establishing strong, safe, healthy and educated communities by investing time and resources into projects that directly address local needs. Our Social Action Programme (under Shakarganj Foundation) delivers a variety of social services in our extended community under the banner of “Sukh Char Programme” These services include education, healthcare, promotion of arts, and protection of our cultural heritage.
Our school adoption initiative provides support to 35 local girls’ and boys’ schools that includes provision of clean drinking water, nutrition supplements, uniforms, maintenance of infrastructure and building additional facilities where required. Shakarganj also provides support to education programme of The Citizens Foundation. To provide backbone support to the education initiative a purpose built teachers training
15
institute was established at Shakarganj premises as a public service.
Shakarganj funded special incentives for school children include recognition of high achievers in school exams with scholarships and awards, sports competitions for school children, and inter-school handwriting competitions for school children and teachers. Our Healthcare initiative delivers primary medical facilities at the doorsteps of our extended community. Three teams of qualified doctors, paramedical staff, and mobile dispensaries served over 19,345 patients during the year. Due to Covid-19 activities the numbers were decreased during the year. Diagnostic facilities, preventive treatment, and free medicines are provided through this programme.
We provide support to promising local talent in improving their artistic skills in a structured training programme at the School of Art and Calligraphy. A display centre exhibiting the works of these artists and promotion of cultural heritage is also maintained by Shakarganj at the School.
Health, Safety, and Environment
As we always aim to be an exemplary corporate citizen, health, safety, and environmental concerns are always among our key focal points. We are committed to providing healthy, safe, and clean conditions for our employees, contractors and visitors. In providing a good working environment there is no higher priority than safety and we target continuous improvement to reduce recordable injury and accident times to zero. Nearly eight hundred and fifty five members of Team Shakarganj have participated in a structured program to obtain professional training and certification in first aid in collaboration with Pakistan Red Crescent Society – Punjab. Preventive action and training and timely response procedures to deal with potential accidents have resulted in minimising recordable injuries and accidents.
Environmental protection issues are always considered on a higher priority than profit concerns. Shakarganj produces all its products from renewable crops and raw materials and does not believe in making profits at the cost of damage to our environment. We proactively fund and support environmental protection activities in our communities in particular and on national level generally. Energy conservation and aiming for ‘zero’ waste are our key environment friendly policies. Using sugar by-products in our production lines substantially reduces use of fossil fuels and waste disposal problems. Distillery spent-wash is the ultimate waste product in
our production process. This is now biologically treated to produce bio-gas as fuel, and water which is safe to use for irrigation. In addition to this we encourage and promote biological pest control, organic farming techniques, and return of all natural nutrients to the soil that are brought with supply of sugarcane to the mills. We strongly support the activities of Worldwide Fund for Nature - Pakistan, run regular training and education programmes for water management and participate in tree plantation campaigns twice every year. Our approach to HSE is apparent in our Mission Zero Agenda that targets zero accidents and work-related illnesses. To effectively implement the mission zero agenda, we empower and encourage our people to play their part. We all have a part to play in keeping our workplaces safe. One of the most effective ways we can do this is by being aware of the risks around us and taking action to address these. That’s why we actively encourage all our people to regularly assess their working environments and report any identified risks - as they arise. As a result, we have achieved 4.3 million safe working man hours without lost time injury.
Shakarganj is committed to providing a healthy and safe workplace for all personnel performing their duties on its behalf, in a manner that protects the environment, prevention of pollution, and compliance of applicable legal and other requirements. We remain committed to protecting the physical and mental health of our employees, extending the scope and coverage of occupational health services, and constantly improving our occupational health management system. At Shakarganj, health checks are organised on a regular basis for our employees. In addition, we keep health records of employees for better health management and disease prevention. We also pay close attention to a dedicated health support system and provide special disease checks to ensure the health and safety of our employees. We have also released the comprehensive Emergency Plan for incidents and accidents at Shakarganj, and have established a safety management and risk prevention system for the Company. We organise regular emergency drills to improve the plan, enhance awareness of prevention and self-help of the employees and improve the team’s ability to handle emergencies.
Board of Directors & its Committees
The election of Directors was held on 01 June 2020 and a seven member Board excluding the Chief Executive Officer was elected unopposed whose term of office will expire on 31 May 2023. The Board of Directors consists of eight members including seven male members and one female member as per the

16
following composition: During the year, six (6) meetings of the Board of Directors, four (4) meetings of the Audit Committee and one (1) meeting of Human Resource
and Remuneration Committee were held. Attendance of each director is also given below.
Category Names of Director Meeting Attended
Independent Directors Mr. Sheikh Asim Rafiq 6 Ms. Zahra Ahsan Saleem 3 Mr. Jawad Amjad 1 Outgoing Director Mr. Khawaja Jalaluddin (Retired on 31 May 2020) 3
Non-Executive Directors Mr. Khalid Bashir 5 Mr. Mian Muhammad Anwar 6 Mr. Javed Anjum - Outgoing Directors Ms. Hajerah Ahsan Saleem (Retired on 31 May 2020) 3 Mr. Muhammad Arshad (Retired on 31 May 2020) 3 Mr. Muhammad Anees (Resigned on 09 December 2020) 3 Executive Directors Mr. Anjum Muhammad Saleem (Chief Executive Officer) 6 Mr. Ali Altaf Saleem (Deputy Chief Executive Officer) 6 The Board has formed committees comprising of members given below: Name of Committee Names of Members and Chairman Meeting Attended
Audit Committee Mr. Sheikh Asim Rafiq (Chairman) 4 Mr. Khalid Bashir 3 Ms. Zahra Ahsan Saleem 1 Mr. Javed Anjum -
Outgoing Members Mr. Muhammad Anees (Resigned on 09 December 2020) 1 Ms. Hajerah Ahsan Saleem (Retired on 31 May 2020) 3 Mr. Khawaja Jalaluddin (Retired on 31 May 2020) 3 Human Resource and Remuneration Committee Ms. Zahra Ahsan Saleem (Chairperson) - Mr. Mian Muhammad Anwar 1 Mr. Khalid Bashir 1 Mr. Anjum Muhammad Saleem 1
Casual vacancies were filled up as and when occurred on the Board. Subsequent to the Election of Directors, the Board in its 192nd meeting held on 08 June 2020 unanimously re-appointed Mr. Anjum Muhammad Saleem as Chief Executive Officer and Mr. Ali Altaf Saleem as Deputy Chief Executive Officer for a period of three years till 31 May 2023. However, there is no change in CEO remuneration except normal increment at the rate of 10% on yearly basis.
As per threshold reviewed by the Board of Directors, the heads of all departments of the Company shall be considered as “executives”.
17
Non executive and Independent Director’s RemunerationThe Board of Directors has approved a ‘Directors’ Remuneration Policy’, the salient features of the approved policy are as follows:
• No Director shall determine his/her own remuneration.
• Meeting fee of a Director other than regular paid Chief Executive, Sponsors and or family Directors and full time working Director(s), shall be amounting to Rs. 20,000 (twenty thousand rupees only) per meeting or as time to time determined by the Board for attending the Board and its Committee meetings.
• Directors shall also be entitled for all reasonable expenses including travelling, stay and other expenses incurred by them for attending meetings.
Performance Evaluation of Board of Directors and its Committees
Human Resource and Remuneration Committee has assessed the performance of Board of Directors and its Committees based on the established mechanism of self-assessment by the individual Board or Committee members as the case may be. The above mechanism was approved by the Board on the recommendation of Human Resource and Remuneration Committee.
CEO’s Performance Evaluation
During the year, the Human Resource and Remuneration Committee of the Board evaluated the performance of the CEO in line with the established performance based evaluation system. The evaluation was reviewed against the following criteria:
• Leadership • Policy and Strategy • People Management • Business Processes/Excellence • Governance and Compliance • Financial Performance • Impact on Society
Subsequently, on the recommendation of the Committee, the evaluation was approved by the Board after their review.
Pattern of Shareholding and Shares Traded
The pattern of shareholding and additional information thereof is attached with this report. No trade in the
shares of the Company was reported / carried out by the directors, executives and their spouses and minor children. Financial Statements
As required under the accounting and reporting standards as applicable in Pakistan and as per the requirements of Companies Act, 2017 (XIX of 2017), the management is aware of its responsibility for the preparation and fair presentation of the financial statements for such internal control as management determines is necessary to enable the preparation of financial statements that are free from material misstatement, whether due to fraud or error. The Chief Executive Officer and Chief Financial Officer presented the financial statements, duly endorsed under their respective signatures, for consideration and approval of the Board of Directors and the Board, after consideration and approval, authorised the signing of financial statements for issuance and circulation. The financial statements of the Company have been duly audited and approved without qualification by the auditors of the Company, Riaz Ahmad & Co., Chartered Accountants and their report is attached with the financial statements. The Directors endorse the contents of this annual report and those shall form an integral part of the Directors’ Report in terms of Section 227 of the Companies Act, 2017 and the requirements of the Listed Companies (Code of Corporate Governance) Regulations 2017.
Dividend and Carried Forward
The Directors have not recommended the payment of dividend for the year ended 30 September 2020. Moreover, no amount is being carried forward to the general reserve or any other reserve funds account.
Subsequent EventsNo material changes and commitments affecting the financial position of the Company have occurred between the end of the financial year to which this Balance Sheet relates and the date of the Directors’ Report.
Default in Payments, Debt or Loan
The Company recognizes its responsibility of timely repayments of due amount and adhering to the best practices prevails in the industry it is stated that no default in payment of any loan or debts was occurred during the year under review.

18
Change in Nature of Business
No change has been occurred during the financial year relating to the nature of the business of the Company.
Related Party Transactions
All related party transactions are approved by the Board after review and recommendation of Audit Committee. The Company has made detailed disclosures about related party transactions in its financial statements annexed with this annual report. Such disclosure is in line with the requirements of the 4th Schedule to the Companies Act, 2017 and applicable International Financial Reporting Standards.
Financial Review
In spite of the impacts of COVID-19 pandemic on Company’s operations, the Company undertook significant financial and operational measures in the current year to improve its productivity. During the year, the Company’s sugarcane crushing was almost double as compared to last year. During the year, the Company has successfully renewed its working capital lines. The measures taken by the Government to support businesses after spread of COVID-19 have also positive impact on liquidity position of the Company as repayment of long term financing has been deferred by one year and repayment of significant portion of short term borrowings has been deferred for a period of six months to one year. The Company also availed facility of Rupees 165.6 million under SBP Refinance Scheme for payment of wages and salaries. The Company expects significant improvement in its biofuel and textile businesses in the next year owing to restoration of exports of biofuel and increased demand of yarn. Subsequent to the reporting date, the Company is in negotiations with its lenders for working capital finance for operational liquidity. The Company is also arranging long term financing of Rupees 500 million to finance capital expenditure. Further, fresh working capital lines of Rupees 1,000 million, in addition to existing lines, are being arranged to meet operational liquidity requirements. The Company remains committed to its best efforts to improve liquidity position. The financial projections of the Company show improvements in cash generation and profits. The Company is expected to generate sufficient cash flows in the next year. The management believes that the measures taken will generate sufficient financial resources from operations during the next year to meet the company’s targets.
Future Outlook
We hope that as the Federal and Provincial Governments in Pakistan responded well to the crisis and implemented a carefully crafted lockdown during first phase, the current wave of Covid-19 would also be managed well. The country’s macroeconomic indicators are expected to slowly revert to a stable trajectory and with the revival efforts for businesses; we are hopeful for restoration of our exports of biofuel as well as local businesses next financial year. Company’s management is reviewing the situation and would take all necessary measures for continuity of business whenever possible.
In fiscal year 2021, we expect improvement in sugar recovery by crushing quality sugarcane and measures would be taken to control the cost and improvements of margins. As the future outlook of our distilleries operation depends on continuous availability of good quality molasses on feasible rates and the management would try its best to operate distilleries to create enough margins for better bottom line. The Textile Division performance is expected to improve as this time no shut down due to lock down so far till the writing of this report. The management remains committed for improving operational profitability and the liquidity position of the Company to achieve profitable results in fiscal year 2021.
Acknowledgment
The Directors wish to express their appreciation to the staff & workers of the Company for their dedication and devotion to the Company. The Directors feel pleasure in expressing appreciation for the continued interest and support of the shareholders, bankers and all other parties involved and hope that the same spirit will prevail in the future as well.
By Order of the Board
Anjum Muhammad SaleemChief Executive Officer
Ali Altaf SaleemDirector
04 January 2021
19
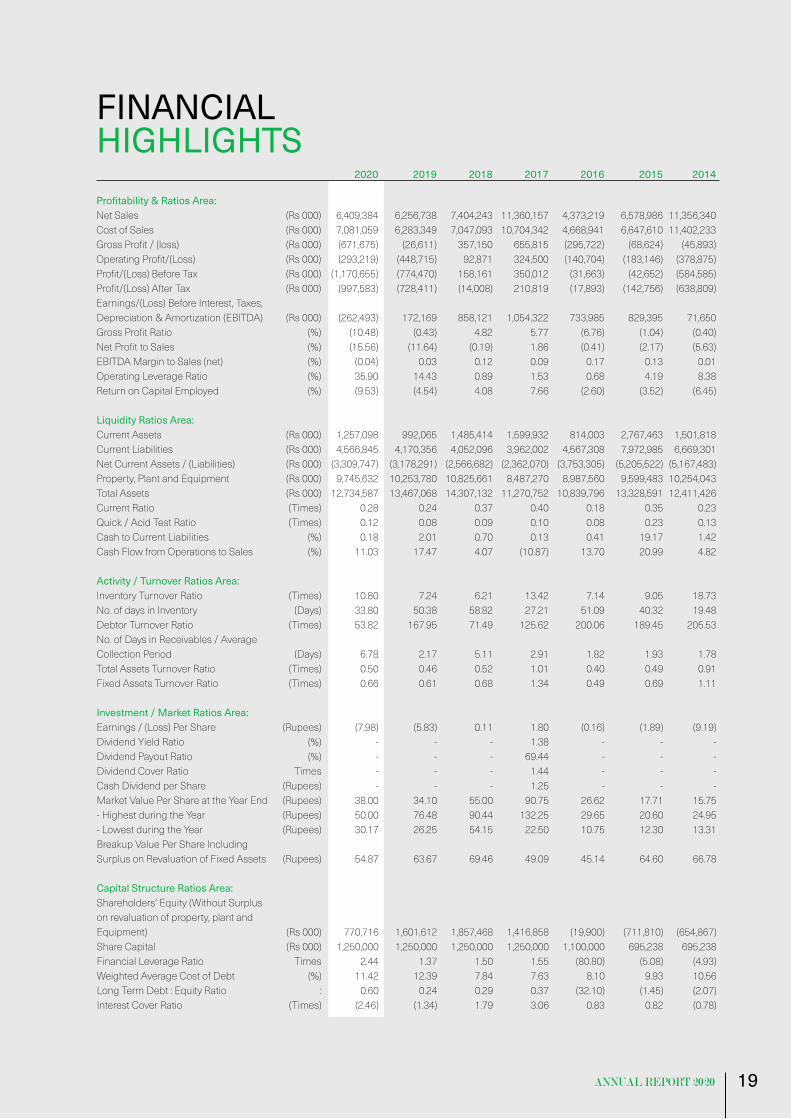
FINANCIAL HIGHLIGHTS 2020 2019 2018 2017 2016 2015 2014
Profitability & Ratios Area: Net Sales (Rs 000) 6,409,384 6,256,738 7,404,243 11,360,157 4,373,219 6,578,986 11,356,340 Cost of Sales (Rs 000) 7,081,059 6,283,349 7,047,093 10,704,342 4,668,941 6,647,610 11,402,233 Gross Profit / (loss) (Rs 000) (671,675) (26,611) 357,150 655,815 (295,722) (68,624) (45,893)Operating Profit/(Loss) (Rs 000) (293,219) (448,715) 92,871 324,500 (140,704) (183,146) (378,875)Profit/(Loss) Before Tax (Rs 000) (1,170,655) (774,470) 158,161 350,012 (31,663) (42,652) (584,585)Profit/(Loss) After Tax (Rs 000) (997,583) (728,411) (14,008) 210,819 (17,893) (142,756) (638,809)Earnings/(Loss) Before Interest, Taxes, Depreciation & Amortization (EBITDA) (Rs 000) (262,493) 172,169 858,121 1,054,322 733,985 829,395 71,650 Gross Profit Ratio (%) (10.48) (0.43) 4.82 5.77 (6.76) (1.04) (0.40)Net Profit to Sales (%) (15.56) (11.64) (0.19) 1.86 (0.41) (2.17) (5.63)EBITDA Margin to Sales (net) (%) (0.04) 0.03 0.12 0.09 0.17 0.13 0.01 Operating Leverage Ratio (%) 35.90 14.43 0.89 1.53 0.68 4.19 8.38 Return on Capital Employed (%) (9.53) (4.54) 4.08 7.66 (2.60) (3.52) (6.45) Liquidity Ratios Area: Current Assets (Rs 000) 1,257,098 992,065 1,485,414 1,599,932 814,003 2,767,463 1,501,818 Current Liabilities (Rs 000) 4,566,845 4,170,356 4,052,096 3,962,002 4,567,308 7,972,985 6,669,301 Net Current Assets / (Liabilities) (Rs 000) (3,309,747) (3,178,291) (2,566,682) (2,362,070) (3,753,305) (5,205,522) (5,167,483)Property, Plant and Equipment (Rs 000) 9,745,632 10,253,780 10,825,661 8,487,270 8,987,560 9,599,483 10,254,043 Total Assets (Rs 000) 12,734,587 13,467,068 14,307,132 11,270,752 10,839,796 13,328,591 12,411,426 Current Ratio (Times) 0.28 0.24 0.37 0.40 0.18 0.35 0.23 Quick / Acid Test Ratio (Times) 0.12 0.08 0.09 0.10 0.08 0.23 0.13 Cash to Current Liabilities (%) 0.18 2.01 0.70 0.13 0.41 19.17 1.42 Cash Flow from Operations to Sales (%) 11.03 17.47 4.07 (10.87) 13.70 20.99 4.82 Activity / Turnover Ratios Area: Inventory Turnover Ratio (Times) 10.80 7.24 6.21 13.42 7.14 9.05 18.73No. of days in Inventory (Days) 33.80 50.38 58.82 27.21 51.09 40.32 19.48Debtor Turnover Ratio (Times) 53.82 167.95 71.49 125.62 200.06 189.45 205.53No. of Days in Receivables / Average Collection Period (Days) 6.78 2.17 5.11 2.91 1.82 1.93 1.78 Total Assets Turnover Ratio (Times) 0.50 0.46 0.52 1.01 0.40 0.49 0.91 Fixed Assets Turnover Ratio (Times) 0.66 0.61 0.68 1.34 0.49 0.69 1.11 Investment / Market Ratios Area: Earnings / (Loss) Per Share (Rupees) (7.98) (5.83) 0.11 1.80 (0.16) (1.89) (9.19)Dividend Yield Ratio (%) - - - 1.38 - - - Dividend Payout Ratio (%) - - - 69.44 - - - Dividend Cover Ratio Times - - - 1.44 - - - Cash Dividend per Share (Rupees) - - - 1.25 - - - Market Value Per Share at the Year End (Rupees) 38.00 34.10 55.00 90.75 26.62 17.71 15.75 - Highest during the Year (Rupees) 50.00 76.48 90.44 132.25 29.65 20.60 24.95 - Lowest during the Year (Rupees) 30.17 26.25 54.15 22.50 10.75 12.30 13.31 Breakup Value Per Share Including Surplus on Revaluation of Fixed Assets (Rupees) 54.87 63.67 69.46 49.09 45.14 64.60 66.78 Capital Structure Ratios Area: Shareholders’ Equity (Without Surplus on revaluation of property, plant and Equipment) (Rs 000) 770,716 1,601,612 1,857,468 1,416,858 (19,900) (711,810) (654,867)Share Capital (Rs 000) 1,250,000 1,250,000 1,250,000 1,250,000 1,100,000 695,238 695,238 Financial Leverage Ratio Times 2.44 1.37 1.50 1.55 (80.80) (5.08) (4.93)Weighted Average Cost of Debt (%) 11.42 12.39 7.84 7.63 8.10 9.93 10.56 Long Term Debt : Equity Ratio : 0.60 0.24 0.29 0.37 (32.10) (1.45) (2.07)Interest Cover Ratio (Times) (2.46) (1.34) 1.79 3.06 0.83 0.82 (0.78)

20
PRODUCTION DATA Duration Cane Raw Sugar Sugar Season Crushed Processed Produced Recovery Season (Days) (MT) (MT) (MT) (Percent)
2019-20 108 884,724 77,560 8.762018-19 83 484,762 49,016 10.132017-18 105 669,064 61,634 9.202016-17 145 1,543,849 144,460 9.362015-16 97 450,804 45,707 10.162014-15 129 615,394 59,905 9.732013-14 140 1,259,272 112,271 8.922012-13 135 1,409,811 133,753 9.492011-12 164 1,957,358 173,620 8.872010-11 136 1,567,361 141,549 9.012009-10 109 913,272 78,540 8.622008-09 110 784,056 71,600 9.13 2007-08 174 2,254,712 177,092 7.85 2006-07 155 1,587,929 128,170 8.04 2005-06 170 1,288,548 92,968.40 178,934 6.97 2004-05 160 1,324,510 67,930.40 177,679 8.63 2003-04 159 1,614,539 136,813 8.48 2002-03 196 1,675,370 127,060 7.58 2001-02 195 1,704,812 128,000 7.53 2000-01 161 1,054,992 27,811.59 105,550 7.50 1999-00 144 524,377 39,965 7.63 1998-99 157 1,350,119 101,479 7.51 1997-98 163 1,434,389 112,430 7.85 1996-97 176 1,036,955 79,740 7.69 1995-96 151 763,316 60,285 7.92 1994-95 157 1,057,036 86,075 8.11 1993-94 196 1,203,371 88,117 7.34 1992-93 161 691,839 54,055 7.85 1991-92 174 746,506 63,986 8.57 1990-91 204 866,552 65,537 7.56 1989-90 187 708,632 57,912 8.17 1988-89 170 446,325 36,367 7.70 1987-88 193 698,605 55,726 7.98 1986-87 149 333,601 27,899 8.36 1985-86 113 237,602 20,625 8.66 1984-85 168 441,718 39,523 8.96 1983-84 173 427,169 35,501 8.31 1982-83 173 361,291 29,440 8.16 1981-82 207 466,040 39,474 8.47 1980-81 187 287,723 25,562 8.89 1979-80 112 61,207 5,619 8.95 1978-79 114 107,106 9,267 8.80 1977-78 177 319,960 27,620 8.61 1976-77 166 308,987 26,086 8.45 1975-76 157 246,394 18,865 7.61 1974-75 107 104,069 8,253 8.30 1973-74 101 87,825 5,477 6.28

21
Process Process Building Losses Molasses Biofuel Materials Yarn Bio Power (Percent) (MT) (Litres) (m3) (Bags) (MWh)
2.02 40,229 9,816,686 36,9302.22 22,458 15,164,206 102,9782.17 31,025 56,728,278 76,1072.12 68,086 41,621,230 1,578 75,559 2.06 19,295 10,201,684 72,776 2.15 27,270 46,134,870 95,719 10,7022.07 55,817 76,377,765 6,096 112,846 12,8572.16 61,450 63,372,339 6,894 146,466 22,8652.20 93,575 93,796,731 8,789 149,872 27,7792.02 70,505 68,860,824 5,920 86,209 21,826 2.05 40,901 22,669,768 3,562 149,878 27,292 1.95 33 ,070 33,319,694 1,643 148,426 23,542 2.17 117,742 66,490,739 6,540 149,788 17,714 2.30 79,340 35,093,676 1,834 135,935 2.54 71,008 27,625,611 1,477 133,580 2.17 66,190 33,245,964 3,584 119,106 2.41 81,953 35,408,000 5,141 119,922 2.36 84,277 26,233,000 1,668 109,096 2.42 91,890 15,800,156 5,670 96,326 2.31 53,601 10,469,000 1,571 82,063 2.20 24,243 4,967,000 497 96,999 2.23 61,756 5,324,756 1,922 103,555 2.38 73,477 6,350,000 2,784 85,259 2.50 54,711 6,015,000 98,406 2.65 39,397 2,573,700 2,118 83,542 2.77 53,172 5,460,000 5,299 73,938 2.65 60,150 5,250,076 4,335 50,880 2.68 35,980 4,887,020 1,663 115,488 2.53 37,710 4,525,900 3,360 117,902 2.59 47,135 3,422,204 643 113,341 2.31 33,180 3,030,217 97,388 2.44 22,410 2.61 38,740 308,494 2.24 15,060 1,855,809 2.29 11,470 20,239 2.38 22,580 2.40 21,860 2.44 16,255 2.48 21,255 2.42 13,373 2.25 2,358 2.27 4,147 2.44 14,103 2.67 15,228 2.68 11,424 2.75 4,182 3.57 4,726
22
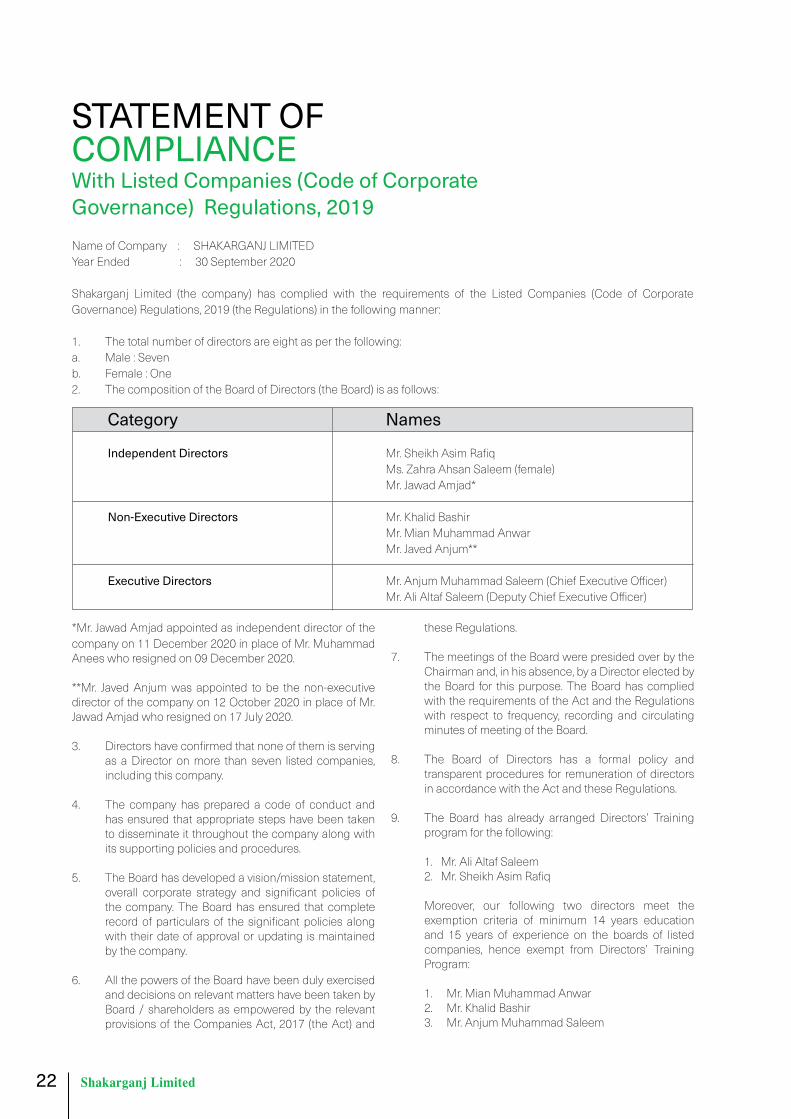
STATEMENT OF COMPLIANCE With Listed Companies (Code of Corporate Governance) Regulations, 2019Name of Company : SHAKARGANJ LIMITED Year Ended : 30 September 2020
Shakarganj Limited (the company) has complied with the requirements of the Listed Companies (Code of Corporate Governance) Regulations, 2019 (the Regulations) in the following manner:
1. The total number of directors are eight as per the following:a. Male : Sevenb. Female : One2. The composition of the Board of Directors (the Board) is as follows:
Category Names
Independent Directors Mr. Sheikh Asim Rafiq Ms. Zahra Ahsan Saleem (female) Mr. Jawad Amjad*
Non-Executive Directors Mr. Khalid Bashir Mr. Mian Muhammad Anwar Mr. Javed Anjum**
Executive Directors Mr. Anjum Muhammad Saleem (Chief Executive Officer) Mr. Ali Altaf Saleem (Deputy Chief Executive Officer)
*Mr. Jawad Amjad appointed as independent director of the company on 11 December 2020 in place of Mr. Muhammad Anees who resigned on 09 December 2020.
**Mr. Javed Anjum was appointed to be the non-executive director of the company on 12 October 2020 in place of Mr. Jawad Amjad who resigned on 17 July 2020.
3. Directors have confirmed that none of them is serving as a Director on more than seven listed companies, including this company.
4. The company has prepared a code of conduct and has ensured that appropriate steps have been taken to disseminate it throughout the company along with its supporting policies and procedures.
5. The Board has developed a vision/mission statement, overall corporate strategy and significant policies of the company. The Board has ensured that complete record of particulars of the significant policies along with their date of approval or updating is maintained by the company.
6. All the powers of the Board have been duly exercised and decisions on relevant matters have been taken by Board / shareholders as empowered by the relevant provisions of the Companies Act, 2017 (the Act) and
these Regulations.
7. The meetings of the Board were presided over by the Chairman and, in his absence, by a Director elected by the Board for this purpose. The Board has complied with the requirements of the Act and the Regulations with respect to frequency, recording and circulating minutes of meeting of the Board.
8. The Board of Directors has a formal policy and transparent procedures for remuneration of directors in accordance with the Act and these Regulations.
9. The Board has already arranged Directors’ Training program for the following:
1. Mr. Ali Altaf Saleem 2. Mr. Sheikh Asim Rafiq
Moreover, our following two directors meet the exemption criteria of minimum 14 years education and 15 years of experience on the boards of listed companies, hence exempt from Directors’ Training Program:
1. Mr. Mian Muhammad Anwar 2. Mr. Khalid Bashir 3. Mr. Anjum Muhammad Saleem
23
10. The Board has approved appointment of Chief Financial Officer, Company Secretary and Head of Internal Audit including their remuneration and terms and conditions of employment and complied with relevant requirements of the Regulations.
11. Chief Financial Officer and Chief Executive Officer duly endorsed the financial statements before approval of the Board.
12. The Board has formed committees comprising of members given below:
a) Audit Committee Mr. Sheikh Asim Rafiq (Chairman) Mr. Javed Anjum (Member) Mr. Khalid Bashir (Member) Ms. Zahra Ahsan Saleem (Member)
b) HR and Remuneration Committee Ms. Zahra Ahsan Saleem (Chairperson) Mr. Khalid Bashir (Member) Mr. Mian Muhammad Anwar (Member) Mr. Anjum Muhammad Saleem Member)
13. The terms of reference of the aforesaid committees have been formed, documented and advised to the committee for compliance.
14. The frequency of meetings of the aforesaid committees were as per following:
a) Audit Committee: Four meetings during the financial year ended 30 September 2020
b) HR and Remuneration Committee: One meeting was held during the financial year ended 30 September 2020
15. The Board has set up an effective outsourced internal audit function that is considered suitably qualified and experienced for the purpose and is conversant with the policies and procedures of the company.
16. The statutory auditors of the company have confirmed that they have been given a satisfactory rating under the Quality Control Review program of the Institute of Chartered Accountants of Pakistan and registered with Audit Oversight Board of Pakistan, that they and all their partners are in compliance with International Federation of Accountants (IFAC) guidelines on code of ethics as adopted by the Institute of Chartered Accountants of Pakistan and that they and the partners of the firm involved in the audit are not a close relative (spouse, parent, dependent and non-dependent children) of the Chief Executive Officer, Chief Financial Officer, Head of Internal Audit, Company secretary or Director of the company.
17. The statutory auditors or the persons associated with them have not been appointed to provide other services except in accordance with the Act, these Regulations or any other regulatory requirement and the auditors have confirmed that they have observed IFAC guidelines in this regard.
18. We confirm that all requirements of regulations 3, 6, 7, 8, 27, 32, 33 and 36 of the Regulations have been complied with and all other requirements of the Regulations have been complied with.
19. Explanation for non-compliance with requirements, other than regulations 3, 6, 7, 8, 27, 32, 33 and 36 are below:
Non-Mandatory Requirement Reg. No. Explanation
Nomination Committee:The Board may constitute a separate committee, designated as the nomination committee, of such number and class of directors, as it may deem appropriate in its circumstances.
29(1) The Board has not constituted separate Nomination Committee and currently functions required to be performed by nomination committee are being dealt with by HR & R Committee.
Risk Management Committee:The Board may constitute the risk management committee, of such number and class of directors, as it may deem appropriate in its circumstances, to carry out a review of effectiveness of risk management procedures and present a report to the Board.
30(1) The Board has not constituted separate Risk Management Committee and currently functions required to be performed by such committee are currently being performed by the Board.
By Order of the Board
Anjum Muhammad Saleem Ali Altaf Saleem04 January 2021 Chief Executive Officer Director
24
INDEPENDENT AUDITOR’S REVIEW REPORTTo the members of Shakarganj Limited.Review Report on the Statement of Compliance contained in Listed Companies (Code of Corporate Governance) Regulations, 2019
We have reviewed the enclosed Statement of Compliance with the Listed Companies (Code of Corporate Governance) Regulations, 2019 (the Regulations) prepared by the Board of Directors of Shakarganj Limited (the Company) for the year ended 30 September 2020 in accordance with the requirements of regulation 36 of the Regulations.
The responsibility for compliance with the Regulations is that of the Board of Directors of the Company. Our responsibility is to review whether the Statement of Compliance reflects the status of the Company’s compliance with the provisions of the Regulations and report if it does not and to highlight any non-compliance with the requirements of the Regulations. A review is limited primarily to inquiries of the Company’s personnel and review of various documents prepared by the Company to comply with the Regulations.
As a part of our audit of the financial statements we are required to obtain an understanding of the accounting and internal control systems sufficient to plan the audit and develop an effective audit approach. We are not required to consider whether the Board of Directors’ statement on internal control covers all risks and controls or to form an opinion on the effectiveness of such internal controls, the Company’s corporate governance procedures and risks.
The Regulations require the Company to place before the Audit Committee, and upon recommendation of the Audit Committee, place before the Board of Directors for their review and approval, its related party transactions. We are only required and have ensured compliance of this requirement to the extent of the approval of the related party transactions by the Board of Directors upon recommendation of the Audit Committee.
Based on our review, nothing has come to our attention which causes us to believe that the Statement of Compliance does not appropriately reflect the Company’s compliance, in all material respects, with the requirements contained in the Regulations as applicable to the Company for the year ended 30 September 2020.
Faisalabad RIAZ AHMAD & COMPANY 04 January 2021 Chartered Accountants
560-F, Raja Road, Gulistan ColonyFaisalabad 38000, PakistanT: +92(41) 886 10 42, 886 36 44F: +92 (41) 886 36 [email protected]
25
FINANCIAL STATEMENTS (UNCONSOLIDATED)
for the year ended 30 September 2020

26
INDEPENDENT AUDITOR’S REPORT To the members of Shakarganj Limited Report on the Audit of the Financial Statements Opinion
We have audited the annexed financial statements of Shakarganj Limited (the Company), which comprise the statement of financial position as at 30 September 2020, and the statement of profit or loss, the statement of comprehensive income, the statement of changes in equity, the statement of cash flows for the year then ended, and notes to the financial statements, including a summary of significant accounting policies and other explanatory information, and we state that we have obtained all the information and explanations which, to the best of our knowledge and belief, were necessary for the purposes of the audit.
In our opinion and to the best of our information and according to the explanations given to us, the statement of financial position, the statement of profit or loss, the statement of comprehensive income, the statement of changes in equity and the statement of cash flows together with the notes forming part thereof conform with the accounting and reporting standards as applicable in Pakistan and give the information required by the Companies Act, 2017 (XIX of 2017), in the manner so required and respectively give a true and fair view of the state of the Company’s affairs as at 30 September 2020 and of the loss, other comprehensive loss, the changes in equity and its cash flows for the year then ended.
Basis for Opinion
We conducted our audit in accordance with International Standards on Auditing (ISAs) as applicable in Pakistan. Our responsibilities under those standards are further described in the Auditor’s Responsibilities for the Audit of the Financial Statements section of our report. We are independent of the Company in accordance with the International Ethics Standards Board for Accountants’ Code of Ethics for Professional Accountants as adopted by the Institute of Chartered Accountants of Pakistan (the Code) and we have fulfilled our other ethical responsibilities in accordance with the Code. We believe that the audit evidence we have obtained is sufficient and appropriate to provide a basis for our opinion.
Key Audit Matters
Key audit matters are those matters that, in our professional judgment, were of most significance in our audit of the financial statements of the current period. These matters were addressed in the context of our audit of the financial statements as a whole, and in forming our opinion thereon, and we do not provide a separate opinion on these matters.
560-F, Raja Road, Gulistan ColonyFaisalabad - 38000, PakistanT: +92(41) 886 10 42, 886 36 44F: +92 (41) 886 36 [email protected]
27
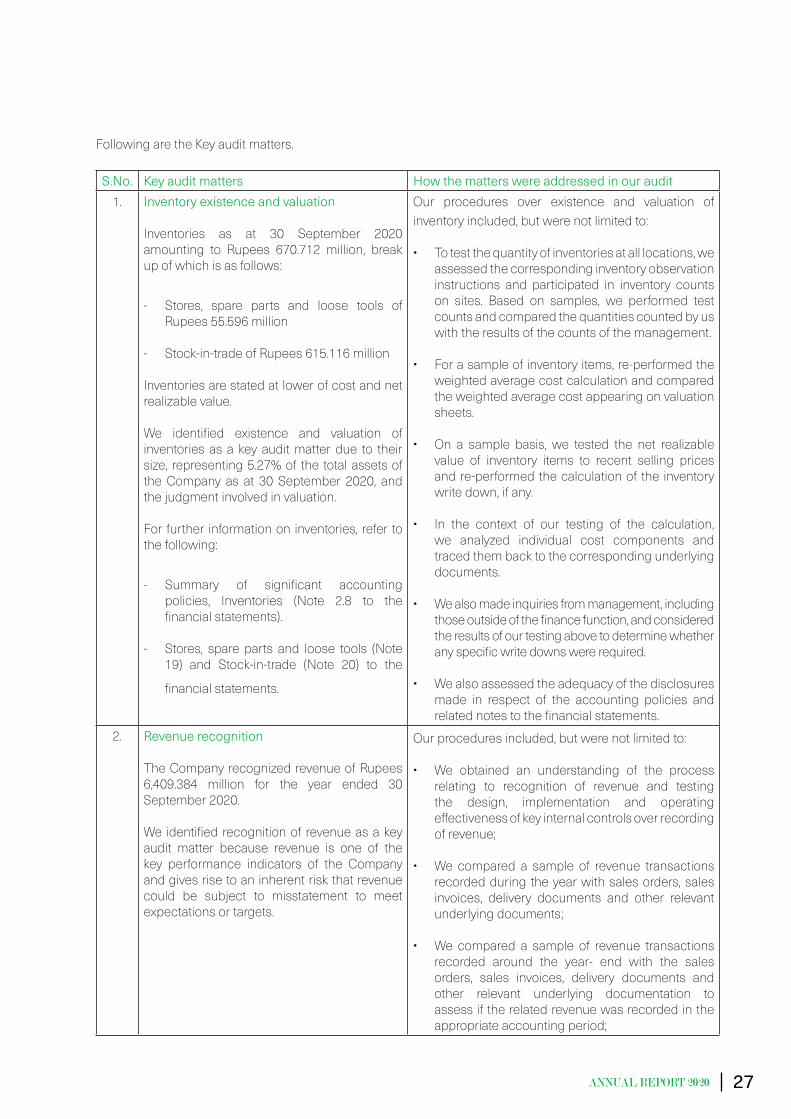
Following are the Key audit matters.
S.No. Key audit matters How the matters were addressed in our audit1. Inventory existence and valuation
Inventories as at 30 September 2020 amounting to Rupees 670.712 million, break up of which is as follows:
- Stores, spare parts and loose tools of Rupees 55.596 million
- Stock-in-trade of Rupees 615.116 million
Inventories are stated at lower of cost and net realizable value.
We identified existence and valuation of inventories as a key audit matter due to their size, representing 5.27% of the total assets of the Company as at 30 September 2020, and the judgment involved in valuation.
For further information on inventories, refer to the following:
- Summary of significant accounting policies, Inventories (Note 2.8 to the financial statements).
- Stores, spare parts and loose tools (Note 19) and Stock-in-trade (Note 20) to the
financial statements.
Our procedures over existence and valuation of inventory included, but were not limited to:
• To test the quantity of inventories at all locations, we assessed the corresponding inventory observation instructions and participated in inventory counts on sites. Based on samples, we performed test counts and compared the quantities counted by us with the results of the counts of the management.
• For a sample of inventory items, re-performed the weighted average cost calculation and compared the weighted average cost appearing on valuation sheets.
• On a sample basis, we tested the net realizable value of inventory items to recent selling prices and re-performed the calculation of the inventory write down, if any.
• In the context of our testing of the calculation, we analyzed individual cost components and traced them back to the corresponding underlying documents.
• We also made inquiries from management, including those outside of the finance function, and considered the results of our testing above to determine whether any specific write downs were required.
• We also assessed the adequacy of the disclosures made in respect of the accounting policies and related notes to the financial statements.
2. Revenue recognition
The Company recognized revenue of Rupees 6,409.384 million for the year ended 30 September 2020.
We identified recognition of revenue as a key audit matter because revenue is one of the key performance indicators of the Company and gives rise to an inherent risk that revenue could be subject to misstatement to meet expectations or targets.
Our procedures included, but were not limited to:
• We obtained an understanding of the process relating to recognition of revenue and testing the design, implementation and operating effectiveness of key internal controls over recording of revenue;
• We compared a sample of revenue transactions
recorded during the year with sales orders, sales invoices, delivery documents and other relevant underlying documents;
• We compared a sample of revenue transactions recorded around the year- end with the sales orders, sales invoices, delivery documents and other relevant underlying documentation to assess if the related revenue was recorded in the appropriate accounting period;
28
S.No. Key audit matters How the matters were addressed in our auditFor further information on revenue recognition, refer to the following:
- Summary of significant accounting policies,
Revenue from contracts with customers (Note 2.2 to the financial statements).
- Revenue (Note 25 to the financial
statements).
• We assessed whether the accounting policies for revenue recognition complies with the requirements of IFRS 15 ‘Revenue from Contracts with Customers’;
• We compared the detail of a sample of journal entries posted to revenue accounts during the year, which met certain specific risk-based criteria, with the relevant underlying documentation.
• We also considered the appropriateness of disclosures in the financial statements.
Information Other than the Financial Statements and Auditor’s Report Thereon
Management is responsible for the other information. The other information comprises the information included in the annual report, but does not include the financial statements and our auditor’s report thereon.
Our opinion on the financial statements does not cover the other information and we do not express any form of assurance conclusion thereon.
In connection with our audit of the financial statements, our responsibility is to read the other information and, in doing so, consider whether the other information is materially inconsistent with the financial statements or our knowledge obtained in the audit or otherwise appears to be materially misstated. If, based on the work we have performed, we conclude that there is a material misstatement of this other information; we are required to report that fact. We have nothing to report in this regard.
Responsibilities of Management and Board of Directors for the Financial Statements
Management is responsible for the preparation and fair presentation of the financial statements in accordance with the accounting and reporting standards as applicable in Pakistan and the requirements of Companies Act, 2017 (XIX of 2017) and for such internal control as management determines is necessary to enable the preparation of financial statements that are free from material misstatement, whether due to fraud or error.
In preparing the financial statements, management is responsible for assessing the Company’s ability to continue as a going concern, disclosing, as applicable, matters related to going concern and using the going concern basis of accounting unless management either intends to liquidate the Company or to cease operations, or has no realistic alternative but to do so.
Board of directors is responsible for overseeing the Company’s financial reporting process.
Auditor’s Responsibilities for the Audit of the Financial Statements
Our objectives are to obtain reasonable assurance about whether the financial statements as a whole are free from material misstatement, whether due to fraud or error, and to issue an auditor’s report that includes our opinion. Reasonable assurance is a high level of assurance, but is not a guarantee that an audit conducted in accordance with ISAs as applicable in Pakistan will always detect a material misstatement when it exists. Misstatements can arise from fraud or error and are considered material if, individually or in the aggregate, they could reasonably be expected to influence the economic decisions of users taken on the basis of these financial statements.
As part of an audit in accordance with ISAs as applicable in Pakistan, we exercise professional judgment and maintain professional skepticism throughout the audit. We also:
• Identify and assess the risks of material misstatement of the financial statements, whether due to fraud or error, design and perform audit procedures responsive to those risks, and obtain audit evidence that is sufficient and appropriate to provide a basis for our opinion. The risk of not detecting a material misstatement resulting from fraud is higher than for one resulting from error, as fraud may involve collusion, forgery, intentional omissions, misrepresentations, or the override of internal control.
29
• Obtain an understanding of internal control relevant to the audit in order to design audit procedures that are appropriate in the circumstances, but not for the purpose of expressing an opinion on the effectiveness of the Company’s internal control.
• Evaluate the appropriateness of accounting policies used and the reasonableness of accounting estimates and related disclosures made by management.
• Conclude on the appropriateness of management’s use of the going concern basis of accounting and, based on the audit evidence obtained, whether a material uncertainty exists related to events or conditions that may cast significant doubt on the Company’s ability to continue as a going concern. If we conclude that a material uncertainty exists, we are required to draw attention in our auditor’s report to the related disclosures in the financial statements or, if such disclosures are inadequate, to modify our opinion. Our conclusions are based on the audit evidence obtained up to the date of our auditor’s report. However, future events or conditions may cause the Company to cease to continue as a going concern.
• Evaluate the overall presentation, structure and content of the financial statements, including the disclosures, and whether the financial statements represent the underlying transactions and events in a manner that achieves fair presentation.
We communicate with the board of directors regarding, among other matters, the planned scope and timing of the audit and significant audit findings, including any significant deficiencies in internal control that we identify during our audit.
We also provide the board of directors with a statement that we have complied with relevant ethical requirements regarding independence, and to communicate with them all relationships and other matters that may reasonably be thought to bear on our independence, and where applicable, related safeguards.
From the matters communicated with the board of directors, we determine those matters that were of most significance in the audit of the financial statements of the current period and are therefore the key audit matters. We describe these matters in our auditor’s report unless law or regulation precludes public disclosure about the matter or when, in extremely rare circumstances, we determine that a matter should not be communicated in our report because the adverse consequences of doing so would reasonably be expected to outweigh the public interest benefits of such communication.
Report on Other Legal and Regulatory Requirements
Based on our audit, we further report that in our opinion:
a) proper books of account have been kept by the Company as required by the Companies Act, 2017 (XIX of 2017);
b) the statement of financial position, the statement of profit or loss, the statement of comprehensive income, the statement of changes in equity and the statement of cash flows together with the notes thereon have been drawn up in conformity with the Companies Act, 2017 (XIX of 2017) and are in agreement with the books of account and returns;
c) investments made, expenditure incurred and guarantees extended during the year were for the purpose of the Company’s business; and
d) no Zakat was deductible at source under the Zakat and Usher Ordinance, 1980 (XVIII of 1980)
Other Matter
The financial statements for the year ended 30 September 2019 were audited by another firm of Chartered Accountants whose auditor’s report dated 04 January 2020 expressed unmodified opinion.
The engagement partner on the audit resulting in this independent auditor’s report is Liaqat Ali Panwar.
Faisalabad Riaz Ahmad & Co.04 January 2021 Chartered Accountants

30
STATEMENT OF FINANCIAL POSITIONAs at 30 September 2020
ChiefExecutiveOfficer
2020 2019 Note (Rupees in thousand) EQUITY AND LIABILITIES Share capital and reserves Authorized share capital 150 000 000 (2019: 150 000 000) ordinary shares of Rs. 10 each 1,500,000 1,500,000 50 000 000 (2019: 50 000 000) preference shares of Rs. 10 each 500,000 500,000
2,000,000 2,000,000 Issued, subscribed and paid up share capital 3 1,250,000 1,250,000 Capital reserves Surplus on revaluation of property, plant and equipment - net of deferred income tax 4 6,087,758 6,356,860 Other capital reserves 4 1,683,231 1,696,421 Revenue reserves 5 516,306 516,306 Accumulated loss (2,678,821) (1,861,115)
Total equity 6,858,474 7,958,472 LIABILITIES NON-CURRENT LIABILITIES Long term financing 6 219,945 128,291 Deferred income - Government grant 7 3,405 - Employees’ retirement benefits 8 160,503 - Deferred income tax liability 9 925,415 1,209,949
1,309,268 1,338,240 CURRENT LIABILITIES Trade and other payables 10 2,808,451 2,028,140 Short term borrowings 11 1,415,698 1,804,077 Accrued mark-up 12 57,152 79,647 Current portion of non-current liabilities 13 245,419 256,453 Unclaimed dividend 1,954 2,039 Provision for taxation 38,171 - 4,566,845 4,170,356
TOTAL LIABILITIES 5,876,113 5,508,596 CONTINGENCIES AND COMMITMENTS 14
TOTAL EQUITY AND LIABILITIES 12,734,587 13,467,068 The annexed notes form an integral part of these financial statements.
Restated

31
Director ChiefFinancialOfficer
2020 2019 Note (Rupees in thousand) ASSETS Non-current assets Property, plant and equipment 15 9,745,632 10,253,780 Biological assets 16 18,819 17,017 Long term investments 17 1,679,003 2,131,209 Employees’ retirement benefits 8 - 38,996 Long term advances and deposits 18 34,035 34,001
11,477,489 12,475,003 CURRENT ASSETS Biological assets 16 20,973 29,299 Stores, spare parts and loose tools 19 55,596 63,691 Stock-in-trade 20 615,116 576,860 Trade debts 21 203,093 35,078 Loans and advances 22 70,369 126,738 Prepayments and other receivables 23 283,852 76,697 Cash and bank balances 24 8,099 83,702
1,257,098 992,065
TOTAL ASSETS 12,734,587 13,467,068
Restated

32
2020 2019 Note (Rupees in thousand) Restated Revenue 25 6,409,384 6,256,738 Cost of sales 26 (7,081,059) (6,283,349)
Gross loss (671,675) (26,611) Distribution cost 27 (66,676) (137,699)Administrative expenses 28 (320,360) (311,176)Other expenses 29 (38,460) (38,707)Other income 30 803,952 65,478
Loss from operations (293,219) (448,715) Finance cost 31 (338,799) (331,034) Share of (loss) / profit from equity accounted investee 17 (538,637) 5,279
Loss before taxation (1,170,655) (774,470) Taxation 32 173,072 46,059
Loss after taxation (997,583) (728,411)
Loss per share - basic and diluted (rupees) 33 (7.98) (5.83)
The annexed notes form an integral part of these financial statements.
ChiefExecutiveOfficer Director ChiefFinancialOfficer
STATEMENT OF PROFIT OR LOSSFor the year ended 30 September 2020

33
ChiefExecutiveOfficer Director ChiefFinancialOfficer
2020 2019 (Rupees in thousand)
LOSS AFTER TAXATION (997,583) (728,411) OTHER COMPREHENSIVE (LOSS) / INCOME Itemsthatwillnotbereclassifiedsubsequentlytoprofitorloss:
Remeasurement of defined benefit obligations (207,519) 27,198 Related deferred income tax liability 44,964 (5,733)
(162,555) 21,465 Surplus / (deficit) arising on remeasurement of investments at fair value through other comprehensive income 5,413 (5,964)Share of other comprehensive income of equity accounted investee 6,330 47,911
(150,812) 63,412 Itemsthatmaybereclassifiedsubsequentlytostatementofprofitorloss - - Other comprehensive (loss) / income for the year - net of deferred income tax - restated (150,812) 63,412
TOTAL COMPREHENSIVE LOSS FOR THE YEAR (1,148,395) (664,999)
The annexed notes form an integral part of these financial statements.
Restated
STATEMENT OF COMPREHENSIVE INCOMEFor the year ended 30 September 2020
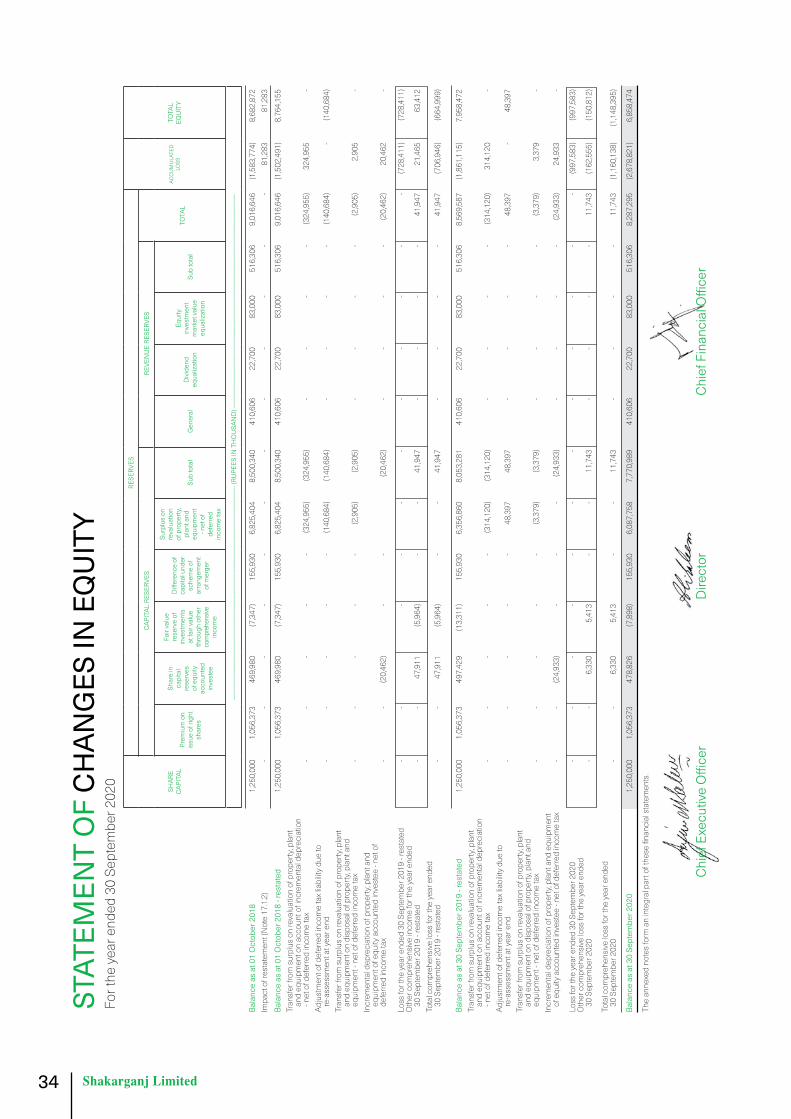
34
STAT
EMEN
T O
F C
HAN
GES
IN E
QU
ITY
For t
he y
ear e
nded
30
Sept
embe
r 202
0
SHAR
E CA
PITA
L
RESE
RVES
ACC
UM
ULA
TED
LO
SSTO
TAL
EQU
ITY
CAP
ITAL
RES
ERVE
S R
EVEN
UE
RESE
RVES
TOTA
LPr
emiu
m o
n is
sue
of ri
ght
shar
es
Shar
e in
ca
pita
l re
serv
es
of e
quity
ac
coun
ted
inve
stee
Fair
valu
e re
serv
e of
in
vest
men
ts
at fa
ir va
lue
thro
ugh
othe
r co
mpr
ehen
sive
inco
me
Differenceof
capi
tal u
nder
sc
hem
e of
ar
rang
emen
t of
mer
ger
Surp
lus
on
reva
luat
ion
of p
rope
rty,
plan
t and
eq
uipm
ent
- net
of
defe
rred
inco
me
tax
Sub
tota
lG
ener
alD
ivide
nd
equa
lizat
ion
Equi
ty
inve
stm
ent
mar
ket v
alue
eq
ualiz
atio
n
Sub
tota
l
------
------
------
------
------
------
------
------
------
------
------
------
------
------
------
------
------
------
--- (R
UPE
ES IN
TH
OU
SAN
D) -
------
------
------
------
------
------
------
------
------
------
------
------
------
------
------
------
------
------
-- Ba
lanc
e as
at 0
1 O
ctob
er 2
018
1,2
50,0
00
1,0
56,3
73
469
,980
(7
,347
) 1
55,9
30
6,8
25,4
04
8,5
00,3
40
410
,606
2
2,70
0
83,
000
5
16,3
06
9,0
16,6
46
(1,5
83,7
74)
8,6
82,8
72
Impa
ct o
f res
tate
men
t (N
ote
17.1
.2)
-
-
-
-
-
-
-
-
-
-
-
-
81,
283
8
1,28
3 Ba
lanc
e as
at 0
1 O
ctob
er 2
018
- res
tate
d 1
,250
,000
1
,056
,373
4
69,9
80
(7,3
47)
155
,930
6
,825
,404
8
,500
,340
4
10,6
06
22,
700
8
3,00
0
516
,306
9
,016
,646
(1
,502
,491
) 8
,764
,155
Tr
ansf
er fr
om s
urpl
us o
n re
valu
atio
n of
pro
perty
, pla
nt
an
d eq
uipm
ent o
n ac
coun
t of i
ncre
men
tal d
epre
ciat
ion
- n
et o
f def
erre
d in
com
e ta
x -
-
-
-
-
(3
24,9
55)
(324
,955
) -
-
-
-
(3
24,9
55)
324
,955
-
Ad
just
men
t of d
efer
red
inco
me
tax
liabi
lity
due
to
re
-ass
essm
ent a
t yea
r end
-
-
-
-
-
(1
40,6
84)
(140
,684
) -
-
-
-
(1
40,6
84)
-
(140
,684
)
Tr
ansf
er fr
om s
urpl
us o
n re
valu
atio
n of
pro
perty
, pla
nt
an
d eq
uipm
ent o
n di
spos
al o
f pro
perty
, pla
nt a
nd
eq
uipm
ent -
net
of d
efer
red
inco
me
tax
-
-
-
-
-
(2,9
05)
(2,9
05)
-
-
-
-
(2,9
05)
2,9
05
-
Incr
emen
tal d
epre
ciat
ion
of p
rope
rty, p
lant
and
equi
pmen
t of e
quity
acc
ount
ed in
vest
ee -
net o
f
defe
rred
inco
me
tax
-
-
(20,
462)
-
-
(20,
462)
-
-
-
-
(2
0,46
2)
20,
462
-
Lo
ss fo
r the
yea
r end
ed 3
0 Se
ptem
ber 2
019
- res
tate
d -
-
-
-
-
-
-
-
-
-
-
(728
,411
) (7
28,4
11)
Oth
er c
ompr
ehen
sive
inco
me
for t
he y
ear e
nded
30 S
epte
mbe
r 201
9 - r
esta
ted
-
-
47,
911
(5
,964
) -
-
4
1,94
7
-
-
-
-
41,
947
2
1,46
5
63,
412
Tota
l com
preh
ensi
ve lo
ss fo
r the
yea
r end
ed
30
Sep
tem
ber 2
019
- res
tate
d -
-
4
7,91
1
(5,9
64)
-
-
41,
947
-
-
-
-
4
1,94
7
(706
,946
) (6
64,9
99)
Bala
nce
as a
t 30
Sept
embe
r 201
9 - r
esta
ted
1,2
50,0
00
1,0
56,3
73
497
,429
(1
3,31
1)
155
,930
6
,356
,860
8
,053
,281
4
10,6
06
22,
700
8
3,00
0
516
,306
8
,569
,587
(1
,861
,115
) 7
,958
,472
Tr
ansf
er fr
om s
urpl
us o
n re
valu
atio
n of
pro
perty
, pla
nt
an
d eq
uipm
ent o
n ac
coun
t of i
ncre
men
tal d
epre
ciat
ion
- n
et o
f def
erre
d in
com
e ta
x -
-
-
-
-
(3
14,1
20)
(314
,120
) -
-
-
-
(3
14,1
20)
314
,120
-
Ad
just
men
t of d
efer
red
inco
me
tax
liabi
lity
due
to
re
-ass
essm
ent a
t yea
r end
-
-
-
-
-
4
8,39
7
48,
397
-
-
-
-
4
8,39
7
-
48,
397
Tran
sfer
from
sur
plus
on
reva
luat
ion
of p
rope
rty, p
lant
and
equi
pmen
t on
disp
osal
of p
rope
rty, p
lant
and
equi
pmen
t - n
et o
f def
erre
d in
com
e ta
x -
-
-
-
-
(3
,379
) (3
,379
) -
-
-
-
(3
,379
) 3
,379
-
In
crem
enta
l dep
reci
atio
n of
pro
perty
, pla
nt a
nd e
quip
men
t
of e
quity
acc
ount
ed in
vest
ee -
net o
f def
erre
d in
com
e ta
x -
-
(2
4,93
3)
-
-
-
(24,
933)
-
-
-
-
(2
4,93
3)
24,
933
-
Lo
ss fo
r the
yea
r end
ed 3
0 Se
ptem
ber 2
020
-
-
-
-
-
-
-
-
-
-
-
-
(997
,583
) (9
97,5
83)
Oth
er c
ompr
ehen
sive
loss
for t
he y
ear e
nded
30 S
epte
mbe
r 202
0 -
-
6
,330
5
,413
-
-
1
1,74
3
-
-
-
-
11,
743
(1
62,5
55)
(150
,812
)
Tota
l com
preh
ensi
ve lo
ss fo
r the
yea
r end
ed
30
Sep
tem
ber 2
020
-
-
6,3
30
5,4
13
-
-
11,
743
-
-
-
-
1
1,74
3
(1,1
60,1
38)
(1,1
48,3
95)
Bala
nce
as a
t 30
Sept
embe
r 202
0 1
,250
,000
1
,056
,373
4
78,8
26
(7,8
98)
155
,930
6
,087
,758
7
,770
,989
4
10,6
06
22,
700
8
3,00
0
516
,306
8
,287
,295
(2
,678
,821
) 6
,858
,474
Th
e an
nexe
d no
tes
form
an
inte
gral
par
t of t
hese
fina
ncia
l sta
tem
ents
.
ChiefExecutiveOfficer
Director
ChiefFinancialOfficer
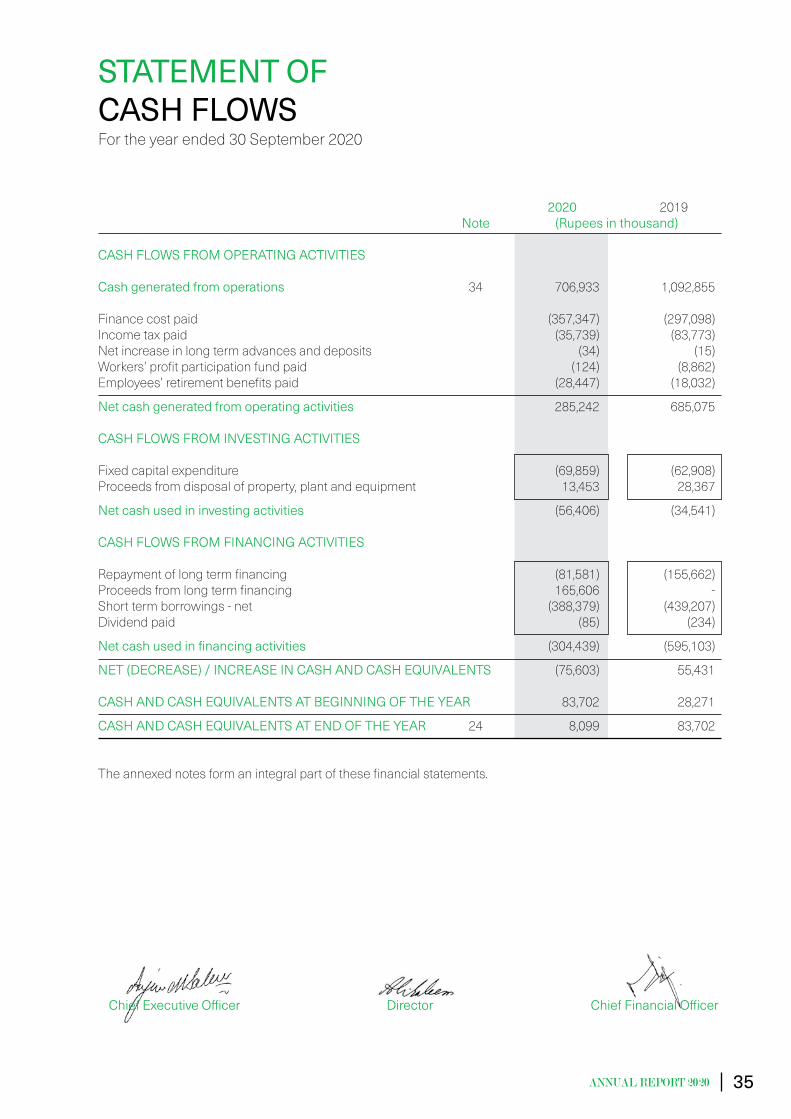
35
STATEMENT OF CASH FLOWS For the year ended 30 September 2020
2020 2019 Note (Rupees in thousand) CASH FLOWS FROM OPERATING ACTIVITIES Cash generated from operations 34 706,933 1,092,855 Finance cost paid (357,347) (297,098)Income tax paid (35,739) (83,773)Net increase in long term advances and deposits (34) (15)Workers’ profit participation fund paid (124) (8,862)Employees’ retirement benefits paid (28,447) (18,032)
Net cash generated from operating activities 285,242 685,075 CASH FLOWS FROM INVESTING ACTIVITIES Fixed capital expenditure (69,859) (62,908)Proceeds from disposal of property, plant and equipment 13,453 28,367
Net cash used in investing activities (56,406) (34,541) CASH FLOWS FROM FINANCING ACTIVITIES Repayment of long term financing (81,581) (155,662)Proceeds from long term financing 165,606 - Short term borrowings - net (388,379) (439,207)Dividend paid (85) (234)
Netcashusedinfinancingactivities (304,439) (595,103)
NET (DECREASE) / INCREASE IN CASH AND CASH EQUIVALENTS (75,603) 55,431 CASH AND CASH EQUIVALENTS AT BEGINNING OF THE YEAR 83,702 28,271
CASH AND CASH EQUIVALENTS AT END OF THE YEAR 24 8,099 83,702
The annexed notes form an integral part of these financial statements.
ChiefExecutiveOfficer Director ChiefFinancialOfficer

36
NOTES TO THE FINANCIAL STATEMENTSFor the year ended 30 September 2020
1. THE COMPANY AND ITS OPERATIONS Shakarganj Limited (the Company) is a public limited company incorporated on 20 September 1967 in
Pakistan under the Companies Act, 1913 (Now Companies Act, 2017) and is listed on Pakistan Stock Exchange Limited. It is principally engaged in manufacture, purchase and sale of sugar, biofuel and yarn. The Company has its principal manufacturing facilities at Jhang and satellite manufacturing facilities at Bhone. The registered office of the Company is situated at E-Floor, IT tower, 73-E/1, Hali Road, Gulberg-III, Lahore.
1.1 Geographical locations and addresses of all business units of the Company except for the registered office are as follows:
Manufacturing Unit Address Jhang Unit (Sugar, Biofuel and Textile) 5 KM Toba Tek Singh Road, Jhang, Punjab Bhone Unit (Sugar and Biofuel) 63 KM Jhang - Sargodha Road, Bhone, Tehsil and District Jhang, Punjab Liaison Office Nishatabad, Chak Jhumra Road, Faisalabad, Punjab Liaison Office 12th Floor, Sidco Avenue Centre, 264 R.A. Lines, Karachi, Sindh 1.2 These financial statements are the separate financial statements of the Company. Consolidated financial
statements are prepared separately. 1.3 ImpactofCOVID-19onthefinancialstatements The pandemic of COVID-19 which rapidly spread all across the world has not only endangered human
lives but has also adversely impacted the global economy. From 24 March 2020, Punjab Government announced a temporary lockdown as a measure to reduce the spread of the COVID–19. The Company’s operations were also affected, as sugar sales, biofuel exports and yarn sales of the Company dropped after the country-wide lockdown. However, after lifting of lockdown by Punjab Government in June 2020, supply chain system of the Company reverted back to normal level. Moreover, State Bank of Pakistan vide BPRD circular No. 13 of 2020 dated 26 March 2020 allowed deferment of principal repayments on loan obligations due to banks by a period of one year. The Company has availed this opportunity and its long term financing as given in Note 6.1.2 were deferred for a period of one year and its short term borrowings as given in Note 11.2 were deferred for a period of six months to one year. Furthermore, the Company has availed a facility of Rupees 165.606 million from MCB Bank Limited, sanctioned under State Bank of Pakistan Refinance Scheme for payment of wages and salaries to workers and employees of business concerns, as given in Note 6.1.1. According to management’s assessment, there is no other significant accounting impact of the effects of COVID-19 in these financial statements.
1.4 In spite of the impacts of COVID-19 pandemic on Company’s operations as stated in Note 1.3 above, the
Company undertook significant operational measures in the current year to improve its productivity. During the year, the Company has crushed 884 724 MT which is almost double as compared to 484 762 MT of sugarcane crushed in the corresponding period and produced 77 560 MT (2019: 49 016 MT) of sugar. During the year, the Company has successfully renewed its working capital lines. The measures taken by the Government to support businesses after spread of COVID-19 have positive impact on liquidity position of the Company as repayment of long term financing has been deferred by one year and repayment of significant portion of short term borrowings has been deferred for a period of six months to one year. The

37
NOTES TO THE FINANCIAL STATEMENTSFor the year ended 30 September 2020
Company also availed facility of Rupees 165.606 million under SBP Refinance Scheme for payment of wages and salaries. The Company expects drastic improvement in its Biofuel and Textile Segments in next year owing to restoration of exports of biofuel and increased demand of yarn. Subsequent to the reporting date, the Company is in negotiations with its lenders for working capital finance for operational liquidity. The Company is also arranging long term financing of Rupees 500 million to finance capital expenditure. Further, fresh working capital lines of Rupees 1,000 million, in addition to existing lines, are being arranged to meet operational liquidity requirements. The Company remains committed to its best efforts to improve liquidity position. The financial projections of the Company show improvements in cash generation and profits. The management believes that the measures taken by it will generate sufficient financial resources from operations. The Company is expected to generate sufficient cashflows in the next year.
2. SUMMARY OF SIGNIFICANT ACCOUNTING POLICIES The significant accounting policies applied in the preparation of these financial statements are set out
below. These policies have been consistently applied to all years presented, unless otherwise stated: 2.1 Basis of preparation a) Statement of compliance These financial statements have been prepared in accordance with the accounting and reporting standards
as applicable in Pakistan. The accounting and reporting standards applicable in Pakistan comprise of:
- International Financial Reporting Standards (IFRSs) issued by the International Accounting Standards Board (IASB) as notified under the Companies Act, 2017; and
- Provisions of and directives issued under the Companies Act, 2017.
Where provisions of and directives issued under the Companies Act, 2017 differ from the IFRSs, the provisions of and directives issued under the Companies Act, 2017 have been followed.”
b) Accounting convention These financial statements have been prepared under the historical cost convention except as otherwise
stated in the respective accounting policies. c) Critical accounting estimates and judgments The preparation of financial statements in conformity with the approved accounting standards requires
the use of certain critical accounting estimates. It also requires the management to exercise its judgment in the process of applying the Company’s accounting policies. Estimates and judgments are continually evaluated and are based on historical experience and other factors, including expectations of future events that are believed to be reasonable under the circumstances. The areas where various assumptions and estimates are significant to the Company’s financial statements or where judgments were exercised in application of accounting policies are as follows:
Usefullives,patternsofeconomicbenefitsandimpairments The estimates for revalued amounts of different classes of property, plant and equipment, are based
on valuation performed by external professional valuers and recommendations of technical teams of the Company. The said recommendations also include estimates with respect to residual values and depreciable lives. Further, the Company reviews the value of the assets for possible impairment on an annual basis. Estimates with respect to residual values and useful lives and pattern of flow of economic
38
benefits are based on the analysis of the management of the Company. Any change in the estimates in future years might affect the carrying amounts of the respective items of property, plant and equipment with a corresponding effect on the depreciation charge and impairment.
Inventories Net realizable value of inventories is determined with reference to currently prevailing selling prices less
estimated expenditure to make sales. Taxation In making the estimates for income tax currently payable by the Company, the management takes into
account the current income tax law and the decisions of appellate authorities on certain issues in the past. Deferred tax is measured at the tax rates that are expected to apply to the period when the asset is realized or the liability is settled based on the tax rates (and tax laws) that have been enacted or substantially enacted at the reporting date. Deferred income tax assets are recognized for deductible temporary differences only if the Company considers it is probable that future taxable amounts will be available to utilize those temporary differences and losses.
Allowance for expected credit losses The allowance for expected credit losses assessment requires a degree of estimation and judgement. It is
based on the lifetime expected credit loss, based on the Company’s experience of actual credit loss in past years.
Revenue from contracts with customers involving sale of goods When recognizing revenue in relation to the sale of goods to customers, the key performance obligation of
the Company is considered to be the point of delivery of the goods to the customer, as this is deemed to be the time that the customer obtains control of the promised goods and therefore the benefits of unimpeded access.
Provision for obsolescence of stores, spare parts and loose tools The Company reviews the carrying amount of stores, spare parts and loose tools on regular basis and
provision for obsolescence is made if there is any change in usage pattern and physical form of stores, spare parts and loose tools.
Employees’retirementbenefits Certain actuarial assumptions have been adopted for valuation of present value of defined benefit
obligations. Changes in these assumptions in future years may affect the liability under these schemes in those years.
Provisions As the actual outflows can differ from estimates made for provisions due to changes in laws, regulations,
public expectations, technology, prices and conditions, and can take place many years in the future, the carrying amounts of provisions are reviewed at each reporting date and adjusted to take account of such changes. Any adjustments to the amount of previously recognized provision is recognized in the statement of profit or loss unless the provision was originally recognized as part of cost of an asset.
NOTES TO THE FINANCIAL STATEMENTSFor the year ended 30 September 2020
39
d) Standard, interpretation and amendments to published approved accounting standards that are effectiveincurrentyearandarerelevanttotheCompany
Following standard, interpretation and amendments to published approved accounting standards are
mandatory for the Company’s accounting periods beginning on or after 01 October 2019: • IFRS 16 ‘Leases’ • Amendments to IFRS 09 ‘Financial Instruments’ • IFRIC 23 ‘Uncertainty over Income Tax Treatments’ • Amendments to IAS 19 ‘Employee Benefits’ - Plan Amendment, Curtailment or Settlement • Annual Improvements to IFRSs: 2015 – 2017 Cycle” The amendments and interpretation listed above do not have any impact on the amounts recognized
in prior periods and are not expected to significantly affect the current or future periods. However the implications of IFRS 16 are given hereunder:
IFRS 16 ‘Leases’ has replaced the guidance on accounting for leases, including IAS 17 ‘Leases’, IFRIC 4
‘Determining whether an Arrangement Contains a Lease’, SIC-15 ‘Operating Leases - Incentive’ and SIC-27 ‘Evaluating the Substance of Transactions Involving the Legal Form of a Lease’. IFRS 16 provided a single lessee accounting model, requiring lessees to recognize assets and liabilities for all leases unless the lease term is twelve months or less or the underlying asset has a low value. A lessee recognizes a right of use asset representing the right of use of the underlying asset and a lease liability representing its obligations to make lease payments. Lessor accounting remains similar to IAS 17. The Company has only short-term operating leases, hence, the adoption of IFRS 16 does not have any impact on the amounts recognized in prior periods and is not expected to significantly affect the current or future periods.
e) Standardandamendmentstopublishedapprovedaccountingstandardsthatareeffectiveincurrent
year but not relevant to the Company There are other standard and amendments to published approved accounting standards that are
mandatory for accounting periods beginning on or after 01 October 2019 but are considered not to be relevant or do not have any significant impact on the Company’s financial statements and are therefore not detailed in these financial statements.
f) Amendmentstopublishedapprovedaccountingstandardsthatarenotyeteffectivebutrelevanttothe
Company Following amendments to existing standards have been published and are mandatory for the Company’s
accounting periods beginning on or after 01 October 2020 or later periods: Amendment to IFRS 3 ‘Business Combinations’ – Definition of a Business (effective for business
combinations for which the acquisition date is on or after the beginning of annual period beginning on or after 1 January 2020). The IASB has issued amendments aiming to resolve the difficulties that arise when an entity determines whether it has acquired a business or a group of assets. The amendments clarify that to be considered a business, an acquired set of activities and assets must include, at a minimum, an input and a substantive process that together significantly contribute to the ability to create outputs. The amendments include an election to use a concentration test. The standard is effective for transactions in the future and therefore would not have an impact on past financial statements.
Interest Rate Benchmark Reform which amended IFRS 7 ‘Financial Instruments: Disclosures’, IFRS 9
‘Financial Instruments’ and IAS 39 ‘Financial Instruments: Recognition and Measurement’, is applicable for annual financial periods beginning on or after 01 January 2020. The G20 asked the Financial Stability Board (FSB) to undertake a fundamental review of major interest rate benchmarks. Following the review, the FSB published report setting out its recommended reforms of some major interest rate benchmarks
NOTES TO THE FINANCIAL STATEMENTSFor the year ended 30 September 2020

40
such as Interbank Offer Rates (IBORs). Public authorities in many jurisdictions have since taken steps to implement those recommendations. This has in turn led to uncertainty about the long-term viability of some interest rate benchmarks. In these amendments, the term ‘interest rates benchmarks reform’ refers to the market-wide reform of an interest rate benchmark including its replacement with an alternative benchmark rate, such as that resulting from the FSB’s recommendations set out in its July 2014 report ‘Reforming Major Interest Rate Benchmarks’ (the reform). The amendments made provided relief from the potential impacts of the uncertainty caused by the reform. A company shall apply these exceptions to all hedging relationships directly affected by interest rate benchmark reform. The amendments are not likely to affect the financial statements of the Company.
Amendments to IFRS 16 ‘Leases’ (effective for annual periods beginning on or after 01 June 2020). Under
pervious requirements of IFRS 16, lessee assesses whether rent concessions are leased modifications, if so, apply the specific guidance on accounting for lease modifications. This generally involves remeasuring these lease liabilities using the revised lease payments and revised discount rates. In light of the effects of the COVID-19 pandemic and the fact that many lessees are applying the standard for the first time in their financial statements, the IASB has provided an optional practical expedient for lessees. Under the practical expedient, lessees are not required to assess whether eligible rent concessions are lease modifications, and instead are permitted to account for as if these were not lease modifications. Rent concessions are eligible for the practical expedient if these occur as a direct consequence of the COVID-19 pandemic and if following criteria are met:
- the change in lease payments results in revised consideration for the lease that is substantially same as,
or less than, the considerations for the lease immediately preceding the change; any reduction in lease payments affects only payments originally due on or before 30 June 2021; and
- there is no substantive change to the other terms and conditions of the lease. The above amendments are not likely to affect the financial statements of the Company. Amendments to IAS 1 ‘Presentation of Financial Statements’ and IAS 8 ‘Accounting Policies, Changes
in Accounting Estimates and Errors’ (effective for annual periods beginning on or after 01 January 2020). The amendments are intended to make the definition of material in IAS 1 easier to understand and are not intended to alter the underlying concept of materiality in IFRSs. In addition, the IASB has also issued guidance on how to make materiality judgments when preparing their general purpose financial statements in accordance with IFRSs. The amendments are not likely to affect the financial statements of the Company.
Amendments to IAS 1 ‘Presentation of Financial Statements’ (effective for annual periods beginning on or
after 01 January 2022). These amendments have been added to further clarify when a liability is classified as current. These amendments also changes the aspect of classification of liability as non-current by requiring the assessment of the entity’s right at the end of the reporting period to defer the settlement of liability for at least twelve months after the reporting period. An entity shall apply these amendments retrospectively in accordance with IAS 8. The amendments are not likely to affect the financial statements of the Company.
Amendments to IAS 37 ‘Provisions, Contingent Liabilities and Contingent Assets’ (effective for annual
periods beginning on or after 01 January 2022). These amendments clarify what comprise the cost of fulfilling a contract. Cost of fulfilling a contract is relevant when determining whether a contract is onerous. An entity is required to apply the amendments to contracts for which it has not yet fulfilled all its obligations at the beginning of the annual reporting period in which it first applies the amendments (the date of initial application). Restatement of comparative information is not required, instead the amendments require an entity to recognize the cumulative effect of initially applying the amendments as an adjustment to opening balance of retained earnings or other component of equity, as appropriate, at the date of initial application. The amendments are not likely to affect the financial statements of the Company.
NOTES TO THE FINANCIAL STATEMENTSFor the year ended 30 September 2020

41
Amendments to IAS 16 ‘Property, Plant and Equipment’ (effective for annual periods beginning on or after 01 January 2022). These amendments clarify that sales proceeds and cost of items produced while bringing an item of property, plant and equipment to the location and condition necessary for it to be capable of operating in the manner intended by management, are recognized in profit or loss in accordance with applicable standards. The entity measures the cost of those items applying the measurement requirements of IAS 2 ‘Inventories’. The standard also removes the requirement of deducting the net sales proceeds from cost of testing. An entity shall apply these amendments retrospectively, but only to items of property, plant and equipment which are brought to the location and condition necessary for them to be capable of operating in the manner intended by management on or after the beginning of the earliest period presented in the financial statements in which the entity first applies the amendments. The entity shall recognize the cumulative effect of initially applying the amendments as an adjustment to the opening balance of retained earnings (or other component of equity, as appropriate) at the beginning of that earliest period presented. The amendments are not likely to affect the financial statements of the Company.
Following Annual Improvements to IFRSs: 2018 - 2020 issued by IASB on 14 May 2020 are effective for
annual reporting periods beginning on or after 01 January 2022: - IFRS 9 ‘Financial Instruments’ - the amendment clarifies that an entity includes only fees paid or received
between the entity (the borrower) and the lender, including fees paid or received by either the entity or the lender on the other’s behalf, when it applies the ‘10 percent’ test in paragraph B3.3.6 of IFRS 9 in assessing whether to the de-recognize a financial liability.
-IFRS 16 ‘Leases’ - the amendment partially amends Illustrative Example 13 accompanying IFRS 16 ‘Leases’
by excluding the Illustration of reimbursement of leasehold improvements by the lessor. The objective of the amendment is to resolve any potential confusion that might rise in lease incentives.
-IAS 41 ‘Agriculture’ - the amendment removes the requirement in paragraph 22 of IAS 41 for entities to
exclude taxation cash flows when measuring the fair value of a biological asset using a present value technique.
The above amendments and improvements do not have a material impact on these financial statements. On 29 March 2018, the IASB has issued a revised Conceptual Framework. The new Framework: reintroduces
the terms stewardship and prudence; introduces a new asset definition that focuses on rights and a new liability definition that is likely to be broader than the definition it replaces, but does not change the distinction between a liability and an equity instrument; removes from the asset and liability definitions references to the expected flow of economic benefits–this lowers the hurdle for identifying the existence of an asset or liability and puts more emphasis on reflecting uncertainty in measurement; discusses historical cost and current value measures, and provides some guidance on how the IASB would go about selecting a measurement basis for a particular asset or liability; states that the primary measure of financial performance is profit or loss, and that only in exceptional circumstances will the IASB use other comprehensive income and only for income or expenses that arise from a change in the current value of an asset or liability; and discusses uncertainty, de-recognition, unit of account, the reporting entity and combined financial statements. The Framework is not an IFRS and does not override any standard, so nothing will change in the short term. The revised Framework will be used in future standard-setting decisions, but no changes will be made to current IFRSs. Preparers might also use the Framework to assist them in developing accounting policies where an issue is not addressed by an IFRS. It is effective for annual periods beginning on or after 01 January 2020 for preparers that develop an accounting policy based on the Framework.
g) Standardsandamendmentstopublishedapprovedaccountingstandardsthatarenotyeteffectiveand
not considered relevant to the Company There are other standards and amendments to published approved accounting standards that are
mandatory for accounting periods beginning on or after 01 October 2020 but are considered not to be relevant or do not have any significant impact on the Company’s financial statements and are therefore not detailed in these financial statements.
NOTES TO THE FINANCIAL STATEMENTSFor the year ended 30 September 2020

42
2.2 Revenue from contracts with customers i) Revenue recognition Sale of goods Revenue from the sale of goods is recognized at the point in time when the customer obtains control of the
goods, which is generally at the time of delivery. Interest Interest income is recognized as interest accrues using the effective interest method. This is a method
of calculating the amortized cost of a financial asset and allocating the interest income over the relevant period using the effective interest rate, which is the rate that exactly discounts estimated future cash receipts through the expected life of the financial asset to the net carrying amount of the financial asset.
Rent Revenue is recognized when rent is accrued. Dividend Dividend on equity investments is recognized when right to receive the dividend is established. Other revenue Other revenue is recognized when it is received or when the right to receive payment is established. ii) Contract assets Contract assets arise when the Company performs its performance obligations by transferring goods to a
customer before the customer pays its consideration or before payment is due. Contract assets are treated as financial assets for impairment purposes.
iii) Contract liabilities Contract liability is the obligation of the Company to transfer goods to a customer for which the Company
has received consideration from the customer. If a customer pays consideration before the Company transfers goods, a contract liability is recognized when the payment is made. Contract liabilities are recognized as revenue when the Company performs its performance obligations under the contract.
2.3 Financial Instruments i) Recognitionoffinancialinstruments The Company initially recognizes financial assets on the date when they are originated. Financial liabilities
are initially recognized on the trade date when the entity becomes a party to the contractual provisions of the instrument.
ii) Classificationandmeasurementoffinancialinstruments Investments and other financial assets a) Classification The Company classifies its financial assets in the following measurement categories:
NOTES TO THE FINANCIAL STATEMENTSFor the year ended 30 September 2020
43
• those to be measured subsequently at fair value through other comprehensive income, and • those to be measured at amortized cost” The classification depends on the Company’s business model for managing the financial assets and the
contractual terms of the cash flows. For assets measured at fair value, gains and losses will be recorded in other comprehensive income. For
investments in debt instruments, this will depend on the business model in which the investment is held. For investments in equity instruments, this will depend on whether the Company has made an irrevocable election at the time of initial recognition to account for the equity investment at fair value through other comprehensive income. The Company reclassifies debt investments when and only when its business model for managing those assets changes.
b) Measurement At initial recognition, the Company measures a financial asset at its fair value plus transaction costs that are
directly attributable to the acquisition of the financial asset. Financial assets with embedded derivatives are considered in their entirety when determining whether their cash flows are solely payment of principal and interest.
Debt instruments Subsequent measurement of debt instruments depends on the Company’s business model for managing
the asset and the cash flow characteristics of the asset. The Company classifies its debt instruments into following measurement category:
Amortized cost Financial assets that are held for collection of contractual cash flows where those cash flows represent
solely payments of principal and interest are measured at amortized cost. Interest income from these financial assets is included in other income using the effective interest rate method. Any gain or loss arising on de-recognition is recognized directly in profit or loss and presented in other income / (other expenses) together with foreign exchange gains and losses.
Equity instruments The Company subsequently measures all equity investments at fair value for financial instruments quoted
in an active market, the fair value corresponds to a market price (level 1). For financial instruments that are not quoted in an active market, the fair value is determined using valuation techniques including reference to recent arm’s length market transactions or transactions involving financial instruments which are substantially the same (level 2), or discounted cash flow analysis including, to the greatest possible extent, assumptions consistent with observable market data (level 3). The Company classifies its equity instruments into following measurement category:
Fair Value Through Other Comprehensive Income (FVTOCI) Where the Company’s management has elected to present fair value gains and losses on equity investments
in other comprehensive income, there is no subsequent reclassification of fair value gains and losses to profit or loss. Impairment losses (and reversal of impairment losses) on equity investments measured at FVTOCI are not reported separately from other changes in fair value. Dividend from such investments is recognized in statement of profit or loss as other income when the Company’s right to receive payments is established.
NOTES TO THE FINANCIAL STATEMENTSFor the year ended 30 September 2020

44
Financial liabilities Classificationandmeasurement Financial liabilities are classified at amortized cost. These are also subsequently measured at amortized
cost using the effective interest method. Interest expense and foreign exchange gains and losses are recognized in statement of profit or loss.
iii) Impairmentoffinancialassets The Company assesses on a forward looking basis the expected credit losses associated with its debt
instruments carried at amortized cost. The impairment methodology applied depends on whether there has been a significant increase in credit risk.
For trade debts and other receivables, the Company applies the simplified approach permitted by IFRS 9,
which requires expected lifetime losses to be recognized from initial recognition of the receivables. iv) De-recognition Financial assets The Company de-recognizes a financial asset when the contractual rights to the cash flows from the asset
expire, or it transfers the rights to receive the contractual cash flows in a transaction in which substantially all of the risks and rewards of ownership of the financial asset are transferred, or it neither transfers nor retains substantially all of the risks and rewards of ownership and does not retain control over the transferred asset. Any interest in such de-recognized financial assets that is created or retained by the Company is recognized as a separate asset or liability.
Financial liabilities The Company de-recognizes a financial liability (or a part of financial liability) from its statement of financial
position when the obligation specified in the contract is discharged or cancelled or expired. Any gain or loss on de-recognition is included in profit or loss.
v) Offsettingoffinancialinstruments Financial assets and financial liabilities are set off and the net amount is reported in the financial statements
when there is a legal enforceable right to set off and the Company intends either to settle on a net basis or to realize the assets and to settle the liabilities simultaneously.
2.4 Taxation Current Provision of current tax is based on the taxable income for the year determined in accordance with the
prevailing law for taxation of income. The charge for current tax is calculated using prevailing tax rates or tax rates expected to apply to the profit for the year if enacted. The charge for current tax also includes adjustments, where considered necessary, to provision for tax made in previous years arising from assessments framed during the year for such years.
Deferred Deferred tax is accounted for using the liability method in respect of all temporary differences arising
from differences between the carrying amount of assets and liabilities in the financial statements and the
NOTES TO THE FINANCIAL STATEMENTSFor the year ended 30 September 2020
45
corresponding tax bases used in the computation of the taxable profit. Deferred tax liabilities are generally recognized for all taxable temporary differences and deferred tax assets are recognized to the extent that it is probable that taxable profits will be available against which the deductible temporary differences, unused tax losses and tax credits can be utilized.
Deferred tax is calculated at the rates that are expected to apply to the period when the differences reverse
based on tax rates that have been enacted or substantively enacted at the reporting date. Deferred tax is charged or credited in the statement of profit or loss, except in the case of items credited or charged to other comprehensive income or equity in which case it is included in other comprehensive income or equity respectively.
2.5 Property, plant and equipment Property, plant and equipment except freehold land, building, plant and machinery are stated at cost less
accumulated depreciation and any identified impairment loss. Freehold land is stated at revalued amount less any identified impairment loss. Building, plant and machinery are stated at revalued amount less accumulated depreciation and any identified impairment loss. Cost of the property, plant and equipment consists of historical cost pertaining to erection / construction period of qualifying assets and other directly attributable costs of bringing the asset to working condition.
Increases in the carrying amount arising on revaluation of property, plant and equipment are credited
to surplus on revaluation of property, plant and equipment. Decreases that offset previous increases of the same assets are charged against this surplus, all other decreases are charged to income. Each year the difference between depreciation based on the revalued carrying amount of the asset charged to the statement of profit or loss, and depreciation based on the asset’s original cost is transferred from ‘surplus on revaluation of property, plant and equipment’ to ‘accumulated loss’. All transfers to / from surplus on revaluation of property, plant and equipment are net of applicable deferred income tax.
Subsequent costs are included in the asset’s carrying amount or recognized as a separate asset, as
appropriate, only when it is probable that future economic benefits associated with the item will flow to the Company and the cost of the item can be measured reliably. All other repair and maintenance costs are charged to income during the period in which they are incurred.
Capital work-in-progress is stated at cost less any identified impairment loss. It consists of all expenditure
and advances connected with specific assets incurred and made during installations and construction period. These are transferred to relevant property, plant and equipment as and when assets are available for use.
Depreciation Depreciation on property, plant and equipment is charged to statement of statement of profit or loss on
the reducing balance method so as to write off the cost of an asset over its estimated useful life at the annual rates given in Note 15.1 after taking into account the impact of their residual values, if considered significant. The residual values and useful lives are reviewed by the management, at each financial year-end and adjusted if impact on depreciation is significant.
Depreciation on additions to property, plant and equipment is charged from the month in which the asset
is acquired or capitalized, while no depreciation is charged for the month in which the asset is disposed of. De-recognition An item of property, plant and equipment is de-recognized upon disposal or when no future economic
benefits are expected from its use or disposal.
NOTES TO THE FINANCIAL STATEMENTSFor the year ended 30 September 2020
46
The gain or loss on disposal or retirement of an asset represented by the difference between the sale proceeds and the carrying amount of the asset is recognized as an income or expense.
2.6 Impairmentofnon-financialassets The carrying amounts of the Company’s non-financial assets are reviewed at each reporting date to
determine whether there is any indication of impairment. If such indication exists, the asset’s recoverable amount, being higher of value in use and fair value less cost to sell, is estimated. For the purpose of impairment testing, assets which cannot be tested individually are grouped together into smallest group of assets that generates cash inflows from continuing use that are largely independent of the cash flows of other assets or group of assets. An impairment loss is recognized whenever, the carrying amount of an asset exceeds its recoverable amount. Impairment loss is charged to the statement of profit or loss. Reversal of the impairment losses are restricted to the extent that the asset’s carrying amount does not exceed the carrying amount that would have been determined, net of depreciation, if impairment loss had not been recognized. Reversal of impairment loss is also recognized in the statement of profit or loss.
2.7 Biological assets Biological assets comprise of standing crops and livestock. These are stated at fair value less estimated
point-of-sale costs, with any resultant gain or loss recognized in the statement of profit or loss. The fair value of standing crops is based on the support price fixed by the Government and other factors such as estimated crop yield and area under cultivation. The fair value of livestock is estimated on the basis of market prices of livestock of similar age, breed and genetic merit. Point-of-sale costs include all costs that are necessary to sell the assets, excluding costs necessary to get the assets to the market.
2.8 Inventories Stores, spare parts and loose tools Usable stores, spare parts and loose tools are valued principally at moving average cost, while items
considered obsolete are carried at nil value. Items in transit are valued at cost comprising invoice value plus other charges paid thereon up-to the reporting date. Provision is made in the financial statements for obsolete and slow moving stores and spares based on management’s estimate as a result of changes in usage pattern and physical form.
Stock-in-trade Stock of raw materials, work-in-process and finished goods, except for those in transit are valued
principally at the lower of weighted average cost and net realizable value. Cost of work-in-process and finished goods comprises cost of direct materials, labour and appropriate manufacturing overheads. Cost of own produced molasses, a by product, is determined on the basis of monthly average cost of molasses purchased from third parties. Cost of stillage, a by product of the Effluent Treatment Plant, used in the generation of electricity by the Power division is valued at Nil as it does not have any market value.
Materials in transit are stated at cost comprising invoice values plus other charges paid thereon up to the
reporting date. Net realizable value signifies the estimated selling price in the ordinary course of business less estimated
costs of completion and estimated costs necessary to be incurred in order to make a sale. Provision is made in the financial statements for obsolete and slow moving stock in trade based on management’s estimate.
2.9 Trade and other receivables Trade and other receivables are initially recognized at fair value and subsequently measured at amortized
cost using the effective interest method, less any allowance for expected credit losses. Trade receivables generally do not include amounts overdue by 365 days.
NOTES TO THE FINANCIAL STATEMENTSFor the year ended 30 September 2020
47
2.10 Cash and cash equivalents Cash and cash equivalents comprise cash in hand, cash at banks on current, saving and deposit accounts
and other short term highly liquid instruments that are readily convertible into known amounts of cash and which are subject to insignificant risk of changes in values.
2.11 Share capital Ordinary shares are classified as equity and recognized at their face value. Incremental costs directly
attributable to the issue of new shares are shown in equity as a deduction, net of tax, if any. 2.12 Borrowings Financing and borrowings are initially recognized at fair value of the consideration received, net of
transaction costs. They are subsequently measured at amortized cost using the effective interest method. 2.13 Government grants Grants from the Government are recognized at their fair value where there is a reasonable assurance that
the grant will be received and the Company will comply with all attached conditions. Government grants relating to costs are deferred and recognized in the profit or loss over the period
necessary to match them with the costs that they are intended to compensate. 2.14 Trade and other payables Liabilities for trade and other amounts payable are initially recognized at fair value, which is normally the
transaction cost. 2.15 Provisions Provisions are recognized when the Company has a present, legal or constructive obligation as a result of
past events and it is probable that an outflow of resources embodying economic benefits will be required to settle the obligations and a reliable estimate of the amount can be made. Provisions are reviewed at each reporting date and adjusted to reflect the current best estimate.
2.16 Functional and presentation currency along with foreign currency transactions and translation Items included in the financial statements of the Company are measured using the currency of the primary
economic environment in which the Company operates (the functional currency). The financial statements are presented in Pak Rupees, which is the Company’s functional and presentation currency.
All monetary assets and liabilities in foreign currencies are translated into Pak Rupees using the exchange
rate at the reporting date. Exchange gains and losses resulting from the settlement of such transactions and from the translations at the year end exchange rates of monetary assets and liabilities denominated in foreign currencies are recognized in statement of profit or loss. Non-monetary assets and liabilities denominated in foreign currency that are measured in terms of historical cost are translated using the exchange rates as at the dates of the initial transactions. Non-monetary assets and liabilities denominated in foreign currency that are measured at fair value are translated using the exchange rates at the date when the fair value was determined.
NOTES TO THE FINANCIAL STATEMENTSFor the year ended 30 September 2020
48
2.17 Borrowing costs General and specific borrowing costs directly attributable to the acquisition, construction or production of
qualifying assets, which are assets that necessarily take a substantial period of time to get ready for their intended use or sale, are added to the cost of those assets, until such time as the assets are substantially ready for their intended use or sale. All other borrowing costs are recognized in statement of profit or loss in the period in which they are incurred.
2.18 Contingent liabilities A contingent liability is disclosed when: - there is a possible obligation that arises from past events and whose existence will be confirmed only
by the occurrence or non-occurrence of one or more uncertain future events not wholly within the control of the Company; or
- there is present obligation that arises from past events but it is not probable that an outflow of
resources embodying economic benefits will be required to settle the obligation or the amount of the obligation cannot be measured with sufficient reliability.
2.19 Contingent assets Contingent assets are disclosed when the Company has a possible asset that arises from past events and
whose existence will only be confirmed by the occurrence or non-occurrence of one or more uncertain future events not wholly within the control of the Company. Contingent assets are not recognized until their realization becomes certain.
2.20 Segment reporting Operating segments are reported in a manner consistent with the internal reporting provided to the chief
operating decision maker. The chief operating decision maker, who is responsible for allocating resources and assessing performance of the operating segments, has been identified as the Board of Directors of the Company that makes strategic decisions.
Segment results that are reported to the Board of Directors include items directly attributable to a segment
as well as those that can be allocated on a reasonable basis. Those income, expenses, assets, liabilities and other balances which cannot be allocated to a particular segment on a reasonable basis are reported as unallocated.
Transactions among the business segments are recorded at arm’s length prices using admissible valuation
methods. Inter segment sales and purchases are eliminated from the total. 2.21 Earnings / (Loss) Per Share (EPS / LPS) Basic EPS / LPS is calculated by dividing the profit or loss attributable to ordinary shareholders of the
Company by weighted average number of ordinary shares outstanding during the year. 2.22 Employees’retirementbenefits Definedbenefitplans The main feature of the schemes operated by the Company for its employees are as follows:
NOTES TO THE FINANCIAL STATEMENTSFor the year ended 30 September 2020

49
The Company operates a funded gratuity scheme as a defined benefit plan for its permanent employees and also funded defined benefit pension plan. All permanent employees who are in the management cadre of the Company participate in these plans subject to a minimum qualifying period of service according to the terms of employment. Monthly contributions are made to these funds on the basis of actuarial recommendation at the rate of 20% per annum of basic salary for pension and 8.33% per annum of basic salary for gratuity. Actuarial valuation using projected unit credit method for the schemes was carried out as at 30 September 2020. The main features of defined benefit schemes are mentioned in Note 8.1 and Note 8.2.
The Company’s net obligation in respect of these defined benefit plans is calculated by estimating the
amount of future benefit that employees have earned in the current and prior periods, discounting that amount and deducting the fair value of any plan assets. The calculation of defined benefit obligations is performed annually by a qualified actuary using the projected unit credit method. When the calculation results in a potential asset for the Company, the recognized asset is limited to the present value of economic benefits available in the form of any future refunds from the plan or reductions in future contributions to the plan. To calculate the present value of economic benefits, consideration is given to any applicable minimum funding requirements.
Remeasurements of the net defined benefit liabilities, which comprise actuarial gains and losses, the
return on plan assets (excluding interest) and the effect of the asset ceiling (if any, excluding interest), are recognized immediately in other comprehensive income. The Company determines the net interest expense / (income) on the net defined benefit liability / (asset) for the period by applying the discount rate used to measure the defined benefit obligation at the beginning of the annual period to the then net defined benefit liability / (asset), taking into account any changes in the net defined benefit liability / (asset) during the period as a result of contributions and benefit payments. Net interest expense and other expenses related to defined benefit plan are recognized in profit or loss.
When the benefits of plans are changed or when plans are curtailed, the resulting change in benefits that
relate to past service or the gain or loss on curtailment are recognized immediately in profit or loss. The Company recognizes gains and losses on the settlement of defined benefit plans when the settlement occurs.
Definedcontributionplan There is an approved contributory provident fund for all employees. Equal monthly contributions are made
both by the employees and the Company to the fund in accordance with the fund rules. The Company’s contributions are charged to statement of profit or loss.
2.23 Dividend and other appropriations Dividend distribution to the Company’s shareholders is recognized as a liability in the Company’s financial
statements in the period in which the dividends are declared and other appropriations are recognized in the period in which these are approved by the Board of Directors.
2.24 Investment in subsidiary company Investment in subsidiary company is accounted for using equity method in accordance with IAS 27
‘Separate Financial Statements’.
NOTES TO THE FINANCIAL STATEMENTSFor the year ended 30 September 2020

50
3. ISSUED, SUBSCRIBED AND PAID UP CAPITAL 2020 2019 2020 2019 (Number of shares) (Rupees in thousand)
Ordinary shares of Rs. 10 each 79,021,000 79,021,000 fully paid in cash 790,210 790,210 Ordinary shares of Rs. 10 each issued as fully 33,131,816 33,131,816 paid bonus shares 331,318 331,318 Ordinary shares of Rs. 10 each issued as fully 12,847,184 12,847,184 paid for consideration other than cash 128,472 128,472
125,000,000 125,000,000 1,250,000 1,250,000
3.1 Ordinary shares of the Company held by related parties:
2020 2019 Note (NUMBER OF SHARES) Crescent Steel and Allied Products Limited 27 409 075 27 409 075 Crescent Cotton Mills Limited 3.1.1 - 1 531 193 The Crescent Textile Mills Limited 9 019 690 9 019 690 CS Capital (Private) Limited 7 602 272 7 602 272 Premier Insurance Limited 5 000 5 000 Roomi Fabrics Limited 3.1.1 - 11 984 754 Shakarganj Mills Limited Employees’ Provident Fund Trust 1 375 427 1 375 427 Shakarganj Mills Limited Gratuity Fund 107 876 107 876 Shakarganj Mills Limited Pension Fund 916 582 916 582
46 435 922 59 951 869 3.1.1 Crescent Cotton Mills Limited and Roomi Fabrics Limited ceased to be the related parties due to elimination
of common directorship after election of directors on 01 June 2020.
2020 2019 Note (Rupees in thousand) 4. CAPITAL RESERVES Surplus on revaluation of property, plant and equipment - net of deferred income tax (Note 4.1) 6,087,758 6,356,860 Other capital reserves Premium on issue of right shares 4.2 1,056,373 1,056,373 Share in capital reserves of equity accounted investee 478,826 497,429 Fair value reserve of investments at fair value through other comprehensive income 4.3 (7,898) (13,311) Difference of capital under scheme of arrangement of merger 155,930 155,930
1,683,231 1,696,421
7,770,989 8,053,281
NOTES TO THE FINANCIAL STATEMENTSFor the year ended 30 September 2020
51
2020 2019 Note (Rupees in thousand)
4.1 SURPLUS ON REVALUATION OF PROPERTY, PLANT AND EQUIPMENT - NET OF DEFERRED INCOME TAX Surplus on revaluation of operating fixed assets as at 01 October 6,356,860 6,825,404 Add: Impact of change in deferred tax rate 48,397 -
6,405,257 6,825,404 Less: Impact of change in deferred tax rate - (140,684) Transferred to accumulated loss in respect of incremental depreciation charged during the year - net of deferred income tax (314,120) (324,955) Surplus on revaluation of property, plant and equipment disposed of during the year - net of deferred income tax (3,379) (2,905)
(317,499) (468,544)
6,087,758 6,356,860 4.1.1 The latest valuation of land, building, plant and machinery was carried out by independent valuers Tristar
International Consultant (Private) Limited and Saleem Engineers on 27 September 2018 and 09 April 2018 respectively. The valuation was determined by reference to current market value of the similar properties / assets. Previously revaluations were carried out on 30 September 2012 and 30 September 2014 by independent valuers.
4.2 This reserve can be utilized by the Company only for the purposes specified in section 81 of the Companies
Act, 2017. 4.3 This represents the unrealized (loss) / gain on remeasurement of investments at fair value through other
comprehensive income. Reconciliation of fair value reserve is as under: 2020 2019 Note (Rupees in thousand) Balance as on 01 October (13,311) (7,347) Fair value adjustment during the year 5,413 (5,964)
Balance as on 30 September (7,898) (13,311) 5. REVENUE RESERVES General 410,606 410,606 Dividend equalization 22,700 22,700 Equity investment market value equalization 83,000 83,000
516,306 516,306 6. LONG TERM FINANCING From banking companies - secured 6.1 456,919 384,744 Less: Current portion shown under current liabilities 13 236,974 256,453
219,945 128,291
NOTES TO THE FINANCIAL STATEMENTSFor the year ended 30 September 2020

52
6.1
From
ban
king
com
pani
es
LEN
DER
2020
2019
RATE
OF
INTE
REST
PE
R AN
NU
M E
FFEC
TIVE
RAT
E O
F IN
TERE
ST
NU
MBE
R O
F IN
STAL
LMEN
TS
INTE
REST
RE
PRIC
ING
INTE
REST
PA
YABL
ESE
CU
RITY
(RU
PEES
IN T
HO
USA
ND
)
Nat
iona
l Ban
k of
Pak
ista
n 7
8,16
3 1
17,2
44
3 M
onth
KIB
OR
+ 1%
8.26
% -
14.8
5%Si
xtee
n eq
ual
quar
terly
in
stal
lmen
ts
com
men
ced
on
31 M
arch
201
7 an
d en
ding
on
31 D
ecem
ber
2021
due
to
defe
rmen
t of o
ne y
ear
Qua
rterly
Q
uarte
rly
Firs
t jo
int
pari
pass
u ch
arge
of
182.
378
milli
on
over
ent
ire p
rese
nt a
nd f
utur
e fix
ed a
sset
s of
th
e C
ompa
ny
with
25
%
mar
gin
and
pers
onal
gu
aran
tees
of
Chi
ef E
xecu
tive
Offi
cer
and
one
Dire
ctor
of t
he C
ompa
ny.
Nat
iona
l Ban
k of
Pak
ista
n 1
68,7
50
200
,000
3
Mon
th K
IBO
R +
3%10
.26%
- 16
.85
%Se
ven
quar
terly
inst
allm
ents
com
men
ced
on 3
1 O
ctob
er 2
019
and
endi
ng o
n 30
Apr
il 20
22 d
ue to
def
erm
ent o
f one
yea
r
Qua
rterly
Q
uarte
rly
Firs
t jo
int
pari
pass
u ch
arge
of
Rupe
es 3
06.6
67
milli
on o
ver p
rese
nt a
nd fu
ture
fixe
d as
sets
of t
he
Com
pany
with
25%
mar
gin
and
pers
onal
gua
rant
ee
of C
hief
Exe
cutiv
e O
ffice
r an
d on
e D
irect
or o
f the
C
ompa
ny. It
is a
lso
secu
red
thro
ugh
pled
ge o
f 6
387
000
num
ber o
f sha
res
of C
resc
ent S
teel
and
Al
lied
Prod
ucts
Lim
ited.
Firs
t Cre
dit a
nd
Inve
stm
ent B
ank
Lim
ited
56,
250
67,
500
3 M
onth
KIB
OR
+ 3.
5%11
.65%
- 17
.40%
Six
equa
l qu
arte
rly
inst
allm
ents
co
mm
ence
d on
07
M
arch
20
20
and
endi
ng o
n 07
June
202
2 du
e to
def
erm
ent
of o
ne y
ear
Qua
rterly
Q
uarte
rly
Rank
ing
hypo
thec
atio
n ch
arge
ove
r pr
esen
t an
d fu
ture
ass
ets
of t
he C
ompa
ny w
ith 2
5% m
argi
n ex
clud
ing
land
and
bui
ldin
g pl
us a
gain
st p
ledg
e of
sh
ares
from
KSE
100
inde
x ac
cept
able
to th
e Ba
nk
at m
arke
t va
lue
with
35%
mar
gin
and
pers
onal
gu
aran
tee
of
Chi
ef
Exec
utive
O
ffice
r an
d on
e D
irect
or o
f the
Com
pany
.
MC
B Ba
nk L
imite
d - L
oan
unde
r SBP
Re
finan
ce S
chem
e (N
ote
6.1.
1)
153
,756
-
SBP
rate
+ 3
%3%
Eigh
t eq
ual
quar
terly
in
stal
lmen
ts
com
men
ced
on
01
Janu
ary
2021
an
d en
ding
on
30 S
epte
mbe
r 202
2.
- Q
uarte
rly
Firs
t joi
nt p
ari p
assu
cha
rge
over
pre
sent
and
futu
re
fixed
ass
ets
of R
upee
s 1,
000
milli
on, fi
rst p
ari p
assu
ch
arge
of R
upee
s 55
1 m
illion
ove
r sto
cks,
rank
ing
char
ge o
f Ru
pees
200
milli
on o
n fix
ed a
sset
s, ch
arge
on
plan
t an
d m
achi
nery
of
Rupe
es 2
50
milli
on o
f th
e C
ompa
ny a
nd p
erso
nal
guar
ante
e of
Chi
ef E
xecu
tive
Offi
cer
and
one
Dire
ctor
of t
he
Com
pany
.
456
,919
3
84,7
44
6.1.
1 Th
is fa
cilit
y agg
rega
ting
to R
upee
s 16
5.60
6 m
illion
is o
btai
ned
by th
e C
ompa
ny u
nder
SBP
Refi
nanc
e Sc
hem
e fo
r pay
men
t of w
ages
and
sal
arie
s to
wor
kers
and
em
ploy
ees
of b
usin
ess
conc
erns
. Thi
s lo
an is
reco
gnize
d an
d m
easu
red
in a
ccor
danc
e w
ith IF
RS 9
‘Fin
anci
al In
stru
men
ts’. F
air v
alue
adj
ustm
ent i
s re
cogn
ized
at d
isco
unt r
ate
of 1
0.25
% p
er a
nnum
. 6.
1.2
Repa
ymen
t ter
ms
of th
e ab
ove
men
tione
d lo
ans
outs
tand
ing
durin
g th
e ye
ar fr
om N
atio
nal B
ank
of P
akis
tan
and
Firs
t Cre
dit a
nd In
vest
men
t Ban
k Li
mite
d w
ere
defe
rred
by o
ne ye
ar o
n re
ques
t of t
he C
ompa
ny in
acc
orda
nce
with
BPR
D c
ircul
ar N
o. 1
3 of
202
0 da
ted
26 M
arch
202
0 is
sued
by S
tate
Ban
k of P
akis
tan
to c
ope
the
impa
cts
of C
OVI
D-1
9 pa
ndem
ic.
NOTES TO THE FINANCIAL STATEMENTSFor the year ended 30 September 2020

53
2020 2019 Note (Rupees in thousand) 7. DEFERREDINCOME-GOVERNMENTGRANT Recognized during the year 15,797 - Amortized during the year 3 0 (3,947) -
11,850 - Current portion shown under current liabilities 13 (8,445) -
3,405 - 7.1 The State Bank of Pakistan (SBP), through its Circular No. 06 of 2020 dated 10 April 2020 has introduced
a temporary Refinance Scheme for Payment of Wages and Salaries to the Workers and Employees of Business Concerns (the Refinance Scheme). The Refinance Scheme is funded by SBP. Borrowers can obtain loans from the Banks and ease their cash flow constraints to avoid layoffs. One of the key feature of the Refinance Scheme is that borrowers can obtain loan at mark-up rates that are below normal lending rates. As per International Accounting Standard (IAS) 20 ‘Accounting for Government Grants and Disclosure of Government Assistance’ the benefit of a Government loan at a below-market rate of interest is treated as a Government Grant. The Company has obtained this loan as disclosed in Note 6.1 to the financial statements. In accordance with IFRS 9 ‘Financial Instruments’, loan obtained under the Refinance Scheme was initially recognized at its fair value which is the present value of loan proceeds received, discounted using prevailing market rates of interest for a similar instrument. Hence, the benefit of the below-market rate of interest has been measured as the difference between the initial carrying value of the loan determined in accordance with IFRS 9 and the proceeds received. This benefit is accounted for and presented as deferred grant in accordance with IAS 20. The grant is being amortized in the statement of profit or loss, in line with the recognition of interest expense the grant is compensating.
2020 2019 Note (Rupees in thousand) 8. EMPLOYEES’ RETIREMENT BENEFITS Pension fund 8.1 132,896 (27,222) Gratuity fund 8.2 27,607 (11,774)
160,503 (38,996) 8.1 Pension fund The amount recognized in the statement of financial position are determined as follows: Present value of defined benefit obligation 8.1.1 511,634 401,271 Fair value of plan assets 8.1.2 (378,738) (428,493)
Net defined benefit obligation / (asset) 132,896 (27,222)
NOTES TO THE FINANCIAL STATEMENTSFor the year ended 30 September 2020

54
2020 2019 Note (Rupees in thousand)
8.1.1 The movement in the defined benefit obligation over the year is as follows: Present value of defined benefit obligation as at 01 October 401,271 381,034 Current service cost 18,917 15,456 Interest cost 50,599 36,896 Remeasurement losses / (gains) 64,950 (7,963) Benefits paid during the year (24,103) (24,152)
Present value of defined benefit obligation as at 30 September 511,634 401,271 8.1.2 The movement in the fair value of plan assets for the year is as follows: Fair value as at 01 October 428,493 390,711 Expected return on plan assets 55,399 38,476 Contributions during the year 19,405 12,242 Benefits paid during the year (24,103) (24,152) Remeasurement (losses) / gains (100,456) 11,216
Fair value as at 30 September 378,738 428,493 8.1.3 The amounts recognized in the statement of profit or loss are as follows: Current service cost 18,917 15,456 Interest cost 50,599 36,896 Expected return on plan assets (55,399) (38,476)
14,117 13,876 8.1.3.1 The amounts recognized in the statement of profit or loss are classified as follows: Cost of sales 26.2 4,531 5,165 Distribution cost 27.1 487 431 Administrative expenses 28.1 8,845 8,010 Other expenses 29.1 254 270
14,117 13,876 8.1.4 Remeasurementsofnetdefinedbenefitliability/(asset) Actuarial losses / (gains) due to experience adjustments 64,950 (7,963) Return on plan assets excluding interest income 100,456 (11,216)
Amount chargeable to other comprehensive income 165,406 (19,179)
NOTES TO THE FINANCIAL STATEMENTSFor the year ended 30 September 2020
55
2020 2019 Note (Rupees in thousand)
8.1.5 Reconciliationofnetdefinedbenefitliability/(asset) As at 01 October (27,222) (9,677) Expense chargeable to profit or loss during the year 14,117 13,876 Amount chargeable to other comprehensive income during the year 165,406 (19,179) Contributions paid by the Company during the year (19,405) (12,242)
As at 30 September 132,896 (27,222) 8.1.6 The estimated expenses to be charged to the statement of profit or loss for the year ending on 30 September
2021 is Rupees 38.592 million. 2020 2019 Note (Rupees in thousand)
8.1.7 Actual return on plan assets Interest income for the year 55,399 38,476 Return on plan assets excluding interest income (100,456) 11,216
(45,057) 49,692 2020 20198.1.8 The principal actuarial assumptions used were as follows: Discount rate (per annum) 10.50% 13.00% Future salary increases (per annum) 9.50% 12.00% Expected rate of future pension increases (per annum) 5.50% 8.00% Average expected remaining working life time of employees 10 years 10 years Expected average duration of obligation 19 years 20 years Expected mortality rate SLIC (2001-05) mortality table 2020 2019 Note (Rupees in thousand)
8.1.9 Planassetsarecomprisedasfollows: Equity instruments 307,054 56,033 Cash and cash equivalents 135,379 422,944 Others - net (63,695) (50,484)
378,738 428,493
NOTES TO THE FINANCIAL STATEMENTSFor the year ended 30 September 2020
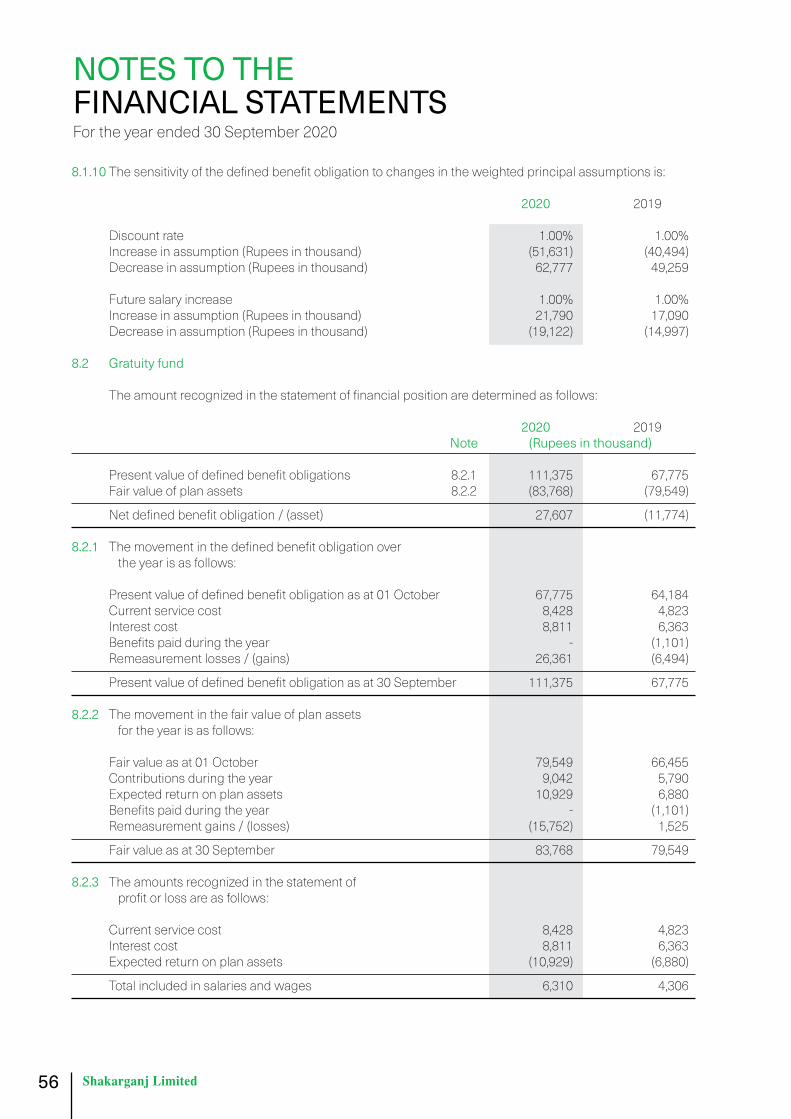
56
8.1.10 The sensitivity of the defined benefit obligation to changes in the weighted principal assumptions is:
2020 2019 Discount rate 1.00% 1.00% Increase in assumption (Rupees in thousand) (51,631) (40,494) Decrease in assumption (Rupees in thousand) 62,777 49,259 Future salary increase 1.00% 1.00% Increase in assumption (Rupees in thousand) 21,790 17,090 Decrease in assumption (Rupees in thousand) (19,122) (14,997) 8.2 Gratuity fund The amount recognized in the statement of financial position are determined as follows:
2020 2019 Note (Rupees in thousand) Present value of defined benefit obligations 8.2.1 111,375 67,775 Fair value of plan assets 8.2.2 (83,768) (79,549)
Net defined benefit obligation / (asset) 27,607 (11,774) 8.2.1 The movement in the defined benefit obligation over the year is as follows: Present value of defined benefit obligation as at 01 October 67,775 64,184 Current service cost 8,428 4,823 Interest cost 8,811 6,363 Benefits paid during the year - (1,101) Remeasurement losses / (gains) 26,361 (6,494)
Present value of defined benefit obligation as at 30 September 111,375 67,775 8.2.2 The movement in the fair value of plan assets for the year is as follows: Fair value as at 01 October 79,549 66,455 Contributions during the year 9,042 5,790 Expected return on plan assets 10,929 6,880 Benefits paid during the year - (1,101) Remeasurement gains / (losses) (15,752) 1,525
Fair value as at 30 September 83,768 79,549 8.2.3 The amounts recognized in the statement of profit or loss are as follows: Current service cost 8,428 4,823 Interest cost 8,811 6,363 Expected return on plan assets (10,929) (6,880)
Total included in salaries and wages 6,310 4,306
NOTES TO THE FINANCIAL STATEMENTSFor the year ended 30 September 2020
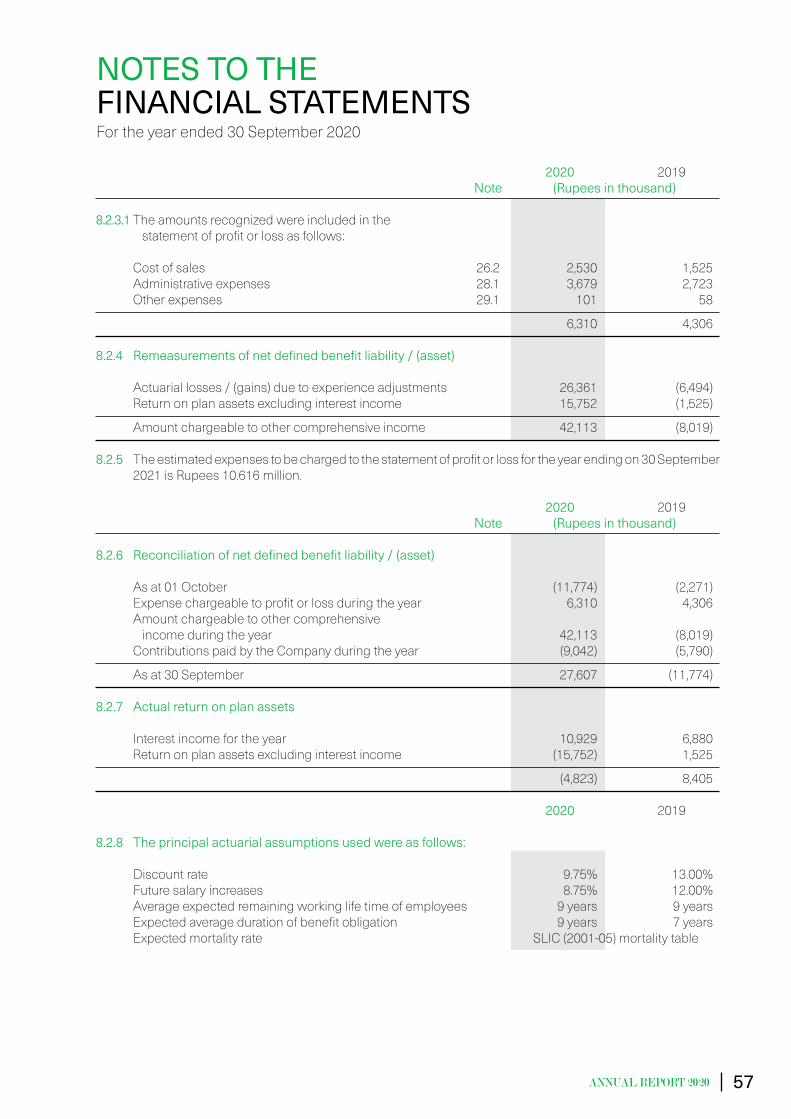
57
2020 2019 Note (Rupees in thousand)
8.2.3.1 The amounts recognized were included in the statement of profit or loss as follows: Cost of sales 26.2 2,530 1,525 Administrative expenses 28.1 3,679 2,723 Other expenses 29.1 101 58
6,310 4,306 8.2.4 Remeasurementsofnetdefinedbenefitliability/(asset) Actuarial losses / (gains) due to experience adjustments 26,361 (6,494) Return on plan assets excluding interest income 15,752 (1,525)
Amount chargeable to other comprehensive income 42,113 (8,019) 8.2.5 The estimated expenses to be charged to the statement of profit or loss for the year ending on 30 September
2021 is Rupees 10.616 million. 2020 2019 Note (Rupees in thousand)
8.2.6 Reconciliationofnetdefinedbenefitliability/(asset) As at 01 October (11,774) (2,271) Expense chargeable to profit or loss during the year 6,310 4,306 Amount chargeable to other comprehensive income during the year 42,113 (8,019) Contributions paid by the Company during the year (9,042) (5,790)
As at 30 September 27,607 (11,774) 8.2.7 Actual return on plan assets Interest income for the year 10,929 6,880 Return on plan assets excluding interest income (15,752) 1,525
(4,823) 8,405 2020 2019
8.2.8 Theprincipalactuarialassumptionsusedwereasfollows: Discount rate 9.75% 13.00% Future salary increases 8.75% 12.00% Average expected remaining working life time of employees 9 years 9 years Expected average duration of benefit obligation 9 years 7 years Expected mortality rate SLIC (2001-05) mortality table
NOTES TO THE FINANCIAL STATEMENTSFor the year ended 30 September 2020
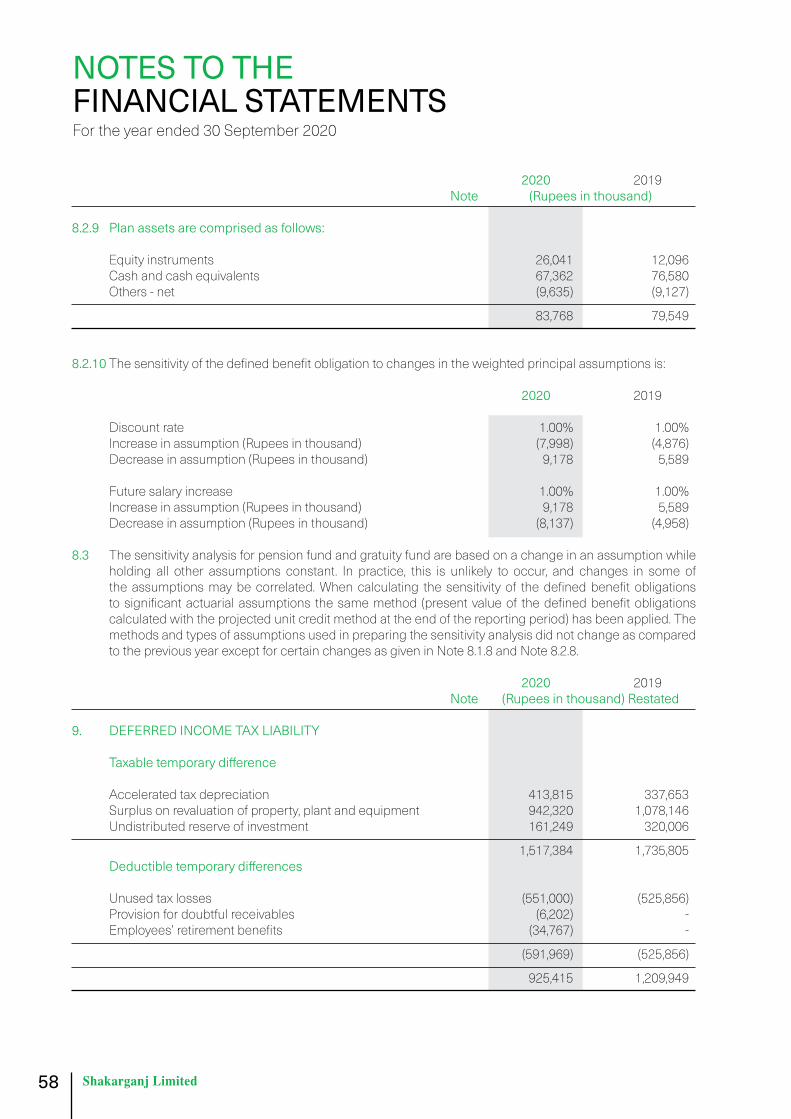
58
2020 2019 Note (Rupees in thousand)
8.2.9 Planassetsarecomprisedasfollows: Equity instruments 26,041 12,096 Cash and cash equivalents 67,362 76,580 Others - net (9,635) (9,127)
83,768 79,549 8.2.10 The sensitivity of the defined benefit obligation to changes in the weighted principal assumptions is:
2020 2019 Discount rate 1.00% 1.00% Increase in assumption (Rupees in thousand) (7,998) (4,876) Decrease in assumption (Rupees in thousand) 9,178 5,589 Future salary increase 1.00% 1.00% Increase in assumption (Rupees in thousand) 9,178 5,589 Decrease in assumption (Rupees in thousand) (8,137) (4,958) 8.3 The sensitivity analysis for pension fund and gratuity fund are based on a change in an assumption while
holding all other assumptions constant. In practice, this is unlikely to occur, and changes in some of the assumptions may be correlated. When calculating the sensitivity of the defined benefit obligations to significant actuarial assumptions the same method (present value of the defined benefit obligations calculated with the projected unit credit method at the end of the reporting period) has been applied. The methods and types of assumptions used in preparing the sensitivity analysis did not change as compared to the previous year except for certain changes as given in Note 8.1.8 and Note 8.2.8.
2020 2019 Note (Rupees in thousand) Restated
9. DEFERRED INCOME TAX LIABILITY Taxabletemporarydifference Accelerated tax depreciation 413,815 337,653 Surplus on revaluation of property, plant and equipment 942,320 1,078,146 Undistributed reserve of investment 161,249 320,006
1,517,384 1,735,805 Deductibletemporarydifferences Unused tax losses (551,000) (525,856) Provision for doubtful receivables (6,202) - Employees’ retirement benefits (34,767) -
(591,969) (525,856)
925,415 1,209,949
NOTES TO THE FINANCIAL STATEMENTSFor the year ended 30 September 2020
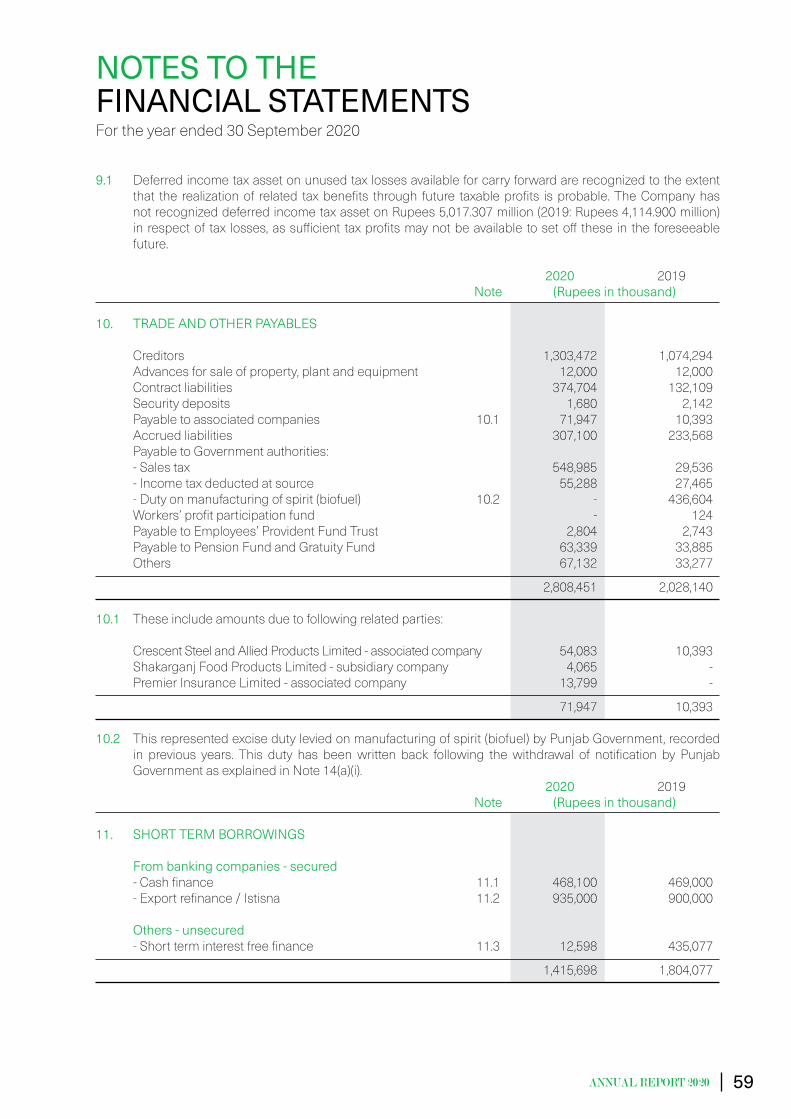
59
9.1 Deferred income tax asset on unused tax losses available for carry forward are recognized to the extent that the realization of related tax benefits through future taxable profits is probable. The Company has not recognized deferred income tax asset on Rupees 5,017.307 million (2019: Rupees 4,114.900 million) in respect of tax losses, as sufficient tax profits may not be available to set off these in the foreseeable future.
2020 2019 Note (Rupees in thousand)
10. TRADE AND OTHER PAYABLES Creditors 1,303,472 1,074,294 Advances for sale of property, plant and equipment 12,000 12,000 Contract liabilities 374,704 132,109 Security deposits 1,680 2,142 Payable to associated companies 10.1 71,947 10,393 Accrued liabilities 307,100 233,568 Payable to Government authorities: - Sales tax 548,985 29,536 - Income tax deducted at source 55,288 27,465 - Duty on manufacturing of spirit (biofuel) 10.2 - 436,604 Workers’ profit participation fund - 124 Payable to Employees’ Provident Fund Trust 2,804 2,743 Payable to Pension Fund and Gratuity Fund 63,339 33,885 Others 67,132 33,277
2,808,451 2,028,140
10.1 These include amounts due to following related parties: Crescent Steel and Allied Products Limited - associated company 54,083 10,393 Shakarganj Food Products Limited - subsidiary company 4,065 - Premier Insurance Limited - associated company 13,799 -
71,947 10,393 10.2 This represented excise duty levied on manufacturing of spirit (biofuel) by Punjab Government, recorded
in previous years. This duty has been written back following the withdrawal of notification by Punjab Government as explained in Note 14(a)(i).
2020 2019 Note (Rupees in thousand)
11. SHORT TERM BORROWINGS From banking companies - secured - Cash finance 11.1 468,100 469,000 - Export refinance / Istisna 11.2 935,000 900,000 Others - unsecured - Short term interest free finance 11.3 12,598 435,077
1,415,698 1,804,077
NOTES TO THE FINANCIAL STATEMENTSFor the year ended 30 September 2020
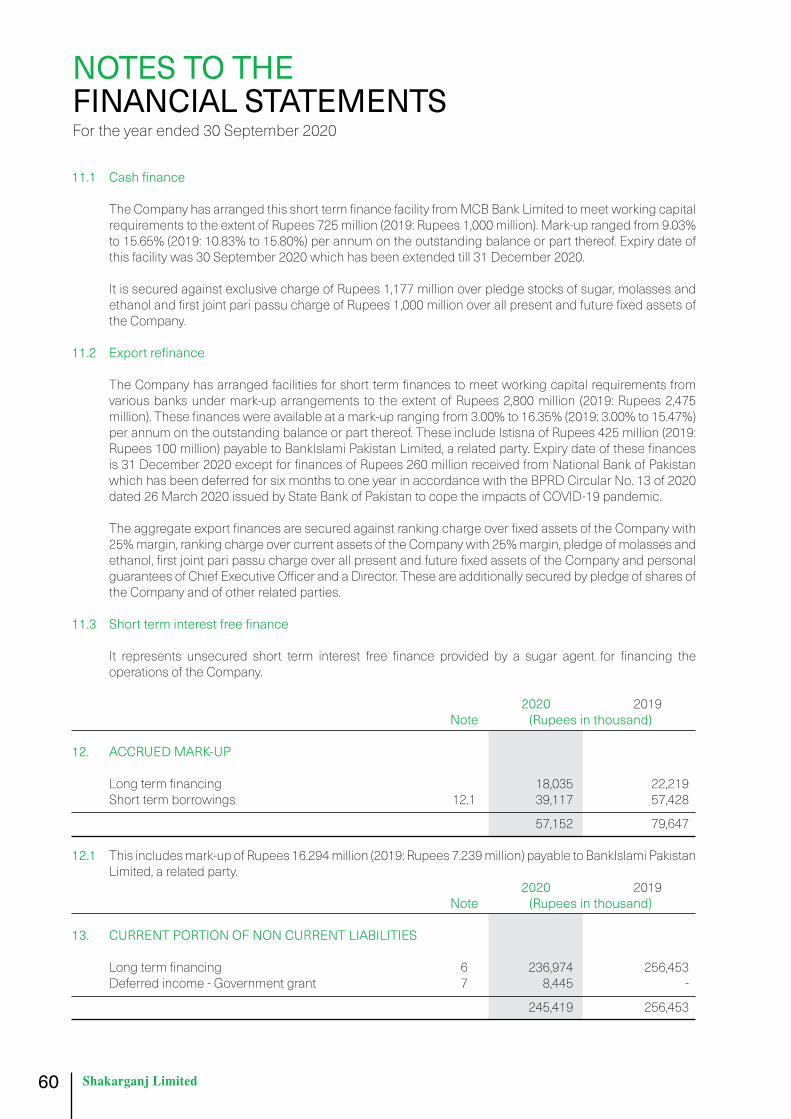
60
11.1 Cashfinance The Company has arranged this short term finance facility from MCB Bank Limited to meet working capital
requirements to the extent of Rupees 725 million (2019: Rupees 1,000 million). Mark-up ranged from 9.03% to 15.65% (2019: 10.83% to 15.80%) per annum on the outstanding balance or part thereof. Expiry date of this facility was 30 September 2020 which has been extended till 31 December 2020.
It is secured against exclusive charge of Rupees 1,177 million over pledge stocks of sugar, molasses and ethanol and first joint pari passu charge of Rupees 1,000 million over all present and future fixed assets of the Company.
11.2 Exportrefinance The Company has arranged facilities for short term finances to meet working capital requirements from
various banks under mark-up arrangements to the extent of Rupees 2,800 million (2019: Rupees 2,475 million). These finances were available at a mark-up ranging from 3.00% to 16.35% (2019: 3.00% to 15.47%) per annum on the outstanding balance or part thereof. These include Istisna of Rupees 425 million (2019: Rupees 100 million) payable to BankIslami Pakistan Limited, a related party. Expiry date of these finances is 31 December 2020 except for finances of Rupees 260 million received from National Bank of Pakistan which has been deferred for six months to one year in accordance with the BPRD Circular No. 13 of 2020 dated 26 March 2020 issued by State Bank of Pakistan to cope the impacts of COVID-19 pandemic.
The aggregate export finances are secured against ranking charge over fixed assets of the Company with 25% margin, ranking charge over current assets of the Company with 25% margin, pledge of molasses and ethanol, first joint pari passu charge over all present and future fixed assets of the Company and personal guarantees of Chief Executive Officer and a Director. These are additionally secured by pledge of shares of the Company and of other related parties.
11.3 Shortterminterestfreefinance It represents unsecured short term interest free finance provided by a sugar agent for financing the
operations of the Company. 2020 2019 Note (Rupees in thousand)
12. ACCRUED MARK-UP Long term financing 18,035 22,219 Short term borrowings 12.1 39,117 57,428
57,152 79,647 12.1 This includes mark-up of Rupees 16.294 million (2019: Rupees 7.239 million) payable to BankIslami Pakistan
Limited, a related party. 2020 2019 Note (Rupees in thousand)
13. CURRENT PORTION OF NON CURRENT LIABILITIES Long term financing 6 236,974 256,453 Deferred income - Government grant 7 8,445 -
245,419 256,453
NOTES TO THE FINANCIAL STATEMENTSFor the year ended 30 September 2020

61
14. CONTINGENCIES AND COMMITMENTS a) Contingencies (i) The Government of Punjab under the powers conferred through the Punjab Excise Act, 1914 through
notification No. SO. Tax (E&T) 3-4/2012 dated 03 July 2012, levied a duty of Rupees 2 per liter on manufacturing of spirit (biofuel) with effect from 01 July 2012. In view of legal lacunas, discrimination as to other provinces, no legislative competence and lawful authority of Government of Punjab to impose such duty on industrial ethanol which is not alcohol liquor and the fact that the Company is exporter of the spirit which is exempted under Order 6 of the Punjab Liquor Import, Export, Transportation and Possessions Orders, the management through its legal counsel has challenged the imposition of said levy and is currently contesting it at Honorable Lahore High Court, Lahore. Keeping in view all the court proceedings and grounds discussed in various higher courts, Punjab Government, after due deliberations of the Provincial Cabinet of the Punjab Government, on 20 August 2019, through its notification no. SO(E&M)2-5/2018/ED withdrew the imposed duty of Rupees 2 per liter upon the manufacture of spirit in any distillery. As per Company’s legal counsel, the Company has clear-cut case and the decision of the case shall be in favor of the Company. In view of the aforesaid, the duty on manufacturing of spirit (biofuel) previously recognized as liability amounting to Rupees 436.604 million has been de-recognized and Rupees 229.918 million previously deposited on this account has been recognized as receivable being refundable.
(ii) The Company has paid an advance amounting to Rupees 12.999 million to Messrs Industrial
Enterprises for designing the boiler project to use only biogas as fuel with no option of burning bagasse. However, the boiler could not generate steam as per specification. It is unlikely that this project will be completed. Therefore the Company has gone into litigation with Industrial Enterprises in Civil Court, Jhang on 03 July 2018 for the recovery of the advance paid along with damages. Based on the advice of legal counsel, there are favourable grounds that the case will be decided in favour of the Company and the advance amount paid will be refunded back.
(iii) Subsequent to the reporting date, an appellate order was made by Commissioner Inland Revenue,
Appeals, Lahore on 30 November 2020 under section 33 of Federal Excise Act, 2005, confirming payment of federal excise duty of Rupees 12.757 million including penalty regarding export of sugar to Afghanistan through land route in 2014. The Company has filed appeal before Appellate Tribunal Inland Revenue, Lahore against this order on 23 December 2020. No provision has been recognized in the books of account as the Company is confident on positive outcome of the appeal, on the advice of legal counsel.
(iv) The Competition Commission of Pakistan (CCP) issued show cause notices on 03 November 2020
and 04 November 2020, subsequent to the reporting date, under the provisions of the Competition Act, 2010, demanding facts and materials to satisfy CCP against various violations given in the show cause notice including closure of sugarcane crushing, price hike and other factors. The Company submitted replies before the CCP on 21 November 2020, denying any of the violations contained in the show cause notice. Management is confident that the above-mentioned reply will satisfy CCP accordingly.
(v) In addition to above-mentioned matters there are certain cases which have been filed against the
Company, primarily by the Company’s employees, customers and vendors. However, the management is of the view that in the overall context of these financial statements, there would be no significant liability of the Company against such cases.
b) Commitments There is no contract for capital and other expenditure as at 30 September 2020 (2019: Rupees Nil).
2020 2019 Note (Rupees in thousand)
15. PROPERTY, PLANT AND EQUIPMENT Operating fixed assets 15.1 9,603,953 10,109,369 Capital work-in-progress 15.2 141,679 144,411
9,745,632 10,253,780
NOTES TO THE FINANCIAL STATEMENTSFor the year ended 30 September 2020

62
15.1
Operatingfixedassets
Free
hold
la
ndBu
ildin
gPl
ant a
nd
mac
hine
ryTo
ols
and
equi
pmen
t
Wat
er,
elec
tric
and
wei
ghbr
idge
eq
uipm
ent
Furn
iture
and
fixtures
Office
equi
pmen
t V
ehic
les
Lab
orat
ory
equi
pmen
t Ar
ms
and
amm
uniti
onLi
brar
y bo
oks
Tota
l
----------------------------------------------------------------------------------------------------------------------(RUPE
ESIN
THOUSA
ND)----------------------------------------------------------------------------------------------------------------------
At
30
Sept
embe
r 201
8
C
ost /
reva
lued
am
ount
2
,661
,150
1
,076
,485
6
,899
,348
5
1,10
9
276
,014
4
8,93
2
59,
602
1
52,6
41
23,
106
5
75
10,
983
1
1,25
9,94
5
Accu
mul
ated
dep
reci
atio
n -
-
-
(4
9,01
5)
(257
,307
) (4
4,18
7)
(59,
562)
(1
09,2
84)
(22,
892)
(4
98)
(10,
774)
(5
53,5
19)
N
et b
ook
valu
e 2
,661
,150
1
,076
,485
6
,899
,348
2
,094
1
8,70
7
4,7
45
40
4
3,35
7
214
7
7
209
1
0,70
6,42
6
Year
end
ed 3
0 Se
ptem
ber 2
019
Ope
ning
net
boo
k va
lue
2
,661
,150
1
,076
,485
6
,899
,348
2
,094
1
8,70
7
4,7
45
40
4
3,35
7
214
7
7
209
1
0,70
6,42
6
Addi
tions
-
4
,193
2
8,09
7
690
3
,003
5
32
400
8
16
-
-
-
37,
731
D
ispo
sals
:
C
ost /
reva
lued
am
ount
(5
,300
) (2
,266
) (1
0,44
0)
(50)
(1
,957
) (2
02)
(41)
(1
9,15
8)
-
-
-
(39,
414)
Ac
cum
ulat
ed d
epre
ciat
ion
-
1,4
73
283
5
0
1,8
65
129
4
0
16,
391
-
-
-
2
0,23
1
(5,3
00)
(793
) (1
0,15
7)
-
(92)
(7
3)
(1)
(2,7
67)
-
-
-
(19,
183)
D
epre
ciat
ion
char
ge
-
(80,
959)
(5
18,9
67)
(627
) (4
,687
) (9
96)
(400
) (8
,819
) (8
9)
(15)
(4
6)
(615
,605
)
Clo
sing
net
boo
k va
lue
2
,655
,850
9
98,9
26
6,3
98,3
21
2,1
57
16,
931
4
,208
3
9
32,
587
1
25
62
1
63
10,
109,
369
At
30
Sept
embe
r 201
9
C
ost /
reva
lued
am
ount
2
,655
,850
1
,078
,412
6
,917
,005
5
1,74
9
277
,060
4
9,26
2
59,
961
1
34,2
99
23,
106
5
75
10,
983
1
1,25
8,26
2
Accu
mul
ated
dep
reci
atio
n -
(7
9,48
6)
(518
,684
) (4
9,59
2)
(260
,129
) (4
5,05
4)
(59,
922)
(1
01,7
12)
(22,
981)
(5
13)
(10,
820)
(1
,148
,893
)
Net
boo
k va
lue
2,6
55,8
50
998
,926
6
,398
,321
2
,157
1
6,93
1
4,2
08
39
3
2,58
7
125
6
2
163
1
0,10
9,36
9
Year
end
ed 3
0 Se
ptem
ber 2
020
Ope
ning
net
boo
k va
lue
2
,655
,850
9
98,9
26
6,3
98,3
21
2,1
57
16,
931
4
,208
3
9
32,
587
1
25
62
1
63
10,
109,
369
Ad
ditio
ns
-
3,7
12
65,
402
3
32
2,3
53
709
-
8
3
-
-
-
72,
591
D
ispo
sals
:
C
ost /
reva
lued
am
ount
(3
,000
) -
(6
,000
) (1
,444
) (2
,936
) (1
08)
-
(3,3
19)
-
-
-
(16,
807)
Ac
cum
ulat
ed d
epre
ciat
ion
-
-
832
1
,443
2
,843
8
9
-
2,9
56
-
-
-
8,1
63
(3,0
00)
-
(5,1
68)
(1)
(93)
(1
9)
-
(363
) -
-
-
(8
,644
)
Dep
reci
atio
n ch
arge
-
(7
5,17
4)
(481
,602
) (8
03)
(4,1
85)
(947
) (1
6)
(6,5
36)
(51)
(1
2)
(37)
(5
69,3
63)
C
losi
ng n
et b
ook
valu
e
2,6
52,8
50
927
,464
5
,976
,953
1
,685
1
5,00
6
3,9
51
23
2
5,77
1
74
5
0
126
9
,603
,953
At 3
0 Se
ptem
ber 2
020
Cos
t / re
valu
ed a
mou
nt
2,6
52,8
50
1,0
82,1
24
6,9
76,4
07
50,
637
2
76,4
77
49,
863
5
9,96
1
131
,063
2
3,10
6
575
1
0,98
3
11,
314,
046
Ac
cum
ulat
ed d
epre
ciat
ion
-
(154
,660
) (9
99,4
54)
(48,
952)
(2
61,4
71)
(45,
912)
(5
9,93
8)
(105
,292
) (2
3,03
2)
(525
) (1
0,85
7)
(1,7
10,0
93)
N
et b
ook
valu
e 2
,652
,850
9
27,4
64
5,9
76,9
53
1,6
85
15,
006
3
,951
2
3
25,
771
7
4
50
1
26
9,6
03,9
53
An
nual
rate
of d
epre
ciat
ion
(%)
-
7.5
7.5,
30
20, 4
0 20
, 40
20
40
20
40
20
20, 3
0
NOTES TO THE FINANCIAL STATEMENTSFor the year ended 30 September 2020

63
15.1.1 Particulars of immoveable fixed assets (i.e. land and building) in the name of the Company are as follows:
Particulars Location Area of land Covered Area of building
Sq. ft. Free hold land (Farms) Land of Chak Rasool Pur 103.65 Kanals - Land of Mouza Billi Nualan Par 284.80 Kanals - Land of Mouza Chandia Nasheb 437 Kanals - Land of Mouza Billi Habib 17.45 Kanals - Land of Mouza Doka Baloucha 639.25 Kanals - Land At Mouza Khai Kalan 495.16 Acres - Land of Mouza Kot Esa Shah 1 262 Kanals - Land of Mouza Kot Khan 2 926.2 Kanals - Land at Chak 462 JB 753 Kanals, 19 Marlas - Land at Kot Sahai Singh 52.2 Kanals - Free hold land (Bhone) Land of Chund Bharwana 1 Kanal - Land of Adda Massan 1 Kanal - Land of Mouza Wadhi The 1 Kanal - Land of Wijhalka (Muhammad Wala) 1 Kanal - Land of Mouza Dholka Adda Akrian Wala 1.05 Kanals - Bhone Unit (factory land) 1 419.74 Kanals 496 365 Free hold land (Jhang) Land at Lalazar 1 Kanal - Land at Mouza Suleman Adda Sher Abad 1 Kanal - Land at Chak 338 Adda Nia Lahore 1 Kanal - Land at Chak 426 Adda Pul 1 Kanal - Land at Chak 428 Adda Pul 1 Kanal - Land at Chak 316 Talwandi 15.8 Kanals - Land at Mouza Sangra Adda Kot Shakir 1 Kanal - Land at Adda Daal More 1 Kanal - Land at Islam Wala Adda Pul Gagan 1 Kanal - Land at Adda Kot Bahadar 1 Kanal - Land at Dari Gondal Maharaja Road 1 Kanal - Land at Chak 1/3L Ahmad Pur Sial 1 Kanal - Land at Mouza Kalachi Adda 1 Kanal - Land at Mouza Bagh 1 Kanal - Land at Chak 214 Adda Gojra More 1 Kanal - Land at Mouza Gilmala 1 Kanal - Land at Malluana More 1 Kanal - Land at Chak 457 Kot Lakhana 1 Kanal - Land at Roran Wali 1 Kanal - Land at Ballo Shahabal (Adda Chabeel) 1 Kanal - Land at Jhang Shumali (Pacca Wala) 12 Marlas - Jhang Unit (factory land) 1 289.25 Kanals 1 710 670
NOTES TO THE FINANCIAL STATEMENTSFor the year ended 30 September 2020

64
15.1.2Detailofoperatingfixedassets,exceedingthebo
okva
lueofRup
ees500,000,dispo
sedofduringtheyearisasfollows:
Des
crip
tion
Cos
t /
reva
lued
am
ount
Accu
mul
ated
de
prec
iatio
nBo
ok va
lue
Sale
pr
ocee
dsG
ain
/ (lo
ss)
Mod
e of
di
spos
alPa
rticu
lars
of p
urch
aser
s
------
------
------
------
----(R
UPE
ES IN
TH
OU
SAN
D)--
------
------
------
------
---
Free
hold
land
Land
of M
ouza
Wal
la (T
irkha
na W
ala)
3
,000
-
3
,000
3
,300
3
00
Neg
otia
tion
Muh
amm
ad N
awaz
, Tirk
hana
Wal
a,
Tehs
il Lal
ian,
Dis
trict
Chi
niot
.
Plan
t and
mac
hine
ry
M
achc
orne
r (2
Nos
) 3
,000
4
16
2,5
84
1,8
38
(746
) N
egot
iatio
n M
ubas
har B
roth
ers,
Raso
ol P
ura,
Fa
isal
abad
6,0
00
416
5
,584
5
,138
(4
46)
Aggr
egat
e of
oth
er it
ems
of p
rope
rty,
pl
ant a
nd e
quip
men
t with
indi
vidua
l
book
valu
es n
ot e
xcee
ding
Rupe
es 5
00,0
00
10,
807
7
,747
3
,060
8
,315
5
,255
16,
807
8
,163
8
,644
1
3,45
3
4,80
9
15.1
.3 T
he c
arry
ing
amou
nt o
f fre
ehol
d la
nd, b
uild
ing
and
plan
t and
mac
hine
ry w
ould
hav
e be
en R
upee
s 22
1.99
milli
on (2
019:
Rup
ees
222.
42 m
illion
), Ru
pees
223
.762
milli
on (2
019:
Rup
ees
220.
05 m
illion
) and
Rup
ees
2,08
1.43
7 m
illion
(201
9: R
upee
s 2,
020.
13 m
illion
) res
pect
ively,
had
ther
e be
en n
o re
valu
atio
n.
15.1
.4 F
orce
d sa
le v
alue
as
per l
ast r
eval
uatio
n w
as o
f Rup
ees
2,25
4.92
3 m
illion
, Rup
ees
788.
344
milli
on a
nd R
upee
s 5,
080.
410
milli
on fo
r fre
ehol
d la
nd,
build
ing
and
plan
t and
mac
hine
ry re
spec
tivel
y.
NOTES TO THE FINANCIAL STATEMENTSFor the year ended 30 September 2020

65
2020 2019 Note (Rupees in thousand)
15.1.5 The depreciation charge has been allocated as follows:
Cost of sales 26 552,217 595,460 Administrative expenses 28 17,146 20,145
569,363 615,605 15.2 CAPITAL WORK-IN-PROGRESS Civil works - 3,712 Plant and machinery 15.2.1 71,271 109,691
71,271 113,403 Advances given for capital work in progress 15.2.2 70,408 31,008
141,679 144,411 15.2.1 This mainly relates to energy conservation project and capacity enhancement of sugar plant.
15.2.2 This relates to advances given to various parties for supplies and consultancy services relates to for energy
conservation. It also includes advance given to Industrial Enterprises amounting to Rupees 31.01 million (2019: Rupees 31.01 million).
2020 2019 Note (Rupees in thousand) Considered good: - Plant and machinery 15.2.3 70,408 31,008 Considered doubtful: - Plant and machinery 21,664 21,664 - Intangibles 15,274 15,274
36,938 36,938
107,346 67,946 Less: Provision against doubtful advances (36,938) (36,938)
70,408 31,008 15.2.3 Advances included an amount given to Mian Muhammad Sugar Mill Limited in pursuance to a purchase
arrangement whereby the Company was to get a beneficial interest in the machinery installed at the premises. In prior years, the management re-evaluated the status of this arrangement and decided to discontinue with it. Appropriate legal proceedings were initiated in this regard and consequently provision was created against the remaining advance. The movement to date is as follows:
NOTES TO THE FINANCIAL STATEMENTSFor the year ended 30 September 2020
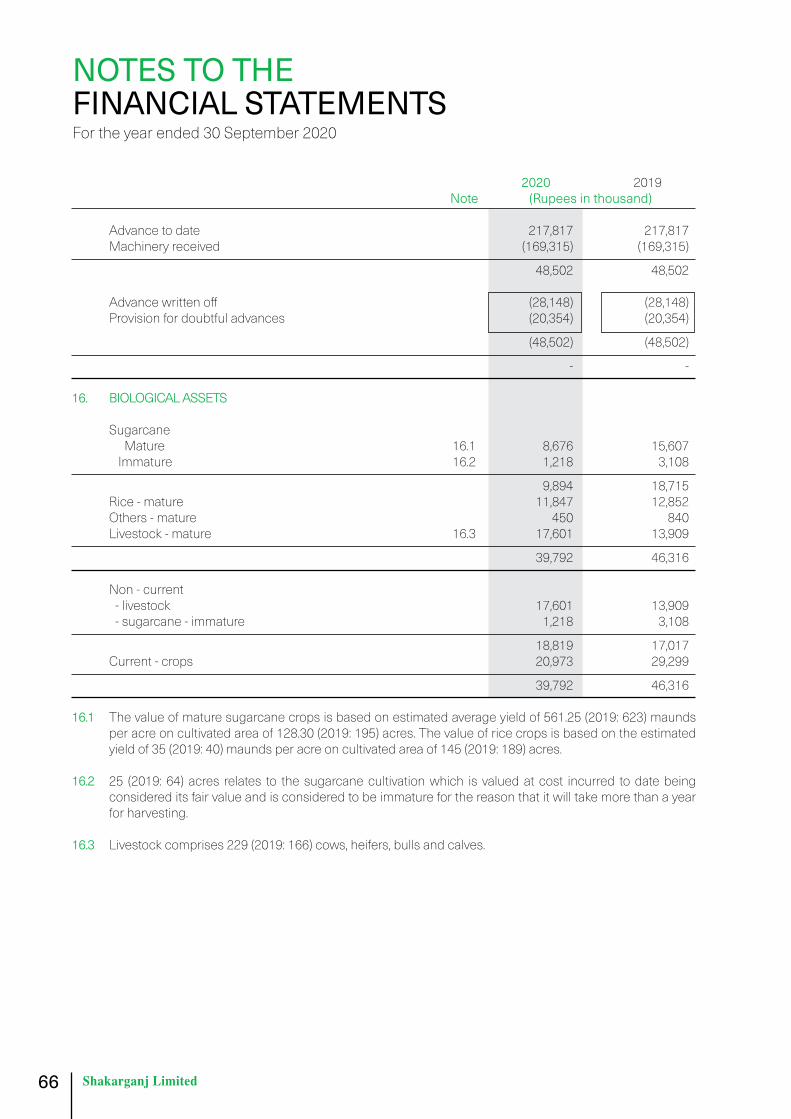
66
2020 2019 Note (Rupees in thousand)
Advance to date 217,817 217,817 Machinery received (169,315) (169,315)
48,502 48,502 Advance written off (28,148) (28,148) Provision for doubtful advances (20,354) (20,354)
(48,502) (48,502)
- -
16. BIOLOGICAL ASSETS Sugarcane Mature 16.1 8,676 15,607 Immature 16.2 1,218 3,108
9,894 18,715 Rice - mature 11,847 12,852 Others - mature 450 840 Livestock - mature 16.3 17,601 13,909
39,792 46,316
Non - current - livestock 17,601 13,909 - sugarcane - immature 1,218 3,108
18,819 17,017 Current - crops 20,973 29,299
39,792 46,316 16.1 The value of mature sugarcane crops is based on estimated average yield of 561.25 (2019: 623) maunds
per acre on cultivated area of 128.30 (2019: 195) acres. The value of rice crops is based on the estimated yield of 35 (2019: 40) maunds per acre on cultivated area of 145 (2019: 189) acres.
16.2 25 (2019: 64) acres relates to the sugarcane cultivation which is valued at cost incurred to date being
considered its fair value and is considered to be immature for the reason that it will take more than a year for harvesting.
16.3 Livestock comprises 229 (2019: 166) cows, heifers, bulls and calves.
NOTES TO THE FINANCIAL STATEMENTSFor the year ended 30 September 2020

67
2020 2019 Note (Rupees in thousand
16.4 Movement during the year Livestock As at 01 October 13,910 11,558 Gain arising from changes in fair value less estimated point of sale costs 4,149 3,381 Decrease due to sale / deceased livestock (458) (1,029)
As at 30 September 17,601 13,910 Crops As at 01 October 32,406 19,717 Increase due to purchases / costs incurred 50,753 39,217 Decrease due to harvest / sales (47,444) (47,246) Fair value adjustment related to sales during the year (3,307) 8,028 Fair value adjustment of agricultural assets 26 (10,217) 12,690
As at 30 September 22,191 32,406
39,792 46,316 2020 2019 Note (Rupees in thousand
Restated17. LONG TERM INVESTMENTS Investment in equity accounted investee 17.1 1,665,780 2,123,399 Classified as fair value through other comprehesive income 17.2 13,223 7,810
1,679,003 2,131,209 17.1 Investment in equity accounted investee
Shakarganj Food Products Limited - Unquoted 87 785 643 (2019: 87 785 643) fully paid ordinary shares of Rupees 10 each. Equity held: 52.39% (2019: 52.39%) Cost 590,784 590,784
Share of post acquisition reserves:
As at 01 October 1,532,615 1,429,634 Share of (loss) / profit for the year before taxation (538,637) 5,279 Provision for taxation 32 74,688 49,791 Share of other comprehensive for the year 6,330 47,911
1,074,996 1,532,615
Balance as on 30 September 1,665,780 2,123,399
NOTES TO THE FINANCIAL STATEMENTSFor the year ended 30 September 2020

68
17.1.1 Shakarganj Food Products Limited (SFPL) is a public unlisted company incorporated in Pakistan and is principally engaged in the business of manufacturing, processing and sale of food products. Its registered office is situated at E- Floor, IT Tower, 73-E/1, Hali Road, Gulberg – III, Lahore. On 08 August 2018, the Company’s shareholding in SFPL increased to 52.39% from 49.24%. However, the Company did not classify this investment as investment in subsidiary company in its financial statements for the year ended 30 September 2018 and onwards. In view of the applicable requirements of the Companies Act, 2017, the Company has now classified this investment as investment in subsidiary company and accounted for this investment using the equity method in accordance with IAS 27 ‘Separate Financial Statements’ in its separate financial statements. As the Company was already applying equity method of accounting to this investment, hence there is no impact of this reclassification on separate financial statements of current and previous periods. However, the Company has now started preparing consolidated financial statements.
17.1.2 The Company has restated the post acquisition reserves as at 30 September 2019 in respect of its
investment in SFPL by revising the share of post acquisition profit from the subsidiary, which was wrongly disclosed in the annual financial statements of the Company. This prior period error has been corrected retrospectively in these financial statements in accordance with International Accounting Standard IAS 8 ‘Accounting Policies, Changes in Accounting Estimates and Errors’. Consequently, as at 30 September 2019, investment in equity accounted investee and deferred income tax liability have been increased by Rupees 116.085 million and Rupees 17.413 million, loss after taxation has been decreased by Rupees 17.389 million and loss per share has been decreased by Rupee 0.14 per share. There was no cash flow impact as a result of the restatement. Moreover accumulated loss as at 01 October 2018 has been decreased by Rupees 81.283 million. Furthermore, the Company has not presented the third statement of financial position as at the beginning of the preceding period as the retrospective restatement do not have a significant effect on the information in the statement of financial position at the beginning of the preceding period.
2020 2019 (Rupees in thousand)
Restated Summarizedstatementoffinancialposition Non-current assets 7,834,405 7,836,557 Current assets 2,772,705 3,135,481 Non-current liabilities (1,795,651) (2,006,583) Current liabilities (5,767,903) (5,048,414)
Net assets 3,043,556 3,917,041 2020 2019
Company’s share (%) 52.39% 52.39% 2020 2019 (Rupees in thousand)
Restated Company’s share 1,594,519 2,052,138 Excess of purchase consideration over net assets 71,261 71,261
1,665,780 2,123,399
NOTES TO THE FINANCIAL STATEMENTSFor the year ended 30 September 2020

69
2020 2019 (Rupees in thousand)
Restated Reconciliationtocarryingamounts: As at 01 October 3,917,041 2,663,525 (Loss) / profit after income tax (885,568) 105,115 Other comprehensive income 12,083 1,009,971 Musharika financing-equity portion - 138,430
As at 30 September 3,043,556 3,917,041 Summarized statement of comprehensive income
Revenue 15,383,420 16,588,008 (Loss) / profit for the year (885,568) 105,115 Other comprehensive income 12,083 1,009,971
Total comprehensive (loss) / income (873,485) 1,115,086 2020 2019 (Rupees in thousand)
17.2 At fair value through other comprehensive income Associated company - quoted
Crescent Steel and Allied Products Limited 180 000 (2019: 180 000) fully paid ordinary shares of Rupees 10 each 15,921 15,921 Others - unquoted
Crescent Group (Private) Limited 220 000 (2019: 220 000) fully paid ordinary shares of Rupees 10 each 2,200 2,200 Crescent Standard Telecommunications Limited 300 000 (2019: 300 000) fully paid ordinary shares of Rupees 10 each 3,000 3,000 Innovative Investment Bank Limited 51 351 (2019: 51 351) fully paid ordinary shares of Rupees 10 each - -
21,121 21,121 Less: Fair value adjustment (7,898) (13,311)
13,223 7,810
NOTES TO THE FINANCIAL STATEMENTSFor the year ended 30 September 2020

70
2020 2019 Note (Rupees in thousand)
18. LONG TERM ADVANCES AND DEPOSITS Security deposits: Considered good 34,035 34,001 Considered doubtful 265 265
34,300 34,266 Advance to Creek Marina (Private) Limited - considered doubtful 18.1 38,557 38,557
72,857 72,823 Less: Provision against doubtful receivables (38,822) (38,822)
34,035 34,001 18.1 This represents payment for two apartments in the Creek Marina Projects pursuant to a settlement
agreement entered into by the Company and the former Crescent Standard Investment Bank Limited in year 2006. The construction work at the site has been halted since year 2011 due to differences between Defence Housing Authority and the developer. The resumption of construction work is still uncertain in near future. Consequently, based on prudence principal the Company provided the above advance in full.
2020 2019 Note (Rupees in thousand)
19. STORES, SPARE PARTS AND LOOSE TOOLS Stores 34,460 31,129 Spare parts 23,130 34,465 Loose tools 826 917
58,416 66,511
Less: Provision for obsolete items (2,820) (2,820)
55,596 63,691 20. STOCK-IN-TRADE Raw materials 38,827 2,652 Work-in-process 16,100 20,724
Finished goods 20.2 - Manufactured 560,189 269,484 - Trading - 284,000
560,189 553,484
615,116 576,860 20.1 Stock-in-trade of Rupees 31.200 million (2019: Rupees 1.417 million) is being carried at net realizable
value. 20.2 These include stock of Rupees 0.211 million (2019: Rupees Nil) held by a third party.
NOTES TO THE FINANCIAL STATEMENTSFor the year ended 30 September 2020

71
2020 2019 Note (Rupees in thousand)
21. TRADE DEBTS Consideredgood: Unsecured 21.1 203,093 35,078 Considered doubtful 11,934 10,522
215,027 45,600 Less: Allowance for expected credit losses 21.2 (11,934) (10,522)
203,093 35,078 21.1 As at 30 September 2020, trade debts due from the related party, Shakarganj Food Products Limited are
amounting to Rupees 51.167 million (2019: Rupees Nil). The ageing analysis of these trade debts is as follows:
2020 2019 (Rupees in thousand)
Upto 1 month 23,672 - 1 to 6 months 27,495 -
51,167 - 21.1.1 Maximum aggregate balance due from the related party at the end of any month during the year was
Rupees 87.485 million (2019: Rupees 11.430 million).
2020 2019 Note (Rupees in thousand) 21.2 Allowance for expected credit losses Balance as at 01 October 10,522 11,476 Provision for the year 29 1,412 - Written off during the year - (954)
Balance as at 30 September 11,934 10,522 21.3 As at 30 September 2020, trade debts due from other than the related party are aggregating to Rupees
140.355 million (2019: Rupees 34.124 million) which are past due but not impaired. These relate to a number of independent customers from whom there is no recent history of default. The ageing analysis of these trade debts is as follows:
2020 2019 (Rupees in thousand)
Upto 1 month 118,553 1,312 1 to 6 months 21,539 5,141 More than 6 months 263 27,671
140,355 34,124
NOTES TO THE FINANCIAL STATEMENTSFor the year ended 30 September 2020
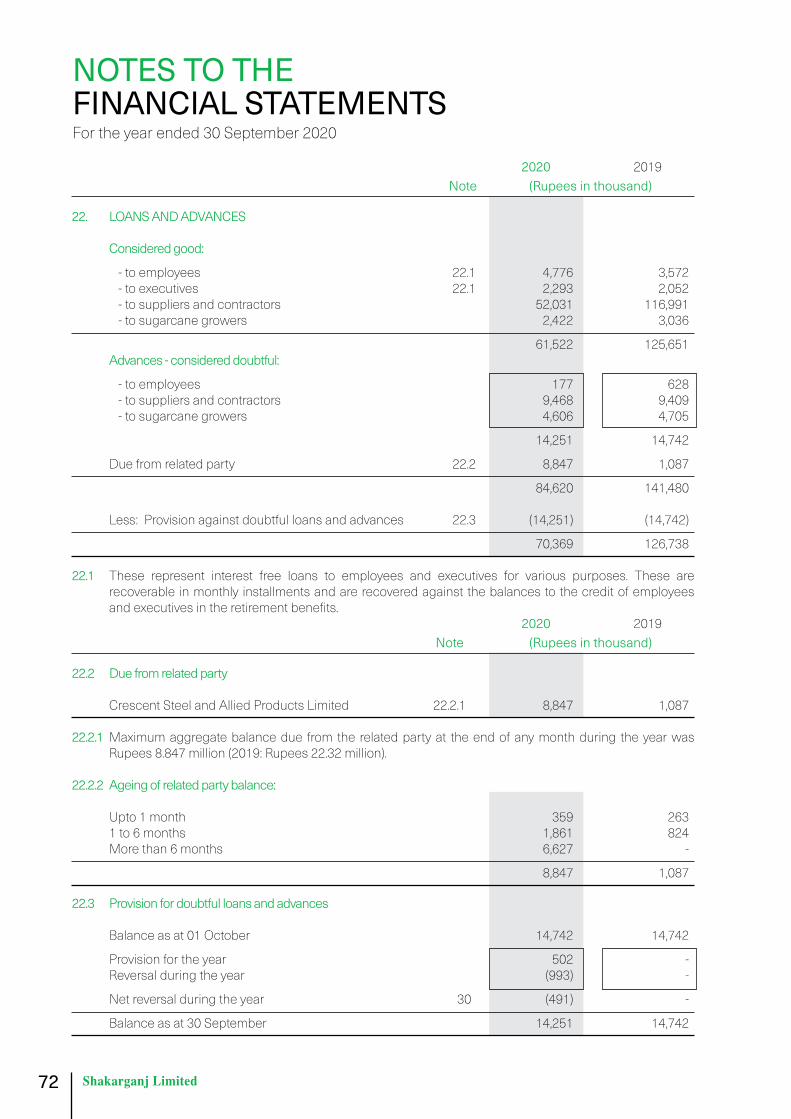
72
2020 2019 Note (Rupees in thousand)
22. LOANS AND ADVANCES Consideredgood:
- to employees 22.1 4,776 3,572 - to executives 22.1 2,293 2,052 - to suppliers and contractors 52,031 116,991 - to sugarcane growers 2,422 3,036
61,522 125,651 Advances-considereddoubtful:
- to employees 177 628 - to suppliers and contractors 9,468 9,409 - to sugarcane growers 4,606 4,705
14,251 14,742 Due from related party 22.2 8,847 1,087
84,620 141,480 Less: Provision against doubtful loans and advances 22.3 (14,251) (14,742)
70,369 126,738 22.1 These represent interest free loans to employees and executives for various purposes. These are
recoverable in monthly installments and are recovered against the balances to the credit of employees and executives in the retirement benefits.
2020 2019 Note (Rupees in thousand)
22.2 Due from related party
Crescent Steel and Allied Products Limited 22.2.1 8,847 1,087 22.2.1 Maximum aggregate balance due from the related party at the end of any month during the year was
Rupees 8.847 million (2019: Rupees 22.32 million). 22.2.2 Ageingofrelatedpartybalance: Upto 1 month 359 263 1 to 6 months 1,861 824 More than 6 months 6,627 -
8,847 1,087
22.3 Provision for doubtful loans and advances Balance as at 01 October 14,742 14,742
Provision for the year 502 - Reversal during the year (993) -
Net reversal during the year 30 (491) -
Balance as at 30 September 14,251 14,742
NOTES TO THE FINANCIAL STATEMENTSFor the year ended 30 September 2020
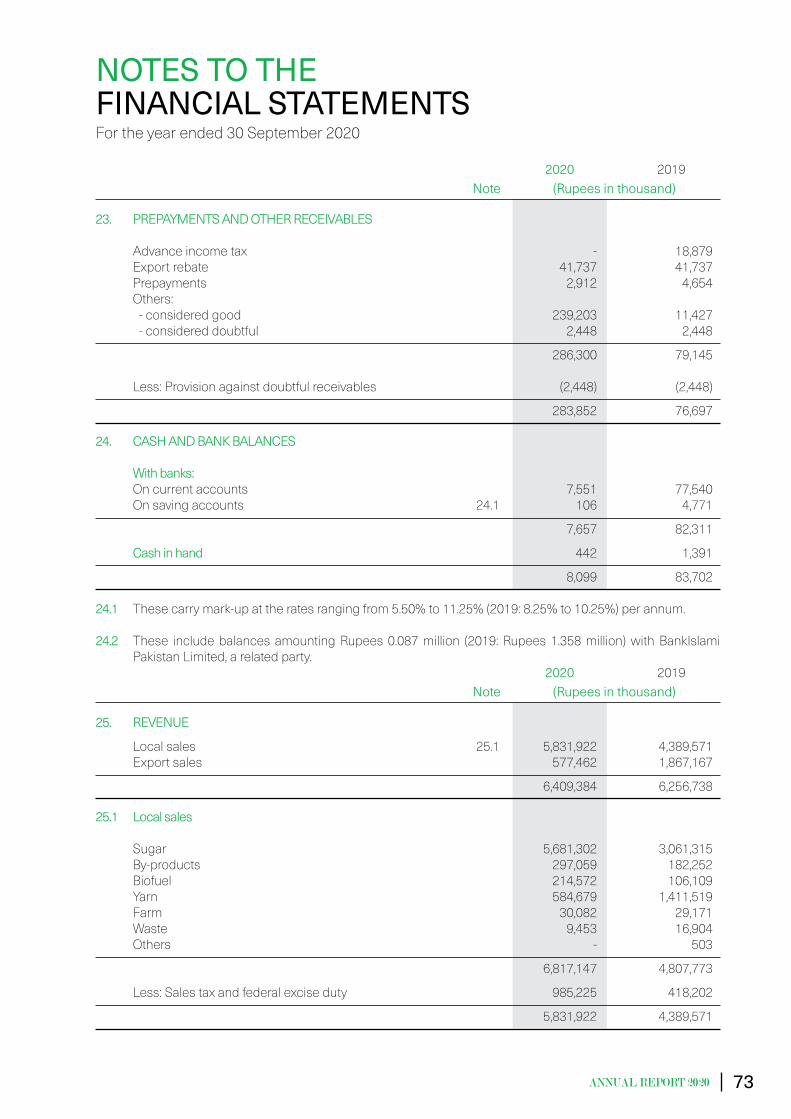
73
2020 2019 Note (Rupees in thousand)
23. PREPAYMENTS AND OTHER RECEIVABLES Advance income tax - 18,879 Export rebate 41,737 41,737 Prepayments 2,912 4,654 Others: - considered good 239,203 11,427 - considered doubtful 2,448 2,448
286,300 79,145 Less: Provision against doubtful receivables (2,448) (2,448)
283,852 76,697
24. CASH AND BANK BALANCES Withbanks: On current accounts 7,551 77,540 On saving accounts 24.1 106 4,771
7,657 82,311
Cash in hand 442 1,391
8,099 83,702 24.1 These carry mark-up at the rates ranging from 5.50% to 11.25% (2019: 8.25% to 10.25%) per annum.
24.2 These include balances amounting Rupees 0.087 million (2019: Rupees 1.358 million) with BankIslami
Pakistan Limited, a related party. 2020 2019 Note (Rupees in thousand)
25. REVENUE
Local sales 25.1 5,831,922 4,389,571 Export sales 577,462 1,867,167
6,409,384 6,256,738
25.1 Local sales Sugar 5,681,302 3,061,315 By-products 297,059 182,252 Biofuel 214,572 106,109 Yarn 584,679 1,411,519 Farm 30,082 29,171 Waste 9,453 16,904 Others - 503
6,817,147 4,807,773
Less: Sales tax and federal excise duty 985,225 418,202
5,831,922 4,389,571
NOTES TO THE FINANCIAL STATEMENTSFor the year ended 30 September 2020
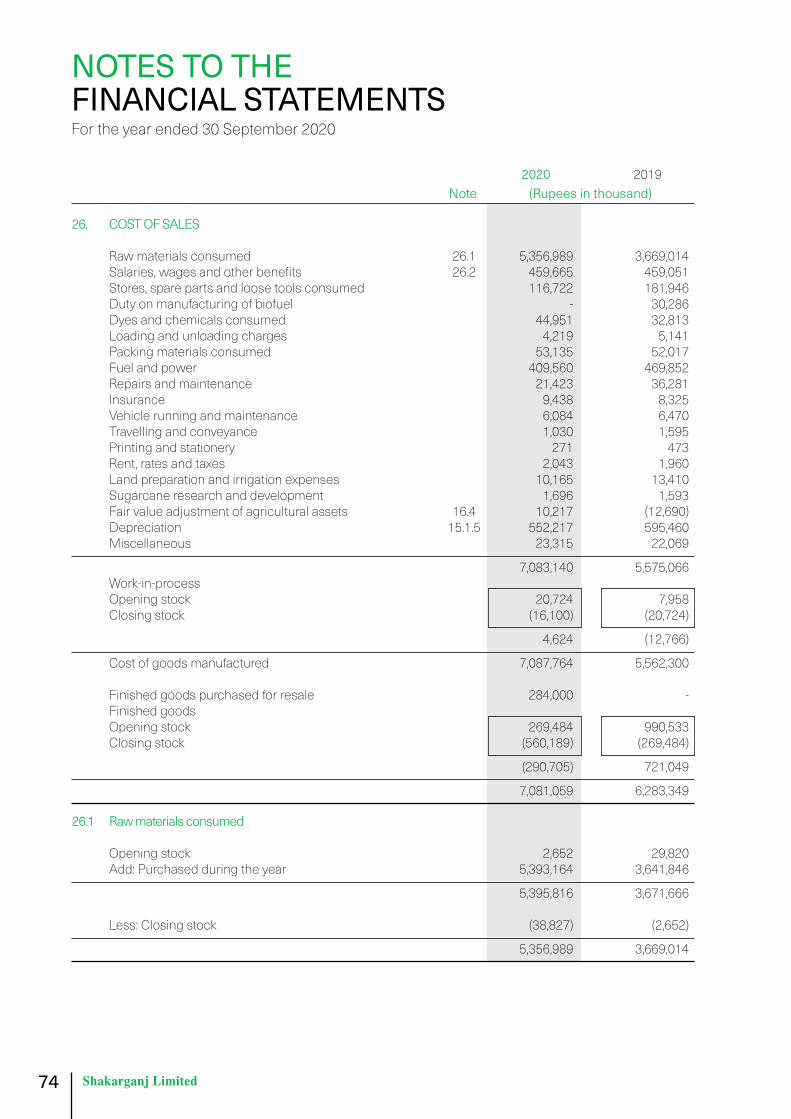
74
2020 2019 Note (Rupees in thousand)
26. COST OF SALES Raw materials consumed 26.1 5,356,989 3,669,014 Salaries, wages and other benefits 26.2 459,665 459,051 Stores, spare parts and loose tools consumed 116,722 181,946 Duty on manufacturing of biofuel - 30,286 Dyes and chemicals consumed 44,951 32,813 Loading and unloading charges 4,219 5,141 Packing materials consumed 53,135 52,017 Fuel and power 409,560 469,852 Repairs and maintenance 21,423 36,281 Insurance 9,438 8,325 Vehicle running and maintenance 6,084 6,470 Travelling and conveyance 1,030 1,595 Printing and stationery 271 473 Rent, rates and taxes 2,043 1,960 Land preparation and irrigation expenses 10,165 13,410 Sugarcane research and development 1,696 1,593 Fair value adjustment of agricultural assets 16.4 10,217 (12,690) Depreciation 15.1.5 552,217 595,460 Miscellaneous 23,315 22,069
7,083,140 5,575,066 Work-in-process Opening stock 20,724 7,958 Closing stock (16,100) (20,724)
4,624 (12,766)
Cost of goods manufactured 7,087,764 5,562,300 Finished goods purchased for resale 284,000 - Finished goods Opening stock 269,484 990,533 Closing stock (560,189) (269,484)
(290,705) 721,049
7,081,059 6,283,349
26.1 Raw materials consumed Opening stock 2,652 29,820 Add: Purchased during the year 5,393,164 3,641,846
5,395,816 3,671,666 Less: Closing stock (38,827) (2,652)
5,356,989 3,669,014
NOTES TO THE FINANCIAL STATEMENTSFor the year ended 30 September 2020

75
26.2 Salaries, wages and other benefits include following in respect of retirement benefits:
2020 2019 Note (Rupees in thousand) Pension Fund 8.1.3.1 4,531 5,165 Gratuity Fund 8.2.3.1 2,530 1,525 Employees’ Provident Fund Trust 3,685 5,530
10,746 12,220
27. DISTRIBUTION COST Storage tank charges 1,162 24,205 Freight and forwarding 49,823 99,794 Handling and distribution 1,443 1,669 Commission to selling agents 6,167 4,831 Salaries and other benefits 27.1 5,413 4,034 Insurance 2,093 2,325 Sales promotion expenses 575 841
66,676 137,699 27.1 Salaries and other benefits include following in respect of retirement benefits: Pension Fund 8.1.3.1 487 431 Employees’ Provident Fund Trust 170 160
657 591 28. ADMINISTRATIVE EXPENSES Salaries, wages and other benefits 28.1 246,142 227,293 Repairs and maintenance 5,313 7,126 Insurance 3,950 3,927 Vehicle running and maintenance 7,508 10,353 Travelling and conveyance 1,656 3,148 Printing and stationery 999 1,008 Electricity and gas 2,333 1,934 Telephone and postage 3,743 3,264 Legal and professional 10,924 12,124 Auditor’s remuneration 28.2 2,724 2,769 IT consultancy and advisory services - 10 Rent, rates and taxes 6,774 6,349 Staff training and development 430 137 Entertainment 2,985 3,055 Subscriptions 5,181 6,783 Advertisement 231 241 Registered office expenses 965 898 Depreciation 15.1.5 17,146 20,145 Others 1,356 612
320,360 311,176
NOTES TO THE FINANCIAL STATEMENTSFor the year ended 30 September 2020

76
28.1 Salaries, wages and other benefits include following in respect of retirement benefits:
2020 2019 Note (Rupees in thousand)
Pension Fund 8.1.3.1 8,845 8,010 Gratuity Fund 8.2.3.1 3,679 2,723 Employees’ Provident Fund Trust 3,141 4,024
15,665 14,757
28.2 Auditor’s remuneration Audit fee 1,764 1,764 Half yearly review 635 635 Reimbursable expenses 325 370
2,724 2,769
29. OTHER EXPENSES Net exchange loss 21,981 20,471 Social action programme expenses including salaries 29.1 5,468 5,514 Waste water drainage 6,577 11,088 Allowance for expected credit loss 21.2 1,412 - Donations 29.2 3,000 1,000 Others 22 634
38,460 38,707 29.1 Social action programme salaries expenses include following in respect of retirement benefits:
2020 2019 Note (Rupees in thousand) Pension Fund 8.1.3.1 254 270 Gratuity Fund 8.2.3.1 101 58 Employees’ Provident Fund Trust 112 83
467 411 29.2 During the year, donation amounting to Rupees 2.500 million (2019: Rupees 1.000 million) was given to
Lyallpur Golf and Country Club, Faisalabad, in which a director Mr. Ali Altaf Saleem is a member.
NOTES TO THE FINANCIAL STATEMENTSFor the year ended 30 September 2020

77
2020 2019 Note (Rupees in thousand)
30. OTHER INCOME Incomefromfinancialassets
Dividend income - 180 Return on bank deposits 617 301 Reversal of provision for doubtful loans and advances - net 22.3 491 -
1,108 481 Incomefromnon-financialassets
Scrap sales 17,248 19,487 Gain on sale of property, plant and equipment 15.1.2 4,809 9,183 Agriculture income - net 1,788 7,141 Liabilities no longer payable written back 1,249 1,710 Adjustment on account of excise duty on manufacturing of ethanol 666,522 - Rental income 23,787 17,956 Amortization of deferred income - Government grant 7 3,947 - Others 83,494 9,520
802,844 64,997
803,952 65,478 31. FINANCE COST Markupon:
Long term financing 52,816 63,777 Short term borrowings 192,003 205,030 Due to Gratuity Fund and Pension Fund - related parties 44,603 48,870 Interest on workers’ profit participation fund - 842 Bank and other charges 49,377 12,515
338,799 331,034 2020 2019 Note (Rupees in thousand)
Restated32. TAXATION
Chargefortheyear:
Current 32.1 92,802 84,005 Deferred (191,186) (80,273)
(98,384) 3,732
Equity accounted investee 17.1 (74,688) (49,791)
(173,072) (46,059)
NOTES TO THE FINANCIAL STATEMENTSFor the year ended 30 September 2020

78
32.1 Provision for current taxation represents the final tax against export sales and minimum tax on local sales under the relevant provisions of the Income Tax Ordinance, 2001. Unused tax losses available for carry forward as at 30 September 2020 are of Rupees 6,917.307 million (2019: Rupees 5,928.29 million). Reconciliation of tax expenses and product of accounting profit multiplied by the applicable tax rate is not required in view of unused tax losses of the Company.
2020 201933. LOSS PER SHARE - BASIC AND DILUTED
Loss for the year (Rupees in thousand) (997,583) (728,411)
Weighted average number of ordinary shares (Numbers) 125 000 000 125 000 000
Loss per share (Rupees) (7.98) (5.83) 33.1 There is no dilutive effect on basic loss per share. 2020 2019 Note (Rupees in thousand)
Restated34. CASH GENERATED FROM OPERATIONS Loss before taxation (1,170,655) (774,470) Adjustmentsfornon-cashchargesandotheritems:
Depreciation 569,363 615,605 Liabilities no longer payable written back (1,249) (1,710) Gain on sale of property, plant and equipment (4,809) (9,183) Fair value adjustment of agricultural assets 8,429 (19,831) Allowance for expected credit losses 1,412 - Reversal of provision for doubtful loans and advances (491) - Provision for employees’ retirement benefits 20,427 18,182 Adjustment on account of excise duty on manufacturing of ethanol (666,522) - Share of loss / (profit) from equity accounted investee 538,637 (5,279) Amortization of deferred grant (3,947) - Unrealized (gain) / loss on agriculture income (14) 1,682 Finance cost 338,799 331,034 Working capital changes 34.1 1,077,553 936,825
706,933 1,092,855
34.1 Working capital changes Decrease / (increase) in current assets:
- Stores, spare parts and loose tools 8,095 2,065 - Stock-in-trade (38,256) 451,451 - Biological assets (1,891) 3,108 - Trade debts (168,015) 4,353 - Loans and advances 55,448 (1,960) - Prepayments and other receivables 10,420 103,063
(134,199) 562,080
Increase in trade and other payables 1,211,752 374,745
1,077,553 936,825
NOTES TO THE FINANCIAL STATEMENTSFor the year ended 30 September 2020

79
34.2 Reconciliation of movement of liabilities to cash flows arising from financing activities:
2020 2019
Unclaimed Dividend
Long term financing
Short term
borrowings Total Unclaimed
DividendLong term financing
Short term borrowings Total
- - - - - - - - - - - - - - - - - - - - - - - - - - - - - - (Rupees in thousand) - - - - - - - - - - - - - - - - - - - - - - - - - - - - - - - - - -
Balance as at 01 October 2,039 384,744 1,804,077 2,190,860 2,273 540,406 2,243,284 2,785,963 Dividend paid (85) - - (85) (234) - - (234) Loans availed - 165,606 2,775,325 2,940,931 - 3,998,655 3,998,655 Repayment of loans - (81,581) (3,163,704) (3,245,285) - (155,662) (4,437,862) (4,593,524) Fair value adjustment - (11,850) - (11,850) - - - - Balance as at 30 September 1,954 456,919 1,415,698 1,874,571 2,039 384,744 1,804,077 2,190,860
35. REMUNERATION OF CHIEF EXECUTIVE OFFICER, DIRECTORS AND EXECUTIVES The aggregate amount charged in the financial statements for remuneration including all benefits to Chief
Executive Officer, directors and executives of the Company is as follows: ChiefExecutiveOfficerExecutiveDirectorsNon-ExecutiveDirectorsExecutives
2020 2019 2020 2019 2020 2019 2020 2019 - - - - - - - - - - - - - - - - - - - - - - - - - - (Rupees in thousand) - - - - - - - - - - - - - - - - - - - - - - - - - - Managerial remuneration 10,503 9,828 6,000 6,000 - - 81,887 66,314 Allowances House rent 4,726 4,423 2,400 2,400 - - 26,716 21,542 Utilities 1,050 983 600 600 - - 6,213 4,919 Medical - - 480 480 - - 5,573 4,415 Others - - - - - - 1,816 2,802 Reimbursable expenses - 24 - 275 - - - 76 Contribution to retirement benefits 3,712 3,472 2,120 2,120 - - 14,252 9,923 Meeting fee - - - - 800 620 - - 19,991 18,730 11,600 11,875 800 620 136,457 109,991 Number of persons 1 1 1 1 6 6 32 34
35.1 The Chief Executive Officer, some directors and some executives are provided with company maintained car, travel facilities and club membership.
35.2 Out of six directors to whom the meeting fee was paid during the year, one director Mr. Jawad Amjad
resigned on 24 June 2020. 36. PROVIDENT FUND RELATED DISCLOSURE As at the reporting date, Shakarganj Limited - Employees’ Provident Fund Trust is in the process of
regularizing its investments in accordance with section 218 of the Companies Act, 2017 and the regulations formulated for this purpose by Securities and Exchange Commission of Pakistan which allows transition period of three years for bringing the Trust in conformity with the requirements of the regulations.
NOTES TO THE FINANCIAL STATEMENTSFor the year ended 30 September 2020
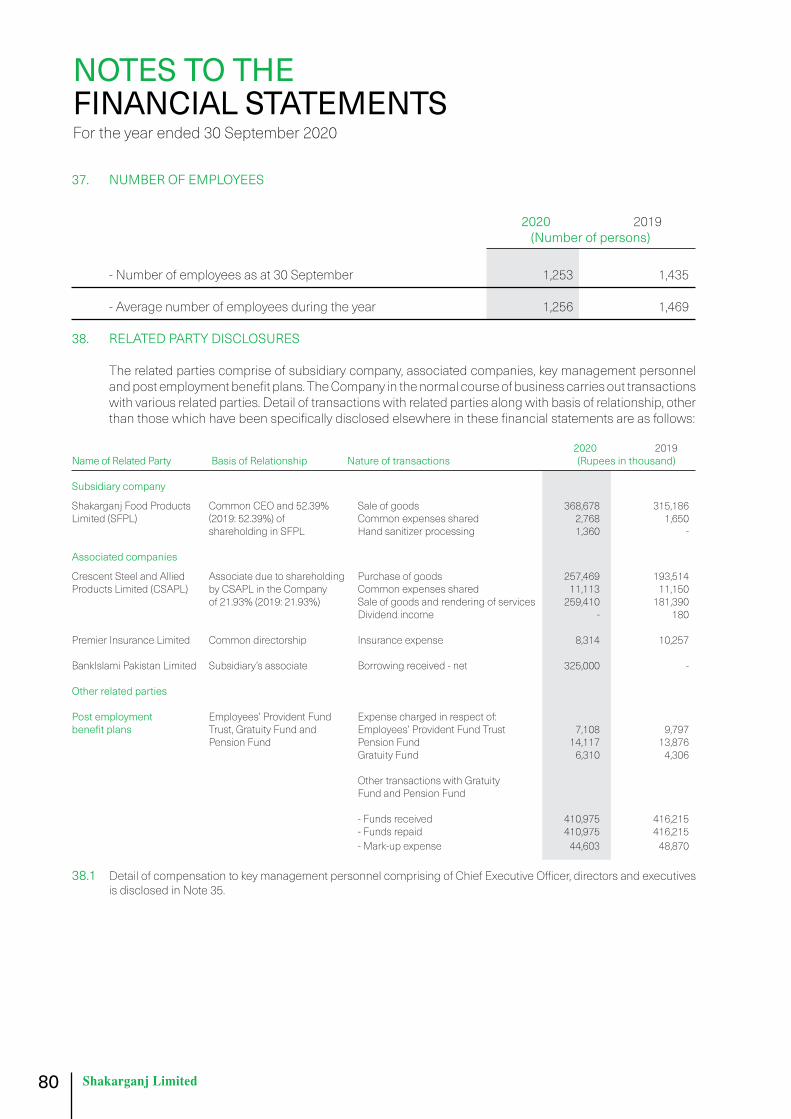
80
37. NUMBER OF EMPLOYEES 2020 2019 (Number of persons)
- Number of employees as at 30 September 1,253 1,435 - Average number of employees during the year 1,256 1,469
38. RELATED PARTY DISCLOSURES The related parties comprise of subsidiary company, associated companies, key management personnel
and post employment benefit plans. The Company in the normal course of business carries out transactions with various related parties. Detail of transactions with related parties along with basis of relationship, other than those which have been specifically disclosed elsewhere in these financial statements are as follows:
2020 2019Name of Related Party Basis of Relationship Nature of transactions (Rupees in thousand)
Subsidiary company Shakarganj Food Products Common CEO and 52.39% Sale of goods 368,678 315,186 Limited (SFPL) (2019: 52.39%) of Common expenses shared 2,768 1,650 shareholding in SFPL Hand sanitizer processing 1,360 - Associated companies Crescent Steel and Allied Associate due to shareholding Purchase of goods 257,469 193,514 Products Limited (CSAPL) by CSAPL in the Company Common expenses shared 11,113 11,150 of 21.93% (2019: 21.93%) Sale of goods and rendering of services 259,410 181,390 Dividend income - 180 Premier Insurance Limited Common directorship Insurance expense 8,314 10,257 BankIslami Pakistan Limited Subsidiary’s associate Borrowing received - net 325,000 - Other related parties Post employment Employees’ Provident Fund Expense charged in respect of: benefitplans Trust, Gratuity Fund and Employees’ Provident Fund Trust 7,108 9,797 Pension Fund Pension Fund 14,117 13,876 Gratuity Fund 6,310 4,306 Other transactions with Gratuity Fund and Pension Fund - Funds received 410,975 416,215 - Funds repaid 410,975 416,215 - Mark-up expense 44,603 48,870
38.1 Detail of compensation to key management personnel comprising of Chief Executive Officer, directors and executives is disclosed in Note 35.
NOTES TO THE FINANCIAL STATEMENTSFor the year ended 30 September 2020

81
2020 2019
39. PLANT CAPACITY AND ACTUAL PRODUCTION Sugar Jhang Rated crushing capacity (MT / day) 10 000 10 000 On the basis of 104 days (2019: 77 days) (MT) 1040 000 770 000 Actual sugarcane crushed (MT) 497 156 226 738 Bhone Rated crushing capacity (MT / day) 6 000 6 000 On the basis of 102 days (2019: 83 days) (MT) 612 000 498 000 Actual sugarcane crushed (MT) 387 568 258 024 The low crushing was due to low quality sugarcane. Biofuel Jhang Rated production capacity (Litres / day) 150 000 150 000 On the basis of average number of 69 days (2019: 108 days) working (Litres) 10 350 000 16 150 000 Actual production (Litres) 9 816 686 14 450 368 Bhone Rated production capacity (Litres / day) 200 000 200 000 On the basis of average number of Nil days (2019: 4 days) working (Litres) - 750 000 Actual production (Litres) - 713 838 Major reason for low production was due to non-availability of raw material at feasible prices. Textile Capacity (converted in 20s counts) (Kg) 9 198 418 9 198 418 Actual production (converted in 20s counts) (Kg) 3 102 521 8 850 689 The actual production was low due to COVID-19 pandemic lockdown and high prices of raw materials.
NOTES TO THE FINANCIAL STATEMENTSFor the year ended 30 September 2020
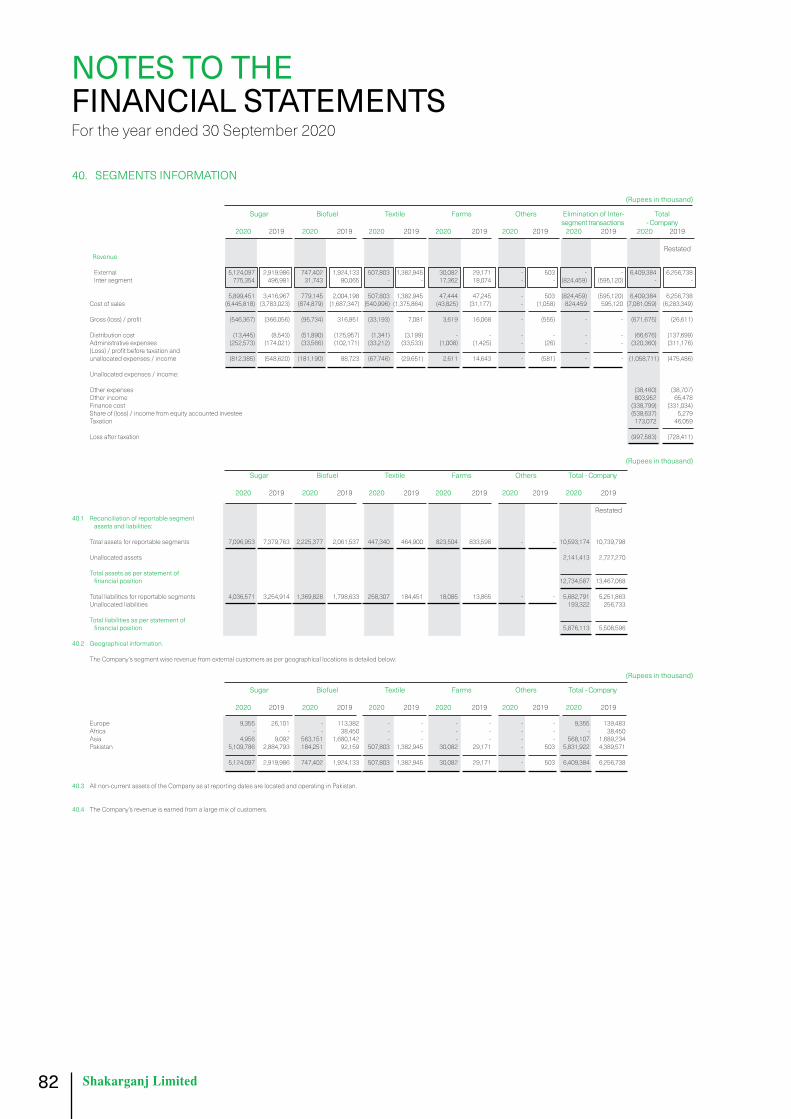
82
40. SEGMENTS INFORMATION (Rupees in thousand)
Sugar Biofuel Textile Farms Others Elimination of Inter- Total segment transactions - Company 2020 2019 2020 2019 2020 2019 2020 2019 2020 2019 2020 2019 2020 2019
Restated Revenue External 5,124,097 2,919,986 747,402 1,924,133 507,803 1,382,945 30,082 29,171 - 503 - - 6,409,384 6,256,738 Inter segment 775,354 496,981 31,743 80,065 - - 17,362 18,074 - - (824,459) (595,120) - -
5,899,451 3,416,967 779,145 2,004,198 507,803 1,382,945 47,444 47,245 - 503 (824,459) (595,120) 6,409,384 6,256,738 Cost of sales (6,445,818) (3,783,023) (874,879) (1,687,347) (540,996) (1,375,864) (43,825) (31,177) - (1,058) 824,459 595,120 (7,081,059) (6,283,349) Gross (loss) / profit (546,367) (366,056) (95,734) 316,851 (33,193) 7,081 3,619 16,068 - (555) - - (671,675) (26,611) Distribution cost (13,445) (8,543) (51,890) (125,957) (1,341) (3,199) - - - - - - (66,676) (137,699) Administrative expenses (252,573) (174,021) (33,566) (102,171) (33,212) (33,533) (1,008) (1,425) - (26) - - (320,360) (311,176) (Loss) / profit before taxation and unallocated expenses / income (812,385) (548,620) (181,190) 88,723 (67,746) (29,651) 2,611 14,643 - (581) - - (1,058,711) (475,486) Unallocated expenses / income: Other expenses (38,460) (38,707) Other income 803,952 65,478 Finance cost (338,799) (331,034) Share of (loss) / income from equity accounted investee (538,637) 5,279 Taxation 173,072 46,059 Loss after taxation (997,583) (728,411)
(Rupees in thousand)
Sugar Biofuel Textile Farms Others Total - Company 2020 2019 2020 2019 2020 2019 2020 2019 2020 2019 2020 2019 Restated40.1 Reconciliation of reportable segment assetsandliabilities: Total assets for reportable segments 7,096,953 7,379,763 2,225,377 2,061,537 447,340 464,900 823,504 833,598 - - 10,593,174 10,739,798
Unallocated assets 2,141,413 2,727,270 Total assets as per statement of financialposition 12,734,587 13,467,068 Total liabilities for reportable segments 4,036,571 3,254,914 1,369,828 1,798,633 258,307 184,451 18,085 13,865 - - 5,682,791 5,251,863 Unallocated liabilities 193,322 256,733 Total liabilities as per statement of financialposition 5,876,113 5,508,596 40.2 Geographical information The Company’s segment wise revenue from external customers as per geographical locations is detailed below: (Rupees in thousand)
Sugar Biofuel Textile Farms Others Total - Company 2020 2019 2020 2019 2020 2019 2020 2019 2020 2019 2020 2019
Europe 9,355 26,101 - 113,382 - - - - - - 9,355 139,483 Africa - - - 38,450 - - - - - - - 38,450 Asia 4,956 9,092 563,151 1,680,142 - - - - - - 568,107 1,689,234 Pakistan 5,109,786 2,884,793 184,251 92,159 507,803 1,382,945 30,082 29,171 - 503 5,831,922 4,389,571 5,124,097 2,919,986 747,402 1,924,133 507,803 1,382,945 30,082 29,171 - 503 6,409,384 6,256,738
40.3 All non-current assets of the Company as at reporting dates are located and operating in Pakistan. 40.4 The Company’s revenue is earned from a large mix of customers.
NOTES TO THE FINANCIAL STATEMENTSFor the year ended 30 September 2020

83
41. FINANCIAL RISK MANAGEMENT 41.1 Financial risk factors The Company’s activities expose it to a variety of financial risks: market risk (including currency risk, price
risk and interest rate risk), credit risk and liquidity risk. The Company’s overall risk management program focuses on the unpredictability of financial markets and seeks to minimize potential adverse effects on the financial performance.
Risk management is carried out by the Company’s Board of Directors. The Board provides principles for
overall risk management, as well as policies covering specific areas such as currency risk, other price risk, interest rate risk, credit risk and liquidity risk.
(a) Market risk (i) Currency risk Currency risk is the risk that the fair value or future cash flows of a financial instrument will fluctuate because
of changes in foreign exchange rates. Currency risk arises mainly from future commercial transactions or receivables and payables that exist due to transactions in foreign currencies. The Company is not exposed to any currency risk at statement of financial position date as it doesn’t have any outstanding balance in foreign currency.
(ii) Other price risk Other price risk represents the risk that the fair value or future cash flows of a financial instrument will
fluctuate because of changes in market prices (other than those arising from interest rate risk or currency risk), whether those changes are caused by factors specific to the individual financial instrument or its issuer, or factors affecting all similar financial instrument traded in the market. The Company is not exposed to commodity price risk.
Sensitivity analysis The table below summarizes the impact of increase / decrease in the Pakistan Stock Exchange Limited
(PSX) Index on the Company’s equity (fair value reserve of FVTOCI investments). The analysis is based on the assumption that the equity index had increased / decreased by 5% with all other variables of FVTOCI instruments held constant and all the Company’s equity instruments moved according to the historical correlation with the index:
Index Impact on statement of other
comprehensive income (fair value reserve)
2020 2019 (Rupees in thousand) PSX 100 (5% increase) 661 391 PSX 100 (5% decrease) (661) (391) Equity (fair value reserve) would increase / decrease as a result of gains / losses on equity investments
classified as FVTOCI.
NOTES TO THE FINANCIAL STATEMENTSFor the year ended 30 September 2020
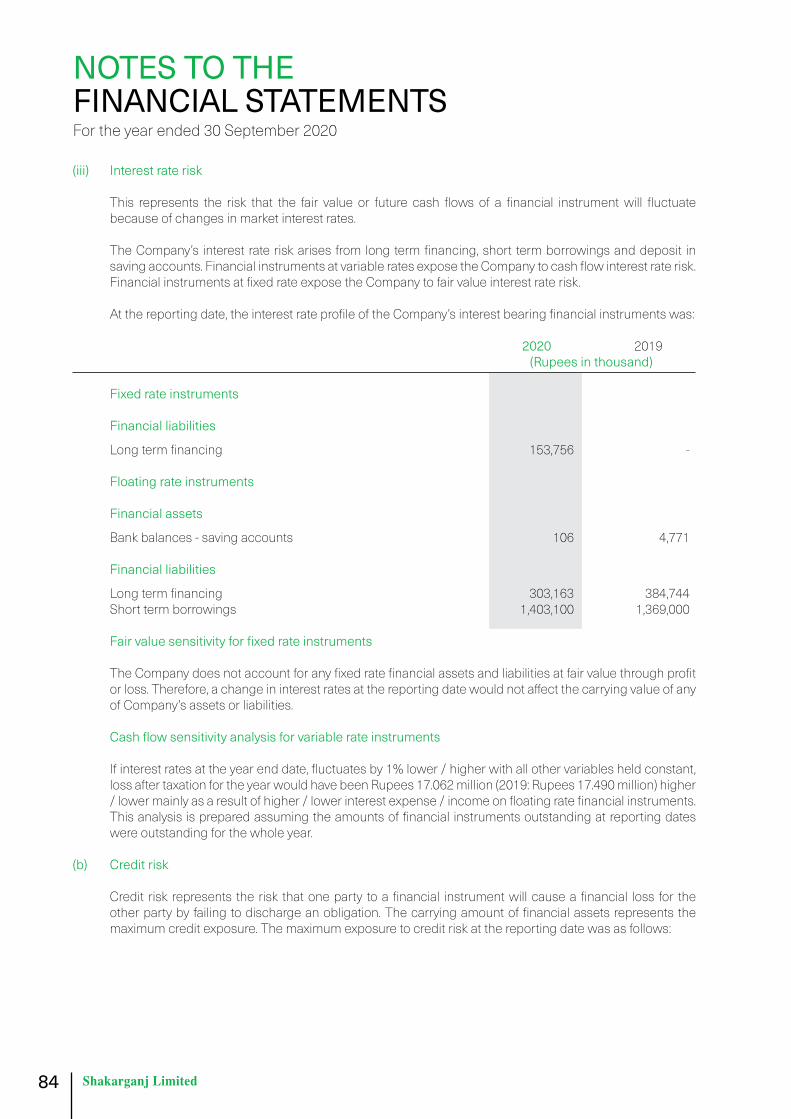
84
(iii) Interest rate risk This represents the risk that the fair value or future cash flows of a financial instrument will fluctuate
because of changes in market interest rates. The Company’s interest rate risk arises from long term financing, short term borrowings and deposit in
saving accounts. Financial instruments at variable rates expose the Company to cash flow interest rate risk. Financial instruments at fixed rate expose the Company to fair value interest rate risk.
At the reporting date, the interest rate profile of the Company’s interest bearing financial instruments was:
2020 2019 (Rupees in thousand)
Fixed rate instruments Financial liabilities
Long term financing 153,756 - Floating rate instruments Financial assets
Bank balances - saving accounts 106 4,771 Financial liabilities
Long term financing 303,163 384,744 Short term borrowings 1,403,100 1,369,000 Fairvaluesensitivityforfixedrateinstruments The Company does not account for any fixed rate financial assets and liabilities at fair value through profit
or loss. Therefore, a change in interest rates at the reporting date would not affect the carrying value of any of Company’s assets or liabilities.
Cashflowsensitivityanalysisforvariablerateinstruments If interest rates at the year end date, fluctuates by 1% lower / higher with all other variables held constant,
loss after taxation for the year would have been Rupees 17.062 million (2019: Rupees 17.490 million) higher / lower mainly as a result of higher / lower interest expense / income on floating rate financial instruments. This analysis is prepared assuming the amounts of financial instruments outstanding at reporting dates were outstanding for the whole year.
(b) Credit risk Credit risk represents the risk that one party to a financial instrument will cause a financial loss for the
other party by failing to discharge an obligation. The carrying amount of financial assets represents the maximum credit exposure. The maximum exposure to credit risk at the reporting date was as follows:
NOTES TO THE FINANCIAL STATEMENTSFor the year ended 30 September 2020

85
2020 2019 (Rupees in thousand) Investments 13,223 7,810 Trade debts 203,093 35,078 Loans and advances 18,338 9,747 Deposits 34,035 34,001 Prepayments and other receivables 2,749 11,427 Bank balances 7,657 82,311
279,095 180,374 The credit quality of financial assets that are neither past due nor impaired can be assessed by reference
to external credit ratings (if available) or to historical information about counterparty default rate:
The Company’s exposure to credit risk and allowance for expected credit losses related to trade debts is disclosed in Note 21.
The credit quality of Company’s bank balances can be assessed with reference to external credit ratings
as follows:
Rating Long Rating 2020 2019 Banks Short term term Agency (Rupees in thousand) Conventional accounts Allied Bank Limited A1+ AAA PACRA 519 20 Bank Alfalah Limited A1+ AA+ PACRA 1,152 379 Habib Bank Limited A-1+ AAA VIS 798 43,085 MCB Bank Limited A1+ AAA PACRA 1,190 5,166 National Bank of Pakistan A-1+ AAA VIS 319 31,363 Standard Chartered Bank (Pakistan) Limited A1+ AAA PACRA 29 30 Askari Bank Limited A1+ AA+ PACRA 1 12 The Bank of Punjab A1+ AA PACRA 3 46 United Bank Limited A-1+ AAA VIS - 424
4,011 80,525
Shariah compliant accounts Askari Bank Limited A1+ AA+ PACRA 12 202 BankIslami Pakistan Limited A1 A+ PACRA 87 1,358 Bank Alfalah Limited A1+ AA+ PACRA 14 13 Dubai Islamic Bank Pakistan Limited A-1+ AA VIS 152 152 Meezan Bank Limited A-1+ AA+ VIS 3,303 4 Habib Bank Limited A-1+ AAA VIS 7 48 AlBaraka Bank (Pakistan) Limited A-1 A+ VIS 71 9 3,646 1,786
7,657 82,311 Due to the Company’s long standing business relationships with these counterparties and after giving due
consideration to their strong financial standing, management does not expect non-performance by these counter parties on their obligations to the Company. Accordingly, the credit risk is minimal.
NOTES TO THE FINANCIAL STATEMENTSFor the year ended 30 September 2020
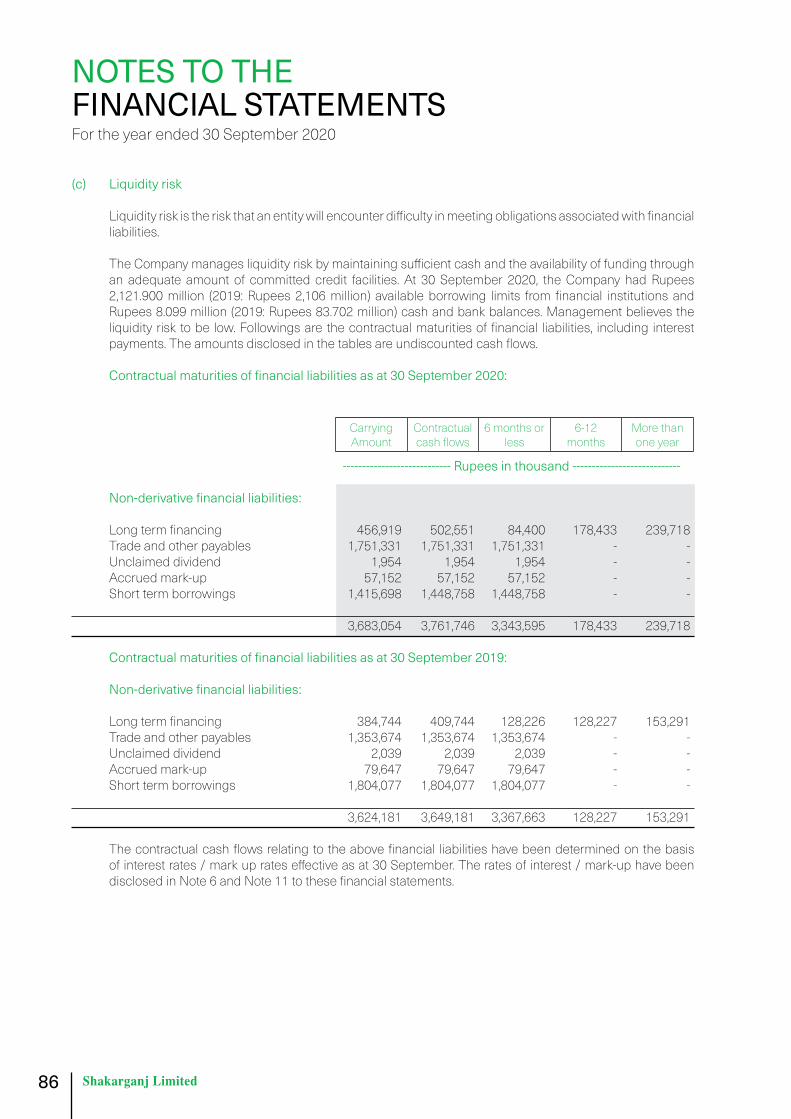
86
(c) Liquidity risk Liquidity risk is the risk that an entity will encounter difficulty in meeting obligations associated with financial
liabilities. The Company manages liquidity risk by maintaining sufficient cash and the availability of funding through
an adequate amount of committed credit facilities. At 30 September 2020, the Company had Rupees 2,121.900 million (2019: Rupees 2,106 million) available borrowing limits from financial institutions and Rupees 8.099 million (2019: Rupees 83.702 million) cash and bank balances. Management believes the liquidity risk to be low. Followings are the contractual maturities of financial liabilities, including interest payments. The amounts disclosed in the tables are undiscounted cash flows.
Contractualmaturitiesoffinancialliabilitiesasat30September2020:
Carrying Amount
Contractual cash flows
6 months or less
6-12 months
More than one year
---------------------------- Rupees in thousand ----------------------------
Non-derivativefinancialliabilities:
Long term financing 456,919 502,551 84,400 178,433 239,718 Trade and other payables 1,751,331 1,751,331 1,751,331 - - Unclaimed dividend 1,954 1,954 1,954 - - Accrued mark-up 57,152 57,152 57,152 - - Short term borrowings 1,415,698 1,448,758 1,448,758 - - 3,683,054 3,761,746 3,343,595 178,433 239,718 Contractualmaturitiesoffinancialliabilitiesasat30September2019:
Non-derivativefinancialliabilities: Long term financing 384,744 409,744 128,226 128,227 153,291 Trade and other payables 1,353,674 1,353,674 1,353,674 - - Unclaimed dividend 2,039 2,039 2,039 - - Accrued mark-up 79,647 79,647 79,647 - - Short term borrowings 1,804,077 1,804,077 1,804,077 - - 3,624,181 3,649,181 3,367,663 128,227 153,291 The contractual cash flows relating to the above financial liabilities have been determined on the basis
of interest rates / mark up rates effective as at 30 September. The rates of interest / mark-up have been disclosed in Note 6 and Note 11 to these financial statements.
NOTES TO THE FINANCIAL STATEMENTSFor the year ended 30 September 2020

87
41.2 Financial instruments by categories
2020 2019At
amortized cost
At FVTOCI Total
At amortized
costAt FVTOCI Total
---------------------------- Rupees in thousand ----------------------------
Assetsasperstatementoffinancialposition Investments - 13,223 13,223 - 7,810 7,810 Loans and advances 18,338 - 18,338 9,747 - 9,747 Deposits 34,035 - 34,035 34,001 - 34,001 Prepayments and other receivables 2,749 - 2,749 11,427 - 11,427 Trade debts 203,093 - 203,093 35,078 - 35,078 Cash and bank balances 8,099 - 8,099 83,702 - 83,702 266,314 13,223 279,537 173,955 7,810 181,765
At Amortized Cost 2020 2019 (Rupees in thousand) Liabilitiesasperstatementoffinancialposition Long term financing 456,919 384,744 Short term borrowings 1,415,698 1,804,077 Trade and other payables 1,751,331 1,353,674 Accrued mark-up 57,152 79,647 Unclaimed dividend 1,954 2,039
3,683,054 3,624,181
41.3 Offsettingfinancialassetsandfinancialliabilities As on reporting date, recognized financial instruments are not subject to offsetting as there are no
enforceable master netting arrangements and similar agreements.
41.4 Capital risk management The Company’s objectives when managing capital are to safeguard the Company’s ability to continue
as a going concern in order to provide returns for shareholders and benefits for other stakeholders and to maintain an optimal capital structure to reduce the cost of capital. In order to maintain or adjust the capital structure, the Company may adjust the amount of dividends to be paid to shareholders, issue new shares or sell assets to reduce debt. Consistent with others in the industry and the requirements of the lenders, the Company monitors the capital structure on the basis of gearing ratio. This ratio is calculated as borrowings divided by total capital employed. Borrowings represent long term financing and short term borrowings obtained by the Company as referred in Note 6 and 11 respectively. Total capital employed includes ‘total equity’ as shown in the statement of financial position plus ‘borrowings’.
NOTES TO THE FINANCIAL STATEMENTSFor the year ended 30 September 2020

88
2020 2019 Borrowings Rupees in thousand 1,881,062 2,188,821 Total equity Rupees in thousand 6,858,474 7,958,472
Total capital employed Rupees in thousand 8,739,536 10,147,293
Gearing ratio Percentage 21.52 21.57 Decrease in gearing ratio resulted primarily from decrease in borrowings of the Company.
42. RECOGNIZED FAIR VALUE MEASUREMENTS - FINANCIAL INSTRUMENTS
(i) Fair value hierarchy Judgements and estimates are made in determining the fair values of the financial instruments that are
recognized and measured at fair value in these financial statements. To provide an indication about the reliability of the inputs used in determining fair value, the Company has classified its financial instruments into following three levels. An explanation of each level follows underneath the table:
Recurring fair value measurements Level 1 Level 2 Level 3 Total
--------------Rupees in thousand--------------
Financial assets At 30 September 2020 At fair value through other comprehensive income 13,223 - - 13,223 At 30 September 2019 At fair value through other comprehensive income 7,810 - - 7,810 The above table does not include fair value information for financial assets and financial liabilities not
measured at fair value if the carrying amounts are a reasonable approximation of fair value. Due to the short term nature, carrying amounts of certain financial assets and financial liabilities are considered to be the same as their fair value. For the majority of the non-current receivables, the fair values are also not significantly different to their carrying amounts.
There were no transfers between levels 1 and 2 for recurring fair value measurements during the year.
Further there was no transfer out of level 3 measurements. The Company’s policy is to recognize transfers into and transfers out of fair value hierarchy levels as at the
end of the reporting period. The above table does not include fair value information for financial assets and financial liabilities not
measured at fair value if the carrying amounts are a reasonable approximation of fair value. Due to the short term nature, carrying amounts of certain financial assets and financial liabilities are considered to be the same as their fair value. For the majority of the non-current receivables, the fair values are also not significantly different to their carrying amounts.
There was no transfer between levels 1 and 2 for recurring fair value measurements during the year.
Further there was no transfer out of level 3 measurements.
NOTES TO THE FINANCIAL STATEMENTSFor the year ended 30 September 2020
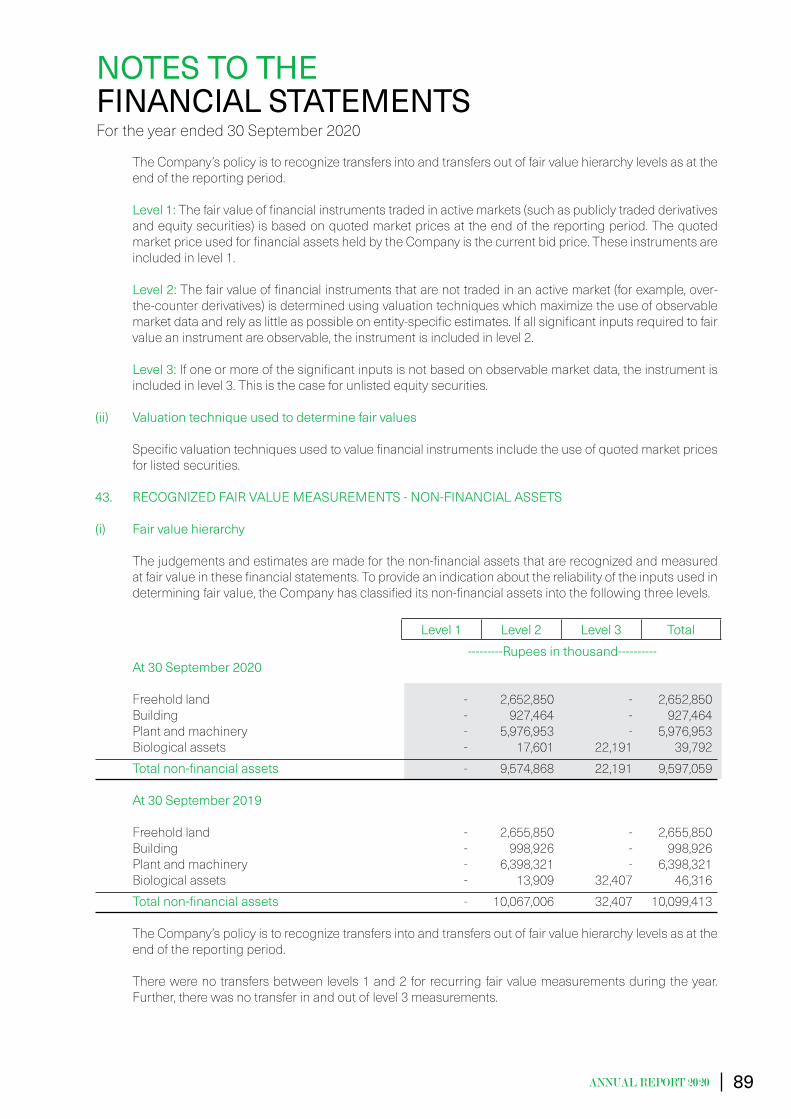
89
The Company’s policy is to recognize transfers into and transfers out of fair value hierarchy levels as at the end of the reporting period.
Level1:The fair value of financial instruments traded in active markets (such as publicly traded derivatives
and equity securities) is based on quoted market prices at the end of the reporting period. The quoted market price used for financial assets held by the Company is the current bid price. These instruments are included in level 1.
Level2: The fair value of financial instruments that are not traded in an active market (for example, over-
the-counter derivatives) is determined using valuation techniques which maximize the use of observable market data and rely as little as possible on entity-specific estimates. If all significant inputs required to fair value an instrument are observable, the instrument is included in level 2.
Level3:If one or more of the significant inputs is not based on observable market data, the instrument is included in level 3. This is the case for unlisted equity securities.
(ii) Valuation technique used to determine fair values Specific valuation techniques used to value financial instruments include the use of quoted market prices
for listed securities.
43. RECOGNIZED FAIR VALUE MEASUREMENTS - NON-FINANCIAL ASSETS
(i) Fair value hierarchy The judgements and estimates are made for the non-financial assets that are recognized and measured
at fair value in these financial statements. To provide an indication about the reliability of the inputs used in determining fair value, the Company has classified its non-financial assets into the following three levels.
Level 1 Level 2 Level 3 Total ---------Rupees in thousand----------
At 30 September 2020 Freehold land - 2,652,850 - 2,652,850 Building - 927,464 - 927,464 Plant and machinery - 5,976,953 - 5,976,953 Biological assets - 17,601 22,191 39,792 Totalnon-financialassets - 9,574,868 22,191 9,597,059 At 30 September 2019 Freehold land - 2,655,850 - 2,655,850 Building - 998,926 - 998,926 Plant and machinery - 6,398,321 - 6,398,321 Biological assets - 13,909 32,407 46,316 Totalnon-financialassets - 10,067,006 32,407 10,099,413 The Company’s policy is to recognize transfers into and transfers out of fair value hierarchy levels as at the
end of the reporting period. There were no transfers between levels 1 and 2 for recurring fair value measurements during the year.
Further, there was no transfer in and out of level 3 measurements.
NOTES TO THE FINANCIAL STATEMENTSFor the year ended 30 September 2020
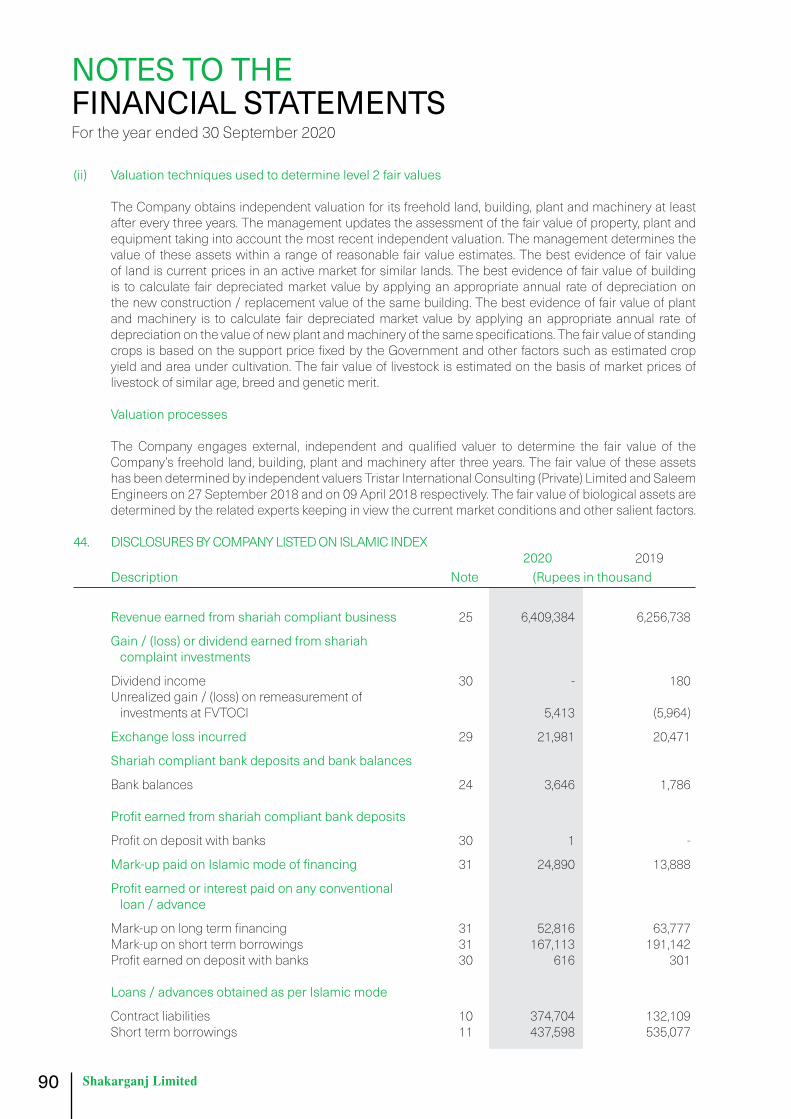
90
(ii) Valuation techniques used to determine level 2 fair values The Company obtains independent valuation for its freehold land, building, plant and machinery at least
after every three years. The management updates the assessment of the fair value of property, plant and equipment taking into account the most recent independent valuation. The management determines the value of these assets within a range of reasonable fair value estimates. The best evidence of fair value of land is current prices in an active market for similar lands. The best evidence of fair value of building is to calculate fair depreciated market value by applying an appropriate annual rate of depreciation on the new construction / replacement value of the same building. The best evidence of fair value of plant and machinery is to calculate fair depreciated market value by applying an appropriate annual rate of depreciation on the value of new plant and machinery of the same specifications. The fair value of standing crops is based on the support price fixed by the Government and other factors such as estimated crop yield and area under cultivation. The fair value of livestock is estimated on the basis of market prices of livestock of similar age, breed and genetic merit.
Valuation processes The Company engages external, independent and qualified valuer to determine the fair value of the
Company’s freehold land, building, plant and machinery after three years. The fair value of these assets has been determined by independent valuers Tristar International Consulting (Private) Limited and Saleem Engineers on 27 September 2018 and on 09 April 2018 respectively. The fair value of biological assets are determined by the related experts keeping in view the current market conditions and other salient factors.
44. DISCLOSURES BY COMPANY LISTED ON ISLAMIC INDEX 2020 2019 Description Note (Rupees in thousand
Revenue earned from shariah compliant business 25 6,409,384 6,256,738
Gain / (loss) or dividend earned from shariah complaint investments
Dividend income 30 - 180 Unrealized gain / (loss) on remeasurement of investments at FVTOCI 5,413 (5,964) Exchange loss incurred 29 21,981 20,471 Shariah compliant bank deposits and bank balances Bank balances 24 3,646 1,786 Profitearnedfromshariahcompliantbankdeposits Profit on deposit with banks 30 1 - Mark-uppaidonIslamicmodeoffinancing 31 24,890 13,888 Profitearnedorinterestpaidonanyconventional loan / advance Mark-up on long term financing 31 52,816 63,777 Mark-up on short term borrowings 31 167,113 191,142 Profit earned on deposit with banks 30 616 301 Loans / advances obtained as per Islamic mode Contract liabilities 10 374,704 132,109 Short term borrowings 11 437,598 535,077
NOTES TO THE FINANCIAL STATEMENTSFor the year ended 30 September 2020
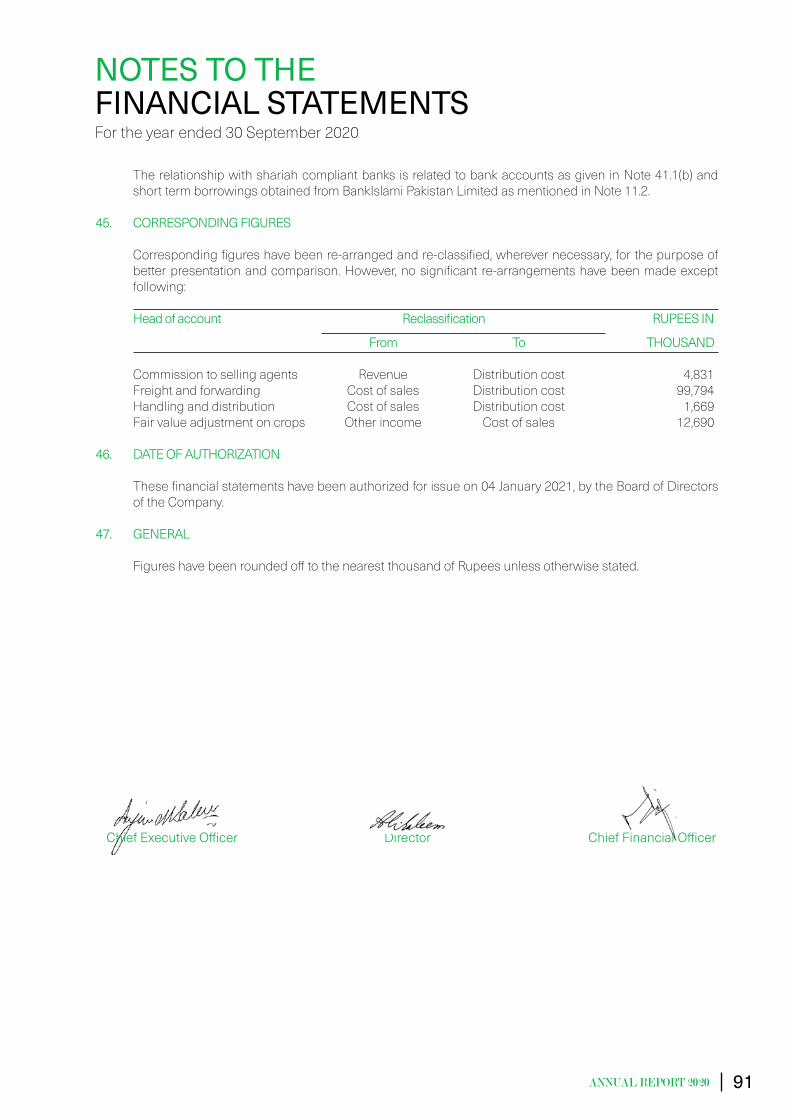
91
The relationship with shariah compliant banks is related to bank accounts as given in Note 41.1(b) and short term borrowings obtained from BankIslami Pakistan Limited as mentioned in Note 11.2.
45. CORRESPONDING FIGURES Corresponding figures have been re-arranged and re-classified, wherever necessary, for the purpose of
better presentation and comparison. However, no significant re-arrangements have been made except following:
Headofaccount Reclassification RUPEESIN
From To THOUSAND Commission to selling agents Revenue Distribution cost 4,831 Freight and forwarding Cost of sales Distribution cost 99,794 Handling and distribution Cost of sales Distribution cost 1,669 Fair value adjustment on crops Other income Cost of sales 12,690 46. DATE OF AUTHORIZATION These financial statements have been authorized for issue on 04 January 2021, by the Board of Directors
of the Company. 47. GENERAL Figures have been rounded off to the nearest thousand of Rupees unless otherwise stated.
ChiefExecutiveOfficer Director ChiefFinancialOfficer
NOTES TO THE FINANCIAL STATEMENTSFor the year ended 30 September 2020

92
93
FINANCIAL STATEMENTS (CONSOLIDATED)
for the year ended 30 September 2020

94 Shakarganj Limited and Its Subsidiary

95
The directors of Shakarganj Limited have pleasure in presenting their report together with the audited consolidated financial statements of the Group for the year ended 30 September 2020. The Group comprises of Shakarganj Limited and its partially owned subsidiary namely Shakarganj Food Products Limited.
The comments on performance of Shakarganj Limited for the year ended 30 September 2020 has been presented separately in directors’ report.
Group Financial Results
The financial results of the Group are summarised below:
2020 2019 (Rupees in thousand)
Sales – net 21,424,125 22,529,561Gross profit 559,321 2,044,268Loss from operations (905,129) (256,770)Loss before taxation (1,660,149) (769,673)Taxation 399,702 (47,576)Loss for the year (1,260,447) (817,249)Loss per share - basic and diluted (Rupees) (6.71) (6.94)
Pattern of Shareholding and Shares Traded
The pattern of shareholding and additional information thereof is attached with this report. No trade in the shares of the Company was reported / carried out by the directors, executives and their spouses and minor children.
Subsequent Events and Commitments
No material changes and commitments affecting the financial position of the Company have occurred between the end of the financial year to which this balance sheet relates and the date of the directors’ report.
Acknowledgment
The Directors wish to express their appreciation to the staff & workers of the Company for their dedication and devotion to the Company. The Directors feel pleasure in expressing appreciation for the continued interest and support of the shareholders, bankers and all other parties involved and hope that the same spirit will prevail in the future as well.
By Order of the Board
Anjum Muhammad Saleem Ali Altaf SaleemChief Executive Officer Director
04 January 2021
CONSOLIDATED DIRECTORS’ REPORT

96 Shakarganj Limited and Its Subsidiary
To the members of Shakarganj Limited Report on the Audit of the Consolidated Financial Statements Opinion
We have audited the annexed consolidated financial statements of Shakarganj Limited and its Subsidiary Company (the Group), which comprise the consolidated statement of financial position as at 30 September 2020, and the consolidated statement of profit or loss, the consolidated statement of comprehensive income, the consolidated statement of changes in equity, the consolidated statement of cash flows for the year then ended, and notes to the consolidated financial statements, including a summary of significant accounting policies and other explanatory information.
In our opinion, the consolidated financial statements give a true and fair view of the consolidated financial position of the Group as at 30 September 2020, and its consolidated financial performance and its consolidated cash flows for the year then ended in accordance with the accounting and reporting standards as applicable in Pakistan.
Basis for Opinion
We conducted our audit in accordance with International Standards on Auditing (ISAs) as applicable in Pakistan. Our responsibilities under those standards are further described in the Auditor’s Responsibilities for the Audit of the Consolidated Financial Statements section of our report. We are independent of the Group in accordance with the International Ethics Standards Board for Accountants’ Code of Ethics for Professional Accountants as adopted by the Institute of Chartered Accountants of Pakistan (the Code) and we have fulfilled our other ethical responsibilities in accordance with the Code. We believe that the audit evidence we have obtained is sufficient and appropriate to provide a basis for our opinion.
Other Matter
The figures of the consolidated statement of financial position, the consolidated statement of profit or loss, the consolidated statement of comprehensive income, the consolidated statement of changes in equity, the consolidated statement of cash flows and notes relating thereto for the year ended 30 September 2019 are un-audited.
Key Audit Matters
Key audit matters are those matters that, in our professional judgment, were of most significance in our audit of the consolidated financial statements of the current period. These matters were addressed in the context of our audit of the consolidated financial statements as a whole, and in forming our opinion thereon, and we do not provide a separate opinion on these matters.
INDEPENDENT AUDITOR’S REPORT
560-F, Raja Road, Gulistan ColonyFaisalabad - 38000, PakistanT: +92(41) 886 10 42, 886 36 44F: +92 (41) 886 36 [email protected]

97
Following are the Key audit matters.
S.No. Key audit matters How the matters were addressed in our audit1. Inventory existence and valuation
We identified existence and valuation of inventories of the sugar, biofuel, textile and farms segments of the Group as at 30 September 2020 as a key audit matter due to the judgment involved in valuation.
Inventories are stated at lower of cost and net realizable value.
For further information on inventories refer to following:
- Summary of significant accounting policies, Inventories (Note 2.11 to the consolidated financial statements).
- Stores, spare parts and loose tools (Note 21) and Stock-in-trade (Note 22) to the consolidated financial statements.
Our procedures over existence and valuation of inventory included, but were not limited to:
• To test the quantity of inventories at all locations, we assessed the corresponding inventory observation instructions and participated in inventory counts on sites. Based on samples, we performed test counts and compared the quantities counted by us with the results of the counts of the management.
• For a sample of inventory items, re-performed the weighted average cost calculation and compared the weighted average cost appearing on valuation sheets.
• On a sample basis, we tested the net realizable value of inventory items to recent selling prices and re-performed the calculation of the inventory write down, if any.
• In the context of our testing of the calculation, we analyzed individual cost components and traced them back to the corresponding underlying documents.
• We also made inquiries from management, including those outside of the finance function, and considered the results of our testing above to determine whether any specific write downs were required.
• We also assessed the adequacy of the disclosures made in respect of the accounting policies and related notes to the financial statements.
2. Revenue recognition
We identified recognition of revenue of sugar, biofuel, textile and farms segments of the Group as a key audit matter because revenue is one of the key performance indicator of the Group and gives rise to an inherent risk that revenue could be subject to misstatement to meet expectations or targets.
For further information, refer to the following:
Our procedures included, but were not limited to:
• We obtained an understanding of the process relating to recognition of revenue and testing the design, implementation and operating effectiveness of key internal controls over recording of revenue;
• We compared a sample of revenue transactions
recorded during the year with sales orders, sales invoices, delivery documents and other relevant underlying documents;
• We compared a sample of revenue transactions recorded around the year-end with the sales orders, sales invoices, delivery documents and other relevant underlying documentation to assess if the related revenue was recorded in the appropriate accounting period;

98 Shakarganj Limited and Its Subsidiary
S.No. Key audit matters How the matters were addressed in our audit- Summary of significant accounting
policies, Revenue from contracts with customers (Note 2.3 to the consolidated financial statements).
- Revenue (Note 27 to the consolidated financial statements).
• We assessed whether the accounting policies for revenue recognition complies with the requirements of IFRS 15 ‘Revenue from Contracts with Customers’;
• We compared the detail of a sample of journal entries posted to revenue accounts during the year, which met certain specific risk-based criteria, with the relevant underlying documentation;
• We also considered the appropriateness of disclosures in the consolidated financial statements.
Information Other than the Financial Statements and Auditor’s Report Thereon
Management is responsible for the other information. The other information comprises the information included in the annual report, but does not include the consolidated financial statements and our auditor’s report thereon.
Our opinion on the consolidated financial statements does not cover the other information and we do not express any form of assurance conclusion thereon.
In connection with our audit of the consolidated financial statements, our responsibility is to read the other information and, in doing so, consider whether the other information is materially inconsistent with the consolidated financial statements or our knowledge obtained in the audit or otherwise appears to be materially misstated. If, based on the work we have performed, we conclude that there is a material misstatement of this other information, we are required to report that fact. We have nothing to report in this regard.
Responsibilities of Management and Board of Directors for the Consolidated Financial Statements
Management is responsible for the preparation and fair presentation of the consolidated financial statements in accordance with the accounting and reporting standards as applicable in Pakistan and Companies Act, 2017 and for such internal control as management determines is necessary to enable the preparation of consolidated financial statements that are free from material misstatement, whether due to fraud or error.
In preparing the consolidated financial statements, management is responsible for assessing the Group’s ability to continue as a going concern, disclosing, as applicable, matters related to going concern and using the going concern basis of accounting unless management either intends to liquidate the Group or to cease operations, or has no realistic alternative but to do so.
The Board of directors is responsible for overseeing the Group’s financial reporting process.
Auditor’s Responsibilities for the Audit of the Consolidated Financial Statements
Our objectives are to obtain reasonable assurance about whether the consolidated financial statements as a whole are free from material misstatement, whether due to fraud or error, and to issue an auditor’s report that includes our opinion. Reasonable assurance is a high level of assurance, but is not a guarantee that an audit conducted in accordance with ISAs as applicable in Pakistan will always detect a material misstatement when it exists. Misstatements can arise from fraud or error and are considered material if, individually or in the aggregate, they could reasonably be expected to influence the economic decisions of users taken on the basis of these consolidated financial statements.
As part of an audit in accordance with ISAs as applicable in Pakistan, we exercise professional judgment and maintain professional skepticism throughout the audit. We also:
99
• Identify and assess the risks of material misstatement of the consolidated financial statements, whether due to fraud or error, design and perform audit procedures responsive to those risks, and obtain audit evidence that is sufficient and appropriate to provide a basis for our opinion. The risk of not detecting a material misstatement resulting from fraud is higher than for one resulting from error, as fraud may involve collusion, forgery, intentional omissions, misrepresentations, or the override of internal control.
• Obtain an understanding of internal control relevant to the audit in order to design audit procedures that are appropriate in the circumstances, but not for the purpose of expressing an opinion on the effectiveness of the Group’s internal control.
• Evaluate the appropriateness of accounting policies used and the reasonableness of accounting estimates and related disclosures made by management.
• Conclude on the appropriateness of management’s use of the going concern basis of accounting and, based on the audit evidence obtained, whether a material uncertainty exists related to events or conditions that may cast significant doubt on the Group’s ability to continue as a going concern. If we conclude that a material uncertainty exists, we are required to draw attention in our auditor’s report to the related disclosures in the consolidated financial statements or, if such disclosures are inadequate, to modify our opinion. Our conclusions are based on the audit evidence obtained up to the date of our auditor’s report. However, future events or conditions may cause the Group to cease to continue as a going concern.
• Evaluate the overall presentation, structure and content of the consolidated financial statements, including the disclosures, and whether the consolidated financial statements represent the underlying transactions and events in a manner that achieves fair presentation.
• Obtain sufficient appropriate audit evidence regarding the financial information of the entities or business activities within the Group to express an opinion on the consolidated financial statements. We are responsible for the direction, supervision and performance of the group audit. We remain solely responsible for our audit opinion.
We communicate with the Board of Directors regarding, among other matters, the planned scope and timing of the audit and significant audit findings, including any significant deficiencies in internal control that we identify during our audit.
We also provide the Board of Directors with a statement that we have complied with relevant ethical requirements regarding independence, and to communicate with them all relationships and other matters that may reasonably be thought to bear on our independence, and where applicable, related safeguards.
From the matters communicated with the Board of Directors, we determine those matters that were of most significance in the audit of the consolidated financial statements of the current period and are therefore the key audit matters. We describe these matters in our auditor’s report unless law or regulation precludes public disclosure about the matter or when, in extremely rare circumstances, we determine that a matter should not be communicated in our report because the adverse consequences of doing so would reasonably be expected to outweigh the public interest benefits of such communication.
The engagement partner on the audit resulting in this independent auditor’s report is Liaqat Ali Panwar.
Faisalabad Riaz Ahmad & Co.04 January 2021 Chartered Accountants

100 Shakarganj Limited and Its Subsidiary
ChiefExecutiveOfficer
2020 2019 Note (Rupees in thousand) EQUITY AND LIABILITIES Share capital and reserves Authorized share capital 150 000 000 (2019: 150 000 000) ordinary shares of Rs. 10 each 1,500,000 1,500,000 50 000 000 (2019: 50 000 000) preference shares of Rs. 10 each 500,000 500,000
2,000,000 2,000,000 Issued, subscribed and paid up share capital 3 1,250,000 1,250,000 Capital reserves Surplus on revaluation of property, plant and equipment - net of deferred income tax 4 6,600,793 6,894,890 Other capital reserves 4 1,276,928 1,271,515 Revenue reserves 5 516,306 516,306 Accumulated loss (2,695,569) (2,043,010)
Equity attributable to equity holders of the Holding Company 6,948,458 7,889,701 Non-controlling interest 1,449,037 1,864,903
Total equity 8,397,495 9,754,604 LIABILITIES NON-CURRENT LIABILITIES
Long term financing 6 1,067,406 859,853 Long term deposits 7,000 7,000 Liabilities against assets subject to finance lease 7 - 714,538 Lease liabilities 8 639,181 - Deferred liabilities 9 1,120,162 1,404,430
2,833,749 2,985,821 CURRENT LIABILITIES
Trade and other payables 10 7,306,744 6,250,335 Short term borrowings 11 1,764,892 2,103,271 Accrued mark-up 12 96,846 119,385 Current portion of non-current liabilities 13 448,392 802,248 Unclaimed dividend 1,954 2,039
9,618,828 9,277,278
TOTAL LIABILITIES 12,452,577 12,263,099 CONTINGENCIES AND COMMITMENTS 14
TOTAL EQUITY AND LIABILITIES 20,850,072 22,017,703 The annexed notes form an integral part of these consolidated financial statements.
CONSOLIDATED STATEMENT OF FINANCIAL POSITIONAs at 30 September 2020
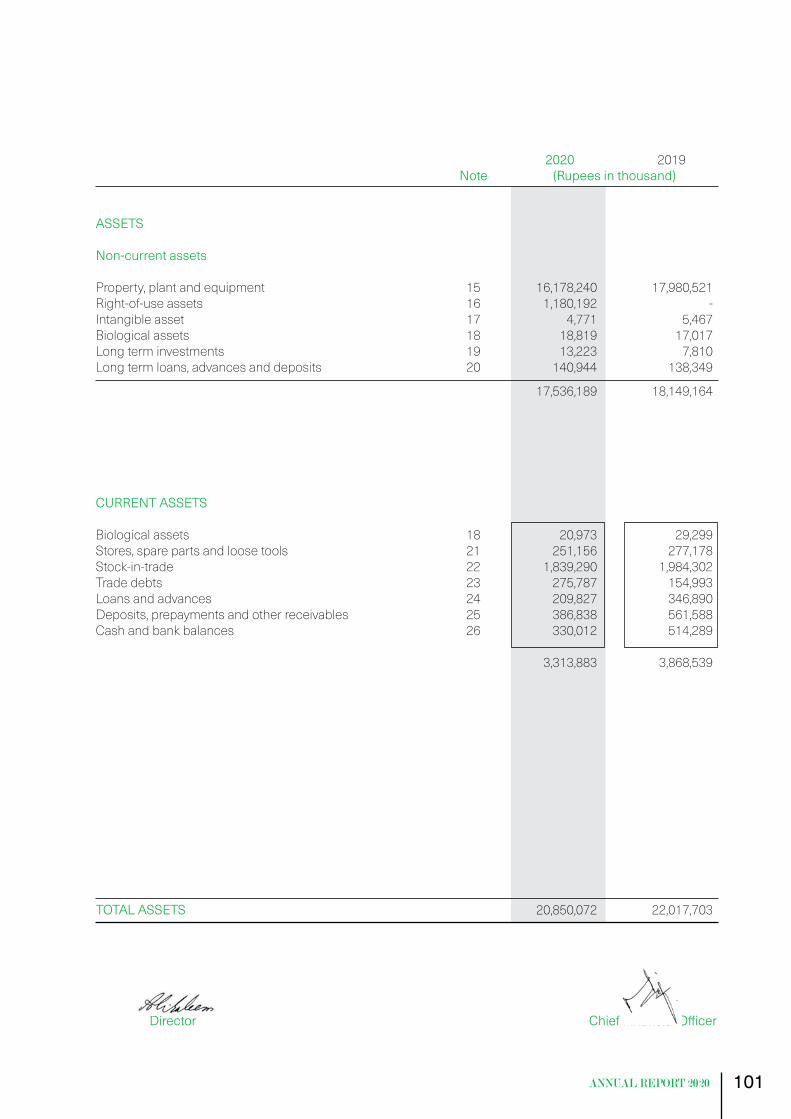
101
Director ChiefFinancialOfficer
2020 2019 Note (Rupees in thousand) ASSETS Non-current assets Property, plant and equipment 15 16,178,240 17,980,521 Right-of-use assets 16 1,180,192 - Intangible asset 17 4,771 5,467 Biological assets 18 18,819 17,017 Long term investments 19 13,223 7,810 Long term loans, advances and deposits 20 140,944 138,349
17,536,189 18,149,164
CURRENT ASSETS Biological assets 18 20,973 29,299 Stores, spare parts and loose tools 21 251,156 277,178 Stock-in-trade 22 1,839,290 1,984,302 Trade debts 23 275,787 154,993 Loans and advances 24 209,827 346,890 Deposits, prepayments and other receivables 25 386,838 561,588 Cash and bank balances 26 330,012 514,289 3,313,883 3,868,539
TOTAL ASSETS 20,850,072 22,017,703
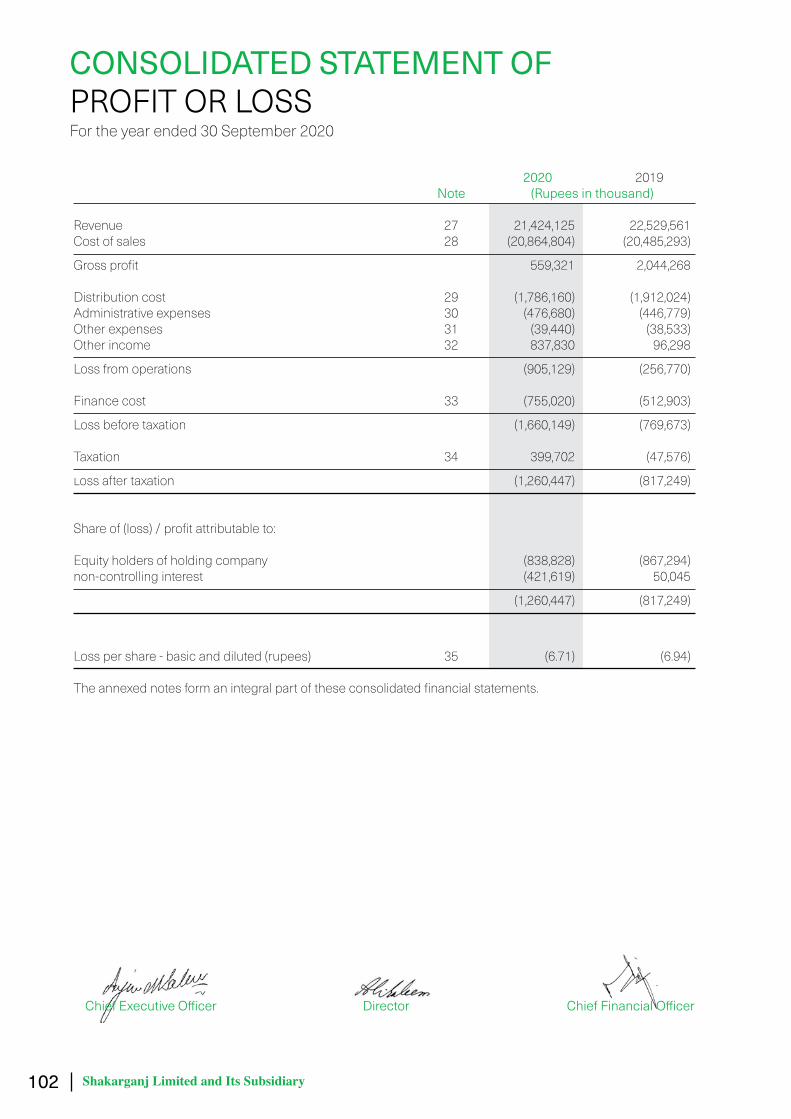
102 Shakarganj Limited and Its Subsidiary
2020 2019 Note (Rupees in thousand) Revenue 27 21,424,125 22,529,561 Cost of sales 28 (20,864,804) (20,485,293)
Gross profit 559,321 2,044,268 Distribution cost 29 (1,786,160) (1,912,024)Administrative expenses 30 (476,680) (446,779)Other expenses 31 (39,440) (38,533)Other income 32 837,830 96,298
Loss from operations (905,129) (256,770) Finance cost 33 (755,020) (512,903)
Loss before taxation (1,660,149) (769,673) Taxation 34 399,702 (47,576)
Loss after taxation (1,260,447) (817,249)
Share of (loss) / profit attributable to: Equity holders of holding company (838,828) (867,294)non-controlling interest (421,619) 50,045
(1,260,447) (817,249)
Loss per share - basic and diluted (rupees) 35 (6.71) (6.94)
The annexed notes form an integral part of these consolidated financial statements.
ChiefExecutiveOfficer Director ChiefFinancialOfficer
CONSOLIDATED STATEMENT OF PROFIT OR LOSSFor the year ended 30 September 2020

103
2020 2019 (Rupees in thousand)
LOSS AFTER TAXATION (1,260,447) (817,249) OTHER COMPREHENSIVE (LOSS) / INCOME Itemsthatwillnotbereclassifiedsubsequentlytoprofitorloss: Remeasurement of retirement benefits (195,436) 10,198 Related deferred income tax liability 44,964 (5,733)
(150,472) 4,465 Surplus on revaluation of property, plant and equipment - 1,415,783 Related deferred income tax liability - (388,812)
- 1,026,971 Surplus / (deficit) arising on remeasurement of investments at fair value through other comprehensive income 5,413 (5,964)
(145,059) 1,025,472 Items that may be reclassified subsequently to statement of profit or loss - - Other comprehensive (loss) / income for the year - net of deferred income tax (145,059) 1,025,472
TOTAL COMPREHENSIVE (LOSS) / INCOME FOR THE YEAR (1,405,506) 208,223 SHARE OF TOTAL COMPREHENSIVE (LOSS) / INCOMEATTRIBUTABLETO: EQUITY HOLDERS OF HOLDING COMPANY (989,640) (322,669) NON-CONTROLLING INTEREST (415,866) 530,892
(1,405,506) 208,223 The annexed notes form an integral part of these consolidated financial statements.
ChiefExecutiveOfficer Director ChiefFinancialOfficer
CONSOLIDATED STATEMENT OF COMPREHENSIVE INCOMEFor the year ended 30 September 2020
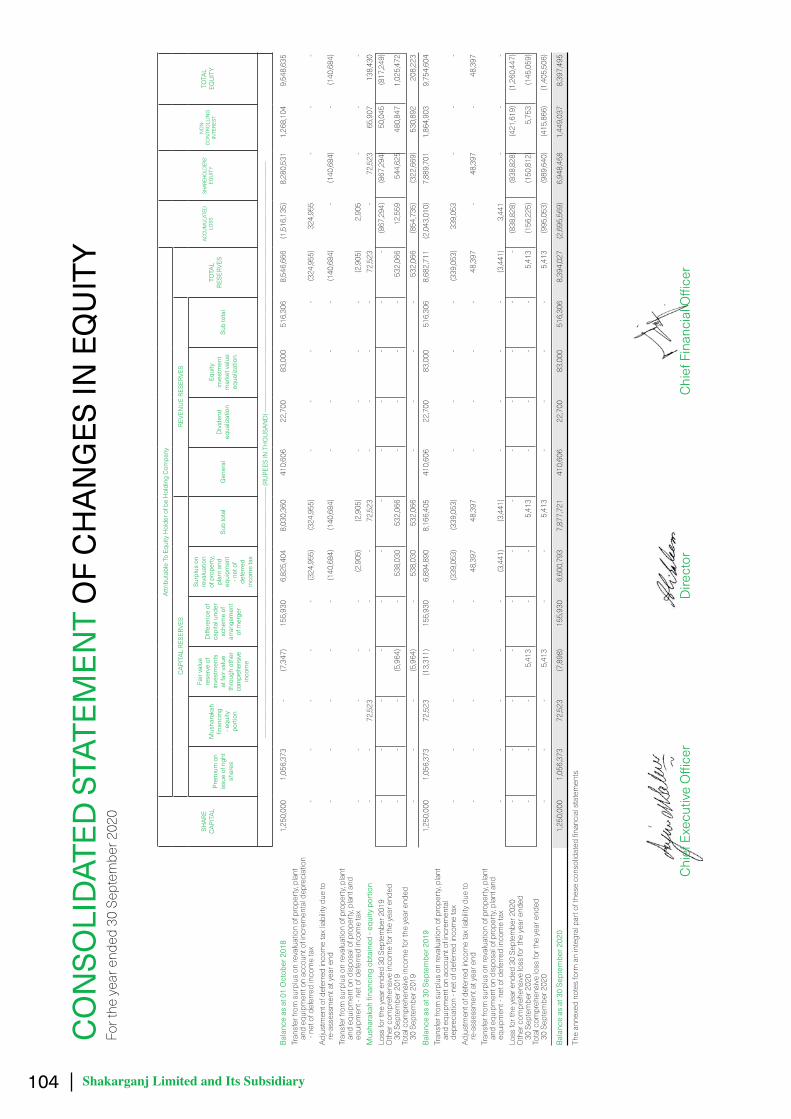
104 Shakarganj Limited and Its Subsidiary
CON
SOLI
DAT
ED S
TATE
MEN
T O
F C
HAN
GES
IN E
QU
ITY
For t
he y
ear e
nded
30
Sept
embe
r 202
0
SHAR
E CA
PITA
L
Attri
buta
ble
To E
quity
Hol
der o
f be
Hol
ding
Com
pany
ACCU
MUL
ATED
LO
SSSH
AREH
OLDE
RS’
EQU
ITY
NO
N-
CO
NTR
OLL
ING
IN
TERE
ST
TOTA
L EQ
UIT
Y
CAP
ITAL
RES
ERVE
S R
EVEN
UE
RESE
RVES
TOTA
L RE
SERV
ESPr
emiu
m o
n is
sue
of ri
ght
shar
es
Mus
hara
kah
financing
- equ
ity
porti
on
Fair
valu
e re
serv
e of
in
vest
men
ts
at fa
ir va
lue
thro
ugh
othe
r co
mpr
ehen
sive
inco
me
Differenceof
capi
tal u
nder
sc
hem
e of
ar
rang
emen
t of
mer
ger
Surp
lus
on
reva
luat
ion
of p
rope
rty,
plan
t and
eq
uipm
ent
- net
of
defe
rred
inco
me
tax
Sub
tota
lG
ener
alD
ivide
nd
equa
lizat
ion
Equi
ty
inve
stm
ent
mar
ket v
alue
eq
ualiz
atio
n
Sub
tota
l
------
------
------
------
------
------
------
------
------
------
------
------
------
------
------
------
------
------
------
------
------
------
-- (R
UPE
ES IN
TH
OU
SAN
D) -
------
------
------
------
------
------
------
------
------
------
------
------
------
------
------
------
------
------
------
------
------
------
- Ba
lanc
e as
at 0
1 O
ctob
er 2
018
1,2
50,0
00
1,0
56,3
73
-
(7,3
47)
155
,930
6
,825
,404
8
,030
,360
4
10,6
06
22,
700
8
3,00
0
516
,306
8
,546
,666
(1
,516
,135
) 8
,280
,531
1
,268
,104
9
,548
,635
Tr
ansf
er fr
om s
urpl
us o
n re
valu
atio
n of
pro
perty
, pla
nt
an
d eq
uipm
ent o
n ac
coun
t of i
ncre
men
tal d
epre
ciat
ion
-
net o
f def
erre
d in
com
e ta
x -
-
-
-
-
(3
24,9
55)
(324
,955
) -
-
-
-
(3
24,9
55)
324
,955
-
-
-
Adju
stm
ent o
f def
erre
d in
com
e ta
x lia
bilit
y du
e to
re-a
sses
smen
t at y
ear e
nd
-
-
-
-
-
(140
,684
) (1
40,6
84)
-
-
-
-
(140
,684
) -
(1
40,6
84)
-
(140
,684
)
Tr
ansf
er fr
om s
urpl
us o
n re
valu
atio
n of
pro
perty
, pla
nt
an
d eq
uipm
ent o
n di
spos
al o
f pro
perty
, pla
nt a
nd
eq
uipm
ent -
net
of d
efer
red
inco
me
tax
-
-
-
-
-
(2,9
05)
(2,9
05)
-
-
-
-
(2,9
05)
2,9
05
-
-
-
Musharakahfinancingobtained-equityportion
-
-
72,
523
-
-
-
7
2,52
3
-
-
-
-
72,
523
-
7
2,52
3
65,
907
1
38,4
30
Loss
for t
he y
ear e
nded
30
Sept
embe
r 201
9 -
-
-
-
-
-
-
-
-
-
-
-
(8
67,2
94)
(867
,294
) 5
0,04
5
(817
,249
)O
ther
com
preh
ensi
ve in
com
e fo
r the
yea
r end
ed
30
Sep
tem
ber 2
019
-
-
-
(5,9
64)
-
538
,030
5
32,0
66
-
-
-
-
532
,066
1
2,55
9
544
,625
4
80,8
47
1,0
25,4
72
Tota
l com
preh
ensi
ve in
com
e fo
r the
yea
r end
ed
30
Sep
tem
ber 2
019
-
-
-
(5,9
64)
-
538
,030
5
32,0
66
-
-
-
-
532
,066
(8
54,7
35)
(322
,669
) 5
30,8
92
208
,223
Ba
lanc
e as
at 3
0 Se
ptem
ber 2
019
1,2
50,0
00
1,0
56,3
73
72,
523
(1
3,31
1)
155
,930
6
,894
,890
8
,166
,405
4
10,6
06
22,
700
8
3,00
0
516
,306
8
,682
,711
(2
,043
,010
) 7
,889
,701
1
,864
,903
9
,754
,604
Tr
ansf
er fr
om s
urpl
us o
n re
valu
atio
n of
pro
perty
, pla
nt
an
d eq
uipm
ent o
n ac
coun
t of i
ncre
men
tal
de
prec
iatio
n - n
et o
f def
erre
d in
com
e ta
x -
-
-
-
-
(3
39,0
53)
(339
,053
) -
-
-
-
(3
39,0
53)
339
,053
-
-
-
Adju
stm
ent o
f def
erre
d in
com
e ta
x lia
bilit
y du
e to
re-a
sses
smen
t at y
ear e
nd
-
-
-
-
-
48,
397
4
8,39
7
-
-
-
-
48,
397
-
4
8,39
7
-
48,
397
Tran
sfer
from
sur
plus
on
reva
luat
ion
of p
rope
rty, p
lant
and
equi
pmen
t on
disp
osal
of p
rope
rty, p
lant
and
equi
pmen
t - n
et o
f def
erre
d in
com
e ta
x -
-
-
-
-
(3
,441
) (3
,441
) -
-
-
-
(3
,441
) 3
,441
-
-
-
Loss
for t
he y
ear e
nded
30
Sept
embe
r 202
0 -
-
-
-
-
-
-
-
-
-
-
-
(8
38,8
28)
(838
,828
) (4
21,6
19)
(1,2
60,4
47)
Oth
er c
ompr
ehen
sive
loss
for t
he y
ear e
nded
30 S
epte
mbe
r 202
0 -
-
-
5
,413
-
-
5
,413
-
-
-
-
5
,413
(1
56,2
25)
(150
,812
) 5
,753
(1
45,0
59)
Tota
l com
preh
ensi
ve lo
ss fo
r the
yea
r end
ed
30
Sep
tem
ber 2
020
-
-
-
5,4
13
-
-
5,4
13
-
-
-
-
5,4
13
(995
,053
) (9
89,6
40)
(415
,866
) (1
,405
,506
)
Ba
lanc
e as
at 3
0 Se
ptem
ber 2
020
1,2
50,0
00
1,0
56,3
73
72,
523
(7
,898
) 1
55,9
30
6,6
00,7
93
7,8
77,7
21
410
,606
2
2,70
0
83,
000
5
16,3
06
8,3
94,0
27
(2,6
95,5
69)
6,9
48,4
58
1,4
49,0
37
8,3
97,4
95
The
anne
xed
note
s fo
rm a
n in
tegr
al p
art o
f the
se c
onso
lidat
ed fi
nanc
ial s
tate
men
ts.
ChiefExecutiveOfficer
Director
ChiefFinancialOfficer
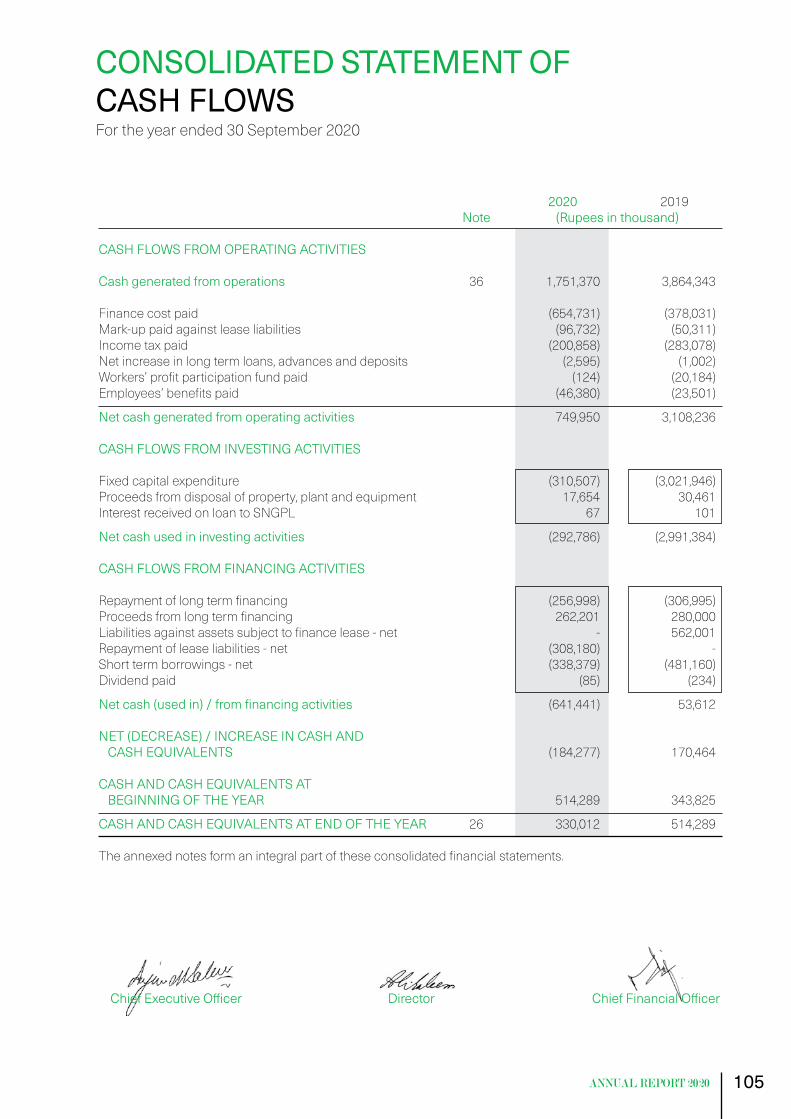
105
2020 2019 Note (Rupees in thousand) CASH FLOWS FROM OPERATING ACTIVITIES Cash generated from operations 36 1,751,370 3,864,343 Finance cost paid (654,731) (378,031)Mark-up paid against lease liabilities (96,732) (50,311)Income tax paid (200,858) (283,078)Net increase in long term loans, advances and deposits (2,595) (1,002)Workers’ profit participation fund paid (124) (20,184)Employees’ benefits paid (46,380) (23,501)
Net cash generated from operating activities 749,950 3,108,236 CASH FLOWS FROM INVESTING ACTIVITIES Fixed capital expenditure (310,507) (3,021,946)Proceeds from disposal of property, plant and equipment 17,654 30,461 Interest received on loan to SNGPL 67 101
Net cash used in investing activities (292,786) (2,991,384) CASH FLOWS FROM FINANCING ACTIVITIES Repayment of long term financing (256,998) (306,995)Proceeds from long term financing 262,201 280,000 Liabilities against assets subject to finance lease - net - 562,001 Repayment of lease liabilities - net (308,180) - Short term borrowings - net (338,379) (481,160)Dividend paid (85) (234)
Netcash(usedin)/fromfinancingactivities (641,441) 53,612 NET (DECREASE) / INCREASE IN CASH AND CASH EQUIVALENTS (184,277) 170,464 CASH AND CASH EQUIVALENTS AT BEGINNING OF THE YEAR 514,289 343,825
CASH AND CASH EQUIVALENTS AT END OF THE YEAR 26 330,012 514,289 The annexed notes form an integral part of these consolidated financial statements.
ChiefExecutiveOfficer Director ChiefFinancialOfficer
CONSOLIDATED STATEMENT OF CASH FLOWS For the year ended 30 September 2020

106 Shakarganj Limited and Its Subsidiary
1. THE GROUP AND ITS OPERATIONS The Group consists of Shakarganj Limited (the Holding Company) and its Subsidiary Company, Shakarganj
Food Products Limited. Shakarganj Limited Shakarganj Limited (SL) is a public limited company incorporated on 20 September 1967 in Pakistan under
the Companies Act, 1913 (Now Companies Act, 2017) and is listed on Pakistan Stock Exchange Limited. It is principally engaged in manufacture, purchase and sale of sugar, biofuel and yarn. SL has its principal manufacturing facilities at Jhang and satellite manufacturing facilities at Bhone. The registered office of SL is situated at E-Floor, IT Tower, 73-E/1, Hali Road, Gulberg-III, Lahore.
Geographical locations and addresses of all business units of SL except for the registered office are as
follows: Manufacturing Unit Address Jhang Unit (Sugar, biofuel and textile) 5 KM Toba Tek Singh Road, Jhang, Punjab Bhone Unit (Sugar and biofuel) 63 KM Jhang - Sargodha Road, Bhone, Tehsil and District Jhang, Punjab Liaison Office Nishatabad, Chak Jhumra Road, Faisalabad, Punjab Liaison Office 12th Floor, Sidco Avenue Centre, 264 R.A. Lines, Karachi, Sindh Shakarganj Food Products Limited Shakarganj Food Products Limited (SFPL) was incorporated in Pakistan initially as a private limited
company on 03 April 2001 under the Companies Ordinance, 1984 (Now Companies Act, 2017). Its name was later changed from A.M. Fruit Products (Private) Limited to Shakarganj Food Products Limited along with change of its status from private limited to public limited on 03 January 2006. The principal activity of the SFPL is manufacturing, processing and sale of food products (dairy, fruit pulps and concentrate juices). The registered office of SFPL is situated at E-Floor, IT Tower, 73-E/1, Hali Road, Gulberg-III, Lahore.
Geographical locations and addresses of all business units of SFPL except for the registered office are as
follows:
Manufacturing Unit Address Dairy Plant 4 KM Lahore Road, Jaranwala Juice Plant Near Ahmad Nagar, Sargodha Road, Tehsil Lalian, District Chiniot 1.1 These consolidated financial statements have been prepared for the first time after treating Shakarganj
Food Products Limited as a subsidiary of Shakarganj Limited.
2. SUMMARY OF SIGNIFICANT ACCOUNTING POLICIES The significant accounting policies applied in the preparation of these consolidated financial statements
are set out below:
NOTES TO THE CONSOLIDATED FINANCIAL STATEMENTSFor the year ended 30 September 2020
107
2.1 Basis of preparation a) Statement of compliance “These consolidated financial statements have been prepared in accordance with the accounting and
reporting standards as applicable in Pakistan. The accounting and reporting standards applicable in Pakistan comprise of:
- International Financial Reporting Standards (IFRSs) issued by the International Accounting Standards Board (IASB) and Islamic Financial Accounting Standards (IFASs) issued by the Institute of Chartered Accountants of Pakistan (ICAP), as notified under the Companies Act, 2017; and
- Provisions of and directives issued under the Companies Act, 2017.
Where provisions of and directives issued under the Companies Act, 2017 differ from the IFRSs and IFASs, the provisions of and directives issued under the Companies Act, 2017 have been followed.”
b) Accounting convention These consolidated financial statements have been prepared under the historical cost convention except
as otherwise stated in the respective accounting policies. c) Critical accounting estimates and judgments The preparation of these consolidated financial statements in conformity with the approved accounting
standards requires the use of certain critical accounting estimates. It also requires the management to exercise its judgment in the process of applying the accounting policies. Estimates and judgments are continually evaluated and are based on historical experience and other factors, including expectations of future events that are believed to be reasonable under the circumstances. The areas where various assumptions and estimates are significant to the consolidated financial statements or where judgments were exercised in application of accounting policies are as follows:
Usefullives,patternsofeconomicbenefitsandimpairments The estimates for revalued amounts of different classes of property, plant and equipment, are based on
valuation performed by external professional valuers and recommendations of technical teams of the Group. The said recommendations also include estimates with respect to residual values and depreciable lives. Further, the Group reviews the value of the assets for possible impairment on an annual basis. Estimates with respect to residual values and useful lives and pattern of flow of economic benefits are based on the analysis of the management of the Group. Any change in the estimates in future years might affect the carrying amounts of the respective items of property, plant and equipment with a corresponding effect on the depreciation charge and impairment.
Inventories Net realizable value of inventories is determined with reference to currently prevailing selling prices less
estimated expenditure to make sales. Taxation In making the estimates for income tax currently payable by the Group, the management takes into account
the current income tax law and the decisions of appellate authorities on certain issues in the past. Deferred tax is measured at the tax rates that are expected to apply to the period when the asset is realized or the liability is settled based on the tax rates (and tax laws) that have been enacted or substantially enacted at
NOTES TO THE CONSOLIDATED FINANCIAL STATEMENTSFor the year ended 30 September 2020

108 Shakarganj Limited and Its Subsidiary
the reporting date. Deferred income tax assets are recognized for deductible temporary differences only if the Group considers it is probable that future taxable amounts will be available to utilize those temporary differences and losses.
Allowance for expected credit losses The allowance for expected credit losses assessment requires a degree of estimation and judgement. It
is based on the lifetime expected credit loss, based on the Group’s experience of actual credit loss in past years.
Revenue from contracts with customers involving sale of goods When recognizing revenue in relation to the sale of goods to customers, the key performance obligation of the
Group is considered to be the point of delivery of the goods to the customer, as this is deemed to be the time that the customer obtains control of the promised goods and therefore the benefits of unimpeded access.
Provision for obsolescence of stores, spare parts and loose tools The Group reviews the carrying amount of stores, spare parts and loose tools on regular basis and provision
for obsolescence is made if there is any change in usage pattern and physical form of stores, spare parts and loose tools.
Employees’retirementbenefits Certain actuarial assumptions have been adopted for valuation of present value of defined benefit
obligations. Changes in these assumptions in future years may affect the liability under these schemes in those years.
Provisions As the actual outflows can differ from estimates made for provisions due to changes in laws, regulations,
public expectations, technology, prices and conditions, and can take place many years in the future, the carrying amounts of provisions are reviewed at each reporting date and adjusted to take account of such changes. Any adjustments to the amount of previously recognized provision is recognized in the consolidated statement of profit or loss unless the provision was originally recognized as part of cost of an asset.
d) Standard, interpretation and amendments to published approved accounting standards that are
effectiveincurrentyearandarerelevanttotheGroup Following standard, interpretation and amendments to published approved accounting standards are
mandatory for the Group’s accounting periods beginning on or after 01 October 2019: • IFRS 16 ‘Leases’ • Amendments to IFRS 09 ‘Financial Instruments’ • IFRIC 23 ‘Uncertainty over Income Tax Treatments’ • Amendments to IAS 19 ‘Employee Benefits’ - Plan Amendment, Curtailment or Settlement • Annual Improvements to IFRSs: 2015 – 2017 Cycle” The Group’s accounting policy of leases in accordance with IFRS 16 is disclosed in Note 2.5 to these
consolidated financial statements. However, the amendments and interpretation listed above do not have any impact on the amounts recognized in prior periods and are not expected to significantly affect the current or future periods.
NOTES TO THE CONSOLIDATED FINANCIAL STATEMENTSFor the year ended 30 September 2020

109
e) Standardandamendmentstopublishedapprovedaccountingstandardsthatareeffectiveincurrentyear but not relevant to the Group
There are other standard and amendments to published approved accounting standards that are
mandatory for accounting periods beginning on or after 01 October 2019 but are considered not to be relevant or do not have any significant impact on the Group’s financial statements and are therefore not detailed in these consolidated financial statements.
f) Amendmentstopublishedapprovedaccountingstandardsthatarenotyeteffectivebutrelevanttothe
Group Following amendments to existing standards have been published and are mandatory for the Group’s
accounting periods beginning on or after 01 October 2020 or later periods: Amendment to IFRS 3 ‘Business Combinations’ – Definition of a Business (effective for business
combinations for which the acquisition date is on or after the beginning of annual period beginning on or after 01 January 2020). The IASB has issued amendments aiming to resolve the difficulties that arise when an entity determines whether it has acquired a business or a group of assets. The amendments clarify that to be considered a business, an acquired set of activities and assets must include, at a minimum, an input and a substantive process that together significantly contribute to the ability to create outputs. The amendments include an election to use a concentration test. The standard is effective for transactions in the future.
Interest Rate Benchmark Reform which amended IFRS 7 ‘Financial Instruments: Disclosures’, IFRS 9
‘Financial Instruments’ and IAS 39 ‘Financial Instruments: Recognition and Measurement’, is applicable for annual financial periods beginning on or after 01 January 2020. The G20 asked the Financial Stability Board (FSB) to undertake a fundamental review of major interest rate benchmarks. Following the review, the FSB published report setting out its recommended reforms of some major interest rate benchmarks such as Interbank Offer Rates (IBORs). Public authorities in many jurisdictions have since taken steps to implement those recommendations. This has in turn led to uncertainty about the long-term viability of some interest rate benchmarks. In these amendments, the term ‘interest rates benchmarks reform’ refers to the market-wide reform of an interest rate benchmark including its replacement with an alternative benchmark rate, such as that resulting from the FSB’s recommendations set out in its July 2014 report ‘Reforming Major Interest Rate Benchmarks’ (the reform). The amendments made provided relief from the potential impacts of the uncertainty caused by the reform. A company shall apply these exceptions to all hedging relationships directly affected by interest rate benchmark reform. The amendments are not likely to affect the financial statements of the Group.
Amendments to IFRS 16 ‘Leases’ (effective for annual periods beginning on or after 01 June 2020). Under
pervious requirements of IFRS 16, lessee assesses whether rent concessions are leased modifications, if so, apply the specific guidance on accounting for lease modifications. This generally involves remeasuring these lease liabilities using the revised lease payments and revised discount rates. In light of the effects of the COVID-19 pandemic and the fact that many lessees are applying the standard for the first time in their financial statements, the IASB has provided an optional practical expedient for lessees. Under the practical expedient, lessees are not required to assess whether eligible rent concessions are lease modifications, and instead are permitted to account for as if these were not lease modifications. Rent concessions are eligible for the practical expedient if these occur as a direct consequence of the COVID-19 pandemic and if following criteria are met:
- the change in lease payments results in revised consideration for the lease that is substantially same
as, or less than, the considerations for the lease immediately preceding the change; any reduction in lease payments affects only payments originally due on or before 30 June 2021; and
NOTES TO THE CONSOLIDATED FINANCIAL STATEMENTSFor the year ended 30 September 2020
110 Shakarganj Limited and Its Subsidiary
- there is no substantive change to the other terms and conditions of the lease. The above amendments are not likely to affect the financial statements of the Group. Amendments to IAS 1 ‘Presentation of Financial Statements’ and IAS 8 ‘Accounting Policies, Changes
in Accounting Estimates and Errors’ (effective for annual periods beginning on or after 01 January 2020). The amendments are intended to make the definition of material in IAS 1 easier to understand and are not intended to alter the underlying concept of materiality in IFRSs. In addition, the IASB has also issued guidance on how to make materiality judgments when preparing their general purpose financial statements in accordance with IFRSs. The amendments are not likely to affect the financial statements of the Group.
Amendments to IAS 1 ‘Presentation of Financial Statements’ (effective for annual periods beginning on or
after 01 January 2022). These amendments have been added to further clarify when a liability is classified as current. These amendments also changes the aspect of classification of liability as non-current by requiring the assessment of the entity’s right at the end of the reporting period to defer the settlement of liability for at least twelve months after the reporting period. An entity shall apply these amendments retrospectively in accordance with IAS 8. The amendments are not likely to affect the financial statements of the Group.
Amendments to IAS 37 ‘Provisions, Contingent Liabilities and Contingent Assets’ (effective for annual
periods beginning on or after 01 January 2022). These amendments clarify what comprise the cost of fulfilling a contract. Cost of fulfilling a contract is relevant when determining whether a contract is onerous. An entity is required to apply the amendments to contracts for which it has not yet fulfilled all its obligations at the beginning of the annual reporting period in which it first applies the amendments (the date of initial application). Restatement of comparative information is not required, instead the amendments require an entity to recognize the cumulative effect of initially applying the amendments as an adjustment to opening balance of retained earnings or other component of equity, as appropriate, at the date of initial application. The amendments are not likely to affect the financial statements of the Group.
Amendments to IAS 16 ‘Property, Plant and Equipment’ (effective for annual periods beginning on or
after 01 January 2022). These amendments clarify that sales proceeds and cost of items produced while bringing an item of property, plant and equipment to the location and condition necessary for it to be capable of operating in the manner intended by management, are recognized in profit or loss in accordance with applicable standards. The entity measures the cost of those items applying the measurement requirements of IAS 2 ‘Inventories’. The standard also removes the requirement of deducting the net sales proceeds from cost of testing. An entity shall apply these amendments retrospectively, but only to items of property, plant and equipment which are brought to the location and condition necessary for them to be capable of operating in the manner intended by management on or after the beginning of the earliest period presented in the financial statements in which the entity first applies the amendments. The entity shall recognize the cumulative effect of initially applying the amendments as an adjustment to the opening balance of retained earnings (or other component of equity, as appropriate) at the beginning of that earliest period presented. The amendments are not likely to affect the financial statements of the Group.
Following Annual Improvements to IFRSs: 2018 - 2020 issued by IASB on 14 May 2020 are effective for
annual reporting periods beginning on or after 01 January 2022: - IFRS 9 ‘Financial Instruments’ - the amendment clarifies that an entity includes only fees paid or
received between the entity (the borrower) and the lender, including fees paid or received by either the entity or the lender on the other’s behalf, when it applies the ‘10 percent’ test in paragraph B3.3.6 of IFRS 9 in assessing whether to de-recognize a financial liability.
- IFRS 16 ‘Leases’ - the amendment partially amends Illustrative Example 13 accompanying IFRS 16
‘Leases’ by excluding the Illustration of reimbursement of leasehold improvements by the lessor. The objective of the amendment is to resolve any potential confusion that might rise in lease incentives.
NOTES TO THE CONSOLIDATED FINANCIAL STATEMENTSFor the year ended 30 September 2020
111
- IAS 41 ‘Agriculture’ - the amendment removes the requirement in paragraph 22 of IAS 41 for entities to exclude taxation cash flows when measuring the fair value of a biological asset using a present value technique.
The above amendments and improvements do not have a material impact on these consolidated financial
statements. On 29 March 2018, the IASB has issued a revised Conceptual Framework. The new Framework:
reintroduces the terms stewardship and prudence; introduces a new asset definition that focuses on rights and a new liability definition that is likely to be broader than the definition it replaces, but does not change the distinction between a liability and an equity instrument; removes from the asset and liability definitions references to the expected flow of economic benefits–this lowers the hurdle for identifying the existence of an asset or liability and puts more emphasis on reflecting uncertainty in measurement; discusses historical cost and current value measures, and provides some guidance on how the IASB would go about selecting a measurement basis for a particular asset or liability; states that the primary measure of financial performance is profit or loss, and that only in exceptional circumstances will the IASB use other comprehensive income and only for income or expenses that arise from a change in the current value of an asset or liability; and discusses uncertainty, de-recognition, unit of account, the reporting entity and combined financial statements. The Framework is not an IFRS and does not override any standard, so nothing will change in the short term. The revised Framework will be used in future standard-setting decisions, but no changes will be made to current IFRSs. Preparers might also use the Framework to assist them in developing accounting policies where an issue is not addressed by an IFRS. It is effective for annual periods beginning on or after 01 January 2020 for preparers that develop an accounting policy based on the Framework.
g) Standardsandamendmentstopublishedapprovedaccountingstandardsthatarenotyeteffectiveand
not considered relevant to the Group There are other standards and amendments to published approved accounting standards that are
mandatory for accounting periods beginning on or after 01 October 2020 but are considered not to be relevant or do not have any significant impact on the Group’s financial statements and are therefore not detailed in these consolidated financial statements.
2.2 Consolidation Subsidiary is the entity over which the Group has control. The Group controls an entity when the Group is
exposed to, or has rights to, variable returns from its involvement with the entity and has the ability to affect those returns through its power to direct the activities of the entity. The subsidiary is fully consolidated from the date of acquisition, being the date on which the control is transferred to the Group. They are deconsolidated from the date the control ceases.
The assets and liabilities of the Subsidiary Company have been consolidated on a line by line basis and the
carrying value of investment held by the Holding Company is eliminated against the Holding Company’s in the paid up capital of the Subsidiary Company.
Non-controlling interest is that part of net results of the operations and of net assets of the Subsidiary
Company attributable to interest which are not owned by the Holding Company either directly or indirectly. Non-controlling interest is presented as a separate item in the consolidated financial statements.
Intragroup balances and transactions are eliminated.
NOTES TO THE CONSOLIDATED FINANCIAL STATEMENTSFor the year ended 30 September 2020

112 Shakarganj Limited and Its Subsidiary
2.3 Revenue from contracts with customers i) Revenue recognition Sale of goods Revenue from the sale of goods is recognized at the point in time when the customer obtains control of the
goods, which is generally at the time of delivery. Interest Interest income is recognized as interest accrues using the effective interest method. This is a method
of calculating the amortized cost of a financial asset and allocating the interest income over the relevant period using the effective interest rate, which is the rate that exactly discounts estimated future cash receipts through the expected life of the financial asset to the net carrying amount of the financial asset.
Rent
Revenue is recognized when rent is accrued. Dividend
Dividend on equity investments is recognized when right to receive the dividend is established. Other revenue Other revenue is recognized when it is received or when the right to receive payment is established. ii) Contract assets Contract assets arise when the Group performs its performance obligations by transferring goods to a
customer before the customer pays its consideration or before payment is due. Contract assets are treated as financial assets for impairment purposes.
iii) Contract liabilities Contract liability is the obligation of the Group to transfer goods to a customer for which the Group has
received consideration from the customer. If a customer pays consideration before the Group transfers goods, a contract liability is recognized when the payment is made. Contract liabilities are recognized as revenue when the Group performs its performance obligations under the contract.
2.4 Intangible asset and amortization Intangible asset represents the cost of computer software acquired and is stated at cost less accumulated
amortization and any identified impairment loss. Amortization is charged to the consolidated statement of profit or loss on straight line basis so as to write
off the cost of an asset over its estimated useful life. Amortization is charged from the month in which the asset is acquired or capitalized while no amortization is charged for the month in which the asset is disposed of. Intangible asset is amortized over a period of five years.
The Group assesses at each reporting date whether there is any indication that intangible asset may be
impaired. If such indication exists, the carrying amount of such asset is reviewed to assess whether it is recorded in excess of its recoverable amount. When carrying value exceeds the respective recoverable amount, asset is written down to its recoverable amount and resulting impairment is recognized in the consolidated statement of profit or loss. When an impairment loss is recognized, the amortization charge is adjusted in the future periods to allocate the asset’s revised carrying amount over its estimated useful life.
NOTES TO THE CONSOLIDATED FINANCIAL STATEMENTSFor the year ended 30 September 2020

113
2.5 IFRS 16 ‘Leases’ The Group has adopted IFRS 16 from 01 October 2019. The standard replaces IAS 17 ‘Leases’ and for
lessees eliminates the classifications of operating leases and finance leases. Except for short-term leases and leases of low-value assets, right-of-use assets and corresponding lease liabilities are recognized in the consolidated statement of financial position. Straight-line operating lease expense recognition is replaced with a depreciation charge for the right-of-use assets (included in operating costs) and an interest expense on the recognized lease liabilities (included in finance cost). In the earlier periods of the lease, the expenses associated with the lease under IFRS 16 will be higher when compared to lease expenses under IAS 17, as the operating expense is now replaced by interest expense and depreciation in the consolidated statement of profit or loss. For classification within the consolidated statement of cash flows, the interest portion is disclosed in operating activities and the principal portion of the lease payments are separately disclosed in financing activities. For lessor accounting, the standard does not substantially change how a lessor accounts for leases.
Right-of-use assets A right-of-use asset is recognized at the commencement date of a lease. The right-of-use asset is measured
at cost, which comprises the initial amount of the lease liability, adjusted for, as applicable, any lease payments made at or before the commencement date net of any lease incentives received, any initial direct costs incurred, and, except where included in the cost of inventories, an estimate of costs expected to be incurred for dismantling and removing the underlying asset, and restoring the site or asset.
Right-of-use assets are depreciated on a straight-line basis over the unexpired period of the lease or the
estimated useful life of the asset, whichever is shorter. Where the Group expects to obtain ownership of the leased asset at the end of the lease term, the depreciation is charged over its estimated useful life. Right-of-use assets are subject to impairment or adjusted for any re-measurement of lease liabilities.
The Group has elected not to recognize a right-of-use asset and corresponding lease liability for short-term
leases with terms of 12 months or less and leases of low-value assets. Lease payments on these assets are charged to income as incurred.
Lease liabilities A lease liability is recognized at the commencement date of a lease. The lease liability is initially recognized at
the present value of the lease payments to be made over the term of the lease, discounted using the interest rate implicit in the lease or, if that rate cannot be readily determined, the Group’s incremental borrowing rate. Lease payments comprise of fixed payments less any lease incentives receivable, variable lease payments that depend on an index or a rate, amounts expected to be paid under residual value guarantees, exercise price of a purchase option when the exercise of the option is reasonably certain to occur, and any anticipated termination penalties. The variable lease payments that do not depend on an index or a rate are expensed in the period in which these are incurred.
Lease liabilities are measured at amortized cost using the effective interest method. The carrying amounts
are re-measured if there is a change in the following: future lease payments arising from a change in an index or a rate used; residual guarantee; lease term; certainty of a purchase option and termination penalties. When a lease liability is re-measured, an adjustment is made to the corresponding right-of-use asset, or to consolidated statement of profit or loss if the carrying amount of the right-of-use asset is fully written down.
Impacts on adoption of IFRS 16 on these consolidated financial statements as on 01 October 2019 IFRS 16 has been adopted using the modified retrospective approach and as such the comparatives have
not been restated. The impacts of adoption as at 01 October 2019 are as follows:
NOTES TO THE CONSOLIDATED FINANCIAL STATEMENTSFor the year ended 30 September 2020

114 Shakarganj Limited and Its Subsidiary
RUPEES IN THOUSAND Right-of-use assets increased by 29,295 Lease liabilities increased by 743,833 Liabilities against assets subject to finance lease decreased by 714,538
2.6 Financial Instruments i) Recognitionoffinancialinstruments The Group initially recognizes financial assets on the date when they are originated. Financial liabilities are
initially recognized on the trade date when the entity becomes a party to the contractual provisions of the instrument.
ii) Classificationandmeasurementoffinancialinstruments Investments and other financial assets a)Classification
The Group classifies its financial assets in the following measurement categories: • those to be measured subsequently at fair value through other comprehensive income, and • those to be measured at amortized cost” The classification depends on the Group’s business model for managing the financial assets and the
contractual terms of the cash flows. For assets measured at fair value, gains and losses will be recorded in other comprehensive income. For
investments in debt instruments, this will depend on the business model in which the investment is held. For investments in equity instruments, this will depend on whether the Group has made an irrevocable election at the time of initial recognition to account for the equity investment at fair value through other comprehensive income. The Group reclassifies debt investments when and only when its business model for managing those assets changes.
b) Measurement At initial recognition, the Group measures a financial asset at its fair value plus transaction costs that are
directly attributable to the acquisition of the financial asset. Financial assets with embedded derivatives are considered in their entirety when determining whether their cash flows are solely payment of principal and interest.
Debt instruments Subsequent measurement of debt instruments depends on the Group’s business model for managing
the asset and the cash flow characteristics of the asset. The Group classifies its debt instruments into following measurement category:
Amortized cost Financial assets that are held for collection of contractual cash flows where those cash flows represent
solely payments of principal and interest are measured at amortized cost. Interest income from these financial assets is included in other income using the effective interest rate method. Any gain or loss arising on de-recognition is recognized directly in profit or loss and presented in other income / (other expenses) together with foreign exchange gains and losses.
NOTES TO THE CONSOLIDATED FINANCIAL STATEMENTSFor the year ended 30 September 2020

115
Equity instruments The Group subsequently measures all equity investments at fair value for financial instruments quoted in
an active market, the fair value corresponds to a market price (level 1). For financial instruments that are not quoted in an active market, the fair value is determined using valuation techniques including reference to recent arm’s length market transactions or transactions involving financial instruments which are substantially the same (level 2), or discounted cash flow analysis including, to the greatest possible extent, assumptions consistent with observable market data (level 3). The Group classifies its equity instruments into following measurement category:
Fair Value Through Other Comprehensive Income (FVTOCI) Where the Group’s management has elected to present fair value gains and losses on equity investments
in other comprehensive income, there is no subsequent reclassification of fair value gains and losses to profit or loss. Impairment losses (and reversal of impairment losses) on equity investments measured at FVTOCI are not reported separately from other changes in fair value. Dividend from such investments is recognized in consolidated statement of profit or loss as other income when the Group’s right to receive payments is established.
Financial liabilities Classificationandmeasurement Financial liabilities are classified at amortized cost. These are also subsequently measured at amortized
cost using the effective interest method. Interest expense and foreign exchange gains and losses are recognized in consolidated statement of profit or loss.
iii) Impairmentoffinancialassets The Group assesses on a forward looking basis the expected credit losses associated with its debt
instruments carried at amortized cost. The impairment methodology applied depends on whether there has been a significant increase in credit risk.
For trade debts and other receivables, the Group applies the simplified approach permitted by IFRS 9,
which requires expected lifetime losses to be recognized from initial recognition of the receivables. iv) De-recognition Financial assets The Group de-recognizes a financial asset when the contractual rights to the cash flows from the asset
expire, or it transfers the rights to receive the contractual cash flows in a transaction in which substantially all of the risks and rewards of ownership of the financial asset are transferred, or it neither transfers nor retains substantially all of the risks and rewards of ownership and does not retain control over the transferred asset. Any interest in such de-recognized financial assets that is created or retained by the Group is recognized as a separate asset or liability.
Financial liabilities The Group de-recognizes a financial liability (or a part of financial liability) from its consolidated statement
of financial position when the obligation specified in the contract is discharged or cancelled or expired. Any gain or loss on de-recognition is included in profit or loss.
NOTES TO THE CONSOLIDATED FINANCIAL STATEMENTSFor the year ended 30 September 2020

116 Shakarganj Limited and Its Subsidiary
v) Offsettingoffinancialinstruments Financial assets and financial liabilities are set off and the net amount is reported in the consolidated
financial statements when there is a legal enforceable right to set off and the Group intends either to settle on a net basis or to realize the assets and to settle the liabilities simultaneously.
2.7 Taxation Current Provision of current tax is based on the taxable income for the year determined in accordance with the
prevailing law for taxation of income. The charge for current tax is calculated using prevailing tax rates or tax rates expected to apply to the profit for the year if enacted. The charge for current tax also includes adjustments, where considered necessary, to provision for tax made in previous years arising from assessments framed during the year for such years.
Deferred Deferred tax is accounted for using the liability method in respect of all temporary differences arising from
differences between the carrying amount of assets and liabilities in the consolidated financial statements and the corresponding tax bases used in the computation of the taxable profit. Deferred tax liabilities are generally recognized for all taxable temporary differences and deferred tax assets are recognized to the extent that it is probable that taxable profits will be available against which the deductible temporary differences, unused tax losses and tax credits can be utilized.
Deferred tax is calculated at the rates that are expected to apply to the period when the differences reverse
based on tax rates that have been enacted or substantively enacted at the reporting date. Deferred tax is charged or credited in the consolidated statement of profit or loss, except in the case of items credited or charged to other comprehensive income or directly in equity, in which case it is included in other comprehensive income or directly in equity, respectively.
2.8 Property, plant and equipment Property, plant and equipment except freehold land, building, plant and machinery are stated at cost less
accumulated depreciation and any identified impairment loss. Freehold land is stated at revalued amount less any identified impairment loss. Building, plant and machinery are stated at revalued amount less accumulated depreciation and any identified impairment loss. Cost of the property, plant and equipment consists of historical cost pertaining to erection / construction period of qualifying assets and other directly attributable costs of bringing the asset to working condition.
Increases in the carrying amount arising on revaluation of property, plant and equipment are credited
to surplus on revaluation of property, plant and equipment. Decreases that offset previous increases of the same assets are charged against this surplus, all other decreases are charged to income. Each year the difference between depreciation based on the revalued carrying amount of the asset charged to the consolidated statement of profit or loss, and depreciation based on the asset’s original cost is transferred from ‘surplus on revaluation of property, plant and equipment’ to ‘accumulated loss’. All transfers to / from surplus on revaluation of property, plant and equipment are net of applicable deferred income tax.
Subsequent costs are included in the asset’s carrying amount or recognized as a separate asset, as
appropriate, only when it is probable that future economic benefits associated with the item will flow to the Group and the cost of the item can be measured reliably. All other repair and maintenance costs are charged to income during the period in which they are incurred.
NOTES TO THE CONSOLIDATED FINANCIAL STATEMENTSFor the year ended 30 September 2020
117
Capital work-in-progress is stated at cost less any identified impairment loss. It consists of all expenditure and advances connected with specific assets incurred and made during installations and construction period. These are transferred to relevant property, plant and equipment as and when assets are available for use.
Depreciation Depreciation on property, plant and equipment is charged to consolidated statement of statement of profit
or loss on the reducing balance method so as to write off the cost of an asset over its estimated useful life at the annual rates given in Note 15.1 after taking into account the impact of their residual values, if considered significant. The residual values and useful lives are reviewed by the management, at each financial year-end and adjusted if impact on depreciation is significant.
Depreciation on additions to property, plant and equipment is charged from the month in which the asset
is acquired or capitalized, while no depreciation is charged for the month in which the asset is disposed of. De-recognition An item of property, plant and equipment is de-recognized upon disposal or when no future economic
benefits are expected from its use or disposal. The gain or loss on disposal or retirement of an asset represented by the difference between the sale
proceeds and the carrying amount of the asset is recognized as an income or expense. 2.9 Impairmentofnon-financialassets The carrying amounts of the Group’s non-financial assets are reviewed at each reporting date to determine
whether there is any indication of impairment. If such indication exists, the asset’s recoverable amount, being higher of value in use and fair value less cost to sell, is estimated. For the purpose of impairment testing, assets which cannot be tested individually are grouped together into smallest group of assets that generates cash inflows from continuing use that are largely independent of the cash flows of other assets or group of assets. An impairment loss is recognized whenever, the carrying amount of an asset exceeds its recoverable amount. Impairment loss is charged to the consolidated statement of profit or loss. Reversal of the impairment losses are restricted to the extent that the asset’s carrying amount does not exceed the carrying amount that would have been determined, net of depreciation, if impairment loss had not been recognized. Reversal of impairment loss is also recognized in the consolidated statement of profit or loss.
2.10 Biological assets Biological assets comprise of standing crops and livestock. These are stated at fair value less estimated
point-of-sale costs, with any resultant gain or loss recognized in the consolidated statement of profit or loss. The fair value of standing crops is based on the support price fixed by the Government and other factors such as estimated crop yield and area under cultivation. The fair value of livestock is estimated on the basis of market prices of livestock of similar age, breed and genetic merit. Point-of-sale costs include all costs that are necessary to sell the assets, excluding costs necessary to get the assets to the market.
2.11 Inventories Stores, spare parts and loose tools Usable stores, spare parts and loose tools are valued principally at moving average cost, while items
considered obsolete are carried at nil value. Items in transit are valued at cost comprising invoice value plus other charges paid thereon up-to the reporting date. Provision is made in the consolidated financial statements for obsolete and slow moving stores and spares based on management’s estimate as a result of changes in usage pattern and physical form.
NOTES TO THE CONSOLIDATED FINANCIAL STATEMENTSFor the year ended 30 September 2020

118 Shakarganj Limited and Its Subsidiary
Stock-in-trade Stock of raw materials, work-in-process and finished goods, except for those in transit are valued principally
at the lower of weighted average cost and net realizable value. Cost of work-in-process and finished goods comprises cost of direct materials, labour and appropriate manufacturing overheads. Cost of own produced molasses, a by-product, is determined on the basis of monthly average cost of molasses purchased from third parties. Cost of stillage, a by-product of the Effluent Treatment Plant, used in the generation of electricity by the Power division is valued at Nil as it does not have any market value.
Materials in transit are stated at cost comprising invoice values plus other charges paid thereon up to the
reporting date. Net realizable value signifies the estimated selling price in the ordinary course of business less estimated
costs of completion and estimated costs necessary to be incurred in order to make a sale. Provision is made in the consolidated financial statements for obsolete and slow moving stock-in-trade based on management’s estimate.
2.12 Trade and other receivables Trade and other receivables are initially recognized at fair value and subsequently measured at amortized
cost using the effective interest method, less any allowance for expected credit losses. Trade receivables generally do not include amounts overdue by 365 days.
2.13 Cash and cash equivalents Cash and cash equivalents comprise cash in hand, cash at banks on current, saving and deposit accounts
and other short term highly liquid instruments that are readily convertible into known amounts of cash and which are subject to insignificant risk of changes in values.
2.14 Ijarah contracts Under the Ijarah contracts, the Group obtains usufruct of an asset for an agreed period and consideration.
The Group accounts for its Ijarah contracts in accordance with the requirements of IFAS 2 ‘Ijarah’. Accordingly, the Group as a Mustaj’ir (lessee) in the Ijarah contract recognizes the Ujrah (lease) payments as an expense in the consolidated statement of profit or loss on straight line lease over the Ijarah term.
2.15 Share capital Ordinary shares are classified as equity and recognized at their face value. Incremental costs directly
attributable to the issue of new shares are shown in equity as a deduction, net of tax, if any. 2.16 Borrowings Financing and borrowings are initially recognized at fair value of the consideration received, net of
transaction costs. These are subsequently measured at amortized cost using the effective interest method. 2.17 Government grants Grants from the Government are recognized at their fair value where there is a reasonable assurance that
the grant will be received and the Group will comply with all attached conditions. Government grants relating to costs are deferred and recognized in the profit or loss over the period
necessary to match them with the costs that they are intended to compensate. Grants relating to the purchase of property, plant and equipment are included in non-current liabilities as
deferred income and are credited to profit or loss over the expected lives of the related assets.
NOTES TO THE CONSOLIDATED FINANCIAL STATEMENTSFor the year ended 30 September 2020

119
2.18 Trade and other payables Liabilities for trade and other amounts payable are initially recognized at fair value, which is normally the
transaction cost. 2.19 Provisions Provisions are recognized when the Group has a present, legal or constructive obligation as a result of past
events and it is probable that an outflow of resources embodying economic benefits will be required to settle the obligations and a reliable estimate of the amount can be made. Provisions are reviewed at each reporting date and adjusted to reflect the current best estimate.
2.20 Functional and presentation currency along with foreign currency transactions and translation Items included in the financial statements of the Group are measured using the currency of the primary
economic environment in which the Group operates (the functional currency). The consolidated financial statements are presented in Pak Rupees, which is the Group’s functional and presentation currency.
All monetary assets and liabilities in foreign currencies are translated into Pak Rupees using the exchange
rate at the reporting date. Exchange gains and losses resulting from the settlement of such transactions and from the translations at the year end exchange rates of monetary assets and liabilities denominated in foreign currencies are recognized in consolidated statement of profit or loss. Non-monetary assets and liabilities denominated in foreign currency that are measured in terms of historical cost are translated using the exchange rates as at the dates of the initial transactions. Non-monetary assets and liabilities denominated in foreign currency that are measured at fair value are translated using the exchange rates at the date when the fair value was determined.
2.21 Borrowing costs General and specific borrowing costs directly attributable to the acquisition, construction or production of
qualifying assets, which are assets that necessarily take a substantial period of time to get ready for their intended use or sale, are added to the cost of those assets, until such time as the assets are substantially ready for their intended use or sale. All other borrowing costs are recognized in consolidated statement of profit or loss in the period in which these are incurred.
2.22 Contingent liabilities A contingent liability is disclosed when: - there is a possible obligation that arises from past events and whose existence will be confirmed only
by the occurrence or non-occurrence of one or more uncertain future events not wholly within the control of the Group; or
- there is present obligation that arises from past events but it is not probable that an outflow of
resources embodying economic benefits will be required to settle the obligation or the amount of the obligation cannot be measured with sufficient reliability.
2.23 Contingent assets Contingent assets are disclosed when the Group has a possible asset that arises from past events and
whose existence will only be confirmed by the occurrence or non-occurrence of one or more uncertain future events not wholly within the control of the Group. Contingent assets are not recognized until their realization becomes certain.
NOTES TO THE CONSOLIDATED FINANCIAL STATEMENTSFor the year ended 30 September 2020
120 Shakarganj Limited and Its Subsidiary
2.24 Segment reporting Operating segments are reported in a manner consistent with the internal reporting provided to the
chief operating decision makers. The chief operating decision makers, who are responsible for allocating resources and assessing performance of the operating segments, have been identified as the Board of Directors of the Group that makes strategic decisions.
Segment results that are reported to the Board of Directors include items directly attributable to a segment
as well as those that can be allocated on a reasonable basis. Those income, expenses, assets, liabilities and other balances which cannot be allocated to a particular segment on a reasonable basis are reported as unallocated.
2.25 Earnings / (Loss) Per Share (EPS / LPS) Basic EPS / LPS is calculated by dividing the profit or loss attributable to ordinary shareholders of the
Holding Company by weighted average number of ordinary shares outstanding during the year. 2.26 Employees’benefits Definedbenefitplans The main feature of the schemes operated by the Group for its employees are as follows: The Holding Company operates a funded gratuity scheme as a defined benefit plan for its permanent
employees and also funded defined benefit pension plan. All permanent employees who are in the management cadre of the Holding Company participate in these plans subject to a minimum qualifying period of service according to the terms of employment. Monthly contributions are made to these funds on the basis of actuarial recommendation at the rate of 20% per annum of basic salary for pension and 8.33% per annum of basic salary for gratuity. Actuarial valuation using projected unit credit method for the schemes was carried out as at 30 September 2020.
The Holding Company’s net obligation in respect of these defined benefit plans is calculated by estimating the amount of future benefit that employees have earned in the current and prior periods, discounting that amount and deducting the fair value of any plan assets. The calculation of defined benefit obligations is performed annually by a qualified actuary using the projected unit credit method. When the calculation results in a potential asset for the Holding Company, the recognized asset is limited to the present value of economic benefits available in the form of any future refunds from the plan or reductions in future contributions to the plan. To calculate the present value of economic benefits, consideration is given to any applicable minimum funding requirements.
Remeasurements of the net defined benefit liabilities, which comprise actuarial gains and losses, the
return on plan assets (excluding interest) and the effect of the asset ceiling (if any, excluding interest), are recognized immediately in other comprehensive income. The Holding Company determines the net interest expense / (income) on the net defined benefit liability / (asset) for the period by applying the discount rate used to measure the defined benefit obligation at the beginning of the annual period to the then net defined benefit liability / (asset), taking into account any changes in the net defined benefit liability / (asset) during the period as a result of contributions and benefit payments. Net interest expense and other expenses related to defined benefit plan are recognized in profit or loss.
When the benefits of plans are changed or when plans are curtailed, the resulting change in benefits
that relate to past service or the gain or loss on curtailment are recognized immediately in profit or loss. The Holding Company recognizes gains and losses on the settlement of defined benefit plans when the settlement occurs.
NOTES TO THE CONSOLIDATED FINANCIAL STATEMENTSFor the year ended 30 September 2020
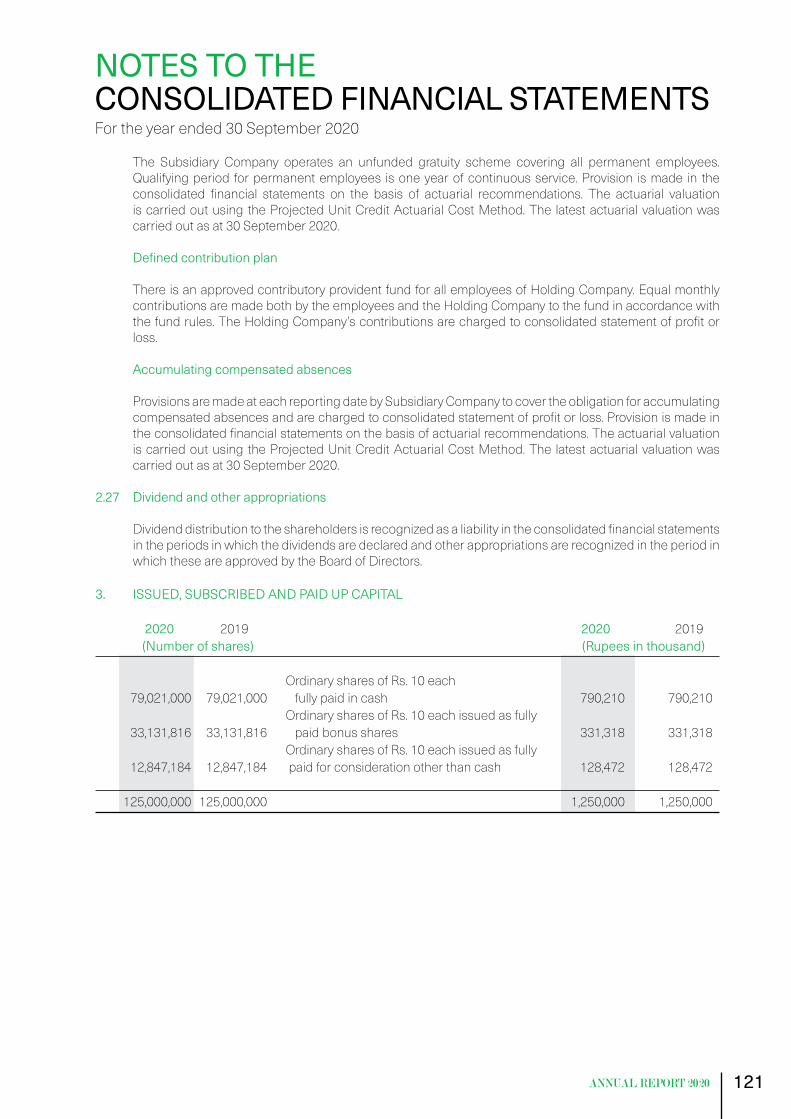
121
The Subsidiary Company operates an unfunded gratuity scheme covering all permanent employees. Qualifying period for permanent employees is one year of continuous service. Provision is made in the consolidated financial statements on the basis of actuarial recommendations. The actuarial valuation is carried out using the Projected Unit Credit Actuarial Cost Method. The latest actuarial valuation was carried out as at 30 September 2020.
Definedcontributionplan There is an approved contributory provident fund for all employees of Holding Company. Equal monthly
contributions are made both by the employees and the Holding Company to the fund in accordance with the fund rules. The Holding Company’s contributions are charged to consolidated statement of profit or loss.
Accumulating compensated absences Provisions are made at each reporting date by Subsidiary Company to cover the obligation for accumulating
compensated absences and are charged to consolidated statement of profit or loss. Provision is made in the consolidated financial statements on the basis of actuarial recommendations. The actuarial valuation is carried out using the Projected Unit Credit Actuarial Cost Method. The latest actuarial valuation was carried out as at 30 September 2020.
2.27 Dividend and other appropriations Dividend distribution to the shareholders is recognized as a liability in the consolidated financial statements
in the periods in which the dividends are declared and other appropriations are recognized in the period in which these are approved by the Board of Directors.
3. ISSUED, SUBSCRIBED AND PAID UP CAPITAL 2020 2019 2020 2019 (Number of shares) (Rupees in thousand)
Ordinary shares of Rs. 10 each 79,021,000 79,021,000 fully paid in cash 790,210 790,210 Ordinary shares of Rs. 10 each issued as fully 33,131,816 33,131,816 paid bonus shares 331,318 331,318 Ordinary shares of Rs. 10 each issued as fully 12,847,184 12,847,184 paid for consideration other than cash 128,472 128,472
125,000,000 125,000,000 1,250,000 1,250,000
NOTES TO THE CONSOLIDATED FINANCIAL STATEMENTSFor the year ended 30 September 2020

122 Shakarganj Limited and Its Subsidiary
3.1 Ordinary shares of the Holding Company held by related parties: 2020 2019 Note (NUMBER OF SHARES) Crescent Steel and Allied Products Limited 27 409 075 27 409 075 Crescent Cotton Mills Limited 3.1.1 - 1 531 193 The Crescent Textile Mills Limited 9 019 690 9 019 690 CS Capital (Private) Limited 7 602 272 7 602 272 Premier Insurance Limited 5 000 5 000 Roomi Fabrics Limited 3.1.1 - 11 984 754 Shakarganj Mills Limited Employees’ Provident Fund Trust 1 375 427 1 375 427 Shakarganj Mills Limited Gratuity Fund 107 876 107 876 Shakarganj Mills Limited Pension Fund 916 582 916 582
46 435 922 59 951 869 3.1.1 Crescent Cotton Mills Limited and Roomi Fabrics Limited ceased to be the related parties due to elimination
of common directorship after election of directors on 01 June 2020.
2020 2019 Note (Rupees in thousand) 4. CAPITAL RESERVES
Surplus on revaluation of property, plant and equipment - net of deferred income tax (Note 4.1) 6,600,793 6,894,890
Other capital reserves Premium on issue of right shares 4.2 1,056,373 1,056,373 Musharakah financing - equity portion 72,523 72,523 Fair value reserve of investments at fair value through other comprehensive income 4.3 (7,898) (13,311) Difference of capital under scheme of arrangement of merger 155,930 155,930
1,276,928 1,271,515
7,877,721 8,166,405 4.1 SURPLUS ON REVALUATION OF PROPERTY, PLANT AND EQUIPMENT - NET OF DEFERRED INCOME TAX
Surplus on revaluation of operating fixed assets as at 01 October 6,894,890 6,825,404
Add: Surplus arising on revaluation during the year - net of deferred income tax - 538,030 Impact of change in deferred tax rate 48,397 -
6,943,287 7,363,434 Less: Impact of change in deferred tax rate - (140,684) Transferred to accumulated loss in respect of incremental depreciation charged during the year - net of deferred income tax (339,053) (324,955) Surplus on revaluation of property, plant and equipment disposed of during the year - net of deferred income tax (3,441) (2,905)
(342,494) (468,544)
6,600,793 6,894,890
NOTES TO THE CONSOLIDATED FINANCIAL STATEMENTSFor the year ended 30 September 2020
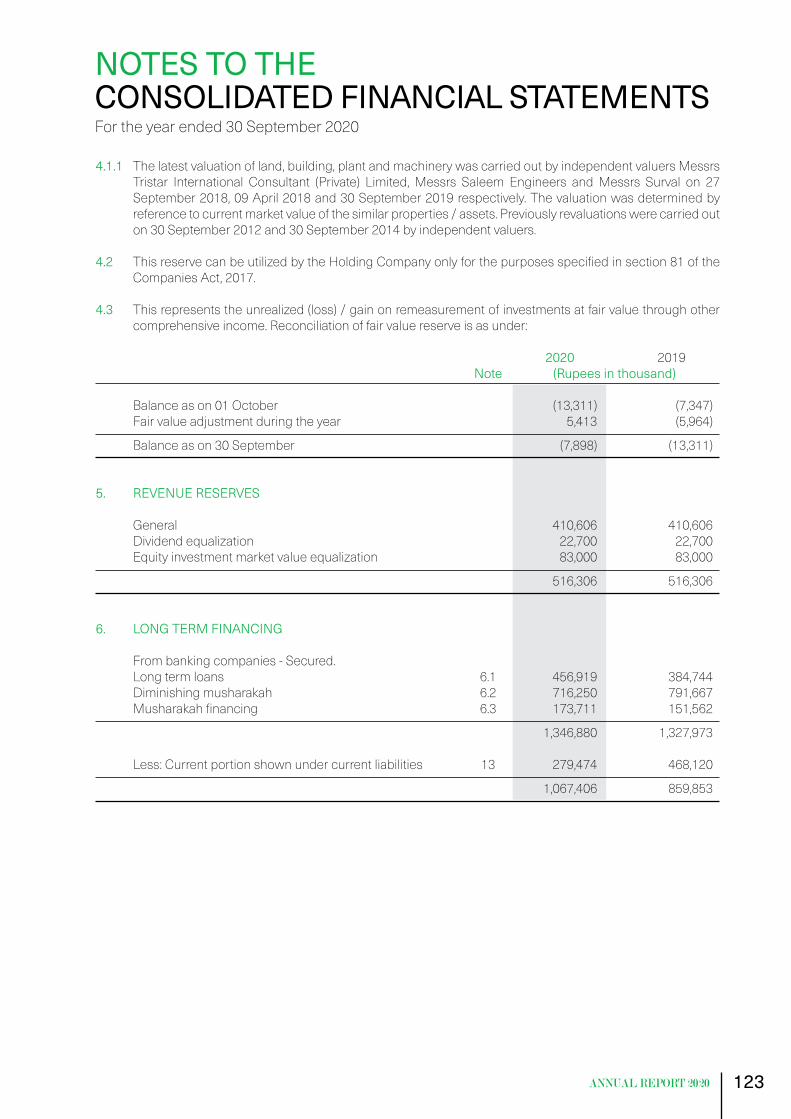
123
4.1.1 The latest valuation of land, building, plant and machinery was carried out by independent valuers Messrs Tristar International Consultant (Private) Limited, Messrs Saleem Engineers and Messrs Surval on 27 September 2018, 09 April 2018 and 30 September 2019 respectively. The valuation was determined by reference to current market value of the similar properties / assets. Previously revaluations were carried out on 30 September 2012 and 30 September 2014 by independent valuers.
4.2 This reserve can be utilized by the Holding Company only for the purposes specified in section 81 of the
Companies Act, 2017. 4.3 This represents the unrealized (loss) / gain on remeasurement of investments at fair value through other
comprehensive income. Reconciliation of fair value reserve is as under: 2020 2019 Note (Rupees in thousand) Balance as on 01 October (13,311) (7,347) Fair value adjustment during the year 5,413 (5,964)
Balance as on 30 September (7,898) (13,311)
5. REVENUE RESERVES General 410,606 410,606 Dividend equalization 22,700 22,700 Equity investment market value equalization 83,000 83,000
516,306 516,306
6. LONG TERM FINANCING From banking companies - Secured. Long term loans 6.1 456,919 384,744 Diminishing musharakah 6.2 716,250 791,667 Musharakah financing 6.3 173,711 151,562
1,346,880 1,327,973 Less: Current portion shown under current liabilities 13 279,474 468,120
1,067,406 859,853
NOTES TO THE CONSOLIDATED FINANCIAL STATEMENTSFor the year ended 30 September 2020
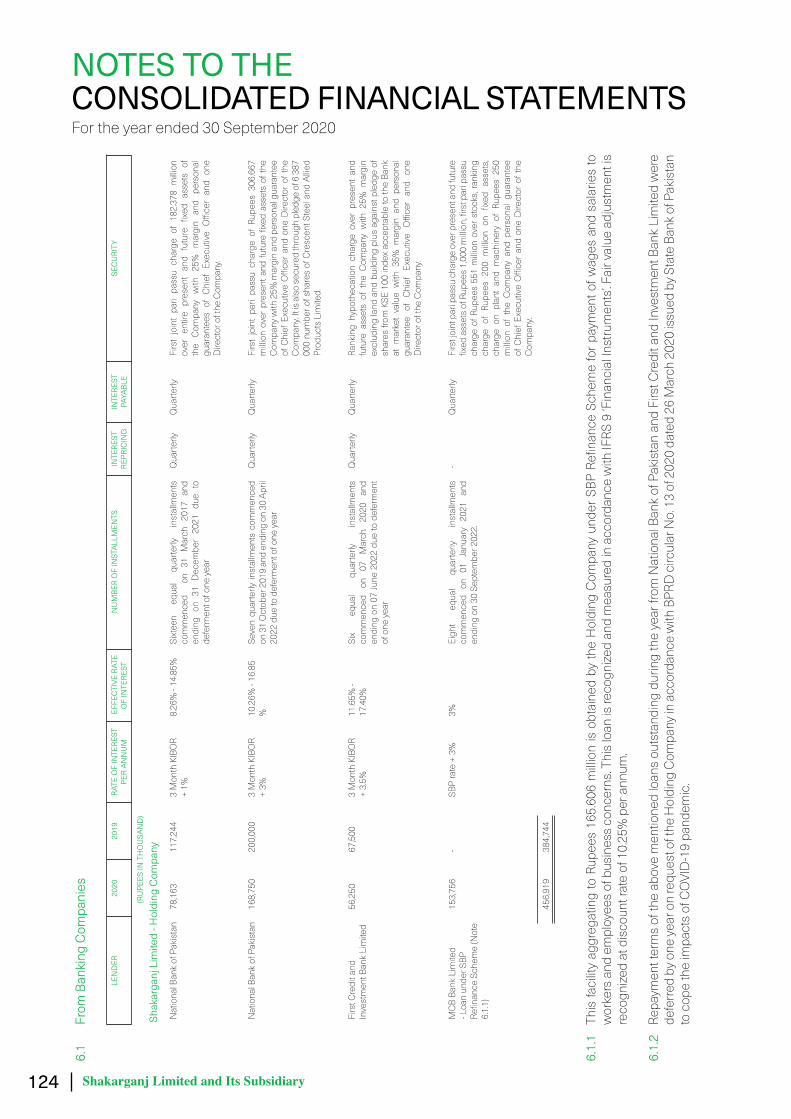
124 Shakarganj Limited and Its Subsidiary
6.1
From
Ban
king
Com
pani
es
LEN
DER
2020
2019
RATE
OF
INTE
REST
PE
R AN
NU
M E
FFEC
TIVE
RAT
E O
F IN
TERE
ST
NU
MBE
R O
F IN
STAL
LMEN
TS
INTE
REST
RE
PRIC
ING
INTE
REST
PA
YABL
ESE
CU
RITY
(RU
PEES
IN T
HO
USA
ND
)
Nat
iona
l Ban
k of
Pak
ista
n 7
8,16
3 1
17,2
44
3 M
onth
KIB
OR
+ 1%
8.26
% -
14.8
5%Si
xtee
n eq
ual
quar
terly
in
stal
lmen
ts
com
men
ced
on
31 M
arch
201
7 an
d en
ding
on
31 D
ecem
ber
2021
due
to
defe
rmen
t of o
ne y
ear
Qua
rterly
Q
uarte
rly
Firs
t jo
int
pari
pass
u ch
arge
of
182.
378
milli
on
over
ent
ire p
rese
nt a
nd f
utur
e fix
ed a
sset
s of
th
e C
ompa
ny
with
25
%
mar
gin
and
pers
onal
gu
aran
tees
of
Chi
ef E
xecu
tive
Offi
cer
and
one
Dire
ctor
of t
he C
ompa
ny.
Nat
iona
l Ban
k of
Pak
ista
n 1
68,7
50
200
,000
3
Mon
th K
IBO
R +
3%10
.26%
- 16
.85
%Se
ven
quar
terly
inst
allm
ents
com
men
ced
on 3
1 O
ctob
er 2
019
and
endi
ng o
n 30
Apr
il 20
22 d
ue to
def
erm
ent o
f one
yea
r
Qua
rterly
Q
uarte
rly
Firs
t jo
int
pari
pass
u ch
arge
of
Rupe
es 3
06.6
67
milli
on o
ver p
rese
nt a
nd fu
ture
fixe
d as
sets
of t
he
Com
pany
with
25%
mar
gin
and
pers
onal
gua
rant
ee
of C
hief
Exe
cutiv
e O
ffice
r an
d on
e D
irect
or o
f the
C
ompa
ny. It
is a
lso
secu
red
thro
ugh
pled
ge o
f 6 3
87
000
num
ber o
f sha
res
of C
resc
ent S
teel
and
Allie
d Pr
oduc
ts L
imite
d.
Firs
t Cre
dit a
nd
Inve
stm
ent B
ank
Lim
ited
56,
250
67,
500
3 M
onth
KIB
OR
+ 3.
5%11
.65%
- 17
.40%
Six
equa
l qu
arte
rly
inst
allm
ents
co
mm
ence
d on
07
M
arch
20
20
and
endi
ng o
n 07
June
202
2 du
e to
def
erm
ent
of o
ne y
ear
Qua
rterly
Q
uarte
rly
Rank
ing
hypo
thec
atio
n ch
arge
ove
r pr
esen
t an
d fu
ture
ass
ets
of t
he C
ompa
ny w
ith 2
5% m
argi
n ex
clud
ing
land
and
bui
ldin
g pl
us a
gain
st p
ledg
e of
sh
ares
from
KSE
100
inde
x ac
cept
able
to th
e Ba
nk
at m
arke
t va
lue
with
35%
mar
gin
and
pers
onal
gu
aran
tee
of
Chi
ef
Exec
utive
O
ffice
r an
d on
e D
irect
or o
f the
Com
pany
.
MC
B Ba
nk L
imite
d - L
oan
unde
r SBP
Re
finan
ce S
chem
e (N
ote
6.1.
1)
153
,756
-
SBP
rate
+ 3
%3%
Eigh
t eq
ual
quar
terly
in
stal
lmen
ts
com
men
ced
on
01
Janu
ary
2021
an
d en
ding
on
30 S
epte
mbe
r 202
2.
- Q
uarte
rly
Firs
t joi
nt p
ari p
assu
cha
rge
over
pre
sent
and
futu
re
fixed
ass
ets
of R
upee
s 1,
000
milli
on, fi
rst p
ari p
assu
ch
arge
of R
upee
s 55
1 m
illion
ove
r sto
cks,
rank
ing
char
ge o
f Ru
pees
200
milli
on o
n fix
ed a
sset
s, ch
arge
on
plan
t an
d m
achi
nery
of
Rupe
es 2
50
milli
on o
f th
e C
ompa
ny a
nd p
erso
nal
guar
ante
e of
Chi
ef E
xecu
tive
Offi
cer
and
one
Dire
ctor
of t
he
Com
pany
.
456
,919
3
84,7
44
6.1.
1 Th
is fa
cilit
y ag
greg
atin
g to
Rup
ees
165.
606
milli
on is
obt
aine
d by
the
Hol
ding
Com
pany
und
er S
BP R
efina
nce
Sche
me
for p
aym
ent o
f wag
es a
nd s
alar
ies
to
wor
kers
and
em
ploy
ees
of b
usin
ess
conc
erns
. Thi
s lo
an is
reco
gnize
d an
d m
easu
red
in a
ccor
danc
e w
ith IF
RS 9
‘Fin
anci
al In
stru
men
ts’. F
air v
alue
adj
ustm
ent i
s re
cogn
ized
at d
isco
unt r
ate
of 1
0.25
% p
er a
nnum
. 6.
1.2
Repa
ymen
t ter
ms
of th
e ab
ove
men
tione
d lo
ans
outs
tand
ing
durin
g th
e ye
ar fr
om N
atio
nal B
ank
of P
akis
tan
and
Firs
t Cre
dit a
nd In
vest
men
t Ban
k Li
mite
d w
ere
defe
rred
by o
ne ye
ar o
n re
ques
t of t
he H
oldi
ng C
ompa
ny in
acc
orda
nce
with
BPR
D c
ircul
ar N
o. 1
3 of
202
0 da
ted
26 M
arch
202
0 is
sued
by S
tate
Ban
k of P
akis
tan
to c
ope
the
impa
cts
of C
OVI
D-1
9 pa
ndem
ic.
NOTES TO THE CONSOLIDATED FINANCIAL STATEMENTSFor the year ended 30 September 2020
Shak
arga
nj L
imite
d - H
oldi
ng C
ompa
ny

125
6.2
Dim
inis
hing
mus
hara
kah
Sh
akar
ganj
Foo
d Pr
oduc
ts L
imite
d - S
ubsi
diar
y C
ompa
ny
LEN
DER
2020
2019
RATE
OF
INTE
REST
PE
R AN
NU
M E
FFEC
TIVE
RAT
E O
F IN
TERE
ST
NU
MBE
R O
F IN
STAL
LMEN
TS
INTE
REST
RE
PRIC
ING
INTE
REST
PA
YABL
ESE
CU
RITY
(RU
PEES
IN T
HO
USA
ND
)
Bank
Isla
mi P
akis
tan
Lim
ited
- rel
ated
par
ty -
66,
667
One
yea
r KIB
OR
+ 2%
10.4
5% -
16.4
8%Fa
cilit
y w
as c
ompl
etel
y re
paid
dur
ing
the
year
. Q
uarte
rly
Qua
rterly
Fi
rst
pari
pass
u ch
arge
ove
r fix
ed a
sset
s of
the
C
ompa
ny a
mou
ntin
g to
Rup
ees
471
milli
on a
nd a
tit
le o
ver d
imin
ishi
ng m
usha
raka
h as
sets
.
Sind
h M
odar
aba
(SM
) 1
00,0
00
- 6
Mon
th K
IBO
R +
3.5%
10.8
0% -
15.8
1%Si
xtee
n eq
ual q
uarte
rly in
stal
lmen
ts to
be
com
men
ced
in M
arch
202
1 an
d en
ding
in
Dec
embe
r 202
4
Sem
i an
nual
ly Q
uarte
rly
Post
dat
ed c
hequ
es a
nd a
title
of t
he a
sset
s in
the
nam
e of
SM
for e
ntire
faci
lity
perio
d.
Dim
inis
hing
Mus
hara
ka
Suku
k (N
ote
6.2.
1) 6
16,2
50
725
,000
3
Mon
th K
IBO
R +
1.75
%8.
61%
- 15
.31%
Twen
ty
equa
l qu
arte
rly
inst
allm
ents
co
mm
ence
d in
Oct
ober
201
9 an
d en
ding
in
July
2024
.
Qua
rterly
Q
uarte
rly
Firs
t pa
ri pa
ssu
char
ge o
ver
fixed
ass
ets
of t
he
Com
pany
am
ount
ing
to R
upee
s 96
7 m
illion
.
716
,250
7
91,6
67
6.2.
1 Th
is re
pres
ents
rate
d an
d pr
ivate
ly pl
aced
Dim
inis
hing
Mus
hara
kah
Suku
k C
ertifi
cate
s of
Rup
ees
725
milli
on is
sued
in 2
018.
The
Sub
sidi
ary
Com
pany
has
ex
erci
sed
the
optio
n to
def
er p
rinci
pal r
epay
men
t for
a p
erio
d of
one
year
in a
ccor
danc
e w
ith B
PRD
circ
ular
No.
13
of 2
020
date
d 26
Mar
ch 2
020
issu
ed b
y Sta
te
Bank
of P
akis
tan
to c
ope
the
impa
cts
of C
OVI
D-1
9 pa
ndem
ic.
NOTES TO THE CONSOLIDATED FINANCIAL STATEMENTSFor the year ended 30 September 2020

126 Shakarganj Limited and Its Subsidiary
2020 2019 Note (Rupees in thousand) 6.3 Musharakahfinancing Balance as at 01 October 151,562 -
Add: Financing obtained during the year - 280,000 Unwinding of discount 33 22,149 9,992
173,711 289,992
Less: Equity portion - 138,430
Balance as at 30 September 173,711 151,562 6.3.1 This represents musharakah financing facility amounting to Rupees 280 million obtained from BankIslami
Pakistan Limited, a related party on 01 April 2019 for a period of five years. To secure the musharakah facility, the Subsidiary Company has provided an Equity Warrant Option to Bank under which Bank may opt for conversion of its musharakah finance claim, either wholly or partially, into ordinary shares of the Subsidiary Company at a fixed price of Rupees 15 per share, subject to necessary approval from its regulator. The facility has been treated as a compound financial instrument with the debt instrument being measured first using an effective rate of 14.12% per annum while the remainder has been classified as equity portion as given above. In subsequent years, mark-up expense shall be recognized through consolidated statement of profit or loss by using the same rate of interest, and equivalent amount shall be reinstated to the loan through unwinding of discount.
2020 2019 Note (Rupees in thousand) 7. LIABILITIES AGAINST ASSETS SUBJECT TO FINANCE LEASE Future minimum lease payments - 1,242,622 Less: Un-amortized financial charge - 193,956
Present value of minimum lease rental payments - 1,048,666 Less: Current portion shown under current liabilities 13 - 334,128
- 714,538 7.1 As on 01 July 2019, the Group has adopted IFRS 16 ‘Leases’, hence, liabilities against assets subject to
finance lease have been classified as lease liabilities (Note 8 to these consolidated financial statements). The value of minimum lease payments were discounted using implicit interest rate ranged from 8.50 percent to 14.29 percent per annum. These arrangements relate to Tetra Pak processing and filling machines. Repayment period ranges from 36 to 60 months.
NOTES TO THE CONSOLIDATED FINANCIAL STATEMENTSFor the year ended 30 September 2020

127
7.2 Minimum lease payments and their present values are regrouped as under:
2020 2019Not later than
one yearLater than
one year but not later than
five years
Not later than one year
Later than one year but not later than
five years --------------------(Rupees in thousand) --------------------- Future minimum lease payments - - 395,927 846,695 Less: Un-amortized finance charge - - 61,799 132,157 Present value of future minimum lease payments - - 334,128 714,538 2020 2019 Note (Rupees in thousand) 8. LEASE LIABILITIES Total lease liabilities 8.1.1 799,654 - Less: Current portion shown under current liabilities 13 160,473 -
639,181 - 8.1 Reconciliation of lease liabilities Opening balance - - Add: Adjustment on adoption of IFRS 16 on 01 July 2019 1,077,961 - Additions during the year 29,996 - Interest accrued on lease liabilities 33 78,922 -
1,186,879 - Less: Payments during the period 387,225 -
Closing balance 799,654 -
Less: Current portion shown under current liabilities 160,473 -
Non-current portion 639,181 -
8.1.1 The value of minimum lease payments were discounted using implicit interest rate ranged from 8.50 percent to 10.29 percent per annum. These arrangements relate to Tetra Pak processing and filling machines and corresponding liability of head office building classified as right-of-use asset under IFRS 16. Repayment period ranges from 36 to 60 months.
8.2 Minimum lease payments and their present values are regrouped as under:
2020 2019Not later than
one yearLater than
one year but not later than
five years
Not later than one year
Later than one year but not later than
five years --------------------(Rupees in thousand) --------------------- Future minimum lease payments 196,736 783,622 - - Less: Un-amortized finance charge 36,263 144,441 - - Present value of future minimum lease payments 160,473 639,181 - -
NOTES TO THE CONSOLIDATED FINANCIAL STATEMENTSFor the year ended 30 September 2020
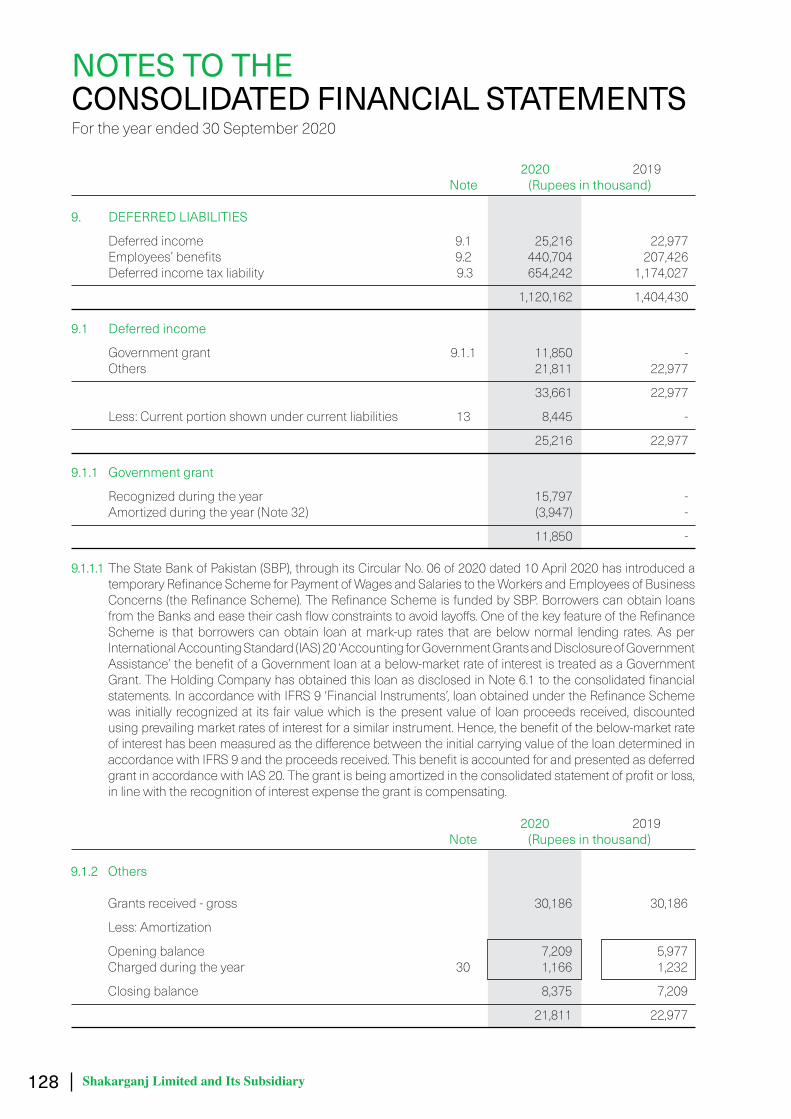
128 Shakarganj Limited and Its Subsidiary
2020 2019 Note (Rupees in thousand)
9. DEFERRED LIABILITIES
Deferred income 9.1 25,216 22,977 Employees’benefits 9.2 440,704 207,426 Deferredincometaxliability 9.3 654,242 1,174,027
1,120,162 1,404,430
9.1 Deferred income
Governmentgrant 9.1.1 11,850 - Others 21,811 22,977
33,661 22,977
Less:Currentportionshownundercurrentliabilities 13 8,445 -
25,216 22,977
9.1.1 Government grant
Recognizedduringtheyear 15,797 - Amortizedduringtheyear(Note32) (3,947) -
11,850 - 9.1.1.1TheStateBankofPakistan(SBP),throughitsCircularNo.06of2020dated10April2020hasintroduceda
temporaryRefinanceSchemeforPaymentofWagesandSalariestotheWorkersandEmployeesofBusinessConcerns(theRefinanceScheme).TheRefinanceSchemeisfundedbySBP.BorrowerscanobtainloansfromtheBanksandeasetheircashflowconstraintstoavoidlayoffs.OneofthekeyfeatureoftheRefinanceScheme is thatborrowerscanobtain loanatmark-up rates that arebelownormal lending rates.AsperInternationalAccountingStandard(IAS)20‘AccountingforGovernmentGrantsandDisclosureofGovernmentAssistance’thebenefitofaGovernmentloanatabelow-marketrateofinterestistreatedasaGovernmentGrant.TheHoldingCompanyhasobtainedthisloanasdisclosedinNote6.1totheconsolidatedfinancialstatements.InaccordancewithIFRS9‘FinancialInstruments’,loanobtainedundertheRefinanceSchemewas initially recognizedat its fairvaluewhich is thepresentvalueof loanproceedsreceived,discountedusingprevailingmarketratesofinterestforasimilarinstrument.Hence,thebenefitofthebelow-marketrateofinteresthasbeenmeasuredasthedifferencebetweentheinitialcarryingvalueoftheloandeterminedinaccordancewithIFRS9andtheproceedsreceived.ThisbenefitisaccountedforandpresentedasdeferredgrantinaccordancewithIAS20.Thegrantisbeingamortizedintheconsolidatedstatementofprofitorloss,inlinewiththerecognitionofinterestexpensethegrantiscompensating.
2020 2019 Note (Rupees in thousand)
9.1.2 Others Grantsreceived-gross 30,186 30,186
Less:Amortization
Openingbalance 7,209 5,977 Chargedduringtheyear 30 1,166 1,232
Closingbalance 8,375 7,209
21,811 22,977
NOTES TO THE CONSOLIDATED FINANCIAL STATEMENTSFortheyearended30September2020

129
9.1.2.1 This represents the grants received by Subsidiary Company in 2014 from United States Agency for International Development (USAID) amounting to Rupees 8.527 million and from Market Development Facility (MDF), Australia amounting to Rupees 21.659 million from 2014-2017. These grants were provided in order to support the Subsidiary Company for the purchase and installation of Farm Cooling Tanks (FCTs) at different locations of milk collections, purchase of motor bikes and training of farmers for dairy farming development.
2020 2019 Note (Rupees in thousand) 9.2 EMPLOYEES’ BENEFITS Shakarganj Limited - Holding Company
Pension fund 9.2.1 132,896 (27,222) Gratuity fund 9.2.2 27,607 (11,774) Shakarganj Food Products Limited - Subsidiary Company
Staff retirement gratuity 9.2.3 255,679 222,044 Accumulating compensated absences 9.2.4 24,522 24,378
440,704 207,426 9.2.1 Pension fund The amount recognized in the consolidated statement of financial position are determined as follows: Present value of defined benefit obligation 9.2.1.1 511,634 401,271 Fair value of plan assets 9.2.1.2 (378,738) (428,493)
Net defined benefit obligation / (asset) 132,896 (27,222)
9.2.1.1 The movement in the defined benefit obligation over the year is as follows: Present value of defined benefit obligation as at 01 October 401,271 381,034 Current service cost 18,917 15,456 Interest cost 50,599 36,896 Remeasurement losses / (gains) 64,950 (7,963) Benefits paid during the year (24,103) (24,152)
Present value of defined benefit obligation as at 30 September 511,634 401,271 9.2.1.2 The movement in the fair value of plan assets for the year is as follows: Fair value as at 01 October 428,493 390,711 Expected return on plan assets 55,399 38,476 Contributions during the year 19,405 12,242 Benefits paid during the year (24,103) (24,152) Remeasurement (losses) / gains (100,456) 11,216
Fair value as at 30 September 378,738 428,493
NOTES TO THE CONSOLIDATED FINANCIAL STATEMENTSFor the year ended 30 September 2020

130 Shakarganj Limited and Its Subsidiary
2020 2019 Note (Rupees in thousand)
9.2.1.3 The amounts recognized in the consolidated statement of profit or loss are as follows: Current service cost 18,917 15,456 Interest cost 50,599 36,896 Expected return on plan assets (55,399) (38,476)
14,117 13,876 9.2.1.4 The amounts recognized in the consolidated statement of profit or loss are classified as follows: Cost of sales 28.2 4,531 5,165 Distribution cost 29.2 487 431 Administrative expenses 30.1 8,845 8,010 Other expenses 31.1 254 270
14,117 13,876 9.2.1.5Remeasurementsofnetdefinedbenefitliability/(asset) Actuarial losses / (gains) due to experience adjustments 64,950 (7,963) Return on plan assets excluding interest income 100,456 (11,216)
Amount chargeable to other comprehensive income 165,406 (19,179)
9.2.1.6Reconciliationofnetdefinedbenefitliability/(asset) As at 01 October (27,222) (9,677) Expense chargeable to profit or loss during the year 14,117 13,876 Amount chargeable to other comprehensive income during the year 165,406 (19,179) Contributions paid by the Company during the year (19,405) (12,242)
As at 30 September 132,896 (27,222) 9.2.1.7 The estimated expenses to be charged to the consolidated statement of profit or loss for the year ending
on 30 September 2021 is Rupees 38.592 million. 2020 2019 Note (Rupees in thousand)
9.2.1.8 Actual return on plan assets Interest income for the year 55,399 38,476 Return on plan assets excluding interest income (100,456) 11,216
(45,057) 49,692
NOTES TO THE CONSOLIDATED FINANCIAL STATEMENTSFor the year ended 30 September 2020

131
2020 20199.2.1.9 The principal actuarial assumptions used were as follows: Discount rate (per annum) 10.50% 13.00% Future salary increases (per annum) 9.50% 12.00% Expected rate of future pension increases (per annum) 5.50% 8.00% Average expected remaining working life time of employees 10 years 10 years Expected average duration of obligation 19 years 20 years Expected mortality rate SLIC (2001-05) mortality table 2020 2019 Note (Rupees in thousand)
9.2.1.10Planassetsarecomprisedasfollows: Equity instruments 307,054 56,033 Cash and cash equivalents 135,379 422,944 Others - net (63,695) (50,484)
378,738 428,493 9.2.1.11 The sensitivity of the defined benefit obligation to changes in the weighted principal assumptions is:
2020 2019 Discount rate 1.00% 1.00% Increase in assumption (Rupees in thousand) (51,631) (40,494) Decrease in assumption (Rupees in thousand) 62,777 49,259 Future salary increase 1.00% 1.00% Increase in assumption (Rupees in thousand) 21,790 17,090 Decrease in assumption (Rupees in thousand) (19,122) (14,997) 9.2.2 Gratuity fund The amount recognized in the consolidated statement of financial position are determined as follows:
2020 2019 Note (Rupees in thousand) Present value of defined benefit obligations 9.2.2.1 111,375 67,775 Fair value of plan assets 9.2.2.2 (83,768) (79,549)
Net defined benefit obligation / (asset) 27,607 (11,774) 9.2.2.1 The movement in the defined benefit obligation over the year is as follows: Present value of defined benefit obligation as at 01 October 67,775 64,184 Current service cost 8,428 4,823 Interest cost 8,811 6,363 Benefits paid during the year - (1,101) Remeasurement losses / (gains) 26,361 (6,494)
Present value of defined benefit obligation as at 30 September 111,375 67,775
NOTES TO THE CONSOLIDATED FINANCIAL STATEMENTSFor the year ended 30 September 2020

132 Shakarganj Limited and Its Subsidiary
2020 2019 Note (Rupees in thousand)
9.2.2.2 The movement in the fair value of plan assets for the year is as follows: Fair value as at 01 October 79,549 66,455 Contributions during the year 9,042 5,790 Expected return on plan assets 10,929 6,880 Benefits paid during the year - (1,101) Remeasurement gains / (losses) (15,752) 1,525
Fair value as at 30 September 83,768 79,549 9.2.2.3 The amounts recognized in the consolidated statement of profit or loss are as follows: Current service cost 8,428 4,823 Interest cost 8,811 6,363 Expected return on plan assets (10,929) (6,880)
Total included in salaries and wages 6,310 4,306
9.2.2.4 The amounts recognized were included in the consolidated statement of profit or loss as follows: Cost of sales 28.2 2,530 1,525 Administrative expenses 30.1 3,679 2,723 Other expenses 31.1 101 58
6,310 4,306 9.2.2.5Remeasurementsofnetdefinedbenefitliability/(asset) Actuarial losses / (gains) due to experience adjustments 26,361 (6,494) Return on plan assets excluding interest income 15,752 (1,525)
Amount chargeable to other comprehensive income 42,113 (8,019) 9.2.2.6 The estimated expenses to be charged to the consolidated statement of profit or loss for the year ending
on 30 September 2021 is Rupees 10.616 million. 2020 2019 Note (Rupees in thousand)
9.2.2.7Reconciliationofnetdefinedbenefitliability/(asset) As at 01 October (11,774) (2,271) Expense chargeable to profit or loss during the year 6,310 4,306 Amount chargeable to other comprehensive income during the year 42,113 (8,019) Contributions paid by the Company during the year (9,042) (5,790)
As at 30 September 27,607 (11,774)
NOTES TO THE CONSOLIDATED FINANCIAL STATEMENTSFor the year ended 30 September 2020
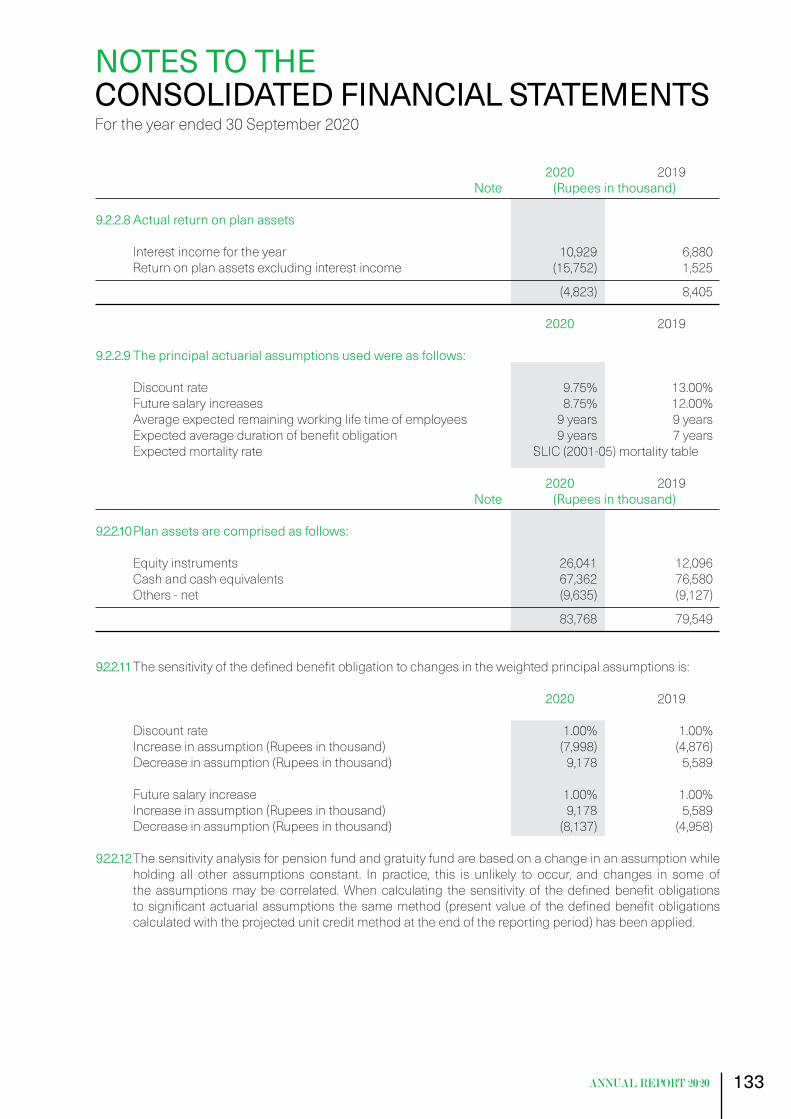
133
2020 2019 Note (Rupees in thousand)
9.2.2.8 Actual return on plan assets Interest income for the year 10,929 6,880 Return on plan assets excluding interest income (15,752) 1,525
(4,823) 8,405 2020 2019
9.2.2.9Theprincipalactuarialassumptionsusedwereasfollows: Discount rate 9.75% 13.00% Future salary increases 8.75% 12.00% Average expected remaining working life time of employees 9 years 9 years Expected average duration of benefit obligation 9 years 7 years Expected mortality rate SLIC (2001-05) mortality table 2020 2019 Note (Rupees in thousand)
9.2.2.10Planassetsarecomprisedasfollows: Equity instruments 26,041 12,096 Cash and cash equivalents 67,362 76,580 Others - net (9,635) (9,127)
83,768 79,549 9.2.2.11 The sensitivity of the defined benefit obligation to changes in the weighted principal assumptions is:
2020 2019 Discount rate 1.00% 1.00% Increase in assumption (Rupees in thousand) (7,998) (4,876) Decrease in assumption (Rupees in thousand) 9,178 5,589 Future salary increase 1.00% 1.00% Increase in assumption (Rupees in thousand) 9,178 5,589 Decrease in assumption (Rupees in thousand) (8,137) (4,958) 9.2.2.12 The sensitivity analysis for pension fund and gratuity fund are based on a change in an assumption while
holding all other assumptions constant. In practice, this is unlikely to occur, and changes in some of the assumptions may be correlated. When calculating the sensitivity of the defined benefit obligations to significant actuarial assumptions the same method (present value of the defined benefit obligations calculated with the projected unit credit method at the end of the reporting period) has been applied.
NOTES TO THE CONSOLIDATED FINANCIAL STATEMENTSFor the year ended 30 September 2020

134 Shakarganj Limited and Its Subsidiary
9.2.3 Staffretirementgratuity 9.2.3.1 The amount recognized in the consolidated statement of financial position is as follows:
2020 2019 Note (Rupees in thousand) Present value of defined benefit obligation as at 01 October 222,044 156,353 Current service cost 40,402 30,817 Interest cost 26,250 15,778 Benefits paid during the year (15,998) (4,847) Remeasurements (gains) / losses (17,019) 23,943
Present value of defined benefit obligation as at 30 September 255,679 222,044 9.2.3.2 The amounts recognized in the consolidated statement of profit or loss are as follows: Current service cost 40,402 30,817 Interest cost 26,250 15,778
66,652 46,595 9.2.3.3 The amounts recognized were included in the consolidated statement of profit or loss as follows: Cost of sales 28.2 25,598 20,202 Distribution cost 29.2 27,910 20,533 Administrative expenses 30.1 13,144 5,860
66,652 46,595 9.2.3.4 The principal actuarial assumptions used were as follows: 2020 2019 Future salary increases 8.75% 11.50% Discount rate 9.75% 12.50% Expected average duration of benefit obligation 9 years 9 years 9.2.3.5 The estimated expenses to be charged to the consolidated statement of profit or loss for the year ending
on 30 September 2021 is Rupees 59.378 million. 9.2.4 Accumulating compensated absences 9.2.4.1 The amount recognized in the consolidated statement of financial position is as follows:
2020 2019 (Rupees in thousand) Present value of defined benefit obligation as at 01 October 24,378 17,733 Current service cost 1,957 1,677 Interest cost 2,926 1,785 Benefits paid during the year (1,935) (622) Re-measurement (gains) / losses (2,804) 3,805
Present value of defined benefit obligation as at 30 September 24,522 24,378
NOTES TO THE CONSOLIDATED FINANCIAL STATEMENTSFor the year ended 30 September 2020

135
9.2.4.2 The amounts recognized in the consolidated statement of profit or loss are as follows:
2020 2019 Note (Rupees in thousand) Current service cost 1,957 1,677 Interest cost 2,926 1,785 Re-measurement (gains) / losses (2,804) 3,805
2,079 7,267 9.2.4.3 The amounts recognized were included in the consolidated statement of profit or loss as follows: Cost of sales 28.2 116 3,183 Distribution cost 29.2 1,601 3,192 Administrative expenses 30.1 362 892
2,079 7,267 9.2.4.4 The principal actuarial assumptions used were as follows: 2020 2019 Future salary increases 8.75% 11.50% Discount rate 9.75% 12.50% Expected average duration of benefit obligation 10 years 10 years
2020 2019 Note (Rupees in thousand)
9.3 DEFERRED INCOME TAX LIABILITY Taxabletemporarydifference Accelerated tax depreciation 1,274,209 1,118,901 Surplus on revaluation of property, plant and equipment 1,311,646 1,466,958
2,585,855 2,585,859 Deductibletemporarydifferences Unused tax losses, minimum tax and alternate corporate tax (1,868,741) (1,399,725) Provision for doubtful receivables (6,202) - Deferred and unpaid liabilities (56,670) (12,107)
(1,931,613) (1,411,832)
654,242 1,174,027 9.3.1 Deferred income tax asset of the Holding Company on unused tax losses available for carry forward are
recognized to the extent that the realization of related tax benefits through future taxable profits is probable. The Holding Company has not recognized deferred income tax asset on Rupees 5,017.307 million (2019: Rupees 4,114.900 million) in respect of tax losses, as sufficient tax profits may not be available to set off these in the foreseeable future.
NOTES TO THE CONSOLIDATED FINANCIAL STATEMENTSFor the year ended 30 September 2020
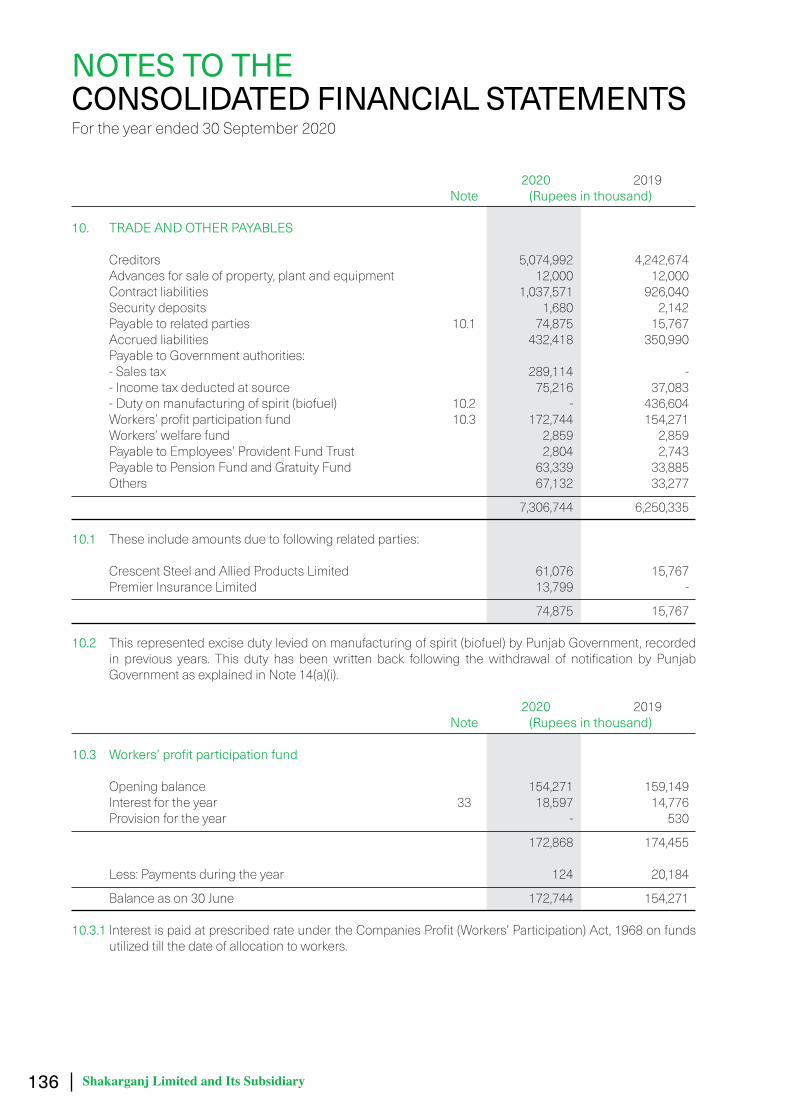
136 Shakarganj Limited and Its Subsidiary
2020 2019 Note (Rupees in thousand)
10. TRADE AND OTHER PAYABLES Creditors 5,074,992 4,242,674 Advances for sale of property, plant and equipment 12,000 12,000 Contract liabilities 1,037,571 926,040 Security deposits 1,680 2,142 Payable to related parties 10.1 74,875 15,767 Accrued liabilities 432,418 350,990 Payable to Government authorities: - Sales tax 289,114 - - Income tax deducted at source 75,216 37,083 - Duty on manufacturing of spirit (biofuel) 10.2 - 436,604 Workers’ profit participation fund 10.3 172,744 154,271 Workers’ welfare fund 2,859 2,859 Payable to Employees’ Provident Fund Trust 2,804 2,743 Payable to Pension Fund and Gratuity Fund 63,339 33,885 Others 67,132 33,277
7,306,744 6,250,335
10.1 These include amounts due to following related parties: Crescent Steel and Allied Products Limited 61,076 15,767 Premier Insurance Limited 13,799 -
74,875 15,767 10.2 This represented excise duty levied on manufacturing of spirit (biofuel) by Punjab Government, recorded
in previous years. This duty has been written back following the withdrawal of notification by Punjab Government as explained in Note 14(a)(i).
2020 2019 Note (Rupees in thousand)
10.3 Workers’profitparticipationfund Opening balance 154,271 159,149 Interest for the year 33 18,597 14,776 Provision for the year - 530
172,868 174,455 Less: Payments during the year 124 20,184
Balance as on 30 June 172,744 154,271 10.3.1 Interest is paid at prescribed rate under the Companies Profit (Workers’ Participation) Act, 1968 on funds
utilized till the date of allocation to workers.
NOTES TO THE CONSOLIDATED FINANCIAL STATEMENTSFor the year ended 30 September 2020
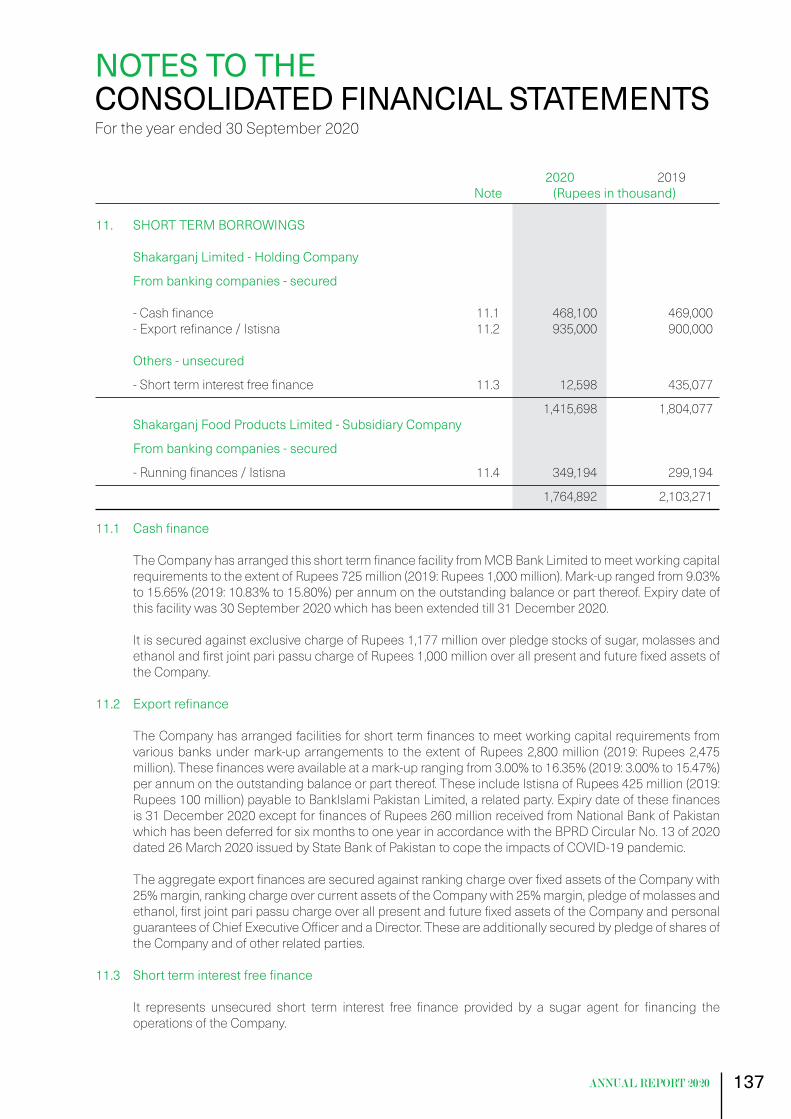
137
2020 2019 Note (Rupees in thousand)
11. SHORT TERM BORROWINGS Shakarganj Limited - Holding Company
From banking companies - secured - Cash finance 11.1 468,100 469,000 - Export refinance / Istisna 11.2 935,000 900,000 Others - unsecured
- Short term interest free finance 11.3 12,598 435,077
1,415,698 1,804,077 Shakarganj Food Products Limited - Subsidiary Company
From banking companies - secured
- Running finances / Istisna 11.4 349,194 299,194
1,764,892 2,103,271
11.1 Cashfinance The Company has arranged this short term finance facility from MCB Bank Limited to meet working capital
requirements to the extent of Rupees 725 million (2019: Rupees 1,000 million). Mark-up ranged from 9.03% to 15.65% (2019: 10.83% to 15.80%) per annum on the outstanding balance or part thereof. Expiry date of this facility was 30 September 2020 which has been extended till 31 December 2020.
It is secured against exclusive charge of Rupees 1,177 million over pledge stocks of sugar, molasses and ethanol and first joint pari passu charge of Rupees 1,000 million over all present and future fixed assets of the Company.
11.2 Exportrefinance The Company has arranged facilities for short term finances to meet working capital requirements from
various banks under mark-up arrangements to the extent of Rupees 2,800 million (2019: Rupees 2,475 million). These finances were available at a mark-up ranging from 3.00% to 16.35% (2019: 3.00% to 15.47%) per annum on the outstanding balance or part thereof. These include Istisna of Rupees 425 million (2019: Rupees 100 million) payable to BankIslami Pakistan Limited, a related party. Expiry date of these finances is 31 December 2020 except for finances of Rupees 260 million received from National Bank of Pakistan which has been deferred for six months to one year in accordance with the BPRD Circular No. 13 of 2020 dated 26 March 2020 issued by State Bank of Pakistan to cope the impacts of COVID-19 pandemic.
The aggregate export finances are secured against ranking charge over fixed assets of the Company with 25% margin, ranking charge over current assets of the Company with 25% margin, pledge of molasses and ethanol, first joint pari passu charge over all present and future fixed assets of the Company and personal guarantees of Chief Executive Officer and a Director. These are additionally secured by pledge of shares of the Company and of other related parties.
11.3 Shortterminterestfreefinance It represents unsecured short term interest free finance provided by a sugar agent for financing the
operations of the Company.
NOTES TO THE CONSOLIDATED FINANCIAL STATEMENTSFor the year ended 30 September 2020

138 Shakarganj Limited and Its Subsidiary
11.4 Runningfinances/Istisna The Company has an Istisna Islamic running finance facility with BankIslami Pakistan Limited (BIPL), a
related party of Rupees 200 million (2019: Rupees 200 million), running finance facilities from National Bank of Pakistan (NBP) and United Bank Limited (UBL) of Rupees 100 million (2019: Rupees 100 million) and Rupees 49.500 million (2019: Rupees 50 million) respectively. The mark-up rates on these facilities from BIPL, NBP and UBL were KIBOR + 1% (2019: 6 Month KIBOR + 2 %) per annum, 3 Month KIBOR + 2% (2019: 3 Month KIBOR + 2%) per annum and deposit rate + 1% (deposit rate + 1%) to be charged monthly, respectively. The effective mark-up rates during the year for the facilities availed from BIPL, NBP and UBL ranged from 14.23% to 15.64% (2019: 10.02% to 15.23%) per annum, 9.03% to 15.86% (2019: 9.82% to 14.97%) per annum and 7.73% to 13.50% (2019: 7.90% to 12.50%) per annum respectively. The facility from BIPL is secured against first charge over fixed assets (land, building, plant and machinery) amounting to Rupees 286 million (inclusive of 30% safety margin) and ownership of Istisna assets and will expire on 31 December 2020. The facility from NBP is secured against first charge over present and future current assets of the Company amounting to Rupees 133.300 million (inclusive of 25% safety margin). Meanwhile the facility from UBL is secured by lien over Term Deposit Receipt of the Company maintained with UBL amounting to Rupees 55 million and will expire on 30 November 2020.
2020 2019 Note (Rupees in thousand)
12. ACCRUED MARK-UP Long term financing 12.1 31,731 24,682 Liabilities against assets subject to finance lease - 26,803 Lease liabilities 8,993 - Short term borrowings 12.2 56,122 67,900
96,846 119,385 12.1 This includes mark-up of Rupees 1.214 million (2019: Rupees 1.415 million) payable to BankIslami Pakistan
Limited, a related party. 12.2 This includes mark-up of Rupees 30.012 million (2019: Rupees 12.387 million) payable to BankIslami
Pakistan Limited, a related party. 2020 2019 Note (Rupees in thousand)
13. CURRENT PORTION OF NON-CURRENT LIABILITIES Long term financing 6 279,474 468,120 Liabilities against assets subject to finance lease 7 - 334,128 Lease liabilities 8 160,473 - Deferred income - Government grant 9.1.1 8,445 -
448,392 802,248
NOTES TO THE CONSOLIDATED FINANCIAL STATEMENTSFor the year ended 30 September 2020

139
14. CONTINGENCIES AND COMMITMENTS a) Contingencies (i) The Government of Punjab under the powers conferred through the Punjab Excise Act, 1914 through
notification No. SO. Tax (E&T) 3-4/2012 dated 03 July 2012, levied a duty of Rupees 2 per liter on manufacturing of spirit (biofuel) with effect from 01 July 2012. In view of legal lacunas, discrimination as to other provinces, no legislative competence and lawful authority of Government of Punjab to impose such duty on industrial ethanol which is not alcohol liquor and the fact that the Holding Company is exporter of the spirit which is exempted under Order 6 of the Punjab Liquor Import, Export, Transportation and Possessions Orders, the management of the Holding Company through its legal counsel has challenged the imposition of said levy and is currently contesting it at Honorable Lahore High Court, Lahore. Keeping in view all the court proceedings and grounds discussed in various higher courts, Punjab Government, after due deliberations of the Provincial Cabinet of the Punjab Government, on 20 August 2019, through its notification no. SO(E&M)2-5/2018/ED withdrew the imposed duty of Rupees 2 per liter upon the manufacture of spirit in any distillery. As per Holding Company’s legal counsel, this is clear-cut case and the decision of the case shall be in favor of the Holding Company. In view of the aforesaid, the duty on manufacturing of spirit (biofuel) previously recognized as liability amounting to Rupees 436.604 million has been de-recognized and Rupees 229.918 million previously deposited on this account has been recognized as receivable being refundable.
(ii) The Holding Company has paid an advance amounting to Rupees 12.999 million to Messrs Industrial
Enterprises for designing the boiler project to use only biogas as fuel with no option of burning bagasse. However, the boiler could not generate steam as per specification. It is unlikely that this project will be completed. Therefore the Holding Company has gone into litigation with Messrs Industrial Enterprises in Civil Court, Jhang on 03 July 2018 for the recovery of the advance paid along with damages. Based on the advice of legal counsel, there are favourable grounds that the case will be decided in favour of the Holding Company and the advance amount paid will be refunded back.
(iii) Subsequent to the reporting date, an appellate order was made by Commissioner Inland Revenue,
Appeals, Lahore on 30 November 2020 under section 33 of Federal Excise Act, 2005, confirming payment of federal excise duty of Rupees 12.757 million including penalty regarding export of sugar to Afghanistan through land route in 2014. The Holding Company has filed appeal before Appellate Tribunal Inland Revenue, Lahore against this order on 23 December 2020. No provision has been recognized in the books of account as the Holding Company is confident on positive outcome of the appeal, on the advice of legal counsel.
(iv) The Competition Commission of Pakistan (CCP) issued show cause notices on 03 November 2020 and
04 November 2020, subsequent to the reporting date, under the provisions of the Competition Act, 2010, demanding facts and materials to satisfy CCP against various violations given in the show cause notice including closure of sugarcane crushing, price hike and other factors. The Holding Company submitted replies before the CCP on 21 November 2020, denying any of the violations contained in the show cause notice. Management is confident that the above-mentioned reply will satisfy CCP accordingly.
(v) In addition to above-mentioned matters there are certain cases which have been filed against the
Holding Company, primarily by the Holding Company’s employees, customers and vendors. However, the management is of the view that in the overall context of these consolidated financial statements, there would be no significant liability of the Holding Company against such cases.
(vi) Bank guarantee amounting to Rupees 59.400 million (2019: Rupees 59.900 million) given by the Bank of
the Subsidiary Company in favor of Sui Northern Gas Pipelines Limited for the performance of contract.
NOTES TO THE CONSOLIDATED FINANCIAL STATEMENTSFor the year ended 30 September 2020
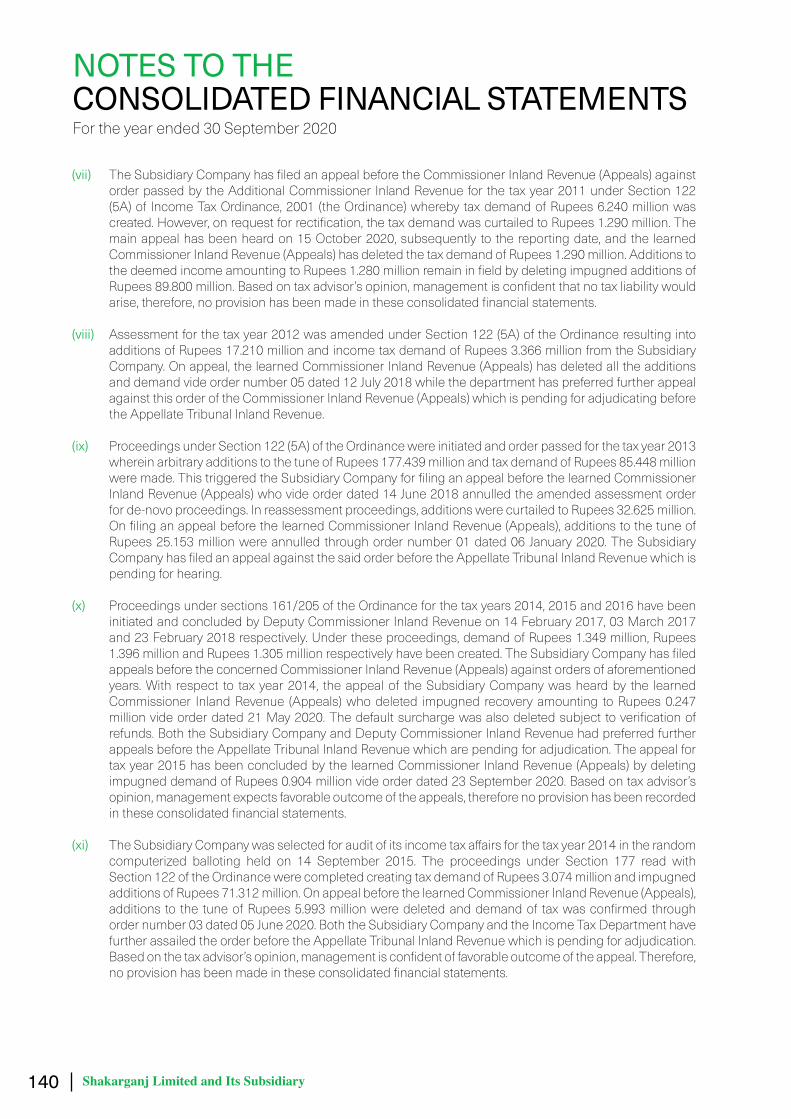
140 Shakarganj Limited and Its Subsidiary
(vii) The Subsidiary Company has filed an appeal before the Commissioner Inland Revenue (Appeals) against order passed by the Additional Commissioner Inland Revenue for the tax year 2011 under Section 122 (5A) of Income Tax Ordinance, 2001 (the Ordinance) whereby tax demand of Rupees 6.240 million was created. However, on request for rectification, the tax demand was curtailed to Rupees 1.290 million. The main appeal has been heard on 15 October 2020, subsequently to the reporting date, and the learned Commissioner Inland Revenue (Appeals) has deleted the tax demand of Rupees 1.290 million. Additions to the deemed income amounting to Rupees 1.280 million remain in field by deleting impugned additions of Rupees 89.800 million. Based on tax advisor’s opinion, management is confident that no tax liability would arise, therefore, no provision has been made in these consolidated financial statements.
(viii) Assessment for the tax year 2012 was amended under Section 122 (5A) of the Ordinance resulting into additions of Rupees 17.210 million and income tax demand of Rupees 3.366 million from the Subsidiary Company. On appeal, the learned Commissioner Inland Revenue (Appeals) has deleted all the additions and demand vide order number 05 dated 12 July 2018 while the department has preferred further appeal against this order of the Commissioner Inland Revenue (Appeals) which is pending for adjudicating before the Appellate Tribunal Inland Revenue.
(ix) Proceedings under Section 122 (5A) of the Ordinance were initiated and order passed for the tax year 2013
wherein arbitrary additions to the tune of Rupees 177.439 million and tax demand of Rupees 85.448 million were made. This triggered the Subsidiary Company for filing an appeal before the learned Commissioner Inland Revenue (Appeals) who vide order dated 14 June 2018 annulled the amended assessment order for de-novo proceedings. In reassessment proceedings, additions were curtailed to Rupees 32.625 million. On filing an appeal before the learned Commissioner Inland Revenue (Appeals), additions to the tune of Rupees 25.153 million were annulled through order number 01 dated 06 January 2020. The Subsidiary Company has filed an appeal against the said order before the Appellate Tribunal Inland Revenue which is pending for hearing.
(x) Proceedings under sections 161/205 of the Ordinance for the tax years 2014, 2015 and 2016 have been
initiated and concluded by Deputy Commissioner Inland Revenue on 14 February 2017, 03 March 2017 and 23 February 2018 respectively. Under these proceedings, demand of Rupees 1.349 million, Rupees 1.396 million and Rupees 1.305 million respectively have been created. The Subsidiary Company has filed appeals before the concerned Commissioner Inland Revenue (Appeals) against orders of aforementioned years. With respect to tax year 2014, the appeal of the Subsidiary Company was heard by the learned Commissioner Inland Revenue (Appeals) who deleted impugned recovery amounting to Rupees 0.247 million vide order dated 21 May 2020. The default surcharge was also deleted subject to verification of refunds. Both the Subsidiary Company and Deputy Commissioner Inland Revenue had preferred further appeals before the Appellate Tribunal Inland Revenue which are pending for adjudication. The appeal for tax year 2015 has been concluded by the learned Commissioner Inland Revenue (Appeals) by deleting impugned demand of Rupees 0.904 million vide order dated 23 September 2020. Based on tax advisor’s opinion, management expects favorable outcome of the appeals, therefore no provision has been recorded in these consolidated financial statements.
(xi) The Subsidiary Company was selected for audit of its income tax affairs for the tax year 2014 in the random
computerized balloting held on 14 September 2015. The proceedings under Section 177 read with Section 122 of the Ordinance were completed creating tax demand of Rupees 3.074 million and impugned additions of Rupees 71.312 million. On appeal before the learned Commissioner Inland Revenue (Appeals), additions to the tune of Rupees 5.993 million were deleted and demand of tax was confirmed through order number 03 dated 05 June 2020. Both the Subsidiary Company and the Income Tax Department have further assailed the order before the Appellate Tribunal Inland Revenue which is pending for adjudication. Based on the tax advisor’s opinion, management is confident of favorable outcome of the appeal. Therefore, no provision has been made in these consolidated financial statements.
NOTES TO THE CONSOLIDATED FINANCIAL STATEMENTSFor the year ended 30 September 2020
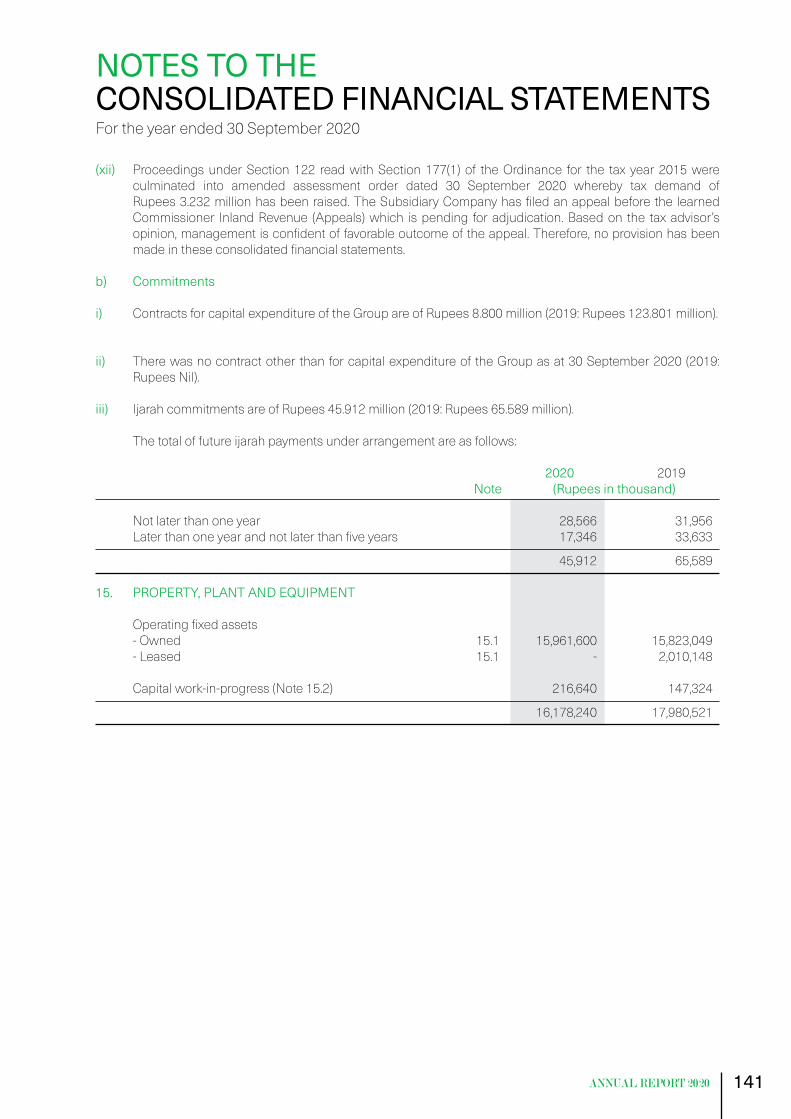
141
(xii) Proceedings under Section 122 read with Section 177(1) of the Ordinance for the tax year 2015 were culminated into amended assessment order dated 30 September 2020 whereby tax demand of Rupees 3.232 million has been raised. The Subsidiary Company has filed an appeal before the learned Commissioner Inland Revenue (Appeals) which is pending for adjudication. Based on the tax advisor’s opinion, management is confident of favorable outcome of the appeal. Therefore, no provision has been made in these consolidated financial statements.
b) Commitments i) Contracts for capital expenditure of the Group are of Rupees 8.800 million (2019: Rupees 123.801 million).
ii) There was no contract other than for capital expenditure of the Group as at 30 September 2020 (2019:
Rupees Nil). iii) Ijarah commitments are of Rupees 45.912 million (2019: Rupees 65.589 million). The total of future ijarah payments under arrangement are as follows: 2020 2019 Note (Rupees in thousand) Not later than one year 28,566 31,956 Later than one year and not later than five years 17,346 33,633
45,912 65,589 15. PROPERTY, PLANT AND EQUIPMENT Operating fixed assets - Owned 15.1 15,961,600 15,823,049 - Leased 15.1 - 2,010,148 Capital work-in-progress (Note 15.2) 216,640 147,324
16,178,240 17,980,521
NOTES TO THE CONSOLIDATED FINANCIAL STATEMENTSFor the year ended 30 September 2020
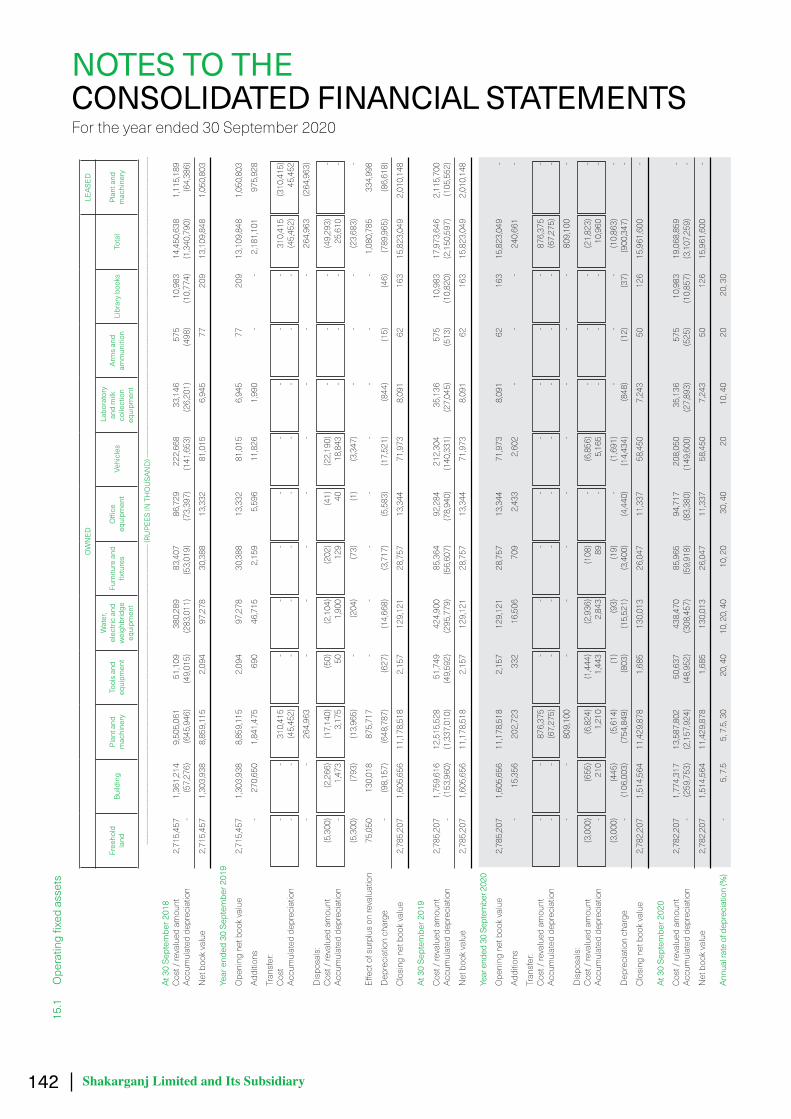
142 Shakarganj Limited and Its Subsidiary
15.1
Operatingfixedassets
OW
NED
LEAS
ED
Free
hold
la
ndBu
ildin
gPl
ant a
nd
mac
hine
ryTo
ols
and
equi
pmen
t
Wat
er,
elec
tric
and
wei
ghbr
idge
eq
uipm
ent
Furn
iture
and
fixtures
Office
equi
pmen
t V
ehic
les
Lab
orat
ory
and
milk
co
llect
ion
equi
pmen
t
Arm
s an
d am
mun
ition
Libr
ary
book
sTo
tal
Plan
t and
m
achi
nery
------------------------------------------------------------------------------------------------------------------------------------------(RUPE
ESIN
THOUSA
ND)------------------------------------------------------------------------------------------------------------------------------------------
At
30
Sept
embe
r 201
8
Cos
t / re
valu
ed a
mou
nt
2,7
15,4
57
1,3
61,2
14
9,5
05,0
61
51,
109
3
80,2
89
83,
407
8
6,72
9
222
,668
3
3,14
6
575
1
0,98
3
14,
450,
638
1
,115
,189
Accu
mul
ated
dep
reci
atio
n -
(5
7,27
6)
(645
,946
) (4
9,01
5)
(283
,011
) (5
3,01
9)
(73,
397)
(1
41,6
53)
(26,
201)
(4
98)
(10,
774)
(1
,340
,790
) (6
4,38
6)
N
et b
ook
valu
e 2
,715
,457
1
,303
,938
8
,859
,115
2
,094
9
7,27
8
30,
388
1
3,33
2
81,
015
6
,945
7
7
209
1
3,10
9,84
8
1,0
50,8
03
Year
end
ed 3
0 Se
ptem
ber 2
019
Ope
ning
net
boo
k va
lue
2
,715
,457
1
,303
,938
8
,859
,115
2
,094
9
7,27
8
30,
388
1
3,33
2
81,
015
6
,945
7
7
209
1
3,10
9,84
8
1,0
50,8
03
Addi
tions
-
2
70,6
50
1,8
41,4
75
690
4
6,71
5
2,1
59
5,5
96
11,
826
1
,990
-
-
2
,181
,101
9
75,9
28
Tran
sfer
:
Cos
t -
-
3
10,4
15
-
-
-
-
-
-
-
-
310
,415
(3
10,4
15)
Ac
cum
ulat
ed d
epre
ciat
ion
-
-
(45,
452)
-
-
-
-
-
-
-
-
(4
5,45
2)
45,
452
-
-
2
64,9
63
-
-
-
-
-
-
-
-
264
,963
(2
64,9
63)
D
ispo
sals
:
Cos
t / re
valu
ed a
mou
nt
(5,3
00)
(2,2
66)
(17,
140)
(5
0)
(2,1
04)
(202
) (4
1)
(22,
190)
-
-
-
(4
9,29
3)
-
Ac
cum
ulat
ed d
epre
ciat
ion
-
1,4
73
3,1
75
50
1
,900
1
29
40
1
8,84
3
-
-
-
25,
610
-
(5,3
00)
(793
) (1
3,96
5)
-
(204
) (7
3)
(1)
(3,3
47)
-
-
-
(23,
683)
-
Eff
ect o
f sur
plus
on
reva
luat
ion
75,
050
1
30,0
18
875
,717
-
-
-
-
-
-
-
-
1
,080
,785
3
34,9
98
Dep
reci
atio
n ch
arge
-
(9
8,15
7)
(648
,787
) (6
27)
(14,
668)
(3
,717
) (5
,583
) (1
7,52
1)
(844
) (1
5)
(46)
(7
89,9
65)
(86,
618)
Clo
sing
net
boo
k va
lue
2
,785
,207
1
,605
,656
1
1,17
8,51
8
2,1
57
129
,121
2
8,75
7
13,
344
7
1,97
3
8,0
91
62
1
63
15,
823,
049
2
,010
,148
At
30
Sept
embe
r 201
9
C
ost /
reva
lued
am
ount
2
,785
,207
1
,759
,616
1
2,51
5,52
8
51,
749
4
24,9
00
85,
364
9
2,28
4
212
,304
3
5,13
6
575
1
0,98
3
17,
973,
646
2
,115
,700
Accu
mul
ated
dep
reci
atio
n -
(1
53,9
60)
(1,3
37,0
10)
(49,
592)
(2
95,7
79)
(56,
607)
(7
8,94
0)
(140
,331
) (2
7,04
5)
(513
) (1
0,82
0)
(2,1
50,5
97)
(105
,552
)
N
et b
ook
valu
e 2
,785
,207
1
,605
,656
1
1,17
8,51
8
2,1
57
129
,121
2
8,75
7
13,
344
7
1,97
3
8,0
91
62
1
63
15,
823,
049
2
,010
,148
Ye
ar e
nded
30
Sept
embe
r 202
0
O
peni
ng n
et b
ook
valu
e
2,7
85,2
07
1,6
05,6
56
11,
178,
518
2
,157
1
29,1
21
28,
757
1
3,34
4
71,
973
8
,091
6
2
163
1
5,82
3,04
9
-
Addi
tions
-
1
5,35
6
202
,723
3
32
16,
506
7
09
2,4
33
2,6
02
-
-
-
240
,661
-
Tr
ansf
er:
C
ost /
reva
lued
am
ount
-
-
8
76,3
75
-
-
-
-
-
-
-
-
876
,375
-
Accu
mul
ated
dep
reci
atio
n -
-
(6
7,27
5)
-
-
-
-
-
-
-
-
(67,
275)
-
-
-
809
,100
-
-
-
-
-
-
-
-
8
09,1
00
-
D
ispo
sals
:
Cos
t / re
valu
ed a
mou
nt
(3,0
00)
(655
) (6
,824
) (1
,444
) (2
,936
) (1
08)
-
(6,8
56)
-
-
-
(21,
823)
-
Accu
mul
ated
dep
reci
atio
n -
2
10
1,2
10
1,4
43
2,8
43
89
-
5
,165
-
-
-
1
0,96
0
-
(3
,000
) (4
45)
(5,6
14)
(1)
(93)
(1
9)
-
(1,6
91)
-
-
-
(10,
863)
-
Dep
reci
atio
n ch
arge
-
(1
06,0
03)
(754
,849
) (8
03)
(15,
521)
(3
,400
) (4
,440
) (1
4,43
4)
(848
) (1
2)
(37)
(9
00,3
47)
-
Clo
sing
net
boo
k va
lue
2
,782
,207
1
,514
,564
1
1,42
9,87
8
1,6
85
130
,013
2
6,04
7
11,
337
5
8,45
0
7,2
43
50
1
26
15,
961,
600
-
At
30
Sept
embe
r 202
0
C
ost /
reva
lued
am
ount
2
,782
,207
1
,774
,317
1
3,58
7,80
2
50,
637
4
38,4
70
85,
965
9
4,71
7
208
,050
3
5,13
6
575
1
0,98
3
19,
068,
859
-
Accu
mul
ated
dep
reci
atio
n -
(2
59,7
53)
(2,1
57,9
24)
(48,
952)
(3
08,4
57)
(59,
918)
(8
3,38
0)
(149
,600
) (2
7,89
3)
(525
) (1
0,85
7)
(3,1
07,2
59)
-
Net
boo
k va
lue
2,7
82,2
07
1,5
14,5
64
11,
429,
878
1
,685
1
30,0
13
26,
047
1
1,33
7
58,
450
7
,243
5
0
126
1
5,96
1,60
0
-
Annu
al ra
te o
f dep
reci
atio
n (%
) -
5,
7.5
5,
7.5
, 30
20, 4
0 10
, 20,
40
10, 2
0 30
, 40
20
10, 4
0 20
20
, 30
NOTES TO THE CONSOLIDATED FINANCIAL STATEMENTSFor the year ended 30 September 2020

143
15.1.1 Particulars of immoveable fixed assets (i.e. land and building) in the name of the Company are as follows:
Particulars Location Area of land Covered Area of building
Sq. ft. Shakarganj Limited Free hold land (Farms) Land of Chak Rasool Pur 103.65 Kanals - Land of Mouza Billi Nualan Par 284.80 Kanals - Land of Mouza Chandia Nasheb 437 Kanals - Land of Mouza Billi Habib 17.45 Kanals - Land of Mouza Doka Baloucha 639.25 Kanals - Land At Mouza Khai Kalan 495.16 Acres - Land of Mouza Kot Esa Shah 1 262 Kanals - Land of Mouza Kot Khan 2 926.2 Kanals - Land at Chak 462 JB 753 Kanals, 19 Marlas - Land at Kot Sahai Singh 52.2 Kanals - Free hold land (Bhone) Land of Chund Bharwana 1 Kanal - Land of Adda Massan 1 Kanal - Land of Mouza Wadhi The 1 Kanal - Land of Wijhalka (Muhammad Wala) 1 Kanal - Land of Mouza Dholka Adda Akrian Wala 1.05 Kanals - Bhone Unit (factory land) 1 419.74 Kanals 496 365 Free hold land (Jhang) Land at Lalazar 1 Kanal - Land at Mouza Suleman Adda Sher Abad 1 Kanal - Land at Chak 338 Adda Nia Lahore 1 Kanal - Land at Chak 426 Adda Pul 1 Kanal - Land at Chak 428 Adda Pul 1 Kanal - Land at Chak 316 Talwandi 15.8 Kanals - Land at Mouza Sangra Adda Kot Shakir 1 Kanal - Land at Adda Daal More 1 Kanal - Land at Islam Wala Adda Pul Gagan 1 Kanal - Land at Adda Kot Bahadar 1 Kanal - Land at Dari Gondal Maharaja Road 1 Kanal - Land at Chak 1/3L Ahmad Pur Sial 1 Kanal - Land at Mouza Kalachi Adda 1 Kanal - Land at Mouza Bagh 1 Kanal - Land at Chak 214 Adda Gojra More 1 Kanal - Land at Mouza Gilmala 1 Kanal - Land at Malluana More 1 Kanal - Land at Chak 457 Kot Lakhana 1 Kanal - Land at Roran Wali 1 Kanal - Land at Ballo Shahabal (Adda Chabeel) 1 Kanal - Land at Jhang Shumali (Pacca Wala) 12 Marlas - Jhang Unit (factory land) 1 289.25 Kanals 1 665 196
Shakarganj Food Products Limited
Dairy plant 4 KM Lahore Road, Jaranwala 701 316 Square Feet
187 207 Square Feet
Juice plant Near Ahmad Nagar, Sargodha Road, Tehsil Lalian, District Chiniot
231 957 Square Feet
71 656 Square Feet
Fruit procurement centre
Chak No. 13 S.B. Ajnala Station, Muazamabad Road, Tehsil Bhalwal, District Sargodha
43 560 Square Feet
1 672 Square Feet
NOTES TO THE CONSOLIDATED FINANCIAL STATEMENTSFor the year ended 30 September 2020

144 Shakarganj Limited and Its Subsidiary
15.1.2Detailofoperatingfixedassets,exceedingthebo
okva
lueofRup
ees500,000,dispo
sedofduringtheyearisasfollows:
Des
crip
tion
Cos
t /
reva
lued
am
ount
Accu
mul
ated
de
prec
iatio
nBo
ok va
lue
Sale
pr
ocee
dsG
ain
/ (lo
ss)
Mod
e of
di
spos
alPa
rticu
lars
of p
urch
aser
s
------
------
------
------
----(R
UPE
ES IN
TH
OU
SAN
D)--
------
------
------
------
---
Free
hold
land
Land
of M
ouza
Wal
la (T
irkha
na W
ala)
3
,000
-
3
,000
3
,300
3
00
Neg
otia
tion
Muh
amm
ad N
awaz
, Tirk
hana
Wal
a,
Tehs
il Lal
ian,
Dis
trict
Chi
niot
.
Plan
t and
mac
hine
ry
M
achc
orne
r (2
Nos
) 3
,000
4
16
2,5
84
1,8
38
(746
) N
egot
iatio
n M
ubas
har B
roth
ers,
Raso
ol P
ura,
Fa
isal
abad
6,0
00
416
5
,584
5
,138
(4
46)
Aggr
egat
e of
oth
er it
ems
of p
rope
rty,
pl
ant a
nd e
quip
men
t with
indi
vidua
l
book
valu
es n
ot e
xcee
ding
Rupe
es 5
00,0
00
15,
823
1
0,54
4
5,2
79
12,
516
7,
237
21,
823
1
0,96
0
10,
863
1
7,65
4
6,79
1
15.1
.3 T
he c
arry
ing
amou
nt o
f fre
ehol
d la
nd, b
uild
ing
and
plan
t and
mac
hine
ry w
ould
hav
e be
en R
upee
s 27
6.29
7 m
illion
(201
9: R
upee
s 27
6.72
7 m
illion
), Ru
pees
687
.345
milli
on (2
019:
Rup
ees
697.
762
milli
on) a
nd R
upee
s 7,
544.
822
milli
on (2
019:
Rup
ees
7,59
9.76
0 m
illion
) res
pect
ively,
had
ther
e be
en
no re
valu
atio
n.
15.1
.4 F
orce
d sa
le va
lue
as p
er la
st re
valu
atio
n w
as o
f Rup
ees
2,35
8.40
9 m
illion
, Rup
ees
1,27
3.72
8 m
illion
and
Rup
ees
10,6
39.3
05 m
illion
for f
reeh
old
land
, bu
ildin
g an
d pl
ant a
nd m
achi
nery
resp
ectiv
ely.
NOTES TO THE CONSOLIDATED FINANCIAL STATEMENTSFor the year ended 30 September 2020

145
2020 2019 Note (Rupees in thousand)
15.1.5 The depreciation charge has been allocated as follows: Owned:
Cost of sales 28 872,024 757,123 Distribution cost 29 8,772 10,078 Administrative expenses 30 19,551 22,764
900,347 789,965 Leased:
Cost of sales 28 - 86,618
900,347 876,583 15.1.6 Plant and machinery includes assets having cost of Rupees 25.890 million (2019: Rupees 25.890 million)
and book value of Rupees 15.877 million (2019: Rupees 16.713 million) mounted on transport contractors’ vehicles.
15.2 CAPITAL WORK-IN-PROGRESS Civil works 1,200 5,885 Plant and machinery 145,011 110,431 Water, electric and weighbridge equipment 21 -
146,232 116,316
Advances given for capital work in progress 15.2.1 70,408 31,008
216,640 147,324 15.2.1 This relates to advances given to various parties for supplies and consultancy services relates to energy
conservation. It also includes advance given to Industrial Enterprises amounting to Rupees 31.01 million (2019: Rupees 31.01 million).
2020 2019 Note (Rupees in thousand) Considered good: - Plant and machinery 15.2.2 70,408 31,008 Considered doubtful: - Plant and machinery 21,664 21,664 - Intangibles 15,274 15,274
36,938 36,938
107,346 67,946 Less: Provision against doubtful advances (36,938) (36,938)
70,408 31,008
NOTES TO THE CONSOLIDATED FINANCIAL STATEMENTSFor the year ended 30 September 2020

146 Shakarganj Limited and Its Subsidiary
15.2.2 Advances included an amount given to Mian Muhammad Sugar Mill Limited in pursuance to a purchase arrangement whereby the Holding Company was to get a beneficial interest in the machinery installed at the premises. In prior years, the management re-evaluated the status of this arrangement and decided to discontinue with it. Appropriate legal proceedings were initiated in this regard and consequently provision was created against the remaining advance. The movement to date is as follows:
2020 2019 Note (Rupees in thousand)
Advance to date 217,817 217,817 Machinery received (169,315) (169,315)
48,502 48,502 Advance written off (28,148) (28,148) Provision for doubtful advances (20,354) (20,354)
(48,502) (48,502)
- -
16. RIGHT-OF-USE ASSETS Plant and Building Total machinery (Rupees in thousand) Net carrying amount 01 October 2019 2,010,148 29,295 2,039,443 30 September 2020 1,160,565 19,627 1,180,192 Depreciation expense for the year (Note 16.1) 70,479 9,668 80,147 Additions during the year 29,996 - 29,996 Book value of assets transferred during the year to operating fixed assets - owned 809,100 - 809,100 Annual rate of depreciation (%) 5 33 2020 2019 Note (Rupees in thousand)
16.1 Depreciation charge for the year has been allocated as follows: Cost of sales 28 70,479 - Distribution cost 29 4,914 - Administrative expenses 30 4,754 -
80,147 -
NOTES TO THE CONSOLIDATED FINANCIAL STATEMENTSFor the year ended 30 September 2020
147
2020 2019 Note (Rupees in thousand) 17. INTANGIBLE ASSET Computer software
Net carrying value basis
Opening net book value 5,467 - Add: Additions during the year 530 6,075 Amortization 30 (1,226) (608)
Closing net book value 4,771 5,467 Gross carrying amount
Cost 6,605 6,075 Accumulated amortization (1,834) (608)
Closing net book value 4,771 5,467 2020 2019 Amortization rate (per annum) 20% 20%
2020 2019 Note (Rupees in thousand)
18. BIOLOGICAL ASSETS Sugarcane Mature 18.1 8,676 15,607 Immature 18.2 1,218 3,108
9,894 18,715 Rice - mature 11,847 12,852 Others - mature 450 840 Livestock - mature 18.3 17,601 13,909
39,792 46,316
Non - current - livestock 17,601 13,909 - sugarcane - immature 1,218 3,108
18,819 17,017 Current - crops 20,973 29,299
39,792 46,316 18.1 The value of mature sugarcane crops is based on estimated average yield of 561.25 (2019: 623) maunds
per acre on cultivated area of 128.30 (2019: 195) acres. The value of rice crops is based on the estimated yield of 35 (2019: 40) maunds per acre on cultivated area of 145 (2019: 189) acres.
18.2 25 (2019: 64) acres relates to the sugarcane cultivation which is valued at cost incurred to date being
considered its fair value and is considered to be immature for the reason that it will take more than a year for harvesting.
18.3 Livestock comprises 229 (2019: 166) cows, heifers, bulls and calves.
NOTES TO THE CONSOLIDATED FINANCIAL STATEMENTSFor the year ended 30 September 2020

148 Shakarganj Limited and Its Subsidiary
2020 2019 Note (Rupees in thousand)
18.4 Movement during the year Livestock As at 01 October 13,910 11,558 Gain arising from changes in fair value less estimated point of sale costs 4,149 3,381 Decrease due to sale / deceased livestock (458) (1,029)
As at 30 September 17,601 13,910 Crops As at 01 October 32,406 19,717 Increase due to purchases / costs incurred 50,753 39,217 Decrease due to harvest / sales (47,444) (47,246) Fair value adjustment related to sales during the year (3,307) 8,028 Fair value adjustment of agricultural assets 28 (10,217) 12,690
As at 30 September 22,191 32,406
39,792 46,316 2020 2019 Note (Rupees in thousand)
19. LONG TERM INVESTMENTS At fair value through other comprehensive income
Related party - quoted
Crescent Steel and Allied Products Limited 180 000 (2019: 180 000) fully paid ordinary shares of Rupees 10 each. 15,921 15,921 Others - unquoted
Crescent Group (Private) Limited 220 000 (2019: 220 000) fully paid ordinary shares of Rupees 10 each. 2,200 2,200 Crescent Standard Telecommunications Limited 300 000 (2019: 300 000) fully paid ordinary shares of Rupees 10 each. 3,000 3,000 Innovative Investment Bank Limited 51 351 (2019: 51 351) fully paid ordinary shares of Rupees 10 each - -
21,121 21,121
Less: Fair value adjustment (7,898) (13,311)
13,223 7,810
NOTES TO THE CONSOLIDATED FINANCIAL STATEMENTSFor the year ended 30 September 2020

149
2020 2019 Note (Rupees in thousand)
20. LONG TERM LOANS, ADVANCES AND DEPOSITS Long term loans - considered good: Sui Northern Gas Pipelines Limited 20.1 2,496 4,992 Executives 20.2 & 20.3 12,723 15,861 Employees 20.3 11,338 12,058
26,557 32,911 Security deposits: Considered good 66,559 60,728 Considered doubtful 265 265
66,824 60,993 Margin against bank guarantee - considered good 59,400 59,400 Advance to Creek Marina (Private) Limited - considered doubtful 20.4 38,557 38,557
191,338 191,861
Less: Provision against doubtful receivables 38,822 38,822
152,516 153,039
Less: Current portion showed under current assets 24 11,572 14,690
140,944 138,349 20.1 This represents unsecured long term loan provided to Sui Northern Gas Pipelines Limited (SNGPL) for the
development of infrastructure for supply of natural gas to the dairy plant of the Subsidiary Company. The loan is repayable by SNGPL in 10 equal annual installments with two years grace period started from 30 September 2011. The loan carries mark up at the rate of 1.5% (2019: 1.5%) per annum payable annually in arrears.
20.2 Maximum aggregate balance due from executives at the end of any month during the year was Rupees
12.723 million (2019: Rupees 15.861 million). 20.3 These include the interest free advances given to Subsidiary Company’s executives and other employees
recoverable in equal monthly installments and secured against the retirement benefit payable to these employees. The fair value adjustment in accordance with the requirements of IFRS 9 ‘Financial Instruments: Recognition and Measurement’ arising in respect of advances to employees is not considered material and hence not recognized.
20.4 This represents payment for two apartments in the Creek Marina Projects pursuant to a settlement
agreement entered into by the Holding Company and the former Crescent Standard Investment Bank Limited in year 2006. The construction work at the site has been halted since year 2011 due to differences between Defence Housing Authority and the developer. The resumption of construction work is still uncertain in near future. Consequently, based on prudence principal the Holding Company provided the above advance in full.
NOTES TO THE CONSOLIDATED FINANCIAL STATEMENTSFor the year ended 30 September 2020
150 Shakarganj Limited and Its Subsidiary
2020 2019 (Rupees in thousand)
21. STORES, SPARE PARTS AND LOOSE TOOLS Stores 79,005 78,985 Spare parts 174,145 200,096 Loose tools 826 917
253,976 279,998 Less: Provision for obsolete items (2,820) (2,820)
251,156 277,178 21.1 The Group holds stores and spare parts for specific capitalization amounting to Rupees 9.888 million
(2019: Rupees 2.242 million). 2020 2019 Note (Rupees in thousand)
22. STOCK-IN-TRADE Raw materials 775,667 832,461 Work-in-process 16,100 20,724 Finished goods 22.2 - Manufactured 1,047,523 847,117 - Trading - 284,000
1,047,523 1,131,117
1,839,290 1,984,302 22.1 Stock-in-trade of Rupees 31.200 million (2019: Rupees 1.417 million) is being carried at net realizable
value. 22.2 These include stock of Rupees 0.211 million (2019: Rupees Nil) held by a third party.
2020 2019 Note (Rupees in thousand)
23. TRADE DEBTS Considered good - unsecured 275,787 154,993 Considered doubtful 11,934 10,522
287,721 165,515 Less: Allowance for expected credit losses 23.1 11,934 10,522
275,787 154,993
NOTES TO THE CONSOLIDATED FINANCIAL STATEMENTSFor the year ended 30 September 2020
151
2020 2019 Note (Rupees in thousand)
23.1 Allowance for expected credit losses Balance as at 01 October 10,522 15,709 Provision for the year 31 1,412 - Written off during the year - (5,187)
Balance as at 30 September 11,934 10,522 23.2 As at 30 September 2020, trade debts aggregating to Rupees 191.649 million (2019: Rupees 81.167 million)
are past due but not impaired. These relate to a number of independent customers from whom there is no recent history of default. The ageing analysis of these trade debts is as follows:
2020 2019 Note (Rupees in thousand)
Upto 1 month 142,754 18,907 1 to 6 months 45,592 34,025 More than 6 months 3,303 28,235
191,649 81,167
24. LOANS AND ADVANCES Consideredgood:
- to employees 21,169 12,105 - to executives 2,293 2,052 - to suppliers and contractors 157,844 312,400 - to sugarcane growers 2,422 3,036
183,728 329,593 Current portion of long term loans, advances and deposits 20 11,572 14,690 Due from related party 24.1 14,527 2,607 Advances - considered doubtful: - to employees 177 628 - to suppliers and contractors 9,468 9,409 - to sugarcane growers 4,606 4,705
14,251 14,742
224,078 361,632 Less: Provision against doubtful loans and advances 24.2 14,251 14,742
209,827 346,890 24. Due from related party
Crescent Steel and Allied Products Limited 24.1.1 14,527 2,607
24.1.1 Maximum aggregate balance due from the related party at the end of any month during the year was Rupees 14.527 million (2019: Rupees 23.84 million).
NOTES TO THE CONSOLIDATED FINANCIAL STATEMENTSFor the year ended 30 September 2020
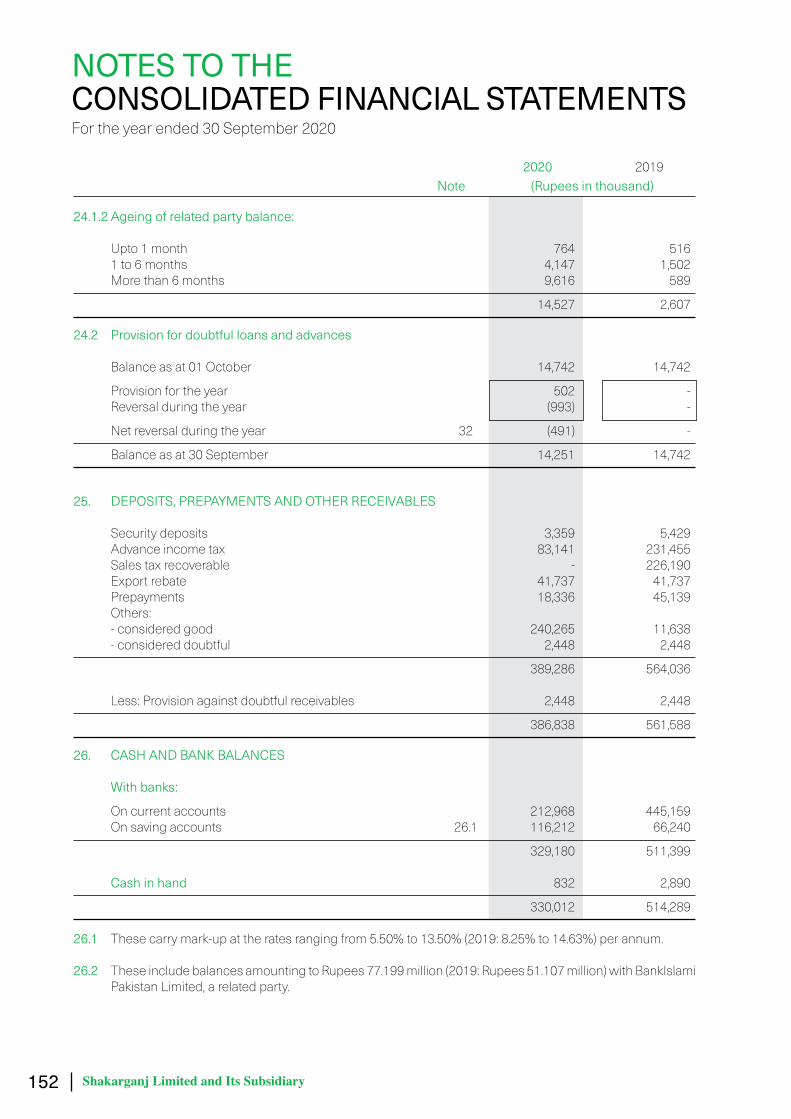
152 Shakarganj Limited and Its Subsidiary
2020 2019 Note (Rupees in thousand)
24.1.2Ageingofrelatedpartybalance: Upto 1 month 764 516 1 to 6 months 4,147 1,502 More than 6 months 9,616 589
14,527 2,607
24.2 Provision for doubtful loans and advances Balance as at 01 October 14,742 14,742
Provision for the year 502 - Reversal during the year (993) -
Net reversal during the year 32 (491) -
Balance as at 30 September 14,251 14,742
25. DEPOSITS, PREPAYMENTS AND OTHER RECEIVABLES Security deposits 3,359 5,429 Advance income tax 83,141 231,455 Sales tax recoverable - 226,190 Export rebate 41,737 41,737 Prepayments 18,336 45,139 Others: - considered good 240,265 11,638 - considered doubtful 2,448 2,448
389,286 564,036 Less: Provision against doubtful receivables 2,448 2,448
386,838 561,588
26. CASH AND BANK BALANCES Withbanks:
On current accounts 212,968 445,159 On saving accounts 26.1 116,212 66,240
329,180 511,399 Cash in hand 832 2,890
330,012 514,289 26.1 These carry mark-up at the rates ranging from 5.50% to 13.50% (2019: 8.25% to 14.63%) per annum.
26.2 These include balances amounting to Rupees 77.199 million (2019: Rupees 51.107 million) with BankIslami
Pakistan Limited, a related party.
NOTES TO THE CONSOLIDATED FINANCIAL STATEMENTSFor the year ended 30 September 2020
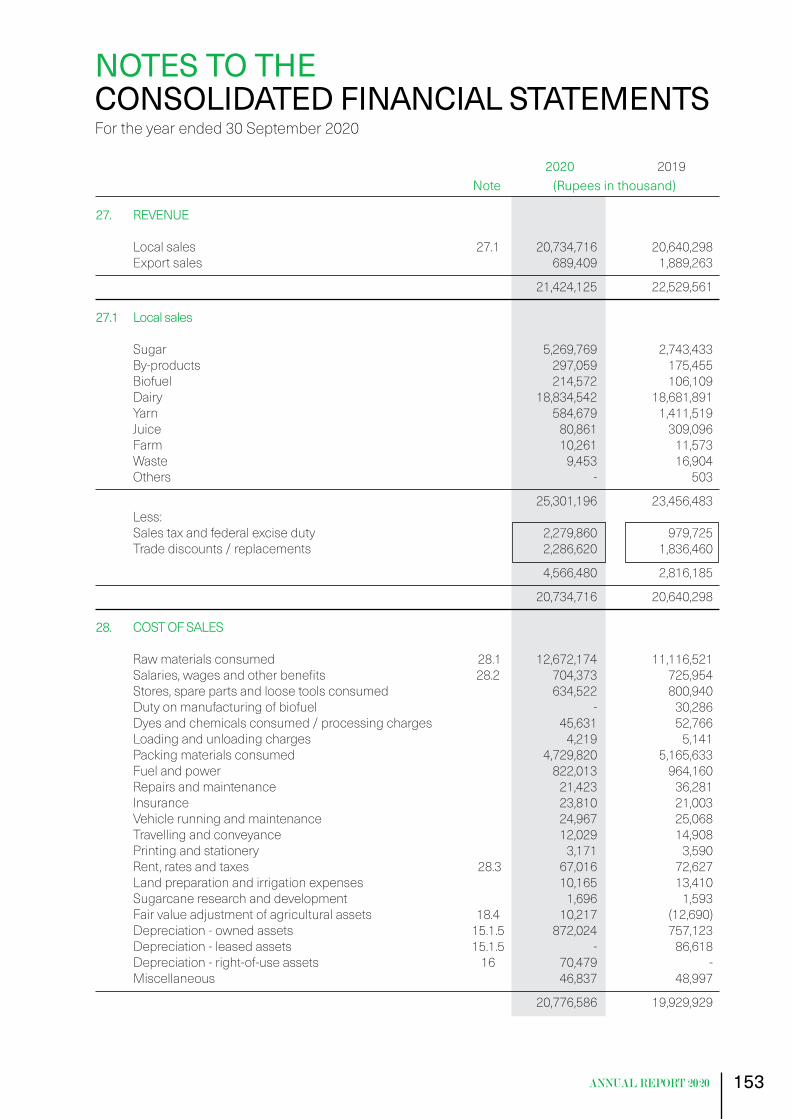
153
2020 2019 Note (Rupees in thousand)
27. REVENUE Local sales 27.1 20,734,716 20,640,298 Export sales 689,409 1,889,263
21,424,125 22,529,561
27.1 Local sales Sugar 5,269,769 2,743,433 By-products 297,059 175,455 Biofuel 214,572 106,109 Dairy 18,834,542 18,681,891 Yarn 584,679 1,411,519 Juice 80,861 309,096 Farm 10,261 11,573 Waste 9,453 16,904 Others - 503
25,301,196 23,456,483 Less: Sales tax and federal excise duty 2,279,860 979,725 Trade discounts / replacements 2,286,620 1,836,460
4,566,480 2,816,185
20,734,716 20,640,298
28. COST OF SALES Raw materials consumed 28.1 12,672,174 11,116,521 Salaries, wages and other benefits 28.2 704,373 725,954 Stores, spare parts and loose tools consumed 634,522 800,940 Duty on manufacturing of biofuel - 30,286 Dyes and chemicals consumed / processing charges 45,631 52,766 Loading and unloading charges 4,219 5,141 Packing materials consumed 4,729,820 5,165,633 Fuel and power 822,013 964,160 Repairs and maintenance 21,423 36,281 Insurance 23,810 21,003 Vehicle running and maintenance 24,967 25,068 Travelling and conveyance 12,029 14,908 Printing and stationery 3,171 3,590 Rent, rates and taxes 28.3 67,016 72,627 Land preparation and irrigation expenses 10,165 13,410 Sugarcane research and development 1,696 1,593 Fair value adjustment of agricultural assets 18.4 10,217 (12,690) Depreciation - owned assets 15.1.5 872,024 757,123 Depreciation - leased assets 15.1.5 - 86,618 Depreciation - right-of-use assets 16 70,479 - Miscellaneous 46,837 48,997
20,776,586 19,929,929
NOTES TO THE CONSOLIDATED FINANCIAL STATEMENTSFor the year ended 30 September 2020
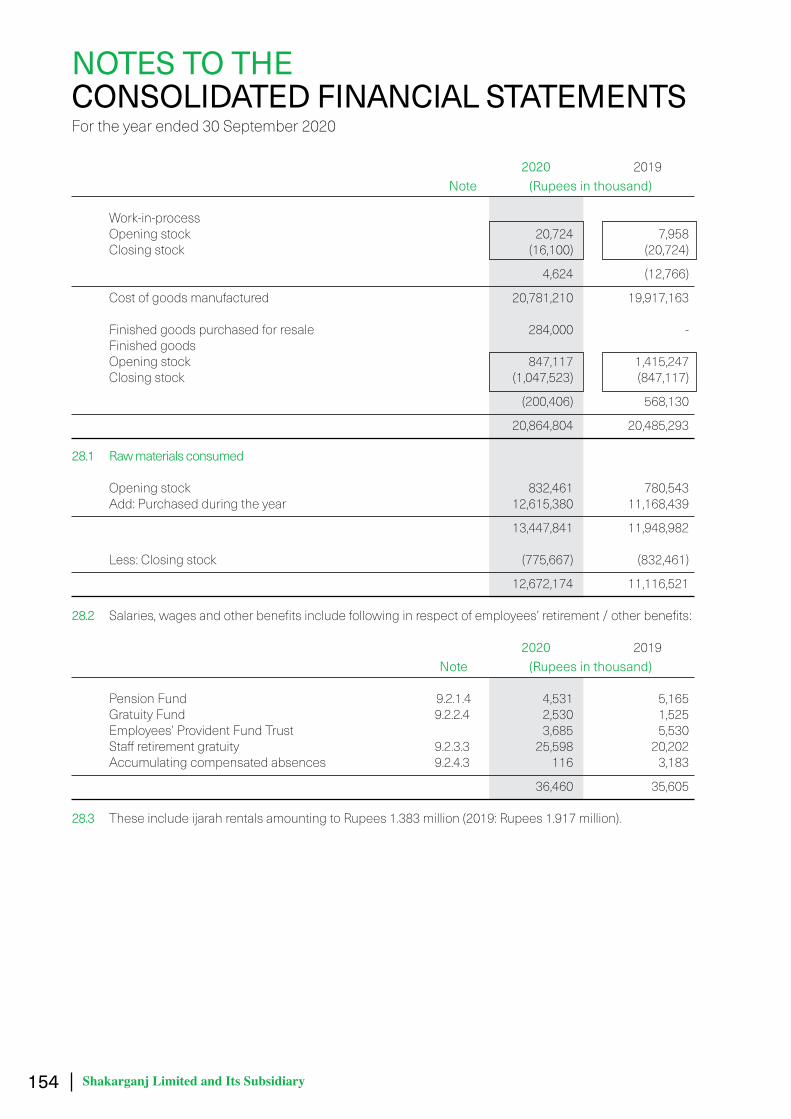
154 Shakarganj Limited and Its Subsidiary
2020 2019 Note (Rupees in thousand)
Work-in-process Opening stock 20,724 7,958 Closing stock (16,100) (20,724)
4,624 (12,766)
Cost of goods manufactured 20,781,210 19,917,163 Finished goods purchased for resale 284,000 - Finished goods Opening stock 847,117 1,415,247 Closing stock (1,047,523) (847,117)
(200,406) 568,130
20,864,804 20,485,293
28.1 Raw materials consumed Opening stock 832,461 780,543 Add: Purchased during the year 12,615,380 11,168,439
13,447,841 11,948,982 Less: Closing stock (775,667) (832,461)
12,672,174 11,116,521
28.2 Salaries, wages and other benefits include following in respect of employees’ retirement / other benefits:
2020 2019 Note (Rupees in thousand) Pension Fund 9.2.1.4 4,531 5,165 Gratuity Fund 9.2.2.4 2,530 1,525 Employees’ Provident Fund Trust 3,685 5,530 Staff retirement gratuity 9.2.3.3 25,598 20,202 Accumulating compensated absences 9.2.4.3 116 3,183
36,460 35,605 28.3 These include ijarah rentals amounting to Rupees 1.383 million (2019: Rupees 1.917 million).
NOTES TO THE CONSOLIDATED FINANCIAL STATEMENTSFor the year ended 30 September 2020
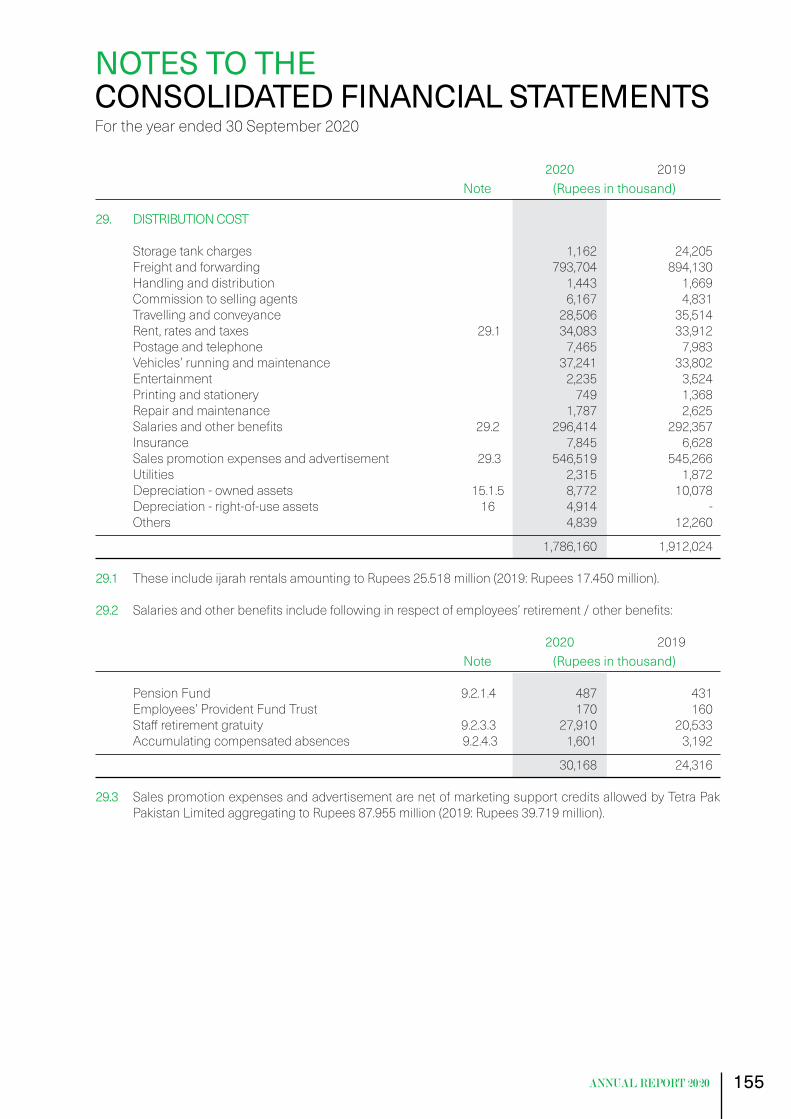
155
2020 2019 Note (Rupees in thousand)
29. DISTRIBUTION COST Storage tank charges 1,162 24,205 Freight and forwarding 793,704 894,130 Handling and distribution 1,443 1,669 Commission to selling agents 6,167 4,831 Travelling and conveyance 28,506 35,514 Rent, rates and taxes 29.1 34,083 33,912 Postage and telephone 7,465 7,983 Vehicles’ running and maintenance 37,241 33,802 Entertainment 2,235 3,524 Printing and stationery 749 1,368 Repair and maintenance 1,787 2,625 Salaries and other benefits 29.2 296,414 292,357 Insurance 7,845 6,628 Sales promotion expenses and advertisement 29.3 546,519 545,266 Utilities 2,315 1,872 Depreciation - owned assets 15.1.5 8,772 10,078 Depreciation - right-of-use assets 16 4,914 - Others 4,839 12,260
1,786,160 1,912,024 29.1 These include ijarah rentals amounting to Rupees 25.518 million (2019: Rupees 17.450 million).
29.2 Salaries and other benefits include following in respect of employees’ retirement / other benefits:
2020 2019 Note (Rupees in thousand)
Pension Fund 9.2.1.4 487 431 Employees’ Provident Fund Trust 170 160 Staff retirement gratuity 9.2.3.3 27,910 20,533 Accumulating compensated absences 9.2.4.3 1,601 3,192
30,168 24,316 29.3 Sales promotion expenses and advertisement are net of marketing support credits allowed by Tetra Pak
Pakistan Limited aggregating to Rupees 87.955 million (2019: Rupees 39.719 million).
NOTES TO THE CONSOLIDATED FINANCIAL STATEMENTSFor the year ended 30 September 2020
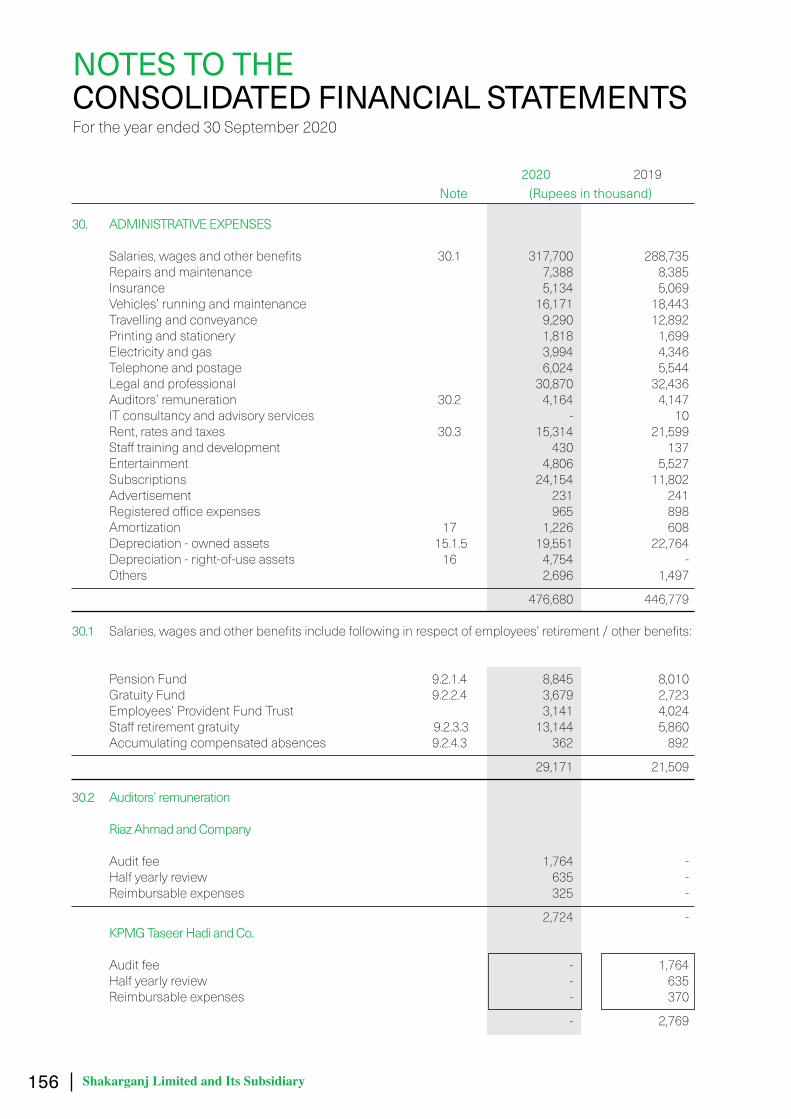
156 Shakarganj Limited and Its Subsidiary
2020 2019 Note (Rupees in thousand)
30. ADMINISTRATIVE EXPENSES Salaries, wages and other benefits 30.1 317,700 288,735 Repairs and maintenance 7,388 8,385 Insurance 5,134 5,069 Vehicles’ running and maintenance 16,171 18,443 Travelling and conveyance 9,290 12,892 Printing and stationery 1,818 1,699 Electricity and gas 3,994 4,346 Telephone and postage 6,024 5,544 Legal and professional 30,870 32,436 Auditors’ remuneration 30.2 4,164 4,147 IT consultancy and advisory services - 10 Rent, rates and taxes 30.3 15,314 21,599 Staff training and development 430 137 Entertainment 4,806 5,527 Subscriptions 24,154 11,802 Advertisement 231 241 Registered office expenses 965 898 Amortization 17 1,226 608 Depreciation - owned assets 15.1.5 19,551 22,764 Depreciation - right-of-use assets 16 4,754 - Others 2,696 1,497
476,680 446,779 30.1 Salaries, wages and other benefits include following in respect of employees’ retirement / other benefits:
Pension Fund 9.2.1.4 8,845 8,010 Gratuity Fund 9.2.2.4 3,679 2,723 Employees’ Provident Fund Trust 3,141 4,024 Staff retirement gratuity 9.2.3.3 13,144 5,860 Accumulating compensated absences 9.2.4.3 362 892
29,171 21,509
30.2 Auditors’ remuneration Riaz Ahmad and Company Audit fee 1,764 - Half yearly review 635 - Reimbursable expenses 325 -
2,724 - KPMG Taseer Hadi and Co. Audit fee - 1,764 Half yearly review - 635 Reimbursable expenses - 370
- 2,769
NOTES TO THE CONSOLIDATED FINANCIAL STATEMENTSFor the year ended 30 September 2020

157
2020 2019 Note (Rupees in thousand)
EY Ford Rhodes Audit fee 715 650 Review of interim financial statements 325 325 Group reporting 200 200 Certifications 100 116 Reimbursable expenses 100 87
1,440 1,378
4,164 4,147 30.3 These include ijarah rentals amounting to Rupees 8.442 million (2019: Rupees 8.584 million). 2020 2019 Note (Rupees in thousand)
31. OTHER EXPENSES Workers’ profit participation fund - 530 Trade debts written off 907 - Net exchange loss 21,884 19,767 Social action programme expenses including salaries 31.1 5,468 5,514 Waste water drainage 6,577 11,088 Allowance for expected credit loss 23.1 1,412 - Donations 31.2 3,170 1,000 Others 22 634
39,440 38,533 31.1 Social action programme salaries expenses include following in respect of retirement benefits:
2020 2019 Note (Rupees in thousand) Pension Fund 8.1.3.1 254 270 Gratuity Fund 8.2.3.1 101 58 Employees’ Provident Fund Trust 112 83
467 411 31.2 During the year, donation amounting to Rupees 2.500 million (2019: Rupees 1.000 million) was given to
Lyallpur Golf and Country Club, Faisalabad, in which a director Mr. Ali Altaf Saleem is a member.
NOTES TO THE CONSOLIDATED FINANCIAL STATEMENTSFor the year ended 30 September 2020
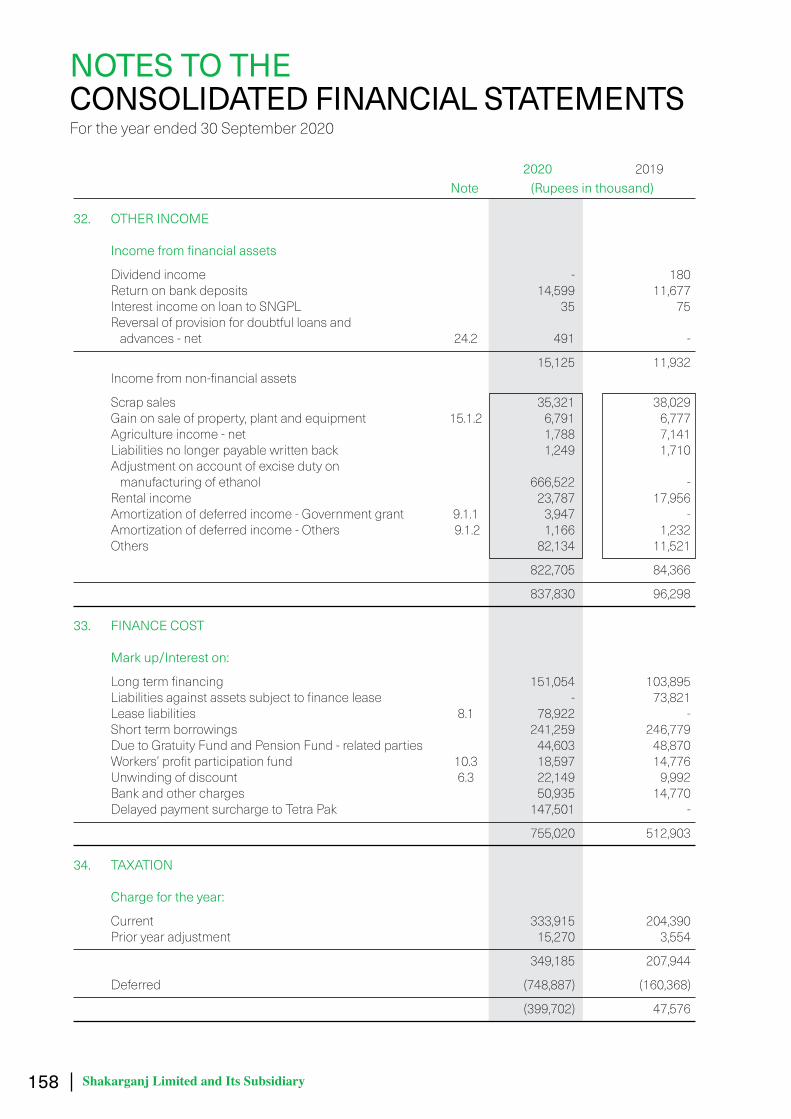
158 Shakarganj Limited and Its Subsidiary
2020 2019 Note (Rupees in thousand)
32. OTHER INCOME Incomefromfinancialassets
Dividend income - 180 Return on bank deposits 14,599 11,677 Interest income on loan to SNGPL 35 75 Reversal of provision for doubtful loans and advances - net 24.2 491 -
15,125 11,932 Income from non-financial assets
Scrap sales 35,321 38,029 Gain on sale of property, plant and equipment 15.1.2 6,791 6,777 Agriculture income - net 1,788 7,141 Liabilities no longer payable written back 1,249 1,710 Adjustment on account of excise duty on manufacturing of ethanol 666,522 - Rental income 23,787 17,956 Amortization of deferred income - Government grant 9.1.1 3,947 - Amortization of deferred income - Others 9.1.2 1,166 1,232 Others 82,134 11,521
822,705 84,366
837,830 96,298 33. FINANCE COST Markup/Intereston:
Long term financing 151,054 103,895 Liabilities against assets subject to finance lease - 73,821 Lease liabilities 8.1 78,922 - Short term borrowings 241,259 246,779 Due to Gratuity Fund and Pension Fund - related parties 44,603 48,870 Workers’ profit participation fund 10.3 18,597 14,776 Unwinding of discount 6.3 22,149 9,992 Bank and other charges 50,935 14,770 Delayed payment surcharge to Tetra Pak 147,501 -
755,020 512,903 34. TAXATION
Chargefortheyear:
Current 333,915 204,390 Prior year adjustment 15,270 3,554
349,185 207,944
Deferred (748,887) (160,368)
(399,702) 47,576
NOTES TO THE CONSOLIDATED FINANCIAL STATEMENTSFor the year ended 30 September 2020
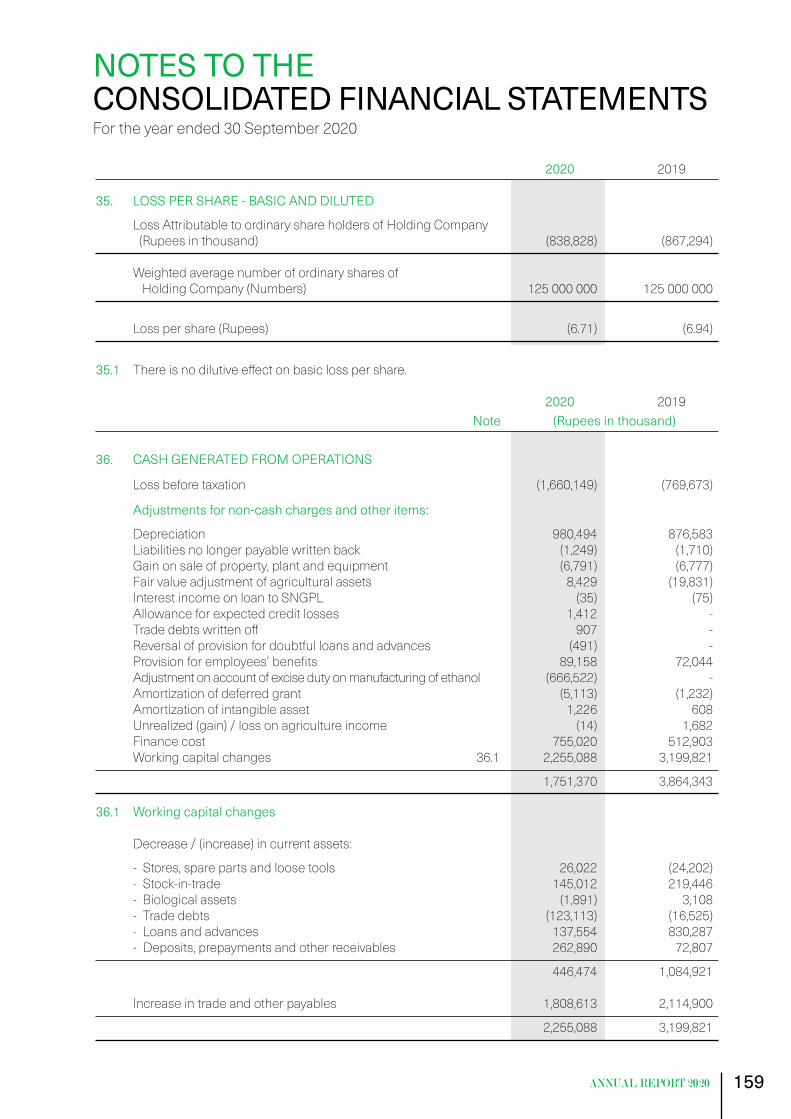
159
2020 2019
35. LOSS PER SHARE - BASIC AND DILUTED
Loss Attributable to ordinary share holders of Holding Company (Rupees in thousand) (838,828) (867,294) Weighted average number of ordinary shares of Holding Company (Numbers) 125 000 000 125 000 000
Loss per share (Rupees) (6.71) (6.94)
35.1 There is no dilutive effect on basic loss per share. 2020 2019 Note (Rupees in thousand)
36. CASH GENERATED FROM OPERATIONS
Loss before taxation (1,660,149) (769,673)
Adjustmentsfornon-cashchargesandotheritems:
Depreciation 980,494 876,583 Liabilities no longer payable written back (1,249) (1,710) Gain on sale of property, plant and equipment (6,791) (6,777) Fair value adjustment of agricultural assets 8,429 (19,831) Interest income on loan to SNGPL (35) (75) Allowance for expected credit losses 1,412 - Trade debts written off 907 - Reversal of provision for doubtful loans and advances (491) - Provision for employees’ benefits 89,158 72,044 Adjustment on account of excise duty on manufacturing of ethanol (666,522) - Amortization of deferred grant (5,113) (1,232) Amortization of intangible asset 1,226 608 Unrealized (gain) / loss on agriculture income (14) 1,682 Finance cost 755,020 512,903 Working capital changes 36.1 2,255,088 3,199,821
1,751,370 3,864,343
36.1 Working capital changes Decrease / (increase) in current assets:
- Stores, spare parts and loose tools 26,022 (24,202) - Stock-in-trade 145,012 219,446 - Biological assets (1,891) 3,108 - Trade debts (123,113) (16,525) - Loans and advances 137,554 830,287 - Deposits, prepayments and other receivables 262,890 72,807
446,474 1,084,921 Increase in trade and other payables 1,808,613 2,114,900
2,255,088 3,199,821
NOTES TO THE CONSOLIDATED FINANCIAL STATEMENTSFor the year ended 30 September 2020

160 Shakarganj Limited and Its Subsidiary
36.2 Reconciliation of movement of liabilities to cash flows arising from financing activities:
2020
Unclaimed Dividend
Long term financing
Lease liabilities
Short term borrowings Total
- - - - - - - - - - - - - - - - - - (Rupees in thousand) - - - - - - - - - - - - - - - - - -
Balance as at 01 October 2,039 1,327,973 - 2,103,271 3,433,283 Transferred on adoption of IFRS 16 ‘Leases’ - - 1,077,961 - 1,077,961 Lease liabilities obtained - - 29,996 - 29,996 Dividend paid (85) - - - (85) Loans availed - 265,606 - - 265,606 Short term borrowings repaid - net - - - (338,379) (338,379) Repayment of loans - (256,998) - - (256,998) Repayment of lease liabilities - - (308,303) - (308,303) Fair value adjustment - (11,850) - - (11,850) Unwinding of discount - 22,149 - - 22,149 Balance as at 30 September 1,954 1,346,880 799,654 1,764,892 3,913,380
2019
Unclaimed Dividend
Long term financing
Liabilities against assets
subject to financelease
Short term borrowings Total
- - - - - - - - - - - - - - - - - - (Rupees in thousand) - - - - - - - - - - - - - - - - - -
Balance as at 01 October 2,273 1,344,976 740,486 2,584,431 4,672,166 Liabilities against assets subject to finance lease obtained - net - - 308,180 - 308,180 Dividend paid (234) - - - (234) Loans availed - 280,000 - - 280,000 Short term borrowings repaid - net - - - (481,160) (481,160) Repayment of loans - (306,995) - - (306,995) Unwinding of discount - 9,992 - - 9,992 Balance as at 30 September 2,039 1,327,973 1,048,666 2,103,271 4,481,949 37. REMUNERATION OF CHIEF EXECUTIVE OFFICER, DIRECTORS AND EXECUTIVES The aggregate amount charged in these consolidated financial statements for remuneration including all
benefits to Chief Executive Officer, directors and executives of the Holding Company is as follows: ChiefExecutiveOfficerExecutiveDirectorsNon-ExecutiveDirectorsExecutives
2020 2019 2020 2019 2020 2019 2020 2019 - - - - - - - - - - - - - - - - - - - - - - - - - - (Rupees in thousand) - - - - - - - - - - - - - - - - - - - - - - - - - - Managerial remuneration 10,503 9,828 6,000 6,000 - - 81,887 66,314 Allowances House rent 4,726 4,423 2,400 2,400 - - 26,716 21,542 Utilities 1,050 983 600 600 - - 6,213 4,919 Medical - - 480 480 - - 5,573 4,415 Others - - - - - - 1,816 2,802 Reimbursable expenses - 24 - 275 - - - 76 Contribution to retirement benefits 3,711 3,472 2,120 2,120 - - 14,252 9,923 Meeting fee - - - - 800 620 - - 19,991 18,730 11,600 11,875 800 620 136,457 109,991 Number of persons 1 1 1 1 6 6 32 34
371 The Chief Executive Officer, some directors and some executives of the Holding Company are provided with company maintained car, travel facilities and club membership.
NOTES TO THE CONSOLIDATED FINANCIAL STATEMENTSFor the year ended 30 September 2020
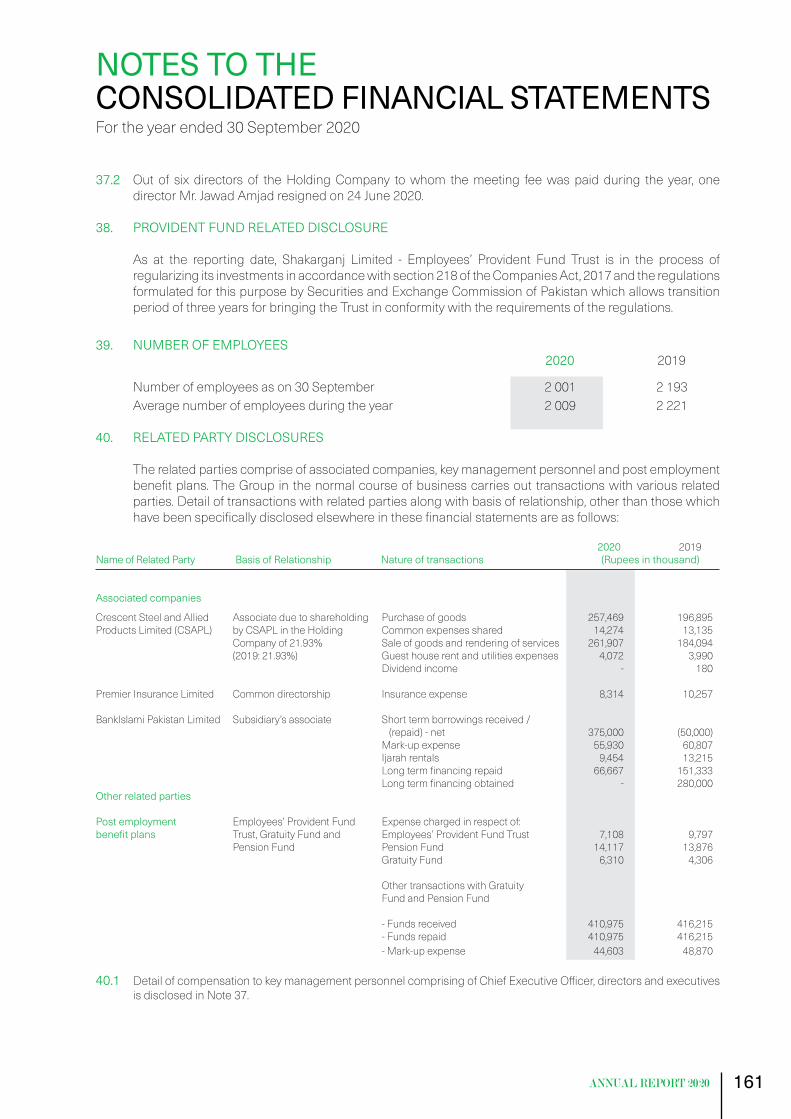
161
37.2 Out of six directors of the Holding Company to whom the meeting fee was paid during the year, one director Mr. Jawad Amjad resigned on 24 June 2020.
38. PROVIDENT FUND RELATED DISCLOSURE As at the reporting date, Shakarganj Limited - Employees’ Provident Fund Trust is in the process of
regularizing its investments in accordance with section 218 of the Companies Act, 2017 and the regulations formulated for this purpose by Securities and Exchange Commission of Pakistan which allows transition period of three years for bringing the Trust in conformity with the requirements of the regulations.
39. NUMBER OF EMPLOYEES 2020 2019 Number of employees as on 30 September 2 001 2 193 Average number of employees during the year 2 009 2 221
40. RELATED PARTY DISCLOSURES The related parties comprise of associated companies, key management personnel and post employment
benefit plans. The Group in the normal course of business carries out transactions with various related parties. Detail of transactions with related parties along with basis of relationship, other than those which have been specifically disclosed elsewhere in these financial statements are as follows:
2020 2019Name of Related Party Basis of Relationship Nature of transactions (Rupees in thousand)
Associated companies Crescent Steel and Allied Associate due to shareholding Purchase of goods 257,469 196,895Products Limited (CSAPL) by CSAPL in the Holding Common expenses shared 14,274 13,135 Company of 21.93% Sale of goods and rendering of services 261,907 184,094 (2019: 21.93%) Guest house rent and utilities expenses 4,072 3,990 Dividend income - 180 Premier Insurance Limited Common directorship Insurance expense 8,314 10,257 BankIslami Pakistan Limited Subsidiary’s associate Short term borrowings received / (repaid) - net 375,000 (50,000) Mark-up expense 55,930 60,807 Ijarah rentals 9,454 13,215 Long term financing repaid 66,667 151,333 Long term financing obtained - 280,000 Other related parties Post employment Employees’ Provident Fund Expense charged in respect of: benefitplans Trust, Gratuity Fund and Employees’ Provident Fund Trust 7,108 9,797 Pension Fund Pension Fund 14,117 13,876 Gratuity Fund 6,310 4,306 Other transactions with Gratuity Fund and Pension Fund - Funds received 410,975 416,215 - Funds repaid 410,975 416,215 - Mark-up expense 44,603 48,870
40.1 Detail of compensation to key management personnel comprising of Chief Executive Officer, directors and executives is disclosed in Note 37.
NOTES TO THE CONSOLIDATED FINANCIAL STATEMENTSFor the year ended 30 September 2020

162 Shakarganj Limited and Its Subsidiary
2020 2019
41. PLANT CAPACITY AND ACTUAL PRODUCTION a) Holding Company - Shakarganj Limited Sugar Jhang Rated crushing capacity (MT / day) 10 000 10 000 On the basis of 104 days (2019: 77 days) (MT) 1040 000 770 000 Actual sugarcane crushed (MT) 497 156 226 738 Bhone Rated crushing capacity (MT / day) 6 000 6 000 On the basis of 102 days (2019: 83 days) (MT) 612 000 498 000 Actual sugarcane crushed (MT) 387 568 258 024 The low crushing was due to low quality sugarcane. Biofuel Jhang Rated production capacity (Litres / day) 150 000 150 000 On the basis of average number of 69 days (2019: 108 days) working (Litres) 10 350 000 16 150 000 Actual production (Litres) 9 816 686 14 450 368 Bhone Rated production capacity (Litres / day) 200 000 200 000 On the basis of average number of Nil days (2019: 4 days) working (Litres) - 750 000 Actual production (Litres) - 713 838 Major reason for low production was due to non-availability of raw material at feasible prices. Textile Capacity (converted in 20s counts) (Kg) 9 198 418 9 198 418 Actual production (converted in 20s counts) (Kg) 3 102 521 8 850 689 The actual production was low due to COVID-19 pandemic lockdown and high prices of raw materials. b) Subsidiary Company - Shakarganj Food Products Limited Dairy segment Ultra Heat Treated Packed Milk, Juice and Cream Rated processing capacity on the basis of 354 days (2019: 353 days) (Litres) 422 781 120 381 821 040 Actual milk, juice and cream processed (Litres) 187 509 058 222 838 284 Desi Ghee Rated production capacity on the basis of 354 days (2019: 353 days) (Kg) 531 000 353 000 Actual desi ghee produced (Kg) 98 745 113 041 Juice segment Fruit Pulps and Concentrate Juices Rated production capacity on the basis of 36 days (2019: 102 days) (Kg) 5 740 000 5 465 600 Actual fruit processed (Kg) 578 244 2 231 991 Under utilization of production / processing capacities was due to limited sales orders.
NOTES TO THE CONSOLIDATED FINANCIAL STATEMENTSFor the year ended 30 September 2020
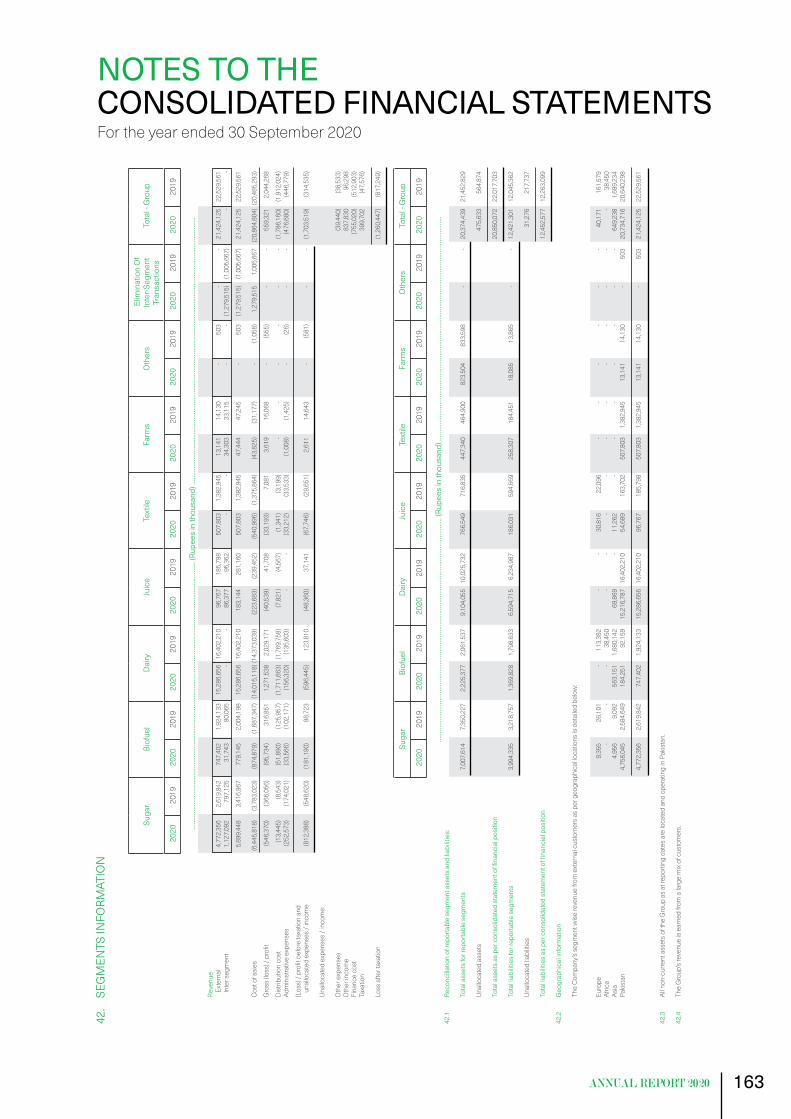
163
42.
SEG
MEN
TS IN
FORM
ATIO
N
Suga
rBi
ofue
lD
airy
Juic
eTe
xtile
Farm
sO
ther
s E
limin
atio
n O
f In
ter-S
egm
ent
Tran
sact
ions
T
otal
- G
roup
202
0 2
019
202
0 2
019
2020
2019
202
0 2
019
202
0 2
019
202
0 2
019
202
0 2
019
202
0 2
019
202
0 2
019
…
……
……
……
……
……
……
……
……
……
……
……
……
……
……
……
……
……
……
……
……
……
……
……
…....
(Rup
ees
in th
ousa
nd) …
……
……
……
……
……
……
……
……
……
……
……
……
……
……
……
……
……
……
……
……
……
……
……
…....
Re
venu
e
Exte
rnal
4
,772
,356
2
,619
,842
7
47,4
02
1,9
24,1
33
15,
286,
656
16,
402,
210
9
6,76
7
185
,798
5
07,8
03
1,3
82,9
45
13,
141
1
4,13
0
-
503
-
-
2
1,42
4,12
5
22,5
29,5
61
Inte
r seg
men
t 1
,127
,092
7
97,1
25
31,
743
8
0,06
5
-
-
86,
377
9
5,36
2
-
-
34,
303
3
3,11
5
-
-
(1,2
79,5
15)
(1,0
05,6
67)
-
-
5,89
9,44
8
3,4
16,9
67
779
,145
2
,004
,198
1
5,28
6,65
6 1
6,40
2,21
0
183
,144
2
81,1
60
507
,803
1
,382
,945
4
7,44
4
47,
245
-
5
03
(1,2
79,5
15)
(1,0
05,6
67)
21,
424,
125
22
,529
,561
C
ost o
f sal
es
(6,4
45,8
18)
(3,7
83,0
23)
(874
,879
) (1
,687
,347
) (1
4,01
5,11
8) (1
4,37
3,03
9)
(223
,683
) (2
39,4
52)
(540
,996
) (1
,375
,864
) (4
3,82
5)
(31,
177)
-
(1
,058
) 1
,279
,515
1
,005
,667
(2
0,86
4,80
4) (
20,4
85,2
93)
Gro
ss (l
oss)
/ pr
ofit
(546
,370
) (3
66,0
56)
(95,
734)
3
16,8
51
1,2
71,5
38
2,0
29,1
71
(40,
539)
4
1,70
8
(33,
193)
7
,081
3
,619
1
6,06
8
-
(555
) -
-
5
59,3
21
2,0
44,2
68
Dis
tribu
tion
cost
(1
3,44
5)
(8,5
43)
(51,
890)
(1
25,9
57)
(1,7
11,6
63)
(1,7
69,7
58)
(7,8
21)
(4,5
67)
(1,3
41)
(3,1
99)
-
-
-
-
-
-
(1,7
86,1
60)
(1,9
12,0
24)
Ad
min
istra
tive
expe
nses
(2
52,5
73)
(174
,021
) (3
3,56
6)
(102
,171
) (1
56,3
20)
(135
,603
) -
-
(3
3,21
2)
(33,
533)
(1
,008
) (1
,425
) -
(2
6)
-
-
(476
,680
) (4
46,7
79)
(Los
s) /
profi
t bef
ore
taxa
tion
and
un
allo
cate
d ex
pens
es /
inco
me
(812
,388
) (5
48,6
20)
(181
,190
) 8
8,72
3
(596
,445
) 1
23,8
10
(48,
360)
3
7,14
1
(67,
746)
(2
9,65
1)
2,6
11
14,
643
-
(5
81)
-
-
(1,7
03,5
19)
(314
,535
)
U
nallo
cate
d ex
pens
es /
inco
me:
Oth
er e
xpen
ses
(39,
440)
(3
8,53
3)
Oth
er in
com
e
8
37,8
30
96,
298
Fi
nanc
e co
st
(755
,020
) (5
12,9
03)
Ta
xatio
n
3
99,7
02
(47,
576)
Loss
afte
r tax
atio
n
(1
,260
,447
) (8
17,2
49)
Suga
rBi
ofue
lD
airy
Juic
eTe
xtile
Farm
sO
ther
s T
otal
- G
roup
202
0 2
019
202
0 2
019
2020
2019
202
0 2
019
202
0 2
019
202
0 2
019
202
0 2
019
202
0 2
019
…
……
……
……
……
……
……
……
……
……
……
……
……
……
……
……
……
……
……
……
…....
(Rup
ees
in th
ousa
nd) …
……
……
……
……
……
……
……
……
……
……
……
……
……
……
……
……
……
……
……
…....
42.1
Reconciliationofreporta
blesegm
entassetsandliabilities:
To
tal a
sset
s fo
r rep
orta
ble
segm
ents
7
,007
,614
7
,350
,227
2
,225
,377
2
,061
,537
9
,104
,055
10
,025
,732
7
66,5
49
716
,835
4
47,3
40
464
,900
8
23,5
04
833
,598
-
-
2
0,37
4,43
9
21,4
52,8
29
U
nallo
cate
d as
sets
4
75,6
33
564
,874
Totalassetsasperconsolidatedstatementoffinancialposition
2
0,85
0,07
2
22,0
17,7
03
Tota
l lia
bilit
ies
for r
epor
tabl
e se
gmen
ts
3,9
94,3
35
3,2
18,7
57
1,3
69,8
28
1,7
98,6
33
6,5
94,7
15
6,2
34,9
87
186
,031
5
94,6
69
258
,307
1
84,4
51
18,
085
1
3,86
5
-
-
12,
421,
301
12
,045
,362
U
nallo
cate
d lia
bilit
ies
31,
276
2
17,7
37
Totalliabilitiesasperconsolidatedstatementoffinancialposition
12,
452,
577
12
,263
,099
42.2
G
eogr
aphi
cal i
nfor
mat
ion
Th
e C
ompa
ny’s
segm
ent w
ise
reve
nue
from
ext
erna
l cus
tom
ers
as p
er g
eogr
aphi
cal lo
catio
ns is
det
aile
d be
low
:
Euro
pe
9,3
55
26,
101
-
1
13,3
82
-
-
30,
816
2
2,09
6
-
-
-
-
-
-
40,
171
1
61,5
79
Af
rica
-
-
-
38,
450
-
-
-
-
-
-
-
-
-
-
-
3
8,45
0
Asia
4
,956
9
,092
5
63,1
51
1,6
80,1
42
69,
869
-
1
1,26
2
-
-
-
-
-
-
-
649
,238
1
,689
,234
Pakis
tan
4,7
58,0
45
2,5
84,6
49
184
,251
9
2,15
9
15,
216,
787
16,
402,
210
5
4,68
9
163
,702
5
07,8
03
1,3
82,9
45
13,
141
1
4,13
0
-
503
2
0,73
4,71
6
20,6
40,2
98
4
,772
,356
2
,619
,842
7
47,4
02
1,9
24,1
33
15,
286,
656
16,
402,
210
9
6,76
7
185
,798
5
07,8
03
1,3
82,9
45
13,
141
1
4,13
0
-
503
2
1,42
4,12
5
22,5
29,5
61
42.3
Al
l non
-cur
rent
ass
ets
of th
e G
roup
as
at re
porti
ng d
ates
are
loca
ted
and
oper
atin
g in
Pak
ista
n.
42.4
Th
e G
roup
’s re
venu
e is
ear
ned
from
a la
rge
mix
of c
usto
mer
s.
NOTES TO THE CONSOLIDATED FINANCIAL STATEMENTSFor the year ended 30 September 2020

164 Shakarganj Limited and Its Subsidiary
43. INTERESTS IN OTHER ENTITY Non-Controlling Interest (NCI) Set out below is summarized financial information for Shakarganj Food Products Limited - Subsidiary
Company that has non-controlling interest which is material to the Group. The amounts disclosed for Subsidiary Company are before inter-company eliminations.
2020 2019 (Rupees in thousand)
Summarizedstatementoffinancialposition Current assets 2,772,705 3,135,481 Current liabilities (5,767,903) (5,048,414)
Net current liabilities (2,995,198) (1,912,933) Non-current assets 7,834,405 7,836,557 Non-current liabilities (1,795,651) (2,006,583) Net non-current assets 6,038,754 5,829,974
Net assets 3,043,556 3,917,041
Accumulated non-controlling interest 1,449,037 1,864,903 Summarized statement of comprehensive income Revenue 15,383,420 16,588,008 (Loss) / profit for the year (885,568) 105,115 Other comprehensive income 12,083 1,009,971
Total comprehensive (loss) / income (873,485) 1,115,086
(Loss) / profit allocated to non-controlling interest (421,619) 50,045 Total comprehensive (loss) / income allocated to non-controlling interest (415,866) 530,892 Summarizedcashflows Cash flows from operating activities 447,321 2,411,785 Cash flows used in investing activities (252,394) (2,945,467) Cash flows (used in ) / from financing activities (303,601) 648,715
Net (decrease) / increase in cash and cash equivalents (108,674) 115,033
NOTES TO THE CONSOLIDATED FINANCIAL STATEMENTSFor the year ended 30 September 2020
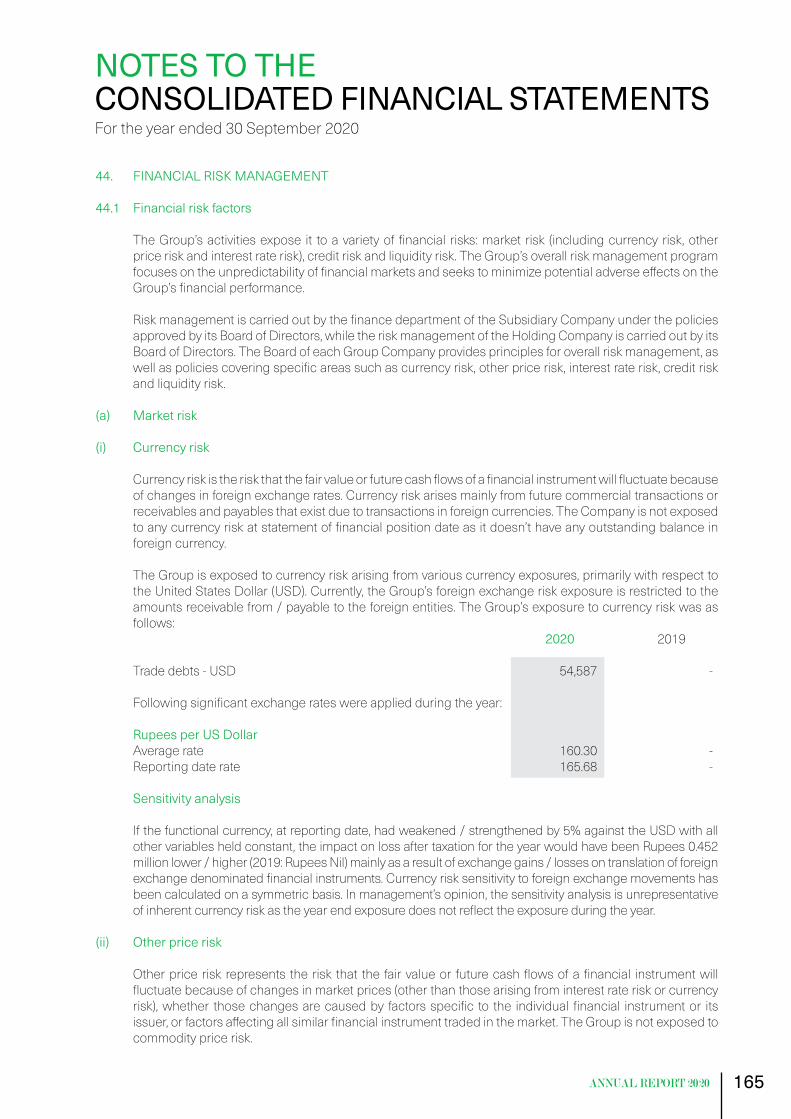
165
44. FINANCIAL RISK MANAGEMENT 44.1 Financial risk factors The Group’s activities expose it to a variety of financial risks: market risk (including currency risk, other
price risk and interest rate risk), credit risk and liquidity risk. The Group’s overall risk management program focuses on the unpredictability of financial markets and seeks to minimize potential adverse effects on the Group’s financial performance.
Risk management is carried out by the finance department of the Subsidiary Company under the policies
approved by its Board of Directors, while the risk management of the Holding Company is carried out by its Board of Directors. The Board of each Group Company provides principles for overall risk management, as well as policies covering specific areas such as currency risk, other price risk, interest rate risk, credit risk and liquidity risk.
(a) Market risk (i) Currency risk Currency risk is the risk that the fair value or future cash flows of a financial instrument will fluctuate because
of changes in foreign exchange rates. Currency risk arises mainly from future commercial transactions or receivables and payables that exist due to transactions in foreign currencies. The Company is not exposed to any currency risk at statement of financial position date as it doesn’t have any outstanding balance in foreign currency.
The Group is exposed to currency risk arising from various currency exposures, primarily with respect to
the United States Dollar (USD). Currently, the Group’s foreign exchange risk exposure is restricted to the amounts receivable from / payable to the foreign entities. The Group’s exposure to currency risk was as follows:
2020 2019 Trade debts - USD 54,587 - Following significant exchange rates were applied during the year: Rupees per US Dollar Average rate 160.30 - Reporting date rate 165.68 -
Sensitivity analysis If the functional currency, at reporting date, had weakened / strengthened by 5% against the USD with all
other variables held constant, the impact on loss after taxation for the year would have been Rupees 0.452 million lower / higher (2019: Rupees Nil) mainly as a result of exchange gains / losses on translation of foreign exchange denominated financial instruments. Currency risk sensitivity to foreign exchange movements has been calculated on a symmetric basis. In management’s opinion, the sensitivity analysis is unrepresentative of inherent currency risk as the year end exposure does not reflect the exposure during the year.
(ii) Other price risk Other price risk represents the risk that the fair value or future cash flows of a financial instrument will
fluctuate because of changes in market prices (other than those arising from interest rate risk or currency risk), whether those changes are caused by factors specific to the individual financial instrument or its issuer, or factors affecting all similar financial instrument traded in the market. The Group is not exposed to commodity price risk.
NOTES TO THE CONSOLIDATED FINANCIAL STATEMENTSFor the year ended 30 September 2020

166 Shakarganj Limited and Its Subsidiary
Sensitivity analysis The table below summarizes the impact of increase / decrease in the Pakistan Stock Exchange Limited
(PSX) Index on the Group’s equity (fair value reserve of FVTOCI investments). The analysis is based on the assumption that the equity index had increased / decreased by 5% with all other variables of FVTOCI instruments held constant and all the Group’s equity instruments moved according to the historical correlation with the index:
Index Impact on statement of other
comprehensive income (fair value reserve)
2020 2019 (Rupees in thousand) PSX 100 (5% increase) 661 391 PSX 100 (5% decrease) (661) (391) Equity (fair value reserve) would increase / decrease as a result of gains / losses on equity investments
classified as FVTOCI.
(iii) Interest rate risk This represents the risk that the fair value or future cash flows of a financial instrument will fluctuate
because of changes in market interest rates. The Group’s interest rate risk arises from long term financing, lease liabilities, short term borrowings, long
term loans, advances and deposits and deposit in saving accounts. Financial instruments at variable rates expose the Group to cash flow interest rate risk. Financial instruments at fixed rate expose the Group to fair value interest rate risk.
At the reporting date, the interest rate profile of the Group’s interest bearing financial instruments was:
2020 2019 (Rupees in thousand)
Fixed rate instruments
Financial assets Long term loan to SNGPL 2,496 4,992 Financial liabilities Long term financing 153,756 - Floating rate instruments
Financial assets Bank balances - saving accounts 116,212 66,240 Financial liabilities Long term financing 1,019,413 1,176,411 Short term borrowings 1,752,294 1,668,194
NOTES TO THE CONSOLIDATED FINANCIAL STATEMENTSFor the year ended 30 September 2020
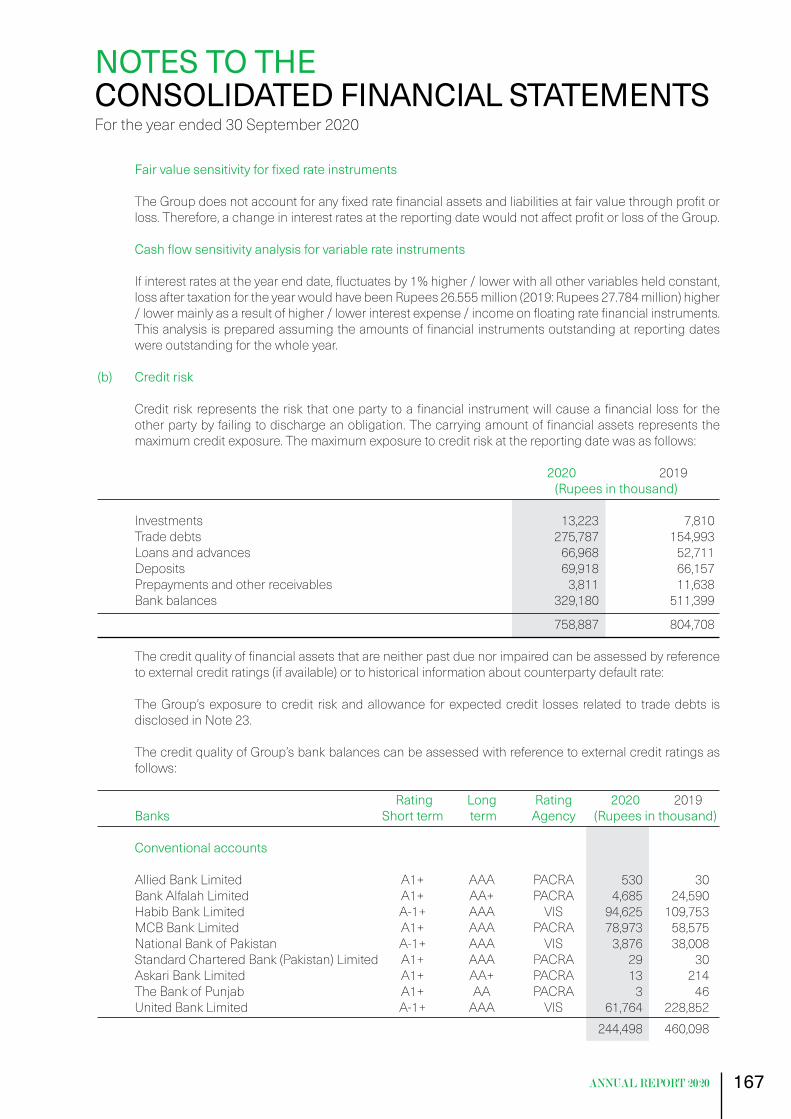
167
Fairvaluesensitivityforfixedrateinstruments The Group does not account for any fixed rate financial assets and liabilities at fair value through profit or
loss. Therefore, a change in interest rates at the reporting date would not affect profit or loss of the Group. Cashflowsensitivityanalysisforvariablerateinstruments If interest rates at the year end date, fluctuates by 1% higher / lower with all other variables held constant,
loss after taxation for the year would have been Rupees 26.555 million (2019: Rupees 27.784 million) higher / lower mainly as a result of higher / lower interest expense / income on floating rate financial instruments. This analysis is prepared assuming the amounts of financial instruments outstanding at reporting dates were outstanding for the whole year.
(b) Credit risk Credit risk represents the risk that one party to a financial instrument will cause a financial loss for the
other party by failing to discharge an obligation. The carrying amount of financial assets represents the maximum credit exposure. The maximum exposure to credit risk at the reporting date was as follows:
2020 2019 (Rupees in thousand) Investments 13,223 7,810 Trade debts 275,787 154,993 Loans and advances 66,968 52,711 Deposits 69,918 66,157 Prepayments and other receivables 3,811 11,638 Bank balances 329,180 511,399
758,887 804,708 The credit quality of financial assets that are neither past due nor impaired can be assessed by reference
to external credit ratings (if available) or to historical information about counterparty default rate: The Group’s exposure to credit risk and allowance for expected credit losses related to trade debts is
disclosed in Note 23. The credit quality of Group’s bank balances can be assessed with reference to external credit ratings as
follows:
Rating Long Rating 2020 2019 Banks Short term term Agency (Rupees in thousand) Conventional accounts Allied Bank Limited A1+ AAA PACRA 530 30 Bank Alfalah Limited A1+ AA+ PACRA 4,685 24,590 Habib Bank Limited A-1+ AAA VIS 94,625 109,753 MCB Bank Limited A1+ AAA PACRA 78,973 58,575 National Bank of Pakistan A-1+ AAA VIS 3,876 38,008 Standard Chartered Bank (Pakistan) Limited A1+ AAA PACRA 29 30 Askari Bank Limited A1+ AA+ PACRA 13 214 The Bank of Punjab A1+ AA PACRA 3 46 United Bank Limited A-1+ AAA VIS 61,764 228,852 244,498 460,098
NOTES TO THE CONSOLIDATED FINANCIAL STATEMENTSFor the year ended 30 September 2020
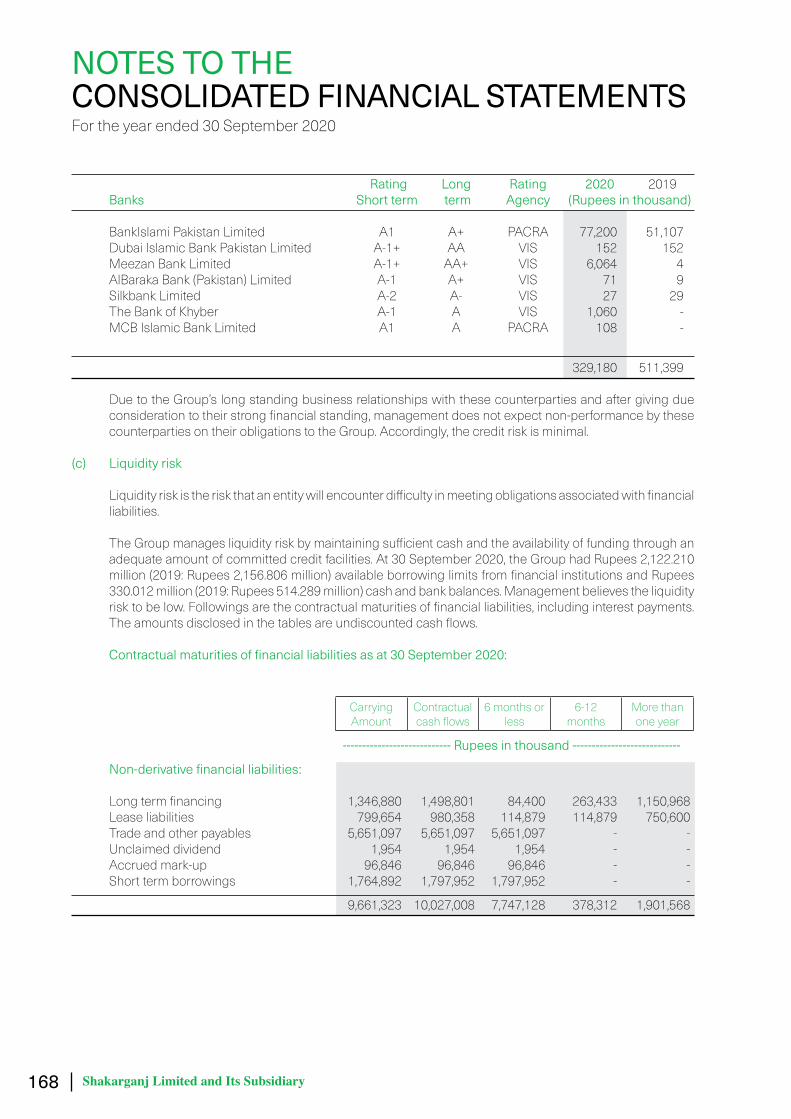
168 Shakarganj Limited and Its Subsidiary
Rating Long Rating 2020 2019 Banks Short term term Agency (Rupees in thousand) BankIslami Pakistan Limited A1 A+ PACRA 77,200 51,107 Dubai Islamic Bank Pakistan Limited A-1+ AA VIS 152 152 Meezan Bank Limited A-1+ AA+ VIS 6,064 4 AlBaraka Bank (Pakistan) Limited A-1 A+ VIS 71 9 Silkbank Limited A-2 A- VIS 27 29 The Bank of Khyber A-1 A VIS 1,060 - MCB Islamic Bank Limited A1 A PACRA 108 -
329,180 511,399 Due to the Group’s long standing business relationships with these counterparties and after giving due
consideration to their strong financial standing, management does not expect non-performance by these counterparties on their obligations to the Group. Accordingly, the credit risk is minimal.
(c) Liquidity risk Liquidity risk is the risk that an entity will encounter difficulty in meeting obligations associated with financial
liabilities. The Group manages liquidity risk by maintaining sufficient cash and the availability of funding through an
adequate amount of committed credit facilities. At 30 September 2020, the Group had Rupees 2,122.210 million (2019: Rupees 2,156.806 million) available borrowing limits from financial institutions and Rupees 330.012 million (2019: Rupees 514.289 million) cash and bank balances. Management believes the liquidity risk to be low. Followings are the contractual maturities of financial liabilities, including interest payments. The amounts disclosed in the tables are undiscounted cash flows.
Contractualmaturitiesoffinancialliabilitiesasat30September2020:
Carrying Amount
Contractual cash flows
6 months or less
6-12 months
More than one year
---------------------------- Rupees in thousand ---------------------------- Non-derivativefinancialliabilities:
Long term financing 1,346,880 1,498,801 84,400 263,433 1,150,968 Lease liabilities 799,654 980,358 114,879 114,879 750,600 Trade and other payables 5,651,097 5,651,097 5,651,097 - - Unclaimed dividend 1,954 1,954 1,954 - - Accrued mark-up 96,846 96,846 96,846 - - Short term borrowings 1,764,892 1,797,952 1,797,952 - - 9,661,323 10,027,008 7,747,128 378,312 1,901,568
NOTES TO THE CONSOLIDATED FINANCIAL STATEMENTSFor the year ended 30 September 2020
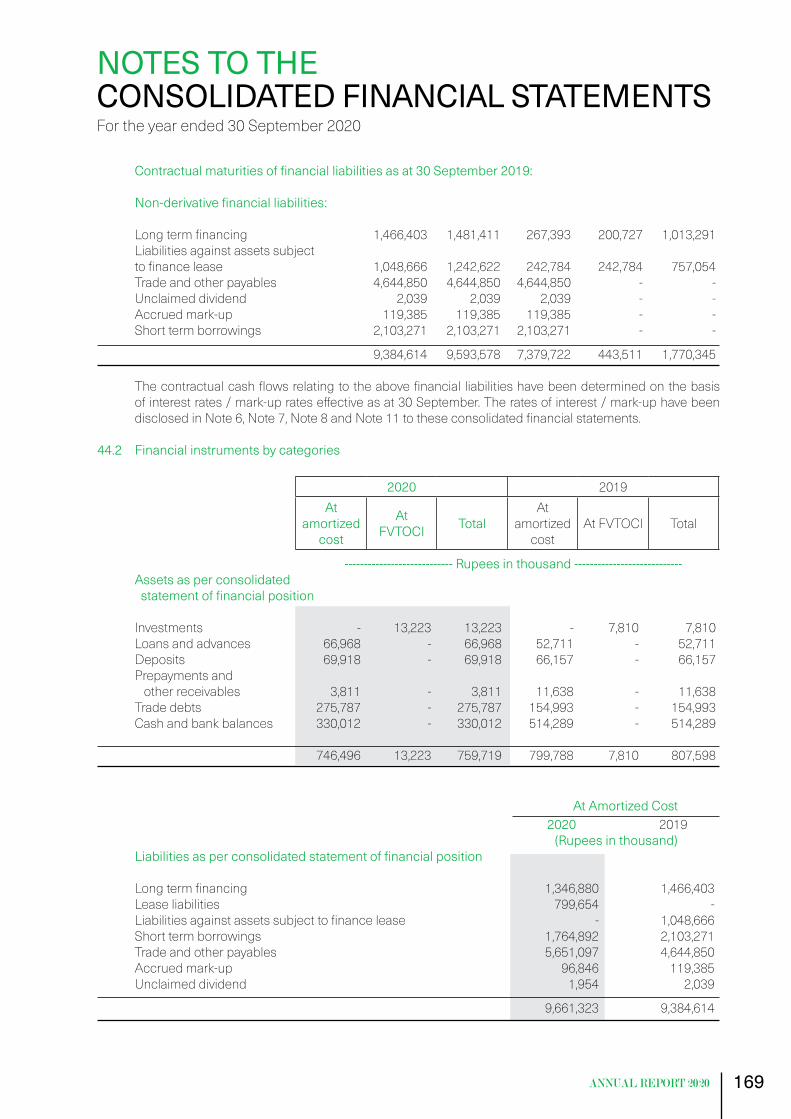
169
Contractualmaturitiesoffinancialliabilitiesasat30September2019:
Non-derivativefinancialliabilities: Long term financing 1,466,403 1,481,411 267,393 200,727 1,013,291 Liabilities against assets subject to finance lease 1,048,666 1,242,622 242,784 242,784 757,054 Trade and other payables 4,644,850 4,644,850 4,644,850 - - Unclaimed dividend 2,039 2,039 2,039 - - Accrued mark-up 119,385 119,385 119,385 - - Short term borrowings 2,103,271 2,103,271 2,103,271 - - 9,384,614 9,593,578 7,379,722 443,511 1,770,345 The contractual cash flows relating to the above financial liabilities have been determined on the basis
of interest rates / mark-up rates effective as at 30 September. The rates of interest / mark-up have been disclosed in Note 6, Note 7, Note 8 and Note 11 to these consolidated financial statements.
44.2 Financial instruments by categories
2020 2019At
amortized cost
At FVTOCI Total
At amortized
costAt FVTOCI Total
---------------------------- Rupees in thousand ---------------------------- Assets as per consolidated statementoffinancialposition Investments - 13,223 13,223 - 7,810 7,810 Loans and advances 66,968 - 66,968 52,711 - 52,711 Deposits 69,918 - 69,918 66,157 - 66,157 Prepayments and other receivables 3,811 - 3,811 11,638 - 11,638 Trade debts 275,787 - 275,787 154,993 - 154,993 Cash and bank balances 330,012 - 330,012 514,289 - 514,289 746,496 13,223 759,719 799,788 7,810 807,598
At Amortized Cost 2020 2019 (Rupees in thousand) Liabilitiesasperconsolidatedstatementoffinancialposition
Long term financing 1,346,880 1,466,403 Lease liabilities 799,654 - Liabilities against assets subject to finance lease - 1,048,666 Short term borrowings 1,764,892 2,103,271 Trade and other payables 5,651,097 4,644,850 Accrued mark-up 96,846 119,385 Unclaimed dividend 1,954 2,039
9,661,323 9,384,614
NOTES TO THE CONSOLIDATED FINANCIAL STATEMENTSFor the year ended 30 September 2020
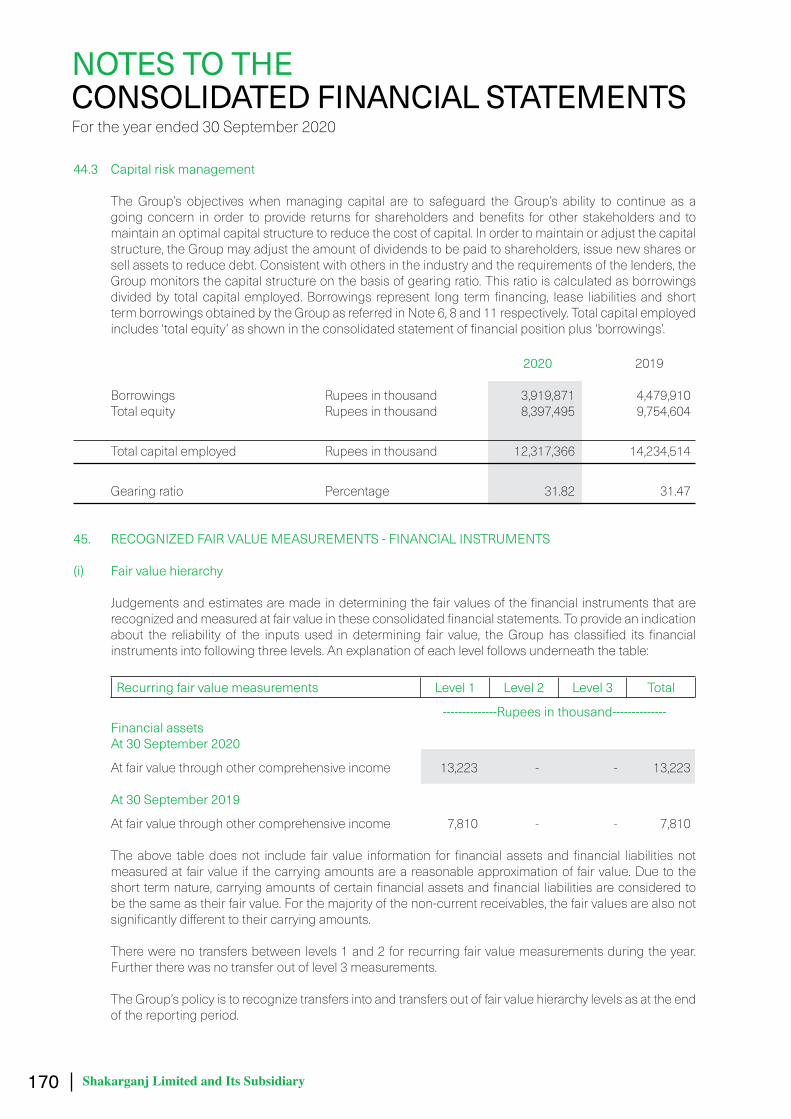
170 Shakarganj Limited and Its Subsidiary
44.3 Capital risk management The Group’s objectives when managing capital are to safeguard the Group’s ability to continue as a
going concern in order to provide returns for shareholders and benefits for other stakeholders and to maintain an optimal capital structure to reduce the cost of capital. In order to maintain or adjust the capital structure, the Group may adjust the amount of dividends to be paid to shareholders, issue new shares or sell assets to reduce debt. Consistent with others in the industry and the requirements of the lenders, the Group monitors the capital structure on the basis of gearing ratio. This ratio is calculated as borrowings divided by total capital employed. Borrowings represent long term financing, lease liabilities and short term borrowings obtained by the Group as referred in Note 6, 8 and 11 respectively. Total capital employed includes ‘total equity’ as shown in the consolidated statement of financial position plus ‘borrowings’.
2020 2019 Borrowings Rupees in thousand 3,919,871 4,479,910 Total equity Rupees in thousand 8,397,495 9,754,604
Total capital employed Rupees in thousand 12,317,366 14,234,514
Gearing ratio Percentage 31.82 31.47 45. RECOGNIZED FAIR VALUE MEASUREMENTS - FINANCIAL INSTRUMENTS
(i) Fair value hierarchy Judgements and estimates are made in determining the fair values of the financial instruments that are
recognized and measured at fair value in these consolidated financial statements. To provide an indication about the reliability of the inputs used in determining fair value, the Group has classified its financial instruments into following three levels. An explanation of each level follows underneath the table:
Recurring fair value measurements Level 1 Level 2 Level 3 Total
--------------Rupees in thousand-------------- Financial assets At 30 September 2020 At fair value through other comprehensive income 13,223 - - 13,223 At 30 September 2019 At fair value through other comprehensive income 7,810 - - 7,810 The above table does not include fair value information for financial assets and financial liabilities not
measured at fair value if the carrying amounts are a reasonable approximation of fair value. Due to the short term nature, carrying amounts of certain financial assets and financial liabilities are considered to be the same as their fair value. For the majority of the non-current receivables, the fair values are also not significantly different to their carrying amounts.
There were no transfers between levels 1 and 2 for recurring fair value measurements during the year.
Further there was no transfer out of level 3 measurements. The Group’s policy is to recognize transfers into and transfers out of fair value hierarchy levels as at the end
of the reporting period.
NOTES TO THE CONSOLIDATED FINANCIAL STATEMENTSFor the year ended 30 September 2020
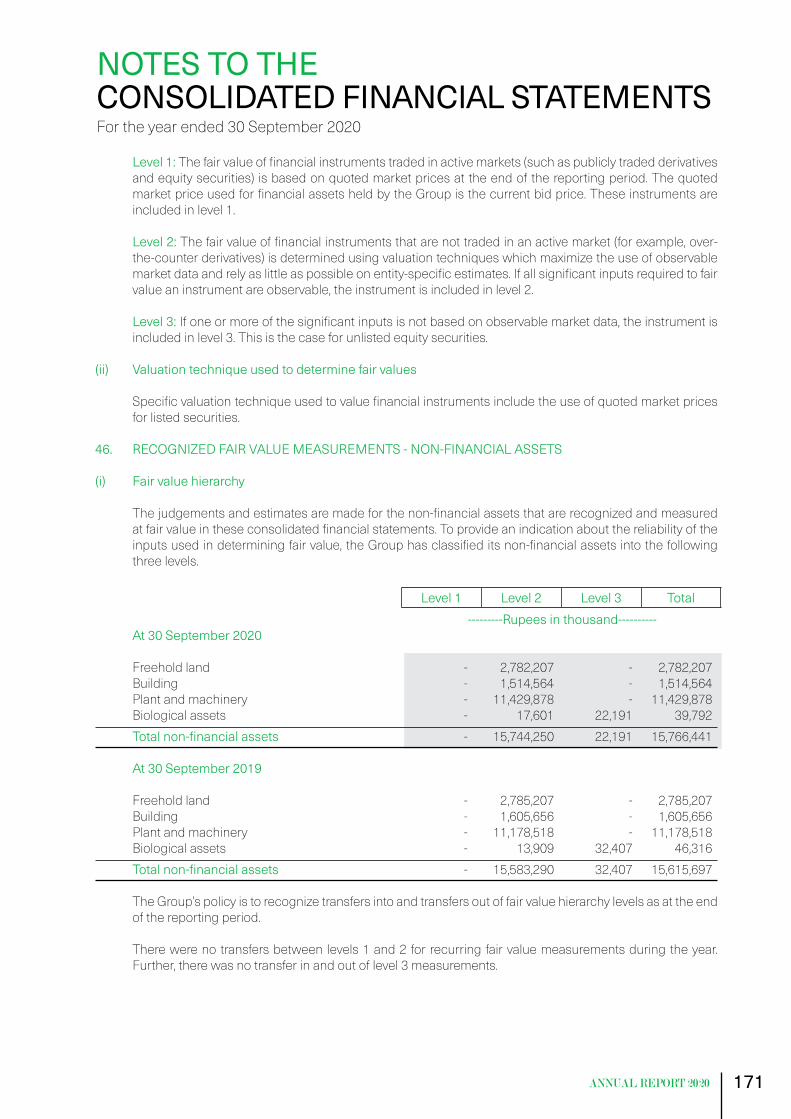
171
Level1:The fair value of financial instruments traded in active markets (such as publicly traded derivatives and equity securities) is based on quoted market prices at the end of the reporting period. The quoted market price used for financial assets held by the Group is the current bid price. These instruments are included in level 1.
Level2: The fair value of financial instruments that are not traded in an active market (for example, over-
the-counter derivatives) is determined using valuation techniques which maximize the use of observable market data and rely as little as possible on entity-specific estimates. If all significant inputs required to fair value an instrument are observable, the instrument is included in level 2.
Level3: If one or more of the significant inputs is not based on observable market data, the instrument is
included in level 3. This is the case for unlisted equity securities. (ii) Valuation technique used to determine fair values Specific valuation technique used to value financial instruments include the use of quoted market prices
for listed securities.
46. RECOGNIZED FAIR VALUE MEASUREMENTS - NON-FINANCIAL ASSETS
(i) Fair value hierarchy The judgements and estimates are made for the non-financial assets that are recognized and measured
at fair value in these consolidated financial statements. To provide an indication about the reliability of the inputs used in determining fair value, the Group has classified its non-financial assets into the following three levels.
Level 1 Level 2 Level 3 Total
---------Rupees in thousand---------- At 30 September 2020
Freehold land - 2,782,207 - 2,782,207 Building - 1,514,564 - 1,514,564 Plant and machinery - 11,429,878 - 11,429,878 Biological assets - 17,601 22,191 39,792 Totalnon-financialassets - 15,744,250 22,191 15,766,441 At 30 September 2019 Freehold land - 2,785,207 - 2,785,207 Building - 1,605,656 - 1,605,656 Plant and machinery - 11,178,518 - 11,178,518 Biological assets - 13,909 32,407 46,316 Totalnon-financialassets - 15,583,290 32,407 15,615,697 The Group’s policy is to recognize transfers into and transfers out of fair value hierarchy levels as at the end
of the reporting period. There were no transfers between levels 1 and 2 for recurring fair value measurements during the year.
Further, there was no transfer in and out of level 3 measurements.
NOTES TO THE CONSOLIDATED FINANCIAL STATEMENTSFor the year ended 30 September 2020

172 Shakarganj Limited and Its Subsidiary
(ii) Valuation techniques used to determine level 2 fair values The Group obtains independent valuation for its freehold land, building, plant and machinery at least
after every three years. The management updates the assessment of the fair value of property, plant and equipment taking into account the most recent independent valuation. The management determines the value of these assets within a range of reasonable fair value estimates. The best evidence of fair value of land is current prices in an active market for similar lands. The best evidence of fair value of building is to calculate fair depreciated market value by applying an appropriate annual rate of depreciation on the new construction / replacement value of the same building. The best evidence of fair value of plant and machinery is to calculate fair depreciated market value by applying an appropriate annual rate of depreciation on the value of new plant and machinery of the same specifications. The fair value of standing crops is based on the support price fixed by the Government and other factors such as estimated crop yield and area under cultivation. The fair value of livestock is estimated on the basis of market prices of livestock of similar age, breed and genetic merit.
Valuation processes The Group engages external, independent and qualified valuer to determine the fair value of the Group’s
freehold land, building, plant and machinery after three years. The fair value of these assets has been determined by independent valuers Messrs Tristar International Consulting (Private) Limited, Messrs Saleem Engineers and Messrs Surval on 27 September 2018, on 09 April 2018 and on 30 September 2019 respectively. The fair value of biological assets are determined by the related experts keeping in view the current market conditions and other salient factors.
47. CORRESPONDING FIGURES As the consolidated financial statements have been prepared for the first time, therefore the corresponding
figures have been consolidated for the first time for the previous year presented. 48. DATE OF AUTHORIZATION These consolidated financial statements were authorized for issue on 04 January 2021 by the Board of
Directors. 49. GENERAL Figures have been rounded off to the nearest thousand of Rupees unless otherwise stated.
ChiefExecutiveOfficer Director ChiefFinancialOfficer
NOTES TO THE CONSOLIDATED FINANCIAL STATEMENTSFor the year ended 30 September 2020

173
2.2 No. of Shareholding Total shares Shareholders From To held 449 1 100 12,766 344 101 500 106,746 228 501 1,000 177,529 331 1,001 5,000 746,697 67 5,001 10,000 463,945 23 10,001 15,000 271,458 11 15,001 20,000 197,504 11 20,001 25,000 249,024 7 25,001 30,000 191,845 4 30,001 35,000 135,369 3 35,001 40,000 117,164 4 40,001 45,000 165,633 4 45,001 50,000 185,849 3 50,001 55,000 155,839 5 55,001 60,000 285,409 2 60,001 65,000 125,041 3 65,001 70,000 200,120 8 70,001 75,000 587,105 2 75,001 80,000 153,752 1 80,001 85,000 84,504 3 85,001 90,000 262,959 1 95,001 100,000 95,146 2 100,001 105,000 202,372 3 105,001 110,000 326,852 1 110,001 115,000 113,636 4 115,001 120,000 472,797 1 120,001 125,000 120,861 1 130,001 135,000 133,178 1 140,001 145,000 142,017 1 160,001 165,000 164,772 1 175,001 180,000 175,230 1 185,001 190,000 189,501 1 195,001 200,000 198,863 1 220,001 225,000 223,140
Form - 34THE COMPANIES ACT, 2017
THE COMPANIES (GENERAL PROVISIONS AND FORMS) REGULATIONS, 2018 [Section 227(2)(f)]
Part-I1.1 Name of The Company Shakarganj Limited
Part-II2.1 Pattern of Holding of the Shares held by the Shareholders as at : 30 September 2020
PATTERN OF SHAREHOLDING
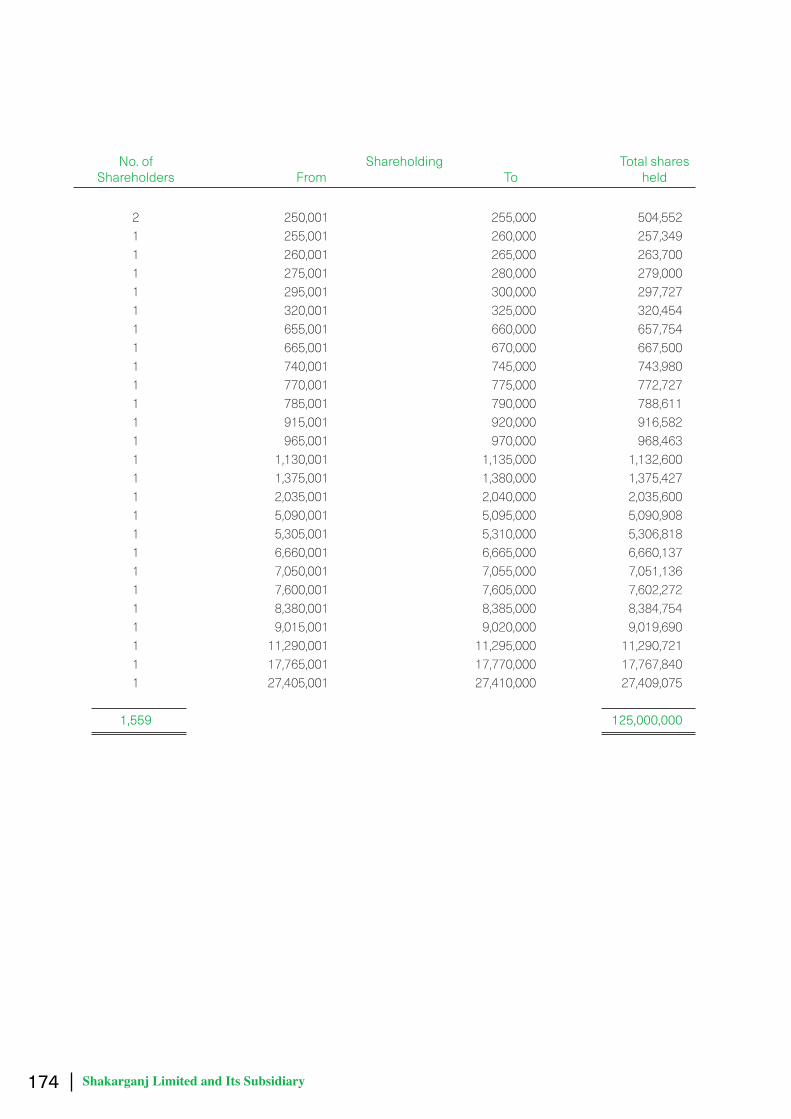
174 Shakarganj Limited and Its Subsidiary
2 250,001 255,000 504,552 1 255,001 260,000 257,349 1 260,001 265,000 263,700 1 275,001 280,000 279,000 1 295,001 300,000 297,727 1 320,001 325,000 320,454 1 655,001 660,000 657,754 1 665,001 670,000 667,500 1 740,001 745,000 743,980 1 770,001 775,000 772,727 1 785,001 790,000 788,611 1 915,001 920,000 916,582 1 965,001 970,000 968,463 1 1,130,001 1,135,000 1,132,600 1 1,375,001 1,380,000 1,375,427 1 2,035,001 2,040,000 2,035,600 1 5,090,001 5,095,000 5,090,908 1 5,305,001 5,310,000 5,306,818 1 6,660,001 6,665,000 6,660,137 1 7,050,001 7,055,000 7,051,136 1 7,600,001 7,605,000 7,602,272 1 8,380,001 8,385,000 8,384,754 1 9,015,001 9,020,000 9,019,690 1 11,290,001 11,295,000 11,290,721 1 17,765,001 17,770,000 17,767,840 1 27,405,001 27,410,000 27,409,075
1,559 125,000,000
No. of Shareholding Total shares Shareholders From To held
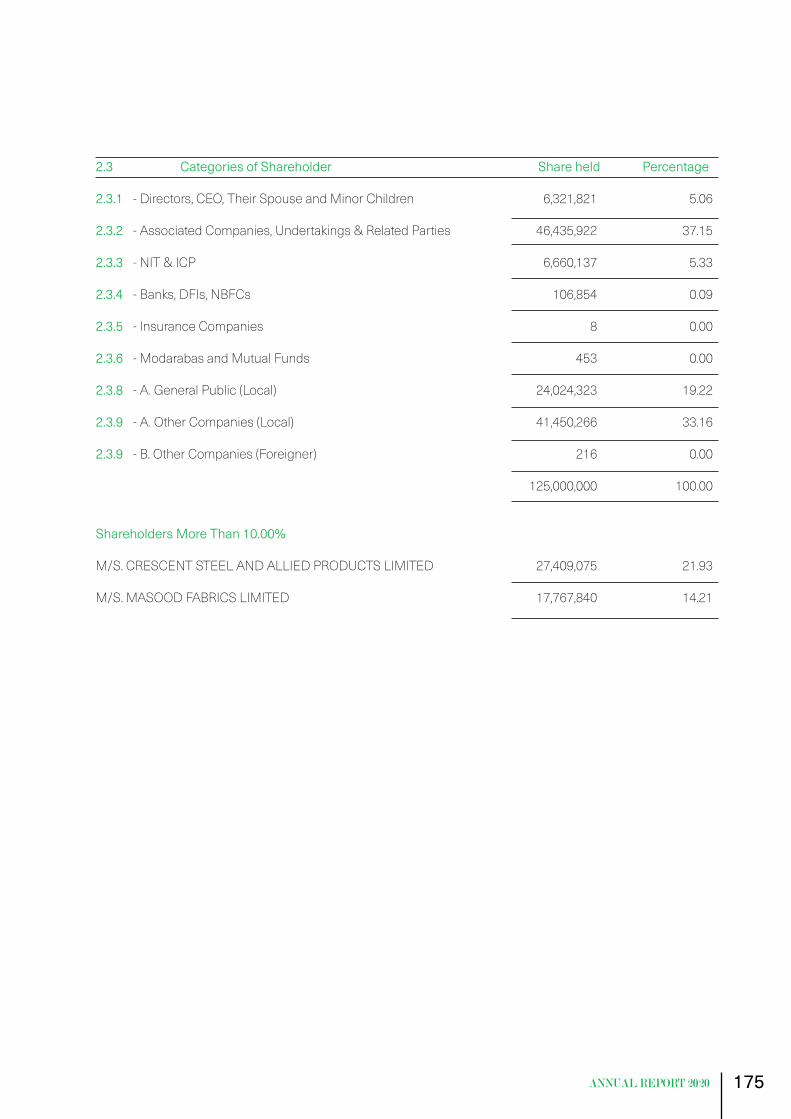
175
2.3 Categories of Shareholder Share held Percentage 2.3.1 - Directors, CEO, Their Spouse and Minor Children 6,321,821 5.06
2.3.2 - Associated Companies, Undertakings & Related Parties 46,435,922 37.15 2.3.3 - NIT & ICP 6,660,137 5.33 2.3.4 - Banks, DFIs, NBFCs 106,854 0.09 2.3.5 - Insurance Companies 8 0.00 2.3.6 - Modarabas and Mutual Funds 453 0.00 2.3.8 - A. General Public (Local) 24,024,323 19.22
2.3.9 - A. Other Companies (Local) 41,450,266 33.16 2.3.9 - B. Other Companies (Foreigner) 216 0.00
125,000,000 100.00 Shareholders More Than 10.00% M/S. CRESCENT STEEL AND ALLIED PRODUCTS LIMITED 27,409,075 21.93 M/S. MASOOD FABRICS LIMITED 17,767,840 14.21

176 Shakarganj Limited and Its Subsidiary
Notice is hereby given that the 53rd Annual General Meeting (“AGM”) of shareholders of Shakarganj Limited (the “Company”) will be held on Thursday, 28 January 2021 at 11:00 a.m through video-link to transact the following Ordinary Business::
1. To receive, consider and adopt the Chairman’s Review Report, Reports of Directors and Auditors together with Audited Consolidated and Unconsolidated Annual Financial Statements of the Company for the year ended 30 September 2020.
2. To appoint Company’s auditors and to fix their remuneration. The members are hereby notified that the Audit Committee and the Board of directors have recommended the name of M/s. Riaz Ahmad & Company, Chartered Accountants for re-appointment as auditors of the Company.
By Order of the Board
Asif AliLahore: : 04 January 2021 Company Secretary
NOTES:
In view of the SECP instructions due to Pandemic Covid19, the AGM will be conducted virtually via video link for safety and well-being of the shareholders of the Company and general public. The AGM can be attended using smart phones/tablets/computers. To attend the meeting through video link, members and their proxies are requested to register themselves by providing the following information along with valid copy of Computerized National Identity Card (both sides)/passport, attested copy of board resolution / power of attorney (in case of corporate shareholders) through WhatsApp at 0300-0801554 or email at [email protected] by 26 January 2021.
Name of member CNIC No. CDC Account
No/Folio No.
Cell Number. Email address
The members who are registered after the necessary verification shall be provided a video link by the Company on the same email address that they email with the Company with. The Login facility will remain open from start of the meeting till its proceedings are concluded.
The shareholders who wish to send their comments/ suggestions on the agenda of the AGM can email the Company at [email protected] or WhatsApp at 0300-0801554. The Company shall ensure that comments/ suggestions of the shareholders will be read out at the meeting and the responses will be made part of the minutes of the meeting.
BookClosureandProxies:
The Share Transfer Books of the Company will remain closed from 21 January 2021 to 28 January 2021 (both days inclusive). Transfers received in order at the office of our Share Registrar, M/s CorpTec Associates (Pvt) Limited,
NOTICE OF 53rd ANNUAL GENERAL MEETING

177
503-E, Johar Town, Lahore by the close of business on 20 January 2021, will be treated in time for the entitlement to attend, speak and vote at the AGM.
A member entitled to attend and vote at this meeting may appoint any other member as his/her proxy to attend and vote instead of him/her and a proxy so appointed shall have the same rights, as respects attending, speaking and voting at the AGM as are available to the members. The proxy form shall be witnessed by two persons, whose names, addresses and CNIC numbers shall be mentioned on the form. A Proxy must be a member of the Company.
The instrument appointing a proxy and the power of attorney or other authority under which it is signed or a notarial attested copy of the power of attorney must be deposited at the Registered Office of the Company at least 48 hours before the time of the meeting. Proxy Forms, in English and Urdu languages, have been dispatched to the members along with the notice of AGM.
CNIC/IBANforE-DividendPayment:
The provisions of Section 242 of the Companies Act, 2017 require the listed companies that any dividend payable in cash shall only be paid through electronic mode directly into the bank account of designated by the entitled shareholders. Accordingly, the shareholders holding physical shares are requested to provide the Company’s Share Registrar at the address given herein above, electronic dividend mandate on E-Dividend Form provided in the annual report and also available on website of the Company. In the case of shares held in CDC, the same information should be provided to the CDS participants for updating and forwarding to the Company. In case of non-submission, all future dividend payments may be withheld.
ZakatDeclarations:
The members of the Company are required to submit Declarations for Zakat exemption to the Company in terms of Zakat and Ushr Ordinance, 1980.
Circulations of Annual Reports through CD/DVD/USB/ Email
The shareholders who wish to receive hard copy of the aforesaid documents may send to the Company Secretary / Share Registrar, the Standard Request Form provided in the annual report and also available on the website of the Company and the Company will supply hard copies of the aforesaid document to the shareholders on demand, free of cost, within one week of such demand. The shareholders who intend to receive the annual report including the notice of meeting through e-mail are requested to provide their written consent on the Standard Request Form provided in the annual report and also available on the Company’s website: www.shakarganj.com.pk.
Unclaimed Dividend and Bonus Shares
Shareholders, who by any reason, could not claim their dividend or bonus shares or did not collect their physical shares, if any, are advised to contact our Share Registrar M/s Corptec Associates (Private) Limited, 503-E, Johar Town, Lahore, to collect/enquire about their unclaimed dividend or pending shares, if any.
Placement of Financial Statements
The Company has placed the Annual Report containing, notice of Annual General Meeting, Audited Consolidated and Unconsolidated Annual Financial Statements for the year ended 30 September 2020 along with Auditors and Directors Reports thereon and Chairman’s Review on its website: www.shakarganj.com.pk


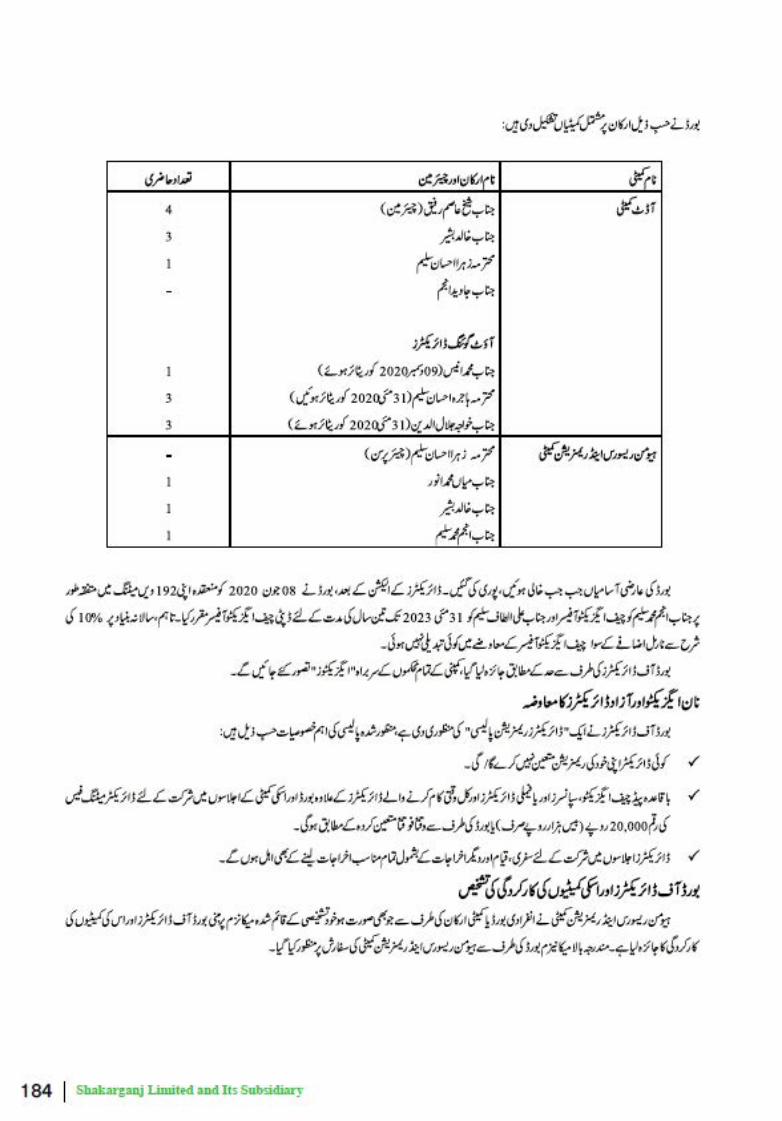


191
I/We _______________________________________________________________________, being member(s) of Shakarganj Limited and holder of ___________________ Shares as per Folio No._________/CDC Participation ID # ______________ and Sub Account # ______________ /CDC Investor Account ID #______________do hereby appoint ____________________________________ of _____________________________ having Folio No.________CDC Participation ID # __________ and Sub Account # _________/CDC Investor Account ID #______________as my/our proxy to attend, speak and vote for me/us and on my/our behalf at the Annual General Meeting of Shakarganj Limited scheduled to be held on Thursday, 28 January 2021 at 11:00 a.m through video-link to transact the following Ordinary Business:
As witness my / our hand this __________________________ day of __________________________ 2021.
1. Name ______________________________________
C.N.I.C ________________________________________
Address _____________________________________
________________________________________________
2. Name ______________________________________
C.N.I.C ________________________________________
Address _____________________________________
________________________________________________
Notes:
1. A member entitled to attend and vote at a General Meeting is entitled to appoint a proxy.2. The instrument appointing a Proxy together with the Power of Attorney, if any, under which it is signed
or a notarially certified copy thereof, should be deposited at the Share Registrar Office of the Company, CorpTec Associates (Private) Limited, 503-E, Johar Town, Lahore, not less than 48 hours before the time of holding the Meeting.
3. CDC account holders will further have to follow the under mentioned guidelines as laid down in circular# 1 dated January 26, 2000 of the Securities and Exchange Commission of Pakistan for appointing Proxies:
i) In case of individuals, the account holder or sub-account holder whose securities and their registration details are uploaded as per the Regulations, shall submit the proxy form as per the above requirement.
ii) The proxy form shall be witnessed by two persons whose names, addresses and CNIC numbers
shall be mentioned on the form. iii) Attested copies of CNIC or the passport of the beneficial owners and the proxy shall be furnished
with the proxy form. iv) The proxy shall produce his original CNIC or original passport at the time of the meeting. v) In case of a corporate entity, the Board of Directors’ resolution/Power of attorney with specimen
signatures of the proxy holder shall be submitted (unless it has been provided earlier) alongwith proxy form to the Company.
FORM OF PROXY
Please affix here Revenue Stamp of
Rs. 5/-

193
M/s Corptec Associates (Private) Limited503-E Johar Town, LahoreEmail: [email protected]
SUBJECT:CONSENTFORMFORELECTRONICTRANSMISSIONOFANNUALREPORTANDNOTICEOFAGM
Dear Sirs,
I/we, being the shareholder(s) of Shakarganj Limited (“Company”), do hereby consent and authorize the Company for electronic transmission of the Audited Annual Financial Statements of the Company along with Notice of Annual General Meeting via the Email provided herein below and further undertake to promptly notify the Company of any change in my Email address.
I understand that the transmission of Annual Audited Financial Statements of the Company along with Notice of Annual General Meeting via the Email shall meet the requirements as mentioned under the provisions of Companies Act, 2019.
1. Name of Shareholder(s) : ______________________________________________________________________
_______________________________________
2. Fathers / Husband Name:_____________________________________________________________________
_______________________________________
3. CNIC: ______________________________________________________________________________________
______________________________________________
4. NTN: _______________________________________________________________________________________
______________________________________________
5. Participant ID / Folio No: ______________________________________________________________________
_______________________________________
6. E-mail address: ______________________________________________________________________________
__________________________________________
7. Telephone: __________________________________________________________________________________
___________________________________________
8. Mailing address:______________________________________________________________________________
____________________________________________
Date: __________________________Signature:(In case of corporate shareholders,the authorized signatory must sign)
CONSENT FORM FOR ELECTRONIC TRANSMISSION OF ANNUAL REPORT AND NOTICE OF AGM

195
1. Name of member: ____________________________________________________________________________
_________________________________________
2. CNIC No/Passport No: ________________________________________________________________________
_______________________________________
3. Folio/CDC Participant ID/ Sub a/c/Investor a/c: ____________________________________________________
______________________________
4. Registered Address: __________________________________________________________________________
_____________________________________________________________________________________________
_____________________________________________________________________________________________
I/We hereby request you to provide me/us a hard copy of the Annual Report of Shakarganj Limited for the year ended September 30, ______at my above mentioned registered address instead of CD/DVD/USB. I undertake to intimate any change in the above information through revised Standard Request Form.
Date: Member’s Signature:
Note:This Standard Request Form may be sent at either of the following addresses of the Company Secretary or Independent Share Registrar of the Company:
Company SecretaryShakarganj LimitedE-Floor, IT Tower, 73/E-1, Hali Road, LahoreEmail: [email protected]
Chief Executive,M/s Corptec Associates (Private) LimitedIndependent Share Registrar of Shakarganj Limited503-E, Johar Town, LahoreEmail: [email protected]
In case a member prefers to receive hard copies for all the future annual audited accounts, then such preference shall be communicated to the company in writing.
STANDARD REQUEST FORM FOR HARD COPIES OF ANNUAL AUDITED ACCOUNTS

197
The Company Secretary/Share Registrar,I/We, __________________________, holding CNIC No. _____________________, being the registered shareholder of the company under folio no. __________________, state that pursuant the relevant provisions of Section 242 of the Companies Act, 2019 pertaining to dividend payments by listed companies, the below mentioned information relating to my Bank Account for receipt of current and future cash dividends through electronic mode directly into my bank account are true and correct and I will intimate the changes, if any in the above-mentioned information to the company and the concerned Share Registrar as soon as these occur through revised E-Dividend Form.
Title of Bank Account
Bank Account Number
IBAN Number
Bank’s Name
Branch Name and Address
Cell Number of Shareholder
Landline number of Shareholder
Email of Shareholder
In case of CDC shareholding, I hereby also undertake that I shall update the above information of my bank account in the Central Depository System through respective participant.
Date: Member’s Signature:
Note:This Standard Request Form may be sent at either of the following addresses of the Company Secretary or Independent Share Registrar of the Company:
Company SecretaryShakarganj LimitedE-Floor, IT Tower, 73/E-1, Hali Road, LahoreEmail: [email protected]
Chief Executive,M/s Corptec Associates (Private) LimitedIndependent Share Registrar of Shakarganj Limited503-E, Johar Town, LahoreEmail: [email protected]
E-DIVIDEND FORM (DIVIDEND PAYMENTTHROUGH ELECTRONIC MODE)
199
The Company Secretary/Share Registrar,
I/we,__________________________, of _____________________, being the registered shareholder(s) of the
company under Folio No(s). __________________/ CDC Participant ID No.___ and Sub Account No.___ CDC
Investor Account ID No., and holder of ___________ Ordinary Shares, hereby request for video conference facility
at _________________ for the Annual General Meeting of the Company to be held on ________________.
Date: Member’s Signature:
Note:This Standard Request Form may be sent at either of the following addresses of the Company Secretary or Independent Share Registrar of the Company:
Company SecretaryShakarganj LimitedE-Floor, IT Tower, 73/E-1, Hali Road, LahoreEmail: [email protected]
Chief Executive,M/s Corptec Associates (Private) LimitedIndependent Share Registrar of Shakarganj Limited503-E, Johar Town, LahoreEmail: [email protected]
FORM FOR VIDEO CONFERENCE FACILITY

Shakarganj LimitedExecutive Floor, IT Tower, 73 E 1 Hali Road, Gulberg III, Lahore, PakistanTelephone: (042) 111 111 765Fax: (042) 3578 3811