annual report 2018–19€¦ · annual report fi106702 at a glance who we are figure 1 department...
TRANSCRIPT

Annual report2018–19

iiDepartment of Agriculture Annual report 2018–19
At a glance
Who we areFIGURE 1 Department of Agriculture demographics as at 30 June 2019
attendance types
approximately
employees5,000
Casual
Part Time
Full Time
locationsCocos IslandsChristmas Island
Norfolk Island
+16 locations around the world
age groups
UNDER30
%
30–39 40–49 50–59OVER
60
11.3
24.028.1
25.5
11.1
diversity
51% of the workforce are women
1% of employees identify as LGBTIQ
6% of employees are from non-English speaking backgrounds
2% of employees have a disability
2% of employees identify asAboriginal and/or Torres Strait Islander
46% of EL2 and SES leaders are women76.9%
17.2%
5.9%
Note: an employee has a non-English speaking background (NESB) if they arrived in Australia after the age of 5 and their first language is a language other than English. Diversity data are self-identified by employees.

iiiDepartment of Agriculture
Annual report 2018–19
At a glance
What we doFIGURE 2 Department of Agriculture strategic framework, 2018–19
Regulation and
service delivery
Trade and market access
Research and innovation
Enterprise-wideenablingservices
Forecastingand
strategicintelligence
Increase, improve
and maintain m
arkets
Encourage and reduce risks to agricultural productivity
Supp
ort s
usta
inab
le
high
-qua
lity
natu
ral
reso
urce
s
Policies andprograms
OBJECTIVES
To a
chie
ve o
ur p
ur
pose, we strive for these objectives in the national interest
FUNCTIONSOur f
unctions are directed towards achieving our objectives
We deliver these functions with government and industry
PURPOSEWe work with national and
international governments and industry to grow the value of
agricultural trade and reduce risk to the
agricultural sector

ivDepartment of Agriculture Annual report 2018–19
At a glance
Our portfolioFIGURE 3 Agriculture portfolio as at 30 June 2019
Murray–Darling Basin Authority
Chief Executive O�cer Phillip Glyde
Regional Investment Corporation
Executive DirectorBruce King
Minister for Water Resources, Drought, Rural Finance,
Natural Disaster andEmergency Management
The Hon. David Littleproud MP
Minister for Agriculture Senator the Hon. Bridget McKenzie
Assistant Minister for Forestry and Fisheries
Senator the Hon. Jonathon Duniam
Agrifutures AustraliaManaging Director
John Harvey
Australian Fisheries Management
AuthorityChief Executive O�cer
Wez Norris
Fisheries Research and Development Corporation
Executive Director Patrick Hone
Grains Research and Development Corporation
Managing Director Steve Je�eries
Wine AustraliaChief Executive O�cer
Andreas Clark
Department of AgricultureSecretary
Daryl Quinlivan
Australian Pesticides and Veterinary
Medicines AuthorityChief Executive O�cer
Chris Parker
Cotton Research and Development Corporation
A/g Executive DirectorIan Taylor

vDepartment of Agriculture
Annual report 2018–19
At a glance
Our departmentFIGURE 4 Department of Agriculture organisational structure as at 30 June 2019
SecretaryDaryl Quinlivan
DeputySecretary
Neal Mason (A/g)
Assurance and Legal
General CounselAlice Linacre
CorporateStrategy
and GovernanceTi�any Blight (A/g)
Finance andBusiness Support
Chief FinanceO�cer
Scott Brown
Biosecurity AnimalRobyn Martin
Biosecurity PlantMarion Healy
Biosecurity Policy and
ImplementationMatt Koval
Australian ChiefVeterinary O�cer
Mark Schipp
Chief ScientistChief Plant
Protection O�cerKim Ritman
ChiefEnvironmental
BiosecurityO�cer
Ian Thompson
CompliancePeta Lane
ABARESExecutive DirectorPeter Gooday (A/g)
ExportsFran Freeman
Trade &Market Access
Louise Van Meurs
Agricultural PolicyRosemary Deininger
Rural Policy andFarm Performance
Sally Standen
Agvet Chemicals, Fisheries and
ForestryCass Kennedy
InformationServices
Chief InformationO�cer
Peter McKeon
DeputySecretary
Lyn O’Connell
DeputySecretary
Malcolm Thompson
DeputySecretary
Cindy Briscoe
WaterPaul Morris
Live AnimalExports Principal
Regulatory O�cerMelissa McEwen
(A/g)
Biosecurity Operations
Emily Canning

viDepartment of Agriculture Annual report 2018–19
At a glance
Our performanceTABLE 1 Summary of performance, 2018–19
Measure Result Page
The value of food and fibre exports exceeds the average value of the previous 10 years Achieved 16
Average annual productivity growth is equal to or exceeds average annual market sector productivity growth of the previous 10 years
Achieved 17
The status and productivity of agricultural land, water resources and Commonwealth fisheries is at least maintained in trend terms
On track 17
Rates of compliance with regulations administered by the department are maintained or improved
Achieved 21
Over time, the department achieves a substantial, cost-effective reduction in biosecurity risk, measured by avoided loss and return on investment
Achieved 25
Qualitative assessment of the development of new and amended regulations in line with whole-of-government practice
Achieved 25
Agreed service standards are met and stakeholders provide positive feedback Partially achieved
26
Evaluations of programs have positive findings Achieved 28–29
Positive ministerial feedback on the quality and timeliness of the department’s advice Achieved 29
The number of export markets that are gained, maintained, improved or restored Achieved 29
New or improved markets show an overall increase in export values in trend terms. Achieved 30
Qualitative assessment using case studies of benefits from rural research and development
On track 32
Levy collection processes cost no more than 1.2% of levies disbursed Achieved 32
Inspections of levy agent records cover at least 20% of levy revenue over a three-year rolling average
Achieved 34
The department’s employee engagement measures in the APS employee census are maintained or improved
Achieved 36
The notifiable workplace incident rate is maintained or reduced Achieved 40
The end-of-year financial position is consistent with the budget at the start of the year Achieved 41
The department’s satisfaction with the delivery of ICT services is improved Achieved 41
Outcomes are consistent with forecasts and predictions, allowing for unforeseeable events
Achieved 41

viiDepartment of Agriculture
Annual report 2018–19
At a glance
What we did in 2018–19FIGURE 5 Department of Agriculture key activities, 2018–19
Screened more than 120 million mail items for biosecurity risks
Provided assistance to more than 6,100 people through the Rural Financial Counselling Service
Funded 110 Smart Farms Small Grants to promote sustainable agriculture
Helped save 122 billion litres of water through the Water E�ciency Labelling and Standards scheme
Provided post-entry quarantine for 6,412 cats and dogs
Regulated the export of 2,279,071 livestock

viiiDepartment of Agriculture Annual report 2018–19
ContentsWho we are iiWhat we do iiiOur portfolio ivOur department vOur performance viWhat we did in 2018–19 vii
Part 1: Annual performance statements 1
Accountable authority statement 2Introduction 3Secretary’s review 5Our performance 16Financial performance 44
Part 2: Management and accountability 49
Our governance 50Our executive 50External service providers 61External scrutiny 65
Part 3: Appendices 69
A Entity resource and outcome statements 70B Ecologically sustainable development and environmental performance 88C Human resources statistics 94D Executive remuneration 106E Client service standards 110F Report on the operation of the Natural Resources Management (Financial Assistance) Act 1992 117G National Residue Survey annual report 2018–19 118H Water Efficiency Labelling and Standards scheme annual report 2018–19 121I Water for the Environment Special Account annual report 2018–19 124J Disability reporting 126
Part 4: Financial statements 127
Part 5: References 189
Acronyms 190Glossary 191List of tables 192List of figures 193Aids to access 193Compliance index 194Subject index 202

DA
3310
_021
8
Contents
Snapshots
1 Responding to Darling River fish deaths 182 A new Chief Environmental Biosecurity Officer 203 Protecting Australia from animal diseases 224 Combatting brown marmorated stink bug 275 Collaborating with industry on chemicals for minor uses 306 Improved use of seasonal forecasting to increase farmer profitability 337 More profit from nitrogen—enhancing the nutrient use efficiency of intensive cropping and pasture systems 358 3D X-rays helping the biosecurity effort 369 Integrity culture program 3810 ABARES Insights informing agricultural issues 43
ixDepartment of Agriculture
Annual report 2018–19

xDepartment of Agriculture Annual report 2018–19

1Department of Agriculture
Annual report 2018–19
Part 1
Annual performance statements

2Department of Agriculture Annual report 2018–19
Accountable authority statement

3Department of Agriculture
Annual report 2018–19
Introduction
IntroductionThe corporate plan sets out our purpose, the activities we will undertake to achieve that purpose and how we will measure our performance.
The annual performance statements report the actual results in a given reporting year and analyse the factors that contributed to the results.
Our purposeWe work with national and international governments and industry to grow the value of agricultural trade and reduce risk to the agricultural sector.
Our outcomesUnder the Portfolio Budget Statements 2018–19 (PBS), we have 3 outcomes:
1. More sustainable, productive, internationally competitive and profitable Australian agricultural, food and fibre industries through policies and initiatives that promote better resource management practices, innovation, self-reliance and improved access to international markets.
2. Safeguard Australia’s animal and plant health status to maintain overseas markets and protect the economy and environment from the impact of exotic pests and diseases, through risk assessment, inspection and certification, and the implementation of emergency response arrangements for Australian agricultural, food and fibre industries.
3. Improve the health of rivers and freshwater ecosystems and water use efficiency through implementing water reforms and ensuring enhanced sustainability, efficiency and productivity in the management and use of water resources.
Our objectives and programsWe have 3 strategic objectives to deliver our purpose. Table 2 shows which PBS programs contribute to these objectives.

4Department of Agriculture Annual report 2018–19
Introduction
TABLE 2 Department of Agriculture objectives, by program
Program Objectives
Increase, improve and maintain
markets
Encourage agricultural productivity
Support sustainable, high-quality
natural resources
1.1 Agricultural Adaptation –
1.2 Sustainable Management—Natural Resources
–
1.3 Forest Industry
1.4 Fishing Industry
1.5 Horticulture Industry
1.6 Wool Industry
1.7 Grains Industry
1.8 Dairy Industry
1.9 Meat and Livestock Industry
1.10 Agricultural Resources
1.11 Drought Programs –
1.12 Rural Programs –
1.13 International Market Access – –
2.1 Biosecurity and Export Services
2.2 Plant and Animal Health
3.1 Water Reform –

5Department of Agriculture
Annual report 2018–19
Secretary’s review
Secretary’s reviewWelcome to the Department of Agriculture annual report 2018–19. I’m pleased to report here on our efforts to achieve our purpose, to work with national and international governments and industry to grow the value of agricultural trade and reduce risk to the agricultural sector.
Our work during 2018–19 has been dominated by the impact of drought and extreme weather events on Australian agriculture and by the continuing scrutiny of the way we work as a government regulator.
In my review last year, I wrote that, at the end of 2017–18, areas of NSW and Queensland were experiencing, or entering into, drought conditions. At the end of 2018–19 the Bureau of Meteorology advised us that the Murray–Darling Basin, which occupies most of south-eastern Australia, had experienced the driest 30 months since records have been collected. The forecast for the coming months is not optimistic for a change to this pattern. Our own climate research by ABARES indicates Australia faces significant changes in future rainfall, including lower rainfall in southern Australia and more severe droughts and floods.
In 2019 we also saw the damage caused by severe flooding in north Queensland, resulting in the reported loss of more than half a million livestock.
These conditions take their toll on individuals and families that depend on the land. They also affect our objectives for Australian agriculture. Drought and floods reduce supply for Australia’s agricultural exports, undermine the productivity of primary producers and the businesses and communities that rely on them, and deplete the country’s natural resources. Responding to these challenges has been a significant part of our work for the year, and it will continue into the future.
Our work in achieving and maintaining market access is a major part of that response and the foundation for a strong agricultural sector. The significance of this can be seen by comparing our experience during this drought and the worst years of the Millennium Drought, when prices collapsed, producers rushed the saleyards and there was enormous commercial damage. This time, with greater access to markets, that has so far not eventuated. This is a great turnaround in a decade and an indication of the greater commercial strength and resilience of the sector.
This year, the government received the findings of the independent review of our capability and culture as the regulator of live animal exports. Philip Moss AM recommended the department make a range of changes to its regulatory practice. We have made significant progress on implementing those recommendations and many of them have been fully implemented.
In 2019 we suspended sheep exports to the Middle East for the northern summer from June to late September. This was the first ever prohibition of the export of sheep on animal welfare grounds. We also set conditions for sheep exports during May in the lead up to the suspension. We finalised the export conditions after examining all aspects of live export regulation, and considering a range of feedback.
We received the recommendations of the review of the Australian Standards for the Export of Livestock for live animals transported by sea. These recommendations will help ensure animals are fit for export from Australia, and their health and welfare is managed throughout the export voyage.
Our response to these reviews forms part of a broader program of work to enhance our regulatory practice across exports, biosecurity, imported food, illegal logging, water efficiency labelling and standards, and industry levies. We are developing a new Regulatory Practice Framework, encompassing initiatives that will strengthen our culture and capability as professional regulators across our business.

6Department of Agriculture Annual report 2018–19
Secretary’s review
This is the first annual report reflecting the new strategic framework introduced in our Corporate Plan 2018–19. This year, we have streamlined the report’s presentation of performance information. The remainder of my review gives an overview of our performance against each of our strategic objectives. This is followed by the results against our published performance measures. I am pleased to note that we have met or are on track for the measures we set for ourselves at the beginning of the planning cycle.
Increase, improve and maintain marketsFree trade agreementsWe work with the Department of Foreign Affairs and Trade (DFAT) to achieve the best outcomes for Australian agricultural and food export interests in bilateral and multilateral trade negotiations. During the year, we achieved milestones on 2 important free trade agreements.
Australia and Indonesia signed a Comprehensive Economic Partnership Agreement. Once it comes into force, the agreement will boost Australia’s economic cooperation with Indonesia, support strengthened commercial links and stimulate increased 2-way trade and investment.
Under the agreement, 99% of Australian goods will enter Indonesia duty-free or with significantly improved preferential arrangements. In turn, all Indonesian exports will enter Australia duty-free. Both countries will benefit from improved access for Australian agricultural commodities, including live cattle, feed grains, beef and sheep meat and horticulture.
This agreement will help build the infrastructure and industries for a prosperous Indonesia. Australian suppliers will have more opportunities to contribute to Indonesia’s fast-growing economy.
In February 2019 the Peruvian Government ratified the Peru–Australia Free Trade Agreement (PAFTA). The process for Australian ratification is underway. The PAFTA negotiations were a great success, delivering an agreement in record time for an Australian free trade agreement (FTA).
Peru is one of the fastest-growing economies in the world. Removing tariffs will open this market for Australian agricultural exports and put Australia on an even footing with competitors that already have a preferential FTA with Peru. The PAFTA will provide significant benefits for Australian exporters that build on the substantial gains achieved with Peru through the Comprehensive and Progressive Agreement for Trans-Pacific Partnership.

7Department of Agriculture
Annual report 2018–19
Secretary’s review
Market accessNegotiating market access protocols is a significant part of our work. In 2018–19 we had a number of achievements in key markets. This includes gaining market access for walnuts to India, and establishing new export requirements that increased the number of Australian meat establishments eligible to export to Brunei. We maintained access for processed pork products to Thailand following regulatory changes in that country, and worked with Singapore to simplify the approval process for processors that export Australian products containing imported pork from other countries.
We successfully reinstated northern Tasmania’s fruit fly pest-free area status for 7 export markets following an outbreak in 2018. We also maintained access for citrus to the European Union for states and territories unaffected by the citrus canker outbreak.
During the year, the Chinese Government increased the number of fish species Australia can trade with China. This provides improved access to a key market for Australian seafood exports. It is the first outcome reported through the Australian Government’s new Trade Barriers Gateway.
We kept building our overseas counsellor network, establishing new posts in Chile, Mexico and the United Kingdom, and expanding our presence in Japan, India and Brussels. After Peru’s recognition of the Australian Export Meat Inspection System, our new counsellor in Chile has been working with Austrade to finalise revised certification arrangements for beef exports to Peru. This presents an opportunity for Australian beef exporters to re-enter a high-end niche market and meet the needs of Peru’s growing ‘foodie’ culture.
We also facilitate audits by trading partners to demonstrate that Australian exports meet the requirements of importing countries. In 2018–19 we hosted audits of export meat systems by 3 trading partners, including the United States, which is Australia’s second-largest market for meat exports. A successful audit is a requirement to maintain current market access to the United States for meat exports. The audit report was finalised in the first quarter of 2019–20.
Standards and systemsWe continue to work through the World Trade Organization (WTO) to promote free trade and to maintain an international approach to biosecurity obligations. This includes contributing to reforms in the WTO that are focused on dispute settlement, monitoring and notification functions, and trade rule negotiations. We now have a Minister-Counsellor (Agriculture) in the United Kingdom to work with DFAT and like-minded countries to progress all issues, particularly agricultural trade reform.
We also coordinate Australia’s input to the Codex Alimentarius Commission, which develops global food safety standards. In October 2018 we chaired the 24th session of the Codex Committee on Food Import and Export Inspection and Certification Systems. The committee addressed issues, including food fraud in the context of food safety and fair trade practices, electronic (paperless) certification and third-party assurance of food safety.
We are working with the state and territory governments on how we work with industries to enhance agricultural traceability systems. Good traceability helps inform consumers and trading partners about the safety, pest and disease status and authenticity of Australian export commodities. In 2018–19 we implemented Stage 2 of the National Traceability Project, which involves developing a traceability framework and action plan. The action plan is expected to be released later in 2019.

8Department of Agriculture Annual report 2018–19
Secretary’s review
Encourage agricultural productivitySupporting agricultural communitiesThe drought and the floods in northern Queensland highlighted the importance of targeted programs that assist primary producers experiencing hardship. They need support to improve their ability to manage risks to their businesses and livelihood.
In December 2018 the Council of Australian Governments signed a new National Drought Agreement, setting out an ongoing joint approach to drought preparedness, responses and recovery. This agreement builds on drought policy reform, including moving away from drought declarations, exceptional circumstances arrangements and associated lines on maps to qualify for drought support. It provides a framework to enable a consistent approach to drought policy and complements measures by different jurisdictions to promote adaptation to climate change.
During the year, we made substantial changes to the Farm Household Allowance (FHA) program. The length of the program was increased from 3 to 4 years, the farm assets threshold was temporarily increased, and 2 lump sum payments of up to $12,000 were made available. In 2018–19 around 4,100 new recipients gained access to the FHA. The program has now assisted more than 12,000 recipients since 2014, providing support payments of more than $343.4 million.
Demand for the Rural Financial Counselling Service (RFCS) continues to be strong, particularly since the FHA changes. In 2018–19 the RFCS had more than 6,100 clients, an increase on the previous year. The government increased the RFCS budget by $5 million, ensuring more counsellors were on the ground to support farmers.
To further support farmers in need, we funded a 2-year pilot for 2 Farm Liaison Officers to connect farmers, businesses and communities with support from the RFCS and other community assistance measures.
Farm management deposits reached a record high of $6.755 billion on 30 June 2019. Around 45,000 primary producers use the accounts to manage their cash flow. During the year there was evidence that some primary producers in drought-affected or flood-affected areas of NSW, Queensland and South Australia were drawing down their accounts, or depositing less than in the past.
We worked on policy design to improve the drought resilience of our farmers and communities. We evaluated the Pilot of Drought Reform Measures in Western Australia, which was undertaken by the Australian and WA governments in 2010. The evaluation found that the pilot delivered positive outcomes for farmers and communities, including improved long-term drought resilience for farmers who participated in the strategic planning programs.
We commissioned research, using results from the Regional Wellbeing Survey and other sources, to determine a baseline of drought resilience and to design metrics for future monitoring and evaluation at both farmer and community scales.
We also began preparations for the Future Drought Fund, which will provide $100 million annually from 2020–21. The fund will support drought-resilience projects that increase the adoption of the best farming practices and technology, enhance community resilience, address infrastructure needs and support better management of natural resources. This investment will help lift the productivity and profitability of Australian agriculture and enhance the health and sustainability of our farming landscapes.

9Department of Agriculture
Annual report 2018–19
Secretary’s review
Supporting agricultural industriesWe support rural research and development to help primary producers increase their productivity, profitability and competitiveness. In 2018–19 we worked with an independent consultant to co-design with stakeholders a shared vision for the future of Australia’s agricultural innovation system. Agricultural innovation—a national approach to grow Australia’s future is based on engagement with more than 550 stakeholders and an examination of global innovation systems. It makes recommendations in 5 areas to strengthen the agricultural innovation system, to help Australia reach the goal of a $100 billion agricultural sector by 2030.
We worked with other government agencies on agricultural workforce matters, implementing measures to help farmers access the seasonal labour they need. This includes extending the period of time working holiday visa holders can work for the one agricultural employer and making it easier for farmers to access workers through the Seasonal Worker Programme. The government also added 16 skilled agriculture occupations to the Regional Occupation List, which will help agricultural employers find and retain skilled migrant employees.
At an industry level, we collaborated with the Department of the Treasury to review the Sugar Code of Conduct. The review found that while industry partners are working together on a number of challenges, relationships between some parties remain tense, which affects their ability to reach commercial terms of contracts without regulatory support. The government agreed to amend the code and set another review for 4 years’ time. We also worked with the Department of the Treasury on consultation to develop a mandatory code of conduct for the dairy industry.
In 2018 we reviewed the Port Terminal Access (Bulk Wheat) Code of Conduct. The review recommended the code continue with a small number of amendments to improve its operation, based on the Australian Competition and Consumer Commission’s experience in monitoring the code’s operation. The government is considering the review.

10Department of Agriculture Annual report 2018–19
Secretary’s review
Support sustainable, high-quality natural resourcesWaterFurther progress was made towards meeting the 'bridging the gap' target under the Murray–Darling Basin Plan. Surface water recovery in the Basin (including some contracted water still to be delivered) reached 2,028 gigalitres (GL) long-term average annual yield (LTAAY) at 30 June 2019.
The ‘bridging the gap’ target decreased to 2,075GL, following the adoption of 2 amendments by Parliament to the Basin Plan that gave effect to the outcomes of the Northern Basin Review and the operation of the Sustainable Diversion Limit (SDL) Adjustment Mechanism. Approximately 47GL of surface water (around 2.3% of the target) is still required to meet surface water SDLs for some individual catchments. The Australian Government continues to work with states and private sector project proponents to deliver the final volumes of water required using existing contracts and the pursuit of additional proposals.
In July 2018 a Basin-wide program was launched to recover water from efficiency measures. Project agreements to undertake state-led projects were negotiated with South Australia and the ACT. The Basin water ministers agreed to new socio-economic criteria for the program in December 2018 and the program was paused to incorporate these criteria.
During the year, we implemented the On-farm Emergency Water Infrastructure Rebate Scheme to assist drought-affected farmers to build resilience to dry conditions. The scheme offers eligible farmers a 25% rebate up to $25,000 for water infrastructure expenses. By late June 2019 the scheme had approved at least 1,600 projects with a rebate value of $7,877,312.
Our work on the Water Efficiency Labelling and Standards (WELS) scheme continues to deliver benefits to consumers and Australia’s water resources. A 2018 evaluation by the Institute for Sustainable Futures at the University of Technology Sydney estimates the scheme has resulted in Australian households saving more than $1.1 billion a year on utility bills and is helping save 122 billion litres of water a year—enough to fill more than 47,000 Olympic-sized swimming pools.
We are now expanding our compliance efforts under the WELS scheme, addressing areas of risk such as online sales, new property developments and modular building construction.
ForestsThis year, we released the fifth Australia’s State of the Forests Report. The 5-yearly report examines the social, economic and environmental values of Australia’s forests. Australia has 134 million hectares of forest (more than 3% of the world’s forests) and has the seventh-largest forested area by country. Between 2011 and 2016 Australia’s forest area increased by 3.9 million hectares.
The report shows Australia’s wood products industry employed 51,983 people in 2016. In 2015–16 the value of logs harvested was $2.3 billion, the wood products industry had a value of production of $23.7 billion, and the value added by the forest and wood products industries was $8.6 billion. This represented a contribution of 0.52% to Australia’s gross domestic product. In the same year, Australia’s trade in wood products (imports plus exports) was worth $8 billion.
The report found that around 4.2 million tourists visit Australia’s major forested tourism regions each year. Our forests contain an estimated 126,000 registered Indigenous heritage sites, and 11 million hectares of forest is on non-Indigenous heritage-listed sites.

11Department of Agriculture
Annual report 2018–19
Secretary’s review
In September 2018 the Australian Government launched the National Forest Industries Plan. The plan sets out measures to underpin growth in Australia’s renewable forest industry and support the industry to plant a billion new plantation trees for forestry. As part of the plan, the government has announced sites to pilot new Regional Forestry Hubs in northern NSW, the South-West Slopes Bioregion in NSW, north-west Tasmania, Western Australia and the Green Triangle on the Victoria–South Australia border. The hubs are intended to help identify impediments to industry growth and opportunities such as options for new plantations.
Regional Forest Agreements (RFAs) are long-term, bilateral agreements for the sustainable management and conservation of Australia’s native forests. In 2018–19 we reached agreement with NSW and WA to renew and extend RFAs in these states. These agreements and the Tasmanian RFA (extended in August 2017) now have a 20-year rolling life. We are progressing the renewal and extension of the 5 Victorian RFAs to ensure their extension before 31 March 2020.
Renewing and extending RFAs is a significant and important achievement, because these agreements provide certainty to the forest industry, support regional forest communities and provide protection for endangered species.
FisheriesAustralia has a world-leading, environmentally responsible fisheries management framework. In 2018–19 we released the new Commonwealth Fisheries Harvest Strategy Policy and Commonwealth Fisheries Bycatch Policy.
The Harvest Strategy Policy implements an evidence-based approach to setting harvest levels in Commonwealth fisheries. It is designed to meet economic and sustainability objectives. The Bycatch Policy provides a framework to manage the risk of fishing-related impacts on bycatch species, by ensuring the exploitation of fisheries resources is consistent with the principles of ecologically sustainable development.
The Status of Australian Fish Stocks Reports 2018 provide the most scientifically robust, up-to-date information on the sustainability of Australia’s wild-catch fish stocks. This edition assessed 120 species or species groups, including finfish, crustaceans, molluscs, sharks and rays. Of 324 classifiable fish stocks, 254 stocks were classified as sustainable, 18 as recovering, 23 as depleting and 29 as depleted. The overall stock numbers classified as sustainable have improved.
The reports cover the majority of Australian-caught fish that Australians eat. In 2018 the commercial catch accounted for 142,328 tonnes, an increase of almost 8,000 tonnes since 2016. The reports provide a roadmap to ensure that sustainable stocks remain that way, and identify where action is needed to address species and stocks of concern. The reports also inform Australia’s reporting on achievements against the United Nations Sustainable Development Goals.

12Department of Agriculture Annual report 2018–19
Secretary’s review
Agricultural landWe implemented a $15 million program to help communities manage the impact of pests and weeds during drought. The program complements other Australian Government pest and weed management programs, supports the government’s broader biosecurity objectives and will stimulate local economies. We awarded a total of $15 million in grants to 48 projects focusing on pest and weed management activities or wild dog exclusion fencing. The projects will be undertaken in 2019 and 2020.
We continued our collaboration with the Department of the Environment and Energy to deliver Phase Two of the National Landcare Program, implementing the $450 million Regional Land Partnerships program. We have contracted 49 service providers across Australia to deliver 56 regional sustainable agriculture projects to improve the condition of soils, biodiversity and vegetation on-farm and to help farmers adapt to a changing climate and markets.
We implemented the second round of the Smart Farms Small Grants, providing a total of $9.2 million to 110 projects to help organisations and individuals to undertake sustainable agriculture projects and build the capacity of land managers to adopt best practice natural resource management methods.
The National Landcare Program also funds Smart Farming Partnerships, which offer larger grants for partnerships between skilled organisations to work on new and innovative approaches to enhancing both the productivity and sustainability of primary industries. The second round of grants opened in March 2019 and closed in May 2019.
Biosecurity—managing risks to agriculture and the environmentAustralia’s biosecurity system is recognised as world-class. It is a significant economic asset that also protects Australia’s unique environment and way of life, operating offshore, at the border and post-border.
We are committed to the continuous improvement of the biosecurity system. The volume of people, mail and cargo entering Australia is expected to nearly double between 2015 and 2030. This will likely be accompanied by increases in trade and passengers from higher-risk areas. At the same time, the rate of spread of pests and diseases is accelerating.
For example, in just a few years the brown marmorated stink bug (BMSB) has become a major pest of concern, resulting in significant demands on our staff and resources. As part of our seasonal intervention to detect and prevent BMSB incursions we expanded our focus from 2 countries to 9. We have worked with industry to implement control measures as smoothly as possible.
The spread of African swine fever (ASF) to neighbouring countries also poses a threat to Australia's 2,700 pork producers and to the country's reputation as a provider of clean, green and safe food. We have stepped up activities to keep ASF out of Australia, including increased screening at international airports and mail centres. Between November 2018 and August 2019 we intercepted 27 tonnes of pork at our airports.
In 2018–19 we continued to implement the findings of the 2017 review of the national biosecurity system and the Intergovernmental Agreement on Biosecurity (IGAB). In November 2018 agriculture ministers released their final response to the review’s recommendations, all of which they agreed to or agreed to in-principle. This included agreement on a revised IGAB, which came into effect in
13Department of Agriculture
Annual report 2018–19
Secretary’s review
January 2019. For the first time, the new agreement clearly articulates a set of core commitments for all parties. It specifies Commonwealth and state and territory responsibilities that advance the shared responsibility for the biosecurity system.
As part of the national response, we developed the National Biosecurity Statement. This sets out a vision and goals for biosecurity, clarifies roles and responsibilities, and outlines priorities and principles for managing biosecurity risks. The statement is based on consultation with industry, environmental groups and state and territory governments. It has been an excellent example of collaboration to achieve a common goal.
We worked to deliver the government’s Biosecurity Innovation Program to support smarter biosecurity into the future. In its first year, the program has funded 14 projects, including behavioural studies of detector dogs, next-generation DNA sequencing and a trial of sensing technology to detect BMSB in shipping containers. These emerging technologies and approaches have the potential to improve the rates of early detection of biosecurity pests and diseases.
Our Biosecurity 2025 and Beyond initiative is taking a co-design approach with industry to identify ways to better manage the risks associated with the increased volume of passengers and trade. This work is being undertaken across small, targeted projects and builds on existing initiatives across the department. The first area for change is improving approved arrangements with multi-commodity freight forwarders and cargo terminal operators.
In October 2018 the Australian Government appointed Ian Thompson as the first Chief Environmental Biosecurity Officer (CEBO). The new office recognises the importance of biosecurity to Australia’s environment. The CEBO is also the national point of notification for environmental pest and disease detections and responses under the National Environmental Biosecurity Response Agreement (NEBRA).
During the year, we achieved a milestone in the fight against red imported fire ants, when an incursion at Brisbane Airport was declared as successfully eradicated. The incursion was first detected in September 2015 and was being managed under the NEBRA. Governments also agreed to a new 5-year cost plan to ensure the eradication of an incursion of browsing ants in Western Australia, and to extend the response to eradicate browsing ants from Darwin until 2022.
An efficient and capable departmentOur work relies on having an efficient and effective department with a professional, engaged and committed workforce.
This year we committed to continue building an organisational culture that is accountable and aligned, collaborative and integrated, and future oriented. We have developed our new People Strategy and Workforce Plan for 2019–2023 to embed this culture, build employee capability, meet future workforce requirements and support a diverse and inclusive workplace.
As part of this approach, we have also increased our focus on diversity, developing a new Inclusion Strategy and action plans, and supporting our staff networks to drive diversity initiatives with support from senior executive champions.
We made a significant investment in enhancing our integrity culture. This included training and educational campaigns to increase awareness of integrity and security risks, and ensuring staff have access to support and appropriate mechanisms to report integrity issues. During the year, staff attended more than 100 integrity awareness sessions, and we held our first Security Month to provide specialist training across our regions.

14Department of Agriculture Annual report 2018–19
Secretary’s review
Our continued focus on rehabilitation management resulted in our highest-ever compliance rate in Comcare’s annual audit of our Rehabilitation Management System. We received a compliance rate of 100%, and were commended on our early intervention policy.
We sharpened our focus on cyber security in response to the heightened awareness within government about existing and probable future threats. Collaboration between our cyber security staff, the Australian Signals Directorate, service providers and capability vendors is key to improving our security posture and better managing cyber risks.
We are investing in expertise and contemporary technology, and improving our systems. For example, we have made progress in providing strong management of staff and contractor accounts. This will help align our operations with government security standards. In 2019–20 we will continue to dedicate resources to identifying security weaknesses, assessing associated risks and progressing a prioritised cyber security remediation program.
We recognise the vital role that technology will play to meet the challenges of growing Australian agriculture. In December 2018 we released our new 4-year ICT Strategy. As part of the strategy, we have commenced our first ICT enterprise capability development projects. These will give us a single view of our clients and our workforce, and simplify client digital engagement. We are working with industry on initiatives to promote innovation in the way we develop our ICT systems and provide services.
We are working through our Information and Data Management Agenda to make the most of our information and data assets. This work builds on whole-of-government data reforms that are underway. We are implementing information and data governance arrangements, developing strategic data policy and data-sharing practices, and looking at ways we can manage data to provide greater services to our clients and stakeholders.
The year aheadOur department ended 2018–19 with the appointment of 2 Cabinet ministers responsible for different parts of the portfolio. We have commenced a significant body of work to deliver the government’s priorities.
The drought will continue to be a priority for primary producers and the department. We will implement the National Drought Agreement and prepare to implement the Future Drought Fund, which will invest in drought-resilience projects. We will also make changes to the Farm Household Allowance (FHA) as part of the government’s response to the 2018 FHA review, and finalise a review of the Rural Financial Counselling Service.
The Prime Minister has committed the government to developing a national plan to enable Australian agriculture, fisheries and forestry to become a $100 billion sector by 2030. This is an exciting opportunity for us to effect real change for Australia, delivering important policy that will benefit producers and the industries that support them, and create jobs for regional Australia.
In 2019 –20 we will build on the work that produced Agricultural innovation—a national approach to grow Australia’s future. We will work with stakeholders to identify and implement the actions needed to transform the agricultural innovation system into one that can deliver the productivity gains needed.
We will continue to strengthen our culture and capability as a regulator, publishing a regulatory practice statement as part of our new framework. Our work will include implementing the recommendations of the ASEL sea transport review, and responding to the findings of the next ASEL review for live animals exported by air.

15Department of Agriculture
Annual report 2018–19
Secretary’s review
Implementing the Modernising Agricultural Trade initiative will be a significant focus in 2019–20 and beyond. This is the start of a long-term enhancement of our capacity to facilitate agricultural exports. We will work across the department to understand future business needs, collaborate with stakeholders and drive improvements to key biosecurity and exports systems.
Free trade agreements (FTAs) are an important means of getting Australian agricultural commodities to international markets. In 2019–20 we will continue to implement the Comprehensive and Progressive Agreement for Trans-Pacific Partnership, which came into force at the end of 2018. The Australian Government has finalised FTA negotiations with Indonesia and Hong Kong. We will support negotiations with the European Union and the development of the Regional Comprehensive Economic Partnership between the 10 members of the Association of Southeast Asian Nations (ASEAN) and Australia, China, India, Japan, New Zealand and the Republic of Korea.
We will build on our work to modernise our export systems. We are developing a modern ICT platform to improve export certification and quota systems. Exporters will see an improvement in service delivery, with the ability to easily access relevant certification information and better online administration of these activities.
The state-led water efficiency projects will continue in the year ahead. We will also raise awareness and encourage participation in the Water Efficiency Program. The Australian Government has agreed to fund a range of state-led water efficiency projects that will proceed in the year ahead. This includes appointing Community Engagement Officers to help eligible participants apply. The program seeks to recover 450 gigalitres of environmental water by 2024.
We will continue to lead the development of an international standard for water efficiency labelling, in partnership with Standards Australia and industry. The new standard is expected to reduce business costs, improve access to overseas markets for Australian manufacturers and provide a tool that can be used by other countries to save water through consumer labelling schemes.
We will continue to implement the National Forest Industries Plan. The Regional Forestry Hubs pilot will involve work with industry, state and local governments, other key stakeholders and the community to help the Commonwealth consider plantation development opportunities, infrastructure needs and employment opportunities for the forest industries.
Two major international agriculture meetings in Australia are scheduled in the second half of 2019. We worked with industry for several months preparing for the 55th Council Session of the International Sugar Organization, held in Cairns in July 2019. We will provide industry support ahead of the 78th International Cotton Advisory Committee Plenary Meeting in Brisbane, in December. Attendees from around 90 countries will attend providing a tremendous opportunity to showcase Australia’s agricultural industries.
We anticipate another busy year in biosecurity, continuing to strengthen arrangements to address the risk of pests and diseases entering the country. Our focus is on working smarter, building up our Biosecurity Integrated Information System, upgrading our ICT and investing in new opportunities through the Biosecurity Innovation Program.
Our people remain our greatest asset. In 2019–20 we will deliver against the priorities we have set for ourselves in the new People Strategy and Workforce Plan. We will also be working to address the government’s decisions on the findings and recommendations of the APS Review. We will keep looking at the way we work, to meet the Prime Minister's expectations for improved service delivery and a clear focus on the contribution we are making to the agricultural sector and the Australian public.

16Department of Agriculture Annual report 2018–19
Our performance
Our performanceOur objectivesWe work to achieve our purpose through 3 strategic objectives. This part of the annual performance statements reports results against the high-level performance criteria for these objectives.
Objective 1: Increase, improve and maintain markets
Performance criterion: The trend in value of agricultural exports increases in real terms over time
Measure The value of food and fibre exports exceeds the average value of the previous 10 years
Source Portfolio Budget Statements 2018–19, page 26
Corporate Plan 2018–19, page 12
Result Achieved
In 2018–19 the value of agriculture, fisheries and forestry exports is forecast to be $52.5 billion, still higher than the 10-year average to 2017–18 of $48.1 billion (expressed in 2018–19 dollars). This is slightly lower than agricultural, fisheries and forestry exports of $55.1 billion in 2017–18 (Figure 6).
Exports volumes and values declined in 2018–19 because of dry conditions in the eastern states that limited crop production and export supplies. The decline was partially offset by a depreciation of the Australian dollar. Export values for grains, oilseeds and pulses fell about 18%, making up the majority of the decline.
More detailed information is available from the March 2019 edition of ABARES Agricultural Commodities.
FIGURE 6 Value of rural exports in real terms, 2008–09 to 2018–19
2018–19 $b
10-year prior average
Total agricultural, �sheries and forestry exports
10
20
30
40
50
60
2018–19p
2016–17
2014–15
2012–13
2010–11
2008–09
Note: The 10-year average is based on ABARES and Australian Bureau of Statistics data for the period 2008–09 to 2017–18. p The value of 2018–19 exports is based on preliminary estimates.

17Department of Agriculture
Annual report 2018–19
Our performance
Objective 2: Encourage agricultural productivity
Performance criterion: Portfolio industries record an increase in productivity
Measure Average annual productivity growth is equal to or exceeds average annual market sector productivity growth of the previous 10 years
Source Portfolio Budget Statements 2018–19, page 26
Corporate Plan 2018–19, page 12
Result Achieved
Over the 10 years to 2018–19 average annual productivity growth for the agricultural, forestry, and fisheries sectors was 2.01%. This continued to be higher than annual market sector productivity growth, which averaged 0.32% over the same period.
Total factor productivity (TFP) is used as the measure of productivity and is calculated on a value-added basis. Agricultural productivity is susceptible to significant volatility because of seasonal conditions, so we have used the trend of TFP between 1995–96 and 2018–19 to calculate productivity growth. Data are sourced from the Australian Bureau of Statistics, with a preliminary estimate for 2018–19.
Objective 3: Support sustainable, high-quality natural resources
Performance criterion: The quality of the resource base is maintained or improved
Measure The status and productivity of agricultural land, water resources and Commonwealth fisheries is at least maintained in trend terms
Source Portfolio Budget Statements 2018–19, page 26
Corporate Plan 2018–19, page 12
Result On track
WaterProgress continued to be made in 2018–19 towards meeting the ‘bridging the gap’ water recovery targets under the Murray–Darling Basin Plan. Further water recovery is required in some individual catchments to meet the Sustainable Diversion Limits (SDLs) in the Basin Plan. Further recovery of efficiency measures is also required to meet the 62GL target to allow the full supply contribution to be utilised.
The Australian Government continues to work with Basin state governments to deliver all water recovery required by the Basin Plan. All factors affecting the achievement of the water recovery targets are being monitored. Basin states are working with the Murray–Darling Basin Authority to update planning assumptions. These could include changes to cap factors that may affect the extent of the remaining gap bridging water recovery volumes. The final outcome will not be known until all state Water Resource Plans (WRPs) are finalised.
As at 30 June 2019 water entitlements of 2,028GL had been secured or agreed in funding contracts towards ‘bridging the gap’ to the surface water SDLs in the Basin Plan. This total included 163.5GL recovered by Basin states. Of this, 1,853GL is registered with the Commonwealth Environmental Water Holder (CEWH). State recoveries are not held by the CEWH. All figures are in long-term average annual yield terms.

18Department of Agriculture Annual report 2018–19
Our performance
In 2018–19 the final surface water recovery target was influenced by factors including settlement of shared reduction amounts for individual catchments and the release of updated NSW cap factors. The target remains uncertain because of delays in accrediting WRPs and other Basin states releasing updated cap factors. Water recovery activities were affected by delays in delivery of water from and variations to contracted infrastructure projects and by the need to implement new socio-economic criteria for efficiency measures projects that were agreed at the December 2018 Murray–Darling Basin Ministerial Council Meeting.
SNAPSHOT 1: Responding to Darling River fish deathsIn December 2018 and January 2019 a combination of natural events resulted in the death of an estimated 1 million fish along a 40 kilometre stretch of the lower Darling River. The events prompted widespread attention and discussion across the Australian community. The Australian Government responded immediately by providing funding for the Native Fish Management and Recovery Strategy, developing an action plan to support recovery of fish populations and supporting work including relocating fish, cleaning up the river and installing aerators.
The government also appointed Professor Rob Vertessy to chair an independent panel to investigate the fish deaths. In February 2019 the panel visited Menindee and met representatives of the Barkandji people, local residents and landholders from the lower Darling.
On 21 February 2019 the panel released its interim report on possible factors behind the events. In response, the government announced works to improve fish movement through the Murray–Darling Basin and committed an extra $3 million to fish and Basin research.
The government released the panel’s final report in April 2019. The report indicated that a sudden reduction in air temperature and increased wind resulted in low-oxygen water in weir pools in the lower Darling, leaving no refuge for fish and causing the fish death events.
Based on the findings, the government announced it would work with the NSW and Queensland governments and communities to secure Class A water licences in the Barwon–Darling, fund investment in metering and introduce live video monitoring of rivers. The government made a commitment to fund research and projects including using hatcheries to help restock fish populations and to fence riverbanks. It also provided more funding for the Toorale Water Infrastructure Project.
We advised the government on its responses to the recommendations and are implementing the announced measures.

19Department of Agriculture
Annual report 2018–19
Our performance
As at 30 June 2019, 34.8GL had been secured towards bridging the gap to the groundwater SDLs in the Basin Plan. This total is registered with the CEWH. In 2018–19 we ran a series of successful open tenders to recover groundwater in Queensland.
As at 30 June 2019, 1.9GL had been secured or agreed in funding contracts towards the 62GL efficiency measures target. Of this, 1.3GL is registered with and held by the CEWH and is included on the register of efficiency measures in accordance with Basin Plan. For the 2019–20 water year, the adjustment to SDLs will be reduced from 605GL to 544GL per year in accordance with Basin Plan provisions. This figure will be increased in future years as efficiency measures are implemented.
The Australian Government is working with Basin states to recover further water through efficiency measures. This includes state-led proposals to deliver the initial 62GL and investment in water saving projects through the Water Efficiency Program to deliver the remainder of the 450GL by 2024.
FisheriesThe percentage of fish stocks solely managed by the Commonwealth that are not overfished has improved, increasing from 72% in 2016 to 74% in 2017. The number of fish stocks classified as ‘uncertain if overfished’ fell from 11 to 10. The number of stocks classified as overfished was steady (Figure 7).
FIGURE 7 Australian managed fish stocks, 2004 to 2017
0
Uncertain if over�shedNot over�shed
Over�shed
10
20
30
40
50
60
2017201520132009 201120072005
Note: Based on the ABARES Fishery status reports 2018. Status is assessed retrospectively for the previous year.
Agricultural landThe Australian Government has contracted natural resource management (NRM) unit service providers to deliver activities and projects against Regional Land Partnerships outcomes in each NRM unit. We have run workshops for NRM regional staff and are making technological enhancements to support the data collection processes for groundcover comparisons.
The workshops have helped NRM regional staff increase their capacity to:
\ understand the role of groundcover in landscape protection
\ establish baseline groundcover levels
\ use the baseline to establish locally relevant targets
\ use available groundcover data to monitor and report under the National Landcare Program.

20Department of Agriculture Annual report 2018–19
Our performance
The technological enhancements to the Rangeland and Pasture Productivity (RaPP) Map tool will support timely and cost-efficient information to underpin improved reporting of groundcover at the regional and national scale. This will address the National Landcare Program Phase Two priority areas for investment—wind and water erosion.
The projects relating to data collection and technological enhancements are due for completion in late 2019.
SNAPSHOT 2: A new Chief Environmental Biosecurity Officer The 2017 review of the Intergovernmental Agreement on Biosecurity and the 2014 Senate Environment and Communications References Committee Inquiry into Environmental Biosecurity highlighted the importance of placing protection of the environment from exotic pests and diseases at the same level as protection of agriculture and other production systems.
In 2018 the Australian Government appointed Ian Thompson as the inaugural Chief Environmental Biosecurity Officer (CEBO) to provide policy leadership on national environmental biosecurity issues. The CEBO’s role is to enhance understanding and oversight of environmental biosecurity risks, including better definition and prioritisation of those risks.
The CEBO is a major source of advice to the Commonwealth on environmental biosecurity matters. The officer’s work will improve the maturity of Australia’s environmental biosecurity preparedness, surveillance and response capacity. This includes strengthening responses to the detection and incursion of environmental pests and diseases.
The CEBO has already established the Environmental Biosecurity Advisory Group, a forum for key stakeholders to provide advice on environmental biosecurity issues.
The CEBO has commissioned work under the Environmental Biosecurity Fund on environmental biosecurity plans for Acacia species and mangroves and a simulation exercise for environmental disease incursion. He is leading a collaboration between our department and the Department of the Environment and Energy to implement the National Invasive Ant Biosecurity Plan, and is working with ABARES to develop a priority list of exotic environmental pests and diseases.

21Department of Agriculture
Annual report 2018–19
Our performance
Our functionsWe deliver our objectives through 6 broad categories of activities. Through these functions, we strive to provide the most effective support to primary industries, regulated businesses and our other stakeholders.
This part of the annual performance statements shows our performance in delivering these functions.
Function 1: Regulation and service deliveryPerformance criterion: Effective intervention on compliance pathways
Measure Rates of compliance with regulations administered by the department are maintained or improved
Source Corporate Plan 2018–19, page 13
Result Achieved
Biosecurity import screeningThe post-intervention compliance rate is the percentage of international mail articles and air passengers that were compliant after intervention. The rates shown in Table 3 indicate we are highly effective at promoting and enforcing compliance in these pathways.
TABLE 3 Post-intervention compliance rate, 2014–15 to 2018–19
Item2014–15
(%)2015–16
(%)2016–17
(%)2017–18
(%)2018–19
(%)
Mail 99.9 100 99.9 99.9 99.9
Air passengers 97.3 97.4 96.9 97.1 97.0
Post-intervention compliance relies on factors including the before-intervention compliance rate of arriving passengers or mail (the inherent risk of the pathway) and our ability to intervene as soon as non-compliant passengers or mail arrive in Australia.
We have a range of strategies in place to maintain and improve the compliance rate in the passengers and mail pathways, including:
\ ‘Don’t be sorry, just declare it’ communication and education activities
\ air traveller and mail profiling for higher-risk goods.
Imported food safetyThe overall compliance rate for imported food inspections in 2018–19 was 98.3%, compared to 98.5% in 2017–18. The compliance rate has remained steady.
We publish our inspection data reports on our website.

22Department of Agriculture Annual report 2018–19
Our performance
Live animal exportsWe are committed to ensuring compliance with the Exporter Supply Chain Assurance System (ESCAS). The system aims to ensure the humane treatment and handling of Australian livestock from arrival in an importing country through to the point of slaughter. Since the implementation of ESCAS in July 2011, more than 22 million animals have been exported to 26 countries under the system.
In 2018–19 we completed investigations into 45 reports of alleged regulatory infringements. Of these, 34 were self-reports by exporters, 8 reports were made by third parties, and 3 alleged infringements were identified by the department or an Independent Observer.
Our response to investigations included removing facilities from approved supply chains, undertaking additional independent audits, or requiring exporters to provide further information about proposed exports. In some cases we applied additional conditions to export approvals, set further reconciliation requirements to account for animals in supply chains, or required exporters to provide further training to improve animal handling practices.
In 2018 we cancelled the export licenses of Emanuel Exports Pty Ltd and EMS Rural Exports Pty Ltd in accordance with the Australian Meat and Live-stock Industry Act 1997.
See more about livestock export compliance on our website.
SNAPSHOT 3: Protecting Australia from animal diseasesAfrican swine fever (ASF) is a highly contagious viral disease of domestic and wild pigs. An outbreak in Australia would have a significant effect on our pig industry and would be difficult and expensive to eradicate.
In response to the spread of ASF in Europe and Asia, we stepped up our biosecurity activity, including increased screening for high-risk pork products at international airports and mail centres. As a result, between December 2018 and February 2019 we detected ASF viral fragments in banned pork products seized from international passengers. The detections, in a percentage of the seized products, were not unexpected, as the products are a known biosecurity risk.
We have been working to raise public awareness about ASF, reminding incoming passengers that they must declare food products and potentially contaminated clothing and shoes. We have updated our website to emphasise that online shoppers must check that the pork products they are purchasing are allowed into Australia.
We have also been reviewing import conditions, including changing the requirements for some commercial pork products, pet chews and pork jerky.
We continue to advise pig producers, veterinarians, trading partners and importers on changes to import conditions, as well as on measures to strengthen on-farm biosecurity. We will be working closely with industry and other stakeholders to keep raising awareness of the threat of ASF.

23Department of Agriculture
Annual report 2018–19
Our performance
Illegal loggingUnder the Illegal Logging Prohibition Regulation 2012 importers of timber and wood products are required to comply with requirements for due diligence. We identify non-compliance through self-reporting by importers and assessments by our officers.
In 2018–19 there were 20,746 importers of regulated timber products, with 1,109,144 lines of declared products worth almost $7.9 billion. The self-declared compliance rate was 82%, an increase of 1% from 2017–18.
Our assessments of due diligence indicate compliance rates have risen from around 10% in 2017 to 65% in 2019.
In 2018 we ended a 3-year ‘soft start’ compliance period under the Regulation. Assessments conducted during the soft start period were often the first contact importers had with the illegal logging legislation. Assessments conducted since then have generally involved importers who had previously received education about the due diligence requirements. Because of the large number of one-off or smaller importers that have not received a request for assessment, the actual level of compliance may be lower than indicated.
In 2018–19 we issued the first infringement notice to an importer for failure to provide their due diligence system and information for a specific import to the department for assessment. This notice attracted a $12,600 penalty.
Water efficiency labellingThe Water Efficiency Labelling and Standards (WELS) scheme aims to reduce demand for potable water by setting standards for a range of regulated water-using appliances, fixtures and fittings. From January 2018 we increased our use of enforcement actions in response to suppliers who do not meet the WELS requirements.
In 2018–19 WELS compliance activities focused on internet-based sales. We used internal decision processes and escalation pathways to address non-compliance identified by WELS inspectors. All inspections and follow-up enforcement actions were in accordance with the WELS Compliance and Enforcement Policy.
We typically address non-compliance through direct contact to educate suppliers about the scheme. If that is unsuccessful, the cases are escalated and we send non-statutory warning letters to suppliers. If non-compliance persists, we are able to use statutory powers under the Water Efficiency Labelling and Standards Act 2005, such as issuing Remedial Action Notices.

24Department of Agriculture Annual report 2018–19
Our performance
Following the use of warning letters and statutory notices, the level of compliance between 1 January 2018 and 30 June 2019 was 94%. The remaining cases are ongoing in 2019–20 (Table 4).
TABLE 4 WELS scheme website assessments and store inspections—compliance intervention effectiveness, January to June 2018 and 2018–19
ItemJanuary–June
2018 a 2018–19
Case management
Cases opened in period 68 154
Cases carried over from previous period 12 34
Cases closed because compliance was achieved 46 161
Cases remaining open at end of period 34 27
Early escalation stages
Warning letters sent 8 7
Compliance achieved after warning letter sent b 7 11
Notice of intent to give coercive notice sent 1 2
Compliance achieved after notice of intent to give coercive notice sent
0 1
Escalation to statutory actions
Remedial Action Notices given 1 0
Compliance achieved after Remedial Action Notice given 1 0
a The current record keeping method commenced in January 2018 and data collected prior to this is not comparable. Twelve cases from before January 2018 are incorporated in the figures above. b Some cases where compliance was achieved or additional steps were taken are cases where warning letters were sent in previous periods.
For products sold online, we achieve compliance through a combination of direct contact with online sellers and marketplaces, or intervention activities by online marketplace providers (Table 5).
TABLE 5 WELS Scheme online marketplaces—compliance intervention effectiveness, 2018–19
Item 2018–19
Cases opened in period 182
Cases closed because compliance was achieved 133
Cases remaining open at end of period 49
As at 30 June 2019 more than 370 entities had registered 30,905 products in WELS. Entities included manufacturers, importers and wholesalers. This compares to 28,815 products registered as at 30 June 2018 (Table 6). The increase in registered products may be attributed to effective compliance activities and sellers having a greater awareness of the WELS scheme and its requirements.

25Department of Agriculture
Annual report 2018–19
Our performance
TABLE 6 WELS Scheme product registrations, 2018 and 2019
Registration status 30 June 2018 30 June 2019
Ceasing registrations a 3,834 3,045
Registered products 24,981 27,860
Total 28,815 30,905
a WELS product registrations must be renewed each year to remain valid. WELS products, where the registration was not renewed, changed to ‘ceasing’ status in our product registration database on 22 January 2018. The registration for those products expired on 22 July 2018 and after that the products cannot legally be offered for sale in Australia.
Performance criterion: Maintained or improved effectiveness and efficiency in managing biosecurity risk
Measure The department achieves a substantial, cost-effective reduction in biosecurity risk, measured by avoided loss and return on investment
Source Corporate Plan 2018–19, page 13
Result Achieved
Through various investments in biosecurity, we were able to achieve a substantial reduction in biosecurity risk consistent with that achieved in previous years.
This response is based on departmental and inter-agency data sources and departmental modelling, comparing a scenario of current biosecurity controls as implemented by the Commonwealth to a hypothetical scenario of no Commonwealth biosecurity controls. This response brings together corporate and scientific knowledge. Modelling requires a number of simplifications and assumptions, and uncertainty is inherent in some model parameters.
Performance criterion: Regulatory practices seek to minimise the impact of regulation on clients and stakeholders
Measure Qualitative assessment of the development of new and amended regulations in line with whole-of-government practice
Source Corporate Plan 2018–19, page 13
Result Achieved
We consider the regulatory burden for individuals, businesses and community organisations before we amend or make new regulations. Where the regulatory impacts are deemed significant we prepare regulation impact statements (RISs) or seek independent reviews, a RIS-like process. The Office of Best Practice Regulation (OBPR) oversees this work and publishes regulation impact statements on its website.
In 2018–19 we completed RISs on:
\ Export tariff rate quota regulatory streamlining
\ Dairy Industry (Farmer-Processor transactions) code of conduct.

26Department of Agriculture Annual report 2018–19
Our performance
The OBPR assessed the Tariffs RIS as compliant and consistent with best practice. The OBPR assessed the Dairy Code RIS as compliant with government requirements and reflective of extensive consultation and thorough analysis.
We also commissioned 4 independent reviews:
\ Review of the Australian Standards for the Export of Livestock (ASEL): sea transport
\ Biosecurity Import Levy
\ Murray–Darling Basin—Basin Amendment Instrument
\ Water Charge Amendment Rules 2019.
We undertake extensive consultation with stakeholders and regulated entities on the impacts of proposed changes. Even where a RIS or independent review is not required, we still seek feedback from regulated entities, stakeholders and the community on changes to policies and regulations. This informs the design and refinement of our regulations.
We also assess our regulatory performance annually. This helps improve regulatory practice and engagement with our stakeholders. See the 2017–18 regulator performance self-assessment report on our website.
We continue to strive to minimise the impact of regulation on regulated entities. Since 2014 we have reported a reduced net regulatory burden of $127 million for the portfolio.
Performance criterion: Business processes and services are improved through the better use of modern technology and improved work practices
Measure Agreed service standards are met and stakeholders provide positive feedback
Source Corporate Plan 2018–19, page 13
Result Partially achieved
Client service standardsIn 2018–19 we met or exceeded our targets across 20 of the 32 client service standards published on our website:
\ Client contact services—1 of 3 met
\ Import services—4 of 7 met
\ Export services—7 of 8 met
\ Live animal export services—8 of 14 met.
Details of our service standard performance are provided at Appendix E.
The increased biosecurity measures for the 2018–19 brown marmorated stink bug (BMSB) season from September 2018 to May 2019 created a significantly increased workload for the department. The client contact area saw an increase in call volumes and inspections booked from the previous year.
The inspection of goods at an approved premises, treatments, and inspection of non-commercial vessels standards were not met in 2 locations because of the increased BMSB measures, as well as periods of significant short-term increases in inspection activity.

27Department of Agriculture
Annual report 2018–19
Our performance
The majority of import permit applications received through BICON were issued within the target. However, delays associated in processing more complex import permit applications adversely affected the overall result.
information and communication technology service standards
In 2018–19 service standards relating to core ICT infrastructure and internal network availability met the agreed targets, averaging 99.99% to 100% availability. Average monthly availability metrics between December 2017 and June 2018 ranged from 99.98% to 100%.
SNAPSHOT 4: Combatting brown marmorated stink bugBrown marmorated stink bug (BMSB or Halyomorpha halys) is an exotic pest of concern. It is a significant threat to Australia’s agricultural production and exports and the environment.
BMSB is native to China, Japan, Taiwan and South Korea and has spread to North America and throughout Europe. If it established in Australia, this pest would be extremely difficult and expensive to manage, partly because it is able to feed on more than 300 different plant species, including fruit, vegetables and ornamental plants.
BMSB is of particular concern because of its threat to Australia’s horticultural industry—valued at more than $9 billion—as well as the fruit and nut industry, which is valued at more than $4 billion. It also poses a threat to people’s health and way of life. The insect enters vehicles, homes and factories in large numbers. It ‘stinks’ as its name suggests, and can cause an allergic reaction in some people who come into contact with it.
The insects are known as ‘hitchhikers’ and arrive in Australia on cargo and containers shipped between September and April, which coincides with autumn and winter in the northern hemisphere.
Since 2015 we have applied seasonal measures to prevent BMSB from entering and establishing in Australia. These measures apply to countries where BMSB has established, and include mandatory offshore treatment for a range of high-risk goods that have been identified as the most likely pathway for BMSB. We continue to review the BMSB’s pest status and have increased onshore intervention through random inspections to detect the insect and verify the effectiveness of treatments.
These measures strike a reasonable balance, ensuring we appropriately manage the risks to biosecurity and trade.

28Department of Agriculture Annual report 2018–19
Our performance
There was a total of 109 high-severity incidents that had the potential to affect multiple business services. This included:
\ 3 Severity 1 incidents that affected multiple applications:
∙ 1 incident in August 2018 affected multiple business applications and was traced back to a SAN migration error
∙ 1 incident in December 2018 caused a widespread network outage; this was traced back to a Managed Services for VMWare (MSV) migration network connection
∙ 1 incident in April 2019 affected multiple applications; this was traced back to an old Oracle software fault.
\ 106 Severity 2 incidents:
∙ 25 computer infrastructure incidents
∙ 81 other incidents where the unplanned outage had a more localised effect on users, networks and individual services, including events that were outside the department’s control such as power outages. The effect of these incidents ranged from reduced performance through to full system outages.
Measure Evaluations of programs have positive findings
Source Corporate Plan 2018–19, page 13
Result Achieved
We administer a range of programs to raise awareness and ensure compliance across our regulatory portfolios. Evaluations and other reviews are valuable to monitor program deliverables so that we can continuously improve what we do and understand the impact of our activities.
We commissioned the Institute for Sustainable Futures (ISF) to evaluate the environmental and economic impact of the Water Efficiency Labelling and Standards scheme (WELS). The evaluation included data analysis and stakeholder interviews.
WELS commenced in July 2006, mandating star-rated water efficiency labelling for water fixtures and appliances, as well as imposing a minimum standard for some products.
The ISF found the scheme is having a significant impact on water usage. In 2017–18 WELS and associated measures saved an estimated 112GL of water, projected to rise to 231GL per year in 2036. The scheme has also resulted in a general trend towards more registrations of higher star-rated products. The economic benefit, through reduced water and energy bills, has far exceeded the costs of WELS, with an estimated net benefit of more than $23 billion.
The study has identified areas where WELS could be improved. Stakeholders raised concerns about non-compliance and unapproved products coming into Australia. Since 2017–18 we have increased our use of enforcement actions in response to non-compliance with the scheme. Stakeholders also raised questions about the distribution of compliance costs between large and small suppliers, and the risk that customers from lower socio-demographic groups are not benefiting as much from WELS as other water users.

29Department of Agriculture
Annual report 2018–19
Our performance
The ISF findings will inform our 5-yearly evaluation of WELS in 2020.
Function 2: Policy and programsPerformance criterion: Effective programs are developed and delivered to achieve policy objectives
Measure Evaluations of programs have positive findings
Source Corporate Plan 2018–19, page 14
Result Achieved
We are responsible for developing and administering programs to implement the government’s policy decisions. Evaluations and other reviews monitor program deliverables so that we can understand the effect of our programs.
In 2019 ABARES reviewed the Assistance Grants—Access to Industry Priority Uses of Agvet Chemicals Grants Program. Since 2015–16 the program has provided a total of $7.96 million for 149 grants to improve farmers’ access to chemicals for minor uses. These are uses for which chemical manufacturers do not register their products, covering small-scale use in specific industries.
ABARES reviewed 15 of these projects over a 20-year span. The report estimates the average return for industry under the program is $117 per grant dollar, and totals an average of $17 million per project over 20 years. The projects reviewed spanned cereals, horticultural crops and fodder for the dairy industry.
The large commodities generally showed higher returns. For example, canola treatment for weeds returned around $350 per dollar invested, tea tree $300 and rice $230. Bulb vegetables returned around $30 per dollar and tropical fruit $150. Emerging commodities such as jujubes had much smaller returns but improved pest control may allow these industries to grow.
All projects returned a profit on the amount invested by government, indicating strong benefits to Australia’s agricultural industry from the grants program. These resemble returns achieved by similar programs in Canada and the United States.
Performance criterion: Policy advice is evidence-based, practical and timely
Measure Positive ministerial feedback on the quality and timeliness of the department’s advice
Source Corporate Plan 2018–19, page 14
Result Achieved
We provided a range of advice to our ministers and the government including ministerial submissions and meeting briefings. Our submissions cover the range of policy areas for which we are responsible, including agricultural policy, farm performance, drought assistance, biosecurity, exports, trade and water resources.
We worked to provide high-quality advice within agreed time frames, based on evidence including research by ABARES, and informed by stakeholder consultation. Our senior officers met regularly with ministers and their staff to ensure our advice and support continued to meet their requirements.

30Department of Agriculture Annual report 2018–19
Our performance
Function 3: Trade and market accessPerformance criterion: increased access to overseas markets generates more export opportunities for Australian primary producers
Measure New or improved markets show an increase in export volumes and values in trend terms
Source Corporate Plan 2018–19, page 14
Result Achieved
We reported 40 market access achievements in 2018–19. We play a lead role in opening access to markets for Australian agriculture, fisheries and forestry exports. We negotiate technical market access with trading partners on arrangements to open, maintain and improve access, and provide expert advice in negotiations to restore markets when trade is disrupted.
SNAPSHOT 5: Collaborating with industry on chemicals for minor uses Ensuring farmers have access to safe and effective agricultural and veterinary (agvet) chemicals protects Australian cropping and livestock industries from pests and diseases. This supports farm productivity and business viability. Farmers in specialist industries, or those managing an uncommon pest or disease, find it harder to access these chemicals because manufacturers do not consider their ‘minor use’ to be large enough to justify investing in registration.
The Australian Government has committed $14.3 million from 2014–15 to 2019–20 to improve farmer access to agvet chemicals for minor uses. It includes a grants program for research and development corporations to fund solutions for priority minor use needs.
In 2018–19 AgriFutures Australia received a grant of $96,000 to support the generation of data on a chemical product that controls budworms and green mirids in lucerne seeds. Certified lucerne seed production is a specialised industry, producing 9,700 tonnes annually and contributing around $95 million to the Australian economy. Approximately 2,500 tonnes of seeds are sold domestically and the remaining balance is exported. Budworms and green mirids are a significant issue, causing losses of 10% to 15% and up to $12 million of damage each year.
If the research is successful, the new minor use product will help control the pests and address existing resistance issues, benefiting up to 50 species of lucerne.

31Department of Agriculture
Annual report 2018–19
Our performance
Working through our expanded overseas counsellor network, we achieved:
\ 12 new market access gains, such as an agreement on import conditions for Australian almonds to Chile and walnuts to India
\ 17 improved access arrangements, such as the approval of an irradiation pathway for persimmons to Thailand
\ maintained access arrangements for 5 commodities, such as simpler requirements to certify Australian pork for export to New Caledonia is free from African swine fever
\ restored access for 6 markets, such as a recommencement of trade for Australian strawberries exports to markets including the United Arab Emirates and Kuwait following suspension of trade.
Measure New or improved markets show an increase in export volumes and values in trend terms
Source Corporate Plan 2018–19, page 14
Result Achieved
In 2017–18 Australia exported more than $22.5 million worth of walnuts around the world (Table 7).
TABLE 7 Australian walnut exports, 2014–15 to 2017–18
Commodity2014–15
($)2015–16
($)2016–17
($)2017–18
($)
Fresh or dried walnuts in shell 23,908,422 13,128,219 14,240,152 20,464,380
Shelled, fresh or dried walnuts, whether or not peeled
1,826,393 1,043,502 1,627,325 2,217,523
Total 25,734,815 14,171,721 15,867,477 22,681,903
Source: Based on Australian Bureau of Statistics Catalogue 9920.0 with partial adjustments made on sugar. Several commodities are subject to confidentiality restrictions, which affects the overall trade estimate. See ABS 5372.0.55.001—International Merchandise Trade: Confidential Commodities List for more information.
Australian walnut exports will be boosted as a result of Australia gaining market access to India. Shipments of Australian walnuts to India commenced in May 2019.
This significant agricultural outcome came after walnuts were identified as a market access priority through the Horticulture Innovation Australia prioritisation process. India is a large export market for Australian almonds, but it holds significant potential for other nut commodities, such as walnuts.
Our overseas counsellor in New Delhi, Dr Nora Galway, was at the forefront of negotiations to open the new market. Working with our technical plant experts, the Department of Foreign Affairs and Trade and the walnut industry, Dr Galway facilitated discussions with the Indian Government and Indian importers.
This gain provides a key additional market for Australian walnut producers, and highlights Australia’s growing economic relationship with India, as is recommended in the India Economic Strategy.
During 2019–20 we appointed new counsellors in Belgium, Chile, India, Japan, Mexico, and the United Kingdom. From January 2019 we had 22 staff in overseas posts to help represent Australia’s trade interests overseas.

32Department of Agriculture Annual report 2018–19
Our performance
Function 4: Research and innovationPerformance criterion: investment in rural research and development programs demonstrates positive returns
Measure Qualitative assessment using case studies of benefits from rural research and development
Source Corporate Plan 2018–19, page 15
Result On track
As reported in the last annual report, in 2017–18 an independent, mid-program evaluation considered the conduct of rounds 1 to 3 of the Rural Research and Development for Profit program. Snapshots 6 and 7 are drawn from Rounds 1 (2015) and 2 (2016) respectively.
In 2018–19 we drew on outcomes from the mid-program evaluation to improve the implementation of Round 4 of the program, including:
\ reviewing the design and assessment criteria of the grant guidelines to focus on sustaining collaborations (projects building on the success of previous funding) as well as establishing new collaborations
\ extending the application time frame to 12 weeks
\ reviewing reporting templates to build a knowledge base of success factors for collaboration, extension and adoption
\ increasing the emphasis on outlining pathways for the adoption of research.
Performance criterion: The efficient collection and distribution of levies to fund rural research and development
Measure Levy collection processes cost no more than 1.2% of levies disbursed
Source Corporate Plan 2018–19, page 15
Result Achieved
In 2018–19 the department disbursed $529.025 million at a cost of $4.841 million, which represents 0.92% of levies disbursed. This is a 4.73% increase from 2017–18, when $523.986 million was disbursed at a cost of $4.622 million, or 0.88% of levies disbursed. This increase is mainly attributed to increased effort in agent management (levy payer and intermediary liaison) and targeted compliance activities through our operational and strategic compliance program (Figure 8).

33Department of Agriculture
Annual report 2018–19
Our performance
SNAPSHOT 6: Improved use of seasonal forecasting to increase farmer profitabilityThe success of agricultural industries relies on the weather. Being able to accurately forecast the weather on a seasonal scale will provide valuable input to farm management decisions.
This 3-year research project, led by AgriFutures Australia, aimed to improve farm productivity and profitability by bridging the gap between seasonal climate forecasts (SCFs) and farm business decisions.
The project adopted a collaborative approach to research, engaging 13 partners that contributed knowledge, cash, and in-kind support, to help achieve its objectives:
• Valuing the forecast—Identify critical seasonal climate risks by sector, type of decision and region
• Using the forecast—Identify and develop support tools, products, services, information and training to overcome the barriers to adoption of SCFs by farmers and advisors in farm business decisions
• ACCESS-S model enhancement—Improve the SCF abilities of Australia’s primary forecasting model, the Australian Community Climate and Earth-System Simulator (ACCESS-S).
The project developed 9 industry-specific and region-specific case studies that defined SCF needs and identified key decision points. Regular Community of Practice meetings were held to enable practitioners to share knowledge, cultivate best practice and foster innovation.
The project found that barriers to the adoption of SCFs by farmers and advisors predominantly relate to perceived and real inaccuracies in SCFs, leading to a lack of trust in the forecasts. The Community of Practice and supporting materials developed through the project have provided a significant opportunity for improving adoption of SCFs in agricultural management.
The project partners also conducted experiments to improve the forecasting ability of models currently used in Australia. These were successful in reducing longstanding issues, and as a result the models have produced more realistic representations.

34Department of Agriculture Annual report 2018–19
Our performance
FIGURE 8 Levy administration revenue and costs, 2014–15 to 2018–19
Commonwealth matching
Levy/charge
$m
Cost as a % of levy(right axis)
2018–19
2017–18
2016–17
2015–16
2014–15
200
400
600
800
1,000
0.4
%
0.8
1.2
1.6
2
Note: The percentage is calculated by dividing the total cost recovery charge by the total levy/charge disbursed for that financial year. It does not include Commonwealth matching payments.
Measure Inspections of levy agent records cover at least 20% of levy revenue over a 3-year rolling average
Source Corporate Plan 2018–19, page 15
Result Achieved
The agents inspected under our national compliance program collectively contributed $150.510 million, which represents 28.5% of all levies and charges collected in 2018–19. We achieved a rolling 3-year average of 29.5% coverage for levies and charges collected from 2016–17 to 2018–19 (Figure 9).
FIGURE 9 National compliance program levy coverage, 2014–15 to 2018–19
Levy coverage
$m
Rolling 3-year average(right axis)
2018–19
2017–18
2016–17
2015–16
2014–15
%
40
80
120
160
200
10
20
30
40
50
Note: The levy coverage for the national compliance program is made up of the annual levy contributions of agents inspected from the operational compliance program and targeted compliance assessment program.

35Department of Agriculture
Annual report 2018–19
Our performance
SNAPSHOT 7: More profit from nitrogen—enhancing the nutrient use efficiency of intensive cropping and pasture systemsNitrogen is essential for plant growth, but the nitrogen cycle is complex and its availability is affected by many factors.
Improving our understanding of how nitrogen availability is influenced by management practices will give producers the confidence to reduce nitrogen application rates and maintain, or even improve, yields. Avoiding over-application has both on-farm and off-farm benefits. On-farm, it can reduce costs and improve profitability through avoiding excessive vegetative growth and the increased risk of plant disease. Off-farm, it can reduce greenhouse gas emissions and the risk of adverse impacts on air and water quality.
This 5-year project, led by the Cotton Research and Development Corporation, will help growers better understand factors that influence nitrogen availability, and improve confidence to adopt management practices tailored to irrigated cotton, dairy, cherry, mango and sugar production.
The project is a collaboration between 23 organisations that involves 10 industry-supported research projects.
The objectives of the project are to:
• generate a better understanding of interactions between factors such as soil type and condition, field history, irrigation management practices, the form, timing and placement of fertilisers, and prevailing weather on nitrogen use efficiency
• quantify the rate and timing of nitrogen supply through mineralisation
• develop more efficient fertilisers better able to match a crop’s specific nitrogen requirements, and develop a better understanding of how various enhanced-efficiency fertilisers perform under different conditions.
Extension activities have focused on communicating outcomes of the research and illustrating practical management of nitrogen use to encourage farmers, service providers and community members to engage with the research.
Communication and awareness raising is being achieved through websites, electronic newsletters, farmer-associated publications and printed and online industry magazines. Researchers are also preparing scientific papers for major national and international publications.

36Department of Agriculture Annual report 2018–19
Our performance
Function 5: Enterprise-wide enabling servicesPerformance criterion: The department maintains a positive, professional and engaged workforce
Measure The department’s employee engagement measures in the APS employee census are maintained or improved
Source Corporate Plan 2018–19, page 16
Result Achieved
The department’s 2019 Employee Engagement: Say, Stay, Strive score was 72%, an increase on the previous year (Figure 10).
SNAPSHOT 8: 3D X-rays helping the biosecurity effortAs the volume of people, mail and cargo entering Australia continues to increase, we are looking to technologies to help manage biosecurity risks. In 2018–19 we started trialling 3D X-ray technology to screen for biosecurity risk material at the border.
The X-rays produce high-resolution 3D images, or ‘slices’, in real time as an item passes through the unit. This saves time and is more effective than the existing system, which requires rotating the X-ray emitter and detector around the object.
Our first 3D X-ray unit was installed in the international passenger baggage area of Melbourne Airport. The unit has delivered early success, detecting risk material at more than three times the rate of 2D units.
We are using the 3D slices to build an image library, enabling us to develop the world’s first biosecurity auto-detection algorithm. Within hours of being deployed in April 2019, the algorithm detected a banana, an apple and mangosteens in passenger baggage. Further algorithms are being developed and we are trialling a second unit at the nearby international mail gateway facility.
The NZ Ministry for Primary Industries has installed an identical unit at Auckland Airport. We are collaborating on the development of the image library and algorithms under the Trans-Tasman Cooperation on Biosecurity Risk Detection Technology agreement.

37Department of Agriculture
Annual report 2018–19
Our performance
FIGURE 10 APS employee census employee engagement scores, 2017 to 2019
%
Employee engagement: Stay, Say, Strive
2017 2018 2019
20
40
60
80
100
People strategy and cultureIn 2018–19 we continued work on understanding our culture and improving employee engagement. Our executive shared their vision for the future where success will be characterised by a workforce that is accountable and aligned, collaborative and integrated, and future oriented.
We spoke to employees around Australia and asked how they see these cultural attributes in their everyday work, to understand what is working well and where we could do better.
We used the feedback to develop our People Strategy 2019–2023 and released it in August 2019. The People Strategy identifies our priorities and provides clear and measurable actions to support continuous improvement of our culture and employee engagement over the next 4 years.
Learning and developmentWe developed innovative digital learning solutions to support a competent, diverse and agile workforce. This includes peer-to-peer bite-sized videos to support our biosecurity officers, who use digital learning kits to record and share operational biosecurity tasks. We have introduced new flexible learning options to give staff equal access to development opportunities and allow learners to take control of when and where they can access their training.
We implemented improved compliance reporting capability in our learning management system Learnhub. This enables supervisors to more promptly and accurately assess mandatory learning compliance in their work areas. The introduction of automated reminder messaging from Learnhub has made it easier for staff and managers to keep up with mandatory learning requirements.
Diversity and inclusionWe have made significant progress in implementing the Growing reconciliation: Reconciliation Action Plan 2017–2019 (RAP).
We established the department’s first Executive Leadership Group for Indigenous Matters (ELGIM) under the RAP focus area ‘Collective decisions’. The RAP requires divisions that work with Indigenous policy matters to meet twice a year to share data and advice. The role of the ELGIM is to ensure that our work practices, policy and program work effectively take into account and promote positive Indigenous outcomes.

38Department of Agriculture Annual report 2018–19
Our performance
We enrolled 6 indigenous staff to participate in the Milparanga Leadership program, which is part of the Australian Rural Leadership Program. The program aims to allow Aboriginal and Torres Strait Islander people to engage in powerful and different conversations.
We supported an Indigenous officer to undertake the Pat Turner Postgraduate Coursework Scholarship at the Australian National University. The scholarship aims to increase the capability of Indigenous employees in the Australian Public Service, in order to improve public sector leadership and public policy. We continue to offer opportunities for staff to work with Indigenous communities through the Jawun APS Secondment Program.
We commenced activities under our Aboriginal and Torres Strait Islander Employment Strategy 2018–2020. The strategy aims to increase recruitment of Aboriginal and Torres Strait Islander employees across all levels and to ensure career progression for employees, with a focus on middle and senior management. We will also strive to provide a culturally safe work environment that acknowledges and celebrates Aboriginal and Torres Strait Islander cultures.
Work is underway to increase Aboriginal and Torres Strait Islander staff representation from 2.5% to 4% by the end of 2020. We have engaged 5 staff through the Indigenous Apprenticeships Program and 2 through the Indigenous Australian Government Development Program. We also employed 2 Indigenous graduates in our 2019 Graduate Development Program.
During the year we introduced Indigenous language training for staff. This has contributed to staff making an acknowledgment of country before meetings. We also commenced cultural training for staff on Torres Strait Islander and Aboriginal culture.
SNAPSHOT 9: Integrity culture program We are building a strong integrity culture in our department by establishing an Integrity Unit and Hotline and delivering a bespoke integrity awareness training program.
Understanding the difference between behaviour that constitutes misconduct, fraud, corruption or a security concern can be complex. Our training program, designed and delivered by in-house subject matter experts, has overcome these differences by focusing on a general concept of ‘wrongdoing’. In 2018–19 we delivered more than 150 face-to-face training sessions, travelling as far afield as Christmas Island, Norfolk Island, Thursday Island and Cocos (Keeling) Islands to reach as many of our staff as possible.
The dedicated Integrity Unit and Hotline has facilitated the reporting of all integrity concerns in one place, enabling a holistic and practical approach to matters. It also enables us to identify opportunities to mitigate risks by improving controls.
We are actively communicating the outcomes of activities undertaken in response to reporting of wrongdoing. Each quarter, an Integrity Snapshot is published for all staff, improving the transparency of our actions to manage integrity risk and increasing confidence in staff that reporting leads to action by the department.
Together, these initiatives have fostered professional relationships, strengthened credibility and encouraged staff to report wrongdoing. Results in the APS employee census indicate this approach has been effective. Our staff are now more likely to report corruption and their understanding of the department’s policies and procedures to manage corruption has improved. The number of staff who report they have witnessed corrupt behaviour has reduced.

39Department of Agriculture
Annual report 2018–19
Our performance
We developed an inclusion strategy to commence in 2019–20. The strategy outlines how the department will foster inclusion in the workplace. It identifies key actions to embed behavioural, cultural and systemic changes, focused on 3 guiding themes:
\ Opportunities—Attract and recruit diverse employees and ensure all employees are provided opportunities to build their capability and contribute to the department’s objectives
\ Culture—Fostering an inclusive culture where employees feel they can bring their authentic selves to work
\ Leadership—Our leaders drive business outcomes by being open-minded, flexible, encouraging innovation and modelling inclusive behaviours.
We established the Reach program for people with Autism. The program is a new initiative that places skilled employees with Autism in roles within the department.
We coordinated several successful events including NAIDOC week, Wear it Purple Day, International Women’s Day and a Men’s Mental Health seminar. In March 2019 we held an inclusion workshop in Canberra, bringing together the ambassadors from our diversity networks to collaborate on delivering the department’s inclusion agenda.
The department is a member of Pride in Diversity, a national not-for-profit employee support program for LGBTIQ work inclusion. Pride in Diversity coordinates the annual Australian Workplace Equality Index, which is a national benchmark to gauge the overall impact of inclusion initiatives on organisational culture. In 2019 we were awarded Bronze status in the index, indicating there has been a significant improvement in the department’s LGBTIQ inclusion outcomes.
Attendance and retentionThe unscheduled absence rate for 2018–19 was 14.4 FTE days. This is an increase of 0.4 FTE days compared to 2017–18 (Figure 11).
FIGURE 11 Unscheduled absence rates, 2015–16 to 2018–19 a
Miscellaneous
Carer's leave
Sick leave
2018–19
2017–18
2016–17
2015–16
0
2
4
6
8
10
12
14
16
a The unscheduled leave rate is calculated by totalling the full-time equivalent (FTE) days of sick leave, carers’ leave and miscellaneous leave (excluding unauthorised and compensation leave) used in the reporting period. This total is divided by the average FTE days for departmental employees (excluding casual employees) during the reporting period.

40Department of Agriculture Annual report 2018–19
Our performance
In 2018–19 the department’s ongoing separation rate was 9.1% (Table 8).
TABLE 8 Ongoing separation rates, 2015–16 to 2018–19 a
Item 2015–16 2016–17 2017–18 2018–19
% separating 6.5 7.5 8.5 9.1
a The separation rate is calculated by dividing the total number of ongoing separations in the reporting period by the average headcount of ongoing employees during the reporting period, multiplied by 100.
Performance criterion: The department maintains safe and healthy workplaces
Measure The notifiable workplace incident rate is maintained or reduced
Source Corporate Plan 2018–19, page 16
Result Achieved
We report notifiable incidents to Comcare as required under the Work Health and Safety (WHS) Act 2011. A notifiable incident is defined in the Act and includes the death of a worker or serious injury or illness requiring immediate treatment as an inpatient at a hospital or treatment within 48 hours of exposure to a substance or dangerous incident prescribed by the Work Health and Safety Regulations 2011.
In 2018–19 the notifiable workplace incident rate fell significantly, continuing a downward trend (Table 9).
TABLE 9 Notifiable incident rate, 2016–17 to 2018–19
Item 2016–17 2017–18 2018–19
Notifiable incident rate (per 1,000) a 3.89 2.53 1.60
a The number of notifiable incidents may include incidents relating to ‘workers’ under the Work Health and Safety Act 2011 who are not counted in the average employee headcount—this could result in a higher notifiable incident rate (per 1,000).
In 2018–19 Comcare completed an initial assessment of our WHS management system and awarded the department an outstanding conformance result of 90%.
Our WHS activities during the year included holding an inaugural ‘mock trial’, facilitated by an external WHS legal specialist, to enhance our understanding of legislated due diligence obligations. We completed a project to identify risk factors and develop tailored risk mitigation strategies for hazardous manual tasks carried out by our veterinary and meat inspector workforce.
We also allocated funding for a configurable off-the-shelf IT system. The system will be implemented in 2019–20 and will deliver an integrated solution to report and manage WHS events, risk and ongoing cases.

41Department of Agriculture
Annual report 2018–19
Our performance
TABLE 10 Investigations, directions and notices under work health and safety legislation, 2016–17 to 2018–19
Category2016–17
(no.)2017–18
(no.)2018–19
(no.)
Investigations 3 3 0
Provisional improvement notices 0 0 0
Directions or notices 0 0 1
Performance criterion: The department delivers a balanced and financially sustainable budget
Measure The end-of-year financial position is consistent with the budget at the start of the year
Source Corporate Plan 2018–19, page 15
Result Achieved
The department ended the year with an operating surplus of $1.6 million before unfunded depreciation of $17.1 million.
We concluded the year with a healthy balance sheet and cash reserves. This will enable the department to continue to invest in modernising ICT systems to support our business operations.
Our average staffing level was within the cap set by the government.
Further information is provided in Financial performance (page 44)
Performance criterion: information and communication technology meets business needs
Measure The department’s satisfaction with the delivery of ICT services is improved
Source Corporate Plan 2018–19, page 15
Result Achieved
A survey of internal clients indicated that 64.5% of respondents were satisfied with ICT services. Of the respondents, 79% were satisfied with the services provided through our ICT service desk and 92% indicated they had worked with the Information Services Division to deliver ICT projects and were satisfied with the division’s engagement and delivery on those projects.
Function 6: Forecasting and strategic intelligencePerformance criterion: Fit-for-purpose economic and scientific modelling
Measure Outcomes are consistent with forecasts and predictions, allowing for unforeseeable events
Source Corporate Plan 2018–19, page 16
Result Achieved

42Department of Agriculture Annual report 2018–19
Our performance
ABARES forecastingOur research arm, ABARES, publishes quarterly agricultural forecasts in the Australian crop report and Agricultural commodities publications. These cover domestic and global production, consumption, exports and prices of agricultural commodities.
In 2019 ABARES analysed the performance of its September agricultural forecasts from 2000–01 through to 2017–18, publishing the results in an ABARES ‘Snapshot’ Insights article, Summary of ABARES agricultural forecasting. The analysis (Table 11) showed that the forecasts had an average error of:
\ 11% for total winter crop production
\ 2% for total meat production
\ 10% for global indicator prices averaged across major commodities
\ 6% for the total value of agricultural exports
\ 15% for export volumes averaged across major commodities.
TABLE 11 ABARES price forecast error, 2000–01 to 2017–18
Commodity Average forecast
error (%)Forecast bias
(%) a
Proportion of forecasts within
10% of actuals (%)
Proportion of forecasts within
15% of actuals (%)
Naïve model forecast
accuracy (%) b
Wheat 9 –2 72 83 15
Barley c 10 –2 61 78 21
Canola d 12 3 50 67 18
Sugar 18 –1 50 67 37
Cotton 11 –1 67 78 23
Beef 5 –2 89 100 11
Lamb 10 –4 67 83 12
Wool 9 –5 67 83 16
Milk 9 –5 56 89 na
a Forecast bias is defined as the average percentage difference between ABARES September forecasts and actual observations. b Naïve forecasts use the average of observed prices between July and September as a fiscal year forecast. c Before 2010–11, a US no. 2 yellow corn, fob Gulf series was used as the coarse grains indicator price rather than a barley indicator price. As a result, barley forecast accuracy accounts for accuracy of corn prices between 2000–01 and 2010–11 and barley prices between 2011–12 and 2017–18. d Before 2010–11 a US no. 2 soybeans, fob Gulf was used as an oilseeds indicator price rather than a canola indicator price. As a result, canola forecast accuracy consists of oilseeds price forecasts between 2000–01 and 2010–11 and canola prices between 2011–12 and 2017–18. na Not available
These results show a range of forecast accuracy that are well within global standards for a public sector forecasting agency. This is remarkable given Australia’s extreme climate variability relative to agricultural sectors in similarly industrialised countries. For example, winter crop production is highly variable, and our historical forecast error was higher in seasons with significant climatic events.

43Department of Agriculture
Annual report 2018–19
Our performance
Risk return modellingWe operate an extensive and complex biosecurity system comprising multiple, complementary measures and actions applied along the biosecurity continuum: pre-border ‘at the border’ and post-border. The Risk Return Resource Allocation (RRRA) model brings together corporate and scientific knowledge to mathematically represent the structure and function of the biosecurity system.
The RRRA is a unique tool to assess and quantify relationships between biosecurity risk and our investments in biosecurity controls. The primary feature of the model is a series of probabilistic networks to represent an exhaustive range of mutually exclusive pest and disease entry pathways. The use of probabilistic networks is well established in the field of risk estimation. The majority of the modelled pathway structures have been developed in collaboration with departmental experts on biosecurity pathways to ensure they align with our real-world processes.
SNAPSHOT 10: ABARES Insights informing agricultural issuesABARES is our research division, providing independent data, research, analysis and advice that informs government and private decisions about Australian agriculture. The bureau is well-known for its research reports, commodity forecasts and statistical series. In October 2018 we launched ABARES Insights, a new publication series to provide evidence-based context for discussion of industry issues.
ABARES Insights are written in a non-technical style, with infographics, maps and images to give readers access to our knowledge and understanding of agriculture, fisheries and forestry industries.
The Insights series comprises 3 types of research paper:
• Analysis—analyses issues, such as the importance of changes in policy setting for China’s agricultural sector.
• Snapshot—captures key aspects of a field of research, such as a particular industry or the role of Australian agriculture in the national economy.
• Stocktake—reviews publicly released research on an issue of interest in the portfolio and examines what the research says, including possible public policy responses.
During the year, we also joined The Conversation website as a partner organisation to publish timely and topical articles written by ABARES researchers. The Conversation is an independent, non-commercial organisation that provides news and analysis, sourced from the academic and research community.
In 2018–19 ABARES published 3 articles on The Conversation, examining policy responses to drought, how to best help farmers manage climate risk, and the tough choices facing government and industry in reaching the target of $100 billion in agricultural output by 2030.
44Department of Agriculture Annual report 2018–19
Financial performance
Financial performanceOur 2018–2021 finance strategy supports the department to build an efficient and sustainable organisation, contributing to an internationally competitive and sustainable agricultural sector towards 2021. In particular, the strategy aims to ensure our cost-recovered services, which represent more than half of departmental expenditure, are efficient and appropriately funded.
In 2018–19, we implemented a number of initiatives to improve financial management. All of the initiatives have supported improved financial capability and strategic decision-making on the allocation of resources to meet changing business needs, ensuring the department is financially sustainable.
The largest single initiative was the implementation of our new financial management information system which went live on 1 July 2018. This has provided more timely and flexible reporting through real time dashboards, higher quality information to facilitate more informed decision making; and productivity improvements through a more integrated and efficient system.
We also continued to deliver on targeted red tape reduction strategies. Initiatives included making improvements in internal processes to promote self-service for staff, automation of expense management reporting previously done manually and changes to processes to ensure better accountability or demonstrated requirement for international travel.
Our 2018–19 internal budget aligned to the Portfolio Budget Statements with an expected balanced budget (consistent with allowable losses). The 2018–19 full-year result is in a surplus of $1.6 million after allowable losses.
Table 12 provides the department’s entity resource statement subset summary current report period (2018–19). This is a new requirement for financial performance reporting, and is a mandated template as part of the shift to digital annual reporting through the Australian Government’s Transparency Portal.

45Department of Agriculture
Annual report 2018–19
Financial performance
TABLE 12 Entity Resource Statement subset Summary Current Report Period (2018–19)
Actual available
appropriation for 2018–19
$’000
Payments made
2018–19$’000
Balance remaining
2018–19$’000
Departmental
Annual appropriations - ordinary annual services 465,853 396,789 69,064
Annual appropriations - other services - non-operating
20,704 20,184 520
Total departmental annual appropriations 486,557 416,973 69,584
Departmental special appropriations 17,500 17,500 –
Total departmental special appropriations 17,500 17,500 –
Special accounts 585,839 550,551 35,288
Total special accounts 585,839 550,551 35,288
Less departmental appropriations drawn from annual/special appropriations and credited to special accounts
(130,286) (130,286) –
Total departmental resourcing A 959,610 854,738 104,872
Administered
Annual appropriations - ordinary annual services 725,441 334,492
Annual appropriations - other services - non-operating
1,092,414 194,012 898,402
Total administered annual appropriations 1,817,855 528,504
Administered special appropriations 972,216 972,216
Total administered special appropriations 972,216 972,216
Special accounts 912,182 11,109 901,073
Total special accounts receipts 912,182 11,109 901,073
Less administered appropriations drawn from annual/special appropriations and credited to special accounts
(320,000) (320,000)
Less payments to corporate entities from annual/special appropriations
(463,815) (463,815)
Total administered resourcing B 2,918,438 728,014
Total resourcing and payments for Department of Agriculture
A + B 3,878,048 1,582,752

46Department of Agriculture Annual report 2018–19
Financial performance
Revenue In 2018–19, our revenue increased by $21.6 million from 2017–18 to $832.3 million. The increase was primarily due to higher sales of goods and services revenue of $8.1 million and increased appropriation revenue of $11.1 million.
Figure 12 shows the own source revenue received by the department over the past 6 years and budgeted own source revenue from 2019–20 as per the Portfolio Budget Statements 2019–20.
FIGURE 12 Own source revenue, 2013–14 to 2022–23
2022–23
2020–21
2018–19
2016–17
2014–15
$m
100
200
300
400
500
Total sales of goods and rendering of services revenue (including cost recovery) collected in 2018–19 was $409.4 million. Figure 13 shows the breakdown by cost recovery arrangement.
FIGURE 13 Sale of goods and rendering of services revenue by cost recovery activity 2018–19
Biosecurity Arrangement
Food Export Arrangement
Plant Export Arrangement
Passenger, Mail and O�shore
Live Animal Export Arrangement
Other
Levies Revenue Service
Water E�ciency Labelling and Standards
National Residue Survey
$m 50 100 150 200 250
251.0
93.5
20.0
18.6
11.2
8.0
4.7
1.7
0.8
300
Note: ‘Other’ includes PGPA s. 74 receipts for biosecurity plant and animal health programs.

47Department of Agriculture
Annual report 2018–19
Financial performance
Departmental expensesOur expenses totalled $847.7 million in 2018–19 against an original budget of $818.4 million (Portfolio Budget Statements 2018–19).
Figure 14 shows the trend of departmental operating expenses over the past 6 years, and budgeted expenditure figures from 2019–20 as per the Portfolio Budget Statements 2019–20.
FIGURE 14 Departmental expenses, 2013–14 to 2022–23
$m
200
400
600
800
1,000
2022–23
2020–21
2018–19
2016–17
2014–15
Note: Budget influx in 2015 is mainly due to Water Resources machinery of government changes and Agricultural Competitiveness White Paper measures.
Cost recovery reservesWe operate a number of cost recovery arrangements across biosecurity, export certification and other services in accordance with the Australian Government charging framework.
Figure 15 outlines the cost recovery reserve balances at the end of the year.
FIGURE 15 Cost recovery reserve balances at 30 June 2019
$m
39.0
18.9
2.61.5
1.5
0.9
0.8
0.2–0.8
–5.4
–6.3
Import Clearance Arrangement
National Residue Survey Arrangement
Seaports Arrangement
Water E�ciency and Labelling Standards
Grain & Seed Exports Arrangement
Non-Prescribed Goods Arrangement
Seafood & Eggs Arrangement
Meat Export Arrangement
Dairy Export Arrangement
Post Entry Quarantine Arrangement
Horticultural Exports Arrangement
Live Animal Exports Arrangement
–20 –15 –10 –5 5 10 15 20 25 30 35 40
–18.2
Note: Surplus reserves are recorded in the industry reserves balance as reported in the Statement of Changes in Equity in the department's financial statements.

48Department of Agriculture Annual report 2018–19
Financial performance
Asset managementAs at 30 June 2019 our asset base was valued at $185.6 million. Our major investments are in land, buildings and ICT hardware and software.
We make strategic investments to maintain and improve services to the government and to clients consistent with government priorities and ongoing business needs. We manage capital investment through a comprehensive process that involves multiple governance bodies. The process is designed to help prioritise and evaluate capital proposals and ensure investments are made effectively.
In 2018–19 we developed the 2018–2022 ICT Strategy to help us take the first steps towards digital transformation. One of our ICT strategic priorities is for improving our strategic ICT investment. To ensure our return on investment in ICT is optimised in the future, we will focus on implementing improvements that result in more sustainable services, improved partnering and smarter engagement.
A significant portion of our expenditure is related to property leases and property maintenance costs. We maintain around 110 sites across Australia ranging from office accommodation to post-entry quarantine facilities, laboratories, data facilities and residences in remote locations.
Administered program performanceWe have a range of administered programs, the material ones being:
\ A Competitive Agriculture Sector—boosting farm profits through rural research and development
\ Stronger Farmers, Stronger Economy—improvements to access premium markets—improve biosecurity
\ Communities Combating Pests and Weeds Impacts During Drought Program
\ Rural Financial Counselling Service
\ Farm Household Allowance
\ Sustainable Rural Water Use and Infrastructure Program (SRWUIP).
We managed administered assets of $2,956.9 million on behalf of the government. This largely comprised $729.7 million in loans and investments in 8 portfolio entities of $501.5 million.
Administered revenue received for 2018–19 was $600.5 million, a decrease of $11.8 million on the 2017–18 revenue figure of $612.3 million. This result is mainly due to decreased non-taxation revenue of $9.9 million. Additionally, other gains of $256.4 million are recognised in 2018–19, primarily relating to the recognition of water entitlement assets received free-of-charge under the SRWUIP.
Administered expenditure for 2018–19 was $1,755.3 million, an increase of $193.8 million on the 2017–18 expenditure figure of $1,561.5 million.

49Department of Agriculture
Annual report 2018–19
Management and accountability
Part 2
Management and accountability

50Department of Agriculture Annual report 2018–19
Our governance
Our governanceOur executiveDaryl Quinlivan has been Secretary of the department since June 2015. Mr Quinlivan is the department’s accountable authority, and is responsible for its efficient and effective operation. His other roles include chairing:
\ the National Biosecurity Committee
\ National Management Group for nationally coordinated emergency responses to pest and disease incursions
\ the Agriculture Senior Officials Committee.
TABLE 13 Details of accountable authority during the reporting period 2018–19
Period as the accountable authority
Name Position title Date of commencement Date of cessation
Daryl Quinlivan Secretary 1 July 2018 30 June 2019
Deputy secretaries assist the Secretary across a range of issues and departmental functions and oversee the work of particular divisions. Our deputy secretaries are:
Cindy Briscoe—responsible for the Agricultural Policy Division, Agvet Chemicals, Fisheries and Forestry Division, and Rural Policy and Farm Performance Division.
Neal Mason (acting)—responsible for the Assurance and Legal Division, Corporate Strategy and Governance Division, Finance and Business Support Division, and Information Services Division.
Lyn O’Connell PSM—responsible for the Biosecurity divisions and the Compliance Division, and oversees the Australian Chief Veterinary, Chief Environmental Biosecurity and Chief Plant Protection Officers.
Malcolm Thompson—responsible for the Exports Division, Live Animal Exports Division, Trade and Market Access Division, Water Division and the Australian Bureau of Agricultural and Resource Economics and Sciences (ABARES).
Governance frameworkThe Executive Management Committee (EMC) oversees the implementation and improvement of our governance structures and business operations, shares responsibility for building capability and promotes collaboration between business areas, other agencies and our stakeholders.

51Department of Agriculture
Annual report 2018–19
Our governance
In 2018–19 the EMC was supported by 4 subcommittees (Table 14):
\ Business Transformation Committee
\ Information and Data Management Committee
\ People, Safety and Culture Committee
\ Security and Business Continuity Committee.
As part of building the department’s performance, capability and efficiency, the EMC and its subcommittees have focused on informed strategic discussion and streamlined decision-making. Each committee’s meeting agenda item links to the department’s Corporate Plan, enabling targeted strategic and operational discussion. Any risks associated with each proposal or item under discussion are also a standing item.
Governance committee memberships have been revised to ensure best practice arrangements are in place for effective decision-making. We have implemented a Governance module in our online Planning Hub system to produce, track and manage action item reports.
TABLE 14 Executive committees—roles and membership, 30 June 2019
Committee Role Membership
Executive Management Committee (EMC)—met 25 times in 2018–19
The primary governance body supporting the Secretary. The committee makes decisions and provides guidance to:
• ensure the department is achieving its purpose and objectives
• build and maintain organisational capability
• monitor performance against departmental objectives and priorities
• set an appropriate risk appetite and risk tolerance for the department
• monitor and respond to strategic risks, and risks that may materially impact the department achieving its objectives
• allocate budgets and ensure financial sustainability
• assure compliance with legislative, governance and administrative frameworks
• communicate decisions and guidance in a timely manner to enable staff to make informed decisions.
Secretary (Chair)
Deputy secretaries (members)
First Assistant Secretary, Compliance (rotational member)
First Assistant Secretary, Rural Policy and Farm Performance (rotational member)
Chief Finance Officer (Advisor)
General Counsel (Advisor)
The chair of the Audit Committee attends meetings each quarter as an observer and may attend other scheduled EMC meetings as necessary.

52Department of Agriculture Annual report 2018–19
Our governance
TABLE 14 Executive committees—roles and membership, 30 June 2019
Committee Role Membership
Business Transformation Committee (BTC)—met 9 times in 2018–19
Oversees business improvements that have significant impact, including ICT projects. BTC responsibilities include:
• identifying and articulating the investment priorities for business transformation, in alignment with strategic priorities and risks
• requesting proposals from divisions for activities that meet the department’s strategic priorities or risk mitigation needs
• approving (with Chief Finance Officer endorsement), seed funding for the development of business cases for complex programs and projects to a threshold of $200,000 per project
• approving (with Chief Finance Officer endorsement) or declining project change requests
• endorsing all program and project business cases prior to their consideration for funding by the EMC
• advising the EMC on the prioritisation for funding of proposed program and projects and other initiatives
• reviewing the status of the department’s current programs, projects and other major change activities on a regular basis
• recommending to the EMC to pause, revise or cancel initiatives that are not expected to deliver the expected outcomes and/or benefits
• overseeing the management of the impacts of change activities throughout the department including resourcing, consultation, communications and cost implications.
Deputy Secretary (Chair)
Deputy Secretary (Deputy Chair)
Chief Finance Officer
Chief Information Officer
First Assistant Secretary, Corporate Strategy and Governance
First Assistant Secretary, Compliance
First Assistant Secretary, Biosecurity Operations
First Assistant Secretary, Biosecurity Policy and Implementation
Executive Director, ABARES
Assistant Secretary, Productivity, Projects and Innovation
Chief Risk Officer and Assistant Secretary, Planning and Governance
Assistant Secretary, Modernising Agriculture Trade Taskforce
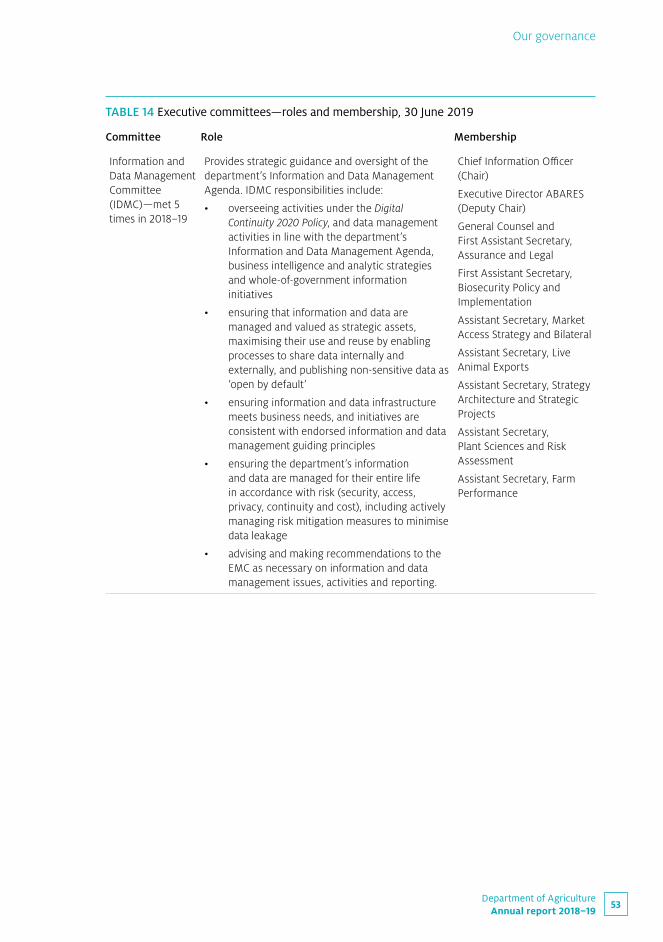
53Department of Agriculture
Annual report 2018–19
Our governance
TABLE 14 Executive committees—roles and membership, 30 June 2019
Committee Role Membership
Information and Data Management Committee (IDMC)—met 5 times in 2018–19
Provides strategic guidance and oversight of the department’s Information and Data Management Agenda. IDMC responsibilities include:
• overseeing activities under the Digital Continuity 2020 Policy, and data management activities in line with the department’s Information and Data Management Agenda, business intelligence and analytic strategies and whole-of-government information initiatives
• ensuring that information and data are managed and valued as strategic assets, maximising their use and reuse by enabling processes to share data internally and externally, and publishing non-sensitive data as ‘open by default’
• ensuring information and data infrastructure meets business needs, and initiatives are consistent with endorsed information and data management guiding principles
• ensuring the department’s information and data are managed for their entire life in accordance with risk (security, access, privacy, continuity and cost), including actively managing risk mitigation measures to minimise data leakage
• advising and making recommendations to the EMC as necessary on information and data management issues, activities and reporting.
Chief Information Officer (Chair)
Executive Director ABARES (Deputy Chair)
General Counsel and First Assistant Secretary, Assurance and Legal
First Assistant Secretary, Biosecurity Policy and Implementation
Assistant Secretary, Market Access Strategy and Bilateral
Assistant Secretary, Live Animal Exports
Assistant Secretary, Strategy Architecture and Strategic Projects
Assistant Secretary, Plant Sciences and Risk Assessment
Assistant Secretary, Farm Performance

54Department of Agriculture Annual report 2018–19
Our governance
TABLE 14 Executive committees—roles and membership, 30 June 2019
Committee Role Membership
People, Safety and Culture Committee (PSCC)—met 8 times in 2018–19
Addresses issues affecting the department’s people (including its external workforce), their safety and the organisation’s culture. PSCC responsibilities include:
• making recommendations to the EMC on people strategies
• monitoring workforce impacts and associated risks and overseeing the effective implementation of appropriate management actions
• undertaking regular performance monitoring on work health and safety, rehabilitation, performance management, culture and unscheduled absence
• overseeing the management of the department’s people systems
• responding to strategic issues including work health and safety incidents, hazards and risks.
First Assistant Secretary, Corporate Strategy and Governance (Chair)
First Assistant Secretary, Exports (Deputy Chair)
Chief Risk Officer and Assistant Secretary, Planning and Governance
Assistant Secretary, Compliance Policy
Assistant Secretary, Workforce and HR Strategy
Assistant Secretary, Veterinary and Export Meat Services
Assistant Secretary, Bilateral Engagement
Assistant Secretary, Commercial Business
Assistant Secretary, HR People
Assistant Secretary, Farm Performance

55Department of Agriculture
Annual report 2018–19
Our governance
TABLE 14 Executive committees—roles and membership, 30 June 2019
Committee Role Membership
Security and Business Continuity Committee (SBCC)—met 9 times in 2018–19
The key advisory body to the Secretary on security and business continuity management matters. SBCC responsibilities include:
• specifying policies and standards with reference to government security policies
• promoting and driving a positive security culture within the department
• providing a cohesive and coordinated approach to risk, security and business continuity
• establishing long-term security goals and objectives
• monitoring security plans and identifying and managing risks
• considering outcomes of security incidents and investigations
• facilitating information sharing for security improvements
• reviewing the department’s security policies, procedures and plans in accordance with the PSPF and the Information Security Manual, with consideration to the department’s service delivery and investment priorities
Deputy Secretary (Chief Security Officer, Chair)
Assistant Secretary, Assurance (Deputy Chair)
Deputy Secretary
Chief Finance Officer
General Counsel and First Assistant Secretary, Assurance and Legal
Chief Information Officer
First Assistant Secretary, Corporate Strategy and Governance
First Assistant Secretary, Trade and Market Access
Assistant Secretary, Operations Integration
Assistant Secretary, Commercial Business
Audit CommitteeThis committee provides independent advice to the Secretary (as the accountable authority) on the department’s risk, finance, control and compliance frameworks and its external accountability responsibilities.
Under its charter, the Audit Committee must include:
\ at least 3 people, who have appropriate qualifications, knowledge, skills or experience to assist the committee to perform its functions
\ a majority of members who are not officials of the department (Table 15).
The committee oversees an annual internal audit work program, undertaken by an independent internal audit team and contracted service providers. The work program is developed in consultation with senior management and is reviewed regularly to ensure it is relevant and responsive to changes and business risks. The program is approved by the Secretary.

56Department of Agriculture Annual report 2018–19
Our governance
TABLE 15 Audit Committee—role and membership at 30 June 2019
Committee Role Membership
Audit Committee— met 5 times in 2018–19
The Audit Committee provides independent assurance and advice to the Secretary on the department’s risk, finance, control and compliance framework.
Geoff Knuckey (Chair, Independent Member)
David Bryant (Independent Member)
Malcolm Thompson (Deputy chair, Deputy Secretary, Department Member)
Managing our riskOur Enterprise Risk Management Policy and Framework are administered in line with the requirements of the Commonwealth Risk Management Policy, and are approved by the Secretary. The Audit Committee reviews our systems of risk oversight and management. We take a risk-based approach to policy and program development, integrating risk management with governance, planning and performance management processes.
Our risk management includes identifying areas of strategic risk that, if realised, could affect our ability to achieve our organisational objectives. The EMC monitors these risks, including the effectiveness of identified controls and mitigation strategies. During the year, we reviewed the strategic risks to align them with the objectives and functions in the Corporate Plan 2018–19. We identified 8 areas of strategic risk to be monitored in 2019–20 (Figure 16).
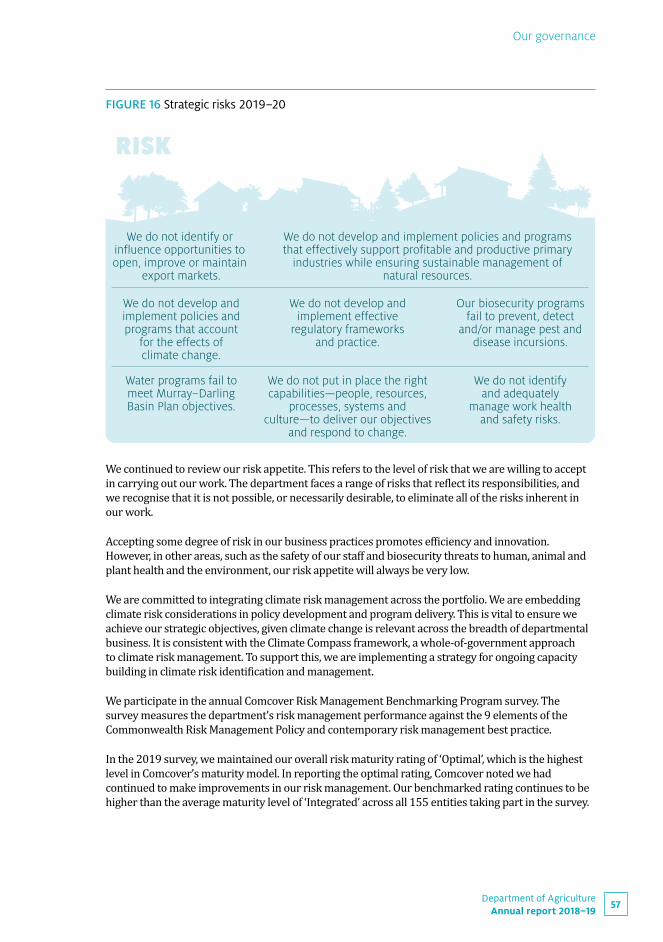
57Department of Agriculture
Annual report 2018–19
Our governance
FIGURE 16 Strategic risks 2019–20
We do not identify or influence opportunities to open, improve or maintain
export markets.
We do not develop and implement policies and programs that effectively support profitable and productive primary
industries while ensuring sustainable management of natural resources.
We do not develop and implement effective
regulatory frameworks and practice.
Our biosecurity programs fail to prevent, detect
and/or manage pest and disease incursions.
Water programs fail to meet Murray–Darling Basin Plan objectives.
We do not put in place the right capabilities—people, resources,
processes, systems and culture—to deliver our objectives
and respond to change.
We do not identify and adequately
manage work health and safety risks.
We do not develop and implement policies and programs that account
for the effects of climate change.
RISK
We continued to review our risk appetite. This refers to the level of risk that we are willing to accept in carrying out our work. The department faces a range of risks that reflect its responsibilities, and we recognise that it is not possible, or necessarily desirable, to eliminate all of the risks inherent in our work.
Accepting some degree of risk in our business practices promotes efficiency and innovation. However, in other areas, such as the safety of our staff and biosecurity threats to human, animal and plant health and the environment, our risk appetite will always be very low.
We are committed to integrating climate risk management across the portfolio. We are embedding climate risk considerations in policy development and program delivery. This is vital to ensure we achieve our strategic objectives, given climate change is relevant across the breadth of departmental business. It is consistent with the Climate Compass framework, a whole-of-government approach to climate risk management. To support this, we are implementing a strategy for ongoing capacity building in climate risk identification and management.
We participate in the annual Comcover Risk Management Benchmarking Program survey. The survey measures the department’s risk management performance against the 9 elements of the Commonwealth Risk Management Policy and contemporary risk management best practice.
In the 2019 survey, we maintained our overall risk maturity rating of ‘Optimal’, which is the highest level in Comcover’s maturity model. In reporting the optimal rating, Comcover noted we had continued to make improvements in our risk management. Our benchmarked rating continues to be higher than the average maturity level of ‘Integrated’ across all 155 entities taking part in the survey.

58Department of Agriculture Annual report 2018–19
Our governance
Our department is also involved in the whole-of-government Chief Risk Officers Forum and the Commonwealth Risk Managers Forum. The forums provide an opportunity to discuss and share risk management approaches, issues, lessons learnt and best practices to improve risk management across the Commonwealth.
Strengthening integrityMaintaining a strong integrity culture is essential to meet our legislative and parliamentary requirements, and to maintain the trust of the Australian Government, the public and our business partners.
We have continued to implement our integrity strategy to further strengthen our prevention, detection and response capabilities. This will enable us to maintain and support a strong integrity culture. A key component of this strategy has been the use of our existing employment framework and practices, with enhancements to support integrity checking. These are the foundations of the department’s integrity framework.
The integrity framework includes:
\ the APS Values, Employment Principles and Code of Conduct
\ integrity checking, using risk factors pertinent to different staff roles
\ declaration of interests (including conflicts of interest)
\ the Engaging in Outside Employment or Voluntary Work Policy
\ the Workplace Drug and Alcohol Policy.
The framework builds on the capabilities and approaches developed in 2017–18. It supports employee awareness and compliance through the development of clear and concise policies, training and easily accessible reporting mechanisms that reinforce a pro-integrity culture.
We are committed to actively promoting the standards of behaviour outlined in the:
\ APS Values, Employment Principles and Code of Conduct
\ Public Interest Disclosure Act 2013
\ Public Governance, Performance and Accountability Act 2013.
Our Fraud and Corruption Control Plan is informed by independent fraud and corruption risk assessments. These assessments evaluate existing and emerging fraud and corruption risk, and detail controls and treatment strategies to address these risks.
We have invested in greater resourcing and capability to prevent and detect fraudulent behaviour. This includes increasing resourcing across our fraud, corruption and integrity functions to enable us to prioritise and direct resources to areas of highest impact. Our fraud, corruption and integrity teams work in conjunction with our enterprise risk management and internal audit teams to strengthen our control environment.

59Department of Agriculture
Annual report 2018–19
Our governance
FIGURE 17 Integrity snapshot, 2018–19
• The Integrity Hotline was established in 2018–19 and received 240 individual reports
• In October 2018 the Australian Commissioner for Law Enforcement Integrity published an investigation report on Operation Volker. This investigation related to the corrupt conduct of a former departmental employee. The investigation resulted in the employee being terminated.
• The Conduct team nalised 157 matters including 10 formal investigations, resulting in 6 people being found in breach of the Code.
ConductCases �nalised 157
Reports received 151
Performance Improvement Plans concluded 3
SecurityChange of circumstances forms processed 1,404
Incident reports 250
Travel security risk assessments provided 363
IntegrityReports received 240Matters completed 196
Fraud and corruptionMatters completed 17
The Integrity team received reports relating to corruption; inappropriate behaviour; fraud; security concerns and generalised reporting for information only.
Conduct, security, integrity and fraud and corruption statistics are not mutually exclusive and any one report, case, matter or individual may be present in another count.

60Department of Agriculture Annual report 2018–19
Our governance
Our securityThe department’s commitment to a strong security culture is set out in our Protective Security Policy. The policy outlines our obligations to mitigate security risks to our people, information and assets in accordance with the Australian Government Protective Security Policy Framework.
We evaluate the department’s maturity and compliance against the Protective Security Policy Framework through regular reporting to our Security and Business Continuity Committee, the Attorney-General’s Department and other key stakeholders.
In 2018–19 we increased the department’s capability and understanding of relevant vulnerabilities and delivered a program reflective of our risk profile and resourcing. Initiatives included:
\ appointing a Chief Security Officer and Departmental Security Advisor
\ consolidating our access systems and assets
\ improving the performance of security guarding and after hours monitoring services
\ establishing a national 24/7 security helpdesk
\ developing guidelines to address security risks, and delivering personal safety awareness training for our officers who travel overseas for work
\ developing the Protective Security Policy
\ rolling out a Security Month, where security awareness sessions were delivered nationally.
Disclosure of protected information under the Biosecurity ActSection 590 of the Biosecurity Act 2015 requires the Director of Biosecurity to prepare a report on the use of protected information for the period from 1 July to 30 June.
During the reporting period, there were 16 written authorisations to disclose protected information under section 580(3) of the Act.
GrantsInformation on grants awarded by the Department of Agriculture during 2018–19 is available on the GrantConnect website at grants.gov.au.

61Department of Agriculture
Annual report 2018–19
External service providers
External service providersThe department is a non-corporate Commonwealth entity. Our procurement policies and practices are consistent with:
\ relevant Commonwealth legislation
\ the Commonwealth Resource Management Framework, which includes the Commonwealth Procurement Rules and the Public Governance, Performance and Accountability Act 2013
\ our Accountable Authority Instructions.
Our procurement practices reflect the Commonwealth’s procurement framework, with the focus on:
\ value for money
\ encouraging competition
\ efficient, effective, economical and ethical procurement
\ accountability and transparency.
We provide departmental guides, specialist advice and assistance to all our divisions to help ensure we meet our obligations.
Procurement initiatives to support small and medium enterprisesWe support small business participation in the Commonwealth procurement market. Small and medium-sized enterprise participation statistics are available on the Department of Finance website.
We recognise the importance of ensuring small businesses are paid on time. The department’s payment practice complies with the Commonwealth’s Supplier Pay-On-time or Pay Interest policy. The results of the Survey of Australian Government Payments to Small Business are available on the Treasury website.
Our procurement practices support small and medium enterprises by using:
\ the Commonwealth Contracting Suite (CCS) for low-risk procurements valued at under $1 million
\ small business engagement principles such as communicating in clear, simple language and presenting information in an accessible format
\ credit cards where possible for purchases under $10,000.
Indigenous procurementThe government’s Indigenous Procurement Policy was launched on 1 July 2015 and aims to use the Commonwealth’s annual multi-billion dollar procurement spend to:
\ drive demand for Indigenous goods and services
\ stimulate Indigenous economic development
\ grow the Indigenous business sector.

62Department of Agriculture Annual report 2018–19
External service providers
We support and have implemented the government’s policy, which includes considering Indigenous suppliers for all remote contracts and all contracts valued between $80,000 and $200,000.
In 2018–19 the portfolio was set a target of 3%, or 37 contracts. We entered into more than 100 contracts, which also included multi-year contracts from previous years. Goods and services provided included Indigenous ranger services, building construction, maintenance and repair, and temporary personnel.
For more information see the Indigenous Procurement Policy overview on the Department of the Prime Minister and Cabinet website.
Other contract informationDuring 2018–19 the secretary did not exempt any contracts or standing offers entered into by the department from being published on AusTender.
All contracts entered into by the department during 2018–19 valued at $100,000 or more (GST inclusive) included a clause providing for the Auditor-General to have access to the contractor’s premises.
The annual report contains information about actual expenditure on contracts for consultancies. Further information on the value of contracts and consultancies is available on the AusTender website.
ConsultanciesIn 2018–19 we entered into 107 new consultancy contracts involving total actual expenditure of $7,787,944. In addition, 17 ongoing consultancy contracts were active during the period, involving total actual expenditure of $561,991.
Table 16 shows the number and total expenditure of new and ongoing consultancies in 2018–19.
TABLE 16 Number and expenditure on consultants current report period (2018–19)
Total
No. of new contracts entered into during the period 107
Total actual expenditure during the period on new contracts (inc. GST) $7,787,944
No. of ongoing contracts engaging consultants that were entered into during a previous period
17
Total actual expenditure during the period on ongoing contracts (inc. GST) $561,991
We engage consultants when we require specialist expertise or independent assessment, research or review. Consultants are typically engaged to:
\ investigate or diagnose a defined issue or problem
\ carry out defined reviews or evaluations
\ provide independent advice, information or creative solutions to assist in the department’s decision-making.

63Department of Agriculture
Annual report 2018–19
External service providers
Before engaging consultants, we take into account the skills and resources required for the task, the skills available internally and the cost-effectiveness of engaging external expertise.
Consultants are sourced in line with the Commonwealth Procurement Rules. The selection process may involve open tender, selective tender, direct sourcing or a panel consisting of recognised experts. We may choose a consultant who has the requisite skills if the value of the project does not justify the expense or delay associated with seeking tenders.
We also enter into purchaser–provider arrangements with a range of government, industry and private sector agencies for services to improve the productivity, competitiveness and sustainability of Australia’s agricultural, fisheries and forestry industries.
Advertising and market researchDuring 2018–19 the Department of Agriculture conducted the following advertising campaigns:
\ Rural Financial Counselling Service for Farm Safety Week
\ Biosecurity awareness for international students
\ Biosecurity awareness for incoming passengers
\ African swine fever.
Further information on those advertising campaigns is available in the reports on Australian Government advertising prepared by the Department of Finance. Those reports are available on the Department of Finance’s website.
Payments to advertising agencies, market research organisations, polling organisations, direct mail organisations and media advertising organisations are set out in Table 17.
TABLE 17 Advertising and market research for 2018–19
Organisation Description Expenditure
Advertising agencies
na – –
Market research organisations
The Social Research Centre National survey of agricultural businesses about on-farm pest and weed management
$219,611.00
CSIRO Report on the future of the agriculture workforce $180,000.00
Global agriculture and food systems $330,000.00
Iugotech Feasibility study of sensors for the detection of brown marmorated stink bug
$25,271.40
Andrew Michael Hannon Assessing automated options for phytosanitary assurance
$65,877.81
University of Melbourne Biosecurity Risk Insurance scoping study $90,000.00

64Department of Agriculture Annual report 2018–19
External service providers
Organisation Description Expenditure
Essence Communications Exploratory research and strategic communication advice on water market literacy
$37,620.00
Cutthru Services to inform the Australian Government’s contributions to a jointly-funded project developing forest industry social licence and communications
$60,000.00
Jones Lang LaSalle Market research for Melbourne consolidation project
$29,980.83
Polling organisations
na – –
Direct mail organisations
na – –
Media advertising organisations
Universal McCann Advertising $374,363.18
Recruitment $91,368.96
Total $1,504,093.18
na Not applicable

65Department of Agriculture
Annual report 2018–19
External scrutiny
External scrutinyParliamentary committeesInquiry reportsParliamentary committees tabled 5 reports relevant to the department’s operations (Table 18).
TABLE 18 Parliamentary committee reports tabled, 2018–19
Committee Inquiry Tabling date
House of Representatives Standing Committee on Agriculture and Water Resources
Super-charging Australian agriculture: an inquiry based on superannuation fund investment in agriculture
11 December 2018
Senate Standing Rural and Regional Affairs and Transport Committee
Regulatory approaches to ensure the safety of pet food
16 October 2018
Integrity of the water market in the Murray–Darling Basin
29 November 2018
The independence of regulatory decisions made by the Australian Pesticides and Veterinary Medicines Authority (APVMA)
1 February 2018
Agricultural and Veterinary Chemicals Legislation Amendment (Streamlining Regulation) Bill 2018
11 February 2019
Government responses to inquiry reportsThe Australian Government responded to 4 parliamentary committee reports relevant to the department (Table 19).
TABLE 19 Government responses tabled, 2018–19
Committee Inquiry Response date
House of Representatives Standing Committee on Agriculture and Water Resources
Australian Pesticides and Veterinary Medicines Authority regulatory reforms
26 November 2018
Senate Standing Rural and Regional Affairs and Transport Committee
The effect of market consolidation on the red meat processing sector
17 December 2018
The independence of regulatory decisions made by the Australian Pesticides and Veterinary Medicines Authority
5 April 2019
Agricultural and Veterinary Chemicals Legislation Amendment (Streamlining Regulation) Bill 2018
3 April 2019
66Department of Agriculture Annual report 2018–19
External scrutiny
Auditor-GeneralIn 2018–19 the Auditor-General tabled 5 Australian National Audit Office (ANAO) reports on our activities.
Implementation of the Australian Government’s Workplace Bargaining FrameworkAuditor-General report no. 16, 2018–19 examined the implementation of the Australian Government’s 2014 and 2015 workplace bargaining policies by the department and 6 other entities. The audit found that overall the department’s implementation of the bargaining framework was broadly effective and that appropriate governance arrangements were established.
The ANAO recommended that the department and all selected entities establish key governance arrangements such as implementation plans, communication plans and risk management documentation before commencing bargaining activities. They also suggested we actively use these arrangements throughout the process. We agreed with the recommendation.
Northern Australia Quarantine Strategy (NAQS)— Follow-on AuditAuditor-General report no. 23, 2018–19 assessed the extent to which the department has addressed recommendations from a 2011–12 ANAO audit of the administration of the Northern Australia Quarantine Strategy. The audit found the department is progressing but has not yet fully addressed the recommendations of the previous audit.
The ANAO made 3 recommendations covering the verification of scientific surveillance activities, documenting a risk-based approach to biosecurity inspections in the Torres Strait, and developing measures to assess our performance in managing biosecurity risks in northern Australia. We agreed with the recommendations.
Application of cost recovery principlesAuditor-General report no. 38, 2018–19 assessed whether the department, the Australian Maritime Safety Authority and the Therapeutic Goods Administration effectively apply the cost recovery principles of the Australian Government’s cost recovery framework. The audit found that the department and the other entities have been partially effective in implementing these principles, but that we had scope to improve the effectiveness of our cost recovery arrangements.
The ANAO made 3 recommendations relating to the department:
\ ensure our Cost Recovery Implementation Statements are fully compliant with the Cost Recovery Guidelines
\ align our fees and levies with the guidelines and develop an improved cost recovery model
\ implement ongoing stakeholder engagement strategies.
We agreed with the recommendations.
67Department of Agriculture
Annual report 2018–19
External scrutiny
Coordination arrangements of Australian Government entities operating in Torres StraitAuditor-General report no. 41, 2018–19 assessed the effectiveness of coordination arrangements of key entities operating in Torres Strait, including the department, the Torres Strait Regional Authority, the Department of Foreign Affairs and Trade, the Department of Home Affairs and the Australian Fisheries Management Authority. The audit found the coordination arrangements are largely effective in supporting Australian Government activities.
The ANAO did not make any recommendations relating to the department. We noted other recommendations and committed to maintain awareness of initiatives to address the audit findings and to participate in those initiatives where appropriate.
Farm Management Deposits SchemeAuditor-General report no. 51, 2018–19 assessed whether the Australian Taxation Office (ATO) and the department have effectively administered the Farm Management Deposits Scheme. The audit found risk identification and compliance arrangements administered by the ATO have not fully captured key elements of the scheme’s design, and that the department, as the policy owner, should work with the ATO to be satisfied that these processes are appropriate.
The ANAO made 3 recommendations relating to the department, including elements that should be included in a planned evaluation of the scheme. We agreed with the recommendations.
Inspector-General of BiosecurityIn April 2016 the Australian Government appointed Helen Scott-Orr as the inaugural Inspector-General of Biosecurity. Her role was to independently evaluate and verify the adequacy of the department’s pre-border, border and post-border biosecurity risk management programs. We provide administrative support to the Inspector-General, including staff, office space, travel and legal assistance required in relation to reviews.
Dr Scott-Orr completed her 3-year term on 24 July 2019. Rob Delane commenced in the role on 25 July 2019.
During 2018–19 the Inspector-General published reports on:
\ hitchhiker pest and contaminant biosecurity risk management in Australia
\ military biosecurity risk management in Australia
\ horse importation biosecurity risk management
\ implementation of Interim Inspector-General of Biosecurity recommendations
\ environmental biosecurity risk management in Australia
\ effectiveness of biosecurity measures to manage the risk of brown marmorated stink bugs entering Australia
\ pest and disease interceptions and incursions in Australia.
For more information see Current and completed reviews on the Inspector-General of Biosecurity website.

68Department of Agriculture Annual report 2018–19
External scrutiny
Interim Inspector-General of Live Animal ExportsIn March 2019 the Australian Government appointed Ross Carter as the Interim Inspector-General of Live Animal Exports (IIGLAE). His role is to independently review the systems and processes that underpin our regulation of livestock exports. This oversight will give farmers, industry and the community more confidence in the regulation of livestock exports. The Interim Inspector-General position was established as part of the government’s response to the Review of the Regulatory Capability and Culture of the Department of Agriculture and Water Resources in the Regulation of Live Animal Exports.
For more information see the work program on the Interim Inspector-General of Live Animal Exports website.
Commonwealth OmbudsmanIn 2018–19 the Commonwealth Ombudsman did not release any reports covering the department’s operations.
Freedom of informationAny agency subject to the FOI Act is required to publish information on its website as part of the Information Publication Scheme (IPS). This includes a plan showing what information the agency publishes in accordance with the IPS requirements. For more information see the Information Publication Scheme on our website.
We also publish corporate and operational information on our website, and reports on information accessed through FOI applications in a disclosure log.
In 2018–19 we received 117 requests for access under the FOI Act, 8 requests for internal review and 4 requests for external review. We finalised 117 requests and 7 internal reviews.
For more information on requests received and processed by all Commonwealth agencies see the FOI reports on the Office of the Australian Information Commissioner website.

69Department of Agriculture
Annual report 2018–19
Appendices
Part 3
Appendices

70Department of Agriculture Annual report 2018–19
Appendix A: Entity resource and outcome statements
Appendix A:
Entity resource and outcome statementsTABLE 20 Entity resource statement, 2018–19
Actual available appropriation for
2018–19$’000
Payments made
2018–19$’000
Balance remaining
2018–19$’000
(a) (b) (a)–(b)
Ordinary annual services 1
Departmental appropriation
Prior year departmental appropriation 51,094 51,094 –
Departmental appropriation 2 401,636 332,572 69,064
Section 74 retained revenue receipts 13,123 13,123 –
Total 465,853 396,789 69,064

71Department of Agriculture
Annual report 2018–19
Appendix A: Entity resource and outcome statements
TABLE 20 Entity resource statement, 2018–19
Actual available appropriation for
2018–19$’000
Payments made
2018–19$’000
Balance remaining
2018–19$’000
Administered expenses
Outcome 1 122,149 118,821
Section 74 retained revenue receipts 14,187 13,396
Prior year available 36,251 5,417
Section 51 determinations (790) –
Outcome 2 41,706 36,532
Section 74 retained revenue receipts 12 12
Prior year available 2,064 177
Outcome 3 290,561 27,903
Section 74 retained revenue receipts 1,209 –
Prior year available 98,636 77
Section 51 determinations (13,976) –
Payments to corporate entities 132,932 131,657
Prior year available 500 500
Total 725,441 334,492

72Department of Agriculture Annual report 2018–19
Appendix A: Entity resource and outcome statements
TABLE 20 Entity resource statement, 2018–19
Actual available appropriation for
2018–19$’000
Payments made
2018–19$’000
Balance remaining
2018–19$’000
Total ordinary annual services A 1,191,294 731,281
Other services 3
Departmental non-operating
Prior year available 16,390 13,431 –
Equity injections 7,273 6,753 520
Prior year Appropriation Acts repealed (2,959)
Total 20,704 20,184 520
Administered non-operating
Prior year available 446,039 159,444 286,595
Administered assets and liabilities 715,478 34,568 680,910
Prior year Appropriation Acts repealed (69,103)
Total 1,092,414 194,012 898,402
Total other services B 1,113,118 214,196 898,922

73Department of Agriculture
Annual report 2018–19
Appendix A: Entity resource and outcome statements
TABLE 20 Entity resource statement, 2018–19
Actual available appropriation for
2018–19$’000
Payments made
2018–19$’000
Balance remaining
2018–19$’000
Total available annual appropriations and payments
(A+B) 2,304,412 945,477
Special appropriations
Special appropriations limited by criteria/entitlement
Agricultural and Veterinary Chemicals (Administration) Act 1992—s. 58 (6) amount payable to the APVMA
28,500
Australian Animal Health Council (Live-stock Industries) Funding Act 1996, s. 5—appropriation
7,787
Australian Meat and Live-stock Industry Act 1997, s. 63(2)—payments to marketing body
84,584
Australian Meat and Live-stock Industry Act 1997, s. 64(2)—payments to research body
28,466
Australian Meat and Live-stock Industry Act 1997, s. 64A(2)—payments to marketing body
3,853
Australian Meat and Live-stock Industry Act 1997, s. 64B(2)—payments to research body
771
Australian Meat and Live-stock Industry Act 1997, s. 64C(2)—payments to marketing body
10,306
Australian Meat and Live-stock Industry Act 1997, s. 64D(2)—payments to research body
9,880
Australian Meat and Live-stock Industry Act 1997, s. 66(1)—Commonwealth contribution to research body
79,125
Dairy Produce Act 1986, s. 6(1)—payments under funding contract
54,884

74Department of Agriculture Annual report 2018–19
Appendix A: Entity resource and outcome statements
TABLE 20 Entity resource statement, 2018–19
Actual available appropriation for
2018–19$’000
Payments made
2018–19$’000
Balance remaining
2018–19$’000
Egg Industry Service Provision Act 2002, s. 8(1)—payments under funding contract
11,428
Farm Household Support Act 2014, s. 105—Payments for Farm Household Allowance
112,381
Forestry Marketing and Research and Development Services Act 2007, s. 9(1) payments and matching payments to an industry services body and Commonwealth administration expenses
11,947
Horticulture Marketing and Research and Development Services Act 2000, s. 16(9)—payments to industry services body
107,020
Public Governance, Performance and Accountability Act 2013—s. 58, National Residue Survey, Departmental
17,500
Pig Industry Act 2001, s. 10(1)—payments under funding contract
23,362
Plant Health Australia (Plant Industries) Funding Act 2002, s. 10B—payments to PHA from EPPR levies and charges
5,192
Plant Health Australia (Plant Industries) Funding Act 2002, s. 6—appropriation
4,657
Primary Industries Research and Development Act 1989, s. 30(3)—Cotton R&D Corporation
19,232
Primary Industries Research and Development Act 1989, s. 30(3)—Grains R&D Corporation—Other Grains
97,313
Primary Industries Research and Development Act 1989, s. 30(3)—Grains R&D Corporation—Wheat
77,981
Primary Industries Research and Development Act 1989, s. 30(3)—Rural Industries R&D Corporation
10,924
Primary Industries Research and Development Act 1989, s. 30A(3) and s. 30B(9)—Fisheries R&D Corporation
23,342
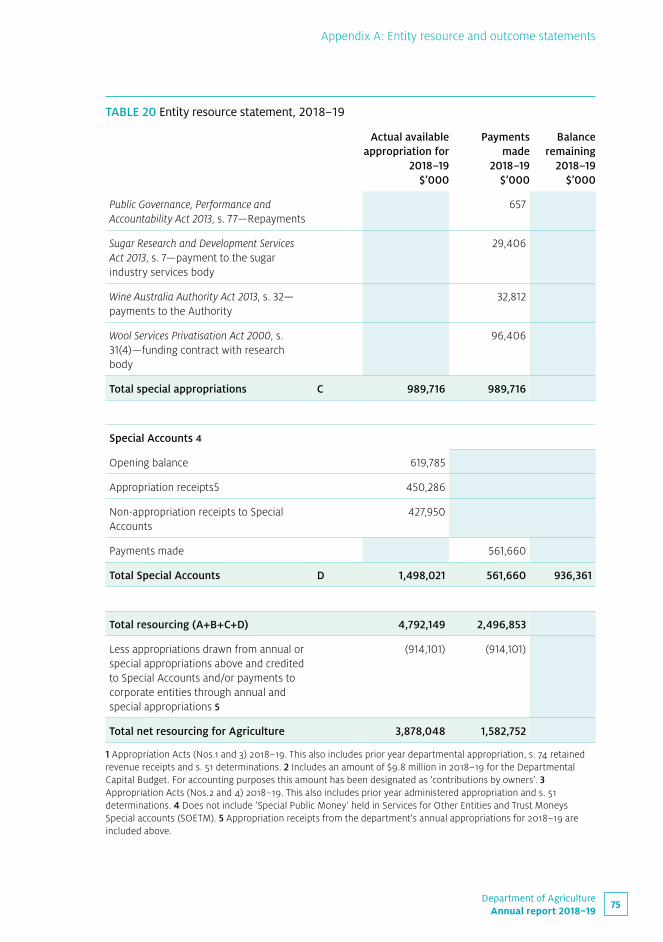
75Department of Agriculture
Annual report 2018–19
Appendix A: Entity resource and outcome statements
TABLE 20 Entity resource statement, 2018–19
Actual available appropriation for
2018–19$’000
Payments made
2018–19$’000
Balance remaining
2018–19$’000
Public Governance, Performance and Accountability Act 2013, s. 77—Repayments
657
Sugar Research and Development Services Act 2013, s. 7—payment to the sugar industry services body
29,406
Wine Australia Authority Act 2013, s. 32—payments to the Authority
32,812
Wool Services Privatisation Act 2000, s. 31(4)—funding contract with research body
96,406
Total special appropriations C 989,716 989,716
Special Accounts 4
Opening balance 619,785
Appropriation receipts5 450,286
Non-appropriation receipts to Special Accounts
427,950
Payments made 561,660
Total Special Accounts D 1,498,021 561,660 936,361
Total resourcing (A+B+C+D) 4,792,149 2,496,853
Less appropriations drawn from annual or special appropriations above and credited to Special Accounts and/or payments to corporate entities through annual and special appropriations 5
(914,101) (914,101)
Total net resourcing for Agriculture 3,878,048 1,582,752
1 Appropriation Acts (Nos.1 and 3) 2018–19. This also includes prior year departmental appropriation, s. 74 retained revenue receipts and s. 51 determinations. 2 Includes an amount of $9.8 million in 2018–19 for the Departmental Capital Budget. For accounting purposes this amount has been designated as ‘contributions by owners’. 3 Appropriation Acts (Nos.2 and 4) 2018–19. This also includes prior year administered appropriation and s. 51 determinations. 4 Does not include ‘Special Public Money’ held in Services for Other Entities and Trust Moneys Special accounts (SOETM). 5 Appropriation receipts from the department's annual appropriations for 2018–19 are included above.

76Department of Agriculture Annual report 2018–19
Appendix A: Entity resource and outcome statements
TABLE 21 Expenses for Outcome 1, 2018–19
Outcome 1: More sustainable, productive, internationally competitive and profitable Australian agricultural, food and fibre industries through policies and initiatives that promote better resource management practices, innovation, self-reliance and improved access to international markets.
Budget* 2018–19
$’000(a)
ActualExpenses
2018–19
$’000(b)
Variation 2018–19
$’000(a) – (b)
Program 1.2: Sustainable Management—Natural Resources
Administered expenses
Ordinary annual services (Appropriation Act No. 1)
National Carp Control Plan 2,015 1,015 1,000
Pest Animal and Weeds Management 6,305 5,713 592
Special Accounts
Natural Resources Management Account—s. 80, PGPA Act [s. 11, Natural Resources Management (Financial Assistance) Act 1992]
– 2,790 (2,790)
Total for Program 1.2 8,320 9,518 (1,198)
Program 1.3: Forestry Industry
Administered expenses
Ordinary annual services (Appropriation Act No. 1)
National Forestry Industry Plan 1,200 1,000 200
National Institute for Forest Products Innovation 1,000 1,000 –
Special appropriations
Forestry Marketing and Research and Development Services Act 2007, s. 9(1)—payments and matching payments to an industry services body and Commonwealth administration expenses
12,302 12,304 (2)
Total for Program 1.3 14,502 14,304 198

77Department of Agriculture
Annual report 2018–19
Appendix A: Entity resource and outcome statements
TABLE 21 Expenses for Outcome 1, 2018–19
Outcome 1: More sustainable, productive, internationally competitive and profitable Australian agricultural, food and fibre industries through policies and initiatives that promote better resource management practices, innovation, self-reliance and improved access to international markets.
Budget* 2018–19
$’000(a)
ActualExpenses
2018–19
$’000(b)
Variation 2018–19
$’000(a) – (b)
Program 1.4: Fishing Industry
Administered expenses
Ordinary annual services (Appropriation Act No. 1)
Fisheries Resources Research Fund 529 427 102
Special appropriations
Primary Industries Research and Development Act 1989, s. 30A(3) and s. 30B(9)—Fisheries R&D Corporation
23,317 24,655 (1,338)
Total for Program 1.4 23,846 25,082 (1,236)
Program 1.5: Horticulture Industry
Administered expenses
Special appropriations
Horticulture Marketing and Research and Development Services Act 2000, s. 16(9)—payments to industry services body
108,988 111,351 (2,363)
Total for Program 1.5 108,988 111,351 (2,363)
Program 1.6: Wool Industry
Administered expenses
Special appropriations
Wool Services Privatisation Act 2000, s. 31(4)—funding contract with research body
89,000 88,878 122
Total for Program 1.6 89,000 88,878 122
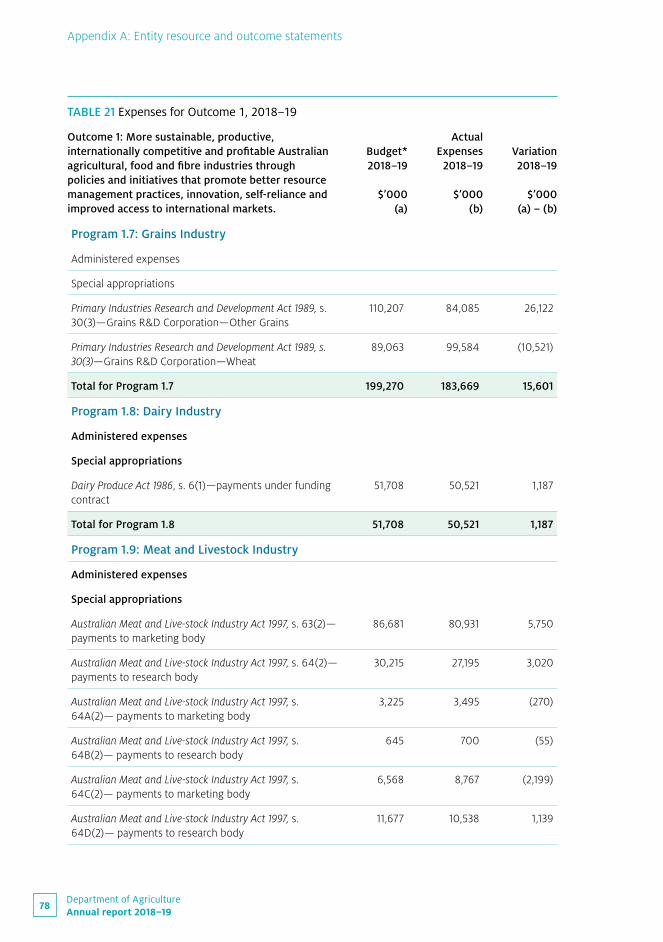
78Department of Agriculture Annual report 2018–19
Appendix A: Entity resource and outcome statements
TABLE 21 Expenses for Outcome 1, 2018–19
Outcome 1: More sustainable, productive, internationally competitive and profitable Australian agricultural, food and fibre industries through policies and initiatives that promote better resource management practices, innovation, self-reliance and improved access to international markets.
Budget* 2018–19
$’000(a)
ActualExpenses
2018–19
$’000(b)
Variation 2018–19
$’000(a) – (b)
Program 1.7: Grains Industry
Administered expenses
Special appropriations
Primary Industries Research and Development Act 1989, s. 30(3)—Grains R&D Corporation—Other Grains
110,207 84,085 26,122
Primary Industries Research and Development Act 1989, s. 30(3)—Grains R&D Corporation—Wheat
89,063 99,584 (10,521)
Total for Program 1.7 199,270 183,669 15,601
Program 1.8: Dairy Industry
Administered expenses
Special appropriations
Dairy Produce Act 1986, s. 6(1)—payments under funding contract
51,708 50,521 1,187
Total for Program 1.8 51,708 50,521 1,187
Program 1.9: Meat and Livestock Industry
Administered expenses
Special appropriations
Australian Meat and Live-stock Industry Act 1997, s. 63(2)— payments to marketing body
86,681 80,931 5,750
Australian Meat and Live-stock Industry Act 1997, s. 64(2)— payments to research body
30,215 27,195 3,020
Australian Meat and Live-stock Industry Act 1997, s. 64A(2)— payments to marketing body
3,225 3,495 (270)
Australian Meat and Live-stock Industry Act 1997, s. 64B(2)— payments to research body
645 700 (55)
Australian Meat and Live-stock Industry Act 1997, s. 64C(2)— payments to marketing body
6,568 8,767 (2,199)
Australian Meat and Live-stock Industry Act 1997, s. 64D(2)— payments to research body
11,677 10,538 1,139

79Department of Agriculture
Annual report 2018–19
Appendix A: Entity resource and outcome statements
TABLE 21 Expenses for Outcome 1, 2018–19
Outcome 1: More sustainable, productive, internationally competitive and profitable Australian agricultural, food and fibre industries through policies and initiatives that promote better resource management practices, innovation, self-reliance and improved access to international markets.
Budget* 2018–19
$’000(a)
ActualExpenses
2018–19
$’000(b)
Variation 2018–19
$’000(a) – (b)
Australian Meat and Live-stock Industry Act 1997, s. 66(1)— Commonwealth contribution to research body
78,945 80,865 (1,920)
Pig Industry Act 2001, s. 10(1)—payments under funding contract
23,460 22,563 897
Total for Program 1.9 241,416 235,054 6,362
Program 1.10: Agricultural Resources
Administered expenses
Ordinary annual services (Appropriation Act No. 1)
A Competitive Agriculture Sector—Boosting Farm Profits Through Rural Research and Development
23,501 21,134 2,367
A Competitive Agriculture Sector—Improved Access to Agricultural and Veterinary Chemicals
2,050 2,000 50
Agricultural and Veterinary Chemicals Minor Use Program 130 130 –
AgriFutures Australia 9,479 11,479 (2,000)
Beef Week and Beef Australia 550 550 –
Changes to the Seasonal Worker Program – 50 (50)
Leadership in Agriculture Industries Fund 1,000 706 294
Northern Australia Rice Industry 1,000 1,000 –
Wine Australia 15,924 15,924 –
Payments to corporate entities (Draw-Down)
Australian Pesticides and Veterinary Medicines Authority 1,606 2,106 (500)
Relocation of the Australian Pesticides and Veterinary Medicines Authority
23,296 23,296 -
Special appropriations
Agricultural and Veterinary Chemicals (Administration) Act 1992—s. 58 (6) amount payable to the APVMA
28,233 32,758 (4,525)
Egg Industry Service Provision Act 2002, s. 8(1)—payments under funding contract
10,623 10,629 (6)

80Department of Agriculture Annual report 2018–19
Appendix A: Entity resource and outcome statements
TABLE 21 Expenses for Outcome 1, 2018–19
Outcome 1: More sustainable, productive, internationally competitive and profitable Australian agricultural, food and fibre industries through policies and initiatives that promote better resource management practices, innovation, self-reliance and improved access to international markets.
Budget* 2018–19
$’000(a)
ActualExpenses
2018–19
$’000(b)
Variation 2018–19
$’000(a) – (b)
Primary Industries Research and Development Act 1989, s. 30(3)—Cotton R&D Corporation
17,840 17,375 465
Primary Industries Research and Development Act 1989, s. 30(3)—Rural Industries R&D Corporation
9,877 10,449 (572)
Sugar Research and Development Services Act 2013, s. 7—payment to industry services body
30,639 28,999 1,640
Wine Australia Act 2013, s. 32—payments to the Authority 32,600 33,421 (821)
Public Governance, Performance and Accountability Act 2013—s. 77 Repayments
– 31 (31)
Expenses not requiring appropriation in the Budget year
Write-down and impairment of assets – 872 (872)
Total for Program 1.10 208,348 212,909 (4,561)
Program 1.11: Drought Programs
Administered expenses
Ordinary annual services (Appropriation Act No. 1)
Assistance for Farmers and Farm Communities in Drought— Drought Pests and Weeds
– 15,000 (15,000)
Payments to corporate entities (Draw-Down)
Regional Investment Corporation 12,555 12,555 –
Expenses not requiring appropriation in the Budget year
Drought Concessional Loans Scheme—administration 2,106 2,106 –
Drought Recovery Concessional Loans Scheme—state administration
234 234 –
Farm Business Concessional Loans Scheme—discount expenses
27,620 21,945 5,675
Farm Business Concessional Loans Scheme—state administration
1,250 984 266
Write-down and impairment of assets – 776 (776)
Total for Program 1.11 43,765 53,600 (9,835)

81Department of Agriculture
Annual report 2018–19
Appendix A: Entity resource and outcome statements
TABLE 21 Expenses for Outcome 1, 2018–19
Outcome 1: More sustainable, productive, internationally competitive and profitable Australian agricultural, food and fibre industries through policies and initiatives that promote better resource management practices, innovation, self-reliance and improved access to international markets.
Budget* 2018–19
$’000(a)
ActualExpenses
2018–19
$’000(b)
Variation 2018–19
$’000(a) – (b)
Program 1.12: Rural Programs
Administered expenses
Ordinary annual services (Appropriation Act No. 1)
Assistance for Farmers and Farm Communities in Drought— Farm Hub
– 524 (524)
Rural Financial Counselling Service 16,688 21,689 (5,001)
Stronger Farmers, Stronger Economy—new drought management framework—managing farm risk program
903 197 706
Special appropriations
Farm Household Support Act 2014, s. 105—payments for Farm Household Allowance
37,945 114,155 (76,210)
Expenses not requiring appropriation in the Budget year
Write-down and impairment of assets – 2,461 (2,461)
Farm Finance Concessional Loans Scheme—administration
1,550 1,550 –
Total for Program 1.12 57,086 140,576 (83,490)
Program 1.13: International Market Access
Administered expenses
Ordinary annual services (Appropriation Act No. 1)
Agriculture Trade and Market Access Cooperation Program
50 60 (10)
Food and Agriculture Organization of the United Nations 12,733 15,973 (3,240)
Indonesia-Australia Red Meat and Cattle Partnership 500 659 (159)
International Agricultural Cooperation 216 527 (311)
International Organisations Contributions 1,906 2,221 (315)
Total for Program 1.13 15,405 19,440 (4,035)

82Department of Agriculture Annual report 2018–19
Appendix A: Entity resource and outcome statements
TABLE 21 Expenses for Outcome 1, 2018–19
Outcome 1: More sustainable, productive, internationally competitive and profitable Australian agricultural, food and fibre industries through policies and initiatives that promote better resource management practices, innovation, self-reliance and improved access to international markets.
Budget* 2018–19
$’000(a)
ActualExpenses
2018–19
$’000(b)
Variation 2018–19
$’000(a) – (b)
Outcome 1: Totals by appropriation type
Administered expenses
Ordinary annual services (Appropriation Act No. 1) 97,679 118,978 (21,299)
Special appropriations 893,758 954,249 (60,491)
Special Accounts – 2,790 (2,790)
Payments to corporate entities (Draw-downs) 37,457 37,957 (500)
Expenses not requiring appropriation in the Budget year 32,760 30,928 1,832
Departmental expenses
Departmental appropriation 1,2 120,426 128,105 (7,679)
Expenses not requiring appropriation in the Budget year 3 3,820 3,217 603
Total expenses for Outcome 1 1,185,900 1,276,224 (90,324)
2018–19 2018–19
Average Staffing Level (number) 512 580
* Original budget as presented in the 2018–19 Portfolio Budget Statements (PBS). 1 Departmental Appropriation combines Ordinary annual services (Appropriation Acts No. 1) and Retained Revenue Receipts under Section 74 of the Public Governance, Performance and Accountability Act 2013. 2 Departmental appropriation allocations are notional and reflect the current structure of the department. 3 Departmental ‘Expenses not requiring appropriation in the Budget year’ is made up of depreciation expenses, amortisation expense, write down and impairment of assets and resources received free-of-charge.

83Department of Agriculture
Annual report 2018–19
Appendix A: Entity resource and outcome statements
TABLE 22 Expenses for Outcome 2, 2018–19
Outcome 2: Safeguard Australia's animal and plant health status to maintain overseas markets and protect the economy and environment from the impact of exotic pests and diseases, through risk assessment, inspection and certification, and the implementation of emergency response arrangements for Australian agricultural, food and fibre industries.
Budget*
2018–19
$'000
(a)
Actual
Expenses
2018–19
$'000
(b)
Variation
2018–19
$'000
(a) – (b)
Program 2.1: Biosecurity and Export Services
Administered expenses
Ordinary annual services (Appropriation Act No. 1)
Centre of Excellence for Biosecurity Risk Analysis and Research
1,781 1,781 –
Enhancing Australia’s Biosecurity System—Priority Pest and Disease Planning and Response
2,030 2,002 28
Livestock Exports Global Assurance Program 2,400 3,227 (827)
Package Assisting Small Exporters 155 135 20
Priorities for Australia's Biosecurity System—Environment Protection Officer
– 525 (525)
Stronger Farmers, Stronger Economy—improvements to access premium markets—improve biosecurity
12,500 11,945 555
Expenses not requiring appropriation in the Budget year
National Residue Survey Account—s. 80, PGPA Act [s. 6, National Residue Survey Administration Act 1992]
11,256 10,471 785
Write-down and impairment of assets – 65 (65)
Total for Program 2.1 30,122 30,151 (29)

84Department of Agriculture Annual report 2018–19
Appendix A: Entity resource and outcome statements
TABLE 22 Expenses for Outcome 2, 2018–19
Outcome 2: Safeguard Australia's animal and plant health status to maintain overseas markets and protect the economy and environment from the impact of exotic pests and diseases, through risk assessment, inspection and certification, and the implementation of emergency response arrangements for Australian agricultural, food and fibre industries.
Budget*
2018–19
$'000
(a)
Actual
Expenses
2018–19
$'000
(b)
Variation
2018–19
$'000
(a) – (b)
Program 2.2: Plant and Animal Health
Administered expenses
Ordinary annual services (Appropriation Act No. 1)
Animal Biosecurity and Response Reform 984 895 89
Commonwealth membership of Animal Health Australia and Plant Health Australia
2,055 2,309 (254)
International Organisations Contribution—World Organisation for Animal Health
242 323 (81)
Other Exotic Disease Preparedness Program 651 650 1
Payment to CSIRO – Contribution to the operating costs of the Australian Animal Health Laboratory
11,774 11,774 –
Plant Biosecurity and Response Reform 1,386 1,384 2
Stronger Farmers, Stronger Economy—strengthening research, skills and management of natural resources—immediate assistance fund
2,023 – 2,023
Special appropriations
Australian Animal Health Council (Live–stock Industries) Funding Act 1996, s. 5—appropriation
8,523 7,409 1,114
Plant Health Australia (Plant Industries) Funding Act 2002, s. 6—appropriation
4,332 4,472 (140)
Plant Health Australia (Plant Industries) Funding Act 2002, s. 10B—payments to PHA from EPPR levies and charges
5,405 4,952 453
Total for Program 2.2 37,375 34,168 3,207

85Department of Agriculture
Annual report 2018–19
Appendix A: Entity resource and outcome statements
TABLE 22 Expenses for Outcome 2, 2018–19
Outcome 2: Safeguard Australia's animal and plant health status to maintain overseas markets and protect the economy and environment from the impact of exotic pests and diseases, through risk assessment, inspection and certification, and the implementation of emergency response arrangements for Australian agricultural, food and fibre industries.
Budget*
2018–19
$'000
(a)
Actual
Expenses
2018–19
$'000
(b)
Variation
2018–19
$'000
(a) – (b)
Special Accounts
Australian Quarantine and Inspection Service Special Account—s. 78, PGPA Act 2013
374,788 390,522 (15,734)
National Residue Survey Account—s. 80, PGPA Act 2013 [s. 6(1), National Residue Survey Administration Act 1992]
11,960 11,169 791
Outcome 2: Totals by appropriation type
Administered expenses
Ordinary annual services (Appropriation Act No. 1) 37,981 36,950 1,031
Special appropriations 18,260 16,833 1,427
Expenses not requiring appropriation in the Budget year 11,256 10,536 720
Departmental expenses
Departmental appropriation 1,2 252,234 260,727 (8,493)
Special Accounts 386,748 401,691 (14,943)
Expenses not requiring appropriation in the Budget year3 28,691 26,779 1,912
Total expenses for Outcome 2 735,170 753,516 (18,346)
2018–19 2018–19
Average Staffing Level (number) 3,913 3,677
* Original budget as presented in the 2018–19 Portfolio Budget Statements (PBS). 1 Departmental Appropriation combines Ordinary annual services (Appropriation Act No. 1) and Retained Revenue Receipts under Section 74 of the Public Governance, Performance and Accountability Act 2013. 2 Departmental appropriation allocations are notional and reflect the current structure of the department. 3 Departmental 'Expenses not requiring appropriation in the Budget year' is made up of depreciation expenses, amortisation expense, write down and impairment of assets and resources received free of charge.

86Department of Agriculture Annual report 2018–19
Appendix A: Entity resource and outcome statements
TABLE 23 Expenses for Outcome 3, 2018–19
Outcome 3: Improve the health of rivers and freshwater ecosystems and water use efficiency through implementing water reforms, and ensuring enhanced sustainability, efficiency and productivity in the management and use of water resources.
Budget*
2018–19
$'000
(a)
Actual
Expenses
2018–19
$'000
(b)
Variation
2018–19
$'000
(a) – (b)
Program 3.1: Water Reform
Administered expenses
Ordinary annual services (Appropriation Act No. 1)
Commonwealth Contribution under the Murray–Darling Basin Agreement
12,741 12,006 735
Sustainable Rural Water Use and Infrastructure Program 225,328 16,762 208,566
Payments to corporate entities (Draw-down)
Murray-Darling Basin Authority 91,700 94,200 (2,500)
Special Accounts
Water Efficiency Labelling Scheme Account 1,946 1,789 157
Water for the Environment Special Account 120,000 5,816 114,184
Water Resources Special Account 510 166 344
Expenses not requiring appropriation in the Budget year 742,911 414,999 327,912
Write-down and impairment of assets – 383 (383)
Total for Program 3.1 1,195,136 546,121 649,015
Outcome 3: Totals by appropriation type
Administered expenses
Ordinary annual services (Appropriation Act No. 1) 238,069 28,768 209,301
Special accounts 122,456 7,771 114,685
Payments to corporate entities (Draw-downs) 91,700 94,200 (2,500)
Expenses not requiring appropriation in the Budget year 742,911 415,382 327,529

87Department of Agriculture
Annual report 2018–19
Appendix A: Entity resource and outcome statements
TABLE 23 Expenses for Outcome 3, 2018–19
Outcome 3: Improve the health of rivers and freshwater ecosystems and water use efficiency through implementing water reforms, and ensuring enhanced sustainability, efficiency and productivity in the management and use of water resources.
Budget*
2018–19
$'000
(a)
Actual
Expenses
2018–19
$'000
(b)
Variation
2018–19
$'000
(a) – (b)
Departmental expenses
Departmental appropriation 1,2 25,614 26,299 (685)
Expenses not requiring appropriation in the Budget year 3 916 923 (7)
Total expenses for Outcome 3 1,221,666 573,343 648,323
2018–19 2018–19
Average Staffing Level (number) 133 146
* Original budget as presented in the 2018–19 Portfolio Budget Statements (PBS). 1 Departmental Appropriation combines Ordinary annual services (Appropriation Acts No. 1) and Retained Revenue Receipts under Section 74 of the Public Governance, Performance and Accountability Act 2013. 2 Departmental appropriation allocations are notional and reflect the current structure of the department. 3 Departmental 'Expenses not requiring appropriation in the Budget year' is made up of depreciation expenses, amortisation expense, write down and impairment of assets and resources received free-of-charge.

88Department of Agriculture Annual report 2018–19
Appendix B: Ecologically sustainable development and environmental performance
Appendix B: Ecologically sustainable development and environmental performanceThe Department of Agriculture has a statutory requirement under section 516A of the Environment Protection and Biodiversity Conservation Act 1999 (the EPBC Act) to report on:
\ our contribution to ecologically sustainable development (ESD) through our outcomes and activities
\ the environmental performance of our internal operations.
Ecologically sustainable development principlesThe principles of ESD outlined in section 3A of the EPBC Act are that:
\ decision-making processes should effectively integrate both long-term and short-term economic, environmental, social and equity considerations
\ if there are threats of serious or irreversible environmental damage, lack of full scientific certainty should not be used as a reason for postponing measures to prevent environmental degradation
\ the present generation should ensure that the health, diversity and productivity of the environment is maintained or enhanced for the benefit of future generations
\ the conservation of biological diversity and ecological integrity should be a fundamental consideration in decision-making
\ improved valuation, pricing and incentive mechanisms should be promoted.
Our contribution to ecologically sustainable development Our outcomes embody the ESD principles:
Outcome 1: More sustainable, productive, internationally competitive and profitable Australian agricultural, food and fibre industries through policies and initiatives that promote better resource management practices, innovation, self-reliance and improved access to international markets.
Outcome 2: Safeguard Australia’s animal and plant health status to maintain overseas markets and protect the economy and environment from the impact of exotic pests and diseases, through risk assessment, inspection and certification, and the implementation of emergency response arrangements for Australian agricultural, food and fibre industries.
Outcome 3: Improve the health of rivers and freshwater ecosystems and water-use efficiency through implementing water reforms, and ensuring enhanced sustainability, efficiency and productivity in the management and use of water resources.

89Department of Agriculture
Annual report 2018–19
Appendix B: Ecologically sustainable development and environmental performance
We play a leading role or contribute to national and international policies with significant ESD objectives. We deliver programs to fund research, training and projects aimed at mitigating climate change and improving sustainable resource management. Our role in biosecurity is critical to maintaining biodiversity in Australia and overseas. We also deliver funding to community organisations and to the portfolio research and development corporations whose work includes activities supporting ESD.
Our work supports the goal of development that meets Australia’s current needs while conserving our ecosystems for the benefit of future generations.
Our key activities in 2018–19 are outlined in Part 1: Annual performance statements.
Legislative responsibilities The following legislation, administered by the department under the current Administrative Arrangements Order, contributes directly to ESD:
\ Agricultural and Veterinary Chemicals Act 1994
\ Agricultural and Veterinary Chemicals (Administration) Act 1992
\ Agricultural and Veterinary Chemicals Code Act 1994
\ Biosecurity Act 2015
\ Export Control Act 1982
\ Fisheries Administration Act 1991
\ Fisheries Management Act 1991
\ Illegal Logging Prohibition Act 2012
\ Natural Resources Management (Financial Assistance) Act 1992
\ Primary Industries and Energy Research and Development Act 1989
\ Regional Forest Agreements Act 2002
\ Torres Strait Fisheries Act 1984
\ Water Act 2007
\ Water Efficiency Labelling and Standards Act 2005.
2030 Agenda and Sustainable Development Goals The 2030 Agenda, including the 17 Sustainable Development Goals (SDGs), is a non-binding, universal roadmap for sustainable development, applying to developed and developing countries. The SDGs address a diverse range of social, economic and environmental subject matters, underpinned by a broad suite of targets and indicators.
We are engaged in the Australian Government’s response to the 2030 Agenda and SDGs, including contributing to Australia’s first Voluntary National Review. Our department is designated as the lead Commonwealth agency for 2 goals:
\ SDG2—zero hunger
\ SDG6—clean water and sanitation.

90Department of Agriculture Annual report 2018–19
Appendix B: Ecologically sustainable development and environmental performance
We also have an interest in other SDGs, including:
\ SDG12—responsible consumption and production
\ SDG13—climate action
\ SDG14—life below water
\ SDG15—life on land
\ SDG17—partnerships for the goals.
We are active participants in the 2030 Agenda Inter-Departmental Committee and the associated working group, led by the Department of the Prime Minister and Cabinet and the Department of Foreign Affairs and Trade.
Many of our portfolio’s domestic and international activities already give effect to aspects of the SDGs. Australia reports relevant SDG data online through the Australian Government's Reporting Platform on the SDG Indicators at sdgdata.gov.au.
SDG 2 is about ending hunger, food security, improved nutrition and sustainable agriculture. In Australia, enough food is produced to feed approximately 60 million people annually (2018). With our current population well below this figure, Australian agriculture contributes to both domestic and global food supply, with more than two-thirds of Australian agricultural produce exported.
To support sustainable agriculture, the government invests in a range of programs and research to build adaptive capacity, preparedness, sustainability and risk management capability. The National Landcare Program is a key part of the government’s commitment to natural resource management (NRM), with measures to support NRM and sustainable agriculture, and to protect Australia’s biodiversity. The government is investing more than $1 billion to June 2023 through our department and the Department of the Environment and Energy for phase two of the National Landcare Program.
Australia’s agricultural, fisheries and forestry industries are highly successful in producing a variety of food and fibre products for our nation and our trading partners. Innovation has always been a significant contributor to the success of Australian agriculture. Participants across the agriculture value chain are constantly improving practices to drive productivity and profitability, and are determined to make Australia a global leader in food and fibre products. Australia is also recognised for excellent agricultural research outcomes supported by multiple streams of industry and government-backed investments.
Australia’s current water policy and practices are well in line with the SDGs. Australia has made significant efforts, investments and progress on provision of safe drinking water and sanitation, wastewater treatment and reuse, efficiency use of water in both rural and urban sectors, groundwater management, improving water quality and sustainable environmental protection.
An SDG6 Working Group, with expert representation from the government and non-government sectors, has been established as the primary coordination mechanism to advise on the collection and collation of data and information on the SDG6 indicators. The SDG6 indicators on the Australian Government SDG data website were updated in 2019.
Australia is also well-positioned in its efforts to deliver on the forest-related aspects of SDG15. Sustainable forest management in Australia is achieved through our implementation of policy and legislation including the National Forest Policy Statement and the Regional Forest Agreements, which provide effective governance of Australia’s forests.

91Department of Agriculture
Annual report 2018–19
Appendix B: Ecologically sustainable development and environmental performance
Australia also supports further expansion of the plantation estate through the National Forest Industry Plan Growing a better Australia—A billion trees for jobs and growth, supporting the establishment of a billion new plantation trees over the next decade.
The Illegal Logging Prohibition Act 2012 supports sustainable forest management and legal timber trade by prohibiting both the importation of timber wood products and the processing of domestically grown raw logs that have come from illegally harvested sources.
Internationally, particularly within the Asia-Pacific region, we have focused on bilateral engagement with key trading partners, and worked within multilateral bodies to promote the trade in sustainable and legal timber products, supporting the objectives of SDG12 and SDG15. Australia continues to support the successful delivery of the United Nations Global Forest Goals. In May 2019 Australia announced its Voluntary National Contribution to the United Nations Forum on Forests.
We have historically used international aid programs for capacity-building in forest governance and managing timber supply chains; these relate to the objectives of SDG15 and SDG12.
Environmental impact of our operations Energy efficiencyOur central office buildings in the Canberra central business district maintain a base building rating of 4.5 stars under the National Australian Built Environment Rating System (NABERS). Both buildings contain T5 energy-efficient lighting and movement sensors, which turn off lighting in office areas after hours. The buildings also contain energy efficient window blinds, which reduce the energy required to heat and cool the buildings during the day, and air conditioning energy is offset by onsite solar electricity.
The department participates in the APS Demand Reduction Initiative—an effort across government agencies to reduce energy consumption. The initiative calls for Australian Public Service agencies to lead by example and reduce their electricity demand when called upon across ACT and NSW during an energy emergency such as a supply shortfall during a heatwave. We have developed an action plan outlining actions we will take to reduce our energy consumption when needed. The demand response action plan complements efforts to reduce our day-to-day energy consumption.
In 2018–19 our energy consumption (excluding diesel and petroleum products) decreased by around 3% to 85,301 gigajoules (GJ) (Figure 18). This decrease is attributable to more efficient gas usage at our post-entry quarantine facility in Mickleham, Victoria. However, electricity consumption at the same site, and nationally, has increased. The total electricity consumption increase is approximately 2% or 876.24 GJ.

92Department of Agriculture Annual report 2018–19
Appendix B: Ecologically sustainable development and environmental performance
FIGURE 18 Energy consumption, 2014–15 to 2018–19
Gigajoules2018–192017–182016–172015–162014–15
10,000
20,000
30,000
40,000
50,000
60,000
70,000
80,000
90,000
TransportWe monitor the fuel consumption and kilometres travelled for all fleet vehicles and encourage drivers to purchase ethanol blended fuel (E10). Although our overall fleet numbers have increased slightly we are continually replacing our vehicles with efficient hybrid or diesel vehicles where practical. In 2018–19 the proportion of hybrid vehicles increased to 49% and diesel vehicles increased to 22% of our total fleet. As at 30 June 2019 we had 378 fleet vehicles, which included 188 hybrid vehicles and 84 diesel vehicles.
In 2018–19 we consumed 15,033.62GJ in transport fuels for passenger vehicles. There was a fall in consumption due to an increase in hybrid vehicles and fewer kilometres travelled (Figure 19).
FIGURE 19 Transport energy consumption, 2014–15 to 2018–19
Gigajoules2018–192017–182016–172015–162014–15
6,000
12,000
18,000
24,000
30,000
Older vehicles in the department’s current fleet exceed the target set under the Commonwealth Green Vehicle Guide (GVG), largely obtaining 5-star ratings under that system. Newer vehicles in our fleet are now ranked based on CO2 tailpipe emissions and indicators are that fuel consumption has dropped. Our fleet now consists of more hybrids, which also contributes to lower emissions and more environmentally friendly vehicles.

93Department of Agriculture
Annual report 2018–19
Appendix B: Ecologically sustainable development and environmental performance
Water conservation Our central office buildings recycle and capture stormwater to flush all toilets. In bathrooms and change rooms, we have waterless urinals, water-saving shower heads, infrared motion-active hand basins and 4A-rated dual flush toilets. These initiatives contribute to reducing our reliance on the local water supply.
Waste management We support and encourage good recycling practices, providing ready access to segregated waste streams in the office environment. Recycling bins are located throughout central office buildings in kitchens and common areas and include general waste, organic waste and co-mingled recycling. Elsewhere, combined paper and cardboard recyclables are aggregated for collection. The department also maintains a staff-led battery recycling initiative at our Canberra central office.
The organic waste stream is a unique feature of our central office buildings and can be used to dispose of compostable materials and foodstuffs. Through this process, all organic waste from all levels of the participating buildings is collected and relocated off-site and then processed into mulch for further use. This reclaims usable materials and reduces the quantity of general waste from these sites.
Based on available information, in 2018–19 our Canberra offices generated 119.38 tonnes of waste. Of this, around 53.5% was recycled, comprising 44.45 tonnes of co-mingled recyclables (Figure 20), 12.02 tonnes of paper and cardboard and 7.38 tonnes of organic waste (Figure 21).
FIGURE 20 Co-mingled recycling collected, 2014–15 to 2018–19
Tonnes2018–192017–182016–172015–162014–15
10
20
30
40
50
60
70
80
FIGURE 21 Organic waste collected, 2014–15 to 2018–19
Tonnes2018–192017–182016–172015–162014–15
3
6
9
12
15
Because the battery recycling initiative is staff-led, information on the total weight of batteries recycled is not available.

94Department of Agriculture Annual report 2018–19
Appendix C: Human resources statistics
Appendix C: Human resources statisticsManagement of human resourcesTABLE 24 All ongoing employees current report period (2018–19)
Male Female Indeterminate Total
FulltimePart
TimeTotal Male Fulltime
Part Time
Total Female
Full -time
Part Time
Total Indeterminate
NSW 314 38 352 187 104 291 0 0 0 643
Qld 305 32 337 156 79 235 0 0 0 572
SA 89 17 106 45 21 66 0 0 0 172
Tas 7 0 7 2 0 2 0 0 0 9
Vic 292 20 312 185 69 254 0 0 0 566
WA 134 7 141 80 39 119 0 0 0 260
ACT 827 60 887 998 315 1,313 1 1 2 2202
NT 20 5 25 16 7 23 0 0 0 48
Overseas 13 0 13 9 0 9 0 0 0 22
Total 2,001 179 2,180 1,678 634 2,312 1 1 2 4,494 Note: Includes staff on leave without pay and excludes Statutory Appointed positions.

95Department of Agriculture
Annual report 2018–19
Appendix C: Human resources statistics
TABLE 25 All non-ongoing employees current report period (2018–19)
Male Female Indeterminate Total
FulltimePart
Time CasualTotal Male Fulltime
Part Time Casual
Total Female
Full -time
Part Time
Total Indeterminate
NSW 5 0 44 49 3 0 29 32 0 0 0 81
Qld 20 6 36 62 18 7 20 45 0 0 0 107
SA 1 0 13 14 0 0 3 3 0 0 0 17
Tas 0 0 4 4 0 0 2 2 0 0 0 6
Vic 23 7 39 69 25 12 24 61 0 0 0 130
WA 4 0 15 19 4 0 36 40 0 0 0 59
ACT 34 8 9 51 49 13 20 82 0 0 0 133
NT 3 0 1 4 1 0 4 5 0 0 0 9
Overseas 0 0 0 0 0 0 0 0 0 0 0 0
Total 90 21 161 272 100 32 138 270 0 0 0 542 Note: Includes staff on leave without pay and excludes Statutory Appointed positions.
TABLE 26 All ongoing employees previous report period (2017–18)
Male Female Indeterminate Total
FulltimePart
TimeTotal Male Fulltime
Part Time
Total Female Fulltime
Part Time
Total Indeterminate
NSW 323 40 363 196 108 304 0 0 0 667
Qld 314 39 353 158 87 245 0 0 0 598
SA 92 18 110 39 25 64 0 0 0 174
Tas 6 0 6 2 0 2 0 0 0 8
Vic 269 21 290 156 69 225 0 0 0 515
WA 136 6 142 81 43 124 0 0 0 266
ACT 848 61 909 1018 302 1320 1 0 1 2,230
NT 24 5 29 16 8 24 0 0 0 53
Overseas 11 0 11 8 0 8 0 0 0 19
Total 2,023 190 2,213 1,674 642 2,316 0 0 0 4,530 Note: Includes staff on leave without pay and excludes Statutory Appointed positions.

96Department of Agriculture Annual report 2018–19
Appendix C: Human resources statistics
TABLE 27 All non-ongoing employees previous report period (2017–18)
Male Female Indeterminate Total
FulltimePart
Time CasualTotal Male Fulltime
Part Time Casual
Total Female Fulltime
Part Time
Total Indeterminate
NSW 2 0 40 42 1 17 18 0 0 0 60
Qld 12 7 42 61 7 4 20 31 0 0 0 92
SA 0 0 17 17 0 0 8 8 0 0 0 25
Tas 0 0 3 3 0 0 2 2 0 0 0 5
Vic 8 5 45 58 8 7 29 8 0 0 0 102
WA 1 0 17 18 1 0 31 1 0 0 0 50
ACT 29 8 15 52 38 16 19 38 0 0 0 125
NT 3 0 0 3 0 0 4 4 0 0 0 7
Overseas 0 0 0 0 0 0 0 0 0 0 0 0
Total 55 20 179 254 55 27 130 212 0 0 0 466 Note: Includes staff on leave without pay and excludes Statutory Appointed positions.

97Department of Agriculture
Annual report 2018–19
Appendix C: Human resources statistics
Australian Public Sector classification and gender
TABLE 28 Australian Public Service Act ongoing employees current report period (2018–19) by substantive classification
Male Female Indeterminate Total
FulltimePart
TimeTotal Male Fulltime
Part Time
Total Female Fulltime
Part Time
Total Indeterminate
SES 3 3 0 3 2 0 2 0 0 0 5
SES 2 11 0 11 10 1 11 0 0 0 22
SES 1 40 0 40 36 2 38 0 0 0 78
EL 2 a 203 10 213 136 34 170 0 0 0 383
EL 1 312 20 332 292 110 402 0 0 0 734
APS 6 b 396 29 425 378 135 513 1 0 1 939
APS 5 c 276 10 286 296 91 387 0 0 0 673
APS 4 d 643 59 702 431 174 605 0 1 1 1,308
APS 3 e 114 49 163 94 87 181 0 0 0 344
APS 2 3 0 3 3 0 3 0 0 0 6
APS 1 0 2 2 2 0 2 0 0 0 2
Other 0 0 0 0 0 0 0 0 0 0
Total 2,001 179 2,180 1,678 634 2,312 1 1 2 4,494 Note: Includes staff on leave without pay and excludes Statutory Appointed positions. a Includes Science DAFF Band Three Work Level Six classification and Transitional Veterinarian classification. b Includes APS Meat Inspector Four classification and DAFF Band Two Work Level Six B classification. c Includes APS Meat Inspector Three classification. d Includes APS Meat Inspector Two classification. e Includes Graduates

98Department of Agriculture Annual report 2018–19
Appendix C: Human resources statistics
TABLE 29 Australian Public Service Act non-ongoing employees current report period (2018–19) by substantive classification
Male Female Indeterminate Total
FulltimePart
Time CasualTotal Male Fulltime
Part Time Casual
Total Female Fulltime
Part Time
Total Indeterminate
SES 3 0 0 0 0 0 0 0 0 0 0 0 0
SES 2 0 1 0 1 0 0 0 0 0 0 0 1
SES 1 0 0 0 0 0 0 0 0 0 0 0 0
EL 2 2 1 1 4 1 2 2 5 0 0 0 9
EL 1 5 2 0 7 7 1 0 8 0 0 0 15
APS 6 a 14 3 28 45 12 5 26 43 0 0 0 88
APS 5 b 12 1 0 13 27 1 2 30 0 0 0 43
APS 4 c 46 4 82 132 42 14 34 90 0 0 0 222
APS 3 11 8 47 66 10 5 72 87 0 0 0 153
APS 2 0 0 3 3 1 3 2 6 0 0 0 9
APS 1 0 0 1 1 0 1 0 1 0 0 0 2
Other 0 0 0 0 0 0 0 0 0 0 0 0
Total 90 21 161 272 100 32 138 270 0 0 0 542 Note: Includes staff on leave without pay and excludes Statutory Appointed positions. a Includes APS Meat Inspector Four classification. b Includes APS Meat Inspector Three classification. c Includes APS Meat Inspector Two classification

99Department of Agriculture
Annual report 2018–19
Appendix C: Human resources statistics
TABLE 30 Australian Public Service Act ongoing employees previous report period (2017–18) by substantive classification
Male Female Indeterminate Total
FulltimePart
TimeTotal Male Fulltime
Part Time
Total Female Fulltime
Part Time
Total Indeterminate
SES 3 3 0 3 2 0 2 0 0 0 5
SES 2 10 0 10 8 0 8 0 0 0 18
SES 1 33 2 35 31 3 34 0 0 0 69
EL 2 a 201 10 211 134 36 170 0 0 0 381
EL 1 302 17 319 286 98 384 0 0 0 703
APS 6 b 411 27 438 366 123 489 0 0 0 927
APS 5 C 276 9 285 311 94 405 0 0 0 690
APS 4 d 659 70 729 434 188 622 1 0 1 1,352
APS 3 e 125 54 179 98 99 197 0 0 0 376
APS 2 3 0 3 4 1 5 0 0 0 8
APS 1 0 1 1 0 0 0 0 0 0 1
Other 0 0 0 0 0 0 0 0 0 0
Total 2,023 190 2,213 1,674 642 2,316 1 0 1 4,530 Note: Includes staff on leave without pay and excludes Statutory Appointed positions. a Includes Science DAFF Band Three Work Level Six classification and Transitional Veterinarian classification. b Includes APS Meat Inspector Four classification and DAFF Band Two Work Level Six B classification. c Includes APS Meat Inspector Three classification. d Includes APS Meat Inspector Two classification. e Includes Graduates.

100Department of Agriculture Annual report 2018–19
Appendix C: Human resources statistics
TABLE 31 Australian Public Service Act non-ongoing employees previous report period (2017–18) by substantive classification
Male Female Indeterminate Total
FulltimePart
Time CasualTotal Male Fulltime
Part Time Casual
Total Female Fulltime
Part Time
Total Indeterminate
SES 3 0 0 0 0 0 0 0 0 0 0 0 0
SES 2 0 1 0 1 0 0 0 0 0 0 0 1
SES 1 0 0 0 0 0 0 0 0 0 0 0 0
EL 2 2 0 0 2 1 2 2 5 0 0 0 7
EL 1 8 3 1 12 5 6 1 12 0 0 0 24
APS 6 a 9 2 34 45 11 5 21 37 0 0 0 82
APS 5 b 9 1 0 10 19 2 1 22 0 0 0 32
APS 4 c 24 0 94 118 16 2 18 36 0 0 0 154
APS 3 3 10 44 57 2 9 83 94 0 0 0 151
APS 2 0 1 6 7 1 3 2 6 0 0 0 13
APS 1 0 2 0 1 0 0 0 0 0 0 0 2
Other 0 0 0 0 0 0 0 0 0 0 0 0
Total 55 20 179 254 55 27 130 212 0 0 0 466 Note: Includes staff on leave without pay and excludes Statutory Appointed positions. a Includes APS Meat Inspector Four classification. b Includes APS Meat Inspector Three classification. c Includes APS Meat Inspector Two classification.

101Department of Agriculture
Annual report 2018–19
Appendix C: Human resources statistics
Australian Public Sector employment type
TABLE 32 Australian Public Service Act employees by attendance status current report period (2018–19)
Ongoing Non–ongoing Total
Fulltime Part Time Total Ongoing Fulltime Part Time CasualTotal Non–
ongoing
SES 3 5 0 5 0 0 0 0 5
SES 2 21 1 22 0 1 0 1 23
SES 1 76 2 78 0 0 0 0 78
EL 2 a 339 44 383 3 3 3 9 392
EL 1 604 130 734 12 3 0 15 749
APS 6 b 775 164 939 26 8 54 88 1,027
APS 5 c 572 101 673 39 2 2 43 716
APS 4 d 1,074 234 1,308 88 18 116 222 1,530
APS 3 e 208 136 344 21 13 119 153 497
APS 2 6 0 6 1 3 5 9 15
APS 1 0 2 2 0 2 0 2 4
Other 0 0 0 0 0 0 0 0
Total 3,680 814 4,494 190 53 299 542 5,036 Note: Includes staff on leave without pay and excludes Statutory Appointed positions. a Includes Science DAFF Band Three Work Level Six classification and Transitional Veterinarian classification. b Includes APS Meat Inspector Four classification and DAFF Band Two Work Level Six B classification. c Includes APS Meat Inspector Three classification. d Includes APS Meat Inspector Two classification. e Includes APS Meat Inspector One classification and Graduates.
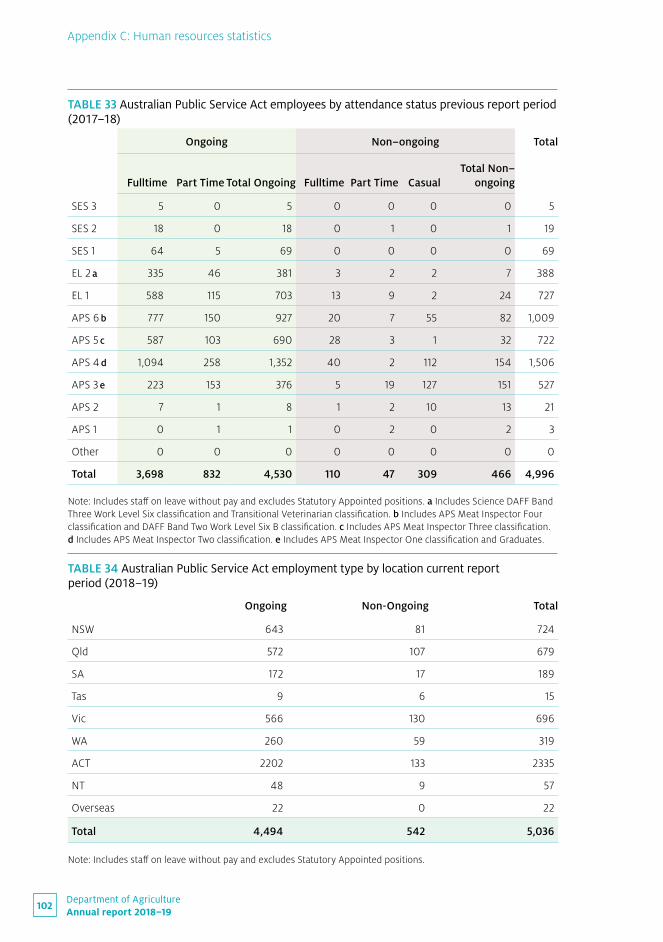
102Department of Agriculture Annual report 2018–19
Appendix C: Human resources statistics
TABLE 33 Australian Public Service Act employees by attendance status previous report period (2017–18)
Ongoing Non–ongoing Total
Fulltime Part Time Total Ongoing Fulltime Part Time CasualTotal Non–
ongoing
SES 3 5 0 5 0 0 0 0 5
SES 2 18 0 18 0 1 0 1 19
SES 1 64 5 69 0 0 0 0 69
EL 2 a 335 46 381 3 2 2 7 388
EL 1 588 115 703 13 9 2 24 727
APS 6 b 777 150 927 20 7 55 82 1,009
APS 5 c 587 103 690 28 3 1 32 722
APS 4 d 1,094 258 1,352 40 2 112 154 1,506
APS 3 e 223 153 376 5 19 127 151 527
APS 2 7 1 8 1 2 10 13 21
APS 1 0 1 1 0 2 0 2 3
Other 0 0 0 0 0 0 0 0
Total 3,698 832 4,530 110 47 309 466 4,996 Note: Includes staff on leave without pay and excludes Statutory Appointed positions. a Includes Science DAFF Band Three Work Level Six classification and Transitional Veterinarian classification. b Includes APS Meat Inspector Four classification and DAFF Band Two Work Level Six B classification. c Includes APS Meat Inspector Three classification. d Includes APS Meat Inspector Two classification. e Includes APS Meat Inspector One classification and Graduates.
TABLE 34 Australian Public Service Act employment type by location current report period (2018–19)
Ongoing Non-Ongoing Total
NSW 643 81 724
Qld 572 107 679
SA 172 17 189
Tas 9 6 15
Vic 566 130 696
WA 260 59 319
ACT 2202 133 2335
NT 48 9 57
Overseas 22 0 22
Total 4,494 542 5,036 Note: Includes staff on leave without pay and excludes Statutory Appointed positions.

103Department of Agriculture
Annual report 2018–19
Appendix C: Human resources statistics
TABLE 35 Australian Public Service Act employment type by location previous report period (2017–18)
Ongoing Non-Ongoing Total
NSW 667 60 727
Qld 598 92 690
SA 174 25 199
Tas 8 5 13
Vic 515 102 617
WA 266 50 316
ACT 2,230 125 2,355
NT 53 7 60
Overseas 19 0 19
Total 4,530 466 4,996 Note: Includes staff on leave without pay and excludes Statutory Appointed positions.
TABLE 36 Australian Public Service Act Indigenous employment current report period (2018–19)
Total
Ongoing 83
Non-Ongoing 20
Total 103 Note: Includes staff on leave without pay and excludes Statutory Appointed positions.
TABLE 37 Australian Public Service Act Indigenous employment previous report period (2017–18)
Total
Ongoing 79
Non-Ongoing 14
Total 93 Note: Includes staff on leave without pay and excludes Statutory Appointed positions.

104Department of Agriculture Annual report 2018–19
Appendix C: Human resources statistics
TABLE 38 Australian Public Service Act Employment arrangements Current Report Period (2018-19)
SES Non-SES Total
Department of Agriculture and Water Resources Enterprise Agreement
0 4,677 4,677
Department of Agriculture and Water Resources Meat Inspector Enterprise Agreement
0 253 253
Section 24 (1) determinations 106 0 106
Total 106 4,930 5,036 Note: Includes staff on leave without pay and excludes Statutory Appointed positions.
Australian Public Sector salary and performance pay
TABLE 39 Australian Public Service Act employment salary ranges by classification level (Minimum/Maximum) current report period (2018–19)
Minimum salary Maximum salary
SES 3 335,683 378,905
SES 2 272,413 327,744
SES 1 218,867 245,265
EL 2 a 120,619 180,259
EL 1 b 99,966 129,108
APS 6 c 82,346 116,282
APS 5 d 73,471 86,893
APS 4 e 66,658 81,129
APS 3 f 59,460 75,717
APS 2 54,433 56,591
APS 1 46,273 51,834
Other 0 0 a Only positions requiring mandatory veterinary qualifications can access paypoints between $142,717 and $144,429. Only positions requiring mandatory science qualifications can access paypoints between $142,717 and $155,954. The paypoint of $180,259 is maintained through enterprise agreement transitional arrangements and this has not been available to new employees since 2009. b Only positions requiring mandatory veterinary qualifications can access paypoints between $120,619 and $129,108. c Only positions requiring mandatory veterinary qualifications can access paypoints between $98,052 and $116,282. Only previous positions being maintained through enterprise agreement transitional arrangements can access the paypoint of $99,965. Only positions with an APS Meat Inspector Four classification can access the paypoint $92,032. d Only positions with an APS Meat Inspector Three classification can access the paypoint $86,893. e Only positions with an APS Meat Inspector Two classification can access the paypoint $81,129. f Only positions with an APS Meat Inspector One classification can access the paypoints between $62,197 and $75,717. Note: The maintenance of employees’ salaries upon commencement from another APS agency or salaries negotiated through Individual Flexibility Arrangements can exceed the salary ranges for non-SES classifications.

105Department of Agriculture
Annual report 2018–19
Appendix C: Human resources statistics
TABLE 40 Australian Public Service Act employment performance pay by classification level current report period (2018–19). Nil payments made for performance pay
Number of employees
receiving performance pay
Aggregated (sum total) of all payments made
Average of all payments made
Minimum Payment Made
Maximum Payment made
SES 3 0 0 0 0 0
SES 2 0 0 0 0 0
SES 1 0 0 0 0 0
EL 2 0 0 0 0 0
EL 1 0 0 0 0 0
APS 6 0 0 0 0 0
APS 5 0 0 0 0 0
APS 4 0 0 0 0 0
APS 3 0 0 0 0 0
APS 2 0 0 0 0 0
APS 1 0 0 0 0 0
Other 0 0 0 0 0
Total 0 0 0 0 0
Non-salary benefitsNon-salary benefits provided to SES Band 3 employees as part of their remuneration package include superannuation and car parking. SES Band 1 and 2 employees receive superannuation as the only non-salary benefit and pay for car parking.
Non-salary benefits provided to non-SES officers as part of their remuneration package are generally limited to superannuation. In exceptional cases, employees may have private use of a Commonwealth vehicle where it is deemed necessary for the performance of their duties.

106Department of Agriculture Annual report 2018–19
Appendix D: Executive remuneration
Appendix D: Executive remuneration
TAB
LE 4
1 In
form
atio
n ab
out r
emun
erat
ion
for
key
man
agem
ent p
erso
nnel
Shor
t–te
rm b
enefi
ts
Post
–em
ploy
men
t be
nefit
sO
ther
lo
ng–t
erm
ben
efits
Term
inat
ion
bene
fits
($)
Tota
l re
mun
erat
ion
($)
Nam
e
Posi
tion
ti
tle
Bas
e sa
lary
($
)B
onus
es
($)
Oth
er
bene
fits
and
allo
wan
ces
($)
Supe
rann
uati
on
cont
ribu
tion
s ($
)
Long
se
rvic
e le
ave
($)
Oth
er lo
ng–
term
ben
efits
($
)
Dar
yl Q
uinl
ivan
Secr
etar
y66
1,625
.88
0 8
,169.
00
9
2,26
7.78
17,9
69.0
0
00
780
,031
.66
Cind
y Br
isco
eD
eput
y Se
cret
ary
377,6
38.7
2 0
8,16
9.0
0
68,
087
.07
10,
113.
25
00
464
,00
8.0
4
Lyn
O'C
onne
llD
eput
y Se
cret
ary
328,
903.
12
0 8
,169.
00
6
7,10
8.88
1
0,13
2.60
0
0 4
14,3
13.5
9
Mal
colm
Th
omps
onD
eput
y Se
cret
ary
370,
979.
22
0 8
,169.
00
6
8,29
5.11
1
0,11
3.25
0
0 4
57,5
56.5
8
Emily
Can
ning
Dep
uty
Secr
etar
y27
5,42
9.16
0
0 4
6,0
85.9
9 6
,20
6.02
0
0 3
27,7
21.16
Barr
y St
erla
ndD
eput
y Se
cret
ary
181
,219
.68
00
00
00
181
,219
.68
Nic
o Pa
dova
nFi
rst
Ass
ista
nt
Secr
etar
y
149,
883.
92
00
27,
520.
42
3,9
51.2
4 0
0 1
81,3
55.5
7

107Department of Agriculture
Annual report 2018–19
Appendix D: Executive remuneration
TAB
LE 4
1 In
form
atio
n ab
out r
emun
erat
ion
for
key
man
agem
ent p
erso
nnel
Shor
t–te
rm b
enefi
ts
Post
–em
ploy
men
t be
nefit
sO
ther
lo
ng–t
erm
ben
efits
Term
inat
ion
bene
fits
($)
Tota
l re
mun
erat
ion
($)
Nam
e
Posi
tion
ti
tle
Bas
e sa
lary
($
)B
onus
es
($)
Oth
er
bene
fits
and
allo
wan
ces
($)
Supe
rann
uati
on
cont
ribu
tion
s ($
)
Long
se
rvic
e le
ave
($)
Oth
er lo
ng–
term
ben
efits
($
)
Pete
r McK
eon
Chie
f In
form
atio
n O
ffice
r
168,
363.
65
00
25,
051
.06
4,4
69.4
1 0
0 19
7,88
4.12
Nea
l Mas
onFi
rst
Ass
ista
nt
Secr
etar
y,
Dep
uty
Secr
etar
y
205,
739.
10
0 0
35,
771.2
7 5
,189.
18
00
246
,699
.56
Scot
t Bro
wn
CFO
136,
825.
94
00
16,
658.
02
3,6
83.12
0
0 15
7,167
.08
Lion
el R
iley
Ass
ista
nt
Secr
etar
y10
7,57
6.0
4 0
0 1
8,60
8.60
1,
694.
82
00
127
,879
.46
Peta
Lan
eFi
rst
Ass
ista
nt
Secr
etar
y
125,
634.
24
00
24,
940.
61
3,6
05.
57
00
154,
180.
42
Sally
Sta
nden
Firs
t A
ssis
tant
Se
cret
ary
135,
910.
16
00
24,
489.
58
3,6
05.
57
00
164
,00
5.31
Not
es: O
nly
disc
lose
s re
mun
erat
ion
paid
dur
ing
office
rs’ t
ime
as m
embe
rs o
f the
Exe
cutiv
e M
anag
emen
t Com
mitt
ee.
Base
sal
ary
incl
udes
mov
emen
t in
recr
eatio
n le
ave
accr
uals
. Lo
ng S
ervi
ce L
eave
use
d is
not
cap
ture
d in
bas
e sa
lary
but
is in
clud
ed in
oth
er lo
ng-t
erm
ben
efits
. A
s m
etho
dolo
gy u
ses
chan
ges
in a
ccru
als,
the
amou
nts
do n
ot n
eces
saril
y re
flect
act
ual p
aym
ents
or d
ispa
ritie
s be
twee
n in
divi
dual
s.
The
met
hodo
logy
is in
acc
orda
nce
with
the
Dep
artm
ent o
f Fin
ance
Res
ourc
e M
anag
emen
t Gui
de n
o. 13
8—Co
mm
onw
ealth
ent
ities
Exe
cutiv
e Re
num
erat
ion
Repo
rtin
g Gu
ide
for A
nnua
l Rep
orts
.

108Department of Agriculture Annual report 2018–19
Appendix D: Executive remuneration
TAB
LE 4
2 In
form
atio
n ab
out r
emun
erat
ion
for
seni
or e
xecu
tives
Shor
t–te
rm b
enefi
tsPo
st–e
mpl
oym
ent
bene
fits
Oth
er
long
–ter
m b
enefi
tsTe
rmin
atio
n be
nefit
sTo
tal
rem
uner
atio
n
Tota
l rem
uner
atio
n ba
nds
Num
ber
of s
enio
r ex
ecut
ives
Ave
rage
ba
se s
alar
y ($
)
Ave
rage
bo
nuse
s ($
)
Ave
rage
ot
her
bene
fits
and
allo
wan
ces
($)
Ave
rage
su
pera
nnua
tion
co
ntri
buti
ons
($)
Ave
rage
long
se
rvic
e le
ave
($)
Ave
rage
oth
er
long
–ter
m
bene
fits
($)
Ave
rage
te
rmin
atio
n be
nefit
s ($
)
Ave
rage
tot
al
rem
uner
atio
n ($
)
$0–$
220,
00
0
4199
,780
.95
0 2
84.16
1
6,20
9.27
1
64.5
6 0
0 1
16,4
38.9
3
$220
,00
1–$2
45,0
00
4
182,
271.6
7 0
(4.9
0) 3
3,80
8.22
(6
,039
.97)
0 2
2,37
6.18
2
32,4
11.19
$245
,00
1–$2
70,0
00
26
215,
046
.43
0 15
2.34
3
7,53
8.17
4
,162.
50
00
256
,899
.44
$270
,00
1–$2
95,0
00
16
229,
605.
49
0 2
,647
.18
41,3
90.5
7 2
,918
.12
00
276
,561
.36
$295
,00
1–$3
20,0
00
8
246,
058
.82
0 1
6,0
60.6
1 4
1,28
0.25
2
,765
.37
00
30
6,16
5.0
4
$320
,00
1–$3
45,0
00
8
261,
271.3
8 0
18,
293.
36
48,
914.
13
5,9
61.5
3 0
0 3
34,4
40.3
9
$345
,00
1–$3
70,0
00
3
288,
374.
93
0 4
,656
.26
51,4
40.9
9 7
,469
.21
00
351
,941
.39
$370
,00
1–$3
95,0
00
1
223,
203.
12
0 1
10,9
87.4
2 4
0,25
4.86
5
,852
.89
00
380
,298
.30
$395
,00
1–$4
20,0
00
1
218,
926.
28
0 1
36,7
80.3
8 4
0,34
0.0
4 5
,841
.72
00
40
1,888
.42
$420
,00
1–$4
45,0
00
1
208,
267.0
0
0 1
78,3
81.7
0
40,
439.
37
5,8
52.8
6 0
0 4
32,9
40.9
3
$445
,00
1–$4
70,0
00
1
209,
778.
06
0 1
89,6
35.0
8 4
0,56
3.53
5
,852
.86
00
445
,829
.53
$47
0,0
01-
$49
5,0
00
0
00
00
00
00
$495
,00
1- …
.0
00
00
00
00
Not
e: S
enio
r exe
cutiv
es w
ho w
ere
part
of k
ey m
anag
emen
t per
sonn
el (
Tabl
e 41
) for
par
t of t
he y
ear h
ave
the
rem
aind
er o
f the
ir re
mun
erat
ion
repo
rted
in th
is ta
ble.

109Department of Agriculture
Annual report 2018–19
Appendix D: Executive remuneration
TAB
LE 4
3 In
form
atio
n ab
out r
emun
erat
ion
for
othe
r hi
ghly
pai
d st
aff
Shor
t–te
rm b
enefi
tsPo
st–e
mpl
oym
ent
bene
fits
Oth
er
long
–ter
m b
enefi
tsTe
rmin
atio
n be
nefit
sTo
tal
rem
uner
atio
n
Tota
l rem
uner
atio
n ba
nds
Num
ber
of
othe
r hi
ghly
pa
id s
taff
Ave
rage
ba
se s
alar
y ($
)
Ave
rage
bo
nuse
s ($
)
Ave
rage
ot
her
bene
fits
and
allo
wan
ces
($)
Ave
rage
su
pera
nnua
tion
co
ntri
buti
ons
($)
Ave
rage
long
se
rvic
e le
ave
($)
Ave
rage
oth
er
long
–ter
m
bene
fits
($)
Ave
rage
te
rmin
atio
n be
nefit
s ($
)
Ave
rage
tot
al
rem
uner
atio
n ($
)
$0- $
220,
00
0
00
00
00
00
0
$220
,00
1–$2
45,0
00
4
136,
141.1
0
0 7
2,14
0.4
4 2
3,02
2.99
2
,946
.67
00
234
,251
.19
$245
,00
1–$2
70,0
00
3
164,
986.
49
0 5
9,49
8.46
2
8,0
09.
54
3,4
33.4
2 0
0 2
55,9
27.9
1
$270
,00
1–$2
95,0
00
6
137,
971.7
0
0 1
16,5
08.
82
26,
905.
51
3,7
73.9
5 0
0 2
85,15
9.98
$295
,00
1–$3
20,0
00
0
00
00
00
00
$320
,00
1–$3
45,0
00
3
134,
145.
96
0 1
66,8
57.5
0
24,
180.
42
3,17
9.46
0
0 3
28,3
63.3
5
$345
,00
1–$3
70,0
00
1
126,
838.
85
0 1
89,2
05.
66
25,
945.
42
3,7
08.
32
00
345
,698
.25
$37
0,0
01-
$39
5,0
00
0
00
00
00
00
$39
5,0
01-
$42
0,0
00
0
00
00
00
00
$42
0,0
01-
$4
45,0
00
0
00
00
00
00
$4
45,0
01-
$47
0,0
00
0
00
00
00
00
$47
0,0
01-
$49
5,0
00
0
00
00
00
00
$495
,00
1- …
.0
00
00
00
00

110Department of Agriculture Annual report 2018–19
Appendix E: Client service standards
Appendix E: Client service standardsTABLE 44 Department of Agriculture service standards results, 2018–19
Service Standard Description Target Result
Client contact services
Correspondence by phone
For calls received through the national contact number we will answer your call within 5 minutes.
This standard applies to clients contacting the department through the national contact number: 1800 900 090.
80% of calls to be answered within our service standard
66.4% a
Correspondence by online forms
For general enquiries received through the department’s online contact form we will provide immediate confirmation of receipt and respond to your request within 10 business days of receipt.
If we cannot fully answer your query in that time we will advise you of when a complete response can be expected.
Wherever possible, we will respond earlier. For some services, such as permit and grant applications, specific service standards may exist.
80% of requests to be responded to within our service standard
90.3%
Bookings by phone/email
We will confirm your booking request, cancellation or amendment within 1 business day of receipt.
95% of bookings to be confirmed within our service standard
83.6% a
Import services
Inspection of goods at an approved premises
We will provide this service within 3 business days of confirmation of your scheduled appointment.
During periods of significant short-term increases in trade activity, there may be delays. If this is the case, we will consult you to agree on a mutually suitable time for your appointment.
95% of inspections to be provided within our service standard
74.5% a
Treatments
We will provide your or your representative with treatment direction within 2 business days following an inspection.
The time taken for processing your goods is dependent on the nature of treatment or the mandatory duration of quarantine periods.
95% of treatments to be processed within our service standard
78.7% b

111Department of Agriculture
Annual report 2018–19
Appendix E:Client service standards
TABLE 44 Department of Agriculture service standards results, 2018–19
Service Standard Description Target Result
Inspection of non-commercial vessels
On arrival at a port at which the department has a permanent staff presence, we will aim to provide an initial inspection within 1 business day from you advising the department of your arrival.
In periods of increased arrivals, such as regattas, the time to attend an inspection may be slightly longer.
95% of inspections to be provided within our service standard
100%
Assess/issue import documentation lodged via COLS
We will process your lodgement within 1 business day of receipt for urgent items.
Non-urgent items will be processed within 2 business days of receipt.
Lodgement processing may take longer if:
• they require policy advice
• incomplete or incorrect information is provided
• additional information is required to continue the assessment (applicants will be notified of this by the assessing officers).
80% of assessments to be processed within our service standard
89.2%
Assess/issue import documentation lodged via email
We will process your lodgement within 3 business day of receipt.
Lodgement processing may take longer if:
• they require policy advice
• incomplete or incorrect information is provided
• additional information is required to continue the assessment (applicants will be notified of this by the assessing officers).
Email lodgement is to be used only for items listed as per industry notice 20–2016.
80% of assessments to be processed within our service standard
98.9%
Attendance in-office for clearing of imported or exported goods
We aim to attend to you within 30 minutes of you arriving at the office.
During peak periods throughout a business day and when there are significant short-term increases in trade activity, there may be delays in our larger offices.
You can expect to spend about 15 minutes with a departmental officer for each standard transaction that is accompanied by valid documentation.
Urgent and non-commercial client personal effects will be considered higher priority.
80% of clearances to be processed within our service standard
100%
(continued)

112Department of Agriculture Annual report 2018–19
Appendix E:Client service standards
TABLE 44 Department of Agriculture service standards results, 2018–19
Service Standard Description Target Result
Import permits—applications using BICON
We will issue import permits within 20 business days of completed applications being received and paid for in full.
Applications may take longer if:
• they require technical assessment
• incomplete or incorrect information is provided by the applicant
• additional information is required to continue the assessment (applicants will be notified of this by the assessing officers)
• it is a novel product or has been prepared in a novel manner.
90% of import permits to be issued within our service standard
84.6% a
Export services
Inspection of goods at an export-registered establishment
We will aim to provide an officer to inspect goods at an export-registered establishment within 3 business days of your request for an appointment.
Inspection times are based on availability so we may be able to provide the service within a shorter timeframe.
95% of inspections to be provided within our service standard
99.2%
Inspection of goods for air freight exports
We will aim to provide an inspection for goods exported by air freight within 24 hours of your request for an appointment.
During periods of increased trade activity, there may be delays in meeting your requested inspection time.
95% of inspections to be provided within our service standard
99.0%
Inspection of goods for sea freight exports
We will aim to provide an inspection for goods exported by sea freight within 3 business days of your request for an appointment.
During periods of increased trade activity, there may be delays in meeting your requested inspection time.
95% of inspections to be provided within our service standard
99.3%
Inspection of bulk vessels for export
We will aim to provide a physical inspection within 3 business days of a confirmed appointment.
95% of inspections to be provided within our service standard
100%
(continued)

113Department of Agriculture
Annual report 2018–19
Appendix E:Client service standards
TABLE 44 Department of Agriculture service standards results, 2018–19
Service Standard Description Target Result
Assess/issue export documentation
We will process your lodgement within 1 business day for air freight.
We will process your lodgement within 3 business days for sea freight.
95% of assessments to be processed within our service standard
99.3%
Plant export authorised officer application—application assessment
When an application is received and the application fee has been paid, we will aim to assess your application within 15 business days.
90% of application assessments to be processed within our service standard
100% of application assessments were processed within our service standard
Plant export authorised officer application—Deed of Obligations
When an assessment tool that has a competent result is received, we will require a further 10 business days to process an invoice for the appointment fee.
90% of requests to be processed within our service standard
80% of requests were processed within our service standard.
The lower-than-expected result can generally be related to delays in the receipt of hard copy assessment tools through the mail system.
Plant export authorised officer application—Instrument of Appointment
When all training, assessment and further documentation have been completed and all fees have been paid, we will require a further 10 business days to provide the Instrument of Appointment.
90% of Instruments of Appointment to be processed within our service standard
100% of Instruments of Appointment were processed within our service standard
Live Animal Export services
Inspection of livestock at an export registered premise, approved premise, airside or vessel
We will service an appointment made 3 business days prior to the required inspection.
95% inspections provided within standard.
100%
(continued)

114Department of Agriculture Annual report 2018–19
Appendix E:Client service standards
TABLE 44 Department of Agriculture service standards results, 2018–19
Service Standard Description Target Result
Assess/ issue export documentation
We will:
• assess documents during standard hours of service (6.30am-6.30pm).
• advise you as soon as practical if there are missing, incomplete, incorrect or ineligible documents.
95% processed within standard.
100%
Application for (or renewal of) an export licence or variation of an export licence
Assess and make a decision on the application within 40 business days of receipt.
Advise you as soon as practical if there are missing, incomplete, incorrect or ineligible documents.
Wherever possible, we will respond earlier, however the complexity of the application and the volume of applications being processed will have an effect on processing time.
90% of applications processed within standard
96% (in 2019)
Registration or renewal of registered premises
Assess and make a decision on the application within 40 business days of receipt. c
Advise you as soon as practical if there are missing, incomplete, incorrect or ineligible documents.
Wherever possible, we will respond earlier, however the complexity of the application and the volume of applications being processed will have an effect on processing time.
90% of applications processed within standard
100% (sample size:10)
Registration of an Australian Government Accredited Veterinarians for livestock export
Assess and make a decision on the application within 10 business days of receipt. c
Advise you as soon as practicable if there are missing, incomplete, incorrect or ineligible documents.
90% of applications processed within standard
90% (in 2019)
(continued)

115Department of Agriculture
Annual report 2018–19
Appendix E:Client service standards
TABLE 44 Department of Agriculture service standards results, 2018–19
Service Standard Description Target Result
Application for an approved arrangement
Assess the application, audit the business and make a decision within 40 business days of receipt. c
If we do not make a decision within 60 days you have the right to appeal to the Administrative Appeals Tribunal to get a decision.
Advise you as soon as practical if there are missing, incomplete, incorrect or ineligible documents. Give you least 5 business days’ notice of an audit.
90% of applications processed within standard
Within the last year, we have completed 3 applications for new approved arrangements.
Two were completed within 40 business days and 1 was completed in 47 business days
Application for a variation to an approved arrangement
We will assess and make a decision on the application within 20 business days of receipt. c We will advise you as soon as practicable if there are missing, incomplete, incorrect or ineligible documents. Applications for variations which include more than 5 Standard Export Plans will wherever possible be assessed and a decision made within 20 business days of receipt. c However, due to the many possible variables and complexities involved, the department reserves the right to vary the time frame according to the quantity and complexity of SEPs. If we do not make a decision within 60 days you have the right to appeal to the Administrative Appeals Tribunal to get a decision.
90% of applications processed within standard
60% of applications that have been finalised (sample size:25)
Submission of Notice of Intention (without an approved arrangement)
Make a decision on the application within 10 business days of receipt of a complete application. c
Variations that require reassessment will be assessed and decided on within 7 business days of receipt.
95% of applications processed within standard
Insufficient recording of data.
Submission of Notice of Intention (with an approved arrangement)
Assess and approve or reject Notices of Intention for consignments under approved arrangements within 3 business days of receipt. c
95% of applications processed within our service standard
Insufficient recording of data.
(continued)
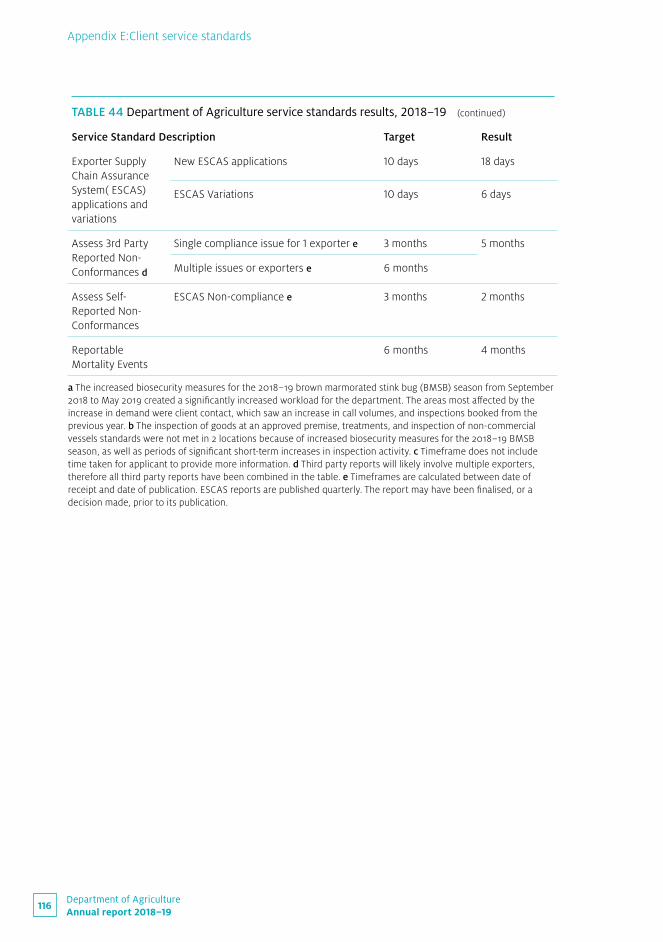
116Department of Agriculture Annual report 2018–19
Appendix E:Client service standards
TABLE 44 Department of Agriculture service standards results, 2018–19
Service Standard Description Target Result
Exporter Supply Chain Assurance System( ESCAS) applications and variations
New ESCAS applications 10 days 18 days
ESCAS Variations 10 days 6 days
Assess 3rd Party Reported Non-Conformances d
Single compliance issue for 1 exporter e 3 months 5 months
Multiple issues or exporters e 6 months
Assess Self-Reported Non-Conformances
ESCAS Non-compliance e 3 months 2 months
Reportable Mortality Events
6 months 4 months
a The increased biosecurity measures for the 2018–19 brown marmorated stink bug (BMSB) season from September 2018 to May 2019 created a significantly increased workload for the department. The areas most affected by the increase in demand were client contact, which saw an increase in call volumes, and inspections booked from the previous year. b The inspection of goods at an approved premise, treatments, and inspection of non-commercial vessels standards were not met in 2 locations because of increased biosecurity measures for the 2018–19 BMSB season, as well as periods of significant short-term increases in inspection activity. c Timeframe does not include time taken for applicant to provide more information. d Third party reports will likely involve multiple exporters, therefore all third party reports have been combined in the table. e Timeframes are calculated between date of receipt and date of publication. ESCAS reports are published quarterly. The report may have been finalised, or a decision made, prior to its publication.
(continued)

117Department of Agriculture
Annual report 2018–19
Appendix F: Report on the operation of the Natural Resources Management (Financial Assistance) Act 1992
Appendix F: Report on the operation of the Natural Resources Management (Financial Assistance) Act 1992The Natural Resources Management (Financial Assistance) Act 1992 assists the development and implementation of an integrated approach to natural resource management. In particular, this approach supports the Sustainable Agriculture component of the National Landcare Program. Under subsection 26(1) of the Act, a report must be prepared each year on the operation of the Act and agreements made under it. This report covers the period from 1 July 2018 to 30 June 2019.
Payments were made from the account in 2018–19 as follows:
\ $0.681 million to Regional Development Australia—Far North Queensland and Torres Strait Incorporated—Compost for a farming future
\ $0.698 million to South Australia No-Till Farmers Association—transforming land management practices through supporting early stage adoption of Ultra High Pressure water jet technology
\ $0.090 million to Soil Science Australia—strategic initiatives to build soils capability and capacity
\ $0.558 million to Australian National University—Sustainable Farms project, shelter belts and improving farm dams
\ $0.136 million to National Farmers' Federation—Environment Protection and Biodiversity Conservation Act 1999 resource for farmers
\ $0.424 million to Cooperative Research Centre for High Performance Soils—extension activities for grower groups to develop soil knowledge.

118Department of Agriculture Annual report 2018–19
Appendix G: National Residue Survey Annual Report 2018–19
Appendix G: National Residue Survey Annual Report 2018–19The National Residue Survey (NRS) monitors residues of pesticides and veterinary medicines and environmental contaminants in Australian food commodities. This monitoring is fully industry funded, principally through levies on the commodities that are tested.
The NRS tests animal commodities including cattle, sheep and pigs, camels, deer, goats, horses, kangaroos, poultry (chicken, duck turkey etc.) ratites (emus and ostriches) wild boars, honey, eggs and aquatic species (both aquaculture and wild-caught seafood).
In horticulture, the almond, apple, citrus, macadamia and pear industries all participate in NRS testing.
The NRS grains program covers:
\ cereals (wheat, barley, oat, maize, sorghum and triticale)
\ pulses (chickpea, cow pea, pigeon pea, field pea, faba bean, lentil, vetch, navy bean, mung bean and lupin)
\ oilseeds (canola, sunflower, soybean, safflower and linseed).
Under Section 10 of the National Residue Survey Administration Act 1992 (the NRS Act), the Minister for Agriculture is required to provide an annual report to Parliament, setting out details of the operation of the NRS Special Account. In accordance with the NRS Act we provide the annual report for the NRS for the period 1 July 2018 to 30 June 2019, including key financial information.
TABLE 45 National Residue Survey—summary of results for all random monitoring programs, 2018–19
Commodity Total number of samplesCompliance with relevant
Australian standards (%) a
Animal products (42 different products sampled)
Meat, eggs, honey and aquatic species 9,952 99.79
Plant products (35 different products sampled)
Grains and horticulture 5,046 97.00
a Compliance rate based on numbers of samples in compliance. In a very small number of samples, 1 sample may contain more than 1 violative residue.

119Department of Agriculture
Annual report 2018–19
Appendix G:National Residue Survey Annual Report 2018–19
TABLE 46 National Residue Survey—revenue and expenses, 2017–18 and 2018–19
Item2018–19
$’0002017–18
$’000
Revenue
Sale of goods and rendering of services
770 827
Interest on investments 433 422
Levies 10,471 10,427
Revenue from government 5 4
Total revenue 11,679 11,680
Expenses
Employee benefits 1,839 1,926
Analytical testing 6,879 6,758
Other 2,285 2,484
Total expenses 11,003 11,168
Surplus/(deficit) 676 512
Note: Certain comparative amounts have been reclassified to conform to the current year’s reporting presentation. There has been no impact on the net operating result or net assets as a result of these adjustments.
TABLE 47 National Residue Survey—assets, liabilities and equity, 2017–18 and 2018–19
Item2018–19
$’0002017–18
$’000
Assets
Cash and cash equivalents 1,079 1,113
Trade and other receivables 15 47
Investments 17,500 16,500
Intangibles 622 728
Accrued revenue 678 902
Other assets 31 39
Total assets 19,925 19,328
Liabilities
Employee provisions 768 715
Other provisions 6 9

120Department of Agriculture Annual report 2018–19
Appendix G:National Residue Survey Annual Report 2018–19
TABLE 47 National Residue Survey—assets, liabilities and equity, 2017–18 and 2018–19
Item2018–19
$’0002017–18
$’000
Suppliers and other payables 399 531
Operating lease payables 238 238
Total liabilities 1,411 1,492
Equity
Reserves 17,988 17,322
Other 526 514
Total equity 18,514 17,836
TABLE 48 Transactions in and out of the National Residue Survey Account, 2017–18 and 2018–19
Item2018–19
$’0002017–18
$’000
Balance brought forward from previous period
1,113 1,237
Receipts
Appropriation for reporting period
5 3
Other receipts 28,470 27,570
Total receipts 28,475 27,573
Payments
Payments made to employees (1,771) (1,862)
Payments made to other (26,738) (25,835)
Total payments (28,509) (27,697)
Total balance carried to the next period
1,079 1,113

121Department of Agriculture
Annual report 2018–19
Appendix H: Water Efficiency Labelling and Standards scheme annual report 2018–19
Appendix H: Water Efficiency Labelling and Standards scheme annual report 2018–19Section 75 of the Water Efficiency Labelling and Standards Act 2005 (WELS Act) requires the WELS Regulator to, as soon as practicable after the end of each financial year, prepare a report on the operation of the WELS scheme during the year.
The Water Efficiency Labelling and Standards Scheme Annual Report 2018–19 covers the operation of the WELS scheme from 1 July 2018 to 30 June 2019.
BackgroundThe objectives of the WELS Act are to:
\ conserve water supplies by reducing water consumption
\ provide information for purchasers of water-use and water-saving products
\ promote the adoption of efficient and effective water-use and water-saving technologies.
The WELS Act and corresponding state and territory legislation provide for the operation of the WELS scheme. The Australian Government administers the scheme on behalf of the other governments. Costs of administering WELS are largely covered through registration fees, with a target of 80% cost recovery from industry. A further 10% is recovered from state and territory governments, with 10% from the Commonwealth.
Through the scheme, information is provided to consumers on the water efficiency and general performance of water-using and water-saving products, allowing an informed choice to be made regarding water use. As a result, domestic water savings in the order of 122 gigalitres per annum are now being realised nationally. These savings are projected to increase to 231 gigalitres per annum by 2036 as products are replaced with more efficient models.
It is estimated that water efficiency improvements are resulting in consumer savings of $1.1 billion per annum in household utility bills (water, electricity and gas). These savings are projected to increase to $2.6 billion per annum by 2036.
Dishwashers, clothes washing machines, taps, showers, lavatories, urinals and flow controllers are all covered by the WELS scheme. To be legally supplied, these products must meet the performance and testing requirements of the WELS standard, and must be registered and labelled correctly.

122Department of Agriculture Annual report 2018–19
Appendix H:Water Efficiency Labelling and Standards scheme annual report 2018–19
Operation of the WELS schemeGeneralIn early 2018 Australia secured international support for the establishment of a new International Organization for Standardization (ISO) project committee on water efficiency, with Standards Australia as secretariat. The project committee for ISO PC (Project Committee) 316 has since held 2 meetings, in Australia and Switzerland, to facilitate the development of a new international standard on water efficiency labelling. The standard is expected to be completed in 2021.
An internationally consistent standard is expected to decrease costs for Australian businesses, improve access to overseas markets for Australian manufacturers, increase compliance with the WELS scheme in Australia, and provide a tool that can be used by other countries to reduce water use by implementing similar consumer labelling schemes.
We published 3 issues of the WELS scheme newsletter InkWELS, with information about the latest developments with WELS and highlights of our achievements.
The Institute for Sustainable Futures at the University of Technology Sydney completed an evaluation of the environmental and economic impacts of the WELS scheme. The evaluation estimated water and utility bill savings were slightly greater than expected based on earlier analyses.
Assistance was provided to product manufacturers and suppliers, particularly giving guidance on product registrations through telephone and online enquiries.
As at 30 June 2019 there were 30,905 products registered by more than 370 organisations, including manufacturers, importers and wholesalers. This consisted of 27,860 registrations (22,338 products and 5,522 variants) and 3,045 ceasing registrations (2,874 products and 171 variants) under the WELS scheme.
This compares to 28,815 products registered as at 30 June 2018, consisting of 24,981 registrations and 3,834 ceasing registrations. Details of all registered WELS products are searchable on the WELS website.
Compliance and enforcementThe WELS Act requires that all products be registered and labelled at all points in the supply chain. The approach to our compliance strategy with the WELS legislation is outlined in the WELS Compliance and Enforcement Policy.
In 2018–19 WELS compliance activities continued to focus on internet-based sales and on the building and property development industry. Internal decision processes and escalation pathways were used to address non-compliance identified by WELS inspectors.
The joint compliance program with eBay continued to work effectively, with more than 100 non-compliant sellers reported to eBay. As a result, 17 seller accounts were restricted from selling WELS products to Australia, and more than 100 sellers were educated in how to comply with WELS registration and labelling requirements.
We have initiated a similar program with Amazon Australia to improve the level of compliance on amazon.com.au. Amazon Australia is working to design and implement tools that will identify and remove non-compliant WELS products on this platform. In the interim, compliance officers identified and reported 34 non-compliant sellers to Amazon Australia and these sellers’ products were removed from sale.

123Department of Agriculture
Annual report 2018–19
Appendix H:Water Efficiency Labelling and Standards scheme annual report 2018–19
WELS inspectors had 188 open cases, which included 34 cases carried over from 2017–18 and 154 new cases that were identified directly through online searches, store inspections and from a number of allegations from industry and the public. Since January 2018, 94% of these entities’ businesses became compliant after education and warnings from WELS staff or escalation to statutory actions. The remaining 6% were still being addressed at the end of June 2019.
We completed the first phase of the new property building program with inspections held in Sydney, Melbourne, Brisbane, the Gold Coast, Perth, Adelaide and Canberra. Follow-up inspections will commence in late 2019. Communication materials were provided to building and property industry groups, and WELS inspectors shared information and discussed linkages with state and territory building and plumbing regulators.
All inspections and follow-up enforcement actions were undertaken in accordance with the WELS Compliance and Enforcement Policy.
FinancialThe WELS Strategic Plan 2016–19 set out agreed budgets and projected industry fee revenue. Industry fee revenue in 2018–19 was 6% above the projections (Table 49).
TABLE 49 WELS industry fee revenue, 2016–17 to 2018–19
Item 2016–17 2017–18 2018–19
Industry fee revenue $1,526,295 $1,570,400 $1,606,300
Projected fee revenue $1,390,000 $1,450,000 $1,510,000

124Department of Agriculture Annual report 2018–19
Appendix I: Water for the Environment Special Account annual report 2018–19
Appendix I: Water for the Environment Special Account annual report 2018–19Section 86AI of the Water Act 2007 requires the secretary of the department to, as soon as practicable after 30 June each year, prepare and provide to the minister a report on the operation of the Water for the Environment Special Account (WESA).
The Water Act provides funding through the WESA to recover an additional 450 gigalitres of water for the environment and to ease or remove delivery constraints. The WESA allocates $1.775 billion in total—nominally split into $1.575 billion for additional water recovery and $200 million to ease or remove constraints.
Payments totalling $5.816 million were made from the WESA during 2018–19.
Constraints measures are rules and structures that influence the volume and timing of regulated water delivery through the Basin, including the delivery of environmental water. Constraints measures through the regulated system are a key element of the Sustainable Diversion Limit (SDL) Adjustment Mechanism set out in the Basin Plan 2012. Measures to address system constraints in 5 key reaches of the southern-connected Murray–Darling Basin contribute to the SDL adjustment of 605 gigalitres, which came into law in January 2018.
During 2018–19 Stage 1 funding agreements for constraints measure projects were signed with NSW ($64.49 million) and South Australia ($2.5 million). A payment of $815,138 was made to NSW under a Project Agreement for Stage 1 of constraints activities.
Efficiency measure projects are activities that change water use practices and recover additional water for the environment. Efficiency measure projects are required under the Basin Plan to have neutral or improved social and economic outcomes. Water saved through efficiency projects will form part of the Commonwealth environmental water holdings.
In September 2016 we launched the Commonwealth On-Farm Further Irrigation Efficiency (COFFIE) program pilot, an efficiency measures pilot program in the South Australian Murray–Darling Basin. Under this program, the department approved 66 on-farm projects for a total value of $12.3 million and water recovery of 1,939.68 megalitres long-term average annual yield (LTAAY) (contracted). To date payments of around $12 million have been made and 1,284.21 megalitres LTAAY of South Australia 3a High Reliability irrigation entitlement has been transferred to the Commonwealth. All water contracted under the SA COFFIE pilot program has involved works within the South Australian River Murray water resource plan area (SS11). The COFFIE pilot program closed to new applications on 5 October 2018.

125Department of Agriculture
Annual report 2018–19
Appendix I: Water for the Environment Special Account annual report 2018–19
In June 2018 Basin Water Ministers noted that the Commonwealth would shortly launch a new Basin-wide water infrastructure program. Ministers asked that Basin states and the Commonwealth government work to develop agreed additional program criteria to ensure neutral or beneficial socio-economic outcomes. The work was to be completed and presented to the next Murray–Darling Basin Ministerial Council (Ministerial Council) meeting in December 2018.
On 13 July 2018 we launched the Basin-wide Murray–Darling Basin Water Infrastructure Program. The program included urban, industrial, off-farm, and water metering infrastructure across the Basin. For South Australia, Queensland and the ACT the program also included applications for on-farm infrastructure. Under the program, we tendered for delivery partners to help eligible water rights holders design and deliver projects. We contracted 2 delivery partners and approved 3 additional delivery partners, subject to further information on their ability to contract with the Commonwealth. No funds were spent on program delivery; however, costs incurred for program promotional activities are reported below.
In October 2018 we commissioned Sefton and Associates to assist the department in consulting community members, farmers, irrigators, peak bodies and businesses across the Basin on the development of additional criteria to ensure the socio-economic neutrality of projects. At the conclusion of the community consultation, Sefton’s delivered a consultation report that was noted by Basin Water Ministers in December 2018. Funds expended for this activity totalled $255,294.
On 14 December 2018 Basin Water Ministers agreed that additional socio economic criteria and associated assessment process be adopted as the basis of the neutrality test for assessing efficiency measure projects. Following this decision, we suspended the Murray–Darling Basin Water Infrastructure Program to incorporate the new requirements in consultation with the Basin States. As at 30 June 2019 the program had not re-opened for new applications. The revised program design includes the Ministerial Council’s additional socio-economic criteria and allows for Basin States to each establish a process to assess projects against the criteria. Provision has also been made for public comments on all proposals.
Other expenses from the account were $163,741 on promotional activities and $41,791 on legal advice (Table 50).
TABLE 50 Water for the Environment Special Account, 2015–16 to 2018–19
Item2015–16
$0002016–17
$0002017–18
$0002018–19
$000
Opening Balance $0 $50,595 $158,805 $581,846
Balance Transfer $53,175 $0 $0 $0
Appropriated amount $0 $110,000 $430,000 $320,000
Actuals –$2,580 –$1,790 –$6,959 –$6,324
Closing Balance $50,595 $158,805 $581,846 $895,522

126Department of Agriculture Annual report 2018–19
Appendix J: Disability reporting
Appendix J: Disability reportingSince 1994 non-corporate Commonwealth entities have reported on their performance as policy adviser, purchaser, employer, regulator and provider under the Commonwealth Disability Strategy. In 2007–08 reporting on the employer role was transferred to the Australian Public Service Commission’s State of the Service reports and the APS Statistical Bulletin. These reports are available on the Commission’s website. Since 2010–11 entities have not been required to report on these functions.
The Commonwealth Disability Strategy has been overtaken by the National Disability Strategy 2010–2020, which sets out a 10-year national policy framework to improve the lives of people with disability, promote participation and create a more inclusive society. A high-level, 2-yearly report will track progress against each of the 6 outcome areas of the strategy and present a picture of how people with a disability are faring. The first of these progress reports was published in 2014, and reports can be found at the Department of Social Services website.

127Department of Agriculture
Annual report 2018–19
Financial Statements
Financial Statements
Part 4

128Department of Agriculture Annual report 2018–19
Financial Statements
GPO Box 707 CANBERRA ACT 260119 National Circuit BARTON ACT
Phone (02) 6203 7300 Fax (02) 6203 7777
INDEPENDENT AUDITOR’S REPORTTo the Minister for AgricultureOpinion In my opinion, the financial statements of the Department of Agriculture (‘the Entity’) for the year ended 30 June 2019:
(a) comply with Australian Accounting Standards – Reduced Disclosure Requirements and the Public Governance, Performance and Accountability (Financial Reporting) Rule 2015; and
(b) present fairly the financial position of the Entity as at 30 June 2019 and its financial performance and cash flows for the year then ended.
The financial statements of the Entity, which I have audited, comprise the following statements as at 30 June 2019 and for the year then ended:
• Statement by the Secretary and Chief Finance Officer; • Statement of Comprehensive Income; • Statement of Financial Position; • Statement of Changes in Equity; • Cash Flow Statement; • Administered Schedule of Comprehensive Income; • Administered Schedule of Assets and Liabilities; • Administered Reconciliation Schedule; • Administered Cash Flow Statement; and • Notes to and forming part of the financial statements, comprising a summary of significant accounting
policies and other explanatory information.
Basis for opinion
I conducted my audit in accordance with the Australian National Audit Office Auditing Standards, which incorporate the Australian Auditing Standards. My responsibilities under those standards are further described in the Auditor’s Responsibilities for the Audit of the Financial Statements section of my report. I am independent of the Entity in accordance with the relevant ethical requirements for financial statement audits conducted by the Auditor-General and his delegates. These include the relevant independence requirements of the Accounting Professional and Ethical Standards Board’s APES 110 Code of Ethics for Professional Accountants (the Code) to the extent that they are not in conflict with the Auditor-General Act 1997. I have also fulfilled my other responsibilities in accordance with the Code. I believe that the audit evidence I have obtained is sufficient and appropriate to provide a basis for my opinion.
Key audit matters
Key audit matters are those matters that, in my professional judgement, were of most significance in my audit of the financial statements of the current period. These matters were addressed in the context of my audit of the financial statements as a whole, and in forming my opinion thereon, and I do not provide a separate opinion on these matters.

129Department of Agriculture
Annual report 2018–19
Financial Statements
Key audit matter
Accuracy and completeness of Own Source Revenue
Refer to Note 2A ‘Sale of Goods and Rendering of Services’ and Note 15 ‘Regulatory Charging Summary’
The Entity collects a range of fees and charges for import and export regulatory functions. Information is captured through multiple business systems via manual data entry and online applications. In 2018–19, total own source revenue from import and export regulatory functions was $409.4 million.
The fees and charges revenue is dependent on information provided by importers or exporters via a self-assessment declaration. The Entity undertakes a compliance program to obtain assurance that declarations accurately report the value and nature of goods declared.
I focused on this area due to the value of revenue from import and export regulatory functions, the risk that the self-assessment process results in under-collection of import and export revenue, and the complex administrative and IT system arrangements that support the collection of fees and charges.
How the audit addressed the matter
To audit the accuracy and completeness of own source revenue, I performed the following procedures:
• assessed the governance and reporting arrangements implemented by the Entity to obtain assurance over the completeness of own source revenue;
• assessed the design and effectiveness of compliance programs that provide the Entity with assurance over the completeness and accuracy of own source revenue;
• tested the Entity’s assurance processes over the interface and transfer of data between revenue business systems and the finance system, including the IT general and application controls for the significant systems that record receipts;
• agreed the fees and charges recorded in business systems, which are used to calculate own source revenue, to legislation;
• tested a sample of revenue transactions and checked the manual calculations were accurate based on the information declared by the importer or exporter; and
• tested the year end amount of revenue accrued by agreeing inputs used in calculations to information in the revenue business systems and Australian Bureau of Agricultural and Resource Economics and Sciences estimates.
Key audit matter
Accuracy and completeness of primary industry levies and charges
Refer to Note 17A ‘Levies, Fees and Charges’
Levies are collected from primary industry producers and agents using a self-assessment regime. For the 2018–19 reporting period the total levies reported were $564.1 million.
I considered this area a key audit matter as there is a risk of under-collection arising from the submission of inaccurate levy returns and declarations, whether accidental or deliberate. The Entity undertakes a compliance program to obtain assurance that levy returns and declarations accurately report the value and quantity of agricultural commodities declared.
How the audit addressed the matter
To audit the accuracy and completeness of primary industry levies and charges revenue, I performed the following procedures:
• assessed the design and operating effectiveness of the IT general and application controls to confirm the integrity of data within the levies IT system. This included an assessment of the completeness and accuracy of data transferred between the levies IT system and the finance system;
• evaluated the design and effectiveness of, and tested on a sample basis, the Entity’s National Compliance Program which applies a risk based approach to assessing the accuracy and completeness of submitted returns and levies collected;
• tested a sample of revenue transactions by agreeing calculations to supporting documentation, and sighted approvals; and
• agreed changes of levy rates recorded in the levies IT system to approvals signed by the Minister.

130Department of Agriculture Annual report 2018–19
Financial Statements
Key audit matter
Valuation of Loans to State and Territory Governments and Farm Businesses
Refer to Note 18B ‘Trade, Taxation and Other Receivables’
The Entity is responsible for administering a range of Farm Finance and Drought Assistance loan packages which provide eligible recipients with low interest loans to assist in managing their farm businesses. Loans are made to the State and Territory Governments and to farm businesses through the Regional Investment Corporation, who are responsible for the ongoing maintenance and management of the loans.
I focused on this area given the significance of this balance to the Entity’s receivable balances and the significant judgement applied to assessing eligibility criteria, lending limits, lending terms and the complexity of calculations in determining the valuation and impairment of the loan balances, some of which are classified as concessional loans. Impairment of the loan balances is calculated using a 12 month expected credit losses valuation model. This model is dependent on assumptions that require significant judgement about the value of security held against each loan, the impact of worsening drought conditions, and macroeconomic factors including interest rates and commodity pricing. The Entity engaged an expert to assist in calculating the impairment of loans.
For the year ended 30 June 2019 the receivables balance was $801.8 million.
How the audit addressed the matter
To audit the valuation of the loans to State and Territory Governments and farm business, I performed the following procedures:
• evaluated the application of the Entity’s accounting policy for the recognition and measurement of the fair value of new loans in accordance with Australian Accounting Standards, including any concessional component;
• assessed the reasonableness of the methodology and key assumptions applied to the impairment assessment supporting the valuation of the loans against accepted industry benchmarks;
• assessed the Entity’s monitoring of loans and service payments collected to assess the accuracy and completeness of information provided by the State and Territory Governments and the Regional Investment Corporation;
• agreed a sample of approvals of new loans, or variations to existing loans, to supporting documentation; and
• for a sample of loans, recalculated the interest revenue received using the approved interest rates and agreed principal repayments to the loan agreement.
Key audit matter
Valuation of the Jointly Controlled Arrangements: River Murray Operations and Living Murray Initiative
Refer to Note 19 ‘Reconciliation of the Opening and Closing Balances of Property, Plant and Equipment and Intangibles’
The Entity recognises a 20 percent interest in the assets of the joint ventures in River Murray Operations and the Living Murray Initiative.
I considered this a key audit matter as the balance is significant to the Entity’s asset balances and the joint venture arrangements are managed by another entity on behalf of the joint owners.
How the audit addressed the matter
To audit the valuation of the jointly controlled arrangements I performed the following procedures:
• evaluated the governance arrangements supporting the Entity’s oversight and information-gathering processes over the balances reported in the joint ventures’ financial statements;
• obtained the audited joint venture financial statements for the year ended 30 June 2019 and agreed material balances to the associated balances and disclosures in the Entity’s financial statements; and
• performed an assessment of the audited financial statements of the joint venture which included considering the regulatory framework under which

131Department of Agriculture
Annual report 2018–19
Financial Statements
For the year ended 30 June 2019 the balances that relate to these jointly controlled operations are $531.1 million infrastructure and other assets and $133.8 million water entitlements.
the financial statements were prepared, the accounting policies adopted and evaluating the competence and objectivity of the audit firm performing the audit and the opinion provided.
Accountable Authority’s responsibility for the financial statements
As the Accountable Authority of the Entity, the Secretary is responsible under the Public Governance, Performance and Accountability Act 2013 (the Act) for the preparation and fair presentation of annual financial statements that comply with Australian Accounting Standards – Reduced Disclosure Requirements and the rules made under the Act. The Secretary is also responsible for such internal control as the Secretary determines is necessary to enable the preparation of financial statements that are free from material misstatement, whether due to fraud or error.
In preparing the financial statements, the Secretary is responsible for assessing the ability of the Entity to continue as a going concern, taking into account whether the Entity’s operations will cease as a result of an administrative restructure or for any other reason. The Secretary is also responsible for disclosing, as applicable, matters related to going concern and using the going concern basis of accounting unless the assessment indicates that it is not appropriate.
Auditor’s responsibilities for the audit of the financial statements My objective is to obtain reasonable assurance about whether the financial statements as a whole are free from material misstatement, whether due to fraud or error, and to issue an auditor’s report that includes my opinion. Reasonable assurance is a high level of assurance, but is not a guarantee that an audit conducted in accordance with the Australian National Audit Office Auditing Standards will always detect a material misstatement when it exists. Misstatements can arise from fraud or error and are considered material if, individually or in the aggregate, they could reasonably be expected to influence the economic decisions of users taken on the basis of the financial statements.
As part of an audit in accordance with the Australian National Audit Office Auditing Standards, I exercise professional judgement and maintain professional scepticism throughout the audit. I also:
• identify and assess the risks of material misstatement of the financial statements, whether due to fraud or error, design and perform audit procedures responsive to those risks, and obtain audit evidence that is sufficient and appropriate to provide a basis for my opinion. The risk of not detecting a material misstatement resulting from fraud is higher than for one resulting from error, as fraud may involve collusion, forgery, intentional omissions, misrepresentations, or the override of internal control;
• obtain an understanding of internal control relevant to the audit in order to design audit procedures that are appropriate in the circumstances, but not for the purpose of expressing an opinion on the effectiveness of the Entity’s internal control;
• evaluate the appropriateness of accounting policies used and the reasonableness of accounting estimates and related disclosures made by the Accountable Authority;
• conclude on the appropriateness of the Accountable Authority’s use of the going concern basis of accounting and, based on the audit evidence obtained, whether a material uncertainty exists related to events or conditions that may cast significant doubt on the Entity’s ability to continue as a going concern. If I conclude that a material uncertainty exists, I am required to draw attention in my auditor’s report to the related disclosures in the financial statements or, if such disclosures are inadequate, to modify my opinion. My conclusions are based on the audit evidence obtained up to the date of my auditor’s report. However, future events or conditions may cause the Entity to cease to continue as a going concern; and
• evaluate the overall presentation, structure and content of the financial statements, including the disclosures, and whether the financial statements represent the underlying transactions and events in a manner that achieves fair presentation.
I communicate with the Accountable Authority regarding, among other matters, the planned scope and

132Department of Agriculture Annual report 2018–19
Financial Statements
timing of the audit and significant audit findings, including any significant deficiencies in internal control that I identify during my audit.
From the matters communicated with the Accountable Authority, I determine those matters that were of most significance in the audit of the financial statements of the current period and are therefore the key audit matters. I describe these matters in my auditor’s report unless law or regulation precludes public disclosure about the matter or when, in extremely rare circumstances, I determine that a matter should not be communicated in my report because the adverse consequences of doing so would reasonably be expected to outweigh the public interest benefits of such communication.
Australian National Audit Office
Serena Buchanan Senior Executive Director
Delegate of the Auditor-General
Canberra 9 September 2019

133Department of Agriculture
Annual report 2018–19
Financial Statements
DEPARTMENT OF AGRICULTURE Financial Statements for the period ended 30 June 2019

134Department of Agriculture Annual report 2018–19
Financial Statements

135Department of Agriculture
Annual report 2018–19
Financial Statements
DEPARTMENT OF AGRICULTURE
Overview Basis of Preparation of the Financial Statements
The financial statements are general purpose financial statements and are required by section 42 of the Public Governance, Performance and Accountability Act 2013 (PGPA).
The financial statements have been prepared in accordance with the:
• PGPA (Financial Reporting) Rule 2015 (FRR); and
• Australian Accounting Standards and Interpretations – Reduced Disclosure Requirements issued by the Australian Accounting Standards Board (AASB) that apply for the reporting period.
The financial statements have been prepared on an accrual basis and are in accordance with the historical cost convention, except for certain assets and liabilities at fair value. Except where stated, no allowance is made for the effect of changing prices on the results or the financial position.
The financial statements are presented in Australian dollars and values are rounded to the nearest thousand dollars unless otherwise specified.
New Accounting Standards
No accounting standard has been adopted in the current reporting period earlier than the application date as required by the standard.
The only new, revised or amended standards and interpretations first applied to the current reporting period and have been reflected in the department’s financial statements was AASB 9 Financial instruments (AASB 9). The impacts of adopting this standard have been incorporated into the statement of changes in equity and the administered reconciliation schedule as opening balance adjustments – refer Note 12 Financial Instruments and Note 24 Administered - Financial Instruments.
All other new, revised or amended standards and interpretations that were issued prior to the sign-off date and are applicable in the current reporting period did not have a material effect, and are not expected to have a future material effect on the department’s financial statements.
Comparative Figures
Certain comparative amounts have been reclassified to conform with the current year’s reporting presentation. There has been no impact on the net operating result or net assets as a result of these adjustments.
Taxation
The department is exempt from all forms of taxation except Fringe Benefits Tax (FBT) and the Goods and Services Tax (GST). Revenues, expenses, assets and liabilities are recognised net of GST except where the amount of GST incurred is not recoverable from the Australian Taxation Office and for receivables and payables.
Reporting of Administered activities Administered revenues, expenses, assets, liabilities and cash flows are disclosed in the administered schedules and related notes. Except where otherwise stated, administered items are accounted for on the same basis and using the same policies as for departmental items, including the application of Australian Accounting Standards.
Breach of Section 83 of the Constitution
Section 83 of the Commonwealth of Australia Constitution Act 1900 (“the Constitution”) provides that no amount may be paid out of the Consolidated Revenue Fund except under an appropriation by law. In 2018-19, the department identified payments that did not meet the statutory conditions for payment under Section 83, which resulted in one confirmed breach of the Plant Health Australia Funding Act 2002 (PHA Act) and potential breaches of the Farm Household Support Act 2014 (FHA Act).
The confirmed Section 83 breach of the PHA Act related to an overpayment of $222,036. Upon identification of this breach corrective action was taken on 6th August 2018 for the department to recover the amount incorrectly paid.

136Department of Agriculture Annual report 2018–19
Financial Statements
DEPARTMENT OF AGRICULTURE
Total payments of $112,381,000 under the FHA Act was made during 2018-19. As at 30 June 2019, $7,538,000 worth of overpayments have been recorded as debts, and within this there may be amounts that relate to potential breaches. It should be noted that it is impossible to completely eliminate the potential for Section 83 breaches for FHA Act payments made by Department of Human Services on behalf of the department. In the majority of cases, information provided by customers is relied upon to estimate the entitlements paid. This information provided by customers is not always accurate or is subject to circumstances which can result in a breach of Section 83 of the Constitution.
Events After the Reporting Period
Departmental
There have been no events after the reporting period that had the potential to significantly affect the ongoing structure and financial activities of the department.
Administered
On 1 July 2019 Appropriation Act (No.2) 2016-17 ($25 000 000) and Supply Act (No.2) 2016-17 ($15 000 000) self-repealed. There have been no other events after the reporting period that had the potential to significantly affect the ongoing structure and financial activities of the department.

137Department of Agriculture
Annual report 2018–19
Financial Statements
DEPARTMENT OF AGRICULTURE NOTES TO AND FORMING PART OF THE FINANCIAL STATEMENTS
Overview ……………………………………………………………………………………………………………….135 Departmental Financial Statements ..................................................................................................................... 138 Note 1: Expenses ....................................................................................................................................... 144 Note 2: Income ........................................................................................................................................... 146 Note 3: Financial Assets............................................................................................................................. 148 Note 4: Non–Financial Assets .................................................................................................................... 149 Note 5: Payables ........................................................................................................................................ 152 Note 6: Provisions ...................................................................................................................................... 153 Note 7: Aggregate Assets and Liabilities .................................................................................................... 154 Note 8: Restructuring ................................................................................................................................. 154 Note 9: Contingent Assets and Liabilities ................................................................................................... 155 Note 10: Key Management Personnel Remuneration .................................................................................. 155 Note 11: Related Party Disclosures ............................................................................................................. 156 Note 12: Financial Instruments ..................................................................................................................... 156 Note 13: Appropriations ............................................................................................................................... 159 Note 14: Special Accounts ........................................................................................................................... 160 Note 15: Regulatory Charging Summary ..................................................................................................... 161 Administered Financial Schedules ....................................................................................................................... 162 Note 16: Administered – Expenses .............................................................................................................. 168 Note 17: Administered – Income .................................................................................................................. 170 Note 18: Administered – Financial Assets .................................................................................................... 172 Note 19: Administered – Non-Financial Assets ............................................................................................ 175 Note 20: Administered – Payables ............................................................................................................... 178 Note 21: Administered – Provisions ............................................................................................................. 179 Note 22: Administered - Aggregate Assets and Liabilities ............................................................................ 179 Note 23: Administered – Contingent Assets and Liabilities .......................................................................... 180 Note 24: Administered – Financial Instruments ............................................................................................ 181 Note 25: Administered – Appropriations ....................................................................................................... 184 Note 26: Administered – Special accounts ................................................................................................... 186 Note 27: Interest in Cooperative Research Centre ....................................................................................... 188

138Department of Agriculture Annual report 2018–19
Financial Statements
DEPARTMENT OF AGRICULTURE STATEMENT OF COMPREHENSIVE INCOME for the period ended 30 June 2019
The above statement should be read in conjunction with the accompanying notes.
Departmental Financial Statements
Original Budget Variance
2019 2018 2019 2019 Notes $'000 $'000 $'000 $'000NET COST OF SERVICES Expenses
Employee benefits 1A 542 506 527 794 502 482 40 024Suppliers 1B 264 680 237 921 278 535 ( 13 855)Grants 1C 3 341 12 654 4 060 ( 719)Depreciation and amortisation 4 31 782 31 485 28 240 3 542Finance costs 6B 58 34 250 ( 192)Impairment loss allowance on financial instruments 1D 1 692 4 320 - 1 692Write-down and impairment of other assets 1E 1 646 1 060 4 882 ( 3 236)Other expenses 1F 2 036 3 509 - 2 036
Total expenses 847 741 818 777 818 449 29 292 Own-source income Own-source revenue
Sale of goods and rendering of services 2A 409 371 401 306 382 707 26 664Interest 2B 419 767 423 ( 4)Other revenue 2C 30 400 26 976 36 407 ( 6 007)
Total own-source revenue 440 190 429 049 419 537 20 653 Gains
Other gains 2D 310 945 - 310Total gains 310 945 - 310Total own-source income 440 500 429 994 419 537 20 963 Net cost of services 407 241 388 783 398 912 8 329 Revenue from Government 391 812 380 677 382 674 9 138Deficit ( 15 429) ( 8 106) ( 16 238) 809 Total comprehensive loss ( 15 429) ( 8 106) ( 16 238) 809

139Department of Agriculture
Annual report 2018–19
Financial Statements
DEPARTMENT OF AGRICULTURE STATEMENT OF FINANCIAL POSITION as at 30 June 2019
The above statement should be read in conjunction with the accompanying notes.
Original Budget Variance
2019 2018 2019 2019 Notes $'000 $'000 $'000 $'000 ASSETS Financial assets
Cash and cash equivalents 3A 38 547 32 069 27 270 11 277 Trade and other receivables 3B 105 131 98 095 77 602 27 529 Other investments 17 500 16 500 15 500 2 000
Total financial assets 161 178 146 664 120 372 40 806 Non-financial assets
Land, buildings and leasehold improvements 4 40 706 46 174 39 860 846 Property, plant and equipment 4 31 449 32 744 29 570 1 879 Computer software 4 113 492 98 764 126 660 ( 13 168) Inventories 2 110 2 275 2 297 ( 187) Prepayments 6 799 8 822 8 086 ( 1 287)
Total non-financial assets 194 556 188 779 206 473 ( 11 917) Total assets 355 734 335 443 326 845 28 889 LIABILITIES Payables
Suppliers 5A 45 634 42 448 21 587 24 047 Other payables 5B 12 532 10 329 44 440 ( 31 908)
Total payables 58 166 52 777 66 027 ( 7 861) Provisions
Employee provisions 6A 169 916 150 962 138 714 31 202 Other provisions 6B 11 846 13 459 5 161 6 685
Total provisions 181 762 164 421 143 875 37 887 Total liabilities 239 928 217 198 209 902 30 026 Net assets 115 806 118 245 116 943 ( 1 137) EQUITY
Contributed equity 163 496 149 357 172 426 ( 8 930) Asset revaluation reserves 25 665 25 665 25 665 - Industry reserves 63 112 54 322 43 931 19 181 Accumulated deficit ( 136 467) ( 111 099) ( 125 079) ( 11 388)
Total equity 115 806 118 245 116 943 ( 1 137)

140Department of Agriculture Annual report 2018–19
Financial Statements
DEP
AR
TMEN
T O
F A
GR
ICU
LTU
RE
STA
TEM
ENT
OF
CH
AN
GES
IN E
QU
ITY
for t
he p
erio
d en
ded
30 J
une
2019
Th
e ab
ove
stat
emen
t sho
uld
be re
ad in
con
junc
tion
with
the
acco
mpa
nyin
g no
tes.
A
ccum
ulat
ed d
efic
it A
sset
reva
luat
ion
rese
rves
In
dust
ry re
serv
es
Con
trib
uted
equ
ity
Tota
l equ
ity
20
19
2018
20
19
2018
20
19
2018
20
19
2018
20
19
2018
$'00
0 $'
000
$'00
0 $'
000
$'00
0 $'
000
$'00
0 $'
000
$'00
0 $'
000
Ope
ning
bal
ance
B
alan
ce c
arrie
d fo
rwar
d fro
m p
revi
ous
perio
d ( 1
11 0
99)
( 92
602)
2
5 66
5 2
5 66
5 5
4 32
2 4
3 93
1 1
49 3
57
120
844
1
18 2
45
97
838
App
licat
ion
of n
ew a
ccou
ntin
g st
anda
rd
( 1 1
49)
- -
- -
- -
- ( 1
149
) -
Adj
uste
d op
enin
g ba
lanc
e ( 1
12 2
48)
( 92
602)
2
5 66
5 2
5 66
5 5
4 32
2 4
3 93
1 1
49 3
57
120
844
1
17 0
96
97
838
C
ompr
ehen
sive
inco
me
Sur
plus
/ (d
efic
it) fo
r the
per
iod
( 15
429)
( 8
106
) -
- -
- -
- ( 1
5 42
9)
( 8 1
06)
Tota
l com
preh
ensi
ve in
com
e/ (l
oss)
( 1
5 42
9)
( 8 1
06)
- -
- -
- -
( 15
429)
( 8
106
)
Tran
sact
ions
with
ow
ners
C
ontr
ibut
ions
by
owne
rs
Equ
ity in
ject
ion
- App
ropr
iatio
ns
- -
- -
- -
4 3
15
16
777
4 3
15
16
777
Dep
artm
enta
l cap
ital b
udge
t -
- -
- -
- 9
824
1
1 73
6 9
824
1
1 73
6 To
tal t
rans
actio
ns w
ith o
wne
rs
- -
- -
- -
14
139
28
513
14
139
28
513
Tran
sfer
s be
twee
n eq
uity
com
pone
nts
( 8 7
90)
( 10
391)
-
- 8
790
1
0 39
1 -
- -
- C
losi
ng b
alan
ce a
s at
30
June
( 1
36 4
67)
( 111
099
) 2
5 66
5 2
5 66
5 6
3 11
2 5
4 32
2 1
63 4
96
149
357
1
15 8
06
118
245
Acc
ount
ing
polic
y
Equ
ity In
ject
ions
Am
ount
s ap
prop
riate
d w
hich
are
des
igna
ted
as ‘e
quity
inje
ctio
ns’ f
or a
yea
r (le
ss a
ny fo
rmal
redu
ctio
ns) a
nd D
epar
tmen
tal C
apita
l Bud
gets
(DC
Bs) a
re re
cogn
ised
dire
ctly
in c
ontri
bute
d eq
uity
in th
at y
ear.
Indu
stry
Res
erve
s
Eac
h co
st re
cove
red
prog
ram
hol
ds a
sep
arat
e in
dust
ry re
serv
e. P
rogr
ams
in s
urpl
us a
re h
eld
with
in th
e in
dust
ry re
serv
e ba
lanc
e. P
rogr
ams
in d
efic
it ar
e he
ld a
gain
st th
e ac
cum
ulat
ed d
efic
it of
the
depa
rtmen
t.

141Department of Agriculture
Annual report 2018–19
Financial Statements
DEPARTMENT OF AGRICULTURE CASH FLOW STATEMENT for the period ended 30 June 2019
The above statement should be read in conjunction with the accompanying notes.
Original Budget Variance
2019 2018 2019 2019 Notes $'000 $'000 $'000 $'000 OPERATING ACTIVITIES Cash received
Appropriations 375 119 384 001 390 316 ( 15 197) Sale of goods and rendering of services 400 764 395 182 378 044 22 720 Interest - 351 423 ( 423) GST received 25 469 22 477 26 096 ( 627) Other 58 724 24 506 19 218 39 506
Total cash received 860 076 826 517 814 097 45 979 Cash used
Employees 527 915 520 507 505 621 22 294 Suppliers 272 696 265 729 291 379 ( 18 683) Grants 41 088 13 822 4 060 37 028 Other 93 1 161 1 206 ( 1 113)
Total cash used 841 792 801 219 802 266 39 526 Net cash from operating activities 18 284 25 298 11 831 6 453 INVESTING ACTIVITIES Cash received
Proceeds from sales of property, plant and equipment 33 37 - 33 Proceeds from sales of investments 16 500 16 000 16 000 500 Interest 416 422 - 416
Total cash received 16 949 16 459 16 000 949 Cash used
Purchase of land and buildings 3 249 11 517 8 950 ( 5 701) Purchase of property, plant and equipment 6 134 6 287 4 887 1 247 Purchase of software 31 881 26 862 20 876 11 005 Purchase of investments 17 500 16 500 15 500 2 000
Total cash used 58 764 61 166 50 213 8 551 Net cash used by investing activities ( 41 815) ( 44 707) ( 34 213) ( 7 602) FINANCING ACTIVITIES Cash received
Contributed equity 20 184 11 631 12 176 8 008 Departmental capital budget 9 824 12 195 9 824 -
Total cash received 30 008 23 826 22 000 8 008 Net cash from financing activities 30 008 23 826 22 000 8 008 Net increase / (decrease) in cash held 6 477 4 417 ( 382) 6 859 Cash and cash equivalents at the beginning of the reporting period 32 069 27 652 27 652 4 417 Cash and cash equivalents at the end of the reporting period 3A 38 547 32 069 27 270 11 276

142Department of Agriculture Annual report 2018–19
Financial Statements
DEPARTMENT OF AGRICULTURE NOTES TO AND FORMING PART OF THE FINANCIAL STATEMENTS
Budget Variance Commentary
The following tables provide a comparison of the original budget as presented in the 2018-19 Portfolio Budget Statements (PBS) to the 2018-19 final outcome as presented in accordance with Australian Accounting Standards for the department. The Budget is not audited. Explanations of major variances are provided below.
Variances are considered to be ‘major’ based on the following criteria:
• the variance between budget and actual is greater than +/- 10% of the original budget and $10 million for a line item; or
• the variance between budget and actual is greater than 2% of the relevant sub-total (i.e. total expenses, total income, total assets or total liabilities) and $10 million; or
• an item below this threshold but is considered important for the reader’s understanding or is relevant to an assessment of the discharge of accountability and to an analysis of performance of the department.
Major variances and explanations
Statement of Comprehensive Income
Total expenses were $29.3 million higher than the original budget estimate as a result of:
• Higher than budgeted employee benefits expenses of $40.0 million due to increases in employee provisions as a result of a decrease in the 10 year government bond rate and pay increases per the Enterprise Agreement.
• Offset by lower than budgeted worker compensation expenses as a result of a reduction in claims.
Affected line items
• Total expenses
• Employee benefits expense
• Suppliers expense
Total own-source income was $20.7 million higher than the original budget primarily due to higher rendering of services revenue of $26.7 million. Revenue was higher as a result of higher than budgeted fees from imported goods, vessel arrival charges and the implementation of the independent observer function.
• Total own-source income
• Sale of goods and rendering of services

143Department of Agriculture
Annual report 2018–19
Financial Statements
DEPARTMENT OF AGRICULTURE NOTES TO AND FORMING PART OF THE FINANCIAL STATEMENTS
Statement of Financial Position
Cash and cash equivalents balance was $11.3 million higher compared with the original budget. The variance predominantly relates to higher revenue from cost recovery arrangements. This also contributed to the higher than budgeted industry reserve equity balance.
Trade and other receivables balance was $27.5 million higher than the original budget due to appropriation receivable and higher revenue from cost recovery arrangements.
• Cash and cash equivalents
• Industry reserves
• Trade and other receivables
Intangibles balance was $13.2 million lower than the original budget due to a lower opening balance in actuals compared to budget.
• Intangibles
Employee provisions balance was $31.2 million higher than the original budget due to significant increases in employee provisions as a result of a decrease in the 10 year government bond rate and the pay rises per the Enterprise Agreement.
• Employee provisions
Cash Flow Statement
The net change in cash held during 2018-19 was $6.9 million higher than budget. The change was driven by increased cash from cost recovery revenue collections, offset by increased expenditure on employee expenses and capital items to account for delays in the prior year.
• Net increase/(decrease) in cash held

144Department of Agriculture Annual report 2018–19
Financial Statements
DEPARTMENT OF AGRICULTURE NOTES TO AND FORMING PART OF THE FINANCIAL STATEMENTS
Note 1: Expenses
2019 2018 $'000 $'000 Note 1A: Employee Benefits Wages and salaries 387 976 387 716 Superannuation:
Defined contribution plans 41 405 39 587 Defined benefit plans 34 891 35 693
Leave and other entitlements 61 310 48 348 Separation and redundancies 3 000 4 070 Other employee expenses 13 924 12 380 Total employee benefits 542 506 527 794
Accounting policy
Accounting policies for employee related expenses are contained in Note 6A.
Note 1B: Suppliers Goods and services supplied or rendered
Analytical testing 11 161 11 337 Contractors and consultants 51 152 36 296 IT services 50 079 47 305 Legal expenditure 5 606 4 096 Office equipment, stores and consumables 7 462 7 159 Travel 25 942 24 478 Property operating expense 21 131 18 623 Quarantine services 4 739 3 359 Staff development and recruitment 8 157 7 918 Other 17 879 13 131
Total goods and services supplied or rendered 203 308 173 702 Goods supplied 46 299 16 412 Services rendered 157 009 157 290 Total goods and services supplied or rendered 203 308 173 702 Other suppliers
Operating lease rentals 55 419 52 581 Workers compensation expenses 5 953 11 638
Total other suppliers 61 372 64 219 Total suppliers 264 680 237 921

145Department of Agriculture
Annual report 2018–19
Financial Statements
DEPARTMENT OF AGRICULTURE NOTES TO AND FORMING PART OF THE FINANCIAL STATEMENTS
Leasing commitments
The department in its capacity as lessee holds the following significant leasing arrangements:
• Leases of motor vehicles for operations - the department has a Fleet Services Contract with SG Fleet Pty Ltd. An individual fixed rate is defined for each sub-agreement (vehicle). Retention of the vehicle past expiry date may result in a new lease sub-agreement; and
• Leases for office, laboratory or other accommodation – lease contracts for accommodation are subject to adjustment on an annual fixed basis, to market values and for consumer price index (CPI) increases. Renewal options vary from 1 to 5 years.
Commitments for minimum lease payments in relation to non-cancellable operating leases are payable as follows:
2019 2018 $'000 $'000 Within 1 year 33 873 38 308 Between 1 to 5 years 78 139 95 035 More than 5 years 12 983 6 520 Total leasing commitments 124 995 139 863
Accounting policy
Operating lease payments are expensed on a straight-line basis which is representative of the pattern of benefits derived from the leased assets.
Note 1C: Grants Public sector:
Australian Government entities (related parties) 522 7 900 State and Territory Governments 445 1 419
Private sector: Non-profit organisations 2 078 2 733 For profit organisations 119 99 Overseas 177 503
Total grants 3 341 12 654
Note 1D: Impairment Loss Allowance on Financial Instruments Impairment on financial instruments 1 692 4 320 Total impairment loss allowance on financial instruments 1 692 4 320
Note 1E: Write-Down and Impairment of Other Assets Impairment of intangibles 1 414 654 Impairment on inventories 165 - Impairment of leasehold improvements 50 - Write-off of property, plant and equipment 17 406 Total write-down and impairment of other assets 1 646 1 060
Note 1F: Other Expenses Remission of fees 1 941 3 297 Official Development Assistance 93 212 Loss from asset sales:
Carrying value of assets sold 35 - Proceeds from sale ( 33) -
Total other expenses 2 036 3 509

146Department of Agriculture Annual report 2018–19
Financial Statements
DEPARTMENT OF AGRICULTURE NOTES TO AND FORMING PART OF THE FINANCIAL STATEMENTS
Note 2: Income
2019 2018 $'000 $'000 Own-Source Revenue Note 2A: Sale of Goods and Rendering of Services Rendering of services 409 364 401 297 Sale of goods 7 9 Total sale of goods and rendering of services 409 371 401 306
Accounting policy
Revenue from the sale of goods is recognised when:
• the risks and rewards of ownership have been transferred to the buyer; and
• the department retains no managerial involvement or effective control over the goods.
Revenue from rendering of services is recognised by reference to the stage of completion of contracts at the reporting date. The stage of completion of contracts at the reporting date is determined by reference to the proportion that costs incurred as at 30 June bear to the estimated total costs of the transaction.
Rendering of services revenue includes the collection of fees for regulatory charging under the Export Control Act 1982 and the Biosecurity Act 2015. Regulatory charging disclosure is included at Note 15.
Note 2B: Interest Deposits 419 422 Penalties - 345 Total interest 419 767
Accounting policy
Interest revenue is recognised using the effective interest method.
Note 2C: Other Revenue Resources received free of charge - Mickleham Post Entry Quarantine Facility 13 827 9 691 Levies 10 471 10 427 State contributions 1 751 1 765 Sub-lease rental 856 1 041 Resources received free of charge - airport accommodation 1 154 1 155 Resources received free of charge - ANAO fees 570 570 Other 1 771 2 327 Total other revenue 30 400 26 976

147Department of Agriculture
Annual report 2018–19
Financial Statements
DEPARTMENT OF AGRICULTURE NOTES TO AND FORMING PART OF THE FINANCIAL STATEMENTS
Accounting policy
Resources Received Free of Charge
Resources received free of charge are recognised as revenue when, and only when, a fair value can be reliably determined and the services would have been purchased if they had not been donated. Use of those resources is recognised as an expense. Resources received free of charge are recorded as either revenue or gains depending on their nature.
Contributions of assets at no cost of acquisition or for nominal consideration are recognised as gains at their fair value when the asset qualifies for recognition, unless received from another Government entity as a consequence of a restructuring of administrative arrangements or as contributions by owners.
Gains 2019 2018 $'000 $'000 Note 2D: Other Gains Gain from asset sales:
Proceeds from sale - 37 Carrying value of assets sold - ( 23)
Gain on derecognition of makegood: Carrying value of liability derecognised 40 274 Carrying value of asset derecognised - ( 15)
Other 270 672 Total other gains 310 945
Accounting policy
Sale of Assets
Gains from the disposal of assets are recognised when control of the asset has passed to the buyer.
Other Gains
Gains may be realised or unrealised and are recognised on a net basis.
Revenue from Government
Amounts appropriated for departmental appropriations for the year (adjusted for any formal additions and reductions) are recognised as Revenue from Government when the department gains control of the appropriation. Appropriations receivable are recognised at their nominal amounts.

148Department of Agriculture Annual report 2018–19
Financial Statements
DEPARTMENT OF AGRICULTURE NOTES TO AND FORMING PART OF THE FINANCIAL STATEMENTS
Note 3: Financial Assets
2019 2018 $'000 $'000 Note 3A: Cash and Cash Equivalents Cash in special accounts 35 288 30 087 Cash on hand or on deposit 3 259 1 982 Total cash and cash equivalents 38 547 32 069
Note 3B: Trade and Other Receivables Goods and services receivables in connection with
Goods and services 35 897 27 157 Total goods and services receivables 35 897 27 157 Appropriations receivables
Operating 65 805 49 112 Equity injection 520 16 390
Total appropriations receivables 66 325 65 502 Other receivables
Statutory receivables 3 298 4 607 Interest 197 194 Other 3 383 1 753
Total other receivables 6 878 6 554 Total trade and other receivables (gross) 109 100 99 213 Less impairment loss allowance ( 3 969) ( 1 118)
Total impairment loss allowance ( 3 969) ( 1 118) Total trade and other receivables (net) 105 131 98 095
During the 2019 financial year, credit terms for goods and services were within 30 days (2018: 30 days).
Accounting policy
Financial Assets
Trade receivables, loans and other receivables that are held for the purpose of collecting the contractual cash flows where the cash flows are solely payments of principal and interest and are subsequently measured at amortised cost using the effective interest method adjusted for any loss allowance.

149Department of Agriculture
Annual report 2018–19
Financial Statements
D
EPA
RTM
ENT
OF
AG
RIC
ULT
UR
E N
OTE
S TO
AN
D F
OR
MIN
G P
AR
T O
F TH
E FI
NA
NC
IAL
STA
TEM
ENTS
Not
e 4:
N
on–F
inan
cial
Ass
ets
R
econ
cilia
tion
of th
e O
peni
ng a
nd C
losi
ng B
alan
ces
of P
rope
rty,
Pla
nt a
nd E
quip
men
t and
Inta
ngib
les
La
nd1
Bui
ldin
gs1
Leas
ehol
d Im
prov
emen
ts1
Oth
er p
rope
rty,
pl
ant &
eq
uipm
ent1
Com
pute
r So
ftwar
e2 To
tal
$’
000
$’00
0 $’
000
$’00
0 $’
000
$’00
0 As
at 1
Jul
y 20
18
Gro
ss b
ook
valu
e 2
205
1
629
5
0 00
8 3
8 81
4 1
24 0
70
216
726
W
ork
in p
rogr
ess
- -
3 3
53
3 8
54
44
428
51
635
Accu
mul
ated
dep
reci
atio
n, a
mor
tisat
ion
and
impa
irmen
t -
( 69
) ( 1
0 95
2)
( 9 9
24)
( 69
734)
( 9
0 67
9)
Tota
l as
at 1
Jul
y 20
18
2 2
05
1 5
60
42
409
32
744
98
764
177
682
Ad
ditio
ns
By p
urch
ase
- 3
039
2
09
6 1
34
6 8
50
16
232
Inte
rnal
ly d
evel
oped
-
- -
- 2
5 03
1 2
5 03
1 Im
pairm
ents
reco
gnis
ed in
the
net c
ost o
f ser
vice
s -
- (
50)
- ( 1
414
) ( 1
464
) R
ecla
ssifi
catio
n -
- 2
23
2 3
51
( 2 5
74)
- D
epre
ciat
ion
and
amor
tisat
ion
expe
nse
- (
99)
( 8 7
90)
( 9 7
28)
( 13
165)
( 3
1 78
2)
Dis
posa
ls
By w
rite-
off
- -
- (
17)
- (
17)
By s
ale
- -
- (
35)
- (
35)
Tota
l as
at 3
0 Ju
ne 2
019
2 2
05
4 5
00
34
001
31
449
113
492
1
85 6
47
To
tal a
s at
30
June
201
9 re
pres
ente
d by
:
G
ross
boo
k va
lue
2 2
05
4 6
68
52
154
48
313
149
361
2
56 7
01
Wor
k in
pro
gres
s -
- 1
392
2
768
4
6 39
9 5
0 55
9 Ac
cum
ulat
ed d
epre
ciat
ion,
am
ortis
atio
n an
d im
pairm
ent
- (
168)
( 1
9 54
5)
( 19
632)
( 8
2 26
8)
( 121
613
) To
tal a
s at
30
June
201
9 2
205
4
500
3
4 00
1 3
1 44
9 1
13 4
92
185
647
1 Th
ese
clas
ses
of a
sset
s ar
e he
ld a
t fai
r val
ue.
2 Th
e ca
rryin
g am
ount
of c
ompu
ter s
oftw
are
incl
uded
$22
618
968
pur
chas
ed s
oftw
are
and
$90
873
289
inte
rnal
ly d
evel
oped
sof
twar
e.
No
sign
ifica
nt it
ems
of p
rope
rty, p
lant
and
equ
ipm
ent a
re e
xpec
ted
to b
e so
ld o
r dis
pose
d of
with
in th
e ne
xt 1
2 m
onth
s.

150Department of Agriculture Annual report 2018–19
Financial Statements
DEPARTMENT OF AGRICULTURE NOTES TO AND FORMING PART OF THE FINANCIAL STATEMENTS
Accounting policy
Assets are recorded at cost on acquisition except as stated. The cost of acquisition includes the fair value of assets transferred in exchange and liabilities undertaken.
Assets acquired at no cost, or for nominal consideration, are initially recognised as assets and income at their fair value at the date of acquisition, unless acquired as a consequence of restructuring of administrative arrangements. In the latter case, assets are initially recognised as contributions by owners at the amounts at which they were recognised in the transferor’s accounts immediately prior to the restructuring.
Asset Recognition Threshold
Purchases of property, plant and equipment are recognised initially at cost in the Statement of Financial Position. The department applied the following asset recognition thresholds:
2019 2018 Land and buildings $0 $0 Leasehold improvements $150 000 $150 000 Property, plant and equipment $5 000 individual purchases/
$50 000 group purchases $5 000 individual purchases/ $50 000 group purchases
Internally developed software $200 000 $200 000 Purchased software $150 000 $150 000 Purchases under the asset recognition thresholds are expensed in the year of acquisition.
The initial cost of an asset includes an estimate of the cost of dismantling and removing the item and restoring the site on which it is located. This is particularly relevant to restoration provisions in property leases taken up by the department where an obligation exists to restore the property to its original condition. These costs are included in the value of the department’s leasehold improvements with a corresponding provision for the restoration recognised.
The department’s intangible assets comprise internally developed software and purchased software for internal use. These assets are carried at cost less accumulated amortisation and accumulated impairment losses.
Revaluations and fair value measurement
All property, plant and equipment assets are measured at fair value.
Following initial recognition at cost, property, plant and equipment are carried at fair value less subsequent accumulated depreciation and accumulated impairment losses. Valuations are conducted with sufficient frequency to ensure that the carrying amounts of assets do not differ materially from the assets’ fair values at the reporting date. Independent revaluations for property, plant and equipment are conducted every three years, however further valuations are undertaken dependent upon the volatility of movements in market values for the relevant assets.
Revaluation adjustments are made on a class basis. Any revaluation increment is credited to equity under the heading of asset revaluation reserve except to the extent that it reverses a previous revaluation decrement of the same asset class that was previously recognised in the surplus or deficit. Revaluation decrements for a class of assets are recognised in the surplus or deficit except to the extent that they reverse a previous revaluation increment for that class.
Any accumulated depreciation at the revaluation date is eliminated against the gross carrying amount of the asset and the asset restated to the revalued amount.

151Department of Agriculture
Annual report 2018–19
Financial Statements
DEPARTMENT OF AGRICULTURE NOTES TO AND FORMING PART OF THE FINANCIAL STATEMENTS
Recurring and non-recurring fair value measurements – valuation processes
The department engaged the service of Australian Valuation Solutions (AVS) to conduct a detailed external valuation of non-financial assets (excluding intangibles) at 30 June 2017 and has relied upon those outcomes to establish carrying amounts.
No valuation has been conducted for financial year 2018-19.
Depreciation and amortisation
Depreciable property, plant and equipment assets are written-off to their estimated residual values over their estimated useful lives to the department using, in all cases, the straight-line method of depreciation.
Intangible assets are amortised on a straight-line basis over their anticipated useful life.
Depreciation rates (useful lives) and residual values are reviewed at each reporting date and necessary adjustments are recognised as appropriate. Depreciation rates applying to each class of depreciable asset are based on the following useful lives.
D
2019 2018
Buildings 40-50 years 40-50 years
Leasehold improvements Lesser of useful life or lease term
Lesser of useful life or lease term
Property, plant and equipment 3 to 15 years 3 to 15 years
Internally developed software 5 to 10 years 5 to 10 years
Purchased software 3 years 3 years
The department’s depreciation charges for 2018-19 were comprised of: • Amounts funded by cost recovery arrangements totalling $14 704 271 (2018: $13 916 730); and • Unfunded totalling $17 077 435 (2018: $17 568 333).
Impairment
All non-financial assets were assessed for impairment at 30 June 2019. Where indications of impairment exist, the asset’s recoverable amount is estimated and an impairment adjustment made if the asset’s recoverable amount is less than its carrying amount.
The recoverable amount of an asset is the higher of its fair value less costs of disposal and its value in use. Value in use is the present value of the future cash flows expected to be derived from the asset. Where the future economic benefit of an asset is not primarily dependent on the asset’s ability to generate future cash flows, and the asset would be replaced if the department were deprived of the asset, its value in use is taken to be its depreciated replacement cost.
An impairment loss of $1 464 326 (2018: $654 375) was recognised in the net cost of services.
Inventories
All Inventory is held for distribution and valued at cost, adjusted for any loss of service potential.
Costs incurred in bringing each item of inventory to its present location and condition are recorded at purchase cost and managed on a first-in-first-out basis.

152Department of Agriculture Annual report 2018–19
Financial Statements
DEPARTMENT OF AGRICULTURE NOTES TO AND FORMING PART OF THE FINANCIAL STATEMENTS
Note 5: Payables
2019 2018 $'000 $'000 Note 5A: Suppliers Trade creditors and accruals 31 201 25 963 Operating lease payable 14 433 16 485 Total suppliers 45 634 42 448
Settlement is usually made within 30 days.
Note 5B: Other Payables Salaries and wages 3 404 3 042 Unearned income 2 315 1 248 Statutory payables associated with employees 2 050 1 844 Separations and redundancies 931 1 227 Superannuation 580 569 Other 3 252 2 399 Total other payables 12 532 10 329
Accounting policy
Separation and Redundancy
Provision is made for separation and redundancy benefit payments. The department recognises a provision for termination when it has developed a detailed formal plan for the terminations, identified the positions affected, assessed expressions of interest from employees and made formal offers. Separation and redundancy is reported as a payable when an agreement has been reached with the relevant employee.
Superannuation
The majority of the department’s staff are members of the Commonwealth Superannuation Scheme (CSS), the Public Sector Superannuation Scheme (PSS) or the PSS accumulation plan (PSSap). However, some staff have elected to be members of other private superannuation funds.
The CSS and PSS are defined benefit schemes for the Australian Government. The PSSap is a defined contribution scheme.
The liability for defined benefits is recognised in the financial statements of the Australian Government and is settled by the Australian Government in due course. This liability is reported in the Department of Finance’s administered schedules and notes.
The department makes employer contributions to the defined benefits superannuation scheme at rates determined by an actuary to be sufficient to meet the current cost to the Government. The department accounts for the contributions as if they were contributions to defined contribution schemes.
The liability for superannuation recognised at 30 June 2019 represents outstanding contributions.
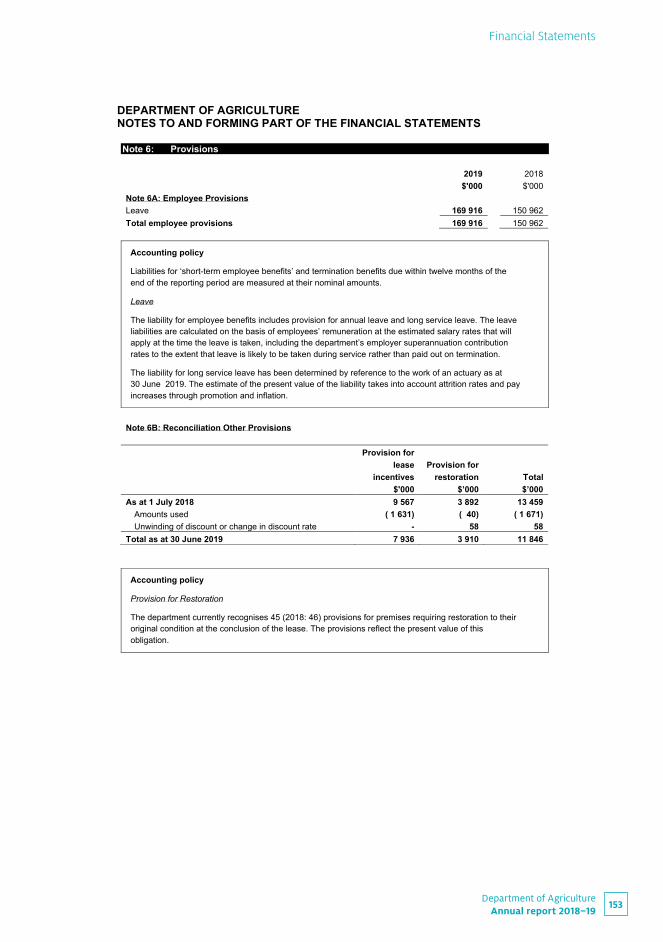
153Department of Agriculture
Annual report 2018–19
Financial Statements
DEPARTMENT OF AGRICULTURE NOTES TO AND FORMING PART OF THE FINANCIAL STATEMENTS
Note 6: Provisions
2019 2018 $'000 $'000 Note 6A: Employee Provisions Leave 169 916 150 962 Total employee provisions 169 916 150 962
Accounting policy
Liabilities for ‘short-term employee benefits’ and termination benefits due within twelve months of the end of the reporting period are measured at their nominal amounts.
Leave
The liability for employee benefits includes provision for annual leave and long service leave. The leave liabilities are calculated on the basis of employees’ remuneration at the estimated salary rates that will apply at the time the leave is taken, including the department’s employer superannuation contribution rates to the extent that leave is likely to be taken during service rather than paid out on termination.
The liability for long service leave has been determined by reference to the work of an actuary as at 30 June 2019. The estimate of the present value of the liability takes into account attrition rates and pay increases through promotion and inflation.
Note 6B: Reconciliation Other Provisions
Provision for lease
incentives Provision for
restoration Total $'000 $’000 $’000 As at 1 July 2018 9 567 3 892 13 459
Amounts used ( 1 631) ( 40) ( 1 671) Unwinding of discount or change in discount rate - 58 58
Total as at 30 June 2019 7 936 3 910 11 846
Accounting policy
Provision for Restoration
The department currently recognises 45 (2018: 46) provisions for premises requiring restoration to their original condition at the conclusion of the lease. The provisions reflect the present value of this obligation.

154Department of Agriculture Annual report 2018–19
Financial Statements
DEPARTMENT OF AGRICULTURE NOTES TO AND FORMING PART OF THE FINANCIAL STATEMENTS
Note 7: Aggregate Assets and Liabilities
2019 2018 $'000 $'000 Assets expected to be recovered in:
No more than 12 months 167 798 155 383 More than 12 months 187 936 180 060
Total assets 355 734 335 443 Liabilities expected to be settled in:
No more than 12 months 98 154 85 762 More than 12 months 141 774 131 436
Total liabilities 239 928 217 198 Note 8: Restructuring
2019 2018
National Water Infrastructure
Development Fund The Department of
Infrastructure, Transport, Cities and Regional
Development2 $'000 $'000 FUNCTIONS RELINQUISHED Assets relinquished
Trade and other receivables - 305 Total assets relinquished - 305 Liabilities relinquished
Employee provisions - 305 Total liabilities relinquished - 305 Net liabilities relinquished - -
1. The National Water Infrastructure Development Fund function was relinquished to the Department of Infrastructure, Transport, Cities and Regional Development (formerly known as the Department of Infrastructure and Regional Development) during 2017-18 as a result of the Prime Minister's announcement on 19 December 2017.
2. No administered assets and liabilities were transferred.
3. There were no Administrative Arrangement Order changes related to the department during 2018-19.

155Department of Agriculture
Annual report 2018–19
Financial Statements
DEPARTMENT OF AGRICULTURE NOTES TO AND FORMING PART OF THE FINANCIAL STATEMENTS
Note 9: Contingent Assets and Liabilities Quantifiable Contingencies
There were no quantifiable contingent assets or contingent liabilities at 30 June 2019 (2018: Nil).
Unquantifiable Contingencies
As at 30 June 2019, the department had a number of legal claims lodged against it for damages and costs. The department is responding to these claims in accordance with its obligations under the Legal Services Directions 2017. It is not possible to estimate the amount of any eventual payments in relation to these matters.
As at 30 June 2019, the department was investigating issues with billing of certain cost recovery charges. The department is in the process of assessing any potential liability and determining what, if any, additional action may be required.
Proceedings were commenced in the Federal Court of Australia seeking compensation for alleged losses due to the temporary suspension of exports of live animals to Indonesia that was put in place on 7 June 2011. The matter has been fully heard and judgment is expected in 2019. The quantum of any damages sought has not been quantified. The Department of Finance, which has responsibility for Comcover (the Australian Government’s general insurance fund), has assumed insurance responsibility for the potential claims under its insurance arrangements with the department.
Accounting policy
Contingent liabilities and contingent assets are not recognised in the statement of financial position but are reported in the relevant notes. They may arise from uncertainty as to the existence of a liability or asset or represent an asset or liability in respect of which the amount cannot be reliably measured. Contingent assets are disclosed when settlement is probable but not virtually certain and contingent liabilities are disclosed when settlement is greater than remote.
Note 10: Key Management Personnel Remuneration Key management personnel are those persons having authority and responsibility for planning, directing and controlling the activities of the department, directly or indirectly. This includes those personnel who have temporarily performed the relevant roles for a period of eight weeks or more. The department has determined the key management personnel to be all Ministers and Assistant Ministers of the department, the Secretary and members of the Executive Management Committee. Key management personnel remuneration is reported in the table below:
2019 2018 $'000 $'000 Short-term employee benefits 3 258 3 618 Post-employment benefits 515 583 Other long-term benefits 81 40 Total key management personnel remuneration expenses1 3 854 4 241
The total number of key management personnel that are included in the above table is 13, being four substantive officers for the full year, six substantive officers for part of the year, one officer that acted for part of the year and was later substantive for part of the year, and two acting officers for part of the year (2018: 11, being eight substantive officers for the full year, one substantive officer for part of the year and two acting officers).
1 The above key management personnel remuneration excludes the remuneration and other benefits of the Ministers and Assistant Ministers of the department. The Minister's and Assistant Minister’s remuneration and other benefits are set by the Remuneration Tribunal and are not paid by the department.

156Department of Agriculture Annual report 2018–19
Financial Statements
DEPARTMENT OF AGRICULTURE NOTES TO AND FORMING PART OF THE FINANCIAL STATEMENTS
Note 11: Related Party Disclosures Related party relationships
The department is an Australian Government controlled entity. Related parties to the department are Key Management Personnel, including the Ministers and Assistant Ministers of the department, the River Murray Operation (RMO) and Living Murray Initiative (LMI) joint operations as well as other Australian Government entities.
Transactions with related parties
Given the breadth of Government activities, related parties may transact with the government sector in the same capacity as ordinary citizens. These transactions have not been separately disclosed in this note.
Giving consideration to relationships with related entities, and transactions entered into during the reporting period, the department has determined there are no related party transactions that require separate disclosure (2018: Nil).
Note 12: Financial Instruments
2019 2018 $'000 $'000 Note 12A: Categories of Financial Instruments Financial Assets under AASB 139 Held-to-maturity investments
Negotiable securities - certificates of deposit 16 500 Total held-to-maturity investments 16 500 Loans and Receivables
Cash and cash equivalents 32 069 Trade and other receivables (net) 27 986
Total loans and receivables 60 055 Financial Assets under AASB 9 Financial assets at amortised cost 1,2
Negotiable securities - certificates of deposit 17 500 Cash and cash equivalents 38 547 Trade and other receivables (net) 35 508
Total financial assets at amortised cost 91 555 Total financial assets 91 555 76 555 Financial Liabilities Financial liabilities measured at amortised cost
Trade creditors 31 201 25 963 Total financial liabilities measured at amortised cost 31 201 25 963 Total financial liabilities 31 201 25 963
At 30 June 2019, there are 11 (2018: 11) certificates of deposit maturing at different dates within the next 12 months. Interest rates range from 2.20% to 2.77% (2018: 2.51% to 2.72%), payable upon maturity.
1. The net income from interest revenue for financial assets at amortised cost in 2019 is $419 000 (2018: $767 000). 2. The impairment recognised in the comprehensive income statement for financial assets at amortised cost in 2019 is $1 692 000 (2018: $4 320 000).

157Department of Agriculture
Annual report 2018–19
Financial Statements
DEPARTMENT OF AGRICULTURE NOTES TO AND FORMING PART OF THE FINANCIAL STATEMENTS
Classification of financial assets on the date of initial application of AASB 9
Financial assets class Notes
AASB 139 original
classification
AASB 9 new classification
AASB 139 carrying
amount at 1 July 2018
AASB 9 carrying
amount at 1 July 2018
$'000 $'000 Negotiable securities - certificates of deposit
Held-to-maturity Amortised Cost 16 500 16 500
Cash and cash equivalents 3A Loans and receivable Amortised Cost 32 069 32 069
Trade receivables 3B Loans and receivable Amortised Cost 27 986 26 837
Total financial assets 76 555 75 406
Reconciliation of carrying amounts of financial assets on the date of initial application of AASB 9
AASB 139 carrying
amount at 1 July 2018
Re-classification
Re-measurement
AASB 9 carrying
amount at 1 July 2018
$'000 $'000 $'000 $'000 Financial assets at amortised cost Held to maturity
Negotiable securities - certificates of deposit 16 500 - - 16 500
Loans and receivable Cash and cash equivalents 32 069 - - 32 069 Trade receivables 27 986 - ( 1 149) 26 837
Total amortised cost 76 555 - ( 1 149) 75 406
These tables reflect the transition from AASB 139 to AASB 9 whereby classifications of financial assets and the impairment methodology have changed from the ‘incurred loss’ model to the ‘expected credit loss’ model, which means that a loss event will no longer need to occur before an impairment allowance is recognised.
Accounting policy
Financial assets
With the implementation of AASB 9 Financial Instruments for the first time in 2019, the department now classifies its financial assets in the following categories:
a) financial assets at fair value through profit or loss;
b) financial assets at fair value through other comprehensive income; and
c) financial assets measured at amortised cost.
The classification depends on both the department’s business model for managing the financial assets and contractual cash flow characteristics of the item on initial recognition. Financial assets are recognised when the department becomes a party to the contract and, as a consequence, has legal right to receive or a legal obligation to pay cash and derecognised when the contractual rights to the cash flows from the financial asset expire or are transferred upon a trade date.
Comparatives have not been restated on initial application.

158Department of Agriculture Annual report 2018–19
Financial Statements
DEPARTMENT OF AGRICULTURE NOTES TO AND FORMING PART OF THE FINANCIAL STATEMENTS
Financial Assets at Amortised Cost
Financial assets included in this category need to meet two criteria:
1. the financial asset is held in order to collect the contractual cash flows; and
2. the cash flows are solely payments of principal and interest (SPPI) on the principal outstanding amount.
Amortised cost is determined using the effective interest method.
Effective Interest Method
Income is recognised on an effective interest rate basis for financial assets that are recognised at amortised cost.
Financial Assets at Fair Value Through Other Comprehensive Income (FVOCI)
Financial assets measured at fair value through other comprehensive income are held with the objective of both collecting contractual cash flows and selling the financial assets and the cash flows meet the SPPI test.
Any gains or losses as a result of fair value measurement or the recognition of an impairment loss allowance is recognised in other comprehensive income.
Financial Assets at Fair Value Through Profit or Loss (FVTPL)
Financial assets are classified as financial assets at fair value through profit or loss where the financial assets either doesn’t meet the criteria of financial assets held at amortised cost or at FVOCI (i.e. mandatorily held at FVTPL) or may be designated.
Financial assets at FVTPL are stated at fair value, with any resultant gain or loss recognised in profit or loss. The net gain or loss recognised in profit or loss incorporates any interest earned on the financial asset.
Impairment of Financial Assets
Financial assets are assessed for impairment at the end of each reporting period based on Expected Credit Losses, using the simplified approach which measures the loss allowance based on an amount equal to lifetime expected credit losses where risk has significantly increased, or an amount equal to 12-month expected credit losses if the risk has not increased.
The department has used the simplified approach for trade, contract and lease receivables. This approach always measures the loss allowance as the amount equal to the lifetime expected credit losses.
A write-off constitutes a derecognition event where the write-off directly reduces the gross carrying amount of the financial asset.
Financial liabilities
Financial liabilities are classified as either financial liabilities ‘at fair value through profit or loss’ or ‘other financial liabilities’. Financial liabilities are recognised and derecognised upon ‘trade date’. All of the department’s financial liabilities are categorised as other financial liabilities.
Other Financial Liabilities
Financial liabilities, including borrowings, are initially measured at fair value, net of transaction costs. These liabilities are subsequently measured at amortised cost using the effective interest method, with interest expense recognised on an effective interest basis.
Supplier and other payables are recognised at amortised cost. Liabilities are recognised to the extent that the goods or services have been received (and irrespective of having been invoiced).
All payables are expected to be settled within 12 months except where indicated.

159Department of Agriculture
Annual report 2018–19
Financial Statements
DEPARTMENT OF AGRICULTURE NOTES TO AND FORMING PART OF THE FINANCIAL STATEMENTS
Note 13: Appropriations
Note 13A: Annual and Unspent Appropriations ('Recoverable GST exclusive') 2019 2018
$'000 $'000 Ordinary annual services Opening unspent appropriation balance 51 094 55 214 Annual Appropriation - Operating1 391 812 381 223 Annual Appropriation - Capital budget1,2 9 824 11 736 PGPA Act Section 74 receipts1 13 123 24 383 PGPA Act Section 75 transfers - ( 546) Prior year PGPA Act section 75 transfers - ( 305) Total appropriation available 465 853 471 705 Appropriation applied (current and prior years)1 ( 396 789) ( 420 611) Closing unspent appropriation balance 69 064 51 094 Balance comprises appropriations as follows: Appropriation Act (No. 1) 2017-18 - 39 684 Appropriation Act (No. 3) 2017-18 - 5 126 Appropriation Act (No. 5) 2017-18 - 4 302 Appropriation Act (No. 1) 2018-19 56 667 - Appropriation Act (No. 3) 2018-19 9 138 - Cash on hand - Appropriation Act (No.1) 2017-18 - 1 982 Cash on hand - Appropriation Act (No.1) 2018-19 3 259 - Total unspent appropriation - ordinary annual services 69 064 51 094 1The variance between amounts appropriated in 2019 and appropriation applied is $17 970 000. 2 Departmental Capital Budgets are appropriated through Appropriation Acts (No.1,3,5). They form part of ordinary annual services, and are not separately identified in the Appropriation Acts. Other Services Opening unspent appropriation balance 16 390 11 244 Annual Appropriation - Equity injection3 7 273 17 017 Prior years Appropriation Acts repealed ( 2 959) ( 240) Total appropriation available 20 704 28 021 Appropriation applied (current and prior years)3 ( 20 184) ( 11 631) Closing unspent appropriation balance 520 16 390 Balance comprises appropriations as follows: Appropriation Act (No. 2) 2015-16 - 203 Appropriation Act (No. 4) 2015-16 - 2 756 Appropriation Act (No. 4) 2016-17 - 1 711 Appropriation Act (No. 2) 2017-18 - 9 637 Appropriation Act (No. 4) 2017-18 - 2 083 Appropriation Act (No. 2) 2018-19 520 - Total unspent appropriation - other services 520 16 390 3The variance between amounts appropriated in 2019 and appropriation applied is ($12 911 000). Total unspent appropriation 69 584 67 484

160Department of Agriculture Annual report 2018–19
Financial Statements
DEPARTMENT OF AGRICULTURE NOTES TO AND FORMING PART OF THE FINANCIAL STATEMENTS
Note 13B: Special Appropriations ('Recoverable GST exclusive')
Authority
Appropriation applied
2019 2018 $'000 $'000
Public Governance, Performance and Accountability Act 2013, s. 58 (National Residue Survey) Prior year investments redeemed in current year ($16 500 000), Redemptions of current year investments (gross) (nil). ( 17 500) ( 16 500) Total special appropriations applied ( 17 500) ( 16 500)
Note 14: Special Accounts
Australian Quarantine and Inspection Service Special
Account (AQIS)1 National Residue Survey
Account (NRS)2
2019 2018 2019 2018$'000 $'000 $'000 $'000
Balance brought forward from previous period 28 974 24 401 1 113 1 237Increases: Appropriations credited to special account 130 281 139 094 5 3Other increases 396 996 381 127 28 470 27 570Total increases 527 277 520 221 28 475 27 573Available for payments 556 251 544 622 29 588 28 810Departmental decreases Payments made to employees ( 302 073) ( 302 921) ( 1 771) ( 1 862)Payments made to other ( 219 969) ( 212 727) ( 26 738) ( 25 835)Total departmental decreases ( 522 042) ( 515 648) ( 28 509) ( 27 697)Total decreases ( 522 042) ( 515 648) ( 28 509) ( 27 697)Total balance carried to the next period 34 209 28 974 1 079 1 113Balance made up of: Cash held in the Official Public Account 30 521 26 369 1 079 1 113Cash held in entity bank accounts 3 688 2 605 - -Total balance carried to the next period 34 209 28 974 1 079 1 1131 Appropriation: Public Governance, Performance and Accountability Act 2013 section 78. Establishing Instrument: Financial Management and Accountability Determination 2010/11 – Australian Quarantine and Inspection Service Special Account Establishment 2010.
Purpose: For expenditure relating to the provision of quarantine and inspection services and payment of moneys to the Consolidated Revenue Fund as agreed to by the relevant Minister and Minister for Finance. 2 Appropriation: Public Governance, Performance and Accountability Act 2013 section 80. Establishing Instrument: National Residue Survey Administration Act 1992 section 6 (1).
Purpose: For the purposes of conducting national residue surveys and to provide for collection of the NRS levy imposed by various acts.

161Department of Agriculture
Annual report 2018–19
Financial Statements
DEPARTMENT OF AGRICULTURE NOTES TO AND FORMING PART OF THE FINANCIAL STATEMENTS
Note 15: Regulatory Charging Summary
2019 2018 $'000 $'000 Amounts applied
Departmental Annual appropriations 80 507 80 284 Own source revenue 410 653 392 027
Total amounts applied 491 160 472 311 Expenses
Departmental 494 430 470 894 Total expenses 494 430 470 894 Revenue
Departmental 411 219 392 416 Total revenue 411 219 392 416 Amounts written off
Departmental 2 061 3 980 Total amounts written off 2 061 3 980
Competitive Neutrality
The department operates a number of cost recovery arrangements across the Biosecurity, Export Certification and other business services areas in accordance with the Australian Government Charging Framework and are not for profit activities. The department is not subject to competitive neutrality arrangements for this reason.
The following are the department’s Regulatory Charging Activities:
• Dairy Exports Program Services • Meat Export Program Services • Fish and Egg Export Program Services • National Residue Survey Services • Grain and Seed Export Program Services • Non-Prescribed Goods Export Program Services • Horticulture Exports Program Services • Passenger Program Services • Import Clearance Program Services • Post Entry Plant Quarantine Program Services • Levies Revenue Service • Seaports Program Services • Live Animal Export Program Services • Water Efficiency Labelling and Standards Scheme
Documentation (Cost Recovery Implementation Statements) for the above activities is available at:
• Water Efficiency Labelling and Standards Scheme www.waterrating.gov.au/about/review-evaluation/cost-recovery-impact-statement
• Other regulatory charging activities www.agriculture.gov.au/fees/cost-recovery/
Industry Rebates and Program Results
Biosecurity, export certification and quota management, and National Residue Survey (NRS) cost recovered activities are maintained on a program basis with many of the programs aligning to an industry sector. The management of each program, including the establishment of the level and structure of fees and charges, is conducted in consultation with an Industry Consultative Committee (ICC), as applicable, and the Department of Finance.
Where fees and charges collected for a cost recovered program exceed its costs during a financial year, the excess revenue is reported in the total comprehensive income (loss) for the period. The amount of excess revenue is transferred from retained earnings into an industry reserve

162Department of Agriculture Annual report 2018–19
Financial Statements
DEPARTMENT OF AGRICULTURE ADMINISTERED SCHEDULE OF COMPREHENSIVE INCOME for the period ended 30 June 2019
The above statement should be read in conjunction with the accompanying notes.
Original Budget Variance
2019 2018 2019 2019 Notes $'000 $'000 $'000 $'000 NET COST OF SERVICES Expenses
Levy disbursements and Commonwealth contributions 16A 867 369 875 716 874 073 ( 6 704) Grants 16B 125 922 267 596 425 118 ( 299 196) Payments to corporate Commonwealth entities 16C 173 711 127 062 180 384 ( 6 673) Suppliers 16D 32 692 30 499 36 236 ( 3 544) Direct personal benefits - Income support for farmers 114 155 33 735 37 945 76 210 Assets transferred to related entities 19 407 243 210 334 735 152 ( 327 909) Depreciation and amortisation 19 7 747 7 753 7 759 ( 12) Concessional loan discount 21 945 1 006 27 620 ( 5 675) Impairment loss allowance on financial instruments 16E 1 403 690 - 1 403 Write-down and impairment of assets 16F 3 155 6 895 - 3 155 Other expenses - 234 - -
Total expenses 1 755 342 1 561 520 2 324 287 ( 568 945) Income Revenue Taxation revenue
Levies, fees and charges 17A 564 064 565 931 575 466 ( 11 402) Total taxation revenue 564 064 565 931 575 466 ( 11 402) Non-taxation revenue
Interest 17B 23 976 23 919 28 566 ( 4 590) Other revenue 17C 12 452 22 454 10 180 2 272
Total non-taxation revenue 36 428 46 373 38 746 ( 2 318) Total revenue 600 492 612 304 614 212 ( 13 720) Gains
Other gains 17D 256 416 96 386 209 929 46 487 Total gains 256 416 96 386 209 929 46 487 Total income 856 908 708 690 824 141 32 767 Net cost of services 898 434 852 830 1 500 146 ( 601 712) OTHER COMPREHENSIVE INCOME Items not subject to subsequent reclassification to net cost of services
Administered revaluations taken to reserves Non-financial assets 9 229 2 448 - 9 229 Investments in corporate Commonwealth entities 101 323 30 709 - 101 323
Total other comprehensive income 110 552 33 157 - 110 552 Total comprehensive loss ( 787 882) ( 819 673) (1 500 146) 712 264
Administered Financial Schedules

163Department of Agriculture
Annual report 2018–19
Financial Statements
DEPARTMENT OF AGRICULTURE ADMINISTERED SCHEDULE OF ASSETS AND LIABILITIES as at 30 June 2019
The above statement should be read in conjunction with the accompanying notes.
Original Budget Variance
2019 2018 2019 2019 Notes $'000 $'000 $'000 $'000 ASSETS Financial assets
Cash and cash equivalents 18A 902 105 589 698 713,658 188 447 Trade, taxation and other receivables 18B 801 821 852 463 898 986 ( 97 165) Investments in corporate Commonwealth entities 18C 501 545 400 222 342 518 159 027 Other financial assets 18D 75 184 69 313 66 428 8 756
Total financial assets 2 280 655 1 911 696 2 021 590 259 065 Non-financial assets
Land 19 1 467 1 467 1 467 - Infrastructure 19 527 029 524 541 515 599 11 430 Plant and equipment 19 1 836 1 715 - 1 836 Flooding easements 19 814 814 - 814 Water entitlements 19 133 842 126 520 125 048 8 794 Prepayments 11 226 15 665 14 052 ( 2 826)
Total non-financial assets 676 214 670 722 656 166 20 048 Total assets administered on behalf of Government 2 956 869 2 582 418 2 677 756 279 113 LIABILITIES Payables
Levy disbursements and Commonwealth contributions 20A 153 348 101 196 95 738 57 610 Grants 20B 3 550 3 368 8 153 ( 4 603) Suppliers 718 298 2 312 ( 1 594) Personal benefits - Income support to farmers 2 470 654 1 270 1 200 Corporate Commonwealth entities - 1 953 - - Other payables 54 72 - 54
Total payables 160 140 107 541 107 473 52 667 Provisions
Loan commitments to Farm Businesses 21A 17 881 - - 17 881 Total provisions 17 881 - - 17 881 Total liabilities administered on behalf of Government 178 021 107 541 107 473 70 548 Net assets 2 778 848 2 474 877 2 570 283 208 565

164Department of Agriculture Annual report 2018–19
Financial Statements
DEPARTMENT OF AGRICULTURE BUDGET VARIANCE COMMENTARY – ADMINISTERED as at 30 June 2019
The above statement should be read in conjunction with the accompanying notes.
Budget Variance Commentary
The following tables provide a comparison of the original budget as presented in the 2018-19 Portfolio Budget Statements (PBS) to the 2018-19 final outcome as presented in accordance with Australian Accounting Standards for the department. The Budget is not audited. Explanations of major variances are provided below.
Variances are considered to be ‘major’ based on the following criteria:
• the variance between budget and actual is greater than +/- 10% of the original budget and $10 million for a line item; or
• the variance between budget and actual is greater than 2% of the relevant sub-total (i.e. total expenses, total income, total assets or total liabilities) and $10 million; or
• an item below this threshold but is considered important for the reader’s understanding or is relevant to an assessment of the discharge of accountability and to an analysis of performance of the department.
Major variances and explanations Affected line items
Administered Schedule of Comprehensive Income
Total expenses were $568.9 million lower than the original budget predominantly as a result of:
• Lower than budgeted assets transferred to related entities expenses of $327.9 million and grant expenses of $299.2 million, arising from delays to the implementation of the Murray-Darling Basin Plan.
• Offset by an increase of $76.2 million in personal benefits expense as a result of the Special Drought Supplement combined with higher than budgeted recipients.
• Total expenses
• Grant expenses
• Assets transferred to related entities expenses
• Personal benefits expense
Total income was $32.8 million higher than the original budget predominantly as a result of:
• Higher than budgeted other gains of $46.5 million due to higher than anticipated water received through infrastructure programs.
• Other gains
Total other comprehensive income was $110.6 million higher than the original budget. This was mainly due to increases to the net assets of portfolio corporate Commonwealth entities.
• Total other comprehensive income

165Department of Agriculture
Annual report 2018–19
Financial Statements
DEPARTMENT OF AGRICULTURE BUDGET VARIANCE COMMENTARY – ADMINISTERED as at 30 June 2019
The above statement should be read in conjunction with the accompanying notes.
Administered Schedule of Assets and Liabilities
Total assets balance was $279.1 million higher than the original budget. This variance was predominantly due to:
• Higher than budgeted cash and cash equivalents balance by $188.4 million was mainly due to the lower than expected use of the Water for the Environment special account from delays by Basin states to bring forward efficiency measures projects.
• Higher than budgeted investments in corporate Commonwealth entities balance by $159.0 million due to increases to portfolio corporate Commonwealth entities’ net assets.
• Lower than budgeted trade, taxation and other receivables balance by $97.2 million due to:
o Lower than anticipated loan advances by $214.5 million due to delays in processing applications as a result of higher than anticipated demand following the establishment of the Regional Investment Corporation;
o Offset by lower than anticipated loan repayments from the state and territory governments by $54.1 million, higher than expected statutory receivables of $38.8 million and a higher opening position of $17.5 million when compared to budget.
• Cash and cash equivalents
• Other investments
• Trade, taxation and other receivables
Total liabilities was $70.5 million higher than the original budget due to:
• Higher than budgeted levy disbursements and Commonwealth contributions payables of $57.6 million as a result of delays in payments being made; and
• Higher than budgeted provisions for loan commitments to farm businesses of $17.9 million for loans that are yet to be settled. The department expects the settlements to occur in 2019-20.
• Levy disbursements and Commonwealth contributions
• Loan commitments to Farm Businesses

166Department of Agriculture Annual report 2018–19
Financial Statements
DEPARTMENT OF AGRICULTURE ADMINISTERED RECONCILIATION SCHEDULE for the period ended 30 June 2019
The above statement should be read in conjunction with the accompanying notes.
2019 2018 $'000 $'000 Opening assets less liabilities as at 1 July 2 474 877 1 906 548 Adjustment for new accounting standard (7 542) - Adjusted opening assets less liabilities 2 467 335 1 906 548 Net cost of services
Income 856 908 708 690 Expenses
Payments to entities other than corporate Commonwealth entities (1 581 631) (1 434 458) Payments to corporate Commonwealth entities ( 173 711) ( 127 062)
Other comprehensive income Revaluations transferred to reserves
Non-financial assets 9 229 2 448 Investments in corporate Commonwealth entities 101 323 30 709
Transfers (to)/from the Australian Government Appropriation transfers from Official Public Account
Administered assets and liabilities appropriations 202 945 307 022 Annual appropriations
Payments to entities other than corporate Commonwealth entities 169 982 377 744 Payments to corporate Commonwealth entities 175 664 125 109
Special appropriations (unlimited) Payments to entities other than corporate Commonwealth entities 702 722 572 493 Payments to corporate Commonwealth entities 292 139 325 981
Special account statutory credits 320 000 430 000 Appropriation transfers to Official Public Account
Transfers to Official Public Account (763 465) ( 749 886) Personal Benefits - Withholding ( 592) ( 461) Closing assets less liabilities as at 30 June 2 778 848 2 474 877
Accounting Policy Administered Cash Transfers to and from the Official Public Account (OPA) Revenue collected by the department for use by the Government rather than the department is administered revenue. Collections are transferred to the OPA which is maintained by the Department of Finance. Conversely, cash is drawn from the OPA to make payments under Parliamentary appropriation on behalf of Government. These transfers to and from the OPA are adjustments to the administered cash held by the department on behalf of the Government and reported as such in the schedule of administered cash flows and in the administered reconciliation schedule.

167Department of Agriculture
Annual report 2018–19
Financial Statements
DEPARTMENT OF AGRICULTURE ADMINISTERED CASH FLOW STATEMENT for the period ended 30 June 2019
The above statement should be read in conjunction with the accompanying notes.
2019 2018 $'000 $'000 OPERATING ACTIVITIES Cash received
Taxes 557 795 560 841 GST received 27 807 85 303 Other 13 486 12 961
Total cash received 599 088 659 105 Cash used
Levy disbursements and Commonwealth contributions 815 217 870 220 Grants 189 121 358 789 Suppliers 27 878 31 268 Personal benefits 112 338 34 752 Payments to corporate Commonwealth entities 175 664 125 109 Other 18 234
Total cash used 1 320 236 1 420 372 Net cash used by operating activities ( 721 148) ( 761 267) INVESTING ACTIVITIES Cash received
Repayments of loans 106 182 82 181 Interest received from loans 21 900 20 908
Total cash received 128 082 103 089 Cash used
Loan advances 34 569 190 000 Purchase of water entitlements 159 945 117 022
Total cash used 194 514 307 022 Net cash used by investing activities ( 66 432) ( 203 933) Net decrease in cash held ( 787 580) ( 965 200) Cash and cash equivalents at the beginning of the reporting period 589 698 166 435 Cash from Official Public Account for
- Appropriations 1 543 452 1 708 349 - Special accounts 320 000 430 000
Total cash from Official Public Account 1 863 452 2 138 349 Cash to Official Public Account for:
- Appropriations 763 465 749 886 Total cash to Official Public Account 763 465 749 886 Cash and cash equivalents at the end of the reporting period 902 105 589 698

168Department of Agriculture Annual report 2018–19
Financial Statements
DEPARTMENT OF AGRICULTURE NOTES TO AND FORMING PART OF THE FINANCIAL STATEMENTS
Note 16: Administered – Expenses 2019 2018 $'000 $'000 Note 16A: Levy Disbursements and Commonwealth Contributions Levy disbursements
Corporate Commonwealth entities 181 918 188 129 Other 367 271 374 224
Commonwealth Contributions Corporate Commonwealth entities 120 410 121 832 Other 197 770 191 531
Total levy disbursements and Commonwealth contributions 867 369 875 716 Note 16B: Grants Non-profit organisations 65 462 71 312 Australian Government entities (related parties) 24 220 17 989 Local Governments 15 038 90 For profit organisations 10 844 163 025 State and Territory Governments 9 588 15 032 Other 770 148 Total grants 125 922 267 596
Accounting policy The department administers a number of grant and subsidy schemes on behalf of the Government. Grant and subsidy liabilities are recognised to the extent that (i) the services required to be performed by the grantee have been performed or (ii) the grant eligibility criteria have been satisfied, but payments due have not been made. When the Government enters into an agreement to make these grants and subsidies but services have not been performed or criteria satisfied, this is considered a commitment.
Note 16C: Payments to Corporate Commonwealth Entities Murray-Darling Basin Authority 106 206 90 611 Australian Pesticides and Veterinary Medicines Authority 25 532 6 190 Wine Australia 15 924 16 014 Regional Investment Corporation 12 555 - AgriFutures Australia 12 479 10 342 Fisheries Research and Development Corporation 1 015 3 905 Total payments to corporate Commonwealth entities 173 711 127 062
Accounting policy Payments to corporate Commonwealth entities from amounts appropriated for that purpose are classified as administered expenses, equity injections or loans of the department. The appropriation to the department is disclosed in Note 25.

169Department of Agriculture
Annual report 2018–19
Financial Statements
DEPARTMENT OF AGRICULTURE NOTES TO AND FORMING PART OF THE FINANCIAL STATEMENTS
2019 2018 $'000 $'000 Note 16D: Suppliers Goods and services supplied or rendered
Membership fees 18 517 16 548 Administration charge - loans 4 871 4 853 Contractors 4 866 4 258 Consultants 906 2 072 Other 3 532 2 768
Total goods and services supplied or rendered 32 692 30 499 Goods supplied 750 723 Services rendered 31 942 29 776 Total goods and services supplied or rendered 32 692 30 499 Total supplier expenses 32 692 30 499
Note 16E: Impairment Loss Allowance on Financial Instruments Impairment on loans 1 139 410 Impairment on trade and other receivables 264 280 Total impairment loss allowance on financial instruments 1 403 690
Note 16F: Write-Down and Impairment of Assets Impairment on financial assets 1 668 2 110 Debt waiver of personal benefits receivable 792 4 109 Debt waiver - under Primary Industries Levies and Charges Collection Act 1991 575 463 Write-off of non-financial assets 120 213 Total write-down and impairment of other assets 3 155 6 895

170Department of Agriculture Annual report 2018–19
Financial Statements
DEPARTMENT OF AGRICULTURENOTES TO AND FORMING PART OF THE FINANCIAL STATEMENTS
Note 17: Administered – Income
2019 2018$'000 $'000
Revenue
Taxation Revenue
Note 17A: Levies, Fees and ChargesPrimary industry levies 549 871 553 062Primary industry charges 14 193 12 869
Total levies, fees and charges 564 064 565 931
Non-Taxation Revenue
Note 17B: InterestLoans 23 483 21 993Unwinding of concessional loan discount 475 1 632Other 18 294Total interest 23 976 23 919
Figure 1 Levy revenue by industry for 2018–19
$ $20,000
$40,000
$60,000
$80,000
$100,000
$120,000
$140,000
$160,000
$180,000
$152,435
$124,378
$000
$104,860
$66,698
$38,538
$33,037
$21,725
$9,253
$7,287
$4,779
$777
$167
$130
Field crops
Livestock transaction
Animal products
Horticulture
Livestock processing
Agricultural andveterinary chemicals
WinePoultry
Forestry
Live animal export
Other rural industries
Game animals
Fisheries
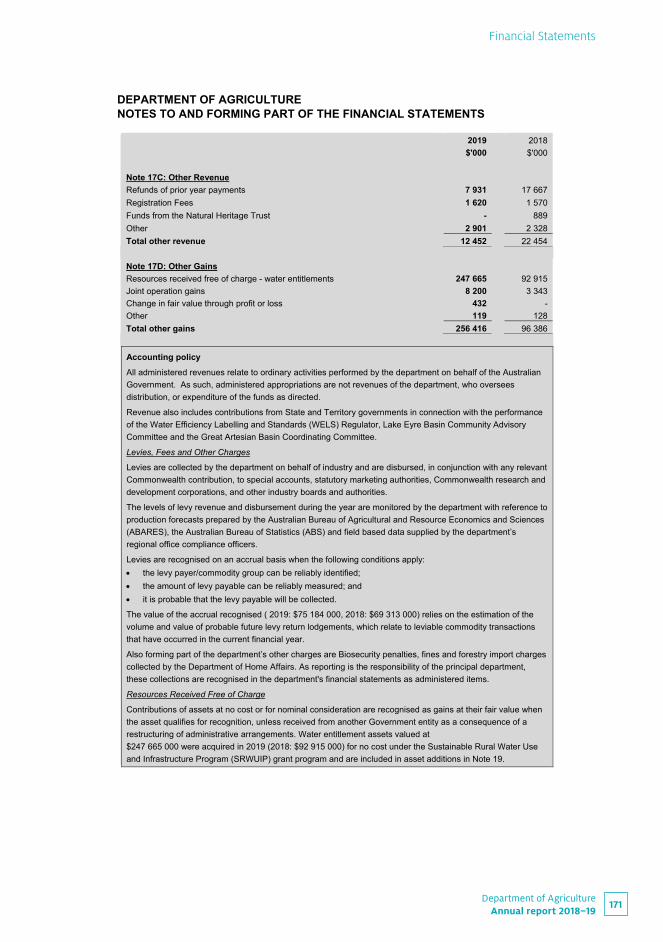
171Department of Agriculture
Annual report 2018–19
Financial Statements
DEPARTMENT OF AGRICULTURE NOTES TO AND FORMING PART OF THE FINANCIAL STATEMENTS
2019 2018 $'000 $'000 Note 17C: Other Revenue Refunds of prior year payments 7 931 17 667 Registration Fees 1 620 1 570 Funds from the Natural Heritage Trust - 889 Other 2 901 2 328 Total other revenue 12 452 22 454
Note 17D: Other Gains Resources received free of charge - water entitlements 247 665 92 915 Joint operation gains 8 200 3 343 Change in fair value through profit or loss 432 - Other 119 128 Total other gains 256 416 96 386
Accounting policy All administered revenues relate to ordinary activities performed by the department on behalf of the Australian Government. As such, administered appropriations are not revenues of the department, who oversees distribution, or expenditure of the funds as directed.
Revenue also includes contributions from State and Territory governments in connection with the performance of the Water Efficiency Labelling and Standards (WELS) Regulator, Lake Eyre Basin Community Advisory Committee and the Great Artesian Basin Coordinating Committee.
Levies, Fees and Other Charges
Levies are collected by the department on behalf of industry and are disbursed, in conjunction with any relevant Commonwealth contribution, to special accounts, statutory marketing authorities, Commonwealth research and development corporations, and other industry boards and authorities.
The levels of levy revenue and disbursement during the year are monitored by the department with reference to production forecasts prepared by the Australian Bureau of Agricultural and Resource Economics and Sciences (ABARES), the Australian Bureau of Statistics (ABS) and field based data supplied by the department’s regional office compliance officers.
Levies are recognised on an accrual basis when the following conditions apply: the levy payer/commodity group can be reliably identified; the amount of levy payable can be reliably measured; and it is probable that the levy payable will be collected.
The value of the accrual recognised ( 2019: $75 184 000, 2018: $69 313 000) relies on the estimation of the volume and value of probable future levy return lodgements, which relate to leviable commodity transactions that have occurred in the current financial year.
Also forming part of the department’s other charges are Biosecurity penalties, fines and forestry import charges collected by the Department of Home Affairs. As reporting is the responsibility of the principal department, these collections are recognised in the department's financial statements as administered items.
Resources Received Free of Charge
Contributions of assets at no cost or for nominal consideration are recognised as gains at their fair value when the asset qualifies for recognition, unless received from another Government entity as a consequence of a restructuring of administrative arrangements. Water entitlement assets valued at $247 665 000 were acquired in 2019 (2018: $92 915 000) for no cost under the Sustainable Rural Water Use and Infrastructure Program (SRWUIP) grant program and are included in asset additions in Note 19.

172Department of Agriculture Annual report 2018–19
Financial Statements
DEPARTMENT OF AGRICULTURE NOTES TO AND FORMING PART OF THE FINANCIAL STATEMENTS
Note 18: Administered – Financial Assets
2019 2018 $'000 $'000 Note 18A: Cash and Cash Equivalents Cash in special accounts 901 073 589 698 Cash on hand or on deposit 1 032 - Total cash and cash equivalents 902 105 589 698
Note 18B: Trade, Taxation and Other receivables Goods and services receivables
Goods and services 1 975 736 Total goods and services receivables 1 975 736 Taxation receivables
Levies, fees and charges 11 670 12 283 Total taxation receivables 11 670 12 283 Loans
State and Territory Governments 706 177 804 949 Farm businesses 23 570 -
Total loans 729 747 804 949 Other receivables
Statutory receivables 51 407 16 486 Personal benefits 7 538 7 394 Emergency response receivables 6 469 10 801 Interest receivable from loans 5 565 3 982
Total other receivables 70 979 38 663 Total trade, taxation and other receivables (gross) 814 371 856 631 Less impairment loss allowance
Goods and services receivables ( 811) ( 277) Taxation receivables ( 1 739) ( 1 858) Loans ( 8 256) ( 410) Other receivables ( 1 744) ( 1 623)
Total impairment loss allowance ( 12 550) ( 4 168) Total trade, taxation and other receivables (net) 801 821 852 463

173Department of Agriculture
Annual report 2018–19
Financial Statements
DEPARTMENT OF AGRICULTURE NOTES TO AND FORMING PART OF THE FINANCIAL STATEMENTS
Loans to State and Territory Governments
At 30 June 2019, five loan schemes were in place for loans to State and Territory Governments. Loans to State and Territory Governments were made under the Farm Finance and Drought loan schemes for periods up to 5 years and the Dairy Recovery, Drought Recovery and Farm Business loan schemes for up to 10 years.
Loans are subject to biannual impairment assessments. No security is required on these loans to government agencies, but a charge over assets is registered by jurisdictions issuing the loans to farmers. If a State or Territory Government is unable to recover loans provided to program recipients, the respective liability to the Commonwealth will be reviewed in accordance with the applicable loan agreements.
Principal is repaid in full at maturity for the 5 year loans, and is partially amortised during years 6 – 10 of the 10 year loans (with balance paid at maturity). Interest rates were fixed with a 6 monthly review period. Effective interest rates averaged 3.71% (2018: 3.53%) for Farm Finance loans, 3.20% (2018: 3.01%) for Drought loans, 2.73% (2018: 2.67%) for Dairy Recovery and Drought Recovery loans, and 3.14% (2018: 3.08%) for Farm Business loans. Interest payments to the Commonwealth are due on the 10th day of the month following collection.
Loans to Farm Businesses
At 30 June 2019, two loan schemes were in place for loans provided to farm businesses managed through the Regional Investment Corporation (RIC). Loans were made under the Farm Investment and the Drought loan schemes for periods up to 10 years.
Loans are subject to biannual impairment assessments. Farm businesses must provide security on these loans. If the RIC are unable to recover loans provided to program recipients, the respective liability to the Commonwealth will be reviewed in accordance with section 11 of the Regional Investment Corporation Operating Mandate Direction 2018.
Principal is partially amortised during years 6 – 10 (with balance paid at maturity). Interest rates were fixed with a 6 monthly review period. Effective interest rates averaged 3.64% (2018:N/A) for Farm Investment and Drought loans. Interest payments are due on the 10th day of the month following collection.
Accounting Judgements and Estimates
Loans to State and Territory Governments and Farm Businesses
The impairment provision for the loans provided to State and Territory Governments and farm businesses has been calculated using a 12-month Expected Credit Loss (ECL) methodology and represents a best estimate of the potential loss that may arise in the event of loan default. The ECL calculation is a result of three key parameters: • Probability of default (PD) - the likelihood of a loan recipient defaulting on repayment commitments, • Loss given default (LGD) - the financial loss to the Commonwealth if a loan defaults; and • Risk overlay - the uncertainty inherent in the loan portfolio.
The value of the provision varies from year to year due to changes in loan recipient’s ability to repay which, in turn, may be impacted by macroeconomic factors, commodity prices, interest rates, and input prices. The department engaged an independent expert to ensure the provision is consistent with commercial practices and appropriate loan provisioning parameters.
Emergency response receivables
Emergency response receivables relate to arrangements where the Commonwealth initially funds an affected industry’s share of the response to emergency plant pest or animal disease incursions. The industry must ensure that the Commonwealth is repaid within a reasonable period (usually defined as within 10 years). These receivables are usually repaid through statutory biosecurity levies. As there are no fixed repayment amounts, and only a maximum period of time in which to repay, these receivables are held at fair value through profit or loss. To estimate the fair value of the receivable balance, the department uses a discounted cash flow approach to adjust the receivable to the net present value of the anticipated cash flows.

174Department of Agriculture Annual report 2018–19
Financial Statements
DEPARTMENT OF AGRICULTURE NOTES TO AND FORMING PART OF THE FINANCIAL STATEMENTS
2019 2018 $'000 $'000 Note 18C: Investments in Corporate Commonwealth Entities AgriFutures Australia 26 643 22 555 Australian Pesticides and Veterinary Medicines Authority 16 826 7 203 Cotton Research and Development Corporation 38 784 37 704 Fisheries Research and Development Corporation 28 671 24 335 Grains Research and Development Corporation 258 844 199 363 Murray-Darling Basin Authority 102 848 79 394 Regional Investment Corporation 8 016 6 793 Wine Australia 20 913 22 875 Total investments in corporate Commonwealth entities 501 545 400 222
Accounting policy
Administered Investments
Administered investments in subsidiaries, joint ventures and associates are not consolidated because their consolidation is relevant only at the Whole of Government level.
Administered investments are not held for sale and are measured at fair value as at 30 June 2019. Fair value has been taken to be the Australian Government’s proportional interest in the net assets of the investment as at the end of reporting period.
2019 2018 $'000 $'000 Note 18D: Other Financial Assets Accrued primary industry levies 72 618 67 322 Accrued primary industry charges 2 566 1 991 Total other financial assets 75 184 69 313

175Department of Agriculture
Annual report 2018–19
Financial Statements
DEP
AR
TMEN
T O
F A
GR
ICU
LTU
RE
NO
TES
TO A
ND
FO
RM
ING
PA
RT
OF
THE
FIN
AN
CIA
L ST
ATE
MEN
TS
Not
e 19
: A
dmin
iste
red
– N
on-F
inan
cial
Ass
ets
R
econ
cilia
tion
of th
e O
peni
ng a
nd C
losi
ng B
alan
ces
of P
rope
rty,
Pla
nt a
nd E
quip
men
t and
Inta
ngib
les
La
nd
Infr
astr
uctu
re
Plan
t &
equi
pmen
t Fl
oodi
ng
ease
men
ts
Wat
er
entit
lem
ents
To
tal
$’
000
$’00
0 $’
000
$’00
0 $’
000
$’00
0 A
s at
1 J
uly
2018
G
ross
boo
k va
lue
1 4
67
860
027
4
345
8
14
139
227
1
005
880
Acc
umul
ated
dep
reci
atio
n an
d im
pairm
ent
- ( 3
35 4
86)
( 2 6
30)
- ( 1
2 70
7)
( 350
823
) To
tal a
s at
1 J
uly
2018
1
467
5
24 5
41
1 7
15
814
1
26 5
20
655
057
Add
ition
s -
713
5
34
- 4
07 6
10
408
857
R
eval
uatio
ns re
cogn
ised
in o
ther
com
preh
ensi
ve in
com
e -
9 2
29
- -
- 9
229
R
ever
sal o
f im
pairm
ents
reco
gnis
ed in
the
oper
atin
g re
sult
- -
- -
6 9
55
6 9
55
Dep
reci
atio
n ex
pens
e -
( 7 4
54)
( 29
3)
- -
( 7 7
47)
Dis
posa
ls:
Tran
sfer
red
to re
late
d en
titie
s -
- -
- ( 4
07 2
43)
( 407
243
) W
rite-
off
- -
( 12
0)
- -
( 12
0)
Tota
l as
at 3
0 Ju
ne 2
019
1 4
67
527
029
1
836
8
14
133
842
6
64 9
88
To
tal a
s at
30
June
201
9 re
pres
ente
d by
:
G
ross
boo
k va
lue
1 4
67
876
133
4
607
8
14
139
594
1
022
615
Acc
umul
ated
dep
reci
atio
n an
d im
pairm
ent
- ( 3
49 1
04)
( 2 7
71)
- ( 5
752
) ( 3
57 6
27)
Tota
l as
at 3
0 Ju
ne 2
019
1 4
67
527
029
1
836
81
4 1
33 8
42
664
988

176Department of Agriculture Annual report 2018–19
Financial Statements
DEPARTMENT OF AGRICULTURE NOTES TO AND FORMING PART OF THE FINANCIAL STATEMENTS
Disposal of non-financial assets No property, plant and equipment is expected to be sold or disposed of within the next 12 months. Water entitlements acquired as part of the department’s responsibilities under Water Act 2007 will be transferred to the Department of the Environment and Energy upon finalisation.
Revaluations of non-financial assets Revaluations are conducted in accordance with the revaluation policy. Infrastructure assets held by the River Murray Operation (RMO) joint operation are revalued by an independent, external valuer on a three year cycle. For the year ended 30 June 2019 an internal management valuation, using the relevant Rawlinson’s Building Price Index, was performed by the Murray-Darling Basin Authority (MDBA). Refer to the Joint Operations section below for more information on joint operation arrangements. A revaluation increment of $9 229 000 was recognised by the department. All increments and decrements were credited to the asset revaluation surplus by asset class and included in the other comprehensive income section of the Administered Schedule of Comprehensive Income. No decrements were expensed.
Contractual commitments for the acquisition of property, plant, equipment and intangible assets
There were no contractual commitments for the acquisition of water entitlements as at 30 June 2019 (2018: $90 680 000).
There were no contractual commitments for the acquisition of property, plant and equipment as at 30 June 2019.
Joint operations The Australian Government is a joint operator in the following jointly controlled operations and assets: Share of Output Principal 2019 2018 activity % % River Murray Operations joint operation Asset Management 20 20 Living Murray Initiative joint operation Asset Management 20 20 The Australian Government’s interest, as a joint operator, in assets employed in the above joint operations is detailed below. The amounts are included in the financial statements under their respective asset categories: 2019 2018 $'000 $'000 Joint Operations Non-current assets
Land River Murray Operations 1 467 1 467
Infrastructure River Murray Operations 527 029 524 541
Plant & equipment River Murray Operations 1 836 1 715
Flooding easements River Murray Operations 814 814
Water entitlements Living Murray Initiative 133 435 126 481
Total non-current assets 664 581 655 018 Total assets 664 581 655 018

177Department of Agriculture
Annual report 2018–19
Financial Statements
DEPARTMENT OF AGRICULTURE NOTES TO AND FORMING PART OF THE FINANCIAL STATEMENTS
Accounting policy
Joint Operations
The Australian Government is an operator of jointly controlled assets held in the RMO and Living Murray Initiative (LMI) joint operations. The Australian Government has control over its share of future economic benefits through its 20% share of the jointly controlled assets. The Australian Government recognises its share of the jointly controlled assets in its financial statements, classified according to the nature of the assets, its share of any liabilities incurred in respect of the joint operation and any income from the sale or use of its share of the output of the joint operation, together with its share of any expenses incurred by the joint operation.
Land, plant and equipment and flooding easements
Land, plant and equipment, and flooding easements assets recognised by the department represent the Commonwealth Government's share in the RMO.
RMO land, plant and equipment, and flooding easements are carried at cost, consistent with the FRR.
Infrastructure
Infrastructure assets recognised by the department represent the Commonwealth Government's share in the RMO.
RMO infrastructure assets are recorded at fair value in accordance with AASB 116 Property, Plant and Equipment, and AASB 13 Fair Value Measurement. Infrastructure assets are valued by an independent external valuer on behalf of the RMO every three years. In the intervening two years of the revaluation cycle, values are assessed by means of an internal management valuation. The latter is an indexation based valuation using the relevant Building Price Index.
Impairment
Administered items are accounted for on the same basis and using the same policies as for departmental items, including the application of Australian Accounting Standards.
Depreciation
Depreciable infrastructure and plant and equipment assets are written-down over their estimated useful lives using the straight-line method of depreciation.
2019 2018 Infrastructure 7 to 400 years 7 to 400 years Plant and equipment 3 to 80 years 3 to 80 years Water Entitlements
The department acquires water entitlements in the Murray Darling Basin to achieve the Government's environmental policy objectives under the Water Act 2007. Water entitlements are acquired in two ways, by direct purchase or ‘free of charge’.
Under the Federal Financial Relations Framework, National Partnership Payments are processed centrally by the Department of the Treasury and paid directly to each state treasury for delivery of services, including water efficiency projects that generate water savings.
State Treasuries are responsible for distributing the funding within their jurisdiction. In the Commonwealth, the Treasurer is accountable for the appropriations, estimates and payments under the framework. For National Partnership agreements, the primary responsibility for policy is with the relevant portfolio Minister. The department receives water entitlements 'free of charge' in accordance with the terms and conditions of payments made by the Treasury under the National Partnership on Water for the Future (refer to Note 17D).
Under the various water-related programs, there are a number of projects which improve the efficiency of irrigation infrastructure and generate savings in the use of water. As part of these arrangements, the Australian Government will receive a share of that water saving in the form of water entitlements for use in delivering the Government's environmental watering objectives.
Water entitlements received ‘free of charge’ are recognised as gains at their fair value using a valuation hierarchy. The valuation hierarchy prioritises recent comparable Commonwealth water purchases, followed by recent comparable prices on State registers, and may then require a cost-benefit analysis before an external or in-house valuation is undertaken. Comparable prices may include water

178Department of Agriculture Annual report 2018–19
Financial Statements
DEPARTMENT OF AGRICULTURE NOTES TO AND FORMING PART OF THE FINANCIAL STATEMENTS
entitlements for the equivalent category of entitlement (trading zone and security type) and excludes non-market or low value trades.
Once the department has finalised water entitlements as an asset in use, the Water Act 2007 requires the department to transfer the entitlements to the Commonwealth Environmental Water Holder. The department recognises the transfer of the asset as an expense in accordance with the FRR.
The department's remaining water entitlement holdings are as a result of the LMI joint operation and entitlements that are not yet classified as in use.
The department values water entitlements at cost, in the absence of an active market, in accordance with AASB 138 Intangible Assets. Water entitlements are classified as indefinite life intangible assets as there is no foreseeable limit to the period over which the assets are expected to generate future economic benefits. Consistent with AASB 136 Impairment of Assets and the FRR, they are subject to annual impairment testing.
Under AASB 136, the impairment test is carried out by comparing the carrying amount (per the department's asset register) to the recoverable amount of the water entitlements. The recoverable amount of the water entitlements is the higher of fair value less costs to sell and value in use. The recoverable amount calculation is performed at the lowest practical level, taking into account the quality and availability of data.
The department's valuation methodology calculates the recoverable amount of the water entitlements based on the best information available to reflect the amount that the department could obtain from the disposal of the water entitlements in an arm's length transaction between knowledgeable, willing parties. This approach is consistent with AASB 136.
The determination of impairment and impairment reversals is conducted annually by an independent expert, using the volume-weighted average price on publicly reported market information on State registers reported from 1 July 2018 to 31 May 2019.
An impairment loss recognised in prior periods will be reversed if there is any indication that the impairment may no longer exist or may have decreased. The increased carrying amount attributable to a reversal of an impairment loss shall not exceed the carrying amount that would have been determined had no impairment loss been recognised for the asset in prior years.
Data from State registers has been relied upon to determine the impairment and the fair value of the water entitlements received ‘free of charge’ as required by the valuation hierarchy. As noted in a recent audit of trade prices published by MDBA this data contains uncertainties over its accuracy. The department has addressed this by excluding non-market or low value trades. To ensure the validity of the impairment and fair value of the water entitlements received ‘free of charge’ the department undertook additional reviews using broker data from an independent consultant. The broker data was sourced from surveys of water brokers and trading exchanges and supports the department’s calculations.
Note 20: Administered – Payables
2019 2018 $'000 $'000 Note 20A: Levy Disbursements and Commonwealth Contributions Levy disbursements 52 113 34 891 Commonwealth contributions 101 235 66 305 Total levy disbursements and Commonwealth contributions 153 348 101 196
Note 20B: Grants Non-profit organisations 3 244 2 385 State and Territory Governments 92 754 Australian Government entities (related parties) 50 150 For profit organisations 164 79 Total grants 3 550 3 368

179Department of Agriculture
Annual report 2018–19
Financial Statements
DEPARTMENT OF AGRICULTURE NOTES TO AND FORMING PART OF THE FINANCIAL STATEMENTS
Note 21: Administered – Provisions Note 21A: Loan Commitments to Farm Businesses
Loans to Farm
Businesses As at 1 July 2018 -
Additional commitments made 17 881 Total as at 30 June 2019 17 881
Accounting policy Concessional loan commitments represent the concessional cost of commitments to provide loan advances at a below-market interest rate. Commitments to Farm Businesses reflect the concessional cost of loan advances that were committed, but not paid, by the Regional Investment Corporation on behalf of the Department of Agriculture as at 30 June 2019. All advances are expected to be paid in the 2019-20 financial year. Accounting Judgements and Estimates Concessional loan commitments are initially measured at their fair value, calculated as the present value of cash flows associated with loan advances committed, but not paid, at the time the commitment is made, discounted at the commercial market interest rate. The provision is subsequently measured at amortised cost and reduced for the concessional component as each loan is advanced.
Note 22: Administered - Aggregate Assets and Liabilities
2019 2018 $'000 $'000 Note 22A: Administered Aggregate Assets and Liabilities Assets to be recovered in:
No more than 12 months 1 218 523 840 573 More than 12 months 1 738 346 1 741 845
Total assets 2 956 869 2 582 418 Liabilities to be settled in:
No more than 12 months 178 021 107 541 More than 12 months - -
Total liabilities 178 021 107 541

180Department of Agriculture Annual report 2018–19
Financial Statements
DEPARTMENT OF AGRICULTURE NOTES TO AND FORMING PART OF THE FINANCIAL STATEMENTS
Note 23: Administered – Contingent Assets and Liabilities
Quantifiable Contingencies
There were no quantifiable contingent assets or contingent liabilities as at 30 June 2019 (2018: Nil).
Unquantifiable Contingencies
The Australian Government encourages expenditure on research and development to increase the competitiveness and sustainability of industries within Australia. Under several Acts, the Commonwealth provides contributions to a number of nominated entities responsible for undertaking research and development activities in respect of portfolio industries. These contributions are typically made on a matching basis. Under legislation, entities are eligible for matching contributions which are subject to annual “caps” based on the total cumulative amount of levies collected, amounts spent on qualifying research and development and the annual level of the determined gross value of production. The operation of these annual caps can result in annual entitlements being limited to less than full cumulative levy collections and/or cumulative qualifying research and development expenditure. However, unpaid balances may still be claimable, depending on the level of the caps determined in future years and are therefore carried forward from year to year.
At 30 June 2019, the Commonwealth had a maximum potential liability in respect of matching payments of approximately $659 million (30 June 2018: $599 million). The Commonwealth's actual future liability is contingent on a combination of several currently indeterminable independent factors which are beyond the control of both the department and the recipient entities, in particular the future annual levels of levy collections and determined gross values of production. The likelihood of meeting the eligibility requirements and the amount of future payments is uncertain. Hence, the total liability is considered unquantifiable.
Accounting policy Indemnities At the time of completion of the financial statements, there was no reason to believe that the indemnities would be called upon, and no liability has been recognised.

181Department of Agriculture
Annual report 2018–19
Financial Statements
DEPARTMENT OF AGRICULTURE NOTES TO AND FORMING PART OF THE FINANCIAL STATEMENTS
Note 24: Administered – Financial Instruments
2019 2018 $'000 $'000 Note 24A: Categories of Financial Instruments Financial Assets under AASB 139 Loans and receivables
Cash and cash equivalents 589 698 Goods and services 459 Loans 804 539 Interest receivable from loans 3 982 Emergency response receivables 10 801
Total loans and receivables 1 409 479 Available-for-sale financial assets
Investments in corporate Commonwealth entities 400 222 Total available-for-sale financial assets 400 222 Financial Assets under AASB 9 Financial assets at amortised cost1, 2
Cash and cash equivalents 902 105 Goods and services 1 164 Loans 721 491 Interest receivable from loans 5 565
Total financial assets at amortised cost 1 630 325 Financial assets at fair value through profit or loss3
Emergency response receivables 6 469 Total financial assets at fair value through profit or loss 6 469 Financial assets at fair value through other comprehensive income4
Investments in corporate Commonwealth entities 501 545 Total financial assets at fair value through other comprehensive income 501 545 Total financial assets 2 138 339 1 809 701 Financial Liabilities Financial liabilities measured at amortised cost
Trade creditors 718 298 Grants payable 3 550 3 368
Total financial liabilities at amortised cost 4 268 3 666 Total financial liabilities 4 268 3 666
1. The net income from interest revenue for loans and receivables in 2019 is $23 976 000 (2018: $23 919 000). 2. The impairment recognised in the comprehensive income statement for financial assets at amortised cost in 2019 is $1 403 000 (2018: $690 000). 3. The net fair value gain in the administered comprehensive income statement for financial assets at fair value through profit or loss in 2019 is $432 000 (2018: nil). 4. The net fair value gain recognised in the administered comprehensive income statement for financial assets at fair value through other comprehensive in 2019 is $101 323 000 (2018: $30 709 000).

182Department of Agriculture Annual report 2018–19
Financial Statements
DEPARTMENT OF AGRICULTURE NOTES TO AND FORMING PART OF THE FINANCIAL STATEMENTS
Classification of financial assets on the date of initial application of AASB 9
Financial assets class Notes
AASB 139 original
classification
AASB 9 new classification
AASB 139 carrying
amount at 1 July 2018
AASB 9 carrying
amount at 1 July 2018
$'000 $'000
Cash and cash equivalents 18A Loans and receivable Amortised Cost 589 698 589 698
Goods and services 18B Loans and receivable Amortised Cost 459 189
Loans 18B Loans and receivable Amortised Cost 804 539 797 832
Interest receivable from loans 18B
Loans and receivable Amortised Cost 3 982 3 982
Emergency response receivables 18B
Loans and receivable FVTPL 10 801 10 236
Investments in corporate Commonwealth entities 18C
Available-for-sale financial assets FVOCI 400 222 400 222
Total financial assets 1 809 701 1 802 159

183Department of Agriculture
Annual report 2018–19
Financial Statements
DEPARTMENT OF AGRICULTURE NOTES TO AND FORMING PART OF THE FINANCIAL STATEMENTS
Reconciliation of carrying amounts of financial assets on the date of initial application of AASB 9
AASB 139 carrying
amount at 1 July 2018 Re-classification
Re-measurement
AASB 9 carrying
amount at 1 July 2018
$'000 $'000 $'000 $'000 Financial assets at amortised cost Loans and receivable
Cash and cash equivalents 589 698 - - 589 698 Goods and services 459 - ( 270) 189 Loans 804 539 - ( 6 707) 797 832 Interest receivable from loans 3 982 - - 3 982 Emergency response receivables 10 801 ( 10 801) - -
Total amortised cost 1 409 479 ( 10 801) ( 6 977) 1 391 701
Financial assets at fair value through profit or loss Loans and receivable
Emergency response receivables - 10 801 ( 565) 10 236
Financial assets at fair value through profit or loss - 10 801 ( 565) 10 236 Financial assets at fair value through other comprehensive income Available-for-sale financial assets
Investments in corporate Commonwealth entities 400 222 - - 400 222
Total fair value through other comprehensive income 400 222 - - 400 222
Total financial assets 1 809 701 - ( 7 542) 1 802 159
These tables reflect the transition from AASB 139 to AASB 9 whereby classifications of financial assets and the impairment methodology have changed from the ‘incurred loss’ model to the ‘expected credit loss’ model, which means that a loss event will no longer need to occur before an impairment allowance is recognised. The emergency response receivables were reclassified from loans and receivable to fair value through profit or loss as it does not meet the requirements of basic lending arrangements and therefore cannot be recognised at amortised cost.

184Department of Agriculture Annual report 2018–19
Financial Statements
DEPARTMENT OF AGRICULTURE NOTES TO AND FORMING PART OF THE FINANCIAL STATEMENTS
Note 25: Administered – Appropriations Note 25A: Annual and Unspent Appropriations ('Recoverable GST exclusive')
2019 2018 $'000 $'000
Ordinary annual services Opening unspent appropriation balance 136 951 71 254
Annual Appropriation - Operating1 587 848 548 867 PGPA Act section 74 receipts1 15 408 1 181 PGPA Act section 75 transfers - ( 3 000) PGPA Act section 51 determinations ( 14 766) ( 56 394) Prior years Appropriation Acts repealed - ( 5 755)
Total available appropriation 725 441 556 153 Appropriation applied (current and prior years)1 ( 334 493) ( 419 202) Closing unspent appropriation balance 390 948 136 951 Balance comprises appropriations as follows:
Appropriation Act (No.1) 2016-172 23 250 23 250 Supply Act (No.1) 2016-172 1 750 1 750 Appropriation Act (No.1) 2017-18 65 531 70 257 Appropriation Act (No.3) 2017-18 40 698 41 644 Appropriation Act (No.5) 2017-18 50 50 Appropriation Act (No.1) 2018-19 202 816 - Appropriation Act (No.3) 2018-19 56 797 - Cash on hand - Appropriation Act (No.1) 2018-19 56 -
Total unspent appropriation - ordinary annual services 390 948 136 951
1 The variance between amounts appropriated in 2019 and appropriation applied is $268 763 000. This is due to unspent current year appropriations ($259 669 000) which is predominantly due to delays to the implementation of the Murray-Darling Basin Plan, PGPA Act section 51 determinations made in the current year ($14 766 000) offset by prior years appropriation applied in 2019 ($5 672 000). 2 Appropriation Act (No.1) 2016-17 and Supply Act (No.1) 2016-17 were administratively quarantined and self-repealed on 1 July 2019. Other services Opening unspent appropriation balance 446 039 504 968
Annual appropriation - Administered assets and liabilities3 715 478 671 000 PGPA Act section 75 transfers - ( 50 000) Prior year PGPA Act section 75 transfers - ( 50 000) PGPA Act section 51 determinations - ( 140 127) Prior years Appropriation Acts repealed4 ( 69 103) ( 182 780)
Total available appropriation 1 092 414 753 061 Appropriation applied (current and prior years)3 ( 194 012) ( 307 022) Closing unspent appropriation balance 898 402 446 039 Balance comprises appropriations as follows:
Appropriation Act (No.2) 2015-164 - 69 103 Appropriation Act (No.2) 2016-175 25 000 134 104 Supply Act (No.2) 2016-175 15 000 68 851 Appropriation Act (No.2) 2017-18 177 492 173 981 Appropriation Act (No.2) 2018-19 659 977 - Appropriation Act (No.4) 2018-19 20 000 - Cash on hand - Appropriation Act (No.2) 2018-19 933 -
Total unspent appropriation - other services 898 402 446 039
3 The variance between amounts appropriated in 2019 and appropriation applied is $521 466 000. This is comprised of unspent current year appropriations ($680 910 000) offset by prior years appropriation applied in 2019 ($159 444 000). The variance is due to lower than anticipated loan advances ($465 431 000) and lower than anticipated water entitlement purchases ($56 035 000). 4 Appropriation Act (No.2) 2015-16 self-repealed on 1 July 2018. 5 Appropriation Act (No.2) 2016-17 and Supply Act (No.2) 2016-17 self-repealed on 1 July 2019. Total unspent appropriation 1 289 350 582 990

185Department of Agriculture
Annual report 2018–19
Financial Statements
DEPARTMENT OF AGRICULTURE NOTES TO AND FORMING PART OF THE FINANCIAL STATEMENTS
Note 25B: Special Appropriations ('Recoverable GST exclusive')
Authority
Appropriation applied 2019 2018 $'000 $'000
Agricultural and Veterinary Chemicals (Administration) Act 1992 ( 28 500) ( 32 400) Australian Animal Health Council (Live-stock Industries) Funding Act 1996 ( 7 787) ( 7 568) Australian Meat and Live-stock Industry Act 1997 ( 216 985) ( 198 911) Dairy Produce Act 1986 ( 54 884) ( 49 149) Egg Industry Service Provision Act 2002 ( 11 428) ( 10 357) Farm Household Support Act 20141 ( 112 381) ( 34 752) Forestry Marketing and Research and Development Services Act 2007 ( 11 947) ( 12 456) Horticulture Marketing and Research and Development Services Act 2000 ( 107 020) ( 107 675) Pig Industry Act 2001 ( 23 362) ( 22 906) Plant Health Australia (Plant Industries) Funding Act 2002 ( 9 849) ( 9 135) Primary Industries Research and Development Act 1989 ( 228 792) ( 257 778) Public Governance, Performance and Accountability Act 2013 ( 657) ( 1 899) Sugar Research and Development Services Act 2013 ( 29 406) ( 31 709) Wine Australia Act 2013 ( 32 812) ( 35 802) Wool Services Privatisation Act 2000 ( 96 406) ( 85 977) Total special appropriations applied ( 972 216) ( 898 474)
1 The amount of $112 381 000 (2018: $34 752 000) was transferred to the Department of Human Services.
The following special appropriations had no transactions and budgets during the reporting and comparative years:
Australian Meat and Live-stock Industry (Repeals and Consequential Provisions) Act 1997
Dairy Industry Service Reform Act 2003
Egg Industry Service Provision (Transitional and Consequential Provisions) Act 2002
Horticulture Marketing and Research and Development Services (Repeals and Consequential Provisions) Act 2000
Public Governance, Performance and Accountability (Consequential and Transitional Provisions) Act 2014
Sewerage Agreements Act 1973
Sewerage Agreements Act 1974
Water Act 2007

186Department of Agriculture Annual report 2018–19
Financial Statements
DEPARTMENT OF AGRICULTURE NOTES TO AND FORMING PART OF THE FINANCIAL STATEMENTS
Note 26: Administered – Special accounts
Natural Resources
Management1
Water for the Environment Special
Account2 2019 2018 2019 2018 $'000 $'000 $'000 $'000 Balance brought forward from previous period 2 590 2 777 581 846 158 805 Increases 400 889 320 000 430 000 Total increases 400 889 320 000 430 000 Available for payments 2 990 3 666 901 846 588 805 Decreases ( 2 990) ( 1 076) ( 6 324) ( 6 959) Total decreases ( 2 990) ( 1 076) ( 6 324) ( 6 959) Total balance carried to the next period - 2 590 895 522 581 846 Balance made up of: Cash held in the Official Public Account - 2 590 895 522 581 846 Total balance carried to the next period - 2 590 895 522 581 846
1 Appropriation: Public Governance, Performance and Accountability Act 2013 section 80.
Establishing Instrument: Natural Resources Management (Financial Assistance) Act 1992 section 11.
Purpose: For the purposes of granting financial assistance in connection with projects relating to natural resources management. 2 Appropriation: Public Governance, Performance and Accountability Act 2013 section 80.
Establishing Instrument: Water Act 2007 section 86AB.
Purpose: For the purpose of improving the water efficiency of irrigation infrastructure and improving delivery and storage of environmental water supply within the Murray Darling Basin.
The Water for the Environment Special Account increases related to statutory credits in Water Act 2007 section 86AG.

187Department of Agriculture
Annual report 2018–19
Financial Statements
DEPARTMENT OF AGRICULTURE NOTES TO AND FORMING PART OF THE FINANCIAL STATEMENTS
Water Efficiency Labelling Scheme
Account1 Water Resources Special
Account 20162 2019 2018 2019 2018 $'000 $'000 $'000 $'000 Balance brought forward from previous period 4 272 3 844 975 994 Increases 1 901 1 922 183 394 Total increases 1 901 1 922 183 394 Available for payments 6 173 5 766 1 158 1 388 Decreases ( 1 584) ( 1 494) ( 211) ( 413) Total decreases ( 1 584) ( 1 494) ( 211) ( 413) Total balance carried to the next period 4 589 4 272 947 975 Balance made up of: Cash held in the Official Public Account 4 589 4 272 947 975 Total balance carried to the next period 4 589 4 272 947 975
1Appropriation: Public Governance, Performance and Accountability Act 2013 section 80.
Establishing Instrument: Water Efficiency Labelling and Standards Act 2005 section 64.
Purpose: For the purpose of conserving water by reducing demand through the provision of water efficiency information about water-using products and promoting the adoption of efficient water-saving techniques. 2 Appropriation: Public Governance, Performance and Accountability Act 2013 section 78.
Establishing Instrument: PGPA Act (Water Resources Special Account 2016 - Establishment) Determination 2016/01.
Purpose: For the purpose of supporting inter-governmental activities relating to water.
The department has responsibility for the National Cattle Disease Eradication Account. For the year ended 30 June 2019, the total balance carried to the next period was $15 161 (2018: $15 161). There were no transactions debited or credited to the account during the current or prior reporting period.
Appropriation: Public Governance, Performance and Accountability Act 2013 section 80.
Establishing Instrument: National Cattle Disease Eradication Act 1991 section 4.
Purpose: For the purpose of the eradication of any disease of cattle that is endemic in Australia.
The department has responsibility for the Building Australia Fund Water Portfolio Special Account. For the year ended 30 June 2019, the account had a nil balance and there were no transactions debited or credited to it during the current or prior reporting period.
Appropriation: Public Governance, Performance and Accountability Act 2013 section 80.
Establishing Instrument: Nation-building Funds Act 2008 section 82.
Purpose: For the purpose of creating and developing water infrastructure.

188Department of Agriculture Annual report 2018–19
Financial Statements
DEPARTMENT OF AGRICULTURE NOTES TO AND FORMING PART OF THE FINANCIAL STATEMENTS
Note 27: Interest in Cooperative Research Centre The Cooperative Research Centres Program, launched in 1990 by the Commonwealth Government, was established to assist two or more collaborators to carry out research contributing to the development of internationally competitive industry sectors. The program supported long term high quality research, improved links between research and application, and stimulation of education and training. The original agreement, that expired on 1 July 2012, for the Cooperative Research Centre for National Plant Biosecurity, was for seven years.
The subsequent five year agreement amended the name to the Plant Biosecurity Cooperative Research Centres (PBCRC) ended on 30 June 2018. The department’s interest in the PBCRC for the year ending 30 June 2019 was nil (2018: 1.6%).
During the financial year the department made no cash and in kind contributions to the PBCRC from its own resources (2018 actual: $309 425).
The department’s made no contributions and recognised no expenses during 2019 in the Statement of Comprehensive Income. The department’s total contribution for the life of the Cooperative Research Centres listed above was $2 552 621 (2018 actual: $2 552 621).
The department now facilitates plant biosecurity research, development and extension through the Plant Biosecurity Research Initiative (PBRI).

189Department of Agriculture
Annual report 2018–19
References
Part 5
References

190Department of Agriculture Annual report 2018–19
Acronyms
AcronymsABARES Australian Bureau of Agricultural and Resource Economics and Sciences
ANAO Australian National Audit Office
APS Australian Public Service
APVMA Australian Pesticides and Veterinary Medicines Authority
BTC Business Transformation Committee
CEWH Commonwealth Environmental Water Holder
DFAT Department of Foreign Affairs and Trade
EMC Executive Management Committee
EPBC Act Environment Protection and Biodiversity Conservation Act 1999
ESD Ecologically Sustainable Development
FHA Farm Household Allowance
FOI Freedom of Information
FTE Full-time equivalent
GST Goods and services tax
ICT Information, Communication and Technology
IDMC Information and Data Management Committee
IGAB Intergovernmental Agreement on Biosecurity
IPS Information Publication Scheme
LTAAY Long-term average annual yield
MDBA Murray–Darling Basin Authority
NAQS Northern Australia Quarantine Strategy
OBPR Office of Best Practice Regulation
PBS Portfolio Budget Statements
PGPA Act Public Governance, Performance and Accountability Act 2013
PSCC People, Safety and Culture Committee
RFA Regional Forestry Agreement
RFCS Rural Financial Counselling Service
SBCC Security and Business Continuity Committee
SDL Sustainable Diversion Limit
SES Senior Executive Service
WELS Water Efficiency Labelling and Standards scheme
WESA Water for the Environment Special Account

191Department of Agriculture
Annual report 2018–19
Glossary
Glossary APS employee: a person engaged under section 22, or a person who is engaged as an Australian public service employee under section 72 of the Public Service Act 1999
biosecurity: managing risks to Australia’s economy, environment and community of pests and diseases entering, emerging, establishing or spreading in Australia
certification of exports: the provision of official documentation confirming that goods exported from Australia conform to the importing countries conditions
Codex: Codex Alimentarius Commission develops international food standards, guidelines and codes of practice for an international food code that contributes to the safety, quality and fairness of food trade.
cost recovery: the charging of fees to cover the costs of provision of government goods and services.
drivers: Forces of change, either positive or negative, that affect supply and demand, for example, population growth or limits on natural resources
enterprise agreement: an agreement between an employer and a group of employees, or between an employer and a union or unions representing employees, made under the Fair Work Act 2009
G20: the Group of Twenty forum for international economic cooperation, comprising members from 19 countries and the European Union
headcount: the number of actual individuals—including staff on temporary transfer from other agencies and staff on any type of leave—employed at the time the data is collected. The total headcount figure only excludes office holders
levies: money collected and administered by the department on behalf of industry for use in research and development, marketing and promotion, plant and animal health programs and residue testing activities that benefit industry
market access: the openness of a country’s trading market to foreign goods and services
outcomes: the government’s objectives in each portfolio area. Outcomes are desired results, impacts or consequences for the Australian community, as influenced by the actions of the Australian Government. Actual outcomes are assessments of the end results or impacts achieved
program: the name given to the variety of activities a government agency may undertake to achieve stated outcomes
Portfolio budget statements: statements prepared by portfolios to explain the Budget appropriations in terms of outcomes and outputs (that is, where the appropriated funds are going to be spent)
quota: a limit to the amount of a particular commodity that can be exported or imported
regulation: A rule or order, as for conduct, prescribed by authority; a governing direction or law.
Regional Forest Agreement: agreement between the Australian and some state governments to set requirements for sustainable forest management
Sustainable development limits: mechanism under the Murray–Darling Basin Plan that limits the amount of water that can be taken out of the system for consumptive use.
sanitary and phytosanitary: relating to issues of human, animal and plant health, most often in regard to biosecurity measures
sustainability: The capacity for development that can be sustained into the future, within the capacity of the natural resource base. This includes encouraging sustainable agricultural and fishing practices which maintain and improve the natural resource base.

192Department of Agriculture Annual report 2018–19
List of tables
List of tables 1 Summary of performance, 2018–19 vi
2 Department of Agriculture objectives by program 4
3 Post-intervention compliance rate, 2014–15 to 2018–19 21
4 WELS Scheme website assessments and store inspections—compliance intervention effectiveness, January to June 2018 and 2018–19 24
5 WELS scheme online marketplaces—compliance intervention effectiveness, 2018–19 24
6 WELS scheme product registrations, 2018 and 2019 25
7 Australian walnut exports, 2014–15 to 2017–18 31
8 Ongoing separation rates, 2015–16 to 2018–19 a 40
9 Notifiable incident rate, 2016–17 to 2018–19 40
10 Investigations, directions and notices under work health and safety legislation, 2016–17 to 2018–19 41
11 ABARES price forecast error, 2000–01 to 2017–18 42
12 Entity Resource Statement subset Summary Current Report Period (2018–19) 45
13 Details of accountable authority during the reporting period 2018–19 50
14 Executive committees—roles and membership, 30 June 2019 51
15 Audit Committee—role and membership, 30 June 2019 56
16 Number and expenditure on consultants current report period (2018–19) 62
17 Advertising and market research for 2018–19 63
18 Parliamentary committee reports tabled, 2018–19 65
19 Government responses tabled, 2018–19 65
20 Entity resource statement 2018–19 70
21 Expenses for Outcome 1, 2018–19 76
22 Expenses for Outcome 2, 2018–19 83
23 Expenses for Outcome 3, 2018–19 86
24 All ongoing employees current report period (2018–19) 95
25 All non-ongoing employees current report period (2018–19) 96
26 All ongoing employees previous report period (2017–18) 96
27 All non-ongoing employees previous report period (2017–18) 97
28 Australian Public Service Act ongoing employees current report period (2018–19) by substantive classification 98
29 Australian Public Service Act non-ongoing employees current report period (2018–19) by substantive classification 99
30 Australian Public Service Act ongoing employees previous report period (2017–18) by substantive classification 100
31 Australian Public Service Act non-ongoing employees previous report period (2017–18) by substantive classification 101
32 Australian Public Service Act employees by attendance status current report period (2018–19) 102
33 Australian Public Service Act employees by attendance status previous report period (2017–18) 103
34 Australian Public Service Act employment type by location current report period (2018–19) 103
35 Australian Public Service Act employment type by location previous report period (2017–18) 104
36 Australian Public Service Act Indigenous employment current report period (2018–19) 104
37 Australian Public Service Act Indigenous employment previous report period (2017–18) 104
38 Australian Public Service Act Employment arrangements Current Report Period (2018-19) 105
39 Australian Public Service Act employment salary ranges by classification level (Minimum/Maximum) current report period (2018–19) 105
40 Australian Public Service Act employment performance pay by classification level current report period (2018–19) 106
41 Information about remuneration for key management personnel 107

193Department of Agriculture
Annual report 2018–19
List of figures
42 Information about remuneration for senior executives 109
43 Information about remuneration for other highly paid staff 110
44 Department of Agriculture service standards results, 2018–19 111
45 National Residue Survey—summary of results for all random monitoring programs, 2018–19 119
46 National Residue Survey— revenue and expenses, 2017–18 and 2018–19 120
47 National Residue Survey— assets, liabilities and equity, 2017–18 and 2018–19 121
48 Transactions in and out of the National Residue Survey Account, 2017–18 and 2018–19 121
49 WELS industry fee revenue, 2016–17 to 2018–19 124
50 Water for the Environment Special Account, 2015–16 to 2018–19 126
51 Aids to access details current report period (2018–19) 194
List of figures1 Departure of Agriculture demographics as at 30 June 2019 ii
2 Department of Agriculture strategic framework, 2018–19 iii
3 Agriculture portfolio as at 30 June 2019 iv
4 Department of Agriculture organisational structure as at 30 June 2019 v
5 Department of Agriculture achievements, 2018–19 vii
6 Value of rural exports in real terms 2008–09 to 2018–19 16
7 Australian managed fish stocks 2004 to 2017 19
8 Levy administration revenue and costs, 2014–15 to 2018–19 34
9 National compliance program levy coverage, 2014–15 to 2018–19 34
10 APS Employee Census Employee Engagement scores, 2017 to 2019 37
11 Unscheduled absence rates, 2015–16 to 2018–19 39
12 Own source revenue, 2013–14 to 2022–23 46
13 Sale of goods and rendering of services revenue by cost recovery activity 2018–19 46
14 Departmental expenses 2013–14 to 2022–23 47
15 Cost recovery reserve balances at 30 June 2019 47
16 Strategic risks 2019–20 57
17 Integrity snapshot, 2018–19 59
18 Energy consumption 2014–15 to 2018–19 92
19 Transport energy consumption, 2014–15 to 2018–19 92
20 Co-mingled recycling collected, 2014–15 to 2018–19 93
21 Organic waste collected, 2014–15 to 2018–19 94
Aids to accessTABLE 51 Aids to access details current report period (2018–19)
Annual report Contact Officer Assistant Director Performance and Risk
Contact Phone Number 1800 900 090
Contact Email [email protected]
Entity website (URL) www.agriculture.gov.au

194Department of Agriculture Annual report 2018–19
Compliance index
Compliance index17AD(g) Letter of
transmittal
PGPA Rule Reference
Part of Report Description Requirement Page
17AI A copy of the letter of transmittal signed and dated by accountable authority on date final text approved, with statement that the report has been prepared in accordance with section 46 of the Act and any enabling legislation that specifies additional requirements in relation to the annual report.
Mandatory x
17AD(h) Aids to access
17AJ(a) Table of contents. Mandatory viii
17AJ(b) Alphabetical index. Mandatory 203
17AJ(c) Glossary of abbreviations and acronyms.
Mandatory 190-191
17AJ(d) List of requirements. Mandatory 194
17AJ(e) Details of contact officer. Mandatory 193
17AJ(f) Entity’s website address. Mandatory 193
17AJ(g) Electronic address of report. Mandatory 216
17AD(a) Review by Accountable Authority
17AD(a) A review by the Accountable Authority of the entity.
Mandatory 5
17AD(b) Overview of the entity
17AE(1)(a)(i) A description of the role and functions of the entity.
Mandatory iii
17AE(1)(a)(ii) A description of the organisational structure of the entity.
Mandatory v
17AE(1)(a)(iii) A description of the outcomes and programs administered by the entity.
Mandatory 3-4
17AE(1)(a)(iv) A description of the purposes of the entity as included in corporate plan.
Mandatory iii

195Department of Agriculture
Annual report 2018–19
Compliance index
PGPA Rule Reference
Part of Report Description Requirement Page
17AE(1)(aa)(i) Name of the accountable authority or each member of the accountable authority
Mandatory 50
17AE(1)(aa)(ii) Position title of the accountable authority or each member of the accountable authority
Mandatory 50
17AE(1)(aa)(iii) Period as the accountable authority or member of the accountable authority within the reporting period
Mandatory 50
17AE(1)(b) An outline of the structure of the portfolio of the entity.
Portfolio departments - mandatory
iv
17AE(2) Where the outcomes and programs administered by the entity differ from any Portfolio Budget Statement, Portfolio Additional Estimates Statement or other portfolio estimates statement that was prepared for the entity for the period, include details of variation and reasons for change.
If applicable, Mandatory
Not applicable
17AD(c) Report on the performance of the entity
Annual performance statements
17AD(c)(i); 16F Annual performance statements in accordance with paragraph 39(1)(b) of the Act and section 16F of the Rule.
Mandatory 1-43
17AD(c)(ii) Report on financial performance
17AF(1)(a) A discussion and analysis of the entity’s financial performance.
Mandatory 44–48
17AF(1)(b) A table summarising the total resources and total payments of the entity.
Mandatory 45

196Department of Agriculture Annual report 2018–19
Compliance index
PGPA Rule Reference
Part of Report Description Requirement Page
17AF(2) If there may be significant changes in the financial results during or after the previous or current reporting period, information on those changes, including: the cause of any operating loss of the entity; how the entity has responded to the loss and the actions that have been taken in relation to the loss; and any matter or circumstances that it can reasonably be anticipated will have a significant impact on the entity’s future operation or financial results.
If applicable, Mandatory.
Not applicable
17AD(d) Management and accountability
Corporate governance
17AG(2)(a) Information on compliance with section 10 (fraud systems)
Mandatory 2
17AG(2)(b)(i) A certification by accountable authority that fraud risk assessments and fraud control plans have been prepared.
Mandatory 2
17AG(2)(b)(ii) A certification by accountable authority that appropriate mechanisms for preventing, detecting incidents of, investigating or otherwise dealing with, and recording or reporting fraud that meet the specific needs of the entity are in place.
Mandatory 2
17AG(2)(b)(iii) A certification by accountable authority that all reasonable measures have been taken to deal appropriately with fraud relating to the entity.
Mandatory 2
17AG(2)(c) An outline of structures and processes in place for the entity to implement principles and objectives of corporate governance.
Mandatory 50–60
17AG(2)(d) – (e) A statement of significant issues reported to Minister under paragraph 19(1)(e) of the Act that relates to non-compliance with Finance law and action taken to remedy non-compliance.
If applicable, Mandatory
2

197Department of Agriculture
Annual report 2018–19
Compliance index
PGPA Rule Reference
Part of Report Description Requirement Page
External scrutiny
17AG(3) Information on the most significant developments in external scrutiny and the entity’s response to the scrutiny.
Mandatory 65–68
17AG(3)(a) Information on judicial decisions and decisions of administrative tribunals and by the Australian Information Commissioner that may have a significant effect on the operations of the entity.
If applicable, Mandatory
Not applicable
17AG(3)(b) Information on any reports on operations of the entity by the Auditor-General (other than report under section 43 of the Act), a Parliamentary Committee, or the Commonwealth Ombudsman.
If applicable, Mandatory
65–67
17AG(3)(c) Information on any capability reviews on the entity that were released during the period.
If applicable, Mandatory
Not applicable
Management of human resources
17AG(4)(a) An assessment of the entity’s effectiveness in managing and developing employees to achieve entity objectives.
Mandatory 36–40
17AG(4)(aa) Statistics on the entity’s employees on an ongoing and non-ongoing basis, including the following:
(a) statistics on full-time employees;
(b) statistics on part-time employees;
(c) statistics on gender
(d) statistics on staff location
Mandatory 94–96
17AG(4)(b) Statistics on the entity’s APS employees on an ongoing and non-ongoing basis; including the following:
statistics on staffing classification level;
statistics on full-time employees;
statistics on part-time employees;
statistics on gender;
statistics on staff location;
statistics on employees who identify as Indigenous.
Mandatory 97–103

198Department of Agriculture Annual report 2018–19
Compliance index
PGPA Rule Reference
Part of Report Description Requirement Page
17AG(4)(c) Information on any enterprise agreements, individual flexibility arrangements, Australian workplace agreements, common law contracts and determinations under subsection 24(1) of the Public Service Act 1999.
Mandatory 104
17AG(4)(c)(i) Information on the number of SES and non-SES employees covered by agreements etc. identified in paragraph 17AG(4)(c).
Mandatory 104
17AG(4)(c)(ii) The salary ranges available for APS employees by classification level.
Mandatory 104
17AG(4)(c)(iii) A description of non-salary benefits provided to employees.
Mandatory 105
17AG(4)(d)(i) Information on the number of employees at each classification level who received performance pay.
If applicable, Mandatory
105
17AG(4)(d)(ii) Information on aggregate amounts of performance pay at each classification level.
If applicable, Mandatory
105
17AG(4)(d)(iii) Information on the average amount of performance payment, and range of such payments, at each classification level.
If applicable, Mandatory
105
17AG(4)(d)(iv) Information on aggregate amount of performance payments.
If applicable, Mandatory
105
Assets management
17AG(5) An assessment of effectiveness of assets management where asset management is a significant part of the entity’s activities
If applicable, mandatory
48
Purchasing
17AG(6) An assessment of entity performance against the Commonwealth Procurement Rules.
Mandatory 61–62

199Department of Agriculture
Annual report 2018–19
Compliance index
PGPA Rule Reference
Part of Report Description Requirement Page
Consultants
17AG(7)(a) A summary statement detailing the number of new contracts engaging consultants entered into during the period; the total actual expenditure on all new consultancy contracts entered into during the period (inclusive of GST); the number of ongoing consultancy contracts that were entered into during a previous reporting period; and the total actual expenditure in the reporting year on the ongoing consultancy contracts (inclusive of GST).
Mandatory 62
17AG(7)(b) A statement that “During [reporting period], [specified number] new consultancy contracts were entered into involving total actual expenditure of $[specified million]. In addition, [specified number] ongoing consultancy contracts were active during the period, involving total actual expenditure of $[specified million]”.
Mandatory 62
17AG(7)(c) A summary of the policies and procedures for selecting and engaging consultants and the main categories of purposes for which consultants were selected and engaged.
Mandatory 62–63
17AG(7)(d) A statement that “Annual reports contain information about actual expenditure on contracts for consultancies. Information on the value of contracts and consultancies is available on the AusTender website.”
Mandatory 62
Australian National Audit Office access clauses
17AG(8) If an entity entered into a contract with a value of more than $100 000 (inclusive of GST) and the contract did not provide the Auditor-General with access to the contractor’s premises, the report must include the name of the contractor, purpose and value of the contract, and the reason why a clause allowing access was not included in the contract.
If applicable, Mandatory
62

200Department of Agriculture Annual report 2018–19
Compliance index
PGPA Rule Reference
Part of Report Description Requirement Page
Exempt contracts
17AG(9) If an entity entered into a contract or there is a standing offer with a value greater than $10 000 (inclusive of GST) which has been exempted from being published in AusTender because it would disclose exempt matters under the FOI Act, the annual report must include a statement that the contract or standing offer has been exempted, and the value of the contract or standing offer, to the extent that doing so does not disclose the exempt matters.
If applicable, Mandatory
62
Small business
17AG(10)(a) A statement that “[Name of entity] supports small business participation in the Commonwealth Government procurement market. Small and Medium Enterprises (SME) and Small Enterprise participation statistics are available on the Department of Finance’s website.”
Mandatory 61
17AG(10)(b) An outline of the ways in which the procurement practices of the entity support small and medium enterprises.
Mandatory 61
17AG(10)(c) If the entity is considered by the Department administered by the Finance Minister as material in nature—a statement that “[Name of entity] recognises the importance of ensuring that small businesses are paid on time. The results of the Survey of Australian Government Payments to Small Business are available on the Treasury’s website.”
If applicable, Mandatory
61
Financial statements
17AD(e) Inclusion of the annual financial statements in accordance with subsection 43(4) of the Act.
Mandatory 127–188
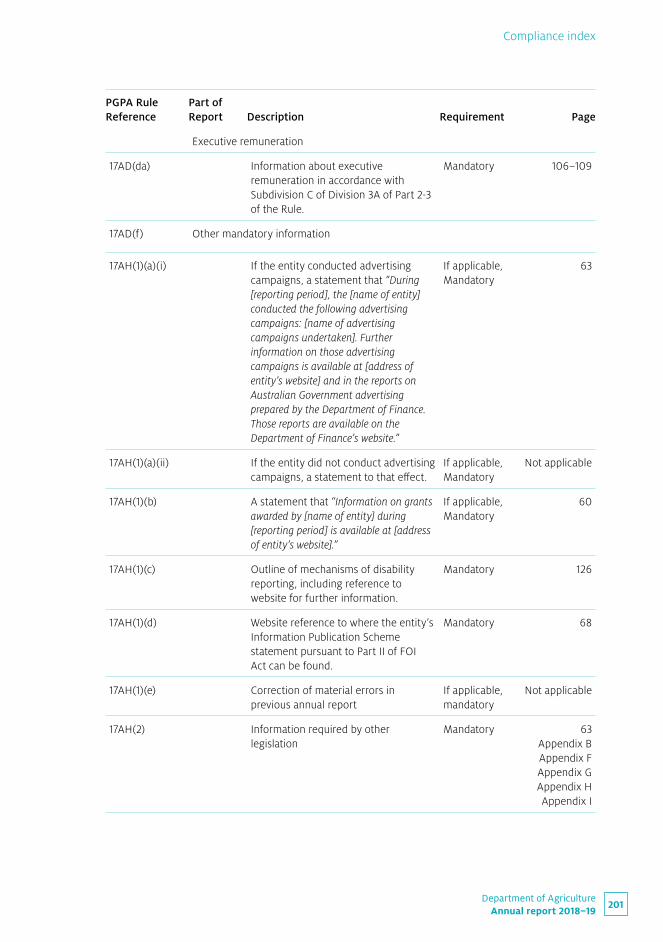
201Department of Agriculture
Annual report 2018–19
Compliance index
PGPA Rule Reference
Part of Report Description Requirement Page
Executive remuneration
17AD(da) Information about executive remuneration in accordance with Subdivision C of Division 3A of Part 2-3 of the Rule.
Mandatory 106–109
17AD(f) Other mandatory information
17AH(1)(a)(i) If the entity conducted advertising campaigns, a statement that “During [reporting period], the [name of entity] conducted the following advertising campaigns: [name of advertising campaigns undertaken]. Further information on those advertising campaigns is available at [address of entity’s website] and in the reports on Australian Government advertising prepared by the Department of Finance. Those reports are available on the Department of Finance’s website.”
If applicable, Mandatory
63
17AH(1)(a)(ii) If the entity did not conduct advertising campaigns, a statement to that effect.
If applicable, Mandatory
Not applicable
17AH(1)(b) A statement that “Information on grants awarded by [name of entity] during [reporting period] is available at [address of entity’s website].”
If applicable, Mandatory
60
17AH(1)(c) Outline of mechanisms of disability reporting, including reference to website for further information.
Mandatory 126
17AH(1)(d) Website reference to where the entity’s Information Publication Scheme statement pursuant to Part II of FOI Act can be found.
Mandatory 68
17AH(1)(e) Correction of material errors in previous annual report
If applicable, mandatory
Not applicable
17AH(2) Information required by other legislation
Mandatory 63 Appendix B Appendix F Appendix G Appendix H Appendix I

202Department of Agriculture Annual report 2018–19
Subject index
Subject indexA
ABARES Division, v
ABARES Insights, 43
and exotic environmental pests and diseases, 20
forecasting, 42–43
Aboriginal and Torres Strait Island Employment Strategy 2018– 2020, 38
Aboriginal and Torres Strait Islander staff, ii, 38, 103
absences of staff, unscheduled, 39
access details for current report period (2018–19), 193
access to markets, 6, 30–31
accidents (notifiable incidents), 40
accountability see management and accountability
Accountable Authority see Secretary
Accountable Authority Instructions, 61
achievements, vii
acronyms, 191
administered program performance, 48
advertising and market research, 63–64
African swine fever, 12, 22
agricultural and veterinary chemicals, 29, 30
Agricultural and Veterinary Chemicals Act 1994, 89
Agricultural and Veterinary Chemicals (Administration) Act 1992, 89
Agricultural and Veterinary Chemicals Code Act 1994, 89
Agricultural commodities, 42
agricultural communities and industries, support for, 8
Agricultural innovation—a national approach to grow Australia’s future, 9, 15
agricultural land, 12, 19–20
Agricultural Policy Division, v
agricultural productivity, 8–9
performance of portfolio industries, 17
agricultural traceability systems, 7
agricultural workforce, 9
agriculture, risks to, 12–13
Agrifutures Australia, iv
agvet chemicals, 29, 30
Agvet Chemicals, Fisheries and Forestry Division, v
Amazon Australia, 123
ANAO (Australian National Audit Office), 65–67
ANAO reports, 65–67
animal diseases, 22
annual performance statements see performance
ant incursions, 13, 20
APS Code of Conduct, 58
APS Demand Reduction Initiative, 91
APS Employee Census, 36, 38
APS Statistical Bulletin, 126
APS Values, 58
ASEL sea transport review, 14
assets management, 48
Assistance Grants—Access to Industry Priority Uses of Agvet Chemicals Grants program, 29, 30
Assistant Minister for Forestry and Fisheries, iv
Assurance and General Legal Counsel Division, v
attendance status of staff, 102, 103
Attorney-General’s Department
security reporting to, 60
Audit Committee, 55–56
Auditor-General, 65–67
and access to contractors' premises, 62
audits
Australian National Audit Office, 65–67
Comcare, 13
internal audit program, 55
by trading partners, 7
AusTender, 62
Austrade, 7
Australia–Indonesia free trade agreement, 6
Australian Chief Veterinary Officer, v

203Department of Agriculture
Annual report 2018–19
Subject index
Australian Competition and Consumer Commission
and wheat port code of conduct, 9
Australian crop report, 42
Australian Export Meat Inspection System, 7
Australian Fisheries Management Authority, iv
Australian Government Protective Security Policy Framework, 60
Australian Government Reporting Platform on the SDG Indicators, 90
Australian Information Commissioner, 68
Australian Meat and Live-stock Industry Act 1997, 22
Australian National Audit Office (ANAO), 65–67
Australian National University, 38
Australian Pesticides and Veterinary Medicines Authority, iv
Australian Public Service Commission
code of conduct, 58
demand reduction initiative, 91
employee census, 36, 38
review of, 14, 15
State of the Service reports, 126
Statistical Bulletin, 126
values, 58
Australian Rural Leadership Program, 38
Australian Standards for the Export of Livestock
review of live animals transported by sea, 5
Australian Workplace Equality Index, 39
Australia–Peru Free Trade Agreement, 6
Australia’s State of the Forests Report, 10
autism, people with, 39
B
Basin Plan, 10, 17, 19, 125
biosecurity
import screening, 21
international approach to biosecurity obligations, 7
managing risk, 25, 43
review of national biosecurity system, 12
risks to agriculture and the environment, 12–13, 15
use of 3D X-rays, 36
Biosecurity 2025 and Beyond initiative, 13
Biosecurity Act 2015, 60, 89
Biosecurity Animal Division, v
Biosecurity Innovation Program, 13
Biosecurity Operations Division, v
Biosecurity Plant Division, v
Biosecurity Policy and Implementation Division, v
Blight, Tiffany, v
'bridging the gap' target under the Murray–Darling Basin Plan, 10, 17, 19
Briscoe, Cindy, v, 50
Brown, Scott, v
brown marmorated stink bug, 12, 26, 27
browsing ants, 13
Brunei
market access to, 7
Bryant, David, 56
budget, 41, 44
business processes and services, 26–28, 41
Business Transformation Committee, 51, 52
Bycatch Policy, Commonwealth Fisheries, 11
C
Canning, Emily, v
Carter, Ross, 68
casual staff, ii, 102, 103
CCS (Commonwealth Contracting Suite), 61
census of employees, 36, 38
CEWH (Commonwealth Environmental Water Holder), 17, 19
chemicals for minor uses, 29, 30
Chief Environmental Biosecurity Officer, v, 13
Chief Finance Officer, v
Chief Information Officer, v
Chief Risk Officers Forum, 58
Chief Scientist and Chief Plant Protection Officer, v

204Department of Agriculture Annual report 2018–19
Subject index
China
market access to, 7
Clark, Andreas, iv
classification levels of staff, 97–100
client contact services, 110
client service standards, 26–28, 110–116
climate risk management, 57
codes of conduct
APS Code of Conduct, 58
conduct snapshot, 59
dairy industry and wheat port, 9
Codex Alimentarius Commission, 7
Codex Committee on Food Import and Export Inspection and Certification Systems, 7
COFFIE (Commonwealth On-Farm Further Irrigation Efficiency) program pilot, 124
Collaborating with industry on chemicals for minor uses, snapshot, 30
Combatting brown marmorated stink bug, snapshot, 27
Comcare annual audit, 13
Comcare WHS management system, 40
Comcover Risk Management Benchmarking Program survey, 57
Comcover risk maturity rating, 57
Commonwealth Contracting Suite(CCS), 61
Commonwealth Disability Strategy, 126
Commonwealth Environmental Water Holder (CEWH), 17, 19
Commonwealth Fisheries Bycatch Policy, 11
Commonwealth Fisheries Harvest Strategy Policy, 11
Commonwealth Ombudsman, 67
Commonwealth On-Farm Further Irrigation Efficiency (COFFIE) program pilot, 124
Commonwealth Procurement Rules, 61, 63
Commonwealth Risk Management Policy, 56, 57
Commonwealth Risk Managers Forum, 58
communities, agricultural
support for, 8
Community Engagement Officers, 15
compliance
across regulatory portfolios, 28
Farm Management Deposits Scheme, 67
and integrity framework, 58
intervention on compliance pathways, 21–25
rate in Comcare audit, 13
reporting in Learnhub, 37
and security policy, 60
WELS scheme, 10, 122–123
Compliance Division, v
compliance index, 194–202
Comprehensive and Progressive Agreement for Trans-Pacific Partnership, 6, 14
Comprehensive Economic Partnership Agreement
Australia–Indonesia, 6
consultancies, 62–63
contact details, 221
contractors' premises access by Auditor-General, 62
contracts, exempt, 62
The Conversation website, 43
corporate governance, 14, 50–60
Corporate Plan 2018–19, 3, 6, 56
Corporate Strategy and Governance Division, v
cost-recovery reserves, 47
Cotton Advisory Committee 78th International Plenary Meeting, 15
Cotton Research and Development Corporation, iv, 35
Council of Australian Governments, 8
counsellor network, overseas, 7, 31
Creative Commons licence, 216
criteria for performance see performance criteria
culture, department, 36
cyber security, 14
D
dairy industry code of conduct, 9
Darling River fish deaths, 18
Deininger, Rosemary, v
Demand Reduction Initiative, APS, 91

205Department of Agriculture
Annual report 2018–19
Subject index
demographics of employees, ii
Department of Agriculture
achievements, vii
corporate plan, 3, 6, 56
demographics, ii
financial performance, 44–48
integrity culture, 13, 38
objectives and programs, 3–4
organisational structure, v
outcomes, 3
portfolio, iv
purpose, 3, 5
security, 60
strategic framework, iii
see also performance; Secretary
Department of Finance
and government advertising, 63
and small and medium-sized business statistics, 61
Department of Foreign Affairs and Trade
and 2030 Agenda, 90
and free trade agreements, 6
and Minister-Counsellor (Agriculture), 7
and walnut industry, 31
Department of Social Services
and reports on people with disability, 126
Department of the Environment and Energy
and National Invasive Ant Biosecurity Plan, 20
and National Landcare Program, 12, 90
Department of the Prime Minister and Cabinet
and 2030 Agenda, 90
and Indigenous procurement, 62
departmental expenses, 47
deputy secretaries, v, 50
digital learning, 37
directions and notices under work health and safety legislation, 41
disability, staff with, ii
disability reporting, 126
disclosure of information, 60
diseases see pests and diseases
diversity and inclusion in the workplace, ii, 13, 37–39
domestic water savings, 121
drought and floods, 5, 8, 10, 14
impact of pests and weeds during drought, 12
Drought Reform Measures in Western Australia, pilot program, 8
Duniam, Jonathon (Assistant Minister for Forestry and Fisheries), iv
E
eBay, 122
ecologically sustainable development, 88–93
economic and scientific modelling, 41–43
Emanuel Exports, 22
EMC (Executive Management Committee), 50–51
employee census, 36, 38
employee engagement, 36
employees see staff
Employment Principles, 58
EMS Rural Exports Pty Ltd, 22
encourage agricultural productivity, strategic objective, 17
energy efficiency in central office buildings, 91–92
engagement scores, APS Census, 36
Engaging in Outside Employment, 58
enterprise agreements, 105
Enterprise ICT Capability Program, 48
Enterprise Risk Management Policy and Framework, 56
enterprise-wide enabling services, function, 36–41
entity resource statement, 45, 70–87
environment
environmental performance, 88–93
environmental water, 124–125
risks to, 12–13
Environment Protection and Biodiversity Conservation Act 1999, 88
Environmental Biosecurity Advisory Group, 20

206Department of Agriculture Annual report 2018–19
Subject index
Environmental Biosecurity Fund, 20
environmental contaminants in food, 118
erosion, wind and water, 20
ESCAS (Exporter Supply Chain Assurance System), 22
European Union
free trade negotiations, 14
market access to, 7
evidence-based policy, 29
executive, 50
remuneration, 106
Executive Director, ABARES Division, v
Executive Leadership Group for Indigenous Matters, 37
Executive Management Committee (EMC), 50–51
executive remuneration, 106
exempt contracts, 62
Export Control Act 1982, 89
export services, 112–113
Exporter Supply Chain Assurance System (ESCAS), 22
exports
live animals, 5
systems for, 14
trend in value of, 16
Exports Division, v
external scrutiny
ANAO reports, 65–67
Commonwealth Ombudsman, 68
freedom of information, 68
Inspector-General of Biosecurity, 67
Interim Inspector-General of Live Animal Exports, 68
parliamentary committees, 65
see also audits; reviews
external service providers, 61–64
F
Farm Household Allowance (FHA), 8, 14
Farm Liaison Officers, 8
farm management deposits, 8, 67
female staff, ii
FHA (Farm Household Allowance), 8, 14
finance
budget, 41, 44
financial management information system, 44
financial performance, 44–48
financial statements, 127–188
fraud and corruption, 59
purchaser–provider arrangements, 63
resource statement, 45, 70–72
see also audits; remuneration
Finance and Business Support Division, v
financial statements, 127–188
fire ants, red imported, 13
fisheries, 11, 19
fish deaths, 18
Fisheries Administration Act 1991, 89
Fisheries Bycatch Policy, 11
Fisheries Harvest Strategy Policy, 11
Fisheries Management Act 1991, 89
Fisheries Research and Development Corporation, iv
floods see drought and floods
food
food and fibre products, SDGs, 90
food production, SDGs, 90
imported food safety, 21
residues in, 119
safety standards, 7
forecasting and strategic intelligence, function, 41–43
forecasting the weather, 33
forests, 10–11
forest management, SDGs, 91
frameworks, 55
fraud and corruption, 59

207Department of Agriculture
Annual report 2018–19
Subject index
Fraud and Corruption Control Plan, 58
free trade agreements
Australia–Indonesia, 6, 15
negotiations with Hong Kong, 14
Peru–Australia, 6
freedom of information, 68
Freeman, Fran, v
fruit and nut industry, 27, 31
fruit fly pest free-status, 7
fuel consumption in department vehicles, 92
full time staff, ii, 102, 103
functions, iii
Function 1: Regulation and service delivery, 21–29
Function 2: Policy and programs, 29–30
Function 3: Trade and market access, 30–31
Function 4: Research and innovation, 32–36
Function 5: Enterprise-wide enabling services, 36–41
Function 6: Forecasting and strategic intelligence, 41–43
see also performance; purpose; strategic objectives
Future Drought Fund, 8, 14
G
Galway, Nora, 31
gender of staff, 98–101
glossary, 192
Glyde, Phillip, iv
Gooday, Peter, v
governance, 14, 50–60
governance framework, 50–56
government regulator, 5, 14, 26
Graduate Development Program 2019, 38
Grains Research and Development Corporation, iv
grants, 29, 30, 60
green energy, 91
groundcover, 19, 20
Growing a better Australia—A billion trees for jobs and growth, 91
Growing reconciliation: Reconciliation Action Plan 2017–2019 (RAP), 37
H
Harvest Strategy Policy, Commonwealth Fisheries, 11
Harvey, John, iv
health and safety see workplace health and safety
Healy, Marion, v, 56
Hone, Patrick, iv
Hong Kong
free trade negotiations, 14
horticultural industry, 27
Horticulture Innovation Australia prioritisation process, 31
human resources management, 13–14, 15
see also staff
I
ICT Strategy, 14
IGAB (Intergovernmental Agreement on Biosecurity), 12
IIGLAE (Interim Inspector-General of Live Animal Exports), 68
illegal logging, 23, 91
Illegal Logging Prohibition Act 2012, 89, 91
Illegal Logging Prohibition Regulation 2012, 23
import screening, 21
import services, 110–112
imported food safety, 21
Improved use of seasonal forecasting to increase farmer profitability, snapshot, 33
incidents (accidents and injury), 40
Inclusion Strategy, 13
increase, improve and maintain markets, strategic objective, 16
independent review bodies' reports see external scrutiny
India
market access to, 7

208Department of Agriculture Annual report 2018–19
Subject index
Indigenous Apprenticeship Program, 38
Indigenous Australian Government Development Program, 38
Indigenous heritage sites, forests, 10
Indigenous language training for staff, 38
Indigenous procurement, 61–62
Indigenous Procurement Policy, 61, 62
Indigenous staff, ii, 37–39, 103
Indonesia–Australia free trade agreement, 6, 14
industries, agricultural
support for, 9
information
access to, 68
Australian Information Commissioner, 68
disclosure of, 60
information and communication technology
business processes and services, 26–29, 41
ICT Strategy, 14
Information and Data Management Agenda, 14
Information and Data Management Committee, 51, 53
Information Publication Scheme (IPS), 68
Information Services Division, v
infrastructure
in agricultural communities, 8
for forest industries, 15
ICT infrastructure, 27
Murray–Darling Basin Water Infrastructure Program, 125
water infrastructure, 10, 18
injuries (notifiable incidents), 40
InkWELS newsletter, 122
innovation in agriculture, 9
inquiries by parliamentary committees, 65
Inspector-General of Biosecurity, 67
Institute for Sustainable Futures (ISF), University of Technology Sydney, 28, 122
Integrity Awareness training program, 38
integrity culture
in department, 13, 38
Integrity culture program, snapshot, 38
strengthening integrity, 58–59
Integrity Unit and Hotline, 38
Intergovernmental Agreement on Biosecurity (IGAB), 12
Interim Inspector-General of Live Animal Exports (IIGLAE), 68
internal audit program, 55
International Organization for Standardization (ISO) project committee on water efficiency, 123
International Sugar Organization 55th Council Session, 15
International Women’s Day, 39
internet home page, 216
investigations, directions and notices under work health and safety legislation, 41
IPS (Information Publication Scheme), 68
ISF (Institute for Sustainable Futures), University of Technology Sydney, 10, 28
ISO (International Organization for Standardization) project committee on water efficiency, 122
J
Jawun APS Secondment Program, 38
Jefferies, Steve, iv
K
Kennedy, Cass, v
King, Bruce, iv
Knuckey, Geoff, 56
Koval, Matt, v
L
Lane, Peta, v
Learnhub, 37
learning and development, staff, 13, 37
legislation
Agricultural and Veterinary Chemicals Act 1994, 89

209Department of Agriculture
Annual report 2018–19
Subject index
Agricultural and Veterinary Chemicals (Administration) Act 1992, 89
Agricultural and Veterinary Chemicals Code Act 1994, 89
Australian Meat and Live-stock Industry Act 1997, 22
Biosecurity Act 2015, 60, 89
Environment Protection and Biodiversity Conservation Act 1999, 88
Export Control Act 1982, 89
Fisheries Administration Act 1991, 89
Fisheries Management Act 1991, 89
Illegal Logging Prohibition Act 2012, 89
National Residue Survey Administration Act 1992, 118
Natural Resources Management (Financial Assistance) Act 1992, 89, 117
Primary Industries and Energy Research and Development Act 1989, 89
Public Governance, Performance and Accountability Act 2013, 2, 58, 61
Public Interest Disclosure Act 2013, 58
Regional Forest Agreements Act 2002, 89
Torres Strait Fisheries Act 1984, 89
Water Act 2007, 89
Water Efficiency Labelling and Standards Act 2005, 23, 89, 121
Work Health Safety Act 2011, 40
letter of transmittal, x
levies
and cost recovery, 66
to fund rural research and development, 32, 34
industry levies, 5
for monitoring residues in food, 118
LGBTIQ staff, ii, 39
Linacre, Alice, v
list of figures, 193
list of tables, 192–193
Littleproud, David (Minister for Water Resources, Drought, Rural Finance, Natural Disaster and Emergency Management), iv
Live Animal Exports Division, v
live animals
export regulation, 5, 22, 68
export services, 112–116
exported by sea and air, 14
location of staff, ii, 102, 103
logging, illegal, 23
M
management and accountability, 49–68
map tools, 20
market research and advertising, 63–64
markets, 5, 6–7
access to, 6, 30–31
value of agricultural exports, 16
marmorated stink bug, 12, 26, 27
Martin, Robyn, v
Mason, Neil, v, 50
McEwen, Melissa, v
McKenzie, Bridget (Minister for Agriculture), iv
McKeon, Peter, v
medium sized business participation in procurement, 61
Men’s Mental Health seminar, 39
Milparanga Leadership program, 38
Minister-Counsellor (Agriculture), 7
Minister for Agriculture, iv
Minister for Water Resources, Drought, Rural Finance, Natural Disaster and Emergency Management, iv
Modernising Agricultural Trade, 14
More profit from nitrogen—enhancing the nutrient use efficiency of cropping and pasture systems, snapshot, 35
Morris, Paul, v
Moss, Philip, 5
Murray–Darling Basin Authority, iv, 17
Murray–Darling Basin Ministerial Council, 18, 125
Murray–Darling Basin Plan, 10, 17, 19, 124
Water Infrastructure Program, 125

210Department of Agriculture Annual report 2018–19
Subject index
N
NAIDOC week, 39
National Australian Built Environment Rating System, 91
National Biosecurity Statement, 12
national biosecurity system, review, 12
National Disability Strategy 2010–2020, 126
National Drought Agreement, 8, 14
National Environmental Biosecurity Response Agreement (NEBRA), 13
National Forest Industries Plan, 11, 15
National Forest Industry Plan Growing a better Australia—A billion trees for jobs and growth, 91
National Forest Policy Statement, 91
National Invasive Ant Biosecurity Plan, 20
National Landcare Program, 12, 19, 20, 90, 117
National Residue Survey (NRS), 118
National Residue Survey Administration Act 1992, 118
National Residue Survey Annual Report 2018-19, 118
National Traceability Project, 7
Native Fish Management and Recovery Strategy, 18
natural resource management (NRM) unit, 19
natural resources
management, SDGs, 90
quality of resource base, 17–20
sustainable high-quality, 10–12
Natural Resources Management (Financial Assistance) Act 1992, 89
report on operation of, 117
NEBRA (National Environmental Biosecurity Response Agreement), 13
neutrality test for assessing water efficiency measure projects, 125
A new Chief Environmental Biosecurity Officer, snapshot, 20
nitrogen use, 35
non-English speaking backgrounds staff, ii
non-ongoing staff, 95, 96
non-salary benefits, 105
Norris, Wez, iv
Northern Basin Review, 10
notices under work health and safety legislation, 41
notifiable incidents, 40
NRM (natural resource management) unit, 19
NRS (National Residue Survey), 118
nut industry, 27, 31
O
objectives see strategic objectives
OBPR (Office of Best Practice Regulation), 25
Occupation List, Regional, 9
occupational health and safety, 40–41
O’Connell, Lyn, v, 50
Office of Best Practice Regulation (OBPR), 25
Office of the Australian Information Commissioner, 68
Ombudsman, Commonwealth, 67
On-farm Emergency Water Infrastructure Rebate Scheme, 10
ongoing staff, 95, 96
organisational structure, v
Outcome 1
ecologically sustainable development principles, 88
expenses for, 75–82
Outcome 2
ecologically sustainable development principles, 88
expenses for, 83–85
Outcome 3
ecologically sustainable development principles, 88
expenses for, 86–87
outcome statements, 3
outlook see year ahead
overseas counsellor network, 7, 31

211Department of Agriculture
Annual report 2018–19
Subject index
P
Parker, Chris, iv
parliamentary committees, 65
part time staff, ii, 102, 103
Pat Turner Scholarship, 38
pay see remuneration
payment to small and medium sized businesses, 61
people see staff
People, Safety and Culture Committee, 51, 54
People Strategy, 13, 15, 37
People Strategy 2019–2023, 37
performance
in delivering functions, 21–43
financial, 44–48
overview against strategic objectives, 6–14
results against criteria for objectives, 16–20
summary, vi
performance criteria
for functions, 21, 25, 26, 28, 29, 30, 32, 36, 40, 41
for objectives, 16, 17
performance pay, 105
personnel see staff
Peru
market access to, 7
Peru–Australia Free Trade Agreement, 6
pesticides residues in food, 118
pests and diseases
animal diseases, 22
biosecurity, 12–13, 15
brown marmorated stink bug, 12, 26, 27
impact of exotic pests and diseases, 3, 12, 20
impact of pests and weeds during drought, 12
risk management, 15
use of agvet chemicals, 30
pig industry, 22
Pilot of Drought Reform Measures in Western Australia, 8
plantation trees, 11, 91
policy and programs, function, 29–30
portfolio, iv
Portfolio Budget Statements 2018–19, 3, 44, 46, 47
Pride in Diversity, 39
Primary Industries and Energy Research and Development Act 1989, 89
Principal Regulatory Officer, Live Animal Exports Division, v
procurement, 61–64
productivity, agricultural see agricultural productivity
programs, 3–4
Program 1.1 expenses, 71–75
Program 1.2 expenses, 76
Program 2.1 expenses, 83
Program 2.2 expenses, 74–85
Program 3.1 expenses, 86
see also policy and programs, function
protected information, 60
Protecting Australia from animal diseases, snapshot, 22
Protective Security Policy, 60
Public Governance, Performance and Accountability Act 2013, 2, 58, 61
review of, 14
Public Interest Disclosure Act 2013, 58
purchaser–provider arrangements, 63
purchasing, 61–64
purpose
statement, 3, 5
and strategic objectives, 16–20
see also strategic framework
Q
Quinlivan, Daryl, iv, v
Accountable Authority, 2, 50
see also Secretary

212Department of Agriculture Annual report 2018–19
Subject index
R
RAP (Growing reconciliation: Reconciliation Action Plan 2017–2019), 37
RaPP (Rangeland and Pasture Productivity) Map tool, 20
Reach program for people with Autism, 39
rebate schemes, 10
recycling, 93–94
red imported fire ants, 13
Regional Comprehensive Economic Partnership, 14
Regional Forest Agreements Act 2002, 89
Regional Forest Agreements (RFAs), 11, 91
Regional Forestry Hubs, 11, 15
Regional Investment Corporation, iv
Regional Land Partnerships program, 12, 19
Regional Occupation List, 9
Regional Wellbeing Survey, 8
regulation
and clients and stakeholders, 25
government regulator, 5, 14, 26
of live animal exports, 5, 22, 68
regulatory practice statement, 14
regulation and service delivery, function, 21–29
regulation impact statements (RISs) and independent reviews, 25–26
regulator, government, 5, 14, 26
Regulatory Practice Framework, 5
rehabilitation management, 13
Rehabilitation Management System, 13
Remedial Action Notices, 23
remuneration
employment arrangements, 104
executive and senior staff remuneration, 106–109
non-salary benefits, 105
performance pay, 105
salary structure, 104
Reporting Platform on the SDG Indicators, 90
research and innovation, function, 32–35
residues of pesticides and veterinary medicines in
food, 118
resource statement, 45, 70–72
resources see natural resources
Responding to Darling River fish deaths, snapshot, 18
retention of staff, 40
revenue, 46
Review of the Regulatory Capability and Culture of the Department of Agriculture and Water Resources, 68
review of year, Secretary
biosecurity -- managing risks to agriculture and the environment, 12–13
efficient and capable department, 13–14
encourage agricultural productivity, 8–9
increase, improve and maintain markets, 6–7
support sustainable high–quality natural resources, 10–12
year ahead, 14–15
reviews
ASEL sea transport review, 14
of Australian Public Service Commission, 14, 15
of live animals transported by sea, 5
of national biosecurity system, 12
Northern Basin Review, 10
regulation impact statements and independent reviews, 25–26
of the Regulatory Capability and Culture of the Department of Agriculture and Water Resources, 68
RFAs (Regional Forest Agreements), 11, 91
RFCS (Rural Financial Counselling Service), 8
risk management, 56–58
risks to agriculture and the environment, 12–13, 15
Risk Return Resource Allocation, 43
RISs (regulation impact statements) and independent reviews, 25–26
Ritman, Kim, v
Rural Financial Counselling Service (RFCS), 8, 14
Rural Policy and Farm Performance Division, v
rural research and development, 9

213Department of Agriculture
Annual report 2018–19
Subject index
S
safety
food safety standards, 7
of imported food, 21
workplace health and safety, 40–41
salaries see remuneration
salary structure, 104
Schipp, Mark, v
scientific and economic modelling, 41–43
Scott-Orr, Helen, 67
SDGs (Sustainable Development Goals), 89–90
SDL (Sustainable Diversion Limit) Adjustment Mechanism, 10, 17, 19, 124
sea transport review, ASEL, 14
seasonal labour, 9
Seasonal Worker Programme, 9
Secretary, iv, v
Accountable Authority, 2, 50
remuneration, 107
review of year, 5–15
Section 24 (1) determinations, 104
Security
cybersecurity, 16
Security Month, 13, 60
snapshot, 59
Security and Business Continuity Committee, 51, 55, 60
senior staff remuneration, 107–110
senior executive staff (SES), 105
service delivery, 21–29
service providers, external, 61–64
service standards, client, 26–29, 110–116
SES (senior executive staff)
remuneration, 104
Singapore
market access to, 7
skilled migrant employees, 9
small and medium sized business participation in procurement, 61
small and medium-sized business statistics, 61
Smart Farming Partnerships, 12
Smart Farms Small Grants, 12
snapshots
3D X-rays helping the biosecurity effort, 36
Collaborating with industry on chemicals for minor uses, snapshot, 30
Combatting brown marmorated stink bug, 27
Improved use of seasonal forecasting to increase farmer profitability, 33
Integrity culture program, 38
More profit from nitrogen—enhancing the nutrient use efficiency of cropping and pasture systems, 35
A new Chief Environmental Biosecurity Officer, snapshot, 20
Protecting Australia from animal diseases, 22
Responding to Darling River fish deaths, 18
socio-economic neutrality of Basin projects, 124
solar power in Marcus Clarke building, 91
staff
age groups, ii
classification and gender, 97–100
diversity and inclusion, ii, 13, 37–39
employee engagement, 36
employment arrangements, 105
employment type, ii, 94–96, 101, 102, 103
executive and senior staff remuneration, 106–109
learning and development, 13, 37, 38
locations, ii, 102, 103
non-salary benefits, 105
performance pay, 105
salary structure, 104
separations, 40
statistics, 94–105
unscheduled absences, 39
stakeholders
agricultural innovation, 9, 14
cost recovery, 66
and data policy, 14
and Executive Management Committee, 50

214Department of Agriculture Annual report 2018–19
Subject index
Regional Forestry Hubs pilot, 15
security reporting to, 60
see also functions
standards and systems for markets, 7
Standards Australia, 15, 122
Standen, Sally, v
State of the Service reports, 126
Status of Australian Fish Stocks Reports 2018, 11
stink bugs, brown marmorated, 12, 26, 27
strategic framework, iii, 6
strategic objectives, 3–4, 6
effect of drought and floods on, 5
Objective 1: Increase, improve and maintain markets, 16
Objective 2: Encourage agricultural productivity, 17
Objective 3: Support sustainable, high-quality natural resources, 17–20
see also functions; performance; purpose
strategic risks, 57
Strategic Workforce Plan for 2019–2023, 13, 15
structure see organisational structure
Sugar Code of Conduct, 9
Summary of ABARES agricultural forecasting, 42
support for agricultural communities and industry, 8–9
support sustainable, high-quality natural resources, strategic objective, 17–20
Survey of Australian Government Payments to Small Business, 61
Sustainable Development Goals (SDGs), 89–90
Sustainable Diversion Limit (SDL) Adjustment Mechanism, 10, 17, 19
T
Taylor, Ian, iv
tendering see purchasing
Thailand
market access to, 7
Thompson, Ian, v, 13, 20
Thompson, Malcolm, v, 50, 56
3D X-rays helping the biosecurity effort, snapshot, 36
timber and wood products, 23
Torres Strait Fisheries Act 1984, 89
traceability systems, agricultural, 7
trade and market access, function, 30–31
Trade Barriers Gateway, 7
Trade & Market Access Division, v
Trans-Pacific Partnership Comprehensive and Progressive Agreement, 6, 14
transport energy, 92
Treasury
and industry codes of conduct, 9
and results of survey of payments to small business, 61
2030 Agenda, 89–90
Inter-Departmental Committee and working group, 90
U
United Nations Global Forest Goals, 91
United Nations Sustainable Development Goals, 11
University of Technology Sydney, Institute for Sustainable Futures, 10, 122
unscheduled absences, 39
V
values, 58
Van Meurs, Louise, v
Vertessy, Rob, 18
veterinary chemicals, 30
veterinary medicines residues in food, 118
visas for working holidays, 9
Voluntary National Contribution to the United Nations Forum on Forests, 91
Voluntary Work Policy, 58

215Department of Agriculture
Annual report 2018–19
Subject index
W
waste management, 93
water
conservation, 93
efficiency and recovery, 10, 15, 17, 18, 19, 121, 124
entitlements, 17
performance of resource base, 17–19
policy and practices, SDGs, 90
wind and water erosion, 20
Water Act 2007, 89, 124
Water Division, v
Water Efficiency Labelling and Standards Act 2005, 23, 89, 122
Water Efficiency Labelling Standards (WELS) scheme, 10, 15, 23–25, 28–29
Annual Report, 122–124
Water Efficiency Program, 19
Water for the Environment Special Account (WESA) Annual Report 2018- 19, 125
Water Resource Plans (WRPs), 17, 18
Way, Dennis, 56
Wear it Purple Day, 39
weather forecasting, 33
website, department, 216
Wellbeing Survey, Regional, 8
WELS Compliance and Enforcement Policy, 23, 122, 123
WELS Scheme see Water Efficiency Labelling Standards (WELS) scheme
WESA (Water for the Environment Special Account) Annual Report 2018–19, 124
wheat ports
code of conduct, 9
WHS management system, 40
WHS (Work Health Safety) Act 2011, 40
investigations, directions and notices under, 41
wild-catch fish stocks, 11
wind and water erosion, 20
Wine Australia, iv
wood products industry, 10
Work Health and Safety Regulations 2011, 40
Work Health Safety (WHS) Act 2011, 40
workforce, agricultural, 9
workforce, department see staff
working holiday visas, 9
workplace agreements, 105
workplace diversity and inclusion, ii, 13, 37–39
Workplace Drug and Alcohol Policy, 58
workplace health and safety, 40–41
World Trade Organization (WTO), 7
'wrongdoing' concept, 38
WRPs (Water Resource Plans), 17, 18
WTO (World Trade Organization), 7
Y
year ahead, 14–15

216Department of Agriculture Annual report 2018–19
© Commonwealth of Australia 2019
Ownership of intellectual property rights
Unless otherwise noted, copyright (and any other intellectual property rights, if any) in this publication is owned by the Commonwealth of Australia (referred to as the Commonwealth).
Creative Commons licence
All material in this publication is licensed under a Creative Commons Attribution 4.0 International Licence except content supplied by third parties, logos and the Commonwealth Coat of Arms.
Inquiries about the licence and any use of this document should be emailed to [email protected].
Cataloguing data
This publication (and any material sourced from it) should be attributed as: Department of Agriculture 2019, Annual report 2018–19, Canberra. CC BY 4.0.
ISBN 978-1-76003-225-8 (printed)
ISBN 978-1-76003-177-0 (online)
This publication is available at agriculture.gov.au/about/reporting/annual report.
Department of Agriculture
GPO Box 858 Canberra ACT 2601
Telephone 1800 900 090
Web agriculture.gov.au
The Australian Government acting through the Department of Agriculture has exercised due care and skill in preparing and compiling the information and data in this publication. Notwithstanding, the Department of Agriculture, its employees and advisers disclaim all liability, including liability for negligence and for any loss, damage, injury, expense or cost incurred by any person as a result of accessing, using or relying on any of the information or data in this publication to the maximum extent permitted by law.
Acknowledgements
Printed by: The Printing Factory
Index by: Shirley Campbell
Thank you to all coordinators and contributors in the department.