annual report 2018 - vkr holding a/s...13 consolidated financial highlights 16 risk factors 17...
TRANSCRIPT
VKR Holding A/STranslation from the adopted staturory Danish annual report
ANN
UAL
REP
ORT
2018

CONTENTS4 MANAGEMENT’S REVIEW
4 2018 overview
6 VKR Holding business model
12 Operations and investments
13 Consolidated financial highlights
16 Risk factors
17 Outlook for 2019
18 Governance
20 The Board of Directors of VKR Holding A/S
24 FINANCIAL STATEMENTS 2018
24 Income statement 1 January – 31 December
25 Balance sheet at 31 December
27 Statement of changes in equity
28 Cash flow statement
29 Notes
41 MANAGEMENT’S STATEMENT
42 INDEPENDENT AUDITORS’ REPORT
44 COMPANY OVERVIEW
Front page: VELFAC vertical windows and VELUX roof windows, Lilla Fjellsholmen, Sweden. Photo: SE360, 2016
JET Group glass roof in school building in Heppenheim, Germany. Photo: Peter Witt, 2017

MANAGEMENT’S REVIEW MANAGEMENT’S REVIEW
2018 ANNUAL REPORT VKR HOLDING 5VKR HOLDING 2018 ANNUAL REPORT4
THE YEAR AT A GLANCE
THE VKR GROUP’S REVENUE REACHED A NEW RECORD HIGH OF DKK 19.6 BILLION, DRIVEN BY
BOTH ORGANIC AND ACQUISITIVE GROWTH
• David Briggs becomes CEO of the VELUX Group
• The DOVISTA Group initiates the implementation of a
new ERP system
• The VELUX Group officially launches the MyDaylight
app on the first markets
• The VELUX Group acquires Wasco Skylights
• The VELUX Group launches the Indoor Generation
campaign focusing on indoor climate
• The VELUX Group introduces the VELUX ACTIVE
indoor climate control system, which automates
roof windows, blinds and shutters
• The VELUX Group acquires JET Group and Vitral
• The DOVISTA Group opens a new factory in Lithuania
• Arcon-Sunmark commissions a solar thermal
heating plant in Tibet, China
2018 OVERVIEW
5% 14% 31%
GROWTH IN REVENUE EBITA MARGIN RETURN ON CAPITAL EMPLOYED
(2017: 3%) (2017: 15%) (2017: 39%)
COMPANIES IN 41 COUNTRIES
Q1 Q3Q2 Q4

MANAGEMENT’S REVIEW MANAGEMENT’S REVIEW
2018 ANNUAL REPORT VKR HOLDING 7VKR HOLDING 2018 ANNUAL REPORT6
VKR HOLDING BUSINESS MODEL
Our business areas
ROOF WINDOWS & SKYLIGHTS
The business area comprises:
The VELUX Group
Altaterra
The product range includes:
• Roof windows & skylights
• Blinds and shutters
• Home automation
The business area sells its products in
more than 40 countries to both residential
and commercial segments
VERTICAL WINDOWS
The business area comprises:
The DOVISTA Group
The product range includes:
• Vertical windows
• Exterior doors
The business area primarily sells its
products in Northern Europe
SOLAR THERMAL ENERGY
The business area comprises:
Arcon-Sunmark
The product range includes:
• Solar collectors and storage pits for
complete and large turnkey solar
thermal heating plants
• Piping systems and control systems
The business area sells its products to
industrial companies and the energy
sector, primarily in Europe but also in the
rest of the world
Financial independence Companies in the Group must generate a
profit over time that can finance growth
and development
Model Company ObjectiveThe Group works with products that are
useful to society and aspires to treat its
stakeholders better than most others do
Active investment strategy Well-established acquisition opportunities
that supplement and complement exist-
ing business areas are actively pursued
Long investment horizonInvestments are made in the business
areas on an ongoing basis, and companies
are acquired for long-term ownership
Active ownershipVKR Holding practises active ownership
to ensure compliance with the Group’s
values
VKR Holding
See the complete organisation chart on page 22
VKR Holding creates value through financial investments and ownership of companies within daylight, fresh air and better environment

Vitral glass roof in MT Højgaard’s new headquarters, Søborg, Denmark. Photo: Mads Frederik Architectural Photography, 2018
MANAGEMENT’S REVIEW
2018 ANNUAL REPORT VKR HOLDING 9
THE GROUP WAS STRENGTHENED BY
STRATEGIC ACQUISITIONS
The VKR Group’s strategy remains
unchanged: to develop and improve
the competitive position of its business
areas. Within the Roof window business
area, strategic acquisitions of companies
were made in 2018 within the commer-
cial segment (skylights for commercial
buildings). The acquired companies create
a platform for increased growth in the
commercial market, and together, they
constitute a new division in the VELUX
Group, VELUX Commercial. The acquisi-
tions are in line with both VKR Holding’s
acquisition strategy and the VELUX
Group’s growth strategy.
The VKR Group will continue the pursuit
of potential acquisition opportunities
that are either a strategic match for the
existing business areas or that may form
a new business area within daylight, fresh
air and better environment.
The revenue in the VKR Group increased by 5.1% in 2018 to DKK 19.6 billion. The operating profit from Roof windows met expectations, while the other business areas experienced a challenging year. Large negative fluctuations
in the financial markets impacted the VKR Group’s share portfolio.
Acquisitions contributed by 2.1 percentage
points of revenue growth in 2018.
Overall, expectations for the year were
partially met, as revenue increased and
operating profit came close to the expect-
ed level, which is considered satisfactory.
However, the negative return on the finan-
cial portfolio was unsatisfactory for the
year, but still met the long-term target.
VKR HOLDING’S ACTIVITIESVKR Holding is a holding and investment
company with the objective of creating
value through financial investments and
ownership of companies bringing daylight,
fresh air and better environment into
people’s lives. The Company’s primary
activities are the ownership of companies
within development, production and sale
of roof windows and vertical windows. Fur-
thermore, the Group’s activities include
development, sales and advisory services
within large-scale solar thermal energy
systems as well as managing a financial
portfolio. The financial portfolio com-
prises listed shares and bonds as well as
illiquid investments in mezzanine funds,
property funds, and private equity funds.
VKR Holding practises active owner-
ship of the business areas based on the
Model Company Objective, current Group
policies and our governance structure
(see section on governance). The business
areas largely operate independently from
VKR Holding within the given guidelines.
One of VKR Holding’s most important
goals is to ensure that all types of in-
vestments create a return reflecting as
a minimum the assumed risk.

VELUX Modular Skylights in SOMFY Lighthouse, France. Photo: Cédric Bérieau, 2018
MANAGEMENT’S REVIEW MANAGEMENT’S REVIEW
2018 ANNUAL REPORT VKR HOLDING 1 1VKR HOLDING 2018 ANNUAL REPORT1 0
VELFAC vertical windows in social housing in north-western Copenhagen, Denmark. Photo: BIG, 2018
BUSINESS AREAS
Strategic acquisitions in the commercial segment for roof windows
In 2017, the VELUX Group launched a new strategy, which gener-
ally focused on growing the core business, establishing a position
within the commercial segment, and increasing digitalisation.
The establishment of a position within the commercial segment
was greatly advanced in 2018 by the acquisitions of US-based
Wasco Skylights, German JET Group and Vitral in Denmark. The
acquired companies complement the VELUX Group’s existing
daylight solutions for commercial buildings, VELUX
Modular Skylight, and will form a new division in the
VELUX Group, VELUX Commercial.
In line with the digital strategy, the VELUX Group
continued developing the digital user experience
by launching the mobile application MyDaylight in
continuation of the “Smart Home” solution VELUX
ACTIVE. MyDaylight can simulate daylight from
VELUX roof windows and flat roof windows in a home,
and VELUX ACTIVE uses smart sensors to monitor
temperatures, humidity and carbon dioxide levels in
the home and automatically opens or closes roof win-
dows, blinds and shutters. This helps ensure a healthy
and comfortable indoor climate for the inhabitants.
Moreover, the VELUX Group launched the “Indoor
Generation” campaign in 2018 to bring more focus to
the fact that we spend 90% of our time indoors with
consequences for our health, well-being and produc-
tivity. The campaign went viral on social media with
more than 100 million views.
Overall, the VELUX Group met expectations in 2018.
Challenging market conditions for Vertical windows but prepared for future growth
In 2018, the DOVISTA Group did not meet expecta-
tions. This was primarily due to deteriorating market
conditions in Sweden and Brexit uncertainties in Great
Britain. The DOVISTA Group divested its subsidiary
West Port to the company’s management at 1 July
2018 as it did not fit into the future strategy for the
British market.
In 2018, the DOVISTA Group continued its investment strategy
to strengthen the Group’s future position and meet customer
requirements. This entailed the implementation of a new ERP sys-
tem and the completion of new production facilities in Lithuania.
The new factory in Lithuania officially opened in October 2018.
Another challenging year for large-scale Solar thermal energy
Overall, Arcon-Sunmark had a disappointing year, which ended
with unsatisfactory results. In terms of revenue, 2018 saw pro-
gress as expected, but from a low level. Progress primarily took
place in the domestic market in Denmark, aided by projects in
new markets such as China and Latvia.
The internationalisation is expected to continue in 2019.
IN 2018, THE DOVISTA GROUP CONTINUED ITS INVESTMENT STRATEGY TO STRENGTHEN THE GROUP’S FUTURE POSITION AND MEET CUSTOMER REQUIREMENTS
THE ESTABLISHMENT OF A POSITION WITHIN THE COMMERCIAL SEGMENT WAS GREATLY ADVANCED IN 2018 BY THE ACQUISITIONS OF US-BASED WASCO SKYLIGHTS, GERMAN JET GROUP AND VITRAL IN DENMARK

MANAGEMENT’S REVIEW MANAGEMENT’S REVIEW
2018 ANNUAL REPORT VKR HOLDING 1 3VKR HOLDING 2018 ANNUAL REPORT1 2
K e y f i g u r e s , M D K K 2 0 1 8 2 0 1 7 2 0 1 6 2 0 1 5 2 0 1 4
Net revenue 19,592 18,648 18,125 17,734 16,412
Earnings before depreciation (EBITDA) 3,225 3,324 3,556 3,743 2,950
Earnings before goodwill amortisation (EBITA) 2,669 2,849 3,095 2,900 2,011
Earnings before financial items and tax (EBIT) 2,617 2,820 3,014 2,804 1,916
Net financials -281 458 462 -17 -3
Profit after tax 1,785 2,532 2,613 2,004 1,340
Investments in tangible fixed assets (net) 592 864 238 503 244
Free cash flow before tax 663 2,164 3,264 3,235 2,880
Total assets 21,102 19,720 17,940 16,060 14,550
Equity 16,914 15,948 14,276 12,522 11,180
F i n a n c i a l r a t i o s ( % )
EBITA margin 13.6 15.3 17.1 16.4 12.3
Return on capital employed 31.0 39.2 43.7 39.2 24.9
Equity ratio 80.2 80.9 79.6 78.0 76.8
Av e r a g e n u m b e r o f e m p l o y e e s 15,459 14,764 13,885 13,644 13,444
Financial ratios have been prepared in accordance with the Danish Finance Society’s recommendations. Reference is made to the accounting policies.
CONSOLIDATED FINANCIAL HIGHLIGHTS
NET REVENUE – MDKK
EBITA MARGIN – %
PROFIT AFTER TAX – MDKK
RETURN ON CAPITAL EMPLOYED – %
OPERATIONS AND INVESTMENTS
IN 2018, THE VKR GROUP REACHED A RECORD REVENUE OF DKK 19.6 BILLION AGAINST DKK 18.6 BILLION IN 2017, CORRESPONDING TO A GROWTH RATE OF 5.1%. 3.0 PERCENTAGE POINTS OF THE GROWTH RATE RELATED TO ORGANIC GROWTH, WHILE 2.1 PERCENTAGE POINTS WERE DUE TO ACQUISITIONS
In 2018, the underlying macroeconomic indicators were generally positive
for the construction industry, which supported growth in the VKR Group’s
revenue. Towards the end of the year, some markets showed signs of down-
turn and lower levels of activity. Correspondingly, the financial markets saw
significant negative fluctuations in the fourth quarter.
Despite revenue growth, profit for the year was lower than last year and
lower than expected, primarily due to the negative return on the financial
portfolio caused by the general development in the financial markets.
Revenue and results of operationsIn 2018, the VKR Group reached a record revenue of DKK 19.6 billion against
DKK 18.6 billion in 2017, corresponding to a growth rate of 5.1%. 3.0 percent-
age points of the growth rate related to organic growth, while 2.1 percentage
points were due to acquisitions. Growth was largely driven by the VELUX
Group’s successful growth strategy, which resulted in increased sales in
the core business and higher revenue in the commercial segment driven by
strategic acquisitions. The expected growth in the DOVISTA Group was chal-
lenged by a declining level of activity in the important Swedish and British
markets. Arcon-Sunmark contributed to total growth by increased sales
within large-scale solar thermal energy solutions.
Group earnings before interest, depreciation and amortisation (EBITDA)
amounted to DKK 3.2 billion in 2018, which was generally at the same level as
the DKK 3.3 billion realised in 2017. As planned, the business areas Roof win-
dows and Vertical windows maintained increased cost levels and relatively
high investment levels in 2018.
In 2018, earnings before amortisation (EBITA) amounted to DKK 2.7 billion
against DKK 2.8 billion in the previous year.
Operating investmentsInvestments in tangible fixed assets amounted to DKK 0.6 billion in 2018, cor-
responding to 3.0% of revenue, and thus investments decreased in line with
expectations compared to the abnormally high level in 2017. As in previous
years, investments were primarily carried out by the VELUX Group and the
DOVISTA Group.
The VELUX Group’s investments in 2018 primarily re-
lated to new production equipment and maintenance
of existing equipment in the factories. Moreover,
investments were made in IT hardware and software
to support the continued digitalisation of the business
internally as well as towards the customers.
In 2018, the DOVISTA Group completed construction of
the new factory in Lithuania, which was a significant
part of total investments in the business area. The
remaining part of investments related to ERP imple-
mentation as well as optimisation and streamlining of
existing production facilities.
Cash flows from operating activities and working capitalCash flows from operating activities before tax
decreased to DKK 3.0 billion in 2018 against DKK 3.2
billion in the previous year. The decrease is primarily
due to higher levels of working capital.
In 2018, cash flows from operations after tax amount-
ed to DKK 2.6 billion against DKK 2.5 billion in 2017.
Financial investmentsVKR Holding holds a substantial portfolio of financial
investments, which can significantly affect annual
results.
In 2018, return on financial investments was negative
and thus significantly lower than in previous years
when trends in the financial markets were gener-
ally positive. The development in 2018 is primarily
affected by a negative unrealised return on listed
shares due to a general geopolitical uncertainty that
resulted in large negative fluctuations in the financial
markets, especially in the last quarter of the year.
On the other hand, the return on illiquid investments
was higher than in previous years but not sufficient to
compensate for the loss on listed shares.
Despite the negative absolute return, the relative re-
turn (i.e. compared to similar portfolios) is considered
acceptable.
2017201620152014 2018
39.2%
43.7%
39.2%
31.0%
24.9%
2017201620152014 2018
16.4%17.1%
15.3%
13.6%12.3%
2017201620152014 2018
17,734 18,125 18,64819,592
16,412
2017201620152014 2018
2,004
2,613 2,532
1,785
1,340

MANAGEMENT’S REVIEW MANAGEMENT’S REVIEW
2018 ANNUAL REPORT VKR HOLDING 1 5VKR HOLDING 2018 ANNUAL REPORT1 4
OVERALL, THE OPERATING PROFIT IN THE BUSINESS AREAS WAS IN LINE WITH EXPECTATIONS, WHICH WAS LARGELY DUE TO THE DEVELOPMENTS IN THE VELUX GROUP. MANAGEMENT CONSIDERS RESULTS IN 2018 SATISFACTORY WHEN DISREGARDING THE NEGATIVE RETURN ON THE FINANCIAL PORTFOLIO
THE VKR GROUP ACTIVELY SUPPORTS THE UN GLOBAL COMPACT AND THE “SUSTAINABLE DEVELOPMENT GOALS”
TaxationThe income tax expense for 2018 amount-
ed to DKK 0.6 billion compared to DKK 0.8
billion in 2017.
Profit for the yearIn 2018, profit for the year of DKK 1.8
billion was realised against DKK 2.5 billion
in the previous year.
The decrease in profit is primarily due to
an unrealised loss on financial invest-
ments in 2018, whereas 2017 saw a gain.
Moreover, exchange rate developments in
2018 were unfavourable for the VKR Group
where particularly developments in SEK
and USD had a negative effect on revenue.
Overall, the operating profit in the busi-
ness areas was in line with expectations,
which was largely due to the develop-
ments in the VELUX Group. Management
considers results in 2018 satisfactory
when disregarding the negative return on
the financial portfolio.
Financial resourcesAt 31 December 2018, the financial
resources of the VKR Group amounted
to DKK 7.3 billion, which is a decrease
compared to the previous year when they
amounted to DKK 8.8 billion. The devel-
opment is primarily attributable to the
acquisition of companies which meant an
increase in total assets to DKK 21.1 billion
at the end of 2018 against DKK 19.7 billion
in the previous year.
At 31 December 2018, equity in VKR Hold-
ing amounted to DKK 16.9 billion against
DKK 15.9 billion in the previous year. The
equity ratio was thus marginally reduced
from 80.9% in 2017 to 80.2% in 2018. The
VKR Group has a large liquid portfolio to
fund existing activities as well as relevant
acquisitions.
After the annual general meeting in March
2018, ordinary dividend of DKK 1.0 billion
was distributed to the shareholders. This
level is expected to be maintained at the
annual general meeting in March 2019.
Innovation and development activities Improved indoor climate and energy
efficiency measures continued to be focus
areas within the VKR Group. The Group’s
products are continuously improved to
meet ever stricter energy requirements for
both new construction and renovation of
existing buildings. Moreover, product func-
tionality is increasingly enhanced by means
of digitalisation and Smart Home solutions.
The Group’s innovative culture and
product development activities result in
submission of numerous patent applica-
tions each year. At the end of 2018, VKR
Holding owned and managed 2,167 active
patents as well as other intellectual prop-
erty rights that are protected actively and
systematically to maintain the Group’s
competitiveness.
EmployeesAt the end of 2018, the VKR Group had
almost 16,000 employees against just over
14,900 employees in the previous year.
A significant number of employees work
in Poland (approx. 4,300) and Denmark
(approx. 2,900), so in total, approx. 45% of
the Group’s employees work in these two
countries. The number of employees in
Germany increased considerably in 2018
due to the VELUX Group’s acquisition of
JET Group.
Corporate Social ResponsibilityThe VKR Group actively supports the UN
Global Compact and the “Sustainable
Development Goals”. VKR Holding
and the business areas joined the UN
Global Compact in 2016 and annually
report on progress in relation to the
Ten Principles within human and labour
rights, environment and anti-corruption
in a Communication on Progress report.
The Communication on Progress report of
VKR Holding also constitute the statutory
report on Corporate Social Responsi-
bility pursuant to section 99a of the
Danish Financial Statements Act for the
financial year 2018 and can be found on
our website (https://vkr-holding.com/vkr/
un-global-compact/?lang=en) and on the
website of the UN Global Compact. During
2019, the business areas will publish their
individual Communication on Progress
reports, which will further describe their
progress on the development goals.
Working environmentThe Group’s business areas have a
strong focus on a good and safe working
environment. As the VKR Group has many
employees in production facilities, special
efforts are made to ensure a good and
safe working environment in line with the
international standard on working envi-
ronment ISO 45001 (occupational health
and safety management), formerly known
as OHSAS 18001.
Diversity goalsIn VKR Holding, employees and members
of the Board of Directors are always se-
lected based on qualifications and skills.
At the same time, we acknowledge the
value of diversity, which has resulted in
VKR Holding setting a target that at least 1
board member should be of the underrep-
resented gender.
At the end of 2018, VKR Holding had 1
female and 5 male board members, and
thus, the target was met. Following this
composition, the underrepresented gen-
der constituted 17% of the board members
compared to 20% in 2017. The change in
percentage is due to the fact that 1 male
member joined the Board of Directors at
the annual general meeting in March 2018.
In VELUX A/S, which represents the
Group’s largest business area, the Board
of Directors elected by the general meet-
ing comprises 2 female board members
and 4 male board members.
In DOVISTA A/S, the Board of Directors
elected by the general meeting comprises
1 female board member and 4 male board
members.
Malin Sehlstedt, production at Snidex, Burträsk, Sweden. Photo: Per Norell, 2018

MANAGEMENT’S REVIEW MANAGEMENT’S REVIEW
2018 ANNUAL REPORT VKR HOLDING 1 7VKR HOLDING 2018 ANNUAL REPORT1 6
RISK FACTORS
OUTLOOK FOR 2019
Generally, the activity level of the VKR Group is expected to
increase in 2019. The expected increase will be driven partly by
the full-year effect of the strategic acquisitions in the Commer-
cial roof windows & skylights division and partly by the organic
growth expectations of the business areas. Earnings are anticipat-
ed to be in line with 2018. Investments in tangible fixed assets are
expected to increase compared to the level in 2018 to support the
business areas’ continued improvement of their market positions.
The political and macroeconomic risks are considered elevated,
and consequently, expectations to sales and results of operations
are subject to increased uncertainty.
Moreover, large fluctuations may occur in the financial markets
related to the uncertainties associated with the geopolitical
situation, including Brexit and trade relations between USA and
China. This may affect the VKR Group’s operating activities and
the financial investments, in particular. The Management of the
VKR Group fully realises the importance of having an adaptable
business model capable of handling changes to market condi-
tions and framework conditions.
The acquisition strategy formulated in 2016 will remain un-
changed in 2019. The VKR Group will continue the pursuit of
potential acquisitions, both within existing business areas and to
create a new business area if the right opportunity arises.
The VKR Group’s activities are affected by
cyclical developments and are dependent
on the ability to maintain strong market
positions through, among other things,
continued product development and
optimisation of the entire value chain. The
VKR Group as a whole and the underlying
business areas are considered reasonably
positioned in the relevant markets.
The level of activity in the construction
sector is one of the largest risks to the
VKR Group as a whole. The macroeconom-
ic conditions in the individual markets
where the business areas operate are the
underlying growth drivers in the construc-
tion industry. The general development
in the level of activity in 2018 was positive
for the Group, but towards the end of
the year, some markets started showing
signs of stagnation in economic growth,
and the probability of a recession seems
to have increased. Moreover, the current
geopolitical uncertainties, which among
other things relate to the Brexit process
and the trade dispute between USA and
China, may affect growth prospects.
During 2018, prices of several raw mate-
rials used in production in the business
areas increased, which had an adverse
effect on earnings.
The VKR Group’s business areas con-
tinuously focus on the trend towards
energy-efficient buildings and renewable
energy sources. We consider these focus
areas important for future business
opportunities. Ambitious political goals
regarding energy-efficient solutions as
well as open competition are in the inter-
est of the Group.
GENERAL RISKSThe VKR Group operates globally and is
exposed to several financial risks related
to the Group’s income statement and
equity:
• Interest rate risk
• Foreign exchange risk
• Credit risk
• Liquidity risk
• Product quality and product liability
• Cybercrime
Interest rate riskFor financial investments, movements
in interest rates are a significant factor
in terms of fluctuations in the value of
the bond portfolio and derived effects on
other asset classes. Consequently, the
interest rate risk on financial investments
is considered moderate, and interest
rate trends are monitored on an ongoing
basis in relation to investment portfolio
management.
The VKR Group only occasionally takes
on external interest-bearing debt. Taking
into consideration the Group’s high equity
ratio, the interest rate risk on debt is
considered limited.
Foreign exchange riskThe VKR Group operates globally with
both sales and production activities. A
very significant part of the activities is
denominated in EUR and due to the Danish
fixed exchange rate policy, there is only
minor fluctuations against DKK, and
consequently, no significant currency risk.
The largest exposures in terms of risk are
related to GBP and PLN.
The Group does not engage in hedging of
operational foreign currency exposure.
Credit riskThe VKR Group’s receivables from custom-
ers are widely distributed, both in terms
of geography and number of customers.
Moreover, standard procedures for man-
aging customers’ credit agreements have
been established.
VKR Holding uses many different banks
around the world due to the significant
geographic distribution of the Group’s
activities. As a rule, VKR Holding prefers
large, well-established banks to provide
required services and minimise the risk
related to placing cash and cash equiva-
lents. The largest of these banks are credit
rated on an ongoing basis.
Liquidity riskThe VKR Group has sufficient cash avail-
able. VKR Holding continuously monitors
the development in cash flows in the
business areas. The majority of cash is
concentrated in VKR Holding via various
liquidity tools, including cash pools. This
means that most of the companies in the
Group have relatively low balances with
external banks. Thus, VKR Holding acts as
internal bank to the business areas.
Product quality and product liability The VKR Group is highly dependent on
the quality of the products sold by the
business areas. Failing to maintain high
quality standards may expose the Group
to reputational risks, potential warranty
expenses and lower earnings. Moreover,
high quality is necessary to ensure and
improve market positions. It is therefore a
potentially large cost burden if products
do not live up to the expected quality.
The risk is managed by comprehensive
quality and environmental management
systems which monitor all products from
own production and suppliers. Continuous
thorough testing of the products is carried
out both internally and by external inde-
pendent and certified testing institutes.
CybercrimeCompanies in the VKR Group are highly
dependent on IT systems in the daily op-
erations to manage the entire value chain
from product development to delivery
of products to the customer. IT system
downtime may result in partial or com-
plete suspension of business activities.
Consequently, a high IT security level is
highly prioritised to counter the increas-
ingly sophisticated attacks on the Group’s
IT systems. This includes maintenance
and development of our already strong
and secure technical IT platform as well
as continuous training of employees.
Moreover, we constantly strive to improve
our ability to identify successful attacks
so that they can be stopped at an early
stage and to improve our IT contingency
plans so systems can be re-established as
soon as possible in case of inoperability.
Interior with VELFAC vertical windows, Lilla Fjellsholmen, Sweden. Photo: SE360, 2016
The newly developed JET VARIO-GLAS for flat roofs. Photo: JET Group, 2018

MANAGEMENT’S REVIEW MANAGEMENT’S REVIEW
2018 ANNUAL REPORT VKR HOLDING 1 9VKR HOLDING 2018 ANNUAL REPORT1 8
CORPORATE GOVERNANCEAs early as 1965, the founder of the Group, Villum
Kann Rasmussen, defined the “Model Company
Objective”. The Objective is the essence of the VKR
Group’s approach to Corporate Social Responsibility
and defines the overall ambition for Corporate Social
Responsibility that all companies in the Group aspire
to – i.e. to act responsibly and at the same time ensure
financial profits for continued growth. Moreover, the
Board of Directors of VKR Holding has approved 15
Group policies that, together with the Model Company
Objective, constitute the Group’s guidelines on cor-
porate governance. The Management and the Board
of Directors of the business areas are responsible for
compliance with the guidelines.
The VKR Group has three overall levels of govern-
ance: shareholders, VKR Holding and business areas.
Formal guidelines on active ownership and interaction
between the three levels have been established.
GOVERNANCE
VELUX roof window in a family home in Hoeilaart, Belgium. Photo: Jasper Leonard, 2018
The shareholdersThe shareholders perform all the
functions attributed to the owners of the
Company at general meetings. In addition,
four shareholders’ meetings are held each
year between shareholder representatives
and VKR Holding’s chairmanship and
Executive Management. At these meet-
ings, the shareholders are informed of
developments in the VKR Group, including
strategy, risk profile and results of the
Group’s companies, etc. The meetings are
held according to a pre-approved agenda.
VKR HoldingAt the annual general meeting in March 2018,
Mr. Jørgen Tang-Jensen joined VKR Holding’s
Board of Directors, so that six persons serve
on the board. Up to two board members are
elected among the Company’s shareholders,
including a representative from the Board of
VILLUM FONDEN, while at least three board
members should be independent of the
shareholders, including VILLUM FONDEN.
One of the maximum two board members
elected among the shareholders should
also serve on the Board of VILLUM FONDEN.
All board members must meet general Fit
and Proper Criteria. The chair of the Board
of Directors is elected by the shareholders
at the annual general meeting. The Board
of Directors is responsible for the overall
management of VKR Holding and works
according to an annual schedule ensuring
discussion of and progress on significant
strategic, financial and operational matters
as well as initiatives regarding environment,
employees and organisation, etc. The Board
of Directors also ensures that the Company
and its shareholders communicate regularly
so that expectations are aligned. According
to the annual schedule, four ordinary board
meetings are held each year. Extraordinary
board meetings are held whenever neces-
sary. To ensure that the Board of Directors
has first-hand knowledge of the Group’s
activities, at least one of the annual meet-
ings includes visits to the business areas. In
June 2018, the Board of Directors visited the
VELUX factories in Brædstrup and Østbirk
as well as Arcon-Sunmark in Skørping, all
located in Denmark.
CommitteesAs preparatory bodies to the Board of Di-
rectors, two committees have been set up:
the Audit Committee and the Nomination
Committee.
The purpose of the Audit Committee is
to assist the Board of Directors of VKR
Holding in supervising the Company’s risk
management processes, including the
Company’s internal control systems, as
well as financial reporting and external
auditors. Moreover, the committee assists
the Board of Directors in evaluating the
VKR Group’s overall risks. The committee
consists of two members appointed by the
Board of Directors: Anne Broeng (chair)
and Jørgen Tang-Jensen. The committee
holds two scheduled meetings each year.
The purpose of the Nomination Committee
is to ensure the appropriate composition of
the Boards of Directors in the VKR Group.
Furthermore, the committee acts as a
preparatory body for VKR Holding’s Board
of Directors, which is the decision-making
body. On behalf of the Board, the committee
discusses the composition of the Board of
Directors of VKR Holding A/S. The Nomina-
tion Committee comprises the chairman-
ship of the Company (the chair and vice
chair of the Board) and the Company’s CEO.
The committee meets at least once a year.
Business areasVKR Holding’s business areas largely oper-
ate independently from VKR Holding. The
Boards of Directors of the business areas
are responsible for operations, develop-
ment, strategy, reputation and risk man-
agement. The strategy, capital resources
and risk profile of the business areas are
regularly aligned with VKR Holding.
As part of the interaction between VKR
Holding and the business areas, the
Boards of Directors of the business areas
should also include a member that serves
on VKR Holding’s Board of Directors.
Only independent members of the VKR
Holding’s Board of Directors should serve
on boards on business area level.
The VKR Group’s overall Group policies
support the operational independence
of the business areas by allowing and
encouraging the Boards of Directors of the
business areas to implement additional
or more comprehensive policies where
appropriate.
Tax governanceThe VKR Group’s tax strategy and tax man-
agement are also based on the foundation
of the Model Company Objective to act
responsibly and at the same time ensure
financial profits for continued growth.
The Board of Directors of VKR Holding is
responsible for tax in VKR Holding and the
VKR Group, while the Boards of Directors
of the business areas are responsible
for tax in the individual business areas.
The individual Boards of Directors of the
business areas must ensure that relevant
procedures have been established for
purposes of reporting to VKR Holding in
relation to compliance with tax policies,
tax risks, and related trends.
The VKR Group has internal tax expertise
that is qualified to either determine the
tax implications of transactions or is able
to assess the need for external tax advice.
Business in the VKR Group is driven by
commercial rationale where the tax
implications of commercial transactions
are evaluated, and relevant deductions and
incentives are applied within the framework
of relevant legislation. The Group does not
engage in artificial non-business driven
planning of transactions or business struc-
tures solely for the purpose of reducing tax.
The VKR Group cooperates with tax
authorities and has a timely, open, and
honest dialogue.
Whistle-blower programmeIn 2018, the VKR Group implemented a
whistle-blower programme where stake-
holders can report non-compliance or
suspected non-compliance with applica-
ble legislation, internal policies, etc.
Shareholders
VKR Holding
Business areas
Roof windows
& skylights
Vertical windows Solar thermal energy
Holders of
class A shares
Other holders of
class B shares
Class A shares refer to a classification of common stock that is accompanied by more voting rights than Class B shares.

VELUX flat roof windows in a residence in Mouscroun, Belgium. Photo: Jasper Leonard, 2018
MANAGEMENT’S REVIEW
VKR HOLDING 2018 ANNUAL REPORT2 0
THE BOARD OF DIRECTORS OF VKR HOLDING A/S
SØREN BJERRE-NIELSEN
Chair of the Board
Chair since 2010
Member since 1996
Chair of the Nomination Committee
Chair of the boards of among others
VELUX A/S and MT Højgaard A/S,
and board member of Scandinavian
Tobacco Group A/S
ANNE BROENG
Member of the Board of Directors
Member since 2012
Chair of the Audit Committee
Chair of Velliv and board member of
among others VELUX A/S, NNIT A/S,
NASDAQ Nordic Ltd., ATP, IFU and
Aquaporin A/S
THOMAS THUNE ANDERSEN
Vice chair
Vice chair since 2011
Member since 2010
Vice chair of the Nomination Committee
Chair of the boards of Ørsted A/S, Lloyd’s
Register Group and Lloyd’s Register
Foundation, and board member of
Arcon-Sunmark A/S and BW Offshore
OSCAR MOSGAARD
Member of the Board of Directors
Member since 2016
Senior advisor to Triton Partners
STEEN RIISGAARD
Member of the Board of Directors
Member since 2015
Directly appointed by the shareholders of
VKR Holding A/S
Chair of the boards of among others
ALK-Abelló A/S, COWI Holding A/S and
New Xellia Group A/S, vice chair of VILLUM
FONDEN, and board member of the Novo
Nordisk Foundation
JØRGEN TANG-JENSEN
Member of the Board of Directors
Member since 2018
Member of the Audit Committee
Chair of the Danish Green Investment
Fund, and board member of among others
ROCKWOOL International, Geberit AG and
Coloplast A/S

Krone windows at the new NOMA restaurant, Copenhagen, Denmark. Photo: Rasmus Hjortshøj, 2018
MANAGEMENT’S REVIEW
VKR HOLDING 2018 ANNUAL REPORT2 2
COMPANY INFORMATION
VKR Holding A/S
Breeltevej 18
2970 Hørsholm
Denmark
Telephone
+45 39 69 11 44
Website
www.vkr-holding.com
Company reg. no. (CVR)
30 83 04 15
Registered office
Hørsholm, Denmark
Established
7 February 1968
Financial year
1 January – 31 December
Financial statements no.
51
Søren Bjerre-Nielsen
Chair
Thomas Thune Andersen
Vice chair
Anne Broeng
Oscar Mosgaard
Steen Riisgaard
Jørgen Tang-Jensen
Mads Kann-Rasmussen
CEO
Ernst & Young
Godkendt
Revisionspartnerselskab
Osvald Helmuths Vej 4
2000 Frederiksberg
The annual general meeting
will be held on 21 March 2019 at
the Company’s address.
BOARD OF DIRECTORS EXECUTIVE MANAGEMENT AUDITOR ANNUAL GENERAL MEETING
THE VKR GROUP AT 31 DECEMBER 2018
ROOF WINDOWS & SKYLIGHTS VERTICAL WINDOWS SOLAR THERMAL ENERGY
FINANCIAL STATEMENTS 2018 FINANCIAL STATEMENTS 2018
2018 ANNUAL REPORT VKR HOLDING A/S 2 5VKR HOLDING A/S 2018 ANNUAL REPORT2 4
FINANCIAL STATEMENTS 2018
G R O U PPA R E N T
C O M PA N Y
D K K m N o t e 2 0 1 8 2 0 1 7 2 0 1 8 2 0 1 7
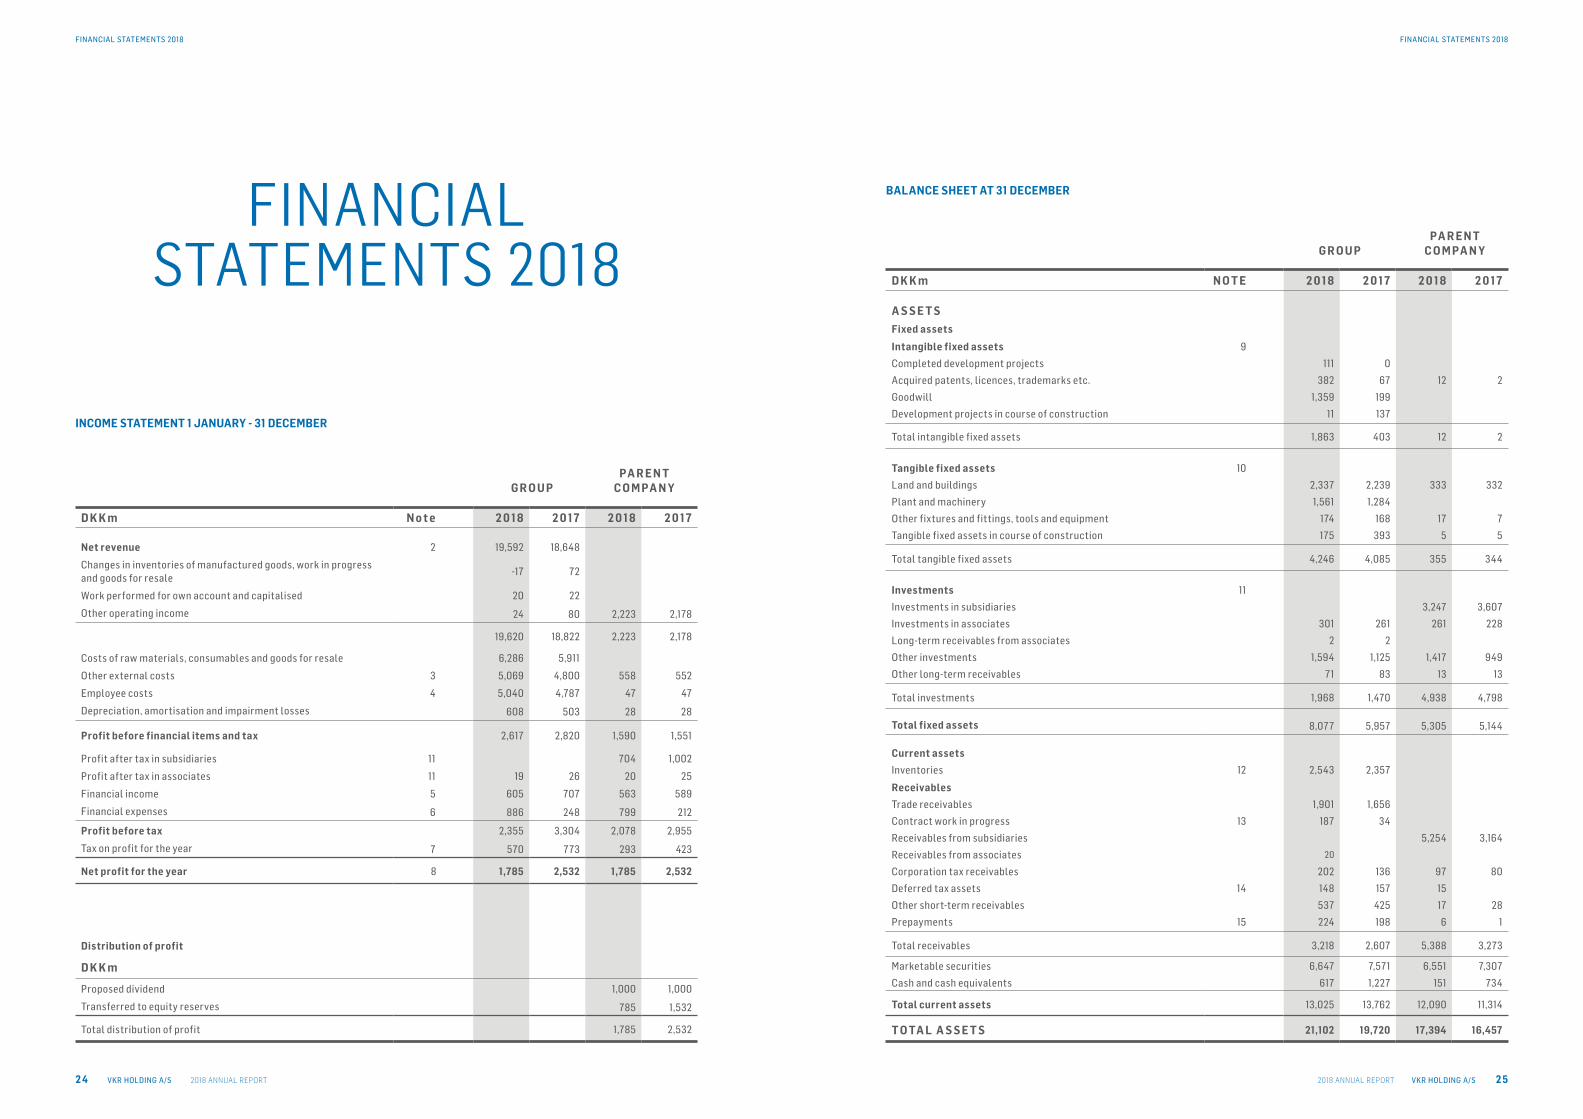
Net revenue 2 19,592 18,648
Changes in inventories of manufactured goods, work in progress and goods for resale
-17 72
Work performed for own account and capitalised 20 22
Other operating income 24 80 2,223 2,178
19,620 18,822 2,223 2,178
Costs of raw materials, consumables and goods for resale 6,286 5,911
Other external costs 3 5,069 4,800 558 552
Employee costs 4 5,040 4,787 47 47
Depreciation, amortisation and impairment losses 608 503 28 28
Profit before financial items and tax 2,617 2,820 1,590 1,551
Profit after tax in subsidiaries 11 704 1,002
Profit after tax in associates 11 19 26 20 25
Financial income 5 605 707 563 589
Financial expenses 6 886 248 799 212
Profit before tax 2,355 3,304 2,078 2,955
Tax on profit for the year 7 570 773 293 423
Net profit for the year 8 1,785 2,532 1,785 2,532
Distribution of profit
D K K m
Proposed dividend 1,000 1,000
Transferred to equity reserves 785 1,532
Total distribution of profit 1,785 2,532
INCOME STATEMENT 1 JANUARY - 31 DECEMBER
G R O U PPA R E N T
C O M PA N Y
D K K m N O T E 2 0 1 8 2 0 1 7 2 0 1 8 2 0 1 7
A S S E T S
Fixed assets
Intangible fixed assets 9
Completed development projects 111 0
Acquired patents, licences, trademarks etc. 382 67 12 2
Goodwill 1,359 199
Development projects in course of construction 11 137
Total intangible fixed assets 1,863 403 12 2
Tangible fixed assets 10
Land and buildings 2,337 2,239 333 332
Plant and machinery 1,561 1,284
Other fixtures and fittings, tools and equipment 174 168 17 7
Tangible fixed assets in course of construction 175 393 5 5
Total tangible fixed assets 4,246 4,085 355 344
Investments 11
Investments in subsidiaries 3,247 3,607
Investments in associates 301 261 261 228
Long-term receivables from associates 2 2
Other investments 1,594 1,125 1,417 949
Other long-term receivables 71 83 13 13
Total investments 1,968 1,470 4,938 4,798
Total fixed assets 8,077 5,957 5,305 5,144
Current assets
Inventories 12 2,543 2,357
Receivables
Trade receivables 1,901 1,656
Contract work in progress 13 187 34
Receivables from subsidiaries 5,254 3,164
Receivables from associates 20
Corporation tax receivables 202 136 97 80
Deferred tax assets 14 148 157 15
Other short-term receivables 537 425 17 28
Prepayments 15 224 198 6 1
Total receivables 3,218 2,607 5,388 3,273
Marketable securities 6,647 7,571 6,551 7,307
Cash and cash equivalents 617 1,227 151 734
Total current assets 13,025 13,762 12,090 11,314
T O TA L A S S E T S 21,102 19,720 17,394 16,457
BALANCE SHEET AT 31 DECEMBER
FINANCIAL STATEMENTS 2018 FINANCIAL STATEMENTS 2018
2018 ANNUAL REPORT VKR HOLDING A/S 2 7VKR HOLDING A/S 2018 ANNUAL REPORT2 6
G R O U PPA R E N T
C O M PA N Y
D K K m N O T E 2 0 1 8 2 0 1 7 2 0 1 8 2 0 1 7
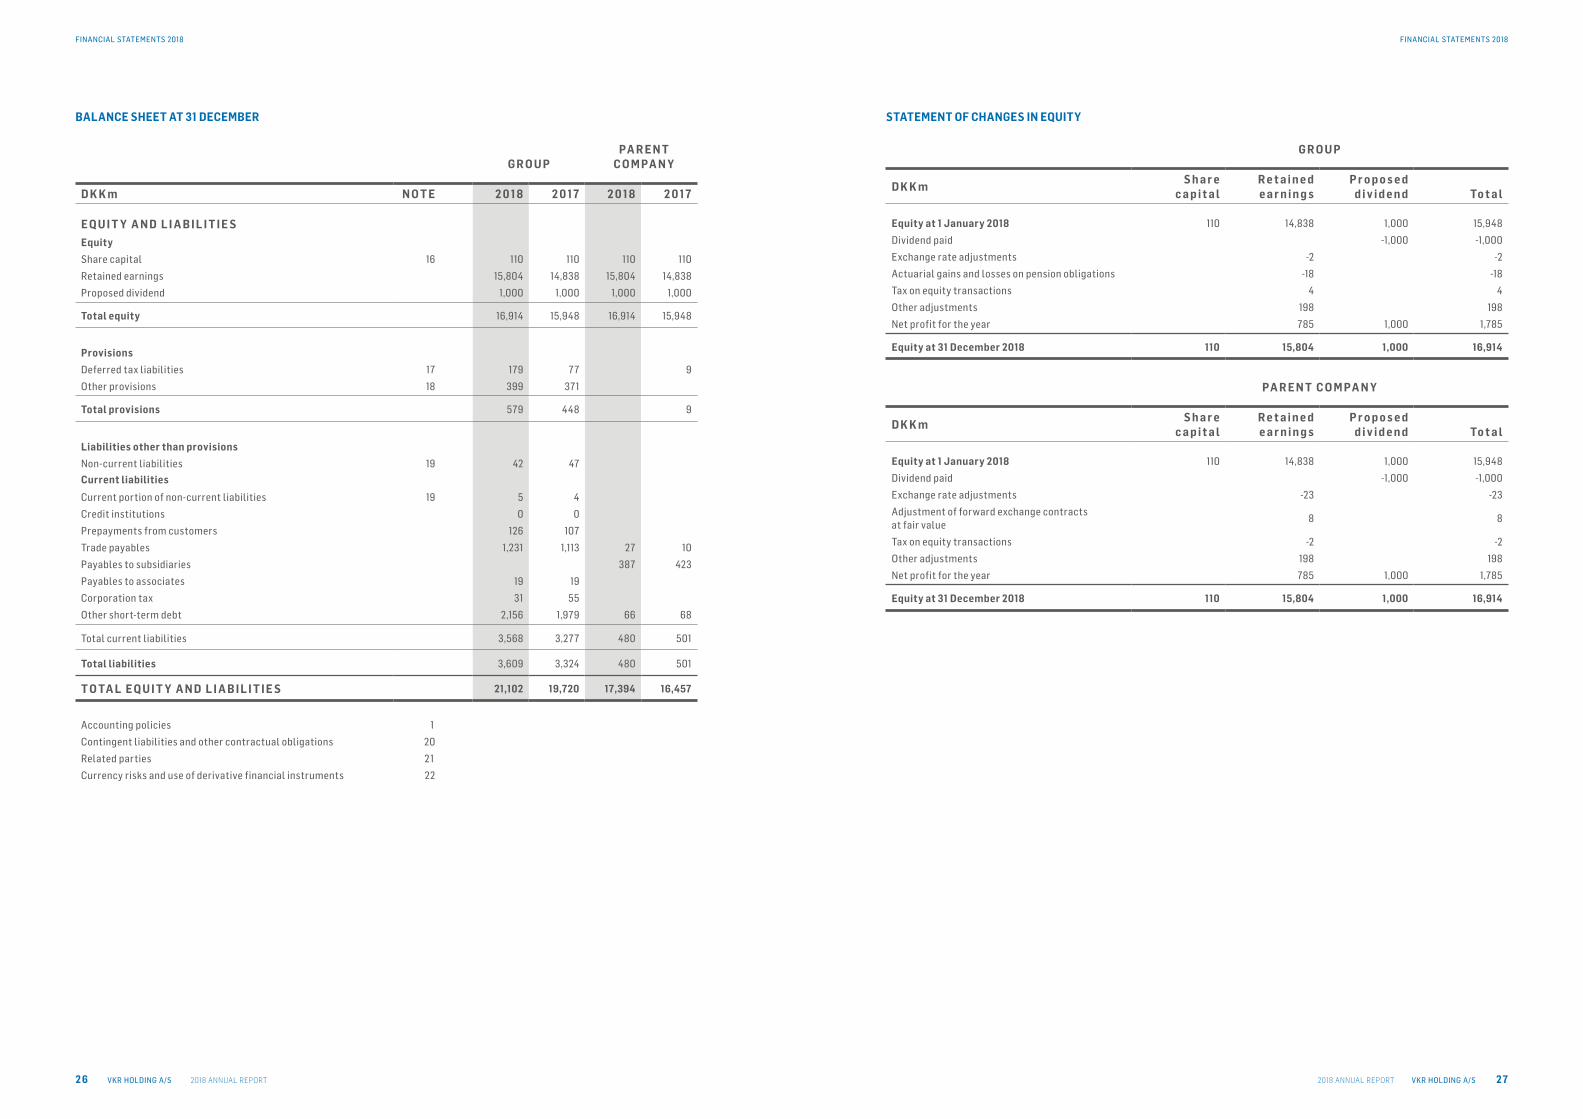
E Q U I T Y A N D L I A B I L I T I E S
Equity
Share capital 16 110 110 110 110
Retained earnings 15,804 14,838 15,804 14,838
Proposed dividend 1,000 1,000 1,000 1,000
Total equity 16,914 15,948 16,914 15,948
Provisions
Deferred tax liabilities 17 179 77 9
Other provisions 18 399 371
Total provisions 579 448 9
Liabilities other than provisions
Non-current liabilities 19 42 47
Current liabilities
Current portion of non-current liabilities 19 5 4
Credit institutions 0 0
Prepayments from customers 126 107
Trade payables 1,231 1,113 27 10
Payables to subsidiaries 387 423
Payables to associates 19 19
Corporation tax 31 55
Other short-term debt 2,156 1,979 66 68
Total current liabilities 3,568 3,277 480 501
Total liabilities 3,609 3,324 480 501
T O TA L E Q U I T Y A N D L I A B I L I T I E S 21,102 19,720 17,394 16,457
Accounting policies 1
Contingent liabilities and other contractual obligations 20
Related parties 2 1
Currency risks and use of derivative financial instruments 22
BALANCE SHEET AT 31 DECEMBER
G R O U P
D K K mS h a r e
c a p i t a lR e t a i n e d e a r n i n g s
P r o p o s e d d i v i d e n d To t a l
Equity at 1 January 2018 110 14,838 1,000 15,948
Dividend paid -1,000 -1,000
Exchange rate adjustments -2 -2
Actuarial gains and losses on pension obligations -18 -18
Tax on equity transactions 4 4
Other adjustments 198 198
Net profit for the year 785 1,000 1,785
Equity at 31 December 2018 110 15,804 1,000 16,914
PA R E N T C O M PA N Y
D K K mS h a r e
c a p i t a lR e t a i n e d e a r n i n g s
P r o p o s e d d i v i d e n d To t a l
Equity at 1 January 2018 110 14,838 1,000 15,948
Dividend paid -1,000 -1,000
Exchange rate adjustments -23 -23
Adjustment of forward exchange contracts at fair value
8 8
Tax on equity transactions -2 -2
Other adjustments 198 198
Net profit for the year 785 1,000 1,785
Equity at 31 December 2018 110 15,804 1,000 16,914
STATEMENT OF CHANGES IN EQUITY
FINANCIAL STATEMENTS 2018 FINANCIAL STATEMENTS 2018
2018 ANNUAL REPORT VKR HOLDING A/S 2 9VKR HOLDING A/S 2018 ANNUAL REPORT2 8
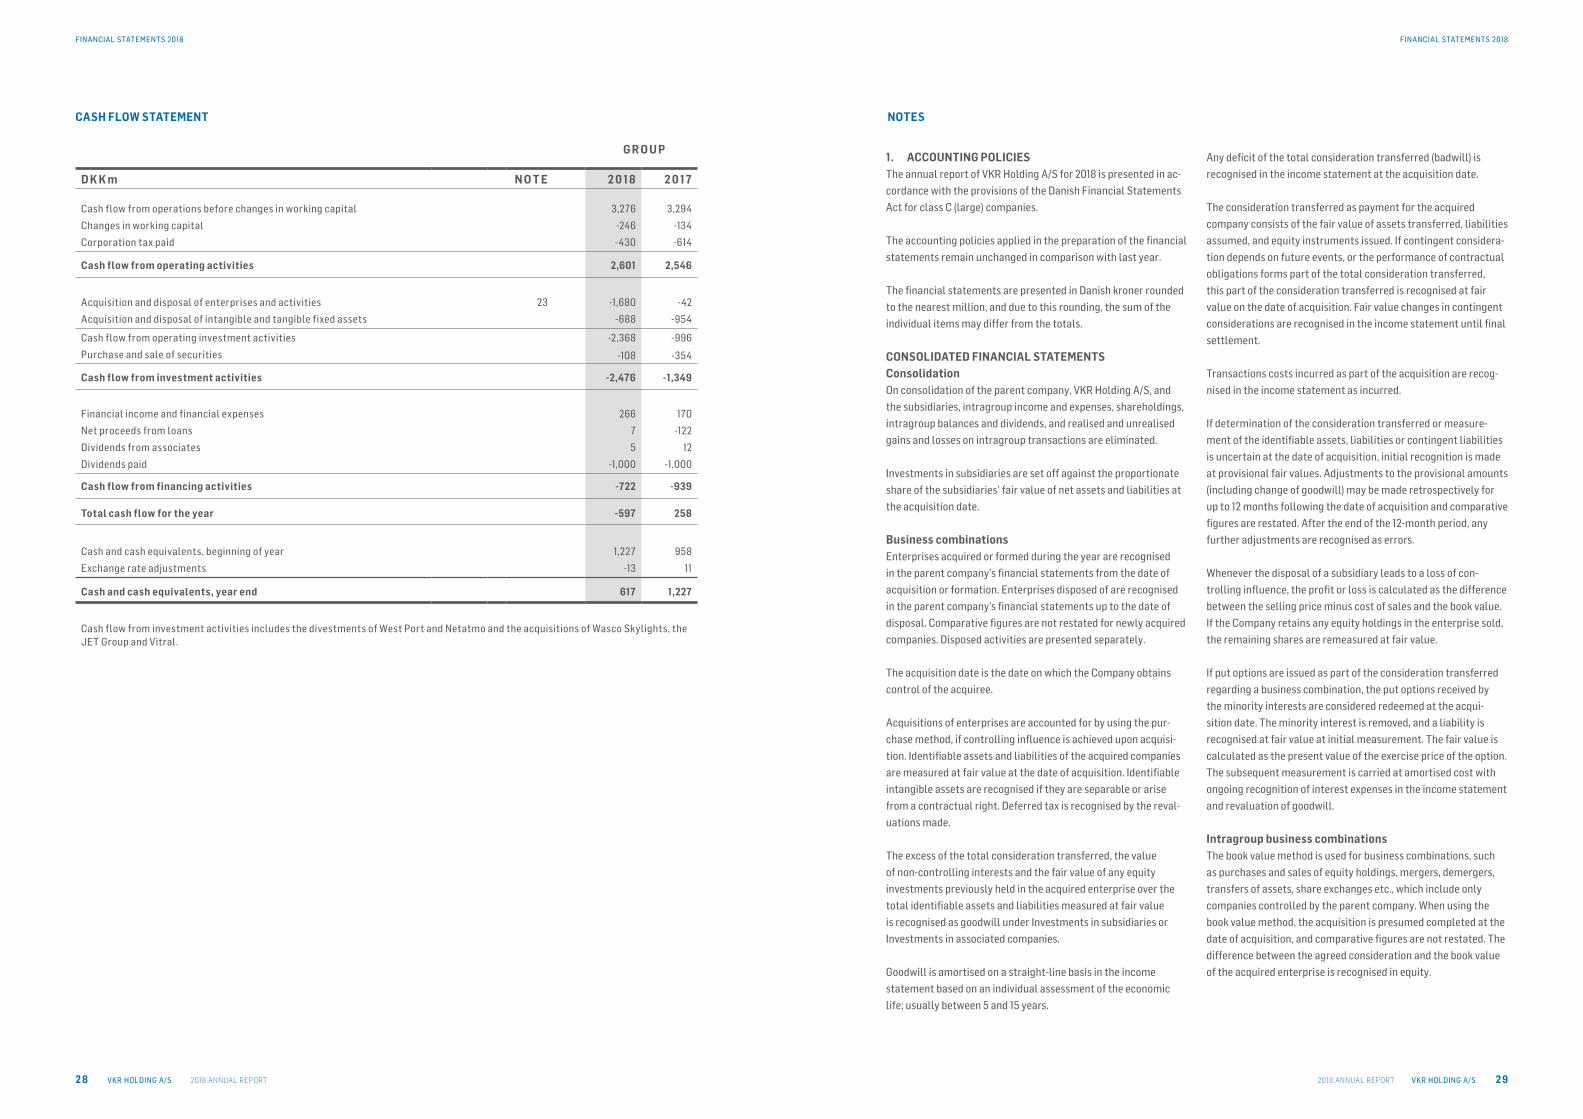
G R O U P
D K K m N O T E 2 0 1 8 2 0 1 7
Cash flow from operations before changes in working capital 3,276 3,294
Changes in working capital -246 -134
Corporation tax paid -430 -614
Cash flow from operating activities 2,601 2,546
Acquisition and disposal of enterprises and activities 23 -1,680 -42
Acquisition and disposal of intangible and tangible fixed assets -688 -954
Cash flow from operating investment activities -2,368 -996
Purchase and sale of securities -108 -354
Cash flow from investment activities -2,476 -1,349
Financial income and financial expenses 266 170
Net proceeds from loans 7 -122
Dividends from associates 5 12
Dividends paid -1,000 -1,000
Cash flow from financing activities -722 -939
Total cash flow for the year -597 258
Cash and cash equivalents, beginning of year 1,227 958
Exchange rate adjustments -13 11
Cash and cash equivalents, year end 617 1,227
Cash flow from investment activities includes the divestments of West Port and Netatmo and the acquisitions of Wasco Skylights, the JET Group and Vitral.
CASH FLOW STATEMENT NOTES
1. ACCOUNTING POLICIESThe annual report of VKR Holding A/S for 2018 is presented in ac-
cordance with the provisions of the Danish Financial Statements
Act for class C (large) companies.
The accounting policies applied in the preparation of the financial
statements remain unchanged in comparison with last year.
The financial statements are presented in Danish kroner rounded
to the nearest million, and due to this rounding, the sum of the
individual items may differ from the totals.
CONSOLIDATED FINANCIAL STATEMENTSConsolidationOn consolidation of the parent company, VKR Holding A/S, and
the subsidiaries, intragroup income and expenses, shareholdings,
intragroup balances and dividends, and realised and unrealised
gains and losses on intragroup transactions are eliminated.
Investments in subsidiaries are set off against the proportionate
share of the subsidiaries’ fair value of net assets and liabilities at
the acquisition date.
Business combinationsEnterprises acquired or formed during the year are recognised
in the parent company’s financial statements from the date of
acquisition or formation. Enterprises disposed of are recognised
in the parent company’s financial statements up to the date of
disposal. Comparative figures are not restated for newly acquired
companies. Disposed activities are presented separately.
The acquisition date is the date on which the Company obtains
control of the acquiree.
Acquisitions of enterprises are accounted for by using the pur-
chase method, if controlling influence is achieved upon acquisi-
tion. Identifiable assets and liabilities of the acquired companies
are measured at fair value at the date of acquisition. Identifiable
intangible assets are recognised if they are separable or arise
from a contractual right. Deferred tax is recognised by the reval-
uations made.
The excess of the total consideration transferred, the value
of non-controlling interests and the fair value of any equity
investments previously held in the acquired enterprise over the
total identifiable assets and liabilities measured at fair value
is recognised as goodwill under Investments in subsidiaries or
Investments in associated companies.
Goodwill is amortised on a straight-line basis in the income
statement based on an individual assessment of the economic
life; usually between 5 and 15 years.
Any deficit of the total consideration transferred (badwill) is
recognised in the income statement at the acquisition date.
The consideration transferred as payment for the acquired
company consists of the fair value of assets transferred, liabilities
assumed, and equity instruments issued. If contingent considera-
tion depends on future events, or the performance of contractual
obligations forms part of the total consideration transferred,
this part of the consideration transferred is recognised at fair
value on the date of acquisition. Fair value changes in contingent
considerations are recognised in the income statement until final
settlement.
Transactions costs incurred as part of the acquisition are recog-
nised in the income statement as incurred.
If determination of the consideration transferred or measure-
ment of the identifiable assets, liabilities or contingent liabilities
is uncertain at the date of acquisition, initial recognition is made
at provisional fair values. Adjustments to the provisional amounts
(including change of goodwill) may be made retrospectively for
up to 12 months following the date of acquisition and comparative
figures are restated. After the end of the 12-month period, any
further adjustments are recognised as errors.
Whenever the disposal of a subsidiary leads to a loss of con-
trolling influence, the profit or loss is calculated as the difference
between the selling price minus cost of sales and the book value.
If the Company retains any equity holdings in the enterprise sold,
the remaining shares are remeasured at fair value.
If put options are issued as part of the consideration transferred
regarding a business combination, the put options received by
the minority interests are considered redeemed at the acqui-
sition date. The minority interest is removed, and a liability is
recognised at fair value at initial measurement. The fair value is
calculated as the present value of the exercise price of the option.
The subsequent measurement is carried at amortised cost with
ongoing recognition of interest expenses in the income statement
and revaluation of goodwill.
Intragroup business combinations The book value method is used for business combinations, such
as purchases and sales of equity holdings, mergers, demergers,
transfers of assets, share exchanges etc., which include only
companies controlled by the parent company. When using the
book value method, the acquisition is presumed completed at the
date of acquisition, and comparative figures are not restated. The
difference between the agreed consideration and the book value
of the acquired enterprise is recognised in equity.

FINANCIAL STATEMENTS 2018 FINANCIAL STATEMENTS 2018
2018 ANNUAL REPORT VKR HOLDING A/S 3 1VKR HOLDING A/S 2018 ANNUAL REPORT3 0
Foreign currency translation
Transactions denominated in foreign currencies are translated at
the exchange rates at the transaction date. Exchange rate differ-
ences are recognised in the income statement as financial income
and financial expenses.
Monetary items denominated in foreign currencies are translated
at the exchange rates at the balance sheet date. The difference
between the exchange rates on the balance sheet date and the
time at which the receivable or payable arose or was recognised
in the latest annual report is recognised in the income statement
as financial income and financial expenses.
On recognition of foreign enterprises, the income statements
are translated at average exchange rates and the balance sheet
items are translated at the exchange rates on the balance sheet
date. Exchange rate differences arising on translation are recog-
nised directly in equity.
Exchange rate adjustments of intragroup balances with inde-
pendent foreign enterprises considered part of the total invest-
ment in the subsidiary are recognised directly in equity.
Derivative financial instruments
Derivative financial instruments are initially recognised in the
balance sheet at cost and subsequently recognised at fair value.
Changes in the fair value of derivative financial instruments
designated as and qualifying for recognition as hedges of the fair
value of a recognised asset or liability are recognised in the in-
come statement together with changes in the value of the hedged
asset or the hedged liability.
Changes in the fair value of derivative financial instruments
designated as and qualifying for recognition as hedges of future
assets or liabilities are recognised in other receivables or other
payables and in equity.
If the future transaction results in recognition of assets or lia-
bilities, amounts previously recognised in equity are transferred
at the cost of the asset or liability, respectively. If the future
transaction results in financial income or financial expenses, the
amounts previously recognised in equity are recognised in the in-
come statement in the period when the hedge affects the results.
For derivative financial instruments that do not qualify for hedge
accounting, changes in fair value are recognised in the income
statement when they occur.
INCOME STATEMENT
Net revenue
Income from the sale of goods for resale and finished goods as
well as the sale of services is recognised in the income statement
provided that delivery and transfer of risk to the buyer have taken
place before year-end. Contract work in progress is recognised as
net revenue by reference to the stage of completion. Accordingly,
net revenue corresponds to the selling price of work performed
during the year (the percentage of completion method).
Other operating income and costsOther operating income and costs comprise items secondary to
the activities of the companies, including gains and losses on
disposal of intangible and tangible fixed assets.
Other external costsOther external costs comprise distribution costs and costs relat-
ing to sales, advertising, administration, office premises, bad debt
losses, operating leases, etc.
Employee costsEmployee costs comprise wages, salaries, pensions and other
social security costs for the employees.
Profits/losses from investments in subsidiaries and associatesThe proportionate share of the result after tax of the individual
subsidiaries is recognised in the income statement of the parent
company after full elimination of intragroup profits/losses. The
proportionate share of the result after tax of the associates is
recognised in both the parent company and the consolidated
income statements after elimination of the proportionate share
of intragroup profits/losses.
Financial income and financial expensesFinancial income and financial expenses are recognised in the
income statement at the amounts relating to the financial year.
Financial items include interest income and interest expenses, fi-
nancing costs of finance leases, realised and unrealised gains and
losses on securities, debt and transactions in foreign currencies, etc.
Tax on profit/loss for the yearTax for the year comprises current tax and deferred tax for the
year. The tax expense relating to the profit/loss for the year is
recognised in the income statement, and the tax expense relating
to changes is recognised directly in equity.
Changes in deferred tax as a result of changes in tax rates are
recognised in the income statement.
The Company is taxed jointly with its Danish subsidiaries. The
tax effect of the joint taxation with the subsidiaries is allocated
between profit- and loss-making companies in proportion to
their taxable income (full absorption with refunds for tax losses).
The jointly taxed companies are taxed under the on-account
tax scheme. The Company manages the joint taxation and
consequently settles the total Danish tax from the jointly taxed
companies’ taxable income.
NOTES
BALANCE SHEETIntangible fixed assetsGains and losses from sale of intangible fixed assets are recog-
nised in the income statement as other operating income or other
operating expenses.
GoodwillGoodwill is measured at cost less accumulated amortisation and
is amortised on a straight-line basis over the estimated useful life,
which is usually 5-15 years. The amortisation period is determined
based on the expected repayment period, and this is longest for
strategic acquisitions with strong market positions and a long-
term earnings profile.
Development projectsDevelopment costs comprise costs, salaries and amortisation
directly and indirectly attributable to the companies’ develop-
ment activities. Development projects that are clearly defined,
identifiable, and with evidenced future utilisation are recognised
as intangible fixed assets if there is sufficient assurance that
future earnings will be generated. Other development costs are
recognised in the income statement as incurred. Capitalised
development costs are measured at cost less accumulated
amortisation and impairment losses. Development costs are
amortised on a straight-line basis over the estimated useful life.
The amortisation period is usually 3-5 years.
Acquired patents, licences, trademarks etc.Acquired patents, licences, trademarks etc. – including software –
are measured at cost less accumulated amortisation and impair-
ment losses. Acquired patents are amortised on a straight-line
basis over the remaining patent period. Licences, trademarks and
software are amortised over the agreement period. For licenses
and trademarks, the period is usually up to 5 years, while software
is amortised over 3-5 years. Additional impairment is made when
deemed necessary.
TANGIBLE FIXED ASSETSTangible fixed assets are measured at cost minus accumulated
depreciation and impairment losses. Tangible fixed assets are
written down to the net realisable value if this is lower than the
carrying amount. Land is not depreciated. Assets held under fi-
nance leases are treated in the same way as the Company’s other
tangible fixed assets.
Depreciation is provided on a straight-line basis over the expected
useful lives of the assets. The expected useful lives are as follows:
• Buildings 25 years
• Plant and machinery 5-10 years
• Other fixtures and fittings, tools and equipment 3-5 years
Depreciation is calculated taking into account any residual value
after useful life and impairment losses. The depreciation period
and the residual value are determined at the acquisition date and
reassessed annually. If the residual value exceeds the carrying
amount, depreciation is discontinued.
Gains and losses from sale of tangible fixed assets are recognised
in the income statement as other operating income or other
operating expenses.
INVESTMENTSInvestments in subsidiaries and associatesInvestments in subsidiaries and associates are measured in
accordance with the equity method minus or plus unrealised
intragroup profits and losses. Subsidiaries and associates with
negative net asset values are measured at DKK 0 (nil), and any
amounts owed by such enterprises are written down by the parent
company’s share of the negative net asset value, if the amount
owed is considered irrecoverable. If the negative net asset value
exceeds the amount owed, the remaining amount is recognised
under Other provisions in the balance sheet, if there is a legal or
actual obligation to cover the imbalance.
Other investmentsOther investments which do not have fixed expiry dates and are
recognised as fixed assets are measured at fair value at the bal-
ance sheet date. The fair value represents the market value of the
assets forming part of an active market. Other securities which
the company intends to hold to maturity and with fixed expiry
dates are recognised at amortised cost.
CURRENT ASSETSInventoriesInventories are recognised at cost in accordance with the FIFO
method. If the net realisable value is lower than cost, inventories
are written down to this lower value. The cost price for goods
for resale and raw materials and consumables comprises the
purchase price plus delivery costs. The cost price for manufac-
tured goods and work in progress comprises direct and indirect
production overheads.
ReceivablesReceivables are measured at amortised cost. Write-down is made
for bad debt losses.
Contract work in progressContract work in progress is measured at the selling price of the
work performed minus on-account invoicing and expected losses.
If the selling price of a construction contract cannot be reliably
measured, the selling price is measured at the lower of costs
incurred and net realisable value. Selling costs and costs incurred
NOTES

FINANCIAL STATEMENTS 2018 FINANCIAL STATEMENTS 2018
2018 ANNUAL REPORT VKR HOLDING A/S 3 3VKR HOLDING A/S 2018 ANNUAL REPORT3 2
in securing contracts are recognised in the income statement as
incurred.
PrepaymentsPrepayments relates to goods and services not yet received and
expenses incurred for goods and services which will not be used
until the subsequent financial year.
Marketable securitiesListed securities recognised as current assets are measured at
fair value on the balance sheet date.
EQUITYDividendThe expected dividend payment for the year is disclosed as a
separate item under equity.
LIABILITIESDeferred taxDeferred tax is measured using the balance sheet liability method
on differences between the carrying amount and the tax base of
assets and liabilities. Deferred tax assets, including the tax value
of tax loss carryforwards, are recognised at the expected value of
their utilisation. That will be either by elimination in tax on future
earnings or against deferred tax liabilities within the same legal
tax entity.
Deferred tax is measured on the basis of the tax rules and at
the rates applicable in the respective countries on the balance
sheet date when the deferred tax is expected to become current
tax. Changes in deferred tax due to changes in tax rates are
recognised in the income statement except for items recognised
directly in equity.
Other provisionsOther provisions comprise anticipated costs related to warran-
ties, losses on work in progress, restructurings, pension obliga-
tions, etc.
Liabilities other than provisionsFinancial liabilities are recognised at the date of borrowing, net
of transaction costs incurred. In subsequent periods, financial
liabilities are measured at amortised cost. Premiums/discounts
are accrued over the term of the liability. Capitalised obligations
on finance leases are recognised as liabilities other than provi-
sions. Other liabilities other than provisions are measured at net
realisable value.
NOTES
CASH FLOW STATEMENTThe cash flow statement shows the Group’s cash flow from
operating, investing, and financing activities for the year, the
year’s changes in cash and cash equivalents, and the Group’s cash
and cash equivalents at the beginning and at the end of the year.
The cash flow effect of acquisitions and disposals of enterprises
is included in cash flow for investing activities. Cash flow from
acquisitions of enterprises is recognised in the cash flow state-
ment from the date of acquisition. Cash flow from disposals of
enterprises is recognised up until the date of disposal.
FINANCIAL HIGHLIGHTSThe financial highlights have been calculated in accordance with
the Danish Finance Society’s recommendations and Financial
ratios 2015.
Earnings before financial items and tax (EBIT) correspond to
Profit before financial items and tax as shown in the income
statement.
The financial ratios mentioned are calculated as follows:
EBITA margin:
EBITA x 100
Net revenue
Return on capital employed:
EBITA x 100
Average capital employed including goodwill
Equity ratio (Solidity):
Equity x 100
Total assets
EBITA:Earnings before goodwill amortisation, financial items and tax.
Capital employed including goodwill:Intangible and tangible fixed assets + other receivables + working
capital.
Goodwill is recognised at book value + accumulated amortisation.
2 N e t r e v e n u e G R O U P
D K K m 2 0 1 8 2 0 1 7
Break-down by geographical segments:
Europe 17,650 16,925
Rest of the world 1,943 1,723
Total net revenue 19,592 18,648
Pursuant to section 96(1) of the Danish Financial Statements Act, net revenue is not disclosed by business segments.
3 Fe e t o a u d i t o r s a p p o i n t e d a t t h e a n n u a l g e n e r a l m e e t i n g G R O U PPA R E N T
C O M PA N Y
D K K m 2 0 1 8 2 0 1 7 2 0 1 8 2 0 1 7
Total fee
Fee to auditor appointed at the annual general meeting 31 13 1 1
Other auditors 1 2 0 1
32 15 1 2
The fee can be specified as follows:
Statutory audit 10 10 0 0
Tax consultancy 6 3 1 1
Other assurance engagements 0 0
Non-audit services 16 2 0
Total fee to auditors appointed at the annual general meeting 32 15 1 2
4 E m p l o y e e c o s t s G R O U PPA R E N T
C O M PA N Y
D K K m 2 0 1 8 2 0 1 7 2 0 1 8 2 0 1 7
Wages and salaries 4,229 3,999 43 43
Pensions 281 282 4 3
Other social security costs 529 506 0 0
Total employee costs 5,040 4,787 47 47
Average number of employees (full time) 15,459 14,764 43 40
Employee costs comprise remuneration of the Executive Management and of the Board of Directors DKKm 10 (2017: DKKm 8).
NOTES

FINANCIAL STATEMENTS 2018 FINANCIAL STATEMENTS 2018
2018 ANNUAL REPORT VKR HOLDING A/S 3 5VKR HOLDING A/S 2018 ANNUAL REPORT3 4
5 F i n a n c i a l i n c o m e
The parent company’s interest income from subsidiaries amounted to DKKm 18 (2017: DKKm 21).
6 F i n a n c i a l e x p e n s e s
The parent company’s interest paid to subsidiaries amounted to DKKm 0 (2017: DKKm 1).
7 Ta x o n p r o f i t f o r t h e y e a r G R O U PPA R E N T
C O M PA N Y
D K K m 2 0 1 8 2 0 1 7 2 0 1 8 2 0 1 7
Current tax for the year 580 749 318 411
Prior year adjustment -15 -12 -4
Deferred tax adjustment for the year 5 35 -24 17
Total tax on profit for the year 570 773 293 423
The Group’s current and deferred tax including prior year adjustments amounted to DKKm 570 (2017: DKKm 773), equivalent to an effective tax rate of 24,2% (2017: 23.4%).
8 D i s t r i b u t i o n o f p r o f i tPA R E N T
C O M PA N Y
D K K m 2 0 1 8 2 0 1 7
Proposed dividend 1,000 1,000
Transferred to equity reserves 785 1,532
Total distribution of profit 1,785 2,532
NOTES
9 I n t a n g i b l e f i x e d a s s e t s G R O U P
D K K m
Completed development
projects
Acquired patents, licences,
trademarks etc. Goodwill
Development projects in course of
construction *) Total
Cost at 1 January 2018 510 275 1,635 137 2,557
Exchange rate and other adjustments 2 1 -12 -9
Additions through acquisition of enterprises 307 1,216 1,523
Additions during the year 75 13 88
Disposals during the year -9 0 -10
Transferred 139 4 -139 4
Cost at 31 December 2018 650 653 2,840 11 4,153
Amortisation and impairment losses at 1 January 2018 510 208 1,437 2,154
Exchange rate and other adjustments 2 1 -8 -5
Additions through acquisition of enterprises 29 29
Amortisation for the year 28 41 52 120
Disposals during the year -9 -9
Transferred 2 2
Amortisation and impairment losses at 31 December 2018 539 271 1,481 2,291
Carrying amount at 31 December 2018111 382 1,359 11 1,863
*) Development projects in course of construction include prepayments for intangible fixed assets.
PA R E N T C O M PA N Y
D K K m
Acquired patents, licenses,
trademarks etc.
Cost at 1 January 2018 262
Additions during the year 13
Cost at 31 December 2018 275
Amortisation and impairment losses at 1 January 2018 260
Amortisation for the year 2
Amortisation and impairment losses at 31 December 2018 263
Carrying amount at 31 December 2018 12
NOTES
FINANCIAL STATEMENTS 2018 FINANCIAL STATEMENTS 2018
2018 ANNUAL REPORT VKR HOLDING A/S 3 7VKR HOLDING A/S 2018 ANNUAL REPORT3 6
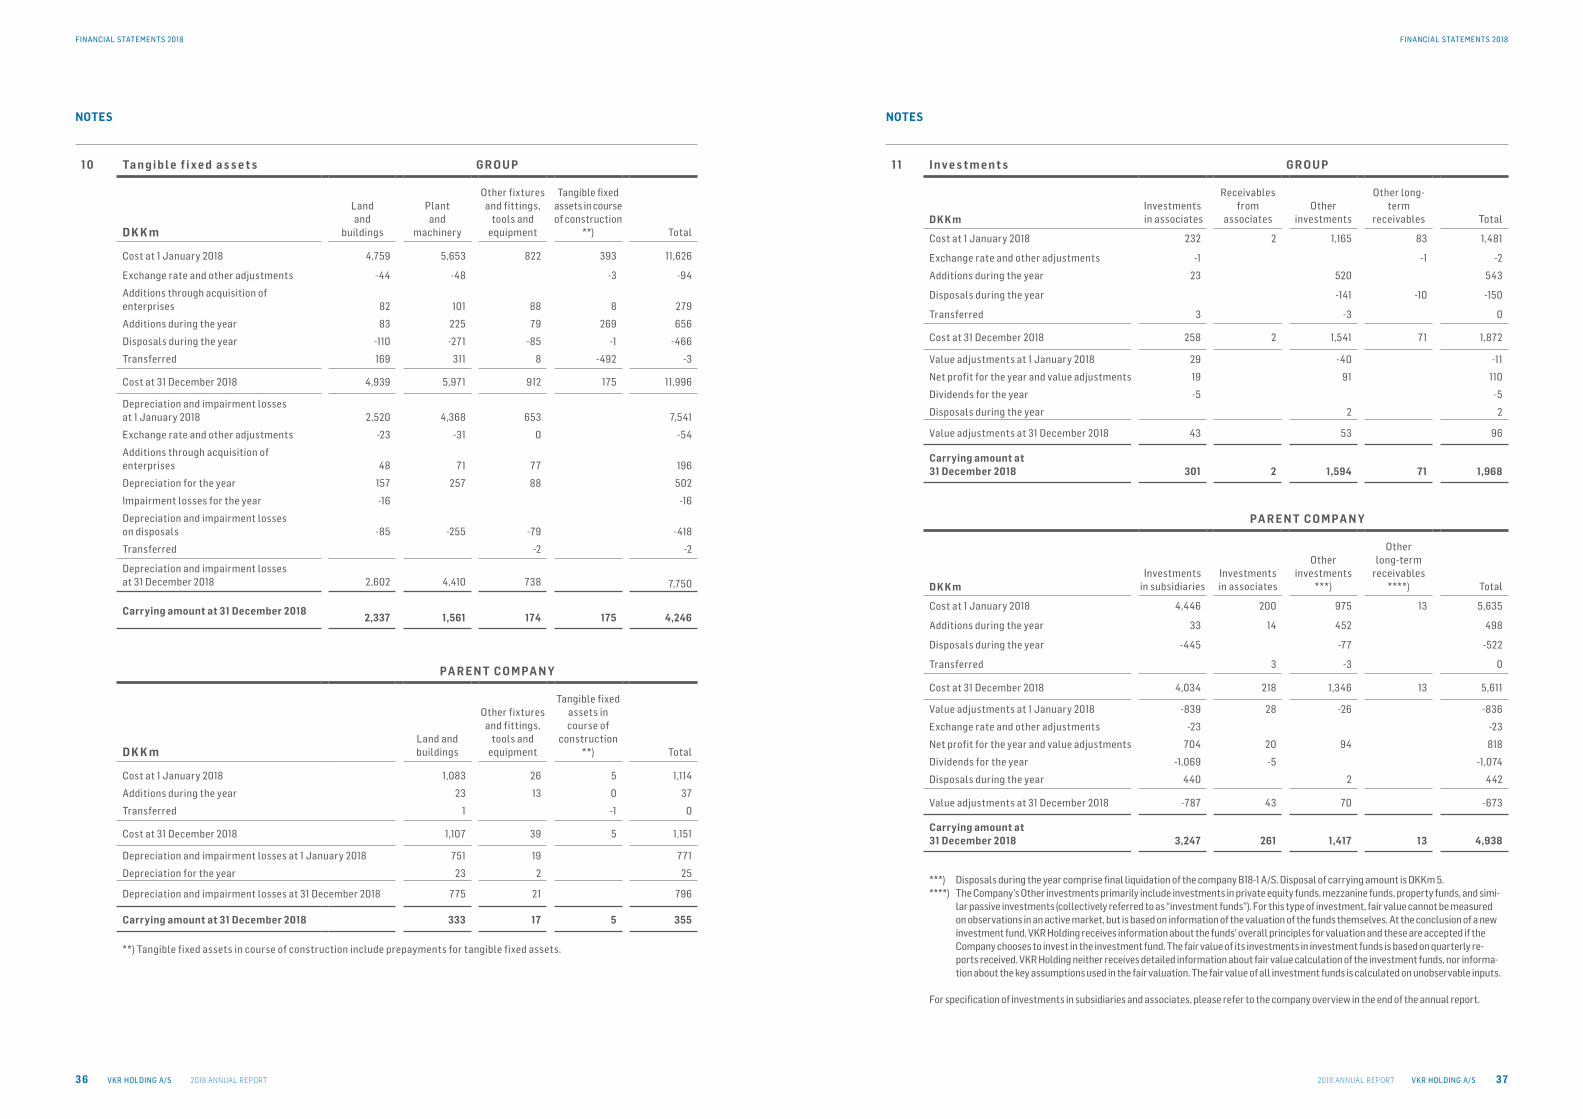
1 0 Ta n g i b l e f i x e d a s s e t s G R O U P
D K K m
Land and
buildings
Plant and
machinery
Other fixtures and fittings,
tools and equipment
Tangible fixed assets in course of construction
**) Total
Cost at 1 January 2018 4,759 5,653 822 393 11,626
Exchange rate and other adjustments -44 -48 -3 -94
Additions through acquisition of enterprises 82 101 88 8 279
Additions during the year 83 225 79 269 656
Disposals during the year -110 -271 -85 -1 -466
Transferred 169 311 8 -492 -3
Cost at 31 December 2018 4,939 5,971 912 175 11,996
Depreciation and impairment losses at 1 January 2018 2,520 4,368 653 7,541
Exchange rate and other adjustments -23 -31 0 -54
Additions through acquisition of enterprises 48 71 77 196
Depreciation for the year 157 257 88 502
Impairment losses for the year -16 -16
Depreciation and impairment losses on disposals -85 -255 -79 -418
Transferred -2 -2
Depreciation and impairment losses at 31 December 2018 2,602 4,410 738 7,750
Carrying amount at 31 December 20182,337 1,561 174 175 4,246
PA R E N T C O M PA N Y
D K K mLand and buildings
Other fixtures and fittings,
tools and equipment
Tangible fixed assets in course of
construction **) Total
Cost at 1 January 2018 1,083 26 5 1,114
Additions during the year 23 13 0 37
Transferred 1 -1 0
Cost at 31 December 2018 1,107 39 5 1,151
Depreciation and impairment losses at 1 January 2018 751 19 771
Depreciation for the year 23 2 25
Depreciation and impairment losses at 31 December 2018 775 21 796
Carrying amount at 31 December 2018 333 17 5 355
**) Tangible fixed assets in course of construction include prepayments for tangible fixed assets.
NOTES
1 1 I n v e s t m e n t s G R O U P
D K K mInvestments
in associates
Receivables from
associatesOther
investments
Other long-term
receivables Total
Cost at 1 January 2018 232 2 1,165 83 1,481
Exchange rate and other adjustments -1 -1 -2
Additions during the year 23 520 543
Disposals during the year -141 -10 -150
Transferred 3 -3 0
Cost at 31 December 2018 258 2 1,541 71 1,872
Value adjustments at 1 January 2018 29 -40 -11
Net profit for the year and value adjustments 19 91 110
Dividends for the year -5 -5
Disposals during the year 2 2
Value adjustments at 31 December 2018 43 53 96
Carrying amount at 31 December 2018 301 2 1,594 71 1,968
PA R E N T C O M PA N Y
D K K mInvestments
in subsidiaries Investments in associates
Other investments
***)
Other long-term
receivables ****) Total
Cost at 1 January 2018 4,446 200 975 13 5,635
Additions during the year 33 14 452 498
Disposals during the year -445 -77 -522
Transferred 3 -3 0
Cost at 31 December 2018 4,034 218 1,346 13 5,611
Value adjustments at 1 January 2018 -839 28 -26 -836
Exchange rate and other adjustments -23 -23
Net profit for the year and value adjustments 704 20 94 818
Dividends for the year -1,069 -5 -1,074
Disposals during the year 440 2 442
Value adjustments at 31 December 2018 -787 43 70 -673
Carrying amount at 31 December 2018 3,247 261 1,417 13 4,938
***) Disposals during the year comprise final liquidation of the company B18-1 A/S. Disposal of carrying amount is DKKm 5.****) The Company’s Other investments primarily include investments in private equity funds, mezzanine funds, property funds, and simi-
lar passive investments (collectively referred to as “investment funds”). For this type of investment, fair value cannot be measured on observations in an active market, but is based on information of the valuation of the funds themselves. At the conclusion of a new investment fund, VKR Holding receives information about the funds’ overall principles for valuation and these are accepted if the Company chooses to invest in the investment fund. The fair value of its investments in investment funds is based on quarterly re-ports received. VKR Holding neither receives detailed information about fair value calculation of the investment funds, nor informa-tion about the key assumptions used in the fair valuation. The fair value of all investment funds is calculated on unobservable inputs.
For specification of investments in subsidiaries and associates, please refer to the company overview in the end of the annual report.
NOTES

FINANCIAL STATEMENTS 2018 FINANCIAL STATEMENTS 2018
2018 ANNUAL REPORT VKR HOLDING A/S 3 9VKR HOLDING A/S 2018 ANNUAL REPORT3 8
NOTES
1 2 I n v e n t o r i e s G R O U P
D K K m 2 0 1 8 2 0 1 7
Raw materials and consumables 758 614
Work in progress 474 440
Manufactured goods and goods for resale 1,311 1,303
Inventories at 31 December 2,543 2,357
1 3 C o n t r a c t w o r k i n p r o g r e s s G R O U PPA R E N T
C O M PA N Y
D K K m 2 0 1 8 2 0 1 7 2 0 1 8 2 0 1 7
Sales value of construction contracts 527 63
On-account invoicing -353 -29
Contract work in progress at 31 December 174 34
Recognised as follows:
Contract work in progress (assets) 187 34
Prepayments from customers (liabilities) -13 0
Contract work in progress at 31 December 174 34
1 4 D e f e r r e d t a x a s s e t s G R O U PPA R E N T
C O M PA N Y
D K K m 2 0 1 8 2 0 1 7 2 0 1 8 2 0 1 7
Deferred tax assets at 1 January 157 189 8
Exchange rate adjustments -1 -2
Additions through acquisition of enterprises 11
Deferred tax adjustments for the year recognised in the income statement
-20 -31 15 -8
Tax on equity transactions 0 0
Deferred tax assets at 31 December 148 157 15 0
At 31 December 2018, the Company has recognised tax assets of DKKm 148. The tax assets represent tax loss carryforwards of DKKm 8 and unused tax credits from timing differences of DKKm 140. Based on budgets until 2020, Management has considered that future taxable income will be available for utilisation of the tax assets.
1 5 P r e p a y m e n t s G R O U PPA R E N T
C O M PA N Y
D K K m 2 0 1 8 2 0 1 7 2 0 1 8 2 0 1 7
Prepaid costs 224 198 6 1
Prepayments at 31 December 224 198 6 1
1 7 D e f e r r e d t a x l i a b i l i t i e s G R O U PPA R E N T
C O M PA N Y
D K K m 2 0 1 8 2 0 1 7 2 0 1 8 2 0 1 7
Deferred tax liabilities at 1 January 77 88 9
Exchange rate adjustments -1 0
Additions through acquisition of enterprises 87
Deferred tax adjustment for the year recognised in the income statement 15 -11 -9 9
Tax on equity transactions 0 0
Deferred tax liabilities at 31 December 179 77 0 9
NOTES
1 8 O t h e r p r o v i s i o n s G R O U PPA R E N T
C O M PA N Y
D K K m
The provisions mainly relate to warranty provisions.Other provisions are expected to fall due as follows:
0-1 year 125
> 1 year 274
Other provisions at 31 December 2018 399
1 9 N o n - c u r r e n t l i a b i l i t i e s G R O U P
D K K m
Total non-current
liabilities 31/12 2018
Current portion
of non-current liabilities (0-1 year)
Long-term portion of non-
current liabilities
(more than 1 year)
Non-current liabilities
falling due more than five years
after the balance
sheet date
Non-current liabilities are recognised as follows:
Leases 14 1 1 13
Other non-current liabilities 33 4 28
Total liabilities at 31. december 2018 47 5 29 13
1 6 S h a r e c a p i t a lAt 31 December 2018, the share capital comprises:10,000 A shares of DKK 1,000 each99,869 B shares of DKK 1,000 eachThe share capital has not changed during the past five years.Each A share carries 10 voting rights, and each B share carries 1 voting right.
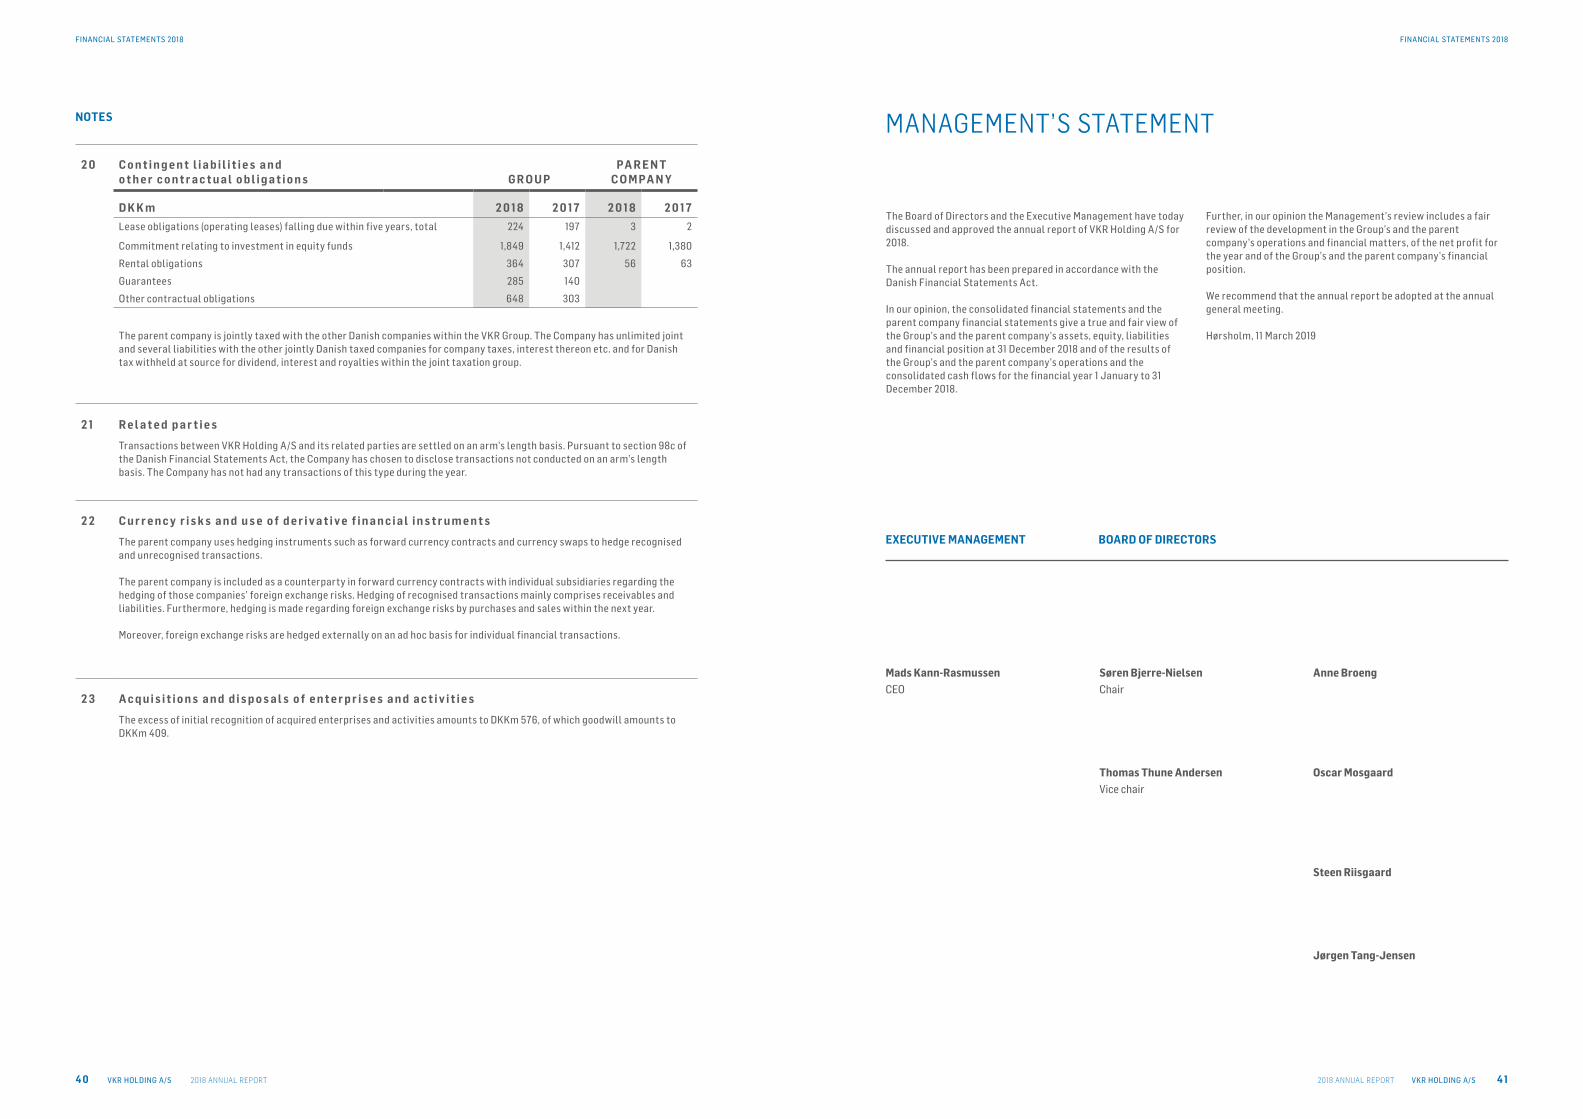
FINANCIAL STATEMENTS 2018 FINANCIAL STATEMENTS 2018
2018 ANNUAL REPORT VKR HOLDING A/S 4 1VKR HOLDING A/S 2018 ANNUAL REPORT4 0
2 0 C o n t i n g e n t l i a b i l i t i e s a n d o t h e r c o n t r a c t u a l o b l i g a t i o n s G R O U P
PA R E N T C O M PA N Y
D K K m 2 0 1 8 2 0 1 7 2 0 1 8 2 0 1 7
Lease obligations (operating leases) falling due within five years, total 224 197 3 2
Commitment relating to investment in equity funds 1,849 1,412 1,722 1,380
Rental obligations 364 307 56 63
Guarantees 285 140
Other contractual obligations 648 303
The parent company is jointly taxed with the other Danish companies within the VKR Group. The Company has unlimited joint and several liabilities with the other jointly Danish taxed companies for company taxes, interest thereon etc. and for Danish tax withheld at source for dividend, interest and royalties within the joint taxation group.
2 1 R e l a t e d p a r t i e s
Transactions between VKR Holding A/S and its related parties are settled on an arm’s length basis. Pursuant to section 98c of the Danish Financial Statements Act, the Company has chosen to disclose transactions not conducted on an arm’s length basis. The Company has not had any transactions of this type during the year.
2 2 C u r r e n c y r i s k s a n d u s e o f d e r i v a t i v e f i n a n c i a l i n s t r u m e n t s
The parent company uses hedging instruments such as forward currency contracts and currency swaps to hedge recognised and unrecognised transactions.
The parent company is included as a counterparty in forward currency contracts with individual subsidiaries regarding the hedging of those companies’ foreign exchange risks. Hedging of recognised transactions mainly comprises receivables and liabilities. Furthermore, hedging is made regarding foreign exchange risks by purchases and sales within the next year.
Moreover, foreign exchange risks are hedged externally on an ad hoc basis for individual financial transactions.
2 3 A c q u i s i t i o n s a n d d i s p o s a l s o f e n t e r p r i s e s a n d a c t i v i t i e s
The excess of initial recognition of acquired enterprises and activities amounts to DKKm 576, of which goodwill amounts to DKKm 409.
NOTES
EXECUTIVE MANAGEMENT BOARD OF DIRECTORS
Mads Kann-Rasmussen
CEO
Søren Bjerre-Nielsen
Chair
Thomas Thune Andersen
Vice chair
Anne Broeng
Oscar Mosgaard
Steen Riisgaard
Jørgen Tang-Jensen
MANAGEMENT’S STATEMENT
The Board of Directors and the Executive Management have today discussed and approved the annual report of VKR Holding A/S for 2018.
The annual report has been prepared in accordance with the Danish Financial Statements Act.
In our opinion, the consolidated financial statements and the parent company financial statements give a true and fair view of the Group’s and the parent company’s assets, equity, liabilities and financial position at 31 December 2018 and of the results of the Group’s and the parent company’s operations and the consolidated cash flows for the financial year 1 January to 31 December 2018.
Further, in our opinion the Management’s review includes a fair review of the development in the Group’s and the parent company’s operations and financial matters, of the net profit for the year and of the Group’s and the parent company’s financial position.
We recommend that the annual report be adopted at the annual general meeting.
Hørsholm, 11 March 2019

FINANCIAL STATEMENTS 2018 FINANCIAL STATEMENTS 2018
2018 ANNUAL REPORT VKR HOLDING A/S 4 3VKR HOLDING A/S 2018 ANNUAL REPORT4 2
INDEPENDENT AUDITORS’ REPORT
TO THE SHAREHOLDERS OF VKR HOLDING A/S
OPINION We have audited the consolidated financial statements and the
parent company financial statements of VKR Holding A/S for
the financial year 1 January - 31 December 2018, which comprise
income statement, balance sheet, statement of changes in equity
and notes, including accounting policies, for the Group and the
parent company, and a consolidated cash flow statement. The
consolidated financial statements and the parent company
financial statements are prepared in accordance with the Danish
Financial Statements Act.
In our opinion, the consolidated financial statements and the
parent company financial statements give a true and fair view
of the financial position of the Group and the parent company at
31 December 2018 and of the results of the Group’s and the parent
company’s operations as well as the consolidated cash flows for
the financial year 1 January - 31 December 2018 in accordance
with the Danish Financial Statements Act.
BASIS FOR OPINION We conducted our audit in accordance with International Stand-
ards on Auditing (ISAs) and additional requirements applicable
in Denmark. Our responsibilities under those standards and
requirements are further described in the “Auditor’s responsibili-
ties for the audit of the consolidated financial statements and the
parent company financial statements” (hereinafter collectively
referred to as “the financial statements”) section of our report.
We believe that the audit evidence we have obtained is sufficient
and appropriate to provide a basis for our opinion.
IndependenceWe are independent of the Group in accordance with the Interna-
tional Ethics Standards Board for Accountants’ Code of Ethics for
Professional Accountants (IESBA Code) and additional requirements
applicable in Denmark, and we have fulfilled our other ethical
responsibilities in accordance with these rules and requirements.
MANAGEMENT’S RESPONSIBILITIES FOR FINANCIAL STATEMENTSManagement is responsible for the preparation of consolidated
financial statements and parent company financial statements
that give a true and fair view in accordance with the Danish
Financial Statements Act, and for such internal control as Man-
agement determines is necessary to enable the preparation of
financial statements that are free from material misstatement,
whether due to fraud or error.
In preparing the financial statements, Management is responsible
for assessing the Group’s and the parent company’s ability to
continue as a going concern, disclosing, as applicable, matters
related to going concern and using the going concern basis of
accounting in preparing the financial statements unless Manage-
ment either intends to liquidate the Group or the company or to
cease operations, or has no realistic alternative but to do so.
AUDITOR’S RESPONSIBILITIES FOR THE AUDIT OF THE FINANCIAL STATEMENTS Our objectives are to obtain reasonable assurance about whether
the financial statements as a whole are free from material mis-
statement, whether due to fraud or error, and to issue an auditor’s
report that includes our opinion. Reasonable assurance is a high
level of assurance, but is not a guarantee that an audit conducted
in accordance with ISAs and additional requirements applicable
in Denmark will always detect a material misstatement when
it exists. Misstatements can arise from fraud or error and are
considered material if, individually or in the aggregate, they could
reasonably be expected to influence the economic decisions of
users taken on the basis of the financial statements.
As part of an audit conducted in accordance with ISAs and the
additional requirements applicable in Denmark, we exercise
professional judgment and maintain professional scepticism
throughout the audit. We also:
• Identify and assess the risks of material misstatement of the
financial statements, whether due to fraud or error, design
and perform audit procedures responsive to those risks, and
obtain audit evidence that is sufficient and appropriate to
provide a basis for our opinion. The risk of not detecting a
material misstatement resulting from fraud is higher than
for one resulting from error, as fraud may involve collusion,
forgery, intentional omissions, misrepresentations or the
override of internal control.
• Obtain an understanding of internal control relevant to the
audit in order to design audit procedures that are appropriate
in the circumstances, but not for the purpose of expressing
an opinion on the effectiveness of the Group’s and the parent
company’s internal control.
• Evaluate the appropriateness of accounting policies used
and the reasonableness of accounting estimates and related
disclosures made by Management.
• Conclude on the appropriateness of Management’s use of the
going concern basis of accounting in preparing the finan-
cial statements and, based on the audit evidence obtained,
whether a material uncertainty exists related to events or
conditions that may cast significant doubt on the Group’s and
the parent company’s ability to continue as a going concern.
If we conclude that a material uncertainty exists, we are re-
quired to draw attention in our auditor’s report to the related
disclosures in the financial statements or, if such disclosures
are inadequate, to modify our opinion. Our conclusion is
based on the audit evidence obtained up to the date of our
auditor’s report. However, future events or conditions may
cause the Group and the company to cease to continue as a
going concern.
• Evaluate the overall presentation, structure and contents of
the financial statements, including the note disclosures, and
whether the financial statements represent the underlying
transactions and events in a manner that gives a true and fair
view.
• Obtain sufficient appropriate audit evidence regarding the
financial information of the entities or business activities
within the Group to express an opinion on the consolidated
financial statements. We are responsible for the direction,
supervision and performance of the group audit. We remain
solely responsible for our audit opinion.
We communicate with those charged with governance regarding,
among other matters, the planned scope and timing of the audit
and significant audit findings, including any significant deficien-
cies in internal control that we identify during our audit.
STATEMENT ON MANAGEMENT’S REVIEW Management is responsible for the Management’s review.
Our opinion on the financial statements does not cover Man-
agement’s review, and we do not express any form of assurance
conclusion thereon.
In connection with our audit of the financial statements, our
responsibility is to read Management’s review and, in doing so,
consider whether Management’s review is materially inconsistent
with the financial statements or our knowledge obtained during
the audit, or otherwise appears to be materially misstated.
Moreover, it is our responsibility to consider whether Manage-
ment’s review provides the information required under the Danish
Financial Statements Act.
Based on the work we have performed, we conclude that Manage-
ment’s review is in accordance with the financial statements and
has been prepared in accordance with the requirements of the
Danish Financial Statements Act. We did not identify any material
misstatement of Management’s review.
Copenhagen, 11 March 2019
Ernst & YoungGodkendt Revisionspartnerselskab
CVR no. 30 70 02 28
Jesper Koefoed Morten Østergaard Koch State Authorised State Authorised
Public Accountant Public Accountant
mne11689 mne35420

FINANCIAL STATEMENTS 2018 FINANCIAL STATEMENTS 2018
2018 ANNUAL REPORT VKR HOLDING A/S 4 5VKR HOLDING A/S 2018 ANNUAL REPORT4 4
COMPANY OVERVIEW AT 31 DECEMBER 2018
Argentina
VELUX Argentina S.A.
Australia
VELUX Australia Pty. Ltd.
Austria
Arcon-Sunmark GmbH
JET Gruppe Austria GmbH
SWV Solar Wärme Versorgungs GmbH - 90%
VELUX Österreich GmbH
Belarus
Unitary enterprise ”VELUX Roof Windows”
Belgium
VELUX Belgium S.A.
Bosnia and Herzegovina
VELUX Bosna i Hercegovina d.o.o.
Bulgaria
VELUX Bulgaria EOOD
Canada
VELUX Canada Inc.
Chile
VELUX Chile SpA
China
Solareast Arcon-Sunmark Large-Scale Solar Systems Integration Co., Ltd. - 45%
Dovista (Guangzhou) Windows and Doors Technology Co. Ltd.
VELUX (CHINA) CO., Ltd.
Croatia
VELUX Hrvatska d.o.o.
COMPANY OVERVIEW AT 31 DECEMBER 2018
Subsidiary Associated company or joint venture Subsidiary Associated company or joint venture
Information in the company overview is provided pursuant to section 97a, (3) of the Danish Financial Statements Act.
The companies are 100% owned by VKR unless otherwise stated after the company name
Czech Republic
BKR ČR, s.r.o.
VELUX Česká republika, s.r.o.
Denmark
A/S Østbirk Bygningsindustri
Arcon-Sunmark A/S
BT Components A/S
Core Bolig IV Investoraktieselskab Nr. 1 - 38%
Core Bolig VIII Investoraktieselskab Nr. 1 - 22%
DOVISTA A/S
Greystone Special Situations Fund K/S - 33%
Gåsdal Bygningsindustri A/S
Homecontrol A/S
JET Domex A/S
Krone Holding ApS - 39%
O.H. Industri A/S
Rationel Vinduer A/S
Skærbæk Bygningsindustri A/S
SolarCAP A/S
Thyregod Bygningsindustri A/S
VELFAC A/S
Velterm A/S
VELUX A/S
VELUX Danmark A/S
VELUX Newco A/S
Ventilation Holding ApS
Vitral A/S
VKR Invest ApS
VKR Newco A/S
Estonia
VELUX Eesti OÜ
Finland
Kurikka Timber OY - 50%
VELUX Suomi Oy
France
KH-SK France S.A.S.
Velsol France S.A.S.
VELUX France S.A.S.
VKR France S.A.S.
Germany
Arcon-Sunmark GmbH
DEUTSCHE-CAP GmbH
JET Brakel Aero GmbH
JET Daylight & Ventilation GmbH
JET Germany GmbH & Co. KG
JET Germany Holding GmbH
JET Grundbesitz GmbH & Co. KG
JET Grundbesitz Holding GmbH
JET Lichtkuppel-Zentrum GmbH
JET RaWa GmbH
JET Schaumstoff-Formteile GmbH
JET Steinbrecher GmbH
JET Tageslicht & RWA GmbH
JTJ Sonneborn Industrie GmbH
Plattform Dach.de GbR - 20%
Ulrich Kreft Vermögensverwaltungsgesellshaft mbH
VELFAC GmbH
VELUX Deutschland GmbH
Hungary
Altaterra Kft.
VELUX Magyarország LKR Korlátolt Felelősségű Társaság
Ireland
Rationel Vinduer Ltd.
VELFAC Ireland Ltd.
Italy
VELUX Italia s.p.a.
Japan
VELUX-Japan Ltd.
Latvia
VELUX Latvia SIA
Lithuania
UAB ”DOVISTA”
"VELUX Lietuva", UAB
UAB ”Vitral”
The Netherlands
Daylighttechnics B.V.
JET BIK Producten B.V.
JET BIK Projecten B.V.
JET Group International B.V.
JET Group Holding B.V.
JET Group B.V.
VELUX Nederland B.V.
New Zealand
VELUX New Zealand Ltd.
Norway
DOVISTA Norge AS
JET Bramo AS
Lian Trevarefabrikk AS
Natre Vinduer AS
VELUX Norge AS
Vindusmesteren AS

FINANCIAL STATEMENTS 2018 FINANCIAL STATEMENTS 2018
2018 ANNUAL REPORT VKR HOLDING A/S 4 7VKR HOLDING A/S 2018 ANNUAL REPORT4 6
COMPANY OVERVIEW AT 31 DECEMBER 2018
Subsidiary Associated company or joint venture
Poland
Altaterra Polska Sp. z o.o.
DOVISTA Polska Sp. z o.o.
JET Grupa Polska Sp. z o.o.
NB Polska Sp. z o.o.
NM Polska Sp. z o.o.
VELUX Polska Sp. z o.o.
Portugal
VELUX Portugal, Unipessoal Lda.
Romania
S.C. VELUX România S.R.L.
Russia
ZAO MD-RUS
ZAO VELUX
Serbia
VELUX Srbija d.o.o.
Slovakia
Partizánske Building Components-SK s.r.o.
VELUX Slovensko spol. s.r.o.
Slovenia
VELUX Slovenija d.o.o.
Spain
VELUX Spain, S.A.
Sweden
DOVISTA Sverige AB
Mockfjärds Fönster AB
Mockfjärds FönsterEntreprenard AB
Mockfjärds Fönstermästaren AB
Snidex AB
Svenska Fönster AB
VELFAC AB
VELUX Svenska AB
Switzerland
JET Tageslichttechnik AG
VELUX Schweiz AG
Turkey
VELUX Çati Pencereleri Ticaret Limited Şirketi
Ukraine
VELUX Ukraina TOV
United Kingdom
EVL Cessation Ltd.
JET Cox Ltd.
Rationel Windows (UK) Ltd.
VELFAC Ltd.
VELUX Company Ltd.
V.U.K. HOLDINGS LIMITED
Vitral UK Limited
Xtralite (Rooflights) Ltd.
COMPANY OVERVIEW AT 31 DECEMBER 2018
Subsidiary Associated company or joint venture
USA
TVC Holdings LLC
VELUX America LLC
VELUX Design and Development USA LLC
VELUX Greenwood LLC
VELUX Group USA Inc.
VELUX Sky Forwarding LLC
VELUX Solutions LLC
Vietnam
Arcon-Sunmark Production Co. Ltd.
Information in the company overview is provided pursuant to section 97a, (3) of the Danish Financial Statements Act.
The companies are 100% owned by VKR unless otherwise stated after the company name

FINANCIAL STATEMENTS 2018
VKR HOLDING A/S 2018 ANNUAL REPORT4 8
VKR Holding A/S
Breeltevej 18
2970 Hørsholm
Denmark
Telephone: +45 3969 1144
Company reg. no. (CVR): 30 83 04 15
www.vkr-holding.com
Published by VKR Holding A/S, Breeltevej 18, 2970 Hørsholm
Print file no. 1753-0319-UK Design BystedFFW