annual report 2016 - hamamatsu photonics · annual report 2016 for the year ended september 30,...
TRANSCRIPT
ANNUAL REPORT 2016For the year ended September 30, 2016
HAMAMATSU PHOTONICS K.K., Headquarters325-6, Sunayama-cho, Naka-ku, Hamamatsu City, Shizuoka Pref., 430-8587, JapanTelephone:(81)53-452-2141 Fax:(81)53-456-7889
HAMAMATSU PHOTONICS K.K. HAMAMATSU PHOTONICS K.K.www.hamamatsu.com

C案扉面
ANNUAL REPORT 2016For the year ended September 30, 2016

C案扉面
ANNUAL REPORT 2016For the year ended September 30, 2016
Table of contents
FINANCIAL HIGHLIGHTS ..............................................................................2TO OUR SHAREHOLDERS ............................................................................4DIVISIONAL REVIEW .....................................................................................6RESEARCH & DEVELOPMENT .....................................................................8TOPICS ......................................................................................................... 10FINANCIAL REVIEW .................................................................................... 12FIVE-YEAR SUMMARY ................................................................................ 14CONSOLIDATED SUBSIDIARIES ................................................................ 15CONSOLIDATED BALANCE SHEET ........................................................... 16CONSOLIDATED STATEMENT OF INCOME ............................................... 18CONSOLIDATED STATEMENT OF COMPREHENSIVE INCOME .............. 18CONSOLIDATED STATEMENT OF CHANGES IN NET ASSETS ................ 19CONSOLIDATED STATEMENT OF CASH FLOWS ......................................20NOTES TO CONSOLIDATED FINANCIAL STATEMENTS ...........................21REPORT OF INDEPENDENT AUDITORS ....................................................29DIRECTORS AND AUDIT & SUPERVISORY BOARD MEMBERS ..............30CORPORATE DATA ...................................................................................... 31PROFILE OF THE HAMAMATSU FAMILY ...................................................32
1

FINANCIAL HIGHLIGHTS
(*) The U.S. dollar amounts above and elsewhere in this report represent translations, solely for the convenience of the reader, using the exchange rate of JPY 101 = US$ 1.
Net sales
0
20
40
60
80
100
140
120
(¥ billion)
Profit attributable toowners of parent
0
2
4
6
8
10
12
14
18
16
(¥ billion)
Return on assets,Return on equity
0
2
4
6
8
10(%) ROE ROA
12 13 14 15 16 12 13 14 15 16 12 13 14 15 16
Consolidated:
Millions of Japanese Yen
Thousands of U.S. Dollars (*)
2015 2016 2015 2016
Net sales....................................................................................... ¥ 120,691 ¥ 121,852 $ 1,194,961 $ 1,206,456 Operating income ......................................................................... 23,596 20,544 233,623 203,406 Profit before income taxes ............................................................ 24,672 20,080 244,286 198,818 Profit attributable to owners of parent........................................... 16,598 14,419 164,341 142,770
Total assets .................................................................................. 226,179 217,300 2,239,404 2,151,492 Net assets..................................................................................... 180,770 169,716 1,789,809 1,680,364
R & D expenses............................................................................ 11,615 11,873 115,002 117,558
Per share information (in Yen and U.S. Dollars)Earnings per share ................................................................ ¥ 103.23 ¥ 90.23 $ 1.02 $ 0.89 Cash dividends ....................................................................... ¥ 49.00 ¥ 34.00 $ 0.48 $ 0.33
* Hamamatsu Photonics implemented a two-for-one stock split on April 1, 2015. Earnings per share has been calculated by assuming this stock split had been executed at the beginning of the fiscal year ended September 30, 2015. Our annual cash dividends for the previous fiscal year came to JPY 49 (US$ 0.48) per share.
2

Non-consolidated:
Millions of Japanese Yen
Thousands of U.S. Dollars (*)
2015 2016 2015 2016
Net sales....................................................................................... ¥ 99,157 ¥ 101,786 $ 981,760 $ 1,007,783 Operating income ......................................................................... 16,626 13,663 164,622 135,282 Profit before income taxes ............................................................ 17,863 15,883 176,869 157,261 Profit ............................................................................................. 12,182 11,922 120,617 118,041
Total assets .................................................................................. 188,392 184,019 1,865,276 1,821,979 Net assets..................................................................................... 149,933 145,992 1,484,488 1,445,471
R & D expenses............................................................................ 11,357 11,608 112,449 114,931
Per share information (in Yen and U.S. Dollars)Earnings per share ................................................................ ¥ 75.64 ¥ 74.48 $ 0.74 $ 0.73 Cash dividends ....................................................................... ¥ 49.00 ¥ 34.00 $ 0.48 $ 0.33
* Hamamatsu Photonics implemented a two-for-one stock split on April 1, 2015. Earnings per share has been calculated by assuming this stock split had been executed at the beginning of the fiscal year ended September 30, 2015. Our annual cash dividends for the previous fiscal year came to JPY 49 (US$ 0.48) per share.
Net sales
0
40
20
60
80
120
100
12 13 14 15 16
(¥ billion)
Profit
0
2
4
6
8
10
12
14
12 13 14 15 16 12 13 14 15 16
(¥ billion)
Return on assets,Return on equity
0
2
4
6
8
10(%) ROE ROA
3
Annual Report 2016
TO OUR SHAREHOLDERS
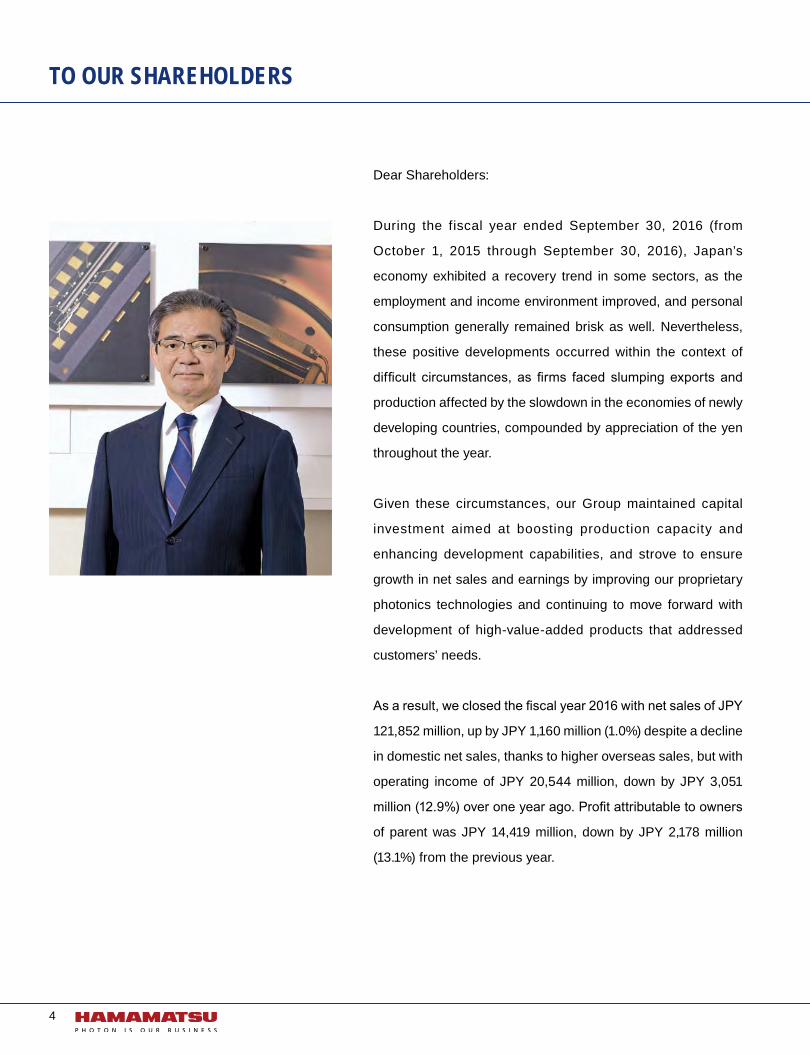
Dear Shareholders:
During the fiscal year ended September 30, 2016 (from
October 1, 2015 through September 30, 2016), Japan’s
economy exhibited a recovery trend in some sectors, as the
employment and income environment improved, and personal
consumption generally remained brisk as well. Nevertheless,
these positive developments occurred within the context of
difficult circumstances, as firms faced slumping exports and
production affected by the slowdown in the economies of newly
developing countries, compounded by appreciation of the yen
throughout the year.
Given these circumstances, our Group maintained capital
investment aimed at boosting production capacity and
enhancing development capabilities, and strove to ensure
growth in net sales and earnings by improving our proprietary
photonics technologies and continuing to move forward with
development of high-value-added products that addressed
customers’ needs.
As a result, we closed the fiscal year 2016 with net sales of JPY
121,852 million, up by JPY 1,160 million (1.0%) despite a decline
in domestic net sales, thanks to higher overseas sales, but with
operating income of JPY 20,544 million, down by JPY 3,051
million (12.9%) over one year ago. Profit attributable to owners
of parent was JPY 14,419 million, down by JPY 2,178 million
(13.1%) from the previous year.
4

Akira HirumaPresident and CEODecember 16, 2016
With regard to the business environment surrounding our Group, we acknowledge that the direction of the economy
remains unpredictable, clouded by factors that include not only opaque global conditions such as the economic
slowdown in newly developing countries and Britain’s exit from the EU, but also concerns of the effects of the ongoing
appreciation of the yen on corporate operating performance.
Given such circumstances, the range of applications of photonics technology in areas such as medical care and
industrial fields is expanding every year, and photonics technology has now become an indispensable fundamental
technology for not only the development of state-of-the-art science and technology but also for the improvement of
society and people’s lives. On the other hand, many aspects of the essence of light remain to be explored and clarified,
and we believe the sectors in which light can be applied will expand indefinitely, and that the role we will play as the
leading global company in photonics technologies will grow more and more in the future.
To respond rapidly and accurately to the growing demands on photonics technology in various sectors, our Group will
seek to create a sustainable, stable and strong earnings organization in the future, by strengthening the links within
the Group’s structure in Japan and overseas and pursuing proactive research and development investment and capital
investments to support the development of next-generation products.
As a Group, we will concentrate on creating innovations by never forgetting the venture mentality we have cultivated
since the Company was established and never being satisfied with the status quo. We will expand our business domain,
and contribute to the development of industry and society while also meeting the expectations of our shareholders, by
continuing to provide high-value added products based on our Group’s medium and long-term vision.
We look forward to continuing to receive your unwavering support and encouragement in the future.
Sincerely,
5
Annual Report 2016

DIVISIONAL REVIEW
Electron Tube Division (Electron Tube Segment)
For over 60 years, Hamamatsu Photonics has developed and manufactured photomultiplier tubes (PMTs). This technology continues to evolve today at the Electron Tube Division, one of the company’s primary manufacturing divisions. The Electron Tube Division also develops and manufactures a variety of products for use in medical applications, chemical analysis, measurement, industrial testing, and academic research. These products include PMTs, electron multipliers, microchannel plates, image intensifiers, X-ray products, and a wide variety of light sources. In fiscal year 2016, sales of these products accounted for 37.4% of the company’s total revenue.
Sales of PMTs
Photomultiplier tubes (PMT) for laser scanning microscopes used in the field of biotechnology, which are highly regarded for their excellent sensitivity, enjoyed higher sales. However, sales for oil-well logging applications in the measuring instrument field contracted sharply because of the prolonged slump in oilfield investment, and sales in the medical field for inspection and monitoring systems such as blood analyzers, which were affected by inventory adjustments by customers, slipped lower as well. As a result, net sales of photomultiplier tubes (PMT) declined.
Sales of imaging devices and light sources
In imaging devices and light sources, sales of deuterium lamps rose as the demand for environmental analysis in Asia increased. However, sales in the medical field of scintillators for converting X-rays into visible light moved lower. In addition, sales in the industrial field of our Stealth Dicing Engine for high-speed, high-quality silicon wafer dicing and of UV-LED light sources for highly accurate bonding of large-scale panels were off as well, affected by constraints on capital investment. Net sales of imaging devices and light sources decreased as a result.In total, the Electron Tube business comprised of photomultiplier tubes (PMT) and imaging devices and light sources closed the fiscal year 2016 with net sales of JPY 45,608 million, down by 6.4% from the previous year.
Photomultiplier tubes and the modules for Laser scanning microscope
Deuterium lamps
6

Solid State Division (Opto-semiconductor Segment)
The Solid State Division develops and manufactures opto-semiconductors for demanding applications in medical imaging, high-energy physics, and scientific measurement. Products from this division include silicon photodiodes, photo IC components, position sensitive detectors, infrared detectors, image sensors for low-light-level imaging and X-ray imaging, mini-spectrometers, and light emitting devices. In fiscal year 2016, sales of these products accounted for 45.6% of the company’s total revenue.
Sales of opto-semiconductors
In opto-semiconductors, our core silicon photodiodes have earned a positive reputation for accurately addressing customers’ needs and continued to achieve robust sales for medical devices in North America, and sales of our flat panel sensors remained strong, centered on dental applications. In the industrial field, sales of opto-semiconductors increased on the strength of expanding sales in Europe of Photo ICs, which are used for optical communication networks in automobiles, and higher sales of silicon photodiodes for luggage inspections as well.As a result, net sales in the Opto-semiconductor business came to JPY 55,592 million, up by 7.0% from the previous year.
Systems Division (Imaging and Measurement Instruments Segment)
The Systems Division develops and manufactures a wide variety of cameras for scientific and industrial applications, as well as specialized instruments for use in fields such as pharmaceutical development, semiconductor manufacturing, X-ray nondestructive inspection, spectrophotometry, and optical communications. In fiscal year 2016, sales of these products accounted for 13.4% of the company’s total revenue.
Sales of image processing and measurement systems
In image processing and measurement systems business, sales of digital cameras used in the field of life sciences and biotechnology declined under the impact of several factors, including inventory adjustment by customers. On the other hand, our failure analysis systems for semiconductor devices, which have earned a solid reputation for high resolution and high-sensitivity in a wide range of fields as well as for enabling diverse analyses tailored to applications, continued to achieve strong sales, especially in Asia. In addition, sales of X-ray line sensor cameras, primarily for food inspection applications, remained steady.As a result, net sales for the Imaging and Measurement Instruments business were JPY 16,352 million, up by 0.9% from the previous year.
Flat panel sensor for dental application
X-ray line scan camera
7
Annual Report 2016

RESEARCH & DEVELOPMENT
With decades of accumulated expertise in the development of photonic technologies to rely upon, Hamamatsu Photonics conducts basic research to discover new knowledge and create new industries in the fields of biotechnology, medicine, information technology, communications, energy, materials, astronomy, and agriculture. We also strive to continuously develop exciting new products and enhance existing products with added functionality. In fiscal year 2016, funds allocated to research and development totaled JPY 11,873 million, an increase of 2.2% over the previous fiscal year. Some highlights of our R&D efforts are presented here.
Basic research
Imaging of circulating tumor cells with quantitative phase microscopy
In the medical care sector, the development of technology to capture images of cancer cells in blood is moving forward through applications of the quantitative phase microscopy technology developed by the Company(*1). As cancer progresses, cancer metastasis occurs when some cancer cells are carried by the flow of blood, circulating within the body until they are carried to other internal organs. Through the application of its quantitative phase microscopy technology to examine the cancer cells circulating in blood, the Company has established the basic three-dimensional imaging technology for measuring these cancer cells without staining or destroying them. This technology offers a promising methodology for selecting and recovering cancer cells in vivo with minimal damage to the cells. The technology also enables examination of cancer lesion presence and cancer states through blood collection, without the need to insert a needle into the cancer lesion and gather cells. Because of these characteristics, the technology is expected to contribute to early cancer diagnosis and tailor-made medical treatment for each patient, including projection of the danger of a post-operation recurrence, evaluation of condition during treatment, and projection of receptivity to anti-cancer drugs.
Basic concept of label-free nondestructive 3D imaging of circulating tumor cells
Blood sample
Laser light (A) Transmitted light (A') Camera
Laser light (A)In the blood sample, rare circulating tumor cells can be found as the patient’s cancer progresses.
Blood cells
Cancer cellsFlow direction
Cancer cell (image)
Computer analysis of image data
The difference in phase between laser light (A) and laser light transmitted through the blood sample in a flow cell (A') is continuously imaged.
(*1) Implemented as part of the “Development of Advanced Measurement and Analysis Systems (SENTAN)” under the FY2016 Medical Research and Development Programs Focused on Technology Transfer of the Japan Agency for Medical Research and Development (AMED).
8

Product development
Thin-type mini-spectrometers
Spectroscopy is a methodology for chemical analysis that is used in various sectors such as industry, medical care, environment analysis and foods to detect the constituents of materials by examining the kinds or characteristics of light radiated or absorbed by a material. The Company has developed and sells small, portable mini-spectrometers for spectroscopy equipment for use at measurement sites, including sites outdoors, and more recently has developed mini-spectrometers equipped with CMOS image sensors made by the Company that feature the same high degree of sensitivity as CCD image sensors. This product achieves a significant reduction in thickness and power consumption, while maintaining a high level of performance. The product can be embedded in spectroscopy devices for use in various applications, including security, analysis of components in foods and other products, and color measurement of LED lighting, etc., and is expected to contribute to industry advancement.
High-speed, high-precision X-ray TDI camera
The Company has developed a new high-speed, high-precision X-ray TDI camera to achieve nondestructive testing. In recent years, 100% inspections are being conducted to ensure the safety and reliability of various products, and improved camera processing speed for nondestructive testing is being demanded. By installing a custom sensor that it manufactures in-house, the Company recently developed an X-ray TDI camera that achieves 2.5 times faster speeds compared with conventional products while maintaining high-sensitivity and high-resolution. The camera also enables efficient imaging of the items being inspected by supporting two-way readouts, and X-ray tolerance has been improved by optimizing the component parts. The Company will seek to realize even greater performance and introduce the camera into new applications and high-value added products in the future.
Thin-type mini-spectrometers
New X-ray TDI camera and an example of the using
X-ray lightsource
X-ray TDI camera
Object
9
Annual Report 2016

Radiation-resistant image sensor for nuclear reactor decommissioning
Efforts continue around the world to develop the technology required to decommission the Fukushima Daiichi Nuclear Power Plant, which was critically damaged in the Great East Japan Earthquake in 2011. In decommissioning the plant, a major step is to first remove the nuclear fuel debris from inside the nuclear reactor. This requires being able to see inside the reactor, which is a highly radioactive environment that is too harsh for conventional solid-state image sensors such as CCD or CMOS image sensors. Hamamatsu’s image pick up tubes have received attention as a possible solution to this urgent need.
Image pick up tubes are vacuum tube devices which were used in TV cameras prior to the development of solid-state image sensors. Image pick up tubes are considerably more resistant to radiation than solid-state image sensors, and are considered to be the only device that could possibly meet the required specifications (10 kGy/h dose rate, 2 MGy cumulative dose). However, ensuring that image pick up tubes can produce images in such harsh radioactive conditions for the desired period of roughly 1 week (≒ 200 hours) called for a dramatic increase in device performance.
Hamamatsu is applying expertise gained from years of making specialized image pick up tubes to this problem and are currently testing a brand new type of image pick up tube, which has been confirmed to produce a mostly unchanged image after 200 hours of radiation exposure.(*1) It is hoped this new image pick up tube will be usable as a visual device for workers and robots to inspect inside the nuclear reactor at the Fukushima power plant for fuel debris.
(*1) This development is supported by Japan’s Ministry of Economy, Trade and Industry (Team for Countermeasures for Decommissioning and Contaminated Water Treatment).
TOPICS
Image pick up tube Without irradiation With irradiation (10 kGy/h)
10

Essential components for LIDAR: light emitters, detectors
LIDAR is a light-based method for obtaining information about the distances to remote objects and their size, and is being adopted in applications such as security, robotics, and self-driving cars. A typical LIDAR system includes light-emitting components (such as lasers) to illuminate the surroundings and also light-detecting components (such as photodiodes) to detect the reflected light for analysis by the LIDAR system. Hamamatsu is uniquely positioned to help customers with this growing technology because we are one of very few companies to design and manufacture a wide variety of both types of components, as well as modules that integrate photosensors with amplifiers and signal processing circuits.
Construction of new buildings at Miyakoda and Shingai
Miyakoda Factory’s new building will consolidate the wafer processing of compound semiconductors(*2) at various sites into one location, enabling us to develop revolutionary new infrared devices and increase production for the growing market in infrared applications. Shingai Factory’s expansion will prepare us to meet growing demand for opto-semiconductors, as more space will be given to assembly inspection and more automation will be installed.
(*2) Opto-semiconductors are commonly made from silicon (Si), but they can also be made from compounds of other materials in different ratios. This makes it possible to emit and detect longer wavelengths of light than silicon (i.e., infrared light).
Cars of the future may use LIDAR to scan their surroundings and drive autonomously.
New building at Miyakoda Factory New building at Shingai Factory
11
Annual Report 2016

FINANCIAL REVIEW
Net salesDuring the fiscal year ended September 30, 2016 (from October 1, 2015 through September 30, 2016), Japan’s economy exhibited a recovery trend in some sectors, as the employment and income environment improved, and personal consumption generally remained brisk as well. Nevertheless, these positive developments occurred within the context of difficult circumstances, as firms faced slumping exports and production affected by the slowdown in the economies of newly developing countries, compounded by appreciation of the yen throughout the year. As a result, we closed the fiscal year 2016 with net sales of JPY 121,852 million (US$ 1,206,456 thousand), up by 1.0% from the previous year despite a decline in domestic sales, thanks to higher overseas sales.Performance by segment, sales in the Electron Tube business comprised of Photomultiplier Tubes (PMT) and Imaging Devices and Light Sources amounted JPY 45,608 million (US$ 451,566 thousand), down by 6.4% from the previous year. Sales of Opto-semiconductor was JPY 55,592 million (US$ 550,421 thousand), up by 7.0% over the previous year. Sales of the Imaging and Measurement Instruments business including Image Processing and Measurement Systems, Failure Analysis Systems for semiconductor devices increased 0.9% to JPY 16,352 million (US$ 161,902 thousand). Net sales from other business, mainly semiconductor laser business, hotel operations and a business relating to the proprietary products of Beijing Hamamatsu Photon Techniques, Inc., which is a subsidiary in China, were JPY 4,299 million (US$ 42,565 thousand), up by 12.0% over last year.
Operating incomeCost of sales increased 5.6% or JPY 3,225 million (US$ 31,934 thousand) over the previous year to JPY 60,807 million (US$ 602,053 thousand). The cost of sales ratio weakened 2.2 points to 49.9% this year. Selling, general and administrative expenses were JPY 28,627 million (US$ 283,437 thousand), up by 2.6%, JPY 729 million (US$ 7,221 thousand). Research and development expenses were JPY 11,873 million (US$ 117,558 thousand), up by 2.2% from previous year. As a result, operating income was JPY 20,544 million (US$ 203,406 thousand), down by 12.9%. Operating income for Electron tube, Opto-semiconductor and Imaging and measurement instruments business segment was JPY 15,342 million (US$ 151,904 thousand), down by 14.1%, JPY 16,141 million (US$ 159,813 thousand), up by 0.2% and JPY 3,538 million (US$ 35,035 thousand), down by 6.7%, respectively. Other business recorded an operating income of JPY 572 million (US$ 5,667 thousand), up by 232.1%.
Profit attributable to owners of parentOther expenses, on net basis, was JPY 463 million (US$ 4,587 thousand), compared with JPY 1,076 million (US$ 10,662 thousand) net of other income for the previous year. Reflecting the previously cited factors, profit attributable to owners of parent for the fiscal year ended September 30, 2016 was down by 13.1% to JPY 14,419 million (US$ 142,770 thousand) from JPY 16,598 million (US$ 164,341 thousand). Consequently, earnings per share decreased from JPY 103.23 (US$ 1.02) to JPY 90.23 (US$ 0.89). Dividend per share applicable to the fiscal year was JPY 34 (US$ 0.33).
Net sales
0
60
40
20
140
120
100
80
(¥ billion)
Operating income
02468
10121416182022
2624
(¥ billion)
Profit attributable toowners of parent
0
2
4
6
8
10
12
14
16
18(¥ billion)
14 15 16
14 15 16
14 15 16
12

Financial positionCurrent assets decreased by JPY 6,651 million (US$ 65,854 thousand) from the year ended September 30, 2015. This mainly reflected a decrease in cash and deposits of JPY 7,045 million (US$ 69,757 thousand), and a decrease in notes and accounts receivable-trade of JPY 820 million (US$ 8,124 thousand), respectively.Non-current assets decreased by JPY 2,227 million (US$ 22,058 thousand) from the year ended September 30, 2015, this was mainly from a decrease in property, plant and equipment of JPY 2,562 million (US$ 25,369 thousand), that resulted from a decrease in buildings and structures.Total assets at the fiscal year-end were JPY 217,300 million (US$ 2,151,492 thousand), down by JPY 8,879 million (US$ 87,912 thousand) from the year ended September 30, 2015.Current liabilities were down by JPY 3,957 million (US$ 39,178 thousand) from the prior fiscal year-end. Total current liabilities fell because of a decrease in current portion of long-term loans payable of JPY 2,953 million (US$ 29,245 thousand) and a decrease in income taxes payable of JPY 743 million (US$ 7,366 thousand), respectively.Non-current liabilities increased by JPY 6,131 million (US$ 60,711 thousand) from the previous fiscal year-end, mainly due to an increase in net defined benefit liability of JPY 3,161 million (US$ 31,306 thousand) and an increase in long-term loans payable of JPY 3,036 million (US$ 30,062 thousand), respectively. As a result, total liabilities at the fiscal year-end were JPY 47,583 million (US$ 471,128 thousand), up by JPY 2,174 million (US$ 21,532 thousand) from the year ended September 30, 2015. Net assets were JPY 169,716 million (US$ 1,680,364 thousand), down by JPY 11,054 million (US$ 109,445 thousand) from the previous fiscal year-end. This mainly reflected an increase in retained earnings of JPY 8,621 million (US$ 85,364 thousand) as a result of reporting profit attributable to owners of parent, and decreases of JPY 10,000 million (US$ 99,012 thousand) as a result of the purchase of treasury shares and JPY 7,289 million (US$ 72,171 thousand) as a result of the foreign currency translation adjustment, respectively.
Cash flowsAt the end of this fiscal year, cash and cash equivalents stood at JPY 53,595 million (US$ 530,651 thousand), up by JPY 8,039 million (US$ 79,600 thousand) from the year ended September 30, 2015. Cash flows for the fiscal year ended September 30, 2016 (from October 1, 2015 through September 30, 2016) were as follows. Net cash provided by operating activities during the year was JPY 24,160 million (US$ 239,212 thousand), up by JPY 8,113 million (US$ 80,332 thousand) over the previous year. The increase mainly reflected a cash contribution to the retirement benefit trust in the previous fiscal year, and a decrease in income taxes paid, etc. Net cash provided by investing activities was JPY 4,186 million (US$ 41,453 thousand), due mainly to an increase in cancellation of time deposits for longer than three months, which are not counted as cash, in conjunction with the purchase of treasury shares. This compares with net cash used in investing activities in the previous fiscal year of JPY 17,057 million (US$ 168,885 thousand), which mainly reflected purchases of property, plant and equipment. Net cash used in financing activities was JPY 15,413 million (US$ 152,607 thousand), up by JPY 10,535 million (US$ 104,310 thousand) from the previous year, due mainly to an increase in expenditures for purchase of treasury shares.
Capital expendituresCapital expenditures during fiscal year 2016 totaled JPY 9,315 million (US$ 92,230 thousand), 35.0% or JPY 5,023 million (US$ 49,733 thousand) lower than previous fiscal year. Major investments were made in new facility for Opto-semiconductor production aimed at boosting the production. Investments were made in expanding and improving manufacturing, research and development facilities. There was no major sale or disposal of material fixed assets during this fiscal year.
R&D expenses(¥ billion)
Capital expenditures
(¥ billion)
Total assets/Net Assets
0
2
4
6
8
10
14
12
0
2
4
6
8
10
12
14
16
18
50
200
100
150
250(¥ billion)
14 15 16
14 15 16
14 15 16
Total assets Net assets
0
13
Annual Report 2016

FIVE-YEAR SUMMARY
Hamamatsu Photonics K.K. and Consolidated SubsidiariesYears ended September 30
Millions of Japanese Yen2012 2013 2014 2015 2016
For the year:Net sales ....................................................... ¥ 98,067 ¥ 102,156 ¥ 112,092 ¥ 120,691 ¥ 121,852 Operating income .......................................... 17,587 16,781 21,665 23,596 20,544 Profit before income taxes ............................. 17,812 17,904 22,462 24,672 20,080 Profit attributable to owners of parent ........... 11,206 11,529 15,155 16,598 14,419
Capital expenditures ...................................... 8,633 9,184 15,499 14,338 9,315 Depreciation .................................................. 8,223 7,769 7,396 8,561 9,888 R&D expenses .............................................. 10,765 10,885 10,977 11,615 11,873
At year-end:Working capital .............................................. ¥ 97,326 ¥ 105,517 ¥ 106,901 ¥ 111,326 ¥ 108,631 Total assets ................................................... 189,970 198,278 215,412 226,179 217,300 Capital stock .................................................. 34,928 34,928 34,928 34,928 34,928 Net assets ..................................................... 140,873 154,385 168,815 180,770 169,716
Number of shares issued (thousands) .......... 83,764 83,764 83,764 167,529 167,529 Number of employees ................................... 4,386 4,415 4,420 4,482 4,592
Japanese YenPer share information:
Earnings per shareBasic......................................................... ¥ 139.39 ¥ 143.41 ¥ 94.26 ¥ 103.23 ¥ 90.23 Diluted ...................................................... - - - - -
Cash dividends .............................................. 46.00 50.00 55.00 49.00 34.00 Net assets ..................................................... 1,745.18 1,913.98 1,046.56 1,120.38 1,075.31
* Hamamatsu Photonics implemented a two-for-one stock split on April 1, 2015. Earnings per share has been calculated by assuming this stock split had been executed at the beginning of the fiscal year ended September 30, 2014.
PercentRatios:
Equity ratio .................................................... 73.9 77.6 78.1 79.6 77.8 Return on net sales ....................................... 11.4 11.3 13.5 13.8 11.8 Return on assets ........................................... 5.9 5.9 7.3 7.5 6.5 Return on equity ............................................ 8.2 7.8 9.4 9.5 8.3
14
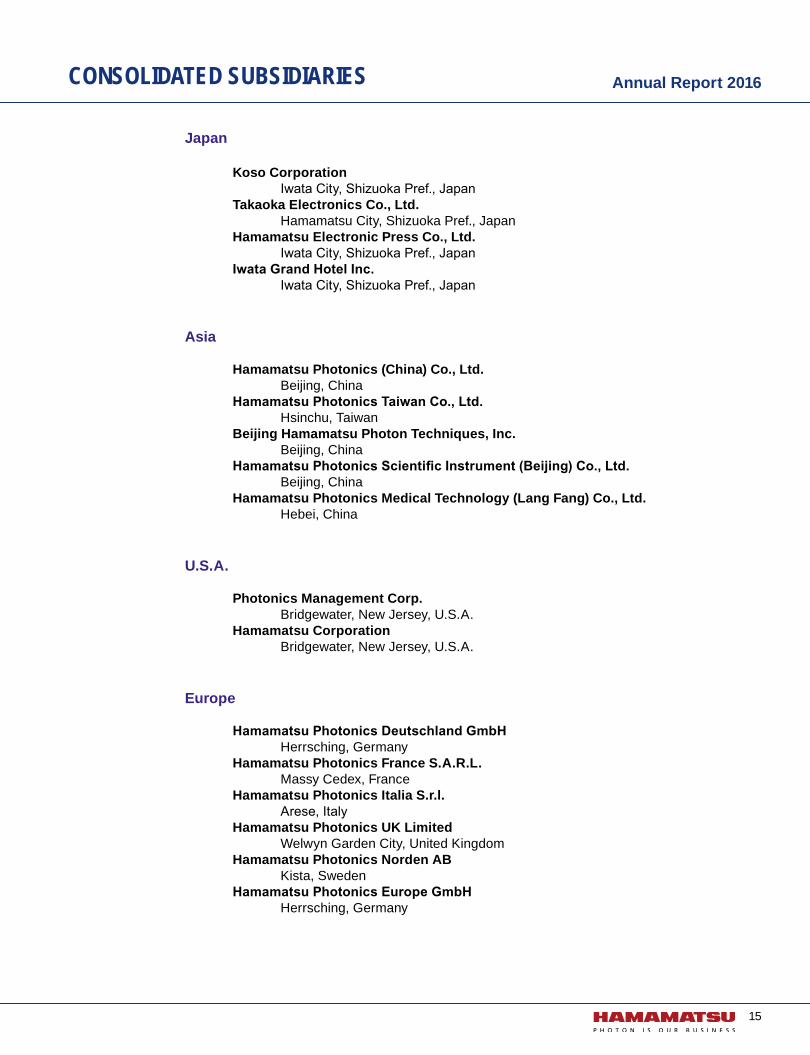
Japan
Koso Corporation Iwata City, Shizuoka Pref., Japan Takaoka Electronics Co., Ltd. Hamamatsu City, Shizuoka Pref., Japan Hamamatsu Electronic Press Co., Ltd. Iwata City, Shizuoka Pref., Japan Iwata Grand Hotel Inc. Iwata City, Shizuoka Pref., Japan
Asia
Hamamatsu Photonics (China) Co., Ltd. Beijing, China Hamamatsu Photonics Taiwan Co., Ltd. Hsinchu, Taiwan Beijing Hamamatsu Photon Techniques, Inc. Beijing, China Hamamatsu Photonics Scientific Instrument (Beijing) Co., Ltd. Beijing, China Hamamatsu Photonics Medical Technology (Lang Fang) Co., Ltd. Hebei, China
U.S.A.
Photonics Management Corp. Bridgewater, New Jersey, U.S.A. Hamamatsu Corporation Bridgewater, New Jersey, U.S.A.
Europe
Hamamatsu Photonics Deutschland GmbH Herrsching, Germany Hamamatsu Photonics France S.A.R.L. Massy Cedex, France Hamamatsu Photonics Italia S.r.l. Arese, Italy Hamamatsu Photonics UK Limited Welwyn Garden City, United Kingdom Hamamatsu Photonics Norden AB Kista, Sweden Hamamatsu Photonics Europe GmbH Herrsching, Germany
CONSOLIDATED SUBSIDIARIES
15
Annual Report 2016
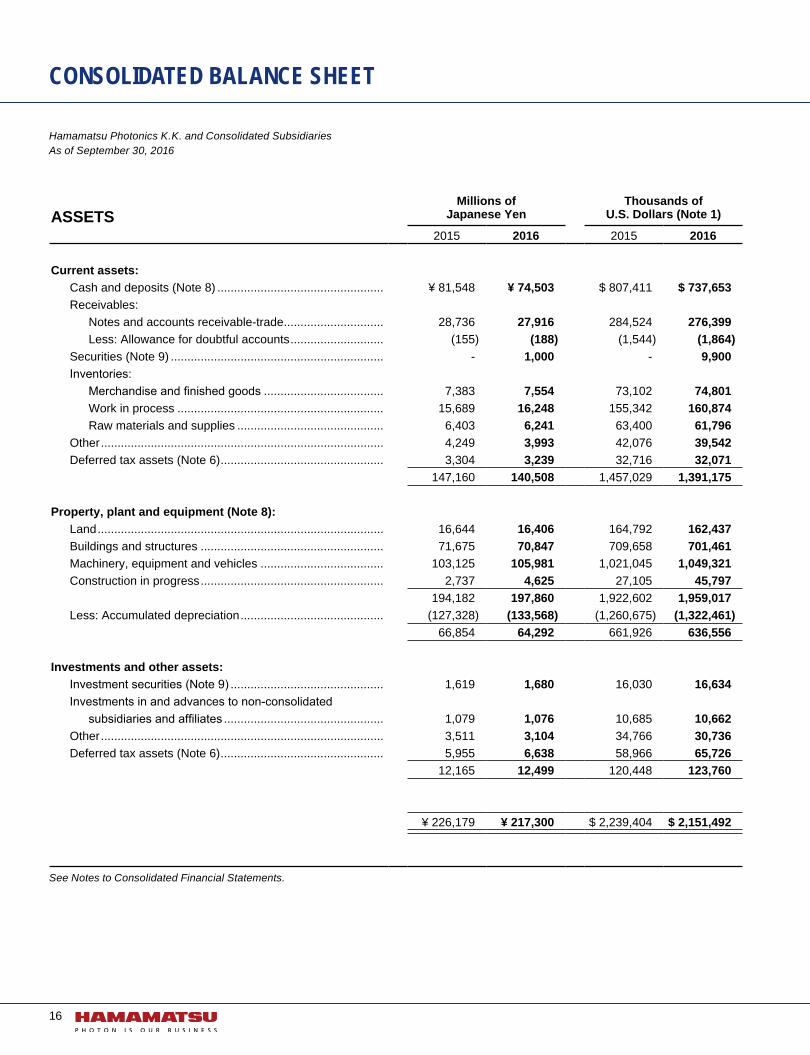
CONSOLIDATED BALANCE SHEET
Hamamatsu Photonics K.K. and Consolidated SubsidiariesAs of September 30, 2016
ASSETSMillions of
Japanese YenThousands of
U.S. Dollars (Note 1)
2015 2016 2015 2016
Current assets:Cash and deposits (Note 8) .................................................. ¥ 81,548 ¥ 74,503 $ 807,411 $ 737,653 Receivables:
Notes and accounts receivable-trade .............................. 28,736 27,916 284,524 276,399 Less: Allowance for doubtful accounts ............................ (155) (188) (1,544) (1,864)
Securities (Note 9) ................................................................ - 1,000 - 9,900Inventories:
Merchandise and finished goods .................................... 7,383 7,554 73,102 74,801 Work in process .............................................................. 15,689 16,248 155,342 160,874 Raw materials and supplies ............................................ 6,403 6,241 63,400 61,796
Other ..................................................................................... 4,249 3,993 42,076 39,542 Deferred tax assets (Note 6) ................................................. 3,304 3,239 32,716 32,071
147,160 140,508 1,457,029 1,391,175
Property, plant and equipment (Note 8):Land ...................................................................................... 16,644 16,406 164,792 162,437 Buildings and structures ....................................................... 71,675 70,847 709,658 701,461 Machinery, equipment and vehicles ..................................... 103,125 105,981 1,021,045 1,049,321 Construction in progress ....................................................... 2,737 4,625 27,105 45,797
194,182 197,860 1,922,602 1,959,017 Less: Accumulated depreciation ........................................... (127,328) (133,568) (1,260,675) (1,322,461)
66,854 64,292 661,926 636,556
Investments and other assets:Investment securities (Note 9) .............................................. 1,619 1,680 16,030 16,634Investments in and advances to non-consolidated
subsidiaries and affiliates ................................................ 1,079 1,076 10,685 10,662Other ..................................................................................... 3,511 3,104 34,766 30,736 Deferred tax assets (Note 6) ................................................. 5,955 6,638 58,966 65,726
12,165 12,499 120,448 123,760
¥ 226,179 ¥ 217,300 $ 2,239,404 $ 2,151,492
See Notes to Consolidated Financial Statements.
16

LIABILITIES AND NET ASSETSMillions of
Japanese YenThousands of
U.S. Dollars (Note 1)
2015 2016 2015 2016
Current liabilities:Short-term loans payable (Note 8) ........................................ ¥ 2,040 ¥ 2,183 $ 20,207 $ 21,618 Current portion of long-term loans payable (Note 8) ............ 3,172 218 31,413 2,168 Payables:
Notes and accounts payable-trade ................................. 13,513 13,461 133,797 133,279 Construction and other .................................................... 4,533 4,507 44,890 44,632
Income taxes payable (Note 6) ............................................. 2,763 2,019 27,357 19,991 Accrued expenses ................................................................ 6,429 6,484 63,662 64,200 Other ..................................................................................... 3,379 3,002 33,461 29,723
35,833 31,876 354,791 315,613
Non-current liabilities:Long-term loans payable (Note 8) ........................................ 3,808 6,844 37,709 67,771 Net defined benefit liability (Note 5) ...................................... 3,956 7,118 39,171 70,478 Other ..................................................................................... 1,633 1,561 16,174 15,461 Deferred tax liabilities (Note 6) ............................................. 176 182 1,747 1,804
9,575 15,707 94,803 155,514
Net assets:Shareholders’ equity
Capital stock, no par value: ............................................. 34,928 34,928 345,828 345,828 Authorized - 500,000,000 sharesIssued - 167,529,968 shares in 2015
- 167,529,968 shares in 2016Capital surplus ................................................................ 34,672 34,672 343,292 343,292 Retained earnings ........................................................... 110,637 119,259 1,095,419 1,180,783 Less: Treasury shares ..................................................... (6,059) (16,059) (59,995) (159,007)
- 6,743,639 shares in 2015 - 10,213,758 shares in 2016
Accumulated other comprehensive incomeValuation difference on available-for-sale securities ....... 520 455 5,150 4,509 Foreign currency translation adjustment ......................... 4,367 (2,921) 43,242 (28,929)Remeasurements of defined benefit plans ...................... 1,074 (1,170) 10,637 (11,593)
Non-controlling interests ....................................................... 629 553 6,234 5,479 180,770 169,716 1,789,809 1,680,364
¥ 226,179 ¥ 217,300 $ 2,239,404 $ 2,151,492
See Notes to Consolidated Financial Statements.
17
Annual Report 2016

CONSOLIDATED STATEMENT OF INCOME
Hamamatsu Photonics K.K. and Consolidated SubsidiariesYear ended September 30, 2016 Millions of
Japanese YenThousands of
U.S. Dollars (Note 1)
2015 2016 2015 2016Net sales .................................................................................... ¥ 120,691 ¥ 121,852 $ 1,194,961 $ 1,206,456
Operating costs and expensesCost of sales ......................................................................... 57,582 60,807 570,119 602,053 Selling, general and administrative expenses ...................... 27,897 28,627 276,215 283,437 Research and development expenses ................................. 11,615 11,873 115,002 117,558
Operating income ..................................................................... 23,596 20,544 233,623 203,406
Other income (expenses):Interest and dividend income ................................................ 242 278 2,404 2,754 Interest expenses ................................................................. (97) (97) (968) (969)Other, net .............................................................................. 931 (643) 9,226 (6,372)
Profit before income taxes ...................................................... 24,672 20,080 244,286 198,818
Income taxes (Note 6)Current .................................................................................. 7,185 5,294 71,145 52,424 Deferred ................................................................................ 852 318 8,443 3,149
8,038 5,612 79,589 55,574
Profit .......................................................................................... 16,634 14,467 164,697 143,244
Profit attributable to non-controlling interests ...................... (35) (47) (355) (474)
Profit attributable to owners of parent ................................... ¥ 16,598 ¥ 14,419 $ 164,341 $ 142,770
CONSOLIDATED STATEMENT OF COMPREHENSIVE INCOME (Note 3)
Hamamatsu Photonics K.K. and Consolidated SubsidiariesYear ended September 30, 2016 Millions of
Japanese YenThousands of
U.S. Dollars (Note 1)
2015 2016 2015 2016Profit ............................................................................................ ¥ 16,634 ¥ 14,467 $ 164,697 $ 143,244
Other comprehensive incomeValuation difference on available-for-sale securities .............. (175) (64) (1,732) (640)Foreign currency translation adjustment ................................. 2,817 (7,352) 27,898 (72,801)Remeasurements of defined benefit plans, net of tax ............ (86) (2,245) (854) (22,230)Share of other comprehensive income of entities
accounted for using equity method ................................... 34 (39) 336 (390)Total other comprehensive income ......................................... 2,590 (9,702) 25,647 (96,063)
Comprehensive income ............................................................. ¥ 19,224 ¥ 4,765 $ 190,344 $ 47,180
Comprehensive income attributable toComprehensive income attributable to owners of parent ....... ¥ 19,114 ¥ 4,820 $ 189,256 $ 47,727 Comprehensive income attributable to non-controlling interests ...... 109 (55) 1,088 (546)
See Notes to Consolidated Financial Statements.
18

Hamamatsu Photonics K.K. and Consolidated SubsidiariesYear ended September 30, 2016
Millions ofJapanese Yen
Thousands ofU.S. Dollars (Note 1)
2015 2016 2015 2016Capital stock:
Balance at beginning of current period ................................. ¥ 34,928 ¥ 34,928 $ 345,828 $ 345,828 Total changes of items during period .................................... - - - -Balance at end of current period ........................................... 34,928 34,928 345,828 345,828
Capital surplus:Balance at beginning of current period ................................. 34,672 34,672 343,292 343,292 Total changes of items during period .................................... - - - -Balance at end of current period ........................................... 34,672 34,672 343,292 343,292
Retained earnings:Balance at beginning of current period ................................. 101,278 110,637 1,002,752 1,095,419 Cumulative effect of changes in accounting policies ............ (2,407) - (23,836) -Restated balance .................................................................. 98,870 110,637 978,916 1,095,419 Dividends of surplus ............................................................. (4,831) (5,797) (47,838) (57,405)Profit attributable to owners of parent ................................... 16,598 14,419 164,341 142,770 Balance at end of current period ........................................... 110,637 119,259 1,095,419 1,180,783
Treasury shares:Balance at beginning of current period ................................. (6,050) (6,059) (59,905) (59,995)Purchase of treasury shares ................................................. (9) (10,000) (89) (99,012)Balance at end of current period ........................................... (6,059) (16,059) (59,995) (159,007)
Valuation difference on available-for-sale securities:Balance at beginning of current period ................................. 695 520 6,883 5,150 Net changes of items other than shareholders’ equity .......... (175) (64) (1,732) (640)Balance at end of current period ........................................... 520 455 5,150 4,509
Foreign currency translation adjustment:Balance at beginning of current period ................................. 1,589 4,367 15,740 43,242 Net changes of items other than shareholders' equity .......... 2,777 (7,289) 27,501 (72,171)Balance at end of current period ........................................... 4,367 (2,921) 43,242 (28,929)
Remeasurements of defined benefit plans:Balance at beginning of current period ................................. 1,160 1,074 11,491 10,637 Net changes of items other than shareholders’ equity .......... (86) (2,245) (854) (22,230)Balance at end of current period ........................................... 1,074 (1,170) 10,637 (11,593)
Non-controlling interests:Balance at beginning of current period ................................. 541 629 5,358 6,234 Net changes of items other than shareholders’ equity .......... 88 (76) 876 (754)Balance at end of current period ........................................... 629 553 6,234 5,479
Total net assets ........................................................................ ¥ 180,770 ¥ 169,716 $ 1,789,809 $ 1,680,364
See Notes to Consolidated Financial Statements.
CONSOLIDATED STATEMENT OF CHANGES IN NET ASSETS
19
Annual Report 2016

CONSOLIDATED STATEMENT OF CASH FLOWS
Hamamatsu Photonics K.K. and Consolidated SubsidiariesYear ended September 30, 2016
Millions ofJapanese Yen
Thousands ofU.S. Dollars (Note 1)
2015 2016 2015 2016
Cash flows from operating activities:Profit before income taxes ................................................................ ¥ 24,672 ¥ 20,080 $ 244,286 $ 198,818 Depreciation ...................................................................................... 9,517 10,547 94,230 104,433 Increase (decrease) in allowance for doubtful accounts ................... 1 65 17 648 Increase (decrease) in provision for bonuses ................................... (247) 189 (2,455) 1,876 Increase (decrease) in net defined benefit liability ............................ (4,803) 2 (47,557) 24 Interest and dividend income ............................................................ (242) (278) (2,404) (2,754)Interest expenses .............................................................................. 97 97 968 969 Foreign exchange losses (gains) ...................................................... (295) 59 (2,922) 587 Share of (profit) loss of entities accounted for using equity method ... (86) (57) (859) (566)Loss on retirement of property, plant and equipment........................ 52 71 516 708 Loss (gain) on sales of property, plant and equipment ..................... (72) (27) (720) (270)Decrease (increase) in notes and accounts receivable-trade ........... (2,065) (1,669) (20,454) (16,529)Decrease (increase) in inventories .................................................... (2,104) (2,369) (20,840) (23,456)Increase (decrease) in notes and accounts payable-trade ............... (44) 2,408 (438) 23,846 Other, net .......................................................................................... 145 812 1,437 8,049
Subtotal ....................................................................................... 24,523 29,934 242,804 296,385 Interest and dividend income received.............................................. 241 280 2,387 2,773 Interest expenses paid ...................................................................... (97) (97) (968) (969)Income taxes (paid) refund ............................................................... (8,619) (5,956) (85,343) (58,976)Net cash provided by (used in) operating activities........................... 16,046 24,160 158,880 239,212
Cash flows from investing activities:Net decrease (increase) in time deposits .......................................... (1,472) 14,936 (14,583) 147,888 Purchase of securities ....................................................................... - (1,000) - (9,900)Purchase of property, plant and equipment ...................................... (14,779) (9,144) (146,333) (90,536)Proceeds from sales of property, plant and equipment..................... 315 47 3,120 469 Purchase of intangible assets ........................................................... (621) (424) (6,152) (4,207)Other, net .......................................................................................... (498) (228) (4,937) (2,260)Net cash provided by (used in) investing activities ........................... (17,057) 4,186 (168,885) 41,453
Cash flows from financing activities:Net increase (decrease) in short-term loans payable ....................... 157 419 1,561 4,153 Proceeds from long-term loans payable ........................................... 3,216 3,261 31,841 32,287 Repayments of long-term loans payable ........................................... (3,318) (3,178) (32,860) (31,470)Purchase of treasury shares ............................................................. (9) (10,000) (89) (99,012)Cash dividends paid .......................................................................... (4,826) (5,798) (47,789) (57,406)Other, net .......................................................................................... (97) (117) (960) (1,159)Net cash provided by (used in) financing activities ........................... (4,878) (15,413) (48,297) (152,607)
Effect of exchange rate change on cash and cash equivalents ....... 2,163 (4,894) 21,421 (48,458)Net increase (decrease) in cash and cash equivalents ..................... (3,725) 8,039 (36,882) 79,600 Cash and cash equivalents at beginning of period ............................ 49,281 45,556 487,933 451,051 Cash and cash equivalents at end of period (Note 4) ........................ ¥ 45,556 ¥ 53,595 $ 451,051 $ 530,651
See Notes to Consolidated Financial Statements.
20

(a) Principles of ConsolidationThe consolidated financial statements as of and for the years ended September 30, 2015 and 2016 included the accounts of the Company, four domestic subsidiaries and thirteen foreign subsidiaries in the United States of America, EU and Asia. The Company has adopted the equity method of accounting for its investment in three affiliates for the years ended September 30, 2015 and 2016. All significant intercompany balances and transactions have been eliminated in consolidation.
(b) Cash and Cash Equivalents Cash and cash equivalents include cash on hand, readily available deposits and highly liquid investments with insignificant risk of changes in value, which have original maturities of three months or less.
(c) Investment SecuritiesMarketable securities are valued by market price method based on the fair market price at the balance sheet date (unrealized gain or loss, net of applicable income taxes, included directly in net assets) and non-marketable securities are stated at cost determined by the total average method.
(d) InventoriesInventories of the Company and consolidated subsidiaries are mainly stated at cost determined by the total average method or by reducing book value when the inventory profitability declines.
(e) Property, Plant and Equipment, and DepreciationProperty, plant and equipment are stated at cost. Significant renewals and additions are capitalized. Maintenance and repairs, including minor renewals and improvements, are charged to income as incurred. Interest expense relating to the construction of property, plant and equipment is not capitalized. Depreciation of property, plant and equipment is determined by the declining-balance method over the estimated useful lives of the individual assets for the Company and its domestic subsidiaries. The straight-line method over the estimated useful lives of the individual assets is primarily applied to the property, plant and equipment of foreign subsidiaries.
(f) Retirement BenefitsWhen calculating retirement benefit obligations, the Company applies the benefit formula method to attribute expected retirement benefits to the period until the end of the fiscal year. Prior service cost is amortized by the straight-line method over 10 years. Actuarial gain or loss is amortized by the straight-line method over 10 years from the following fiscal year.
(g) Foreign Currency TranslationMonetary assets and liabilities denominated in foreign currencies are translated into yen at the exchange rates in effect on the respective balance sheet dates and differences arising from the translation are included in the consolidated statement of income. Assets and liabilities accounts of foreign consolidated subsidiaries are translated into yen amounts at the exchange rates in effect at the each balance sheet date. Revenue and expense accounts of foreign consolidated subsidiaries were translated into yen amounts at average rates for the period for each fiscal year. Any resulting translation differences are included in Foreign currency translation adjustment and Non-controlling interests as a separate component of net assets.
(h) DerivativeThe Companies have entered into foreign forward contracts in order to manage the exposures to risk arising from fluctuations in foreign currency exchange rates. All derivative financial instruments are recognized as either assets or liabilities and measured at fair value with any changes in unrealized gain or loss recognized in the statements of income.
(i) Income TaxesDeferred income taxes are provided on the asset and liability method by which deferred tax assets and liabilities are recognized based on the temporary differences between the assets and liabilities for financial reporting and those for tax purpose, and are measured by applying currently enacted tax laws.
(j) Per share informationEarnings per share is computed based on the profit attributable to owners of parent available for distribution to the shareholders of common stock and the weighted average number of shares outstanding during the year. Cash dividends per share represent dividends declared as applicable to the respective periods.
2. Summary of Significant Accounting Policies
NOTES TO CONSOLIDATED FINANCIAL STATEMENTS
1. Basis of Presenting Consolidated Financial Statements
The accompanying consolidated financial statements of Hamamatsu Photonics K.K. (the “Company”) and consolidated subsidiaries are prepared on the basis of accounting principles generally accepted in Japan, which are different in certain respects as to application and disclosure requirements of International Financial Reporting Standards, and are compiled from the consolidated financial statements prepared by the Company as required by the Financial Instruments and Exchange Law of Japan. For convenience, the accompanying consolidated financial statements have been presented in U.S. dollars by arithmetically translating all Japanese yen amounts at JPY 101 = US$ 1, the exchange rate prevailing on September 30, 2016. The translations should not be construed as a representation that Japanese
yen have been, could have been, or could in the future be, converted into U.S. dollars at that or any other rate.In preparing the consolidated financial statements, certain rearrangements and reclassifications have been made and certain additional financial information has been included in the consolidated financial statements issued in Japan for the convenience of readers outside Japan. Amount less than one million yen and one thousand dollars have been omitted. As a result, the total in Japanese yen and U.S. dollars shown in the consolidated financial statements do not necessarily agree with the individual amounts.
21
Annual Report 2016

NOTES TO CONSOLIDATED FINANCIAL STATEMENTS
3. Other Comprehensive Income
Reclassification adjustments and income tax effect allocated to each component of other comprehensive income for the years ended September 30, 2015 and 2016 were as follows:
Millions of Japanese Yen
Thousands of U.S. Dollars
2015 2016 2015 2016Valuation difference on available-for-sale securities:
Amount arising during the year .............................................................. ¥ (200) ¥ (99) $ (1,980) $ (981)Amount before income tax effect ..................................................... (200) (99) (1,980) (981)Income tax effect ............................................................................. 25 34 247 340 Valuation difference on available-for-sale securities ....................... (175) (64) (1,732) (640)
Foreign currency translation adjustment:Amount arising during the year .............................................................. 2,823 (7,352) 27,955 (72,801)Reclassification adjustments .................................................................. (5) - (57) -
Foreign currency translation adjustment .......................................... 2,817 (7,352) 27,898 (72,801)Remeasurements of defined benefit plans:
Amount arising during the year .............................................................. (92) (3,057) (918) (30,274)Reclassification adjustments .................................................................. (121) (161) (1,203) (1,603)
Amount before income tax effect ..................................................... (214) (3,219) (2,122) (31,878)Income tax effect ............................................................................. 128 974 1,267 9,647 Remeasurements of defined benefit plans ...................................... (86) (2,245) (854) (22,230)
Share of other comprehensive income of entities accounted for using equity method:
Amount arising during the year .............................................................. 34 (39) 336 (390)Total other comprehensive income .......................................................... ¥ 2,590 ¥ (9,702) $ 25,647 $ (96,063)
4. Supplementary Cash Flow Information
Cash and cash equivalents in the consolidated statement of cash flows for years ended September 30, 2015 and 2016 are reconciled to cash and deposits in the consolidated balance sheet as follows:
Millions of Japanese Yen
Thousands of U.S. Dollars
2015 2016 2015 2016Cash and deposits ................................................................................. ¥ 81,548 ¥ 74,503 $ 807,411 $ 737,653Time deposits with maturities of more than three months ...................... (35,992) (20,907) (356,358) (207,002)Cash and cash equivalents .................................................................... ¥ 45,556 ¥ 53,595 $ 451,052 $ 530,651
(k) Accounting ChangesEffective October 1, 2015, the Company and its domestic consolidated subsidiaries have adopted “Revised Accounting Standard for Business Combination” (Accounting Standard Board of Japan (“ASBJ”) Statement No. 21 of September 13, 2013), “Revised Accounting Standard for Consolidated Financial Statements” (ASBJ Statement No. 22 of September 13, 2013), and “Revised Accounting Standards for Business Divestitures” (ASBJ Statement No. 7 of September 13, 2013), etc.Accordingly, the accounting treatment for business combination has been amended as follows: Any changes in a parent’s ownership interests in its controlled subsidiaries are recorded as changes in capital surplus and the acquisition-related costs are expensed for the consolidated fiscal year in which they arise. Revisions in provisional amounts of purchase price allocations are recorded in the consolidated fiscal year in which the business combination is completed.
In addition, the presentation method of net income and other related items have been changed and the title of “minority interests” was changed to “non-controlling interests.”Consolidated financial statements for the previous fiscal year have been reclassified in order to reflect this change in presentation.In accordance with transitional treatment as stipulated in paragraph 58-2 (4) of the Revised Accounting Standard for Business Combination, paragraph 44-5 (4) of the Revised Accounting Standard for Consolidated Financial Statements, and paragraph 57-4 (4) of the Revised Accounting Standard for Business Divestitures, the Company and its domestic consolidated subsidiaries started to apply these standards at the beginning of the current consolidated fiscal year and will continue to do so in the future.These changes do not affect the consolidated financial statements for the current consolidated fiscal year.
22
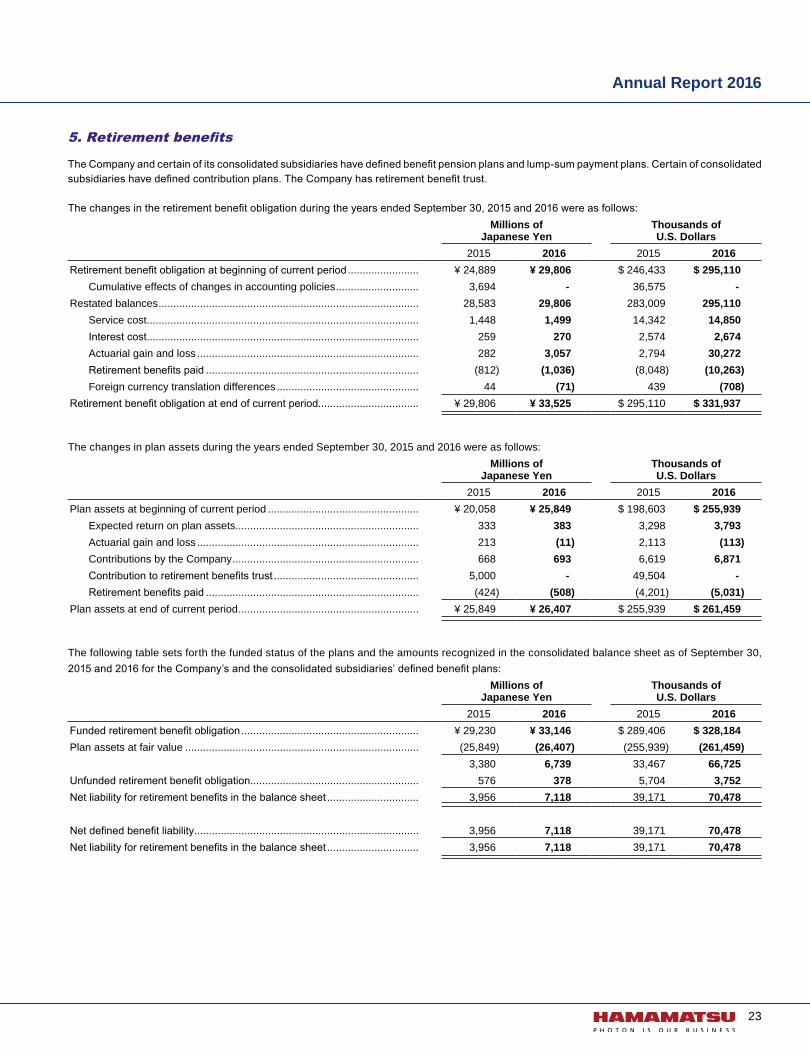
5. Retirement benefits
The Company and certain of its consolidated subsidiaries have defined benefit pension plans and lump-sum payment plans. Certain of consolidated subsidiaries have defined contribution plans. The Company has retirement benefit trust.
The changes in the retirement benefit obligation during the years ended September 30, 2015 and 2016 were as follows:Millions of
Japanese YenThousands of U.S. Dollars
2015 2016 2015 2016Retirement benefit obligation at beginning of current period ........................ ¥ 24,889 ¥ 29,806 $ 246,433 $ 295,110
Cumulative effects of changes in accounting policies ............................ 3,694 - 36,575 - Restated balances ........................................................................................ 28,583 29,806 283,009 295,110
Service cost ............................................................................................ 1,448 1,499 14,342 14,850 Interest cost ............................................................................................ 259 270 2,574 2,674 Actuarial gain and loss ........................................................................... 282 3,057 2,794 30,272 Retirement benefits paid ........................................................................ (812) (1,036) (8,048) (10,263)Foreign currency translation differences ................................................ 44 (71) 439 (708)
Retirement benefit obligation at end of current period.................................. ¥ 29,806 ¥ 33,525 $ 295,110 $ 331,937
The changes in plan assets during the years ended September 30, 2015 and 2016 were as follows:Millions of
Japanese YenThousands of U.S. Dollars
2015 2016 2015 2016Plan assets at beginning of current period ................................................... ¥ 20,058 ¥ 25,849 $ 198,603 $ 255,939
Expected return on plan assets .............................................................. 333 383 3,298 3,793 Actuarial gain and loss ........................................................................... 213 (11) 2,113 (113)Contributions by the Company ............................................................... 668 693 6,619 6,871 Contribution to retirement benefits trust ................................................. 5,000 - 49,504 - Retirement benefits paid ........................................................................ (424) (508) (4,201) (5,031)
Plan assets at end of current period ............................................................. ¥ 25,849 ¥ 26,407 $ 255,939 $ 261,459
The following table sets forth the funded status of the plans and the amounts recognized in the consolidated balance sheet as of September 30, 2015 and 2016 for the Company’s and the consolidated subsidiaries’ defined benefit plans:
Millions of Japanese Yen
Thousands of U.S. Dollars
2015 2016 2015 2016Funded retirement benefit obligation ............................................................ ¥ 29,230 ¥ 33,146 $ 289,406 $ 328,184 Plan assets at fair value ............................................................................... (25,849) (26,407) (255,939) (261,459)
3,380 6,739 33,467 66,725 Unfunded retirement benefit obligation......................................................... 576 378 5,704 3,752 Net liability for retirement benefits in the balance sheet ............................... 3,956 7,118 39,171 70,478
Net defined benefit liability............................................................................ 3,956 7,118 39,171 70,478 Net liability for retirement benefits in the balance sheet ............................... 3,956 7,118 39,171 70,478
23
Annual Report 2016

NOTES TO CONSOLIDATED FINANCIAL STATEMENTS
The components of retirement benefit expense for the years ended September 30, 2015 and 2016 were as follows:Millions of
Japanese YenThousands of U.S. Dollars
2015 2016 2015 2016Service cost .................................................................................................. ¥ 1,448 ¥ 1,499 $ 14,342 $ 14,850 Interest cost .................................................................................................. 259 270 2,574 2,674 Expected return on plan assets .................................................................... (333) (383) (3,298) (3,793)Amortization of actuarial gain and loss ......................................................... (35) (75) (347) (746)Amortization of prior service cost ................................................................. (86) (86) (856) (856)Retirement benefit expense.......................................................................... ¥ 1,253 ¥ 1,224 $ 12,414 $ 12,128
Prior service cost and actuarial gain and loss included in other comprehensive income (before tax effect) for the years ended September 30, 2015 and 2016 were as follows:
Millions of Japanese Yen
Thousands of U.S. Dollars
2015 2016 2015 2016Prior service cost .......................................................................................... ¥ 86 ¥ 86 $ 856 $ 856 Actuarial gain and loss ................................................................................. 103 3,144 1,028 31,133 Other............................................................................................................. 24 (11) 238 (111)Total.............................................................................................................. ¥ 214 ¥ 3,219 $ 2,122 $ 31,878
Unrecognized prior service cost and unrecognized actuarial gain and loss included in accumulated other comprehensive income (before tax effect) as of September 30, 2015 and 2016 were as follows:
Millions of Japanese Yen
Thousands of U.S. Dollars
2015 2016 2015 2016Unrecognized prior service cost ................................................................... ¥ (432) ¥ (345) $ (4,281) $ (3,425)Unrecognized actuarial gain and loss........................................................... (1,109) 2,023 (10,987) 20,034 Total.............................................................................................................. ¥ (1,542) ¥ 1,677 $ (15,268) $ 16,609
The fair value of plan assets, by major category, as a percentage of total plan assets as of September 30, 2015 and 2016 were as follows:2015 2016
Bonds ........................................................................................................... 56% 56%General accounts at life insurance companies ............................................. 26% 26%Stocks ........................................................................................................... 14% 12%Other............................................................................................................. 4% 6%Total.............................................................................................................. 100% 100%
The expected return on assets has been estimated based on anticipated allocation to each asset class and the expected long-term returns on assets held in each category.
The assumptions used in accounting for the above plans were as follows:2015 2016
Discount rate ................................................................................................ 0.9% 0.2%Expected rates of return on plan assets ....................................................... 2.0% Principally 2.0%Estimated rate of salary increase ................................................................. 2.9% 2.9%
The amount paid to the defined contribution plans for the years ended September 30, 2015 and 2016 were ¥392 million (US$ 3,890 thousand) and ¥483 million (US$ 4,788 thousand), respectively.
24

6. Income Taxes
The Company and its domestic subsidiaries are subject to Japanese national and local income taxes which, in the aggregate, resulted in statutory effective tax rate of approximately 34.83% and 32.33% for the years ended September 30, 2015 and 2016 respectively.
Significant components of deferred tax assets and liabilities at September 30, 2015 and 2016 were as follows:Millions of
Japanese YenThousands of U.S. Dollars
2015 2016 2015 2016Deferred tax assets:
Contribution to retirement benefit trust ................................................... ¥ 3,156 ¥ 3,034 $ 31,247 $ 30,048 Net defined benefit liability ..................................................................... 1,143 2,015 11,319 19,960 Depreciation ........................................................................................... 1,961 1,930 19,421 19,117 Provision for bonuses ............................................................................. 1,023 1,016 10,135 10,068 Unrealized gain on sales of inventories ................................................. 1,146 978 11,354 9,683 Write down of inventories ....................................................................... 425 470 4,209 4,660 Noncurrent accounts payable ................................................................ 422 382 4,185 3,785 Impairment loss ...................................................................................... 271 257 2,688 2,553 Write down of investment securities ....................................................... 219 220 2,172 2,183 Others .................................................................................................... 1,153 1,182 11,421 11,703 Less valuation allowance ....................................................................... (1,585) (1,486) (15,693) (14,721)
Total deferred tax assets .............................................................................. ¥ 9,338 ¥ 10,003 $ 92,460 $ 99,042 Amount set off against deferred tax liabilities......................................... (78) (125) (777) (1,245)
Net deferred tax assets ................................................................................ ¥ 9,260 ¥ 9,877 $ 91,683 $ 97,797
Deferred tax liabilities
Deferred income under preferential tax treatment ................................. ¥ 154 ¥ 137 $ 1,526 $ 1,359
Others .................................................................................................... 124 191 1,229 1,897
Total deferred tax liabilities ........................................................................... ¥ 278 ¥ 329 $ 2,755 $ 3,257
Amount set off against deferred tax assets ............................................ (78) (125) (777) (1,245)Net deferred tax liabilities ............................................................................. ¥ 199 ¥ 203 $ 1,978 $ 2,012
A reconciliation between the statutory effective tax rate and the actual effective tax rate reflected in the accompanying consolidated statements of income for the years ended September 30, 2015 and 2016 were as follows:
2015 2016Statutory effective tax rate for the Company ................................................ 34.83% 32.33%
Tax credit ............................................................................................... (5.27) (5.30) Statutory tax rates variance of overseas subsidiaries ............................ (2.08) (2.77) Expenses not deductible for income tax purposes................................. 0.57 0.88 Reduction in deferred tax assets due to tax rate changes ..................... 3.24 1.97 Other, net ............................................................................................... 1.29 0.84
Actual effective tax rate ................................................................................ 32.58% 27.95%
25
Annual Report 2016
NOTES TO CONSOLIDATED FINANCIAL STATEMENTS
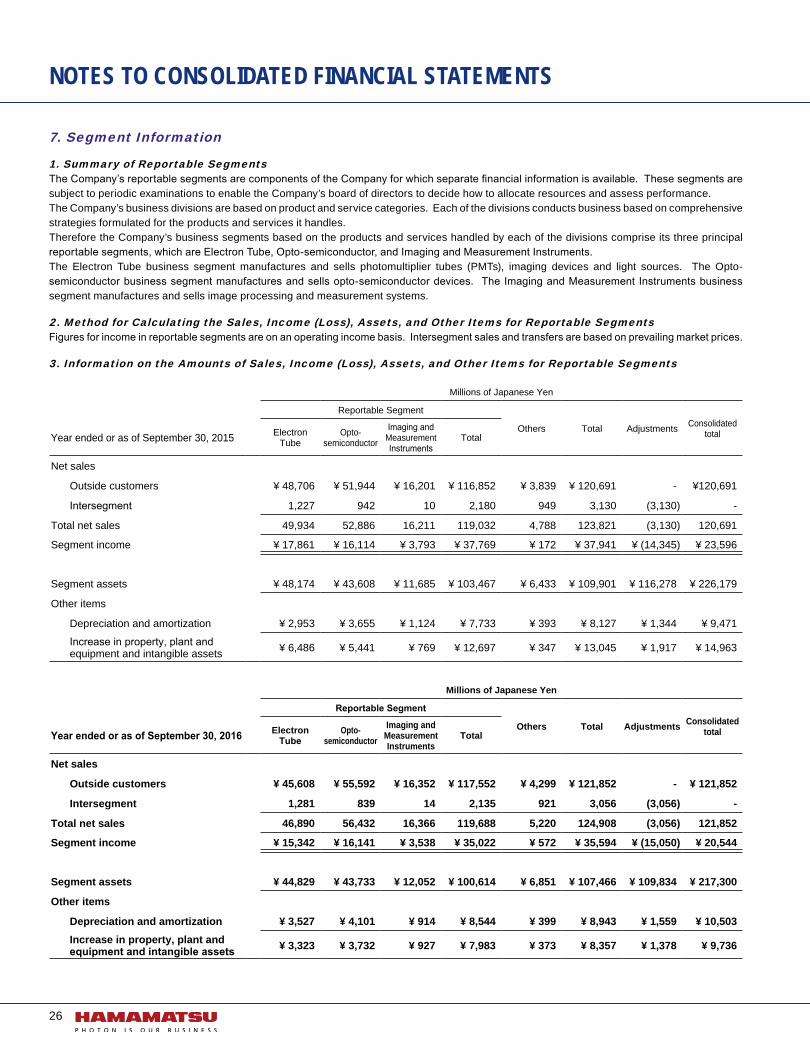
7. Segment Information
1. Summary of Reportable SegmentsThe Company’s reportable segments are components of the Company for which separate financial information is available. These segments are subject to periodic examinations to enable the Company’s board of directors to decide how to allocate resources and assess performance.The Company’s business divisions are based on product and service categories. Each of the divisions conducts business based on comprehensive strategies formulated for the products and services it handles.Therefore the Company’s business segments based on the products and services handled by each of the divisions comprise its three principal reportable segments, which are Electron Tube, Opto-semiconductor, and Imaging and Measurement Instruments.The Electron Tube business segment manufactures and sells photomultiplier tubes (PMTs), imaging devices and light sources. The Opto-semiconductor business segment manufactures and sells opto-semiconductor devices. The Imaging and Measurement Instruments business segment manufactures and sells image processing and measurement systems.
2. Method for Calculating the Sales, Income (Loss), Assets, and Other Items for Reportable SegmentsFigures for income in reportable segments are on an operating income basis. Intersegment sales and transfers are based on prevailing market prices.
3. Information on the Amounts of Sales, Income (Loss), Assets, and Other Items for Reportable Segments
Millions of Japanese Yen
Reportable Segment
Others Total Adjustments Consolidated totalYear ended or as of September 30, 2015 Electron
TubeOpto-
semiconductor
Imaging and Measurement Instruments
Total
Net sales
Outside customers ¥ 48,706 ¥ 51,944 ¥ 16,201 ¥ 116,852 ¥ 3,839 ¥ 120,691 - ¥120,691
Intersegment 1,227 942 10 2,180 949 3,130 (3,130) -
Total net sales 49,934 52,886 16,211 119,032 4,788 123,821 (3,130) 120,691
Segment income ¥ 17,861 ¥ 16,114 ¥ 3,793 ¥ 37,769 ¥ 172 ¥ 37,941 ¥ (14,345) ¥ 23,596
Segment assets ¥ 48,174 ¥ 43,608 ¥ 11,685 ¥ 103,467 ¥ 6,433 ¥ 109,901 ¥ 116,278 ¥ 226,179
Other items
Depreciation and amortization ¥ 2,953 ¥ 3,655 ¥ 1,124 ¥ 7,733 ¥ 393 ¥ 8,127 ¥ 1,344 ¥ 9,471
Increase in property, plant and equipment and intangible assets ¥ 6,486 ¥ 5,441 ¥ 769 ¥ 12,697 ¥ 347 ¥ 13,045 ¥ 1,917 ¥ 14,963
Millions of Japanese Yen
Reportable Segment
Others Total Adjustments Consolidated totalYear ended or as of September 30, 2016 Electron
TubeOpto-
semiconductorImaging and
Measurement Instruments
Total
Net sales
Outside customers ¥ 45,608 ¥ 55,592 ¥ 16,352 ¥ 117,552 ¥ 4,299 ¥ 121,852 - ¥ 121,852
Intersegment 1,281 839 14 2,135 921 3,056 (3,056) -
Total net sales 46,890 56,432 16,366 119,688 5,220 124,908 (3,056) 121,852
Segment income ¥ 15,342 ¥ 16,141 ¥ 3,538 ¥ 35,022 ¥ 572 ¥ 35,594 ¥ (15,050) ¥ 20,544
Segment assets ¥ 44,829 ¥ 43,733 ¥ 12,052 ¥ 100,614 ¥ 6,851 ¥ 107,466 ¥ 109,834 ¥ 217,300
Other items
Depreciation and amortization ¥ 3,527 ¥ 4,101 ¥ 914 ¥ 8,544 ¥ 399 ¥ 8,943 ¥ 1,559 ¥ 10,503 Increase in property, plant and equipment and intangible assets ¥ 3,323 ¥ 3,732 ¥ 927 ¥ 7,983 ¥ 373 ¥ 8,357 ¥ 1,378 ¥ 9,736
26

Thousands of U.S. Dollars
Reportable Segment
Others Total Adjustments Consolidated totalYear ended or as of September 30, 2015 Electron
TubeOpto-
semiconductor
Imaging and Measurement Instruments
Total
Net sales
Outside customers $ 482,242 $ 514,300 $ 160,408 $ 1,156,951 $ 38,010 $ 1,194,961 - $ 1,194,961
Intersegment 12,154 9,330 104 21,589 9,403 30,993 (30,993) -
Total net sales 494,396 523,631 160,512 1,178,541 47,413 1,225,954 (30,993) 1,194,961
Segment income $ 176,847 $ 159,549 $ 37,555 $ 373,952 $ 1,706 $ 375,659 $ (142,035) $ 233,623
Segment assets $ 476,975 $ 431,762 $ 115,696 $ 1,024,434 $ 63,698 $ 1,088,132 $ 1,151,272 $ 2,239,404
Other items
Depreciation and amortization $ 29,239 $ 36,193 $ 11,133 $ 76,566 $ 3,899 $ 80,465 $ 13,313 $ 93,778
Increase in property, plant and equipment and intangible assets $ 64,221 $ 53,878 $ 7,620 $ 125,720 $ 3,443 $ 129,163 $ 18,988 $ 148,152
Thousands of U.S. Dollars
Reportable Segment
Others Total Adjustments Consolidated totalYear ended or as of September 30, 2016 Electron
TubeOpto-
semiconductorImaging and
Measurement Instruments
Total
Net sales
Outside customers $ 451,566 $ 550,421 $ 161,902 $ 1,163,890 $ 42,565 $ 1,206,456 - $ 1,206,456
Intersegment 12,692 8,312 141 21,146 9,120 30,266 (30,266) -
Total net sales 464,258 558,733 162,044 1,185,036 51,685 1,236,722 (30,266) 1,206,456
Segment income $ 151,904 $ 159,813 $ 35,035 $ 346,753 $ 5,667 $ 352,421 $ (149,014) $ 203,406
Segment assets $ 443,852 $ 433,000 $ 119,333 $ 996,185 $ 67,841 $ 1,064,026 $ 1,087,465 $ 2,151,492
Other items
Depreciation and amortization $ 34,922 $ 40,613 $ 9,059 $ 84,594 $ 3,958 $ 88,553 $ 15,439 $ 103,993 Increase in property, plant and equipment and intangible assets $ 32,908 $ 36,957 $ 9,180 $ 79,046 $ 3,702 $ 82,748 $ 13,649 $ 96,398
8. Short-Term and Long-Term Loans Payable
Short-term bank loans represent notes maturing generally within six months. The average annual interest rate applicable to the short-term bank loans at September 30, 2016 is 0.8%.
Long-term debt at September 30, 2015 and 2016 were as follows:
Millions of Japanese Yen
Thousands ofU.S. Dollars
2015 2016 2015 2016Loans principally from banks due serially through 2031............... ¥ 6,981 ¥ 7,063 $ 69,123 $ 69,939 Less current portion ...................................................................... (3,172) (218) (31,413) (2,168)
¥ 3,808 ¥ 6,844 $ 37,709 $ 67,771
At September 30, 2015 and 2016, cash & deposits and property, plant & equipment which had a carrying amount of ¥4,872 million (US$48,245 thousand) and ¥4,815 million (US$47,674 thousand) were pledged as collateral for short-term bank loans and long-term debt, respectively.
27
Annual Report 2016

NOTES TO CONSOLIDATED FINANCIAL STATEMENTS
9. Investment Securities
Information regarding the marketable securities classified as other securities as of September 30, 2015 and 2016 were as follows:
Millions of Japanese Yen Thousands of U.S. Dollars2015 2015
Carrying amount Cost Unrealized
gainUnrealized
lossCarrying amount Cost Unrealized
gainUnrealized
lossEquity securities ¥ 1,487 ¥ 911 ¥ 576 - $ 14,729 $ 9,023 $ 5,706 - Other - - - - - - - -
¥ 1,487 ¥ 911 ¥ 576 - $ 14,729 $ 9,023 $ 5,706 -
Millions of Japanese Yen Thousands of U.S. Dollars2016 2016
Carrying amount Cost Unrealized
gainUnrealized
lossCarrying amount Cost Unrealized
gainUnrealized
lossEquity securities ¥ 1,388 ¥ 911 ¥ 483 ¥ (6) $ 13,748 $ 9,023 $ 4,788 $ (63) Other ¥ 1,000 ¥ 1,000 - - $ 9,900 $ 9,900 - -
¥ 2,388 ¥ 1,911 ¥ 483 ¥ (6) $ 23,649 $ 18,924 $ 4,788 $ (63)
10. Related Party Transactions
Related party transactions for the year ended September 30, 2016 are as follows;
2016
Attribute Name Location
Amount of capital or
investment in capital
The contents of a business operation or
an occupation
Ownership (Owned) ratio (%)
Relationship Nature of transaction
Trading amount Account
Balance at the end of the fiscal
year
Director Teruo Hiruma - - Chairman of
the Board(Owned) Direct 0.6 -
Acquisition of treasury
shares
¥2,870 million($28,415thousand)
- -
(Transaction terms and conditions, policy to decide such terms and conditions) The acquisition of its treasury shares by the Company is a form of stock purchase through the Tokyo Stock Exchange Trading Network Off-Auction Own Share Repurchase Trading (ToSTNeT-3) at the closing stock price on May 27, 2016.
11. Per Share Information
Japanese Yen U.S. Dollars2015 2016 2015 2016
Per share of common stock:Earnings per share ¥ 103.23 ¥ 90.23 $ 1.02 $ 0.89 Cash dividends 49.00 34.00 0.48 0.33
* Hamamatsu Photonics implemented a two-for-one stock split on April 1, 2015. Earnings per share has been calculated by assuming this stock split had been executed at the beginning of the fiscal year ended September 30, 2015. Our annual cash dividends for the previous fiscal year came to JPY 49 (US$ 0.48) per share.
28

REPORT OF INDEPENDENT AUDITORS
29
Annual Report 2016

DIRECTORS AND AUDIT & SUPERVISORY BOARD MEMBERS
Directors and Audit & Supervisory Board Members
Chairman of the Board
Teruo Hiruma
President and CEO
Akira Hiruma, Representative Director
Vice President
Haruji Ohtsuka, Representative Director
Senior Managing Directors
Koei Yamamoto, Representative DirectorJunichi Takeuchi, Representative Director
Managing Directors
Hitoshi IidaKenji Suzuki
Mitsutaka TakemuraTsutomu HaraKenji Yoshida
Directors
Tadahiko ShimazuKiyotaka Ise
Naofumi ToriyamaKashiko Kodate
Audit & Supervisory Board Members
Kazuhiko Mori (Standing)Hiroshi Mizushima (Standing)
Yuji MakiSaburo Sano
30

Hamamatsu Photonics K.K.(Registered address)
1126-1 Ichino-cho, Higashi-ku, Hamamatsu CityShizuoka Pref., 435-8558, Japan
Telephone : (81)53-434-3311
Established: September 29, 1953
Paid-in Capital: 34,928,648,325 yen
Common Stock Authorized: 500,000,000 shares Issued: 167,529,968 shares
Stock Listing: Tokyo Stock Exchange (1st Section) ID number 6965 Trading Unit 100 shares
Number of Shareholders: 27,996
Number of Employees: 4,592
Independent Auditors: Ernst & Young ShinNihon LLC Hamamatsu City, Shizuoka Pref.
Transfer Agent and Registrar: Sumitomo Mitsui Trust Bank, Limited Chiyoda-ku, Tokyo
Annual Meeting: The annual meeting of shareholders is held in December of each year in Hamamatsu City, Japan
Price range of stock traded(Thousand yen)
2.4
2.6
2.8
3.0
3.2
3.4
3.6
10/15 11 12 1/16 2 3 4 5 6 7 8 9
Major shareholders Percentage to total As of September 30, 2016(*) shares outstanding (%)
The Master Trust Bank of Japan, Ltd. (Trust Account) ................................................................. 5.25Toyota Motor Corporation ............................................................................................................. 5.01State Street Bank and Trust Company ......................................................................................... 4.46JP Morgan Chase Bank 380055 ...................................................................................................3.54Japan Trustee Services Bank, Ltd. (Trust Account) ..................................................................... 3.41Japan Trustee Services Bank, Ltd. (Trust Account 9) .................................................................. 3.40Hamamatsu Photonics K.K. employees ....................................................................................... 3.09The Nomura Trust and Banking Co., Ltd. (Investment Trust)........................................................ 1.78The Chase Manhattan Bank, N.A. London Special Account No.1 ............................................... 1.46State Street Bank and Trust Company 505225 ............................................................................ 1.31(*)1. The Company holds 9,945,153 shares of treasury shares that is not included in the shares of the major shareholders shown above.
2. In this fiscal period, the Company purchased 3,470,000 shares of common stock as treasury stock.
CORPORATE DATA
31
Annual Report 2016

PROFILE OF THE HAMAMATSU FAMILY
Hamamatsu Photonics Italia S.r.l.Main officeStrada della Moia, 1 int. 620020 Arese (Milano), ItalyTelephone: (39)02-93 58 17 33
Rome officeViale Cesare Pavese, 43500144 Roma, ItalyTelephone: (39)06-50 51 34 54
Hamamatsu Photonics UK LimitedMain office2 Howard Court, 10 Tewin Road,Welwyn Garden City,Hertfordshire AL7 1BW, UKTelephone: (44)1707-294888
South African office9 Beukes Avenue, Highway Gardens,Edenvale 1609, South AfricaTelephone: (27)11 609 0367
Europe
Hamamatsu Photonics Deutschland GmbHMain officeArzbergerstr. 10D-82211 Herrsching am Ammersee, GermanyTelephone: (49)8152-375-0
Danish officeLautruphøj 1-3DK-2750 Ballerup, DenmarkTelephone: (45)70 20-93 69
Netherlands officeTelevisieweg 2NL-1322 AC Almere, The NetherlandsTelephone: (31)36-5405384
Poland office02-525 Warsaw, 8 St. A.Boboli Str., PolandTelephone: (48)22-646-0016
Hamamatsu Photonics Norden ABMain officeTorshamnsgatan 3516440 Kista, SwedenTelephone: (46)8-509 031 00
Russian office11, Christoprudny Boulevard, Building 1, office 114, Moscow, RussiaTelephone: (7)495 258 85 18
Hamamatsu Photonics France S.A.R.L.Main office19, Rue du Saule TrapuParc du Moulin de Massy91882 Massy Cedex, FranceTelephone: (33)1 69 53 71 00
Grenoble officeREGUS Center,29 Boulevard des Alpes38246 Meylan Cedex, FranceTelephone: (33)4 76 61 44 50
Swiss officeDornacherplatz 74500 Solothurn, SwitzerlandTelephone: (41)32 625 60 60
Belgian officeAxisparc Technology, Rue Andre Dumont 7 1435 Mont-Saint-Guilbert, BelgiumTelephone: (32)10 45 63 34
Spanish officeC. Argenters, 4 edif 2Parque Tecnológico del Vallés08290 Cerdanyola (Barcelona), SpainTelephone: (34)93 582 44 30
32

U.S.A.
Photonics Management Corp.360 Foothill Road,Bridgewater, NJ 08807, U.S.A.Telephone: (1)908-231-0960
Hamamatsu CorporationMain office360 Foothill Road,Bridgewater, NJ 08807, U.S.A.Telephone: (1)908-231-0960
Factory250 Wood Avenue,Middlesex, NJ 08846, U.S.A.Telephone: (1)732-356-1203
California office - Northern2875 Moorpark Avenue,San Jose, CA 95128, U.S.A.Telephone: (1)408-261-2022
California office - Southern6310 Greenwich Drive, Suite 200San Diego, CA 92122, U.S.A.Telephone: (1)858-210-6701
Chicago office4711 w. Golf Road, Suite 805Skokie, IL 60076, U.S.A.Telephone: (1)847-825-6046
Boston office20 Park Plaza, Suite 312Boston, MA 02116, U.S.A.Telephone: (1)617-536-9900
Pittsburgh office2593 Wexford Bayne Road, Suite 300, Spectra I Office Bldg.Sewickley, PA 15143, U.S.A. Telephone: (1)724-935-3600
Asia
Hamamatsu Photonics (China) Co., Ltd.1201 Tower B, Jiaming Center, No.27 Dongsanhuan Beilu, Chaoyang District, 100020 Beijing, ChinaTelephone: (86)10-6586-6006
Hamamatsu Photonics Taiwan Co., Ltd.8F-3, No.158, Section 2, Gongdao 5th Road, East District, Hsinchu, 300, Taiwan R.O.C.Telephone: (886)03-659-0080
Beijing Hamamatsu Photon Techniques Inc.Head officeRoom 903, Noble Center #3, 128 South 4th Ring Road West, Fengtai District, Beijing, 100070 ChinaTelephone: (86)10-6370-6370
Japan
Hamamatsu Photonics K.K.Headquarters325-6, Sunayama-cho, Naka-kuHamamatsu City, Shizuoka Pref.430-8587, JapanTelephone: (81)53-452-2141
Electron Tube Division314-5, ShimokanzoIwata City, Shizuoka Pref.438-0193, JapanTelephone: (81)539-62-3151
Solid State Division1126-1, Ichino-cho, Higashi-kuHamamatsu City, Shizuoka Pref.435-8558, JapanTelephone: (81)53-434-3311
Systems Division812, Joko-cho, Higashi-kuHamamatsu City, Shizuoka Pref.431-3196, JapanTelephone: (81)53-435-1560
Central Research Laboratory5000, Hirakuchi, Hamakita-kuHamamatsu City, Shizuoka Pref.434-8601, JapanTelephone: (81)53-586-7111
33
Annual Report 2016

ANNUAL REPORT 2016For the year ended September 30, 2016
HAMAMATSU PHOTONICS K.K., Headquarters325-6, Sunayama-cho, Naka-ku, Hamamatsu City, Shizuoka Pref., 430-8587, JapanTelephone:(81)53-452-2141 Fax:(81)53-456-7889
HAMAMATSU PHOTONICS K.K. HAMAMATSU PHOTONICS K.K.www.hamamatsu.com