annual report 2015 - danske bank · pdf file04 danske bank / annual report 2015 letter to our...
TRANSCRIPT

Danske Bank Group
Annual Report2015


Contents
Management’s report
4 Letter to our shareholders6 Financial highlights – Danske Bank Group7 Executive summary8 Strategy execution
13 Outlook 14 Financial review
Business units
19 Personal Banking23 Business Banking26 Corporates & Institutions29 Danske Capital32 Danica Pension35 Non-core 37 Other Activities38 Capital and liquidity management41 Investor Relations42 Corporate responsibility42 Organisation and management
Financial statements
45 Contents 46 Income statement 47 Statement of comprehensive income48 Balance sheet 49 Statement of capital 53 Cash flow statement54 Notes
Statements and reports
184 Statement by the management185 Independent Auditors’ report
Management and directorships
186 Board of Directors 190 Executive Board 193 Supplementary information

Danske Bank / Annual Report 201504
Letter to our shareholders2015 was another year of significant progress for Danske Bank. We are well on track to becoming a more customer-centric, simple and efficient bank to the benefit of all our stakeholders.
Net profit before goodwill impairments was DKK 17.7 billion for 2015 and the return on shareholders’ equity before goodwill impairments was 11.6%, and we have thus delivered on the financial targets we have pursued since 2013. We maintained a strong capital position, and our credit ratings were improved.
At the same time, we made progress towards meeting our long-term ambition of becoming number one in customer experience. We are pursuing this objective by combining the financial expertise we have developed over more than 140 years of banking with our ability to turn technological advances into leading solutions for our customers.
Our increased focus on customer centricity has translated into positive developments in customer satisfaction at all of our business units, even though we have not yet reached all of our targets. Personal Banking is on target in one of five countries and made significant progress in our largest market, Denmark. Private
Banking kept its leading position in Denmark. Business Banking is on target in three of five countries, while Corporates & Institutions is fully on target, maintaining its leading position as clients rank us number one in many key areas.
Moreover, in 2015 we continued to review and fine-tune our business model to maximise the value we create for both customers and shareholders:
To further strengthen our position in the attractive growth market for private banking, pension savings and asset management, we have decided to establish a new unit that will encompass our extensive expertise in this area. The objective of the new Wealth Management unit is to enable us to more rapidly respond to customer demand for investment solutions and high-quality proactive advisory services.
We also refocused our efforts in the Baltic region on business customers, divesting the personal customer business in Lithuania and Latvia. Pending approval by the Lithuanian competition authorities, the transaction is expected to be completed in the first half of 2016. In addition, we decided to run and report on our operations in Northern Ireland as a separate business unit to increase customer focus and to simplify operations.
In recent years, we have strengthened Danske Bank’s leadership, in particular the leadership of support and staff functions. This work continued during 2015 with the overall objective of increasing our customer focus and becoming a more simple and efficient business. We have increased our focus on leadership development, succession planning and talent development. We have also initiated a cultural transformation process, which on the basis of value-based leadership promotes customer-centricity, performance management and empowerment of staff.
The journey aheadOur 2015 results bring us a significant step closer to delivering on our target of a return on shareholders’ equity above 12.5% by 2018 at the latest.
Although the interest rate environment remains challenging, our ambitions are intact. We have a solid platform to build on, with a strong position in the marketplace and a clear strategic direction for the next leg of our journey. We are confident that this will enable us to seize the opportunities and mitigate the risks arising from changes in the marketplace and macroeconomic conditions.
Our key priorities going forward include the continual

Danske Bank / Annual Report 2015 05
Ole AndersenChairman of the Board of Directors
development and optimisation of our customer offerings, seizing digital opportunities to provide innovative solutions, and our ongoing efforts to reap the full benefits of our Nordic platform. We will also continue our strong focus on becoming more efficient and reducing costs, while maintaining a prudent risk profile. In short, we will continue to adjust our business model in order to ensure that we reach our targets.
The progress we made in 2015, the value we created for our customers, and the financial results we delivered would not have been possible without the dedication and hard work of our more than 19,000 employees, and we would like to express our gratitude to all of them for their efforts.
Finally, on the basis of our solid capital position, the Board of Directors is pleased to propose a dividend of DKK 8.0 per share, or 46% of net profit for the year before goodwill impairments. Moreover, we have decided to conduct a share buy-back programme that will total DKK 9 billion and run for no more than 12 months, beginning on 4 February 2016.
Thomas F. BorgenChief Executive Officer

Danske Bank / Annual Report 201506
Income statement(DKK millions)
2015 2014 Index15/14
2013 2012 2011
Net interest income** 21,476 22,313 96 22,077 22,778 23,537
Net fee income** 12,122 11,154 109 9,468 8,866 8,298
Net trading income** 6,933 6,693 104 5,799 10,562 7,325
Other income 1,778 1,344 132 1,308 1,285 3,648
Net income from insurance business** 1,892 2,496 76 1,088 2,171 569
Total income** 44,201 44,000 100 39,740 45,662 43,377
Operating expenses 21,827 22,641 96 23,794 24,642 25,826
Goodwill impairment charges 4,601 9,099 51 - - 161
Profit before loan impairment charges** 17,773 12,260 145 15,947 21,020 17,390
Loan impairment charges 57 2,788 2 4,111 7,680 13,185
Profit before tax, core** 17,716 9,472 187 11,836 13,340 -
Profit before tax, Non-core 46 -1,503 - -1,777 -4,801 -
Profit before tax** 17,762 7,969 223 10,059 8,539 4,205
Tax** 4,639 4,020 115 2,944 3,814 2,482
Net profit for the year** 13,123 3,948 - 7,115 4,725 1,723
Net profit for the year before goodwill impairment charges** 17,724 13,047 136 7,115 4,725 1,884
Attributable to additional tier 1 etc. 607 261 - 0 4 11
Balance sheet (end of year)(DKK millions)
Due from credit institutions and central banks 75,221 63,786 118 53,714 113,657 74,041
Repo loans 216,303 290,095 75 316,079 307,177 256,027
Loans 1,609,384 1,563,729 103 1,536,773 1,640,656 1,698,025
Trading portfolio assets 547,019 742,512 74 695,722 812,966 909,755
Investment securities 343,304 330,994 104 161,917 107,724 109,264
Assets under insurance contracts 265,572 268,450 99 246,484 241,343 230,668
Total assets in Non-core 24,236 32,329 75 41,837 33,100 -
Other assets 211,840 161,120 131 174,531 228,326 146,623
Total assets 3,292,878 3,453,015 95 3,227,057 3,484,949 3,424,403
Due to credit institutions and central banks 137,068 126,800 108 132,253 241,238 177,592
Repo deposits 177,456 400,618 44 331,091 359,276 269,515
Deposits 816,762 763,441 107 776,412 783,759 795,275
Bonds issued by Realkredit Danmark 694,519 655,965 106 614,196 614,325 557,699
Other issued bonds 363,931 330,207 110 310,178 340,005 366,920
Trading portfolio liabilities 471,131 550,629 86 435,183 531,860 697,913
Liabilities under insurance contracts 285,030 288,352 99 262,468 266,938 248,966
Total liabilities in Non-core 5,520 4,950 112 17,476 4,831 -
Other liabilities 140,640 138,642 101 135,924 136,928 117,340
Subordinated debt 39,991 41,028 97 66,219 67,785 67,328
Additional tier 1 etc. 11,317 5,675 199 - 4 60
Shareholders' equity 149,513 146,708 102 145,657 138,000 125,795
Total liabilities and equity 3,292,878 3,453,015 95 3,227,057 3,484,949 3,424,403
Ratios and key figures
Dividends per share (DKK) 8.0 5.5 2.0 - -
Earnings per share (DKK)*** 12.8 3.8 7.1 5.0 1.9
Return on avg. shareholders' equity (%)*** 8.5 2.5 5.0 3.6 1.4
Return before goodwill impairment charges on avg. shareholders' equity (%)*** 11.6 8.6 5.0 3.6 2.1
Return on avg. tangible equity (%)*** 12.9 10.5 6.4 5.3 2.6
Net interest income as % of loans and deposits 0.89 0.96 0.95 0.94 0.94
Cost/income ratio (%) 59.8 72.1 59.9 54.0 59.9
Cost/income ratio before goodwill impairment charges (%) 49.4 51.5 59.9 54.0 59.5
Total capital ratio (%) 21.0 19.3 21.4 21.3 17.9
Common equity tier 1 capital ratio (%) 16.1 15.1 14.7 14.5 11.8
Share price (end of year) (DKK) 185.2 167.4 124.4 95.7 73.0
Book value per share (DKK)*** 153.2 146.8 145.6 138.0 135.7
Full-time-equivalent staff (end of year) 19,049 18,603 19,122 20,126 21,320
Financial highlights – Danske Bank Group
* See note 1 (c) to the financial statement for an explanation of differences in the presentation between IFRS and the financial highlights.** Changes have been made to the highlights for 2014, as presented in note 2. Apart from 2011, the effect on the highlights for 2011-13 is not significant, and comparative figures for 2011-13 therefore have not been restated. A restatement of comparative figures for 2011 would have reduced net profit by DKK 387 million.*** Ratios are calculated as if the additional tier 1 capital were classified as a liability. Average shareholders’ equity is calculated as a quarterly average.

Danske Bank / Annual Report 2015 07
Executive summary“In 2015, Danske Bank continued to progress and delivered strong results despite a challenging environment. The results are testament to the strength of our diversified business model as a Nordic universal bank and reflect our firm focus on executing our strategy of becoming a more customer-centric, simple and efficient bank,” says Thomas F. Borgen, Chief Executive Officer.
“We continued to strengthen relations with our customers and launched a number of initiatives aimed at making daily banking and important financial decisions easier for our customers. We have a sound platform and a strong position in the marketplace as well as a clear strategic direction for the next part of our journey towards realising the full potential of Danske Bank.”
• Danske Bank Group’s net profit for 2015 was DKK 13.1 billion. The result was affected by goodwill impairments of DKK 4.6 billion. Net profit before goodwill impairments rose 36% to DKK 17.7 billion, against DKK 13.0 billion in 2014.
• The return on shareholders’ equity after tax was 8.5%. The return before goodwill impairments was 11.6%, against 8.6% for 2014.
• Net interest income was down 4%. The negative short-term interest rates continued to put pressure on deposit margins and net interest income. Lending volume growth and lower funding costs partly offset this pressure.
• Net fee income totalled DKK 12.1 billion, which was 9% higher than the year-earlier level, mainly because of extensive mortgage refinancing in the first half of the year, stronger customer activity at the banking units and positive developments at Danske Capital.
• Net trading income increased 4% from the level in 2014, even though 2014 benefited from a one-off gain from the sale of shares in Nets. In the first half of 2015, trading income benefited from high client activity owing to volatility in the financial markets, whereas activity in the second half was somewhat lower.
• Net income from insurance business amounted to DKK 1.9 billion, against DKK 2.5 billion in 2014. It was possible to book the full risk allowance for all four interest rate groups and to book DKK 0.2 billion from the shadow account, against DKK 0.6 billion in 2014.
• Operating expenses fell 4% to DKK 21.8 billion, and the cost/income ratio before goodwill impairments improved 2.1 percentage points to 49.4%. We achieved this by continuing to implement efficiency initiatives.
• The goodwill impairments of DKK 4.6 billion were the result of assumptions about lower interest rates long-term than previously assumed and increased capital allocated to our activities in Finland and Northern Ireland. The goodwill impairments do not
relate to the expected short-term developments at the units.
• Loan impairments in core activities amounted to DKK 57 million, or 0.00% of lending and guarantees, against 0.15% in 2014. The decline reflects our ongoing work to improve credit quality as well as improved macroeconomic conditions. This positive development took place at all business units.
• Non-core activities posted a profit before tax of DKK 46 million, against a loss of DKK 1.5 billion in 2014. The winding-up of our Irish Non-core portfolio continued, and most of the commercial property portfolio has now been sold.
• We reached our rating targets when Moody’s upgraded our long-term rating to A2 and our short-term rating to P-1 in June, and S&P changed its outlook for our long-term A rating to stable in July. This was a very important milestone that is testament to the sustained effect of our strategic initiatives. The improvement in our ratings means that we are able to do more business with specific customer groups and that we can further optimise our funding.
• The common equity tier 1 capital ratio and the total capital ratio were 16.1% and 21.0%, respectively, at 31 December 2015, against 15.1% and 19.3% at 31 December 2014. Our capital base remained strong, also after deduction of the proposed dividends. With a liquidity coverage ratio (LCR) of 125% at 31 December 2015, our liquidity position also remained robust.
• The Board of Directors is proposing a dividend of DKK 8.0 per share, corresponding to 46% of net profit before goodwill impairments. In addition, the Board of Directors has decided to initiate a share buy-back programme of DKK 9 billion that will start on 4 February 2016 and run for no more than 12 months.
• For 2016, we expect the net profit to be in line with the net profit before goodwill impairments in 2015. We remain committed to our target of a return on equity above 12.5% in 2018 at the latest. See page 13 for our full outlook.

Strategy execution
Danske Bank / Annual Report 201508
In 2015, we made further progress on our journey to become a more customer-centric, simple and efficient bank for the benefit of customers and shareholders alike. The year also represented another step towards our goal of being recognised as the most trusted financial partner by consistently delivering long-term value for customers, investors and the societies where we operate.
Our underlying business remained robust, with good customer activity throughout the year. Lending volumes rose 3% from the end of 2014. Increased customer activity led, among other things, to an increase in net fee income of 9%. Personal Banking and Business Banking in particular benefited from good customer inflow in many markets.
Despite a challenging environment of negative short-term interest rates, our diversified business model enabled us to deliver satisfactory financial results: net profit before goodwill impairments of DKK 17.7 billion and a return before goodwill impairments on shareholders’ equity of 11.6%. We thus achieved our ambition for 2015 by delivering a return on equity of above 9.5%.
In doing so, we also reached an important milestone by reaching each of our financial targets for 2015.
Financial targets 2015 ambition Status at the end of 2015
Return on sharehol-ders’ equity
9.5% 11.6% before goodwill impairments
Ratings S&P rating outlook improved to stable
S&P/Moody’s/FitchA (stable)/A2 (stable)/A (stable)
Common equity tier 1 capital ratio
Around 14% 16.1%
Total capital ratio Well above 17% 21.0%
Dividend payments Payout of 40-50% of net profit
46% payout ratio for 2015 (proposed)
The solid improvement in return on equity was driven by a combination of factors. Higher customer activity, particularly in the beginning of the year, and our improved customer offerings increased both net fee income and net trading income, which more than offset the pressure on net interest income from the lower-than-expected short-term interest rates. Our tight cost control and a significant reduction in impairments, resulting both from our efforts to improve credit quality and from the general improvement in the economy, also contributed significantly.
We saw continued improvements in customer satisfaction across markets and customer segments, not least among our personal customers in our biggest market, Denmark. But we still have a way to go to reach our ambition of being ranked as number one or two in our focus segments in all our markets. This area still takes priority for us.
Ef fects of negative short-term interest ratesShort-term interest rates declined throughout 2015, falling much lower than we had expected at the beginning of the year. In Denmark, Sweden and the eurozone, monetary policy rates were negative, and higher rates appear to be a more distant prospect than previously expected.
Net interest income was challenging, but we managed to meet our expectations for total income for 2015 despite the negative short-term interest rates and pressure on margins. We held interest rates on personal customer current accounts at or above 0% and advised customers how to take advantage of the low rate environment. The low rates also led us to develop new loan products and investment solutions that will benefit customers.
Business reviewsThroughout the year, we continued to review and fine-tune our business to increase the value we create for customers and shareholders within our defined strategic core:
To be a modern bank for people and businesses across the Nordics with deep financial competence and leading, innovative solutions.
We completed two reviews: Wealth Management and Northern Ireland, and we executed on a previous business review by divesting part of the Non-core Baltic exposure.
Wealth ManagementIn order to strengthen our position further and expand our development capabilities within pensions and wealth management, we are establishing a new business unit, which organisationally will be in place from 1 April 2016. Financial reporting will take place from the first quarter of 2016. The new unit will encompass customers and expertise from Danica Pension, Danske Capital and Private Banking.
The objective is to ensure that we are well placed to capture the expected growth in the wealth management area. By combining three strong units in one, we will be able to ensure an even more rapid response to customer demand. We will continue to
Danske Bank / Annual Report 2015 09
develop investment solutions and deliver high-quality, proactive advisory services. Danica Pension’s new investment strategy supports this objective, and with the new Wealth Management unit, we will continue to advise and provide services to our various customer types.
Northern IrelandSince 1 January 2016, our business in Northern Ireland has operated and reported as a separate unit. This organisational simplification enables us to develop our market position further, to increase the focus on creating value for customers, and to improve profitability.
Non-coreAs part of our strategy, we refocused our efforts in the Baltics on our existing Business Banking operations. On 1 January 2015, we moved our Baltic Personal Banking activities to the Non-core unit because of the lack of scale to generate an acceptable return.
In the third quarter of 2015, we reached an agreement to sell our Non-core personal customer business in Lithuania and Latvia. Pending approval by the Lithuanian competition authorities, the transaction is expected to be completed in the first half of 2016.
The winding-up of our Irish Non-core portfolio continued throughout 2015, and the commercial exposure has now been almost run down.
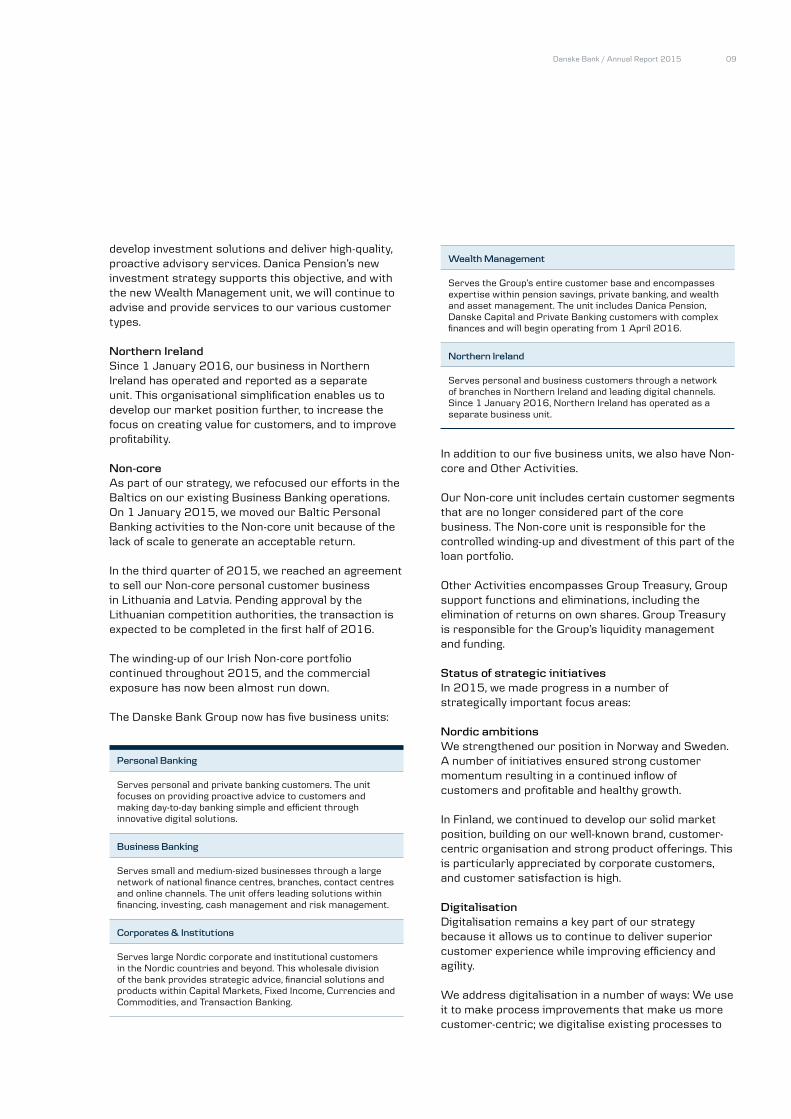
The Danske Bank Group now has five business units:
In addition to our five business units, we also have Non-core and Other Activities.
Our Non-core unit includes certain customer segments that are no longer considered part of the core business. The Non-core unit is responsible for the controlled winding-up and divestment of this part of the loan portfolio.
Other Activities encompasses Group Treasury, Group support functions and eliminations, including the elimination of returns on own shares. Group Treasury is responsible for the Group’s liquidity management and funding.
Status of strategic initiativesIn 2015, we made progress in a number of strategically important focus areas:
Nordic ambitions We strengthened our position in Norway and Sweden. A number of initiatives ensured strong customer momentum resulting in a continued inflow of customers and profitable and healthy growth.
In Finland, we continued to develop our solid market position, building on our well-known brand, customer-centric organisation and strong product offerings. This is particularly appreciated by corporate customers, and customer satisfaction is high.
DigitalisationDigitalisation remains a key part of our strategy because it allows us to continue to deliver superior customer experience while improving efficiency and agility.
We address digitalisation in a number of ways: We use it to make process improvements that make us more customer-centric; we digitalise existing processes to
Personal Banking
Serves personal and private banking customers. The unit focuses on providing proactive advice to customers and making day-to-day banking simple and efficient through innovative digital solutions.
Business Banking
Serves small and medium-sized businesses through a large network of national finance centres, branches, contact centres and online channels. The unit offers leading solutions within financing, investing, cash management and risk management.
Corporates & Institutions
Serves large Nordic corporate and institutional customers in the Nordic countries and beyond. This wholesale division of the bank provides strategic advice, financial solutions and products within Capital Markets, Fixed Income, Currencies and Commodities, and Transaction Banking.
Wealth Management
Serves the Group’s entire customer base and encompasses expertise within pension savings, private banking, and wealth and asset management. The unit includes Danica Pension, Danske Capital and Private Banking customers with complex finances and will begin operating from 1 April 2016.
Northern Ireland
Serves personal and business customers through a network of branches in Northern Ireland and leading digital channels. Since 1 January 2016, Northern Ireland has operated as a separate business unit.
Danske Bank / Annual Report 201510
make our routine operations as efficient as possible; and we explore opportunities to use new technology to disrupt existing service models. Together, these efforts enable us to develop and protect our franchise, to solidify our position as a leading innovator in the Nordics, and to ensure our competitiveness against existing and new market players.
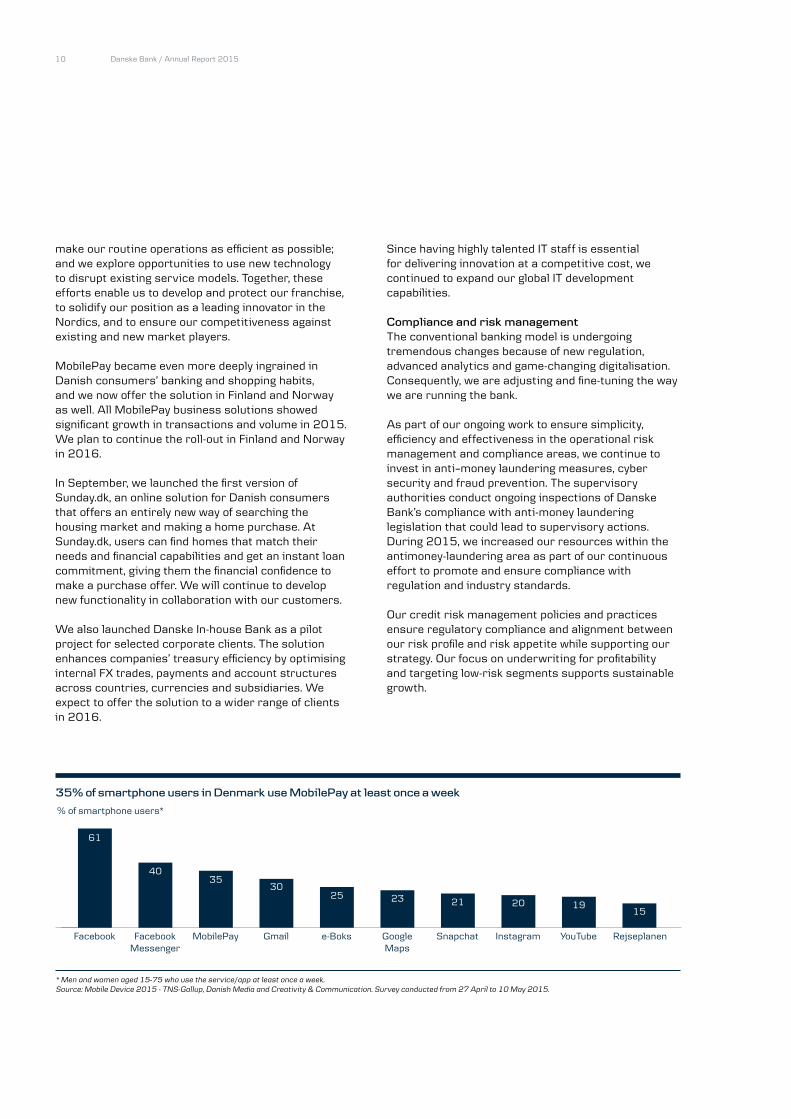
MobilePay became even more deeply ingrained in Danish consumers’ banking and shopping habits, and we now offer the solution in Finland and Norway as well. All MobilePay business solutions showed significant growth in transactions and volume in 2015. We plan to continue the roll-out in Finland and Norway in 2016.
In September, we launched the first version of Sunday.dk, an online solution for Danish consumers that offers an entirely new way of searching the housing market and making a home purchase. At Sunday.dk, users can find homes that match their needs and financial capabilities and get an instant loan commitment, giving them the financial confidence to make a purchase offer. We will continue to develop new functionality in collaboration with our customers.
We also launched Danske In-house Bank as a pilot project for selected corporate clients. The solution enhances companies’ treasury efficiency by optimising internal FX trades, payments and account structures across countries, currencies and subsidiaries. We expect to offer the solution to a wider range of clients in 2016.
Since having highly talented IT staff is essential for delivering innovation at a competitive cost, we continued to expand our global IT development capabilities.
Compliance and risk managementThe conventional banking model is undergoing tremendous changes because of new regulation, advanced analytics and game-changing digitalisation. Consequently, we are adjusting and fine-tuning the way we are running the bank.
As part of our ongoing work to ensure simplicity, efficiency and effectiveness in the operational risk management and compliance areas, we continue to invest in anti–money laundering measures, cyber security and fraud prevention. The supervisory authorities conduct ongoing inspections of Danske Bank’s compliance with anti-money laundering legislation that could lead to supervisory actions. During 2015, we increased our resources within the antimoney-laundering area as part of our continuous effort to promote and ensure compliance with regulation and industry standards.
Our credit risk management policies and practices ensure regulatory compliance and alignment between our risk profile and risk appetite while supporting our strategy. Our focus on underwriting for profitability and targeting low-risk segments supports sustainable growth.
35% of smartphone users in Denmark use MobilePay at least once a week
* Men and women aged 15-75 who use the service/app at least once a week. Source: Mobile Device 2015 - TNS-Gallup, Danish Media and Creativity & Communication. Survey conducted from 27 April to 10 May 2015.
% of smartphone users*
RejseplanenYouTubeInstagramSnapchatGoogle Maps
e-BoksGmailMobilePayFacebook Messenger
40
61
3530
25 23 21 20 1915
Danske Bank / Annual Report 2015 11
The approval of foundation IRB models for the corporate segment in Finland improved our capital ratios.
In September, we sent our Recovery Plan 2015, which SIFIs must have in place, to the Danish FSA.
The winding-up of Non-core activities contributed to a DKK 16 billion reduction in the risk exposure amount (REA), while lower risk positions at Corporates & Institutions, combined with a high degree of diversification and lower market volatility, led to a reduced REA for market risk.
The positive development in our ratings, improved asset quality, lower impairments as well as improved and stable earnings also contributed to our improved risk profile. With capital and liquidity ratios well above our 2015 targets, our risk resilience is strong.
Customer satisfaction
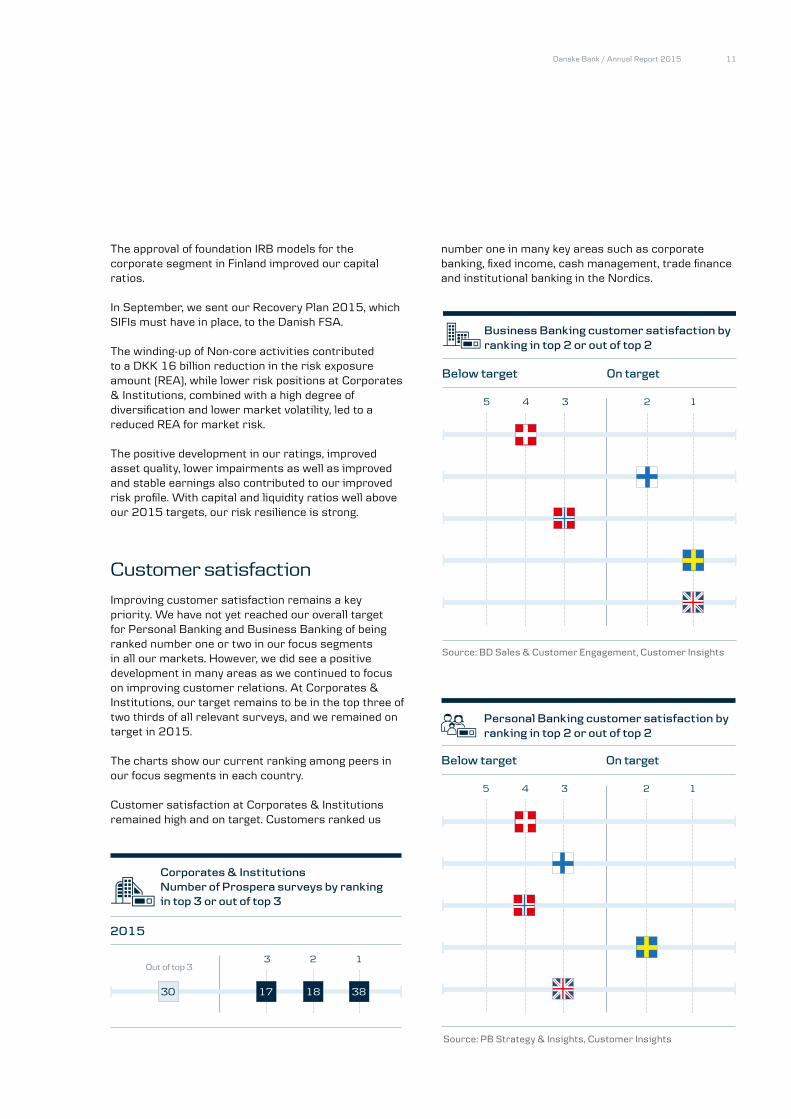
Improving customer satisfaction remains a key priority. We have not yet reached our overall target for Personal Banking and Business Banking of being ranked number one or two in our focus segments in all our markets. However, we did see a positive development in many areas as we continued to focus on improving customer relations. At Corporates & Institutions, our target remains to be in the top three of two thirds of all relevant surveys, and we remained on target in 2015.
The charts show our current ranking among peers in our focus segments in each country.
Customer satisfaction at Corporates & Institutions remained high and on target. Customers ranked us
number one in many key areas such as corporate banking, fixed income, cash management, trade finance and institutional banking in the Nordics.
Source: BD Sales & Customer Engagement, Customer Insights
On targetBelow target
125 34
Business Banking customer satisfaction by ranking in top 2 or out of top 2
T5
T2
T3
T1
T4
C1
B1
B2
B3
On targetBelow target
125 34
Personal Banking customer satisfaction by ranking in top 2 or out of top 2
Source: PB Strategy & Insights, Customer Insights
T5
T2
T3
T1
T4
C1
B1
B2
B3
17 34
2015
123Out of top 3
Corporates & InstitutionsNumber of Prospera surveys by ranking in top 3 or out of top 3
30 17
T5
T2
T3
T1
T4
C1
B1
B2
B3
18 38

Danske Bank / Annual Report 201512
Business Banking saw good progress for customer satisfaction in all countries in 2015. We are on target in three of the five countries, as we are number two in Finland, and number one in Sweden and Northern Ireland. In Denmark, customer satisfaction improved throughout 2015, although we were ranked just below our peers towards the end of the year. In Norway, we were ranked between first and third position throughout the year.
At Personal Banking, customer satisfaction is on target in Sweden, where we were also named bank of the year by Privata Affärer, the largest Nordic personal finances magazine. In Finland, Northern Ireland, Denmark and Norway, we recorded solid improvements from the level a year ago and narrowed the gap to our peers significantly, but we remain below target. In Denmark, it was particularly encouraging that we improved our ranking to fourth place. The upward trend reflects our commitment and hard work to constantly improve our services and solutions and to give our customers the best experience every time they are in touch with us. We are confident that we are moving in the right direction.
Satisfaction remained high among private banking customers. For the third consecutive year, we were named best private banking bank in Denmark by The Banker, and Euromoney named us best private banking bank in Denmark for the tenth time. Furthermore, Prospera’s annual survey ranked Danske Bank first among private banking banks in Denmark and Norway.
Danske Capital ranks second in customer satisfaction in the Nordic institutional segment among bank peers across all client segments. Client surveys showed improvement in 2015, especially in Sweden. In Norway, we maintained our strong position, whereas we saw minor declines in average rankings in Denmark and Finland, albeit from strong levels.
The Aalund Business Research survey ranked Danica Pension third overall in Denmark. We saw positive development, especially among large customers, and enhancing customer satisfaction will remain a focus area for 2016 and the coming years.

Danske Bank / Annual Report 2015 13
Outlook
Outlook for 2016For net interest income, we expect continued pressure on margins in 2016, while we will benefit from volume growth and lower funding costs.
We expect the underlying trend in net fee income that we saw in 2015 to continue, but we do not expect to repeat the high level of remortgaging activity.
Net trading income remains subject to customer activity and volatility in the financial markets.
Net income from insurance business is expected to be around the 2015 level.
Expenses are expected to decline from the level in 2015. We will continue our strong focus on costs to fuel investments in digitalisation and customer solutions. Costs will benefit from a lower net contribution to the resolution fund and the deposit guarantee fund, and from lower depreciation on intangible assets.
Loan impairments are expected to be at a low level because of our ongoing efforts to improve credit quality and expectations of a generally unchanged macroeconomic climate.
Profit before tax at Non-core is expected to be close to zero.
Net profit for 2016 is thus expected to be in line with net profit before goodwill impairments in 2015.
Outlook towards end-2018Danske Bank is aiming for a return on shareholders’ equity of at least 12.5% in 2018 at the latest. In 2015, the return on shareholders’ equity, excluding goodwill impairments, was 11.6%.
Our outlook towards end-2018 is based on an assumption of largely unchanged macroeconomic conditions and persistently low interest rate levels. Consequently, we expect overall moderate credit demand, with low demand in Denmark. We expect the savings market to show healthy growth rates, however.
The key elements of our medium-term financial plan are income initiatives coupled with diligent cost and capital optimisation measures.
We expect income improvements to be achieved through moderate growth in lending volumes, as well as an increase in income from wealth management. Moreover, we will continue to optimise our pricing and product mix.
We will continue to pursue structural cost efficiencies through digitalisation, process improvements and organisational optimisation.
Loan impairments are expected to be at a low level.
Moreover, we will continue our strong focus on efficient capital use and will grow income in less capital-intensive areas.
To ensure continued access to competitive funding, we aim to maintain strong A ratings. With regard to funding costs, we assume that maturing funding will be refinanced at current market prices.
We intend to continue to return excess capital to our shareholders after we have paid out ordinary dividends of 40-50% of net profit. Our capital targets will be confirmed annually.
Danske Bank / Annual Report 201514
Financial review
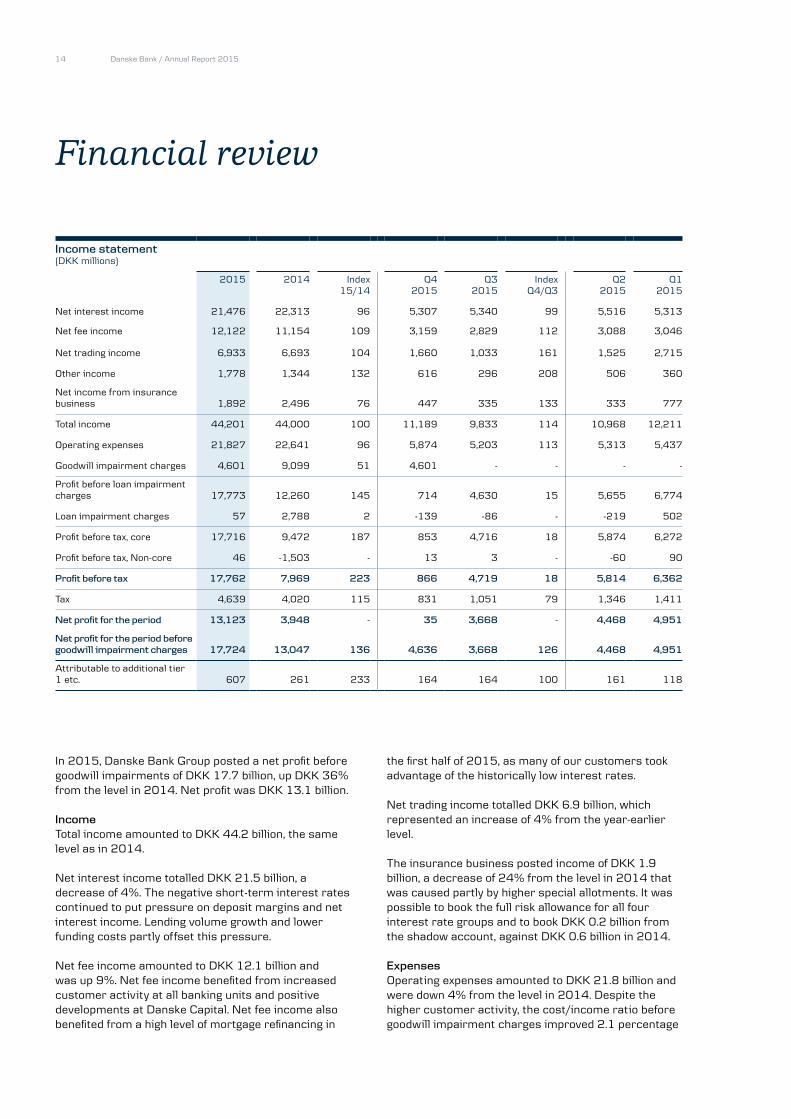
In 2015, Danske Bank Group posted a net profit before goodwill impairments of DKK 17.7 billion, up DKK 36% from the level in 2014. Net profit was DKK 13.1 billion.
IncomeTotal income amounted to DKK 44.2 billion, the same level as in 2014.
Net interest income totalled DKK 21.5 billion, a decrease of 4%. The negative short-term interest rates continued to put pressure on deposit margins and net interest income. Lending volume growth and lower funding costs partly offset this pressure. Net fee income amounted to DKK 12.1 billion and was up 9%. Net fee income benefited from increased customer activity at all banking units and positive developments at Danske Capital. Net fee income also benefited from a high level of mortgage refinancing in
the first half of 2015, as many of our customers took advantage of the historically low interest rates.
Net trading income totalled DKK 6.9 billion, which represented an increase of 4% from the year-earlier level.
The insurance business posted income of DKK 1.9 billion, a decrease of 24% from the level in 2014 that was caused partly by higher special allotments. It was possible to book the full risk allowance for all four interest rate groups and to book DKK 0.2 billion from the shadow account, against DKK 0.6 billion in 2014.
ExpensesOperating expenses amounted to DKK 21.8 billion and were down 4% from the level in 2014. Despite the higher customer activity, the cost/income ratio before goodwill impairment charges improved 2.1 percentage
Income statement(DKK millions)
2015 2014 Index15/14
Q4 2015
Q3 2015
IndexQ4/Q3
Q22015
Q12015
Net interest income 21,476 22,313 96 5,307 5,340 99 5,516 5,313
Net fee income 12,122 11,154 109 3,159 2,829 112 3,088 3,046
Net trading income 6,933 6,693 104 1,660 1,033 161 1,525 2,715
Other income 1,778 1,344 132 616 296 208 506 360
Net income from insurance business 1,892 2,496 76 447 335 133 333 777
Total income 44,201 44,000 100 11,189 9,833 114 10,968 12,211
Operating expenses 21,827 22,641 96 5,874 5,203 113 5,313 5,437
Goodwill impairment charges 4,601 9,099 51 4,601 - - - -
Profit before loan impairment charges 17,773 12,260 145 714 4,630 15 5,655 6,774
Loan impairment charges 57 2,788 2 -139 -86 - -219 502
Profit before tax, core 17,716 9,472 187 853 4,716 18 5,874 6,272
Profit before tax, Non-core 46 -1,503 - 13 3 - -60 90
Profit before tax 17,762 7,969 223 866 4,719 18 5,814 6,362
Tax 4,639 4,020 115 831 1,051 79 1,346 1,411
Net profit for the period 13,123 3,948 - 35 3,668 - 4,468 4,951
Net profit for the period before goodwill impairment charges 17,724 13,047 136 4,636 3,668 126 4,468 4,951
Attributable to additional tier 1 etc. 607 261 233 164 164 100 161 118

Danske Bank / Annual Report 2015 15
points to 49.4% as we continued to implement efficiency initiatives.
The goodwill impairments are the result of assumptions about lower interest rates long-term and increased capital allocation to Finland and Northern Ireland.
Our contribution to the new Danish resolution fund amounted to DKK 194 million for 2015.
Expenses for VAT and payroll tax for 2015 amounted to DKK 1.9 billion, against DKK 2.2 billion in 2014. Loan impairmentsLoan impairments declined from the level in 2014 at all business units. The lower impairment level reflected general improvements in credit quality and collateral values. In the agricultural and oil sectors, impairments increased, reflecting weakened market conditions.
Loan impairment charges(DKK millions)
2015 2014
Charges % of lending
and gua-rantees
Charges % of lending
and gua-rantees
Personal Banking 332 0.04 1,412 0.17
Business Banking -343 -0.05 1,007 0.17
C&I 65 0.01 372 0.07
Other 3 0.03 -2 0.00
Total 57 0.00 2,788 0.15
TaxTax on the profit for the year amounted to DKK 4.6 billion, or 20.7% of profit before goodwill impairments and tax. Tax was affected by net adjustments of DKK 0.3 billion regarding prior years.
In the fourth quarter of 2015, Danske Bank posted a net profit before goodwill impairments of DKK 4.6 billion.
Net interest income amounted to DKK 5.3 billion, and was thus unchanged from the level in the third quarter. Increased lending volumes and lower customer rates on deposits offset the pressure on lending margins.
Net fee income showed an increase of DKK 0.3 billion over the third quarter. The increase was driven by higher performance fees at Danske Capital.
Net trading income amounted to DKK 1.7 billion, against DKK 1.0 billion in the third quarter. The increase was due to increased client activity in the financial markets.
The insurance business generated net income of DKK 0.4 billion and was up 33% from the third quarter. The increase was due to the transfer of DKK 0.2 billion from the shadow account and a higher return on investments, although the payment of special allotments had an adverse effect.
In the fourth quarter, we recognised a DKK 4.6 billion goodwill impairment charge as a result of assumptions about lower interest rates long-term and increased capital allocation to Finland and Northern Ireland.
Loan impairments showed a net reversal of DKK 0.1 billion, matching the level in the third quarter. The level of reversals reflected increases in collateral values driven by improved economic conditions. In the agricultural and oil sectors, impairments increased owing to concerns about weaker market conditions.
Q4 2015 vs Q3 2015

Danske Bank / Annual Report 201516
Balance sheet
LendingAt the end of 2015, total lending was up 3% from the level at the end of 2014. Lending increased at almost all banking units.
In Denmark, new gross lending, excluding repo loans, amounted to DKK 78.6 billion. Lending to personal customers accounted for DKK 36.6 billion of this amount.
In Denmark, our market share of total lending, including repo loans, fell from 26.5% at the end of 2014 to 26.1%. In Finland, our market share of lending also fell. In Norway, our market share rose, and in Sweden, we maintained our market share of lending.
Lending (end of period)(DKK billions)
2015 2014 Index15/14
Q42015
Q32015
IndexQ4/Q3
Q22015
Q12015
Personal Banking 808.5 794.1 102 808.5 801.0 101 805.7 807.5
Business Banking 662.9 633.7 105 662.9 647.3 102 651.6 644.0
C&I 172.2 172.4 100 172.2 174.3 99 179.2 189.7
Other Activities incl. eliminations -7.3 -4.1 - -7.3 -4.5 - -4.8 -3.7
Allowance account, lending 26.9 32.4 83 26.9 28.3 95 30.6 32.5
Total lending 1,609.4 1,563.7 103 1,609.4 1,589.8 101 1,601.1 1,605.0
Deposits (end of period)(DKK billions)
2015 2014 Index15/14
Q42015
Q32015
IndexQ4/Q3
Q22015
Q12015
Personal Banking 346.9 329.5 105 346.9 344.4 101 353.2 334.8
Business Banking 256.3 259.8 99 256.3 250.3 102 258.5 262.2
C&I 213.5 174.2 123 213.5 226.5 94 229.5 230.0
Other Activities incl. eliminations 0.1 -0.1 - 0.1 2.4 - -1.5 -0.2
Total deposits 816.8 763.4 107 816.8 823.6 99 839.7 826.8
Bonds issued by Realkredit Danmark (end of period)(DKK billions)
2015 2014 Index15/14
Q42015
Q32015
IndexQ4/Q3
Q22015
Q12015
Bonds issued 694.5 656.0 106 694.5 687.6 101 691.5 678.9
Own holdings of bonds 56.6 88.5 64 56.6 55.2 103 48.6 69.8
Total Realkredit Danmark bonds 751.1 744.5 101 751.1 742.8 101 740.2 748.7
Other covered bonds 188.9 211.7 89 188.9 224.8 84 219.5 218.1
Total deposits and issued mortgage bonds etc. 1,756.8 1,719.6 102 1,756.8 1,791.2 98 1,799.4 1,793.6
Lending as % of deposits and issued mortgage bonds etc. 91.6 90.9 91.6 88.8 89.0 89.5

Danske Bank / Annual Report 2015 17
Market shares of lending(%)
31 December2015
31December 2014
Denmark (excluding mortgage loans) 26.1 26.5
Finland* 9.6 9.8
Sweden* 4.9 4.9
Norway* 5.6 4.6
Source: Market shares are based on data from the central banks. Market shares include repo loans, with the exception of the market shares for Sweden.* The market shares for Finland, Sweden and Norway are based on data from the central banks at 30 November 2015.
Lending equalled 91.6% of the total amount of deposits, mortgage bonds and other covered bonds, against 90.9% at the end of 2014.
DepositsAt the end of 2015, total deposits were up 7% from the level at the end of 2014, with an increase recorded in particular at Corporates & Institutions.
Market shares of deposits(%)
31 December2015
31 December 2014
Denmark 27.8 27.1
Finland* 12.9 11.9
Sweden* 3.9 4.2
Norway* 5.5 5.1
Source: Market shares are based on data from the central banks. Market shares include repo deposits, with the exception of the market shares for Sweden.* The market shares for Finland, Sweden and Norway are based on data from the central banks at 30 November 2015.
Credit exposureNet credit exposure totalled DKK 3,600 billion, against DKK 3,722 billion at the end of 2014.
Risk Management 2015, chapter 4, which is available at danskebank.com/ir, provides details on Danske Bank’s credit risks.
Credit qualityThe general improvement in the economy, the low interest rate level and managerial efforts enabled us to improve credit quality during the year. Total gross non-performing loans (NPL) decreased, and the coverage ratio remained high.
The risk management notes on pp. 141-142 provide more information about non-performing loans.
Non performance loans (NPL)(DKK millions)
31 December 2015
31 December 2014
Gross NPL 47,820 58,439
Individual allowance account 23,151 29,049
Net NPL 24,670 29,390
Collateral (after haircut) 19,848 24,722
NPL coverage ratio (%) 82.8 86.2
NPL coverage ratio of which is in default (%) 92.8 95.5
NPL as percentage of total gross exposure 2.0 2.5
The NPL coverage ratio is calculated as individual impairment (allowance account) amounts relative to gross NPL net of collateral (after haircuts).
Accumulated individual impairments amounted to DKK 23.2 billion, or 1.2% of lending and guarantees. Accumulated collective impairments amounted to DKK 4.3 billion, or 0.2% of lending and guarantees. The corresponding figures at 31 December 2014 were DKK 29.0 billion and DKK 4.0 billion, respectively.
Allowance account by business units (DKK millions)
2015 2014
Accum.Impairm. charges*
% of lending
and gua-rantees
Accum.Impairm. charges*
% of lending
and gua-rantees
Personal Banking 7,601 0.93 8,382 1.03
Business Banking 17,524 2.56 21,493 3.28
C&I 2,369 0.59 3,157 0.54
Other Activities incl. eliminations 2 0.05 2 0.00
Total 27,496 1.45 33,034 1.73
Recognised losses amounted to DKK 6.8 billion. Of these losses, DKK 0.6 billion was attributable to facilities not already subject to impairment.
Trading and investment activitiesCredit exposure from trading and investment activities amounted to DKK 891 billion at the end of 2015, against DKK 1,074 billion at the end of 2014.
Danske Bank / Annual Report 201518
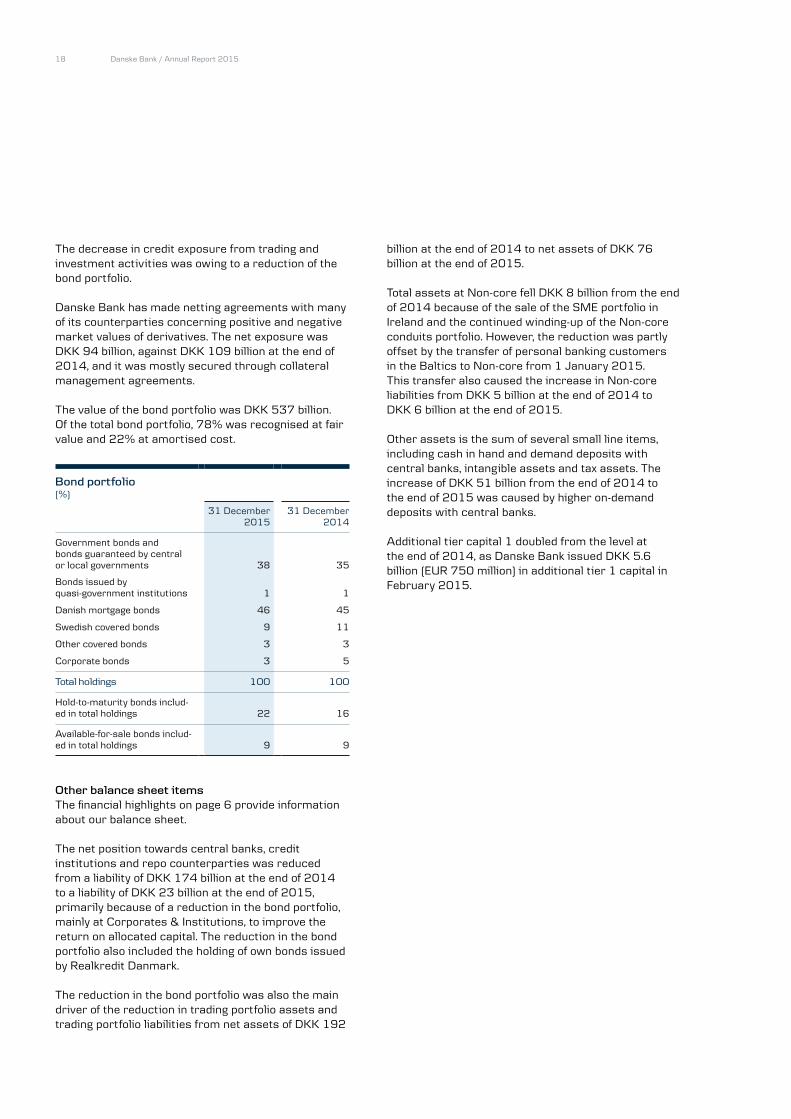
The decrease in credit exposure from trading and investment activities was owing to a reduction of the bond portfolio.
Danske Bank has made netting agreements with many of its counterparties concerning positive and negative market values of derivatives. The net exposure was DKK 94 billion, against DKK 109 billion at the end of 2014, and it was mostly secured through collateral management agreements.
The value of the bond portfolio was DKK 537 billion. Of the total bond portfolio, 78% was recognised at fair value and 22% at amortised cost.
Bond portfolio(%)
31 December2015
31 December2014
Government bonds and bonds guaranteed by central or local governments 38 35
Bonds issued by quasi-government institutions 1 1
Danish mortgage bonds 46 45
Swedish covered bonds 9 11
Other covered bonds 3 3
Corporate bonds 3 5
Total holdings 100 100
Hold-to-maturity bonds includ-ed in total holdings 22 16
Available-for-sale bonds includ-ed in total holdings 9 9
Other balance sheet items The financial highlights on page 6 provide information about our balance sheet.
The net position towards central banks, credit institutions and repo counterparties was reduced from a liability of DKK 174 billion at the end of 2014 to a liability of DKK 23 billion at the end of 2015, primarily because of a reduction in the bond portfolio, mainly at Corporates & Institutions, to improve the return on allocated capital. The reduction in the bond portfolio also included the holding of own bonds issued by Realkredit Danmark.
The reduction in the bond portfolio was also the main driver of the reduction in trading portfolio assets and trading portfolio liabilities from net assets of DKK 192
billion at the end of 2014 to net assets of DKK 76 billion at the end of 2015.
Total assets at Non-core fell DKK 8 billion from the end of 2014 because of the sale of the SME portfolio in Ireland and the continued winding-up of the Non-core conduits portfolio. However, the reduction was partly offset by the transfer of personal banking customers in the Baltics to Non-core from 1 January 2015. This transfer also caused the increase in Non-core liabilities from DKK 5 billion at the end of 2014 to DKK 6 billion at the end of 2015.
Other assets is the sum of several small line items, including cash in hand and demand deposits with central banks, intangible assets and tax assets. The increase of DKK 51 billion from the end of 2014 to the end of 2015 was caused by higher on-demand deposits with central banks.
Additional tier capital 1 doubled from the level at the end of 2014, as Danske Bank issued DKK 5.6 billion (EUR 750 million) in additional tier 1 capital in February 2015.

Danske Bank / Annual Report 2015 19
Personal Banking
Mortgage refinancing and investment activities were especially strong in the first half of the year and partly offset the adverse effect of the negative short-term interest rates in 2015. Along with tight cost control and lower impairments, this resulted in an increase in profit before tax and goodwill impairments of 11% and an improvement in the return on allocated capital.
Personal Banking(DKK millions)
2015 2014 Index15/14
Q42015
Q32015
IndexQ4/Q3
Q22015
Q12015
Net interest income 9,416 10,764 87 2,359 2,329 101 2,330 2,398
Net fee income 5,108 4,567 112 1,152 1,222 94 1,383 1,351
Net trading income 724 723 100 169 139 122 148 268
Other income 610 632 97 131 139 94 187 153
Total income 15,858 16,686 95 3,811 3,829 100 4,048 4,170
Operating expenses 10,389 10,626 98 2,741 2,424 113 2,597 2,627
Goodwill impairment charges 3,305 5,539 60 3,305 - - - -
Profit before loan impairment charges 2,164 521 - -2,235 1,405 - 1,451 1,543
Loan impairment charges 332 1,412 24 -56 13 - 131 245
Profit before tax 1,832 -891 - -2,179 1,392 - 1,322 1,298
Profit before tax and goodwill impairment charges 5,137 4,648 111 1,126 1,392 81 1,322 1,298
Loans, excluding reverse trans. before impairments 808,453
794,063 102 808,453 801,003 101 805,726 807,549
Allowance account, loans 6,991 7,668 91 6,991 7,171 97 7,527 7,616
Deposits, excluding repo deposits 346,920
329,463 105 346,920 344,429 101 353,175 334,783
Bonds issued by Realkredit Danmark 424,255
426,203 100 424,255 420,264 101 420,259 425,741
Allowance account, guarantees 610 714 610 636 96 696 701
Allocated capital (average) 24,471 31,722 77 22,620 24,361 93 25,060 25,881
Net interest income as % p.a. of loans and deposits 0.82 0.96 0.82 0.82 0.81 0.85
Profit before goodwill and loan impairment charges as % p.a. of allocated capital 22.1 18.8 18.0 23.1 23.2 23.8
Profit before tax and goodwill impairment charges as % p.a. of allocated capital (ROAC) 20.8 14.4 19.0 22.9 21.1 20.1
Cost/income ratio before goodwill impairment charges (%) 65.5 63.7 71.9 63.3 64.2 63.0
Full-time-equivalent staff 6,491 6,673 97 6,491 6,527 99 6,695 6,713
Note 3 and Fact Book Q4 2015 provide financial highlights at the country level for Personal Banking. Fact Book Q4 2015 is available at danskebank.com/ir.

Danske Bank / Annual Report 201520
At Personal Banking, we aim to make daily banking and financial decisions easier and to create the best experience for our customers every time they are in touch with us.
In 2015, we continued to pursue these goals through innovative digital solutions, simplification of processes, freeing up more time for serving our customers, and further empowerment of the organisation. The aim is to create the best customer experience.
In Norway and Sweden, we strengthened our market positions, and we continued to expand our offerings in Denmark and Finland.
A strong Danish value propositionIn Denmark, the customer programme is an important part of our value proposition. In 2015, more customers gathered their banking business with us.
Over the years, digitalisation has transformed our intereaction with customers. Today, mobile solutions are the preferred way of banking for most customers, and e-meetings provide a convenient alternative to visiting a branch for advisory meetings.
Our ambition is to advise customers proactively on all life events and to be an agile partner that responds quickly to customer requests. We seek to put our customers at the centre of everything we do, for example by maximising the time advisers spend with them and by delegating decision-making.
In 2015, we continued to introduce new products and services in response to the low interest rate environment. For example, we introduced a new type of loan with a fixed interest rate option for home and auto financing. Growing our business in Sweden and NorwayIn Sweden, we introduced a transparent, competitive benefit programme and launched a flexible mortgage loan to fit the individual needs of our customers. Nearly 140,000 customers have registered for the customer programme, and the demand for mortgage loans grew. At the end of the year, Privata Affärer, the largest Nordic personal finances magazine, named us bank of the year, with reference, among other things, to the transparency and clarity of our benefit programme.
In Norway, the strong inflow of new customers from the Akademikerne agreement continued throughout the year. We saw satisfactory increases in business volume and cross-selling, while maintaining a strong credit quality and increasing our market share of lending. The initial investments and costs of welcoming the new customers impacted our profitability.
In 2015, we reached an agreement with Saco (a Swedish confederation of professional organisations) to offer our services to its more than 650,000 members. This agreement is expected to increase customer inflow from 2016. Consolidating our position in Finland Customers in Finland appreciate our benefit programme, and more than 280,000 have joined. We continued to add new benefits, most recently purchase and cash withdrawal protection insurance linked to Danske Bank MasterCard. We also developed new savings accounts to meet customer needs in collaboration with customers.
Private Banking maintained its strong positionWe saw a net inflow of private banking customers during the year, and satisfaction among customers remained high. For the third consecutive year, we were named best private banking bank in Denmark by The Banker, owing to our customer-centric growth strategy and business model, which give us as a strong foundation for advising customers with complex finances. Euromoney named us best private banking bank in Denmark for the tenth time, and Prospera’s annual survey ranked Danske Bank first among private banking banks in Denmark and Norway.
Banking made easyMobilePay and Sunday.dk both exemplify our efforts to develop strong digital offerings that can form an integral part of people’s lives.
With around 2.8 million regular users in Denmark and high business growth rates, MobilePay can now be used in more than 19,000 online and physical stores. To make MobilePay the logical choice in all payment situations, we continued to raise amount limits. And with value-adding services, such as MobilePay Bonus and electronic receipts, we not only meet user needs but also open the door to merchants and thus a large number of potential customers.

Danske Bank / Annual Report 2015 21
We launched MobilePay successfully in Norway, where it was rated the best payment app by kortogkontant.no. Together with REMA 1000, a large Norwegian supermarket chain, we are now implementing our MobilePay point-of-sale solution in more than 500 shops.
With Sunday.dk in Denmark, we launched a unique way for people to find a new home and get an instant loan commitment. We will continue to develop new functionality in collaboration with our customers.
We know that convenient access to banking services and advice is crucial for customers. By introducing chat, webinars, access to our apps with touch ID and through devices such as Apple Watch and a website based on major life events, we continued to expand and enhance the way in which customers can reach us when they need us.
With the launch of contactless cards, payment in shops has become even faster. And with MasterCard, customers can choose between debit and credit payment and even split up payments with the new instalment payment feature. In addition, the GeoControl feature enhances protection against international fraud.
2015 vs 2014Profit before tax and goodwill impairments increased 11% to DKK 5.1 billion, and the return on allocated capital improved 6.4 percentage points to 20.8%. Negative short-term interest rates in Denmark, Finland and Sweden and a decline in rates in other markets continued to put pressure on net interest income. This negative impact was partially offset by a combination of higher net fee income and lower loan impairment charges.
Total income amounted to DKK 15.9 billion. The decline in short-term interest rates put considerable pressure on deposit margins, causing net interest income to fall 13% from the level in 2014.
Net fee income rose 12% while net trading income remained at the 2014 level. Keen customer interest in investment solutions, driven by the historically low deposit rates in all markets, had a positive effect on net trading income. We also saw very strong customer remortgaging activity in Denmark, and the high level of
activity supported both net fee income and net trading income, in particular in the first half of the year.
We succeeded in bringing down back-office production costs, and this reduction more than offset the upward drift in costs resulting from the increase in customer activity. Overall, operating expenses fell 2%.
Loan impairments fell 76% to DKK 0.3 billion. The decline was driven by our continued efforts to improve credit quality, as well as lower LTV ratios in most markets, though particularly in Denmark and Sweden, where higher property prices acted as the main driver of this development.
Loan-to-value ratio, home loans
31 December 2015 31 December 2014
LTV (%)
Credit exposure (DKK bn) LTV (%)
Credit exposure (DKK bn)
Denmark 66.8 489 72.9 500
Finland 62.0 86 61.3 84
Sweden 62.2 67 65.8 61
Norway 64.0 84 63.5 65
Northern Ireland 66.2 18 71.3 17
Average 65.5 70.1
Credit exposureCredit exposure consists of mortgages, loans secured on other assets, consumer loans and fully or partially secured credits.

Danske Bank / Annual Report 201522
Profit before tax and goodwill impairments fell 19% to DKK 1.1 billion in the fourth quarter of 2015. Total income remained stable quarter–on-quarter. Net interest income increased 1%, however, primarily because of an increase in deposit margins.
Net fee income fell 6% because of lower remortgaging activity than in the third quarter.
Net trading income increased 22% as a consequence of higher refinancing income in Realkredit Danmark.
Operating expenses increased 13% quarter-on–quarter, reflecting the seasonality of expenses, and matched the level in the fourth quarter of 2014.
Loan impairments showed a net reversal and reflected the ongoing improvement in credit quality.
Q4 2015 vs Q3 2015
Total net credit exposure rose 2% in 2015 to DKK 828 billion, driven mainly by an increase in activity in Norway generated by the agreement with the Norwegian Akademikerne federation, as well as by the competitive benefit programme in Sweden. In Denmark, net credit exposure decreased, mainly because of fair value adjustments.
Net credit exposure Impairments(%)
(DKK millions)31 December
201531 December
201431 December
2015
Denmark 526,105 538,980 0.06
Finland 93,680 92,234 0.05
Sweden 77,259 71,552 0.01
Norway 105,455 85,461 -0.01
Northern Ireland 19,413 18,499 -0.16
Other 6,275 5,631 -0.24
Total 828,186 812,357 0.04
Credit qualityCredit quality improved in most markets as a result of more favourable macroeconomic conditions.
The delinquency rate at Realkredit Danmark remained low and stable throughout the year.

Danske Bank / Annual Report 2015 23
Business Banking
Profit before tax and goodwill impairments rose 32% as a result of strong business momentum in all markets and lower impairments. Business activity rose and, combined with tight cost control, this more than offset the effect of negative short-term interest rates. Impairments fell owing to our continued efforts to improve credit quality and because of more favourable market conditions.
Business Banking(DKK millions)
2015 2014 Index15/14
Q42015
Q32015
IndexQ4/Q3
Q22015
Q12015
Net interest income 9,091 8,978 101 2,309 2,245 103 2,313 2,224
Net fee income 2,109 2,082 101 480 490 98 567 572
Net trading income 665 637 104 150 73 205 230 212
Other income* 594 516 115 113 142 80 165 174
Total income 12,459 12,213 102 3,052 2,950 103 3,275 3,182
Operating expenses 5,211 5,473 95 1,362 1,239 110 1,288 1,322
Goodwill impairment charges 1,296 3,559 36 1,296 - - - -
Profit before loan impairment charges 5,953 3,181 187 395 1,711 23 1,988 1,860
Loan impairment charges -343 1,007 - -150 -90 - -194 91
Profit before tax 6,296 2,174 290 545 1,801 30 2,182 1,769
Profit before tax and goodwill impairment charges 7,592 5,733 132 1,841 1,801 102 2,182 1,769
Loans, excluding reverse trans. before impairments 662,924 633,746 105 662,924 647,279 102 651,572 644,031
Allowance account, loans 17,166 21,211 81 17,166 18,493 93 19,668 20,909
Deposits, excluding repo deposits 256,279 259,770 99 256,279 250,300 102 258,517 262,206
Bonds issued by Realkredit Danmark 301,799 294,661 102 301,799 299,852 101 297,092 300,035
Allowance account, guarantees 357 281 127 357 326 110 300 291
Allocated capital (average) 36,980 42,084 88 35,857 37,128 97 37,162 37,791
Net interest income as % p.a. of loans and deposits 1.01 1.03 1.02 1.02 1.04 1.00
Profit before goodwill and loan impairment charges as % p.a. of allocated capital 19.5 15.9 18.6 18.4 21.4 19.7
Profit before tax and goodwill impairment charges as % p.a. of allocated capital (ROAC) 20.5 13.5 20.3 19.4 23.5 18.7
Cost/income ratio before goodwill impairment charges (%) 41.8 44.8 44.6 42.0 39.3 41.5
Full-time-equivalent staff 2,943 3,663 80 2,943 2,955 100 3,065 3,115
*Operational leasing, excluding property leasing, is presented on a net basis under Other income.Note 3 and Fact Book Q4 2015 provide financial highlights at the country level for Business Banking. Fact Book Q4 2015 is available at danskebank.com/ir.
Danske Bank / Annual Report 201524
At Business Banking, we strive to deliver the best possible customer experience and to make banking as easy and efficient as possible. In 2015, we continued to strengthen our Nordic set-up and to optimise the value propositions for all segments in the Nordic countries.
The rise in profitability was driven to a large extent by a decline in costs because of more efficient processes and the continued effect of our strong value propositions. The latter brought an increase in fee income owing to higher activity and increased cross-selling. Net reversals of impairments also contributed to profitability.
Increased business momentumOur customer-centric approach increased our business momentum, with positive trends in volume and cross-sales in all markets.
In Denmark, the combination of easy-to-use packaged solutions for small business customers and MobilePay Business caused a strong increase in customer inflow, and we saw positive trends in volumes in most segments in 2015.
In Norway and Sweden, we have strong value propositions for all segments but relatively low market shares. We continued to attract customers with complex needs, and our focus on cross-sales for these customers showed good progress. Our position enabled us to reach profitable growth above the market average.
In Finland, we continued to develop our offering and saw good progress in both fee income and business volume. This enabled us to grow with the market and consolidate our position as a leading bank for the SME segment.
New initiatives well received by customersTo further enhance the customer experience, we launched a wide range of new offerings while taking actions to become more efficient.
The tailor-made solutions we have offered since 2013 have proven very effective in attracting larger customers. With our new packages for smaller businesses, we now also have an efficient, simple and attractive offering for this segment in all of the Nordic countries. As a consequence, we saw a turnaround to a net inflow of customers in this segment.
In Norway and Denmark, we introduced a new digital portal that enables customers to sign agreements online. Digital signing makes it possible, for example, to sign an agreement to become a customer or buy and use our products and systems almost instantly. In addition, the digital portal will make us more efficient throughout the value chain. In 2016, we will implement the digital portal in Sweden and Finland.
MobilePay Business is now available in Denmark, Norway and Finland. The full range of solutions available in Denmark, which makes it easier for all types of business customers to receive payments and pay bills, is the market-leading offer in the area.
In Denmark, we co-created an online community with external partners and customers that is intended to help SMEs with good growth potential. The objective is to build relations with this important segment in the start-up phase.
2015 vs 2014Profit before tax and goodwill impairments increased 32% to DKK 7.6 billion, and the return on allocated capital improved 7.0 percentage points to 20.5%. The improvement was driven by a positive development in income based on good business momentum, a 5% reduction in costs from the level in 2014 and significantly lower loan impairments.
All income lines increased. Strong lending growth and income initiatives more than offset the adverse effect on deposit margins of the negative short-term interest rates, resulting in an increase of 1% in net interest income.
A 1% rise in net fee income was the result of an increase in mortgage refinancing activity driven by the low interest rates in the first half of 2015, stronger demand from existing customers and a general increase in activity.
The increase in net trading income reflected higher mortgage refinancing activity, in particular in the first half of 2015.
Operating expenses fell 5% owing to increased efficiency and tight cost control in general.
Danske Bank / Annual Report 2015 25
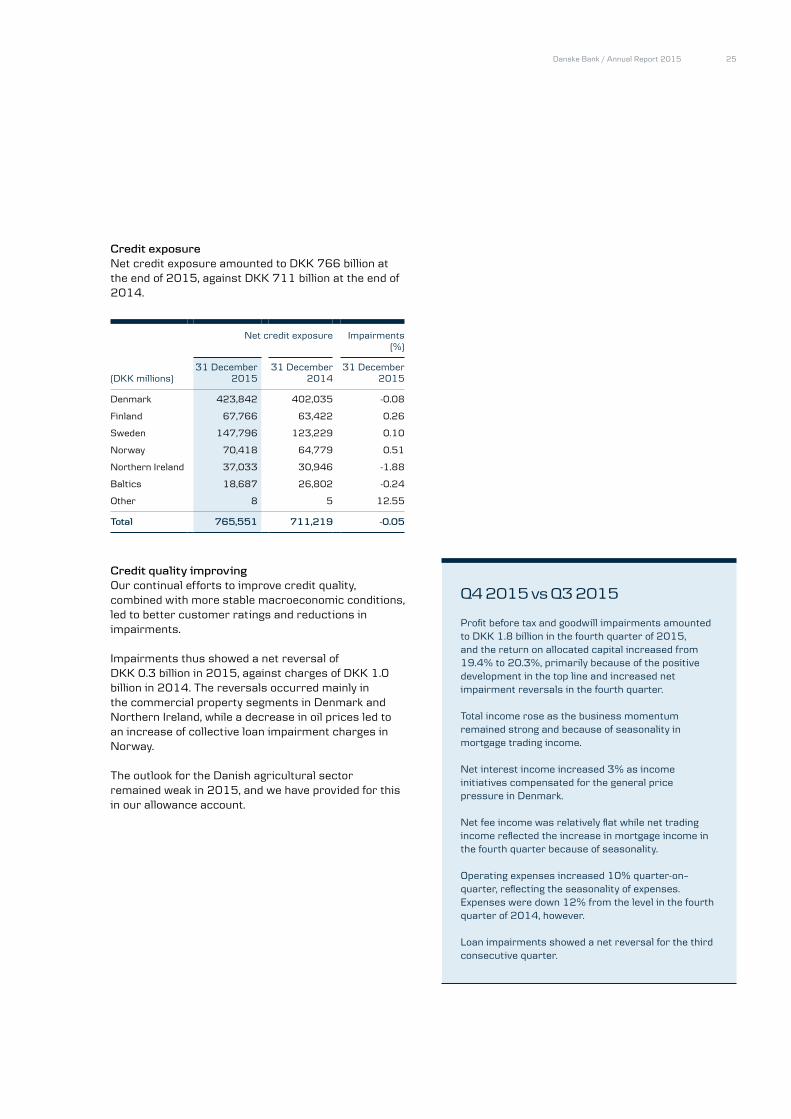
Credit exposureNet credit exposure amounted to DKK 766 billion at the end of 2015, against DKK 711 billion at the end of 2014.
Net credit exposure Impairments
(%)
(DKK millions)31 December
201531 December
201431 December
2015
Denmark 423,842 402,035 -0.08
Finland 67,766 63,422 0.26
Sweden 147,796 123,229 0.10
Norway 70,418 64,779 0.51
Northern Ireland 37,033 30,946 -1.88
Baltics 18,687 26,802 -0.24
Other 8 5 12.55
Total 765,551 711,219 -0.05
Credit quality improvingOur continual efforts to improve credit quality, combined with more stable macroeconomic conditions, led to better customer ratings and reductions in impairments.
Impairments thus showed a net reversal of DKK 0.3 billion in 2015, against charges of DKK 1.0 billion in 2014. The reversals occurred mainly in the commercial property segments in Denmark and Northern Ireland, while a decrease in oil prices led to an increase of collective loan impairment charges in Norway.
The outlook for the Danish agricultural sector remained weak in 2015, and we have provided for this in our allowance account.
Profit before tax and goodwill impairments amounted to DKK 1.8 billion in the fourth quarter of 2015, and the return on allocated capital increased from 19.4% to 20.3%, primarily because of the positive development in the top line and increased net impairment reversals in the fourth quarter.
Total income rose as the business momentum remained strong and because of seasonality in mortgage trading income.
Net interest income increased 3% as income initiatives compensated for the general price pressure in Denmark.
Net fee income was relatively flat while net trading income reflected the increase in mortgage income in the fourth quarter because of seasonality.
Operating expenses increased 10% quarter-on–quarter, reflecting the seasonality of expenses. Expenses were down 12% from the level in the fourth quarter of 2014, however.
Loan impairments showed a net reversal for the third consecutive quarter.
Q4 2015 vs Q3 2015
Danske Bank / Annual Report 201526
Corporates & Institutions
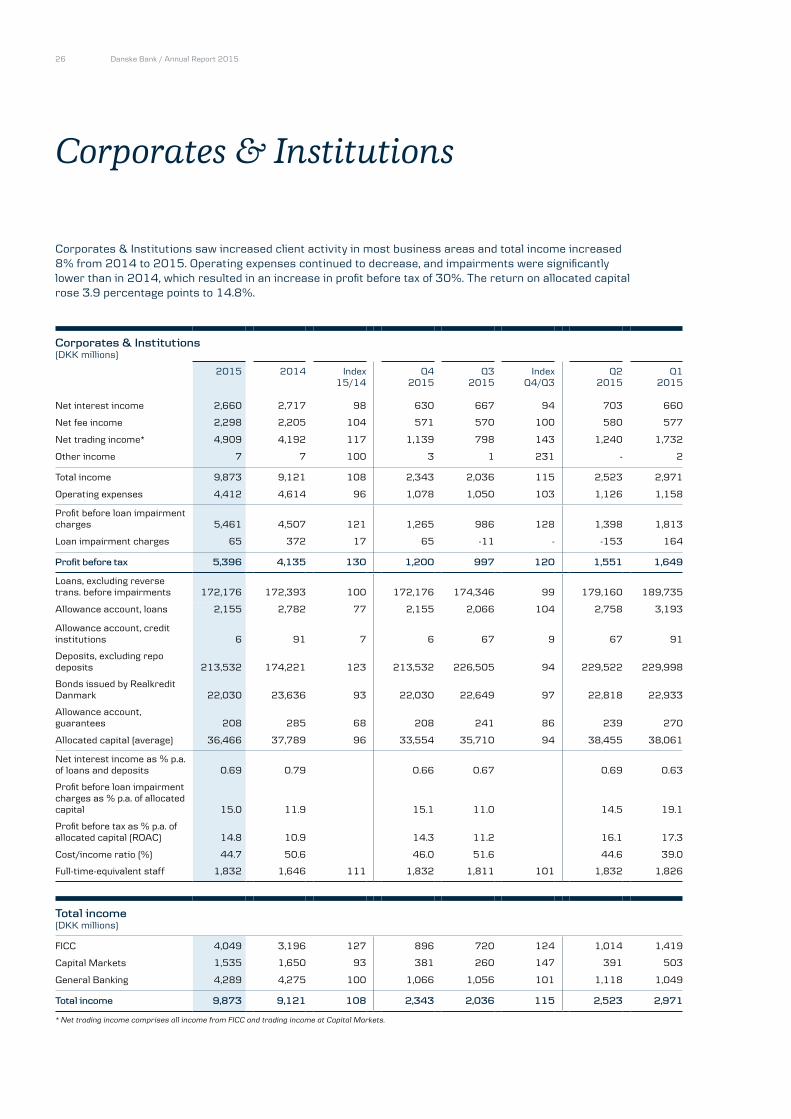
Corporates & Institutions saw increased client activity in most business areas and total income increased 8% from 2014 to 2015. Operating expenses continued to decrease, and impairments were significantly lower than in 2014, which resulted in an increase in profit before tax of 30%. The return on allocated capital rose 3.9 percentage points to 14.8%.
Corporates & Institutions(DKK millions)
2015 2014 Index15/14
Q42015
Q32015
IndexQ4/Q3
Q22015
Q12015
Net interest income 2,660 2,717 98 630 667 94 703 660
Net fee income 2,298 2,205 104 571 570 100 580 577
Net trading income* 4,909 4,192 117 1,139 798 143 1,240 1,732
Other income 7 7 100 3 1 231 - 2
Total income 9,873 9,121 108 2,343 2,036 115 2,523 2,971
Operating expenses 4,412 4,614 96 1,078 1,050 103 1,126 1,158
Profit before loan impairment charges 5,461 4,507 121 1,265 986 128 1,398 1,813
Loan impairment charges 65 372 17 65 -11 - -153 164
Profit before tax 5,396 4,135 130 1,200 997 120 1,551 1,649
Loans, excluding reverse trans. before impairments 172,176 172,393 100 172,176 174,346 99 179,160 189,735
Allowance account, loans 2,155 2,782 77 2,155 2,066 104 2,758 3,193
Allowance account, credit institutions 6 91 7 6 67 9 67 91
Deposits, excluding repo deposits 213,532 174,221 123 213,532 226,505 94 229,522 229,998
Bonds issued by Realkredit Danmark 22,030 23,636 93 22,030 22,649 97 22,818 22,933
Allowance account, guarantees 208 285 68 208 241 86 239 270
Allocated capital (average) 36,466 37,789 96 33,554 35,710 94 38,455 38,061
Net interest income as % p.a. of loans and deposits 0.69 0.79 0.66 0.67 0.69 0.63
Profit before loan impairment charges as % p.a. of allocated capital 15.0 11.9 15.1 11.0 14.5 19.1
Profit before tax as % p.a. of allocated capital (ROAC) 14.8 10.9 14.3 11.2 16.1 17.3
Cost/income ratio (%) 44.7 50.6 46.0 51.6 44.6 39.0
Full-time-equivalent staff 1,832 1,646 111 1,832 1,811 101 1,832 1,826
Total income (DKK millions)
FICC 4,049 3,196 127 896 720 124 1,014 1,419
Capital Markets 1,535 1,650 93 381 260 147 391 503
General Banking 4,289 4,275 100 1,066 1,056 101 1,118 1,049
Total income 9,873 9,121 108 2,343 2,036 115 2,523 2,971
* Net trading income comprises all income from FICC and trading income at Capital Markets.

Danske Bank / Annual Report 2015 27
At Corporates & Institutions, we continued to strengthen our advisory services across business areas, to develop new, innovative client solutions, and to adapt our internal set-up to better cater for client needs. We also continued to allocate resources to less capital-intensive areas of the business while maintaining a strong focus on cost and capital consumption.
High client satisfactionOur efforts to generate additional client value through customised solutions and a more strategic and holistic approach to advisory services paid off. Clients rewarded us with good results in a number of client satisfaction surveys (Prospera). Our clients thus ranked Danske Bank number one in Corporate Banking Nordic, in Institutional Banking Nordic, in Trade Finance and in Cash Management in the Nordics. Euromoney also once again named Danske Bank “Best Regional Cash Manager” in the Nordic and Baltic regions.
Transforming the business modelDuring 2015, we continued to adapt our business model to changes in the regulatory enviroment and the financial markets. This entailed a focus on capital optimisation, including increased attention to less capital-intensive activities and on lowering risks.
We continued to develop stronger capital markets and transaction banking operations on the basis of our good client relations and to offer additional services and opportunities in these areas. The aim is to develop a more balanced income distribution between areas with differing return dynamics.
New innovative solutionsIn the autumn of 2015, we launched Danske In-house Bank for a few pilot clients. Danske In-house Bank helps clients increase treasury efficiency by combining a flexible real-time cash pool solution with automated internal FX trades.
We continued to develop our full-scale post-trade services solution, offering a customised, bundled service for individual clients.
Danske OneTrader, the electronic foreign exchange trading and market information platform, also continued to attract new clients in 2015.
Increased client activityStrengthened strategic advisory services, closer cooperation between business areas and a generally
improved holistic set-up around clients led to a satisfactory increase in client activity during the year, including within IPOs, M&A transactions, bond issues and transaction banking mandates.
Corporate Finance won several key mandates, including the sale of Fortum’s Swedish energy distribution business, the IPOs of NNIT and Nobina and the acquisition of Mols-Linien by Polaris.
Equities further developed its franchise with higher activity in secondary and equity capital markets. This included a significant share placing for DSV.
Debt Capital Markets saw a high level of activity from core clients and a rise in new issue fees. This increased the market share and further consolidated our position as a leading Debt Capital Markets house.
There was high activity within corporate issues, including transactions for Volvo, Vattenfall, Finnair, and KLP.
2015 vs 2014At DKK 5.4 billion, profit before tax was up 30% from the level in 2014. The main reasons were higher client activity and lower impairments. The return on allocated capital rose 3.9 percentage points to 14.8%.
Operating expenses were down 4% as cost efficiency gains more than offset an increase in performance-based compensation resulting from the strong performance in 2015.
In 2015, total loan impairments for Corporates & Institutions amounted to DKK 65 million and included both new impairments and reversals.
Accumulated impairments totalled DKK 2.4 billion and related to a small number of corporate clients. Impairments have fluctuated over the past quarters and are expected to continue to do so, given the nature of Corporates & Institutions’ activities.
General BankingGeneral Banking income was on a par with 2014 despite the negative short-term interest rates. This was mainly because of increased volumes as well as increased client activity within transaction banking services.
Capital MarketsClient activity at Capital Markets increased satisfactorily throughout 2015. At DKK 1.5 billion,
Danske Bank / Annual Report 201528
Capital Markets income declined 7% from the level in 2014, however. This was because of a decline in trading income from Debt Capital Markets that was caused primarily by low liquidity in secondary markets.
Fee income from Corporate Finance and Debt Capital Markets activities and income from equity activities rose owing to strong growth in client activity. The increase in fee income from Debt Capital Markets was particularly satisfactory, driven by a high number of new issues.
Fixed Income, Currencies and CommoditiesFixed Income, Currencies and Commodities (FICC) benefited from increased client activity in 2015, which meant that income rose 27% from the level in 2014.
Activity was especially high in the first quarter, when the markets experienced significant volatility. This volatility was caused by a number of events, including the Swiss National Bank’s abandoning its minimum target for EUR/CHF, the launch of a large QE programme by the European Central Bank, and a reduction of leading interest rates by the Danish central bank.
During 2015, income was adversely affected by credit value adjustments (CVA).
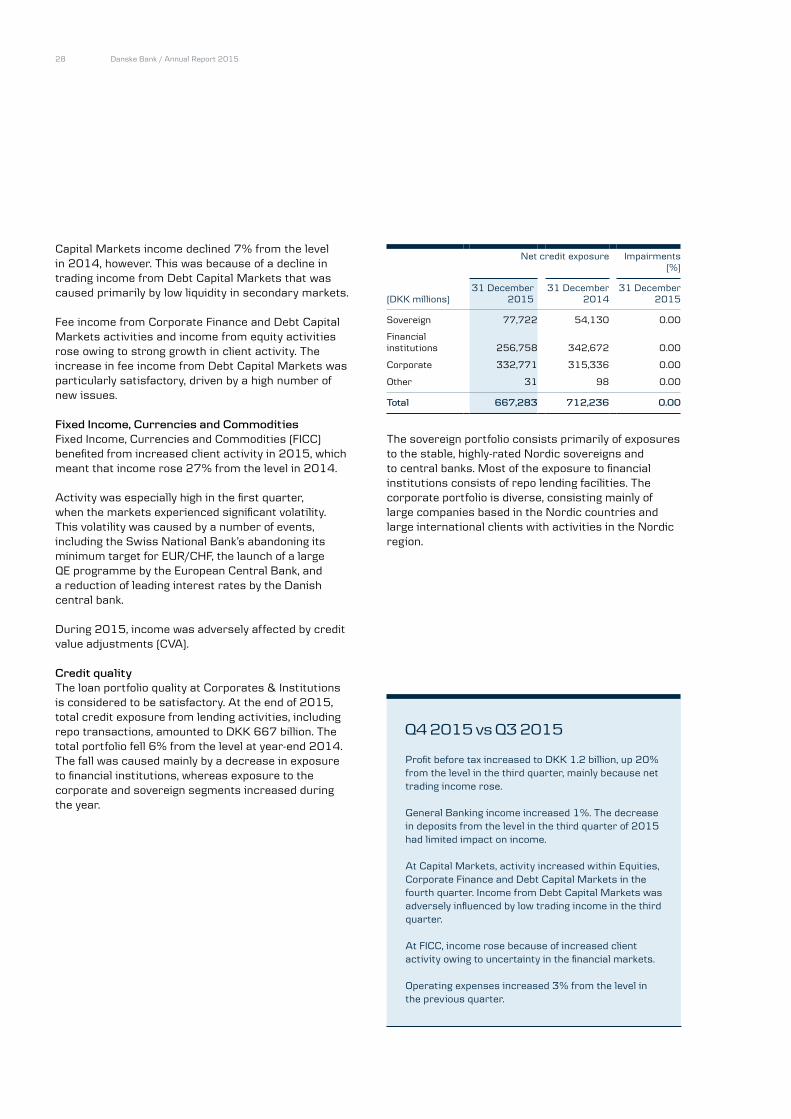
Credit quality The loan portfolio quality at Corporates & Institutions is considered to be satisfactory. At the end of 2015, total credit exposure from lending activities, including repo transactions, amounted to DKK 667 billion. The total portfolio fell 6% from the level at year-end 2014. The fall was caused mainly by a decrease in exposure to financial institutions, whereas exposure to the corporate and sovereign segments increased during the year.
Net credit exposure Impairments(%)
(DKK millions)31 December
201531 December
201431 December
2015
Sovereign 77,722 54,130 0.00
Financial institutions 256,758 342,672 0.00
Corporate 332,771 315,336 0.00
Other 31 98 0.00
Total 667,283 712,236 0.00
The sovereign portfolio consists primarily of exposures to the stable, highly-rated Nordic sovereigns and to central banks. Most of the exposure to financial institutions consists of repo lending facilities. The corporate portfolio is diverse, consisting mainly of large companies based in the Nordic countries and large international clients with activities in the Nordic region.
Profit before tax increased to DKK 1.2 billion, up 20% from the level in the third quarter, mainly because net trading income rose.
General Banking income increased 1%. The decrease in deposits from the level in the third quarter of 2015 had limited impact on income.
At Capital Markets, activity increased within Equities, Corporate Finance and Debt Capital Markets in the fourth quarter. Income from Debt Capital Markets was adversely influenced by low trading income in the third quarter.
At FICC, income rose because of increased client activity owing to uncertainty in the financial markets.
Operating expenses increased 3% from the level in the previous quarter.
Q4 2015 vs Q3 2015

Danske Bank / Annual Report 2015 29
Danske Capital
Driven by higher margins and performance fees, Danske Capital’s profit before tax rose 17% from the level in 2014. Danske Capital benefited from an increased focus on alternative investments, with assets under management of DKK 67 billion, up 27% from the level at year-end 2014.
Danske Capital(DKK millions)
2015 2014 Index15/14
Q42015
Q32015
IndexQ4/Q3
Q22015
Q12015
Net interest income -7 2 - -3 -1 - -1 -2
Net fee income 2,682 2,402 112 974 558 175 583 567
Other income -12 1 - -3 -10 - -1 2
Total income 2,663 2,405 111 968 547 177 581 567
Operating expenses 1,014 999 102 307 230 133 233 244
Profit before tax 1,649 1,406 117 661 317 209 349 323
Loans, excluding reverse trans. before impairments 258 340 76 258 255 101 124 101
Deposits, excluding repo deposits 228 132 173 228 291 78 263 196
Allocated capital (average) 2,628 2,567 102 2,628 2,629 100 2,631 2,625
Cost/income ratio (%) 38.1 41.5 31.7 42.0 40.1 43.0
Assets under management (DKK billions) 714 795 90 714 759 94 803 813
Total income (DKK millions)
Performance fees 440 328 134 404 2 - 19 14
Other fee income 2,241 2,074 108 570 556 103 564 553
Total net fee income 2,682 2,402 112 974 558 175 583 567

Danske Bank / Annual Report 201530
Danske Capital’s strategy builds on our ambition to deliver substantial value to clients. We offer two types of asset management products: alpha investment components for investors in individual assets and full investment solutions for retail and institutional clients, who seek a more comprehensive offering.
In 2015, we put special focus on expanding our offering within alternative investments and on strengthening our market position outside Denmark.
Above-benchmark returns Our priority remains to generate satisfactory investment returns for clients. The table below shows the percentage of our investment products with above-benchmark returns in various asset classes for 2015 and the 2013-2015 period.
% of investment products (GIPS composites) with above-benchmark returns (pre-costs)
2015 2013-2015
All funds 71 76
Equity funds 78 71
Fixed-income funds 63 81
Balanced funds etc. 67 80
In 2015, 71% of Danske Capital’s investment products generated above-benchmark returns. We were especially pleased that most equity and hedge fund products generated satisfactory returns.
On a three-year horizon, 76% of all Danske Capital investment products generated above-benchmark returns.
Morningstar rating
2015 2014
Danske Invest, avg. all funds 3.29 3.38
European average 3.00 3.00
The average Morningstar rating of all Danske Invest funds for 2015 was 3.29, compared with the European average of 3.0. The rating is based on a comparison with similar European funds according to risk- and cost-adjusted returns achieved over the past three, five and ten years.
We were proud to receive various awards in 2015, the most important ones being the following:
• Morningstar: Danske Invest was named best in equities in Denmark for the seventh year running
• Nordic Hedge Award: Danske Invest Hedge Fixed Income Strategies ranked second
Growth in managed accountsIn recent years, we have introduced managed account products for retail clients. Personal Banking and Danske Capital have worked closely together to promote the products and ensure a good customer experience. Managed accounts offer a choice of risk profile and are a relevant alternative to ordinary savings products, especially in a low interest rate environment. The solution is now available in all Nordic countries and for private banking clients in Luxembourg. At the end of 2015, assets under management in managed account products amounted to DKK 145 billion, an increase of 14% from the end of 2014.
Alternative investment productsIn early 2015, we successfully launched Danske Private Equity PEP VI, which contributed DKK 5.1 billion to the increase in assets under management. The fund is one of the largest private equity fund of funds raised in the world in 2015.
Our hedge fund offerings performed very well in 2015, particularly the Danske Invest Long Short Dynamic fund, which, besides posting an annual return of 13.5%, also demonstrated robust positive returns during the market turmoil in the third quarter. Another well-performing hedge fund in 2015 was Danske Invest European Equities Absolute, which posted an annual return of 17.6%.
Total assets under management in alternative investments amounted to DKK 67 billion at 31 December 2015, an increase of 27% from 31 December 2014.
Higher retail and institutional salesNet sales totalled DKK 38 billion: DKK 10 billion to retail clients and DKK 28 billion to institutional clients. Sales to retail clients through Personal Banking and Business Banking consisted mainly of balanced products within the managed accounts concept. Total net sales rose DKK 4 billion from the level in 2014.
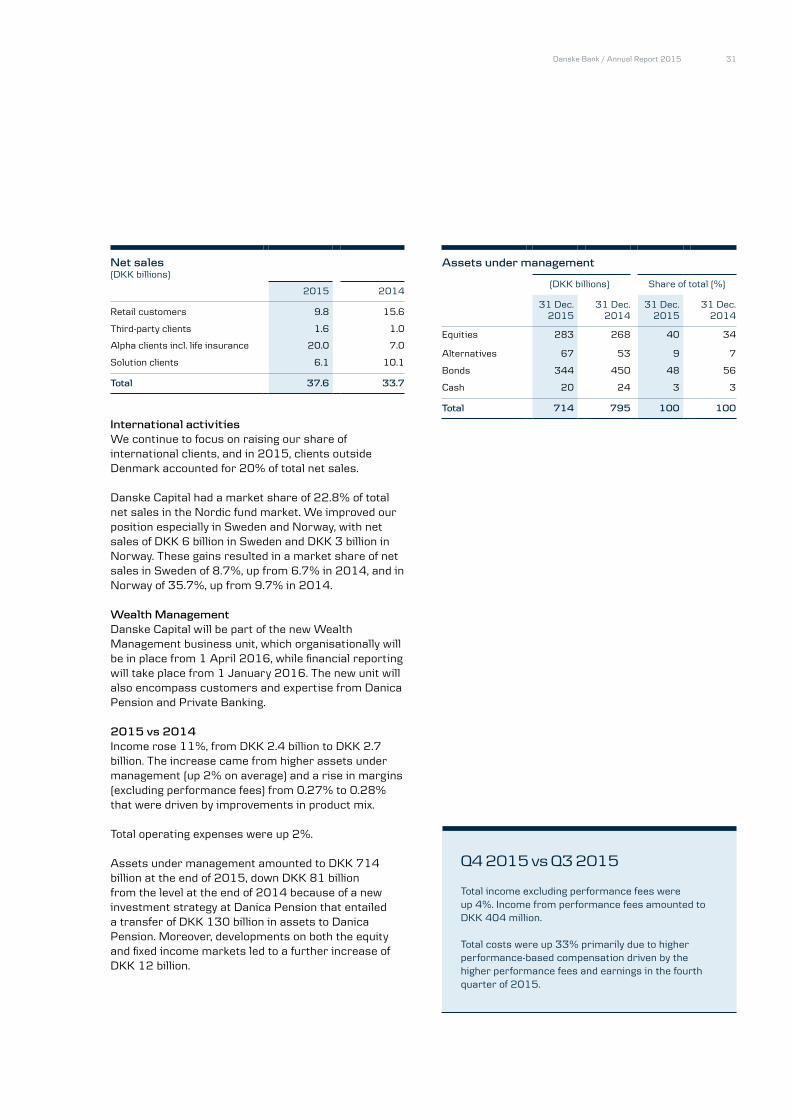
Danske Bank / Annual Report 2015 31
Net sales (DKK billions)
2015 2014
Retail customers 9.8 15.6
Third-party clients 1.6 1.0
Alpha clients incl. life insurance 20.0 7.0
Solution clients 6.1 10.1
Total 37.6 33.7
International activitiesWe continue to focus on raising our share of international clients, and in 2015, clients outside Denmark accounted for 20% of total net sales.
Danske Capital had a market share of 22.8% of total net sales in the Nordic fund market. We improved our position especially in Sweden and Norway, with net sales of DKK 6 billion in Sweden and DKK 3 billion in Norway. These gains resulted in a market share of net sales in Sweden of 8.7%, up from 6.7% in 2014, and in Norway of 35.7%, up from 9.7% in 2014.
Wealth ManagementDanske Capital will be part of the new Wealth Management business unit, which organisationally will be in place from 1 April 2016, while financial reporting will take place from 1 January 2016. The new unit will also encompass customers and expertise from Danica Pension and Private Banking.
2015 vs 2014Income rose 11%, from DKK 2.4 billion to DKK 2.7 billion. The increase came from higher assets under management (up 2% on average) and a rise in margins (excluding performance fees) from 0.27% to 0.28% that were driven by improvements in product mix.
Total operating expenses were up 2%.
Assets under management amounted to DKK 714 billion at the end of 2015, down DKK 81 billion from the level at the end of 2014 because of a new investment strategy at Danica Pension that entailed a transfer of DKK 130 billion in assets to Danica Pension. Moreover, developments on both the equity and fixed income markets led to a further increase of DKK 12 billion.
Total income excluding performance fees were up 4%. Income from performance fees amounted to DKK 404 million.
Total costs were up 33% primarily due to higher performance-based compensation driven by the higher performance fees and earnings in the fourth quarter of 2015.
Q4 2015 vs Q3 2015
Assets under management
(DKK billions) Share of total (%)
31 Dec.
201531 Dec.
201431 Dec.
201531 Dec.
2014
Equities 283 268 40 34
Alternatives 67 53 9 7
Bonds 344 450 48 56
Cash 20 24 3 3
Total 714 795 100 100

Danske Bank / Annual Report 201532
Danica Pension
Net income from insurance business amounted to DKK 1.9 billion, against DKK 2.5 billion in 2014. It was possible to book the full risk allowance for all four interest rate groups and to book DKK 0.2 billion from the shadow account, against DKK 0.6 billion in 2014.
At Danica Pension, our ambition is to become the most trusted pension provider. We pursue this ambition by providing financial security for our customers. We make it easy for customers to make pension scheme decisions, and we focus on accessibility, clear recommendations and sound returns on customers’ pension savings.
Collaboration with Personal Banking and Business BankingWe strengthened our collaboration across the bank in 2015 by working more closely together with both Personal Banking and Business Banking in particular, where Danica Pension advisers have joined the customer teams. With this setup, we have improved our ability to advise customers proactively, and we will benefit from synergies.
Danica Pension(DKK millions)
2015 2014 Index15/14
Q42015
Q32015
IndexQ4/Q3
Q22015
Q12015
Danica Traditionel 1,329 1,353 98 327 330 99 339 333
Unit-linked business 572 573 100 116 156 74 147 153
Health and accident busi-ness -182 -302 - -65 -36 - -45 -36
Result from insurance business 1,719 1,624 106 378 450 84 441 450
Return on investments 283 459 62 44 -51 - -70 360
Financing result -61 -116 - -16 -16 - -17 -12
Special allotment -270 -82 - -207 -21 - -21 -21
Change in shadow account 221 611 36 248 -27 - - -
Net income from insurance business 1,892 2,496 76 447 335 133 333 777
Premiums, insurance contracts 21,454 20,693 104 5,673 5,110 111 5,031 5,640
Premiums, investment contracts 8,119 6,129 132 1,881 1,434 131 2,091 2,713
Provisions, insurance contracts 275,026 277,807 99 275,026 274,155 100 279,761 292,610
Provisions, investment contracts 45,811 38,027 120 45,811 41,637 110 43,656 43,515
Customer funds, investment assets
Danica Traditionel 160,542 176,505 91 160,542 163,950 98 166,774 181,220
Danica Balance 84,563 70,711 120 84,563 77,758 109 78,865 77,599
Danica Link 75,311 66,417 113 75,311 69,613 108 74,115 74,717
Allocated capital (average) 12,012 11,974 100 12,067 11,883 102 12,147 11,954
Net income as % p.a. of allocated capital 15.8 20.8 14.8 11.3 - 11.0 26.0

Danske Bank / Annual Report 2015 33
DigitalisationIn 2015, we introduced several new digital solutions for customers, including an app for tablets that enables customers to adjust their pension cover online and get an immediate overview of the effect. We also introduced Pension Start to give our customers a simple and easy solution for setting up new pension schemes and getting advice on the most appropriate cover.
Stronger health conceptIn 2015, we strengthened our health offerings by introducing a new health package that includes a stress hotline, annual blood pressure and cholesterol checks, assistance in finding the right public health services and a second opinion from Best Doctors. Our work with Best Doctors is unique in Denmark, and only Danica Pension customers are covered. Moreover, in response to changes in the Danish public disability pension and sickness benefit systems, we changed our cover for loss of earning capacity for the benefit of customers who go through a work capability assessment.
InvestmentsIn 2015, Danica Pension implemented a new investment strategy with the purpose of generating competitive long-term returns.
Important elements of that strategy are to build stronger and broader competencies in the investment department and to improve risk management across all asset classes through narrow and precise mandates for our investment partners. Our investment setup was also made more flexible, allowing us to use a larger variety of financial instruments to ensure that we have the right portfolio mix and can manage portfolio risk more effectively.
The new investment strategy also focuses on increasing the use of alternative investments, such as direct investments in sound companies in the Nordic countries. So far, we have invested more than DKK 2 billion in such companies.
As part of the new investment strategy, we have improved Danica Balance by introducing a fund that invests across asset classes and in attractive property developments. The fund’s investment mix is flexible and varies over time depending on our expectations for market trends, which enables us to adjust customers’ investment mix in response to market developments.
In 2015, Danica Balance customers with 30 years to retirement and a medium risk profile typically saw a return of 3.2% to 9.9%.
Norway and SwedenIn Sweden, we strengthened our position, and premiums increased 41% as a result, among other things, of a wider collaboration with Danske Bank in Sweden. Other areas, such as brokerage and labour market pensions, also increased in 2015.
The positive development continued in Norway, with a sound increase in contributions. In 2015, we implemented a new strategy, which entails closer collaboration with Danske Bank on personal and business customers to increase our advisory focus.
Tier II bond issueTo strengthen our capital structure and adjust it to reflect the capital structure in the European pension industry in general, Danica Pension issued Solvency II-compliant tier 2 capital in the form of a bond loan in the amount of EUR 500 million (DKK 3.73 billion). The issue was heavily oversubscribed, which is testament to investors’ satisfaction with our results and confidence in our strategy.
Wealth ManagementDanica Pension will be part of the new Wealth Management business unit, which organisationally will be in place from 1 April 2016, while financial reporting will take place from 1 January 2016. The new unit will also encompass customers and expertise from Danske Capital and Private Banking.
2015 vs 2014 Total premiums rose 11% to DKK 29.6 billion, driven by a 16% increase in premiums for the unit-linked products while premiums for Danica Traditionel, as expected, were 16% lower.
At the end of 2015, the collective bonus potential for the contribution groups was DKK 3.6 billion, up DKK 1.1 billion from the level at the end of 2014.
IncomeNet income from insurance business amounted to DKK 1.9 billion, against DKK 2.5 billion in 2014. It was possible to book the full risk allowance for all four interest rate groups and to book DKK 0.2 billion from the shadow account, against DKK 0.6 billion in 2014. In addition, the result for 2015 was influenced

Danske Bank / Annual Report 201534
by payment of DKK 0.3 billion in special allotments triggered in particular by dividends of DKK 3.9 billion from Danica Pension to Danske Bank.
The technical result of Danica Traditionel was DKK 1,329 million, against DKK 1,353 million in 2014. The fall was caused partly by the transfer of business from Danica Traditionel to the unit-linked business. In addition, the result for 2014 increased DKK 116 million as a result of a correction made, in agreement with the Danish FSA, regarding the treatment of a pension scheme.
The technical result of the unit-linked business amounted to DKK 572 million, which is the same level as in 2014. Unit-linked business accounted for DKK 49 million in Sweden and DKK 73 million in Norway. The Swedish result was adversely affected by higher pension costs because of a lower discount yield curve.
The health and accident business posted a technical result of a negative DKK 182 million, against a negative DKK 302 million in 2014. The improvement was due to an additional provision made in 2014.
The return on investments fell to DKK 283 million, against DKK 459 million in 2014. The fall was the result of less positive financial markets in 2015 than in 2014.
Investment return on customer fundsThe return on investments for customers with the Danica Balance, Danica Link and Danica Select unit-linked products was DKK 4.5 billion, or 4.8%, while the return on investments of Danica Traditionel customer funds was DKK 2.0 billion, or 1.0%. Including changes in technical provisions, the return on customer funds was 5.1%.
In the fourth quarter of 2015, net income from insurance business amounted to DKK 0.4 billion, which was DKK 0.1 billion more than in the third quarter. The increase was due to the booking of DKK 0.2 billion from the shadow account and a higher return on investments, although the payment of special allotments had an adverse effect of DKK 0.2 billion, mainly because a provision for dividends was made at the end of 2015.
The return on investments of Danica Traditionel customer funds was 0.4%, against 1.0% in the third quarter. Including changes in technical provisions, the return on customer funds was a negative 0.1%.
The return on investments for customers with Danica Balance, Danica Link and Danica Select totalled DKK 4.5 billion, or an average rate of return of 4.1%, against a negative 4.7% in the third quarter.
In Denmark, total premiums rose 13% to DKK 5.2 billion. Total premiums for all markets rose 15% and amounted to DKK 7.6 billion. The rise was owing mainly to higher unit-link premiums in all three countries in the fourth quarter of 2015.
Q4 2015 vs Q3 2015

35Danske Bank / Annual Report 2015
Non-core
Profit before tax for 2015 was DKK 46 million, an increase of DKK 1.6 billion from the level in 2014. The improvement was driven by a combination of higher income, lower expenses and reversals of impairments as the Irish property portfolio continued to unwind satisfactorily.
Non-core(DKK millions)
2015 2014 Index15/14
Q42015
Q32015
IndexQ4/Q3
Q22015
Q12015
Total income 334 209 160 71 157 45 52 54
Operating expenses 405 782 52 94 98 96 113 100
Profit before loan impairment charges -71 -573 - -23 59 - -61 -46
Loan impairment charges -118 930 - -37 56 - -1 -136
Profit before tax 46 -1,503 - 13 3 - -60 90
Loans, excluding reverse trans. before impairments 27,714 37,462 74 27,714 28,776 96 35,187 44,559
Allowance account, loans 3,870 7,853 49 3,870 4,018 96 5,040 7,705
Deposits, excluding repo deposits 3,735 4,331 86 3,735 6,975 54 5,525 6,719
Allowance account, guarantees 46 59 77 46 39 118 39 74
Allocated capital (average) 6,224 8,420 74 4,797 5,270 91 5,864 9,167
Net interest income as % p.a. of loans and deposits 1.06 0.55 0.94 1.70 0.48 0.44
Profit before loan impairment charges as % p.a. of allocated capital -1.2 -6.8 -2.0 4.5 -4.2 -2.0
Profit before tax as % p.a. of allocated capital (ROE) 0.7 -17.9 1.1 0.2 -4.1 3.9
Cost/income ratio (%) 121.6 374.2 32 133.8 62.4 214 217.3 185.2
Full-time-equivalent staff 277 75 - 277 325 85 393 428
Loan impairment charges (DKK millions)
Non-core banking* -118 733 - -40 53 - -2 -130
Non-core conduits etc. - 197 - 2 3 92 1 -6
Total -118 930 - -38 56 - -1 -136
*Non-core banking encompasses Non-core Baltics (personal customers in the Baltics) and Non-core Ireland. Non-core Baltics is included in Non-core banking from 1 January 2015. Comparative figures for 2014 have not been restated.

Danske Bank / Annual Report 201536
In 2015, we continued to focus on the controlled winding-up of the loan portfolio that is no longer considered part of Danske Bank’s core activities. The reduction of loan volume progressed as expected over the year.
On 1 January 2015, all personal banking customers in the Baltics were transferred to the Non-core banking portfolio.
Reduced exposure and property salesIn the second quarter of 2015, the Group sold a portfolio of Irish SME loans with a nominal value of DKK 3.9 billion.
In the third quarter of 2015, the Group entered into an agreement to sell a residential mortgage loan portfolio relating to the Group’s Non-core mass personal customer business in Lithuania and Latvia with a nominal value of DKK 4.8 billion. Pending approval by the Lithuanian competition authorities, the transaction is expected to be completed in the first half of 2016.
For accounting purposes, both portfolios were recognised under Assets held for sale and therefore were not included in the credit exposure since the end of 2014 and since the third quarter of 2015, respectively.
At the end of 2015, the Non-core Ireland portfolio consisted of a personal mortgage portfolio of DKK 15.9 billion and a small residual commercial portfolio. In 2015, we reduced the net exposure of the commercial portfolio from DKK 2.9 billion to DKK 0.5 billion, primarily through property sales.
2015 vs 2014Profit before tax was DKK 46 million, against a loss of DKK 1.5 billion in 2014, with the increase coming mainly from a decline in impairments. Total income rose 60%, while operating expenses fell 48%.
Total income benefited from a rating upgrade in 2015 that allowed the release of interest accrued over several years on a number of collateralised liquidity facilities.
Operating expenses declined because 2014 included expenses for the settlement of an agreement on life insurance products in the Baltics.
Total lending, which amounted to DKK 27.7 billion, consisted mainly of exposure to personal mortgages and conduits. Personal mortgages in the Baltics (after the third quarter of 2015, only Estonia) and Ireland will mature according to contractual terms.
The winding-up of the Non-core Ireland portfolio is proceeding according to plan.
(DKK millions) Net credit exposure Accumulated impairment charges
31 Dec. 2015
31 Dec. 2014
31 Dec. 2015
31 Dec. 2014
Non-core banking* 20,571 20,222 3,673 7,643
- portion relating to personal customers 20,035 17,351 2,560 3,024
Non-core conduits etc. 7,992 11,104 243 269
Total 28,563 31,326 3,916 7,912
*Non-core Baltics is included in Non-core banking from 1 January 2015 (from the end of the third quarter of 2015, only Estonia). Comparative figures for 2014 have not been restated
The Non-core conduits portfolio amounted to DKK 8.0 billion, against DKK 11.1 billion in 2014. The portfolio consists mainly of liquidity facilities for conduits. The credit quality of the portfolio remained stable.
Total impairments improved to a net reversal of DKK 0.1 billion, against charges of DKK 0.9 billion for 2014. This development was driven by reversals of previously made impairments in Ireland as the property market continued to improve and collateral values rose.
Profit before tax amounted to DKK 13 million, up from DKK 3 million in the third quarter.
The third quarter result reflected the release of interest accrued over several years on a number of collateralised liquidity facilities after the rating upgrade earlier in 2015.
Loan impairment charges improved from DKK 56 million in the third quarter to a net reversal of DKK 38 million in the fourth quarter.
Q4 2015 vs Q3 2015
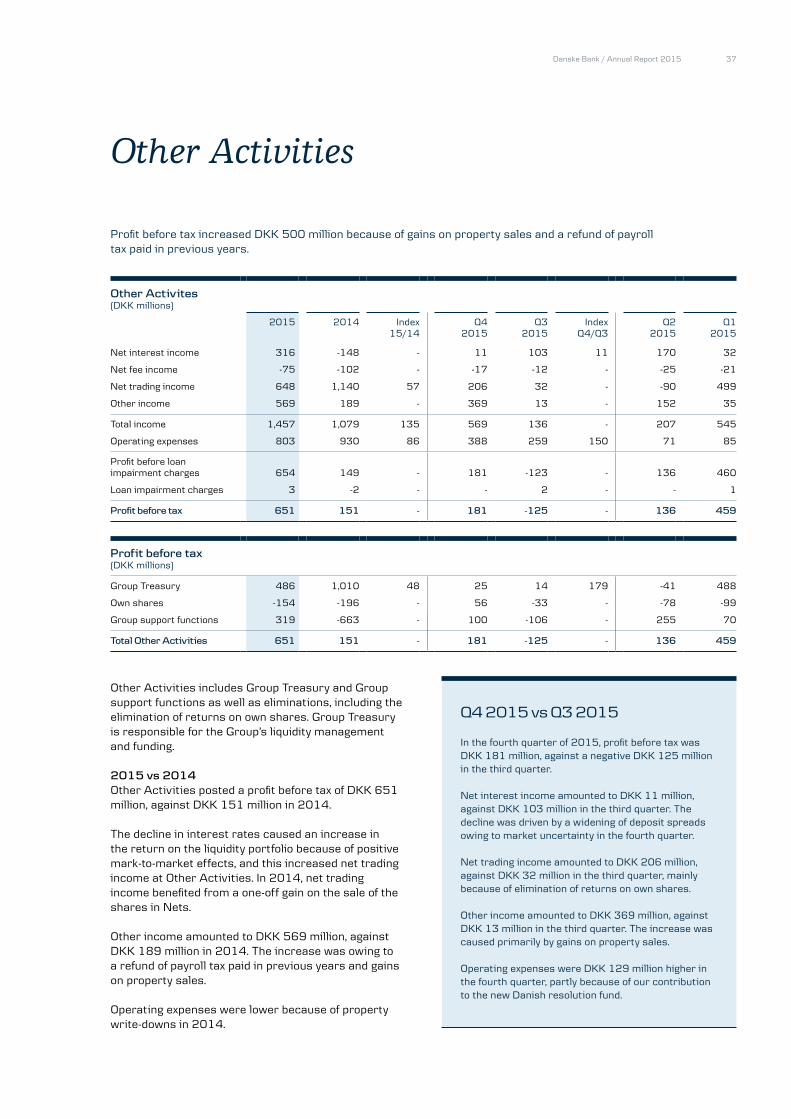
Danske Bank / Annual Report 2015 37
Other Activities
Profit before tax increased DKK 500 million because of gains on property sales and a refund of payroll tax paid in previous years.
Other Activites(DKK millions)
2015 2014 Index15/14
Q42015
Q32015
IndexQ4/Q3
Q22015
Q12015
Net interest income 316 -148 - 11 103 11 170 32
Net fee income -75 -102 - -17 -12 - -25 -21
Net trading income 648 1,140 57 206 32 - -90 499
Other income 569 189 - 369 13 - 152 35
Total income 1,457 1,079 135 569 136 - 207 545
Operating expenses 803 930 86 388 259 150 71 85
Profit before loan impairment charges 654 149 - 181 -123 - 136 460
Loan impairment charges 3 -2 - - 2 - - 1
Profit before tax 651 151 - 181 -125 - 136 459
Profit before tax (DKK millions)
Group Treasury 486 1,010 48 25 14 179 -41 488
Own shares -154 -196 - 56 -33 - -78 -99
Group support functions 319 -663 - 100 -106 - 255 70
Total Other Activities 651 151 - 181 -125 - 136 459
Other Activities includes Group Treasury and Group support functions as well as eliminations, including the elimination of returns on own shares. Group Treasury is responsible for the Group’s liquidity management and funding.
2015 vs 2014Other Activities posted a profit before tax of DKK 651 million, against DKK 151 million in 2014.
The decline in interest rates caused an increase in the return on the liquidity portfolio because of positive mark-to-market effects, and this increased net trading income at Other Activities. In 2014, net trading income benefited from a one-off gain on the sale of the shares in Nets.
Other income amounted to DKK 569 million, against DKK 189 million in 2014. The increase was owing to a refund of payroll tax paid in previous years and gains on property sales.
Operating expenses were lower because of property write-downs in 2014.
In the fourth quarter of 2015, profit before tax was DKK 181 million, against a negative DKK 125 million in the third quarter.
Net interest income amounted to DKK 11 million, against DKK 103 million in the third quarter. The decline was driven by a widening of deposit spreads owing to market uncertainty in the fourth quarter.
Net trading income amounted to DKK 206 million, against DKK 32 million in the third quarter, mainly because of elimination of returns on own shares.
Other income amounted to DKK 369 million, against DKK 13 million in the third quarter. The increase was caused primarily by gains on property sales.
Operating expenses were DKK 129 million higher in the fourth quarter, partly because of our contribution to the new Danish resolution fund.
Q4 2015 vs Q3 2015
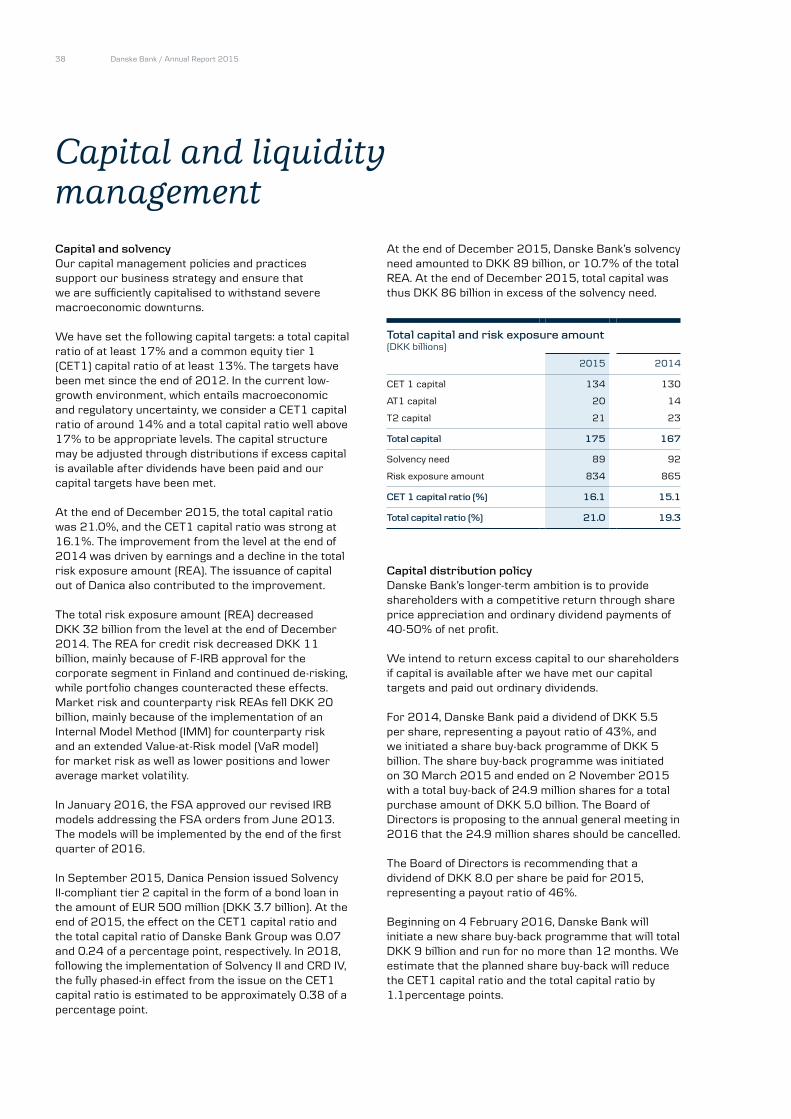
Danske Bank / Annual Report 201538
Capital and solvencyOur capital management policies and practices support our business strategy and ensure that we are sufficiently capitalised to withstand severe macroeconomic downturns.
We have set the following capital targets: a total capital ratio of at least 17% and a common equity tier 1 (CET1) capital ratio of at least 13%. The targets have been met since the end of 2012. In the current low-growth environment, which entails macroeconomic and regulatory uncertainty, we consider a CET1 capital ratio of around 14% and a total capital ratio well above 17% to be appropriate levels. The capital structure may be adjusted through distributions if excess capital is available after dividends have been paid and our capital targets have been met.
At the end of December 2015, the total capital ratio was 21.0%, and the CET1 capital ratio was strong at 16.1%. The improvement from the level at the end of 2014 was driven by earnings and a decline in the total risk exposure amount (REA). The issuance of capital out of Danica also contributed to the improvement.
The total risk exposure amount (REA) decreased DKK 32 billion from the level at the end of December 2014. The REA for credit risk decreased DKK 11 billion, mainly because of F-IRB approval for the corporate segment in Finland and continued de-risking, while portfolio changes counteracted these effects. Market risk and counterparty risk REAs fell DKK 20 billion, mainly because of the implementation of an Internal Model Method (IMM) for counterparty risk and an extended Value-at-Risk model (VaR model) for market risk as well as lower positions and lower average market volatility.
In January 2016, the FSA approved our revised IRB models addressing the FSA orders from June 2013. The models will be implemented by the end of the first quarter of 2016.
In September 2015, Danica Pension issued Solvency II-compliant tier 2 capital in the form of a bond loan in the amount of EUR 500 million (DKK 3.7 billion). At the end of 2015, the effect on the CET1 capital ratio and the total capital ratio of Danske Bank Group was 0.07 and 0.24 of a percentage point, respectively. In 2018, following the implementation of Solvency II and CRD IV, the fully phased-in effect from the issue on the CET1 capital ratio is estimated to be approximately 0.38 of a percentage point.
At the end of December 2015, Danske Bank’s solvency need amounted to DKK 89 billion, or 10.7% of the total REA. At the end of December 2015, total capital was thus DKK 86 billion in excess of the solvency need.
Total capital and risk exposure amount (DKK billions)
2015 2014
CET 1 capital 134 130
AT1 capital 20 14
T2 capital 21 23
Total capital 175 167
Solvency need 89 92
Risk exposure amount 834 865
CET 1 capital ratio (%) 16.1 15.1
Total capital ratio (%) 21.0 19.3
Capital distribution policyDanske Bank’s longer-term ambition is to provide shareholders with a competitive return through share price appreciation and ordinary dividend payments of 40-50% of net profit.
We intend to return excess capital to our shareholders if capital is available after we have met our capital targets and paid out ordinary dividends.
For 2014, Danske Bank paid a dividend of DKK 5.5 per share, representing a payout ratio of 43%, and we initiated a share buy-back programme of DKK 5 billion. The share buy-back programme was initiated on 30 March 2015 and ended on 2 November 2015 with a total buy-back of 24.9 million shares for a total purchase amount of DKK 5.0 billion. The Board of Directors is proposing to the annual general meeting in 2016 that the 24.9 million shares should be cancelled.
The Board of Directors is recommending that a dividend of DKK 8.0 per share be paid for 2015, representing a payout ratio of 46%.
Beginning on 4 February 2016, Danske Bank will initiate a new share buy-back programme that will total DKK 9 billion and run for no more than 12 months. We estimate that the planned share buy-back will reduce the CET1 capital ratio and the total capital ratio by 1.1percentage points.
Capital and liquidity management

Danske Bank / Annual Report 2015 39
Ratings In June, Moody’s raised Danske Bank’s long-term rating to A2 from A3 and its short-term rating to P-1 from P-2. Moody’s affirmed its stable outlook for the long-term rating.
In July, S&P changed its outlook for our long-term rating to stable.
Danske Bank’s long- and short-term ratings from Fitch were unchanged.
Danske Bank’s ratings
Moody’s S&P Fitch
Long-term A2 A A
Short-term P-1 A-1 F1
Outlook Stable Stable Stable
Danske Bank Plc’s A2 long-term rating and its P-1 short-term rating were affirmed by Moody’s despite expectations of reduced government support to banks. Both ratings have a stable outlook. S&P also affirmed its A long-term rating and its A-1 short-term rating but raised its outlook to stable.
Mortgage bonds and mortgage-covered bonds issued by Realkredit Danmark are rated AAA by S&P (stable outlook). In addition, bonds issued from capital centre S are rated AAA by Fitch, while bonds issued from capital centre T are rated AA+. Both ratings have a stable outlook.
ICAAPDanske Bank’s capital management policies and practices are based on an internal capital adequacy assessment process (ICAAP). In this process, Danske Bank identifies its risks and determines its solvency need.
The calculation of the solvency need for the Group and the parent company, Danske Bank A/S, is described in more detail in Risk Management 2015, chapter 3, which is available at danskebank.com/ir.
Funding and liquidity In order to further support our growth ambitions in Sweden and Norway, we have decided to divide our international covered bond pool (I-Pool) into geographically separate cover pools and establish a local Swedish covered bond programme to ensure
competitive funding. Further details are available on danskebank.com/ir.
With a liquidity buffer of DKK 452 billion at the end of December 2015, Danske Bank’s liquidity position remains robust.
With effect from 1 October 2015, Danske Bank has had to comply with an LCR requirement as defined by the new EU standards under CRR/CRD IV. For Danish SIFI banks, Danish Bank Package 6 sets this LCR requirement at 100%. Danske Bank fully meets the requirement. Danske Bank’s LCR as calculated according to the new EU standards was 125% at the end of December 2015.
Prior to October 2015, Danske Bank had to comply with an LCR requirement as defined by the Danish FSA. Danske Bank complied with this requirement and also complied with all other liquidity requirements.
Stress tests show that we have a sufficient liquidity buffer well beyond 12 months.
In 2015, Danske Bank issued senior debt for DKK 38.0 billion, covered bonds for DKK 25.9 billion, and additional tier 1 capital for DKK 5.6 billion, totaling DKK 69.5 billion. We also redeemed long-term debt of DKK 61.9 billion.
Danske Bank further diversified its funding sources through USD domestic debt issues. In the second half of 2015, we increased our presence on the US commercial paper market and re-entered the professional investor market for long-term funding after a three-year absence.
At the end of 2015, the total amount of outstanding long-term funding, excluding additional tier 1 capital and debt issued by Realkredit Danmark, was DKK 342 billion, against DKK 330 billion at the end of 2014.
Danske Bank excluding Realkredit Danmark (DKK billions)
31 December 2015
31 December 2014
Covered bonds 190 186
Senior unsecured debt 112 103
Subordinated debt 40 41
Total 342 330

Danske Bank / Annual Report 201540
The Supervisory DiamondThe Danish FSA has identified a number of specific risk indicators for banks and has set threshold values that all Danish banks must comply with. The requirements are known as the Supervisory Diamond.
Supervisory Diamond (%)
Threshold value
2015 2014
Sum of large exposures <125 - -
Lending growth <20 5 -
Real property exposure <25 12 10
Funding ratio <100 64 63
Surplus liquidity in relation to statutory liquidity requirements >50 193 161
At 31 December 2015, Danske Bank was in compliance with all threshold values. A separate report is available at danskebank.com/ir.
The supervisory diamond for mortgage credit institutions will be implemented gradually in the period until 2020. Realkredit Danmark already complies with the threshold values for lending growth, borrower interest rate exposure, large exposures and interest-only lending. Realkredit Danmark expects to comply with the threshold value concerning short-term funding well ahead of 2020.
Capital regulation We estimate that the remaining phase-in effect of CRR/CRD IV on our fully-loaded CET1 capital ratio in 2018 will be a reduction of about 0.7 of a percentage point.
The Danish FSA has approved Danske Bank’s continued use of the financial conglomerate deduction method for equity holdings in Danica Pension. The deduction method is based on Danica Pension’s solvency need less the difference between Danica Pension’s capital base and Danske Bank’s holdings. The non-deductible part of the holdings is risk-weighted at 100%.
CRR/CRD IV requires credit institutions to calculate, report, monitor and disclose their leverage ratios, defined as tier 1 capital as a percentage of total exposure. The Group’s leverage ratio was 4.7% at 31 December 2015 when transitional rules are taken into account. Assuming fully phased-in tier 1 capital
under CRR/CRD IV without taking into account any refinancing of non-eligible additional tier 1 instruments, the leverage ratio would be 4.2%.
Danske Bank is designated a SIFI in Denmark and is required to comply with an additional CET1 capital buffer requirement of 0.6%. The additional CET1 capital buffer requirement will increase gradually to 3% in 2019. Danske Bank’s countercyclical buffer requirement was 0.3% at 31 December 2015 and related to its exposures in Sweden and Norway. The Group’s combined buffer requirement was thus 0.9% or DKK 7.3 billion at 31 December 2015. Bank Recovery and Resolution Directive The Bank Recovery and Resolution Directive (including bail-in provisions) was implemented in Danish law with effect from 1 June 2015.
By law, every credit institution must have a minimum amount of “bail-in-able” liabilities. The Danish FSA is authorised to set the minimum amount for Danske Bank and is expected to do so during 2016.
Furthermore, a Danish resolution fund has been established. All Danish credit institutions must make contributions to the fund on the basis of their size and risks relative to other credit institutions in Denmark. The assets of the resolution fund must equal at least 1% of the covered deposits of all Danish credit institutions by 31 December 2024. The first contributions to the Danish fund were paid in the fourth quarter of 2015, with Danske Bank’s and Realkredit Danmark’s payment totalling DKK 194 million. Our contribution constituted 55% of the total sector contributions.
Solvency IIThe Solvency II rules for insurance companies were implemented in Danish law with effect from 1 January 2016. This implies that Danica Pension includes expected future profit in its calculation of its capital base and solvency need. In total, the increase in the capital base will be partially offset by the increase in the solvency need.
New capital allocation frameworkIn the first quarter of 2016, a new, simplified and more transparent capital allocation framework will be implemented. The new framework will be based on a regulatory approach and will be in accordance with our CET1 capital target. This means that the capital consumption of the Group’s individual business units will be aligned with the Group’s total capital consumption.

Danske Bank / Annual Report 2015 41
Investor Relations at Danske Bank contributes to the Group’s pursuit of its strategic goals by ensuring that stakeholders receive correct and adequate information according to the best practices in proactive investor communications and consultation, including innovative digital solutions.
To maintain and build stakeholder relations, we hold roadshows after the release of our financial reports as well as roadshows on major transactions and other topics for debt investors.
Together with executive management, Investor Relations builds relations with analysts, shareholders and prospective investors by presenting and discussing current topics relevant to Danske Bank at seminars and conferences.
In 2015, investor events were held in the Nordic countries, other European countries and the US, with more than 537 investors attending.
Danske Bank shares Danske Bank shares are listed on NASDAQ OMX Copenhagen and are included in a number of Danish and international equity indices, such as the OMX Copenhagen 20 CAP Index (OMXC20CAP). At the end of 2015, Danske Bank shares had an index weighting of about 12.7%.
Danske Bank’s share price rose from DKK 167.4 at 31 December 2014 to DKK 185.2 at 31 December 2015, an increase of 10.6%. In comparison, the OMXC20CAP Index gained 29%, while the MSCI Europe Banks Index fell 6.7%.
Danske Bank shares (DKK)
2015 2014
Share capital (millions) 10,086 10,086
Share price (end of year) 185.2 167.4
Total market capitalisation (end of year) (billions) 180.8 167.3
Earnings per share 12.8 3.8
Dividend per share 8.0 5.5
Book value per share 153.2 146.8
Share price/book value per share 1.2 1.1
At the end of 2015, 32 equity analysts covered Danske Bank.
The average daily trading volume of Danske Bank shares was 2.4 million. Danske Bank shares were the third most actively traded shares on NASDAQ OMX Copenhagen.
Danske Bank sharesIndex 2011 = 100
Danske Bank MSCI Europe Banks
0
50
100
150
200
20152014201320122011
Shareholders At the end of 2015, Danske Bank had about 279,000 shareholders. The 10 largest shareholders together owned about 41% of the share capital.
We estimate that shareholders outside Denmark, mainly in the UK and the US, hold almost 53% of the share capital.
Rest of Denmark 25.3%
Den
mar
k
Cevian Capital7.4%
Rest of Europe 10.8%
UK 16.3%
USA & Canada 18.1%
Other 0.6%
Danske Bank shareholders 2015
A. P. Møller Holding Group
21.6%
According to the Danish Companies Act, shareholders must notify the company if the voting rights of their shares exceed 5% of the voting rights of the company’s share capital or if the nominal value of their shares exceeds 5% of the share capital. Shareholders must
Investor Relations

Danske Bank / Annual Report 201542
also disclose changes in shareholdings if they exceed or fall below specified percentage thresholds. Two shareholder groups have notified Danske Bank that they hold more than 5% of the share capital:
• The A.P. Møller and Chastine Mc-Kinney Møller Foundation and companies of the A.P. Moller Holding Group, Copenhagen, hold 21.6% of the share capital.
• Cevian Capital II GP Limited, Jersey, holds 7.4% of the share capital.
Each share entitles the holder to one vote, and all shares carry the same rights.
At the end of 2015, Danske Bank held about 3.2% of its own share capital. These shares are held to compensate employees in the form of conditional shares granted under share programmes in previous years and for investments on behalf of Danica Pension policyholders and under pooled investment schemes. The portfolio also contains shares that have been bought back but have not yet been cancelled.
Corporate responsibilityCorporate responsibilityCorporate responsibility is an important part of Danske Bank’s strategy. We want to create long-term value for all our stakeholders, and we want them to feel confident that we manage our business with proper attention to environmental, social, ethical and governance issues. This applies to credit granting, investing, responsible sourcing, and our contribution to financial stability and economic growth. We consider responsible business conduct a precondition for long-term value creation.
Reporting on corporate responsibilityWe report on our corporate responsibility activities and performance in the independently assured Corporate Responsibility Report 2015. The report serves as our Communication on Progress as required by the UN Global Compact and ensures compliance
with the requirements of the Danish FSA’s Executive Order on Financial Reports for Credit Institutions and Investment Firms etc. (sections 135 and 135a) on corporate responsibility reporting. The report is available at danskebank.com/crreport.
The report is supplemented by our Corporate Responsibility Fact Book 2015. Our combined reporting offers a comprehensive and balanced view of material corporate responsibility matters relating to our business activities. These reports and further information about our CR initiatives and projects are available at danskebank.com /responsibility.
General meetingThe general meeting is Danske Bank’s highest decision-making authority.
In 2015, the annual general meeting was held on 18 March.
Danske Bank’s Articles of Association, available at danskebank.com/aoa, contain information about the notice of the general meeting, shareholders’ rights to table proposals and to have special items added to the agenda, admission and voting rights.
All shareholders have equal voting rights (one share equals one vote), and there are no limitations on holdings or voting rights.
Only the general meeting can amend the Articles of Association. Amendments require a two-thirds majority of the votes cast and a two-thirds majority of the share capital represented at the general meeting and entitled to vote.
A resolution to wind up Danske Bank by merger or voluntary liquidation can be passed only if adopted by at least three-quarters of the votes cast and by at least three-quarters of the share capital represented at the general meeting and entitled to vote.
Organisation and management

Danske Bank / Annual Report 2015 43
Board of DirectorsThe Board currently consists of 12 members, eight elected by the general meeting and four elected by and among the employees.
Board members elected by the general meeting stand for election every year. As prescribed by Danish law, members elected by the employees serve on the Board of Directors for a four-year term.
The Nomination Committee identifies and recommends candidates for the Board of Directors. Board candidates are nominated by the Board of Directors or the shareholders and are elected by the general meeting. The retirement age for board members is 70, which means that board members must retire at the first annual general meeting after they have reached the age of 70.
At the annual general meeting held on 18 March 2015, the incumbent members of the Board of Directors were re-elected.
Work of the Board of Directors in 2015In the fourth quarter, the Board of Directors carried out its annual evaluation of the performance and achievements of its members, both individually and collectively. To ensure anonymity, the evaluation was facilitated by an external consulting firm. All members of the Board of Directors and the Executive Board answered a comprehensive questionnaire and were offered an interview with the consulting firm. The findings and conclusions were subsequently presented to and discussed by the full Board of Directors, and the chairman gave individual feedback to all board members.
Overall, the results of the 2015 evaluation were positive. The areas for improvement identified in the 2014 evaluation – particularly an adjustment of the balance between regulatory and strategic matters – were addressed in 2015, and the Board of Directors will continue to work on its performance in these areas. The 2015 evaluation identified only minor new areas in need of improvement, the most important one being the Board of Directors’ visibility in succession planning and talent management, which the Board will address going forward.
Executive BoardThe Executive Board consists of Thomas F. Borgen, Chief Executive Officer; Tonny Thierry Andersen, Head of Personal Banking; James Ditmore, Chief Operating Officer and Head of COO area; Gilbert Kohnke, Group Chief Risk
Officer and Head of Group Risk Management; Lars Mørch, Head of Business Banking; Henrik Ramlau-Hansen, Chief Financial Officer and Head of CFO area; and Glenn Söderholm, Head of Corporates & Institutions.
CFO Henrik Ramlau-Hansen, who turns 60 in 2016, will vacate his position at the end of March 2016. He will be replaced as CFO and on the Executive Board by Jacob Aarup-Andersen, who has served as deputy CFO since 1 January.
Corporate governance recommendationsCorporate governance recommendations issued by the Danish Committee on Corporate Governance can be found at corporategovernance.dk. The recommendations are best practice guidelines that all companies with shares traded on NASDAQ OMX Copenhagen should generally follow. If a company fails to comply with a recommendation, it must explain why it deviates from the recommendation and what it has done differently. Danske Bank complies with all the recommendations.
The statutory corporate governance report issued in accordance with section 107b of the Danish Financial Statements Act is available at danskebank.com/cgreport. The report includes an explanation of Danske Bank’s status on all recommendations.
The Corporate Governance Code of the Danish Bankers Association, which applies to all member institutions, can be found at danskebank.com/dba. All member institutions must comply with the recommendations or explain why they do not comply. Danske Bank complies with all recommendations set out in the code. Danske Bank’s explanation of the status on all recommendations is included in section E of its Corporate Governance Report 2015.

44 Danske Bank / Annual Report 2015

Danske Bank / Annual Report 2015 4545Danske Bank / Annual Report 2015
Financial statements46 Income statement 47 Statement of comprehensive income 48 Balance sheet 49 Statement of capital 53 Cash flow statement
54 Notes 54 1. Basis of preparation60 2. Changes and forthcoming changes to
accounting policies and presentation 63 3. Business model and busines segmentation 69 4. Acticities by country 71 5. Net interest and net trading income 73 6. Fee income and expenses 74 7. Other income 75 8. Insurance contracts 75 9. Operating expenses78 10. Audit fees78 11. Loan impairment charges79 12. Trading portfolio assets and liabilities82 13. Investment securities
14. Due from credit institutions and central banks and Loans at amortised cost
86 15. Loans at fair value and bonds issued by Realkredit Danmark
87 16. Assets and deposits under pooled schemes and unit-linked investment contracts
88 17. Assets and liabilities under insurance contracts
90 18. Intangible assets95 19. Due to credit institutions and central banks
and Deposits 95 20. Tax 99 21. Issued bonds
102 22. Other assets and other liabilities 104 23. Equity 106 24. Contingent liabilities108 25. Balance sheet items broken down by
expected due date109 26. Contractual due dates of financial liabilities 110 27. Transferred financial assets that are not
derecognised
111 28. Assets provided or received as collateral 112 29. Offsetting of financial assets and liabilities113 30. Fair value information for financial
instruments 119 31. Non-financial assets recognised at fair
value 120 32. Related parties121 33. Remuneration of management and material
risk takers 127 34. Danske Bank shares held by the Board of
Directors and the Executive Board 128 35. Group holdings and undertakings130 36. Interests in associates and joint
arrangements 130 37. Interests in unconsolidated structured
entities 131 38. Transfer of Personal Banking and Business
Banking customers in Northern Ireland to the new Northern Ireland segment
132 Risk management 132 Risk exposure 132 Total capital 133 Credit risk 149 Market risk 154 Liquidity risk 157 Insurance risk 161 Highlights, ratios and key figures 162 Definitions of ratios and key figures 163 Financial statements of the parent company,
Danske Bank A/S

46 Danske Bank / Annual Report 2015
Income statement – Danske Bank Group
Note (DKK millions) 2015 2014
5 Interest income 59,666 66,951
5 Interest expense 26,333 32,344
Net interest income 33,333 34,607
6 Fee income 15,566 14,585
6 Fee expenses 4,887 4,771
5 Net trading income 6,908 9,854
7 Other income 5,275 4,546
8 Net premiums 21,359 20,631
8 Net insurance benefits 30,468 33,024
9 Operating expenses 24,785 25,642
18 Impairment charges on goodwill and customers relations 4,601 9,099
Profit before loan impairment charges 17,701 11,687
11 Loan impairment charges -61 3,718
Profit before tax 17,762 7,969
20 Tax 4,639 4,020
Net profit for the year 13,123 3,948
Portion attributable to
shareholders of Danske Bank A/S (the Parent Company) 12,516 3,687
additional tier 1 capital holders 607 259
non-controlling interests - 2
Net profit for the year 13,123 3,948
Earnings per share (DKK) 12.8 3.8
Diluted earnings per share (DKK) 12.8 3.8
Proposed dividend per share (DKK) 8.0 5.5
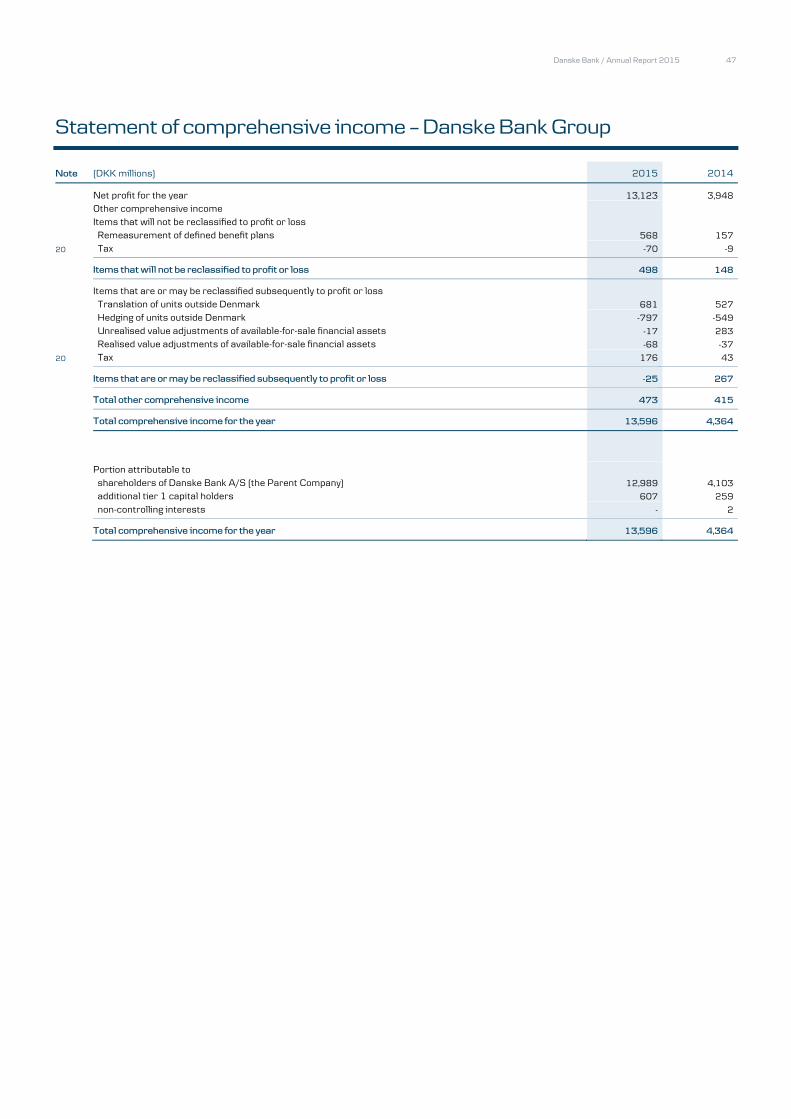
Danske Bank / Annual Report 2015 47
Statement of comprehensive income – Danske Bank Group
Note (DKK millions) 2015 2014
Net profit for the year 13,123 3,948
Other comprehensive income
Items that will not be reclassified to profit or loss
Remeasurement of defined benefit plans 568 157
20 Tax -70 -9
Items that will not be reclassified to profit or loss 498 148
Items that are or may be reclassified subsequently to profit or loss
Translation of units outside Denmark 681 527
Hedging of units outside Denmark -797 -549
Unrealised value adjustments of available-for-sale financial assets -17 283
Realised value adjustments of available-for-sale financial assets -68 -37
20 Tax 176 43
Items that are or may be reclassified subsequently to profit or loss -25 267
Total other comprehensive income 473 415
Total comprehensive income for the year 13,596 4,364
Portion attributable to
shareholders of Danske Bank A/S (the Parent Company) 12,989 4,103
additional tier 1 capital holders 607 259
non-controlling interests - 2
Total comprehensive income for the year 13,596 4,364

48 Danske Bank / Annual Report 2015
Balance sheet – Danske Bank Group
Note (DKK millions) 2015 2014
ASSETS
Cash in hand and demand deposits with central banks 76,837 33,876 14 Due from credit institutions and central banks 103,859 112,760 12 Trading portfolio assets 547,019 742,513 13 Investment securities 343,304 330,994 14 Loans at amortised cost 1,079,257 1,092,902 15 Loans at fair value 741,660 741,609 16 Assets under pooled schemes and unit-linked investment contracts 91,893 80,148 17 Assets under insurance contracts 265,572 268,450 18 Intangible assets 6,505 11,253 20 Tax assets 1,550 1,543 22 Other assets 35,422 36,966
Total assets 3,292,878 3,453,015
LIABILITIES
19 Due to credit institutions and central banks 271,588 329,048 12 Trading portfolio liabilities 471,131 550,629 19 Deposits 863,474 966,197 15 Bonds issued by Realkredit Danmark 694,519 655,965 16 Deposits under pooled schemes and unit-linked investment contracts 96,958 86,433 17 Liabilities under insurance contracts 285,030 288,352 21 Other issued bonds 363,931 330,207 20 Tax liabilities 8,333 8,647 22 Other liabilities 37,093 44,126 21 Subordinated debt 39,991 41,028
Total liabilities 3,132,048 3,300,632
EQUITY
Share capital 10,086 10,086 Foreign currency translation reserve -593 -477 Reserve for available-for-sale financial assets -401 -316 Retained earnings 132,352 131,868 Proposed dividends 8,069 5,547
Shareholders of Danske Bank A/S (the Parent Company) 149,513 146,708 Additional tier 1 capital holders 11,317 5,673 Non-controlling interests - 2
23 Total equity 160,830 152,384
Total liabilities and equity 3,292,878 3,453,015

Danske Bank / Annual Report 2015 49
Statement of capital – Danske Bank Group
Changes in equity
Shareholders of Danske Bank A/S (the Parent Company)
Foreign Reserve for
currency available- Additional Non- Share translation for-sale Retained Proposed tier 1 controlling
(DKK millions) capital reserve assets earnings dividends Total capital interests Total
Total equity at 1 January 2015 10,086 -477 -316 132,605 5,547 147,445 5,673 2 153,120
Changed recognition of pension scheme - - - -736 - -736 - - -736
Restated total equity at 1 January 2015 10,086 -477 -316 131,869 5,547 146,709 5,673 2 152,384
Net profit for the year - - - 12,516 - 12,516 607 - 13,123
Other comprehensive income
Remeasurement of defined benefit plans* - - - 568 - 568 - - 568
Translation of units outside Denmark - 681 - - - 681 - - 681
Hedging of units outside Denmark - -797 - - - -797 - - -797
Unrealised value adjustments - - -17 - - -17 - - -17
Realised value adjustments - - -68 - - -68 - - -68
Tax - - - 106 - 106 - - 106
Total other comprehensive income - -116 -85 674 - 473 - - 473
Total comprehensive income for the year - -116 -85 13,190 - 12,989 607 - 13,596
Transactions with owners
Issuance of additional tier 1 capital,
net of transaction costs - - - -56 - -56 5,583 - 5,527
Paid interest on additional tier 1 capital - - - - - - -529 - -529
Dividends paid - - - 53 -5,547 -5,494 - -2 -5,496
Dividends proposed - - - -8,069 8,069 - - - -
Acquisition of own shares and additional tier 1 capital - - - -35,087 - -35,087 -41 - -35,128
Sale of own shares and
additional tier 1 capital - - - 30,119 - 30,119 24 - 30,143
Share-based payments - - - 195 - 195 - - 195
Tax - - - 138 - 138 - - 138
Total equity at 31 December 2015 10,086 -593 -401 132,352 8,069 149,513 11,317 - 160,830
*Remeasurement of defined benefit plans includes changes between expected trends in pension assets and benefits and actual trends in, for example, interest rates
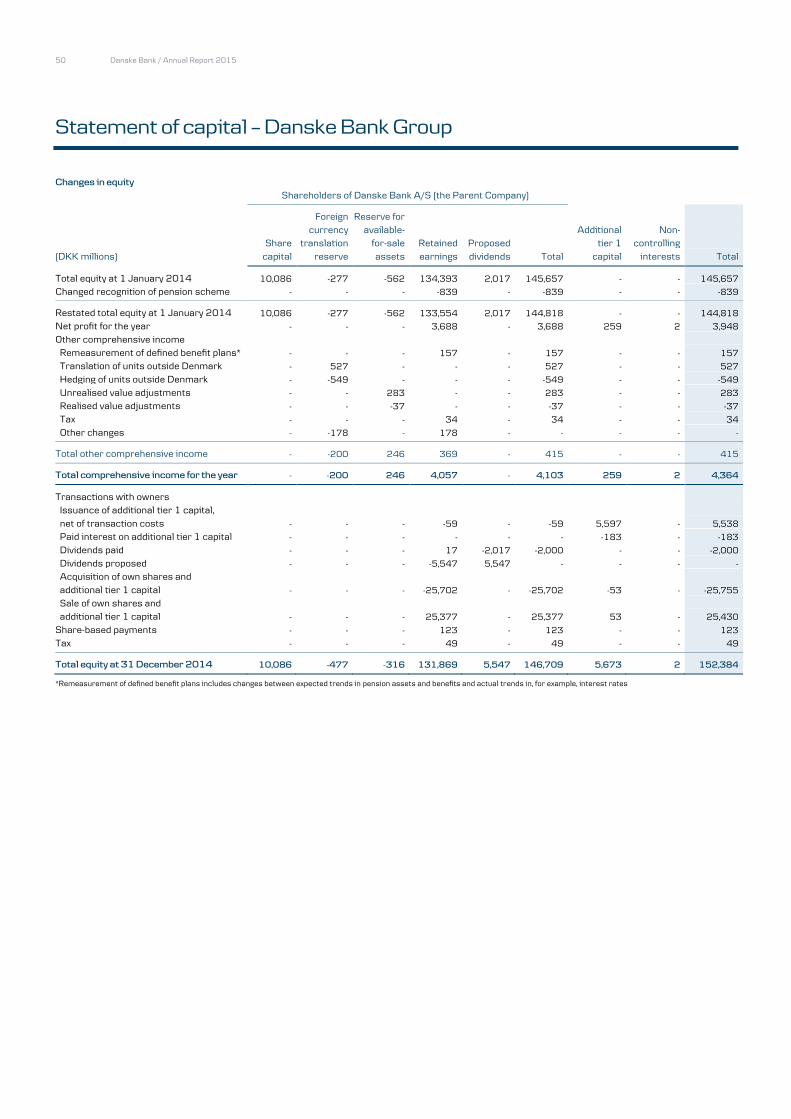
50 Danske Bank / Annual Report 2015
Statement of capital – Danske Bank Group
Changes in equity
Shareholders of Danske Bank A/S (the Parent Company)
Foreign Reserve for
currency available-
Additional Non-
Share translation for-sale Retained Proposed
tier 1 controlling
(DKK millions) capital reserve assets earnings dividends Total capital interests Total
Total equity at 1 January 2014 10,086 -277 -562 134,393 2,017 145,657 - - 145,657
Changed recognition of pension scheme - - - -839 - -839 - - -839
Restated total equity at 1 January 2014 10,086 -277 -562 133,554 2,017 144,818 - - 144,818
Net profit for the year - - - 3,688 - 3,688 259 2 3,948
Other comprehensive income
Remeasurement of defined benefit plans* - - - 157 - 157 - - 157
Translation of units outside Denmark - 527 - - - 527 - - 527
Hedging of units outside Denmark - -549 - - - -549 - - -549
Unrealised value adjustments - - 283 - - 283 - - 283
Realised value adjustments - - -37 - - -37 - - -37
Tax - - - 34 - 34 - - 34
Other changes - -178 - 178 - - - - -
Total other comprehensive income - -200 246 369 - 415 - - 415
Total comprehensive income for the year - -200 246 4,057 - 4,103 259 2 4,364
Transactions with owners
Issuance of additional tier 1 capital,
net of transaction costs - - - -59 - -59 5,597 - 5,538
Paid interest on additional tier 1 capital - - - - - - -183 - -183
Dividends paid - - - 17 -2,017 -2,000 - - -2,000
Dividends proposed - - - -5,547 5,547 - - - -
Acquisition of own shares and
additional tier 1 capital - - - -25,702 - -25,702 -53 - -25,755
Sale of own shares and additional tier 1 capital - - - 25,377 - 25,377 53 - 25,430
Share-based payments - - - 123 - 123 - - 123
Tax - - - 49 - 49 - - 49
Total equity at 31 December 2014 10,086 -477 -316 131,869 5,547 146,709 5,673 2 152,384
*Remeasurement of defined benefit plans includes changes between expected trends in pension assets and benefits and actual trends in, for example, interest rates
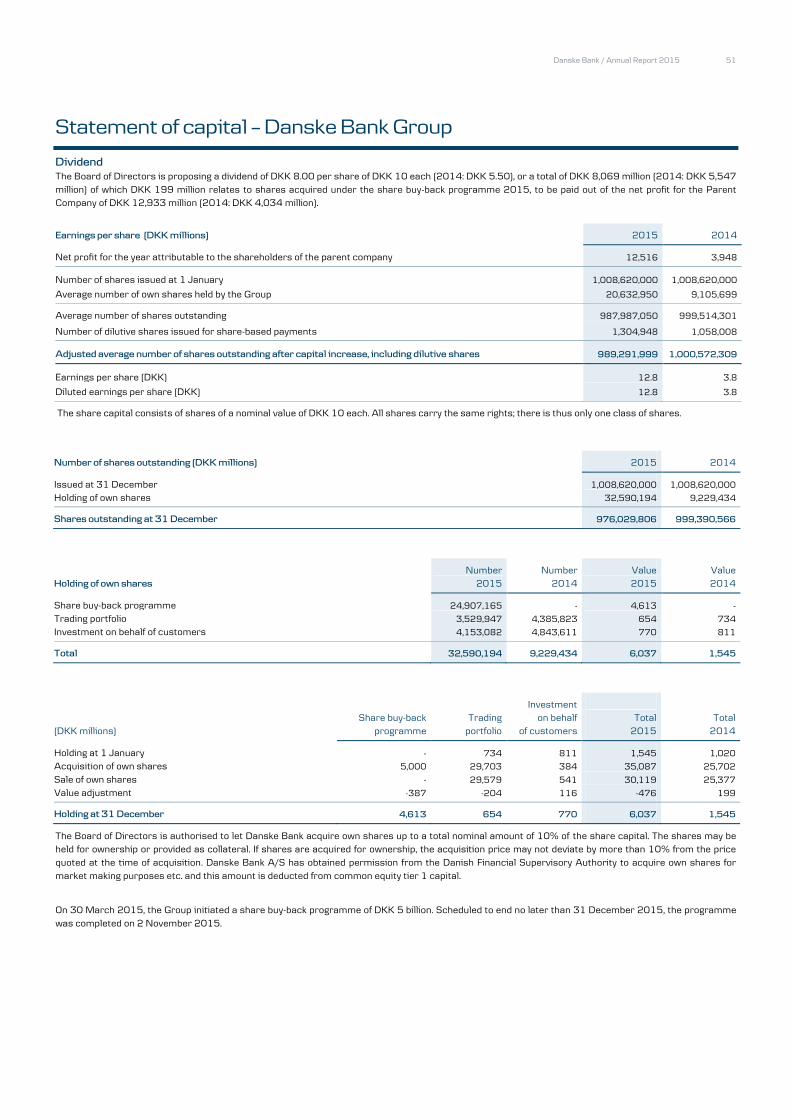
Danske Bank / Annual Report 2015 51
Statement of capital – Danske Bank Group
Dividend
The Board of Directors is proposing a dividend of DKK 8.00 per share of DKK 10 each (2014: DKK 5.50), or a total of DKK 8,069 million (2014: DKK 5,547
million) of which DKK 199 million relates to shares acquired under the share buy-back programme 2015, to be paid out of the net profit for the Parent Company of DKK 12,933 million (2014: DKK 4,034 million).
Earnings per share (DKK millions) 2015 2014
Net profit for the year attributable to the shareholders of the parent company 12,516 3,948
Number of shares issued at 1 January 1,008,620,000 1,008,620,000
Average number of own shares held by the Group 20,632,950 9,105,699
Average number of shares outstanding 987,987,050 999,514,301
Number of dilutive shares issued for share-based payments 1,304,948 1,058,008
Adjusted average number of shares outstanding after capital increase, including dilutive shares 989,291,999 1,000,572,309
Earnings per share (DKK) 12.8 3.8
Diluted earnings per share (DKK) 12.8 3.8
The share capital consists of shares of a nominal value of DKK 10 each. All shares carry the same rights; there is thus only one class of shares.
Number of shares outstanding (DKK millions) 2015 2014
Issued at 31 December 1,008,620,000 1,008,620,000
Holding of own shares 32,590,194 9,229,434
Shares outstanding at 31 December 976,029,806 999,390,566
Number Number Value Value Holding of own shares 2015 2014 2015 2014
Share buy-back programme 24,907,165 - 4,613 -
Trading portfolio 3,529,947 4,385,823 654 734
Investment on behalf of customers 4,153,082 4,843,611 770 811
Total 32,590,194 9,229,434 6,037 1,545
Investment Share buy-back Trading on behalf Total Total (DKK millions) programme portfolio of customers 2015 2014
Holding at 1 January - 734 811 1,545 1,020
Acquisition of own shares 5,000 29,703 384 35,087 25,702
Sale of own shares - 29,579 541 30,119 25,377
Value adjustment -387 -204 116 -476 199
Holding at 31 December 4,613 654 770 6,037 1,545
The Board of Directors is authorised to let Danske Bank acquire own shares up to a total nominal amount of 10% of the share capital. The shares may be held for ownership or provided as collateral. If shares are acquired for ownership, the acquisition price may not deviate by more than 10% from the price
quoted at the time of acquisition. Danske Bank A/S has obtained permission from the Danish Financial Supervisory Authority to acquire own shares for
market making purposes etc. and this amount is deducted from common equity tier 1 capital.
On 30 March 2015, the Group initiated a share buy-back programme of DKK 5 billion. Scheduled to end no later than 31 December 2015, the programme
was completed on 2 November 2015.

52 Danske Bank / Annual Report 2015
Statement of capital – Danske Bank Group
(DKK millions) 2015 2014
Total capital and total capital ratio
Total equity 160,830 152,384
Revaluation of domicile property at fair value 884 1,013
Tax effect of revaluation of domicile property at fair value -172 -209
Reserves in undertakings consolidated on a pro rata basis 3,002 3,002
Total equity calculated in accordance with the rules of the Danish FSA 164,544 156,190
Additional tier 1 capital instruments included in total equity -11,177 -5,597
Accrued interest on additional tier 1 capital instruments -155 -77
Tax on accrued interest on additional tier 1 capital instruments 36 17
Common equity tier 1 capital instruments 153,248 150,533
Adjustment to eligible capital instruments -154 -117
Prudential filters -507 -315
Proposed dividends -8,069 -5,547
Intangible assets of banking operations -6,426 -11,169
Deferred tax on intangible assets 337 372
Deferred tax assets that rely on future profitability excluding temporary differences -343 -465
Defined benefit pension fund assets -808 -317
Statutory deduction for insurance subsidiaries -2,885 -1,850
Other statutory deductions -35 -722
Common equity tier 1 capital 134,358 130,403
Additional tier 1 capital instruments 22,338 17,434
Statutory deduction for insurance subsidiaries -2,164 -3,701
Other statutory deductions -7 -10
Tier 1 capital 154,525 144,126
Tier 2 capital instruments 22,782 26,310
Statutory deduction for insurance subsidiaries -2,164 -3,701
Other statutory deductions -7 -10
Total capital 175,136 166,725
Total risk exposure amount 833,594 865,086
Common equity tier 1 capital ratio (%) 16.1 15.1
Tier 1 capital ratio (%) 18.5 16.7
Total capital ratio (%) 21.0 19.3
Total capital and the total risk exposure amount are calculated in accordance with the rules applicable under CRR, taking transitional rules into account as stipulated by the Danish Financial Supervisory Authority. A new filter has been introduced for deduction from common equit y tier 1 capital of addi-
tional value adjustments of assets and liabilities measured at fair value (prudent valuation). The European Commission has adopted a Delegated Regu-lation on regulatory technical standards for prudent valuation that will be effective from February 2016, at the latest. Implementation is expected to
lead to a further reduction in common equity tier 1 capital of around DKK 1.2 billion.
The risk exposure amount calculated under the Basel I rules amounted to DKK 1,422,024 million at 31 December 2015 (31 December 2014: DKK 1,398,421 million). The capital need under the transitional rules was DKK 91,010 million, equal to 10.9% of the risk exposure amount under the Basel
I rules (31 December 2014: DKK 89,499 million).
Risk Management 2015 provides more details about the Group’s total capital and total risk exposure amount. Risk Management 2015 is not covered
by the statutory audit.

Danske Bank / Annual Report 2015 53
Cash flow statement – Danske Bank Group
(DKK millions) 2015 2014
Cash flow from operations
Profit before tax 17,762 7,969
Tax paid -4,770 -4,095
Adjustment for non-cash operating items 6,858 15,027
Total 19,850 18,901
Changes in operating capital
Amounts due to/from credit institutions and central banks -56,229 14,960
Trading portfolio 115,996 68,656
Acquisition / sale of own shares and additional tier 1 capital 15 -325
Other financial instruments -24,083 -172,309
Loans at amortised cost 13,706 -7,879
Loans at fair value -51 -13,528
Deposits -102,722 22,294
Bonds issued by Realkredit Danmark 38,553 41,769
Assets/liabilities under insurance contracts 593 2,964
Other assets/liabilities 34,704 17,273
Cash flow from operations 40,332 -7,224
Cash flow from investing activities
Acquisition/sale of businesses 11 -
Acquisition of intangible assets -626 -418
Acquisition of tangible assets -378 -316
Sale of tangible assets 661 415
Cash flow from investing activities -332 -319
Cash flow from financing activities
Issues of subordinated debt 3,725 3,732
Redemption of subordinated debt -5,212 -29,110
Dividends -5,494 -2,000
Share buy-back programme -5,000 -
Issued additional tier 1 capital 5,527 5,539
Paid interest on additional tier 1 capital -529 -183
Change in non-controlling interests -2 2
Cash flow from financing activities -6,985 -22,020
Cash and cash equivalents at 1 January 143,543 173,500
Foreign currency translation 2,277 -394
Change in cash and cash equivalents 33,015 -29,563
Cash and cash equivalents, end of period 178,835 143,543
Cash and cash equivalents end of period
Cash in hand 10,638 10,582
Demand deposits with central banks 66,199 23,294
Amounts due from credit institutions and central banks within three months 101,998 109,667
Total 178,835 143,543
The list of Group holdings and undertakings in note 35 provides information about restrictions on the use of cash flows from Group undertakings.
The cash flow statement is prepared according to the indirect method. The statement is based on the pre-tax profit for the year and shows the cash flows
from operating, investing and financing activities and the increase or decrease in cash and cash equivalents during the year. Cash and cash equivalents
consists of cash in hand and demand deposits with central banks as well as amounts due from credit institutions and central banks with an original matur-ity shorter than three months.
54 Danske Bank / Annual Report 2015
Notes – Danske Bank Group
1. Basis of preparation
Danske Bank Group prepares its consolidated financial statements in accordance with the International Financial Reporting Standards (IFRSs) and with applicable interpretations (IFRIC), issued by the International Accounting Standards Board (IASB), as adopted by the EU . Furthermore, the consolidated
financial statements comply with the Danish FSA’s executive order No. 1306 dated 16 December 2008 on the use of IFRSs by undertakings subject to
the Danish Financial Business Act.
Financial statement figures are stated in Danish kroner and whole millions, unless otherwise stated. As a result, rounding discrepancies may occur be-cause sum totals have been rounded off and the underlying decimals are not presented to financial statement users.
Monetary assets and liabilities in foreign currency are translated at the exchange rates at the balance sheet date. Exchange rate adjustments of mone-tary assets and liabilities arising as a result of differences in the exchange rates at the transaction date and at the balan ce sheet date are recognised in
the income statement. Non-monetary assets and liabilities in foreign currency that are subsequently revalued at fair value are translated at the e x-
change rates at the date of revaluation. Exchange rate adjustments are included in the fair value adjustment of an asset or l iability. Other non-monetary items in foreign currency are translated at the exchange rates at the transaction date. The accounting treatment of foreign currency translation of
units outside Denmark is described in note 23.
For the purpose of clarity, the primary financial statements and the notes to the financial statements are prepared using the concepts of materiality
and relevance. This means that line items not considered material in terms of quantitative and qualitative measures or relevant to financial statement
users are aggregated and presented together with other items in the primary financial statements. Similarly, information not considered material is not presented in the notes.
The significant accounting policies are incorporated into the notes to which they relate. Except for the changes implemented during the year and ex-plained in note 2, Danske Bank has not changed its significant accounting policies from those applied in Annual Report 201 4.
(a) Significant accounting estimates
Management’s estimates and assumptions of future events that will significantly affect the carrying amounts of assets and liabilities underlie the pre p-
aration of the consolidated financial statements. Those estimates and assumptions are presented in the following sections.
The estimates and assumptions are based on premises that management finds reasonable but which are inherently uncertain and unpredictable. The
premises may be incomplete, unexpected future events or situations may occur, and other parties may arrive at other estimated values.
Fair value measurement of financial instruments
Measurements of financial instruments that are only to a limited extent based on observable market data, such as the measurem ent of unlisted shares
and certain bonds for which there is no active market, are subject to significant estimates. The estimated fair value of illiquid bonds significantly de-pends on the credit spread estimate. A credit spread widening of 50bp at the end of 2015 would have caused the fair value of the bonds to decrease
DKK 65 million (2014: DKK 36 million). The Group makes fair value adjustments to cover changes in counterparty risk (CVA and DVA) on derivatives,
bid-offer spreads on the net open position of the portfolio of assets and liabilities with offsetting market risk recognised at mid-market prices, and model risk on level 3 derivatives. During 2015, the CVA and DVA model was enhanced in a number of areas. Most importantly, the mapping of the probability
of default to proxies was changed to a more advanced model. Further, a fair value adjustment to cover expected funding costs (FVA) was included at the
end of 2015. At 31 December 2015, the adjustments totaled DKK 1.3 billion (31 December 2014: DKK 1.0 billion), including the adjustment for credit risk on derivatives with customers subject to objective evidence of impairment. Note 30 provides more details.
Measurement of loans
The Group makes impairment charges to account for any impairment of loans that occurs after initial recognition. Impairment c harges consist of indi-
vidual and collective charges and rely on a number of estimates, including identification of loans or portfolios of loans with objective evidence of i m-
pairment, expected future cash flows and the value of collateral. The Group determines the need for impairment charges on the basis of the customer’s expected ability to repay debt. This ability depends on a number of factors, including the customer’s earnings capacity and t rends in general economic
environment and unemployment. Expectations of deteriorating repayment ability reduce credit quality and lead to downgrading of the customer.
The losses incurred under non-performing loan agreements depend, among other factors, on the value of collateral received. If the value of collateral
decreased 10%, individual impairment charges would increase by about DKK 2.8 billion (2014: DKK 2.9 billion). The collective impairment charges are
sensitive to the credit rating of customers. If all customers were downgraded one rating category, collective impairment charges would increase by about DKK 3.0 billion (2014: DKK 3.9 billion). Further, a collective impairment charge of DKK 3.8 billion (2014: DKK 3.5 billion) has been recognised as
a management judgement to reflect market conditions at the balance sheet date that are not fully reflected in the Group’s models. Note 14 and the sec-
tion on credit risk in the risk management notes provide more details on impairment charges for loans. At end-2015, loans accounted for about 55% of total assets (31 December 2014: 53%).

Danske Bank / Annual Report 2015 55
Notes – Danske Bank Group
(a) Significant accounting estimates continued
Measurement of goodwill Goodwill on acquisition is tested for impairment once a year or more frequently if indications of impairment exist. Impairmen t testing requires man-
agement to estimate the future cash flows. A number of factors affect the value of such cash flows, including discount rates, changes in the econom ic
outlook, customer behaviour and competition. The impairment test conducted in 2015 resulted in impairment charges on goodwill of DKK 4.1 billion (2014: DKK 9.1 billion) and on customer relations of DKK 0.5 billion (2014: DKK 0 billion) in the Group’s banking units, mainly due to a further worsen-
ing of the long-term economic outlook and an increase in capital allocated to the banking units under the new capital allocation framework that will be
implemented in the first quarter of 2016. At 31 December 2015, goodwill amounted to DKK 5.4 billion (31 December 2014: DKK 9.5 billion). Following the impairment charges made in 2015, no goodwill at the banking units remains. For Danske Capital, the carrying amount of goodwill is DKK 1.8 billion.
The excess value (the amount by which the cash-generating unit’s recoverable amount exceeds the carrying amount) in the impairment test 2015 for
Danske Capital amounted to DKK 0.1 billion. If growth in the terminal period were lowered by 0.5 percentage points to 1.2%, or the discount rate were increased by 0.4 percentage points to 9.4%, the excess value would be zero. In 2014, as goodwill impairment charges were recognised against the
Group’s banking units, no excess value remained, and changes to the key assumptions applied in the test could cause further impairment, although the
assumptions applied in the impairment test for 2014 included management judgements that, among others, reduced expectations for the interest lev-el. Note 18 provides more information about impairment testing and sensitivity to changes in impairment test assumptions.
Measurement of liabilities under insurance contracts Measurement of liabilities under insurance contracts is based on a number of actuarial com putations that rely on assumptions about a number of vari-
ables, including mortality and disability rates . Assumptions of future mortality rates are based on the Danish FSA’s benchmark, while other assum p-
tions are based on data from the Group’s own portfolio of insurance contracts. The liabilities also depend on the discount yield curve, which is fixed on the basis of a zero-coupon yield curve estimated on the basis of euro swap market rates to which is added the yield spread between Danish and Ge r-
man government bonds and a mortgage yield curve spread. Note 17 provides more information. The risk management notes contain a sensitivity analy-
sis for life insurance. The Danish FSA’s executive order on financial reports for insurance companies etc. has been changed. The changes must be im-plemented at 1 January 2016.Note 2(b) provides more information.
Recognition of deferred tax assets and liabilities
Recognition of deferred tax requires management to assess the probability and amount of future profit. Deferred tax assets ar ising from unused tax losses are recognised to the extent that such losses can be offset against tax on future profit. At end -2015 deferred tax assets from recognised tax
loss carry-forwards amounted to DKK 0.3 billion (31 December 2014: DKK 0.5 billion). The tax base of unrecognised tax loss carry-forwards, relating
primarily to the Group’s banking operations in Ireland, amounted to DKK 3.2 billion (31 December 2014: DKK 3.5 billion). The full deferred tax liability arising from international joint taxation was recognised and amounted to DKK 5.9 billion (31 December 2014: DKK 6.4 billion). Note 20 provides more
information about deferred tax.
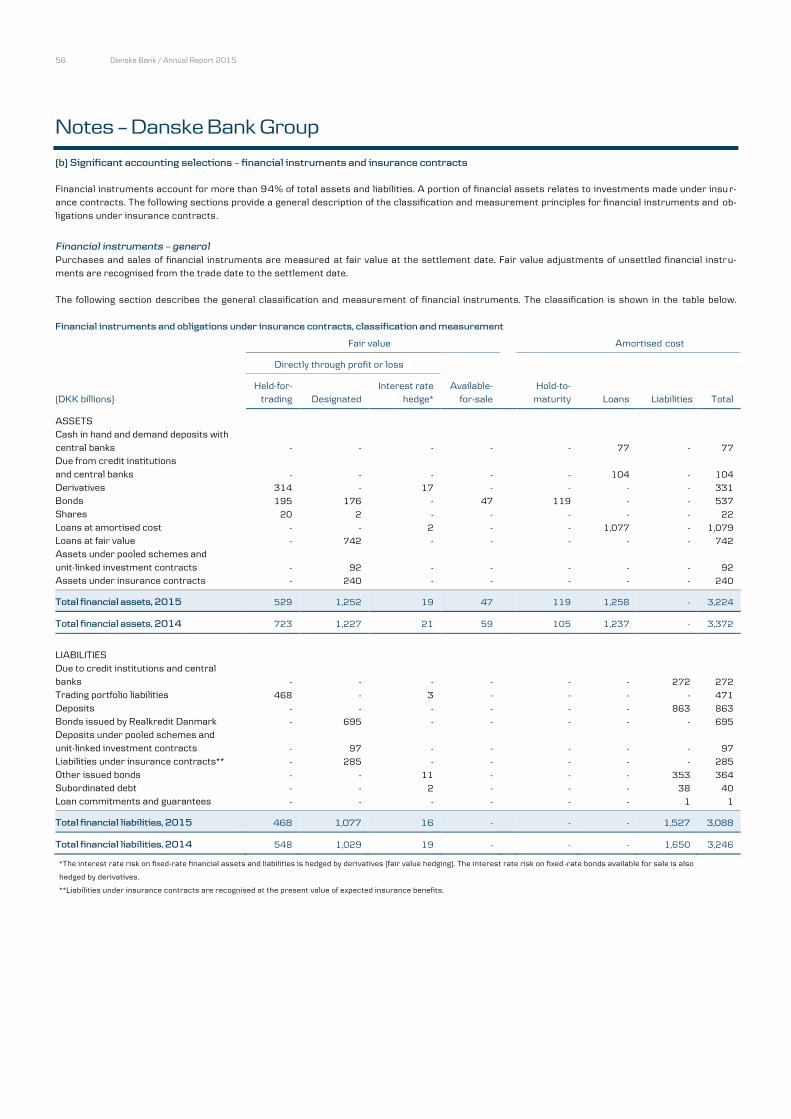
56 Danske Bank / Annual Report 2015
Notes – Danske Bank Group
(b) Significant accounting selections – financial instruments and insurance contracts
Financial instruments account for more than 94% of total assets and liabilities. A portion of financial assets relates to investments made under insu r-ance contracts. The following sections provide a general description of the classification and measurement principles for financial instruments and ob-
ligations under insurance contracts.
Financial instruments – general Purchases and sales of financial instruments are measured at fair value at the settlement date. Fair value adjustments of unsettled financial instru-
ments are recognised from the trade date to the settlement date.
The following section describes the general classification and measurement of financial instruments. The classification is shown in the table below.
Financial instruments and obligations under insurance contracts, classification and measurement
Fair value
Amortised cost
Directly through profit or loss
Held-for-
Interest rate Available-
Hold-to-
(DKK billions) trading Designated hedge* for-sale
maturity Loans Liabilities Total
ASSETS
Cash in hand and demand deposits with
central banks
- - - -
- 77 - 77
Due from credit institutions
and central banks
- - - -
- 104 - 104
Derivatives 314 - 17 -
- - - 331
Bonds 195 176 - 47
119 - - 537
Shares 20 2 - -
- - - 22
Loans at amortised cost - - 2 -
- 1,077 - 1,079
Loans at fair value - 742 - -
- - - 742
Assets under pooled schemes and
unit-linked investment contracts - 92 - -
- - - 92
Assets under insurance contracts - 240 - -
- - - 240
Total financial assets, 2015 529 1,252 19 47
119 1,258 - 3,224
Total financial assets, 2014 723 1,227 21 59
105 1,237 - 3,372
LIABILITIES
Due to credit institutions and central banks - - - -
- - 272 272
Trading portfolio liabilities 468 - 3 -
- - - 471
Deposits - - - -
- - 863 863
Bonds issued by Realkredit Danmark - 695 - -
- - - 695
Deposits under pooled schemes and
unit-linked investment contracts - 97 - -
- - - 97
Liabilities under insurance contracts** - 285 - -
- - - 285
Other issued bonds - - 11 -
- - 353 364
Subordinated debt - - 2 -
- - 38 40
Loan commitments and guarantees - - - -
- - 1 1
Total financial liabilities, 2015 468 1,077 16 -
- - 1,527 3,088
Total financial liabilities, 2014 548 1,029 19 -
- - 1,650 3,246
*The interest rate risk on fixed-rate financial assets and liabilities is hedged by derivatives (fair value hedging). The interest rate risk on fixed -rate bonds available for sale is also
hedged by derivatives.
**Liabilities under insurance contracts are recognised at the present value of expected insurance benefits.

Danske Bank / Annual Report 2015 57
Notes – Danske Bank Group
(b) Significant accounting selections – financial instruments and insurance contracts continued
Loans and financial liabilities Loans and non-derivative financial liabilities are generally measured at amortised cost. Loans granted under Danish mortgage finance law and the is-
sued mortgage bonds funding these loans are measured using the fair value option, however.
Loans granted under Danish mortgage finance law are funded by issuing listed mortgage bonds with matching terms. Borrowers may repa y such loans
by delivering the underlying bonds. Such loans and bonds are granted and issued by the Realkredit Danmark subsidiary only.
The Group buys and sells own bonds issued by Realkredit Danmark on an ongoing basis because the bonds play an important role in the Danish money
market. If the loans and bonds were measured at amortised cost, the purchase and sale of own mortgage bonds would create timing differences in the
recognition of gains and losses.
Consequently, the Group measures loans and issued bonds at fair value in accordance with the fair value option offered by IAS 39 to ensure that nei-
ther gain nor loss will occur on the purchase of own bonds. The fair value of bonds issued by Realkredit Danmark is normally equal to their market value. A small number of the issued bonds are illiquid, however, and the fair value of these bonds is calculated on the basis of a d iscounted cash flow valuation
technique.
The fair value of the loans is based on the fair value of the underlying bonds adjusted for changes in the fair value of the credit risk on borrowers.
Changes in the fair value of issued bonds cause corresponding changes to be made to the fair value of the loans. Consequently, changes to the fair value
of issued bonds, including as a result of changes to own credit risk, do not affect net profit or loss. Changes to the fair v alue of loans as a result of changes to the credit risk on borrowers are reflected in Loan impairment charges in the income statement.
Securities Securities are generally measured at fair value through profit or loss and are classified as either trading portfolio assets or securities designated at fair
value, using the fair value option. Certain bond portfolios are held for the purpose of generating a return until maturity. These portfolios are measured at
amortised cost and are classified as hold-to-maturity financial assets. Owing to significant distortion of the pricing of bonds, in 2008, the Group reclas-sified bonds in the held-for-trading category to available-for-sale financial assets. This is the only time the Group has used the available-for-sale valua-
tion method. These bonds are measured at fair value. Unrealised fair value adjustments are recognised in Other comprehensive income, whereas i m-
pairment charges are recognised in the income statement.
Trading portfolio assets and liabilities
The trading portfolio includes financial assets acquired for sale in the near term. The trading portfolio also contains collectively managed financial assets for which a pattern of short-term profit taking exists. Trading portfolio liabilities consist of derivatives and obligations to r epurchase securities.
All derivatives, including bifurcated embedded derivatives and derivatives used for hedging, are measured at fair value and r ecognised under the trad-
ing portfolio.
Securities designated at fair value
Other financial assets designated at fair value include securities that are managed on a fair value basis with no short-term profit taking. This category consists mainly of securities purchased as part of the investment of insurance customer funds and recognised in the balance s heet under Assets un-
der insurance contracts as well as the liquidity portfolio managed by Group Treasury. Other securities portfolios managed on a fair value basis are rec-
ognised in the balance sheet under Investment securities.
For both trading portfolio assets and securities designated at fair value, realised and unrealised capital gains and losses and dividends are recognised
in the income statement under Net trading income.
Hold-to-maturity financial assets This category consists of bonds not managed on a fair value basis and held for the purpose of generating a return until maturity. The bonds are meas-
ured at amortised cost. The Group has increased its use of this category since 2013.
Hedge accounting
The Group uses derivatives to hedge the interest rate risk on most fixed-rate assets and fixed-rate liabilities measured at amortised cost and available-for-sale financial assets. Hedged risks that meet the criteria for fair value hedge accounting are treated accordingly. The inter est rate risk on the
hedged assets and liabilities is measured at fair value through profit or loss. At end-2015, hedging derivatives measured at fair value accounted for
about 0.1% of total assets and about 0.5% of total liabilities (31 December 2014: 0.6% and 0.2%, respectively).

58 Danske Bank / Annual Report 2015
Notes – Danske Bank Group
(b) Significant accounting selections – financial instruments and insurance contracts continued
Insurance activities – general The Group issues life insurance policies, which are divided into insurance and investment contracts. Insurance contracts are contracts that entail si g-
nificant insurance risk or entitle policyholders to bonuses. Investment contracts are contracts that entail no significant in surance risk and comprise
unit-linked contracts under which the investment risk lies with the policyholder.
Insurance contracts
Insurance contracts comprise both an investment element and an insurance element, which are recognised as aggregate figures.
IFRS 4, Insurance Contracts, includes an option to continue the accounting treatment of insurance contracts under local GAAP. The Group’s life insur-
ance provisions are therefore recognised at their present value in accordance with the Danish FSA’s executive order on financial reports for insurance
companies etc. The life insurance provisions are presented under Liabilities under insurance contracts.
Assets earmarked for insurance contracts are recognised under Assets under insurance contracts if most of the return on the assets accrues to the policyholders. Most of these assets are measured at fair value.
Investment contracts Investment contracts are recognised as financial liabilities, and, consequently, contributions and benefits under such contracts are recognised directly
in the balance sheet as adjustments of liabilities. Deposits are measured at the value of the savings under Deposits under po oled schemes and unit-
linked investment contracts.
Savings under unit-linked investment contracts are measured at fair value under Assets under pooled schemes and unit -linked investment contracts.
The return on the assets and the crediting of the amounts to policyholders’ accounts are recognised under Net trading income.
Assets funded by shareholders’ equity
The separate pool of assets equal to shareholders’ equity is recognised at fair value and consolidated with other similar ass ets.
Income from insurance business
Insurance activities are consolidated in the various income statement items. Insurance premiums are recognised under Net premiums. Net insurance
benefits in the income statement consists of benefits disbursed under insurance contracts and the annual change in insurance obligations not deriving from additional provisions for benefit guarantees. The return on earmarked assets is allocated to the relevant items in the i ncome statement. The re-
turn to policyholders is recognised under Net trading income as are changes to additional prov isions for benefit guarantees. Note 5 provides more in-
formation.
The sources of the Group’s net income from insurance business comprise the return on assets funded by Danica Pension’s shareholders’ equity, in-
come from unit-linked business and health and accident business, and a risk allowance for conventional life insurance.
The risk allowance is determined in accordance with the Danish FSA’s executive order on the contribution principle. If the te chnical basis for the con-
ventional life insurance business for a given period is insufficient to allow booking of the risk allowance, the amount may b e booked in later periods when the technical basis permits. Insurance contracts guarantee a certain long-term return on policyholders’ funds. If the technical basis exceeds the inter-
est accrual to policyholders and the risk allowance, the difference is allocated to the bonus potential. The bonus potential serves as a risk buffer. If the
technical basis is insufficient to cover the interest accrual to policyholders, the shortfall is covered by the bonus potential. If the bonus potential is insu f-ficient to cover the shortfall, the difference is paid by the Group. Similarly to the risk allowance, amounts paid by the Gro up are booked to the shadow
account and may be recovered at a later date when the technical basis permits. However, as of 1 January 2016, a change of the executive order on the
contribution principle implies that if the technical basis in a given year is insufficient to allow the booking of the risk allowance, the amount can no longer be recovered in later years. Under the transitional provisions, any unrecognised risk allowance amount at 31 December 2015 may be recovered over
the next five years.
Danske Bank / Annual Report 2015 59
Notes – Danske Bank Group
(c) Financial highlights
The financial highlights shown in note 3 are used in the Management’s report and represent the financial information regularly provided to manage-ment. The presentation in the financial highlights deviates from the presentation in the consolidated financial statements prepared under IFRS as fol-
lows:
Income contributed by Fixed Income, Currencies and Commodities (FICC) and trading income at Capital Markets (both part of C&I) is recognised as net
interest income, net fee income, net trading income and other income in the consolidated income statement. Similarly, income at Group Treasury (part
of Other Activities) is presented as net interest income, net trading income etc. in the consolidated income statement. As the distribution of income be-tween the various income line items can vary considerably from year to year, depending on the underlying transactions and market conditions, income
contributed by FICC, trading income at Capital Markets and income at Group Treasury (except income from the internal bank and the hold-to-maturity
portfolio) are presented net in the financial highlights as net trading income. Income and expenses from Danica Pension are consolidated on a line-by-line basis in the consolidated income statement. The return on conventional
insurance activities accruing to the Group is determined by the contribution princip le. Since the Group’s return cannot be derived directly from the ind i-vidual income statement items, earnings contributed by Danica Pension is presented on a single line in the financial highlights as net income from in-
surance business.
The Non-core segment includes certain customer segments that are no longer considered part of the Group’s core business. The profit or loss is there-
fore presented as a separate line item in the financial highlights Profit before tax, Non-core, whereas the individual income and expense items are in-
cluded in the various line items in the consolidated income statements.
For operating leases, the gains or losses on the sale of lease assets at the end of the lease agreement are presented on a net basis under Other income
in the financial highlights to better reflect the development in the cost base. In the consolidated income statement, gains or losses on the sale of operat-ing lease assets, excluding properties, are recognised on a gross basis, i.e. the revenue on the sale of the assets are recognised under Other income
and the carrying amount of the lease assets is recognised under Expenses.
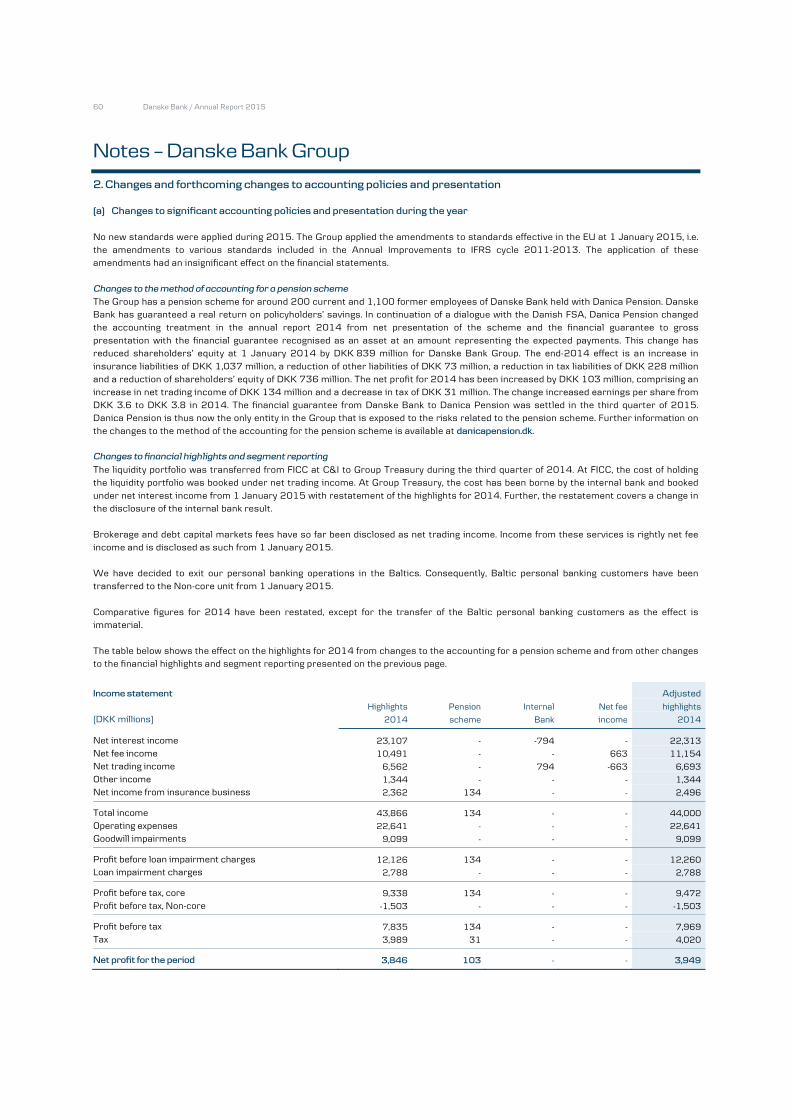
60 Danske Bank / Annual Report 2015
Notes � Danske Bank Group
2. Changes and forthcoming changes to accounting policies and presentation
(a) Changes to significant accounting policies and presentation during the year
No new standards were applied during 2015. The Group applied the amendments to standards effective in the EU at 1 January 2015, i.e.
the amendments to various standards included in the Annual Improvements to IFRS cycle 2011-2013. The application of these
amendments had an insignificant effect on the financial statements.
Changes to the method of accounting for a pension scheme
The Group has a pension scheme for around 200 current and 1,100 former employees of Danske Bank held with Danica Pension. Danske Bank has guaranteed a real return on policyholders� savings. In continuation of a dialogue with the Danish FSA, Danica Pension changed
the accounting treatment in the annual report 2014 from net presentation of the scheme and the financial guarantee to gross
presentation with the financial guarantee recognised as an asset at an amount representing the expected payments. This change has reduced shareholders� equity at 1 January 2014 by DKK 839 million for Danske Bank Group. The end-2014 effect is an increase in
insurance liabilities of DKK 1,037 million, a reduction of other liabilities of DKK 73 million, a reduction in tax liabilities of DKK 228 million
and a reduction of shareholders� equity of DKK 736 million. The net profit for 2014 has been increased by DKK 103 million, comprising an
increase in net trading income of DKK 134 million and a decrease in tax of DKK 31 million. The change increased earnings per share from
DKK 3.6 to DKK 3.8 in 2014. The financial guarantee from Danske Bank to Danica Pension was settled in the third quarter of 2015.
Danica Pension is thus now the only entity in the Group that is exposed to the risks related to the pension scheme. Further information on
the changes to the method of the accounting for the pension scheme is available at danicapension.dk.
Changes to financial highlights and segment reporting
The liquidity portfolio was transferred from FICC at C&I to Group Treasury during the third quarter of 2014. At FICC, the cost of holding
the liquidity portfolio was booked under net trading income. At Group Treasury, the cost has been borne by the internal bank and booked
under net interest income from 1 January 2015 with restatement of the highlights for 2014. Further, the restatement covers a change in the disclosure of the internal bank result.
Brokerage and debt capital markets fees have so far been disclosed as net trading income. Income from these services is rightly net fee
income and is disclosed as such from 1 January 2015.
We have decided to exit our personal banking operations in the Baltics. Consequently, Baltic personal banking customers have been
transferred to the Non-core unit from 1 January 2015.
Comparative figures for 2014 have been restated, except for the transfer of the Baltic personal banking customers as the effect is immaterial.
The table below shows the effect on the highlights for 2014 from changes to the accounting for a pension scheme and from other changes to the financial highlights and segment reporting presented on the previous page.
Income statement Adjusted
Highlights Pension Internal Net fee highlights
(DKK millions) 2014 scheme Bank income 2014
Net interest income 23,107 - -794 - 22,313
Net fee income 10,491 - - 663 11,154
Net trading income 6,562 - 794 -663 6,693
Other income 1,344 - - - 1,344
Net income from insurance business 2,362 134 - - 2,496
Total income 43,866 134 - - 44,000
Operating expenses 22,641 - - - 22,641
Goodwill impairments 9,099 - - - 9,099
Profit before loan impairment charges 12,126 134 - - 12,260
Loan impairment charges 2,788 - - - 2,788
Profit before tax, core 9,338 134 - - 9,472
Profit before tax, Non-core -1,503 - - - -1,503
Profit before tax 7,835 134 - - 7,969
Tax 3,989 31 - - 4,020
Net profit for the period 3,846 103 - - 3,949

Danske Bank / Annual Report 2015 61
Notes – Danske Bank Group
2. Changes and forthcoming changes to accounting policies and presentation continued
(b) Standards and interpretations not yet in force
The IASB has issued a number of amendments to IFRSs that have not yet come into force. Similarly, the IFRIC has issued a new interpretation that has
not yet come into force. The sections below explain the changes that are likely to affect the Group’s future financial report ing.
IFRS 9, Financial Instruments In July 2014, the IASB issued IFRS 9 Financial Instruments that wil l replace IAS 39. The standard provides principles for classification and measure-
ment of financial instruments, provisioning for expected credit losses and the new general hedge accounting model. The general hedge accounting
model will later be supplemented by a new macro hedge accounting model, which the IASB is working on.
IFRS 9, which has not yet been adopted by the EU, is effective from 1 January 2018. The Group does not plan to adopt IFRS 9 before the effective date.
Classification and measurement
Under IFRS 9, financial assets are classified on the basis of the business model adopted for managing the assets and on their contractual cash flow
characteristics, including any embedded derivatives (unlike IAS 39, IFRS 9 no longer requires bi furcation). Assets held with the objective of collecting contractual cash flows that are solely payments of principal and interest on the principal amount outstanding are measured at amortised cost. Assets
held with the objective of both collecting contractual cash flows and to sell and at the same time have contractual cash flows that are solely payments
of principal and interest are measured at fair value through Other comprehensive income. Fair value through Other comprehensive income results in the assets being recognised at fair value in the balance sheet and at amortised cost in the income statement. All other financial assets are measured at
fair value through profit or loss. As in IAS 39, IFRS 9 includes an option to designate at fair value through profit or loss if doing so eliminates or signifi-
cantly reduces a measurement or recognition inconsistency that would otherwise arise from measuring assets or liabilities or recognising the gains or losses on them on different bases. Further, IFRS 9 includes an option to irrevocably elect to present fair value changes on equity instruments that are
not held for trading in Other comprehensive income. Such fair value changes will not subsequently be reclassified to the income statement. Dividends
from such investments are recognised in the income statement.
The principles applicable to financial liabilities are largely unchanged from IAS 39. Generally, financial liabilities are st ill measured at amortised cost
with bifurcation of embedded derivatives not closely related to the host contract. Financial liabilities measured at fair value comprise derivatives, the trading portfolio and liabilities designated at fair value through profit or loss under the fair value option. Value adjustments relating to the inherent cred-
it risk of financial liabilities designated at fair value are, however, recognised in Other comprehensive income unless this leads to an accounting mis-
match.
Provisioning for expected credit losses
Provisioning for expected credit losses on financial assets recognised at amortised cost in the income statement depends on whether the credit risk has increased significantly since initial recognition. If the credit risk has not increased significantly, the provision equals 12-month expected credit
losses. If the credit risk has increased significantly, the provision equals the lifetime expected credit losses. Under IAS 39, only incurred credit losses
are recognised.
Hedge accounting
The general hedge accounting model does not fundamentally change the types of hedging relationships or the requirements to recognise ineffectiv e-ness through profit or loss. IFRS 9 includes an option to continue to use the IAS 39 principles for hedge accounting until the IASB has finalised its pro-
ject on the new macro hedge accounting.
Impact on the Group’s financial statements
The Group is currently assessing the impact from IFRS 9 on the Group’s financial statements. The implementation of the principles for classification
and measurement in IFRS 9 is not expected to lead to significant reclassifications between fair value and amortised cost. The allowance account is ex-pected to increase when provisions for expected credit losses on loans at amortised cost are to be recognised instead of provisions for incurred losses
only. No firm decision has yet been taken on whether the Group should continue to apply the hedge accounting under IAS 39 (until the IASB’s macro
hedge accounting project is finalised) or not.
IFRS 9 introduces several new concepts etc., especially on the provisioning for expected credit losses. While it is the Group’s ambition to leverage
models from the IRB framework, these concepts require interpretation and internal model development. Further, it is expected that EBA will issue guidelines during 2016, and these guidelines may influence the Group’s final choice of the definitions to be applied. During 2015, the Group started to
analyse the changes that will have to be implemented to the Group’s modelling framework and IT systems to co pe with the provisioning for expected
credit losses. The design of and changes to the Group’s modelling framework and IT systems are expected to start in the first quarter of 201 6 and stretch into 2017. It is not yet possible to give an estimate of the quantitative impact from the implementation of IFRS 9.

62 Danske Bank / Annual Report 2015
Notes – Danske Bank Group
2. Changes and forthcoming changes to accounting policies and presentation continued
IFRS 15, Revenue from Contracts with Customers In May 2014, the IASB issued IFRS 15, Revenue from Contracts with Customers. IFRS 15 replaces IAS 18, Revenue, and other existing IFRSs on reve-
nue recognition. Under IFRS 15, revenue is recognised when the performance obligations inherent in the contract with a customer are satisfied. The
new standard also includes additional disclosure requirements.
IFRS 15, which has not yet been adopted by the EU, is effective from 1 January 2018. Danske Bank is assessing the potential impact of the new stand-
ard on revenue recognition in the Group and the financial statements. It is not yet possible to give an estimate of the effect on the financial statements.
IFRS 16, Leases In January 2016, the IASB issued IFRS 16, Leases. IFRS 16, that replaces IAS 17, Leases, will only imply insignificant changes t o the accounting for lessors. For lessees, the accounting will change significantly, as all leases (except short-term leases and small asset leases) will be recognised in the
balance as a right-of-use asset. Initially, the lease liability and the right-of-use asset are measured at the present value of future lease payments (de-
fined as economically unavoidable payments). The right-of-use asset is subsequently depreciated in a way similar to depreciation of other assets, such as tangible assets, i.e. typically on a straight-line basis over the lease term.
IFRS 16, which has not yet been adopted by the EU, is effective from 1 January 2019. It is not yet possible to give an estima te of the effect on the finan-cial statements from the changes in the accounting treatment when the Group acts as a lessee.
Changes to the accounting for insurance activities In July 2015, the Danish FSA issued changes to the executive order on financial reports for insurance companies etc. The changes were made to re-
flect the measurement of insurance liabilities under the Solvency II framework. The changes must be implemented at 1 January 2016. The implementa-
tion is expected to reduce shareholders’ equity by around DKK 0.2 billion, and 2015 is expected to be restated in the interim report for the first quarter of 2016.
Forthcoming changes to financial highlights and segment reporting As of 1 January 2016, Danske Bank in Northern Ireland will be disclosed as a separate business unit. In addition, a new wealth management business
unit will be established and will be presented as a separate business unit in the financial reporting effective from the inte rim report for the first quarter
of 2016. The Wealth Management unit will include Danica Pension, Danske Capital and parts of the private banking operations. Note 38 provides more information.

Danske Bank / Annual Report 2015 63
Notes – Danske Bank Group
3. Business model and business segmentation
Danske Bank is a Nordic universal bank with bridges to the rest of the world. The Group offers customers a wide range of services in the fields of bank-
ing, mortgage finance, insurance, pension, real-estate brokerage, asset management and trading in fixed income products, foreign exchange and equi-
ties.
The Group consists of a number of business units and support functions. The business units are segmented according to customers, legislation and
products and services characteristics:
Personal Banking serves personal and private banking customers. The unit focuses on providing proactive advice to customers and making day-to-day
banking simple and efficient through innovative digital solutions.
Business Banking serves small and medium-sized businesses through a large network of national finance centres, branches, contact centres and online
channels. The unit offers leading solutions within financing, investing, cash management and risk management.
Corporates & Institutions serves large Nordic corporate and institutional customers in the Nordic countries and beyond. This wholesale division of the bank
provides strategic advice, financial solutions and products within Capital Markets, Fixed Income, Currencies and Commodities, and Transaction Banking.
Danske Capital develops and sells asset and wealth management products and services that are marketed through Personal Banking and directly to busi-
nesses, institutional clients and third-party distributors. Danske Capital also supports the advisory and asset management activities of Personal Banking.
Danica Pension carries out the Group’s activities in the life insurance and pensions market. Danica Pension serves both personal and business customers.
Its products are marketed through a range of channels in the Group, primarily Personal Banking and Danica Pension’s own insurance brokers and advisers. Danica Pension offers unit-linked products that allow customers to select their own investment profiles and the return on savings depends on market
trends. Danica Pension also offers Danica Traditionel. This product does not offer individual investment profiles, and Danica Pension sets the rate of inter-
est on policyholders’ savings.
Non-core includes certain customer segments that are no longer considered part of the core business. The Non-core unit is responsible for the con-
trolled winding-up and divestment of this part of the loan portfolio. The portfolio consists of loans to customers in Ireland and liquidity back-up facilities for Special Purpose Vehicles (SPVs) and conduit structures. On 1 January 2015, all personal banking customers in the Baltics were transferred to the
Non-core unit.
Other Activities encompasses Group Treasury, Group support functions and eliminations, including the elimination of returns on own shares. Group
Treasury is responsible for the Group’s liquidity management and funding.
Accounting policy
Segment reporting complies with the significant accounting policies. The ‘Reclassification’ column shows adjustments made to the IFRS statements
in the calculation of the financial highlights.
Internal income and expenses are allocated to the individual segments on an arm’s -length basis. Expenses incurred centrally, including expenses in-curred by support, administrative and back-office functions, are charged to the business units according to consumption and activity. Funding costs
for lending and deposit activities (FTP) are allocated on the basis of a maturity analysis of loans and deposits, interbank rates and funding spreads,
and depend on market trends.
Segment assets and liabilities are assets and liabilities that are used for maintaining the operating activities of a segment or have come into existence
as a result of such activities and that are either directly attributable or may be reasonably allocated to a segment. A calculated share of shareholders’ equity is allocated to each segment. Other assets and liabilities are recognised in the Other activities segment.
Capital (shareholders’ equity) is allocated to the business units based on the relative share of the risks with goodwill allocated directly to the r elevant business segments and capital allocated to the insurance business in accordance with regulatory requirements for insurance business.
A calculated interest income equal to the risk-free return on its allocated capital is apportioned to each business unit and offset by a corresponding interest expense at Other Activities. This income is calculated on the basis of the short-term money market rate. The interest expense on equity ac-
counted additional tier 1 capital is charged to the business units on the basis of the capital allocated to each unit and off set at Other Activities.
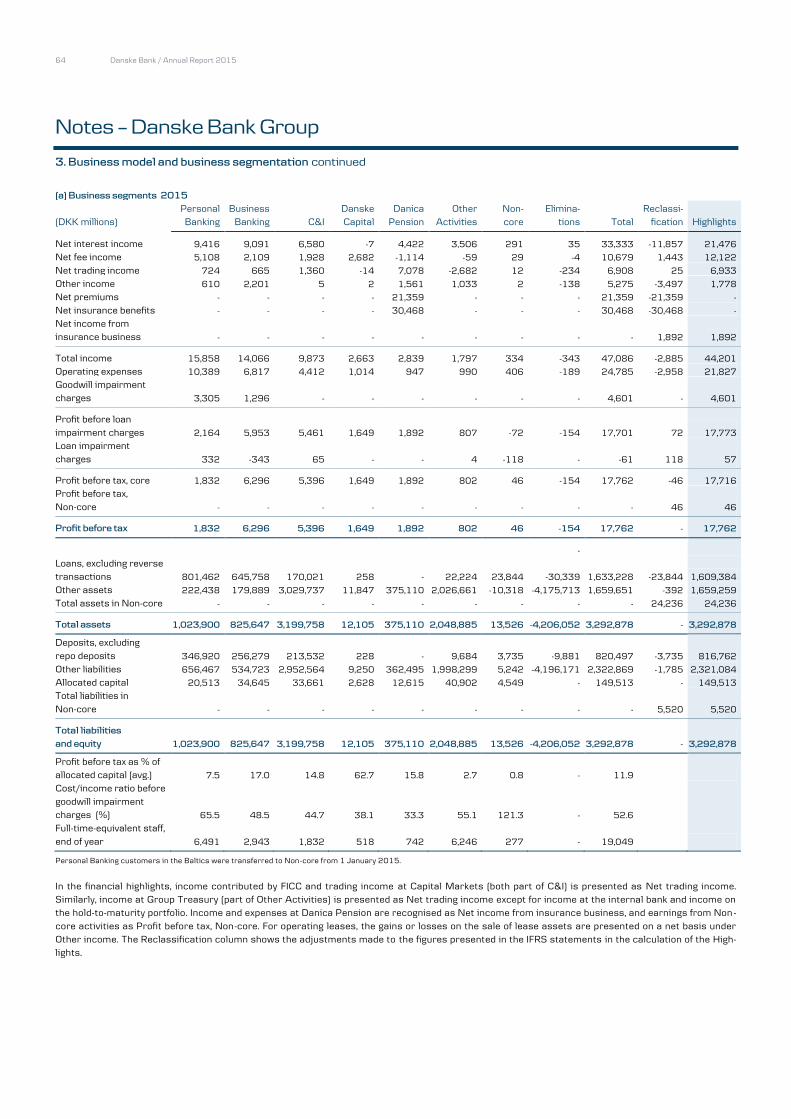
64 Danske Bank / Annual Report 2015
Notes – Danske Bank Group
3. Business model and business segmentation continued
(a) Business segments 2015
Personal Business
Danske Danica Other Non- Elimina-
Reclassi-
(DKK millions) Banking Banking C&I Capital Pension Activities core tions Total fication Highlights
Net interest income 9,416 9,091 6,580 -7 4,422 3,506 291 35 33,333 -11,857 21,476
Net fee income 5,108 2,109 1,928 2,682 -1,114 -59 29 -4 10,679 1,443 12,122
Net trading income 724 665 1,360 -14 7,078 -2,682 12 -234 6,908 25 6,933
Other income 610 2,201 5 2 1,561 1,033 2 -138 5,275 -3,497 1,778
Net premiums - - - - 21,359 - - - 21,359 -21,359 -
Net insurance benefits - - - - 30,468 - - - 30,468 -30,468 -
Net income from insurance business - - - - - - - - - 1,892 1,892
Total income 15,858 14,066 9,873 2,663 2,839 1,797 334 -343 47,086 -2,885 44,201
Operating expenses 10,389 6,817 4,412 1,014 947 990 406 -189 24,785 -2,958 21,827
Goodwill impairment
charges 3,305 1,296 - - - - - - 4,601 - 4,601
Profit before loan
impairment charges 2,164 5,953 5,461 1,649 1,892 807 -72 -154 17,701 72 17,773
Loan impairment
charges 332 -343 65 - - 4 -118 - -61 118 57
Profit before tax, core 1,832 6,296 5,396 1,649 1,892 802 46 -154 17,762 -46 17,716
Profit before tax,
Non-core - - - - - - - - - 46 46
Profit before tax 1,832 6,296 5,396 1,649 1,892 802 46 -154 17,762 - 17,762
-
Loans, excluding reverse transactions 801,462 645,758 170,021 258 - 22,224 23,844 -30,339 1,633,228 -23,844 1,609,384
Other assets 222,438 179,889 3,029,737 11,847 375,110 2,026,661 -10,318 -4,175,713 1,659,651 -392 1,659,259
Total assets in Non-core - - - - - - - - - 24,236 24,236
Total assets 1,023,900 825,647 3,199,758 12,105 375,110 2,048,885 13,526 -4,206,052 3,292,878 - 3,292,878
Deposits, excluding
repo deposits 346,920 256,279 213,532 228 - 9,684 3,735 -9,881 820,497 -3,735 816,762
Other liabilities 656,467 534,723 2,952,564 9,250 362,495 1,998,299 5,242 -4,196,171 2,322,869 -1,785 2,321,084
Allocated capital 20,513 34,645 33,661 2,628 12,615 40,902 4,549 - 149,513 - 149,513
Total liabilities in
Non-core - - - - - - - - - 5,520 5,520
Total liabilities
and equity 1,023,900 825,647 3,199,758 12,105 375,110 2,048,885 13,526 -4,206,052 3,292,878 - 3,292,878
Profit before tax as % of allocated capital (avg.) 7.5 17.0 14.8 62.7 15.8 2.7 0.8 - 11.9
Cost/income ratio before
goodwill impairment charges (%) 65.5 48.5 44.7 38.1 33.3 55.1 121.3 - 52.6
Full-time-equivalent staff,
end of year 6,491 2,943 1,832 518 742 6,246 277 - 19,049
Personal Banking customers in the Baltics were transferred to Non-core from 1 January 2015.
In the financial highlights, income contributed by FICC and trading income at Capital Markets (both part of C&I) is presented as Net trading income. Similarly, income at Group Treasury (part of Other Activities) is presented as Net trading income except for income at the internal bank and income on
the hold-to-maturity portfolio. Income and expenses at Danica Pension are recognised as Net income from insurance business, and earnings from Non -
core activities as Profit before tax, Non-core. For operating leases, the gains or losses on the sale of lease assets are presented on a net basis under Other income. The Reclassification column shows the adjustments made to the figures presented in the IFRS statements in the calculation of the High-
lights.
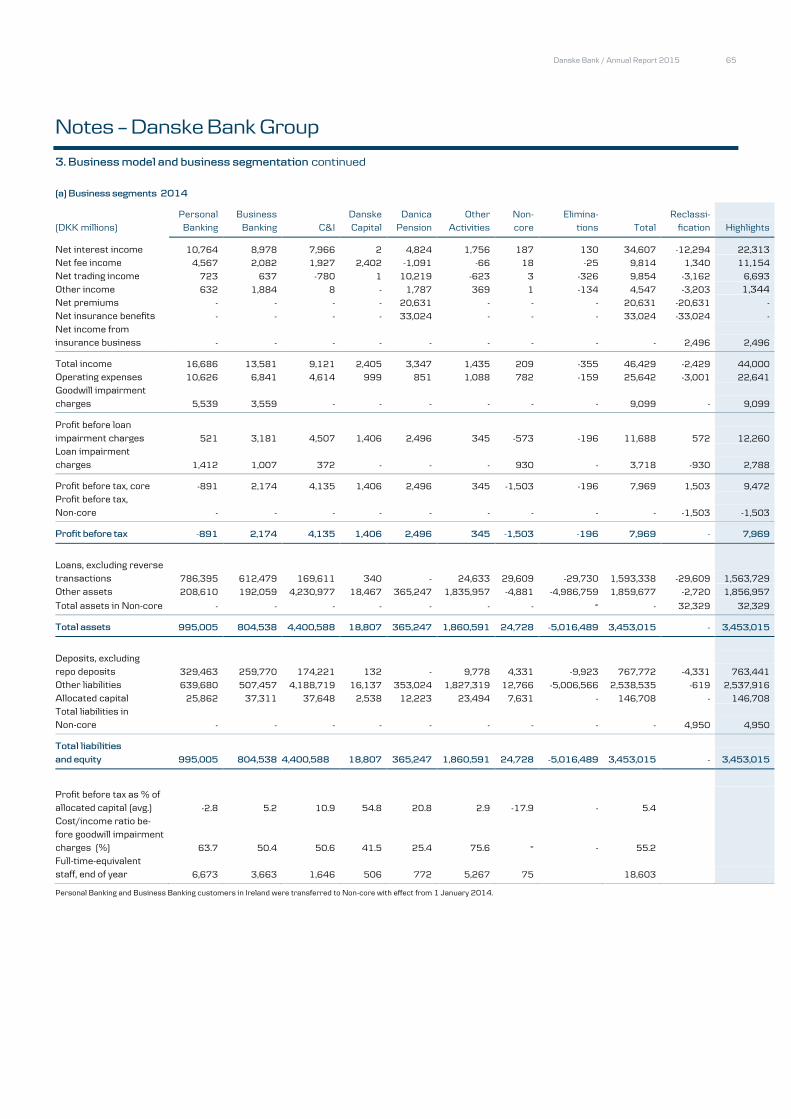
Danske Bank / Annual Report 2015 65
Notes – Danske Bank Group
3. Business model and business segmentation continued
(a) Business segments 2014
Personal Business
Danske Danica Other Non- Elimina-
Reclassi-
(DKK millions) Banking Banking C&I Capital Pension Activities core tions Total fication Highlights
Net interest income 10,764 8,978 7,966 2 4,824 1,756 187 130 34,607 -12,294 22,313 Net fee income 4,567 2,082 1,927 2,402 -1,091 -66 18 -25 9,814 1,340 11,154 Net trading income 723 637 -780 1 10,219 -623 3 -326 9,854 -3,162 6,693 Other income 632 1,884 8 - 1,787 369 1 -134 4,547 -3,203 1,344 Net premiums - - - - 20,631 - - - 20,631 -20,631 - Net insurance benefits - - - - 33,024 - - - 33,024 -33,024 - Net income from insurance business - - - - - - - - - 2,496 2,496
Total income 16,686 13,581 9,121 2,405 3,347 1,435 209 -355 46,429 -2,429 44,000 Operating expenses 10,626 6,841 4,614 999 851 1,088 782 -159 25,642 -3,001 22,641 Goodwill impairment
charges 5,539 3,559 - - - - - - 9,099 - 9,099
Profit before loan
impairment charges 521 3,181 4,507 1,406 2,496 345 -573 -196 11,688 572 12,260 Loan impairment
charges 1,412 1,007 372 - - - 930 - 3,718 -930 2,788
Profit before tax, core -891 2,174 4,135 1,406 2,496 345 -1,503 -196 7,969 1,503 9,472 Profit before tax,
Non-core - - - - - - - - - -1,503 -1,503
Profit before tax -891 2,174 4,135 1,406 2,496 345 -1,503 -196 7,969 - 7,969
Loans, excluding reverse transactions 786,395 612,479 169,611 340 - 24,633 29,609 -29,730 1,593,338 -29,609 1,563,729 Other assets 208,610 192,059 4,230,977 18,467 365,247 1,835,957 -4,881 -4,986,759 1,859,677 -2,720 1,856,957 Total assets in Non-core - - - - - - - - - 32,329 32,329
Total assets 995,005 804,538 4,400,588 18,807 365,247 1,860,591 24,728 -5,016,489 3,453,015 - 3,453,015
Deposits, excluding repo deposits 329,463 259,770 174,221 132 - 9,778 4,331 -9,923 767,772 -4,331 763,441 Other liabilities 639,680 507,457 4,188,719 16,137 353,024 1,827,319 12,766 -5,006,566 2,538,535 -619 2,537,916 Allocated capital 25,862 37,311 37,648 2,538 12,223 23,494 7,631 - 146,708 - 146,708 Total liabilities in
Non-core - - - - - - - - - 4,950 4,950
Total liabilities
and equity 995,005 804,538 4,400,588 18,807 365,247 1,860,591 24,728 -5,016,489 3,453,015 - 3,453,015
Profit before tax as % of
allocated capital (avg.) -2.8 5.2 10.9 54.8 20.8 2.9 -17.9 - 5.4 Cost/income ratio be-
fore goodwill impairment
charges (%) 63.7 50.4 50.6 41.5 25.4 75.6 - - 55.2 Full-time-equivalent
staff, end of year 6,673 3,663 1,646 506 772 5,267 75 18,603
Personal Banking and Business Banking customers in Ireland were transferred to Non-core with effect from 1 January 2014.

66 Danske Bank / Annual Report 2015
Notes – Danske Bank Group
3. Business model and business segmentation continued
Personal Banking by country, 2015
(DKK millions) Denmark Finland Sweden Norway Northern
Ireland Other* Total
Net interest income 5,968 877 640 1,173 714 44 9,416
Net fee income 3,271 921 349 165 243 159 5,108
Net trading income 598 39 22 -18 59 24 724
Other income 145 50 1 414 1 -1 610
Total income 9,982 1,887 1,012 1,734 1,017 226 15,858
Operating expenses 5,677 1,329 716 1,198 801 668 10,389
Goodwill impairment charges - 3,155 - - 150 - 3,305
Profit before loan impairment charges 4,305 -2,597 296 536 66 -442 2,164
Loan impairment charges 328 43 8 -4 -29 -14 332
Profit before tax 3,977 -2,640 288 540 95 -428 1,832
Loans, excluding reverse transactions 519,329 94,098 73,113 89,921 18,879 6,122 801,462
Deposits, excluding repo deposits 203,883 48,024 28,132 26,481 33,300 7,100 346,920
Net interest income as % p.a. of loans and deposits 0.83 0.62 0.63 1.01 1.37 0.33 0.82
Cost/income ratio before goodwill
impairment charges (%) 56.9 70.4 70.8 69.1 78.8 - 65.5
*Other includes staff functions and other non-country-specific costs.
Personal Banking by country, 2014
(DKK millions) Denmark Finland Sweden Norway Northern
Ireland Other* Total
Net interest income 7,197 1,123 581 1,118 680 65 10,764
Net fee income 2,827 917 313 149 210 151 4,567
Net trading income 608 26 19 -12 54 28 723
Other income 139 52 1 438 - 2 632
Total income 10,771 2,118 914 1,693 944 246 16,686
Operating expenses 6,067 1,411 708 1,164 762 514 10,626
Goodwill impairment charges - 3,493 - - 2,046 - 5,539
Profit before loan impairment charges 4,704 -2,786 206 529 -1,864 -268 521
Loan impairment charges 1,329 58 51 14 -41 1 1,412
Profit before tax 3,375 -2,844 155 515 -1,823 -269 -891
Loans, excluding reverse transactions 532,446 92,754 67,090 70,758 17,850 5,497 786,395
Deposits, excluding repo deposits 194,708 46,450 26,672 25,545 30,321 5,767 329,463
Net interest income as % p.a. of loans and deposits 0.99 0.81 0.62 1.16 1.41 0.58 0.96
Cost/income ratio before goodwill
impairment charges (%) 56.3 66.6 77.5 68.8 80.7 - 63.7
*Other includes staff functions and other non-country-specific costs.

Danske Bank / Annual Report 2015 67
Notes – Danske Bank Group
3. Business model and business segmentation continued
Business Banking by country, 2015
(DKK millions) Denmark Finland Sweden Norway Northern
Ireland Baltics Other* Total
Net interest income 4,708 789 1,683 962 782 292 -125 9,091 Net fee income 784 435 336 199 245 111 -1 2,109 Net trading income 336 44 111 68 59 48 -1 665 Other income 2,055 24 14 93 14 1 - 2,201
Total income 7,883 1,292 2,144 1,322 1,100 452 -127 14,066 Operating expenses 3,754 679 867 608 507 268 134 6,817 Goodwill impairment charges - 1,296 - - - - - 1,296
Profit before loan impairment charges 4,129 -683 1,277 714 593 184 -261 5,953 Loan impairment charges -300 135 112 292 -534 -49 1 -343
Profit before tax 4,429 -818 1,165 422 1,127 233 -262 6,296
Loans, excluding reverse transactions 371,489 50,820 122,230 58,580 30,600 12,026 13 645,758 Deposits, excluding repo deposits 84,569 44,434 42,298 39,566 30,316 15,096 - 256,279
Net interest income as % p.a. of loans and deposits 1.03 0.83 1.02 0.98 1.28 1.08 - 1.01 Cost/income ratio before goodwill
impairment charges (%) 47.6 52.6 40.4 46.0 46.1 59.3 - 48.5
*Other includes staff functions and other non-country-specific costs.
Business Banking by country, 2014
(DKK millions) Denmark Finland Sweden Norway Northern
Ireland Baltics Other* Total
Net interest income 4,811 797 1,505 846 698 414 -93 8,978
Net fee income 733 421 318 194 223 194 -1 2,082
Net trading income 285 37 106 55 59 94 1 637
Other income 1,726 33 5 99 11 12 -3 1,884
Total income 7,555 1,288 1,934 1,194 991 714 -96 13,581
Operating expenses 3,486 730 875 617 544 465 123 6,841
Goodwill impairment charges - 1,501 - - - 2,058 - 3,559
Profit before loan impairment charges 4,069 -943 1,059 577 447 -1,809 -219 3,181
Loan impairment charges 1,148 87 -3 99 -312 -12 - 1,007
Profit before tax 2,921 -1,030 1,062 478 759 -1,797 -219 2,174
Loans, excluding reverse transactions 360,690 47,017 106,367 52,035 27,603 18,823 - 612,535
Deposits, excluding repo deposits 82,769 45,726 40,454 39,519 26,242 25,060 - 259,770
Net interest income as % p.a. of loans and deposits 1.08 0.86 1.03 0.92 1.30 0.94 - 1.03
Cost/income ratio before goodwill impairment charges (%) 46.1 56.7 45.3 51.7 54.9 65.1 - 50.4
*Other includes staff functions and other non-country-specific costs.
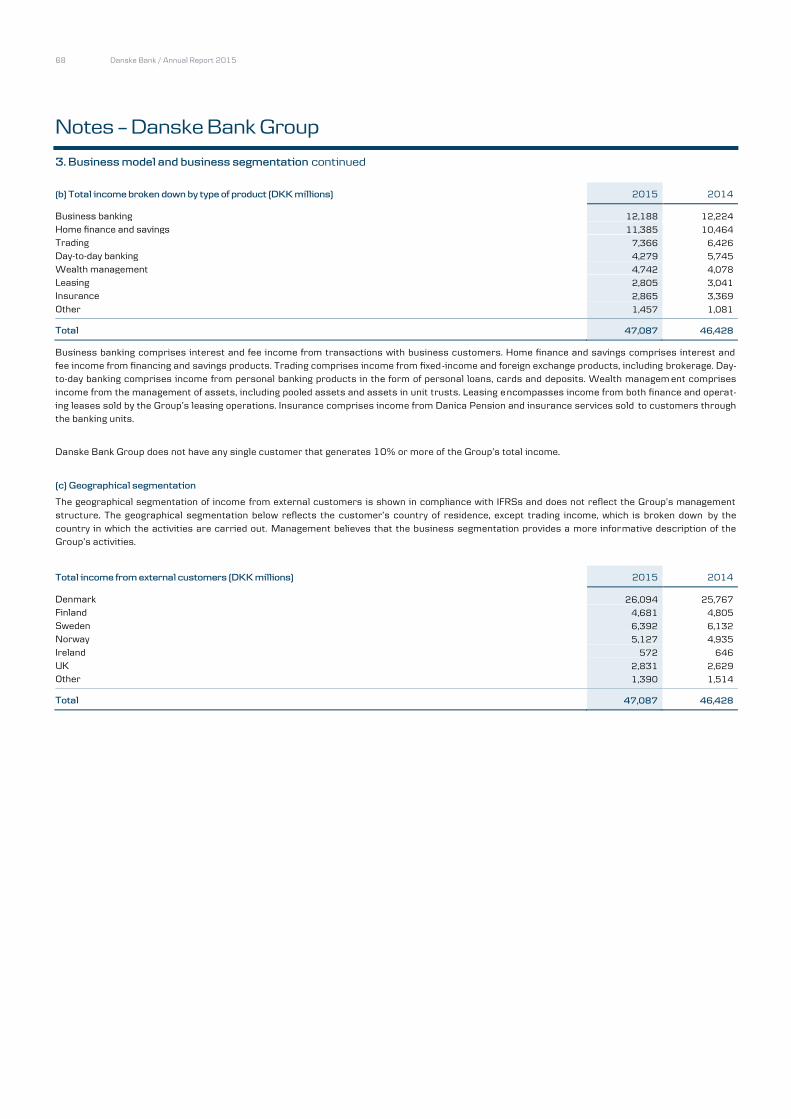
68 Danske Bank / Annual Report 2015
Notes – Danske Bank Group
3. Business model and business segmentation continued (b) Total income broken down by type of product (DKK millions) 2015 2014
Business banking 12,188 12,224
Home finance and savings 11,385 10,464
Trading 7,366 6,426
Day-to-day banking 4,279 5,745
Wealth management 4,742 4,078
Leasing 2,805 3,041
Insurance 2,865 3,369
Other 1,457 1,081
Total 47,087 46,428
Business banking comprises interest and fee income from transactions with business customers. Home finance and savings comprises interest and fee income from financing and savings products. Trading comprises income from fixed-income and foreign exchange products, including brokerage. Day-to-day banking comprises income from personal banking products in the form of personal loans, cards and deposits. Wealth managem ent comprises
income from the management of assets, including pooled assets and assets in unit trusts. Leasing encompasses income from both finance and operat-
ing leases sold by the Group’s leasing operations. Insurance comprises income from Danica Pension and insurance services sold to customers through the banking units.
Danske Bank Group does not have any single customer that generates 10% or more of the Group’s total income.
(c) Geographical segmentation
The geographical segmentation of income from external customers is shown in compliance with IFRSs and does not reflect the Group’s management
structure. The geographical segmentation below reflects the customer’s country of residence, except trading income, which is broken down by the
country in which the activities are carried out. Management believes that the business segmentation provides a more informative description of the Group’s activities.
Total income from external customers (DKK millions) 2015 2014
Denmark 26,094 25,767
Finland 4,681 4,805
Sweden 6,392 6,132
Norway 5,127 4,935
Ireland 572 646
UK 2,831 2,629
Other 1,390 1,514
Total 47,087 46,428

Danske Bank / Annual Report 2015 69
Notes – Danske Bank Group
4. Activities by country
Under CRD IV, a financial institution must disclose, by country in which it operates through a subsidiary or a branch, information about income, number of employees, profit before tax, tax and public subsidies received. This information is not comparable to the geographical segmentation presented in
note 3(c), in which segmentation is based on the customer’s country of residence. The Group has not received any public subsidies that relate to the
Group’s activities as a financial institution. The goodwill impairment charge of DKK 4.1 billion is included in profit before tax in Denmark (2014: DKK9.1
billion).
Income* Full-time- Profit before tax Tax on profit
2015 (DKK millions) equivalent staff (DKK millions) (DKK millions)
Denmark 55,259 10,098 11,868 -2,508
Finland 6,226 2,021 -2,801 -199
Sweden 6,180 1,327 3,521 -731
Norway 7,522 1,379 2,138 -600
United Kingdom 2,826 1,384 1,553 -321
Ireland 528 56 930 37
Estonia 352 406 126 -226
Latvia 74 80 25 3
Lithuania 212 1,423 85 -18
Luxembourg 705 92 164 -48
Russia 144 47 49 -10
Germany 198 34 33 -5
Poland 93 41 49 -11
USA 189 24 23 5
India - 637 - -8
Total 80,507 19,049 17,762 -4,639
*Income is defined as interest income, fee and commission income and other operating income.
Income* Full-time- Profit before tax Tax on profit 2014 (DKK millions) equivalent staff (DKK millions) (DKK millions)
Denmark 54,872 10,567 8,296 -1,925
Finland 6,557 2,092 -3,236 -294
Sweden 9,651 1,277 3,490 -749
Norway 9,607 1,281 2,511 -637
United Kingdom 2,659 1,420 -914 -265
Ireland 703 101 -742 0
Estonia 400 489 -1,841 -61
Latvia 78 85 -18 14
Lithuania 247 994 66 -7
Luxembourg 746 92 128 -36
Russia 113 46 39 -8
Germany 256 32 110 -31
Poland 99 45 48 -9
USA 96 23 32 -9
India - 59 - -2
Total 86,082 18,603 7,969 -4,020
*Income is defined as interest income, fee and commission income and other operating income.

70 Danske Bank / Annual Report 2015
Notes – Danske Bank Group
4. Activities by country continued
Danske Bank carries out its activities in the countries listed below under a variety of names, of which the main ones are: Danske Bank (banking, trading and wealth management activities carried out in all countries, except for mortgage finance activities in Denmark, which are carried out under the Realkredit
Danmark A/S name, Danica Pension (life insurance), and Danske Leasing A/S (leasing). Note 35 discloses the company names of the Group’s significant
subsidiaries.
Activities in the individual countries
Activities in Denmark include: Banking, trading, wealth management, life insurance, leasing and other activities.
Activities in Finland include: Banking, trading, wealth management and leasing. Activities in Sweden include: Banking, trading, wealth management, life insurance and leasing.
Activities in Norway include: Banking, trading, wealth management, leasing, life insurance and other activities.
Activities in the United Kingdom include: Banking, trading and leasing. Activities in Ireland include: Banking.
Activities in Estonia include: Banking, wealth management and leasing.
Activities in Latvia include: Banking. Activities in Lithuania include: Banking, wealth management, leasing, life insurance and other activities.
Activities in Luxembourg include: Banking and wealth management.
Activities in Russia include: Banking. Activities in Germany include: Banking.
Activities in Poland include: Banking.
Activities in the USA include: Trading. Activities in India include: Other activities.
Other activities include: Group support functions, real-estate brokerage and activities taken over by the Group under non-performing-loan agreements.

Danske Bank / Annual Report 2015 71
Notes – Danske Bank Group
5. Net interest and net trading income
This note shows interest income, interest expense and net trading income broken down by balance sheet item and by portfolios of financial instruments measured at amortised cost or fair value.
Accounting policy
Interest income and expenses
Interest income and expenses arising from interest-bearing financial instruments measured at amortised cost are recognised according to the effec-tive interest rate method on the basis of the cost of the individual financial instrument. Interest includes amortised amounts of fees that are an inte-
gral part of the effective yield on a financial instrument, such as origination fees, and amortised differences between cost and redemption price, if any.
Interest on loans subject to individual impairment is recognised on the basis of the impaired value. The interest rate risk on most financial portfolios recognised at amortised cost is hedged by derivatives using fair value hedge accounting. Note 13 provides more information on hedge accounting.
Interest income and expenses arising from financial instruments measured at fair value also include origination fees on those instruments, except in-terest on assets and deposits under pooled schemes and unit-linked investment contracts which is recognised under Net trading income.
Net trading income
Net trading income includes realised and unrealised capital gains and losses on trading portfolio assets and other securities recognised at fair value
as well as exchange rate adjustments and dividends. Further, the fair value adjustments of Loans at fair value and bonds issued by Realkredit Dan-
mark are recognised in net trading income except for the fair value adjustments of the credit risk on loans that are recognised under Loan impairment charges. Moreover, the item includes the change in insurance obligations during the year due to additional provisions for benefit guarantees and the
tax on pension returns.
Returns (interest income and fair value changes) on assets under pooled schemes and unit-linked investment contracts and the crediting of these re-
turns to customer accounts are recognised under Net trading income.
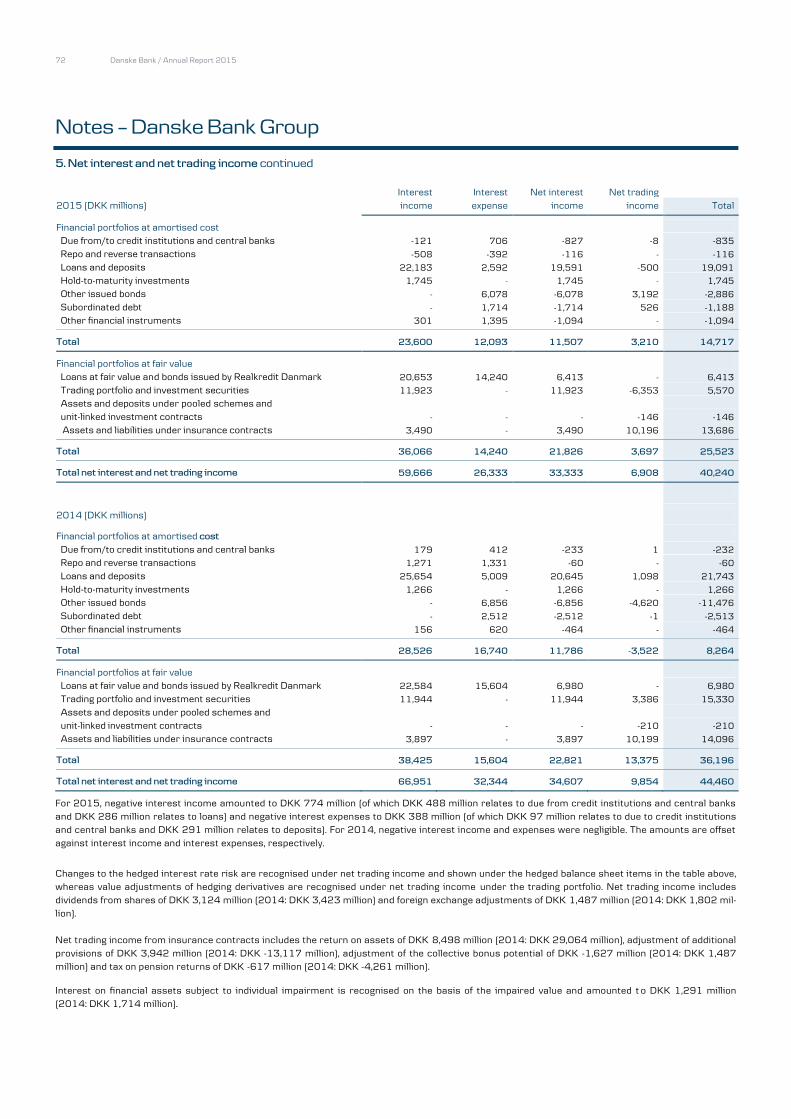
72 Danske Bank / Annual Report 2015
Notes – Danske Bank Group
5. Net interest and net trading income continued
Interest Interest Net interest Net trading
2015 (DKK millions) income expense income income Total
Financial portfolios at amortised cost
Due from/to credit institutions and central banks -121 706 -827 -8 -835
Repo and reverse transactions -508 -392 -116 - -116
Loans and deposits 22,183 2,592 19,591 -500 19,091
Hold-to-maturity investments 1,745 - 1,745 - 1,745
Other issued bonds - 6,078 -6,078 3,192 -2,886
Subordinated debt - 1,714 -1,714 526 -1,188
Other financial instruments 301 1,395 -1,094 - -1,094
Total 23,600 12,093 11,507 3,210 14,717
Financial portfolios at fair value
Loans at fair value and bonds issued by Realkredit Danmark 20,653 14,240 6,413 - 6,413
Trading portfolio and investment securities 11,923 - 11,923 -6,353 5,570
Assets and deposits under pooled schemes and
unit-linked investment contracts - - - -146 -146
Assets and liabilities under insurance contracts 3,490 - 3,490 10,196 13,686
Total 36,066 14,240 21,826 3,697 25,523
Total net interest and net trading income 59,666 26,333 33,333 6,908 40,240
2014 (DKK millions)
Financial portfolios at amortised cost
Due from/to credit institutions and central banks 179 412 -233 1 -232
Repo and reverse transactions 1,271 1,331 -60 - -60
Loans and deposits 25,654 5,009 20,645 1,098 21,743
Hold-to-maturity investments 1,266 - 1,266 - 1,266
Other issued bonds - 6,856 -6,856 -4,620 -11,476
Subordinated debt - 2,512 -2,512 -1 -2,513
Other financial instruments 156 620 -464 - -464
Total 28,526 16,740 11,786 -3,522 8,264
Financial portfolios at fair value
Loans at fair value and bonds issued by Realkredit Danmark 22,584 15,604 6,980 - 6,980
Trading portfolio and investment securities 11,944 - 11,944 3,386 15,330
Assets and deposits under pooled schemes and unit-linked investment contracts - - - -210 -210
Assets and liabilities under insurance contracts 3,897 - 3,897 10,199 14,096
Total 38,425 15,604 22,821 13,375 36,196
Total net interest and net trading income 66,951 32,344 34,607 9,854 44,460
For 2015, negative interest income amounted to DKK 774 million (of which DKK 488 million relates to due from credit institutions and central banks and DKK 286 million relates to loans) and negative interest expenses to DKK 388 million (of which DKK 97 million relates to due to credit institutions
and central banks and DKK 291 million relates to deposits). For 2014, negative interest income and expenses were negligible. The amounts are offset
against interest income and interest expenses, respectively.
Changes to the hedged interest rate risk are recognised under net trading income and shown under the hedged balance sheet items in the table above, whereas value adjustments of hedging derivatives are recognised under net trading income under the trading portfolio. Net trading income includes
dividends from shares of DKK 3,124 million (2014: DKK 3,423 million) and foreign exchange adjustments of DKK 1,487 million (2014: DKK 1,802 mil-
lion).
Net trading income from insurance contracts includes the return on assets of DKK 8,498 million (2014: DKK 29,064 million), adjustment of additional
provisions of DKK 3,942 million (2014: DKK -13,117 million), adjustment of the collective bonus potential of DKK -1,627 million (2014: DKK 1,487 million) and tax on pension returns of DKK -617 million (2014: DKK -4,261 million). Interest on financial assets subject to individual impairment is recognised on the basis of the impaired value and amounted t o DKK 1,291 million
(2014: DKK 1,714 million).

Danske Bank / Annual Report 2015 73
Notes – Danske Bank Group
6. Fee income and expenses
Fee income and expenses are broken down into fees generated by activities and fees generated by portfolios. Fees generated by activities comprises fees for the execution of one-off transactions. Fees generated by portfolios comprises recurring fees from the product portfolio.
Accounting policy
Income from and expenses for services provided over a period of time, such as guarantee commissions and investment management fees, are ac-
crued over the period. Transaction fees, such as brokerage and custody fees, are recognised on settlement of the individual transaction. Fees that form an integral part of the effective rates of interest on loans and deposits are carried under Interest income and Interest expense. Fees for Loans at
fair value are carried under Fee income, except for origination fees, which are carried under Net interest income.
(a) Fee income (DKK millions) 2015 2014
Financing (loans and guarantees) 2,363 2,025
Investment (securities trading and advisory services) 2,551 2,549
Services (insurance and foreign exchange trading) 65 59
Fees generated by activities 4,979 4,633
Financing (guarantees) 659 639
Investment (asset management and custody services) 6,280 5,282
Services (payment services and cards) 3,648 4,032
Fees generated by portfolios 10,587 9,953
Total 15,566 14,585
(b) Fee expenses (DKK millions) 2015 2014
Financing (property valuation) 243 69
Investment (securities trading and advisory services) 833 1,275
Services (referrals) 68 69
Fees generated by activities 1,144 1,413
Financing (guarantees) 15 14
Investment (asset management and custody services) 1,364 1,246
Services (payment services and cards) 2,364 2,098
Fees generated by portfolios 3,743 3,358
Total 4,887 4,771
Fees for financial instruments not recognised at fair value, such as loans and issued bonds, are recognised as financing fee income or expenses. Such income amounted to DKK 2,520 million (2014: DKK 2,208 million), whereas expenses amounted to DKK 15 million (2014: DKK 14 million).
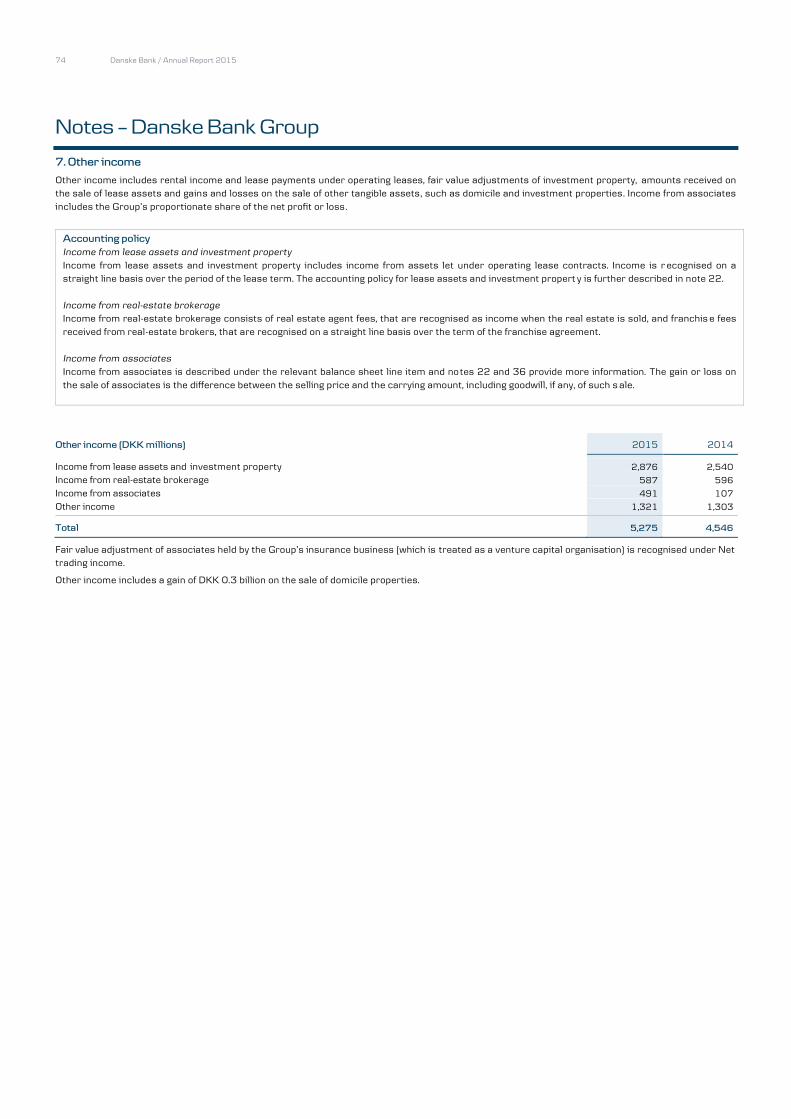
74 Danske Bank / Annual Report 2015
Notes – Danske Bank Group
7. Other income
Other income includes rental income and lease payments under operating leases, fair value adjustments of investment property, amounts received on the sale of lease assets and gains and losses on the sale of other tangible assets, such as domicile and investment properties. Income from associates
includes the Group’s proportionate share of the net profit or loss .
Accounting policy
Income from lease assets and investment property
Income from lease assets and investment property includes income from assets let under operating lease contracts. Income is r ecognised on a straight line basis over the period of the lease term. The accounting policy for lease assets and investment propert y is further described in note 22.
Income from real-estate brokerage
Income from real-estate brokerage consists of real estate agent fees, that are recognised as income when the real estate is sold, and franchis e fees
received from real-estate brokers, that are recognised on a straight line basis over the term of the franchise agreement.
Income from associates
Income from associates is described under the relevant balance sheet line item and notes 22 and 36 provide more information. The gain or loss on
the sale of associates is the difference between the selling price and the carrying amount, including goodwill, if any, of such s ale.
Other income (DKK millions) 2015 2014
Income from lease assets and investment property 2,876 2,540
Income from real-estate brokerage 587 596
Income from associates 491 107
Other income 1,321 1,303
Total 5,275 4,546
Fair value adjustment of associates held by the Group’s insurance business (which is treated as a venture capital organisation) is recognised under Net trading income.
Other income includes a gain of DKK 0.3 billion on the sale of domicile properties.
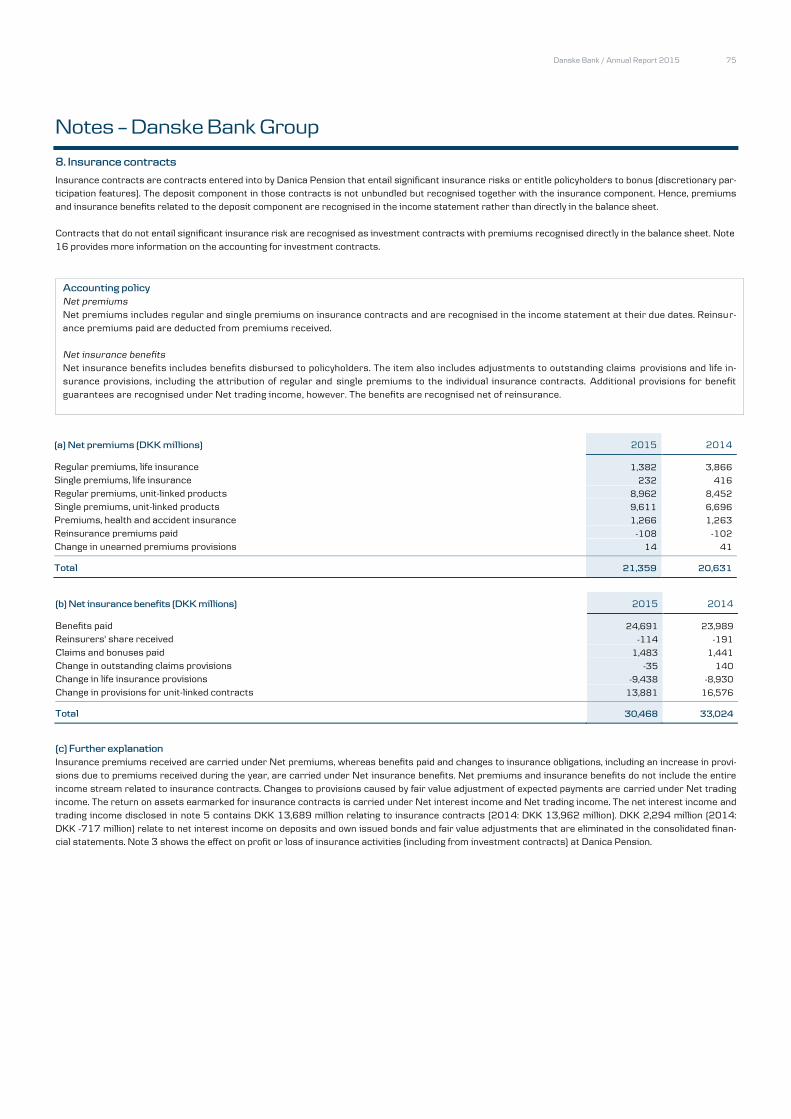
Danske Bank / Annual Report 2015 75
Notes – Danske Bank Group
8. Insurance contracts
Insurance contracts are contracts entered into by Danica Pension that entail significant insurance risks or entitle policyholders to bonus (discretionary par-ticipation features). The deposit component in those contracts is not unbundled but recognised together with the insurance component. Hence, premiums
and insurance benefits related to the deposit component are recognised in the income statement rather than directly in the balance sheet.
Contracts that do not entail significant insurance risk are recognised as investment contracts with premiums recognised directly in the balance sheet. Note
16 provides more information on the accounting for investment contracts.
Accounting policy
Net premiums
Net premiums includes regular and single premiums on insurance contracts and are recognised in the income statement at their due dates. Reinsur-
ance premiums paid are deducted from premiums received.
Net insurance benefits
Net insurance benefits includes benefits disbursed to policyholders. The item also includes adjustments to outstanding claims provisions and life in-surance provisions, including the attribution of regular and single premiums to the individual insurance contracts. Additional provisions for benefit
guarantees are recognised under Net trading income, however. The benefits are recognised net of reinsurance.
(a) Net premiums (DKK millions) 2015 2014
Regular premiums, life insurance 1,382 3,866
Single premiums, life insurance 232 416
Regular premiums, unit-linked products 8,962 8,452
Single premiums, unit-linked products 9,611 6,696
Premiums, health and accident insurance 1,266 1,263
Reinsurance premiums paid -108 -102
Change in unearned premiums provisions 14 41
Total 21,359 20,631
(b) Net insurance benefits (DKK millions) 2015 2014
Benefits paid 24,691 23,989
Reinsurers' share received -114 -191
Claims and bonuses paid 1,483 1,441
Change in outstanding claims provisions -35 140
Change in life insurance provisions -9,438 -8,930
Change in provisions for unit-linked contracts 13,881 16,576
Total 30,468 33,024
(c) Further explanation
Insurance premiums received are carried under Net premiums, whereas benefits paid and changes to insurance obligations, including an increase in provi-
sions due to premiums received during the year, are carried under Net insurance benefits. Net premiums and insurance benefits do not include the entire
income stream related to insurance contracts. Changes to provisions caused by fair value adjustment of expected payments are carried under Net trading income. The return on assets earmarked for insurance contracts is carried under Net interest income and Net trading income. The net interest income and
trading income disclosed in note 5 contains DKK 13,689 million relating to insurance contracts (2014: DKK 13,962 million). DKK 2,294 million (2014:
DKK -717 million) relate to net interest income on deposits and own issued bonds and fair value adjustments that are eliminated in the consolidated finan-cial statements. Note 3 shows the effect on profit or loss of insurance activities (including from investment contracts) at Danica Pension.

76 Danske Bank / Annual Report 2015
Notes – Danske Bank Group
9. Operating expenses
Operating expenses includes staff costs, administrative expenses, depreciation, amortisation and impairment charges on tangible and intangible a s-sets. However the impairment charge on goodwill and customer relations of DKK 4,601 million recognised in the fourth quarter of 2015 is, presented
as a separate line item in the income statement. Note 18 provides more information about the impairment on goodwill and customer relations.
Accounting policy
Staff costs
This item includes salaries, performance-based pay, expenses for share-based payments, holiday allowances, anniversary bonuses, pension costs and
other remuneration. Salaries and other remuneration that the Group expects to pay are expensed when the employees render the services. Perform-
ance-based remuneration is expensed as it is earned.
Share-based payment
Part of the performance-based remuneration for the year is paid in the form of conditional shares. Rights to conditional shares vest up to f our years after the grant date, provided that the employee, with the exception of retirement, has not res igned from the Group. In addition to this requirement, the
vesting of rights is conditional on certain targets being met. Until 2008, part of the performance-based remuneration was paid in equity-settled op-
tions. The share options could be exercised within three to seven years after the grant date and were conditional on the employee’s not having re-signed. By the end of 2015, no share options were outstanding. The fair value of share-based payments at the grant date is expensed over the vesting
period with the intrinsic value expensed in the year in which the share-based payments are earned, and the time value (if any) accrued over the re-
maining service period. Expenses are set off against shareholders’ equity. Subsequent fair value adjustments are not recognised in the income state-ment.
Pension obligations The Group’s contributions to defined contribution pension plans are recognised in the income statement as they are earned by the employees. For de-
fined benefit pension plans, the Group expenses the standard cost. Actuarial gains or losses as a result of the difference between expected trends in
pension assets and benefits and actual trends are recognised in Other comprehensive income.
Amortisation, depreciation and impairment charges
In addition to amortisation, depreciation and impairment charges for intangible and tangible assets, the Group expenses the carrying amount of lease assets sold at the expiry of a lease agreement.
(a) Staff costs, administrative expenses, depreciations and impairment charges (DKK millions) 2015 2014
Staff costs 13,938 14,192
Administrative expenses 8,177 8,839
Amortisation/depreciation of intangible and tangible assets 2,782 2,542
Impairment charges for intangible and tangible assets before goodwill impairment charges -112 70
Total 24,785 25,642
Administrative expenses includes a preliminary contribution for 2015 to the new Danish resolution fund of DKK 194 million.
Staff costs 2015 2014
Salaries 10,222 10,448
Share-based payments 190 123
Pension, defined contribution plans 1,218 1,279
Pension, defined benefit plans 198 174
Severance payments 589 640
Financial services employer tax and social security costs 1,520 1,529
Total 13,938 14,192
Remuneration Report 2015, which is available at www.danskebank.com/remuneration, provides a detailed description of remuneration paid.
Total salary costs amounted to DKK 12.4 billion (2014: DKK 12.6 billion), with variable remuneration accounting for 6.3% of this amount (2014:
6.5%). Note 33 provides more information on share-based payments.

Danske Bank / Annual Report 2015 77
Notes – Danske Bank Group
9. Operating expenses continued
(b) Pension plans
Most of the Group’s pension plans are defined contribution plans under which the Group pays contributions to insurance companies, including Danica Pen-
sion. Such payments are expensed regularly. The Group has to a minor extent entered into defined benefit pension plans. Under defined benefit pension
plans, the Group is under an obligation to pay defined future benefits from the time of retirement. Defined benefit plans are typically funded by ordinary con-
tributions made by employers and employees to separate pension funds investing the contributions on behalf of the members to fund future pension obliga-
tions. Defined benefit plans in Northern Ireland and Ireland account for most of the Group’s obligations under such plans, but the Group also has a small number of defined benefit plans in Denmark and Sweden. The plans in these countries do not accept new members and for most of the plans, contributions
payable by existing members have been discontinued.
The present value of obligations under defined benefit plans less the fair value of pension assets is recognised for each plan under Other assets and Other
liabilities. At 31 December 2015, the net present value of pension obligations was DKK 16,934 million (31 December 2014: DKK 18,121 million), and the
fair value of plan assets was DKK 19,040 million (31 December 2014: DKK 19,533 million). The Group recognises the standard cost in the income state-ment, whereas actuarial gains or losses are recognised in Other comprehensive income.
The calculation of the net obligation is based on valuations made by external actuaries. These valuations rely on assumptions about a number of variables, including discount and mortality rates and salary increases. Pension asset ceiling constraints also apply when recognising the ultimate cost for the pension
plans. Following a review of such constraints, the recognised net pension asset for the Group has been reduced by DKK 0.9 billion in 2014, based on man-
agement’s best estimate of future economic benefits available. The measurement of the net obligation is particularly sensitive to changes in the discount rate. The discount rate is determined by reference to yields on high-quality corporate bonds with terms matching the terms of the pension obligations. If the
discount rate were lowered half a percentage point, the gross pension obligation would increase DKK 1.5 billion (2014: DKK 1.6 billion). The amount would
be recognised in Other comprehensive income.

78 Danske Bank / Annual Report 2015
Notes – Danske Bank Group
10. Audit fees
Audit fees (DKK millions) 2015 2014
Audit firms appointed by the general meeting
Fees for statutory audit of the consolidated and parent company financial statements 16 4
Fees for other assurance engagements 4 1
Fees for tax advisory services 1 3
Fees for other services 14 1
Total 35 9
Other audit firms Fees for statutory audit of the consolidated and parent company financial statements 1 6
Fees for other assurance engagements - 1
Fees for tax advisory services - 1
Fees for other services - 1
Total 1 9
Total audit fees 36 18
At the general meeting in 2015, Deloitte Statsautoriseret Revisionspartnerskab was appointed as external auditors and replaced Ernst & Young P/S. From
2015, the external auditors conduct the financial audit that was previously conducted by the internal audit department. Costs for the internal audit depart-
ment are recognised under Operating expenses.
11. Loan impairment charges
Loan impairment charges include losses on and impairment charges against loans, provisions for loan commitments and guarantees, as well as fair value adjustments of the credit risk on loans measured at fair value.
The item also includes impairment charges and realised gains and losses on tangible assets and group undertakings taken over by the Group under non-performing loan agreements if the assets qualify as held-for-sale assets. Similarly, subsequent value adjustments of assets that the Group has taken over and does not expect to sell within 12 months are recognised under loan impairment charges, provided that the Group has a right of recourse
against the borrower.
Accounting policy
The accounting policy for when a loan impairment charge is recognised and how the charge is determined is described under the relevant balance
sheet line items. Notes 14, 15 and 22 provide more information.
Loan impairment charges (DKK millions) 2015 2014
Due from credit institutions and central banks -13 5
Loans at amortised cost -435 2,516
Loans at fair value 432 1,262
Loan commitments and guarantees etc. -47 -65
Total -61 3,718
New and increased impairment charges 7,601 12,226
Reversals of impairment charges 7,224 9,300
Write-offs charged directly to income statement 835 2,198
Received on claims previously written off 980 966
Interest income, effective interest method -294 -439
Total -61 3,718

Danske Bank / Annual Report 2015 79
Notes – Danske Bank Group
12. Trading portfolio assets and liabilities
Trading portfolio assets comprise the equities and bonds held by the Group’s trading departments at C&I and all derivatives with positive fair value. Trading portfolio liabilities consist of derivatives with negative fair value and obligations to deliver securities (obligati ons to repurchase securities).
Accounting policy
The trading portfolio is recognised at fair value through profit or loss. Realised and unrealised capital gains and losses and dividends are recognised in
the income statement under Net trading income. Fair value is the amount for which a financial asset can be sold or a financial liability be transferred to a knowledgeable, willing third party. Note 30 provides information about fair value measurement and fair value adjustments.
The Group uses fair value hedge accounting when the criteria in IAS 39 are fulfilled. The derivatives used as hedging instruments are presented in the balance sheet together with other derivatives.
(a) Trading portfolio assets (DKK millions) 2015 2014
Derivatives with positive fair value 331,015 409,442 Listed bonds 193,421 324,573 Unlisted bonds 1,776 524 Listed shares 19,955 7,442 Unlisted shares 852 532
Total 547,019 742,513
(b )Trading portfolio liabilities (DKK millions) 2015 2014
Derivatives with negative fair value 320,270 389,746 Obligations to repurchase securities 150,861 160,883
Total 471,131 550,629
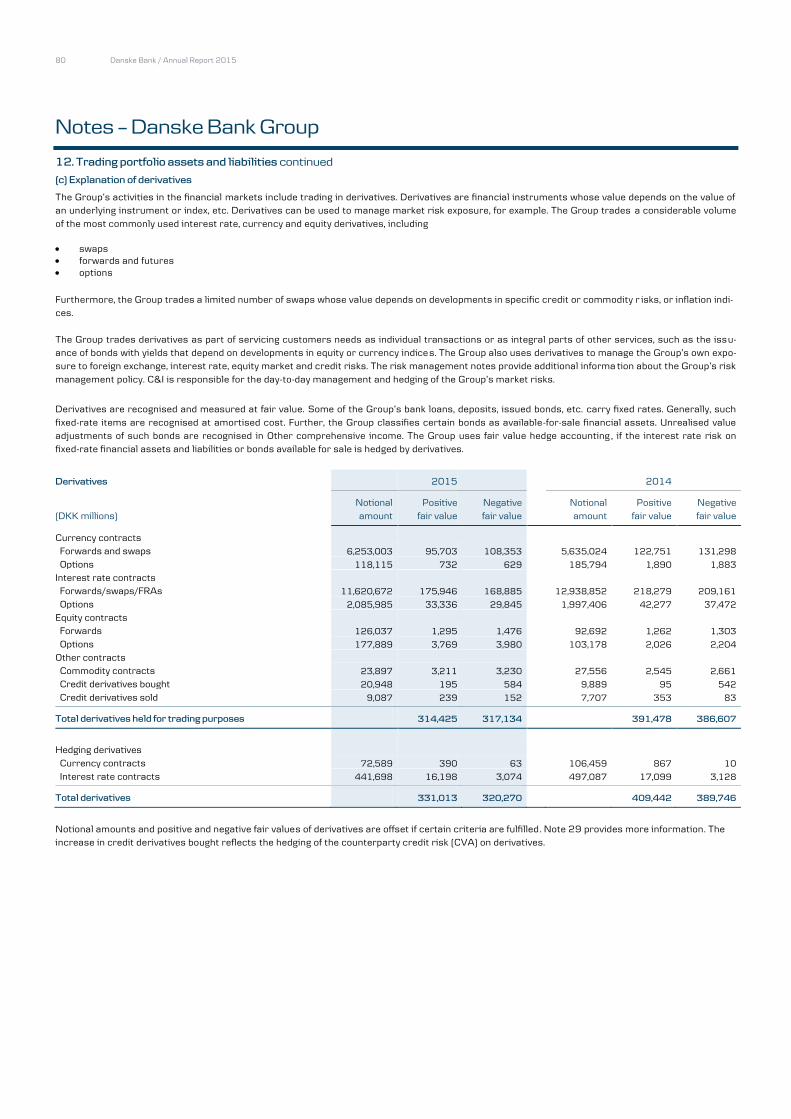
80 Danske Bank / Annual Report 2015
Notes – Danske Bank Group
12. Trading portfolio assets and liabilities continued
(c) Explanation of derivatives
The Group’s activities in the financial markets include trading in derivatives. Derivatives are financial instruments whose value depends on the value of an underlying instrument or index, etc. Derivatives can be used to manage market risk exposure, for example. The Group trades a considerable volume
of the most commonly used interest rate, currency and equity derivatives, including
swaps forwards and futures options
Furthermore, the Group trades a limited number of swaps whose value depends on developments in specific credit or commodity r isks, or inflation indi-
ces.
The Group trades derivatives as part of servicing customers needs as individual transactions or as integral parts of other services, such as the issu-
ance of bonds with yields that depend on developments in equity or currency indices. The Group also uses derivatives to manage the Group’s own expo-sure to foreign exchange, interest rate, equity market and credit risks. The risk management notes provide additional informa tion about the Group’s risk
management policy. C&I is responsible for the day-to-day management and hedging of the Group’s market risks.
Derivatives are recognised and measured at fair value. Some of the Group’s bank loans, deposits, issued bonds, etc. carry fixed rates. Generally, such
fixed-rate items are recognised at amortised cost. Further, the Group classifies certain bonds as available-for-sale financial assets. Unrealised value
adjustments of such bonds are recognised in Other comprehensive income. The Group uses fair value hedge accounting , if the interest rate risk on fixed-rate financial assets and liabilities or bonds available for sale is hedged by derivatives.
Derivatives
2015
2014
Notional Positive Negative
Notional Positive Negative
(DKK millions) amount fair value fair value
amount fair value fair value
Currency contracts
Forwards and swaps 6,253,003 95,703 108,353
5,635,024 122,751 131,298
Options 118,115 732 629
185,794 1,890 1,883
Interest rate contracts
Forwards/swaps/FRAs 11,620,672 175,946 168,885
12,938,852 218,279 209,161
Options 2,085,985 33,336 29,845
1,997,406 42,277 37,472
Equity contracts
Forwards 126,037 1,295 1,476
92,692 1,262 1,303
Options 177,889 3,769 3,980
103,178 2,026 2,204
Other contracts
Commodity contracts 23,897 3,211 3,230
27,556 2,545 2,661
Credit derivatives bought 20,948 195 584
9,889 95 542
Credit derivatives sold 9,087 239 152
7,707 353 83
Total derivatives held for trading purposes 314,425 317,134 391,478 386,607
Hedging derivatives
Currency contracts 72,589 390 63
106,459 867 10
Interest rate contracts 441,698 16,198 3,074
497,087 17,099 3,128
Total derivatives 331,013 320,270 409,442 389,746
Notional amounts and positive and negative fair values of derivatives are offset if certain criteria are fulfilled. Note 29 provides more information. The increase in credit derivatives bought reflects the hedging of the counterparty credit risk (CVA) on derivatives.

Danske Bank / Annual Report 2015 81
Notes – Danske Bank Group
12. Trading portfolio assets and liabilities continued
(d) Explanation of hedge accounting
Hedge of interest rate risk
The interest rate risk on fixed-rate assets and liabilities with terms longer than six months is generally hedged by derivatives. The interest rate risk on
fixed-rate loans extended by the Group’s operations in Finland, Northern Ireland and Ireland is, however, hedged by hedging the interest rate risk on
core free funds. Any interest rate risk not hedged by core free funds is hedged by derivatives. The interest rate risk on bonds classified as hold-to-
maturity is not hedged.
For hedged assets and liabilities to which a fixed rate of interest applies for a specified period of time starting at the commencement date of the agree-
ment, future interest payments are divided into basic interest and a profit margin and into periods of time. By entering int o swaps or forwards with matching payment profiles in the same currencies and for the same periods, the Group hedges the risk at a portfolio level from the commencement
date of the hedged items. The fair values of the hedged interest rate risk and the hedging derivatives are measured at frequent intervals to ensure that
changes in the fair value of the hedged interest rate risk lie within a band of 80-125% of the changes in the fair value of the hedging derivatives. Portfo-lios of hedging derivatives are adjusted if necessary.
With effective hedging, the hedged interest rate risk on hedged assets and liabilities is measured at fair value and recognis ed as a value adjustment of the hedged items. Value adjustments are carried in the income statement under Net trading income. Any ineffective portion of a hedge that lies within
the range for effective hedging is therefore also included under Net trading income.
At the end of 2015, the carrying amounts of effectively hedged fixed-rate financial assets and liabilities were DKK 60,744 million (31 December 2014:
DKK 60,260 million) and DKK 428,900 million (31 December 2014: DKK 502,402 million), respectively. The table below shows the value adjustments
of these assets and liabilities and the hedging derivatives. The value adjustments have been recognised in the income statement as Net trading income.
Effect of interest rate hedging on profit (DKK millions) 2015 2014
Effect of fixed-rate asset hedging on profit Hedged amounts due from credit institutions 2 5
Hedged loans -529 1,163 Hedged bonds available for sale -23 460 Hedging derivatives 556 -1,624
Total 6 4
Effect of fixed-rate liability hedging on profit Hedged amounts due to credit institutions -10 -4 Hedged deposits 29 -65 Hedged issued bonds 3,192 -4,620 Hedged subordinated debt 526 -1 Hedging derivatives -3,735 4,700
Total 2 10
Hedge of foreign exchange risk of net investments in foreign entities The Group hedges the foreign exchange risk of net investments in branches and subsidiaries outside Denmark by establishing fin ancing arrangements
in the matching currencies. The Group does not hedge the expected financial results of units outside Denmark or other future transactions. The foreign
exchange adjustments of the investments are recognised in Other comprehensive income together with the foreign exchange adjus tments of the fi-nancing arrangements designated as hedging of exchange rate fluctuations. The statement of comprehensive income shows the tra nslation amounts.
At the end of 2015, the carrying amount of financing arrangements in foreign currency used to hedge net investments in units outside Denmark
amounted to DKK 40,344 million (31 December 2014: DKK 42,884 million).

82 Danske Bank / Annual Report 2015
Notes – Danske Bank Group
13. Investment securities
Investment securities consists of financial assets which, under the fair value option, are designated at fair value through p rofit or loss, available-for-sale financial assets and hold-to-maturity financial assets.
Investment securities includes the liquidity portfolio managed by Group Treasury. The liquidity portfolio is recognised at fair value through the use of the
fair value option or is part of the hold-to-maturity portfolio. The Group has an available-for-sale bond portfolio. This portfolio was reclassified from the
held-for-trading category in 2008 when the IASB changed the reclassification provisions of IAS 39 in response to the significant distortion of the pric-ing of bonds at the time.
Accounting policy
Financial assets designated at fair value
Financial assets designated at fair value include securities that are managed on a fair value basis with no short -term profit taking. Realised and unre-
alised capital gains and losses and dividends are carried in the income statement under Net trading income.
Available-for-sale financial assets
This category comprises bonds only. The bonds are measured at fair value through Other comprehensive income. Unrealised value adjustments of hedged interest rate risks that qualify for fair value hedge accounting and impairment charges are, however, recognised under Net trading income.
The impairment charge equals the difference between the fair value at the time of calculation and amortised cost. If the fair value subsequently rises,
and the increase is attributable to one or more events that have occurred after the impairment charge was recognised, the Gro up reverses the charge in the income statement. The Group recognises interest income according to the effective interest method, including amortisation of the dif-
ference between cost and the redemption value over the term to maturity of the bonds. When bonds are sold, the Group reclassifies unrealised value
adjustments recognised in Other comprehensive income under Net trading income in the income statement.
Hold-to-maturity financial assets
Hold-to-maturity financial assets consists of bonds with quoted prices in an active market held for the purpose of gene rating a return until maturity. The bonds are measured at amortised cost. Interest income is recognised according to the effective interest method, including amortisation of the dif-
ference between cost and the redemption value over the term to maturity of the bonds. Fixed-rate bonds are not hedged.
(a) Investment securities (DKK millions) 2015 2014
Financial assets at fair value through profit or loss
Listed bonds 175,660 165,746
Unlisted bonds 25 25
Listed shares 105 53
Unlisted shares 1,542 1,772
Total financial assets designated at fair value through profit or loss 177,332 167,596
Available-for-sale financial assets
Listed bonds 46,770 58,543
Total available-for-sale financial assets 46,770 58,543
Total at fair value 224,102 226,139
Hold-to-maturity financial assets
Listed bonds 119,202 104,855
Unlisted bonds - -
Total investment securities 343,304 330,994
Danske Bank / Annual Report 2015 83
Notes – Danske Bank Group
13. Investment securities continued
(b) Further explanation
Financial assets designated at fair value through profit or loss
During 2014, the Group transferred the responsibility for the liquidity portfolio from FICC at C&I to Group Treasury. The liquidity portfolio is incorpo-
rated in the balance sheet management to optimise the balance sheet composition. The portfolio comprises primarily Danish mortgage bonds.
Available-for-sale financial assets Part of the bond portfolio that was reclassified in 2008 from the trading portfolio to the available-for-sale portfolio due to significant distortion of the
pricing of bonds has subsequently matured or been sold. For the part of the portfolio sold in 2015, the Group realised value adjustments of DKK 68 mil-
lion (2014: DKK 37 million) that were reclassified from Other comprehensive income to the income statement. The portfolio comprises primarily Da n-ish mortgage bonds and foreign covered bonds. Some 99% of the portfolio is rated AA or higher (2014: 97%), while the remaining portfolio has invest-
ment grade ratings.
In 2015, the Group recognised unrealised value adjustments of the reclassified bonds in the amount of DKK -72 million in the income statement, cor-
responding to the part of the interest rate risk that is hedged by derivatives (2014: DKK 460 million). The Group also recognised unrealised value ad-
justments of DKK -17 million (2014: DKK 283 million) in Other comprehensive income that would have been recognised in the income statement if re-classification had not taken place. The Group recognised interest income of DKK 368 million (2014: DKK 695 million) on the reclassified bonds.
Hold-to-maturity financial assets Hold-to-maturity financial assets consists of bonds with quoted prices in an active market held for the purpose of generating a retur n until maturity.
The bonds are primarily Danish mortgage bonds, government bonds and government-guaranteed bonds. Some 92% of the portfolio is rated AA or higher, while the remaining portfolio has investment grade ratings.

84 Danske Bank / Annual Report 2015
Notes – Danske Bank Group
14. Due from credit institutions and central banks and Loans at amortised cost
Most of the Group’s loans are recognised at amortised cost, the only exception being loans granted by Realkredit Danmark (see note 15) that are rec-ognised at fair value.
Accounting policy
At initial recognition, loans are measured at fair value plus transaction costs less origination fees and other charges. This us ually corresponds to the
amount disbursed to the customer. Subsequently, they are measured at amortised cost, using the effective interest method, less any impairment charges. The difference between the value at initial recognition and the redemption value is amortised over the term to matur ity and recognised under
Interest income. If fixed-rate loans are hedged effectively by derivatives, the fair value of the hedged interest rate risk is added to the of the assets.
Impairment
For significant loans for which default or other objective evidence of impairment exists, the Group determines the impairment charge individually. The
impairment charge equals the difference between the carrying amount of the loan and the present value of the most likely futu re cash flows from the loan and is assessed by credit officers.
For non-significant loans for which default or other objective evidence of impairment is identified, the Group calculates the individual impairment charge statistically. Loans for which objective evidence of impairment has not been identified are included in an assessment of collective impairment
at portfolio level. For individual impairment charges calculated statistically and for collectively assessed loans , the impairment charges are calculated
as the difference between the carrying amount of the loans in a portfolio and the present value of expected future cash flows.
(a) Due from credit institutions and central banks (DKK millions) 2015 2014
Reverse transactions 28,614 48,922
Other amounts due 75,251 63,929
Allowance account 7 91
Total 103,859 112,760
Due from credit institutions and central banks includes amounts due within three months totalled DKK 101,998 million at the end of 2015 (31 De-
cember 2014: DKK 109,667 million). This amount is included as Cash and cash equivalents in the Cash flow statement.
(b) Loans at amortised cost (DKK millions) 2015 2014
Reverse transactions 187,689 241,173
Other loans 917,929 887,370
Allowance account 26,361 35,641
Total 1,079,257 1,092,902
Loans included payments due under finance leases of DKK 24,877 million at the end of 2015 (31 December 2014: DKK 24,960 million). The section
on credit risk in the risk management notes provides information about the allowance account, including the reconciliation of changes in the allowance
account during the year.
(c) Further explanation
Objective evidence of impairment of loans exists if at least one of the following events has occurred:
1) The borrower is experiencing significant financial difficulty.
2) The borrower’s actions, such as default or delinquency in interest or principal payments, lead to a breach of contract.
3) The Group, for reasons relating to the borrower’s financial difficulty, grants to the borrower a concession that the Group would not otherwise have granted.
4) It becomes probable that the borrower will enter bankruptcy or other financial restructuring.
If a customer facility is past due 90 days or more, the customer is considered in default and an the impairment charge is recognis ed for the customer’s
total exposure.
Significant loans and amounts due are tested individually for impairment quarterly and the impairment charge is calculated individually. This is the case
for around 50% of the exposure subject to objective evidence of impairment.

Danske Bank / Annual Report 2015 85
Notes – Danske Bank Group
14. Due from credit institutions and central banks and Loans at amortised cost continued
The impairment charge equals the difference between the carrying amount of the loan and the present value of the most likely future cash flows from the loan and is assessed by credit officers. The present value of fixed-rate loans is calculated at the original effective interest rate, whereas the present
value of loans with a variable rate of interest is calculated at the current effective interest rate.
The customer’s debt is written down to the amount that the borrower is expected to be able to repay after financial restructuring. If financial restructur-ing is not possible, the debt is written down to the estimated recoverable amount in the event of bankruptcy, which depends, among other factors, on
the value of the collateral received by the Group. If the borrower’s ability to repay depends significantly on the assets that have been provided as colla t-
eral (asset financing), the customer’s debt is written down to the fair value of the collateral. The impairment charges are therefore sensitive to changes to the estimated value of collateral received. If the value of collateral decreased 10%, individual impairment charges would increase by about DKK 2.5
billion (2014: DKK 2.4 billion).
Loans without objective evidence of impairment are included in a collective assessment of the need for impairment charges. The collective assessment
also includes customers with objective evidence of impairment, but without need for impairment.
Collective impairment charges are calculated for loans with similar credit risk characteristics to recognise the losses that occur when the expected
cash flow from a group of customers deteriorates, i.e. when an increase in credit risk is not accompanied by adjustments to t he interest rate charged to
the customer to reflect the increase in credit risk. A charge is therefore recognised for customers that have been downgraded without changes being made to the credit margin. Charges are based on expectations of future changes in customers’ rating classifications (which is called “migration”) over
time, represented by the emergence period. If all customers were downgraded one rating category, the collective impairment ch arge would increase
about DKK 2.7 billion (2014: DKK 3.2 billion). The emergence period is assumed to be two years. If the emergence period is increased to three years, the collective impairment charge would increase DKK 0.3 billion.
When external market information indicates that an impairment event has occurred, even though it has not yet caused a change in rating, the Group registers an “early event” impairment charge. Early events represent an expected rating change because of deteriorating marke t conditions in an indus-
try. If a rating downgrade does not occur as expected, the charge is reversed. A management judgement is therefore applied to adjust the collective im-
pairment charge if the Group becomes aware of market conditions at the balance sheet date that are not fully reflected in the Group’s models. By the end of 2015, such collective impairment charges amounted to DKK 3.8 billion (2014: DKK 3.5 billion).
Collective impairment charges are calculated as the difference between the carrying amount of the loans in the portfolio and the present value of ex-pected future cash flows. The cash flows used to determine the present value of future cash flows are specified by means of parameters used for sol-
vency calculations and historical loss data adjusted for use in the financial statements, for example. The adjustm ent reflects the loss identification pe-
riod shown by the Group’s empirical data. This period is the period from the first significant downgrade to the determination of a loss at customer level.
Impairment charges for loans and guarantees are booked in an allowance account and set off against loans or recognised as provisions for guarantees.
Impairment charges for loans are recorded under Loan impairment charges in the income statement. If subsequent events show th at impairment is not
permanent, charges are reversed.
Loans that are considered uncollectible are written off. Write-offs are debited to the allowance account. Loans are written off once the usual collection procedure has been completed and the loss on the individual loan can be calculated. If the full loss is not expected to be realised until after a number of
years, for example in the event of administration of complex estates, a partial write-off is recognised, reflecting the Group’s claim less collateral, est i-
mated dividend and other cash flows.
In accordance with the effective interest method, interest is recognised on the basis of the value of the loans less impairme nt charges. Consequently,
part of the allowance account balance is set aside for future interest income.
d) Reconciliation of total allowance account
The total allowance account below relates to the Due from credit institutions and central banks, Loans at amortised cost, Loans at fair value, and Loan
commitments and guarantees balance sheet items.
(DKK millions) 2015 2014
Balance at 1 January 40,947 46,900
New and increased impairment charges 7,601 12,226
Reversals of impairment charges 7,224 9,300
Write-offs debited to the allowance account 9,716 7,322
Foreign currency translation 580 514
Other items* -775 -2,070
Balance at 31 December 31,412 40,947
*Other items include changes from the presentation of some loan portfolios as held for sale in 2014 and 2015 . Note 22, Other assets, provides more information.
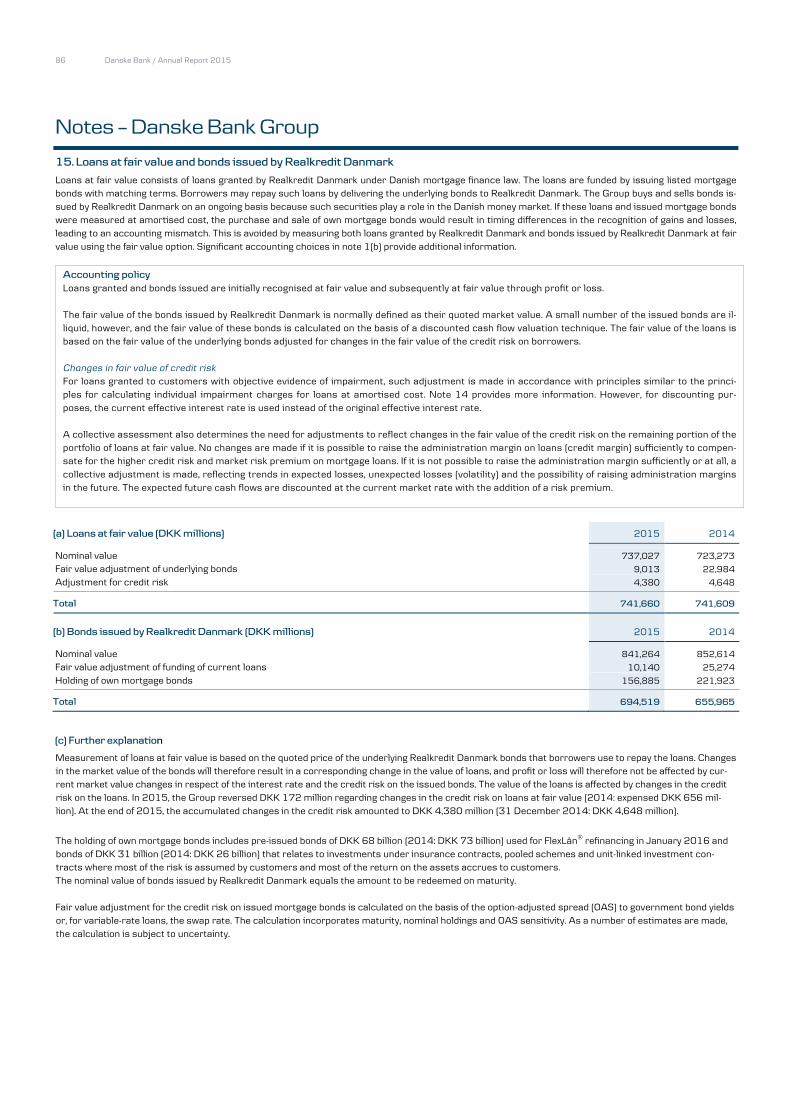
86 Danske Bank / Annual Report 2015
Notes – Danske Bank Group
15. Loans at fair value and bonds issued by Realkredit Danmark
Loans at fair value consists of loans granted by Realkredit Danmark under Danish mortgage finance law. The loans are funded by issuing listed mortgage bonds with matching terms. Borrowers may repay such loans by delivering the underlying bonds to Realkredit Danmark. The Group buys and sells bonds is-
sued by Realkredit Danmark on an ongoing basis because such securities play a role in the Danish money market. If these loans and issued mortgage bonds
were measured at amortised cost, the purchase and sale of own mortgage bonds would result in timing differences in the recognition of gains and losses,
leading to an accounting mismatch. This is avoided by measuring both loans granted by Realkredit Danmark and bonds issued by Realkredit Danmark at fair
value using the fair value option. Significant accounting choices in note 1(b) provide additional information.
Accounting policy
Loans granted and bonds issued are initially recognised at fair value and subsequently at fair value through profit or loss.
The fair value of the bonds issued by Realkredit Danmark is normally defined as their quoted market value. A small number of the issued bonds are il-
liquid, however, and the fair value of these bonds is calculated on the basis of a discounted cash flow valuation technique. The fair value of the loans is based on the fair value of the underlying bonds adjusted for changes in the fair value of the credit risk on borrowers.
Changes in fair value of credit risk
For loans granted to customers with objective evidence of impairment, such adjustment is made in accordance with principles similar to the princi-
ples for calculating individual impairment charges for loans at amortised cost. Note 14 provides more information. However, for discounting pur-
poses, the current effective interest rate is used instead of the original effective interest rate.
A collective assessment also determines the need for adjustments to reflect changes in the fair value of the credit risk on the remaining portion of the
portfolio of loans at fair value. No changes are made if it is possible to raise the administration margin on loans (credit margin) sufficiently to compen-sate for the higher credit risk and market risk premium on mortgage loans. If it is not possible to raise the administration margin sufficiently or at all, a
collective adjustment is made, reflecting trends in expected losses, unexpected losses (volatility) and the possibility of raising administration margins
in the future. The expected future cash flows are discounted at the current market rate with the addition of a risk premium.
(a) Loans at fair value (DKK millions) 2015 2014
Nominal value 737,027 723,273
Fair value adjustment of underlying bonds 9,013 22,984
Adjustment for credit risk 4,380 4,648
Total 741,660 741,609
(b) Bonds issued by Realkredit Danmark (DKK millions) 2015 2014
Nominal value 841,264 852,614
Fair value adjustment of funding of current loans 10,140 25,274
Holding of own mortgage bonds 156,885 221,923
Total 694,519 655,965
(c) Further explanation
Measurement of loans at fair value is based on the quoted price of the underlying Realkredit Danmark bonds that borrowers use to repay the loans. Changes in the market value of the bonds will therefore result in a corresponding change in the value of loans, and profit or loss will therefore not be affected by cur-rent market value changes in respect of the interest rate and the credit risk on the issued bonds. The value of the loans is affected by changes in the credit
risk on the loans. In 2015, the Group reversed DKK 172 million regarding changes in the credit risk on loans at fair value (2014: expensed DKK 656 mil-
lion). At the end of 2015, the accumulated changes in the credit risk amounted to DKK 4,380 million (31 December 2014: DKK 4,648 million).
The holding of own mortgage bonds includes pre-issued bonds of DKK 68 billion (2014: DKK 73 billion) used for FlexLån® refinancing in January 2016 and
bonds of DKK 31 billion (2014: DKK 26 billion) that relates to investments under insurance contracts, pooled schemes and unit-linked investment con-tracts where most of the risk is assumed by customers and most of the return on the assets accrues to customers.
The nominal value of bonds issued by Realkredit Danmark equals the amount to be redeemed on maturity.
Fair value adjustment for the credit risk on issued mortgage bonds is calculated on the basis of the option-adjusted spread (OAS) to government bond yields
or, for variable-rate loans, the swap rate. The calculation incorporates maturity, nominal holdings and OAS sensitivity. As a number of estimates are made,
the calculation is subject to uncertainty.
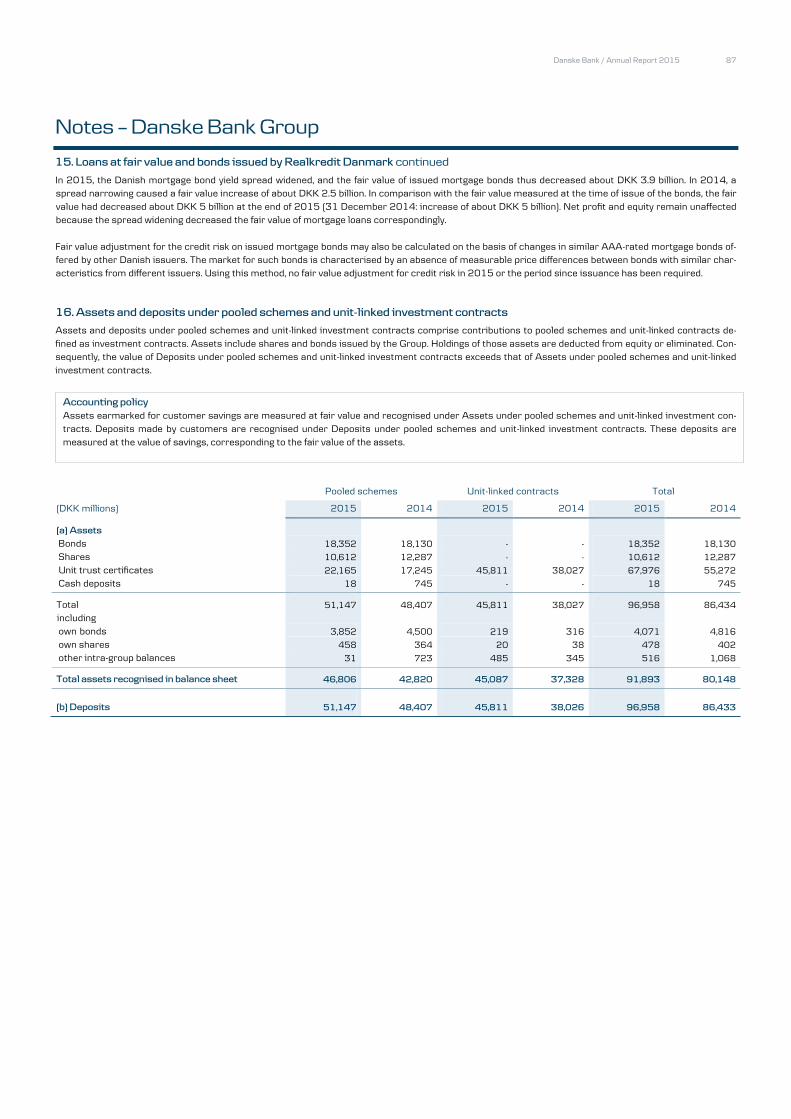
Danske Bank / Annual Report 2015 87
Notes – Danske Bank Group
15. Loans at fair value and bonds issued by Realkredit Danmark continued
In 2015, the Danish mortgage bond yield spread widened, and the fair value of issued mortgage bonds thus decreased about DKK 3.9 billion. In 2014, a spread narrowing caused a fair value increase of about DKK 2.5 billion. In comparison with the fair value measured at the time of issue of the bonds, the fair
value had decreased about DKK 5 billion at the end of 2015 (31 December 2014: increase of about DKK 5 billion). Net profit and equity remain unaffected
because the spread widening decreased the fair value of mortgage loans correspondingly.
Fair value adjustment for the credit risk on issued mortgage bonds may also be calculated on the basis of changes in similar AAA-rated mortgage bonds of-fered by other Danish issuers. The market for such bonds is characterised by an absence of measurable price differences between bonds with similar char-
acteristics from different issuers. Using this method, no fair value adjustment for credit risk in 2015 or the period since issuance has been required.
16. Assets and deposits under pooled schemes and unit-linked investment contracts
Assets and deposits under pooled schemes and unit-linked investment contracts comprise contributions to pooled schemes and unit-linked contracts de-
fined as investment contracts. Assets include shares and bonds issued by the Group. Holdings of those assets are deducted from equity or eliminated. Con-sequently, the value of Deposits under pooled schemes and unit-linked investment contracts exceeds that of Assets under pooled schemes and unit-linked
investment contracts.
Accounting policy
Assets earmarked for customer savings are measured at fair value and recognised under Assets under pooled schemes and unit-linked investment con-
tracts. Deposits made by customers are recognised under Deposits under pooled schemes and unit-linked investment contracts. These deposits are
measured at the value of savings, corresponding to the fair value of the assets.
Pooled schemes Unit-linked contracts Total
(DKK millions) 2015 2014 2015 2014 2015 2014
(a) Assets
Bonds 18,352 18,130 - - 18,352 18,130
Shares 10,612 12,287 - - 10,612 12,287
Unit trust certificates 22,165 17,245 45,811 38,027 67,976 55,272
Cash deposits 18 745 - - 18 745
Total 51,147 48,407 45,811 38,027 96,958 86,434
including
own bonds 3,852 4,500 219 316 4,071 4,816
own shares 458 364 20 38 478 402
other intra-group balances 31 723 485 345 516 1,068
Total assets recognised in balance sheet 46,806 42,820 45,087 37,328 91,893 80,148
(b) Deposits 51,147 48,407 45,811 38,026 96,958 86,433

88 Danske Bank / Annual Report 2015
Notes – Danske Bank Group
17. Assets and liabilities under insurance contracts
Assets under insurance contracts comprise assets earmarked for policyholders because most of the return accrues to policyholders. As the assets can be used only for payment of insurance liabilities, they are presented as a single line in the balance sheet. Liabilities under insurance contracts com-
prise primarily life insurance provisions and obligations for guaranteed benefits under unit-linked insurance contracts. Assets include shares and
bonds issued by the Group. The holding of those assets are deducted from equity or eliminated. Consequently, the value of Liabilities under insurance
contracts exceeds Assets under insurance contracts.
Accounting policy
Assets include financial assets, investment property, tangible assets and associates. The valuation technique used matches the Group’s accounting
policy for similar assets with the exception of holdings in associates. Such holdings are treated as held by a venture capital organisation and meas-ured at fair value.
Recognition of life insurance provisions is based on actuarial computations of the present value of expected benefits for each insurance contract. Ob-ligations for guaranteed benefits are calculated as the present value of the current guaranteed benefits plus the present value of expected future ad-
ministrative expenses less the present value of future premiums. The actuarial computations rely on assumptions about a number of variables, in-
cluding mortality and disability rates, and include an allowance for risk. Provisions for unit-linked insurance contracts are measured at fair value on the basis of each contract’s share of the earmarked assets and of the benefits guaranteed in the contract.
Policyholders’ share of the technical basis for insurance policies with a bonus entitlement not yet allocated to the individual policyholder is recognised in the collective bonus potential.
Liabilities also depend on the discount yield curve, which is determined by Danish rules on insurance accounting.
(a) Assets under insurance contracts (DKK millions) 2015 2014
Due from credit institutions 1,635 8,100
Investment securities 268,042 263,726
Holdings in associates 1,059 870
Investment property 23,895 20,386
Tangible assets 415 410
Reinsurers' share of provisions 145 2,283
Other assets 3,377 3,555
Total 298,568 299,330
including
own bonds 21,608 21,174
own shares 287 408
other intra-group balances 11,101 9,298
Total assets 265,572 268,450
Investment securities under insurance contracts (DKK millions) 2015 2014
Listed bonds 109,448 121,284
Listed shares 11,644 11,515
Unlisted shares 16,140 12,429
Unit trust certificates 114,062 99,102
Other securities 16,748 19,396
Total 268,042 263,726

Danske Bank / Annual Report 2015 89
Notes – Danske Bank Group
17. Assets and liabilities under insurance contracts continued
(b) Liabilities under insurance contracts (DKK millions) 2015 2014
Life insurance provisions 146,752 166,047
Provisions for unit-linked insurance contracts 114,817 99,370
Collective bonus potential 3,583 2,450
Other technical provisions 9,874 9,940
Total provisions for insurance contracts 275,026 277,807
Other liabilities 22,383 21,153
Intra-group balances -12,379 -10,608
Total 285,030 288,352
Provisions for insurance contracts (DKK millions) 2015 2014
Balance at 1 January 277,807 258,745
Premiums paid 20,192 19,429
Benefits paid -24,691 -23,989
Interest added to policyholders' savings 5,313 9,926
Fair value adjustment -5,094 13,591
Foreign currency translation -288 -1,167
Change in collective bonus potential 1,627 1,487
Other changes 160 -215
Balance at 31 December 275,026 277,807
(c) Further explanation
Life insurance provisions
Life insurance provisions comprise obligations towards policyholders to
pay guaranteed benefits
pay bonuses over time on agreed premiums not yet due pay bonuses on premiums and other payments due
Recognition of life insurance provisions is based on actuarial computations of the present value of expected future benefits for each insurance contract using the discount rate at the balance sheet date. These computations rely on assumptions about a number of variables, including mortality and disabil-
ity rates. Estimates of future mortality rates are based on Danish FSA benchmarks, while other estimates are based on empirical data from Danica
Pension’s portfolio of insurance contracts. Estimates are updated regularly. The insurance liability also includes an allowance for risk. Obligations for guaranteed benefits are calculated as the present value of the current guaranteed benefits plus the present value of expected future administrative ex-
penses less the present value of future premiums.
Danish rules on insurance accounting determine the discount yield curve, which is fixed on the basis of a zero-coupon yield curve estimated on the ba-
sis of Euro swap market rates to which is added a country spread between Danish and German government bonds, calculated as a 12-month moving
average. A mortgage yield spread is also added as stipulated by the agreement on financial stability in the pension and insurance industry signed by the Danish Ministry of Business and Growth and the Danish Insurance Association. For maturities beyond 20 years, the forward rate between 20 and 30
years is extrapolated, the forward rate at the 30–year mark being fixed at 4.2%. A sensitivity analysis showing the effect of changes in the assumptions
used is provided in the section on insurance risk in the risk management notes.
Provisions for unit-linked insurance contracts
Provisions are measured at fair value on the basis of each contract’s share of the earmarked assets and of the benefits guaranteed in the contract.
Collective bonus potential
Provisions for the collective bonus potential comprise policyholders’ share of the technical basis for insurance policies with a bonus entitlement not yet allocated to the individual policyholder.
Other technical provisions Other technical provisions includes outstanding claims provisions, unearned premiums provisions, and provisions for bonuses and premium discounts.
Other liabilities
Other liabilities includes the portion of Danica Pension’s other liabilities assumed by customers. Other types of liabilities are measured in accordance
with the Group’s accounting policies for such liability types.

90 Danske Bank / Annual Report 2015
Notes – Danske Bank Group
18. Intangible assets
Intangible assets consist of goodwill and customer relations taken over on the acquisition of undertakings. Further, acquired and internally developed software is recognised as an asset if certain criteria are fulfilled.
The Group did not make any acquisitions of undertakings in 2014 and 2015. In 2015, the Group recognised impairment charges of DKK 4.1 billion
(2014: DKK 9.1 billion) on goodwill and DKK 0.5 billion (2014: DKK 0 billion) on customer relations in the banking units in Finland, see further below.
Accounting policy Goodwill
Goodwill arises on the acquisition of an undertaking and is calculated as the difference between the cost (until 1 January 2010 including direct transaction costs) of the undertaking and the fair value of its net assets, including contingent liabilities, at the time of acquisition. Goodwill is allocated
to cash-generating units at the level at which management monitors the investment.
Goodwill is not amortised; instead, each cash-generating unit is tested for impairment once a year, or more frequently if indications of impairment
exist. Goodwill is written down to its recoverable amount through profit and loss if the carrying amount of the net assets of the cash-generating unit
exceeds the higher of the assets’ fair value less costs to sell and their value in use, which equals the present value of the future cash flows expected from the unit.
Goodwill on associates is recognised under Holdings in associates.
Other intangible assets
Identifiable intangible assets taken over on the acquisition of undertakings, such as customer relations, are measured at their fair value at the time of acquisition and amortised over their expected useful lives, usually five to ten years, according to the straight-line method and tested for impairment if
indications of impairment exist. Intangible assets with indefinite useful lives are not amortised, but the assets are tested for impairment at least once
a year according to principles similar to the principles applicable to goodwill.
Software acquired is measured at cost, including expenses incurred to make a software application ready for use. Software acquired is amortised
over its expected useful life, usually three years, according to the straight-line method.
Software developed by the Group is recognised as an asset if the cost of development is reliably measurable and analyses show that future earnings
from using the individual software applications exceed the cost. Cost includes expenses incurred to make a software application ready for use. Once a software application has been developed, the cost is amortised over its expected useful life, usually three years, according to the straight-line method.
The cost of development consists primarily of direct remuneration and other directly attributable development costs. Costs incurred in the planning
phase are not included but are expensed when incurred.
Software is tested for impairment if indications of impairment exist and is written down to its value in use.
(a) Intangible assets (DKK millions) 2015 2014
Goodwill 5,363 9,453
Customer relations 25 909
Software, acquired or internaly developed 1,116 891
Total 6,505 11,253
In 2015, the Group recognised software development costs of DKK 611 million as an asset (2014: DKK 397 million) and expensed DKK 2,056 million
(2014: DKK 2,080 million).
(b) Further explanation of impairment testing of goodwill and customer relations
The Group’s goodwill is tested for impairment at least once a year by testing at the level of identifiable cash-generating units to which goodwill have
been allocated. Further, if goodwill in a cash-generating unit is fully impaired a further impairment loss is recognised as an impairment loss on cus-tomer relations, if any.
The impairment test conducted in 2015 resulted in impairment charges of DKK 4,117 million on goodwill in the banking units in Finland and Northern Ireland and DKK 484 million on customer relations in the banking units in Finland. The reasons were a further worsening of the macroeconomic out-
look, with expectations of even lower interest levels than those applied in the impairment test 2014, and an increase in the capital allocated to the
banking units under the Group’s new capital allocation framework that will be implemented in 2016. In 2014, goodwill impairment charges of DKK 9,099 million were recognised following a worsening of the long-term economic outlook and from Danske Bank’s strategy of being a Nordic universal
bank.
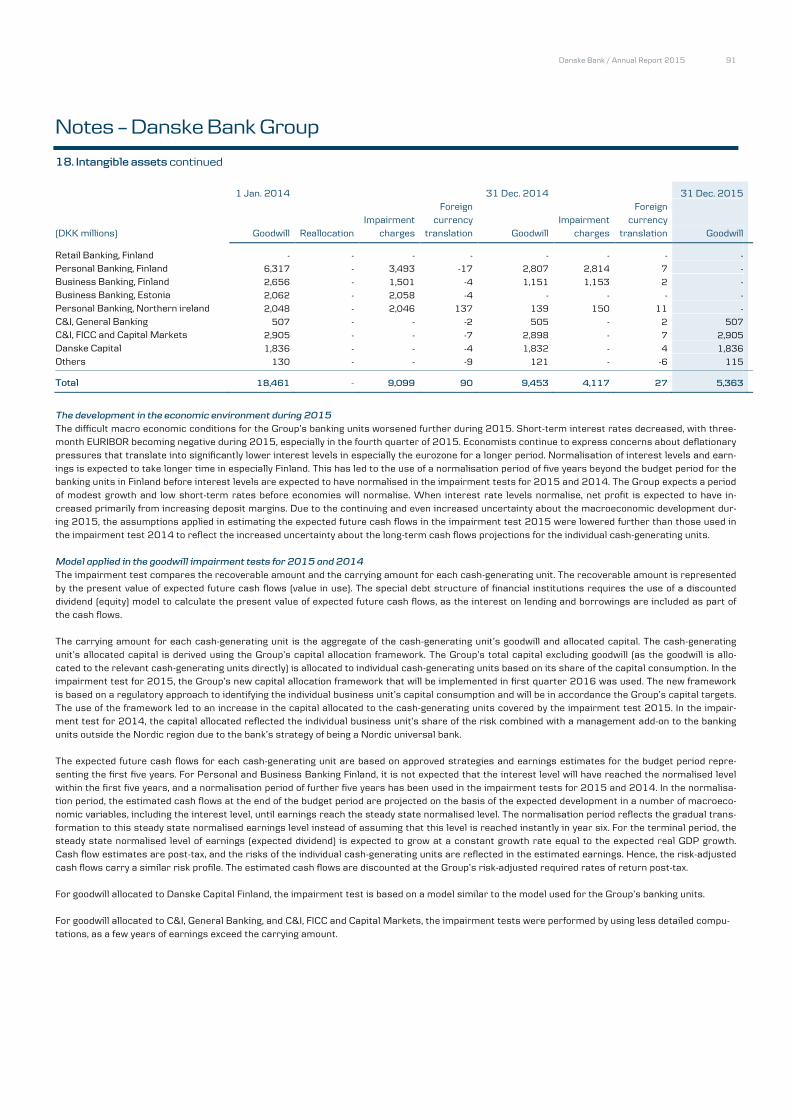
Danske Bank / Annual Report 2015 91
Notes – Danske Bank Group
18. Intangible assets continued
1 Jan. 2014
31 Dec. 2014
31 Dec. 2015
Foreign
Foreign
Impairment currency
Impairment currency
(DKK millions) Goodwill Reallocation charges translation Goodwill charges translation Goodwill
Retail Banking, Finland - - - - - - - - Personal Banking, Finland 6,317 - 3,493 -17 2,807 2,814 7 -
Business Banking, Finland 2,656 - 1,501 -4 1,151 1,153 2 -
Business Banking, Estonia 2,062 - 2,058 -4 - - - -
Personal Banking, Northern ireland 2,048 - 2,046 137 139 150 11 -
C&I, General Banking 507 - - -2 505 - 2 507
C&I, FICC and Capital Markets 2,905 - - -7 2,898 - 7 2,905
Danske Capital 1,836 - - -4 1,832 - 4 1,836
Others 130 - - -9 121 - -6 115
Total 18,461 - 9,099 90 9,453 4,117 27 5,363
The development in the economic environment during 2015
The difficult macro economic conditions for the Group’s banking units worsened further during 2015. Short-term interest rates decreased, with three-month EURIBOR becoming negative during 2015, especially in the fourth quarter of 2015. Economists continue to express concerns about deflationary
pressures that translate into significantly lower interest levels in especially the eurozone for a longer period. Normalisation of interest levels and earn-
ings is expected to take longer time in especially Finland. This has led to the use of a normalisation period of five years beyond the budget period for the banking units in Finland before interest levels are expected to have normalised in the impairment tests for 2015 and 2014. The Group expects a period
of modest growth and low short-term rates before economies will normalise. When interest rate levels normalise, net profit is expected to have in-
creased primarily from increasing deposit margins. Due to the continuing and even increased uncertainty about the macroeconomic development dur-ing 2015, the assumptions applied in estimating the expected future cash flows in the impairment test 2015 were lowered further than those used in
the impairment test 2014 to reflect the increased uncertainty about the long-term cash flows projections for the individual cash-generating units.
Model applied in the goodwill impairment tests for 2015 and 2014
The impairment test compares the recoverable amount and the carrying amount for each cash-generating unit. The recoverable amount is represented
by the present value of expected future cash flows (value in use). The special debt structure of financial institutions requires the use of a discounted dividend (equity) model to calculate the present value of expected future cash flows, as the interest on lending and borrowings are included as part of
the cash flows.
The carrying amount for each cash-generating unit is the aggregate of the cash-generating unit’s goodwill and allocated capital. The cash-generating
unit’s allocated capital is derived using the Group’s capital allocation framework. The Group’s total capital excluding goodwill (as the goodwill is allo-
cated to the relevant cash-generating units directly) is allocated to individual cash-generating units based on its share of the capital consumption. In the impairment test for 2015, the Group’s new capital allocation framework that will be implemented in first quarter 2016 was used. The new framework
is based on a regulatory approach to identifying the individual business unit’s capital consumption and will be in accordance the Group’s capital targets.
The use of the framework led to an increase in the capital allocated to the cash-generating units covered by the impairment test 2015. In the impair-ment test for 2014, the capital allocated reflected the individual business unit’s share of the risk combined with a management add-on to the banking
units outside the Nordic region due to the bank’s strategy of being a Nordic universal bank.
The expected future cash flows for each cash-generating unit are based on approved strategies and earnings estimates for the budget period repre-
senting the first five years. For Personal and Business Banking Finland, it is not expected that the interest level will have reached the normalised level
within the first five years, and a normalisation period of further five years has been used in the impairment tests for 2015 and 2014. In the normalisa-tion period, the estimated cash flows at the end of the budget period are projected on the basis of the expected development in a number of macroeco-
nomic variables, including the interest level, until earnings reach the steady state normalised level. The normalisation period reflects the gradual trans-
formation to this steady state normalised earnings level instead of assuming that this level is reached instantly in year six. For the terminal period, the steady state normalised level of earnings (expected dividend) is expected to grow at a constant growth rate equal to the expected real GDP growth.
Cash flow estimates are post-tax, and the risks of the individual cash-generating units are reflected in the estimated earnings. Hence, the risk-adjusted
cash flows carry a similar risk profile. The estimated cash flows are discounted at the Group’s risk-adjusted required rates of return post-tax.
For goodwill allocated to Danske Capital Finland, the impairment test is based on a model similar to the model used for the Group’s banking units.
For goodwill allocated to C&I, General Banking, and C&I, FICC and Capital Markets, the impairment tests were performed by using less detailed compu-
tations, as a few years of earnings exceed the carrying amount.

92 Danske Bank / Annual Report 2015
Notes – Danske Bank Group
18. Intangible assets continued
Key assumptions for goodwill impairment tests in 2015 and 2014
Cash flows until the terminal period
For the period until the terminal period, earnings in the Group’s banking units are affected by expectations of the interest level through the resulting ef-
fect on lending margins and on deposit margins in the banking units in Finland and Northern Ireland in particular, expectations of growth in lending and deposits, and on expectations of credit losses.
The interest levels used in the impairment test are based on Danske Research’s expectations of developments in overnight money market interest rates. The expectations are based on expected future growth and inflation. Due to the severe uncertainty, a management judgement was applied, result-
ing in the interest rate estimates mainly in the terminal period being revised downwards in the impairment test 2015 combined with a further sensitiv-
ity analysis to consider the effect of using reasonably possible alternative assumptions for interest rates. Similarly, in the impairment test 2014 a management judgement was applied, and economists’ expectations of the interest rate development were revised downwards.
The lending margin reflects the excess earnings on lending over the Group’s central funding costs. Lending margins are estimated based on actual lend-ing margins and management’s expectations of the future competition. The lending margin is assumed to be relatively stable irrespective of interest
level movements.
The deposit margin reflects the excess earnings achieved by the fact that the customer rates are lower than alternative funding. Deposit margins are
estimated based on actual deposit margins. Deposit margins are highly sensitive to changes in the interest level. How much of an increase in the inter-
est rate that is transferred to the deposit margin depends on the type of deposit. In the impairment test for 2015 and 2014, it has been assumed that the majority of the core free funds (non-maturing deposits carrying a zero interest rate) will be substituted by other interest-bearing deposits when the
interest level increases.
Expectations of growth in lending and deposits reflect the bank’s estimates/budgets for the first two years and thereafter Danske Research’s forecasts
of real GDP growth for the relevant markets. Expectations of long-term GDP growth are unchanged from the impairment test in 2014.
The expectations of credit losses are for the budget period based on the bank’s estimates/budgets for each year, reflecting historical data adjusted to
reflect the current situation. Thereafter, expected credit losses are kept constant and reflect historical data for long-term annual credit losses. In the
impairment test for 2015, the expected impairment levels have been adjusted upwards for Northern Ireland compared to the impairment test for 2014 following the merger of all units in Northern Ireland to a separate unit.
Earnings at Danske Capital depend primarily on the management fee on assets under management.Expected cash flows therefore depend on expecta-tions of changes in assets under management and of the average margin on those assets. For the period until the terminal period, changes in assets
under management depend on net sales and on the accumulation of market returns on the assets. In the impairment test 2015, net sales and market
return are expected to be 2.7% and 3.2%, respectively (2014: 4.3% and 1.5%). The average margin on asset under management is expected to be
0.3% (2014: 0.4%). All assumptions reflect Management’s expectations.
Cash flows in the terminal period
Cash flows in the terminal period reflect net earnings (dividend) in the preceding year growing at a constant rate. The growth estimates are determined
on the basis of Danske Research’s forecasts of real GDP growth for the relevant markets, which are unchanged from the impairment test for 2014 as
described above. Around 71% of the net present value of future cash flows is expected to be generated in the terminal period (2014: 68%).
Discount rate
The discount rate used to calculate the present value of expected future cash flows is unchanged from the test in 2014 and is 9% after tax, represent-ing 12% pre tax. The discount rate has been determined based on the Capital Asset Pricing Model and comprise a risk-free interest rate, the market
risk premium and a factor covering the systematic market risk (beta factor). The values for the risk-free interest rate, the market risk premium and the
beta factor are determined using external sources of information. The Group applies the same discount rate for all cash-generating units as the risks of the individual cash-generating units are reflected in their estimated cash flows.

Danske Bank / Annual Report 2015 93
Notes – Danske Bank Group
18. Intangible assets continued Impairment test assumptions
2015 Annual growth
Money market rate
until terminal in terminal
until terminal in terminal (%) period period Discount rate period period
Personal Banking, Finland 0.8-2.0 1.7 9.0 -0.1-2.1 2.1
Business Banking, Finland 0.8-2.0 1.7 9.0 -0.1-2.1 2.1
Personal Banking, Northern Ireland 2.0-2.3 2.0 9.0 0.9-2.7 2.7
Danske Capital - 1.7 9.0 - -
2014 Annual growth
Money market rate
until terminal in terminal
until terminal in terminal (%) period period Discount rate period period
Personal Banking, Finland 0.8-1.7 1.7 9.0 -0.1-3.0 3.0
Business Banking, Finland 0.8-1.7 1.7 9.0 -0.1-3.0 3.0
Personal Banking, Northern Ireland 2.0-2.3 2.0 9.0 0.9-3.25 3.25
Danske Capital - 1.7 9.0 - -
The expected cash flows in the impairment test for Danske Capital are not sensitive to changes in the overnight money market rate.
As mentioned above, significant uncertainty in the forecast of the future interest rate development exists. It is the Management’s assessment that a scenario of lower interest rates over a longer time horizon is not unlikely. For Personal Banking and Business Banking Finland and Personal Banking
Northern Ireland, the impairment test 2015 has therefore been combined with a sensitivity analysis to assess the impact of using reasonably possible
alternative assumptions for interest rates. These interest rates are disclosed in the table above and are used in the goodwill impairment. Management assess that these assumptions are reasonably possible alternative assumptions and has concluded that goodwill and customer relations in these
cash-generating units are fully impaired in 2015.
Sensitivity analysis, Danske Capital
For Danske Capital, the excess value (the amount by which the recoverable amount exceeds the carrying amount of goodwill) amounts to DKK 98 mil-
lion. If growth in asset under management until the terminal period were lowered by 0.5 percentage points to 1.2%, or the discount rate were increased
by 0.4 percentage points to 9.4%, the excess value would be zero.
Sensitivity analysis, impairment test 2014
If the expectation of the money market rate used in the impairment test 2014 were further decreased by 1 percentage point, representing a money
market interest rate of 2.0% in the terminal period, a further impairment loss of DKK 2.0 billion relating to the banking units in Finland would have been
recognised. If the discount rate were increased by 1 percentage point to 10%, the impairment loss would increase by DKK 1.3 billion. If the growth rate in the terminal period were reduced by 1 percentage point to 0.7%, a further impairment loss of DKK 0.7 billion would have been recognised. No other
cash-generated units with significant goodwill recognised at the end of 2014 would be impaired if reasonable alternative key assumptions were used.
The sensitivity analysis presented above does not include the effect that a change in one of the three key assumptions would have on the other two key assumptions, for example the effect that a change in the money market rate would have on the discount rate and the annual growth rate.

94 Danske Bank / Annual Report 2015
Notes – Danske Bank Group
18. Intangible assets continued
Personal Banking and Business Banking, Finland
In 2007, Danske Bank acquired the shares of the Sampo Bank group. The activities of the Sampo Bank group were incorporated into the business
structure of Danske Bank Group at the beginning of 2007. With the acquisition, the Group strengthened its competitive position in the entire northern
European market. In 2008, Banking Activities Finland migrated to the Group’s platform. At the beginning of 2011, Corporate & Institutional Banking was separated from Banking Activities Finland, resulting in a reallocation of goodwill. At the same time, the name was changed to Retail Banking
Finland. In 2012, rights to names were written down to zero when the Group decided to rebrand the banking units to Danske Bank. In 2013, goodwill at
Retail Banking Finland was reallocated to Personal Banking Finland and Business Banking Finland as a result of the new organisational structure. In 2014, the Group recognised goodwill impairment charges of DKK 4,994 million against the Personal Banking and Business Banking units in Finland
owing to a worsening of the long-term economic outlook in Finland. In 2015, an impairment charge on the remaining goodwill and the customer rela-
tions in these units of DKK 4,441 million was recognised. The impairment charge was recognised due to a further increase in the uncertainty about the long-term economic outlook and due to the increase in the allocated capital under the Group’s new capital allocation framework that will be imple-
mented in the first quarter of 2016.
Personal Banking, Northern Ireland
In 2005, Danske Bank acquired Northern Bank. The acquisition followed the Group’s strategy of strengthening its competitive position in the northern
European market. The launch of new product packages and other services supports Northern Bank’s position as a leading retail bank in the highly com-petitive Northern Ireland market. In 2013, the goodwill in Banking Activities Northern Ireland was allocated to Personal Banking Northern Ireland as a
result of the new organisational structure. In 2014, the Group recognised a goodwill impairment charge of DKK 2,046 million owing to a worsening of
the economic situation in Northern Ireland and the positioning of the Group as a Nordic universal bank. In the impairment test 2015, the cash-generating unit includes both Personal and Business Banking as Northern Ireland is operated and reported as a separate business unit from 2016. An
impairment charge on the remaining goodwill of DKK 139 million was recognised. The impairment reflects the further increase in the uncertainty about
the long-term economic outlook and due to the increase in the allocated capital under the Group’s new capital allocation framework that will be imple-mented in the first quarter of 2016.
Corporates & Institutions, General Banking
General Banking (formerly Corporate & Institutional Banking (CIB)) was established as a separate unit at the beginning of 2011, resulting in realloca-
tion of goodwill to the unit. As a result of the new organisational structure in 2012, General Banking became part of Corporates & Institutions.
Corporates & Institutions, FICC and Capital Markets
The trading activities of Sampo Bank were incorporated into the business structure of Danske Bank Markets. With the acquisition, the Group strength-
ened its competitive position within trading activities. The integration process and the budgets and business plans confirmed the financial assumptions on which the Group based its acquisition. As a result of the new organisational structure in 2012, Danske Bank Markets became part of Corporates &
Institutions.
Danske Capital
The wealth management activities of Sampo Bank were incorporated into the business structure of Danske Capital in 2007. In addition to the acquisi-
tion of Sampo Bank, goodwill recognised by Danske Capital is attributable to a number of minor acquisitions. With the acquisition of Sampo Bank, the Group strengthened its competitive position within asset management in Finland.
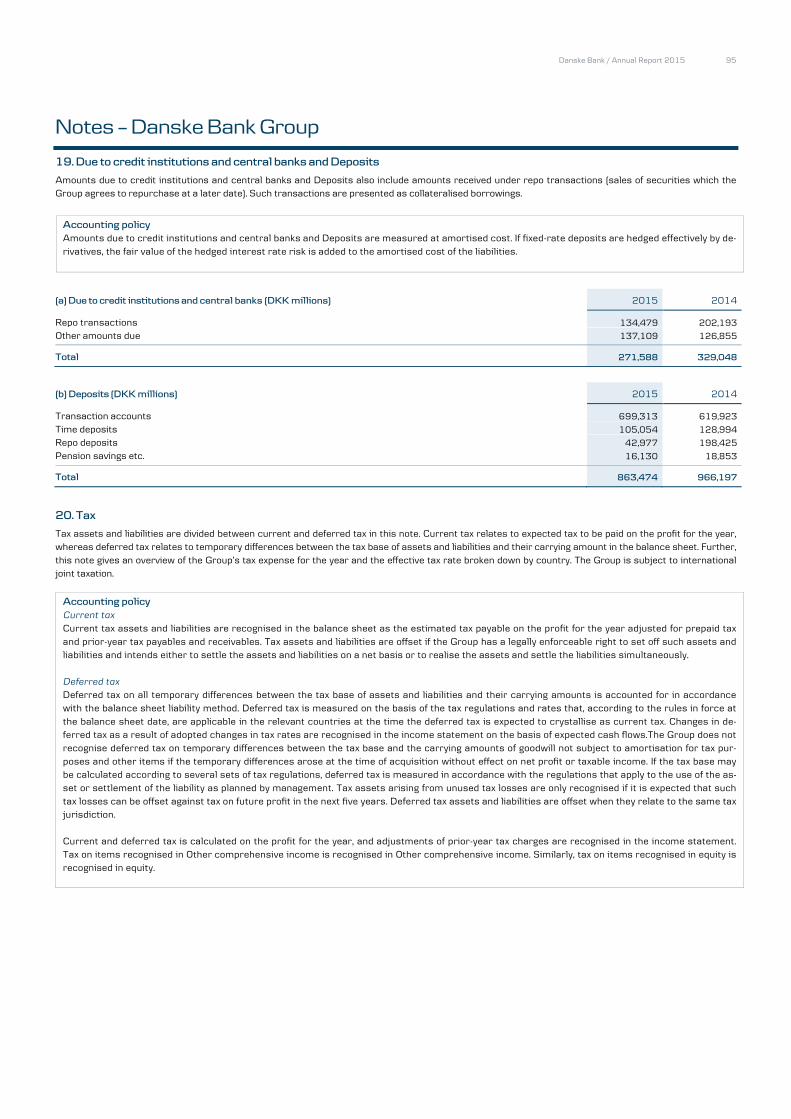
Danske Bank / Annual Report 2015 95
Notes – Danske Bank Group
19. Due to credit institutions and central banks and Deposits
Amounts due to credit institutions and central banks and Deposits also include amounts received under repo transactions (sales of securities which the Group agrees to repurchase at a later date). Such transactions are presented as collateralised borrowings.
Accounting policy
Amounts due to credit institutions and central banks and Deposits are measured at amortised cost. If fixed-rate deposits are hedged effectively by de-
rivatives, the fair value of the hedged interest rate risk is added to the amortised cost of the liabilities.
(a) Due to credit institutions and central banks (DKK millions) 2015 2014
Repo transactions 134,479 202,193
Other amounts due 137,109 126,855
Total 271,588 329,048
(b) Deposits (DKK millions) 2015 2014
Transaction accounts 699,313 619,923
Time deposits 105,054 128,994
Repo deposits 42,977 198,425
Pension savings etc. 16,130 18,853
Total 863,474 966,197
20. Tax
Tax assets and liabilities are divided between current and deferred tax in this note. Current tax relates to expected tax to be paid on the profit for the year, whereas deferred tax relates to temporary differences between the tax base of assets and liabilities and their carrying amount in the balance sheet. Further,
this note gives an overview of the Group’s tax expense for the year and the effective tax rate broken down by country. The Group is subject to international joint taxation.
Accounting policy
Current tax
Current tax assets and liabilities are recognised in the balance sheet as the estimated tax payable on the profit for the year adjusted for prepaid tax
and prior-year tax payables and receivables. Tax assets and liabilities are offset if the Group has a legally enforceable right to set off such assets and
liabilities and intends either to settle the assets and liabilities on a net basis or to realise the assets and settle the liabilities simultaneously.
Deferred tax
Deferred tax on all temporary differences between the tax base of assets and liabilities and their carrying amounts is accounted for in accordance
with the balance sheet liability method. Deferred tax is measured on the basis of the tax regulations and rates that, according to the rules in force at
the balance sheet date, are applicable in the relevant countries at the time the deferred tax is expected to crystallise as current tax. Changes in de-ferred tax as a result of adopted changes in tax rates are recognised in the income statement on the basis of expected cash flows.The Group does not
recognise deferred tax on temporary differences between the tax base and the carrying amounts of goodwill not subject to amortisation for tax pur-
poses and other items if the temporary differences arose at the time of acquisition without effect on net profit or taxable income. If the tax base may be calculated according to several sets of tax regulations, deferred tax is measured in accordance with the regulations that apply to the use of the as-
set or settlement of the liability as planned by management. Tax assets arising from unused tax losses are only recognised if it is expected that such
tax losses can be offset against tax on future profit in the next five years. Deferred tax assets and liabilities are offset when they relate to the same tax jurisdiction.
Current and deferred tax is calculated on the profit for the year, and adjustments of prior-year tax charges are recognised in the income statement. Tax on items recognised in Other comprehensive income is recognised in Other comprehensive income. Similarly, tax on items recognised in equity is
recognised in equity.

96 Danske Bank / Annual Report 2015
Notes – Danske Bank Group
20. Tax continued
(a) Tax assets and liabilities (DKK millions)
Tax assets Tax liabilities
2015 2014 2015 2014
Current tax charge 1,021 1,142 637 494
Deferred tax 529 401 7,696 8,153
Total tax 1,550 1,543 8,333 8,647
(b) Change in deferred tax (DKK millions) Foreign Included in Included in currency profit for shareholders'
2015 1 Jan. translation the year equity 31 Dec.
Intangible assets 192 - -177 - 15
Tangible assets 2,195 -1 -313 - 1,881
Securities 44 -2 -44 - -2
Provisions for obligations 107 9 49 70 235
Tax loss carryforwards -465 -28 150 - -343
Recapture of tax loss 6,428 - -485 - 5,943
Other -749 7 181 - -561
Total 7,752 -15 -639 70 7,168
Adjustment of prior-year tax charges included in above item -656
2014
Intangible assets 277 -3 -82 - 192
Tangible assets 2,193 -21 23 - 2,195
Securities 22 -2 24 - 44
Provisions for obligations 32 28 38 9 107
Tax loss carryforwards -640 -34 209 - -465
Recapture of tax loss 5,904 - 524 - 6,428
Other -605 15 -159 - -749
Total 7,183 -17 577 9 7,752
Adjustment of prior-year tax charges included in above item -145
Recognition of deferred tax requires management to assess the probability and amount of future profit. Deferred tax assets arising from unused tax
losses are recognised to the extent that such losses can be offset against tax on future profit. The tax base of unrecognised tax loss carry-forwards, re-lating primarily to the Group’s banking operations in Ireland, amounted to DKK 3.2 billion (31 December 2014: DKK 3.5 billion).
Recapture of tax loss consists of the full deferred tax liability arising from international joint taxation.

Danske Bank / Annual Report 2015 97
Notes – Danske Bank Group
20. Tax continued
(c) Tax expense
Tax 2015 (DKK millions) Denmark Finland Sweden Norway UK Ireland Other Total
Tax on profit for the year 2,318 376 734 604 322 -37 323 4,640
Tax on other comprehensive income -171 - 76 - -11 - - -106
Tax on changes in shareholders' equity -138 - - - - - - -138
Tax on profit for the year
Current tax charge 2,734 353 728 610 156 - 115 4,696
Transferred to other comprehensive income 176 - - - - - - 176
Change in deferred tax -197 6 -4 -18 197 - 20 4
Adjustment of prior-year tax charges -356 17 9 1 -72 -37 188 -250
Change in deferred tax charge as a result
of lowered tax rate -40 - - 11 42 - - 13
Total 2,318 376 734 604 323 -37 323 4,640
Effective tax rate %
Tax rate 23.5 20.0 22.0 27.0 20.3 12.5 22.3 22.4
Non-taxable income and non-deductible expenses* 15.2 -0.2 -1.4 -0.2 0.4 -12.5 1.1 5.1
Tax on profit for the year 38.7 19.8 20.6 26.8 20.7 - 23.4 27.5
Adjustment of prior-year tax charges -5.1 1.0 0.3 0.1 -4.2 -4.0 34.6 -1.4
Change in deferred tax charge as a result
of lowered tax rate -0.6 - - 0.5 2.5 - - 0.1
Effective tax rate 33.0 20.8 20.9 27.4 19.0 -4.0 58.0 26.2
Tax on other comprehensive income
Remeasurement of defined benefit plans 5 - 76 - -11 - - 70
Hedging of units outside Denmark -156 - - - - - - -156
Unrealised value adjustments of available- for-sale financial assets -4 - - - - - - -4
Realised value adjustments of available-
for-sale financial assets -16 - - - - - - -16
Total -171 - 76 - -11 - - -106
*Non-deductible expenses in Denmark consist primarily of goodwill impairment charges

98 Danske Bank / Annual Report 2015
Notes – Danske Bank Group
20. Tax continued
Tax 2014 (DKK millions) Denmark Finland Sweden Norway UK Ireland Other Total
Tax on profit for the year 1,847 381 749 638 265 - 140 4,020
Tax on other comprehensive income -45 - -15 - 26 - - -34
Tax on changes in shareholders' equity -49 - - - - - - -49
Tax on profit for the year
Current tax charge 1,259 370 762 637 36 - 145 3,209
Transferred to other comprehensive income 43 - - - - - - 43
Change in deferred tax 526 15 -20 60 212 - 6 799
Adjustment of prior-year tax charges 80 -4 7 -59 32 - -11 45
Change in deferred tax charge as a result
of lowered tax rate -61 - - - -15 - - -76
Total 1,847 381 749 638 265 - 140 4,020
Effective tax rate %
Tax rate 24.5 20.0 22.0 27.0 21.5 12.5 26.9 24.0
Non-taxable income and non-deductible expenses* -234.2 0.8 -0.7 0.2 0.2 -12.5 -1.2 26.5
Tax on profit for the year -209.7 20.8 21.3 27.2 21.7 - 25.7 50.5
Adjustment of prior-year tax charges -9.0 -0.2 0.2 -2.3 2.8 - -2.0 0.5
Change in deferred tax charge as a result
of lowered tax rate 7.0 - - - -1.3 - - -1.0
Effective tax rate -211.6 20.6 21.5 24.9 23.2 - 23.7 50.1
Tax on other comprehensive income
Remeasurement of defined benefit plans -2 - -15 - 26 - - 9
Hedging of units outside Denmark -106 - - - - - - -106
Unrealised value adjustments of available- for-sale financial assets 72 - - - - - - 72
Realised value adjustments of available-
for-sale financial assets -9 - - - - - - -9
Total -45 - -15 - 26 - - -34
*Non-deductible expenses in Denmark consist primarily of goodwill impairment charges

Danske Bank / Annual Report 2015 99
Notes – Danske Bank Group
21. Issued bonds
The Issued bonds presented in this note consist of senior and senior secured and subordinated bonds issued by the Group, with the exception of bonds is-sued by Realkredit Danmark and additional tier 1 capital accounted for as equity. Note 15 provides more information about bonds issued by Realkredit
Danmark and note 23 on the equity accounted additional tier 1 capital. Senior and senior secured bonds are presented under Other issued bonds, while
subordinated bonds are presented in a separate line item. Subordinated bonds are liabilities in the form of subordinated loan capital and other capital in-
struments which, in case of the Group’s voluntary or compulsory winding-up, will not be repaid until the claims of its ordinary creditors have been met.
Acconting policy
Issued bonds, both senior and senior secured and subordinated, are at initial recognition measured at fair value less transaction cost and subse-
quently measured at amortised cost plus the fair value of the hedged interest rate risk. Interest income is recognised according to the effective inter-est rate method, including amortisation of any difference between the amount received on issue and the redemption amount. However, a small part of
the issued commercial paper and certificates of deposit is part of the trading portfolio and therefore recognised at fair value through profit or loss.
Those issues are presented together with other issued bonds.
The yield on some issued bonds depends on an index that is not closely linked to the bonds’ financial characteristics, for example an equity or com-
modity index. Such embedded derivatives are bifurcated and measured at fair value in the trading portfolio.
(a) Other issued bonds (DKK millions) 2015 2014
Commercial paper and certificates of deposit 60,839 25,673 Other 303,092 304,534
Total 363,931 330,207
Other includes covered bonds and other senior bonds. Commercial paper and certificates of deposit include DKK 3.6 billion (2014: DKK 5.3 billion) recognised at fair value.
The issuance and redemption of other issued bonds during the year and the maturity of the outstanding bonds are presented in the tables below.
1 January
Foreign currency 31 December
Nominal value (DKK millions) 2015 Issued Redeemed translation 2015
Commercial paper and certificates of deposit 25,671 94,826 61,148 1,487 60,836 Other 342,520 82,414 78,861 4,707 350,780
Other issued bonds 368,191 177,240 140,009 6,194 411,616
1 January
Foreign currency 31 December
Nominal value (DKK millions) 2014 Issued Redeemed translation 2014
Commercial paper and certificates of deposit 25,253 91,526 92,663 1,555 25,671 Other 317,231 95,522 70,394 161 342,520
Other issued bonds 342,484 187,048 163,057 1,716 368,191
Broken down by maturity
2015
2014
(DKK millions) DKK Other currency Total Total
Redeemed loans
88,598
2016
1,000 120,113 121,113 57,321
2017
12,000 64,215 76,215 55,154
2018
15,970 37,574 53,544 40,501
2019 eller senere
14,689 146,055 160,744 126,617
Nominal value of other issued bonds
43,659 367,957 411,616 368,191
Fair value hedging of interest rate risk
10,550 13,714
Premium/discount
-1,033 -1,544
Own holding of bonds issued
9,259 47,943 57,202 50,154
Total other issued bonds
34,400 320,014 363,931 330,207

100 Danske Bank / Annual Report 2015
Notes – Danske Bank Group
21. Issued bonds continued
(b) Subordinated debt
Subordinated debt consists of liabilities in the form of issued subordinated bonds. Some of those bonds (presented as liability accounted additional tier
1 capital below) rank below other subordinated bonds. Early redemption of subordinated debt must be approved by the Danish FSA. Subordinated debt
is included in total capital in accordance with the Capital Requirements Regulation (CRR), including the provisions on grandfathering of instruments
that, prior to the CRR, fulfilled the requirements in section 128 of the Danish Financial Business Act and applicable orders.
The issuance and redemption of subordinated debt during the year and the maturity of the outstanding debt are presented in the tables below.
Foreign
1 Jan.
currency Other 31 Dec.
Nominal value (DKK millions) 2015 Issued Redeemed translation changes 2015
Subordinated debt, excluding liabilty accounted additional tier 1 capital 26,025 3,731 5,211 378 - 24,923
Liability accounted additional tier 1 capital 13,128 - - 456 - 13,584
Total subordinated debt 39,153 3,731 5,211 834 - 38,507
Foreign
1 Jan.
currency Other 31 Dec.
Nominal value (DKK millions) 2014 Issued Redeemed translation changes 2014
Subordinated debt, excluding liabilty accounted
additional tier 1 capital 22,276 3,722 - 27 - 26,025 Liability accounted additional tier 1 capital 41,891 - 29,038 275 - 13,128
Total subordinated debt 64,167 3,722 29,038 302 - 39,153
Nominal Interest Year of
Redemption 2015 2014
Currency Borrower Note (millions) rate issue Maturity price (DKK m) (DKK m)
Subordinated debt, excluding liabilty accounted additional tier 1 capital
Redeemed loans 2015
5,211 GBP Danske Bank A/S a 350 5.375 2003 29.09.2021 100 3,539 3,330 EUR Danske Bank A/S b 1,000 3.875 2013 04.10.2023 100 7,463 7,444 SEK Danske Bank A/S c 900 4.75 2013 05.06.2024 100 731 707 SEK Danske Bank A/S d 1,600 var. 2013 05.06.2024 100 1,300 1,257 NOK Danske Bank A/S e 700 var. 2013 06..12.2023 100 543 576 DKK Danske Bank A/S f 1,700 var. 2013 06.06.2024 100 1,700 1,700 DKK Danske Bank A/S g 1,150 4.125 2013 09.12.2025 100 1,150 1,150 CHF Danske Bank A/S h 150 3.125 2013 18.12.2025 100 1,035 928 EUR Danske Bank A/S i 500 2.750 2014 19.05.2026 100 3,731 3,722 EUR Dannica Pension j 500 4.375 2015 29.09.2045 100 3,731 0
Subordinated debt, excluding liabilty accounted additional tier 1 capital
24,923 26,025
Liabilty accounted additional tier 1 capital
GBP Danske Bank A/S k 150 5.563 2005 Perpetual 100 1,517 1,427 GBP Danske Bank A/S l 500 5.684 2006 Perpetual 100 5,056 4,757 EUR Danske Bank A/S m 600 4.878 2007 Perpetual 100 4,478 4,466 SEK Danske Bank A/S n 1,350 var. 2007 Perpetual 100 1,096 1,061 SEK Danske Bank A/S o 650 5.119 2007 Perpetual 100 528 511 EUR Danske Bank Oyj q 22 var. 2005 Perpetual 100 163 162 EUR Danske Bank Oyj r 100 var. 2004 Perpetual 100 746 744
Liabilty accounted additional tier 1 capital
13,584 13,128
Nominal subordinated debt
38,507 39,153 Discount
-78 -100 Fair value hedging of interest rate risk
1,603 2,162 Own holding of subordinated debt
-42 -187
Total subordinated debt
39,991 41,028
Portion included in Total capital as additional tier 1 or tier 2 capital instruments
33,943 38,259
Total capital further includes DKK 11.1 billion from the additional tier 1 bond issues accounted for as equity, see note 23.
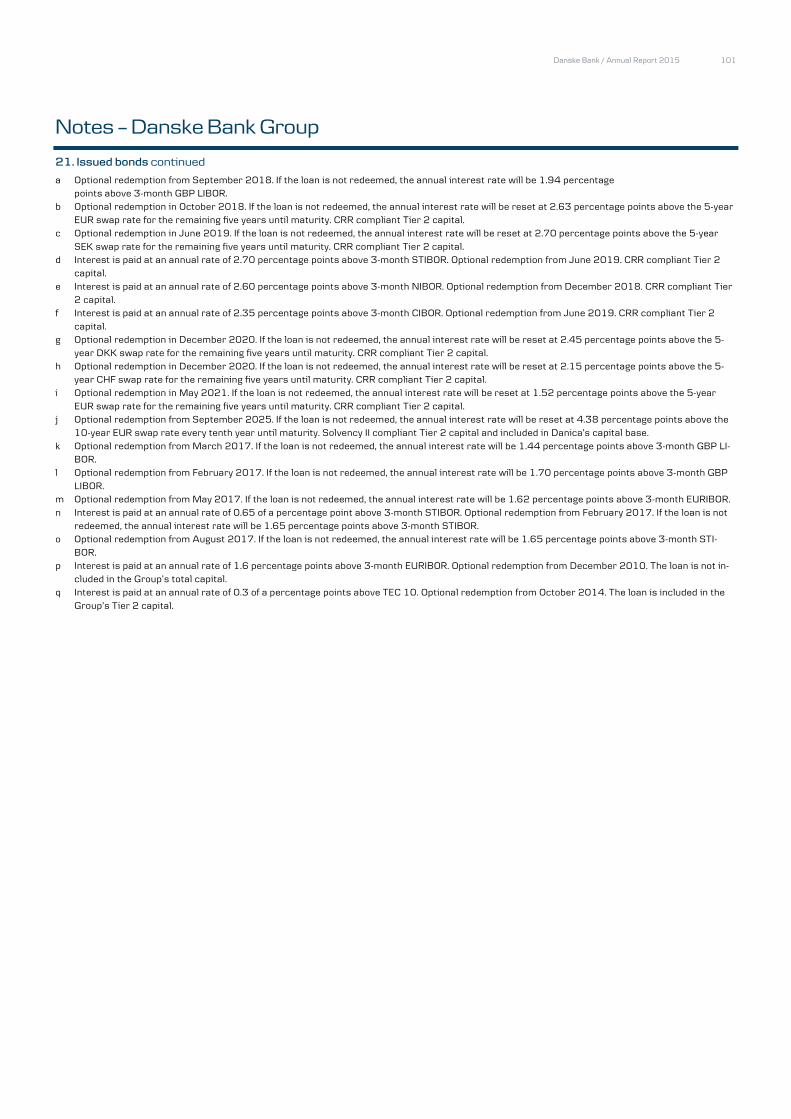
Danske Bank / Annual Report 2015 101
Notes – Danske Bank Group
21. Issued bonds continued
a Optional redemption from September 2018. If the loan is not redeemed, the annual interest rate will be 1.94 percentage points above 3-month GBP LIBOR.
b Optional redemption in October 2018. If the loan is not redeemed, the annual interest rate will be reset at 2.63 percentage points above the 5-year
EUR swap rate for the remaining five years until maturity. CRR compliant Tier 2 capital.
c Optional redemption in June 2019. If the loan is not redeemed, the annual interest rate will be reset at 2.70 percentage points above the 5-year
SEK swap rate for the remaining five years until maturity. CRR compliant Tier 2 capital. d Interest is paid at an annual rate of 2.70 percentage points above 3-month STIBOR. Optional redemption from June 2019. CRR compliant Tier 2
capital.
e Interest is paid at an annual rate of 2.60 percentage points above 3-month NIBOR. Optional redemption from December 2018. CRR compliant Tier 2 capital.
f Interest is paid at an annual rate of 2.35 percentage points above 3-month CIBOR. Optional redemption from June 2019. CRR compliant Tier 2
capital. g Optional redemption in December 2020. If the loan is not redeemed, the annual interest rate will be reset at 2.45 percentage points above the 5-
year DKK swap rate for the remaining five years until maturity. CRR compliant Tier 2 capital.
h Optional redemption in December 2020. If the loan is not redeemed, the annual interest rate will be reset at 2.15 percentage points above the 5-year CHF swap rate for the remaining five years until maturity. CRR compliant Tier 2 capital.
i Optional redemption in May 2021. If the loan is not redeemed, the annual interest rate will be reset at 1.52 percentage points above the 5-year
EUR swap rate for the remaining five years until maturity. CRR compliant Tier 2 capital. j Optional redemption from September 2025. If the loan is not redeemed, the annual interest rate will be reset at 4.38 percentage points above the
10-year EUR swap rate every tenth year until maturity. Solvency II compliant Tier 2 capital and included in Danica’s capital base.
k Optional redemption from March 2017. If the loan is not redeemed, the annual interest rate will be 1.44 percentage points above 3-month GBP LI-BOR.
l Optional redemption from February 2017. If the loan is not redeemed, the annual interest rate will be 1.70 percentage points above 3-month GBP
LIBOR. m Optional redemption from May 2017. If the loan is not redeemed, the annual interest rate will be 1.62 percentage points above 3-month EURIBOR.
n Interest is paid at an annual rate of 0.65 of a percentage point above 3-month STIBOR. Optional redemption from February 2017. If the loan is not
redeemed, the annual interest rate will be 1.65 percentage points above 3-month STIBOR. o Optional redemption from August 2017. If the loan is not redeemed, the annual interest rate will be 1.65 percentage points above 3-month STI-
BOR.
p Interest is paid at an annual rate of 1.6 percentage points above 3-month EURIBOR. Optional redemption from December 2010. The loan is not in-cluded in the Group’s total capital.
q Interest is paid at an annual rate of 0.3 of a percentage points above TEC 10. Optional redemption from October 2014. The loan is included in the
Group’s Tier 2 capital.

102 Danske Bank / Annual Report 2015
Notes – Danske Bank Group
22. Other assets and other liabilities
The Group uses quantitative and qualitative materiality considerations when aggregating line items in the balance sheet that are not considered indi-vidually material. Such line items are presented under Other assets or Other liabilities and consist of net assets or net liabilities in defined benefit pen-
sion plans, investment property, tangible assets, holdings in associates and assets held for sale.
The Group uses clean pricing of financial instruments, and accrued interest is therefore included in Other assets and Other liabilities. Further, prepay-
ments, and accrued income and expences are included under Other assets and Other liabilities. Other staff commitments includes consideration ex-
pected to be paid for services rendered by employees, such as holiday allowances and serverance payments.
Accounting policy
Defined benefit pension plans
When the Group has entered into defined benefit pension plans, the amounts payable are recognised on the basis of an actuarial computation of the
present value of expected benefits. The present value is calculated on the basis of expected future trends in salaries and interest rates, the time of re-tirement, mortality rates and other factors. The present value of pension benefits less the fair value of pension assets is recognised as a pension obli-
gation for each plan under Other liabilities. If the net amount of a defined benefit pension plan is positive and may be repaid to the Group or reduce its
future contributions to the plan, the net amount is recognised under Other assets. The discount rate is determined by reference to yields on high-quality corporate bonds with terms matching the terms of the pension obligations.
Investment property
Investment property is real property, including real property let under operating leases, which the Group owns for the purpose of receiving rent
and/or obtaining capital gains. Real property with both domicile (occupied by the Group’s support, administrative and back-office functions) and in-
vestment property elements is allocated proportionately to the two categories if the elements are separately sellable. If that is not the case, such real property is classified as investment property if the Group occupies less than 10% of the total floorage.
Investment property is recognised at fair value. Fair value adjustments and rental income are recognised under Other income. Real property taken over by the Group under non-performing loan agreements that is expected to be sold within 12 months of classification is valued in accordance with
the principles used for investment property but presented as Assets held for sale.
Tangible assets
Tangible assets include domicile property, and plant and equipment. Plant and equipment covers equipment, vehicles, furniture, fixtures and leasehold
improvements. Tangible assets also include lease assets, i.e. assets let under operating leases, except real property. Tangible assets are measured at cost and depreciated over the estimated useful life. The estimated useful life is 20-50 years for domicile property, 3-10 years for plant and equipment
and 3 years for lease assets. Depreciation charges are recognised under Operating expenses.
Tangible assets are tested for impairment if indications of impairment exist. An impaired asset is written down to its recoverable amount, which is the
higher of its fair value less costs to sell its value in use.
Assets held for sale
Assets held for sale are tangible assets and assets of group undertakings actively marketed for sale within 12 months, for example assets and busi-
nesses taken over under non-performing loan agreements.
Such assets are measured at the lower of their carrying amount at the time of reclassification and their fair value less expected costs to sell and are
no longer depreciated. Liabilities of group undertakings are initially measured at fair value and subsequently in accordance with the Group’s general accounting policies.
Further, loans that are marketed for sale are transferred to Assets held for sale. The loans are written down to their expected selling price. The differ-ence is recognised under Loan impairment charges.
Loan commitments and guarantees The Group issues a number of loan commitments and guarantees. Such exposures are valued at the higher of the received premium amortised over
the life of the individual obligation and the provision made, if any. Provisions are made if it is likely that drawings will be made under a loan commitment
or claims will be made under a guarantee and the amount payable can be reliably measured. The liability is measured at the present value of expected payments. Loan commitments are discounted in accordance with the interest terms.
Other obligations
Provisions for other obligations, such as lawsuits, are recognised if it is likely to result in a payment obligation and the amount can be measured relia-
bly. Liabilities are recognised at the present value of expected payments.

Danske Bank / Annual Report 2015 103
Notes – Danske Bank Group
22. Other assets and other liabilities continued
Other assets and other liabilities (DKK millions) 2015 2014
Other assets
Accrued interest and commissions due 4,821 6,256
Prepayments, accruals and other amounts due 11,710 14,093
Defined benefit pension plan, net assets 2,336 1,861
Investment property 4,681 3,536
Tangible assets 5,082 6,625
Holdings in associates 1,209 1,318
Assets held for sale 5,582 3,278
Total 35,422 36,966
2015 2014
Other liabilities
Sundry creditors 18,904 26,296
Accrued interest and commissions due 12,569 13,323
Defined benefit pension plans, net liabilities 229 449
Other staff commitments 3,186 3,249
Loan commitments and guarantees etc. 611 495
Reserves subject to a reimbursement obligation 49 62
Liabilities in disposal groups held for sale 1,334 -
Other obligations 211 254
Total 37,093 44,126
(a) Further explanation
Investment property is recognised at fair value through profit or loss under Other income.
Tangible assets include domicile property of DKK 286 million (2014: DKK 2,656 million). If indications of impairment exist, domicile property is written down to the lower of the carrying amount and its value in use determined on the basis of the rate of return used for investment property. Note 31 pro-
vides more information. This caused a reversal of DKK 112 million relating to a previous write-down of domicile property (2014: write-down of DKK 77
million). In the fourth quarter 2015, domicile properties in Denmark were actively marketed for sale and transferred to Assets held for sale. At the time of reclassification, these properties were recognised at the lower of carrying amount and fair value less expected costs to sell. At the time of classifica-
tion as held for sale, fair value less costs to sell was at or above the carrying amount of these properties. At the end of 2015, the fair value of domicile
properties held for sale was DKK 1,929 million. The fair value of domicile properties not held for sale was DKK 503 million (31 December 2014: DKK 3,518 million). The required rate of return of 7.9% (2014: 6.8%) was determined in accordance with Danish FSA rules.
In the third quarter of 2015, the Group entered into an agreement to sell a residential mortgage loan portfolio in the Group’s non-core segment relating to the mass personal customer business in Lithuania and Latvia. Pending approval by the Lithuanian competition authorities, the transaction is e x-
pected to be completed in the first half of 2016. The loans and deposits are presented as Assets held for sale and Liabilities in disposal groups held for
sale, respectively. The loan portfolio has a nominal value of DKK 4.8 billion, and the deposit portfolio has a value of DKK 1.3 billion. Similarly, in 2014, Assets held for sale included a loan portfolio with a nominal amount of DKK 3.9 billion in the non-core segment that by the end of 2014 was marketed
for sale and sold in April 2015. Further, assets held for sale includes the above-mentioned domicile properties in Denmark actively marketed for sale
and lease assets put up for sale at the end of the lease. Assets held for sale also includes properties taken over by the Group under non-performing loan agreements. The Group expects to sell the properties through a real-estate agent within twelve months from the date of acquisition. The properties
comprise properties in Denmark and properties in other countries.
Information on defined benefit plans and on investments in associates is provided in note 9 and note 36, respectively.

104 Danske Bank / Annual Report 2015
Notes – Danske Bank Group
23. Equity
Equity is the residual interest in the assets after deducting all liabilities recognised in the balance sheet. Equity is divided between capital and reserves that are attributable to holders of shares issued by the Group (owners of Danske Bank A/S) and other parties holding an interest in the net assets of
the Group.
In February 2015, Danske Bank A/S issued EUR 750 million (DKK 5,583 million) in additional tier 1 capital (2014: an issue of EUR 750 million equal to
DKK 5,597 million). Danske Bank A/S may, at its sole discretion, omit interest and principal payments to bondholders. The issues are included in equity as a non-controlling interest. This means that equity was increased at the time of issue by the net proceeds received. When interest is paid, the amount
paid to investors reduces equity at the time of payment and does not affect net profit. If the Group decides to repay the capital, equity will be reduced by
the redemption amount at the time of redemption. The capital issued is included in tier 1 capital instruments in the Statement of capital as it meets the criteria of the Capital Requirements Regulation for such instruments.
Accounting policy
Equity is the residual interest in recognised assets after deduction of recognised liabilities. In this context, the following items are of special interest:
Own shares
Amounts received or paid for the Group’s sale or purchase of Danske Bank shares are recognised directly in equity under transactions with owners.
The same applies to premiums received or paid for derivatives entailing settlement in own shares. A capital reduction by cancellation of own shares
will lower the share capital by an amount equal to the nominal value of the shares at the time of registration of the capital reduction.
Additional tier 1 capital
The capital instruments include no contractual obligation to deliver cash or another financial asset to the holders, as Danske Bank A/S may, at its sole discretion, omit payment of interest and principal payments to the bondholders. Therefore, the issue does not qualify as a financial liability according
to IAS 32. The net amount received at the time of issue is recognised as an increase in equity. Interest payments are accounted for as dividends,
which are recognised directly in equity at the time the payment obligation arises. If Danske Bank A/S chooses to redeem the bonds, equity will be re-duced by the redemption amount at the time of redemption. Amounts received or paid for the sale or acquisition of additional tier 1 capital instru-
ments are recognised directly in equity, similarly to holdings of own shares.
(a) Further explanation
Equity consists of various components, including the accumulated balance of each class of other comprehensive income, retained earnings and issued
additional tier 1 capital. The various components of equity are described below. Tax on items recognised directly in equity is recognised in Retained
earnings.
Foreign currency translation reserve
Assets and liabilities of units outside Denmark are translated into Danish kroner at the exchange rates at the balance sheet date. Income and expenses are translated at the exchange rates at the transaction date. Gains and losses arising at the translation of net investments in units outside Denmark
are recognised in Other comprehensive income and recognised in the foreign currency translation reserve in equity. Net investments include the net
assets and goodwill of the units as well as holdings in the form of subordinated loan capital. Exchange rate adjustments of financial liabilities used for hedging the Group’s net investments are also recognised in Other comprehensive income and in the foreign currency translation reserve.
If the net investment in a unit outside Denmark is fully or partly realised, translation differences are recognised in the income statement.
Reserve for available-for-sale financial assets
The reserve covers unrealised value adjustments of bonds treated as available-for-sale financial assets recognised in Other comprehensive income. Unrealised value adjustments of hedged interest rate risks that qualify for fair value hedge accounting are recognised in the income statement and are
not included in the reserve.
If objective evidence of impairment exists, the Group reclassifies accumulated unrealised capital losses from the reserve to the income statement.
When bonds are sold, the Group also reclassifies unrealised value adjustments from the reserve to the income statement.
Proposed dividends
The Board of Directors’ proposal for dividends for the year submitted to the general meeting is included as a separate reserve in equity. The dividends
are recognised as a liability when the general meeting has adopted the proposal.
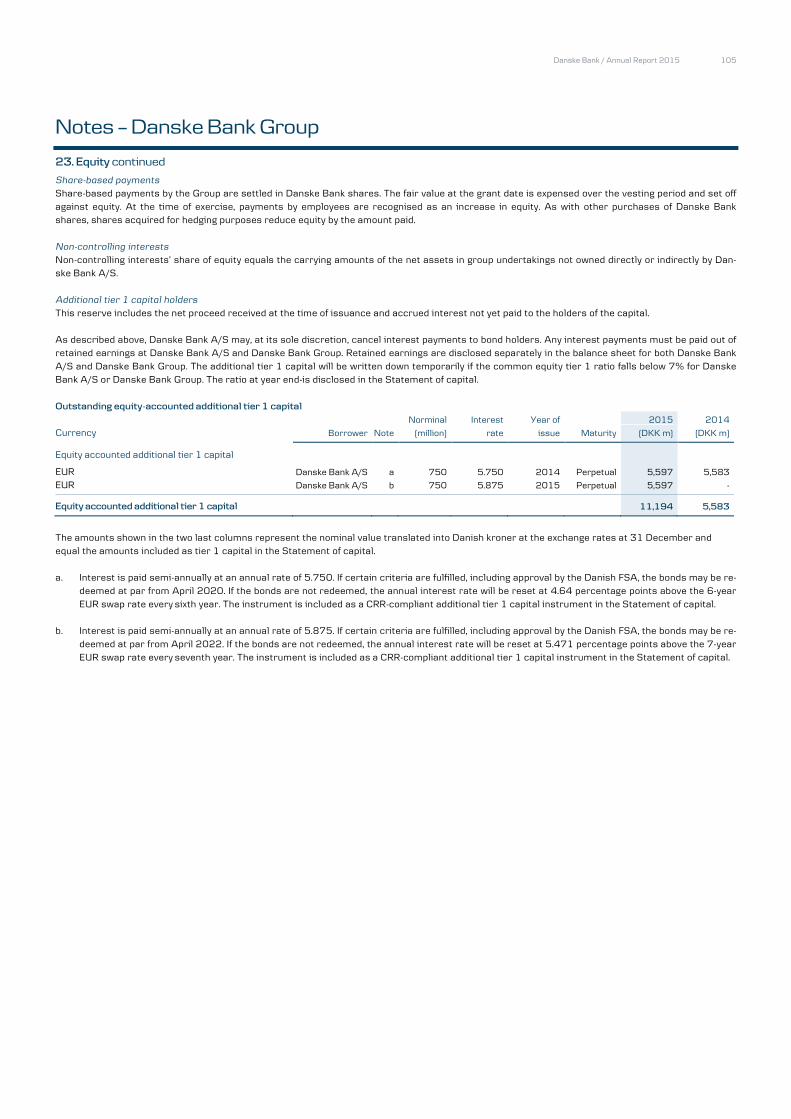
Danske Bank / Annual Report 2015 105
Notes – Danske Bank Group
23. Equity continued
Share-based payments
Share-based payments by the Group are settled in Danske Bank shares. The fair value at the grant date is expensed over the vesting period and set off
against equity. At the time of exercise, payments by employees are recognised as an increase in equity. As with other purchases of Danske Bank
shares, shares acquired for hedging purposes reduce equity by the amount paid.
Non-controlling interests
Non-controlling interests’ share of equity equals the carrying amounts of the net assets in group undertakings not owned directly or indirectly by Dan-
ske Bank A/S.
Additional tier 1 capital holders
This reserve includes the net proceed received at the time of issuance and accrued interest not yet paid to the holders of the capital.
As described above, Danske Bank A/S may, at its sole discretion, cancel interest payments to bond holders. Any interest payments must be paid out of
retained earnings at Danske Bank A/S and Danske Bank Group. Retained earnings are disclosed separately in the balance sheet for both Danske Bank
A/S and Danske Bank Group. The additional tier 1 capital will be written down temporarily if the common equity tier 1 ratio falls below 7% for Danske Bank A/S or Danske Bank Group. The ratio at year end-is disclosed in the Statement of capital.
Outstanding equity-accounted additional tier 1 capital
Norminal Interest Year of
2015 2014
Currency Borrower Note (million) rate issue Maturity (DKK m) (DKK m)
Equity accounted additional tier 1 capital
EUR Danske Bank A/S a 750 5.750 2014 Perpetual 5,597 5,583
EUR Danske Bank A/S b 750 5.875 2015 Perpetual 5,597 -
Equity accounted additional tier 1 capital
11,194 5,583
The amounts shown in the two last columns represent the nominal value translated into Danish kroner at the exchange rates at 31 December and
equal the amounts included as tier 1 capital in the Statement of capital.
a. Interest is paid semi-annually at an annual rate of 5.750. If certain criteria are fulfilled, including approval by the Danish FSA, the bonds may be re-
deemed at par from April 2020. If the bonds are not redeemed, the annual interest rate will be reset at 4.64 percentage points above the 6-year
EUR swap rate every sixth year. The instrument is included as a CRR-compliant additional tier 1 capital instrument in the Statement of capital.
b. Interest is paid semi-annually at an annual rate of 5.875. If certain criteria are fulfilled, including approval by the Danish FSA, the bonds may be re-
deemed at par from April 2022. If the bonds are not redeemed, the annual interest rate will be reset at 5.471 percentage points above the 7-year
EUR swap rate every seventh year. The instrument is included as a CRR-compliant additional tier 1 capital instrument in the Statement of capital.

106 Danske Bank / Annual Report 2015
Notes – Danske Bank Group
24. Contingent liabilities
Contingent liabilities consist of possible liabilities arising from past events. The existence of such liabilities will be confirmed only by the occurrence or non-occurrence of one or more uncertain future events not wholly within the Group’s control. Contingent liabilities that can, but are not likely to, result
in an outflow of economic resources are disclosed.
The Group uses a variety of loan-related financial instruments to meet customers’ financial requirements. Instruments include loan offers and other
credit facilities, guarantees and instruments not recognised in the balance sheet. If an instrument is likely to result in a payment obligation, a liability is recognised under Other liabilities corresponding to the present value of expected payments.
(a) Guarantees (DKK millions) 2015 2014
Financial guarantees 8,638 9,344
Mortgage finance guarantees 1,367 1,128
Other guarantees 71,750 66,958
Total 81,755 77,430
(b) Other contingent liabilities 2015 2014
Loan commitments shorter than 1 year 124,978 115,511
Loan commitments longer than 1 year 153,650 136,064
Other unutilised loan commitments 523 520
Total 279,151 252,095
In addition to credit exposure from lending activities, loan offers made and uncommitted lines of credit granted by the Group amounted to DKK 329 billion
(31 December 2014: DKK 308 billion). These items are included in the calculation of the total risk exposure amount in accordance with the Capital Re-
quirements Directive.
(c) Further explanation
Owing to its business volume, Danske Bank is continually a party to various lawsuits and disputes and has an ongoing dialogue with public authorities such as the Danish FSA. In view of its size, Danske Bank does not expect the outcomes of pending lawsuits and disputes or its dialogue with public authorities to
have any material effect on its financial position. The Danish FSA has pending investigations regarding compliance with applicable anti-money laundering
laws, which could lead to supervisory actions against Danske Bank.
A limited number of employees are employed under terms which grant them, if they are dismissed before reaching their normal retirement age, an
extraordinary severance and/or pension payment in excess of their entitlement under ordinary terms of employment. As the sponsoring employer, the Group is also liable for the pension obligations of a number of company pension funds.
The revised Deposits Guarantee Scheme Directive and the Bank Recovery and Resolution Directive were implemented in Danish law with effect from 1 June 2015. Through participation in the new Deposit Guarantee Fund, Danish credit institutions undertake to cover losses incurred on covered
deposits held with distressed credit institutions. The fund’s capital must amount to at least 0.8% of the covered deposits of all Danish credit
institutions. The capital of the previous Danish Deposit Guarantee Fund has been transferred to the new Deposit Guarantee Fund, and no significant underfunding is expected to exist at the end of 2015. From 2016, contributions to the fund, if any, will be calculated on the basis of the individual credit
institution’s covered deposits and risk relative to other credit institutions in Denmark. Extraordinary contributions of up to 0.5 percent of the individual
institution’s covered deposits may be required if the fund does not have sufficient means to make the required payments. Extraordinary contributions above this percentage rate require the consent of the Danish FSA. If the fund’s capital falls below two thirds of the minimum amount (0.8 percent of
covered deposits), the fund must be re-established within six years. Moreover, a Danish resolution fund has been established. Danske Bank A/S and
Realkredit Danmark A/S must make contributions to the fund on the basis of their size and risk relative to other credit institutions in Denmark. The resolution fund’s capital must amount to 1% of the covered deposits of all Danish credit institutions by 31 December 2024. The first contribution to
the fund was made in December 2015 as a preliminary contribution. The intention is for losses to be covered by the annual contributions made by the
participating credit institutions. Consequently, if the resolution fund does not have sufficient means, extraordinary contributions of up to three times the latest annual contributions may be required. Furthermore, Danish banks must, through participation in the Danish restructuring fund, reimburse
creditors if the final dividend is lower than the interim dividend in respect of banks that were in distress before 1 June 2015. Similarly, Danish banks
have made payment commitments (totalling DKK 1 billion) to cover losses incurred by the Danish restructuring fund for the withdrawal of distressed banks from data centres etc. Payments to the restructuring fund will be calculated on the basis of the individual credit institution’s share of covered
deposits relative to other credit institutions in Denmark, however, each institution’s contribution to the restructuring fund may not exceed 0.2 % of its
covered deposits.
The Group is a member of deposit guarantee schemes and other compensation schemes in Finland, Norway, the UK and Luxembourg. For Finland, the
schemes are fully funded, and no further contributions are expected during 2016-2017. The contributions to the schemes in the other countries are annual contributions combined with extraordinary contributions if the means of the schemes are not sufficient to cover the required payments.

Danske Bank / Annual Report 2015 107
Notes – Danske Bank Group
24. Contingent liabilities continued
The Group is the lessee in a number of non-cancellable operating leases, involving mainly leasing of real property, equipment, furniture and fixtures. The Group recognises lease payments as an expense over the lease term but does not recognise the operating lease assets in its balance sheet. Such as-
sets are recognised by lessors. At 31 December 2015, minimum lease payments under operating leases amounted to DKK 3,415 million (31 Decem-
ber 2014: DKK 2,801 million), with DKK 678 million (2014: DKK 533 million) relating to operating leases expiring within one year.
Danske Bank A/S is taxed jointly with all entities in Danske Bank Group and is jointly and severally liable for payment of Danish corporate tax and with-
holding tax, etc.
Danske Bank A/S is registered jointly with all significant Danish entities in Danske Bank Group for financial services employer tax and VAT, for which it
is jointly and severally liable.
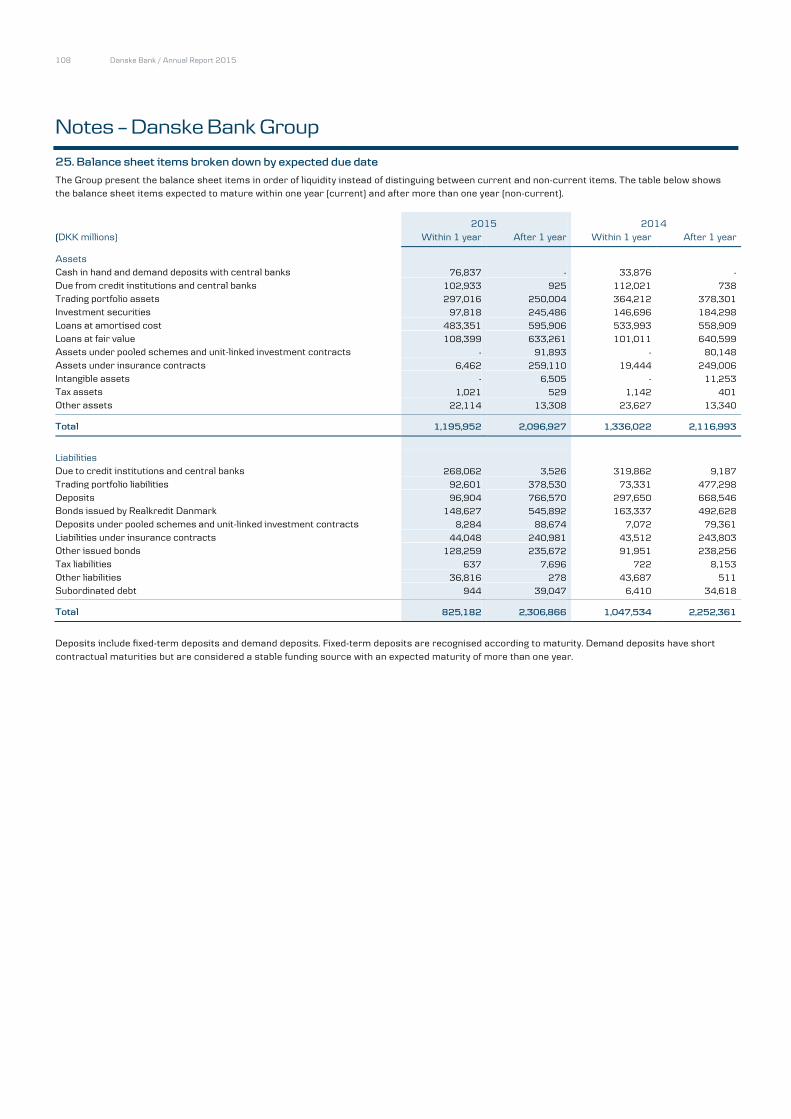
108 Danske Bank / Annual Report 2015
Notes – Danske Bank Group
25. Balance sheet items broken down by expected due date
The Group present the balance sheet items in order of liquidity instead of distinguing between current and non-current items. The table below shows the balance sheet items expected to mature within one year (current) and after more than one year (non-current).
2015 2014
(DKK millions) Within 1 year After 1 year Within 1 year After 1 year
Assets
Cash in hand and demand deposits with central banks 76,837 - 33,876 -
Due from credit institutions and central banks 102,933 925 112,021 738
Trading portfolio assets 297,016 250,004 364,212 378,301
Investment securities 97,818 245,486 146,696 184,298
Loans at amortised cost 483,351 595,906 533,993 558,909
Loans at fair value 108,399 633,261 101,011 640,599
Assets under pooled schemes and unit-linked investment contracts - 91,893 - 80,148
Assets under insurance contracts 6,462 259,110 19,444 249,006
Intangible assets - 6,505 - 11,253
Tax assets 1,021 529 1,142 401
Other assets 22,114 13,308 23,627 13,340
Total 1,195,952 2,096,927 1,336,022 2,116,993
Liabilities
Due to credit institutions and central banks 268,062 3,526 319,862 9,187
Trading portfolio liabilities 92,601 378,530 73,331 477,298
Deposits 96,904 766,570 297,650 668,546
Bonds issued by Realkredit Danmark 148,627 545,892 163,337 492,628
Deposits under pooled schemes and unit-linked investment contracts 8,284 88,674 7,072 79,361
Liabilities under insurance contracts 44,048 240,981 43,512 243,803
Other issued bonds 128,259 235,672 91,951 238,256
Tax liabilities 637 7,696 722 8,153
Other liabilities 36,816 278 43,687 511
Subordinated debt 944 39,047 6,410 34,618
Total 825,182 2,306,866 1,047,534 2,252,361
Deposits include fixed-term deposits and demand deposits. Fixed-term deposits are recognised according to maturity. Demand deposits have short
contractual maturities but are considered a stable funding source with an expected maturity of more than one year.

Danske Bank / Annual Report 2015 109
Notes – Danske Bank Group
26. Contractual due dates of financial liabilities
The contractual due dates of financial liabilities are broken down by maturity time bands in the table below. The maturity analysis is based on the earli-est date on which the Group can be required to pay and does not reflect the expected due date. The section on liquidity risk in the risk management
notes provides information about the Group’s liquidity risk and liquidity risk management.
2015 (DKK millions) 0-1 month 1-3 months 3-12 months 1-5 years > 5 years
Due to credit institutions and central banks 205,516 56,122 6,207 2,614 894
Deposits 797,048 25,194 17,672 15,527 8,239
Repurchase obligation under reverse transactions 150,861 - - - -
Derivatives settled on a gross basis (cash outflows) 4,041,081 3,225,318 1,817,618 528,940 154,150
Derivatives settled on a gross basis (cash inflows) 4,044,577 3,224,351 1,819,569 530,860 157,432
Derivatives settled on a gross basis (net cash flows) 3,496 -967 1,951 1,920 3,282
Derivatives settled on a net basis -31,225 -7,198 1,891 -6,420 -50
Bonds issued by Realkredit Danmark 41,677 - 115,141 371,032 263,499
Other issued bonds 26,814 42,862 60,174 206,858 48,418
Subordinated debt 133 266 1,213 22,125 34,436
Other financial liabilities 1,537 353 6,395 57,420 31,254
Financial and loss guarantees 81,755 - - - -
Loan commitments shorter than 1 year 124,978 - - - -
Loan commitments longer than 1 year 153,650 - - - -
Other unutilised loan commitments 518 - - - -
Total 1,556,758 116,631 210,643 671,077 389,970
2014 (DKK millions)
Due to credit institutions and central banks 247,208 62,183 10,725 2,706 6,559
Deposits 863,952 43,421 33,260 18,170 8,817
Repurchase obligation under reverse transactions 160,883 - - - -
Derivatives settled on a gross basis (cash outflows) 3,274,332 2,408,733 1,407,221 250,739 62,160
Derivatives settled on a gross basis (cash inflows) 3,278,994 2,409,714 1,409,124 252,550 64,380
Derivatives settled on a gross basis (net cash flows) 4,662 981 1,903 1,811 2,220
Derivatives settled on a net basis -12,104 -17,435 102 -3,937 50
Bonds issued by Realkredit Danmark 62,277 - 110,278 340,346 249,393
Other issued bonds 17,071 12,182 64,501 201,940 68,060
Subordinated debt 135 270 1,228 25,879 24,584
Other financial liabilities 1,643 343 5,086 49,889 29,472
Financial and loss guarantees 77,430 - - - -
Loan commitments shorter than 1 year 115,511 - - - -
Loan commitments longer than 1 year 136,064 - - - -
Other unutilised loan commitments 517 - - - -
Total 1,675,249 101,945 227,083 636,804 389,155
(a) Further explanation
Disclosures comprise agreed payments, including principal and interest. For liabilities with variable cash flows, for example variable-rate financial li-
abilities, disclosure is based on the contractual conditions at the balance sheet date. Derivatives disclosures include the contractual cash flows for all derivatives, irrespective of whether the fair value at the balance sheet date is negative or positive and whether the derivatives are held for trading or
hedging purposes.
Usually, deposits are contractually very short-term funding, but in practice, they are considered a stable funding source, as amounts disbursed largely
equal deposits received. A number of loan commitments and guarantees expire without being utilised. Loan commitments and guarantees are included
at the earliest date on which the Group can be required to pay. To take account of potential drawings under loan commitments, the Group factors in the effect of the unutilised portion of the facilities in the calculation of liquidity risk.
For guarantees to result in a payment obligation to the Group, a number of individual conditions must be met. As it is not possible to break down the earliest dates on which such conditions are met by maturity time bands, all guarantees are included in the 0-1 month column.

110 Danske Bank / Annual Report 2015
Notes – Danske Bank Group
27. Transferred financial assets that are not derecognised
The Group enters into transactions that transfer ownership of financial assets, such as bonds and shares, to a counterparty, while the Group retains the risks associated with the holding of the assets. If the Group retains all significant risks, the securities remain in the balance sheet, and the transa c-
tions are accounted for as loans received against collateral. Such transactions are repo transactions and securities lending. The transactions involve
selling the securities to be repurchased at a fixed price at a later date. Counterparties are entitled to sell the securities or deposit them as collat eral for
loans.
Trading portfolio 2015 2014
(DKK millions) Bonds Shares Bonds Shares
Carrying amount of transferred assets - - - -
Repo transactions 161,165 - 386,797 -
Securities lending - 6,817 - 721
Total transferred assets 161,165 6,817 386,797 721
Repo transactions, own issued bonds 12,487 - 11,480 -
Carrying amount of associated liabilities 177,456 7,158 400,618 757
Net positions 3,804 341 2,341 36
The Group has not entered into any agreements on the sale of assets that entail the Group’s continuing involvement in derecognised financial assets.

Danske Bank / Annual Report 2015 111
Notes – Danske Bank Group
28. Assets provided or received as collateral
At the end of 2015, Danske Bank A/S had deposited securities worth DKK 10.1 billion as collateral with Danish and international clearing centres and other institutions (31 December 2014: DKK 1.0 billion).
At the end of 2015, Danske Bank A/S had provided cash and securities worth DKK 80.7 billion as collateral for derivatives transactions (31 December
2014: DKK 85.0 billion).
At the end of 2015, the Group had registered assets (including bonds and shares issued by the Group) under insurance contracts worth DKK 326.9
billion (31 December 2014: DKK 320.3 billion) as collateral for policyholders’ savings of DKK 320.8 billion (31 December 2014: DKK 315.8 billion).
At the end of 2015, the Group had registered loans at fair value and securities worth a total of DKK 743.0 billion (31 December 2014 DKK 743.3 bil-
lion) as collateral for bonds issued by Realkredit Danmark, including mortgage-covered bonds, worth a total of DKK 694.5 billion (31 December 2014:
DKK 656.0 billion). Note 15 provides additional information. Similarly, the Group had registered loans and other assets worth DKK 273.1 billion (31 December 2014: DKK 270.8 billion) as collateral for covered bonds issued under Danish and Finnish law.
The table below shows assets provided as collateral for obligations, including obligations under repo transactions and securities lending:
2015 2014
(DKK millions) Repo Other Total Repo Other Total
Due from credit institutions - 33,800 33,800 - 32,353 32,353
Trading portfolio securities 161,165 63,108 224,273 386,797 66,063 452,860
Loans at fair value - 741,660 741,660 - 741,609 741,609
Loans at amortised cost - 281,721 281,721 - 275,923 275,923
Assets under insurance contracts - 273,954 273,954 - 270,861 270,861
Other assets - 105 105 - 166 166
Total 161,165 1,394,348 1,555,513 386,797 1,386,975 1,773,772
Own issued bonds 12,487 88,136 100,623 11,480 89,644 101,124
Total, including own issued bonds 173,652 1,482,484 1,656,136 398,277 1,476,619 1,874,896
Securities provided as collateral under agreements that entitle the counterparty to sell the securities or provide them as collateral for other loans
amounted to DKK 161.2 billion at the end of 2015 (31 December 2014 DKK 386.8 billion).
At the end of 2015, the Group had received securities worth DKK 225.7 billion (31 December 2014: DKK 290.6 billion) as collateral for reverse repo
transactions, securities lending, derivatives transactions and other transactions entered into on the standard terms for such transactions. As the
party receiving the collateral, the Group is entitled in many cases to sell the securities or provide the securities as collateral for other loans in exchange for returning similar securities to the counterparty at the expiry of the transactions. At the end of 2015, the Group had sold securities or provided se-
curities as collateral worth DKK 150.9 billion (31 December 2014: DKK 160.9 billion).
The Group also receives many other types of assets as collateral in connection with its ordinary lending activities. The Group has not transferred the ownership of these assets. The risk management notes provide more details on assets received as collateral.

112 Danske Bank / Annual Report 2015
Notes – Danske Bank Group
29. Offsetting of financial assets and liabilities
Offsetting of financial assets and liabilities in the financial statements requires some criteria to be fulfilled. In the event the counterparty or the Group defaults, further offsetting will take place. This note shows the offsetting in the financial statements, further netting according to enforceable master
netting agreements and similar agreements (i.e. in the event of default) and collateral provided or received under those agreements.
Accounting policy
Assets and liabilities are offset when the Group and the counterparty have a legally enforceable right to offset recognised amounts and have agreed to settle the balances on a net basis or to realise the asset and settle the liability simultaneously. Positive and negative fair values of derivatives with
the same counterparty are offset if the Group has agreed with the counterparty to settle contractual cash flows net and to make cash payments or
provide collateral on a daily basis to cover changes in the fair value of the derivative position. Master netting agreements or similar agreements give the right to additional offset in the event of default. Such agreements reduce the exposure further in the event of default, but do not qualify for offset-
ting in accordance with IFRS.
2015 (DKK millions) Gross amount Offsetting
Net amount presented in
balance sheet
Further offsetting, master netting
agreements Collateral Net amount
Financial assets
Derivatives with positive market value 512,418 181,403 331,015 237,014 52,624 41,376 Reverse transactions 447,397 231,094 216,303 - 212,281 4,022 Other financial assets 6,065 2,815 3,250 - - 3,250
Total 965,880 415,312 550,568 237,014 264,,906 48,648
Financial liabilities
Derivatives with negative market value 501,673 181,403 320,270 237,014 66,688 16,568 Repo transactions 408,550 231,094 177,456 - 173,652 3,804 Other financial liabilities 12,111 2,815 9,296 - - 9,296
Total 922,334 415,312 507,022 237,014 240,340 29,668
2014 (DKK millions)
Financial assets
Derivatives with positive market value 783,901 374,459 409,442 300,206 59,170 50,066
Reverse transactions 462,274 172,179 290,095 - 290,095 -
Other financial assets 4,406 1,754 2,652 - - 2,652
Total 1,250,581 548,392 702,189 300,206 349,264 52,718
Financial liabilities
Derivatives with negative market value 764,205 374,459 389,746 300,206 71,745 17,795
Repo transactions 572,797 172,179 400,618 - 398,277 2,341
Other financial liabilities 10,859 1,754 9,105 - - 9,105
Total 1,347,861 548,392 799,469 300,206 470,022 29,241

Danske Bank / Annual Report 2015 113
Notes – Danske Bank Group
30. Fair value information for financial instruments
Financial instruments are carried in the balance sheet at fair value or amortised cost. The Group breaks down its financial instruments by valuation method (note 1 provides additional information).
(a) Financial instruments at fair value
The fair value is the amount for which a financial asset or a financial liability can be exchanged between knowledgeable, willing parties. Fair value is
measured on the basis of the following hierarchy:
The fair value hierarchy
Quoted price (level 1) consists of financial instruments that are quoted in an active market. The Group uses the price quoted in the principal mar-ket.
Valuation based on observable input (level 2) consists of financial instruments valued substantially on the basis of observable input other than a
quoted price for the instrument itself. If a financial instrument is quoted in a market that is not active, the Group bases its measurement on the most recent transaction price. Adjustment is made for subsequent changes in market conditions, for instance, by including transactions in similar
financial instruments that are assumed to be motivated by normal business considerations. For a number of financial assets and liabilities, no
market exists. In such cases, the Group uses recent transactions in similar instruments and discounted cash flows or other generally accepted estimation and valuation techniques based on market conditions at the balance sheet date to calculate an estimated value. This category covers
instruments such as derivatives valued on the basis of observable yield curves and exchange rates and illiquid mortgage bonds valued by refer-
ence to the value of similar, liquid bonds. Valuation based on significant non-observable input (level 3): The valuation of certain financial instruments is based substantially on non-
observable input. Such instruments include unlisted shares, some unlisted bonds and a limited portion of the derivatives portfolio (2%).
If, at the balance sheet date, a financial instrument’s classification differs from its classification at the beginning of the year, the classification of the in-
strument changes. Changes are considered to have taken place at the balance sheet date. Developments in the financial markets have resulted in re-
classifications between the categories. Some bonds have become illiquid and have therefore been moved from the Quoted prices to the Observable input category, while other bonds have become liquid and have been moved from the Observable input to the Quoted prices category. The net amount trans-
ferred is insignificant. Furthermore, because of an improvement in the quality of market data input used for the valuation of primary interest rate swaps
in a number of currencies, more than half of the derivatives previously included in the Non-observable input category were moved to the Observable in-put category in 2014.
Valuation techniques The most frequently used valuation techniques include the pricing of transactions with future settlement and swap models that apply present value cal-
culations, credit pricing models and options models, such as Black & Scholes models. As part of the Group’s control environment, valuation models are
validated by units that are independent of the business units that develop the models and trade in the products covered by the models. Validation is made to test the implementation, quality and operating stability of models to ensure that the models can be used for pricing and risk management of fi-
nancial products.
Loans at fair value (mortgage loans) and bonds issued by Realkredit Danmark are recognised at the fair value of the issued bonds (the quoted price in
an active market). The Group adjusts for changes in the fair value of the credit risk on borrowers. For loans granted to customers with objective evi-
dence of impairment, such adjustment is made on the basis of an assessment of the expected cash flows from the loans. For the remaining portion of the portfolio, adjustments depend on the possibility of raising the administration margin on loans (credit margin) sufficiently to offset higher credit risk
and market risk premiums on mortgage loans. No changes are made if it is possible to raise the administration margin sufficiently. If it is not possible to
raise the administration margin sufficiently or at all, a collective adjustment is made, reflecting trends in expected losses, unexpected losses (volatility) and the possibility of raising the administration margin in the future. The expected future cash flows are discounted at the current market rate with the
addition of a risk premium. The adjustment is described further in note 15.
The value of derivatives, primarily long-term contracts, is determined on observable yields extrapolated to yield curves for the full duration af the con-
tracts. Moreover, the very limited portfolio of credit derivatives are valued on the basis of observable input as well as assumptions about the probability
of default (recovery rate). Unlisted shares are measured at fair value in accordance with the International Private Equity and Venture Capital Valuation Guidelines (IPEV) which are compliant with IFRS. IPEV guide the calculation of estimated fair value of unlisted shares as the price that would be received
to sell an asset or paid to transfer a liability in an orderly transaction between market participants at the measurement date. Valuation methods include
discounted cash flow models and princing based on a multiply on earnings or equity.

114 Danske Bank / Annual Report 2015
Notes – Danske Bank Group
30. Fair value information for financial instruments continued
Fair value adjustments Management estimates underlie the valuation of financial instruments for which the value is based on valuation techniques. The Group makes fair value
adjustments to cover changes in counterparty risk (CVA and DVA) on derivatives, bid-offer spreads on the net open position of portfolios with offsetting
market risk, and model risk on level 3 derivatives.
Credit value adjustment (CVA), debit value adjustment (DVA) and funding value adjustment (FVA)
The Group makes a fair value adjustment to cover the counterparty credit risk on derivatives with a positive fair value (CVA) for customers without ob-jective evidence of impairment. For a given counterparty’s portfolio of derivatives, CVA is calculated as a function of the probability of default (PD), the
expected positive exposure (EPE) and the loss given default in the event of bankruptcy (LGD). The Group enters into derivatives transactions mainly with
counterparties on the Scandinavian market.
The PDs used in the CVA model are derived from single name liquid CDS. If this is not available, the PDs are derived using proxy-mapping to a CDS index.
This proxy-mapping was enhanced during 2015. For the calculation of EPE, the Group uses simulations to estimate the range of positive exposures to the counterparty’s portfolio over the term of the derivatives. For the calculation of LGD, the Group uses market compliant LGD. However, for customers
with objective evidence of impairment, CVA is calculated as if the derivatives were loans subject to impairment because of credit losses.
A fair value adjustment for derivatives with an expected negative exposure is made to cover the counterparty's credit risk on Danske Bank (DVA), with
PD calculated according to principles similar to CVA. The Group uses PD values derived from Danske Bank’s liquid CDS spread.
The Group has included a fair value adjustment for derivatives to cover expected funding costs (FVA) by end of 2015. FVA primarily arises from the cost
of funding uncollaterialised derivatives. The adjustment is a function of the unsecured funding curve and expected future exposures.
At the end of 2015, CVA, DVA and FVA came to a net amount of DKK 1.2 billion, including the adjustment for credit risk on derivatives with customers
subject to objective evidence of impairment. At the end of 2014, the net amount of CVA and DVA amounted at DKK 0.9 billion.
Bid-offer spread
For portfolios of assets and liabilities with offsetting market risk, the Group bases its measurement of the portfolios on mid-market prices and makes
fair value adjustments to recognise net assets at the bid price and net liabilities at the offer price (exit prices). At the end of 2015, these fair value ad-justments totalled DKK 131 million (31 December 2014: DKK 101 million).
Model risk
To account for the uncertainty associated with measuring the value of derivatives on the basis of non-observable input (level 3 in the fair value hierar-
chy), the Group has established guidelines to quantify risk. The Group calculates and monitors the reserve on an ongoing basis. At the end of 2015, the
reserve totalled DKK 5 million (31 December 2014: DKK 5 million).
Amortisation of initial margin
If, at the time of acquisition, a difference arises between the model value of a financial instrument, calculated on the basis of non-observable input and actual cost (day-one profit or loss), and the difference is not the result of transaction costs, the Group adjusts model parameters to actual cost to take
account of the initial margin. The valuation of derivatives thus includes amortisation of the value of initial margins over the remaining term to maturity.
The initial margins relate to elements not covered by the above CVA, DVA and FVA adjustments, such as future administrative expenses and capital consumption. At 31 December 2015, the value of unamortised initial margins was DKK 1,256 million (2014: DKK 935 million).
(DKK millions) 2015 2014
Unamortised initial margins at 1 January 935 1,133
Amortised to the income statement during the year -637 -628
Initial margins on new derivatives contracts 1,084 542
Terminated derivatives contracts -126 -112
Unamortised initial margins at 31 December 1,256 935
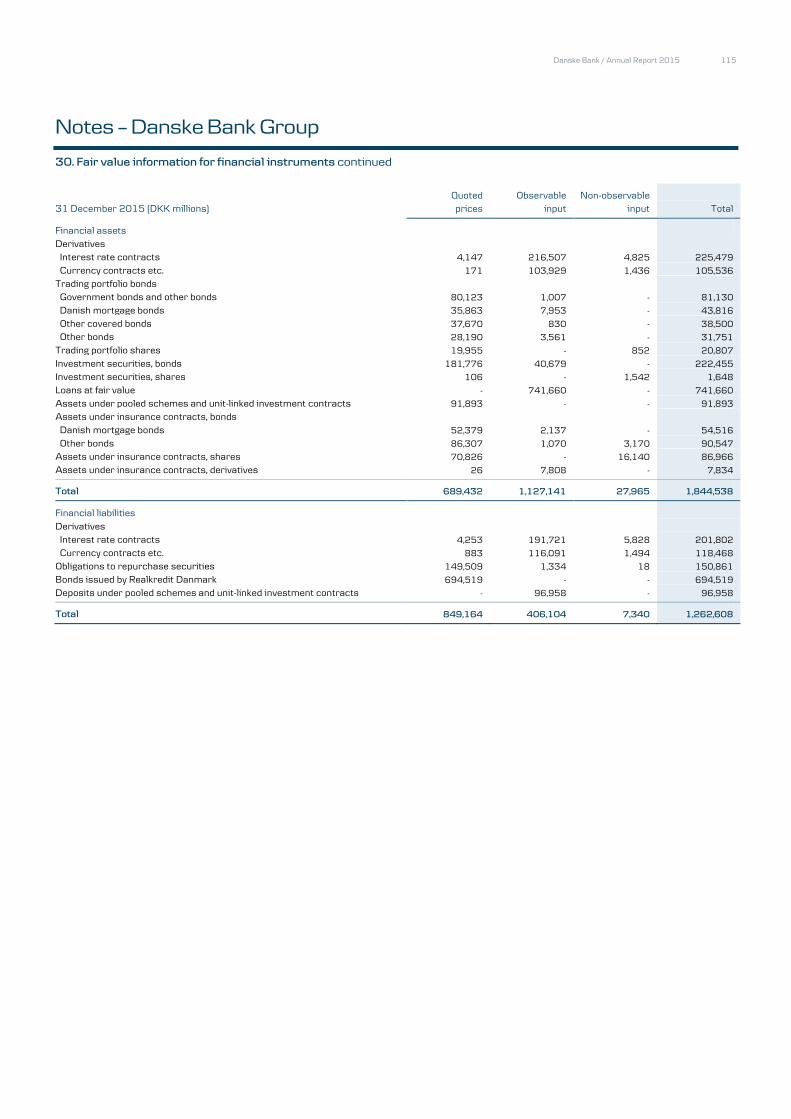
Danske Bank / Annual Report 2015 115
Notes – Danske Bank Group
30. Fair value information for financial instruments continued
Quoted Observable Non-observable
31 December 2015 (DKK millions) prices input input Total
Financial assets
Derivatives
Interest rate contracts 4,147 216,507 4,825 225,479
Currency contracts etc. 171 103,929 1,436 105,536
Trading portfolio bonds
Government bonds and other bonds 80,123 1,007 - 81,130
Danish mortgage bonds 35,863 7,953 - 43,816
Other covered bonds 37,670 830 - 38,500
Other bonds 28,190 3,561 - 31,751
Trading portfolio shares 19,955 - 852 20,807
Investment securities, bonds 181,776 40,679 - 222,455
Investment securities, shares 106 - 1,542 1,648
Loans at fair value - 741,660 - 741,660
Assets under pooled schemes and unit-linked investment contracts 91,893 - - 91,893
Assets under insurance contracts, bonds
Danish mortgage bonds 52,379 2,137 - 54,516
Other bonds 86,307 1,070 3,170 90,547
Assets under insurance contracts, shares 70,826 - 16,140 86,966
Assets under insurance contracts, derivatives 26 7,808 - 7,834
Total 689,432 1,127,141 27,965 1,844,538
Financial liabilities
Derivatives
Interest rate contracts 4,253 191,721 5,828 201,802
Currency contracts etc. 883 116,091 1,494 118,468
Obligations to repurchase securities 149,509 1,334 18 150,861
Bonds issued by Realkredit Danmark 694,519 - - 694,519
Deposits under pooled schemes and unit-linked investment contracts - 96,958 - 96,958
Total 849,164 406,104 7,340 1,262,608

116 Danske Bank / Annual Report 2015
Notes – Danske Bank Group
30. Fair value information for financial instruments continued
Quoted Observable Non-observable 2014 (DKK millions) prices input input Total
Financial assets
Derivatives Interest rate contracts 3,807 269,285 4,562 277,654
Currency contracts etc. 127 130,860 801 131,788
Trading portfolio bonds
Government bonds and other bonds 143,749 - - 143,749
Danish mortgage bonds 74,695 3,188 - 77,883
Other covered bonds 57,776 2,077 - 59,853
Other bonds 33,780 9,832 - 43,612
Trading portfolio shares 7,442 - 532 7,974
Investment securities, bonds 186,024 38,264 25 224,313
Investment securities, shares 53 - 1,772 1,825
Loans at fair value - 741,609 - 741,609
Assets under pooled schemes and unit-linked investment contracts 80,148 - - 80,148
Assets under insurance contracts, bonds
Danish mortgage bonds 37,357 2,703 - 40,060
Other bonds 105,021 26 1,610 106,657
Assets under insurance contracts, shares 64,464 453 12,429 77,346
Assets under insurance contracts, derivatives 44 12,996 - 13,040
Total 794,487 1,211,293 21,731 2,027,511
Financial liabilities
Derivatives
Interest rate contracts 4,221 239,798 5,743 249,762
Currency contracts etc. 543 138,609 832 139,984
Obligations to repurchase securities 160,707 117 59 160,883
Bonds issued by Realkredit Danmark 655,965 - - 655,965
Deposits under pooled schemes and unit-linked investment contracts - 86,433 - 86,433
Total 821,436 464,957 6,634 1,293,027
At 31 December 2015, financial instruments valued on the basis of non-observable input comprised unlisted shares of DKK 18,516 million (2014:
DKK 14,674 million), illiquid bonds of DKK 3,170 million (2014: DKK 1,610 million) and derivatives with a net market value of DKK -1,061 million (2014: DKK -1,211 million).
Unlisted shares of DKK 16,140 million (2014: DKK 12,429 million) are allocated to insurance contract policyholders, and the policyholders assume most of the risk on the shares. Changes in the fair value of those shares will only to a limited extent affect the Group’s net profit. The remaining portfolio
of unlisted shares of DKK 2,376 million (2014: DKK 2,245 million) consists primarily of banking related investments and holdings in private equity
funds. A 10% increase or decrease in the fair value would amount to DKK 238 million (2014: DKK 224 million). Under the current market conditions, a 10% decrease in the fair value is considered to be below a possible alternative estimate of the fair value at the end of the year. In 2015, the Group rec-
ognised DKK 146 million in unrealised gains (2014: DKK 272 million) and DKK 74 million in realised gains (2014: DKK 1,271 million) on those share.
The unrealised adjustments in 2015 and 2014 were attributable to various unlisted shares. For shares allocated to insurance contract policyholders, the unrealised gains in 2015 amounted to DKK 1,292 million (2014: DKK 1,225 million) and the realised gains to DKK 1,137 million (2014: DKK 595
million).
The estimated fair value of illiquid bonds depends significantly on the estimated credit spread. If the credit spread widens 50bp, fair value will decrease
DKK 65 million (2014: DKK 36 million). If the credit spread narrows 50bp, fair value will increase DKK 67 million (2014: DKK 37 million).
A substantial number of derivatives valued on the basis of non-observable input are hedged by similar derivatives or are used for hedging the credit risk
on bonds also valued on the basis of non-observable input. Changing one or more of the non-observable inputs to reflect reasonably possible alternative
assumptions would not change the fair value of the derivatives significantly above what is already covered by the reserve related to fair value adjust-ment for model risk.

Danske Bank / Annual Report 2015 117
Notes – Danske Bank Group
30. Fair value information for financial instruments continued
Shares, bonds and derivatives valued on the basis of non-observable input
Shares, bonds and derivatives valued on the basis of non-
observable input
2015
2014
(DKK millions)
Shares Bonds Derivatives Shares Bonds Derivatives
Fair value at 1 January
14,674 1,610 -1,211 12,500 674 1,591
Value adjustment through profit or loss
2,649 125 -148 3,362 61 -51
Acquisitions
4,704 1,520 -670 3,957 1,335 -1,726
Sale and redemption
-3,511 -85 837 -5,145 -460 275
Transferred from quoted prices and observable input
- - - - - 659
Transferred to quoted prices and observable input
- - 131 - - -1,959
Fair value 31 December
18,516 3,170 -1,062 14,674 1,610 -1,211
The value adjustment through profit or loss is recognised under Net trading income. The transfer of derivatives to the Observable input category con-sists primarily of maturity reductions, implying that the yield curves have become observable. However, in 2014 the quality of the market data input
used improved, and this resulted in a further transfer of derivatives to the Observable input category.
(b) Financial instruments at amortised cost
In this section, the fair value of financial instruments recognised at amortised cost is presented. The fair value is based on quoted market prices, if
available. If quoted prices are not available, the value is approximated to reflect the price that would have been fixed, had the terms been agreed at the balance sheet date.
The fair values disclosed below are determined on the basis of the following principles:
Investment securities (bonds classified as held-to-maturity), other issued bonds and subordinated debt Quoted prices in an active market exist for a significant part of these financial instruments. If quoted prices in an active market do not exist, the Group
uses an estimate of the current return required by the market to estimate the fair value.
Other financial instruments
The determination of the fair value of financial instruments recognised at amortised cost is based on the following preconditions relating to interest
rate risk:
For a significant number of the Group’s deposits and loans, the interest rate depends on the standard variable rate fixed by the Group. The rate is
adjusted only upon certain changes in market conditions. Such deposits and loans are considered to carry interest at a variable rate, as the stan-dard variable rate fixed by the Group at any time applies to both new and existing arrangements.
The interest rate risk on fixed-rate financial assets and liabilities is generally hedged by derivatives. The interest rate risk on fixed-rate loans ex-
tended by the Group’s operations in Finland, Northern Ireland and Ireland is, however, hedged by hedging the interest rate risk on core free funds. Any interest rate risk not hedged by core free funds is hedged by derivatives. The hedges are accounted for as fair value hedges, and value ad-
justments are recognised in the hedged financial instruments. Consequently, only fair value changes in fixed-rate loans in Finland, Northern Ireland
and Ireland are unhedged. The presented fair values include these unhedged changes.
For financial instruments that are only to a limited extent influenced by changes in credit risk, the amortised cost, including the adjustment for the fair
value hedge accounting of the interest rate risk, is a reasonable approximation of fair value. This is the case for Due from/to credit institutions and cen-tral banks and Deposits.
For loans, the following adjustments are made to reach a fair value of the credit risk: The fair value of the Group’s syndicated loans etc. is estimated on the basis of the Group’s current required rate of return on similar transactions.
As regards other loans, impairment charges are assumed to equal the fair value of the credit risk with the following adjustments:
The calculation of impairment charges for loans subject to individual impairment is based on the most likely outcome, and loans that are considered asset finance are written down to the fair value of collateral provided, i.e. assuming that restructuring is not possible. The fair
value is adjusted by weighting all possible outcomes. For other loans, impairment charges are recognised if a customer is downgraded to
reflect a change in the probability of default. The credit margins on individual risks are accounted for by adjusting the fair value for the difference between the current credit premium
and the credit premium demanded at the balance sheet date.
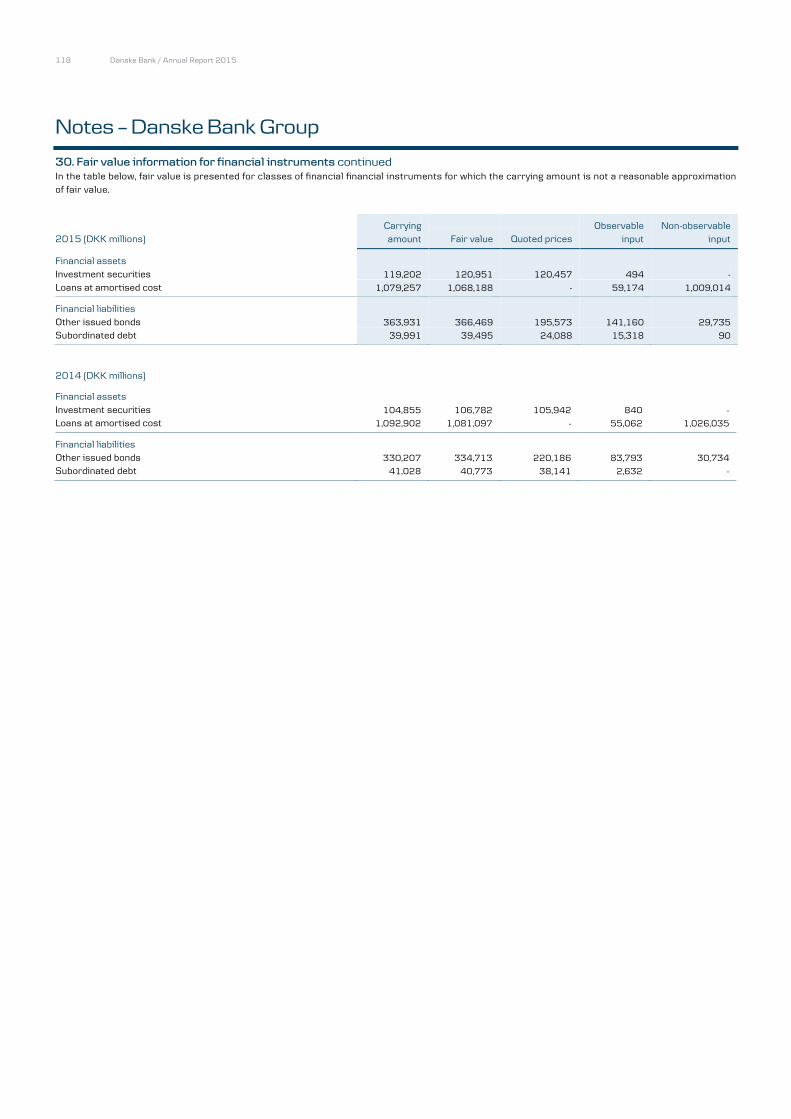
118 Danske Bank / Annual Report 2015
Notes – Danske Bank Group
30. Fair value information for financial instruments continued
In the table below, fair value is presented for classes of financial financial instruments for which the carrying amount is not a reasonable approximation
of fair value.
2015 (DKK millions) Carrying
amount Fair value Quoted prices Observable
input
Non-observable
input
Financial assets
Investment securities 119,202 120,951 120,457 494 -
Loans at amortised cost 1,079,257 1,068,188 - 59,174 1,009,014
Financial liabilities
Other issued bonds 363,931 366,469 195,573 141,160 29,735
Subordinated debt 39,991 39,495 24,088 15,318 90
2014 (DKK millions)
Financial assets
Investment securities 104,855 106,782 105,942 840 -
Loans at amortised cost 1,092,902 1,081,097 - 55,062 1,026,035
Financial liabilities
Other issued bonds 330,207 334,713 220,186 83,793 30,734
Subordinated debt 41,028 40,773 38,141 2,632 -
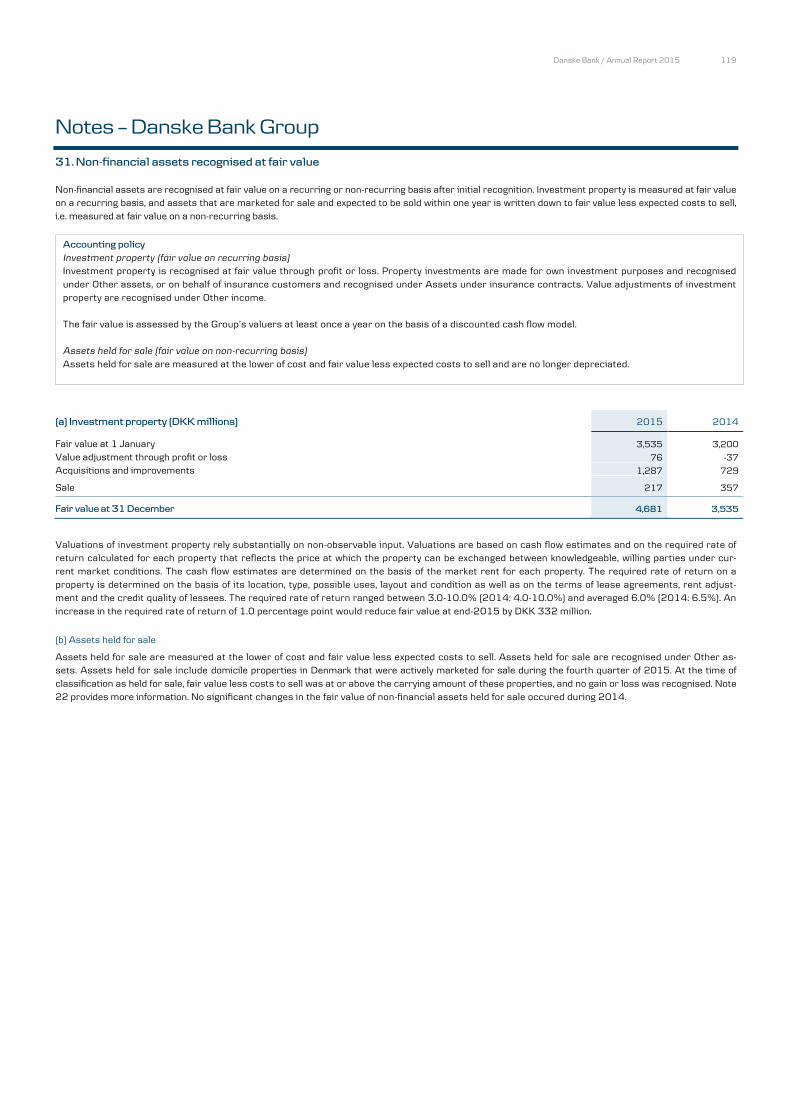
Danske Bank / Annual Report 2015 119
Notes – Danske Bank Group
31. Non-financial assets recognised at fair value
Non-financial assets are recognised at fair value on a recurring or non-recurring basis after initial recognition. Investment property is measured at fair value on a recurring basis, and assets that are marketed for sale and expected to be sold within one year is written down to fair value less expected costs to sell,
i.e. measured at fair value on a non-recurring basis.
Accounting policy
Investment property (fair value on recurring basis)
Investment property is recognised at fair value through profit or loss. Property investments are made for own investment purposes and recognised
under Other assets, or on behalf of insurance customers and recognised under Assets under insurance contracts. Value adjustments of investment
property are recognised under Other income.
The fair value is assessed by the Group’s valuers at least once a year on the basis of a discounted cash flow model.
Assets held for sale (fair value on non-recurring basis)
Assets held for sale are measured at the lower of cost and fair value less expected costs to sell and are no longer depreciated.
(a) Investment property (DKK millions) 2015 2014
Fair value at 1 January 3,535 3,200 Value adjustment through profit or loss 76 -37 Acquisitions and improvements 1,287 729 Sale 217 357
Fair value at 31 December 4,681 3,535
Valuations of investment property rely substantially on non-observable input. Valuations are based on cash flow estimates and on the required rate of return calculated for each property that reflects the price at which the property can be exchanged between knowledgeable, willing parties under cur-
rent market conditions. The cash flow estimates are determined on the basis of the market rent for each property. The required rate of return on a
property is determined on the basis of its location, type, possible uses, layout and condition as well as on the terms of lease agreements, rent adjust-ment and the credit quality of lessees. The required rate of return ranged between 3.0-10.0% (2014: 4.0-10.0%) and averaged 6.0% (2014: 6.5%). An
increase in the required rate of return of 1.0 percentage point would reduce fair value at end-2015 by DKK 332 million.
(b) Assets held for sale
Assets held for sale are measured at the lower of cost and fair value less expected costs to sell. Assets held for sale are recognised under Other as-sets. Assets held for sale include domicile properties in Denmark that were actively marketed for sale during the fourth quarter of 2015. At the time of
classification as held for sale, fair value less costs to sell was at or above the carrying amount of these properties, and no gain or loss was recognised. Note
22 provides more information. No significant changes in the fair value of non-financial assets held for sale occured during 2014.
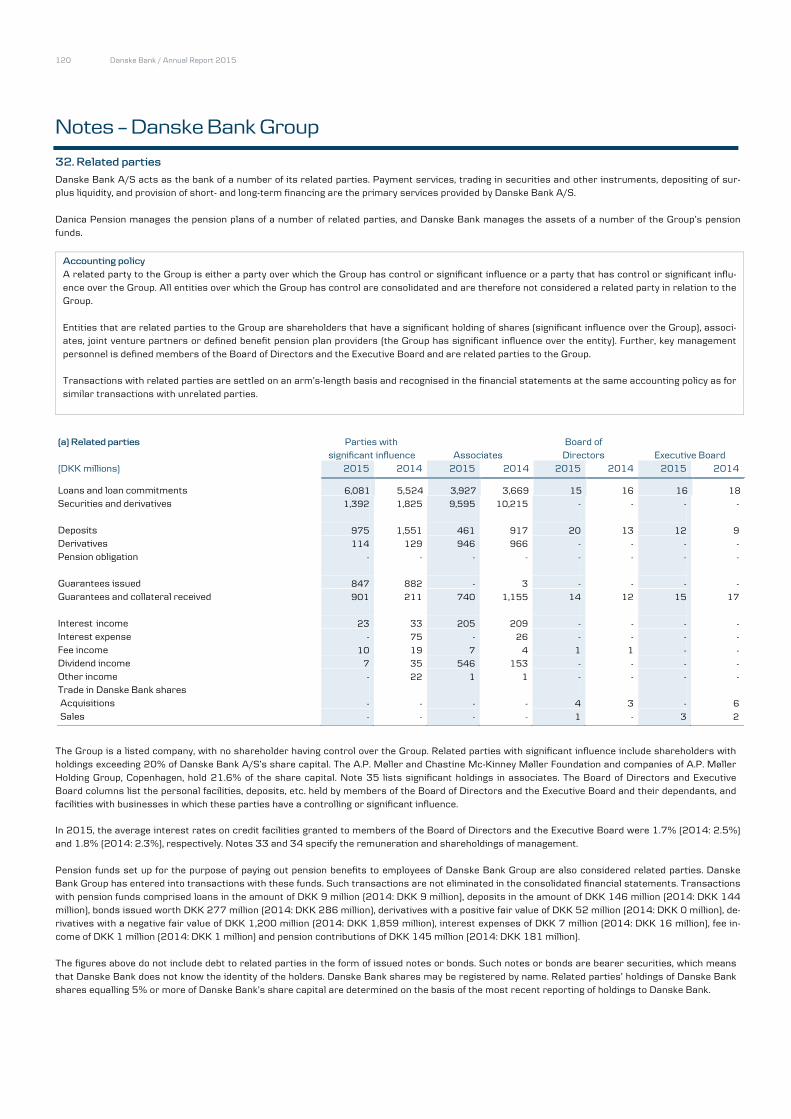
120 Danske Bank / Annual Report 2015
Notes – Danske Bank Group
32. Related parties
Danske Bank A/S acts as the bank of a number of its related parties. Payment services, trading in securities and other instruments, depositing of sur-plus liquidity, and provision of short- and long-term financing are the primary services provided by Danske Bank A/S.
Danica Pension manages the pension plans of a number of related parties, and Danske Bank manages the assets of a number of the Group’s pension
funds.
Accounting policy
A related party to the Group is either a party over which the Group has control or significant influence or a party that has control or significant influ-
ence over the Group. All entities over which the Group has control are consolidated and are therefore not considered a related party in relation to the Group.
Entities that are related parties to the Group are shareholders that have a significant holding of shares (significant influence over the Group), associ-ates, joint venture partners or defined benefit pension plan providers (the Group has significant influence over the entity). Further, key management
personnel is defined members of the Board of Directors and the Executive Board and are related parties to the Group.
Transactions with related parties are settled on an arm’s-length basis and recognised in the financial statements at the same accounting policy as for
similar transactions with unrelated parties.
(a) Related parties Parties with Board of significant influence Associates Directors Executive Board
(DKK millions) 2015 2014 2015 2014 2015 2014 2015 2014
Loans and loan commitments 6,081 5,524 3,927 3,669 15 16 16 18
Securities and derivatives 1,392 1,825 9,595 10,215 - - - -
Deposits 975 1,551 461 917 20 13 12 9
Derivatives 114 129 946 966 - - - -
Pension obligation - - - - - - - -
Guarantees issued 847 882 - 3 - - - -
Guarantees and collateral received 901 211 740 1,155 14 12 15 17
Interest income 23 33 205 209 - - - -
Interest expense - 75 - 26 - - - -
Fee income 10 19 7 4 1 1 - -
Dividend income 7 35 546 153 - - - -
Other income - 22 1 1 - - - -
Trade in Danske Bank shares
Acquisitions - - - - 4 3 - 6
Sales - - - - 1 - 3 2
The Group is a listed company, with no shareholder having control over the Group. Related parties with significant influence include shareholders with holdings exceeding 20% of Danske Bank A/S’s share capital. The A.P. Møller and Chastine Mc-Kinney Møller Foundation and companies of A.P. Møller
Holding Group, Copenhagen, hold 21.6% of the share capital. Note 35 lists significant holdings in associates. The Board of Directors and Executive
Board columns list the personal facilities, deposits, etc. held by members of the Board of Directors and the Executive Board and their dependants, and facilities with businesses in which these parties have a controlling or significant influence.
In 2015, the average interest rates on credit facilities granted to members of the Board of Directors and the Executive Board were 1.7% (2014: 2.5%) and 1.8% (2014: 2.3%), respectively. Notes 33 and 34 specify the remuneration and shareholdings of management.
Pension funds set up for the purpose of paying out pension benefits to employees of Danske Bank Group are also considered related parties. Danske Bank Group has entered into transactions with these funds. Such transactions are not eliminated in the consolidated financial statements. Transactions
with pension funds comprised loans in the amount of DKK 9 million (2014: DKK 9 million), deposits in the amount of DKK 146 million (2014: DKK 144
million), bonds issued worth DKK 277 million (2014: DKK 286 million), derivatives with a positive fair value of DKK 52 million (2014: DKK 0 million), de-rivatives with a negative fair value of DKK 1,200 million (2014: DKK 1,859 million), interest expenses of DKK 7 million (2014: DKK 16 million), fee in-
come of DKK 1 million (2014: DKK 1 million) and pension contributions of DKK 145 million (2014: DKK 181 million).
The figures above do not include debt to related parties in the form of issued notes or bonds. Such notes or bonds are bearer securities, which means
that Danske Bank does not know the identity of the holders. Danske Bank shares may be registered by name. Related parties’ holdings of Danske Bank
shares equalling 5% or more of Danske Bank’s share capital are determined on the basis of the most recent reporting of holdings to Danske Bank.

Danske Bank / Annual Report 2015 121
Notes – Danske Bank Group
33. Remuneration of management and material risk takers
This note gives information on the remuneration of the management of the Group in the form of the Board of Directors and the Executive Board, and of other material risk takers. This note further includes information on the Group’s share-based payment.
(a) Remuneration of the Board of Directors
Danske Bank’s directors receive fixed remuneration only and are not covered by incentive programmes. Directors also receive a fee for board commit-tee membership. The Board of Directors is remunerated by the Parent Company, Danske Bank A/S. No director has received remuneration for mem-
bership of the Executive Board or the Board of Directors in any of the Group’s subsidiaries. The Group has no pension obligations towards the directors.
Remuneration of the Board of Directors (DKK thousands) 2015 2014
Ole Andersen 2,002 1,931
Trond Ø. Westlie 1,040 907
Urban Bäckström 793 767
Lars Förberg 621 617
Jørn P. Jensen 713 657
Rolv Erik Ryssdal 1) 493 354
Carol Sergeant 886 807
Jim Hagemann Snabe 621 617
Kirsten Ebbe Brich 1) 493 354
Carsten Eilertsen 493 467
Charlotte Hoffmann 621 579
Steen Lund Olsen 1) 493 354
Niels B. Christiansen 2) - 300
Susanne Arboe 2) - 113
Helle Brøndum 2) - 113
Per Alling Toubro 2) - 113
Total remuneration 9,268 9,048
Remuneration for committee work included in total remuneration 2,118 2,110
1) From 18 March 2014
2) Until 18 March 2014
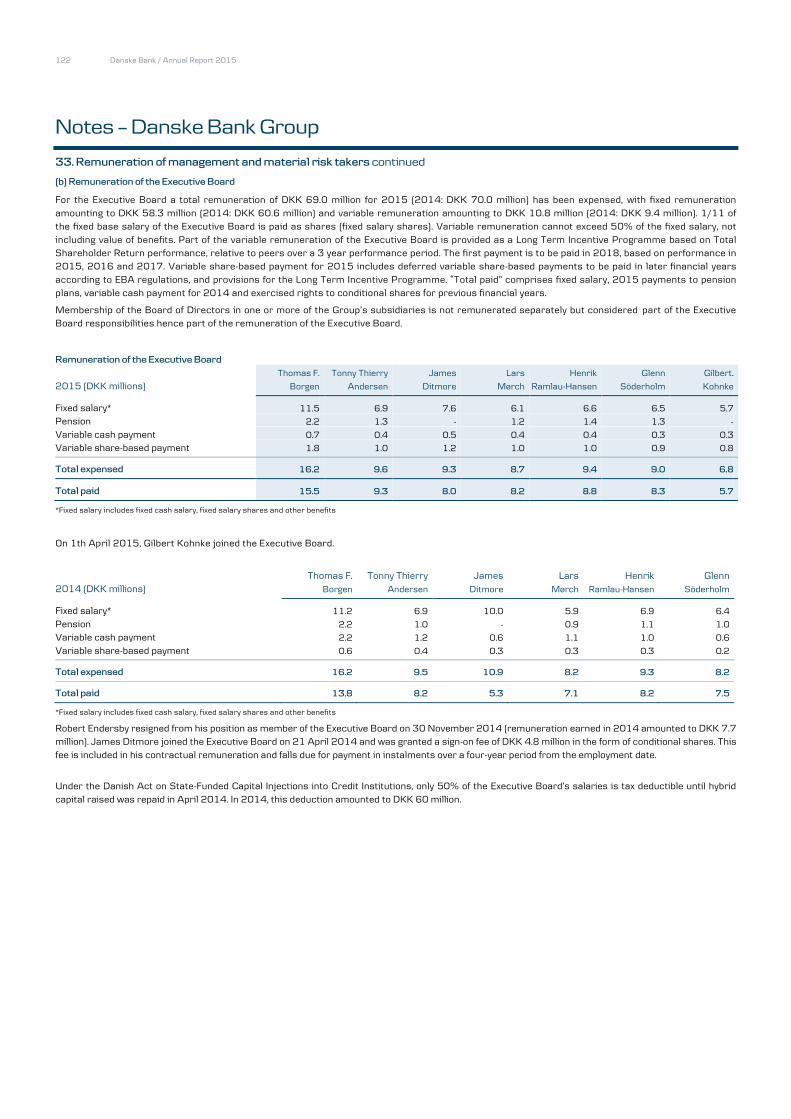
122 Danske Bank / Annual Report 2015
Notes – Danske Bank Group
33. Remuneration of management and material risk takers continued
(b) Remuneration of the Executive Board
For the Executive Board a total remuneration of DKK 69.0 million for 2015 (2014: DKK 70.0 million) has been expensed, with fixed remuneration
amounting to DKK 58.3 million (2014: DKK 60.6 million) and variable remuneration amounting to DKK 10.8 million (2014: DKK 9.4 million). 1/11 of the fixed base salary of the Executive Board is paid as shares (fixed salary shares). Variable remuneration cannot exceed 50% of the fixed salary, not
including value of benefits. Part of the variable remuneration of the Executive Board is provided as a Long Term Incentive Programme based on Total
Shareholder Return performance, relative to peers over a 3 year performance period. The first payment is to be paid in 2018, based on performance in 2015, 2016 and 2017. Variable share-based payment for 2015 includes deferred variable share-based payments to be paid in later financial years
according to EBA regulations, and provisions for the Long Term Incentive Programme. “Total paid” comprises fixed salary, 2015 payments to pension
plans, variable cash payment for 2014 and exercised rights to conditional shares for previous financial years.
Membership of the Board of Directors in one or more of the Group’s subsidiaries is not remunerated separately but considered part of the Executive Board responsibilities hence part of the remuneration of the Executive Board.
Remuneration of the Executive Board
Thomas F. Tonny Thierry James Lars Henrik Glenn Gilbert.
2015 (DKK millions) Borgen Andersen Ditmore Mørch Ramlau-Hansen Söderholm Kohnke
Fixed salary* 11.5 6.9 7.6 6.1 6.6 6.5 5.7
Pension 2.2 1.3 - 1.2 1.4 1.3 -
Variable cash payment 0.7 0.4 0.5 0.4 0.4 0.3 0.3
Variable share-based payment 1.8 1.0 1.2 1.0 1.0 0.9 0.8
Total expensed 16.2 9.6 9.3 8.7 9.4 9.0 6.8
Total paid 15.5 9.3 8.0 8.2 8.8 8.3 5.7
*Fixed salary includes fixed cash salary, fixed salary shares and other benefits
On 1th April 2015, Gilbert Kohnke joined the Executive Board.
Thomas F. Tonny Thierry James Lars Henrik Glenn 2014 (DKK millions) Borgen Andersen Ditmore Mørch Ramlau-Hansen Söderholm
Fixed salary* 11.2 6.9 10.0 5.9 6.9 6.4
Pension 2.2 1.0 - 0.9 1.1 1.0
Variable cash payment 2.2 1.2 0.6 1.1 1.0 0.6
Variable share-based payment 0.6 0.4 0.3 0.3 0.3 0.2
Total expensed 16.2 9.5 10.9 8.2 9.3 8.2
Total paid 13.8 8.2 5.3 7.1 8.2 7.5
*Fixed salary includes fixed cash salary, fixed salary shares and other benefits
Robert Endersby resigned from his position as member of the Executive Board on 30 November 2014 (remuneration earned in 2014 amounted to DKK 7.7 million). James Ditmore joined the Executive Board on 21 April 2014 and was granted a sign-on fee of DKK 4.8 million in the form of conditional shares. This
fee is included in his contractual remuneration and falls due for payment in instalments over a four-year period from the employment date.
Under the Danish Act on State-Funded Capital Injections into Credit Institutions, only 50% of the Executive Board’s salaries is tax deductible until hybrid
capital raised was repaid in April 2014. In 2014, this deduction amounted to DKK 60 million.

Danske Bank / Annual Report 2015 123
Notes – Danske Bank Group
33. Remuneration of management and material risk takers continued
Pension and termination (end of 2015) Thomas F. Tonny Thierry James Lars Henrik Glenn Gilbert
Borgen Andersen Ditmore Mørch Ramlau-Hansen Söderholm Kohnke
Annual Bank contributes Bank contributes Bank contributes Bank contributes Bank contributes
contribution 20% of salary p.a. 20% of salary p.a. - 20% of salary p.a. 22% of salary p.a. 20% of salary p.a. -
Notice of termination by Danske Bank 18 months 18 months 18 months 18 months 18 months 18 months 18 months
Notice of termination by the board member 12 months 9 months 9 months 9 months 9 months 9 months 9 months
Non-competition clause 24 months 12 months 12 months 12 months 12 months 12 months 12 months
(c) Remuneration of other material risk takers
In accordance with the Danish Financial Business Act and the accompanying order, Danske Bank Group is required to identify all employees whose professional activities could have a material impact on the risk profile of Danske Bank. EBA issued a Regulatory Technical Standard (RTS) that came into ef-
fect on 26 June 2014 and outlines prescriptive qualitative and quantitative criteria for identifying other material risk takers. This standard has been
adopted by the Danish FSA during 2014.
At the end of 2015, 876 other material risk takers are designated while 883 full-time equivalents (FTE) were designated as material risk takers during
2015 (as of 31 December 2014: designated 718 other material risk takers corresponding to 475 FTE as the majority was designated as material risk tak-ers on the implementation of the new RTS in June 2014). The 883 (FTE) designated as other material risk takers earned remuneration of DKK 1,552 mil-
lion (2014: 475 (FTE) other material risk takers earned remuneration of DKK 949 million), with fixed remuneration amounting to DKK 1,169 million and
variable remuneration amounting to DKK 383 million (2014: DKK 742 million and DKK 207 million, respectively).
Of the above remuneration for 2015, 430 (FTE) other material risk takers at the Parent Company, Danske Bank A/S, earned DKK 1,054 million (2014: DKK
707 million to 276 (FTE) other material risk takers), with fixed remuneration amounting to DKK 738 million and variable remuneration amounting to DKK 316 million (2014: DKK 521 million and DKK 186 million, respectively).
The Group’s pension obligations towards other material risk takers amounted to DKK 964 million to 157 employees at year-end 2015 (31 December 2014: DKK 886 million and 130 employees).
Variable payment for other material risk takers is split into cash and equity shares according to EBA regulations. Further, 40-60% of variable payments are deferred minimum 3 years. All variable payments are subject to claw back provisions if granted on the basis of data which has subsequently proven to be
manifestly misstated or inaccurate.
(d) Share-based payment
Until 2008, the Group offered senior staff and selected employees incentive programmes in the form of share-based payment, that included share op-
tions. During 2015, the last share options were exercised.
Effective from 2010, the Group has granted rights to conditional shares – under the bonus structure for material risk takers – for part of their variable
remuneration. Rights to Danske Bank shares for material risk takers vest up to four years after being granted (four years for the Executive Board), pro-
vided that the employee, with the exception of retirement, has not resigned from the Group. In addition to this requirement and before pay -out of de-ferred shares, back testing is conducted to assess whether the initial criteria for granting the bonus still are considered f ulfilled, whether the banks
economic situation has deteriorated significantly and whether the individual has proven fit and proper. The fair value of the conditional shares is calcu-
lated as the share price at grant date less the payment made by the employee, if any.
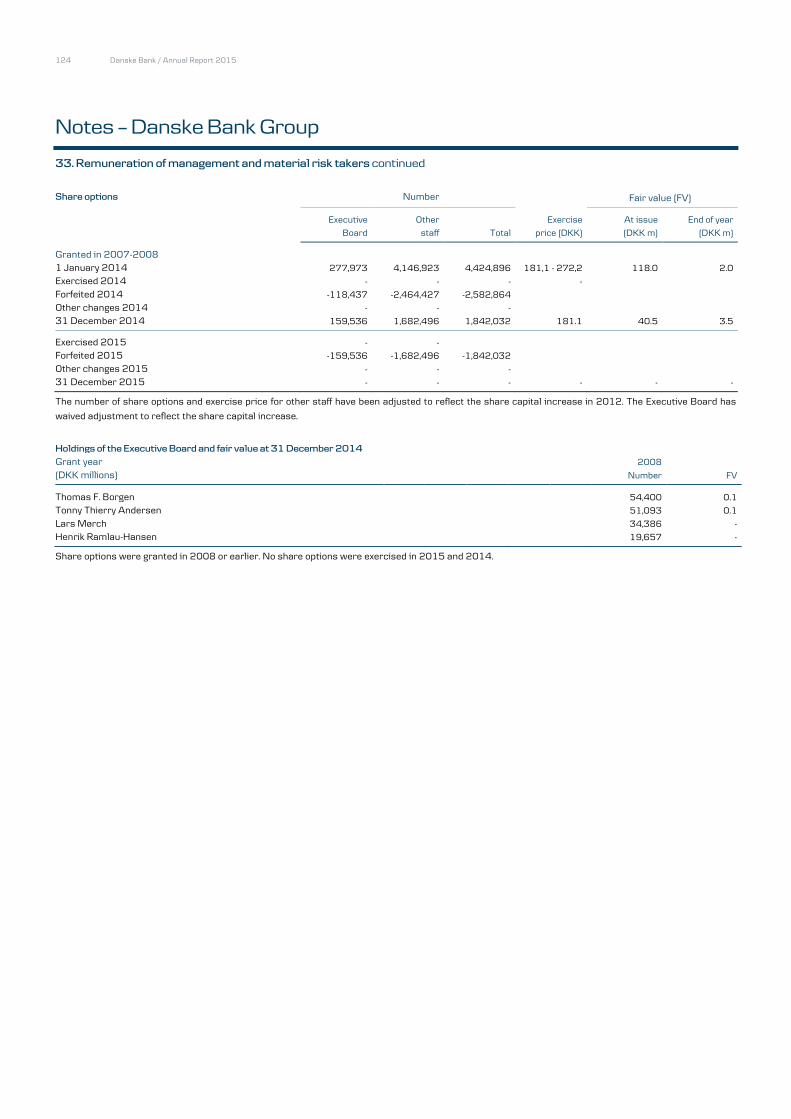
124 Danske Bank / Annual Report 2015
Notes – Danske Bank Group
33. Remuneration of management and material risk takers continued
Share options Number Fair value (FV)
Executive Other
Exercise At issue End of year
Board staff Total price (DKK) (DKK m) (DKK m)
Granted in 2007-2008
1 January 2014 277,973 4,146,923 4,424,896 181,1 - 272,2 118.0 2.0
Exercised 2014
- - - -
Forfeited 2014
-118,437 -2,464,427 -2,582,864
Other changes 2014
- - -
31 December 2014 159,536 1,682,496 1,842,032 181.1 40.5 3.5
Exercised 2015
- -
Forfeited 2015
-159,536 -1,682,496 -1,842,032
Other changes 2015
- - -
31 December 2015 - - - - - -
The number of share options and exercise price for other staff have been adjusted to reflect the share capital increase in 2012. The Executive Board has
waived adjustment to reflect the share capital increase.
Holdings of the Executive Board and fair value at 31 December 2014
Grant year
2008
(DKK millions) Number FV
Thomas F. Borgen
54,400 0.1
Tonny Thierry Andersen
51,093 0.1
Lars Mørch
34,386 -
Henrik Ramlau-Hansen 19,657 -
Share options were granted in 2008 or earlier. No share options were exercised in 2015 and 2014.
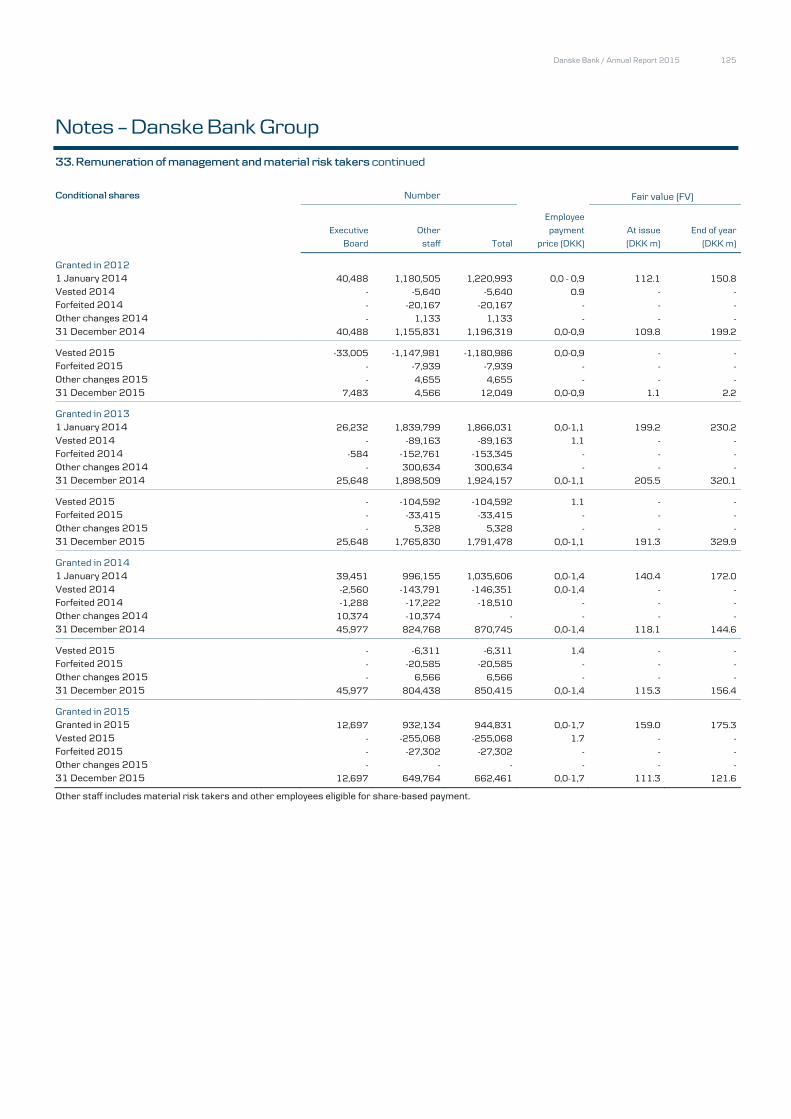
Danske Bank / Annual Report 2015 125
Notes – Danske Bank Group
33. Remuneration of management and material risk takers continued
Conditional shares Number Fair value (FV)
Executive Other
Employee
payment At issue End of year
Board staff Total price (DKK) (DKK m) (DKK m)
Granted in 2012
1 January 2014
40,488 1,180,505 1,220,993 0,0 - 0,9 112.1 150.8
Vested 2014
- -5,640 -5,640 0.9 - -
Forfeited 2014
- -20,167 -20,167 - - -
Other changes 2014
- 1,133 1,133 - - -
31 December 2014
40,488 1,155,831 1,196,319 0,0-0,9 109.8 199.2
Vested 2015
-33,005 -1,147,981 -1,180,986 0,0-0,9 - -
Forfeited 2015
- -7,939 -7,939 - - -
Other changes 2015
- 4,655 4,655 - - -
31 December 2015
7,483 4,566 12,049 0,0-0,9 1.1 2.2
Granted in 2013
1 January 2014
26,232 1,839,799 1,866,031 0,0-1,1 199.2 230.2
Vested 2014
- -89,163 -89,163 1.1 - -
Forfeited 2014
-584 -152,761 -153,345 - - -
Other changes 2014
- 300,634 300,634 - - -
31 December 2014
25,648 1,898,509 1,924,157 0,0-1,1 205.5 320.1
Vested 2015
- -104,592 -104,592 1.1 - -
Forfeited 2015
- -33,415 -33,415 - - -
Other changes 2015
- 5,328 5,328 - - -
31 December 2015
25,648 1,765,830 1,791,478 0,0-1,1 191.3 329.9
Granted in 2014
1 January 2014
39,451 996,155 1,035,606 0,0-1,4 140.4 172.0
Vested 2014
-2,560 -143,791 -146,351 0,0-1,4 - -
Forfeited 2014
-1,288 -17,222 -18,510 - - -
Other changes 2014
10,374 -10,374 - - - -
31 December 2014
45,977 824,768 870,745 0,0-1,4 118.1 144.6
Vested 2015
- -6,311 -6,311 1.4 - -
Forfeited 2015
- -20,585 -20,585 - - -
Other changes 2015
- 6,566 6,566 - - -
31 December 2015
45,977 804,438 850,415 0,0-1,4 115.3 156.4
Granted in 2015
Granted in 2015
12,697 932,134 944,831 0,0-1,7 159.0 175.3
Vested 2015
- -255,068 -255,068 1.7 - -
Forfeited 2015
- -27,302 -27,302 - - -
Other changes 2015
- - - - - -
31 December 2015
12,697 649,764 662,461 0,0-1,7 111.3 121.6
Other staff includes material risk takers and other employees eligible for share-based payment.

126 Danske Bank / Annual Report 2015
Notes – Danske Bank Group
33. Remuneration of management and material risk takers continued
Holdings of the Executive Board and fair value at 31 December 2015 Grant year
2012-2015
(DKK millions)
Number FV
Thomas F. Borgen
9,190 1.7
Tonny Thierry Andersen
7,018 1.3
James Ditmore
36,545 6.8
Gilbert Kohnke
- -
Lars Mørch
6,112 1.1
Henrik Ramlau-Hansen
5,874 1.1
Glenn Söderholm
27,066 5.0
Holdings of the Executive Board and fair value at 31 December 2014
Grant year
2012-2014
(DKK millions)
Number FV
Thomas F. Borgen
5,395 0.9
Tonny Thierry Andersen
4,885 0.8
James Ditmore
34,699 5.8
Lars Mørch
12,390 2.1
Henrik Ramlau-Hansen
3,984 0.7
Glenn Söderholm
50,760 8.5
In 2015, the average price at the vesting date for rights to conditional shares was DKK 179.8 (2014: DKK 142.0).

Danske Bank / Annual Report 2015 127
Notes – Danske Bank Group
34. Danske Bank shares held by the Board of Directors and the Executive Board
Upon appointment/ (DKK millions) Beginning of 2015 retirement Additions Disposals End of 2015
Board of Directors
Ole Andersen 31,199 - 22,000 - 53,199
Rolv Erik Ryssdal - - - - -
Urban Bäckström 11,000 - - - 11,000
Kirsten Ebbe Brich 2,208 - - - 2,208
Steen Lund Olsen 788 - - - 788
Jørn P. Jensen 2,098 - - - 2,098
Trond Ø Westlie 7,000 - - - 7,000
Carsten Eilertsen 120 - - - 120
Charlotte Hoffmann 5,175 - - 3,000 2,175
Lars Förberg 5,000 - - - 5,000
Carol Sergeant 5,073 - - - 5,073
Jim Hagemann Snabe 2,645 - - - 2,645
Total 72,306 - 22,000 3,000 91,306
Executive Board
Thomas F. Borgen 20,452 - 6,440 - 26,892
Tonny Thierry Andersen 22,338 - 3,625 - 25,963
James Ditmore 2,000 - 3,206 - 5,206
Lars Mørch 18,333 - 11,372 4,140 25,565
Henrik Ramlau-Hansen 24,505 - 3,821 - 28,326
Glenn Söderholm 18,864 - 28,045 15,000 31,909
Gilbert Kohnke - - 2,219 - 2,219
Total 106,492 - 58,728 19,140 146,080
Under the Danish Securities Trading Act, the acquisition and sale of Danske Bank shares by members of the Board of Directors and the Executive Board and related parties must be reported to the Danish FSA and be publicly disclosed when transactions exceed EUR 5,000 per calendar year. Danske Bank
discloses all additions, disposals and total holdings of members of the Board of Directors and the Executive Board and related parties. Holdings of share op-
tions and conditional shares of the members of the Executive Board are disclosed in note 33.

128 Danske Bank / Annual Report 2015
Notes – Danske Bank Group
35. Group holdings and undertakings
This note provides information on subsidiaries.
Accounting policy
The financial statements consolidate Danske Bank A/S and group undertakings in which the Group has control over financial and operating policy deci-sions. Control is said to exist if Danske Bank A/S, directly or indirectly, is exposed, or has rights, to variable returns from the involvement with the entity
and has the ability to affect those returns through the power over the entity. Power exists if Danske Bank A/S, directly or indirectly, holds more than half
of the voting rights in an undertaking or otherwise has power to control management and operating policy decisions. Operating policy control may be exercised through agreements about the undertaking’s activities. In the rare situations where potential voting rights exists, these are taken into ac-
count if Danske Bank has the practical ability to exercise those rights.
When assessing whether to consolidate investment funds, the Group reviews all facts and circumstances to determine whether the Group, as fund
manager, is acting as agent or principal. The Group is deemed to be a principal, and hence controls and consolidates a fund, when the Group acts as
fund manager and cannot be removed without cause (i.e. when kick-out rights are weak), has variable returns through significant holdings, and is able to influence the returns of the funds by exercising its power. Holdings where all returns belongs to customers (pooled schemes and unit link investment
contracts) are not considered as exposure to variable returns, whereas holdings where the majority of the return belongs to customers (holdings relat-
ed to insurance contracts) are only considered limited exposure to variable returns.
The consolidated financial statements are prepared by consolidating items of the same nature and eliminating intra-group transactions, balances and
trading profits and losses.
Undertakings acquired are included in the financial statements at the time of acquisition. The net assets of such undertakings (assets, including identi-
fiable intangible assets, less liabilities and contingent liabilities) are measured at fair value at the date of acquisition according to the acquisition meth-od.
If the cost of acquisition (until 1 January 2010 including direct transaction costs) exceeds the fair value of the net assets acquired, the excess amount is recognised as goodwill. Goodwill is recognised in the functional currency of the undertaking acquired. The portion of the acquisition that is attributa-
ble to non-controlling interests does not include goodwill.
Divested undertakings are included in the financial statements until the transfer date.
Held-for-sale group undertakings
Companies taken over by the Group under non-performing loan agreements and actively marketed for sale and expected to be sold within 12 months of
classification are recognised as held-for-sale. Asets and liabilities in such companies are presented under Other assets and Other liabilities. The assets
are recognised at the lower of cost and fair value less expected costs to sell.
(a) Further explanation
All credit institutions and insurance companies supervised by national FSAs are subject to local statutory capital requirements. These requirements
restrict intra-group facilities and dividend payouts.
Danica Pension has an obligation to allocate part of the margin by which Danica Pension’s equity exceeds the statutory solvency requirement to certain
policyholders who were previously policyholders of Statsanstalten for Livsforsikring (now part of Danica Pension). This applies only if the margin
exceeds the margin in Statsanstalten for Livsforsikring before the privatisation in 1990 and relates to any excess included in the shareholders’ equity or paid out as dividend. Such special allotments are expensed and recognised under Net insurance benefits.
Restrictions impacting the Group’s ability to use assets are disclosed in note 28 and include, among others, assets pledged as collateral under repo transactions, loans behind covered bonds and assets held by insurance subsidiaries that are primarily held to satisfy obligations to policyholders’
savings.
The Group has established a number of investment funds in which the Group acts as fund manager. The Group has consolidated investment funds of
DKK 3,928 million (2014: DKK 15,672 million) as the Group is deemed to be acting as principal rather than agent in its role as fund manager and as
the Group is the sole investor. The investments are held to satisfy obligations towards insurance policyholders and are recognised under Assets under insurance contracts. The Group does not have consolidated structured entities in the form of securitisation vehicles or asset-backed financing vehicles.
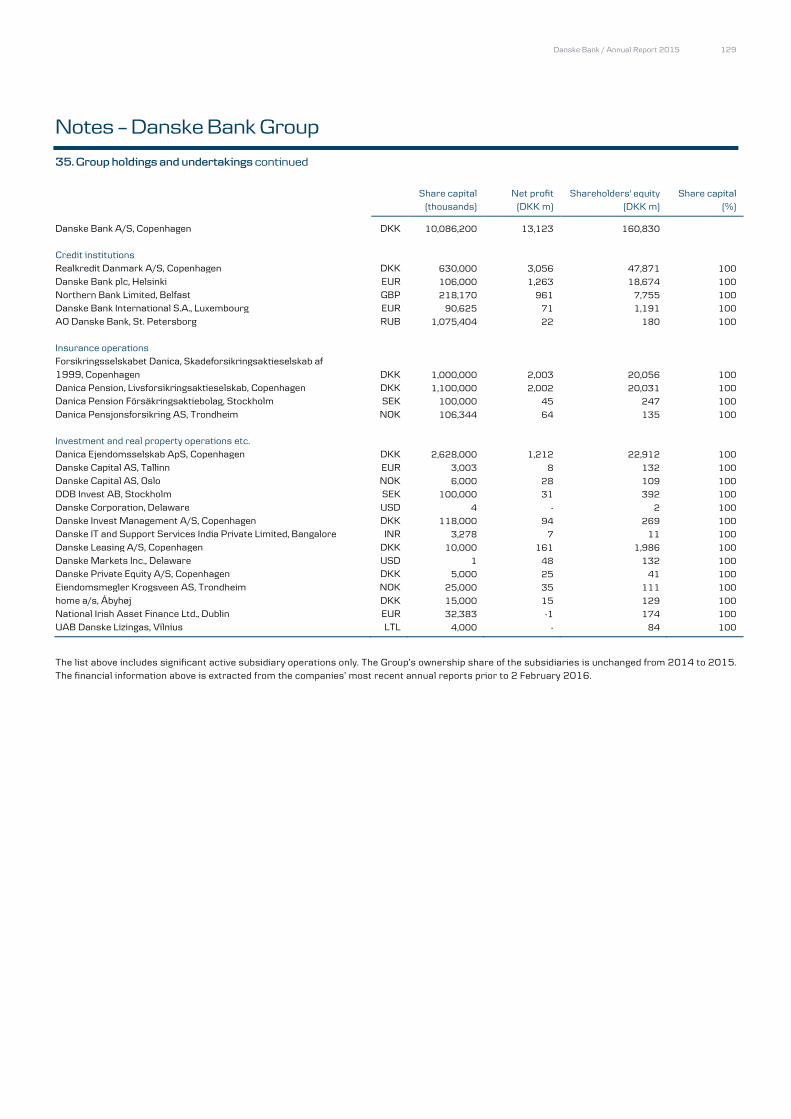
Danske Bank / Annual Report 2015 129
Notes – Danske Bank Group
35. Group holdings and undertakings continued
Share capital Net profit Shareholders' equity Share capital
(thousands) (DKK m) (DKK m) (%)
Danske Bank A/S, Copenhagen DKK 10,086,200 13,123 160,830
Credit institutions
Realkredit Danmark A/S, Copenhagen DKK 630,000 3,056 47,871 100
Danske Bank plc, Helsinki EUR 106,000 1,263 18,674 100
Northern Bank Limited, Belfast GBP 218,170 961 7,755 100
Danske Bank International S.A., Luxembourg EUR 90,625 71 1,191 100
AO Danske Bank, St. Petersborg RUB 1,075,404 22 180 100
Insurance operations Forsikringsselskabet Danica, Skadeforsikringsaktieselskab af
1999, Copenhagen DKK 1,000,000 2,003 20,056 100 Danica Pension, Livsforsikringsaktieselskab, Copenhagen DKK 1,100,000 2,002 20,031 100
Danica Pension Försäkringsaktiebolag, Stockholm SEK 100,000 45 247 100
Danica Pensjonsforsikring AS, Trondheim NOK 106,344 64 135 100
Investment and real property operations etc. Danica Ejendomsselskab ApS, Copenhagen DKK 2,628,000 1,212 22,912 100
Danske Capital AS, Tallinn EUR 3,003 8 132 100 Danske Capital AS, Oslo NOK 6,000 28 109 100 DDB Invest AB, Stockholm SEK 100,000 31 392 100 Danske Corporation, Delaware USD 4 - 2 100
Danske Invest Management A/S, Copenhagen DKK 118,000 94 269 100
Danske IT and Support Services India Private Limited, Bangalore INR 3,278 7 11 100
Danske Leasing A/S, Copenhagen DKK 10,000 161 1,986 100
Danske Markets Inc., Delaware USD 1 48 132 100
Danske Private Equity A/S, Copenhagen DKK 5,000 25 41 100
Eiendomsmegler Krogsveen AS, Trondheim NOK 25,000 35 111 100
home a/s, Åbyhøj DKK 15,000 15 129 100
National Irish Asset Finance Ltd., Dublin EUR 32,383 -1 174 100
UAB Danske Lizingas, Vilnius LTL 4,000 - 84 100
The list above includes significant active subsidiary operations only. The Group’s ownership share of the subsidiaries is unchanged from 2014 to 2015. The financial information above is extracted from the companies’ most recent annual reports prior to 2 February 2016.
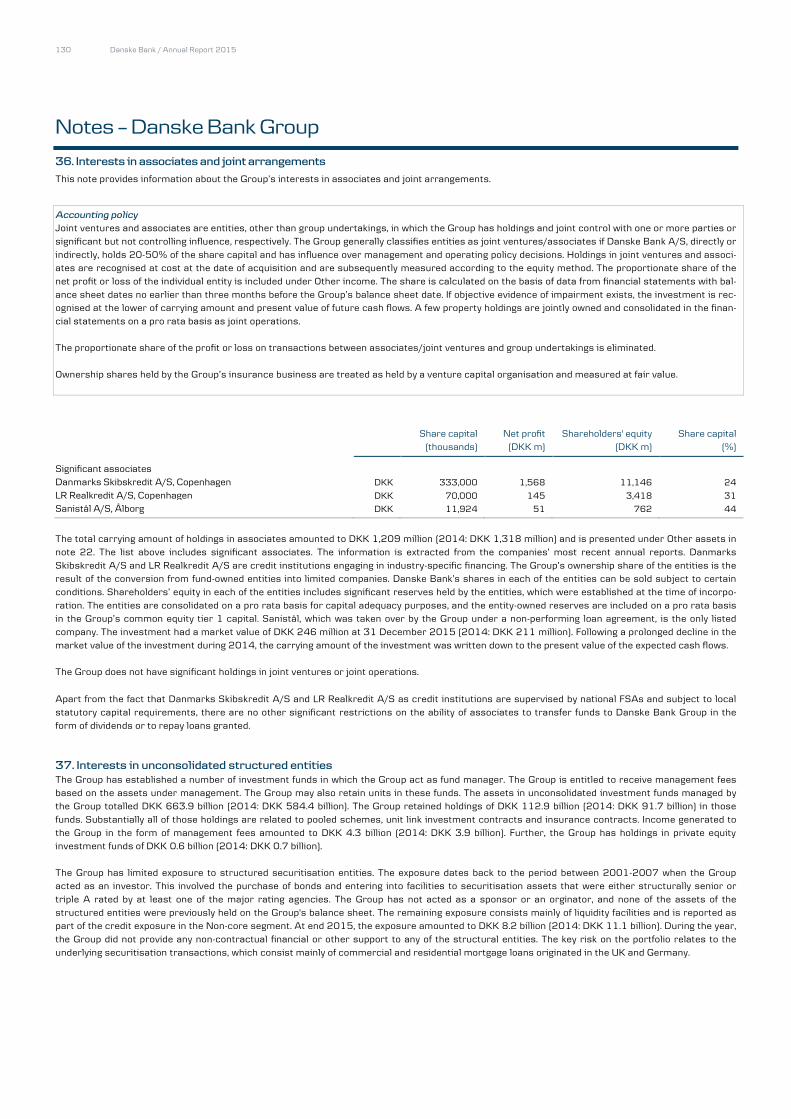
130 Danske Bank / Annual Report 2015
Notes – Danske Bank Group
36. Interests in associates and joint arrangements
This note provides information about the Group’s interests in associates and joint arrangements.
Accounting policy Joint ventures and associates are entities, other than group undertakings, in which the Group has holdings and joint control with one or more parties or
significant but not controlling influence, respectively. The Group generally classifies entities as joint ventures/associates if Danske Bank A/S, directly or
indirectly, holds 20-50% of the share capital and has influence over management and operating policy decisions. Holdings in joint ventures and associ-ates are recognised at cost at the date of acquisition and are subsequently measured according to the equity method. The proportionate share of the
net profit or loss of the individual entity is included under Other income. The share is calculated on the basis of data from financial statements with bal-
ance sheet dates no earlier than three months before the Group’s balance sheet date. If objective evidence of impairment exists, the investment is rec-ognised at the lower of carrying amount and present value of future cash flows. A few property holdings are jointly owned and consolidated in the finan-
cial statements on a pro rata basis as joint operations.
The proportionate share of the profit or loss on transactions between associates/joint ventures and group undertakings is eliminated.
Ownership shares held by the Group’s insurance business are treated as held by a venture capital organisation and measured at fair value.
Share capital Net profit Shareholders' equity Share capital
(thousands) (DKK m) (DKK m) (%)
Significant associates
Danmarks Skibskredit A/S, Copenhagen DKK 333,000 1,568 11,146 24
LR Realkredit A/S, Copenhagen DKK 70,000 145 3,418 31
Sanistål A/S, Ålborg DKK 11,924 51 762 44
The total carrying amount of holdings in associates amounted to DKK 1,209 million (2014: DKK 1,318 million) and is presented under Other assets in
note 22. The list above includes significant associates. The information is extracted from the companies’ most recent annual reports. Danmarks
Skibskredit A/S and LR Realkredit A/S are credit institutions engaging in industry-specific financing. The Group’s ownership share of the entities is the result of the conversion from fund-owned entities into limited companies. Danske Bank’s shares in each of the entities can be sold subject to certain
conditions. Shareholders’ equity in each of the entities includes significant reserves held by the entities, which were established at the time of incorpo-
ration. The entities are consolidated on a pro rata basis for capital adequacy purposes, and the entity-owned reserves are included on a pro rata basis in the Group’s common equity tier 1 capital. Sanistål, which was taken over by the Group under a non-performing loan agreement, is the only listed
company. The investment had a market value of DKK 246 million at 31 December 2015 (2014: DKK 211 million). Following a prolonged decline in the
market value of the investment during 2014, the carrying amount of the investment was written down to the present value of the expected cash flows.
The Group does not have significant holdings in joint ventures or joint operations.
Apart from the fact that Danmarks Skibskredit A/S and LR Realkredit A/S as credit institutions are supervised by national FSAs and subject to local
statutory capital requirements, there are no other significant restrictions on the ability of associates to transfer funds to Danske Bank Group in the
form of dividends or to repay loans granted.
37. Interests in unconsolidated structured entities
The Group has established a number of investment funds in which the Group act as fund manager. The Group is entitled to receive management fees
based on the assets under management. The Group may also retain units in these funds. The assets in unconsolidated investment funds managed by the Group totalled DKK 663.9 billion (2014: DKK 584.4 billion). The Group retained holdings of DKK 112.9 billion (2014: DKK 91.7 billion) in those
funds. Substantially all of those holdings are related to pooled schemes, unit link investment contracts and insurance contracts. Income generated to
the Group in the form of management fees amounted to DKK 4.3 billion (2014: DKK 3.9 billion). Further, the Group has holdings in private equity investment funds of DKK 0.6 billion (2014: DKK 0.7 billion).
The Group has limited exposure to structured securitisation entities. The exposure dates back to the period between 2001-2007 when the Group acted as an investor. This involved the purchase of bonds and entering into facilities to securitisation assets that were either structurally senior or
triple A rated by at least one of the major rating agencies. The Group has not acted as a sponsor or an orginator, and none of the assets of the
structured entities were previously held on the Group's balance sheet. The remaining exposure consists mainly of liquidity facilities and is reported as part of the credit exposure in the Non-core segment. At end 2015, the exposure amounted to DKK 8.2 billion (2014: DKK 11.1 billion). During the year,
the Group did not provide any non-contractual financial or other support to any of the structural entities. The key risk on the portfolio relates to the
underlying securitisation transactions, which consist mainly of commercial and residential mortgage loans originated in the UK and Germany.
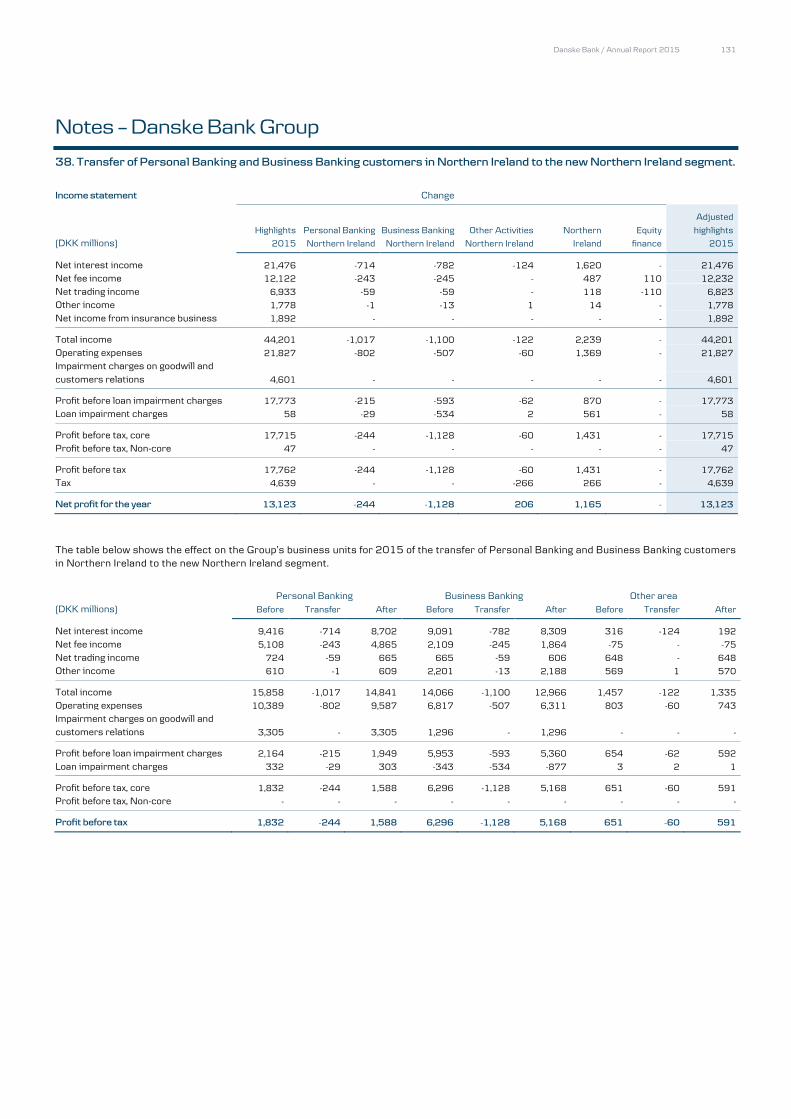
Danske Bank / Annual Report 2015 131
Notes – Danske Bank Group
38. Transfer of Personal Banking and Business Banking customers in Northern Ireland to the new Northern Ireland segment.
Income statement Change
Highlights Personal Banking Business Banking Other Activities Northern Equity
Adjusted
highlights
(DKK millions) 2015 Northern Ireland Northern Ireland Northern Ireland Ireland finance 2015
Net interest income 21,476 -714 -782 -124 1,620 - 21,476
Net fee income 12,122 -243 -245 - 487 110 12,232
Net trading income 6,933 -59 -59 - 118 -110 6,823
Other income 1,778 -1 -13 1 14 - 1,778
Net income from insurance business 1,892 - - - - - 1,892
Total income 44,201 -1,017 -1,100 -122 2,239 - 44,201
Operating expenses 21,827 -802 -507 -60 1,369 - 21,827
Impairment charges on goodwill and
customers relations 4,601 - - - - - 4,601
Profit before loan impairment charges 17,773 -215 -593 -62 870 - 17,773
Loan impairment charges 58 -29 -534 2 561 - 58
Profit before tax, core 17,715 -244 -1,128 -60 1,431 - 17,715
Profit before tax, Non-core 47 - - - - - 47
Profit before tax 17,762 -244 -1,128 -60 1,431 - 17,762
Tax 4,639 - - -266 266 - 4,639
Net profit for the year 13,123 -244 -1,128 206 1,165 - 13,123
The table below shows the effect on the Group’s business units for 2015 of the transfer of Personal Banking and Business Banking customers in Northern Ireland to the new Northern Ireland segment.
Personal Banking Business Banking Other area (DKK millions) Before Transfer After Before Transfer After Before Transfer After
Net interest income 9,416 -714 8,702 9,091 -782 8,309 316 -124 192
Net fee income 5,108 -243 4,865 2,109 -245 1,864 -75 - -75
Net trading income 724 -59 665 665 -59 606 648 - 648
Other income 610 -1 609 2,201 -13 2,188 569 1 570
Total income 15,858 -1,017 14,841 14,066 -1,100 12,966 1,457 -122 1,335
Operating expenses 10,389 -802 9,587 6,817 -507 6,311 803 -60 743
Impairment charges on goodwill and
customers relations 3,305 - 3,305 1,296 - 1,296 - - -
Profit before loan impairment charges 2,164 -215 1,949 5,953 -593 5,360 654 -62 592
Loan impairment charges 332 -29 303 -343 -534 -877 3 2 1
Profit before tax, core 1,832 -244 1,588 6,296 -1,128 5,168 651 -60 591
Profit before tax, Non-core - - - - - - - - -
Profit before tax 1,832 -244 1,588 6,296 -1,128 5,168 651 -60 591

132 Danske Bank / Annual Report 2015
Notes – Danske Bank Group – Risk Management
Risk exposure
Danske Bank Group is exposed to a number of risks and manages them at various organisational levels.
The main categories of risk are the following:
Credit risk: The risk of losses because debtors or counterparties fail to meet all or part of their payment obligations to the Group.
Market risk: The risk of losses because the fair value of the Group’s assets , liabilities and off-balance-sheet items varies with changes in market conditions.
Liquidity risk: The risk of losses because funding costs become excessive, lack of funding prevents the Group from maintaining its business model,
or lack of funding prevents the Group from fulfilling its payment obligations. Insurance risk: All types of risk at Danica Pension, including market risk, life insurance risk and operational risk .
Danica Pension is a wholly-owned subsidiary of Danske Bank. As required by Danish law and the Executive Order on the Contribution Principle, Danica Pension has notified the Danish FSA of its profit policy. The contribution principle and the profit policy mean that policyho lders assume the risks and
receive the returns on assets allocated to them. Assets are allocated to policyholders to secure their guaranteed benefits. Market risk and other risks
on assets and liabilities allocated to policyholders are therefore not consolidated in the tables of this section, but are tr eated in the section on insur-ance risk.
The management’s report and Risk Management 2015 provide a detailed description of Danske Bank Group’s risk management practices. Risk Man-agement 2015 is available at danskebank.com/ir. The publication is not covered by the statutory audit.
Total capital
The Group’s capital management policies and practices support its business strategy and ensure that it is sufficiently capita lised to withstand even se-
vere macroeconomic downturns.
Danske Bank is a licensed financial services provider and must therefore comply with the capital requirements of the Capital Requirements Regulation
(CRR) and the Danish Financial Business Act. The Danish rules are based on the EU Capital Requirements Directive (CRD IV) and apply to both Danske Bank A/S (the Parent Company) and the Group. Similarly, the Group’s financial subsidiaries in and outside Denmark must comply with local capital r e-
quirements. The regulatory requirements stipulate a minimum capital level of 8% of the total risk exposure amou nt (REA) under Pillar I (risk exposure
amounts for credit risk (including counterparty risk), market risk and operational risk). In addition, financial institutions are required to calculate their solvency need under Pillar II to reflect all relevant risks. The Bank was designated a systemically important financial insti tution (SIFI) in Denmark in
2014. This means that the Group is subject to stricter requirements than non-SIFI banks. Danske Bank’s SIFI buffer requirement is set at an additional
3% above the regulatory requirements for common equity tier 1 (CET1) capital. The SIFI buffer requirement phase-in began on 1 January 2015 and will be completed by 2019. The Group’s SIFI buffer requirement is currently 0.6%.
The Group’s total capital consists of tier 1 capital (share capital and additional tier 1 capital after deductions) and tier 2 capital (subordinated loan capi-
tal after deductions).
The Group’s CET1 capital is based on the carrying amount of shareholders’ equity with the following adjustments: domicile pro perty revalued at its es-timated fair value and proposed dividends; intangible assets of banking operat ions; statutory deductions for insurance companies; and deferred tax as-
sets that rely on future profitability, etc. The presentation of the Group’s total capital in the statement of capital shows the difference between the car-
rying amount of shareholders’ equity and CET1 capital.
The Group’s additional tier 1 capital and tier 2 capital may, subject to certain conditions, be included in total capital. Th e conditions are described in the
CRR. Until the CRR is fully phased in, transitional rules apply to instruments which do not qualify for inclusion according to the CRR. Notes 21 and 23(b) show additional tier 1 capital and tier 2 capital. At the end of 2015, the Group’s total capital was DKK 175.1 billion (2014: DKK 166.7 billion), and the
total capital ratio was 21.0% (2014: 19.3%). Tier 1 capital was DKK 154.5 billion (2014: DKK 144.1 billion), and the tier 1 capital ratio was 18.5%
(2014: 16.7%).
Risk Management 2015 provides a description of the Group’s solvency need.
The Group’s capital considerations are based on an assessment of the capital requirements under the rules on the transition f rom current regulations
to the CRR and CRD IV and on the requirements for SIFIs.
The Group has set capital targets that are in accordance with its business strategy: a total capital ratio of at least 17% and a CET1 capital ratio of at
least 13%.
The Group aspires to improve its credit ratings, which are important for its access to liquidity and for the pricing of its l ong-term funding. The Group therefore includes rating targets in its capital considerations.

Danske Bank / Annual Report 2015 133
Notes – Danske Bank Group – Risk Management
Credit risk
The Group offers loans, credits, guarantees and other products as part of its business model and thus takes on credit risk.
Credit risk is the risk of losses because counterparties or debtors fail to meet all or part of their payment obligations.
The Group grants credits on the basis of information about customers’ individual financial circumstances and monitors their f inancial situation with the aim of assessing whether the basis for granting credit facilities has changed. Facilities should adhere to the guidelines outlined in the Group’s Credit
Policy, including the Principles of Responsible Lending. The Principles of Responsible Lending focus on customers’ understand ing of the consequences
of borrowing, on an assessment of their needs and ability to repay, and on possible conflicts with the Group’s ethical guidelines. Facilities should match customers’ financial situation, including their earnings, capital and assets, and business volume with Danske Bank to a reasonable degree, and custom-
ers must be able to substantiate their repayment ability. In order to mitigate credit risk, the Group uses collateral, guaran tees and covenants.
Credit exposure
Credit exposure consists of balance sheet items and off-balance-sheet items that carry credit risk. Most of the exposure derives from lending activities
in the form of secured and unsecured loans. The Non-core business unit is not considered part of Danske Bank’s core activities and is stated sepa-rately. Securities positions taken by the Group’s trading and investment units also entail credit risk and are presented as credit ex posure from trading
and investment securities. One segment of credit risk concerns OTC derivatives. This is presented as counterparty risk.
The overall management of credit risk thus covers credit risk from direct lending activities, including repo transactions, co unterparty risk on OTC de-
rivatives, and credit risk from securities positions.
The Group’s exposure to the risk on some balance sheet items is limited. This is the case for assets under customer -funded investment pools, unit-
linked investment contracts and insurance contracts. The risk on assets under pooled schemes and unit-linked investment contracts is assumed solely
by the customers, while the risk on assets under insurance contracts is assumed primarily by the customers. The section on in surance risk describes the Group’s credit risk on insurance contracts.
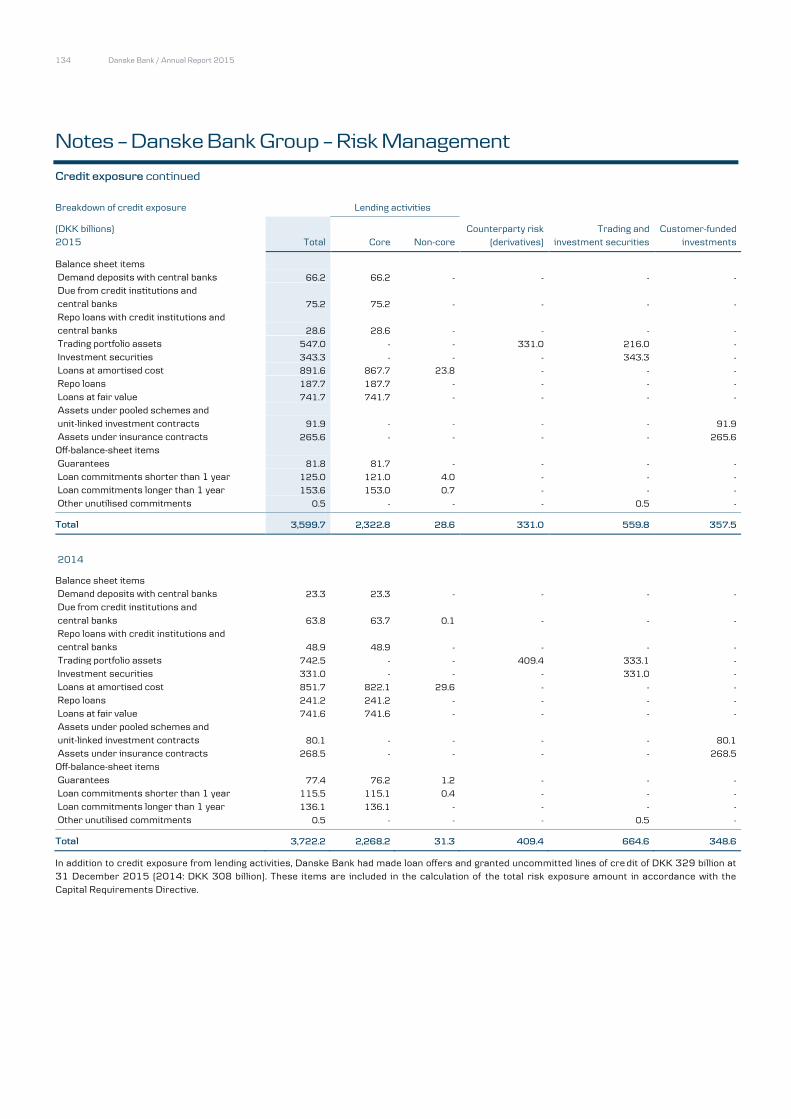
134 Danske Bank / Annual Report 2015
Notes – Danske Bank Group – Risk Management
Credit exposure continued
Breakdown of credit exposure
Lending activities
(DKK billions)
Counterparty risk Trading and Customer-funded 2015 Total Core Non-core (derivatives) investment securities investments
Balance sheet items
Demand deposits with central banks 66.2 66.2 - - - - Due from credit institutions and
central banks 75.2 75.2 - - - - Repo loans with credit institutions and central banks 28.6 28.6 - - - - Trading portfolio assets 547.0 - - 331.0 216.0 - Investment securities 343.3 - - - 343.3 - Loans at amortised cost 891.6 867.7 23.8 - - - Repo loans 187.7 187.7 - - - - Loans at fair value 741.7 741.7 - - - - Assets under pooled schemes and
unit-linked investment contracts 91.9 - - - - 91.9 Assets under insurance contracts 265.6 - - - - 265.6 Off-balance-sheet items
Guarantees 81.8 81.7 - - - - Loan commitments shorter than 1 year 125.0 121.0 4.0 - - - Loan commitments longer than 1 year 153.6 153.0 0.7 - - - Other unutilised commitments 0.5 - - - 0.5 -
Total 3,599.7 2,322.8 28.6 331.0 559.8 357.5
2014
Balance sheet items
Demand deposits with central banks 23.3 23.3 - - - -
Due from credit institutions and
central banks 63.8 63.7 0.1 - - -
Repo loans with credit institutions and
central banks 48.9 48.9 - - - -
Trading portfolio assets 742.5 - - 409.4 333.1 -
Investment securities 331.0 - - - 331.0 -
Loans at amortised cost 851.7 822.1 29.6 - - -
Repo loans 241.2 241.2 - - - -
Loans at fair value 741.6 741.6 - - - -
Assets under pooled schemes and
unit-linked investment contracts 80.1 - - - - 80.1 Assets under insurance contracts 268.5 - - - - 268.5 Off-balance-sheet items
Guarantees 77.4 76.2 1.2 - - -
Loan commitments shorter than 1 year 115.5 115.1 0.4 - - -
Loan commitments longer than 1 year 136.1 136.1 - - - -
Other unutilised commitments 0.5 - - - 0.5 -
Total 3,722.2 2,268.2 31.3 409.4 664.6 348.6
In addition to credit exposure from lending activities, Danske Bank had made loan offers and granted uncommitted lines of cre dit of DKK 329 billion at 31 December 2015 (2014: DKK 308 billion). These items are included in the calculation of the total risk exposure amount in accordance with the
Capital Requirements Directive.

Danske Bank / Annual Report 2015 135
Notes – Danske Bank Group – Risk Management
Credit exposure continued
Credit exposure from core lending activities Credit exposure from lending activities in the Group’s core banking business includes loans , amounts due from credit institutions and central banks,
guarantees and irrevocable loan commitments. The exposure is measured net of accumulated impairment charges and includes repo loans. For report-
ing purposes, all collateral values are net of haircuts and capped at the exposure amount. The credit exposure from Non -core lending activities is dis-closed later in these notes.
Classification of customers The main objectives of risk classification are to rank the Group’s customers according to risk and to estimate each customer’s probability of default (PD). As part of the credit process, the Group classifies customers according to risk and updates their classifications upon receipt of new information. Risk classifi-
cation comprises rating and credit scoring of customers.
The Group has developed a number of classification models to assess customer PD and to classify customers in various seg ments. Large business and
financial customers are classified on the basis of rating models, while small business and personal customers are classified by means of scoring mod-
els.
In its credit risk management, the Group uses point-in-time (PIT) PD estimates for risk classification. These PIT PD estimates express a customer’s
probability of default in the current economic situation. The Group’s classification scale consists of 11 main rating categor ies with fixed PD bands. Dur-ing a downturn, a customer’s PIT PD may increase, and the customer may migrate to a lower rating category. The effect from a downturn is thus larger
when PIT PD is used than if the classification were based on through-the-cycle (TTC) PD, which the Group uses to calculate the risk exposure amount
for credit risk.
Loans to customers for which objective evidence of impairment exists are placed in rating category 10 or 11, including loans for which no impairment
charges have been recognised, for example because adequate collateral has been provided.
At the end of 2015, the exposure-weighted average PD was 1.00%, against 1.09% in 2014. Credit portfolio in core activities broken down by rating category
2015
2014
Acc. individual
Net
Acc. individual
Net
Gross impairment Net exposure,
Gross impairment Net exposure,
PD level
exposure charges exposure ex collateral
exposure charges exposure ex collateral
(DKK billions) Upper Lower a b =a-b
a b =a-b
1 0.00 0.01 99.3 - 99.3 83.1
69.4 - 69.4 52.0
2 0.01 0.03 248.1 - 248.1 118.5
184.8 - 184.8 75.1
3 0.03 0.06 382.2 - 382.2 126.5
394.1 - 394.1 117.5
4 0.06 0.14 458.5 - 458.5 162.4
447.2 - 447.2 153.4
5 0.14 0.31 494.5 - 494.5 158.8
510.2 - 510.2 171.0
6 0.31 0.63 302.5 - 302.5 81.8
289.3 - 289.3 79.6
7 0.63 1.90 195.7 - 195.7 50.1
213.5 - 213.5 60.2
8 1.90 7.98 70.2 - 70.2 20.5
82.2 - 82.2 25.1
9 7.98 25.70 16.1 - 16.1 4.5
21.9 - 21.9 6.8
10 25.70 99.99 44.3 7.0 37.3 10.9
47.7 10.1 37.6 11.0
11 (default) 100.00 100.00 34.7 16.2 18.5 1.8
37.0 18.9 18.0 1.9
Total before collective impairment
charges
2,345.9 23.2 2,322.8 818.8
2,297.3 29.0 2,268.2 753.7
Collective impairment charges
4.3 - - -
4.0 - - -
Total gross exposure
2,350.3 - - -
2,301.3 - - -
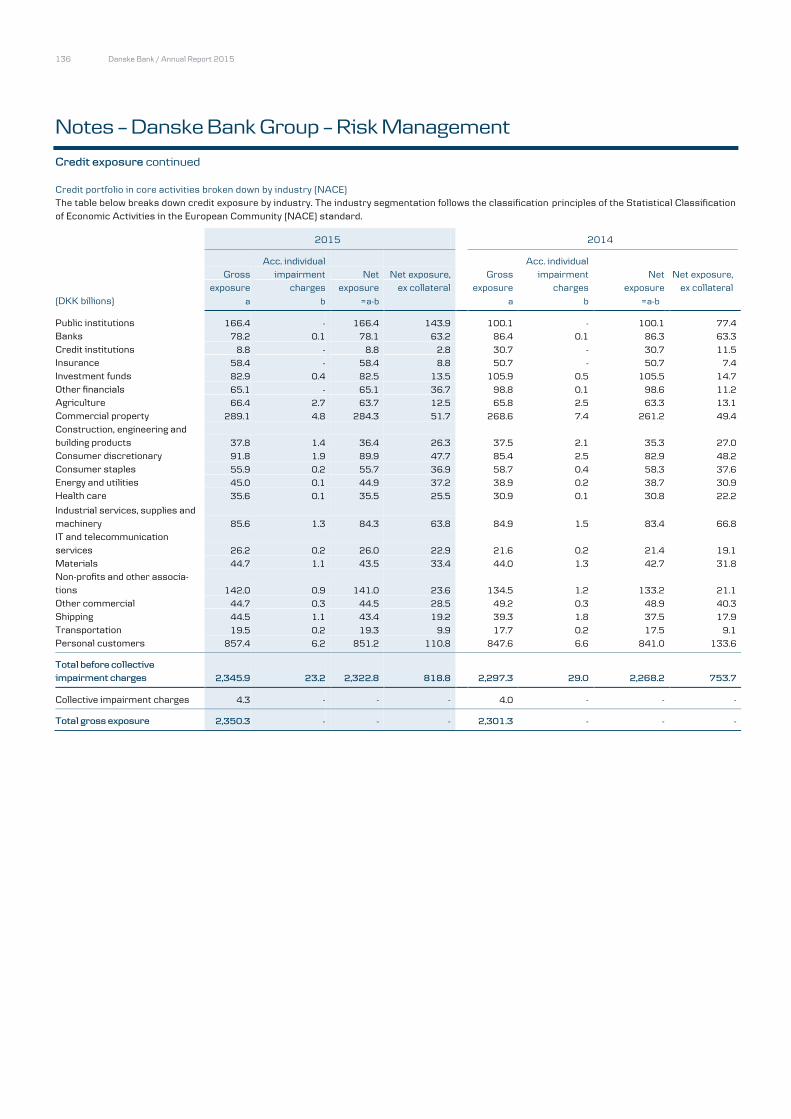
136 Danske Bank / Annual Report 2015
Notes – Danske Bank Group – Risk Management
Credit exposure continued
Credit portfolio in core activities broken down by industry (NACE) The table below breaks down credit exposure by industry. The industry segmentation follows the classification principles of the Statistical Classification
of Economic Activities in the European Community (NACE) standard.
2015
2014
Acc. individual
Acc. individual
Gross impairment Net Net exposure,
Gross impairment Net Net exposure,
exposure charges exposure ex collateral
exposure charges exposure ex collateral
(DKK billions) a b =a-b
a b =a-b
Public institutions 166.4 - 166.4 143.9
100.1 - 100.1 77.4
Banks 78.2 0.1 78.1 63.2
86.4 0.1 86.3 63.3
Credit institutions 8.8 - 8.8 2.8
30.7 - 30.7 11.5
Insurance 58.4 - 58.4 8.8
50.7 - 50.7 7.4
Investment funds 82.9 0.4 82.5 13.5
105.9 0.5 105.5 14.7
Other financials 65.1 - 65.1 36.7
98.8 0.1 98.6 11.2
Agriculture 66.4 2.7 63.7 12.5
65.8 2.5 63.3 13.1
Commercial property 289.1 4.8 284.3 51.7
268.6 7.4 261.2 49.4
Construction, engineering and building products 37.8 1.4 36.4 26.3
37.5 2.1 35.3 27.0
Consumer discretionary 91.8 1.9 89.9 47.7
85.4 2.5 82.9 48.2
Consumer staples 55.9 0.2 55.7 36.9
58.7 0.4 58.3 37.6
Energy and utilities 45.0 0.1 44.9 37.2
38.9 0.2 38.7 30.9
Health care 35.6 0.1 35.5 25.5
30.9 0.1 30.8 22.2
Industrial services, supplies and machinery 85.6 1.3 84.3 63.8
84.9 1.5 83.4 66.8
IT and telecommunication
services 26.2 0.2 26.0 22.9
21.6 0.2 21.4 19.1
Materials 44.7 1.1 43.5 33.4
44.0 1.3 42.7 31.8
Non-profits and other associa-
tions 142.0 0.9 141.0 23.6
134.5 1.2 133.2 21.1
Other commercial 44.7 0.3 44.5 28.5
49.2 0.3 48.9 40.3
Shipping 44.5 1.1 43.4 19.2
39.3 1.8 37.5 17.9
Transportation 19.5 0.2 19.3 9.9
17.7 0.2 17.5 9.1
Personal customers 857.4 6.2 851.2 110.8
847.6 6.6 841.0 133.6
Total before collective
impairment charges 2,345.9 23.2 2,322.8 818.8
2,297.3 29.0 2,268.2 753.7
Collective impairment charges 4.3 - - -
4.0 - - -
Total gross exposure 2,350.3 - - -
2,301.3 - - -

Danske Bank / Annual Report 2015 137
Notes – Danske Bank Group – Risk Management
Credit exposure continued
Credit portfolio in core activities broken down by business unit
The table below breaks down credit exposure by core business unit and underlying segment.
2015
2014
Acc. individual
Acc. individual
Gross impairment Net Net exposure,
Gross impairment Net Net exposure,
exposure charges exposure ex collateral
exposure charges exposure ex collateral
(DKK billions) a b =a-b
a b =a-b
Denmark 530.8 4.7 526.1 66.4
544.6 5.6 539.0 89.2
Finland 94.1 0.4 93.7 5.3
92.8 0.6 92.2 5.6
Sweden 77.4 0.1 77.3 10.5
71.6 0.1 71.6 10.4
Norway 105.6 0.1 105.5 21.3
85.6 0.1 85.5 20.7
Northern Ireland 19.8 0.4 19.4 2.2
18.7 0.2 18.5 2.5
Other 6.4 0.1 6.3 2.5
5.7 0.1 5.6 2.4
Personal Banking 834.0 5.8 828.2 108.1
819.1 6.7 812.4 130.9
Denmark 434.1 10.2 423.8 103.7
413.5 11.4 402.0 95.3
Finland 68.8 1.0 67.8 32.0
64.3 0.9 63.4 29.8
Sweden 148.4 0.6 147.8 50.1
123.9 0.6 123.2 42.1
Norway 71.2 0.7 70.4 25.0
65.5 0.7 64.8 27.1
Northern Ireland 39.3 2.3 37.0 18.1
35.6 4.7 30.9 14.9
Baltics 19.0 0.3 18.7 10.4
27.5 0.7 26.8 11.8
Other - - - -
- - - -
Business Banking 780.8 15.2 765.6 239.3
730.3 19.1 711.2 220.9
C&I* 669.4 2.1 667.3 413.7
715.3 3.1 712.2 372.8
Other 61.8 - 61.8 57.7
32.6 0.1 32.4 29.1
Total before collective
impairment charges 2,345.9 23.2 2,322.8 818.8
2,297.3 29.0 2,268.2 753.7
Collective impairment charges 4.3 - - -
4.0 - - -
Total gross exposure 2,350.3 - - -
2,301.3 - - -
*The Corporates & Institutions (C&I) segment comprises large corporate customers and financial institutions. As these customers typically have business activities in multiple countries, a geo-
graphical split is not applicable.

138 Danske Bank / Annual Report 2015
Notes – Danske Bank Group – Risk Management
Concentration risk
The Group has implemented a set of frameworks to manage concentration risk encountered by the Group. These frameworks cover single-name concentra-tions, industry concentrations and geographical concentrations.
Industry concentrations
The Industry Concentration Framework outlines the principles of managing industry exposures. A portfolio committee consisting of industry experts,
risk representatives and business unit representatives proposes industry limits based on scorecard s, tailored analytics and expert knowledge.
Geographical concentrations
Credit reporting includes a breakdown by region. Limits are set on exposures outside the Group’s home markets (sovereigns, financial institutions and
counterparties in derivatives trading). A country portfolio committee proposes limits based on expected business volume and an assessment of the specific country risk. The committee then submits the proposed limits to the Executive Board.
Single-name concentrations
Single-name concentrations are managed according to two frameworks:
Single-name concentration framework: This risk-sensitive internal framework specifies limits on exposure, expected loss (EL) and loss given de-
fault (LGD) in order to limit potential losses on single-name exposures. Single-name concentrations are monitored and reported on a monthly ba-
sis to the All Risk Committee and the Credit & Risk Committee.
Large exposures framework: This framework is based on the regulatory definition of large exposures as specified in article 395 of the CRR (Regu-
lation (EU) No. 575/2013).
The Group has also defined stricter internal limits for managing single-name concentrations, including the following:
- absolute limit on single-name exposures
- the sum of single-name exposures larger than 10% of the total adjusted capital may not exceed a portfolio limit of 95% of the total adjusted
capital - the sum of single-name exposures equal to 5% to 10% of the total adjusted capital may not exceed 150% of the total adjusted capital
The largest single-name exposures are monitored daily under the large exposures framework. Large exposures are reported on a monthly basis to the All Risk Committee and the Credit & Risk Committee and on a quarterly basis to the Board of Directors. At the end of 2015, the Group was well within the regu-
latory limits for large exposures.
The Group has reduced single-name exposures substantially in recent years.
Collateral
The Group uses a number of measures to mitigate credit risk, including collateral, guarantees and covenants. The main method is obtaining collateral.
The market value of collateral is monitored and evaluated by advisers, internal or external as sessors, or automatic valuation models. Automatic valua-tion models are validated annually and monitored quarterly. The Group regularly evaluates the validity of external inputs on which the valuation models
are based. The Collateral System supports the process of reassessing the market value to ensure that the Group complies with regulatory require-
ments.
The market value of collateral is subject to a haircut. The haircut reflects the risk that the Group will not be able to obtain the estimated marke t value
upon the sale of the individual asset in a distressed situation and thus includes forced sale reduction, price volatility during the sales period, realisation costs and maintenance costs. The haircut applied depends on the type of collateral. For regulatory purposes, the Group also applies a downturn haircut.
The composition of the Group’s collateral base reflects the product composition of the credit portfolio. The most important collateral types, measured by volume, are real property and financial assets in the form of shares and bonds. For reporting purposes, all collateral values are net of haircut and
capped by the exposure amount at facility level.
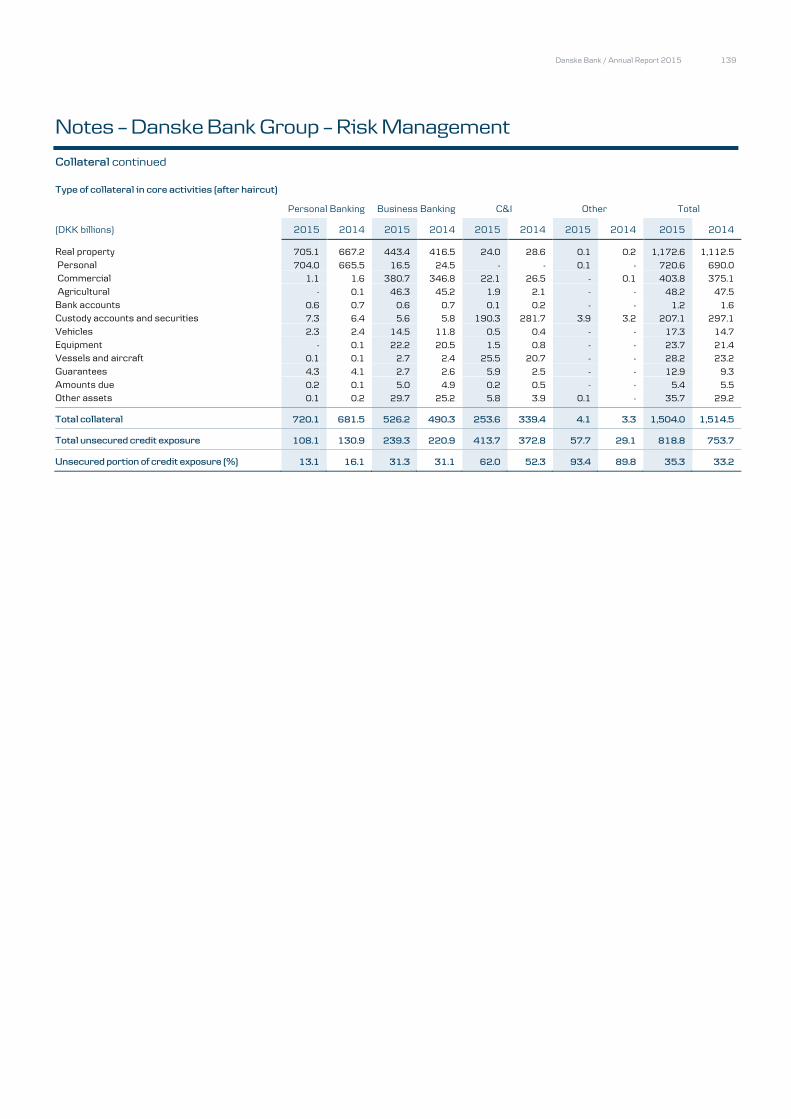
Danske Bank / Annual Report 2015 139
Notes – Danske Bank Group – Risk Management
Collateral continued
Type of collateral in core activities (after haircut)
Personal Banking Business Banking C&I Other Total
(DKK billions) 2015 2014 2015 2014 2015 2014 2015 2014 2015 2014
Real property 705.1 667.2 443.4 416.5 24.0 28.6 0.1 0.2 1,172.6 1,112.5
Personal 704.0 665.5 16.5 24.5 - - 0.1 - 720.6 690.0
Commercial 1.1 1.6 380.7 346.8 22.1 26.5 - 0.1 403.8 375.1
Agricultural - 0.1 46.3 45.2 1.9 2.1 - - 48.2 47.5
Bank accounts 0.6 0.7 0.6 0.7 0.1 0.2 - - 1.2 1.6
Custody accounts and securities 7.3 6.4 5.6 5.8 190.3 281.7 3.9 3.2 207.1 297.1
Vehicles 2.3 2.4 14.5 11.8 0.5 0.4 - - 17.3 14.7
Equipment - 0.1 22.2 20.5 1.5 0.8 - - 23.7 21.4
Vessels and aircraft 0.1 0.1 2.7 2.4 25.5 20.7 - - 28.2 23.2
Guarantees 4.3 4.1 2.7 2.6 5.9 2.5 - - 12.9 9.3
Amounts due 0.2 0.1 5.0 4.9 0.2 0.5 - - 5.4 5.5
Other assets 0.1 0.2 29.7 25.2 5.8 3.9 0.1 - 35.7 29.2
Total collateral 720.1 681.5 526.2 490.3 253.6 339.4 4.1 3.3 1,504.0 1,514.5
Total unsecured credit exposure 108.1 130.9 239.3 220.9 413.7 372.8 57.7 29.1 818.8 753.7
Unsecured portion of credit exposure (%) 13.1 16.1 31.3 31.1 62.0 52.3 93.4 89.8 35.3 33.2

140 Danske Bank / Annual Report 2015
Notes – Danske Bank Group – Risk Management
Past due amounts in core activities (no objective evidence of individual impairment)
Past due amounts (no evidence of impairment)
Personal Banking Business Banking C&I Other
Total past due
amounts
Total due under
loans
(DKK millions) 2015 2014 2015 2014 2015 2014 2015 2014 2015 2014 2015 2014
6-30 days 59 64 40 63 2 1 - - 101 128 1,756 2,246
31-60 days 36 16 17 8 - 4 - - 53 28 897 738
> 60 days 40 36 28 16 - - - - 68 52 585 816
Total past due amounts 134 115 85 87 2 6 - - 222 207 - -
Total due under loans 2,280 2,541 910 1,249 45 10 3 - - - 3,238 3,799
The average unsecured portion of the claims recorded as past due amounts with no evidence of impairment was 24.5% at the end of 2015 (2014:
31.1%). Real property accounted for 86.0% of collateral provided (2014: 90.6%).
Forbearance practices and repossessed assets
The Group adopts forbearance plans to assist customers in financial difficulty. Concessions granted to customers include interest-reduction sched-
ules, interest-only schedules, temporary payment holidays, term extensions, cancellation of outstanding fees, w aiver of covenant enforcement and set-
tlements.
Forbearance plans must comply with the Group’s Credit Policy. They are used as an instrument to retain long-term business relationships during
economic downturns if there is a realistic possibility that the customer will be able to meet obligations again, or are used for minimising loss in the event of default.
If it proves impossible to improve the customer’s financial situation by forbearance measures, the Group will consider whethe r to subject the cus-tomer’s assets to a forced sale or whether the assets could be realised later at higher net proceeds. At the end of 2015, the Group recognised proper-
ties taken over in Denmark at a carrying amount of DKK 76 million (2014: DKK 106 million) and properties taken over in other countries at DKK 388
million (2014: DKK 520 million). The properties are held for sale and included under Other assets in the balance sheet.
Forbearance leads to objective evidence of impairment, and impairments relating to forborne exposures are handled according to the principles de-
scribed in Note 1, Basis of preparation - Measurement of loans.
The Group has implemented the European Banking Authority’s (EBA’s) definition of loans subject to forbearance measures. The table below is based on
the EBA’s definition, which states that a minimum two-year probation period must pass from the date forborne exposures are considered to be per-
forming again. Such exposures are included in the Under Probation category in the table below. Exposures with forbearance measures are divided into
performing and non-performing loans. The Group’s definition of non-performing loans is described in the next section. The increase in forborne expo-
sures to the refinancing segment relates to pro-active forbearance measures taken by the Bank to improve the financial position of weak customers.
Exposures subject to forbearance measures
2015
2014
(DKK millions) Performing Non-performing
Performing Non-performing
Modification 36 1,347
163 1,394
Refinancing 1,848 9,150
789 3,884
Under probation 5,312 -
2,657 -
Total 7,196 10,497
3,609 5,278
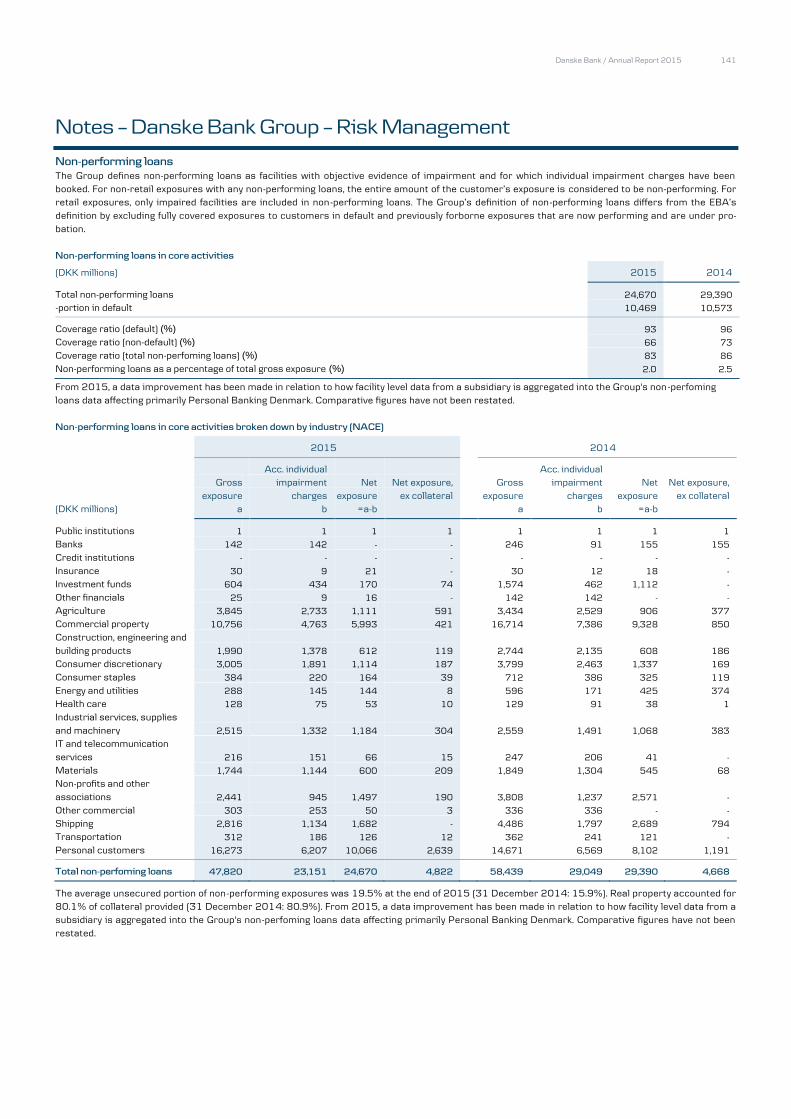
Danske Bank / Annual Report 2015 141
Notes – Danske Bank Group – Risk Management
Non-performing loans
The Group defines non-performing loans as facilities with objective evidence of impairment and for which individual impairment charges have been
booked. For non-retail exposures with any non-performing loans, the entire amount of the customer’s exposure is considered to be non-performing. For retail exposures, only impaired facilities are included in non-performing loans. The Group’s definition of non-performing loans differs from the EBA’s
definition by excluding fully covered exposures to customers in default and previously forborne exposures that are now performing and are under pro-
bation.
Non-performing loans in core activities
(DKK millions) 2015 2014
Total non-performing loans 24,670 29,390 -portion in default 10,469 10,573
Coverage ratio (default) (%) 93 96
Coverage ratio (non-default) (%) 66 73
Coverage ratio (total non-perfoming loans) (%) 83 86
Non-performing loans as a percentage of total gross exposure (%) 2.0 2.5
From 2015, a data improvement has been made in relation to how facility level data from a subsidiary is aggregated into the Group's non-perfoming
loans data affecting primarily Personal Banking Denmark. Comparative figures have not been restated.
Non-performing loans in core activities broken down by industry (NACE)
2015
2014
Acc. individual
Acc. individual
Gross impairment Net Net exposure,
Gross impairment Net Net exposure,
exposure charges exposure ex collateral
exposure charges exposure ex collateral
(DKK millions) a b =a-b a b =a-b
Public institutions 1 1 1 1
1 1 1 1
Banks 142 142 - -
246 91 155 155
Credit institutions - - - -
- - - -
Insurance 30 9 21 -
30 12 18 -
Investment funds 604 434 170 74
1,574 462 1,112 -
Other financials 25 9 16 -
142 142 - -
Agriculture 3,845 2,733 1,111 591
3,434 2,529 906 377
Commercial property 10,756 4,763 5,993 421
16,714 7,386 9,328 850
Construction, engineering and
building products 1,990 1,378 612 119
2,744 2,135 608 186
Consumer discretionary 3,005 1,891 1,114 187
3,799 2,463 1,337 169
Consumer staples 384 220 164 39
712 386 325 119
Energy and utilities 288 145 144 8
596 171 425 374
Health care 128 75 53 10
129 91 38 1
Industrial services, supplies
and machinery 2,515 1,332 1,184 304
2,559 1,491 1,068 383
IT and telecommunication
services 216 151 66 15
247 206 41 -
Materials 1,744 1,144 600 209
1,849 1,304 545 68
Non-profits and other
associations 2,441 945 1,497 190
3,808 1,237 2,571 -
Other commercial 303 253 50 3
336 336 - -
Shipping 2,816 1,134 1,682 -
4,486 1,797 2,689 794
Transportation 312 186 126 12
362 241 121 -
Personal customers 16,273 6,207 10,066 2,639
14,671 6,569 8,102 1,191
Total non-perfoming loans 47,820 23,151 24,670 4,822
58,439 29,049 29,390 4,668
The average unsecured portion of non-performing exposures was 19.5% at the end of 2015 (31 December 2014: 15.9%). Real property accounted for 80.1% of collateral provided (31 December 2014: 80.9%). From 2015, a data improvement has been made in relation to how facility level data from a
subsidiary is aggregated into the Group's non-perfoming loans data affecting primarily Personal Banking Denmark. Comparative figures have not been
restated.

142 Danske Bank / Annual Report 2015
Notes – Danske Bank Group – Risk Management
Non-performing loans continued Non-performing loans in core activities broken down by business unit
2015
2014
Acc. individual
Acc.individual
Gross impairment Net Net exposure,
Gross impairment Net Net exposure,
exposure charges exposure ex collateral
exposure charges exposure ex collateral
(DKK millions) a b =a-b a b =a-b
Denmark 11,646 4,681 6,966 2,837
9,426 5,603 3,823 1,295
Finland 1,863 412 1,451 18
1,996 560 1,436 -
Sweden 592 141 451 19
594 79 515 132
Norway 322 102 220 23
371 107 264 29
Northern Ireland 1,093 356 737 7
1,178 239 939 169
Other 224 87 138 54
216 108 108 4
Personal Banking 15,740 5,778 9,962 2,959
13,782 6,696 7,086 1,629
Denmark 19,356 10,246 9,110 1,410
24,156 11,415 12,741 74
Finland 1,939 1,028 911 238
1,857 905 952 133
Sweden 1,164 614 549 -
1,348 632 716 148
Norway 1,362 743 620 4
1,542 735 807 -
Northern Ireland 3,526 2,286 1,240 -
6,074 4,688 1,387 -
Baltics 625 316 309 22
1,870 738 1,132 175
Other 8 6 2 2
3 - 2 -
Business Banking 27,980 15,239 12,741 1,677
36,850 19,114 17,736 530
C&I* 4,088 2,132 1,955 183
7,680 3,112 4,568 2,510
Other 13 2 11 3
127 127 - -
Total non-performing loans 47,820 23,151 24,670 4,822
58,439 29,049 29,390 4,668
From 2015, a data improvement has been made in relation to how facility level data from a subsidiary is aggregated into the Group's non-perfoming loans data affecting primarily Personal Banking Denmark. Comparative figures have not been restated.
Impairment charges Rating categories 10 (non-default) and 11 (default) include customers with exposures for which objective evidence of impairment exists. Exposure to cus-
tomers in the other rating categories is subject to collective impairment testing. Note 14 in the consolidated financial statements for 2015 provides more
details.

Danske Bank / Annual Report 2015 143
Notes – Danske Bank Group – Risk Management
Allowance account in core activities
Allowance account in core activities broken down by segment
Personal Business
Allowance account Impairment
(DKK millions) Banking Banking C&I Other total Individual Collective
1 January 2014 8,319 23,655 2,774 - 34,748 31,464 3,284
New and increased impairment charges 3,401 4,997 999 24 9,421 7,728 1,694
Reversals of impairment charges from previ-
ous periods 1,851 3,996 660 3 6,510 5,508 1,002
Write-offs debited to allowance account 1,298 3,035 149 22 4,503 4,503 -
Foreign currency translation 7 285 193 1 486 477 9
Other items -196 -413 -1 2 -608 -608 -
31 December 2014 8,382 21,493 3,157 2 33,034 29,049 3,985
New and increased impairment charges 2,089 3,614 558 1 6,261 5,161 1,100
Reversals of impairment charges from previ-ous periods 1,599 3,819 432 - 5,850 5,197 654
Write-offs debited to allowance account 1,021 4,083 1,150 - 6,254 6,254 -
Foreign currency translation 35 313 175 - 523 503 20
Other items -285 7 61 -1 -218 -113 -106
31 December 2015 7,601 17,524 2,369 2 27,496 23,151 4,345
Collective impairment charges include charges that reflect the migration of customers from one rating category to another without changes’ being made to the credit margin to reflect the increase in credit risk. If all customers were downgraded one rating category with no corresponding change in
the interest rate charged to the customers, collective impairment charges would increase by about DKK 2.7 billion (2014: about DKK 3.2 billion). The
migration impairment charges also depend on the emergence period, i.e. the period over which rating migrations are considered. An increase in this p e-riod from 2 to 3 years would increase the collective impairment charges by DKK 0.3 billion. If the value of collateral provided by customers in rating categories 10 and 11 decreased 10%, individual impairment charges would increase by about
DKK 2.5 billion (2014: about DKK 2.4 billion).
Allowance account in core activities broken down by balance sheet items
(DKK millions) 2015 2014
Due from credit institutions and central banks 7 91
Loans at amortised cost 22,490 27,787
Loans at fair value 4,380 4,648
Loan commitments and guarantees 619 508
Total 27,496 33,034

144 Danske Bank / Annual Report 2015
Notes – Danske Bank Group – Risk Management
Credit exposure from Non-core lending activities
The Non-core business unit is responsible for the controlled winding-up and divestment of exposures that are no longer considered part of the Group’s core
activities. The portfolio consists of the Non-core exposures in Ireland, the Baltics and conduits etc.
In the first quarter of 2015, the Group entered into a binding agreement on the sale of a portfolio of SME loans with a nominal value of DKK 3.9 billion. The
transaction was settled in April 2015. For accounting purposes, the portfolio was recognised under Assets held for sale and therefore not included in the credit exposure at the end of 2014. In the third quarter of 2015, the Group entered into an agreement to sell a residential mortgage loan portfolio relating
to the Group's Non-core mass personal customer business in Lithuania and Latvia with a nominal value of DKK 4.8 billion. Pending approval by the Lithua-
nian competition authorities, the transaction is expected to be completed in the first half of 2016. The portfolio has been recognised under Assets held for sale and therefore not included in the credit exposure since the third quarter of 2015.
Credit portfolio in Non-core activities broken down by industry (NACE)
2015
2014
Acc. individual
Acc. individual
Gross impairment Net Net exposure,
Gross impairment Net Net exposure,
exposure charges exposure ex collateral
exposure charges exposure ex collateral
(DKK millions) a b =a-b
a b =a-b
Personal customers 21,879 1,844 20,035 1,093
19,830 2,479 17,351 1,312
Consumer discretionary 191 129 61 12
551 477 74 -
Commercial property 752 445 307 -
3,415 2,733 682 -
Other 556 389 167 -
3,266 1,151 2,115 1,748
Non-core banking 23,378 2,807 20,570 1,105
27,062 6,840 20,222 3,060
Non-core conduits etc. 8,235 243 7,992 3,109
11,362 259 11,104 2,858
Total Non-core before collec-
tive impairment charges 31,613 3,050 28,563 4,214
38,425 7,099 31,326 5,917
Collective impairment
charges 865 - - -
813 - - -
Total Non-core exposure 32,479 - - -
39,238 - - -
Credit portfolio in Non-core activities broken down by rating category
2015
2014
Acc. individual
Net
Acc. individual
Net
Gross impairment Net exposure,
Gross impairment Net exposure,
PD level exposure charges exposure ex collateral
exposure charges exposure ex collateral
(DKK millions) Upper Lower a b =a-b
a b =a-b
1 0.00 0.01 208 - 208 -
996 - 996 -
2 0.01 0.03 2,398 - 2,398 -
3,109 - 3,109 435
3 0.03 0.06 1,447 - 1,447 864
1,494 - 1,494 548
4 0.06 0.14 2,704 - 2,704 1,028
1,698 - 1,698 583
5 0.14 0.31 490 - 490 113
2,271 - 2,271 632
6 0.31 0.63 680 - 680 -
840 - 840 -
7 0.63 1.90 13,142 - 13,142 1,177
9,843 - 9,843 1,510
8 1.90 7.98 1,194 - 1,194 -
3,424 - 3,424 1,161
9 7.98 25.70 716 - 716 54
791 - 791 306
10 25.70 99.99 3,570 640 2,929 978
3,720 676 3,044 743
11 (default) 100.00 100.00 5,063 2,410 2,653 -
10,238 6,423 3,815 -
Total before collective
impairment charges
31,613 3,050 28,563 4,214
38,425 7,099 31,326 5,917
Collective impairment charges
865 - - -
813 - - -
Total gross exposure
32,479 - - -
39,238 - - -

Danske Bank / Annual Report 2015 145
Notes – Danske Bank Group – Risk Management
Credit exposure from Non-core lending activities continued
Non-performing loans in Non-core activities broken down by industry (NACE)
2015
2014
Acc. individual
Acc. individual
Gross impairment Net Net exposure,
Gross impairment Net Net exposure,
exposure charges exposure ex collateral
exposure charges exposure ex collateral
(DKK millions) a b =a-b
a b =a-b
Personal customers 5,998 1,844 4,153 265
6,706 2,479 4,227 37
Consumer discretionary 180 129 51 10
545 477 68 -
Commercial property 746 445 302 18
3,492 2,733 759 -
Other 544 389 155 8
1,412 1,151 261 -
Non-core banking 7,468 2,807 4,661 300
12,154 6,840 5,315 37
Non-core conduits etc. 893 243 650 650
1,410 259 1,151 660
Total non-performing
exposure in Non-core 8,361 3,050 5,311 950
13,564 7,099 6,466 698
The average unsecured portion of non-performing loans was 18.0% at the end of 2015 (2014: 10.8%). Real property accounted for 99.7% of collateral provided (2014: 93.1%).
Counterparty risk
Exposure to counterparty risk (derivatives) and credit exposure from trading and investment securities
(DKK billions) 2015 2014
Counterparty risk
Derivatives with positive fair value 331.0 409.4
Credit exposure from other trading and investment securities
Bonds 535.9 654.2
Shares 22.5 9.8
Other unutilised commitments 0.5 0.5
Total 889.8 1,073.9
Other unutilised commitments comprises private equity investment commitments and other obligations.

146 Danske Bank / Annual Report 2015
Notes – Danske Bank Group – Risk Management
Counterparty credit risk continued
Counterparty risk (derivatives)
Derivatives are subject to credit risk. Positive and negative fair values of derivatives with the same counterparty are offset in the balance sheet if cer-
tain conditions are fulfilled. The Group has entered into master netting or similar agreements that include rights to additio nal set-off in the event of de-
fault by a counterparty. Such agreements reduce the exposure further, but they do not qualify for offsetting under IFRSs. The net current exposure to
derivatives with positive market value after offsetting under master netting agreements amounted to DKK 94.0 billion (2014: D KK 109.2 billion) (see note 29). The exposure is broken down by rating category in the table below.
Net current exposure broken down by category (DKK millions) 2015 2014
1 7,793 10,510
2 9,513 13,513
3 30,733 34,185
4 18,622 23,426
5 18,497 19,186
6 5,518 4,542
7 1,967 1,988
8 628 675
9 225 241
10 322 441
11 184 530
Total 94,001 109,236
The counterparty credit risk on derivatives is managed by PFE (potential future exposure) lines on a set of maturity buckets. Pre-deal line checks are per-formed prior to trading. The Group carries out counterparty credit risk measurement and monitoring as well as intraday line utilisation monitoring on a daily
basis. Consolidated counterparty credit risk exposure is reported to senior management. The Group uses a simulation model to calculate counterparty
credit risk exposure for the majority of its portfolio.
The Group makes fair value adjustments to cover the credit risk on derivatives with positive fair value (CVA) that are recognised in the financial statements,
see further in note 30.
Bond portfolio
Bond portfolio
Central and Quasi- Danish Swedish Other (DKK millions) local govern- government mortgage covered covered Corporate
2015 ment bonds bonds bonds bonds bonds bonds Total
Held-for-trading 90,321 4,506 49,781 30,637 6,633 13,319 195,197 Designated at fair value 41,298 2,207 108,442 16,844 5,008 1,886 175,685 Available-for-sale 150 - 45,534 - 1,085 - 46,770 Hold-to-maturity 68,899 1,325 45,863 545 1,925 645 119,202
Total 200,668 8,038 249,620 48,027 14,651 15,850 536,854
2014
Held-for-trading 155,750 6,346 78,356 50,684 9,461 24,500 325,097
Designated at fair value 22,455 1,214 112,689 20,024 3,793 5,596 165,771
Available-for-sale 156 676 55,103 - 2,608 - 58,543
Hold-to-maturity 53,628 1,324 47,679 - 1,487 738 104,856
Total 231,989 9,560 293,827 70,708 17,349 30,834 654,267
At 31 December 2015, the Group had an additional bond portfolio worth DKK 145,063 million (31 December 2014: DKK 146,717 million) recognised as assets under insurance contracts and thus not included in the table above. The section on insurance risk provides more information. For bonds classified as hold-to-maturity, fair value exceeded amortised cost at the end of 31 December 2015 and 31 December 2014.

Danske Bank / Annual Report 2015 147
Notes – Danske Bank Group – Risk Management
Bond portfolio continued
Bond portfolio broken down by geographical area
Central and Quasi- Danish Swedish Other
(DKK millions) local govern- government mortgage covered covered Corporate
2015 ment bonds bonds bonds bonds bonds bonds Total
Denmark 22,345 - 249,620 - - 1,652 273,618
Sweden 27,285 - - 48,027 - 3,719 79,031
UK 19,548 135 - - 2,224 1,121 23,027
Norway 5,763 - - - 6,914 1,287 13,964
USA 8,081 1,132 - - - 771 9,984
Spain 9,502 - - - 917 - 10,418
France 20,846 - - - 1,123 528 22,497
Luxembourg - 6,502 - - - 11 6,513
Finland 14,593 247 - - 1,849 1,927 18,616
Ireland 4,618 - - - 90 48 4,756
Italy 7,194 - - - - - 7,194
Portugal 1,506 - - - - - 1,506
Austria 7,626 - - - 224 - 7,850
Netherlands 11,069 - - - 86 2,751 13,906
Germany 31,001 - - - 589 754 32,344
Belgium 8,873 - - - 333 - 9,206
Other 817 23 - - 302 1,282 2,424
Total 200,668 8,038 249,620 48,027 14,651 15,850 536,854
2014
Denmark 16,835 - 293,827 - 1,508 6,748 318,919
Sweden 24,794 - - 70,708 - 7,191 102,692
UK 17,434 102 - - 3,443 1,667 22,646
Norway 8,556 - - - 6,741 3,138 18,435
USA 2,486 1,264 - - - 1,586 5,336
Spain 7,750 - - - 2,380 - 10,130
France 24,753 - - - 1,146 1,778 27,676
Luxembourg - 8,133 - - - 49 8,182
Finland 18,406 60 - - 1,525 2,566 22,557
Ireland 11,469 - - - 112 29 11,610
Italy 10,587 - - - - - 10,587
Portugal 2,123 - - - - - 2,123
Austria 8,876 - - - - 3 8,878
Netherlands 14,986 - - - 171 3,375 18,533
Germany 50,644 - - - 233 1,458 52,335
Belgium 10,865 - - - 89 - 10,954
Other 1,425 2 - - 0 1,248 2,675
Total 231,989 9,560 293,827 70,708 17,349 30,834 654,267
Risk Management 2015 provides additional details about the risk on the Group’s bond portfolio. The publication is not covered by the statutory audit.

148 Danske Bank / Annual Report 2015
Notes – Danske Bank Group – Risk Management
Bond portfolio continued
Bond portfolio broken down by external ratings
Central and Quasi- Danish Swedish Other
(DKK millions) local govern- government mortgage covered covered Corporate
2015 ment bonds bonds bonds bonds bonds bonds Total
AAA 103,778 4,814 249,578 48,027 12,403 849 419,448
AA+ 40,696 2,064 - - 1,249 464 44,474
AA 25,435 1,160 - - 346 529 27,470
AA- 7,118 - - - - 1,186 8,304
A+ 4,769 - - - 273 2,602 7,644
A 41 - - - 188 4,046 4,275
A- 600 - - - 186 1,077 1,863
BBB+ 9,288 - - - - 1,709 10,997
BBB 7,412 - 41 - - 2,136 9,589
BBB- 1 - - - - 346 347
BB+ 1,499 - - - - 270 1,769
BB 7 - - - - 366 373
BB- - - - - - 33 33
Sub-inv. grade or unrated 25 - - - 8 236 269
Total 200,668 8,038 249,620 48,027 14,651 15,850 536,854
2014
AAA 129,636 5,477 290,763 64,717 13,067 518 504,179
AA+ 48,303 1,146 - - 59 957 50,465
AA 15,207 2,937 - 5,990 1,473 934 26,542
AA- 6,426 - 199 - - 3,852 10,477
A+ 156 - 2,643 - - 8,076 10,874
A 209 - 1 - 231 8,329 8,769
A- 3 - - - 1,466 2,315 3,784
BBB+ 16,362 - 2 - 185 1,419 17,969
BBB 13,358 - 220 - 2 2,982 16,562
BBB- 34 - - - 401 343 778
BB+ 2,157 - - - 184 249 2,590
BB - - - - 254 566 820
BB- - - - - 8 26 35
Sub-inv. grade or unrated 137 - - - 18 267 422
Total 231,989 9,560 293,827 70,708 17,349 30,834 654,267

Danske Bank / Annual Report 2015 149
Notes – Danske Bank Group – Risk Management
Market risk
Market risk is the risk of losses or gains caused by changes in the market values of the Group’s financial assets, liabilitie s and off-balance-sheet items
resulting from changes in market prices or rates. The Group’s market risk originates from trading -related positions at C&I or as part of treasury man-agement at Group Treasury. Market risk associated with activities at Personal Banking and Business Banking is either hedged by C&I or managed as
part of Group Treasury’s market risk positions.
The Market Risk Policy set by the Board of Directors lays out the overall framework for market risk management and identifies the bou ndaries within
which the Group’s market risk profile and business strategy are defined. The Market Risk Policy is supported by the Market Risk Instructions, which de-
fines the overall limits for various market risk factors and additional boundaries within which the trading activities operate. The Market Risk Policy and the Market Risk Instructions form the basis of written business procedures and daily control procedures fo r the Group’s market risk management.
The Group operates with a market risk appetite for its trading-related activities. The market risk appetite is expressed as a risk mandate assessment that is based on the business strategy and the market environment expected in the near future. The purpose of the risk mandate assessment is to
measure the effect of proposed limits by quantifying the expected upside of using the limits (that is, expected earnings) and the potential downside (that
is, the potential loss if the expectations are not realised).
The Group’s market risk management is designed to ensure proper oversight of all market risks, both trading -related market risk and non-trading-
related market risk. Market risk stemming from activities at Danica Pension and from the Group’s defined benefit pension plans is managed separately. The market risk on assets in which the shareholders’ equity of Danica Pension is invested and on assets allocated to Danica P ension’s policyholders is
treated as an insurance risk. The market risk on defined benefit pension plans is treated as a pension risk. Risk measures
The Group uses a range of measures to create a framework that captures the material market risks to which the Group is exposed – both conventional risk
measures, such as sensitivities and market value, and mathematical and statistical measures, such as Value-at-Risk (VaR). The Group also develops and
maintains internal models that are used for the pricing and risk management of financial products that cannot be valued directly or risk-managed on the ba-sis of quoted market prices.
The Group uses VaR to calculate and manage market risk at the portfolio level in day-to-day risk management. In June 2015, the Danish FSA approved an extension of the Group’s internal VaR model for calculating the capital requirement for market risk to include bond spread risk and company-specific equity
risk (i.e., specific market risk) and also approved the Group’s incremental risk model. The following risk types are now included in the Group’s internal VaR
model: interest rate, bond spread, interest rate options, inflation rate, foreign exchange, equity market and company-specific equity risks.
The Group uses a historical simulation model to estimate VaR on the basis of two years’ historical market data. The main advantage of this method is that it
makes no assumptions regarding loss distribution. The simulation uses one thousand scenarios to generate the loss distribution. To construct the scenar-ios, independent drawings are made from a data set of two years’ historical daily returns. The drawings are generated at random, and 70% of the scenarios
are based on the latest year of historical market data. Each outcome contains all the risk factors so that the correlation is maintained. The constructed sce-
narios are used for calculating the market value of the trading portfolio through a full revaluation of each position. Consequently, the model incorporates
both linear and non-linear effects. The model does not cover commodity risk, to which the exposure is very limited.
One of the major strengths of VaR is that it provides an aggregate measure of all risk types included in the model and factors in the correlation structure of the financial markets. Furthermore, it takes portfolio diversification or hedging activities into account. However, the VaR measure assumes that the recent
history is a good projection of the future. If this assumption does not hold, VaR does not provide a satisfactory estimate of the future potential loss.
For regulatory purposes, the Group has a separate internal model designed to measure incremental risk. The incremental risk model captures the potential
loss resulting from downgrades (or upgrades for short positions) and defaults of bond issuers and underlying securities in CDSs. The incremental risk
model is a Monte Carlo simulation model featuring correlations between the underlying issuers. The correlations are introduced into the model by means of a Gaussian copula with one systemic factor and one idiosyncratic factor. Key inputs to the model are default and migration probabilities, recovery rates, as-
set correlations and scenario spread changes. The liquidity horizon is fixed at one year for all asset classes, implying a one-year constant position approach.
In the Group’s day-to-day risk management, rating migration risk is captured in the VaR measure and supplemented by limits on rating categories, whereas
default risk is limited by individual credit assessments and credit lines for bond holdings and CDS positions.
Risk monitoring and reporting
Market risk limits are established on various metrics so that activities subject to market risk are covered from several perspectives. The Group oper-
ates with three levels in the limit hierarchy for market risk (encompassing trading-related and non-trading-related market risks):
1. Board limits
2. All Risk Committee limits 3. Detailed operational limits
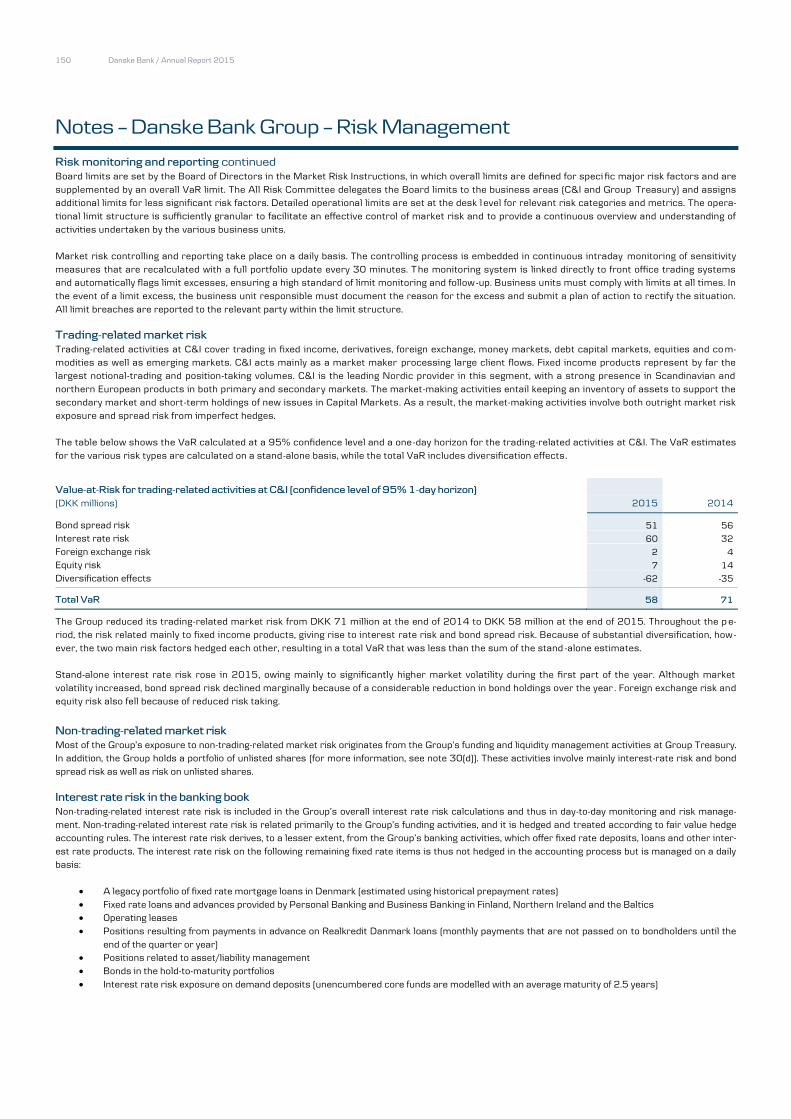
150 Danske Bank / Annual Report 2015
Notes – Danske Bank Group – Risk Management
Risk monitoring and reporting continued
Board limits are set by the Board of Directors in the Market Risk Instructions, in which overall limits are defined for speci fic major risk factors and are
supplemented by an overall VaR limit. The All Risk Committee delegates the Board limits to the business areas (C&I and Group Treasury) and assigns additional limits for less significant risk factors. Detailed operational limits are set at the desk l evel for relevant risk categories and metrics. The opera-
tional limit structure is sufficiently granular to facilitate an effective control of market risk and to provide a continuous overview and understanding of
activities undertaken by the various business units.
Market risk controlling and reporting take place on a daily basis. The controlling process is embedded in continuous intraday monitoring of sensitivity
measures that are recalculated with a full portfolio update every 30 minutes. The monitoring system is linked directly to front office trading systems and automatically flags limit excesses, ensuring a high standard of limit monitoring and follow-up. Business units must comply with limits at all times. In
the event of a limit excess, the business unit responsible must document the reason for the excess and submit a plan of action to rectify the situation.
All limit breaches are reported to the relevant party within the limit structure. Trading-related market risk
Trading-related activities at C&I cover trading in fixed income, derivatives, foreign exchange, money markets, debt capital markets, equities and co m-modities as well as emerging markets. C&I acts mainly as a market maker processing large client flows. Fixed income products represent by far the
largest notional-trading and position-taking volumes. C&I is the leading Nordic provider in this segment, with a strong presence in Scandinavian and
northern European products in both primary and secondary markets. The market-making activities entail keeping an inventory of assets to support the secondary market and short-term holdings of new issues in Capital Markets. As a result, the market-making activities involve both outright market risk
exposure and spread risk from imperfect hedges.
The table below shows the VaR calculated at a 95% confidence level and a one-day horizon for the trading-related activities at C&I. The VaR estimates
for the various risk types are calculated on a stand-alone basis, while the total VaR includes diversification effects.
Value-at-Risk for trading-related activities at C&I (confidence level of 95% 1-day horizon)
(DKK millions) 2015 2014
Bond spread risk 51 56
Interest rate risk 60 32
Foreign exchange risk 2 4
Equity risk 7 14
Diversification effects -62 -35
Total VaR 58 71
The Group reduced its trading-related market risk from DKK 71 million at the end of 2014 to DKK 58 million at the end of 2015. Throughout the p e-riod, the risk related mainly to fixed income products, giving rise to interest rate risk and bond spread risk. Because of substantial diversification, how-
ever, the two main risk factors hedged each other, resulting in a total VaR that was less than the sum of the stand -alone estimates.
Stand-alone interest rate risk rose in 2015, owing mainly to significantly higher market volatility during the first part of the year. Although market
volatility increased, bond spread risk declined marginally because of a considerable reduction in bond holdings over the year . Foreign exchange risk and equity risk also fell because of reduced risk taking.
Non-trading-related market risk
Most of the Group’s exposure to non-trading-related market risk originates from the Group’s funding and liquidity management activities at Group Treasury. In addition, the Group holds a portfolio of unlisted shares (for more information, see note 30(d)). These activities involve mainly interest-rate risk and bond
spread risk as well as risk on unlisted shares.
Interest rate risk in the banking book
Non-trading-related interest rate risk is included in the Group’s overall interest rate risk calculations and thus in day-to-day monitoring and risk manage-
ment. Non-trading-related interest rate risk is related primarily to the Group’s funding activities, and it is hedged and treated according to fair value hedge accounting rules. The interest rate risk derives, to a lesser extent, from the Group’s banking activities, which offer fixed rate deposits, loans and other inter-
est rate products. The interest rate risk on the following remaining fixed rate items is thus not hedged in the accounting process but is managed on a daily
basis:
A legacy portfolio of fixed rate mortgage loans in Denmark (estimated using historical prepayment rates)
Fixed rate loans and advances provided by Personal Banking and Business Banking in Finland, Northern Ireland and the Baltics Operating leases
Positions resulting from payments in advance on Realkredit Danmark loans (monthly payments that are not passed on to bondholders until the
end of the quarter or year) Positions related to asset/liability management
Bonds in the hold-to-maturity portfolios
Interest rate risk exposure on demand deposits (unencumbered core funds are modelled with an average maturity of 2.5 years)

Danske Bank / Annual Report 2015 151
Notes – Danske Bank Group – Risk Management
Interest rate risk in the banking book continued
The Group’s total interest rate sensitivity in the banking book is shown in the table below.
Interest rate risk in the banking book (parallel shift in yield curve of 100 basis points)
2015 2014
2014
(DKK millions) +100 bp -100 bp +100 bp -100 bp
DKK -1,903 1,975 -1,105 1,155
EUR -1,004 1,033 -1,308 1,360
SEK -150 156 -10 10
GBP 20 -20 -12 15
NOK -4 4 -8 8
USD -1 1 1 -1
Other -2 2 -1 1
Total -3,044 3,151 -2,443 2,548
The interest rate risk in the banking book increased in 2015, mainly because of the acquisition of longer-dated bonds in order to increase the average ma-
turity of the hold-to-maturity bond portfolio to match the risk on the liabilities more closely. The Group established this portfolio in 2013 in order to stabilise
the Group’s net interest income by hedging its liabilities.
At the end of 2015, the book value of the hold-to-maturity bond portfolio totalled DKK 100 billion, against DKK 92 billion at the end of 2014. After the in-
crease in average maturity, the interest rate risk in the portfolio rose to DKK 2.8 billion assuming a 100 basis point increase in the yield curve at the end of 2015.

152 Danske Bank / Annual Report 2015
Notes – Danske Bank Group – Risk Management
Value-at-Risk for capital requirement purposes
The Group uses its internal VaR model to calculate the capital requirement for market risk on positions in the trading book (the Group uses the standard-ised approach to calculate regulatory capital for commodity risk).
The tables below show the VaR figures calculated at a confidence level of 99% and a 10-day horizon used for calculating the capital requirement for market risk. The figures for 2015 and 2014 are not directly comparable because bond spread risk was not implemented in the internal VaR model until after the
extension approved by the FSA at the end of June 2015:
2015 Daily VaR Stressed VaR
Avg. Minimum Maximum Avg. Minimum Maximum
Risk category VaR VaR VaR 31 Dec. VaR VaR VaR 31 Dec.
Interest rate risk 471 106 903 575 461 179 705 476
Bond spread risk 314 225 488 325 850 617 1,259 824
Foreign exchange risk 16 5 67 8 39 3 96 12
Equity market risk 27 4 185 18 56 9 321 39
Diversification benefit -402 - - -369 -644 - - -518
Total VaR 426 112 788 557 762 176 1,223 833
2014 Daily VaR Stressed VaR
Avg. Minimum Maximum Avg. Minimum Maximum
Risk category VaR VaR VaR 31 Dec. VaR VaR VaR 31 Dec.
Interest rate risk 219 138 387 160 343 279 413 296
Foreign exchange risk 32 8 73 22 68 14 126 46
Equity market risk 28 5 92 10 94 18 266 24
Diversification benefit -63 - - -36 -167 - - -73
Total VaR 216 126 379 156 338 273 427 293
In connection with the extension of the internal VaR model in June 2015, the Group implemented a separate internal model designed to calculate the in-cremental risk charge for regulatory purposes. The incremental risk is calculated with a one-year horizon at a 99.9% confidence level on positions in the
trading book. The table below shows the average, minimum, maximum and end-period values of the incremental risk for the period Q2-Q4 2015:
Avg. Minimum Maximum 31 Dec.
Incremental risk charge 938 558 1,399 698

Danske Bank / Annual Report 2015 153
Notes – Danske Bank Group – Risk Management
Backtesting and stress testing
The Group conducts daily backtests to document the accuracy of the internal VaR model. Backtesting compares 1-day VaR calculated on trading book
positions with the actual and hypothetical profit or loss. For the latter, positions are assumed to be unchanged until the fo llowing business day (no intra-day trading is included). If the hypothetical or actual loss exceeds the predicted possible loss (VaR), an exception has occu rred. Since the VaR figures
used for backtesting are based on a confidence level of 99% (as in the calculation of the ca pital requirement), the expected number of exceptions per
year is two to three. The backtest results for 2015 are shown in the chart below.
The backtest of the internal VaR model showed two exceptions in the actual P/L in 2015 and three exceptions in the hypothetical P/L. All the excep-tions occurred in the first half of 2015 before the internal VaR model was extended to include bond spread risk.
The exception in the hypothetical P/L in January was caused by the Swiss National Bank’s removal of the 1.20 CHF /EUR cap, which sent the CHF 17% higher against the EUR. The exceptions in the actual and hypothetical P/L in February were caused by a combination of widenin g spreads between DKK
and EUR rates and widening credit spreads on bonds. The exceptions in the actual and hypothetical P/L in May were caused by a combination of rela-
tively large increases at the long end of the yield curves for EUR, NOK, SEK and DKK and widening credit spreads in the Danish mortgage bond market.
As a supplement to the daily calculation of VaR and the more conventional risk figures, the Group performs stress tests and s ensitivity analyses on a
regular basis. Some of these tests are part of the daily limit control, while others are performed weekly or quarterly.
Stress test scenarios feature changes in interest rates, exchange rates, equity prices, volatilities and bond spreads. Such changes affect the Group’s
earnings directly through value adjustments. The scenarios are often based on large changes in a single risk factor or on con ditions that reflect histori-cal periods of economic or financial crisis, combined with factors relevant under the current market conditions.
The Group’s stress testing framework also includes scenarios with extreme market developments, such as hypothetical scenarios involving extreme fi-nancial or macroeconomic events. This includes scenarios periodically defined by the European Banking Authority (EBA) or the Danish FSA as well.
154 Danske Bank / Annual Report 2015
Notes – Danske Bank Group – Risk Management
Liquidity risk
Liquidity risk is the risk of losses because funding costs become excessive, lack of funding prevents the Group from maintaining its business model, or
lack of funding prevents the Group from fulfilling its payment obligations.
Taking on liquidity risk is an integral part of the Group’s business strategy. Realkredit Danmark and Danica Pen sion each manage their liquidity sepa-
rately and are thus not included in the Group’s general liquidity reporting. At Realkredit Danmark, the financing of mortgage loans through the issuance of listed mortgage bonds with matching conditions has eliminated l iquidity risk in all material respects. Danica Pension’s balance sheet contains long -
term life insurance liabilities and assets, most of which are invested in easily marketable bonds and shares. Both companies are subject to statutory
limits on their exposures to Danske Bank A/S. In the following, references to the Group’s liquidity thus exclude Realkredit Danmark and Danica Pen sion with the exception of the Group’s LCR, which includes Realkredit Danmark data.
After a strong start in the financial markets in 2015, sentiment deteriorated somewhat in the second quarter of 2015 because of the Greek situation, jittery Chinese equity markets and uncertainty about regulation. Monetary policy and buying programmes a t central banks continued to support liquid-
ity in the market, and all funding markets were open to Danske Bank. In order to prepare for new regulation, Danske Bank increased its new issuance
volumes in 2015. In spite of the increase in volumes, Danske Bank yield spreads in covered and senior bonds continued to tighten. Rating improve-ments and monetary policy initiatives from the ECB, such as the targeted longer-term refinancing operations (TLTRO) and the purchase programme for
covered bonds (CBPP3), contributed to sustained positive market conditions for Danske Bank. The Group has grown its liquidity reserves throughout
2015 and adhered to its funding plan, including for subordinated debt.
At the end of 2015, the Group’s LCR was 125% calculated on the basis of the EBA’s rules.
Internal measures At the group level, internal liquidity management is based on the monitoring and management of short - and long-term liquidity risks. Liquidity triggers
make up a vital part of daily liquidity management since they are used as early warnings of a potential liquidity crisis. The triggers are monitored by
various functions across the Group, depending on the type of trigger. Liquidity management is organised according to the framework described in the following sections, although it is not limited to that framework.
Survival horizon The principal aim of the Group’s short-term risk management is to ensure that, in the short term, the liquidity buffer is always sufficient to absorb the
net effects of known future receipts and payments from current transactions. Bond holdings that can be used in repo agreements with central banks
are considered liquid assets. To take account of the potential risk of drawings under loan commitments, the Group factors in the unutilised portion of the facilities in the calculation of liquidity risk.
For liquidity management purposes, the Group distinguishes between liquidity in Danish kroner and liquidity in other currencies. This is because of the Group’s strong position in the Danish market and because the Group has a net deposit surplus in Danish kroner (deposits exceed lending) and a net d e-
posit shortfall in other currencies (lending exceeds deposits). The net deposit surplus in Danish kroner is a valuable, stabl e funding source for the
Group.
The Group uses limits for total liquidity and for liquidity in currencies other than Danish kroner to manage its short-term liquidity risk. In addition to lim-
its set by the Board of Directors and the All Risk Committee, the Group Liquidity Risk Committee has set overnight targets fo r each key currency.
Survival horizon under stress
The Group conducts stress tests to measure its immediate liquidity risk and to ensure that it has sufficient time to respond to potential crises. The stress tests estimate liquidity risk in various scenarios, including three standard scenarios: a scenario specific to the Gro up, a general market crisis
scenario and a combination of the two. It also conducts a stress-to-fail test.
All stress tests are based on the assumption that the Group does not reduce its lending activities. This means that existing lending activities are main-
tained and require funding. The degree of possible refinancing varies, depending on the scenario in question and the specific funding source. To assess
the stability of the funding, the Group considers maturity as well as behavioural assumptions.
Most of the Group’s unencumbered bond holdings can be used as collateral for loan facilities with central banks and are thus considered liquid assets.
Scenario-specific haircuts are applied to the bond portfolio.
Market reliance
Retail deposits are a valuable, stable funding source for the Group. Most of the retail deposits are covered by a deposit insurance scheme, and analyses indicate that they are indeed stable over time.
Wholesale funding is another important funding source. This type of funding is less stable, especially when the markets are s trained.
Stress tests show that the Group’s liquidity buffer is sufficient to close any liquidity gap if all capital markets are close d and refinancing is impossible.
The liquidity buffer is monitored continuously to ensure a minimum survival period of 12 months in such a scenario.
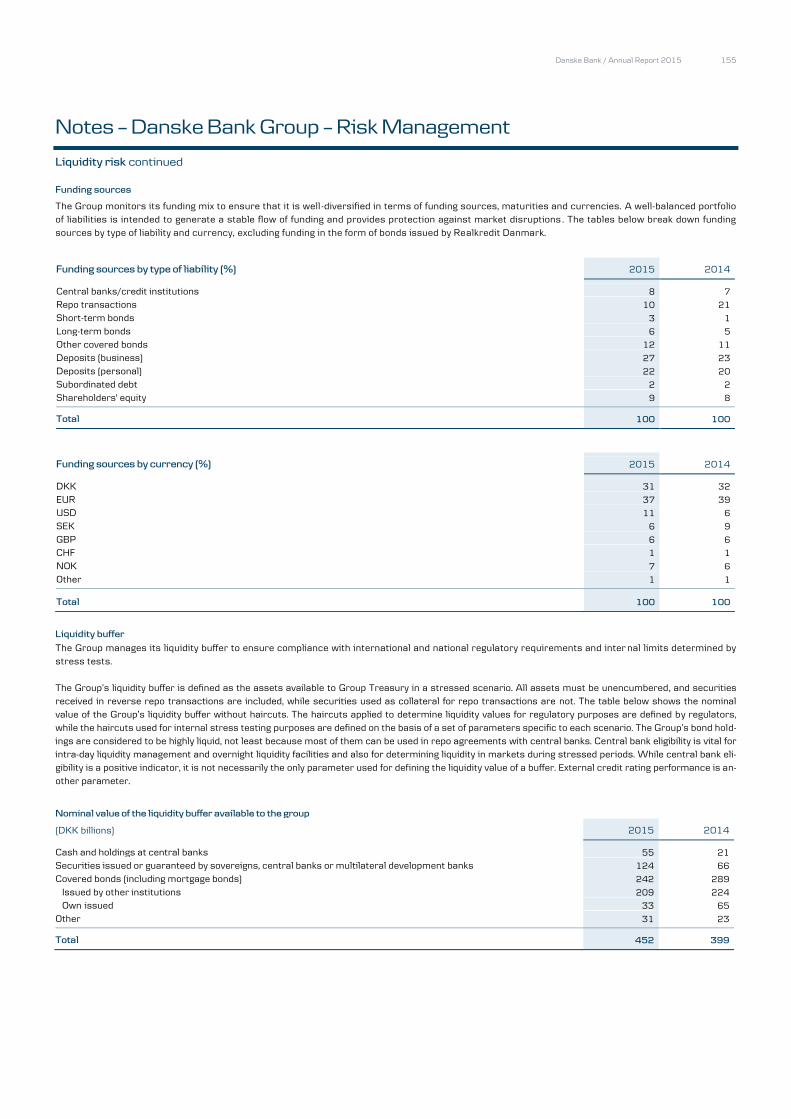
Danske Bank / Annual Report 2015 155
Notes – Danske Bank Group – Risk Management
Liquidity risk continued
Funding sources
The Group monitors its funding mix to ensure that it is well-diversified in terms of funding sources, maturities and currencies. A well-balanced portfolio
of liabilities is intended to generate a stable flow of funding and provides protection against market disruptions . The tables below break down funding
sources by type of liability and currency, excluding funding in the form of bonds issued by Realkredit Danmark.
Funding sources by type of liability (%) 2015 2014
Central banks/credit institutions 8 7
Repo transactions 10 21
Short-term bonds 3 1
Long-term bonds 6 5
Other covered bonds 12 11
Deposits (business) 27 23
Deposits (personal) 22 20
Subordinated debt 2 2
Shareholders' equity 9 8
Total 100 100
Funding sources by currency (%) 2015 2014
DKK 31 32
EUR 37 39
USD 11 6
SEK 6 9
GBP 6 6
CHF 1 1
NOK 7 6
Other 1 1
Total 100 100
Liquidity buffer
The Group manages its liquidity buffer to ensure compliance with international and national regulatory requirements and inter nal limits determined by
stress tests.
The Group’s liquidity buffer is defined as the assets available to Group Treasury in a stressed scenario. All assets must be unencumbered, and securities
received in reverse repo transactions are included, while securities used as collateral for repo transactions are not. The table below shows the nominal value of the Group’s liquidity buffer without haircuts. The haircuts applied to determine liquidity values for regulatory purposes are defined by regulators,
while the haircuts used for internal stress testing purposes are defined on the basis of a set of parameters specific to each scenario. The Group’s bond hold-
ings are considered to be highly liquid, not least because most of them can be used in repo agreements with central banks. Central bank eligibility is vital for intra-day liquidity management and overnight liquidity facilities and also for determining liquidity in markets during stressed periods. While central bank eli-
gibility is a positive indicator, it is not necessarily the only parameter used for defining the liquidity value of a buffer. External credit rating performance is an-
other parameter.
Nominal value of the liquidity buffer available to the group
(DKK billions) 2015 2014
Cash and holdings at central banks 55 21
Securities issued or guaranteed by sovereigns, central banks or multilateral development banks 124 66
Covered bonds (including mortgage bonds) 242 289
Issued by other institutions 209 224
Own issued 33 65
Other 31 23
Total 452 399

156 Danske Bank / Annual Report 2015
Notes – Danske Bank Group – Risk Management
Regulatory measures
The Basel Committee has defined new liquidity standards in the form of the Liquidity Coverage Ratio (LCR) and the Net Stable Funding Ratio (NSFR). The
LCR stipulates that banks must have a liquidity buffer that ensures a survival horizon of at least 30 calendar days in case of a ser iously stressed liquid-ity situation. The NSFR is intended to ensure a sound funding structure by promoting an increase in the amount of long-dated funding. The NSFR stipu-
lates that banks must at all times have stable funding equal to the amount of their illiquid assets for one year ahead.
The European Commission has now finalised the LCR legislation package. Danish mortgage bonds will be assigned the highest qualification if they meet
certain criteria, and they may account for up to 70% of a bank’s liquidity portfolio.
Danske Bank was designated a SIFI in Denmark in 2014. Under the Danish Bank Package 6, Danish SIFI banks must have an LCR of 100%. The LCR re-
quirement entered into force on 1 October 2015.
Danske Bank no longer has to meet the Danish liquidity requirement set forth in section 152 of the Danish Financial Business Act because Danske
Bank is committed to having an LCR of at least 100%. However, since the excess liquidity coverage requirement of the Supervisory Diamond is set as a
percentage above the requirement in section 152, Danske Bank must still calculate and report a liquidity ratio. Section 152 states that a credit institu-tion’s liquidity must equal at least
15% of the debt obligations that, regardless of any disbursement conditions, the institution must pay on demand or at less than one month’s no-tice
10% of the institution’s total debt and guarantee obligations, excluding subordinated loan capital infusions that can be coun ted as part of the
Group’s total capital
The liquidity benchmark in the Supervisory Diamond states that banks must have excess liquidity coverage 50% above the regulatory requirements
stated in section 152 of the Danish Financial Business Act. At the end of 2015, Danske Bank A/S’s excess liquidity coverage ratios were 214% and 193%, respectively, above the regulatory requirements.
The funding benchmark stipulates that lending may not exceed stable funding (deposits as well as issued bonds and subordinate d debt with a maturity of more than one year). This means that banks must have a funding ratio of less than 1.00. At the end of 2015, the Group’s ratio was 0.64%.

Danske Bank / Annual Report 2015 157
Notes – Danske Bank Group – Risk Management
Insurance risk
The Group’s insurance risk consists of all risks related to its investment in Danica Pension, including market risk and life insurance risks.
Net income from insurance business is derived primarily from
the risk allowance from conventional life insurance business with guaranteed benefits
unit-linked business health and accident business
return on assets in which the shareholders’ equity of Danica Pension is invested
The risk allowance is the annual return that Danica Pension may book from its conventional life insurance business (Danica Traditionel), and it currently
amounts to 0.60-0.90% of technical provisions (depending on the interest rate group). The risk allowance is governed by the Danish FSA’s Executiv e
Order on the Contribution Principle and can be booked only if the technical basis permits and if the bonus potential of paid-up policies is not used for loss absorption. The technical basis for the risk allowance is essentially the investment return on policyholders’ funds less the change in life insurance
provisions. If the risk allowance cannot be booked, in whole or in part, or the Group must cover losses that cannot be absorbed by the collective bonus
potential or the bonus potential of paid-up policies, the amount may be transferred to a shadow account and booked at a later date when the technical basis so permits. All profits and losses after interest payments to policyholders, risk allowance and changes in insurance provisions are transferred to
the collective bonus potential. Beginning on 1 January 2016, new accounting rules apply to life insurance companies in Denmark. As a result, going
forward, the risk allowance can be booked if it does not exceed the sum of all individual and collective buffers. If the risk allowance for the year cannot be booked, it is lost – that is, from 2016 it can no longer be transferred to the shadow account. The remaining balance on the shadow account at year-end
2015 may still be booked to income over a five-year period. If it cannot be booked, it will be written off over the next five years.
According to the Danish FSA’s Executive Order on the Contribution Principle, policyholders’ funds in Danica Traditionel must be ring-fenced in groups
with generally the same technical rate of interest, insurance risk and expenses. Danica Pension has individual investment and hedging strategies for
each group. Furthermore, the collective bonus potential, the risk allowance, etc., are also determined for each group individ ually.
In 2015, the financial markets generally saw rising equity prices and volatile interest rates. Low interest rates kept Danica’s bonus potential of paid-up
policies low and left little room for risky assets in Danica’s investment portfolio. To improve its investment returns, Danic a changed its investment ap-proach, implementing a new strategy that included managing much of the investment portfolio in-house. Danica’s Risk Management staff monitors and
conducts stress tests involving interest rates as well as equities, bond spreads and other factors on a daily basis to manage the risk of losses for
Danica’s own equity.
Financial risks
Market risk involves the risk of losses on assets in which the shareholders’ equity of Danica Pension is invested and the risk of losses on policies with guaranteed benefits because the fair value of assets and liabilities allocated to these contracts changes. Such changes in fair value can be caused by
changes in interest rates, exchange rates, equity prices, property prices, credit spreads and market liquidity and also by issuer or counterparty de-
faults. Insurance obligations carry interest rate risk owing to the guarantees issued. For example, if market interest rates drop, the fair value of insu r-ance obligations increases.
The Group monitors the market risk on an ongoing basis and has set maximum risk targets for each asset class. Danica Pension conducts internal stress tests to ensure that it can withstand significant losses on its equity and credit exposure and substantial changes in interest rates.
The risk relating to the relationship between investment assets and guaranteed benefits is managed by keeping the interest rate sensitivity of the bond and derivatives portfolios at a suitable level. The bond spread risk is limited since, at end-2015, 71% (2014: 72%) of the portfolio consisted of govern-
ment and mortgage bonds of high quality (AA-AAA ratings from the international rating agencies) or unrated mortgage bonds issued by institutions
with similarly high ratings, and only 11% (2014: 10%) of the portfolio was invested in sub-investment grade bonds.

158 Danske Bank / Annual Report 2015
Notes – Danske Bank Group – Risk Management
Insurance risk continued
Bond portfolio (insurance business) broken down by geographical area Central and Quasi- Danish Swedish Other
(DKK millions) local govern- government mortgage covered covered Corporate
2015 ment bonds bonds bonds bonds bonds bonds Total
Denmark 13,972 744 54,516 - 2,834 8,354 80,420
Sweden 6 - - 5 - 4,065 4,076
UK 245 - - - 187 2,327 2,759
Norway 410 203 - - 57 3,645 4,315
USA 151 - - - 9 13,162 13,322
Spain 3,663 23 - - 200 502 4,388
France 1,640 266 - - 153 993 3,052
Luxembourg - 379 - - - 1,352 1,731
Canada 11 - - - 14 589 614
Finland 59 - - - 14 110 183
Ireland 2,992 19 - - 26 600 3,637
Italy 5,027 - - - 85 478 5,590
Portugal 677 - - - 21 30 728
Austria - - - - - 29 29
Netherlands 341 - - - 14 1,751 2,106
Germany 8,606 2,470 - - - 798 11,874
Other 3,468 140 - - 24 2,606 6,238
Total 41,268 4,244 54,516 5 3,638 41,391 145,062
2014
Denmark 17,668 673 40,060 - 3,499 3,878 65,778 Sweden 24 - - 495 - 3,704 4,223 UK 279 - - - 1,204 1,809 3,292 Norway - 206 - - 854 2,791 3,851 USA 221 - - - 10 11,407 11,638 Spain 2,613 288 - - 1,219 856 4,976 France 7,955 812 - - 1,602 1,344 11,713 Luxembourg - 1,421 - - - 1,047 2,468 Canada 18 - - - 14 219 251 Finland 150 - - - 185 46 381 Ireland 1,611 108 - - 1,632 968 4,319 Italy 8,166 - - - 540 738 9,444 Portugal 12 - - - 112 44 168 Austria 559 - - - 78 20 657 Netherlands 3,448 - - - 287 1,884 5,619 Germany 7,103 599 - - 466 491 8,659 Other 5,187 90 - - 215 3,788 9,280
Total 55,014 4,197 40,060 495 11,917 35,034 146,717
Concentration risk and counterparty risk are limited because of internal investing restrictions and the use of collateral management agreements for derivatives.
Danica Pension hedges most of its foreign exchange risk. At the end of 2015, 64% was hedged (2014: 69%)
Early surrender by policyholders may force Danica Pension to sell some of its investment assets at a low price. Danica Pension reduces this liquidity
risk by investing a substantial portion of funds in liquid bonds and shares. The liquidity risk is also modest since Danica Pension can, to some extent,
adapt the timing of payment upon surrender of pension schemes to the situation in the financial markets .

Danske Bank / Annual Report 2015 159
Notes – Danske Bank Group – Risk Management
Insurance risk continued
Bond portfolio (insurance business) broken down by external ratings
Central and Quasi- Danish Swedish Other
(DKK millions) local govern- government mortgage covered covered Corporate
2015 ment bonds bonds bonds bonds bonds bonds Total
AAA 23,684 3,546 45,959 5 455 8,729 82,378
AA+ 117 63 - - 36 133 349
AA 3,011 254 - - 151 741 4,157
AA- 6 11 19 - 81 328 445
A+ 2,992 - - - 97 472 3,561
A 377 - - - 55 767 1,199
A- 177 22 - - 1 715 915
BBB+ 8,858 23 - - - 927 9,808
BBB 224 37 - - 2,759 934 3,954
BBB- 474 1 - - - 930 1,405
Sub-inv. grade or unrated 1,348 287 8,538 - 3 26,715 36,891
Total 41,268 4,244 54,516 5 3,638 41,391 145,062
2014
AAA 29,294 1,681 30,903 495 3,989 1,822 68,184 AA+ 8,118 1,289 - - 823 168 10,398 AA 1,268 641 - - 428 432 2,769 AA- 7 - - - 127 267 401 A+ 72 - 47 - 1,509 719 2,347 A 2,381 - - - 1,223 3,377 6,981 A- 461 3 - - 266 846 1,576 BBB+ 11,569 317 - - - 1,435 13,321 BBB 615 12 - - 3,534 1,383 5,544 BBB- 528 7 - - 13 1,245 1,793 Sub-inv. grade or unrated 701 247 9,110 - 5 23,340 33,403
Total 55,014 4,197 40,060 495 11,917 35,034 146,717
Policyholders assume the risk on investment assets under unit-linked contracts (Danica Link, Danica Balance and Danica Select) with the exception of policies with investment guarantees. At the end of 2015, about 19% of policyholders had investment guarantees, mainly related to Danica Balance. The guarantees cannot be exercised until the time of retirement and are paid for by an annual fee. Danica Pension manages the risk on Danica Link
guarantees with derivatives, for example, and by adjusting the investment allocation over the last five years before disbursement. It manages the risk on
Danica Balance guarantees by adjusting the investment allocation for the individual policies. Because of these hedging and risk management strategies, Danica Pension considers the investment risk on guarantees in unit-linked products to be minor.
Danica Pension has set a separate investment strategy for assets in which its shareholders’ equity is invested.
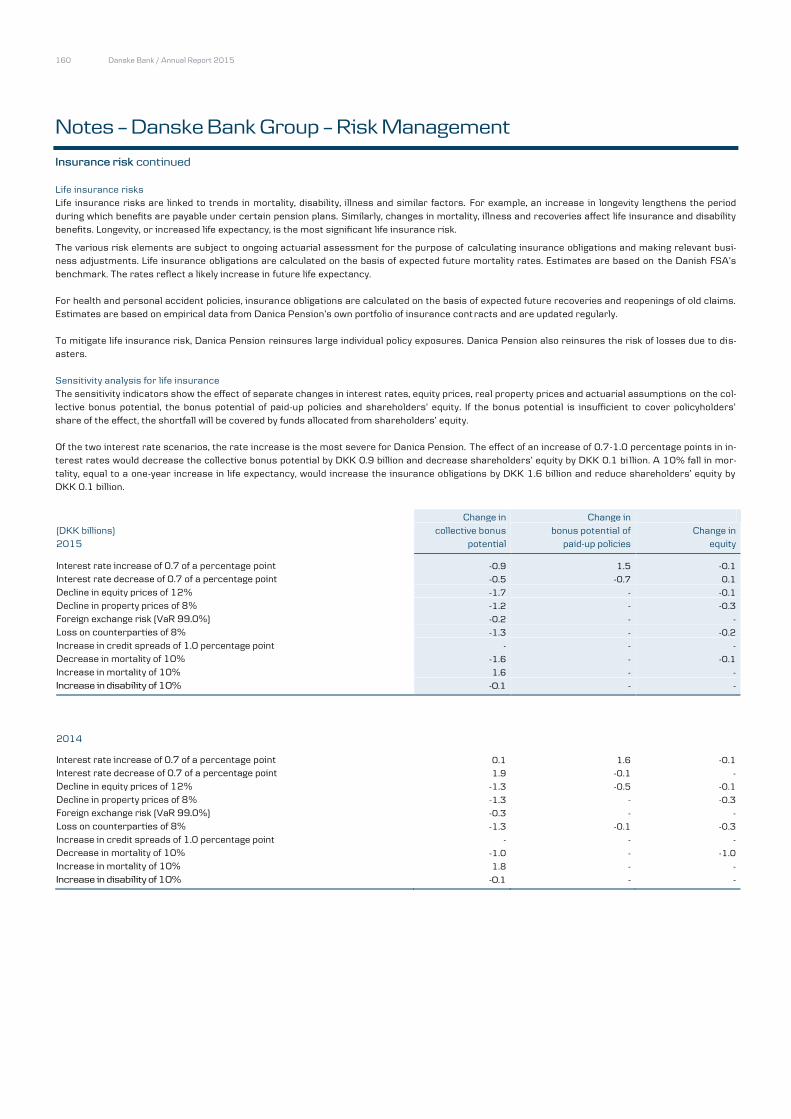
160 Danske Bank / Annual Report 2015
Notes – Danske Bank Group – Risk Management
Insurance risk continued
Life insurance risks Life insurance risks are linked to trends in mortality, disability, illness and similar factors. For example, an increase in longevity lengthens the period
during which benefits are payable under certain pension plans. Similarly, changes in mortality, illness and recoveries affect life insurance and disability
benefits. Longevity, or increased life expectancy, is the most significant life insurance risk.
The various risk elements are subject to ongoing actuarial assessment for the purpose of calculating insurance obligations and making relevant busi-ness adjustments. Life insurance obligations are calculated on the basis of expected future mortality rates. Estimates are based on the Danish FSA’s
benchmark. The rates reflect a likely increase in future life expectancy.
For health and personal accident policies, insurance obligations are calculated on the basis of expected future recoveries and reopenings of old claims.
Estimates are based on empirical data from Danica Pension’s own portfolio of insurance cont racts and are updated regularly.
To mitigate life insurance risk, Danica Pension reinsures large individual policy exposures. Danica Pension also reinsures the risk of losses due to dis-
asters.
Sensitivity analysis for life insurance
The sensitivity indicators show the effect of separate changes in interest rates, equity prices, real property prices and actuarial assumptions on the col-lective bonus potential, the bonus potential of paid-up policies and shareholders’ equity. If the bonus potential is insufficient to cover policyholders’
share of the effect, the shortfall will be covered by funds allocated from shareholders’ equity.
Of the two interest rate scenarios, the rate increase is the most severe for Danica Pension. The effect of an increase of 0.7-1.0 percentage points in in-
terest rates would decrease the collective bonus potential by DKK 0.9 billion and decrease shareholders’ equity by DKK 0.1 bi llion. A 10% fall in mor-
tality, equal to a one-year increase in life expectancy, would increase the insurance obligations by DKK 1.6 billion and reduce shareholders’ equity by DKK 0.1 billion.
Change in Change in
(DKK billions) collective bonus bonus potential of Change in
2015 potential paid-up policies equity
Interest rate increase of 0.7 of a percentage point -0.9 1.5 -0.1
Interest rate decrease of 0.7 of a percentage point -0.5 -0.7 0.1
Decline in equity prices of 12% -1.7 - -0.1
Decline in property prices of 8% -1.2 - -0.3
Foreign exchange risk (VaR 99.0%) -0.2 - -
Loss on counterparties of 8% -1.3 - -0.2
Increase in credit spreads of 1.0 percentage point - - -
Decrease in mortality of 10% -1.6 - -0.1
Increase in mortality of 10% 1.6 - -
Increase in disability of 10% -0.1 - -
2014
Interest rate increase of 0.7 of a percentage point 0.1 1.6 -0.1
Interest rate decrease of 0.7 of a percentage point 1.9 -0.1 -
Decline in equity prices of 12% -1.3 -0.5 -0.1
Decline in property prices of 8% -1.3 - -0.3
Foreign exchange risk (VaR 99.0%) -0.3 - -
Loss on counterparties of 8% -1.3 -0.1 -0.3
Increase in credit spreads of 1.0 percentage point - - -
Decrease in mortality of 10% -1.0 - -1.0
Increase in mortality of 10% 1.8 - -
Increase in disability of 10% -0.1 - -
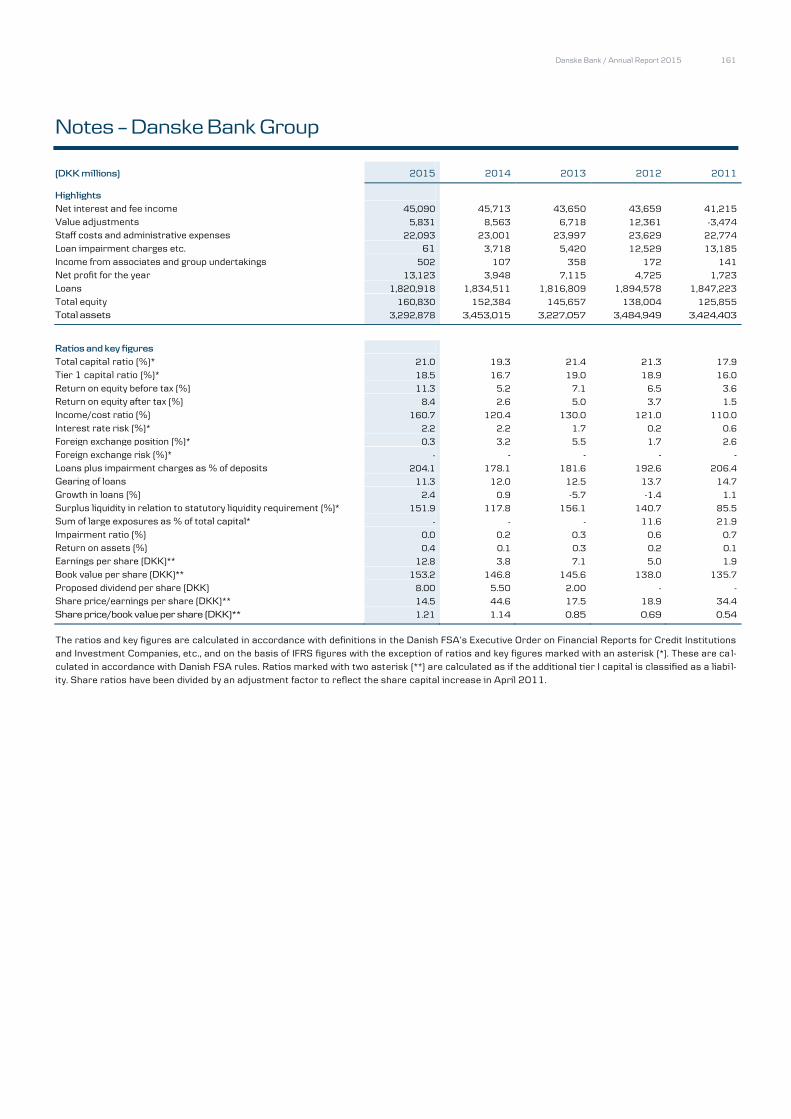
Danske Bank / Annual Report 2015 161
Notes – Danske Bank Group
(DKK millions) 2015 2014 2013 2012 2011
Highlights Net interest and fee income 45,090 45,713 43,650 43,659 41,215 Value adjustments 5,831 8,563 6,718 12,361 -3,474 Staff costs and administrative expenses 22,093 23,001 23,997 23,629 22,774 Loan impairment charges etc. 61 3,718 5,420 12,529 13,185 Income from associates and group undertakings 502 107 358 172 141 Net profit for the year 13,123 3,948 7,115 4,725 1,723 Loans 1,820,918 1,834,511 1,816,809 1,894,578 1,847,223 Total equity 160,830 152,384 145,657 138,004 125,855 Total assets 3,292,878 3,453,015 3,227,057 3,484,949 3,424,403
Ratios and key figures Total capital ratio (%)* 21.0 19.3 21.4 21.3 17.9 Tier 1 capital ratio (%)* 18.5 16.7 19.0 18.9 16.0 Return on equity before tax (%) 11.3 5.2 7.1 6.5 3.6 Return on equity after tax (%) 8.4 2.6 5.0 3.7 1.5 Income/cost ratio (%) 160.7 120.4 130.0 121.0 110.0 Interest rate risk (%)* 2.2 2.2 1.7 0.2 0.6 Foreign exchange position (%)* 0.3 3.2 5.5 1.7 2.6 Foreign exchange risk (%)* - - - - -
Loans plus impairment charges as % of deposits 204.1 178.1 181.6 192.6 206.4 Gearing of loans 11.3 12.0 12.5 13.7 14.7 Growth in loans (%) 2.4 0.9 -5.7 -1.4 1.1 Surplus liquidity in relation to statutory liquidity requirement (%)* 151.9 117.8 156.1 140.7 85.5 Sum of large exposures as % of total capital* - - - 11.6 21.9 Impairment ratio (%) 0.0 0.2 0.3 0.6 0.7 Return on assets (%) 0.4 0.1 0.3 0.2 0.1 Earnings per share (DKK)** 12.8 3.8 7.1 5.0 1.9 Book value per share (DKK)** 153.2 146.8 145.6 138.0 135.7 Proposed dividend per share (DKK) 8.00 5.50 2.00 - - Share price/earnings per share (DKK)** 14.5 44.6 17.5 18.9 34.4 Share price/book value per share (DKK)** 1.21 1.14 0.85 0.69 0.54
The ratios and key figures are calculated in accordance with definitions in the Danish FSA’s Executive Order on Financial Reports for Credit Institutions
and Investment Companies, etc., and on the basis of IFRS figures with the exception of ratios and key figures marked with an asterisk (*). These are ca l-
culated in accordance with Danish FSA rules. Ratios marked with two asterisk (**) are calculated as if the additional tier I capital is classified as a liabi l-
ity. Share ratios have been divided by an adjustment factor to reflect the share capital increase in April 2011.
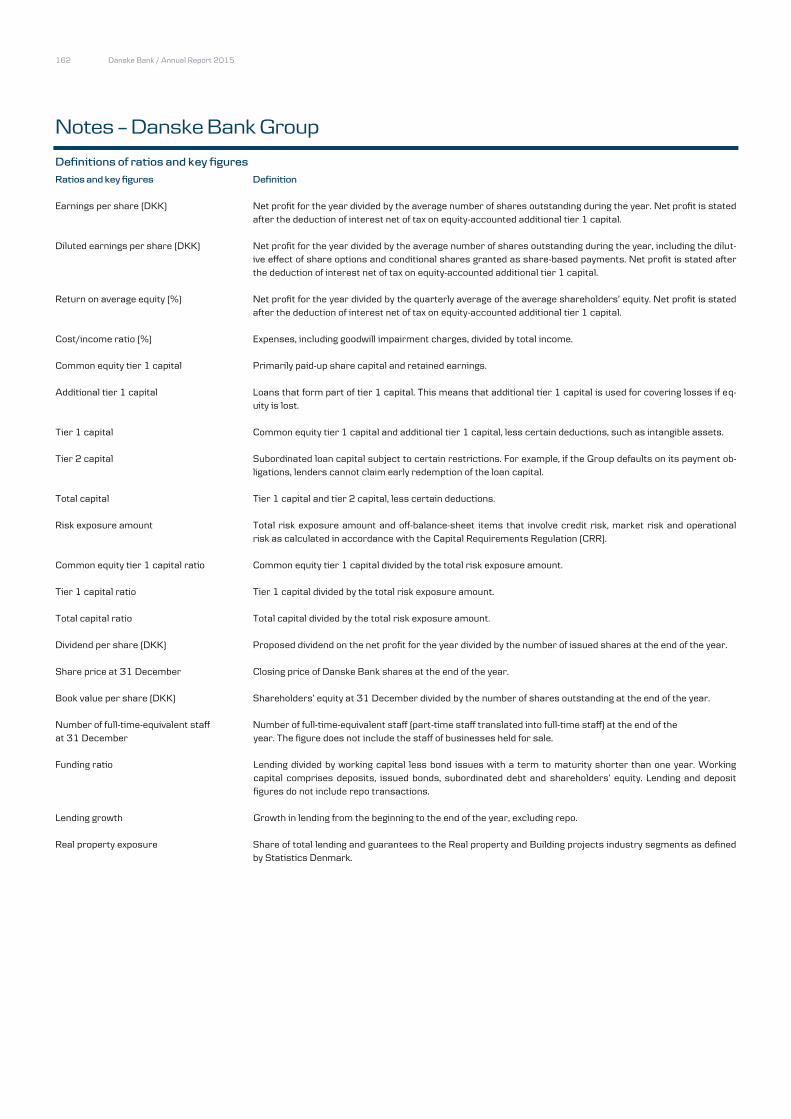
162 Danske Bank / Annual Report 2015
Notes – Danske Bank Group
Definitions of ratios and key figures
Ratios and key figures Definition
Earnings per share (DKK) Net profit for the year divided by the average number of shares outstanding during the year. Net profit is stated
after the deduction of interest net of tax on equity-accounted additional tier 1 capital.
Diluted earnings per share (DKK) Net profit for the year divided by the average number of shares outstanding during the year, including the dilut-
ive effect of share options and conditional shares granted as share-based payments. Net profit is stated after
the deduction of interest net of tax on equity-accounted additional tier 1 capital.
Return on average equity (%) Net profit for the year divided by the quarterly average of the average shareholders’ equity. Net profit is stated
after the deduction of interest net of tax on equity-accounted additional tier 1 capital.
Cost/income ratio (%) Expenses, including goodwill impairment charges, divided by total income.
Common equity tier 1 capital Primarily paid-up share capital and retained earnings.
Additional tier 1 capital Loans that form part of tier 1 capital. This means that additional tier 1 capital is used for covering losses if eq-uity is lost.
Tier 1 capital Common equity tier 1 capital and additional tier 1 capital, less certain deductions, such as intangible assets.
Tier 2 capital Subordinated loan capital subject to certain restrictions. For example, if the Group defaults on its payment ob-
ligations, lenders cannot claim early redemption of the loan capital.
Total capital Tier 1 capital and tier 2 capital, less certain deductions.
Risk exposure amount Total risk exposure amount and off-balance-sheet items that involve credit risk, market risk and operational
risk as calculated in accordance with the Capital Requirements Regulation (CRR).
Common equity tier 1 capital ratio Common equity tier 1 capital divided by the total risk exposure amount.
Tier 1 capital ratio Tier 1 capital divided by the total risk exposure amount.
Total capital ratio Total capital divided by the total risk exposure amount.
Dividend per share (DKK) Proposed dividend on the net profit for the year divided by the number of issued shares at the end of the year.
Share price at 31 December Closing price of Danske Bank shares at the end of the year.
Book value per share (DKK) Shareholders’ equity at 31 December divided by the number of shares outstanding at the end of the year.
Number of full-time-equivalent staff Number of full-time-equivalent staff (part-time staff translated into full-time staff) at the end of the
at 31 December year. The figure does not include the staff of businesses held for sale.
Funding ratio Lending divided by working capital less bond issues with a term to maturity shorter than one year. Working
capital comprises deposits, issued bonds, subordinated debt and shareholders’ equity. Lending and deposit
figures do not include repo transactions.
Lending growth Growth in lending from the beginning to the end of the year, excluding repo.
Real property exposure Share of total lending and guarantees to the Real property and Building projects industry segments as defined
by Statistics Denmark.

Danske Bank / Annual Report 2015 163
Financial statements – Danske Bank A/S
The financial statements of the Parent Company, Danske Bank A/S, are prepared in accordance with the Danish Financial Business Act and the Danish
FSA’s Executive Order No. 281 of 26 March 2014 on Financial Reports for Credit Institutions and Investment Companies, etc.
The rules are identical to the Group’s IFRS-compliant valuation and measurement principles with the following exceptions:
Domicile property is measured (revalued) at its estimated fair value through Other comprehensive income.
The available-for-sale financial assets category is not used.
The estimated fair value of domicile property is determined in accordance with the Danish FSA’s Executive Order on Financial Reports for Credit Insti-
tutions and Investment Companies, etc. Available-for-sale financial assets are measured at fair value through profit or loss.
Holdings in subsidiaries are measured on the basis of the equity method, and tax payable by these undertakings is expensed under Income from associ-
ates and group undertakings.
The format of the Parent Company’s financial statements is not identical to the format of the consolidated financial statements prepared in accordance
with IFRSs.
The table below shows the differences in net profit and shareholders’ equity between the IFRS consolidated financial statements and the Parent Com-
pany’s financial statements presented in accordance with Danish FSA rules.
Net profit Total equity
(DKK millions) 2015 2014 2015 2014
Consolidated financial statements (IFRSs) 13,123 3,949 160,830 152,384
Domicile property -159 -97 884 1,013
Available-for-sale financial assets -85 246 - -
Tax effect 53 -62 -172 -209
Reserves in undertakings consolidated on a pro rata basis - - 3,002 3,002
Consolidated financial statements (Danish FSA rules) 12,933 4,036 164,544 156,190
Non-controlling interests - 2 - 2
Reserves in undertakings consolidated on a pro rata basis - - 3,002 3,002
Parent Company financial statements (Danish FSA rules) 12,933 4,034 161,542 153,186
Note 35 to the consolidated financial statements lists the Group’s holdings and undertakings.
The method of accounting for a pension scheme for a number of employees of Danske Bank held with Danica Pension was changed in 2015. The end-
2014 effect was a decrease in holdings in group undertakings and in shareholders’ equity of DKK 736 million and an increase in the net profit for 2014
of DKK 103 million. Note 1 to the consolidated financial statements provides more information.
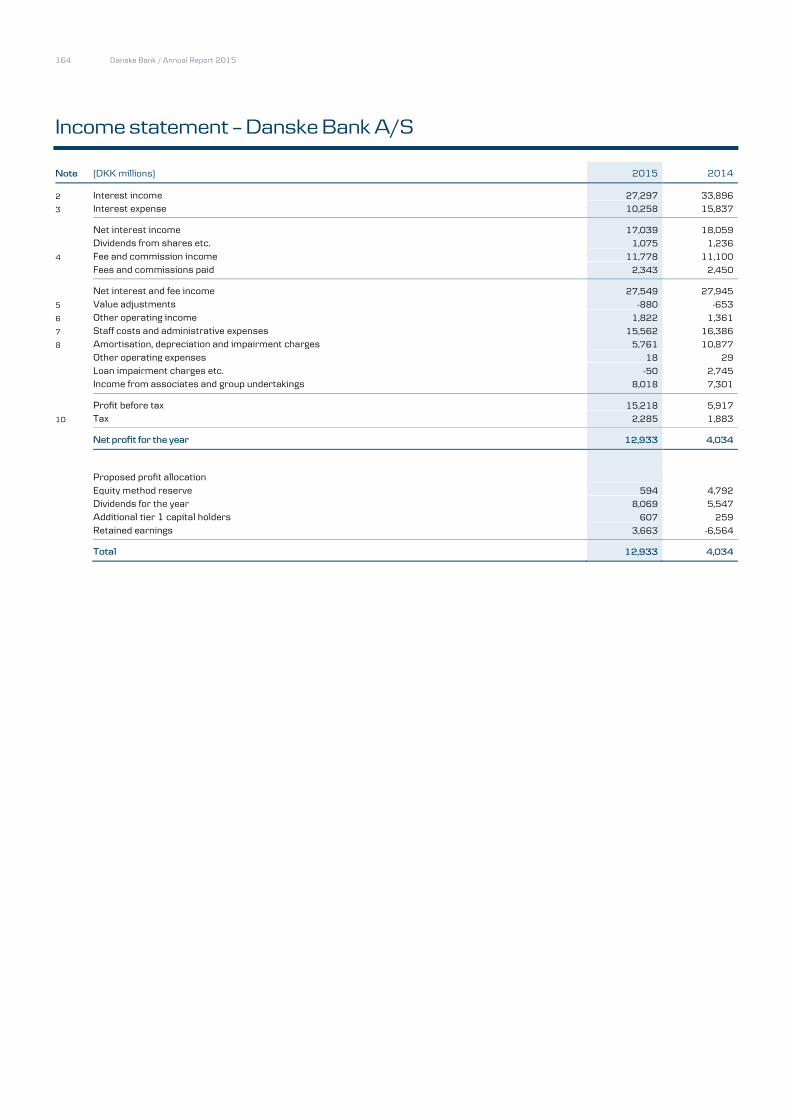
164 Danske Bank / Annual Report 2015
Income statement – Danske Bank A/S
Note (DKK millions) 2015 2014
2 Interest income 27,297 33,896
3 Interest expense 10,258 15,837
Net interest income 17,039 18,059
Dividends from shares etc. 1,075 1,236
4 Fee and commission income 11,778 11,100
Fees and commissions paid 2,343 2,450
Net interest and fee income 27,549 27,945
5 Value adjustments -880 -653
6 Other operating income 1,822 1,361
7 Staff costs and administrative expenses 15,562 16,386
8 Amortisation, depreciation and impairment charges 5,761 10,877
Other operating expenses 18 29
Loan impairment charges etc. -50 2,745
Income from associates and group undertakings 8,018 7,301
Profit before tax 15,218 5,917
10 Tax 2,285 1,883
Net profit for the year 12,933 4,034
Proposed profit allocation
Equity method reserve 594 4,792
Dividends for the year 8,069 5,547
Additional tier 1 capital holders 607 259
Retained earnings 3,663 -6,564
Total 12,933 4,034

Danske Bank / Annual Report 2015 165
Statement of comprehensive income – Danske Bank A/S Note (DKK millions) 2015 2014
Net profit for the year 12,933 4,034 Other comprehensive income
Items that will not be reclassified to profit or loss
Fair value adjustment of domicile property 2 -82 Remeasurement of defined benefit plans 568 157 10 Tax -70 -9
Items that will not be reclassified to profit or loss 500 148
Items that are or may be reclassified subsequently to profit or loss
Translation of units outside Denmark 673 537 Hedging of units outside Denmark -797 -549 10 Tax 178 127
Items that are or may be reclassified subsequently to profit or loss 54 115
Total other comprehensive income 554 263
Total comprehensive income for the year 13,487 4,297
Portion attributable to
Shareholders of Danske Bank A/S (the Parent Company) 12,880 4,038 Additional tier 1 capital holders 607 259
Total comprehensive income for the year 13,487 4,297

166 Danske Bank / Annual Report 2015
Balance sheet – Danske Bank A/S
Note (DKK millions) 2015 2014
Assets
Cash in hand and demand deposits with central banks 30,948 16,789
11 Due from credit institutions and central banks 122,470 127,570
12 Loans and other amounts due at amortised cost 878,321 901,168
Bonds at fair value 383,052 557,128
14 Bonds at amortised cost 80,371 67,377
Shares etc. 21,657 8,867
Holdings in associates 860 1,004
Holdings in group undertakings 104,529 102,981
15 Assets under pooled schemes 50,658 47,320
Intangible assets 6,345 10,201
Land and buildings 375 3,247
16 Investment property 301 301
16 Domicile property 74 2,946
17 Other tangible assets 3,214 2,709
Current tax assets 901 1,189
18 Deferred tax assets 181 441
19 Assets held for sale 5,482 2,562
20 Other assets 346,425 424,170
Prepayments 1,401 989
Total assets 2,037,190 2,275,712
Liabilities and equity
Amounts due
21 Due to credit institutions and central banks 304,731 381,372
22 Deposits and other amounts due 665,115 794,027
Deposits under pooled schemes 51,147 48,407
23 Issued bonds at amortised cost 311,166 268,892
Current tax liabilities 688 751
19 Liabillities in disposal groups held for sale 1,334 -
24 Other liabilities 497,802 579,539
Deferred income 951 1,026
Total amounts due 1,832,934 2,074,014
PROVISIONS FOR LIABILITIES
Provisions for pensions and similar obligations 289 449
18 Provisions for deferred tax 5,861 6,609
Provisions for losses on guarantees 1,097 1,201
Other provisions for liabilities 95 110
Total provisions for liabilities 7,342 8,369
Subordinated debt
25 Subordinated debt 35,372 40,144
Equity
Share capital 10,086 10,086
Accumulated value adjustments -169 33
Equity method reserve 30,475 29,881
Retained earnings 101,764 101,965
Proposed dividends 8,069 5,547
Shareholders of Danske Bank A/S (the Parent Company) 150,225 147,512
Additional tier 1 etc. 11,317 5,673
Total equity 161,542 153,185
Total liabilities and equity 2,037,190 2,275,712
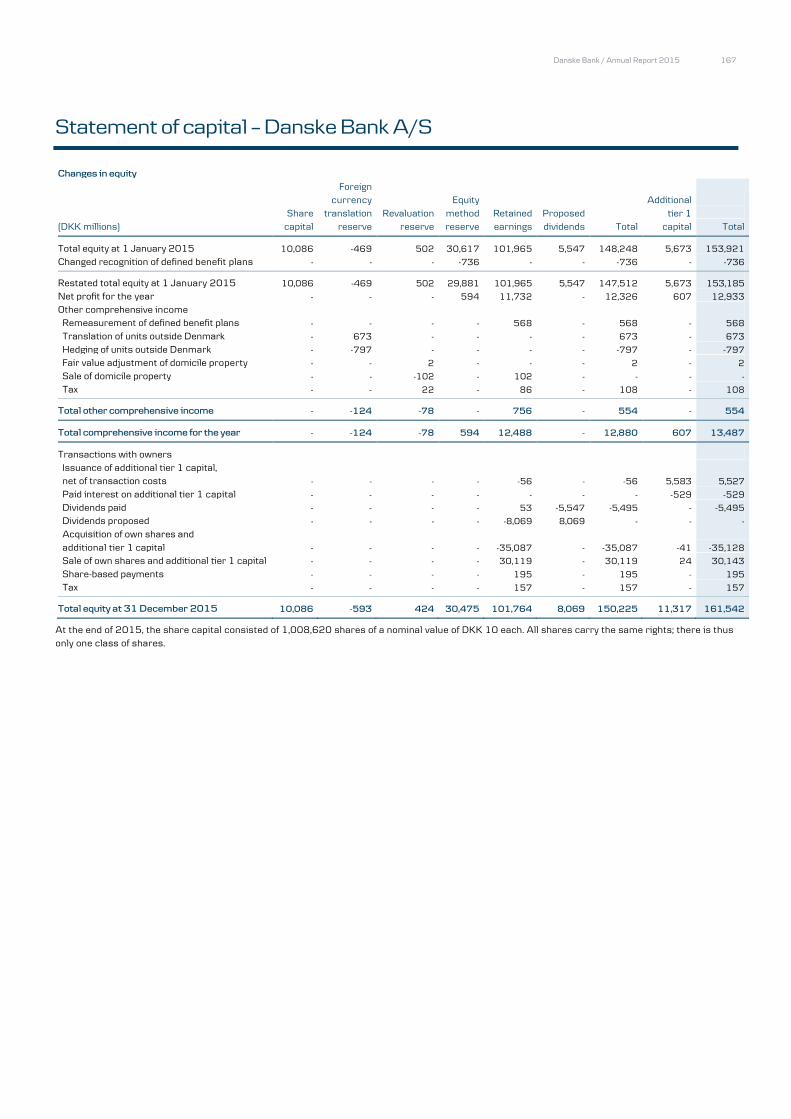
Danske Bank / Annual Report 2015 167
Statement of capital – Danske Bank A/S
Changes in equity
Foreign
currency Equity Additional
Share translation Revaluation method Retained Proposed tier 1
(DKK millions) capital reserve reserve reserve earnings dividends Total capital Total
Total equity at 1 January 2015 10,086 -469 502 30,617 101,965 5,547 148,248 5,673 153,921
Changed recognition of defined benefit plans - - - -736 - - -736 - -736
Restated total equity at 1 January 2015 10,086 -469 502 29,881 101,965 5,547 147,512 5,673 153,185
Net profit for the year - - - 594 11,732 - 12,326 607 12,933
Other comprehensive income
Remeasurement of defined benefit plans - - - - 568 - 568 - 568
Translation of units outside Denmark - 673 - - - - 673 - 673
Hedging of units outside Denmark - -797 - - - - -797 - -797
Fair value adjustment of domicile property - - 2 - - - 2 - 2
Sale of domicile property - - -102 - 102 - - - -
Tax - - 22 - 86 - 108 - 108
Total other comprehensive income - -124 -78 - 756 - 554 - 554
Total comprehensive income for the year - -124 -78 594 12,488 - 12,880 607 13,487
Transactions with owners
Issuance of additional tier 1 capital, net of transaction costs - - - - -56 - -56 5,583 5,527
Paid interest on additional tier 1 capital - - - - - - - -529 -529
Dividends paid - - - - 53 -5,547 -5,495 - -5,495
Dividends proposed - - - - -8,069 8,069 - - -
Acquisition of own shares and
additional tier 1 capital - - - - -35,087 - -35,087 -41 -35,128
Sale of own shares and additional tier 1 capital - - - - 30,119 - 30,119 24 30,143
Share-based payments - - - - 195 - 195 - 195
Tax - - - - 157 - 157 - 157
Total equity at 31 December 2015 10,086 -593 424 30,475 101,764 8,069 150,225 11,317 161,542
At the end of 2015, the share capital consisted of 1,008,620 shares of a nominal value of DKK 10 each. All shares carry the same rights; there is thus
only one class of shares.

168 Danske Bank / Annual Report 2015
Statement of capital – Danske Bank A/S
Changes in equity
Foreign
currency Equity Additional
Share translation Revaluation method Retained Proposed tier 1
(DKK millions) capital reserve reserve reserve earnings dividends Total capital Total
Total equity at 1 January 2014 10,086 -434 596 25,928 108,410 2,017 146,603 - 146,603
Changed recognition of defined benefit plans - - - -839 - - -839 - -839
Restated total equity at 1 January 2014 10,086 -434 596 25,089 108,410 2,017 145,764 - 145,764
Net profit for the year - - - 4,792 -1,017 - 3,775 259 4,034
Other comprehensive income
Remeasurement of defined benefit plans - - - - 157 - 157 - 157
Translation of units outside Denmark - 537 - - - - 537 - 537
Hedging of units outside Denmark - -549 - - - - -549 - -549
Fair value adjustment of domicile property - - -38 - -44 - -82 - -82
Sale of domicile property - - -99 - 99 - - - -
Tax - - 43 - 75 - 118 - 118
Other changes - -23 - - 23 - - - -
Total other comprehensive income - -35 -94 - 310 - 181 - 181
Total comprehensive income for the year - -35 -94 4,792 -707 - 3,956 259 4,215
Transactions with owners
Issuance of additional tier 1 capital,
net of transaction costs - - - - -59 - -59 5,597 5,538
Paid interest on additional tier 1 capital - - - - - - - -183 -183
Dividends paid - - - - 17 -2,017 -2,000 - -2,000
Dividends proposed - - - - -5,547 5,547 - - -
Acquisition of own shares and
additional tier 1 capital - - - - -25,702 - -25,702 -53 -25,755
Sale of own shares and additional tier 1 capital - - - - 25,377 - 25,377 53 25,430
Share-based payments - - - - 123 - 123 - 123
Tax - - - - 53 - 53 - 53
Total equity at 31 December 2014 10,086 -469 502 29,881 101,965 5,547 147,512 5,673 153,185
At the end of 2014, the share capital consisted of 1,008,620 shares of a nominal value of DKK 10 each. All shares carry the same rights; there is thus
only one class of shares.

Danske Bank / Annual Report 2015 169
Statement of capital – Danske Bank A/S
Holding of own shares, Danske Bank A/S Nominal Sales/purchase Number of value Percentage of price
shares (DKK m) share capital (DKK m)
Holding at 1 January 2014 5,601,501 56 0.56
Acquired in 2014 172,118,508 1,721 17.06 25,615 Sold in 2014 171,159,529 1,712 16.97 25,293
Holding at 31 December 2014 6,560,480 65 0.65
Acquired in 2015 183,322,221 1,833 18.18 34,863
Sold in 2015 158,971,857 1,590 15.76 29,697
Holding at 31 December 2015 30,910,844 308 3.07
Acquisitions in 2015 and 2014 comprised shares acquired under the share buy-back programme, shares acquired for the trading portfolio and shares acquired on behalf of customers.
Danske Bank shares held by subsidiares Nominal Sales/purchase
Number of value Percentage of price
shares (DKK m) share capital (DKK m)
Holding at 1 January 2014 2,601,121 26 0.26
Acquired in 2014 631,445 6 0.06 87 Sold in 2014 563,612 6 0.06 83
Holding at 31 December 2014 2,668,954 27 0.26
Acquired in 2015 1,209,679 12 0.12 223
Sold in 2015 2,199,283 22 0.22 423
Holding at 31 December 2015 1,679,350 17 0.16
Acquisitions in 2015 and 2014 comprised shares acquired on behalf of customers.

170 Danske Bank / Annual Report 2015
Statement of capital – Danske Bank A/S
(DKK millions) 2015 2014
Total capital and total capital ratio
Total equity 161,542 153,184
Additional tier 1 capital instruments included in total equity -11,177 -5,597
Accrued interest on additional tier 1 capital instruments -155 -77
Tax on accrued interest on additional tier 1 capital instruments 36 17
Common equity tier 1 capital instruments 150,246 147,527
Adjustment to eligible capital instruments -154 -117
Prudential filters -418 -255
Proposed dividends -8,069 -5,547
Intangible assets of banking operations -6,345 -10,201
Deferred tax assets on intangible assets 243 190
Deferred tax assets that rely on future profitability, excluding temporary differences -40 -53
Defined benefit pension fund assets -356 -113
Statutory deduction for insurance subsidiaries -2,885 -1,850
Other statutory deductions -35 -721
Common equity tier 1 capital 132,187 128,860
Additional tier 1 capital instruments 22,338 17,434
Statutory deduction for insurance subsidiaries -2,164 -3,701
Other statutory deductions -7 -10
Tier 1 capital 152,354 142,583
Tier 2 capital instruments 22,067 25,599
Statutory deduction for insurance subsidiaries -2,164 -3,701
Other statutory deductions -7 -10
Total capital 172,250 164,471
Total risk exposure amount 676,723 677,156
Common equity tier 1 capital ratio (%) 19.5 19.0
Tier 1 capital ratio (%) 22.5 21.2
Total capital ratio (%) 25.5 24.4
The total capital and tier 1 capital ratios are calculated in accordance with the Danish Financial Business Act and applicable executive orders.
Internal Capital Adequacy Assessment 2015 (not covered by the statutory audit) provides more details on the solvency need of Danske Bank A/S. The section on risk exposure for Danske Bank Group in the risk management notes provides information about the Group’s financial risks and financial risk
management.

Danske Bank / Annual Report 2015 171
Notes – Danske Bank A/S
1. Net interest and fee income and value adjustments broken down by business segment
(DKK millions) 2015 2014
Personal Banking 9,597 9,886
Business Banking 6,382 6,958
C&I 8,933 8,179
Danske Capital 1,767 1,546
Other Activities 275 723
Total 26,954 27,292
Geographical segmentation
Denmark 13,980 14,592
Finland 504 523
Ireland 576 645
Norway 4,437 4,222
UK 481 542
Sweden 6,156 5,862
Baltics 587 665
Germany 138 154
Poland 96 87
Total 26,954 27,292
Geographical segmentation is based on the location in which the individual transaction is recorded. The figures for Denmark include financing costs re-
lated to investments in activities outside Denmark.
2. Interest income (DKK millions) 2015 2014
Reverse transactions with credit institutions and central banks -152 173
Other transactions with credit institutions and central banks 89 620
Reverse loans -385 994
Loans and other amounts due 17,332 20,780
Bonds 5,822 7,936
Derivatives, total 4,414 3,386
Currency contracts -445 -2,031
Interest rate contracts 4,859 5,416
Other interest income 177 8
Total 27,297 33,896
3. Interest expense (DKK millions) 2015 2014
Repo transactions with credit institutions and central banks -258 405
Other transactions with credit institutions and central banks 1,455 1,510
Repo deposits -152 885
Deposits and other amounts due 2,224 4,496
Issued bonds 5,363 6,103
Subordinated debt 1,510 2,363
Other interest expenses 116 75
Total 10,258 15,837
4. Fee and commission income (DKK millions) 2015 2014
Securities trading and custody account fees 6,274 5,545
Payment services fees 1,231 1,271
Origination fees 2,022 1,836
Guarantee commissions 899 861
Other fees and commissions 1,352 1,587
Total 11,778 11,100

172 Danske Bank / Annual Report 2015
Notes – Danske Bank A/S
5. Value adjustments (DKK millions) 2015 2014
Loans at fair value -175 1,026
Bonds -3,215 682
Shares etc. 886 996
Investment property -15 97
Currency 1,867 2,291
Derivatives -3,362 -1,671
Assets under pooled schemes 1,805 4,169
Deposits under pooled schemes -1,871 -4,249
Other liabilities 3,200 -3,994
Total -880 -653
6. Other operating income
Other operating income includes a refund of excess taxes and duties paid of DKK 151 million (2014: DKK 13 million), and gain of DKK 285 million on the
sale of domicile properties.
7. Staff costs and administrative expenses (DKK millions) 2015 2014
Remuneration of the Executive Board and the Board of Directors
Executive Board 69 70
Board of Directors 9 9
Total 78 79
The remuneration of the Executive Board includes remuneration for membership of the board of directors of one or more of the Group's subsidiaries. Such remuneration is deducted from the contractual remuneration. See note 33 of the consolidated financial statements for Remuneration of material risk tak-
ers of Danske Bank Group and Danske Bank A/S.
Staff costs (DKK millions) 2015 2014
Salaries 8,567 8,804
Pensions 997 1,048
Financial services employer tax and social security costs 1,297 1,310
Total 10,861 11,162
Other administrative expenses 4,621 5,145
Total staff costs and administrative expenses 15,562 16,386
Number of full-time-equivalent staff (avg.) 13,886 14,041
Note 33 of the consolidated financial statements contains additional information about the remuneration of the Board of Directors, the Executive Board, and other material risk takers.
8. Amortisation, depreciation and impairment charges
This item includes an impairment charge relating to goodwill and customer relations of DKK 4.6 billion for 2015. Note 18 of the consolidated financial statements contains additional information.

Danske Bank / Annual Report 2015 173
Notes – Danske Bank A/S
9. Audit fees (DKK millions) 2015 2014
Audit firms appointed by the general meeting
Fees for statutory audit of the parent company financial statements 7 3
Fees for other assurance engagements 2 1
Fees for tax advisory services 1 2
Fees for other services 11 1
Total 21 7
Other audit firms
Fees for statutory audit of the parent company financial statements - 1
Fees for other assurance engagements - -
Fees for tax advisory services - 1
Fees for other services - -
Total - 2
Total audit fees 21 9
At the general meeting in 2015, Deloitte Statsautoriseret Revisionspartnerskab was appointed as external auditors and replaced Ernst & Young P/S. From 2015 the external auditors conduct the financial audit that was previously conducted by the internal audit department.
10. Tax (DKK millions) 2015 2014
Calculated tax charge for the year 2,826 1,318
Deferred tax -305 586
Adjustment of prior-year tax charges -226 32
Lowering of tax rate -10 -53
Total 2,285 1,883
Effective tax rate (%) (%)
Danish tax rate 23.5 24.5
Non-taxable income and non-deductible expenses 13.1 -157.8
Difference between tax rates of units outside Denmark and Danish tax rate -1.6 -4.1
Adjustment of prior-year tax charges -3.2 -2.3
Lowering of tax rate -0.1 3.8
Effective tax rate 31.7 -135.9
Portion included under Income from associates and group undertakings -16.7 168.3
Total 15.0 32.4
Tax on other comprehensive income
Remeasurement of defined benefit plans 70 9
Hedging of units outside Denmark -156 -106
Fair value adjustment of domicile property -22 -21
Total -108 -118
11. Due from credit institutions and central banks (DKK millions) 2015 2014
On demand 22,596 12,799
Up to 3 months 96,383 109,918
From 3 months to 1 year 1,545 2,432
From 1 to 5 years 907 1,321
Over 5 years 1,039 1,100
Total 122,470 127,570
Due from credit institutions 87,821 106,980
Term deposits with central banks 34,649 20,590
Total 122,470 127,570
Reverse transactions included in above item 45,414 56,548

174 Danske Bank / Annual Report 2015
Notes – Danske Bank A/S
12. Loans and other amounts due at amortised cost (DKK millions) 2015 2014
On demand 61,375 57,125
Up to 3 months 345,699 396,916
From 3 months to 1 year 119,287 120,609
From 1 to 5 years 115,239 97,620
Over 5 years 236,720 228,898
Total 878,321 901,168
Reverse transactions included in above item 194,926 248,320
Loans and guarantees broken down by sector and industry (%)
Public sector 3.6 7.6
Business customers
Agriculture, hunting, forestry and fisheries 1.5 1.2
Manufacturing industries and extraction of raw materials 8.7 7.2
Energy and utilities 1.2 0.9
Building and construction 1.5 1.1
Trade 4.0 3.2
Transport, hotels and restaurants 4.5 3.4
Information and communication 0.8 0.8
Finance and insurance 30.1 34.4
Property administration 12.0 9.8
Other 2.9 2.2
Total business customers 67.2 64.3
Personal customers 29.2 28.1
Total 100.0 100.0
13. Impairment charges for loans and guarantees
Loans Loans Other Other
and guarantees, and guarantees, amounts due, amounts due,
individual collective individual collective
(DKK millions) impairment impairment impairment impairment Total
Impairment charges at 1 January 2015 25,671 3,514 92 - 29,277
Impairment charges during the period 4,193 1,464 - - 5,657
Reversals of impairment charges from previous periods 4,422 732 11 2 5,167
Other changes -6,639 -529 -74 20 -7,222
Impairment charges at 31 December 2015 18,803 3,718 7 18 22,545
Value adjustment of assets taken over - - - - -
Impairment charges at 1 January 2014 31,673 2,624 88 - 34,385
Impairment charges during the year 6,896 2,316 2 - 9,214
Reversals of impairment charges from previous years 11,596 804 2 - 12,402
Other changes -1,302 -622 4 - -1,920
Impairment charges at 31 December 2014 25,671 3,514 92 - 29,277
Value adjustment of assets taken over - - - - -
2015 2014 (DKK millions) Individual Collective Individual Collective
Total loans and other amounts due,
with objective evidence of impairment before impairment charges.
The amount does not include loans and other amounts due recognised at nil 36,008 1,246,311 41,552 1,248,449
Carrying amount net of impairment charges 26,464 1,242,578 30,440 1,244,999

Danske Bank / Annual Report 2015 175
Notes – Danske Bank A/S
14. Bonds at amortised cost (DKK millions) 2015 2014
Fair value of hold-to-maturity assets 81,703 68,874
Carrying amount of hold-to-maturity assets 80,371 67,377
15. Assets under pooled schemes (DKK millions) 2015 2014
Bonds at fair value 18,352 18,130
Shares 10,612 12,287
Unit trust certificates 22,165 17,245
Cash deposits etc. 18 745
Total assets before elimination 51,147 48,407
Own shares 458 364
Other internal balances 31 723
Total 50,658 47,320
16. Investment and domicile property
2015 2014
Investment Domicile Investment Domicile
(DKK millions) property property property property
Fair value/revaluation at 1 January 301 2,946 371 3,245
Additions, including property improvement expenditure 27 28 7 3
Disposals 18 188 40 138
Depreciation charges - 21 - 30
Value adjustment recognised through other comprehensive income - 7 - -74
Value adjustment recognised through profit or loss 5 -3 -19 -58
Other changes including properties moved to Assets held for sale -13 -2,696 -18 -1
Fair value/revaluation at 31 December 301 74 301 2,946
Required rate of return for calculation of fair value/revaluation (% p.a.) 4.8-6.0 5.0-10.0 4.8-6.0 5.0-10.0
Fair value and revaluations are assessed by the Group’s valuers.
17. Other tangible assets (DKK millions) 2015 2014
Cost at 1 January 6,493 6,278
Foreign currency translation -4 -54
Additions, including leasehold improvements 1,670 1,382
Disposals 1,072 1,113
Cost at 31 December 7,087 6,493
Depreciation and impairment charges at 1 January 3,784 3,763
Foreign currency translation 5 -35
Depreciation charges 848 834
Depreciation and impairment charges for assets sold 764 778
Depreciation and impairment charges at 31 December 3,873 3,784
Carrying amount at 31 December 3,214 2,709

176 Danske Bank / Annual Report 2015
Notes – Danske Bank A/S
18. Change in deferred tax Recognised Recognised in
Foreign currency in profit for shareholders'
2015 (DKK millions) At 1 Jan. translation the year equity At 31 Dec.
Intangible assets 8 - - - 8 Tangible assets 647 -5 -487 -2 153 Securities 30 -1 -37 - -8 Provisions for obligations -291 -2 31 245 -17 Tax loss carryforwards -52 -1 13 - -40 Recapture of tax loss 6,428 - -485 - 5,943
Other -602 13 229 - -360
Total 6,168 4 -736 243 5,680
Adj. of prior-year tax charges included in above item -421
2014 (DKK millions)
Intangible assets 8 - - - 8
Tangible assets 797 -17 -90 -43 647
Securities 18 -1 13 - 30
Provisions for obligations -109 4 -14 -172 -291
Tax loss carryforwards -42 - -10 - -52
Recapture of tax loss 5,904 - 524 - 6,428
Other -589 18 -31 - -602
Total 5,987 4 392 -215 6,168
Adj. of prior-year tax charges included in above item -141
Unrecognised tax loss carryforwards amounted to DKK 3.2 billion at the end of 2015 (31 December 2014: DKK 3.5 billion).
Deferred tax (DKK millions) 2015 2014
Deferred tax assets 181 441
Provisions for deferred tax 5,861 6,609
Deferred tax, net 5,680 6,168
19. Assets held for sale and liabilities in disposal groups held for sale
In the third quarter of 2015, the Group entered into an agreement to sell a loan portfolio relating to the Group's personal customer business in Lithuania and Latvia. Pending approval by the Lithuanian competition authorities, the transaction is expected to be completed in the first half of 2016. The loans and
deposits are presented as Asset held for sale and Liabilities held for sale, respectively. The loan portfolio has a nominal value of DKK 4.8 billion, and the de-
posit portfolio has a value of DKK 1.3 billion. In 2014, Assets held for sale included a loan portfolio at Non-core with a nominal value of DKK 3.9 billion that was marketed for sale by the end of 2014 and sold during the first half of 2015.
Assets held for sale also includes domicile properties amounting to DKK 1,844 million classified as held for sale.
20. Other assets (DKK millions) 2015 2014
Positive fair value of derivatives 335,306 409,635
Other assets 11,119 14,535
Total 346,425 424,170
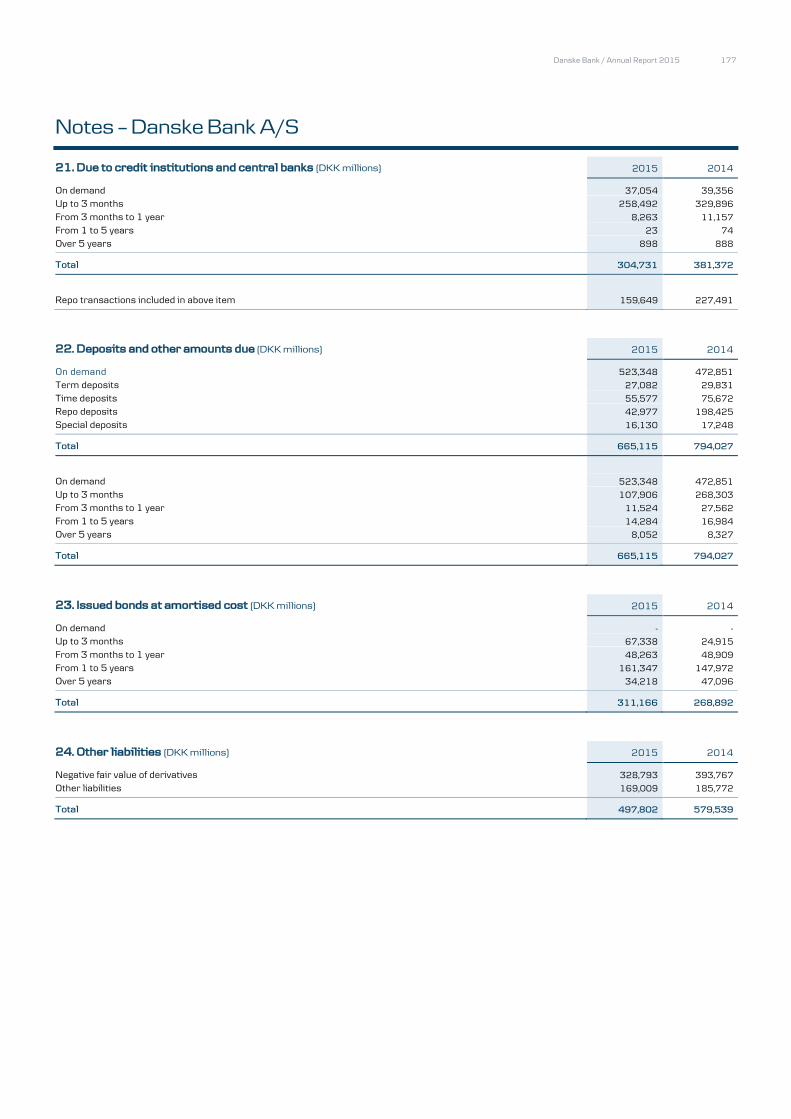
Danske Bank / Annual Report 2015 177
Notes – Danske Bank A/S
21. Due to credit institutions and central banks (DKK millions) 2015 2014
On demand 37,054 39,356
Up to 3 months 258,492 329,896
From 3 months to 1 year 8,263 11,157
From 1 to 5 years 23 74
Over 5 years 898 888
Total 304,731 381,372
Repo transactions included in above item 159,649 227,491
22. Deposits and other amounts due (DKK millions) 2015 2014
On demand 523,348 472,851
Term deposits 27,082 29,831
Time deposits 55,577 75,672
Repo deposits 42,977 198,425
Special deposits 16,130 17,248
Total 665,115 794,027
On demand 523,348 472,851
Up to 3 months 107,906 268,303
From 3 months to 1 year 11,524 27,562
From 1 to 5 years 14,284 16,984
Over 5 years 8,052 8,327
Total 665,115 794,027
23. Issued bonds at amortised cost (DKK millions) 2015 2014
On demand - -
Up to 3 months 67,338 24,915
From 3 months to 1 year 48,263 48,909
From 1 to 5 years 161,347 147,972
Over 5 years 34,218 47,096
Total 311,166 268,892
24. Other liabilities (DKK millions) 2015 2014
Negative fair value of derivatives 328,793 393,767
Other liabilities 169,009 185,772
Total 497,802 579,539
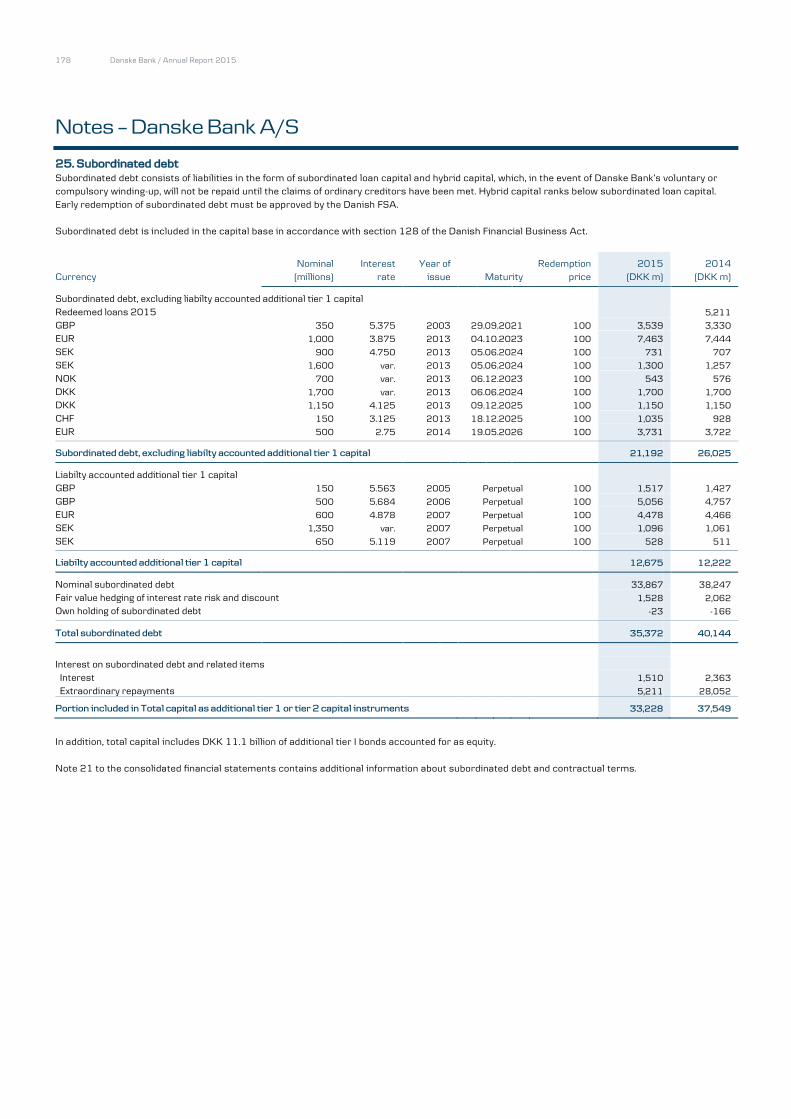
178 Danske Bank / Annual Report 2015
Notes – Danske Bank A/S
25. Subordinated debt
Subordinated debt consists of liabilities in the form of subordinated loan capital and hybrid capital, which, in the event of Danske Bank’s voluntary or compulsory winding-up, will not be repaid until the claims of ordinary creditors have been met. Hybrid capital ranks below subordinated loan capital.
Early redemption of subordinated debt must be approved by the Danish FSA.
Subordinated debt is included in the capital base in accordance with section 128 of the Danish Financial Business Act.
Nominal Interest Year of
Redemption 2015 2014 Currency (millions) rate issue Maturity price (DKK m) (DKK m)
Subordinated debt, excluding liabilty accounted additional tier 1 capital
Redeemed loans 2015
5,211 GBP 350 5.375 2003 29.09.2021 100 3,539 3,330
EUR 1,000 3.875 2013 04.10.2023 100 7,463 7,444
SEK 900 4.750 2013 05.06.2024 100 731 707
SEK 1,600 var. 2013 05.06.2024 100 1,300 1,257
NOK 700 var. 2013 06.12.2023 100 543 576
DKK 1,700 var. 2013 06.06.2024 100 1,700 1,700
DKK 1,150 4.125 2013 09.12.2025 100 1,150 1,150
CHF 150 3.125 2013 18.12.2025 100 1,035 928
EUR 500 2.75 2014 19.05.2026 100 3,731 3,722
Subordinated debt, excluding liabilty accounted additional tier 1 capital 21,192 26,025
Liabilty accounted additional tier 1 capital
GBP 150 5.563 2005 Perpetual 100 1,517 1,427
GBP 500 5.684 2006 Perpetual 100 5,056 4,757
EUR 600 4.878 2007 Perpetual 100 4,478 4,466
SEK 1,350 var. 2007 Perpetual 100 1,096 1,061
SEK 650 5.119 2007 Perpetual 100 528 511
Liabilty accounted additional tier 1 capital 12,675 12,222
Nominal subordinated debt
33,867 38,247
Fair value hedging of interest rate risk and discount
1,528 2,062 Own holding of subordinated debt
-23 -166
Total subordinated debt 35,372 40,144
Interest on subordinated debt and related items
Interest
1,510 2,363 Extraordinary repayments
5,211 28,052 Portion included in Total capital as additional tier 1 or tier 2 capital instruments 33,228 37,549
In addition, total capital includes DKK 11.1 billion of additional tier I bonds accounted for as equity.
Note 21 to the consolidated financial statements contains additional information about subordinated debt and contractual terms.
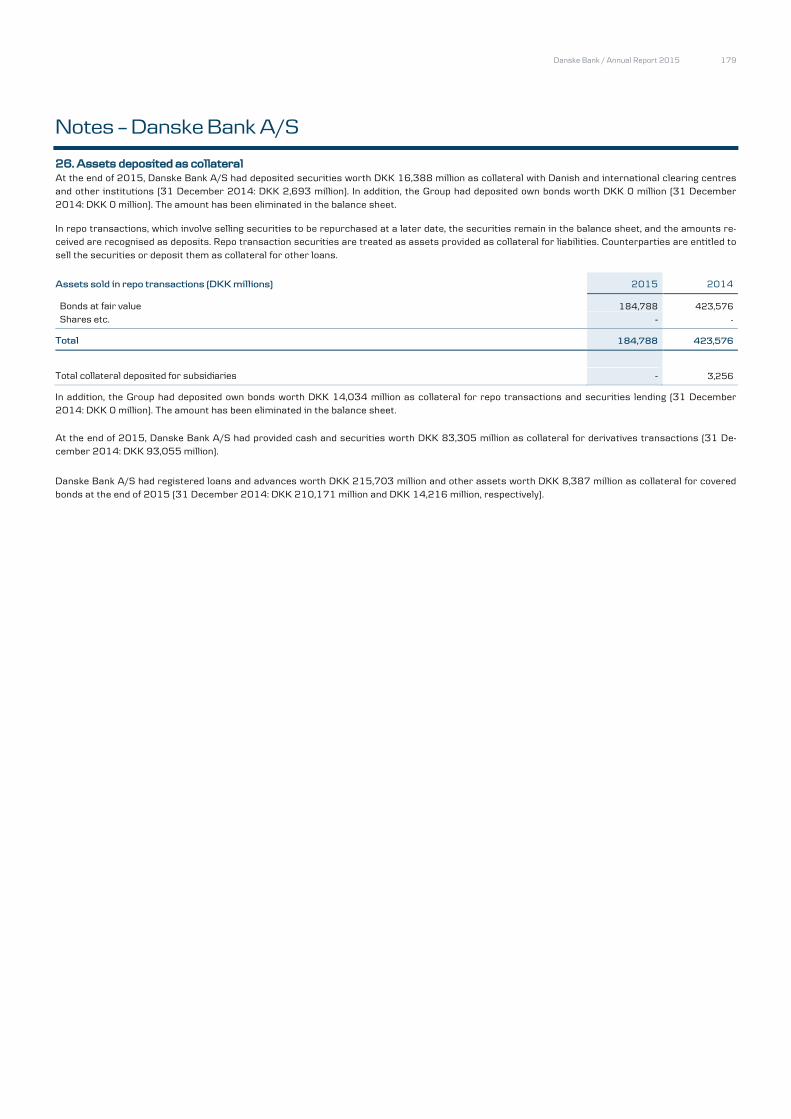
Danske Bank / Annual Report 2015 179
Notes – Danske Bank A/S
26. Assets deposited as collateral
At the end of 2015, Danske Bank A/S had deposited securities worth DKK 16,388 million as collateral with Danish and international clearing centres and other institutions (31 December 2014: DKK 2,693 million). In addition, the Group had deposited own bonds worth DKK 0 million (31 December
2014: DKK 0 million). The amount has been eliminated in the balance sheet.
In repo transactions, which involve selling securities to be repurchased at a later date, the securities remain in the balance sheet, and the amounts re-ceived are recognised as deposits. Repo transaction securities are treated as assets provided as collateral for liabilities. Counterparties are entitled to
sell the securities or deposit them as collateral for other loans.
Assets sold in repo transactions (DKK millions) 2015 2014
Bonds at fair value 184,788 423,576
Shares etc. - -
Total 184,788 423,576
Total collateral deposited for subsidiaries - 3,256
In addition, the Group had deposited own bonds worth DKK 14,034 million as collateral for repo transactions and securities lending (31 December 2014: DKK 0 million). The amount has been eliminated in the balance sheet.
At the end of 2015, Danske Bank A/S had provided cash and securities worth DKK 83,305 million as collateral for derivatives transactions (31 De-cember 2014: DKK 93,055 million).
Danske Bank A/S had registered loans and advances worth DKK 215,703 million and other assets worth DKK 8,387 million as collateral for covered bonds at the end of 2015 (31 December 2014: DKK 210,171 million and DKK 14,216 million, respectively).
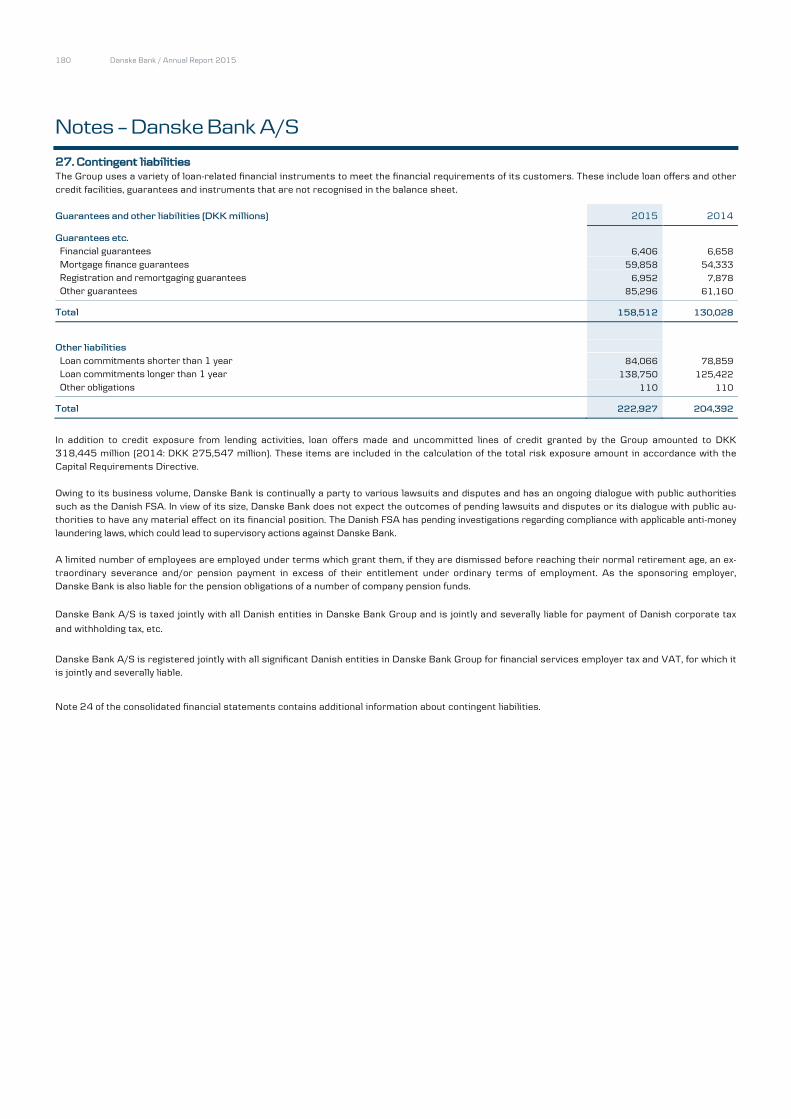
180 Danske Bank / Annual Report 2015
Notes – Danske Bank A/S
27. Contingent liabilities
The Group uses a variety of loan-related financial instruments to meet the financial requirements of its customers. These include loan offers and other
credit facilities, guarantees and instruments that are not recognised in the balance sheet.
Guarantees and other liabilities (DKK millions) 2015 2014
Guarantees etc.
Financial guarantees 6,406 6,658
Mortgage finance guarantees 59,858 54,333
Registration and remortgaging guarantees 6,952 7,878
Other guarantees 85,296 61,160
Total 158,512 130,028
Other liabilities
Loan commitments shorter than 1 year 84,066 78,859
Loan commitments longer than 1 year 138,750 125,422
Other obligations 110 110
Total 222,927 204,392
In addition to credit exposure from lending activities, loan offers made and uncommitted lines of credit granted by the Group amounted to DKK
318,445 million (2014: DKK 275,547 million). These items are included in the calculation of the total risk exposure amount in accordance with the Capital Requirements Directive.
Owing to its business volume, Danske Bank is continually a party to various lawsuits and disputes and has an ongoing dialogue with public authorities such as the Danish FSA. In view of its size, Danske Bank does not expect the outcomes of pending lawsuits and disputes or its dialogue with public au-
thorities to have any material effect on its financial position. The Danish FSA has pending investigations regarding compliance with applicable anti-money
laundering laws, which could lead to supervisory actions against Danske Bank.
A limited number of employees are employed under terms which grant them, if they are dismissed before reaching their normal retirement age, an ex-
traordinary severance and/or pension payment in excess of their entitlement under ordinary terms of employment. As the sponsoring employer, Danske Bank is also liable for the pension obligations of a number of company pension funds.
Danske Bank A/S is taxed jointly with all Danish entities in Danske Bank Group and is jointly and severally liable for payment of Danish corporate tax
and withholding tax, etc.
Danske Bank A/S is registered jointly with all significant Danish entities in Danske Bank Group for financial services employer tax and VAT, for which it is jointly and severally liable.
Note 24 of the consolidated financial statements contains additional information about contingent liabilities.
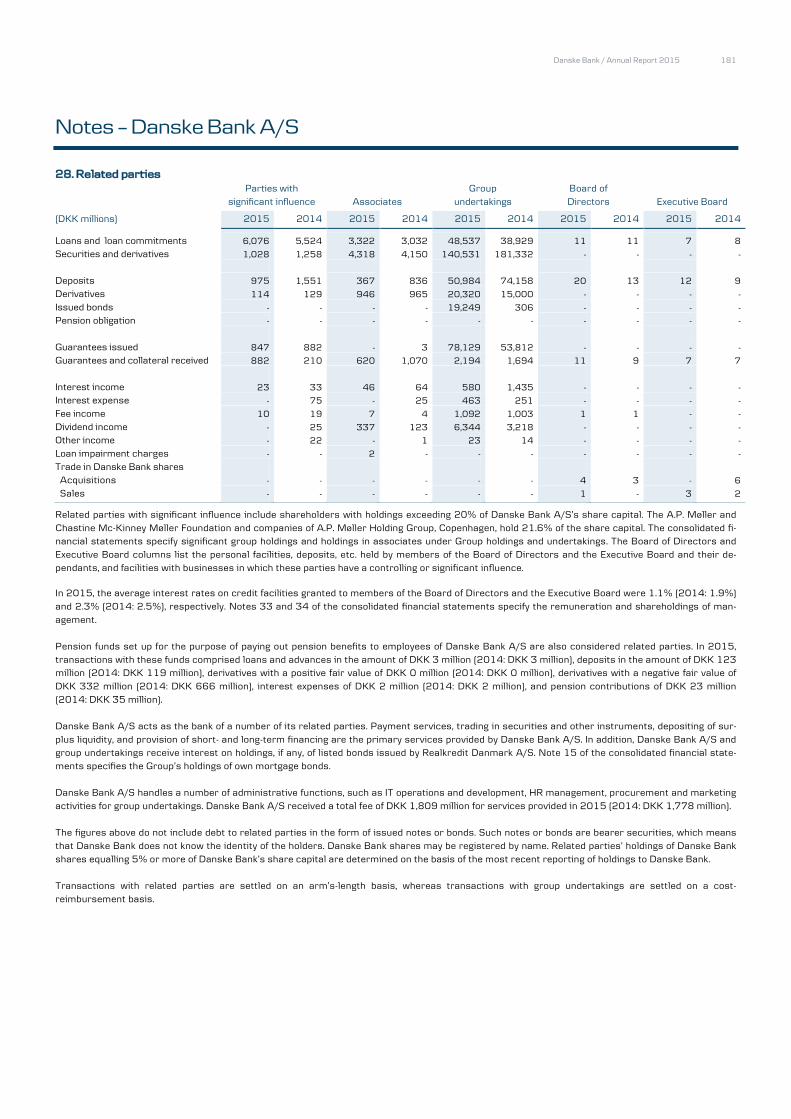
Danske Bank / Annual Report 2015 181
Notes – Danske Bank A/S
28. Related parties Parties with Group Board of
significant influence Associates undertakings Directors Executive Board
(DKK millions) 2015 2014 2015 2014 2015 2014 2015 2014 2015 2014
Loans and loan commitments 6,076 5,524 3,322 3,032 48,537 38,929 11 11 7 8
Securities and derivatives 1,028 1,258 4,318 4,150 140,531 181,332 - - - -
Deposits 975 1,551 367 836 50,984 74,158 20 13 12 9
Derivatives 114 129 946 965 20,320 15,000 - - - -
Issued bonds - - - - 19,249 306 - - - -
Pension obligation - - - - - - - - - -
Guarantees issued 847 882 - 3 78,129 53,812 - - - -
Guarantees and collateral received 882 210 620 1,070 2,194 1,694 11 9 7 7
Interest income 23 33 46 64 580 1,435 - - - -
Interest expense - 75 - 25 463 251 - - - -
Fee income 10 19 7 4 1,092 1,003 1 1 - -
Dividend income - 25 337 123 6,344 3,218 - - - -
Other income - 22 - 1 23 14 - - - -
Loan impairment charges - - 2 - - - - - - -
Trade in Danske Bank shares
Acquisitions - - - - - - 4 3 - 6
Sales - - - - - - 1 - 3 2
Related parties with significant influence include shareholders with holdings exceeding 20% of Danske Bank A/S’s share capital. The A.P. Møller and
Chastine Mc-Kinney Møller Foundation and companies of A.P. Møller Holding Group, Copenhagen, hold 21.6% of the share capital. The consolidated fi-nancial statements specify significant group holdings and holdings in associates under Group holdings and undertakings. The Board of Directors and
Executive Board columns list the personal facilities, deposits, etc. held by members of the Board of Directors and the Executive Board and their de-
pendants, and facilities with businesses in which these parties have a controlling or significant influence. In 2015, the average interest rates on credit facilities granted to members of the Board of Directors and the Executive Board were 1.1% (2014: 1.9%)
and 2.3% (2014: 2.5%), respectively. Notes 33 and 34 of the consolidated financial statements specify the remuneration and shareholdings of man-
agement.
Pension funds set up for the purpose of paying out pension benefits to employees of Danske Bank A/S are also considered related parties. In 2015,
transactions with these funds comprised loans and advances in the amount of DKK 3 million (2014: DKK 3 million), deposits in the amount of DKK 123 million (2014: DKK 119 million), derivatives with a positive fair value of DKK 0 million (2014: DKK 0 million), derivatives with a negative fair value of
DKK 332 million (2014: DKK 666 million), interest expenses of DKK 2 million (2014: DKK 2 million), and pension contributions of DKK 23 million
(2014: DKK 35 million).
Danske Bank A/S acts as the bank of a number of its related parties. Payment services, trading in securities and other instruments, depositing of sur-
plus liquidity, and provision of short- and long-term financing are the primary services provided by Danske Bank A/S. In addition, Danske Bank A/S and group undertakings receive interest on holdings, if any, of listed bonds issued by Realkredit Danmark A/S. Note 15 of the consolidated financial state-
ments specifies the Group’s holdings of own mortgage bonds.
Danske Bank A/S handles a number of administrative functions, such as IT operations and development, HR management, procurement and marketing
activities for group undertakings. Danske Bank A/S received a total fee of DKK 1,809 million for services provided in 2015 (2014: DKK 1,778 million).
The figures above do not include debt to related parties in the form of issued notes or bonds. Such notes or bonds are bearer securities, which means
that Danske Bank does not know the identity of the holders. Danske Bank shares may be registered by name. Related parties’ holdings of Danske Bank
shares equalling 5% or more of Danske Bank’s share capital are determined on the basis of the most recent reporting of holdings to Danske Bank.
Transactions with related parties are settled on an arm’s-length basis, whereas transactions with group undertakings are settled on a cost-
reimbursement basis.

182 Danske Bank / Annual Report 2015
Notes – Danske Bank A/S
29. Hedging of risk
2015 2014
Carrying Amortised/ Carrying Amortised/
(DKK millions) amount notional value amount notional value
Assets
Due from credit institutions 849 836 4,614 4,604
Loans 49,424 47,458 42,853 40,581
Total 50,273 48,294 47,467 45,185
Financial instruments hedging interest rate risk
Derivatives -4,090 48,992 -4,952 64,959
Liabilities
Deposits 11,450 11,365 49,069 48,955
Due to credit institutions 7,049 7,044 51,001 50,990
Issued bonds 271,690 312,676 271,866 297,310
Subordinated debt 35,372 33,866 40,144 38,247
Total 325,561 364,951 412,081 435,502
Financial instruments hedging interest rate risk
Derivatives 15,455 379,051 16,914 451,982
Note 12 of the consolidated financial statements includes additional information about hedge accounting.
30. Group holdings and undertakings
Note 35 of the consolidated financial statements lists the Group’s major holdings and undertakings as well as associates.

Danske Bank / Annual Report 2015 183
Notes – Danske Bank A/S
(DKK millions) 2015 2014 2013 2012 2011
Highlights Net interest and fee income 27,549 27,945 25,259 25,607 25,328
Value adjustments -595 -653 254 4,758 1,491
Staff costs and administrative expenses 15,562 16,386 17,186 17,038 15,702
Loan impairment charges etc. -50 2,745 3,545 9,308 9,725
Income from associates and group undertakings 8,018 7,199 4,957 4,333 2,309
Net profit for the year 12,933 3,931 7,802 5,148 1,324
Loans 878,321 901,168 899,572 957,971 917,201
Total equity 161,542 153,921 146,603 138,973 127,390
Total assets 2,037,190 2,276,448 2,126,382 2,357,319 2,426,635
2015 2014 2013 2012 2011
Ratios and key figures
Total capital ratio (%) 25.5 24.4 27.2 27.9 23.1
Tier 1 capital ratio (%) 22.5 21.2 24.3 25.1 20.9
Return on equity before tax (%) 9.6 3.9 6.4 5.7 2.5
Return on equity after tax (%) 8.2 2.6 5.5 3.9 1.1
Income/cost ratio (%) 171.5 119.0 141.0 127.0 110.0
Interest rate risk (%) 1.5 1.6 1.1 0.1 0.4
Foreign exchange position (%) 1.2 3.4 5.9 2.1 2.5
Foreign exchange risk (%) - - - - -
Loans plus impairment charges as % of deposits 125.6 110.3 113.7 122.3 130.6
Gearing of loans 5.4 5.9 6.1 6.9 7.2
Growth in loans (%) 4.7 - -10.7 -4.0 -1.2
Surplus liquidity in relation to statutory liquidity requirement (%) 192.8 141.0 199.6 166.5 107.4
Sum of large exposures as % of total capital - - - 11.8 32.6
Funding ratio 0.6 0.6 0.6 0.7 0.7
Real property exposure 12 10 10 12 13
Impairment ratio (%) 0.0 0.3 0.3 0.8 0.9
Return on assets (%) 0.6 0.4 0.4 0.2 0.1
Earnings per share (DKK) 12.8 3.8 7.7 5.3 1.6
Book value per share (DKK) 165.2 153.6 146.2 138.5 137.0
Proposed dividend per share (DKK) 8.00 5.50 2.00 - -
Share price end of period/earnings per share (DKK) 14.4 43.0 16.1 18.0 44.7
Share price end of period/book value per share (DKK) 1.12 1.09 0.85 0.69 0.53
The ratios are defined by the Danish FSA in, for example, its Executive Order on Financial Reports for Credit Institutions and Investment Companies, etc.
Changes have been made to the highlights for 2014, as presented in note 1. Apart from 2011, the effect on the highlights for 2011-13 is not signifi-
cant, and comparative figures for 2011-13 therefore have not been restated. A restatement of comparative figures for 2011 would have reduced net profit by DKK 387 million.
Danske Bank / Annual Report 2015184
The Board of Directors and the Executive Board (the management) have considered and approved the annual report of Danske Bank A/S for the financial year 2015.
The consolidated financial statements have been prepared in accordance with the International Financial Reporting Standards as adopted by the EU, and the Parent Company financial statements have been prepared in accordance with the Danish Financial Business Act. Furthermore, the annual report has been prepared in accordance with Danish disclosure requirements for annual reports of listed financial institutions.
In our opinion, the consolidated financial statements and the Parent Company financial statements give a true and fair view of the Group’s and the Parent Company’s assets, liabilities, shareholders’ equity and financial position at 31 December 2015 and of the results of the Group’s and the Parent Company’s operations and the consolidated cash flows for the financial year 2015. Moreover, in our opinion, the management’s report includes a fair review of developments in the Group’s and the Parent Company’s operations and financial position and describes the significant risks and uncertainty factors that may affect the Group and the Parent Company.
The management will submit the annual report to the general meeting for approval.
Copenhagen, 2 February 2016
Executive Board
Thomas F. BorgenCEO
Tonny Thierry Andersen James Ditmore Gilbert Kohnke
Lars Mørch Henrik Ramlau-Hansen Glenn Söderholm
Board of Directors
Ole Andersen Trond Ø. Westlie Urban Bäckström Chairman Vice Chairman
Lars Förberg Jørn P. Jensen Rolv Erik Ryssdal
Carol Sergeant Jim Hagemann Snabe Kirsten Ebbe Brich Elected by the employees Carsten Eilertsen Charlotte Hoffmann Steen Lund Olsen Elected by the employees Elected by the employees Elected by the employees
Statement by the management

Danske Bank / Annual Report 2015 185
To the shareholders of Danske Bank A/S
Report on the consolidated financial statements and parent financial statementsWe have audited the consolidated financial statements and parent financial statements of Danske Bank A/S for the financial year 1 January 2015 to 31 December 2015, pp 46-183 which comprise the income statement, statement of comprehensive income, balance sheet, statement of capital and notes, including the accounting policies, for the Group as well as the Parent, and the cash flow statement of the Group. The consolidated financial statements are prepared in accordance with International Financial Reporting Standards as adopted by the EU and Danish disclosure requirements for listed financial companies, and the parent financial statements are prepared in accordance with the Danish Financial Business Act.
Management’s responsibility for the consolidated financial statements and parent financial statementsManagement is responsible for the preparation of consolidated financial statements that give a true and fair view in accordance with International Financial Reporting Standards as adopted by the EU and Danish disclosure requirements for listed financial companies as well as the preparation of parent financial statements that give a true and fair view in accordance with the Danish Financial Business Act, and for such internal control as Management determines is necessary to enable the preparation of consolidated financial statements and parent financial statements that are free from material misstatement, whether due to fraud or error.
Auditor’s responsibilityOur responsibility is to express an opinion on the consolidated financial statements and parent financial statements based on our audit. We conducted our audit in accordance with International Standards on Auditing and additional requirements under Danish audit regulation. This requires that we comply with ethical requirements and plan and perform the audit to obtain reasonable assurance about whether the consolidated financial statements and parent financial statements are free from material misstatement.
An audit involves performing procedures to obtain audit evidence about the amounts and disclosures in the consolidated financial statements and parent financial statements. The procedures selected depend on the auditor’s judgement, including the assessment of the risks of material misstatements of the consolidated financial statements and parent financial statements, whether due to fraud or error. In making those risk assessments, the auditor considers internal control relevant to the entity’s preparation of consolidated financial statements and parent financial statements that give a true and fair view in order to design audit procedures that are appropriate in the circumstances, but not for the purpose of expressing an opinion on the effectiveness of the entity’s internal control. An audit also includes evaluating the appropriateness of accounting policies used and the reasonableness of accounting estimates made by Management, as well as the overall presentation of the consolidated financial statements and parent financial statements. We believe that the audit evidence we have obtained is sufficient and appropriate to provide a basis for our audit opinion.
Our audit has not resulted in any qualification.
OpinionIn our opinion, the consolidated financial statements give a true and fair view of the Group’s financial position at 31 December 2015, and of the results of its operations and cash flows for the financial year 1 January 2015 to 31 December 2015 in accordance with International Financial Reporting Standards as adopted by the EU and Danish disclosure requirements for listed financial companies.
Further, in our opinion, the parent financial statements give a true and fair view of the Parent’s financial position at 31 December 2015, and of the results of its operations for the financial year 1 January 2015 to 31 December 2015 in accordance with the Danish Financial Business Act.
Statement on the management reportPursuant to the Danish Financial Business Act, we have read the management report. We have not performed any further procedures in addition to the audit of the consolidated financial statements and parent financial statements.
On this basis, it is our opinion that the information provided in the management report is consistent with the consolidated financial statements and parent financial statements.
Copenhagen, 2 February 2016Deloitte
Statsautoriseret Revisionspartnerselskab
Erik Holst Jørgensen Jens Ringbæk State-Authorised State-Authorised Public Accountant Public Accountant
Independent Auditors’ Report

Danske Bank / Annual Report 2015186
Ole AndersenChairmanElected by the general meeting
Born on 11 July 1956Nationality: DanishGender: MaleJoined the Board on 23 March 2010 and was appointed Chairman in December 2011Most recently re-elected in 2015Term expires in 2016Independent
Chairman of the Remuneration Committee and the Nomina-tion Committee and member of the Credit and Risk Committee
Competencies:• Professional experience in leading and developing
large financial and non-financial international companies
• Setting of corporate strategy, budgets and targets• Financial and economic expertise• General risk management experience
Directorships and other of fices:Bang & Olufsen A/S (chairman)Chr. Hansen Holding A/S (chairman)EQT Partners (senior adviser)NASDAQ Nordic Ltd. (member of the nomination committee)The Danish Committee on Corporate Governance (member)Copenhagen Business School (adjunct professor)
Trond Ø. WestlieVice ChairmanElected by the general meeting
Group Chief Financial Officer and member of the executive board of A.P. Møller-Mærsk A/S
Born on 8 June 1961Nationality: NorwegianGender: MaleJoined the Board on 27 March 2012Most recently re-elected in 2015Term expires in 2016Independent
Member of the Audit Committee and the Nomination Committee
Competencies:• Long executive experience in managing overall
corporate financial affairs• Funding of international companies requiring
significant investments through debt and equity markets
• Strategic and business development expertise• Experience in managing substantial international
operations• General risk management experience
Directorships and other of fices:A.P. Moller - Maersk Group (chairman or member of the boards of directors of 12 subsidiaries)Shama AS (chairman)VimpelCom Ltd. (member of the board of directors and chairman of the audit committee)
Urban BäckströmElected by the general meeting
Born on 25 May 1954Nationality: SwedishGender: MaleJoined the Board on 27 March 2012Most recently re-elected in 2015Term expires in 2016Independent
Member of the Credit and Risk Committee and the Nomination Committee
Competencies:• Broad and in-depth experience with economics and
finance• Leading major financial companies and not-for-profit
institutions• Insight into the Swedish business sector and
international influence on this• Experience with and knowledge of sophisticated risk
models
Directorships and other of fices:Rederiaktiebolaget Gotland and a subsidiary (chairman)Lancelot Holding AB and a subsidiary (member of the board of directors)Stiftelsen Fritt Näringsliv/Timbro (member of the board of directors)Jönköping University (honorary doctor)
Management and directorships – Board of Directors

Danske Bank / Annual Report 2015 187
Lars FörbergElected by the general meeting
Managing Partner at Cevian Capital AG
Born on 30 November 1965Nationality: Swedish Gender: MaleJoined the Board on 18 March 2013Most recently re-elected in 2015Term expires in 2016Independent
Member of the Remuneration Committee
Competencies:• Extensive board and investment experience across
multiple industries (including financial services) and geographies, in particular with companies managing strategic, operational and organisational change
Directorships and other of fices:Alent Plc. (member of the board of directors)AB Volvo (member of the nomination committee)Cevian Capital Ltd. (member of the board of directors)Cevian Capital AG (chairman)
Jørn P. JensenElected by the general meeting
Born on 2 January 1964Nationality: DanishGender: MaleJoined the Board on 27 March 2012Most recently re-elected in 2015Term expires in 2016Independent
Chairman of the Audit Committee
The Board of Directors considers Jørn P. Jensen to fulfill the requirements to be the independent qualified member of the Audit Committee. Jørn P. Jensen’s qualifications and expertise within accountancy and auditing is based on his education as master of Science in Economics and Business Administration and his long career as Chief Financial Officer of Carlsberg A/S, Carlsberg Breweries A/S and other Danish companies.
Moreover, as Chairman of the Audit Committee since 2012, Jørn P. Jensen has proven his ability to make independent assessments on Danske Bank Group’s financial reporting, internal controls, risk management and statutory audit.
Competencies:• Broad experience in international business
operations and solid understanding of Danish and international financial reporting practices
• Funding of international companies requiring significant investments through debt and equity markets
• Knowledge of cultures and economic/political conditions in Danske Bank’s markets
• General risk management experience
Directorships and other of fices:Carlsberg Byen P/S and six subsidiaries (vice chairman or member of the boards of directors)The Danish Committee on Corporate Governance (member)
Rolv Erik RyssdalElected by the general meeting
CEO, Schibsted ASA
Born on 7 November 1962Nationality: NorwegianGender: MaleJoined the Board on 18 March 2014Most recent re-elected in 2015Term expires in 2016Independent
Competencies:• Extensive consumer business experience, including
experience with communication strategies.• In-depth knowledge of digital business models and
transformation processes.
Directorships and other of fices:Schibsted Media Group (chairman of the boards of directors of five subsidiaries)J.E. Pedersen & Co. (member of the board of directors)

Danske Bank / Annual Report 2015188
Carol SergeantElected by the general meeting
Born on 7 August 1952Nationality: BritishGender: FemaleJoined the Board on 18 March 2013Most recently re-elected in 2015Term expires in 2016Independent
Chairman of the Credit and Risk Committee and member of the Audit Committee
Competencies:• Senior management experience from the public and
private financial services sectors in the UK • Broad and in-depth knowledge of credit and risk
management and regulatory issues in the UK and Europe
• Significant change management experience
Directorships and other of fices:Private sector directorships:Tullett Prebon plc. (member of the board of directors, chairman of the risk committee and member of the audit committee)
Public policy, charity and academic positions:Public Concern at Work (UK whistleblowing charity) (chairman)Cass Business School (member of the advisory board)British Standards Institute Policy and Strategy Committee (chairman)The Lloyds Register Foundation (trustee)The Governing Council of the Centre for the Study of Financial Innovation (CSFI) (member)
Jim Hagemann SnabeElected by the general meeting
Born on 27 October 1965Nationality: DanishGender: MaleJoined the Board on 18 March 2013Most recently re-elected in 2015Term expires in 2016Independent
Member of the Remuneration Committee
Competencies:• In-depth knowledge of IT systems and solutions• High-level management experience from large
international organisation• Experience in strategy development and execution• Understanding of banking and financial services
sector
Directorships and other of fices:Allianz SE (member of the supervisory board)Bang & Olufsen A/S (vice chairman)SAP SE (member of the supervisory board)Siemens AG (member of the supervisory board)World Economic Forum (member of the Foundation Board and chair of the Forum’s Centre for Global Industries)
Kirsten Ebbe BrichElected by the employees
Board member of Danske Kreds
Born on 15 July 1973Nationality: DanishGender: FemaleJoined the Board on 18 March 2014Term expires in 2018
Carsten EilertsenElected by the employees
Vice Chairman of Danske Kreds
Born on 17 September 1949Nationality: DanishGender: MaleJoined the Board on 23 March 2010Most recently re-elected in 2014Term expires in 2018
Directorships and other of fices:Apostelgaardens Fond (vice chairman)Danske UnionsThe Parish Church Council of Sct. Mortens Church, Næstved (treasurer)The Næstved Cemeteries

Danske Bank / Annual Report 2015 189
Danske Banks Pensionskasse for medarbejdere med tilsagnsordning i Danica (member of the board of directors)
Charlotte Hof fmannElected by the employees
Senior Personal Adviser
Born on 8 October 1966Nationality: DanishGender: FemaleJoined the Board on 14 March 2006Most recently re-elected in 2015Term expires in 2018
Member of the Remuneration Committee
Steen Lund OlsenElected by the employees
Chairman of Danske Kreds
Born on 21 February 1972Nationality: DanishGender: MaleJoined the Board on 18 March 2014Term expires in 2018
Directorships and other of fices:Danske Unions (chairman)Finansforbundet (Financial Services Union Denmark) (member of the executive committee)Danske Bank Pensionskasse for førtidspensionister (member of the board of directors)Danske Bank Velfærdsfond af 1993 (member of the board of directors)
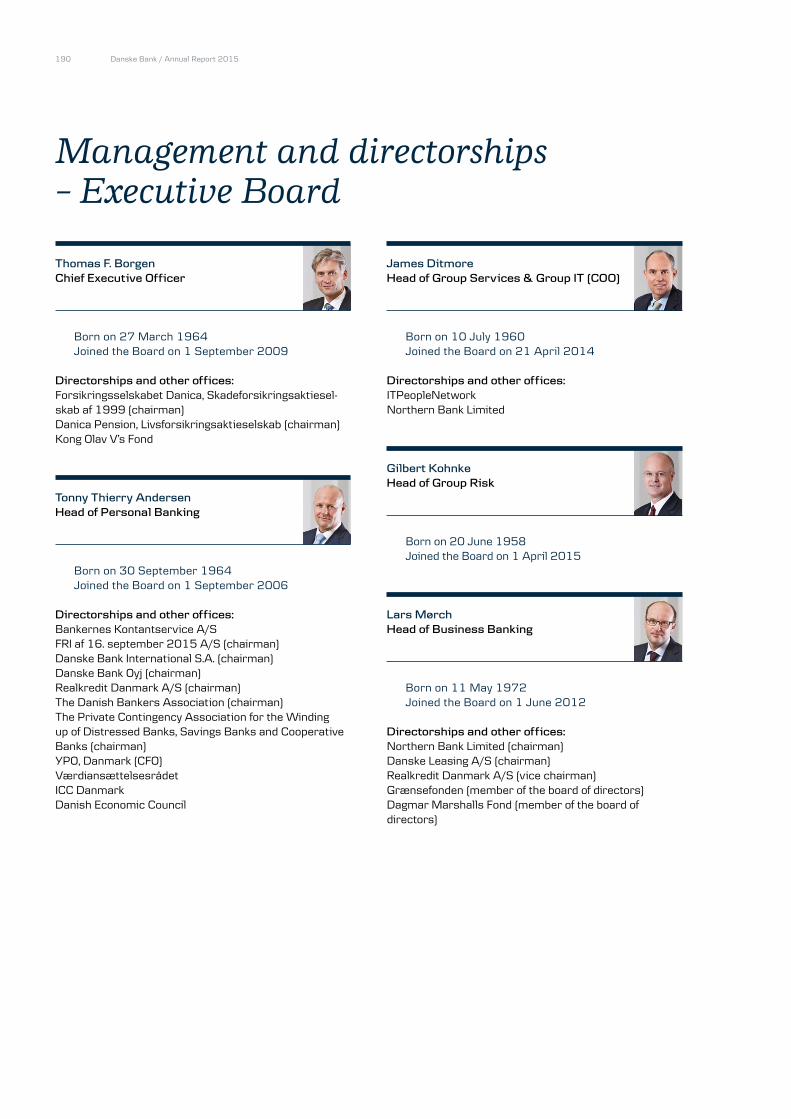
Danske Bank / Annual Report 2015190
Thomas F. BorgenChief Executive Of ficer
Born on 27 March 1964Joined the Board on 1 September 2009
Directorships and other of fices:Forsikringsselskabet Danica, Skadeforsikringsaktiesel-skab af 1999 (chairman)Danica Pension, Livsforsikringsaktieselskab (chairman)Kong Olav V’s Fond
Tonny Thierry AndersenHead of Personal Banking
Born on 30 September 1964Joined the Board on 1 September 2006
Directorships and other of fices:Bankernes Kontantservice A/SFRI af 16. september 2015 A/S (chairman)Danske Bank International S.A. (chairman)Danske Bank Oyj (chairman)Realkredit Danmark A/S (chairman)The Danish Bankers Association (chairman)The Private Contingency Association for the Winding up of Distressed Banks, Savings Banks and Cooperative Banks (chairman)YPO, Danmark (CFO)VærdiansættelsesrådetICC DanmarkDanish Economic Council
Management and directorships – Executive Board
James DitmoreHead of Group Services & Group IT (COO)
Born on 10 July 1960Joined the Board on 21 April 2014
Directorships and other of fices:ITPeopleNetworkNorthern Bank Limited
Gilbert KohnkeHead of Group Risk
Born on 20 June 1958Joined the Board on 1 April 2015
Lars MørchHead of Business Banking
Born on 11 May 1972Joined the Board on 1 June 2012
Directorships and other of fices:Northern Bank Limited (chairman)Danske Leasing A/S (chairman)Realkredit Danmark A/S (vice chairman)Grænsefonden (member of the board of directors)Dagmar Marshalls Fond (member of the board of directors)

Danske Bank / Annual Report 2015 191
Henrik Ramlau-HansenChief Financial Of ficer
Born on 2 October 1956Joined the Board on 1 January 2011
Directorships and other of fices:Forsikringsselskabet Danica, Skadeforsikringsaktieselskab af 1999 (vice chairman)Danica Pension, Livsforsikringsaktieselskab (vice chairman)Kreditforeningen Danmarks Pensionsafviklingskasse (chairman)LR Realkredit A/S (member of the board of directors)Realkredit Danmark A/S (member of the board of directors)
Glenn SöderholmHead of Corporates & Institutions
Born on 26 July 1964Joined the Board on 1 November 2013
Directorships and other of fices:Danish Ship Finance A/S (Danmarks Skibskredit A/S) (member of the board of directors and of the audit committee)NASDAQ Nordic Ltd. (member of the board of directors)

Danske Bank / Annual Report 2015192

Danske Bank / Annual Report 2015 193
Supplementary information
Financial calendar
17 March 2016 Annual General Meeting
29 April 2016 Interim report - first quarter 2016
21 July 2016 Interim report - first half 2016
28 October 2016 Interim report - first nine months 2016
Links
Danske Bank danskebank.com
Denmark danskebank.dk
Finland danskebank.fi
Sweden danskebank.se
Norway danskebank.no
Northern Ireland danskebank.co.uk
Ireland danskebank.ie
Realkredit Danmark rd.dk
Danske Capital danskecapital.com
Danica Pension danicapension.dk
Contacts
Henrik Ramlau-HansenChief Financial Officer +45 45 14 06 66
Claus Ingar Jensen Head of Investor Relations +45 45 12 84 83
Danske Bank’s financial statements are available online at danskebank.com/Reports.


Corporate Responsibility 2015
Other Danske Bank Group publications, available at danskebank.com/ir:
Risk Management 2015

Danske Bank A/SHolmens Kanal 2-12DK-1092 København K
Tel. +45 33 44 00 00CVR No. 611262 28-Københavndanskebank.com