annual report 2014 - carlsberg group · at a glance 2014 highlights we continued the roll-out of...
TRANSCRIPT

AnnuAl RepoRt 2014

ManageMent Review Financial StateMentS
DISCLAIMERThis Annual Report contains forward-looking statements, including statements about the Group’s sales, revenues, earn-ings, spending, margins, cash flow, inventory, products, ac-tions, plans, strategies, objectives and guidance with respect to the Group’s future operating results. Forward-looking state-ments include, without limitation, any statement that may predict, forecast, indicate or imply future results, performance or achievements, and may contain the words “believe, antici-pate, expect, estimate, intend, plan, project, will be, will con-tinue, will result, could, may, might”, or any variations of such words or other words with similar meanings. Any such state-
ments are subject to risks and uncertainties that could cause the Group’s actual results to differ materially from the results discussed in such forward-looking statements. Prospective information is based on management’s then current expecta-tions or forecasts. Such information is subject to the risk that such expectations or forecasts, or the assumptions underlying such expectations or forecasts, may change. The Group assumes no obligation to update any such forward-looking statements to reflect actual results, changes in assumptions or changes in other factors affecting such forward-looking statements. Some important risk factors that could cause
the Group’s actual results to differ materially from those expressed in its forward-looking statements include, but are not limited to: economic and political uncertainty (including interest rates and exchange rates), financial and regulatory developments, demand for the Group’s products, increasing industry consolidation, competition from other breweries, the availability and pricing of raw materials and packaging materials, cost of energy, production- and distribution-related issues, information technology failures, breach or unexpected termination of contracts, price reductions resulting from market-driven price reductions, market acceptance of new
products, changes in consumer preferences, launches of rival products, stipulation of market value in the opening balance sheet of acquired entities, litigation, environmental issues and other unforeseen factors. New risk factors can arise, and it may not be possible for management to predict all such risk factors, nor to assess the impact of all such risk factors on the Group’s business or the extent to which any individual risk factor, or combination of factors, may cause results to differ materially from those contained in any forward-looking state-ment. Accordingly, forward-looking statements should not be relied on as a prediction of actual results.
Editor Carlsberg Group Corporate Affairs Design and production Kontrapunkt Photos Nana Reimers Proofreading Borella projects
4 The Group at a glance 11 Letter from the Chairman 12 Statement from the CEO 14 2015 earnings expectations 16 Regional review 25 Our brand portfolio 26 Our business model 27 Our strategy
34 KPIs 37 Risk management 42 Corporate governance 51 Remuneration report 57 Executive Board & Committee 59 Shareholder information 61 Group financial review160 Supervisory Board
64 Consolidated financial statements146 Parent Company158 Management statement159 The independent auditors’ report
cOntentS
2Carlsberg Group Annual Report 2014 Contents

thirst for great. Great people. Great brands. Great moments. Founded on the motto, Semper Ardens – Always Burning – we never settle, but always thirst for the better. We are stronger together because we share best practices, ideas, and successes. We brand as many, but stand as one. With the courage to dare, to try, to take risks, we constantly raise the bar. We don’t stop at brewing great beer. We brew a greater future – for our consumers and customers, our communities, and our people. this passion will continue to burn and forever keep us thirsty.
3Carlsberg Group Annual Report 2014 Thirst for Great

our high-quality beer brands include our flagship brand Carlsberg as well as our other international premium and local power brands. they secure strong market positions and drive value.
glOBal ReacH
cORPORate SOcial ReSPOnSiBilitY
OUR winning PORtFOliO
OUR MaRKetS
leaDing POSitiOnS
BalanceD geOgRaPHY
the Carlsberg Group is the fourth largest global brewer with leading positions in Western Europe, Eastern Europe and Asia. We service the rest of the world through export and licence agreements.
We aim to be the most efficient global brewer, develop sustainable packaging solutions and promote responsible drinking.
Our beer markets range from the old, mature beer markets in Western Europe to the new and emerging markets of Asia – a market portfolio that supports long-term value growth. Our regional beer volume split is:
75%
25%25% of volumes and 46% of operating profit are generated in developed markets, giving us a bal-anced geography to drive the top and bottom lines.
Scale and strong market positions are important in the beer business. 75% of our beer volumes are sold in markets where we are no. 1 or 2.
OUR inteRnatiOnal PReMiUM BRanDS
at a glanceWho we are
41%Western
Europe
31%Eastern Europe
28%Asia
4Carlsberg Group Annual Report 2014 The Group at a glance

Delivering sustainable value growth to our shareholders and other stakeholders guides the way we run our business and how we set our goals.
at a glanceDriving value
Dividend per share (DKK)
2014
2013
2012
DiviDenD PaYOUt
Improving the return on invested capital (ROIC) is important for creating value for our shareholders. We drive ROIC by executing on our strategic priorities.
The proposed dividend for 2014 of DKK 9.00 equals an increase of 13% versus 2013. The average annual growth rate (CAGR) since 2009 has been 21%.
ROic PROgReSSiOn
>25%Our dividend policy is a payout ratio of at least 25% of adjusted net profit1.
DiviDenD POlicY
-3.6%We aim to continuously reduce trade working capital to net revenue. In 2014, average TWC/net revenue was -3.6%.
tRaDe wORKing caPital
1 Adjusted for special items after tax.
25
20
15
10
5
0
Adjusted payout ratio1
(%)
2014
2013
2012
10
8
6
4
2
0
Driving free cash flow
1. Reducing working capital
2. Optimising investments• Supply chain• Sales & marketing
3. Efficient financial management
Reducing costs
1. Reducing costs
2. Driving effectiveness & efficiency• Centralisation• Standardisation• Optimisation• Simplification
Driving net revenue
1. Growing volume• Increasing market
share• Capturing market
growth
2. Growing value/hl• Value management• Premiumisation
& innovations• Portfolio optimisation• Commercial execution
20
16
12
8
4
0
Return on invested capital (ROIC) (%)
2014
2013
2012
ROICROIC excl. goodwill
5Carlsberg Group Annual Report 2014 The Group at a glance

at a glance 2014 results
OPeRating PROFitnet RevenUe
The Group delivered strong results in Western Europe and Asia. However, these results were offset by market challenges in Eastern Europe.
KeY Financial FigUReS122.83%We achieved a strong price/mix of 3%.
Pro rata beer volumes were 122.8m hl.
OUR BeeR vOlUMeS
PRice/MiX
2014
2013
2014
2013
58
%
46
%
19%21%
14%17%
59
%
51
%
22%
28%
28%
37%
Western Europe Eastern EuropeAsia
Western Europe Eastern EuropeAsia
Free operating cash flow(DKKbn)
2014
2013
2012
80
70
60
50
40
30
11
9
7
5
3
1
10
8
6
4
2
0
10
8
6
4
2
0
Net revenue(DKKbn)
2014
2013
2012
Adj. net profit(DKKbn)
2014
2013
2012
Operating profit(DKKbn)
2014
2013
2012
In 2014, the Carlsberg Group generated net revenue of DKK 64.5bn.
In 2014, operating profit was DKK 9.2bn and the Group operating margin 14.3%.
6Carlsberg Group Annual Report 2014 The Group at a glance

at a glance 2014 highlights
We continued the roll-out of BSp1 and went live in four more countries.
We gained market share across our regions during the year.
BSP11
MaRKet SHaRe
OUR BRanDS
43%Somersby continued its global expansion in 2014 and is now available in 43 markets worldwide. Volumes grew 43%.
12%The Carlsberg brand grew 12% in its premium markets in Asia. Globally, the brand grew 1% in its premium markets.
incReaSing Digital FOOtPRint
caRlSBeRg ciRcUlaR cOMMUnitY
We launched the Carlsberg Circular Community (CCC), working with external partners to develop packaging solutions optimised for recycling and reuse while retaining or upscaling their quality and value.
>4mEach month, the Carlsberg and Tuborg brands are reaching more than 4 million consumers through social platforms.
In 2014, we kept a strong push behind our commercial agenda and our achievements reflect the strength of our business model, our brands and our people.
24%Tuborg continued its strong growth in 2014. The brand grew 24%, not least due to its impressive performance in Asia.
1 Supply chain integration and business standardisation project.
7Carlsberg Group Annual Report 2014 The Group at a glance

eaSteRn eUROPe
The Carlsberg Group is the sec-ond largest brewer in Western Europe. According to Canadean1, beer market volumes in the re-gion amounted to approx. 250m hl in 2014. Facts and figures on our Western European markets are shown on page 10.
The region mainly comprises mature markets, with market volumes in most markets being flat or slightly declining. In value terms, the region is growing slightly. In 2014, beer category dynamics improved slightly, driven by innovations, increased interest in speciality/craft beers and an overall improved category perception. The region is generally characterised by well-established retail structures and a strong tradition of beer consumption, particularly in the northern and eastern part of the region. The share of on-trade varies between markets, but generally speaking the weak macroenvironment of recent years has led to a shift from on-trade to off-trade consumption.
The competitive landscape com-prises the global and regional brewers, with intense but gener-ally rational market behaviour. Read more about our strategy in Western Europe and our 2014 results on page 16.
The Carlsberg Group is a strong market leader in the region’s main market, Russia, and no. 2 in the second largest market, Ukraine. According to Canadean1, beer market volumes in the re-gion amounted to approx. 130m hl in 2014. Facts and figures on our Eastern European markets are shown on page 10.
In recent years, Russian beer market volumes have declined, but in value terms the market
has seen positive growth rates. The volume decline has been due to the macroeconomy, unavoidable significant price increases and changed regula-tion. The Ukrainian market has also been in decline due to a macroeconomic slowdown. In 2014, regional market volumes were negatively impacted by the uncertain and challenging macroenvironment as well as increasing inflation.
The off-trade accounts for the majority of the market, but the retail universe is in a stage with a traditional trade that remains strong and a growing modern trade element.
The global brewers are present in Russia and, to a lesser extent, Ukraine. Competitive behaviour is fierce but generally rational. Read more about our strategy in Eastern Europe and our 2014 results on page 19.
37.8bn 3.0bn
14.1bn
5.5bn
12.5bn
2.2bn
DKK – Western Europe net revenue
DKK – Eastern Europe operating profit
DKK – Eastern Europe net revenue
DKK – Western Europe operating profit
DKK – Asia net revenue
DKK – Asia operating profit
The Carlsberg Group has an attractive footprint with solid market positions in Asia. Accord-ing to Canadean1, beer market volumes in the region amounted to approx. 640m hl in 2014. Facts and figures on our Asian markets are shown on page 10.
The Asian markets are diverse, with our Asian portfolio of busi-nesses consisting of mature markets such as Malaysia, Hong Kong and Singapore as well as attractive growing beer markets such as China, India, Vietnam, Laos and Cambodia. These mar-kets offer considerable prospects for growth, underpinned by expanding populations, urbanisa-tion, rising disposable income levels, growing economies and relatively low per capita beer consumption. However, as emerging markets, development can be subject to volatility.
On-trade is a large sales channel in the Asian markets, with the exception of India. Competitive intensity varies, with markets being contested by strong local brewers as well as the global brewers. Read more about our strategy in Asia and our 2014 results on page 22.
at a glance our regions
weSteRn eUROPe aSia
1 Independent market research and data management provider.
8Carlsberg Group Annual Report 2014 The Group at a glance

Statement of cash flows 2010 2011 2012 2013 2014Cash flow from operating activities 11,020 8,813 9,871 8,142 7,405
Cash flow from investing activities -5,841 -4,883 -3,974 -8,012 -6,735
Free cash flow 5,179 3,930 5,897 130 670
InvestmentsAcquisition and disposal of property, plant and equipment, net -2,197 -3,618 -2,264 -4,522 -4,828
Acquisition and disposal of entities, net -477 -260 -27 -2,314 -1,681
Financial ratiosOperating margin % 17.1 15.4 14.6 15.1 14.3
Return on invested capital (ROIC)2 % 8.8 8.4 8.0 8.1 8.0
Return on invested capital excl. goodwill (ROIC excl. goodwill)2
% 15.4 14.7 14.3 14.5 15.3
Equity ratio % 44.5 44.6 45.6 45.2 38.3
Debt/equity ratio (financial gearing) x 0.47 0.45 0.44 0.48 0.65
Debt/operating profit before depreciation and amortisation x 2.30 2.39 2.35 2.55 2.74
Interest cover x 4.76 4.86 5.53 6.46 7.75
Stock market ratiosEarnings per share (EPS) DKK 35.1 33.8 36.8 35.9 28.9
Earnings per share, adjusted (EPS-A)1 DKK 35.6 34.1 36.1 37.8 36.0
Cash flow from operating activities per share (CFPS) DKK 72.1 57.7 64.6 53.4 48.4
Free cash flow per share (FCFPS) DKK 33.9 25.7 38.6 0.9 4.4
Dividend per share (proposed) DKK 5.0 5.5 6.0 8.0 9.0
Payout ratio % 14 16 16 22 31
Payout ratio, adjusted1 % 14 16 17 21 25
Share price (B shares) DKK 558.5 405.0 554.0 600.0 478.8
Number of shares (year-end, excl. treasury shares) 1,000 152,539 152,523 152,555 152,533 152,538
Number of shares (average, excl. treasury shares) 1,000 152,548 152,538 152,543 152,548 152,5351 Adjusted for special items after tax. 2 12-month rolling average.
The effect of the change in accounting policies from the implementation of IFRS 10-12 as of 1 January 2014 is recognised in the opening balance at 1 January 2013 in accordance with the specific transition requirements of the standards. Comparative figures for 2013 have been restated accordingly.
at a glance Five-year summary
Sales volumes, gross (million hl) 2010 2011 2012 2013 2014Beer 136.5 139.8 140.9 138.7 134.5
Other beverages 22.5 22.2 22.0 21.5 22.7
Sales volumes, pro rata (million hl)Beer 114.2 118.7 120.4 119.7 122.8
Other beverages 19.3 19.2 19.1 19.7 21.0
DKK million
Income statementNet revenue 60,054 63,561 66,468 64,350 64,506
Operating profit before special items 10,249 9,816 9,793 9,723 9,230
Special items, net -249 -268 85 -435 -1,353
Financial items, net -2,155 -2,018 -1,772 -1,506 -1,191
Profit before tax 7,845 7,530 8,106 7,782 6,686
Corporation tax -1,885 -1,838 -1,861 -1,833 -1,748
Consolidated profit 5,960 5,692 6,245 5,949 4,938
Attributable to:
Non-controlling interests 609 543 638 478 524
Shareholders in Carlsberg A/S 5,351 5,149 5,607 5,471 4,414
Shareholders in Carlsberg A/S, adjusted1 5,425 5,203 5,504 5,772 5,496
Statement of financial positionTotal assets 144,250 147,714 153,961 152,308 136,983
Invested capital, year-end 117,119 118,196 121,467 119,112 103,587
Invested capital excluding goodwill, year-end 66,281 62,199 67,553 61,946 51,041
Interest-bearing debt, net 32,743 32,460 32,480 34,610 36,567
Equity, shareholders in Carlsberg A/S 64,248 65,866 70,261 67,811 52,437
9Carlsberg Group Annual Report 2014 The Group at a glance

OUR MaRKetS
MaRKet Data1
cOnSUMPtiOn cHaRacteRiSticS1
OUR POSitiOn
OUR OPeRatiOnS
Western EuropePopulation (millions)
Est. GDP/capita PPP (USD)
Est. real GDP growth (%)
Inflation, avg. consumer prices (%)
Per capita beer consumption (litres)
On-trade share of market,
approx. (%)Market
position (no.)Market
share (%) Breweries
Denmark 5.6 44,325 1.5 0.6 80 27 1 54 1
Sweden 9.7 44,695 2.1 0.1 60 21 1 33 1
Norway 5.2 65,896 1.8 2.0 47 20 1 54 2
Finland 5.5 40,455 -0.2 1.2 84 15 1 51 1
France 64.0 40,445 0.4 0.7 29 22 1 29 1
Switzerland 8.1 55,237 1.3 0.1 57 42 1 42 1
UK 64.5 37,744 2.6 1.6 70 51 4 14 1
Poland 38.5 24,429 3.2 0.1 96 11 3 19 3
Germany 80.9 44,741 1.5 0.9 107 22 12 162 2
Italy 60.0 34,455 -0.4 0.1 27 38 4 7 1
Portugal 10.5 26,307 1.0 0.0 47 56 1 48 1
The Baltics3 6.3 25,7675 1.2-3.0 0.3-0.8 72-96 4-8 1-2 28-41 3
South East Europe4 29.7 19,6955 -0.8-1.4 -1.2-2.3 37-71 17-56 2-3 15-26 5
Eastern EuropeRussia 143.7 24,764 0.6 7.4 55 10 1 38 8
Ukraine 45.3 8,240 -6.5 11.4 52 11 2 28 3
Belarus 9.4 18,178 0.9 18.6 51 4 1 32 1
Kazakhstan 17.4 24,144 4.6 6.9 27 11 2 21 1
Azerbaijan 9.4 17,943 4.5 2.8 6 21 1 72 1
AsiaChina 1,367.5 12,893 7.4 2.3 32 46 5 ~556 44
Vietnam 90.6 5,621 5.5 5.2 33 49 2 33 67
Laos 6.9 4,999 7.4 5.5 38 44 1 98 2
Cambodia 15.3 3,282 7.2 4.5 33 39 1 56 1
Nepal 28.1 2,381 5.5 9.0 2 81 1 72 1
India 1,259.7 5,777 5.8 7.8 2 16 3 11 6
Malaysia 30.5 24,521 5.9 2.9 6 77 2 44 1
Singapore 5.5 81,346 3.0 1.4 22 75 2 20 -
Hong Kong 7.3 55,167 3.0 3.9 24 29 1 26 -
at a glanceour main markets
Source: IMF, Canadean, Carlsberg estimates. 1 2014E. 2 Northern Germany (Schleswig-Holstein, Hamburg, Lower Saxony). 3 Estonia, Latvia, Lithuania. 4 Bulgaria, Croatia, Serbia, Greece. 5 Weighted average. 6 Western China. 7 Excl. Habeco.
10Carlsberg Group Annual Report 2014 The Group at a glance

Flemming Besenbacher
letteR FROM tHe cHaiRMan
strong confidence in his ability to define the next phase strategy of the Carlsberg Group’s long-term profitable and sustainable growth, working with the Executive Committee. I would like to thank Jørgen for his signifi-cant contribution to the Carlsberg Group during his tenure. The Group today is a transformed company compared to when Jørgen took over. Although performance has been challenged by macro developments in Russia, Jørgen has succeeded in creating a strong international leadership team and a highly commercially capable and efficient organisation, which has delivered strong results across many markets.
Board changesIn 2014, Per Øhrgaard, a long-time member of the Board, stepped down having reached the age limit stipulated in the Articles of As-sociation. Likewise, Jess Søderberg, currently Deputy Chairman, will step down at the AGM in March. I would like to thank both Per and Jess for their fantastic contribution to the Group during their tenure. Carl Bache was elected by the AGM in March 2014 to replace Per. At the coming AGM, the Board will propose Lars Rebien Sørensen, CEO of Novo Nordisk A/S, as a new member of the Board.
ThanksOn behalf of the Supervisory Board, I would like to thank all our employees for their hard work and dedication during 2014, and the Executive Committee for its leadership.
Flemming Besenbacher
Welcome to our 2014 Annual Report for shareholders and other stakeholders, which outlines the operational and financial results of the Carlsberg Group and the strategies employed to deliver value. The section on corporate governance details our govern-ance structure and the activities carried out by the Supervisory Board during the year. See page 42.
PerformanceOur Company has strong fundamentals with market-leading positions across Western Europe, Eastern Europe and Asia. In 2014, our Company delivered organic profit growth driven by strong performances in Western Europe and Asia. This growth was in spite of an extremely difficult macroenvironment in Eastern Europe, particularly Russia, where both the very challenging consumption envi-ronment and the significant currency decline severely impacted our business, and on a reported basis 2014 profit was down. Let me assure you that the management team has taken decisive action and that all markets have done an impressive job to mitigate the impact of the challenges.
Overall, the Company’s adjusted net profit was DKK 5.5bn and the Board is recom-mending a dividend of DKK 9.00.
Board activitiesThe Board is focused on ensuring that our Company delivers shareholder value while also responsibly meeting our obligations to stakeholders. The Board regularly reviews our Company’s short-term and long-term strategy, and assesses a wide range of our business activities, taking a more in-depth look at certain particularly critical business areas. In 2014, this included Eastern Europe
and the performance of the business in a very difficult macroeconomic situation, the opportunities and risks associated with the various business enhancement and efficien-cy initiatives, emerging categories such as craft beer, financial structure and M&A, as well as business ethics and regulatory compliance. As ongoing innovation capabil-ity is important for the Group’s role in the industry longer term, we also closely follow the work carried out by the Carlsberg Lab-oratory and Research Center.
The Board wants our Company to be a lead-er in CSR. We engage in the development of responsible and sustainable solutions as we believe this will benefit not only the environment, but also the Company’s long-term profitability. Packaging is an important contributor to CO2 emissions, and for some years the Group has worked on increasing the sustainability of packaging using a circu-lar economy approach.
Change of CEOIn agreement with the Board, our President and CEO of the past seven years, Jørgen Buhl Rasmussen, will retire from the Com-pany as of June 15. Replacing him will be Cees ’t Hart, a Dutch national with a strong international business career. He joins the Carlsberg Group from a position as President and CEO of one of the largest global dairy companies, Royal FrieslandCampina, with operations in 30 countries across Europe, the Middle East, Asia and Africa and with sales in over 100 markets. Prior to joining Royal Fries landCampina in 2008 Cees spent 25 years with Unilever, with his last position being as a member of the Europe Executive Board. The Supervisory Board and I look very much forward to welcoming Cees and have
The Carlsberg Group’s Supervisory Board is focused on ensuring that the Company is run in a responsible manner and that we create value for our shareholders.
Flemming BesenbacherChairman of the Supervisory Board
11Carlsberg Group Annual Report 2014 Letter from the Chairman

Jørgen Buhl Rasmussen
In 2014, we delivered solid performance, with our Western Europe and Asia regions achieving organic growth in operating profit of 7% and 8% respectively. These achievements were the result of continued brand support, clear priorities and focus on execution across our business. They enabled us to more than offset the profit decline in Eastern Europe caused by the very chal-lenging macroeconomic and geopolitical situation in Russia and Ukraine as well as the adverse currency impact.
Delivering on market shareI am pleased to report another year of strengthened market share in the majority of our markets in Western Europe and Asia, and an improved market share during the year in Russia.
Our market share performance is proof of our successful commercial strategy, an important part of which is to ensure that we have a strong portfolio of both international premium brands and local power brands to offer to our customers and consumers. During 2014, we grew all our international premium brands – Carlsberg, Tuborg, Kro-nenbourg 1664, Grimbergen and Somersby
StateMent FROM tHe ceO
– and achieved strong results for our local power brands.
Another important part of our strategy is to apply our best-in-class sales and market-ing tools across all markets. In 2014, this included the continued application and, in some mature markets, further development and improvement of our value management toolbox, which has been an important driver of the Group’s overall market share gains and positive price/mix in recent years.
Innovation is another key priority. In 2014, our efforts included launches of the non- alcoholic beer Carlsberg Nordic, Brewmasters Collection and K by Kronenbourg, further roll-out of Radler and Seth & Riley’s Garage, and further expansion of our pro prietary DraughtMaster™ technology.
A strong portfolio of international brandsIn 2014, the Carlsberg brand grew 1% in its premium markets, with particularly strong performance in India, China and France, while the brand declined in Eastern Europe due to the overall market decline. Several important activities took place during the year, such as activation in 66 countries of the English Premier League sponsorship, the UEFA EURO 2016™ activation, which kicked off in September, a step-up in digital marketing activities, and, last but not least, commencement of the roll-out of the latest communication platform with the taglines “Probably the best beer in the world” and “If Carlsberg did”.
The Tuborg brand grew strongly, by 24%, as a result of impressive growth in Asia, par-
ticularly in China and India. The brand has become the fastest growing international premium brand in China and the no. 1 in-ternational premium brand in India. During the year, we continued to deploy the brand rejuvenation programme and strong global consumer programmes.
Our French brewery Brasseries Kronen-bourg celebrated its 350th anniversary in 2014, and Kronenbourg 1664 delivered 9% volume growth for the year. The growth was partly the result of easy comparisons with the previous year, but it was also driven by market share gains in France, growth in export markets and further roll-outs in new markets. 1664 Blanc achieved good results in several Asian markets.
Somersby continued its very successful pro-gression, growing 43%. It was once again the fastest growing cider brand among the top 10 biggest ciders globally and is now available in 43 markets across the world. The achievement was driven by category growth in existing markets, the global activ-ation platform “Friendsie”, line extensions in established markets and launches in new markets.
Our Belgian abbey ale, Grimbergen, grew 27%, and since 2011 it has been the fast-est growing international abbey beer. We continued to expand the brand’s footprint, as a result of which it is now available in 36 markets globally.
Speeding up on digital reachIn 2014, we determinedly expanded our digital activities, aiming to continuously strengthen content, maximise connections,
The organic earnings growth in 2014 was the result of our strong brands, clear priorities and strong execution, enabling us to offset the challenging conditions in Eastern Europe.
Jørgen Buhl RasmussenPresident & CEO
12Carlsberg Group Annual Report 2014 Statement from the CEO

Moving ahead on CSROur CSR work is addressed in detail in our CSR report, but I would like to highlight two events from 2014. Firstly, we joined forces with a coalition of the world’s biggest companies and non-profit organisations to launch the global digital media platform “Collectively”, which aims to drive conversation and action on sustainability.
Secondly, we officially launched the Carls-berg Circular Community (CCC) at the World Economic Forum in Davos, Switzerland. CCC is about working with external partners across the value chain to develop packaging solutions optimised for recycling and reuse while retaining their quality and value.
Structural changes During 2014, we took further steps to strengthen the Group’s growth profile. In Vietnam, we increased our ownership of South-East Asia Brewery and Hanoi-Vung Tau Beer to 100%, while in China we com-pleted the acquisition of Chongqing Beer Group Assets Management. In Europe, we acquired 51% of Zatecky Pivovar in the Czech Republic and announced the merger of our Greek business Mythos with Olym-pic Brewery, creating a strong no. 2 in the Greek market. The merger is pending anti-trust approval.
Changes to the Executive CommitteeIn 2014, there were some changes to the Executive Committee as Khalil Younes chose to pursue new challenges outside the Group, while Isaac Sheps and Anne-Marie Skov announced their retirement. I would like to
During 2014, the supply chain integration and business standardisation project (BSP1) in Western Europe was rolled out in the UK, Finland, Poland and Switzerland. The system is now live in six countries, with the next wave of the remaining large markets going live in the spring of 2015.
In addition to BSP1, all three regions are fo-cused on improving efficiencies in all areas. In Eastern Europe, this meant, among other things, considering brewery closures as an unavoidable response to past years’ decline in market volumes. Consequently, in Janu-ary 2015, we announced the closure of two breweries in Russia.
thank them very much for their highly valued contributions and dedication to the Group.
Their respective replacements were Graham Fewkes, previously Commercial Vice President, Asia; Jacek Pastuszka, previously CEO of Ringnes in Norway; and Andraea Dawson-Shepherd, who joined from a global position as Senior Vice President for Corporate Communica-tion & Affairs at RB plc. They are great contributors to the Executive Committee and I warmly welcome them.
Change of guardOn June 15, I will retire from the position as President and CEO of the Carlsberg Group. It has been seven exciting years in this fantastic company with its great heritage, strong brands and very pas-sionate and highly qualified people. I am proud of handing over a company with strong fundamentals to Cees ’t Hart, who I am sure will take the Group to the next level.
Thank youI would like to thank all our employees around the world for another year of hard work and commitment to achieving our goals in spite of tough challenges. I would also like to thank our shareholders for their support, and our customers, partners and suppliers for their cooperation.
Jørgen Buhl Rasmussen
and develop and implement tools and systems to reach consumers and customers.
We achieved significant reach with our social platforms. The Carlsberg and Tuborg brands now reach more than 4 million consumers every month. During the year, our digital activities included #happybeertime for on-trade customers, the Carlsberg Premier League Live Match Centre, UEFA EURO 2016™ engagement through Facebook and Twitter, and, in Denmark, Zulu BFF, a reality show featuring multi-channel viewing.
Continued emphasis on efficienciesDelivering on our strategy also requires the back-end of the business to function smoothly and efficiently.
13Carlsberg Group Annual Report 2014 Statement from the CEO

While we expect our Western Europe and Asia regions to continue their positive de-velopment, the expected GDP decline and currency devaluation in Russia and Ukraine will put significant pressure on the Group’s overall performance. To mitigate this, in our planning for 2015 we have taken tough decisions aiming at further improving our cost-effectiveness, while also continuing to invest in our brands and our longer-term capabilities for competitiveness. Clearly the Eastern European business is working on different scenarios and plans that can be executed if the environment changes.
2015 will be a year when we intensify focus on return on invested capital (ROIC). This key metric is also reflected in the organisa-tion’s incentive programmes for the year. In addition, we are also aiming for improved credit metrics. This also means that despite the M&A strategy staying intact, the M&A agenda will have a low priority for a period of time.
Although we are taking all necessary sensible actions to protect short-term profitability and improve cash flow and returns, we will continue to build on the strengths of our company to ensure that we capture both the
short- and longer-term opportunities that are present in our markets. We will continue to invest in our brands and growth opportunities.
Some of the key actions and priorities for 2015 are:
Group• Continue investing in our brands and
organic growth opportunities.• Keep developing and expanding sales and
go-to-market tools and capabilities.• Implementation of a Group-wide push
to further improve the organisational efficiencies by simplifying, streamlining and removing duplication in processes and functions.
• Implementation of operating cost man-agement which is a new framework for budgeting (including ZBB), tracking and monitoring costs, commencing in 2015.
• Improvement of return on invested capital through further trade working capital improvements and lower capital expenditures.
• Continue building on the strength of the global supply chain to ensure further efficiency gains – on both costs and capital employed.
Western Europe• Maintaining the strong momentum of the
Western European business and continu-ing the positive value market share trend by applying a focused commercial agenda.
• Finalising the BSP1 roll-out in the remain-ing large markets in Western Europe during the spring.
• In general focusing on achieving benefits faster than previously planned.
Eastern Europe• Balancing price increases and affordability.• Utilising the strength of our Russian brand
portfolio, route-to-market, innovation capabilities and execution skills to further strengthen our market leadership.
• Executing the closure of two Russian breweries (as announced on 29 January 2015).
Asia• Further developing and investing in our
Asian business to capture the growth opportunities in the region.
• Finalising the integration of Chongqing Brewery Group and beginnng the integra-tion of Chongqing Eastern Assets with the aim of fast earnings recovery.
We expect the market development in our three regions to be mixed for 2015:• The Western European beer markets are
expected to be flat. Driven by innova-tions, increased interest in speciality and craft beers and overall improved category perception, beer category dynamics have improved slightly compared with the past years of decline.
• The Eastern European markets are expected to decline due to the expected decline in GDP and accelerating infla-tion in Russia and Ukraine, which will put consumers and the beer category under pressure. We expect that the Russian beer market will continue to grow in value terms as price increases will more than offset the volume decline.
• The Asian markets are expected to con-tinue to grow. Our non-Chinese markets are expected to grow in line with recent years while we assume that the Chinese beer market will grow in contrast to the weak 2014, although volume growth is expected to be below historic averages.
2015 eaRningS eXPectatiOnS
14Carlsberg Group Annual Report 2014 2015 earnings expectations

EUR/RUB avg. YTD 2015
EUR/RUB change
Operating profit impact
75 +/- 10% +/- DKK 200m
Based on these market assumptions, our ability to outperform the market and the actions we are taking to improve profitability, for 2015 the Group expects:
• Operating profit to grow organically by mid- to high-single-digit percentages.
Due to the recent volatility of currency rates, especially the Russian rouble, we do not provide any guidance on reported operating profit development. However, the sensitivity of reported operating profit to movements in RUB vs EUR (combined transaction and translation effect) is shown in the table below. The EUR/RUB YTD 2015 has averaged around 75. Assuming that this rate will prevail for the full year, the negative translation impact for 2015 will be around DKK 0.9bn. For 2014, the rouble proportion of operating profit (before not allocated costs) was around 25%. No other non-EUR currencies account for more than 7% of operating profit. In reported terms, Eastern Europe is expected to account for less than 20% of operating profit in 2015 (before not allocated costs).
Other significant assumptions and sensiti-vities are: Cost of goods sold per hl is expected to be lower than in 2014. In organic terms, cost of goods sold per hl is expected to be higher than last year in Eastern Europe, primarily due to currency impact on materials priced in USD or EUR.
Sales and marketing investments to net revenue are expected to be slightly higher than last year.
As a consequence of the aforementioned focus in 2015 on realising the full range of benefits earlier, we will postpone the BSP1 implementation in small markets to 2016.
Average all-in cost of debt is assumed to be around 4%.
The tax rate is expected to increase to approximately 28%, mainly because the Russian business, where the corporate tax rate is below Group average, will decline in importance.
As part of the intensified focus on ROIC, capital expenditures will be approximately DKK 4bn in 2015 (around index 90 to expected depreciation), a reduction of approximately 30% compared with 2014.
Net debt to EBITDA is expected to be less than 2.5 end of 2015.
15Carlsberg Group Annual Report 2014 2015 earnings expectations

OUR RegiOnSWestern europe
Beer category dynamics improved in Western Europe in 2014, and we delivered strong results.
Living our strategyOur Western European region primarily com-prises mature beer markets. While market volumes tend to be flat or slightly declining, the overall value of the market has seen a positive development in recent years.
Our main objective in Western Europe is to improve profitability, cash flow and returns.
Our commercial focus is on supporting the top line by driving a positive trend in net revenue per hl and increasing our market share, measured in terms of both volume and value. We aim to achieve this by pre-miumising our portfolio through expand-ing the reach of our international premium brands, supporting and developing our strong local power brands, and being at the forefront of launching innovations.
We are driving a customer-focused organi-sation and establishing close cooperation with our winning customers. To this end, we apply best-in-class tools such as value management, ROMI (return on marketing investments) and our FIT model (Focus- Implement-Track), which supports the delivery of superior in-store execution. To increase the return on our activities, we identify “pockets of growth” in our local markets, such as types of beer, packaging types, sales channels and geographic areas, in order to target our efforts and capture their growth potential.
Simultaneously, we maintain a sharp focus on reducing costs and capital employed. We aim to achieve this by optimising asset utilisation, increasing efficiencies across the business and simplifying our business mod-el, while still providing superior customer service and top-quality products.
An important enabler on this journey is the roll-out of the supply chain integration and business standardisation project (BSP1). Additional measures include alignment of organisational structures and harmonised ways of working across markets.
Delivering on our ambitions for the region requires us to develop our people and create a performance culture as well as in-creasing mobility across the region and the Group. Furthermore, we want to improve the image of the beer category to pro-tect our licence to operate. We do this by continuously enhancing our environmental efficiency, engaging in responsible drink-ing activities and introducing sustainable packaging solutions to our customers.
Driving results in 2014The Western European markets showed slightly better volume dynamics in 2014 than in recent years and we estimate that the overall beer market was flat. The weath-er impact for the year was very limited.
Our positive market share performance of the previous three years continued in 2014 and our Western European business has now gained market share for four years in a row. We delivered good market share performance in the majority of our markets, including Poland, Norway, France, Denmark, Portugal, Italy, Greece, Germany and Croatia.
Operating margin(%)
2014
2013
2012
Beer volume, pro rata(Million hl)
55
45
35
25
15
5
6
5
4
3
2
1
16
15
14
13
12
11
40
32
24
16
8
0
Net revenue(DKKbn)
Operating profit(DKKbn)
2014
2013
2012
2014
2013
2012
2014
2013
2012
16Carlsberg Group Annual Report 2014 Our regions

Change Change
Pro rata, million hl 2013 Organic Acq., net FX 2014 Reported
Beer 49.0 2% 0% 50.0 2%
Other beverages 14.9 6% 0% 15.8 6%
Total volume 63.9 3% 0% 65.8 3%
DKK million
Net revenue 37,393 1% 0% 0% 37,762 1%
Operating profit 5,183 7% 0% -1% 5,470 6%
Operating margin (%) 13.9 14.5 60bp
weSteRn eUROPe
This strong performance was driven by the further deployment of our commercial tools, such as value management and sales force efficiency tools, roll-out of our international premium brands and product launches and innovations. A few examples are the Carlsberg Nordic Collection in a number of markets, Somersby in Germany, K by Kro-nenbourg in France, Radler in new markets and the non-alcoholic beer Carlsberg Nordic in Denmark. In addition, we have strength-ened our position in the speciality beer category in several markets with products such as Grimbergen, Frydenlund Pale Ale in Norway, Nya Carnegie in Sweden, Okocim Browar in Poland and Jacobsen, which all continued to grow.
Beer volumes grew organically by 2% with particularly strong growth in France, Denmark, Poland, Norway and Germany. Beer volume declined in the Balkans, Italy, the Baltic States, the UK and Finland. Other beverages grew organically by 6%, mainly due to strong performance in the Nordics, driven by a strong activation programme, and in Switzerland.
Net revenue grew organically by 1%. While we achieved a positive effect from our value management efforts, price/mix declined by 1%, impacted negatively by the strong growth in other beverages, a negative chan-nel mix and last year’s strong price/mix development.
Operating profit grew organically by 7%. The improvement was driven by volume growth, cost savings within the supply chain and our ongoing focus on improving efficiencies in all areas. Operating margin improved 60bp to 14.5%.
Poland and the Nordics The Polish market grew by an estimated 1%. We continued to gain volume and value market share, and increased volumes by 3%. The strong performance was driven by excellent commercial execution, increased distribution and growth of the local brands Kasztelan, Harnas and Okocim, as well as the continued good progress of innovations such as Somersby and Radler.
We continued to strengthen our market position in
Western Europe, growing our overall market share for the
fourth year in a row.
17Carlsberg Group Annual Report 2014 Our regions

We continued our strong performance in Poland in 2014, growing volume and value market share as well as profitability.
Our Nordic business performed strongly, driven by market growth in Denmark (+1%) and Norway (+3%), soft drinks category growth and strong commercial execution, including product launches and value management. Our beer volumes grew in Denmark (+3%), Norway (+4%) and Sweden (+1%), while volumes declined in Finland (-5%) due to a declining Fin-nish beer market. We gained market share in Denmark, Sweden and Norway and in Finland in the second half of the year. In Denmark, we benefitted from strong growth in the speciality beer category, our relisting at a major customer and good performance by Tuborg and Carlsberg. In Norway, our local brands Frydenlund and Munkholm per-formed well, as did Tuborg. Our soft drinks business did particularly well in Denmark, Sweden and Norway.
France and the UK In France, the market grew by an esti-mated 3%. Our French beer volumes grew by 11%, impacted positively by last year’s destocking in Q1 and market share gains. Our premium brands Kronenbourg 1664, Grimbergen and Skøll by Tuborg, as well as the flavoured K by Kronenbourg in the mainstream category, all delivered strong performance. This was driven by strong commercial execution and a high level of innovations in liquids and packaging.
The UK market grew by approximately 1% driven by a growing off-trade channel, although the on-trade continued to decline. We lost market share in both channels partly as we chose not to participate fully in various promotional activities during the year. Our price/mix improved slightly. The Somersby brand continued to grow.
18Carlsberg Group Annual Report 2014 Our regions

OUR RegiOnSeastern europe
The Eastern European beer markets were challenged in 2014, but we increased our market share during the year.
Living our strategyOur two main markets in Eastern Europe are Russia, which accounts for approx. 75% of regional beer volumes, and Ukraine, which accounts for a little less than 20%.
In recent years, the Russian market has undergone significant changes, but the value of the beer market has still gener-ally seen mid- to high-single-digit annual growth rates, while market volumes have come down by mid-single-digit percent-ages (CAGR1).
The Carlsberg Group’s share of the beer profit pool in Russia significantly exceeds its volume market share of 37.8%. We want to maintain our position as the undisputed leader of the beer category in value and volume terms, and we believe that the Eastern European region, including Russia, offers long-term growth opportunities.
Consequently, our main focus in the region is on strengthening our Russian business. Notwithstanding the greater uncertainty and volatility of recent years, which have required detailed contingency and scenario planning, we will continue to invest in the long-term profitability of the business.
To this end, we are utilising Group tools to optimise product offerings and drive a
positive mix by means of innovations and focusing on our local premium and interna-tional premium brands. We are continuous-ly improving our commercial execution by applying best-in-class tools and concepts at the point of sale, optimising our route-to-market capabilities and improving in-store communication and cooler efficiency.
A number of actions have been taken to enhance the cost-efficiency and asset utilisation of the Eastern European busi-ness, and to align structure, organisation and ways of working in areas such as production, logistics, marketing, sales and administration.
The challenges of recent years have em-phasised the crucial role of our people. We have therefore taken major steps to drive a performance culture, manage talent, and build a resilient and engaged organisation with strong skills in change and project management.
Protecting our licence to operate and sup-porting the image of the beer category are important priorities in the region.
We are actively working to reduce the im-pact of our business on the environment, we are promoting the perception of beer and responsible drinking, and we have strong and proactive interaction with local, regional and federal governments both as a company and through the brewers’ associations.
Driving results in 2014Our Eastern European beer markets were negatively impacted by the uncertain and challenging macroenvironment, as well as
Operating margin(%)
Beer volume, pro rata(Million hl)
Net revenue(DKKbn)
Operating profit(DKKbn)
2014
2013
2012
2014
2013
2012
2014
2013
2012
2014
2013
2012
55
45
35
25
15
5
5
4
3
2
1
0
25
20
15
10
5
0
25
20
15
10
5
0
1 Compounded annual growth rate.
19Carlsberg Group Annual Report 2014 Our regions

Change Change
Pro rata, million hl 2013 Organic Acq., net FX 2014 Reported
Beer 42.4 -11% 0% 37.8 -11%
Other beverages 1.7 1% 0% 1.7 1%
Total volume 44.1 -10% 0% 39.5 -10%
DKK million
Net revenue 17,711 -3% 0% -17% 14,100 -20%
Operating profit 4,127 -12% 0% -16% 2,962 -28%
Operating margin (%) 23.3 21.0 -230bp
eaSteRn eUROPeincreasing inflation during the year which reduced consumer purchasing power and impacted the beer category negatively. Consequently, our regional beer volumes declined organically by 11%.
Despite the market challenges, we contin-ued to invest in our brands and maintained commercial activities at a high level. These included the activation of sponsorships, such as the Continental Hockey League and local football teams, with the Baltika brand being activated in stadia and in TV commercials. Other activities included the Tuborg Green-
Fest music festival, which was rolled out to more cities. In addition, we continued to upgrade our regional brands and launched innovations such as Koff, Brewmasters Col-lection, Jacobsen and Seth & Riley’s Garage.
Organic net revenue declined by 3%. Price/mix was strong at 9%, driven by price in-creases, a positive mix and slightly smaller pack sizes in Russia. Reported net revenue declined by 20% due to the substantial negative currency impact of -17% as the Ukrainian hryvnia (UAH) devalued by 31% and the Russian rouble (RUB) by 16% for the year.
Operating profit declined organically by 12%. The decline was mainly caused by lower volumes, higher logistics costs and one-offs, such as the write-off of obsolete stocks. The decline was further compounded by the very negative currency impact, resulting in a decline of 28% in reported operating profit. While gross profit per hl increased by 9% organically and operat-ing profit per hl declined modestly by 1% organically, reported operating profit margin declined by 230bp to 21.0%.
RussiaThe Russian beer market declined by an estimated 7% as a result of macroeconomic
Find more details about our markets and our many brands.www.carlsberggroup.com
While maintaining a high level of commercial activities in Russia to support our strong position in the market, we also took several actions to reduce costs.
20Carlsberg Group Annual Report 2014 Our regions

weakness, especially during H2, accelerated inflation throughout the year and the subse-quent impact on consumers’ ability to spend on the beer category. Driven by strong pricing in the market, the value of the Rus-sian beer market grew by a mid-single-digit percentage. We increased prices in Russia in March, May, October and November.
Our Russian shipments fell 14% due to the overall market decline, less stocking by wholesalers in Q4 than in 2013 and market share development. As a result of the rapid channel shift from traditional to modern trade, end-of-year stock levels at whole-salers were higher than previously expected although lower than at year-end 2013.
Our Russian volume market share im-proved sequentially through the year and grew 50bp year-on-year in Q4 to 38.6%. For the full year, our volume market share declined by 80bp to 37.8% (source: Nielsen Retail Audit, Urban & Rural Russia). The full-year market share loss was mainly due to the launch of slightly smaller pack sizes to minimise price increases, our price leadership during the first nine months and the temporary disruption in late Q1 and early Q2 following the change in the legal structure of Baltika Breweries. Our mix was positive, driven by particularly good results for Baltika 7, Baltika 9, Baltika Praha and Brewmasters Collection, while Baltika 3, Cooler and Bolshaya Kruzhka declined.
To ensure a strong and profitable Russian business, we have taken several actions to reduce costs. However, while we have been
meticulous in our efforts to reduce costs in our Russian operations, we are nevertheless conscious of the need to maintain a strong business that will be in a position to exploit the longer-term opportunities of the Rus-sian market. Actions taken have included closure of the Krasnoyarsk and Chelyabinsk breweries, further streamlining of the sales organisation etc.
Mainly as a result of the currency headwind, the Russian market accounted for around 25% of Group operating profit in 2014 (before not allocated costs).
UkraineThe Ukrainian beer market declined by an estimated 8% due to the highly challenging and uncertain macroeconomic climate as well as significant price increases to cover inflation and a 43% excise tax increase in May. We have been able to operate our business in Ukraine, albeit with disruptions. We estimate that our market share was slightly up.
In spite of consumers being under pressure from the challenging macro- environment in Eastern Europe, price/mix was strong at 9%.
21Carlsberg Group Annual Report 2014 Our regions

OUR RegiOnSAsia
Most markets in Asia grew in 2014, and we increased our market share in most markets.
Living our strategyThe Carlsberg Group has an attractive footprint in Asia. Over the years, we have continuously expanded our presence in the region, both organically and through acquisitions. Our strategy in Asia is to build strong, scalable positions and to invest with a long-term perspective in the key growth markets.
Commercially, our focus in the region is on expanding the reach of our interna-tional premium brands, and strengthening and premiumising our local power brands. The latter includes upgrading packaging, visual identity and communication as well as simplifying and rationalising the brand portfolios. In addition, we are sharpen-ing our commercial execution capabilities by applying toolkits based on Group best practices in order to accelerate growth. Ini-tiatives include improving the performance and efficiency of sales teams, applying IT and smartphone applications in sales and customer management, updating channel segmentation and increasing the frequency of customer visits.
With the increasing consolidation of our Asian footprint, we are also driving an ef-ficiency agenda across our business with an emphasis on optimising structures and ways of working by using well-proven Group concepts and operating models.
Our people are an important strategic prior-ity. Our focus is on developing leadership capabilities and enhancing the professional skills of our employees in order to increase workforce competence levels.
Across the Asian region, we are actively working to protect our reputation as a responsible and efficient brewer, and to enhance the image of the beer category. Initiatives include health & safety cam-paigns, improving the environmental foot-print of our breweries, promoting sustain-able packaging and launching responsible drinking campaigns.
Driving results in 2014Our Asian business, which delivered another year of strong performance, has in recent years become a significant part of the Carlsberg Group, now accounting for 20% of operating profit (before not allocated costs). Asia has been, and will remain, an important growth driver for the Group, and consequently we will continue our invest-ment strategy, which includes investments in brands, breweries and infrastructure.
Beer volumes were flat organically, though with volume dynamics stronger in H2 than in H1. Including acquisitions, beer volumes grew by 24%. Our businesses in Cambodia, Laos and India did particularly well. The acquisition impact derived mainly from the increased ownership in Chongqing Brewery Group from December 2013 and the Chong-qing Eastern Assets acquisition in November 2014. Other beverages grew organically by 12%, mainly driven by the soft drinks busi-ness in Laos.
Operating margin(%)
Beer volume, pro rata(Million hl)
Net revenue(DKKbn)
Operating profit(DKKbn)
2014
2013
2012
2014
2013
2012
2014
2013
2012
2014
2013
2012
40
32
24
16
8
0
2.5
2.0
1.5
1.0
0.5
0.0
25
20
15
10
5
0
15
12
9
6
3
0
22Carlsberg Group Annual Report 2014 Our regions

The Carlsberg brand grew by 12% in its premium markets in Asia, primarily as a consequence of good results in India, driven by Carlsberg Elephant, and in China, driven by Carlsberg Chill and Carlsberg Light.
In just a few years, Tuborg has become our key international brand in the region. In 2014, the brand more than doubled its Asian volumes thanks to very strong per-formance in China and India, as well as in the more established Tuborg market Nepal, where the 3G bottle was launched. Tuborg has become the fastest growing internatio-nal premium brand in China and the largest international beer brand in India.
We continued the further roll-out of Kronen bourg 1664, primarily the Blanc variety. The brand, which is establish-ing a solid footprint in the super-premium segment across our Asian markets, is now available in Malaysia, Singapore, Hong Kong and China. The Somersby cider brand doubled its volumes, albeit from a low base, due to very good results in the more mature Asian markets.
Net revenue grew organically by 11% with reported net revenue growth of 38%, which can mainly be attributed to the Chong-qing Brewery Group acquisition. Price/mix continued to develop favourably at +5% in spite of a negative country mix. The price/mix improvement was driven by price increases across most markets, continued premiumisation efforts, including SKU ra-tionalisation, and market share gains in the premium segments.
The Asian business continues to grow profits organically alongside our investments in growth opportunities, such as the start-up in Myanmar, and substantial investments in our local power brands and international brand portfolio. Operating profit increased by 8% organically and 17% in reported terms. The organic operating profit growth was supported by the positive price/mix and income from a terminated licence agree-ment in Q2. As expected, gross profit and operating profit margins declined due to the consolidation of Chongqing Brewery Group, which has a lower revenue per hl and lower margins than the regional average.
Change Change
Pro rata, million hl 2013 Organic Acq., net FX 2014 Reported
Beer 28.3 0% 24% 35.0 24%
Other beverages 3.1 12% 1% 3.5 13%
Total volume 31.4 1% 22% 38.5 23%
DKK million
Net revenue 9,063 11% 30% -3% 12,491 38%
Operating profit 1,882 8% 11% -2% 2,195 17%
Operating margin (%) 20.8 17.6 -320bp
aSia
Our Asian business delivered another year of strong performance. The region now accounts for 20% of Group operating profit.
23Carlsberg Group Annual Report 2014 Our regions

China/Hong KongOur Chinese volumes grew by 33% due to the consolidation of Chongqing Brewery Group and Chongqing Eastern Assets. Organically, our volumes declined by 7%. The overall Chinese market declined by an estimated 4%, while the beer market in our major provinces declined by an estimated 7% as several provinces were impacted by poor weather during the summer, com-pounded by the unrest in Xinjiang province. The premium category continued to grow by close to double-digit percentages. In addi-tion to the market decline, our volumes were impacted by the reduction of unprofitable products in southern China.
Net revenue grew organically by 3% as we delivered a positive price/mix improvement driven by the growth of our international premium brands, successful premiumisa-tion efforts with our local power brands and portfolio optimisation. Our international premium brands continued to grow, with particularly strong performance by Tuborg, which more than tripled in volume terms to 2m hl, and Kronenbourg 1664, which almost doubled its volumes. The Carlsberg brand delivered high-single-digit percentage growth.
The integration of Chongqing Brewery Group is progressing according to plan, with the most notable milestone being the relaunch of the Chongqing brand in Q4. In addition, we are strengthening and refreshing sales capabilities and the brand portfolio, while at the same time implementing Carlsberg Group tools and processes in functions such as finance, HR, supply chain and IT.
IndochinaIn Indochina, our beer volumes grew organically by 8%. As in recent years, our businesses in Laos and Cambodia continued to grow, while the Vietnamese operations recovered during the year.
The overall strong performance was driven by our strong local power brands, namely Beerlao in Laos, Angkor in Cambodia and Huda in Vietnam. In Laos, Beerlao is main-taining its strong market position and the relaunch of the Beerlao Gold premium line extension delivered good results. In Viet-nam, Huda improved its market share in the central region with refreshed packaging. The Halida brand was relaunched in northern Vietnam with new brand positioning, pack-aging and advertising support.
IndiaOur Indian business continued its strong growth trend, delivering 42% organic volume growth in a market growing at an estimated mid-single-digit rate. Our market share in India is now around 11%. The growth was mainly driven by very strong performance by Tuborg and Carlsberg Elephant, with the former now being the third-largest brand overall and the largest international premium brand in the country.
Our business in Cambodia continued
to grow, supported by our strong local
brand, Angkor.

Tuborg is a success story of a brand that bridges its powerful legacy with modern-day appeal. It is connected with young people’s exploration of life and growing up, and it has close ties to music. Tuborg is available in more than 70 markets and grew 24% in 2014.
Kronenbourg 1664 is the most famous French beer in the world. This premium brand is a long-standing favourite of beer connoisseurs. Sold in at least 65 markets across the globe, the brand grew 9% in 2014.
Carlsberg, our flagship brand, is available in more than 150 mar-kets across the world. The brand dates back to 1847 when our founder, J.C. Jacobsen, pioneered the first lager beer. Since then, we have passionately strived to brew and share probably the best beer with consumers worldwide. In 2014, the brand grew 1% in its premium markets.
Somersby is our international cider brand. Since its launch in Denmark in 2008, the brand has become the fastest growing international cider brand in the world and is one of the 10 larg-est international cider brands. Somersby is available in 43 markets and grew 43% in 2014.
Grimbergen is our super-premium Belgian abbey ale dating back to 1128. It appeals to consumers looking for high-quality ales with unique flavour variants. The geographic expan-sion of the brand is ongoing, and Grimbergen is currently sold in 36 markets. In 2014, it grew 27%.
Local power brands. We have many strong local power brands, including Karhu in Finland, Ringnes in Norway, Feldschlösschen in Switzerland, Baltika in Russia, Lvivske in Ukraine, Chongqing and Wusu in China, Huda in Vietnam and Beerlao in Laos.
OUR BRanD PORtFOliOThe Carlsberg Group has a winning portfolio of around 140 beer brands.
Our international premium brands are at the core of our business, meeting general and rep-licated consumer needs across many markets. Our strong local power brands respond to local cultures and taste preferences, and are sup-ported by a high level of consumer loyalty.
We maximise the value of our brands by hav-ing a portfolio that meets consumer needs and preferences. We have a clear strategy for how our brands should work together and how we can efficiently leverage local market knowledge with global tools, insights and concepts. To capture and secure market shares, we continuously assess and adjust our product portfolio across markets.
Innovation is a key strategic priority for the Carlsberg Group and vital for driving beer category growth and business results. By offering consumers new experiences, we ensure that our brands remain relevant and that we retain consumer loyalty as well as attracting new consumers.
Our core product is beer, but where it makes business sense we also pursue opportunities in adjacent categories, such as cider.
25Carlsberg Group Annual Report 2014 Our brand portfolio

OUR BUSineSS MODel
Our business model is designed to support sustainable, long-term value growth of our business.
Key KPIs are organic net revenue and earn-ings growth, cash flow and return on invested capital, allowing us to maximise long-term shareholder returns.
The Carlsberg Group’s business model sup-ports our ambition to deliver sustainable value growth and embraces our core product, our ways of working and our market presence.
Beer has been around for millennia and is one of the most popular beverages in the world, only surpassed by water and tea.
Nevertheless, the Carlsberg Group’s beer markets differ significantly in terms of maturity, volume growth expectations, and market, cost and regulatory structures.
Consequently, their contribution to growth, earnings and development differs both at present and in the longer-term projections. Our business model reflects these differ-ences, turning them into strengths and opportunities both now and in the future.
Beer is coreOur core product is beer
and that is where we focus our efforts. However, where
it makes business sense, we pursue adjacent
category opportunities.
Balanced market exposureOur balanced exposure
towards mature and growing beer markets supports the
sustainability of our business model. Our mature markets
generate high returns and solid cash flow that will either be
invested in further expansion in growing beer markets or
redistributed to shareholders.
Significant player in our marketsBeer is a volume business. In order to drive value, operational scale is neces-sary and we must therefore be a significant player in our markets and maintain a strong market position.
Global and local approachOur operating model is GloCal (short for global and local) with a focus on globalising, optimising, centralising and standardising processes across the Group while rec-ognising the strength of local brands and initiatives.
Maximising long-term shareholder
returns
1 23
26Carlsberg Group Annual Report 2014 Our business model

OUR StRategYOur business model is made operational through our strategy and strategic priorities.
While the overall strategy is the same across our markets, we apply it in a GloCal manner, recognising the diversity and specific charac-teristics of our local markets and the need to prioritise and adapt tools to local conditions.
Our strategy is illustrated by a wheel with five interconnected levers, each representing one of our strategic priorities. A set of winning behaviours guides us in how we execute the strategy and bring it to life.
Living our strategy enables us to manoeuvre and manage the opportunities and challenges of our diverse markets, and deliver sustainable, long-term value growth to our shareholders.
Acceptance and appreciation by key stake-holders in society are important prerequisites for the commercial success of our company. Our strategy emphasises our commitment to growing our business in a responsible manner, and we embed corporate social responsibility across functions and markets.
We measure our performance and evaluate our progress using a number of financial and strategy-linked KPIs. A selection of these KPIs is shown on pages 34-36. Other KPIs are commercially sensitive and not disclosed.
Together we are strongerWe respect and welcome differences in culture, people and brands, at the same time recognising that working closely together and actively shar-ing best practices across functions, countries and regions are what it takes to grow and win.
We want to winWe always strive for winning solutions and are will-ing to take bold steps to reach our goals. Whether big or small in the marketplace, we behave as en-trepreneurs/underdogs – fast, proactive and action-oriented in both decision-making and execution.
Our customers and consumers are at the heart of every decision we makeWe put ourselves in the shoes of our consumers and customers, and have a detailed insight into their needs and preferences. We base our strat-egies and plans on this insight and continuously evaluate the way we work to improve their experi-ence of our brands, services and people.
We are each empowered to make a differenceWe take ownership of challenges and problems, both individually and in teams, and have the autonomy to deliver outstanding results. We do not let fear of failure overcome the desire to succeed, and we learn from our mistakes. We work in an en-vironment where good ideas and passion to deliver are recognised and rewarded.
We are engaged with societyWe are socially and environmentally responsible, and believe it makes business sense to be so. We make a positive contribution to the societies in which we operate and the communities in which we live. We listen to and engage with our stake-holders and always strive for responsible use of natural resources.
OUR winning BeHaviOURS
Our winning behaviours guide us in how we execute our strategy and bring it to life. They pull our company together across national borders and functions as well as promoting commitment and engagement.
Our strategy is illustrated by a wheel with five interconnected levers, each representing one of our strategic priorities.
tHe caRlSBeRg gROUP StRategY wHeel
WINNING BEHAVIOURS
We are engagedwith society
We are each empowered to make a difference
We want to win Our consumers and customers are the heart of every decision we make
Together weare stronger
THIRST FOR GREAT Great people. Great brands. Great moments Founded on the motto, Semper Ardens – Always Burning – we never settle, but always thirst for the better We are stronger together because we share best practices, ideas, and successes. We brand as many, but stand as one With the courage to dare, to try, to take risks, we constantly raise the bar. We don’t stop at brewing great beer. We brew a greater future – for our consumers and customers, our communities, and our people This passion will continue to burn and forever keep us thirsty.
PEOPLE• Embed a high performance culture• Develop, retain and attract best in class people• Empower and engage our people
EFFECTIVENESS & EFFICIENCY• Create an efcient, consumer- and customer-focused organisation• Focus and prioritise to maximise return on investments• Continuously develop and implement Carlsberg Group Ways of Working and Best Practices
SOCIETY AND REPUTATION• Enhance our reputation as a responsible global brewer• Integrate Corporate Social Responsibility throughout our value chain• Improve the image of the beer category
CONSUMERS, BRANDS AND INNOVATION • Iconize Carlsberg• Outperform with winning portfolio of international and local power brands• Accelerate scalable, consumer, relevant innovation
CUSTOMERS • Collaborate with customers to drive category growth• Create a winning route to market• Win with winning customers in on- and off-trade• Be the industry benchmark in Point-of-Purchase execution
Society &Reputation
Customers
People
Effe
ctiv
enes
s&
Ef�
cien
cy
GLOBAL BEER COMPANY
BE THE FASTEST GROWING
Cons
umers
, Brands
& Inno
vation
BE
A SIG
NIFIC
AN
T PLAYER
IN TH
E MARKETS WHERE WE CHOOSE TO COMPETE BALANCE PRESENCE B
ETWEE
N G
ROW
TH A
ND
MAT
UR
E M
AR
KE
TS FO
CUS
ON
BEE
R AS
CORE
SELECTIVELY PURSUE MARKET OPPORTUNITIES IN SUPPORT OF OUR BEER BU
SINESS
Our strategy comes to life through our actions and initiatives. Examples of these are presented on the following pages.
27Carlsberg Group Annual Report 2014 Our strategy

Jacobsen, the Group’s super-premium craft beer, made its debut in Russia in 2014. The brand was introduced in prestigious bars and restaurants, as well as in premium stores in Moscow and St Petersburg.
In 2014, numerous Tuborg-sponsored music festivals were held across Western Europe, Eastern Europe and Asia. In Denmark, Tuborg has sponsored Northern Europe’s biggest music event, the Roskilde Festival, for more than 20 years.
Our French brewery, Brasseries Kronenbourg, celebrated its 350th anniversary in 2014. To mark the
occasion, specially designed bottles, cans and glasses were available in limited editions across the world.
Somersby, our international cider brand, has generated impressive
results in recent years. Expanding its geographic reach further in
2014, the brand is now available in 43 markets around the world.
Job No.
232867-01Client
CarlsbergBrand
Kronenbourg 350 years
[email protected] Telephone
Ronnie Greve
Country
Generic
SKU
Poster
Format
420x297 mmSubstrate:
Papir
Cyan
Magenta
Yellow
Black
+45 33 93 18 83
Proof Initial - Date
BLL: 2013-12-17
BLL: 2013-12-19
Laurent Helbert 2013-12-19
Bianca Lauesen 2013-12-19
xxx
Approved by Date
Comments
Submitted by Date
THIS DOCUMENT HAS BEEN CHECKED FOR*:
Cutter/format
Number of colours(Colours in checkbox matches the document)
Preparation for the appropiate substrate
Colour separations have been checked
Editable + outlined text layers
Uploaded to Media Bank/sent to client
✓✓✓✓✓✓
✓ ✓*Depending on the job not all boxes are necessarily checked
#1
#2
#3
#4
#5
#6
#7
#8
Mock-up made: Digital Physical
CONSUMERS, BRANDS & INNOvATIONAt Carlsberg, the consumer is at the heart of every decision we make. We think about our consumers in the context of needs, occasions, brands and innovations, and we are on a continuous journey to sharpen up our approach to these areas. This strategic priority is about ensuring that at all times we have a strong portfolio of beer brands catering to consumers across markets to deliver organic growth in net revenue.
Three prioritiesThis strategic lever has three priorities:1. Expand the global footprint of the
Carlsberg brand and implement world-class consumer-, shopper- and customer- relevant programmes and activities.
2. Outperform in our markets with a win-ning portfolio, leveraging local and Group insights and tools to fulfil consumer needs and win in attractive profit pools.
3. Accelerate scalable and consumer- relevant innovations in beer and adjacent categories in order to recruit and retain consumers.
Actions and activitiesCarlsberg2014 was the first season for the Carlsberg brand as sponsor of the English Premier League, and the associated marketing campaign “That Premier Feeling” ran in 66 markets across the world. The campaign included the TVC “The Ride”, which won a Silver Lion at the prestigious Cannes ad-vertising awards. In the second half of the year, we kicked off our second sponsorship season with a diverse marketing activation
around the world, including in the digital space, where #CarlsbergTalk live chats on Twitter with Liverpool FC celebrities reached more than 1 million impressions.
International premium portfolioWe continued the support of our inter-national premium portfolio with further geographic expansion of Kronenbourg 1664, Grimbergen and Somersby. Brasseries Kronenbourg cele brated its 350th anniver-sary in 2014, and we marked the event with special campaigns and celebrations during the year. Three campaigns were developed in tandem with local markets to respond to different consumer preferences in different parts of the world, but all based on some quintessential element of French culture to ensure consistency with the brand’s marketing strategy.
To support the further growth of our suc-cessful cider brand Somersby, we launched a new global campaign, #friendsie. The campaign encouraged people to look at life from a fresh perspective by getting together to share experiences and embrace the friendsie concept.
InnovationsInnovations are important for support-ing and increasing the value of the beer category. In order to improve transparency, reduce duplication and accelerate speed to market of our innovation efforts, we rolled out the new Carlsberg Innovation Process across the Group.
Craft and speciality beers are a clear priority in our innovation efforts. We set up “Board
28Carlsberg Group Annual Report 2014 Our strategy

An important initiative to support in-store execution in Western Europe was the roll-out of the FIT (Focus-Implement-Track) model in 2014.
of Brewmasters” to drive the develop - ment of new products that meet the taste and experience needs of our consumers. Brewmasters Collection, the first launch by the Brewmasters, is now available in three markets.
Our proprietary DraughtMaster™ one-way PET draught keg technology enables customers to have a convenient equipment solution and a strong portfolio of premium brands. In 2014, the system was success-fully expanded across key markets and we established a dedicated business unit to further unleash the full potential of this breakthrough technology.
Innovation in packaging is also in focus. One example is the launch in 2014 of the limited edition of the Carlsberg Nordic Collection across 13 European markets. The Nordic Collection comprised three premium-design bottles decorated to reflect the landscape and industrial design of the Nordic region.
Digital mediaIn recent years, we have increased our focus on digital, aiming to make our brands the most shared and talked about in the beer category with a view to driving growth and recruiting new consumers. Activities have included a social media newsroom team that ensures that our brands are part of consumer conversations across key social media platforms on a daily basis. In addition, we initiated the implementation of a new digital infrastructure that will host the websites of our international premium brands and many local brands to facilitate faster sharing of creative ideas. The infra-structure will sharpen our marketers’ focus
on consumers and content, and enable them to reuse content and react faster to real-world events.
CUSTOMERSSuperior execution at the point of sale is of crucial importance if we want to be a trusted and attractive partner for our cus-tomers. In line with our GloCal approach, we service our customers locally with best-in-class, globally developed tools and systems. This strategic priority supports our ambition to grow the beer category in both volume and value terms, recognising that this can most efficiently be achieved in close collaboration with our customers, not least in times of regulatory restrictions in several of our markets.
Two prioritiesThis strategic lever has two priorities:1. Win with our customers by understanding
the drivers of customer and shopper be-haviour, and by having best-in-class tools for value management and key account and channel management.
2. Excel at the point of sale by having the highest standards when it comes to channel marketing capabilities and execution, commercial capability building and on-shelf availability.
Actions and activitiesWe continued our focus on commercial productivity, with Group-wide value man-agement programmes and ROMI (return on marketing investment).
Value managementValue management covers the following areas: price, ensuring the right price points for our
products for the consumer and customer; promotion, optimising the return on trade investment based on a holistic understanding of trade promotions; assortment, ensur-ing that the right products with the highest shopper demand are available in the store; and trade terms, optimising the trade term architecture to maximise returns. The further expansion and enhancement of our value management toolbox was on the agenda for 2014 as well as the roll-out of a new trade term programme in several markets.
ROMIMaking the right decision at the right time with the right investment is crucial. ROMI supplements our value management ap-proach and is our model for optimising our marketing spend. The model helps us to determine which media we should invest in and which promotions are most effect-ive, and addresses both above-the-line and

Recognising that in the right hands beer can be the perfect ingredient to enhance flavours in gourmet food, Carlsberg Danmark collaborates with the Copenhagen Hospitality College to promote the use of beer in fine cuisine.
national-level investments, such as TV and radio, and below-the-line investments, such as customer and channel investments. In 2014, we continued to embed our ROMI methodology across a number of markets in our three regions, including the sharing of best-practice examples.
Supporting in-store executionConsumer insights show that more and more shoppers are making their beverage purchase decision in store and that this trend is likely to continue. Superior in-store execution is therefore critical in order to win in the marketplace. An important initiative in 2014 was the roll-out of the FIT model
across a number of markets in Western Europe. FIT – short for Focus-Implement-Track – is our way of optimising in-store execution. The FIT model is a structured yet flexible approach that ensures that the nec-essary processes, structures and tools are in place to enable local sales forces to consist-ently deliver superior in-store execution every day and everywhere. The use of the FIT model is based on a GloCal approach, combining clear standard parts with locally defined elements and processes.
Driving digital innovationsIn the digital sphere, we are developing inno-vations to engage consumers in the on-trade
with solutions that directly help to sell more beer and also help our customers to build traf-fic, experiences and awareness. To this end, #happybeertime was launched in 2014. This social media innovation provides participating bars with a USB drive that they can connect to any TV running in the bar. The TV will then dis-play images and a call to action for the guests to shoot Instagram photos and tag them with #”the bar’s name” and #happybeertime. For each photo uploaded, time is added to happy hour. The advantage of this innovation is the integration of the outlet into the promotion.
PEOPLEHighly skilled and engaged employees are pivotal to us achieving our ambition. We strive to be the company of choice for our employees by providing them with the nec-essary tools for personal and professional development. We expect our employees to be highly motivated and ambitious – and to never settle but always thirst for better. The Carlsberg Group will in turn provide a cor-responding working environment and global career opportunities.
Three prioritiesThis strategic lever has three priorities:1. Embed a high-performance culture
throughout the Group by creating an environment where people are motivated to do their best.
2. Develop, retain and attract best-in-class people by being a highly desirable em-ployer and workplace for high-performing employees.
3. Create a working environment character-ised by empowerment and engagement
to allow our employees to thrive and always raise the bar.
Actions and activitiesLeadership CompetencesIn 2014, the global roll-out of the Carlsberg Group Leadership Competences continued as they were integrated into the Group’s performance assessment system, becoming a benchmark for how we assess employee potential and behaviour. The Leadership Competences – driving for results, cus-tomer/consumer focus, business acumen, passion & integrity, analytical & strategic thinking, cross-team interacting & commu-nicating with impact, developing & em-powering people, and driving & managing change – define a common understanding and language that enable the Group to iden-tify and develop leaders who will support a highly efficient, growth-driven and execu-tion-oriented company.
Leadership Academy To follow up on the roll-out of the Leader-ship Competences, we launched the Carls-berg Group Leadership Academy in 2014. The purpose of this Group-wide initiative is to train and develop our leaders through-out the Group in executing and improving their Leadership Competences. In 2014, the training focused on how to apply the Lead-ership Competences when driving strategy execution across a matrix organisation, and motivating and developing employees to continually improve their performance. The Leadership Academy will continue in 2015.
In order to support career development and fill vacancies faster with applicants from inside the Carlsberg Group, talent panels across commercial, finance and supply chain
30Carlsberg Group Annual Report 2014 Our strategy

functions were established during 2014. The talent panels provide a platform for enhanc-ing the awareness and transparency of talents across the Group, and they reinforce our commitment to retaining and developing our talented employees at all levels.
Short-term assignmentsIn 2014, the STA (short-term assignment) programme was further embedded in the organisation. STAs typically last for one to six months and effectively utilise and exchange skills and knowledge, bringing together different competences across the Group. They enable the Group to secure the right candidates with the necessary skills for short-term projects across functions and geographies, and they represent a unique opportunity to grow talent, strengthen suc-cession pools and increase development opportunities. During the year, STAs were
successfully used for various projects, such as value management, field force efficiency and BSP1.
Training for sales and marketingIn 2014, we continued our extensive training programme to facilitate high performance and superior execution in sales and market-ing. The training sessions followed a struc-tured approach and involved both manage-rial and non-managerial employees. The hands-on training sessions enhanced the existing processes and tools for developing strategy and operational execution, and fo-cused on applying insights to develop brand and customer strategies and on translating strategies into action. Topics included devel-oping distinctive and memorable advertising, defining brand assets that are uniquely rec-ognisable for consumers and driving growth opportunities through compelling customer-
focused arguments for category activation. More than 750 employees participated in the programme during the year.
EFFECTIvENESS & EFFICIENCY Producing, marketing and selling products of consistently high quality at the right price is critical for creating a competitive advantage within the beer industry. We therefore engage in value-adding activities to get the most out of our resources, and we have a relentless focus on optimising our business across the value chain with a view to optimising, standardising and centralising processes and systems where it makes business sense. These efforts will drive earnings and improve return on invested capital.
Three prioritiesThis strategic lever has three priorities:1. Develop and maintain an efficient con-
sumer- and customer-focused organisa-tion, reducing costs that do not add value for our customers.
2. Maximise return on investment by being selective in our investments and invest-ing proportionally more in activities with the highest return and impact.
3. Apply the Carlsberg Group way of working by sharing best practices and using our capabilities to the best possible effect.
Actions and activities2014 was the second year of operations for Carlsberg Supply Company (CSC), which has brought together the Group’s central procurement, production, logistics and plan-ning functions under one roof. CSC man-ages the production and logistics network in Western Europe and sets the standards for supply chain operations for all companies in the Group.
ProcurementIn 2014, the central Group Procurement function in CSC increased its scope by tak-ing more of the Group’s total spend under central control, thereby ensuring steadier supply, less price volatility, and better terms and conditions. Strategic partnerships were agreed with selected key suppliers of brew-ing and packaging equipment, leading to a higher degree of standardisation across the Group. Steps were also taken to consolidate local suppliers of various business services.
Standard ways of workingThe process of defining standard ways of working continued, and global best practices were rolled out across all breweries, cover-
Driving effectiveness and efficiency is important for achieving strong business results. Our many initiatives include standardised ways
of working and optimising procurement.
31Carlsberg Group Annual Report 2014 Our strategy

ing areas such as brewing & processing, packaging, maintenance, utilities, quality, health, safety & environment etc. This work will continue, leading to higher efficiency, lower costs and less use of resources such as water and energy.
Similarly, defining the best way of work-ing globally in areas such as transportation, warehousing and distribution also continued in 2014. Due to different geographies and routes to market, the methods of transporta-tion and distribution vary greatly between markets, but central insight into route plan-ning across borders in Europe still led to cost savings as a result of fewer kilometres driven and less diesel used. New fully automated warehouses have been established, most re-cently in Sweden, with the aim of increasing efficiency in picking and distribution.
On-shelf availability (OSA)A key driver of OSA is the planning func-tion, ensuring that demand meets supply in the most efficient way across our markets by optimising and allocating production vol-umes at the plants and in the flows between the plants. In 2014, Group Planning focused on improving the accuracy of sales volume forecasting from markets, on managing the portfolio of SKUs – stock keeping units – in the markets, and increasing the ability to respond to new and unforeseen market demands, for instance when a supermarket chain launches a campaign at short notice leading to an unexpected uplift in sales.
BSP1A key enabler for the new business model in Western Europe is the roll-out of BSP1 – the business standardisation project that
aims to standardise work processes across markets, enabled by a single shared IT plat-form. The roll-out continued, and by the end of 2014 six markets were on the system.
Shared service centreDuring 2014, the Group’s shared service centre in Poznan, Poland, expanded its scope, extending services for controlling, master data, procurement, logistics, plan-ning, HR and legal to Group functions and local entities.
SOCIETY & REPUTATIONThe long-term success of the Carlsberg Group is dependent on what we do, what we say and how we behave when we interact with our stakeholders. We recognise the importance of actively building a strong, sustainable corporate brand position for the Carlsberg Group while ensuring that our people are well prepared to manage any potential crises and issues in a sensitive, responsible manner.
Three prioritiesThis strategic lever has three priorities:1. Raise our reputation as a responsible
global brewer among key stakeholder groups, as this is critical for securing our licence to operate and grow.
2. Integrate corporate social responsibility (CSR) across the value chain to ensure that we make decisions that have a positive impact on our business, the environment and the communities in which we operate.
3. Enhance the image of the beer category in collaboration with other global brew-ers and brewers’ associations in order to nurture the health of the beer category and contribute to its growth.
Actions and activitiesReputation and stakeholder managementWe continued our strategic approach to managing and measuring our corporate reputation among key stakeholders, includ-ing consumers, customers, employees, journalists and politicians. Reputation data gives strategic guidance to our stakeholder relations, and reputation management is now closely embedded at Group level as well as in key markets across all three regions. We will continue the roll-out of this approach to achieve even broader coverage in 2015, while maintaining active stake-
holder dialogues about future regulation, taxation etc.
Integrating CSRThe execution of our global CSR strategy continued, focusing on four priorities: man-aging environmental efficiency and safety; managing sustainable packaging; promoting responsible drinking; and ensuring compli-ance with our CSR policies.
Environmental efficiency and safetyIn 2014, our main focus was on improving our environmental and safety manage-ment in the newly acquired operations in China. The integration of Chongqing Brewery Group impacted our environmen-tal efficiency slightly. During the year, we conducted a series of internal audits and identified opportunities to improve our
To promote responsible drinking, festival-goers in Denmark were asked to define what it meant to them.
32Carlsberg Group Annual Report 2014 Our strategy

OUR cSR POlicieS
Business ethicsIn the Carlsberg Group, we believe in fair and transparent business practices. Our Business Ethics Policy and Guidelines seek to ensure eth-ical business conduct by guiding our employees when they face dilemmas of a business ethics nature in their day-to-day tasks. The Business Ethics Policy clearly sets out our positions.
Community engagementBeing engaged with society is one of the Carlsberg Group’s winning behaviours. We recognise our impact and the opportunity to engage with the communities where we operate – and we are committed to making a positive contribution.
EnvironmentThe sustainability of the environment plays a vital role within our business. Most of our raw materials and ingredients are sourced directly from nature. The continued success of our business is directly linked to the health of the environment. However, as we grow, our environmental impact increases, and we are therefore continually looking for ways to reduce our impact on the environment and climate.
Health & safetyWe continuously work to build a safe working environment for all our employees and contract-ors. Every accident is one too many. We strive towards zero accidents by instilling a culture of safety in each and every one of our employees.
Labour & human rightsOur employees are our single most valuable resource and are vital for the Carlsberg Group’s continued success. A globally implemented Labour and Human Rights Policy is a fundamen-tal element in ensuring that our employees are fully engaged and that we can drive the growth of our business. The implementation of the policy forms an integral part of the core values for which the Carlsberg Group stands.
Marketing communication Our Marketing Communication Policy sets the standards to ensure that our marketing, adver-tising and other consumer information reflect our overall commitment to promoting respon-sible use of our products, on the right occasions, by people above the legal drinking age.
Responsible drinkingBeer brings people together in joyful and happy moments, and that is what the Carlsberg Group, as a responsible brewer, wants to be a part of. We are conscious that beer is an alcoholic be v-erage and that its misuse can have severe and harmful effects on people. We are addressing these potentially negative effects of misuse of alcohol through the provisions in our Respon-sible Drinking Policy.
Supplier and Licensee Code of ConductWe are committed to improving our environ-mental and social footprint throughout the value chain. We implement necessary actions to understand, monitor and improve the social and environmental aspects of our sourcing, thereby protecting our reputation as a respon-sible brewer.
performance. Across the Group, our safety record improved, while our environmental efficiency decreased slightly, mainly due to the integration of Chongqing Brewery Group into the reporting scope.
Sustainable packagingAt the World Economic Forum in Davos in January 2014, we launched the Carlsberg Circular Community. This is a partnership-driven initiative that seeks to develop the next generation of packaging products optimised for recycling, reuse and upcyc-ling. During the year, we initiated a number of projects in order to deliver innovative Cradle-to-Cradle® products in 2016.
Responsible drinkingWe launched a new Responsible Drink-ing Policy to further step up our efforts to position beer as the responsible choice and drive a proactive approach to tackling the misuse of alcohol. Our approach was guided by a number of individual and industry-wide commitments related to high-risk areas, such as underage drinking and drink driving, and enabling consumers to make informed choices. These commitments translated into local activities in our markets, such as the “Drink with Respect” campaign in Denmark and employee ambassadors at the Future Music Festival Asia in Malaysia.
Compliance with our CSR policiesIn 2014, we launched an updated Busi-ness Ethics Policy globally and initiated a Group-wide awareness campaign to manage compliance risks. We strengthened our ef-forts to ensure global implementation of and compliance with our policies, with specific focus on business ethics and on labour & human rights. To understand and address
potential risks in our new market of Myan-mar, we carried out an impact assessment in collaboration with the Danish Institute for Human Rights.
Promoting the image of the beer categoryIn close partnership with other brewers and brewers’ associations across the world, we have strengthened our efforts to promote the beer category and offer ourselves as reliable partners, contributing positively to local societies around the world. Among the highlights in 2014 was the launch of the Europe-wide beer category campaign “Love Beer”, backed by Europe’s 5,000 brewers. The campaign was launched in a few mar-kets in 2014 and will be further rolled out across Europe in 2015.
CSR reporting The Carlsberg Group publishes an annual CSR report that serves as our United Na-tions Global Compact Communication on Progress. Furthermore, it enables us to live up to our legal responsibility for CSR disclosure under section 99a of the Danish Financial Statements Act.
The full 2014 CSR report, including the KPMG assurance statement and GRI table, is available online at www.carlsberggroup.com/csr/reports.
33Carlsberg Group Annual Report 2014 Our strategy

KPisMeasuring our performance
We measure our financial performance and progress towards our strategic priorities using a number of KPIs. These are integrated in incentive schemes throughout the organisation to align the performance of the Group. Selected financial and non-financial KPIs are presented here, while other KPIs are commercially sensitive and not disclosed.
FInAnCIAl KPIs
The Carlsberg Group publishes a report on the total economic contribution of the Group. www.carlsberggroup.com
Adjusted earnings per share is adjusted for the after-tax impact of special items and is a key meas-ure of the underlying earnings of the Group. Our longer-term ambi-tion is to deliver average growth in adjusted EPS of more than 10% p.a. Growth in adjusted EPS is a perform ance criterion in manage-ment’s long-term incentive plan.
In 2014, adjusted EPS was DKK 36. The decline versus last year was due to the negative currency impact.
Operating profit(DKKbn)
11
9
7
5
3
1
Operating profit is a measure of our ability to enhance oper-ational performance through top- line growth and continued focus on cost-effectiveness. Operating profit is a performance criterion in management’s annual bonus plan.
In 2014, operating profit grew 1% organically. Strong results in Western Europe and Asia more than offset the decline in Eastern Europe.
2012
2013
2014
40
34
28
22
16
10
Adjusted EPS(DKK)
2012
2013
2014
Free operating cash flow
Free cash flow (FCF)
A strong FCF allows us to return cash to our shareholders and pay down debt, enabling us to rein-vest in our business and engage in value-creating M&A activities. FCF is a performance criterion in manage-ment’s annual bonus plan.
In 2014, FCF was DKK 670m. Organic growth in EBITDA was offset by a negative impact from currencies and trade working capital and higher CapEx than last year.
10
8
6
4
2
0
2014
2013
2012
Cash flow(DKKbn)
20
16
12
8
4
0
Return on invested capital (ROIC) (%)
2014
2013
2012
Maximising return on all invest-ments is the key to delivering sustainable value to sharehold-ers. An increased focus across the Group will ensure proper analyses of all investments throughout the value chain in addition to acquisition targets in order to ensure the right basis for decision-making. In 2015, a ROIC measure will be a per-formance criterion in the short-term bonus plan.
In 2014, ROIC was at the same level as in 2013.
ROICROIC excl. goodwill
34Carlsberg Group Annual Report 2014 KPIs

Engagement score
Participation
+30bp +3%
-80bp
+3%1%
8%
Western Europe 2014
Russia
20132014
2013
79
90%2014
7820132014
88%2013
The Carlsberg brand is a key priority as “the name above our door”. In most markets around the world it is a premium brand. The brand still has untapped commercial potential, not least in its premium markets, particularly in Asia.
In 2014, Carlsberg grew 1% in its premium mar-kets. In Asia, Carlsberg grew 12% in its premium markets, with notable growth in China and India.
Growing our market share is necessary to be a significant player in our markets and is a strong indicator of our execution capabilities. Organic growth in market share is part of management’s annual bonus and long-term incentive plans.
In 2014, we grew our market share in Western Europe for the fourth year in a row. In Russia, we improved our market share throughout the year, though it was down year-on-year.
Organic growth in net revenue/hl is an important measure of our top-line performance manage-ment. This includes our ability to premiumise our portfolio and drive a positive brand mix as well as our ability to utilise our value management tools, deliver superior execution and win with our
winning customers. Delivering organic growth in net revenue/hl is also testimony to our focus on balancing volume and value.
In 2014, we grew net revenue/hl, measured in organic terms, by 3%.
My Voice is a tool for tracking employees’ engage-ment and opinions on their work, workplace and the Carlsberg Group in order to continuously drive improvements and the performance of the Carlsberg Group.
In 2014, 90% of the Group’s employees partici-pated in the annual survey against 88% in 2013. The overall engagement score was up 1 percentage point versus 2013.
cOnSUMeRS, BRanDS & innOvatiOn
STRATEGY KPIs
cUStOMeRS
PeOPle
Employee engagement score and participation (My voice)
Market share growth Carlsberg brand volume growth in premium markets
Organic growth in net revenue/hl
35Carlsberg Group Annual Report 2014 KPIs

SOcietY & RePUtatiOneFFectiveneSS & eFFiciencY
20
16
12
8
4
0
0
-1
-2
-3
-4
-5
Operating profit margin(%)
2014
2013
2012
ATWC/net revenue (%)
2014
2013
2012
Operating profit margin is a profitability ratio that measures the percentage of total revenue made up by operating income. Measured over time, it shows our ability to efficiently reduce our cost base relative to net rev-enue. The cost drivers include COGS, logistics, administration, sales and marketing.
In 2014, Group operating profit margin declined 80bp to 14.3%, primarily due to the acquisition impact from Asia and the East-ern Europe profit decline.
Net working capital is the amount of capital tied up in in-ventories and outstanding trade receivables less payables to sup-pliers. By reducing the average trade working capital (ATWC), the Group can free up cash, and this continues to be a key focus area throughout the Group. The ongoing work involves increas-ing days payable outstanding (DPO), and reducing days sales outstanding (DSO) and days sales of inventory (DSI).
Significant results have been achieved, with ATWC/net rev-enue reduced to -3.6% in 2014 from 3.8% in 2009.
6 17 67%2014 onboarded partners 2017 partners target 2014
100%2017 target
29.42014 performance
5-102017 target (%)Reduction in relative consumption over 3 years1
7.32014 performance
5-102017 target (%)Reduction in relative consumption over 3 years1
3.42014 performance
5-102017 target (%)Reduction in relative consumption over 3 years1
9.12014 performance
402017 target (%)Reduction in lost-time accidents1,2
The Carlsberg Group reduces energy consumption through individual breweries’ energy efficiency projects and process optimisation.
Reduction in CO2 emissions is a primary measure of how the Group is progressing on the ambitious targets for reducing its environmental impact.
Making more beer with less water is a high priority for Carlsberg’s breweries around the world.
A strong safety performance is a prerequisite for a sustainable and healthy workplace for our employees.
The Carlsberg Circular Community (CCC) is an initiative in which Carlsberg cooperates with key partners using the Cradle-to-Cradle® design framework to develop products that are optimised for recyc-ling and reuse while retaining their quality and value. The approach is increasingly referred to as upcycling. By 2017, we aim to be cooperating with 17 key partners to have at least three products Cradle-to-Cradle®-certified. 1 Allowing for adjustments of 2014 baseline when relevant.
2 Group-wide (per 1,000 employees)
In order to promote responsible drinking, the Group will display health messages on its primary or secondary packaging of alcoholic beverages. The messaging will relate to drinking and driving, underage consumption and consumption by pregnant women.
Energy(kWh/hl)
Water(hl/hl)
CO2
(kg CO2/hl)Lost-time accident rate in Production (per 1,000 employees)
See the full CSR performance in our 2014 CSR report.www.carlsberggroup.com/csr
Sustainable packaging (partners participating in CCC)
Responsible drinking (percentage of volume containing health-related messaging)
STRATEGY KPIs
36Carlsberg Group Annual Report 2014 KPIs

The Carlsberg Group’s comprehensive ap-proach to risk management involves the identification, assessment, prioritisation and economic management of risks that might prevent the Group from achieving its strategic objectives. The Risk Management Policy sets out the requirements for the risk management process in the Group.
Risk management frameworkThe Group’s risk management framework is a systematic process of risk identifica-tion, analysis and evaluation, providing a comprehensive overview of strategic risks and enabling us to mitigate and monitor the most significant risks.
Our risk management approach is top-down and covers all major entities across regions, markets and functions. The framework is
based at the strategic level to ensure that the risks related to carrying out the Group’s strategy – both short-term and long-term – are identified and that relevant preventive actions are taken.
Risk management governance structureUltimately, the Supervisory Board is responsible for risk management. The Supervisory Board has appointed the Audit Committee to act on behalf of the Super-visory Board, and the Committee monitors the overall strategic risk exposure and individual risk factors associated with the Group’s activities. Monitoring is mainly performed in connection with the quarterly reporting process. The Audit Committee adopts guidelines for key areas of risk, monitors developments and ensures that
plans are in place for the management of individual risk factors, including commercial and financial risks.
The Executive Committee (ExCom) is responsible for reviewing the overall risk exposure associated with the Group’s activities. Risks are assessed according to a two-dimensional heat map rating system that estimates the impact of the risk on net revenue or brand/image and the likelihood of the risk materialising.
Based on this assessment, ExCom updates the existing heat map to reflect changes in perceived risks to the business, and a number of high-risk issues for the coming year are identified. In addition, any risks in relation to the Group strategy for the sub-sequent three-year period are identified and appropriate actions are agreed upon.
In accordance with the Risk Management Policy, ExCom identifies owners of short-term and long-term risks, who are then responsible for mitigating the risks through a programme of risk-reducing activities.
Local entities and Group functions are re-sponsible for the identification, evaluation, qualification, recording and reporting of the management of strategic risks at local level. Local-level risk assessment follows the same principles as Group-level risk as-sessment and is based upon the heat map described above. The local risk review is carried out regularly, following which local risk owners are appointed and given re-sponsibility for mitigating the risks through a programme of risk-reducing activities.
A formal procedure is in place for ongoing identification, assessment and reporting during the year of any new or emerging risks that are determined to have a material impact upon the business.
Group Internal Audit is responsible for fa-cilitating and following up on risk-reducing activities/action plans for the most signifi-cant risks in the Carlsberg Group.
The financial risks, including foreign ex-change, interest rate, and credit and liquid-ity risks, are described in sections 4.5-4.7 of the consolidated financial statements.
Risk assessment 2015Local risk management workshops and heat mapping were carried out during the third quarter of 2014. In the fourth quarter of 2014, ExCom carried out the annual risk management workshop to evaluate the adequacy of the existing heat map. The review resulted in a revision of the identified risks, and a revised set of high risks for 2015 was identified.
The correlation between the high risks iden-tified at Group and local level was signifi-cant, which indicates that the strategy and associated risks at local and regional level are aligned with the overall Group strategy.
The high risks identified for 2015, placed in the upper-right quartile of the risk heat map, were the Russian economy, duties and regulation, value realisation of BSP1, and the ability to increase prices and trade term pressure. These risks are presented in more detail on page 40.
RiSK ManageMent
We consider effective risk management an integral part of our business operations as it reduces uncertainty, helps the Group achieve its strategic objectives and facilitates value creation for all stakeholders.
37Carlsberg Group Annual Report 2014 Risk management

Other risks identified for 2015, though not classified as high risks, were value realisa-tion of the recent acquisitions in China, delivery of cost savings and satisfactory customer service levels by the Carlsberg Supply Company (CSC), the ability of employees and the organisation as a whole to successfully incorporate changes in structure and ways of working, particularly in Western Europe, and possible relative underinvestment in key brands.
The Group closely monitors and undertakes risk-reducing activities to minimise the likeli-
hood and potential impact of the identified risks.
Risk assessment 2016-2019During the annual risk management workshop, ExCom also evaluated the strategic risks facing the Carlsberg Group for 2016-2019.
The identified strategic high risks included recruitment into the beer category and the image of beer in Europe, taxes and regula-tion, lack of top-line growth, new ways of working and change management in con-
nection with key change projects such as BSP1, and economic downturn.
Our strategy levers and the associated priorities, as described on pages 27-33, address the strategic risks.
Our actions and activities, described under each strategic lever, are examples of proac-tive steps to minimise the likelihood of the risks materialising. These include our corp-orate reputation management, compliance with CSR policies and responsible drinking commitments, and local activities to respond to the risks related to taxes, regulation and the image of beer.
Driving top-line growth in a profitable way is a key focus area of the Consumers, Brands & Innovation and Customers strategy levers, while new ways of working and change management in connection with key change projects are primarily covered by the People and Effectiveness & Efficiency levers.
RiSK aSSeSSMent Heat MaP – HigH RiSKS 2015
Impact on operating profit or brand/image
tHe caRlSBeRg gROUP’S OngOing RiSK ManageMent FRaMewORK
Risk categories covered by the Group’s risk management are:
Strategic risks relate to issues such as market development, competition, stakeholders and politics.
Operational risks relate to issues such as technology, people, processes, infrastructure and information.
Compliance risks relate to issues such as corporate social responsi bility, legal and tax.
Financial risks relate to issues such as foreign exchange, interest rate, and credit and liquidity risks (described in sections 1 and 4 in the consolidated financial statements).
IDENTIFICATION
ASSESSMENT
MAPPING
RECORDING
MONITORING
RISKMANAGEMENT
Strategic risks are assessed according to a two-dimensional heat map rating system that estimates the impact of the risk on net revenue or brand/image and the likelihood of the risk materialising.
Russian economy
Likelihood
Duties & regulation
BSP1 value realisation
Ability to increase prices & trade term pressure
High
Medium
Low
Medium HighLow
38Carlsberg Group Annual Report 2014 Risk management

Economic slowdownThe economic slowdown of recent years, particularly in Western Europe, was expected to continue in 2014. By late 2013, slower growth was also evident in Eastern Europe and some Asian countries. The challenging geopolitical environment in Russia, Ukraine and the EU escalated during 2014, leading to a further worsening of the macroeconomic situation.
The Group’s Western European beer markets proved resilient in 2014, showing a flat volume development. In Eastern Europe, the beer market declined by 7% in Russia and 8% in Ukraine as the tough macroenviron-ment and high inflation significantly impact-ed consumer sentiment and spending.
In Asia, China experienced a slowdown in economic growth, which, combined with unusually bad weather and unrest in the
RiSK ManageMent High risks 2014
Three high risks were identified for 2014. We report on their impact on the Group and our actions to mitigate them here.
Xinjiang province, had a negative impact on beer market volumes in 2014.
During the year, we closely monitored the macroeconomic health of our markets and took the necessary actions to reduce the impact of the adverse economic environ-ment. Examples of mitigating actions were the further premiumisation of our beer portfolio to support a positive mix develop-ment and the continued diversification of our portfolio outside beer, for example by supporting the expansion of the Somersby cider brand.
From a cost perspective, we applied a rigid and systematic approach, allocating our resources to fewer areas with the highest impact, and maintained our focus on im-plementing efficiency initiatives across the Group to reduce the cost base.
Implementation of BSP12014 was the second year of the three-year implementation period for the supply chain integration and business standardisation project (BSP1). During the year, the UK went live in April and Finland, Poland and Switzerland in October.
BSP1 represents a substantial change in the operating model in Western Europe, and rolling out the project requires significant resources and entails substantial implemen-tation costs. If the implementation of the project or the adoption of the new operat-ing model fails, this could have a negative impact on regional and Group earnings.
The implementation in 2014 went according to plan as a result of detailed planning and follow-up post implementation. Due to the complexity of our UK business, however, we experienced some initial challenges in our wholesale business in that market. These challenges were mitigated through increased deployment of manual work procedures.
Impact and speed of large Group projectsBesides the BSP1 project, the Carlsberg Group is running a number of large structural and efficiency projects to reduce the overall cost base of the Group. In addition, the integration of Chongqing Brewery Group was a large project in 2014.
These kinds of structural, efficiency and integration projects represent important
levers for increasing Group operating profit, and failure to successfully implement them was deemed a high risk for 2014.
Generally, the Group achieved its plans for 2014 with respect to the large projects dur-ing the year. The integration of Chongqing Brewery Group is on track and expected to be finalised as planned by mid-2015. This performance was the result of de-tailed attention by top management and a structured approach, closely monitoring and tracking the status of key initiatives, includ-ing progress versus plan, issues, risks and savings. Where relevant, KPIs were linked to project performance.
39Carlsberg Group Annual Report 2014 Risk management

RiSK ManageMent High risks 2015
Russian economyDescriptionIn 2014, the rouble-denominated share of operating profit (before not allocated costs) was around 25%. While this number will be lower in 2015, the development of the Rus-sian economy, including GDP growth and the exchange rate, may have a negative impact on the Carlsberg Group’s results. The Rus-sian economy was under increasing pressure during 2014, and the World Bank and the IMF estimate GDP growth in 2015 of -2.9% and -3% respectively.
Possible impactThe negative Russian macroeconomic situ-ation impacts employment, income levels and savings, ultimately driving a negative development in consumer sentiment. In addition, the import sanctions on many
agricultural products have led to increasing inflation for staple food items. Combined, these factors may impact the ability of con-sumers to buy beer.
MitigationWhen developing our plans and budget for 2015, we have applied very specific, flexible assumptions and prepared detailed scenario plans to enable a fast response to changes in the assumptions. We continuously mon-itor the development of and expectations for the Russian economy using a variety of data sources so that we are able to execute our contingency plans for different economic scenarios. In addition, in January 2015 we announced the closure of two breweries in Russia to further optimise our structure and reduce capital employed.
Duties & regulation DescriptionBeer is a highly taxable consumer prod-uct. In any market, the national govern-ment may decide to increase beer duties to increase state revenues or as a means to reduce alcohol consumption. In addition, several of the Group’s markets operate with restrictive measures relating to sales, avail-
ability and advertising. In Russia specific-ally, discussions are ongoing to reduce PET pack sizes. Such measures could be further strengthened or implemented in our markets as a means to reduce alcohol consumption.
Possible impactThe Carlsberg Group views beer duties as a tax on the consumer and, as a general rule, any increase in beer duties is there-fore added to the sales price of the beer. Consequently, major changes in beer duties may reduce the demand for the Group’s products. Likewise, tightening of regulations may impact consumer behaviour and con-sequently result in decreased demand. De-creasing demand may negatively impact the Group’s net revenue and operating profit.
MitigationThe Group closely monitors the risks related to increases in duties in all its markets and acts to limit the potential impact. Local markets are supported by the Group’s cen-tral public affairs department. This support includes lobbying tools and guidance as well as economic impact assessments to promote informed political decisions. Through tar-
geted campaigns in local markets, the Group works to limit the negative consequences of inappropriate consumption of beer and other alcoholic beverages, and actively promotes responsible sale and consumption to reduce the risk of regulatory tightening.
We actively engage in industry-wide dis-cussions and actions through the Global Brewers Initiative (GBI), the International Alliance for Responsible Drinking (IARD) and local brewers’ associations to secure joint lobbying efforts and voluntarily develop industry codes of conduct.
value realisation of BSP1Description2015 is the third year of implementation of the supply chain integration and business standardisation project (BSP1) in Western Europe. The implementation began in 2013, and by the end of 2014 six markets were on the system. The project is a key enabler for the transformation of the operating model in Western Europe. It will lead to increased speed, optimised asset utilisation and improved capabilities, and will yield significant long-term benefits in the Western European region.
The Carlsberg Group’s Executive Committee has identified four high risks facing the Group in 2015. These risks were assessed as belonging in the upper-right quartile of the risk heat map.
40Carlsberg Group Annual Report 2014 Risk management

Possible impactImplementation of the BSP1 project entails significant changes in structures, ways of working and responsibilities. If implementa-tion of the project or adoption of the new operating model is hampered, this could limit the benefits of the project and have a nega-tive impact on regional and Group earnings.
MitigationIn order to ensure that we reap the full benefits of BSP1 and the business transfor-mation, a number of activities are ongo-ing. They include post-go-live assessment of ways of working to identify issues and create solutions; accumulating and adapt-ing to lessons learned from past roll-outs; securing key resources across the markets; and, when and if appropriate, reorganising BSP1 and relevant teams to ensure clear responsibilities at all times during and after the roll-outs. In addition, the focus is on securing and improving end-to-end collab-oration between local commercial operations and the central supply chain organisation to ensure that efficiencies and improvements are achieved as planned.
Ability to increase prices & trade term pressureDescriptionCompetition in most of the Group’s markets is generally fierce. Across most markets, there is an ongoing shift in the marketplace from on- to off-trade and, in some markets, to low-priced outlets within the off-trade. With the macroeconomic situation in many markets still under pressure, customers are becoming increasingly aggressive in their demand for promotions and favourable trade terms.
Possible impactA difficult pricing environment and stronger trade term pressure from our custom-ers could have a negative impact on our net sales prices. Lower net revenue per hl would have a negative impact on margins. Conversely, not accommodating pricing and trade term pressure from customers could have a negative impact on volumes, reduc-ing operational leverage.
MitigationBalancing volume and value is the key to the way we approach our customers. The Group works with a sophisticated value management toolbox with the aim of in-creasing net revenue per hl, while simul-taneously strengthening our position with customers. We continuously develop the value management levers and are currently rolling out a trade term module across our large markets. By combining value man-agement with ROMI (return on marketing investment), we apply a holistic commercial approach to our customers to drive a posi-tive development in the value of the beer category. In addition, by delivering a portfo-lio of value-generating innovations for both our international premium brands and our local power brands, we will drive a positive development in net revenue per hl.
41Carlsberg Group Annual Report 2014 Risk management

cORPORate gOveRnance
The Carlsberg Group aims to maintain an appropriate corporate governance framework to ensure active, reliable and profitable business management across the Group.
The Supervisory Board and Executive Board of Carlsberg A/S constantly strive to ensure that the Group’s management structure and control systems are appropriate and work satisfactorily. The internal procedures are regularly updated in order to ensure active, reliable and profitable business management.
The basis of the Group’s corporate govern-ance includes the Danish Companies Act, the Danish Financial Statements Act, IFRS, the Danish Securities Trading Act, NASDAQ OMX Copenhagen A/S’s rules for issuers of shares, and the Company’s Articles of Association.
Recommendations on Corporate Governance The recommendations of the Danish Com-mittee on Corporate Governance form part of NASDAQ OMX Copenhagen A/S’s rules for issuers of shares. These recommendations were last updated in November 2014 and can be found online1.
The Carlsberg Group complies with all the corporate governance recommendations, and the Supervisory Board actively uses the recommendations in relevant areas to optimise the way it works.
The Group’s statutory report on corporate governance includes a full list of the recom-mendations, together with our comments with regard to each recommendation; see www.carlsberggroup.com/Company/Governance/Pages/UKrecommendations.aspx.
Shareholders and capital structureThe Carlsberg Group aims to provide infor-mation and opportunities for dialogue to its shareholders through regular publication of news, interim reports and annual reports, and at Annual General Meetings. The Com-pany’s website is continuously updated with published information. Regular teleconfer-ences, conferences and meetings are also arranged with investors.
The Supervisory Board regularly assesses whether the Company’s capital structure fulfils the interests of the Group and its shareholders. The overall goal is to ensure a capital structure that supports long-term profitable growth and value creation. The Company’s Articles of Association contain no limits on ownership or voting rights.
Carlsberg A/S’s share capital is divided into two classes. All shares have the same nominal value (DKK 20). An A share carries 20 votes, while a B share carries two votes and is entitled to a preferential dividend. Both classes of shares are listed on NASDAQ in Copenhagen. The Supervisory Board believes that the different share classes, combined with the Carlsberg Foundation’s position as principal shareholder, have been and will remain advantageous for all of the Company’s shareholders as this structure supports the long-term development of the business.
The Annual General Meeting To ensure that shareholders receive detailed information about the Annual General Meet-ing (and any other General Meetings), enab-ling them to make informed decisions when casting their votes, the following applies: • Notice of the Annual General Meeting is
published at least three weeks prior to the meeting and is sent to all shareholders who have provided an e-mail address.
• All shareholders who own shares one week before the Annual General Meet-ing are entitled to participate in and vote at the Annual General Meeting, provided they have requested an admission card no later than three days before the meeting.
• Any shareholder is also entitled to put forward proposals for consideration at the Annual General Meeting to the Super-visory Board no later than six weeks before the date of the meeting.
• Any shareholder who has the right to at-tend the Annual General Meeting may give a proxy to the Supervisory Board or to somebody else attending the Annual Gen-eral Meeting for each individual item on the agenda or vote by letter as set out in the notice of the Annual General Meeting.
Minutes of the Annual General Meeting are made available on the Company’s website no later than two weeks after the meeting.
According to the authorisation of the Annual General Meeting, the Supervisory Board may, in the period until 19 March 2019, al-low the Company to acquire treasury shares up to a total holding of 10% of the nominal share capital at the price quoted on NASDAQ in Copenhagen at the time of acquisition with a deviation of up to 10%.
1 http://corporategovernance.dk/file/479181/commitee-on-corporate-governance-recommendations-for-corporate-governance-of-may-2014.pdf
In 2014, the Annual General Meeting took place on 20 March in Copenhagen. 351 shareholders attended in person and 84.7% of the votes (excl. treasury shares) were represented at the meeting.
42Carlsberg Group Annual Report 2014 Corporate governance

Stakeholders and the CompanyThe Carlsberg Group aims to develop and maintain a good relationship with its stake-holders as this is important for the Com-pany’s positive development.
For this reason, and also in order to reduce risk and promote good governance in the Carlsberg Group, the Company has formu-lated policies for a number of key areas, such as communications, human resources, environment, business ethics, competition law, marketing communication, and respon-sibility to customers and society in general. One element of the Supervisory Board’s work is to ensure compliance with and regu-lar adjustment of policies to reflect develop-ments both inside and outside the Company.
Communication with investors and ana-lysts is primarily handled by the Company’s Executive Board and the Investor Relations department.
This dialogue includes a comprehensive programme of activities and complies with the rules of NASDAQ OMX Copenhagen A/S. All company announcements are published in English and, for the time being, simultaneously in Danish (except quarterly announcements), and are distributed electronically, immediately following publication, directly to shareholders and others who have requested them.
Investor presentations are usually made available on the Company’s website at the same time as the presentations are given.
Following each quarterly announcement, the Executive Board hosts a telephone conference where the results are presented and questions may be asked. Anyone who wishes to participate in these telephone conferences may sign up to dial in.
The composition of the Supervisory BoardThe General Meeting elects the Supervisory Board. The Supervisory Board currently has 10 members elected by the General Meeting and five members elected by the employees in accordance with the Danish Companies Act. Consequently, the Supervisory Board has a total of 15 members.
The members elected by the employees hold the same rights and obligations as the members elected by the General Meeting and are elected for a term of four years. The current employee representatives were elected in 2014. The next election will take place in February 2018.
Five of the 10 members elected by the General Meeting are affiliated to the Carls-berg Foundation, the Company’s principal shareholder, and have an academic back-ground, while the other five members have an international business background.
This composition ensures appropriate diver-sity and breadth in the members’ approach to their duties. The Supervisory Board believes that this also helps to ensure that decisions are well considered.
According to the Articles of Association, the members of the Supervisory Board are
elected individually and for a term of one year. Re-election is possible. Members must step down at the first General Meeting after they reach the age of 70.
Each year, the Supervisory Board consid-ers the skills that should be represented on the Supervisory Board on the basis of a recommendation from the Nomination Committee.
These skills are described in the Specification of Competencies on www.carlsberggroup.com. The Nomination Committee and the Super visory Board take the description of the required skills into consideration when recommending new candidates for the Supervisory Board.
A description of the composition of the Supervisory Board and the individual mem-bers’ particular competences with respect to the work of the Supervisory Board is found on pages 160-163 as well as on the Company’s website.
None of the members of the Supervisory Board are or have been involved in the executive management of the Group.
Prior to recommending candidates for elec-tion at the General Meeting, the Super -visory Board (based on a proposal from the Nomination Committee) distributes a presentation of each candidate’s background, relevant competences and any managerial positions or positions of responsibility, and the Supervisory Board justifies its recom-mendations on the basis of the recruitment criteria and Specification of Competencies it has laid down.
Board member NationalityOrdinary Board meetings attended
Extraordinary meetings attended
Strategy sem-inar attended
Flemming Besenbacher1,4 Danish
Jess Søderberg1,2 Danish
Richard Burrows1,2 Irish
Donna Cordner1,2 American
Elisabeth Fleuriot1,2 French
Kees van der Graaf1,2 Dutch
Carl Bache1 Danish
Søren-Peter Fuchs Olesen1 Danish
Nina Smith1 Danish
Lars Stemmerik1 Danish
Eva Vilstrup Decker3 Danish
Hans Andersen3 Danish
Elena Pachkova3 Russian
Finn Lok3 Danish
Peter Petersen3 Danish
1 Elected by the General Meeting.2 Independent.
3 Employee representative.4 Chairman.
Not Board member until March.
BOaRD MeMBeRS
43Carlsberg Group Annual Report 2014 Corporate governance

DiversityThe Supervisory Board believes that its members should be chosen for their overall competences, yet it also recognises the benefits of a diverse Supervisory Board in respect of experience, culture, international experience and gender.
On that basis, the Supervisory Board has laid down the following objectives in relation to gender and international experience:
• The Supervisory Board’s objective is to increase the proportion of the underrepre-sented gender on the Supervisory Board so that it will reach at least 40% of the Supervisory Board members elected by the General Meeting no later than 2017.
• Currently, women are underrepresented compared with men, both on the Super-visory Board and in senior management positions in the Company. On that basis,
the Company also has a general aim of increasing the number of women in senior management positions in the Company, and the Supervisory Board has drawn up a policy for such an increase and set out specific action points that the Executive Board must implement.
• With regard to international experience, the objective is that 50% or more of the Supervisory Board members elected by the General Meeting should have substan-tial international experience from manag-ing large corporations or institutions.
Objectives regarding the proportion of the underrepresented gender on the Supervisory Board The objective with regard to the propor-tion of the underrepresented gender on the Supervisory Board (40%) applies to the Boards of all Danish Carlsberg Group com-panies that are required to lay down such
objectives. This is currently Carlsberg A/S, Carlsberg Breweries A/S, Carlsberg Business Solutions A/S and Carlsberg Danmark A/S. Currently, three Supervisory Board mem-bers in Carlsberg A/S elected by the General Meeting and two elected by the employees are women. Accordingly, the objective with regard to gender diversity on the Super-visory Board is not yet met with regard to Carlsberg A/S. In Carlsberg Breweries A/S, all four Supervisory Board members elected by the General Meeting are men. The Board consists of the members of the Chairman-ship and of the Executive Board in Carlsberg A/S and it was not considered appropriate to change this approach in 2014. In Carlsberg Business Solutions A/S, one of the three Su-pervisory Board members is a woman, which means that the objective with regard to gender diversity can be considered fulfilled. In Carlsberg Danmark A/S, one of the four Supervisory Board members is a woman, which means that the objective is not cur-rently met.
On the basis of a recommendation from the Nomination Committee, the Supervisory Board has set out a policy to increase the proportion of women in senior management positions. The 2014 actions to implement the policy were as follows:
• Recruitment firms presented at least one qualified female candidate when recruit-ing for senior management positions. This requirement is incorporated in the Group Recruitment Policy, and recruit-ment firms have been instructed to deliver accordingly. In 2015, it is planned to analyse to what extent this measure has increased the number of female
managers who are actually employed at the end of a search process.
• The Carlsberg Group has a leadership pro-gramme (ALDP – Accelerated Leadership Development Programme) to which high-potential employees are appointed once a year. The target is to ensure on a continu-ous basis that at least one third of the par-ticipants in each programme are women. This was achieved in 2014, when 33% of new enrolments in ALDP were women.
• Finally, all women who, based on a very strong performance and potential rating, including full international mobility, qualify to take on a role at CEO or management board level in local subsidiaries and/or at VP level in the commercial supply chain or finance areas in Carlsberg Group functions/headquarters/regions/Carls-berg Supply Company AG, Switzerland, were assigned a mentor in spring 2014. All members of the Carlsberg Group’s Executive Committee and one CEO of a Carlsberg Group subsidiary acted as men-tors. The mentors were given the role of encouraging the strong-performing female leaders to develop their competences within management and consider career opportunities and promotions (including in Carlsberg Group businesses in other countries). The mentor programme will be reviewed during the first quarter of 2015 to determine its effects.
The Group wants to be an attractive work-place for both female and male managers where men and women consider that they have equal and fair opportunities for promo-tion to higher managerial positions and that their competences can be used in the best possible way irrespective of gender.
1-4 years 53% 5-9 years 33%
SUPeRviSORY BOaRD tenURe DiveRSitY
10-15 years 7% >15 years 7%
Men 67% Women 33%
44Carlsberg Group Annual Report 2014 Corporate governance

International experienceThe objective regarding the international experience of Supervisory Board members is met as at least six of the 10 members of the Supervisory Board elected by the General Meeting can be considered to have substantial international experience from managing large corporations or institutions, and all members elected by the General Meeting are able to operate in an international environment.
The work of the Supervisory BoardThe Supervisory Board of the Carlsberg Group’s parent company, Carlsberg A/S, and the supervisory boards of the other compa-nies in the Group ensure that their Execu-tive Boards observe the goals, strategies and business procedures established by the Supervisory Boards. Information from the Executive Boards of the various companies is provided systematically at Supervisory Board meetings, as well as in written and oral reports covering areas such as market developments and the companies’ perform-ance, profitability and financial position.
According to its Rules of Procedure, the Supervisory Board meets at least six times a year in addition to an annual strategy meet-ing at which the Company’s strategy and overall organisation are discussed. In be-tween its ordinary meetings, the Supervisory Board receives written information on the Company’s operations and financial position. Extraordinary meetings are convened if nec-
essary. The Supervisory Board decides on major investments and divestments, the size and composition of the Company’s capital base, long-term obligations, significant pol-icies, control and audit issues, risk manage-ment and significant operational matters.
The Supervisory Board’s Rules of Procedure set out the procedures for the Executive Board’s reporting to the Supervisory Board and for any other communication between the two bodies. The Rules of Procedure are reviewed annually by the Supervisory Board and adjusted if required.
The Chairman and Deputy Chairman of the Supervisory Board constitute the Chair-manship, which organises meetings of the Supervisory Board in cooperation with the Executive Board. The Chairmanship and the Executive Board held five meetings in 2014; all meetings were attended by the Chairman and three attended by the Deputy Chairman. The specific duties of the Chairman – and in his absence the Deputy Chairman – are set out in the Rules of Procedure.
The Supervisory Board of Carlsberg A/S held seven meetings in 2014 as well as a two-day strategy seminar in Moscow.
Supervisory Board evaluation processEach year, the Chairman of the Supervisory Board heads a structured evaluation of the
SUPeRviSORY BOaRD wORK 2014
Strategy• Attended a two-day strategy meeting off-site,
allowing time to focus on: – Reviewing and debating overall Group
strategy, including the three-year regional strategy as well as the three-year consol-idated strategy and the long-term strategy (beyond five years)
– Deep dive in Network Optimisation – Deep dive in Russia/Ukraine – Deep dive in Asia/China – External speakers on relevant macro-
economic and political topics – Reviewing and debating M&A strategy and
key projects – Meeting key people from the organisation
and hearing presentations of their areas – Market visits to on- and off-trade locations.• Conducted ongoing review of and debate on
M&A, R&D, innovation, branding and other strate-gic projects, and their role in the Group strategy.
• Scrutinised and approved the Group’s capital structure and funding.
• Continuously debated, challenged and ap-proved the three-year plan, both by region and consolidated.
People, succession planning and talent management• Attended presentations by country CEOs and
function vice presidents, and debated their areas of responsibility with them, thus further familiaris-ing the Supervisory Board with the organisation’s key people, markets and functions.
• Discussed the composition of and succession planning for the Supervisory Board and its committees, and approved the recommenda-tion of a new Supervisory Board member for election by the Annual General Meeting.
• Reviewed the HR strategy, and management and development of the internal talent pool and succession planning, focusing on key lead-ership positions across the business.
• Discussed employee engagement across the organisation, including a summary of the an-nual My Voice employee survey report.
Compliance and core values• Discussed on an ongoing basis the Carlsberg
Group’s strategic levers, winning behaviours, history and heritage, and how these are best embedded in the business and strategy.
• Reviewed the Carlsberg Group’s Business Ethics Policy and discussed how to best main-tain and continuously strengthen ethical busi-ness conduct and compliance with applicable regulations throughout the Carlsberg Group.
Governance and risk management• Reviewed the outcome of the Board evaluation
process 2013, including follow-up on all sug-gestions.
• Based on the recommendation of the Executive Board and the Audit Committee, appointed KPMG 2014 P/S (now KPMG Statsautoriseret Revisionspartnerselskab) as the Carlsberg Group’s new auditor for approval at the Annual General Meeting.
• Reviewed and debated the Group Internal Au-dit reports and the working processes around them to ensure efficiency and good governance (through the Audit Committee).
• Approved a Group-wide Expense Policy.• Held separate sessions with the head of Group
Internal Audit, head of Group Finance and head of Group Accounting, without the presence of the executive directors, to ensure that these functions have the appropriate support and resources, and to allow them to raise potential concerns (through the Audit Committee).
• Discussed relevant specific issues and ways of working with the external auditor, without the presence of executives and management, in separate meetings (through the Audit Committee).
45Carlsberg Group Annual Report 2014 Corporate governance

Board’s work, accomplishments and com-position in a structured dialogue with each Board member. The evaluation is carried out in accordance with a written procedure established by the Supervisory Board on the basis of a recommendation from the Nomination Committee and a question-naire comprising a number of items that the Supervisory Board members are to consider as part of the evaluation. This evaluation also includes the cooperation between the Supervisory Board and the Executive Board, and the work, accomplishments and composition of the Executive Board, and a Supervisory Board session without the presence of the Executive Board at which its performance is evaluated.
In 2014, the Chairman introduced a ques-tionnaire to be completed in writing by each Board member prior to the evalua-tion conversation with the Chairman. The questionnaire includes some 30 ques-tions on the Board member’s views on the Supervisory Board’s key duties, composi-tion, dynamics and processes as well as
SUPeRviSORY BOaRD MeetingS aBROaD
In 2014, the Supervisory Board held a two-day strategy seminar in Moscow, where it conducted in-depth discus-sions of the Group’s strategy with the Executive Board and the Executive Committee, as well as hearing pres-entations on relevant macroeconomic and political topics by various expert speakers. The Supervisory Board also took the opportunity to visit several on-trade and off-trade points of sale to study how the Group brands are presented in the Russian market.
The Supervisory Board meeting in De-cember was held in Stockholm, where the Board visited the craft brewery Nya Carnegiebryggeriet (a joint venture with Brooklyn Brewery), further famil-iarised itself with Carlsberg’s Swedish operation and spent time with the CEO of Carlsberg Sverige.
points to consider as part of the review of each individual Board member and their performance. The Board members were asked to score questions on a scale from 1 to 4, allowing a quantitative comparison across questionnaires. Finally, the process includes a meeting without the presence of the Chairman at which the performance of the Chairman is discussed.
During the evaluation process in 2014, the Supervisory Board members generally expressed that they were very content with the structure and function of the Super-visory Board and, in particular, with the detailed meeting planning, the amount and quality of meeting material and the pres-entation of issues by the Executive Board and the subsequent open discussions at the Supervisory Board meetings.
The Supervisory Board also expressed sat-isfaction with the focus on risk evaluation, strategy and direction-setting during Board discussions. The evaluation process led to a short catalogue of ideas for minor changes to the way the Supervisory Board works. These ideas will be considered and, where relevant, implemented by the Supervisory Board, and some of them have been incor-porated into the Supervisory Board’s meet-ing plan and procedures for 2015.
In 2014, the Chairman and the Executive Board introduced evening meetings prior to each Supervisory Board meeting: one or two CEOs or other relevant key people from the Carlsberg Group present a market or other relevant Group topic to the Super-visory Board and those members of the Ex-ecutive Committee who are able to attend,
followed by a light meal where the members of the Supervisory Board and ExCom, as well as those who gave the presentations, have a chance to discuss the evening’s topic or other relevant matters. This enables the Super-visory Board to further familiarise itself with the business and key people from the organi-sation. Topics on the agenda for the evening meetings in 2014 included Norway (Ringnes), CSR, France (Brasseries Kronenbourg), Group Quality, Poland (Carlsberg Polska), Finland (Sinebrychoff) and Sweden (the Nya Carnegie bryggeriet and Carlsberg Sverige).
The Supervisory Board considers regularly – and at least once a year – whether its mem-bers’ expertise should be updated or strength-ened with respect to their duties. In 2014, this was based on input from the Nomination Committee as well as the Board evaluation process. The Carlsberg Group provides a de-tailed introduction programme for all new Su-pervisory Board members and holds relevant courses for all Supervisory Board members.
Board CommitteesThe Audit CommitteeIn 2014, the Audit Committee consisted of three members of the Supervisory Board: Donna Cordner (Chairman), Jess Søderberg and Richard Burrows. All qualify as being independent of the Company and all possess the relevant financial expertise.
The Audit Committee is appointed for one year at a time. In December 2014, Donna Cordner, Jess Søderberg and Richard Burrows had their membership extended, with Donna Cordner continuing as Chairman until the Supervisory Board meeting in March 2015, when new members will be elected.
The Nya Carnegiebryggeriet in Stockholm, Sweden, is a cooperation between Carlsberg and US craft brewer Brooklyn. In 2014, we further expanded our international cooperation with Brooklyn.
46Carlsberg Group Annual Report 2014 Corporate governance

The Audit Committee works according to Terms of Reference, which are reviewed and approved annually by the Supervisory Board, and a detailed annual meeting plan approved by the Supervisory Board prior to the beginning of each financial year. The Supervisory Board approved the Audit Com-mittee meeting plan for 2015 at the Super-visory Board meeting in December 2014 and the current Terms of Reference at the Su-pervisory Board meeting in February 2015. The Terms of Reference are available on the Company’s website. In accordance with its Terms of Reference and annual meeting plan, the Audit Committee has primarily car-ried out the following work:
a) Monitored the financial reporting process. The presentations to the Audit Committee and the Audit Committee’s discussions had special focus on management judgements, estimates, changes in accounting policies and procedures, and the clarity of disclo-sures. In addition, they focused on compli-ance with accounting standards, stock ex-change and other legal requirements related to financial reporting. The Audit Committee also discussed the assumptions behind the Company’s full-year profit expectations be-fore all releases of financial statements. In addition, the Audit Committee reviewed the financial personnel succession planning.
b) Monitored the effectiveness of the internal control and risk management systems. This work included regular updates from Group Finance with regard to the Company’s fi-nancial control framework. The Audit Com-mittee reviewed the Company’s relevant policies in relation to internal control and risk management systems and the financial reporting process, and received reports and presentations from Group Finance about the effectiveness of these systems as well as the scope, plans and status for controls throughout the year. The Audit Committee
also reviewed quarterly reports from Group Internal Audit on risk management, includ-ing the risk management process at the Company and the status of risks identified in the strategic risk map and heat map. The Audit Committee monitored the develop-ment and implementation of a global expense policy. Finally, the Audit Com-mittee recommended to the Supervisory Board that the Carlsberg Group compliance organisation and programme should be enhanced. On this basis, a Chief Compli-ance Officer was hired and tasked with strengthening the Group-wide compliance structure, policy framework and processes. In addition, an enhanced business ethics programme, including two new policies for this area, was implemented.
c) Monitored the internal audit function. The work included a review and approval of internal audit plans and a review of the internal audit function and competences.
d) Monitored the external audit of financial reporting and the independence of the external audit. In 2014, KPMG in Denmark (up to then the auditor of the Carlsberg Group) and EY decided to combine their operations. Following this, KPMG Interna-tional formed a new Danish firm, KPMG 2014 P/S (now KPMG Statsautoriseret Revisions partnerselskab). On this basis, in March 2014 the Audit Committee decided to recommend to the Supervisory Board that it should appoint KPMG 2014 P/S as the Supervisory Board’s candidate for election by the Annual General Meeting as the Carlsberg Group’s external auditor. The Audit Committee’s monitoring of the ex-ternal auditor’s work included discussions regarding audit planning and scope, terms
of engagement, audit fees and a review at each meeting of the external auditor’s work and findings.
In accordance with the Terms of Reference, four of the Audit Committee meetings were held prior to the approval and announce-ment of external financial reporting.
In addition, all minutes and material were made available to the Supervisory Board, in-ternal and external auditors and the Execu-tive Board. The Audit Committee Chairman also reported at each Supervisory Board meeting on the key findings and conclusions from the previous Audit Committee meeting.
At each Audit Committee meeting, the Audit Committee examines relevant issues with the external auditors and the head of Group Internal Audit, and the Committee invites other relevant function heads from the Carlsberg Group organisation depending on the topics being discussed at the meeting.
The heads of Group Finance and Group Ac-counting are usually invited to participate in Audit Committee meetings. In 2014, the Audit Committee held regular meetings with the external auditors and Group Internal Audit as well as with other relevant internal function heads without the presence of the Executive Board of the Company.
The Nomination CommitteeIn 2014, the Nomination Committee con-sisted of three members of the Supervisory Board: Flemming Besenbacher (Chairman), Jess Søderberg and Kees van der Graaf. Jess Søderberg and Kees van der Graaf are independent of the Company as defined in the recommendations.
Committee member Ordinary meetings Extraordinary meetingsDonna Cordner1,2,3
Richard Burrows1,2
Jess Søderberg1,2
Flemming Besenbacher1*
aUDit cOMMittee MeetingS
SUPeRviSORY BOaRD StRUctURe
Audit Committee
Remuneration Committee
Nomination Committee
Supervisory Board
1 Elected by the General Meeting. 2 Independent. 3 Chairman. * Flemming Besenbacher is not a member of the Audit Committee but attends the meetings in his capacity as Chairman of the Supervisory Board.
47Carlsberg Group Annual Report 2014 Corporate governance

The Nomination Committee works according to Terms of Reference, which are reviewed and approved annually by the Supervisory Board. The Terms of Reference are available on the Company’s website.
In 2014, the Committee’s work included rec-ommendations to the Supervisory Board with regard to the Specification of Competencies required for the Supervisory Board and, in particular, the minimum number of members who must possess financial expertise.
The Committee also considered succession planning at Executive Committee, Execu-tive Board and Supervisory Board level, and considered the outcome of the Board evalu-ation and made recommendations to the Board. Finally, the Nomination Committee advised and made recommendations to the Supervisory Board with regard to candidates for the Supervisory Board.
In 2014, the Nomination Committee identi-fied a new member for the Supervisory Board, recommending Carl Bache to the Annual General Meeting in March 2014. Carl Bache was elected by the Annual General Meeting
and replaced Per Øhrgaard, who stepped down in accordance with the age stipulation of the Articles of Association.
In December 2014, the Supervisory Board agreed to extend the existing memberships of Jess Søderberg, Kees van der Graaf and Flem-ming Besenbacher (as Chairman) until the Annual General Meeting in 2015, when new members will be elected.
The Remuneration CommitteeThe work of the Remuneration Committee is described in the Remuneration report on pages 51-56.
The Executive BoardThe Supervisory Board appoints the CEO and other members of the Executive Board. Led by the CEO, the Executive Board is responsible for the preparation and imple-mentation of strategic plans.
The Executive Board consists of two per-sons: Jørgen Buhl Rasmussen, President and CEO, and Jørn P. Jensen, CFO and Deputy CEO. The members of the Executive Board are not members of the Supervisory Board but do attend Supervisory Board meetings.
The Company also has a wider Executive Committee (ExCom), which consists of eight Senior Vice Presidents in addition to the two Executive Board members. The composition of ExCom can be seen on pages 57-58.
AuditingTo safeguard the interests of sharehold-ers and the general public, an independent auditor is appointed at the Annual General Meeting following a recommendation from
Beer is a natural product made from barley, hops, yeast and water.
Enjoyed in moderation, it makes the perfect accompaniment to time
spent with good friends.
Committee member Ordinary meetingsFlemming Besenbacher1,3
Jess Søderberg1,2
Kees van der Graaf1,2
nOMinatiOn cOMMittee MeetingS
1 Elected by the General Meeting.2 Independent. 3 Chairman.
48Carlsberg Group Annual Report 2014 Corporate governance

the Supervisory Board based on a proposal from the Audit Committee. Before making its recommendation, the Supervisory Board undertakes a critical evaluation of the audit-or’s independence, competence etc.
The auditor reports any significant find-ings regarding accounting matters and any significant internal control deficiencies to the Supervisory Board via the Audit Committee and through its written long-form audit re-ports, which are issued at least twice a year. The auditor takes part in all Audit Committee meetings and, as a minimum, the Supervis-ory Board meeting at which the Annual Report is discussed and approved.
Internal control and risk management related to the financial reporting processOverall control environmentThe Supervisory Board and the Executive Board have overall responsibility for the
Group’s control environment. The Audit Committee appointed by the Supervisory Board is responsible for monitoring the inter-nal control and risk management systems related to the financial reporting process on an ongoing basis.
The Company has a number of policies and procedures in key areas of financial reporting, including the Finance Manual, the Controller Manual, the Chart of Authority, the Risk Management Policy, the Treasury Policy, the Information Security Policy and the Business Ethics Policy. The policies and procedures apply to all subsidiaries, and similar requirements are set out in collabor-ation with the partners in joint ventures.
The internal control and risk management systems are designed to mitigate rather than eliminate the risks identified in the financial reporting process. Internal controls related to the financial reporting process are
established to detect, mitigate and correct material misstatements in the consolidated financial statements.
The monitoring of risk and internal controls in relation to the financial reporting process are anchored by the reporting of the matur-ity level of the control environment using the Company’s financial control framework.
Risk assessmentThe risk assessment process related to the risk in relation to the financial reporting process is assessed annually and approved by the Audit Committee.
The risk related to each accounting process and account in the consolidated financial statements is assessed based on quantita-tive and qualitative factors. The associated financial reporting risks are identified based on the evaluation of the likelihood of them materialising and their potential impact.
The identified areas are divided into accounts with high, medium or low risk. High-risk areas are accounts that include significant accounting estimates, including goodwill and special items, and the sales and purchase process. The Company’s financial control framework reporting covers relevant Group companies and functions to the level where high-risk accounts are at least 80% covered and medium-risk accounts at least 60%. Low-risk accounts are not covered.
Control activitiesThe Group has implemented a formalised financial reporting process for the strategy process, budget process, quarterly esti-mates and monthly reporting on actual performance. The accounting information
reported by all Group companies is reviewed both by controllers with regional or func-tional in-depth knowledge of the individual companies/functions and by technical ac-counting specialists. In addition, significant Group companies have controllers with extensive commercial and/or accounting knowledge and insight.
Based on the risk assessment, the Group has established minimum requirements for the conduct and documentation of IT and manual control activities to mitigate identi-fied significant financial reporting risks. The Company’s financial control framework cov-ers 132 controls relating to 23 accounting processes and areas.
The relevant Group companies and functions must ensure that the Company’s financial control framework is implemented in their business and that individual controls are designed to cover the predefined specific risk. The local management is responsible for ensuring that the internal control activ-ities are performed and documented, and is required to report compliance quarterly to the Group’s finance organisation.
The entities in the Group are dependent on IT systems. Any weaknesses in the system controls or IT environment are compensated for by manual controls in order to mitigate any significant risk relating to the financial reporting. This includes the implementation of compensatory controls during implemen-tation of the supply chain integration and business standardisation project (BSP1), giv-en that an increased number of people will have access to systems. During 2014, four more countries implemented the project.
49Carlsberg Group Annual Report 2014 Corporate governance

Information and communicationThe Group has established information and communication systems to ensure that ac-counting and internal control compliance is established, including a Finance Manual, a Controller Manual and internal control requirements.
In addition, the Group has implemented a formalised reporting process for reporting monthly, quarterly, budget and estimate figures from all countries and functions.
MonitoringThe Audit Committee’s monitoring covers both the internal control environment and business risk. Monitoring of the internal control environment is covered by the Company’s financial control framework. The business risk is assessed and reviewed at multiple levels in the Group, including periodic review of control documentation, controller visits and audits performed by Group Internal Audit.
Additionally, business risks are discussed and monitored at business review meetings between ExCom, regional management and local management at which potential finan-cial impacts are identified.
The Audit Committee’s Terms of Reference outline its roles and responsibilities concerning supervision and monitoring of the internal con-trol and risk management systems related to financial reporting. Monitoring is performed on the basis of periodic reporting from the finance organisation, internal and external audit.
Group Internal AuditThe Internal Audit department ensures ob-jective and independent assessment of the
adequacy, effectiveness and quality of the Group’s internal controls. The head of Group Internal Audit reports to the Chairman of the Audit Committee. The Audit Committee must approve the appointment and poten-tial dismissal of the head of Group Internal Audit as well as changes to his or her terms. Group Internal Audit works in accordance with a charter and Terms of Reference ap-proved by the Audit Committee.
Group Internal Audit conducts an annual review of business risks. On the basis of this and input from the Supervisory Board, the Audit Committee and senior executives in the Group, an audit plan is drawn up for the year. The plan is reviewed and approved by the Audit Committee and the Supervisory Board. Group Internal Audit is responsible for planning, executing and reporting on the audit performed. The reporting includes observations and conclusions, together with suggestions for improvements to the inter-nal controls in each area audited.
When conducting an audit, Group Internal Audit assesses whether the audited entity/function has well-established accounting practices, written policies and procedures in all important business areas, and adequate internal control procedures. This includes the assessment of whether controls in rela-tion to key IT systems are satisfactory and whether they comply with the IT Policy.
Whistleblower system The Carlsberg Group has a whistleblower system that enables employees to report activities that may involve criminal conduct or violations of the Carlsberg Group’s pol-icies and guidelines.
The whistleblower system consists of a website and a hotline set up by an inde-pendent third party to ensure the highest level of security and confidentiality. Reports filed through the whistleblower system are handled by the Chief Compliance Officer, who regularly, and at least every quarter, reports to the Audit Committee on issues reported via the whistleblower system and action taken as a result. In 2014, 23 reports were submitted to the system.
Since the establishment of the whistle-blower system in April 2010, some reports and their subsequent investigation have led
to various disciplinary sanctions for one or more employees, including dismissal on the basis of violation of Group policies and, in some cases, relevant criminal laws.
Most of these matters related to isolated incidents of fraud carried out by individual employees in the Group. The incidents have not had any material impact on the financial results of the Group or the Group company in question.
In recent years, Asia’s importance to the Carlsberg Group has increased. The region accounted for 28% of Group beer volumes and 21% of Group operating profit in 2014.
50Carlsberg Group Annual Report 2014 Corporate governance

ReMUneRatiOn RePORt
The Carlsberg Group established a Remu-neration Committee in late 2010. In 2012, the Committee undertook a complete review of the remuneration policy and structure for executive directors, resulting in several changes to the Remuneration Policy.
These changes were approved by the shareholders at the Annual General Meet-ing in March 2013. The principal aim was to ensure that the Company’s executives share our shareholders’ long-term performance and value perspective, and that their remu-neration aligns these interests.
Our continuing policy is to provide a good balance between the drivers of performance and alignment with shareholders. Our policy does this by tilting the balance of executive remuneration towards the long term and requiring executives to build up a significant shareholding in the Company by retaining shares that they earn.
The Committee continues to monitor the new arrangements but does not anticipate changes in 2015.
Remuneration policyThe main elements of the executive direct- ors’ remuneration arrangements are sum-marised in the table below and are ex-plained in more detail in the subsequent paragraphs.
Fixed salaryThe Committee reviews fixed salaries an-nually, taking into account a number of relevant factors, including the individual’s performance, role and responsibilities.
The Committee also takes into account levels of remuneration for similar roles at comparable companies in both the drinks and fast moving consumer goods sectors, as well as companies across industry sectors based in the Nordic region.
OUR aPPROacH tO ReMUneRatiOn
The Carlsberg Group’s remuneration is designed to enable us to recruit and retain individuals with the expertise and ability required to run a growing international company, and to do so in a way that drives our business success and rewards execu-tives when shareholders are rewarded.
Levels of fixed remuneration are set based on individuals’ experience and contribution, and in the context of the external market. While we do not seek to adhere rigidly to market benchmarks, we monitor and take into account pay levels and incentive op-portunities in the principal markets from which we recruit: our European brewing and spirits peers and the global consumer goods sector, as well as companies across industry sectors in the Nordic region.
Many of our investors – including our main shareholder – are long-term holders of our shares. We want our executives to share their perspective and believe that remuneration should align their interests accordingly. Recent developments in our remuneration have sought to strengthen this link by tilting the balance of the package to long-term share-based pay and requiring any shares awarded to be retained for longer.
The Company’s full Remuneration Policy for the Supervisory Board and Execu-tive Board and guidelines for incentive programmes as approved at the Annual General Meeting on 20 March 2014 are available on the Company’s website.
MAIn ACTIVITIES In 2014During 2014, the main activities of the Remuneration Committee were:
• Considering the achievement of per-formance criteria for the annual bonus plan and approving levels of vesting.
• Determining levels of long-term incentive awards for 2014.
• Considering shareholders’ feedback from the 2014 Annual General Meeting.
• Reviewing fixed salary levels, bonus targets and levels of long-term incentive awards for 2015.
• Evaluating the remuneration of the Supervisory Board.
• Reviewing the link between the remu-neration of the executive directors and the Group’s Executive Committee.
2015 OBJECTIVES• Ensuring that senior executives remain
appropriately compensated and incentiv-ised to deliver on the Group’s strategy.
• Continuing to monitor the workings and outcomes of the changes made to
the remuneration structure in 2013, which has been extended to all senior management.
We want our executives to share our shareholders’ long-term interests, and the remuneration of executive directors should support this alignment.
51Carlsberg Group Annual Report 2014 Remuneration report

Annual bonusThe annual bonus is structured to incentiv-ise the executive directors to deliver on the Group’s short-term strategic objectives.
For 2015, the potential maximum bonus will remain at 100% of fixed salary with 60% of fixed salary payable for on-target performance. A scorecard of performance measures is used to assess performance.
The determination of the final bonus is sub-ject to the discretion of the Committee and the Supervisory Board, taking into account the overall performance of the business.
The measures used in the scorecard for the 2015 annual bonus will be operating profit, free cash flow, return on invested capital, adjusted net profit and market share. Com-pared with 2014, return on invested capital is a new measure.
Long-term incentive arrangementsAward levels and types of awardThe long-term incentive arrangements for the executive directors currently comprise two types of award:• Share options, which vest after three
years subject to continued employment. • Performance shares, which vest over
three years subject to the performance conditions.
tHe cOMMittee’S ReSPOnSiBilitieS
The Carlsberg Group’s Remuneration Committee is responsible for the Remu-neration Policy (including the general guidelines for incentive programmes) for all members of the Supervisory Board and the Executive Board, for recommending proposals on changes to the Remuneration Policy, and for ob-taining the approval of the Supervisory Board prior to seeking shareholders’ ap-proval at the Annual General Meeting.
The Committee is responsible for making proposals to the Supervisory Board on the actual structure and content of the remuneration packages of the members of the Supervisory Board and the Execu-tive Board, in accordance with the policy approved by the shareholders.
The Committee monitors and advises the Supervisory Board on any ma-jor changes to the policy on senior employee remuneration structures for the Group, including for the Executive Committee. The Committee’s Terms of Reference, which govern how it operates, are approved by the Super-visory Board and are available on the Company’s website.
The maximum combined value of awards that can be made in any one financial year is 200% of fixed salary.
Whilst the Committee has not granted at this level to date and does not intend to grant at the maximum level in the near fu-ture, it wishes to have the flexibiliy to do so if it deems higher awards to be appropriate in future years.
Each year, the Committee determines the to-tal level of the long-term incentive award to be made to each executive director, and how much of that award will be made using per-formance shares and how much using share options. All long-term incentive awards are made at the discretion of the Committee.
Committee member Ordinary meetingsRichard Burrows1,2,3
Jess Søderberg1,2
Kees van der Graaf1,2
Elisabeth Fleuriot1,2
Flemming Besenbacher1*
1 Elected by the General Meeting. 2 Independent. 3 Chairman. * Flemming Besenbacher is not a member of the Remuneration Committee but attends the meetings in his capacity as Chairman of the Supervisory Board.
The CEO, Deputy CEO, Senior Vice President HR and Vice President Compensation & Benefits are invited to attend meetings of the Committee where appropriate but are not present when their own remuneration is discussed directly.
New Bridge Street, an Aon Hewitt company, is the Committee’s external adviser. No other services are provided to the Group by Aon Hewitt, and the Commit-tee is satisfied as to the independence of its advisers.
ReMUneRatiOn cOMMittee MeetingS
Performance shares The vesting of any performance shares is subject to achievement of performance con-ditions determined by the Committee prior to the date of grant and measured over a three-year period.
The performance conditions further increase and support alignment between the execu-tive directors’ reward and long-term Group strategy and shareholder value. In order for any award (or part of an award) to vest, the Committee must be satisfied that underlying Group performance is at a satisfactory level.
52Carlsberg Group Annual Report 2014 Remuneration report

Element of pay Objective Award level Performance criteria Performance period
Fixed salary
Attract and retain high-performing individuals by reflecting market value of role, and executive’s skills and experience. Reward day-to-day performance. Set at a level to prevent over-reliance on variable pay.
Takes into account the market rate for similar roles in international comparator companies as well as the skills and experience of the executive.
No performance criteria per se, but the performance of the individual is taken into account when fixed salary levels are reviewed.
N/A
Benefits Operate a competitive benefits suite to aid recruitment and retention.
Perquisites and other benefits corresponding to market practices.
N/A N/A
Pension Executives make their own provision for retirement. N/A N/A N/A
Annual bonus plan
Drive and reward delivery of short-term business objectives.
Maximum bonus opportunity is 100% of fixed salary. Bonus opportunity at target is 60% of fixed salary.
Operating profit, free cash flow, return on invested capital (from 2015), adjusted net profit, market share.
1 year
Long-term incentive plan
Drive and reward longer-term business objectives. Maximise alignment with shareholder value.
The maximum level of long-term incentive awards is 200% of fixed salary based on the fair value of an award at the grant date. However, actual awards in 2014 were below the permitted maximum.
For share options, inherent share price growth target (further elaborated in table below). For performance share awards:• Relative total shareholder return (TSR).• Growth in adjusted EPS.• Organic growth in market share.• CSR target.
Options exercisable between 3rd and 8th anniversary of grant. Performance period for performance shares: 3 years.
Measure Weighting Performance condition and periodRelative total shareholder return (TSR)TSR measures the total return to investors.
The Group’s TSR performance will be measured relative to a comparator group of 18 companies1.
40% • Measured over 3 years from date of grant. • 25% of TSR element vests if the Group’s TSR performance is at median
of comparator group1.• 100% vests for upper-quartile performance. • Straight-line vesting between median and upper quartile.
Adjusted earnings per share (EPS) growthAdjusted EPS growth targets measure the Group’s underlying financial success.
30% • Measured over 3 financial years.• 25% of the adjusted EPS element vests for 3% p.a. growth. • 100% vests for 8% p.a. growth.• Straight-line vesting between 3% p.a. and 8% p.a.
Organic growth in market share Strong market positions drive scale, which is important for value creation in the beer business.
20% • Measured over 3 financial years.• Account taken of the majority of the Group’s markets, weighted by volume.
Corporate social responsibility (CSR) The Group has long held itself to high standards of corporate social performance.
10% • Measurement of CSR (environment, consumers, employees, communities and other stakeholders) for our major markets.
1 TSR comparator group: Anheuser-Busch Inbev, Asahi Group Holdings, Britvic, Brown-Forman ‘B’, Coca-Cola, Davide Campari-Milano, Diageo, Dr Pepper Snapple, Heineken, Kirin Holdings, Molson Coors Brewing ‘B’, Monster Beverage, PepsiCo, Pernod Ricard, Rémy Cointreau, SAB Miller, Sapporo Holdings.
PeRFORMance cOnDitiOnS FOR PeRFORMance SHaReS
ReMUneRatiOn POlicY
The aim of the Remuneration Committee is to ensure that our executives share our shareholders’ long-term performance and value perspective, and that their remuneration is aligned with these interests.
53Carlsberg Group Annual Report 2014 Remuneration report

Reclaiming variable payIn the event of serious misconduct, or if an annual bonus or long-term incentive award is made on the basis of accounts that prove to be materially misstated, the Company may reclaim, in full or in part, any overpayment from annual bonus, or cancel or withdraw unexercised or unvested long-term incentive awards in respect of the executive directors.
Share ownership guidelinesIn order to strengthen the alignment be-tween executive directors and shareholders, the Committee has introduced sharehold-ing guidelines for the executives. Executive directors are required to retain shares on the vesting of long-term incentive awards (subject to disposals required to meet any tax and other associated obligations).
The CEO is expected to build up a holding of shares equivalent to 150% of fixed salary, and the Deputy CEO/CFO a holding equiv-alent to 120% of fixed salary.
Executive directors’ service contractsService contracts for executive directors contain terms and conditions that are con-sidered common to executive board mem-bers in Danish listed companies.
Remuneration of the Supervisory BoardThe remuneration of the Supervisory Board for 2014 was approved by the Annual Gen-eral Meeting in March 2014.
The members of the Supervisory Board of Carlsberg A/S are remunerated for duties performed in the Company. The fees are re-
viewed, but not necessarily increased, annu-ally after taking into account market practice with reference to an international compara-tor group as well as the need to attract and retain high-calibre individuals.
The remuneration of the Supervisory Board consists of a fixed annual base fee. The Chairman receives a single fee of three and a half times the base fee and no additional fee for committee work, if any. The ad-ditional fee for committee work for other members of the Supervisory Board is shown below.
Members of the Supervisory Board are not included in share incentive programmes, retirement benefit plans or other schemes.No agreements have been entered into con-
cerning termination benefits, and no such payments were made in 2014.
Remuneration for 2014This section sets out how the Carlsberg Group’s Remuneration Policy was imple-mented during the 2014 financial year. Spe-cific detail is provided regarding the various elements of pay that the Supervisory Board and executive directors received and how those amounts were calculated.
Remuneration of executive directors The actual fixed salaries paid in 2014 were DKK 11.2m to Jørgen Buhl Rasmussen and DKK 9.7m to Jørn P. Jensen.
Base fee(DKK
thousand)
Additional fee
(as % of base fee)
All Supervisory Board members 400
Chairman of Supervisory Board 250%
Deputy Chairman of Supervisory Board 50%
Chairman of Audit Committee 75%
Chairman of Remunera-tion Committee/Chairman of Nomination Committee 50%
Member of Board Committee (per Committee) 38%
Share owner-
ship guide-line as
% of fixed
salary
Actual %
held at 31 Dec.
2014
Fair value of unvested
options and performance shares as %
of fixed salary (prior to
deductions for tax and incidental
costs)
Jørgen Buhl Rasmussen 150% 44% 491%
Jørn P. Jensen 120% 49% 443%
Jørgen Buhl Rasmussen
Jørn P. Jensen
DKK million 2014 2013 2014 2013
Fixed salary 11.2 11.0 9.7 9.5
Cash bonus 3.5 4.7 3.1 4.1
Non-monetary benefits 0.3 0.3 0.3 0.3
Share-based payment 10.1 8.6 8.4 7.3
Total 25.1 24.6 21.5 21.2
Performance shares
Share options
CEO (150% of total salary) 26,924 51,000
CFO (120% of total salary) 14,001 44,000
SHaRe OwneRSHiP gUiDelineS SUPeRviSORY BOaRD ReMUneRatiOn PRinciPleS in 2014
ReMUneRatiOn OF eXecUtive DiRectORS lOng-teRM incentive awaRDS gRanteD in 2014
54Carlsberg Group Annual Report 2014 Remuneration report

Fixed salaryIn 2014, the Committee and the Supervis-ory Board decided to increase the executive directors’ fixed salaries by 2% with effect from 2014.
Annual bonusFor the financial year 2014, the bonus targets were not fully met and, as a result, 31.5% of the maximum bonus, being 100% of fixed salary, was payable for performance in 2014. The actual amounts of bonus payable equated to DKK 3.5m and DKK 3.1m for Jørgen Buhl Rasmussen and Jørn P. Jensen respectively.
Long-term incentive awards Granted in 2014. In the financial year 2014, the CEO and CFO were awarded long-term incentive awards that, at the time of award, had a fair value of 150% and 120% of fixed salary respectively. The composition of these awards is shown in the table.
SHARE OPTIONS NumberDKK
million
Grant yearExercise
year1 Jan. 2014 Granted Exercised
31 Dec. 2014
For exercise 31 Dec.
Fair value31 Dec.
Jørgen Buhl Rasmussen2007 2010-2015 12,388 - - 12,388 12,388 -
2008 2011-2016 44,776 - - 44,776 44,776 4
2009 2012-2017 30,000 - - 30,000 30,000 8
2010 2013-2018 15,000 - - 15,000 15,000 2
2011 2014-2019 30,000 - - 30,000 30,000 2
2012 2015-2020 69,500 - - 69,500 - 10
2013 2016-2021 49,000 - - 49,000 - 6
2014 2017-2022 51,000 - 51,000 - 6
Total 250,664 51,000 - 301,664 132,164 38
Jørn P. Jensen2006 2009-2014 12,388 - -12,388 - - -
2007 2010-2015 12,388 - - 12,388 12,388 -
2008 2011-2016 44,776 - - 44,776 44,776 4
2009 2012-2017 30,000 - - 30,000 30,000 8
2010 2013-2018 15,000 - - 15,000 15,000 2
2011 2014-2019 30,000 - - 30,000 30,000 2
2012 2015-2020 62,000 - - 62,000 - 9
2013 2016-2021 42,000 - - 42,000 - 5
2014 2017-2022 44,000 - 44,000 - 5
Total 248,552 44,000 -12,388 280,164 132,164 35Executive directors, total 499,216 95,000 -12,388 581,828 264,328 73
PERFORMANCE SHARESJørgen Buhl Rasmussen2013-2015 2016 29,694 - - 29,694 - 9
2014-2016 2017 - 26,924 - 26,924 - 8
Total 29,694 26,924 - 56,618 - 17
Jørn P. Jensen2013-2015 2016 15,441 - - 15,441 - 4
2014-2016 2017 - 14,001 - 14,001 - 4
Total 15,441 14,001 - 29,442 - 8Executive directors, total 45,135 40,925 - 86,060 - 25
Vested in 2014. In February 2014, the op-tions granted to the CEO and CFO in 2011 vested and became exercisable at 30,000 shares each.
Shareholdings. The number of shares, share options and performance shares in Carlsberg A/S held by the executive dir-ectors at the beginning of the financial year and movements to 31 December 2014 are shown in the tables.
Remuneration of the Supervisory Board The fees for the Supervisory Board members for the financial year 2014 are set out below.
The number of shares in Carlsberg A/S held by Supervisory Board members at the begin-ning of the financial year and movements to 31 December 2014 are also shown here.
eXecUtive DiRectORS’ gRanteD SHaRe OPtiOnS anD PeRFORMance SHaReS
Number DKK million
1 Jan. 2014 Additions Sold
31 Dec. 2014
Market value
Jørgen Buhl Rasmussen B shares 10,261 - - 10,261 4.9
Jørn P. Jensen A shares 400 - - 400 0.2
Jørn P. Jensen B shares 6,754 12,388 -9,500 9,642 4.6
Executive directors, total 17,415 12,388 -9,500 20,303 9.7
1 The holdings also include the holdings of the related parties of the executive directors. Neither of the executive directors owns shares or bonds in any of the subsidiaries or associates of Carlsberg A/S.
eXecUtive DiRectORS’ HOlDingS OF caRlSBeRg a/S SHaReS1
55Carlsberg Group Annual Report 2014 Remuneration report

DKK million 2014 2013
Flemming Besenbacher (Chairman of the Supervisory Board and of the Nomination Committee)1 1.38 1.30
Jess Søderberg (Deputy Chairman)1,2 1.09 1.20
Richard Burrows (Chairman of the Remuneration Committee)1,2 0.75 0.75
Donna Cordner (Chairman of the Audit Committee)1,2 0.66 0.55
Elisabeth Fleuriot1,2 0.55 0.55
Kees van der Graaf1,2 0.70 0.70
Carl Bache1 0.31 -
Niels Kærgård1 - 0.10
Søren-Peter Fuchs Olesen1 0.40 0.40
Nina Smith1 0.40 0.31
Lars Stemmerik1 0.40 0.40
Per Øhrgaard1 0.10 0.40
Hans Andersen3 0.40 0.40
Eva V. Decker3 0.31 -
Thomas Knudsen3 0.10 0.40
Finn Lok3 0.31 -
Elena V. Pachkova3 0.31 -
Bent Ole Petersen3 0.10 0.40
Peter Petersen3 0.40 0.40
Total 8.67 8.26
Number DKK million
1 Jan. 2014
Additions Sold 31 Dec. 2014
Market value
Flemming Besenbacher B shares 1,850 - - 1,850 0.89
Jess Søderberg B shares 7,754 - - 7,754 3.71
Richard Burrows B shares 2,040 - - 2,040 0.98
Donna Cordner B shares - - - - -
Elisabeth Fleuriot B shares - - - - -
Kees van der Graaf B shares 950 - - 950 0.45
Carl Bache B shares 100 - - 100 0.05
Søren-Peter Fuchs Olesen B shares 452 200 - 652 0.31
Nina Smith B shares - 192 - 192 0.09
Lars Stemmerik B shares - - - - -
Hans Andersen B shares 1 - - 1 0.00
Eva V. Decker B shares 68 - - 68 0.03
Finn Lok B shares - - - - -
Elena V. Pachkova B shares - - - - -
Peter Petersen B shares - - - - -
Supervisory Board, total 13,215 392 - 13,607 6.51
1 The holdings also include the holdings of the related parties of the Supervisory Board. No members of the Supervisory Board own shares or bonds in any of the subsidiaries or associates of Carlsberg A/S.
1 Elected by the General Meeting. 2 Independent. 3 Employee representative.
ReMUneRatiOn OF tHe SUPeRviSORY BOaRD tHe SUPeRviSORY BOaRD’S HOlDingS OF caRlSBeRg a/S SHaReS1
56Carlsberg Group Annual Report 2014 Remuneration report

ExECuTIVE BOARD
eXecUtive BOaRD & cOMMittee
The role of the Executive Committee is to drive the Group’s strategic development and ensure alignment and clear objectives across the Group.
JøRGEN BUHL RASMUSSENPresident and CEO since 2007. Appointed to the Executive Board of Carlsberg A/S in 2006. Jørgen will retire as President and CEO on 15 June 20151.
Chairman, Deputy Chairman or member of the Supervisory Boards of Carlsberg Group companies. Member of the Board of Directors of Novozymes A/S. Prior to joining Carlsberg, Jørgen held senior managerial positions covering Western, Central and Eastern Europe, the Middle East, Africa and Asia in several global FMCG companies, including Gillette Group, Duracell, Mars and Unilever. Jørgen is based in Copenhagen.
JøRN P. JENSENDeputy CEO since 2007, CFO since 2004. Appointed to the Executive Board of Carlsberg A/S in 2000.
Chairman, Deputy Chairman or member of the Supervisory Boards of Carlsberg Group companies. Member of the Board of Directors of Danske Bank A/S and of the Committee on Corporate Governance in Denmark. Deputy Chairman of the Board of Directors of DONG Energy A/S until 4 March 2015. Prior to joining Carlsberg, Jørn held senior managerial positions in, among others, Nilfisk Advance A/S and Foss Electric A/S. Jørn is based in Copenhagen.
1 Jørgen will be succeeded by Cees ’t Hart, ref. Company Announcement as of 18 February 2015.
57Carlsberg Group Annual Report 2014 Executive Board & Committee

ANDRAEA DAWSON-SHEPHERD Senior Vice President, Group Corporate Affairs since 2015.
Andraea joined Carlsberg in 2015 and is respon-sible for Carlsberg’s corporate affairs activities, including investor and media relations, govern-mental and external relations, and sustainability and corporate responsibility. She was previously Senior VP for Global Corporate Communications & Affairs at RB plc. Before RB, Andraea was Global Corporate Communications Director at Cadbury Schweppes plc. Andraea is based in Copenhagen.
PETER ERNSTINGSenior Vice President, Group Supply Chain since 2011.
Member of the Supervisory Board of Accell Group N.V., Netherlands. Peter joined Carlsberg in 2011 from Unilever, where he was Chairman of Unilever Supply Chain Company AG, leading the total end-to-end supply chain of Unilever in Europe. Prior to that, he managed Unilever’s supply chain in Asia and Russia. Peter is based in Ziegelbrücke, Switzerland.
GRAHAM FEWKESSenior Vice President, Group Sales, Marketing & Innovation since 2014.
Graham joined Carlsberg as Commercial Vice Presi-dent, Asia region after the S&N transaction in 2008, having served as S&N’s commercial representa-tive in the BBH joint venture company in Eastern Europe. Prior to joining Carlsberg, Graham held a wide range of sales and marketing roles across Western and Eastern Europe in Grand Metropolitan plc, Foster’s Brewing Group and S&N plc. Graham is based in Copenhagen.
BENGT ERLANDSSONSenior Vice President, Group Procurement since 2011.
Bengt joined Carlsberg in 2007 as head of Carls-berg Group Procurement. Before joining Carlsberg, he worked for IKEA for 28 years, mostly within procurement. His last position was as head of IKEA Indirect Material & Services. Bengt is based in Ziegelbrücke, Switzerland.
CLAUDIA SCHLOSSBERGERSenior Vice President, Group HR since 2012.
Claudia joined Carlsberg in 2012. She was previ-ously Chief HR Officer with the Metro Group and Metro Cash & Carry. Prior to that, she held various senior HR leadership positions across Daimler Benz, where she started in marketing and sales in 1982, having worked in Russia and India. Claudia is based in Copenhagen.
CHRISTOPHER WARMOTHSenior Vice President, Asia since 2014.
Chris joined Carlsberg in 2014 from H.J. Heinz, where he held various senior positions in Con-tinental/Eastern Europe and the Far East. Most recently, he was Executive VP for Asia Pacific, Middle East and Africa. Prior to joining Heinz, Chris worked for The Coca-Cola Company and Procter & Gamble. Chris is based in Hong Kong.
JACEK PASTUSzKASenior Vice President, Eastern Europe since 2015.
President of Baltika Breweries since 2015. Jacek joined Carlsberg in 2009 as CEO of Carlsberg Pol-ska. From 2011 to 2014, he was CEO of Ringnes, Carlsberg’s Norwegian subsidiary. Prior to joining Carlsberg, Jacek was CEO of American Interna-tional Group (AIG) in Poland. He has also held senior managerial positions in Procter & Gamble both in Poland and internationally, and in Danone Dairy in Poland and the Baltic States. Jacek is based in St Petersburg.
ExECuTIVE COMMITTEE
JøRN TOLSTRUP ROHDESenior Vice President, Western Europe since 2012 (Northern Europe since 2009).
Chairman, Deputy Chairman or member of the Supervisory Boards of Carlsberg Group compa-nies. Jørn joined Carlsberg in 2004 to initiate the ComEx project and was appointed CEO of Carlsberg Danmark in the same year. From 2007 to 2009, he was President & CEO of 3C Retail A/S. He has also held senior managerial positions in, among others, Orkla Group and Sara Lee. Jørn is based in Copenhagen.
58Carlsberg Group Annual Report 2014 Executive Board & Committee

the Carlsberg B share declined 20% and ended the year at DKK 478.8. The develop-ment in the share price is assessed to be closely linked to the uncertain macrositua-tion in Eastern Europe, in particular Russia, further compounded at the end of the year by the weakening of the rouble and declining oil prices. At the end of 2014, the market value of the Company’s shares was DKK 74.5bn, compared to DKK 92.4bn at the end of 2013.
ShareholdersAt 31 December 2014, the Company’s larg-est shareholder was the Carlsberg Founda-tion, holding 30% of the share capital and 75% of the votes.
At the end of 2014, Carlsberg A/S had ap-proximately 47,000 registered sharehold-ers, together holding a nominal capital of DKK 2,848m, corresponding to 93% of the share capital.
Investor relationsThe Carlsberg Group aims to give investors and analysts the best possible insight into
As a supplement to its listing on NASDAQ in Copenhagen, the Company has established a sponsored level 1 ADR (American Depository Receipt) programme with the Bank of New York Mellon. The ADRs trade over-the-counter in the USA under the symbol CABGY. More in-formation on the ADR programme is available on the Carlsberg Group’s investor website.
In addition to NASDAQ in Copenhagen, the Company’s shares are also traded on a number of other equity exchanges, includ-ing BATS Chi-X. In 2014, approximately 36% of the trading in the Carlsberg B share took place on NASDAQ in Copenhagen. In 2014,
The Company’s shares are listed on NASDAQ OMX Copenhagen A/S in two classes: Carlsberg A and Carlsberg B. Each A share carries 20 votes, while each B share carries two votes and is entitled to a preferential dividend. The B share is included in the NASDAQ OMX Nordic Large Cap and OMXC20 blue-chip indices. NASDAQ OMX Nordic also operates sec-tor indices in accordance with the Global Industry Classification Standard, and here the Carlsberg A and B shares are included in the Food & Beverage and Consumer Goods indices.
factors considered relevant for ensuring efficient and fair pricing of the Company’s shares. This is achieved through the quality, consistency and continuity of the information the Carlsberg Group provides to the market.
As part of its investor relations work, the Company maintains an active dialogue with equity and credit analysts, and with existing and potential shareholders, including domestic and international institutional investors as well as private investors. The Group’s Investor Relations department handles day-to-day contact with analysts and investors. As part of the ongoing IR activities, in 2014 the Carlsberg Group held investor and analyst meetings in a number of cities across Europe, North America and Asia, as well as a market visit to the Group’s Polish subsidiary for analysts and investors.
The Company’s investor website includes both current and historical information about the Company and its shares and
SHaReHOlDeR inFORMatiOn
The Carlsberg Group aims to create the best conditions to ensure efficient and fair pricing of its shares by providing balanced and open information to the stock market.
The Annual General Meeting of Carlsberg A/S will be held on Thursday 26 March 2015 at Tap 1, ny Carlsberg Vej 91, Copenhagen.
Financial calenDaR 2015 SHaReHOlDeRS (FRee FlOat)
%End- 2014
End- 2013
End- 2012
DK 13 20 21USA 39 34 28UK 14 20 22Other 34 26 29
26 March Annual General Meeting
Quarterly financial statements12 May Interim results – Q1
19 August Interim results – Q2
11 November Interim results – Q3
59Carlsberg Group Annual Report 2014 Shareholder information

bonds, including company announcements, share prices, investor presentations, web-casts and transcripts, financial calendar, quarterly financial statements, historical financial data and annual reports. A free service allows subscribers to receive instant e-mail alerts when the Company publishes new information. In addition, the Group maintains an Investor Relations iPad app featuring the latest news, financial and annual reports, financial presentations and magazines.
A total of 39 analysts had coverage of the Company at the end of 2014, 10 of them based in Denmark. A list of analysts cover-ing the Company, their recommendations and consensus estimates can also be found on the investor website. The Company’s communication with investors, analysts and the press is subject to special limitations during a four-week period prior to the pub-lication of its annual reports and financial statements.
Registration and share registerShares can be registered in the name of the shareholder by contacting the depository bank. Registered shareholders may receive financial statements, annual reports and other shareholder publications automatically. All registered shareholders are invited to at-tend the Company’s Annual General Meetings.
The Company’s share register is managed by VP Securities A/S, Weidekampsgade 14,2300 Copenhagen S, Denmark.
Contact Investor RelationsVP Peter Kondrup +45 3327 1221Director Iben Steiness +45 3327 [email protected]
cOMPanY annOUnceMentS
Share class A B TotalNumber of shares 33,699,252 118,857,554 152,556,806
Carlsberg Foundation 32,973,540 13,290,432 46,263,972
Votes per share 20 2
Par value DKK 20 DKK 20
ISIN DK001018167-6 DK001018175-9
Bloomberg CARLA DC CARLB DC
Reuters CARCa.CO CARCb.CO
Share price at year-end DKK 523.0 DKK 478.8
Proposed dividend per share DKK 9.0 DKK 9.0
SHaRe inFORMatiOn
650600550500450400
Jan
Oct
Apr
Jul
Nov
Dec
Feb
Mar
May
Jun
Aug
Sep
SHaRe PRice 2014 (DKK peR SHARe, CARlSBeRG B)
Download a comprehensive presentation of the Carlsberg Group.www.carlsberggroup.com/investor/ downloadcentre
27/11/2014 Changes in Carlsberg Group’s Executive Committee
18/11/2014 Creating a stronger market position in Greece
10/11/2014 Financial statement as of 30 September 2014
23/10/2014 Acquisition of Chongqing Beer Group Assets Management Co. Ltd completed
29/08/2014 Major shareholder announcement – OppenheimerFunds Inc.
20/08/2014 Financial statement as of 30 June 2014
20/05/2014 Carlsberg issues 10-year EUR Notes
07/05/2014 Financial statement as at 31 March 2014
20/03/2014 Carlsberg A/S – Annual General Meeting – Summary
27/02/2014 Carlsberg A/S – Election of employee representatives to the Supervisory Board
26/02/2014 Carlsberg A/S Annual Report 2013 now published
26/02/2014 Notice to convene the Annual General Meeting
19/02/2014 Financial statement as at 31 December 2013
13/02/2014 Major shareholder announcement – OppenheimerFunds Inc.
12/02/2014 Major shareholder announcement – OppenheimerFunds Inc.
60Carlsberg Group Annual Report 2014 Shareholder information

tHe gROUPFinancial review
Income statementIn 2014, the Group’s net revenue was flat versus 2013. In organic terms, net revenue grew by 2% as the positive price/mix of 3% more than offset the organic decline in total volumes of 2%. Reported net revenue was impacted by -6% from currencies and a net acquisition impact of +4%. The negative currency impact was mainly due to the sig-nificant weakness of the Russian rouble and the Ukrainian hryvnia.
Organically, cost of sales per hl grew slightly as a result of negative operational leverage and write-off of obsolete stocks in Eastern Europe. In reported terms, cost of sales per hl declined by 2% due to the currency impact. Gross profit grew organically by 2%, while the organic growth in gross profit per hl was 4%. The gross profit margin was up organically by 40bp to 50.0%. The reported gross profit margin was 49.3%.
Marketing, sales and distribution expenses amounted to DKK 18,695m. The increase of 3% compared with 2013 was mainly due to higher logistics costs, primarily in Eastern
Europe, and higher sales expenses. Admin-istrative expenses increased by 5% to DKK 4,633m, primarily as a result of the acquisi-tion impact in Asia. Other operating activities amounted to DKK +369m (DKK +22m in 2013). The increase was partly due to a terminated licence agreement in Asia. The Group’s share of operating profit in associ-ates and joint ventures was DKK 408m (DKK 370m in 2013). Total operating expenses thus grew by approximately 2%.
Organically, Group operating profit grew by 1%. Strong performance in Western Europe and Asia more than offset the profit decline in Eastern Europe. Reported operating profit was DKK 9,230m, impacted by a negative currency impact of DKK 789m, mainly from the weaker Eastern European currencies. Group operating profit margin declined 80bp to 14.3%, primarily as a result of the acqui-sition impact from Asia.
Net special items (pre-tax) amounted to DKK -1,353m and were particularly impacted by the non-cash write-down of DKK -703m related to the closure of two breweries in
Operating margin(%)
Beer volume, pro rata(Million hl)
Net revenue(DKKbn)
Operating profit(DKKbn)
2014
2013
2012
2014
2013
2012
2014
2013
2012
2014
2013
2012
130
110
90
70
50
30
11
9
7
5
3
1
20
16
12
8
4
0
80
70
60
50
40
30
Change Change
Pro rata, million hl 2013 Organic Acq., net FX 2014 Reported
Beer 119.7 -3% 6% 122.8 3%
Other beverages 19.7 6% 0% 21.0 6%
Total volume 139.4 -2% 5% 143.8 3%
DKK million
Net revenue 64,350 2% 4% -6% 64,506 0%
Operating profit 9,723 1% 2% -8% 9,230 -5%
Operating margin (%) 15.1 14.3 -80bp
tHe gROUP
61Carlsberg Group Annual Report 2014 Group financial review

Russia. In addition, special items included costs related to other restructuring measures across the Group, connected, among other things, with optimisation and standardisation measures in Western Europe. A specification of special items is included in section 3.1 of the consolidated financial statements.
Net financial items were positively impacted by lower average funding costs and amount-ed to DKK -1,191m against DKK -1,506m in 2013. Net interest costs were DKK -1,182m compared to DKK -1,443m in 2013, and other net financial items were DKK -9m versus DKK -63m in 2013.
Tax totalled DKK -1,748m against DKK -1,833m in 2013. The tax rate was 26.1%.
Non-controlling interests were DKK 524m (2013: DKK 478m), impacted by the in-creased ownership in Chongqing Brewery Group. Carlsberg’s share of net profit was DKK 4,414m (2013: DKK 5,471m), impacted negatively by the higher special items in 2014. Adjusted net profit (adjusted for special items after tax) was DKK 5,496m compared to DKK 5,772m in 2013.
Statement of financial positionAt 31 December 2014, Carlsberg had total assets of DKK 137.0bn against DKK 152.3bn at 31 December 2013. Invested capital
2013 2014
DKK million Q1 Q2 Q3 Q4 Q1 Q2 Q3 Q4Net revenueWestern Europe 7,483 10,371 10,542 8,997 7,640 10,945 10,575 8,602
Eastern Europe 2,902 6,245 4,598 3,966 2,484 4,992 3,916 2,708
Asia 2,262 2,416 2,232 2,153 2,732 3,193 3,582 2,984
Not allocated 57 26 47 53 40 32 47 34
Beverages, total 12,704 19,058 17,419 15,169 12,896 19,162 18,120 14,328Other activities - - - - - - - -
Total 12,704 19,058 17,419 15,169 12,896 19,162 18,120 14,328
Operating profit before special itemsWestern Europe 408 1,709 1,985 1,081 440 1,871 2,038 1,121
Eastern Europe 83 1,608 1,297 1,139 -8 1,518 907 545
Asia 477 484 485 436 455 580 664 496
Not allocated -288 -376 -350 -316 -402 -331 -190 -359
Beverages, total 680 3,425 3,417 2,340 485 3,638 3,419 1,803Other activities -52 -26 -25 -36 -32 -37 -29 -17
Total 628 3,399 3,392 2,304 453 3,601 3,390 1,786
Special items, net -49 -81 -43 -262 -29 -95 -94 -1,135
Financial items, net -353 -405 -290 -458 -346 -368 -299 -178
Profit before tax 226 2,913 3,059 1,584 78 3,138 2,997 473Corporation tax -46 -717 -738 -332 -16 -788 -749 -195
Consolidated profit 180 2,196 2,321 1,252 62 2,350 2,248 278
Attributable toNon-controlling interests 118 122 113 125 129 140 145 110
Shareholders in Carlsberg A/S 62 2,074 2,208 1,127 -67 2,210 2,103 168
SegMent RePORting BY qUaRteRamounted to DKK 103.6bn against DKK 119.1bn at 31 December 2013.
Total assets and invested capital were both impacted by a significant reduction in intan-gible assets and property, plant and equip-ment from foreign exchange adjustments, primarily RUB and UAH. This was partially offset by the increase from the acquisition of Chongqing Beer Group Assets Manage-ment and investments in new breweries in Asia. Liabilities offset in the invested capital remained stable. Total assets in Russia and Ukraine decreased by DKK 23.9bn as of 31 December 2014 compared with the DKK val-ue they would have had if translated at the exchange rates applied at year-end 2013.
AssetsIntangible assets were DKK 81.8bn (DKK 94.2bn at 31 December 2013). Property, plant and equipment declined to DKK 28.7bn from DKK 31.7bn at 31 December 2013. The total decrease in intangible assets and property, plant and equipment of DKK 15.4bn was mainly due to foreign exchange adjustments, primarily related to the rouble-denominated assets and additions of DKK 1.9bn from acquisition of entities.
Financial assets amounted to DKK 7.8bn against DKK 7.0bn at 31 December 2013. The increase was due to recognised profits from investments in associates and joint ventures as well as an increase in deferred tax assets.
62Carlsberg Group Annual Report 2014 Group financial review

Inventories and receivables amounted to DKK 11.4bn (DKK 12.3bn at 31 December 2013), primarily driven by lower receivables in Rus-sia due to the development in the exchange rate. In rouble terms, receivables remained largely unchanged compared with 2013. Other receivables etc. totalled DKK 3.8bn against DKK 3.5bn at 31 December 2013. Cash amounted to DKK 2.4bn at 31 Decem-ber 2014. The decline of DKK 1.2bn versus 31 December 2013 was the result of acquisition of entities, higher CapEx and dividends paid.
LiabilitiesEquity decreased to DKK 56.0bn compared to DKK 71.0bn at 31 December 2013. DKK 52.4bn was attributed to shareholders in Carlsberg A/S and DKK 3.6bn to non-controlling interests.
The decline in equity of DKK 15.4bn attrib-uted to shareholders in Carlsberg A/S was mainly due to foreign exchange losses of DKK -17.3bn, profit for the period of DKK +4.4bn, payment of dividends to sharehold-ers of DKK -1.2bn, and retirement benefit obligations of DKK -1.2bn.
Liabilities were DKK 81.0bn compared to DKK 81.3bn at 31 December 2013. The most notable change was the increase in long-term borrowings and the decrease
in short-term borrowings, reflecting the refinancing of a EUR 1bn bond that matured in May with another EUR 1bn bond with a coupon of 2.5%.
Cash flow Operating profit before depreciation and amortisation was DKK 13,338m (DKK 13,592m in 2013).
The change in trade working capital was DKK -177m (DKK +620m in 2013). The change in trade working capital was impact-ed by a decrease in payable excise duties. Average trade working capital to net revenue (MAT) was -3.6% at the end of 2014, in line with 2013. The change in other work-ing capital was DKK -682m (DKK -843m in 2013), partly due to lower VAT payable, temporarily impacted by the implementation of the BSP1 structure in three new countries as of October 2014, and an increase in other receivables from sale of assets. Paid net interest etc. amounted to DKK -1,995m (DKK -2,095m in 2013). The decline was mainly due to lower funding costs.
Cash flow from operating activities was DKK 7,405m against DKK 8,142m in 2013.
Cash flow from investing activities amounted to DKK -6,735m against DKK -8,012m in 2013. Operational investments totalled DKK -5,549m (DKK -5,385m in 2013), whereas financial investments amounted to DKK -1,166m, down from DKK -2,609m in 2013, impacted in 2014 by the purchase of Chong-qing Beer Group Assets Management and in 2013 by the acquisition of shares in Chongqing Brewery Group.
Free cash flow amounted to DKK 670m versus DKK 130m in 2013.
Financing At 31 December 2014, gross interest- bearing debt amounted to DKK 40.7bn and net interest-bearing debt to DKK 36.6bn. The difference of DKK 4.1bn comprised other interest-bearing assets, including DKK 2.4bn in cash and cash equivalents.
Of the gross interest-bearing debt, 95% (DKK 38.7bn) was long-term, i.e. with maturity more than one year from 31 December 2014. Of the net financial debt, 78% was denominated in EUR and DKK (after swaps) and 69% was at fixed interest (fixed-interest period exceeding one year).
Current and historical quarterly financial data are available in Excel.www.carlsberggroup.com/investor/financials
Operating profit before special items Adjusted net profit1
19.02.2014 Actual (Financial Statements for 2013) DKK 9,723m DKK 5,772m
19.02.2014 Financial Statements for 2013 Will grow organically by high-single-digit percentages (reported mid-single-digit percentage growth)
Will grow by mid-single-digit percentages
07.05.2014 Interim results Q1 2014 Will grow organically by high-single-digit percentages (reported low-single-digit percentage growth)
Will grow by low-single-digit percentages
20.08.2014 Interim results Q2 2014Will grow organically by low- to mid-single-digit percentages (reported low- to mid-single-digit percentage decline)
Will decline by mid- to high-single-digit percentages
18.02.2015 Actual (Financial Statements for 2014) DKK 9,230m DKK 5,496m
eXPectatiOnS anD ReSUltS 2014
1 Adjusted for special items after tax.
63Carlsberg Group Annual Report 2014 Group financial review

64Carlsberg Group Annual Report 2014 Financial Statements
71 1.1 Business developments72 1.2 Revenue and segmentation
of operations
74 1.3 Operating expenses, inventories and deposit liabilities
77 1.4 Foreign exchange risk related to earnings
78 1.5 Cash flow from operating activities
79 1.6 Trade receivables and on-trade loans
100 4.1 Financial income and expenses
101 4.2 Net interest-bearing debt
102 4.3 Capital structure
104 4.4 Borrowings and cash105 4.5 Foreign exchange risk related to net
investments and financing activities
108 4.6 Interest rate risk
110 4.7 Liquidity risk
112 4.8 Financial instruments
113 4.9 Determination of fair value
Financial StateMentS
SectiOn 1
Operating activities 70
SectiOn 2
Asset base and returns 82
SectiOn 3
Special items and provisions 95
SectiOn 4
Financing costs, capital structure and equity 99
SectiOn 5
Acquisitions, associates and joint ventures 114
SectiOn 7
Staff costs and remuneration 126
SectiOn 8
Other disclosure requirements 135
SectiOn 6
Tax 122
SectiOn 9
Basis for preparation 137
SectiOn 10
Group companies 144
83 2.1 Return on invested capital
84 2.2 Segmentation of assets
85 2.3 Impairment90 2.4 Intangible assets and property,
plant and equipment114 5.1 Acquisition of subsidiaries
119 5.2 Impact from acquisitions
119 5.3 Cash flow effect from acquisitions
120 5.4 Non-controlling interests
121 5.5 Associates and joint ventures
122 6.1 Corporation tax
124 6.2 Deferred tax
126 7.1 Staff costs
127 7.2 Remuneration
128 7.3 Share-based payments132 7.4 Retirement benefit obligations
and similar obligations
135 8.1 Earnings per share
136 8.2 Related party disclosures
136 8.3 Fees to auditors
136 8.4 Events after the reporting period
137 9.1 Significant accounting estimates
138 9.2 General accounting policies
143 9.3 New legislation
65 Income statement 65 Statement of
comprehensive income 66 Statement of financial position 67 Statement of changes in equity 69 Statement of cash flows 70 Notes 146 Parent Company 158 Management statement159 The independent auditors’ report
95 3.1 Special items
97 3.2 Provisions
98 3.3 Contingent liabilities

DKK million Section 2014 2013Revenue 91,569 91,237
Excise duties on beer and soft drinks etc. -27,063 -26,887
Net revenue 1.2 64,506 64,350Cost of sales 1.3.1 -32,725 -32,423
Gross profit 31,781 31,927Sales and distribution expenses 1.3.3 -18,695 -18,181
Administrative expenses 1.3.3 -4,633 -4,415
Other operating activities, net 1.3.4 369 22
Share of profit after tax, associates and joint ventures 5.5 408 370
Operating profit before special items 9,230 9,723Special items, net 3.1 -1,353 -435
Financial income 4.1 806 717
Financial expenses 4.1 -1,997 -2,223
Profit before tax 6,686 7,782Corporation tax 6.1 -1,748 -1,833
Consolidated profit 4,938 5,949
Attributable toNon-controlling interests 524 478
Shareholders in Carlsberg A/S 4,414 5,471
DKK
Earnings per share 8.1
Basic earnings per share of DKK 20 28.9 35.9
Diluted earnings per share of DKK 20 28.8 35.7
incOMe StateMent
DKK million Section 2014 2013Consolidated profit 4,938 5,949
Other comprehensive incomeRetirement benefit obligations 7.4 -1,208 824
Share of other comprehensive income in associates and joint ventures -3 2
Corporation tax relating to items that will not be reclassified 6.1 -118 -195
Items that will not be reclassified to the income statement -1,329 631
Foreign exchange adjustments of foreign entities 4.1 -16,938 -7,499
Value adjustments of hedging instruments 4.1 151 10
Effect of hyperinflation 4.1 - 61
Other 3 -29
Corporation tax relating to items that may be reclassified 6.1 8 -8
Items that may be reclassified to the income statement -16,776 -7,465
Other comprehensive income -18,105 -6,834Total comprehensive income -13,167 -885
Attributable toNon-controlling interests 825 305
Shareholders in Carlsberg A/S -13,992 -1,190
StateMent OF cOMPReHenSive incOMe
StateMentS
65Carlsberg Group Annual Report 2014 Financial Statements

DKK million Section 31 Dec. 2014 31 Dec. 2013
ASSETS
Non-current assetsIntangible assets 2.3, 2.4 81,754 94,236
Property, plant and equipment 2.3, 2.4 28,748 31,738
Investments in associates and joint ventures 5.5 4,277 3,771
Receivables 1.6 2,131 2,049
Deferred tax assets 6.2 1,430 1,130
Total non-current assets 118,340 132,924
Current assetsInventories 1.3.1 4,498 4,592
Trade receivables 1.6 6,872 7,681
Tax receivables 196 203
Other receivables 1.6 2,614 1,795
Prepayments 977 1,501
Cash and cash equivalents 4.4.2 2,418 3,612
Total current assets 17,575 19,384Assets classified as held for sale 2.4 1,068 -
Total assets 136,983 152,308
DKK million Section 31 Dec. 2014 31 Dec. 2013
EQUITY AND LIABILITIES
EquityShare capital 4.3.2 3,051 3,051
Reserves -31,006 -13,890
Retained earnings 80,392 78,650
Equity, shareholders in Carlsberg A/S 52,437 67,811
Non-controlling interests 3,560 3,190
Total equity 55,997 71,001
Non-current liabilitiesBorrowings 4.2, 4.4 38,690 30,239
Retirement benefit obligations and similar obligations 7.4 4,580 3,292
Deferred tax liabilities 6.2 7,105 9,215
Provisions 3.2 2,646 2,567
Other liabilities 1,442 1,355
Total non-current liabilities 54,463 46,668
Current liabilitiesBorrowings 4.2, 4.4 1,835 9,417
Trade payables 12,031 12,614
Deposits on returnable packaging 1.3.2 2,046 1,812
Provisions 3.2 510 441
Corporation tax 775 614
Other liabilities etc. 9,326 9,741
Total current liabilities 26,523 34,639Total liabilities 80,986 81,307Total equity and liabilities 136,983 152,308
StateMent OF Financial POSitiOn
66Carlsberg Group Annual Report 2014 Financial Statements

DKK million Shareholders in Carlsberg A/S
2014Share
capitalCurrency
translationHedgingreserves
Totalreserves
Retainedearnings
Equity,shareholders in Carlsberg
A/S
Non- controlling
interestsTotal
equityEquity at 1 January 2014 3,051 -13,208 -682 -13,890 78,650 67,811 3,190 71,001
Consolidated profit - - - - 4,414 4,414 524 4,938
Other comprehensive incomeForeign exchange adjustments of foreign entities - -17,271 - -17,271 - -17,271 333 -16,938
Value adjustments of hedging instruments - -50 201 151 - 151 - 151
Retirement benefit obligations - - - - -1,165 -1,165 -43 -1,208
Share of other comprehensive income in associates and joint ventures - - - - -3 -3 - -3
Other - - - - 3 3 - 3
Corporation tax - 31 -27 4 -125 -121 11 -110
Other comprehensive income - -17,290 174 -17,116 -1,290 -18,406 301 -18,105Total comprehensive income for the year - -17,290 174 -17,116 3,124 -13,992 825 -13,167
Acquisition/disposal of treasury shares - - - - 5 5 - 5
Exercise of share options - - - - -19 -19 - -19
Share-based payments - - - - 36 36 - 36
Dividends paid to shareholders - - - - -1,220 -1,220 -413 -1,633
Acquisition of non-controlling interests - - - - -184 -184 -50 -234
Acquisition of entities - - - - - - 8 8
Total changes in equity - -17,290 174 -17,116 1,742 -15,374 370 -15,004Equity at 31 December 2014 3,051 -30,498 -508 -31,006 80,392 52,437 3,560 55,997
StateMent OF cHangeS in eqUitY
The proposed dividend of DKK 9.00 per share, in total DKK 1,373m (2013: DKK 8.00 per share, in total DKK 1,220m), is included in retained earnings at 31 December 2014. Dividends paid out in 2014 for 2013 amount to DKK 1,220m (paid out in 2013 for 2012: DKK 915m), which is DKK 8.00 per share (2013: DKK 6.00 per share). Dividends paid out to shareholders of Carlsberg A/S do not impact tax-able income in Carlsberg A/S.
67Carlsberg Group Annual Report 2014 Financial Statements

DKK million Shareholders in Carlsberg A/S
2013Share
capitalCurrency
translationHedgingreserves
Totalreserves
Retainedearnings
Equity,shareholders in Carlsberg
A/S
Non- controlling
interestsTotal
equityEquity at 1 January 2013 3,051 -5,865 -758 -6,623 73,833 70,261 3,389 73,650
Changes in accounting policies - - - - - - -13 -13
Restated equity at 1 January 2013 3,051 -5,865 -758 -6,623 73,833 70,261 3,376 73,637
Consolidated profit - - - - 5,471 5,471 478 5,949
Other comprehensive incomeForeign exchange adjustments of foreign entities - -7,327 - -7,327 - -7,327 -172 -7,499
Value adjustments of hedging instruments - -118 128 10 - 10 - 10
Retirement benefit obligations - - - - 817 817 7 824
Share of other comprehensive income in associates and joint ventures - - - - 2 2 - 2
Effect of hyperinflation - 58 - 58 - 58 3 61
Other - - - - -18 -18 -11 -29
Corporation tax - 44 -52 -8 -195 -203 - -203
Other comprehensive income - -7,343 76 -7,267 606 -6,661 -173 -6,834Total comprehensive income for the year - -7,343 76 -7,267 6,077 -1,190 305 -885
Capital increase - - - - - - 32 32
Acquisition/disposal of treasury shares - - - - -13 -13 - -13
Exercise of share options - - - - -57 -57 - -57
Share-based payments - - - - 57 57 - 57
Dividends paid to shareholders - - - - -915 -915 -357 -1,272
Acquisition of non-controlling interests - - - - -332 -332 -224 -556
Acquisition of entities - - - - - - 58 58
Total changes in equity - -7,343 76 -7,267 4,817 -2,450 -186 -2,636Equity at 31 December 2013 3,051 -13,208 -682 -13,890 78,650 67,811 3,190 71,001
StateMent OF cHangeS in eqUitY
68Carlsberg Group Annual Report 2014 Financial Statements

DKK million Section 2014 2013Operating profit before special items 9,230 9,723
Adjustment for depreciation and amortisation 4,103 3,863
Adjustment for impairment losses1 5 6
Operating profit before depreciation, amortisation and impairment losses1 13,338 13,592Adjustment for other non-cash items 1.5.1 -514 -221
Change in trade working capital 1.5.1 -177 620
Change in other working capital 1.5.1 -682 -843
Restructuring costs paid -397 -617
Interest etc. received 224 329
Interest etc. paid -2,219 -2,424
Corporation tax paid -2,168 -2,294
Cash flow from operating activities 7,405 8,142Acquisition of property, plant and equipment and intangible assets -5,888 -5,582
Disposal of property, plant and equipment and intangible assets 261 149
Change in on-trade loans 1.5.1 78 48
Total operational investments -5,549 -5,385Free operating cash flow 1,856 2,757Acquisition and disposal of entities, net 5.3 -1,681 -2,314
Acquisition and disposal of associates and joint ventures, net -90 -191
Acquisition and disposal of financial assets, net 25 5
Change in financial receivables 1.5.1 400 -250
Dividends received 180 141
Total financial investments -1,166 -2,609Other investments in property, plant and equipment -20 -18
Total other activities2 -20 -18Cash flow from investing activities -6,735 -8,012Free cash flow 1.5 670 130Shareholders in Carlsberg A/S 4.3.2 -1,234 -985
Non-controlling interests 4.3.2 -663 -677
External financing 4.4.1 82 -67
Cash flow from financing activities -1,815 -1,729Net cash flow -1,145 -1,599Cash and cash equivalents at 1 January3 3,234 5,000
Foreign exchange adjustment of cash and cash equivalents 89 -167
Cash and cash equivalents at 31 December3 4.4.2 2,178 3,234
StateMent OF caSH FlOwS
1 Impairment losses excluding those reported in special items, cf. section 3.1.
2 Other activities cover real estate, separate from beverage activities.
3 Cash and cash equivalents less bank overdrafts.
69Carlsberg Group Annual Report 2014 Financial Statements

70Carlsberg Group Annual Report 2014 Financial Statements
SectiOn 1operating activities
Operating profit is a measure of our ability to enhance operational performance through top-line growth while containing or reducing costs by working more effectively and efficiently.
A strong operating cash flow allows us to return value to shareholders, pay down debt, reinvest in our business and engage in value-creating acquisitions in growth markets.
2%
9.2bn
KeY DevelOPMentS 2014
Organic net revenue growth of 2% to DKK 64.5bn. Reported growth flat due to foreign exchange effects during the year.
Operating profit before special items of DKK 9.2bn, down 0.5bn due to a negative currency effect of 0.8bn and 1% organic growth.
1.9bn 670m
1% 5.5bn
Free operating cash flow of DKK 1.9bn, down 0.9bn due to higher CapEx.
Free cash flow of DKK 670m, impacted by acquisitions in Asia.
Adjusted net profit of DKK 5.5bn, down 5%.
Operating profit growth(DKKbn)
Operating profit(DKKbn)
10
9
8
7
6
5
11
9
7
5
3
1
+1%
+2%
+2%
+4%
-8%
-6%
2014
2014FX
2013
Orga
nic
2011
Acqu
isitio
ns
2012
2013
2010
Net revenue growth(DKKbn)
69
67
65
63
61
59
2014FX
Orga
nic
Acqu
isitio
ns
2013

71Carlsberg Group Annual Report 2014 Financial Statements
Group beer volumes declined organically by 3% due to weak Russian and Ukrainian beer markets. Reported beer volumes grew by 3% as a result of acquisitions in Asia. Other beverages grew organically by 6% due to strong volume development in the Nordic soft drinks businesses.
Net revenue grew 2% organically as the positive price/mix of 3% more than offset the organic decline in total volumes of 2%. Reported net revenue was flat as a result of -6% from currencies and a net acquisi-tion impact of +4%. The negative currency impact was mainly due to the significant weakness of the Russian rouble (RUB) and Ukrainian hryvnia (UAH).
Organically, cost of sales per hl grew slightly as a result of negative operational leverage and write-off of obsolete stocks in Eastern Europe. In reported terms, cost of sales per hl declined by 2% due to the currency impact. Gross profit grew organically by 2%, while organic growth in gross profit per hl was 4%. The gross profit margin was up organically by 40bp to 50.0% (reported 49.3%).
Operating expenses grew organically by approximately 4%, mainly due to higher lo-gistics costs, primarily in Eastern Europe, and higher sales expenses.
Organically, Group operating profit grew by 1%. Strong performance in Western Europe and Asia more than offset the profit decline in Eastern Europe. Reported operating profit was DKK 9,230m, impacted by a negative currency impact of DKK 789m, mainly from the weaker Eastern European currencies. The Group’s operating profit margin declined 80bp to 14.3%, primarily as a result of the acquisition impact from Asia and the Eastern European profit decline.
Reported net profit was DKK 4,414m (2013: DKK 5,471m), impacted negatively by special items of DKK 1,353m (2013: DKK 435m), which included a DKK 0.7bn write-down related to the closure of two Russian breweries.
gROUP
Change Change
Pro rata (million hl) 2013 Organic Acq., net FX 2014 ReportedBeer 119.7 -3% 6% 122.8 3%
Other beverages 19.7 6% 0% 21.0 6%
Total volume, pro rata 139.4 -2% 5% 143.8 3%
DKK million
Net revenue 64,350 2% 4% -6% 64,506 0%
Operating profit before special items 9,723 1% 2% -8% 9,230 -5%
Operating margin (%) 15.1 14.3 -80bp
Adjusted net profit (adjusted for special items after tax) declined 5% to DKK 5,496m versus DKK 5,772m in 2013.
Free operating cash flow was DKK 1,856m (2013: DKK 2,757m) as organic EBITDA growth was offset by negative currency impact, negative impact from trade work-ing capital and higher CapEx than in 2013. Average trade working capital to net revenue was -3.6%, on par with 2013. Free cash flow was DKK 670m versus DKK 130m in 2013.
1.1 ACCountinG poliCieS
Growth represents the combined effect of the following three elements: organic growth, acquisitions and foreign exchange effects. The acquisition effect is calculated as the effect of acquisitions and divestments, including any additional share obtained from increased ownership of associates and joint ventures, for a 12-month period from the acquisition date. The foreign exchange effect is the difference between the figures for the current reporting period translated at the exchange rates applying to the previous reporting period and at the rates applying to the current reporting period. Organic growth is the remaining growth that is not related to acquisitions, divestments or foreign ex-change effects.
Business developments
SectiOn 1.1

72Carlsberg Group Annual Report 2014 Financial Statements
The segmentation reflects the geographical and strategic management, decision and reporting structure applied by the Executive Committee (Chief Operating Decision Maker).
The non-beverage activities are managed separately and therefore also shown sep-arately.
Not allocated net revenue, DKK 153m (2013: DKK 183m), consists of DKK 17,996m (2013: DKK 9,948m) net revenue from other companies and activities and DKK -17,843m (2013: DKK -9,765m) from eliminations of sales between these other companies and the geographical segments.
Not allocated operating profit before special items, DKK -1,282m (2013: DKK -1,330m), consists of DKK -1,331m (2013: DKK -1,355m) from other companies and activ-ities and DKK 49m (2013: DKK 25m) from eliminations.
DKK million
2014Western
EuropeEastern Europe Asia
Not allocated
Beverages, total
Non- beverage
Carlsberg Group, total
Net revenue 37,598 14,086 12,491 331 64,506 - 64,506
Intra-segment revenue 164 14 - -178 - - -
Total net revenue 37,762 14,100 12,491 153 64,506 - 64,506Total cost -32,407 -11,142 -10,582 -1,435 -55,566 -118 -55,684
Share of profit after tax, associates and joint ventures 115 4 286 - 405 3 408
Operating profit before special items 5,470 2,962 2,195 -1,282 9,345 -115 9,230Special items, net -1,245 -108 -1,353
Financial items, net -1,169 -22 -1,191
Profit before tax 6,931 -245 6,686Corporation tax -1,883 135 -1,748
Consolidated profit 5,048 -110 4,938Operating margin 14.5% 21.0% 17.6% 14.5% 14.3%
2013Net revenue 37,293 17,700 9,063 294 64,350 - 64,350
Intra-segment revenue 100 11 - -111 - - -
Total net revenue 37,393 17,711 9,063 183 64,350 - 64,350Total cost -32,298 -13,589 -7,446 -1,513 -54,846 -151 -54,997
Share of profit after tax, associates and joint ventures 88 5 265 - 358 12 370
Operating profit before special items 5,183 4,127 1,882 -1,330 9,862 -139 9,723Special items, net -442 7 -435
Financial items, net -1,486 -20 -1,506
Profit before tax 7,934 -152 7,782Corporation tax -2,025 192 -1,833
Consolidated profit 5,909 40 5,949Operating margin 13.9% 23.3% 20.8% 15.3% 15.1%
SegMentatiOn OF incOMe StateMent etc.
Revenue and segmentation of operations
SectiOn 1.2

73Carlsberg Group Annual Report 2014 Financial Statements
DKK million 2014 2013Denmark (Carlsberg A/S’s domicile) 5,279 5,007
Russia 11,058 14,014
Other countries 48,169 45,329
Total 64,506 64,350
geOgRaPHical allOcatiOn OF net RevenUe1.2 ACCountinG poliCieS
For information about segmentation, please refer to section 9.2 (General accounting policies).
Revenue is generated mainly by sales of goods, royalty income, porterage income, rental income from non-stationary equipment, service fees and sales of by-products.
Revenue from the sale of own-produced finished goods, goods for resale (third-party products) and by-products is recognised in the income statement when all significant risks and rewards have been transferred to the buyer and when the income can be reliably measured and is expected to be received.
Royalty and licence fees are recognised when earned according to the terms of the licence agreements.
Revenue is measured including excise duties on beer and soft drinks and excluding dis-counts, VAT and duties.
DiscountsSales reductions in the form of discounts and fees are widely used in the beverage industry. Furthermore, the Carlsberg Group grants or pays various discounts and fees depending on the nature of the customer and business.
Discounts comprise off-invoice, volume- and activity-related discounts, including specific promotion prices offered and other discounts. On-trade loans to on-trade customers are also classified as discounts.
Off-invoice discounts arise from sales trans-actions where the customer immediately receives a reduction in the sales price. This also includes cash discounts and incentives for early payment.
Activity-related discounts is a broad term covering incentives for customers to sustain business with the Carlsberg Group over a longer time and can be related to a cur-rent campaign or a sales target measured in volume. Examples include discounts paid as a lump sum, discounts for meeting all or certain sales targets or for exceeding targets, or progressive discounts offered in step with increasing sales to a customer.
Other discounts include listing fees, i.e. fees for listing on certain shelves or coolers or payment for a favourable store location, as such specific point-of-sale promotions are closely related to the volumes sold.
On-trade loans are described in section 1.6.
All discounts are estimated and recognised on a monthly basis based on experience and expectations for sales to an individual customer or group of customers.
1.2 SiGniFiCAnt ACCountinG eStiMAteS AnD juDGeMentS
The classification of duties and fees paid to local authorities or brewery organisa-tions etc. and of discounts and market-ing-related activities entails significant accounting estimates to be made by management.
Locally imposed duties and fees are classified as either sales-related duties, which are deducted from revenue, or as fees related to the input/use of goods in production, transportation, distribution etc., which are therefore recognised as an expense in the rel-evant line item.
Customer discounts are recognised in the same period as the sales to which they relate and deducted from revenue.
Customer discounts are based on expect-ed accumulated sales volumes over a period of time using historical and year-to-date sales figures and other current information about trading with the cus-tomer. These calculations are performed by local management in cooperation with sales managers.
Management assesses the agreements with, services provided by and payments made to customers and to their customers to determine the substance and thereby the classification as either discounts or as trade marketing expenses. Expenses incurred for activities closely related to volumes sold are classified as discounts, while costs related to more general market activities are classi-fied as trade marketing expenses.
SectiOn 1.2 Revenue and segmentation of operations

74Carlsberg Group Annual Report 2014 Financial Statements
Cost of sales increased by 0.9% due to the full-year effect of the consolidation of Chongqing Brewery Group, partly offset by a reduction in cost of materials. Organically, cost of sales per hl grew slightly as a result of negative operational leverage and write-off of obsolete stocks in Eastern Europe. In reported terms, cost of sales per hl declined by 2% due to the currency impact.
Cost of materials mainly relates to barley/malt, hops, glass, cans and other packag-ing materials.
Purchased finished goods include cost of point-of-sale materials sold to customers and third-party products.
Inventories declined slightly despite the acquisition of Chongqing Beer Group As-sets Management, which was fully consol-idated from November 2014 and therefore impacted the level of inventories at year-end, while having only a minor impact on the cost of sales (included for two months only). The figures for 2013 were impacted by the acquisition of Chongqing Brewery Group with full consolidation as of Decem-ber 2013.
1.3.1 Cost of sales and inventories
DKK million 2014 2013Cost of materials 18,100 18,767
Direct staff costs 1,412 1,357
Machinery costs 881 917
Depreciation, amortisation and impairment losses 2,890 2,763
Indirect production overheads 3,797 3,568
Purchased finished goods and other costs 5,645 5,051
Total 32,725 32,423
cOSt OF SaleS
DKK million 2014 2013Raw materials and consumables 2,246 2,216Work in progress 296 298
Finished goods 1,956 2,078
Total 4,498 4,592
inventORieS
Raw and packaging material risksRaw and packaging material risks are associ-ated in particular with purchasing of cans (aluminium), malt (barley) and energy. The management of raw and packaging mate-
1.3 SiGniFiCAnt ACCountinG eStiMAteS AnD juDGeMentS
At least once a year, the local entities assess whether the standard cost of inventories is a close approximation of the actual cost. The standard cost is also revised if, during the year, it deviates by more than 5% from the actual cost of the individual product.
Management also assesses the impact on the standard cost of government and other grants received to fund operating activities. This involves assessing the terms and conditions of grants received, including the risk of any repayment.
Funding and grants are recognised in the income statement in the same period as the activities to which they relate.
Indirect production overheads are calcu-lated on the basis of relevant assump-
tions as to capacity utilisation, production time and other factors pertaining to the individual product.
The calculation of the net realisable value of inventories is mainly relevant to packaging materials, point-of-sale mate-rials and spare parts. The net realisable value is normally not calculated for beer and soft drinks because their limited shelf-life means that slow-moving goods must be scrapped instead. The individual entities impacted by the current macro-economic situation in Eastern Europe have paid special attention to inventory turnover and the remaining shelf-life when determining the net realisable value and scrapping.
rial risks is coordinated centrally and aimed at achieving stable and predictable raw and packaging material prices in the medium term and avoiding capital and liquidity being tied up unnecessarily.
As the underlying markets for the speci-fied categories of raw and packaging materials vary, so does the way in which they are hedged against price increases. The most common form of hedging is fixed-price agreements in local currencies with suppliers.
Operating expenses, inventories and deposit liabilities
SectiOn 1.3
To hedge the implicit risk of volatile alu-minium prices associated with the purchase of cans, the Group’s purchase price in the majority of purchase agreements is variable and based on the global market price of alu-minium (London Metal Exchange, LME). The Group is thus able to hedge the underlying aluminium price risk.
For 2015, the majority of the aluminium price risk has been hedged for Western Europe and Eastern Europe. For 2014 the risk was partially hedged. The total vol-

75Carlsberg Group Annual Report 2014 Financial Statements
1.3.1 ACCountinG poliCieS
Cost of sales comprises costs of products sold during the year, indirect production overheads (IPO) not allocated to specific products and development costs.
Own-produced finished goods and work in progress are measured at standard cost com-prising the cost of raw materials, consumables, direct labour and indirect production overheads. Indirect production overheads comprise indirect supplies, wages and salaries, amortisation of trademarks and software, as well as mainte-nance and depreciation of machinery, plant and equipment used for production and costs of production, administration and management.
The cost of purchased finished goods, raw and packaging materials and point-of-sale materials includes any costs that are directly related to bringing inventories to the relevant place of sale and getting them ready for sale, e.g. purchase cost, insurance, freight, duties and similar costs.
Inventories are measured at the lower of stand-ard cost (own-produced finished goods) and weighted average cost (other inventories) and net realisable value. The net realisable value of inventories is calculated as the selling price less costs of completion and costs necessary to make the sale and is determined taking into account marketability, obsolescence and devel-opments in expected selling price.
The cost of scrapped/impaired goods is ex-pensed within the function (line item) respon-sible for the loss, i.e. losses during distribution are included in the cost of distribution while the scrapping of products due to sales not meeting forecasts is included in sales expenses.
ume of aluminium purchased via financial instruments was approximately 70,500 tonnes at the end of 2014 (2013: 110,800 tonnes). Based on this volume, and as-suming 100% efficiency, a 10% increase (decrease) in aluminium prices would impact equity positively (negatively) by DKK 80m (2013: DKK 108m). Fair values of the financial instruments are specified in section 4.8.
1.3.2 ACCountinG poliCieS
The obligation to refund deposits on return-able packaging is stated on the basis of deposit price as well as an estimate of the number of bottles, kegs, cans and crates in circulation and expected return rates.
The accounting policy for returnable packag-ing capitalised as property, plant and equip-ment is described in section 2.4.
1.3.2 SiGniFiCAnt ACCountinG eStiMAteS AnD juDGeMentS
Management assesses the local busi-ness model, contracts and agree-ments, the level of control over the returnable packaging material and the return rate to determine the ac-counting treatment of the packaging material as either property, plant and equipment or inventory.
The deposit liability provided for is estimated based on movements dur-ing the year in recognised deposit liabilities and on historical information about return rates and loss of bottles in the market as well as planned changes in packaging types.
1.3.2 Deposit liabilities on returnable packaging
In a number of countries, the local entities have a legal or constructive obligation to take back returnable packaging from the market. When invoicing customers, the entity adds a deposit to the sales price and recognises a deposit liability. The deposit is paid out on return of bottles, cans etc.
The deposit liability amounted to DKK 2,046m (2013: DKK 1,812m) at 31 De-cember 2014, while the value of return-able packaging materials amounted to DKK 2,352m (2013: DKK 1,986m). The capital-ised value of returnable packaging materi-als exceeds the deposit liability as each of the returnable packaging items circulates a number of times in the market and as the deposit value in some markets is legally set lower than the cost of the returnable packaging. The deposit liability was almost unchanged compared to the liability at the end of 2014 except for the effect of the acquisition of Chongqing Beer Group Assets Management, which increased the deposit liability.
SectiOn 1.3 operating expenses, inventory and deposit liability
It is Group policy to secure delivery of malt and hops for the coming budget year, and the main part of the exposure for 2014 was thus hedged through fixed-price purchase agreements for the majority of the Group during 2013. Likewise the majority of the exposure for 2015 has been hedged during 2014. The percen tage which is hedged or price-fixed is higher for Western Europe than for Eastern Europe.

76Carlsberg Group Annual Report 2014 Financial Statements
1.3.4 ACCountinG poliCieS
Gains and losses on the disposal of intangi-ble assets and property, plant and equip-ment are determined as the sales price less selling costs and the carrying amount at the disposal date. On-trade loans, net, comprise the effective interest rate on on-trade loans calculated on the basis of amortised cost less impairment of on-trade loans.
Expenses relating to research activities com-prise research in Denmark and France less funding received from the Carlsberg Founda-tion for the operation of the Carlsberg Labo-ratory and grants received to fund research. The funding and grants are recognised in the income statement in the same period as the activities to which they relate. Develop-ment costs are included in cost of sales.
1.3.4 other operating activities, net
Other operating activities are secondary to the principal activities of the entities and in-clude income and expenses relating to rental properties, restaurants, on-trade loans, research activities, and gains and losses on the disposal of intangible assets and prop-erty, plant and equipment.
On-trade loan activities are described in section 1.6.
DKK million 2014 2013
Gains and losses on disposal of property, plant and equipment and intangible assets within beverage activities, net 98 2
On-trade loans, net 68 5
Real estate, net -5 -35
Research centres, net -85 -99
Other, net 293 149
Total 369 22
DKK million 2014 2013Marketing expenses 5,859 5,719
Sales expenses 5,215 5,072
Distribution expenses 7,621 7,390
Total 18,695 18,181
1.3.3 ACCountinG poliCieS
Brand and trade marketing expenses com-prise sales campaigns, sponsorships, adver-tising and in-store display expenses.
Sales and distribution expenses comprise costs relating to general sales activities, sales staff as well as depreciation and impairment of sales equipment and costs incurred in distributing goods sold during the year.
Administrative expenses comprise expenses incurred during the year for management and administration, including expenses for administrative staff, office premises and office expenses, and depreciation and write-downs for bad debt losses.
1.3.3 Sales, distribution and administrative expenses
Total operating expenses grew by 3%. Mar keting, sales and distribution expenses increased by DKK 514m compared to 2013, mainly due to higher logistics costs, pri-marily in Eastern Europe, and higher sales expenses. Additionally, the reported figure was impacted by the full-year effect of the acquisition of Chongqing Brewery Group and the consolidation of Chongqing Beer Group Assets Management as of November 2014 and a reduction due to currency impact.
Marketing expenses consist of expenses for brand marketing and trade marketing.
Brand marketing is an investment in the Group’s brands and consists of brand-specific investments in the development of communication vehicles and the use of these to drive the sale of branded products and services.
Trade marketing is promotional activities di-rected towards customers, such as the sup-ply of point-of-sale materials, promotional material and trade offers.
SectiOn 1.3 operating expenses, inventory and deposit liability

77Carlsberg Group Annual Report 2014 Financial Statements
A significant part of the Group’s activities takes place outside Denmark and in curren-cies other than DKK. Foreign exchange risk is therefore a principal financial risk for the Group and, as such, exchange rate fluctua-tions can have a significant impact on the income statement.
Transaction risks on purchases and salesThe Group is exposed to transaction risks on purchases and sales in currencies other than the functional currency of the local entities. It is therefore Group policy to hedge future cash flows in currencies other than the functional currency of the entities for a one-year period. This policy applies to Western Europe, excluding some of the Baltic and Balkan states. Hedging is carried out when plans for the following year are being pre-pared, effectively hedging the entities’ oper-ating profit in local currency. Since a major part of the purchases in foreign currency is in EUR, this will not constitute a risk at Group level. However, at Group level these hedges are effectively an economic hedge of (parts of) the net revenue in the relevant currency, and they are accounted for as cash flow hedges.
Impact from Eastern EuropeThe foreign exchange risk in the entities in Eastern Europe is managed differently from Carlsberg’s operations in the main parts of the rest of the Group because of the excessive cost of hedging these currencies over a longer period of time. With regard to transaction risk, Baltika Breweries has expenses in both USD and EUR and appre-ciation and depreciation of the RUB have affected and will continue to affect operat-ing profit measured in both DKK and RUB.
Translation riskThe Group is exposed to risk from trans-lation of foreign entities into the Group’s functional currency, DKK. The Group is primarily exposed to RUB and secondarily to other currencies. The exposure to fluc-tuations in EUR/DKK is considered insignifi-cant due to Denmark’s fixed exchange rate policy towards EUR.
The Group has chosen not to hedge the exposure arising from translation of revenue or earnings in foreign currencies but does in certain cases hedge specific cash flows such as dividends to be received in foreign currencies.
Impact on operating profitDevelopments in exchange rates between DKK and the functional currencies of foreign entities had a negative impact on the Group’s operat-ing profit measured in DKK, cf. section 1.1.
EUR 19% RUB 17% CNY 10% GBP 8%
2014
DKK 7% CHF 6% NOK 5% SEK 4%
PLN 4% UAH 3% Other 19%
EUR 18% RUB 22% CNY 5% GBP 8%
net RevenUe BY cURRencY (% oF net ReVenue)
2013
DKK 10% CHF 5% NOK 5% SEK 4%
PLN 4% UAH 4% Other 15%
Foreign exchange risk related to earnings
SectiOn 1.4
Entity Functional currencyChange in average
FX rate 2013 to 2014Entities in the eurozone EUR -0.03%
Baltika Breweries RUB -14.80%
Greater China Group CNY -0.60%
Carlsberg UK GBP 5.30%
Carlsberg Danmark DKK 0.00%
Feldschlösschen Getränke CHF 1.30%
Ringnes NOK -6.40%
Carlsberg Sverige SEK -5.00%
Carlsberg Polska PLN 0.50%
Carlsberg Ukraine UAH -33.70%
The table shows net sales for key subsidiar-ies as a percentage of total net sales and the change in the average exchange rate from 2013 to 2014.
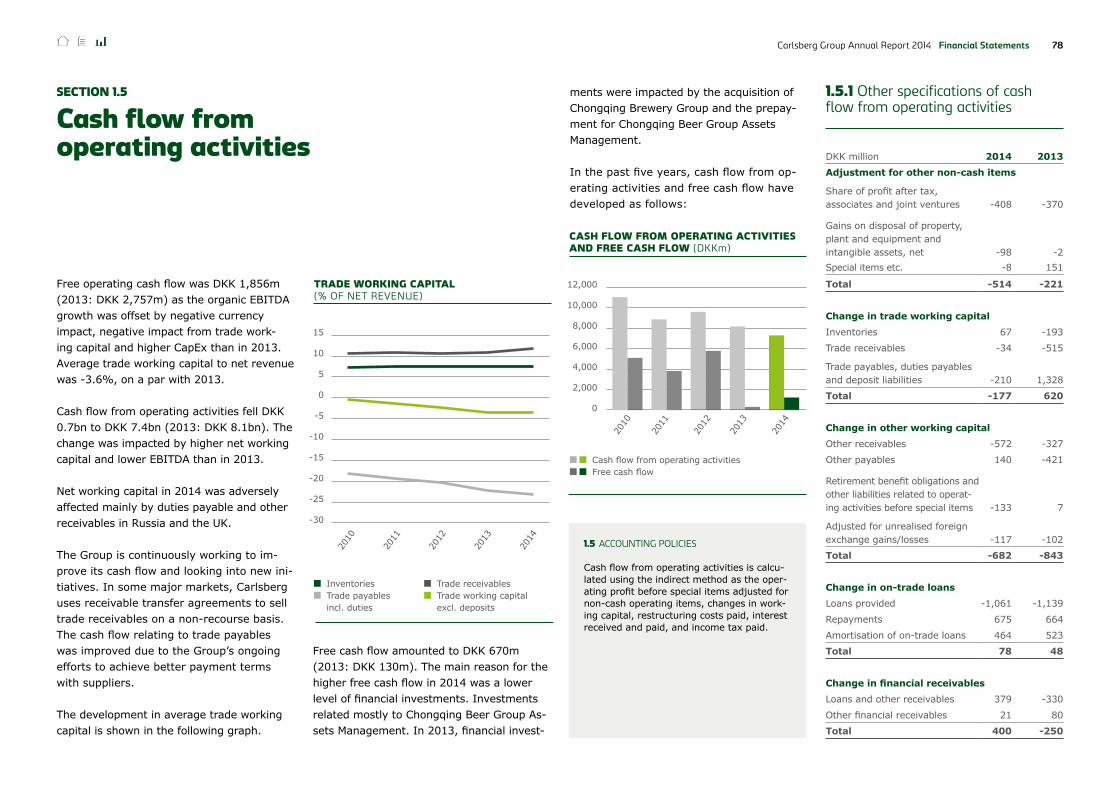
78Carlsberg Group Annual Report 2014 Financial Statements
DKK million 2014 2013Adjustment for other non-cash items
Share of profit after tax, associates and joint ventures -408 -370
Gains on disposal of property, plant and equipment and intangible assets, net -98 -2Special items etc. -8 151
Total -514 -221
Change in trade working capitalInventories 67 -193
Trade receivables -34 -515
Trade payables, duties payables and deposit liabilities -210 1,328
Total -177 620
Change in other working capitalOther receivables -572 -327
Other payables 140 -421
Retirement benefit obligations and other liabilities related to op era t-ing activities before special items -133 7
Adjusted for unrealised foreign exchange gains/losses -117 -102
Total -682 -843
Change in on-trade loansLoans provided -1,061 -1,139
Repayments 675 664
Amortisation of on-trade loans 464 523
Total 78 48
Change in financial receivablesLoans and other receivables 379 -330
Other financial receivables 21 80
Total 400 -250
Free operating cash flow was DKK 1,856m (2013: DKK 2,757m) as the organic EBITDA growth was offset by negative currency impact, negative impact from trade work-ing capital and higher CapEx than in 2013. Average trade working capital to net revenue was -3.6%, on a par with 2013.
Cash flow from operating activities fell DKK 0.7bn to DKK 7.4bn (2013: DKK 8.1bn). The change was impacted by higher net working capital and lower EBITDA than in 2013.
Net working capital in 2014 was adversely affected mainly by duties payable and other receivables in Russia and the UK.
The Group is continuously working to im-prove its cash flow and looking into new ini-tiatives. In some major markets, Carlsberg uses receivable transfer agreements to sell trade receivables on a non-recourse basis. The cash flow relating to trade payables was improved due to the Group’s ongoing efforts to achieve better payment terms with suppliers.
The development in average trade working capital is shown in the following graph.
1.5 ACCountinG poliCieS
Cash flow from operating activities is calcu-lated using the indirect method as the oper-ating profit before special items adjusted for non-cash operating items, changes in work-ing capital, restructuring costs paid, interest received and paid, and income tax paid.
1.5.1 other specifications of cash flow from operating activities
2014
Trade payables incl. duties
Inventories Trade working capital excl. deposits
Trade receivables
15
10
5
0
-5
-10
-15
-20
-25
-30
2012
2010
2011
2013
tRaDe wORKing caPital (% oF net ReVenue)
ments were impacted by the acquisition of Chongqing Brewery Group and the prepay-ment for Chongqing Beer Group Assets Management.
In the past five years, cash flow from op-erating activities and free cash flow have developed as follows:
2010
12,000
10,000
8,000
6,000
4,000
2,000
0
Cash flow from operating activities Free cash flow
2012
2011
2013
2014
caSH FlOw FROM OPeRating activitieS anD FRee caSH FlOw (DKKm)
Free cash flow amounted to DKK 670m (2013: DKK 130m). The main reason for the higher free cash flow in 2014 was a lower level of financial investments. Investments related mostly to Chongqing Beer Group As-sets Management. In 2013, financial invest-
cash flow from operating activities
SectiOn 1.5

79Carlsberg Group Annual Report 2014 Financial Statements
DKK million 2014 2013Trade receivables 6,872 7,681
Other receivables 2,614 1,795
Total current receivables 9,486 9,476
Non-current receivables 2,131 2,049
Total 11,617 11,525 DKK million 2014 2013
Interest and amortisation of on-trade loans 83 78
Losses and write-downs on on-trade loans -15 -73
On-trade loans, net 68 5
% 2014 2013On-trade loans 4.0% 3.7%
The Group’s non-current receivables consist mainly of on-trade loans.
Current receivables comprise trade and other receivables.
ReceivaBleS inclUDeD in tHe StateMent OF Financial POSitiOn
ReceivaBleS BY ORigin
aveRage eFFective inteReSt RateS
On-tRaDe lOanS
DKK million 2014 2013
Sale of goods and services 6,278 7,072
On-trade loans 1,839 1,851
Other receivables 3,500 2,602
Total 11,617 11,525
The fair value of on-trade loans was DKK 1,839m (2013: DKK 1,851m).
1.6 SiGniFiCAnt ACCountinG eStiMAteS AnD juDGeMentS
On-trade loan agreements are typic-ally complex and cover several as-pects of the relationship between the parties. Management assesses the recognition and classification of in-come and expenses for each of these agreements, including the allocation of payments from the customer be-tween revenue, discounts, interest on the loan (other operating activities) and repayment of the loan.
Trade receivables comprise invoiced goods and services as well as short-term on-trade loans to customers. Other receivables com-prise VAT receivables, loans to partners, as-sociates and joint ventures, interest receiv-ables and other financial receivables.
On-trade loansUnder certain circumstances the Group grants loans to on-trade customers in France, the UK, Germany, Switzerland and Sweden. On-trade loans are spread across a large number of customers/debtors and con-sist of several types of loan, including loans repaid in cash or through reduced discounts, and prepaid discounts. The operating entities monitor and control these loans in accord-ance with central guidelines.
The following on-trade loan items are recog-nised in other operating activities, net:
Non-current receivables fall due more than one year from the end of the reporting pe-riod, with DKK 38m (2013: DKK 137m) fall-ing due more than five years from the end of the reporting period.
trade receivables and on-trade loans
SectiOn 1.6

80Carlsberg Group Annual Report 2014 Financial Statements
DKK million
2014
Net carrying amount
at 31 Dec.
Of which neither impaired nor
past due at the reporting date
Past due less than
30 days
Past due between
30 and 90 days
Past due more than
90 days
Sale of goods and services 6,278 5,542 271 142 323On-trade loans 1,839 1,738 4 6 91
Other receivables 3,500 3,001 87 271 141
Total 11,617 10,281 362 419 555Total 2013 11,525 10,449 361 193 522
Exposure to on-trade receivables is man-aged locally in the operating entities and credit limits set as deemed appropriate for the customer taking into account the current local market conditions.
The Group does not generally renegotiate the terms of trade receivables with the individual customer and trade receivables are not changed to on-trade loans. However, if a negotiation takes place, the outstanding balance is included in the sensitivity analysis based on the original payment terms. No sig-nificant trade receivables or on-trade loans were renegotiated during 2013 and 2014.
It is Group policy to reduce the credit risk through prepayments or cash payments on delivery, especially for certain categories of customers in each country. The local enti-ties assess the credit risk and whether it is appropriate and cost-effective to hedge the credit risk by way of credit or bank guaran-tees, credit insurance, conditional sale etc. Such security is taken into account when assessing impairment losses. Security is pri-marily received from on-trade customers.
As a result of the international geopolitical situation and subsequent macroeconomic development, the risk of bad debt losses has increased in the Eastern Europe region. This increased risk has been taken into consid-
eration in the assessment of impairment at the end of the reporting period and included in the general management and monitoring of usual trade credits.
On-trade loans are usually repaid through discounts during the continuing sales relationship with the individual customer, which is reflected in the repayment scheme and the discounting of the loans. Conse-quently, there are no significant overdue on-trade loans.
Management also assesses whether devel-opments of importance to the on-trade could indicate impairment of on-trade loans in a market in general. Such developments also include changes in local legislation, which may have an adverse effect on earnings in the industry as a whole and where the effect cannot be allocated to individual loans.
The credit risk on on-trade loans is usually reduced through collateral and pledges of on-trade movables (equipment in bars, cafés etc.). The fair value of the pledged on-trade movables cannot be estimated reliably but is assessed to be insignificant as the movables are used. Movables received through pledges usually need major repair before they can be used again.
The credit risk on loans to partners is reduced through pledge of shares in one of the Group’s subsidiaries that are held by the borrower.
Exposure to credit riskThe carrying amount of financial assets rep-resents the maximum credit exposure. The carrying amount of financial assets, excluding cash and cash equivalents, of DKK 11,617m (2013: DKK 11,525m) is summarised above.
The Group’s receivables from the sale of goods and services and on-trade loans are allocated to the countries shown to the right.
The Group’s exposure to receivables in Russia, in local currency, has declined slightly compared to year-end 2013, while the translation into DKK has reduced the proportional share of the Group’s total trade receivables and on-trade loans from 30% at year-end 2013 to 22% at year-end 2014. All other cur-rencies’ proportionate shares are largely unchanged from 2013.
1.6.1 Credit risk
Russia 22% UK 12% France 10% Switzerland 7%
tRaDe ReceivaBleS anD On-tRaDe lOanS BRoKen DoWn By CountRy
Germany 6% Poland 5% Sweden 4% Ukraine 2%
Norway 3% Other 29%
ageing OF ReceivaBleS anD On-tRaDe lOanS
SectiOn 1.6 trade receivables and on-trade loans

81Carlsberg Group Annual Report 2014 Financial Statements
DKK million
2014Trade
receivablesOn-trade
loansOther
receivables Total2013Total
Impairment at 1 January -618 -211 -153 -982 -1,061
Impairment loss recognised -133 -28 -8 -169 -274
Realised impairment losses 130 35 1 166 199
Reversed impairments 32 13 8 53 168
Acquisition of entities -12 - -18 -30 -14
Impairment at 31 December -601 -191 -170 -962 -982
1.6.1 ACCountinG poliCieS
Receivables are measured at amortised cost less impairment losses.
Regarding loans to the on-trade, any difference between present value and the nominal amount at the loan date is treated as a prepaid discount to the customer, which is recognised in the income statement in accordance with the terms of the agreement.
The market interest rate is used as the discount rate, corresponding to the money market rate based on the maturity of the loan with the ad-dition of a risk premium. The effective interest rate on these loans is recognised in other op-erating activities, net. The amortisation of the difference between the discount rate and the effective interest rate is included as a discount in revenue.
Objective indication of impairment is assessed for a portfolio of receivables when no objec-tive indication of individual impairment losses exists. The portfolios are based on on-trade and off-trade customers, and on-trade receivables and loans. The objective indications used for portfolios are based on historical experiences and actual market developments.
Impairment losses are calculated as the differ-ence between carrying amount and net realis-able value, including the expected net realisable value of any collateral provided.
1.6.1 SiGniFiCAnt ACCountinG eStiMAteS AnD juDGeMentS
In assessing credit risk, management analyses the need for write-downs for bad debt losses due to customers’ in-ability to pay.
Impairment losses are based on an individual review for impairment based on customers’ creditworthiness and ex-pected ability to pay, customer insolvency or anticipated insolvency, and past due amounts as well as collateral received. Management also uses mathematically computed impairment losses based on customer segments, historical informa-tion on payment patterns, terms of pay-ment and concentration maturity, as well as information about the general eco-nomic situation in the markets/countries.
The financial uncertainty associated with write-downs for bad debt losses is usually considered to be limited. However, if the ability to pay deteriorates in the future, further write-downs may be necessary.
With regard to loans to the on-trade, the individual Group companies manage and control these loans as well as standard trade credits in accordance with Group guidelines.
Derecognition of groups of receivables, e.g. in business combinations or other structured transactions, is based on management’s judgement of contractual terms and other factors related to the transaction.
No significant impairment losses were in-curred in respect of individual trade receiv-ables or on-trade loans in 2013 and 2014. The current macroeconomic situation in Eastern Europe did not lead to any significant losses on receivables in 2014. The impairment losses at 31 December 2014 relate to several minor customers that have – in different ways –
DevelOPMent in iMPaiRMent lOSSeS On ReceivaBleS
indicated that they do not expect to be able to pay their outstanding balances, mainly due to adverse economic developments. Based on historical payment behaviour and extensive analysis of the underlying customers’ credit ratings, the Group believes that the unim-paired amounts that are past due by more than 30 days are still collectable.
SectiOn 1.6 trade receivables and on-trade loans

82Carlsberg Group Annual Report 2014 Financial Statements
ROIC (%)
ROIC excl. goodwill (%)
Changes in asset base (DKKm)
Changes in asset base, excl. goodwill(DKKm)
10
9
8
7
6
16
15
14
13
12
2012
2012
2014
2014
2011
2011
2010
2010
2013
2013
SectiOn 2Asset base and returns
Maximising return on investments is key in delivering sustainable value to shareholders. Return on invested capital (RoiC) analyses all investments throughout the value chain and is a key measure in ensuring the proper basis for decision-making.
ROIC is calculated as operating profit before special items as a percentage of average invested capital, including goodwill, and as a percentage of average invested capital, excluding goodwill.
the asset base represents the total investment in intangible assets and property, plant and equipment. the asset base represents the most signifi-cant part of the total invested capital.
KeY DevelOPMentS 2014 RetURn On inveSteD caPital
8%
703m
The Group’s return on invested cap-ital (ROIC) decreased by 10bp to 8% due to a decline in operating profit before special items and an increase in average invested capital from ac-quisition of entities and breweries.
Impairment losses of DKK 703m on property, plant and equipment due to closure of two breweries in Russia.
CapEx of DKK 5.9bn, up DKK 308m, due to investment in new breweries and capacity expansions in Asia.
15bn
5.9bn
Intangible assets and property, plant and equipment decreased by DKK 15bn due to decreases in the currency exchange rates of RUB and UAH.
FX im
pact
FX im
pact
Acqu
isitio
n
of e
ntiti
es
Acqu
isitio
n
of e
ntiti
es
Additio
ns/
disp
osals, n
et
Additio
ns/
disp
osals, n
et
Amor
tisat
ion/
depr
eciatio
n
Amor
tisat
ion/
depr
eciatio
n
Asse
t bas
e,
open
ing
Asse
t bas
e,
excl.
goo
dwill,
ope
ning
Asse
t bas
e,
closin
g
Asse
t bas
e,
excl.
goo
dwill,
closin
g
Impa
irmen
t los
ses
and
othe
r
Impa
irmen
t los
ses
and
othe
r
125,974 68,808+1,925
+482
+5,737+5,737
-17,402-11,339
-4,103
-4,103
-1,629
-1,629
110,502
57,956

83Carlsberg Group Annual Report 2014 Financial Statements
ments, which was partially offset by an increase from the acquisition of Chongqing Beer Group Assets Management and invest-ments in new breweries in Asia. Liabilities offset in the invested capital remained stable.
The decline in ROIC by 10bp to 8.0% was caused by the decline in operating profit and the increase in average invested capital from the acquisition of entities and brewer-ies. As the decline in invested capital from foreign exchange adjustments happened in December and the average is calculated on a monthly basis, it had only a minor impact on average invested capital.
The change in the RUB/DKK exchange rate in December 2014 has reduced the value in DKK. This has no effect on the income statement, as the change is recognised in other comprehensive income as described in section 4.3.2.
The development in capital expenditure (CapEx) and in amortisation and deprecia-tion is shown in the table.
CapEx increased by DKK 308m, mainly due to capacity expansions in Asia to drive future sales and growth and a move into new markets.
RetURn On inveSteD caPital
DKK million 2014 2013Total assets 136,983 152,308
LessDeferred tax assets -1,430 -1,130
Loans to associates and joint ventures (current) -64 -59
Interest receivables, fair value of hedging instruments and financial receivables -1,812 -534
Cash and cash equivalents -2,418 -3,612
Assets included 131,259 146,973
Trade payables -12,031 -12,614
Deposits on returnable packaging -2,046 -1,812
Provisions, excluding restructurings -2,731 -2,571
Corporation tax -775 -614
Deferred income -1,059 -1,064
Finance lease liabilities, included in borrowings -36 -46
Other liabilities, excluding deferred income, interest payable and fair value of hedging instruments -8,994 -9,140
Liabilities offset -27,672 -27,861Invested capital 103,587 119,112Goodwill -52,546 -57,166
Invested capital excluding goodwill 51,041 61,946Invested capital, average 114,886 119,630
6
5
4
3
2
1
0
CapEx Amortisation/depreciation
2012
2011
2013
2010
2014
caPeX anD aMORtiSatiOn/DePReciatiOn (DKKbn)
Return on invested capital
SectiOn 2.1
Furthermore, the Group continued invest-ments mainly in the supply chain integration and business standardisation project (BSP1), which is one of the largest and most import-ant projects in recent years. This project is a key enabler in transforming the Western European operating model.
Return on invested capital (ROIC) was 8% (2013: 8.1%). Return on invested capital excluding goodwill was 15.3% (2013: 14.5%).
Invested capital including goodwill de-creased, due to a significant reduction in intangible assets and property, plant and equipment from foreign exchange adjust-

84Carlsberg Group Annual Report 2014 Financial Statements
DKK million
2014Western
EuropeEastern Europe Asia
Not allocated
Beverages, total
Non- beverage
Carlsberg Group, total
Total assets 59,335 50,256 36,597 -9,701 136,487 496 136,983
Invested capital, cf. section 2.1 35,004 40,793 25,036 2,187 103,020 567 103,587
Invested capital excluding goodwill, cf. section 2.1 14,814 24,313 9,160 2,187 50,474 567 51,041
Acquisition of property, plant and equipment and intangible assets 1,830 1,397 2,128 522 5,877 31 5,908
Amortisation and depreciation 1,658 1,237 964 234 4,093 10 4,103Impairment losses 22 744 67 - 833 100 933
Return on invested capital (ROIC) 15.3% 5.6% 9.7% - 8.2% - 8.0%
Return on invested capital excluding goodwill (ROIC excl. goodwill) 35.2% 9.3% 23.5% - 15.8% - 15.3%
2013Total assets 58,176 74,094 31,041 -11,586 151,725 583 152,308
Invested capital, cf. section 2.1 34,687 60,453 21,011 1,566 117,717 1,395 119,112
Invested capital excluding goodwill, cf. section 2.1 14,449 36,588 7,948 1,566 60,551 1,395 61,946
Acquisition of property, plant and equipment and intangible assets 2,088 1,208 1,611 651 5,558 42 5,600Amortisation and depreciation 1,734 1,440 593 88 3,855 8 3,863
Impairment losses 213 104 28 24 369 - 369
Return on invested capital (ROIC) 14.4% 6.5% 10.1% - 8.3% - 8.1%
Return on invested capital excluding goodwill (ROIC excl. goodwill) 32.7% 10.8% 16.2% - 14.9% - 14.5%
DKK million 2014 2013
Denmark (Carlsberg A/S’s domicile) 5,506 5,812
Russia 35,539 54,892
Other countries 73,734 69,041
Total 114,779 129,745
geOgRaPHical allOcatiOn OF nOn-cURRent aSSetS
SegMentatiOn OF aSSetS etc.
The Group’s assets are segmented on the basis of geographical regions in accordance with the management reporting for 2014, cf. section 1.
Total assets and invested capital decreased in Eastern Europe, which is primarily attrib-utable to changes in foreign exchange rates.
Total assets in Russia and Ukraine decreased by DKK 23.9bn as at 31 December 2014 com-pared to the DKK value they would have had if they were translated at the exchange rate applied at year-end 2013.
Total assets in Asia were affected by the acqui-sition of Chongqing Beer Group Assets Manage-ment, investments in new breweries in Asia and appreciation of certain Asian currencies.
Not allocated total assets, DKK -9,701m (2013: DKK -11,586m), comprise entities that are not business segments and eliminations of invest-ments in subsidiaries, receivables, loans etc.
The Group’s non-current segment assets are allocated as specified below.
Non-current segment assets comprise intangible assets and property, plant and equipment owned by the segment/country, even if the income is also earned outside the segment/country that owns the asset. Non-current assets also comprise non-current financial assets other than financial instru-ments, deferred tax assets and retirement benefit plan assets.
Allocated goodwill and trademarks by seg-ment are specified in section 2.3.2.
Segmentation of assets
SectiOn 2.2

85Carlsberg Group Annual Report 2014 Financial Statements
The Carlsberg Group performs annual impairment tests to verify the value of recognised goodwill, trademarks and other non-current assets.
In connection with impairment testing man-agement reassesses the useful life and residu-al value of assets with impairment indicators.
Based on the impairment tests performed, the Group has recognised impairment losses totalling DKK 933m in respect of trademarks, breweries and other non-current assets.
The impairment losses on trademarks relate to local trademarks in Kazakhstan (2014 and 2013) and in Russia, Estonia and France (2013) that have suffered from the economic crisis and changes in the brand strategy. The trademarks therefore showed a recoverable amount below the carrying amount and were written down to the lower recoverable amount.
The Group expects to dispose of real estate, which has resulted in an impairment loss of DKK 100m.
2.3.1 impairment losses
DKK million 2014 2013TrademarksTrademarks with finite useful life - 18
Trademarks with indefinite useful life 35 182
Total 35 200
Other intangible assetsOther - 23
Total - 23
Property, plant and equipmentImpairment of real estate, Carlsberg A/S 100 -
Impairment of breweries, Baltika Breweries, Russia 703 -
Impairment of Aldaris Brewery, Latvia 20 43
Impairment of plant, machinery and equipment, Ringnes, Norway - 31
Impairment of plant, machinery and equipment, Carlsberg Deutschland, Germany - 18
Impairment of plant, machinery and equipment, Carlsberg UK - 17
Impairment of plant, machinery and equipment, Ningxia Xixia Jianiang Brewery Group, China 27 -
Impairment of plant, machinery and equipment, Xinjiang Wusu Group, China 40 28
Other 8 9
Total 898 146Total impairment losses 933 369
iMPaiRMent OF tRaDeMaRKS anD OtHeR nOn-cURRent aSSetS
impairmentSectiOn 2.3
Impairment of breweries, Baltika Breweries, relates to two breweries which were perma-nently closed in January 2015.
Other impairments of property, plant and equipment are a consequence of restruct-uring and process optimisation in Western Europe and Asia.
Impairment losses of DKK 928m (2013: DKK 363m) are recognised in special items and of DKK 5m (2013: DKK 6m) in cost of sales.

86Carlsberg Group Annual Report 2014 Financial Statements
2.3.2 General assumptions applied
Western EuropeThe mature Western European markets are generally characterised by stable or declin-ing volumes. The entire region continues to experience strong competition, requiring ongoing optimisation of cost structures and use of capital. Our key focus is to improve profitability, cash flow and returns. Our commercial focus is to increase volume and value market share through continued de-velopment of our local power brands, further roll-out of our international premium brands, innovations and premiumisation efforts. This is supported by the deployment of best-in-class commercial tools. At the same time, we focus on reducing costs and capital em-ployed through optimising asset utilisation, further increasing efficiencies across the business and simplifying our business model. An important enabler on this journey is the roll-out of a comprehensive set of standard-ised business processes and an integrated supply chain (BSP1).
Eastern Europe The Russian beer market has been highly impacted by the challenging macroeconomic environment, which has caused consumers to reduce their spending on beer. The Russian economy has been impacted by sanctions and low oil prices. Revenue in the region is expected to increase as a result of price increases and inflation.
Following the recent macroeconomic de-velopment in Eastern Europe, the budget for 2015 was reassessed and updated in January 2015. Expectations for the target years were also reassessed. These updated expectations as well as expectations for the macroeconomic development formed the basis of the impairment testing of both goodwill and trademarks at year-end 2014. It is the expectation of management that the current macroeconomic situation and devel-opments will continue in the short term, and that, in the long term, interest rates, WACC and growth rates will decline and stabilise at a much lower level than what is observed in the markets today. These expectations are in line with those of leading international banks and have been applied in the long-term expectations in the impairment testing. The assumptions applied are described in detail in section 2.3.3.
AsiaThe Group has an attractive footprint in the Asian region with significant growth oppor-tunities in the majority of the markets. To capture the growth opportunities we con-tinuously expand our presence in the region through investments with a long-term view in the existing business and in new markets. Our commercial focus is to further strength-en and premiumise our local brand portfolios and expand the reach of our international premium brands. Furthermore, we continu-ously upgrade our commercial execution
capabilities by applying Group and region-ally developed tools and best practices. In addition to growing our Asian businesses, we drive efficiencies across our businesses with an emphasis on optimising structures and ways of working, using well-proven Group concepts and operating models.
Growth rates Growth rates are determined for each individ-ual cash-generating unit, trademark and item of property, plant and equipment tested. The growth rates applied for the terminal period are in line with the expected rate of inflation.
The applied projections for growth rates and dis count rates are compared to ensure a reason able link between the two (real inter-est rate).
Discount rates applied The risk-free interest rates used in impair-ment tests performed at year-end 2014 were based on observed market data. For countries where long-term risk-free inter est rates are not observable or valid due to specific national or macroeconomic changes affecting the country, the interest rate is estimated based on observations from other markets and/or long-term expectations expressed by major interna-tional credit institutions.
The risk premium (spread) for the risk-free interest rate was fixed at market price or
SectiOn 2.3 impairment
slightly lower reflecting the expected long-term market price. The total interest rate, including spread, thereby reflected the long-term interest rate applicable to the Group’s investments in the individual markets.
Significant amount of goodwill and trademarksGoodwill and trademarks with indefinite useful life related to Baltika Breweries, Brasseries Kronenbourg, Chongqing Brew-ery Group and the acquisition of the 40% non-controlling interest in Carlsberg Brew-eries A/S each account for 10% or more of the total carrying amount of goodwill and trademarks with an indefinite useful life at 31 December 2014.

87Carlsberg Group Annual Report 2014 Financial Statements
SectiOn 2.3 impairment
DKK million 2014 % 2013 %
Western EuropeWestern Europe 20,190 38% 20,238 35%
Eastern EuropeEastern Europe 16,480 31% 23,865 42%
Asia
Greater China, Malaysia and Singapore 11,137 21% 8,850 16%
Indochina 4,167 8% 3,699 6%
India 235 1% 211 0%
Nepal 337 1% 303 1%
Total 52,546 100% 57,166 100%
Growth in the terminal period
Discount rates (risk-free interest rate)
% 2014 2013 2014 2013Western Europe 1.0% 1.5% 1.2% 2.7%
Eastern Europe 3.5% 2.5% 7.0% 6.1%
Asia 2.0-3.0% 2.5-3.5% 4.0-11.3% 4.8-12.7%
gOODwill
2.3.3 SiGniFiCAnt ACCountinG eStiMAteS AnD juDGeMentS
GoodwillThe impairment test of goodwill is per-formed for the cash-generating units to which goodwill is allocated. The cash-generating units are determined based on the management structure, linkage of the cash flows between entities and the indi-vidual entities’ integration in regions or sub-regions. The structure and cash-generating units are reassessed each year.
The impairment test of goodwill for each cash-generating unit calculates the re-
coverable amount, corresponding to the discounted value of the expected future free cash flow (value in use).
Key parameters include assumptions about revenue growth, future free cash flow, future capital expenditure and growth expectations beyond the next three years. Budgets and target plans do not incorporate the effect of future re-structurings and non-contracted capacity increases.
Future free cash flow
The expected future free cash flow (value in use) is based on budgets and business plans for the next three years and projections for subse-quent years.
Growth The budgets and target plans are based on concrete commercial initiatives, and the risks associated with the key parameters are assessed and incorporated in expected future free cash flows. The impairment test is based on scenarios for possible future cash flows. Potential upsides and downsides identified during the budget process and in the daily business are reflected in the future cash flow scenarios for each individual cash-generating unit. The scenarios reflect, among other things, different assumptions about combinations of market, price and input cost developments.
Projections for the terminal period are based on general expectations and risks, taking into account the general growth expectations for the brewing industry in the relevant segments. The growth rates applied are not expected to exceed the average long-term growth rate for the Group’s individual geographical segments.
Discount rates
In the impairment testing of goodwill, the Group uses a pre-tax risk-free interest rate that reflects the risk-free borrowing rate in each particular geographical segment.
2.3.3 impairment test of goodwill
The impairment test of goodwill is per-formed for Western Europe and Eastern Europe, while entities in Asia are tested at sub-regional levels. Entities that are less integrated in regions or sub-regions are tested at individual entity level.
The management of the Group is centralised and decisions are carried out by the regional managements, which are responsible for performance, investments and growth initia-tives in their respective regions.
The management structure and responsi-bilities support and promote optimisations across countries focusing on the Group or region as a whole and not just on the specific country. Changes in procurement and sourcing between countries increase intra-Group trade/transactions, which will also have an increasing impact on the al-location of profits.

88Carlsberg Group Annual Report 2014 Financial Statements
Trademarks are impairment-tested individu-ally at Group level. The carrying amount of trademarks which have an indefinite useful life and are therefore not amortised was DKK 25,589m (2013: DKK 32,186m) at 31 December 2014, equivalent to 98% (2013: 93%) of the capitalised trademarks. Man-agement assesses that the value of these trademarks can be maintained for an indefi-nite period, as these are well-established trademarks in the markets concerned and these markets are expected to be profitable in the long term. In the opinion of manage-ment, there is only a minimal risk of the current situation in the markets reducing the useful life of these trademarks, primarily due
to the respective market share in each mar-ket and the current and planned marketing efforts, which are helping to maintain and increase the value of these trademarks.
2.3.4 impairment test of trademarks
Growth in the terminal period
Discount rates (WACC)
% 2014 2013 2014 2013Western Europe 2.0-3.0% 2.0-3.0% 3.6-4.8% 5.0-6.9%
Eastern Europe 2.0-4.5% 2.0-4.5% 8.1-22.1% 8.3-19.8%
Asia 2.0-2.5% 2.0-2.5% 6.7-10.9% 7.8-13.6%
% 2014 2013
International, premium and speciality beers 3.5-15.0% 3.5-15.0%
Strong regional and national trademarks 3.0-5.0% 3.0-5.0%
Local trade-marks and mainstream trademarks 2.0-3.5% 2.0-3.5%
tRaDeMaRKS witH inDeFinite USeFUl liFe
ROYaltY RateS
SectiOn 2.3 impairment
DKK million 2014 % 2013 %Western Europe 6,314 25% 6,320 20%
Eastern Europe 16,647 65% 25,381 79%
Asia 2,628 10% 485 1%
Total 25,589 100% 32,186 100%
2.3.4 SiGniFiCAnt ACCountinG eStiMAteS AnD juDGeMentS
TrademarksThe impairment test of trademarks is performed using the relief from royalty method and is based on expected future free cash flows from the Group’s calcu-lated royalty income generated by the in-dividual trademark for the next 20 years and projections for subsequent years.
Key parameters include royalty rate, expected useful life, growth rate and a theoretically calculated tax effect. A post-tax discount rate is used which reflects the risk-free interest rate with the addi-tion of a risk premium associated with the individual trademark.
Royalty rate Royalty income generated by the trademark is based on the Group’s total income and earned globally, i.e. the income is also earned outside the segment that owns the trademark. If external licence agreements for the individual trademark already exist, the market terms of such agreements are considered when assessing the royalty rate which the trademark is expected to generate in a transaction with independ-ent parties. The royalty rate is based on the actual market position of the individual trademark in the global, regional and local markets.
Expected useful life
Management assesses the market, market position and strength to determine the useful life of the trademarks. When the value of well-established trademarks is expected to be maintained for an indefinite period in the relevant markets, and these markets are expected to be profitable for a long period, the useful life of the trade-mark is determined to be indefinite.
Growth rate For each individual trademark, a 20-year curve is projected, reflecting the expected future growth in revenue per year. Depending on the expectations for the individual trademark, the growth in individual years is above, equal to or below the current inflation level in the countries where the individual trademark is sold.
The curve for each individual trademark is determined by reference to its market posi-tion, the overall condition of the markets where the trademark is marketed, as well as regional and national macroeconomic trends etc. For some trademarks, national, regional and international potential has been linked to the value of the trademark, and investments in terms of product development and marketing strategy are expected to be made. For these trademarks, the expected growth rate is generally higher than for comparable trademarks, especially at the beginning of the 20-year period. The growth rates determined for the terminal period are in line with the expected rate of inflation.
Discount rates
In the impairment testing of trademarks, the Group uses a post-tax discount rate for each country. In determining the discount rate, a risk premium (spread) on the risk-free interest rate is fixed at a level that reflects management’s expectations of the spread for future borrowings. The total interest rate, including spread, thereby reflects the long-term interest rate applicable to the Group’s investments in the individual markets. The tax rate is the expected future tax rate in each country based on current legislation. The impairment test at year-end 2014 incorporated tax rates in the range of 15-38%. The WACC rates in Asia vary within a wide range with the low-est rate for China and developed countries, whereas the subcontinent, including India and Nepal, has the highest WACC rates in the region.

89Carlsberg Group Annual Report 2014 Financial Statements
2.3 ACCountinG poliCieS
Goodwill and trademarks with indefinite useful life are subject to an annual impairment test, initially before the end of the acquisition year.
The carrying amount of goodwill is tested for impairment annually, together with the other non-current assets in the cash-generating unit to which goodwill is allocated. The recoverable amount is generally calculated as the present value of expected future net cash flows (value in use) from the entity or activity (cash-generating unit) to which the goodwill is allocated.
The carrying amount of trademarks with indefi-nite useful life is subject to an annual impairment
test. The recoverable amount is generally cal-culated as the present value of expected future net cash flows from the trademark in the form of royalties (the relief from royalty method).
The carrying amount of other non-current assets is subject to an annual test for indications of impairment. When there is an indication that as-sets may be impaired, the recoverable amount of the asset is determined. The impairment test is performed for the individual asset or in combina-tion with related assets which form an integrated cash-generating unit. The recoverable amount is the higher of an asset’s fair value less expected costs to sell and its value in use. Value in use is
the present value of the future cash flows ex-pected to be derived from an asset or the cash-generating unit to which the asset belongs.
An impairment loss is recognised if the carrying amount of an asset or its cash-generating unit exceeds the recoverable amount of the asset or the cash-generating unit. Impairment of goodwill, trademarks and significant impairment losses on property, plant and equipment, associ-ates and joint ventures, and impairment losses arising on extensive structuring of processes and fundamental structural adjustments are recognised under special items. Minor impair-ment losses are recognised in the income state-
ment under cost of sales, sales and distribution expenses, administrative expenses or other operating activities, net.
Impairment of goodwill is not reversed. Impair-ment of other assets is reversed only to the extent of changes in the assumptions and estimates underlying the impairment calcula-tion. Impairment is only reversed to the extent that the asset’s new carrying amount does not exceed the carrying amount of the asset after amortisation/depreciation had the asset not been impaired.
SectiOn 2.3 impairment
2.3 SiGniFiCAnt ACCountinG eStiMAteS AnD juDGeMentS
Property, plant and equipmentProperty, plant and equipment are impair-ment-tested when there are indications of impairment. Management performs an annual assessment of the assets’ future ap-plication, e.g. in relation to changes in pro-duction structure, restructurings or closing of breweries. The impairment test is based on budgeted and estimated cash flows from the cash-generating unit. The assessment is based on the lowest cash-generating unit affected by the changes that indicate impairment. The discount rate is an after-tax WACC that reflects the risk-free interest rate with the addition of a risk premium associated with the particular asset.
Associates and joint venturesManagement performs an impairment test of investments in associates and joint ventures when there are indications of impairment, e.g. due to loss-making activities or major changes in the busi-ness environment. The impairment test is based on budgeted and estimated cash flows from the associate or joint venture and related assets which form an integrated cash-generating unit. The pre-tax discount rate reflects the risk-free interest rate with the addition of a risk premium associated with the particular investments.
Sensitivity tests have been performed to determine the lowest growth rates and/or highest discount rates that can occur in the cash-generating units and for trademarks with indefinite useful life without resulting in any impairment loss.
Due to the current macroeconomic situation in some countries and regions, the Group has performed additional sensitivity tests to ensure that potential impairment is not overlooked.
In the last part of 2014, interest rates and inflation in the Eastern European countries increased significantly due to the current macroeconomic situation. The sensitivity tests calculate the impact of higher interest rates and inflation, reflecting changed economic conditions compared to current expectations.
The WACC rates applied in Western Europe continued to be impacted by the relatively low risk-free interest rates at the end of 2014. The sensitivity tests calculate the impact of higher interest rates reflecting an assumption of a significantly higher risk-free interest rate level allowing for double-digit increase in risk-free interest rates.
These additional sensitivity tests did not identify potential impairment.
2.3.5 Sensitivity test
%Growth
rateDiscount rate,
after tax
2014Allowed
decreaseAllowed increase
Goodwill 2.4% 8.1%
Trademarks 17.0% 10.2%
2013Goodwill 3.9% 3.4%
Trademarks 1.6% 0.8%
Trademarks which have recently been recognised at fair value in a purchase price allocation or impaired will have less ability to absorb changes in the risk-free interest rate
or a decline in growth. These trademarks are sensitivity-tested separately and show no or a very low margin between recoverable amount and carrying amount.

90Carlsberg Group Annual Report 2014 Financial Statements
DKK million Intangible assets Property, plant and equipment
2014 Goodwill Trademarks
Other intangible
assets TotalLand and buildings
Plant and machinery
Fixtures and fittings,
other plant and equipment Total
CostCost at 1 January 2014 57,239 35,800 4,688 97,727 18,387 29,653 12,377 60,417
Acquisition of entities 1,443 - 95 1,538 197 205 -15 387
Additions - 4 806 810 300 3,064 1,734 5,098
Disposals - - -270 -270 -171 -704 -758 -1,633
Transfers - - -8 -8 -328 -824 426 -726
Foreign exchange adjustments etc. -6,062 -8,743 -12 -14,817 -1,579 -2,715 -940 -5,234
Cost at 31 December 2014 52,620 27,061 5,299 84,980 16,806 28,679 12,824 58,309
Amortisation, depreciation and impairment lossesAmortisation, depreciation and impairment losses at 1 January 2014 73 1,251 2,167 3,491 5,779 15,264 7,636 28,679
Disposals - - -269 -269 -67 -689 -707 -1,463
Amortisation and depreciation - 35 284 319 546 1,643 1,595 3,784
Impairment losses - 35 - 35 462 382 54 898
Transfers - - -5 -5 36 -44 -25 -33
Foreign exchange adjustments etc. 1 -276 -70 -345 -405 -1,371 -528 -2,304
Amortisation, depreciation and impairment losses at 31 December 2014 74 1,045 2,107 3,226 6,351 15,185 8,025 29,561Carrying amount at 31 December 2014 52,546 26,016 3,192 81,754 10,455 13,494 4,799 28,748Carrying amount of assets pledged as security for loans 918 - - 918
Additions to goodwill are described in more detail in section 5.
intangible assets and property, plant and equipment
SectiOn 2.4

91Carlsberg Group Annual Report 2014 Financial Statements
DKK million Intangible assets Property, plant and equipment
2013 Goodwill Trademarks
Other intangible
assets TotalLand and buildings
Plant and machinery
Fixtures and fittings,
other plant and equipment Total
CostCost at 1 January 2013 54,010 37,043 3,512 94,565 18,625 31,130 12,439 62,194
Changes in accounting policies -700 -25 -15 -740 -560 -1,463 -374 -2,397
Restated cost at 1 January 2013 53,310 37,018 3,497 93,825 18,065 29,667 12,065 59,797
Acquisition of entities 6,797 1,898 442 9,137 843 592 357 1,792
Additions - 2 929 931 275 3,006 1,388 4,669
Disposals - - -189 -189 -115 -1,293 -1,259 -2,667
Transfers - - 4 4 184 -749 444 -121
Foreign exchange adjustments etc./effect of hyperinflation -2,868 -3,118 5 -5,981 -865 -1,570 -618 -3,053
Cost at 31 December 2013 57,239 35,800 4,688 97,727 18,387 29,653 12,377 60,417
Amortisation, depreciation and impairment lossesAmortisation, depreciation and impairment losses at 1 January 2013 96 1,116 2,137 3,349 5,770 16,345 8,088 30,203
Changes in accounting policies -12 -18 -5 -35 -225 -775 -329 -1,329
Restated amortisation, depreciation and impairment losses at 1 January 2013 84 1,098 2,132 3,314 5,545 15,570 7,759 28,874
Disposals - - -175 -175 -18 -1,177 -1,096 -2,291
Amortisation and depreciation - 24 224 248 519 1,664 1,432 3,615
Impairment losses - 200 23 223 - 112 34 146
Transfers - - - - -27 -73 -8 -108
Foreign exchange adjustments etc./effect of hyperinflation -11 -71 -37 -119 -240 -832 -485 -1,557
Amortisation, depreciation and impairment losses at 31 December 2013 73 1,251 2,167 3,491 5,779 15,264 7,636 28,679Carrying amount at 31 December 2013 57,166 34,549 2,521 94,236 12,608 14,389 4,741 31,738Carrying amount of assets pledged as security for loans 1,002 251 1 1,254
Additions to goodwill are described in more detail in section 5.
SectiOn 2.4 intangible assets and property, plant and equipment

92Carlsberg Group Annual Report 2014 Financial Statements
Intangible assets under development amount-ed to DKK 1,330m (2013: DKK 1,338m) and are included in other intan gible assets. Property, plant and equipment under con-struction amounted to DKK 2,323m (2013: DKK 2,373m) and are included in plant and machinery.
The carrying amount of other intangible assets at 31 December 2014 included capitalised software costs of DKK 775m (2013: DKK 429m) and beer delivery rights of DKK 69m (2013: DKK 86m).
Fixtures and fittings, other plant and equip-ment include rolling equipment such as cars and trucks, draught beer equipment, coolers, returnable packaging and office equipment.
Assets held for saleAssets held for sale of DKK 1,068m com-prise real estate expected to be disposed of during 2015 and property, plant and equipment classified as held for sale in the opening statement of financial position of newly acquired entities.
Gain/loss on disposal of assetsGain/loss on disposal is recognised in other operating activities, net and is specified in the table to the right.
Leases Operating lease liabilities totalled DKK 1,409m (2013: DKK 1,362m), with DKK 389m (2013: DKK 469m) falling due within one year. Operating leases primarily relate to properties, IT equipment and transport equipment (cars, trucks and forklifts). These leases contain no special purchase rights etc.
Assets held under finance leases with a total carrying amount of DKK 37m (2013: DKK 47m) have been pledged as secu-rity for lease liabilities totalling DKK 37m (2013: DKK 46m).
Service agreements The Group has entered into service contracts of various lengths in respect of sales, logis-tics and IT. Costs related to the contracts are recognised as the services are received.
Capital commitments The Group has entered into various capital commitments which are agreed to be made after the reporting date and are therefore not recognised in the consolidated financial statements.
Intangible assets Property, plant and equipment
DKK million 2014 2013 2014 2013Cost of sales 50 46 2,840 2,717
Sales and distribution expenses 36 41 722 737
Administrative expenses 233 161 227 168
Special items 35 223 893 139
Total 354 471 4,682 3,761
DKK million 2014 2013
Gain on disposal of property, plant and equipment and intangible assets within beverage activities 127 67
Loss on disposal of property, plant and equipment and intangible assets within beverage activities -29 -65
Total 98 2
RecOgnitiOn OF aMORtiSatiOn, DePReciatiOn anD iMPaiRMent lOSSeS in tHe incOMe StateMent
gain/lOSS On DiSPOSal OF aSSetS
DKK million 2014 2013Property, plant and equipment 92 262
Total 92 262
caPital cOMMitMentS
SectiOn 2.4 intangible assets and property, plant and equipment

93Carlsberg Group Annual Report 2014 Financial Statements
2.4 SiGniFiCAnt ACCountinG eStiMAteS AnD juDGeMentS
Useful life and residual value of intangible assets with finite useful life and property, plant and equipment Useful life and residual value are initially assessed both in acquisitions and in busi-ness combinations, cf. section 5. The value of the trademarks acquired and their expected useful life are assessed based on the trademarks’ market position, expected long-term developments in the relevant markets and the trademarks’ profitability.
Management assesses trademarks and property, plant and equipment for changes in useful life. When there is an indication of a reduction in the value or useful life, the asset is tested for impairment and is written down if necessary, or the amorti-sation/depreciation period is reassessed and if necessary adjusted in line with the asset’s changed useful life.
Reassessment of the expected future use is as a minimum made in connection with an evaluation of changes in produc-tion structure, restructuring and brewery closures. The expected future use and
residual values may not be realised, which will require reassessment of useful life and residual value and recognition of impair-ment losses or losses on disposal of non-current assets.
When changing the amortisation or de preciation period due to a change in useful life, the effect on amortisation/de-preciation is recognised prospectively as a change in accounting estimates.
The Group has entered into a number of leases and service contracts. When enter-ing into these agreements, management considers the substance of the service being rendered in order to classify the agreement as either a lease or a service contract. In making this judgement, par-ticular importance is attached to whether fulfilment of the agreement depends on the use of specific assets. The Group as-sesses whether contracts are onerous by determining only the direct variable costs and not the costs that relate to the busi-ness as a whole.
For leases, an assessment is made as to whether the lease is a finance lease or an operating lease. The Group has mainly entered into operating leases for standardised assets with a short dura-tion relative to the life of the assets, and accordingly the leases are classified as operating leases.
Leases are classified as finance leases if they transfer substantially all the risks and rewards incident to ownership to the lessee. All other leases are classified as operating leases.
Significant accounting estimates and judgements related to impairment are described above, cf. section 2.3.3.
SectiOn 2.4 intangible assets and property, plant and equipment

94Carlsberg Group Annual Report 2014 Financial Statements
2.4 ACCountinG poliCieS
Cost Intangible assets and property, plant and equip-ment are initially recognised at cost and subse-quently measured at cost less accumulated amor-tisation, depreciation and impairment losses.
Cost comprises the purchase price and any costs directly attributable to the acquisition until the date when the asset is available for use. The cost of self-constructed assets comprises direct and indirect costs of materials, components, sub-suppliers, wages and salaries, and capitalised borrowing costs on specific or general borrowing attributable to the construction of the asset.
Research costs are recognised in the income statement as they are incurred. Development costs are recognised as intangible assets if the costs are expected to generate future economic benefits.
For assets acquired in business combinations, including trademarks and property, plant and equipment, cost at initial recognition is de-termined by estimating the fair value of the individual assets in the purchase price allocation. Goodwill is only acquired in business combina-tions and is measured by the purchase price allocation. Goodwill is not amortised.
CO2 emission rights are measured at cost at the date of allocation (i.e. normally DKK 0), while acquired rights are measured at cost. A liability is recognised (at fair value) only if actual emissions of CO2 exceed allocated levels based on the hold-ing of rights.
The present value of estimated liabilities related to dismantling and removing the asset and restoring the site on which the asset is located is added to the cost of self-constructed assets if the liabilities are provided for.
Where individual components of an item of prop-erty, plant and equipment have different useful lives, they are accounted for as separate items and are depreciated separately.
The cost of assets held under finance leases is stated at the lower of fair value of the assets and the present value of the future minimum lease payments. For the calculation of the net present value, the interest rate implicit in the lease or an approximation thereof is used as the discount rate.
Subsequent costs, e.g. in connection with replacement of components of property, plant and equipment, are recognised in the carry-ing amount of the asset if it is probable that the costs will result in future economic benefits for the Group. The replaced components are derecognised from the statement of financial position and recognised as an expense in the income statement. Costs incurred for ordinary repairs and maintenance are recognised in the income statement as incurred.
Useful life, amortisation and depreciation Useful life and residual value are determined at the acquisition date and reassessed annually. If the residual value exceeds the carrying amount, depreciation is discontinued.
Amortisation and depreciation are recognised on a straight-line basis over the expected useful life of the assets, taking into account any residual value. The expected useful life and residual value are determined based on past experience and expectations of the future use of assets.
The basis of depreciation is calculated on the basis of the cost less the residual value and impairment losses.
The expected useful life for the various items is as follows:
Trademarks with finite useful life Normally 20 years
Software etc. Normally 3-5 years. Group-wide systems developed as an integrated part of a major business development programme: 5-7 years
Delivery rights Depending on contract; if no contract term has been agreed, normally not exceeding 5 years
Customer agreements/ relationships
Depending on contract with the customer; if no contract exists, normally not exceeding 20 years
CO2 rights Production period where utilised
Buildings 20-40 years
Technical installations 15 years
Brewery equipment 15 years
Filling and bottling equipment 8-15 years
Technical installations in warehouses 8 years
On-trade and distribution equipment 5 years
Fixtures and fittings, other plant and equipment 5 - 8 years
Returnable packaging 3 - 10 years
Hardware 3 - 5 years
Land Not depreciated
Amortisation and depreciation are recognised in the income statement under cost of sales, sales and distribution expenses, and administrative expenses to the extent that they are not included in the cost of self-constructed assets.
Impairment losses Impairment losses of a non-recurring nature are recognised in the income statement under special items.
Operating leases Operating lease payments are recognised in the income statement on a straight-line basis over the lease term.
Government grants and other funding Grants and funding received for the acquisition of assets and development projects are recog-nised in the statement of financial position by deducting the grant from the carrying amount of the asset. The grant is recognised in the income statement over the life of the asset as a reduced depreciation expense.
SectiOn 2.4 intangible assets and property, plant and equipment

95Carlsberg Group Annual Report 2014 Financial Statements
-100mImpairment of real estate of DKK 100m relating to a disposal which is expected to be completed during 2015.
-1,219mCost of restructuring projects and impairment of DKK 1,219m, primarily in Eastern and Western Europe.
-703mImpairment of two breweries in Russia which have been permanently closed down in January 2015.
Special items include major impairments and expenses related to restructuring initiatives implemented across the Group. Restructur-
DKK million 2014 2013Special items, incomeRevaluation gain on step acquisition of entities 13 -
Recycling of cumulative exchange rate differences of entities acquired in step acquisitions - 239
Gain on disposal of property, plant and equipment impaired in prior years 33 40
Total 46 279
Special items, expensesRestructuring projects and termination benefits -1,219 -593
Impairment of trademarks -35 -200
Impairment of real estate -100 -
Costs related to acquisitions of entities -45 -28
Reversal of provision for onerous malt and hops contracts - 107
Total -1,399 -714Special items, net -1,353 -435
If special items had been recognised in operating profit before special items, they would have been included in the following itemsCost of sales -1,036 -514
Sales and distribution expenses -102 -69
Administrative expenses -109 -131
Other operating activities, net -106 279
Special items, net -1,353 -435
ings are initiated to enhance the Group’s future earnings potential and to make the Group more efficient going forward.
Special itemsSectiOn 3.1SectiOn 3
Special items and provisions
KeY DevelOPMentS 2014

96Carlsberg Group Annual Report 2014 Financial Statements
3.1 SiGniFiCAnt ACCountinG eStiMAteS AnD juDGeMentS
The use of special items entails man-agement judgement in the separation from other items in the income state-ment. Management carefully considers such changes in order to ensure the correct distinction between operat-ing activities and restructuring of the Group carried out to enhance the future earnings potential.
Management reassesses the useful life and residual value of non-current assets used in the entity undergoing restruc-turing. The extent and amount of oner-ous contracts as well as employee and other obligations arising in connection with the restructuring are also estimat-ed. Management initially assesses the entire project and recognises all present costs of the project, but the project is also assessed on an ongoing basis with additional costs possibly occurring dur-ing the lifetime of the project.
Impairment and restructuring of Baltika Breweries relate to the impairment of two breweries which were permanently closed in January 2015, DKK 703m, and a restructur-ing of several functions which was initiated in 2013 and continued during 2014, DKK 42m (2013: DKK 37m).
The Group is optimising and standardising business processes across Western Europe, which resulted in restructuring costs and impairments totalling DKK 285m (2013: DKK 309m). The optimisation and standard-isation project is running in a number of entities, including Brasseries Kronenbourg, Carlsberg Sweden and Carlsberg Business Solutions.
Restructuring of Ringnes, DKK 49m (2013: DKK 88m), relates to the full transition to one-way packaging before the first half of 2015, which also includes investment in new production equipment and added capac-ity as well as a reduction in the number of employees during 2015.
Restructuring of Aldaris, DKK 20m (2013: DKK 74m), relates to the closure of a brew-ery. At the same time, a microbrewery and sourcing from neighbouring countries have been established.
Restructuring of Xinjiang Wusu Group, DKK 35m (2013: DKK 62m), relates to the restruc-turing and closure of three breweries in 2013.
Impairment of trademarksThe impairment loss on trademarks relates to local trademarks in Kazakhstan (2014 and 2013) and in Russia, Estonia and France (2013) that have suffered from the economic crisis and changes in the brand strategy.
3.1.2 Special items, expenses
DKK million 2014 2013Impairment and restructuring of Baltika Breweries, Russia -745 -37
Impairment and restructuring of Carlsberg Uzbekistan -29 -
Impairment and restructuring in relation to optimisation and standardisation in Western Europe -285 -309
Restructuring of Ringnes, Norway -49 -88
Impairment of other non-current assets -24 -23
Restructuring of Aldaris, Latvia -20 -74
Impairment and restructuring of Xinjiang Wusu Group, China -35 -62
Impairment of Ningxia Xixia Jianiang, China -32 -
Total -1,219 -593
iMPaiRMent, ReStRUctURing anD teRMinatiOn BeneFitS
3.1 ACCountinG poliCieS
Special items include significant income and costs of a special nature in terms of the Group’s revenue-generating operating activities which cannot be attributed directly to the Group’s ordinary operating activities. Such income and costs include the cost of extensive restructuring of processes and fundamental structural adjust-ments, as well as any gains or losses arising from disposals of assets which have a material effect over a given period.
Special items also include significant non- recurring items, including impairment of good -will (including goodwill allocated to associates and joint ventures) and trademarks, gains and losses on the disposal of activities, revaluation of the shareholding in an entity held immedi-ately before a step acquisition of that entity and transaction costs in a business combination.
3.1.1 Special items, income
The Group has recognised a gain on step acquisition of Hanoi-Vung Tau Beer Joint Stock Company of DKK 13m, including recycled cumulative exchange differences. In 2013, the Group also recycled cumulative exchange differences of DKK 239m relating to entities acquired in step acquisitions.
The Group disposed of some assets which had been impaired in prior years, resulting in a gain of DKK 33m (2013: DKK 40m).
Impairment of real estateThe Group expects to complete a disposal of real estate during 2015, which has resulted in an impairment loss of DKK 100m.
Cost related to acquisition and disposalsCost related to the acquisition of entities in 2014, DKK 45m (2013: DKK 28m), primar-ily relates to the acquisitions of Chongqing Brewery Group and Chongqing Beer Group Assets Management.
SectiOn 3.1 Special items

97Carlsberg Group Annual Report 2014 Financial Statements
Restructuring projects comprise expected costs directly linked to the restructuring. These costs are typically recognised in special items and provided for as provisions. The restructuring provisions are calculated on the basis of detailed plans announced to the par-ties concerned and relate mainly to termina-tion benefits to employees made redundant.
In 2014, restructuring provisions amount-ed to DKK 425m. The provisions related
primarily to the restructuring of Ringnes, due to the switch to one-way recyclable packaging, cf. section 3.1, and to Carlsberg Italia, Carlsberg Deutschland and Brasseries Kronenbourg.
Other provisions totalling DKK 2,715m related primarily to profit sharing in France, employee obligations other than retirement benefits, and ongoing disputes, lawsuits etc.
3.2 SiGniFiCAnt ACCountinG eStiMAteS AnD juDGeMentS
In connection with large restructurings, management assesses the timing of costs to be incurred, which influences the classification as current or non-current liabilities. Provision for losses on onerous procurement contracts is based on agreed terms with the supplier and expected fulfilment of the contract based on the current estimate of volumes and use of raw materials. Warranty provisions are based on the substance of the agreements entered into, including the guarantees is-sued covering customers in the on-trade.
Management assesses provisions, contin-gent assets and contingent liabilities, and the likely outcome of pending or probable lawsuits etc. on an ongoing basis. The outcome depends on future events, which are by nature uncertain. In assessing the likely outcome of lawsuits and tax disputes etc., management bases its assessment on external legal assistance and estab-lished precedents.
DKK million RestructuringsOnerous
contracts Other TotalProvisions at 1 January 2014 437 19 2,552 3,008
Additional provisions recognised 207 - 281 488
Used during the year -128 -3 -242 -373
Reversal of unused provisions -53 - -34 -87
Transfers -2 - 14 12
Discounting 12 - 117 129
Foreign exchange adjustments etc. -48 - 27 -21
Provisions at 31 December 2014 425 16 2,715 3,156
Provisions are recognised in the statement of financial position as followsNon-current provisions 237 15 2,394 2,646
Current provisions 188 1 321 510
Total 425 16 2,715 3,156
ProvisionsSectiOn 3.2
3.2 ACCountinG poliCieS
Provisions, including warranty provisions, are recognised when, as a result of events arising before or at the end of the reporting period, the Group has a legal or a construc-tive obligation and it is probable that there may be an outflow of resources embodying economic benefits to settle the obligation. Other provisions are discounted if the effect is material to the measurement of the liability. The Carlsberg Group’s average borrowing rate is used as the discount rate.
Restructuring costs are recognised under li-abilities when a detailed, formal restructuring plan has been announced to the persons af-fected no later than at the end of the reporting period. On acquisition of entities, restructuring provisions in the acquiree are only included in the opening balance when the acquiree has a restructuring liability at the acquisition date.
A provision for onerous contracts is recognised when the benefits expected to be derived by
the Group from a contract are lower than the unavoidable costs of meeting its obligations under the contract.
When the Group has a legal obligation to dis-mantle or remove an asset or restore the site on which the asset is located, a provision is recognised corresponding to the present value of expected future costs.

98Carlsberg Group Annual Report 2014 Financial Statements
The Federal Cartel Office in Germany has issued a decision against Carlsberg Deutschland and imposed a fine of EUR 62m for alleged infringement of the com-petition rules in 2007. Management does not agree with the conclusions or findings of the Federal Cartel Office and, accord-ingly, Carlsberg Deutschland has appealed the decision to the relevant German court. The imposed fine is therefore not provided for in the financial statements.
The Group is party to certain other lawsuits, disputes etc. of various scopes. It is man-agement’s opinion that, apart from items recognised in the statement of financial posi-tion or disclosed in the consolidated financial statements, the outcome of these lawsuits, disputes etc. will not have a material effect on the Group’s financial position.
The Group has issued guarantees for loans etc. raised by third parties (non-consolidated entities) of DKK 537m (2013: DKK 626m). Guarantees issued for loans raised by as-sociates and joint ventures are described in section 5.5.
Certain guarantees etc. are issued in connection with disposal of entities and activities etc. Apart from items recognised in the statement of financial position or disclosed in the consolidated financial statements, these guarantees etc. will not have a material effect on the Group’s financial position.
Contractual commitments, and lease and service agreements are described in section 2.4.
contingent liabilitiesSectiOn 3.3

99Carlsberg Group Annual Report 2014 Financial Statements
Borrowings-1,191mNet financial items totalled DKK -1,191m, down from DKK -1,506m in 2013.
3.1%Average funding rate of 3.1%, down from 4.1% in 2013. The main reason for the decline was the redemption of a EUR 1bn
Borrowings diversified between a number of funding sources.
13bn
gross financial debt
Available credit resources of DKK 13bn at 31 December 2014, up DKK 5.2bn due to refinancing of bond.
Non-current bank borrowing Issued bonds Non-current mortgages Current bank borrowing Other current and non-current borrowing
SectiOn 4Financing costs, capital structure and equity
KeY DevelOPMentS 2014
6% coupon bond maturing in May 2014. The bond was re-plac ed with a 10-year EUR 1bn 2.5% coupon bond in May, thus lowering the funding costs and extending the maturity profile at the same time.
Distribution of gross financial debt – 2014
DKK 40,525m
1%
4%
4%
71%
20%
Distribution of gross financial debt – 2013
DKK 39,656m
1%
4%
4%
73%
18%
Allocation (%)

100Carlsberg Group Annual Report 2014 Financial Statements
Financial items, net, decreased by DKK 315m, primarily due to the issue in May 2014 of a EUR 1bn bond with a coupon of 2.5%. The bond replaced a bond maturing at the same time, which had a coupon of 6%. Furthermore, in 2013 interest expenses were impacted by high interest payments on EUR 1bn of swaps which matured mid-2013.
Interest expenses primarily relate to interest on borrowings measured at amortised cost. Borrowing costs on specific or general bor-rowings which are directly attributable to the development or construction of a qualifying asset are included in the cost of that asset. Interest, losses and write-downs relating to on-trade loans, which are measured at amortised cost, are included as income and expenses in other operating activities, cf. section 1.3.4, as such loans are seen as a prepaid discount to the customer.
The net gain on fair value adjustment of financial instruments and foreign exchange, DKK 291m (2013: DKK 178m), primarily re-lates to foreign currency deposits in Eastern Europe.
The foreign currency translation of foreign entities, DKK -16,950m, primarily relates to the decline in the exchange rates of
RUB and UAH, which had an impact of DKK -20,563m, and the appreciation of CNY, LAK and VND, which had an impact of DKK 1,825m.
4.1 ACCountinG poliCieS
Financial income and expenses comprise interest income and expenses, payables and transactions denominated in foreign curren-cies, amortisation of financial assets (other than loans to customers in the on-trade, which are included in other operating activ-ities, net) and liabilities, including defined benefit retirement plans, and surcharges and refunds under the on-account tax scheme etc. Realised and unrealised gains and losses on derivative financial instru-ments which are not designated as hedging arrangements and the ineffective portion of those designated as hedging arrangements are also included.
Borrowing costs on specific or general bor-rowings which are directly attributable to the development or construction of a qualifying asset are included in the cost of that asset.
DKK million 2014 2013Financial incomeInterest income 245 303
Fair value adjustments of financial instruments, net, cf. section 4.8 226 20
Foreign exchange gains, net 65 158
Expected return on plan assets, defined benefit plans 245 217
Other financial income 25 19
Total 806 717
Financial expensesInterest expenses -1,439 -1,742
Capitalised financial expenses 12 4
Impairment of financial assets -1 -8
Interest cost on obligations, defined benefit plans -371 -332
Other financial expenses -198 -145
Total -1,997 -2,223Financial items, net, recognised in the income statement -1,191 -1,506
DKK million 2014 2013Foreign exchange adjustments of foreign entitiesForeign currency translation of foreign entities -16,950 -7,260
Recycling of cumulative translation differences of entitiesacquired in step acquisitions 12 -239
Effect of hyperinflation - 61
Total -16,938 -7,438
value adjustments of hedging instrumentsChange in fair value of effective portion of cash flow hedges -22 -176
Change in fair value of cash flow hedges transferred to the income statement 223 304
Change in fair value of net investment hedges -50 -118
Total 151 10Financial items, net, recognised in other comprehensive income -16,787 -7,428
Financial iteMS RecOgniSeD in tHe incOMe StateMent
Financial iteMS RecOgniSeD in OtHeR cOMPReHenSive incOMe
Of the net change in fair value of cash flow hedges transferred to the income statement, DKK 103m (2013: DKK 58m) is included in cost of sales and DKK 120m (2013: DKK 246m) is included in financial items.
Interest income relates primarily to interest from cash and cash equivalents measured at amortised cost.
Financial income and expenses
SectiOn 4.1

101Carlsberg Group Annual Report 2014 Financial Statements
At 31 December 2014, gross interest-bearing debt amounted to DKK 40.7bn and net interest-bearing debt amounted to DKK
36.6bn. Of the gross interest-bearing debt, 95% (DKK 38.7bn) was long-term, i.e. with maturity after more than one year.
DKK million 2014 2013Non-current borrowings 38,690 30,239
Current borrowings 1,835 9,417
Payables, acquisitions 147 188
Gross interest-bearing debt 40,672 39,844Cash and cash equivalents -2,418 -3,612
Loans to associates and joint ventures, interest-bearing portion -59 -55
On-trade loans, net -934 -981
Other receivables, net -694 -586
Net interest-bearing debt 36,567 34,610
cHangeS in net inteReSt-BeaRing DeBt (DKKm) net inteReSt-BeaRing DeBt
net interest-bearing debt
SectiOn 4.2
34,610 -7,405
+5,054
+1,681
+1,633+250
+358 -51 36,567+437
Net interest-bearing debt increased by DKK 2.0bn during 2014, primarily due to divi-dends paid, DKK 1.6bn, acquisition of enti-ties, DKK 1.7bn, and the inclusion of the net
Cash
flow
from
acqu
isitio
n of
ent
ities
Cash
flow
from
oper
atin
g ac
tiviti
es
Cash
flow
from
inve
stin
g ac
tiviti
es
Divid
ends
to
shar
eholde
rs a
nd N
CI
NIBD
, beg
inni
ng
of p
eriod
Acqu
ired
NIBD
Effe
ct o
f cur
renc
y
trans
latio
n
Othe
r
mov
emen
ts
NIBD
, end
of
per
iod
Acqu
isitio
n of
NCI
interest-bearing debt in Chongqing Beer Group Assets Management, DKK 0.4bn, which was fully consolidated from Novem-ber 2014.

102Carlsberg Group Annual Report 2014 Financial Statements
Management regularly assesses whether the Group’s capital structure is in the interests of the Group and its sharehold-ers. The overall objective is to ensure a continued development and strengthen-ing of the Group’s capital structure which supports long-term profitable growth and a solid increase in key earnings and state-ment of financial position ratios.
This includes assessment of and decisions on the split of financing between share capital and loans, which is a long-term strategic de-cision to be made in connection with major acquisitions and similar transactions.
Carlsberg A/S’s share capital is divided into two classes (A shares and B shares). Combined with the Carlsberg Foundation’s position as majority shareholder (in terms of control), management considers that this di-vision will remain advantageous for all of the Company’s shareholders, as this structure enables and supports the long-term devel-opment of the Group.
As an element in strategic decisions on capital structure, management assesses
In 2014, total equity decreased to DKK 55,997m from DKK 71,001m. The decrease in equity was mainly due to profit for the period of DKK 4.9bn less foreign cur-rency translation of foreign entities of DKK 16.9bn. Payment of dividends to Carlsberg shareholders and non-controlling interests amounted to DKK 1.6bn.
the risk of changes in the Group’s invest-ment-grade rating. In 2006 the Group was awarded investment-grade ratings by Moody’s Investor Service and Fitch Ratings. In February 2011 both ratings were upgraded one notch. In January 2015 Moody’s affirmed the Baa2 issuer and senior unsecured ratings, but changed the outlook from stable to negative for Carlsberg Breweries. The rating and outlook from Fitch Ratings remained unchanged. Identification and monitor-ing of risks were carried out continuously during the year. In the fourth quarter of 2014 Carlsberg carried out its annual risk management workshop, which identified new risks and updated ongoing mitigating actions to address previously identified risks and uncertainties, as described in the risk management section of the Manage-ment review.
Other operational decisions relate to the issue of bonds, and the entering into and changing of bank loan agreements. To facilitate these decisions and man-age the operational capital structure, management assesses committed credit facilities, expected future cash flows and net debt ratio.
4.3.1 Capital structure
4.3.2 equity
Class A shares Class B shares Total share capital
Shares of DKK 20
Nominal value,
DKK ’000Shares of
DKK 20
Nominal value,
DKK ’000Shares of
DKK 20
Nominal value,
DKK ’0001 January 2013 33,699,252 673,985 118,857,554 2,377,151 152,556,806 3,051,136
No change in 2013 - - - - - -
31 December 2013 33,699,252 673,985 118,857,554 2,377,151 152,556,806 3,051,136No change in 2014 - - - - - -
31 December 2014 33,699,252 673,985 118,857,554 2,377,151 152,556,806 3,051,136
SHaRe caPital
A shares carry 20 votes per DKK 20 share. B shares carry two votes per DKK 20 share. A preferential right to an 8% non-cumulative dividend is attached to B shares. Apart from votes and dividends, all shares rank equally.
capital structure
SectiOn 4.3 eqUitY (DKKm)
71,001
+4,938 -16,938
-1,208-1,633 -234 -110 +181 55,997
Retir
emen
t ben
efit
oblig
ations
Cons
olidat
ed
profi
tFo
reign
exch
ange
adju
stm
ents
of
fore
ign
entit
ies
Divid
ends
paid
Equi
ty a
t
1 Ja
nuar
y
Corp
orat
ion
tax
Othe
r
mov
emen
ts
Equi
ty a
t
31 D
ecem
ber
Acqu
isitio
n of
NCI
Shares of DKK 20
Nominal value, DKKm
Percentage of share capital
1 January 2013 1,587 - 0.0%
Acquisition of treasury shares 288,582 6 0.2%
Used to settle share options -266,228 -5 -0.2%
31 December 2013 23,941 1 0.0%1 January 2014 23,941 1 0.0%
Acquisition of treasury shares 87,000 2 0.1%
Used to settle share options -92,489 -2 -0.1%
31 December 2014 18,452 1 0.0%
tReaSURY SHaReS

103Carlsberg Group Annual Report 2014 Financial Statements
4.3.2 ACCountinG poliCieS
Currency translations in equityCurrency translations in equity comprise foreign exchange adjustments arising on translation of financial statements of foreign entities from their functional currencies into the presentation currency used by Carlsberg A/S (DKK), balances considered to be part of the total net investment in foreign entities, and financial instruments used to hedge net investments in foreign entities.
On full or partial realisation of the net invest-ment, the foreign exchange adjustments are recognised in the income statement in the same item as the gain/loss.
Fair value adjustments in equityFair value adjustments in equity comprise changes in the fair value of hedging transactions that qualify for recognition as cash flow hedges and where the hedged transaction has not yet been realised.
Proposed dividendsProposed dividends are recognised as a liability at the date when they are adopted at the Annual General Meeting (declaration date). The dividend recommended by the Supervisory Board and therefore expected to be paid for the year is dis-closed in the statement of changes in equity.
Treasury sharesCost of acquisition, consideration received and dividends received from treasury shares are recognised directly as retained earnings in equity. Capital reductions from the cancellation of treasury shares are deducted from the share capital at an amount corresponding to the nomi-nal value of the shares.
Proceeds from the sale of treasury shares in connection with the exercise of share options are recognised directly in equity.
tRanSactiOnS witH SHaReHOlDeRS in caRlSBeRg a/S
DKK million 2014 2013Dividends to shareholders -1,220 -915
Acquisition of treasury shares -49 -167
Disposal of treasury shares 35 97
Total -1,234 -985
tRanSactiOnS witH nOn-cOntROlling inteReStS
DKK million 2014 2013
Acquisition of non-controlling interests -250 -320
Dividends to non-controlling interests -413 -357
Total -663 -677
The Group’s activities create exposure to a variety of financial risks. These risks include market risk (foreign exchange risk, interest rate risk and raw material risk), credit risk and liquidity risk.
The Group’s financial risks are managed by Group Treasury in accordance with the Finan-cial Risk Management Policy approved by the Supervisory Board and are an integrated part of the overall risk management process in Carlsberg. The risk management framework is described in the Management review.
To reduce the exposure to these risks, the Group enters into a variety of financial instru-ments and generally seeks to apply hedge accounting to reduce volatility in the income statement.
While the risk management activities were largely unchanged during 2014, the macro-economic situation affecting markets and ex-change rates in Russia and Ukraine warranted increased monitoring and planning.
4.3.3 Financial risk managementAt 31 December 2014, the fair value of treasury shares amounted to DKK 9m (2013: DKK 14m).
According to the authorisation of the General Meeting, the Supervisory Board may, in the period until 19 March 2019, allow the Company to acquire treasury shares up to a total holding of 10% of the nominal share capital, at a price quoted on NASDAQ OMX Copenhagen at the time of acquisition with a deviation of up to 10%.
During the financial year the Company ac-quired class B treasury shares of a nominal amount of DKK 2m (2013: DKK 6m) at an average price of DKK 570 (2013: DKK 578), corre sponding to a purchase price of DKK 49m (2013: DKK 167m).
Class B treasury shares are primarily acquired to facilitate settlement of share option schemes. The Company holds no class A shares.
During the financial year the Company disposed of class B treasury shares at a total price of DKK 35m (2013: DKK 97m). The disposal was made in connection with settlement of share options.
Transactions with shareholdersTransactions with shareholders, primarily dividends, led to a total cash outflow of DKK -1,234m (2013: DKK -985m).
The Group proposes dividends of DKK 1,373m (2013: DKK 1,220m), amounting to DKK 9.00 per share (2013: DKK 8.00 per share). The proposed dividends are included in retained earnings at 31 December 2014.
Transactions with non-controlling interestsDuring 2014, the Group had the following transactions with non-controlling interests.
SectiOn 4.3 Capital structure
Dividends paid to non-controlling interests primarily related to entities in Asia.

104Carlsberg Group Annual Report 2014 Financial Statements
Other total borrowings include finance lease liabilities of DKK 36m (2013: DKK 46m) and employee bonds of DKK 13m (2013: DKK 18m). No new employee bonds were issued in 2014 or 2013.
4.4.1 Borrowings
In the statement of cash flows, bank over-drafts are offset against cash and cash equivalents as specified below.
4.4.2 Cash
DKK million 2014 2013
Cash and cash equivalents 2,418 3,612Bank overdrafts -240 -378
Cash and cash equivalents, net 2,178 3,234
DKK million 2014 2013Non-current borrowingsIssued bonds 28,893 21,413
Mortgages 1,457 1,457
Bank borrowings 8,290 7,298
Other non-current borrowings 50 71
Total 38,690 30,239
Current borrowingsIssued bonds - 7,455
Current portion of other non-current borrowings 369 185
Bank borrowings 1,442 1,768
Other current borrowings 24 9
Total 1,835 9,417
Total non-current and current borrowings 40,525 39,656Fair value 42,211 40,274
gROSS Financial DeBt
4.4.1 ACCountinG poliCieS
Amounts owed to credit institutions, bonds etc. are recognised at the date of borrow-ing at fair value less transaction costs. In subsequent periods, the financial liabilities are measured at amortised cost using the effective interest method. Accordingly, the difference between the fair value less transaction costs and the nominal value is recognised in the income statement under financial expenses over the term of the loan.
Financial liabilities also include the capital-ised residual obligation on finance leases, which is measured at amortised cost. Other liabilities are measured at amortised cost.
caSH FlOw FROM eXteRnal Financing
DKK million 2014 2013
Proceeds from issue of bonds 7,368 -
Repayment of bonds -7,464 -1,731
Credit institutions, long-term 615 1,609
Credit institutions, short-term -214 -22Other financing liabilities -223 77
Total 82 -67
Borrowings and cash
SectiOn 4.4
The Group has designated a fixed-interest-rate GBP 300m bond as the hedged item in a fair value hedge with the designated risk be-ing movements in a benchmark interest rate (floating interest rate). The carrying amount of this borrowing is therefore adjusted for movements in the fair value due to move-ments in the benchmark rate. The carrying amount of this borrowing was DKK 2,994m as at 31 December 2014.
A EUR 1,000m bond matured during the year and was replaced with a EUR bond of the same amount. The development in net interest-bearing debt is shown in section 4.2.
Short-term bank deposits amounted to DKK 520m (2013: DKK 1,688m). The average interest rate on these deposits was 8.0% (2013: 8.2%). Assessment of credit riskThe Group is exposed to credit risk on cash and cash equivalents (including fixed de-posits), investments and derivative financial instruments with a positive fair value due to uncertainty as to whether the counterparty will be able to meet its contractual obliga-tions as they fall due.
The Group has established a credit policy under which financial transactions may be entered into only with financial institutions with a solid credit rating. The credit expo-sure on financial institutions is effectively managed by Group Treasury.
The Group primarily enters into financial in-struments and transactions with the Group’s relationship banks, i.e. banks extending loans to the Group. In most cases, the Group will be in a net debt position with its relationship banks.
Group Treasury monitors the Group’s gross credit exposure to banks and operates with individual limits on banks based on rating, level of government support and access to netting of assets and liabilities.
Exposure to credit risk The carrying amount of DKK 2,418m (2013: DKK 3,612m) represents the maximum credit exposure related to cash and cash equivalents.
The credit risk on receivables is described in section 1.6.

105Carlsberg Group Annual Report 2014 Financial Statements
4.5.1 Currency profile of the Group’s borrowings
The Group is exposed to foreign exchange risk on borrowings denominated in a cur-rency other than the Group’s functional
The Group is exposed to foreign exchange risk on the translation of the net result and net assets in foreign investments to DKK and on borrowings denominated in a cur-rency other than the functional currency of the individual Group entity.
DKK million
2014Original
principalEffect
of swapAfter swap
CHF 47 2,579 2,626
DKK 1,476 14,835 16,311
EUR 32,501 -18,806 13,695
GBP 2,996 -1,853 1,143
RUB -1 130 129
USD 1,963 1,848 3,811
Other 1,543 1,267 2,810
Total 40,525 - 40,525Total 2013 39,656 - 39,656
cURRencY PROFile OF BORROwingS BeFoRe AnD AFteR DeRiVAtiVe FinAnCiAl inStRuMentS
4.5.2 Hedging of net investments in foreign subsidiaries
Foreign exchange risk related to net investments and financing activities
SectiOn 4.5
Million
2014
Hedging of investment, amount
in local currency
Addition to net investment, amount
in local currency
Total adjust ment to other comprehensive
income (DKK)
Incomestatement
(DKK)
CNY -1,250 - -131 -
MYR -336 - -54 -
HKD - 1,428 32 -
CHF -430 - -44 -
GBP - 97 75 -
NOK - 3,000 -186 -
SEK -4,048 - 197 -
SGD - 223 82 -
Other - - -21 -
Total -50 -
2013CNY -1,250 - 8 -
CHF -380 - 29 -
NOK - 3,000 -326 -
SEK -4,630 - 160 -
SGD - - -39 -
Other - - 50 -
Total -118 -
net inveStMent HeDgeS
The Group holds a number of investments in foreign subsidiaries where the translation of net assets to DKK is exposed to foreign exchange risks. The Group hedges part of this foreign exchange exposure by enter-ing into forward exchange contracts (net investment hedges). This applies to net in-vestments in CHF, CNY and MYR. The basis for hedging is reviewed at least once a year, and the two parameters, risk reduction and cost, are balanced.
Where the fair value adjustments do not exceed the value adjustments of the invest-ment, the adjustments of the financial instruments are recognised in other com-prehensive income; otherwise the fair value
currency due to the foreign exchange risk as well as the risk that arises when net cash in-flow is generated in one currency and loans are denominated in and have to be repaid in another currency.
At 31 December 2014, 43% of the Group’s net financial debt was in DKK (2013: 6%) and 35% was in EUR (2013: 78%), cf. section 4.6.
adjustments are recognised in the income statement. For 2014, all fair value adjust-ments were recognised in other comprehen-sive income. The effect of net investment hedges on the income statement and other comprehensive income is summarised above. The most significant net risk relates to for-eign exchange adjustment of net assets in RUB. This risk was not hedged during 2014.
Fair value adjustments of net investment hedges and loans classified as additions to net investments in the financial year are recognised in other comprehensive
income and amounted to DKK -50m (2013: DKK -118m).
The fair value of derivatives used as net investment hedges recognised at 31 Decem-ber 2014 amounted to DKK -52m (2013: DKK 35m).

106Carlsberg Group Annual Report 2014 Financial Statements
4.5.3 Financing of local entities
The Group is exposed to foreign exchange risk on borrowings denominated in a cur-rency other than the functional currency of the individual Group entity.
The main principle for funding of subsidiar-ies is that loans and borrowings should be in local currency or hedged to local currency to avoid foreign exchange risk. However, in some Group entities debt is denominated in a currency other than the local entity’s func-tional currency without the foreign exchange risk being hedged. This applies primarily to a few entities in Eastern Europe and is based on an assessment of the alternative cost of financing the entity in the local currency. For the countries concerned, the interest rate level in the local currency, and thus the additional cost of financing in local currency, is so high that it justifies a foreign exchange risk. In some countries financing in local cur-rency is not available at all.
The tables in the sensitivity analysis show the impact of a 10% adverse development in exchange rates for the relevant currencies at 31 December.
Impact on operating profitThe impact on operating profit is primarily currency impact as described in section 1.4.
Impact on financial items, netIn 2014, the Group had net gains on foreign exchange and fair value adjustments of financial instruments of DKK 291m (2013: DKK 178m), cf. section 4.1.
Impact on statement of financial positionFluctuations in foreign exchange rates will also affect the level of debt as funding is obtained in a number of currencies. In 2014, net interest-bearing debt increased by DKK 358m (2013: a decrease of DKK 139m) due to changes in foreign exchange rates. The main reason for the foreign exchange impact in 2014 was the appreciation of GBP/DKK and USD/DKK during 2014.
Impact on other comprehensive incomeFor 2014, the total losses on net invest-ments (Carlsberg’s share), loans granted to subsidiaries as an addition to the net investment and net investment hedges amounted to DKK -17,333m (2013: DKK -7,206m). Losses were primarily incurred in RUB, as the RUB/DKK rate depreciated 34% during the year.
Sensitivity analysisAn adverse development in the exchange rates would, all other things being equal, have the following hypothetical impact on the consolidated profit and loss for 2014. The hypothetical impact ignores the fact that the subsidiaries’ initial recognition of revenue, cost and debt would be similarly exposed to the changes in the exchange rates. The calculation is made on the basis of items
DKK million
2014EUR
receivableEUR
payableEUR
borrowingsEUR cash
Gross exposure Derivative
Net exposure
% change
Effect on P/L
2013Effect
on P/L
EUR/RUB 5 -125 - 11 -109 - -109 10.00% -11 -9
EUR/UZS - -6 -196 1 -201 - -201 10.00% -20 -21
EUR/Other - - - - - - - - -5
Total -31 -35
2014USD
receivableUSD
payableUSD
borrowingsUSD cash
Gross exposure Derivative
Net exposure
% change
Effect on P/L
2013Effect
on P/LUSD/UAH 1 -44 - 285 242 - 242 10.00% 24 32
USD/KZT - - - - - - - - -7
Total 24 25
eXcHange Rate SenSitivitY
SectiOn 4.5 Foreign exchange risk related to net investments and financing activities
in the statement of financial position at 31 December.
Other comprehensive income is affected by changes in the fair value of currency derivatives designated as cash flow hed ges of future purchases and sales. If the foreign exchange rates of the currencies hedged had been 5% higher on 31 December, other comprehensive income would have been DKK 145m lower (2013: DKK 162m lower).
4.5.4 impact on financial statements and sensitivity analysis

107Carlsberg Group Annual Report 2014 Financial Statements
SectiOn 4.5 Foreign exchange risk related to net investments and financing activities
Applied exchange ratesThe DKK exchange rates applied for the most significant currencies when preparing the consolidated financial statements are presented below. The average exchange rate for the year was calculated using the monthly exchange rates weighted according to the phasing of the Group’s net revenue throughout the year.
Closing rate Average rate
DKK 2014 2013 2014 2013Swiss Franc (CHF) 6.1886 6.0856 6.1380 6.0589
Chinese Yuan (CNY) 0.9867 0.8929 0.9088 0.9144
Euro (EUR) 7.4436 7.4603 7.4554 7.4577
Pound Sterling (GBP) 9.5150 8.9195 9.2634 8.7930
Laotian Kip (LAK) 0.0008 0.0007 0.0007 0.0007
Norwegian Krone (NOK) 0.8232 0.8854 0.8929 0.9538
Polish Zloty (PLN) 1.7269 1.7982 1.7837 1.7743
Russian Rouble (RUB) 0.1089 0.1659 0.1499 0.1759
Swedish Krona (SEK) 0.7856 0.8356 0.8183 0.8614
Ukrainian Hryvnia (UAH) 0.3870 0.6757 0.4676 0.7053
aPPlieD eXcHange RateS

108Carlsberg Group Annual Report 2014 Financial Statements
DKK million
2014Interest
rate
Average effective interest
rateFixed
forCarrying amount
Interest rate risk
Issued bondsGBP 300m maturing 28 November 2016 Fixed 7.41% 1-2 years 2,994 Fair value
EUR 1,000m maturing 13 October 2017 Fixed 3.55% 2-3 years 7,408 Fair value
EUR 750m maturing 3 July 2019 Fixed 2.58% 4-5 years 5,594 Fair value
EUR 750m maturing 15 November 2022 Fixed 2.71% >5 years 5,544 Fair value
EUR 1,000m maturing 28 May 2024 Fixed 2.63% >5 years 7,353 Fair value
Total issued bonds 3.37% 28,893Total issued bonds 2013 4.25% 28,868
MortgagesFloating-rate Floating 1.02% <1 year 1,248 Cash flow
Fixed-rate Fixed 3.12% 1-2 years 209 Fair value
Total mortgages 1.32% 1,457Total mortgages 2013 1.29% 1,457
Bank borrowingsFloating-rate Floating 0.66% <1 year 9,642 Cash flow
Fixed-rate Fixed 4.94% 1-2 years 90 Fair value
Total bank borrowings 9,732Total bank borrowings 2013 9,066
inteReSt Rate RiSK at 31 DeceMBeR
The most significant interest rate risk in the Group relates to borrowings. As the Group’s net debt is primarily in EUR and DKK, inter-est rate exposure relates to the development in the interest rates in these two currencies.
The interest rate risk is measured by the du-ration of the net borrowings. The target is to have a duration between one and five years.
Interest rate risks are mainly managed using fixed-rate bonds and interest rate swaps.
The EUR 1,000m bond maturing 28 May 2024 was issued in May 2014.
The EUR 750m bond maturing 3 July 2019 consists of two bond issues of EUR 250m and EUR 500m.
net Financial inteReSt-BeaRing DeBt BY cURRencY
DKK million
2014 Net financial
interest-bearing debt1 Floating1 Fixed1 Floating2 %
Interest rate
Fixed2 % EUR 13,296 -12,664 25,960 19% 81%
DKK 16,294 16,085 209 86% 14%
PLN 167 167 - 100% -
USD 3,427 3,427 - 100% -
CHF 2,631 2,631 - 100% -
RUB 135 135 - 100% -
Other 2,157 2,127 30 99% 1%
Total 38,107 11,908 26,199 31% 69%
2013EUR 28,191 6,549 21,642 30% 70%
DKK 2,045 1,823 222 88% 12%
PLN 508 508 - 100% -
USD 3,020 3,020 - 100% -
CHF 1,857 1,857 - 100% -
RUB -653 -653 - 100% -
Other 1,076 1,023 53 98% 2%
Total 36,044 14,127 21,917 39% 61%
1 Net financial interest-bearing debt consists of current and non-current items after swaps and currency derivatives less cash and cash equivalents.
2 Net financial interest-bearing debt consists of current and non-current items after interest rate swaps less cash and cash equivalents.
interest rate risk SectiOn 4.6

109Carlsberg Group Annual Report 2014 Financial Statements
A cross-currency swap has been used to change the interest on the GBP 300m bond from fixed to floating 6-month EURIBOR +4.01%. The bond and the swap are des-ignated as a fair value hedge relationship, meaning that the carrying amount of the bond is the fair value.
The floating-rate mortgage was repriced in December 2014 at a rate of 0.37% (excl. margin) commencing in January 2015 and will be repriced again in July 2015. The time to maturity is more than five years. The floating-rate mortgage is repriced semi-annually with reference to 6-month CIBOR.
The main part of the bank borrowings pre-sented as having a fixed rate was originally at floating rate but has been swapped to a fixed rate of 4.94% incl. margin. The matu-rity of these interest rate swaps is less than one year.
Sensitivity analysisAt the reporting date, 69% of the net borrow-ings consisted of fixed-rate loans with rates fixed for more than one year (2013: 61%). It is estimated that an interest rate increase of 1 percentage point would lead to an increase in annual interest expenses of DKK 119m (2013: DKK 146m). The analysis assumes a parallel shift in the relevant yield curves and 100% ef-fective hedging of changes in the yield curve.
At 31 December 2014, the duration of the borrowings can be specified as in the table below.
DKK million
2014 1-2 years 2-3 years 3-4 years 4-5 years >5 years Total
Issued bonds 2,994 7,408 - 5,594 12,897 28,893
Mortgages - - - - 1,457 1,457
Bank borrowings 71 3 - - 8,216 8,290
Other non-current borrowings 10 9 24 2 5 50
Total 3,075 7,420 24 5,596 22,575 38,690Total 2013 298 2,881 7,421 27 19,612 30,239
tiMe tO MatURitY FOR nOn-cURRent BORROwingS
The increase in duration was primarily due to the issue of a new 10-year EUR 1bn bond. The Group did not enter into new swaps dur-ing 2014.
If the market interest rate had been 1 per-centage point higher (lower) at the reporting date, it would have led to a financial gain (loss) of DKK 1,453m (2013: DKK 1,072m). However, since only interest rate swaps and not fixed-rate borrowings are recognised at fair value, marked-to-market, only the dura-tion contained in financial instruments will impact other comprehensive income or the income statement.
It is estimated that DKK 5m (2013: DKK 32m) of the duration is contained in inter-est rate derivatives designated as cash flow hedges, meaning that the impact from changes in interest rates will be recognised in other comprehensive income, provided that the hedges are effective and that there
DKK million 2014 2013Swaps 5 32
Bonds and other borrowings 1,448 1,040
Total duration 1,453 1,072Duration in years 3.8 2.9
DURatiOn
is/are no ineffective portion(s). If the market interest rates had been 1 percentage point higher (lower) at 31 December 2014, equity would have been DKK 5m (2013: DKK 32m) higher (lower). The remaining duration is included in borrowings at fixed interest – primarily the issued bonds which are carried at amortised cost.
The sensitivity analysis is based on the financial instruments recognised at the reporting date. The sensitivity analysis as-sumes a parallel shift in interest rates and that all other variables, in particular foreign exchange rates and interest rate differentials between the different currencies, remain constant. The analysis was performed on the same basis as for 2013.
SectiOn 4.6 interest rate risk

110Carlsberg Group Annual Report 2014 Financial Statements
Liquidity risk results from the Group’s potential inability to meet the obligations associated with its financial liabilities, e.g. settlement of its financial debt and paying its suppliers. The Group’s liquidity is man-aged by Group Treasury. The aim is to en-sure effective liquidity management, which primarily involves obtaining sufficient com-mitted credit facilities to ensure adequate financial resources, and to some extent tapping a diversity of funding sources.
Credit resources availableAt 31 December 2014, the Carlsberg Group had net financial interest-bearing debt of DKK 38,107m (2013: DKK 36,044m). The credit resources available and the ac-cess to unused committed credit facilities are considered reasonable in light of the Group’s current needs in terms of financial flexibility.
At 31 December 2014, the Group had total unutilised credit facilities of DKK 12,439m (2013: DKK 13,653m). Carlsberg is us-ing the term Credit resources available to determine the adequacy of access to credit facilities. Credit resources available consist of the unutilised non-current credit facili-ties and cash and cash equivalents of DKK
2,418m (2013: DKK 3,612m) less utilisation of current facilities of DKK 1,835m (2013: DKK 9,417m).
A few insignificant non-current committed credit facilities include financial covenants with reference to the ratio between net debt and EBITDA. Management monitors this ratio, and at 31 December 2014 there was sufficient headroom below the ratio.
In addition to efficient working capital man-agement and credit management, the Group mitigates liquidity risk by arranging borrow-ing facilities with solid financial institutions.
The Group uses cash pools in its day-to-day liquidity management for most of the enti-ties in Western Europe, as well as intra-Group loans between Group Treasury and subsidiaries. As a result of withholding tax and local legislation, the majority-owned en-tities in Eastern Europe have their own credit facilities and borrowings from banks.
DKK million
2014
Total non-current
committed loans and
credit facilities
Utilised portion
of credit facilities
Unused credit
facilities
2013Unused
credit facilities
<1 year 1,835 1,835 - -
Total current committed loans and credit facilities 1,835 1,835 - -<1 year - - -1,835 -9,417
1-2 years 5,037 3,075 1,962 2,001
2-3 years 7,420 7,420 - -
3-4 years 24 24 - -
4-5 years 5,596 5,596 - -
>5 years 33,052 22,575 10,477 11,652
Total non-current committed loans and credit facilities 51,129 38,690 10,604 4,236Cash and cash equivalents 2,418 3,612
Credit resources available (total non-current committed loans and credit facilities – net debt) 13,022 7,848
cOMMitteD nOn-cURRent cReDit FacilitieS anD cReDit ReSOURceS availaBle at 31 DeceMBeR
liquidity risk SectiOn 4.7

111Carlsberg Group Annual Report 2014 Financial Statements
The above table lists the contractual maturities of financial liabilities, including estimated interest payments and excluding the impact of netting agreements, and thus summarises the gross liquidity risk.
The risk implied from the values shown in the table reflects the one-sided scenario of cash outflows only. Trade payables and other financial liabilities mainly originate from the financing of assets in ongoing operations such as property, plant and equipment and
investments in working capital, e.g. invento-ries and trade receivables.
Derivative financial instruments are in general traded with the Group’s relation-ship banks. The nominal amount/contractual cash flow of the financial debt is DKK 112m higher (2013: DKK 29m higher) than the carrying amount. The difference between the nominal amount and the carrying amount comprises differences between these amounts at initial recognition, which are
treated as cost that is capitalised and am-ortised over the duration of the borrowings, and differences between nominal amounts and the fair values of bonds which are held at fair value, cf. section 4.4.
The interest expense is the contractual cash flows expected on the financial gross debt at 31 December 2014. For the part of bank borrowing that has been swapped, the expected interest expense (before swaps but including margin) has been included.
DKK million
2014Contractualcash flows
Maturity<1 year
Maturity>1 year
<5 yearsMaturity
>5 yearsCarryingamount
Derivative financial instrumentsDerivative financial instruments, payables 300 300 - - 299
Non-derivative financial instrumentsFinancial debt, gross 40,637 1,835 16,000 22,802 40,525
Interest expenses 5,349 1,132 2,792 1,425 N/A
Trade payables and other liabilities 14,095 14,095 - - 14,095
Liabilities related to acquisition of entities 1,859 503 287 1,069 1,859
Non-derivative financial instruments 61,940 17,565 19,079 25,296 -Financial liabilities 62,240 17,865 19,079 25,296 -Financial liabilities 2013 60,466 25,643 13,344 21,479 -
MatURitY OF Financial liaBilitieS
All items are stated at their nominal amounts. Derivative financial instruments are presented gross.
SectiOn 4.7 liquidity risk
The expected net cash flow from the swaps related to the borrowings is included in the contractual cash flow for the deriva-tive financial instrument. It should be noted that the cash flow regarding the interest expenses is estimated cash flow based on the notional amount of the above-mentioned borrowings and expected interest rates at year-end 2014 and 2013. Interest on debt recognised at year-end 2014 and 2013, for which no contractual obligation exists (current borrowing and part of the amount drawn on credit facilities and cash pools), has been included for a two-year period.

112Carlsberg Group Annual Report 2014 Financial Statements
Value adjustments of fair value hedges and financial derivatives not designated as hedging instruments in the financial year are recognised in the income statement. The adjustments are included in financial income and financial expenses, cf. section 4.1. In 2014, fair value adjustments amounted to DKK 226m (2013: DKK 20m).
The ineffective portion of hedge in 2014 re-lates to the ineffective portion of the Group’s aluminium hedging scheme (DKK 4m) and
the ineffective portion of certain foreign ex-change hedges (DKK -12m). Both ineffective portions relate to hedged transactions that are expected to take place in 2015.
The fair value of the entire derivative classi-fied as a cash flow hedge is presented in the cash flow hedge section below. Other instru-ments are primarily aluminium hedges, which were not classified as cash flow hedges.
The value of fair value hedges recognised at 31 December amounted to DKK 419m (2013: DKK 262m).
Cash flow hedgesCash flow hedges comprise interest rate swaps where the hedged item is the under-lying (floating-rate) borrowing (EUR 400m maturing June 2015), aluminium hedges where the hedged item is aluminium cans that will be used in a number of Group entities in Western Europe and Eastern Europe during 2015, and currency swaps
DKK million
2014
Fair value adjustment
recognised in the income statement Fair value
Exchange rate instruments 234 419
Other instruments - -
Ineffective portion of hedge -8 -
Total 226 419
2013Exchange rate instruments -8 264
Other instruments -6 -2
Ineffective portion of hedge 34 -
Total 20 262
FaiR valUe HeDgeS anD Financial DeRivativeS nOt DeSignateD aS HeDging inStRUMentS (ecOnOMic HeDgeS)
to cover the foreign exchange risk on transactions expected to take place in 2015 and 2016.
Fair value adjustments of cash flow hedges in the financial year are recognised in other comprehensive income and amounted to DKK 201m (2013: DKK 128m).
The fair value of cash flow hedges recog-nised at 31 December amounted to DKK -65m (2013: DKK -275m). This does not include the value of cash flow hedges closed and not yet transferred to the income statement.
The impact on other comprehensive income from exchange rate instruments relates to hedges of Group entities’ purchases and sales in currencies other than their func-tional currencies. The impact on other com-prehensive income from other instruments relates to hedges of Group entities’ exposure to changes in aluminium prices.
DKK million
2014
Fair value adjustment
recognised in other comprehensive income Fair value
Expected recognition
Interest rate instruments 115 -56 2015
Exchange rate instruments -70 -42 2015-2016
Other instruments 156 33 2015
Total 201 -65
2013Interest rate instruments 232 -174 2014-2015
Exchange rate instruments -21 27 2014
Other instruments -83 -128 2014-2015
Total 128 -275
caSH FlOw HeDgeS
Financial instruments
SectiOn 4.8
4.8 SiGniFiCAnt ACCountinG eStiMAteS AnD juDGeMentS
When entering into financial instru-ments, management assesses whether the instrument is an effective hedge of recognised assets and liabilities, expected future cash flows or financial investments.
The effectiveness of recognised hedge instruments is assessed at least quar-terly. Any ineffectiveness is recognised in the income statement.

113Carlsberg Group Annual Report 2014 Financial Statements
4.8 ACCountinG poliCieS
Derivative financial instruments are initially recognised in the statement of financial position at fair value on the trade date and subsequently measured at fair value. At-tributable transaction costs are recognised in the income statement.
The fair values of derivative financial instru-ments are included in other receivables and other payables, and positive and negative values are offset only when the Group has the right and the intention to settle several financial instruments net. Fair values of de-rivative financial instruments are computed on the basis of current market data and generally accepted valuation methods.
Changes in the fair value of derivative finan-cial instruments designated as and qualifying for recognition as a fair value hedge of rec-ognised assets and liabilities are recognised in the income statement, together with changes in the value of the hedged asset or liability with respect to the hedged portion. Except for foreign currency hedges, hedg-ing of future cash flows according to a firm agreement is treated as a fair value hedge of a recognised asset or liability.
Changes in the portion of the fair value of derivative financial instruments which are designated and qualify as a cash flow hedge and which effectively hedge changes in the value of the hedged item are recognised in other comprehensive income and attributed to a separate reserve in equity. When the hedged transaction results in gains or losses, amounts previously recognised in other comprehensive income are transferred to the same item as the hedged item when the hedged risk impacts the income statement. When the hedged item is a non-financial as-
set, the amount recognised in other compre-hensive income is transferred to the carrying amount of the asset when the non-financial asset is recognised.
Derivatives designated as and qualifying for recognition as a cash flow hedge of financial investments are recognised in other compre-hensive income. On complete or partial dis-posal of the financial investment, the portion of the hedging instrument that is recognised in other comprehensive income and relates to that financial investment is recognised in the income statement when the gain or loss on disposal is recognised.
For derivative financial instruments that do not qualify for hedge accounting, changes in fair value are recognised in the income statement as financial income or financial expenses.
Changes in the fair value of derivative finan-cial instruments used to hedge net invest-ments in foreign subsidiaries, associates and joint ventures and which effectively hedge currency fluctuations in these entities are recognised in other comprehensive income and attributed to a separate translation reserve in equity.
Embedded derivatives are recognised separ-ately from the host contract and measured at fair value if their economic characteristics and risks are not closely related to those of the host contract, as a separate instrument with the same terms would meet the defini-tion of a derivative, and the entire combined instrument is not measured at fair value through profit and loss. Separated embed-ded derivatives are subsequently measured at fair value.
SectiOn 4.8 Financial instruments
Carlsberg has no financial instruments measured at fair value on the basis of level 1 input (quoted prices) or level 3 input (non-observable data).
The fair value of borrowings is disclosed in section 4.4.1. The carrying amount of other financial assets and liabilities approximates their fair value.
categORY MeaSUReMent MetHOD
Derivative financial instruments
Fair value is determined based on observable market data using generally accepted methods. Internally calculated values are used, and these are compared to exter-nal market quotes on a quarterly basis. Calculated by:
Interest rate swapsa) estimating the notional future cash flows using observable market data such as yield b) discounting the estimated and fixed cash flow to present valuec) translating the amounts in foreign currency into the functional currency at the
year-end foreign exchange rate
Currency and aluminium derivativesa) comparing the forward market rate with the agreed rate on the derivatives and
calculating the difference in cash flow at the future point in timeb) discounting the amounts to present value
Loans and other receivables
Carrying amount approximates fair value.
On-trade loans Recognised at amortised cost. Based on discounted cash flows using the interest rates at the end of the reporting year, these loans have a fair value of DKK 1,839m (2013: DKK 1,851m).
Other financial liabilities
Other financial liabilities, including issued bonds, mortgages, bank borrowings, finance lease obligations, trade payables and other liabilities, are measured at amortised cost with the exception of a GBP 300m bond, which is measured at fair value based on movements in a benchmark interest rate.
Determination of fair value
SectiOn 4.9
Methods and assumptions to determine fair value The methods and assumptions used in de-termining the fair values of each category of financial assets and financial liabilities are described below.
The methods are unchanged from 2013.

114Carlsberg Group Annual Report 2014 Financial Statements
chongqing Beer group assets Man agement Acquisition of Chongqing Beer Group Assets Management Co. Ltd in October for a total consideration of DKK 1.7bn.
Hanoi-vung tau BeerStep acquisition of Hanoi-Vung Tau Beer Joint Stock Company in February for a consid-eration of DKK 92m. A gain of DKK 13m was recognised following the revaluation of the previously held shareholding.
chongqing Brewery groupCompletion of the purchase price allocation following the acquisition of Chongqing Brewery Group in December 2013, with allocation of DKK 7.0bn to goodwill.
SectiOn 5Acquisitions, associates and joint ventures
KeY DevelOPMentS 2014 Acquisition of entities in 2014In 2014, Carlsberg gained control of Chong-qing Beer Group Assets Management Co. Ltd (China) and Maybev Pte Ltd. (Singapore) through acquisitions and of Hanoi-Vung Tau Beer Joint Stock Company (Vietnam) through a step acquisition.
The acquisition of Chongqing Beer Group Assets Management was a natural step in line with Carlsberg’s strategy to gain further market shares in China and grow the business. The acquisition of Maybev expanded Carlsberg’s premium drinks portfolio in Singapore and is in line with the premiumisation strategy in Asia. The step acquisition of Hanoi-Vung Tau Beer was carried out to obtain full control.
The calculated goodwill, DKK 1,428m in total, represents staff competences and synergies from optimisation of sales and dis-tribution, supply chain and procurement. For the acquisitions of Chongqing Beer Group Assets Management and Chongqing Brewery Group (in 2013), it further represents the positive growth provided by the opportunity for Carlsberg to take full advantage of the potential of our international brands, includ-ing Tuborg, in the Chinese market in
acquisition of subsidiaries
SectiOn 5.1
conjunction with the existing Carlsberg-owned business. Increased sales volumes provide Carlsberg with the opportunity to gener ate significant synergies from supply chain optimisations, including reduced indi-rect production overheads and implementa-tion of best practice in the brewing industry, and cost savings on procurement.
In October 2014 Carlsberg gained control of Chongqing Beer Group Assets Management following government approval of the transac-tion agreed in December 2013 at a purchase price of DKK 1,530m. In addition, a put option was granted allowing non-controlling inter-ests of various subsidiaries in the group to be sold to Carlsberg at a price negotiated by the seller prior to the acquisition. The options were exercised before year-end 2014 at a total price of DKK 212m and are considered to be an integral part of the transaction.
Immediately following the acquisition, a num-ber of the breweries in the group were put up for sale. As these breweries are expected to be disposed of within the next 12 months, they have been classified as assets held for sale in the opening statement of finan cial position. The purchase price allocation of the fair value of identified assets, liabilities and

115Carlsberg Group Annual Report 2014 Financial Statements
DKK million
2014
Chongqing Beer Group Assets Management Other Total
Fair value of consideration transferred for acquired ownership interest 1,742 97 1,839
Fair value of previously held ownership interest - 43 43
Deferred consideration - 5 5
Total cost of acquisition 1,742 145 1,887Net assets of acquired entities, attributable to Carlsberg -403 -56 -459
Goodwill from acquisitions 1,339 89 1,428
Revaluation of put option related to acquisitions in prior years recognised as goodwill 15
Total change in recognised goodwill 1,443
cOnSiDeRatiOn anD gOODwill RecOgniSeD
contingent liabilities is still ongoing. Adjust-ments are therefore expected to be made to all items in the opening statement of financial position, especially in relation to trademarks, property, plant and equipment and assets held for sale. Accounting for the acquisition
2014Country of
main operations
Previous method of
consolidation
Previously held ownership
interest
Acquired ownership
interest
Total Carlsberg
interestAcquisition
dateMain
activityConsideration
DKK million
Chongqing Beer Group Assets Management Co. Ltd China Not applicable Not applicable 100% 100% 23 Oct. 2014 Brewery 1,742
Maybev Pte Ltd. Singapore Not applicable Not applicable 51% 51% 3 Apr. 2014 Sales 10
Hanoi-Vung Tau Beer Joint Stock Company Vietnam Equity method 55% 45% 100% 12 Feb. 2014 Brewery 92
acqUiReD entitieS
will be completed within the 12-month period required by IFRS 3.
In April 2014, Carlsberg Singapore gained control of Maybev through the acquisition of a 51% shareholding. As Carlsberg effectively
SectiOn 5.1 Acquisitions, associates and joint ventures
DKK million
2014
Chongqing Beer Group Assets Management Other Total
Intangible assets 78 17 95
Property, plant and equipment 244 143 387
Inventories 297 14 311
Loans and receivables, current 92 34 126
Cash and cash equivalents 137 21 158
Assets classified as held for sale 341 - 341
Borrowings -315 -122 -437
Trade payables and other payables -471 -43 -514
Net assets of acquired entities 403 64 467
Non-controlling interests' proportionate share of acquired net assets, recognised - -8 -8
Net assets of acquired entities, attributable to Carlsberg 403 56 459
FaiR valUe OF net aSSetS acqUiReD
holds 51% of Carlsberg Singapore, the Group has an effective ownership interest of 26% in Maybev. 50% of the consideration was paid at completion, while the remaining 50% was paid in January 2015.
In February 2014, Carlsberg gained con-trol of Hanoi-Vung Tau Beer through the acquisition of a 45% shareholding previously held by our partner. The shareholding in the company recognised prior to gaining control had a fair value that was higher than the
carrying amount, leading to recognition of a revaluation adjustment of DKK 13m.
The purchase price allocation of the fair value of identified assets, liabilities and con-tingent liabilities has been completed forboth Maybev and Hanoi-Vung Tau Beer.

116Carlsberg Group Annual Report 2014 Financial Statements
cOnSiDeRatiOn anD gOODwill RecOgniSeD
DKK million
2013
Chongqing Brewery
Group Other Total
Fair value of consideration transferred for acquired ownership interest 2,646 143 2,789
Fair value of previously held ownership interest 4,086 - 4,086
Fair value of put options recognised as part of acquisition 428 - 428
Total cost of acquisition 7,160 143 7,303Net assets of acquired entities, attributable to Carlsberg -179 -143 -322
Goodwill from step acquisitions 6,981 - 6,981
Other adjustments including revaluation of put option related to acquisitions in prior years recognised as goodwill -184
Total change in recognised goodwill 6,797
acqUiReD entitieS
2013Country of
main operations
Previous method of
consolidation
Previously held ownership
interest
Acquired ownership
interest
Total Carlsberg
interestAcquisition
dateMain
activityConsideration
DKK millionChongqing Brewery Group China Equity method 30% 30% 60% 10 Dec. 2013 Brewery 2,646Distribution entities Germany Equity method 50% 50% 100% 1 Jan. 2013 Logistics 143
Acquisition of entities in 2013In 2013, Carlsberg gained control of Chongqing Brewery Group (China) and distribution entities acquired from Nordic Getränke (Germany).
These step acquisitions were a natural step for Carlsberg and in line with the strategy of obtaining full control of key operating activities. The calculation of goodwill, DKK 6,981m in total, represents staff competen ces, synergies and positive growth potential as described earlier in section 5.1.
The acquisition of Chongqing Brewery Group was completed through a partial takeover of 30.29% of the shares at a purchase price of DKK 2,646m. In addi-tion, a put option was granted allowing a non-controlling interest of 4.95% of the shares to be sold to Carlsberg before December 2015. This put option was recognised at fair value amounting to DKK 428m. Prior to Carlsberg gaining control, Chongqing Brewery Group was classified as an associate and consolidated accord-ing to the equity method.
The acquisition of Chongqing Brewery Group was made in several steps over a period of 2-3 years, leading to Carlsberg gaining control in December 2013. The shareholding recognised prior to gaining control had a fair value equal to the carry-ing amount, and no revaluation adjust-ment was therefore recognised.
Adjustments were made in 2014 to the provisional purchase price allocation reported in 2013. Adjustments primarily related to the fair value of trademarks, property, plant and equipment and other provisions based on new information obtained within one year of the acquisition date concerning facts and circumstances that existed at the acquisition date.
The information comprises details on performance, strategy and potential for the individual trademarks; market dynamics; capacity, quality and mainte-nance level of the individual breweries. In addition, contractual and other agree-ments have been reviewed. The adjust-ment of fair value increased goodwill by DKK 815m to DKK 6,981m. A description of the items valued and the techniques and estimates applied is provided on the following pages. The purchase price allocation of the fair value of identified assets, liabilities and contingent liabili-ties was completed in 2014.
SectiOn 5.1 Acquisitions, associates and joint ventures
FaiR valUe OF net aSSetS acqUiReD
DKK million
2013
Chongqing Brewery
Group Other Total
Intangible assets 2,332 8 2,340
Property, plant and equipment 1,657 135 1,792
Financial assets, excl. deferred tax 104 29 133
Inventories 264 42 306
Loans and receivables, current 127 123 250
Cash and cash equivalents 470 5 475
Provisions -1,510 -29 -1,539
Deferred tax assets and liabilities, net -397 20 -377
Borrowings -1,097 62 -1,035
Trade payables and other payables -1,717 -248 -1,965
Net assets of acquired entities 233 147 380
Non-controlling interests' proportionate share of acquired net assets, recognised -54 -4 -58
Net assets of acquired entities, attributable to Carlsberg 179 143 322

117Carlsberg Group Annual Report 2014 Financial Statements
5.1 SiGniFiCAnt ACCountinG eStiMAteS AnD juDGeMentS
Purchase price allocation For acquisitions of entities, the assets, liabilities and contingent liabilities of the acquiree are recognised using the acquisi-tion method. The most significant assets acquired generally comprise goodwill, trademarks, non-current assets, receiv-ables and inventories.
No active market exists for the majority of the acquired assets and liabilities, in particular in respect of acquired intangible assets. Accordingly, management makes estimates of the fair value of acquired assets, liabilities and contingent liabilities. Depending on the nature of the item, the determined fair value of an item may be associated with uncertainty and possibly adjusted subsequently.
The unallocated purchase price (positive amount) is recognised in the statement of financial position as goodwill, which is allocated to the Group’s cash-generating units. Management makes estimates of the acquired cash-generating units, the cash-generating units that already existed in the Group and the allocation of goodwill. The al-location of goodwill is based on the expected future cash flows for each activity. In each business combination, management decides whether or not to recognise goodwill related to non-controlling interests. If such goodwill
is recognised, it is estimated based on the fair value of the non-controlling interests less the non-controlling interests’ share of the fair value of acquired assets, liabilities and contingent liabilities. The fair value of the non-controlling interests is estimated based on the net present value of expected future cash flows from the entity, the cost of newly acquired shareholdings in the entity excluding a control premium paid, and other fair value models as applicable for the transaction.
In a step acquisition, the Group gains control of an entity in which the Group already held a shareholding immediately before the step acquisition. Management estimates the total fair value of the share-holding in the entity held immediately after the completion of the step acquisition. The estimated total fair value is accounted for as the cost of the total shareholding in the entity. The shareholding held immediately before the step acquisition is remeasured at fair value at the acquisition date. The fair value is calculated as the estimated total fair value less the fair value of the consideration paid for the shareholdings acquired in the step acquisition and the fair value of non-controlling interests. The re-sulting gain or loss on the remeasurement is recognised in the income statement under special items.
The total fair value is based on various valuation methods, including the net pre-sent value of expected future cash flows from the entity, the cost of newly acquired shareholdings in the entity including a control premium paid, and other fair value models as applicable for the transaction.
The net present value of expected future cash flows (value in use) is based on budg-ets and business plans for the next three years and projections for subsequent years as well as management’s expectations for the future development following gain of control of the business. Key parameters are revenue growth, operating margin, future capital expenditure and growth expectations beyond the next three years. Budgets and business plans for the next three years are based on concrete commercial initiatives. Projections for the following years (up to seven years) are based on more general expectations and risks for the entity and assumptions about the market in which it operates. As the risk associated with cash flows is not included in the expected cash flows for newly acquired entities, the ex-pected future cash flows are discounted us-ing a WACC rate, cf. the description below.
Management believes that the purchase price accounted for in the consolidated financial statements reflects the best esti-
mate of the total fair value of the business and the fair value of the non-controlling interests, and hence the allocation of goodwill to controlling and non-controlling interests.
Trademarks The value of the trademarks acquired and their expected useful life are assessed based on the trademarks’ market position, expected long-term developments in the relevant markets and the trademarks’ prof-itability. The estimated value of acquired trademarks includes all future cash flows associated with the trademarks, including the value of customer relations etc. related to the trademarks. For most entities ac-quired there is a close relationship between trademarks and sales. Consumer demand for beer and other beverages drives sales, and therefore the value of a trademark is closely linked to consumer demand, while there is no separate value attached to cus-tomers (shops, bars etc.) as their choice of products is driven by consumer demand.
Management determines the useful life for each trademark based on its relative local, regional and global market strength, market share and the current and planned marketing efforts which are helping to maintain and increase the value of the trademark. When the value of a well-
SectiOn 5.1 Acquisitions, associates and joint ventures

118Carlsberg Group Annual Report 2014 Financial Statements
established trademark is expected to be maintained for an indefinite period in the relevant markets, and these markets are expected to be profitable for a long period, the useful life of the trademark is deter-mined to be indefinite.
The Chongqing and Shancheng trademarks were recognised as trademarks with indefi-nite useful life in the purchase price alloca-tion for Chongqing Brewery Group.
For each trademark or group of trade-marks, measurement is based on the relief from royalty method under which the value is calculated based on expected future cash flows for the trademarks on the basis of key assumptions about expected useful life, royalty rate and growth rate and a theoretically calculated tax effect. A post-tax discount rate is used which reflects the risk-free interest rate with the addition of a risk premium associated with the particular trademark. The model and assumptions applied are consistent with those used in impairment testing and described in further detail in section 2.3.3.
Customer agreements and portfolios In business combinations, the value of acquired customer agreements and customer portfolios is assessed based on the local market and trading conditions.
The relationship between trademarks and customers is carefully considered so that trademarks and customer agreements are not both recognised on the basis of the same underlying cash flows. Usually there is a particularly close relationship between trademarks and sales. In these cases, no separate value for customer relations is recognised as the relations are closely associated with the value of the acquired trademarks. No customer relationships were recognised in the purchase price allocation for Chongqing Brewery Group.
Fair value of property, plant and equipment In business combinations, the fair value of land and buildings, and standard pro-duction and office equipment is based, as far as possible, on the fair value of assets of similar type and condition that may be bought and sold in the open market.
Property, plant and equipment for which there is no reliable evidence of the fair value in the market (in particular breweries, including production equipment) are valued using the depreciated replace-ment cost method.
This method is based on the replacement cost of a similar asset with similar function-ality and capacity. The calculated replace-ment cost for each asset is then reduced
to reflect functional and physical obsoles-cence. The expected synergies and the user-specific intentions for the expected use of assets are not included in the deter-mination of the fair value.
The fair value and expected useful life of brewery equipment and related buildings in the acquisitions of Chongqing Brewery Group and Hanoi-Vung Tau Beer have been estimated with assistance from leading external engineering experts in the brewery industry.
Assessment of control The classification of entities where Carls-berg does not control 100% of the voting rights is based on an assessment of the contractual and operational relationship be-tween the parties. This includes assessing the conditions in shareholder agreements, contracts etc. Consideration is also given to the extent to which each party can govern the financial and operating policies of the entity, how the operation of the entity is designed, and which party possesses the relevant know ledge and competences to operate the entity.
Another factor relevant to this assessment is the extent to which each of the parties can direct the activities and affect the returns, e.g. through casting vote, rights or exclusive reserved matters. In addi-
tion, it is considered how the operation of the entity is designed and who actually possesses the relevant knowledge and competences to operate the entity.
SectiOn 5.1 Acquisitions, associates and joint ventures
5.1 SiGniFiCAnt ACCountinG eStiMAteS AnD juDGeMentS (ContinueD)

119Carlsberg Group Annual Report 2014 Financial Statements
5.1 ACCountinG poliCieS
For acquisitions of new subsidiaries, associates and joint ventures, the acquisition method is used. The acquired entities’ identifiable assets, liabilities and contingent liabilities are measured at fair value at the acquisition date. Identifi-able intangible assets are recognised if they are separable or arise from a contractual right. Deferred tax on revaluations is recognised.
The acquisition date is the date when the Carlsberg Group effectively obtains control of an acquired subsidiary or significant influence over an associate or joint venture.
The cost of a business combination comprises the fair value of the consideration agreed upon. When a business combination agreement provides for an adjustment to the cost of the combination contingent on future events, the fair value of that adjustment is included in the cost of the combination.
Goodwill and fair value adjustments in connec-tion with the acquisition of a foreign entity with a functional currency other than the presenta-tion currency used in the Carlsberg Group are treated as assets and liabilities belonging to the foreign entity and translated into the foreign entity’s functional currency at the exchange rate at the transaction date.
If uncertainties regarding measurement of acquired identifiable assets, liabilities and con-tingent liabilities exist at the acquisition date, initial recognition will take place on the basis of preliminary fair values. If identifiable assets, liabilities and contingent liabilities are sub-sequently determined to have a different fair value at the acquisition date from that first as-sumed, goodwill is adjusted up until 12 months after the acquisition. The effect of the adjust-ments is recognised in the opening balance of equity and the comparative figures are restated accordingly.
Changes in estimates of contingent purchase considerations, except in cases of material error, are recognised in the income statement under special items. Changes in estimates of contingent purchase considerations in busi-ness combinations completed no later than 31 December 2009 are recognised as an adjust-ment to goodwill.
Step acquisitions In a business combination achieved in stages (step acquisition), the shareholding held immediately before the step acquisition is remeasured at fair value at the acquisition date. The resulting gain or loss is recognised in the income statement under special items. The total fair value of the shareholding held immediately after the step acquisition is esti-mated and recognised as the cost of the total shareholding in the entity.
Non-controlling interests in a business combination In each business combination, management decides whether or not to recognise goodwill related to non-controlling interests. If such goodwill is recognised, it is estimated based on the fair value of the non-controlling interests less the non-controlling interests’ share of the fair value of acquired assets, liabilities and contingent liabilities.
SectiOn 5.1 Acquisitions, associates and joint ventures
In 2014, Carlsberg gained control of various entities, cf. section 5.1, which impacted the income statement by the following amounts:
DKK million 2014 2013
Operating profit before special items -12 -93
Net profit for the year -21 -163
Net profit for the year had the acquisition been completed 1 January -144 48
impact from acquisitions
SectiOn 5.2
The cash flow from acquisition of entities comprises the cash consideration paid net of cash and cash equivalents acquired with the entities.
DKK million
2014
Chongqing Beer
Group Assets Management Other Total
Cash 1,742 97 1,839
Cash and cash equivalents acquired -137 -21 -158
Total cash con-sideration paid 1,605 76 1,681
2013
Chongqing Brewery
Group Other TotalCash 2,646 143 2,789
Cash and cash equivalents acquired -470 -5 -475
Total cash con-sideration paid 2,176 138 2,314
eleMentS OF caSH cOnSiDeRatiOn PaiD
cash flow effect from acquisitions
SectiOn 5.3

120Carlsberg Group Annual Report 2014 Financial Statements
DKK million Other entities1
2014
Attributable to shareholders in
Carlsberg A/S
Attributable to non-controlling
interests
Consideration paid for acquisition of non-controlling interests -250 -
Utilisation of liability recognised in previous periods to acquire non-controlling interests 43 -
Proportionate share of equity acquired from non-controlling interests 58 -58
Fair value adjustment of contingent consideration -35 8
Recognised in equity -184 -502013 -332 -224
1 Comprises acquisitions of shareholdings in
2014: Carlsberg South Asia Pte Ltd, South-East Asia Brewery Ltd., JSC Aldaris, PJSC Carlsberg Ukraine, Luen Heng F&B Sdn BHD, Solo AS and Carlsberg Serbia d.o.o.
2013: Carlsberg South Asia Pte Ltd, Lao Brewery Co. Ltd., JSC Aldaris, PJSC Carlsberg Ukraine, Luen Heng F&B Sdn BHD and Myanmar Carlsberg Co. Ltd.
5.4 ACCountinG poliCieS
On acquisition of non-controlling inter-ests (i.e. subsequent to the Carlsberg Group obtaining control), acquired net assets are not remeasured at fair value. The difference between the cost and the non-controlling interests’ share of the total carrying amount, including goodwill, is transferred from the non-controlling interests’ share of equity to equity attrib-utable to shareholders in Carlsberg A/S. The amount deducted cannot exceed the non-controlling interests’ share of equity immediately before the transaction.
On disposal of shareholdings to non-con-trolling interests, the difference between the sales price and the share of the total carrying amount, including goodwill acquired by the non-controlling interests, is transferred from equity attributable to shareholders in Carlsberg A/S to the non-controlling interests’ share of equity.
Fair value adjustment of put options writ-ten on non-controlling interests on or after 1 January 2010 is recognised directly in the statement of changes in equity. Fair value adjustment of put options written no later than 31 December 2009 is recog-nised in goodwill.
DKK million 2014 2013
Chongqing Brewery Group 28 -2
Carlsberg Malaysia Group 186 165
Asia, other 300 297
Other regions 10 18
Total 524 478
nOn-cOntROlling inteReStS’ SHaRe OF PROFit FOR tHe YeaR tRanSactiOnS witH nOn-cOntROlling inteReStS
The Group has entities, primarily in Asia, which are not fully owned. The share of the consolidated profit attributable to the non-controlling interests is shown below.
Contingent considerationFair value of contingent consideration is estimated using generally accepted valuation methods, including discounted cash flows and EBITDA multiples, in ac-cordance with the agreements made with non-controlling interests. Estimates are based on updated information since initial recognition of the contingent consideration including new budgets and sales forecasts, discount rates etc.
non-controlling interests
SectiOn 5.4
The total fair value adjustment recognised in 2014 amounted to DKK 42m (2013: DKK 131m). Of this, the fair value adjustment of contingent consideration for acquisitions
completed before 1 January 2010 amounted to DKK 15m (2013: DKK -6m), which was recognised as an adjustment to goodwill.

121Carlsberg Group Annual Report 2014 Financial Statements
The Group gained control of Chongqing Brewery Group in December 2013. The group was subsequently derecognised as an associate and fully consolidated as a subsidiary. Accordingly, the 2013 profit after tax in associates and joint ventures includes 11 months’ activity for Chongqing Brewery Group.
Section 5.1 contains a more detailed de-scription of the acquisition and purchase price allocation for this transaction.
For associates in which the Group holds an ownership interest of less than 20%, the Group participates in the management of the company and is therefore exercising significant influence.
The Group also has minor investments in entities in which the Group is unable to exercise significant influence.
None of the associates and joint ventures are material to the Group.
Contingent liabilities The Group did not issue any guarantees for loans etc. raised by associates and joint ventures (non-consolidated share of loans) in 2014 (2013: DKK 71m).
5.5 ACCountinG poliCieS
The proportionate share of the results of as-sociates and joint ventures after tax is recog-nised in the consolidated income statement after elimination of the proportionate share of unrealised intra-Group profits/losses.
Investments in associates and joint ventures are recognised according to the equity method and measured at the proportion-ate share of the entities’ net asset values calculated in accordance with the Group’s accounting policies. The proportionate share of unrealised intra-Group profits and the carrying amount of goodwill are added, whereas the proportionate share of unreal-ised intra-Group losses is deducted.
Investments in associates and joint ventures with negative net asset values are meas-ured at DKK 0. If the Group has a legal or constructive obligation to cover a deficit in the associate or joint venture, the deficit is recognised under provisions. Any amounts owed by associates and joint ventures are written down to the extent that the amount owed is deemed irrecoverable.
On acquisition of investments in associates and joint ventures, the acquisition method is used, cf. section 5.1.
DKK million Carlsberg Group share
2014
Profit from continuing operations
Other comprehensive
income
Total comprehensive
income
Interests in associates and joint ventures
Associates 274 -3 271 3,285
Joint ventures 134 - 134 992
408 -3 405 4,277
2013Associates 203 2 205 2,972
Joint ventures 167 - 167 799
370 2 372 3,771
KeY FigUReS FOR aSSOciateS anD JOint ventUReS
FaiR valUe OF inveStMent in liSteD aSSOciateS anD JOint ventUReS
DKK million 2014 2013The Lion Brewery Ceylon, Biyagama, Sri Lanka 614 294
Total 614 294
associates and joint ventures
SectiOn 5.5

122Carlsberg Group Annual Report 2014 Financial Statements
KeY DevelOPMentS 2014
corporation taxSectiOn 6.1
2014 2013% DKK million % DKK million
Nominal weighted tax rate for the Carlsberg Group 23.8% 1,590 21.0% 1,632
Change in tax rate 0.0% 2 -1.4% -108
Adjustments to tax for previous years 0.7% 52 -0.2% -16
Non-capitalised tax assets, net movements -1.7% -116 2.1% 160
Non-taxable income -0.4% -27 -0.6% -47
Non-deductible expenses 3.4% 230 3.0% 230
Tax incentives etc. -0.6% -43 -0.6% -45
Special items 0.2% 14 -0.4% -30
Withholding taxes 2.1% 141 1.4% 106
Other and tax in associates and joint ventures -1.4% -95 -0.7% -49
Effective tax rate for the year 26.1% 1,748 23.6% 1,833
RecOnciliatiOn OF tHe eFFective taX Rate FOR tHe YeaR
The nominal weighted tax rate for the Group is calculated as domestic tax rates applicable to profits in the entities as a proportion of each entity’s share of the Group’s profit before tax. 1,748m
Tax totalled DKK 1,748m, against DKK 1,833m in 2013.
tax rate of 26.1%
Tax rate of 26.1%, negatively impacted by the increased nom-inal weighted tax rate due to lower earnings in Russia, which has a lower-than-average tax rate.
SectiOn 6tax

123Carlsberg Group Annual Report 2014 Financial Statements
6.1 ACCountinG poliCieS
Tax for the year comprises current tax and changes in deferred tax for the year, including changes as a result of a change in the tax rate. The tax expense relating to the profit/loss for the year is recognised in the income statement, and the tax expense relating to items recognised in other comprehensive income is recognised directly in equity.
If the Group obtains a tax deduction on computation of the taxable income in Denmark or in foreign jurisdictions as a result of share-based payment programmes, the tax effect of the programmes is recognised in tax on the profit/loss for the year. However, if the total tax deduction exceeds the total tax expense, the tax benefit for the excess deduction is recognised directly in equity.
taX RecOgniSeD in OtHeR cOMPReHenSive incOMe
2014 2013
DKK millionRecognised
item before taxTax income/
expense After taxRecognised
item before taxTax income/
expense After taxForeign exchange adjustments -16,938 - -16,938 -7,499 - -7,499
Hedging instruments 151 4 155 10 -8 2
Retirement benefit obligations -1,208 -118 -1,326 824 -195 629
Share of other comprehensive income in associates and joint ventures -3 - -3 2 - 2
Effect of hyperinflation - - - 61 - 61
Other 3 4 7 -29 - -29
Total -17,995 -110 -18,105 -6,631 -203 -6,834
cORPORatiOn taX
2014 2013
DKK millionIncome
statement
Other comprehensive
income
Total comprehensive
incomeIncome
statement
Other comprehensive
income
Total comprehensive
incomeTax for the year can be specified as followsCurrent tax 2,250 -6 2,244 2,200 15 2,215
Change in deferred tax during the year -556 132 -424 -243 188 -55
Change in deferred tax from change in tax rate 2 - 2 -108 - -108
Prior-year adjustments 52 -16 36 -16 - -16
Total 1,748 110 1,858 1,833 203 2,036
SectiOn 6.1 Corporation tax
Fair value adjustments of hedging instru-ments arise in Denmark, but it is not pos-sible to deduct all fair value adjustments due to local thin capitalisation rules. Tax on such adjustments therefore fluctuates from year to year.
The tax effect regarding retirement benefit obligations in other comprehensive income has been materially impacted by an increase in the valuation allowance on net tax assets.
Prior-year adjustments of DKK 16m (2013: DKK 0m) are included in the tax income/ expense for hedging instruments.

124Carlsberg Group Annual Report 2014 Financial Statements
DKK million 2014 2013Deferred tax at 1 January, net 8,085 8,512
Changes in accounting policies - 19
Restated deferred tax at 1 January, net 8,085 8,531
Adjustments to previous years 48 -2
Acquisition of entities - 377
Recognised in other comprehensive income 132 188
Recognised in the income statement -556 -243
Change in tax rate 2 -108
Foreign exchange adjustments -2,036 -658
Deferred tax at 31 December, net 5,675 8,085
Specified as followsDeferred tax liabilities 7,105 9,215
Deferred tax assets -1,430 -1,130
Deferred tax at 31 December, net 5,675 8,085
DeFeRReD taX aSSetS anD DeFeRReD taX liaBilitieS SPeciFicatiOn OF DeFeRReD taX aSSetS anD liaBilitieS
Deferred tax assets Deferred tax liabilities
DKK million 2014 2013 2014 2013Intangible assets 624 735 6,018 7,709
Property, plant and equipment 484 397 2,002 2,502
Current assets 155 160 34 45
Provisions and retirement benefit obligations 628 686 73 71
Fair value adjustments 23 29 53 165
Tax losses etc. 1,403 1,414 812 1,014
Total before set-off 3,317 3,421 8,992 11,506Set-off -1,887 -2,291 -1,887 -2,291
Deferred tax assets and liabilities at 31 December 1,430 1,130 7,105 9,215
Expected to be used as follows
Within 12 months after the end of the reporting period 304 303 402 558
More than 12 months after the end of the reporting period 1,126 827 6,703 8,657
Total 1,430 1,130 7,105 9,215
Deferred taxSectiOn 6.2
Of the total deferred tax assets recognised, DKK 711m (2013: DKK 728m) relates to tax loss carryforwards, the utilisation of which depends on future positive taxable income exceeding the realised deferred tax liabilities. It is management’s opinion that the tax loss carryforwards can be utilised.
Tax assets not recognised, DKK 1,437m (2013: DKK 1,489m), primarily related to tax losses which are not expected to be utilised in the foreseeable future. Tax losses that will not expire amounted to DKK 1,013m (2013: DKK 1,102m).
Deferred tax of DKK 34m (2013: DKK 77m) was recognised in respect of earnings in enti-ties in the Eastern Europe region which are intended for distribution in the short term, as tax of 5% is payable on distributions. For other subsidiaries where distributable reserves are planned to be distributed, any distribution
of earnings will not trigger a significant tax liability based on current tax legislation.
Deferred tax on temporary differences relat-ing to investments in subsidiaries, associates and joint ventures amounted to DKK 0m (2013: DKK 0m).

125Carlsberg Group Annual Report 2014 Financial Statements
6.2 ACCountinG poliCieS
Current tax payable and receivable is recog-nised in the statement of financial position as tax computed on the taxable income for the year, adjusted for tax on the taxable income of prior years and for tax paid on account.
Deferred tax on all temporary differences be-tween the carrying amount and the tax base of assets and liabilities is measured using the balance sheet liability method. However, de-ferred tax is not recognised on temporary dif-ferences relating to goodwill which is not de-ductible for tax purposes or on office premises and other items where temporary differences, apart from business combinations, arise at the acquisition date without affecting either profit/loss for the year or taxable income. Where alternative tax rules can be applied to determine the tax base, deferred tax is meas-ured based on management’s planned use of the asset or settlement of the liability.
If specific dividend plans exist for subsidiaries, associates and joint ventures in countries levy-ing withholding tax on distributions, deferred tax is recognised on expected dividend payments.
Deferred tax assets, including the tax base of tax loss carryforwards, are recognised under other non-current assets at the ex-pected value of their utilisation, either as a set-off against tax on future income or as a set-off against deferred tax liabilities in the same legal tax entity and jurisdiction.
Deferred tax assets and tax liabilities are offset if the entity has a legally enforceable right to offset current tax liabilities and tax assets or intends either to settle current tax liabilities and tax assets or to realise the as-sets and settle the liabilities simultaneously. Deferred tax assets are subject to annual impairment tests and are recognised only to the extent that it is probable that the assets will be utilised.
Adjustments are made to deferred tax result-ing from elimination of unrealised intra-Group profits and losses.
Deferred tax is measured according to the tax rules and at the tax rates applicable in the re-spective countries at the end of the reporting period and when the deferred tax is expected to crystallise as current tax. The change in deferred tax as a result of changes in tax rates is recognised in the income statement. Changes to deferred tax on items recognised in other comprehensive income are, however, recognised in other comprehensive income.
6.2 SiGniFiCAnt ACCountinG eStiMAteS AnD juDGeMentS
The Group recognises deferred tax as-sets, including the expected tax value of tax loss carryforwards, if manage-ment assesses that these tax assets can be offset against positive taxable income in the foreseeable future. This judgement is made annually and based on budgets and business plans for the coming years, including planned commercial initiatives.
SectiOn 6.2 Deferred tax

126Carlsberg Group Annual Report 2014 Financial Statements
Staff costsSectiOn 7.1
increase in defined benefit obligations
46,832
employees
Decrease in the average discount rate, leading to an increase in retirement benefit obligations for the largest plans in the Group.
Average number of employees increased by 8,127 as a result of acquisition of entities in Asia.
DKK million 2014 2013Salaries and other remuneration 8,051 7,942
Severance pay 341 124
Social security costs 1,355 1,325
Retirement benefit costs – defined contribution plans 263 158
Retirement benefit costs – defined benefit plans 215 247
Share-based payments 36 57
Other employee benefits 226 189
Total 10,487 10,042Average number of employees 46,832 38,705
Staff costs are included in the following items in the income statementCost of sales 2,821 2,698
Sales and distribution expenses 5,318 5,204
Administrative expenses 2,247 1,927
Other operating activities, net 70 62
Special items (restructurings) 31 151
Total 10,487 10,042
The average number of employees increased, driven by the acquisition of entities, primarily Chongqing Brewery Group in December 2013 and Chongqing Beer Group Assets Manage-ment in October 2014.
SectiOn 7Staff costs and remuneration
KeY DevelOPMentS 2014 StaFF cOStS
By region (%) By function (%)
Western Europe Eastern Europe Asia Other
Production Distribution Sales & Marketing Administration
2014
2013
12%
13%
19%
36%
29%
22%
38%
2014
2013
41
%
29%
3%
3%
25%
31%
31%
37
%
31
%

127Carlsberg Group Annual Report 2014 Financial Statements
Remuneration of the executive directors and key management personnel is based on a fixed salary, cash bonus payments and non-monetary benefits such as company car, telephone etc. Furthermore, share op-tion programmes and incentive schemes have been established for the executive directors and other management personnel. These programmes and schemes cover a number of years.
Employment contracts for the executive directors contain terms and conditions that are considered common to executive board members in Danish listed compa-nies, including terms of notice and non-competition clauses.
Executive directors
Key management personnel
Supervisory Board
Jørgen Buhl Rasmussen Jørn P. Jensen
DKK million 2014 2013 2014 2013 2014 2013 2014 2013Fixed salary 11.2 11.0 9.7 9.5 56.2 52.0 8.26 8.26
Cash bonus 3.5 4.7 3.1 4.1 27.7 21.1 - -
Non-monetary benefits 0.3 0.3 0.3 0.3 7.4 7.5 - -
Share-based payments 10.1 8.6 8.4 7.3 3.9 6.8 - -
Total 25.1 24.6 21.5 21.2 95.2 87.4 8.26 8.26
KEY MANAGEMENT PERSONNEL
Key management personnel comprise the Executive Committee and CEOs in the most significant Group entities. Other management personnel comprise Vice Presidents and other key employees in central functions as well as the manage-ment of significant subsidiaries. The key management personnel are, together with the executive directors, responsible for planning, directing and controlling of the Group’s activities.
7.2 ACCountinG poliCieS
Staff costs comprise wages and salaries, social security contributions, paid leave and sick leave, bonuses and other employee benefits and are recognised in the financial year in which the employee renders the related service. Further, the cost of share-based payments, which is expensed over the vesting period of the programme according to the service conditions, is recognised in staff costs and provisions or equity, depend-ing on how the programme is settled with the employees.
The remuneration policy which applies to the Supervisory Board, the executive directors and key management personnel is described in detail in the Remuneration section in the Management review.Management review, page 51
For 2015, the potential maximum bonus will remain at 100% of fixed salary, with a bonus equal to 60% of fixed salary payable for on-target performance. A scorecard of performance measures is used to assess performance, cf. Remuneration report, and the measures are the same as those ap-plied for 2014.
In respect of other benefits and bonus schemes, the remuneration of CEOs in foreign subsidiaries is based on local terms and conditions.
RemunerationSectiOn 7.2

128Carlsberg Group Annual Report 2014 Financial Statements
The Carlsberg Group has set up share-based incentive programmes to attract, retain and motivate the Group’s executive directors and other levels of management personnel and to align their interests with those of the shareholders. No share-based incentive pro-gramme has been set up for Carlsberg A/S’s Supervisory Board.
The current programmes are the share op-tion programme, the long-term incentive programme (performance shares) and the long-term incentive programme (PSUs). All programmes are equity-settled programmes.
The fair value at 31 December 2014 was DKK 206m (2013: DKK 363m).
Upon resignation, a proportion of the options may be exercised within one to three months unless special severance terms are agreed. Special terms and conditions apply in the case of retirement, illness, death or changes in Carlsberg A/S’s capital resources.
Share option programme
Long-term incentive programme
(performance shares)
Long-term incentive
programme (PSUs)
Carlsberg Group 2014 2013 2014 2013 2014 2013
Granted in the year 95,000 91,000 340,182 372,049 - -
Number of employees 2 2 333 336 - -
DKK million
Fair value at grant date 16 15 156 160 - -
Cost of share-based payments granted in the year recognised in the income statement 4 3 17 17 - -
Total cost of share-based payments granted 2011-2014 (2010-2013) 17 15 12 17 7 25
Not recognised in respect of share-based payments expected to vest 19 20 62 60 - 30
geneRal teRMS anD cOnDitiOnS FOR tHe tHRee PROgRaMMeS
Share-based payments SectiOn 7.3
7.3 SiGniFiCAnt ACCountinG eStiMAteS
For share options and PSUs granted or measured after 1 January 2010, the volatility is based on presently ob-served data on Bloomberg’s Options Valuation Function, while prior to 2010 it was based on the historical volatility of the price of Carlsberg A/S’s class B shares over the previous two years. For performance shares, the volatility is based on similar data over the previous three years.
The risk-free interest rate is the interest rate on Danish government bonds of the relevant maturity, while the dividend yield is calculated as the expected fu-ture dividends at the grant date of DKK 8.00-9.50 per share (2013: DKK 5.50 per share) divided by the share price. The fair value at 31 December 2014 has been calculated by applying an expected dividend of DKK 9.00 per share.
For share options, performance shares and PSUs granted or measured after 1 January 2010, the expected life is based on exercise at the end of the exercise period, while for share options granted prior to 2010, it was based on exercise in the middle of the exercise period.

129Carlsberg Group Annual Report 2014 Financial Statements
SHaRe OPtiOn PROgRaMMelOng-teRM incentive PROgRaMMe (PeRFORMance SHaReS)
lOng-teRM incentive PROgRaMMe (PSUS)
Years granted Every year since 2001 Every year since 2013 Only in 2012
Equity-settled scheme Each share option entitles the holder to purchase one class B share in Carlsberg A/S. The options may only be settled in shares. The Group has not purchased a significant number of treasury shares to meet this obligation. Treasury share holdings at 31 December 2014 totalled 18,452 shares (2013: 23,941 shares).
The long-term incentive programme is settled in performance shares. A participant in the programme will receive a number of Carlsberg B shares. For each grant, the exact number of shares granted is determined after publication of the Annual Report for the last year in the vesting period.
The long-term incentive programme is settled in performance share units (PSUs). A partici-pant in the programme will receive a number of PSUs, each giving the right to receive one Carlsberg B share. The exact number of PSUs granted is determined after publication of the Annual Report for the year in which the PSUs are granted.
Valuation The fair value of granted share options is esti-mated using the Black-Scholes call option-pricing model based on the exercise price.
The share price and the exercise price for share options are calculated as the average price of Carlsberg A/S’s class B shares on NASDAQ OMX Copenhagen during the first five trading days after publication of Carlsberg A/S’s Annual Report following the granting of the options.
Calculation of the number of performance shares is based on the estimated number of performance shares expected to vest. The final number of performance shares is the number that ultimately vest.
The fair value of performance shares is calculated at the grant date using a stochastic valuation model.
The value of PSUs is calculated using the same method as for the share option pro-gramme, although not until after publication of the Annual Report in the year following the grant year.
The value of the remuneration received under the long-term incentive programme is calcu-lated as a predetermined percentage of the employee’s yearly salary. Based on the Group’s performance in 2012, this percentage was ad-justed to 124% of the predetermined percent-age in accordance with the programme rules.
Time of valuation of option Immediately after publication of the Annual Report for the Group for the prior reporting period.
Immediately after publication of the Annual Report for the Group for the prior reporting period.
Immediately after publication of the Annual Report for the Group for the grant year.
Vesting conditions 3 years of service. 3 years of service and achievement of 4 KPIsin the vesting period.
3 years of service and the Group’s financial performance for the grant year.
Earliest time of exercise 3 years from grant date. - -
Latest time of exercise 8 years from grant date. Shares are transferred to the employee immediatelyafter they have vested.
Shares are transferred to the employee immediately after the PSUs have vested in February 2015.
SectiOn 7.3 Share-based payments

130Carlsberg Group Annual Report 2014 Financial Statements
Exercise price Number
Fixed, weighted
averageExecutive directors
Key management
personnel
Other management
personnelResigned
employees Total
Share option programmeShare options outstanding at 31 December 2012 413.37 420,604 76,756 349,609 266,423 1,113,392Granted 573.50 91,000 - - - 91,000
Forfeited/expired 305.22 - - -2,550 - -2,550
Exercised 363.20 -12,388 -19,648 -145,129 -89,063 -266,228
Transferred 342.73 - - -7,417 7,417 -
Share options outstanding at 31 December 2013 443.93 499,216 57,108 194,513 184,777 935,614Granted 583.10 95,000 - - - 95,000
Forfeited/expired 428.63 - - -7,034 -2,787 -9,821
Exercised 387.05 -12,388 -6,858 -20,505 -51,105 -90,856
Transferred 438.52 - - -33,694 33,694 -
Share options outstanding at 31 December 2014 463.87 581,828 50,250 133,280 164,579 929,937
Long-term incentive programme (performance shares)Performance shares outstanding at 31 December 2012 - - - - -Granted 45,135 52,535 274,379 - 372,049
Forfeited/expired/adjusted -23,695 -30,167 -140,823 -485 -195,170
Transferred - - -924 924 -
Performance shares outstanding at 31 December 2013 21,440 22,368 132,632 439 176,879Granted 40,925 43,470 255,787 - 340,182
Forfeited/expired/adjusted -53,756 -62,992 -331,558 -3,851 -452,157
Exercised - - - -938 -938
Transferred - 4,858 -10,226 5,368 -
Performance shares outstanding at 31 December 2014 8,609 7,704 46,635 1,018 63,966
Long-term incentive programme (PSU)Performance share units outstanding at 31 December 2012 - 24,595 168,830 9,530 202,955Forfeited/expired/adjusted - 3,278 19,061 -6,786 15,553
Transferred - -3,614 -11,955 15,569 -
Performance share units outstanding at 31 December 2013 - 24,259 175,936 18,313 218,508Forfeited/expired/adjusted - -4,770 -29,284 -13,272 -47,326
Exercised - - - -695 -695
Transferred - -2,034 -6,340 8,374 -
Performance share units outstanding at 31 December 2014 - 17,455 140,312 12,720 170,487
SHaRe-BaSeD incentive PROgRaMMeSSectiOn 7.3 Share-based payments
170,487 PSUs are expected to vest in Febru-ary 2015. Immediately after vesting, they will be converted to Carlsberg B shares and transferred to the employees.
The granted number of performance shares included in the specification is the number of performance shares that are expected to vest. The estimated number is revised on a regular basis until vesting. Transferred performance shares and PSUs comprise performance shares and PSUs that have been granted to employees who have either moved between management categories or left the Group during the year. Adjusted performance shares and PSUs comprise the change in the number of performance shares and PSUs expected to vest based on an as-sessment of the extent to which the vesting conditions are expected to be met.

131Carlsberg Group Annual Report 2014 Financial Statements
SectiOn 7.3 Share-based payments
Share options Performance shares Performance share units
2014 2013 2014 2013 2014 2013
Average share price at the exercise date for share options exercised in the year 567 583 - - - -
Weighted average contractual life for awards outstanding at 31 December 3.3 3.8 1.7 2.4 0.2 1.2
Range of exercise prices for share options outstanding at 31 December 203.50-583.10 203.50-573.50 - - - -
Exercisable outstanding share options at 31 December 612,437 651,914 None None None None
Weighted average exercise price for share options exercisable at 31 December 433 414 - - - -
AssumptionsExercise price 583.10 573.50 None None No grant No grant
Expected volatility 28% 27% 28% 28% - -
Risk-free interest rate 1.9% 1.5% 0.2% 0.2% - -
Expected dividend yield 1.7% 1.0% 1.6% 1.1% - -
Expected life of options, years 8.0 8.0 3.0 3.0 - -
Fair value at measurement date 167.39 167.98 459.44 429.92 - -
KeY inFORMatiOn
7.3 ACCountinG poliCieS
The fair value of equity-settled programmes is measured at the grant date and recog-nised in the income statement under staff costs, net, over the vesting period with a corresponding increase in equity.
The fair value of granted share options and PSUs is estimated using the Black-Scholes call option-pricing model, taking into ac-count the terms and conditions upon which the options were granted.
The fair value of granted performance shares is estimated using a stochastic (quasi-Monte Carlo) valuation model and a Black-Scholes call option-pricing model, taking into account the terms and condi-tions upon which the performance shares were granted.
On initial recognition of share options, PSUs and performance shares, an estimate is made of the number of awards expected to vest.
The estimated number is subsequently re-vised for changes in the number of awards expected to vest. Accordingly, recognition is based on the number of awards that ultimately vested.

132Carlsberg Group Annual Report 2014 Financial Statements
Retirement benefit obligations and similar obligations
SectiOn 7.4
Group assumes the risk associated with future developments in interest rates, inflation, mortality and disability etc.
The majority of the obligations are fund-ed, with assets placed in independent pension funds in e.g. Switzerland, the UK and Hong Kong.
2014 2013
DKK millionPresent value of obligation
Fair value of plan assets
Obligation, net
Present value of obligation
Fair value of plan assets
Obligation, net
Obligation at 1 January 11,135 7,843 3,292 11,605 7,648 3,957
Changes in accounting policies - - - -29 -33 4
Restated obligation at 1 January 11,135 7,843 3,292 11,576 7,615 3,961
Recognised in the income statementCurrent service cost 252 - 252 221 - 221
Interest cost 371 - 371 332 - 332
Expected return on plan assets - 245 -245 - 217 -217
Curtailments and settlements -37 - -37 26 - 26
Total 586 245 341 579 217 362
RemeasurementsGain/loss from changes in actuarial assumptions 75 -2 77 31 -2 33
Gain/loss from changes in financial assumptions 1,530 399 1,131 -510 347 -857
Total 1,605 397 1,208 -479 345 -824
Other changesContributions to plans - 262 -262 6 252 -246
Benefits paid -509 -402 -107 -477 -399 -78
Acquisition of entities - - - 199 - 199
Disposals and transfers -331 -327 -4 - 2 -2
Foreign exchange adjustments etc. 396 284 112 -269 -189 -80
Obligation at 31 December 12,882 8,302 4,580 11,135 7,843 3,292
OBligatiOn, net
The total return on plan assets for the year amounted to DKK 642m (2013: DKK 562m).
In some countries, primarily Germany, Sweden and Italy, the obligation is unfunded. For these unfunded plans, the retirement benefit obliga-tions amounted to DKK 1,896m (2013: DKK 1,536m) or approximately 15% (2013: 14%) of the total gross liability.
The Group’s obligation, net, is specified below.
A number of the Group’s employees are covered by retirement benefit plans. The nature of the retirement benefit plans varies depending on labour market condi-tions, legal requirements, tax legislation and economic conditions in the individual countries. Benefits are generally based on wages and salaries and length of employ-ment. Retirement benefit obligations cover both present and future retirees’ entitle-ment to retirement benefits.
The future retirement obligation is primarily based on seniority and salary at the point of retirement.
Defined contribution plansApproximately 55% (2013: approximately 40%) of the Group’s retirement benefit costs relate to defined contribution plans, which limit the Group’s obligation to the contributions paid. The retirement benefit plans are funded by payments to funds that are independent of the Group.
Defined benefit plans The defined benefit plans typically guar-antee the employees covered a retirement benefit based on the salary at the time of retirement. For defined benefit plans, the

133Carlsberg Group Annual Report 2014 Financial Statements
2014 DKK million %Shares 3,101 37%
Bonds and other securities 3,125 38%
Real estate 1,772 21%
Cash and cash equivalents 304 4%
Total 8,302 100%
2013Shares 2,834 36%Bonds and other securities 3,485 45%
Real estate 1,192 15%
Cash and cash equivalents 332 4%
Total 7,843 100%
BReaKDOwn OF Plan aSSetS
%
2014 CHF UK EUR OthersWeighted
average
Discount rate 1.2% 3.5% 1.9-2.8% 1.0-16.0% 2.2%
Future salary increases 1.0% 2.6% 1.7-2.0% 0.0-16.0% 1.8%
2013Discount rate 2.1% 4.5% 2.4-4.0% 2.1-18.6% 3.1%
Future salary increases 1.0% 3.0% 1.0-3.0% 3.5-16.0% 2.0%
aSSUMPtiOnS aPPlieD
7.4.1 Significant assumptions applied
The UK represents 46% (2013: 42%), Switzerland 37% (2013: 39%) and the eurozone countries 10% (2013: 11%) of the gross obligation.
The two most significant plans in the Group are in Carlsberg UK and in the Swiss entities, including Feldschlösschen. The mortality ta-bles used in Carlsberg UK are S1PMA/S1PFA tables for post-retirement and AMC00/AFC00 for pre-retirement, both with CMI_2013 projections, while the Swiss entities use the BVG 2010-2014 (KJ) mortality table for valuation of their retirement obligations.
The main assumptions applied in calculating the defined benefit obligations can be sum-marised as follows:
SectiOn 7.4 Retirement benefit obligations and similar obligations 7.4 SiGniFiCAnt ACCountinG
eStiMAteS AnD juDGeMentS
When calculating the value of the Group’s defined benefit plans, a num-ber of significant actuarial assumptions are made, including discount rates, ex-pected return on plan assets, expected growth in wages and salaries, mortality and retirement benefits. The range and weighted average for these assump-tions are disclosed in the table.
The value of the Group’s defined ben-efit plans is based on valuations from external actuaries.
The actuarial assumptions underly-ing the calculations and valuations vary from country to country due to local economic conditions and labour market conditions.
The present value of the net obliga-tion is calculated using the expected long-term interest rate in each country, where available, based on long-term government bonds.
Mortality assumptions are based on the Group entity’s best estimate of the mortality of plan members during and after employment, and include expect-ed changes in mortality, for example using estimates of mortality improve-ments. Due to the broad range of enti-ties comprising the retirement benefit obligation, several different mortality tables are used to calculate the future retirement benefit obligation.
During 2014 the majority of the Norwegian defined benefit plan was transferred to an external pension fund.
The Group expects to contribute DKK 34m (2013: DKK 22m) to the plan assets in 2015.
Plan assets do not include shares in or properties used by Group companies.
The actuarial loss and foreign exchange ad-justment recognised in other comprehensive income amounted to DKK -1,320m (2013: DKK -904m). The accumulated amount
recognised at 31 December 2014 was DKK -3,692m (2013: DKK -2,372m), of which actuarial losses, net, totalled DKK 3,523m (2013: DKK 2,315m).

134Carlsberg Group Annual Report 2014 Financial Statements
7.4.2 Sensitivity analysis
The table above shows a sensitivity analysis of the total calculated retirement benefit obligation.
The sensitivity analysis is based on a change in one of the assumptions while all other assumptions remain constant. This is highly unlikely as a change in one assump-
tion will probably affect other assumptions as well. When calculating the obligation on the basis of a changed assumption, the same method has been applied as when calculating the pension liability recognised in the statement of financial position.
Expected maturity and durationRetirement benefit obligations are primar-ily expected to mature after five years. The non-discounted maturity is:
DKK million 2014 2013Reported pension obligation 12,882 11,135
Sensitivity relating to discount rateDiscount assumption +0.5% -1,002 -781
Discount assumption -0.5% 1,856 555
Sensitivity relating to increase in future salary
Future salary assumption +0.5% 779 180
Future salary assumption -0.5% -774 -251
Sensitivity relating to mortalityMortality assumption +1 year 291 154
Mortality assumption -1 year -820 -153
SenSitivitY analYSiS
SectiOn 7.4 Retirement benefit obligations and similar obligations
DKK million<1
year1-5
years>5
years Total
Pension benefits 378 1,764 23,523 25,665
MatURitY OF PenSiOn OBligatiOnS
The expected duration of the obligations at year-end 2014 was 23 years, comprising active employees at 25 years and retired employees at 17 years.
The duration is calculated using a weighted average of the duration compared to the benefit obligation.
7.4 ACCountinG poliCieS
A defined contribution plan is a post-employ-ment benefit plan under which the Group pays fixed contributions into a separate entity and will have no legal or constructive obliga-tion to pay further amounts. Contributions to defined contribution plans are recognised in the income statement in the period during which services are rendered by employees. Any contributions outstanding are recognised in the statement of financial position as other liabilities.
A defined benefit plan is a post-employment benefit plan other than a defined contribution plan. The Group’s net obligation in respect of defined benefit pension plans is calculated separately for each plan by estimating the amount of future benefits that employees have earned in return for their service in the current and previous years. The future benefits are discounted to determine the present value. The calculation is performed annually by a qualified actuary.
The present value is determined on the basis of assumptions about the future development in variables such as salary levels, interest rates, inflation and mortality. The actuarial present value less the fair value of any plan assets is recognised in the statement of financial position under retirement benefit obligations.
Pension costs for the year are recognised in the income statement based on actuarial esti-mates and financial expectations at the begin-ning of the year. Any difference between the
expected development in pension assets and liabilities and realised amounts at year-end are designated as actuarial gains or losses and recognised in other comprehensive income.
If changes in benefits relating to services ren-dered by employees in previous years result in changes in the actuarial present value, the changes are recognised as historical costs. Historical costs are recognised immediately, provided employees have already earned the changed benefits. If employees have not earned the benefits, the historical costs are recognised in the income statement over the period in which the changed benefits are earned by the employees.
If a retirement benefit plan constitutes a net asset, the asset is only recognised if it offsets future refunds from the plan or will lead to reduced future payments to the plan.
Interest on retirement benefit obligations and the expected return on plan assets are recognised under financial income or financial expenses.
Realised gains and losses on the adjustment of retirement benefit obligations as a result of large-scale termination of jobs in connec-tion with restructurings are recognised in the income statement under special items.
Realised gains and losses on the curtailment or settlement of retirement benefit plans are recognised in the income statement under staff costs.

135Carlsberg Group Annual Report 2014 Financial Statements
eaRningS PeR SHaRe
nUMBeR OF SHaReS
PROFit attRiBUtaBle tO SHaReHOlDeRS
DKK 2014 2013Basic earnings per share of DKK 20 (EPS) 28.9 35.9
Diluted earnings per share of DKK 20 (EPS-D) 28.8 35.7
Earnings per share, adjusted (EPS-A) 36.0 37.8
The Supervisory Board proposes a dividend per share of DKK 9.00, an increase of 13% (2013: DKK 8.00).
Diluted earnings per share exclude 247,200 share options (2013: 152,200) which do not have a dilutive effect as the total of the ex-ercise price and the fair value of the options at the grant date is higher than the average market price of the Carlsberg B share in the year. These share options could potentially dilute earnings in the future.
earnings per shareSectiOn 8.1SectiOn 8
other disclosure requirements
9.00 13%The Supervisory Board proposes a dividend per share of DKK 9.00, equalling a payout ratio of 25% on adjusted net profit.
Dividend per share increased by 13%.
36.0Adjusted earnings per share decreased to DKK 36.0 due to lower operating profits only partly offset by lower financial items, net.
28.9Basic earnings per share decreased to DKK 28.9 in line with adjusted earnings per share and were also negatively impacted by higher special items, net.
KeY DevelOPMentS 2014
DKK million
Consolidated profit 4,938 5,949
Non-controlling interests -524 -478
Profit attributable to shareholders in Carlsberg A/S 4,414 5,471Special items after tax 1,082 301
Profit attributable to shareholders in Carlsberg A/S, adjusted 5,496 5,772
1,000 shares
Average number of shares 152,557 152,557
Average number of treasury shares -22 -9
Average number of shares outstanding 152,535 152,548
Average dilutive effect of outstanding share options 478 535
Diluted average number of shares outstanding 153,013 153,083

136Carlsberg Group Annual Report 2014 Financial Statements
Related parties exercising controlThe Parent Company, the Carlsberg Founda-tion, H.C. Andersens Boulevard 35, 1553 Copenhagen V, Denmark, holds 30.3% of the shares and 75.3% of the voting power in Carlsberg A/S, excluding treasury shares.
Apart from dividends and grants, no trans-actions were carried out with the Carlsberg Foundation during the year. Funding and grants received for research and develop-ment activities from the Carlsberg Foundation amounted to DKK 22m (2013: DKK 16m) for the operation of the Carlsberg Laboratory.
Related parties exercising significant influence Related parties exercising significant influ-ence comprise the Group’s Supervisory Board, Executive Board, key management personnel and close members of their fami-lies. Related parties also comprise compa-nies in which the persons referred to above have significant influence.
During the year the Group was not involved in any transactions with major shareholders, members of the Supervisory Board, mem-bers of the Executive Board, key manage-ment personnel or companies outside the
Carlsberg Group in which these parties have significant influence, except for remunera-tion to the Supervisory Board, Executive Board and key management personnel as disclosed in section 7.2.
Related parties also include the Group’s associates and joint ventures.
Associates and joint ventures
DKK million 2014 2013Revenue 234 215
Cost of sales -226 -339
Loans 194 212
Receivables 47 31
Trade payables and other liabilities etc. -13 -29
tHe incOMe StateMent anD tHe State-Ment OF Financial POSitiOn inclUDe tHe FOllOwing tRanSactiOnS
Related party disclosures
SectiOn 8.2
Assurance engagements include fees for assurances in relation to opinions issued to third parties and assurances in relation to bond issue. Tax advisory services mainly re-late to fees for assistance on Group restruc-turing projects and general tax consultancy.
Other services include fees for advice and services in relation to acquisition and dis-posal of entities, which includes accounting and tax advice and due diligence.
DKK million 2014 2013KPMGStatutory audit 24 26
Assurance engagements 1 -
Tax advisory 3 4
Other services 8 11
Fees to the auditors appointed by the Annual General Meeting are specified as follows.
Fees to auditorsSectiOn 8.3
In January 2015 the Group announced the closure of two breweries in Russia. The im-pairment losses relating to these closures have been recognised under special items in 2014, cf. section 3.1, while the related restructuring cost will be recognised when the obligations arise during 2015. The restructuring cost will be recognised under special items and therefore has no impact on adjusted net profit.
Apart from the events recognised or dis-closed in the consolidated financial state-ments, including the closures mentioned above, no events have occurred after the reporting period of importance to the con-solidated financial statements.
events after the reporting period
SectiOn 8.4

137Carlsberg Group Annual Report 2014 Financial Statements
KeY DevelOPMentS 2014 In preparing the Carlsberg Group’s con-solidated financial statements, manage-ment makes various accounting estimates, judgements and assumptions which form the basis of presentation, recognition and measurement of the Group’s assets and liabilities.
The judgements, estimates and assump-tions made are based on historical expe-rience and other factors which manage-ment assesses to be reliable, but which, by their very nature, are associated with uncertainty and unpredictability. These assumptions may prove incomplete or incorrect, and unexpected events or circumstances may arise.
The significant accounting estimates and judgements made and the accounting policies specific to the income statement, statement of financial position and state-ment of cash flows are presented in the explanatory notes in section 1-7.
Accounting policies for more general areas, including consolidation, financial instruments and segmentation, are presented on the fol-lowing pages.
change in consolidation method Changed consolidation method for investments in joint ventures as the Group has implemented IFRS 10-12, including amendments, and the amendments to IAS 27-28.
change in classification in the statement of cash flowsChanged classification of duties payable and amortisation of on-trade loans.
Significant accounting estimates
SectiOn 9.1SectiOn 9Basis for preparation
The most significant accounting es-timates and judgements performed relate to these areas:
Business combinations Section 5
Impairment testing Section 2
Useful life and residual value of intangible assets with finite useful life and property, plant and equipment Section 2
Restructurings Section 3
Provisions and contingencies Section 3
Receivables Section 1
Deferred tax assets Section 6
Retirement benefit obligations and similar obligations Section 7

138Carlsberg Group Annual Report 2014 Financial Statements
The 2014 consolidated financial statements of the Carlsberg Group have been prepared in accordance with International Financial Reporting Standards (IFRS) as adopted by the EU and Danish disclosure requirements for listed companies, cf. the statutory order pursuant to the Danish Financial State-ments Act.
The consolidated financial statements are presented in Danish kroner (DKK), which is the Parent Company’s functional currency.
The consolidated financial statements have been prepared on the historical cost basis except for the following assets and liabilities measured at fair value: derivative financial instruments, financial instruments in the trading portfolio and financial instruments classified as available-for-sale.
Non-current assets and disposal groups classified as held for sale are measured at the lower of the carrying amount before the changed classification and fair value less costs to sell.
Changed accounting policies and classification in the Annual Report 2014Apart from the implementation of IFRS 10 “Consolidated Financial Statements”, IFRS 11 “Joint Arrangements”, IFRS 12 “Disclo-sure of Interests in Other Entities”, all in-cluding amendments, and the amendments to IAS 27 “Separate Financial Statements” and IAS 28 “Investments in Associates and Joint Ventures”, the Annual Report has been prepared using the same accounting policies for recognition and measurement as those applied to the consolidated financial state-ments for 2013.
The implementation of IFRS 10-12 and the amendments to IAS 27-28 as of 1 January 2014 impacted the Group’s financials and segments, as entities which were previously proportionately consolidated are now ac-counted for using the equity method.
The consequences of the change in con-solidation method were assessed for each individual shareholding taking the changed guidance on assessment of control into con-sideration. The change primarily impacted the consolidation method for Unicer (Portu-gal) and Cambrew (Cambodia).
The effect of the change in accounting pol-icies was recognised in the opening balances at 1 January 2013 in accordance with the specific transition requirements in the stand-ards. Comparative figures for 2013 have been restated accordingly.
The changed consolidation method impact-ed all line items in the statement of finan-cial position and statement of cash flows due to deconsolidation of the previously proportionately consolidated share of the entities. The changes in accounting policies had no impact on the equity attributable to shareholders in Carlsberg A/S, whereas the equity attributable to non-controlling interests at 31 December 2013 decreased by DKK 13m.
The free cash flow at 31 December 2013 was reduced by DKK 96m, whereas cash flow from financing activities increased by DKK 49m.
The impact of the changed accounting pol-icies on the key financials for the Group for 2013 is specified in the tables. Reported figures for 2013 are stated as reported in the Annual Report for 2013 but adjusted for the completion of the purchase price alloca-
general accounting policies
SectiOn 9.2
DKK million2013
Reported2013
Restated
Net revenue 66,552 64,350 Cost of sales -33,622 -32,423
Gross profit 32,930 31,927
Sales and distribution expenses -18,717 -18,181
Administrative expenses -4,502 -4,415
Other operating activities, net 17 22
Share of profit after tax, associates and joint ventures 116 370
Operating profit before special items 9,844 9,723 Special items, net -466 -435
Financial income 721 717
Financial expenses -2,254 -2,223
Profit before tax 7,845 7,782 Corporation tax -1,894 -1,833
Consolidated profit 5,951 5,949
iMPact On tHe incOMe StateMent
DKK million2013
Reported2013
Restated
AssetsTotal non-current assets 133,393 132,924
Total current assets 20,061 19,384
Total assets 153,454 152,308
Equity and liabilities
Equity, shareholders in Carlsberg A/S 67,811 67,811
Non-controlling interests 3,203 3,190
Total equity 71,014 71,001 Total non-current liabilities 47,176 46,668
Total current liabilities 35,264 34,639
Total equity and liabilities 153,454 152,308
iMPact On tHe StateMent OF Financial POSitiOn

139Carlsberg Group Annual Report 2014 Financial Statements
ing to the allocation made for impairment testing of goodwill (CGUs) and trademarks already used in prior years. Comparative figures have been restated accordingly.
Furthermore, amendments to IAS 36 “Recoverable Amount Disclosures for Non-Financial Assets” and IAS 39 “Novation of Derivatives and Continuation of Hedge Ac-counting”, as well as IFRIC 21 “Levies”, have been implemented without impacting the financial reporting.
Additionally, the classification of duties pay-able and amortisation of on-trade loans in the statement of cash flows was changed as of 1 January 2014. Duties payable are now included in change in trade working capital, whereas in prior periods they were included in change in other working capital. Amorti-sation of on-trade loans is now included in change in on-trade loans, whereas in prior periods it was included in adjustment for non-cash items. Comparative figures have been restated accordingly.
The accounting policies set out below have been used consistently in respect of the financial year and the comparative figures.
Consolidated financial statementsThe consolidated financial statements comprise the Parent Company, Carlsberg A/S, and sub-sidiaries in which Carlsberg A/S has control, i.e. the power to govern the financial and operating policies. Control is obtained when Carlsberg A/S directly or indirectly owns or controls more than 50% of the voting rights in the subsidiary or has control in some other way.
Entities over which the Group exercises a significant influence, but which it does not
SectiOn 9.2 General accounting policies
DKK million2013
Reported2013
Restated
Operating profit before depreciation, amortisation and impairment losses 13,833 13,592
Cash flow from operating activities 9,083 8,142
Total operational investments -6,125 -5,385
Free operating cash flow 2,958 2,757
Cash flow from investing activities -8,857 -8,012
Free cash flow 226 130
Cash flow from financing activities -1,778 -1,729
Net cash flow -1,552 -1,599
iMPact On tHe StateMent OF caSH FlOwS
control, are considered associates. Signifi-cant influence is generally obtained by direct or indirect ownership or control of more than 20% but less than 50% of the voting rights. When assessing whether Carlsberg A/S exer-cises control or significant influence, poten-tial voting rights exercisable at the end of the reporting period are taken into account.
Entities which by agreement are managed jointly with one or more other parties are considered joint ventures. Associates and joint ventures are consolidated using the equity method, cf. section 5.
The consolidated financial statements have been prepared as a consolidation of the financial statements of the Parent Company and subsidiaries according to the Group’s accounting policies.
On consolidation, intra-Group income and expenses, shareholdings, intra-Group balances and dividends, and realised and unrealised gains on intra-Group transactions are eliminated. Unrealised gains on trans-actions with associates and joint ventures are eliminated in proportion to the Group’s ownership share of the entity. Unrealised losses are eliminated in the same way as unrealised gains to the extent that impair-ment has not taken place.
Investments in subsidiaries are set off against the proportionate share of the sub-sidiaries’ fair value of identifiable net assets, including recognised contingent liabilities, at the acquisition date.
The accounting items of subsidiaries are included in full in the consolidated financial statements. Non-controlling interests’ share
of the profit/loss for the year and of the eq-uity of subsidiaries is included in the Group’s profit/loss and equity respectively, but is disclosed separately.
Entities acquired or formed during the year are recognised in the consolidated financial statements from the date of acquisition or formation. Entities which are disposed of or wound up are recognised in the con-solidated income statement until the date of disposal or winding-up. The compara-tive figures are not restated for entities acquired, disposed of or wound up.
Defining materialitySignificant items are presented individually in the financial statements as required by IAS 1. Other items which may not be significant but have been considered relevant to stake-holders and the understanding of the Carls-berg business model, including research, real estate, geographical diversity etc., are also presented in the financial statements.
Foreign currency translation A functional currency is determined for each of the reporting entities in the Group. The functional currency is the primary currency used for the reporting entity’s operations. Transactions denominated in currencies other than the functional cur-rency are considered transactions denom-inated in foreign currencies.
On initial recognition, transactions denom-inated in foreign currencies are translated to the functional currency at the exchange rates at the transaction date. Foreign exchange differences arising between the exchange rates at the transaction date and at the date of payment are recognised in
tion for Chongqing Brewery Group. Restated figures for 2013 are stated as reported in the Annual Report for 2014.
In the segmentation of assets and calculation of invested capital, the goodwill and trade-mark related to Carlsberg A/S’s acquisition of the 40% non-controlling interest in Carlsberg Breweries A/S (in 2004) have been allocated to the beverage segments, while in prior years it was kept in the non-beverage seg-ment. The allocation is made to give the cor-rect basis and amount of invested capital for the calculation of ROIC, and is made accord-

140Carlsberg Group Annual Report 2014 Financial Statements
the income statement as financial income or financial expenses.
Receivables, payables and other monetary items denominated in foreign currencies are translated at the exchange rates at the end of the reporting period. The difference between the exchange rates at the end of the reporting period and at the date at which the receivable or payable arose or the exchange rate in the latest consolidated financial statements is recognised in the income statement as financial income or financial expenses.
On recognition in the consolidated financial statements of entities with a functional cur-rency other than the presentation currency of Carlsberg A/S (DKK), the income statement and statement of cash flows are translated at the exchange rates at the transaction date, and the statement of financial position items are translated at the exchange rates at the end of the reporting period. An average exchange rate for the month is used as the exchange rate at the transaction date to the extent that this does not significantly deviate from the exchange rate at the transaction date. Foreign exchange differences arising on translation of the opening balance of equity of foreign entities at the exchange rates at the end of the reporting period and on translation of the income statement from the exchange rates at the transaction date to the exchange rates at the end of the reporting period are recognised in other comprehen-
sive income and attributed to a separate translation reserve in equity.
Foreign exchange adjustment of balances with foreign entities which are consid-ered part of the investment in the entity is recognised in the consolidated financial statements in other comprehensive income if the balance is denominated in the func-tional currency of the Parent Company or the foreign entity. Correspondingly, foreign exchange gains and losses on the part of loans and derivative financial instruments which is designated as hedges of invest-ments in foreign entities with a functional currency other than that of Carlsberg A/S and which effectively hedges against corre-sponding foreign exchange gains and losses on the investment in the entity are also recognised in other comprehensive income and attributed to a separate translation reserve in equity.
On recognition in the consolidated financial statements of associates and joint ventures with a functional currency other than the presentation currency of Carlsberg A/S, the share of profit/loss and other comprehen-sive income for the year is translated at average exchange rates and the share of equity, including goodwill, is translated at the exchange rates at the end of the report-ing period. Foreign exchange differences arising on the translation of the share of the opening balance of equity of foreign as-sociates and joint ventures at the exchange
rates at the end of the reporting period, and on translation of the share of profit/loss and other comprehensive income for the year from average exchange rates to the exchange rates at the end of the reporting period, are recognised in other comprehen-sive income and attributed to a separate translation reserve in equity.
On complete or partial disposal of a foreign entity or on repayment of balances which constitute part of the net investment in the foreign entity, the share of the cumula-tive amount of the exchange differences recognised in other comprehensive income relating to that foreign entity is recognised in the income statement when the gain or loss on disposal is recognised.
Prior to translation of the financial state-ments of foreign entities in countries with hyperinflation, the financial statements are inflation-adjusted for changes in purchasing power in the local currency. Inflation ad-justment is based on relevant price indexes at the end of the reporting period.
HyperinflationThe financial statements of foreign entities whose functional currency is the currency of a hyperinflationary market are stated in terms of the measuring unit current at the end of the reporting period using a gen-eral price index. Non-monetary assets are restated to the current purchasing power at the reporting date from the value on
the date when they were first recognised in the financial statements.
The gain/loss is recognised in other comprehensive income. The gain/loss on the net monetary position is recognised as financial income or expenses in the income statement. Income statement items are restated from the value on the transaction date to the value on the reporting date except for items related to non-monetary assets, such as deprecia-tion and amortisation and consumption of inventories etc. Deferred tax is adjusted accordingly. The comparative figures for the Group are not restated in terms of the measuring unit current at the end of the reporting period.
Income statement and statement of financial position, general
Special items These items are shown separately in order to give a more true and fair view of the Group’s operating profit.
Presentation of discontinued operationsDiscontinued operations comprise activ-ities and cash flows that can be clearly distinguished from the other business areas and have either been disposed of or are held for sale. The sale is expected to be carried out within 12 months in accordance with a formal plan.
SectiOn 9.2 General accounting policies

141Carlsberg Group Annual Report 2014 Financial Statements
Discontinued operations also include enti-ties which are classified as held for sale in connection with an acquisition.
Discontinued operations are presented in a separate line in the income statement and as assets and liabilities held for sale in the statement of financial position, and main items are specified in the notes. Compara-tive figures are restated.
Statement of cash flowsThe statement of cash flows shows the cash flows from operating, investing and financing activities for the year, the year’s changes in cash and cash equivalents as well as cash and cash equivalents at the beginning and end of the year.
Cash flow from operating activities Cash flow from operating activities is calcu-lated using the indirect method as the operat-ing profit before special items adjusted for non-cash operating items, changes in working capital, restructuring costs paid, interest re-ceived and paid, and income tax paid.
Cash flow from investing activitiesCash flow from investing activities comprises payments in connection with acquisitions and disposals of entities and activities, and of intangible assets, property, plant and equipment and other non-current assets.
The cash flow effect of acquisitions and disposals of entities is shown separately
in cash flow from investing activities. Cash flow from acquisition of entities is recognised in the statement of cash flows from the acquisition date. Cash flow from disposal of entities is recognised up until the disposal date.
Acquisitions of assets by means of finance leases are treated as non-cash transac-tions.
Cash flow from financing activities Cash flow from financing activities com-prises changes in the size or composition of the share capital and related costs as well as the acquisition and disposal of non-controlling interests, raising of loans, repayment of interest-bearing debt, acqui-sition and disposal of treasury shares, and payment of dividends to shareholders.
Cash flow from assets held under finance leases is recognised as payment of inter-est and repayment of debt.
Cash and cash equivalentsCash and cash equivalents comprise cash, less bank overdrafts, and short-term marketable securities with a term of three months or less at the acquisition date which are subject to an insignificant risk of changes in value.
Cash flows in currencies other than the functional currency are translated using average exchange rates, unless these
deviate significantly from the exchange rates at the transaction date.
Segment informationFor segment reporting purposes, the Chief Operating Decision Maker is the Executive Committee. The Executive Committee manages and makes business decisions based on geographical regional information. Segments are managed and decisions are made based on business performance measured as operating profit before special items. Decisions on financ-ing and tax planning are made based on information for the Group as a whole and therefore not segmented. The non-bev-erage activities are managed separately and therefore also shown separately. The segmentation reflects the structure used for internal reporting and monitoring of the strategic and financial targets of the Carlsberg Group.
In accordance with the Group’s manage-ment structure, beverage activities are segmented according to the geographical regions where production takes place. The segment information is based on the Group’s accounting policies.
A segment’s operating profit/loss includes revenue, operating costs and share of profit/loss in associates and joint ventures to the extent that they can be allocated directly to the individual segment. Income and expenses related to Group functions
have not been allocated and, as is the case with eliminations and non-beverage activities, are not included in the operating profit/loss of the segments.
Total segment assets comprise non-cur-rent assets used directly in the operating activities of the segment, including intan-gible assets, property, plant and equip-ment, investments in associates and joint ventures, and current segment assets to the extent that they can be allocated directly to the individual segment, includ-ing inventories, trade receivables, other receivables and prepayments.
The geographical allocation is made on the basis of the selling entities’ domicile and comprises entities individually accounting for more than 10% of the Group’s consol-idated net revenue as well as the domicile country.
Financial ratiosEarnings per share (EPS) and diluted earn-ings per share (EPS-D) are calculated in accordance with IAS 33.
Other financial ratios are calculated in ac-cordance with the Danish Society of Finan-cial Analysts’ guidelines on the calculation of financial ratios, “Recommendations and Financial Ratios 2010”, unless specifically stated.
SectiOn 9.2 General accounting policies

142Carlsberg Group Annual Report 2014 Financial Statements
Cash flow from operating activities per share (CFPS)
Cash flow from operating activities divided by the number of shares outstanding, fully diluted for share options in the money in accordance with IAS 331.
Debt/operating profit be-fore depreciation, amorti-sation and impairment
Net interest-bearing debt2 divided by operating profit before special items adjusted for deprecia-tion, amortisation and impairment.
Earnings per share (EPS) Consolidated profit for the year, excluding non-controlling interests, divided by the aver-age number of shares outstanding.
Earnings per share, adjusted (EPS-A)
Consolidated profit for the year adjusted for special items after tax, excluding non-controlling interests, divided by the average number of shares outstanding.
Earnings per share, diluted (EPS-D)
Consolidated profit for the year, excluding non-controlling interests, divided by the average number of shares outstanding, fully diluted for share options in the money and the bonus element in a rights issue in accordance with IAS 331.
Equity ratio Equity attributable to shareholders in Carlsberg A/S at year-end as a percentage of total assets at year-end.
Financial gearing Net interest-bearing debt2 at year-end divided by total equity at year-end.
Free cash flow per share (FCFPS)
Free cash flow3 divided by average number of shares outstanding, fully diluted for share options in the money in accordance with IAS 331.
Interest cover Operating profit before special items divided by interest expenses, net.
Number of shares, average
Number of issued shares, excluding treasury shares, as an average for the year (= average number of shares outstanding).
Number of shares, year-end
Total number of issued shares, excluding treasury shares, at year-end (= number of shares outstanding at year-end).
Operating margin Operating profit before special items as a percentage of revenue.
Operating profit Expression used for operating profit before special items in the Management review.
Organic development
Measure of growth excluding the impact of acquisitions, divestitures and foreign exchange from year-on-year comparisons. We believe this provides investors with a better understanding of underlying trends.
Payout ratio Dividend for the year as a percentage of consol-idated profit, excluding non-controlling interests.
Pro rata volumes The Group’s sale of beverages in consolidated entities, and 100% of the sale of the Group’s international brands in associates and joint ventures and the proportionate share of the sale of local brands in these entities.
Return on invested capital, including goodwill (ROIC)
Operating profit before special items as a percentage of average invested capital4 calculated as a 12-month rolling average.
Return on invested capital, excluding goodwill (ROIC excl. goodwill)
Operating profit before special items as a percentage of average invested capital excluding goodwill4 calculated as a 12-month rolling average.
Volumes The Group’s total sale of beverages, including the total sales through associates and joint ventures.
1 The dilutive effect is calculated as the differ-ence between the number of shares that could be acquired at fair value for the proceeds from exercise of the share options and the number of shares that could be issued assuming that the options are exercised.
2 The calculation of net interest-bearing debt is specified in section 4.2.
3 The calculation of free cash flow is specified in the statement of cash flows.
4 The calculation of invested capital is specified in section 2.1.
calcUlatiOn OF tHe KeY FigUReS anD Financial RatiOS StateD in tHe annUal RePORt
SectiOn 9.2 General accounting policies

143Carlsberg Group Annual Report 2014 Financial Statements
New and amended IFRSs and Interpretations not yet applicable within the EUImprovements to IFRS 2010-2012 and 2011-2013 and amendments to IAS 19 are effective for financial years beginning on or after 1 July 2014. Amendments to IAS 19 “Defined Benefit Plans: Employee Contributions” clarify the requirements on how contributions from employees or third parties linked to service should be attributed to periods of service.
The Group will implement the improve-ments and amendments as of 1 January 2015.
Impact from changes in accounting policies for 2015The implementation of Amendments to IAS 19 “Defined Benefit Plans: Employee Contributions” and Improvements to IFRS 2010-2012 and 2011-2013 will not have any significant impact on the Group’s financials.
New and amended IFRSs and Interpretations not yet adopted by or applicable within the EUFurthermore, the following new or amend-ed IFRSs and Interpretations of relevance to the Carlsberg Group have been issued but not yet adopted by the EU:
• IFRS 9 “Financial Instruments”, effective for financial years beginning on or after 1 January 2018.
• IFRS 14 “Regulatory Deferral Accounts”, effective for financial years beginning on or after 1 January 2016.
• IFRS 15 “Revenue from Contracts with Customers”, effective for financial years beginning on or after 1 January 2017.
• Improvements to IFRS 2012-2014, effective for financial years beginning on or after 1 January 2016.
• Amendments to IFRS 10, IFRS 12 and IAS 28 “Investment Entities: Applying the Consolidation Exception”, effective for financial years beginning on or after 1 January 2016.
• Amendments to IFRS 10 and IAS 28 “Sale or Contribution of Assets between an Investor and its Associate or Joint Venture”, effective for financial years beginning on or after 1 January 2016.
• Amendments to IAS 1 “Disclosure Initia-tive”, effective for financial years begin-ning on or after 1 January 2016.
• Amendments to IAS 27 “Equity Method in Separate Financial Statements”, effective for financial years beginning on or after 1 January 2016.
• Amendments to IAS 16 and IAS 38 “Clarification of Acceptable Methods of Depreciation and Amortisation”, effective for financial years beginning on or after 1 January 2016.
• Amendments to IFRS 11 “Accounting for Acquisitions of Interests in Joint Operations”, effective for financial years beginning on or after 1 January 2016.
The new and amended Standards and Interpretations are not mandatory for the financial reporting for 2014. The Carlsberg Group expects to adopt the Standards and Interpretations when they become mandatory.
new legislationSectiOn 9.3

144Carlsberg Group Annual Report 2014 Financial Statements
SectiOn 10Group companies
Number of subsidiaries
Owner-ship
share1
Nominal share capital
(’000)Cur-
rencyCarlsberg Breweries A/S, Copenhagen, Denmark 11 £ 100% 501 DKK
Carlsberg Danmark A/S, Copenhagen, Denmark £ 100% 100,000 DKK
Carlsberg Supply Company Danmark A/S, Copenhagen, Denmark £ 100% 500 DKK
Pripps Ringnes AB, Stockholm, Sweden 1 £ 100% 287,457 SEK
Carlsberg Sverige AB, Stockholm, Sweden 2 £ 100% 70,000 SEK
Carlsberg Supply Company Sverige AB, Falkenberg, Sweden £ 100% 50 SEK
Ringnes Norge AS, Oslo, Norway 7 £ 100% 50,000 NOK
Ringnes AS, Oslo, Norway 2 £ 100% 210,366 NOK
Ringnes Supply Company AS, Oslo, Norway £ 100% 20,907 NOK
Oy Sinebrychoff Ab, Kerava, Finland £ 100% 1,000 EUR
Sinebrychoff Supply Company Oy, Kerava, Finland £ 100% 1,000 EUR
Carlsberg Deutschland GmbH, Hamburg, Germany 8 £ 100% 26,900 EUR
Carlsberg Supply Company Deutschland GmbH, Hamburg, Germany £ 100% 26,000 EUR
Nordic Getränke GmbH, Hamburg, Germany 8 £ 100% 5,000 EUR
Carlsberg Polska Sp. z o.o., Warsaw, Poland £ 100% 6,662 PLN
Carlsberg Supply Company Polska SA, Warsaw, Poland £ 100% 28,721 PLN
Saku Ölletehase AS, Tallinn, Estonia £ 100% 5,113 EUR
JSC Aldaris, Riga, Latvia £ 99% 7,500 LVL
UAB Svyturys-Utenos Alus, Utena, Lithuania £ 99% 118,000 LTL
Carlsberg UK Holdings Limited, Northampton, United Kingdom 1 £ 100% 180,004 GBP
Carlsberg UK Limited, Northampton, United Kingdom 4 £ 100% 2,100 GBP
Carlsberg Supply Company UK Limited, Northampton, United Kingdom £ 100% 128,146 GBP
Emeraude S.A.S., Strasbourg, France 6 £ 100% 206,022 EUR
Brasseries Kronenbourg S.A.S., Strasbourg, France 9 £ 100% 507,891 EUR
Feldschlösschen Getränke Holding AG, Rheinfelden, Switzerland 2 £ 100% 95,000 CHF
Feldschlösschen Getränke AG, Rheinfelden, Switzerland 1 £ 100% 36,200 CHF
Feldschlösschen Supply Company AG, Rheinfelden, Switzerland £ 100% 97,575 CHF
Carlsberg Italia S.p.A., Lainate, Italy 3 £ 100% 331,400 EUR
Unicer-Bebidas de Portugal, S.G.P.S., S.A., Leca do Balio, Portugal4 6 n 44% 50,000 EUR
Mythos Brewery SA, Thessaloniki, Greece 1 £ 100% 39,405 EUR
Carlsberg Serbia d.o.o., Celarevo, Serbia 2 £ 100% 2,998,273 RSD
Carlsberg Croatia d.o.o., Koprivnica, Croatia £ 100% 239,932 HRK
Carlsberg Bulgaria AD, Mladost, Bulgaria £ 100% 37,325 BGN
B to B Distribution EOOD, Mladost, Bulgaria £ 100% 10 BGN
Carlsberg Hungary Kft., Budaörs, Hungary £ 100% 25,700 HUF
CTDD Beer Imports Ltd., Montreal, Canada £ 100% 532 CAD
Carlsberg Canada Inc., Mississauga, Canada £ 100% 11,000 CAD
Nuuk Imeq A/S, Nuuk, Greenland4 n 32% 38,000 DKK
Western Europe Eastern Europe Asia
Our regions

145Carlsberg Group Annual Report 2014 Financial Statements
Number of subsidiaries
Owner-ship
share1
Nominal share capital
(’000)Cur-
rencyEastern EuropeBaltika Breweries, Saint Petersburg, Russia 4 £ 100% 156,087 RUB
Baltika Baku LLC, Baku, Azerbaijan £ 100% 26,849 AZN
Carlsberg Georgia LLC, Tblisi, Georgia4 £ 100% 1,173 GEL
PJSC Carlsberg Ukraine, Zaporizhzhya, Ukraine 1 £ 99% 1,022,433 UAH
OJSC Olivaria Brewery, Minsk, Belarus £ 68% 61,444,801 BYR
Carlsberg Kazakhstan, Almaty, Kazakhstan 1 £ 100% 5,362,774 KZT
UzCarlsberg LLC., Tashkent, Uzbekistan4 £ 100% 82,282,014 UZS
Baltic Beverages Holding AB, Stockholm, Sweden 4 £ 100% 12,000 EUR
AsiaCarlsberg Brewery Hong Kong Limited, Hong Kong, China 3 £ 100% 9,734,520 HKD
Carlsberg Brewery (Guangdong) Limited, Huizhou, China £ 99% 442,330 CNY
Kunming Huashi Brewery Company Limited, Kunming, China £ 100% 79,528 CNY
Xinjiang Wusu Beer Co., Ltd., Urumqi, China 10 £ 65% 105,480 CNY
Ningxia Xixia Jianiang Brewery Company Limited, Xixia, China £ 70% 194,351 CNY
Dali Beer Company Limited, Dali, China £ 100% 97,799 CNY
Chongqing Brewery Co., Ltd, Chongqing, China2,4 6 £ 60% 483,971 CNY
Chongqing Jianiang Brewery Ltd., Chongqing, China4 6 £ 79% 435,000 CNY
Chongqing Beer Group Assets Management Co. Ltd, Chongqing, China4 10 £ 100% 648,580 CNY Tibet Lhasa Brewery Company Limited, Lhasa, China n 50% 380,000 CNY
Lanzhou Huanghe Jianiang Brewery Co. Limited, Lanzhou, China n 50% 210,000 CNY
Qinghai Huanghe Jianiang Brewery Company Ltd., Xining, China n 50% 85,000 CNY Jiuquan West Brewery Company Limited, Jiuquan, China n 50% 36,000 CNY
Tianshiui Huanghe Jianiang Brewery Co. Ltd, Tianshui, China n 50% 58,220 CNY
Carlsberg Brewery Malaysia Berhad, Selangor Darul Ehsan, Malaysia2 £ 51% 300,000 MYR
Carlsberg Marketing Sdn BHD, Selangor Darul Ehsan, Malaysia £ 100% 10,000 MYR
Euro Distributors Sdn BHD, Selangor Darul Ehsan, Malaysia £ 100% 100 MYR
Luen Heng F&B Sdn BHD, Selangor Darul Ehsan, Malaysia £ 70% 5,000 MYR
Carlsberg Singapore Pte Ltd, Singapore £ 100% 1,000 SGD
Maybev Pte Ltd., Singapore £ 51% 2,512 SGD
Lion Brewery (Ceylon) PLC, Biyagama, Sri Lanka2,4 n 25% 850,000 LKR
Carlsberg Distributors Taiwan Limited, Taipei, Taiwan 1 n 50% 100,000 TWD
Caretech Ltd, Hong Kong, China4 n 50% 10,000 HKD
Cambrew Ltd, Phnom Penh, Cambodia4 1 n 50% 125,000 USD
Carlsberg Indochina Limited, Hanoi, Vietnam £ 100% 80,000,000 VND
South-East Asia Brewery Ltd., Hanoi, Vietnam £ 100% 212,705,000 VND
International Beverage Distributors Ltd., Hanoi, Vietnam £ 100% 15,622,000 VND
Number of subsidiaries
Owner-ship
share1
Nominal share capital
(’000)Cur-
rency
Hue Brewery Ltd., Hue, Vietnam £ 100% 216,788,000 VND
Hanoi-Vung Tau Beer Joint Stock Company, Vung Tàu, Vietnam £ 100% 540,000,000 VND
Hanoi Beer Alcohol and Beverage Joint-Stock Corp., Hanoi, Vietnam4 n 17% 2,318,000,000 VND
Lao Brewery Co. Ltd., Vientiane, Laos £ 61% 22,808,641 LAK
CB Distribution Co., Ltd., Bangkok, Thailand £ 100% 200,000 THB
Carlsberg India Private Limited, New Delhi, India 1 £ 100% 16,522,288 INR
Parag Breweries Limited, Kolkata, India £ 100% 1,074,354 INR
The Bottling and Brewing Group Limited, Blantyre, Malawi4 3 £ 59% 1,267,128 MWK
Brewery Invest Pte Ltd, Singapore £ 100% 3,200 SGD
South Asian Breweries Pte. Ltd., Singapore £ 67% 200,000 SGD
Carlsberg Asia Pte Ltd, Singapore 1 £ 100% 565,292 SGD
Paduak Holding Pte. Ltd., Singapore £ 100% 26,395 USD
Myanmar Carlsberg Co. Ltd, Yangon, Myanmar4 £ 51% 75 USD
Not allocatedDanish Malting Group A/S, Vordingborg, Denmark £ 100% 100,000 DKK
Danish Malting Group Polska Sp. z o.o., Sierpc, Poland £ 100% 20,000 PLN
Carlsberg Finans A/S, Copenhagen, Denmark £ 100% 8,308,000 DKK
Carlsberg International A/S, Copenhagen, Denmark £ 100% 1,100 DKK
Carlsberg Invest A/S, Copenhagen, Denmark 3 £ 100% 33,000 DKK
Carlsberg IT A/S, Copenhagen, Denmark £ 100% 50,000 DKK
Carlsberg Insurance A/S, Copenhagen, Denmark £ 100% 25,000 DKK
Carlsberg Shared Services Sp. z o.o., Poznan, Poland £ 100% 50 PLN
Carlsberg Supply Company AG, Ziegelbrücke, Switzerland £ 100% 50 CHF
Non-beverageEjendomsaktieselskabet Tuborg Nord C, Copenhagen, Denmark £ 100% 10,000 DKK
Ejendomsaktieselskabet af 4. marts 1982, Copenhagen, Denmark £ 100% 9,500 DKK
Carlsberg Ejendomme Holding A/S, Copenhagen, Denmark £ 100% 500 DKK
Boliginteressentskabet Tuborg, Copenhagen, Denmark3 n 50% - DKK
Carlsberg Byen P/S, Copenhagen, Denmark4 5 n 25% 17,000 DKK
£ Subsidiary n Associate or joint venture 1 For some entities the consolidation percentage is higher than the ownership share due to written put options.2 Listed company. 3 A separate annual report is not prepared. 4 Company not audited by KPMG.

146Carlsberg Group Annual Report 2014 Parent Company
PaRent cOMPanY
150 1.1 Investments in subsidiaries and joint ventures
150 1.2 Related party disclosure
155 4.1 Other operating activities, net
155 4.2 Provisions
155 4.3 Fees to auditors
155 4.4 Asset base and leases
156 4.5 Tax
157 4.6 Contingent liabilities and other commitments
157 4.7 Events after the reporting period
SectiOn 1
Investments in subsidiaries and joint ventures 150
SectiOn 2
Capital structure and equity 151
SectiOn 3
Staff costs and remuneration 153
SectiOn 4
Other disclosure requirements 155
SectiOn 5
General accounting policies 157
151 2.1 Financial income and expenses
151 2.2 Receivables and borrowings
151 2.3 Interest rate risk
152 2.4 Net interest-bearing debt
152 2.5 Share capital
147 Income statement 147 Statement of
comprehensive income 148 Statement of financial position148 Statement of changes in equity 149 Statement of cash flows
153 3.1 Staff costs and remuneration of executive directors
153 3.2 Share-based payments154 3.3 Retirement benefit obligations
and similar obligations

147Carlsberg Group Annual Report 2014 Parent Company
DKK million Section 2014 2013Administrative expenses -69 -66
Other operating activities, net 4.1 -54 -91
Operating profit before special items -123 -157Special items 4.4 -108 -7
Financial income 2.1 1,229 931
Financial expenses 2.1 -26 -25
Profit before tax 972 742Corporation tax 4.5 132 43
Profit for the year 1,104 785
Attributable toDividend to shareholders 1,373 1,220
Reserves -269 -435
Profit for the year 1,104 785
incOMe StateMent
DKK million Section 2014 2013Profit for the year 1,104 785
Other comprehensive incomeRetirement benefit obligations 3.3 -1 -3
Corporation tax 4.5 - 1
Other - 1
Items that may be reclassified to the income statement -1 -1
Other comprehensive income -1 -1Total comprehensive income 1,103 784
StateMent OF cOMPReHenSive incOMe
StateMentS

148Carlsberg Group Annual Report 2014 Parent Company
DKK million Shareholders in Carlsberg A/S
2014Share
capitalRetained earnings
Total equity
Equity at 1 January 2014 3,051 42,640 45,691
Profit for the year - 1,104 1,104
Other comprehensive incomeRetirement benefit obligations - -1 -1
Other comprehensive income - -1 -1Total comprehensive income for the year - 1,103 1,103
Acquisition/disposal of treasury shares - 5 5
Exercise of share options - -19 -19
Share-based payments - 19 19
Share-based payments to employees in subsidiaries - 17 17
Dividends paid to shareholders - -1,220 -1,220
Total changes in equity - -95 -95Equity at 31 December 2014 3,051 42,545 45,596
2013Equity at 1 January 2013 3,051 42,784 45,835
Profit for the year - 785 785
Other comprehensive incomeRetirement benefit obligations - -3 -3
Corporation tax - 1 1
Other - 1 1
Other comprehensive income - -1 -1Total comprehensive income for the year - 784 784
Acquisition/disposal of treasury shares - -13 -13
Exercise of share options - -57 -57
Share-based payments - 16 16
Share-based payments to employees in subsidiaries - 41 41
Dividends paid to shareholders - -915 -915
Total changes in equity - -144 -144Equity at 31 December 2013 3,051 42,640 45,691
StateMent OF cHangeS in eqUitY
The proposed dividend of DKK 9.00 per share, in total DKK 1,373m (2013: DKK 8.00 per share, in total DKK 1,220m), is included in retained earnings at 31 December 2014. Dividends paid out in 2014 for 2013 amount to DKK 1,220m (paid out in 2013 for 2012: DKK 915m), which is DKK 8.00 per share (2013: DKK 6.00 per share). Dividends paid out to shareholders of Carlsberg A/S do not impact taxable income in Carlsberg A/S.
StateMent OF Financial POSitiOn
DKK million Section 31 Dec. 2014 31 Dec. 2013
ASSETS
Non-current assetsIntangible assets 4.4 12 14
Property, plant and equipment 4.4 290 1,070
Investments in subsidiaries 1.1 45,573 45,523
Investments in joint ventures 1.1 10 -
Receivables 2.2 492 498
Deferred tax assets 4.5 126 30
Total non-current assets 46,503 47,135
Current assetsReceivables from subsidiaries and joint ventures 2.2 47 66
Tax receivables 6 18
Other receivables 2.2 32 85
Total current assets 85 169Assets held for sale 4.4 696 -
Total assets 47,284 47,304
EQUITY AND LIABILITIES
EquityShare capital 2.5 3,051 3,051
Retained earnings 42,545 42,640
Total equity 45,596 45,691
Non-current liabilitiesBorrowings 2.2 209 222
Retirement benefit obligations and similar obligations 3.3 43 45
Provisions 4.2 94 143
Total non-current liabilities 346 410
Current liabilitiesBorrowings 2.2 1,205 1,098
Trade payables 44 44
Provisions 4.2 62 31
Other liabilities etc. 31 30
Total current liabilities 1,342 1,203Total liabilities 1,688 1,613Total equity and liabilities 47,284 47,304

149Carlsberg Group Annual Report 2014 Parent Company
DKK million Section 2014 2013Operating profit before special items -123 -157
Adjustment for depreciation and amortisation 16 14
Operating profit before depreciation and amortisation -107 -143Adjustment for other non-cash items - 10
Change in working capital1 26 -130
Interest etc. received 7 12
Interest etc. paid -17 -22
Corporation tax paid 48 18
Cash flow from operating activities -43 -255Acquisition of property, plant and equipment and intangible assets -11 -24
Total operational investments -11 -24Acquisition and disposal of entities, net -10 -
Dividends from subsidiaries and joint ventures 1,220 917
Total financial investments 1,210 917Other investments in property, plant and equipment -20 -19
Disposal of other property, plant and equipment - -7
Total other activities2 -20 -26Cash flow from investing activities 1,179 867Free cash flow 1,136 612Shareholders in Carlsberg A/S 2.5 -1,234 -985
External financing 2.4 98 373
Cash flow from financing activities -1,136 -612Net cash flow - -Cash and cash equivalents at 1 January - -
Cash and cash equivalents at 31 December - -
StateMent OF caSH FlOwS
1 Change in working capital consists of other receivables, DKK 5m (2013: DKK 10m), trade payables and other liabilities, DKK 42m (2013: DKK -140m), and other provisions, DKK -21m (2013: DKK 0m).
2 Other activities cover real estate activities.

150Carlsberg Group Annual Report 2014 Parent Company
1.1 investments in subsidiaries and joint ventures
1.2 Related party disclosure
SectiOn 1investments in subsidiaries and joint ventures
Subsidiaries Joint ventures
DKK million 2014 2013 2014Cost at 1 January 45,523 45,517 -Additions during the year - - 10Share-based payments to employees in subsidiaries 50 6 -Cost at 31 December 45,573 45,523 10Carrying amount at 31 December 45,573 45,523 10
cOSt
We refer to the list of companies in the Carlsberg Group, cf. section 10 in the consolidated financial statements. The carrying amount includes goodwill of DKK 11,207m (2013: DKK 11,207m) on acquisi-tion of subsidiaries. Share-based payments to employees in subsidiaries comprise exercised as well as outstanding share options.
Related parties exercising controlThe Carlsberg Foundation, H.C. Andersens Boulevard 35, 1553 Copenhagen V, Denmark, holds 30.3% of the shares and 75.3% of the voting power in Carlsberg A/S, excluding treasury shares. Apart from dividends and grants, no transactions were carried out with the Carlsberg Foundation during the year.
Related parties exercising significant influenceDuring the year, the Company was not in-volved in any transactions with major share-holders, members of the Supervisory Board, members of the Executive Board, other executive employees, or companies outside
1.1 SiGniFiCAnt ACCountinG eStiMAteS AnD juDGeMentS
Management performs an annual test for indications of impairment of invest-ments in subsidiaries and joint ventures. Impairment tests are conducted in the same way as for goodwill in the Carlsberg Group, cf. section 2.3 in the consolidated financial statements.
It is management’s assessment that no indications of impairment existed at year-end 2014. Impairment tests have there-fore not been carried out for subsidiaries and joint ventures.
1.1 ACCountinG poliCieS
Dividends on investments in subsidiaries and joint ventures are recognised as income in the income statement of the Parent Company in the financial year in which the dividend is declared.
Investments in subsidiaries and joint ven-tures are measured at the lower of cost and recoverable amount.
the Carlsberg Group in which these parties have interests. The income statement and statement of financial position items include transactions as shown in the table below.
DKK million 2014 2013Joint venturesReceivables 12 12
Subsidiaries
Other operating activities, net 7 9
Interest income 6 6
Interest expenses -14 -11
Loans 496 501
Receivables 27 57
Borrowings -1,189 -1,093
Trade payables -19 -14
RelateD PaRtY tRanSactiOnS
No losses on loans to or receivables from joint ventures were recognised or provided for in either 2014 or 2013.
Joint ventures Dividends of DKK 0m (2013: DKK 2m) were received from joint ventures.
Subsidiaries Dividends of DKK 1,220m (2013: DKK 915m) were received from subsidiaries.

151Carlsberg Group Annual Report 2014 Parent Company
SectiOn 2Capital structure and equity
DKK million 2014 2013Financial incomeInterest income 6 12
Dividends from subsidiaries and joint ventures 1,220 917
Other financial income 3 2
Total 1,229 931
Financial expenses
Interest expenses -21 -18
Other financial expenses -5 -7
Total -26 -25
Financial items, net recognised in the income statment 1,203 906
Financial iteMS RecOgniSeD in tHe incOMe StateMent
2.1 Financial income and expenses
Interest income relates to interest from cash and cash equivalents.
Interest income further relates to loans to subsidiaries and return of tax on properties.
Other financial income relates to foreign exchange gains in 2014.
Interest expenses primarily relate to inter-est on borrowings.
No financial items have been recognised directly in other comprehensive income.
The average effective interest rate on loans to sub-sidiaries was 1.3% in 2014 (2013: 1.3%).
The fixed-rate mortgage is one loan of DKK 209m (2013: DKK 209m) that carries a fixed interest rate until 2016 and matures after five years.
2.2 Receivables and borrowings
2.3 interest rate risk
DKK million 2014 2013Non-current borrowingsMortgages 209 209
Other non-current borrowings - 13
Total 209 222Current borrowingsOther liabilities 16 5
Borrowings from subsidiaries 1,189 1,093
Total 1,205 1,098
Total non-current and current borrowings 1,414 1,320Fair value 1,417 1,327
Employee bonds of DKK 13m that carry a fixed interest rate matured in January 2015 and have consequently been moved from non-current bor-rowings to current borrowings. No bonds were issued in 2014 or 2013.
Borrowings are measured at amortised cost.
The fair value of receivables and borrowings in subsidiaries corresponds to the carrying amount in all material respects.
ReceivaBleS BY ORigin BORROwingS
DKK million 2014 2013Loans to subsidiaries 497 501
Receivables from subsidiaries and joint ventures 42 57
Other receivables 32 91
Total 571 649
DKK million
2014Interest
rate
Average effective
interest rate Fixed forCarrying amount
Interest rate risk
MortgagesFixed-rate Fixed 3.12% 1-2 years 209 Fair value
Total mortgages 3.12% 209
2013MortgagesFixed-rate Fixed 3.12% 2-3 years 209 Fair value
Total mortgages 3.12% 209
inteReSt Rate RiSK

152Carlsberg Group Annual Report 2014 Parent Company
capital structure and equity
SectiOn 2
2.4 net interest-bearing debt
2.5 Share capital
DKK million 2014 2013Non-current borrowings 209 222
Current borrowings 1,205 1,098
Gross interest-bearing debt 1,414 1,320Loans to subsidiaries and joint ventures -497 -501
Net interest-bearing debt 917 819
Changes in net interest-bearing debtNet interest-bearing debt at 1 January 819 446
Cash flow from operating activities 43 255
Cash flow from investing activities -1,179 -867
Dividends to shareholders 1,220 915
Acquisition/disposal of treasury shares and exercise of share options 14 70
Total change 98 373Net interest-bearing debt at 31 December 917 819
Class A shares Class B shares Total share capital
Shares of DKK 20
Nominal value,
DKK ’000Shares of
DKK 20
Nominal value,
DKK ’000Shares of
DKK 20
Nominal value,
DKK ’0001 January 2013 33,699,252 673,985 118,857,554 2,377,151 152,556,806 3,051,136
No change in 2013 - - - - - -
31 December 2013 33,699,252 673,985 118,857,554 2,377,151 152,556,806 3,051,136No change in 2014 - - - - - -
31 December 2014 33,699,252 673,985 118,857,554 2,377,151 152,556,806 3,051,136
SHaRe caPital
A shares carry 20 votes per DKK 20 share. B shares carry two votes per DKK 20 share. A pre ferential right to an 8% non-cumulative dividend is attached to B shares. Apart from votes and divi-dends, all shares rank equally.
At 31 December 2014 the fair value of treas-ury shares amounted to DKK 9m (2013: DKK 14m). The holdings of treasury shares are specified in section 4.3 in the consolidated financial statements.
According to the authorisation of the General Meeting, the Supervisory Board may, in the period until 19 March 2019, allow the Company to acquire treasury shares up to a total holding of 10% of the nominal share capital at a price quoted on NASDAQ OMX Copenhagen at the time of acquisition with a deviation of up to 10%.
In the financial year the Company acquired class B treasury shares of a nominal amount of DKK 2m (2013: DKK 6m) at an average price of DKK 570 (2013: DKK 578), cor-responding to a purchase price of DKK 49m
tRanSactiOnS witH SHaReHOlDeRS in caRlSBeRg a/S
DKK million 2014 2013
Dividends to shareholders -1,220 -915
Acquisition of treasury shares -49 -167
Disposal of treasury shares 35 97
Total -1,234 -985
(2013: DKK 167m). Class B treasury shares are primarily acquired to facilitate settlement of share option schemes. The Company holds no class A shares.
In the financial year the Company disposed of class B treasury shares at a total price of DKK 35m (2013: DKK 97m). The disposal was made in connection with settlement of share options.

153Carlsberg Group Annual Report 2014 Parent Company
DKK million 2014 2013Salaries and other remuneration 64 68
Retirement benefit costs – defined contribution plans 5 5
Share-based payments 19 16
Total 88 89
Staff costs are included in the following items in the income statementAdministrative expenses 20 30
Other operating activities, net 68 59
Total 88 89
3.1 Staff costs and remuneration of executive directors
3.2 Share-based payments
Remuneration of the executive directors is based on a fixed salary, cash bonus pay-ments and non-monetary benefits such as company car, telephone etc. Furthermore, share option programmes and incentive schemes have been established for the exe cutive directors. These programmes and schemes cover a number of years. The remuneration is specified in section 3.2.
Employment contracts for executive directors contain terms and conditions that are consid-
Share option programmeIn 2014, a total of 95,000 (2013: 91,000) share options were granted to 2 employees (2013: 2). The grant date fair value of these options was a total of DKK 16m (2013: DKK 15m). The total cost of share options was DKK 17m (2013: DKK 14m), which is recognised in the income statement under staff costs. Refunds etc. between Carlsberg A/S and its subsidiaries are recognised directly in equity.
The Company had an average of 94 (2013: 94) full-time employees during the year.
ered common to executive board members in Danish listed companies, including terms of notice and non-competition clauses.
Remuneration of the executive directors and Supervisory Board as well as their holdings of shares in the Company are specified in the Management review and section 7 in the consolidated financial statements.
Long-term incentive programme (performance shares)In 2014 a total of 42,283 (2013: 45,135) performance shares were granted to 4 em-ployees (2013: 2). The grant date fair value of these performance shares was DKK 19m (2013: DKK 10m). The total cost of perform-ance shares was DKK 2m (2013: DKK 2m), which is recognised in the income statement under staff costs. Refunds etc. between Carlsberg A/S and its subsidiaries are recog-nised directly in equity.
Exercise price Number
Fixed, weighted
averageExecutive directors
Other employees
Resigned employees Total
Share options outstanding at 31 December 2012 407.74 420,604 - 79,505 500,109Granted 573.50 91,000 - - 91,000
Exercised 277.20 -12,388 - -51,632 -64,020
Share options outstanding at 31 December 2013 452.21 499,216 - 27,873 527,089Granted 583.10 95,000 - - 95,000
Exercised 306.89 -12,388 - -1,858 -14,246
Share options outstanding at 31 December 2014 477.51 581,828 - 26,015 607,843
Long-term incentive programme (performance shares)
Performance shares out-standing at 31 December 2012 - - - -Granted 45,135 - - 45,135
Forfeited/expired/adjusted -23,695 - - -23,695
Performance shares out-standing at 31 December 2013 21,440 - - 21,440Granted 40,925 1,358 - 42,283
Forfeited/expired/adjusted -53,756 -558 -699 -55,013
Transferred - -737 737 -
Performance shares out-standing at 31 December 2014 8,609 63 38 8,710
SHaRe OPtiOn PROgRaMMe
SectiOn 3Staff costs and remuneration

154Carlsberg Group Annual Report 2014 Parent Company
SectiOn 3
The assumptions underlying the calculation of the fair value of share-based payment awards are described in section 7.3.1 in the consolidated financial statements.
Retirement benefit obligations and similar obligations comprise payments to retired directors that are not covered by an insur-ance company. The plan is unfunded.
Total obligations at 31 December 2014 amounted to DKK 43m (2013: DKK 45m), and included actuarial losses of DKK 1m (2013: DKK 3m) and benefits paid during the year of DKK 3m (2013: DKK 3m).
Of the expected payment obligation DKK 3m is due within one year and DKK 26m after five years from the reporting date.
The actuarial assumptions underlying the cal culations are based on local economic con-ditions and labour market conditions. The dis-count rate of 1% remained unchanged from 2013. The rate of increase in future re tire-ment obligations was 0% (2013: 2%).
During the year DKK 0m (2013: 0m) was recognised in the income statement. As of 31 December 2014 DKK 1m (2013: DKK 3m) is recognised in other comprehensive income.
3.2 ACCountinG poliCieS
The fair value of granted share-based incen-tives to employees in the Parent Company’s subsidiaries is recognised in investments in subsidiaries as the services rendered in exchange for the granted incentives are received in the subsidiaries, with a set-off directly against equity.
The difference between the purchase price and the sales price for the exercise of share-based incentives by employees in subsidiar-ies is settled between Carlsberg A/S and the individual subsidiary, with a set-off directly against investments in subsidiaries.
The difference at the end of the reporting period between the fair value of the Par-ent Company’s equity instruments and the exercise price of outstanding share-based incentives is recognised as a receivable in Carlsberg A/S, with a set-off directly against investments in subsidiaries.
Share-based incentives granted to the Par-ent Company’s own employees are recog-nised and measured in accordance with the accounting policies used by the Carlsberg Group; see the consolidated financial state-ments for a description of accounting policies.
Staff costs and remuneration
3.3 Retirement benefit obligations and similar obligations
Share options Performance shares
2014 2013 2014 2013
Average share price at the exercise date for share options exercised in the year 584 579 - -
Weighted average contractual life for awards outstanding at 31 December 4.2 4.0 1.7 2.4
Range of exercise prices for share options outstanding at 31 December 203.50-583.10 203.50-573.50 - -
Exercisable outstanding share options at 31 December 290,343 244,859 None None
Weighted average exercise price for share options exercisable at 31 December 425 383 - -
KeY FigUReS

155Carlsberg Group Annual Report 2014 Parent Company
4.1 other operating activities, net
4.3 Fees to auditors
4.4 Asset base and leases4.2 provisions
SectiOn 4other disclosure requirements
Audit fees to KPMG, which is appointed by the Annual General Meeting for the statu-tory audit, amounted to DKK 1m (2013: 1m). Fees for other services amounted to DKK 2m (2013: DKK 0m).
The carrying amount of intangible assets was DKK 12m (2013: DKK 14m) and prop-erty, plant and equipment was DKK 290m (2013: DKK 1,070m). Property, plant and equipment comprise mainly land and build-ings of DKK 228m (2013: DKK 1,028m).
The company expects to complete a dis-posal of real estate during 2015, which has
Provisions primarily comprise warranty provisions regarding real estate disposed of and provisions for ongoing disputes and lawsuits etc.
Provisions at 31 December 2014 amounted to DKK 156m (2013: DKK 174 m). Addition-al provisions recognised amounted to DKK 2m (2013: DKK 28m), and DKK 20m (2013: DKK 25m) was utilised during the year.
resulted in impairment of DKK 100m and reclassification of DKK 696m to assets held for sale. The impairment loss was recognised in special items.
Property, plant and equipment under construc-tion amounted to DKK 50m (2013: DKK 32m). Depreciation and amortisation of DKK 16m (2013: DKK 14m) are included in adminis-trative expenses. See the accoun t ing policies on impairment of assets in the Carlsberg Group, cf. section 2 in the consolidated financial statements.
Carlsberg A/S has entered into an operating lease relating to transport equipment. The lease contains no special purchase rights etc. Future lease payments are less than DKK 1m (2013: DKK 1m). Operating lease payments recognised in the income statement in 2014 amounted to DKK 1m (2013: DKK 1m).
DKK million 2014 2013Real estate, net -4 -36
Research activities, including the Carlsberg Laboratory, net -77 -46
Other, net 27 -9
Total -54 -91
DKK 62m of total provisions (2013: DKK 31m) falls due within one year and DKK 57m (2013: DKK 48m) after more than five years from the end of the reporting period.

156Carlsberg Group Annual Report 2014 Parent Company
SectiOn 4
Other disclosure requirements
2014 2013
DKK millionIncome
statement
Other comprehensive
income
Total comprehensive
incomeIncome
statement
Other comprehensive
income
Total comprehensive
incomeChange in deferred tax during the year -134 - -134 -40 -1 -41
Change in deferred tax from change in tax rate 3 - 3 - - -
Adjustments to tax for previous years -1 - -1 -3 - -3
Total -132 - -132 -43 -1 -44
4.5 tax
RecOnciliatiOn OF taX FOR tHe YeaR
DKK million 2014 2013Tax in Denmark 238 185
Change in tax rate 3 -
Adjustments to tax for previous years -1 -3
Non-capitalised tax assets, net movements -78 -
Non-deductible expenses 3 2
Tax-free dividend and tax-exempted items -299 -229
Special items and other 2 2
Tax for the year -132 -43
Deferred tax assets amounted to DKK 126m (2013: DKK 30m) and comprise tax on pro-visions and retirement benefit obligations of DKK 26m (2013: DKK 38m), current assets of DKK 36m (2013: DKK 0m) and tax losses etc. of DKK 86m (2013: DKK 16m). The utilisation of tax loss carryforwards depends on future positive taxable income exceeding the realised deferred tax liabilities. Deferred tax liabilities amounted to DKK 22m (2013: DKK 24m).
The changes in deferred tax assets com-prise tax recognised in total comprehensive income of DKK 132m (2013: DKK 44m) and joint taxation contribution of DKK -36m (2013: DKK -22m).
DKK 38m (2013: DKK 2m) of the deferred tax asset is expected to be used within one year.
For 2014 all tax assets are recognised. For 2013 DKK 78m relating primarily to tax loss-es that were not expected to be utilised in the foreseeable future was not recognised.
As the administrative company, Carlsberg A/S has unlimited and joint legal responsibil-ity with the other companies under the joint taxation scheme for withholding taxes on dividends, interest and royalties.
4.5 SiGniFiCAnt ACCountinG eStiMAteS AnD juDGeMentS
Carlsberg A/S recognises deferred tax assets, including the tax base of tax loss carryforwards, if management assesses that these tax assets can be offset against positive taxable income in the foreseeable future. This judgement is made annually and based on budgets and business plans for the coming years, including planned commercial initiatives.
4.5 ACCountinG poliCieS
Carlsberg A/S is the administrative company and is subject to the Danish rules on manda-tory joint taxation of the Carlsberg Group’s Danish companies. Carlsberg accordingly pays all income taxes to the tax authorities under the joint taxation scheme.
Danish subsidiaries are included in the joint taxation from the date when they are includ-ed in the consolidated financial statements and up to the date when they are excluded from the consolidation.
The jointly taxed Danish companies are taxed under the on-account tax scheme.
On payment of joint taxation contributions, the current Danish corporation tax is allo-cated between the Danish jointly taxed com-panies in proportion to their taxable income. Companies with tax losses receive joint taxation contributions from other companies that have used the tax losses to reduce their own taxable profit (full absorption).
Tax on profit/loss for the yearTax on profit/loss for the year comprises profit/loss from real estate partnerships (joint ventures), as these are not individu-ally taxed but included in the taxable income of the partners. In addition, tax on profit/loss and deferred tax are calculated and recognised as described in section 6 in the consolidated financial statements.

157Carlsberg Group Annual Report 2014 Parent Company
SectiOn 4
Other disclosure requirements
4.6 Contingent liabilities and other commitments
4.7 events after the reporting period
Carlsberg A/S has issued guarantees for pension obligations to subsidiaries of DKK 361m (2013: DKK 377m).
Carlsberg A/S is jointly registered for Dan-ish VAT and excise duties with Carlsberg Breweries A/S, Carlsberg Danmark A/S and various other minor Danish subsidiaries, and is jointly and severally liable for payment of VAT and excise duties.
Carlsberg A/S is party to certain lawsuits, disputes etc. of various scopes. In manage-ment’s opinion, apart from as recognised in the statement of financial position or disclosed in the financial statements, the out come of these lawsuits, disputes etc. will not have a material negative effect on the Company’s financial position.
Carlsberg A/S has issued a guarantee for rent of DKK 112m (2013: DKK 160m).
The 2014 financial statements of Carlsberg A/S have been prepared in accordance with International Financial Reporting Standards (IFRS) as adopted by the EU and Danish disclosure requirements for listed compa-nies, cf. the statutory order pursuant to the Danish Financial Statements Act.
The financial statements are presented in Danish kroner (DKK), which is the func-tional currency.
The accounting policies for the Parent Company are the same as for the Carlsberg Group, cf. section 9 in the consolidated finan-cial statements and the individual sections.
The structure of the explanatory notes has been changed to improve the information provided.
Significant accounting estimatesIn preparing Carlsberg A/S’s financial state-ments, management makes various ac-counting estimates and assumptions which form the basis of presentation, recognition and measurement of the Company’s assets and liabilities.
Apart from the events recognised or dis-closed in the financial statements, no events have occurred after the reporting date of importance to the financial statements.
SectiOn 5General accounting policies
The judgements, estimates and assumptions made are based on historical experience and other factors which management assesses to be reliable, but which by their very nature are associated with uncertainty and unpre-dictability. These assumptions may prove incomplete or incorrect, and unexpected events or circumstances may arise.
The significant accounting estimates and judgements made and accounting policies specific to the Parent Company are present-ed in the explanatory notes.

158Carlsberg Group Annual Report 2014 Financial Statements
The Supervisory Board and the Executive Board have today discussed and approved the Annual Report of the Carlsberg Group and the Parent Company for 2014.
The Annual Report has been prepared in accordance with International Financial Reporting Standards as adopted by the EU and Danish disclosure requirements for annual reports of listed companies.
In our opinion the consolidated financial statements and the Parent Company’s financial statements give a true and fair view of the Carlsberg Group’s and the Parent Company’s assets, liabilities and financial position at 31 December 2014 and of the results of the Carlsberg Group’s and the Parent Company’s operations and cash flows for the financial year 2014.
Further, in our opinion the Management review includes a fair review of the development in the Carlsberg Group’s and the Parent Company’s operations and financial matters, of the result for the year and of the Carlsberg Group’s and the Parent Company’s financial position as well as describes the significant risks and uncertainties affecting the Carlsberg Group and the Parent Company.
Jørn P. JensenJørgen Buhl Rasmussen
Supervisory Board of Carlsberg A/S
We recommend that the Annual General Meeting approve the Annual Report.
Copenhagen, 18 February 2015
Executive Board of Carlsberg A/S
RePORtSManagement statement
Flemming BesenbacherChairman
Kees van der Graaf
Hans S. Andersen
Jess SøderbergDeputy Chairman
Carl Bache
Eva Vilstrup Decker
Richard Burrows
Søren-Peter Fuchs Olesen
Finn Lok
Donna Cordner
Nina Smith
Elena V. Pachkova
Elisabeth Fleuriot
Lars Stemmerik
Peter Petersen

159Carlsberg Group Annual Report 2014 Financial Statements
Mike MaloneyCertifiedPublic Accountant
Henrik O. LarsenState AuthorisedPublic Accountant
To the shareholders of Carlsberg A/S
Independent auditors’ report on the consolidated financial statements and the Parent Company financial statementsWe have audited the consolidated financial statements and the Parent Company financial state-ments of Carlsberg A/S for the financial year 2014. The consolidated financial statements and the Parent Company financial statements comprise income statement, statement of compre-hensive income, statement of financial position, statement of changes in equity, statement of cash flows and notes, including a summary of significant accounting policies for the Carlsberg Group as well as for the Parent Company. The consolidated financial statements and the Parent Company financial statements are prepared in accordance with International Financial Report-ing Standards as adopted by the EU and Danish disclosure requirements for listed companies.
Management’s responsibility for the consolidated financial statements and the Parent Company financial statementsManagement is responsible for the preparation of consolidated financial statements and Parent Company financial statements that give a true and fair view in accordance with International Financial Reporting Standards as adopted by the EU and Danish disclosure requirements for listed companies and for such internal control that Management determines is necessary to enable the preparation of consolidated financial statements and Parent Company financial statements that are free from material misstatement, whether due to fraud or error.
Auditors’ responsibilityOur responsibility is to express an opinion on the consolidated financial statements and the Parent Company financial statements based on our audit. We conducted our audit in accord-ance with International Standards on Auditing and additional requirements under Danish au-dit regulation. This requires that we comply with ethical requirements and plan and perform the audit to obtain reasonable assurance as to whether the consolidated financial statements and the Parent Company financial statements are free from material misstatement.
An audit involves performing procedures to obtain audit evidence about the amounts and dis-closures in the consolidated financial statements and the Parent Company financial statements. The procedures selected depend on the auditors’ judgement, including the assessment of the risks of material misstatement of the consolidated financial statements and the Parent Compa-ny financial statements, whether due to fraud or error. In making those risk assessments, the auditors consider internal control relevant to the Company’s preparation of consolidated finan-cial statements and Parent Company financial statements that give a true and fair view in order to design audit procedures that are appropriate in the circumstances, but not for the purpose of expressing an opinion on the effectiveness of the Company’s internal control. An audit also includes evaluating the appropriateness of accounting policies used and the reasonableness of accounting estimates made by Management, as well as evaluating the overall presentation of the consolidated financial statements and the Parent Company financial statements.
We believe that the audit evidence we have obtained is sufficient and appropriate to provide a basis for our opinion.
Our audit has not resulted in any qualification.
OpinionIn our opinion, the consolidated financial statements and the Parent Company financial state-ments give a true and fair view of the Carlsberg Group’s and the Parent Company’s financial position at 31 December 2014 and of the results of the Carlsberg Group’s and the Parent Com-pany’s operations and cash flows for the financial year 2014 in accordance with International Financial Reporting Standards as adopted by the EU and Danish disclosure requirements for listed companies.
Statement on the Management reviewPursuant to the Danish Financial Statements Act, we have read the Management review. We have not performed any further procedures in addition to the audit of the consolidated financial statements and the Parent Company financial statements. On this basis, it is our opinion that the information provided in the Management review is consistent with the consolidated financial statements and the Parent Company financial statements.
Copenhagen, 18 February 2015
KPMGStatsautoriseret Revisionspartnerselskab
RePORtSthe independent auditors’ report

1 Independent board member.
SUPeRviSORY BOaRD
The Supervisory Board of Carlsberg A/S has 15 members; five members are attached to the Carlsberg Foundation, the Company’s principal shareholder, five members have an international business background and five members are elected by the employees.
FLEMMING BESENBACHERChairman
Born 1952. Professor, D.Sc., h.c. mult., FRSC. Elected 2005 and 2014. Election period expires 2015. Chairman of the Supervisory Board since 2012 and Chairman of the Nomina-tion Committee. Member of the Board of Directors of the Carlsberg Foundation (Chairman as of 1 January 2012) and of the Supervisory Boards of property companies affiliated to the Carlsberg Foundation.
Chairman of the Board of Trustees of the Carlsberg Labor-atory and member of the Boards of the Tuborg Foundation, MedTech Innovation Center, LevOss, the Danish Innovation Fund, Unisense Environment and the Danish Management Development Organisation CfL. He was the founding dir-ector of the Interdisciplinary Nanoscience Center (iNANO), Aarhus University, from 2002 to 2012. He has extensive experience of managing large knowledge-based organisa-tions and has strong competences relating to innovation, research, CSR and sustainable development.
Flemming Besenbacher is Professor Honoris Causa at 10 international universities and has received many inter-national awards, including the Friendship Award and the Highest International Scientific and Technological Coopera-tion Award of the People’s Republic of China. Most recently appointed as Foreign Academician of the Chinese Academy of Sciences, which advises the Chinese government on major scientific decisions.
JESS SøDERBERG1
Deputy Chairman
Born 1944. Elected 2008 and 2014. Election period expires 2015. Member of the Audit Committee, the Nomination Committee and the Remuneration Committee.
Former CEO of the A.P. Møller - Mærsk Group (1993-2007) and before that CFO of the same company from 1981. Member of the Supervisory Board and the Finance and Audit Committees of The Chubb Corporation and advisor to Permira. Managing Director of J.S. Invest ApS and one subsidiary. Jess Søderberg has broad international experience and exten sive experience of financial management and finan-cial reporting processes, performance management, and stake holder and investor relations management as a result of many years in the senior management of A.P. Møller - Mærsk. He has wide experience of growth markets and the identification and management of business risks.
160Carlsberg Group Annual Report 2014 Supervisory Board

1 Independent board member.
KEES vAN DER GRAAF1
Born 1950. Elected 2009 and 2014. Election period expires 2015. Member of the Nomination and Remuneration Committees.
Until May 2008, Kees van der Graaf held the position of President Europe on the Board of Unilever. Chairman of the Supervisory Boards of Grandvision BV, MYLAPS BV and, until February 2015, the University of Twente. He is a member of the Supervisory Boards of ENPRO Industries, OCI NV and, until February 2015, Ben & Jerry’s. Member of the Supervisory Board of ANWB (the Royal Dutch Touring Club) until 1 July 2013. From 2008 to 2011, he was an executive-in-residence of IMD business school based in Lausanne. Founder of the FSHD Foundation. Founder, owner and Chairman of the Board of FSHD Unlimited Cooperation since 2014.
Kees van der Graaf has acquired extensive international management experience through his many years in management positions at Unilever. He has substantial experience of growth markets and of manufacturing, logistics and sales & marketing management. He has also worked extensively with performance management and sustainable development.
ELISABETH FLEURIOT1 Born 1956. Elected 2012 and 2014. Election period expires 2015. Member of the Remuneration Committee.
CEO of MW Brands since August 2013. Before that, Elisabeth Fleuriot was Senior Vice President, Emerging Markets, and Vice President, Kellogg Company. Member of the Supervisory Board of Stora Enso Oyj from 2013.
Elisabeth Fleuriot has substantial international branded consumer goods and management experience through her career in management positions at Kellogg Company (since 2001) and before that at Yoplait (Sodiaal Group) and the Danone Group.
Elisabeth Fleuriot has extensive experience of sales and marketing management, product inno-vation and strategic planning, and wide interna-tional experience of developed and emerging mar-kets. She has worked on business development, acquisitions and partnerships, and has an in-depth understanding of the assessment and mitigation of business risks.
DONNA CORDNER1
Born 1956. Elected 2012 and 2014. Election period expires 2015. Chairman of the Audit Committee.
Donna Cordner is a member of the Advisory Board of Vosges Haut-Chocolat, managing partner of OKM Capital, a venture fund investing in disruptive medical technology, and Chair of HelpAge USA, the US affiliate of HelpAge International, an interna-tional NGO working to address issues that affect older people worldwide. Non-executive director of Millicom International Cellular SA 2004-2013, where she was a member of the Audit Committee and CSR Committee. Formerly Managing Director and Global Head of Telecommunications and Media Structured Finance at Citigroup. She has also held senior positions at Société Générale and ABN Amro Bank N.V. in the USA and Europe. She has been CEO of HOFKAM Limited, the largest rural microfinance company in Uganda, and held the positions of Executive Vice President of Corporate Finance and Treasury, Market Area Director and CEO for Russia at Tele2 AB.
Donna Cordner has extensive international management experience, including experience of growth markets. She has substantial experience of financial management and financial report-ing processes, stakeholder and investor relations management, and the assessment and mitigation of business risks. She has also worked extensively with performance management and CSR and sus-tainable development.
SuPERVISORY BOARD
RICHARD BURROWS1
Born 1946. Elected 2009 and 2014. Election period expires 2015. Chairman of the Remuneration Committee and member of the Audit Committee.
Richard Burrows has spent most of his career in the drinks business. He was joint CEO of Pernod Ricard from 2000 to 2005. He is Chairman of British American Tobacco and VoiceSage Ltd. and a non-executive director of the board of Rentokil Initial plc. Richard Burrows has extensive experi-ence of the branded consumer goods sector and wide international business experience gained through his career with Irish Distillers Group plc and Pernod Ricard. He also has extensive experi-ence of shareholder and investor relations and a broad understanding of the assessment and mitigation of business risks.
Richard Burrows has worked extensively with developing markets and product innovation, and has substantial experience of financial manage-ment and reporting processes.
161Carlsberg Group Annual Report 2014 Supervisory Board

LARS STEMMERIKBorn 1956. Professor, D.Sc. Elected 2010 and 2014. Election period expires 2015.
Member of the Board of Directors of the Carlsberg Foundation and of the Board of Trustees of the Carlsberg Laboratory. Lars Stemmerik was head of the University of Copenhagen’s Department of Geography and Geology 2007-2012. He is currently a member of the Academic Council in the Danish Academy of Technical Sciences.
With this background, he has substantial experience in managing knowledge-based organisations and particular expertise in the analysis of complex issues and the presentation of plans and results.
NINA SMITHBorn 1955. Professor, M.Sc. (Econ). Elected 2013 and 2014. Election period expires 2015.
Member of the Board of Directors of the Carlsberg Foundation and the Supervisory Board of Nykredit Realkredit A/S and Nykredit Holding. Deputy Chairman of the Supervisory Board of Foreningen Nykredit. Chairman of the Risk Committee and a member of the Audit Committee and Nomination Committee of Nykredit Realkredit A/S. Chairman of KORA, the Danish Institute for Local and Regional Government Research. Previously a member of the supervisory board of a number of private companies, including PFA Pension and Nykredit Bank, as well as Chairman of NIRAS and a number of Danish research institutes and organisations. Member of the Danish Economic Council (Chairman 1995-1998).
In addition to her expertise as a professional board member in private and public sector companies, Nina Smith has substantial expertise in the analysis of economic and organisational issues, and exten-sive experience from managing large knowledge-based organisations.
SøREN-PETER FUCHS OLESEN Born 1955. Professor, D.M.Sc. Elected 2012 and 2014. Election period expires 2015.
Member of the Board of Directors of the Carlsberg Foundation and of the Board of Trustees of the Carlsberg Laboratory. Director of the Danish National Research Foundation Centre for Cardiac Arrhythmia at the University of Copenhagen and Copenhagen University Hospital from 2005. Søren-Peter Olesen has been involved in starting up and developing several pharma and device companies as cofounder, CEO, scientific director and board member. Chairman of the evaluation committees for visiting scientists at Danmarks Nationalbank and the Nordea Foundation.
Søren-Peter Olesen has substantial experience of managing knowledge organisations, turning basic science into new products, innovation and planning, and extensive experience of funding, investor relations and CSR.
CARL BACHEBorn 1953. Professor, Ph.D., Dr.Phil. Elected 2014. Election period expires 2015.
Member of the Board of Directors of the Carlsberg Foundation. Carl Bache is affiliated with the Uni-versity of Southern Denmark, where he has spe-cialised in English linguistics and communication, and where he is currently Head of the Doctoral School of the Humanities. Founder of the Institute of Language and Communication. Carl Bache has many years of senior leadership experience from positions as research coordinator, committee chairman, departmental head, university senator and dean. He has been a member of Danish re-search councils and committees, i.a. the Board of the Danish Independent Research Council, and has been chairman of the Research Policies Commit-tee of the Royal Danish Academy of Sciences and Letters. He is a member of the board of a publish-ing firm and of the Board of Trustees of the art museum Ny Carlsberg Glyptotek in Copenhagen.
In addition to his substantial management experi-ence and his aptitude for analytical and strate-gic thinking, Carl Bache has a highly developed intercultural understanding from his international education and work experience.
SuPERVISORY BOARD
162Carlsberg Group Annual Report 2014 Supervisory Board

SuPERVISORY BOARD
2 Employee representative.
PETER PETERSEN2
Born 1969. Chairman of the Staff Association Carlsberg and Demand Planner, Carlsberg Danmark A/S. Elected 2010 and 2014. Election period expires 2018. Employee representative on the Board of Carlsberg Danmark A/S.
ELENA v. PACHKOvA2
Born 1979. Head of Research Support, Carlsberg A/S. Elected 2014. Election period expires 2018.
EvA vILSTRUP DECKER2
Born 1964. Senior Customer Service & Sourcing Manager, Carlsberg Breweries A/S. Elected 2014. Election period expires 2018. Employee repre-sentative on the Board of Carlsberg Breweries A/S.
HANS ANDERSEN2
Born 1955. Brewery Worker, Carlsberg Danmark A/S. Elected 1998 and 2014. Election period expires 2018. Employee representative on the Board of Carlsberg Danmark A/S.
FINN LOK2
Born 1958. Senior Scientist, Ph.D. and Brewmaster, Carlsberg A/S. Elected 2014. Election period expires 2018.
163Carlsberg Group Annual Report 2014 Supervisory Board

Carlsberg A/S100 ny Carlsberg Vej1799 Copenhagen VDenmark
phone +45 3327 3300Fax +45 3327 4701www.carlsberggroup.com
CVR no. 61056416