annual report 2011 - mubadala investment company, … report 2011 2 3 a message from the chairman...
TRANSCRIPT

Annual Report 2011

2011 saw Mubadala reach an impressive number of operational milestones and, despite a challenging global and regional business environment, record total revenues of AED 27.9 billion, a 77 percent rise on 2010.
Contents
2 A Message from the Chairman4 The Board of Directors6 Key Achievements8 A Message from the Chief Executive Officer10 A Message from the Chief Operating Officer12 A Message from the Chief Financial Officer14 A message from the Chief Legal Counsel16 Key Assets18 Our Portfolio20 Mubadala Aerospace 22 Mubadala Capital24 Mubadala Healthcare26 Mubadala Industry28 Mubadala Information & Communications Technology30 Mubadala Infrastructure32 Mubadala Oil & Gas34 Mubadala Real Estate & Hospitality36 Mubadala Services Ventures 38 Advanced Technology Investment Company (ATIC)
40 Masdar42 Investing in the Community44 The Leaders of Tomorrow45 Wellbeing46 Education47 Culture48 Corporate Units
Consolidated Financial Statements52 The Board of Directors’ Report53 The Independent Auditor's Report54 Consolidated Statement of Comprehensive Income56 Consolidated Statement of Financial Position58 Consolidated Statement of Changes in Equity62 Consolidated Statement of Cash Flows64 Notes to the Consolidated Financial Statements

Mub
adal
a A
nnua
l Rep
ort
201
1
32
A Message from the Chairman
His Highness Sheikh Mohamed bin Zayed Al NahyanCrown Prince of Abu Dhabi, Deputy Supreme Commander of the Armed Forces of the UAE, Chairman of Mubadala Development Company
Under the guidance of His Highness Sheikh Khalifa bin Zayed Al Nahyan, President of the UAE and Ruler of Abu Dhabi, the development and diversification of our economy is a fundamental priority for the Government of Abu Dhabi.Through its domestic and international investments, Mubadala Development Company continues to make an important contribution to the development and diversification process while seeking to deliver sustainable financial returns to its Shareholder.
Although highly active in the local economy, Mubadala has always had a truly international outlook with many of its landmark projects spanning both the region and the globe.
This trend has accelerated in recent years with Mubadala actively expanding its presence in emerging markets, and at the same time continuing to deepen its ties in more established economies around the world.
Importantly, in a climate of global economic uncertainty, as its geographic footprint continues to expand, the principles guiding the organization have remained constant.
Most notably, Mubadala remains committed to the establishment of mutually beneficial partnerships with world-leading organizations underpinned by sound values and commercial objectives in each of the markets in which it operates.
Through the delivery of its commercial mandate and by virtue of its long-term investment horizon, Mubadala will continue to have an important role to play in this ongoing process of the Emirate’s economic transformation.
By building an engine to generate sustainable financial returns for its Shareholder while contributing to the diversification of the economy, Mubadala can help strengthen the ability of the Emirate of Abu Dhabi and the UAE as a whole to withstand periods of economic uncertainty both now and in the future.
Alongside more traditional metrics, this must always remain one of the key measures of success for the organization.
I wish to thank the Board, executive leadership and employees of Mubadala for their efforts in 2011 and wish them every success for the years ahead.

Mub
adal
a A
nnua
l Rep
ort
201
1
54
The Board of Directors
Mr Al Bowardi is a member of the Abu Dhabi Executive Council and Chairman of its Executive Committee.
He is the Vice Chairman of Dolphin Energy Limited, and board member of the UAE Offsets Program Bureau. He is Chairman of the Regulatory and Supervision Bureau of the Abu Dhabi, Water and Electricity Sector, the Center for Waste Management, the Technology Development Committee and Committee for Developing and Implementing the Water and Agriculture Strategy for Abu Dhabi.
He is also Managing Director and board member of the Environment Agency-Abu Dhabi, Deputy Chairman of the Mohamed bin Zayed Species Conservation Fund and the International Fund for Houbara Conservation-Abu Dhabi, and a member of the Board of Trustees of Abu Dhabi University.
Mohammed Ahmed Al Bowardi Vice-Chairman
Mohamed bin Zayed Al NahyanChairman
Mr Saeed holds a number of key positions in important government bodies.
He is a board member of the Abu Dhabi Securities Market, Emirates Investment Authority and Emirates Integrated Telecommunication Company (du).
He is the Managing Director and a board member of First Gulf Bank. He is also Chairman of Aseel Finance PJSC, Chairman of First Gulf Financial Services and the Managing Director of Al Reem Investments.
Mr Alsowaidi is Chairman of the Department of Economic Development, ZonesCorp, Etihad Rail, the National Bank of Abu Dhabi and the Abu Dhabi Securities Exchange.
He is also a member of Abu Dhabi’s Executive Council and a board member of the International Petroleum Investment Company (IPIC).
He has held senior roles in a number of Government organizations, including the Abu Dhabi Investment Authority (ADIA) and the Abu Dhabi National Oil Company.
Nasser Ahmed Khalifa AlsowaidiMember
Abdulhamid Mohammed Saeed Member
Mahmood Ebraheem Al MahmoodMember
Khaldoon Khalifa Al MubarakMember and Managing Director
Mr Al Suwaidi is a member of Abu Dhabi’s Executive Council and Chairman of the Department of Finance.
He is a member of the Supreme Petroleum Council and a board member of the Abu Dhabi Investment Authority (ADIA), Etisalat, the International Petroleum Investment Company (IPIC), the Abu Dhabi Water & Electricity Authority and the Abu Dhabi Food Control Authority.
He is also Chairman of TAQA, a publically listed global energy provider.
Hamad Al Hurr Al SuwaidiMember
Mr Al Mahmood is Chief Executive Officer of ADS Holding, a privately held Abu Dhabi based commodities firm and Executive Chairman of ADS Securities, a foreign exchange and commodities trading platform.
He has held senior roles at a number of companies including the Abu Dhabi Investment Authority (ADIA). He was also Chief Executive Officer, Managing Director and a board member of the development and investment company Al Qudra Holdings.
Mr Al Mubarak is Chairman of the Abu Dhabi Executive Affairs Authority, which provides strategic policy advice to the Chairman of the Abu Dhabi Executive Council, of which he is also a member.
He is Chairman of the Emirates Nuclear Energy Corporation, the Abu Dhabi Media Zone Authority and Emirates Aluminium (EMAL).
He is also Deputy Chairman of the Urban Planning Council and a board member of First Gulf Bank and Ferrari SpA.

Mub
adal
a A
nnua
l Rep
ort
201
1
76Key Achievements
Total Assets
+73 %on 2010 results
Contribution to Total Revenues AED
2010
2011
62.1 bn
106.4 bn
2008
2009
31.3 bn
49.4 bn
2010
2011
15.8 bn
27.9 bn
2008
2009
6.7 bn
13.1 bn
2010
2011
102.1 bn
177.1 bn
2008
2009
50.4 bn
88.9 bn
Total Assets AED
Revenue AED
Total Equity AED
Total Assets - Operating Segment Split
20,000 The successful completion of Paris Sorbonne University Abu Dhabi and the iconic new Zayed University campus, coupled with the existing UAE University campus, will help to provide a world-class education for up to 20,000 students per year.
10,000Mubadala has created approximately 10,000 jobs in Abu Dhabi, with plans to add another 8,000 by 2020.
24 hoursIn October, we saw the inauguration of Torresol’s Gemasolar plant in Spain, the world’s first solar power plant capable of 24-hour, uninterrupted electricity generation.
300The Mubadala Youth Forum saw more than 300 Emirati national students come together to learn more about the role they can play in Abu Dhabi's future.
Credit Ratings - Short-Term
Prime-1 / A-1+ / F1+Moody’s / Standard & Poor’s / Fitch
Credit Ratings - Long-Term
Aa3 / AA / AAMoody’s / Standard & Poor’s / Fitch
Revenue
+ 77 %on 2010 results
Total Equity
+71 %on 2010 results
Number of Assets per Business Unit
Mubadala Aerospace 7Mubadala Capital 7Mubadala Healthcare 9Mubadala Industry 8Mubadala Information & Communications Technology 6Mubadala Infrastructure 4Mubadala Oil & Gas 4Mubadala Real Estate 13Mubadala Services Ventures 8ATIC 3Masdar 9
Total 78
ATIC 42%Mubadala Oil & Gas 27%Mubadala Aerospace 21%Infrastructure 3%Others 7%
Total AED 28 billion
Total AED 177 billion
ATIC AED 50bn
Corporate/Acquisitions AED 39bn
Mubadala Information & Communications Technology AED 14bn
Mubadala Oil & Gas AED 14bn
Mubadala Aerospace AED 13bn
Mubadala Real Estate AED 13bn
Mubadala Industry AED 11bn
Masdar AED 9bn
Mubadala Infrastructure AED 9bn
Mubadala Healthcare AED 3bn
Mubadala Services Ventures AED 2bn

Mub
adal
a A
nnua
l Rep
ort
201
1
98
Khaldoon Khalifa Al Mubarak Chief Executive Officer and Managing Director
A Message from the Chief Executive Officer
2011 was a significant year for Mubadala, characterized by the sound management of our businesses, strategic international expansion and the ongoing maturation of a number of landmark projects.Strong partnerships at home and abroad defined much of our activity in 2011. During the year our team has demonstrated its expertise in the management of our investments during a period of relative economic uncertainty while working in close cooperation with our partners.
Importantly, each of our investments continues to promise financial returns to our Shareholder while actively diversifying the enterprise base of the Emirate.
During 2011, a number of our landmark projects came to fruition: Yahsat successfully launched its first satellite; EMAL completed its first year of production at full capacity; Masdar joint-venture Torresol brought its first concentrated solar power plant on stream in Spain; and ATIC maintained a focus on establishing Abu Dhabi as a future hub of research and development.
We continue to create job opportunities and now employ more than 20,000 people across the Mubadala group, with a particular focus on the provision of career development opportunities and educational pathways for Emirati nationals. For example, Strata now employs over one hundred Emirati nationals in the production of aerospace composites, while ATIC is preparing hundreds more for future careers in advanced technology.
Our contribution also extends to the establishment, construction and provision of social infrastructure for Abu Dhabi, particularly in the sectors of education and healthcare.
Through our work as campus developer for Paris-Sorbonne Abu Dhabi and Zayed University, both of which were completed in the last year, and our ongoing campus development for NYU Abu Dhabi, we are having an impact on the local education sector and ensuring that generations of students, from within the UAE and beyond, will have access to world-class higher education facilities in the Emirate of Abu Dhabi for decades to come.
Furthermore, significant local infrastructure projects, such as the Cleveland Clinic Abu Dhabi, Arzanah Medical Complex and Abu Dhabi’s new central business district, are making an important long-term contribution to the Emirate’s real estate and social infrastructure.
Mubadala remains firmly committed to its long-term investment strategy and the fulfillment of its mandate to generate sustainable financial returns to its Shareholder over time while contributing to the development and diversification of the Emirate’s economy.
I would like to thank the executive leadership team and employees of Mubadala, in addition to our partners both at home and internationally, for their ongoing commitment to the success of each of our shared projects and initiatives.

Mub
adal
a A
nnua
l Rep
ort
201
1
1110
Waleed Al Mokarrab Al Muhairi Chief Operating Officer
A Message from the Chief Operating Officer
Mubadala is building upon Abu Dhabi’s competitive advantages to develop global platforms, alongside established international partners, across multiple sectors; from aerospace to aluminium, oil & gas and semiconductors, to real estate and renewable energy. As a development company with the Government of Abu Dhabi as its sole Shareholder, Mubadala has the advantage of being able to take a long-term perspective when evaluating and pursuing opportunities.
Having focused our efforts on laying the foundations required to ensure solid, sustainable growth across the Mubadala portfolio, 2011 saw several of our assets begin to emerge as competitive global players.
During the last twelve months, we continued to cultivate and build our investments in key global platforms such as oil and gas; aluminium; semiconductors; aerospace; satellite technology; and renewables – with encouraging results.
Many of these investments have seen us expand our presence in emerging markets, in recognition of the long-term opportunities and growth potential that they offer, as well as building on our existing investments in more established markets.
During 2011 we signed an agreement with the Republic of Guinea to explore new investments and partnerships in strategic sectors such as bauxite, alumina and iron ore, and established Suyadi, a calcined petroleum coke production facility based in Zhenjiang, China. Both projects will play a vital role in establishing Emirates Aluminium (EMAL) as a global aluminium champion.
The year also saw us consolidate the Advanced Technology Investment Company (ATIC) into the Group’s portfolio. This had a significant impact on the size, breadth and diversity of our asset and revenue base.
During a volatile period for businesses globally, ATIC aggressively pursued its goal of taking its primary asset, GLOBALFOUNDRIES – the world's first global semiconductor foundry – to the next level. It expanded its foundries in Singapore and Dresden to serve existing, leading-edge customers, and continued with construction of the world’s most advanced fabrication plant in upstate New York. ATIC’s focus is now centered on growing and supporting GLOBALFOUNDRIES as it creates a new platform of innovation to drive current and future generations of semiconductor products.
While 2011 was another challenging year for the world economy, it was also a year that saw us make significant strides towards successful delivery against our mandate.
With this in mind, we remain well poised to capitalize on a recovering global environment, and enter our tenth year of operation with confidence.

Mub
adal
a A
nnua
l Rep
ort
201
1
1312
Carlos Obeid Chief Financial Officer
A Message from the Chief Financial OfficerDuring 2011, we maintained overall operational profitability and reached important milestones in delivering against our mandate. Revenues increased substantially to AED 27.9 billion from AED 15.8 billion last year, while assets reached a record AED 177 billion from AED 102 billion in 2010.
The Group’s 2011 financial performance was largely impacted by another significant milestone in its evolution; the consolidation of the Advanced Technology Investment Company (ATIC) and its subsidiary GLOBALFOUNDRIES the world's second largest semiconductor manufacturer.
ATIC now represents Mubadala’s largest business asset and the main contributor of revenue, primarily driving the 76.6% increase in Mubadala’s revenues to AED 27.9 billion in 2011 from AED 15.8 billion in 2010. Year-on-year Group revenues also increased due to higher hydrocarbon prices, the ongoing growth of our aerospace business unit, and the consolidation of Tabreed, the district cooling company.
ATIC represented 42% of revenues, followed by Oil & Gas, which accounted for 27%, Aerospace which contributed 21%, Infrastructure that contributed 3% and Industry which contributed 1.9%.
Gross profit increased by 14% to AED 5.7 billion from AED 5 billion, as the cost of sales of goods and services increased to AED 22.3 billion from AED 10.8 billion in 2010, in line with revenue growth.
Operating income was positive at AED 1.2 billion, mainly derived from our investments in Dolphin Energy, EMAL and Aldar. The year-on-year decline from AED 2.6 billion in 2010 to AED 1.2 billion in 2011 reflects the impact of ATIC’s continued substantial expenditures in Research & Development.
Our loss for the period attributable to the owner of the Group was AED 3.2 billion compared to a profit of AED 1.2 billion in 2010. This loss was primarily driven by negative fluctuations in the fair market value of some of Mubadala’s financial investments, as well as a reduction in the market value of certain real estate holdings due to lower expected rental income.
Further, the decrease of AED 0.9 billion primarily in market values of available-for-sale financial investments and hedging instruments, accounted for under other comprehensive income, resulted in AED 4.2 billion of total comprehensive loss attributable to the owner of the Group.
As an investment and development company with long term objectives, we realize that at times we will be negatively impacted by economic volatility – whether it be the value of certain holdings, reflected in mark-to-market or unrealized losses, or on demand for the goods and services of individual business units.
With regards to our balance sheet, assets increased by 73% to AED 177 billion in 2011 from AED 102 billion in 2010, driven mainly by the consolidation of ATIC. Other large asset contributors were Industry, Information & Communications Technology, Healthcare, Aerospace, Real Estate & Hospitality, and Oil & Gas.
Total equity increased by 71% to AED 106 billion from AED 62 billion in 2010. The increase in equity, primarily in the form of the transfer of ATIC and additional cash contributions reflect the continuing commitment of our Shareholder to our mandate and objectives.
Total liabilities increased by 77% to AED 71 billion in 2011 from AED 40 billion in 2010, primarily due to consolidation of ATIC and Tabreed, and issuance of additional bonds by Mubadala in 2011.
As Mubadala’s asset base has grown, our debt and equity levels have grown in line, but our gearing ratio declined slightly reflecting a stronger balance sheet. Our gearing ratio decreased to 22% in 2011 from 25% in 2010.
We continued to diversify our funding base in 2011, and our success in doing so reflects our achievements in building understanding of Mubadala’s story among local and international investors. Mubadala is rightly recognized as one of the most sophisticated organizations in the region with regards to finance raising at both the Group and the subsidiary level.
In April, the Group issued a 1.5 billion USD dual tranche corporate bond to institutional investors in 144A / Reg S format through its ongoing Global Medium Term Note Programme following a series of roadshows in Asia, Europe, the Middle East and the USA. In doing so, we maintained our commitment to transparency and proactive dialogue with all stakeholders.
Of course, such rapid growth places an increased emphasis on the adoption of processes and systems that are scalable and which help to sustain our operations in the short, medium and long term. We have therefore established an organizational strategy that aspires to deliver best in class performance across the Group – whether this is training and development for our professionals from CFA upwards, strengthening our corporate governance framework and controls, improving technical knowledge across our corporate units, or innovation in the financial planning and performance systems we use to keep pace with the evolution of our business.
While Mubadala is based in the UAE, we hold an increasingly global outlook and reach. We have developed and refined, over the last 10 years, a proven investment and investment management framework that is focused on value creation, asset management, risk management and a commitmentto sustainability. I am confident that our framework will ensure we are well placed to capitalize on the global recovery.
Mubadala’s credit rating remains one of the strongest in the Middle East – a reflection of the strength of our portfolio and the continuing support offered by our Shareholder. We consider Mubadala’s bonds and credit ratings as public markers of its credit quality both in the long term credit category at Aa3/AA/AA, as well as in the short term credit category at Prime-1/A-1+/F1+ by Moody’s, Standard & Poor’s and Fitch respectively.

Mub
adal
a A
nnua
l Rep
ort
201
1
1514
Samer Halawa Chief Legal Counsel
A Message from the Chief Legal Counsel
Over the past few years, Mubadala has grown at an impressive pace both at home and in international markets. With such growth, however, comes a need for Mubadala to safeguard its reputation for excellence by building internal institutions based on global best practices.
In order for us to grow and expand our reach into new industries and geographies, we must continue to be focused and disciplined in implementing our compliance and governance processes and training our people to be passionate about maintaining our commitment to rigor.
Mubadala is committed to pursuing robust corporate governance practices, maintaining the highest level of legal and ethical compliance with local and international laws and standards, and developing its human capital to ensure a personal commitment by each employee to excellence in every area of our work. In recognition of this commitment, we have introduced a number of policies and tools that form an integral part of our effort to develop and maintain the highest standards of corporate integrity.
In 2011, we published the Mubadala Corporate Governance Handbook and implemented a mandatory comprehensive training and certification program for all Mubadala Group Board and Board Committee members. With an increasing number of our employees appointed to sit on Boards, or to serve as Committee members for companies within the Mubadala Group, we are conscious of the need to ensure that they are familiar with the basic tenets of good and effective corporate governance. The Corporate Governance Handbook and its supporting training and certification are a major step in ensuring we meet that need. In addition, we recently updated our delegations of authority across various lines of business, including investments, purchasing, and corporate policies and procedures, to promote responsibility and accountability while ensuring there are adequate internal controls at all times.
Mubadala also revised its Code of Conduct in 2011 and introduced a global and comprehensive compliance program, establishing a Compliance Office staffed by full-time compliance professionals. The Compliance Office is responsible for ensuring that a robust and constantly improving compliance program is in place to assist employees in upholding their ethical and legal compliance responsibilities in line with Mubadala’s values and its mandate.
This year, the Compliance Office distributed the revised Code of Conduct in multiple languages and conducted face-to face training for employees. After training, all employees acknowledged their commitment to the Code of Conduct by taking an annual certification exam. In addition, the Compliance Office manages our Compliance Helpline, which allows for anonymous reporting of concerns or questions.
Looking forward, the Compliance Office will continue to lead the process for all employees to meet Mubadala’s commitment to rigorous ethical and legal standards by managing a robust legal and compliance risk assessment program, maintaining our ongoing training and communications programs, and reviewing and responding to employee concerns. Most importantly, the Compliance Office will support Mubadala employees in practicing continuous improvement and consistent achievement to ensure that Mubadala delivers on its Shareholder’s mandate with the highest level of integrity.
Finally, we understand that our people are the most important part of protecting our reputation: our policies and resources will ultimately stand or fall based on the personal commitment of each employee to excellence. The development of human capital, especially the talent of Emirati nationals, is central to Mubadala’s mission and we have a number of programs that provide-on-the-job training and coaching as part of multidisciplinary teams. These international training programs include a bespoke Legal & Compliance development program; partner secondments and asset rotations; and GE-Mubadala LAB (Leadership Acceleration for Business) programs, all of which assist Mubadala employees in continually building their knowledge and expertise.
Mubadala has an increasingly global outlook, and accordingly it is imperative that we follow and apply international standards. These initiatives we have undertaken—and most importantly, the commitment of our people—will ensure the strength of the Group as it moves into its second decade of activity.

Mub
adal
a A
nnua
l Rep
ort
201
1
80
1581 82 83 85
368887
35 68
6970
71
73
72
65
6362
53
54
5556
61
60
57
58
59
64
20
27
28
29
25
26
44
50
494551
524746
39
1743
38
40
37
18
33
34 3231
30
21
16
22
4841
86
5
3
2
78
76
12
11
10
9
8
13
77
42
79
6
4
14
19
1
7
67
66
74
84
75
23 24
80
1581 82 83 85
368887
35 68
6970
71
73
72
65
6362
53
54
5556
61
60
57
58
59
64
20
27
28
29
25
26
44
50
494551
524746
39
1743
38
40
37
18
33
34 3231
30
21
16
22
4841
86
5
3
2
78
76
12
11
10
9
8
13
77
42
79
6
4
14
19
1
7
67
66
74
84
75
23 24
Colour Key
Key Assets
• Mubadala Aerospace
• Mubadala Capital
• Mubadala Oil & Gas
• Mubadala Healthcare
• Mubadala Industry
• Mubadala Information & Communications Technology
• Mubadala Infrastructure
• Mubadala Real Estate & Hospitality
• Mubadala Services Ventures
•ATIC
• Masdar
• Corporate
1 Abu Dhabi Aircraft
Technologies (ADAT) 100%
2 Advanced Military Maintenance
Repair and Overhaul Center
(AMMROC) 60%
3 Horizon 100%
4 Piaggio Aero 31.50%
5 Sanad 100%
6 SR Technics 70%
7 STRATA 100%
8 AMD 19.4%
9 The Carlyle Group 9.30%
10 GE 0.76%
11 The John Buck Company 24.90%
12 The Raine Group 9.15%
13 The Related Companies 7.50%
14 Verno Capital 25%
15 Tatweer 32%
16 Dolphin Energy 51%
17 Habiba Block 62 (Onshore Oman) 32%
18 Mukhaizna Block 53 (Onshore Oman) 15%
19 “N” Block (Kazakhstan) 24.50%
20 Pearl Energy 100%
21 Petrofac Emirates 51%
22 Block 7 (Offshore Tanzania) 20%
23 Jasmine Field (Offshore Thailand) 100%
24 Manora Field (Offshore Thailand) 60%
25 Block PM324 (Offshore Peninsula Malaysia) 20%
26 Block SK320 (Offshore Sarawak Malaysia) 75%
27 Ruby Gas Development 70%
28 CRD Field (Offshore Vietnam, Block 07/03) 15%
29 Blocks 135/136 (Offshore Vietnam) 20%
30 AD Knee and Sports
Medicine Centre 100%
31 Arzanah Medical Complex 100%
32 Arzanah Wellness and
Diagnostic Centre 100%
33 Capital Health Screening Centre 100%
34 Cleveland Clinic Abu Dhabi 100%
35 Imperial Colleague London
Diabetes Centre 100%
36 National Reference Laboratory 100%
37 Tawam Molecular Imaging Centre 100%
38 Wooridul Spine Centre 100%
39 Azaliya 49%
40 Emirates Aluminium (EMAL) 50%
41 Guinea Alumina 8.33%
42 Hadjret En Nouss 25%
43 SMN Power Holding 30.88%
44 Suyadi 49%
45 Tabreed 26.90%
46 Tanqia 30%
47 du 19.78%
48 Etisalat Nigeria 30%
49 Injazat Data Systems 60%
50 Yahsat 100%
51 Damballa 5.40%
52 Prodea 5%
53 Paris Sorbonne University Abu Dhabi 51%
54 UAE University 100%
55 Zayed University 100%
56 Khadamat 51%
57 Al Maabar 20%
58 Capitala 51%
59 Iskander Holding 31%
60 PF Emirates Interiors 51%
61 Rosewood Abu Dhabi 100%
62 Sowwah Square 100%
63 Viceroy Hotel Group 50%
64 Viceroy Maldives 72%
65 Rihan Heights 100%
66 Abu Dhabi Finance 52%
67 Abu Dhabi Terminals 25%
68 Agility Abu Dhabi 36.50%
69 Al Taif 100%
70 Bayanat 100%
71 Dunia Finance 31%
72 Eships 50%
73 LeasePlan Emirates 51%
74 GLOBALFOUNDRIES 91.43%
75 Intermolecular 3.83%
76 Calxeda 13.14%
77 London Array 20%
78 Toressol Energy 40%
79 Masdar PV 100%
80 Shams 1 60%
81 Masdar City 100%
82 E.ON-Masdar Integrated Carbon 50%
83 Emirates Steel Industry Carbon
Capture and Utilization Project 100%
84 Masdar Clean Tech Fund I 40%
85 Masdar Clean Tech Fund II 17.20%
85 Aldar (35% ownership, as of March 2012) 49%
86 Mubadala Infrastructure Partners 33.3%
87 Mubadala GE Capital 50%
A selection of Mubadala assets, as at 31st December 2011

Mubadala Infrastructurehas a predominant focus on education and other social infrastructure, which is a prime mover in the economic transformation of Abu Dhabi, using public-private partnerships (PPP) with world-class institutions to finance and operate new facilities.
Mubadala Aerospace is helping to establish Abu Dhabi as a global aerospace hub, investing in and developing an integrated network of aerospace businesses.
Mubadala Information & Communications Technologyinvests in and develops a portfolio of world-class ICT assets in Abu Dhabi. The aim is to establish a cluster of businesses that create high-value employment opportunities in IT and technology, telecoms, and satellite communications.
Mubadala Real Estate & Hospitalityfocuses on commercial, residential, and leisure districts that are central to Abu Dhabi’s long-term development and is helping to facilitate the development of a world-class city that is environmentally, socially, and economically sustainable.
Mubadala Healthcareis playing an instrumental role in the creation of a thriving private healthcare sector for the Emirate, working to provide world-class facilities for Emirati nationals and residents, particularly patients who would otherwise have to travel abroad for treatment.
Mubadala Services Ventures focuses on building scalable regional business platforms across three sectors: defense, logistics and transportation, and financial services and leasing.
Mubadala Industry is creating global industrial champions in priority sectors including basic materials (metals and mining), advanced materials and utilities.
Our Portfolio
We invest and operate in areas that are integral to the diversification of Abu Dhabi, focusing on managing long-term, capital-intensive investments that deliver strong financial returns and tangible social benefits.
30 32
16
Masdar is focused on advancing the development, commercialization and deployment of renewable energy solutions and clean technologies.
3628
Advanced Technology Investment Company (ATIC) is focused on investments in the advanced technology sector, with an initial focus on the semiconductor industry.
34
Mubadala Oil & Gas builds on Abu Dhabi’s rich heritage in hydrocarbons. It is active in the production, exploration, and development of oil and gas resources in the Middle East, North Africa, and Central and Southeast Asia.
Mubadala Capital is the primary vehicle for the company’s financial investment activities, focused on the creation of long-term wealth and biased towards capital preservation.
28
18 20 22 24 26

Mub
adal
a A
nnua
l Rep
ort
201
1
2120
Many of Mubadala Aerospace’s most important businesses were showcased at the Dubai Airshow in November. Strata, our manufacturer of advanced composite aerostructures, signed a strategic partnership with Boeing to be a Tier 1 supplier of aircraft components. Strata has also become the single-source supplier of flap track fairings for the Airbus A330 and A340. These agreements position Strata as a supplier to the world’s largest two aircraft manufacturers.
The Dubai Airshow was also the backdrop for the signing of a heads of terms to establish a joint venture between Mubadala Aerospace subsidiary Horizon Flight Academy and Abu Dhabi Aviation (such joint venture remaining subject to regulatory approvals). The partnership will establish an advanced flight training facility in Abu Dhabi to serve global commercial and defense customers.
Piaggio Aero announced the delivery of the first P180 Avanti II aircraft to
Russian-owned Flight Inspection & Systems. Both aviation companies have also jointly announced the signing of a new contract for five more P180 Avanti II aircraft.
Another joint venture which made progress during 2011 is the Advanced Military Maintenance, Repair and Overhaul Centre (AMMROC), in which Sikorsky and Lockheed Martin each have a 20 percent equity stake while Abu Dhabi Aircraft Technologies (ADAT) owns 60 percent.
AMMROC featured strongly in the pipeline of deals signed over the past 12 months, after agreeing an AED 1.15 billion deal with the UAE armed forces to support their Maintenance Repair and Overhaul (MRO) program.
Increasing the skills and employment opportunities for the region, Strata employed 110 (33 percent) Emirati nationals at the end of 2011 and is on course to employ a workforce
that is 50 percent Emirati by 2014, while Horizon trained 50 Emirati cadet pilots for Etihad in 2011.
Many staff within Mubadala Aerospace have benefited from the world-class management and technical training supplied by Air Business Academy, a subsidiary of Airbus. Of the total of 2,921 training hours provided, 53 percent were supplied to Emirati nationals.
of transactions contracted by Sanad since its launch
US$500 million
Mubadala Aerospace“ Mubadala Aerospace enjoyed tremendous success across its portfolio in 2011. The partnerships that we have continued to build upon over the past year will pay dividends as our strategy to develop a long-term, sustainable aerospace industry in Abu Dhabi comes to fruition.’’ Homaid Al Shemmari Executive Director
The Mubadala Aerospace MRO network, encompassing SR Technics and ADAT, signed agreements with a number of airlines including Swiss, Virgin Australia, flydubai, SpiceJet, Thomas Cook and Onur Air. A number of these were also supported by Sanad Aero Solutions, which has contracted over US$500 million in long term engine and component access transactions since its launch in early 2010 which are associated with incremental long term MRO programs now valued in excess of US$2 billion.
50 Etihad Emirati cadet pilots trained in 2011
33%Emirati nationals at Strata; 50% by 2014
Abu Dhabi Aircraft Technologies (ADAT)
Advanced Military Maintenance Repair and Overhaul Centre (AMMROC)
Horizon
Piaggio Aero
Sanad Aero Solutions
SR Technics
STRATA
Key Assets

Mub
adal
a A
nnua
l Rep
ort
201
1
2322
Mubadala Capital has primary responsibility for Mubadala’s financial investments.
Investing throughout the capital structure in a diversified portfolio of global public and private securities, it uses a value oriented investment approach with a primary focus on the creation of long-term value and a bias towards capital preservation.
There are four general areas of activity managed by two investment teams. The direct investment team’s responsibilities include the management of large, non-UAE public positions, including public market investments in AMD and GE, and the management of an allocated pool of capital for deployment across a range of public and private market opportunities using a value oriented investment strategy.
The funds team is responsible for managing both LP/funds activities and a number of GP ownership positions, including The Carlyle Group, Related and
Verno Capital. In addition, the operations team is responsible for a number of middle and back-office functions across Mubadala Capital’s business activities.
During 2011, Mubadala Capital boosted its stake in GE by purchasing 3.3 million shares at an average of $15.84 per share. It now owns a total of 80.2 million shares, bringing total ownership to 0.76 percent.
Terms were also agreed with Carlyle for the redemption of 50 percent of the $500m principal outstanding Carlyle convertible notes, a transaction that resulted in a total proceeds of $265.6 million.
2011 also saw Mubadala Capital agree a number of new fund commitments, including:
• The Related Distressed Opportunity Fund, which focuses on distressed real estate opportunities, origination and acquisition of construction loans and multi-family housing and retail opportunities;
• The Carlyle South America Buyout Fund, which conducts leveraged buyout transactions in targeted industries, primarily in Brazil and other select South American countries, including Argentina, Chile, Colombia and Peru;
• New Horizon Capital, a China-focused private equity firm committed to transforming and growing businesses that exhibit strong underlying fundamentals and high growth potential in the less penetrated regions of China.
redemption of outstanding Carlyle convertible notes, realizing 11.25% return
US$250 million
80.2 millionshares in GE (approximately 0.76%)
19.4%ownership in AMD
AMD
GE
John Buck Company
Raine Group
Related Companies
The Carlyle Group
Verno Capital
Key Assets
Mubadala Capital“ 2011 marked Mubadala Capital’s first full year of operations. The team had a number of successes during the year with significant accomplishments across our LP, public and private portfolios and the continued build-out of our operations team. We are well positioned for future success during 2012 and beyond.’’ Hani Barhoush Executive Director

Mub
adal
a A
nnua
l Rep
ort
201
1
2524
Mubadala Healthcare is playing a key role in the creation of a thriving, world-class healthcare industry - partnering with the leading experts in their field, delivering the highest international standards of care, and reducing the need for patients to seek treatment overseas.
Mubadala Healthcare completed a number of world-class facilities during 2011 that not only improve access to top quality healthcare within Abu Dhabi and the UAE, but also provide the springboard for future growth, both regionally and internationally.
Imperial College London Diabetes Centre, a partnership with Imperial College London, opened a second facility in Al Ain. The main facility, in Abu Dhabi, already has 59,578 registered patients.
Abu Dhabi is also the main regional hub for the National Reference Laboratory, which opened in 2011. Together with the first laboratory in Dubai’s Biotechnology and Research Park (DuBiotech), it now
offers more than 4,000 sophisticated and specialized medical diagnostic tests.
National Reference Laboratory aims to offer healthcare providers in the region a one-stop solution for all of their clinical testing needs, creating an efficient and high-quality service that is closer to home, reducing both turnaround times and logistical costs compared with laboratories abroad.
Wooridul Spine Centre is another development that strengthens local healthcare provision and reduces the need for travel abroad. A partnership with South Korean spine care specialists Wooridul, it is dedicated to minimally invasive spinal care.
Mubadala Healthcare's success is also reflected in the number of patients treated and number of jobs created. For instance, Capital Health Screening Centre, which performs health check-ups for visa applications, served 50,346 people in 2011.
registered patients at the Imperial College London Diabetes Centre59,578
Mubadala Healthcare“ 2011 was an excellent year for Mubadala Healthcare with the opening of four new facilities as well as the structural completion of our two large hospital projects. I am proud to say that not only have we performed well against our financial mandate but, importantly, we have also delivered tremendous socio-economic value by investing in the health of our nation.’’ Suhail Mahmood Al Ansari Executive Director
4,000tests available at National Reference Laboratory
The topping out of Cleveland Clinic Abu Dhabi saw the successful completion of the latest phase of this 364-bed (expandable to 490-bed), multi-specialty facility. Its five institutes of Digestive Disease, Eye, Heart and Vascular, Neurological, and Respiratory and Critical Care, offer an advanced range of tertiary and quaternary medical services. At the end of 2011 the facility employed 160 people in Abu Dhabi, including a full leadership team and almost half of the physician institute chairs, the majority joining from the Cleveland Clinic Ohio campus.
1,094surgical procedures at Abu Dhabi Knee & Sports Medicine Centre in 2011
Abu Dhabi Knee and Sports Medicine Centre
Arzanah Medical Complex
Arzanah Wellness and Diagnostic Centre
Capital Health Screening Centre
Cleveland Clinic Abu Dhabi
Imperial College London Diabetes Centre
National Reference Laboratory
Tawam Molecular Imaging Centre
Wooridul Spine Centre
Key Assets

Mub
adal
a A
nnua
l Rep
ort
201
1
2726
Mubadala Industry grew significantly last year, boosting both revenue and net income by more than 100 percent. The current net equity deployed is AED 6.2 billion*, with a gross asset base under management of AED 47.5 billion, 70 percent of which is deployed in the UAE. In terms of employment, the various assets within the unit’s portfolio have created more than 2,700 direct jobs in the UAE to date. Mubadala Industry also continued to make significant progress in the development of the UAE’s human capital by increasing total Emiratization from 43 percent to 58 percent.
EMAL, formed in partnership with Dubai Aluminium, built on 2010’s record of growth with a series of important milestones. It increased production to full capacity of 750 kilotonnes per year and produced its millionth tonne in November 2011. The Phase I upgrade and Phase II expansion were also launched, representing a US$4.6 billion investment that will make EMAL one of the world’s largest single-site smelters, with an annual production capacity of approximately 1.3 million tonnes.
When the two projects are complete, EMAL will have created a further
1,000 jobs and will annually contribute more than AED 14 billion to non-oil GDP. The company has also started attracting downstream businesses in KIZAD (Khalifa Industrial Zone Abu Dhabi) and signed landmark supply agreements.
The aluminium business also saw two important strategic developments that extended its investments intoChina and Guinea to secure supplies of raw materials. Mubadala Industry launched Suyadi, its first joint venture in China, to supply calcined petroleum coke to EMAL and other smelters. It also signed a collaboration agreement with the Republic of Guinea for the development of bauxite, alumina and iron ore investments.
Tabreed (National District Cooling Company) successfully completed an AED 5.9 billion recapitalization program, including AED 2.8 billion in debt restructuring at lower cost and longer tenor, and secured an additional AED 3.1 billion in convertible facilities and investments.
Tabreed’s operational performance has also continued to exceed expectations for eight consecutive quarters. The core
chilled water revenue has grown 25 percent in 2011, while water and power efficiency continued to improve and 11 new plants came online.
The power and water businesses continue to perform in line with expectations. Mubadala Industry's power generation business, with its global partners, is managing installed capacity of 2.6 GW and gross assets exceeding AED 5 billion. Azaliya, a water services joint venture with Veolia, now employs more than 4,000 people. It is the largest water business in the region, providing services to more than 8.5 million people, and wastewater services to 5.5 million people, from Tangier in Morocco to Riyadh in the Kingdom of Saudi Arabia.
increase in Abu Dhabi's non-oil GDP
3.5%Mubadala Industry“ In its first full year of production, EMAL was an outstanding operational and financial success. We also took steps to secure future performance, executing early works on Phase II to nearly double capacity by the end of 2013 and launching international ventures to secure our supplies of carbon, bauxite and alumina.’’ Ahmed Yahia Al Idrissi Executive Director
In 2011, Mubadala Industry contributed more than AED 9 billion to Abu Dhabi’s GDP, increasing non-oil GDP by an estimated 3.5 percent.
Revenue of
AED 6.2 billion* 2,700direct jobs created in the UAE to date
Azaliya
Emirates Aluminium (EMAL)
Guinea Alumina
Hadjret En Nouss
SMN Power Holding
Suyadi
Tabreed
Tanqia
*including our share of the revenue from investments in associates and joint ventures
Key Assets

Mub
adal
a A
nnua
l Rep
ort
201
1
2928
Mubadala Information & Communications Technology (ICT) invests in and develops a portfolio of global ICT assets to bring industry-leading facilities to the region. In 2011, Mubadala Information & Communications Technology saw a number of investments reach significant milestones in their longer term development. These projects not only involve strong partnerships with acknowledged industry leaders, but also bring expertise and employment opportunities to the communities in which they operate.
Two UAE-based assets, Injazat and du, are continuing to thrive and meet revenue and income targets. Injazat, in which ICT
has a 60 percent stake, is ranked among the leading IT outsourcing companies in the UAE by IDC, a global IT analyst. Injazat sponsored INSEAD’s inaugural Global Business Leaders Conference and received two prestigious international awards during the year. du, 19.8 percent owned by ICT, provides integrated telecommunications – mobile, fixed line, internet and pay TV – and offers services to more than 45 percent of the UAE market.
In Africa, the mobile operator Etisalat Nigeria (EMTS), 30 percent owned by ICT, has seen a 57 percent increase in subscribers to 11 million. It has also seen a strong positive reaction to its 3G service, with an average revenue per user (ARPU) of US$20 within six months of its launch – compared to a blended ARPU of US$5.5 for all mobile traffic.
ICT also owns more than 5 percent of Prodea, a US-based start up that is working with du to offer consumers access to a range of services delivered
through televisions, personal computers and mobile phones. ICT has also taken a 5.4 percent stake in another US-based start-up, Damballa, a specialized cyber-security company.
The number of Emirati nationals in the unit has also increased from 35 percent in 2010 to 45 percent.
market share achieved by du
45%Mubadala Information & Communications Technology“ In challenging economic times, ICT stands out as a truly defensive sector. 2011 was a year of achievement; our first satellite Y1A successfully launched and started operations, Etisalat Nigeria exceeded 11 million mobile subscribers and we achieved over 45 percent mobile market share in the UAE through our investment in du.’’ Jassem Mohamed Al Zaabi Executive Director
Mubadala ICT shot the UAE into the space age with a satellite that will provide communications services on a multi-continent scale. In April, Y1A was launched from the European Space Center in French Guiana. Described by Waleed Al Mokarrab Al Muhairi, Yahsat Chairman, as “a tremendous step forward in delivering an advanced technology and communications offering based in Abu Dhabi”, Yahsat’s space ambitions naturally do not begin and end with Y1A. Y1B, Yahsat’s second satellite scheduled for launch in the first-half of 2012, will be the first satellite in the region delivering broadband services to consumers in 27 countries in the Middle East, Africa and Southwest Asia.
11,000,000 subscribers achieved by EMTS
45%of highly skilled positions in Yahsat filled by EmiratisYahsat became the
1st multi-payload satellite operator from the UAE
Damballa
du
Etisalat Nigeria
Injazat Data Systems
Prodea
Yahsat
Key Assets

Mub
adal
a A
nnua
l Rep
ort
201
1
3130
Mubadala Infrastructure is helping to deliver the promised economic transformation of Abu Dhabi. The unit achieved notable milestones in its mission to develop the physical and social infrastructure required to underpin a well-organized and rapidly evolving society.
Delivered on time and to budget, Zayed University’s new campus opened its doors for the first time in September 2011. Zayed University can provide placements for up to 6,000 students a year. The Paris Sorbonne University Abu Dhabi (PSUAD) campus can provide a further 2,000 places. Combined with the existing UAE University campus, this represents a world-class higher education capacity in excess of 20,000 students annually.
Mubadala Infrastructure also completed stage three of the UAE University in the city of Al Ain in July 2011, which included handing over the male academic and teaching buildings, together with the dining and sports halls.
The unit also sold a 49 percent stake in its previously fully owned SPV - Manhal Development Company - the developer, owner and operator of the PSUAD campus, to Mubadala Infrastructure Partners, an infrastructure focused fund investing in infrastructure in the Middle East, North Africa and Turkey.
Mubadala Infrastructure Partners is co-sponsored by Mubadala, General Electric and Credit Suisse. The sale and partial exit of this significant minority equity stake is an example of how Mubadala aims to both share and diversify its project and financial risk with partners.
Mubadala Infrastructure has an Emiratization rate of 56 percent, well above the target rate of 45 percent.
students at Zayed University's new Abu Dhabi campus
Up to 6,000
Mubadala Infrastructure“ In 2011, we saw the successful completion and delivery of many vital infrastructure projects in the higher education sector as the unit continued to be a center of excellence for the structuring, delivery and operation of projects in Abu Dhabi.’’ Ali Eid AlMheiri Executive Director
Despite the enormous logistics involved in the project, Zayed University was delivered on-time and to budget. It aims to become one of the pre-eminent universities in the region, as well as a center of learning excellence. The 224,000m2, 28-building site has capacity for 6,000 students, split between female and male campuses. The campus features sophisticated sport facilities, a library, residences, dining areas, retail outlets and a cutting-edge convention center, with a 1,000 seat theater.
Up to 15,000students at UAE University's new campus
56%Emirati nationals in Mubadala Infrastructure
Khadamat
Paris Sorbonne University Abu Dhabi
UAE University
Zayed University Abu Dhabi
Key Assets

Mub
adal
a A
nnua
l Rep
ort
201
1
3332
Mubadala Oil & Gas (MOG) enjoyed a successful year, with net income once again well in excess of budget, boosted by steady production, sustained high oil prices, higher gas sales and lower exploration spend. Working Interest Production (WIP) was 140.4 million barrels of oil equivalent (BOE) (an average of approximately 385,000 BOE per day). Importantly, all safety targets were met while achieving this performance, which was driven through a balanced portfolio of production, development and exploration assets.
Dolphin Energy produced and sold its full Development & Production Sharing Agreement entitlement of 730 billion cubic feet of gas and recorded cumulative production of three trillion cubic feet of gas in December.
In South East Asia, the Jasmine field once again exceeded annual production targets, also notching up its 40 millionth barrel of cumulative crude oil production as the year drew to a close. Tatweer recorded gross oil production of more than 40,000 barrels per day – slightly less than target but well above the baseline targets established at the time of award. The Mukhaizna field encountered issues with steam production for part of the year but recovered successfully, and at year-end was producing approximately 125,000 barrels per day.
MOG has also been active in progressing a number of development projects. At the Ruby gas field in Indonesia, it approved a development plan with partners for a total investment of approximately US$500 million, with production expected to commence by Q4 2013. In the Gulf of Thailand at the Manora field, a development concept based on a simple production platform and Floating Storage & Offtake vessel was approved, and work is progressing towards a final investment decision later in 2012.
Key exploration activity included agreeing with the Kazakh authorities on an appraisal program for further defining the 2010 Rak More discovery in N-Block, including shooting new 3D seismic data over the area. The drilling of a second exploration well commenced on N-Block in Q1 2012. In Oman, an appraisal close-out report on Block 62 was submitted to the Ministry of Oil & Gas for its review and discussions between the Ministry and partners are underway on the optimal future development plan for the resources. A program of further exploration drilling on the Block also commenced late in 2011, with the two wells completed before year-end both showing encouraging results.
In Vietnam, pre-development work is being progressed on the Ca Rong Do (CRD) discovery following the drilling of a successful appraisal well. And on Block SK320 in Malaysia, the unit received approval to drill an appraisal well on the M5 gas discovery.
MOG made several exciting acquisitions, including a 20 percent interest in an exploration license area offshore Tanzania, and a 20 percent stake in Block PM324 offshore Malaysia, in partnership with Total and Petronas Carigali. In April it signed a new production sharing contract for Blocks 135 and 136 in Vietnam, adjacent to its CRD discovery. MOG also qualified through the fourth licensing round process to participate in Iraq, where it will continue to seek material, value-adding opportunities.
(Working Interest Production)
140.4 million BOE
Mubadala Oil & Gas“ 2011 was an extremely successful year for Oil & Gas, with production, operating revenues and net income all at record levels. Most importantly, this was achieved alongside solid safety and environmental performance, and a significant increase in the number of Emirati nationals playing central roles in the success of our business.’’ Maurizio La Noce Chief Executive Officer
MOG ventures continue to contribute to Abu Dhabi’s international footprint, developing strong relationships and new partnerships not just in the Gulf region, but across Asia and Africa. MOG now has operations in 12 countries and employs around 470 people, and more than one third of its Abu Dhabi workforce is now Emirati. As MOG's portfolio continues to grow and mature, it continues to evolve too. In 2012, MOG will become a separate wholly-owned subsidiary known as Mubadala Petroleum, which will incorporate Pearl Energy under a single global brand and emphasize its capability as a fully-fledged international exploration and production company.
0 Spills of more than 1 barrel (MOG operated activity)
37%Emiratization in the Abu Dhabi employee base at year end
Block 7 (Offshore Tanzania)
Blocks 135/136 (Offshore Vietnam)
Block PM324 (Offshore Peninsula Malaysia)
Block SK320 (Offshore Sarawak Malaysia)
CRD Field (Offshore Vietnam, Block 07/03)
Dolphin Energy
Habiba Block 62 (Onshore Oman)
Jasmine Field (Offshore Thailand)
Manora Field (Offshore Thailand)
Mukhaizna Block 53 (Onshore Oman)
“N” Block (Kazakhstan)
Pearl Energy
Petrofac Emirates
Ruby Gas Development
Tatweer
Key Assets

Mub
adal
a A
nnua
l Rep
ort
201
1
3534
Mubadala Real Estate & Hospitality (MREH) invests in strategic commercial, residential and hospitality projects that are central to Abu Dhabi’s long term development plans. It focuses on projects that are designed, built and operated to international standards of quality, functionality and sustainability.
MREH’s key projects include Sowwah Island, the 114-hectare new Central Business District (CBD) of Abu Dhabi. Sowwah Square, the flagship development at the heart of the CBD, is the leading mixed use project in Abu Dhabi, featuring four Grade A office towers, The Galleria at Sowwah Square retail precinct and the distinctive new headquarters of the Abu Dhabi Securities Exchange (ADX). Sowwah Square will be flanked by two leading luxury business hotels, Rosewood Abu Dhabi and Four Seasons Hotel Abu Dhabi at Sowwah Island.
The first of the four office towers at Sowwah Square was completed during 2011, welcoming tenants such as Mubadala GE Capital, Clifford Chance,
Al Tamimi & Company and Deloitte, with the remaining three towers expected to be completed in early 2012. More than 30 office leases have been executed and more than 80 percent of the total space is now leased, with tenants including global names such as Booz & Company, Norton Rose LLP and Societe Generale.
The Galleria at Sowwah Square, which will feature approximately 140 retail stores and 25 food and beverage options, is expected to open in 2013. As of year-end, all of the available retail space at the Galleria was under offer to tenants. In addition, construction progressed on Rosewood Abu Dhabi, which is due for completion in late 2012, while Four Seasons Hotel Abu Dhabi is expected to be completed in 2015.
Rihan Heights, the luxury residential project adjacent to the Grand Mosque on Abu Dhabi island, is receiving strong leasing demand, with three towers expected to welcome tenants from the Cleveland Clinic Abu Dhabi in 2012.
The 50 percent MREH-owned Viceroy Hotel Group continued to grow its portfolio of leading hotels and resorts in 2011. The group was awarded contracts to operate the Yas Hotel on Yas Island in Abu Dhabi, and Viceroy Bodrum, a luxury resort and real estate property in Bodrum, Turkey. Viceroy Maldives, an exclusive development on Vagaru Island in the Maldives that is 72 percent owned by Mubadala, opened on April 2nd 2012.
Mubadala Real Estate & Hospitality“ In 2011 we concluded an in-depth review of our operations so as to reinforce our continuing focus on priority projects such as Sowwah Square. Our approach removes any duplication of efforts where Abu Dhabi’s private sector already makes a strong contribution and ensures the continuing maximization of future financial returns.’’ Ali Eid AlMheiri Executive Director
Global Capital & Development, in which MREH has a minority stake, is developing Medini, a 908 hectare (approximately 2,243 acre) city development at the southernmost tip of the Malaysian Peninsula. In late 2011, Global Capital & Development announced that it had agreed to sell two plots of land, covering 279.6 hectares (approximately 691 acres), to Malaysian construction giant Sunway Group and to Khazanah Nasional, the investment arm of the Malaysian government, for a price of RM745.3m (approximately AED904.4m).
of Al Sila (Tower 1) leased to tenants, the first of Sowwah Square’s four office towers
80%
Key Assets
Al Maabar
Arzanah
Capitala
Four Seasons Hotel Abu Dhabi at Sowwah Island
Global Capital & Development
PF Emirates
Rihan Heights
Rosewood Abu Dhabi
Sowwah Island
Sowwah Square
The Galleria at Sowwah Square
Viceroy Hotel Group
Viceroy Maldives

Mub
adal
a A
nnua
l Rep
ort
201
1
3736
Mubadala Services Ventures builds and manages businesses across services industries ranging from financial services, transportation & logistics, and defense. Its eight businesses enjoyed a healthy performance in 2011, with each company’s individual operational successes combining to record a healthy growth in net income for the collective portfolio.
The financial results for the year were anchored by the continued growth in profitability of Abu Dhabi Terminals (ADT), Agility Abu Dhabi and Al Taif Technical Services. Despite challenging conditions in the global shipping market, Emirates Ship Investment Company (Eships) managed to maintain steady growth and positive operating income.
Abu Dhabi Finance retained its market leadership in Abu Dhabi, as the first-choice mortgage provider for Aldar, Sorouh and TDIC properties, and with 52 percent of loan book value granted to Emirati nationals. With its flourishing loan portfolio and customer-centric offering, it has grown to cover three-quarters of the Abu Dhabi real estate market. Recording 90 percent client satisfaction scores - an unparalleled achievement for its peer group - ADF was the proud recipient of the international Stevie Award 2011 for “Customer Service Department of the
Year – Financial Services”. The company was also awarded "The Banker Middle East Industry Award 2011 for Best Use of Technology".
This year also marked notable achievements for Mubadala Services Ventures' other businesses in the Financial Services sector. LeasePlan Emirates won major vehicle tenders with leading organizations such as du, Abu Dhabi Municipality and the National Drilling Company, resulting in a net fleet growth of more than 50 percent for the year. Through Dunia, the unit actively expanded into new business lines, including the launch of a new credit card, co-branded with Club Apparel, one of the largest retail store operators in the UAE. The newest joint ventures in the portfolio, Mubadala Pramerica Real Estate Investors and a partnership with Mesirow Financial, have both successfully laid the foundation for their core operations, in preparation for full operational launches in the first half of 2012.
Agility Abu Dhabi executed yet another year of first-rate integrated logistics service provision for the 2011 Abu Dhabi Formula 1 Grand Prix. As a result of its continued successful service delivery for Borouge at its logistics hub in China,
Agility Abu Dhabi won a second major contract with Borouge to manage the Ruwais Distribution Centre, Borouge’s hub in the Western Region for storing and dispatching polypropylene and polyethylene.
In the defense sector, Al Taif commemorated five years of delivering on its commitments to the UAE Armed Forces, including rolling out lean business practices across workshops and departments. Also in the sector, the team launched Bayanat, a provider of geospatial data services, during the 2011 International Defence Exhibition and Conference (IDEX), and successfully steered it through its operational start-up year.
increase in profitability at Abu Dhabi Terminals
55%
Mubadala Services Ventures“ 2011 was a momentous year for Mubadala Services Ventures, with financial break-even achieved in the young portfolio ahead of plan. We look forward to continued delivery, profitability, growth and successful build-out of our portfolio during 2012, with the operational launches of Mubadala Pramerica Real Estate Investors and our JV with Mesirow Financial.’’ Laurent Depolla Executive Director
Armed with new management and greater operational efficiencies, Abu Dhabi Terminals (ADT) stood out with a 47 percent increase in container throughput and 55 percent rise in profitability. The ADT management team remains on track for the transition to the new Khalifa Port in 2012. Complementing existing port operations, Eships continued to strengthen its presence as a leading regional chemical/product tanker and dry bulk carrier, and its track record for success positioned it to win a strategic long-term contract with a leading regional industrial player through its subsidiary Eships Oldendorff Logistics.
52% of loan book value granted to Emirati nationals by Abu Dhabi Finance
50%increase in vehicle leasing fleet at Leaseplan Emirates
Abu Dhabi Finance
Abu Dhabi Terminals
Agility Abu Dhabi
Al Taif Technical Services
Bayanat for Mapping & Surveying Services
Dunia Finance
Emirates Ship Investment Company
LeasePlan Emirates
Key Assets

Mub
adal
a A
nnua
l Rep
ort
201
1
3938
Mubadala’s advanced technology investment vehicle, the Advanced Technology Investment Company(ATIC), is playing a key role in Abu Dhabi’s diversification into a knowledge-based economy by investing in one of the world’s leading technology industries – semiconductors.
Semiconductor manufacturing is a sector estimated to grow faster than other segments of the semiconductor industry, such as design or packaging. During a volatile period for businesses globally, ATIC aggressively pursued its goal of taking its primary asset, GLOBALFOUNDRIES – the world's first truly global foundry – to the next level. It expanded its foundries in Singapore and Dresden, Germany to serve existing, leading-edge customers and continued construction on the world’s most advanced fabrication plant in upstate New York.
ATIC’s focus is on growing and supporting GLOBALFOUNDRIES as it creates a new platform of innovation to drive current and future generations of
semiconductor products. In the fourth quarter of 2011, GLOBALFOUNDRIES became the second-largest wafer manufacturing company by revenue in the world. Its eight “Fabs” continue to serve over 150 customers globally.
In May 2011, GLOBALFOUNDRIES and its largest customer, AMD, launched the revolutionary ‘Llano’ chip at Ferrari World in Abu Dhabi. Llano is an Accelerated Processing Unit (APU), combining graphics and computer processing on one chip for ultimate performance.
There were also a number of changes to the company’s senior management, with a new CEO, Ajit Manocha, and CFO, Daniel Durn, joining the team. Both were formerly with ATIC and are now helping to drive additional value in this significant asset.
ATIC also made further investments in innovative technology start-ups with the potential to strengthen the GLOBALFOUNDRIES ecosystem. It invested US$13.4 million in
Intermolecular, a firm focused on R&D productivity for the semiconductor and clean energy sectors, and an additional US$2 million bringing its ownership stake to 13.14% in Calxeda, a company that leverages ultra-low power processors to bring efficiency to data centers.
In 2011, GLOBALFOUNDRIES became the second largest foundry, by revenues, in the world
Advanced Technology Investment Company (ATIC)“ ATIC’s focus on building GLOBALFOUNDRIES into a global semiconductor manufacturing leader fits with Mubadala’s long-term strategy of creating high-value global champions. ATIC has also been training a new generation of Emirati technologists and started catalyzing an advanced technology research and development hub in Abu Dhabi.” Ibrahim Ajami Chief Executive Officer
GLOBALFOUNDRIES achieved a number of key milestones in 2011. The company delivered the industry’s first High-K Metal Gate (HKMG) products. This approach to HKMG offers higher performance with a 10-20% cost saving over HKMG solutions offered by other foundries, while still providing the full entitlement of scaling from the 45/40nm node. 28nm wafers were design-ready and customer silicon began running in Fab 1 in Dresden, Germany, the focal point of the company’s transformation. In Q3 and Q4, significant operational changes lead to a dramatic increase in production velocity and several major breakthroughs in yield learning. The company exited 2011 having shipped hundreds of thousands of 32nm HKMG wafers.
610 Emirati nationals enrolled in training and development programs
91%stake in GLOBALFOUNDRIES as at 31 December 2011
Calxeda
GLOBALFOUNDRIES
Intermolecular
Key Assets
#2

Mub
adal
a A
nnua
l Rep
ort
201
1
4140
100MW Shams 1 is on course to start operations in the 4th quarter of 2012
A number of ambitious projects came to fruition over the course of 2011, namely within the power generation sector.
Chief among these was the opening of Gemasolar, Torresol’s 19.9 megawatt (MW) concentrated solar power (CSP) plant in Spain which produces electricity up to 15 hours without sunlight, the only solar thermal plant that can deliver power in 24 hours of uninterrupted operation, which has been selling electricity to the grid since May 2011. Also completed are Torresol’s Valle 1 and 2 CSP plants (50MW each) both of which will become operational in early 2012. In addition in Europe, Masdar completed construction in December of the 11.7MW Gotha solar farm in Germany.
In the UK, the construction of London Array, the 1GW offshore wind farm, has progressed well. Around half the wind turbine foundations have been installed so far and the first electricity should be generated in the second quarter of 2012.
Meanwhile, in Abu Dhabi the 100MW Shams 1 project, the largest CSP project in the world and the first CSP plant in the Middle East, is on course to start operations in the 4th quarter of 2012.
Construction at Masdar City, designed to be a global hub for clean technology and renewable energy, is proceeding well.
Signature buildings such as the Siemens regional headquarters building, the Masdar Institute 1B, and the Courtyard building (the first commercial office building), are due for handover in 2012. More than 70 companies have registered in the Masdar Special Economic Zone and are anticipated to take up tenancies in Masdar City once commercial buildings are completed.
Masdar Capital has successfully exited its investment in Duratherm at an attractive return and has invested in eCullet, a technology enabled glass processor addressing the large and growing market for glass recycling in the United States. The investment company with its partners now has US$540 million under management. It intends to grow its capital base in 2012 through expansion into key Asian markets through a combination of strategic partnerships and third party capital.
Masdar Carbon has re-affirmed its agreement with Abu Dhabi National Oil Company (ADNOC) to continue with the development phase of a carbon capture and storage project, the first of its type to be rolled out in the MENA region. The project will collect and transport carbon dioxide from Emirates Steel toone of ADCO’s onshore fields for EOR (Enhanced Oil Recovery) injection and gas liberation.
After only two years of operations, Masdar Institute now has roughly 250 students from over 33 countries and more than 50 R&D projects across the following strategic research themes: water, environment and health; future energy systems; microsystems and advanced materials.
With 40% of personnel being Emirati nationals, Masdar has focused much of its attention on enhancing and cultivating expertise through its various development programs.
concentrated solar power plant in Spain
19.9 MW
Masdar“ Over 2011, Masdar continued in its progress towards growth, achieving important milestones against its long-term plans. The successes achieved over the past year are a result of Masdar’s strong corporate values and ability to remain agile within a rapidly evolving industry. Looking into 2012, we will focus our efforts on maximizing value from our existing assets and pursuing new growth opportunities, while remaining aligned with our Shareholder and Abu Dhabi’s broader economic vision. Above all, our progress as an organization is owed to the dedication of our people, who we will continue to empower and cultivate.” Dr. Sultan Ahmed Al Jaber Chief Executive Officer
Gemasolar employs the most advanced central tower and energy storage technology. Located inSeville, Spain, the 19.9MW project with over 2,500 heliostats, supplies uninterrupted clean energy toover 25,000 households through its 15 hour thermal storage capacity.50
Research & Development projects
Emirates Steel Industry Carbon Capture and Utilization Project
E.ON-Masdar Integrated Carbon
London Array
Masdar City
Masdar PV
Seychelles Wind Project
Shams 1
Sir Bani Yas Wind Project
Toressol Energy
Key Assets

Mub
adal
a A
nnua
l Rep
ort
201
1
4342
Mubadala Aerospace continues to focus on improving skill levels amongst the local workforce. In particular, Strata, the aerospace composites company, developed two major programs to attract Emirati nationals: the Engineers program, which provides 36 months of training and an international work experience assignment; and the Technicians program, which lasts 22 months. In February 2011, Fatima Al Nuaimi became the first Emirati to be promoted to configuration management at Strata, after completing her training as a technician.
ATIC is equally active in the training and development of Emirati nationals, partnering with local universities and the Abu Dhabi Education Council on a series of educational and internship initiatives.
Investing in the Community
The Al Nokhba Internship program at GLOBALFOUNDRIES and the Al Nokhba Elite Scholarship has now been awarded to 78 students, enabling them to study engineering at some of the world’s top universities. The company has also partnered with leading local institutions in creating a polytechnic curriculum and a re-tooling/work assignment program for Emirati nationals. At the end of 2011, ATIC had enrolled more than 610 Emirati nationals in its training and development programs.
Mubadala Information & Communications Technology also remains a dynamic participant in local academic initiatives. Yahsat, the satellite company, hosted 26 schools on National Day and educated them about space, while Injazat, the IT company, sponsored INSEAD’s Inaugural ‘Global Business Leaders Conference’ and took part in the Third Annual Emiratization Forum.
Lastly, Mubadala Industry companies, such as EMAL and Tabreed, continued to support community development programs and events. These included R&D programs with local research institutions, community open days to explore employment opportunities, collaboration programs with local authorities, and sponsorship of the Al Wahda Football Club. Other contributions provided support to community institutions such as the Emirates Autism Centre which aims to help improve the lives of autistic children.
While our businesses are predominantly focused on the creation of value within the UAE, we are also a conscientious and respectful investor in those countries in which we run operations.
With a diverse portfolio of international assets, Mubadala Oil & Gas exemplifies that commitment. In Malaysia, it is working with MyKasih, a not for profit organization that provides welfare support to impoverished families in the Sarawak region. It has also invested significantly in Thailand, leading a community program in the fishing villages near our operations and supporting several projects to rehabilitate coral colonies in the Gulf of Thailand affected by a widespread bleaching occurrence. It also contributed to victims of the recent floods in Bangkok through the Thai Department of Mineral Fuels and Petroleum Operators’ Foundation, to provide boats, food and sanitary facilities.
As well as delivering sustainable financial returns to its Shareholder and contributing to the development and diversification of the economy of Abu Dhabi and the UAE, Mubadala has a secondary role as a provider of social benefits to the community. We are creating jobs and career development opportunities for Emirati nationals, while facilitating the development of world-class infrastructure in the Emirate, including healthcare, education and industrial facilities.
15,004participants in Mubadala’s community tennis program.
5 millionwork hours achieved by EMAL without a single Lost Time Incident.
13,000 skilled workers are employed by ATIC, with 610 Emirati nationals enrolled in its training and development programs.
20,000 students can now be educated at Zayed University, UAE University and Paris Sorbonne University – Abu Dhabi.
1,000jobs will be provided by STRATA by 2020, with a focus on the development of Emirati nationals.

Mub
adal
a A
nnua
l Rep
ort
201
1
4544
Mubadala is committed to fostering an environment that inspires and prepares today’s young Emirati nationals to participate in Abu Dhabi’s future.
Abu Dhabi’s rapid economic and social development is creating new opportunities for today’s young Emirati nationals. However, this growth has also increased the need to support them as they look to determine their future paths - helping them to understand how they can contribute to Abu Dhabi’s future.
We are particularly aware of how critical the participation of young Emirati nationals will be, not only to the long-term sustainability of Mubadala’s business objectives, but to the continued economic and social development of the UAE.
Just as we invest in a variety of sectors and initiatives to help Abu Dhabi’s economic and social development, we are committed to fostering an environment in which young Emirati nationals can practice a healthy lifestyle, pursue a world-class education and appreciate arts and culture.
Wellbeing
“ With the help of Mubadala we have got more kids active and on the court as opposed to them sitting at home watching TV.” Sigi Meeuws, Professional Sports Services
“ When I was selected to play tennis with Roger Federer and Rafael Nadal it was the best day of my life. One day I would like to be a star tennis player like them.” Ali Al Marzouqi, Student at The Glenelg School of Abu Dhabi, Aged 13
“ Thank you Mubadala for supporting the development of grass-roots football in the UAE.” Ismail Mattar, UAE National Team Player
The Leaders of Tomorrow
As one of the largest investors in Abu Dhabi’s healthcare sector, we are acutely aware of the importance of a healthy population to the Emirate’s future development. Through Mubadala sponsored events and education initiatives, we aim to encourage Emirati nationals to adopt a healthier lifestyle.Mubadala sponsored the World Tennis Championship, held at Zayed Sports City (ZSC) on the 29th, 30th and 31st December. It attracted one of the most prestigious fields ever assembled in the Middle East, featuring the world’s top 3 players: Novak Djokovic, Rafael Nadal and Roger Federer.
Our involvement does not end with the professionals. We launched Mubadala Tennis days, where national schools were able to send students to ZSC for free coaching, while our ‘Tennis in Schools’ program provided equipment, training sessions and tennis manuals to schools.
Our second annual Get Fit Day provided an opportunity for the public to experience all of the programs at ZSC free of charge. The Tennis Academy offered fitness and training programs for the community, while Professional Sports Services’ Tennis Academy hosted 10 tournaments for youth ages 5 to 16 throughout the year.
Launched in 2011, Mubadala’s ‘Football in Schools’ program provided over 100 schools across the UAE with equipment, interactive workshops and manuals for teachers and students to enhance the teaching and learning experience. In addition, regional festivals gave children who participated in the program the chance to play at a competitive level against their peers.

Mub
adal
a A
nnua
l Rep
ort
201
1
4746
Culture Education
“ The Youth Forum provided a powerful platform for the youth to engage & network with industry professionals, which I am sure helped set their future plans.” Noura Al Kaabi, Chief Executive Officer, TwoFour54
The establishment of a knowledge-based economy, supported by world-class human capital, is central to sustaining Abu Dhabi’s growth. In addition to our investments in education infrastructure, we are working closely with local stakeholders to inspire Emirati nationals to achieve excellence in education.
On October 18th 2011, over 300 Emirati nationals aged between 17-24 attended the inaugural Youth Forum held at the Abu Dhabi National Exhibition Centre. Coordinated by Mubadala, the event was designed to raise awareness of career opportunities available across the Emirate in sectors as varied as marketing & branding, healthcare and academia.
The event comprised two panel discussions, entitled "Science, Technology & Industries” and “New Opportunities”, as well as a number of lively Q&A discussions with senior participants drawn from across the Abu Dhabi business community.
Among the speakers were three Mubadala sponsored NASA interns - Shamma Al Qassim, 19, Hazza Bani Malek, 20, and Hamad Rajab, 21 - who recently returned from an internship at the world-famous NASA space center.
The Forum was the first in a series of Mubadala initiatives designed to help Emirati nationals understand the role they can play in contributing to Abu Dhabi’s future success.
“ It is fantastic that Mubadala are supporting the education of arts and culture in schools by providing learning tools to help engage our students. The ’Back to School With Mubadala’ notebook was a great way to give the students an insight into the world of music, creative writing and art, and help them to discover their passion.” Jonathan Lyall, Director of Arts, British School Al Khubairat
“ Thanks to Mubadala, we have managed to reach out to thousands across the UAE.” Lisa Ball-Lechgar, Strategic Advisor, Abu Dhabi Music and Arts Foundation
The development of a thriving arts and cultural capital is a significant part of Abu Dhabi’s future ambitions. Through events and initiatives, and partnerships with local stakeholders, we are creating platforms for young Emirati nationals to develop their talents, pursue their interests, and contribute to Abu Dhabi’s economic and social development.
Through our partnership with the Abu Dhabi Music and Arts Foundation (ADMAF), Mubadala is proud to play a part in bringing internationally renowned artists and musicians to the United Arab Emirates. We believe that, with continued investment and dedicated management, music and arts will provide a broad range of opportunities for a growing local talent pool.
As Main Sponsor of the Abu Dhabi Festival, widely considered to be one of the region’s most important cultural events, we are helping to deliver a diverse annual schedule of classical music, theatre, jazz, ballet and fine arts performances, supported by engaging education programs. Drawing together a program of the very best talent from around the world, the Festival aims to explore the Emirates' artistic and cultural heritage and traditions.
Our commitment to the Abu Dhabi Festival extends via the ‘Back to School with Mubadala’ series, an initiative that takes visiting performers into schools and community centers across Abu Dhabi. The project aims to inspire the next generation of talent through an engaging series of mini-performances, workshops and master-classes.
“ At the Youth Forum, I saw the leaders of the future. Their enthusiasm and dedication left me feeling optimistic for the future of our country.” Dr. Jamal Mohammed Al Kaabi, Director of Customer Service and Corporate Communications, Health Authority – Abu Dhabi
“ I know from my own personal experience at NASA what great opportunities Abu Dhabi is providing for its young people. Our leaders are forging a future full of opportunity and, as the next generation, it’s our responsibility to grasp the chance to make a difference.” Hamad Rajab, NASA Intern
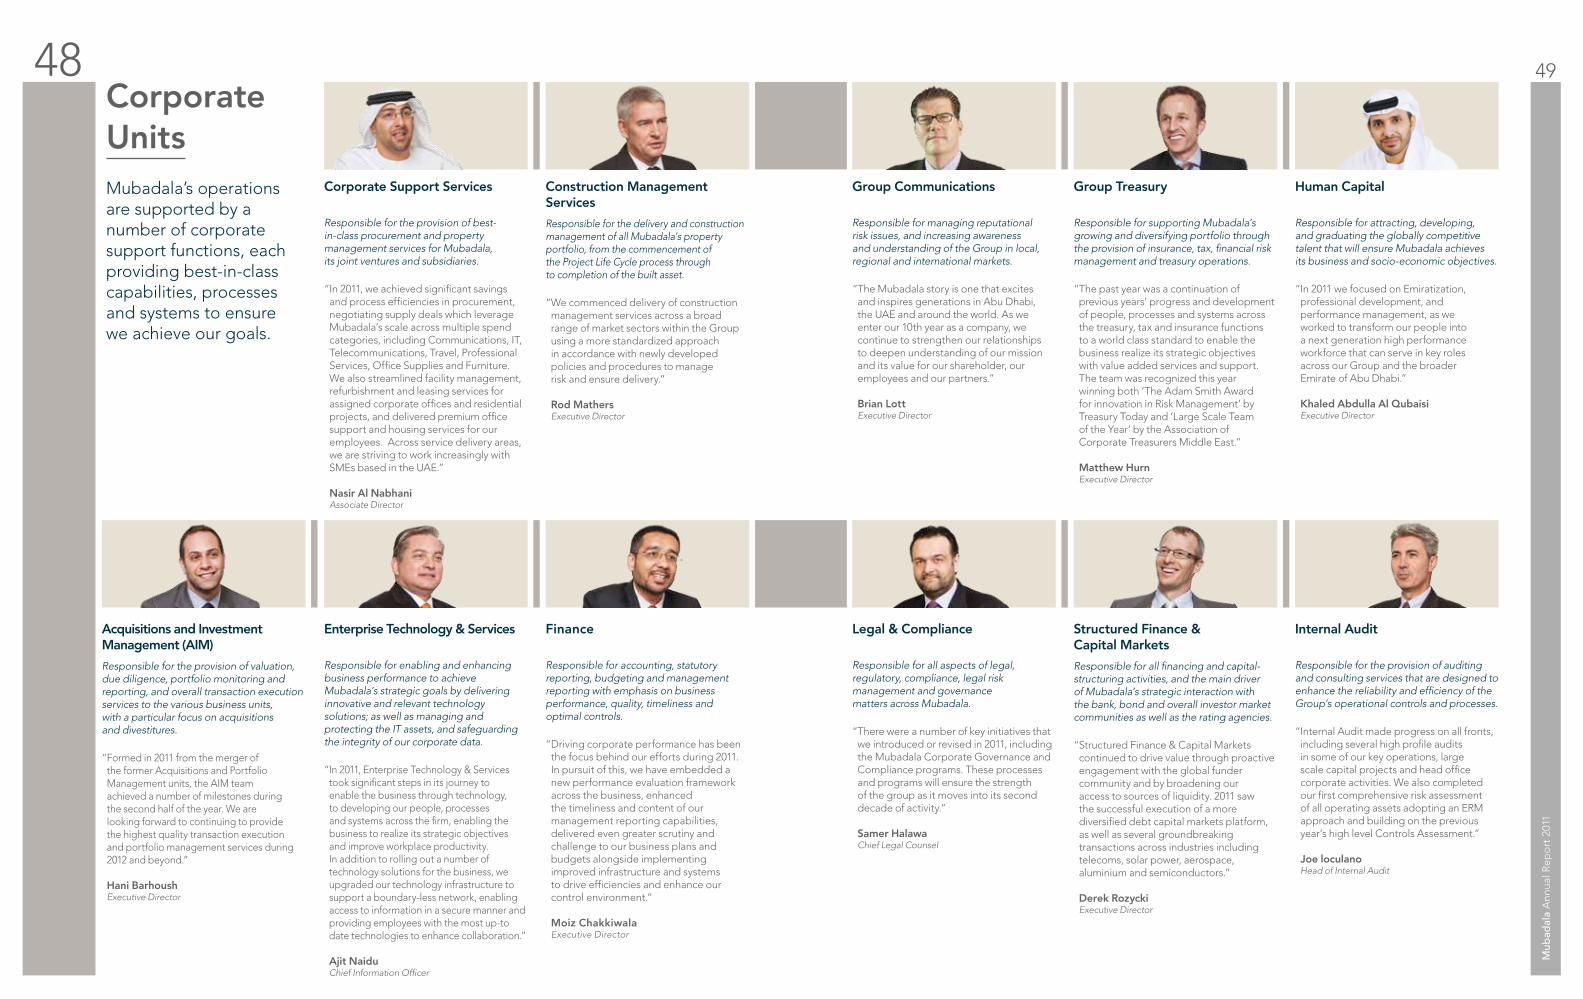
Mub
adal
a A
nnua
l Rep
ort
201
1
4948
Mubadala’s operations are supported by a number of corporate support functions, each providing best-in-class capabilities, processes and systems to ensure we achieve our goals.
CorporateUnits
Structured Finance & Capital Markets
Responsible for all financing and capital-structuring activities, and the main driver of Mubadala’s strategic interaction with the bank, bond and overall investor market communities as well as the rating agencies.
“ Structured Finance & Capital Markets continued to drive value through proactive engagement with the global funder community and by broadening our access to sources of liquidity. 2011 saw the successful execution of a more diversified debt capital markets platform, as well as several groundbreaking transactions across industries including telecoms, solar power, aerospace, aluminium and semiconductors.” Derek Rozycki Executive Director
Human Capital
Responsible for attracting, developing, and graduating the globally competitive talent that will ensure Mubadala achieves its business and socio-economic objectives.
“ In 2011 we focused on Emiratization, professional development, and performance management, as we worked to transform our people into a next generation high performance workforce that can serve in key roles across our Group and the broader Emirate of Abu Dhabi.” Khaled Abdulla Al Qubaisi Executive Director
Internal Audit
Responsible for the provision of auditing and consulting services that are designed to enhance the reliability and efficiency of the Group’s operational controls and processes.
“ Internal Audit made progress on all fronts, including several high profile audits in some of our key operations, large scale capital projects and head office corporate activities. We also completed our first comprehensive risk assessment of all operating assets adopting an ERM approach and building on the previous year’s high level Controls Assessment.” Joe loculano Head of Internal Audit
Finance
Responsible for accounting, statutory reporting, budgeting and management reporting with emphasis on business performance, quality, timeliness and optimal controls.
“ Driving corporate performance has been the focus behind our efforts during 2011. In pursuit of this, we have embedded a new performance evaluation framework across the business, enhanced the timeliness and content of our management reporting capabilities, delivered even greater scrutiny and challenge to our business plans and budgets alongside implementing improved infrastructure and systems to drive efficiencies and enhance our control environment.” Moiz Chakkiwala Executive Director
Construction Management Services
Responsible for the delivery and construction management of all Mubadala’s property portfolio, from the commencement of the Project Life Cycle process through to completion of the built asset.
“ We commenced delivery of construction management services across a broad range of market sectors within the Group using a more standardized approach in accordance with newly developed policies and procedures to manage risk and ensure delivery.” Rod Mathers Executive Director
Group Treasury
Responsible for supporting Mubadala’s growing and diversifying portfolio through the provision of insurance, tax, financial risk management and treasury operations.
“ The past year was a continuation of previous years’ progress and development of people, processes and systems across the treasury, tax and insurance functions to a world class standard to enable the business realize its strategic objectives with value added services and support. The team was recognized this year winning both ‘The Adam Smith Award for innovation in Risk Management’ by Treasury Today and ‘Large Scale Team of the Year’ by the Association of Corporate Treasurers Middle East.” Matthew Hurn Executive Director
Legal & Compliance
Responsible for all aspects of legal, regulatory, compliance, legal risk management and governance matters across Mubadala.
“ There were a number of key initiatives that we introduced or revised in 2011, including the Mubadala Corporate Governance and Compliance programs. These processes and programs will ensure the strength of the group as it moves into its second decade of activity.” Samer Halawa Chief Legal Counsel
Enterprise Technology & Services
Responsible for enabling and enhancing business performance to achieve Mubadala’s strategic goals by delivering innovative and relevant technology solutions; as well as managing and protecting the IT assets, and safeguarding the integrity of our corporate data.
“ In 2011, Enterprise Technology & Services took significant steps in its journey to enable the business through technology, to developing our people, processes and systems across the firm, enabling the business to realize its strategic objectives and improve workplace productivity. In addition to rolling out a number of technology solutions for the business, we upgraded our technology infrastructure to support a boundary-less network, enabling access to information in a secure manner and providing employees with the most up-to date technologies to enhance collaboration.” Ajit Naidu Chief Information Officer
Acquisitions and Investment Management (AIM)
Responsible for the provision of valuation, due diligence, portfolio monitoring and reporting, and overall transaction execution services to the various business units, with a particular focus on acquisitions and divestitures.
“ Formed in 2011 from the merger of the former Acquisitions and Portfolio Management units, the AIM team achieved a number of milestones during the second half of the year. We are looking forward to continuing to provide the highest quality transaction execution and portfolio management services during 2012 and beyond.” Hani Barhoush Executive Director
Corporate Support Services
Responsible for the provision of best-in-class procurement and property management services for Mubadala, its joint ventures and subsidiaries.
“ In 2011, we achieved significant savings and process efficiencies in procurement, negotiating supply deals which leverage Mubadala’s scale across multiple spend categories, including Communications, IT, Telecommunications, Travel, Professional Services, Office Supplies and Furniture. We also streamlined facility management, refurbishment and leasing services for assigned corporate offices and residential projects, and delivered premium office support and housing services for our employees. Across service delivery areas, we are striving to work increasingly with SMEs based in the UAE.” Nasir Al Nabhani Associate Director
Group Communications
Responsible for managing reputational risk issues, and increasing awareness and understanding of the Group in local, regional and international markets.
“ The Mubadala story is one that excites and inspires generations in Abu Dhabi, the UAE and around the world. As we enter our 10th year as a company, we continue to strengthen our relationships to deepen understanding of our mission and its value for our shareholder, our employees and our partners.” Brian Lott Executive Director

52 The Board of Directors’ Report53 The Independent Auditor’s Report54 Consolidated Statement of Comprehensive Income56 Consolidated Statement of Financial Position58 Consolidated Statement of Changes in Equity60 Consolidated Statement of Cash Flows62 Notes to the Consolidated Financial Statements
Consolidated Financial Statements

Mub
adal
a A
nnua
l Rep
ort
201
1
5352
The Board of Directors is pleased to present the consolidated financial statements for the year ended 31 December 2011, covering the overall performance of the Group in all business sectors and areas of activity.
Mubadala achieved overall operational profitability and reached an impressive number of milestones in the delivery of our mandate – despite a very challenging business environment.
Financial HighlightsRevenues increased 77% to AED 27.9 billion in 2011 compared to AED 15.8 billion in 2010. This was mainly driven by the full consolidation of the Advanced Technology Investment Company (ATIC). This consolidation also further diversified Mubadala’s revenue mix, with Semiconductors now accounting for 42% of revenues. Other important revenue contributors were Oil & Gas, which accounted for 27%, Aerospace which contributed 21%, Infrastructure which contributed 3% and Industry which contributed 3%.
Mubadala reported gross profits of AED 5.7 billion in 2011, up 14% from AED 5 billion in 2010.
Profit before fair value changes on financial investments, impairments, net finance expense and taxes was AED 1.2 billion in 2011 compared to AED 2.6 billion in 2010. During 2011, income from investment in equity accounted investees increased from AED 0.9 billion to AED 2.7 billion, mainly derived from investments in Dolphin Energy, EMAL and Aldar. The year-on-year decline reflects the impact of ATIC’s loss which was driven primarily by its continued investment in research and development.
Loss for the period attributable to the owner of the group was AED 3.2 billion, compared to a profit of AED 1.2 billion in 2010. This loss was primarily driven by negative fluctuations in the fair market value of Mubadala’s financial investments, as well as a reduction in the market value of certain real estate holdings.
Further, the decrease of AED 0.9 billion primarily in market values of available for sale financial investments and hedging instruments, accounted under other comprehensive income, resulted in AED 4.2 billion of total comprehensive loss attributable to the owner of the group
Total assets increased by 73% to AED 177 billion in 2011 from AED 102 billion in 2010. The increase in total assets was primarily due to consolidation of ATIC and Tabreed, and additional shareholder equity received during the year.
Total liabilities increased by 78% to AED 71 billion in 2011 from AED 40 billion in 2010. The increase in total liabilities was primarily due to consolidation of ATIC and Tabreed, and issuance of additional bonds by Mubadala in 2011.
Total Equity increased by 71% to AED 106 billion from AED 62 billion in 2010. The increase in equity, primarily in the form of transfer of ATIC and additional cash contribution, reflect the continuing support offered by its Shareholder, the Government of Abu Dhabi.
Looking ahead, we are confident that the business and organizational strategy established over the past years gives Mubadala a strong platform from which we can deliver even greater benefit to all our stakeholders in the coming years.
For and on behalf of Board of Directors.
19 March 2012
The Shareholder Mubadala Development Company PJSC Abu Dhabi United Arab Emirates
Report on the consolidated financial statementsWe have audited the accompanying consolidated financial statements of Mubadala Development Company (“Mubadala” or the “Company”) and its subsidiaries (together, the “Group”) which comprise the consolidated statement of financial position as at 31 December 2011 and the consolidated statements of comprehensive income, consolidated statement of changes in equity and consolidated statement of cash flows for the year then ended, and a summary of significant accounting policies and other explanatory information.
Management’s responsibility for the financial statementsManagement is responsible for the preparation and fair presentation of these consolidated financial statements in accordance with International Financial Reporting Standards, and for such internal control as management determines is necessary to enable the preparation of consolidated financial statements that are free from material misstatement, whether due to fraud or error.
Auditor’s responsibilityOur responsibility is to express an opinion on these consolidated financial statements based on our audit. We conducted our audit in accordance with International Standards on Auditing. Those standards require that we comply with ethical requirements and plan and perform the audit to obtain reasonable assurance about whether the consolidated financial statements are free from material misstatement.
An audit involves performing procedures to obtain audit evidence about the amounts and disclosures in the consolidated financial statements. The procedures selected depend on the auditor’s judgment, including the assessment of the risks of material misstatement of the consolidated financial statements, whether due to fraud or error. In making those risk assessments, the auditor considers internal control relevant to the entity’s preparation and fair presentation of the consolidated financial statements in order to design audit procedures that are appropriate in the circumstances, but not for the purpose of expressing an opinion on the effectiveness of the entity’s internal control. An audit also includes evaluating the appropriateness of accounting policies used and the reasonableness of accounting estimates made by management, as well as evaluating the overall presentation of the consolidated financial statements.
We believe that the audit evidence we have obtained is sufficient and appropriate to provide a basis for our audit opinion.
OpinionIn our opinion, the consolidated financial statements present fairly, in all material respects, the financial position of the Company as at 31 December 2011, and its financial performance and its cash flows for the year then ended in accordance with International Financial Reporting Standards.
Other matterThe Company’s consolidated financial statements as at 31 December 2010 were audited by another auditor whose report dated 21 March 2011 expressed unqualified audit opinion.
Report on other legal and regulatory requirementsAs required by UAE Federal Law No. 8 of 1984 (as amended), we further confirm that we have obtained all the information and explanations necessary for our audit, that proper financial records have been kept by the Group, that physical counts of inventories were carried out by management in accordance with established principles, and that the contents of the Director’s report which relate to these consolidated financial statements are in agreement with the Groups’ financial records. We are not aware of any violation of the above mentioned Law or the Company’s Articles of Association, having occurred during the year ended 31 December 2011, which may have had a material adverse effect on the business of the Group or on its financial position.
Deloitte & Touche (M.E.)
Saba Y. Sindaha Registration No. 410 Abu Dhabi 19 March 2012
The Independent Auditor’s ReportThe Board of Directors' Report

54
Mub
adal
a A
nnua
l Rep
ort
201
1
55
Consolidated statement of comprehensive income (continued)Consolidated statement of comprehensive income
Note 2011 2010 Revenue from sale of goods and services 6 27,911,297 15,841,591
Cost of sales of goods and services 7 (22,257,234) (10,840,404)
Gross profit 5,654,063 5,001,187
Income from investment in equity accounted investees (net) 17 2,672,799 891,699
Government grant income 459,646 280,602
Dividend income 11 393,035 331,378
Finance income from commercial loans 316,305 110,974
Gain on acquisition of stake in subsidiaries 5(a)(ii,iii) 231,093 -
Other income (net) 8 539,943 659,974
Research and development expenses 9 (2,946,806) (80,341)
Project expenses (747,342) (549,920)
Exploration costs (345,853) (534,976)
Other general and administrative expenses 10 (4,986,919) (3,487,367)
Profit before fair value changes on financial investments, impairments, net finance expense and taxes 1,239,964 2,623,210
(Loss) / income from financial investments (net) 11 (3,029,595) 355,427
Decrease in fair value of investment properties (net) 15 (959,867) (927,650)
Impairment losses on property, plant and equipment 13 (652,958) (279,951)
Impairment losses on equity accounted investees (471,984) (10,295)
Impairment losses on intangible assets 14 (29,207) (239,581)
(Loss) / profit before interest and taxes (3,903,647) 1,521,160
Finance income and net foreign exchange gain 12 1,975,801 1,399,653
Finance expense 12 (2,791,782) (1,624,910)
Net finance expense 12 (815,981) (225,257)
(Loss) / profit before income tax (4,719,628) 1,295,903
Income tax credit / (expense) 33 196,216 (168,147)
(Loss) / profit for the year (4,523,412) 1,127,756
Note 2011 2010 Other comprehensive loss
Decrease in fair value of available-for-sale financial assets 18(b) (548,253) (1,401,184)
Effective portion of changes in fair values of cash flow hedges and other reserves (89,649) (265,495)
Net change in translation reserve (2,802) 189,746
Share of effective portion of changes in fair values of hedging instruments of equity accounted investees 17(a,b) (268,586) 32,041
Share of movements in translation reserve of equity accounted investees 17(a,b) 2,249 2,314
Other comprehensive loss for the year net of income tax (907,041) (1,442,578)
Total comprehensive loss for the year (5,430,453) (314,822)
(Loss) / profit for the year (4,523,412) 1,127,756
Less: Loss attributable to non-controlling interest (1,323,757) (77,599)
(Loss) / profit for the year attributable to the owner of the Group (3,199,655) 1,205,355
Total comprehensive loss for the year (5,430,453) (314,822)
Less: Total comprehensive (loss) / profit attributable to non-controlling interests (1,262,724) 22,717
Total comprehensive loss for the year attributable to the owner of the Group (4,167,729) (337,539)
The notes set out on pages 64 to 150 form an integral part of these consolidated financial statements. The independent auditor’s report is set out on page 53.
for the year ended 31 Decemberfor the year ended 31 December
Mubadala Development Company PJSCMubadala Development Company PJSC

56
Mub
adal
a A
nnua
l Rep
ort
201
1
57
Consolidated statement of financial position (continued)Consolidated statement of financial position
Note 2011 2010 Non-current assets
Property, plant and equipment 13 69,276,977 23,201,974
Intangible assets 14 6,767,429 4,890,411
Investment properties 15 5,637,583 4,636,882
Investment in equity accounted investees
- associates 17 6,985,883 411,513
- jointly controlled entities 17 6,212,537 5,848,288
Financial investments 18 18,175,867 24,271,032
Loans receivable 19 12,087,994 10,854,970
Other assets 713,887 315,452
Receivables and prepayments 21 8,907,290 8,902,287
Finance lease receivables 22 1,428,565 -
Deferred tax assets 33 1,088,087 78,077
Total non-current assets 137,282,099 83,410,886
Current assets
Inventories 20 6,383,484 3,814,962
Financial investments 18 1,453,996 204,812
Loans receivable 19 2,475,837 718,160
Receivables and prepayments 21 14,870,163 7,728,204
Finance lease receivables 22 105,582 -
Cash and cash equivalents 23 14,524,088 6,261,890
Total current assets 39,813,150 18,728,028
Total assets 177,095,249 102,138,914
as at 31 Decemberas at 31 December
Mubadala Development Company PJSCMubadala Development Company PJSC
Note 2011 2010 Equity
Share capital 29 15,000,000 15,000,000
Reserves and (deficit) / surplus (3,549,220) 738,347
Additional shareholder contributions 31(e) 94,502,530 45,725,643
Government grants 34(b) 367,350 367,350
Total equity attributable to the owner of the Group 106,320,660 61,831,340
Non-controlling interests 54,216 285,522
Total equity 106,374,876 62,116,862
Non-current liabilities
Interest bearing borrowings 26 38,124,157 24,971,017
Government grants 34(b) 2,062,052 29,676
Obligation under finance lease 28 1,373,380 -
Deferred tax liabilities 33 1,583,311 1,100,758
Financial liabilities at fair value 25 1,397,061 723,062
Other liabilities 27 2,261,474 1,813,503
Total non-current liabilities 46,801,435 28,638,016
Current liabilities
Interest bearing borrowings 26 5,053,303 1,968,047
Government grants 34(b) 309,617 44,085
Obligation under finance lease 28 147,635 -
Payables and accruals 24 16,618,250 7,863,924
Amounts due to equity accounted investees 17 824,323 1,003,881
Income tax payable 33 496,500 301,805
Financial liabilities at fair value 25 469,310 202,294
Total current liabilities 23,918,938 11,384,036
Total liabilities 70,720,373 40,022,052
Total equity and liabilities 177,095,249 102,138,914
These consolidated financial statements were authorised for issue by the Board of Directors on 19 March 2012 and were signed on their behalf by:
Director Chief Executive Officer & Managing Director Chief Financial Officer
The notes set out on pages 64 to 150 form an integral part of these consolidated financial statements. The independent auditor’s report is set out on page 53.

58
Mub
adal
a A
nnua
l Rep
ort
201
1
59
Consolidated statement of changes in equityfor the year ended 31 December
Mubadala Development Company PJSC
Share capital AED ’000
Statutoryreserve1
AED ’000 (note 30)
Fair valuereserve1
AED ’000 (note 30)
Foreign currency
translation reserve1
AED ’000 (note 30)
Hedgingand otherreserves1 AED ’000 (note 30)
Accumulatedlosses
AED ’000
Reservesand surplus AED ’000
Additionalshareholder
contributions AED ’000
(note 31 (e))
Governmentgrants
AED ’000 (note 34 (b)(i))
Totalattributableto the equity
holder AED ’000
Non-controlling
interest AED ’000
Total AED ’000
At 1 January 2010 5,514,579 689,531 4,314,769 541,167 (485,479) (3,984,102) 1,075,886 42,211,064 367,350 49,168,879 262,805 49,431,684
Profit for the year - - - - - 1,205,355 1,205,355 - - 1,205,355 (77,599) 1,127,756
Decrease in fair value of available for sale financial assets (net) - - (1,401,184) - - - (1,401,184) - - (1,401,184) - (1,401,184)
Net change in translation reserve - - - 86,354 - - 86,354 - - 86,354 103,392 189,746
Share of movement in translation reserve of equity accounted investees - - - 2,314 - - 2,314 - - 2,314 - 2,314
Share of effective portion of changes in fair value of hedging instruments of equity accounted investees - - - - 32,041 - 32,041 - - 32,041 - 32,041
Effective portion of changes in fair value of cash flow hedges - - - - (262,419) - (262,419) - - (262,419) (3,076) (265,495)
Total other comprehensive loss - - (1,401,184) 88,668 (230,378) - (1,542,894) - - (1,542,894) 100,316 (1,442,578)
Total comprehensive loss - - (1,401,184) 88,668 (230,378) 1,205,355 (337,539) - - (337,539) 22,717 (314,822)
Additional shareholder contributions - - - - - - - 13,000,000 - 13,000,000 - 13,000,000
Conversion of additional shareholder contributions to share capital (see note 31) 9,485,421 - - - - - - (9,485,421) - - - -
Transfer to statutory reserve - 112,776 - - - (112,776) - - - - - -
At 31 December 2010 15,000,000 802,307 2,913,585 629,835 (715,857) (2,891,523) 738,347 45,725,643 367,350 61,831,340 285,522 62,116,862
1 Non distributable reserves

60
Mub
adal
a A
nnua
l Rep
ort
201
1
61
Share capital AED ’000
Statutoryreserve1
AED ’000 (note 30)
Fair valuereserve1
AED ’000 (note 30)
Foreign currency
translation reserve1
AED ’000 (note 30)
Hedgingand otherreserves1 AED ’000 (note 30)
Accumulatedlosses
AED ’000
Reservesand surplus AED ’000
Additionalshareholder
contributions AED ’000
(note 31 (e))
Governmentgrants
AED ’000 (note 34 (b)(i))
Totalattributableto the equity
holder AED ’000
Non-controlling
interest AED ’000
Total AED ’000
At 1 January 2011 15,000,000 802,307 2,913,585 629,835 (715,857) (2,891,523) 738,347 45,725,643 367,350 61,831,340 285,522 62,116,862
Loss for the year - - - - - (3,199,655) (3,199,655) - - (3,199,655) (1,323,757) (4,523,412)
Decrease in fair value of available for sale financial assets (net) - - (548,253) - - - (548,253) - - (548,253) - (548,253)
Net change in translation reserve - - - (59,328) - - (59,328) - - (59,328) 56,526 (2,802)
Share of movement in translation reserve of equity accounted investees - - - 2,249 - - 2,249 - - 2,249 - 2,249
Share of effective portion of changes in fair value of hedging instruments of equity accounted investees - - - - (268,586) - (268,586) - - (268,586) - (268,586)
Effective portion of changes in fair value of cash flow hedges - - - - (94,156) - (94,156) - - (94,156) 4,507 (89,649)
Total other comprehensive loss - - (548,253) (57,079) (362,742) - (968,074) - - (968,074) 61,033 (907,041)
Total comprehensive loss - - (548,253) (57,079) (362,742) (3,199,655) (4,167,729) - - (4,167,729) (1,262,724) (5,430,453)
Dividends paid to non-controlling interest - - - - - - - - - - (4,335) (4,335)
Additional shareholder contributions - - - - - - - 48,776,887 - 48,776,887 - 48,776,887
Non-controlling interest upon acquisition of subsidiaries - - - - - - - - - - 790,917 790,917
Non-controlling interest upon disposal of stake in a subsidiary - - - - - (119,838) (119,838) - - (119,838) 158,654 38,816
Movement in non-controlling interest - - - - - - - - - - 86,182 86,182
At 31 December 2011 15,000,000 802,307 2,365,332 572,756 (1,078,599) (6,211,016) (3,549,220) 94,502,530 367,350 106,320,660 54,216 106,374,876
1 Non distributable reserves
The notes set out on pages 64 to 150 form an integral part of these consolidated financial statements.
Consolidated statement of changes in equity (continued)
for the year ended 31 December
Mubadala Development Company PJSC

62
Mub
adal
a A
nnua
l Rep
ort
201
1
63
Consolidated statement of cash flows (continued)Consolidated statement of cash flowsfor the year ended 31 Decemberfor the year ended 31 December
Mubadala Development Company PJSCMubadala Development Company PJSC
Note 2011 2010 Cash flows from operating activities
(Loss) / profit for the year (4,523,412) 1,127,756
Adjustments for:
Depreciation of property, plant and equipment 13 6,698,142 1,740,505
Amortisation of intangible assets 14 781,429 425,991
Amortisation of government grants 34 (742,912) (281,954)
Change in fair value of investment properties 15 959,867 927,650
Impairment losses on property, plant and equipment and intangible assets 13,14 682,165 519,532
Gain on disposal of property, plant and equipment 8 (59,364) (9,246)
Net change in fair value of financial assets / liabilities at fair value through profit or loss 11 2,931,036 (582,700)
Finance income relating to finance lease receivables 22 (80,672) -
Other impairment losses 14,356 26,781
Impairment losses on equity accounted investees 471,984 10,295
Impairment losses on available for sale financial assets 11 98,559 227,273
Gain on disposal of investment in equity accounted investees 17 (81,951) (75,646)
Gain on disposal of investment in subsidiaries 5 (20,368) (57,270)
Gain on acquisition of stake in subsidiaries 5(a)(ii,iii) (231,093) -
Loss / (gain) on disposal of financial investments 8 55,848 (126,982)
Share of results of equity accounted investees
- associates 17(a) (1,012,205) (86,526)
- jointly controlled entities 17(b) (1,578,643) (729,527)
Finance income 12 (1,975,801) (1,399,653)
Finance expense 12 2,791,782 1,624,910
Income tax (credit) / expense 33 (196,216) 168,147
Dividend income 11 (393,035) (331,378)
4,589,496 3,117,958
Change in inventories (727,366) (169,074)
Change in receivables and prepayments (4,770,118) (2,698,913)
Change in obligation under finance lease (287,674) -
Change in payables and accruals 4,766,263 701,710
Change in other liabilities (1,642,116) (822,390)
Change in other assets 667,737 (71,613)
Dividends received from financial investments 393,035 331,378
Dividends received from equity accounted investees 17(a),(b) 1,282,043 957,419
Lease rentals received 22 63,753 -
Income taxes paid (327,170) (283,675)
Net cash generated by operating activities 4,007,883 1,062,800
Note 2011 2010 Cash flows from investing activities
Proceeds from disposal of equity accounted investees 43,349 87,051
Proceeds from disposal of financial investments 1,034,779 259,438
Proceeds from disposal of assets held for sale - 3,593,818
Proceeds from disposal of stake in a jointly controlled entity 111,147 -
Purchase consideration from acquisition of a subsidiary 5(a)(iii,iv) (83,584) (126,817)
Cash arising from acquisition of subsidiaries 483,852 -
Proceeds from disposal of subsidiaries and working interest (net of cash disposed) 5(b)(i,ii) 52,732 288,904
Investment in equity accounted investees 17(a)(b) (901,268) (2,530,765)
Acquisition of financial investments (4,716,268) (3,496,201)
Acquisition of property, plant and equipment (25,045,994) (7,060,843)
Acquisition of investment properties 15 (1,048,507) (1,922,759)
Acquisition of intangible assets (932,147) (357,233)
Proceeds from disposal of property, plant and equipment 433,313 53,969
Loans given (net) (4,244,587) (8,521,446)
Interest received 1,975,474 1,358,567
Net cash used in investing activities (32,837,709) (18,374,317)
Cash flows from financing activities
Proceeds from interest bearing borrowings 13,633,451 6,415,197
Cash received upon transfer of a subsidiary 5(a)(i) 6,092,096 -
Repayment of interest bearing borrowings (8,945,807) (6,802,125)
Proceeds from government grants 1,759,951 269,403
Proceeds from disposal of stake in a subsidiary with no loss of control 5(b)(iii) 38,816 -
Additional shareholder contributions 31(e) 27,983,478 13,000,000
Interest paid (3,669,231) (1,259,936)
Dividends paid to non-controlling interest (4,335) -
Change in non-controlling interest 86,182 -
Net cash generated by financing activities 36,974,601 11,622,539
Net increase / (decrease) in cash and cash equivalents 8,144,775 (5,688,978)
Cash and cash equivalents at 1 January 6,261,890 11,776,577
Exchange fluctuation on consolidation of foreign entities 117,423 174,291
Cash and cash equivalents at 31 December 14,524,088 6,261,890
The notes set out on pages 64 to 150 form an integral part of these consolidated financial statements. The independent auditor’s report is set out on page 53.

64 65
Mub
adal
a A
nnua
l Rep
ort
201
1
Notes to the consolidated financial statements (continued)
Mubadala Development Company PJSC
Notes to the consolidated financial statementsMubadala Development Company PJSC
1 Legal status and principal activities
Mubadala Development Company PJSC (“Mubadala” or “the Company”) is registered as a public joint stock company in the Emirate of Abu Dhabi. The Company was established by the Emiri Decree No. 12, dated 6 October 2002, and is wholly owned by the Government of Abu Dhabi (“the Shareholder”). The Company was incorporated on 27 October 2002.
These consolidated financial statements include the financial performance and position of the Company, its subsidiaries and its jointly controlled assets, (collectively referred to as “the Group”), and the Group’s interests in its equity accounted investees (see notes 5, 16 and 17).
The Company is engaged in investing in, and management of, investments, primarily in sectors or entities that contribute to the Emirate of Abu Dhabi’s strategy to diversify its economy. Consequently, the Group holds interests in a wide range of sectors, including energy and natural resources, aerospace, utilities, real estate, commercial finance, basic industries and services, renewable energy, information technology, semi-conductor, infrastructure, sea port operations, medical services and flight training services.
2 Basis of preparation
(a) Statement of compliance The consolidated financial statements have been prepared in accordance with International Financial Reporting Standards
(“IFRSs”), and comply, where appropriate, with the Articles of Association of the Company and the UAE Federal Law No. 8 of 1984 (as amended).
(b) Basis of measurement The consolidated financial statements have been prepared on the historical cost basis, except for the following:
• initial recognition of land and buildings, helicopters and helicopter spare parts received as government grants, which are stated at nominal value; and
• derivative financial instruments, available for sale financial assets, financial instruments at fair value through profit or loss and investment properties, which are measured at fair value.
Historical cost is generally based on the fair value of the consideration given in exchange for assets.
(c) Functional and presentation currency These consolidated financial statements are presented in United Arab Emirates Dirhams (“AED”), which is the Group’s
functional and presentation currency. All financial information presented in AED has been rounded to the nearest thousand, unless otherwise stated.
(d) Use of estimates and judgements The preparation of the consolidated financial statements in conformity with IFRSs requires management to make
judgements, estimates and assumptions that affect the application of accounting policies and the reported amounts of assets, liabilities, income and expenses. Actual results may differ from these estimates.
Estimates and underlying assumptions are reviewed on an ongoing basis. Revisions to accounting estimates are recognised in the period in which the estimates are revised and in any future periods affected.
Judgements in applying accounting policies that have the most significant effect on the amounts recognised in the consolidated financial statements and estimates with a significant risk of material adjustment in the subsequent years are discussed in note 37.
(e) New and revised IFRS
i) New and revised IFRSs adopted with no material effect on the consolidated financial statements The following new and revised IFRSs have been adopted in these financial statements. The application of these new
and revised IFRSs has not had any material impact on the amounts reported for the current and prior years but may affect the accounting for future transactions or arrangements.
New and revised IFRSs Summary of requirement
Amendments to IFRS 1 First-time Adoption of International Financial Reporting Standards – Additional Exemptions for First-time Adopters
The amendments give first time adopters the same transition provisions that Amendments to IFRS 7 provides to current IFRS preparers.
Amendments to IFRS 3 Business Combinations
The amendments clarify the measurement choice regarding non-controlling interests at the date of acquisition and regarding the accounting for share-based payment awards held by acquiree’s employees.
Amendments to IAS 1 Presentation of Financial Statements
The amendments to IAS 1 clarify that an entity may choose to disclose an analysis of other comprehensive income by item in the statement of changes in equity or in the notes to the financial statements.
IAS 24 Related Party Disclosures (as revised in 2009)
IAS 24 (revised in 2009) has been revised on the following two aspects: definition of a related party and the introduction of a partial exemption from the disclosure requirements for government-related entities.
Amendment to IAS 32 Classification of Rights Issues
The amendments address the classification of certain rights issues denominated in a foreign currency as either equity instruments or as financial liabilities. Under the amendments, rights, options or warrants issued by an entity for the holders to acquire a fixed number of the entity’s equity instruments for a fixed amount of any currency are classified as equity instruments in the financial statements of the entity provided that the offer is made pro rata to all of its existing owners of the same class of its non-derivative equity instruments.
Amendments to IFRIC 14 Prepayments of a Minimum Funding Requirement
The amendments address when refunds or reductions in future contributions should be regarded as available; how minimum funding requirements might affect the availability of reductions in future contributions; and when minimum funding requirements might give rise to a liability. The amendments now allow recognition of an asset in the form of a prepaid minimum funding contribution.
IFRIC 19 Extinguishing Financial Liabilities with Equity Instruments
The Interpretation provides guidance on the accounting for the extinguishment of a financial liability by the issue of equity instruments.
Improvements to IFRSs issued in 2010 The application of Improvements to IFRSs issued in 2010 which amended IFRS 7, IAS 27, IAS 34 and IFRIC 13.
(ii) New and revised IFRSs in issue but not yet effective and not early adopted The Group has not yet adopted the following new and revised IFRSs that have been issued but are not yet effective:
New and revised IFRSsEffective for annual periods
beginning on or after
Amendments to IAS 1 Presentation of Financial Statements: relating to grouping items recognised in other comprehensive income 1 July 2012
Amendments to IFRS 7 financial instruments: disclosures, relating to disclosures on transfers of financial assets 1 July 2011
IFRS 9 financial instruments (as amended in 2010) 1 January 2015
Amendments to IAS 12: Income Taxes relating to Deferred Tax: Recovery of Underlying Assets 1 January 2012
Amendment to IFRS 1 removal of fixed dates for first time adopters 1 July 2011
Amendment to IFRS 1 severe hyperinflation 1 July 2011
IFRS 10 Consolidated Financial Statements 1 January 2013
IFRS 11 Joints Arrangements 1 January 2013
IFRS 12 Disclosures of interests in other entities 1 January 2013
2 Basis of preparation (Continued) (e) New and revised IFRS (Continued) (i) New and revised IFRSs adopted with no material effect on the consolidated financial statements (Continued)

66 67
Mub
adal
a A
nnua
l Rep
ort
201
1
Notes to the consolidated financial statements (continued)
Mubadala Development Company PJSC
Notes to the consolidated financial statements (continued)
Mubadala Development Company PJSC
New and revised IFRSsEffective for annual periods
beginning on or after
IFRS 13 Fair Value Measurement 1 January 2013
IAS 19 Employee Benefits (revised 2011) 1 January 2013
IAS 27 Separate Financial Statements (as amended in 2011) 1 January 2013
IAS 28 Investments in Associates and Joint Ventures (as amended in 2011) 1 January 2013
Amendment to IFRS 7 Financial Instruments: Disclosures relating to offsetting of financial assets and financial liabilities 1 January 2013
IFRIC 20 Stripping Costs in the Production Phase of a Surface Mine 1 January 2013
Amendment to IAS 32 Financial Instruments: Presentation relating to offsetting of financial assets and financial liabilities 1 January 2014
Amendment to IFRS 7 Financial Instruments: Disclosures relating to transition to IFRS 9 (or otherwise when IFRS 9 is first applied) 1 January 2015
Management anticipates that these amendments will be adopted in the financial statements for the initial period when they become effective. Management is currently assessing the impact of the same on the financial statements.
3 Significant accounting policies
The significant accounting policies set out below have been applied consistently by the Group and all its entities for all periods presented in these consolidated financial statements.
(a) Basis of consolidation
(i) Subsidiaries Subsidiaries are entities controlled by the Group. Control exists when the Group has the power, directly or indirectly,
to govern the financial and operating policies of an entity so as to obtain benefits from its activities. In assessing control, potential voting rights that are currently exercisable are taken into account. The financial statements of subsidiaries are included in the consolidated financial statements from the date that control commences until the date that control ceases. The accounting policies of subsidiaries are adjusted where necessary to align them with the policies adopted by the Group.
(ii) Transfer of entities under common control Transfers giving rise to transfer of interests in entities, that are under the common control of the shareholder,
are accounted for at the date that the transfer occurred without restatement of prior periods. The assets and liabilities acquired are recognised at the carrying amounts recognised previously in the books of transferor entity. The components of equity of the acquired entities are added to the same components within Group equity. Any cash paid for the acquisition is recognised directly in equity.
(iii) Changes in Group’s ownership interest in existing subsidiaries Changes in the Group’s ownership interests in subsidiaries that do not result in the Group losing control over
the subsidiaries are accounted for as equity transactions. The carrying amounts of the Group‘s interests and the non-controlling interests are adjusted to reflect the changes in their relative interests in the subsidiaries. Any difference between the amount by which the non-controlling interests are adjusted and the fair value of the consideration paid or received is recognised directly in equity and attributed to the owner of the Group.
Upon the loss of control, the Group derecognizes the assets and liabilities of the subsidiary, any non-controlling interests and the other components of equity related to the subsidiary. Any surplus or deficit arising on the loss of control is recognised in profit or loss. If the Group retains any interest in the previous subsidiary, then such interest is measured at fair value at the date that control is lost, which is considered the fair value on initial recognition for subsequent accounting under IAS 39 Financial Instruments: Recognition at measurement or when applicable, the cost on initial recognition of an investment in an associate or a jointly controlled entity.
(iv) Business combinations Acquisitions of businesses are accounted for using the acquisition method. The consideration transferred in a business
combination is measured at fair value, which is calculated as the sum of the acquisition-date fair values of the assets transferred by the Group, liabilities incurred by the Group to the former owners of the acquiree and the equity interests issued by the Group in exchange for control of the acquiree. Acquisition-related costs are generally recognised in profit or loss as incurred.
At the acquisition date, the identifiable assets acquired and the liabilities assumed are recognised at their fair value, except that:
• deferred tax assets or liabilities, and assets or liabilities related to employee benefit arrangements are recognised and measured in accordance with IAS 12 Income Taxes and IAS 19 Employee Benefits respectively;
• liabilities or equity instruments related to share-based payment arrangements of the acquiree are measured in accordance with IFRS 2 Share-based Payment at the acquisition date; and
• assets (or disposal groups) that are classified as held for sale in accordance with IFRS 5 Non-current Assets Held for Sale and Discontinued Operations are measured in accordance with that Standard.
Goodwill is measured as the excess of the sum of the consideration transferred, the amount of any non-controlling interests in the acquiree, and the fair value of the acquirer’s previously held equity interest in the acquiree (if any) over the net of the acquisition-date amounts of the identifiable assets acquired and the liabilities assumed. If, after reassessment, the net of the acquisition-date amounts of the identifiable assets acquired and liabilities assumed exceeds the sum of the consideration transferred, the amount of any non-controlling interests in the acquiree and the fair value of the acquirer’s previously held interest in the acquiree (if any), the excess is recognised immediately in profit or loss as a bargain purchase gain.
Non-controlling interests that are present ownership interests and entitle their holders to a proportionate share of the entity’s net assets in the event of liquidation may be initially measured either at fair value or at the non-controlling interests’ proportionate share of the recognised amounts of the acquiree’s identifiable net assets. The choice of measurement basis is made on a transaction-by-transaction basis. Other types of non-controlling interests are measured at fair value or, when applicable, on the basis specified in another IFRS.
When a business combination is achieved in stages, the Group’s previously held equity interest in the acquiree is remeasured to fair value at the acquisition date (i.e. the date when the Group obtains control) and the resulting gain or loss, if any, is recognised in profit or loss. Amounts arising from interests in the acquiree prior to the acquisition date that have previously been recognised in other comprehensive income are reclassified to profit or loss where such treatment would be appropriate if that interest were disposed of.
If the initial accounting for a business combination is incomplete by the end of the reporting period in which the combination occurs, the Group reports provisional amounts for the items for which the accounting is incomplete. Those provisional amounts are adjusted during the measurement period (see above), or additional assets or liabilities are recognised, to reflect new information obtained about facts and circumstances that existed at the acquisition date that, if known, would have affected the amounts recognised at that date.
(v) Joint ventures and equity accounted investees For the purpose of accounting for its interests in joint ventures, the Group segregates its investments in joint ventures
into two types - jointly controlled entities and jointly controlled assets. The accounting policies of joint ventures and equity accounted investees are adjusted where necessary to align them with the policies adopted by the Group. The accounting treatment for each of these types, and also for other equity accounted investees, is set out below:
Associates and jointly controlled entities (equity accounted investees) Associates are those entities in which the Group has significant influence, but not control, over the financial and
operating policies. Significant influence is presumed to exist when the Group holds between 20 and 50 percent of the voting power of another entity.
Jointly controlled entities are those investments in distinct legal entities over whose activities the Group has joint control, established by contractual agreement and requiring unanimous consent for strategic financial and operating decisions.
Investments in associates and jointly controlled entities (“equity accounted investees”) are accounted for using the equity method and are initially recognised at cost. The cost of the investment includes transaction costs. When the investor has previously held an investment in the entity (generally accounted for under IAS 39), the deemed cost of the equity accounted investee is the fair value of the original investment at the date that significant influence is obtained plus the consideration paid for the additional stake. When the original investment has been classified previously as an available-for-sale financial asset under IAS 39, the revaluation gain or loss recognised in other comprehensive income is not reclassified from equity to profit or loss until such time as there is a realization event. The consolidated financial statements include the Group’s share of the profit or loss and other comprehensive income, after adjustments to align the accounting policies with those of the Group, from the date that significant influence or joint control commences, until the date that significant influence or joint control ceases. When the Group’s share of losses exceeds its interest in an equity accounted investee, the carrying amount of that interest (including any long term investments) is reduced to nil and the recognition of further losses is discontinued except to the extent that the Group has a constructive or legal obligation to contribute to such losses or has made payments on behalf of the investee.
2 Basis of preparation (Continued) (e) New and revised IFRS (Continued) (ii) New and revised IFRSs in issue but not yet effective and not early adopted (Continued)
3 Significant accounting policies (Continued) (a) Basis of consolidation (Continued) (iv) Business combinations (Continued)

68 69
Mub
adal
a A
nnua
l Rep
ort
201
1
Notes to the consolidated financial statements (continued)
Mubadala Development Company PJSC
Notes to the consolidated financial statements (continued)
Mubadala Development Company PJSC
Any excess of the cost of acquisition over the Group’s share of the net fair value of the identifiable assets, liabilities and contingent liabilities of an equity accounted investee recognised at the date of acquisition is recognised as goodwill, which is included within the carrying amount of the investment. Any excess of the Group’s share of the net fair value of the identifiable assets, liabilities over the cost of acquisition, after reassessment, is recognised immediately in profit or loss representing gain on acquisition.
The requirements of IAS 39 are applied to determine whether it is necessary to recognize any impairment loss with respect to the Group’s investment in an equity accounted investee. When necessary, the entire carrying amount of the investment (including goodwill) is tested for impairment in accordance with IAS 36 Impairment of Assets (refer to Note 3(t)).
Upon disposal of equity accounted investees that results in a loss of significant influence or joint control, any retained investment is measured at fair value at that date and the fair value is regarded as its fair value on initial recognition as financial assets in accordance with IAS 39. The difference between the previous carrying amount of the equity accounted investee attributable to the retained interest and its fair value is included in the determination of the gain or loss on disposal of the equity accounted investee. In addition, the group accounts for all amounts previously recognised in other comprehensive income in relation to equity accounted investee on the same basis as would be required if that associate had directly disposed of the related assets or liabilities. Therefore, if a gain or loss previously recognised in other comprehensive income by the equity accounted investees would be reclassified to profit or loss on the disposal of the related assets or liabilities.
Jointly controlled assets Jointly controlled assets represent assets that are jointly controlled and owned by the Group, with other investor(s), but
where no legal entity exists. The Group has joint control, with the other investor(s), established by contractual agreement and requiring unanimous consent over strategic, financial and operating decisions, relating to such jointly held assets. These consolidated financial statements include the Group’s proportionate share of the assets, liabilities, revenue and expenses of such jointly controlled assets, with items of a similar nature, on a line by line basis, from the date that joint control commences until the date that joint control effectively ceases.
(vi) Transactions eliminated on consolidation Intra-group balances and transactions and any unrealised income and expenses arising from intra-group transactions,
are eliminated in preparing the consolidated financial statements. Unrealised gains arising from transactions with equity accounted investees are eliminated against the investment to the extent of the Group’s interest in the investee. Unrealised losses are eliminated in the same way as unrealised gains, but only to the extent that there is no evidence of impairment.
(b) Revenue from sale of goods and services The significant operating activities of the Group include:
• sale of goods and services;
• investments in securities and financial investments;
• acquisition, development and sale of properties; and
• provision of commercial finance.
Accounting policies for revenue from sale of goods and services and land are set out below. Accounting policies for investments in securities and financial investments are set out in notes 3(a) and note 3(g), and those for investment properties is set out in note 3(n).
Revenue from sale of goods and services includes income from sale of semi-conductor wafers, sale of hydrocarbons, aircraft maintenance and repairs, service concessions, sale of land, medical services and flight training services. Revenue from such sales is recognised as follows:
(i) Sale of goods and services rendered Revenue from the sale of goods, other than hydrocarbons, is recognised when the goods are delivered and titles
have passed, at which time all the following conditions are satisfied:
• the group has transferred to the buyer the significant risks and rewards of ownership of the goods; • the group retains neither continuing managerial involvement to the degree usually associated with ownership
nor effective control over the goods sold; • the amount of revenue can be measured reliably; • it is probable that the economic benefits associated with the transaction will flow to the Group; and • the costs incurred or to be incurred in respect of the transaction can be measured reliably.
Revenue from services rendered are recognised in profit or loss in proportion to the stage of completion of the transaction at the reporting date. The stage of completion is assessed by reference to the proportion of the service rendered. No revenue is recognised if there are significant uncertainties regarding the recovery of the consideration due, the associated costs or the possible return of the goods or the rejection of the services provided.
(ii) Sale of semiconductor wafers Revenue from semiconductor wafers is derived primarily from fabricating semiconductor wafers and, to a lesser extent,
from providing associated subcontracted assembly and test services as well as pre-fabricating services such as masks generation and engineering services. Revenue is recognised when the contractual obligations have been performed and title and risk of loss has passed to the customer, there is evidence of the arrangement as to the specific terms of the agreed upon sales, selling prices to the customers are fixed or determinable, collection of the revenue is reasonably assured, and, where applicable, delivery has occurred. Revenue is measured at the fair value of the consideration received, excluding sales taxes, royalties and other similar levies as applicable. Sales taxes collected from customers and remitted to governmental authorities are accounted for on a net basis and therefore excluded from revenues in the consolidated statement of comprehensive income.
(iii) Sale of hydrocarbons Revenue associated with the sale of hydrocarbons is recognised upon delivery, which occurs when title passes to the
customer. Revenue from the production and sale of hydrocarbons from projects undertaken in which the Group has an interest with other producers is recognised on the basis of the Group’s working interest in such projects. Differences between the Group’s share of production sold and its share of production are recognised as inventory or as a liability.
(iv) Aircraft maintenance and repairs For maintenance, repairs and overhaul services of aircraft, the Group enters into two different types of contracts: time
and material contracts and flat-rate contracts. For time and material contracts, the customer pays costs incurred plus a margin. For flat-rate contracts, the customer pays a fixed rate per flight hour.
For time and material contracts, maintenance, repair and overhaul work is recognised as revenue when the products are delivered and / or services are rendered to customers. Prepayments by the customers are deferred until then. Related costs, usually completed work-in-progress, are expensed at the same time. The Group’s business exhibits a large number of individual work events under time and material contracts. These events are evenly distributed throughout the year, with the average duration of individual work events being relatively short (from a few hours up to a few days). Thus the application of the percentage of completion method would not result in any significant differences in revenue recognition. It would however lead to significant additional administrative efforts; the insignificant benefit obtained does not justify such efforts.
For flat-rate contracts revenue and costs are recognised as occurred. Any expected additional costs (e.g. based on contractually defined reconciliation of cost and revenue at contract end) are provided for additionally.
Cost of materials and services include corresponding direct labour and material costs and related overheads for services rendered and goods sold.
As compared to the time and material contracts, the number of individual work events under flat-rate contracts is much smaller, and the events are unevenly distributed throughout the year; furthermore, the average duration of individual work events is longer (several weeks).
(v) Service concession arrangements Revenue relating to construction or upgrade services under service concession arrangements is recognised based on the
stage of completion of the work performed, consistent with the Group’s accounting policy on contract revenue (see (viii) below). Operation or service revenue is recognised in the period in which the services are provided by the Group.
(vi) Supply of chilled water Revenue from supply of chilled water is recognised when the significant risks and rewards of ownership of the goods have
been transferred to the buyer and the amount of revenue can be measured reliably. For supply of chilled water, revenue comprises of available capacity and variable output provided to customers and is recognised when services are provided.
Revenue from supervision contracts services is recognised as supervision services are rendered. Revenue in respect of study and design contracts services is recognised by reference to the stage of completion of the contract, when i) it is probable that the economic benefits associated with the contract will flow to the Group, ii) the contract costs attributable to the contract can be reliably estimated; and iii) the Group is reasonably confident about the collection of amount recognised.
3 Significant accounting policies (Continued) (a) Basis of consolidation (Continued) (v) Joint ventures and equity accounted investees (Continued)
3 Significant accounting policies (Continued) (b) Revenue from sale of goods and services (Continued) (i) Sale of goods and services rendered (Continued)

70 71
Mub
adal
a A
nnua
l Rep
ort
201
1
Notes to the consolidated financial statements (continued)
Mubadala Development Company PJSC
Notes to the consolidated financial statements (continued)
Mubadala Development Company PJSC
(vii) Sale of land Revenue from sale of land is recognised when the equitable interest in a property vests in a buyer and all the following
conditions have been satisfied:
• the Group has transferred to the buyer the significant risks and rewards of ownership of the land; • the Group retains neither continuing managerial involvement to the degree usually associated with ownership
nor effective control over the land sold; • the amount of revenue can be measured reliably; • it is probable that the economic benefits associated with the transaction will flow to the Group; and • the costs incurred or to be incurred in respect of the transaction can be measured reliably.
(viii) Contract revenue Contract revenue includes the initial amount agreed in the contract plus any variations in contract work, claims and
incentive payments to the extent that it is probable that they will result in revenue and can be measured reliably. As soon as the outcome of a construction contract can be estimated reliably, contract revenue and expenses are recognised in profit or loss in proportion to the stage of completion of the contract. Where services are rendered by the performance of an indeterminate number of acts over the period of a contract, revenue is recognised on a straight line basis over the period of the contract. In such cases, if any significant and specifically identifiable act that was planned to be performed, is deferred, revenue (and costs) attributable to that act, is also deferred.
The stage of completion is assessed by reference to the proportion that the contract costs incurred for work performed to date bear to the estimated total contract costs. When the outcome of a construction contract cannot be estimated reliably, contract revenue is recognised only to the extent of contract costs incurred that are likely to be recoverable. An expected loss on a contract is recognised immediately in profit or loss.
(c) Oil and gas exploration, evaluation and development expenditures Mubadala follows the successful efforts method of accounting to account for its oil and gas exploration, evaluation,
appraisal and development expenditures. Under this method, costs of acquiring properties, drilling successful exploration and appraisal wells, and all development costs are capitalised. All other costs are charged to profit or loss as and when incurred.
(i) Licence and property acquisition costs Exploration licence and leasehold property acquisition costs are capitalised within exploration and evaluation assets.
If no future activity is planned, the remaining balance of the licence and property acquisition costs is written off.
These costs are initially amortised over the term of the agreement on a straight-line basis during exploration phase. Upon recognition of proven reserves, including internal approval for development, the relevant expenditure is transferred to property, plant and equipment and is then amortised based on unit of production method (once production is underway).
(ii) Exploration & appraisal expenditures Annual lease rentals, exploratory geological and geophysical costs including seismic costs incurred during exploration
phase, are charged to profit or loss as and when incurred.
Costs associated directly with drilling of exploratory wells are capitalised within exploration and evaluation assets until the drilling of well is complete and the results have been evaluated. These costs include employee remuneration, materials and fuel used, rig costs, delay rentals, drilling services and payments made to contractors.
Costs directly associated with appraisal activity, including the costs of drilling appraisal wells and additional seismic, geological and geophysical activities, undertaken to determine the size, characteristics and commercial potential of a reservoir following the initial discovery of hydrocarbons, are initially capitalised as part of exploration and evaluation assets.
All such carried costs are subject to technical, commercial and management review at least once a year to confirm the continued intent to develop or otherwise extract value from the discovery. When such intent no longer exists, or if there is a change in circumstances signifying an adverse change in initial judgement, these costs are written off. When commercial reserves of hydrocarbons are determined and development is approved by management, the relevant expenditure is transferred to property, plant and equipment.
(iii) Development expenditures Expenditure on the construction, installation or completion of infrastructure facilities such as platforms, pipelines and
the drilling of development wells, including service and unsuccessful development or delineation wells, is capitalised within property, plant and equipment and is depreciated upon the commencement of production as described in the accounting policy for property, plant and equipment. (see note 3(l)(iii)).
(iv) Depreciation, depletion & amortisation of oil and gas assets Oil and gas assets are depreciated using a unit-of-production method, using estimated proven and probable reserves.
The unit-of-production rate for the amortisation of field development costs takes into account expenditures incurred to date, together with approved future development expenditure required to develop reserves.
The impact of changes in estimated reserves is dealt with prospectively by amortising the remaining carrying value of the asset over the expected future production. If reserves estimates are revised downwards, earnings could be affected by higher depreciation expense or an immediate write-down of the property’s carrying value.
For amortisation of licence and acquisition costs, see note 3(c)(i).
(d) Research and development costs Research costs are expensed as incurred. Development expenditures on an individual project are recognised as an
intangible asset when the Group can demonstrate: • the technical feasibility of completing the intangible asset so that it will be available for use or sale; • its intention to complete and its ability to use or sell the asset; • how the asset will generate future economic benefits; • the availability of resources to complete the asset; and • the ability to measure reliably the expenditure during development. Upon initial recognition of the development expenditure as an asset, the cost model is applied requiring the asset to be
carried at cost less any accumulated amortization and accumulated impairment losses. Amortization of the asset begins when development is complete and the asset is available for use over the expected future benefit. During the period of development, the asset it is tested for impairment annually. No development costs have been recognised as intangible assets to date, as in management’s opinion it cannot be demonstrated with sufficient probability how intangible assets created as a result of the Group’s development activities will generate probable future economic benefits.
Development costs which do not meet the above criteria are expensed as incurred.
(e) Project expenses Project expenses comprise expenses incurred on screening, feasibility studies and pre-development phases of various
business development / investment projects undertaken by the Group. Such expenditure is recognised in profit or loss as incurred, other than expenditure on projects related to property, plant and equipment, which are carried as an asset in the consolidated statement of financial position when there is reasonable certainty that the project will be developed and future economic benefits will flow to the Group. In the absence of such certainty, these expenses are charged to profit or loss.
(f) Foreign currency
(i) Foreign currency transactions Transactions in foreign currencies are translated to the respective functional currencies of the Group entities at exchange
rates at the dates of the transactions. Monetary assets and liabilities denominated in foreign currencies at the reporting date are retranslated to the functional currency at the exchange rate at that date.
Foreign currency gains or losses on monetary items is the difference between the amortised cost in the functional currency at the beginning of the period, adjusted for effective interest and payments during the period, and the amortised cost in foreign currency translated at the exchange rate at the end of the period.
Non-monetary assets and liabilities that are measured in terms of historical cost in a foreign currency are translated using the exchange rate at the date of the transaction. Non-monetary assets and liabilities denominated in foreign currencies that are measured at fair value are retranslated to the functional currency at the exchange rate at the date that the fair value was determined.
Foreign currency differences arising on retranslation are recognised in profit or loss, except for differences arising on the translation of available for sale financial assets or a financial liability designated as a hedge of the net investment in a foreign operation which are recognised in other comprehensive income.
(ii) Foreign operations The assets and liabilities of foreign operations, including goodwill and fair value adjustments arising on acquisitions,
are translated to the functional currency at exchange rates at the reporting date. The income and expenses of foreign operations are translated to functional currency at average exchange rates.
Foreign currency differences are recognised in other comprehensive income. Such differences have been recognised in foreign currency translation reserve (“FCTR”). When a foreign operation is disposed of, in part or in full, the associated amount in the FCTR is transferred to profit or loss as a part of profit or loss on disposal. Foreign exchange gains and losses arising from a monetary item receivable from or payable to a foreign operation, the settlement of which is neither planned nor likely in the foreseeable future, are considered to form part of a net investment in a foreign operation and are recognised in other comprehensive income, and are presented within equity in the FCTR.
3 Significant accounting policies (Continued) (b) Revenue from sale of goods and services (Continued)
3 Significant accounting policies (Continued) (c) Oil and gas exploration, evaluation and development expenditures (Continued)

72 73
Mub
adal
a A
nnua
l Rep
ort
201
1
Notes to the consolidated financial statements (continued)
Mubadala Development Company PJSC
Notes to the consolidated financial statements (continued)
Mubadala Development Company PJSC
(g) Financial instruments Financial assets and liabilities are recognised when a group entity becomes a party to the contractual provisions of the
instrument. Financial assets and financial liabilities are initially measured at fair value. Transaction costs that are directly attributable to the acquisition or issue of financial assets and financial liabilities (other than financial assets and financial liabilities at fair value through profit or loss) are added to or deducted from the fair value of the financial assets or financial liabilities, as appropriate, on initial recognition. Transaction costs directly attributable to the acquisition of financial assets or financial liabilities at fair value through profit or loss are recognised immediately in profit or loss.
(i) Non-derivative financial assets The classification depends on the nature and purpose of the financial assets and is determined at the time of initial recognition.
Non-derivative financial assets comprise fair value through profit or loss investments, available for sale investments, trade and other receivables, cash and cash equivalents, loans and receivables and amounts due from related parties.
The Group initially recognises loans and receivables and deposits on the date that they are originated. All other financial assets (including assets designated at fair value through profit or loss) are recognised initially on the trade date at which the Group becomes a party to the contractual provisions of the instrument.
The Group derecognises a financial asset only when the contractual rights to the cash flows from the asset expire, or it transfers the rights to receive the contractual cash flows on the financial asset in a transaction in which substantially all the risks and rewards of ownership of the financial asset are transferred. If the Group neither transfers nor retains substantially all the risks and rewards of ownership and continues to control the transferred asset, the Group recognises its retained interest in the asset and associated liability for amounts it may have to pay. If the Group retains substantially all the risks and rewards of ownership of a transferred financial asset, the Group continues to recognise the financial asset and also recognises a collateralised borrowing for the proceeds received.
On derecognition of a financial asset in its entirety, the difference between the asset’s carrying amount and the sum of the consideration received and receivable and the cumulative gain or loss that had been recognised in other comprehensive income and accumulated in equity is recognised in profit or loss.
Financial assets and liabilities are offset and the net amount presented in the statement of financial position when, and only when, the Group has a legal right to offset the amounts and intends either to settle on a net basis or to realise the asset and settle the liability simultaneously.
Financial assets at fair value through profit or loss A financial asset is classified as held for trading if the Group has acquired it principally for the purpose of selling it in
the near term, or on initial recognition it is part of a portfolio of identified financial instruments that the group manages together and has a recent actual pattern of short-term profit-taking, or it is a derivative that is not designated and effective as a hedging instrument. Financial assets are designated at fair value through profit or loss if the Group manages such investments and their performance is evaluated on a fair valuation basis, in accordance with the Group’s documented risk management or investment strategy. Upon initial recognition attributable transaction costs are recognised in profit or loss as incurred. Financial assets at fair value through profit or loss are measured at fair value, and changes therein are recognised in profit or loss.
Available-for-sale financial assets Available-for-sale financial assets are non-derivative financial assets that are designated as available-for-sale and that are
not classified in any of the other categories. Subsequent to initial recognition, they are measured at fair value and changes therein, other than impairment losses (see note 3(t)) and foreign currency differences on available-for-sale debt instruments (see note 3(f)(i)), are recognised in other comprehensive income and presented within equity in the fair value reserve. When an investment is derecognised, the cumulative gain or loss in other comprehensive income is transferred to profit or loss.
The fair value of financial assets at fair value through profit or loss and available-for-sale financial assets is determined by reference to their quoted bid price at the reporting date. If a quoted market price is not available, the fair value is based on an appropriate valuation technique. However, if the fair value cannot be reliably measured such instruments are carried at cost, less impairment losses.
Loans and receivables Loans and receivables are financial assets with fixed or determinable payments that are not quoted in an active market. Such
assets are recognised initially at fair value plus any directly attributable transaction costs. Subsequent to initial recognition loans and receivables are measured at amortised cost using the effective interest method, less any impairment losses. Loans and receivables comprise trade and other receivables, including service concession receivables, amounts due from related parties, receivable against sale of land, other receivables, loans to related parties and third parties (see notes 19 and 21).
The Group recognises a financial asset arising from a service concession arrangement when it has an unconditional contractual right to receive cash or another financial asset from or at the direction of the grantor for the construction or upgrade services provided. Such financial assets are measured at fair value upon initial recognition. Subsequent to initial recognition the financial assets are measured at amortised cost.
If the Group is paid for the construction services partly by a financial asset and partly by an intangible asset, then each component of the consideration received or receivable is accounted for separately and is recognised initially at the fair value of the consideration received or receivable (see note 3(m)).
Cash and cash equivalents Cash and cash equivalents comprise cash and bank balances, call deposits and short-term deposits. Bank overdrafts
that are repayable on demand and form an integral part of the Group’s cash management are included as a component of cash and cash equivalents for the purpose of the statement of cash flows.
(ii) Non-derivative financial liabilities
Classification of debt or equity Debt and equity instruments issued by a group entity are classified as either financial liabilities or as equity in accordance
with the substance of the contractual arrangements and the definitions of a financial liability and an equity instrument.
Equity instruments An equity instrument is any contract that evidences a residual interest in the assets of an entity after deducting all of its
liabilities. Equity instruments issued by the Group are recognised at the proceeds received, net of direct issue costs.
The Group initially recognises debt securities issued on the date that they are originated. All other financial liabilities (including liabilities designated at fair value through profit or loss) are recognised initially on the trade date at which the Group becomes a party to the contractual provisions of the instrument. For offsetting with financial assets (see note 3 (g)(i)). The Group derecognises a financial liability when its contractual obligations are discharged, or cancelled or expire.
The Group has the following non-derivative financial liabilities: loans and borrowings, payables and accruals and amounts due to related parties.
Such financial liabilities are recognised initially at fair value plus any directly attributable transaction costs. Subsequent to initial recognition these financial liabilities are measured at amortised cost using the effective interest method.
Fair value, which is determined for disclosure purposes, is calculated based on the present value of future principal and interest cash flows, discounted at the market rate of interest at the reporting date.
(iii) Derivative financial instruments, including hedge accounting The Group enters into a variety of derivative financial instruments to manage its exposure to interest rate and foreign
exchange rate risks, including foreign exchange forward contract, interest rate swaps and cross currency swaps. Further details of derivatives financial instruments are disclosed in note 25. Derivatives are initially recognised at fair value at the date the derivative contracts are entered into and are subsequently re-measured to their fair value at the end of each reporting period. The resulting gain or loss is recognised in profit or loss immediately, unless the derivative is designated and effective as a hedging instrument, in which event the timing of the recognition in profit or loss depends on the nature of the hedge relationship. A derivative with a positive fair value is recognised as a financial asset whereas a derivative with a negative fair value is recognised as a financial liability.
Embedded derivatives Embedded derivatives are separated from the host contract and accounted for separately if the economic characteristics
and risks of the host contract and the embedded derivative are not closely related, a separate instrument with the same terms as the embedded derivative would meet the definition of a derivative, and the combined instrument is not measured at fair value through profit or loss.
Other non-trading derivatives When a derivative financial instrument is not held for trading, and is not designated in a qualifying hedge relationship,
all changes in its fair value are recognised immediately in profit or loss.
Hedge accounting On initial designation of the hedge, the Group formally documents the relationship between the hedging instrument(s)
and hedged item(s), including the risk management objectives and strategy in undertaking the hedge transaction, together with the methods that will be used to assess the effectiveness of the hedging relationship.
The Group makes an assessment and documents, both at the inception of the hedge relationship as well as on an ongoing basis, whether the hedging instruments are expected to be “highly effective” in offsetting the changes in the fair value or cash flows of the respective hedged items during the period for which the hedge is designated, and whether the actual results of each hedge are within a range of 80 - 125 percent.
3 Significant accounting policies (Continued) 3 Significant accounting policies (Continued) (g) Financial instruments (Continued) (i) Non-derivative financial assets (Continued) Loans and receivables (Continued)

74 75
Mub
adal
a A
nnua
l Rep
ort
201
1
Notes to the consolidated financial statements (continued)
Mubadala Development Company PJSC
Notes to the consolidated financial statements (continued)
Mubadala Development Company PJSC
Cash flow hedges For a cash flow hedge of a forecast transaction, the transaction should be highly probable to occur and should present an
exposure to variations in cash flows that could ultimately affect reported net income. When a derivative is designated as the hedging instrument in a hedge of the variability in cash flows attributable to a particular risk associated with a recognised asset or liability or a highly probable forecast transaction that could affect profit or loss, the effective portion of changes in the fair value of the derivative is recognised in other comprehensive income and presented in the hedging reserve in equity.
The amount recognised in other comprehensive income is removed and included in profit or loss in the same period as the hedged cash flows affect profit or loss under the same line item in the statement of comprehensive income as the hedged item. Any ineffective portion of changes in the fair value of the derivative is recognised immediately in profit or loss.
If the hedging instrument no longer meets the criteria for hedge accounting, expires, or is sold, terminated, exercised, or the designation is revoked, then hedge accounting is discontinued prospectively. The cumulative gain or loss previously recognised in other comprehensive income and presented in the hedging reserve in equity remains there until the forecast transaction affects profit or loss. When the hedged item is a non-financial asset or non-financial liability, the amount recognised in other comprehensive income is transferred to the carrying amount of the asset when the asset is recognised. If the forecast transaction is no longer expected to occur, then the balance in other comprehensive income is recognised immediately in profit or loss. In other cases the amount recognised in other comprehensive income is transferred to profit or loss in the same period that the hedged item affects profit or loss.
Economic hedges Hedge accounting is not applied to derivative instruments that economically hedge monetary assets and liabilities
denominated in foreign currencies. Changes in the fair value of such derivatives are recognised in profit or loss as part of foreign currency gains and losses.
Short selling In certain instances the Group sells securities that it does not own and therefore, it will be obliged to purchase such
securities at a future date. When the group sells a security short, an amount equal to the proceeds received is recorded as a liability and is subsequently adjusted to the current market value of the securities sold short. Upon the closing of the short position, the difference between the proceeds originally received and the cost of the securities purchased to close the short position is recognised as a realized gain or loss. This is disclosed on the statement of financial position in liabilities under financial liabilities through profit or loss. These positions are shown as financial liabilities at fair value through profit or loss until they are realized. Upon realisation they are shown in the statement of comprehensive income as loss or income from financial investments.
(h) Government grants Considering the Government of Abu Dhabi is the sole shareholder of the Company, on receipt of any assistance from the
Government of Abu Dhabi, the Group evaluates the assistance to determine if the transaction is a transaction with a shareholder in their capacity as a shareholder and therefore treated as equity contribution, or if not, then as a government grant.
This determination is done after considering various factors not limited to the following:
• if the purpose of the assistance was a restricted purpose,
• are there conditions associated with the receipt of the assistance,
• is there evidence of an equity transaction,
• the legal form and documentation of assistance,
• would similar support or assistance be given by the government to an entity not owned by the government.
Government grants are recognised where there is reasonable assurance that the grant will be received and all attached conditions will be complied with.
Non-monetary government grants
(i) Land Management believes that, in most cases, when land is initially received through government grants, the probability that
future economic benefits will flow to the Group is uncertain, since, until management has established plans to utilise the land, it is possible that such land may revert back to the government. In addition, in the absence of identified use of the land, the amount of future economic benefits cannot be determined with reasonable certainty. Accordingly, land so received is not initially recognised in the consolidated financial statements until certain events occur, which enable management to conclude that it becomes probable that future economic benefits will flow to the Group from its ownership of such land.
Land received as government grants that do not meet the criteria that future economic benefits will flow to the Group, are not recognised, but their existence is disclosed in the consolidated financial statements.
Furthermore, for certain plots of land based on their current or intended use, it is certain that no future economic benefits will flow to the Group from use of such lands. These are not recognised as assets, but their existence is disclosed in the consolidated financial statements (see note 34).
The determination of whether future economic benefits will flow to the Group is made by management using guidelines approved by the Board of Directors; each such determination is also approved by the Board of Directors. Once the determination is made, land is recognised in the financial statements at nominal value.
At the point of such initial recognition, and subsequently, at each reporting date, an assessment is made by management as to the ultimate use of the land, and based on such assessment, the land is transferred to the relevant asset category (such as investment property, property, plant and equipment or inventory) depending on its intended use, and is thereafter accounted for using the accounting policy in place for that relevant asset category.
(ii) Others Other non-monetary government grants are recognised in the statement of financial position at nominal value, and the
granted assets are classified with other assets of the same nature as the granted item. Monetary government grants are recognised where there is reasonable assurance that the grant will be received and all attached conditions will be complied with.
Monetary government grants Monetary grants that compensate the Group for expenses to be incurred are initially recognised in the statement of
financial position as a deferred liability. Subsequent to initial recognition, such grants are released to profit or loss on a systematic basis over the periods in which the related expenses are recognised.
Where government grants compensate for the cost of assets, such assets are carried at cost, less the value of the grants received. Asset values so derived are depreciated over the useful life of the relevant asset.
Monetary grants for investments in other business enterprises are credited directly to the statement of changes in equity.
(i) Finance income and expenses Net finance expense comprises interest income on short term deposits and advances, effective interest on service
concession receivables; and interest expenses on term loans, amortisation of loan arrangement fees and foreign exchange gains and losses that are recognised in profit or loss. Interest income and expenses are recognised in profit or loss as they accrue using the effective interest method. Foreign currency gains and losses are reported on a net basis.
(j) Income tax Income tax expense / credit comprise current and deferred tax. Current and deferred tax are recognised in profit
or loss except to the extent that it relates to a business combination, or items recognised directly in equity or in other comprehensive income.
Current tax is the expected tax payable on the taxable income or loss for the year, using tax rates enacted or substantively enacted at the reporting date, and any adjustment to tax payable in respect of previous years.
Deferred tax is recognised in respect of temporary differences between the carrying amounts of assets and liabilities for financial reporting purposes and the amounts used for taxation purposes. Deferred tax is not recognised for the following temporary differences: the initial recognition of assets or liabilities in a transaction that is not a business combination and that affects neither accounting nor taxable profit or loss, and differences relating to investments in subsidiaries and jointly controlled entities to the extent that it is probable that they will not reverse in the foreseeable future. In addition, deferred tax is not recognised for taxable temporary differences arising on the initial recognition of goodwill. Deferred tax is measured at the tax rates that are expected to be applied to temporary differences when they reverse, based on the laws that have been enacted or substantively enacted by the reporting date. Deferred tax assets and liabilities are offset if there is a legally enforceable right to offset current tax liabilities and assets, and they relate to income taxes levied by the same tax authority on the same taxable entity, or on different tax entities, but they intend to settle current tax liabilities and assets on a net basis or their tax assets and liabilities will be realised simultaneously.
A deferred tax asset is recognised for deductible temporary differences, to the extent that it is probable that future taxable profits will be available against which the temporary difference can be utilised. Deferred tax assets are reviewed at each reporting date and are reduced to the extent that it is no longer probable that the related tax benefit will be realised.
Additional income taxes that arise from the distribution of dividends are recognised at the same time that the liability to pay the related dividend is recognised.
3 Significant accounting policies (Continued) (g) Financial instruments (Continued) (iii) Derivative financial instruments, including hedge accounting (Continued)
3 Significant accounting policies (Continued) (h) Government grants (Continued) Non-monetary government grants (Continued) (i) Land (Continued)

76 77
Mub
adal
a A
nnua
l Rep
ort
201
1
Notes to the consolidated financial statements (continued)
Mubadala Development Company PJSC
Notes to the consolidated financial statements (continued)
Mubadala Development Company PJSC
(k) Borrowing costs Borrowing costs directly attributable to the acquisition, construction or production of qualifying assets, which are assets
that necessarily take a substantial period of time to get ready for their intended use or sale, are added to the cost of those assets, until such time as the assets are substantially ready for their intended use or sale. Other borrowing costs are recognised as an expense in the period in which they are incurred (see note 3(i)).
(l) Property, plant and equipment
(i) Recognition and measurement
Owned assets Items of property, plant and equipment are stated at cost, less accumulated depreciation and impairment losses, if any,
except for land, helicopters and helicopter spare parts received as government grants which are stated at nominal value (see note 3(h)). Cost includes expenditures that are directly attributable to the acquisition of the assets.
The cost of self-constructed assets includes the cost of materials and direct labour, any other costs directly attributable to bringing the asset to a working condition for its intended use, and the costs of dismantling and removing the items and restoring the site on which they are located, and capitalised borrowing costs. Purchased software that is integral to the functionality of the related equipment is capitalised as part of that equipment.
When parts of an item of property, plant and equipment have different useful lives, they are accounted for as separate items (major components) of property, plant and equipment.
Gains and losses if any on disposal or retirement of an item of property, plant and equipment are determined by comparing the proceeds from disposal with the carrying amount of property, plant and equipment and are recognised net within “other income (net)” in profit or loss.
Leased assets Leases under the terms of which the Group assumes substantially all the risks and rewards of ownership are classified as
finance leases. Upon initial recognition the leased assets are measured at an amount equal to the lower of its fair value and the present value of the minimum lease payments. Subsequent to initial recognition, the asset is accounted for in accordance with the accounting policy applicable to that asset.
(ii) Subsequent costs The cost of replacing part of an item of property, plant and equipment is recognised in the carrying amount of the item
if it is probable that the future economic benefits embodied within the part will flow to the Group and its cost can be measured reliably. The carrying amount of the replaced part is derecognised. The costs of the day-to day servicing of property, plant and equipment are recognised in profit or loss as incurred.
(iii) Depreciation Oil and gas assets are depreciated using the unit of production method by reference to the ratio of production in the
period and the related proved and probable reserves in the field, taking into account future development expenditure necessary to bring those reserves into production. See note 3(c)(iv) for accounting policy on depreciation, depletion and amortisation of oil and gas assets.
Land is not depreciated. Leased assets are depreciated over the shorter of the lease term and their estimated useful lives unless it is reasonably certain that the Group will obtain ownership by the end of the lease term.
Depreciation on assets other than oil and gas assets, land and leased assets, is charged to profit or loss on a straight-line basis over the estimated useful lives of each part of an item of property, plant and equipment, since this most closely reflects the expected pattern of consumption of the future economic benefits embodied in the asset. The estimated useful lives for the current and comparative periods are as follows:
Particulars Years
Buildings 6 - 30 years and above
Plant and office equipment 2 - 25
Aircraft 10 - 20
Aircraft materials 1 - 24
Distribution network 50 years and above
Computers 3 - 7
Others 3 - 8
Depreciation methods, useful lives and residual values are reviewed at each financial year end and adjusted if appropriate (see note 37).
(iv) Capital work in progress The Group capitalises all costs relating to the construction of property, plant and equipment as capital work in progress,
up to the date of the completion and commissioning of the asset. These costs are transferred from capital work in progress to the appropriate asset classification upon completion and commissioning, and are depreciated over the useful economic life applicable to the respective asset category, from the date of such completion and commissioning.
(m)Intangible assets
Goodwill Goodwill acquired in a business combination is initially measured at cost of the acquisition in excess of the Group’s interest
in the net fair value of identifiable assets, liabilities and contingent liabilities of the acquiree. Following initial recognition goodwill is measured at cost less accumulated impairment losses. In respect of equity accounted investees, the carrying amount of goodwill is included in the carrying amount of the investment, and an impairment loss on such an investment is not allocated to any asset, including goodwill, that forms part of the carrying amount of the equity accounted investee. Goodwill is reviewed for impairment annually or more frequently if events and circumstances indicate that the carrying value may be impaired.
For the purpose of impairment testing, goodwill is allocated to each of the Group’s cash-generating units (or group of cash-generating units) that is expected to benefit from the synergies of the combination. On disposal of the relevant cash-generating unit, the attributable amount of goodwill is included in the determination of the profit or loss on disposal.
Trademarks Acquired trademarks and licences are shown at historical costs. Trademarks and licences primarily have indefinite useful
lives and are subject to impairment testing which is performed annually or in case of triggering events.
Service concession arrangements The Group recognises an intangible asset arising from a service concession arrangement when it has a right to charge for
usage of the concession infrastructure. An intangible asset received as consideration for providing construction or upgrade services in a service concession arrangement is measured at fair value upon initial recognition.
Subsequent to initial recognition the intangible asset is measured at cost, which includes capitalised borrowing costs, less accumulated amortisation and accumulated impairment losses.
Other intangible assets Other intangible assets, which have finite useful lives are measured at cost less accumulated amortisation and accumulated
impairment losses, if any.
Subsequent expenditure Subsequent expenditure is capitalised only when it increases the future economic benefits embodied in the specific asset
to which it relates. All other expenditure, including expenditure on internally generated goodwill and brands, is recognised in profit or loss as incurred.
Amortisation Licence fees relating to mineral exploration and production rights and oil reserves are amortised using the unit of
production method (see note 3(c)(i)). Favourable supply contracts acquired in a business combination are amortised on a straight line basis over the life of the contract.
Possible and contingent hydrocarbons reserves acquired in a business combination are amortised on a straight line basis over the life of the project till the reserves move to the proved and probable category. After the reserves move to the proved and probable category, they are amortised based on the unit of production method.
Amortisation of other intangible assets is recognised in profit or loss on a straight-line basis over the estimated useful lives of the intangible assets, from the date that they are available for use. The estimated useful lives for the current and comparative periods are as follows:
Years
Trademarks Indefinite
Software 5 - 7
Technology, licence and software 3 - 7
Capitalised development costs 25
Customer contracts 5 - 15
Others 3 - 25
3 Significant accounting policies (Continued) 3 Significant accounting policies (Continued) (l) Property, plant and equipment (Continued)

78 79
Mub
adal
a A
nnua
l Rep
ort
201
1
Notes to the consolidated financial statements (continued)
Mubadala Development Company PJSC
Notes to the consolidated financial statements (continued)
Mubadala Development Company PJSC
Amortisation methods, useful lives and residual values are reviewed at each financial year-end date and adjusted if appropriate. The estimated useful life of an intangible asset in a service concession arrangement is the period from when the Group is
able to charge the tenants for the use of the infrastructure to the end of the concession period. Intangible assets acquired in a business combination and recognised separately from goodwill are initially recognised at their
fair value at the acquisition date (which is regarded as their cost). Subsequent to initial recognition, intangible assets acquired in a business combination are reported at cost less accumulated amortization and accumulated impairment losses, if any.
An intangible asset is derecognised on disposal, or when no future economic benefits are expected from use or disposal. Gains or losses arising from derecognition of an intangible asset, measured as the difference between the net disposal proceeds and the carrying amount of the asset, are recognised in profit or loss when the asset is derecognised.
(n) Investment properties Investment properties are properties held to earn rental and/or for capital appreciation (including property under
construction for such purposes). Investment properties are measured initially at cost, including transaction costs. Subsequent to initial recognition, investment properties are measured at fair value. Gain and losses arising from changes in the fair value of investment properties are included in profit or loss in the period in which they arise.
(o) Leases The determination of whether an arrangement is, or contains a lease is based on the substance of the arrangement at
inception date of whether the fulfilment of the arrangement is dependent on the use of a specific asset or assets or the arrangement conveys a right to use the asset.
Group as lessee Finance leases, which transfer to the Group substantially all of the risks and benefits incidental to ownership of the leased
item, are capitalised at the inception of the lease at the fair value of the leased property or, if lower, at the present value of the minimum lease payments. Lease payments are apportioned between the finance charges and reduction of the lease liability so as to achieve a constant rate of interest on the remaining balance of the liability. Finance charges are reflected in the consolidated statement of comprehensive income. Capitalised leased assets are depreciated over the shorter of the estimated useful life of the asset and the lease term, if there is no reasonable certainty that the Group will obtain ownership by the end of the lease term. Operating lease payments are recognised as an expense in the consolidated statement of comprehensive income on a straight line basis over the lease term.
Group as lessor Leases where the Group transfers substantially all of the risks and benefits of ownership of the asset through its contractual
arrangements to the customer are considered as a finance lease. The amounts due from the lessee are recorded in the balance sheet as financial assets (finance lease receivables) and are carried at the amount of the net investment in the lease after making provision for impairment, if any. Leases in which the Group does not transfer substantially all of the risks and benefits of ownership of the asset are classified as operating leases. Finance lease income is allocated to accounting periods so as to reflect a constant periodic rate of return on the Group’s net investment outstanding in respect of the leases. Rental income from operating leases is recognised on a straight-line basis over the term of the relevant lease. Initial direct costs incurred in negotiating and arranging an operating lease are added to the carrying amount of the leased asset and recognize on a straight-line basis over the lease term.
(p) Inventories Inventories are primarily comprised of land held for sale, work in progress, consumables, maintenance spares, and drilling
materials. Inventories are measured at the lower of cost and net realisable value. For inventories other than land held for sale, cost is based on the weighted average cost method or standard costs approximately equal to cost based on weighted average cost method and includes expenditure incurred in acquiring the inventories and bringing them to their existing location and condition.
The cost of land held for sale is determined based on the specific identification method. Where land held for sale is transferred from another asset category, the carrying value at the date of change is the deemed cost of inventory for subsequent accounting.
Net realisable value is the estimated selling price in the ordinary course of business, less estimated selling expenses.
(q) Contract work in progress Contract work in progress represents the gross unbilled amount expected to be collected from customers for contract work
performed to date. It is measured at cost plus profit recognised to date less progress billings and recognised losses. Cost includes all expenditure directly related to specific projects and an allocation of fixed and variable overheads incurred in the Group’s contract activities based on normal operating capacity.
Contract work in progress is presented as part of receivables and prepayments in the consolidated statement of financial position. If payments received from customers exceed costs incurred plus recognised profits, then the difference is presented as deferred income in payables and accruals or other liabilities in the consolidated statement of financial position.
(r) Provisions Provisions are recognised if, as a result of past events, the Group has a present legal or constructive obligation that can be
estimated reliably, and it is probable that an outflow of economic benefits will be required to settle the obligation. Where the effect of time value of money is material, provisions are determined by discounting the expected future cash flows at a pre-tax rate that reflects the current market assessments of the time value of money and the risks specific to the liability. The unwinding of the discount is recognised as finance cost.
Product warranties The group warrants that products will meet the stated functionality as agreed to in each sales arrangements. The group
provides for the estimated warranty costs under these guarantees based upon historical experience and management’s estimates of the level of future claims and accrues for specific items at the time their existence is known and the amounts are estimable. Expenses for warranty costs were not significant in any of the periods presented.
Decommissioning liabilities Liabilities for decommissioning costs are recognised when the Group becomes legally or constructively obliged to dismantle
and remove a facility or an item of plant and to restore the site on which it is located, and when a reasonable estimate of that liability can be made.
The amount of the obligation is estimated at current prices and in accordance with local conditions and requirements. A corresponding item of plant and equipment in an amount equivalent to the provision is included in the respective class of asset. This is subsequently depreciated or depleted as part of the capital costs of the facility or item of plant. Subsequent to initial recognition, any change, other than unwinding of discount, is recognised in property, plant and equipment.
(s) Staff terminal benefits and pensions
Entities domiciled in UAE For the Group entities domiciled in UAE, a provision for staff terminal benefits is made in accordance with the UAE
Federal Labour Law and is determined as the liability that would arise if the employment of all staff were terminated at the consolidated statement of financial position date.
Monthly pension contributions are made in respect of UAE National employees, who are covered by the Law No. 2 of 2000. The contribution made by the Company is recognised in profit or loss. The pension fund is administered by the Government of Abu Dhabi, Finance Department, represented by the Abu Dhabi Retirement Pensions and Benefits Fund. Other than the monthly pension contributions there is no further obligation on the Group.
An actuarial valuation is not performed on staff terminal and other benefits in respect of UAE employees as the net impact of the discount rate and future salary and benefits level on the present value of the benefits obligation are not expected by management to be significant.
Entities domiciled outside UAE For the Group entities domiciled outside the UAE, provision for staff terminal benefits is made in accordance with the
applicable provisions under the regulations prevalent in countries in which the respective entity operates. The Group companies operate various pension schemes. The schemes are generally funded through payments to insurance companies or trustee-administered funds, determined by periodical actuarial calculations and legally independent from the Group. The Group has both defined benefit and defined contribution schemes. A defined contribution plan is a plan under which the Group pays fixed contributions into a separate entity. The Group has no legal or constructive obligations to pay further contributions if the fund does not hold sufficient assets to pay all employees the benefits relating to employee service in the current and prior periods.
Defined benefit plans define an amount of pension benefit that an employee will receive on retirement, usually dependent on one or more factors such as age, years of service and compensation.
The liability recognised in the consolidated statement of financial position in respect of defined benefit pension plans is the present value of the defined benefit obligation at the consolidated statement of financial position date less the fair value of plan assets, together with adjustments for unrecognised actuarial gains or losses and past service costs. The defined benefit obligation is calculated annually by independent actuaries using the projected unit credit method.
The present value of the defined benefit obligation is determined by discounting the estimated future cash outflows using the interest rates of high-quality corporate bonds that are denominated in the currency in which the benefits will be paid and that have terms to maturity approximating the terms of the related pension liability.
Actuarial gains and losses arising from experience adjustments and changes in actuarial assumptions in excess of the greater of 10% of the value of plan assets or 10% of the defined benefit obligation are charged or credited to income over the employees’ expected average remaining working lives. Pension assets are recognised to the extent that they represent probable expected refunds or reductions in contributions.
3 Significant accounting policies (Continued) (m) Intangible assets (Continued)
3 Significant accounting policies (Continued)

80 81
Mub
adal
a A
nnua
l Rep
ort
201
1
Notes to the consolidated financial statements (continued)
Mubadala Development Company PJSC
Notes to the consolidated financial statements (continued)
Mubadala Development Company PJSC
Current service costs are recognised in the profit or loss. Past service costs are recognised immediately in profit or loss, unless the changes to the pension plan are conditional on the employees remaining in service for a specified period of time (the vesting period). In this case, the past-service costs are amortised on a straight-line basis over the vesting period.
For certain defined contribution plans, the Group pays contributions to publicly or privately administered pension insurance plans on a mandatory, contractual or voluntary basis. The Group has no further payment obligation once the contributions have been paid. The contributions are recognised as employee benefit expenses when they are due. Prepaid contributions are recognised as an asset to the extent that a cash refund or a reduction in the future payments is available.
(t) Impairment
Financial assets A financial asset not carried at fair value through profit or loss is assessed at each reporting date to determine whether there
is any objective evidence that it is impaired. A financial asset is impaired if objective evidence indicates that a loss event has occurred after the initial recognition of the asset, and that the loss event had a negative effect on the estimated future cash flows of that asset that can be estimated reliably.
Objective evidence that financial assets (including equity securities) are impaired can include default or delinquency by a debtor, restructuring of an amount due to the Group on terms that the Group would not consider otherwise, indications that a debtor or issuer will enter bankruptcy, the disappearance of an active market for a security. In addition, for an investment |in an equity security, a significant or prolonged decline in its fair value below its cost is objective evidence of impairment.
The Group considers evidence of impairment for receivables at both a specific asset and collective level. All individually significant receivables are assessed for specific impairment. All individually significant receivables found not to be specifically impaired are then collectively assessed for any impairment that has been incurred but not yet identified. Receivables that are not individually significant are collectively assessed for impairment by grouping together receivables with similar risk characteristics.
In assessing collective impairment the Group uses historical trends of the probability of default, timing of recoveries and the amount of loss incurred, adjusted for management’s judgement as to whether current economic and credit conditions are such that the actual losses are likely to be greater or less than suggested by historical trends.
An impairment loss in respect of a financial asset measured at amortised cost is calculated as the difference between its carrying amount, and the present value of the estimated future cash flows discounted at the asset’s original effective interest rate. Losses are recognised in profit or loss and reflected in an allowance account against loans and receivables. Interest on the impaired asset continues to be recognised through the unwinding of the discount. When a subsequent event causes the amount of impairment loss to decrease, the decrease in impairment loss is reversed through profit or loss.
Impairment losses on available-for-sale financial assets are recognised by transferring to profit or loss the cumulative loss that has been recognised in other comprehensive income, and presented in the fair value reserve in equity. The cumulative loss that is removed from other comprehensive income and recognised in profit or loss is the difference between the acquisition cost, net of any principal repayment and amortisation, and the current fair value, less any impairment loss previously recognised in profit or loss. Changes in impairment provisions attributable to time value are reflected as a component of interest income.
In respect of available-for-sale financial assets, impairment losses previously recognised in profit or loss are not reversed through profit or loss. Any increase in fair value subsequent to an impairment loss is recognised in other comprehensive income and accumulated under the heading of fair value reserve. In respect of available-for-sale debt securities, impairment losses are subsequently reversed through profit or loss if an increase in the fair value of the investment can be objectively related to an event occurring after the recognition of the impairment loss.
Non-financial assets The carrying amounts of the Group’s non-financial assets, other than investment properties and inventories, are reviewed at
each reporting date to determine whether there is any indication of impairment. If any such indication exists, then the asset’s recoverable amount is estimated. For goodwill, and intangible assets that have indefinite useful lives or that are not yet available for use, the recoverable amount is estimated each year at the same time.
The recoverable amount of an asset or cash-generating unit is the greater of its value in use and its fair value less costs to sell. In assessing value in use, the estimated future cash flows are discounted to their present value using a discount rate that reflects current market assessments of the time value of money and the risks specific to the asset. For the purpose of impairment testing, assets that cannot be tested individually are grouped together into the smallest group of assets that generates cash inflows from continuing use that are largely independent of the cash inflows of other assets or groups of assets (“the cash-generating unit, or CGU”).
The Group’s corporate assets do not generate separate cash inflows. If there is an indication that a corporate asset may be impaired, then the recoverable amount is determined for the CGU to which the corporate asset belongs.
An impairment loss is recognised if the carrying amount of an asset or its CGU exceeds its estimated recoverable amount.
Impairment losses are recognised in profit or loss. Impairment losses recognised in respect of CGUs are allocated first to reduce the carrying amount of any goodwill allocated to the units, and then to reduce the carrying amounts of the other assets in the unit (group of units) on a pro rata basis.
An impairment loss in respect of goodwill is not reversed. In respect of other assets, impairment losses recognised in prior periods are assessed at each reporting date for any indications that the loss has decreased or no longer exists. An impairment loss is reversed if there has been a change in the estimates used to determine the recoverable amount. An impairment loss is reversed only to the extent that the asset’s carrying amount does not exceed the carrying amount that would have been determined, net of depreciation or amortisation, if no impairment loss had been recognised.
Goodwill that forms part of the carrying amount of an equity accounted investee is not recognised separately, and therefore is not tested for impairment separately. Instead, the entire amount of such investment is tested for impairment as a single asset when there is objective evidence that the investment may be impaired.
(u) Dividend income Dividend income from investments is recognised when the shareholder’s right to receive payment has been established, provided
that it is probable that the economic benefits will flow to the Group and the amount of income can be measured reliably.
(v) Investment in Gold bullion Investments in gold bullion are measured at fair value determined by reference to published price quotations,
with unrealised and realised gains and losses recorded in statement of comprehensive income.
(w) Operating segments The accounting policies of the reportable segments are the same as the Group’s accounting policies described above.
An operating segment is a component of the Group that engages in business activities from which it may earn revenues and incur expenses, including revenues and expenses that relate to transactions with any of the Group’s other components. All operating segments’ operating results are reviewed regularly by the Group’s CEO to make decisions about resources to be allocated to the segment and assess its performance, and for which discrete financial information is available (see note 4).
4 Operating segments
Information about reportable segments The Group has eleven reportable segments, as described below, which are the Group’s strategic business units. The strategic
business units are responsible for the screening due diligence, development and implementation of all business ideas, investment opportunities and acquisitions. The following summary describes the operations in each of the Group’s reportable segments:
• Oil and Gas and Energy – Is focused on diversification in the oil and gas sector; in particular hydrocarbon exploration and production, and creation of a globally competitive oil and gas exploration and production company.
• Renewable Energy (formerly “New Energy Technologies”) - Is focused on achieving the Government of Abu Dhabi’s vision of transforming Abu Dhabi into a global leader in sustainable new energy technologies.
• Industry – Is focused on economic development through the development of sustainable industry. • Real Estate and Hospitality – Is focused on residential, commercial and retail real estate developments and luxury hotels
and resorts, both in Abu Dhabi and internationally. • Infrastructure – Is focused on economic development through developing, owning and operating concession based
infrastructure and educational and other facilities. • Services Ventures - Is focused on economic development by establishing businesses in service-based sectors, such as
leasing and financial, maritime transportation, defence and logistics services. • Aerospace – Is focused on developing aviation and aerospace industry in Abu Dhabi and bringing aerospace technology,
skills and facilities to Abu Dhabi. • Information and Communication Technology - Is focused on economic development by establishing local information,
communications and technology clusters. • Healthcare – Is focused on creating a world class, competitive vertically integrated network of healthcare infrastructure. • Semiconductor Technology – Is focused on advanced technological sector through fabricating semiconductor wafers
and pre-fabricating services such as masks generation and engineering services. • Corporate / Acquisitions – Develops and drives the strategy for the Group as a whole as well as for acquisitions across
all lines of business in collaboration with the relevant business unit. Acquisitions business unit is also mandated to identify and realise opportunities that align with the broader Group strategy through global investments.
All items accounted on IFRS basis are attributed to specific projects mapped to a segment.
Segment reporting information table is presented on the next page.
3 Significant accounting policies (Continued) (s) Staff terminal benefits and pensions (Continued) Entities domiciled outside UAE (Continued)
3 Significant accounting policies (Continued) (t) Impairment (Continued) Non-financial assets (Continued)

82 83
Mub
adal
a A
nnua
l Rep
ort
201
1
Notes to the consolidated financial statements (continued)
Mubadala Development Company PJSC
Notes to the consolidated financial statements (continued)
Mubadala Development Company PJSC
Oil & Gas & Energy 31-Dec-11 AED ‘000
Renewable Energy
31-Dec-11 AED ‘000
Industry 31-Dec-11 AED ‘000
Real Estate & Hospitality
31-Dec-11 AED ‘000
Infrastructure 31-Dec-11 AED ‘000
Services Ventures
31-Dec-11 AED ‘000
Aerospace 31-Dec-11 AED ‘000
Information & Communication
Technology 31-Dec-11 AED ‘000
Healthcare 31-Dec-11 AED ‘000
Semi Conductor1 Technology 31-Dec-11 AED ‘000
Corporate / Acquisitions 31-Dec-11 AED ‘000
Consolidated 31-Dec-11 AED ‘000
Revenues from external customers 7,479,251 100,858 872,432 26,319 847,227 298,778 5,934,309 174,650 427,219 11,731,958 18,296 27,911,297
Finance (expense) / income (net) (294,266) 22,599 (121,587) 60,692 169,519 26,867 (244,538) 344,863 444 (411,092) (369,482) (815,981)
Total assets 13,994,426 9,385,967 11,046,788 13,056,913 9,378,235 2,010,472 13,373,533 13,896,184 2,976,257 49,597,305 38,379,169 177,095,249
Total liabilities (6,638,060) (1,075,015) (4,075,096) (707,022) (7,166,078) (844,849) (7,421,677) (6,058,281) (658,434) (17,283,707) (18,792,154) (70,720,373)
Equity accounted investees 2,057,576 400,398 1,147,947 593,095 7,172 550,088 1,424,227 2,876,660 - 291,381 3,849,876 13,198,420
Depreciation and amortisation (1,424,579) (255,816) (92,265) (18,837) - (10,566) (473,268) (65,667) (14,610) (5,049,680) (74,283) (7,479,571)
Additions to non-current assets2 1,986,935 2,292,179 5,270,045 2,060,938 - 2,361 1,573,192 1,623,191 481,697 43,251,057 270,085 58,811,680
Share of results of equity accounted investees 1,485,980 (109,035) 549,257 19,137 3,762 29,803 28,488 (368,655) - (4,491) 956,602 2,590,848
(Loss) / profit for the year attributable to the owner of the Group 4,589,342 (700,109) 851,337 (1,586,602) (10,528) (10,047) (100,583) 987 8,101 (3,601,898) (2,639,655) (3,199,655)
Total comprehensive income / (loss) attributable to the owner of the Group3 4,593,454 (1,000,018) 894,099 (1,586,284) (10,528) (2,746) (161,178) (108,550) 8,101 (3,620,830) (3,173,249) (4,167,729)
Total comprehensive income / (loss) attributable to the owner of the Group excluding impairments and fair value movements on investment property and financial investments3 4,618,425 (477,120) 617,993 (137,788) 476,026 (3,660) (142,644) 987 8,101 (3,603,728) (271,619) 1,084,973 1 New segment reported arising from the transfer of ATIC (see note 5 (a)(i)). 2 Non-current assets consist of property, plant and equipment, intangible assets and investment properties. 3 For reconciliation between ‘Total comprehensive income (loss) attributable to the owner of the Group’ and ‘Total comprehensive income / (loss) attributable to the owner of the Group excluding impairments and fair value movements on investment property and financial investments’, refer to page 84.
Oil & Gas & Energy 31-Dec-10 AED ‘000
(Restated)1
Renewable Energy
31-Dec-10 AED ‘000
Industry 31-Dec-10 AED ‘000
Real Estate & Hospitality
31-Dec-10 AED ‘000
Infrastructure 31-Dec-10 AED ‘000
Services Ventures
31-Dec-10 AED ‘000
Aerospace 31-Dec-10 AED ‘000
Information & Communication
Technology 31-Dec-10 AED ‘000
Healthcare 31-Dec-10 AED ‘000
Semi Conductor1 Technology 31-Dec-10 AED ‘000
Corporate / Acquisitions 31-Dec-10 AED ‘000
Consolidated 31-Dec-10 AED ‘000
Revenues from external customers 6,065,017 115,929 735 503,230 3,458,560 252,286 5,122,293 - 313,624 - 9,917 15,841,591
Finance (expense) / income (net) (367,694) (124,756) 78,326 77,411 45,344 15,605 91,252 390,555 (2,298) - (429,002) (225,257)
Total assets 12,746,958 7,976,631 3,686,111 12,359,394 8,437,313 1,638,290 11,735,364 11,662,513 968,487 - 30,927,853 102,138,914
Total liabilities (6,720,979) (784,969) (751,562) (1,158,380) (6,282,995) (497,638) (6,764,305) (4,833,132) (397,815) - (11,830,277) (40,022,052)
Equity accounted investees 1,690,576 746,080 986,001 481,550 5,609 551,605 1,218,097 67,037 - - 513,246 6,259,801
Depreciation and amortisation (1,549,828) (80,197) - (15,273) (116) (7,570) (390,752) (2,200) (6,519) - (114,041) (2,166,496)
Additions to non-current assets2 1,717,714 1,717,994 - 2,990,828 7,010 11,651 1,137,867 1,443,724 181,863 - 236,500 9,445,151
Share of results of equity accounted investees 1,237,224 (13,038) (61,228) 41,422 3,286 (9,164) (128,649) (321,862) - - 68,062 816,053
(Loss) / profit for the year attributable to the owner of the Group 2,871,209 (847,395) (47,470) (806,354) 390,633 (9,356) (176,241) (12,155) 20,454 - (177,970) 1,205,355
Total comprehensive income / (loss) attributable to the owner of the Group3 2,892,257 (992,410) (55,878) (813,177) 390,633 (15,366) (100,783) (104,643) 20,454 - (1,558,626) (337,539)
Total comprehensive income / (loss) attributable to the owner of the Group excluding impairments and fair value movements on investment property and financial investments3 3,150,024 (761,133) (103,710) 288,511 635,678 (9,356) (273,241) (12,155) 20,454 - (724,668) 2,210,404 1 New segment reported arising from the transfer of ATIC (see note 5 (a)(i)). 2 Non-current assets consist of property, plant and equipment, intangible assets and investment properties. 3 For reconciliation between ‘Total comprehensive income (loss) attributable to the owner of the Group’ and ‘Total comprehensive income / (loss) attributable to the owner of the Group excluding impairments and fair value movements on investment property and financial investments’, refer to page 84.
4. Operating segments (Continued)

84 85
Mub
adal
a A
nnua
l Rep
ort
201
1
Notes to the consolidated financial statements (continued)
Mubadala Development Company PJSC
Notes to the consolidated financial statements (continued)
Mubadala Development Company PJSC
Reconciliation between “total comprehensive income excluding impairment and fair value movements on investment property and financial investments available to the owner of the Group’ and ‘total comprehensive income attributable to the owner of the Group’ is as follows:
2011 2010 Total comprehensive loss attributable to the owner of the Group (4,167,729) (337,539)
Net change in fair value of financial investments (see note 11) 2,491,659 (847,295)
Net change in the fair value of derivatives used as economic hedges (see note 11) 439,377 264,595
Impairment losses on available-for-sale financial assets (see note 11) 98,559 227,273
Decrease in fair value of investment properties (net) (see note 15) 959,867 927,650
Impairment losses on property, plant and equipment (see note 13) 652,958 279,951
Impairment losses on equity accounted investees 471,984 10,295
Impairment losses on intangible assets (see note 14) 29,207 239,581
Movements in other comprehensive income - attributable to owner 968,074 1,542,894
Gain on acquisitions (See note 5(a)(ii,iii),17(a)) (839,228) -
Non-controlling interest in other comprehensive income (19,755) (97,001)
Total comprehensive income attributable to the owner of the Group excluding impairments and fair value movements on investment property and financial investments 1,084,973 2,210,404
Geographical information In presenting information on the basis of geographical areas, revenue is based on the geographical location of customers.
For the year ended 31 Dec 2011
2011 Non-current
For the year ended 31 Dec 2010
2010 Non-current
Revenue Assets1 Revenue Assets1 United Arab Emirates (country of domicile) 4,531,763 26,450,159 5,929,090 17,678,914
State of Qatar 3,057,235 4,668,767 3,299,265 5,010,113
United States of America 9,273,802 9,510,346 942,289 -
Switzerland 1,255,669 4,571,081 1,212,194 4,172,009
Germany 1,117,673 18,547,933 298,623 809,130
Singapore 1,280,015 11,001,415 - 33,899
Thailand 2,076,159 1,313,735 1,475,117 1,493,792
United Kingdom 627,519 1,363,514 112,319 424,625
Netherlands 115,726 - - -
Others 4,575,736 4,255,039 2,572,694 3,106,785
27,911,297 81,681,989 15,841,591 32,729,267 1Segment non-current assets are based on the geographical location of the assets and consist of property, plant and
equipment, intangible assets and investment properties.
Major customers Revenue from sale of goods and services with customers individually exceeding 10% of the Group’s revenues in certain
segments, is set out below.
2011 2010 Entities under common control
Entities under common control 2,253,939 4,191,087
Aerospace 468,450 462,268
Corporate 703 -
Healthcare 41,349 270,258
Industry 509,937 -
Infrastructure 847,227 3,458,561
Real estate 2,122 -
Renewable energy 2,609 -
Services 248,378 -
Technology 133,164 -
2,253,939 4,191,087
Third parties
Oil and gas 2,998,622 2,676,260
Semi conductor 3,667,152 -
5 Subsidiaries
These consolidated financial statements include the financial performance and position of the following significant subsidiaries:
DomicileOwnership interest
Subsidiaries 2011 2010
Dolphin Investment Company LLC UAE 100% 100%
Liwa Energy Limited LLC UAE 100% 100%
Abu Dhabi Future Energy Company PJSC UAE 100% 100%
Al Yah Satellite Communications Company PJSC UAE 100% 100%
Pearl Energy Limited1 Singapore 100% 100%
SR Technics Group2 Luxembourg 70% 70%
Abu Dhabi Finance PJSC UAE 52% 52%
Abu Dhabi Aircraft Technologies LLC UAE 100% 100%
Al Hikma Development Company PJSC UAE 100% 100%
Manhal Development Company PJSC UAE 100% 51%
Al Maqsed Development Company PJSC UAE 100% 100%
Fifteenth Investment LLC UAE 100% 100%
4. Operating segments (Continued) 4. Operating segments (Continued)

86 87
Mub
adal
a A
nnua
l Rep
ort
201
1
Notes to the consolidated financial statements (continued)
Mubadala Development Company PJSC
Notes to the consolidated financial statements (continued)
Mubadala Development Company PJSC
DomicileOwnership interest
Subsidiaries 2011 2010
Treasury Holding Company LLC UAE 100% 100%
Advanced Technology Investment Company (“ATIC”) UAE 100% -
National Central Cooling Company PJSC (“Tabreed”) UAE 27% -
1Subsidiary of Beta Investment Company LLC.
2Subsidiary of Takeoff Top Luxco S.A.
(a) Acquisition of subsidiaries
i) Transfer of Advanced Technology Investment Company (“ATIC”) Effective 1 January 2011, the Government of Abu Dhabi formally approved the transfer of its ownership in ATIC
to the Company. The consideration is in the nature of soft loan without interest and without condition or repayment date, and may be transferred fully or partially into shares of the Company.
The assets and liabilities of ATIC at 1 January 2011, were as follows:
Assets AED’000Property plant and equipment 24,141,277
Intangible assets 1,872,218
Investment in equity accounted investees 379,305
Deferred tax assets 383,752
Other assets 1,316,776
Inventories 1,266,678
Receivables and prepayments 2,106,157
Cash and cash equivalents 6,092,096
37,558,259
Liabilities
Interest bearing borrowings (8,008,634)
Obligation under finance lease (1,384,122)
Government grants (1,469,400)
Payables and accruals (3,142,789)
Other liabilities (2,033,801)
Deferred tax liabilities (541,757)
Non-controlling interest (184,347)
(16,764,850)
Net assets accounted for as additional shareholder contribution (see note 31(e)) 20,793,409
Transfer of ATIC represents transfer of interest in an entity that was under the control of the Shareholder that controls the Group, and recognised in accordance with the Group’s accounting policy on acquisition of entities under common control (see note 3(a)(ii)).
Accordingly from the effective date of transfer, the assets and liabilities acquired are recognised by the Group at the carrying amounts recognised previously in the books of the transferor.
During the period from the date of transfer to 31 December 2011, ATIC has earned revenue of AED 11,731,958 thousand and incurred a net loss of AED 4,363,844 thousand.
ii) Acquisition of stake in National Central Cooling Company PJSC (“Tabreed”) The Group owned 26.9% of the issued share capital of Tabreed through existing shareholding, additional purchase
during the year and conversion of existing mandatory convertible bond into ordinary shares during the year up to 31 March 2011. On 1 April 2011, the Group converted an existing loan of AED 1.7 billion given to Tabreed into mandatory convertible bonds maturing in 2019, with an early conversion call option at the discretion of the Group, which, when considered on a fully diluted basis, increases the Group’s effective equity ownership of the investee by an additional 50.9%, thereby taking the total effective equity ownership to 77.8%. Considering the features of the new mandatory convertible bonds, they were assessed to provide the Group at present with rights incidental to ownership interest in the equity of the investee. Accordingly, on the basis of 77.8% controlling equity interest, Tabreed was consolidated with effect from 1 April 2011, with the remaining 22.2% attributed to the non-controlling interest holders. A purchase price allocation exercise was conducted on 1 April 2011 to recognize the initial acquisition of the subsidiary.
A summary of the purchase price allocation exercise is as follows:
Recognised values on acquisition
AED’000Property, plant and equipment 4,898,953
Investment in equity accounted investees 337,165
Finance lease receivables 1,082,228
Other assets 81,988
Inventories 32,791
Receivables and prepayments 900,672
Cash and cash equivalents 433,642
Payables and accruals (1,398,689)
Other liabilities (152,715)
Obligations under finance lease (40,815)
Interest bearing borrowings (3,442,923)
Total identifiable net assets 2,732,297
Non controlling interest based on percentage of net assets (22.2%) 606,570
Group’s share of net assets (77.8%) 2,125,727
Purchase consideration (1,900,450)
Bargain purchase 225,277
The fair value of purchase consideration is AED 1,900,450 thousand, as below: Fair value of existing shares - AED 200,450 thousand
Fair value of new mandatory convertible bonds - AED 1,700,000 thousand
In the period from the date of acquisition to 31 December 2011, Tabreed earned revenue of AED 872,285 thousand and profit of AED 134,856 thousand.
5 Subsidiaries (Continued) 5 Subsidiaries (Continued) (a) Acquisition of subsidiaries (Continued) i) Transfer of Advanced Technology Investment Company (“ATIC”) (Continued)

88 89
Mub
adal
a A
nnua
l Rep
ort
201
1
Notes to the consolidated financial statements (continued)
Mubadala Development Company PJSC
Notes to the consolidated financial statements (continued)
Mubadala Development Company PJSC
The bargain purchase arises mainly due to the following:
• Share price of Tabreed was trading (at AED 1.13 per share) below its net assets per share on a fully diluted basis (AED 1.65 per share) at 1 April 2011.
• Tabreed’s net assets as at 1 April 2011 increased from AED 1.6 billion to AED 3.6 billion. The conversion of existing mandatory convertible bond and issuance of the new mandatory convertible bond resulted in debt amounting to AED 2 billion being transferred to equity.
• Up to 31 March 2011, the Group valued the existing mandatory convertible bond at market price, the carrying value of which had dropped compared to their issue price.
iii) Acquisition of stake in JBI Properties Services Company LLC (“JBI”) On 25 April 2011, the Group obtained control of JBI Properties Services Company LLC (JBI), a company incorporated in
Abu Dhabi. Prior to obtaining the control the Group held 51% shareholding in JBI in the form of joint venture partner. The control was obtained by acquiring an additional 49% shareholding from the other joint venture partner and thereby increasing the Group’s shareholding from 51% to 100%. In the period from the date of acquisition to 27 December 2011, JBI made revenues of AED 13,354 thousand and a profit of AED 31,203 thousand. The additional shareholding has been acquired for a consideration of AED 83,584 thousand which results in gain of AED 5,816 thousand. This entity has been disposed of in December 2011 (see note 5(b)(i)).
If the acquisition of a subsidiary (see note 5(a)(ii)) had occurred on 1 January 2011, management estimates that the Group’s consolidated revenue from sale of goods and services would have been AED 28,156,911 thousand and the Group’s consolidated loss for the period would have been AED 4,490,661 thousand for the period ended 31 December 2011.
iv) Acquisition of Pearl Energy (Thailand) Limited (“PETL”) In 2010, the Group acquired 100% voting shares of Pearl Energy (Thailand) Limited that owns working interests in certain
concession blocks in Thailand.
The fair values of the identifiable assets and liabilities of PETL and its subsidiaries as at the date of acquisition were as follows:
2010 Cash 14,041
Other current assets 3,104
Total assets (A) 17,145
Trade payables (694)
Other payables (12,254)
Total liabilities (B) (12,948)
Total identifiable net assets at fair value (A + B) 4,197
Goodwill arising on acquisition 184,457
Purchase consideration transferred 188,654
Non cash consideration - other receivables settlement (47,796)
140,858
Analysis of cash flows on acquisition
Net cash acquired with the subsidiary 14,041
Cash paid (140,858)
(126,817)
The goodwill recognised above was attributable to the possibility of addition of certified reserves by the end of the financial year. As the exploration and evaluation for the relevant blocks was unsuccessful, the goodwill was fully impaired in 2010 as this was not achieved.
(b) Disposals
i) Disposal of subsidiaries During the year, the Group has made disposals of its wholly owned subsidiaries, Pearl Oil (Salawati) Limited and
Pearl Oil (Satria) Limited and JBI Properties Services Company. In 2010, the Group, through its subsidiary, disposed of its investments in Pearl Oil (Basin) Limited, Pearl Oil (Island) Limited and Pearl Oil (Tungkal) Limited.
The total value of assets and liabilities of the subsidiaries disposed of and recorded in the consolidated financial statements on the date of disposal, and the cash flow effects of the disposal, mentioned below, were:
2011 2010 Cash 20,692 11,227
Receivables and prepayments 42,334 69,003
Payables and accruals (55,267) (107,439)
Net current assets / (liabilities) (A) 7,759 (27,209)
Property, plant and equipment 9,720 179,649
Other assets - 47,465
Deferred tax liabilities - (59,143)
Other liabilities - (53,045)
Net non-current assets (B) 9,720 114,926
Carrying value of the net assets (A + B) 17,479 87,717
Goodwill on acquisition 37,110 -
Gain on disposal of subsidiaries recognised in profit or loss (see note 8) 20,368 57,270
Purchase consideration - net of professional fees 74,957 144,987
Cash balances of subsidiaries disposed (20,692) (11,226)
Net proceeds arising from the disposal 54,265 133,761
5 Subsidiaries (Continued) (a) Acquisition of subsidiaries (Continued) ii) Acquisition of stake in National Central Cooling Company PJSC (“Tabreed”) (Continued)
5 Subsidiaries (Continued) (a) Acquisition of subsidiaries (Continued) iv) Acquisition of Pearl Energy (Thailand) Limited (“PETL”) (Continued)

90 91
Mub
adal
a A
nnua
l Rep
ort
201
1
Notes to the consolidated financial statements (continued)
Mubadala Development Company PJSC
Notes to the consolidated financial statements (continued)
Mubadala Development Company PJSC
ii) Disposal of working interest During the year, the Group disposed its working interest of 40% in a concession block in Indonesia. In 2010,
the Group had disposed of 30% of its working interest in another concession block in Indonesia.
The net assets disposed of in the transactions are as follows:
2011 2010 Cash and cash equivalents - 44
Receivables and prepayments 4,203 3,343
Payables and accruals (2,491) (2,369)
Net current assets 1,712 1,018
Property, plant and equipment 793 14,808
Intangible assets - 23,242
Other assets - 42,708
Deferred tax liabilities - (15,032)
Net assets 2,505 66,744
(Loss) / gain on disposal of working interest (4,038) 50,676
Reimbursement of current year expenditure - 37,767
Purchase consideration (1,533) 155,187
Cash balances disposed - (44)
Net (compensation paid) / proceeds arising from disposal (1,533) 155,143
iii) Disposal of stake in a subsidiary with no loss of control During the year, the Group disposed of 49% stake in one of its subsidiaries. Following the disposal, the Group still
controls the subsidiary and retains 51% of the ownership interest.
The transaction has been accounted for as an equity transaction with non-controlling interest, resulting in the following:
2011 Net proceeds from disposal of 49% stake in a subsidiary 38,816
Net assets attributable to non-controlling interest (158,654)
Decrease in equity attributable to the owner of the Group (119,838)
Represented by:
Decrease in retained earnings (119,838)
6 Revenue from sale of goods and services
2011 2010 Sale of semi conductor wafers1 11,611,385 -
Sale of hydrocarbons2 7,479,251 6,055,502
Aircraft maintenance and repairs 5,599,963 4,921,994
Service concession revenue (refer note 38) 844,990 3,457,959
Revenue from supply of chilled water3 529,005 -
Medical services 425,854 314,731
Contract revenue 205,159 223,699
Sale of land - 488,292
Satellite capacity service revenue 174,650 -
Others 1,041,040 379,414
27,911,297 15,841,591
1 Sale from semi-conductor wafers represents the revenue generated by Advanced Technology Investment Company, a subsidiary transferred during the year (see note 5 (a)(i)).
2 Sale of hydrocarbons is recorded net of royalties amounting to AED 462,417 thousand (2010: AED 472,382 thousand).
3 Revenue from supply of chilled water represents the revenue generated by National Central Cooling Company PJSC, a subsidiary acquired during the year (see note 5(a)(ii)).
7 Cost of sales of goods and services
2011 2010 Raw material 10,601,469 2,883,422
Depreciation of property, plant and equipment 4,729,481 1,493,426
Staff costs 4,052,772 2,187,550
Service concession cost 577,346 2,816,462
Amortisation of intangible assets 497,664 332,683
Others 1,798,502 1,126,861
22,257,234 10,840,404
5 Subsidiaries (Continued) (b) Disposals (Continued)

92 93
Mub
adal
a A
nnua
l Rep
ort
201
1
Notes to the consolidated financial statements (continued)
Mubadala Development Company PJSC
Notes to the consolidated financial statements (continued)
Mubadala Development Company PJSC
8 Other income
2011 2010 Rental income 89,366 24,552
Management fee 67,240 66,198
Gain on disposal of property, plant and equipment 59,364 9,246
Gain on disposal of subsidiaries (see note 5(b)(i)) 20,368 57,270
Loss on disposal of financial assets at fair value through profit or loss (55,848) (213)
Gain on disposal of available for sale financial assets - 127,195
Income from insurance claim 101,080 -
Others 258,373 375,726
539,943 659,974
9 Research and development expenses
2011 2010 Depreciation of property, plant and equipment 1,096,316 -
Staff costs 776,769 -
Joint development agreement fees 448,167 -
Amortisation of intangible assets 169,350 -
Other research and development expenses 456,204 80,341
2,946,806 80,341
Research and development expenses primarily represents research and development expenses incurred by ATIC, a subsidiary acquired during the period (see note 5(a)(i)),and conducts microprocessor manufacturing process development activities primarily through a joint development agreement with other technology companies. Under this joint development agreement, the Group jointly conducts development activities on new process technologies to be implemented in silicon wafer manufacturing. This relationship also involves laboratory based research of emerging technologies.
10 Other general and administrative expenses
2011 2010 Staff costs 2,278,993 1,613,635
Depreciation of property, plant and equipment 872,345 247,079
Office expenses 552,202 456,108
Public relations 285,057 364,921
Amortisation of intangible assets 114,415 93,308
Other expenses and losses 883,907 712,316
4,986,919 3,487,367
11 (Loss) / income from financial investments
2011 2010 Financial assets / liabilities at fair value through profit or loss
Net change in fair value of investments1 (see note 18) (2,491,659) 847,295
Net change in the fair value of derivatives used as economic hedges - not designated for hedge accounting (439,377) (264,595)
(2,931,036) 582,700
Available for sale financial assets
Impairment losses (see note 18) (98,559) (227,273)
(3,029,595) 355,427
1 In 2010, the Group invested USD 500 million in an unquoted hybrid convertible preferred instrument. The Group also received free warrants, immediately convertible into shares, equivalent to 2% of the investee company’s equity after the conversion. Both these instruments were recognised at fair value through profit or loss. Upon conversion of the warrants, the equity shares have been classified as available for sale financial assets and a gain of AED 794,945 thousand, representing the fair value of the equity shares upon conversion, was recognised in 2010, and included in the net change in fair value of investments at fair value through profit or loss.
Dividend income from financial assets at fair value through profit or loss was AED 164,753 thousand (2010: AED 185,468 thousand) and dividend income from available-for-sale financial assets was AED 228,282 thousand (2010: AED 145,910 thousand).
12 Finance income and expense
2011 2010 Finance income
Interest income 1,937,714 1,358,567
Net foreign exchange gain 38,087 41,086
1,975,801 1,399,653
Finance expense
Borrowing costs1 (2,791,782) (1,624,910)
Net finance expense (815,981) (225,257)
1 The Group incurred transaction costs in relation to securing various long term financing facilities (see note 26). These costs, which include legal consultancy charges, facility arrangement and structuring fees, are deducted from the carrying values of the respective loans, and are being amortised using the effective interest method. The amortisation expense is included within the related borrowing costs. The balance of these deferred unamortised costs at 31 December 2011 is AED 519,837 thousand (2010: AED 421,306 thousand).

94 95
Mub
adal
a A
nnua
l Rep
ort
201
1
Notes to the consolidated financial statements (continued)
Mubadala Development Company PJSC
Notes to the consolidated financial statements (continued)
Mubadala Development Company PJSC
13 Property, plant and equipment
Land &Buildings 2, 3 AED ’000
Oil andgas assets AED ’000
Plant & office
equipment AED ’000
Aircraft & aircraft materials1 AED ’000
Computers AED ’000
Distributionnetwork AED ’000
Others AED ’000
Capital work in progress AED ’000
Total AED ’000
Cost
At 1 January 2010 505,419 9,927,077 1,260,876 1,873,335 97,194 - 20,240 8,587,047 22,271,188
Additions 167,878 1,047,373 322,671 400,329 46,174 - 44,883 4,840,139 6,869,447
Transfers to intangible assets - - (1,283) - (9,889) - - (136,317) (147,489)
Disposals (777) (404,261) (59,981) (29,314) (984) - (1,026) (318,990) (815,333)
Other transfers 1,849,312 52,659 171,435 8,766 51,396 - (4,522) (2,496,379) (367,333)
Effect of movement in foreign exchange rates (18,598) - 74,726 185,913 2,548 - (762) (73,257) 170,570
At 31 December 2010 2,503,234 10,622,848 1,768,444 2,439,029 186,439 - 58,813 10,402,243 27,981,050
At 1 January 2011 2,503,234 10,622,848 1,768,444 2,439,029 186,439 - 58,813 10,402,243 27,981,050
Additions 480,063 1,335,379 374,867 1,202,937 140,999 - 5,137 22,318,968 25,858,350
Acquisition through business combination 7,514,954 - 12,011,196 - 5,537 1,624,646 (21) 7,893,142 29,049,454
Transfers from intangible assets - - - - - - - 45,623 45,623
Transfer to investment properties - - - - - - - (81,229) (81,229)
Disposals (27,774) - (546,202) (72,385) (20,285) (822) (3,689) (22,292) (693,449)
Other transfers 849,133 161,615 14,804,610 7,706 34,345 156,581 76,842 (17,086,497) (995,665)
Effect of movement in foreign exchange rates (12,544) - (24,939) 7,123 827 - (25) (49,436) (78,994)
At 31 December 2011 11,307,066 12,119,842 28,387,976 3,584,410 347,862 1,780,405 137,057 23,420,522 81,085,140
Land &Buildings2, 3 AED ’000
Oil andgas assets AED ’000
Plant & office
equipment AED ’000
Aircraft &aircraft
materials1 AED ’000
Computers AED ’000
Distributionnetwork
AED ’000Others
AED ’000
Capital work in progress AED ’000
Total AED ’000
Accumulated depreciation and impairment losses
At 1 January 2010 (23,240) (2,640,931) (142,277) (128,676) (60,600) - (9,018) - (3,004,742)
Charge for the year (82,255) (1,213,133) (224,010) (180,751) (36,453) - (3,903) - (1,740,505)
Impairment4 - (39,233) - - - - - (240,718) (279,951)
Disposals - 278,249 13,447 18,131 799 - 631 - 311,257
Effect of movement in foreign exchange rates (600) - (9,817) (53,277) (2,057) - 616 - (65,135)
At 31 December 2010 (106,095) (3,615,048) (362,657) (344,573) (98,311) - (11,674) (240,718) (4,779,076)
At 1 January 2011 (106,095) (3,615,048) (362,657) (344,573) (98,311) - (11,674) (240,718) (4,779,076)
Charge for the year (891,239) (1,216,743) (4,297,776) (200,942) (52,849) (24,069) (14,524) - (6,698,142)
Transfers from intangible assets - - - - - - - (48,960) (48,960)
Other transfers 10,389 26,629 41,759 3,721 (34,822) 1,426 (4,465) - 44,637
Impairment4 (1,642) - (17,754) (11,744) (25) - - (621,793) (652,958)
Disposals 27,010 - 245,017 18,628 15,073 222 3,037 - 308,987
Effect of movement in foreign exchange rates 2,284 - 10,319 5,268 (603) - 81 - 17,349
At 31 December 2011 (959,293) (4,805,162) (4,381,092) (529,642) (171,537) (22,421) (27,545) (911,471) (11,808,163)
Carrying amounts
At 1 January 2010 482,179 7,286,146 1,118,599 1,744,659 36,594 - 11,222 8,587,047 19,266,446
At 31 December 2010 2,397,139 7,007,800 1,405,787 2,094,456 88,128 - 47,139 10,161,525 23,201,974
At 31 December 2011 10,347,773 7,314,680 24,006,884 3,054,768 176,325 1,757,984 109,512 22,509,051 69,276,977
1 It includes certain helicopters and helicopter spare parts that were received by a subsidiary in prior years, as a government grant, are recorded above at nominal value (see note 34(a)(ii)).2 The UAE Armed Forces, General Head Quarters, has granted certain subsidiaries the right to use the land free of charge. Such land does not form part of these consolidated financial statements (see note 34(a)(iii)).3 Includes land recorded at nominal value, carrying amount of which is insignificant.4 Impairment primarily pertains to project costs previously capitalized. Based on management’s current estimate these projects are unlikely to materialize. Further, impairment losses also includes write-off of certain redundant design costs and infrastructure assets of one of the Group companies.5 Property, plant and equipment having carrying value of AED 1,415,631 thousand has been pledged as security (2010: AED 46,214 thousand).6 Property, plant and equipment having carrying value of AED 1,596,478 thousand (2010: AED 22,744 thousand) are held under finance lease.7 The amount of borrowing costs capitalised during the year were AED 431,459 thousand (2010: AED 256,682 thousand).
13 Property, plant and equipment (Continued)

96 97
Mub
adal
a A
nnua
l Rep
ort
201
1
Notes to the consolidated financial statements (continued)
Mubadala Development Company PJSC
Notes to the consolidated financial statements (continued)
Mubadala Development Company PJSC
14 Intangible assets
Exploration licenses AED ’000
Trademarks AED ’000
Proved and probable
oil and gas reserves AED ’000
Possible and
contingent oil and gas
reserves AED ’000
Goodwill AED ’000
Technology, Licence & Software AED ’000
Customer Contracts AED ’000
Others AED ’000
Total AED ’000
Cost
At 1 January 2010 632,339 2,024,403 2,313,996 1,466,072 410,917 7,505 452,868 1,197,472 8,505,572
Additions - - - - 184,687 14,686 - 453,572 652,945
Transfers (to) / from property, plant and equipment (2,007) - - - - 154,713 - (5,217) 147,489
Disposals - - - (322,350) (2,065) (2,747) - (193,041) (520,203)
Other transfers - - - - - 78,151 - (78,151) -
Effect of movement in foreign exchange rates - 185,609 - - - 2,827 - 61,975 250,411
At 31 December 2010 630,332 2,210,012 2,313,996 1,143,722 593,539 255,135 452,868 1,436,610 9,036,214
At 1 January 2011 630,332 2,210,012 2,313,996 1,143,722 593,539 255,135 452,868 1,436,610 9,036,214
Additions 73,470 - - - 238,858 326,282 - 293,537 932,147
Acquisition through business combination - - - - 159,823 1,293,720 270,051 199,628 1,923,222
Transfers to property, plant and equipment - - - - - 7,077 - (52,700) (45,623)
Disposals - - - - (51,004) (109,522) - - (160,526)
Other transfers 2,007 12,737 (3) (39,036) (6,932) 140,348 (132,613) (69,639) (93,131)
Effect of movement in foreign exchange rates - 9,000 - - - 406 756 (815) 9,347
At 31 December 2011 705,809 2,231,749 2,313,993 1,104,686 934,284 1,913,446 591,062 1,806,621 11,601,650
Exploration licenses AED ’000
Trademarks AED ’000
Proved and probable
oil and gas reserves AED ’000
Possible and
contingent oil and gas reserves AED ’000
Goodwill AED ’000
Technology, Licence & Software AED ’000
Customer Contracts AED ’000
Others AED ’000
Total AED ’000
Accumulated amortisation and impairment losses
At 1 January 2010 (26,532) - (1,594,112) (1,269,157) (363,555) (803) - (611,173) (3,865,332)
Charge for the year (58,392) - (173,459) (23,268) - (28,652) (38,063) (104,157) (425,991)
Impairment - - (1,745) (30,597) (184,457) - - (22,782) (239,581)
Disposals - - - 288,193 - 368 - 119,456 408,017
Other transfers - - - - - (36,913) - 36,913 -
Effect of movement in foreign exchange rates - - - - - (6,509) - (16,407) (22,916)
At 31 December 2010 (84,924) - (1,769,316) (1,034,829) (548,012) (72,509) (38,063) (598,150) (4,145,803)
At 1 January 2011 (84,924) - (1,769,316) (1,034,829) (548,012) (72,509) (38,063) (598,150) (4,145,803)
Charge for the year (78,033) - (90,486) (21,358) - (427,623) (125,630) (38,299) (781,429)
Impairment - - - - - (124) - (29,083) (29,207)
Transfers to property, plant and equipment - - - - - - - 48,960 48,960
Disposals - - - - - 103,881 - - 103,881
Other transfers - - (143,716) 114,254 - (60,230) 58,712 (6,816) (37,796)
Effect of movement in foreign exchange rates - - - - - (454) 6,686 941 7,173
At 31 December 2011 (162,957) - (2,003,518) (941,933) (548,012) (457,059) (98,295) (622,447) (4,834,221)
Carrying amounts
At 1 January 2010 605,807 2,024,403 719,884 196,915 47,362 6,702 452,868 586,299 4,640,240
At 31 December 2010 545,408 2,210,012 544,680 108,893 45,527 182,626 414,805 838,460 4,890,411
At 31 December 2011 542,852 2,231,749 310,475 162,753 386,272 1,456,387 492,767 1,184,174 6,767,429
14 Intangible assets (Continued)

98 99
Mub
adal
a A
nnua
l Rep
ort
201
1
Notes to the consolidated financial statements (continued)
Mubadala Development Company PJSC
Notes to the consolidated financial statements (continued)
Mubadala Development Company PJSC
Impairment losses In 2010, the Group changed its accounting policy relating to exploration and evaluation expenditures. As a result of this change,
the carrying values of cash generating units, Sebuku and Jasmine increased due to capitalisation of certain past successful exploratory drilling and acquisition costs. This increase along with the increase in future estimated operating and capital costs for Sebuku resulted in impairment losses of these cash generating units (“CGUs”).
The carrying amounts of intangibles at Bulu and East Muriah fields were assessed during the current year and an impairment loss of AED 29,083 thousand was recognised during the year (2010: AED 55,124 thousand impairment loss for Sebuku and Jasmine and AED 184,457 thousand impairment of goodwill recognised on acquisition of Pearl Energy Thailand Limited) (see note 5(a)(iv)).
The recoverable amounts of the cash-generating units (the producing fields that produce hydrocarbons) were estimated based on their value in use, which was determined with the assistance of independent valuers, as well as by internal estimates. The fair values less cost to sell is not likely to be significantly different from the value in use. For impairment testing, goodwill is allocated to the producing fields which represent the lowest level cash generating unit within the Group at which the goodwill is monitored for internal management purposes.
Value in use was determined by discounting the future cash flows from the continuing use of the unit and was based on the following key assumptions:
• Cash flows were projected for each field based on the projected production plan of the fields’ 2P (proved and probable) reserves.
• Oil prices are based on 31 December 2011 Brent future prices and are adjusted for quality, transportation fees and regional price differences.
• A post-tax discount rate of 11 – 14.5 percent was applied in determining the recoverable amount of the respective units.
The carrying value of AED 2,231,749 thousand (2010: AED 2,210,012 thousand) represents trademarks identified when SR Technics was acquired through business combination. The life of the trademark is assessed as indefinite (based on the fact that it refers to the legal name of Group’s subsidiary and there are no intentions to cease using it). The trademark is tested for impairment according to the requirements of IFRSs. For this purpose, it is allocated to the identified CGU. The basis of impairment test is value in use calculation. Based on this calculation, no impairment was recognised during the year (2010: AED nil). The underlying assumptions, which have been determined based on external sources, are a royalty rate of 2.4% (2010: 2.4%) of the operating businesses’ revenue, a residual life of more than 30 years, a growth rate of 4.1% for the first five years after the business plan period and a perpetual growth rate of 3% for the years thereafter (2010: perpetual growth rate 3% for all years after business plan period). Further a discount rate of 6.8% (2010: 7.2%) was assumed.
Intangible assets include goodwill amounting to AED 348 million pertaining to ATIC, a subsidiary transferred by the Shareholder (see note 5(a)(i)), primarily arising out of acquisition of its two subsidiaries during the current and prior years with respect to their wafer fabrication plants in multiple locations. During the year, ATIC performed a goodwill impairment review based on forecast cash flows. The recoverable amounts of cash generating units were estimated on the basis of their value in use, which is determined by discounting the future cash flows from the continuing use of wafer fabrication plants. The pre-tax discount rate applied to the cash flow projections is 11% and the growth rate used to extrapolate the cash flows beyond nine year period is 1.4%. Based on the results of the goodwill impairment assessment, it is concluded that the recoverable amounts of cash generation units is higher than their carrying values.
Key assumptions used and value in use calculations The calculation of value in use is most sensitive to the following assumptions:
a) Sales prices - sales prices are based on prevailing price levels and historical trends of change in prices while moving from one technological mode to another. As a general trend, prices of products are higher at the time of their launch and demonstrate a declining trend in post launch periods, in line with industry standards.
b) Discount rates - discount rates represent the current market assessment of the risks specific to the business. The discount rate is derived from the weighted average cost of capital (WACC). WACC takes into account both debt and equity. Cost of equity is derived from the expected return on investment by the Group and cost of debt is based on the interest bearing borrowings which the Group is obliged to service.
c) Market share assumptions - these assumptions are important because, as well as using industry data for growth rates, management assesses how the business position, relative to its competitors, might change over the forecast period. Management expects the Group’s share of semi conductor market to moderately grow over the forecast period.
Sensitivity to change in assumptions With regard to the assessment of value in use of the businesses, management believes that no reasonably possible change in
any of the above key assumptions would cause the carrying values of the units to materially exceed their recoverable amounts.
15 Investment properties
2011 2010 Investment properties 1,427,800 63,353
Investment properties under development 4,209,783 4,573,529
5,637,583 4,636,882
Movement in investment properties is as follows:
At 1 January 63,353 65,523
Transferred from advances 1,372,519 -
Decrease in fair value (8,072) (2,170)
1,427,800 63,353
Movement in investment properties under development is as follows:
2011 2010 At 1 January 4,573,529 3,576,250
Additions during the year 1,048,507 1,922,759
Transferred from property, plant and equipment 81,229 -
Transferred to inventories (541,687) -
Decrease in fair value (951,795) (925,480)
4,209,783 4,573,529
Investment property portfolio is valued through a mix of internal valuations and/or independent external valuations. Where external independent valuation is used management engages external independent valuation companies, having appropriate recognised professional qualifications and recent experience in the location and category of property being valued. The fair values are based on market values, being the estimated amount for which the property could be exchanged on the date of valuation between a willing buyer and a willing seller in an arm’s length transaction after proper marketing, wherein the parties had each acted knowledgeably and willingly. Where appropriate, the specific approved usage of the investment property is given due consideration.
In the absence of reliable estimates of current prices in an active market, the valuations are prepared by considering the aggregate of the estimated future cash flows expected to be received from the property. A yield that reflects the specific risks inherent in the net cash flows is then applied to the net annual cash flows to arrive at the property valuation.
Valuations reflect, when appropriate, the type of tenants actually in occupation or responsible for meeting lease commitments or likely to be in occupation after letting vacant accommodation, the allocation of maintenance and insurance responsibilities between the Group and the lessee; and the remaining economic life of the property.
Investment properties comprise the New Fish Market land, Al Sowwah Square land, Musaffah land, Rihan Heights and Masdar City (Courtyard and Siemens) land.
The New Fish Market land is in the city of Abu Dhabi and was granted by the Government of Abu Dhabi. The fair value of this plot of land, amounts to AED 20,981 thousand (2010: AED 23,003 thousand).
Having regard to the nature of the property and the lack of comparable market data, the Group has valued the Al Sowwah Square property in the current and previous years based on the residual valuation methodology through a discounted cash flow technique. Cash flow projections are based on estimated future cash inflows, supported by existing leases, current market rents for similar properties and estimated future cash outflows primarily based on construction contracts already awarded. The valuation of the property is primarily based on the management’s estimate of expected net effective rentals achievable for this property considering rent abatement periods. Cost of development includes direct project costs and an appropriate share of the overall island infrastructure works as well as any value enhancing developments. The fair value of this property amounts
14 Intangible assets (Continued)

100 101
Mub
adal
a A
nnua
l Rep
ort
201
1
Notes to the consolidated financial statements (continued)
Mubadala Development Company PJSC
Notes to the consolidated financial statements (continued)
Mubadala Development Company PJSC
to AED 4,060,767 thousand (2010 : AED 4,573,529 thousand). The valuation methodology and assumptions have been reviewed and critiqued by a firm of independent valuers who have appropriate qualifications and experience in the valuation of similar properties.
Investment properties of Rihan Heights represents certain purchased units, which based on the intended commercial use have been classified as investment property. The Group has valued the Rihan Heights units using residual valuation methodology through a discounted cash flow technique. Cash flow projections are based on management’s estimated future cash inflows, supported by existing leases, current market rents for similar properties and estimated future cash outflows primarily in relation to servicing and repair and maintenance of these Units. Based on this valuation the fair value of this investment property as at 31 December 2011 amounts to AED 1,372,519 thousand.
During the year, the Masdar City (Courtyard and Siemens) land has been recognised as investment property under development based on its intended use. The Group has valued this investment property through an independent external valuer using residual valuation methodology through a discounted cash flow technique. Valuation is based on estimated future cash inflows expected for the net lettable area and future cash outflows based on construction contracts already awarded for part of the land and estimate of the development costs where contracts have not yet been awarded. The fair value of this land amounts to AED 149,016 thousand.
The cash flows from the New Fish Market land, Al Sowwah Square property, Rihan Heights and Masdar City land (Courtyard and Siemens) are discounted using discount rates ranging from 8 - 10% that reflect current market assessments of the uncertainty in the amount and timing of the cash flows.
The Group has reassessed the value of the Musaffah land in the current year and recognised a loss of AED 6,050 thousand (2010: AED nil) to the carrying value which was determined by the independent valuers based on the income capitalization approach. The fair value of this land amounts to AED 34,300 thousand (2010: AED 40,350 thousand).
Details of other plots of lands owned by the Group, which are not recognised and accordingly not included above, are set out in note 34 to these consolidated financial statements.
16 Interest in jointly controlled assets
The Group has joint ownership and control of certain oil and gas assets through exploration, development and/or production sharing agreements entered into with other parties, for the exploitation of mineral rights, under concession agreements with the governments of the respective countries in which such operations are conducted. The Group’s share of the assets, liabilities, income and expenses of such jointly held assets is proportionately consolidated on a line by line basis with items of a similar nature. Details of significant jointly controlled and wholly controlled concession assets are set out below.
Contract area Held by DescriptionGroup’s
working interest
2011 % 2010 %
Concession blocks in Oman
Block 53 Liwa Energy Limited Production stage 15 15
Block 62 Sixteenth Investment Company LLC Exploration stage 32 32
Concession blocks in Qatar
Qatar - North Field Dolphin Investment Company LLC Production stage 51 51
Concession blocks in Kazakhstan
Block N – Caspian seaMDC (Oil & Gas N Block Kazakhstan) GMBH Exploration stage 24.5 24.5
Concession blocks in Bahrain
Bahrain Field MDC Oil & Gas (Bahrain Field) LLC Development stage 32 32
Concession block in Tanzania
Block 7 MDC Oil & Gas (TZ Block 7) Limited Exploration stage 20 -
Contract area Held by DescriptionGroup’s
working interest
2011 % 2010 %
Concession blocks in Indonesia
Sebuku PSC Pearl Oil (Sebuku) Ltd. Development stage 70 70
West Salawati PSC Pearl Oil (Salawati) Limited Exploration stage - 1001
Bulu PSC Pearl Oil (Satria) Limited [Formerly known as Pearl Oil (Sebana) Limited] Exploration stage - 42.5
Karana PSC Pearl Oil (K) Limited Exploration stage - 1001
Sibaru PSC Pearl Oil (Sandstone) Limited Exploration stage - 40
Kerapu PSC Pearl Oil (Tachylyte) Limited Exploration stage 1001 1001
East Muriah PSC Pearl Oil (East Muriah) Limited Exploration stage 50 50
Concession blocks in Thailand
B5/27 Pearl Oil (Thailand) Limited
Production of crude oil under concession agreement 1001 1001
G1/48Pearl Oil (Amata) Limited Exploration Stage 40 40
Pearl Oil (G1) Limited Exploration Stage 20 20
G10/48 Pearl Oil (Thailand) Limited Exploration Stage 50 50
Pearl Oil (G2-G10) Limited Exploration stage 25 25
G2/48 Pearl Oil Offshore Limited Exploration stage 1001 1001
G11/48 Pearl Oil Bangkok Limited Exploration stage 50 50
Pearl Oil (G11) Limited Exploration stage 25 25
G3/48Pearl Oil (Aoa Thai) Limited Exploration stage 40 40
Pearl Oil (G3-G6) Limited Exploration stage 20 20
G2/50 Pearl Oil (Petroleum) Limited Exploration stage 1001 1001
Concession blocks in Vietnam
07/03 PSC Pearl Oil (Ophiolite) Limited Exploration stage 15 15
04/02 PSC Pearl Oil (Tephrite) Limited Exploration stage 90 90
06/94 PSCPearl Oil (Nam Con Son) Limited formerly known as Pearl Oil (Taconite) Limited Exploration stage - 33.3
135/136 PSC Pearl Oil (Vung May) Limited Exploration stage 20 -
Concession block in Malaysia
Malaysia SK320 MDC Oil & Gas (SK 320) Limited Exploration stage 75 75
PM324 MDC Oil & Gas (PM 324) Limited Exploration stage 20 -
1 Contract areas wherein the Group’s effective working interest is at 100% are included in the details of joint ventures for presentation purposes only in order to disclose a list of significant contract areas being held by the Group as at the end of the reporting period. They are not to be construed as joint ventures since there are no joint operating contracts with other joint venture partners at the end of the reporting period.
15 Investment properties (Continued) 16 Interest in jointly controlled assets (Continued)

102 103
Mub
adal
a A
nnua
l Rep
ort
201
1
Notes to the consolidated financial statements (continued)
Mubadala Development Company PJSC
Notes to the consolidated financial statements (continued)
Mubadala Development Company PJSC
17 Investments in equity accounted investees
Income from investments in equity accounted investees
2011 2010 Share of results of associates 1,012,205 86,526
Share of results of jointly controlled entities 1,578,643 729,527
Gain on disposal of investment in equity accounted investees 81,951 75,646
2,672,799 891,699
(a) Investments in associates The Group has the following significant interests in associates:
Ownership interest %
2011 2010 Principal business activity
Abu Dhabi Ship Building PJSC (“ADSB”) 40 40 Ship building
The John Buck Company LLC 24.9 24.9 Property ownership and integrated for real estate services
Aldar Properties PJSC (“Aldar”)1 49 19 Development, sales, investment, construction and associated services for real estate services
Emirates Integrated Telecommunications Company PJSC (“Du”)2
19.8 19.8 Provision of telecommunication services
SMN Power Holding Company S.A.O.G.3 30.9 47.5 Special purpose entity for holding power sector investments
Qatar Central Cooling Company PJSC4 25 - Construct, own, assemble, install, operate and maintain cooling and air conditioning systems, distribution and sale of chilled water for use in district cooling technologies
1 On 16 January 2011, the Company, upon conversion by Aldar of mandatorily convertible bonds in Aldar into 303,734,868 shares, increased its stake in Aldar from 19% to 28%. Accordingly the investment in Aldar has been accounted for as an associate from the date of conversion. On 15 December 2011 the Group increased its stake in Aldar from 28% to 49% through partial conversion of existing Mandatory Convertible Bonds which resulted in allotment of an additional 1,203,499,493 shares of Aldar. The fair value of the acquisition price calculated on 15 December 2011 amounted to AED 1,095,184 thousand. The total acquisition price was allocated to the fair value of assets acquired and liabilities assumed in the amount of AED 1,703,320 thousand resulting in the income of AED 608,135 thousand which is reflected within Share of results of equity accounted investees in the consolidated statement of comprehensive income.
Subsequently the Group entered into a repurchase agreement with a financial institution for 571,918,073 Aldar shares for a value of AED 480,411 thousand. Despite the sale, the Group has retained substantial risks and rewards of ownership, and accordingly equity interest associated with shares sold are not derecognised from the Group’s books. The financial institution retains 14% of voting rights associated with the purchased shares. Accordingly the Group effectively owns 35% of voting rights in Aldar as on December 2011 and continues to account for its investment in Aldar as an associate.
2 Effective 1st November 2011 following its decision to increase its stake in Du which as at 31 December 2011 was at 19.78%, the Group changed its classification of the investment in shares from available for sale investment to Investment in associate. Following the decision to increase, the Group now exercises significant influence over Du. The results of operations of Du have been accounted for under the equity method of accounting since 1st November 2011. The fair value of Du as of acquisition date is deemed the carrying amount at the date of reclassification.
The fair value reserve associated with the Du is kept as part of consolidated statement of equity until the investment is sold, collected, or is determined to be impaired.
Group’s share of provisional values of purchase price allocation are as follows:
AED ‘000
Total assets 2,112
Total liabilities (1,094)
Net assets value 1,018
Goodwill 1,607
Carrying value at the time of acquisition 2,625
3 During the year, the Group has transferred the assets held by SMN Power Holding Company JAFZA (SMN JAFZA) to SMN Power Holding Company SAOC (SMN SAOC), a company existing under the laws of the Sultanate of Oman. As a part of the restructure, the Group received an interest in SMN SAOC equivalent to the interest held in SMN JAFZA. SMN SAOC was converted into a public company, SMN Power Holding Company SAOG (SMN SAOG). SMN SAOG made a public offer of 35% of its issued share capital and was listed on Muscat Securities market on 23 October 2011, with each of the initial shareholders selling 35% of its shareholding. The Group’s share was reduced from 47.5% to 30.875% as a result of public offering. The restructure and public listing satisfied obligations in accordance with an agreement entered into between the initial shareholders and the government of Oman. The Group has recognised a profit of AED 82 million in the consolidated statement of comprehensive income, on this transaction.
4 Became associate through acquisition of Tabreed (see note 5(a)(ii)). The fair values of Group’s investment in Du, a quoted investment that became an associate during the year, amounted to
AED 2,610 million as at 31 December 2011. The fair values of Group’s investment in ADSB, a quoted investment, amounted to AED 127 million as at 31 December 2011
(2010: AED 226 million). The fair values of Group’s investment in Aldar, a quoted investment that became an associate during the year, amounted
to AED 1,839,984 thousand as at 31 December 2011. The fair values of Group’s investment in SMN Power Holding Company S.A.O.G., a quoted investment, transferred from
jointly controlled entities amounted to AED 213,946 thousand as at 31 December 2011. The movements in investment in associates are set out below:
2011 2010 At 1 January 411,513 305,922
Share of results for the year 1,012,205 86,526
Addition during the year 285,445 5,132
Acquisition through business combinations (see note 5) 366,172 -
Disposal during the year - (5,132)
Share of movements in hedging reserves 39,998 28,236
Share of movements in translation reserves (354) -
Transferred from Jointly controlled entities (135,503) -
Transferred from financial investments 5,404,314 -
Dividends received (38,712) (9,171)
Intercompany income eliminated (32,935) -
7,312,143 411,513
Impairment5 (360,042) -
At 31 December 6,952,101 411,513
Disclosed as:
Investment in associates 6,985,883 411,513
Due to associates (33,782) -
6,952,101 411,513
17 Investments in equity accounted investees (Continued) (a) Investments in associates (Continued)

104 105
Mub
adal
a A
nnua
l Rep
ort
201
1
Notes to the consolidated financial statements (continued)
Mubadala Development Company PJSC
Notes to the consolidated financial statements (continued)
Mubadala Development Company PJSC
5 As part of its year end impairment assessment of its investment in associates, the Company concluded that internal and external indicators existed for decline in value of its investment in one of its associate and recognised impairment loss in the amount of AED 360,042 thousand. This was based on a value in use calculation using appropriate risk adjusted discount factor and growth rates. The loss is presented within impairment losses in the consolidated statement of comprehensive income.
Summary financial information for associates, not adjusted for the percentage ownership of the Group:
2011 2010 Total assets 60,186,952 3,091,621
Total liabilities 45,226,311 2,368,429
Revenue 18,000,521 1,432,652
Profit 1,870,363 224,910
(b) Investments in jointly controlled entities The Group has the following significant investments in jointly controlled entities, which are accounted for using the equity method:
Jointly controlled entities DomicileOwnership interest %
Principal business activity
2011 2010
Algerian Utilities International Limited UAE 49 49 Special purpose entity for holding utilities (power) sector investments
Dolphin Energy Limited (“DEL”) UAE 51 51 Procurement, distribution and marketing of hydrocarbons (natural gas)
Emirates Aluminium Company Limited PJSC (“EMAL”)
UAE 50 50 Develop, construct, operate, finance and maintain aluminium smelter
Emirates Ship Investment Company LLC (“Eships”) UAE 50 50 Cargo transportation and other marine services
EMTS Holding B.V.1 Netherlands 30 30 Special purpose entity for holding telecom investments
Azaliya France 49 49 Water treatment, distribution and waste water management
Advanced Military Maintenance Repair and Overhaul Center LLC (AMMROC)2
UAE 60 60 Fully’ integrated military aircraft, supply chain management, modification/upgrade, maintenance, repair and overhaul center
Torresol Energy Investment S.A. Spain 40 40 Develop, own and operate solar power plants
Shams One Company LLC UAE 60 60 Generation of electricity through solar power
1 In 2010, the Group acquired an additional 15% of the shares in EMTS Holding B.V. which were beneficially held on behalf of a related party in 2009.
2 In 2010, the Group entered into a joint venture agreement with two other joint venture partners for the purpose of the establishment and operation of AMMROC. The Group transferred three contracts to the joint venture at their fair value of AED 275,750 thousand and recognised 40% of the fair valuation gain attributable to other joint venture partners, amounting to AED 110,100 thousand, as gain on transfer of contracts in other income.
Although the Company holds more than 50% of the share capital in some of the jointly controlled entities, as all important financial and/or operating decisions are taken jointly with other joint venture partners, these are treated as jointly controlled entities.
The movements in investment in jointly controlled entities are set out below:
2011 2010 At 1 January 5,346,468 4,502,764
Exchange fluctuation in opening balance 1,686 (1,877)
Additions during the year 615,823 2,525,633
Acquisition through business combinations (see note 5) 350,298 -
Disposals during the year (18,582) (6,273)
Share of results for the year 1,578,643 729,527
Dividends received during the year (1,243,331) (948,248)
Share of movements in translation reserves 2,603 2,314
Share of movements in hedging reserves (308,584) 3,805
Share of movements in other reserves 80,049 -
Transfer to loans (446,114) (1,219,723)
Transfer upon acquisition of controlling stake (39,964) -
Transfer to associates 135,503 -
Exchange fluctuation 44,595 -
Intercompany income eliminated (63,094) (241,454)
6,035,999 5,346,468
Impairment3 (614,003) (502,061)
At 31 December 5,421,996 4,844,407
Disclosed as:
Investment in jointly controlled entities 6,212,537 5,848,288
Due to jointly controlled entities4 (790,541) (1,003,881)
5,421,996 4,844,407
3 Impairment includes AED 465,746 thousand (2010: AED 465,746 thousand) on the Group’s investment in Piaggio Aero Industries S.p.A and AED 148,257 thousand (2010: AED 36,315 thousand) on investments in other jointly controlled entities.
4 In certain jointly controlled entities the Group’s share of losses of those entities has exceeded its interest in those entities. The shares of losses exceeding the Group’s interests in such entities have been presented within current liabilities in the consolidated statement of financial position, since the Group has a constructive or legal obligation to contribute to such losses.
17 Investments in equity accounted investees (Continued) (a) Investments in associates (Continued)
17 Investments in equity accounted investees (Continued) (b) Investments in jointly controlled entities (Continued)

106 107
Mub
adal
a A
nnua
l Rep
ort
201
1
Notes to the consolidated financial statements (continued)
Mubadala Development Company PJSC
Notes to the consolidated financial statements (continued)
Mubadala Development Company PJSC
Summary financial information for jointly controlled entities, adjusted for the percentage ownership of the Group:
2011 2010 Current Assets 17,869,698 17,797,145
Non Current Assets 24,709,350 23,613,652
Current Liabilities 22,244,857 19,230,795
Non Current Liabilities 15,016,207 16,203,110
Income 14,003,045 8,832,726
Expenses 12,327,091 8,380,065
18 Financial investments
2011 2010 Financial assets at fair value through profit or loss
- quoted securities 8,228,122 8,065,170
- funds 2,274,006 1,792,683
- convertible bonds issued by related parties1 470,914 2,488,148
- other bonds 1,108,595 1,873,018
- investments held for trading 46,506 49,086
- derivative assets 94,739 121,920
12,222,882 14,390,025
Available for sale financial assets
- quoted securities 2,914,111 5,696,088
- unquoted securities2 4,492,870 4,389,731
7,406,981 10,085,819
At 31 December 19,629,863 24,475,844
Disclosed in the statement of financial position as:
Less: current portion (1,453,996) (204,812)
Non-current portion 18,175,867 24,271,032
a) Financial assets at fair value through profit or loss This represents the Group’s investments in funds, derivatives, bonds, quoted equity securities and convertible bonds issued
by related parties. During the year total additions amounting to AED 5,032,087 thousand (2010: AED 4,115,522 thousand) have been made and an amount of AED 2,491,659 thousand (2010: AED 847,295 thousand increase in fair value) representing a decrease in the fair value has been recorded in profit or loss (see note 11).
The fair value of quoted securities is arrived at based on the closing bid price of the shares in the capital markets. Fair value of funds is provided by the fund manager.
The fair values of derivative instruments are calculated using quoted prices. Where such prices are not available, a discounted cash flow analysis is performed using the applicable yield curve for the duration of the instrument for non-optional derivatives and option pricing models or quotes from counterparties for optional derivatives.
Foreign currency forward contracts are measured using quoted forward exchange rates and yield curves derived from quoted interest rates matching maturities of the contract derived from readily available market data. Interest rate swaps are measured at the present value of future cash flow estimated and discounted based on the applicable yield curves derived from quoted interest rates. Swaps which are not traded through clearing firm or an exchange are valued on the basis of the latest available counterparty valuation.
The fair value of bonds and convertible bonds are determined with reference to quoted market prices. Where such prices are not available valuation is performed by an independent valuation expert based on discounted cash flows analysis using applicable yield curves for the duration of the investment.
1 Convertible bonds issued by related parties primarily comprise mandatory convertible bonds acquired in the year 2011, carrying interest rates ranging from 0% to 4% and maturing in the year 2013-2014. These are convertible only at maturity date at a predetermined conversion rate unless called by the issuers. Conversion rates are adjusted in case new shares are issued or bonus shares are declared. Such bonds are not transferable without the prior approval of the issuer. Upon conversion shares are restricted from being sold in the market for a certain time and/or exceeding certain quantities. In the prior year, convertible bonds include mandatorily convertible bonds acquired in the year 2008, carrying interest rates ranging from 0% to 6.11%, which matured in the year 2011.
b) Available for sale financial assets
i) Quoted securities During the year the Group invested AED 3,371 thousand (2010: AED 197,304 thousand) in quoted securities classified as
available for sale. There was a net decrease of AED 646,351 thousand (2010: net decrease of AED 1,550,590 thousand) in the fair value of quoted securities during the year, of which AED 547,792 thousand was recorded as a decrease (2010: AED 1,323,317 thousand decrease) in the fair value reserve in other comprehensive income and impairment losses of AED 98,559 thousand (2010: AED 227,273 thousand) were recorded in profit or loss (see note 11). Furthermore, quoted securities include AED 545,990 thousand (2010: AED nil) issued by an entity under common control.
The fair value of quoted securities is arrived at based on the closing bid price of the shares in the capital markets. A significant or prolonged decline in the fair value of investments in equity instruments below their cost is considered an impairment in the carrying amount of the instrument, and is accordingly charged to profit or loss.
ii) Unquoted securities Unquoted securities are carried at cost less impairment, since no reliable measure of fair value is available. There was a
net decrease of AED 461 thousand (2010: net decrease of AED 77,867 thousand due to disposal of an investment) in the carrying value of unquoted securities due to exchange loss recognised in other comprehensive income during the year.
The value of the Group’s investments in unquoted securities which are carried at cost less impairment was reassessed at the reporting date. The recoverable values of the investments were reassessed based on the current market conditions. Based on the reassessment, no impairment losses were recognised by the Group.
2 Included above, there is an unquoted equity investment in an asset management firm made by the Group. Being unquoted, there is no reliable estimate of the fair value of the entire investment. Therefore, it is measured at cost less impairment. In assessing the impairment on this unquoted investment, a risk adjusted discount factor of 12.6% (31 December 2010: 13.8%) was used. If the inputs to the valuation model of the unquoted investment were 10% higher or lower while all the other variables were held constant, the carrying amount of the shares would decrease by AED 44,069 thousand (31 December 2010: AED 44,603 thousand) or increase by AED 47,125 thousand (31 December 2010: AED 47,555 thousand).
2 Included above, there are unquoted embedded derivative instruments (“bonds”) of a real estate developer in which the Group invested. The bonds carry interest at a fixed rate of 4.72% per annum which may either be paid in cash or compounded annually. In addition, they are entitled to a contingent interest equal to the cash distributions made by the ultimate investee company to the extent those distributions do not constitute fixed interest payment. The bonds will mature on 16 December 2037. An option to convert to equity can be exercised on or after 18 December 2022. The equity component of the combined instrument is sufficiently significant and precludes the Group from obtaining a reliable estimate of the fair value of the entire instrument. Therefore, the entire instrument is measured at cost less impairment.
In assessing the impairment on this unquoted investment, assumptions used are risk adjusted discount factors 7.2% (2010: from 7.2% to 7.5%),exit cap rates from 5.6% to 5.9% (2010: from 5.8% to 6.2%),and rent growth rates from 4.5% to 4.8% (2010: 4.5% to 4.8%) were used. This instrument was reported as ‘other assets’ in the prior years and has been reclassified to ‘financial investments’ to provide a more consistent presentation with other financial investments of the Group (see note 40).
17 Investments in equity accounted investees (Continued) (b) Investments in jointly controlled entities (Continued)
18 Financial investments (Continued) a) Financial assets at fair value through profit or loss (Continued)
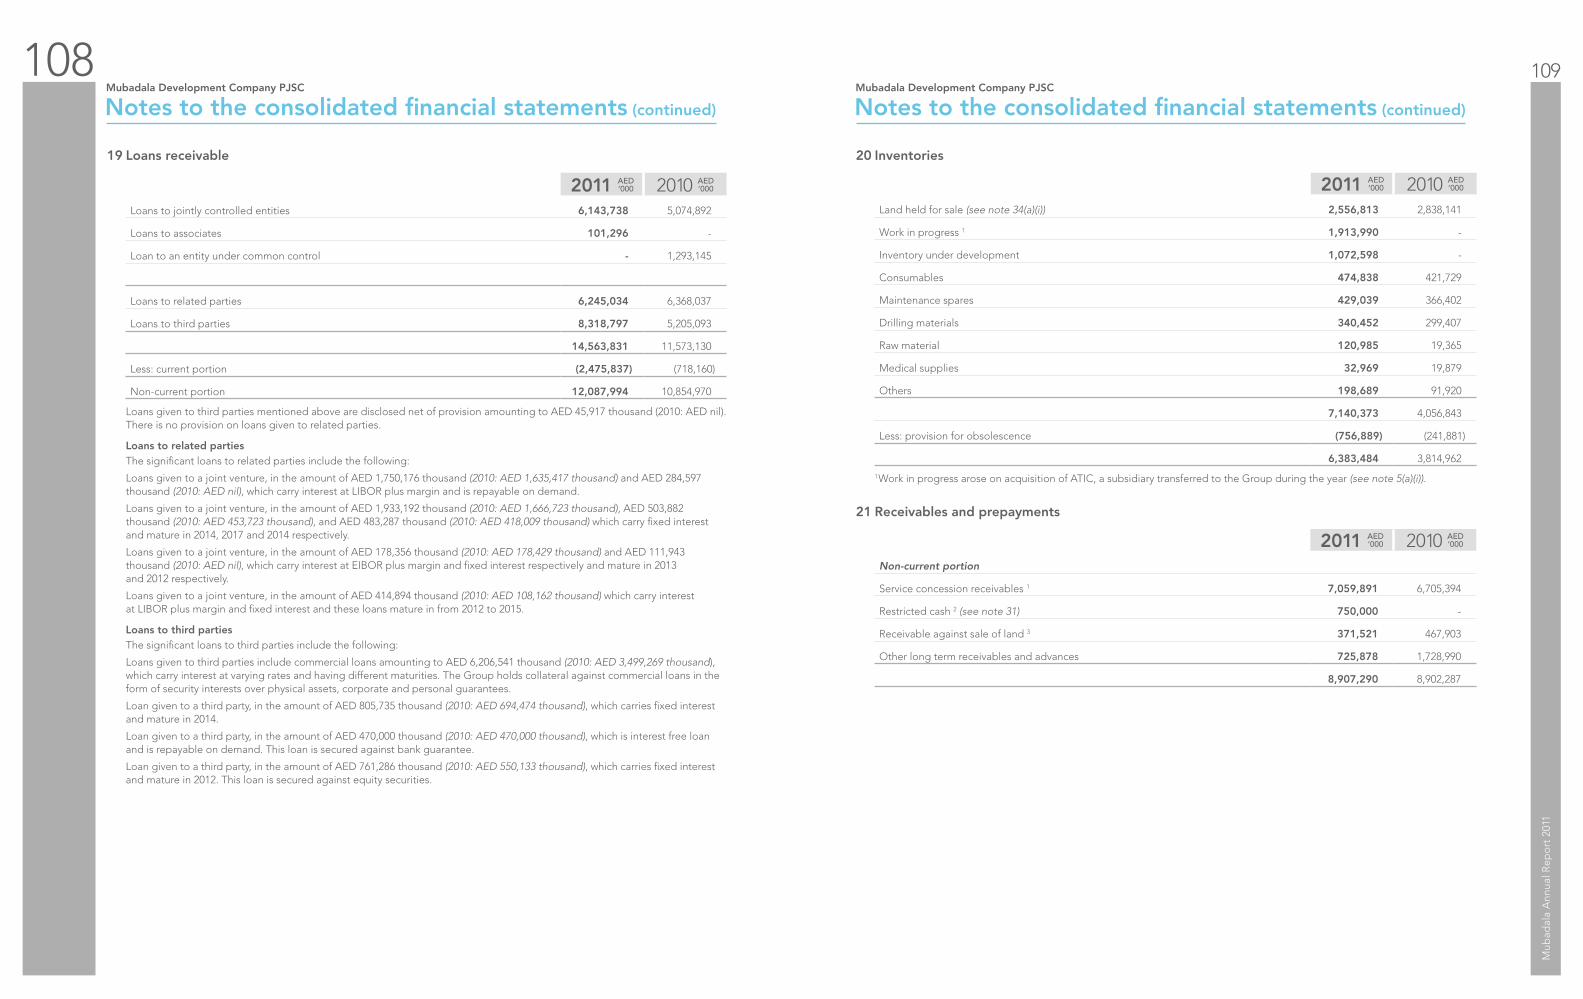
108 109
Mub
adal
a A
nnua
l Rep
ort
201
1
Notes to the consolidated financial statements (continued)
Mubadala Development Company PJSC
Notes to the consolidated financial statements (continued)
Mubadala Development Company PJSC
19 Loans receivable
2011 2010 Loans to jointly controlled entities 6,143,738 5,074,892
Loans to associates 101,296 -
Loan to an entity under common control - 1,293,145
Loans to related parties 6,245,034 6,368,037
Loans to third parties 8,318,797 5,205,093
14,563,831 11,573,130
Less: current portion (2,475,837) (718,160)
Non-current portion 12,087,994 10,854,970
Loans given to third parties mentioned above are disclosed net of provision amounting to AED 45,917 thousand (2010: AED nil). There is no provision on loans given to related parties.
Loans to related parties The significant loans to related parties include the following:
Loans given to a joint venture, in the amount of AED 1,750,176 thousand (2010: AED 1,635,417 thousand) and AED 284,597 thousand (2010: AED nil), which carry interest at LIBOR plus margin and is repayable on demand.
Loans given to a joint venture, in the amount of AED 1,933,192 thousand (2010: AED 1,666,723 thousand), AED 503,882 thousand (2010: AED 453,723 thousand), and AED 483,287 thousand (2010: AED 418,009 thousand) which carry fixed interest and mature in 2014, 2017 and 2014 respectively.
Loans given to a joint venture, in the amount of AED 178,356 thousand (2010: AED 178,429 thousand) and AED 111,943 thousand (2010: AED nil), which carry interest at EIBOR plus margin and fixed interest respectively and mature in 2013 and 2012 respectively.
Loans given to a joint venture, in the amount of AED 414,894 thousand (2010: AED 108,162 thousand) which carry interest at LIBOR plus margin and fixed interest and these loans mature in from 2012 to 2015.
Loans to third parties The significant loans to third parties include the following:
Loans given to third parties include commercial loans amounting to AED 6,206,541 thousand (2010: AED 3,499,269 thousand), which carry interest at varying rates and having different maturities. The Group holds collateral against commercial loans in the form of security interests over physical assets, corporate and personal guarantees.
Loan given to a third party, in the amount of AED 805,735 thousand (2010: AED 694,474 thousand), which carries fixed interest and mature in 2014.
Loan given to a third party, in the amount of AED 470,000 thousand (2010: AED 470,000 thousand), which is interest free loan and is repayable on demand. This loan is secured against bank guarantee.
Loan given to a third party, in the amount of AED 761,286 thousand (2010: AED 550,133 thousand), which carries fixed interest and mature in 2012. This loan is secured against equity securities.
20 Inventories
2011 2010 Land held for sale (see note 34(a)(i)) 2,556,813 2,838,141
Work in progress 1 1,913,990 -
Inventory under development 1,072,598 -
Consumables 474,838 421,729
Maintenance spares 429,039 366,402
Drilling materials 340,452 299,407
Raw material 120,985 19,365
Medical supplies 32,969 19,879
Others 198,689 91,920
7,140,373 4,056,843
Less: provision for obsolescence (756,889) (241,881)
6,383,484 3,814,962
1Work in progress arose on acquisition of ATIC, a subsidiary transferred to the Group during the year (see note 5(a)(i)).
21 Receivables and prepayments
2011 2010 Non-current portion
Service concession receivables 1 7,059,891 6,705,394
Restricted cash 2 (see note 31) 750,000 -
Receivable against sale of land 3 371,521 467,903
Other long term receivables and advances 725,878 1,728,990
8,907,290 8,902,287

110 111
Mub
adal
a A
nnua
l Rep
ort
201
1
Notes to the consolidated financial statements (continued)
Mubadala Development Company PJSC
Notes to the consolidated financial statements (continued)
Mubadala Development Company PJSC
2011 2010 Current portion
Trade receivables 4,225,264 1,761,308
Amounts due from related parties4 (see note 31) 3,931,592 1,726,957
Receivable against government grants 1,208,086 -
Service concession receivables1 971,184 636,133
Prepaid expenses 758,908 367,194
Advances to contractors 598,350 1,143,900
Contract work in progress 541,677 457,682
Sales tax recoverable 488,056 155,103
Restricted cash 311,675 35,000
Receivable against sale of land3 96,383 225,108
Receivable against disposal of available for sale investment - 595,638
Other receivables 1,940,046 859,660
15,071,221 7,963,683
Less: allowance for impairment (201,058) (235,479)
14,870,163 7,728,204
1Service concession receivables primarily represent receivables from related parties, on account of services relating to the construction of buildings for certain universities and facility management services. Service concession receivables will be recovered over the respective concession periods of the universities (see note 38). Details of the same are set out below:
2011 2010 Opening balance 7,341,527 4,033,898
Costs incurred during the year 488,977 2,767,966
Attributable profits 263,255 657,881
Effective interest on receivables 598,635 373,347
Less: availability charges received (658,661) (485,308)
Less: transferred to intangible assets (2,658) (6,257)
8,031,075 7,341,527
Non-current portion 7,059,891 6,705,394
Current portion 971,184 636,133
8,031,075 7,341,527
2 Represents balance held with an entity under common control.
3 Includes AED nil (2010: AED 205,119 thousand) receivable from related parties.
4 Amounts due from related parties are as follows:
2011 2010 Shareholder 2,350,225 387,775
Entities under common control 757,648 564,072
Jointly controlled entities 413,918 762,744
Associates 409,801 12,366
3,931,592 1,726,957
22 Finance lease receivables
During the period, the acquisition of additional equity stake in Tabreed (see note 5(a)(ii)) resulted primarily in the recognition of finance lease receivables in the books of the Group. These represent lease receivables against commissioning of distribution network and related plants.
Movement in the finance lease receivables during the year is as follows:
2011 2010 Acquisition through business combination 1,082,228 -
Transfers from capital work in progress during the period 435,000 -
Finance lease income 80,672 -
Lease rentals received during the period (63,753) -
At 31 December 1,534,147 -
Future minimum lease receivables under the finance lease together with the present value of the net minimum lease receivables are as follows:
2011 2010
Minimumlease payments
AED ‘000
Present valueof payments
AED ‘000
Minimumlease payments
AED ‘000
Present valueof payments
AED ‘000
Within one year 110,676 105,582 - -
After one year but not more than five years 501,327 393,034 - -
After five years 3,405,739 1,035,531 - -
Total 4,017,742 1,534,147 - -
Less: amount representing finance charges (2,483,595) - - -
Present value of minimum lease payments 1,534,147 1,534,147 - -
21 Receivables and prepayments (Continued) 21 Receivables and prepayments (Continued)
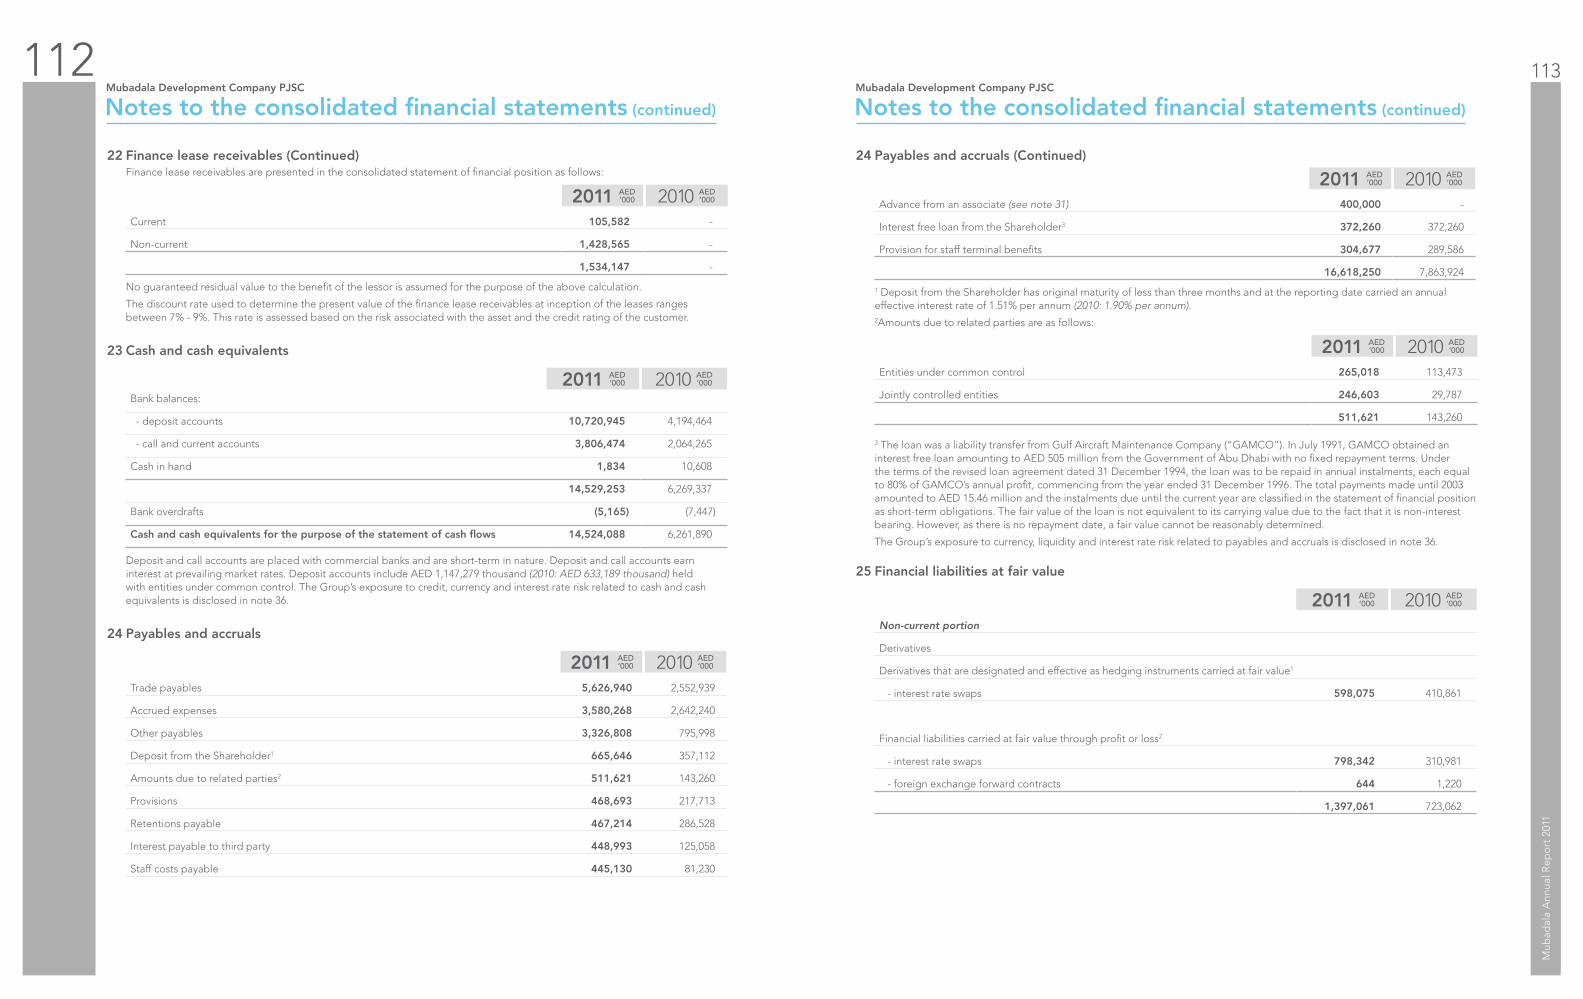
112 113
Mub
adal
a A
nnua
l Rep
ort
201
1
Notes to the consolidated financial statements (continued)
Mubadala Development Company PJSC
Notes to the consolidated financial statements (continued)
Mubadala Development Company PJSC
Finance lease receivables are presented in the consolidated statement of financial position as follows:
2011 2010 Current 105,582 -
Non-current 1,428,565 -
1,534,147 -
No guaranteed residual value to the benefit of the lessor is assumed for the purpose of the above calculation.
The discount rate used to determine the present value of the finance lease receivables at inception of the leases ranges between 7% - 9%. This rate is assessed based on the risk associated with the asset and the credit rating of the customer.
23 Cash and cash equivalents
2011 2010 Bank balances:
- deposit accounts 10,720,945 4,194,464
- call and current accounts 3,806,474 2,064,265
Cash in hand 1,834 10,608
14,529,253 6,269,337
Bank overdrafts (5,165) (7,447)
Cash and cash equivalents for the purpose of the statement of cash flows 14,524,088 6,261,890
Deposit and call accounts are placed with commercial banks and are short-term in nature. Deposit and call accounts earn interest at prevailing market rates. Deposit accounts include AED 1,147,279 thousand (2010: AED 633,189 thousand) held with entities under common control. The Group’s exposure to credit, currency and interest rate risk related to cash and cash equivalents is disclosed in note 36.
24 Payables and accruals
2011 2010 Trade payables 5,626,940 2,552,939
Accrued expenses 3,580,268 2,642,240
Other payables 3,326,808 795,998
Deposit from the Shareholder1 665,646 357,112
Amounts due to related parties2 511,621 143,260
Provisions 468,693 217,713
Retentions payable 467,214 286,528
Interest payable to third party 448,993 125,058
Staff costs payable 445,130 81,230
2011 2010 Advance from an associate (see note 31) 400,000 -
Interest free loan from the Shareholder3 372,260 372,260
Provision for staff terminal benefits 304,677 289,586
16,618,250 7,863,924
1 Deposit from the Shareholder has original maturity of less than three months and at the reporting date carried an annual effective interest rate of 1.51% per annum (2010: 1.90% per annum).
2Amounts due to related parties are as follows:
2011 2010 Entities under common control 265,018 113,473
Jointly controlled entities 246,603 29,787
511,621 143,260
3 The loan was a liability transfer from Gulf Aircraft Maintenance Company (“GAMCO”). In July 1991, GAMCO obtained an interest free loan amounting to AED 505 million from the Government of Abu Dhabi with no fixed repayment terms. Under the terms of the revised loan agreement dated 31 December 1994, the loan was to be repaid in annual instalments, each equal to 80% of GAMCO’s annual profit, commencing from the year ended 31 December 1996. The total payments made until 2003 amounted to AED 15.46 million and the instalments due until the current year are classified in the statement of financial position as short-term obligations. The fair value of the loan is not equivalent to its carrying value due to the fact that it is non-interest bearing. However, as there is no repayment date, a fair value cannot be reasonably determined.
The Group’s exposure to currency, liquidity and interest rate risk related to payables and accruals is disclosed in note 36.
25 Financial liabilities at fair value
2011 2010 Non-current portion
Derivatives
Derivatives that are designated and effective as hedging instruments carried at fair value1
- interest rate swaps 598,075 410,861
Financial liabilities carried at fair value through profit or loss2
- interest rate swaps 798,342 310,981
- foreign exchange forward contracts 644 1,220
1,397,061 723,062
22 Finance lease receivables (Continued) 24 Payables and accruals (Continued)

114 115
Mub
adal
a A
nnua
l Rep
ort
201
1
Notes to the consolidated financial statements (continued)
Mubadala Development Company PJSC
Notes to the consolidated financial statements (continued)
Mubadala Development Company PJSC
2011 2010 Current portion
Derivatives
Derivatives that are designated and effective as hedging instruments carried at fair value1
- interest rate swaps 153,453 70,823
- foreign exchange forward contracts 93,934 -
247,387 70,823
Financial liabilities carried at fair value through profit or loss2
- interest rate swaps 25,112 -
- foreign exchange forward contracts 62,193 16,246
- equity options 41,726 33,987
- equity swaps 3,244 81,238
132,275 131,471
Other financial liabilities
Exchange traded securities3 89,648 -
469,310 202,294
The fair values of derivative instruments are calculated using quoted prices. Where such prices are not available, a discounted cash flow analysis is performed using the applicable yield curve for the duration of the instrument for non-optional derivatives and option pricing models or quotes from counterparties for optional derivatives. Foreign currency forward contracts are measured using quoted forward exchange rates and yield curves derived from quoted interest rates matching maturities of the contract derived from readily available market data. Interest rate and currency swaps are measured at the present value of future cash flow estimated and discounted based on the applicable yield curves derived from quoted interest rates.
1 The hedging reserve comprises the effective portion of the cumulative net change in the fair value of the following cash-flow hedging instruments related to hedged transactions that have not yet occurred.
Foreign exchange forward contract The Group has an obligation to make payments in Euro in connection with the procurement of satellites. The Group has
entered into a forward exchange contract in order to manage foreign currency fluctuations arising from these expected cash flows.
Interest rate swap The Group also has obligation to pay interest at variable rates (LIBOR plus margin) in connection with a borrowing transaction.
To hedge variability in interest rates, the Group entered into a cash flow hedge by acquiring an interest rate swap.
2 Derivatives used as economic hedges are used to hedge interest rate exposures. However, they do not qualify for hedge accounting. These instruments are fair valued using external quotes and changes in fair value are recorded in profit or loss.
3 The Group sells securities that it does not own and therefore, it will be obliged to purchase such securities at a future date. When the Group sells a security short, an amount equal to the proceeds received is recorded as a liability and is subsequently adjusted to the current market value of the securities sold short. Upon the closing of the short position, the difference between the proceeds originally received and the cost of the securities purchased to close the short position is recognised as a realised gain or loss. This is disclosed on the statement of financial position in liabilities under financial liabilities at fair value through profit or loss. These positions are shown as financial liabilities at fair value through profit or loss until they are realised, when they are shown in the statement of comprehensive income as net gain or loss on financial liabilities at fair value through profit or loss. The theoretical risk of loss from short sales is unlimited.
26 Interest bearing borrowings
2011 2010 Unsecured bank borrowings 3,769,217 1,313,031
Unsecured corporate bonds - 71,086
Secured bank borrowing 698,891 205,920
Unsecured borrowing 565,180 378,010
Others 20,015 -
Current portion 5,053,303 1,968,047
Secured bank borrowings 13,748,797 8,033,785
Unsecured bank borrowings 10,447,177 9,638,788
Unsecured corporate bonds 11,843,945 6,373,971
Unsecured borrowings 761,229 924,473
Others 1,323,009 -
Non-current portion 38,124,157 24,971,017
25 Financial liabilities at fair value (Continued)

116 117
Mub
adal
a A
nnua
l Rep
ort
201
1
Notes to the consolidated financial statements (continued)
Mubadala Development Company PJSC
Notes to the consolidated financial statements (continued)
Mubadala Development Company PJSC
Terms and debt repayment schedule
Particulars Entity name / Project name CurrencyNominal interest rate
interest rateYear of maturity 31 Dec 2011 31 Dec 2010
Carrying amount AED ‘000
Carrying amount AED ‘000
Current
Secured bank loan2 Al Hikma Development Company PJSC (UAE University) USD LIBOR + margin 2012 96,559 91,280
Secured bank loan2 Manhal Development Company PJSC (Sorbonne University) USD LIBOR + margin 2012 46,479 49,111
Secured bank loan2 Manhal Development Company PJSC (Sorbonne University) AED EIBOR + margin 2012 15,493 16,370
Secured bank loan2 Maqsed Development Company PJSC (Zayed University) USD LIBOR + margin 2012 49,923 -
Secured bank loan2 Maqsed Development Company PJSC (Zayed University) AED EIBOR + margin 2012 91,382 -
Secured bank loan8 National Central District Cooling Company PJSC- Tabreed Islamic Finance AED EIBOR + margin 2012 11,110 -
Secured bank loan8 National Central District Cooling Company PJSC USD / AED LIBOR/EIBOR + margin 2012 72,810 -
Secured bank loan1 Abu Dhabi Aircraft Technologies LLC AED EIBOR + margin 2012 30,000 30,000
Secured bank loan4 SR Technics CHF/EUR/USD LIBOR + margin 2012 235,194 -
Secured bank loan9 Sanad Aero Limited USD LIBOR + margin 2012 37,053 -
Secured bank loan1 Abu Dhabi Aircraft Technologies LLC USD LIBOR + margin 2012 12,888 19,159
Unsecured bank loan Abu Dhabi Aircraft Technologies LLC AED EIBOR + margin 2012 19,245 55,099
Unsecured bank loan Beta Investment Company LLC (Pearl) USD LIBOR + margin 2012 255,532 507,014
Unsecured bank loan The Specialist Diabetes Treatment and Research Centre LLC AED Fixed coupon 2012 4,234 4,170
Unsecured bank loan5 Dolphin Investment Company LLC USD LIBOR + margin / Fixed 2012 446,275 619,280
Unsecured bank loan MDC - GMTN B.V. - Commercial Paper 2011 USD/GBP/HKD Fixed coupon 2012 625,776 127,468
Unsecured bank loan Mubadala Corporate EUR Term Loan EUR EURIBOR + margin 2012 1,174,749 -
Unsecured bank loan Mubadala - Corporate revolver GBP LIBOR + margin 2012 170,253 -
Unsecured bank loan Al Yahsat Communications Company PJSC USD LIBOR + margin 2012 122,681 -
Unsecured bank loan ATIC - EXIM guaranteed loan USD LIBOR + margin 2012 216,736 -
Unsecured bank loan ATIC - EXIM guaranteed loan USD LIBOR + margin 2012 426,319 -
Unsecured bank loan ATIC - Societe Generale term loan USD LIBOR + margin 2012 87,415 -
Unsecured bank loan ATIC - JBIC / SMBC term loan (Tranche B) USD LIBOR + margin 2012 109,127 -
Unsecured bank loan ATIC - JBIC / SMBC term loan (Tranche A) USD Fixed coupon 2012 110,875 -
Unsecured loan5 Abu Dhabi Aircraft Technologies LLC USD Fixed coupon 2012 565,180 378,010
Unsecured deposits Abu Dhabi Finance AED EIBOR + margin 2012 20,015 -
Unsecured corporate bond MDC - GMTN B.V. - Corporate Bond 2011 SGD Fixed coupon 2011 - 71,086
Current total 5,053,303 1,968,047
26 Interest bearing borrowings (Continued)

118 119
Mub
adal
a A
nnua
l Rep
ort
201
1
Notes to the consolidated financial statements (continued)
Mubadala Development Company PJSC
Notes to the consolidated financial statements (continued)
Mubadala Development Company PJSC
Particulars Entity name / Project name CurrencyNominal interest rate
interest rateYear of maturity 31 Dec 2011 31 Dec 2010
Carrying amount AED ‘000
Carrying amount AED ‘000
Non-Current
Secured bank loan2 Al Hikma Development Company PJSC (UAE University) USD LIBOR + margin 2022 1,227,518 1,322,571
Secured bank loan2 Manhal Development Company PJSC (Sorbonne University) USD LIBOR + margin 2028 767,524 811,816
Secured bank loan2 Manhal Development Company PJSC (Sorbonne University) AED EIBOR + margin 2028 255,841 270,606
Secured bank loan2 Al Maqsed Development Company PJSC (Zayed University) USD LIBOR + margin 2019 1,213,120 982,173
Secured bank loan2 Al Maqsed Development Company PJSC (Zayed University) AED EIBOR + margin 2019 2,220,562 1,797,825
Secured bank loan3 Sigma Investment Company (BVI) (PTC) Limited (GE margin loan) USD LIBOR + margin 2013 1,332,890 1,326,541
Secured bank loan4 SR Technics CHF/EUR/USD LIBOR + margin 2015 883,832 1,401,926
Secured bank loan9 Sanad Aero Limited USD LIBOR + margin 2023 412,722 -
Secured bank loan7 ATIC - Syndicated loan USD LIBOR + margin 2015 2,204,100 -
Secured bank loan8 National Central District Cooling Company PJSC- Tabreed Islamic Finance AED EIBOR + margin 2019 527,096 -
Secured bank loan8 National Central District Cooling Company PJSC USD / AED LIBOR/EIBOR + margin 2013 - 2019 2,110,921 -
Secured bank loan6 Mubadala Development Company PJSC AED Fixed coupon 2012 472,412 -
Secured bank loan1 Abu Dhabi Aircraft Technologies LLC AED EIBOR + margin 2016 120,259 120,327
Unsecured notes ATIC - Senior notes USD Fixed coupon 2013 965,400 -
Unsecured notes ATIC - Senior notes USD Fixed coupon 2015 357,609 -
Unsecured bank loan Abu Dhabi Aircraft Technologies LLC USD LIBOR + margin 2013 6,314 19,272
Unsecured bank loan Al Yah Satellite Communications Company PJSC USD LIBOR + margin 2022 3,183,703 2,574,544
Unsecured bank loan Beta Investment Company LLC (Pearl) USD LIBOR + margin 2012 - 255,532
Unsecured bank loan Mubadala Corporate EUR Term Loan EUR EURIBOR + margin 2012 - 2,393,343
Unsecured bank loan The Specialist Diabetes Treatment and Research Centre LLC AED Fixed coupon 2020 32,375 35,033
Unsecured bank loan5 Dolphin Investment Company LLC USD LIBOR + margin / Fixed coupon 2019 2,770,361 3,216,574
Unsecured bank loan Treasury Holding Company LLC - EIB term loan EUR EURIBOR + margin 2019 1,118,368 1,144,490
Unsecured bank loan MDC - GMTN B.V. - JPY Private Placement JPY Fixed coupon 2031 708,244 -
Unsecured bank loan GMTN BV EUR Private Placement EUR Fixed coupon 2018 378,748 -
Unsecured bank loan ATIC - EXIM guaranteed loan USD LIBOR + margin 2013 108,248 -
Unsecured bank loan ATIC - EXIM guaranteed loan USD LIBOR + margin 2017 1,390,165 -
Unsecured bank loan ATIC - Societe Generale term loan USD LIBOR + margin 2013 87,939 -
Unsecured bank loan ATIC - JBIC / SMBC term loan (Tranche B) USD LIBOR + margin 2015 329,371 -
Unsecured bank loan ATIC - JBIC / SMBC term loan (Tranche A) USD Fixed coupon 2015 333,341 -
Unsecured loan5 Abu Dhabi Aircraft Technologies LLC USD Fixed coupon 2012 - 374,340
Unsecured loan SR Technics EUR Fixed coupon + variable component 2019 761,229 550,133
Unsecured corporate bond MDC - GMTN B.V. - Corporate Bond 2014 USD Fixed coupon 2014 4,563,264 4,549,947
Unsecured corporate bond MDC - GMTN B.V. - Corporate Bond 2016 USD Fixed coupon 2016 2,724,873 -
Unsecured corporate bond MDC - GMTN B.V. - Corporate Bond 2019 USD Fixed coupon 2019 1,821,604 1,824,024
Unsecured corporate bond MDC - GMTN B.V. - Corporate Bond 2021 USD Fixed coupon 2021 2,734,204 -
Non-Current total 38,124,157 24,971,017
Total 43,177,460 26,939,064
26 Interest bearing borrowings (Continued) Terms and debt repayment schedule (Continued)

120 121
Mub
adal
a A
nnua
l Rep
ort
201
1
Notes to the consolidated financial statements (continued)
Mubadala Development Company PJSC
Notes to the consolidated financial statements (continued)
Mubadala Development Company PJSC
1 Secured bank loan represents term loans which are secured against lien on bank deposits of AED 60 million.
2 The purpose of these loans is to fund university projects (refer note 38). The loans are secured against the following onshore and offshore securities:
Onshore securities • Commercial mortgages over their equipment to the extent possible and enforceable under the United Arab Emirates law
including all existing and subsequently acquired tangible and intangible assets.
• A UAE law assignment agreement covering:
i) the Project Documents consisting of Operating Agreement, Project Agreement, Tripartite Agreement, Musataha Agreement, Advance Payment Bond and Performance Bond; and
ii) Direct Insurance policies consisting of combined Construction/Property All Risk Policy and Terrorism Policy and all insurance proceeds in respect of direct insurances.
• Pledge of shares.
• Powers of attorneys.
• An onshore account pledge of monies and any authorised investments held in the Onshore Project Accounts (as defined in the Onshore Account Pledge).
• A mortgage over the Musataha Agreement.
Offshore Securities • An English law assignment and charge (the Security Agreement) covering:
i) a fixed charge over certain bank accounts (the Offshore Project Accounts as defined in the Security Agreement); and
ii) an assignment of the reinsurances in respect of Material Insurances which consist of all insurances other than motor vehicle and employers’ liability risk insurances.
3 The loan is secured by a pledge of GE shares held by the Group with a carrying value of AED 1,327,603 thousand.
4 The loans are secured by pledged assets including bank accounts of AED 169,413 thousand (2010: AED 291,265 thousand) and trade receivables of AED 690,264 thousand (2010: AED 621,854 thousand) of SR Technics Holdco 1 GMBH and its subsidiaries (“the SRT Group”). Furthermore, shares of the SRT Group are also pledged against this loan. Pledged property plant and equipment is disclosed in note 13.
5 These represent loans obtained from related parties.
6 The loan matures in 2012 but the Group has the right to extend it until 2013. Hence the loan is classified as non-current. This loan is secured against pledge of an associate company of the Group. The pledged shares have a carrying value of AED 526,165 thousand.
7 This loan is drawn from a consortium of banks and is secured by a pledge of ordinary shares of a subsidiary company, with a carrying value of AED 4,376,000 thousand.
8 These loans are secured by pledges of plants, equipment (see note 13) and trade debtors.
9 This loan is secured by aircraft engines, with a carrying value of AED 598,780 thousand.
27 Other liabilities
2011 2010 Advances from a related party 1,068,988 1,068,988
Asset retirement obligation 124,168 -
Interest free loan from the Shareholder1 117,281 117,281
Retentions payable 35 54,480
Decommissioning liabilities 276,089 315,379
Others 674,913 257,375
2,261,474 1,813,503
1 See note 24 for interest free loan details.
28 Obligation under finance lease
During the year, the transfer of ATIC (see note 5(a)(i)) resulted primarily in the recognition of obligation under finance lease in the books of the Group. ATIC has service contracts with suppliers of bulk gases, pursuant to which the suppliers have built certain equipment, which the suppliers use to provide the Group with gases used in the manufacturing process. ATIC pays a fixed annual fee over the term of the agreement, plus a variable charge based on the quantity of the gases delivered. Furthermore, obligation under finance lease also resulted from acquisition of Tabreed (see note 5 (a)(ii)).
Future minimum lease payments under finance leases together with the present value of the minimum lease payments are as follows:
31 Dec 2011 31 Dec 2010
Minimumlease payments
AED ‘000
Present valueof payments
AED ‘000
Minimumlease payments
AED ‘000
Present valueof payments
AED ‘000
Within one year 283,514 147,635 - -
After one year but not more than five years 1,121,705 734,209 - -
After five years 801,735 639,171 - -
Total 2,206,954 1,521,015 - -
Less: amount representing finance charges (685,939) - - -
Present value of minimum lease payments 1,521,015 1,521,015 - -
Obligation under finance lease is presented in the consolidated statement of financial position as follows:
2011 2010 Current 147,635 -
Non-current 1,373,380 -
1,521,015 -
For assets held under finance lease, please refer to note 13.
29 Share capital
2011 2010 Authorised, issued and fully paid up:
15,000,000 equity shares (2010: 15,000,000 equity shares) of AED 1,000 each 15,000,000 15,000,000
30 Reserves
Statutory reserve The Articles of Association of the Company require that 10% of the Group’s net profit be transferred to a non-distributable
statutory reserve until the amount of the statutory reserve equals 50% of the Company’s paid up share capital.
Fair value reserve The fair value reserve comprises the cumulative net change in the fair value of available-for-sale financial assets until the
investments are derecognised or impaired.
Foreign currency translation reserve The translation reserve comprises all foreign currency differences arising from the translation of the financial statements of
foreign operations, as well as from the translation of liabilities that hedge the Company’s net investment in foreign operation.
26 Interest bearing borrowings (Continued)

122 123
Mub
adal
a A
nnua
l Rep
ort
201
1
Notes to the consolidated financial statements (continued)
Mubadala Development Company PJSC
Notes to the consolidated financial statements (continued)
Mubadala Development Company PJSC
Hedging reserve Hedging reserve comprises the effective portion of the cumulative net change in the fair value of cash flow hedges related
to hedged transactions that have not yet affected profit or loss.
31 Significant transactions with related parties
(a) Identity of related parties The Group has a related party relationship with its shareholder, subsidiaries (see note 5), joint ventures and associates
(see note 17), and with its directors, executive officers and parties which are under common control of the above parties.
(b) Transactions with key management personnel Key management personnel compensation is as follows:
2011 2010 Directors’ remuneration 39,874 20,908
Short term benefits 135,522 92,121
Post employment benefits 10,160 7,789
145,682 99,910
(c) Other related party transactions In the ordinary course of business the Group provides services to, and receives services from related parties on terms agreed
by management.
Significant transactions with related parties in addition to transfer of a subsidiary from the Shareholder (see note 5(a)(i)), during the year were as follows:
2011 2010 Revenue
Shareholder 240,018 385,281
Entities under common control 1,526,889 3,434,726
Jointly controlled entities 856,832 1,400,441
Associates 106,908 -
2,730,647 5,220,448
Interest income
Shareholder 132,154 91,419
Entities under common control 480,213 459,315
Jointly controlled entities 345,411 571,714
Associates 69,522 -
1,027,300 1,122,448
2011 2010 Income from provision of manpower, project management and consultancy services
Shareholder - 6,773
Entities under common control 27,591 49,537
Jointly controlled entities 72,568 221,604
Associates 21,999 -
122,158 277,914
Purchase of goods and services1
Shareholder - 33,075
Entities under common control 603,508 170,754
Jointly controlled entities 961,666 715,497
Associates 667,381 156,495
2,232,555 1,075,821
Interest bearing borrowing repaid
Jointly controlled entities2 822,046 576,861
Interest bearing borrowing drawn
Entity under common control 472,412 -
Loans given
Jointly controlled entities 949,351 4,676,534
Associates 52,449 -
1,001,800 4,676,534
Loans recovered
Jointly controlled entities 229,654 -
Entities under common control - 1,198,469
229,654 1,198,469
Investment in convertible bond
Associate 2,800,000 -
Consideration for sale of interest in a jointly controlled entity
Jointly controlled entity - 81,919
30 Reserves (Continued) 31 Significant transactions with related parties (Continued) (c) Other related party transactions (Continued)

124 125
Mub
adal
a A
nnua
l Rep
ort
201
1
Notes to the consolidated financial statements (continued)
Mubadala Development Company PJSC
Notes to the consolidated financial statements (continued)
Mubadala Development Company PJSC
2011 2010 Restricted cash
Entity under common control (see note 21) 750,000 -
Loans given
Entities under common control - 2,360,195
Deposit received
Shareholder 309,953 -
Jointly controlled entity - 752,350
309,953 752,350
Advance received
Associate (see note 24) 400,000 -
1 Purchase of goods and services include advance against property under development, amounting to AED 680,906 thousand, given during the year.
2 The balances against these loans are included in interest bearing borrowings (see note 26).
(d) Amounts due from related parties (see note 21) Amounts due from related parties primarily comprise amounts recoverable from the Government of Abu Dhabi and entities
under common control for expenses incurred on their behalf.
(e) Additional shareholder contributions
2011 2010 As at 1 January 45,725,643 42,211,064
Cash contributions1 27,983,478 13,000,000
Conversion to share capital2 - (9,485,421)
Contribution arising from transfer of ATIC (see note 5(a)(i)) 20,793,409 -
As at 31 December 94,502,530 45,725,643
1 Cash contributions represent interest free loans from the Shareholder. As per the terms of the agreement for the amounts received in 2007, there are no contractual obligations to repay the loans. As per the terms of the agreements for the amounts received subsequent to 2007, any repayments are at the discretion of the Board of Directors of the Company, who do not intend to repay any such amounts in the foreseeable future. In addition, the terms of the agreements specify that, on dissolution of the Company, the rights, benefits and obligations in the residual net assets and liabilities, attached to the loans, shall rank pari passu with those attached to the share capital of the Company. Therefore, these loans are more akin to equity instruments rather than liabilities, and accordingly have been presented within equity.
2 During 2010, the Shareholder approved an increase in the share capital of the Company to AED 15,000,000 thousand, by converting additional shareholder contributions amounting to AED 9,485,421 thousand, received by the Group in previous years.
32 Commitments and contingent liabilities
Commitments and contingencies Commitments and contingencies at the end of the reporting period are as follows:
2011 2010 Capital commitments 19,825,303 30,013,483
Contingent liabilities1 18,558,044 19,296,480
38,383,347 49,309,963
1 Contingent liabilities include bank guarantees, performance bonds, advance payment bonds, completion guarantees and counter guarantees.
In addition to the above, the Group’s share, in the commitments and contingencies of its joint ventures and contingencies of its associates, is as follows:
2011 2010 Commitments and contingencies 7,019,368 7,107,516
Exploration commitments The obligations of the Group to perform exploration activities are as follows:
2011 2010 Due in less than one year 781,737 400,323
Later than one year but not later than five years 719,276 794,939
At 31 December 1,501,013 1,195,262
A subsidiary of the Group has production bonus commitments that range from AED 108,730 thousand (2010: AED 113,333 thousand) to AED 404,450 thousand (2010: AED 426,490 thousand) which may be payable depending upon achievement of certain preset production targets. The management believes that such commitments are not likely to be payable within one year. Due to uncertainty of the future production levels and future reserve discoveries, it is not possible to estimate production bonus that may be payable after one year.
Furthermore, operating lease commitments of the Group are as follows:
2011 2010 Within one year 329,097 335,754
After one year but not more than five years 723,906 536,970
After five years 909,030 711,658
Total 1,962,033 1,584,382
33 Income tax
2011 2010 Income tax recognised in profit or loss:
Current tax
On profit of the year (426,959) (265,599)
Adjustment in respect of prior years current tax (49,320) 12,670
Total (476,279) (252,929)
31 Significant transactions with related parties (Continued) (c) Other related party transactions (Continued)

126 127
Mub
adal
a A
nnua
l Rep
ort
201
1
Notes to the consolidated financial statements (continued)
Mubadala Development Company PJSC
Notes to the consolidated financial statements (continued)
Mubadala Development Company PJSC
2011 2010 Deferred tax
Origination and reversal of temporary differences 237,582 (22,396)
Effect of change in accounting policy for explorationand evaluation costs - (31,379)
Recognition of previously unrecognised tax losses 334,267 -
Deferred tax adjustment on depreciation, depletion and amortisation 113,989 -
Deferred tax effect for impairment losses - 138,557
Others (13,343) -
672,495 84,782
Income tax credit / (expense) recognised in statement of comprehensive income 196,216 (168,147)
The United Arab Emirates does not enforce any domestic income tax decrees and, therefore, the domestic tax rate is nil. Income tax is calculated at tax rates prevailing in the respective jurisdictions, and mainly arise from Takeoff Top Luxco SA and overseas subsidiaries of Beta Investment Company LLC and Advanced Technology Investment Company LLC.
The total charge for the year can be reconciled to the accounting profit as follows:
2011 2010 (Loss) / profit before tax from continuing operations (4,719,628) 1,295,903
Income tax expense calculated at domestic tax rate - -
Effect of different tax rates of subsidiaries operating in other jurisdictions (99,152) 76,587
Effect of income that is exempt from taxation 122,801 80,078
Effect of expenses that are not deductible in determining taxable profit (639,354) (405,354)
Effect of unused tax losses and tax offsets not recognised as deferred tax assets (111,699) (210,010)
Effect of previously unrecognised and unused tax losses and deductible temporary differences now recognised as deferred tax assets 615,104 (83,462)
Others 357,836 361,344
245,536 (180,817)
Adjustments recognised in the current year in relation to the current tax of prior years (49,320) 12,670
Income tax credit / (expense) recognised in statement of comprehensive income 196,216 (168,147)
Current tax liabilities:
2011 2010 Income tax payable 496,500 301,805
Deferred income tax assets and liabilities:
2011 2010 Deferred tax assets - non-current 1,088,087 78,077
Deferred tax liabilities - non-current (1,583,311) (1,100,758)
Net (495,224) (1,022,681)
The movements for the year in the net deferred tax position are as follows:
2011 2010 At 1 January (1,022,681) (1,136,667)
Effect of change in accounting policy for exploration and evaluation costs - 14,228
Restated balance as at 1 January (1,022,681) (1,122,439)
Fair value adjustments arising from business combination (see note 5(a)(i)) (158,005) -
Charge to profit or loss 672,495 (22,396)
Disposal of subsidiaries and working interest (see note 5(b)(i)&(ii)) - 74,175
Effect of change in accounting policy for exploration and evaluation costs - (31,379)
Deferred tax (credits) / debits for impairment losses / reversals - 138,557
Foreign currency adjustments 10,038 (59,199)
Recognised in other comprehensive income 2,929 -
Net (495,224) (1,022,681)
Subject to the agreement of the relevant tax authorities, the Group’s unrecognised tax losses, investment allowances or unrecovered cost pools in various jurisdictions as at 31 December 2011 amounted to AED 13,430,467 thousand (2010: AED 4,390,187 thousand) and are available for offset against future taxable income. The decision to recognise deferred tax assets was due to sufficient evidence to support the realisation of those benefits based upon anticipated future taxable income levels. These losses, allowances and cost pools have expiry ranging from 2 years to unlimited carry forward period. The Group has not recognised a deferred tax of AED 1,914,684 thousand (2010: AED 264,125 thousand) in relation to these losses as it is not probable that these losses will be utilised.
The Group’s effective tax rate is 4.2% (2010: 3.5%).
Deferred tax liabilities in certain jurisdictions are primarily in respect of the excess of the carrying amount over the tax written down value of property, plant and equipment and intangible assets.
The Group has entered into various exploration and production sharing agreements. These agreements prescribe that any income tax liability of the Group will be discharged by the governments of the countries in which the agreements are executed. As there will be no cash outflow in relation to taxation, the Group does not recognise any income, expense, tax asset or liability for either current or deferred taxation in relation to these operations.
At 31 December 2011, there was no recognised deferred tax liability for taxes that would be payable on the unremitted earnings of certain of the Group’s subsidiaries as the Group is able to control the timing of the reversal of the temporary difference and it is probable that the temporary difference will not reverse in the foreseeable future.
33 Income Tax (Continued) 33 Income Tax (Continued)

128 129
Mub
adal
a A
nnua
l Rep
ort
201
1
Notes to the consolidated financial statements (continued)
Mubadala Development Company PJSC
Notes to the consolidated financial statements (continued)
Mubadala Development Company PJSC
Recognised deferred tax assets and liabilities are attributable to:
Assets Liabilities Net
2011 2010 2011 2010 2011 2010 Property, plant and equipment 100,298 - (1,127,191) (297,970) (1,026,893) (297,970)
Intangible assets - - (623,903) (670,178) (623,903) (670,178)
Fair value through profit or loss investments - - (2,189) - (2,189) -
Derivatives - - (5,831) - (5,831) -
Other assets 125,446 - (62,684) (52,407) 62,762 (52,407)
Other liabilities 878 - (63,243) (80,203) (62,365) (80,203)
Payables and accruals 241,856 - - - 241,856 -
Tax losses recognised 751,176 78,077 6,259 - 757,435 78,077
Others 227,360 - (63,456) - 163,904 -
Tax assets / liabilities 1,447,014 78,077 (1,942,238) (1,100,758) (495,224) (1,022,681)
Income tax recognised in other comprehensive income:
2011 2010
Before taxTax
(expense) / credit
Net of tax Before taxTax
(expense) / credit
Net of tax
AED ’000 AED ’000 AED ’000 AED ’000 AED ’000 AED ’000
Net change in fair value of available-for-sale financial assets (548,253) - (548,253) (1,401,184) - (1,401,184)
Effective portion of changes in fair values of cash flow hedges and other reserves (92,578) 2,929 (89,649) (265,495) - (265,495)
Net change in translation reserve (2,802) - (2,802) 189,746 - 189,746
Share of effective portion of changes in fair values of hedging instruments of equity accounted investees (268,586) - (268,586) 32,041 - 32,041
Share of movements in translation reserve of equity accounted investees 2,249 - 2,249 2,314 - 2,314
(909,970) 2,929 (907,041) (1,442,578) - (1,442,578)
34 Government grants (a) Non-monetary government grants
(i) Land The Group has received the following parcels of land by way of government grants.
Land identificationGranted in year
Approximate area in
square feet9
Carrying amount as at 31 Dec 2011
Carrying amount as at 31 Dec 2010
Currently classified
as8
AED ‘000 AED ‘000
Future economic benefits certain
Madinat Zayed1 2008 143,111,825 - - PPE
Arzanah land 2006 13,302,119 1,944,109 1,946,050 Inventory
Arzanah Medical Complex 2006 179,486 - - PPE
Military City 2009 12,242,393 - - PPE
Sowwah Island - Abu Dhabi Financial centre2 2006 747,019 - 138,183 IPUD
Sowwah Island - Development work in progress2 2006 103,985 - - Inventory
Sowwah Island - Plots for sale2 2006 4,703,393 612,704 892,091 Inventory
Sowwah Island2 2006 697,864 30,236 98,143 PPE
New Fish Market 2006 484,448 20,981 23,003 IP
New Headquarter 2004 102,675 - - PPE
Parking lot - New Headquarter 2009 70,000 - - PPE
Mussafah 2007 4,041,526 34,300 40,350 IP
Hai Al Dawoody 2009 1,076 - - PPE
Hamran 2009 1,076 - - PPE
Masdar City Land
Masdar Institute of Science and Technology6 2008 353,090 - - PPE
10MW Power Plant6 2008 2,367,200 - - PPE
Masdar Head Quarter6 2008 272,163 - - PPE
Masdar City - Project 16 2008 573,508 - - PPE
Masdar City (Courtyard and Siemens)6 2008 105,594 149,016 - IPUD
Al Falah- Plot 3 2007 4,719,243 - - PPE
Future economic benefits uncertain / no future economic benefits3
Jabel Al Dhannah7 2009 10,956,700 - - N/A
Masdar City Land5 (remaining portion) 2008 56,185,237 - - N/A
Al Reem Island - Sorbonne University4 2006 1,001,934 - - N/A
Sowwah Island - Cleveland Clinic2 2006 1,007,158 - - N/A
Sowwah Island (remaining portion)2 2006 4,907,950 - - N/A
Khalifa City - Zayed University4 2006 8,207,745 - - N/A
East Al Reem Island 2006 3,609,265 - - N/A
Old Fish Market - New York Institute of Technology4
2006 163,877 - - N/A
Al Falah- Plot 5 2008 1,599,939 - - N/A
Al Falah- Plot 3 (remaining portion) 2007 18,360,558 - - N/A
Others 2004-09 61,965,983 - - N/A
1The Madinat Zayed land has been identified for the purpose of construction of a solar power station for the Masdar City
33 Income Tax (Continued)
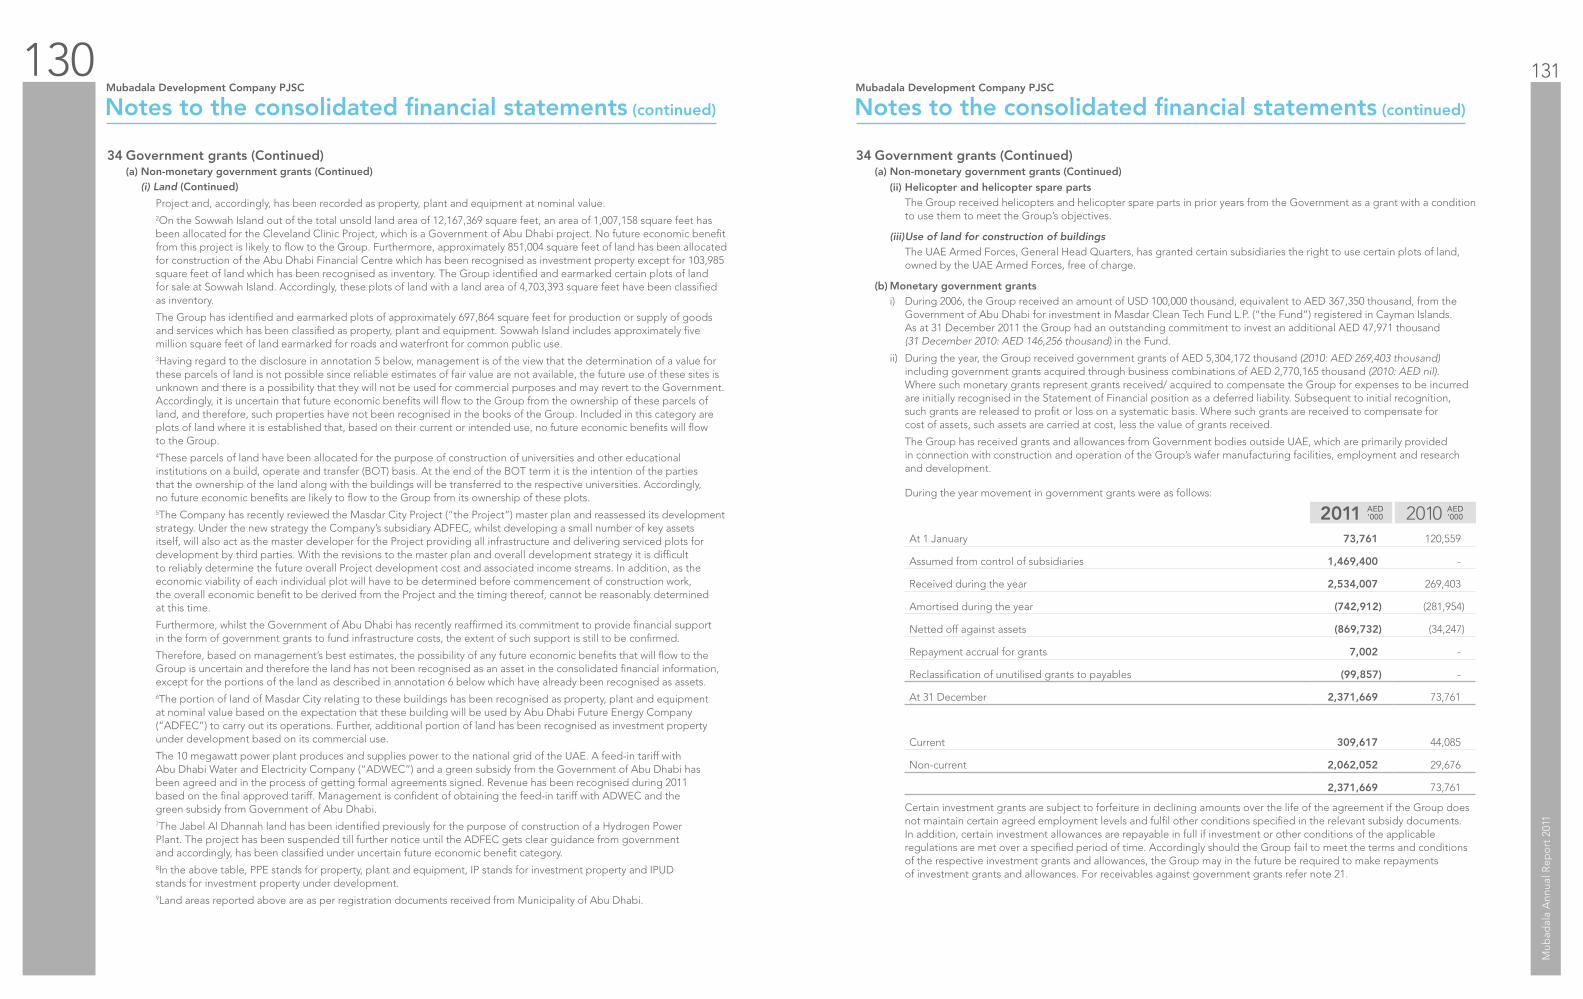
130 131
Mub
adal
a A
nnua
l Rep
ort
201
1
Notes to the consolidated financial statements (continued)
Mubadala Development Company PJSC
Notes to the consolidated financial statements (continued)
Mubadala Development Company PJSC
Project and, accordingly, has been recorded as property, plant and equipment at nominal value.
2On the Sowwah Island out of the total unsold land area of 12,167,369 square feet, an area of 1,007,158 square feet has been allocated for the Cleveland Clinic Project, which is a Government of Abu Dhabi project. No future economic benefit from this project is likely to flow to the Group. Furthermore, approximately 851,004 square feet of land has been allocated for construction of the Abu Dhabi Financial Centre which has been recognised as investment property except for 103,985 square feet of land which has been recognised as inventory. The Group identified and earmarked certain plots of land for sale at Sowwah Island. Accordingly, these plots of land with a land area of 4,703,393 square feet have been classified as inventory.
The Group has identified and earmarked plots of approximately 697,864 square feet for production or supply of goods and services which has been classified as property, plant and equipment. Sowwah Island includes approximately five million square feet of land earmarked for roads and waterfront for common public use.
3Having regard to the disclosure in annotation 5 below, management is of the view that the determination of a value for these parcels of land is not possible since reliable estimates of fair value are not available, the future use of these sites is unknown and there is a possibility that they will not be used for commercial purposes and may revert to the Government. Accordingly, it is uncertain that future economic benefits will flow to the Group from the ownership of these parcels of land, and therefore, such properties have not been recognised in the books of the Group. Included in this category are plots of land where it is established that, based on their current or intended use, no future economic benefits will flow to the Group.
4These parcels of land have been allocated for the purpose of construction of universities and other educational institutions on a build, operate and transfer (BOT) basis. At the end of the BOT term it is the intention of the parties that the ownership of the land along with the buildings will be transferred to the respective universities. Accordingly, no future economic benefits are likely to flow to the Group from its ownership of these plots.
5The Company has recently reviewed the Masdar City Project (“the Project”) master plan and reassessed its development strategy. Under the new strategy the Company’s subsidiary ADFEC, whilst developing a small number of key assets itself, will also act as the master developer for the Project providing all infrastructure and delivering serviced plots for development by third parties. With the revisions to the master plan and overall development strategy it is difficult to reliably determine the future overall Project development cost and associated income streams. In addition, as the economic viability of each individual plot will have to be determined before commencement of construction work, the overall economic benefit to be derived from the Project and the timing thereof, cannot be reasonably determined at this time.
Furthermore, whilst the Government of Abu Dhabi has recently reaffirmed its commitment to provide financial support in the form of government grants to fund infrastructure costs, the extent of such support is still to be confirmed.
Therefore, based on management’s best estimates, the possibility of any future economic benefits that will flow to the Group is uncertain and therefore the land has not been recognised as an asset in the consolidated financial information, except for the portions of the land as described in annotation 6 below which have already been recognised as assets.
6The portion of land of Masdar City relating to these buildings has been recognised as property, plant and equipment at nominal value based on the expectation that these building will be used by Abu Dhabi Future Energy Company (“ADFEC”) to carry out its operations. Further, additional portion of land has been recognised as investment property under development based on its commercial use.
The 10 megawatt power plant produces and supplies power to the national grid of the UAE. A feed-in tariff with Abu Dhabi Water and Electricity Company (“ADWEC”) and a green subsidy from the Government of Abu Dhabi has been agreed and in the process of getting formal agreements signed. Revenue has been recognised during 2011 based on the final approved tariff. Management is confident of obtaining the feed-in tariff with ADWEC and the green subsidy from Government of Abu Dhabi.
7The Jabel Al Dhannah land has been identified previously for the purpose of construction of a Hydrogen Power Plant. The project has been suspended till further notice until the ADFEC gets clear guidance from government and accordingly, has been classified under uncertain future economic benefit category.
8In the above table, PPE stands for property, plant and equipment, IP stands for investment property and IPUD stands for investment property under development.
9Land areas reported above are as per registration documents received from Municipality of Abu Dhabi.
(ii) Helicopter and helicopter spare parts The Group received helicopters and helicopter spare parts in prior years from the Government as a grant with a condition
to use them to meet the Group’s objectives.
(iii) Use of land for construction of buildings The UAE Armed Forces, General Head Quarters, has granted certain subsidiaries the right to use certain plots of land,
owned by the UAE Armed Forces, free of charge.
(b) Monetary government grants i) During 2006, the Group received an amount of USD 100,000 thousand, equivalent to AED 367,350 thousand, from the
Government of Abu Dhabi for investment in Masdar Clean Tech Fund L.P. (“the Fund”) registered in Cayman Islands. As at 31 December 2011 the Group had an outstanding commitment to invest an additional AED 47,971 thousand (31 December 2010: AED 146,256 thousand) in the Fund.
ii) During the year, the Group received government grants of AED 5,304,172 thousand (2010: AED 269,403 thousand) including government grants acquired through business combinations of AED 2,770,165 thousand (2010: AED nil). Where such monetary grants represent grants received/ acquired to compensate the Group for expenses to be incurred are initially recognised in the Statement of Financial position as a deferred liability. Subsequent to initial recognition, such grants are released to profit or loss on a systematic basis. Where such grants are received to compensate for cost of assets, such assets are carried at cost, less the value of grants received.
The Group has received grants and allowances from Government bodies outside UAE, which are primarily provided in connection with construction and operation of the Group’s wafer manufacturing facilities, employment and research and development.
During the year movement in government grants were as follows:
2011 2010 At 1 January 73,761 120,559
Assumed from control of subsidiaries 1,469,400 -
Received during the year 2,534,007 269,403
Amortised during the year (742,912) (281,954)
Netted off against assets (869,732) (34,247)
Repayment accrual for grants 7,002 -
Reclassification of unutilised grants to payables (99,857) -
At 31 December 2,371,669 73,761
Current 309,617 44,085
Non-current 2,062,052 29,676
2,371,669 73,761
Certain investment grants are subject to forfeiture in declining amounts over the life of the agreement if the Group does not maintain certain agreed employment levels and fulfil other conditions specified in the relevant subsidy documents. In addition, certain investment allowances are repayable in full if investment or other conditions of the applicable regulations are met over a specified period of time. Accordingly should the Group fail to meet the terms and conditions of the respective investment grants and allowances, the Group may in the future be required to make repayments of investment grants and allowances. For receivables against government grants refer note 21.
34 Government grants (Continued) (a) Non-monetary government grants (Continued) (i) Land (Continued)
34 Government grants (Continued) (a) Non-monetary government grants (Continued)

132 133
Mub
adal
a A
nnua
l Rep
ort
201
1
Notes to the consolidated financial statements (continued)
Mubadala Development Company PJSC
Notes to the consolidated financial statements (continued)
Mubadala Development Company PJSC
35 Employee benefits
The Group operates various pension schemes for its employees in Switzerland, UK and Ireland.
In Switzerland, the employees of one of the Group’s subsidiary are covered by two pension plans. The “General Pension Scheme” conforms to Swiss Pension Law which stipulates certain minimum benefits for all employees above certain earnings levels. The “Management Insurance Scheme” provides additional benefits to management personnel exceeding certain salary thresholds. Both schemes qualify as defined benefit schemes. In addition, the Swiss subsidiaries also provide for further benefits, shown below as “Employee benefits”, which relate to jubilee gratifications and to early retirement for shift employees.
In the UK, a defined benefit pension scheme was in place until 2010 when the scheme was settled following the decision to restructure the operations in UK. For employees in Ireland defined contribution schemes are in place.
2011 2010 Defined benefit asset 278,354 255,645
Pension liabilities (31,714) (86,001)
246,640 169,644
The decrease of the provision for employee benefits relates to lower jubilee gratifications.
The amounts recognised in the balance sheet are determined as follows:
Defined benefit pension plans
Other employee benefits
Defined benefit pension plans
Other employee benefits
2011 2011 2010 2010 Present value of defined benefit obligation (3,883,868) (31,714) (3,837,060) (86,001)
Fair value of plan assets 3,296,906 - 3,350,081 -
Funded status (586,962) (31,714) (486,979) (86,001)
Unrecognised net actuarial loss 865,316 - 742,624 -
278,354 (31,714) 255,645 (86,001)
The movement in the defined benefit obligation over the year is as follows:
2011 2010 At 1 January 3,837,060 4,060,002
Increase due to plan amendment (past service cost) (34,461) -
Current service cost 103,681 92,054
Interest cost 108,203 105,903
Contribution by plan participants 53,739 41,537
Actuarial losses / (gains) 14,491 35,893
Benefits paid (282,120) (218,280)
Losses due to assumption changes 82,003 302,115
Settlements - (940,319)
Foreign exchange difference 1,272 358,155
At 31 December 3,883,868 3,837,060
The movement in the fair value of plan assets of the year is as follows:
2011 2010 At 1 January 3,350,081 4,063,459
Expected return on plan assets 140,771 121,296
Actuarial (losses) / gains (70,597) (56,415)
Exchange differences 7,178 311,850
Employer contributions 97,854 90,475
Employee contributions 53,739 41,537
Benefits paid (282,120) (218,280)
Plan settlements - (1,003,841)
At 31 December 3,296,906 3,350,081
The above calculations are based on following assumptions:
2011 2010 Discount rate 2.40% 2.75%
Expected return on plan assets 3.70% 4.00%
Future salary increases 1.50% 1.50%
Future pension increases 0.50% 0.50%
Assumptions regarding future mortality experience are set based on advice, published statistics and experience.
The actual return on plan assets was AED 70,294 thousand (2010: AED 64,991 thousand).
The components of employee benefit expense are as follows:
Defined benefit pension plans
Other employee benefits
Defined benefit pension plans
Other employee benefits
2011 2011 2010 2010 Current service costs 97,397 8,069 101,725 7,560
Interest costs 101,645 2,223 117,030 2,748
Amortisation of past service costs (32,372) (50,619) - -
Amortisation of unrecognised actuarial (gains) / losses 35,799 (5,044) 2,151 3,728
Curtailments / settlements - - 49,200 -
Expected return on plan assets (132,239) - (134,040) -
Net periodic employee benefit cost / (income) 70,230 (45,371) 136,066 14,036
35 Employee benefits (Continued)

134 135
Mub
adal
a A
nnua
l Rep
ort
201
1
Notes to the consolidated financial statements (continued)
Mubadala Development Company PJSC
Notes to the consolidated financial statements (continued)
Mubadala Development Company PJSC
The Group’s incorporated cost from the defined benefit plans is AED 74,869 thousand in 2011 (2010: AED 78,766 thousand); the cost related to defined contribution employee benefit schemes amounted to AED 4,159 thousand (2010: AED 5,298 thousand). All employee benefit costs are included in Personnel costs. The expected contributions to defined benefit plans for 2012 amount to AED 88,305 thousand.
The development of net employee benefit assets and liabilities is summarised as follows:
Defined benefit pension plans
Other employee benefits
Defined benefit pension plans
Other employee benefits
2011 2011 2010 2010 Assets / (liabilities) at 1 January 255,645 (86,301) 246,783 (75,711)
Net periodic employee benefit cost (74,761) 48,299 (104,607) (12,701)
Employer contributions 97,854 9,916 90,475 10,158
Foreign exchange difference (1,386) (3,591) 22,994 (8,047)
Assets / (liabilities) at 31 December 277,352 (31,677) 255,645 (86,301)
Plan assets consist of the following:
2011 2011 2010 2010Equity securities 723,183 21.9% 846,284 25.3%
Bonds 1,353,184 41.1% 1,364,976 40.7%
Investments in property 630,974 19.1% 499,352 14.9%
Others 589,565 17.9% 639,469 19.1%
3,296,906 3,350,081
Pension plan assets do not include any shares of the Company. The expected return on plan assets was determined by considering the expected returns available on the assets underlying the current investment policy. Expected yields on fixed interest investments are based on gross redemption yields as at the balance sheet date. Expected returns on equity and property investments reflect long-term rates of return experienced in the respective markets.
At 31 December 2011 2010 2009 Present value of defined benefit obligation (3,883,868) (3,837,060) (4,060,002)
Fair value of plan assets 3,296,906 3,350,081 4,063,459
Deficit / (surplus) (586,962) (486,979) 3,457
Experience adjustments on plan liabilities (13,613) (39,664) 73,631
Experience adjustments on plan assets (66,319) (62,342) 123,908
36 Financial instruments
Overview The Group has exposure to the following risks from its use of financial instruments:
• credit risk
• liquidity risk
• market risk
This note presents information about the Group’s exposure to each of the above risks, the Group’s objectives, policies and processes for measuring and managing risk, and the Group’s management of capital. Further quantitative disclosures are detailed below.
Risk management framework The Board of Directors has overall responsibility for the establishment and oversight of the Group’s risk management
framework.
The Group’s risk management policies are established to identify and analyse the risks faced by the Group, to set appropriate risk limits and controls, and to monitor risks and adherence to limits. Risk management policies and systems are reviewed regularly to reflect changes in market conditions and the Group’s activities. The Group, through its training and management standards and procedures, aims to develop a disciplined and constructive control environment in which all employees understand their roles and obligations.
The Group’s Audit, Risk and Compliance Committee oversees how management monitors compliance with the Group’s risk management policies and procedures and reviews the adequacy of the risk management framework in relation to the risks faced by the Group.
(a) Credit risk Credit risk is the risk of financial loss to the Group if a customer or counterparty to a financial instrument fails to meet its
contractual obligations, and arises principally from the Group’s receivables from customers and investment securities.
Loans and receivables The Group’s exposure to credit risk is influenced mainly by the individual characteristics of each customer. However,
management also considers the demographics of the Group’s customer base, including the default risk of the industry and country, as these factors may have an influence on credit risk, particularly in the currently deteriorating economic circumstances.
Approximately 53% (2010: 55%) of the receivables are from related parties primarily parties under common control of the Company’s shareholder. However, this concentration of credit risk is mitigated by the fact that the overall exposure is being spread over a number of customers.
Investments The Group invests in various financial instruments, both quoted and unquoted, generally based on detailed due diligence
conducted by experts. All investments are approved by the Board of Directors or the Investment Committee as per delegation of authority. As adequate background checks and financial and legal due diligence are conducted, the risk that the counterparty to the financial instrument will fail to meet its contractual obligations is low.
Guarantees The Company provides guarantees to third parties on behalf of its wholly owned subsidiaries and on behalf of joint ventures
in proportion to the Company’s wholly owned subsidiaries’ interests in the joint ventures (see note 32).
Exposure to credit risk The carrying amount of financial assets represents the maximum credit exposure. The maximum exposure to credit risk
at the reporting date was:
35 Employee benefits (Continued)

136 137
Mub
adal
a A
nnua
l Rep
ort
201
1
Notes to the consolidated financial statements (continued)
Mubadala Development Company PJSC
Notes to the consolidated financial statements (continued)
Mubadala Development Company PJSC
The movement in the defined benefit obligation over the year is as follows:
2011 2010 Financial investments
Convertible bonds issued by related parties 470,914 2,488,148
Other bonds 1,155,101 1,916,464
Receivables and prepayments
Service concession receivables 8,031,075 7,341,527
Trade receivables 4,057,540 1,579,823
Contract work in progress 688,002 589,063
Receivable against sale of land 467,904 693,011
Due from related parties 3,931,592 1,706,943
Other receivables 4,505,431 2,051,813
Loans receivable 14,563,831 11,573,130
Other assets 56,585 -
Finance lease receivables 1,534,147 -
Cash at bank 14,527,419 6,258,729
53,989,541 36,198,651
For movement in service concession receivables please refer to note 21.
For collateral held against loans receivable, refer to note 19. The ageing of the loans receivable is as follows:
2011 2010Gross Impairment Gross Impairment
AED ’000 AED ’000 AED ’000 AED ’000
Not past due 10,617,856 (45,917) 8,357,855 -
Past due 0 - 120 days 246,798 - 95,485 -
Past due 121- 180 days 99,548 - 63,230 -
Past due above 180 days 3,645,546 - 3,056,560 -
14,609,748 (45,917) 11,573,130 -
The ageing of the financial assets, other than loans receivable is as follows:
2011 2010Gross Impairment Gross Impairment
AED ’000 AED ’000 AED ’000 AED ’000
Not past due 35,396,389 (45,883) 23,230,028 (99,731)
Past due 0 - 120 days 1,585,958 (13,848) 924,306 (4,252)
Past due 121- 180 days 1,045,220 (2,765) 219,349 (226)
Past due above 180 days 1,599,201 (138,562) 487,317 (131,270)
39,626,768 (201,058) 24,861,000 (235,479)
The entities within the Group have their respective policies to deal with creditworthy customers. Geographically, there is relatively higher concentration of credit risk in United Arab Emirates.
The movement in allowance for impairment in respect of loans, trade receivables and other financial assets during the year was as follows:
2011 2010 Balance at January 1 235,479 213,158
Provision during the year 72,638 60,118
Effect of exchange rate difference 2,918 (26,492)
Written off during the year (64,060) (11,305)
Balance at December 31 246,975 235,479
(b) Liquidity risk Liquidity risk is the risk that the Group will encounter difficulty in meeting the obligations associated with its financial
liabilities that are settled by delivering cash or another financial asset. The Group’s approach to managing liquidity is to ensure, as far as possible, that it will always have sufficient liquidity to meet its liabilities when due, under both normal and stressed conditions, without incurring unacceptable losses or risking damage to the Group’s reputation. The Group ensures that it has sufficient cash and liquid assets on demand to meet its expected operational expenses; this excludes the potential impact of extreme circumstances that cannot reasonably be predicted, such as natural disasters.
36 Financial instruments (Continued) (a) Credit risk (Continued)
36 Financial instruments (Continued) (a) Credit risk (Continued)

138 139
Mub
adal
a A
nnua
l Rep
ort
201
1
Notes to the consolidated financial statements (continued)
Mubadala Development Company PJSC
Notes to the consolidated financial statements (continued)
Mubadala Development Company PJSC
The following are the contractual maturities of financial liabilities, including interest payments and excluding the impact of netting arrangements:
Note
2011 2011 2010
Carrying value AED ’000
Contractual cash flows AED ’000
1 year or less AED ’000
1-5 years AED ’000
More than 5 years AED ’000
Carrying value AED ’000
Contractual cash flows AED ’000
1 year or less AED ’000
1-5 years AED ’000
More than 5 years AED ’000
Non - derivative financial liabilities
Payables and accruals 24 15,187,416 (15,187,416) (15,154,234) (33,182) - 7,614,238 (7,614,238) (7,614,238) - -
Interest bearing borrowings 26 43,177,460 (53,583,324) (6,690,482) (26,867,603) (20,025,239) 26,939,064 (35,220,685) (3,339,728) (19,320,466) (12,560,491)
Obligation under finance lease 28 1,521,015 (2,193,776) (283,129) (1,121,164) (789,483) - - - - -
Other liabilities 27 266,131 (287,056) (66,722) (188,335) (31,999) 284,235 (284,235) - (284,235) -
Bank overdraft 23 5,165 (5,165) (5,165) - - 7,447 (7,447) (7,447) - -
Amounts due to equity accounted investees 17 824,323 (824,323) (824,323) - - 1,003,881 (1,003,881) (1,003,881) - -
Derivative financial liabilities
Derivatives designated and effective as hedging instruments carried at fair value
- interest rate swaps 25 751,528 (823,314) (151,017) (508,237) (164,060) 481,684 (547,531) (71,993) (270,509) (205,029)
- foreign exchange forward contracts 25 93,934 (93,934) (93,934) - - - - - - -
Financial liabilities carried at fair value through profit or loss
- interest rate swaps 25 823,454 (1,059,503) (40,168) (144,247) (875,088) 310,981 (304,365) - - (304,365)
- foreign exchange forward contracts 25 62,837 (46,181) (46,181) - - 17,466 (35,423) (19,278) (16,145) -
- equity options 25 41,726 (41,726) (41,726) - - 33,987 (33,987) (33,987) - -
- equity swaps 25 3,244 (3,244) (3,244) - - 81,238 (81,238) (81,238) - -
Other financial liabilities
Exchange traded securities 25 89,648 (89,648) (89,648) - - - - - - -
62,847,881 (74,238,610) (23,489,973) (28,862,768) (21,885,869) 36,774,221 (45,133,030) (12,171,790) (19,891,355) (13,069,885)
The total undrawn borrowing facilities as at the reporting date is AED 11,573,006 thousand (2010: AED 13,322,293 thousand).
To the extent that interest is based on floating rates, the undiscounted amount is derived from interest rate curves at the balance sheet date. For the derivative instruments, where the payable or receivable is not fixed, the amount disclosed has been determined by reference to the projected interest rate as illustrated by the yield curves existing at the reporting date.
36 Financial instruments (Continued) (b) Liquidity risk (Continued)

140 141
Mub
adal
a A
nnua
l Rep
ort
201
1
Notes to the consolidated financial statements (continued)
Mubadala Development Company PJSC
Notes to the consolidated financial statements (continued)
Mubadala Development Company PJSC
(c) Market risk Market risk is the risk that changes in market prices, such as foreign exchange rates, interest rates and equity prices, will
affect the Group’s profit or loss or the value of its holdings of financial instruments. The objective of market risk management is to manage and control market risk exposures within acceptable parameters, while optimising the return. The Group buys and sells derivatives, and also incurs financial liabilities, in order to manage market risks. All such transactions are carried out within the guidelines set by the Board of Directors.
Currency risk The Group is exposed to currency risk on its transactions, investments and borrowings that are denominated in a currency
other than the respective functional currencies of the Group entities, primarily the Euro (EUR), Swiss Francs (CHF), British Pound (GBP) and Singapore Dollar (SGD).
The Group’s transactions and balance sheet risks are limited, as a significant proportion of its foreign currency transactions, monetary assets and liabilities are denominated in USD, where the exchange rate for conversion to the functional currency of the Company is pegged. It is the Group’s policy to obtain Euro denominated loans to economically hedge its investments in Euro and in certain cases it uses derivatives to hedge its investments in Euros.
Exposure to currency risk The Group’s exposure to foreign currency risk was as follows, based on notional amounts:
2011 2011 2011 2011 Fair value through profit or loss nvestments 60,025 12,813 - -
Available for sale financial assets 3,194 - - -
Trade and other receivables 2,942 22,131 52,863 286
Loans receivable 321,862 57,280 - -
Trade and other payables (22,083) (33,673) (32,081) (76)
Interest bearing borrowings (565,126) (34,994) (452,027) -
Cash and cash equivalents 70,549 47,698 37,498 667
Other assets 16,264 - 1 -
Other liabilities (16,011) (883) 89 -
Net exposure (128,384) 70,372 (393,657) 877
2010 2010 2010 2010 Fair value through profit or loss investments 28,476 - 918 -
Available for sale financial assets 2,200 - - -
Trade and other receivables 303,000 20,433 42,422 307
Loans receivable 15,250 30,173 (40,000) -
Trade and other payables (78,728) (1,716) (43,903) (364)
Interest bearing borrowings (750,191) - (90,379) (25,032)
Cash and cash equivalents 145,156 28,682 55,553 591
Other assets 16,263 - - -
Other liabilities (206) - - -
Net exposure (318,780) 77,572 (75,389) (24,498)
The following significant exchange rates applied during the year:
2011
EURO-AED GBP-AED CHF-AED SGD-AED
Closing rate 4.7553 5.6751 3.9073 2.8266
Average rate 5.1167 5.8937 4.1594 2.8269
2010
EURO-AED GBP-AED CHF-AED SGD-AED
Closing rate 4.8664 5.6803 3.9032 2.8438
Average rate 4.8783 5.6807 3.5321 3.5321
Sensitivity analysis
A 10% strengthening of the AED against the Euro, GBP, CHF and SGD at 31 December would have increased (decreased) equity and consolidated profit or loss for the year by the amounts shown below. This analysis assumes that all other variables, in particular interest rates, remain constant. The analysis was performed on the same basis for 2010.
Equity AED ’000
Profit / (loss) AED ’000
31 December 2011
Euro (1,519) 62,569
GBP - (39,937)
CHF - 153,814
SGD - (247)
31 December 2010
Euro (1,071) 156,200
GBP - (44,063)
CHF - 29,426
SGD - 6,967
A 10% weakening of the AED against Euro, GBP, CHF and SGD at 31 December would have had an equal but opposite effect on the above currencies to the amounts shown above, on the basis that all other variables remain constant.
Interest rate risk The Group is exposed to interest rate risk because entities in the Group borrow funds at both fixed and floating
interest rates. The Group adopts a policy of ensuring that its exposure to significant changes in interest rates is reduced by hedging such risks. This is achieved by entering into interest rate collars and interest rate swaps.
36 Financial instruments (Continued) 36 Financial instruments (Continued) (c) Market risk (Continued) Currency risk (Continued) Exposure to currency risk (Continued)

142 143
Mub
adal
a A
nnua
l Rep
ort
201
1
Notes to the consolidated financial statements (continued)
Mubadala Development Company PJSC
Notes to the consolidated financial statements (continued)
Mubadala Development Company PJSC
At the reporting date, the interest rate profile of the Group’s interest-bearing financial instruments was:
2011 2010 Fixed rate instruments
Financial assets 17,486,652 11,481,153
Financial liabilities (17,832,569) (6,445,057)
(345,917) 5,036,096
Variable rate instruments
Financial assets 10,984,030 6,763,282
Financial liabilities (27,980,545) (19,943,871)
(16,996,515) (13,180,589)
Fair value sensitivity analysis for fixed rate instruments The Group does not account for any fixed rate financial assets and liabilities at fair value through profit or loss, and the
Group does not designate derivatives (interest rate swaps) as hedging instruments under a fair value hedge accounting model. Therefore a change in interest rates would not affect profit or loss.
Cash flow sensitivity analysis for variable rate instruments A change of 100 basis points in interest rates at the reporting date would have increased (decreased) equity and profit
or loss by the amounts shown below. This analysis assumes that all other variables, in particular foreign currency rates, remain constant. The analysis was performed on the same basis for 2010.
Profit/(loss) 100bp increase
100bp decrease
31 December 2011 (in thousands of AED)
Variable rate instruments (50,511) 50,511
31 December 2010 (in thousands of AED)
Variable rate instruments (55,513) 55,513
Other market price risk Equity price risk arises from financial assets at fair value through profit or loss and available-for-sale equity securities.
Management of the Group monitors the mix of debt and equity securities in its investment portfolio based on market indices. Material investments within the portfolio are managed on an individual basis and all buy and sell decisions are approved by the Investment Committee or Board of Directors based on the delegation of authority.
The primary goal of the Group’s investment strategy is to maximise investment returns. Management is assisted by external advisors in this regard. In accordance with this strategy, certain investments are designated at fair value through profit or loss because their performance is actively monitored and they are managed on a fair value basis. The Group does not enter into commodity contracts other than to meet the Group’s expected usage and sale requirements; such contracts are not settled net.
The following table demonstrates the sensitivity of the Group’s equity and profit or loss to a 5% decrease in the price of its equity holdings, assuming all other variables, in particular foreign currency rates, remain constant.
Effect on profit or loss
AED ’000
Effect on othercomprehensive
IncomeAED ’000
31 December 2011
Effect of change in equity portfolio of the Group (416,995) (145,706)
31 December 2010
Effect of change in equity portfolio of the Group (409,960) (284,804)
The following table demonstrates the sensitivity of the Group’s equity and profit or loss to a 5% increase in the price of its equity holdings, assuming all other variables, in particular foreign currency rates, remain constant.
Effect on profit or loss
AED ’000
Effect onequity
AED ’000
31 December 2011
Effect of change in equity portfolio of the Group 416,995 145,706
31 December 2010
Effect of change in equity portfolio of the Group 409,960 284,804
(d) Fair value
Fair value versus carrying amounts The fair values of the financial assets and liabilities, together with their carrying amounts shown in the statement of financial
position, are as follows:
2011 2010
Carrying amount AED ‘000
Fair value AED ‘000
Carrying amount AED ‘000
Fair value AED ‘000
Assets carried at fair value
Financial assets at fair value through profit or loss
- Quoted securities 8,228,122 8,228,122 8,065,170 8,065,170
- Funds 2,274,006 2,274,006 1,792,683 1,792,683
- Convertible bonds issued by related parties 470,914 470,914 2,488,148 2,488,148
- Other bonds 1,108,595 1,108,595 1,873,018 1,873,018
- Investments held for trading 46,506 46,506 49,086 49,086
- Derivative assets 94,739 94,739 121,920 121,920
Available for sale financial assets
- Quoted securities 2,914,111 2,914,111 5,696,088 5,696,088
- Unquoted securities1 4,492,870 - 4,389,731 -
19,629,863 24,475,844
36 Financial instruments (Continued) (c) Market risk (Continued) Interest rate risk (Continued)
36 Financial instruments (Continued) (c) Market risk (Continued) Other market price risk(Continued)

144 145
Mub
adal
a A
nnua
l Rep
ort
201
1
Notes to the consolidated financial statements (continued)
Mubadala Development Company PJSC
Notes to the consolidated financial statements (continued)
Mubadala Development Company PJSC
2011 2010
Carrying amount AED ‘000
Fair value AED ‘000
Carrying amount AED ‘000
Fair value AED ‘000
Assets carried at amortised cost
Receivables and prepayments 21,681,544 21,681,544 13,962,180 13,962,180
Loans receivable 14,563,831 14,563,831 11,573,130 11,573,130
Finance lease receivables 1,534,147 1,534,147 - -
Other assets 56,585 56,585 - -
Cash and cash equivalents 14,524,088 14,524,088 6,261,890 6,261,890
52,360,195 31,797,200
Liabilities carried at fair value
Derivatives designated and effective as hedging instruments carried at fair value
- interest rate swaps (751,528) (751,528) (481,684) (481,684)
- foreign exchange forward contracts (93,934) (93,934) - -
Financial liabilities carried at fair value through profit or loss
- interest rate swaps (823,454) (823,454) (310,981) (310,981)
- foreign exchange forward contracts (62,837) (62,837) (17,466) (17,466)
- equity options (41,726) (41,726) (33,987) (33,987)
- equity swaps (3,244) (3,244) (81,238) (81,238)
Exchange traded securities (89,648) (89,648) - -
(1,866,371) (925,356)
Liabilities carried at amortised cost
Payables and accruals (15,187,416) (15,187,416) (7,614,238) (7,614,238)
Obligation under finance lease (1,521,015) (1,521,015) - -
Amounts due to equity accounted investees (824,323) (824,323) (1,003,881) (1,003,881)
Other liabilities (266,131) (266,131) (284,235) (284,235)
Interest bearing borrowings (43,177,460) (44,210,675) (26,939,064) (27,360,370)
(60,976,345) (35,841,418)
1 Unquoted equity instruments are carried at cost less impairment, since no reliable measure of fair value is available (see note 18).
Fair value hierarchy The table below analyses financial instruments carried at fair value by valuation method. The different levels are defined
as follows: Level 1: Quoted prices in active markets for assets and liabilities; Level 2: Inputs other than quoted prices included within Level 1 that are observable for the asset or liability,
either directly (i.e. as prices) or indirectly (i.e. derived from prices); and Level 3: Inputs for the asset or liability that are not based on observable market data (unobservable inputs).
31 December 2011
Level 1 AED ’000
Level 2 AED ’000
Level 3 AED ’000
Total AED ’000
Financial assets at fair value through profit or loss Available for sale financial assets 8,447,165 524,424 3,251,293 12,222,882
Quoted securities 2,914,111 - - 2,914,111
Derivatives
Cash flow hedges - (837,655) - (837,655)
Interest rate swaps used as economic hedges - (831,262) - (831,262)
Other derivatives (17,614) (90,192) - (107,806)
Exchange traded securities (89,648) - - (89,648)
11,254,014 (1,234,685) 3,251,293 13,270,622
31 December 2010
Level 1 AED ’000
Level 2 AED ’000
Level 3 AED ’000
Total AED ’000
Financial assets at fair value through profit or loss Available for sale financial assets 8,427,476 2,345,886 3,616,663 14,390,025
Quoted securities 5,696,088 - - 5,696,088
Derivatives
Cash flow hedges - (481,684) - (481,684)
Interest rate swaps used as economic hedges - (312,201) - (312,201)
Other derivatives (81,238) (50,233) - (131,471)
14,042,326 1,501,768 3,616,663 19,160,757
The following table demonstrates the movement in the level 3 of fair value hierarchy.
2011 2010
At 1 January 3,616,663 739,223
Additions during the year 570,436 2,864,787
Disposals during the year1 (972,065) (259,438)
Increase in fair value recognised in profit or loss (net)2 36,259 272,091
At 31 December 3,251,293 3,616,663
36 Financial instruments (Continued) (d) Fair value (Continued) Fair value versus carrying amounts (Continued)
36 Financial instruments (Continued) (d) Fair value (Continued)

146 147
Mub
adal
a A
nnua
l Rep
ort
201
1
Notes to the consolidated financial statements (continued)
Mubadala Development Company PJSC
Notes to the consolidated financial statements (continued)
Mubadala Development Company PJSC
1 Disposals include the disposal of a financial asset at fair value through profit or loss resulted in gain of AED 36,735 thousand.
2 Includes increase in fair value recognised in profit or loss, attributable to assets held at the balance sheet date, amounts to AED 37,839 thousand (2010: AED 146,846 thousand). The total net increase in fair value was recorded in “(Loss) / income from financial investments” in the statement of comprehensive income.
(e) Capital management The Board of Directors’ policy is to maintain a strong capital base so as to maintain investor, creditor and market confidence
and to sustain future development of the business. The Board of Directors monitors the return on capital.
The Board seeks to maintain a balance between the higher returns that might be possible with higher levels of borrowings and the advantages and security afforded by a sound capital position. There were no significant changes in the Group’s approach to capital management during the year.
Certain subsidiaries are subject to debt covenants requiring the maintenance of specific debt to equity ratios. Furthermore, the Company and its subsidiaries incorporated in the UAE are subject to certain requirements of the UAE Federal Law No. 8 of 1984 (as amended) to maintain a statutory reserve (see note 30), which they are compliant with.
The Group monitors capital using a gearing ratio, which is net debt divided by total capital plus net debt. The Group’s policy is to keep the gearing ratio within a range to meet the business needs of the Group. The Group includes within net debt, interest bearing borrowings and finance lease less cash and cash equivalents. Capital includes issued share capital, reserves, additional share holder contributions, Government grants, and non-controlling interest.
2011 2010 Interest bearing borrowings (see note 26) 43,177,460 26,939,064
Obligation under finance lease (see note 28) 1,521,015 -
Less: cash and cash equivalents (see note 23) (14,524,088) (6,261,890)
Net debt 30,174,387 20,677,174
Total capital 106,374,876 62,116,862
Total capital and net debt 136,549,263 82,794,036
Gearing ratio 22% 25%
37 Accounting estimates and judgements
In the process of applying the Group’s accounting policies, which are described in note 3, management has made the following judgements that have the most significant effect on the amounts of assets and liabilities recognised in the consolidated financial statements. Estimates and judgements are continually evaluated and are based on historical experience and other factors, including expectations of future events that are believed to be reasonable under the circumstances.
Impairment losses and determination of fair values The Group reviews its investments in equity accounted investees, other investments and receivables to assess impairment
losses at each reporting date (see note 3(t)). The Group’s credit risk is primarily attributable to its unquoted available for sale investments, trade and other receivables and other items disclosed in note 36(a). In determining whether impairment losses should be recorded in profit or loss, the Group makes judgements as to whether there is any observable data including revised business plans of investee companies, indicating that there is a measurable decrease in the estimated future cash flows on a case by case basis. Accordingly, an allowance for impairment is made where there is an identified loss event or a condition which, based on previous experience, is evidence of a reduction in the recoverability of the cash flows.
Determination of fair values Refer to notes 15, 18, 25 and 36 for determination of fair values of investment properties and financial instruments.
Estimated useful lives of property, plant and equipment Management assigns useful lives and residual values to the items of property, plant and equipment based on the intended use of the
assets and the expected economic lives of those assets. Subsequent changes in circumstances such as technological advances or prospective utilisation of the assets concerned could result in the actual useful lives or residual values differing from the initial estimates. Management has reviewed the residual values and useful lives of the major items of property, plant and equipment and has determined that no adjustment is necessary. Refer to note 3(l) for details of the estimated useful lives of property, plant and equipment.
During the year ended 31 December 2011, the Group has revised the estimated useful life of certain equipment and machinery. The useful life has been revised from six years to eight years to better reflect the expected pattern of economic benefits. The revision is made on the basis of an analysis of the expected technology lifecycle, historical usage experience and industry practices. The change in estimated useful life is a change in accounting estimate that has been applied prospectively from 1 July 2011.
The impact of this change in current and future periods is as follows:
2011 AED ’000
2012 AED ’000
2013 AED ’000
2014 AED ’000
2015 onwards AED ’000
Decrease (increase) in net loss 551,925 789,696 282,797 (17,993) (1,606,425)
Quantities of proved oil and gas reserves Depreciation on certain of the Group’s property, plant and equipment is estimated on the basis of oil and gas reserves. There
are numerous uncertainties inherent in estimating quantities of proved and probable oil reserves. Oil reserve engineering is a subjective process of estimating underground volumes of oil that cannot be precisely measured, and estimates of other engineers might differ materially from the estimates utilised by the Group. The accuracy of any reserve estimate is a function of the quality of available data and associated engineering and geological interpretations and judgements. Results of drilling, testing, and production subsequent to the date of the estimate may justify the revision of such estimates. Accordingly, reserve estimates are often different from the quantities of oil and gas that are ultimately recovered. The Group’s share of the oil and gas reserves that may be ultimately recovered from the joint ventures is subject to the production sharing agreements.
Possibility of future economic benefits from land received as government grants Refer to notes 3(h) and 34 for a description of judgements and estimates used to ascertain the possibility of future economic
benefits from land received as government grants.
Decommissioning liabilities Management periodically assesses the numerous uncertainties inherent in estimating the decommissioning and other
environmental liabilities, including judgements relating to cost estimation and the timing of these costs (see note 27).
Determining whether a contract is a service concession Determining whether an arrangement is a service concession, to which International Financial Reporting Interpretations
Committee (“IFRIC”) 12 – Service Concession Arrangements applies, requires significant judgements by management. As per the terms of the concession agreements, grantors control and regulate the activities of the Universities and the services to be performed by the Group. The grantors control the residual interest in the Universities at the end of the concession period.
Furthermore, as per the terms of the arrangement, in addition to a fixed availability charge for construction of the Universities and rendering of facility management services the Group will also receive small rental income from the letting out of commercial spaces in the universities.
Therefore the Group’s consideration is divided into two components - financial assets component based on the guaranteed amount and intangible assets for the remainder.
Revenue recognition for construction contract Revenue from construction contracts is recognised in the profit or loss when the outcome of a contract can be reliably
estimated. The measurement of contract revenue is affected by a variety of uncertainties (including cost estimation and construction margin) that depend on the outcome of future events. These estimates often need to be revised as events occur and uncertainties are resolved. Therefore, the amount of contract revenue recognised may increase or decrease from period to period.
Estimation of costs As per the service concession arrangement the Group will render repairs and maintenance services to the universities during the
concession period. Management has estimated the timing and cost of such cash outflows for such maintenance, which may both change in the future. This may change the project profitability in the future years and the effective interest rate on receivables.
Project expenses Project expenses comprise expenses incurred on screening, feasibility studies and pre-development phases of various business
development / investment projects undertaken by the Group. As stated in note 3(e), the portion of such expenditure relating to property, plant and equipment is capitalised when there is reasonable certainty that projects will be developed in the future and future economic benefits will flow to the Group. The process of estimating the degree of certainty involves significant judgments on the part of senior management. Some of these projects tend to have long gestation periods and in some
36 Financial instruments (Continued) (d) Fair value (Continued) Fair value hierarchy (Continued)
37 Accounting estimates and judgements (Continued) Estimated useful lives of property, plant and equipment (Continued)

148 149
Mub
adal
a A
nnua
l Rep
ort
201
1
Notes to the consolidated financial statements (continued)
Mubadala Development Company PJSC
Notes to the consolidated financial statements (continued)
Mubadala Development Company PJSC
cases depend on some form of Government support. Furthermore, in some instances, the project size and economics are reassessed in the light of the changing economic climate, resulting in an increase in the overall project development timelines, or a downsizing of the project or certain of its components. Management periodically assesses the likelihood of such projects proceeding and uses the results of such assessments to determine whether any provision for impairment losses are required. The estimates and underlying judgments are reviewed on an ongoing basis. Actual results may differ from these estimates and judgments.
Ownership interest in a subsidiary The Group owns GLOBALFOUNDRIES Inc. (GF) through holding a number of complex convertible financial instruments
(Class A Preferred Shares, Class B Preferred Shares, Class A Convertible Notes and Class B Convertible Notes) each of which have economic characteristics which require significant judgment to assess whether the instrument gives access at present to the economic benefits associated with an ownership interest to the Group in GF. Management has exercised its judgment and determined that currently Class A Preferred Shares and Class A Convertible Notes give access to the Group at present, to the economic benefits in GF. Accordingly the economic equity ownership of the Group determined on a diluted equity instruments basis is 88.48% as of 31 December 2011.
Business combination Accounting for the acquisition of a business requires the allocation of the purchase price to the various assets and liabilities
of the acquired business. For most assets and liabilities, the purchase price allocation is accomplished by recording the asset or liability at its estimated fair value. Determining the fair value of assets acquired and liabilities assumed requires judgement by management and often involves the use of significant estimates and assumptions, including assumptions with respect to future cash inflows and outflows, discount rates, the useful lives of licenses and other assets and market multiples. The Group’s management uses all available information to make these fair value determinations.
38 Service concession arrangements The Group entered into service concession arrangements with grantors to construct certain universities as set out below:
University Concession period Commencing in Grantor
UAE University 25 years August 2011 UAE University
Sorbonne University 25 years September 2010 Abu Dhabi Education Council
Zayed University 25 years August 2011 Abu Dhabi Education Council
The Group will be responsible for maintenance services required during the concession period. The Group does not expect significant repairs to be necessary during the concession period.
The grantors mentioned in the table set out above will provide the Group fixed monthly availability charges as reflected in the agreed finance models and monthly service charges based on actual facility management services rendered till the end of concession period. Additionally, in the UAE University concession, the Group has received the right to charge tenants of franchise areas a rental fee for using those areas, which the Group will collect and retain. At the end of the concession period, the universities become the properties of the grantors and it is the intention of the parties that ownership of the land of those universities will also be transferred to the grantors. Upon such transfers, the Group will have no further involvement in their operation or maintenance requirements.
These service concession agreements do not contain renewal options. The standard rights of the grantors to terminate the agreements include poor performance by the Group or material breach of terms of the agreements. The standard rights of the Group to terminate the agreements include failure of the grantors to make payments under the agreements, material breach of terms of the agreements, and any changes in law which would render it impossible for the Group to fulfil their requirements under the agreements.
39 Non-cash transactions
During the current year, the Group entered into the following non-cash investing activities which are not reflected in the consolidated statement of cash flows.
ATIC was transferred to the Group by the Shareholder (see note 5(a)(i)).
The Group acquired control over Tabreed from conversion of an existing loan, given by the Group to Tabreed in the current and prior years, into mandatory convertible bonds (see note 5(a)(ii)).
Ownership interest in Aldar has increased, resulted from conversion of convertible bonds (see note 17(a)).
Ownership interest in Du has increased, due to acquisition of additional stake by the Group (see note 17(a)).
Convertible bonds included in financial investments, having carrying value of AED 1,498,212 thousand (2010: AED nil) have been converted into shares during the year.
40 Comparative figures
Certain comparative figures have been reclassified, where necessary, to conform to the presentation adopted in these consolidated financial statements.
The presentation of the Consolidated statement of comprehensive income has been enhanced over prior year’s presentation.
One of the Company’s investment in unquoted shares earlier reported as “Other Assets” have been reclassed to “Financial Investments” to provide a more consistent presentation with other investments of the Group.
The effect of this change on the consolidated financial statements is as follows:
31 Dec 2010 1 Jan 2010 Statement of financial position items
Financial investments 578,180 578,180
Other assets (578,180) (578,180)
Further, investment property under construction for development has been reclassed from property, plant and equipment to investment properties as a result of amendment in IAS 40, Investment property for periods beginning on or after 1 January 2009. As a result of amendments, property under construction for development for future use as investment property is included in “investment property” as defined under IAS 40.
The effect of this change on the consolidated financial statements is as follows:
31 Dec 2010 1 Jan 2010 Statement of financial position items
Investment properties 4,435,346 2,512,587
Property, plant and equipment (4,435,346) (2,512,587)
Furthermore, one of the loan given by one of the Group’s subsidiary was considered as intercompany loan and netted off in the prior year. This loan is not an intercompany loan and hence the balances of loans given and liabilities have grossed up accordingly.
37 Accounting estimates and judgements (Continued) Project expenses (Continued)

150 151
Mub
adal
a A
nnua
l Rep
ort
201
1
Notes to the consolidated financial statements (continued)
Mubadala Development Company PJSC
Notes to the consolidated financial statements (continued)
Mubadala Development Company PJSC
The effect of this change on the consolidated financial statements is as follows:
31 Dec 2010 1 Jan 2010 Statement of financial position items
Loans receivable (non-current) 550,133 386,683
Receivables and prepayments (non-current) 125,058 37,042
Interest bearing borrowings (non-current) 550,133 386,683
Payables and accruals (current) 125,058 37,042
41 Subsequent events
Subsequent to the year end, Global Foundries Inc (“GF”) announced a revised 2012 Wafer Supply Agreement (“WSA”) with Advanced Micro Devices, Inc. (“AMD”). One important provision in the revised WSA is that ATIC will become the sole owner of GF.
The financial effect in 2012 on the Group’s results flowing from ATIC, of ATIC becoming the sole owner of GF, is that effective the date of the agreement, ATIC will attribute the entire results of GF to the Group as the sole owner and have no portion of the results attributable to non-controlling interests.
40 Comparative figures (Continued) Appendix A
Summary of oil and gas reserves (unaudited) There are numerous uncertainties inherent in estimating quantities of proved crude oil and natural gas reserves. Crude oil and
natural gas reserve engineering is a subjective process of estimating underground volumes of oil that cannot be precisely measured, and estimates of other engineers might differ materially from the estimates set forth herein. The accuracy of any reserve estimate is a function of the quality of available data and the engineering and geological interpretation and judgement. Results of drilling, testing, and production subsequent to the date of the estimate may justify the revision of such estimates. Accordingly, reserves estimates are often different from the quantities of crude oil and natural gas reserves that are ultimately recovered.
The Group’s share of oil and natural gas that may be ultimately recovered from joint ventures is subject to the production sharing agreements.
Proved gas reserves (unaudited) The following reserve schedule was developed by the Group’s reserve engineers and sets out the changes in the estimated
quantities of proved gas reserves of the Group:
2011 2010
Natural gas (Billion SCF)
Natural gas (Billion SCF)
Proved reserves as of:
1 January 2,979 2,447
Revision of previous estimates / additions during the year 721 718
Production during the year (162) (186)
31 December 3,538 2,979
Proved developed reserves as of:
31 December 3,415 2,815
Proved condensate reserves (unaudited)
The following reserve schedule was developed by the Group’s reserve engineers and sets out the changes in the estimated quantities of proved condensate reserves of the Group:
2011 2010
Condensate (Million STB)
Condensate (Million STB)
Proved reserves as of:
1 January 93 99
Revision of previous estimates / additions during the year (4) 1
Production during the year (6) (7)
31 December 83 93
Proved developed reserves as of:
31 December 83 93

152 Notes to the consolidated financial statements (continued)
Mubadala Development Company PJSC
Proved crude oil reserves (unaudited) The following reserve schedule was developed by the Group’s reserve engineers and sets out the changes in the estimated
quantities of proved crude oil reserves of the Group:
2011 2010
Crude oil(Million STB)
Crude oil(Million STB)
Proved reserves as of:
1 January 37.8 29.5
Revision of previous estimates / additions during the year 3.9 21.7
Disposal of working interest in certain joint ventures - (2.8)
Production during the year (10.2) (10.6)
31 December 31.5 37.8
Proved developed reserves as of:
31 December 19.1 23.3
Proved reserves - Proved reserves are estimated quantities of crude oil, natural gas, natural gas liquids and condensate liquids, which geological and engineering data demonstrate with reasonable certainty to be recoverable in future years from known reservoirs under existing economic and operating conditions.
Proved developed reserves - Proved developed reserves are proved reserves that are expected to be recovered through existing wells with existing equipment and operating methods.
The information set out above does not form part of the audited consolidated financial statements and is included solely for the information of management.
Appendix A (Continued)Summary of oil and gas reserves (unaudited) (Continued)

154 Notes to the consolidated financial statements (continued)
Mubadala Development Company PJSC
www.mubadala.ae