his highness the late founder of the united arab emirates · founder of the united arab emirates....
TRANSCRIPT
+971 267 7777
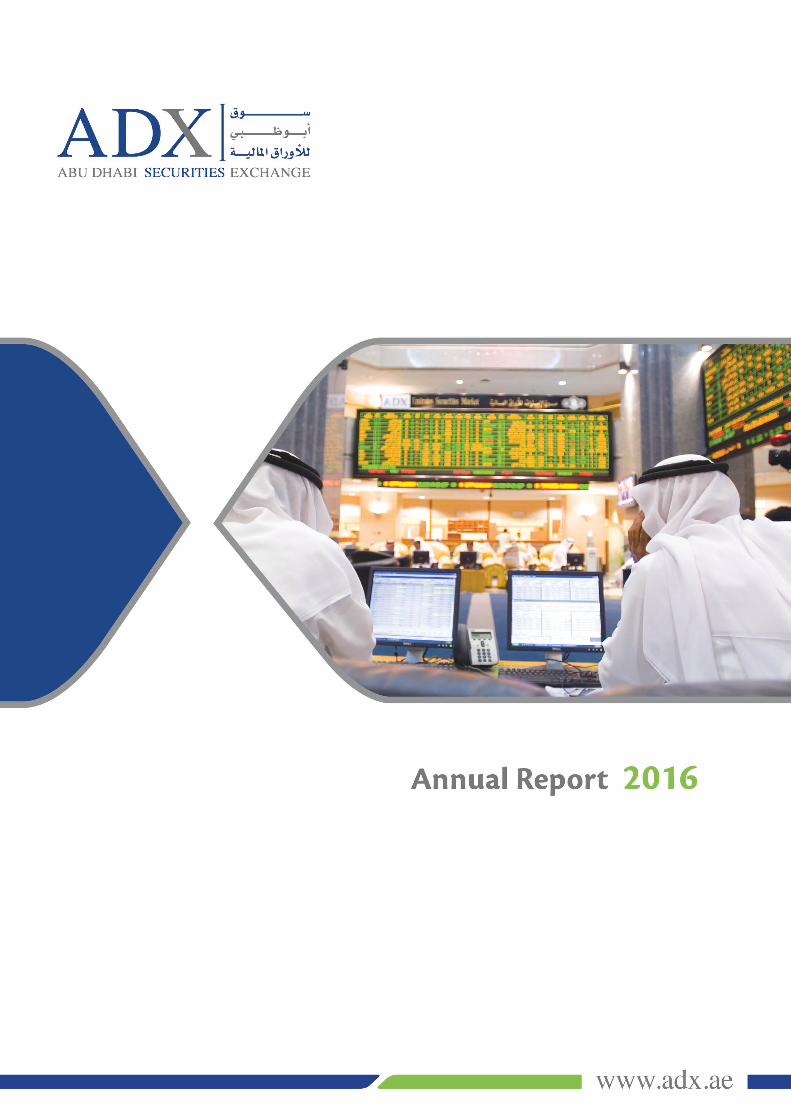
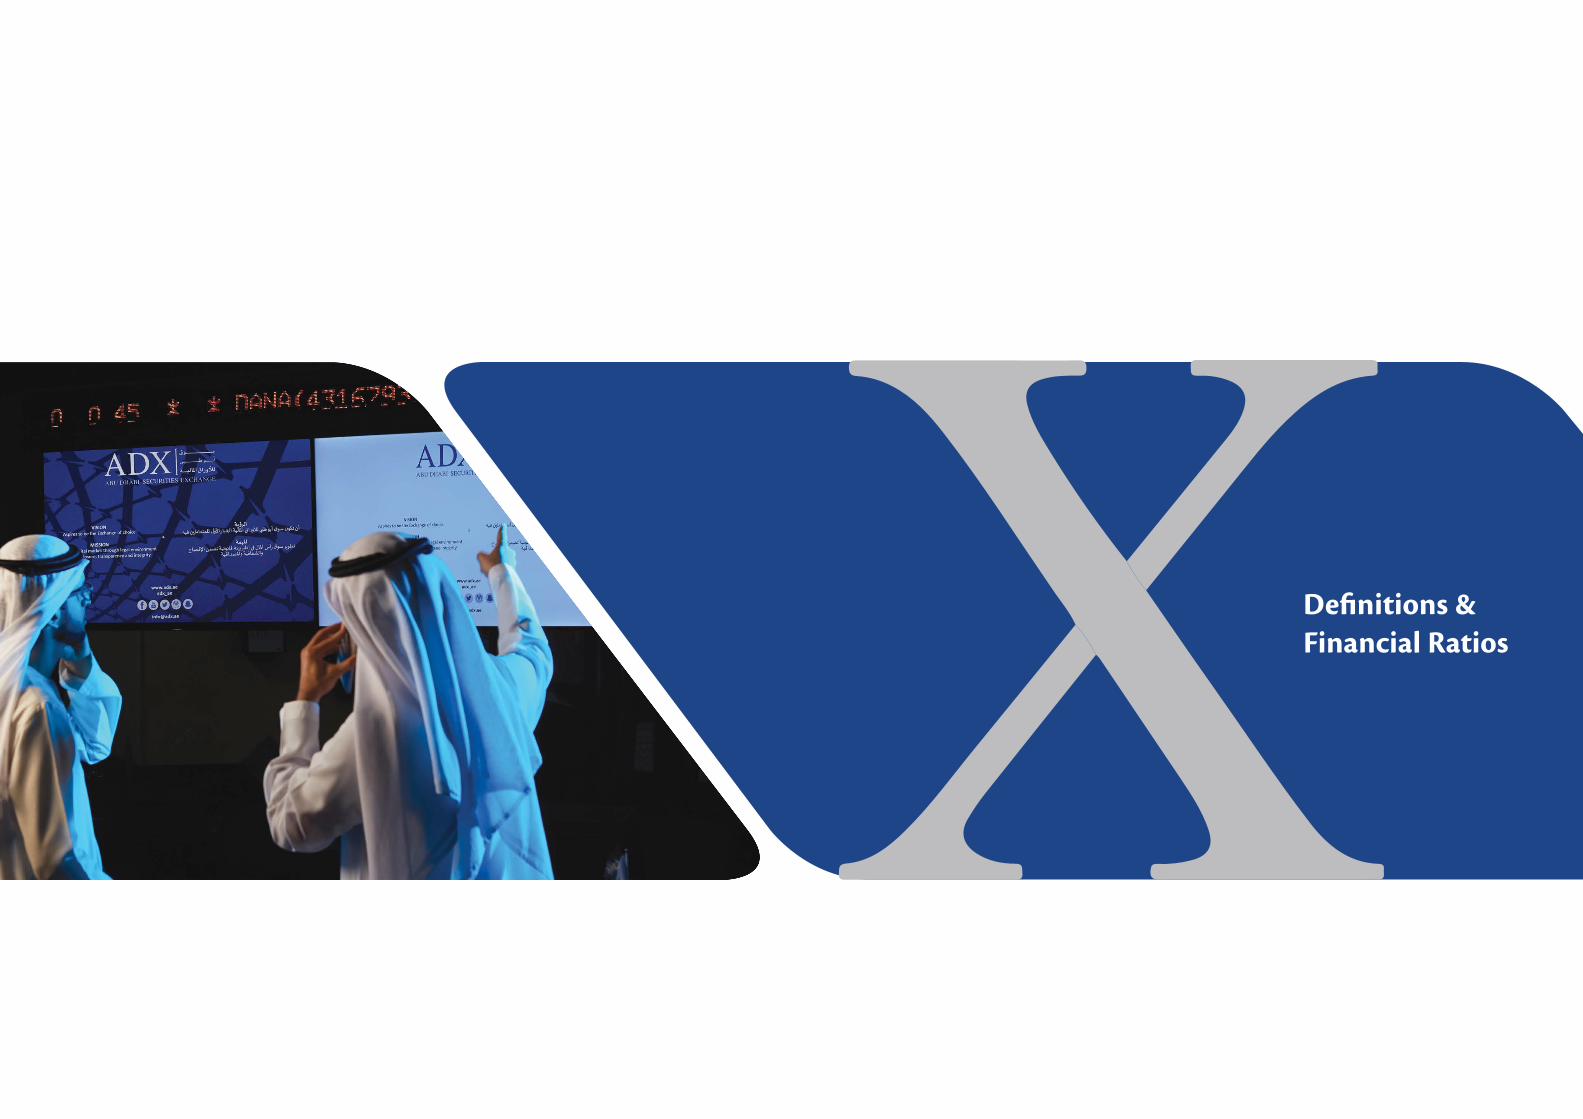
Annual Report2016
His Highness the Late
Sheikh Zayed bin Sultan Al NahyanFounder of the United Arab Emirates
His Highness
Sheikh Khalifa bin Zayed Al NahyanPresident of the United Arab Emirates and Ruler of Abu Dhabi
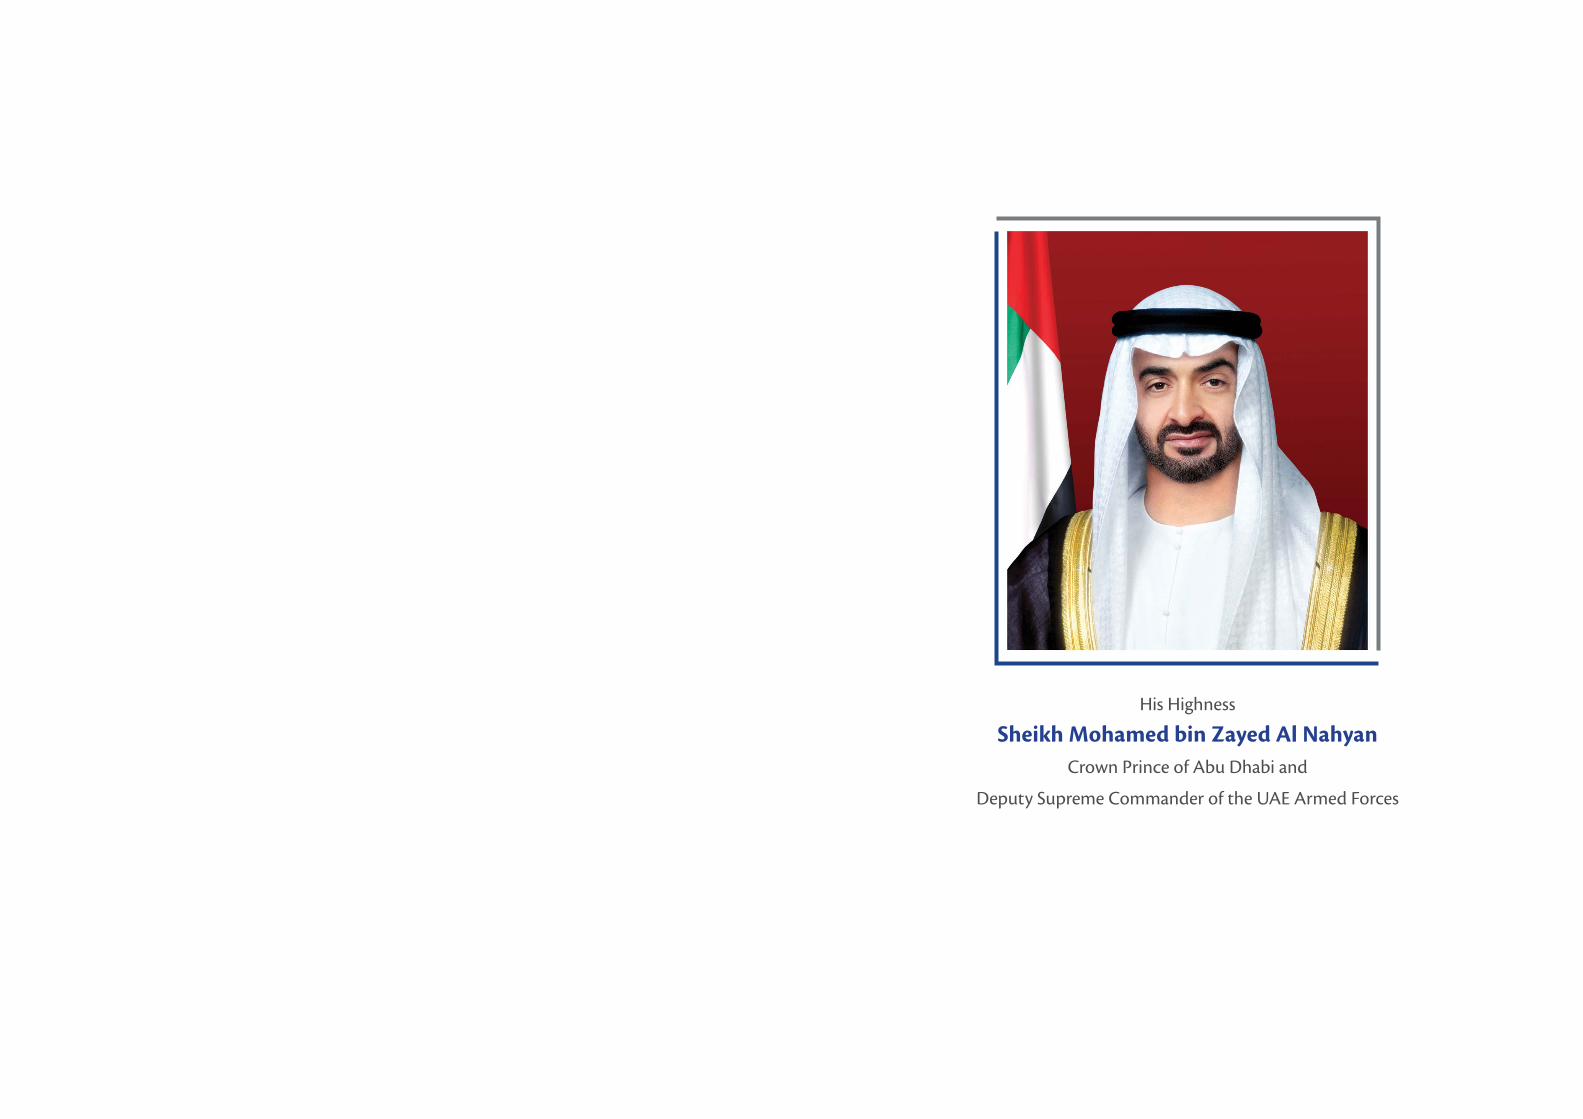
His Highness
Sheikh Mohamed bin Zayed Al NahyanCrown Prince of Abu Dhabi and
Deputy Supreme Commander of the UAE Armed Forces
All the information and data contained in this report is meant for informational purposes only, and nothing thereof is considered an offer
or a recommendation for investment in any of the securities listed in the market.
Though Abu Dhabi Securities Exchange exerts its utmost effort so that such information and data contained in this report be accurate and comprehensive, still
it disclaims any error or omission that has occurred or that may occur in this report.
Abu Dhabi Securities Exchange also disclaims any direct or indirect harm, or any claims resulting from or arising out of the use of this report, and considers the entire material
contained in this report, including all the information, data and content, is considered the property of Abu Dhabi Securities Exchange.
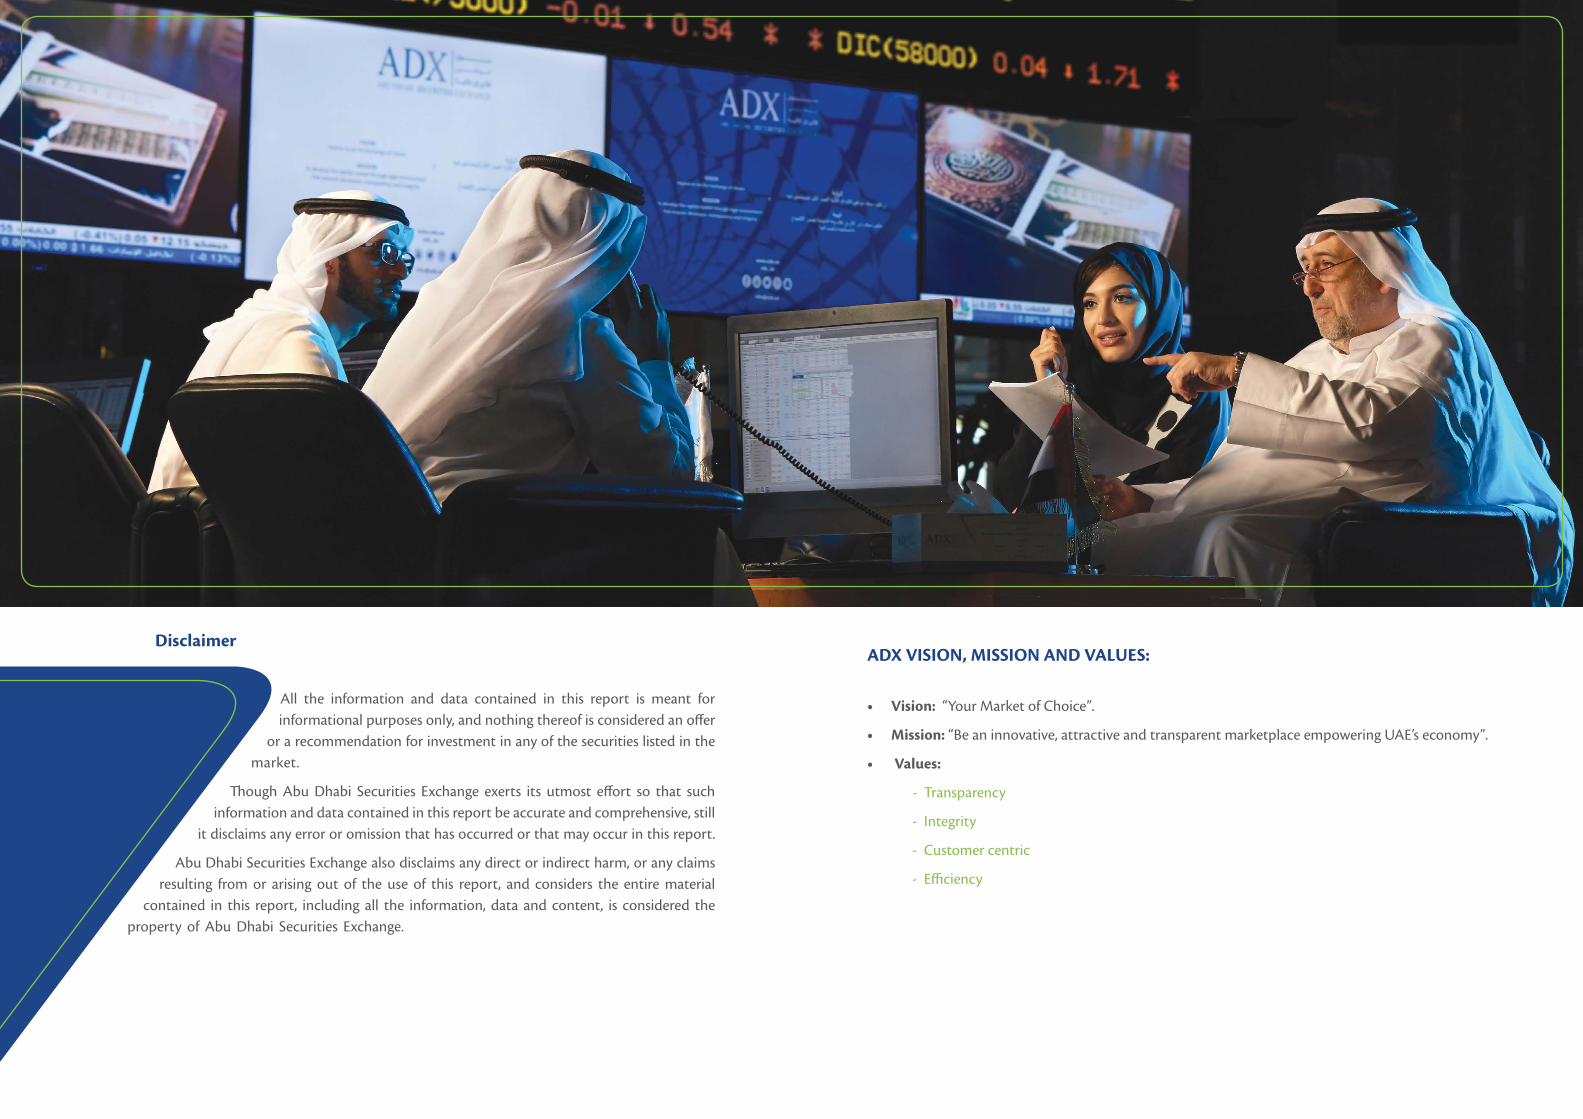
ADX VISION, MISSION AND VALUES:
• Vision: “Your Market of Choice”.
• Mission: “Be an innovative, attractive and transparent marketplace empowering UAE’s economy”.
• Values:
- Transparency
- Integrity
- Customer centric
- Efficiency
Disclaimer
12 13Annual Report 2016
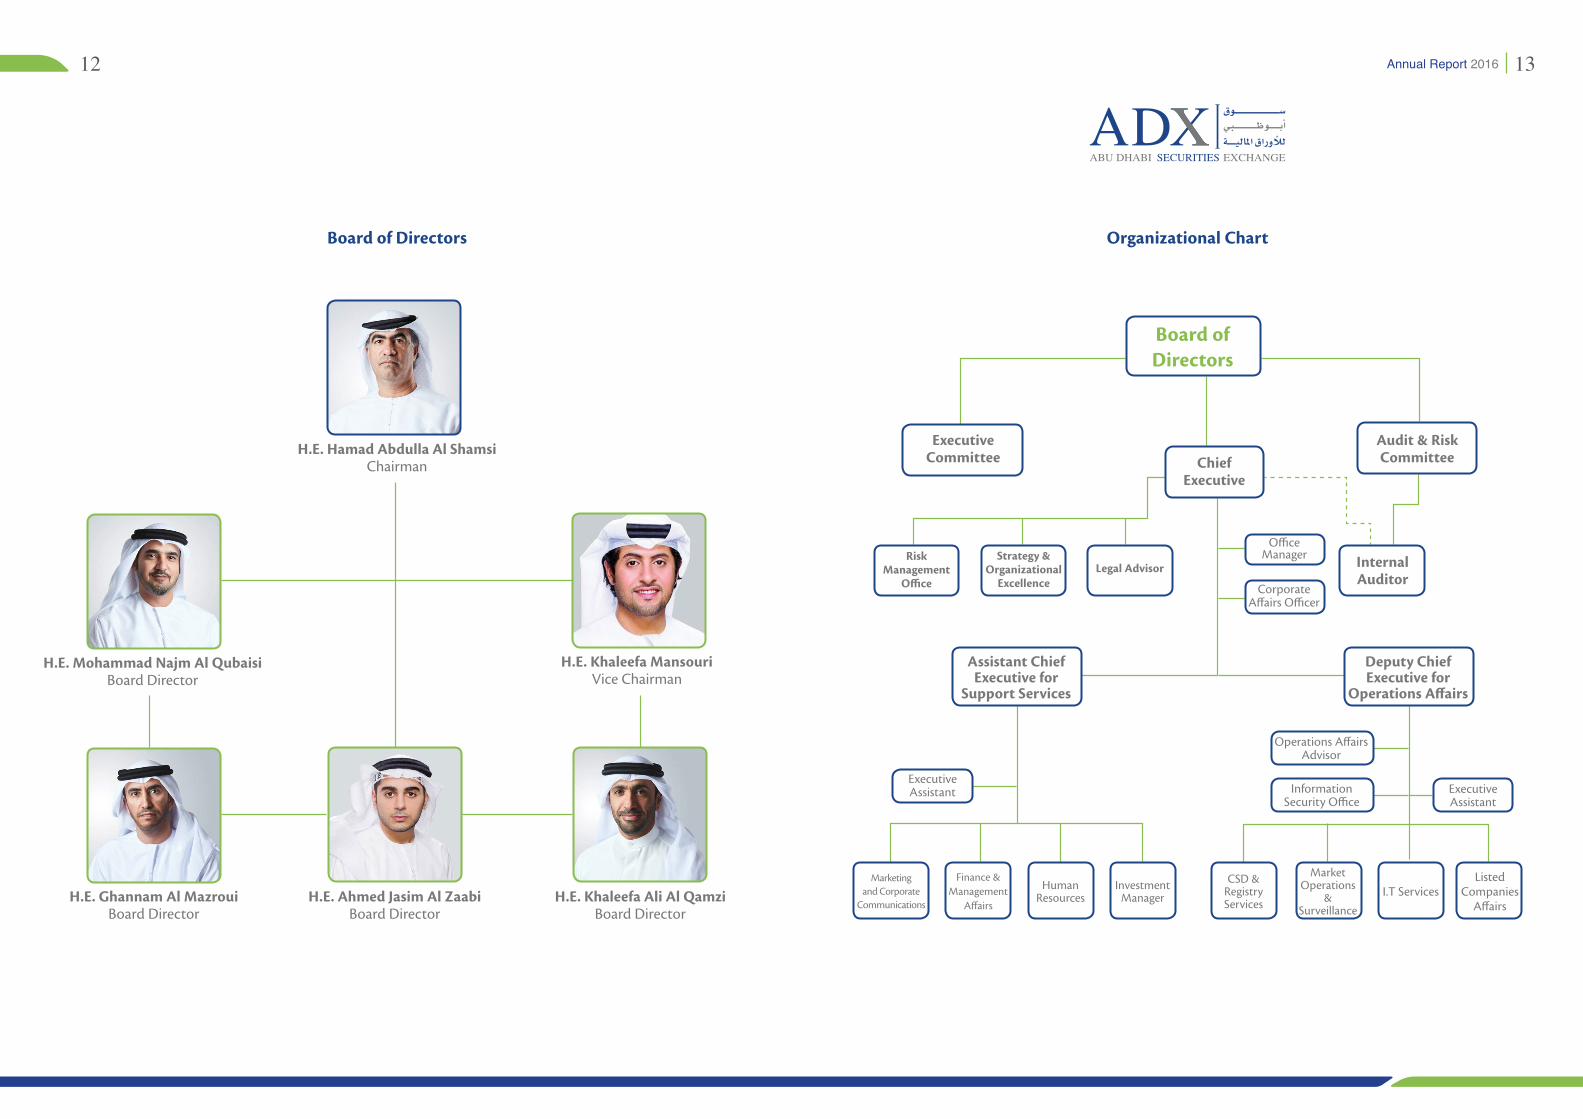
Organizational ChartBoard of Directors
Board of Directors
Audit & Risk CommitteeChief
Executive
Executive Committee
Internal Auditor
Legal AdvisorStrategy &
Organizational Excellence
Risk Management
Office
Executive Assistant
Information Security Office
Executive Assistant
Operations Affairs Advisor
Corporate Affairs Officer
Listed Companies
Affairs
Investment Manager
Market Operations
& Surveillance
Finance &Management
AffairsI.T ServicesHuman
Resources
CSD & Registry Services
Marketing and Corporate
Communications
Office Manager
H.E. Hamad Abdulla Al ShamsiChairman
H.E. Ghannam Al MazrouiBoard Director
H.E. Khaleefa Ali Al QamziBoard Director
H.E. Ahmed Jasim Al ZaabiBoard Director
H.E. Khaleefa MansouriVice Chairman
H.E. Mohammad Najm Al QubaisiBoard Director
Assistant Chief Executive for
Support Services
Deputy ChiefExecutive for
Operations Affairs
CONTENTS
16
18
20
21
22
40
48
74
82
ADX Chairman′s Message
ADX Chief Executive′s Message
ADX Strategy (2016 – 2020)
ADX key achievements in the last year 2016
ADX performance in 2016
Definitions & Financial indicators
Statistical Index
Names and addresses of ADX accredited financial brokers
Names and addresses of ADX listed companies
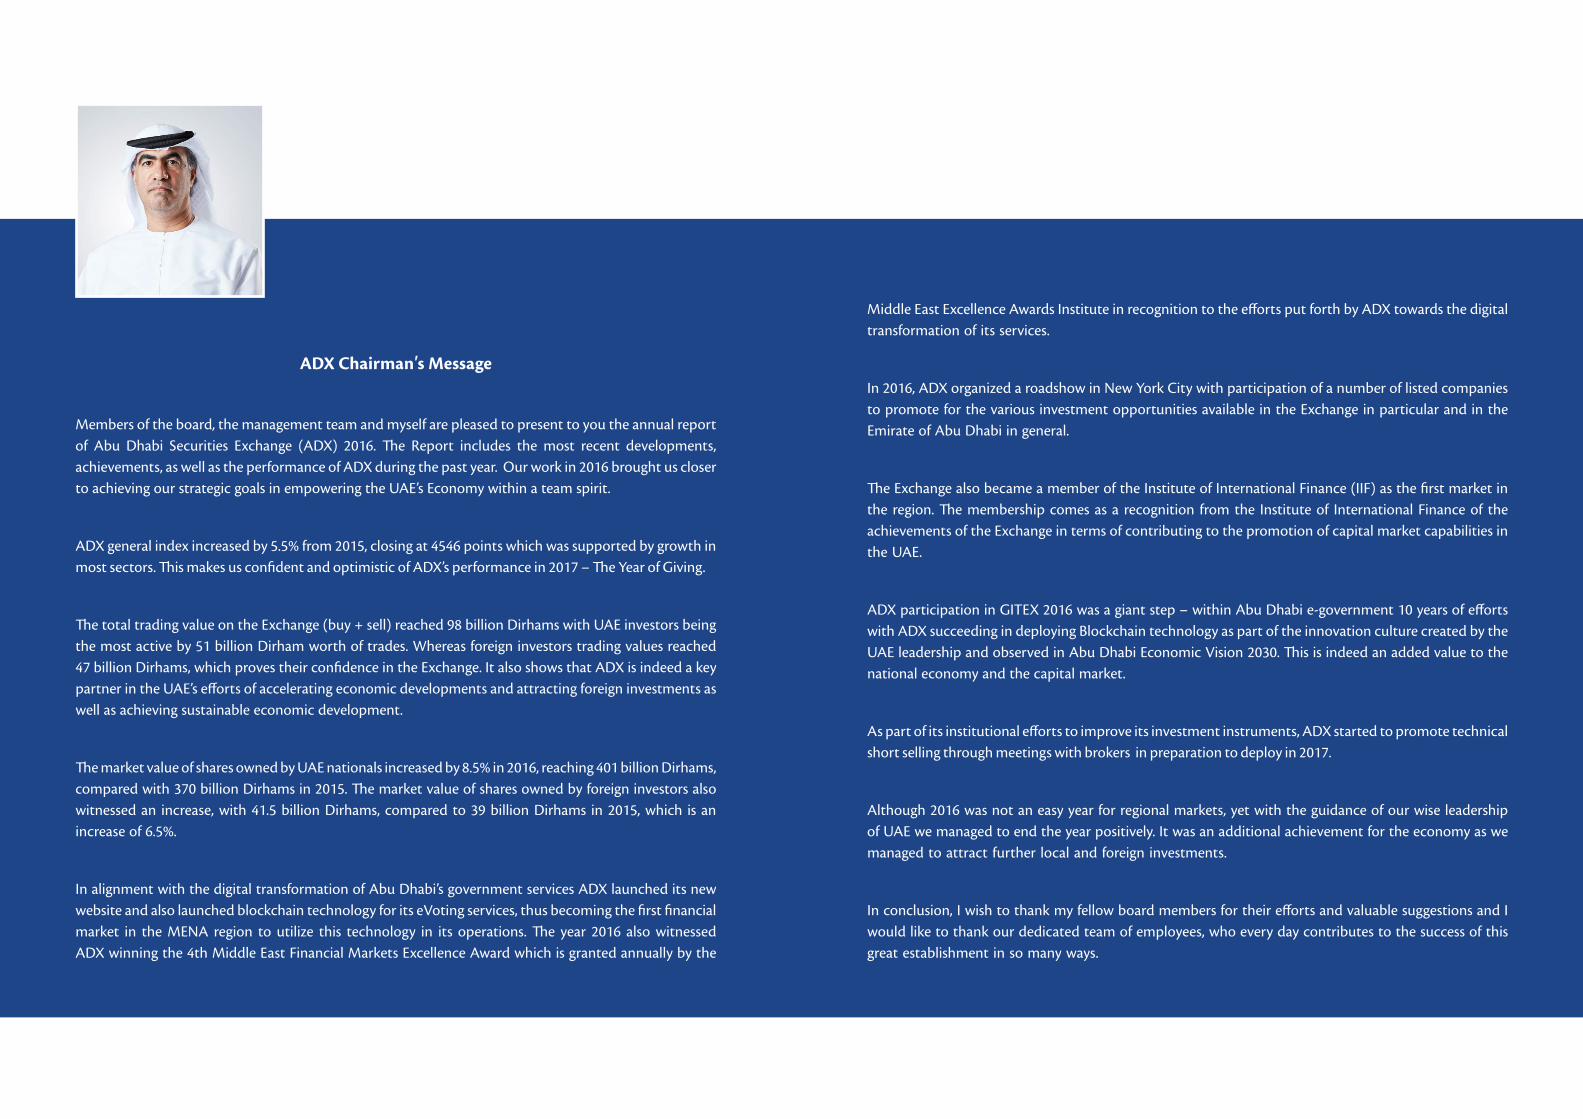
Members of the board, the management team and myself are pleased to present to you the annual report of Abu Dhabi Securities Exchange (ADX) 2016. The Report includes the most recent developments, achievements, as well as the performance of ADX during the past year. Our work in 2016 brought us closer to achieving our strategic goals in empowering the UAE’s Economy within a team spirit.
ADX general index increased by 5.5% from 2015, closing at 4546 points which was supported by growth in most sectors. This makes us confident and optimistic of ADX’s performance in 2017 – The Year of Giving.
The total trading value on the Exchange (buy + sell) reached 98 billion Dirhams with UAE investors being the most active by 51 billion Dirham worth of trades. Whereas foreign investors trading values reached 47 billion Dirhams, which proves their confidence in the Exchange. It also shows that ADX is indeed a key partner in the UAE’s efforts of accelerating economic developments and attracting foreign investments as well as achieving sustainable economic development.
The market value of shares owned by UAE nationals increased by 8.5% in 2016, reaching 401 billion Dirhams, compared with 370 billion Dirhams in 2015. The market value of shares owned by foreign investors also witnessed an increase, with 41.5 billion Dirhams, compared to 39 billion Dirhams in 2015, which is an increase of 6.5%.
In alignment with the digital transformation of Abu Dhabi’s government services ADX launched its new website and also launched blockchain technology for its eVoting services, thus becoming the first financial market in the MENA region to utilize this technology in its operations. The year 2016 also witnessed ADX winning the 4th Middle East Financial Markets Excellence Award which is granted annually by the
ADX Chairman′s Message
Middle East Excellence Awards Institute in recognition to the efforts put forth by ADX towards the digital transformation of its services.
In 2016, ADX organized a roadshow in New York City with participation of a number of listed companies to promote for the various investment opportunities available in the Exchange in particular and in the Emirate of Abu Dhabi in general.
The Exchange also became a member of the Institute of International Finance (IIF) as the first market in the region. The membership comes as a recognition from the Institute of International Finance of the achievements of the Exchange in terms of contributing to the promotion of capital market capabilities in the UAE.
ADX participation in GITEX 2016 was a giant step – within Abu Dhabi e-government 10 years of efforts with ADX succeeding in deploying Blockchain technology as part of the innovation culture created by the UAE leadership and observed in Abu Dhabi Economic Vision 2030. This is indeed an added value to the national economy and the capital market.
As part of its institutional efforts to improve its investment instruments, ADX started to promote technical short selling through meetings with brokers in preparation to deploy in 2017.
Although 2016 was not an easy year for regional markets, yet with the guidance of our wise leadership of UAE we managed to end the year positively. It was an additional achievement for the economy as we managed to attract further local and foreign investments.
In conclusion, I wish to thank my fellow board members for their efforts and valuable suggestions and I would like to thank our dedicated team of employees, who every day contributes to the success of this great establishment in so many ways.
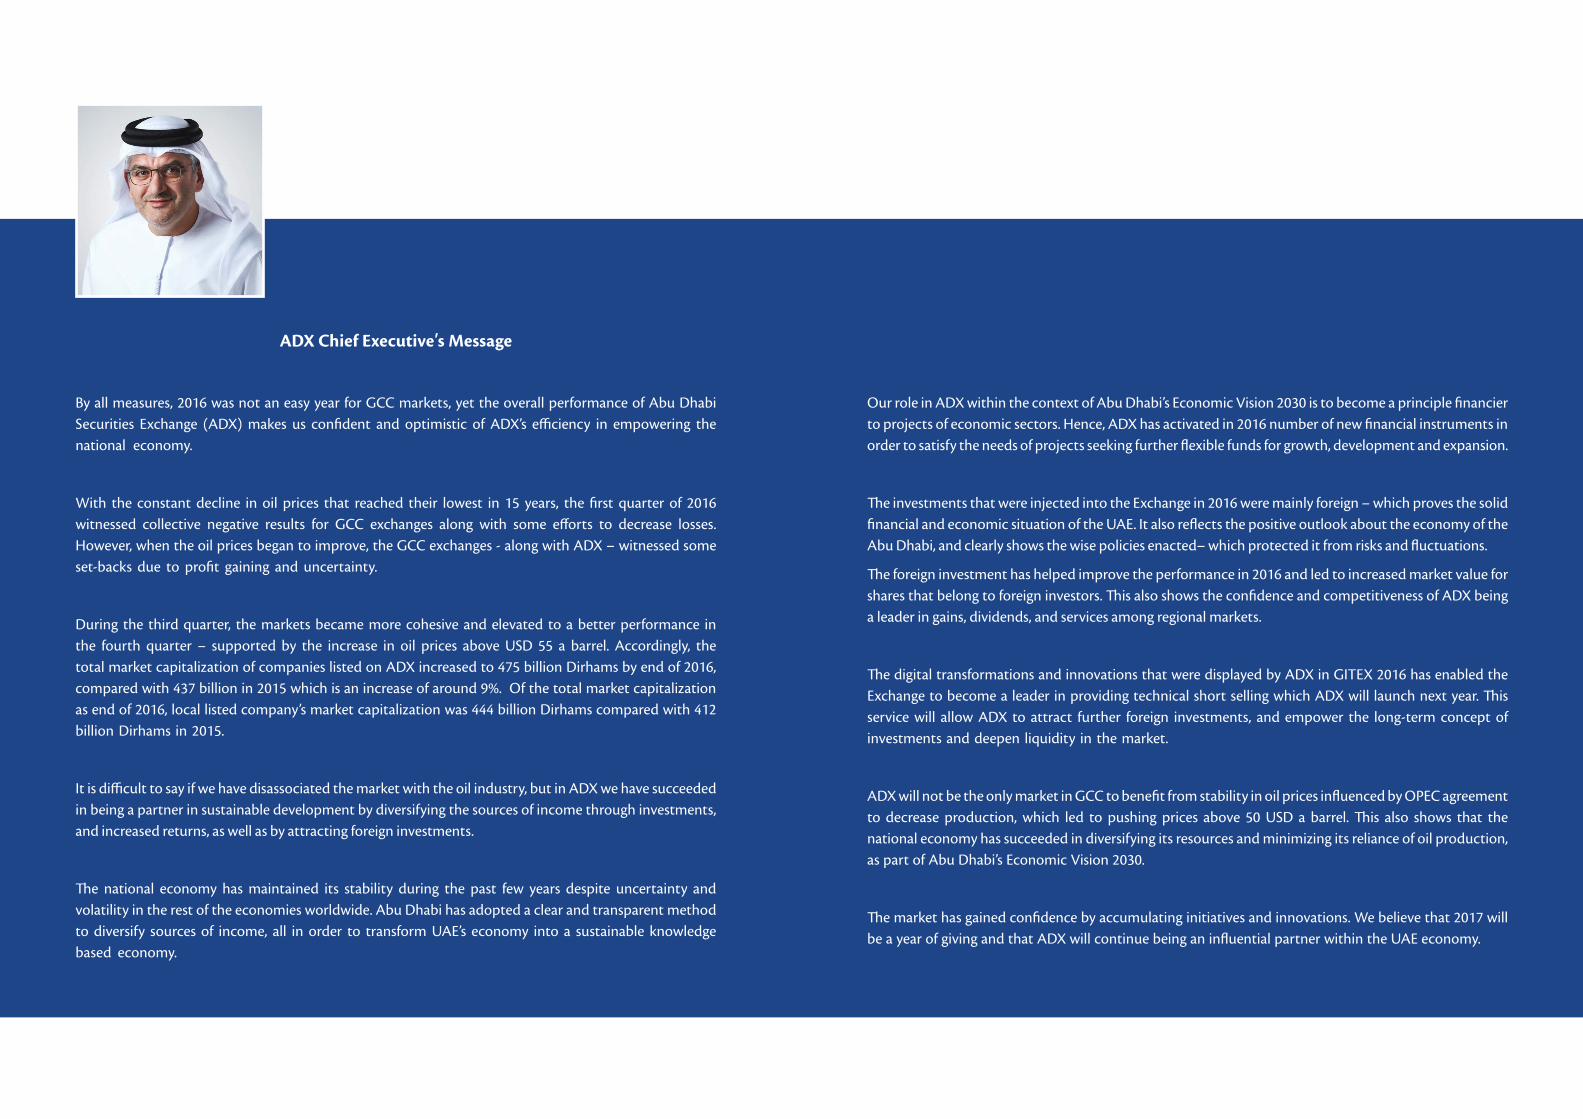
By all measures, 2016 was not an easy year for GCC markets, yet the overall performance of Abu Dhabi Securities Exchange (ADX) makes us confident and optimistic of ADX’s efficiency in empowering the national economy.
With the constant decline in oil prices that reached their lowest in 15 years, the first quarter of 2016 witnessed collective negative results for GCC exchanges along with some efforts to decrease losses. However, when the oil prices began to improve, the GCC exchanges - along with ADX – witnessed some set-backs due to profit gaining and uncertainty.
During the third quarter, the markets became more cohesive and elevated to a better performance in the fourth quarter – supported by the increase in oil prices above USD 55 a barrel. Accordingly, the total market capitalization of companies listed on ADX increased to 475 billion Dirhams by end of 2016, compared with 437 billion in 2015 which is an increase of around 9%. Of the total market capitalization as end of 2016, local listed company’s market capitalization was 444 billion Dirhams compared with 412 billion Dirhams in 2015.
It is difficult to say if we have disassociated the market with the oil industry, but in ADX we have succeeded in being a partner in sustainable development by diversifying the sources of income through investments, and increased returns, as well as by attracting foreign investments.
The national economy has maintained its stability during the past few years despite uncertainty and volatility in the rest of the economies worldwide. Abu Dhabi has adopted a clear and transparent method to diversify sources of income, all in order to transform UAE’s economy into a sustainable knowledge based economy.
ADX Chief Executive′s Message
Our role in ADX within the context of Abu Dhabi’s Economic Vision 2030 is to become a principle financier to projects of economic sectors. Hence, ADX has activated in 2016 number of new financial instruments in order to satisfy the needs of projects seeking further flexible funds for growth, development and expansion.
The investments that were injected into the Exchange in 2016 were mainly foreign – which proves the solid financial and economic situation of the UAE. It also reflects the positive outlook about the economy of the Abu Dhabi, and clearly shows the wise policies enacted– which protected it from risks and fluctuations.
The foreign investment has helped improve the performance in 2016 and led to increased market value for shares that belong to foreign investors. This also shows the confidence and competitiveness of ADX being a leader in gains, dividends, and services among regional markets.
The digital transformations and innovations that were displayed by ADX in GITEX 2016 has enabled the Exchange to become a leader in providing technical short selling which ADX will launch next year. This service will allow ADX to attract further foreign investments, and empower the long-term concept of investments and deepen liquidity in the market.
ADX will not be the only market in GCC to benefit from stability in oil prices influenced by OPEC agreement to decrease production, which led to pushing prices above 50 USD a barrel. This also shows that the national economy has succeeded in diversifying its resources and minimizing its reliance of oil production, as part of Abu Dhabi’s Economic Vision 2030.
The market has gained confidence by accumulating initiatives and innovations. We believe that 2017 will be a year of giving and that ADX will continue being an influential partner within the UAE economy.
20 21Annual Report 2016
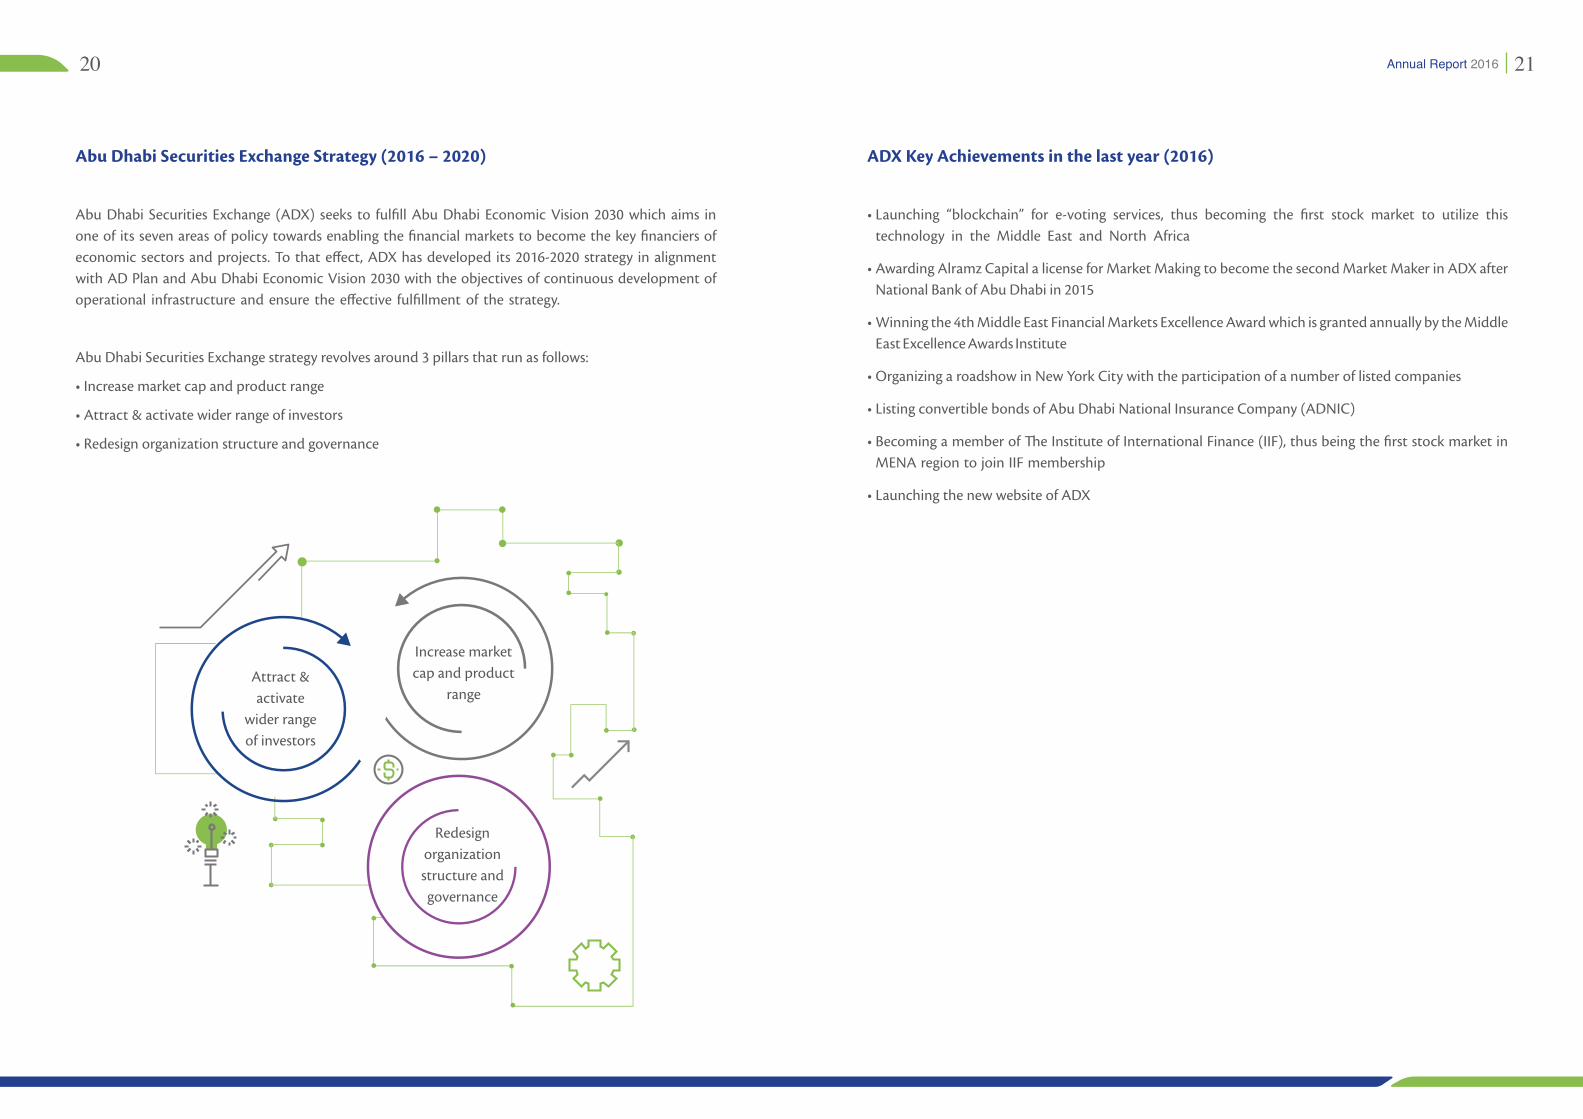
Abu Dhabi Securities Exchange Strategy (2016 – 2020)
Abu Dhabi Securities Exchange (ADX) seeks to fulfill Abu Dhabi Economic Vision 2030 which aims in one of its seven areas of policy towards enabling the financial markets to become the key financiers of economic sectors and projects. To that effect, ADX has developed its 2016-2020 strategy in alignment with AD Plan and Abu Dhabi Economic Vision 2030 with the objectives of continuous development of operational infrastructure and ensure the effective fulfillment of the strategy.
Abu Dhabi Securities Exchange strategy revolves around 3 pillars that run as follows:
• Increase market cap and product range
• Attract & activate wider range of investors
• Redesign organization structure and governance
ADX Key Achievements in the last year (2016)
• Launching “blockchain” for e-voting services, thus becoming the first stock market to utilize this technology in the Middle East and North Africa
• Awarding Alramz Capital a license for Market Making to become the second Market Maker in ADX after National Bank of Abu Dhabi in 2015
• Winning the 4th Middle East Financial Markets Excellence Award which is granted annually by the Middle East Excellence Awards Institute
• Organizing a roadshow in New York City with the participation of a number of listed companies
• Listing convertible bonds of Abu Dhabi National Insurance Company (ADNIC)
• Becoming a member of The Institute of International Finance (IIF), thus being the first stock market in MENA region to join IIF membership
• Launching the new website of ADX
Increase market cap and product
rangeAttract & activate
wider range of investors
Redesign organization structure and governance
22 23Annual Report 2016
ADX PERFORMANCE IN 2016
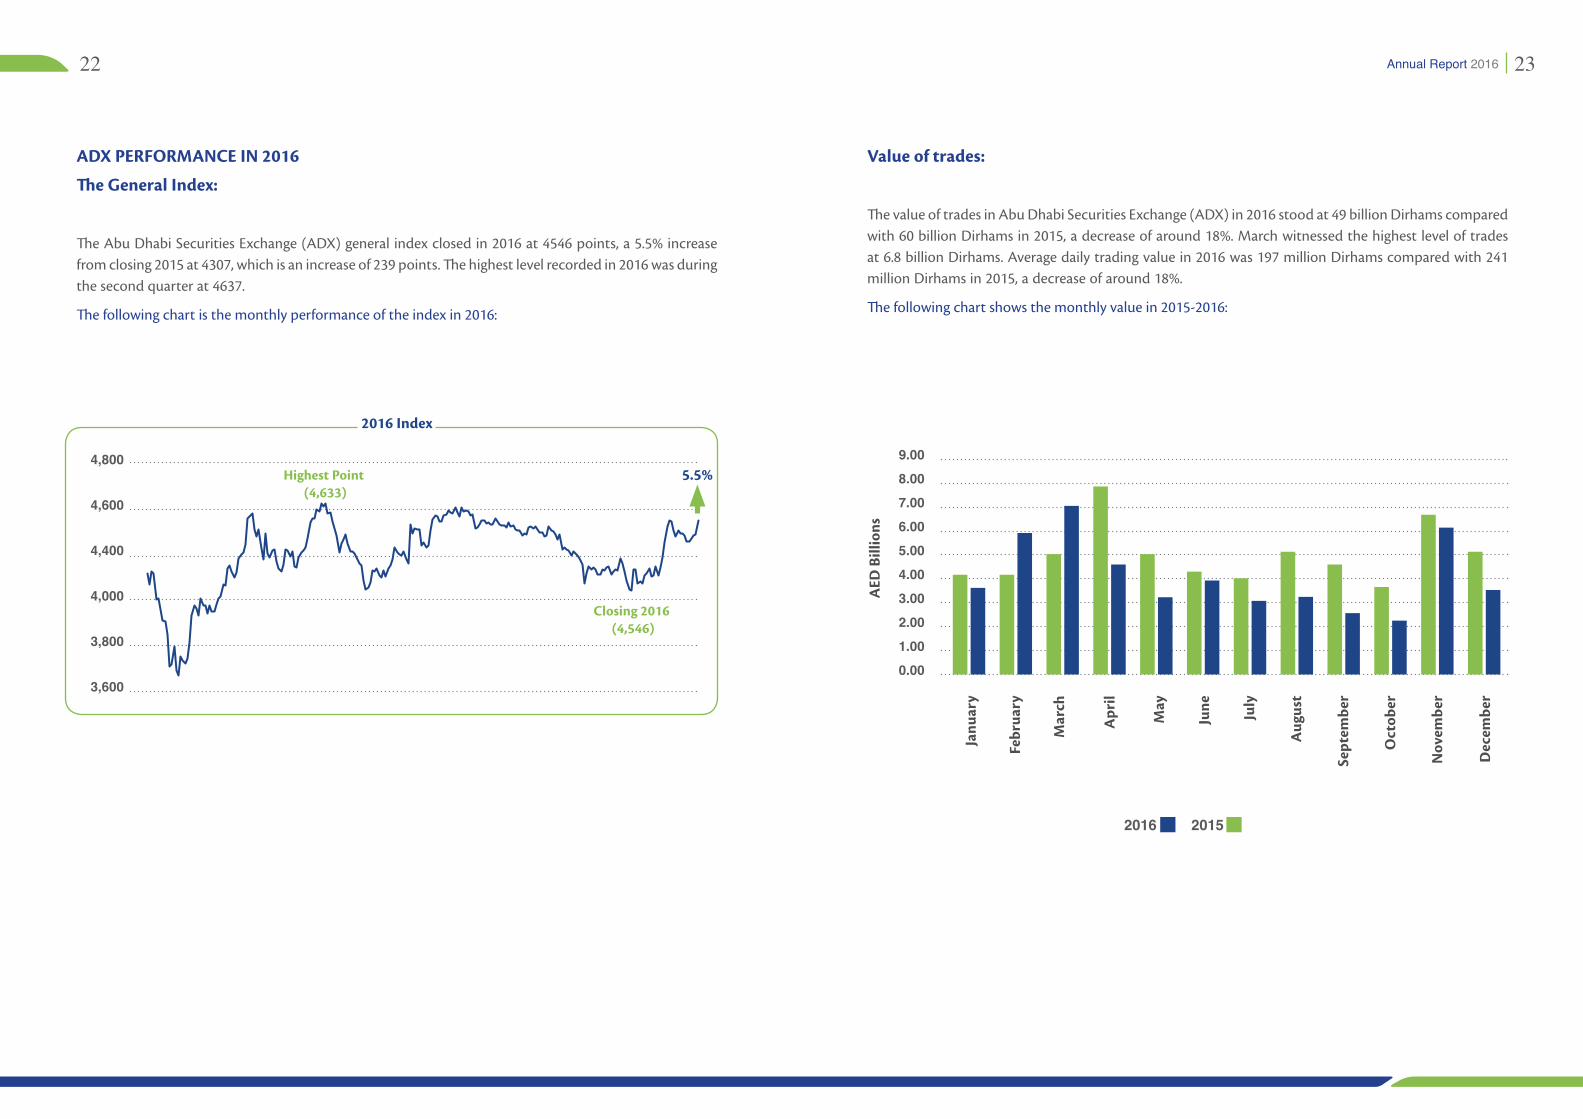
The General Index:
The Abu Dhabi Securities Exchange (ADX) general index closed in 2016 at 4546 points, a 5.5% increase from closing 2015 at 4307, which is an increase of 239 points. The highest level recorded in 2016 was during the second quarter at 4637.
The following chart is the monthly performance of the index in 2016:
2016 Index
Highest Point (4,633)
Closing 2016 (4,546)
4,800
4,600
4,400
4,000
3,800
3,600
5.5%
Value of trades:
The value of trades in Abu Dhabi Securities Exchange (ADX) in 2016 stood at 49 billion Dirhams compared with 60 billion Dirhams in 2015, a decrease of around 18%. March witnessed the highest level of trades at 6.8 billion Dirhams. Average daily trading value in 2016 was 197 million Dirhams compared with 241 million Dirhams in 2015, a decrease of around 18%.
The following chart shows the monthly value in 2015-2016:
9.008.007.006.005.004.003.002.001.000.00
AED
Bill
ions
Janu
ary
Febr
uary
Mar
ch
Apr
il
May
June July
Aug
ust
Sept
embe
r
Oct
ober
Nov
embe
r
Dec
embe
r
20152016
24 25Annual Report 2016
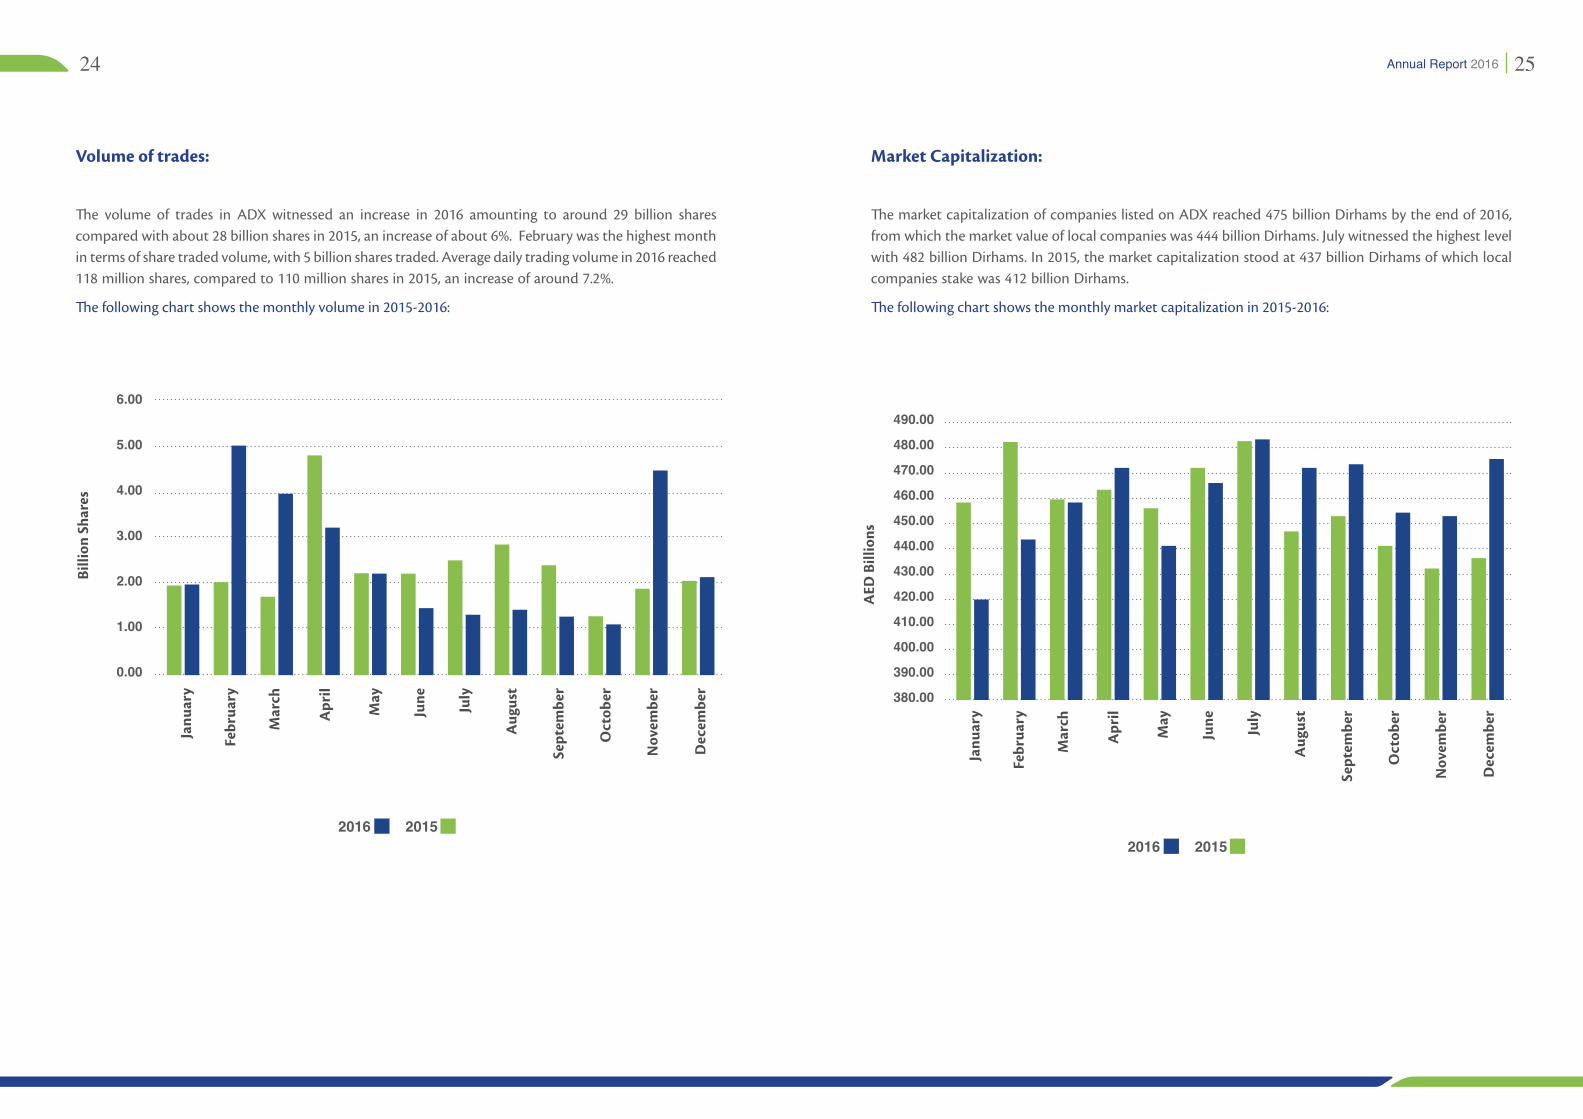
Volume of trades:
The volume of trades in ADX witnessed an increase in 2016 amounting to around 29 billion shares compared with about 28 billion shares in 2015, an increase of about 6%. February was the highest month in terms of share traded volume, with 5 billion shares traded. Average daily trading volume in 2016 reached 118 million shares, compared to 110 million shares in 2015, an increase of around 7.2%.
The following chart shows the monthly volume in 2015-2016:
Janu
ary
Febr
uary
Mar
ch
Apr
il
May
June July
Aug
ust
Sept
embe
r
Oct
ober
Nov
embe
r
Dec
embe
r
6.00
5.00
4.00
3.00
2.00
1.00
0.00
Billi
on S
hare
s
20152016
Market Capitalization:
The market capitalization of companies listed on ADX reached 475 billion Dirhams by the end of 2016, from which the market value of local companies was 444 billion Dirhams. July witnessed the highest level with 482 billion Dirhams. In 2015, the market capitalization stood at 437 billion Dirhams of which local companies stake was 412 billion Dirhams.
The following chart shows the monthly market capitalization in 2015-2016:
490.00
480.00
470.00
460.00
450.00
440.00
430.00
420.00
410.00
400.00
390.00
380.00
AED
Bill
ions
20152016
Janu
ary
Febr
uary
Mar
ch
Apr
il
May
June July
Aug
ust
Sept
embe
r
Oct
ober
Nov
embe
r
Dec
embe
r
26 27Annual Report 2016
Listed Companies Profits by Sector:
By end of 2016, the net profit of all local and foreign public listed companies reached AED 20. 3 billion in comparison to end of 2015 where the companies net profit was AED 39.5 billion, which is a decrease of -48.54%.
The highest recorded decrease was in the Energy sector with -3066.55%, followed by the Industrial sector with -52.00%, Real Estate followed with -12.53%, Financial & Investment Services with -10.42%, Banking sector with -6.67%, Services sector followed closely with -6.17%, whereas Consumer Staples recorded the lowest decrease with -4.93%.
The only two sectors to witness an increase in profit were the Insurance and Telecommunication sectors with an increase of 224.34% and 3.47% respectively.
Listed Companies Net Profit for the Years 2015-2016:
Sector Annual 2015 Annual 2016 %
Insurance -389,276 484,021 224.34%
Telecommunication 12,011,046 12,427,711 3.47%
Consumer Staples 362,495 344,614 -4.93%
Services 1,078,208 1,011,635 -6.17%
Banks 22,807,542 21,285,429 -6.67%
Fin/Invest. 545,222 488,415 -10.42%
Real Estate 2,745,294 2,401,215 -12.53%
Industrial 1,023,838 491,493 -52.00%
Energy -586,000 -18,556,000 -3066.55%
Total 39,598,369 20,384,533 -48.54%
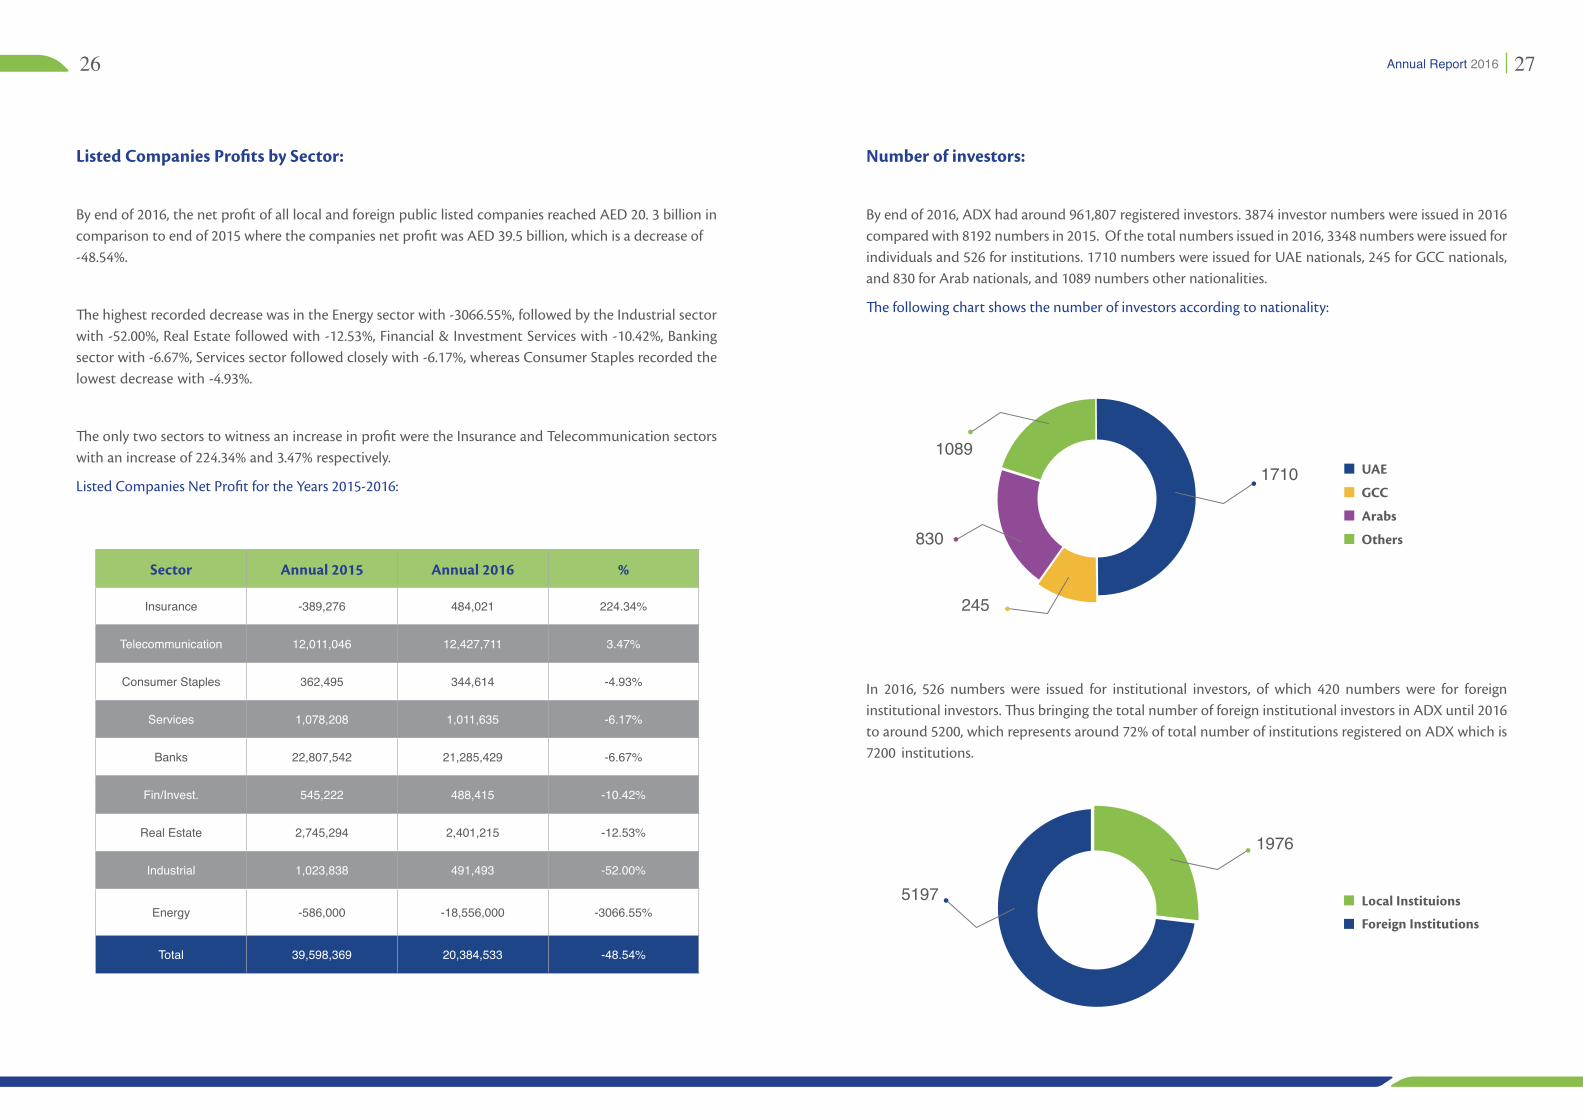
Number of investors:
By end of 2016, ADX had around 961,807 registered investors. 3874 investor numbers were issued in 2016 compared with 8192 numbers in 2015. Of the total numbers issued in 2016, 3348 numbers were issued for individuals and 526 for institutions. 1710 numbers were issued for UAE nationals, 245 for GCC nationals, and 830 for Arab nationals, and 1089 numbers other nationalities.
The following chart shows the number of investors according to nationality:
In 2016, 526 numbers were issued for institutional investors, of which 420 numbers were for foreign institutional investors. Thus bringing the total number of foreign institutional investors in ADX until 2016 to around 5200, which represents around 72% of total number of institutions registered on ADX which is 7200 institutions.
UAE
GCC
Arabs
Others
1710
245
1089
830
Foreign Institutions
Local Instituions
1976
5197
28 29Annual Report 2016
Total Value of Trades (Buy + Sell) By Nationality:
In 2016, the total value of trades on ADX reached around 98 billion Dirhams. UAE investors had the lion share with 51 billion Dirhams. UK investors topped the foreign investors list with around 10 billion Dirhams, followed by investors from the USA with 7.5 billion Dirhams; Jordanian investors with 3.4 billion Dirhams; Luxemburg investors with 2.7 billion Dirhams, and Saudi investors with 1.8 billion Dirhams. Accordingly, non-UAE investors represented 48% of the total value of trades conducted on ADX in 2016, a 5% increase compared to 2015 (43%).
The following chart shows the percentage total of trades for non-UAE investors out of the overall total trades on ADX in 2016:
UK
USA
Jordan
Saudi Arabia
luxembourg
1.83%
10.61%
2.76%
3.48%
7.68%
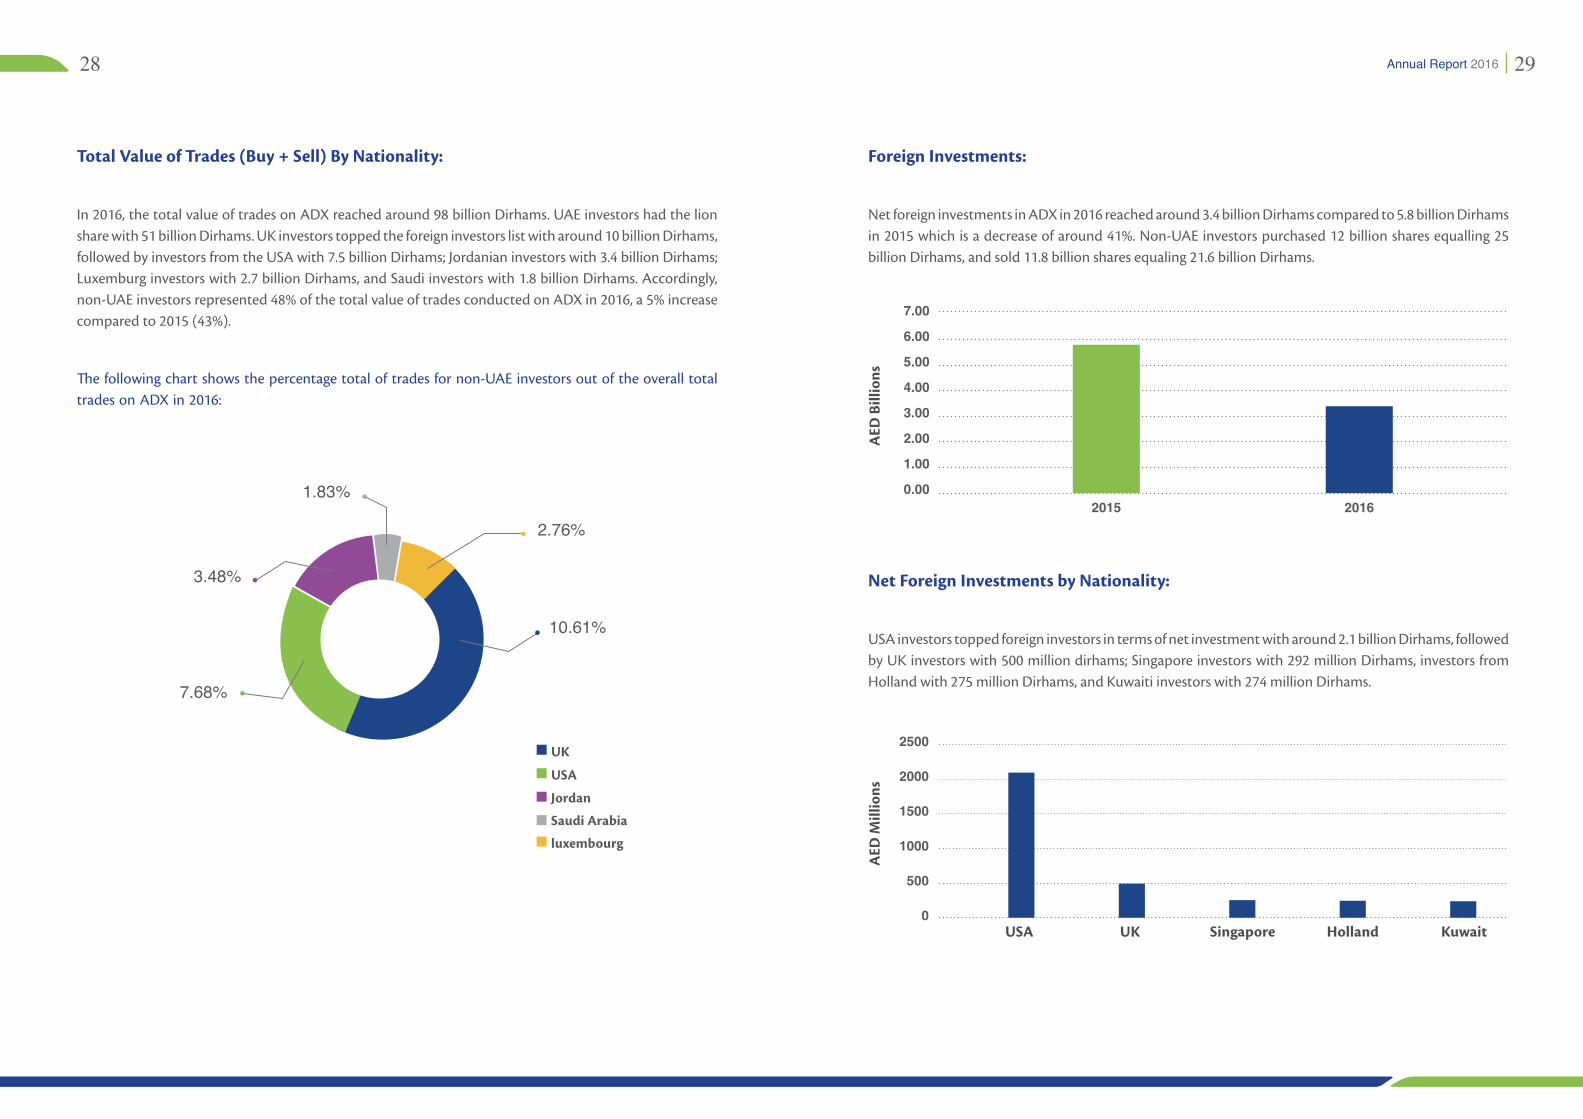
Foreign Investments:
Net foreign investments in ADX in 2016 reached around 3.4 billion Dirhams compared to 5.8 billion Dirhams in 2015 which is a decrease of around 41%. Non-UAE investors purchased 12 billion shares equalling 25 billion Dirhams, and sold 11.8 billion shares equaling 21.6 billion Dirhams.
Net Foreign Investments by Nationality:
USA investors topped foreign investors in terms of net investment with around 2.1 billion Dirhams, followed by UK investors with 500 million dirhams; Singapore investors with 292 million Dirhams, investors from Holland with 275 million Dirhams, and Kuwaiti investors with 274 million Dirhams.
7.00
6.00
5.00
4.00
3.00
2.00
1.00
0.00
AED
Bill
ions
2015 2016
2500
2000
1500
1000
500
0
AED
Mill
ions
USA UK Singapore Holland Kuwait
30 31Annual Report 2016
Institutional Investments:
Institutional investments in ADX recorded a net investment equaling 5 billion Dirhams compared with about 7 billion Dirhams in 2015 which is a 28% decrease).
Market Value of Shares:
The market value of shares belonging to UAE investors jumped to reach 401 billion Dirhams by the end of 2016, compared with 370 billion Dirhams by the end of 2015 (8.5% increase). Meanwhile the market value of shares owned by non-UAE investors reached 41.5 billion Dirhams, compared with 39 billion Dirhams by the end of 2015 (6.5% increase).
8.00
6.00
4.00
2.00
0.002015 2016
405
400
395
390
385
380
375
370
365
360
355
350
42
41.5
41
40.5
40
39
38.5
38
37.52015 20152016 2016
AED
Bill
ions
AED
Bill
ions
Market Value - UAE Investors Market Value - Non UAE Investors
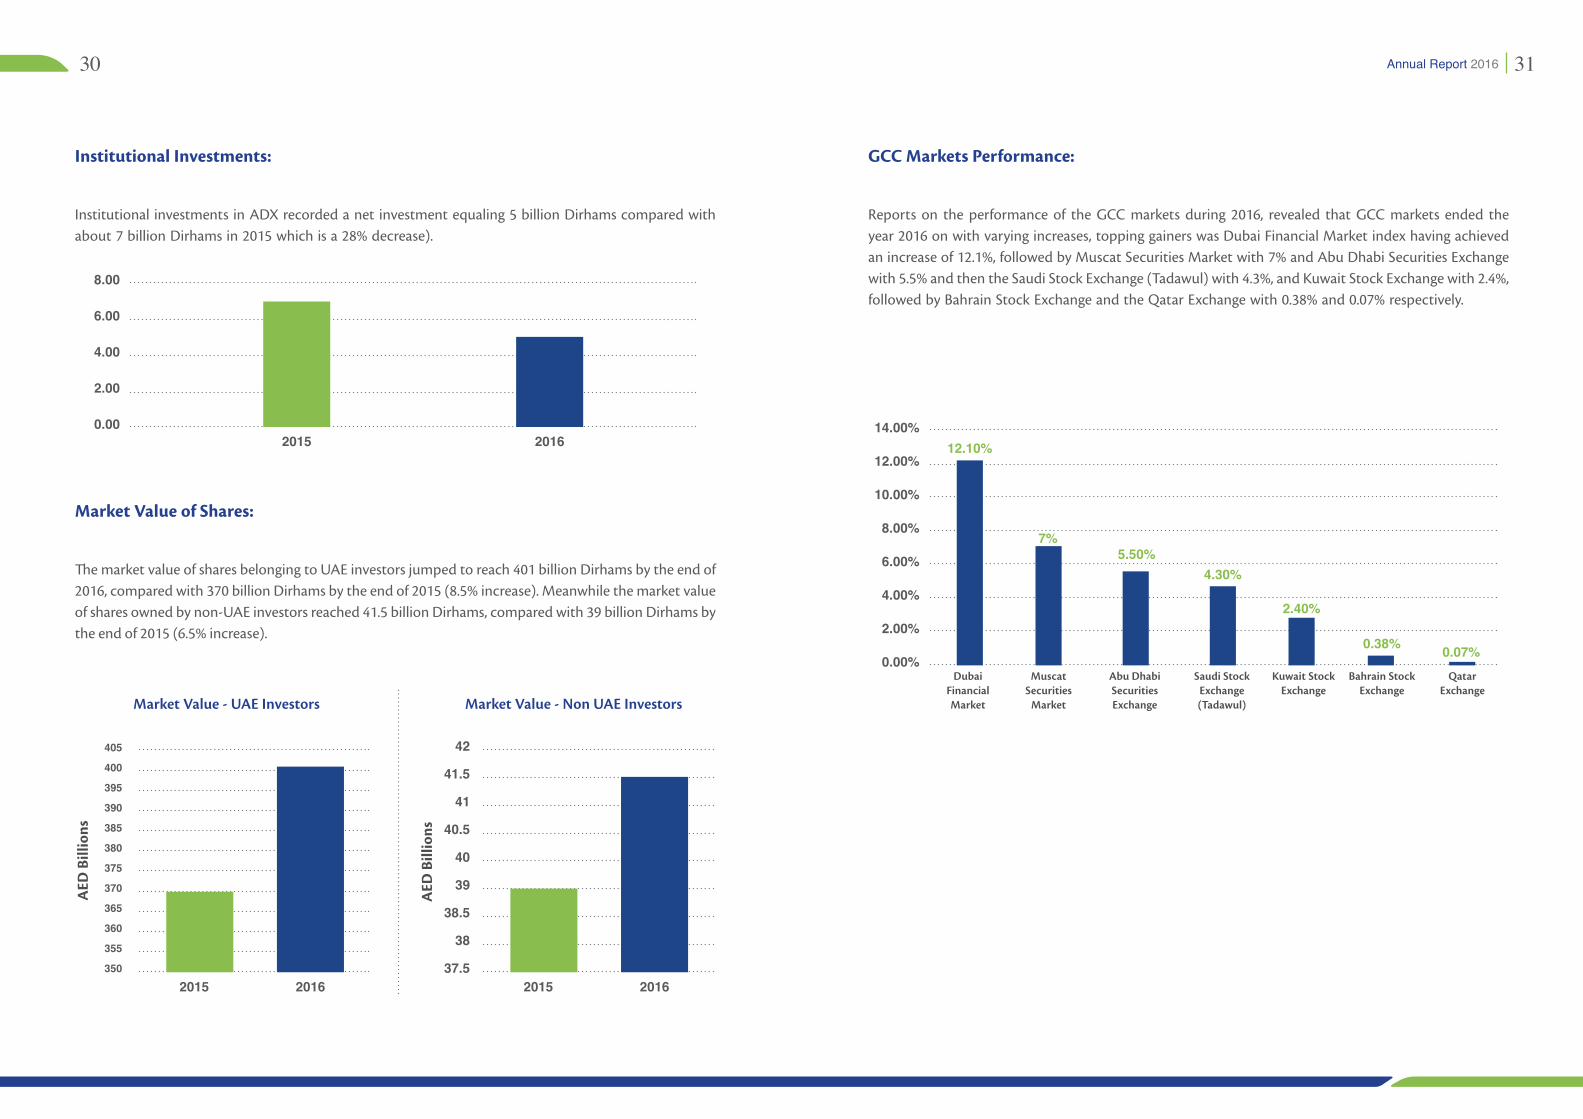
GCC Markets Performance:
Reports on the performance of the GCC markets during 2016, revealed that GCC markets ended the year 2016 on with varying increases, topping gainers was Dubai Financial Market index having achieved an increase of 12.1%, followed by Muscat Securities Market with 7% and Abu Dhabi Securities Exchange with 5.5% and then the Saudi Stock Exchange (Tadawul) with 4.3%, and Kuwait Stock Exchange with 2.4%, followed by Bahrain Stock Exchange and the Qatar Exchange with 0.38% and 0.07% respectively.
14.00%
12.00%
10.00%
8.00%
6.00%
4.00%
2.00%
0.00%Dubai
Financial Market
Muscat Securities
Market
Abu Dhabi Securities Exchange
Saudi Stock Exchange (Tadawul)
Kuwait Stock Exchange
Bahrain Stock Exchange
Qatar Exchange
12.10%
7%5.50%
4.30%
2.40%
0.38% 0.07%
32 33Annual Report 2016
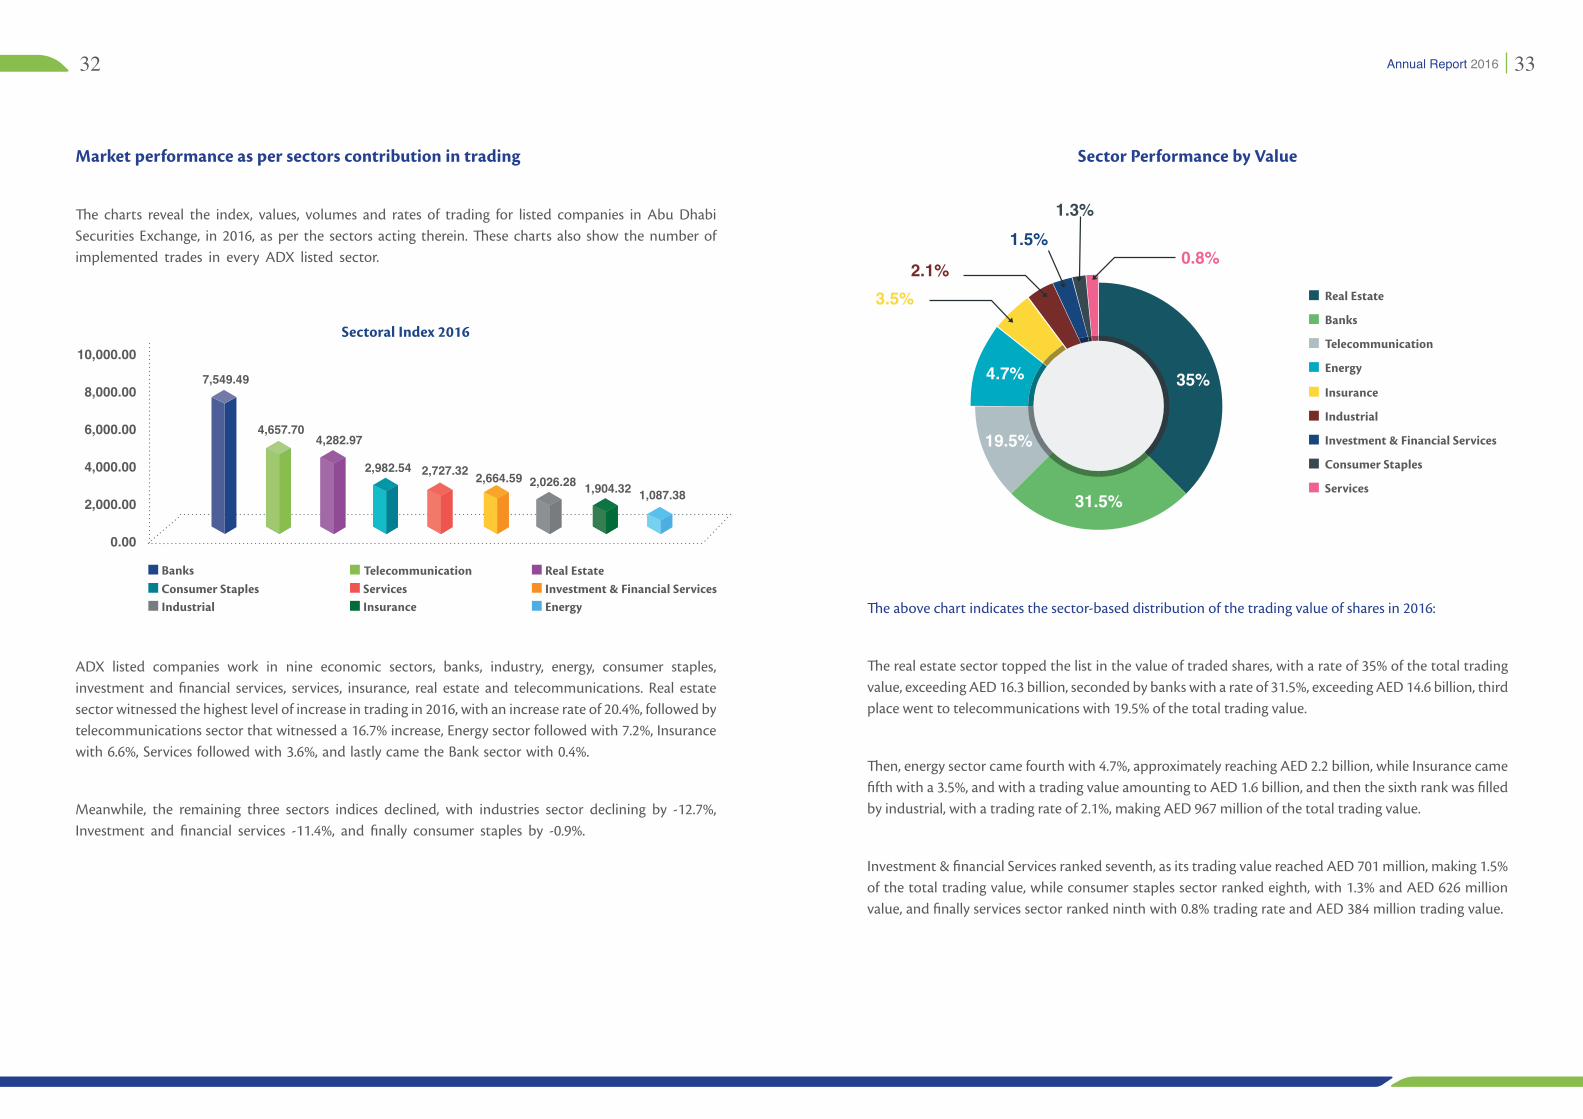
Market performance as per sectors contribution in trading
The charts reveal the index, values, volumes and rates of trading for listed companies in Abu Dhabi Securities Exchange, in 2016, as per the sectors acting therein. These charts also show the number of implemented trades in every ADX listed sector.
Sector Performance by Value
10,000.00
8,000.00
6,000.00
4,000.00
2,000.00
0.00
7,549.49
4,657.704,282.97
2,982.54 2,727.32 2,664.59 2,026.28 1,904.32 1,087.38
Sectoral Index 2016
Banks Telecommunication Real EstateConsumer StaplesIndustrial
ServicesInsurance
Investment & Financial ServicesEnergy
ADX listed companies work in nine economic sectors, banks, industry, energy, consumer staples, investment and financial services, services, insurance, real estate and telecommunications. Real estate sector witnessed the highest level of increase in trading in 2016, with an increase rate of 20.4%, followed by telecommunications sector that witnessed a 16.7% increase, Energy sector followed with 7.2%, Insurance with 6.6%, Services followed with 3.6%, and lastly came the Bank sector with 0.4%.
Meanwhile, the remaining three sectors indices declined, with industries sector declining by -12.7%, Investment and financial services -11.4%, and finally consumer staples by -0.9%.
The above chart indicates the sector-based distribution of the trading value of shares in 2016:
The real estate sector topped the list in the value of traded shares, with a rate of 35% of the total trading value, exceeding AED 16.3 billion, seconded by banks with a rate of 31.5%, exceeding AED 14.6 billion, third place went to telecommunications with 19.5% of the total trading value.
Then, energy sector came fourth with 4.7%, approximately reaching AED 2.2 billion, while Insurance came fifth with a 3.5%, and with a trading value amounting to AED 1.6 billion, and then the sixth rank was filled by industrial, with a trading rate of 2.1%, making AED 967 million of the total trading value.
Investment & financial Services ranked seventh, as its trading value reached AED 701 million, making 1.5% of the total trading value, while consumer staples sector ranked eighth, with 1.3% and AED 626 million value, and finally services sector ranked ninth with 0.8% trading rate and AED 384 million trading value.
Real Estate
Banks
Telecommunication
Energy
Insurance
Industrial
Investment & Financial Services
Consumer Staples
Services
35%
0.8%
31.5%
19.5%
4.7%
2.1%3.5%
1.5%1.3%
34 35Annual Report 2016
Sector Performance by Volume Trades
Real Estate
Energy
Banks
Insurance
Telecommunication
Investment & Financial Services
Industrial
Consumer Staples
Services
Real Estate
Banks
Telecommunication
Energy
Insurance
Investment & Financial Services
Industrial
Consumer Staples
Services
59.6%
0.5%0.4%
16.6%
10.1%
6.8%
2.7%
1.4%2.0%
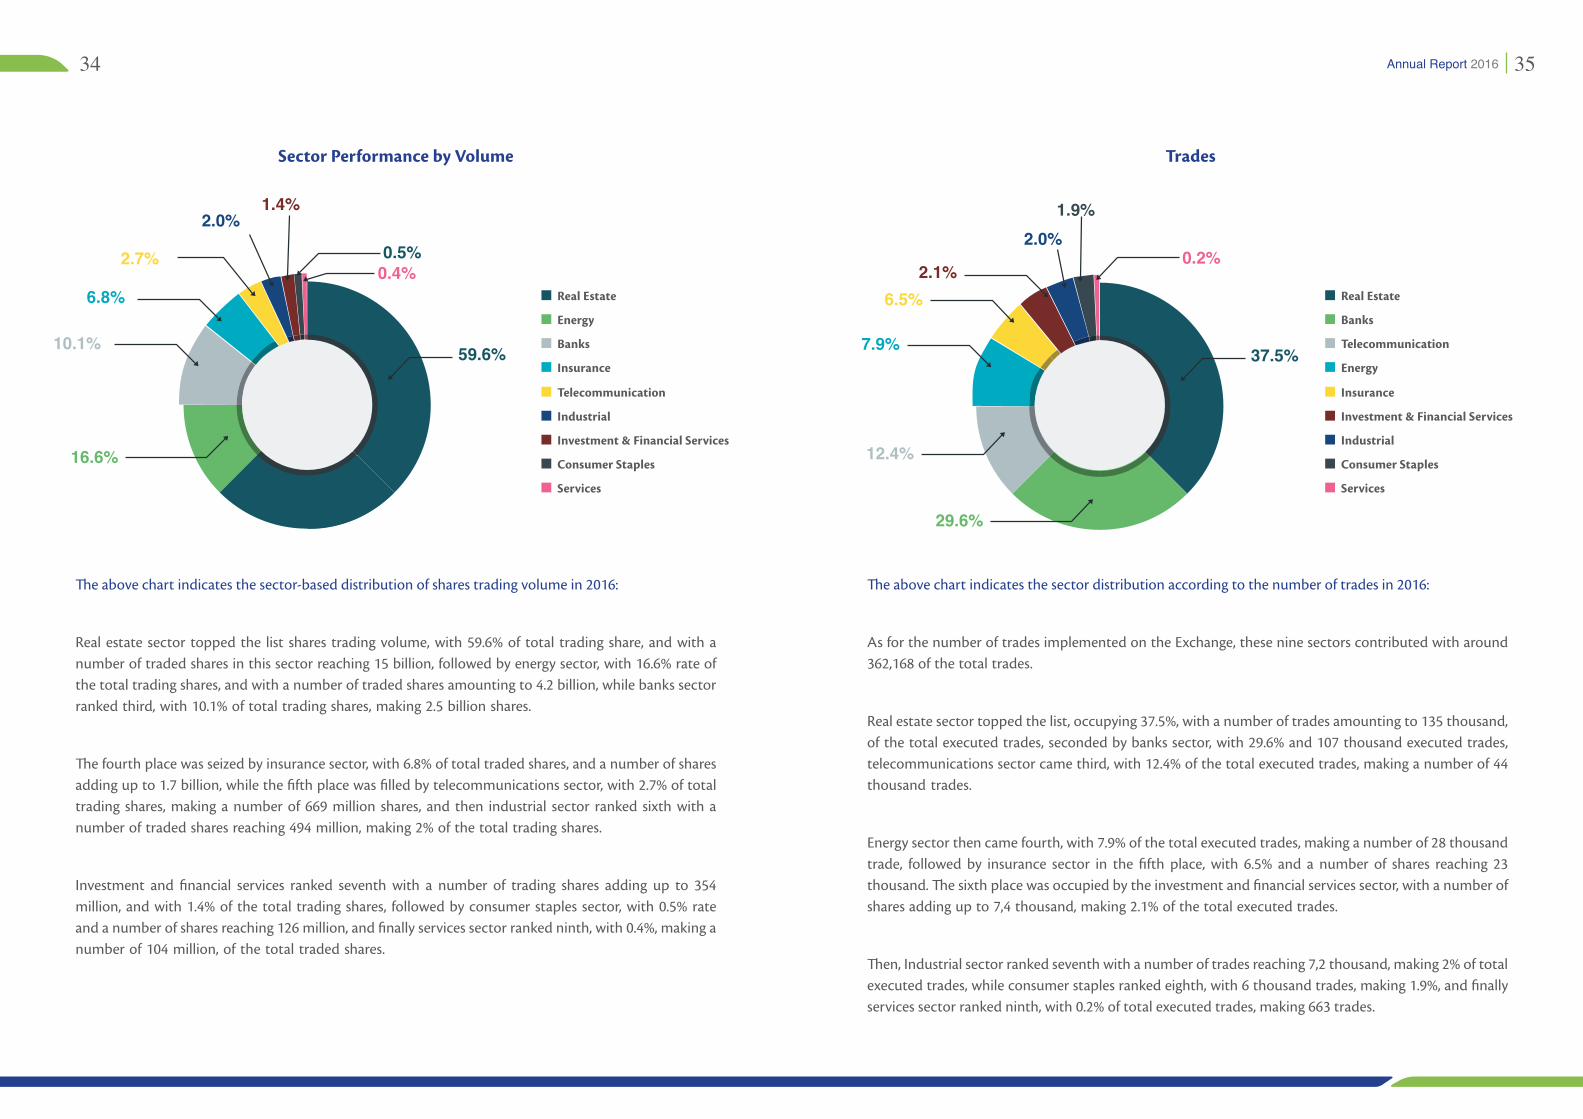
The above chart indicates the sector-based distribution of shares trading volume in 2016:
Real estate sector topped the list shares trading volume, with 59.6% of total trading share, and with a number of traded shares in this sector reaching 15 billion, followed by energy sector, with 16.6% rate of the total trading shares, and with a number of traded shares amounting to 4.2 billion, while banks sector ranked third, with 10.1% of total trading shares, making 2.5 billion shares.
The fourth place was seized by insurance sector, with 6.8% of total traded shares, and a number of shares adding up to 1.7 billion, while the fifth place was filled by telecommunications sector, with 2.7% of total trading shares, making a number of 669 million shares, and then industrial sector ranked sixth with a number of traded shares reaching 494 million, making 2% of the total trading shares.
Investment and financial services ranked seventh with a number of trading shares adding up to 354 million, and with 1.4% of the total trading shares, followed by consumer staples sector, with 0.5% rate and a number of shares reaching 126 million, and finally services sector ranked ninth, with 0.4%, making a number of 104 million, of the total traded shares.
The above chart indicates the sector distribution according to the number of trades in 2016:
As for the number of trades implemented on the Exchange, these nine sectors contributed with around 362,168 of the total trades.
Real estate sector topped the list, occupying 37.5%, with a number of trades amounting to 135 thousand, of the total executed trades, seconded by banks sector, with 29.6% and 107 thousand executed trades, telecommunications sector came third, with 12.4% of the total executed trades, making a number of 44 thousand trades.
Energy sector then came fourth, with 7.9% of the total executed trades, making a number of 28 thousand trade, followed by insurance sector in the fifth place, with 6.5% and a number of shares reaching 23 thousand. The sixth place was occupied by the investment and financial services sector, with a number of shares adding up to 7,4 thousand, making 2.1% of the total executed trades.
Then, Industrial sector ranked seventh with a number of trades reaching 7,2 thousand, making 2% of total executed trades, while consumer staples ranked eighth, with 6 thousand trades, making 1.9%, and finally services sector ranked ninth, with 0.2% of total executed trades, making 663 trades.
37.5%
0.2%
29.6%
12.4%
7.9%
6.5%2.1%
2.0%1.9%
36 37Annual Report 2016
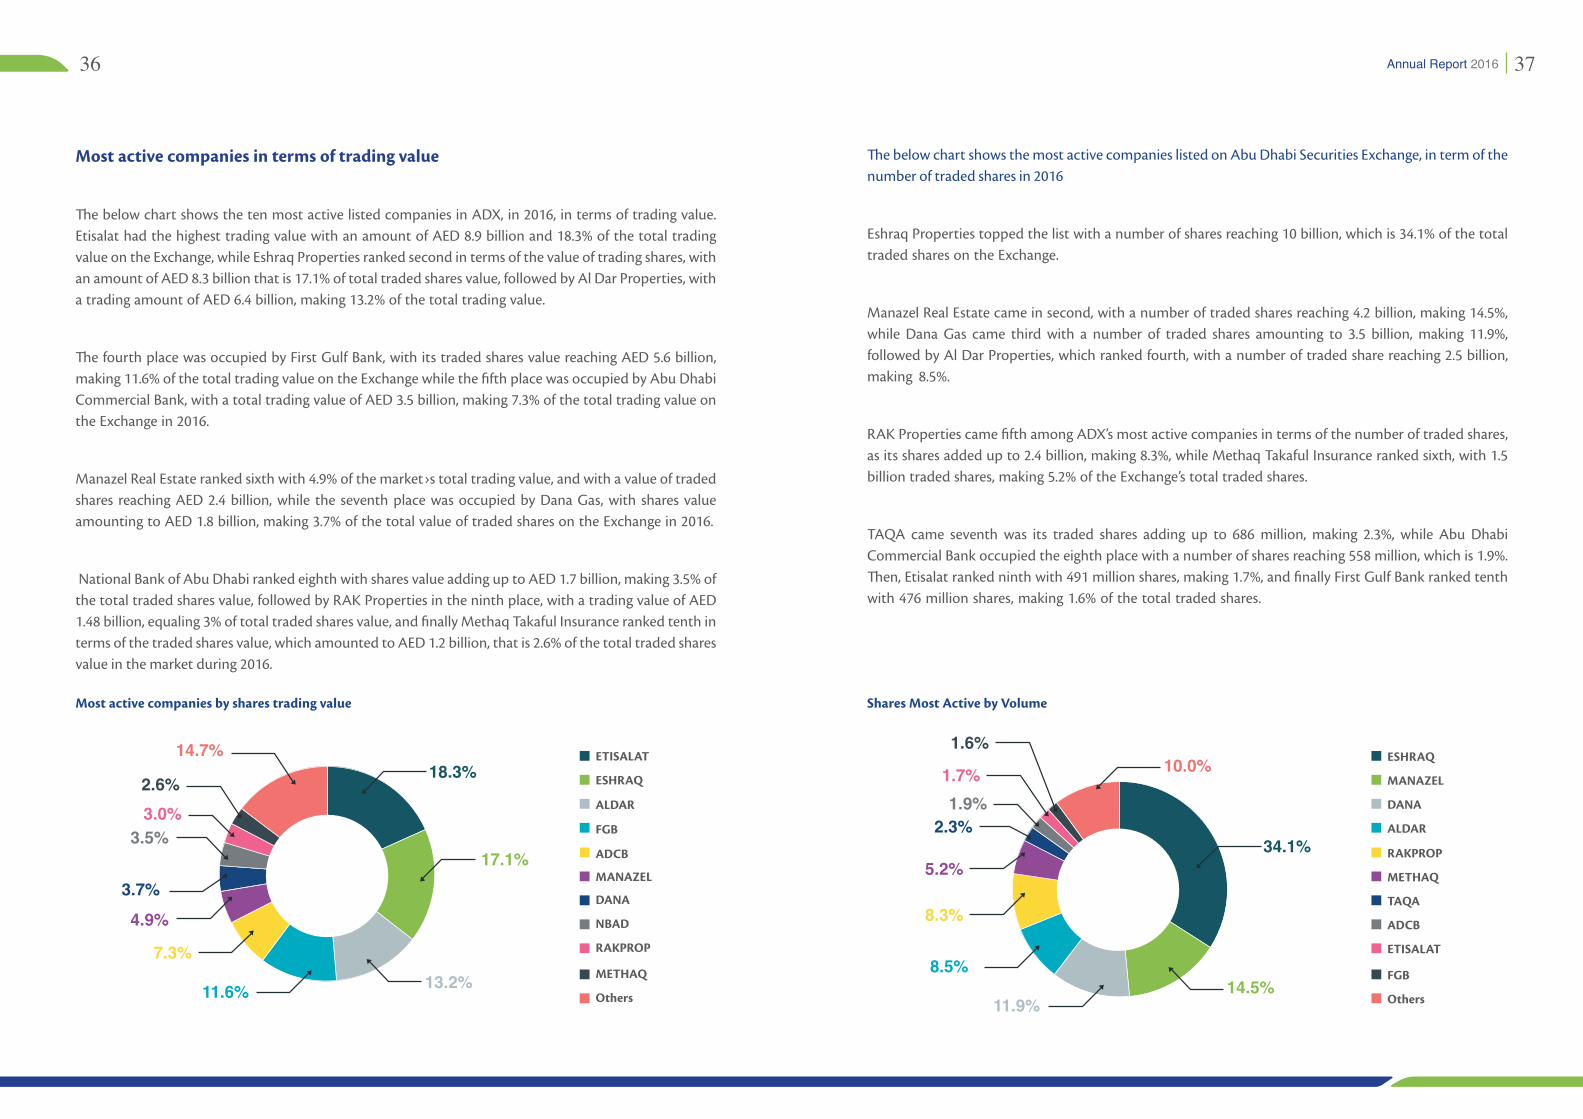
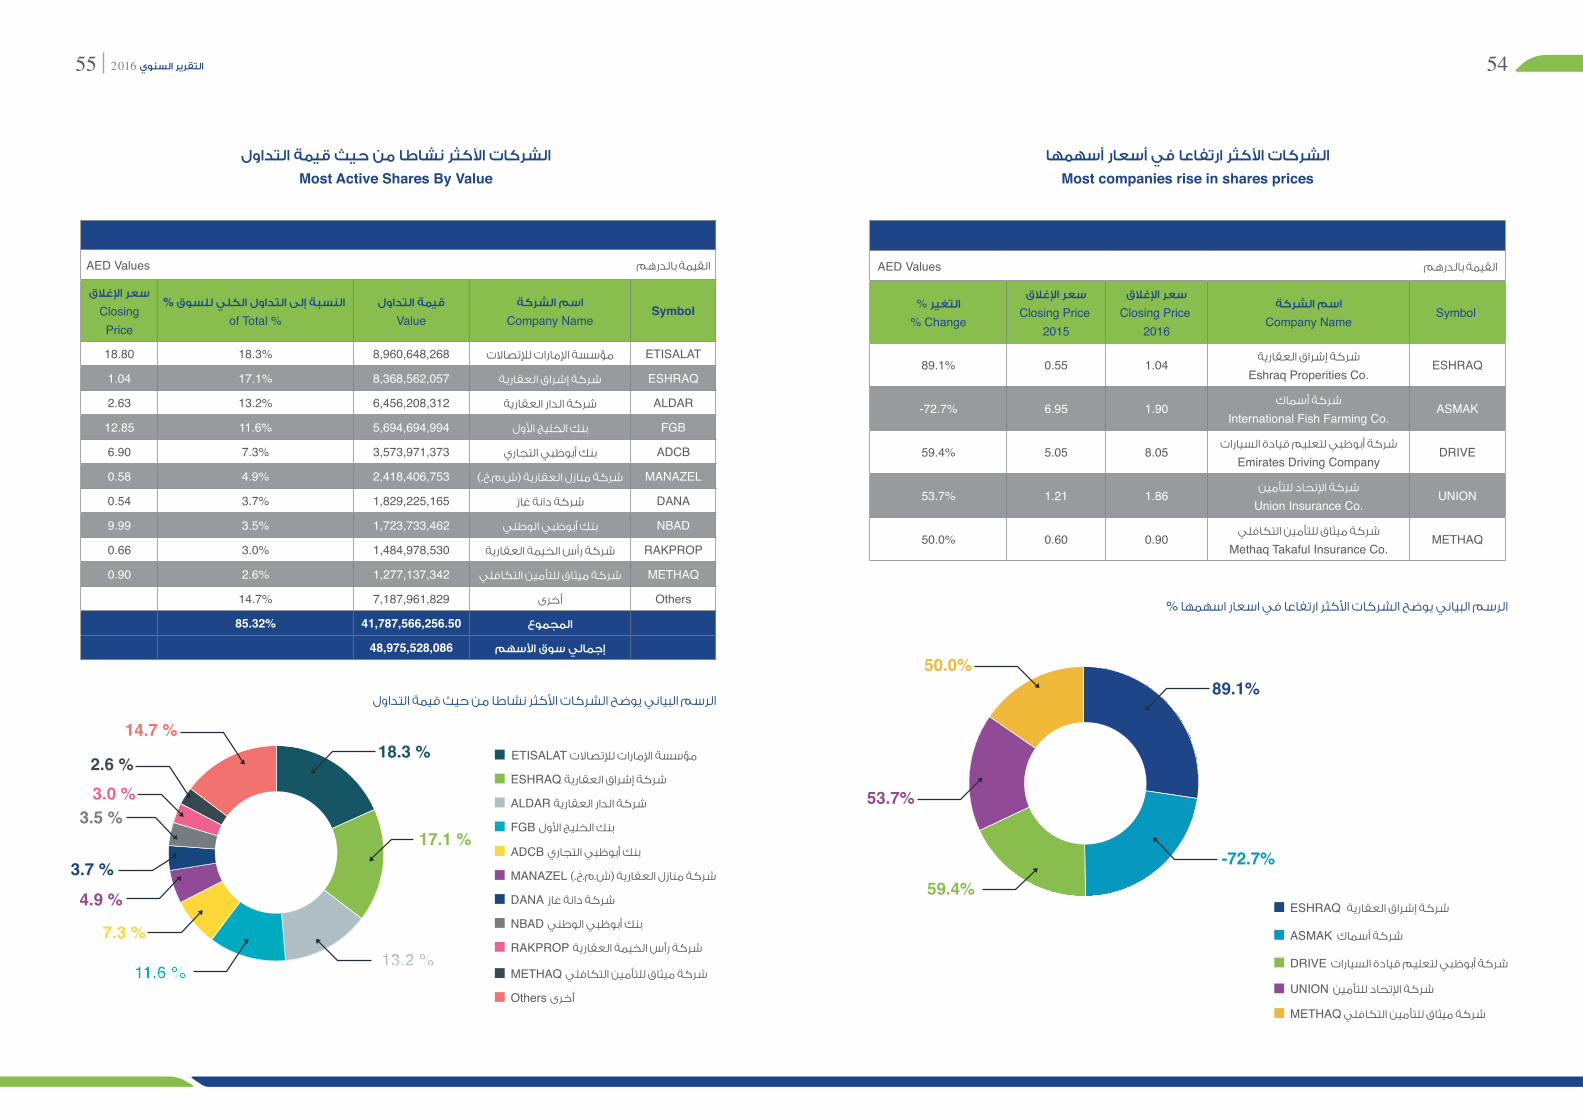
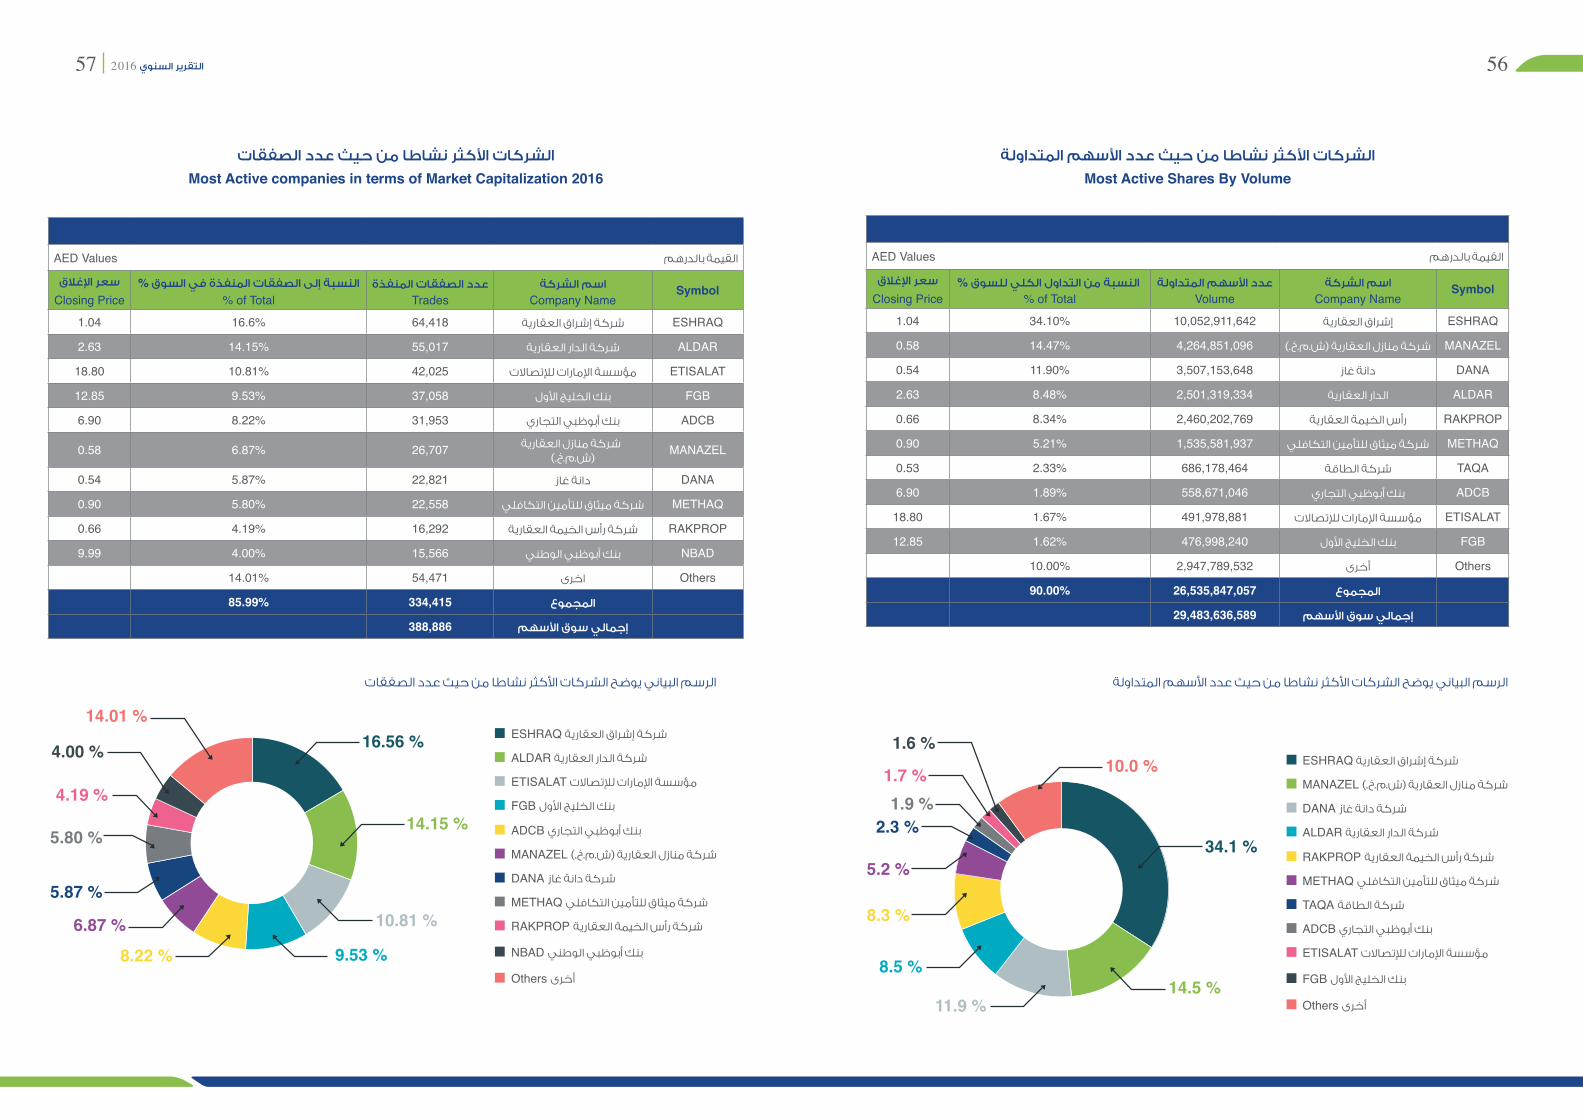
Most active companies in terms of trading value
The below chart shows the ten most active listed companies in ADX, in 2016, in terms of trading value. Etisalat had the highest trading value with an amount of AED 8.9 billion and 18.3% of the total trading value on the Exchange, while Eshraq Properties ranked second in terms of the value of trading shares, with an amount of AED 8.3 billion that is 17.1% of total traded shares value, followed by Al Dar Properties, with a trading amount of AED 6.4 billion, making 13.2% of the total trading value.
The fourth place was occupied by First Gulf Bank, with its traded shares value reaching AED 5.6 billion, making 11.6% of the total trading value on the Exchange while the fifth place was occupied by Abu Dhabi Commercial Bank, with a total trading value of AED 3.5 billion, making 7.3% of the total trading value on the Exchange in 2016.
Manazel Real Estate ranked sixth with 4.9% of the market›s total trading value, and with a value of traded shares reaching AED 2.4 billion, while the seventh place was occupied by Dana Gas, with shares value amounting to AED 1.8 billion, making 3.7% of the total value of traded shares on the Exchange in 2016.
National Bank of Abu Dhabi ranked eighth with shares value adding up to AED 1.7 billion, making 3.5% of the total traded shares value, followed by RAK Properties in the ninth place, with a trading value of AED 1.48 billion, equaling 3% of total traded shares value, and finally Methaq Takaful Insurance ranked tenth in terms of the traded shares value, which amounted to AED 1.2 billion, that is 2.6% of the total traded shares value in the market during 2016.
The below chart shows the most active companies listed on Abu Dhabi Securities Exchange, in term of the number of traded shares in 2016
Eshraq Properties topped the list with a number of shares reaching 10 billion, which is 34.1% of the total traded shares on the Exchange.
Manazel Real Estate came in second, with a number of traded shares reaching 4.2 billion, making 14.5%, while Dana Gas came third with a number of traded shares amounting to 3.5 billion, making 11.9%, followed by Al Dar Properties, which ranked fourth, with a number of traded share reaching 2.5 billion, making 8.5%.
RAK Properties came fifth among ADX’s most active companies in terms of the number of traded shares, as its shares added up to 2.4 billion, making 8.3%, while Methaq Takaful Insurance ranked sixth, with 1.5 billion traded shares, making 5.2% of the Exchange’s total traded shares.
TAQA came seventh was its traded shares adding up to 686 million, making 2.3%, while Abu Dhabi Commercial Bank occupied the eighth place with a number of shares reaching 558 million, which is 1.9%. Then, Etisalat ranked ninth with 491 million shares, making 1.7%, and finally First Gulf Bank ranked tenth with 476 million shares, making 1.6% of the total traded shares.
Most active companies by shares trading value Shares Most Active by Volume
17.1%
13.2%11.6%
7.3%
4.9%3.7%
3.5%3.0%2.6%
14.7%18.3%
ETISALAT
ESHRAQ
ALDAR
FGB
ADCB
MANAZEL
DANA
NBAD
METHAQ
RAKPROP
Others
ESHRAQ
MANAZEL
DANA
ALDAR
RAKPROP
METHAQ
TAQA
ADCB
FGB
ETISALAT
Others14.5%
11.9%
8.5%
8.3%
5.2%
2.3%1.9%
1.7%
1.6%10.0%
34.1%
38 39Annual Report 2016
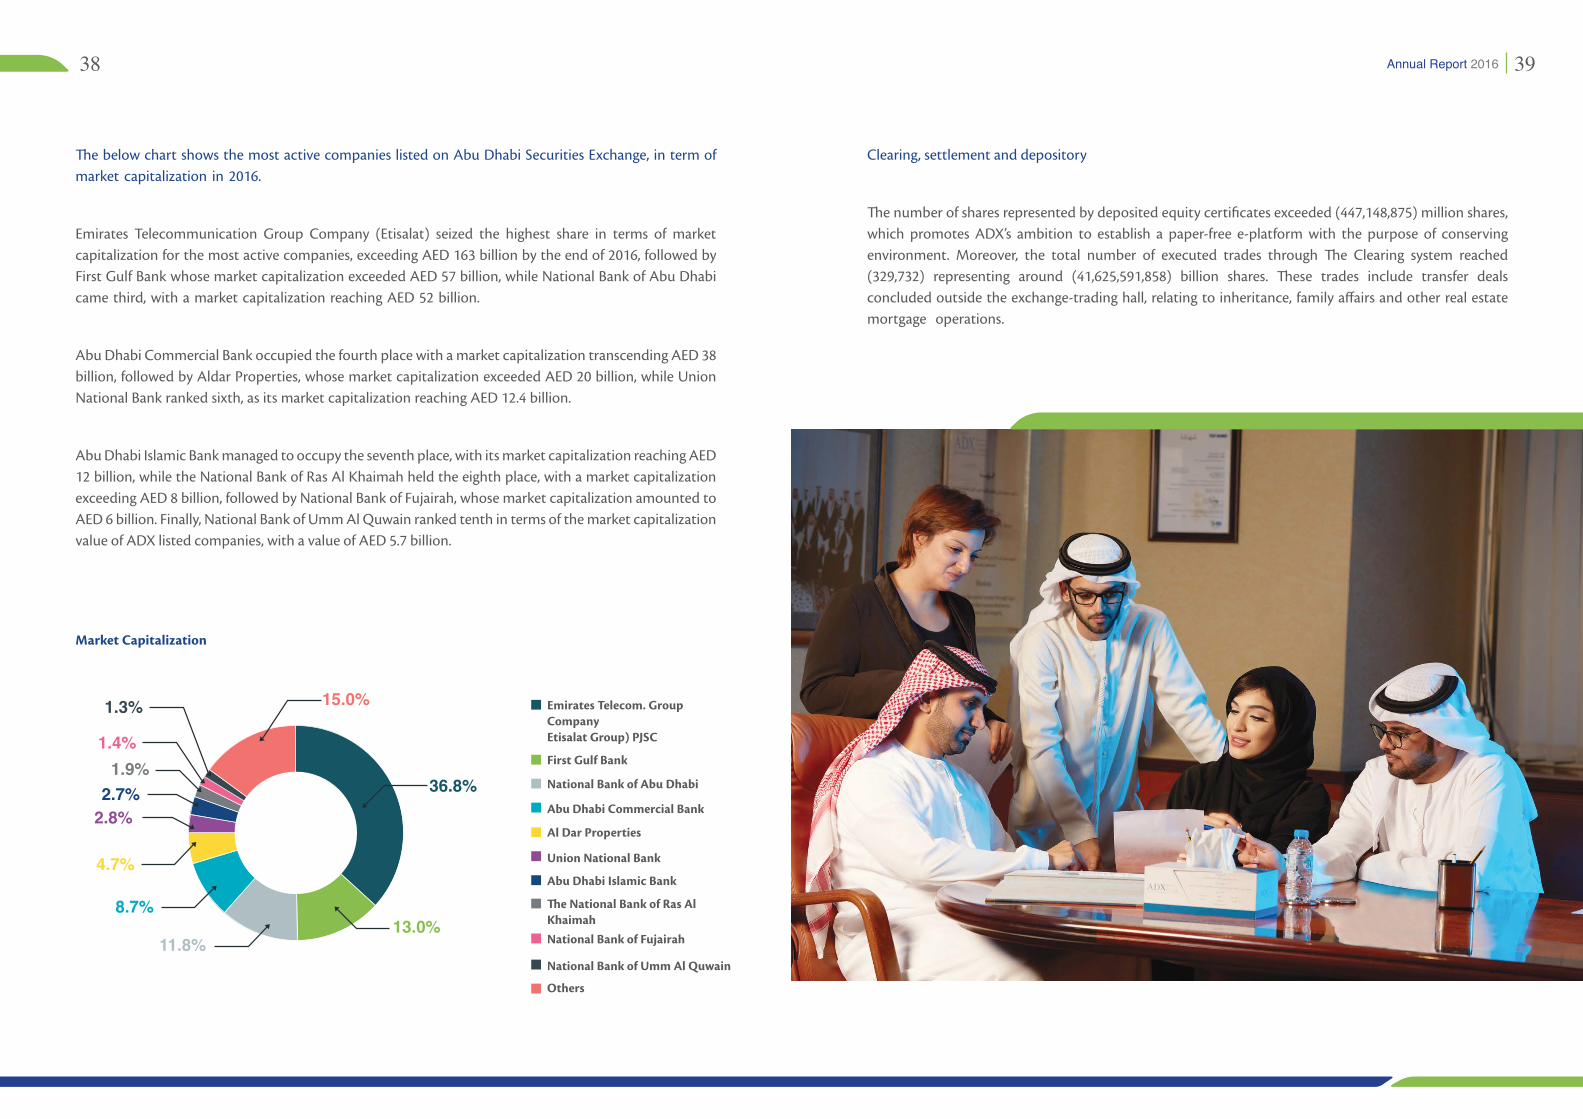
The below chart shows the most active companies listed on Abu Dhabi Securities Exchange, in term of market capitalization in 2016.
Emirates Telecommunication Group Company (Etisalat) seized the highest share in terms of market capitalization for the most active companies, exceeding AED 163 billion by the end of 2016, followed by First Gulf Bank whose market capitalization exceeded AED 57 billion, while National Bank of Abu Dhabi came third, with a market capitalization reaching AED 52 billion.
Abu Dhabi Commercial Bank occupied the fourth place with a market capitalization transcending AED 38 billion, followed by Aldar Properties, whose market capitalization exceeded AED 20 billion, while Union National Bank ranked sixth, as its market capitalization reaching AED 12.4 billion.
Abu Dhabi Islamic Bank managed to occupy the seventh place, with its market capitalization reaching AED 12 billion, while the National Bank of Ras Al Khaimah held the eighth place, with a market capitalization exceeding AED 8 billion, followed by National Bank of Fujairah, whose market capitalization amounted to AED 6 billion. Finally, National Bank of Umm Al Quwain ranked tenth in terms of the market capitalization value of ADX listed companies, with a value of AED 5.7 billion.
Clearing, settlement and depository
The number of shares represented by deposited equity certificates exceeded (447,148,875) million shares, which promotes ADX’s ambition to establish a paper-free e-platform with the purpose of conserving environment. Moreover, the total number of executed trades through The Clearing system reached (329,732) representing around (41,625,591,858) billion shares. These trades include transfer deals concluded outside the exchange-trading hall, relating to inheritance, family affairs and other real estate mortgage operations.
13.0%11.8%
8.7%
4.7%
2.8%2.7%
1.9%1.4%
1.3% 15.0%
36.8%
Emirates Telecom. GroupCompanyEtisalat Group) PJSC
National Bank of Abu Dhabi
First Gulf Bank
Abu Dhabi Commercial Bank
Al Dar Properties
Union National Bank
Abu Dhabi Islamic Bank
The National Bank of Ras AlKhaimahNational Bank of Fujairah
National Bank of Umm Al Quwain
Others
Market Capitalization
Definitions &Financial Ratios
42 43Annual Report 2016
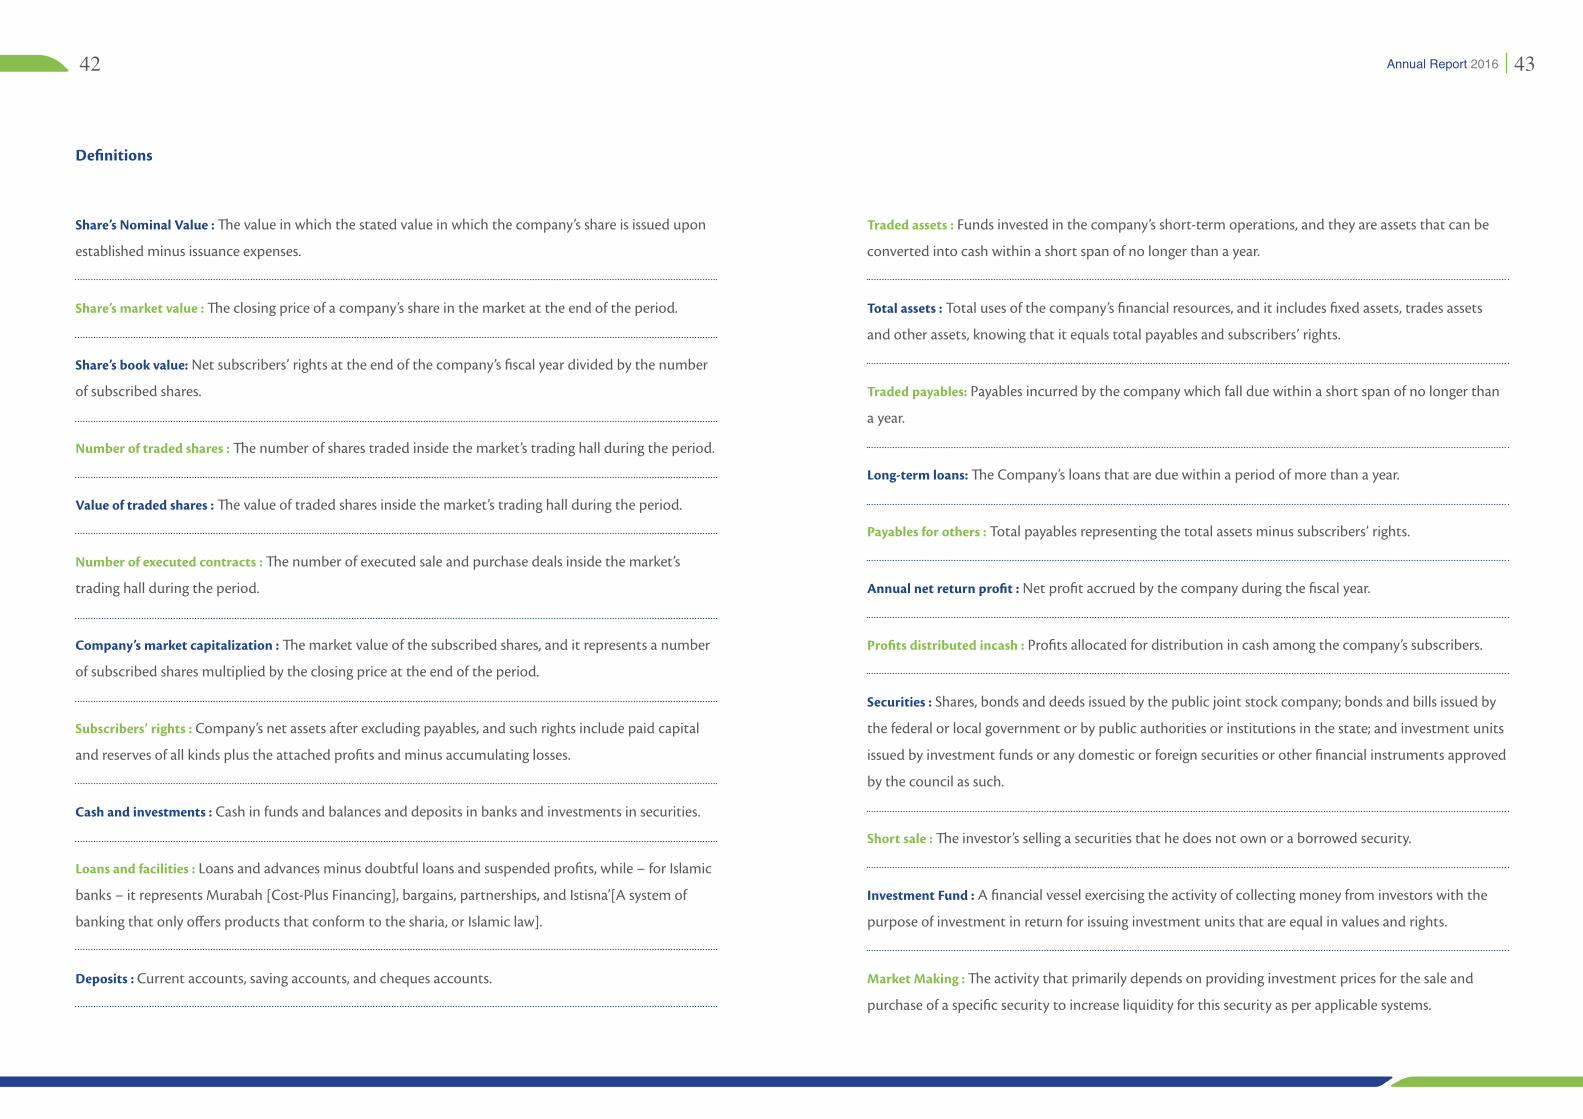
Definitions
Share’s Nominal Value : The value in which the stated value in which the company’s share is issued upon
established minus issuance expenses.
Share’s market value : The closing price of a company’s share in the market at the end of the period.
Share’s book value: Net subscribers’ rights at the end of the company’s fiscal year divided by the number
of subscribed shares.
Number of traded shares : The number of shares traded inside the market’s trading hall during the period.
Value of traded shares : The value of traded shares inside the market’s trading hall during the period.
Number of executed contracts : The number of executed sale and purchase deals inside the market’s
trading hall during the period.
Company’s market capitalization : The market value of the subscribed shares, and it represents a number
of subscribed shares multiplied by the closing price at the end of the period.
Subscribers’ rights : Company’s net assets after excluding payables, and such rights include paid capital
and reserves of all kinds plus the attached profits and minus accumulating losses.
Cash and investments : Cash in funds and balances and deposits in banks and investments in securities.
Loans and facilities : Loans and advances minus doubtful loans and suspended profits, while – for Islamic
banks – it represents Murabah [Cost-Plus Financing], bargains, partnerships, and Istisna’[A system of
banking that only offers products that conform to the sharia, or Islamic law].
Deposits : Current accounts, saving accounts, and cheques accounts.
Traded assets : Funds invested in the company’s short-term operations, and they are assets that can be
converted into cash within a short span of no longer than a year.
Total assets : Total uses of the company’s financial resources, and it includes fixed assets, trades assets
and other assets, knowing that it equals total payables and subscribers’ rights.
Traded payables: Payables incurred by the company which fall due within a short span of no longer than
a year.
Long-term loans: The Company’s loans that are due within a period of more than a year.
Payables for others : Total payables representing the total assets minus subscribers’ rights.
Annual net return profit : Net profit accrued by the company during the fiscal year.
Profits distributed incash : Profits allocated for distribution in cash among the company’s subscribers.
Securities : Shares, bonds and deeds issued by the public joint stock company; bonds and bills issued by
the federal or local government or by public authorities or institutions in the state; and investment units
issued by investment funds or any domestic or foreign securities or other financial instruments approved
by the council as such.
Short sale : The investor’s selling a securities that he does not own or a borrowed security.
Investment Fund : A financial vessel exercising the activity of collecting money from investors with the
purpose of investment in return for issuing investment units that are equal in values and rights.
Market Making : The activity that primarily depends on providing investment prices for the sale and
purchase of a specific security to increase liquidity for this security as per applicable systems.
44 45Annual Report 2016
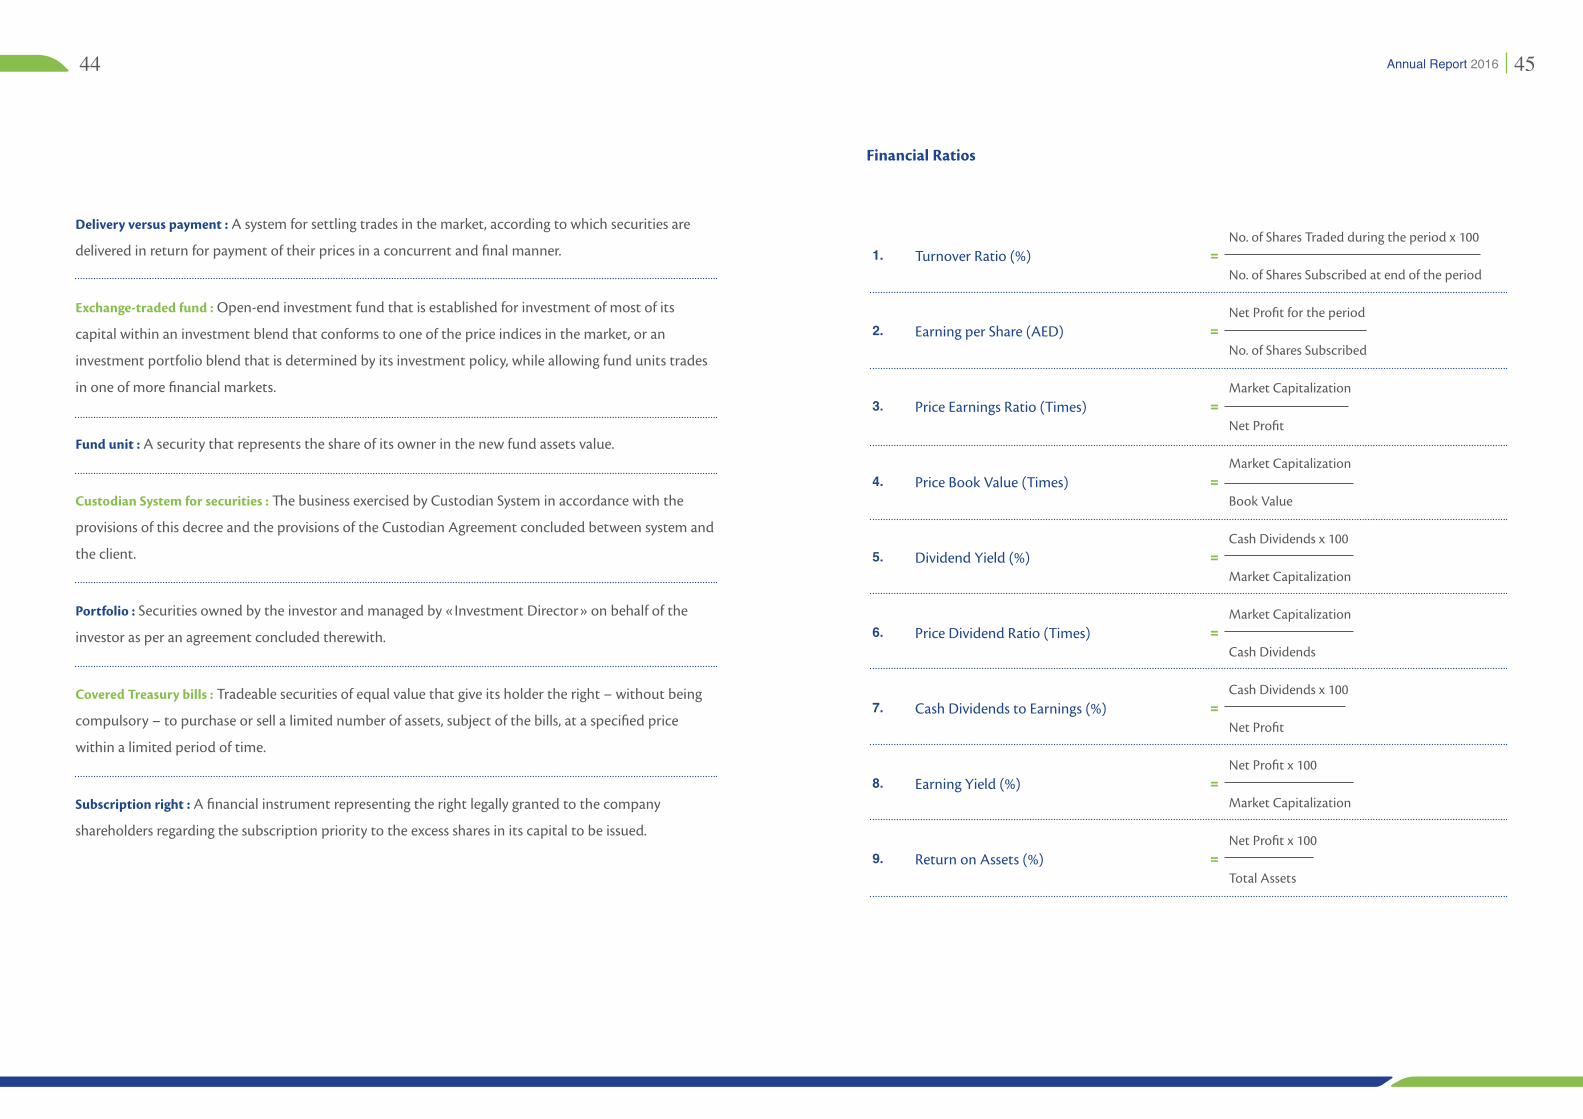
Financial Ratios
1. Turnover Ratio (%) =No. of Shares Traded during the period x 100
No. of Shares Subscribed at end of the period
2. Earning per Share (AED) =Net Profit for the period
No. of Shares Subscribed
3. Price Earnings Ratio (Times) =Market Capitalization
Net Profit
4. Price Book Value (Times) =Market Capitalization
Book Value
5. Dividend Yield (%) =Cash Dividends x 100
Market Capitalization
6. Price Dividend Ratio (Times) =Market Capitalization
Cash Dividends
7. Cash Dividends to Earnings (%) =Cash Dividends x 100
Net Profit
8. Earning Yield (%) =Net Profit x 100
Market Capitalization
9. Return on Assets (%) =Net Profit x 100
Total Assets
Delivery versus payment : A system for settling trades in the market, according to which securities are
delivered in return for payment of their prices in a concurrent and final manner.
Exchange-traded fund : Open-end investment fund that is established for investment of most of its
capital within an investment blend that conforms to one of the price indices in the market, or an
investment portfolio blend that is determined by its investment policy, while allowing fund units trades
in one of more financial markets.
Fund unit : A security that represents the share of its owner in the new fund assets value.
Custodian System for securities : The business exercised by Custodian System in accordance with the
provisions of this decree and the provisions of the Custodian Agreement concluded between system and
the client.
Portfolio : Securities owned by the investor and managed by «Investment Director» on behalf of the
investor as per an agreement concluded therewith.
Covered Treasury bills : Tradeable securities of equal value that give its holder the right – without being
compulsory – to purchase or sell a limited number of assets, subject of the bills, at a specified price
within a limited period of time.
Subscription right : A financial instrument representing the right legally granted to the company
shareholders regarding the subscription priority to the excess shares in its capital to be issued.
46 47Annual Report 2016
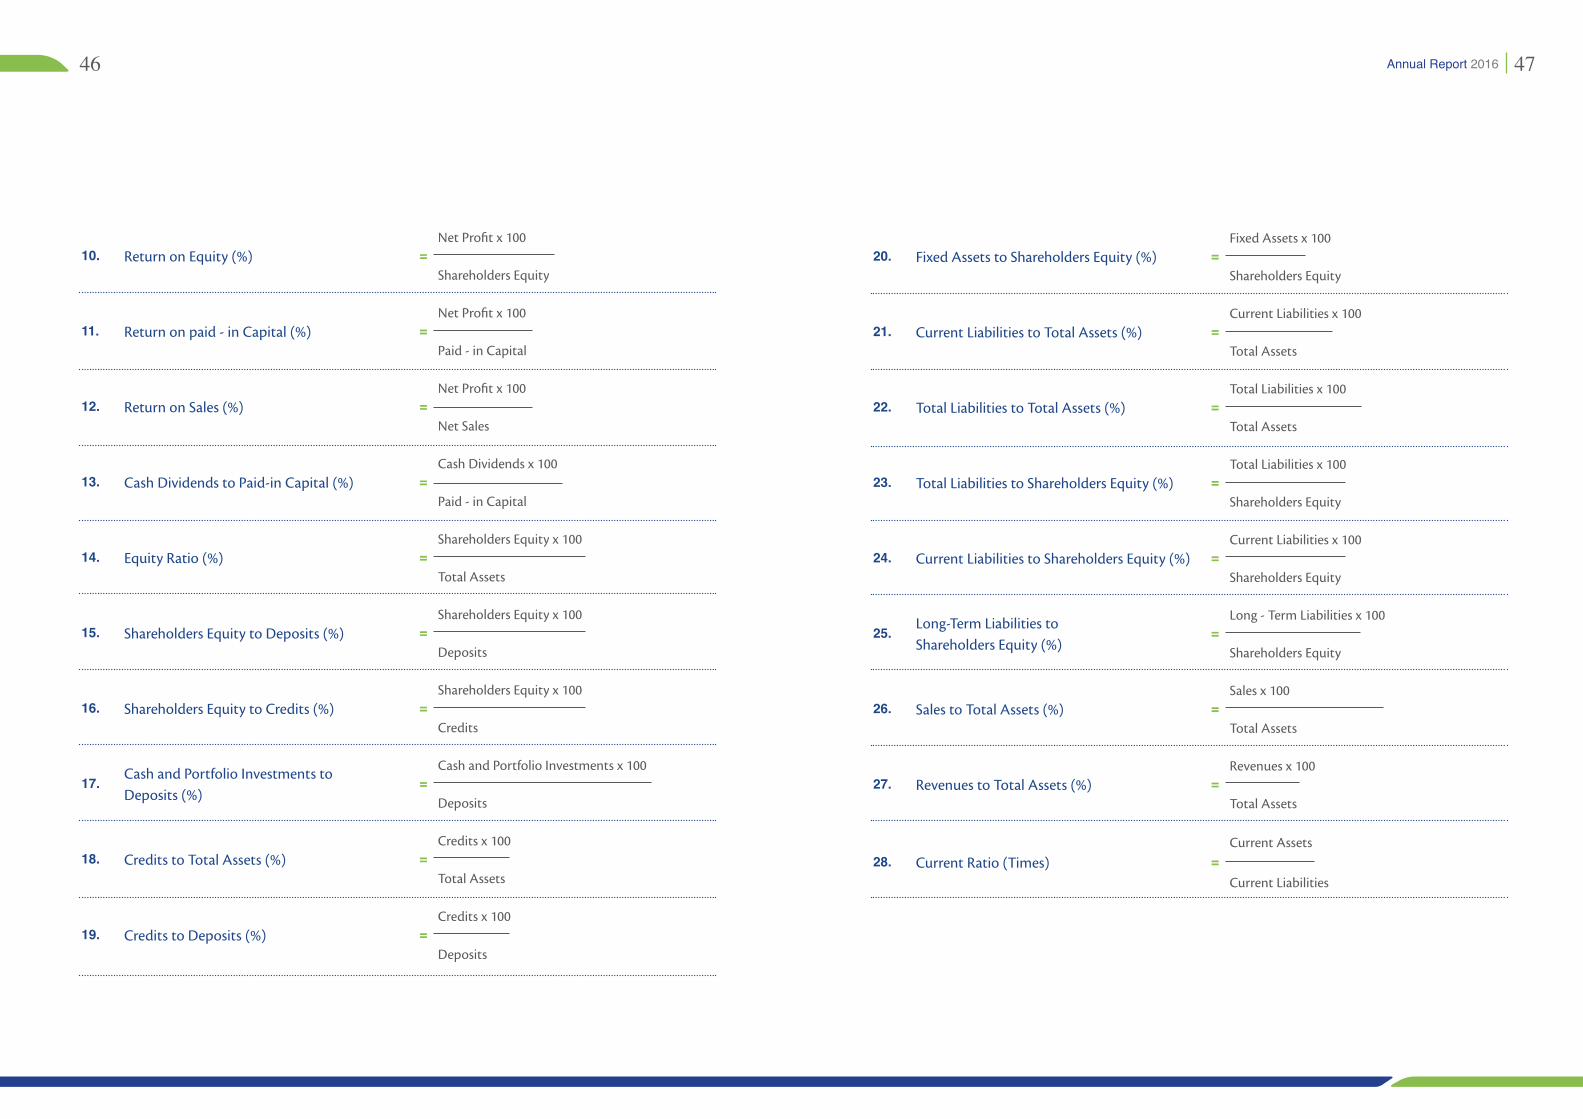
20. Fixed Assets to Shareholders Equity (%) =Fixed Assets x 100
Shareholders Equity
21. Current Liabilities to Total Assets (%) =Current Liabilities x 100
Total Assets
22. Total Liabilities to Total Assets (%) =Total Liabilities x 100
Total Assets
23. Total Liabilities to Shareholders Equity (%) =Total Liabilities x 100
Shareholders Equity
24. Current Liabilities to Shareholders Equity (%) =Current Liabilities x 100
Shareholders Equity
25. Long-Term Liabilities toShareholders Equity (%)
=Long - Term Liabilities x 100
Shareholders Equity
26. Sales to Total Assets (%) =Sales x 100
Total Assets
27. Revenues to Total Assets (%) =Revenues x 100
Total Assets
28. Current Ratio (Times) =Current Assets
Current Liabilities
10. Return on Equity (%) =Net Profit x 100
Shareholders Equity
11. Return on paid - in Capital (%) =Net Profit x 100
Paid - in Capital
12. Return on Sales (%) =Net Profit x 100
Net Sales
13. Cash Dividends to Paid-in Capital (%) =Cash Dividends x 100
Paid - in Capital
14. Equity Ratio (%) =Shareholders Equity x 100
Total Assets
15. Shareholders Equity to Deposits (%) =Shareholders Equity x 100
Deposits
16. Shareholders Equity to Credits (%) =Shareholders Equity x 100
Credits
17. Cash and Portfolio Investments toDeposits (%)
=Cash and Portfolio Investments x 100
Deposits
18. Credits to Total Assets (%) =Credits x 100
Total Assets
19. Credits to Deposits (%) =Credits x 100
Deposits
Statistical Appendix
5051
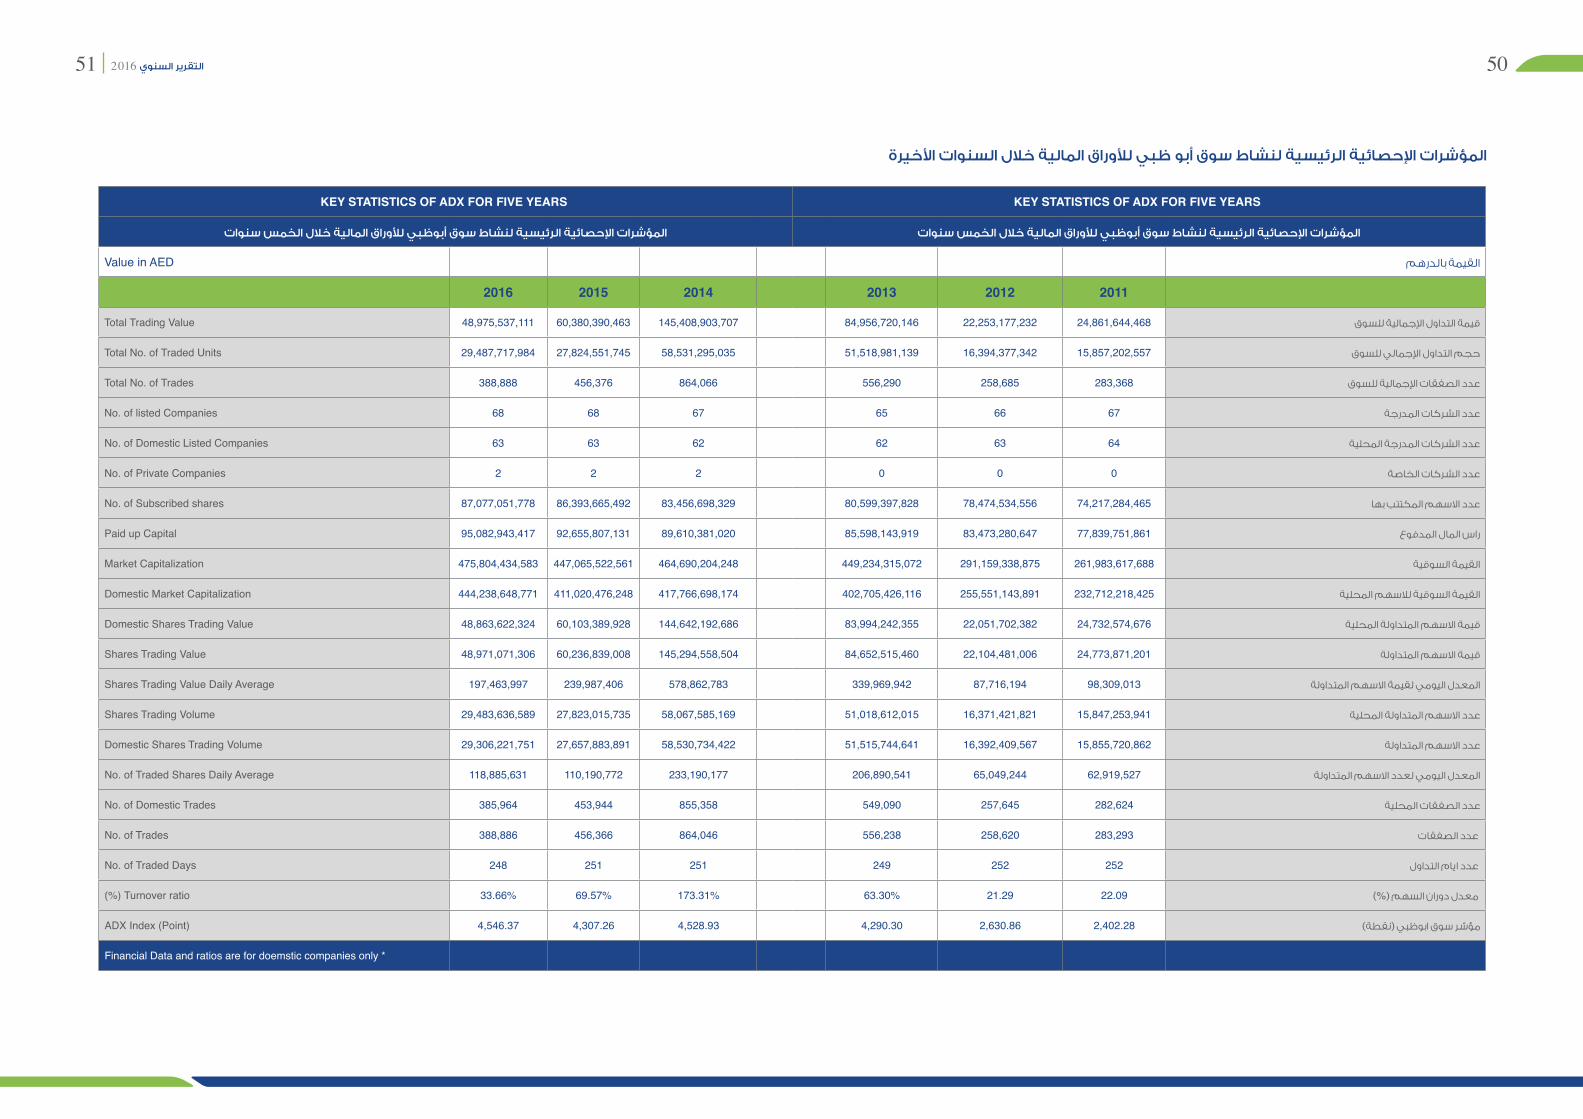
المؤشرات اإلحصايية الرييسية لنشاط سوق أبو ظبي لألوراق المالية خالل السنوات األخيرة
KEY STATISTICS OF ADX FOR FIVE YEARS KEY STATISTICS OF ADX FOR FIVE YEARS
المؤشرات اإلحصايية الرييسية لنشاط سوق أبوظبي لألوراق المالية خالل الخمس سنوات المؤشرات اإلحصايية الرييسية لنشاط سوق أبوظبي لألوراق المالية خالل الخمس سنوات
Value in AED القيمة بالدرهم
2016 2015 2014 2013 2012 2011
Total Trading Value 48,975,537,111 60,380,390,463 145,408,903,707 84,956,720,146 22,253,177,232 24,861,644,468 قيمة التداول اإلجمالية للسوق
Total No. of Traded Units 29,487,717,984 27,824,551,745 58,531,295,035 51,518,981,139 16,394,377,342 15,857,202,557 حجم التداول اإلجمالي للسوق
Total No. of Trades 388,888 456,376 864,066 556,290 258,685 283,368 عدد الصفقات اإلجمالية للسوق
No. of listed Companies 68 68 67 65 66 67 عدد الشركات المدرجة
No. of Domestic Listed Companies 63 63 62 62 63 64 عدد الشركات المدرجة المحلية
No. of Private Companies 2 2 2 0 0 0 عدد الشركات الخاصة
No. of Subscribed shares 87,077,051,778 86,393,665,492 83,456,698,329 80,599,397,828 78,474,534,556 74,217,284,465 عدد االسهم المكتتب بها
Paid up Capital 95,082,943,417 92,655,807,131 89,610,381,020 85,598,143,919 83,473,280,647 77,839,751,861 راس المال المدفوع
Market Capitalization 475,804,434,583 447,065,522,561 464,690,204,248 449,234,315,072 291,159,338,875 261,983,617,688 القيمة السوقية
Domestic Market Capitalization 444,238,648,771 411,020,476,248 417,766,698,174 402,705,426,116 255,551,143,891 232,712,218,425 القيمة السوقية لالسهم المحلية
Domestic Shares Trading Value 48,863,622,324 60,103,389,928 144,642,192,686 83,994,242,355 22,051,702,382 24,732,574,676 قيمة االسهم المتداولة المحلية
Shares Trading Value 48,971,071,306 60,236,839,008 145,294,558,504 84,652,515,460 22,104,481,006 24,773,871,201 قيمة االسهم المتداولة
Shares Trading Value Daily Average 197,463,997 239,987,406 578,862,783 339,969,942 87,716,194 98,309,013 المعدل اليومي لقيمة االسهم المتداولة
Shares Trading Volume 29,483,636,589 27,823,015,735 58,067,585,169 51,018,612,015 16,371,421,821 15,847,253,941 عدد االسهم المتداولة المحلية
Domestic Shares Trading Volume 29,306,221,751 27,657,883,891 58,530,734,422 51,515,744,641 16,392,409,567 15,855,720,862 عدد االسهم المتداولة
No. of Traded Shares Daily Average 118,885,631 110,190,772 233,190,177 206,890,541 65,049,244 62,919,527 المعدل اليومي لعدد االسهم المتداولة
No. of Domestic Trades 385,964 453,944 855,358 549,090 257,645 282,624 عدد الصفقات المحلية
No. of Trades 388,886 456,366 864,046 556,238 258,620 283,293 عدد الصفقات
No. of Traded Days 248 251 251 249 252 252 عدد ايام التداول
)%( Turnover ratio 33.66% 69.57% 173.31% 63.30% 21.29 22.09 معدل دوران السهم )%(
ADX Index )Point( 4,546.37 4,307.26 4,528.93 4,290.30 2,630.86 2,402.28 مؤشر سوق ابوظبي )نقطة(
Financial Data and ratios are for doemstic companies only *
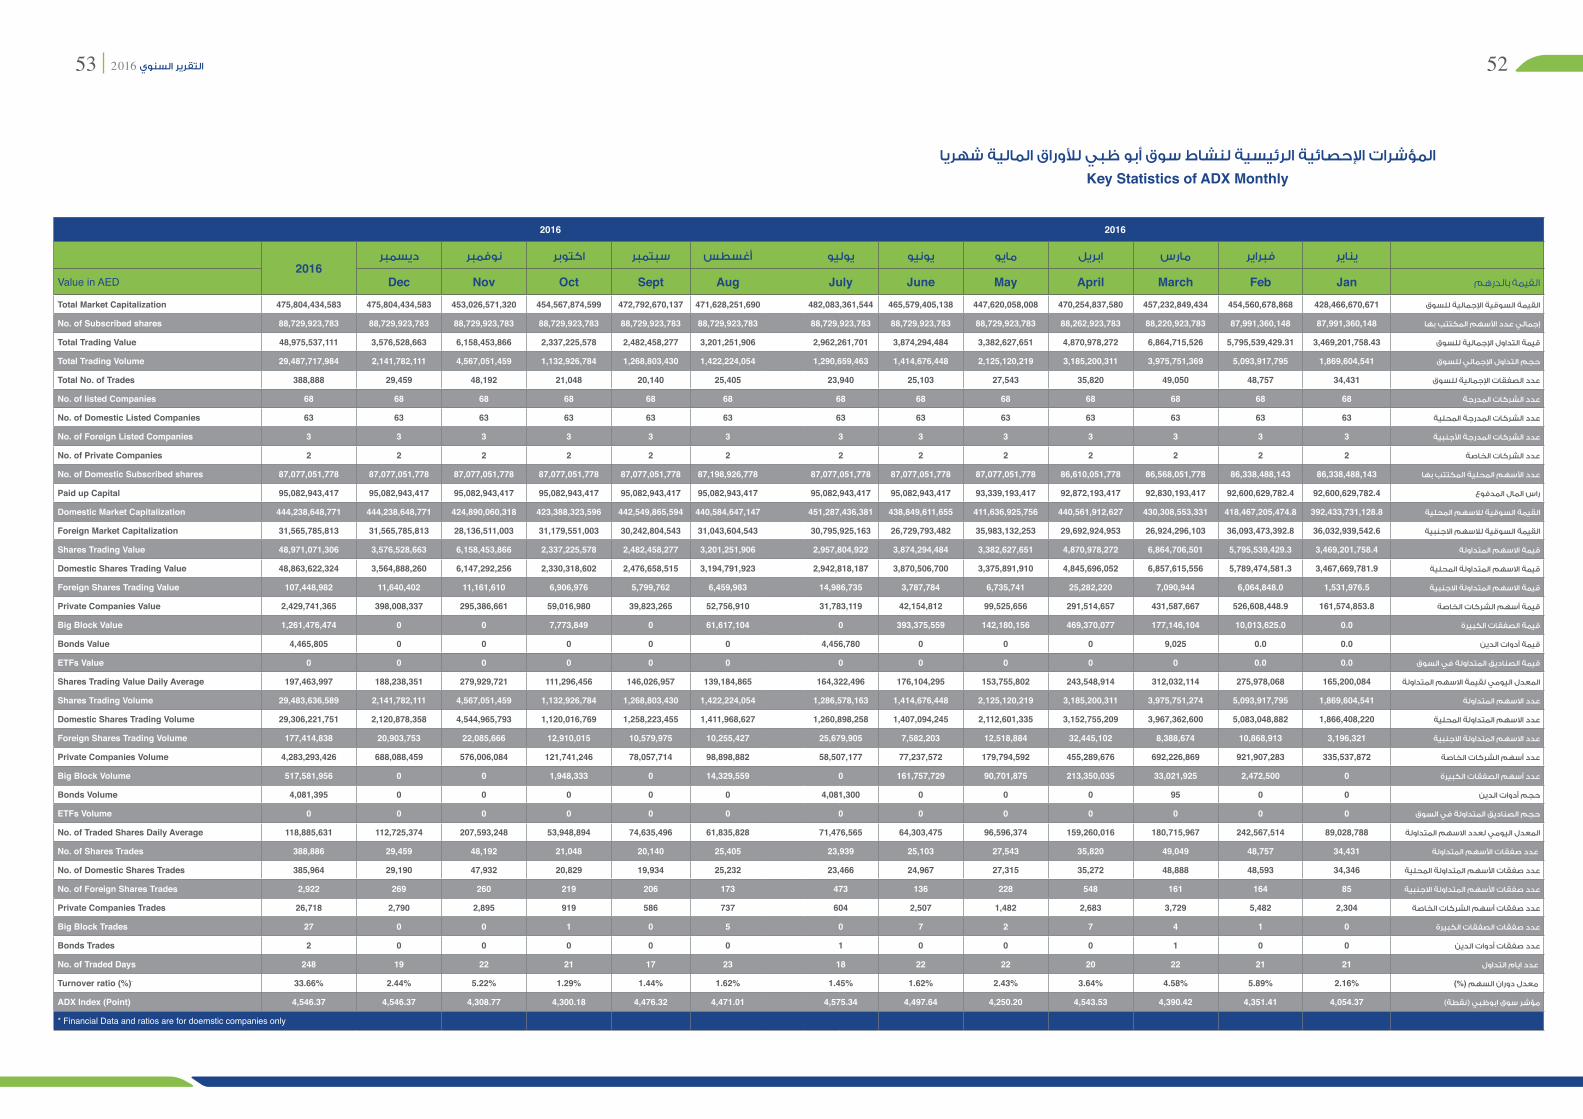
5253
2016 2016
2016ديسمبر نوفمبر اكتوبر سبتمبر أغسطس يوليو يونيو مايو ابريل مارس فبراير يناير
Value in AED Dec Nov Oct Sept Aug July June May April March Feb Jan القيمة بالدرهم
Total Market Capitalization 475,804,434,583 475,804,434,583 453,026,571,320 454,567,874,599 472,792,670,137 471,628,251,690 482,083,361,544 465,579,405,138 447,620,058,008 470,254,837,580 457,232,849,434 454,560,678,868 428,466,670,671 القيمة السوقية اإلجمالية للسوق
No. of Subscribed shares 88,729,923,783 88,729,923,783 88,729,923,783 88,729,923,783 88,729,923,783 88,729,923,783 88,729,923,783 88,729,923,783 88,729,923,783 88,262,923,783 88,220,923,783 87,991,360,148 87,991,360,148 إجمالي عدد األسهم المكتتب بها
Total Trading Value 48,975,537,111 3,576,528,663 6,158,453,866 2,337,225,578 2,482,458,277 3,201,251,906 2,962,261,701 3,874,294,484 3,382,627,651 4,870,978,272 6,864,715,526 5,795,539,429.31 3,469,201,758.43 قيمة التداول اإلجمالية للسوق
Total Trading Volume 29,487,717,984 2,141,782,111 4,567,051,459 1,132,926,784 1,268,803,430 1,422,224,054 1,290,659,463 1,414,676,448 2,125,120,219 3,185,200,311 3,975,751,369 5,093,917,795 1,869,604,541 حجم التداول اإلجمالي للسوق
Total No. of Trades 388,888 29,459 48,192 21,048 20,140 25,405 23,940 25,103 27,543 35,820 49,050 48,757 34,431 عدد الصفقات اإلجمالية للسوق
No. of listed Companies 68 68 68 68 68 68 68 68 68 68 68 68 68 عدد الشركات المدرجة
No. of Domestic Listed Companies 63 63 63 63 63 63 63 63 63 63 63 63 63 عدد الشركات المدرجة المحلية
No. of Foreign Listed Companies 3 3 3 3 3 3 3 3 3 3 3 3 3 عدد الشركات المدرجة األجنبية
No. of Private Companies 2 2 2 2 2 2 2 2 2 2 2 2 2 عدد الشركات الخاصة
No. of Domestic Subscribed shares 87,077,051,778 87,077,051,778 87,077,051,778 87,077,051,778 87,077,051,778 87,198,926,778 87,077,051,778 87,077,051,778 87,077,051,778 86,610,051,778 86,568,051,778 86,338,488,143 86,338,488,143 عدد األسهم المحلية المكتتب بها
Paid up Capital 95,082,943,417 95,082,943,417 95,082,943,417 95,082,943,417 95,082,943,417 95,082,943,417 95,082,943,417 95,082,943,417 93,339,193,417 92,872,193,417 92,830,193,417 92,600,629,782.4 92,600,629,782.4 راس المال المدفوع
Domestic Market Capitalization 444,238,648,771 444,238,648,771 424,890,060,318 423,388,323,596 442,549,865,594 440,584,647,147 451,287,436,381 438,849,611,655 411,636,925,756 440,561,912,627 430,308,553,331 418,467,205,474.8 392,433,731,128.8 القيمة السوقية لالسهم المحلية
Foreign Market Capitalization 31,565,785,813 31,565,785,813 28,136,511,003 31,179,551,003 30,242,804,543 31,043,604,543 30,795,925,163 26,729,793,482 35,983,132,253 29,692,924,953 26,924,296,103 36,093,473,392.8 36,032,939,542.6 القيمة السوقية لالسهم االجنبية
Shares Trading Value 48,971,071,306 3,576,528,663 6,158,453,866 2,337,225,578 2,482,458,277 3,201,251,906 2,957,804,922 3,874,294,484 3,382,627,651 4,870,978,272 6,864,706,501 5,795,539,429.3 3,469,201,758.4 قيمة االسهم المتداولة
Domestic Shares Trading Value 48,863,622,324 3,564,888,260 6,147,292,256 2,330,318,602 2,476,658,515 3,194,791,923 2,942,818,187 3,870,506,700 3,375,891,910 4,845,696,052 6,857,615,556 5,789,474,581.3 3,467,669,781.9 قيمة االسهم المتداولة المحلية
Foreign Shares Trading Value 107,448,982 11,640,402 11,161,610 6,906,976 5,799,762 6,459,983 14,986,735 3,787,784 6,735,741 25,282,220 7,090,944 6,064,848.0 1,531,976.5 قيمة االسهم المتداولة االجنبية
Private Companies Value 2,429,741,365 398,008,337 295,386,661 59,016,980 39,823,265 52,756,910 31,783,119 42,154,812 99,525,656 291,514,657 431,587,667 526,608,448.9 161,574,853.8 قيمة أسهم الشركات الخاصة
Big Block Value 1,261,476,474 0 0 7,773,849 0 61,617,104 0 393,375,559 142,180,156 469,370,077 177,146,104 10,013,625.0 0.0 قيمة الصفقات الكبيرة
Bonds Value 4,465,805 0 0 0 0 0 4,456,780 0 0 0 9,025 0.0 0.0 قيمة أدوات الدين
ETFs Value 0 0 0 0 0 0 0 0 0 0 0 0.0 0.0 قيمة الصناديق المتداولة في السوق
Shares Trading Value Daily Average 197,463,997 188,238,351 279,929,721 111,296,456 146,026,957 139,184,865 164,322,496 176,104,295 153,755,802 243,548,914 312,032,114 275,978,068 165,200,084 المعدل اليومي لقيمة االسهم المتداولة
Shares Trading Volume 29,483,636,589 2,141,782,111 4,567,051,459 1,132,926,784 1,268,803,430 1,422,224,054 1,286,578,163 1,414,676,448 2,125,120,219 3,185,200,311 3,975,751,274 5,093,917,795 1,869,604,541 عدد االسهم المتداولة
Domestic Shares Trading Volume 29,306,221,751 2,120,878,358 4,544,965,793 1,120,016,769 1,258,223,455 1,411,968,627 1,260,898,258 1,407,094,245 2,112,601,335 3,152,755,209 3,967,362,600 5,083,048,882 1,866,408,220 عدد االسهم المتداولة المحلية
Foreign Shares Trading Volume 177,414,838 20,903,753 22,085,666 12,910,015 10,579,975 10,255,427 25,679,905 7,582,203 12,518,884 32,445,102 8,388,674 10,868,913 3,196,321 عدد االسهم المتداولة االجنبية
Private Companies Volume 4,283,293,426 688,088,459 576,006,084 121,741,246 78,057,714 98,898,882 58,507,177 77,237,572 179,794,592 455,289,676 692,226,869 921,907,283 335,537,872 عدد أسهم الشركات الخاصة
Big Block Volume 517,581,956 0 0 1,948,333 0 14,329,559 0 161,757,729 90,701,875 213,350,035 33,021,925 2,472,500 0 عدد أسهم الصفقات الكبيرة
Bonds Volume 4,081,395 0 0 0 0 0 4,081,300 0 0 0 95 0 0 حجم أدوات الدين
ETFs Volume 0 0 0 0 0 0 0 0 0 0 0 0 0 حجم الصناديق المتداولة في السوق
No. of Traded Shares Daily Average 118,885,631 112,725,374 207,593,248 53,948,894 74,635,496 61,835,828 71,476,565 64,303,475 96,596,374 159,260,016 180,715,967 242,567,514 89,028,788 المعدل اليومي لعدد االسهم المتداولة
No. of Shares Trades 388,886 29,459 48,192 21,048 20,140 25,405 23,939 25,103 27,543 35,820 49,049 48,757 34,431 عدد صفقات األسهم المتداولة
No. of Domestic Shares Trades 385,964 29,190 47,932 20,829 19,934 25,232 23,466 24,967 27,315 35,272 48,888 48,593 34,346 عدد صفقات األسهم المتداولة المحلية
No. of Foreign Shares Trades 2,922 269 260 219 206 173 473 136 228 548 161 164 85 عدد صفقات األسهم المتداولة االجنبية
Private Companies Trades 26,718 2,790 2,895 919 586 737 604 2,507 1,482 2,683 3,729 5,482 2,304 عدد صفقات أسهم الشركات الخاصة
Big Block Trades 27 0 0 1 0 5 0 7 2 7 4 1 0 عدد صفقات الصفقات الكبيرة
Bonds Trades 2 0 0 0 0 0 1 0 0 0 1 0 0 عدد صفقات أدوات الدين
No. of Traded Days 248 19 22 21 17 23 18 22 22 20 22 21 21 عدد ايام التداول
Turnover ratio )%( 33.66% 2.44% 5.22% 1.29% 1.44% 1.62% 1.45% 1.62% 2.43% 3.64% 4.58% 5.89% 2.16% معدل دوران السهم )%(
ADX Index )Point( 4,546.37 4,546.37 4,308.77 4,300.18 4,476.32 4,471.01 4,575.34 4,497.64 4,250.20 4,543.53 4,390.42 4,351.41 4,054.37 مؤشر سوق ابوظبي )نقطة(
* Financial Data and ratios are for doemstic companies only
المؤشرات اإلحصايية الرييسية لنشاط سوق أبو ظبي لألوراق المالية شهرياKey Statistics of ADX Monthly
5455
الشركات األكثر نشاطا من حيث قيمة التداول الشركات األكثر ارتفاعا في أسعار أسهمها
AED Values القيمة بالدرهم
Symbol اسم الشركة
Company Name
سعر اإلغالق Closing Price
2016
سعر اإلغالق Closing Price
2015
التغير %% Change
ESHRAQشركة إشراق العقارية
Eshraq Properities Co.1.040.5589.1%
ASMAKشركة أسماك
International Fish Farming Co.1.906.95-72.7%
DRIVEشركة أبوظبي لتعليم قيادة السيارات
Emirates Driving Company8.055.0559.4%
UNIONشركة اإلتحاد للتأمين
Union Insurance Co.1.861.2153.7%
METHAQشركة ميثاق للتأمين التكافلي
Methaq Takaful Insurance Co.0.900.6050.0%
الرسم البياني يوضح الشركات األكثر ارتفاعا في اسعار اسهمها %
AED Values القيمة بالدرهم
سعر اإلغالق Closing
Price
النسبة إلى التداول الكلي للسوق %of Total %
قيمة التداولValue
اسم الشركةCompany Name
Symbol
18.80 18.3% 8,960,648,268 مؤسسة اإلمارات لإلتصاالت ETISALAT
1.04 17.1% 8,368,562,057 شركة إشراق العقارية ESHRAQ
2.63 13.2% 6,456,208,312 شركة الدار العقارية ALDAR
12.85 11.6% 5,694,694,994 بنك الخليج األول FGB
6.90 7.3% 3,573,971,373 بنك أبوظبي التجاري ADCB
0.58 4.9% 2,418,406,753 شركة منازل العقارية )ش.م.خ.( MANAZEL
0.54 3.7% 1,829,225,165 شركة دانة غاز DANA
9.99 3.5% 1,723,733,462 بنك أبوظبي الوطني NBAD
0.66 3.0% 1,484,978,530 شركة رأس الخيمة العقارية RAKPROP
0.90 2.6% 1,277,137,342 شركة ميثاق للتأمين التكافلي METHAQ
14.7% 7,187,961,829 أخرى Others
85.32% 41,787,566,256.50 المجموع
48,975,528,086 إجمالي سوق األسهم
الرسم البياني يوضح الشركات األكثر نشاطا من حيث قيمة التداول
17.1 %
7.3 %
11.6 %13.2 %
4.9 %3.7 %
3.5 %3.0 %2.6 %
14.7 %18.3 % ETISALAT مؤسسة اإلمارات لإلتصاالت
ESHRAQ شركة إشراق العقارية
ALDAR شركة الدار العقارية
FGB بنك الخليج األول
ADCB بنك أبوظبي التجاري
MANAZEL ).شركة منازل العقارية )ش.م.خ
DANA شركة دانة غاز
NBAD بنك أبوظبي الوطني
METHAQ شركة ميثاق للتأمين التكافلي
RAKPROP شركة رأس الخيمة العقارية
Others أخرى
59.4%
89.1%50.0%
-72.7%
53.7%
Most companies rise in shares pricesMost Active Shares By Value
ASMAK شركة أسماك
DRIVE شركة أبوظبي لتعليم قيادة السيارات
UNION شركة اإلتحاد للتأمين
METHAQ شركة ميثاق للتأمين التكافلي
ESHRAQشركة إشراق العقارية
5657
الشركات األكثر نشاطا من حيث عدد الصفقات الشركات األكثر نشاطا من حيث عدد األسهم المتداولة
AED Values القيمة بالدرهم
سعر اإلغالقClosing Price
النسبة من التداول الكلي للسوق %% of Total
عدد األسهم المتداولةVolume
اسم الشركةCompany Name
Symbol
1.04 34.10% 10,052,911,642 إشراق العقارية ESHRAQ
0.58 14.47% 4,264,851,096 شركة منازل العقارية )ش.م.خ.( MANAZEL
0.54 11.90% 3,507,153,648 دانة غاز DANA
2.63 8.48% 2,501,319,334 الدار العقارية ALDAR
0.66 8.34% 2,460,202,769 رأس الخيمة العقارية RAKPROP
0.90 5.21% 1,535,581,937 شركة ميثاق للتأمين التكافلي METHAQ
0.53 2.33% 686,178,464 شركة الطاقة TAQA
6.90 1.89% 558,671,046 بنك أبوظبي التجاري ADCB
18.80 1.67% 491,978,881 مؤسسة اإلمارات لإلتصاالت ETISALAT
12.85 1.62% 476,998,240 بنك الخليج األول FGB
10.00% 2,947,789,532 أخرى Others
90.00% 26,535,847,057 المجموع
29,483,636,589 إجمالي سوق األسهم
الرسم البياني يوضح الشركات األكثر نشاطا من حيث عدد الصفقاتالرسم البياني يوضح الشركات األكثر نشاطا من حيث عدد األسهم المتداولة
14.15 %
10.81 %
9.53 %8.22 %
6.87 %
5.87 %
5.80 %
4.19 %
4.00 %
14.01 %16.56 %
AED Values القيمة بالدرهم
سعر اإلغالقClosing Price
النسبة إلى الصفقات المنفذة في السوق %% of Total
عدد الصفقات المنفذةTrades
اسم الشركةCompany Name
Symbol
1.04 16.6% 64,418 شركة إشراق العقارية ESHRAQ
2.63 14.15% 55,017 شركة الدار العقارية ALDAR
18.80 10.81% 42,025 مؤسسة اإلمارات لإلتصاالت ETISALAT
12.85 9.53% 37,058 بنك الخليج األول FGB
6.90 8.22% 31,953 بنك أبوظبي التجاري ADCB
0.58 6.87% 26,707 شركة منازل العقارية )ش.م.خ.( MANAZEL
0.54 5.87% 22,821 دانة غاز DANA
0.90 5.80% 22,558 شركة ميثاق للتأمين التكافلي METHAQ
0.66 4.19% 16,292 شركة رأس الخيمة العقارية RAKPROP
9.99 4.00% 15,566 بنك أبوظبي الوطني NBAD
14.01% 54,471 اخرى Others
85.99% 334,415 المجموع
388,886 إجمالي سوق األسهم
14.5 %11.9 %
8.5 %
8.3 %
5.2 %
2.3 %1.9 %
1.7 %
1.6 %10.0 %
34.1 %
Most Active Shares By VolumeMost Active companies in terms of Market Capitalization 2016
ETISALAT مؤسسة اإلمارات لإلتصاالت
ESHRAQ شركة إشراق العقارية
ALDAR شركة الدار العقارية
FGB بنك الخليج األول
ADCB بنك أبوظبي التجاري
MANAZEL ).شركة منازل العقارية )ش.م.خ
DANA شركة دانة غاز
NBAD بنك أبوظبي الوطني
METHAQ شركة ميثاق للتأمين التكافلي
RAKPROP شركة رأس الخيمة العقارية
Others أخرى
TAQA شركة الطاقة
ETISALAT مؤسسة اإلمارات لإلتصاالت
ESHRAQ شركة إشراق العقارية
ALDAR شركة الدار العقارية
FGB بنك الخليج األول
ADCB بنك أبوظبي التجاري
MANAZEL ).شركة منازل العقارية )ش.م.خ
DANA شركة دانة غاز
METHAQ شركة ميثاق للتأمين التكافلي
RAKPROP شركة رأس الخيمة العقارية
Others أخرى

58
الشركات المحلية األكبر من حيث القيمة السوقية
الشركات االكبر من حيث القيمة السوقية 2016
AED Values القيمة بالدرهم
اســــم الشــركـــةCompany Name
القيمة السوقيةالنسبة الى القيمة السوقية
للشركات المحلية بالسوق )%( سعر االقفال
Closing Price
ETISALAT 18.80%163,498,975,20036.8 مؤسسة اإلمارات لإلتصاالت
FGB 12.85%57,825,000,00013.0 بنك الخليج األول
NBAD 9.99%52,492,907,72711.8 بنك أبوظبي الوطني
ADCB 6.90%38,609,621,9298.7 بنك أبوظبي التجاري
ALDAR 2.63%20,678,715,8564.7 شركة الدار العقارية
UNB 4.54%12,491,476,5912.8بنك االتحاد الوطني
ADIB 3.80%12,038,400,0002.7مصرف أبوظبي االسالمي
RAKBANK 4.95%8,297,414,8691.9 بنك رأس الخيمة الوطني
NBF 4.78%6,076,276,2501.4بنك الفجيرة الوطني
NBQ 3.10%5,728,800,0471.3 بنك أم القيوين الوطني
Others 66,501,060,30315.0أخرى%
Total 377,737,588,46885.0المجموع%
Total 444,238,648,771المجموع
13.0 %11.8 %
8.7 %
4.7 %
2.8 %2.7 %
1.9 %1.4 %
1.3 % 15.0 %
36.8 %
الرسم البياني يوضح الشركات المحلية األكبر من حيث القيمة السوقية
ETISALAT مؤسسة اإلمارات لإلتصاالت
ALDAR شركة الدار العقارية
FGB بنك الخليج األول
ADCB بنك أبوظبي التجاري
UNB بنك االتحاد الوطني
ADIB مصرف أبوظبي االسالمي
RAKBANK بنك رأس الخيمة الوطني
NBF بنك الفجيرة الوطني
NBQ بنك أم القيوين الوطني
NBAD بنك أبوظبي الوطني
Others أخرى
Most active companies in terms of Market Capitalization 2016
6061
النشرة السنوية لنشاط سوق ابوظبي لالوراق المالية 2016 النشرة السنوية لنشاط سوق ابوظبي لالوراق المالية 2016
VALUE IN AED القيمة بالدرهم
COMPANY›S NAMEعدد أيامالتداول
Shares DaysTraded
معدل دورانالسهمTurnover ratio )%(
نسبة التغير في السعـر%
Percetage change in Price )%(
سعراالقفال 2015
Percetage closing Price
2015
سعر االقفالClosing Price
آخر سعرLast Price
أدنـى سعرLow Price
أعلـى سعرHigh Price
عدد الصفقاتTrades
قيمة االسهمالمتداولة
Value
عدد االسهمالمتداولةVolume
األسهم المصدرة
Issued Shares
رأس المال المدفوع
Paid Up Capital
القيمة السوقية Market
Capitalization
رمزالشركةSymbol
اســــــم الشـــــركــــــة
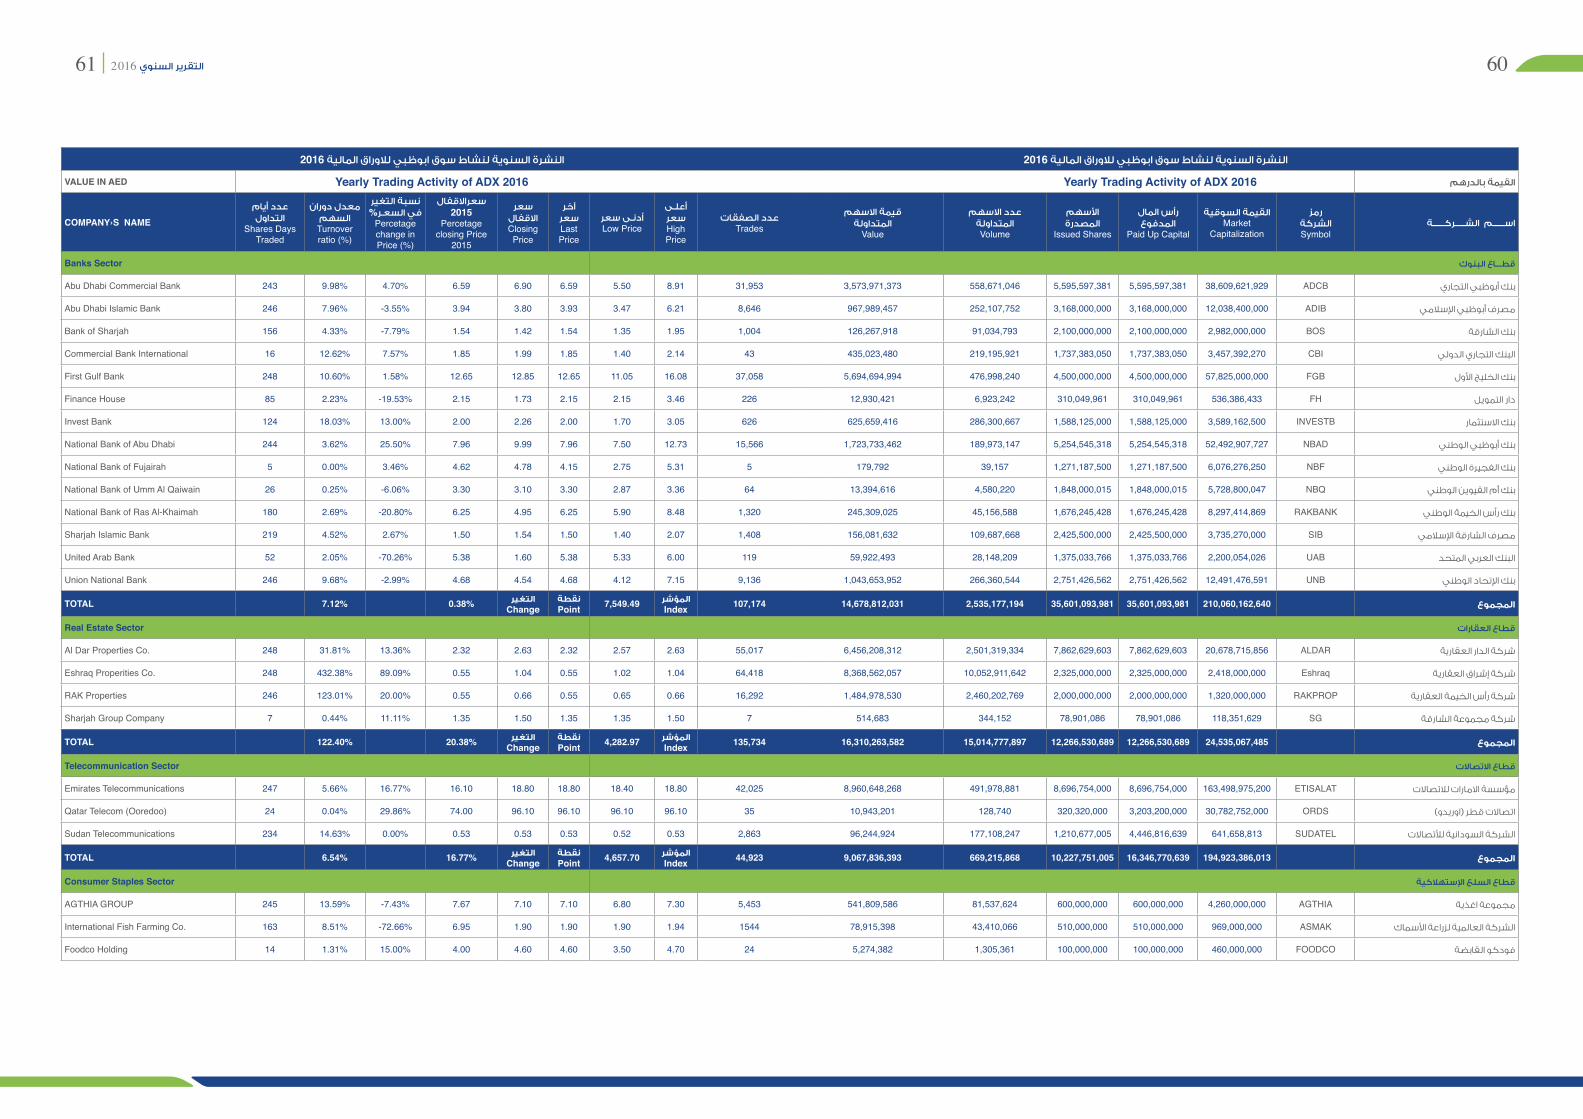
Banks Sector قطـــاع البنوك
Abu Dhabi Commercial Bank 243 9.98% 4.70% 6.59 6.90 6.59 5.50 8.91 31,953 3,573,971,373 558,671,046 5,595,597,381 5,595,597,381 38,609,621,929 ADCB بنك أبوظبي التجاري
Abu Dhabi Islamic Bank 246 7.96% -3.55% 3.94 3.80 3.93 3.47 6.21 8,646 967,989,457 252,107,752 3,168,000,000 3,168,000,000 12,038,400,000 ADIB مصرف أبوظبي اإلسالمي
Bank of Sharjah 156 4.33% -7.79% 1.54 1.42 1.54 1.35 1.95 1,004 126,267,918 91,034,793 2,100,000,000 2,100,000,000 2,982,000,000 BOS بنك الشارقة
Commercial Bank International 16 12.62% 7.57% 1.85 1.99 1.85 1.40 2.14 43 435,023,480 219,195,921 1,737,383,050 1,737,383,050 3,457,392,270 CBI البنك التجاري الدولي
First Gulf Bank 248 10.60% 1.58% 12.65 12.85 12.65 11.05 16.08 37,058 5,694,694,994 476,998,240 4,500,000,000 4,500,000,000 57,825,000,000 FGB بنك الخليج األول
Finance House 85 2.23% -19.53% 2.15 1.73 2.15 2.15 3.46 226 12,930,421 6,923,242 310,049,961 310,049,961 536,386,433 FH دار التمويل
Invest Bank 124 18.03% 13.00% 2.00 2.26 2.00 1.70 3.05 626 625,659,416 286,300,667 1,588,125,000 1,588,125,000 3,589,162,500 INVESTB بنك االستثمار
National Bank of Abu Dhabi 244 3.62% 25.50% 7.96 9.99 7.96 7.50 12.73 15,566 1,723,733,462 189,973,147 5,254,545,318 5,254,545,318 52,492,907,727 NBAD بنك أبوظبي الوطني
National Bank of Fujairah 5 0.00% 3.46% 4.62 4.78 4.15 2.75 5.31 5 179,792 39,157 1,271,187,500 1,271,187,500 6,076,276,250 NBF بنك الفجيرة الوطني
National Bank of Umm Al Qaiwain 26 0.25% -6.06% 3.30 3.10 3.30 2.87 3.36 64 13,394,616 4,580,220 1,848,000,015 1,848,000,015 5,728,800,047 NBQ بنك أم القيوين الوطني
National Bank of Ras Al-Khaimah 180 2.69% -20.80% 6.25 4.95 6.25 5.90 8.48 1,320 245,309,025 45,156,588 1,676,245,428 1,676,245,428 8,297,414,869 RAKBANK بنك رأس الخيمة الوطني
Sharjah Islamic Bank 219 4.52% 2.67% 1.50 1.54 1.50 1.40 2.07 1,408 156,081,632 109,687,668 2,425,500,000 2,425,500,000 3,735,270,000 SIB مصرف الشارقة اإلسالمي
United Arab Bank 52 2.05% -70.26% 5.38 1.60 5.38 5.33 6.00 119 59,922,493 28,148,209 1,375,033,766 1,375,033,766 2,200,054,026 UAB البنك العربي المتحد
Union National Bank 246 9.68% -2.99% 4.68 4.54 4.68 4.12 7.15 9,136 1,043,653,952 266,360,544 2,751,426,562 2,751,426,562 12,491,476,591 UNB بنك اإلتحاد الوطني
TOTAL 7.12% 0.38% التغير Change
نقطةPoint 7,549.49 المؤشر
Index 107,174 14,678,812,031 2,535,177,194 35,601,093,981 35,601,093,981 210,060,162,640 المجموع
Real Estate Sector قطاع العقارات
Al Dar Properties Co. 248 31.81% 13.36% 2.32 2.63 2.32 2.57 2.63 55,017 6,456,208,312 2,501,319,334 7,862,629,603 7,862,629,603 20,678,715,856 ALDAR شركة الدار العقارية
Eshraq Properities Co. 248 432.38% 89.09% 0.55 1.04 0.55 1.02 1.04 64,418 8,368,562,057 10,052,911,642 2,325,000,000 2,325,000,000 2,418,000,000 Eshraq شركة إشراق العقارية
RAK Properties 246 123.01% 20.00% 0.55 0.66 0.55 0.65 0.66 16,292 1,484,978,530 2,460,202,769 2,000,000,000 2,000,000,000 1,320,000,000 RAKPROP شركة رأس الخيمة العقارية
Sharjah Group Company 7 0.44% 11.11% 1.35 1.50 1.35 1.35 1.50 7 514,683 344,152 78,901,086 78,901,086 118,351,629 SG شركة مجموعة الشارقة
TOTAL 122.40% 20.38% التغيرChange
نقطة Point 4,282.97 المؤشر
Index 135,734 16,310,263,582 15,014,777,897 12,266,530,689 12,266,530,689 24,535,067,485 المجموع
Telecommunication Sector قطاع االتصاالت
Emirates Telecommunications 247 5.66% 16.77% 16.10 18.80 18.80 18.40 18.80 42,025 8,960,648,268 491,978,881 8,696,754,000 8,696,754,000 163,498,975,200 ETISALAT مؤسسة االمارات لالتصاالت
Qatar Telecom )Ooredoo( 24 0.04% 29.86% 74.00 96.10 96.10 96.10 96.10 35 10,943,201 128,740 320,320,000 3,203,200,000 30,782,752,000 ORDS اتصاالت قطر )اوريدو(
Sudan Telecommunications 234 14.63% 0.00% 0.53 0.53 0.53 0.52 0.53 2,863 96,244,924 177,108,247 1,210,677,005 4,446,816,639 641,658,813 SUDATEL الشركة السودانية لأتصاالت
TOTAL 6.54% 16.77% التغير Change
نقطةPoint 4,657.70 المؤشر
Index 44,923 9,067,836,393 669,215,868 10,227,751,005 16,346,770,639 194,923,386,013 المجموع
Consumer Staples Sector قطاع السلع اإلستهالكية
AGTHIA GROUP 245 13.59% -7.43% 7.67 7.10 7.10 6.80 7.30 5,453 541,809,586 81,537,624 600,000,000 600,000,000 4,260,000,000 AGTHIA مجموعة اغذية
International Fish Farming Co. 163 8.51% -72.66% 6.95 1.90 1.90 1.90 1.94 1544 78,915,398 43,410,066 510,000,000 510,000,000 969,000,000 ASMAK الشركة العالمية لزراعة األسماك
Foodco Holding 14 1.31% 15.00% 4.00 4.60 4.60 3.50 4.70 24 5,274,382 1,305,361 100,000,000 100,000,000 460,000,000 FOODCO فودكو القابضة
Yearly Trading Activity of ADX 2016Yearly Trading Activity of ADX 2016
6263
النشرة السنوية لنشاط سوق ابوظبي لالوراق المالية 2016 النشرة السنوية لنشاط سوق ابوظبي لالوراق المالية 2016
VALUE IN AED القيمة بالدرهم
COMPANY›S NAMEعدد أيامالتداول
Shares DaysTraded
معدل دورانالسهمTurnover ratio )%(
نسبة التغير في السعـر%
Percetage change in Price )%(
سعراالقفال 2015
Percetage closing Price
2015
سعر االقفالClosing Price
آخر سعرLast Price
أدنـى سعرLow Price
أعلـى سعرHigh Price
عدد الصفقاتTrades
قيمة االسهمالمتداولة
Value
عدد االسهمالمتداولةVolume
األسهم المصدرة
Issued Shares
رأس المال المدفوع
Paid Up Capital
القيمة السوقية Market
Capitalization
رمزالشركةSymbol
اســــــم الشـــــركــــــة
RAK poultry & feeding 12 0.09% 39.11% 2.48 3.45 3.45 1.40 2.48 15 194,697 81,061 86,400,000 86,400,000 298,080,000 RAPCO شركة رأس الخيمة للدواجن والعلف
TOTAL 9.74% -0.89% التغير Change
نقطةPoint 2,982.54 المؤشر
Index 7,036 626,194,063 126,334,112 1,296,400,000 1,296,400,000 5,987,080,000 المجموع
Industrial Sector قطاع الصناعة
Abu Dhabi Ship Building 116 0.86% -2.41% 2.90 2.83 2.90 2.83 2.83 291 5,137,957 1,828,257 211,992,000 211,992,000 599,937,360 ADSB شركة ابوظبي لبناء السفن
Arkan Building Materials Co 207 1.62% -7.78% 0.9 0.83 0.9 1,026 26,306,278 28,326,274 1,750,000,000 1,750,000,000 1,452,500,000 ARKAN شركة أركان لمواد البناء
Abu Dhabi for Building Materials 151 15.97% 44.44% 0.45 0.65 0.45 0.65 0.65 733 24,201,799 47,915,599 300,000,000 300,000,000 195,000,000 BILDCO شركة أبو ظبي الوطنية لمواد البناء
Fujairah Cement Industries 15 2.11% -11.20% 1.25 1.11 1.25 21 7,191,119 7,507,211 355,865,320 355,865,320 395,010,505 FCI صناعات اسمنت الفجيرة
Fujairah Building Industries 15 0.87% -8.77% 1.71 1.56 1.56 24 1,713,803 1,183,712 135,987,500 135,987,500 212,140,500 FBICO شركة الفجيرة لصناعات البناء
Gulf Cement Company 0.87% 4.17% 4.17% 0.96 1.00 0.96 0.94 1.00 457 31,164,088 34,264,708 821,096,820 821,096,820 821,096,820 GCEM شركة اسمنت الخليج
Gulf pharmaceutical industries -8.77% 3.07% -13.20% 2.50 2.17 2.52 2.17 2.17 584 77,722,438 33,523,236 1,092,000,000 1,092,000,000 2,369,640,000 JULPHAR شركة الخليج للصناعات الدوائية
RAK Cement 1.71 11.48% -18.89% 0.90 0.73 0.90 952 52,217,396 64,164,439 559,020,000 559,020,000 408,084,600 RAKCC شركة إسمنت رأس الخيمة
RAK Ceramics 1.56 28.21% -29.80% 3.49 2.45 3.49 2.44 2.45 2,753 704,677,984 242,137,742 858,398,841 858,398,841 2,103,077,160 RAKCEC شركة سيراميك رأس الخيمة
RAK white cement 1.56 3.38% -12.77% 1.41 1.23 1.41 1.23 1.23 82 19,648,318 16,925,344 500,157,000 500,157,000 615,193,110 RAKWCT شركة رأس الخيمة لإلسمنت األبيض
Sharjah Cement & Industrial Development Co 24 2.32% -0.92% 1.09 1.08 1.09 160 12,705,091 12,806,671 552,957,952 552,957,952 597,194,588 SCIDC شركة الشارقة لإلسمنت والتنمية
الصناعية
Union Cement 1,713,803 0.56% -8.40% 1.19 1.09 1.19 181 4,240,049 3,750,474 669,438,000 669,438,000 729,687,420 UCC شركة اسمنت االتحاد
TOTAL 6.33% -12.74% التغير Change
نقطةPoint 2,026.28 المؤشر
Index 7,264 966,926,321 494,333,667 7,806,913,433 7,806,913,433 10,498,562,064 المجموع
Bonds ادوات الدين
1 1.09 1 4,456,780 4,081,300 375,000,000 31,461,500 39,389,798 ADNICCB0619 سندات شركة أبوظبي الوطنية للتأمين
NBAD Subordinated Convertible Notes 1 0.00% 98.00 98.00 95.00 95.50 99.75 1 9,025 95 NBADCN0316 سندات بنك ابو ظبي الوطني
TOTAL 2 4,465,805 4,081,395 375,000,000 31,461,500 39,389,798 المجموع
Insurance Sector قطـــاع التـــأمين
Al Buhaira National Insurance Co. 24 2.74% -6.00% 2.50 2.35 2.35 62 16,401,147 6,862,318 250,000,000 250,000,000 587,500,000 ABNIC شركة البحيرة الوطنية للتأمين
Abu Dhabi National Insurance Co. 61 2.82% -10.42% 2.88 2.58 2.58 2.57 2.58 134 23,898,386 10,571,616 375,000,000 375,000,000 967,500,000 ADNIC شركة أبوظبي الوطنية للتأمين
Al Fujairah National Insurance Company 0.00% 6.72 6.72 300.00 1,000,000 100,000,000 300,000,000 AFNIC شركة الفجيرة الوطنية للتأمين
Al Khazna Insurance Co. 143 6.64% 24.14% 0.29 0.36 0.36 0.36 0.36 443 10,364,673 27,887,314 420,000,000 420,000,000 151,200,000 AKIC شركة الخزنة للتأمين
Al Ain Al Ahlia Insurance Co. 2 0.15% -8.33% 60.00 55.00 55.00 55.00 55.00 3 1,235,300 22,460 15,000,000 150,000,000 825,000,000 ALAIN شركة العين للتأمين
Al Wathba Insurance Co. 14 2.34% 113.43% 3.50 7.47 7.47 6.76 7.47 27 21,763,427 4,841,111 207,000,000 207,000,000 1,546,290,000 AWNIC شركة الوثبة الوطنية للتأمين
Green Cresent Insurance Co. 51 9.12% 0.70 0.70 0.67 0.70 102 11,056,672 18,241,649 200,000,000 200,000,000 140,000,000 AXAGCIC شركة الهالل األخضر للتأمين
Al Dhafra Insurance Co. 7 11.18% 4.17% 4.80 5.00 5.00 5.00 5.00 18 60,936,295 11,183,833 100,000,000 100,000,000 500,000,000 DHAFRA شركة الظفرة للتأمين
Emirates Insurance Co. 12 1.46% 593.33% 0.75 5.20 5.20 24 14,064,718 2,195,189 150,000,000 150,000,000 780,000,000 EIC شركة اإلمارات للتأمين
Insurance House P.S.C 5 1.21% -8.64% 0.81 0.74 0.74 0.74 0.74 6 1,142,293 1,455,990 120,000,000 120,000,000 88,800,000 IH دار التأمين ش.م.ع
Methaq Takaful Insurance Co. 247 1023.72% 50.00% 0.60 0.90 0.90 0.89 0.94 22,558 1,277,137,342 1,535,581,937 150,000,000 150,000,000 135,000,000 METHAQ شركة ميثاق للتأمين التكافلي
Ras Al Khaimah National Insurance Co. 9 0.00% 0.00% 4.10 4.10 4.10 110,000,000 110,000,000 451,000,000 RAKNIC شركة رأس الخيمة الوطنية للتأمين
Sharjah Insurance Co. 1 0.01% 0.00% 3.85 3.85 3.85 1 63,525 16,500 137,500,000 137,500,000 529,375,000 SICO شركة الشارقة للتأمين
Abu Dhabi National Takaful Co. 22 17.19% -10.15% 4.73 4.25 4.25 32 73,272,095 17,191,461 100,000,000 100,000,000 425,000,000 TKFL شركة أبوظبي الوطنية للتكافل
Yearly Trading Activity of ADX 2016Yearly Trading Activity of ADX 2016

6465
النشرة السنوية لنشاط سوق ابوظبي لالوراق المالية 2016 النشرة السنوية لنشاط سوق ابوظبي لالوراق المالية 2016
VALUE IN AED القيمة بالدرهم
COMPANY›S NAMEعدد أيامالتداول
Shares DaysTraded
معدل دورانالسهمTurnover ratio )%(
نسبة التغير في السعـر%
Percetage change in Price )%(
سعراالقفال 2015
Percetage closing Price
2015
سعر االقفالClosing Price
آخر سعرLast Price
أدنـى سعرLow Price
أعلـى سعرHigh Price
عدد الصفقاتTrades
قيمة االسهمالمتداولة
Value
عدد االسهمالمتداولةVolume
األسهم المصدرة
Issued Shares
رأس المال المدفوع
Paid Up Capital
القيمة السوقية Market
Capitalization
رمزالشركةSymbol
اســــــم الشـــــركــــــة
United Insurance Co. 0.00% 2.00 100,000,000 100,000,000 200,000,000 UIC شركة التأمين المتحدة
Union Insurance Co. 10 21.76% 1.21 1.86 1.86 44 100,615,554 71,998,760 330,939,180 330,939,180 615,546,875 UNION شركة االتحاد للتأمين
National Takaful Company 5 0.26% -25.00% 1.08 0.81 0.81 0.81 0.81 14 341,355 386,019 150,000,000 150,000,000 121,500,000 WATANIA شـركـــة الـوطـنـيــــة للتكــافـــل
TOTAL 58.58% 6.60% التغير Change نقطة 1,904.32 المؤشر
Index 23,468 1,612,292,784 1,708,436,157 2,916,439,180 3,150,439,180 8,363,711,875 المجموع
Energy Sector قطاع الطاقة
Dana Gas PJSC 247 50.33% 5.88% 0.51 0.54 0.54 0.52 0.54 22,821 1,829,225,165 3,507,153,648 6,968,616,114 6,968,616,114 3,763,052,702 DANA شركة دانة غاز )ش م ع(
Abu Dhabi National Energy Co. 246 11.31% 12.77% 0.47 0.53 0.53 0.51 0.53 5,638 363,796,966 686,178,464 6,066,300,000 6,066,300,000 3,215,139,000 TAQA شركة أبوظبي الوطنية للطاقة
TOTAL 32.17% 7.24% التغير Change
نقطةPoint 1,087.38 المؤشر
Index 28,459 2,193,022,131 4,193,332,112 13,034,916,114 13,034,916,114 6,978,191,702 محموع قطاع الطاقة
Services Sector قطاع الخدمات
Abu Dhabi Aviation 48 1.75% 0.00% 3.00 3.00 3.00 3.00 3.00 110 23,003,651 7,782,561 444,787,200 444,787,200 1,334,361,600 ADAVIATION شركة طيران ابوظبي
Abu Dhabi National Hotels 65 5.70% 9.31% 2.90 3.17 3.17 2.99 3.17 219 159,774,519 56,981,260 1,000,000,000 1,000,000,000 3,170,000,000 ADNH شركة أبوظبي الوطنية للفنادق
Emirates Driving Company 25 5.72% 59.41% 5.05 8.05 8.05 44 32,581,480 5,140,265 89,786,400 89,786,400 722,780,520 DRIVE شركة اإلمارات لتعليم قيادة السيارات
Gulf Medical Projects Co. 37 0.31% 27.60% 2.50 3.19 3.19 3.08 3.19 77 5,153,965 2,145,270 698,916,094 698,916,094 2,229,542,340 GMPC شركة الخليج للمشاريع الطبية
National Co. for Tourism & Hotels 15 0.49% -20.00% 3.50 2.80 2.80 2.80 2.80 21 9,208,946 2,757,249 567,000,000 567,000,000 1,587,600,000 NCTH المؤسسة الوطنية للسياحة والفنادق
National Marine Dredging 92 11.92% -21.53% 5.48 4.30 4.30 192 154,881,861 29,789,586 250,000,000 250,000,000 1,075,000,000 NMDC شركة الجرافات البحرية الوطنية
TOTAL 3.43% 3.59% التغير Change
نقطةPoint 2,727.32 المؤشر
Index 663 384,604,422 104,596,191 3,050,489,694 3,050,489,694 10,119,284,460 المجموع
ETF صناديق االستثمار المتداولة
NBAD OneShare Dow Jones 1UAE 25 ETF 1 0.00% 6.26 6.26 6.26 6.26 6.26 6,292,300 31,461,500 39,389,798 1UAE بنك أبوظبي ون شير داو جونز لدولة
األمارات
TOTAL 6,292,300 31,461,500 39,389,798 المجموع
Investment & Financial Services Sector االستثمار والخدمات المالية
AL Khaleej Investment 12 0.25% -14.49% 1.38 1.18 1.18 16 439,038 245,152 100,000,000 100,000,000 118,000,000 KICO الخليج اإلستثمارية
Oman & Emirates Invest. Holding Co.-P.J.S.C 22 0.20% -52.65% 2.45 1.16 1.16 1.16 1.16 31 280,010 238,938 121,875,000 121,875,000 141,375,000 OEIHC شركة عمان واإلمارات لالستثمار القابضة
Umm Al Qaiwain Cement Industries 10 1.62% -10.00% 1.00 0.90 0.90 11 5,301,951 5,897,034 363,000,000 363,000,000 326,700,000 QIC شركة صناعات اسمنت أم القيوين
Waha Capital 245 17.88% -10.65% 2.16 1.93 1.93 1.84 1.93 7,389 695,357,216 347,758,841 1,944,514,687 1,944,514,687 3,752,913,346 WAHA واحة كابيتل
TOTAL 14.00% -11.38% التغير Change
نقطةPoint 2,664.59 المؤشر
Index 7,447 701,378,214 354,139,965 2,529,389,687 2,529,389,687 4,338,988,346 المجموع
Private Companies شركات خاصة
Manazel Real Estate PJSC 247 0.00% 0.58 0.58 0.63 0.58 0.59 26,707 2,418,406,753 4,264,851,096 2,600,000,000 2,600,000,000 1,508,000,000 MANAZEL شركة منازل العقارية )ش.م.خ.(
The National Investor company 8 0.00% 0.52 0.52 11 11,334,612 18,442,330 577,500,000 577,500,000 300,300,000 TNI المستثمر الوطني ش م خ
26,718 2,429,741,365 4,283,293,426 3,177,500,000 3,177,500,000 1,808,300,000 المجموع
GRAND TOTAL 31.95% 5.55% التغير Change
نقطةPoint 4,546.37 المؤشر
Index 388,888 48,975,537,111 29,487,717,984 92,288,716,083 98,323,366,417 477,691,514,179 المجموع العام
Yearly Trading Activity of ADX 2016Yearly Trading Activity of ADX 2016
6667
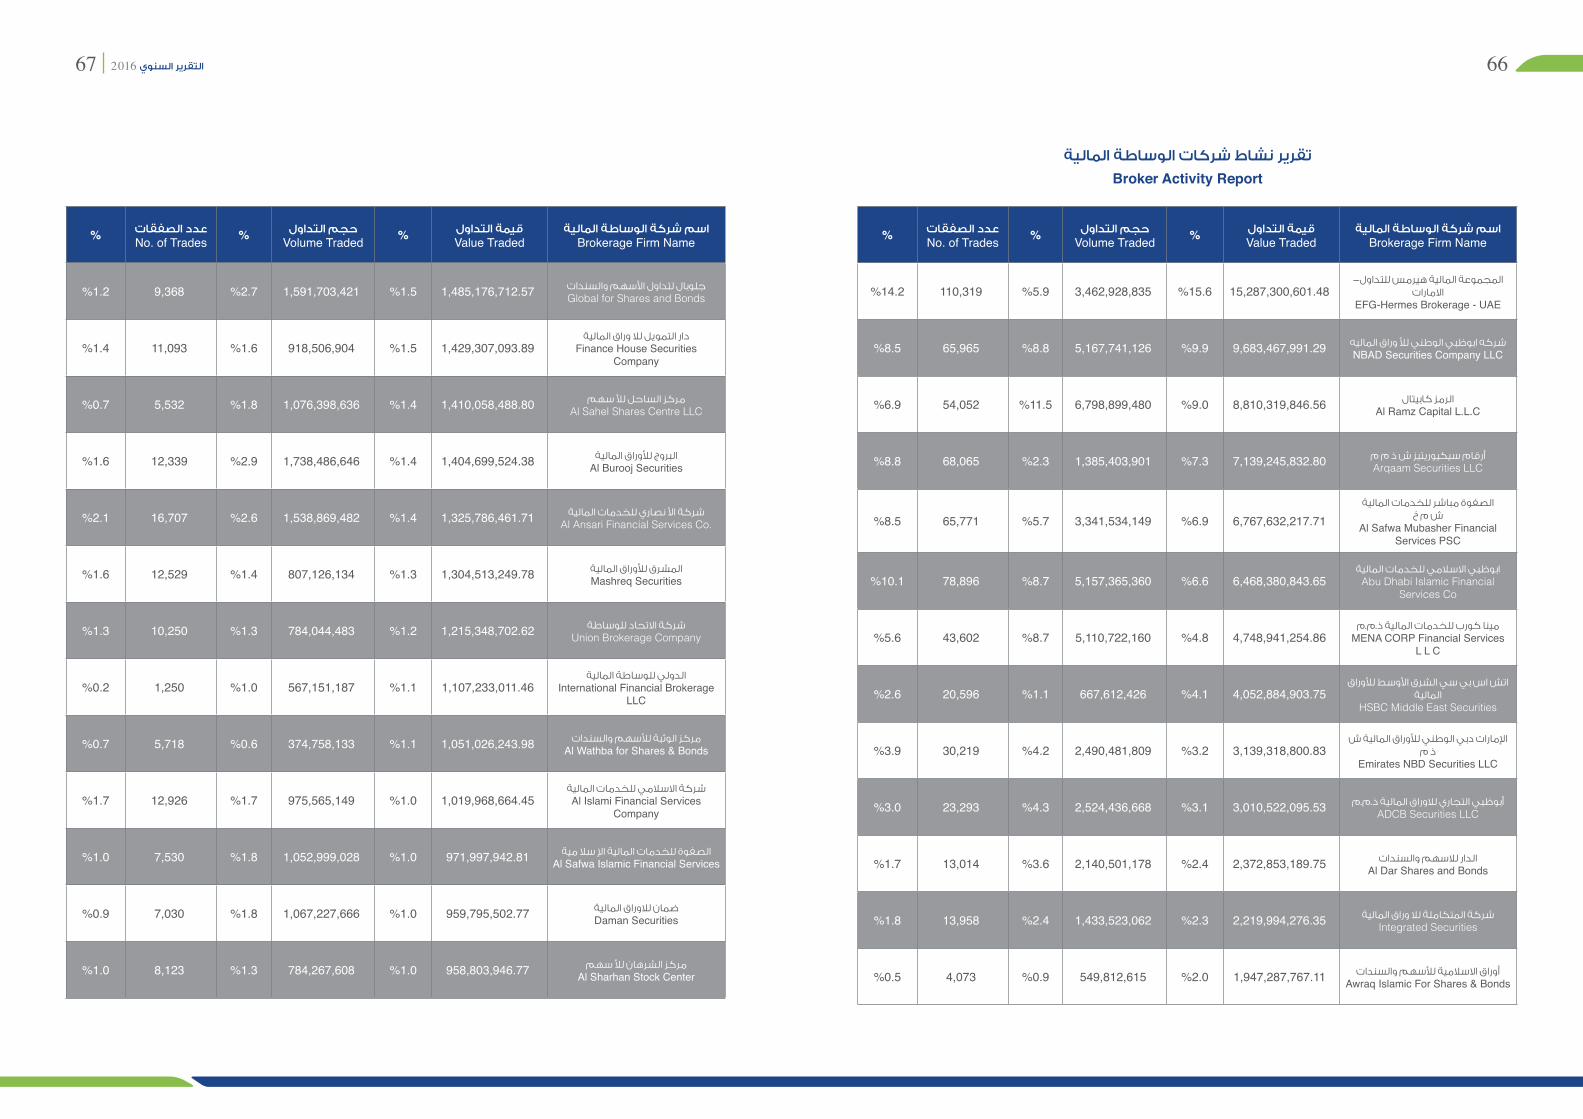
تقرير نشاط شركات الوساطة المالية
اسم شركة الوساطة الماليةBrokerage Firm Name
قيمة التداولValue Traded%حجم التداول
Volume Traded%عدد الصفقاتNo. of Trades%
المجموعة المالية هيرمس للتداول-االمارات
EFG-Hermes Brokerage - UAE 15,287,300,601.48 %15.6 3,462,928,835 %5.9 110,319 %14.2
شركه ابوظبي الوطني لأ وراق الماليهNBAD Securities Company LLC 9,683,467,991.29 %9.9 5,167,741,126 %8.8 65,965 %8.5
الرمز كابيتالAl Ramz Capital L.L.C 8,810,319,846.56 %9.0 6,798,899,480 %11.5 54,052 %6.9
أرقام سيكيوريتيز ش ذ م مArqaam Securities LLC 7,139,245,832.80 %7.3 1,385,403,901 %2.3 68,065 %8.8
الصفوة مباشر للخدمات المالية ش م خ
Al Safwa Mubasher Financial Services PSC
6,767,632,217.71 %6.9 3,341,534,149 %5.7 65,771 %8.5
ابوظبي االسالمي للخدمات الماليةAbu Dhabi Islamic Financial
Services Co 6,468,380,843.65 %6.6 5,157,365,360 %8.7 78,896 %10.1
مينا كورب للخدمات المالية ذ.م.مMENA CORP Financial Services
L L C 4,748,941,254.86 %4.8 5,110,722,160 %8.7 43,602 %5.6
اتش اس بي سي الشرق األوسط لأوراق المالية
HSBC Middle East Securities 4,052,884,903.75 %4.1 667,612,426 %1.1 20,596 %2.6
اإلمارات دبي الوطني لأوراق المالية ش ذ م
Emirates NBD Securities LLC 3,139,318,800.83 %3.2 2,490,481,809 %4.2 30,219 %3.9
أبوظبي التجاري لالوراق المالية ذ.م.مADCB Securities LLC 3,010,522,095.53 %3.1 2,524,436,668 %4.3 23,293 %3.0
الدار لالسهم والسنداتAl Dar Shares and Bonds 2,372,853,189.75 %2.4 2,140,501,178 %3.6 13,014 %1.7
شركة المتكاملة لال وراق الماليةIntegrated Securities 2,219,994,276.35 %2.3 1,433,523,062 %2.4 13,958 %1.8
أوراق االسالمية لأسهم والسنداتAwraq Islamic For Shares & Bonds 1,947,287,767.11 %2.0 549,812,615 %0.9 4,073 %0.5
اسم شركة الوساطة الماليةBrokerage Firm Name
قيمة التداولValue Traded%حجم التداول
Volume Traded%عدد الصفقاتNo. of Trades%
جلوبال لتداول األسهم والسنداتGlobal for Shares and Bonds 1,485,176,712.57 %1.5 1,591,703,421 %2.7 9,368 %1.2
دار التمويل لال وراق الماليةFinance House Securities
Company 1,429,307,093.89 %1.5 918,506,904 %1.6 11,093 %1.4
مركز الساحل لأ سهمAl Sahel Shares Centre LLC 1,410,058,488.80 %1.4 1,076,398,636 %1.8 5,532 %0.7
البروج لأوراق الماليةAl Burooj Securities 1,404,699,524.38 %1.4 1,738,486,646 %2.9 12,339 %1.6
شركة األ نصاري للخدمات الماليةAl Ansari Financial Services Co. 1,325,786,461.71 %1.4 1,538,869,482 %2.6 16,707 %2.1
المشرق لأوراق الماليةMashreq Securities 1,304,513,249.78 %1.3 807,126,134 %1.4 12,529 %1.6
شركة االتحاد للوساطةUnion Brokerage Company 1,215,348,702.62 %1.2 784,044,483 %1.3 10,250 %1.3
الدولي للوساطة الماليةInternational Financial Brokerage
LLC 1,107,233,011.46 %1.1 567,151,187 %1.0 1,250 %0.2
مركز الوثبة لأسهم والسنداتAl Wathba for Shares & Bonds 1,051,026,243.98 %1.1 374,758,133 %0.6 5,718 %0.7
شركة االسالمي للخدمات الماليةAl Islami Financial Services
Company 1,019,968,664.45 %1.0 975,565,149 %1.7 12,926 %1.7
الصفوة للخدمات المالية اإل سال ميةAl Safwa Islamic Financial Services 971,997,942.81 %1.0 1,052,999,028 %1.8 7,530 %1.0
ضمان لالوراق الماليةDaman Securities 959,795,502.77 %1.0 1,067,227,666 %1.8 7,030 %0.9
مركز الشرهان لأ سهمAl Sharhan Stock Center 958,803,946.77 %1.0 784,267,608 %1.3 8,123 %1.0
Broker Activity Report
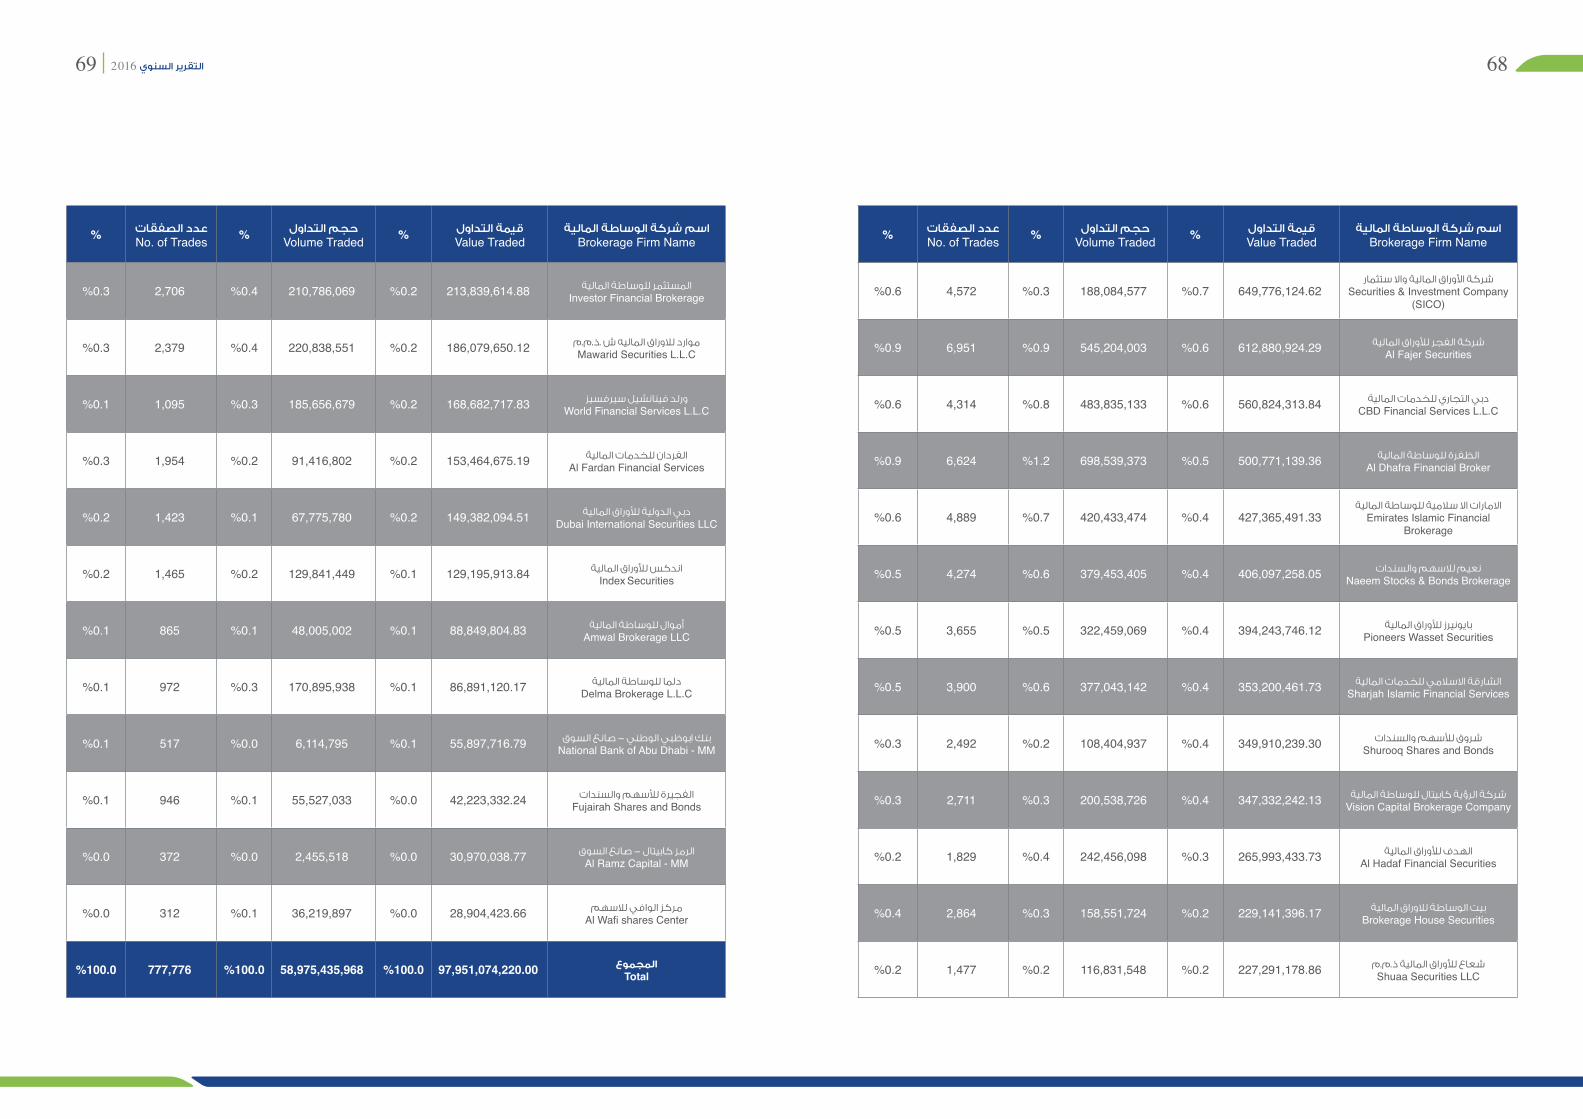
6869
اسم شركة الوساطة الماليةBrokerage Firm Name
قيمة التداولValue Traded%حجم التداول
Volume Traded%عدد الصفقاتNo. of Trades%
شركة األوراق المالية واال ستثمارSecurities & Investment Company
)SICO( 649,776,124.62 %0.7 188,084,577 %0.3 4,572 %0.6
شركة الفجر لأوراق الماليةAl Fajer Securities 612,880,924.29 %0.6 545,204,003 %0.9 6,951 %0.9
دبي التجاري للخدمات الماليةCBD Financial Services L.L.C 560,824,313.84 %0.6 483,835,133 %0.8 4,314 %0.6
الظفرة للوساطة الماليةAl Dhafra Financial Broker 500,771,139.36 %0.5 698,539,373 %1.2 6,624 %0.9
االمارات اال سالمية للوساطة الماليةEmirates Islamic Financial
Brokerage 427,365,491.33 %0.4 420,433,474 %0.7 4,889 %0.6
نعيم لالسهم والسنداتNaeem Stocks & Bonds Brokerage 406,097,258.05 %0.4 379,453,405 %0.6 4,274 %0.5
بايونيرز لأوراق الماليةPioneers Wasset Securities 394,243,746.12 %0.4 322,459,069 %0.5 3,655 %0.5
الشارقة االسالمي للخدمات الماليةSharjah Islamic Financial Services 353,200,461.73 %0.4 377,043,142 %0.6 3,900 %0.5
شروق لأسهم والسنداتShurooq Shares and Bonds 349,910,239.30 %0.4 108,404,937 %0.2 2,492 %0.3
شركة الرؤية كابيتال للوساطة الماليةVision Capital Brokerage Company 347,332,242.13 %0.4 200,538,726 %0.3 2,711 %0.3
الهدف لأوراق الماليةAl Hadaf Financial Securities 265,993,433.73 %0.3 242,456,098 %0.4 1,829 %0.2
بيت الوساطة لالوراق الماليةBrokerage House Securities 229,141,396.17 %0.2 158,551,724 %0.3 2,864 %0.4
شعاع لأوراق المالية ذ.م.مShuaa Securities LLC 227,291,178.86 %0.2 116,831,548 %0.2 1,477 %0.2
اسم شركة الوساطة الماليةBrokerage Firm Name
قيمة التداولValue Traded%حجم التداول
Volume Traded%عدد الصفقاتNo. of Trades%
المستثمر للوساطة الماليةInvestor Financial Brokerage 213,839,614.88 %0.2 210,786,069 %0.4 2,706 %0.3
موارد لالوراق الماليه ش .ذ.م.مMawarid Securities L.L.C 186,079,650.12 %0.2 220,838,551 %0.4 2,379 %0.3
ورلد فينانشيل سيرفسيز World Financial Services L.L.C 168,682,717.83 %0.2 185,656,679 %0.3 1,095 %0.1
الفردان للخدمات الماليةAl Fardan Financial Services 153,464,675.19 %0.2 91,416,802 %0.2 1,954 %0.3
دبي الدولية لأوراق الماليةDubai International Securities LLC 149,382,094.51 %0.2 67,775,780 %0.1 1,423 %0.2
اندكس لأوراق الماليةIndex Securities 129,195,913.84 %0.1 129,841,449 %0.2 1,465 %0.2
أموال للوساطة الماليةAmwal Brokerage LLC 88,849,804.83 %0.1 48,005,002 %0.1 865 %0.1
دلما للوساطة الماليةDelma Brokerage L.L.C 86,891,120.17 %0.1 170,895,938 %0.3 972 %0.1
بنك ابوظبي الوطني - صانع السوقNational Bank of Abu Dhabi - MM 55,897,716.79 %0.1 6,114,795 %0.0 517 %0.1
الفجيرة لأسهم والسنداتFujairah Shares and Bonds 42,223,332.24 %0.0 55,527,033 %0.1 946 %0.1
الرمز كابيتال - صانع السوقAl Ramz Capital - MM 30,970,038.77 %0.0 2,455,518 %0.0 372 %0.0
مركز الوافي لالسهمAl Wafi shares Center 28,904,423.66 %0.0 36,219,897 %0.1 312 %0.0
المجموعTotal 97,951,074,220.00 %100.0 58,975,435,968 %100.0 777,776 %100.0
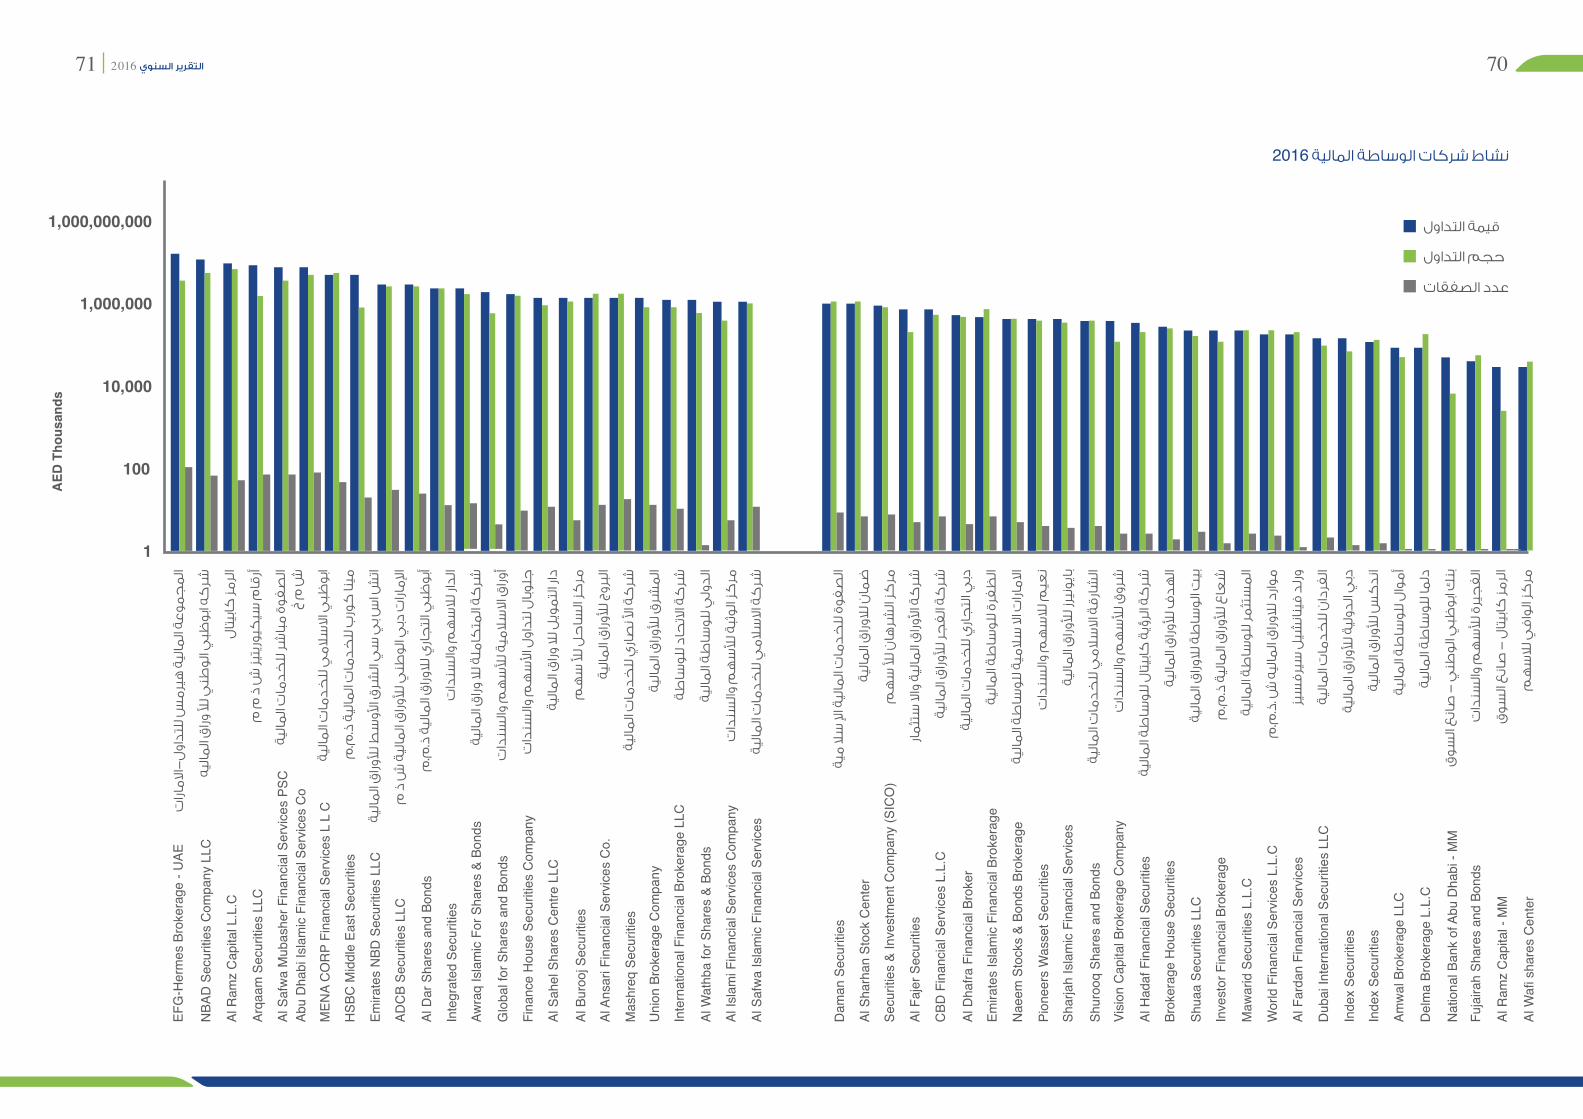
7071
1,000,000,000
AED
Tho
usan
ds
EFG
-Her
mes
Bro
kera
ge -
UAE
Dam
an S
ecur
ities
NBA
D S
ecur
ities
Com
pany
LLC
Al S
harh
an S
tock
Cen
ter
Al R
amz
Cap
ital L
.L.C
Secu
ritie
s &
Inve
stm
ent C
ompa
ny )S
ICO
(
Arqa
am S
ecur
ities
LLC
Al F
ajer
Sec
uriti
es
Al S
afw
a M
ubas
her F
inan
cial
Ser
vice
s PS
C
CBD
Fin
anci
al S
ervi
ces
L.L.
C
Abu
Dha
bi Is
lam
ic F
inan
cial
Ser
vice
s C
o
Al D
hafra
Fin
anci
al B
roke
r
MEN
A C
OR
P Fi
nanc
ial S
ervi
ces
L L
C
Emira
tes
Isla
mic
Fin
anci
al B
roke
rage
HSB
C M
iddl
e Ea
st S
ecur
ities
Nae
em S
tock
s &
Bond
s Br
oker
age
Emira
tes
NBD
Sec
uriti
es L
LC
Pion
eers
Was
set S
ecur
ities
ADC
B Se
curit
ies
LLC
Shar
jah
Isla
mic
Fin
anci
al S
ervi
ces
Al D
ar S
hare
s an
d Bo
nds
Shur
ooq
Shar
es a
nd B
onds
Inte
grat
ed S
ecur
ities
Visi
on C
apita
l Bro
kera
ge C
ompa
ny
Awra
q Is
lam
ic F
or S
hare
s &
Bond
s
Al H
adaf
Fin
anci
al S
ecur
ities
Glo
bal f
or S
hare
s an
d Bo
nds
Brok
erag
e H
ouse
Sec
uriti
es
Fina
nce
Hou
se S
ecur
ities
Com
pany
Shua
a Se
curit
ies
LLC
Al S
ahel
Sha
res
Cen
tre L
LC
Inve
stor
Fin
anci
al B
roke
rage
Al B
uroo
j Sec
uriti
es
Maw
arid
Sec
uriti
es L
.L.C
Al A
nsar
i Fin
anci
al S
ervi
ces
Co.
Wor
ld F
inan
cial
Ser
vice
s L.
L.C
Mas
hreq
Sec
uriti
es
Al F
arda
n Fi
nanc
ial S
ervi
ces
Uni
on B
roke
rage
Com
pany
Dub
ai In
tern
atio
nal S
ecur
ities
LLC
Inte
rnat
iona
l Fin
anci
al B
roke
rage
LLC
Inde
x Se
curit
ies
Nat
iona
l Ban
k of
Abu
Dha
bi -
MM
Al W
athb
a fo
r Sha
res
& Bo
nds
Inde
x Se
curit
ies
Fuja
irah
Shar
es a
nd B
onds
Al Is
lam
i Fin
anci
al S
ervi
ces
Com
pany
Amw
al B
roke
rage
LLC
Al R
amz
Cap
ital -
MM
Al S
afw
a Is
lam
ic F
inan
cial
Ser
vice
s
Del
ma
Brok
erag
e L.
L.C
Al W
afi s
hare
s C
ente
r
1
100
10,000
1,000,000
نشاط شركات الوساطة المالية 2016
قيمة التداول
حجم التداول
عدد الصفقات

أسماء وعناوين شركاتالوساطة المالية في سوق
أبوظبي لألوراق المالية
Names & Addresses of Brokerage Firms
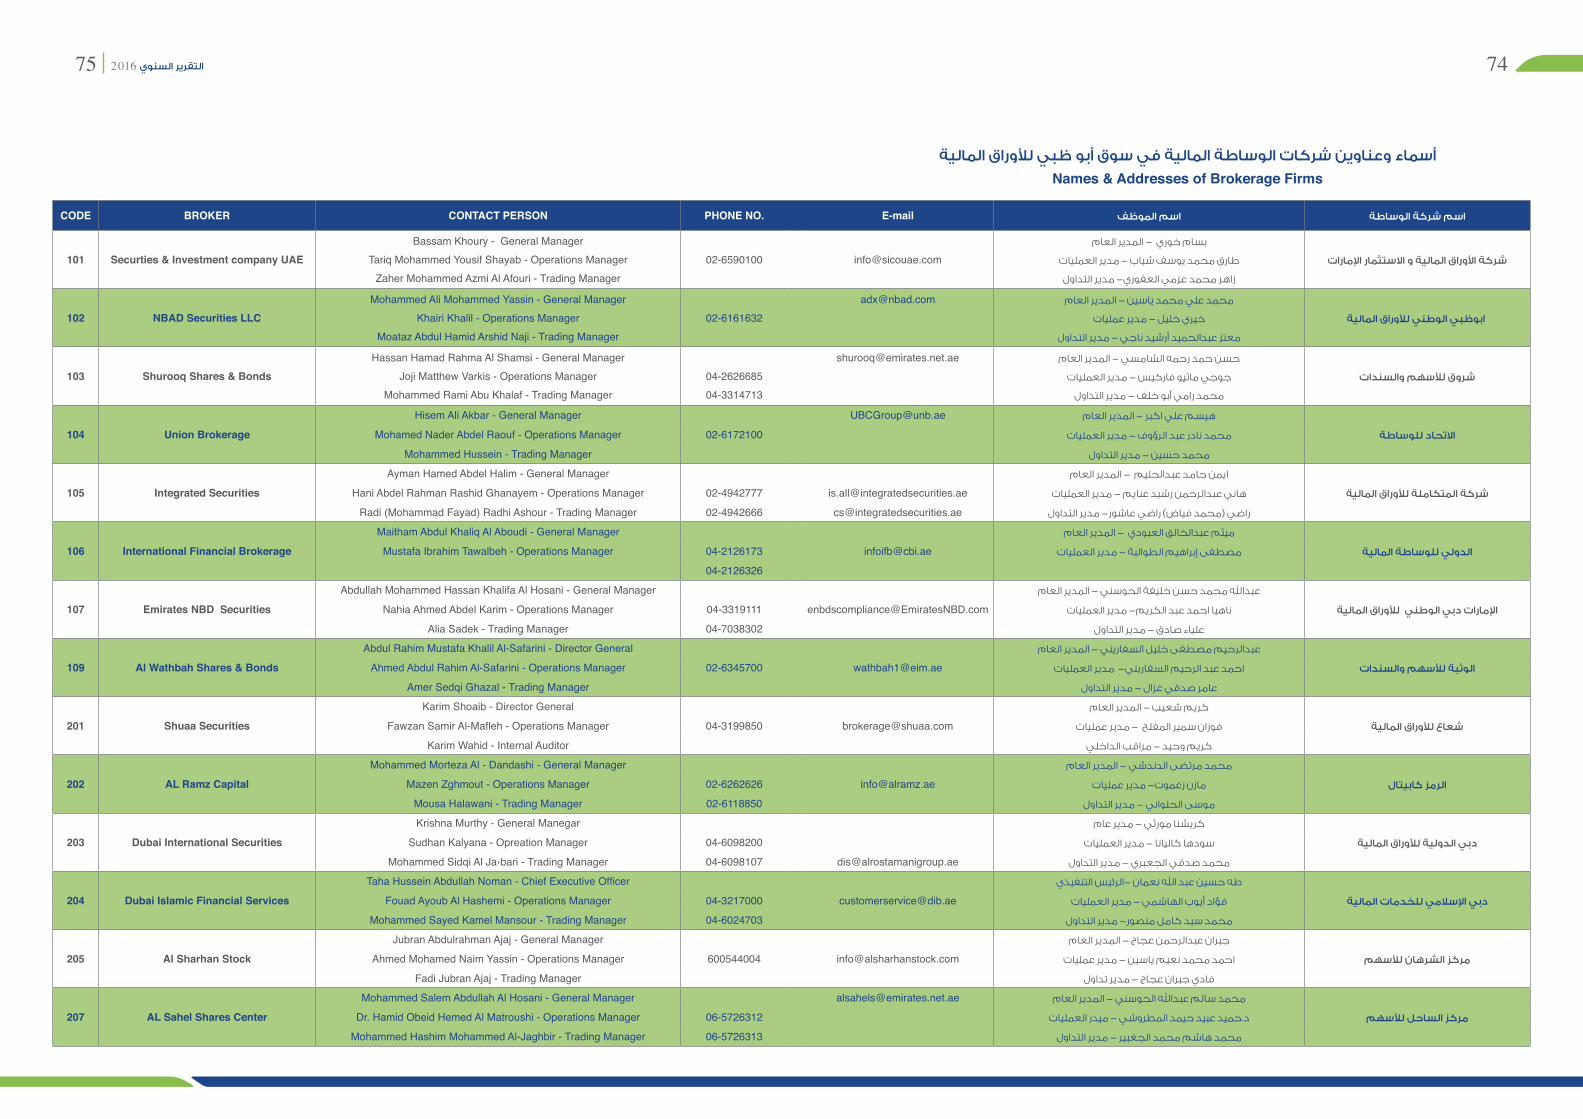
7475
أسماء وعناوين شركات الوساطة المالية في سوق أبو ظبي لألوراق المالية
CODE BROKER CONTACT PERSON PHONE NO. E-mail اسم الموظف اسم شركة الوساطة
101 Securties & Investment company UAE Bassam Khoury - General Manager
Tariq Mohammed Yousif Shayab - Operations ManagerZaher Mohammed Azmi Al Afouri - Trading Manager
02-6590100 [email protected]بسام خوري - المدير العام
طارق محمد يوسف شياب - مدير العمليات
زاهر محمد عزمي العفوري- مدير التداول
شركة األوراق المالية و االستثمار اإلمارات
102 NBAD Securities LLCMohammed Ali Mohammed Yassin - General Manager
Khairi Khalil - Operations ManagerMoataz Abdul Hamid Arshid Naji - Trading Manager
[email protected] محمد علي محمد ياسين - المدير العام
خيري خليل - مدير عمليات
معتز عبدالحميد أرشيد ناجي - مدير التداول
ابوظبي الوطني لألوراق المالية
103 Shurooq Shares & BondsHassan Hamad Rahma Al Shamsi - General Manager
Joji Matthew Varkis - Operations ManagerMohammed Rami Abu Khalaf - Trading Manager
04-262668504-3314713
[email protected] حسن حمد رحمه الشامسي - المدير العام
جوجي ماثيو فاركيس - مدير العمليات
محمد رامي أبو خلف - مدير التداول
شروق لألسهم والسندات
104 Union Brokerage
Hisem Ali Akbar - General Manager [email protected] هيسم علي اكبر - المدير العام
Mohamed Nader Abdel Raouf - Operations Managerاالتحاد للوساطة 02-6172100 محمد نادر عبد الرؤوف - مدير العمليات
Mohammed Hussein - Trading Manager محمد حسين - مدير التداول
105 Integrated Securities
Ayman Hamed Abdel Halim - General Manager ايمن حامد عبدالحليم - المدير العام
Hani Abdel Rahman Rashid Ghanayem - Operations Managerشركة المتكاملة لألوراق المالية 02-4942777 [email protected] هاني عبدالرحمن رشيد غنايم - مدير العمليات
Radi )Mohammad Fayad( Radhi Ashour - Trading Manager 02-4942666 [email protected] راضي )محمد فياض( راضي عاشور- مدير التداول
106 International Financial Brokerage
Maitham Abdul Khaliq Al Aboudi - General Manager ميثم عبدالخالق العبودي - المدير العام
Mustafa Ibrahim Tawalbeh - Operations Managerالدولي للوساطة المالية 04-2126173 [email protected] مصطفى إبراهيم الطوالبة - مدير العمليات
04-2126326
107 Emirates NBD Securities
Abdullah Mohammed Hassan Khalifa Al Hosani - General Manager عبداهلل محمد حسن خليفة الحوسني - المدير العام
Nahia Ahmed Abdel Karim - Operations Managerاإلمارات دبي الوطني لألوراق المالية 04-3319111 [email protected] ناهيا احمد عبد الكريم- مدير العمليات
Alia Sadek - Trading Manager 04-7038302 علياء صادق - مدير التداول
109 Al Wathbah Shares & Bonds
Abdul Rahim Mustafa Khalil Al-Safarini - Director General عبدالرحيم مصطفى خليل السفاريني - المدير العام
Ahmed Abdul Rahim Al-Safarini - Operations Managerالوثبة لألسهم والسندات 02-6345700 [email protected] احمد عبد الرحيم السفاريني- مدير العمليات
Amer Sedqi Ghazal - Trading Manager عامر صدقي غزال - مدير التداول
201 Shuaa Securities
Karim Shoaib - Director General كريم شعيب - المدير العام
Fawzan Samir Al-Mafleh - Operations Managerشعاع لألوراق المالية 04-3199850 [email protected] فوزان سمير المفلح - مدير عمليات
Karim Wahid - Internal Auditor كريم وحيد - مراقب الداخلي
202 AL Ramz Capital
Mohammed Morteza Al - Dandashi - General Manager محمد مرتضى الدندشي - المدير العام
Mazen Zghmout - Operations Managerالرمز كابيتال 02-6262626 [email protected] مازن زغموت- مدير عمليات
Mousa Halawani - Trading Manager 02-6118850 موسى الحلواني - مدير التداول
203 Dubai International Securities
Krishna Murthy - General Manegar كريشنا مورثي - مدير عام
Sudhan Kalyana - Opreation Manager 04-6098200دبي الدولية لألوراق المالية سودها كاليانا - مدير العمليات
Mohammed Sidqi Al Ja›bari - Trading Manager 04-6098107 [email protected] محمد صدقي الجعبري - مدير التداول
204 Dubai Islamic Financial Services
Taha Hussein Abdullah Noman - Chief Executive Officer طه حسين عبد اهلل نعمان -الرئيس التنفيذي
Fouad Ayoub Al Hashemi - Operations Managerدبي اإلسالمي للخدمات المالية 04-3217000 [email protected] فؤاد أيوب الهاشمي - مدير العمليات
Mohammed Sayed Kamel Mansour - Trading Manager 04-6024703 محمد سيد كامل منصور- مدير التداول
205 Al Sharhan Stock
Jubran Abdulrahman Ajaj - General Manager جبران عبدالرحمن عجاج - المدير العام
Ahmed Mohamed Naim Yassin - Operations Managerمركز الشرهان لألسهم 600544004 [email protected] احمد محمد نعيم ياسين - مدير عمليات
Fadi Jubran Ajaj - Trading Manager فادي جبران عجاج - مدير تداول
207 AL Sahel Shares Center
Mohammed Salem Abdullah Al Hosani - General Manager [email protected] محمد سالم عبداهلل الحوسني - المدير العام
Dr. Hamid Obeid Hemed Al Matroushi - Operations Managerمركز الساحل لألسهم 06-5726312 د.حميد عبيد حيمد المطروشي - ميدر العمليات
Mohammed Hashim Mohammed Al-Jaghbir - Trading Manager 06-5726313 محمد هاشم محمد الجغبير - مدير التداول
Names & Addresses of Brokerage Firms
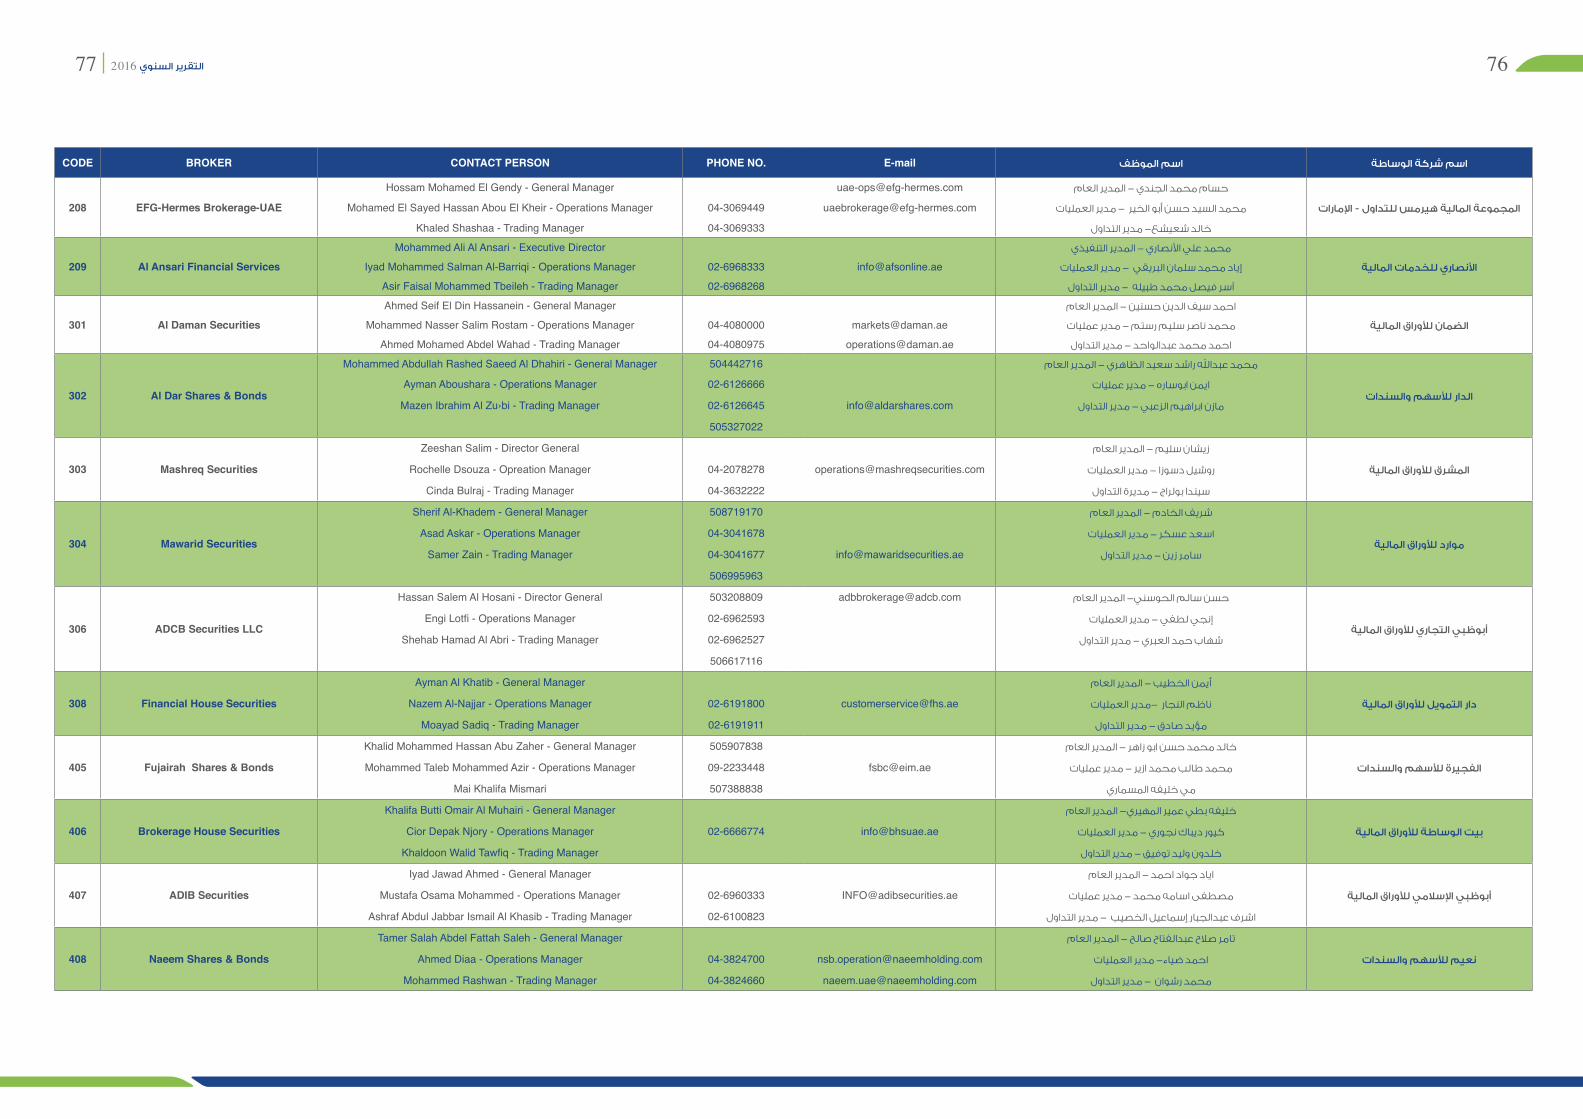
7677
CODE BROKER CONTACT PERSON PHONE NO. E-mail اسم الموظف اسم شركة الوساطة
208 EFG-Hermes Brokerage-UAE
Hossam Mohamed El Gendy - General Manager [email protected] حسام محمد الجندي - المدير العام
Mohamed El Sayed Hassan Abou El Kheir - Operations Managerالمجموعة المالية هيرمس للتداول - اإلمارات 04-3069449 [email protected] محمد السيد حسن أبو الخير - مدير العمليات
Khaled Shashaa - Trading Manager 04-3069333 خالد شعيشع- مدير التداول
209 Al Ansari Financial Services
Mohammed Ali Al Ansari - Executive Director محمد علي األنصاري - المدير التنفيذي
Iyad Mohammed Salman Al-Barriqi - Operations Managerاألنصاري للخدمات المالية 02-6968333 [email protected] إياد محمد سلمان البريقي - مدير العمليات
Asir Faisal Mohammed Tbeileh - Trading Manager 02-6968268 آسر فيصل محمد طبيله - مدير التداول
301 Al Daman Securities
Ahmed Seif El Din Hassanein - General Manager احمد سيف الدين حسنين - المدير العام
Mohammed Nasser Salim Rostam - Operations Managerالضمان لألوراق المالية 04-4080000 [email protected] محمد ناصر سليم رستم - مدير عمليات
Ahmed Mohamed Abdel Wahad - Trading Manager 04-4080975 [email protected] احمد محمد عبدالواحد - مدير التداول
302 Al Dar Shares & Bonds
Mohammed Abdullah Rashed Saeed Al Dhahiri - General Manager 504442716 محمد عبداهلل راشد سعيد الظاهري - المدير العام
الدار لألسهم والسنداتAyman Aboushara - Operations Manager 02-6126666 ايمن ابوساره - مدير عمليات
Mazen Ibrahim Al Zu›bi - Trading Manager 02-6126645 [email protected] مازن ابراهيم الزعبي - مدير التداول
505327022
303 Mashreq Securities
Zeeshan Salim - Director General زيشان سليم - المدير العام
Rochelle Dsouza - Opreation Managerالمشرق لألوراق المالية 04-2078278 [email protected] روشيل دسوزا - مدير العمليات
Cinda Bulraj - Trading Manager 04-3632222 سيندا بولراج - مديرة التداول
304 Mawarid Securities
Sherif Al-Khadem - General Manager 508719170 شريف الخادم - المدير العام
موارد لألوراق المالية Asad Askar - Operations Manager 04-3041678 اسعد عسكر - مدير العمليات
Samer Zain - Trading Manager 04-3041677 [email protected] سامر زين - مدير التداول
506995963
306 ADCB Securities LLC
Hassan Salem Al Hosani - Director General 503208809 [email protected] حسن سالم الحوسني- المدير العام
أبوظبي التجاري لألوراق المالية Engi Lotfi - Operations Manager 02-6962593 إنجي لطفي - مدير العمليات
Shehab Hamad Al Abri - Trading Manager 02-6962527 شهاب حمد العبري - مدير التداول
506617116
308 Financial House Securities
Ayman Al Khatib - General Manager أيمن الخطيب - المدير العام
Nazem Al-Najjar - Operations Managerدار التمويل لألوراق المالية 02-6191800 [email protected] ناظم النجار -مدير العمليات
Moayad Sadiq - Trading Manager 02-6191911 مؤيد صادق - مدير التداول
405 Fujairah Shares & Bonds
Khalid Mohammed Hassan Abu Zaher - General Manager 505907838 خالد محمد حسن ابو زاهر - المدير العام
Mohammed Taleb Mohammed Azir - Operations Managerالفجيرة لألسهم والسندات 09-2233448 [email protected] محمد طالب محمد ازير - مدير عمليات
Mai Khalifa Mismari 507388838 مي خليفه المسماري
406 Brokerage House Securities
Khalifa Butti Omair Al Muhairi - General Manager خليفه بطي عمير المهيري- المدير العام
Cior Depak Njory - Operations Managerبيت الوساطة لألوراق المالية 02-6666774 [email protected] كيور ديباك نجوري - مدير العمليات
Khaldoon Walid Tawfiq - Trading Manager خلدون وليد توفيق - مدير التداول
407 ADIB Securities
Iyad Jawad Ahmed - General Manager اياد جواد احمد - المدير العام
Mustafa Osama Mohammed - Operations Managerأبوظبي اإلسالمي لألوراق المالية 02-6960333 [email protected] مصطفى اسامه محمد - مدير عمليات
Ashraf Abdul Jabbar Ismail Al Khasib - Trading Manager 02-6100823 اشرف عبدالجبار إسماعيل الخصيب - مدير التداول
408 Naeem Shares & Bonds
Tamer Salah Abdel Fattah Saleh - General Manager تامر صالح عبدالفتاح صالح - المدير العام
Ahmed Diaa - Operations Managerنعيم لألسهم والسندات 04-3824700 [email protected] احمد ضياء- مدير العمليات
Mohammed Rashwan - Trading Manager 04-3824660 [email protected] محمد رشوان - مدير التداول
7879
CODE BROKER CONTACT PERSON PHONE NO. E-mail اسم الموظف اسم شركة الوساطة
409 Al Brooge Shares & Bonds
Hossam Salman Daoud Al Ameri - General Manager 557930696 حسام سلمان داود العامري - المدير العام
البروج لألسهم والسنداتFakhruddin Ismail - Operations Manager 02-6333116 [email protected] فخر الدين اسماعيل - مدير العمليات
Ehab Ezzat Abdel Razek - Trading Manager 02-6221000 ايهاب عزت عبد الرازق - مدير التداول
502653559
503 Al Safwa Mubasher Financial Services
Wael Nazih Nazih Darwish - Director General وائل نزيه نزيه درويش - المدير العام
Beloved Abdul Qadir - Director of Operationsالصفوة مباشر للخدمات المالية 04-3258258 [email protected] محبوب باشاة عبدالقادر - مدير العمليات
Makkawi Safwat - Trading Manager مكاوي صفوت - مدير التداول
507 Pioneers Waseet Securities
Mohammed Rifai Abdul Hamid Mustafa - Executive Director 506292888 محمد رفاعي عبد الحميد مصطفي - المدير التنفيذي
بايونيرز لألوراق الماليةSheikh Sultan Bin Majid Al Qasimi - Operations Manager 06-5562777 [email protected] الشيخ سلطان بن ماجد القاسمي - مدير العمليات
Ahmed Mohammed Yousuf Fishar - Trading Manager 04-3055852 أحمد محمد يوسف فيشار- مدير التداول
502252988
509 Arqaam Securities
Fadi Shammas - General Manager 508791482 فادي شماس - المدير العام
أرقام لألوراق الماليةSherif Mustafa - Director of Operations 04-5071752 شريف مصطفي - مدير العمليات
Mohammed Abdulbagi - Trading Manager 04-5071756 [email protected] محمد عبدالباقي - مدير التداول
502450046
605 Awraq Islamic for Shares & Bonds
Atta Al-Mfarajeh - General Manager عطا المفارجه - المدير العام
Ahmed Adeeb Al-Ghalayini - Operations Managerأوراق اإلسالمية لألسهم والسندات 02-6819366 احمد اديب الغالييني- مدير العمليات
Abdul Ghani Al Tamimi - Trading Manager 02-6819322 [email protected] عبدالغني التميمي - مدير التداول
701 Al Dhafra Financial Broker
Mohammed Abdul Latif Saeed Al Refai - General Manager 501050460 محمد عبداللطيف سعيد الرفاعي - المدير العام
الظفرة للوساطة الماليةAyman Eid - Operations Manager 02-6214441 ايمن عيد - مدير العمليات
Mohammed Munther Mohammed - Trading Manager 02-6212220 [email protected] محمد منذر محمد - مدير التداول
703 CBD Financial Services
Hassan Kazem Mr. Abdul Hussain Hashem - General Manager 507652227 حسن كاظم السيد عبدالحسين هاشم - المدير العام
دبي التجاري للخدمات الماليةSomaya Naqi Khoury - Operations Manager 04-2121010 سميه نقي خوري - مديرة عمليات
Rasha Mohammed Bassam Hanbali - Trading Manager 04-2121130 [email protected] رشا محمد بسام حنبلي - مدير التداول
506586645
704 Mena Corp Financial Services
Nabil Ismail Mohammed Al Rantisi - General Manager نبيل اسماعيل محمد الرنتيسي - المدير العام
Anube Aravindakshan - Operation Managerمينا كورب للخدمات المالية 04-3162600 [email protected] أنوب أرافينداكشان - مدير العمليات
Mohammed Sami Al Omairi - Trading Manager 02-6271215 محمد سامي العميري - مدير التداول
707 Al Hadaf For Financial Securities
Yasser Fathy Abdel Raouf Afana - Executive Director 559568887 ياسر فتحي عبدالرؤوف عفانة - المدير التنفيذي
الهدف لألوراق الماليةMohamed Kadoura - Operations Manager 02-6170777 محمد قدورة - مدير العمليات
Firas Kanani - Trading Manager 02-6170724 [email protected] فراس كناني - مدير التداول
505724832
709 Vision Capital Brokerage
Osama Abdelhareth Abu Bakr Mohammed - General Manager 502637756 اسامه عبدالحارث ابوبكر محمد - المدير العام
Ziauddin Fawaz - Operations Managerالرؤية كابيتال للوساطة المالية 02-4477499 ضياء الدين فواز- مدير العمليات
Sharif Abdulla Sayed Ali - Trading Manager 02-4477606 [email protected] شريف عبد اهلل سيد علي - مدير التداول
808 Sharjah Islamic Financial Services
Saif Mohammed Al Zarah - General Manager 509182995 سيف محمد الزرع - المدير العام
الشارقة اإلسالمي للخدمات الماليةRaafat Tawfiq - Operations Manager 06-5772000 رأفت توفيق - مدير العمليات
Shadi Ahmed Bataniah - Trading Manager 06-5992555 [email protected] شادي احمد بطانية - مدير التداول
508445018
905 Al Fardan Financial Services
Tamer Ali Abdel Khalek Ali - General Manager 505942972 تامر على عبد الخالق علي - المدير العام
الفردان للخدمات الماليةKhalid Mahmoud - Operations Manager 04-3865720 خالد محمود - مدير العمليات
Wael Yahya Mohamed - Trading Manager 04-3868046 [email protected] وائل يحيى محمد - مدير تداول
508222296
8081
CODE BROKER CONTACT PERSON PHONE NO. E-mail اسم الموظف اسم شركة الوساطة
906 Al Fajer Securities
Ali Mohamed Saeed Mohammed Al Badi Al Dhaheri - General Manager 504240977 على محمد سعيد محمد البادى الظاهري - المدير العام
الفجر لألوراق الماليةEmad Dawood Shaker - Director of Operations 02-6668899 عماد داوود شاكر - مدير العمليات
Sultan Mohammed Al Ali - Trading Manager 504444516 [email protected] سلطان محمد ال علي - مدير التداول
911 World Financial Services
Ahmed Majed Lootah - General Manager احمد ماجد لوتاه - المدير العام
Mohamed Fathy Noury - Operations Managerورلد فاينانشيال سيرفيز 04-326699 محمد فتحى نورى - مدير عمليات
Wafa Safwat Khalil - Trading Manager [email protected] وفاء صفوت خليل - مدير التداول
913 Investor Financial Brokerage
Alaa Awad Al - Sayed Al - Attar - General Manager 506819517 عالء عوض السيد ابراهيم العتر - المدير العام
Ali Hussein Ahmed Alababdeh - Operations Managerالمستثمر للوساطة المالية 02-6666657 علي حسين احمد العبابده - مدير العمليات
02-6666044 [email protected]
916 Global for Shares & Bonds
Walid Fawzi Mousa Al Khatib - General Manager 504437719 وليد فوزي موسى الخطيب - المدير العام
جلوبال لتداول األسهم والسنداتSherif Mustafa Abou El Nour - Director of Operations 02-4108888 شريف مصطفى ابو النور - مدير العمليات
Ayman Abdel Moneim Al Kasabi - Trading Manager 02-4108890 [email protected] ايمن عبد المنعم القصبي - مدير التداول
502649963
917 Emirates Islamic Financial Brokerage
Hussein Sherif Hussein - Director General حسين شريف حسين - المدير العام
Mohammed Mustafa Mohamed - Operations Managerاإلمارات اإلسالمية للوساطة المالية 04-3834708 محمد مصطفى محمد - مدير عمليات
Asma Al Hosani - Trading Manager 04-3834702 [email protected] أسماء الحوسني - مدير التداول
918 Amwal Brokerage
Mohamed Sayed Ibrahim Ahmed Taha - General Manager 508600056 محمد سيد ابراهيم احمد طه - المدير العام
أموال للوساطة الماليةAbdul Aziz Hafez - Director of Operations 09-2223000 [email protected] عبدالعزيز عبدالحق - مدير العمليات
Nurah Darwish - Trading Manager 09-2223005 نوره درويش - مدير التداول
504709778
919 Index Securities
Mohammed Ayman Saleh Abdul Wahab Al - Jaabah - General Manager 503381028 محمد ايمن صالح عبد الوهاب الجعبه - المدير العام
إندكس لألوراق الماليةEmad Mohammed Abu Hussein - Operations Manager 04-2115500 [email protected] عماد محمد ابو حسين - مدير العمليات
Mohammed Jawad Lotfi - Trading Manager 04-2115506 محمد جواد لطفي - مدير التداول
509414382
924 Al Wafi Shares Center
H.H.Sheikh Humaid bin Khaled Al - Mualla - General Manager 506803818 الشيخ حميد بن خالد المعال - المدير العام
Ghassan Mohammed Al Shara - Director of Initial Operationsمركز الوافي لألسهم 06-7649641 غسان محمد الشرع - مدير عمليات مبدئي
Mohamed Nassar Ismail - Trading Manager 503567600 [email protected] محمد نصار اسماعيل - مدير التداول
929 HSBC Middle East Securities
Nabil Mohammed Seddik Abdul Rahim Al Balushi - Chief Executive Officer 505457764 نبيل محمد صديق عبدالرحيم البلوشي - الرئيس التنفيذي
إتش إس بي سي الشرق األوسط لألوراق الماليةMaher Iskandarani - Operations Manager 04-4236986 [email protected] ماهر اسكندراني- مدير عمليات
Zakaria Hassan Abdel Fattah - Trading Manager 04-4236900 زكريا حسن عبد الفتاح - مدير التداول
558821624
الشركات المدرجة في سوق أبو ظبي لألوراق
الماليةNames & Addresses of Listed Companies
8485
الشركات المدرجة في سوق أبو ظبي لألوراق المالية
البريد االلكتروني
Email Addressرقم الفاكس
Fax Numberرقم الهاتف
Phone Number رمز الشركة
Symbolاسم الشركة
Company Name الرقم
No.
[email protected] 06/5748855 06/5174444 ABNIC شركة البحيرة الوطنية للتأمين 1
[email protected] 5757775 /02 02/5758000 ADAVIATION شركة طيران أبوظبي 2
[email protected] 6109861 /02 02/6962144 ADCB بنك أبوظبي التجاري 3
[email protected] 02/6333316 02/6343000 ADIB مصرف أبوظبي االسالمي 4
[email protected] 02/4448495 02/4447228 ADNH شركة أبوظبي الوطنية للفنادق 5
[email protected] 02/4080604 02/4080100 ADNIC شركة أبوظبي الوطنية للتأمين 6
[email protected] 02/5511067 02/5028498 ADSB شركة ابوظبي لبناء السفن 7
[email protected] 09/2224344 09/2233355 AFNIC شركة الفجيرة الوطنية للتأمين 8
[email protected] 02/6726070 02/5960600 AGTHIA مجموعة اغذية ش. م. ع. 9
[email protected] 02/6418214 02/6969700 AKIC شركة الخزنة للتأمين 10
[email protected] 02/4456685 02/4459900 ALAIN شركة العين االهلية للتأمين 11
[email protected] 02/8105550 02/8105555 ALDAR شركة الدار العقارية ش.م.ع 12
[email protected] 02/6666872 02/6666724 ARKAN شركة أركان لمواد البناء 13
[email protected] 02/6447060 02/6448090 ASMAK الشركة العالمية القابضة لزراعة األسماك 14
[email protected] 02/6776628 02/4185300 AWNIC شركة الوثبة الوطنية للتأمين 15
[email protected] 02/6455544 02/6455500 BILDCO شركة أبوظبي لمواد البناء 16
[email protected] 06/7733568 06/5694411 BOS بنك الشارقة 17
[email protected] 04/2243036 04/2242104 CBI البنك التجاري الدولي 18
[email protected] 06/6552256 06/6554449 DANA دانة غاز ش.م.ع 19
[email protected] 02/6729833 02/6721444 DHAFRA شركة الظفرة للتأمين 20
[email protected] 02/5510227 02/5510544 DRIVE شركة اإلمارات لتعليم قيادة السيارات 21
[email protected] 02/6445227 02/6440400 EIC شركة اإلمارات للتأمين 22
[email protected] 02/6354864 02/6354854 ESHRAQ شركة إشراق العقارية 23
[email protected] 02/6317000 02/6283333 ETISALAT مؤسسة اإلمارات لإلتصاالت 24
[email protected] 09/2227314 09/2222051 FBI شركة الفجيرة لصناعات البناء 25
[email protected] 09/2227718 09/2223111 FCI صناعات أسمنت الفجيرة 26
[email protected] 02/6813727 02/6816666 FGB بنك الخليج األول 27
[email protected] 02/6194699 02/6219712 FH دار التمويل 28
[email protected] 02/6733731 02/6731000 FOODCO فودكو القابضة ش.م.ع 29
[email protected] 07/2660201 07/2668222 GCEM شركة اسمنت الخليج 30
[email protected] 02/4458717 02/4084700 GCIC شركة الهالل األخضر للتأمين 31
[email protected] 07/2288400 07/2281153 GLS شركة الخليج للمواشي 32
[email protected] 06/5616699 06/5619999 GMPC شركة الخليج للمشاريع الطبية 33
البريد االلكتروني
Email Addressرقم الفاكس
Fax Numberرقم الهاتف
Phone Number رمز الشركة
Symbolاسم الشركة
Company Name الرقم
No.
[email protected] 02/4934400 02/4934444 IH دار التأمين ش.م.ع 34
[email protected] 06/5694440 06/5694440 INVESTB بنك اإلستثمار 35
[email protected] 07/2462462 07/2462461 JULPHAR شركة الخليج للصناعات الدوائية 36
[email protected] 02/6565334 02/6565333 METHAQ شركة ميثاق للتأمين التكافلي 37
[email protected] 02/627588 02/6111111 NBAD بنك أبوظبي الوطني 38
[email protected] 09/2229858 09/2224518 NBF بنك الفجيرة الوطني 39
[email protected] 06/7647841 06/7066666 NBQ بنك أم القيوين الوطني 40
[email protected] 02/4099990 02/4099999 NCTH لمؤسسة الوطنية للسياحة والفنادق 41
[email protected] 02/5516500 02/5130000 NMDC شركة الجرافات البحرية الوطنية 42
[email protected] / 0097126266171+96824489465
/ 0097126266443+96824489458 OEIHC شركة عمان واإلمارات لإلستثمار 43
[email protected]. 9744830466 9744404025 ORDS اتصاالت قطر 44
[email protected] 06/7681070 06/7681999 QCEM شركة صناعات إسمنت أم القيوين 45
[email protected] 07/2435454 07/2062222 RAKBANK بنك رأس الخيمة الوطني 46
[email protected] 07/2660006 07/2660111 RAKCC شركة إسمنت رأس الخيمة 47
[email protected] 2445270 7 +971 2445046 7 971 RAKCEC شركة سراميك رأس الخيمة 48
[email protected] 8500 228 7 971 3000 227 7 971 RAKNIC شركة رأس الخمية الوطنية للتأمين 49
[email protected] 07/2272444 07/2330004 RAKPROP شركة رأس الخمية العقارية 50
[email protected] 2668866 9717 2668888 9717 RAKWCT شركة رأس الخيمة لإلسمنت األبيض 51
[email protected] 07/2462220 07/2462222 RAKCO شركة رأس الخمية للدواجن والعلف 52
[email protected] 06/5683171 06/5695666 SCIDC شركة الشارقة لإلسمنت والتنمية 53
[email protected] 06/5309998 06/5998888 SIB مصرف الشارقة اإلسالمي 54
[email protected] 06/5195667 06/5195666 SICO شركة الشارقة للتأمين 55
[email protected] 782 183 00249322
761 183 00249100 SUDATEL مجموعة سوداتل لالتصاالت 56
[email protected] 02/6422555 02/6149000 TAQA شركة أبوظبي الوطنية للطاقة 57
[email protected] 02/4107800 02/4107700 TKFL شركة أبوظبي الوطنية للتكافل 58
[email protected] 06/5733906 06/5733222 UAB البنك العربي المتحد 59
[email protected] 8635 266 7 971 8166 266 7 971 UCC شركة اسمنت االتحاد 60
[email protected] 2502504 4 971 2502501 4 971 UIC شركة التأمين المتحدة 61
[email protected] 02-6786080 02/6741600 UNB بنك االتحاد الوطني 62
[email protected] 997 06/7466 996 06/7466 UNION شركة اإلتحاد للتأمين 63
[email protected] 02/6677383 02/6677343 WAHA شركة الواحة كابيتال ش.م.ع 64
[email protected] 02/6138800 02/6138888 WATANIA الشركة الوطنية للتكافل 65
Names & Addresses of Listed Companies