annual report 2009 - saizeriyanet assets / roe cash flows total assets (= net income (loss) +...
TRANSCRIPT

Saizeriya Co., Ltd.
A n n u a l R e p o r t
2 0 0 9Ye a r E n d e d A u g u s t 3 1 , 2 0 0 9

Phi losophy & Corporate Prof i le
Proposal and challenge of valuable meal every day
The Saizeriya Promise
Harmoniously: wi th the employee, the customer, and soc iety
Right-mindedly: as fe l low people
For people: wi th grat i tude and love
Profile Saizeriya was born in 1967 as an Italian restaurant when family restaurants and Italian food
were not familiar in Japan. Aimed at supplying healthy, tasty Italian food at a price that
means anyone can eat it every day, we have established a system wherein we assume
responsibility for the management of the entire process, from the purchasing of foodstuffs,
to transport up to customers eating our food.
We have called our consistent merchandizing system from ingredients to outlets “vertical
merchandizing.” Saizeriya will further develop its own approach and contribute to creating a
more affluent society.
Saizeriya Iidabashi PLANO outlet Australia Plant New operating format, Eat Run
1 Saizeriya

All three photos taken at atre vie Akihabara outlet
Restaurant Business in Japan
Supplying healthy, tasty Italian food at a price that means anyone can eat it every dayA chain of restaurants comprising 797 outlets within Japan
The changes in the economic climate have made it cheaper to open a restaurant, offering us great
opportunities to open new outlets in prime city-center locations, which we have not entered to
date, often in key buildings right next to stations. The same situation has occurred in suburban
shopping centers. During this term, Saizeriya was able to open more outlets than originally
planned–40 in total–including restaurants in buildings within walking distance of Akihabara,
Iidabashi and Ueno Stations in the center of Tokyo. We plan to open a further 50 new outlets in
the fiscal year ending August 31, 2010.
We also see many opportunities for existing restaurants to move into more attractive
neighboring buildings under improved conditions, and we plan to work on ensuring that our
restaurants’ environments are as efficient as possible.
Status of new outlets openings
2008
9 Kobe Harbor Land Center Bldg. outlet(Hyogo Prefecture)
6 new outlets opened in total
10 Takadanobaba Station outlet (Tokyo)
7 new outlets opened in total
11 Aeon Mall Narita outlet(Chiba Prefecture)
3 new outlets opened in total
12 Lurara Kohoku outlet(Kanagawa Prefecture)
3 new outlets opened in total
2009
1 Kitanarashino Station outlet(Chiba Prefecture)
3 new outlets opened in total
2 Hikawadai Station outlet (Tokyo)
1 new outlet opened
3 Urawa Higashiguchi outlet(Saitama Prefecture)
2 new outlets opened in total
4 OSC Shonan City outlet(Kanagawa Prefecture)
3 new outlets opened in total
5 Iidabashi PLANO outlet (Tokyo)
3 new outlets opened in total
6 Ueno Hirokoji outlet (Tokyo)
2 new outlets opened in total
7 atre vie Akihabara outlet (Tokyo)
7 new outlets opened in total
8 No new outlets opened
Overall total: 40 new outlets opened(As of August 31, 2009)
2Saizeriya
49,267
(millions of yen)(millions of yen)
(millions of yen)
Net Sales Net Income (Loss)
Total Assets Net Assets and Equity Ratio
(millions of yen)
0
20
40
60
80
100(%)
82.3
Net Assets Equity Ratio
82,86688,323
78,976 3,563
0
(4,000)
(5,000)
1,000
2,000
3,000
4,000
5,000
0
10,000
20,000
30,000
40,000
60,000
50,000
70,000
59,870
2006 2007 2009
62,619 68,369
84,949
63,951
4,411
(4,896)
53,156
84.9
69.1
2008
2006 2007 20092008
2006 2007 20092008
2006 2007 20092008
4,011
54,354
85.0
0
20,000
40,000
60,000
80,000
100,000
0
10,000
20,000
30,000
40,000
50,000
60,000
47,244
2009 2008 2009Years Ended August 31, 2009 and 2008 Millions of Yen Thousands of U.S. Dollars
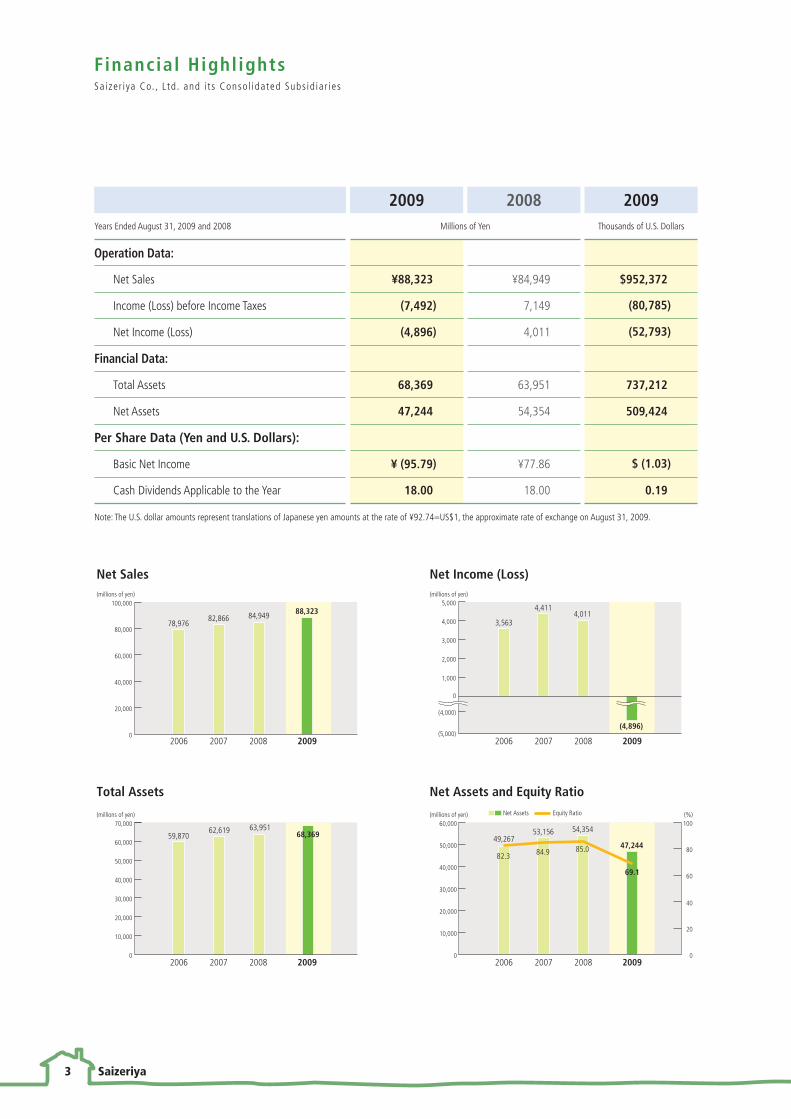
Operation Data:
Net Sales ¥88,323 ¥84,949 $952,372
Income (Loss) before Income Taxes (7,492) 7,149 (80,785)
Net Income (Loss) (4,896) 4,011 (52,793)
Financial Data:
Total Assets 68,369 63,951 737,212
Net Assets 47,244 54,354 509,424
Per Share Data (Yen and U.S. Dollars):
Basic Net Income ¥ (95.79) ¥77.86 $ (1.03)
Cash Dividends Applicable to the Year 18.00 18.00 0.19
Note: The U.S. dollar amounts represent translations of Japanese yen amounts at the rate of ¥92.74=US$1, the approximate rate of exchange on August 31, 2009.
Financial Highl ights Sa ize r i ya Co. , L td . and i t s Conso l idated Subs id ia r ies
3 Saizeriya

Right: Yasuhiko Shogaki, Chairman and Representative Director
Left : Issei Horino, President and Representative Director
To Our Shareholders
Working towards increased profitability through the improvement
of production control technology
During the fiscal year ended August 31, 2009, the domestic economic situation worsened, causing an
extended period of consumer stagnation. Amid ongoing and fierce competition across the restaurant
industry, Saizeriya continued its efforts to ensure improved profitability and a strengthening of its business
base through further advancing the technological levels of its vertical merchandising system. This system is
aimed at consistently managing everything from the purchasing of ingredients to the delivery of our
products to customers in order to enhance efficiency and productivity, as well as quality of ingredients. In
addition to this, we pressed ahead with the strengthening of our products and restaurant service, and
succeeded in opening 40 new outlets in Japan, mainly in urban areas with strong potential to attract
customers. As a result, the Company booked consolidated net sales of 88,323 million yen in the fiscal year
under review, up 4% from the previous fiscal year, operating income of 9,168 million yen, up 22.2%. Net
sales were the highest in the history of the Company, and this year was the 37th term of consecutive increase
since its foundation. Although operating income was also the highest so far, the inclusion of losses on
termination of derivatives contracts meant that we suffered net loss of 4,896 million yen.
The Company strove to strengthen profitability through improvements in productivity, and promoted
improvement measures in the fields of production and logistics cost control, as well as SG&A expenses.
With the currently appreciated yen, results of these measures have come to be reflected clearly in our figures.
We will continue to strengthen our profitability through stringent efforts to revitalize the organization and
improve our production control technology. We will improve the capacity of our existing business, while
building and developing our overseas projects
and new operating formats (fast-food and
fast-casual restaurants) as the
foundations of our future
operations.
We ask for your understanding of
Saizeriya’s measures, and look
forward to enjoying continued
support from you, our
shareholders.
4Saizeriya

Interview with the PresidentReview of business results for the fiscal year ended August 31, 2009, and forecast for the fiscal year ending August 31, 2010
The business environment in our sector remains tough,
but in the second half of the fiscal year under review
Saizeriya was able to turn the economic environment to
our advantage and achieve improvements, leading to
better sales figures in our existing outlets than in the
first half. We did not have a specific marketing strategy
in place to increase sales, but the Company benefited
from the fact that Saizeriya was introduced in a
television program for two consecutive weeks in June,
raising awareness of our brand. We anticipated an
increase in customers after the broadcast, and took
steps to ensure that we did not run out of products or
find ourselves short-staffed so as to cause problems for
our customers. We established guaranteed supplies of
imported foodstuffs and ensured our restaurants were
appropriately staffed. I believe that these improvements
in our store operating efficiency, along with the efforts
we made to ensure higher quality, consistent products
and services, resulted in the increased sales at our
existing outlets.
The Company wi l l l ower cos t s and improve
profitability based on the idea that waste should be
eliminated using production control technologies in a
range of areas–not only in our manufacturing and
logistics, but also in our ingredients and equipment, as
well as our use of heat and light. For example, when
purchasing raw materials, we avoid purchasing
materials that are of unnecessarily high quality,
selecting rather materials that are of exactly the quality
we require, in order to be thorough in regard to
ensuring quality while keeping the price down.
Emphasizing “processing rather than cooking,” we will
analyze our processes scientifically at the substance level
and focus on raw materials that are ideal for our
processes. We will simplify the cooking process not
on ly wi th in our re s taurant s , but a l so a t our
commissaries, in order to ensure that our products are
consistent. In terms of equipment, we will promote
energy saving through measures such as introducing
“dry kitchens” and changing our lighting into LED.
Improving sales at existing outlets Improving productivity
5 Saizeriya
Interview with the President
In our menus, we are striving to improve quality by
further refining popular products and narrowing down
targeted items. Rather than frequently bringing in new
menu items, we plan to change the recipes for existing
products as well as improve quality and lower costs in
order to prioritize supplying our consistently popular
and currently “hot” products in a way that makes them
taste even better and seem more affordable. As part of
this strategy, we have continued to improve our core
products, which use ingredients that come from stable
suppliers in the global market, such as hamburgers and
white sauce from our Australia Plant, and lettuce from
the Saizeriya farms. In order to ensure that our
restaurant operations are made more efficient and
quality is improved at the same time, we are constantly
working on better manufacturing processes for our
food, and we are proactive in introducing new
equipment and facilities into our plants.
In order to improve productivity, we need not only to
create structures and systems but also to raise the level
of awareness among our employees in order to improve
our manpower. We will reform our human resources
systems in order to input a range of stimulating
strategies, and expand the training opportunities
offered to our staff. We believe that internal transfers
and th e open ing o f n e w r e s t au r an t s a r e a l l
opportunities for training. Beginning in the fiscal year
ending August 31, 2010, we will conduct training for
Japanese restaurant managers at Saizeriya outlets
overseas. Through doing this, we aim to achieve a
change in awareness among staff both inside Japan
and overseas. In addition, as part of its strategy to
improve restaurant QSC, (Quality, Service and
Cleanliness) employees who are moved to head office
are being encouraged to visit Saizeriya restaurants as
“mystery diners” in order to assess them anonymously.
The aim of this strategy is to encourage employees to
think about the restaurant from the perspective of a
customer.
Strengthening our core products Increased organizational strength
6Saizeriya

2005
74,602
2006
78,976
2007 2005 2006 2007 2008 2005 2006 2007
82,866
2008
84,949
4,498 2,391
0
6,722
8,298 7,8533,563
4,411
2008
4,011
20,000
40,000
80,000
100,000
(millions of yen)
(8,000)
0 0
(6,000)
2,000
6,000
8,000
10,000
(12)
(8)
4
8
12
16
20
(millions of yen) (%)
Ordinary Income (Loss) /Ordinary Income Margin
(5,000)
0
(4,000)
1,000
2,000
3,000
4,000
5,000
(millions of yen)
Net Income (Loss)
6.08.5
10.09.2
Ordinary IncomeOrdinary Income Margin
2005 2006
Net Assets / ROE Cash Flows(= Net Income (Loss) + Depreciation and Amortization)Total Assets
ROA
59,653
(10,000)
0
10,000
30,000
40,000
20,000
60,000
50,000
70,000
(12)
0
3
6
9
15
12
18
21
(millions of yen) (%)
5.5
44,74249,267
53,156
(10,000) (10)
10,000
20,000
30,000
40,000
60,000
0
5
10
15
25
20
30
(millions of yen) (%)
4,987
6,0166,488
(3,000)
1,500
0
(1,500)
6,000
4,500
3,000
7,500
(millions of yen)
Net AssetsROE
59,870
2007 2005 2006 2007 2008 2005 2006 2008
6,822
2007
62,619
2008
63,951
2009
88,323
(6,929) (4,896)
2009
68,369
2009
2009
47,244
(9.6)
2009
2009
(2,202)
54,354
Net Sales
Total Assets / ROA
60,0004,000
(7.8)
7.58.6
7.6
0
50,000
7.4
11.2
13.5
(10.5)
12.4
Five-Year Summary
Millions of YenThousands ofU.S. Dollars (1)
Years ended August 31 2005 2006 2007 2008 2009 2009Net Sales ¥ 74,602 ¥ 78,976 ¥ 82,866 ¥ 84,949 ¥ 88,323 $ 952,372
Operating Income 4,385 5,616 7,444 7,501 9,168 98,857
Net Income (Loss) 2,391 3,563 4,411 4,011 (4,896) (52,793)
Per Share Data (Yen and U.S. Dollars):
Net Income (Loss) (2) 45.95 68.46 84.77 77.86 (95.79) (1.03)
Cash Dividends 10.00 13.00 18.00 18.00 18.00 0.19
Total Assets ¥ 59,653 ¥ 59,870 ¥ 62,619 ¥ 63,951 ¥ 68,369 $ 737,212
Long-term Debt 482 — — — 6,930 74,725
Net Assets 44,742 49,267 53,156 54,354 47,244 509,424
Capital Expenditures ¥ 2,898 ¥ 2,117 ¥ 2,796 ¥ 3,384 ¥ 4,406 $ 47,509
Depreciation and Amortization 2,596 2,453 2,410 2,477 2,694 29,049
Number of Full-time Employees 1,675 1,611 1,704 1,481 1,845
Number of Restaurants 748 759 768 775 836
Notes: (1) The U.S. dollar amounts represent translations of Japanese yen amounts at the rate of ¥92.74=US$1, the rate of exchange on August 31, 2009.
(2) The computation of net income per share is based on the weighted average number of shares outstanding during each year, retroactively adjusted for stock splits.
On 18th October, 2002, the Company made a stock split by way of a free share distribution at the rate of 1.3 shares for each outstanding share.
(3) Figures at the last digit in the past may have been slightly moved due to changes in calculation at less than a unit.
7 Saizeriya

Review of OperationsSa ize r i ya Co. , L td . and i t s Conso l idated Subs id ia r ies
Operating Results for this Term
The Japanese economy in the fiscal year under review
has been affected by the global financial crisis, resulting
in stagnating corporate profits, particularly in the
export industry, and a decline in consumer confidence
due to employment problems. The future has been
unclear throughout this period.
In terms of the dining-out industry, consumers
who have been uncertain about their income prospects
have become conservative about maintaining their
current standard of living, and have increasingly
decided not to dine out. Warnings against H1N1
influenza have also led people to stay at home rather
than go out, and this has caused additional and
continued difficulties within the market.
Within this business environment, Saizeriya was
fortunate to be shown on television during the fourth
quarter of the year, which raised awareness and led to a
significant consumer response.
The Company strove to meet the expectations of
our customers through improving product appeal and
restaurant service, thereby aiming to ensure that
customers choose our restaurants over others.
We cont inued our e f for t s to improve our
profitability and business base through promoting
operational efficiency and productivity enhancement at
a company-wide level.
Under such circumstances, the Company booked
consolidated net sales of ¥88,323 million and operating
income of ¥9,168 million in the fiscal year under
review. This constituted the highest ever net sales in the
Company’s history, and gave us our 37th consecutive
increase in turnover. Operating income showed an
increase from the previous fiscal year, but due to the
inclusion of ¥15,310 million of losses on cancellation
of derivatives, we ended the period with a net loss of
¥4,896 million.
It is thought that the recovery of the Japanese economy
will require further time, and the forthcoming term is
therefore expected to be a further period of operating
within a difficult economic environment.
Accordingly, our earnings targets are consolidated
net sales of ¥93,000 million, operating income of
¥9,400 million, and net income of ¥4,900 million.
Outlook for the Next Term
8Saizeriya

Consol idated Balance SheetsSa ize r i ya Co. , L td . and i t s Conso l idated Subs id ia r ies
Millions of Yen Thousands of U.S. Dollars
August 31, 2009 and 2008 2009 2008 2009
ASSETS
CURRENT ASSETS:
Cash and deposits with banks ¥14,681 ¥15,245 $158,303
Accounts receivable–tenants 526 603 5,672
Inventories — 3,370 —
Merchandise and fi nished goods 2,854 — 30,774
Raw materials and supplies 619 — 6,675
Deferred tax assets 3,748 648 40,414
Income taxes receivable 1,432 — 15,441
Other 1,908 1,833 20,574
Total current assets 25,772 21,700 277,895
FIXED ASSETS:
Tangible fixed assets
Buildings and structures 17,502 17,651 188,721
Machinery, vehicle and equipment 2,292 2,599 24,714
Furniture and fixtures 1,458 1,069 15,721
Land 5,363 5,400 57,828
Construction in progress 124 163 1,337
Total tangible fixed assets 26,741 26,884 288,344
Intangible fixed assets 234 264 2,523
Investments and other assets
Investment securities 1,532 769 16,519
Caution and guarantee money 6,886 6,496 74,251
Cooperative advances for construction 4,557 5,105 49,137
Deferred tax assets 41 120 442
Other 2,620 2,628 28,251
Allowance for doubtful accounts (17) (17) (183)
Total investments and other assets 15,621 15,102 168,439
Total fixed assets 42,596 42,251 459,306
TOTAL ¥68,369 ¥63,951 $737,212
Notes: (1) The U.S. dollar amounts represent translations of Japanese yen amounts at the rate of ¥92.74=US$1, the rate of exchange on August 31, 2009.
(2) The financial statements are translation of Japanese annual security report's financial statement.
9 Saizeriya

Millions of Yen Thousands of U.S. Dollars
August 31, 2009 and 2008 2009 2008 2009
LIABILITIES
CURRENT LIABILITIES:
Accounts payable–trade ¥ 3,315 ¥ 3,450 $ 35,745
Current portion of long-term loans payable 5,442 — 58,680
Corporation and inhabitants taxes payable 264 1,598 2,847
Accrued bonuses 759 701 8,184
Allowance for special benefit for shareholders 213 224 2,297
Derivatives liabilities 737 — 7,947
Other 3,301 3,520 35,594
Total current liabilities 14,033 9,494 151,316
LONG-TERM LIABILITIES:
Long-term loans payable 6,930 — 74,725
Deferred tax liabilities 21 43 226
Other 140 58 1,510
Total long-term liabilities 7,091 102 76,461
Total liabilities 21,125 9,596 227,787
NET ASSETS
SHAREHOLDERS’ EQUITY:
Capital stock 8,612 8,612 92,862
Capital surplus 9,007 9,007 97,121
Retained earnings 30,011 35,883 323,604
Treasury stock (1,272) (1,270) (13,716)
Total shareholders’ equity 46,358 52,232 499,871
VALUATION AND TRANSLATION ADJUSTMENTS:
Valuation difference on available-for-sale securities (86) (66) (927)
Translation adjustments 972 2,189 10,481
Total valuation and translation adjustments 885 2,122 9,543
Total net assets 47,244 54,354 509,424
TOTAL LIABILITIES AND NET ASSETS ¥68,369 ¥63,951 $737,212
10Saizeriya
Consol idated Statements of IncomeSa ize r i ya Co. , L td . and i t s Conso l idated Subs id ia r ies
Millions of Yen Thousands of U.S. Dollars
Years Ended August 31, 2009 and 2008 2009 2008 2009
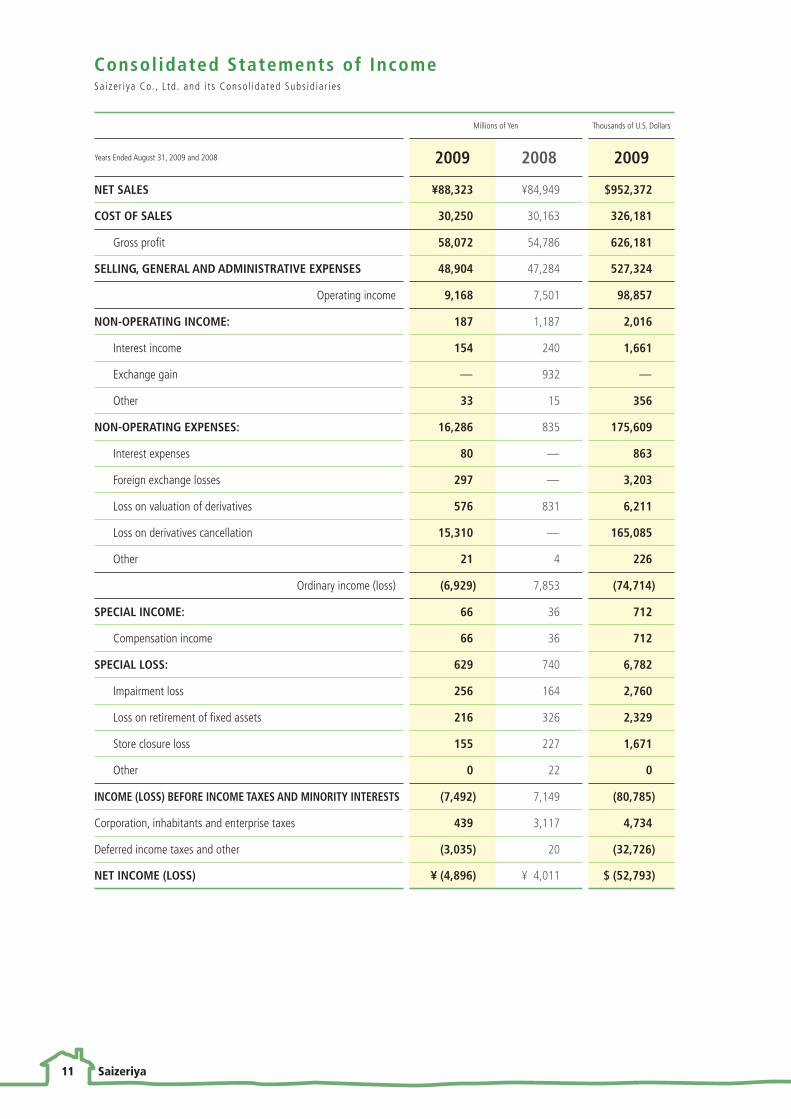
NET SALES ¥88,323 ¥84,949 $952,372
COST OF SALES 30,250 30,163 326,181
Gross profit 58,072 54,786 626,181
SELLING, GENERAL AND ADMINISTRATIVE EXPENSES 48,904 47,284 527,324
Operating income 9,168 7,501 98,857
NON-OPERATING INCOME: 187 1,187 2,016
Interest income 154 240 1,661
Exchange gain — 932 —
Other 33 15 356
NON-OPERATING EXPENSES: 16,286 835 175,609
Interest expenses 80 — 863
Foreign exchange losses 297 — 3,203
Loss on valuation of derivatives 576 831 6,211
Loss on derivatives cancellation 15,310 — 165,085
Other 21 4 226
Ordinary income (loss) (6,929) 7,853 (74,714)
SPECIAL INCOME: 66 36 712
Compensation income 66 36 712
SPECIAL LOSS: 629 740 6,782
Impairment loss 256 164 2,760
Loss on retirement of fixed assets 216 326 2,329
Store closure loss 155 227 1,671
Other 0 22 0
INCOME (LOSS) BEFORE INCOME TAXES AND MINORITY INTERESTS (7,492) 7,149 (80,785)
Corporation, inhabitants and enterprise taxes 439 3,117 4,734
Deferred income taxes and other (3,035) 20 (32,726)
NET INCOME (LOSS) ¥ (4,896) ¥ 4,011 $ (52,793)
11 Saizeriya

Consol idated Statements of Changes in Net AssetsSa ize r i ya Co. , L td . and i t s Conso l idated Subs id ia r ies
Millions of Yen
Year Ended August 31, 2009
Shareholders’ equity Valuation and translation adjustments
Total net assetsCapital
stockCapitalsurplus
Retained earnings
Treasury stock
Total shareholders’
equity
Valuation difference on available-for-sale securities
(losses)
Translation adjustments
Total valuationand translation
adjustments
BALANCE AS OF AUGUST 31, 2008 ¥8,612 ¥9,007 ¥35,883 ¥(1,270) ¥52,232 ¥(66) ¥2,189 ¥2,122 ¥54,354
Changes during the term
Dividends (920) (920) (920)
Net income (4,896) (4,896) (4,896)
Acquisition of treasury stock (2) (2) (2)
Decrease due to increase in consolidated subsidiaries (54) (54) (8) (8) (1,228)
N et changes of items other than shareholders’ equity (19) (1,208) (1,228) (1,228)
Total changes during the term — — (5,872) (2) (5,874) (19) (1,216) (1,236) (7,110)
BALANCE AS OF AUGUST 31, 2009 ¥8,612 ¥9,007 ¥30,011 ¥(1,272) ¥46,358 ¥(86) ¥972 ¥885 ¥47,244
Thousands of U.S. Dollars
Year Ended August 31, 2009
Shareholders’ equity Valuation and translation adjustments
Total net assetsCapital
stockCapitalsurplus
Retained earnings
Treasury stock
Total shareholders’
equity
Valuation difference on available-for-sale securities
(losses)
Translation adjustments
Total valuationand translation
adjustments
BALANCE AS OF AUGUST 31, 2008 $92,862 $97,121 $386,920 $(13,694) $563,209 $(712) $23,604 $22,881 $586,090
Changes during the term
Dividends (9,920) (9,920) (9,920)
Net income (52,793) (52,793) (52,793)
Acquisition of treasury stock (22) (22) (22)
Decrease due to increase in consolidated subsidiaries (582) (582) (86) (86) (13,241)
N et changes of items other than shareholders’ equity (205) (13,026) (13,241) (13,241)
Total changes during the term (63,317) (22) (63,338) (205) (13,112) (13,328) (76,666)
BALANCE AS OF AUGUST 31, 2009 $92,862 $97,121 $323,604 $(13,716) $499,871 $(927) $10,481 $9,543 $509,424
12Saizeriya

Consol idated Statements of Cash FlowsSa ize r i ya Co. , L td . and i t s Conso l idated Subs id ia r ies
Millions of Yen Thousands of U.S. Dollars
Years Ended August 31, 2009 and 2008 2009 2008 2009
OPERATING ACTIVITIES:
Income (loss) before income taxes and minority interests ¥ (7,492) ¥ 7,149 $ (80,785)
Depreciation 2,694 2,477 29,049
Increase (decrease) in allowance for doubtful accounts (0) 0 (0)
Increase in accrued bonuses 58 31 625
Increase (decrease) in reserve for special benefi t for shareholders (10) 78 (108)
Interest income (154) (240) (1,661)
Interest expenses 80 — 863
Exchange gain 268 107 2,890
Loss on valuation of derivatives 576 831 6,211
Loss on derivatives cancellation 15,310 — 165,085
Loss on retirement of fi xed assets 216 326 2,329
Store closure loss 155 227 1,671
Impairment loss 256 164 2,760
Compensation income (66) (36) (712)
Decrease (increase) in accounts receivable–tenants 76 (137) 819
Decrease (increase) in inventories (158) 565 (1,704)
Decrease (increase) in other current assets 70 (92) 755
Increase (decrease) in accounts payable–trade (114) 331 (1,229)
Increase (decrease) in other current liabilities (63) 169 (679)
Other 471 (234) 5,079
Subtotal 12,176 11,720 131,292
Interest and dividends received 86 178 927
Interest paid (86) — (927)
Payments due to cacellation of derivatives transaction (15,310) — (165,085)
Payments of income taxes, etc. (3,147) (3,585) (33,934)
Net cash provided by (used in) operating activities (6,281) 8,313 (67,727)
INVESTING ACTIVITIES:
Purchase of investments in subsidiaries (1,087) (316) (11,721)
Purchase of tangible fixed assets (3,637) (2,818) (39,217)
Purchase of intangible fixed assets (44) (58) (474)
Payments for caution money, guarantee money and cooperative advances for construction (629) (497) (6,782)
Proceeds from collection of caution, guarantee money and cooperative advances for construction 289 796 3,116
Increase in operating loans receivable (100) — (1,078)
Payments for other (48) (60) (518)
Net cash used in investing activities (5,258) (2,954) (56,696)
FINANCING ACTIVITIES:
Proceeds from long-term loans payable 16,000 — 172,525
Repayment of long-term loans payable (3,628) — (39,120)
Purchase of treasury stock (2) (973) (22)
Dividends paid (917) (936) (9,888)
Net cash provided by (used in) financing activities 11,452 (1,909) 123,485
TRANSLATION DIFFERENCES ON CASH AND CASH EQUIVALENTS (597) (185) (6,437)
INCREASE/DECREASE IN CASH AND CASH EQUIVALENTS (683) 3,263 (7,365)
CASH AND CASH EQUIVALENTS AT BEGINNING OF PERIOD 15,245 11,982 164,384DECREASE IN CASH AND CASH EQUIVALENTS RESULTING FROM EXCLUSION OF SUBSIDIARIES FROM CONSOLIDATION 120 — 1,294
CASH AND CASH EQUIVALENTS AT END OF PERIOD ¥ 14,681 ¥15,245 $158,303
13 Saizeriya

Corporate Data & Shareholders’ InformationSa ize r i ya Co. , L td . and i t s Conso l idated Subs id ia r ies
Corporate DataAs o f August 31, 2009
Shareholders’ InformationAs o f August 31, 2009
Board of Directors and Statutory Auditors
Yasuhiko Shogaki Yukihisa TakayamaChairman Director
Issei Horino Minoru OridoPresident Director
Nobuyuki Masuoka Minoru KojimaDirector Director
Hideharu Matsutani Sakae AbeDirector Standing Statutory Auditor
Shin Nagaoka Tsutomu OkadaDirector Statutory Auditor
Ryohei Shibata Yoshiaki MiyazakiDirector Statutory Auditor
Akira HigashiDirector
Principal ShareholdersNumber of Shares Held
(Unit: 1,000 shares)
Percentage ofTotal Shares (%)
Yasuhiko Shogaki 15,953 30.51
Babette Co., Ltd. 4,455 8.52
Japan Trustee Services Bank, Ltd. (Trust Account) 3,825 7.31
The Master Trust Bank of Japan, Ltd. (Trust Account) 2,522 4.82
Saizeriya Employees’ Stock Holding Association 1,856 3.55
Japan Trustee Services Bank, Ltd. (Trust Account 4G) 1,390 2.65
Saizeriya Co., Ltd. 1,149 2.19
Kunio Shogaki 899 1.71
DEUTSCHE BANK AG LONDON-PB NON-TREATY CLIENTS 613 (Standing proxy: Deutsche Securities Inc.) 625 1.19
The Nomura Trust and Banking Co., Ltd. (Investment Account) 502 0.96
The Ownership of the Shares by Category
Number ofShareholders
Number ofShares Held
(Unit: 100 shares)
Percentage ofTotal Shares (%)
Japanese Financial Institutions 42 111,389 21.4
Japanese Securities Companies 28 1,789 0.3
Other Japanese Corporations 145 45,818 8.8
Foreign Corporations and Individuals 154 52,541 10.1
Japanese Individuals and Others 32,535 309,849 59.4
Total 32,904 521,386 100.0
Company Name
Saizeriya Co., Ltd.Chairman and Representative Director
Yasuhiko ShogakiPresident and Representative Director
Issei HorinoHead Office
2-5, Asahi, Yoshikawa City, Saitama 342-0008, Japan
Established
May 1, 1973Capital Stock
¥8,612,500 thousandNumber of Employees
1,845Number of Outlets
836
Total Number of Shares Authorized
73,208,000Number of Shares Issued
52,272,342Shares Listed On
The First Section of the Tokyo Stock Exchange
Number of Shareholders
32,904
Consolidated Subsidiaries
Saizeriya Australia Pty. Ltd.
Shanghai Saizeriya Co., Ltd.
Guangzhou Saizeriya Co., Ltd.
14Saizeriya

Saizeriya Co., Ltd.2-5, Asahi, Yoshikawa City, Saitama 342-0008, JapanPhone: +81-48-991-9611 Fax: +81-48-991-9637
URL http://www.saizeriya.co.jp/