annual report 2002 - grupo banco · pdf fileannual report 2002. 2 general information ......
TRANSCRIPT

Annual Report 2002

2
General Information
Banco Popular Español, S.A. was incorporated on July 14, 1926, and is registered in the Madrid MercantileRegister in volume 174, folio 44, page 5,458, 1st entry. The Bank is a member of the Deposit Guarantee Fundfor banking entities. 2002 was the Bank's 76th year of operations. The Bank's head office is located atVelázquez, 34. 28001 Madrid.
The Ordinary Shareholders' Meeting will take place on Thursday, June 26, 2003, at 1:00 p.m., at José Ortega yGasset, 29, Madrid.
The financial accounting and statistical data provided herein were prepared with the utmost objectivity, detail,reporting clarity and consistency over time, from the specifically prepared financial information periodically filedwith the Bank of Spain. The financial statements are presented in accordance with the standards applicable in2002, specifically those of Bank of Spain Circulars 4/1991, 2/1996, 5/1997 and 7/1998; the figures for periodsprior to the entry into force of the 1998 standards have been adjusted, as far as possible, to conform thereto.
Average balances were calculated on the basis of daily, monthly or quarterly data, depending on the informationavailable in each case. Figures in brackets are negative amounts, differences or variation rates.
In addition to the Annual Report and its accompanying documents, the Bank issues quarterly financial reports onits operations, including a detailed analysis of variations in assets, liabilities, earnings and profitability in eachquarter. All the information is available at the Banco Popular Shareholders Office (José Ortega y Gasset, 29.28006 Madrid; telephone: 34 91.520.72.65, fax: 34 91.577.92.09, e-mail: [email protected]). All theinformation is also available at: http://www.bancopopular.es

3
Contents Page
General information 2
List of tables, boxes and graphs in the Management Report 4
Banco Popular financial highlights 5
Board and management 6
Editorial 7-8
Management report 9-78
Banco Popular Group 11-54
Banco Popular 55-63
Banking subsidiaries 64-72
Nonbanking finance and service subsidiaries 73-78
Financial statements 79-138
Report of independent auditors 80
Financial reporting responsibility 81
Consolidated balance sheets and statements of income 82-84
Notes to the financial statements 85-138
Corporate Governance Report 139-149
Assets and funds: Total assets. Shareholders' equity. Computable capital. Customer funds. Loans anddiscounts. Off-balance sheet risks. Risk management (Credit risk. Cross–border risk. Market risk. Liquidity risk).Securities portfolios. Goodwill in consolidation. Premises and equipment. Balance sheet in euros and foreigncurrency.
Income and profitability: Income statement. Yields and costs. Operating profitability. Final measures of return.Shareholders. Market performance of Banco Popular shares.
Assets and funds: Total assets. Shareholders' equity. Customer funds. Loans and discounts. Riskmanagement. Securities portfolio.
Income and profitability: Income statement. Yields and costs. Net interest revenue and ordinary revenue.Operating costs, depreciation and other operating income and expenses. Operating income. Net income andprofitability.

4
List of Tables, Boxes and Graphs in the Management Report
Tables Consolidated data
1. Summarized consolidated balance sheets2. Consolidated equity3. Customer funds4. Breakdown of euro customer deposits by size of balance5. Breakdown of customer deposits by region in Spain6. Customer deposits by original maturity7. Mutual funds, by type8. Loans and discounts9. Lending matrix
10. Breakdown of loans and discounts by region in Spain11. Loans and discounts by original maturity12. Off–balance sheet risks13. Risk concentration14. Risk distribution by industry15. Risk performance16. Allowance for nonperforming loans17. Country-risk and related allowances18. Country-risk by balance sheet caption19. Maturity and repricing gap in the balance sheet20. Value at Risk (VaR)21. Liquidity gap22. Security portfolios23. Goodwill in consolidation
24. Premises and equipment25. Summarized euro and foreign currency balance sheets26. Income statements27. Causal analysis of the variation in net interest revenue28. Service revenues29. Itemized breakdown of general expenses
and taxes other than income tax30. Operating efficiency31. Quarterly income and profitability32. Corporate income tax calculation33. Per share data34. Yields and costs35. Quarterly yields and costs36. Profitability37. Measures of return38. Breakdown of share ownership39. Common stock ownership distribution40. Shares controlled by the Board of Directors41. Evolution of price of Banco Popular common stock42. Market return on Banco Popular shares 1992-200243. Banco Popular share valuation measures44. Banco Popular share trading volume45. Treasury stock
46. Summarized balance sheets47. Customer funds48. Loans and discounts49. Risk performance50. Allowance for nonperforming loans
51. Security portfolios detail52. Comparative statements of income53. Yields and costs54. Profitability
Banco Popular
55. Customer funds and loans and discounts 56. Risk performance57. Profitability
58. Per share data59. Employees and branches60. Business volume and income returnAnnex: Summarized financial statements
Banking subsidiaries
1. Total assets managed2. Level of solvency3. Customer funds 4. Variation in total resident private-sector deposits5. Mutual funds6. Pension plans7. Loans and discounts8. Variation in total resident private-sector loans and discounts9. Customer funds and loans and discounts per employee
10. Customer funds and loans and discounts per branch11. Variation in the nonperforming loans ratio and coverage for
delinquent balances12. Service revenues
13. Operating efficiency14. Quarterly revenues15. Growth of income16. Income and dividend per share. Pay-out17. Customer spread18. Interest rates19. Net interest margin20. Quarterly ROA and ROE21. ROA and ROE22. Banco Popular vs. the market: 2002 stock market indices23. Market capitalization and book value 24. Share liquidity
Graphs
Boxes
Nonbanking finance and service subsidiariesSummarized financial statements
1. Summary of permanent management policies 2. Banco Popular ratings3. Commercial performance data for 2002
4. Commercial strategy5. Quality of earnings6. Banco Popular named “the best bank in Spain”

5
Banco Popular Financial Highlights (consolidated figures)
(€ million, unless otherwise indicated)
(a) After distribution of income for the year(b) Figures adjusted for the 2 x 1 split in February 2000(c) €0.78 per share were also paid to shareholders out of the paid-in surplus reserves
Business volumeTotal assets managed . . . . . . . . . . . . . . . . . . . . . . .On-balance sheet total assets . . . . . . . . . . . . . . . . .Total equity (a) . . . . . . . . . . . . . . . . . . . . . . . . . . . . .Customer funds:
On-balance sheet funds . . . . . . . . . . . . . . . . . . . .Other intermediated funds . . . . . . . . . . . . . . . . . .
Loans and discounts . . . . . . . . . . . . . . . . . . . . . . . .Off-balance sheet risks . . . . . . . . . . . . . . . . . . . . . .
SolvencyBIS ratio (%) . . . . . . . . . . . . . . . . . . . . . . . . . . . . . . .Of which: Tier 1(%) . . . . . . . . . . . . . . . . . . . . . . . . .
Risk managementTotal risks . . . . . . . . . . . . . . . . . . . . . . . . . . . . . . . .Nonperforming loans . . . . . . . . . . . . . . . . . . . . . . . .Allowances for credit losses . . . . . . . . . . . . . . . . . . .Nonperforming ratio (%) . . . . . . . . . . . . . . . . . . . . . .Coverage (Credit loss allowance/Nonperforming loans) (%)
Income statementsNet interest revenue . . . . . . . . . . . . . . . . . . . . . . . . .Basic banking revenue . . . . . . . . . . . . . . . . . . . . . .Ordinary revenue . . . . . . . . . . . . . . . . . . . . . . . . . . .Operating income . . . . . . . . . . . . . . . . . . . . . . . . . . .Income before taxes . . . . . . . . . . . . . . . . . . . . . . . . .Net income . . . . . . . . . . . . . . . . . . . . . . . . . . . . . . . .Net income attributable to Banco Popular Shareholders .
Net return and efficiencyAverage total assets . . . . . . . . . . . . . . . . . . . . . . . .Average total equity . . . . . . . . . . . . . . . . . . . . . . . .ROA (%) . . . . . . . . . . . . . . . . . . . . . . . . . . . . . . . . . .ROE (%) . . . . . . . . . . . . . . . . . . . . . . . . . . . . . . . . . . .Operating efficiency (%) . . . . . . . . . . . . . . . . . . . . . .
Per share data (b) Shares outstanding (thousands) . . . . . . . . . . . . . . .Share closing market price (€) . . . . . . . . . . . . . . . . .Share book value (€) . . . . . . . . . . . . . . . . . . . . . . . .Net income per share (€) . . . . . . . . . . . . . . . . . . . . .Dividend per share (€) . . . . . . . . . . . . . . . . . . . . . . .Price/Book value (P/BV) . . . . . . . . . . . . . . . . . . . . . .Price/Earnings (P/E) . . . . . . . . . . . . . . . . . . . . . . . . .
Other dataShareholders . . . . . . . . . . . . . . . . . . . . . . . . . . . . . .Employees:
Spain . . . . . . . . . . . . . . . . . . . . . . . . . . . . . . . . . .Abroad . . . . . . . . . . . . . . . . . . . . . . . . . . . . . . . . .
Branches:Spain . . . . . . . . . . . . . . . . . . . . . . . . . . . . . . . . . .Abroad . . . . . . . . . . . . . . . . . . . . . . . . . . . . . . . . .
ATMs . . . . . . . . . . . . . . . . . . . . . . . . . . . . . . . . . . . .
2001%
variation 2000 1999 19982002
47,08137,3952,296
35,55125,8659,686
27,8204,279
11.339.15
32,0982565060.80
197.68
1,4021,9692,0141,157
852614565
34,5702,0441.78
27.6537.20
217,15436.8810.572.6031.360
3.514.2
75,37912,30912,123
1862,1442,118
263,141
10.512.312.612.415.83.3
23.423.5
23.438.034.7
13.59.98.9
13.123.812.012.1
16.012.8
-5.7
12.612.110.3
(6.1)1.31.0
16.10.70.73.85.9
40,65131,3572,047
31,58622,2929,294
23,3083,182
11.489.55
26,4892093840.79
184.03
1,1271,6641,7841,011
810528491
28,6881,8061.84
27.1639.11
217,15437.109.43
2.2591.195
3.916.4
81,45511,94311,825
1182,0692,055
142,824
36,47326,3311,810
28,65818,51610,14218,9392,694
10.679.59
21,6321963280.91
167.44
1,0001,4671,513
777705466433
24,1411,7391.93
24.8841.90
217,15432.388.33
1.9651.075
3.916.5
87,27511,53911,419
1202,0041,989
152,377
34,16324,1561,831
26,38416,37710,00716,8962,413
12.0812.08
19,3122122941.10
138.79
9541,3661,413
687656439407
22,6471,7651.94
23.0544.25
221,55032.168.27
1.8370.977
3.917.5
84,13711,60011,515
851,9661,955
111,903
52,00642,0052,586
39,94629,94510,00134,3225,284
11.008.88
39,6043536820.89
192.98
1,5912,1642,1931,3081,055
688633
40,1072,3061.71
27.4735.69
217,15438.9711.912.9171.500
3.313.4
70,81612,46412,248
2162,1602,133
273,327
(c)

6
Francisco APARICIO, (Representing Sindicaturade Accionistas)Asociación de DirectivosIldefonso AYALADiethart BREIPOHLJosé María CATÁFrancisco DONATEEric GANCEDO *Luis HERRANDO *Manuel LAFFÓNLuis MIRALLES
José BRAVO, CastillaMiguel MOZO, VasconiaFrancisco PARDO, Andalucía
Antonio PUJOL, GaliciaEladio SEBASTIÁN, Crédito Balear
Casimiro MOLINSSantos MONTOROLuis MONTUENGA *Manuel MORILLOMiguel NIGORRAAlberto PARERAEnrique PÉREZ SALAJosé Ramón RODRÍGUEZ *Miguel Angel de SOLÍS Jorge STECHERRafael TERMES
Network Line ManagementBanco Popular
Senior Line Managers:Santiago BERROCAL, Madrid Antonio FÉREZ, Andalucía Francisco J. SAFONT, Cataluña
Regional Banking Subsidiaries
Other Banking and Financial Subsidiaries
Regional Managers:
Board and ManagementBoard of Directors Javier VALLS,* Chairman
Luis VALLS, * ChairmanGabriel GANCEDO, * Deputy Chairman
Angel RON, Chief Executive OfficerJesús PLATERO,* Secretary
Directors
Executive ManagementAngel RON, Chief Executive Officer
Pedro BERLINCHES, Europensiones and EurovidaJuan Manuel COBO, Heller Factoring EspañolaManuel FERRER, Gestora Europea de InversionesJavier GEFAELL, Popular Banca PrivadaGonzalo GÓMEZ, Banco Popular HipotecarioAlfonso JORDÁN, Sogeval
Aníbal MARQUES, Heller Factoring PortuguesaJuan MARTÍNEZ SAMPEDRO, Popular de RentingSusana de MEDRANO, Bancopopular-eJuan PÉREZ ENRÍQUEZ, Banco Popular FranceCarlos RAMOS, Popular BolsaJorge ROSELL, Popular de Participaciones Financieras
Eutimio MORALES, Technical resourcesAngel RIVERA, Human resources
Fernando de SOTO, Corporate Affairs
Rafael BERMEJO, Chief EconomistFrancisco FERNÁNDEZ DOPICO, Commercial networkRoberto HIGUERA, Chief Financial Officer
José SARTORIUS, International activities
Jesús ARELLANO, Control, internal audit, security and premisesIsaac BOTIJA, Remote bankingJuan ECHANOJAUREGUI, Investor relationsJosé María FERNÁNDEZ, Finance companiesFrancisco GÓMEZ, Commercial managementJulio HORTIGÜELA, Asset managementJosé María LUCÍA, LendingLuis Felipe MARCOS, Legal advisory services
Tomás PEREIRA, Risk prevention and impaired assetsAntonio RAMÍREZ, Information technologyErnesto REY, TreasuryRafael ROCA, ControllerJesús RODRÍGUEZ, Country manager PortugalFrancisco SANCHA, International commercial bankingJosé María SANZ, Compliance
José Ramón ALONSO, Castilla and LeónAlonso CUETOS, GaliciaAmadeu FONT, CanariasJesús M. GONZÁLEZ, Andalucía IJorge GOST, Madrid IIVicente LÓPEZ, Cataluña IJosé Luis MANSO, Asturias and CantabriaLuis MARÍN, ExtremaduraJosé Fernando MARTÍNEZ ISACH, Madrid IIIAntonio MÍNGUEZ, Murcia
Antonio PÉREZ, Andalucía IIJosé Manuel PIÑEIRO, AlicantePablo ROMERO, Aragón, Navarra and La RiojaAlfonso RUSPIRA, Cataluña IIJosé Luis SANGÜESA, País VascoAntonio SILVA, Castilla-La ManchaFrancisco SUBIRANA, Cataluña IIIJuan José TORREGLOSA, ValenciaCarlos VELÁZQUEZ, Madrid I
* Member of the Executive Committee

7
The year recently ended was characterized by the negative behavior of the world economy.Although 2001 had ended in a climate of pessimism following the grave events of September of thatyear and the lowering of expectations which those events caused, there was widespread agreementthat the recession would be very short - a "v-shaped recession" - and that activity would recoverwithin a few months. This was the context in which the rapid intervention of the central banksstarting in October 2001 to banish the risk of a global recession, with substantial interest rate cutsin Europe and the USA, must be viewed.
However, this forecast proved to be wrong and the expectations of recovery evaporated rapidly inthe early months of 2002, at the same time as new factors of pessimism emerged to darken theeconomic outlook. The leading European countries, considered to be the locomotives of growth,continued to show worrying signs of weakness in demand, with the fear of possible deflation.Moreover, the discovery of major accounting frauds at certain big US and European companies, inboth the old and the new economies, generated a climate of mistrust about the veracity of theinformation furnished to the markets, which did nothing to favor the relaunching of activity. Thesimultaneous failure by several European countries to comply with the financial stabilityagreements harmed the credibility of the EMU's economic policy. Lastly, recent months have seenthe increased possibility of a war in the Middle East which, among other consequences, wouldseriously affect oil prices and supplies. Faced by this somber panorama the central bankscontinued to relax monetary policy with further cuts in interest rates down to record low levels:2.75% in the euro area and 1.25% in the USA. The world's leading stock exchanges ended 2002with the sharpest falls for the last three years, despite brief and ephemeral moments of recovery,but without any glimpse of changes in the trend.
In short, the outlook at year end for the international economy - and for that of Spain, which isincreasingly integrated in a global world - was negative and, most worrying of all, was uncertain,with serious doubts about when and to what extent the repeatedly announced recovery would occur.
I shall be telling this with a sigh
Somewhere ages and ages hence:
Two roads diverged in a wood, and I
- I took the one less traveled by,
And that has made all the difference.
Robert Frost - The road not taken - Mountain Interval (1916)
8
Such was the scenario in which the performance of the Banco Popular Group summarized in thisAnnual Report should be placed. In a year marked by difficulty and scant visibility, the Grouppreserved its unwaivable signs of identity, expanded its customer base and market share and, at thesame time, maintained its high levels of solvency, profitability and efficiency, which are benchmarksof reference in the Spanish financial system. The stock market assessed these results without anyambiguity, and the price of Banco Popular stock rose by 5.7% in a year in which the Ibex-35 indexplummeted by 28.1%.
Going beyond the numbers, the year 2002 also saw the strengthening of two areas of priorityimportance for the Group: mortgage lending, and private banking and asset management.Additionally, in the early days of the current year, the Group has reached an agreement in principleto buy a bank in Portugal with a network of more than 100 branch offices, which will be thelaunching pad for development of the Popular model in that market.
A fter enduring years of incomprehension about the policies of the Group, aloof from the fads ofthe moment that trumpeted the advisability and desirability of big banking mergers, the entry intonew geographical markets - however distant and scantly known - and heavy investment in the neweconomy, Banco Popular pressed forward with its own criteria, not in order to be original butsimply to try and perform better the type of business of which it has proven experience, using itsown resources and applying its own way of doing things. We did not let ourselves be carried awayby what others were doing. We analyzed the new business opportunities and our means for enteringthem with a reasonable degree of success. In short, we followed the less traveled road, sometimesfeeling that we were "creatures from another planet" but guided by our confidence that it was thepath that best matched our culture and our capabilities.
T imes of difficulty lay bare the mistaken strategies, the organizational weaknesses forimplementing them successfully and, in short, the future expectations that are not firmly groundedin the unforgiving earth of realism. After a cycle of irrational exuberance, as the period of the lastfew years has so aptly been described, we now see banks going back to the basic concepts of ourbusiness, such as restrengthening commercial banking in the domestic market, particularly amongretail customers, giving priority to organic growth and purchases over mergers, and applying othercriteria which have been the signs of identity of our Group for many years. In some cases, the newstrategy has indeed been defined much more directly: take Banco Popular as the business andprofitability model of reference. These avowals reaffirm for us the validity of our corporate cultureand are a motive of pride for the Group's management and all its staff since, as the saying goes,imitation is the sincerest form of flattery.
January 2003

9
Management Report
This report reflects the opinion of the Management ofBanco Popular on the recent performance of andupcoming prospects for the Bank, and explains thepolicies on which daily management decisions havebeen based. The report also contains detailedsupplementary information on the financial statementsappearing later on in this document, drawn from the in-house accounting and statistical records underlyingmanagerial decisions.


Banco Popular Español, SA("Banco Popular" or "the Bank") is theparent banking company of a financegroup ("the Banco Popular Group" or"the Group") which at 2002 year-endalso included nine other banks whichwere either wholly- or majority-ownedand managed:
- Banco de Andalucía, Banco deCastilla, Banco de Crédito Balear,Banco de Galicia and Banco deVasconia, which operate in theregions indicated by their respectivenames.
- B a n c o P o p u l a r H i p o t e c a r i o ,specializing in property financing.
- Bancopopular-e, specializing inInternet banking.
- Popular Banca Privada, whichprovides private banking services inSpain.
- Banco Popular France, a commercialbank operating in France.
The Group also includes a total oft h i r t e e n c o m p a n i e s h a n d l i n gsubstantially all the range of financialservices: factor ing, mutual andpension fund management, securitiesintermediation, portfolio management,life insurance, insurance broking,venture capi ta l investment andequipment renting. Some of thesecompanies are joint ventures of BancoPopular and leading partner entities.The Group also includes other minorcompanies and several instrumentalcompanies to support its activities.
By virtue of Banco Popular'smajority in capital stock and voting
rights or the agreements with itspartners, the Group operates - to alleffects and purposes - as a singlewhole with unif ied direction andmanagement and common technicaland support services. The banking andother subsidiaries act as geographicalor functional units forming part of theBanco Popular Group organization, theonly special differentiating featuresbeing those arising from the differinglegal status of each.
Main variations in the compositionof the Group in 2002
The various changes in the scopeof consolidation of the Group during2002 included most notably:
Acquisition in May 2002 of the50% of the capital of Banco PopularHipotecario previously owned by thirdparties, converting this bank into awholly-owned subsidiary of the Group.
Acquisition in September 2002 of35% of the capital stock of FortiorHolding, the parent company ofIberagentes Activos (a securitiesc o m p a n y ) a n d o f t h r e e o t h e rc o m p a n i e s ( t w o m u t u a l f u n dmanagement companies and onepension plan management company),raising the Group's stake from 25% to60%. Iberagentes Act ivos wastransformed into a bank under thename of Popular Banca Privada.
Analysis of the Group's businessa n d e a r n i n g s i s b a s e d o n t h econsolidated financial statements,which include the financial statementsof the banks and aff i l iates afterelimination of the intragroup financialrelationships, consolidated by the
11
MANAGEMENT REPORT
2002 PERFORMANCE
12
global or proportional integration orequity methods, as appropriate,depending on their degree of linkagewith the parent company and line ofbusiness.
This Management Report startsby evaluating the performance of theconsolidated Group in the year, ascompared with the previous year,analyzing in detail its capital funds, thebusiness volume - assets and funds - ,r isk management, earnings andprofitability and the performance ofBanco Popular shares. Next, a similaranalysis is made of the Group's parente n t i t y a n d o f i t s n i n e b a n k i n gsubsidiaries, which are dealt with on amore summarized basis since they fileindividual financial statements. TheReport ends with the basic financialinformation (balance sheets andincome statements) of the mainfinancial service companies.
Assets and funds
Total assets
The consolidated balance sheetsas of December 31, 2002 and 2001,before the allocation of income for theyear, are summarized in Table 1. The"Financial Statements" section of theA n n u a l R e p o r t i n c l u d e s t h econsolidated balance sheets of thelast five years, in the public reportingformat demanded by the Bank ofSpain.
The to ta l on-ba lance sheetassets amounted to €42,005 million at2002 year end, €4,610 million (12.3%)more than at the end of 2001. Theaverage total assets during the yearwere €40,107 million, 16.0% higherthan in 2001.
The Group also managed othercustomer funds in off-balance sheetsavings instruments, amounting to€10,001 mil l ion at year end, anincrease of 3.3%. The composition ofthese assets is described in detail inthe subsection on customer funds.
Aggregating the on- and off-balance sheet assets, the tota lvolume of assets managed by theGroup at 2002 year end amounted to€52,006 million, up by 10.5% on2001.
Figure 1 plots the growth of year-end total assets managed in the lastfive years and a breakdown into thetwo groups considered.
Shareholders' equity
The Group's consolidated equitybefore the allocation of 2002 incomeamounted to €2 ,279 mi l l i on a tDecember 31, 2002, an increase of12.5% year-on-year.
The Bank's capital stock wasunchanged during the year at €108.6million.
Summary of permanent management policies Box 1
Signs of identity of the Group
- Preference for the domestic retail market- Commercial strategy orientated towards customer banking, based on
bonding through multiple products (cross-selling)- Personalized product offerings, tailored to the preferences of each
homogeneous customer segment- Multiple commercial distribution channels (branch office, card, ATM,
telephone, Internet banking)- Competition based on quality, flexibility and service personalization- Equal-footing agreements and alliances with other entities for the
performance of overall or specific activities
Management criteria
- Profitable growth of the business (increase of market share andmaximization of income)
- Maximum balance sheet soundness- High operating efficiency- Regularity in the conduct of the business, in earnings and in dividends- Flexible, flat and customer-orientated organization- Professionalism in decision-making processes- Active management of intellectual capital, staff training and motivation- Intensive use of information technology to strengthen commercial action- Internal and external reporting transparency

13
The main variations in reserveaccounts, including consolidationreserves, in 2002 were the allocationof €270.0 million for distribution ofyear 2001 earnings; the use of €33.0million from reserves (the amount netof capitalized taxes) to fund an earlyretirements plan described in detail inNote 2 i) to the consolidated financialstatements; a transfer of €12.8 millionof the remaining balance of a similartransaction in 2001; and €2.6 millionof other consolidation adjustments.
The proposed distribution ofearnings adopted by the directors ofBanco Popular on January 30, 2003i s d e s c r i b e d i n N o t e 4 t o t h econsolidated financial statements.Assuming that the ShareholdersMeeting of the Bank called for June26, 2003, approves this proposal,
consolidated equity will amount to€2,586.5 million, an increase of €290million (12.6%) over 2001.
The resulting book value pershare is €11.91, compared with€10.57 at December 31, 2001.
The amount and composition ofconsolidated equity at 2002 and 2001year ends are shown in the upper partof Table 2.
Computable capital
Law 13/1992 on consolidatedequity and supervision of creditentities required finance entities tohave at all times certain minimumcapital amounts, based on the volumeand composition of their assets andrisks.
Table 1. Summarized consolidated balance sheets
Variation
Amount %December 31
2001
Assets
Cash and due from central banks . . . . . . . . . .Government debt securities . . . . . . . . . . . . . . .Due from financial intermediaries . . . . . . . . . .Loans and discounts . . . . . . . . . . . . . . . . . . . .Private fixed-interest securities . . . . . . . . . . . .Equity securities . . . . . . . . . . . . . . . . . . . . . . .Participating interests . . . . . . . . . . . . . . . . . . .Shares of group companies . . . . . . . . . . . . . . .Intangible assets . . . . . . . . . . . . . . . . . . . . . . .Goodwill in consolidation . . . . . . . . . . . . . . . . .Tangible assets . . . . . . . . . . . . . . . . . . . . . . . .Prepayments and accrued income . . . . . . . . .Other asset accounts . . . . . . . . . . . . . . . . . . . .Losses at consolidated companies . . . . . . . . . .
Total . . . . . . . . . . . . . . . . . . . . . . . . . . .
Liabilities and capital
Due to financial intermediaries . . . . . . . . . . . .Customer deposits . . . . . . . . . . . . . . . . . . . . . .Bonds and other marketable debt securities . . . .Subordinated financing . . . . . . . . . . . . . . . . . . .Other liability accounts . . . . . . . . . . . . . . . . . .Accruals and deferred income . . . . . . . . . . . . .Special allowances . . . . . . . . . . . . . . . . . . . . .Negative difference in consolidation . . . . . . . .Shareholders' equity . . . . . . . . . . . . . . . . . . . .Minority interests. . . . . . . . . . . . . . . . . . . . . . . .Net income for the year . . . . . . . . . . . . . . . . . .
Total . . . . . . . . . . . . . . . . . . . . . . . . . . .
683,317129,346
4,706,69233,711,019
544,143390,87226,59922,71917,938
7,253568,280297,242890,345
9,355
42,005,120
6,965,94323,690,3296,009,968
245,356923,709301,041229,471
4182,288,076
663,074687,735
42,005,120
(1,203,788)(494,467)(262,233)
6,342,64848,795
268,2823,358
(10,563)(2,853)
(26,360)(12,314)
(2,728)(43,928)
5,712
4,609,561
40,8661,075,0933,023,502
(18,113)44,758
32(52,909)
(26)258,060164,727
73,571
4,609,561
(63.8)(79.3)
(5.3)23.2
9.9>
14.4(31.7)(13.7)(78.4)
(2.1)(0.9)(4.7)
>
12.3
0.64.8
>(6.9)5.1
–
(18.7)(5.9)
12.733.112.0
12.3
1,887,105623,813
4,968,92527,368,371
495,348122,59023,24133,28220,79133,613
580,594299,970934,273
3,643
37,395,559
6,925,07722,615,2362,986,466
263,469878,951301,009282,380
4442,030,016
498,347614,164
37,395,559
(€ thousand)Fig.1 Total assets managed
at year-end(€ million)
Off-balance sheet assets
Total on-balance sheet assets
0201009998
December 312002
5,000
17,500
55,000
42,500
30,000
47,081
52,006
34,163
40,651
42,00537,39531,35724,156
10,007
9,294
9,686
10,001
36,473
26,331
10,142
14
Capital for the purposes of thislegislation comprises, in addition tothe amounts shown as such in theconsolidated balance sheet, i.e.common stock and reserves, otheritems, namely minority interestsre la t i ng t o common sha res o fconsolidated aff i l iates, minorityinterests relating to preferred stock,and subordinated debt, albeit in thecase of these two latter items only upto a stated limit. On the contrary,i n tang ib le asse ts , goodw i l l i nconsolidation and other minor itemshave to be subtracted in calculatingcomputable capital.
In order to maintain solvency at aprudent level appropriate to the stronggrowth of i ts balance sheet , inDecember 2002 the Group issued€138 million of preferred stock, asd e t a i l e d i n N o t e 2 3 t o t h econsolidated financial statements.
At December 31, 2002, theGroup's computable capital, after thedistribution of income for the year,amounted to €3,490 million per theBank o f Spa in regu la t i ons , anincrease of €467 million (15.5%) over2001.
At that same date, the Group'scapital requirement under the Bank ofSpain regulations amounted to €2,913million and, accordingly, it had acushion of €577 million, 19.8% overthe minimum required amount. Theresulting solvency ratio was 9.59%,compared with the required minimumof 8%.
Under the capital requirementss t i p u l a t e d b y t h e B a n k f o rInternational Settlements (BIS) whichare those used internationally tomeasure the solvency of financeentities, the Group's computablecapital at 2002 year end of €4,020million was €1,097 million in excess ofthe required minimum of €2,924million, signifying a BIS solvency ratioof 11.0%, much above the minimumrequirement of 8%. Of the totalamount, the Tier 1 capital amountedto €3,245 million and the ratio for thistranche was 8.88%.
The ratings assigned to Banco Popular Group by the three leadinginternational credit rating agencies are the highest in the whole Spanishfinancial system. Banco Popular ranks 25th among world banks by solvency,and 7th if State-guaranteed government-owned entities are excluded fromthe list. The current ratings are as follows:
Standard & Poor's bases its latest (November 2002) assessment on "theBank's solid financial fundamentals, excellent earnings, sound asset qualityand good capitalization, as well as management's coherent and conservativestrategy".
The report goes on to say that Banco Popular will foreseeably maintain thehigh profitability achieved by it in the last six years despite the substantialchanges in the Spanish financial system, with a wave of bank mergers andlow interest rates. The report goes on: "the combination of a clearly definedstrategy focused on retail domestic banking, superior pricing policies,comparatively cheaper funding base and strong operating efficiency isindisputably one of the Bank's major strengths and a source of its greatfinancial flexibility". Also noted was the increased market share in lendingand deposits through organic growth, while at the same time safeguarding itsfinancial strengths. S & P considers that the Bank's prospects are "stable"despite the weakening of the economy, since it is considered that BancoPopular will maintain its record of strong profitability, which has been testedin very different economic growth and interest rate scenarios.
On January 10, 2003, Standard & Poor's confirmed the rating and the stableoutlook for Banco Popular, following the announcement by the Bank of anagreement in principle to purchase a bank in Portugal.
Moody's Investor Service confirmed in February 2002 the rating it hadassigned to Banco Popular in 1998, based on "the excellent financialfundamentals, high earning power and strong capitalization" and describedits rating outlook as "stable". It then highlighted the fact that the Bank'sactivity focuses on the domestic retail business which, combined with aprofitable branch network, enables it to obtain high recurring earnings and amuch higher level of profitability than the average for all Spanish banks,which is in turn one of the highest in Europe. The report further notes thatBanco Popular has been able to successfully adapt to an environment of lowinterest rates and to gain market share while simultaneously continuing toapply its customary prudent risk criteria.
Fitch Ratings also confirmed its rating and the "stable" rating outlook ofBanco Popular in a report of March 2002 which "reflects the excellent trackrecord of strong profitability and revenue generation, high asset quality andadequate capital". The rating agency added that Banco Popular "hasmaintained this position throughout various economic cycles, which is proofof its good management".
Banco Popular ratings Box 2
Agency Individual Short-term Long-term
Fitch IBCA A F1+ AAMoody´s A- P1 Aa1Standard & Poor´s A1+ AA

15
Table 2 shows the composition inthe last two years of the Group'scomputable capital per Bank of Spainand BIS regulations, together with themain solvency measures. Figure 2plots the same aggregates for the lastfive years.
Customer funds
At 2002 year end, on-balancesheet customer funds totaled €29,946million, up by 15.8% during the year.The average customer funds balanceamounted to €28,583 million, 19.6%more than a t the end o f 2001 .Customer funds were thereforefinancing 71% of the balance sheet atyear end and the same percentage ofthe average balances, compared with69% in 2001.
C u s t o m e r f u n d s c o m p r i s ecustomer deposits - ordinary deposits
and temporary sales of financialassets (repos)-, the funds raised bydebt securities, and subordinatedfinancing.
Customer deposits increased by4.8% in 2002 to €23,690 million atyear end, and the average balancesamounted to €23,445 mill ion, up10.2% in the year. Private sectorresidents' deposits - which represent86% of the total - increased by 5.0%to €20,432 million. By type, timedepos i ts were up by 9 .8% anddemand and savings accounts wereup by 4.7%; temporary sales ofassets declined by 22.1%.
In 2002 the Group's deposits ofprivate sector residents grew fasterthan those of Spanish banks as awhole, with an edge of 2.8 percentagepoints in average growth rates, grewslightly less (-1 percentage point) than
Fig.2 Level of solvency ( € million and %)
Computable capital
Minimum required
Bank of Spain solvency ratio.(Right-hand scale)
BIS ratio. (Right-hand scale)
Table 2. Consolidated equity (*)
Common stock . . . . . . . . . . . . . . . . . . . . . . . . . . . .Reserves . . . . . . . . . . . . . . . . . . . . . . . . . . . . . . .Consolidation reserves . . . . . . . . . . . . . . . . . . . .Less:
Treasury stock . . . . . . . . . . . . . . . . . . . . . . . . .Losses at consolidated companies . . . . . . . . .
On-balance sheet equity . . . . . . . . . . . . . . . . . .Minority interests . . . . . . . . . . . . . . . . . . . . . . . . .
Preferred stock . . . . . . . . . . . . . . . . . . . . . . . . .Other . . . . . . . . . . . . . . . . . . . . . . . . . . . . . . . .
Subordinated financing . . . . . . . . . . . . . . . . . . . .Less:
Intangible assets . . . . . . . . . . . . . . . . . . . . . . . .Goodwill . . . . . . . . . . . . . . . . . . . . . . . . . . . . . .Other . . . . . . . . . . . . . . . . . . . . . . . . . . . . . . . . .
Bank of Spain computable capital . . . . . . . . . . . . .Minimum requirement . . . . . . . . . . . . . . . . . . . . .Capital cushion . . . . . . . . . . . . . . . . . . . . . . . . . .Bank of Spain solvency ratio (%)BIS computable capital . . . . . . . . . . . . . . . . . . .Of which: Tier 1 capital . . . . . . . . . . . . . . . . . . . . .Minimum requirement . . . . . . . . . . . . . . . . . . . . .Capital cushion . . . . . . . . . . . . . . . . . . . . . . . . . . .BIS ratio (%) . . . . . . . . . . . . . . . . . . . . . . . . . . . . .
Of which: Tier 1(%) . . . . . . . . . . . . . . . . . . . . . .
108,577
1,208,633
983,441
–
4,326
2,296,325
518,177
300,000
218,177
263,469
(20,791)
(33,613)
(742)
3,022,825
2,411,253
611,572
10.03
3,418,438
2,759,819
2,413,388
1,005,050
11.33
9.15
(€ thousand)
–
146,151
149,033
–
5,029
290,155
165,323
138,000
27,323
(18,113)
2,853
26,360
658
467,236
501,378
(34,142)
602,057
484,691
510,401
91,656
108,577
1,354,784
1,132,474
–
9,355
2,586,480
683,500
438,000
245,500
245,356
(17,938)
(7,253)
(84)
3,490,061
2,912,631
577,430
9.59
4,020,495
3,244,510
2,923,789
1,096,706
11.00
8.88
31.12.0131.12.02 Variation
(*) After distribution of 2002 income.
2,605
2,027
3,600
2,950
2,300
1,650
1,000 2
7
12
17
22
11.00
3,023
10.289.59
11.48
0201009998
10.80
12.08
2,411
2,913
1,477
10.03
3,490
1,994
10.67
9.50
1,965
1,655
11.33

16
those at savings banks, and more(+0.7 percentage points) than theaggregate for all Spanish banks andsavings banks. These figures showthat, as occurred in 2001, BancoPopular continued to gain marketshare for deposits in the domesticmarket, which is its priority field ofactivity.
F igu re 4 p lo t s t he ra tes o fvar iat ion in tota l pr ivate sectorresidents' deposits at all Spanishbanks and savings banks in theperiod November 2001 - November2002 (per the latest available Bank ofSpain data) as compared with thoseof the Group. It will be seen thatBanco Popular outperformed Spanishbanks as a whole throughout thisperiod, whereas its position withrespect to the growth at savingsbanks was fluctuating.
Debt and other marketab lesecurities, which amounted to €6,010million at year end, consist of twod i f fe ren t ca tegor ies wh ich a rediscussed below.
The first relates to medium-termnotes issued in the Euromarket by aGroup affiliate, guaranteed by BancoPopular, the proceeds of which areassigned in ful l to f inancing forresidents. These notes amounted to€4 ,240 mi l l i on a t year end , ascompared with €1,968 million a yearearlier. This strong growth of 116.7%was the outcome of the policy oflengthening the average term of fundsin order to permit prudent funding ofthe balance sheet in the face of thesharp growth in long-term credit,mainly for mortgages.
The second category includesthe issues of commercial papera m o u n t i n g t o € 1 , 7 4 5 m i l l i o n ,compared with €1,018 million at theend of 2001, a substantial increase of71.4% year-on-year. These short-term (up to 18 months) securities areplaced in the domestic market as analternative for deposits, and shouldtherefore be aggregated to thed e p o s i t s e v e n t h o u g h u n d e raccounting regulations they appearunder d i f ferent capt ions in thebalance sheet. Consequently, thetotal funds taken by the Group fromprivate sector residents amounted to€22,177 million, an increase of 8.3%in the year.
The subordinated debt relates tolong-term debt securities which rankafter common creditors for creditseniority purposes. The amount of€245 million was raised in four issuesdenominated in euros and othercurrencies by a Group subsidiary,guaranteed by Banco Popular. Allthese securities mature in ten years,although the issuer has the option toredeem them early after the end oft h e f i f t h y e a r . N o i s s u e s o fsubordinated debt were made in 2002and, therefore, the decrease of 6.9%with respect to 2001 year end wasdue exclusively to exchange ratevariations during the year.
The intermediated off-balancesheet funds, dealt with next, are the
12.31.0112.31.02
Variation
* Not comparable with 2001 because of a change in calculation methodology
Absolute %
Total number of customers (000)Individuals . . . . . . . . . . . . .Legal entities . . . . . . . . . . .
Internet customersBank-on-line Number of customers (000) . .
Individuals . . . . . . . . . . . . .Legal entities . . . . . . . . . . .
Bancopopular-eNumber of customers (000) . .
Productivity (Products sold per employee in the commercial network) . .
Cross-selling*(Products per customer) . . . . .
4,2523,925
327
614489125
39
277
40137724
27023733
38
8
4,6534,302
351
884726158
77
285
3.02
9.49.67.5
43.948.226.7
97.4
2.9
Commercial performance data for 2002 Box 3

17
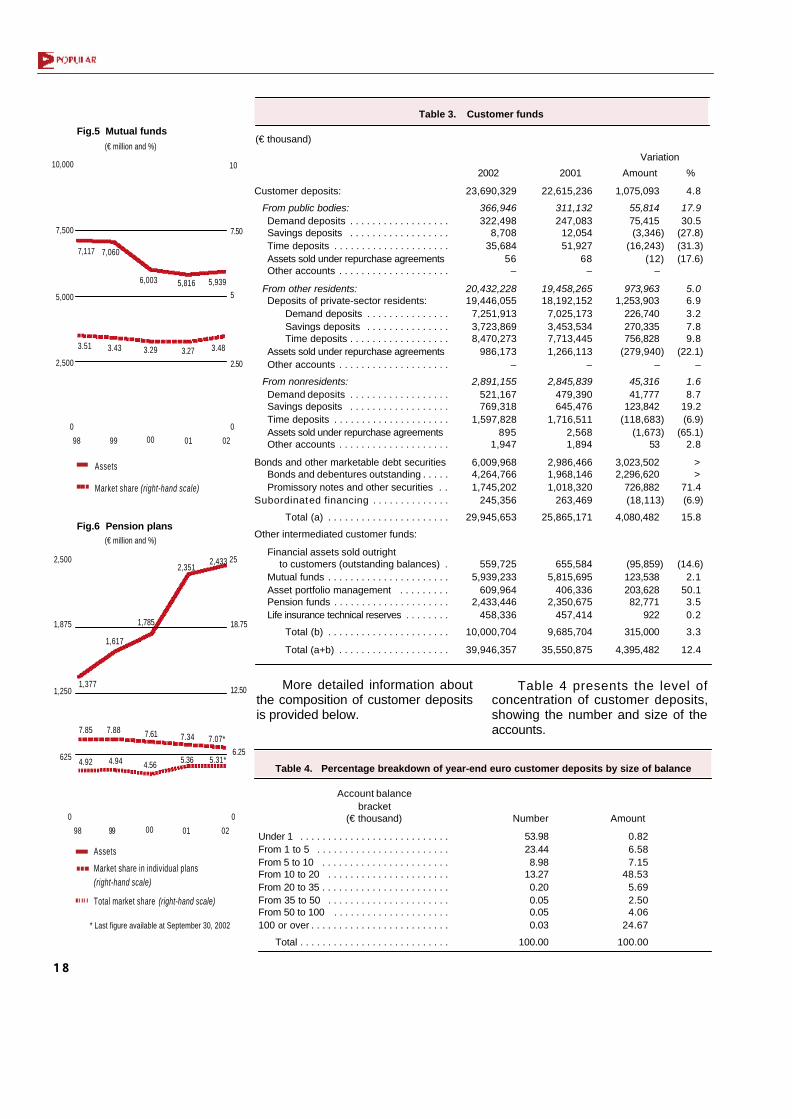
aggregate of the participations inmutual funds, managed portfolios,pension plans, funds raised viainsurance instruments, and financialassets sold to maturity. These fundstotaled €10,001 million at year end,an increase of 3.3% over the figure atthe same date in 2001.
The Group manages a total of 69m u t u a l f u n d s t h r o u g h s e v e r a lsubsidiaries and the assets managedamounted to €5,939 million, 2.1%more than a t the end o f 2001 .Following the acquisition of controllingstakes in two fund managementcompanies ( inc luded in For t iorHolding) in 2002, the variation incomparable terms with 2001 was adecline of 4.7%.
This decrease was due mainly tothe sharp depreciation of the assetsof equity funds (-17.2%) and mixedfunds (- 20.4%), but was lower thanthe decline in the stock marketsduring the year. The fixed-interest andmoneta ry asse t ( f i amm) fundsperformed well, with increases of30.0% and 9.9%, respect ive ly ,whereas the guaranteed fundsremained flat (+0.3%).
Causal analysis of the variationin fund assets dur ing the yeardiscloses that the volume of newcontributions was practically the sameas that of withdrawals, while the valueof the assets decreased by 4.7%.S i m u l t a n e o u s l y t h e r e w a s asubstantial transfer between fundstowards those of lower risk (monetaryassets and fixed-interest instruments).
The latest available advanceddata (to December) for this sector inSpain reveal that the total assets ofmutual funds fell in 2002 for the thirdyear running by 4.0%, and by 26.7%in the case of equity funds.
The Group's market share was3.48% compared with 3.27% in 2001.
The asse ts and secu r i t i esportfolios managed by the Group,including 37 open-end investmentcompanies (Simcav), amounted to€610 million, an increase of 50.1% inthe year. Adjusted for the effect of theinclusion in the Group of the FortiorHolding companies, the growth ratewas 1,3%.
The pension plans managed bythe Group amounted to €2,433million, up by 3.5% during the year.The scant growth was due to the poorp e r f o r m a n c e o f t h e m a r k e t smentioned earlier, since net inflows topension plans were 9.7% higher thanin 2001.
The Group's market share ini n d i v i d u a l p e n s i o n p l a n s ( a tSeptember 30, the latest date forwhich sector data are available) was7.07%, compared with 7.34% at theend of 2001. Considering all types ofpension plans, the market shares atthose same dates were 5.31% and5.36%, respectively.
Accordingly, the Group's total on-and off-balance sheet customer fundsa t 2002 yea r end amoun ted to€39,946 million, an increase of 12.4%over 2001.
Table 3 shows the composition oft o t a l c u s t o m e r f u n d s w i t h abreakdown by type of instrument andsector at 2002 year end, with thecomparative figures for 2001. Figure 3plots the variation in the last fiveyears.
Fig.3 Customer funds (€ million)
On-balance sheet funds
Other intermediated funds
0201009998
Fig.4 % annual variation in totalresident private-sector deposits
* Source: Bank of Spain
5,000
15,000
45,000
35,000
25,0009,294
22,292
39,946
26,384
31,586
35,551
10,001
10,007
25,865 29,94516,377
28,658
10,142
18,516
9,686
Popular
Banks*
0
4
16
12
8
20
Savings banks*
2001
N D J F M J A S NA M J O
2002
18
Table 4. Percentage breakdown of year-end euro customer deposits by size of balance
Under 1 . . . . . . . . . . . . . . . . . . . . . . . . . . .From 1 to 5 . . . . . . . . . . . . . . . . . . . . . . . .From 5 to 10 . . . . . . . . . . . . . . . . . . . . . . .From 10 to 20 . . . . . . . . . . . . . . . . . . . . . .From 20 to 35 . . . . . . . . . . . . . . . . . . . . . . .From 35 to 50 . . . . . . . . . . . . . . . . . . . . . .From 50 to 100 . . . . . . . . . . . . . . . . . . . . .100 or over . . . . . . . . . . . . . . . . . . . . . . . . .
Total . . . . . . . . . . . . . . . . . . . . . . . . . . .
Account balancebracket
(€ thousand) Number Amount
53.9823.448.98
13.270.200.050.050.03
100.00
0.826.587.15
48.535.692.504.06
24.67
100.00
More detailed information aboutthe composition of customer depositsis provided below.
Table 4 presents the level ofconcentration of customer deposits,showing the number and size of theaccounts.
Fig.5 Mutual funds (€ million and %)
Assets
Market share (right-hand scale)
Fig.6 Pension plans(€ million and %)
Assets
Market share in individual plans(right-hand scale)
* Last figure available at September 30, 2002
0
2,500
10,000
7,500
5,000
0201009998
0
10
2.50
7.50
5
0
625
2,500
1,875
1,250
0201009998
0
6.25
25
18.75
12.50
Total market share (right-hand scale)
Table 3. Customer funds
2002
Variation
Amount %
23,690,329
366,946322,498
8,70835,684
56–
20,432,22819,446,055
7,251,9133,723,8698,470,273
986,173–
2,891,155521,167769,318
1,597,828895
1,947
6,009,9684,264,7661,745,202
245,356
29,945,653
559,7255,939,233
609,9642,433,446
458,336
10,000,704
39,946,357
22,615,236
311,132247,083
12,05451,927
68–
19,458,26518,192,152
7,025,1733,453,5347,713,4451,266,113
–
2,845,839479,390645,476
1,716,5112,5681,894
2,986,4661,968,1461,018,320
263,469
25,865,171
655,5845,815,695
406,3362,350,675
457,414
9,685,704
35,550,875
1,075,093
55,81475,415(3,346)
(16,243)(12)
–
973,9631,253,903
226,740270,335756,828
(279,940)–
45,31641,777
123,842(118,683)
(1,673)53
3,023,5022,296,620
726,882(18,113)
4,080,482
(95,859) 123,538203,62882,771
922
315,000
4,395,482
4.8
17.930.5
(27.8)(31.3)(17.6)
5.06.93.27.89.8
(22.1)–
1.68.7
19.2(6.9)
(65.1)2.8
>>
71.4(6.9)
15.8
(14.6)2.1
50.13.50.2
3.3
12.4
(€ thousand)
Customer deposits:
From public bodies:Demand deposits . . . . . . . . . . . . . . . . . .Savings deposits . . . . . . . . . . . . . . . . . .Time deposits . . . . . . . . . . . . . . . . . . . . .Assets sold under repurchase agreements Other accounts . . . . . . . . . . . . . . . . . . . .
From other residents:Deposits of private-sector residents:
Demand deposits . . . . . . . . . . . . . . .Savings deposits . . . . . . . . . . . . . . .Time deposits . . . . . . . . . . . . . . . . . .
Assets sold under repurchase agreements Other accounts . . . . . . . . . . . . . . . . . . . .
From nonresidents:Demand deposits . . . . . . . . . . . . . . . . . .Savings deposits . . . . . . . . . . . . . . . . . .Time deposits . . . . . . . . . . . . . . . . . . . . .Assets sold under repurchase agreementsOther accounts . . . . . . . . . . . . . . . . . . . .
Bonds and other marketable debt securitiesBonds and debentures outstanding . . . . .Promissory notes and other securities . .
Subordinated financing . . . . . . . . . . . . . .
Total (a) . . . . . . . . . . . . . . . . . . . . . .
Other intermediated customer funds:
Financial assets sold outrightto customers (outstanding balances) .
Mutual funds . . . . . . . . . . . . . . . . . . . . . .Asset portfolio management . . . . . . . . .Pension funds . . . . . . . . . . . . . . . . . . . . .Life insurance technical reserves . . . . . . . .
Total (b) . . . . . . . . . . . . . . . . . . . . . .
Total (a+b) . . . . . . . . . . . . . . . . . . . .
2001
6,003
3.29 3.27 3.483.51
5,816 5,939
7,117 7,060
3.43
1,785
4.56 5.36
7.61 7.347.85
4.92
2,3512,433
1,377
1,617
7.88
4.94
7.07*
5.31*

19
T a b l e s 5 a n d 6 s h o w t h edistribution of customer deposits by
region in Spain and term in the lastfive years.
Table 7. Mutual funds, by type
VariationAmount En %2002 2001
FIAMM money market assets funds . . . . . . .FIM fixed-interest securities funds . . . . . . . .FIM equity securities funds . . . . . . . . . . . . .FIM mixed funds . . . . . . . . . . . . . . . . . . . . . .Guaranteed and other funds . . . . . . . . . . . .
Total . . . . . . . . . . . . . . . . . . . . . . . . . . . .
1,730,919884,949648,920
1,018,2921,532,615
5,815,695
1,903,1261,150,811
537,062810,768
1,537,466
5,939,233
172,207265,862
(111,858)(207,524)
4,851
123,538
9.930.0
(17.2)(20.4)
0.3
2.1
(€ thousand)
Table 5. Breakdown of customer deposits by region in Spain
Andalucía . . . . . . . . . . . . . . . . . . . . .Aragón . . . . . . . . . . . . . . . . . . . . . . .Asturias . . . . . . . . . . . . . . . . . . . . . .Balearic Islands . . . . . . . . . . . . . . . .Basque Country . . . . . . . . . . . . . . . .Canary Islands . . . . . . . . . . . . . . . . .Cantabria . . . . . . . . . . . . . . . . . . . . .Castilla-La Mancha . . . . . . . . . . . . . .Castilla-León . . . . . . . . . . . . . . . . . .Cataluña . . . . . . . . . . . . . . . . . . . . . .Extremadura . . . . . . . . . . . . . . . . . .Galicia . . . . . . . . . . . . . . . . . . . . . . .Madrid . . . . . . . . . . . . . . . . . . . . . . .Murcia . . . . . . . . . . . . . . . . . . . . . . .Navarra . . . . . . . . . . . . . . . . . . . . . . .Rioja . . . . . . . . . . . . . . . . . . . . . . .Valencia . . . . . . . . . . . . . . . . . . . . . .
Total . . . . . . . . . . . . . . . . . .
2001 2000 1999 19982002
18.181.172.163.223.382.180.502.17
10.1812.091.118.55
21.142.372.670.808.13
100.00
17.701.052.093.383.092.280.432.12
10.1311.87
1.148.58
22.452.392.670.797.84
100.00
18.161.072.163.822.932.430.412.10
10.5911.22
1.139.08
20.972.762.760.777.96
100.00
17.250.952.233.862.702.280.392.16
11.3811.16
1.159.41
20.712.482.87
.0.768.26
100.00
Region of Spain
18.181.201.982.893.17 1.950.402.20
10.4011.73
1.048.02
23.452.262.610.857.67
100.00
(Annual average %)
Demand1 to 3 months . . . . . . . . . . . . . .3 months to 1 year . . . . . . . . . .1 to 5 years . . . . . . . . . . . . . . . .Over 5 years . . . . . . . . . . . . . . . .Unclassified . . . . . . . . . . . . . . . .
Total . . . . . . . . . . . . . .
2001 2000 1999 19982002
Table 6. Year-end customer deposits by original maturity
45.8634.4310.81
6.272.63
–
100.00
47.9015.7719.6514.662.02
–
100.00
54.4712.2118.7111.103.370.14
100.00
59.4421.2013.185.74
– 0.44
100.00
Term
42.0716.7523.6414.78
2.76–
100.00
(Data in %)
Table 7 shows the variation inmutual fund assets by type, comparedwith 2001.

20
Loans and discounts
This capt ion compr ises thefinancing provided to customers in theform of loans, credits, discounts,overdrafts, financial leasing and otherlending instruments, recorded at thebalances receivable; the portion, if any,not used but drawable by the borroweris included in memorandum accountsunder the caption "Commitments -unused portion of credit lines".
At the end of 2002, the Group'sloans and discounts totaled €34,322million, an increase of 23.4% in theyear. In May 2002 the Group acquiredthe 50% of the capital stock of BancoPopular Hipotecario (BPH) hithertoowned by third parties, leading to theaddition at that date of €752 million ofassets, substantially all mortgageloans, to the consolidated balancesheet. Adjusted for this effect, the
growth of loans and discounts was20.5% over 2001 year end.
The average balance during theyear amounted to €30,959 million, anincrease of 20.0% over 2001.
T h e v o l u m e o f l e n d i n grepresented 82% of the balance sheettotal and 115% of the on-balancesheet customer funds at year end; thematching percentages for averagebalances during the year were 77%and 108%, respectively, with a slightincrease over 2001.
Net loans and discounts, i.e. afters u b t r a c t i o n o f t h e c r e d i t l o s sallowances to cover possible losses inthe event of non-recovery of theseassets, amounted to €33,711 million,an increase of 23.2%, and this is thefigure shown in the summarizedbalance sheet in Table 1.
Table 8. Loans and discounts
To public bodies:
Secured loans . . . . . . . . . . . . . . . .Other term loans . . . . . . . . . . . . . .Overdrafts and other . . . . . . . . . . .
To other residents:
Trade loans and discounts . . . . . .Secured loans:
Mortgage loans . . . . . . . . . . . . .Other . . . . . . . . . . . . . . . . . . . .
Other term loans:
Loans and credits . . . . . . . . . . . .Repos . . . . . . . . . . . . . . . . . . . .
Overdrafts and other . . . . . . . . . . .Financial leasing . . . . . . . . . . . . . .
To nonresidents:
Trade loans and discounts . . . . . .Secured loans . . . . . . . . . . . . . . . .
Mortgage loans . . . . . . . . . . . . .Other . . . . . . . . . . . . . . . . . . . .
Other term loans . . . . . . . . . . . . . .Overdrafts and other . . . . . . . . . . .
Nonperforming loans:
To public bodies . . . . . . . . . . . . . .To other residents . . . . . . . . . . . . .To nonresidents . . . . . . . . . . . . . .
Total . . . . . . . . . . . . . . . . . . . . .
(€ thousand)
Variation
Amounts In %2002 2001
30,429
–30,383
46
26,652,900
4,201,56311,262,796
11,223,59039,206
8,325,869
8,226,52999,340
1,009,1821,853,490
888,822
191,090302,389
296,0196,370
348,42246,921
247,859
698238,497
8,664
27,820,010
31,395
–31,180
215
32,740,751
4,474,63316,154,033
16,099,67654,357
8,869,530
8,715,726153,804
1,161,7682,080,787
1,204,258
239,053424,662
413,80910,853
499,81040,733
345,387
637334,544
10,206
34,321,791
966
–797169
6,087,851
273,0704,891,237
4,876,08615,151
543,661
489,19754,464
152,586227,297
315,436
47,963122,273
117,7904,483
151,388(6,188)
97,528
(61)96,0471,542
6,501,781
3.2
2.6>
22.8
6.543.4
43.438.6
6.5
5.954.8
15.112.3
35.5
25.140.4
39.870.4
43.4(13.2)
39.3
(8.7)40.317.8
23.4
Fig.7 Loans and discounts (€ million)
02009998 0110,000
16,500
36,000
29,500
23,000
23,308
27,820
34,322
16,896
18,939
Fig.8 % annual variation in totalresident private-sectorloans and discounts
* Source: Bank of Spain
Popular
Banks*
0
5
20
15
10
25
Savings banks*
2001
N D J F M J A S NA M J O
2002

21
Commercial strategy Box 4
The starting point of the Group's commercial management is a set of criteria that are systematically applied to all areasof the business and can be summarized by the following guidelines:
Focus on relationship banking: The aim is to construct a relationship of knowledge, of mutual confidence, so as tobind customers closely to the Group and to be able to offer them as wide a range of financial services as possible. Bycontrast with other banks, at Banco Popular looking after customers takes precedence over selling products to them.
Personalized services: The Group must have a range of products that is sufficiently varied and marketed with thenecessary flexibility to cater for the needs of a clientele of 350,000 small, medium and big companies and nearly fourand a half million private individuals, of very diverse sociological and financial profiles, with each customer calling for adifferent relationship that suits their different preferences as to products for savings and investment, financing, servicesand insurance. The notion of tailor-made service, which the Group adopted many years ago, continues to be one ofBanco Popular's signs of identity in the financial market.
Use of multiple marketing channels : The unwaivable objective of customer bonding can be achieved in many ways,depending on the characteristics of each segment. Branch offices are and will continue to be a key, but not the only,route for reaching customers in the commercial banking business. At the same time, other channels such as ATMs,telephone banking and above all Internet, are destined to play a growing role in the provision of services, enquiries aboutoperations and product information.
Optimization of the branch network
In recent years the Group has implemented a plan to expand the number of branch offices in the pursuit of greatermarket share and to insure the closest possible approximation to potential customers in areas with good growthprospects. In the three years 1999-2001 the retail commercial network in Spain (Banco Popular and the five regionalbanks) added 157 branch offices bringing the total to 2,110 branches at the end of 2001.
In 2002, the application of more selective criteria led to the opening of 40 new branch offices, mainly in majormetropolitan areas and certain tourist locations, and to the closure of 36 branches whose business volume or scantprofitability did not justify their continued existence. In short, the net increase in 2002 was four branch offices.
The Group also opened five new private banking branch offices in 2002, bringing the total outlets for the specializednetwork in this business segment to fifteen branches at the end of the year.
Internet banking: the Group's new corporate portal
Bank-on-line, the Group's Internet distribution channel, continued to grow at a strong rate during 2002, and by year endhad 884,000 customers, an increase of 270,000 (44%) in the year.
A new corporate portal was also launched that provides exhaustive information about the products of the Group banksand subsidiaries, most of which can be obtained through the site, together with a wizard for customers to facilitatebrowsing. The portal, the design of which has also been improved, also offers other added value services (a businesssearch engine, company information) and links to other Internet portals.
The commercial penetration of Bank-on-line, i.e. the number of customers who have signed up for this service, hasincreased appreciably and at year end had reached 45% of legal entity customers and nearly 17% of private individuals.These figures reflect the close interrelationship of Internet and conventional banking services.
New commercial management tools
In 2002 the Group equipped itself with new instruments to strengthen its commercial action, including most notably theimplementation of an analytical and operational CRM (Customer Relationship Management) system which makes itpossible, by means of greater knowledge of the customers and their product preferences, to design managementcampaigns and processes targeted on specific segments of the business.

22
Table 8 is a breakdown of theloans and discounts at December 31,2002, by type and sector, with thecomparative figures for 2001.
The credit extended to privatesector residents (other residents inthe table), which accounts for 95% ofthe total , amounted to €32,741million, a year-on-year increase of22.8%. Analysis by type disclosesthat mortgage loans, mostly forhomes, were the most dynamiccomponent, with year-on-year growthof 43.4% (35.3% adjusted for theinclusion of BPH), and accounted fornearly 47% of the Group's total loansand discounts. Trade discounts,which also include factoring and othertransact ions, were up by 6.5%,leasing transactions by 12.3% andoverdrafts by 15.1%, while unsecuredcredits and loans (other term loans)grew by 5.9%.
In 2002 the Group's loans andcredits to private sector residentsgrew much faster than in the Spanishfinancial system as a whole, with anedge of 9.2 percentage points over
Spanish all Spanish banks, of 2.5percentage points over savings banksand of 6.1 percentage points on theaggregate of banks and savingsbanks. As was the case in 2001,Banco Popular continued to win creditmarket share in 2002 in the domesticmarket, which is its area of priorityactivity.
Figure 8 plots the variation inlending to private sector residents byall Spanish banks and savings bankscompared with that of the Group inthe period from November 2001 toNovember 2002 (the latest for whichBank of Spain data are available). Asthis figure reveals, Banco Popularoutperformed both the banks and thesavings banks, and particularly theb a n k s , t h r o u g h o u t t h e p e r i o danalyzed.
Additional information about thestructure and features of loans anddiscounts is presented below.
Table 9 is a breakdown, for thelast two years, of year-end loans anddiscounts by amount and term. This
t a b l e s h o w s a h i g h d e g r e e o fdispersion of risks and a gradual shiftto longer terms and higher amounts,due to the expansion of mortgagelending in the small amounts and thegrowth of lending to companies, in themedium and high amounts.
The distribution of loans anddiscounts (business in Spain) byregion in Spain in the last five years isshown in Table 10, which also revealsthe high degree of dispersion of risksby location.
Table 9. Year-end lending matrix (%)
Up to 150 TotalOver 600150 to 600
Up to 3 months . . . . .3 months to 1 year . .1 to 3 years. . . . . . . .Over 3 years . . . . . . .
Total . . . . . .
6.184.342.316.71
19.54
13.6310.569.34
23.84
57.37
2002
26.1020.6014.7138.59
100.00
6.295.703.068.04
23.09
2001200220012002200120022001
Amounts (€ thousand)
Term
9.878.238.55
26.11
52.77
18.3617.5716.3447.73
100.00
4.475.905.27
13.36
29.01
4.013.442.528.26
18.23
Customer funds (on- and off- balancesheet)
Loans and discounts
Fig.9 Customer funds and loansand discounts per employee (€ thousand)
0201009998
3,500
2,875
2,250
1,625
1,000
3,205
2,645
2,260
1,457
2,754
1,952
2,313
2,888
2,484
1,641
Customer funds (on- and off- balancesheet)
Loans and discounts
Fig.10 Customer funds and loansand discounts per branch (€ thousand)
0201009998
20,000
16,500
13,000
9,500
6,000
11,265
15,266
16,582
18,494
13,649
12,976
15,890
8,596
14,301
9,451
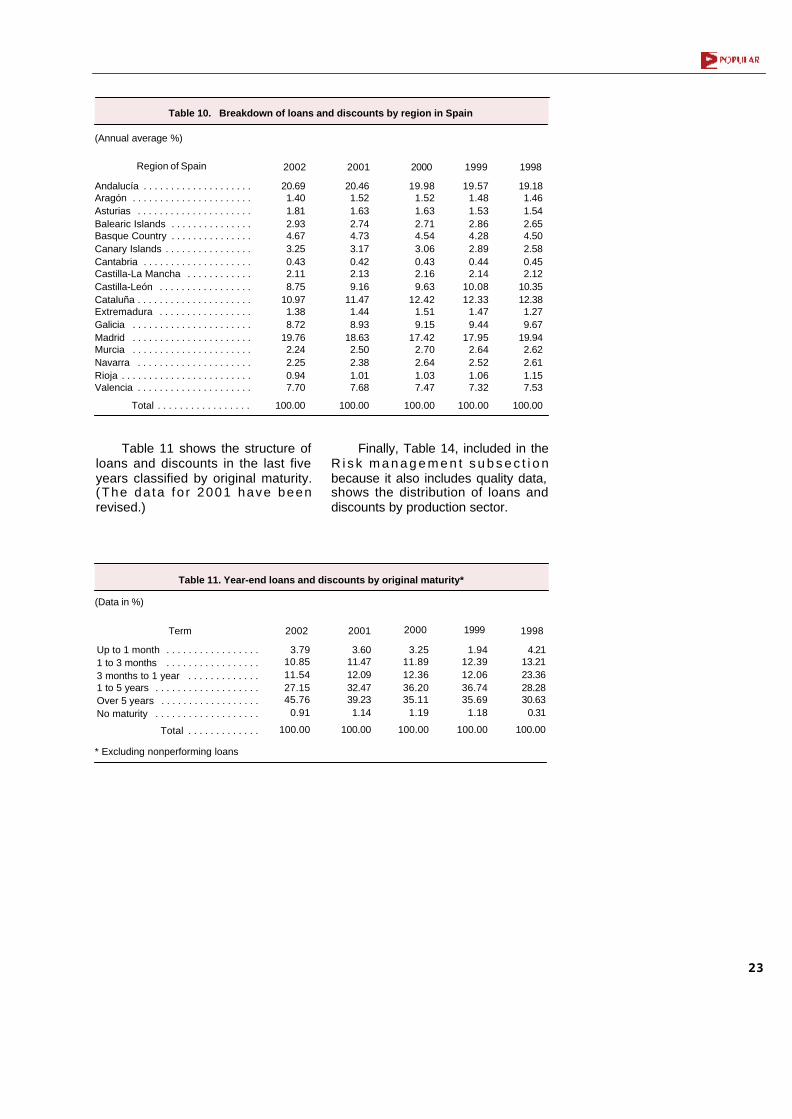
Table 11 shows the structure ofloans and discounts in the last fiveyears classified by original maturity.(The da ta fo r 2001 have beenrevised.)
Finally, Table 14, included in theR i s k m a n a g e m e n t s u b s e c t i o nbecause it also includes quality data,shows the distribution of loans anddiscounts by production sector.
23
Table 10. Breakdown of loans and discounts by region in Spain
Andalucía . . . . . . . . . . . . . . . . . . . .Aragón . . . . . . . . . . . . . . . . . . . . . .Asturias . . . . . . . . . . . . . . . . . . . . .Balearic Islands . . . . . . . . . . . . . . .Basque Country . . . . . . . . . . . . . . .Canary Islands . . . . . . . . . . . . . . . .Cantabria . . . . . . . . . . . . . . . . . . . .Castilla-La Mancha . . . . . . . . . . . .Castilla-León . . . . . . . . . . . . . . . . .Cataluña . . . . . . . . . . . . . . . . . . . . .Extremadura . . . . . . . . . . . . . . . . .Galicia . . . . . . . . . . . . . . . . . . . . . .Madrid . . . . . . . . . . . . . . . . . . . . . .Murcia . . . . . . . . . . . . . . . . . . . . . .Navarra . . . . . . . . . . . . . . . . . . . . .Rioja . . . . . . . . . . . . . . . . . . . . . . . .Valencia . . . . . . . . . . . . . . . . . . . . .
Total . . . . . . . . . . . . . . . . .
2001 2000 1999 19982002
20.691.401.812.934.673.250.432.118.75
10.971.388.72
19.762.242.250.947.70
100.00
20.461.521.632.744.733.170.422.139.16
11.471.448.93
18.632.502.381.017.68
100.00
19.981.521.632.714.543.060.432.169.63
12.421.519.15
17.422.702.641.037.47
100.00
19.571.481.532.864.282.890.442.14
10.0812.33
1.479.44
17.952.642.521.067.32
100.00
19.181.461.542.654.502.580.452.12
10.3512.381.279.67
19.942.622.611.157.53
100.00
Region of Spain
(Annual average %)
2001 2000 1999 19982002
Table 11. Year-end loans and discounts by original maturity*
* Excluding nonperforming loans
Term
Up to 1 month . . . . . . . . . . . . . . . . .1 to 3 months . . . . . . . . . . . . . . . . .3 months to 1 year . . . . . . . . . . . . .1 to 5 years . . . . . . . . . . . . . . . . . . .Over 5 years . . . . . . . . . . . . . . . . . .No maturity . . . . . . . . . . . . . . . . . . .
Total . . . . . . . . . . . . .
3.7910.8511.5427.1545.76
0.91
100.00
3.6011.4712.0932.4739.231.14
100.00
3.2511.8912.3636.2035.11
1.19
100.00
1.9412.3912.0636.7435.69
1.18
100.00
4.2113.2123.3628.2830.63
0.31
100.00
(Data in %)

24
Off-balance sheet risks
This category, included undermemorandum accounts, consists ofthe risks with customers not involvingthe disbursement of funds, alsoreferred to as off-balance sheet risks:avals, other sureties, documentarycredits and other guarantees.
These risks amounted to €5,284million at 2002 year end, up 23.5%year-on-year.
Table 12 contains comparative2002/2001 details of the compositionof these risks, classified by type ofoperation, and discloses the amounto f t he ba lances deemed to bedoubtfully recoverable and of the lossallowances booked for them.
Table 12. Year-end off-balance sheet risks
Guarantees and other sureties:
Credit and off-balance sheet risks of third parties .Foreign trade transactions . . . . . . . . . . . . . . . . . .Deferred payments on sales . . . . . . . . . . . . . . . .Housing construction . . . . . . . . . . . . . . . . . . . . .Construction, service or supply contracts . . . . . .Participation in tenders . . . . . . . . . . . . . . . . . . . .Liabilities to administrative agencies . . . . . . . . . . .Other liabilities . . . . . . . . . . . . . . . . . . . . . . . . . .
Documentary credits . . . . . . . . . . . . . . . . . . . . . . . .
Other contingent liabilities . . . . . . . . . . . . . . . . . . . .
Total . . . . . . . . . . . . . . . . . . . . . . . . . .
Pro memoria: Balances classified as doubtful . . . . .
Allowance for doubtful balances and country-risk . . .
Guarantees provided for. . .2002 2001% %
% variation
(€ thousand)
3,941,196
317,390103,875206,62044,474
498,56361,852
1,548,3121,160,110
310,717
27,111
4,279,024
8,917
(54,691)
4,897,752
319,043147,002404,08768,895
708,93286,419
1,654,1511,509,223
307,571
78,256
5,283,579
9,046
(70,207)
92.70
6.042.787.651.30
13.421.64
31.3128.56
5.82
1.48
100.00
0.17
(1.33)
92.11
7.422.434.831.04
11.651.45
36.1827.11
7.26
0.63
100.00
0.21
(1.28)
24.3
0.541.595.654.942.239.7
6.830.1
(1.0)
>
23.5
1.4
28.4
Risk management
Analysis of risk management inthe year must include a detailedexamination of the quality of the risksassumed by the Group on and off thebalance sheet and of the coveragebooked for possible losses that mayarise therefrom.
The substantial progression ofthe Group's lending activity in 2002was accompan ied by r i go rousanalysis of credi t requests andongoing monitoring of the risks, andeven more so in an environment likethat presently existing of economicslowdown and less visibility of thefuture. At the same time, in 2002 theGroup strengthened its criteria ofprudence by means of provisions tol o s s a l l o w a n c e s w h i c h , a s i s
customary, were higher than thoseset by the demanding Span ishbanking regulations.
The Group therefore starts theyear 2003 from a position of greats o u n d n e s s , i n a n t i c i p a t i o n o feconomic recovery being weaker ortardier than expected.
For the purposes of the followinganalysis, four categories of risk areaddressed: credit risk, cross-borderrisk, market risk and liquidity risk.
Credit risk
Cred i t r i sk a r i ses f rom thepossible loss triggered by the non-recovery of loans and discounts asregards their principal, interest andother contractual obligations of the

25
borrowers. In the case of off-balancesheet risks, it arises from the possiblefailure by customers to fulfill theircommitments, thus forcing the Bankto assume them because of theguarantee provided.
Since the Group's activities focusmainly on the domestic commercialbanking business, credit risk is themost important of the risks consideredhere.
Credit risk analysis requires theexistence of systematic proceduresfor classification of risks as past dueassets (in the event of breach of theloan repayment terms), doubtfullycollectible assets (due to the poorstate of the borrower's f inancialcondition), or disputed assets (wherethe existence of litigation makes asatisfactory outcome problematical).In the following paragraphs thesethree categories are denominated asa whole nonperforming loans ortroubled balances receivable.
R i sks t ha t i t has no t beenpossible to recover in the regulatorilystipulated terms are classified as baddebts and are written off and removedfrom the balance sheet using theprovisions recorded for this purposeor charged d i rec t l y to income,al though the Bank cont inues topursue repayment of them.
As coverage for its credit risk, theBank has booked a cred i t lossallowance, provisions to which arecharged to income and which is thesum of the three component itemsdescribed below.
F i r s t , t h e r e i s a s p e c i f i callowance for nonperforming loans inaccordance wi th a regu la tor i l yestablished calendar and, in the caseof the doubtful or disputed balances,based on a conservative estimate oftheir recoverability. Also, when aba lance c lass i f ied as t roub ledexceeds a stipulated percentage(25%), the regulations require aprov is ion to be booked fo r theremainder of the transaction or for thetotal risk of that particular borrower
( t h e s o - c a l l e d " c a r r y f o r w a r d "provisions).
Risk management thereforerequires all the assets to be correctlyc l a s s i f i e d , t r a n s f e r r i n g t o t h enonperforming loans caption thosethat meet any of the aforementionedconditions, and thereafter to recordprovisions for covering them. As anadditional measure of prudence,classi f icat ion as nonperformingtriggers the non-accrual of the intereston t hese asse ts , wh i ch i s no trecognized in income unless it iseffectively collected.
Secondly, there is a generalcredit loss allowance covering all thea s s e t s n o t c l a s s i f i e d a snonperforming, provision to which iscalculated as 1% of all outstandingrisks (loans and discounts, privatefixed-interest securit ies and off-balance sheet risks). The percentagei s 0 . 5 % i n t h e c a s e o f c e r t a i nmortgage assets deemed to be of lowrisk.
Thirdly, there is the statisticalcoverage allowance established bythe Bank of Spain and in force sinceJune 2000, which as in the previouscase is also applied for all outstandingrisks and is calculated in accordancewith coefficients based on the type ofrisk assumed (unsecured loans andcredits, secured balances, consumerfinancing, etc.).
Pursuant to these criteria, thecontrol of risk quality requires ameticulous process which starts withthe analysis of loan proposals,continues with the monitoring of therisks already assumed, and does notend until the borrowings are finallyrepa id i n acco rdance w i th theprojected contractual conditions.
For this purpose the Group hasin p lace formal procedures fore x t e n d i n g c r e d i t a n d f o r r i s kprevention, with which it permanentlyevaluates the borrowers on the basisof numerous variables, especially theeconomic and financial situation ofthe borrower and the data generated
26
by its transactions with the Bank. In thelight of the resulting information, themonitoring of certain transactions isstrengthened (technical alarm signals)or criteria to reduce or eliminate therelated risks are established.
In addit ion to individualizedc u s t o m e r - b y - c u s t o m e r a n dt r a n s a c t i o n - b y - t r a n s a c t i o nevaluations, the Group also analyzeson an ongoing basis the structure ofits loans and credits, considering their
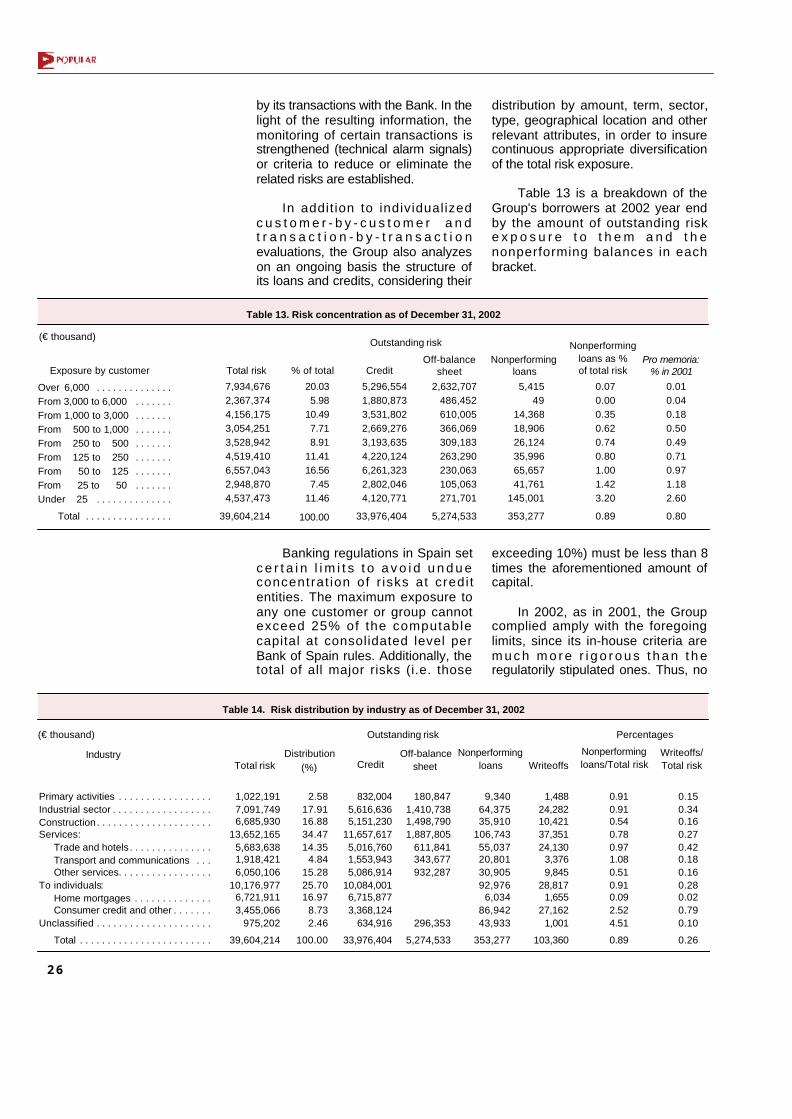
distribution by amount, term, sector,type, geographical location and otherrelevant attributes, in order to insurecontinuous appropriate diversificationof the total risk exposure.
Table 13 is a breakdown of theGroup's borrowers at 2002 year endby the amount of outstanding riske x p o s u r e t o t h e m a n d t h enonperforming balances in eachbracket.
Table 13. Risk concentration as of December 31, 2002
Over 6,000 . . . . . . . . . . . . . .From 3,000 to 6,000 . . . . . . .From 1,000 to 3,000 . . . . . . .From 500 to 1,000 . . . . . . .From 250 to 500 . . . . . . .From 125 to 250 . . . . . . .From 50 to 125 . . . . . . .From 25 to 50 . . . . . . .Under 25 . . . . . . . . . . . . . .
Total . . . . . . . . . . . . . . . .
CreditOff-balance
sheetNonperforming
loansTotal risk % of total
Nonperformingloans as % of total risk
Pro memoria:% in 2001Exposure by customer
Outstanding risk(€ thousand)
5,296,5541,880,8733,531,8022,669,2763,193,6354,220,1246,261,3232,802,0464,120,771
33,976,404
2,632,707486,452610,005366,069309,183263,290230,063105,063271,701
5,274,533
5,41549
14,36818,90626,12435,99665,65741,761
145,001
353,277
7,934,6762,367,3744,156,1753,054,2513,528,9424,519,4106,557,0432,948,8704,537,473
39,604,214
20.035.98
10.497.718.91
11.4116.567.45
11.46
100.00
0.070.000.350.620.740.801.001.423.20
0.89
0.010.040.180.500.490.710.971.182.60
0.80
Table 14. Risk distribution by industry as of December 31, 2002
CreditOff-balance
sheetNonperforming
loansTotal risk WriteoffsNonperformingloans/Total risk
Writeoffs/Total risk
Outstanding risk Percentages
Industry
Primary activities . . . . . . . . . . . . . . . . .Industrial sector . . . . . . . . . . . . . . . . . .Construction. . . . . . . . . . . . . . . . . . . . .Services:
Trade and hotels. . . . . . . . . . . . . . .Transport and communications . . .Other services. . . . . . . . . . . . . . . . .
To individuals:Home mortgages . . . . . . . . . . . . . .Consumer credit and other . . . . . . .
Unclassified . . . . . . . . . . . . . . . . . . . . .
Total . . . . . . . . . . . . . . . . . . . . . . . .
Distribution(%)
(€ thousand)
832,0045,616,6365,151,230
11,657,6175,016,7601,553,9435,086,914
10,084,0016,715,8773,368,124
634,916
33,976,404
180,8471,410,7381,498,7901,887,805
611,841343,677932,287
296,353
5,274,533
9,34064,37535,910
106,74355,03720,80130,90592,976
6,03486,94243,933
353,277
1,022,1917,091,7496,685,930
13,652,1655,683,6381,918,4216,050,106
10,176,9776,721,9113,455,066
975,202
39,604,214
2.5817.9116.8834.4714.35
4.8415.2825.7016.97
8.732.46
100.00
0.910.910.540.780.971.080.510.910.092.524.51
0.89
0.150.340.160.270.420.180.160.280.020.790.10
0.26
1,48824,28210,42137,35124,130
3,3769,845
28,8171,655
27,1621,001
103,360
Banking regulations in Spain setc e r t a i n l i m i t s t o a v o i d u n d u econcentrat ion of r isks at credi tentities. The maximum exposure toany one customer or group cannotexceed 25% of the computablecapital at consolidated level perBank of Spain rules. Additionally, thetotal of all major risks (i.e. those
exceeding 10%) must be less than 8times the aforementioned amount ofcapital.
In 2002, as in 2001, the Groupcomplied amply with the foregoinglimits, since its in-house criteria arem u c h m o r e r i g o r o u s t h a n t h eregulatorily stipulated ones. Thus, no

borrower reached the limit of 10%(the biggest borrower did not reach8%). Accordingly, the second criterionis not applicable.
The foregoing figures summarizethe high level of dispersion of theGroup's risks, which goes far beyondthe regulatorily imposed limits.
As supplementary information,Table 14 presents the composition oftotal risks by production sector, andalso includes the related data of
outstanding monetary and off-balancesheet risks, nonperforming loans andbad debts written off during the year.
A summary of the Group's creditrisk management in the last two yearsis shown in Tab le 15, wh ich isanalyzed in the following paragraphs.
At 2002 year-end, nonperformingloans, including off-balance sheetbalances classified as nonperforming,amounted to €353 million, 38.0%higher than one year earlier.
27
The variations in this account in2002 were: new balances classifiedas nonperforming of €397.1 million;recoveries of €196.5 million; andwriteoffs of €103.4 mil l ion. Theresulting net increase was therefore€97.2 million.
Of the total assets written offduring the year, €95.7 million werewr i t ten o f f by us ing cred i t lossallowances for the same amount and€7.7 million were charged directly toincome.
Table 15. Risk performance
2002 2001
Nonperforming loans*:Balance at January 1 . . . . . . . . . . . . . . . . . . . .
Additions . . . . . . . . . . . . . . . . . . . . . . . . . . .Balances recovered . . . . . . . . . . . . . . . . . .Net variation for the year . . . . . . . . . . . . . . .
% increase . . . . . . . . . . . . . . . . . . . . . . .Writeoffs . . . . . . . . . . . . . . . . . . . . . . . . . . .
Balance at December 31 . . . . . . . . . . . . . . . . .
Allowance for credit losses:Balance at January 1 . . . . . . . . . . . . . . . . . . . .
Annual provision:Gross . . . . . . . . . . . . . . . . . . . . . . . . . . .Recoveries . . . . . . . . . . . . . . . . . . . . . . .Net . . . . . . . . . . . . . . . . . . . . . . . . . . . . .
Other variations . . . . . . . . . . . . . . . . . . . . . .Writeoffs . . . . . . . . . . . . . . . . . . . . . . . . . . .
Balance at December 31 . . . . . . . . . . . . . . . . .
Foreclosed real estate assets. . . . . . . . . . . . . .Allowance for potential losses on foreclosed assets . .
Pro memoria:Total risks . . . . . . . . . . . . . . . . . . . . . . . . . . . . .Loans transferred to suspense accounts . . . . .Nonperforming mortgage loans . . . . . . . . . . . .
Risk quality measures (%):Nonperformance (Nonperforming loans/Total risks)Insolvency (Writeoffs/Total risks) . . . . . . . .Coverage: (Credit loss allowance / Nonperforming loans) . . . . . . . . . . . . . . . . . .Coverage: (Allowance for potential losses onforeclosed assets/total foreclosed assets) . . .
* Including doubtful off-balance sheet risks, but excluding country risk and the related country riskallowance
(€ thousand)
%AmountVariation
208,603268,628
(123,135)145,493
69.7(98,061)256,035
383,891
253,962(35,294)218,668
1,631(98,061)506,129
63,51225,830
32,098,293673,167
12,462
0.800.31
197.68
40.67
22.747.859.537.9
5.438.0
31.8
23.266.216.3
>(2.4)34.7
(5.9)(7.6)
23.411.114.2
256,035397,063
(196,461)200,602
78.3(103,360)353,277
506,129
312,871(58,650)
254,22117,081
(95,683)681,748
59,78823,864
39,604,214748,117
14,230
0.890.26
192.98
39.91
47,432128,435(73,326)55,109
8.6(5,299)97,242
122,238
58,909(23,356)35,55315,450
2,378175,619
(3,724)(1,966)
7,505,92174,950
1,768
0.09(0.05)
(4.70)
(0.76)

T h e n o n p e r f o r m i n g l o a n sbalance at the end of 2002 signified anonperforming ratio of 0.89% of totalrisks at that date, a slight (9 basispoints) increase over the 0.80% figureat the end of 2001.
The insolvency ratio, i.e. baddebts written off as a percentage oftotal risks, was 0.26%, 5 basis pointsl o w e r t h a n i n 2 0 0 1 . G r o s snonperforming loans in the year(before wri teoffs) consequent lyincreased by 4 basis points over2001.
The credit loss allowance of€681.7 million at December 31, 2002,was 34.7% higher than in 2001. Thebalance is comprised of €151.4million of the specific allowance,€ 3 7 5 . 6 m i l l i o n o f t h e g e n e r a lallowance and €154.7 million of thestatistical coverage allowance.
The amount of the credit lossallowance at year end signified acoverage ratio of 193.0% of thebalance of troubled assets, comparedto 197 .7% a yea r ea r l i e r , andrepresented 1.72% of total risks,compared with 1.58% in 2001.
Consider ing the credi t lossallowance, the net nonperformingratio was -0.83% of total risks, animprovement of 5 basis points overthe 2001 figure of -0.78%.
Table 16 shows the requiredcoverage for the different categoriesof assets at 2002 year end and theloss allowances actually booked. Atthe end of 2002 the balance of thecredit loss allowance was €26.6million in excess of the requiredamount, a considerable increase overthe €9.9 million in 2001.
T h e f o r e g o i n g f i g u r e sdemonstrate that the quality of theGroup's assets was maintained at agood level, despite the slowdown ofthe economy during the year. Theyalso show that the troubled risks aresoundly provided for.
Figure 11 plots the risk qualitymeasures analyzed above: thenonperforming ratio, the ratio net ofprovisions, and the ratio of coverageof nonperforming loans.
In addition to the credit lossa l lowance, the Group has a lsobooked other allowances exclusivelyin accordance with in-house criteria ofprudence, which are not assigned tospecific risks, in order to strengthenbalance sheet soundness. Theseprecautionary provisions, added tothe cush ion i n t he c red i t l ossallowance, totaled €94 million at yearend, after €55 million had been usedd u r i n g t h e y e a r t o t a k e e a r l yamortization of goodwill, as explainedlater.
28
Table 16. Allowance for nonperforming loans as of December 31
(€ thousand)2002
Doubtful balances with specific allowances: . . . . . . . . . . .Ordinary . . . . . . . . . . . . . . . . . . . . . . . . . . . . . . . . . . .Secured by prime collateral . . . . . . . . . . . . . . . . . . . .Off-balance sheet risks. . . . . . . . . . . . . . . . . . . . . . . .
Doubtful balances with general allowances . . . . . . . . . . . .Doubtful balances for which allowances are not required .
Total nonperforming loans . . . . . . . . . . . . . . . .Other specific provisioning . . . . . . . . . . . . . . . . . . . . . . . .Allowances for ordinary risks. . . . . . . . . . . . . . . . . . . . . . .
General provisioning (1%) . . . . . . . . . . . . . . . . . . . . .Reduced provisioning (0.5%) . . . . . . . . . . . . . . . . . . .
Statistical allowance . . . . . . . . . . . . . . . . . . . . . . . . . . . . .Total required provisions. . . . . . . . . . . . . . . . . .Balance of credit loss allowances. . . . . . . . . . .
Surplus. . . . . . . . . . . . . . . . . . . .
333,095322,187
3,0437,865
16,9753,207
353,27715,417
38,548,25631,242,443
7,305,813
226,894213,454
5,0518,389
25,8893,252
256,03516,265
31,427,28226,098,029
5,329,253
109,728103,464
1,8864,378
221
109,9491,289
287,585260,937
26,64897,365
496,188506,129
9,941
150,505145,240
1,1404,125
113
150,618886
348,955312,425
36,530154,694655,153681,748
26,595
BalanceTotal
Provisioning
2001
BalanceTotal
Provisioning
Gross nonperforming loans ratio (left-hand scale)
Nonperforming loans ratio net of credit lossallowances (left-hand scale)
Fig.11 Variation in the nonperforming loans ratio and coverage for delinquent balances(Nonperforming loans at year end as % of total
risks, and credit loss allowance as % of non-
performing balances)
Coverage for delinquent balances (right-hand scale)
0099989796959493 0201
(1)
1
7
5
3
1.50
0.80
0.89
2.93
2.40
2.38
(0.22)(0.61)
(0.78)
(0.83)
1.060.58
0.44
0.20
2.06
1.10
(0.43)0
60
240
180193.0
0.91
(0.66)
0.79
120

29
Foreclosed assets, substantiallyall buildings, amounted to €59.8million at year end, a decrease of5.9%. The provisions booked forpossible losses on disposal of theseassets amounted to €23.9 million,39.9% of the book value of theassets. Table 15 shows the variationin these aggregates in the last twoyears.
Cross-border risk
Cross-border risk, also known ascountry risk, arises from the difficultiesbeing experienced by borrowers incertain foreign countries in meetingtheir payment obligations. Breach ofthese obligations may be due to thefinancial situation of the borrower (inwhich case the risk is treated as creditrisk), or to the fact that, even thoughthe loans could be repaid in localcur rency , the funds cannot betransferred abroad due to the country'seconomic difficulties (cross-borderrisk). Under the applicable regulations,provisions must be recorded for theser i sks on the bas is o f the moreun favo rab le o f t he two s ta tedcircumstances.
Under cu r ren t regu la t ions ,countries are classified in six groups,based on a decreasing scale ofsolvency. The first group, whichcomprises the twenty-two most highlydeveloped economies in the world,
involves no country risk. The secondgroup is included in the calculation butdoes not call for provisions. The fourlast groups (countries with transitorydifficulties, those which are doubtful,those classified as very doubtful andthose classified as failed) requireprovisions of increasing percentages,which may reach 100% of the riskexposure and the removal of the riskfrom the balance sheet.
At 2002 year end, the Group'scountry risk amounted to €46 million,43.1% higher than the €32 million in2001. The foregoing figures signified0.12% and 0.10%, respectively, of thetotal risks.
The al lowance recorded forcountry risk amounted to €5.8 million,an increase of 129.7% over 2001; theincrease was due to the variation inbalances and to the lowering ofclassification of certain countries in2002 because of their f inancia ldifficulties. The allowance representedcoverage of 12.6% of the balance andincludes precautionary provisions incertain cases. In 2001 the coveragewas 7.9%.
Table 17 is a breakdown ofcountry risks by groups of countrieswith differing degrees of difficulty,together with the allowances bookedfor this purpose and a comparison withtotal risks.
Table 17. Country risk and related allowances
(€ thousand)
CountriesCoverage not required . . . . . . . . . .Transitory difficulties . . . . . . . . . . .Doubtful . . . . . . . . . . . . . . . . . . . . .Very doubtful . . . . . . . . . . . . . . . . .Failed . . . . . . . . . . . . . . . . . . . . . . .
Total Coverage (%) . . . . . . . . . . . . . . . . . . . .
Pro memoria :Total risks . . . . . . . . . . . . . . . . . . . . . . .Country risk/total risk (%) . . . . . . . . . . .
2002 2001
35,702524
4,0925,633
-45,951
-70
1,4004,338
-5,80812.64
24,4601,3735,493
789-
32,115
15196
1,608710
-2,5297.87
39,604,2140.12
32,098,2930.10
Balance Coverage Balance Coverage
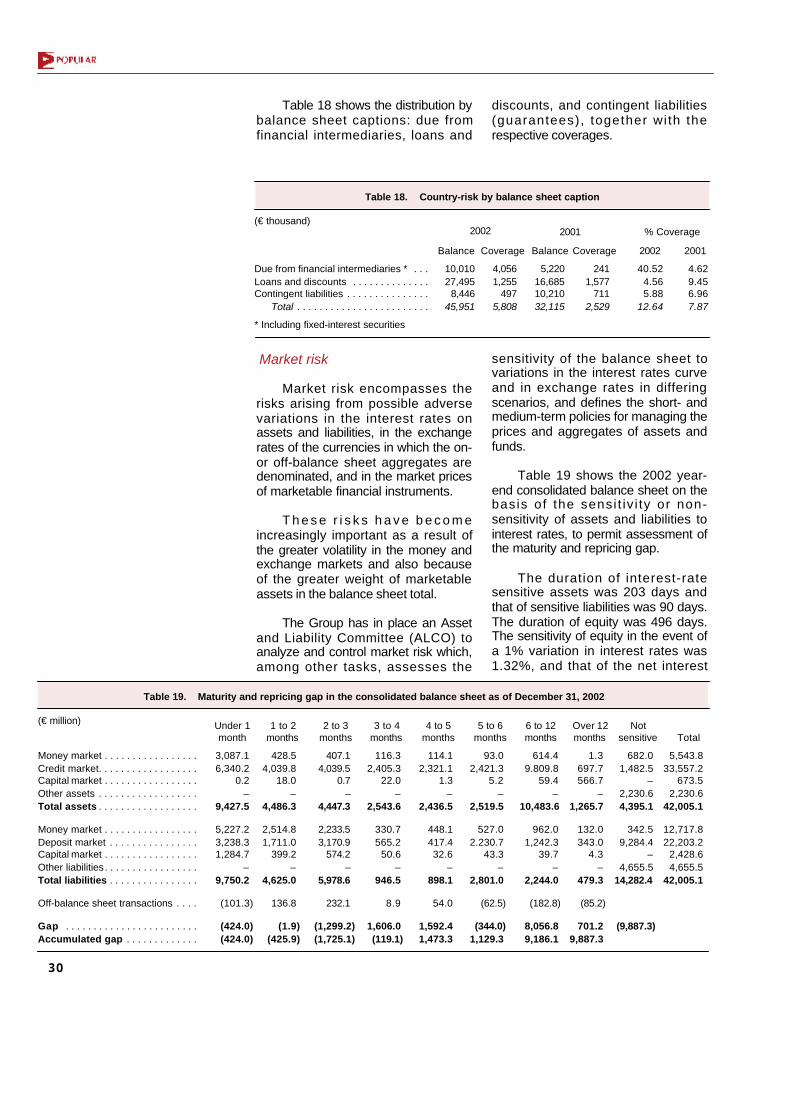
Table 18 shows the distribution bybalance sheet captions: due fromfinancial intermediaries, loans and
discounts, and contingent liabilities(guarantees), together with therespective coverages.
30
Market risk
Market risk encompasses therisks arising from possible adversevariations in the interest rates onassets and liabilities, in the exchangerates of the currencies in which the on-or off-balance sheet aggregates aredenominated, and in the market pricesof marketable financial instruments.
T h e s e r i s k s h a v e b e c o m eincreasingly important as a result ofthe greater volatility in the money andexchange markets and also becauseof the greater weight of marketableassets in the balance sheet total.
The Group has in place an Assetand Liability Committee (ALCO) toanalyze and control market risk which,among other tasks, assesses the
sensitivity of the balance sheet tovariations in the interest rates curveand in exchange rates in differingscenarios, and defines the short- andmedium-term policies for managing theprices and aggregates of assets andfunds.
Table 19 shows the 2002 year-end consolidated balance sheet on thebasis of the sensi t iv i ty or non-sensitivity of assets and liabilities tointerest rates, to permit assessment ofthe maturity and repricing gap.
The duration of interest-ratesensitive assets was 203 days andthat of sensitive liabilities was 90 days.The duration of equity was 496 days.The sensitivity of equity in the event ofa 1% variation in interest rates was1.32%, and that of the net interest
Table 19. Maturity and repricing gap in the consolidated balance sheet as of December 31, 2002
Money market . . . . . . . . . . . . . . . . .Credit market. . . . . . . . . . . . . . . . . .Capital market . . . . . . . . . . . . . . . . .Other assets . . . . . . . . . . . . . . . . . .Total assets . . . . . . . . . . . . . . . . . .
Money market . . . . . . . . . . . . . . . . .Deposit market . . . . . . . . . . . . . . . .Capital market . . . . . . . . . . . . . . . . .Other liabilities. . . . . . . . . . . . . . . . .Total liabilities . . . . . . . . . . . . . . . .
Off-balance sheet transactions . . . .
Gap . . . . . . . . . . . . . . . . . . . . . . . .Accumulated gap . . . . . . . . . . . . .
Under 1month
1 to 2months
3 to 4months
(€ million) 2 to 3months
4 to 5months
5 to 6months
6 to 12months
Over 12months
Notsensitive Total
3,087.16,340.2
0.2–
9,427.5
5,227.23,238.31,284.7
–9,750.2
(101.3)
(424.0)(424.0)
428.54,039.8
18.0–
4,486.3
2,514.81,711.0
399.2–
4,625.0
136.8
(1.9)(425.9)
407.14,039.5
0.7–
4,447.3
2,233.53,170.9
574.2–
5,978.6
232.1
(1,299.2)(1,725.1)
116.32,405.3
22.0–
2,543.6
330.7565.2
50.6–
946.5
8.9
1,606.0(119.1)
114.12,321.1
1.3–
2,436.5
448.1417.432.6
–898.1
54.0
1,592.41,473.3
93.02,421.3
5.2–
2,519.5
527.02.230.7
43.3–
2,801.0
(62.5)
(344.0)1,129.3
614.49.809.8
59.4–
10,483.6
962.01,242.3
39.7–
2,244.0
(182.8)
8,056.89,186.1
1.3697.7566.7
–1,265.7
132.0343.0
4.3–
479.3
(85.2)
701.29,887.3
682.01,482.5
–2,230.64,395.1
342.59,284.4
–4,655.5
14,282.4
(9,887.3)
5,543.833,557.2
673.52,230.6
42,005.1
12,717.822,203.2
2,428.64,655.5
42,005.1
Table 18. Country-risk by balance sheet caption
(€ thousand)
Due from financial intermediaries * . . .Loans and discounts . . . . . . . . . . . . . .Contingent liabilities . . . . . . . . . . . . . . .
Total . . . . . . . . . . . . . . . . . . . . . . . .
* Including fixed-interest securities
2002 2001
Balance Coverage Balance Coverage
10,01027,495
8,44645,951
4,0561,255
4975,808
5,22016,68510,21032,115
2411,577
7112,529
% Coverage
2002 2001
40.524.565.88
12.64
4.629.456.967.87

margin, under the same hypothesis,was 1.42%.
In view of the business activity ofthe Group and the structure of itsbalance sheet, its market risk isconfined almost exclusively to interestrate risk, since the exchange rate andfinancial instrument trading risks areminimal, as explained later.
The indicator used to measuremarket risk is that known as Value atRisk (VaR), defined as the maximumpotential loss in a position as a resultof a given variation in price in a givenperiod of time. In calculating the VaR,the Group applies the past experienceof pr ices wi th a 95% stat is t ica lconfidence level and a time period ofone day.
VaR is calculated daily for thetreasury activity, which comprisesshort-term operations (euro andforeign currency deposits, interest ratederivatives and financial assets up to18 months) and operations the long-term markets (public and private fixed-interest securities and derivatives).
Table 20 shows the variation inVaR during 2002, indicating the dailyvalue at the end of each month andthe average, maximum and minimumamounts for each of the groups citedand the aggregate. The aggregateVaR amounted to €167 thousand(average daily value in the year) with amaximum of €286 thousand and amin imum of €59 thousand. Theaggregate for short-term operations(money market and short-term assets)
31
was €136 thousand in average dailyv a l u e , m o s t l y i n e u r o d e p o s i ttransactions, and ranged from €44thousand to €314 thousand during theyear. The average aggregate for thelong-term financial assets markets was€98 thousand, with a high of €202thousand and a low of €36 thousand.As these figures show, the positions
were small and they were managedconservatively.
Stress tests are also performeddaily to evaluate the sensitivity of VaRto parallel changes in the euro interestrate curve (±50 basis points) and tovolatility in the euro and dollar interestrates (±20%). VaR is also calculated
Table 20. Value at risk (VaR)
Month-end dataJanuary 02 . . . . . . . . . . . . February 02 . . . . . . . . . . . March 02. . . . . . . . . . . . . . April 02 . . . . . . . . . . . . . . . May 02 . . . . . . . . . . . . . . . June 02. . . . . . . . . . . . . . . July 02 . . . . . . . . . . . . . . . August 02 . . . . . . . . . . . . . September 02. . . . . . . . . . October 02 . . . . . . . . . . . . November 02 . . . . . . . . . . December 02 . . . . . . . . . .
Daily average . . . . . . . . . . . . . Maximum . . . . . . . . . . . . . . . . Minimum. . . . . . . . . . . . . . . . .
Stress testingRate curve variation:
+ 50 bps . . . . . . . . . . . . . . – 50 bps . . . . . . . . . . . . . .
Volatility variation:+20% . . . . . . . . . . . . . . . . –20% . . . . . . . . . . . . . . . . .
(€ thousand)Short term Long term Aggregate
142.85122.58
85.8046.17
128.0791.10
121.5786.10
245.41222.09145.56123.42
136.19313.64
43.57
135.32137.21
162.99109.41
166.6882.9756.2636.0671.89
100.55178.33153.01116.2088.1283.1176.66
98.41202.3136.06
95.11101.66
116.5680.28
262.50177.71118.4458.61
164.87150.08122.64127.19209.85200.76160.19116.95
166.87285.8258.61
164.17169.69
198.78135.26
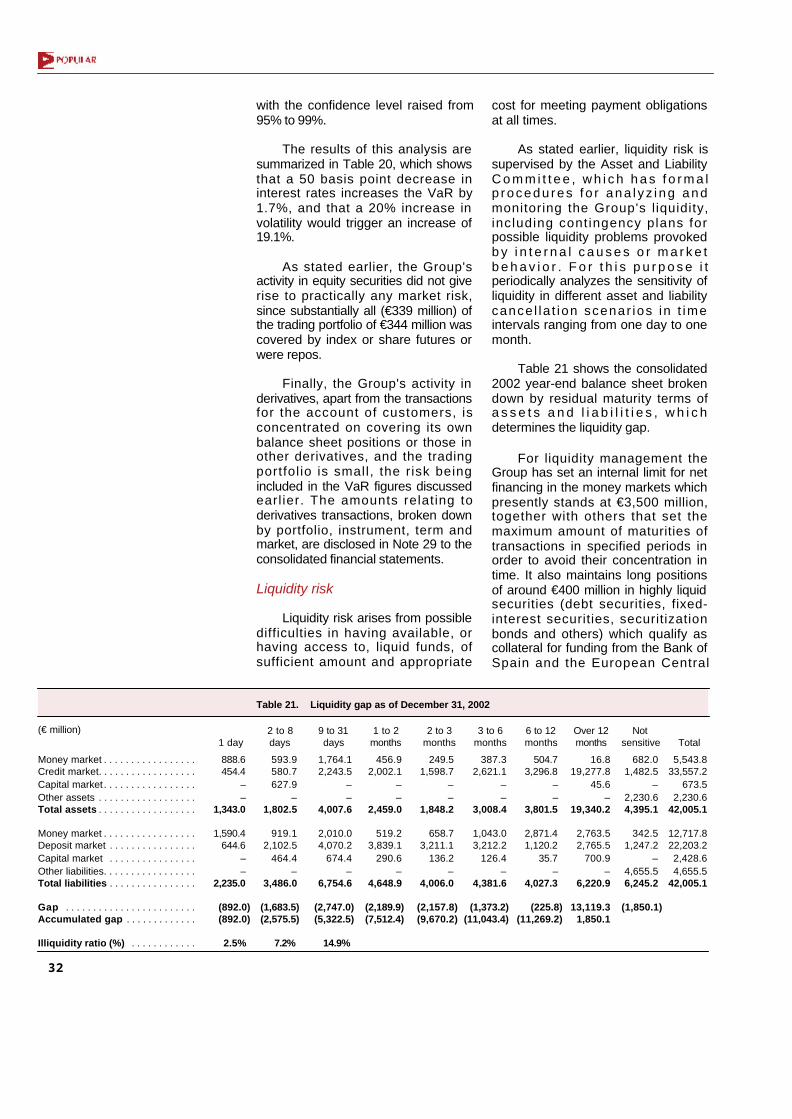
32
Table 21. Liquidity gap as of December 31, 2002
Money market . . . . . . . . . . . . . . . . .Credit market. . . . . . . . . . . . . . . . . .Capital market . . . . . . . . . . . . . . . . .Other assets . . . . . . . . . . . . . . . . . .Total assets . . . . . . . . . . . . . . . . . .
Money market . . . . . . . . . . . . . . . . .Deposit market . . . . . . . . . . . . . . . .Capital market . . . . . . . . . . . . . . . .Other liabilities. . . . . . . . . . . . . . . . .Total liabilities . . . . . . . . . . . . . . . .
Gap . . . . . . . . . . . . . . . . . . . . . . . .Accumulated gap . . . . . . . . . . . . .
Illiquidity ratio (%) . . . . . . . . . . . .
1 day2 to 8days
1 to 2months
(€ million) 9 to 31days
2 to 3months
3 to 6months
6 to 12months
Over 12months
Notsensitive Total
888.6454.4
––
1,343.0
1,590.4644.6
––
2,235.0
(892.0)(892.0)
2.5%
593.9580.7627.9
–1,802.5
919.12,102.5
464.4–
3,486.0
(1,683.5)(2,575.5)
7.2%
1,764.12,243.5
––
4,007.6
2,010.04,070.2
674.4–
6,754.6
(2,747.0)(5,322.5)
14.9%
456.92,002.1
––
2,459.0
519.23,839.1
290.6–
4,648.9
(2,189.9)(7,512.4)
249.51,598.7
––
1,848.2
658.73,211.1
136.2–
4,006.0
(2,157.8)(9,670.2)
387.32,621.1
––
3,008.4
1,043.03,212.2
126.4–
4,381.6
(1,373.2)(11,043.4)
504.73,296.8
––
3,801.5
2,871.41,120.2
35.7–
4,027.3
(225.8)(11,269.2)
16.819,277.8
45.6–
19,340.2
2,763.52,765.5
700.9–
6,220.9
13,119.31,850.1
682.01,482.5
–2,230.64,395.1
342.51,247.2
–4,655.56,245.2
(1,850.1)
5,543.833,557.2
673.52,230.6
42,005.1
12,717.822,203.22,428.64,655.5
42,005.1
with the confidence level raised from95% to 99%.
The results of this analysis aresummarized in Table 20, which showsthat a 50 basis point decrease ininterest rates increases the VaR by1.7%, and that a 20% increase involatility would trigger an increase of19.1%.
As stated earlier, the Group'sactivity in equity securities did not giverise to practically any market risk,since substantially all (€339 million) ofthe trading portfolio of €344 million wascovered by index or share futures orwere repos.
Finally, the Group's activity inderivatives, apart from the transactionsfor the account of customers, isconcentrated on covering its ownbalance sheet positions or those inother derivatives, and the tradingportfol io is small, the risk beingincluded in the VaR figures discussedearl ier. The amounts relating toderivatives transactions, broken downby portfolio, instrument, term andmarket, are disclosed in Note 29 to theconsolidated financial statements.
Liquidity risk
Liquidity risk arises from possibledifficulties in having available, orhaving access to, liquid funds, ofsufficient amount and appropriate
cost for meeting payment obligationsat all times.
As stated earlier, liquidity risk issupervised by the Asset and LiabilityC o m m i t t e e , w h i c h h a s f o r m a lp rocedu res f o r ana l yz i ng andmonitoring the Group's l iquidity,including cont ingency plans forpossible liquidity problems provokedb y i n t e r n a l c a u s e s o r m a r k e tb e h a v i o r . F o r t h i s p u r p o s e i tperiodically analyzes the sensitivity ofliquidity in different asset and liabilitycance l la t ion scenar ios in t imeintervals ranging from one day to onemonth.
Table 21 shows the consolidated2002 year-end balance sheet brokendown by residual maturity terms ofa s s e t s a n d l i a b i l i t i e s , w h i c hdetermines the liquidity gap.
For liquidity management theGroup has set an internal limit for netfinancing in the money markets whichpresently stands at €3,500 million,together with others that set themaximum amount of maturities oftransactions in specified periods inorder to avoid their concentration intime. It also maintains long positionsof around €400 million in highly liquidsecurities (debt securities, fixed-interest securities, securitizationbonds and others) which qualify ascollateral for funding from the Bank ofSpain and the European Central
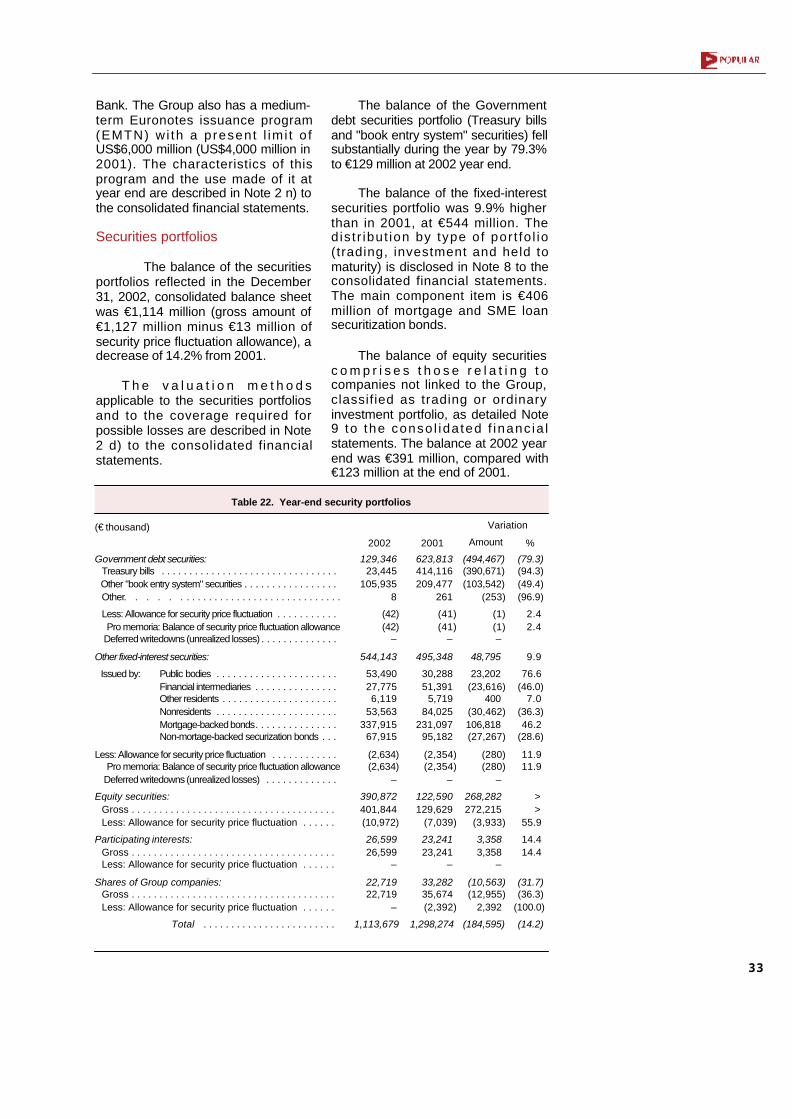
Bank. The Group also has a medium-term Euronotes issuance program(EMTN) wi th a present l im i t o fUS$6,000 million (US$4,000 million in2001). The characteristics of thisprogram and the use made of it atyear end are described in Note 2 n) tothe consolidated financial statements.
Securities portfolios
The balance of the securitiesportfolios reflected in the December31, 2002, consolidated balance sheetwas €1,114 million (gross amount of€1,127 million minus €13 million ofsecurity price fluctuation allowance), adecrease of 14.2% from 2001.
T h e v a l u a t i o n m e t h o d sapplicable to the securities portfoliosand to the coverage required forpossible losses are described in Note2 d) to the consolidated financialstatements.
The balance of the Governmentdebt securities portfolio (Treasury billsand "book entry system" securities) fellsubstantially during the year by 79.3%to €129 million at 2002 year end.
The balance of the fixed-interestsecurities portfolio was 9.9% higherthan in 2001, at €544 million. Thedis t r ibut ion by type of por t fo l io(trading, investment and held tomaturity) is disclosed in Note 8 to theconsolidated financial statements.The main component item is €406million of mortgage and SME loansecuritization bonds.
The balance of equity securitiesc o m p r i s e s t h o s e r e l a t i n g t ocompanies not linked to the Group,classified as trading or ordinaryinvestment portfolio, as detailed Note9 to the conso l ida ted f inanc ia lstatements. The balance at 2002 yearend was €391 million, compared with€123 million at the end of 2001.
33
Table 22. Year-end security portfolios
Government debt securities: Treasury bills . . . . . . . . . . . . . . . . . . . . . . . . . . . . . . . .Other "book entry system" securities . . . . . . . . . . . . . . . . .Other. . . . . . . . . . . . . . . . . . . . . . . . . . . . . . . . . .
Less: Allowance for security price fluctuation . . . . . . . . . . .Pro memoria: Balance of security price fluctuation allowance
Deferred writedowns (unrealized losses) . . . . . . . . . . . . . .
Other fixed-interest securities:
Issued by: Public bodies . . . . . . . . . . . . . . . . . . . . . .Financial intermediaries . . . . . . . . . . . . . . .Other residents . . . . . . . . . . . . . . . . . . . . .Nonresidents . . . . . . . . . . . . . . . . . . . . . .Mortgage-backed bonds. . . . . . . . . . . . . . .Non-mortage-backed securization bonds . . .
Less: Allowance for security price fluctuation . . . . . . . . . . . .Pro memoria: Balance of security price fluctuation allowance
Deferred writedowns (unrealized losses) . . . . . . . . . . . . .
Equity securities:Gross . . . . . . . . . . . . . . . . . . . . . . . . . . . . . . . . . . . . .Less: Allowance for security price fluctuation . . . . . .
Participating interests:Gross . . . . . . . . . . . . . . . . . . . . . . . . . . . . . . . . . . . . .Less: Allowance for security price fluctuation . . . . . .
Shares of Group companies:Gross . . . . . . . . . . . . . . . . . . . . . . . . . . . . . . . . . . . . .Less: Allowance for security price fluctuation . . . . . .
Total . . . . . . . . . . . . . . . . . . . . . . . .
20012002
(€ thousand) Variation
Amount %
623,813414,116209,477
261
(41)(41)
–
495,348
30,28851,391
5,71984,025
231,09795,182
(2,354)(2,354)
–
122,590129,629
(7,039)
23,24123,241
–
33,28235,674(2,392)
1,298,274
129,34623,445
105,9358
(42)(42)
–
544,143
53,49027,7756,119
53,563337,915
67,915
(2,634)(2,634)
–
390,872401,844(10,972)
26,59926,599
–
22,71922,719
–
1,113,679
(494,467)(390,671)(103,542)
(253)
(1)(1)–
48,795
23,202(23,616)
400(30,462)106,818(27,267)
(280)(280)
–
268,282272,215
(3,933)
3,3583,358
–
(10,563)(12,955)
2,392
(184,595)
(79.3)(94.3)(49.4)(96.9)
2.42.4
9.9
76.6(46.0)
7.0(36.3)46.2
(28.6)
11.911.9
>>
55.9
14.414.4
(31.7)(36.3)
(100.0)
(14.2)
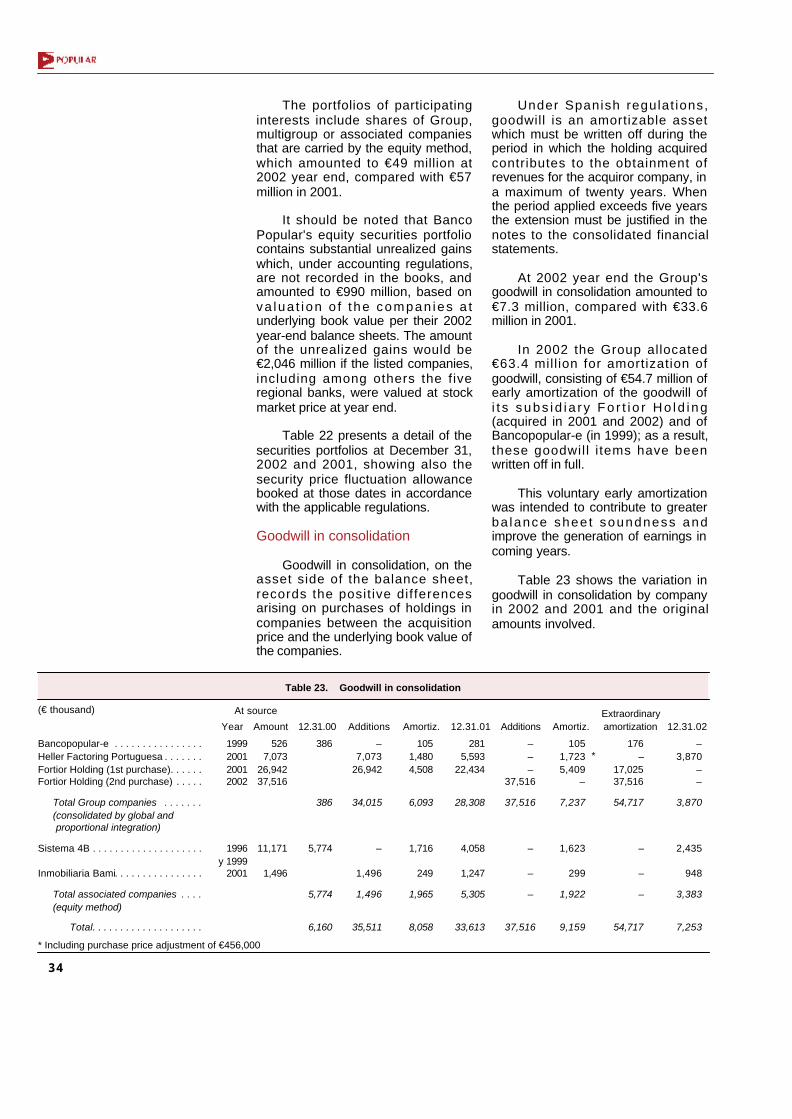
The portfolios of participatinginterests include shares of Group,multigroup or associated companiesthat are carried by the equity method,which amounted to €49 million at2002 year end, compared with €57million in 2001.
It should be noted that BancoPopular's equity securities portfoliocontains substantial unrealized gainswhich, under accounting regulations,are not recorded in the books, andamounted to €990 million, based onva lua t i on o f t he compan ies a tunderlying book value per their 2002year-end balance sheets. The amountof the unrealized gains would be€2,046 million if the listed companies,including among others the fiveregional banks, were valued at stockmarket price at year end.
Table 22 presents a detail of thesecurities portfolios at December 31,2002 and 2001, showing also thesecurity price fluctuation allowancebooked at those dates in accordancewith the applicable regulations.
Goodwill in consolidation
Goodwill in consolidation, on theasset side of the balance sheet,records the posit ive differencesarising on purchases of holdings incompanies between the acquisitionprice and the underlying book value ofthe companies.
Under Spanish regulat ions,goodwill is an amortizable assetwhich must be written off during theperiod in which the holding acquiredcontributes to the obtainment ofrevenues for the acquiror company, ina maximum of twenty years. Whenthe period applied exceeds five yearsthe extension must be justified in thenotes to the consolidated financialstatements.
At 2002 year end the Group'sgoodwill in consolidation amounted to€7.3 million, compared with €33.6million in 2001.
In 2002 the Group allocated€63.4 mill ion for amortization ofgoodwill, consisting of €54.7 million ofearly amortization of the goodwill ofi t s subs id i a r y Fo r t i o r Ho ld i ng(acquired in 2001 and 2002) and ofBancopopular-e (in 1999); as a result,these goodwil l i tems have beenwritten off in full.
This voluntary early amortizationwas intended to contribute to greaterba lance shee t soundness andimprove the generation of earnings incoming years.
Table 23 shows the variation ingoodwill in consolidation by companyin 2002 and 2001 and the originalamounts involved.
34
Table 23. Goodwill in consolidation
Bancopopular-e . . . . . . . . . . . . . . . .Heller Factoring Portuguesa . . . . . . .Fortior Holding (1st purchase). . . . . .Fortior Holding (2nd purchase) . . . . .
Total Group companies . . . . . . .(consolidated by global andproportional integration)
Sistema 4B . . . . . . . . . . . . . . . . . . . .
Inmobiliaria Bami. . . . . . . . . . . . . . . .
Total associated companies . . . .(equity method)
Total. . . . . . . . . . . . . . . . . . . .
(€ thousand) At source
Year Amount 12.31.00 Additions Amortiz.
1999200120012002
1996y 1999
2001
5267,073
26,94237,516
11,171
1,496
386
386
5,774
5,774
6,160
–7,073
26,942
34,015
–
1,496
1,496
35,511
1051,4804,508
6,093
1,716
249
1,965
8,058
12.31.01 Additions Amortiz.Extraordinaryamortization 12.31.02
2815,593
22,434
28,308
4,058
1,247
5,305
33,613
–––
37,516
37,516
–
–
–
37,516
1051,7235,409
–
7,237
1,623
299
1,922
9,159
176–
17,02537,516
54,717
–
–
–
54,717
–3,870
––
3,870
2,435
948
3,383
7,253
*
* Including purchase price adjustment of €456,000
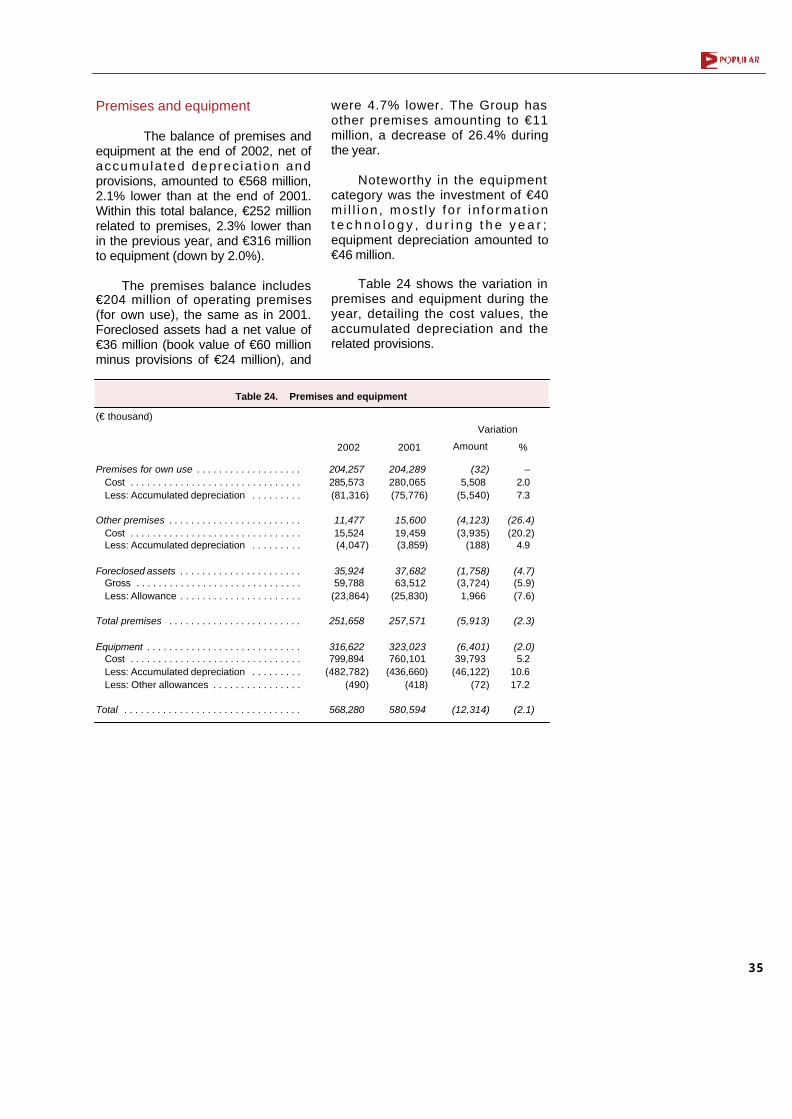
Premises and equipment
The balance of premises andequipment at the end of 2002, net ofaccumula ted deprec ia t ion andprovisions, amounted to €568 million,2.1% lower than at the end of 2001.Within this total balance, €252 millionrelated to premises, 2.3% lower thanin the previous year, and €316 millionto equipment (down by 2.0%).
The premises balance includes€204 million of operating premises(for own use), the same as in 2001.Foreclosed assets had a net value of€36 million (book value of €60 millionminus provisions of €24 million), and
were 4.7% lower. The Group hasother premises amounting to €11million, a decrease of 26.4% duringthe year.
Noteworthy in the equipmentcategory was the investment of €40mi l l i on , mos t l y fo r in fo rmat iont e c h n o l o g y , d u r i n g t h e y e a r ;equipment depreciation amounted to€46 million.
Table 24 shows the variation inpremises and equipment during theyear, detailing the cost values, theaccumulated depreciation and therelated provisions.
35
Table 24. Premises and equipment
Premises for own use . . . . . . . . . . . . . . . . . . .Cost . . . . . . . . . . . . . . . . . . . . . . . . . . . . . . .Less: Accumulated depreciation . . . . . . . . .
Other premises . . . . . . . . . . . . . . . . . . . . . . . .Cost . . . . . . . . . . . . . . . . . . . . . . . . . . . . . . .Less: Accumulated depreciation . . . . . . . . .
Foreclosed assets . . . . . . . . . . . . . . . . . . . . . .Gross . . . . . . . . . . . . . . . . . . . . . . . . . . . . . .Less: Allowance . . . . . . . . . . . . . . . . . . . . . .
Total premises . . . . . . . . . . . . . . . . . . . . . . . .
Equipment . . . . . . . . . . . . . . . . . . . . . . . . . . . .Cost . . . . . . . . . . . . . . . . . . . . . . . . . . . . . . .Less: Accumulated depreciation . . . . . . . . .Less: Other allowances . . . . . . . . . . . . . . . .
Total . . . . . . . . . . . . . . . . . . . . . . . . . . . . . . . .
(€ thousand)
204,257285,573(81,316)
11,47715,524(4,047)
35,92459,788
(23,864)
251,658
316,622799,894
(482,782)(490)
568,280
204,289280,065(75,776)
15,60019,459(3,859)
37,68263,512
(25,830)
257,571
323,023760,101
(436,660)(418)
580,594
(32)5,508
(5,540)
(4,123)(3,935)
(188)
(1,758)(3,724)1,966
(5,913)
(6,401)39,793
(46,122)(72)
(12,314)
–2.07.3
(26.4)(20.2)
4.9
(4.7)(5.9)(7.6)
(2.3)
(2.0)5.2
10.617.2
(2.1)
20012002
Variation
Amount %

Balance sheet in euros and foreigncurrency
T a b l e 2 5 p r e s e n t s t h eGroup's consolidated balance sheetsas of December 31, 2002 and 2001,with the caption balances brokend o w n i n t o e u r o s a n d f o r e i g ncurrencies.
Foreign currency assets, with anequivalent euro value of €2,474 million,accounted for 5.9% of the total.
As mentioned earlier, the Grouphas virtually no exchange rate riskbecause, apart from the scant weightof the foreign currency balance sheet,the foreign currency treasury andfinancial asset positions are confinedto investment in the same currency ofthe excess funds generated by theGroup's commercial activities.
36
Table 25. Summarized euro and foreign currency balance sheets
Assets:
Cash and due from central banks . . . . . . . . . .Government debt securities . . . . . . . . . . . . . .Due from financial intermediaries . . . . . . . . . .Loans and discounts . . . . . . . . . . . . . . . . . . . .Private fixed-interest securities . . . . . . . . . . . .Equity securities . . . . . . . . . . . . . . . . . . . . . . .Participating interests . . . . . . . . . . . . . . . . . . .Shares of group companies . . . . . . . . . . . . . .Intangible assets . . . . . . . . . . . . . . . . . . . . . . .Goodwill in consolidation . . . . . . . . . . . . . . . . .Tangible assets . . . . . . . . . . . . . . . . . . . . . . .Prepayments and accrued income . . . . . . . . .Other asset accounts . . . . . . . . . . . . . . . . . . .Losses at consolidated companies . . . . . . . . .
Total . . . . . . . . . . . . . . . . . . . . . . .
Liabilities and capital:
Due from financial intermediaries . . . . . . . . . .Customer deposits . . . . . . . . . . . . . . . . . . . . .Bonds and other marketable debt securities . .Other liability accounts . . . . . . . . . . . . . . . . . .Accruals and deferred income . . . . . . . . . . . . .Special allowances . . . . . . . . . . . . . . . . . . . . .Negative difference in consolidation . . . . . . . .Subordinated financing . . . . . . . . . . . . . . . . . .Shareholders' equity . . . . . . . . . . . . . . . . . . . .Minority interests . . . . . . . . . . . . . . . . . . . . . . .Net income for the year . . . . . . . . . . . . . . . . . .
Total . . . . . . . . . . . . . . . . . . . . . . .
Pro memoria : Off-balance sheet risks . . . .Unused portion of credit lines
€Foreign
currencies Total
674,814129,346
2,661,95933,364,190
498,949386,17126,59922,71917,938
7,253568,280278,169885,555
9,355
39,531,297
4,978,75822,906,8135,428,243
911,524284,648225,162
418150,000
2,288,076663,074687,735
38,524,451
4,865,3905,375,722
683,317129,346
4,706,69233,711,019
544,143390,872
26,59922,71917,9387,253
568,280297,242890,345
9,355
42,005,120
6,965,94323,690,3296,009,968
923,709301,041229,471
418245,356
2,288,076663,074687,735
42,005,120
5,283,5795,375,722
8,503–
2,044,733346,829
45,1944,701
–––––
19,0734,790
–
2,473,823
1,987,185783,516581,725
12,18516,3934,309
–95,356
–––
3,480,669
418,189–
2002(€ thousand)
€Foreign
currencies Total
1,877,951623,813
2,743,85526,940,349
435,486116,892
23,24133,28220,79133,613
580,594270,190925,208
3,643
34,628,908
4,683,22521,725,307
2,473,994851,965269,049278,120
444150,000
2,030,016498,347614,164
33,574,631
3,862,4974,256,861
1,887,105623,813
4,968,92527,368,371
495,348122,59023,24133,28220,79133,613
580,594299,970934,273
3,643
37,395,559
6,925,07722,615,2362,986,466
878,951301,009282,380
444263,469
2,030,016498,347614,164
37,395,559
4,279,0244,256,861
9,154–
2,225,070428,022
59,8625,698
–––––
29,7809,065
–
2,766,651
2,241,852889,929512,472
26,98631,960
4,260–
113,469–––
3,820,928
416,527–
2001

37
Income and profitability
Income statement
The Group's consolidatedincome statements for the yearsended December 31, 2002 and 2001,are presented in Table 26 in thevertical cascade format with the samelevel of analytical breakdown as inp r e v i o u s y e a r s ' R e p o r t s . T h eFinancial Statements section of this
R e p o r t p r e s e n t s t h e i n c o m estatements for the last five years inthe public reporting format stipulatedby the Bank of Spain.
Interest revenues (total assetrevenues) in 2002 amounted to€2,387 million, an increase of 4.1%over 2001. Of that amount, €2,356mill ion were interest and similarrevenues and €31 mi l l ion weredividends.
Table 26. Income statements
(€ thousand)
Interest and similar revenues . . . . . . . . . . . . . . . . . . . . .– Interest and similar charges:
On liabilities . . . . . . . . . . . . . . . . . . . . . . . . . . . . . . . .Allocable to pension allowance . . . . . . . . . . . . . . . . .
+ Revenues from equity securities . . . . . . . . . . . . . . . . . .= Net interest revenue . . . . . . . . . . . . . . . . . . . . . . . . . . .+ Fees for services, net:
Loan-related fees . . . . . . . . . . . . . . . . . . . . . . . . . . . .Fees for guarantees, other sureties and documentary creditsFees for other banking services . . . . . . . . . . . . . . . . .
= Basic banking revenue . . . . . . . . . . . . . . . . . . . . . . . .+ Asset trading and exchange profits, net:
Financial asset trading income . . . . . . . . . . . . . . . . . .Less: Writedowns of securities portfolio and derivatives . . . .Exchange, translation and dealing gains . . . . . . . . . .
= Ordinary revenue . . . . . . . . . . . . . . . . . . . . . . . . . . . . .– Operating costs:
Personnel expenses . . . . . . . . . . . . . . . . . . . . . . . . . .General expenses . . . . . . . . . . . . . . . . . . . . . . . . . . .Taxes other than income tax . . . . . . . . . . . . . . . . . . .
– Depreciation . . . . . . . . . . . . . . . . . . . . . . . . . . . . . . . . . .+ Other operating income . . . . . . . . . . . . . . . . . . . . . . . . .– Other operating expenses:
Contribution to Guarantee Fund . . . . . . . . . . . . . . . . .Directors’ fees and other mandated appropriations . .Other . . . . . . . . . . . . . . . . . . . . . . . . . . . . . . . . . . . . .
= Operating income . . . . . . . . . . . . . . . . . . . . . . . . . . . .+ Share in equity method investees’ income, net . . . . . . .– Amortization of goodwill in consolidation . . . . . . . . . . . .+ Gains (Losses) on group transactions, net . . . . . . . . . .– Writeoffs and provisions for credit losses:
Provision to allowance for credit losses . . . . . . . . . . .Less: Recovery of bad debts written off . . . . . . . . . . .
– Provision to general banking risk allowance . . . . . . . . .± Extraordinary gains (losses), net:
Gain on disposal of fixed assets . . . . . . . . . . . . . . . .Extraordinary provision to allowance for pensions . . .Provision to allowances for other purposes . . . . . . . .Other . . . . . . . . . . . . . . . . . . . . . . . . . . . . . . . . . . . . .
= Income before taxes . . . . . . . . . . . . . . . . . . . . . . . . . .– Corporate income tax provision . . . . . . . . . . . . . . . . . . .= Net income . . . . . . . . . . . . . . . . . . . . . . . . . . . . . . . . . .– Minority interests . . . . . . . . . . . . . . . . . . . . . . . . . . . . . .
Ordinary shares . . . . . . . . . . . . . . . . . . . . . . . . . . . . .Preference shares . . . . . . . . . . . . . . . . . . . . . . . . . . .
= Net income attributable to Popular shareholders . . .
2001% increase(decrease)
2,355,978 795,750 795,750
–31,153
1,591,381 572,712 73,153 57,042
442,517 2,164,093
28,948 1,772
(8,852)36,028
2,193,041 782,775 552,354 197,119 33,302 67,907
1,901 36,157 12,361 22,936
860 1,308,103
4,745 63,420
108 235,088 265,176 (30,088)
9,40250,383 16,829
(18,098)55,220 (3,568)
1,055,429367,694 687,735 54,245 41.97212.273
633,490
2,284,119 892,578 873,231 19,347 10,000
1,401,541 567,347 74,724 49,151
443,472 1,968,888
44,984 10,151 (1,723)36,556
2,013,872 749,208 538,666 179,305 31,237 68,203
1,474 41,352 17,389 22,976
987 1,156,583
5,048 8,058 2,796
190,617 218,490 (27,873)
–(113,558)
9,084 (39,993)(79,299) (3,350)
852,194238,030 614,164 48,882 40.487
8.395565,282
3.1(10.8)(8.9)
(100.0)>
13.50.9
(2.1)16.1 (0.2) 9.9
(35.6)(82.5)
>(1.4) 8.9 4.5 2.59.96.6
(0.4) 29.0
(12.6)(28.9)(0.2)
(12.9)13.1 (6.0)
>(96.1)23.321.4
7.9
85.3(54.7)
6.523.8 54.5 12.0 11.0
3,746,212.1
2002

38
Interest expenses (interest andsimilar charges) were 10.8% lowerthan in 2001 at €796 million. Due tothe externalization of the Group'spension commitments in November2001, in 2002 there was no allocationof interest expenses to the internalpension al lowance, since it wasremoved from the balance sheet. Incomparable terms with 2001, interestexpenses decreased by 8.9%.
Subtraction of interest expensesfrom interest revenues leaves the netinterest revenue, which at €1,591million was 13.5% higher.
The good performance of the netinterest revenue in a year in whichinterest rates fell sharply, was due tothe strong growth of the balance sheet.
Analysis of the variation in netinterest revenue by the underlyingfactors - the marginal effects ofbusiness volume, on the one hand,and prices, on the other - reveals thatthe total increase of €190 million over2001 was the net result of €251million due to the growth of balancesheet aggregates, assuming stabilityof interest rates, minus €61 milliondue to the fall in rates. These figuresconfirm the close correlation of theincrease in business volume with thatof the financial margin.
Table 27 presents the results ofcausal analysis of the net interestrevenue in 2002.
Service fee revenues amountedto €573 million, up 0.9% year-on-year.
Fig.12 Service revenues(€ million)
Table 27. Causal analysis of the variation in net interest revenue
Treasury bills . . . . . . . . . . . . . . . . . . . . . . . . . . . . .Financial system . . . . . . . . . . . . . . . . . . . . . . . . .Loans and discounts . . . . . . . . . . . . . . . . . . . . . .Securities portfolio . . . . . . . . . . . . . . . . . . . . . . . .Other assets . . . . . . . . . . . . . . . . . . . . . . . . . . . . .
Total assets . . . . . . . . . . . . . . . . . . . . . .
Financial system . . . . . . . . . . . . . . . . . . . . . . . . .Customer funds:
Customer deposits . . . . . . . . . . . . . . . . . . . . .Bonds and other marketable debt securities .
Pension allowance . . . . . . . . . . . . . . . . . . . . . . . .Other funds . . . . . . . . . . . . . . . . . . . . . . . . . . . . . .Capital accounts . . . . . . . . . . . . . . . . . . . . . . . . . .
Total funds . . . . . . . . . . . . . . . . . . . . . . . .
Net interest revenue . . . . . . . . . . . . . . . . . . . . . . .
Variation in ...Increase in
volume
Changes ininterest
ratesTotal
variation(6,725)11,263
388,36212,198
–
405,098
32,629
57,93583,165
(19,347)––
154,382
250,716
(2,384)(99,752)
(206,873)(3,077)
–
(312,086)
(93,861)
(125,047)(32,302)
–––
(251,210)
(60,876)
(9,109)(88,489)181,489
9,121–
93,012
(61,232)
(67,112)50,863
(19,347)––
(96,828)
189,840
(€ thousand) Due to ...
This caption includes in the first placethe fees for asset transactions notincluded in interest revenues, whichdecreased by 2.1%; the fees for off-balance sheet transactions (collateraland other guarantees), which were upby 16.1%; and finally those for thep rov i s i on o f a l l o t he r bank ingserv i ces , wh ich were v i r tua l l yunchanged from 2001 (variation of-0.2%). Figure 12 plots the evolutionof service fee revenues in the last fiveyears.
Table 28 presents a breakdownof service fee revenues in 2002 and2001. Net collection and paymentf e e s ( u p b y 6 . 0 % ) , f e e s f o rguarantees (up by 16.1%), and feesf o r a d m i n i s t r a t i o n o f d e m a n daccounts (up by 12.8%) all increasednotably as compared with 2001. Onthe contrary, fees for trade discounts(down by 8.2%), mutual fund fees(down by 6.1%) which were affectedb y t h e d e c l i n e i n t h e a s s e t sadministered, as discussed in theCustomer funds section, and fees for
200
300
600
500
400
537
0201009998
567 573
412
467

39
Table 28. Service revenues
Loan-related fees:Bill discounting . . . . . . . . . . . . . . . . . . . . . . . .Other . . . . . . . . . . . . . . . . . . . . . . . . . . . . . . .
Provision of guarantees and other sureties . . . . . . .Operating services:
Collection and payment handling :Note collection . . . . . . . . . . . . . . . . . . . . . . . . .Checks . . . . . . . . . . . . . . . . . . . . . . . . . . . . . .Direct debit transactions . . . . . . . . . . . . . . . . .Payment systems . . . . . . . . . . . . . . . . . . . . . .Fund transfers . . . . . . . . . . . . . . . . . . . . . . . .
Foreign currency purchase and sale transactions Customer financial asset management:
Securities portfolio . . . . . . . . . . . . . . . . . . . . .Mutual funds . . . . . . . . . . . . . . . . . . . . . . . . . .Pension plans . . . . . . . . . . . . . . . . . . . . . . . . .
Administration of demand deposits . . . . . . . . . . .Other . . . . . . . . . . . . . . . . . . . . . . . . . . . . . . . . . .
Total . . . . . . . . . . . . . . . . . . . . . . . . . . . . . . . .
2001 % Variation(€ thousand)
73,15341,13232,02157,042
442,517242,504
61,14022,51116,684
100,39641,7732,695
153,15516,46988,85147,83545,570(1,407)
572,712
74,72444,79329,93149,151
443,472228,779
58,96722,49114,81693,84238,663
8,069160,861
19,89694,63146,33440,407
5,356
567,347
(2.1)(8.2)7.0
16.1(0.2)6.03.70.1
12.67.08.0
(66.6)(4.8)
(17.2)(6.1)3.2
12.8
0.9
2002
securities portfolios management(down by 17.2%) because of thelower volume of securities markettrading, were all lower than in theprevious year.
The net interest revenue plusservice fee revenues constitute thebas ic bank ing revenue , wh ichamounted to €2,164 million in 2002,an increase of 9.9% over 2001.
The asset trading and exchangeprof i ts , wh ich cons is t o f thoseobtained on the trading of financialasse ts and der iva t i ves , ne t o fprovisions to the securi ty pr icefluctuation allowance, plus exchangegains, reached a net amount of €29million, compared with €45 million inthe previous year, and this 35.6%decrease was due to the negativeperformance of the markets duringthe year. Exchange gains were at alevel very similar to that of 2001(down by 1.4%).
The total banking revenues(ordinary revenue), i.e. the net interestrevenue plus service fee revenuesand asset trading and exchangeprofits, amounted to €2,193 million, anincrease of 8.9% year-on-year.
Operating costs increased verymoderately by 4.5% to a total of €783million in 2002.
This capt ion inc ludes mostnotably personnel expenses, whichwere up 2.5% at €552 million. In 2001this caption had grown by 12.9%(6.4% after adjustment for the one-t ime e f f ec t i n t ha t yea r o f t hee x t e r n a l i z a t i o n o f p e n s i o ncommitments). This 6.4% increase inthat year is relevant for comparativepurposes, since in 2002 there was asubstantial containment of personnelcosts. The increase in wages andsalaries in 2002 was 3.6%.
General expenses, up by 9.9%,a m o u n t e d t o € 1 9 7 m i l l i o n . I Texpenses, the major component,amounted €56 million, up 13.2% year-on-year , re f lect ing the greaterprov is ion o f resources and thei n t e n s i v e u s e o f i n f o r m a t i o ntechnologies in the Group. Otheritems which increased sharply wereadvertising (up 44.6%), services forsafeguarding and transporting cash(up 22.7%), and insurance (up17.1%), whereas communicationsand travel were down by 7.0% and5.5%, respectively.

40
Sundry taxes, i .e . a l l taxesexcept corporate income tax, were6.6% up at €33 million.
Table 29 presents a detail ofgeneral expenses and sundry taxesfor the year and the comparative 2001figures.
The level of operating efficiency- i .e. the percentage of ordinaryrevenue absorbed by operating costs-continued to improve and for 2002 asa whole stood at 35.7%, comparedwith 37.2% in 2001. In this importantarea, the Group again had a decisiveedge of nearly 15 percentage points
Table 29. Itemized breakdown of general expenses and taxes other than income tax
General expenses:
Rents and common services . . . . . . . . . .Communications . . . . . . . . . . . . . . . . . . .Maintenance of premises and equipment EDP expenses . . . . . . . . . . . . . . . . . . . . .Stationery and office supplies . . . . . . . . .Technical reports and legal expenses . . .Advertising . . . . . . . . . . . . . . . . . . . . . . . .Insurance . . . . . . . . . . . . . . . . . . . . . . . . .Security and fund transport services . . . .Travel . . . . . . . . . . . . . . . . . . . . . . . . . . .Other*. . . . . . . . . . . . . . . . . . . . . . . . . . . .
Total . . . . . . . . . . . . . . . . . . . . . .
Taxes other than income tax:
Stamp duties . . . . . . . . . . . . . . . . . . . . . .Municipal tax . . . . . . . . . . . . . . . . . . . . . .Urban property tax . . . . . . . . . . . . . . . . . .Business license tax . . . . . . . . . . . . . . . . .Value added tax . . . . . . . . . . . . . . . . . . .Other . . . . . . . . . . . . . . . . . . . . . . . . . . .
Total . . . . . . . . . . . . . . . . . . . . . .
* Net of the expenses recovered from third parties not allocated to their respective captions
(€ thousand)
34,47825,54715,16355,776
7,1865,159
10,5714,618
15,7797,879
14,963
197,119
–687
1,4395,856
24,348972
33,302
31,71727,46214,73949,253
7,1014,0297,3113,945
12,8578,333
12,558
179,305
–698
1,5175,468
21,9161,638
31,237
8.7(7.0)2.9
13.21.2
28.044.617.122.7(5.4)19.2
9.9
–(1.6)(5.1)7.1
11.1(40.7)
6.6
2002 2001%
Variation
over Spanish banks as a whole,whose efficiency ratio, per the latestavailable (September 2002) data, was50.6%.
Table 30 and Figure 13 show theevolution of the Group's level ofoperating efficiency in the last fiveyears.
Table 30. Operating efficiency
Intermediation margin . . . . . . . . . . . . . . . . . . . . . . . . . . . . . . . . . . . . . . . . . . . . . . . .Fees for services and asset trading and exchange profits . . . . . . . . . . . . . . . . . . . .
Ordinary margin . . . . . . . . . . . . . . . . . . . . . . . . . . . . . . . . . . . . . . . . . . . . . . . . . . .
Operating costs . . . . . . . . . . . . . . . . . . . . . . . . . . . . . . . . . . . . . . . . . . . . . . . . . . . . .Depreciation . . . . . . . . . . . . . . . . . . . . . . . . . . . . . . . . . . . . . . . . . . . . . . . . . . . . . . . .Other operating income/expenses . . . . . . . . . . . . . . . . . . . . . . . . . . . . . . . . . . . . . . .Writedowns and provisions . . . . . . . . . . . . . . . . . . . . . . . . . . . . . . . . . . . . . . . . . . . .Other items . . . . . . . . . . . . . . . . . . . . . . . . . . . . . . . . . . . . . . . . . . . . . . . . . . . . . . . . .Corporate income tax . . . . . . . . . . . . . . . . . . . . . . . . . . . . . . . . . . . . . . . . . . . . . . . . .
Net income . . . . . . . . . . . . . . . . . . . . . . . . . . . . . . . . . . . . . . . . . . . . . . . . . . . . . . .
69.5930.41
100.00
(37.20)(3.39)(1.98)
(15.78)0.67
(11.82)
30.50
66.0133.99
100.00
(39.11)(3.78)(2.38)(8.36)0.77
(16.57)
30.57
66.1133.89
100.00
(41.90)(4.37)(2.39)(5.83)1.07
(15.79)
30.79
67.4732.53
100.00
(44.25)(4.57)(2.56)(3.61)1.39
(15.33)
31.07
2002 2001 2000* 1999 1998
72.5727.43
100.00
(35.69)(3.10)(1.56)
(12.35)0.83
(16.77)
31.36
(As % of ordinary margin)
* Adjusted for extraordinary gain
Operating efficiency (Right-hand scale)
Ordinary revenue (Left-hand scale)*Adjusted for extraordinary gain
Operating costs (Left-hand scale)
Fig.13 Operating efficiency(€ million and %)
2,500
2,000
1,500
1,000
500
020100*9998
668749 783
625
1,707
100
75
50
25
0
2,014
2,193
1,413
39.11 37.20 35.69
44.25
1,513
41.90
634

41
Depreciation of tangible assetsand amortization of intangible assetsin 2002 totaled €68 million, 0.4% lessthan the 2001 figure.
The other operating revenuesand expenses caption amounted to€1.9 mi l l ion and €36.2 mi l l ion ,respectively, signifying a net chargeof €34.3 million, a decrease of 14.1%compared with 2001. This captionbalance includes mainly the followingitems: €12.4 million of contributions toguarantee funds; provisions of €0.1million for directors' remuneration;and contributions of €22.8 million towelfare foundations, pursuant toresolutions adopted with permanenteffects in the past by the Groupbanks' boards of directors, suchcontributions signifying a reduction,by at least the same amount, of theprovision for directors' remuneration.
S u b t r a c t i o n f r o m o r d i n a r yrevenue of the operating costs, of thedepreciation and amortization, andthe other net operating charges leadsto the operating income, which in2002 amounted to €1,308 million andwas 13.1% higher than in 2001.
This 13.1% increase in operatingincome in a year in which the balancesheet grew by 12.3% summarizes thesuccess of the Group's managementperformance and confirms the validityof its strategy of profitable growth.
Figure 14 shows the quarterlyevolution in the last two years of netinterest revenue, basic bankingrevenue, ord inary revenue andoperating income.
T h e f o l l o w i n g p a r a g r a p h sanalyze, starting from operatingincome, the items in the lower part ofthe cascade-format income statementin order to reach net income for theyear.
The net results of the companiesconsolidated by the equity methodamounted to €4.7 million, 6.0% lowerthan in 2001. This amount is afteradjustment for the €7.8 million of
dividends paid by these companies inthe year , which are inc luded inrevenues from equity securities.
Amortization of the goodwill inconsolidation amounted to €63.4million, compared with €8.1 million in2001. This item reflects the writeoff ofthe goodwill (difference betweenpurchase price and book value) whicharose on purchase of ownershipinterests. The high amount in 2002was due to the fact that the Group, inaccordance w i th i t s c r i te r ia o fprudence, took early amortization ofthe total residual goodwill which aroseon the acquisition of the Fortior group,amounting to €54.5 mill ion, plusothers of minor amount. For thispurpose, the Group used allowancesof the same amount which had beenbooked previously and were in excessof those regulatorily required. Thisvoluntary measure was taken in orderto maintain maximum balance sheets t rength and to f ree the fu turegeneration of earnings from theburden that this writeoff would haveinvolved in the coming years.
T h e r e s u l t s o n G r o u ptransactions, amounting to €0.1million, relate to the gains or losseson the trading of Group companies'securities, and were 96.1% lower thanthe figure for 2001.
The credit loss provisions, net ofallowances released, were 21.4%higher at €265 million. This figure isthe aggregate of €119 million ofspecific provisions for troubled risks,€8 million for writeoff of unprovisionedrisks, €78 million of general allowanceprovisions, €57 million of provisions tothe statistical credit loss allowanceand, finally, €3 million for the country-risk allowance.
Loans written off as bad debtsrecovered in 2002 amounted to €30million, 7.9% more than in 2001.
The ne t p rov is ion to c red i tallowances was €235 million, up by23.3% on the 2001 figure of €191million.
Fig.14 Quarterly revenues(€ million)
Ordinary revenueBasic banking revenueNet interest revenueOperating income
3rd1st 2nd 4th 3rd1st 2nd 4th
2001 2002
600
500
400
300
200
276 288 282
372
329346
354
311
473 488 491516
486 500 495
533546 549 543 555
535543 543 542
397 399 399 396
328 330 322 328

42
These figures clearly reflect thecriteria of prudence consistentlyapplied by the Group.
There was a gain of €16.8 millionon the disposal of assets, comparedwith €9.1 million in 2001, arising from
Additionally, the Group bookedprecautionary provisions of €9.4million to the general banking riskallowance, which is not assigned toany specific balance sheet item and isnot called for by the regulations onprovisions.
Interest and similar revenues . . . . . . . . . . . .– Interest and similar charges . . . . . . . . . . . . .= Net interest revenue . . . . . . . . . . . . . . . . . .+ Fees for services, net . . . . . . . . . . . . . . . . . .+ Asset trading & exchange profits, net . . . . . .= Ordinary revenue . . . . . . . . . . . . . . . . . . . . .– Operating costs:
Personnel expenses . . . . . . . . . . . . . . . . .Other expenses . . . . . . . . . . . . . . . . . . . . .
– Depreciation . . . . . . . . . . . . . . . . . . . . . . . . .± Other operating income/expenses, net . . . . .= Operating income . . . . . . . . . . . . . . . . . . . .± Other items, net . . . . . . . . . . . . . . . . . . . . . . .– Provisions and writedowns . . . . . . . . . . . . . .= Income before taxes . . . . . . . . . . . . . . . . . .– Corporate income tax provision . . . . . . . . . . .= Net income . . . . . . . . . . . . . . . . . . . . . . . . . .– Minority interests . . . . . . . . . . . . . . . . . . . . . .= Net income attributable . . . . . . . . . . . . . . . . .
Pro memoria (€ million):Average total assets. . . . . . . . . . . . . . . . . . . . . .Average total risk-weighted assets (RWA). . . . .
Table 31. Quarterly income and profitability
(€ thousand)
Yield on assets . . . . . . . . . . . . . . . . . . . . . . . .– Cost of funds . . . . . . . . . . . . . . . . . . . . . . . . . .= Net interest margin . . . . . . . . . . . . . . . . . . . .+ Yield on services, net . . . . . . . . . . . . . . . . . . .+ Yield on fin. assets trading & exch. profits . . . . . .= Ordinary margin . . . . . . . . . . . . . . . . . . . . . .– Operating costs:
Personnel costs . . . . . . . . . . . . . . . . . . . . .Other expenses . . . . . . . . . . . . . . . . . . . . .
– Depreciation . . . . . . . . . . . . . . . . . . . . . . . . . .± Other operating income/expenses, net . . . . . .= Operating profitability . . . . . . . . . . . . . . . . .± Other items, net . . . . . . . . . . . . . . . . . . . . . . .– Provisions and writedowns . . . . . . . . . . . . . .= Pre-tax income return . . . . . . . . . . . . . . . . . .– Corporate income tax . . . . . . . . . . . . . . . . . . .= Net income return (ROA) . . . . . . . . . . . . . . .
Pro memoria:Net return on average risk-weighted assets (RORWA) (%) . . . . . . . . . . . . . . . . . . . .Net return on average equity (ROE) (%) . . . .Leverage . . . . . . . . . . . . . . . . . . . . . . . . . . . . .Operating efficiency (%) . . . . . . . . . . . . . . . . .
(As annualized % of average total assets)
2001 2002
20022001
3rd 4th1st 2nd 3rd 4th1st 2nd
3rd 4th1st 2nd 3rd 4th1st 2nd
592,579193,159399,420143,574
6,087549,081193,452136,199
57,25316,685(8,698)
330,2463,367
77,059256,554
91,043165,511
14,139151,372
39,48932,888
578,885225,300353,585137,569
3,450494,604186,081135,501
50,58016,974(9,810)
281,7392,426
57,376226,789
63,013163,776
12,638151,138
35,16728,860
578,107205,711372,396143,759
16,454532,609194,382136,986
57,39617,357(9,906)
310,9644,344
110,126205,182
51,964153,218
11,678141,540
36,62629,747
582,888185,887397,001138,430
10,403545,834192,754136,584
56,17016,893(8,444)
327,7438,816
74,974261,585
95,593165,992
13,593152,399
37,91030,794
602,675204,057398,618144,616
(157)543,077195,631140,031
55,60017,072(8,499)
321,8752,093
48,033275,935
92,612183,323
14,224169,099
40,47334,936
608,989212,647396,342146,09212,615
555,049200,938139,54061,39817,257(8,615)
328,2393,838
70,722261,35588,446
172,90912,289
160,620
42,55936,370
581,919235,611346,308141,92612,004
500,238185,545133,36052,18517,021
(10,070)287,602
6,02183,251
210,37262,435
147,93712,211
135,726
34,06027,650
555,208225,956329,252144,093
13,076486,421183,200132,819
50,38116,851
(10,092)276,278
78767,214
209,85160,618
149,23312,355
136,878
32,42726,005
6.001.954.051.450.065.561.961.380.580.17
(0.08)3.350.030.782.600.921.68
2.0126.02
15.535.23
6.582.564.021.560.045.622.121.540.580.19
(0.11)3.200.030.652.580.721.86
2.2729.5615.9
37.62
6.322.254.071.570.185.822.121.490.630.19
(0.11)3.400.051.212.240.571.67
2.0627.70
16.636.50
6.151.964.191.460.115.762.031.440.590.18
(0.09)3.460.090.792.761.011.75
2.1626.56
15.235.31
5.962.023.941.430.005.371.931.380.550.17
(0.09)3.180.020.472.730.921.81
2.1029.49
16.336.02
5.732.003.731.370.125.221.891.310.580.16
(0.08)3.090.030.662.460.831.63
1.9027.8417.1
36.20
6.832.774.061.670.145.872.181.570.610.20
(0.11)3.380.070.982.470.731.74
2.1426.5515.3
37.09
6.852.794.061.780.166.002.261.640.620.21
(0.12)3.410.010.832.590.751.84
2.3026.7614.5
37.66 x x x x x x x x

43
t h e s a l e o f c e r t a i n p r e m i s e s ,substantially all of which were notused in the Group's operations.
E x t r a o r d i n a r y p e n s i o ncontributions amounted to €18.1million (54.7% lower than in 2001),including €9.2 million of paymentssupplementary to those made whenthe pension commitments wereexternalized in November 2001.Adjusted for this one-time effect, thiscaption balance was 77.8% lowerthan in 2001.
T h e p r o v i s i o n s f o r o t h e rpurposes which were released in2002 amounted to €55.2 million, themain item being the €54.5 million ofallowances used to write off goodwill,as mentioned earlier. The remaininga m o u n t c o n s i s t e d o f t h e n e tprovisions for foreclosed real estateassets, for tax contingencies andothers of minor amount.
The balance of the other sundryresults caption was a net charge of€3.6 million, 6.5% more than the €3.4mill ion in 2001. It encompasses
sundry items not connected withoperat ions for the year and notr e f e r r e d t o i n t h e p r e v i o u sp a r a g r a p h s , s u c h a s i n t e r e s trevenues and expenses allocable toprior years and other minor profits orlosses.
The g ross (p re tax ) i ncomeamounted to €1,055 mi l l ion, anincrease of 23.8% year-on-year.
From the foregoing figure mustbe subtracted the €368 million ofcorporate income tax, which was54.5% higher than the correspondingamount of €238 million in 2001. Thissubstantial increase was due to thefavorable tax effect in 2001 of theexternalization of the Group's pensioncommitments.
For this reason, the apparent taxrate significantly increased by nearly7 percentage points from 27.9% in2001 to 34.8% in 2002.
Calculation of corporate incometax in 2002 and 2001 is shown indetail in Table 32.
Table 32. Corporate income tax calculation
Income before taxes . . . . . . . . . . . . . . . . . . . . . . . . . . . .Additions . . . . . . . . . . . . . . . . . . . . . . . . . . . . . . . . . . . . .Reductions . . . . . . . . . . . . . . . . . . . . . . . . . . . . . . . . . . .
Taxable income . . . . . . . . . . . . . . . . . . . . . . . . . . . . . . . .Tax charge (35 %) . . . . . . . . . . . . . . . . . . . . . . . . . . . . .Tax credits: For double taxation . . . . . . . . . . . . . . . . . .
For tax relief . . . . . . . . . . . . . . . . . . . . . . .For investments. . . . . . . . . . . . . . . . . . . . .
Tax payable . . . . . . . . . . . . . . . . . . . . . . . . . . . . . . . . . . .Adjustment for temporary differences in payments and other, netTotal provision . . . . . . . . . . . . . . . . . . . . . . . . . . . . . . . . .
(€ thousand)
1,055,429277,923192,650
1,140,702399,246
37,795592
3,170
357,68910,005
367,694
2002 2001%
Variation
852,194305,344
87,702
1,069,836374,443
33,862631439
339,511(101,481)
238,030
23.8(9.0)
>
6.66.6
11.6(6.2)
>
5.4
54.5
The net income for the year of€688 million was 12.0% higher than in2001. Subtraction of the minorityinterests in subsidiaries' commonshares not owned by the Groupparent entity and the preferred stockleads f inal ly to the net incomeattributable to the shareholders of
Banco Popular, which at €633 millionwas 12.1% higher than in 2001.
Earnings per share were €2.92,an increase of 12.1% compared withthe €2.60 in the previous year.
Income per share (Left-hand scale)
Dividend per share(Left-hand scale)
Fig.16 Income and dividend per share (€)Pay-out (%)
0201009998
Pay-out (Right-hand scale)
Net incomeIncome before taxes
Net income attributable to Banco Popularshareholders
Fig.15 Growth of income(€ million)
1,100
900
700
500
300
0201009998
852
1,055
656
705
528
614
688
439 491
565
633
407
810
466
433
3
2.25
1.50
0.75
0
1.361.50
0.981.08
2.60
2.92
1.841.97
2.26
1.20
51.453.2 54.1 52.9 52.2
100
75
50
25
0
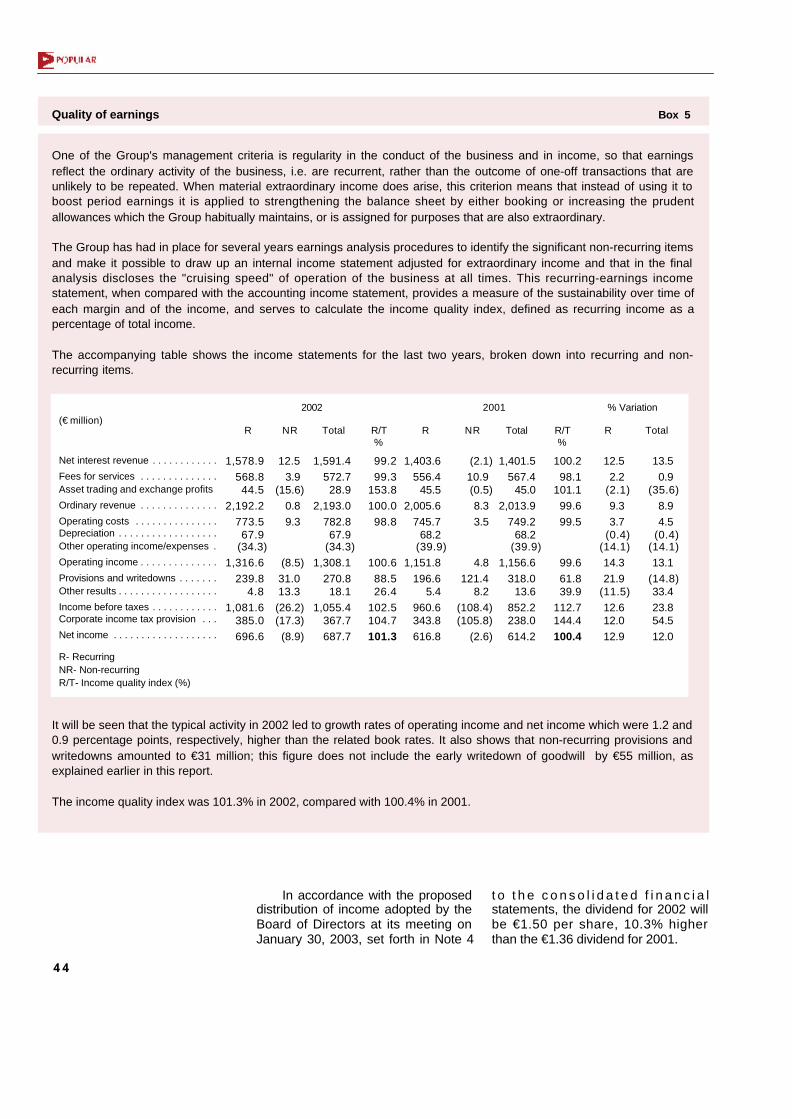
44
In accordance with the proposeddistribution of income adopted by theBoard of Directors at its meeting onJanuary 30, 2003, set forth in Note 4
t o t h e c o n s o l i d a t e d f i n a n c i a lstatements, the dividend for 2002 willbe €1.50 per share, 10.3% higherthan the €1.36 dividend for 2001.
Quality of earnings Box 5
One of the Group's management criteria is regularity in the conduct of the business and in income, so that earningsreflect the ordinary activity of the business, i.e. are recurrent, rather than the outcome of one-off transactions that areunlikely to be repeated. When material extraordinary income does arise, this criterion means that instead of using it toboost period earnings it is applied to strengthening the balance sheet by either booking or increasing the prudentallowances which the Group habitually maintains, or is assigned for purposes that are also extraordinary.
The Group has had in place for several years earnings analysis procedures to identify the significant non-recurring itemsand make it possible to draw up an internal income statement adjusted for extraordinary income and that in the finalanalysis discloses the "cruising speed" of operation of the business at all times. This recurring-earnings incomestatement, when compared with the accounting income statement, provides a measure of the sustainability over time ofeach margin and of the income, and serves to calculate the income quality index, defined as recurring income as apercentage of total income.
The accompanying table shows the income statements for the last two years, broken down into recurring and non-recurring items.
Net interest revenue . . . . . . . . . . . .
Fees for services . . . . . . . . . . . . . .Asset trading and exchange profits
Ordinary revenue . . . . . . . . . . . . . .
Operating costs . . . . . . . . . . . . . . .Depreciation . . . . . . . . . . . . . . . . . .Other operating income/expenses .
Operating income . . . . . . . . . . . . . .
Provisions and writedowns . . . . . . .Other results . . . . . . . . . . . . . . . . . .
Income before taxes . . . . . . . . . . . .Corporate income tax provision . . .
Net income . . . . . . . . . . . . . . . . . . .
R TotalNR R/T%
R NR Total R/T%
20012002
R- RecurringNR- Non-recurringR/T- Income quality index (%)
(€ million)
1,578.9568.844.5
2,192.2773.567.9
(34.3)1,316.6
239.84.8
1,081.6385.0696.6
12.53.9
(15.6)0.89.3
(8.5)31.013.3(26.2)(17.3)(8.9)
1,591.4572.728.9
2,193.0782.867.9
(34.3)1,308.1
270.818.1
1,055.4367.7687.7
99.299.3
153.8100.098.8
100.688.526.4
102.5104.7101.3
1,403.6556.4
45.52,005.6
745.768.2
(39.9)1,151.8
196.65.4
960.6343.8616.8
(2.1)10.9(0.5)8.33.5
4.8121.4
8.2(108.4)(105.8)
(2.6)
1,401.5567.4
45.02,013.9
749.268.2
(39.9)1,156.6
318.013.6
852.2238.0614.2
100.298.1
101.199.699.5
99.661.839.9
112.7144.4100.4
It will be seen that the typical activity in 2002 led to growth rates of operating income and net income which were 1.2 and0.9 percentage points, respectively, higher than the related book rates. It also shows that non-recurring provisions andwritedowns amounted to €31 million; this figure does not include the early writedown of goodwill by €55 million, asexplained earlier in this report.
The income quality index was 101.3% in 2002, compared with 100.4% in 2001.
R
12.52.2
(2.1)9.33.7
(0.4)(14.1)14.321.9
(11.5)12.612.012.9
Total
13.50.9
(35.6)8.94.5
(0.4)(14.1)13.1
(14.8)33.423.854.512.0
% Variation

45
The proposed dividend signifiesa pay-out - the percentage of incomeallocated for dividends - of 51.4%, 0.8percentage points lower than figure of52.2% in 2001.
Table 33 and Figure 16 show theevolution of attributable earnings pershare, dividend per share and pay-outin the last five years.
Table 33. Per share data*
Year Net income (€) Dividend (€) Pay-out (%)
Average numberof shares
(thousands)
19981999200020012002
* Figures adjusted for 2 x 1 share split in 2000** € 0.78 per share were also paid to shareholders out of the paid-in surplus reserves
1.8371.9652.2592.6032.917
0.9771.0751.1951.3601.500
53.254.152.952.251.4
221,550220,212217,154217,154217,154
**
Yields and costs
Ana lys is o f the Group 'sprofitability in 2002 compared with2001 ca l l s fo r a p rev ious b r ie freference to the behavior during theyear of the economy of the EuropeanMonetary Union, of which Spain is amember, and in particular to theevo lu t i on o f eu ro a rea moneymarkets. Since this is the environmentin which the Group operated, it is thef r a m e w o r k o f r e f e r e n c e f o ra p p r o p r i a t e l y e v a l u a t i n g t h emanagement performance.
Short-term euro area interestrates, which declined gently in the firsthalf of 2001 in line with the (at thattime) slight slowdown of the economy,fell precipitously after the end of thethird quarter of that year all over theworld, because of the grave events ofSeptember 2001. The EuropeanCentral Bank, which in May had cutits reference rate (the so-called mainfinancing rate) by 25 basis points,intervened drastically starting inOctober and, following its peer US
institution, made three other cutstaking the reference rate down to3.25% at 2001 year-end, a cumulativereduction of 150 basis points duringthe year. Taking 3-month Euribor as areference of the money market, thefall in 2001 was of 103 basis points,from 4.38% to 3.35%.
During 2002, the weakness ofthe economy in the euro area, whichended the year with estimated GDPgrowth of 0.7%, exer ted st rongpressure for further interest rate cuts,although the opportuneness of thismeasure for the Spanish economyand that of other member states hasy e t t o b e d e m o n s t r a t e d . T h eEuropean Cent ra l Bank f ina l l ydecided to make a fresh cut of 50basis points in December, leaving itsmain financing rate at 2.75% at yearend. The 3-month Euribor followed asimilar pattern: after a timid upturn atthe beginning of the year it again fellmore sharply in the second half, andat the end of 2002 stood at 2.95%, areduction of 40 basis points in theyear.
Customer spread (percentage points)Credit yield
Cost of customer funds
Fig.17 Customer spread(%)
0201009998
12
9
6
3
0
7.677.03
2.582.13
5.094.90
2.10
4.87
6.977.67
5.39
2.28
6.76
5.34
1.42

46
In short, from December 2000 toDecember 2002 the ECB's main ratefell by 200 basis points, and in themoney market the 3-month rate fell by143 basis points and the 1-year rateby 189 basis points.
Figure 18 plots the variation ininterest rates in 2001 and 2002.
Table 34 shows the averagebalances of assets and funds in theconsolidated balance sheet, theirpercentage distribution, the relatedrevenues and costs and the averagerates o f y ie ld and cost o f eachcategory of assets and liabilities for2002 and 2001. Table 35 presents thesame information on a quarterlybasis.
Average total assets in 2002amounted to €40,107 million, anincrease of 16.0% over the 2001figure of €34,570 million.
The average yield on total assetsfell by 68 basis points (bp) to 5.95% in2002, and the average yield on earningassets was 70 bp lower at 6.28%. Theyield on loans and discounts was6.97%, also 70 bp lower.
The average cost of total fundsfell by 60 bp to 1.98% in 2002, theaverage cost of interest-bearing fundswas 2.26%, 69 bp lower than in 2001,and the average cost of customerfunds (deposits and debt securities)was 48 bp lower than in 2001 at2.10%.
Table 34. Yields and costs
(€ thousand and rates annualized)
Treasury bills. . . . . . . . . . . . . . . . . . . . . . . . . . . . .Financial system:
In euros . . . . . . . . . . . . . . . . . . . . . . . . . . . .In foreign currencies . . . . . . . . . . . . . . . . . .
Loans and discounts (a):In euros . . . . . . . . . . . . . . . . . . . . . . . . . . . .In foreign currencies . . . . . . . . . . . . . . . . . .
Securities portfolio:Government debt securities . . . . . . . . . . . . .Other fixed-interest securities . . . . . . . . . . .Equity securities . . . . . . . . . . . . . . . . . . . . .
Total earning assets (b) . . . . . . . . . . . . .Other assets . . . . . . . . . . . . . . . . . . . . . . . . . . .
Total assets . . . . . . . . . . . . . . . . . . . . . . . .
Financial system:In euros . . . . . . . . . . . . . . . . . . . . . . . . . . . .In foreign currencies . . . . . . . . . . . . . . . . . .
Customer funds (c):Customer accounts:
In euros:Demand and savings deposits . . . . . . .Time deposits . . . . . . . . . . . . . . . . . . .Assets sold under repurchase agreements .Other . . . . . . . . . . . . . . . . . . . . . . . . . .
In foreign currencies . . . . . . . . . . . . . . . .Bonds and other marketable debt securities . . . .
Pension allowance . . . . . . . . . . . . . . . . . . . . . .Total interest-bearing liabilities (d) . . . . . . . .
Other non-interest-bearing liabilities . . . . . . . . .Capital accounts . . . . . . . . . . . . . . . . . . . . . . . .
Total liabilities and capital . . . . . . . . . . . .
Customer spread (a-c) . . . . . . . . . . . . . . . . . . . . .Spread (b-d) . . . . . . . . . . . . . . . . . . . . . . . . . . . .
2002 2001
Distri-bution(%)
Revenueor expense
Averagerate(%)
Averagebalance
Distri-bution
(%)Revenue
or expense
Averagerate(%)
161,7075,748,7483,586,9892,161,759
30,958,52930,553,517
405,0121,154,937
99,508526,868528,561
38,023,9212,083,553
40,107,474
6,680,6514,743,2891,937,362
28,582,78223,444,70122,564,28911,817,007
9,249,2071,496,237
1,838880,412
5,138,081
35,263,4332,538,2242,305,817
40,107,474
0.4014.338.945.39
77.1976.181.012.880.251.311.32
94.805.20
100.00
16.6611.834.83
71.2658.4556.2629.4623.073.73
–2.19
12.81
87.926.335.75
100.00
6,258167,312120,11247,200
2,159,2032,148,441
10,76254,358
4,67218,53331,153
2,387,131–
2,387,131
194,847159,52135,326
600,903439,692426,90283,769
291,81651,317
–12,790
161,211
795,750––
795,750
3.872.913.352.186.977.032.664.714.703.525.896.28
–
5.95
2.923.361.822.101.881.890.713.163.43
–1.453.14
2.26––
1.98
4.874.02
343,9835,834,9473,716,9632,117,984
25,799,72625,452,745
346,981904,786142,909596,901164,976
32,883,4421,686,655
34,570,097
6,006,2164,202,6161,803,600
23,905,70621,276,11520,393,98710,670,715
8,257,7221,463,724
1,826882,128
2,629,591358,678
30,270,6002,255,2622,044,235
34,570,097
1.0016.8810.756.13
74.6373.631.002.620.411.730.48
95.134.87
100.00
17.3712.165.21
69.1561.5458.9930.8723.884.230.012.557.611.04
87.566.535.91
100.00
15,367255,801154,604101,197
1,977,7141,960,870
16,84445,2377,012
28,22510,000
2,294,119–
2,294,119
256,079178,900
77,179617,152506,804476,583
90,780318,384
67,419–
30,221110,348
19,347892,578
––
892,578
4.474.384.164.787.677.704.855.004.914.736.066.98
–
6.63
4.264.264.282.582.382.340.853.864.61
–3.434.205.392.95
––
2.58
5.094.03
Averagebalance
5
4
3
2
Fig.18 Interest rates (%)
00 01 02
2.952.882.75
4.38
4.754.77
Euribor 3 months
ECB
Euribor 1 year

47
The margins arising from theseyield and cost rates are discussed inthe following paragraphs.
The customer spread - i.e. thedifference between the yield on loansand d i scoun ts and the cos t o fcustomer funds - was 22 bp lowerthan in 2001 at 4.87%.
The spread, which measures thedifferential between the rates of yieldon earning assets and the rates ofcost of interest-bearing funds, was4.02%, 1 bp lower than in 2001.
The better performance of thespread in compar ison wi th thecustomer spread was due to the factthat the rates on money market fundswere adjusted downwards morequickly than those on customer funds.
Finally, the net interest margin,obtained by comparing the rates ofyield on all assets and the rates coston all liabilities, was 8 bp lower in2002 at 3.97%.
The foregoing figures show that,in an environment of interest rates
moving sharply downwards, theimpact on the Group's businessmargins was very limited, thanks tovery prudent management of assetand liability pricing and of the mix ofassets and funds. This performancewas all the more notable considering,o n t h e o n e h a n d , t h e s h a r pcumulative decline in interest rates in2001 and 2002 (143 basis points in 3-month Euribor and 189 basis points in1-year Euribor) and, on the other, the16.0% growth in 2002 in averagebalance sheet balances.
Figures 17 and 19 show thevariation in the customer spread andthe net interest margin in the last fiveyears, together with the related yieldand cost rates.
Operating profitability
Table 36 shows the 2002 and2001 consolidated income statementsexpressed as percentages of averagetotal assets. This same information on aquarterly basis is provided in Table 31.
Table 35. Quarterly yields and costs
(Data in % and rates annualized)
Treasury bills . . . . . . . . . . . . . . . . .Financial system . . . . . . . . . . . . . . .Loans and discounts (a) . . . . . . . . .Securities portfolio . . . . . . . . . . . . . .
Total earning assets (b) . . . . . . .Other assets . . . . . . . . . . . . . . . . . .
Total assets . . . . . . . . . . . . . . . . .
Financial system . . . . . . . . . . . . . . .Customer funds (c) . . . . . . . . . . . . .Pension allowance . . . . . . . . . . . . .
Total interest-bearing liabilities (d)Other non-interest-bearing liabilitiesCapital accounts . . . . . . . . . . . . . . .
Total liabilities and capital . . . . .
Customer spread (a-c) . . . . . . . . . .Spread (b-d) . . . . . . . . . . . . . . . . . .
1st 2nd 3rd 4th
2001
Distri-bution Rate Rate Rate Rate
1st
Rate
2002
Rate
2nd
Rate
3rdDistri-bution
Distri-bution
Distri-bution
Distri-bution
Distri-bution
Distri-bution
Distri-bution Rate
4th
1.1615.6175.60
2.7595.12
4.88
100.00
17.3268.31
1.2386.86
7.325.82
100.00
4.594.097.644.206.92
–
6.58
4.002.645.452.95
––
2.56
5.003.97
0.9417.1774.49
2.4695.06
4.94
100.00
17.2669.80
1.2288.28
5.726.00
100.00
4.804.987.795.197.19
–
6.83
4.752.705.383.13
––
2.77
5.094.06
0.7018.4173.72
2.6995.52
4.48
100.00
15.5470.25
1.2487.03
6.666.31
100.00
4.224.897.777.077.17
–
6.85
5.092.755.333.20
––
2.79
5.023.97
1.1516.4774.63
2.5794.82
5.18
100.00
19.1667.33
0.5086.99
7.435.58
100.00
4.233.577.483.746.66
–
6.32
3.492.305.432.58
––
2.25
5.184.08
0.9215.3174.53
3.2393.99
6.01
100.00
18.0868.16
–86.24
7.706.06
100.00
4.193.027.335.836.54
–
6.15
3.002.08
–2.27
––
1.96
5.254.27
0.4715.4675.883.18
94.995.01
100.00
17.2169.42
–86.637.525.85
100.00
3.652.747.134.766.32
–
6.00
2.692.15
–2.26
––
1.95
4.984.06
0.2212.9179.05
2.7794.95
5.05
100.00
14.2472.43
–86.67
7.665.67
100.00
3.082.986.865.136.27
–
5.96
3.132.17
–2.33
––
2.02
4.693.94
0.0513.7778.992.40
95.214.79
100.00
17.1870.10
–87.287.305.42
100.00
3.862.926.652.836.01
–
5.73
2.882.14
–2.29
––
2.00
4.513.72
Net interest marginYield on assets
Cost of funds
Fig.19 Net interest margin(As % of average total assets)
0201009998
12
9
6
3
0
6.636.19
2.582.26
4.053.93
1.98
3.97
5.956.49
4.21
2.28
5.67
4.14
1.53
48
Table 36. Profitability
Variation2002 2001
Yield on assets . . . . . . . . . . . . . . . . . . . . . . . . . . . . . . . . .Cost of funds . . . . . . . . . . . . . . . . . . . . . . . . . . . . . . . . . . .
Net interest margin . . . . . . . . . . . . . . . . . . . . . . . . . . . .
Yield on services, net . . . . . . . . . . . . . . . . . . . . . . . . . . . .Yield on financial asset trading and exchange profits, net . .
Ordinary margin . . . . . . . . . . . . . . . . . . . . . . . . . . . . . .
Operating costs:Personnel expenses . . . . . . . . . . . . . . . . . . . . . . . . .Other expenses . . . . . . . . . . . . . . . . . . . . . . . . . . . . .
Depreciation . . . . . . . . . . . . . . . . . . . . . . . . . . . . . . . . . . .Other operating income / expenses, net . . . . . . . . . . . . . .
Operating profitability . . . . . . . . . . . . . . . . . . . . . . . . . .
Other items, net . . . . . . . . . . . . . . . . . . . . . . . . . . . . . . . .Provisions and writedowns . . . . . . . . . . . . . . . . . . . . . . . .
Pre-tax income return . . . . . . . . . . . . . . . . . . . . . . . . . .
Corporate income tax . . . . . . . . . . . . . . . . . . . . . . . . . . . .
Net income return (ROA) . . . . . . . . . . . . . . . . . . . . . . .
Pro memoria:
Average total assets (€ million) . . . . . . . . . . . . . . . . . . . . .Average total risk-weighted assets (RWA) (€ million) . . . .Net return on average risk-weighted assets (RORWA) (%)Net return on average equity (ROE) (%) . . . . . . . . . . . . . .Leverage . . . . . . . . . . . . . . . . . . . . . . . . . . . . . . . . . . . . . .Operating efficiency (%). . . . . . . . . . . . . . . . . . . . . . . . . . .
5.951.98
3.97
1.430.07
5.47
1.951.380.570.17
(0.09)
3.26
0.050.68
2.63
0.92
1.71
40,10733,747
2.0427.47
16.135.69
6.632.58
4.05
1.650.13
5.83
2.171.560.610.20
(0.11)
3.35
0.040.92
2.47
0.69
1.78
34,57028,066
2.1927.6515.5
37.20
(0.68)(0.60)
(0.08)
(0.22)(0.06)
(0.36)
(0.22)(0.18)(0.04)(0.03)0.02
(0.09)
0.01(0.24)
0.16
0.23
(0.07)
16.0%20.2%(0.15)(0.18)
0.6(1.51)
(As % of average total assets)
xx
The operating margin was 3.26%on average total assets, a decrease of9 basis points from 2001.
The return on assets (ROA) - netincome as a percentage of averagetotal assets - was 1.71% in 2002,compared with 1.78% in 2001, adecrease of 7 basis points. Analysis ofTable 36 shows that the main factor inthe improvement in profitability in theyear was the containment of costs,which made a positive contribution of2 2 b a s i s p o i n t s , w h e r e a s t h econtribution of service fee revenueswas lower (down by 22 basis points) aswere, to a much lesser degree, those ofthe net interest margin (down by 8 basispoints) and asset trading and exchangeprofits (down by 6 basis points).
The return on average r isk-weighted assets (RORWA) was 2.04%in 2002 and 2.19% in 2001.
Final measures of return
The attributable income forthe year, expressed as a percentageof average equity, gives the return onequity (ROE), which at 27.47% in2002 was virtually the same as in2001 (27.65%).
The financial leverage coefficient,i.e. the ratio of total funds to equity asadjusted, was 16.1 in 2002 and 15.5in 2001.
The level of operating efficiency,which measures the portion of totalrevenues absorbed by operatingcosts, continued to evolve favorablya n d s t o o d a t 3 5 . 6 9 % i n 2 0 0 2 ,compared with 37.20% in 2001.
The return on equity can bebroken down into two elements whichexplain, on the one hand, the balance
ROE (Left-hand scale)
ROA (Right-hand scale)
Fig.20 Quarterly ROA and ROE (Annualized %)
1st
2002
2nd 3rd 4th2nd 3rd 4th 1st
2001
ROE (Left-hand scale)ROA (Right-hand scale)
0201009998
Fig.21 ROA and ROE (%)
32.00
27.00
22.00
17.00
12.00
1.741.86
1.67 1.68
26.55
3.20
2.70
2.20
1.70
1.20
29.56
27.70
1.84
26.02
26.56
29.49
1.811.75
26.76 27.84
1.63
32.00
27.00
22.00
17.00
12.00
1.781.71
1.94 1.93
27.65 27.47
23.05
24.88
27.16
1.84
3.20
2.70
2.20
1.70
1.20

49
shee t i nves tmen t and l end ingdecisions and, on the other, thedecisions on how the balance sheet isfinanced. The first determines thereturn on invested funds (ROIF), i.e.the ratio of net income plus interestexpenses net of taxes to total assets.The second element is the return dueto financial leverage (ROFL), whichmeasures the extent to which theb a l a n c e s h e e t i s f u n d e d w i t hborrowed funds. In 2002, the ROIFwas 3 .02% and the ROFL was
24.45%, with a decrease of 40 basispoints and an increase of 22 basispoints, respectively, compared with2001.
Table 37 shows the main finalmeasures of return and leverage inthe last five years, and Figures 20and 21 plot the evolution of ROA,RORWA and ROE in the last twoyears, by quarters, and in the last fiveyears, respectively.
Table 37. Measures of return
19981999200020012002
YearTotal netincome
Net incomeattributable to
Popular sharesAverage
total assetsAverageequity Leverage
On averagetotal assets
(ROA)
On averageequity (ROE)
ROE components
ROFL
Net return (%)
ROIF
(€ thousand)
439,129465,782527,509614,164687,735
406,963432,727490,557565,282633,490
22,647,08724,141,09628,688,05034,570,09740,107,474
1,765,3651,738,9801,806,4942,044,2352,305,817
11.912.914.815.516.1
1.941.931.841.781.71
23.0524.8827.1627.6527.47
3.382.893.263.423.02
19.6721.9923.9024.2324.45
Banco Popular named “the best bank in Spain” Box 6
In July 2002, the UK financial publication Euromoney named Banco Popular"the best bank in Spain" in its 2002 Awards for Excellence.
According to Euromoney, Banco Popular was able to devote itself fully tolooking after its customers, with a significant gain in market share and a growthrate of nearly 20% in lending, unhindered by the preoccupations afflicting otherbanks with investments in Latin America. Highlighted was the Bank's priorityfocus on the SME sector, which accounts for 80% of its loan portfolio, and itssuccess in service cross-selling described as "impressive" as the result of theclose relationship with the customers with the Bank performing the role offinancial adviser rather than that of a seller of scantly differentiated products.

50
Shareholders
At t he end o f 2002 , BancoP o p u l a r E s p a ñ o l h a d 7 0 , 8 1 6shareholders, compared with 75,379at the end of the previous year.
Tables 38 and 39 present a detailof the spread of share ownership andof the percentages of holding in thecommon stock of the Bank at the endof 2002 and 2001.
The structure of the shareholdersvar ied sl ight ly in 2002, wi th anincrease in ownership by institutionalinvestors, as occurred in previousyears. Shareholders owning morethan 160,000 shares thus held 63% ofthe common stock, as compared with61.3% in 2001.
T h e l a r g e s t i n d i v i d u a lshareholder owned 0.18% of thecommon stock. In the legal entitiescategory one group owned 9.52%,and a nonresident finance entitywhich manages a substantial number
of institutional portfolios groupedtogether around 6.8% of the capital.
Shareholders who are employeesof the Group represented 1.77% of thetotal number of shareholders and inaggregate owned 0.61% of thecommon stock, without any appreciablevariation with respect to 2001.
The holdings of nonresidentshareholders accounted for 50.58% ofthe capital at 2002 year end, a slightdecrease from the 51.75% of theprevious year.
Up to 200 . . . . . . . . . . . . . .From 201 to 800 . . . .From 801 to 2,000 . . . .From 2,001 to 4,000 . . . .From 4,001 to 8,000 . . . . .From 8,001 to 40,000 . . . .From 40,001 to 80,000 . . .From 80,001 to 160,000 . .Over 160,000 . . . . . . . . . .
Total . . . . . . . . . . . . . . .
34,74622,0497,7843,0451,5531,242
16898
131
70,816
49.0731.1410.99
4.302.191.750.240.140.18
100.00
49.0131.7710.71
4.132.111.710.270.130.16
100.00
36,94623,9478,0753,1171,5881,287
20095
124
75,379
1.274.054.634.034.079.544.365.05
63.00
100.00
1.384.374.794.134.139.885.054.97
61.30
100.00
2002 2001 2002 2001 20012002
Shareholders
Number of shares ownedper shareholder
Number %
Table 38. Breakdown of year-end share ownership
Percentageholding
in common stock
TotalForeign
ownershipDomesticownership
31.59
51.6616.75
100.00
31.38
52.2816.34
100.00
10.11
41.320.32
51.75
9.49
40.780.31
50.58
21.48
10.3416.43
48.25
21.89
11.5016.03
49.42* Directly or indirectly** More than 65,000 shareholders in 2002 and 70,000 in 2001, each one owning fewer than 4,000 shares.
20012002 2001 2001 20022002
Controlled by the Board of Directors* . .
Other: Institutional holdings . . . . . . . .Individual investors** . . . . . . . .
Total . . . . . . . . . . . . . . . . . . . .
Table 39. Common stock ownership distribution
(Data in %)
The Board of Directors controls31.38% of the capital; this figureincludes the shares owned directly or
indirectly by directors and those heldon a representation basis, as shownin detail in Table 40.
51
Market performance of the Bank’sshares
The 217,154,116 commonshares of €0.5 face value each intowhich the Bank's capital stock isdivided are listed on the four Spanishstock exchanges and are traded inthe Spanish continuous market.
Banco Popu la r sha res a rei n c l u d e d i n t h e M a d r i d S t o c kExchange general price index, with aweighting of 2.51% of the total; in theIbex-35 index, which comprises thethirty-five most liquid stocks in themarket, with a weighting of 3.06%;and in the financial Ibex, with aweighting of 8.46%.
The c los ing pr ice o f BancoPopular common stock was €38.97 at2002 year end, compared with €36.88at the end of 2001, an appreciation of5.7% during the year. The share pricerose strongly during the first half andpeaked at a record €47.95 in June,declined appreciably thereafter untilSeptember, went up again in Octoberand fell in December to the above-stated €38.97.
As occurred in 2001, BancoPopular shares notably outperformedthe market in 2002. Whereas theBanco Popular share price rose by5.7%, Spanish stock exchanges fellsharply, by 23.1% in the Madrid StockExchange general index and by
Asociación de Directivos de BPE . . . . . . . . . .Ayala, Ildefonso . . . . . . . . . . . . . . . . . . . . . . .Breipohl, Diethart . . . . . . . . . . . . . . . . . . . . . .Catá, José María . . . . . . . . . . . . . . . . . . . . . .Donate, Francisco . . . . . . . . . . . . . . . . . . . . .Gancedo, Eric * . . . . . . . . . . . . . . . . . . . . . . . .Gancedo, Gabriel . . . . . . . . . . . . . . . . . . . . . .Herrando, Luis . . . . . . . . . . . . . . . . . . . . . . . .Laffón, Manuel . . . . . . . . . . . . . . . . . . . . . . . .Miralles, Luis . . . . . . . . . . . . . . . . . . . . . . . . .Molins, Casimiro . . . . . . . . . . . . . . . . . . . . . .Montoro, Santos . . . . . . . . . . . . . . . . . . . . . . .Montuenga, Luis . . . . . . . . . . . . . . . . . . . . . .Morillo, Manuel . . . . . . . . . . . . . . . . . . . . . . . .Nigorra, Miguel . . . . . . . . . . . . . . . . . . . . . . . .Parera, Alberto . . . . . . . . . . . . . . . . . . . . . . . .Pérez Sala, Enrique . . . . . . . . . . . . . . . . . . . .Platero, Jesús . . . . . . . . . . . . . . . . . . . . . . . .Rodríguez, José Ramón . . . . . . . . . . . . . . . .Ron, Angel Carlos ** . . . . . . . . . . . . . . . . . . . .Sindicatura de Accionistas de BPE *** . . . . . .Solís, Miguel Angel de . . . . . . . . . . . . . . . . . .Stecher, Jorge . . . . . . . . . . . . . . . . . . . . . . . .Termes, Rafael . . . . . . . . . . . . . . . . . . . . . . .Valls, Javier . . . . . . . . . . . . . . . . . . . . . . . . . .Valls, Luis . . . . . . . . . . . . . . . . . . . . . . . . . . . .
Total . . . . . . . . . . . . . . . . . . . . . . . . . . . . .
Name
5,0004,0082,0008,000
52845,80017,000
75018,040
155,9364,400
1016,440
1043,4888,0003,8008,0405,000
401,564,184
157,33710,8004,000
35,000100,258
2,217,869
–––
176,0002,672
27,08039,400
800–
58,50892,000
104,440––
8,800–––
643,000–
22,392,286––
161,7336,830
–
23,713,549
248,036124,691
20,662,132–
713,636–
94,6651,619,581
404,532380,519
2,250,384746
4,114,730744,035
–330,000457,361
56841,776
–5,331,8481,897,069
–158,816
2,642,055–
42,217,180
253,036128,699
20,664,132184,000716,83672,880
151,0651,621,131
422,572594,963
2,346,784105,196
4,131,170744,04552,288
338,000461,161
8,608689,776
4029,288,3182,054,406
10,800324,549
2,683,885100,258
68,148,598
Directly Indirectly Represented Total% of
capital
0.120.069.520.080.330.030.070.750.190.271.080.051.900.340.020.160.210.000.320.00
13.490.950.000.151.240.05
31.38
Table 40. Shares controlled by the Board of Directors at year-end
* Board member since June 20, 2002** Board member since March 14, 2002*** The figure for indirectly controlled shares includes 1,056,661 shares held directly, indirectly or on a representation basis by other Board members(1) At the General Shareholders Meeting held on June 20, 2002(2) Shares relating to Allianz AG(3) Of which 1,549,581 relate to Instituto de Educación e Investigación (4) Of which 2,370,000 relate to Popularinsa and 339,700 to Naarden International(5) Shares relating to the Fundación Carmen y María José Godó(6) Shares relating to the Solís family group
(1)
(3)
(4)
(5)
(6)
(2)

52
28.1% in the Ibex-35 and the financialIbex indices.
Taking into account the fourdividends paid during the year - threeout of 2001 income and the first 2002interim dividend - which totaled€1.393, the dividend return was
3.78%, and the total return was9.44% in 2002.
Table 41 and Figure 22 show theevolution of the share price in the lasttwo yea rs , compared w i t h t hevariation in the indices mentionedabove.
12.31.00 * . . . . . . . . . . . .
2001January . . . . . . . . . . .February . . . . . . . . . .March . . . . . . . . . . . .April . . . . . . . . . . . . . .May . . . . . . . . . . . . . .June . . . . . . . . . . . . . .July . . . . . . . . . . . . . .August . . . . . . . . . . . .September . . . . . . . . .October . . . . . . . . . . .November . . . . . . . . .December . . . . . . . . .
2002January . . . . . . . . . . .February . . . . . . . . . .March . . . . . . . . . . . .April . . . . . . . . . . . . . .May . . . . . . . . . . . . . .June . . . . . . . . . . . . . .July . . . . . . . . . . . . . .August . . . . . . . . . . . .September . . . . . . . . .October . . . . . . . . . . .November . . . . . . . . .December . . . . . . . . .
Table 41. Evolution of price of Banco Popular common stock
ClosingHighest Lowest Banco Popular Ind. Financial IBEX IBEX-35MSEGPI
Price (€)
Year
* Indexes at 12.31.00: Madrid Stock Exchange general price index (MSEGPI): 880.71 points; IBEX-35: 9,109.8 points; financial IBEX: 10,400.3 points
37.8039.3038.9440.2841.4542.1042.4242.5040.4840.4738.6237.35
40.8041.8043.2046.0547.0047.9545.2045.1241.3543.6444.6242.45
34.5035.9035.5836.3138.5038.7739.6239.8530.6536.3536.4035.50
36.0139.5539.1741.0343.3941.8037.3240.0437.0037.0341.0538.20
37.10
36.6038.5137.3540.2438.8041.2941.4540.3638.0037.3036.6536.88
39.3840.8043.2045.5146.9544.7744.6040.4938.9843.2442.9538.97
100.00
98.65103.80100.67108.46104.58111.29111.73108.79102.43100.5498.7999.41
106.15109.97116.44122.67126.55120.67120.22109.14105.07116.55115.77105.04
100.00
109.30103.04100.36106.25103.80
97.8093.9991.8481.9786.6293.6293.61
91.1792.3994.1694.0292.4882.0674.4376.0365.4273.0378.7671.99
100.00
111.05104.85102.18107.15104.2997.4693.0991.3480.2985.3491.8292.18
88.3789.3090.5689.5187.2775.8968.6070.6559.6267.3973.3966.27
100.00
106.03100.48
95.00100.72100.92
96.8590.7690.9275.4878.9986.1686.13
83.5285.0487.9789.0587.7675.7163.6566.0552.0162.8069.0961.92
Fig.22 Banco Popular vs. the market:2002 stock market indices(Month-end figures)
1992199319941995199619971998199920002001
Table 42. Market return on Banco Popular shares 1992-2002*
Year-endin 1993
* Assuming immediate reinvestment of dividends net of withholding tax
200220012000199919981997199619951994
Year-end out
(% compound annual return)
55.0 30.325.932.827.933.43.8
25.61.7
32.822.948.4
28.821.132.117.6
36.432.144.142.071.5
26.021.826.221.222.4
3.43.0
25.021.224.820.521.28.0
10.217.8
22.218.621.217.217.16.57.49.72.0
20.817.519.616.015.76.97.79.35.38.7J A S
2001 2002O ND J F M M J DA
130
100
70
40
105.7
71.9
BancoPopular
IBEX-35
76.9
71.9
Financial IBEX
MadridGeneral

53
The market return on the Bank'sshares (gain or loss, plus dividendspaid in a year, as a percentage of thestarting price) in the last ten years isshown in Table 42 for different timinghypotheses o f inves tment anddivestment. Thus, an investor whoacquired Banco Popular shares at theend of 1992 and reinvested thedividends would have obtained acumulative annual return of 20.8%during the decade. The table alsoshows that the market return waspositive at all possible entry and exitdates from 1992 to 2002.
The price of Banco Popularshares at 2002 year end (€38.97)signified a P/E ratio of 13.4 times andratios of 6.0 times the cashflow and3.3 times the book value per share atthat date.
Table 43 presents these sharevaluation measures for the five years1998-2002, and also includes, foreach year, the dividend return, therate of income capitalization, and themarket return as defined above.
Table 43. Banco Popular share valuation measures*
YearClosing**price (€)
Cash flowP/CF
Net incomeattributable
P/E
BookvalueP/BV
Dividendyield
%
Earningsyield
%
19981999200020012002
32.1632.3837.1036.8838.97
8.67.97.06.16.0
17.516.516.414.213.4
3.93.93.93.53.3
3.04***3.323.223.693.85
5.716.066.097.067.49
Price as a multiple of
* Relating to closing figures for the year** Adjusted for the 2 x 1 split in 2000*** Not including the additional return (1.21%) relating to a dividend of € 0.78 charged to
paid-in surplus**** Appreciation (depreciation) plus dividends as % of initial price in each period
Marketreturn****
%
3.33.8
18.02.79.4
The market capitalization ofBanco Popular at 2002 year end was€8,462 million, an increase of 5.7%over the 2001 figure of €8,009 million.
Figure 23 shows the variation inmarket capitalization and book valuein the last five years.
1998 . . . . . . . . . . . . . . . .1999 . . . . . . . . . . . . . . . .2000 . . . . . . . . . . . . . . . .
2001First quarter . . . . . . .Second quarter . . . .Third quarter . . . . . .Fourth quarter . . . . .Total 2001 . . . . . . . .
2002First quarter . . . . . . .Second quarter . . . .Third quarter . . . . . .Fourth quarter . . . . .Total 2002 . . . . . . . .
Table 44. Banco Popular share trading volume
Average number
outstanding (a)
221,550220,212217,154
217,154217,154217,154217,154217,154
217,154217,154217,154217,154217,154
835.8734.8844.8
786.1654.0679.5
1,230.4832.7
1,144.31,239.21,271.91,410.01,265.2
93.1883.4197.26
23.1718.6720.0333.9995.86
32.6735.9538.0738.96
145.65
YearShares
traded (b) Average daily
tradesShare liquidity
b/a (%)
(Thousands of shares)
206,429183,678211,195
50,30940,54543,48673,824
208,163
70,94678,06982,67684,600
316,291
Market capitalizationBook value
Fig.23 Market capitalizationand book value(€ million)
Fig.24 Share liquidity (Shares traded as % of capital stock)
9,000
6,750
4,500
2,250
0
0201009998
8,4628,0098,056
7,124
2,586
1,8312,047
2,296
7,030
1,810
0
40
160
120
80
95.8697.26
0201009998
93.18
83.41
145.65

54
Trading in Banco Popular sharesin 2002 amply exceeded the figuresfor previous years, raising evenfurther the already high liquidity of thestock. The Bank's shares were tradedat all 250 trading sessions during theyear, and the 316 million sharestraded (representing 145.7% of thetotal stock outstanding) signified adaily average of 1,265,000 shares.The matching figures for 2001 were208 million shares during the yearand 833,000 as a daily average.
Table 44 and Figure 24 show thevolume of trading and the liquidity ofthe shares in the last five years.
In 2002, the Group performedtreasury stock transactions involving2,919,897 shares, 0.92% of the totalnumber traded, for an aggregateamount of €117.5 million and at ana v e r a g e p r i c e o f € 4 0 . 2 3 . T h emaximum treasury stock held was1,645,542 shares in September(0.76% of the total common stock
Table 45. Treasury stock
2001First quarter . . . . . . .Second quarter . . . .Third quarter . . . . . .Fourth quarter . . . . .
2002First quarter . . . . . . .Second quarter . . . .Third quarter . . . . . .Fourth quarter . . . . .
Minimum FinalMaximumTotal
outstanding (a) (b) %(a) %
Number held
(Thousands of shares)
Total traded (b)
* Based on quarterly average number held
Average
Treasury stock as % of *
----
----
613299
67116
200102
1.64690
----
----
217,154217,154217,154217,154
217,154217,154217,154217,154
50,30940,54543,48673,824
70,94678,06982,67684,600
0.110.010.020.02
0.050.030.270.03
0.480.050.080.05
0.140.090.710.08
242203439
10272
58970
outs tanding) , the average was209,220 shares (0.10%), and theminimum was zero.
As was the case at the end of2001, at December 31, 2002, neitherthe Bank nor any of the Group's
subsidiaries, whether consolidable ornot , owned any Banco Popularshares.
See Table 45 for quarterly dataof treasury stock in 2002 and 2001.

55
BANCO POPULAR
This section is the ManagementReport of Banco Popular Español,SA, considered individually as theparent entity of the Group, andanalyzes the evolution of its activity,earnings and profitability in 2002,compared with 2001.
The Bank's financial statements(balance sheets, income statementsand statements of changes infinancial position) as of December 31,2002, and for the four precedingyears, are included in Note 3 to theaccompanying consolidated financialstatements.
Assets and funds
Total assets
At 2002 year-end, the Bank's totalon-balance sheet assets amounted to€31,329 million, representing a growthof 14.9% over the €27,265 million atthe end of 2001. Average total assetsduring 2002 amounted to €28,284million, up by 18.1% on 2001.
Addition to the on-balance sheetassets of the funds intermediated bythe Bank gives the total assetsmanaged or total business volume,which at 2002 year-end amounted to€37,646 million, up 11.3% on 2001.
Table 46. Summarized balance sheets
December 31 Variation
Amount %2002 2001Assets
Cash and due from central banks . . . . . . . . . . . . . .Government debt securities . . . . . . . . . . . . . . . . . . .Due from financial intermediaries . . . . . . . . . . . . . .Loans and discounts . . . . . . . . . . . . . . . . . . . . . . . .Private fixed-interest securities . . . . . . . . . . . . . . . .Equity securities . . . . . . . . . . . . . . . . . . . . . . . . . . . .Participating interests . . . . . . . . . . . . . . . . . . . . . . .Shares of group companies . . . . . . . . . . . . . . . . . . .Intangible assets . . . . . . . . . . . . . . . . . . . . . . . . . . .Tangible assets . . . . . . . . . . . . . . . . . . . . . . . . . . . .Prepayments and accrued income . . . . . . . . . . . . .Other asset accounts . . . . . . . . . . . . . . . . . . . . . . . .
Total . . . . . . . . . . . . . . . . . . . . . . . . . . . . . . .
Liabilities and capital
Due to financial intermediaries . . . . . . . . . . . . . . . .Customer deposits . . . . . . . . . . . . . . . . . . . . . . . . . .Bonds and other marketable debt securities . . . . . .Other liability accounts . . . . . . . . . . . . . . . . . . . . . . .Accruals and deferred income . . . . . . . . . . . . . . . . .Special allowances . . . . . . . . . . . . . . . . . . . . . . . . .Subordinated liabilities . . . . . . . . . . . . . . . . . . . . . . .Shareholders' equity . . . . . . . . . . . . . . . . . . . . . . . .Net income for the year . . . . . . . . . . . . . . . . . . . . . .
Total . . . . . . . . . . . . . . . . . . . . . . . . . . . . . . .
Pro memoria:No. of employees . . . . . . . . . . . . . . . . . . . . . . . . . . .No. of branches . . . . . . . . . . . . . . . . . . . . . . . . . . . .
1,247,225 539,063
6,644,715 16,512,934
319,189 88,664
101,972 499,374
15,946 380,551 181,574 733,423
27,264,630
6,793,344 16,500,779
813,006 599,907 252,136 186,233 562,961
1,109,661 446,603
27,264,630
7,839 1,254
387,067 75,987
8,301,503 19,977,255
301,163 363,623 32,340
620,282 14,516
369,452 196,246 689,795
31,329,229
7,038,288 19,412,193 1,420,728
648,047 262,947 126,139 682,848
1,246,092 491,947
31,329,229
7,856 1,259
(860,158) (463,076)
1,656,788 3,464,321
(18,026)274,959 (69,632) 120,908
(1,430) (11,099) 14,672
(43,628)
4,064,599
244,944 2,911,414
607,722 48,140 10,811
(60,094)119,887 136,431
45,344
4,064,599
17 5
(69.0)(85.9)24.9 21.0 (5.6)
>(68.3)24.2 (9.0) (2.9) 8.1
(5.9)
14.9
3.6 17.6 74.8
8.0 4.3
(32.3)21.3 12.3 10.2
14.9
0.2 0.4
(€ thousand)
Table 46 shows the summarizedbalance sheets as of December 31,2002 and 2001, together with data ofthe employee headcount and numberof branch offices at those dates.
The variations in the mainbalance sheet captions are analyzed indetail in the following subsections.

56
Shareholders' equity
The Bank's book equity atDecember 31, 2001, after thedistribution of income for the year,amounted to €1,261 million.
In December 2002, €34 millionwere transferred from reserves to aspecific account under Specialallowances pursuant to a resolutionadopted by the Shareholders Meetingon December 19, 2002, and theauthorization from the Bank of Spainto implement an early retirementsplan. The prepaid taxes relating tothis operation which were transferredto reserves amounted to €11.9million.
€7.3 million were also recorded inreserves in 2002 as a result of thenon-utilization of this amount for theearly retirements plan initiated inDecember 2001 and its return to theaccount of origin, net of prepaidtaxes.
Assuming that the ShareholdersMeeting, called for June 26, 2003,approves the proposed distribution of2002 income, as shown in Note 4 tothe financial statements, the Bank'stotal equity will amount to €1,412million, 12.0% more than in 2001.
€44 million were transferred inDecember 2001 from reserves to aspecific account for an earlyretirements plan, and €15 million ofprepaid taxes relating to thisoperation were recognized inreserves.
Also in that year €21 million ofprepaid taxes arising from earlyretirement plans implemented inearlier years were transferred toreserves.
Customer funds
The 2002 year-end on-balancesheet customer funds, which totaled€21,516 million, were up 20.4% on
Table 47 . Customer funds
December 31 Variation%2001
195,461162,023
2,788 30,650
–13,473,355
5,223,212 2,097,355 5,189,719
963,069 5,743,377
227,995 389,802
5,124,898 682
1,420,728 682,848
21,515,769
543,274 3,558,166
298,840 1,589,690
326,392 6,316,362
27,832,131
135,680111,340
2,685 21,643
12 12,914,893
5,087,641 1,927,397 4,706,855 1,193,000 3,450,206
211,595 310,458
2,927,039 1,114
813,006 562,961
17,876,746
595,192 3,789,274
292,025 1,552,832
323,387 6,552,710
24,429,456
59,78150,683
103 9,007
(12)558,462
135,571 169,958 482,864
(229,931)2,293,171
16,400 79,344
2,197,859 (432)
607,722 119,887
3,639,023
(51,918)(231,108)
6,81536,858
3,005 (236,348)
3,402,675
44.145.5
3.8 41.6
(100.0)4.3
2.7 8.8
10.3 (19.3)66.5
7.8 25.6 75.1
(38.8)74.8 21.3 20.4
(8.7)(6.1)2.32.4 0.9
(3.6) 13.9
Amount2002
(€ thousand)
Customer deposits:From public bodies:
Demand deposits . . . . . . . . . . . . . . . . . . . . . . .Savings deposits . . . . . . . . . . . . . . . . . . . . . . .Time deposits . . . . . . . . . . . . . . . . . . . . . . . . .Assets sold under repurchase agreements . . .
From other residents:Deposits of private-sector residents
Demand deposits . . . . . . . . . . . . . . . . . . . .Savings deposits . . . . . . . . . . . . . . . . . . . . .Time deposits . . . . . . . . . . . . . . . . . . . . . . .Assets sold under repurchase agreements .
From nonresidents:Demand deposits . . . . . . . . . . . . . . . . . . . . . .Savings deposits . . . . . . . . . . . . . . . . . . . . . . .Time deposits . . . . . . . . . . . . . . . . . . . . . . . . .Assets sold under repurchase agreements . . .
Bonds and other marketable debt securities . . . . . . . . . .Subordinated financing . . . . . . . . . . . . . . . . . . . . . . .
Total (a) . . . . . . . . . . . . . . . . . . . . . . . . . . .Other intermediated customer funds:
Financial assets sold outrightto customers (outstanding balances) . . . . . . . .
Mutual funds . . . . . . . . . . . . . . . . . . . . . . . . . . . . .Asset portfolio management . . . . . . . . . . . . . . . .Pension plans . . . . . . . . . . . . . . . . . . . . . . . . . . . .Life insurance technical reserves . . . . . . . . . . . . . . .
Total (b) . . . . . . . . . . . . . . . . . . . . . . . . . . .Total (a+b) . . . . . . . . . . . . . . . . . . . . . . . . . .
2001. The average customer fundsheld in 2002 were €19,714 million,25.2% up on the 2001 figure.
Customer funds represented68.68% of the Bank's total assets at2002 year-end.
The funds intermediated by theBank which are not included in thebalance sheet because they are inother savings instruments - financialassets sold to maturity, participationsin mutual funds or pension plans,portfolios managed and investmentsin life insurance, totaled €6,316million at 2002 year-end, a decreaseof 3.6% in the year.
Total customer funds managedamounted to €27,832 million, anincrease of 13.9% during the year.
Table 47 details, by sector andtype of account, the balances of thesecustomer funds at the end of 2002and 2001.
Loans and discounts
Banco Popular's gross loans anddiscounts to customers at December31, 2002, including nonperformingloans, totaled €20,316 mill ion,compared with €16,777 million at theend of 2001, an increase of 21.1%.These figures, net of the related creditloss allowance, constitute the amountof loans and discounts to customersreflected in the aforementionedbalance sheets.
Table 48 is a breakdown, byborrower sector and type oftransaction, of total year-end loansand discounts in 2002 and 2001.
Table 48. Loans and discounts
December 31 Variation
Amount %2002 2001
5,363
–5,328
35
16,205,458
2,743,581 6,313,285
6,301,744 11,541
5,283,096 662,086
1,203,410
411,148
2,840 118,635
117,023 1,612
277,142 12,531
155,159
674 151,491
2,994
16,777,128
9,428
–9,352
76
19,518,530
2,910,133 8,886,532
8,870,344 16,188
5,646,875 757,210
1,317,780
583,797
6,506 158,341
157,024 1,317
409,880 9,070
204,367
618 200,301
3,448
20,316,122
4,065
–4,024
41
3,313,072
166,5522,573,247
2,568,600 4,647
363,779 95,124
114,370
172,649
3,666 39,706
40,001 (295)
132,738 (3,461)
49,208
(56) 48,810
454
3,538,994
75.8
75.5>
20.4
6.140.8
40.8 40.3
6.9 14.4 9.5
42.0
> 33.5
34.2 (18.3)
47.9(27.6)
31.7
(8.3) 32.2 15.2
21.1
(€ thousand)
To public bodies:
Secured loans . . . . . . . . . . . . . . . . . . . . . . .Other term loans . . . . . . . . . . . . . . . . . . . . .Overdrafts and other . . . . . . . . . . . . . . . . . .
To other residents:
Trade loans and discounts . . . . . . . . . . . . . .Secured loans. . . . . . . . . . . . . . . . . . . . . . . .
Mortgage loans . . . . . . . . . . . . . . . . . . . .Other . . . . . . . . . . . . . . . . . . . . . . . . . . . .
Other term loans . . . . . . . . . . . . . . . . . . . . .Overdrafts and other . . . . . . . . . . . . . . . . . .Leasing . . . . . . . . . . . . . . . . . . . . . . . . . . . .
To nonresidents:
Trade loans and discounts . . . . . . . . . . . . .Secured loans. . . . . . . . . . . . . . . . . . . . . . . .
Mortgage loans . . . . . . . . . . . . . . . . . . . .Other . . . . . . . . . . . . . . . . . . . . . . . . . . . .
Other term loans . . . . . . . . . . . . . . . . . . . . .Overdrafts and other . . . . . . . . . . . . . . . . . .
Nonperforming loans:
To public bodies . . . . . . . . . . . . . . . . . . . . . .To other residents . . . . . . . . . . . . . . . . . . . .To nonresidents . . . . . . . . . . . . . . . . . . . . . .
Total . . . . . . . . . . . . . . . . . . . . . . . . . . . .
57
Average loans and discountsincreased by 18.4% in 2002 to€18,250 million.
Risk management
Table 49 presents relevantinformation about credit riskmanagement in 2002 compared with2001, and permits detailed analysis ofthe Bank's asset soundness.
The balance of nonperformingloans and doubtful loans at December
31, 2002, amounted to €210 million,representing a nonperforming ratio of0.73% of total risks, compared with0.71% at the end of 2001.
€237 mil l ion of addit ionalbalances were classified asnonperforming during the year, 45.7%more than in 2001, and €118 millionof delinquent loans were recovered,74.0% more than in 2001. The netincrease of €119 million in 2002 was25.4% higher than in 2001.
Table 49. Risk performance
December 31
%2002 2001
Nonperforming loans*:Balance at January 1 . . . . . . . . . . . . . . . . . . . . . . . .
Additions . . . . . . . . . . . . . . . . . . . . . . . . . . . . . . .Balances recovered . . . . . . . . . . . . . . . . . . . . . . .Net variation for the year . . . . . . . . . . . . . . . . . . .
% increase . . . . . . . . . . . . . . . . . . . . . . . . . . . .Writeoffs . . . . . . . . . . . . . . . . . . . . . . . . . . . . . . . .
Balance at December 31 . . . . . . . . . . . . . . . . . . . . .
Allowance for credit losses:Balance at January 1 . . . . . . . . . . . . . . . . . . . . . . . .
Annual provision:Gross . . . . . . . . . . . . . . . . . . . . . . . . . . . . . . . .Recoveries . . . . . . . . . . . . . . . . . . . . . . . . . . .Net . . . . . . . . . . . . . . . . . . . . . . . . . . . . . . . . . .
Other variations . . . . . . . . . . . . . . . . . . . . . . . . . .Writeoffs . . . . . . . . . . . . . . . . . . . . . . . . . . . . . . . .
Balance at December 31 . . . . . . . . . . . . . . . . . . . . .
Foreclosed real estate assets . . . . . . . . . . . . . . . . . .Allowance for potential losses on foreclosed assets .
Pro memoria:Total risks . . . . . . . . . . . . . . . . . . . . . . . . . . . . . . . . .Loans transferred to suspense accounts . . . . . . . . .Nonperforming mortgage loans. . . . . . . . . . . . . . . . .
Risk quality measures (%):Nonperformance (Nonperforming loans/Total risks)Insolvency (Writeoffs/Total risks) . . . . . . . . . . . . .Coverage (Credit loss allowance/Nonperforming loans) Coverage (Allowance for potential losses on foreclosedassets/total foreclosed assets) . . . . . . . . . . . . . . . . .
161,042 237,581
(118,405)119,176
74.0 (70,181)210,037
301,636
182,382 (32,687)149,695
(1,354)(63,915)386,062
33,090 13,989
28,965,656 461,560
7,535
0.73 0.24
183.81
42.28
24.1 45.7 74.125.4
10.1 30.4
27.4
20.9 55.8 15.3 10.3
0.3 28.0
(9.1)(10.4)
28.6 13.0 12.3
* Including doubtful off-balance sheet risks, but excluding country risk and the related country riskallowance
129,775 163,026 (68,017)95,009
73.2 (63,742)
161,042
236,780
150,801 (20,975)
129,826 (1,228)
(63,742)301,636
36,396 15,608
22,530,922 408,486
6,708
0.71 0.28
187.30
42.88
(€ thousand)
31,267 74,555
(50,388)24,167
(6,439)48,995
64,856
31,581 (11,712)19,869
(126)(173)
84,426
(3,306)(1,619)
6,434,734 53,074
827
0.02(0.04)(3.49)
(0.60)
Amount
Variation
58
Loans written off in 2002, eitherbecause of expiration of the periodstipulated by the Bank of Spain forkeeping them on the books orbecause they were classified aslosses, amounted to €70 million. Forthese writeoffs, which in 2002
represented 0.24% of the total risks(0.28% in 2001), €64 million of creditloss allowances were used and €6million were charged directly toincome because they had not beenprovisioned at the time of writeoff.

59
Table 50. Allowance for nonperforming loans as of December 31
BalanceTotal
provisions142,669 134,065
2,663 5,941
16,480 1,893
161,042
19,379,667 16,448,362 2,931,305
68,324 63,822
886 3,616
145
68,469
1,289 179,141 164,484 14,657 51,148
300,047 301,636
1,589
(€ thousand)
BalanceTotal
provisions199,175 192,085
1,624 5,466 9,179 1,683
210,037
23,373,807 19,406,529 3,967,278
87,557 83,417
725 3,415
63
87,620
886 213,901 194,065
19,836 78,944
381,351 386,062
4,711
2002 2001
At 2002 year-end the Bank hadrecorded €386 million of credit lossallowances to cover nonperformingloans, signifying a coverage ratio of183.81%, compared with 187.30% atthe end of 2001. Taking into accountthat nonperforming mortgage loansare also covered by mortgageguarantees, the ratio was 187.39%.
The balance of the credit lossallowance at December 31, 2002,was €4.7 million in excess of thecoverage required under Bank ofSpain regulations.
The net credit loss provisionsrecorded in 2002 and charged to
income for the year totaled €150million, 15.3% more than in 2001.Also, as stated earlier, €6 million ofbalances were written off directly witha charge to income in 2002.
In addition the table shows thebook balance of foreclosed real estateassets (premises), amounting to €33mill ion, for which the Bank hadrecorded provisions of €14 million tocover possible losses on disposal,signifying a coverage ratio for theseassets of 42.28% in 2002, comparedwith 42.88% in 2001.
Doubtful balances with specific allowances: . . . . . . . . . . . .Ordinary . . . . . . . . . . . . . . . . . . . . . . . . . . . . . . . . . .Secured by prime collateral . . . . . . . . . . . . . . . . . . .Off-balance sheet risks . . . . . . . . . . . . . . . . . . . . . .
Doubtful balances with general allowances. . . . . . . . . . . . .Doubtful balances for which allowances are not required. .
Total nonperforming loans . . . . . . . . . . . . .
Other specific provisioning . . . . . . . . . . . . . . . . . . . . . . . . . .Allowances for ordinary risks . . . . . . . . . . . . . . . . . .General provisioning (1%) . . . . . . . . . . . . . . . . . . . .Reduced provisioning (0.5%) . . . . . . . . . . . . . . . . . .
Statistical allowance. . . . . . . . . . . . . . . . . . . . . . . . . . . . . . .Total required provisions . . . . . . . . . . . . . .Balance of credit loss allowances . . . . . . .Surplus . . . . . . . . . . . . . . . . . . . . . . . . . . . .
Securities portfolios
The balance of the securitiesportfolios reflected in the Bank'sDecember 31, 2002, balance sheetwas €1,393 million, a decrease of10.0% from 2001. The securities arevalued in accordance with Bank ofSpain criteria, as detailed in Note 2 d)to the financial statements.
Table 51 details the securitiesportfolios by nature and issuer:government debt securities, privatefixed-interest securities and equitysecurities. The latter category isbroken down into shares ofcompanies not linked to the Bank and
shareholdings both in associatedcompanies and group companies.The related regulatorily requiredsecurity price fluctuation allowance isshown for each category.
The increase in shareholdings ingroup companies was due basically tothe inclusion in this category of BancoPopular Hipotecario and FortiorHolding following the increasedholdings in these companies, with thecorresponding decrease inParticipating interests.
The shareholdings in groupcompanies contain unrecordedunrealized gains, i.e. underlying book

60
Table 51. Year-end security portfolios detail
20012002
539,063
370,054 169,049
1
(41)(41)
–
319,189
27,995 13,973
221,790 56,694
(1,263)(1,263)
–
88,664
90,341 (1,677)
101,972
116,714 (14,742)
499,374
503,868 399,785 104,083
(4,494)
1,548,262
75,987
9,326 66,660
1
–––
301,163
22,762 9,017
225,131 45,555
(1,302)(1,302)
–
363,623
369,750 (6,127)
32,340
44,389 (12,049)
620,282
685,387 511,879 173,508 (65,105)
1,393,395
(€ thousand)
Government debt securities:
Bank of Spain certificates of deposit . . . . . . . . . . . . . . . . . . . . .Treasury bills . . . . . . . . . . . . . . . . . . . . . . . . . . . . . . . . . . . . . .Other "book entry system" securities . . . . . . . . . . . . . . . . . . . .
Less: Allowance for security price fluctuations . . . . . . . . . . . . .Pro memoria: Balance of security price fluctuation allowance
Deferred writedowns (unrealized losses) . . . .
Private fixed-interest securities:
Issued by: Public bodies . . . . . . . . . . . . . . . . . . . . . . . . . . . .Financial intermediaries . . . . . . . . . . . . . . . . . . . .Other residents. . . . . . . . . . . . . . . . . . . . . . . . . . .Nonresidents . . . . . . . . . . . . . . . . . . . . . . . . . . . .
Less: Allowance for security price fluctuations . . . . . . . . . . . . .Pro memoria: Balance of security price fluctuations allowance
Deferred writedowns (unrealized losses) . . . . .
Equity securities :
Equity securities, gross . . . . . . . . . . . . . . . . . . . . . . . . . . . . . . .Less: Allowance for security price fluctuations . . . . . . . . . . . . .
Participating interests:
Participating interests, gross. . . . . . . . . . . . . . . . . . . . . . . . . . .Less: Allowance for security price fluctuations . . . . . . . . . . . . .
Shares of group companies:
Shares of group companies:Banks . . . . . . . . . . . . . . . . . . . . . . . . . . . . . . . . . . . . . . . . . .Other . . . . . . . . . . . . . . . . . . . . . . . . . . . . . . . . . . . . . . . . . .
Less: Allowance for security price fluctuations . . . . . . . . . . . . .
Total . . . . . . . . . . . . . . . . . . . . . . . . . . . . .
Variation
Amount %
(463,076)
(360,728) (102,389)
–
4141
–
(18,026)
(5,233) (4,956)3,341
(11,139)
(39) (39)
–
274,959
279,409 (4,450)
(69,632)
(72,325) 2,693
120,908
181,519 112,094
69,425 (60,611)
(154,867)
(85.9)
(97.5)(60.6)
– – –
(5.6)
(18.7) (35.5)
1.5(19.6)
3.13.1
–
>
>>
(68.3)
(62.0) (18.3)
24.2
36.0 28.0 66.7
>
(10.0)
Income and profitability
Income statement
Table 52 summarizes andcompares the 2002 and 2001 incomestatements.
Yields and costs
The Bank's average total assetsin 2002 amounted to €28,284 million,an increase of 18.1% over 2001.
Total asset revenues of €1,668million were 2.4% higher than in2001. Of this figure, €1,548 millionrelated to interest and similar
revenues, and €120 million todividends, the respective growth ratesbeing 1.6% and 13.4%.
The average yield on total assetswas 5.90%, compared with 6.80% in2001, signifying a decrease of 90basis points.
Interest expenses on third-partyfunds totaled €626 million in 2002,9.0% lower than in the previous year.With the regulatorily required additionin 2001 of the €14 million of interestexpenses allocated to the internalpension allowance, total interestexpenses amounted to €703 million in2001.
value in excess of carrying value,amounting to €990 million, of which€837 million relate to the five regionalbanking subsidiaries. On the basis of
the year-end share market prices,there was a further €1,054 million ofunrealized gains.

61
The average rate of cost of totalfunds decreased by 71 bp to 2.22% in2002.
Table 53 shows the yields onassets and the costs of funds in thetwo years.
Variation
Amount %2002 2001
1,629,141 702,513
926,628
341,677 36,165
1,304,470
479,047 346,869 132,178
46,900 (23,739)
754,784
112,990 8,044
(75,811)
557,939
111,336
446,603
39,345 (76,100)
115,445
1,821 (14,207)
103,059
18,991 5,134
13,857 (277)
3,415
87,760
28,701 50,350
129,625
138,334
92,990
45,344
2.4 (10.8)
12.5
0.5 (39.3)
7.9
4.0 1.5
10.5 (0.6)
(14.4)
11.6
25.4 >
24.8
83.5
10.2
Table 52. Comparative statements of income
(€ thousand)
Total asset revenues . . . . . . . . . . . . . . . . . . . . . .Interest expenses . . . . . . . . . . . . . . . . . . . . . . . . .
Net interest revenue . . . . . . . . . . . . . .
Fees for services, net . . . . . . . . . . . . . . . . . . . . .Asset trading and exchange profits, net . . . . . . . .
Ordinary margin . . . . . . . . . . . . . . . . .
Operating costs:Personnel . . . . . . . . . . . . . . . . . . . . . . . . . . . .Other expenses . . . . . . . . . . . . . . . . . . . . . . .
Depreciation . . . . . . . . . . . . . . . . . . . . . . . . . . . . .Other operating income/expenses, net . . . . . . . .
Operating margin . . . . . . . . . . . . . . . .
Writeoffs and provisions for credit losses . . . . . . .Writedowns of financial assets . . . . . . . . . . . . . . .Extraordinary gains (losses), net . . . . . . . . . . . . .
Income before taxes . . . . . . . . . . . . .
Corporate income tax provision . . . . . . . . . . . . . .
Net income . . . . . . . . . . . . . . . . . . . . .
Table 53. Yields and costs
Monetary assets and financial system. . . . . . . . . .Loans and discounts (a) . . . . . . . . . . . . . . . . . . . .Securities portfolio . . . . . . . . . . . . . . . . . . . . . . . .
Total earning assets (b) . . . . . . . . . . . . . . . . .Other assets . . . . . . . . . . . . . . . . . . . . . . . . . . . . .
Total assets . . . . . . . . . . . . . . . . . . . . . . . . . .
Financial system . . . . . . . . . . . . . . . . . . . . . . . . . .Customer funds (c) . . . . . . . . . . . . . . . . . . . . . . . .Pension allowance. . . . . . . . . . . . . . . . . . . . . . . . .
Total interest bearing liabilities (d) . . . . . . . . .Other . . . . . . . . . . . . . . . . . . . . . . . . . . . . . . . . . . .Capital accounts . . . . . . . . . . . . . . . . . . . . . . . . . .
Total funds . . . . . . . . . . . . . . . . . . . . . . . . . . .
Customer spread (a-c) . . . . . . . . . . . . . . . . . . . . .Spread (b-d) . . . . . . . . . . . . . . . . . . . . . . . . . . . . .
2002 2001
Averagebalance
Distri-bution
(%)
Interestrevenue orexpense
Averagerate(%)
Averagebalance
Distri-bution
(%)
Interestrevenue orexpense
Averagerate(%)
6,399,48715,409,085
1,331,30823,139,880
804,028
23,943,908
5,714,24915,748,549
266,15221,728,950
1,097,4181,117,540
23,943,908
26.7364.35
5.5696.64
3.36
100.00
23.8765.77
1.1190.75
4.584.67
100.00
297,5961,205,874
125,6711,629,141
–
1,629,141
242,223445,913
14,377702,513
––
702,513
4.657.839.447.04
–
6.80
4.242.835.403.23
––
2.93
5.003.81
(€ thousand)
1,668,486 626,413
1,042,073
343,498 21,958
1,407,529
498,038 352,003 146,035 46,623
(20,324)
842,544
141,691 58,394 53,814
696,273
204,326
491,947
3.077.148.426.09
–
5.90
2.882.29
– 2.43
––
2.22
4.853.66
231,9491,302,154
134,3831,668,486
–
1,668,486
175,687450,726
– 626,413
––
626,413
26.7464.525.65
96.913.09
100.00
21.5765.700.04
91.314.214.48
100.00
7,563,39918,249,770
1,596,44227,409,611
874,230
28,283,841
6,099,49519,714,184
10,71225,824,391
1,191,2581,268,192
28,283,841

62
Net interest revenue and ordinaryrevenue
Net interest revenue (total assetrevenues less total interest expenses)amounted to €1,042 million in 2002,12.5% higher than in 2001.
Subtraction of the average rate ofcost of interest-bearing funds (2.43%in 2002) from the average rate of yieldon earning assets (6.09% in 2002)discloses the Bank's spread for theyear, which at 3.66 percentage pointswas 15 bp lower than in 2001.
Subtraction of the average rate ofcost of total funds from the averagerate of yield on total assets disclosesthe net interest margin (net interestrevenue as a percentage of totalassets), which was 3.68 percentagepoints in 2002 as compared with 3.87points in 2001.
Net service fee revenues in 2002amounted to €343 million, which was0.5% higher than in 2001. Theserevenues consist of commissions oncertain lending activities and otherrisks plus the fees for providing otherbanking services.
The asset trading and exchangeprofits, comprising the results onfinancial asset and derivative trading,net of write-downs, and exchangegains and losses, amounted to €22million, as compared with €36 millionin 2001.
Net interest revenue plus theservice fee revenues and the assettrading and exchange profitsconstitute the total operatingrevenues or ordinary revenue, whichamounted to €1,407 million in 2002 ascompared with €1,304 million in 2001,an increase of 7.9%.
Operating costs, depreciation andother operating income andexpenses
Personnel expenses increasedby 1.5% to €352 million in 2002.General expenses were 11.6% higherat €125 million in 2002. Sundry taxes,totaling €21 million, were 5.0% higherthan in 2001.
Total operating costs (personneland general expenses plus sundrytaxes other than income tax) increasedby 4.0% in 2002 to €498 million.
The depreciation andamortization of tangible and intangibleassets booked in 2002 amounted to€47 million, 0.6% down from thefigure for 2001.
The balance of the otheroperating income/expenses captionwas a net expense of €20 million,which was 14.4% lower than in 2001.This heading encompasses, togetherwith certain items of scant amount,the contribution for the year to theDeposit Guarantee Fund, whichamounted to €8 million; a provision of€0.1 million for directors'remuneration; and the contribution of€13 million to a welfare foundationpursuant to a resolution adopted on apermanent basis by the Board ofDirectors in 1979, such contributionsignifying a reduction by at least thesame amount of the provision fordirectors' remuneration authorized byArticle 16 of the Bank's bylaws.
Operating income
The difference between theordinary revenue, on the one hand,and the operating costs, depreciationand amortization, and other operatingexpenses, on the other, is theoperating income, which at €843million in 2002 was 11.6% higher thanthe 2001 figure of €755 million.

63
pension fund amounting to €13million; €4 million of gains on assetdisposals; and other sundry resultssignifying a net expense of €2 million.
Net income and profitability
Aggregation of all the foregoingitems leads to the income beforetaxes, which at €696 million was24.8% higher than in 2001.
Subtraction from that figure ofthe amount for corporate income taxgives the net income for the year,which at €492 million was 10.2%higher than in 2001, signifying a finalnet income return of 1.74% onaverage total assets, as comparedwith 1.86% in 2001.
Table 54 summarizes the Bank's2002 and 2001 income statementsexpressed as percentages of averagetotal assets.
The net credit loss provisionsrecorded in 2002 amounted to €142million (provisions of €153 millionminus €17 million of recoveries of baddebts written off and €6 million ofdirect writeoff of certain balances),25.4% up on 2001. The foregoingfigure includes the provision of €28million to the statistical credit lossallowance (SCLA).
Write-downs of financial assetsamounted to €58 million (2001: €8million). Of the foregoing amount, €55million related to early amortization ofthe goodwill of Fortior Holding (€54.5million) and Popular-e (€0.2 million).
The extraordinary gains (losses)caption includes the release ofprovisions for other purposes, mostlyfor the extraordinary amortization ofgoodwill in consolidation referred to inthe previous paragraph, amounting to€55 million; contributions to the
Table 54. Profitability
Variation2002 2001
6.80 2.93
3.87
1.42 0.15
5.44
2.00 1.45 0.55 0.19
(0.10)
3.15
0.02 0.84
2.33
0.47
1.86
(0.90) (0.71)
(0.19)
(0.20)(0.07)
(0.46)
(0.24)(0.21)(0.03)(0.02)0.03
(0.17)
(0.01) (0.31)
0.13
0.25
(0.12)
Yield on assets . . . . . . . . . . . . . . . . . . . . . . . . . . . . . . . .Cost of funds . . . . . . . . . . . . . . . . . . . . . . . . . . . . . . . . . .
Net interest margin . . . . . . . . . . . . . . . . . . . . . . . . . . .
Yield on services, net . . . . . . . . . . . . . . . . . . . . . . . . . . .Yield on financial asset trading and exchange profits, net .
Ordinary margin . . . . . . . . . . . . . . . . . . . . . . . . . . . . .
Operating costs:Personnel expenses . . . . . . . . . . . . . . . . . . . . . . . .Other expenses . . . . . . . . . . . . . . . . . . . . . . . . . . . .
Depreciation . . . . . . . . . . . . . . . . . . . . . . . . . . . . . . . . . .Other operating income / expenses, net . . . . . . . . . . . . .
Operating profitability . . . . . . . . . . . . . . . . . . . . . . . . .
Other items, net . . . . . . . . . . . . . . . . . . . . . . . . . . . . . . . .Provisions and writedowns . . . . . . . . . . . . . . . . . . . . . . .
Pre-tax income return . . . . . . . . . . . . . . . . . . . . . . . . .
Corporate income tax . . . . . . . . . . . . . . . . . . . . . . . . . . .
Net income return (ROA) . . . . . . . . . . . . . . . . . . . . . .
(As % of average total assets)
5.90 2.22
3.68
1.22 0.08
4.98
1.76 1.24 0.52 0.17
(0.07)
2.98
0.01 0.53
2.46
0.72
1.74

64
The group headed by BancoPopular Español consists of a total ofnine banking subsidiaries: fiveregional banks (Banco de Andalucía,Banco de Castilla, Banco de CréditoBalear, Banco de Galicia and Bancode Vasconia); Banco PopularHipotecario, specializing in propertyfinancing; Bancopopular-e, providingInternet financial services; PopularBanca Privada, serving individuals ofhigh net worth (private banking); andBanco Popular France, a commercialbanking entity operating in the Frenchmarket.
These nine banking subsidiariesare run in accordance with a criterionof unified common Groupmanagement by virtue of the majoritycontrol held by Banco Popular, withwhich they are consolidated by theglobal integration method, andtherefore all the considerations madepreviously in this Report areapplicable to them. At the end of 2002Banco Popular Hipotecario,Bancopopular-e and Banco PopularFrance were wholly-ownedsubsidiaries. Popular Banca Privadawas 60% owned by Banco PopularEspañol and 40% by Dexia-BIL, aBelgian-Luxembourg bank. Banco
Popular Español also has majorityholdings, ranging from 65% to 97%, inthe five regional banks, theirremaining shares being held, throughthe stock exchange, by othershareholders.
This section presents financialdata of all nine banking subsidiaries,whose individual 2002 and 2001summarized financial statements areincluded in an exhibit hereto.
Table 55 shows the variations ineach bank's customer funds andloans and discounts at the end of2002 compared with the figures for2001.
The risk management by thesebanks in 2002 is summarized in Table56 in the same format as that used forthe Group as a whole, showing thevariation in nonperforming loans andcredit loss allowances, the foreclosedreal estate assets and relatedcoverage provisions, and the mainmeasures of risk quality.
Table 57 presents the banks'individual income statementsexpressed as percentages of theiraverage total assets.
Banks 2002 2001%
variation 2002 2001%
variation
Customer funds* Loans and discounts
BANKING SUBSIDIARIES
Table 55. Year-end customer funds and loans and discounts
* On-balance sheet customer funds and other intermediated funds** In 2001 these banks were consolidated by the proportional integration method
(€ thousand)
Andalucía . . . . . . . . . . . . . . . . . . . . .Castilla . . . . . . . . . . . . . . . . . . . . . . .Crédito Balear . . . . . . . . . . . . . . . . . .Galicia . . . . . . . . . . . . . . . . . . . . . . . .Vasconia . . . . . . . . . . . . . . . . . . . . . .Popular Hipotecario** . . . . . . . . . . . .Bancopopular-e . . . . . . . . . . . . . . . . .Popular Banca Privada** . . . . . . . . . .Popular France . . . . . . . . . . . . . . . . .
Total . . . . . . . . . . . . . . .
3,873,5562,824,408
941,6631,886,3981,621,063
70,215111,747244,393305,384
11,878,827
3,696,9662,711,492
955,6461,867,0101,590,562
3,69133,320
273,370
11,132,057
4.84.2
(1.5)1.01.9
>>
11. 7
6.7
4,459,6092,367,7621,027,8082,099,8781,686,9111,638,051
234,22111,009
100,354
13,625,603
3,769,7802,049,890
832,0681,735,2571,418,5571,342,560
159,713
57,144
11,364,969
18.315.523.521.018.922.046.7
75.6
19.9

65
Nonperforming loans*:Balance at January 1 . . . . . . . . . . . . . . . . . . . . . . . . . . . . .
Additions . . . . . . . . . . . . . . . . . . . . . . . . . . . . . . . . . . . . .Balances recovered . . . . . . . . . . . . . . . . . . . . . . . . . . . . .Net variation for the year . . . . . . . . . . . . . . . . . . . . . . . . .
% increase . . . . . . . . . . . . . . . . . . . . . . . . . . . . . . . .Writeoffs . . . . . . . . . . . . . . . . . . . . . . . . . . . . . . . . . . . . . .
Balance at December 31 . . . . . . . . . . . . . . . . . . . . . . . . . .
Allowance for credit losses:Balance at January 1 . . . . . . . . . . . . . . . . . . . . . . . . . . . . .
Annual provision:Gross . . . . . . . . . . . . . . . . . . . . . . . . . . . . . . . . . . . . .Recoveries . . . . . . . . . . . . . . . . . . . . . . . . . . . . . . . .Net . . . . . . . . . . . . . . . . . . . . . . . . . . . . . . . . . . . . . . .
Other variations . . . . . . . . . . . . . . . . . . . . . . . . . . . . . . . .Writeoffs . . . . . . . . . . . . . . . . . . . . . . . . . . . . . . . . . . . . . .
Balance at December 31 . . . . . . . . . . . . . . . . . . . . . . . . . .
Foreclosed real estate assets . . . . . . . . . . . . . . . . . . . . . . .Allowance for potential losses on foreclosed assets. . . . . .
Pro memoria:Total risks . . . . . . . . . . . . . . . . . . . . . . . . . . . . . . . . . . . . . .Loans transferred to suspense accounts . . . . . . . . . . . . . .Nonperforming mortgage loans. . . . . . . . . . . . . . . . . . . .
Risk quality measures (%):Nonperformance (Nonperforming loans/Total risks) . . . .Insolvency (Writeoffs/Total risks) . . . . . . . . . . . . . . . . . . .Coverage (Credit loss allowance / Nonperforming loans)Coverage (Allowance for potential losses on foreclosed
assets/total foreclosed assets) . . . . . . . . . . . . . . . . . . . .
Table 56. 2002 risk performance
(€ thousand)
* Including doubtful off-balance sheet risks, but excluding country-risk balances
Andalucía Castilla Crédito Balear Galicia Vasconia
10,00714,663(6,097)8,566
85.6(4,577)13,996
25,979
16,016(1,670)14,346
(54)(4,502)35,769
3,4461,205
1,931,37145,297
421
0.720.24
255.57
34.97
13,65624,490
(11,807)12,683
92.9(3,274)23,065
32,979
17,403(1,836)15,567
(361)(3,248)44,937
3,739875
2,408,53435,799
912
0.960.14
194.83
23.40
3,44610,139(4,942)5,197150.8
(2,641)6,002
11,863
11,353(843)
10,510–
(2,635)19,738
920607
1,078,44517,801
237
0.560.24
328.86
65.98
17,02930,059
(14,696)15,363
90.2(6,600)
25,792
35,763
20,554(2,823)
17,731(404)
(6,481)46,609
5,9252,329
2,657,11362,748
2,104
0.970.25
180.71
39.31
41,84270,456
(39,471)30,985
74.1(13,556)59,271
67,204
43,289(8,314)
34,975(335)
(12,371)89,473
10,7703,921
5,378,858120,871
1,963
1.100.25
150.96
36.41
Nonperforming loans*:Balance at January 1 . . . . . . . . . . . . . . . . . . . . . . . . . . . . .
Additions . . . . . . . . . . . . . . . . . . . . . . . . . . . . . . . . . . . . .Balances recovered . . . . . . . . . . . . . . . . . . . . . . . . . . . . .Net variation for the year . . . . . . . . . . . . . . . . . . . . . . . . .
% increase . . . . . . . . . . . . . . . . . . . . . . . . . . . . . . . .Writeoffs . . . . . . . . . . . . . . . . . . . . . . . . . . . . . . . . . . . . . .
Balance at December 31 . . . . . . . . . . . . . . . . . . . . . . . . . .
Allowance for credit losses:Balance at January 1 . . . . . . . . . . . . . . . . . . . . . . . . . . . . .
Annual provision:Gross . . . . . . . . . . . . . . . . . . . . . . . . . . . . . . . . . . . . .Recoveries . . . . . . . . . . . . . . . . . . . . . . . . . . . . . . . .Net . . . . . . . . . . . . . . . . . . . . . . . . . . . . . . . . . . . . . . .
Other variations . . . . . . . . . . . . . . . . . . . . . . . . . . . . . . . .Writeoffs . . . . . . . . . . . . . . . . . . . . . . . . . . . . . . . . . . . . . .
Balance at December 31 . . . . . . . . . . . . . . . . . . . . . . . . . .
Foreclosed real estate assets . . . . . . . . . . . . . . . . . . . . . . .Allowance for potential losses on foreclosed assets. . . . . .
Pro memoria:Total risks . . . . . . . . . . . . . . . . . . . . . . . . . . . . . . . . . . . . . .Loans transferred to suspense accounts . . . . . . . . . . . . . .Nonperforming mortgage loans . . . . . . . . . . . . . . . . . . . .
Risk quality measures (%):Nonperformance (Nonperforming loans/Total risks) . . . .Insolvency (Writeoffs/Total risks) . . . . . . . . . . . . . . . . . . .Coverage (Credit loss allowance / Nonperforming loans)Coverage (Allowance for potential losses on foreclosedassets/total foreclosed assets) . . . . . . . . . . . . . . . . . . . .
Popular France
8632,673(384)
2,289265.2(757)
2,395
17,870
14,426(9,614)4,812
17,869(757)
39,794
1,898938
1,829,384559
1,058
0.130.04
1,661.54
49.42
453127
(189)(62)
(13.7)(8)
383
318
106(108)
(2)–
(8)308
––
113,965––
0.340.01
80.42
Bancopopular-e
2,5955,814(412)
5,402208.2
(1,172)6,825
2,956
4,728–
4,728–
(1,172)6,512
––
234,4032,149
–
2.910.50
95.41
–––––––
–
143–
143––
143
––
11,47121–
Popular Hipotecario Popular Banca Privada
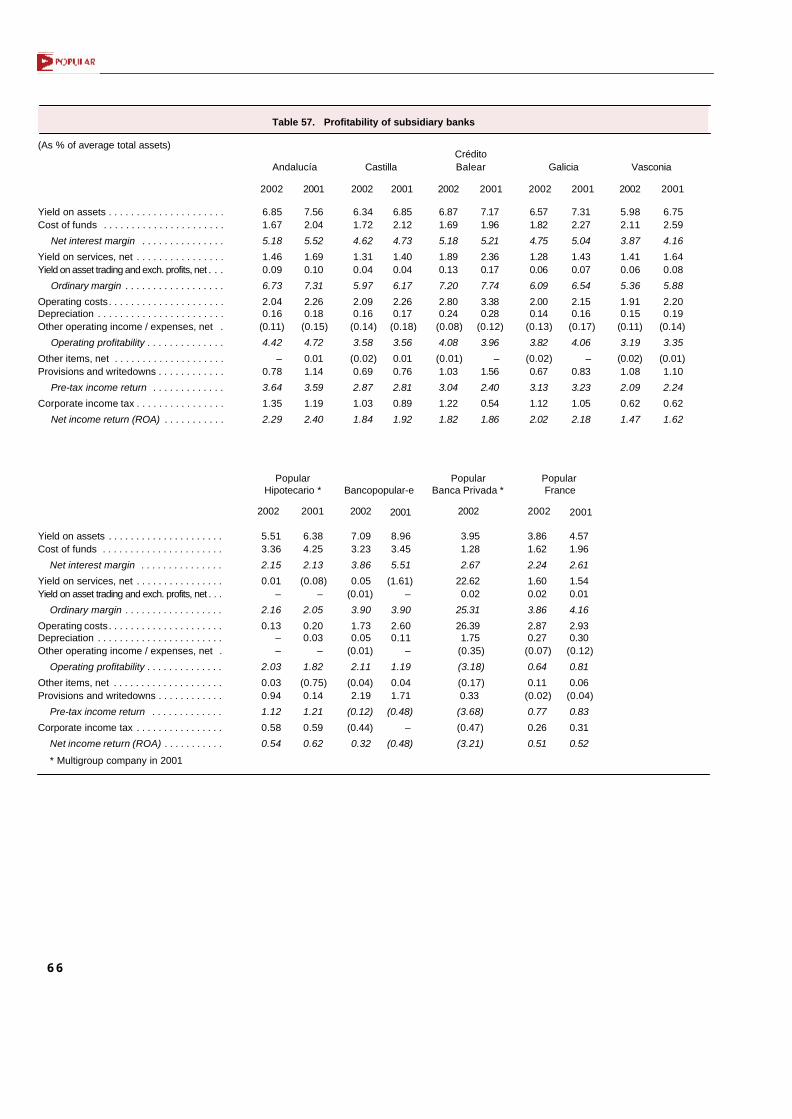
66
Yield on assets . . . . . . . . . . . . . . . . . . . . .Cost of funds . . . . . . . . . . . . . . . . . . . . . .
Net interest margin . . . . . . . . . . . . . . .
Yield on services, net . . . . . . . . . . . . . . . .Yield on asset trading and exch. profits, net . . .
Ordinary margin . . . . . . . . . . . . . . . . . .
Operating costs. . . . . . . . . . . . . . . . . . . . .Depreciation . . . . . . . . . . . . . . . . . . . . . . .Other operating income / expenses, net .
Operating profitability . . . . . . . . . . . . . .
Other items, net . . . . . . . . . . . . . . . . . . . .Provisions and writedowns . . . . . . . . . . . .
Pre-tax income return . . . . . . . . . . . . .
Corporate income tax . . . . . . . . . . . . . . . .
Net income return (ROA) . . . . . . . . . . .
Table 57. Profitability of subsidiary banks
(As % of average total assets)
2002 2001 2002 2001 2002 2001 2002 2001 2002 2001
6.851.67
5.18
1.460.09
6.73
2.040.16
(0.11)
4.42
–0.78
3.64
1.35
2.29
7.562.04
5.52
1.690.10
7.31
2.260.18
(0.15)
4.72
0.011.14
3.59
1.19
2.40
6.341.72
4.62
1.310.04
5.97
2.090.16
(0.14)
3.58
(0.02)0.69
2.87
1.03
1.84
6.852.12
4.73
1.400.04
6.17
2.260.17
(0.18)
3.56
0.010.76
2.81
0.89
1.92
6.871.69
5.18
1.890.13
7.20
2.800.24
(0.08)
4.08
(0.01)1.03
3.04
1.22
1.82
7.171.96
5.21
2.360.17
7.74
3.380.28
(0.12)
3.96
–1.56
2.40
0.54
1.86
6.571.82
4.75
1.280.06
6.09
2.000.14
(0.13)
3.82
(0.02)0.67
3.13
1.12
2.02
7.312.27
5.04
1.430.07
6.54
2.150.16
(0.17)
4.06
–0.83
3.23
1.05
2.18
5.982.11
3.87
1.410.06
5.36
1.910.15
(0.11)
3.19
(0.02)1.08
2.09
0.62
1.47
6.752.59
4.16
1.640.08
5.88
2.200.19
(0.14)
3.35
(0.01)1.10
2.24
0.62
1.62
Andalucía CastillaCrédito Balear Galicia Vasconia
2002 2001
3.861.62
2.24
1.600.02
3.86
2.870.27
(0.07)
0.64
0.11(0.02)
0.77
0.26
0.51
4.571.96
2.61
1.540.01
4.16
2.930.30
(0.12)
0.81
0.06(0.04)
0.83
0.31
0.52
5.513.36
2.15
0.01–
2.16
0.13––
2.03
0.030.94
1.12
0.58
0.54
PopularFrance
Popular Hipotecario *
6.384.25
2.13
(0.08)–
2.05
0.200.03
–
1.82
(0.75)0.14
1.21
0.59
0.62
2002 2001 2001
8.963.45
5.51
(1.61)–
3.90
2.600.11
–
1.19
0.041.71
(0.48)
–
(0.48)
Bancopopular-e
2002
7.093.23
3.86
0.05(0.01)
3.90
1.730.05
(0.01)
2.11
(0.04)2.19
(0.12)
(0.44)
0.32
3.951.28
2.67
22.620.02
25.31
26.391.75
(0.35)
(3.18)
(0.17)0.33
(3.68)
(0.47)
(3.21)
PopularBanca Privada *
2002
Yield on assets . . . . . . . . . . . . . . . . . . . . .Cost of funds . . . . . . . . . . . . . . . . . . . . . .
Net interest margin . . . . . . . . . . . . . . .
Yield on services, net . . . . . . . . . . . . . . . .Yield on asset trading and exch. profits, net . . .
Ordinary margin . . . . . . . . . . . . . . . . . .
Operating costs. . . . . . . . . . . . . . . . . . . . .Depreciation . . . . . . . . . . . . . . . . . . . . . . .Other operating income / expenses, net .
Operating profitability . . . . . . . . . . . . . .
Other items, net . . . . . . . . . . . . . . . . . . . .Provisions and writedowns . . . . . . . . . . . .
Pre-tax income return . . . . . . . . . . . . .
Corporate income tax . . . . . . . . . . . . . . . .
Net income return (ROA) . . . . . . . . . . .
* Multigroup company in 2001

67
Table 60. Business volume and income return
Bank
Average totalassets
Averageequity
Return on assets(ROA) (%)
Return on equity (ROE) (%)
(€ thousand and %)
2002 2001 2002 20012002 2001 2002 2001
Table 58 shows the comparative2002/2001 per share data for income,dividends, book value and, in the
2002 2001 2002 2001
Table 59. Year-end number of employeesand branches
Bank
No.of employees
No. of branches
Andalucía . . . . . . . . . . . . . . . . . . . . . . . . . . . . . . . . . . . . . .Castilla . . . . . . . . . . . . . . . . . . . . . . . . . . . . . . . . . . . . . . . .Crédito Balear. . . . . . . . . . . . . . . . . . . . . . . . . . . . . . . . . . .Galicia. . . . . . . . . . . . . . . . . . . . . . . . . . . . . . . . . . . . . . . . .Vasconia. . . . . . . . . . . . . . . . . . . . . . . . . . . . . . . . . . . . . . .Popular Hipotecario . . . . . . . . . . . . . . . . . . . . . . . . . . . . . .Bancopopular-e . . . . . . . . . . . . . . . . . . . . . . . . . . . . . . . . .Popular Banca Privada . . . . . . . . . . . . . . . . . . . . . . . . . . .Popular France. . . . . . . . . . . . . . . . . . . . . . . . . . . . . . . . . .
Table 58. Per share data
BankNet income Dividend
Bookvalue*
* After distribution of income for the year
Closingmarket price
(€)
2002 2001 2002 20012002 2001 2002 2001
4.841.071.361.390.78
56.86 0.03
(65.45)13.90
4.341.001.191.330.73
55.37 (0.03)
13.85
37.5011.1212.5014.00
8.99
52.7011.8114.0115.40
8.50
25.747.387.858.143.86
831.39 0.97
273.70
28.777.938.488.954.27
888.26 1.01
938.52287.59
1.620.430.540.520.29
1.820.470.610.560.32
Andalucía. . . . . . . . . . . .Castilla. . . . . . . . . . . . . .Crédito Balear . . . . . . . .Galicia . . . . . . . . . . . . . .Vasconia . . . . . . . . . . . .Popular Hipotecario . . . .Bancopopular-e . . . . . . .Popular Banca Privada .Popular France . . . . . . .
1,59685239168051823 51
158125
1,55787742667751526 49
120
298206103136123
11
14
298199102140127
12
1514
Andalucía. . . . . . . . . . . . . . . . . . . . . . .Castilla . . . . . . . . . . . . . . . . . . . . . . . . .Crédito Balear . . . . . . . . . . . . . . . . . . .Galicia . . . . . . . . . . . . . . . . . . . . . . . . .Vasconia . . . . . . . . . . . . . . . . . . . . . . .Popular Hipotecario . . . . . . . . . . . . . . .Bancopopular-e . . . . . . . . . . . . . . . . . .Popular Banca Privada . . . . . . . . . . . .Popular France . . . . . . . . . . . . . . . . . .
4,584,8212,518,7651,056,6592,095,6331,706,8901,485,729
212,58637,600
343,543
3,933,7992,273,713
903,8441,853,9541,445,3681,161,986
115,472
335,586
18.71 %14.6016.1417.9621.17
6.99 (2.82)
5.40
18.67 %14.4417.1716.9820.21
6.84 3.28
(6.54)5.08
2.40 %1.921.862.181.620.62(0.48)
0.52
503,962298,215104,152224,894110,550103,699
19,571
32,078
563,095320,754111,863248,883123,799116,543 20,46618,46534,245
2.29 %1.841.822.021.470.540.32(3.21)0.51
case of the listed banks, the marketprice.
The variations in each bank'snumber of employees and branchoffices are shown in Table 59.
Finally, Table 60 provides asynthesis of the performance of eachbank in 2002 and 2001 by showingthe volume of business as measuredby average total assets and averageequity, and the resulting net return onassets (ROA) and equity (ROE).
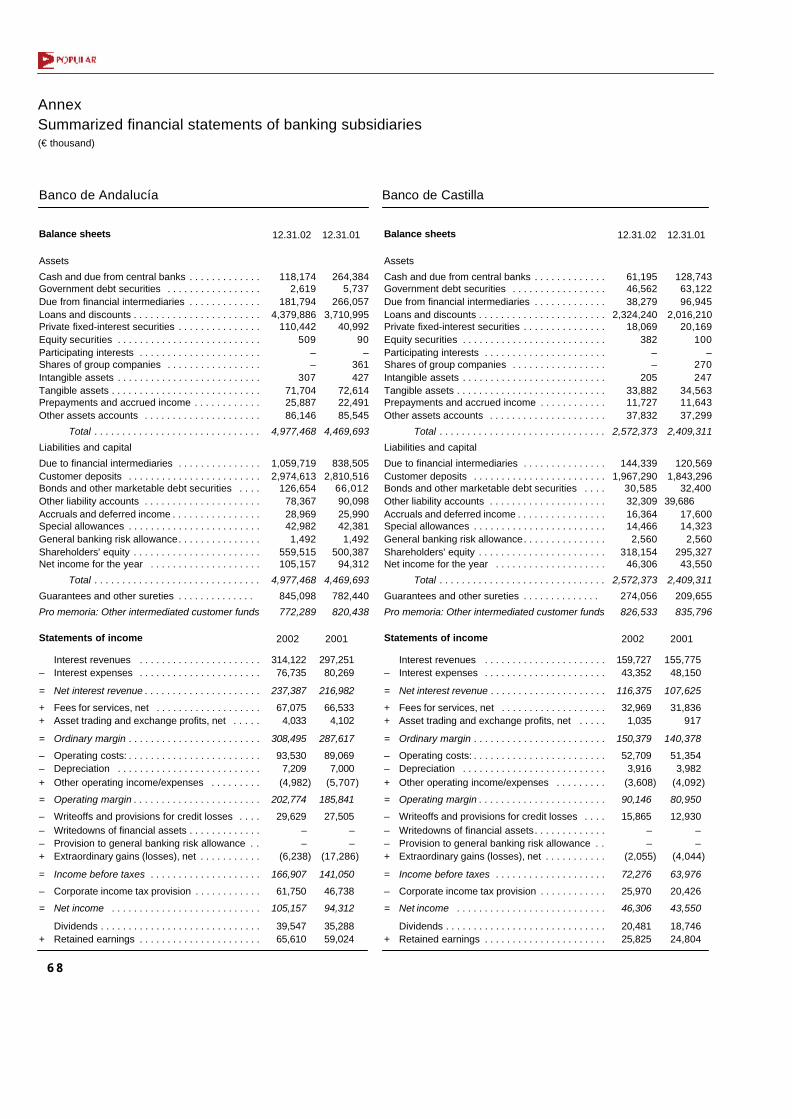
68
AnnexSummarized financial statements of banking subsidiaries(€ thousand)
Assets
Cash and due from central banks . . . . . . . . . . . . .Government debt securities . . . . . . . . . . . . . . . . .Due from financial intermediaries . . . . . . . . . . . . .Loans and discounts . . . . . . . . . . . . . . . . . . . . . . .Private fixed-interest securities . . . . . . . . . . . . . . .Equity securities . . . . . . . . . . . . . . . . . . . . . . . . . .Participating interests . . . . . . . . . . . . . . . . . . . . . .Shares of group companies . . . . . . . . . . . . . . . . .Intangible assets . . . . . . . . . . . . . . . . . . . . . . . . . .Tangible assets . . . . . . . . . . . . . . . . . . . . . . . . . . .Prepayments and accrued income . . . . . . . . . . . .Other assets accounts . . . . . . . . . . . . . . . . . . . . .
Total . . . . . . . . . . . . . . . . . . . . . . . . . . . . . .
Liabilities and capital
Due to financial intermediaries . . . . . . . . . . . . . . .Customer deposits . . . . . . . . . . . . . . . . . . . . . . . .Bonds and other marketable debt securities . . . .Other liability accounts . . . . . . . . . . . . . . . . . . . . .Accruals and deferred income . . . . . . . . . . . . . . . .Special allowances . . . . . . . . . . . . . . . . . . . . . . . .General banking risk allowance. . . . . . . . . . . . . . .Shareholders' equity . . . . . . . . . . . . . . . . . . . . . . .Net income for the year . . . . . . . . . . . . . . . . . . . .
Total . . . . . . . . . . . . . . . . . . . . . . . . . . . . . .
Guarantees and other sureties . . . . . . . . . . . . . .
Pro memoria: Other intermediated customer funds
12.31.02 12.31.01Balance sheets
Banco de Andalucía
264,3845,737
266,0573,710,995
40,99290
–361427
72,61422,49185,545
4,469,693
838,5052,810,516
66,01290,09825,99042,3811,492
500,38794,312
4,469,693
782,440
820,438
118,1742,619
181,7944,379,886
110,442509
––
30771,70425,88786,146
4,977,468
1,059,7192,974,613
126,65478,36728,96942,9821,492
559,515105,157
4,977,468
845,098
772,289
297,25180,269
216,982
66,5334,102
287,617
89,0697,000
(5,707)
185,841
27,505– –
(17,286)
141,050
46,738
94,312
35,28859,024
314,12276,735
237,387
67,0754,033
308,495
93,5307,209
(4,982)
202,774
29,629– –
(6,238)
166,907
61,750
105,157
39,54765,610
2002 2001Statements of income
Banco de Castilla
Interest revenues . . . . . . . . . . . . . . . . . . . . . .– Interest expenses . . . . . . . . . . . . . . . . . . . . . .
= Net interest revenue . . . . . . . . . . . . . . . . . . . . .
+ Fees for services, net . . . . . . . . . . . . . . . . . . .+ Asset trading and exchange profits, net . . . . .
= Ordinary margin . . . . . . . . . . . . . . . . . . . . . . . .
– Operating costs: . . . . . . . . . . . . . . . . . . . . . . . .– Depreciation . . . . . . . . . . . . . . . . . . . . . . . . . .+ Other operating income/expenses . . . . . . . . .
= Operating margin . . . . . . . . . . . . . . . . . . . . . . .
– Writeoffs and provisions for credit losses . . . .– Writedowns of financial assets . . . . . . . . . . . . .– Provision to general banking risk allowance . .+ Extraordinary gains (losses), net . . . . . . . . . . .
= Income before taxes . . . . . . . . . . . . . . . . . . . .
– Corporate income tax provision . . . . . . . . . . . .
= Net income . . . . . . . . . . . . . . . . . . . . . . . . . . .
Dividends . . . . . . . . . . . . . . . . . . . . . . . . . . . . .+ Retained earnings . . . . . . . . . . . . . . . . . . . . . .
Assets
Cash and due from central banks . . . . . . . . . . . . .Government debt securities . . . . . . . . . . . . . . . . .Due from financial intermediaries . . . . . . . . . . . . .Loans and discounts . . . . . . . . . . . . . . . . . . . . . . .Private fixed-interest securities . . . . . . . . . . . . . . .Equity securities . . . . . . . . . . . . . . . . . . . . . . . . . .Participating interests . . . . . . . . . . . . . . . . . . . . . .Shares of group companies . . . . . . . . . . . . . . . . .Intangible assets . . . . . . . . . . . . . . . . . . . . . . . . . .Tangible assets . . . . . . . . . . . . . . . . . . . . . . . . . . .Prepayments and accrued income . . . . . . . . . . . .Other assets accounts . . . . . . . . . . . . . . . . . . . . .
Total . . . . . . . . . . . . . . . . . . . . . . . . . . . . . .
Liabilities and capital
Due to financial intermediaries . . . . . . . . . . . . . . .Customer deposits . . . . . . . . . . . . . . . . . . . . . . . .Bonds and other marketable debt securities . . . .Other liability accounts . . . . . . . . . . . . . . . . . . . . .Accruals and deferred income . . . . . . . . . . . . . . . .Special allowances . . . . . . . . . . . . . . . . . . . . . . . .General banking risk allowance. . . . . . . . . . . . . . .Shareholders' equity . . . . . . . . . . . . . . . . . . . . . . .Net income for the year . . . . . . . . . . . . . . . . . . . .
Total . . . . . . . . . . . . . . . . . . . . . . . . . . . . . .
Guarantees and other sureties . . . . . . . . . . . . . .
Pro memoria: Other intermediated customer funds
12.31.02 12.31.01Balance sheets
128,74363,12296,945
2,016,21020,169
100–
270247
34,56311,64337,299
2,409,311
120,5691,843,296
32,400 39,686
17,60014,323
2,560295,32743,550
2,409,311
209,655
835,796
61,19546,56238,279
2,324,24018,069
382––
20533,88211,72737,832
2,572,373
144,3391,967,290
30,58532,30916,36414,4662,560
318,15446,306
2,572,373
274,056
826,533
155,77548,150
107,625
31,836917
140,378
51,3543,982
(4,092)
80,950
12,930– –
(4,044)
63,976
20,426
43,550
18,74624,804
159,72743,352
116,375
32,9691,035
150,379
52,7093,916
(3,608)
90,146
15,865– –
(2,055)
72,276
25,970
46,306
20,48125,825
2002 2001Statements of income
Interest revenues . . . . . . . . . . . . . . . . . . . . . .– Interest expenses . . . . . . . . . . . . . . . . . . . . . .
= Net interest revenue . . . . . . . . . . . . . . . . . . . . .
+ Fees for services, net . . . . . . . . . . . . . . . . . . .+ Asset trading and exchange profits, net . . . . .
= Ordinary margin . . . . . . . . . . . . . . . . . . . . . . . .
– Operating costs: . . . . . . . . . . . . . . . . . . . . . . . .– Depreciation . . . . . . . . . . . . . . . . . . . . . . . . . .+ Other operating income/expenses . . . . . . . . .
= Operating margin . . . . . . . . . . . . . . . . . . . . . . .
– Writeoffs and provisions for credit losses . . . .– Writedowns of financial assets. . . . . . . . . . . . .– Provision to general banking risk allowance . .+ Extraordinary gains (losses), net . . . . . . . . . . .
= Income before taxes . . . . . . . . . . . . . . . . . . . .
– Corporate income tax provision . . . . . . . . . . . .
= Net income . . . . . . . . . . . . . . . . . . . . . . . . . . .
Dividends . . . . . . . . . . . . . . . . . . . . . . . . . . . . .+ Retained earnings . . . . . . . . . . . . . . . . . . . . . .

69
Assets
Cash and due from central banks . . . . . . . . . . . . .Government debt securities . . . . . . . . . . . . . . . . .Due from financial intermediaries . . . . . . . . . . . . .Loans and discounts . . . . . . . . . . . . . . . . . . . . . . .Private fixed-interest securities . . . . . . . . . . . . . . .Equity securities . . . . . . . . . . . . . . . . . . . . . . . . . .Participating interests . . . . . . . . . . . . . . . . . . . . . .Shares of group companies . . . . . . . . . . . . . . . . .Intangible assets . . . . . . . . . . . . . . . . . . . . . . . . . .Tangible assets . . . . . . . . . . . . . . . . . . . . . . . . . . .Prepayments and accrued income . . . . . . . . . . . .Other assets accounts . . . . . . . . . . . . . . . . . . . . .
Total . . . . . . . . . . . . . . . . . . . . . . . . . . . . . .
Liabilities and capital
Due to financial intermediaries . . . . . . . . . . . . . . .Customer deposits . . . . . . . . . . . . . . . . . . . . . . . .Bonds and other marketable debt securities . . . .Other liability accounts . . . . . . . . . . . . . . . . . . . . .Accruals and deferred income . . . . . . . . . . . . . . . .Special allowances . . . . . . . . . . . . . . . . . . . . . . . .General banking risk allowance. . . . . . . . . . . . . . .Shareholders' equity . . . . . . . . . . . . . . . . . . . . . . .Net income for the year . . . . . . . . . . . . . . . . . . . .
Total . . . . . . . . . . . . . . . . . . . . . . . . . . . . . .
Guarantees and other sureties . . . . . . . . . . . . . .
Pro memoria: Other intermediated customer funds
12.31.02 12.31.01Balance sheets
Banco de Crédito Balear
73,136285
27,357820,861
14,84872
–9011
22,7454,875
28,865
993,145
115,913713,752
5,337 16,918
5,65816,0971,169
101,49016,811
993,145
45,410
236,557
29,121233
27,3111,008,786
15,140170
––
9321,2534,927
27,194
1,134,228
255,614709,439
6,05413,1585,564
15,0851,169
108,94319,202
1,134,228
48,131
226,170
64,78917,728
47,061
21,3481,516
69,925
30,5512,553
(1,069)
35,752
5,271– –
(8,760)
21,721
4,910
16,811
7,6129,199
72,58717,879
54,708
19,9491,432
76,089
29,6432,493(851)
43,102
9,929– –
(1,089)
32,084
12,882
19,202
8,57110,631
2002 2001Statements of income
Banco de Galicia
Interest revenues . . . . . . . . . . . . . . . . . . . . . .– Interest expenses . . . . . . . . . . . . . . . . . . . . . .
= Net interest revenue . . . . . . . . . . . . . . . . . . . . .
+ Fees for services, net . . . . . . . . . . . . . . . . . . .+ Asset trading and exchange profits, net . . . . .
= Ordinary margin . . . . . . . . . . . . . . . . . . . . . . . .
– Operating costs: . . . . . . . . . . . . . . . . . . . . . . . .– Depreciation . . . . . . . . . . . . . . . . . . . . . . . . . .+ Other operating income/expenses . . . . . . . . .
= Operating margin . . . . . . . . . . . . . . . . . . . . . . .
– Writeoffs and provisions for credit losses . . . .– Writedowns of financial assets . . . . . . . . . . . . .– Provision to general banking risk allowance . .+ Extraordinary gains (losses), net . . . . . . . . . . .
= Income before taxes . . . . . . . . . . . . . . . . . . . .
– Corporate income tax provision . . . . . . . . . . . .
= Net income . . . . . . . . . . . . . . . . . . . . . . . . . . .
Dividends . . . . . . . . . . . . . . . . . . . . . . . . . . . . .+ Retained earnings . . . . . . . . . . . . . . . . . . . . . .
Assets
Cash and due from central banks . . . . . . . . . . . . .Government debt securities . . . . . . . . . . . . . . . . .Due from financial intermediaries . . . . . . . . . . . . .Loans and discounts . . . . . . . . . . . . . . . . . . . . . . .Private fixed-interest securities . . . . . . . . . . . . . . .Equity securities . . . . . . . . . . . . . . . . . . . . . . . . . .Participating interests . . . . . . . . . . . . . . . . . . . . . .Shares of group companies . . . . . . . . . . . . . . . . .Intangible assets . . . . . . . . . . . . . . . . . . . . . . . . . .Tangible assets . . . . . . . . . . . . . . . . . . . . . . . . . . .Prepayments and accrued income . . . . . . . . . . . .Other assets accounts . . . . . . . . . . . . . . . . . . . . .
Total . . . . . . . . . . . . . . . . . . . . . . . . . . . . . .
Liabilities and capital
Due to financial intermediaries . . . . . . . . . . . . . . .Customer deposits . . . . . . . . . . . . . . . . . . . . . . . .Bonds and other marketable debt securities . . . .Other liability accounts . . . . . . . . . . . . . . . . . . . . .Accruals and deferred income . . . . . . . . . . . . . . . .Special allowances . . . . . . . . . . . . . . . . . . . . . . . .General banking risk allowance. . . . . . . . . . . . . . .Shareholders' equity . . . . . . . . . . . . . . . . . . . . . . .Net income for the year . . . . . . . . . . . . . . . . . . . .
Total . . . . . . . . . . . . . . . . . . . . . . . . . . . . . .
Guarantees and other sureties . . . . . . . . . . . . . .
Pro memoria: Other intermediated customer funds
12.31.02 12.31.01Balance sheets
106,390889
92,4011,704,760
15,06545
–177202
26,3909,033
35,294
1,990,646
149,3511,450,682
62,001 41,317
13,14010,504
–223,266
40,385
1,990,646
218,536
354,327
46,450377
82,5192,058,528
15,114231
––
10127,33310,02031,718
2,272,391
386,1391,419,532
116,42737,46912,89710,735
–246,933
42,259
2,272,391
286,015
350,439
135,53242,150
93,382
26,6201,291
121,293
39,9162,893
(3,161)
75,323
11,405– –
(4,058)
59,860
19,475
40,385
15,82324,562
137,67338,152
99,521
26,6961,318
127,535
41,9172,957
(2,672)
79,989
14,201– –
(113)
65,675
23,416
42,259
16,91925,340
2002 2001Statements of income
Interest revenues . . . . . . . . . . . . . . . . . . . . . .– Interest expenses . . . . . . . . . . . . . . . . . . . . . .
= Net interest revenue . . . . . . . . . . . . . . . . . . . . .
+ Fees for services, net . . . . . . . . . . . . . . . . . . .+ Asset trading and exchange profits, net . . . . .
= Ordinary margin . . . . . . . . . . . . . . . . . . . . . . . .
– Operating costs: . . . . . . . . . . . . . . . . . . . . . . . .– Depreciation . . . . . . . . . . . . . . . . . . . . . . . . . .+ Other operating income/expenses . . . . . . . . .
= Operating margin . . . . . . . . . . . . . . . . . . . . . . .
– Writeoffs and provisions for credit losses . . . .– Writedowns of financial assets. . . . . . . . . . . . .– Provision to general banking risk allowance . .+ Extraordinary gains (losses), net . . . . . . . . . . .
= Income before taxes . . . . . . . . . . . . . . . . . . . .
– Corporate income tax provision . . . . . . . . . . . .
= Net income . . . . . . . . . . . . . . . . . . . . . . . . . . .
Dividends . . . . . . . . . . . . . . . . . . . . . . . . . . . . .+ Retained earnings . . . . . . . . . . . . . . . . . . . . . .

70
Assets
Cash and due from central banks . . . . . . . . . . . . .Government debt securities . . . . . . . . . . . . . . . . .Due from financial intermediaries . . . . . . . . . . . . .Loans and discounts . . . . . . . . . . . . . . . . . . . . . . .Private fixed-interest securities . . . . . . . . . . . . . . .Equity securities . . . . . . . . . . . . . . . . . . . . . . . . . .Participating interests . . . . . . . . . . . . . . . . . . . . . .Shares of group companies . . . . . . . . . . . . . . . . .Intangible assets . . . . . . . . . . . . . . . . . . . . . . . . . .Tangible assets . . . . . . . . . . . . . . . . . . . . . . . . . . .Prepayments and accrued income . . . . . . . . . . . .Other assets accounts . . . . . . . . . . . . . . . . . . . . .
Total . . . . . . . . . . . . . . . . . . . . . . . . . . . . . .
Liabilities and capital
Due to financial intermediaries . . . . . . . . . . . . . . .Customer deposits . . . . . . . . . . . . . . . . . . . . . . . .Bonds and other marketable debt securities . . . .Other liability accounts . . . . . . . . . . . . . . . . . . . . .Accruals and deferred income . . . . . . . . . . . . . . . .Special allowances . . . . . . . . . . . . . . . . . . . . . . . .General banking risk allowance. . . . . . . . . . . . . . .Shareholders' equity . . . . . . . . . . . . . . . . . . . . . . .Net income for the year . . . . . . . . . . . . . . . . . . . .
Total . . . . . . . . . . . . . . . . . . . . . . . . . . . . . .
Guarantees and other sureties . . . . . . . . . . . . . .
Pro memoria: Other intermediated customer funds
12.31.02 12.31.01Balance sheets
Banco de Vasconia
60,3715,996
476,0141,394,815
15,863400
–180102
22,1146,638
25,680
2,008,173
816,096956,75739,564 40,46410,65111,782
–109,45123,408
2,008,173
174,422
594,241
32,246351
67,1191,654,149
51,319590
––
9421,624
7,36224,787
1,859,641
565,4181,004,814
51,54962,40112,02516,568
–121,84925,017
1,859,641
199,193
564,700
97,54437,429
60,115
23,6491,176
84,940
31,8552,636
(1,996)
48,453
10,747– –
(5,261)
32,445
9,037
23,408
9,34414,064
102,07435,936
66,138
24,1241,162
91,424
32,6282,567
(1,753)
54,476
12,879– –
(5,967)
35,630
10,613
25,017
10,11214,905
2002 2001Statements of income
Interest revenues . . . . . . . . . . . . . . . . . . . . . .– Interest expenses . . . . . . . . . . . . . . . . . . . . . .
= Net interest revenue . . . . . . . . . . . . . . . . . . . . .
+ Fees for services, net . . . . . . . . . . . . . . . . . . .+ Asset trading and exchange profits, net . . . . .
= Ordinary margin . . . . . . . . . . . . . . . . . . . . . . . .
– Operating costs: . . . . . . . . . . . . . . . . . . . . . . . .– Depreciation . . . . . . . . . . . . . . . . . . . . . . . . . .+ Other operating income/expenses . . . . . . . . .
= Operating margin . . . . . . . . . . . . . . . . . . . . . . .
– Writeoffs and provisions for credit losses . . . .– Writedowns of financial assets. . . . . . . . . . . . .– Provision to general banking risk allowance . .+ Extraordinary gains (losses), net . . . . . . . . . . .
= Income before taxes . . . . . . . . . . . . . . . . . . . .
– Corporate income tax provision . . . . . . . . . . . .
= Net income . . . . . . . . . . . . . . . . . . . . . . . . . . .
Dividends . . . . . . . . . . . . . . . . . . . . . . . . . . . . .+ Retained earnings . . . . . . . . . . . . . . . . . . . . . .
Assets
Cash and due from central banks . . . . . . . . . . . . .Government debt securities . . . . . . . . . . . . . . . . .Due from financial intermediaries . . . . . . . . . . . . .Loans and discounts . . . . . . . . . . . . . . . . . . . . . . .Private fixed-interest securities . . . . . . . . . . . . . . .Equity securities . . . . . . . . . . . . . . . . . . . . . . . . . .Participating interests . . . . . . . . . . . . . . . . . . . . . .Shares of group companies . . . . . . . . . . . . . . . . .Intangible assets . . . . . . . . . . . . . . . . . . . . . . . . . .Tangible assets . . . . . . . . . . . . . . . . . . . . . . . . . . .Prepayments and accrued income . . . . . . . . . . . .Other assets accounts . . . . . . . . . . . . . . . . . . . . .
Total . . . . . . . . . . . . . . . . . . . . . . . . . . . . . .
Liabilities and capital
Due to financial intermediaries . . . . . . . . . . . . . . .Customer deposits . . . . . . . . . . . . . . . . . . . . . . . .Bonds and other marketable debt securities . . . .Other liability accounts . . . . . . . . . . . . . . . . . . . . .Accruals and deferred income . . . . . . . . . . . . . . . .Special allowances . . . . . . . . . . . . . . . . . . . . . . . .General banking risk allowance. . . . . . . . . . . . . . .Shareholders' equity . . . . . . . . . . . . . . . . . . . . . . .Net income for the year . . . . . . . . . . . . . . . . . . . .
Total . . . . . . . . . . . . . . . . . . . . . . . . . . . . . .
Guarantees and other sureties . . . . . . . . . . . . . .
Pro memoria: Other intermediated customer funds
12.31.02 12.31.01Balance sheets
Banco Popular Hipotecario
4––
1,308,404–––––
1,5155,9075,049
1,320,879
1,184,4621,943
– 4,044
12,1831,703
–109,298
7,246
1,320,879
83,188
1,748
1,343––
1,601,553–––––
1,2856,7537,870
1,618,804
1,397,20068,659
– 4,372
11,3613,2969,402
116,5437,971
1,618,804
191,333
1,556
74,09249,336
24,756
(910)–
23,846
2,305315(52)
21,174
8,750– –
1,599
14,023
6,777
7,246
–7,246
81,78949,920
31,869
261–
32,130
1,85572
(57)
30,146
4,392–
9,402284
16,636
8,665
7,971
–7,971
2002 2001Statements of income
Interest revenues . . . . . . . . . . . . . . . . . . . . . .– Interest expenses . . . . . . . . . . . . . . . . . . . . . .
= Net interest revenue . . . . . . . . . . . . . . . . . . . . .
+ Fees for services, net . . . . . . . . . . . . . . . . . . .+ Asset trading and exchange profits, net . . . . .
= Ordinary margin . . . . . . . . . . . . . . . . . . . . . . . .
– Operating costs: . . . . . . . . . . . . . . . . . . . . . . . .– Depreciation . . . . . . . . . . . . . . . . . . . . . . . . . .+ Other operating income/expenses . . . . . . . . .
= Operating margin . . . . . . . . . . . . . . . . . . . . . . .
– Writeoffs and provisions for credit losses . . . .– Writedowns of financial assets. . . . . . . . . . . . .– Provision to general banking risk allowance . .+ Extraordinary gains (losses), net . . . . . . . . . . .
= Income before taxes . . . . . . . . . . . . . . . . . . . .
– Corporate income tax provision . . . . . . . . . . . .
= Net income . . . . . . . . . . . . . . . . . . . . . . . . . . .
Dividends . . . . . . . . . . . . . . . . . . . . . . . . . . . . .+ Retained earnings . . . . . . . . . . . . . . . . . . . . . .
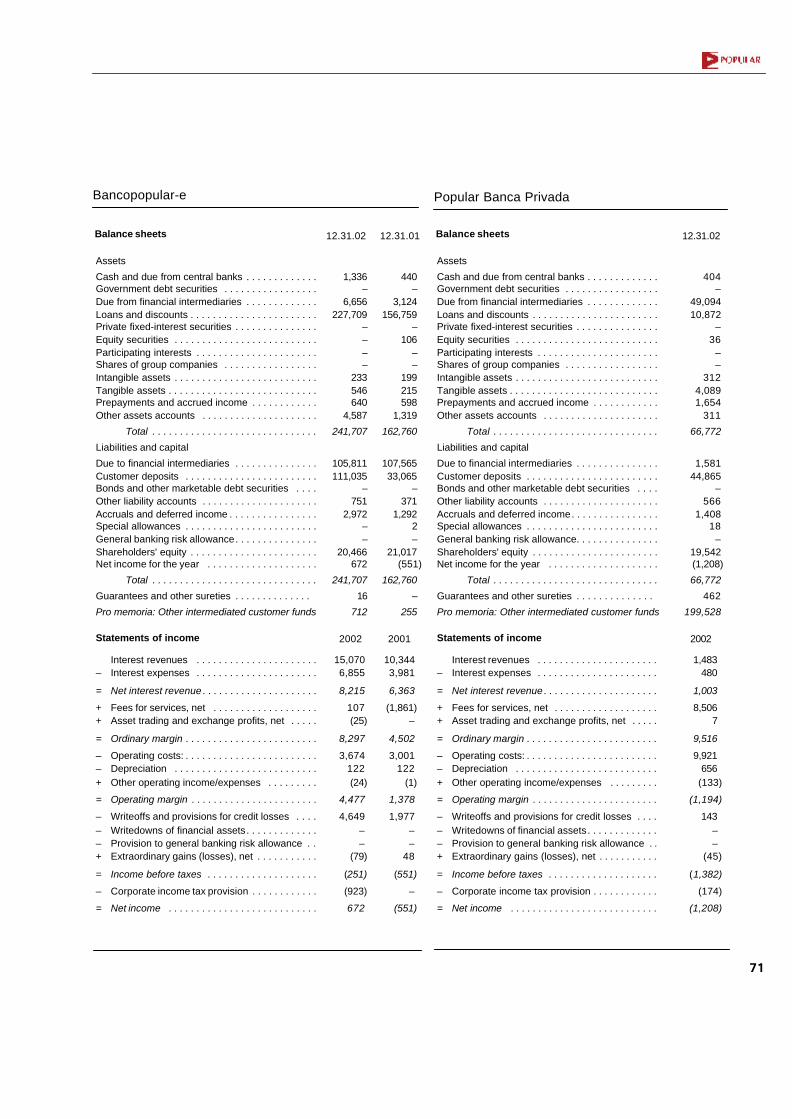
71
Bancopopular-e
Assets
Cash and due from central banks . . . . . . . . . . . . .Government debt securities . . . . . . . . . . . . . . . . .Due from financial intermediaries . . . . . . . . . . . . .Loans and discounts . . . . . . . . . . . . . . . . . . . . . . .Private fixed-interest securities . . . . . . . . . . . . . . .Equity securities . . . . . . . . . . . . . . . . . . . . . . . . . .Participating interests . . . . . . . . . . . . . . . . . . . . . .Shares of group companies . . . . . . . . . . . . . . . . .Intangible assets . . . . . . . . . . . . . . . . . . . . . . . . . .Tangible assets . . . . . . . . . . . . . . . . . . . . . . . . . . .Prepayments and accrued income . . . . . . . . . . . .Other assets accounts . . . . . . . . . . . . . . . . . . . . .
Total . . . . . . . . . . . . . . . . . . . . . . . . . . . . . .
Liabilities and capital
Due to financial intermediaries . . . . . . . . . . . . . . .Customer deposits . . . . . . . . . . . . . . . . . . . . . . . .Bonds and other marketable debt securities . . . .Other liability accounts . . . . . . . . . . . . . . . . . . . . .Accruals and deferred income . . . . . . . . . . . . . . . .Special allowances . . . . . . . . . . . . . . . . . . . . . . . .General banking risk allowance. . . . . . . . . . . . . . .Shareholders' equity . . . . . . . . . . . . . . . . . . . . . . .Net income for the year . . . . . . . . . . . . . . . . . . . .
Total . . . . . . . . . . . . . . . . . . . . . . . . . . . . . .
Guarantees and other sureties . . . . . . . . . . . . . .
Pro memoria: Other intermediated customer funds
12.31.01Balance sheets
440–
3,124156,759
–106
––
199215598
1,319
162,760
107,56533,065
– 371
1,2922–
21,017(551)
162,760
–
255
10,3443,981
6,363
(1,861)–
4,502
3,001122
(1)
1,378
1,977– –
48
(551)
–
(551)
2001Statements of income
Interest revenues . . . . . . . . . . . . . . . . . . . . . .– Interest expenses . . . . . . . . . . . . . . . . . . . . . .
= Net interest revenue . . . . . . . . . . . . . . . . . . . . .
+ Fees for services, net . . . . . . . . . . . . . . . . . . .+ Asset trading and exchange profits, net . . . . .
= Ordinary margin . . . . . . . . . . . . . . . . . . . . . . . .
– Operating costs: . . . . . . . . . . . . . . . . . . . . . . . .– Depreciation . . . . . . . . . . . . . . . . . . . . . . . . . .+ Other operating income/expenses . . . . . . . . .
= Operating margin . . . . . . . . . . . . . . . . . . . . . . .
– Writeoffs and provisions for credit losses . . . .– Writedowns of financial assets. . . . . . . . . . . . .– Provision to general banking risk allowance . .+ Extraordinary gains (losses), net . . . . . . . . . . .
= Income before taxes . . . . . . . . . . . . . . . . . . . .
– Corporate income tax provision . . . . . . . . . . . .
= Net income . . . . . . . . . . . . . . . . . . . . . . . . . . .
12.31.02
1,336–
6,656227,709
––––
233546640
4,587
241,707
105,811111,035
– 751
2,972––
20,466672
241,707
16
712
15,0706,855
8,215
107(25)
8,297
3,674122(24)
4,477
4,649– –
(79)
(251)
(923)
672
2002
Popular Banca Privada
Assets
Cash and due from central banks . . . . . . . . . . . . .Government debt securities . . . . . . . . . . . . . . . . .Due from financial intermediaries . . . . . . . . . . . . .Loans and discounts . . . . . . . . . . . . . . . . . . . . . . .Private fixed-interest securities . . . . . . . . . . . . . . .Equity securities . . . . . . . . . . . . . . . . . . . . . . . . . .Participating interests . . . . . . . . . . . . . . . . . . . . . .Shares of group companies . . . . . . . . . . . . . . . . .Intangible assets . . . . . . . . . . . . . . . . . . . . . . . . . .Tangible assets . . . . . . . . . . . . . . . . . . . . . . . . . . .Prepayments and accrued income . . . . . . . . . . . .Other assets accounts . . . . . . . . . . . . . . . . . . . . .
Total . . . . . . . . . . . . . . . . . . . . . . . . . . . . . .
Liabilities and capital
Due to financial intermediaries . . . . . . . . . . . . . . .Customer deposits . . . . . . . . . . . . . . . . . . . . . . . .Bonds and other marketable debt securities . . . .Other liability accounts . . . . . . . . . . . . . . . . . . . . .Accruals and deferred income. . . . . . . . . . . . . . . .Special allowances . . . . . . . . . . . . . . . . . . . . . . . .General banking risk allowance. . . . . . . . . . . . . . .Shareholders' equity . . . . . . . . . . . . . . . . . . . . . . .Net income for the year . . . . . . . . . . . . . . . . . . . .
Total . . . . . . . . . . . . . . . . . . . . . . . . . . . . . .
Guarantees and other sureties . . . . . . . . . . . . . .
Pro memoria: Other intermediated customer funds
12.31.02Balance sheets
404–
49,09410,872
–36
––
3124,0891,654
311
66,772
1,58144,865
– 566
1,40818
–19,542(1,208)
66,772
462
199,528
1,483480
1,003
8,5067
9,516
9,921656
(133)
(1,194)
143– –
(45)
(1,382)
(174)
(1,208)
2002Statements of income
Interest revenues . . . . . . . . . . . . . . . . . . . . . .– Interest expenses . . . . . . . . . . . . . . . . . . . . . .
= Net interest revenue . . . . . . . . . . . . . . . . . . . . .
+ Fees for services, net . . . . . . . . . . . . . . . . . . .+ Asset trading and exchange profits, net . . . . .
= Ordinary margin . . . . . . . . . . . . . . . . . . . . . . . .
– Operating costs: . . . . . . . . . . . . . . . . . . . . . . . .– Depreciation . . . . . . . . . . . . . . . . . . . . . . . . . .+ Other operating income/expenses . . . . . . . . .
= Operating margin . . . . . . . . . . . . . . . . . . . . . . .
– Writeoffs and provisions for credit losses . . . .– Writedowns of financial assets. . . . . . . . . . . . .– Provision to general banking risk allowance . .+ Extraordinary gains (losses), net . . . . . . . . . . .
= Income before taxes . . . . . . . . . . . . . . . . . . . .
– Corporate income tax provision . . . . . . . . . . . .
= Net income . . . . . . . . . . . . . . . . . . . . . . . . . . .
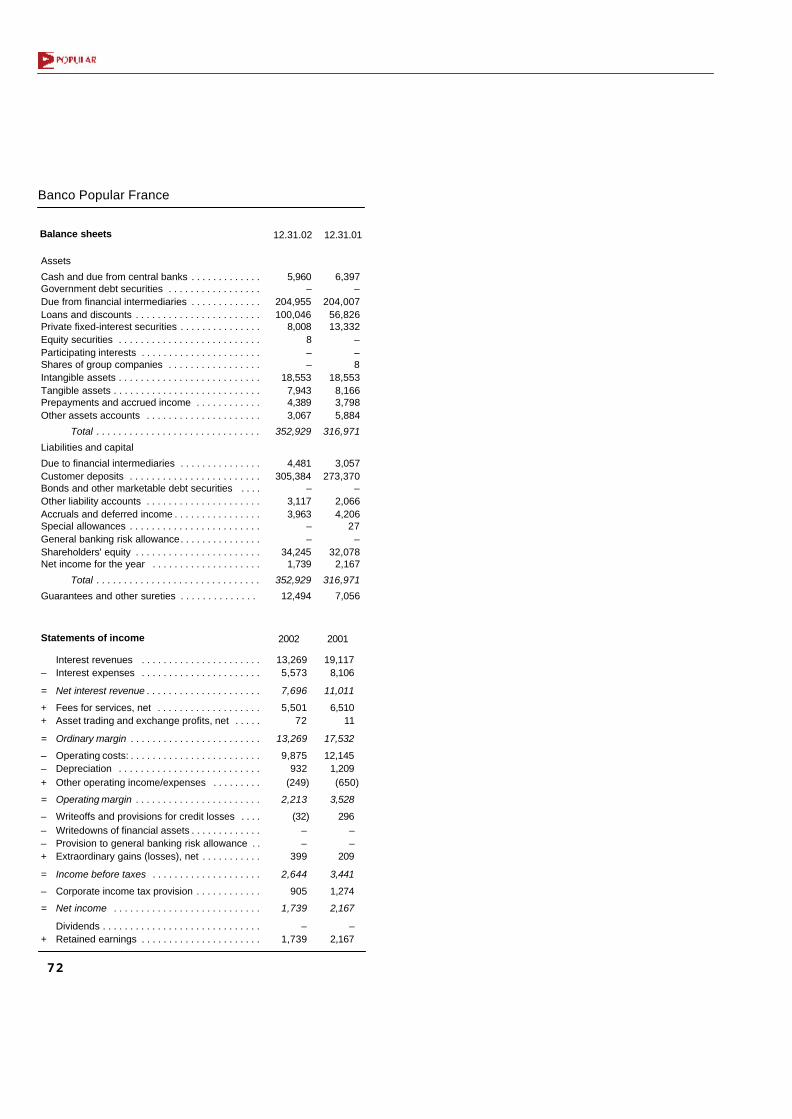
72
Banco Popular France
Assets
Cash and due from central banks . . . . . . . . . . . . .Government debt securities . . . . . . . . . . . . . . . . .Due from financial intermediaries . . . . . . . . . . . . .Loans and discounts . . . . . . . . . . . . . . . . . . . . . . .Private fixed-interest securities . . . . . . . . . . . . . . .Equity securities . . . . . . . . . . . . . . . . . . . . . . . . . .Participating interests . . . . . . . . . . . . . . . . . . . . . .Shares of group companies . . . . . . . . . . . . . . . . .Intangible assets . . . . . . . . . . . . . . . . . . . . . . . . . .Tangible assets . . . . . . . . . . . . . . . . . . . . . . . . . . .Prepayments and accrued income . . . . . . . . . . . .Other assets accounts . . . . . . . . . . . . . . . . . . . . .
Total . . . . . . . . . . . . . . . . . . . . . . . . . . . . . .
Liabilities and capital
Due to financial intermediaries . . . . . . . . . . . . . . .Customer deposits . . . . . . . . . . . . . . . . . . . . . . . .Bonds and other marketable debt securities . . . .Other liability accounts . . . . . . . . . . . . . . . . . . . . .Accruals and deferred income . . . . . . . . . . . . . . . .Special allowances . . . . . . . . . . . . . . . . . . . . . . . .General banking risk allowance. . . . . . . . . . . . . . .Shareholders' equity . . . . . . . . . . . . . . . . . . . . . . .Net income for the year . . . . . . . . . . . . . . . . . . . .
Total . . . . . . . . . . . . . . . . . . . . . . . . . . . . . .
Guarantees and other sureties . . . . . . . . . . . . . .
12.31.02 12.31.01Balance sheets
6,397–
204,00756,82613,332
––8
18,5538,1663,7985,884
316,971
3,057273,370
– 2,0664,206
27–
32,0782,167
316,971
7,056
5,960–
204,955100,046
8,0088––
18,5537,9434,3893,067
352,929
4,481305,384
– 3,1173,963
––
34,2451,739
352,929
12,494
19,1178,106
11,011
6,51011
17,532
12,1451,209(650)
3,528
296– –
209
3,441
1,274
2,167
–2,167
13,2695,573
7,696
5,50172
13,269
9,875932
(249)
2,213
(32)– –
399
2,644
905
1,739
–1,739
2002 2001Statements of income
Interest revenues . . . . . . . . . . . . . . . . . . . . . .– Interest expenses . . . . . . . . . . . . . . . . . . . . . .
= Net interest revenue . . . . . . . . . . . . . . . . . . . . .
+ Fees for services, net . . . . . . . . . . . . . . . . . . .+ Asset trading and exchange profits, net . . . . .
= Ordinary margin . . . . . . . . . . . . . . . . . . . . . . . .
– Operating costs: . . . . . . . . . . . . . . . . . . . . . . . .– Depreciation . . . . . . . . . . . . . . . . . . . . . . . . . .+ Other operating income/expenses . . . . . . . . .
= Operating margin . . . . . . . . . . . . . . . . . . . . . . .
– Writeoffs and provisions for credit losses . . . .– Writedowns of financial assets . . . . . . . . . . . . .– Provision to general banking risk allowance . .+ Extraordinary gains (losses), net . . . . . . . . . . .
= Income before taxes . . . . . . . . . . . . . . . . . . . .
– Corporate income tax provision . . . . . . . . . . . .
= Net income . . . . . . . . . . . . . . . . . . . . . . . . . . .
Dividends . . . . . . . . . . . . . . . . . . . . . . . . . . . . .+ Retained earnings . . . . . . . . . . . . . . . . . . . . . .

73
The Banco Popular Español Groupincludes other specialized affiliates whichprovide substantially all financial andinsurance services.
The most important of these are twofactoring companies (Heller FactoringEspañola and Heller FactoringPortuguesa) which operate in theireponymous markets; a capital equipmentrenting company (Popular de Renting); twomutual fund management companies(Sogeval and Popular Gestión Privada); aportfolio management company (GestoraEuropea de Inversiones); a securitiescompany which is a member of the stockexchange (Popular Bolsa); two pensionplan management companies(Europensiones and IberagentesPrevisión); a life insurance company(Eurovida); and a venture capital company(Popular de Participaciones Financieras).
These companies are wholly-ownedsubsidiaries of Banco Popular except inthe following cases: the Group's holdingsin the two factoring companies are 50%and 49.8%, respectively, together with GECapital; the holdings in Popular GestiónPrivada and Iberagentes Previsión areboth 60%, the remaining capital being heldby the Dexia-BIL bank; and the holdings inEuropensiones and Eurovida are 51% and49%, respectively, the remaining capital inboth cases being held by the GermanAllianz insurance group.
By virtue of the controlling stakes ofBanco Popular or, where appropriate,under the agreements with outsideshareholders, these companies are run inaccordance with the Group's criterion ofunified management and, therefore, theconsiderations made previously in thisReport are applicable to them.
The summarized 2002 and 2001financial statements of these companiesfollow. (€ thousand)
NONBANKING FINANCEAND SERVICE SUBSIDIARIES
Assets
Cash and due from central banks . . . . . . . . . . . . .Government debt securities . . . . . . . . . . . . . . . . .Due from financial intermediaries . . . . . . . . . . . . .Loans and discounts . . . . . . . . . . . . . . . . . . . . . . .Private fixed-interest securities . . . . . . . . . . . . . . .Equity securities . . . . . . . . . . . . . . . . . . . . . . . . . .Participating interests . . . . . . . . . . . . . . . . . . . . . .Shares of group companies . . . . . . . . . . . . . . . . .Intangible assets . . . . . . . . . . . . . . . . . . . . . . . . . .Tangible assets . . . . . . . . . . . . . . . . . . . . . . . . . . .Prepayments and accrued income . . . . . . . . . . . .Other asset accounts . . . . . . . . . . . . . . . . . . . . . .
Total . . . . . . . . . . . . . . . . . . . . . . . . . . . . . .
Liabilities and capital
Due to financial intermediaries . . . . . . . . . . . . . . .Customer deposits . . . . . . . . . . . . . . . . . . . . . . . .Bonds and other marketable debt securities . . . .Other liability accounts . . . . . . . . . . . . . . . . . . . . .Accruals and deferred income . . . . . . . . . . . . . . . .Special allowances . . . . . . . . . . . . . . . . . . . . . . . .General banking risk allowance. . . . . . . . . . . . . . .Shareholders' equity . . . . . . . . . . . . . . . . . . . . . . .Net income for the year . . . . . . . . . . . . . . . . . . . .
Total . . . . . . . . . . . . . . . . . . . . . . . . . . . . . .
Guarantees and other sureties . . . . . . . . . . . . . .
12.31.02 12.31.01Balance sheets
Heller Factoring Española
30–
8,012299,078
––––
56533
27583
308,319
248,206––
28,6723,367
324376
24,9382,436
308,319
32,407
30–
3,929290,001
––––
44460153567
295,184
237,959––
24,5812,812
254376
27,3741,828
295,184
25,388
9,9377,261
2,676
4,721(1)
7,396
2,395104138
5,035
1,517–
(215)
3,303
867
2,436
–2,436
10,6967,702
2,994
4,911(1)
7,904
2,55795
174
5,426
2,131–
(243)
3,052
1,224
1,828
–1,828
2002Statements of income
Interest revenues . . . . . . . . . . . . . . . . . . . . . .– Interest expenses . . . . . . . . . . . . . . . . . . . . . .
= Net interest revenue . . . . . . . . . . . . . . . . . . . .
+ Fees for services, net . . . . . . . . . . . . . . . . . . .+ Asset trading and exchange profits, net . . . . .
= Ordinary margin . . . . . . . . . . . . . . . . . . . . . . . .
– Operating costs: . . . . . . . . . . . . . . . . . . . . . . . .– Depreciation . . . . . . . . . . . . . . . . . . . . . . . . . .+ Other operating income/expenses . . . . . . . . .
= Operating margin . . . . . . . . . . . . . . . . . . . . . . .
– Writeoffs and provisions for credit losses . . . .– Writedowns of financial assets . . . . . . . . . . . . .+ Extraordinary gains (losses), net . . . . . . . . . . .
= Income before taxes . . . . . . . . . . . . . . . . . . . .
– Corporate income tax provision . . . . . . . . . . . .
= Net income . . . . . . . . . . . . . . . . . . . . . . . . . . .
Dividends . . . . . . . . . . . . . . . . . . . . . . . . . . . . .+ Retained earnings . . . . . . . . . . . . . . . . . . . . . .
2001
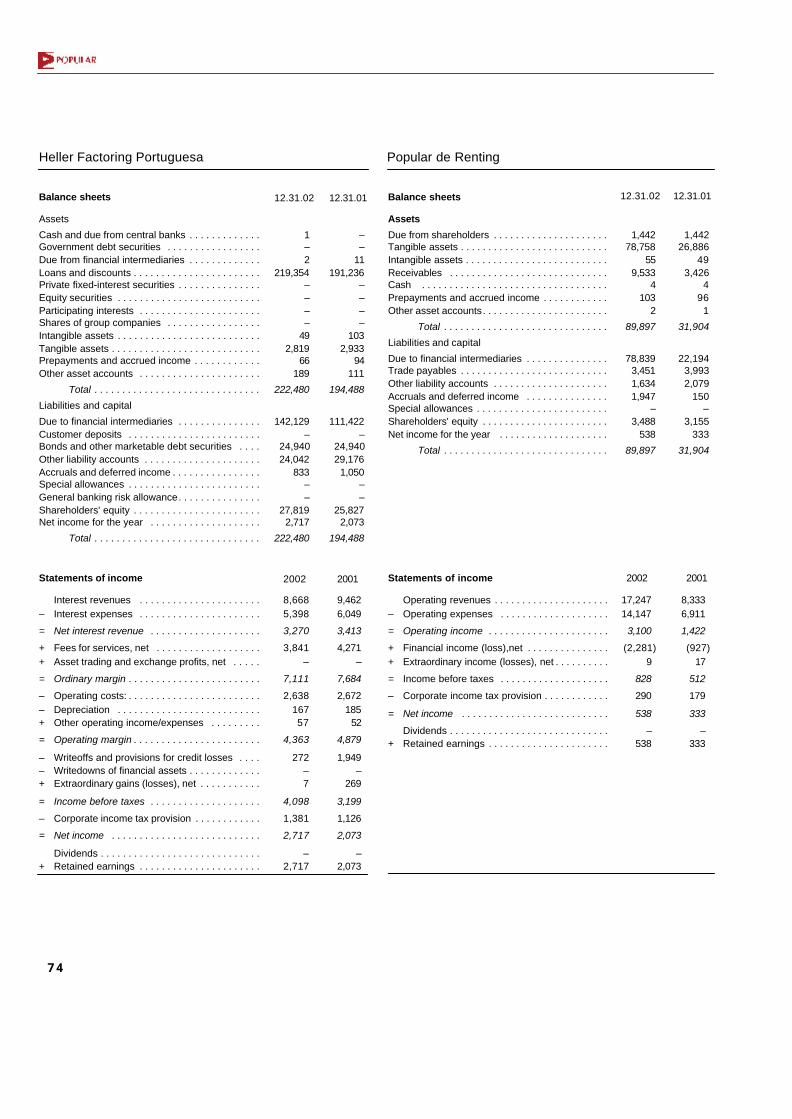
74
Assets
Cash and due from central banks . . . . . . . . . . . . .Government debt securities . . . . . . . . . . . . . . . . .Due from financial intermediaries . . . . . . . . . . . . .Loans and discounts . . . . . . . . . . . . . . . . . . . . . . .Private fixed-interest securities . . . . . . . . . . . . . . .Equity securities . . . . . . . . . . . . . . . . . . . . . . . . . .Participating interests . . . . . . . . . . . . . . . . . . . . . .Shares of group companies . . . . . . . . . . . . . . . . .Intangible assets . . . . . . . . . . . . . . . . . . . . . . . . . .Tangible assets . . . . . . . . . . . . . . . . . . . . . . . . . . .Prepayments and accrued income . . . . . . . . . . . .Other asset accounts . . . . . . . . . . . . . . . . . . . . . .
Total . . . . . . . . . . . . . . . . . . . . . . . . . . . . . .
Liabilities and capital
Due to financial intermediaries . . . . . . . . . . . . . . .Customer deposits . . . . . . . . . . . . . . . . . . . . . . . .Bonds and other marketable debt securities . . . .Other liability accounts . . . . . . . . . . . . . . . . . . . . .Accruals and deferred income . . . . . . . . . . . . . . . .Special allowances . . . . . . . . . . . . . . . . . . . . . . . .General banking risk allowance. . . . . . . . . . . . . . .Shareholders' equity . . . . . . . . . . . . . . . . . . . . . . .Net income for the year . . . . . . . . . . . . . . . . . . . .
Total . . . . . . . . . . . . . . . . . . . . . . . . . . . . . .
12.31.02Balance sheets
Heller Factoring Portuguesa
1–2
219,354––––
492,819
66189
222,480
142,129–
24,940 24,042
833––
27,8192,717
222,480
8,6685,398
3,270
3,841–
7,111
2,63816757
4,363
272– 7
4,098
1,381
2,717
–2,717
2002Statements of income
Interest revenues . . . . . . . . . . . . . . . . . . . . . .– Interest expenses . . . . . . . . . . . . . . . . . . . . . .
= Net interest revenue . . . . . . . . . . . . . . . . . . . .
+ Fees for services, net . . . . . . . . . . . . . . . . . . .+ Asset trading and exchange profits, net . . . . .
= Ordinary margin . . . . . . . . . . . . . . . . . . . . . . . .
– Operating costs: . . . . . . . . . . . . . . . . . . . . . . . .– Depreciation . . . . . . . . . . . . . . . . . . . . . . . . . .+ Other operating income/expenses . . . . . . . . .
= Operating margin . . . . . . . . . . . . . . . . . . . . . . .
– Writeoffs and provisions for credit losses . . . .– Writedowns of financial assets . . . . . . . . . . . . .+ Extraordinary gains (losses), net . . . . . . . . . . .
= Income before taxes . . . . . . . . . . . . . . . . . . . .
– Corporate income tax provision . . . . . . . . . . . .
= Net income . . . . . . . . . . . . . . . . . . . . . . . . . . .
Dividends . . . . . . . . . . . . . . . . . . . . . . . . . . . . .+ Retained earnings . . . . . . . . . . . . . . . . . . . . . .
12.31.01
––
11191,236
––––
1032,933
94111
194,488
111,422–
24,940 29,176
1,050––
25,8272,073
194,488
9,4626,049
3,413
4,271–
7,684
2,672185
52
4,879
1,949–
269
3,199
1,126
2,073
–2,073
2001
Assets
Due from shareholders . . . . . . . . . . . . . . . . . . . . .Tangible assets . . . . . . . . . . . . . . . . . . . . . . . . . . .Intangible assets . . . . . . . . . . . . . . . . . . . . . . . . . .Receivables . . . . . . . . . . . . . . . . . . . . . . . . . . . . .Cash . . . . . . . . . . . . . . . . . . . . . . . . . . . . . . . . . .Prepayments and accrued income . . . . . . . . . . . .Other asset accounts. . . . . . . . . . . . . . . . . . . . . . .
Total . . . . . . . . . . . . . . . . . . . . . . . . . . . . . .
Liabilities and capital
Due to financial intermediaries . . . . . . . . . . . . . . .Trade payables . . . . . . . . . . . . . . . . . . . . . . . . . . .Other liability accounts . . . . . . . . . . . . . . . . . . . . .Accruals and deferred income . . . . . . . . . . . . . . .Special allowances . . . . . . . . . . . . . . . . . . . . . . . .Shareholders' equity . . . . . . . . . . . . . . . . . . . . . . .Net income for the year . . . . . . . . . . . . . . . . . . . .
Total . . . . . . . . . . . . . . . . . . . . . . . . . . . . . .
12.31.02Balance sheets
Popular de Renting
1,44278,758
559,533
4103
2
89,897
78,8393,4511,6341,947
–3,488
538
89,897
17,24714,147
3,100
(2,281)9
828
290
538
–538
2002Statements of income
Operating revenues . . . . . . . . . . . . . . . . . . . . .– Operating expenses . . . . . . . . . . . . . . . . . . . .
= Operating income . . . . . . . . . . . . . . . . . . . . . .
+ Financial income (loss),net . . . . . . . . . . . . . . .+ Extraordinary income (losses), net . . . . . . . . . .
= Income before taxes . . . . . . . . . . . . . . . . . . . .
– Corporate income tax provision . . . . . . . . . . . .
= Net income . . . . . . . . . . . . . . . . . . . . . . . . . . .
Dividends . . . . . . . . . . . . . . . . . . . . . . . . . . . . .+ Retained earnings . . . . . . . . . . . . . . . . . . . . . .
1,44226,886
493,426
496
1
31,904
22,1943,9932,079
150–
3,155333
31,904
12.31.01
2001
8,3336,911
1,422
(927)17
512
179
333
–333
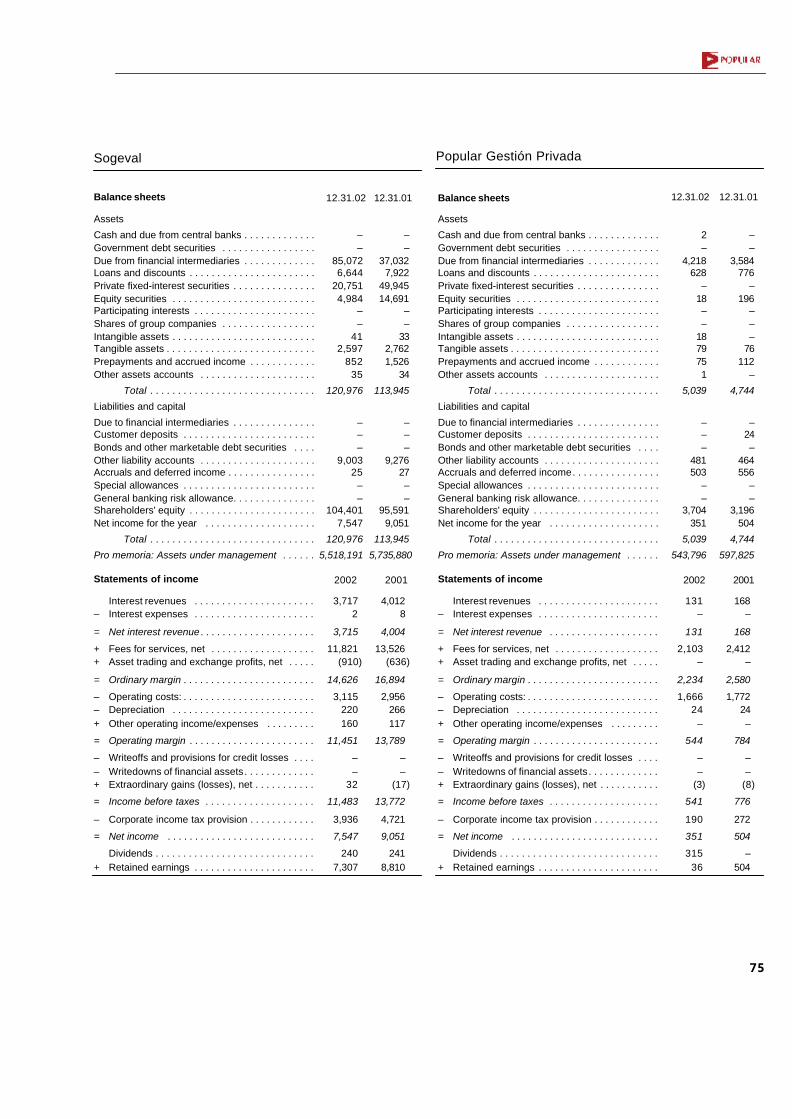
75
Popular Gestión Privada
Assets
Cash and due from central banks . . . . . . . . . . . . .Government debt securities . . . . . . . . . . . . . . . . .Due from financial intermediaries . . . . . . . . . . . . .Loans and discounts . . . . . . . . . . . . . . . . . . . . . . .Private fixed-interest securities . . . . . . . . . . . . . . .Equity securities . . . . . . . . . . . . . . . . . . . . . . . . . .Participating interests . . . . . . . . . . . . . . . . . . . . . .Shares of group companies . . . . . . . . . . . . . . . . .Intangible assets . . . . . . . . . . . . . . . . . . . . . . . . . .Tangible assets . . . . . . . . . . . . . . . . . . . . . . . . . . .Prepayments and accrued income . . . . . . . . . . . .Other assets accounts . . . . . . . . . . . . . . . . . . . . .
Total . . . . . . . . . . . . . . . . . . . . . . . . . . . . . .
Liabilities and capital
Due to financial intermediaries . . . . . . . . . . . . . . .Customer deposits . . . . . . . . . . . . . . . . . . . . . . . .Bonds and other marketable debt securities . . . .Other liability accounts . . . . . . . . . . . . . . . . . . . . .Accruals and deferred income. . . . . . . . . . . . . . . .Special allowances . . . . . . . . . . . . . . . . . . . . . . . .General banking risk allowance. . . . . . . . . . . . . . .Shareholders' equity . . . . . . . . . . . . . . . . . . . . . . .Net income for the year . . . . . . . . . . . . . . . . . . . .
Total . . . . . . . . . . . . . . . . . . . . . . . . . . . . . .
Pro memoria: Assets under management . . . . . .
12.31.02 12.31.01Balance sheets
––
3,584776
–196
–––
76112
–
4,744
–24–
464556
––
3,196504
4,744
597,825
2–
4,218628
–18––
1879751
5,039
–––
481503
––
3,704351
5,039
543,796
168–
168
2,412–
2,580
1,77224–
784
––
(8)
776
272
504
–504
131–
131
2,103–
2,234
1,66624
–
544
––
(3)
541
190
351
31536
2002 2001Statements of income
Interest revenues . . . . . . . . . . . . . . . . . . . . . .– Interest expenses . . . . . . . . . . . . . . . . . . . . . .
= Net interest revenue . . . . . . . . . . . . . . . . . . . .
+ Fees for services, net . . . . . . . . . . . . . . . . . . .+ Asset trading and exchange profits, net . . . . .
= Ordinary margin . . . . . . . . . . . . . . . . . . . . . . . .
– Operating costs: . . . . . . . . . . . . . . . . . . . . . . . .– Depreciation . . . . . . . . . . . . . . . . . . . . . . . . . .+ Other operating income/expenses . . . . . . . . .
= Operating margin . . . . . . . . . . . . . . . . . . . . . . .
– Writeoffs and provisions for credit losses . . . .– Writedowns of financial assets. . . . . . . . . . . . .+ Extraordinary gains (losses), net . . . . . . . . . . .
= Income before taxes . . . . . . . . . . . . . . . . . . . .
– Corporate income tax provision . . . . . . . . . . . .
= Net income . . . . . . . . . . . . . . . . . . . . . . . . . . .
Dividends . . . . . . . . . . . . . . . . . . . . . . . . . . . . .+ Retained earnings . . . . . . . . . . . . . . . . . . . . . .
Assets
Cash and due from central banks . . . . . . . . . . . . .Government debt securities . . . . . . . . . . . . . . . . .Due from financial intermediaries . . . . . . . . . . . . .Loans and discounts . . . . . . . . . . . . . . . . . . . . . . .Private fixed-interest securities . . . . . . . . . . . . . . .Equity securities . . . . . . . . . . . . . . . . . . . . . . . . . .Participating interests . . . . . . . . . . . . . . . . . . . . . .Shares of group companies . . . . . . . . . . . . . . . . .Intangible assets . . . . . . . . . . . . . . . . . . . . . . . . . .Tangible assets . . . . . . . . . . . . . . . . . . . . . . . . . . .Prepayments and accrued income . . . . . . . . . . . .Other assets accounts . . . . . . . . . . . . . . . . . . . . .
Total . . . . . . . . . . . . . . . . . . . . . . . . . . . . . .
Liabilities and capital
Due to financial intermediaries . . . . . . . . . . . . . . .Customer deposits . . . . . . . . . . . . . . . . . . . . . . . .Bonds and other marketable debt securities . . . .Other liability accounts . . . . . . . . . . . . . . . . . . . . .Accruals and deferred income . . . . . . . . . . . . . . . .Special allowances . . . . . . . . . . . . . . . . . . . . . . . .General banking risk allowance. . . . . . . . . . . . . . .Shareholders' equity . . . . . . . . . . . . . . . . . . . . . . .Net income for the year . . . . . . . . . . . . . . . . . . . .
Total . . . . . . . . . . . . . . . . . . . . . . . . . . . . . .
Pro memoria: Assets under management . . . . . .
12.31.02 12.31.01Balance sheets
Sogeval
––
37,0327,922
49,94514,691
––
332,7621,526
34
113,945
–––
9,27627––
95,5919,051
113,945
5,735,880
––
85,0726,644
20,7514,984
––
412,597
85235
120,976
–––
9,00325
––
104,4017,547
120,976
5,518,191
4,0128
4,004
13,526(636)
16,894
2,956266117
13,789
––
(17)
13,772
4,721
9,051
2418,810
3,7172
3,715
11,821(910)
14,626
3,115220160
11,451
––
32
11,483
3,936
7,547
2407,307
2002 2001Statements of income
Interest revenues . . . . . . . . . . . . . . . . . . . . . .– Interest expenses . . . . . . . . . . . . . . . . . . . . . .
= Net interest revenue . . . . . . . . . . . . . . . . . . . . .
+ Fees for services, net . . . . . . . . . . . . . . . . . . .+ Asset trading and exchange profits, net . . . . .
= Ordinary margin . . . . . . . . . . . . . . . . . . . . . . . .
– Operating costs: . . . . . . . . . . . . . . . . . . . . . . . .– Depreciation . . . . . . . . . . . . . . . . . . . . . . . . . .+ Other operating income/expenses . . . . . . . . .
= Operating margin . . . . . . . . . . . . . . . . . . . . . . .
– Writeoffs and provisions for credit losses . . . .– Writedowns of financial assets. . . . . . . . . . . . .+ Extraordinary gains (losses), net . . . . . . . . . . .
= Income before taxes . . . . . . . . . . . . . . . . . . . .
– Corporate income tax provision . . . . . . . . . . . .
= Net income . . . . . . . . . . . . . . . . . . . . . . . . . . .
Dividends . . . . . . . . . . . . . . . . . . . . . . . . . . . . .+ Retained earnings . . . . . . . . . . . . . . . . . . . . . .

76
Gestora Europea de Inversiones
Assets
Cash and due from central banks . . . . . . . . . . . . .Government debt securities . . . . . . . . . . . . . . . . .Due from financial intermediaries . . . . . . . . . . . . .Loans and discounts . . . . . . . . . . . . . . . . . . . . . . .Private fixed-interest securities . . . . . . . . . . . . . . .Equity securities . . . . . . . . . . . . . . . . . . . . . . . . . .Participating interests . . . . . . . . . . . . . . . . . . . . . .Shares of group companies . . . . . . . . . . . . . . . . .Intangible assets . . . . . . . . . . . . . . . . . . . . . . . . . .Tangible assets . . . . . . . . . . . . . . . . . . . . . . . . . . .Prepayments and accrued income . . . . . . . . . . . .Other assets accounts . . . . . . . . . . . . . . . . . . . . .
Total . . . . . . . . . . . . . . . . . . . . . . . . . . . . . .
Liabilities and capital
Due to financial intermediaries . . . . . . . . . . . . . . .Customer deposits . . . . . . . . . . . . . . . . . . . . . . . .Bonds and other marketable debt securities . . . .Other liability accounts . . . . . . . . . . . . . . . . . . . . .Accruals and deferred income . . . . . . . . . . . . . . . .Special allowances . . . . . . . . . . . . . . . . . . . . . . . .General banking risk allowance. . . . . . . . . . . . . . .Shareholders' equity . . . . . . . . . . . . . . . . . . . . . . .Net income for the year . . . . . . . . . . . . . . . . . . . .
Total . . . . . . . . . . . . . . . . . . . . . . . . . . . . . .
Pro memoria: Assets under management . . . . . .
12.31.02 12.31.01Balance sheets
––
2,453186583406
––88
225
3,671
–––
22–––
3,493156
3,671
302,852
––
915136
2,68411
––57
175
3,780
–––
654––
3,64962
3,780
304,709
136–
136
65131
818
5837–
228
–– –
228
72
156
–156
121–
121
48292
695
5929–
94
3–
(1)
90
28
62
–62
2002 2001Statements of income
Interest revenues . . . . . . . . . . . . . . . . . . . . . .– Interest expenses . . . . . . . . . . . . . . . . . . . . . .
= Net interest revenue . . . . . . . . . . . . . . . . . . . .
+ Fees for services, net . . . . . . . . . . . . . . . . . . .+ Asset trading and exchange profits, net . . . . .
= Ordinary margin . . . . . . . . . . . . . . . . . . . . . . . .
– Operating costs: . . . . . . . . . . . . . . . . . . . . . . . .– Depreciation . . . . . . . . . . . . . . . . . . . . . . . . . .+ Other operating income/expenses . . . . . . . . .
= Operating margin . . . . . . . . . . . . . . . . . . . . . . .
– Writeoffs and provisions for credit losses . . . .– Writedowns of financial assets . . . . . . . . . . . . .+ Extraordinary gains (losses), net . . . . . . . . . . .
= Income before taxes . . . . . . . . . . . . . . . . . . . .
– Corporate income tax provision . . . . . . . . . . . .
= Net income . . . . . . . . . . . . . . . . . . . . . . . . . . .
Dividends . . . . . . . . . . . . . . . . . . . . . . . . . . . . .+ Retained earnings . . . . . . . . . . . . . . . . . . . . . .
Assets
Cash and due from central banks . . . . . . . . . . . . .Government debt securities . . . . . . . . . . . . . . . . .Due from financial intermediaries . . . . . . . . . . . . .Loans and discounts . . . . . . . . . . . . . . . . . . . . . . .Private fixed-interest securities . . . . . . . . . . . . . . .Equity securities . . . . . . . . . . . . . . . . . . . . . . . . . .Participating interests . . . . . . . . . . . . . . . . . . . . . .Shares of group companies . . . . . . . . . . . . . . . . .Intangible assets . . . . . . . . . . . . . . . . . . . . . . . . . .Tangible assets . . . . . . . . . . . . . . . . . . . . . . . . . . .Prepayments and accrued income . . . . . . . . . . . .Other assets accounts . . . . . . . . . . . . . . . . . . . . .
Total . . . . . . . . . . . . . . . . . . . . . . . . . . . . . .
Liabilities and capital
Due to financial intermediaries . . . . . . . . . . . . . . .Customer deposits . . . . . . . . . . . . . . . . . . . . . . . .Bonds and other marketable debt securities . . . .Other liability accounts . . . . . . . . . . . . . . . . . . . . .Accruals and deferred income. . . . . . . . . . . . . . . .Special allowances . . . . . . . . . . . . . . . . . . . . . . . .General banking risk allowance. . . . . . . . . . . . . . .Shareholders' equity . . . . . . . . . . . . . . . . . . . . . . .Net income for the year . . . . . . . . . . . . . . . . . . . .
Total . . . . . . . . . . . . . . . . . . . . . . . . . . . . . .
12.31.02 12.31.01Balance sheets
Popular Bolsa
––
9,19031
–2,007
–––
8653
605
11,972
–––
3,114522
––
7,0151,321
11,972
––
6,35126
4,499491
–––
659
10
11,451
–––
2,562553
––
7,0231,313
11,451
837–
837
2,861(67)
3,631
1,62955
(13)
1,934
–– –
1,934
613
1,321
1,3138
602–
602
3,217(208)
3,611
1,60748
(13)
1,943
–– –
1,943
630
1,313
1,313–
2002Statements of income
Interest revenues . . . . . . . . . . . . . . . . . . . . . .– Interest expenses . . . . . . . . . . . . . . . . . . . . . .
= Net interest revenue . . . . . . . . . . . . . . . . . . . .
+ Fees for services, net . . . . . . . . . . . . . . . . . . .+ Asset trading and exchange profits, net . . . . .
= Ordinary margin . . . . . . . . . . . . . . . . . . . . . . . .
– Operating costs: . . . . . . . . . . . . . . . . . . . . . . . .– Depreciation . . . . . . . . . . . . . . . . . . . . . . . . . .+ Other operating income/expenses . . . . . . . . .
= Operating margin . . . . . . . . . . . . . . . . . . . . . . .
– Writeoffs and provisions for credit losses . . . .– Writedowns of financial assets. . . . . . . . . . . . .+ Extraordinary gains (losses), net . . . . . . . . . . .
= Income before taxes . . . . . . . . . . . . . . . . . . . .
– Corporate income tax provision . . . . . . . . . . . .
= Net income . . . . . . . . . . . . . . . . . . . . . . . . . . .
Dividends . . . . . . . . . . . . . . . . . . . . . . . . . . . . .+ Retained earnings . . . . . . . . . . . . . . . . . . . . . .
2001
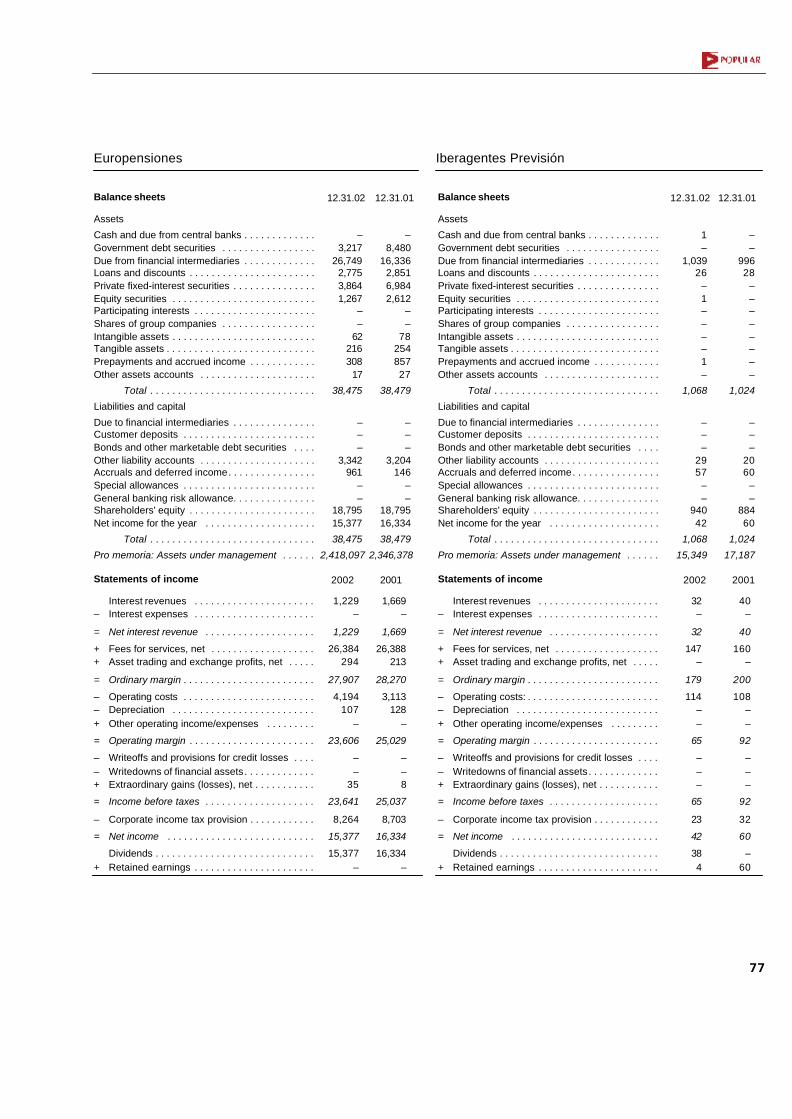
77
Iberagentes Previsión
Assets
Cash and due from central banks . . . . . . . . . . . . .Government debt securities . . . . . . . . . . . . . . . . .Due from financial intermediaries . . . . . . . . . . . . .Loans and discounts . . . . . . . . . . . . . . . . . . . . . . .Private fixed-interest securities . . . . . . . . . . . . . . .Equity securities . . . . . . . . . . . . . . . . . . . . . . . . . .Participating interests . . . . . . . . . . . . . . . . . . . . . .Shares of group companies . . . . . . . . . . . . . . . . .Intangible assets . . . . . . . . . . . . . . . . . . . . . . . . . .Tangible assets . . . . . . . . . . . . . . . . . . . . . . . . . . .Prepayments and accrued income . . . . . . . . . . . .Other assets accounts . . . . . . . . . . . . . . . . . . . . .
Total . . . . . . . . . . . . . . . . . . . . . . . . . . . . . .
Liabilities and capital
Due to financial intermediaries . . . . . . . . . . . . . . .Customer deposits . . . . . . . . . . . . . . . . . . . . . . . .Bonds and other marketable debt securities . . . .Other liability accounts . . . . . . . . . . . . . . . . . . . . .Accruals and deferred income. . . . . . . . . . . . . . . .Special allowances . . . . . . . . . . . . . . . . . . . . . . . .General banking risk allowance. . . . . . . . . . . . . . .Shareholders' equity . . . . . . . . . . . . . . . . . . . . . . .Net income for the year . . . . . . . . . . . . . . . . . . . .
Total . . . . . . . . . . . . . . . . . . . . . . . . . . . . . .
Pro memoria: Assets under management . . . . . .
12.31.02 12.31.01Balance sheets
––
99628
––––––––
1,024
–––
2060
––
88460
1,024
17,187
1–
1,03926
–1––––1–
1,068
–––
2957
––
94042
1,068
15,349
40–
40
160–
200
108––
92
–––
92
32
60
–60
32–
32
147–
179
114––
65
–––
65
23
42
384
2002 2001Statements of income
Interest revenues . . . . . . . . . . . . . . . . . . . . . .– Interest expenses . . . . . . . . . . . . . . . . . . . . . .
= Net interest revenue . . . . . . . . . . . . . . . . . . . .
+ Fees for services, net . . . . . . . . . . . . . . . . . . .+ Asset trading and exchange profits, net . . . . .
= Ordinary margin . . . . . . . . . . . . . . . . . . . . . . . .
– Operating costs: . . . . . . . . . . . . . . . . . . . . . . . .– Depreciation . . . . . . . . . . . . . . . . . . . . . . . . . .+ Other operating income/expenses . . . . . . . . .
= Operating margin . . . . . . . . . . . . . . . . . . . . . . .
– Writeoffs and provisions for credit losses . . . .– Writedowns of financial assets. . . . . . . . . . . . .+ Extraordinary gains (losses), net . . . . . . . . . . .
= Income before taxes . . . . . . . . . . . . . . . . . . . .
– Corporate income tax provision . . . . . . . . . . . .
= Net income . . . . . . . . . . . . . . . . . . . . . . . . . . .
Dividends . . . . . . . . . . . . . . . . . . . . . . . . . . . . .+ Retained earnings . . . . . . . . . . . . . . . . . . . . . .
Assets
Cash and due from central banks . . . . . . . . . . . . .Government debt securities . . . . . . . . . . . . . . . . .Due from financial intermediaries . . . . . . . . . . . . .Loans and discounts . . . . . . . . . . . . . . . . . . . . . . .Private fixed-interest securities . . . . . . . . . . . . . . .Equity securities . . . . . . . . . . . . . . . . . . . . . . . . . .Participating interests . . . . . . . . . . . . . . . . . . . . . .Shares of group companies . . . . . . . . . . . . . . . . .Intangible assets . . . . . . . . . . . . . . . . . . . . . . . . . .Tangible assets . . . . . . . . . . . . . . . . . . . . . . . . . . .Prepayments and accrued income . . . . . . . . . . . .Other assets accounts . . . . . . . . . . . . . . . . . . . . .
Total . . . . . . . . . . . . . . . . . . . . . . . . . . . . . .
Liabilities and capital
Due to financial intermediaries . . . . . . . . . . . . . . .Customer deposits . . . . . . . . . . . . . . . . . . . . . . . .Bonds and other marketable debt securities . . . .Other liability accounts . . . . . . . . . . . . . . . . . . . . .Accruals and deferred income. . . . . . . . . . . . . . . .Special allowances . . . . . . . . . . . . . . . . . . . . . . . .General banking risk allowance. . . . . . . . . . . . . . .Shareholders' equity . . . . . . . . . . . . . . . . . . . . . . .Net income for the year . . . . . . . . . . . . . . . . . . . .
Total . . . . . . . . . . . . . . . . . . . . . . . . . . . . . .
Pro memoria: Assets under management . . . . . .
12.31.02 12.31.01Balance sheets
Europensiones
–8,480
16,3362,8516,9842,612
––
7825485727
38,479
–––
3,204146
––
18,79516,334
38,479
2,346,378
–3,217
26,7492,7753,8641,267
––
62216308
17
38,475
–––
3,342961
––
18,79515,377
38,475
2,418,097
1,669–
1,669
26,388213
28,270
3,113128
–
25,029
–– 8
25,037
8,703
16,334
16,334–
1,229–
1,229
26,384294
27,907
4,194107
–
23,606
––
35
23,641
8,264
15,377
15,377–
2002 2001Statements of income
Interest revenues . . . . . . . . . . . . . . . . . . . . . .– Interest expenses . . . . . . . . . . . . . . . . . . . . . .
= Net interest revenue . . . . . . . . . . . . . . . . . . . .
+ Fees for services, net . . . . . . . . . . . . . . . . . . .+ Asset trading and exchange profits, net . . . . .
= Ordinary margin . . . . . . . . . . . . . . . . . . . . . . . .
– Operating costs . . . . . . . . . . . . . . . . . . . . . . . .– Depreciation . . . . . . . . . . . . . . . . . . . . . . . . . .+ Other operating income/expenses . . . . . . . . .
= Operating margin . . . . . . . . . . . . . . . . . . . . . . .
– Writeoffs and provisions for credit losses . . . .– Writedowns of financial assets. . . . . . . . . . . . .+ Extraordinary gains (losses), net . . . . . . . . . . .
= Income before taxes . . . . . . . . . . . . . . . . . . . .
– Corporate income tax provision . . . . . . . . . . . .
= Net income . . . . . . . . . . . . . . . . . . . . . . . . . . .
Dividends . . . . . . . . . . . . . . . . . . . . . . . . . . . . .+ Retained earnings . . . . . . . . . . . . . . . . . . . . . .

78
Popular de Participaciones Financieras
Assets
Cash and due from central banks . . . . . . . . . . . . .Government debt securities . . . . . . . . . . . . . . . . .Due from financial intermediaries . . . . . . . . . . . . .Loans and discounts . . . . . . . . . . . . . . . . . . . . . . .Private fixed-interest securities . . . . . . . . . . . . . . .Equity securities . . . . . . . . . . . . . . . . . . . . . . . . . .Participating interests . . . . . . . . . . . . . . . . . . . . . .Shares of group companies . . . . . . . . . . . . . . . . .Intangible assets . . . . . . . . . . . . . . . . . . . . . . . . . .Tangible assets . . . . . . . . . . . . . . . . . . . . . . . . . . .Prepayments and accrued income . . . . . . . . . . . .Other assets accounts . . . . . . . . . . . . . . . . . . . . .
Total . . . . . . . . . . . . . . . . . . . . . . . . . . . . . .
Liabilities and capital
Due to financial intermediaries . . . . . . . . . . . . . . .Customer deposits . . . . . . . . . . . . . . . . . . . . . . . .Bonds and other marketable debt securities . . . .Other liability accounts . . . . . . . . . . . . . . . . . . . . .Accruals and deferred income . . . . . . . . . . . . . . . .Special allowances . . . . . . . . . . . . . . . . . . . . . . . .General banking risk allowance. . . . . . . . . . . . . . .Shareholders' equity . . . . . . . . . . . . . . . . . . . . . . .Net income for the year . . . . . . . . . . . . . . . . . . . .
Total . . . . . . . . . . . . . . . . . . . . . . . . . . . . . .
12.31.02 12.31.01Balance sheets
––
25,252––
11,345––––
20–
36,617
–––
15864
––
36,044351
36,617
––
19,056––
16,488––––
1874
35,636
–––
19467
––
36,395(1,020)
35,636
918–
918
(60)(290)
568
27––
541
––
(1)
540
189
351
702–
702
(60)(1,645)
(1,003)
17––
(1,020)
–– –
(1,020)
–
(1,020)
2002 2001Statements of income
Interest revenues . . . . . . . . . . . . . . . . . . . . . .– Interest expenses . . . . . . . . . . . . . . . . . . . . . .
= Net interest revenue . . . . . . . . . . . . . . . . . . . . .
+ Fees for services, net . . . . . . . . . . . . . . . . . . .+ Asset trading and exchange profits, net . . . . .
= Ordinary margin . . . . . . . . . . . . . . . . . . . . . . . .
– Operating costs . . . . . . . . . . . . . . . . . . . . . . . .– Depreciation . . . . . . . . . . . . . . . . . . . . . . . . . .+ Other operating income/expenses . . . . . . . . .
= Operating margin . . . . . . . . . . . . . . . . . . . . . . .
– Writeoffs and provisions for credit losses . . . .– Writedowns of financial assets. . . . . . . . . . . . .+ Extraordinary gains (losses), net . . . . . . . . . . .
= Income before taxes . . . . . . . . . . . . . . . . . . . .
– Corporate income tax provision . . . . . . . . . . . .
= Net income . . . . . . . . . . . . . . . . . . . . . . . . . . .
Eurovida
Assets
Premises and equipment . . . . . . . . . . . . . . . . . . .Securities portfolio . . . . . . . . . . . . . . . . . . . . . . . .Reserves on reinsurance business . . . . . . . . . . . .Loans Prepayments, accrued income and other . . . . . . .Cash and due from banks . . . . . . . . . . . . . . . . . . .
Total . . . . . . . . . . . . . . . . . . . . . . . . . . . . . .
Liabilities and capital
Insurance reserves . . . . . . . . . . . . . . . . . . . . . . . .Other reserves . . . . . . . . . . . . . . . . . . . . . . . . . . .Accounts payable on reinsurance . . . . . . . . . . . . .Other liabilities . . . . . . . . . . . . . . . . . . . . . . . . . . . .Accruals, deferred income and other . . . . . . . . . .Shareholders' equity . . . . . . . . . . . . . . . . . . . . . . .Net income for the year . . . . . . . . . . . . . . . . . . . .
Total . . . . . . . . . . . . . . . . . . . . . . . . . . . . . .
12.31.02 12.31.01Balance sheets
305506,457
3,5921,0276,9131,301
519,595
476,564255
3,5929,796
57816,20812,602
519,595
212504,264
3,407215
7,881837
516,816
477,863259
3,4075,173
66316,78912,662
516,816
167,029(1,478)95,46341,9156,8252,399
18,949
(693)
18,256
9932–
19,251
6,649
12,602
12,020582
126,694(10,170)84,669
6657,6082,368
21,214
963
20,251
(840)54
–
19,465
6,803
12,662
12,100562
2002 2001Statements of income
Premiums written . . . . . . . . . . . . . . . . . . . . . . .+ Technical financial revenues . . . . . . . . . . . . . .– Claims paid. . . . . . . . . . . . . . . . . . . . . . . . . . . .– Increase in insurance reserves . . . . . . . . . . . .– Fees and other . . . . . . . . . . . . . . . . . . . . . . . . .– Operating costs: . . . . . . . . . . . . . . . . . . . . . . . .
= Gross underwriting income . . . . . . . . . . . . . . .
– Reinsurance result . . . . . . . . . . . . . . . . . . . . . .
= Net underwriting income . . . . . . . . . . . . . . . . . .
+ Nontechnical financial revenues . . . . . . . . . . . .+ Other revenues . . . . . . . . . . . . . . . . . . . . . . . .– Extraordinary expenses
= Income before taxes . . . . . . . . . . . . . . . . . . . .
– Corporate income tax provision . . . . . . . . . . . .
= Net income . . . . . . . . . . . . . . . . . . . . . . . . . . .
Dividends . . . . . . . . . . . . . . . . . . . . . . . . . . . . .+ Retained earnings . . . . . . . . . . . . . . . . . . . . . .

Financial Statements

80
Independent Auditors Report

81
Financial Reporting Responsibility
The Bank's General Management, as the technical and executivebody of Banco Popular pursuant to Article 22 of the Bank's Bylaws, isresponsible for the preparation and presentation of all the financialinformation appearing hereinafter.
In the Management's opinion, this information presents a true andfair view of the Bank's financial position, and all the operational andaccounting processes applied comply with current legal andadministrative regulations and with Bank of Spain instructions andrecommendations.
To this end, certain procedures, which are periodically reviewedand optimized, have been implemented to ensure that a uniformaccounting record is kept of all transactions by means of an appropriatesystem of internal controls.
These procedures include monthly management controls at alldecision-making levels, the scrutiny and approval of transactions in theframework of a formal system of functional delegation, ongoingprofessional training of the staff and the issuance and updating ofmanuals and operating standards. Also, the professional independenceof the related control bodies is formally established in the organization.
The financial statements were audited by PricewaterhouseCoopers.The accompanying notes, which are integral part of the financialstatements, include such explanations as were considered necessaryfor a clearer understanding and the disclosure of certain items requiredto bring the information into line with the current legally required formatsfor balance sheets and statements of income. For a thoroughunderstanding of the financial statements, reference should be made tothe background events and major results impacting them, which aredescribed in the Management Report contained in the preceding pagesof this document.

82
Banco Popular GroupConsolidated balance sheets (Notes 1,2,3 and 4)
€ thousand
Assets
Cash and due from central banksCash . . . . . . . . . . . . . . . . . . . . . . . . . . . . . . . . . . . . .Bank of Spain . . . . . . . . . . . . . . . . . . . . . . . . . . . . . .Other central banks . . . . . . . . . . . . . . . . . . . . . . . . .
Government debt securities (Note 5) . . . . . . . . . . . . .Due from financial intermediaries (Note 6)
Demand balances . . . . . . . . . . . . . . . . . . . . . . . . . .Other . . . . . . . . . . . . . . . . . . . . . . . . . . . . . . . . . . . .
Loans and discounts (Note 7) . . . . . . . . . . . . . . . . . . .Private fixed-interest securities (Note 8)
Issued by public bodies . . . . . . . . . . . . . . . . . . . . . .Issued by other issuers . . . . . . . . . . . . . . . . . . . . . .
Pro memoria: own securities . . . . . . . . . . . . . . . .Equity securities (Note 9) . . . . . . . . . . . . . . . . . . . . . .Participating interests (Note 10)
In financial intermediaries . . . . . . . . . . . . . . . . . . . .Other . . . . . . . . . . . . . . . . . . . . . . . . . . . . . . . . . . . .
Shares of Group companies (Note 11)Financial intermediaries . . . . . . . . . . . . . . . . . . . . . .Other . . . . . . . . . . . . . . . . . . . . . . . . . . . . . . . . . . . .
Intangible assets (Note 13)Formation and preopening expenses . . . . . . . . . . .Other amortizable expenses . . . . . . . . . . . . . . . . . .
Goodwill in consolidation (Note 12)Global and proportional integration method companiesEquity method companies . . . . . . . . . . . . . . . . . . . .
Tangible assets (Note 14)Land and buildings for own use . . . . . . . . . . . . . . . .Other properties . . . . . . . . . . . . . . . . . . . . . . . . . . . .Furniture, installations and other . . . . . . . . . . . . . . .
Unpaid subscribed common stockUnpaid capital calls . . . . . . . . . . . . . . . . . . . . . . . . .Remainder . . . . . . . . . . . . . . . . . . . . . . . . . . . . . . . .
Treasury stockPro memoria: face value . . . . . . . . . . . . . . . . . . .
Other asset accounts (Note 15) . . . . . . . . . . . . . . . . .Prepayments and accrued income (Note 16) . . . . . . .Losses at consolidated companies
Global and proportional integration method companiesEquity method companies . . . . . . . . . . . . . . . . . . . .Translation differences . . . . . . . . . . . . . . . . . . . . . . .
Consolidated loss for the yearGroup . . . . . . . . . . . . . . . . . . . . . . . . . . . . . . . . . . . .Minority interests . . . . . . . . . . . . . . . . . . . . . . . . . . .
Total . . . . . . . . . . . . . . . . . . . . . . . . . . . . . . . . . . . . . .
2001 2000
December 31
1999 19982002
1,887,105347,096
1,530,1689,841
623,8134,968,925
253,8974,715,028
27,368,371495,348
30,288465,060
–122,590
23,241–
23,24133,282
–33,28220,791
5520,73633,61328,3085,305
580,594204,289
53,282323,023
–––––
934,273299,970
3,6433,505
138––––
37,395,559
412,106270,284131,612
10,210302,689
5,466,607178,243
5,288,36422,962,523
591,92023,842
568,078–
59,9444,897
–4,897
32,581–
32,58113,615
6813,547
6,160386
5,774571,172193,768
64,005313,399
–––––
583,053349,480
1,047871176
––––
31,357,794
565,729275,066287,258
3,405498,333
4,701,077204,161
4,496,91618,640,575
466,4151,519
464,896–
45,9574,378
–4,378
30,151–
30,15113,500
23713,2638,501
4918,010
589,775194,364
99,439295,972
–––––
528,839237,473
353228125
––––
26,331,056
274,873176,83591,180
6,858517,213
4,771,97691,468
4,680,50816,629,068
494,20024,443
469,757–
79,3042,819
–2,819
27,472–
27,47210,908
610,902
1,316–
1,316619,000191,404132,583295,013
–––––
509,123218,943
13812
126––––
24,156,353
683,317363,890314,313
5,114129,346
4,706,692182,830
4,523,86233,711,019
544,14353,490
490,653–
390,87226,599
–26,59922,719
–22,71917,938
18417,754
7,2533,8703,383
568,280204,25747,401
316,622–––––
890,345297,242
9,3559,195
1564–––
42,005,120

83
Liabilities and Capital
Due to financial intermediaries (Note 17)Demand balances . . . . . . . . . . . . . . . . . . . . . . . . . .Term or prenotification balances . . . . . . . . . . . . . . .
Customer deposits (Note 18)Savings deposits
Demand . . . . . . . . . . . . . . . . . . . . . . . . . . . . . . . .Term . . . . . . . . . . . . . . . . . . . . . . . . . . . . . . . . . . .
Other depositsDemand . . . . . . . . . . . . . . . . . . . . . . . . . . . . . . . .Term . . . . . . . . . . . . . . . . . . . . . . . . . . . . . . . . . . .
Bonds and other marketable debt securities (Note 19)Bonds and debentures outstanding . . . . . . . . . . . . .Promissory notes and other securities . . . . . . . . . . .
Other liability accounts (Note 15) . . . . . . . . . . . . . . . .Accruals and deferred income (Note 16) . . . . . . . . . .Special allowances (Note 20)Pension allowance . . . . . . . . . . . . . . . . . . . . . . . . . .Provision for taxes . . . . . . . . . . . . . . . . . . . . . . . . . .Other allowances . . . . . . . . . . . . . . . . . . . . . . . . . . .
General banking risk allowance (Note 21) . . . . . . . . .Negative difference in consolidation (Note 12)Global and proportional integration method companiesEquity method companies . . . . . . . . . . . . . . . . . . . .
Consolidated income for the yearGroup . . . . . . . . . . . . . . . . . . . . . . . . . . . . . . . . . . .Minority interests . . . . . . . . . . . . . . . . . . . . . . . . . . .
Subordinated liabilities (Note 22) . . . . . . . . . . . . . . . .Minority interests (Note 23) . . . . . . . . . . . . . . . . . . . .Common shares . . . . . . . . . . . . . . . . . . . . . . . . . . . .Preferred shares . . . . . . . . . . . . . . . . . . . . . . . . . . .
Common stock (Note 24) . . . . . . . . . . . . . . . . . . . . . .Paid-in surplus (Note 25) . . . . . . . . . . . . . . . . . . . . . .Reserves (Note 25) . . . . . . . . . . . . . . . . . . . . . . . . . .Revaluation reserves (Note 25) . . . . . . . . . . . . . . . . .Consolidation reserves (Note 26)Global and proportional integration method companiesEquity method companies . . . . . . . . . . . . . . . . . . . .Translation differences . . . . . . . . . . . . . . . . . . . . . . .
Prior years´ earnings . . . . . . . . . . . . . . . . . . . . . . . . .
Total . . . . . . . . . . . . . . . . . . . . . . . . . . . . . . . . . . . . . .Memorandum accounts
Contingent liabilitiesRediscounts, endorsements and acceptances . . . .Assets securing sundry commitments . . . . . . . . . . .Guarantees and other sureties . . . . . . . . . . . . . . . . .Other contingent liabilities . . . . . . . . . . . . . . . . . . . .
CommitmentsRepos . . . . . . . . . . . . . . . . . . . . . . . . . . . . . . . . . . . .Unused portion of credit lines . . . . . . . . . . . . . . . . . .Other commitments . . . . . . . . . . . . . . . . . . . . . . . . .
The accompanying Notes 1 to 33 and Exhibits I to VI are an integral part of the consolidated financial statements
2001 2000
December 31
1999 1998
6,925,077276,854
6,648,22322,615,23621,344,59311,862,7109,481,8831,270,643
–1,270,6432,986,4661,968,1461,018,320
878,951301,009282,380
–12,207
270,173–
44418
426614,164565,282
48,882263,469498,347198,347300,000108,577
21,1641,036,194
–864,080848,354
14,807919
1
37,395,559
4,279,024–
5783,941,196
337,2505,015,418
–4,256,861
758,557
4,888,588202,174
4,686,41420,424,97518,571,63510,678,0887,893,5471,853,340
–1,853,3401,659,1621,161,888
497,274695,844274,261506,697396,966
9,90499,827
–570
18552
527,509490,557
36,952207,469355,908175,908180,000108,577
21,164910,035
–777,034761,730
14,394910
1
31,357,794
3,181,783–
12,9992,899,003
269,7814,464,278
–3,708,572
755,706
4,444,183195,905
4,248,27817,304,10116,070,27810,086,8445,983,4341,233,823
–1,233,8231,212,0831,028,330
183,753595,378193,226340,640295,847
9,47935,314
–552
18534
465,782432,727
33,055–
163,616163,616
–108,577
21,164805,195
–676,556659,990
15,674892
3
26,331,056
2,693,669–
24,6712,438,318
230,6804,086,788
–3,341,086
745,702
4,442,904164,744
4,278,16015,551,30214,408,4489,060,5885,347,8601,142,854
121,142,842
825,388825,388
–576,659177,479348,431310,633
9,17728,621
–553
18535
439,129406,963
32,166–
153,715153,715153,715
83,22248,718
907,787–
601,060585,241
14,923896
6
24,156,353
2,413,310–
28,9452,159,298
225,0673,281,676
–3,096,949
184,727
6,965,943290,351
6,675,59223,690,32922,701,25812,597,47310,103,785
989,071–
989,0716,009,9684,264,7661,745,202
923,709301,041229,471
–24,263
205,208–
418282136
687,735633,490
54,245245,356663,074225,074438,000108,577
21,1641,167,403
–990,931983,404
6,631896
1
42,005,120
5,283,579–
6044,897,752
385,2236,121,536
–5,375,722
745,814
2002

84
Interest and similar revenues (Note 31.b)Of which: revenues from fixed-interest securities . . . . .
Interest and similar charges (Note 31.b) . . . . . . . . . . . . . . .Revenues from equity securities
Shares and other equity securities . . . . . . . . . . . . . . . .Participating interests . . . . . . . . . . . . . . . . . . . . . . . . . .Shares of Group companies . . . . . . . . . . . . . . . . . . . . .
Intermediation margin (net interest revenue) . . . . . . . . .Fee revenues (Note 31.b) . . . . . . . . . . . . . . . . . . . . . . . . . . .Fee expenses (Note 31.b) . . . . . . . . . . . . . . . . . . . . . . . . . .Asset trading and exchange profits (Note 31.c) . . . . . . . . . .Ordinary margin . . . . . . . . . . . . . . . . . . . . . . . . . . . . . . . . .Other operating income (Note 31.e) . . . . . . . . . . . . . . . . . . .General administrative expenses
Personnel expenses (Note 31.d) . . . . . . . . . . . . . . . . . .- Of which: wages and salaries . . . . . . . . . . . . . . .
social security charges . . . . . . . . . . . .- Of which: pensions . . . . . . .
Other administrative expenses . . . . . . . . . . . . . . . . . . .Depreciation and writedowns of tangible and intangible assets .Other operating expenses (Note 31.e) . . . . . . . . . . . . . . . . .Operating margin . . . . . . . . . . . . . . . . . . . . . . . . . . . . . . . .Net earnings (losses) of equity method companies
Share in income of equity method companies . . . . . . .Share in losses of equity method companies . . . . . . . .Value adjustments for dividends collected . . . . . . . . . . .
Amortization of goodwill in consolidation . . . . . . . . . . . . . . .Gains on Group transactions
Gains on disposal of holdings in global and proportionalintegration method companies . . . . . . . . . . . . . . . . . . . .Gains on disposal of holdings in equity methodcompanies . . . . . . . . . . . . . . . . . . . . . . . . . . . . . . . . . . .Gains on transactions involving controlling companyshares and financial liabilities issued by the Group . . . .Reversal of negative differences in consolidation . . . . .
Losses on Group transactionsLosses on disposal of holdings in global and proportionalintegration method companies . . . . . . . . . . . . . . . . . . . .Losses on disposal of holdings in equity methodcompanies . . . . . . . . . . . . . . . . . . . . . . . . . . . . . . . . . . .Losses on transactions involving controlling companyshares and financial liabilities issued by the Group . . . .
Writeoffs and provisions for credit losses (net) . . . . . . . . . . .Writedowns of financial investments (net) . . . . . . . . . . . . . .Provision to general banking risks allowance . . . . . . . . . . . .Extraordinary income (Note 31.f) . . . . . . . . . . . . . . . . . . . . .Extraordinary losses (Note 31.f) . . . . . . . . . . . . . . . . . . . . .Income before taxes . . . . . . . . . . . . . . . . . . . . . . . . . . . . . .Corporate income tax (Note 27) . . . . . . . . . . . . . . . . . . . . . .Other taxes . . . . . . . . . . . . . . . . . . . . . . . . . . . . . . . . . . . . .Consolidated income for the year . . . . . . . . . . . . . . . . . . .
Income attributed to minority interests . . . . . . . . . . . . . .Common shares . . . . . . . . . . . . . . . . . . . . . . . . . .Preferred shares . . . . . . . . . . . . . . . . . . . . . . . . . .
Net income attributable to BPE shareholders . . . . .
Banco Popular GroupConsolidated income statements (Notes 1,2,3,4 and 31)
The accompanying Notes 1 to 33 and Exhibits I to VI are an integral part of the consolidated financial statements
2001 2000 1999 1998
2,284,11950,604
892,57810,000
1,7861,0967,118
1,401,541703,301135,95444,984
2,013,8721,474
749,208538,666393,024132,39129,304
210,54268,20341,352
1,156,5835,048
13,30038
(8,214)8,0583,283
97
132
3,054–
487
8
1
478190,617
––
32,698146,256852,194235,461
2,569614,16448,88240,487
8,395565,282
1,768,40053,548
649,5938,0021,270
7685,964
1,126,809653,375115,954119,491
1,783,7211,474
667,660477,021369,109
97,059–
190,63967,47439,144
1,010,9175,771
12,53935
(6,733)2,3516,355
808
–
5,547––
–
–
–101,905
––
28,361136,734810,414282,056
849527,509
36,95235,7711,181
490,557
1,362,86234,325
368,6635,9232,238
1623,523
1,000,122560,01093,15545,837
1,512,8141,333
633,923461,650356,64093,371
–172,27366,13537,430
776,6596,2589,943
–(3,685)1,459
353
19
–
334––
–
–
–65,403
––
33,82345,605
704,626238,844
–465,78233,05533,055
–432,727
1,460,67636,716
516,3239,1713,2751,1724,724
953,524497,00784,69547,324
1,413,1601,094
625,377455,525351,44891,600
–169,85264,46537,221
687,1916,647
12,543–
(5,896)703
4,628
1,569
3,047
12––
–
–
–45,527
––
36,20532,701
655,740216,052
559439,12932,16632,166
–406,963
2,355,97829,463
795,75031,15323,3761,3536,424
1,591,381729,678156,966
28,9482,193,041
1,901782,775552,354407,342133,866
27,681230,421
67,90736,157
1,308,1034,745
13,194672
(7,777)63,4203,313
139
–
3,174–
3,205
–
–
3,205235,088
–9,402
103,17452,791
1,055,429365,259
2,435687,735
54,24541,97212,273
633,490
2002€ thousand

85
NOTES TO THE FINANCIALSTATEMENTS
(1) Description of Banco Popular Español,basis of presentation of the consolidatedfinancial statements, consolidation principlesand net worth
Description of Banco Popular Español
Banco Popular Español, SA is a private law entitywhose corporate purpose, per Article 4 of itsbylaws, is banking. Its activities are subject to therules and regulations applicable to banksoperating in Spain.
The Bank was founded on July 14, 1926, and isregistered with the Madrid Mercantile Register(volume 174, sheet 44, page 5,458, first entry). Itis a member of the Spanish Bank DepositsGuarantee Fund, and its registered offices are at34 Velázquez Street, 28001 Madrid.
The Bank is the controll ing company of acorporate group whose business activities aredirectly and indirectly controlled by it.
Basis of presentation
The accompanying consolidated financialstatements of the Banco Popular Group arepresented in the formats stipulated in Bank ofSpain Circular 4/1991 and subsequentamendments thereto and, accordingly, give a trueand fair view of the consolidated net worth,financial position, risks and results. All amountsare expressed in thousands of euros.
In accordance with the requirements of Article 8of Law 13/1985 regulating investment and capitalratios and reporting obligations for financialintermediaries, the consolidated financialstatements reflect all the financial businessactivities of the Group in the broadest sense,including the instrumental companies used tolegally support such activities.
The consolidation methods used are those setforth in Royal Decree 1371/1985, regulating theconsolidation of the financial statements ofdeposit-taking entities, in Bank of Spain Circular4/1991 implementing that Royal Decree, and inRoyal Decree 1815/1991 on the preparation ofconsolidated financial statements.
The consolidated financial statements and theaccompanying notes were prepared in accordancewith the specific requirements of Bank of SpainCircular 4/1991 and with the generally applicableprovisions of the Corporations Law, theCommercial Code, the National Chart of Accountsand Royal Decree 1815/1991.
The 2002 consolidated financial statements havenot yet been approved by the ShareholdersMeeting. However, the Bank´s Board of Directorsconsiders that they will be approved without anysignificant changes.
Accounting principles
The generally accepted accounting principles andvaluation methods described in Note 2 were appliedin preparing the consolidated financial statements.
Consolidation principles
The scope of consolidation, defined in accordancewith Bank of Spain Circulars 4/1991 and 5/1993,comprised the Group companies (consolidated andnonconsolidable), the multigroup companies andthe associated companies. The Group includes allthe companies which are directly or indirectly 50%or more owned by the Bank and the less than 50%Bank-owned companies which are effectivelycontrolled by the Bank and constitute, together withthe Bank, a single decision-making unit.
The global integration method was used toconsolidate the finance and instrumentalcompanies in the consolidated Group, theproportional integration method for the multigroupfinancial companies, and the equity method forthe subsidiaries not consolidable due to their lineof business, for the non-financial multigroupcompanies and for the associated companies.
Except for the nonconsolidated portioncorresponding, in the case of business relationshipsbetween global integration method consolidatedcompanies and multigroup companies, to the latter,all accounts and transactions between consolidatedcompanies were eliminated in consolidation; theamounts not eliminated are disclosed in the relevantsections of the notes to the financial statements.Minority interests, which are explicitly reflected assuch in the 2002 and 2001 consolidated balancesheets and income statements, correspond toshareholders not directly or indirectly related to theGroup.

Net worth
The Group´s year-end net worth per books, afterthe distribution of income, and the variationstherein are shown in the following table. TheBanco Popular column reflects the amounts of thefollowing accounts in the consolidated balancesheet: common stock; paid-in surplus; reserves,after consolidation adjustments allocable to theparent company´s net worth; and revaluationreserves. The material amounts and items aredetailed in the section dealing with the individualcomponents of net worth.
Capital requirements
The current legislation on the capital of financialentities and their supervision on a consolidatedbasis came into force in 1993 after the previouslegislation (Law 13/1985 regulating theinvestment ratios, capital and reportingobligations of financial intermediaries) had beenamended by the enactment of Law 13/1992(subsequently implemented by Royal Decrees1343/1992 and 2024/1995, a Ministerial Order ofDecember 30, 1992, modified by Ministerial Orderdated December 4, 1996, and Bank of Spain
86
Balance at 12/31/97 . . . . . . . . . . . . . . . .
Variations:Transfer to pension allowance . . . . . . . .Dividend charged to reserves . . . . . . . . .Transfer from pension allowance . . . . .Consolidation operations (net) . . . . . . . .1998 net income . . . . . . . . . . . . . . . . . . .1998 dividend . . . . . . . . . . . . . . . . . . . . .
Balance at 12/31/98 . . . . . . . . . . . . . . . .
Variations:Transfer to pension allowance . . . . . . . .Cancellation of sares . . . . . . . . . . . . . . .Transfer from pension allowance . . . . .Consolidation operations (net) . . . . . . . .1999 net income . . . . . . . . . . . . . . . . . . .1999 dividend . . . . . . . . . . . . . . . . . . . . .
Balance at 12/31/99 . . . . . . . . . . . . . . . .
Variations:Transfer of prepaid taxes . . . . . . . . . . .Consolidation operations (net) . . . . . . . .2000 net income . . . . . . . . . . . . . . . . . . .2000 dividend . . . . . . . . . . . . . . . . . . . . .
Balance at 12/31/00 . . . . . . . . . . . . . . . .
Variations:Transfer for early retirements (net) . . . . .Capitalization of taxes-early retirements .Consolidation operations (net) . . . . . . . .2001 net income . . . . . . . . . . . . . . . . . . .2001 dividend . . . . . . . . . . . . . . . . . . . . .
Balance at 12/31/01 . . . . . . . . . . . . . . . .
Variations:Transfer from early retirements . . . . . . .Transfer for early retirements (net) . . . . .Consolidation operations (net) . . . . . . . .2002 net income . . . . . . . . . . . . . . . . . . .2002 dividend . . . . . . . . . . . . . . . . . . . . .
Balance at 12/31/02 . . . . . . . . . . . . . . . .
BancoPopular
Consolidationreserves Total
1,197,264
(90,152)(86,552)16,1852,988
313,229(216,376)
1,136,586
(69,002)(147,893)
15,596(348)
323,788(234,041)
1,024,686
7,2127,879
376,290(259,499)
1,156,568
(28,600)20,59817,370
446,604(295,330)
1,317,210
7,257(22,100)(5,222)
491,947(325,731)
1,463,361
636,634
(30,856)–
9,027(13,883)93,734
–
694,656
(19,515)–
5,767(4,705)
108,939–
785,142
2,195(11,350)114,267
–
890,254
(15,556)5,696
(19,957)118,678
–
979,115
5,529(10,898)
7,830141,543
–
1,123,119
1,833,898
(121,008)(86,552)25,212
(10,895)406,963
(216,376)
1,831,242
(88,517)(147,893)
21,363(5,053)
432,727(234,041)
1,809,828
9,407(3,471)
490,557(259,499)
2,046,822
(44,156)26,294(2,587)
565,282(295,330)
2,296,325
12,786(32,998)
2,608633,490(325,731)
2,586,480
€ thousand

87
Circular 5/1993) on the determination and controlof minimum capital. Circular 5/1993 wasexpanded and amended by the inclusion of thefinal implementing instructions on this topic inCircular 12/1993, which regulated the treatment oftrading portfolios and the risks assumed by banksin their foreign currency transactions and cameinto force in 1994. Also, Bank of Spain Circulars12/1996, 3/1997 and 5/1998 introduced the mostrecent changes in this area. Under theseregulations, financial entities must at all timeshave sufficient computable capital to cover theiraggregate exposure for credit risks, based on theassets, commitments and other memorandumaccounts exposed to credit risk, and theirexposure for exchange rate risk, based on the netoverall foreign currency position; and theexposure for trading portfolio risks. The adjustedrisk assets - net of depreciation, specificallowances, capital deductions and compensatingbalances - are weighted by certain coefficientsbased on the level of counterparty risk. Therequirements for contingent liabilities and forexchange and interest rate related memorandumaccounts are determined in the same way asdescribed above for risk assets, with theappl icat ion of cer ta in correct ion factors-depending on the level of risk in the contingentliabilities and on the period of time since originalmaturity in the exchange and interest rate relatedmemorandum accounts- before weighting by thecounterparty risk coefficients.
As of December 31, 2002, when the proposeddistribution of the income for the year is made, theconsolidated Group´s computable capital willexceed the regulatorily required minimum amountby €577,430 thousand. The cushion at 2001 year-end was €611,572 thousand. The regulatorilystipulated limits for foreign currency positions, riskconcentration and fixed asset additions were alsocomplied with in 2002 and 2001.
Changes in accounting regulations in 2002and 2001
In 2002 there was no accounting regulationchange affecting the consolidated financialstatements which calls for comment here.
The only noteworthy regulatory change in 2001was that introduced by Bank of Spain Circular4/2001, which adapted the provisions of Royal
Decree 948/2001 by including in the basis ofcalculation of contributions to the DepositGuarantee Fund 5% of the securities and otherfinancial instruments held in custody, valued by themethod stated in the aforementioned regulation.
External Audit
The consolidated financial statements of BancoPopular Español, SA, and its Group as ofDecember 31, 2002, and the individual financialstatements of Banco Popular Español, SA, at thatdate have been audited byPricewaterhouseCoopers, which also auditedthose of the previous year.
As required by Law 44/2002 on financial systemreform measures, the following additionalinformation is provided here:
In June 2002 the Group andPricewaterhouseCoopers agreed on the rotationof the audit team members, and this was appliedfor the audit work relating to 2002.
The fees paid by the Group toPricewaterhouseCoopers in 2002 for audit andaccounting review work amounted to €873thousand. The Group also paid fees of €85thousand to a firm related with the audit firm forthe provision of other professional services.
(2) Accounting principles and valuationmethods
The consolidated financial statements wereprepared in accordance with the accountingprinciples set forth in Bank of Spain Circular 4/1991and subsequent amendments. The most significantaccounting principles applied are as follows:
a) Recognition of revenues and expenses
Revenues and expenses are recognized foraccounting purposes on an accrual basis. Inaccordance with banking practice, transactionsare recorded as of the date they are made, whichmay differ from the value date as of which interestrevenue and expense are calculated. However, inapplication of the accounting principle ofprudence and as required by Bank of Spainregulations, interest revenues on nonperforming,disputed or doubtful balances are not recognizeduntil they are collected.

88
b) Foreign currency transactions
The balances of accounts in foreign currencies(including those of the branches and dependentcompanies abroad) have generally beentranslated to € at the average official exchangerates published by the European Central Bank ateach year end; the income statements of theforeign companies located in countries outsidethe euro area included in consolidation have beentranslated at the exchange rates ruling on thedates of the related transactions, and thereserves of these companies have beentranslated at historical exchange rates.
The exchange differences at each entity arerecognized and accounted for currently, and arepresented at their net amount under the "Assettrading and exchange profits" caption in theconsolidated income statements. The differencesrelating to term transactions are booked as acontra item in a balance sheet account includedunder the "Other asset accounts" or "Otherliability accounts" caption, depending on theirsign.
Exchange gains in consolidation are recorded asan item of "Consolidation reserves", withindividual disclosure of the companies at whichthey arise.
c) Credit loss allowance
The credit loss allowance is recorded to cover anypotential losses in the recovery of all the risksassumed by the Bank and the companies in itsconsolidated Group. The coverage for creditlosses is provided by the specific, general,statistical and country-risk allowances, whichjointly constitute the credit loss allowance.
As required by Bank of Spain Circular 4/1991, thisallowance is calculated as follows:
- The specific allowance for loans and discountsand off-balance sheet risks (excluding countryrisk), determined on an individual borrower basisas required by Bank of Spain regulations. Thisallowance includes the coverage for thecontributions to securitization funds, thesubordinated securities issued by these funds andthe subordinated financing provided to them. Thiscoverage will be that which the bank would havehad to book had it retained the fund's assets in itsportfolio, up to the limit of the amount of thestated contributions, securities and financing.
- The general 1% allowance (0.5% for mortgageloans for completed housing units provided thatthe guarantees were established as a result of thefinancing provided, and for leasing transactionsprovided that the outstanding risk does notexceed 80% of the appraised value of the housingunits) for private-sector loans and discounts,fixed-interest securities in the investment portfolioand off-balance sheet risks, includingdocumentary credits, which is intended to providecoverage for exposure which, although notspecifically identified, might arise in the future.
- The statistical allowance provided quarterly,since its entry into force on July 1, 2000, for thepositive difference between, on the one hand,one-fourth of the statistically estimated overalllatent credit losses in the various portfolios ofhomogeneous risks (credit and off-balance sheetrisks weighted by the corresponding coefficients)and, on the other, the net provisions recorded forcredit losses in the quarter, these net provisionsfor credit losses being deemed to be the specificprovisions net of the recovery of assets written off.
- The country risk allowance, based on theestimated degree of difficulty being experiencedby each financially troubled country.
The specific allowance account balance isincreased by provisions charged to period incomeand decreased by writeoffs of debts classified asuncollectible or that have been nonperforming formore than three years (six years fornonperforming mortgage loans), by releases ofprovisions previously recorded, and by transfersto the allowance for foreclosed assets when thebanks repossess foreclosed assets. Also, when abalance which is not fully covered by thisallowance is written off as uncollectible, theportion not covered is recorded as a direct writeoffcharged to income for the year.
The general allowance is increased by provisionscharged to income and is decreased when therisks comprising the calculation basis are reducedin comparison with the preceding period, leavingamounts that can be released.
The statistical allowance consists of the quarterlyprovisions from period income and is decreasedby amounts credited to the income statement forrecoveries when the difference is negative, asexplained earlier with respect to the criteria forprovision, because the net provision for specificcredit losses in the quarter exceeds, in the same

89
period, the statistically estimated overall latentlosses in the various portfolios of homogeneousrisks. This statistical allowance cannot exceedthree times the sum of the amounts of thedifferent categories of credit risk weighted by theirrelated coefficients.
The country risk allowance is established byprovisions charged to income and is decreasedby the write-off of debts classified as uncollectibleand by recovery of amounts released ondisappearance of the causes of the risk, and byupgrading of the country classification.
The allowances for loans and discounts and forcountry risk are presented in the balance sheetsas deductions under the asset captions to whichthey relate -"Due from financial intermediaries"and "Loans and discounts" and "Private fixed-interest securities"- and the allowance for off-balance sheet risks is presented under the"Special allowances" liability caption; however,the balances of "Guarantees and other sureties"and "Other contingent l iabil it ies" in thememorandum accounts of the balance sheets arepresented at the gross amount, i.e. not net of therelated allowance for doubtful balances. In thepublic income statements, the provisions bookedare presented net of allowances released and ofrecoveries of bad debts written off.
d) Securities portfolios
The aggregate securities comprising the differentsecurities portfolios are presented in the balancesheet in accordance with their nature. However,Bank of Spain Circular 6/1994 (on accountingstandards and financial statement formats)amended Circular 4/1991 and regulated fourcategories of securities portfolio for valuationpurposes, as follows:
I. Trading portfolio. This portfolio can includefixed-interest and equity securities that a bankwants to hold in its assets to benefit at short-termfrom price variations. Only publicly listedsecurities in which trading is brisk, of good depthand not susceptible to influence by individualprivate agents qualify for inclusion in this portfolio.Securities issued by the bank itself or by group orassociated companies, securities bought and soldon a repo basis, and securities delivered forguarantee purposes may not be included in thetrading portfolio.
The securities in the trading portfolio must be valuedat market prices, and the differences between bookvalue and market price must be reported as "Asset
trading and exchange profits". However, the interestearned and dividends collected are recorded as"Interest and similar revenues" and "Revenues fromequity securities", respectively.
II. Ordinary investment portfolio. This portfolioincludes the fixed-interest or equity securities notassigned to any other category. Fixed-interestsecurities must be recorded initially at purchaseprice, net where appropriate of accrued interest.The positive or negative difference between thepurchase price and the redemption value must beaccrued over the residual term of the security,adjusting the security's initial price by a credit ordebit to income under "Interest and similarrevenues", with the resulting valuation beingdenominated as "adjusted purchase price".
The valuation and security price fluctuationallowance procedures for listed fixed-interestsecurities in this portfolio are as follows:
- The difference between the adjusted purchaseprice, as defined above, and the closing marketprice, net where appropriate of accrued interest,must be calculated for each class of securities. Inthe case of securities for which the market is ofscant depth or erratic, the average market price inthe last ten market days of the year must be usedinstead of the closing market price. Whensecurities are sold under repurchase agreements,the difference is limited to the proportional part forthe period between completion of the repotransaction and the maturity date of the security.
- The aggregate amount of the net unrealizedlosses disclosed by the calculation must berecorded in an asset account under the"Prepayments and accrued income" caption,netting off from its balance the unrealized gainson listed securities in this portfolio. The resultingamount must be deducted from the capital basefor the purpose of calculating compliance with therelated minimum level requirements. The contraitem for these adjustments is the security pricefluctuation allowance.
- When securities in this portfolio are disposed of,the gains or losses with respect to the adjustedpurchase price must be recognized in income,and if there are gains, a provision for the netamount of the gains less the losses on thisportfolio must be made to the security pricefluctuation allowance. This provision may bereleased if and as continued coverage ceases tobe necessary because of market price recovery orlosses on subsequent disposals.
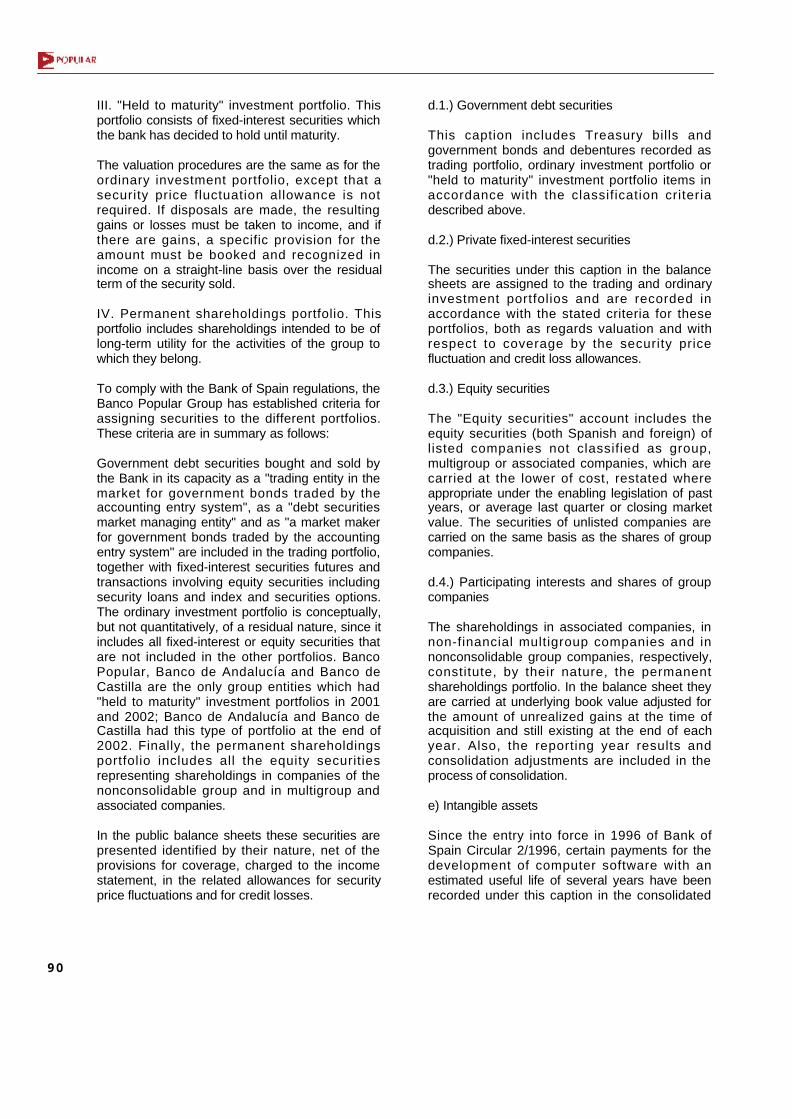
90
III. "Held to maturity" investment portfolio. Thisportfolio consists of fixed-interest securities whichthe bank has decided to hold until maturity.
The valuation procedures are the same as for theordinary investment portfolio, except that asecurity price fluctuation allowance is notrequired. If disposals are made, the resultinggains or losses must be taken to income, and ifthere are gains, a specific provision for theamount must be booked and recognized inincome on a straight-line basis over the residualterm of the security sold.
IV. Permanent shareholdings portfolio. Thisportfolio includes shareholdings intended to be oflong-term utility for the activities of the group towhich they belong.
To comply with the Bank of Spain regulations, theBanco Popular Group has established criteria forassigning securities to the different portfolios.These criteria are in summary as follows:
Government debt securities bought and sold bythe Bank in its capacity as a "trading entity in themarket for government bonds traded by theaccounting entry system", as a "debt securitiesmarket managing entity" and as "a market makerfor government bonds traded by the accountingentry system" are included in the trading portfolio,together with fixed-interest securities futures andtransactions involving equity securities includingsecurity loans and index and securities options.The ordinary investment portfolio is conceptually,but not quantitatively, of a residual nature, since itincludes all fixed-interest or equity securities thatare not included in the other portfolios. BancoPopular, Banco de Andalucía and Banco deCastilla are the only group entities which had"held to maturity" investment portfolios in 2001and 2002; Banco de Andalucía and Banco deCastilla had this type of portfolio at the end of2002. Finally, the permanent shareholdingsportfolio includes all the equity securitiesrepresenting shareholdings in companies of thenonconsolidable group and in multigroup andassociated companies.
In the public balance sheets these securities arepresented identified by their nature, net of theprovisions for coverage, charged to the incomestatement, in the related allowances for securityprice fluctuations and for credit losses.
d.1.) Government debt securities
This caption includes Treasury bills andgovernment bonds and debentures recorded astrading portfolio, ordinary investment portfolio or"held to maturity" investment portfolio items inaccordance with the classification criteriadescribed above.
d.2.) Private fixed-interest securities
The securities under this caption in the balancesheets are assigned to the trading and ordinaryinvestment portfolios and are recorded inaccordance with the stated criteria for theseportfolios, both as regards valuation and withrespect to coverage by the security pricefluctuation and credit loss allowances.
d.3.) Equity securities
The "Equity securities" account includes theequity securities (both Spanish and foreign) oflisted companies not classified as group,multigroup or associated companies, which arecarried at the lower of cost, restated whereappropriate under the enabling legislation of pastyears, or average last quarter or closing marketvalue. The securities of unlisted companies arecarried on the same basis as the shares of groupcompanies.
d.4.) Participating interests and shares of groupcompanies
The shareholdings in associated companies, innon-financial multigroup companies and innonconsolidable group companies, respectively,constitute, by their nature, the permanentshareholdings portfolio. In the balance sheet theyare carried at underlying book value adjusted forthe amount of unrealized gains at the time ofacquisition and still existing at the end of eachyear. Also, the reporting year results andconsolidation adjustments are included in theprocess of consolidation.
e) Intangible assets
Since the entry into force in 1996 of Bank ofSpain Circular 2/1996, certain payments for thedevelopment of computer software with anestimated useful life of several years have beenrecorded under this caption in the consolidated

91
balance sheets and are being amortized on astraight-line basis over the projected period ofuseful life, which cannot exceed three years. Theamortization is recorded on the basis of thenature of the expenses.
The formation and start-up expenses and otheramortizable expenses of consolidated companies,which are of scant amount, are presented net ofaccumulated amortization. These expenses areamortized in a maximum period of five years.
f) Goodwill and negative difference in consolidation
The differences between the cost of the holdingsin each of the consolidated companies and theirrespective adjusted underlying book values at thedate of initial consolidation are accounted for asfollows:
1. If the difference can be allocated directly to theaffiliate´s balance sheet items, it is booked as anincrease in the value of the assets (or as adecrease in the value of the liabilities) whosemarket values are higher than the net book valuesper its balance sheet and which are treated foraccounting purposes in the same way as theGroup treats its similar assets.
2. Any difference remaining after application ofthe foregoing procedure is booked, depending onits sign, as follows:
a) Positive balances are reflected as goodwill inconsolidation and are amortized on a straight-linebasis from the date of purchase in a maximumperiod of five years, which is the period duringwhich the Group considers that it will benefit fromthe goodwill. The charges to the accompanyingconsolidated income statements for amortizationof goodwill are recorded under the "Amortizationof goodwill in consolidation" caption.Exceptionally, in 2002 the Group amortized thetotal amount (€37,516 thousand) of the goodwill inconsolidation of Fortior Holding for the acquisitionof 35% in 2002, and took extraordinaryamortization of €17,025 thousand for theoutstanding balance of the initial purchase. Also,an additional amount of €176 thousand of thegoodwill in consolidation of Bancopopular-e wasamortized in 2002 in order to cancel this balance.
b) The negative differences in consolidation arereflected as a provision in the consolidated
balance sheets and wil l be creditable toconsolidated income if and when theshareholdings in the related companies are whollyor partially disposed of (see Note 12).
g) Tangible assets
Premises and equipment are carried at cost,restated where appropriate pursuant to theenabling restatement legislation, net of the relatedaccumulated depreciation and the specificallowances recorded to cover potential losses onforeclosed assets. All fixed asset items, whetherlegally restated or not, are depreciated at theofficial rate-table rates published in Royal Decree537/1997.
The annual depreciation rates most commonlyused in 2002 and 2001 were as follows:
Buildings 2% - 4%
Office equipment 12% - 25%
Furniture and installations 6% - 16%
Computer equipment 16% - 25%
Accumulated depreciation at the consolidatedcompanies totaled €568,145 thousand in 2002and €516,295 thousand in 2001.
Upkeep and maintenance expenses areexpensed currently.
Leased premises and equipment are recorded atcost, net of the related accumulated depreciation.
Fixed assets, if any, rented to Group companies areincluded under the "Premises and Equipment"caption and fixed assets assigned to third parties areincluded under the "Loans and Discounts" caption.
The premises and equipment of the subsidiariesmerged in prior years are accounted for at thepost-merger company at the book value at whichthey had been carried by the companiesabsorbed, without any write-up.
h) Treasury stock
To insure the liquidity of the stock in the market,in 2002 and 2001 the Bank intervened as a buyerin 0.92% and 1.1%, respectively, of the

92
transactions involving its own shares and as aseller in the same percentage. The maximumtreasury stock held at any time during the yearswas 1,645,542 shares in 2002 and 613,224shares in 2001 (0.76% and 0.28%, respectively).
As of December 31, 2002, and as at the samedate in 2001, the Bank did not own any treasurystock, either directly or through any groupcompany, whether consolidable or not.
i) Pension commitments
At December 31, 2002 and 2001, the Group banksoperating in Spain had externalized the full amountof the pension commitments to their serving andretired employees and these employees'beneficiary rightholders under the current collectivebargaining agreement, or similar regulation, bymeans of insured occupational pension plans andinsurance contracts, pursuant to the terms of RoyalDecree 1588/1999. As a result of thesetransactions, the banks have transferred to theinsurance company all their pension commitmentsand have ceased to have any actuarial, financial orother risk in this connection.
Serving employees
On November 8, 2001, Banco Popular Españoland its subsidiaries Banco de Andalucía, Bancode Castilla, Banco de Crédito Balear, Banco deGalicia, Banco de Vasconia, Popular-e and BancoPopular Hipotecario instrumented theexternalization of their pension commitments totheir serving employees by contributing therecorded internal allowances to the respectivepension plans that had been set up - whichsimultaneously entered into insurance contractsto cover said commitments - , or to insurancecontracts covering the financial limit overrun. Theinsurance company is Allianz, Compañía deSeguros y Reaseguros, SA, with an irrevocablejoint and several guarantee from this company'sparent entity Allianz AG.
The related contributions had been disbursed infull at December 31, 2001.
Accordingly, the externalization agreementsentered into by the banks and their employees'representatives on December 29, 2000, were fullyexecuted.
The amount (€465,163 thousand) of the foregoingcontributions was the present actuarial value ofthe pension commitments at that date, calculatedon the basis of the following hypotheses:
Mortality tables: PERM/F 2000-P
Permanent disability table: Ministerial Order ofJanuary 1977, adjusted to 85%
Interest rate:Years 1-40: Tied to the rate of return on therelated assets per the insurance contractSubsequent period: Maximum rate permittedby the Directorate General of Insurance forunmatched transactions, with a 95% profit-sharing clause
Growth rate of salaries: 2.5% per annum
Growth rate of social security pensions: 1.5% perannum
Accrual period: Proportional to the number ofyears of service at initial retirement age per thecollective bargaining agreement.
The occupational pension plans are included inthe Europopular Integral pension fund, which ismanaged by the Europensiones, SA, a companyowned 51% by Banco Popular Español and 49%by Allianz. The fund depositary is Banco PopularEspañol.
The plan covers two groups of employees, thecommitments to whom are as follows:
-An insured defined benefit plan for employeesentitled to supplementary pension paymentsand additional coverage for permanentdisability, loss of spouse and loss of parent,and occupational hazards.
-A mixed plan, of defined benefit foroccupational hazards and defined contributionfor all other benefits, for all other employees.The Bank undertakes to make annualcontributions to this plan for employees withmore than two years of service, ranging from1.25% to 1.30% of their gross salaries, plus anadditional amount, up to a specified limit,conditional upon a matching contribution of thesame amount by the employee.
At December 31, 2002 and 2001, themathematical reserves for the insurancecontracts amounted to €447,651 thousand and€417,776 thousand, respect ively, for theinsurance contracts of the pension plans, andto €60,210 thousand €50,273 thousand,respectively, for those relating to financial limitoverruns.

93
As required by Bank of Spain Circular 5/2000, the"Differences in pension allowance" account, usedin December 2000 to reflect the effect of usingnew calculation hypotheses as a result ofapplication of this Circular, must be amortized in amaximum period of 14 years (for the portionrelating to contribution to the pension plan) and in9 years (for the insurance contracts). The periodamortization charge for 2002 amounted to €3,311thousand and for 2001 to €3,710 thousand. €3,037thousand were also amortized in 2002 for thevariation in composition of the group of qualifyingemployees. The unamortized balance outstandingat December 31, 2002 and 2001, was €31,148thousand and €37,496 thousand, respectively.
Retired employees
Banco Popular Español and its subsidiariesBanco de Andalucía, Banco de Castilla, Banco deCrédito Balear, Banco de Galicia and Banco deVasconia externalized their pension commitmentsto retired employees in October 1995 by means ofinsurance contracts between these banks andAllianz, Compañía de Seguros y Reaseguros, SA,with an irrevocable joint and several guaranteefrom this company's parent entity Allianz AG. In2001 these contracts were adapted to complywith the provisions of Royal Decree 1588/1999.
At December 31, 2002 and 2001, themathematical reserves relating to these insurancecontracts amounted to €603,046 thousand and€630,517 thousand, respectively.
Under the aforementioned insurance contracts,the banks transferred to the insurance companyall their pension commitments to their retiredemployees and ceased to have any actuarial,financial or other risk in this connection.
Early retirements plan
In December 2002 Banco Popular Español and itssubsidiaries Banco de Andalucía, Banco deCastilla, Banco de Crédito Balear, Banco deGalicia and Banco de Vasconia approved an earlyretirements plan which will affect approximately162 employees (nearly 60% belonging to thecentral services staff and the remainder to thebranch office network).
This plan will be instrumented by including theemployees affected in an insurance contractwhich will bear the total actuarial and investment
risk and will cover the related benefits through thedate of retirement of each employee, from whichtime the employee's benefits will be paid by thecurrent pension plan.
The estimated cost of €54 million of this plan willbe funded by a charge to unrestricted reserves.The related transfer from reserves was approvedin December 2002 by the Shareholders Meetingsof the banks concerned and was authorized bythe Bank of Spain on December 13, 2002.
At December 31, 2002, the banks had recordedaggregate transfers of €54 million from reservesto a specific liability account under the "Specialallowances" caption exclusively to pay theinsurance premiums; any residual amount will bereversed to the reserves accounts at theconclusion of the plan. As authorized by the Bankof Spain, the total prepaid taxes of €18.9 millionwere recorded under "Other asset accounts" witha credit to reserves.
This plan will be implemented during the firstquarter of 2003.
The early retirements plan approved in 2001 bythe same Group banks as stated above wascompleted in the first quarter of 2002. Of the €73million transferred from reserves for this plan, €14million were returned to their accounts of origin,net of prepaid taxes because they were not usedfor the purpose for which they booked.
j) Allowance for general banking risks
This allowance, which has no specificallyassigned purpose, was set up to providecoverage for potential fluctuations andextraordinary risks (see Note 21). Its balance isdeemed to form part of the balance sheetreserves for the purpose of compliance withcapital requirements.
k) Financial futures on securities, interest ratesand commodities
These transactions are booked in memorandumaccounts at their principal amount. The results onhedges are recognized symmetrically with theresults on the transactions hedged. Other futurestransactions in organized markets are marked tomarket daily; futures transactions outside organizedmarkets are recorded at the time of settlement, withcoverage provisions being booked in the case of

94
potential losses; FRAs and interest swaps arebooked at the beginning of the interest period.
In the income statements, the results on hedgesof balance sheet asset or liability items aretreated as adjustments to the interest revenuefrom or interest expense of the item hedged.Other hedging results are booked as "Assettrading and exchange profits".
l) Guarantee Fund
The contributions to the Deposit GuaranteeFunds, in the case of credit entities, and to theInvestment Guarantee Fund, for securitiescompanies and agencies, are booked in the"Other operating expenses" account in theconsolidated income statements. The InvestmentGuarantee Fund was introduced in 2001 by RoyalDecree 948/2001, regulating investor indemnitysystems.
As required by Bank of Spain regulations, thesecontributions are expensed currently.
The contribution by the consolidated banks to theDeposit Guarantee Fund was 0.06% of thecalculation base amount in 2002; in this year thiscontribution included 5% of the depositedsecurit ies and other guaranteed financialinstruments. In 2001 the contribution was 0.10%of the calculation base amount, which did notinclude the new component mentioned above. Forthe Group banks as a whole, the contributionsamounted to €12,348 thousand in 2002 and€17,348 thousand in 2001.
The contribution to the Investment GuaranteeFund by the consolidated companies to which it isapplicable, at a rate of 0.20% of the calculationbase amount, was €41 thousand in 2001. In 2002,the contribution by Popular Bolsa, the only Groupcompany to which it is applicable, amounted to€13 thousand.
m) Corporate income tax
The expense for period corporate income tax iscalculated individually by each company on thebasis of book income before taxes, increased ordecreased, as appropriate, by the permanentdifferences from the taxable income for corporateincome tax purposes.
As required by Bank of Spain regulations and asstipulated in the Spanish National Chart of Accounts,corporate income tax is recorded, net of withholdings
and prepayments, under the "Other liability accounts"caption in the year-end balance sheets.
n) Bonds and other marketable debt securitiesand subordinated liabilities
Marketable debt securities reflect bearer ordemand debts, such as cash or treasury bonds,other bonds, debentures, promissory notes orsimilar instruments.
Subordinated liabilities are presented in thebalance sheet on a separate line and include allsubordinated financing which, for credit rankingpurposes, comes after common creditors,regardless of how instrumented. This financing iscomputable for capital requirement purposeswhen certain regulatorily defined specificrequirements are met.
Subordinated liabilities are presented atredemption value in the balance sheet. In the caseof bonds issued at a discount, the differencebetween the redemption value and the amountreceived is recorded in a compensating accountuntil the liability is removed from the balancesheets. For an explanation of the operation of thiscompensating account, see Note 16 "Prepaymentsand accrued income and accruals and deferredincome". Zero-coupon issues with earlyredemption options are recorded in accordancewith the foregoing principles, with the date of thenext option being deemed to be the maturity date.
n.1) Euronotes issue:
Since 1997 Banco Popular has beenimplementing a program to issue medium-termEuronotes in different currencies in internationalmarkets, up to a limit of US$ 6,000 million(previously US$ 4,000 million). The notes areissued by the wholly owned instrumentalsubsidiaries set up for this purpose by BancoPopular, namely BPE Finance International forthe bond issue and BPE Capital International forthe subordinated debt issue. The payments of theprincipal and interest of these issues areunconditionally and irrevocably guaranteed byBanco Popular. On October 30, 1997, BancoPopular issued the Offering Circular containing allthe information about this program. Thisdocument was renewed on October 11, 2002,raising the issue limit to US$ 6,000 million.
The outstanding balance of the issues at December31, 2002, was €4,239,826 thousand. At 2001 year endthe outstanding balance was €1,943,206 thousand.

95
The subordinated liabilities in the balance sheet atthe end of 2002 amounted to €245,356 thousand,compared with €263,469 thousand at 2001 yearend.
The ratings assigned to the Euronotes programby rating agencies are as follows: AA (Fitch-IBCA); Aa1 (Moody's); and AA (S&P) for thelong-term debt, and AA- (Fitch-IBCA); Aa2(Moody's); and AA- (S&P) for the subordinateddebt.
n.2) Corporate promissory note issue program
The Group banks have commercial paperissuance programs in progress, the prospectusesfor which were registered with the SpanishSecurities and Exchange Commission in August2002 for the latest Banco Popular Español issueand in February 2002 for those of the subsidiarybanks. The features of this program are asfollows: the maximum nominal outstandingbalance at any time will be €2,200 million (BancoPopular €1,600 million, Banco de Andalucía €210million, Banco de Castilla €120 million, Banco deCrédito Balear €30 million, Banco de Galicia €150million, and Banco de Vasconia €90 million),which can be raised to €3,200 million; the facevalue of each note is €3,000, represented by abook-entry system entry, with maturity at any termfrom 7 days to 18 months from the date of issueof each note; the paper is issued at a discount,the cash value of which is determined at the timeof issuance of each note, based on the pactedinterest rate. The program has been rated ashighly liquid and the notes are traded on the AIAForganized market. In 2001 the maximum limit was€1,200 mill ion for all the banks as whole,increasable to €2,400 million.
ñ) Preferred shares
The Banco Popular Group launched preferredshare issues of €138 million (series C) in 2002 andof €120 million (series B) in 2001, through its BPEPreference International subsidiary. These shares,which are not cumulative and are guaranteed byBanco Popular, do not have voting rights. Theywere subscribed by third parties outside the Groupand can be cancelled wholly or partially bydecision of the issuer with prior authorization fromthe Bank of Spain at any time from the sixth yearafter the disbursement date. The related amountsare included in the consolidated balance sheetand income statements as "Minority Interests".The minority interests amount was €438 million atthe end of 2002 and €300 million at the end of2001. The dividends on these shares included inthe income statement amounted to €12,273thousand and €8,395 thousand, respectively, atthose dates. These balances are computable forcapital requirement purposes as Tier 1 capital inaccordance with the classification assigned by theBank of Spain.
The ratings assigned to these preferred shareissues are as follows: Aa2 (Moody's), A (S&P)and A+ (Fitch-IBCA) for series A; A+ (S&P) forseries B; and A+ (Fitch-IBCA) for series C.
o) Asset securitization
In 2002 and 2001 the Banco Popular Group didnot perform any asset securitization operations.At December 31, 2002, there were outstandingbalances of the asset securitization transactionscarried out in 2000 and 1998, as discussed in thenotes to the consolidated financial statements forthose years.

(3) Banco Popular Group
Banco Popular Español
The Bank is the parent company of the Group andaccounted for approximately 61% of the aggregate2002 balance sheet and net income before therelated intra-Group adjustments in consolidation.
Following are the summarized year-end balancesheets, income statements and statements ofchanges in financial position of the Bank for thelast five years. They include the balancesrelating to the branch network in Portugal whichstarted operating during 2000.
96
Banco Popular Español, SA Summarized balance sheets at December 31€ thousand
Assets
Cash and due from central banks . . . . . . . .Government debt securities . . . . . . . . . . . .Due from financial intermediaries . . . . . . . .Loans and discounts . . . . . . . . . . . . . . . . . .Private fixed-interest securities . . . . . . . . . .Equity securities . . . . . . . . . . . . . . . . . . . . .Participating interests . . . . . . . . . . . . . . . . .Shares of Group companies . . . . . . . . . . . .Intangible assets . . . . . . . . . . . . . . . . . . . . .Tangible assets . . . . . . . . . . . . . . . . . . . . . .Unpaid subscribed common stock . . . . . . .Treasury stock . . . . . . . . . . . . . . . . . . . . . . .Other asset accounts . . . . . . . . . . . . . . . . .Prepayments and accrued income . . . . . . .Loss for the year . . . . . . . . . . . . . . . . . . . . .
Total assets . . . . . . . . . . . . . . . . . . . . . . . .
Liabilities and capital
Due to financial intermediaries . . . . . . . . . .Customer deposits . . . . . . . . . . . . . . . . . . .Bonds and other marketable debt securitiesOther liability accounts . . . . . . . . . . . . . . . .Accruals and deferred income . . . . . . . . . . .Special allowances . . . . . . . . . . . . . . . . . . .General banking risk allowance . . . . . . . . .Income for the year . . . . . . . . . . . . . . . . . . .Subordinated liabilities . . . . . . . . . . . . . . . .Common stock . . . . . . . . . . . . . . . . . . . . . .Paid-in surplus . . . . . . . . . . . . . . . . . . . . . . .Reserves . . . . . . . . . . . . . . . . . . . . . . . . . . .Revaluation reserves . . . . . . . . . . . . . . . . . .Prior years´ earnings . . . . . . . . . . . . . . . . . .
Total liabilities and capital . . . . . . . . . . . .
Memorandum accounts
Contingent liabilities . . . . . . . . . . . . . . . . . .Commitments . . . . . . . . . . . . . . . . . . . . . . .
20002002 19992001
1,247,225539,063
6,644,71516,512,934
319,18988,664
101,972499,37415,946
380,551––
733,423181,574
–
27,264,630
6,793,34416,800,779
813,006599,907252,136186,233
–446,603262,961108,57721,164
979,919–1
27,264,630
5,754,3803,200,877
1998
237,786130,017
5,980,52214,100,266
431,93230,09450,314
442,6999,969
373,365––
478,062205,627
–
22,470,653
4,774,49914,721,631
497,274488,251230,120381,716
–376,290
–108,57721,164
871,130–1
22,470,653
3,993,6503,076,218
357,056413,494
4,745,18311,474,999
272,05718,69949,554
403,4439,051
375,718––
421,694116,819
–
18,657,767
4,635,06511,795,269
190,281403,535162,206243,710
–323,788
–108,57721,164
774,169–3
18,657,767
2,858,9392,809,168
153,012372,249
5,048,96510,377,572
292,51238,03243,357
381,8658,883
391,746––
390,71291,751
–
17,590,656
5,196,25610,293,011
–391,234137,109251,457
–313,229
–83,22248,718
876,414–6
17,590,656
2,437,8562,356,785
387,06775,987
8,301,50319,977,255
301,163363,62332,340
620,28214,516
369,452––
689,795196,246
–
31,329,229
7,038,28819,412,1931,420,728
648,047262,947126,139
–491,947682,848108,57721,164
1,116,350–1
31,329,229
8,650,3323,353,168

97
Banco Popular Español, SA Summarized income statements for the years ended December 31
€ thousand
Interest and similar revenues . . . . . . . . . . . . . . . .Interest and similar charges . . . . . . . . . . . . . . . . .Revenues from equity securities . . . . . . . . . . . . . .Intermediation margin (net interest revenue) . .Fee revenues . . . . . . . . . . . . . . . . . . . . . . . . . . . .Fee expenses . . . . . . . . . . . . . . . . . . . . . . . . . . . .Asset trading and exchange profits . . . . . . . . . . . .Ordinary margin . . . . . . . . . . . . . . . . . . . . . . . . .Other operating income . . . . . . . . . . . . . . . . . . . . .General administrative expenses . . . . . . . . . . . . .Depreciation and writedown of tangible and
intangible assets . . . . . . . . . . . . . . . . . . . . . . .Other operating expenses . . . . . . . . . . . . . . . . . . .Operating margin . . . . . . . . . . . . . . . . . . . . . . . .Writeoffs and provisions for credit losses (net) . . .Writedowns of financial investments (net) . . . . . . .Provision to general banking risk allowance . . . . .Extraordinary income . . . . . . . . . . . . . . . . . . . . . .Extraordinary losses . . . . . . . . . . . . . . . . . . . . . . .Income before tax . . . . . . . . . . . . . . . . . . . . . . . .Corporate income tax . . . . . . . . . . . . . . . . . . . . . .Other taxes . . . . . . . . . . . . . . . . . . . . . . . . . . . . . .Income for the year . . . . . . . . . . . . . . . . . . . . . . .
Banco Popular Español, SA Summarized statements of changes in financial position for the years ended December 31
€ thousand
Source of fundsNet income for the year . . . . . . . . . . . . . . . . . . . . .Amounts which reduce income but do notinvolve an application of funds:
Net provision to allowances:For credit loss . . . . . . . . . . . . . . . . . . . . . . .For country risk . . . . . . . . . . . . . . . . . . . . . .For pensions . . . . . . . . . . . . . . . . . . . . . . . .For accelerated depreciation and other . . .
Writedown of securities portfolio . . . . . . . . . . .Depreciation . . . . . . . . . . . . . . . . . . . . . . . . . .Gain on sale of permanent assets (–) . . . . . . .
Funds provided by operations . . . . . . . . . . . . . . . .Net increase in:
Due to banks (net) . . . . . . . . . . . . . . . . . . . . . .Customer deposits . . . . . . . . . . . . . . . . . . . . .
Net decrease in:Fixed-interest securities . . . . . . . . . . . . . . . . . .Shares and nonpermanent participating interests
Sale of permanent assets . . . . . . . . . . . . . . . . . . .Total . . . . . . . . . . . . . . . . . . . . . . .
Application of fundsPrior year´s dividend . . . . . . . . . . . . . . . . . . . . . . .Capital reduction . . . . . . . . . . . . . . . . . . . . . . . . . .Net increase in:
Due from banks (net) . . . . . . . . . . . . . . . . . . . .Loans and discounts . . . . . . . . . . . . . . . . . . . .Fixed-interest securities . . . . . . . . . . . . . . . . . .Shares and nonpermanent participating interestsOther assets and liabilities (net) . . . . . . . . . . .
Acquisition of permanent assets . . . . . . . . . . . . . .Total . . . . . . . . . . . . . . . . . . . . . . .
20002002 19992001
1,522,737702,513106,404926,628436,54194,86436,165
1,304,470667
479,047
46,90024,406
754,784112,990
8,044–
23,45599,266
557,939110,930
406446,603
1998
1,193,131529,01585,522
749,638407,16582,932
107,8241,181,695
614424,323
45,18023,099
689,70763,3743,004
–21,046
113,489530,886154,596
–376,290
894,140301,20975,648
668,579339,97466,23831,469
973,784528
402,964
42,47522,213
506,66043,8971,691
–18,47933,815
445,736121,948
–323,788
972,960415,48076,587
634,067300,66860,95538,280
912,060439
394,962
41,17521,991
454,37124,701
559–
23,80026,553
426,358113,129
–313,229
1,547,796626,413120,690
1,042,073450,797107,29921,958
1,407,5291,084
498,038
46,62321,408
842,544141,69158,394
–93,71839,904
696,273204,177
149491,947
20002002 19992001
446,603
129,826(395)
61,71443,7168,590
46,900(6,074)
730,880
387,5702,663,976
23,429–
25,9563,831,811
259,499–
–2,530,744
–59,545
467,638514,385
3,831,811
1998
376,290
82,270(247)
57,13552,8023,248
45,180(10,640)606,038
–3,220,235
123,578–
41,3213,991,172
234,041–
978,4442,685,708
–11,818(42,328)123,489
3,991,172
323,788
58,7491,459
22,5502,9402,032
42,475(8,443)
445,550
–1,691,170
–20,47349,637
2,206,830
216,376147,893
392,6691,153,962
21,305–
174,78499,841
2,206,830
313,229
42,293409
16,624(1,617)1,989
41,175(5,518)
408,584
1,024,611818,398
––
54,5242,306,117
196,405–
–1,417,126
315,45320,338
229,867126,928
2,306,117
491,947
149,6953,170
–(64,749)62,00046,623(3,936)
684,750
–3,634,057
481,104–
51,2424,851,153
295,330–
546,1923,597,774
–279,976(59,434)191,315
4,851,153

98
constituting, because of their line of business, thenonconsolidable group, which were included inthat documentation by the equity method.
Variations in 2002 and 2001 in the Groupcompanies were as follows:
Group companies
Exhibits I to VI provide information about thecompanies comprising the Banco Popular Groupat December 31, 2002, showing those included inthe consolidated documentation by the globalintegration method separately from those
2002 variations:Banco Popular Hipotecario Addition Purchase of additional 50% Consolidated (G.I.)Fortior Holding Addition Purchase of additional 35% Consolidated (G.I.)
Popular Banca Privada Addition Holding through Fortior Holding Consolidated (G.I.)Popular Gestión Privada Addition Holding through Fortior Holding Consolidated (G.I.)Iberagentes Previsión Addition Holding through Fortior Holding Consolidated (G.I.)Gestión Premier Fund Addition Holding through Fortior Holding Consolidated (G.I.)Iberagentes Servicios Addition Holding through Fortior Holding Consolidated (G.I.)
Urbanizadora Española Reclassified Based on line of business Consolidated (G.I.)Panorama Ibicenca Addition Purchase of additional 50% Not consolidable (E.M.)
2001 variations:Heller Factoring Portuguesa Addition Purchase of 49.76% Consolidated (G.I.)Banco Popular France Addition Spinoff, holding of 100% Consolidated (G.I.)Proassurances Addition Spinoff, holding of 100% Not consolidable (E.M.)Popular de Comunicaciones Addition Formation Not consolidable (E.M.)Popular de Informática Addition Formation Not consolidable (E.M.)Compañía de Gestión Inmobiliaria Deletion Liquidation Not consolidable (E.M.)Proseguros Popular Deletion Liquidation Not consolidable (E.M.)Correduría Bética de Seguros Deletion Liquidation Not consolidable (E.M.)
G.I.: Global integration; E.M.: Equity method
In 2002, Popular Banca Privada (previouslyIberagentes Popular Banca Privada) absorbedIberagentes Activos, and Iberagentes GestiónColectiva changed its name to Popular GestiónPrivada.
Other companies included within the scope ofconsolidation
Although these are not Group companies, they areconsolidated by virtue of being multigroup andassociated companies.
The accompanying exhibits present significant dataof each of these companies.
The variations in 2002 and 2001 relating to thesecompanies included in consolidation were asfollows:
2002 variations:Sociedad conjunta para la emisióny gestión de medios de pago Addition Formation Associated (E.M.)Banco Popular Hipotecario Deletion Increased holding Multigroup (P.I.)Fortior Holding Deletion Increased holding Multigroup (P.I.)Panorama Ibicenca Deletion Increased holding Associated (E.M.)Consorcio Iberión Deletion Liquidation Associated (E.M.)
2001 variations:Fortior Holding Addition Purchase of 25% Multigroup (P.I.)Dieznet Comercio Eléctronico Addition Formation Multigroup (P.I.)Inmobiliaria Bami Addition Purchase of 7.28% Associated (E.M.)Soc.preparatoria medios de pago Addition Formation Multigroup (P.I.)Banco Popular France Deletion Spinoff Multigroup (P.I.)Servicio de Información Bancaria Deletion Liquidation Associated (E.M.)
P.I.: Proportional integration; E.M.: Equity method

99
(4) Distribution of income and Boardremuneration
Distribution of income
The proposed distribution of Banco PopularEspañol´s 2002 income is as follows:
The detail of the dividends paid out of income for2002, compared with the year-to-date net incomeat the end of each preceding quarter, is as follows:
(€ thousand)September 2002 December 2002
Year-to-date net income 362,186 491,947
Interim dividends paid 78,175 79,261
Remuneration and other benefits of BancoPopular Board members
The names of the Board members at December31, 2002, together with additional informationabout them, are shown below.
The amounts for directors' fees, executiveremuneration and risk exposure relate to BancoPopular and, where appropriate, to consolidatedsubsidiaries. In addition to the figures shown, €20thousand were paid for life insurance of 10directors.
The total figure for direct and indirect riskexposure to directors of any of the consolidatedcompanies comprises €34.7 million relating toloans and discounts, €9.5 million relating toguarantees, and €7.4 million to indirect riskexposure as guarantors.
The interest rates on the lending transactionsrange from 3.25% to 6.50% and the quarterly feesfor guarantees range from 0.10% to 0.75%.
The related 2001 figures were directors' fees:€183 thousand; executive remuneration: €1,746thousand; and direct and indirect risk exposure:€54,151 thousand.
€Net income for the year 491,946,576Brought forward from 1999 937Total distributable income 491,947,513Dividend 325,731,174Allocation to reserves:
Voluntary reserves 163,816,000Canary Islands investment reserve 2,400,000
Carried forward to next year 339
In 2002, Banco Popular availed itself of thepossibility provided by Law 19/1994 to make aprovision to the reserve for investments in theCanary Islands. The provision of €2,400 thousandto this reserve led to a reduction of €840thousand in the taxes payable in 2002. Thisamount is included under the "Accruals anddeferred income" caption on the liability side ofthe balance sheet and reduces the expense forcorporate income tax as the investments for whichthe reserve is used are made. The period formaking the investments ends on December 31,2005. The provision to this reserve in 2001 was€3,750 thousand. Investments made in 2002amounted to €1,813 thousand, signifying areduction of €635 thousand in the corporateincome tax expense.
The Bank´s policy is to pay dividends quarterly,as follows: in October a first interim dividend ispaid out of income for the year; second and thirdinterim dividends are paid in the following Januaryand April; and the final supplementary dividend ispaid in the following July. The detail of thedividends paid out of income for 2001 and 2002were as follows:
10/01/0101/02/0204/01/0207/01/02
10/01/0201/02/0304/01/0307/01/03
20011st Interim . . . . . . .2nd Interim . . . . . . .3rd Interim . . . . . . .4th Final . . . . . . . . .Total . . . . . . . . . . . .
2002 (*)1st Interim . . . . . . .2nd Interim . . . . . . .3rd Interim . . . . . . .4th Final . . . . . . . . .Total . . . . . . . . . . . .
0.3270.3320.3470.3541.360
0.3600.3650.3850.3901.500
12.813.314.114.913.8
10.19.9
11.010.210.3
Date ofpayment Amount
% variation onprevious year
(Amounts in €)
(*) Board resolution of January 30, 2003, pending approval ofShareholders Meeting on June 26, 2003.

100
The government debt securities pledged forcommitments of the Group and third partiesamounted to €18,171 in 2002 and €18,275thousand in 2001.
(6) Due from financial intermediaries
An itemized detail of this asset caption isshown in the following table, with breakdownsby type, by currency, by company category,
and by term. Also included are the amounts ofnonperforming balances and the coverage forthem.
The amounts shown for multigroup companiesare the balances not eliminated at the companiesconsolidated by the global integration method fortheir positions with the companies consolidatedby the proportional integration method (multigroupcompanies).
€ thousand
Bank of Spain certificates of deposit . . . . . . . . . . . .Government debt securities:
Treasury bills . . . . . . . . . . . . . . . . . . . . . . . . . . .Other book-entry system securities . . . . . . . . . .Other securities . . . . . . . . . . . . . . . . . . . . . . . . .
Total . . . . . . . . . . . . . . . . . . . . . . . . . . . . . .Detail by portfolios:
Trading . . . . . . . . . . . . . . . . . . . . . . . . . . . . . . . .Ordinary investment . . . . . . . . . . . . . . . . . . . . . .Held to maturity investment . . . . . . . . . . . . . . . .
Total . . . . . . . . . . . . . . . . . . . . . . . . . . . . . .Security price fluctuation allowance charged to income
20002002 19992001
–
414,116209,477
261623,854
117,167319,374187,313623,854
41
1998
–
232,62669,913
278302,817
23,803238,36540,649
302,817128
138,642
345,03514,471
281498,429
–489,322
9,107498,429
96
266,429
197,26453,244
282517,219
38,152445,71733,350
517,2196
–
23,445105,935
8129,388
68,61025,86134,917
129,38842
5) Government debt securities
The breakdown of this caption is shown in thefollowing table.
In 2002, transfers amounting to €43,951thousand were made from the trading portfolio tothe ordinary investment portfolio. The transfers in2001 amounted to €494 thousand.
Asociación de Directivos de BPE . . . . . . . . . .Ayala, Ildefonso . . . . . . . . . . . . . . . . . . . . . . .Breipohl, Diethart . . . . . . . . . . . . . . . . . . . . . .Catá, José María . . . . . . . . . . . . . . . . . . . . . .Donate, Francisco . . . . . . . . . . . . . . . . . . . . .Gancedo, Eric . . . . . . . . . . . . . . . . . . . . . . . .Gancedo, Gabriel . . . . . . . . . . . . . . . . . . . . . .Herrando, Luis . . . . . . . . . . . . . . . . . . . . . . . .Laffón, Manuel . . . . . . . . . . . . . . . . . . . . . . . .Miralles, Luis . . . . . . . . . . . . . . . . . . . . . . . . .Molins, Casimiro . . . . . . . . . . . . . . . . . . . . . .Montoro, Santos . . . . . . . . . . . . . . . . . . . . . . .Montuenga, Luis . . . . . . . . . . . . . . . . . . . . . .Morillo, Manuel . . . . . . . . . . . . . . . . . . . . . . . .Nigorra, Miguel . . . . . . . . . . . . . . . . . . . . . . . .Parera, Alberto . . . . . . . . . . . . . . . . . . . . . . . .Pérez Sala, Enrique . . . . . . . . . . . . . . . . . . . .Platero, Jesús . . . . . . . . . . . . . . . . . . . . . . . .Rodríguez, José Ramón . . . . . . . . . . . . . . . .Ron, Angel Carlos . . . . . . . . . . . . . . . . . . . . . .Sindicatura de Accionistas de BPE . . . . . . . .Solís, Miguel Angel de . . . . . . . . . . . . . . . . . .Stecher, Jorge . . . . . . . . . . . . . . . . . . . . . . . .Termes, Rafael . . . . . . . . . . . . . . . . . . . . . . .Valls, Javier . . . . . . . . . . . . . . . . . . . . . . . . . .Valls, Luis . . . . . . . . . . . . . . . . . . . . . . . . . . . .
Total . . . . . . . . . . . . . . . . . . . . . . . . . . . . .
––––
57–––––––––
56–––––––––––
113
––––––––––––––––
45291
–301
––––
510477
1,624
–115
–––––––
118–––––––––––––––––
233
(1)
–––
33,670–––––––
4,459231
–5,944
–45––––
7,058–––––
51,407
Directors fees(€ thousand)
Direct risk exposure(€ thousand)
Executive remuneration(€ thousand)
Indirect risk exposure(€ thousand)
(1) This amount relate to exposure for loans from Vasco Aragonesa Concesionaria Española,SA, of which he is Deputy Chairman.
Name

101
(7) Loans and discounts
The following table provides breakdowns of thisbalance sheet caption by type of lending, byborrower sector, by currency, by companycategory and by term; also shown is the relatedcredit loss and country risk allowance.
The credit loss allowance reflected in the balancesheets as a deduction from the balance of loansand discounts is the aggregate of the allowances(specific, general and statistical) for credit lossand for country risk. The variations in theseallowances and in the provisions for off-balancesheet risks are disclosed in Note 20.
€ thousand
By type:Trade loans . . . . . . . . . . . . . . . . . . . . . . . . . .Secured loans . . . . . . . . . . . . . . . . . . . . . . . .Other term loans . . . . . . . . . . . . . . . . . . . . . .Demand and sundry loans . . . . . . . . . . . . . . .Leasing . . . . . . . . . . . . . . . . . . . . . . . . . . . . . .Nonperforming loans . . . . . . . . . . . . . . . . . . .
Total . . . . . . . . . . . . . . . . . . . . . . . . . . . . .
By borrower sector:Public authorities . . . . . . . . . . . . . . . . . . . . . .Other residents . . . . . . . . . . . . . . . . . . . . . . . .Nonresidents . . . . . . . . . . . . . . . . . . . . . . . . .Doubtful balances . . . . . . . . . . . . . . . . . . . . .
Total . . . . . . . . . . . . . . . . . . . . . . . . . . . .
By currency:Euros . . . . . . . . . . . . . . . . . . . . . . . . . . . . . . .Foreign currencies . . . . . . . . . . . . . . . . . . . . .
Total . . . . . . . . . . . . . . . . . . . . . . . . . . . . .
By company categories:Group companies . . . . . . . . . . . . . . . . . . . . . .Associated companies . . . . . . . . . . . . . . . . . .Other . . . . . . . . . . . . . . . . . . . . . . . . . . . . . . .
Total . . . . . . . . . . . . . . . . . . . . . . . . . . . . .
20002002 19992001
4,392,65311,565,1858,605,3341,155,4891,853,490
247,85927,820,010
30,42926,652,900
888,822247,859
27,820,010
27,387,459432,551
27,820,010
22,15373,479
27,724,37827,820,010
1998
4,111,9758,758,3657,117,432
942,0941,576,885
200,75023,307,501
32,65622,657,246
416,849200,750
23,307,501
23,029,149278,352
23,307,501
10,894–
23,296,60723,307,501
3,297,9456,952,3216,479,190
735,8961,283,357
190,67118,939,380
25,44018,427,732
295,537190,671
18,939,380
18,702,810236,570
18,939,380
3,355–
18,936,02518,939,380
3,045,9475,812,3886,019,755
764,3861,046,825
206,57416,895,875
30,29116,485,311
173,699206,574
16,895,875
16,718,451177,424
16,895,875
––
16,895,87516,895,875
4,713,68616,578,6959,246,7161,356,5202,080,787
345,38734,321,791
31,39532,740,7511,204,258
345,38734,321,791
33,971,413350,378
34,321,791
78,474180,731
34,062,58634,321,791
€ thousand
By type:Banks operating in Spain . . . . . . . . . . . . . .Savings banks . . . . . . . . . . . . . . . . . . . . . .Credit cooperatives . . . . . . . . . . . . . . . . . .Nonresident credit entities . . . . . . . . . . . . .Asset repos . . . . . . . . . . . . . . . . . . . . . . . .Other . . . . . . . . . . . . . . . . . . . . . . . . . . . . .
Total . . . . . . . . . . . . . . . . . . . . . . . . . . .By currency:
Euros . . . . . . . . . . . . . . . . . . . . . . . . . . . . .Foreign currencies . . . . . . . . . . . . . . . . . . .
Total . . . . . . . . . . . . . . . . . . . . . . . . . . .By company category:
Group companies:Banks operating in Spain . . . . . . . . . . .Resident credit entities . . . . . . . . . . . .Nonresident credit entities . . . . . . . . . .
Multigroup companies . . . . . . . . . . . . . . . .Associated companies . . . . . . . . . . . . . . . .Other . . . . . . . . . . . . . . . . . . . . . . . . . . . . .
Total . . . . . . . . . . . . . . . . . . . . . . . . . . .Distribution of term accounts:
Up to 3 months . . . . . . . . . . . . . . . . . . . . .3 months to 1 year . . . . . . . . . . . . . . . . . . .1 to 5 years . . . . . . . . . . . . . . . . . . . . . . . .Over 5 years . . . . . . . . . . . . . . . . . . . . . . .
Total . . . . . . . . . . . . . . . . . . . . . . . . . . .Nonperforming balances and coverage:
Nonperforming balances . . . . . . . . . . . . . .Provision for credit loss and country risk . .
20002002 19992001
729,396368,775
22,025,3071,698,170
147,5164,969,166
2,743,8782,225,2884,969,166
–––
413,048–
4,556,1184,969,166
3,839,703555,927307,35312,045
4,715,028
117241
1998
406,701394,974
661,897,5532,539,231
228,4605,466,985
3,835,2251,631,7605,466,985
–––
230,318–
5,236,6675,466,985
4,292,124635,316347,72913,195
5,288,364
209378
510,603382,344
3251,887,4011,819,010
101,9474,701,630
3,330,9081,370,7224,701,630
–––
193,216–
4,508,4144,701,630
3,807,828422,171255,59411,323
4,496,916
–553
726,912210,769
5052,041,0131,602,875
190,2454,772,319
3,630,6471,141,6724,772,319
–––
178,182–
4,594,1374,772,319
3,911,586638,052130,672
1984,680,508
–343
359,830395,700
–1,650,7602,047,690
256,7684,710,748
2,662,0192,048,7294,710,748
–––
80,007–
4,630,7414,710,748
3,658,134556,109298,62110,998
4,523,862
4,4804,056

102
€ thousand
By issuer:Public bodies . . . . . . . . . . . . . . . . . . . . . . . . . . . . . .Credit entities:
Own securities . . . . . . . . . . . . . . . . . . . . . . . . . .Other issuers . . . . . . . . . . . . . . . . . . . . . . . . . . .
Other residents . . . . . . . . . . . . . . . . . . . . . . . . . . . . .Other nonresidents . . . . . . . . . . . . . . . . . . . . . . . . . .Total . . . . . . . . . . . . . . . . . . . . . . . . . . . . . . . . . . . . .
By listing status:Listed . . . . . . . . . . . . . . . . . . . . . . . . . . . . . . . . . . . .Unlisted . . . . . . . . . . . . . . . . . . . . . . . . . . . . . . . . . . .Total . . . . . . . . . . . . . . . . . . . . . . . . . . . . . . . . . . . . .
By currency:Euros . . . . . . . . . . . . . . . . . . . . . . . . . . . . . . . . . . . .Foreign currencies . . . . . . . . . . . . . . . . . . . . . . . . . .Total . . . . . . . . . . . . . . . . . . . . . . . . . . . . . . . . . . . . .
By nationality:Spanish securities . . . . . . . . . . . . . . . . . . . . . . . . . .Foreign securities . . . . . . . . . . . . . . . . . . . . . . . . . . .Total . . . . . . . . . . . . . . . . . . . . . . . . . . . . . . . . . . . . .
By portfolio:Trading . . . . . . . . . . . . . . . . . . . . . . . . . . . . . . . . . . .Ordinary investment . . . . . . . . . . . . . . . . . . . . . . . . .Held to maturity . . . . . . . . . . . . . . . . . . . . . . . . . . . .Total . . . . . . . . . . . . . . . . . . . . . . . . . . . . . . . . . . . . .
By company category:Group companies . . . . . . . . . . . . . . . . . . . . . . . . . . .Other . . . . . . . . . . . . . . . . . . . . . . . . . . . . . . . . . . . . .Total . . . . . . . . . . . . . . . . . . . . . . . . . . . . . . . . . . . . .
By term:Maturity in following year . . . . . . . . . . . . . . . . . . . . .Other maturities . . . . . . . . . . . . . . . . . . . . . . . . . . . .Total . . . . . . . . . . . . . . . . . . . . . . . . . . . . . . . . . . . . .
By valuation:Total market value . . . . . . . . . . . . . . . . . . . . . . . . . .Total book value . . . . . . . . . . . . . . . . . . . . . . . . . . . .Difference . . . . . . . . . . . . . . . . . . . . . . . . . . . . . . . . .Unrealized gains . . . . . . . . . . . . . . . . . . . . . . . . . . . .Unrealized losses . . . . . . . . . . . . . . . . . . . . . . . . . . .
Allowance coverage:Security price fluctuation allowance charged to incomeCredit loss allowance . . . . . . . . . . . . . . . . . . . . . . . .Total . . . . . . . . . . . . . . . . . . . . . . . . . . . . . . . . . . . . .
Yield rates by issuer type (in %):Public bodies . . . . . . . . . . . . . . . . . . . . . . . . . . . . . .Credit entities . . . . . . . . . . . . . . . . . . . . . . . . . . . . . .Other residents . . . . . . . . . . . . . . . . . . . . . . . . . . . . .Other nonresidents . . . . . . . . . . . . . . . . . . . . . . . . . .Total . . . . . . . . . . . . . . . . . . . . . . . . . . . . . . . . . . . . .
20002002 19992001
30,28851,391
–51,391
331,99884,025
497,702
493,8983,804
497,702
437,40160,301
497,702
364,283133,419497,702
11,588486,114
–497,702
–497,702497,702
35,667462,035497,702
499,452497,702
1,7502,017
267
2672,0872,354
5.856.174.765.014.88
1998
23,84230,660
–30,660
456,44984,437
595,388
588,0237,365
595,388
537,42657,962
595,388
504,80490,584
595,388
20,475574,913
–595,388
–595,388595,388
16,085579,303595,388
596,202595,388
8141,722
908
9172,5513,468
5.795.094.465.874.71
1,51934,888
–34,888
337,66995,234
469,310
456,68512,625
469,310
420,57648,734
469,310
372,91896,392
469,310
31,257438,053
–469,310
–469,310469,310
29,154440,156469,310
469,904469,310
5941,134
540
5402,3552,895
4.374.833.096.483.46
24,44343,273
–43,273
395,17633,315
496,207
476,28319,924
496,207
472,29323,914
496,207
462,89333,314
496,207
3,516492,691
–496,207
–496,207496,207
19,334476,873496,207
498,660496,207
2,4532,459
6
62,0012,007
5.964.803.366.744.30
53,49027,775
–27,775
411,94953,563
546,777
546,777–
546,777
501,22245,555
546,777
475,82270,955
546,777
5,337511,55029,890
546,777
–546,777546,777
26,187520,590546,777
559,454546,77712,67712,800
123
1132,5212,634
5.624.363.883.553.96
(8) Private fixed-interest securities
The criteria for assignment of securities to thedifferent types of portfolio are described in Note
2.d). Itemized breakdowns of the balances of thiscaption, showing also the portfolio to which theyare assigned, yield rates and coverageallowances, are presented in the following table:
Miles de € 19992001 19982000
7,030,3704,623,3786,617,650 5,036,103
–23,307,501
344,978
(Continuation)By term:
Up to 3 months . . . . . . . . . . . . . . . . . . . . . . . .3 months to 1 year . . . . . . . . . . . . . . . . . . . . .1 to 5 year . . . . . . . . . . . . . . . . . . . . . . . . . . .Over 5 year . . . . . . . . . . . . . . . . . . . . . . . . . .Indefinite . . . . . . . . . . . . . . . . . . . . . . . . . . . . .
Total . . . . . . . . . . . . . . . . . . . . . . . . . . . . .
Coverage allowance:Allowances for credit losses and country risk
5,650,3683,773,1325,303,510 4,212,370
–18,939,380
298,805
5,954,5883,017,9944,535,3403,387,953
–16,895,875
266,807
8,301,7695,404,0257,816,108 6,298,108
–27,820,010
451,639
8,906,4695,981,057
10,055,395 9,378,870
–34,321,791
610,772
2002

103
(9) Equity securities
This balance sheet caption reflects the amount ofthe investment, net of the security pricefluctuation allowance, in shares of or participatinginterests in companies other than the Group,multigroup and associated companies. These
securities are assigned to the trading and ordinaryinvestment portfolios, in accordance with theclassification criteria described in Note 2.d).
Breakdowns by listing status and currency,together with valuation and price fluctuationallowance details, are shown in the following table.
The variations in the caption balance in theconsolidated balance sheets is shown below.
For the variations in the security price fluctuationallowance, see Note 20.
€ thousand
By listing status:Listed . . . . . . . . . . . . . . . . . . . . . . . . . . .Unlisted . . . . . . . . . . . . . . . . . . . . . . . . . .Total . . . . . . . . . . . . . . . . . . . . . . . . . . . . .
By currency:Euros . . . . . . . . . . . . . . . . . . . . . . . . . . . .Foreign currencies . . . . . . . . . . . . . . . . . .Total . . . . . . . . . . . . . . . . . . . . . . . . . . . . .
By type of portfolio:Trading . . . . . . . . . . . . . . . . . . . . . . . . . . .Ordinary investment . . . . . . . . . . . . . . . . .Total . . . . . . . . . . . . . . . . . . . . . . . . . . . . .
By valuation:Total market value . . . . . . . . . . . . . . . . . .Total book value . . . . . . . . . . . . . . . . . . . .Difference . . . . . . . . . . . . . . . . . . . . . . . . .Unrealized gains . . . . . . . . . . . . . . . . . . .Unrealized losses . . . . . . . . . . . . . . . . . . .
Security price fluctuation allowance . . . . .
€ thousand
Beginning balances . . . . . . . . . . . . . . . . . . . .
Increase . . . . . . . . . . . . . . . . . . . . . . . . . .Decrease . . . . . . . . . . . . . . . . . . . . . . . . .Security price fluctuation allowance . . . . .
Ending balances . . . . . . . . . . . . . . . . . . . . . .
20002002 19992001
107,21322,416
129,629
123,2846,345
129,629
63,87165,758
129,629
127,918129,629
(1,711)5,3287,0397,039
1998
60,0367,975
68,011
68,011
68,011
–68,01168,011
63,95568,011(4,056)4,0118,0678,067
39,58611,07150,657
50,59463
50,657
–50,65750,657
107,07250,65756,41561,1154,700 4,700
72,20011,33583,535
82,4111,124
83,535
–83,53583,535
148,87783,53565,34269,5734,2314,231
374,53427,310
401,844
397,1434,701
401,844
344,42957,415
401,844
394,823401,844
(7,021)3,951
10,97210,972
20002002 19992001 1998
59,944
297,887236,269
(1,028)
122,590
45,957
104,44387,0893,367
59,944
79,304
55,84088,718
469
45,957
28,007
133,07677,8793,900
79,304
122,590
2,273,9032,001,688
3,933
390,872
€ thousand
Beginning balances . . . . . . . . .
Increase . . . . . . . . . . . . . . .Decrease . . . . . . . . . . . . . .Coverage allowance (net) .
Ending balances . . . . . . . . . . .
20002002 19992001 1998
591,920
1,104,5191,202,205
(1,114)
495,348
466,415
579,522453,444
573
591,920
494,200
381,791408,688
888
466,415
94,401
1,496,2791,094,581
1,899
494,200
495,348
2,567,6542,518,579
280
544,143
At 2002 and 2001 year ends the balance of the"Other residents" account in the foregoing tableincluded €252,993 thousand (€185,078 thousandof mortgage-backed bonds loans and €67,915thousand of non-mortgage assets) and €326,279
thousand, respectively, of asset-backed bondsissued by the Group in prior years. The variationsin the balance of private fixed-interest securitieswere as follows:

104
(10) Participating interests
This caption reflects the amount, net of therelated security price fluctuation allowance, of theinvestment made in shares of non-Groupcompanies in order to establish lasting links withthem that will contribute to the Banco PopularGroup's business activities. In view of the natureof the investment, these securities are assignedto the permanent shareholdings portfolio, theclassification criteria for which are described inNote 2.d).
The multigroup companies, i.e. entities 20%owned by Banco Popular which are jointlymanaged by the Bank and other partners, areconsolidated by the proportional integrationmethod if they engage in financial businessactivities as defined in Article 3.1 of Royal Decree1343/1992. The interests in associatedcompanies are carried by the equity method in theconsolidated balance sheets, as required by Bankof Spain Circular 4/1991.
The companies in this group are listed in ExhibitII, which also details the percentages of direct andindirect ownership and other relevant data.
In 2002, Banco Popular Hipotecario, FortiorHolding and Panorama Ibicenca were transferredto this category.
Included in this category in 2001 were theholdings in Fortior Holding, Dieznet andInmobiliaria Bami; Banco Popular France(formerly Banco Popular Comercial) was deleteddue to its transfer to holdings in group companies;and Servicios de Información Bancaria wasexcluded because it was liquidated.
€ thousand2002 2001 2000 1999 1998
Multigroup companies 465 – – – –
Associated companies 26,134 23,241 4,897 4,378 2,819
Listed 21,040 18,699 – – –Unlisted 5,094 4,542 4,897 4,378 2,819
Total 26,599 23,241 4,897 4,378 2,819Security price
fluctuation allowance – – – – –
The resulting amounts in consolidation by theproportional integration and equity methods areindividually disclosed in the appropriate notes.
(11) Shares of Group companies
The companies in which the Banco Popular Groupdirectly or indirectly owns a majority of the commonstock or of the voting rights or which, in the case ofinvestees which are 20% or more owned, aremanaged solely by the Group are treated as Groupcompanies. Those engaging in financial business,in a broad sense, including the instrumentalcompanies used as legal support for financialbusiness activities, constitute the global integrationmethod consolidated Group, and the remainingcompanies, i.e. those not engaging in financialbusiness activities, constitute the nonconsolidableGroup. All the shares representing theseinvestments in Group companies are assigned tothe permanent shareholdings portfolio. For theportfolio classification criteria, see Note 2.d).
The exhibits list all the companies comprising theconsolidated - by the global and proportionalintegration methods - Group and the nonconsolidableGroup, and disclose the variations in 2002.
There is no amount in the consolidated balancesheet caption relating to financial intermediariesbecause this investment was eliminated inconsolidation by the global integration method.The amount shown for "Other" relates in full tocompanies in the nonconsolidable Group, whichare carried by the equity method as required byBank of Spain Circular 4/1991. All the amountsarising from consolidation by the globalintegration or equity methods are individuallydisclosed in the appropriate notes. The balancesheet presentation of these amounts is net of thesecurity price fluctuation allowance.
See Exhibit IV for an itemized breakdown of theshareholdings in Group companies, the detail bycompany and the variations in 2002. Included in2002 were Banco Popular Hipotecario, FortiorHolding and Panorama Ibicenca following theincrease of holdings and the exercise of control overthem. Also, Urbanizadora Española was reclassifiedfrom a nonconsolidable company to a consolidatedcompany on the basis of its business activity. At theend of 2001 Popular de Comunicaciones andPopular de Informática were formed, and excludedbecause of liquidation were Compañía de GestiónInmobiliaria, Proseguros Popular and CorreduríaBética de Seguros. The listing status breakdown ofthese shareholdings is as shown below.
€ thousand
Nonconsolidable:Listed . . . . . . . . . . . . . . . . . . . . . . . . . . . . . . . . . .Unlisted . . . . . . . . . . . . . . . . . . . . . . . . . . . . . . . .
Total . . . . . . . . . . . . . . . . . . . . . . . . . . . . . . . .Security price fluctuation allowance . . . . . . . . . . . . . .
20002002 19992001
–35,67435,6742,392
1998
–34,97334,9732,392
–32,69332,6932,542
–30,01430,0142,542
–22,71922,719
–

105
(13) Intangible assets
The intangible assets recorded by theconsolidated companies in accordance with the
principles described in Note 2 are shown below,disclosing the year-by-year variations.
(12) Goodwill and negative difference in consolidation
The balance of the "Goodwill in consolidation"account in the Group's balance sheets reflects theamount by which the price paid for investeecompanies' shares exceeded the book value perthe latter's accounting records, net of amortizationcharged to the consolidated income statement.
This goodwill was not attributed to any balancesheet item and is amortized on a straight-linebasis in five years, this being the period for whichthe Group considers that it will benefit therefrom.
The detail of this consolidated balance sheetcaption, at company level, is as follows:
€ thousand
Companies consolidated (by the global and proportionalintegration methods)Aula 2000 . . . . . . . . . . . . . . . . . . . . . . . . . . . . . . . . . . . . . . . .Urbanizadora Española . . . . . . . . . . . . . . . . . . . . . . . . . . . . . .
Total global and proportional integration methods . . . . . .Nonconsolidable groupDesarrollo Aplicaciones Especiales . . . . . . . . . . . . . . . . . . . .Panorama Ibicenca . . . . . . . . . . . . . . . . . . . . . . . . . . . . . . . . .Promoción Social de Viviendas . . . . . . . . . . . . . . . . . . . . . . . .Other companies . . . . . . . . . . . . . . . . . . . . . . . . . . . . . . . . . .Associated companiesOther . . . . . . . . . . . . . . . . . . . . . . . . . . . . . . . . . . . . . . . . . . ..Total equity method . . . . . . . . . . . . . . . . . . . . . . . . . . . . . . . . .
Total . . . . . . . . . . . . . . . . . . . . . . . . . . . . . . . . . . . . . . . . .
20002002 19992001 1998
18–
18
12–
18264
132426444
18–
18
12–
18390
132552570
18–
18
12––
390
132534552
18–
18
12––
391
132535553
18264282
1210618–
–136418
€ thousand
2000 19992001
386
386
5,774–
5,7746,160
28122,4345,593
28,308
1,2474,058
–5,305
33,613
––
3,8703,870
9482,435
–3,3837,253
491
491
8,010–
8,0108,501
Group and multigroup companiesBancopopular-e . . . . . . . . . . . . . . . . . . . . . . . . . .Fortior Holding . . . . . . . . . . . . . . . . . . . . . . . . . . . .Heller Factoring Portuguesa . . . . . . . . . . . . . . . . .
Total global & proportional consolidation . . . . .Associated companies:
BAMI . . . . . . . . . . . . . . . . . . . . . . . . . . . . . . . . . . .Sistema 4B . . . . . . . . . . . . . . . . . . . . . . . . . . . . . .Other companies . . . . . . . . . . . . . . . . . . . . . . . . . .
Equity method total . . . . . . . . . . . . . . . . . . . . . .Total . . . . . . . . . . . . . . . . . . . . . . . . . . . . . . . .
–
–
1,316–
1,3161,316
19982002
€63,420 thousand and €8,058 thousand ofamortization of goodwill were booked in 2002 and2001, respectively. The amount for 2002 includes,in addition to ordinary amortization, theextraordinary amortization of €54,541 thousandfor Fortior Holding and €176 thousand forBancopopular-e, leading to the elimination of thegoodwill in consolidation relating to thesecompanies.
The amount of the "Negative difference inconsolidation" caption on the liability side of theconsolidated balance sheet reflects thedifferences in the initial consolidation of the Groupcompanies by the global or proportionalintegration or equity methods. Following theinclusion of the equity method in banking
regulations in 1992, the date of init ialconsolidation was taken to be June 1985, whenconsolidation was first performed for thecalculation of the capital ratio. In the case of thecompanies which entered the Group after thatdate, the calculations were based on the relevantdata at their dates of entry. The negativedifference in consolidation is deemed to be aprovision. The 2002 amount of €106 thousand forPanorama Ibicenca is the net amount of €132thousand of the negative difference inconsolidation minus the €26 thousand of goodwillin consolidation which arose on the purchase in2002 of the remaining 50% of the capital of thiscompany.
The detail by company is as follows:

106
Further information about premises andequipment is presented below. The nonoperating
assets consist of buildings, commercial premises,housing units and land.
€ thousand
Nonoperating fixed assets:Book value . . . . . . . . . . . . . . . . . . . . . . . . . . . . . . . .Accumulated depreciation . . . . . . . . . . . . . . . . . . . .Allowance for foreclosed assets . . . . . . . . . . . . . . .Period net rental revenues . . . . . . . . . . . . . . . . . . . .Annual fixed asset insurance premiums . . . . . . . . .
(14) Tangible assets
The variations in the last five years in the bookbalance of premises and equipment, net ofdepreciation and special allowances, are shownbelow.
The "Furniture and installations" and "Buildings"columns include any assets leased to theconsolidated companies by Group companies thatengage in leasing. Buildings rented byconsolidated companies from other consolidatedcompanies are classified in the "Own use" column.
Balance at 12/31/97 . . . . . . . . .Net variation in 1998 . . . . . .Period depreciation . . . . . . .
Balance at 12/31/98 . . . . . . . . .Net variation in 1999 . . . . . .Period depreciation . . . . . . .
Balance at 12/31/99 . . . . . . . . .Net variation in 2000 . . . . . .Period depreciation . . . . . . .
Balance at 12/31/00 . . . . . . . . . .Net variation in 2001 . . . . . .Period depreciation . . . . . . .
Balance at 12/31/01 . . . . . . . . .Net variation in 2002 . . . . . .Period depreciation . . . . . . .
Balance at 12/31/02 . . . . . . . . .
Foreclosed assets are recorded at the lower offoreclosure price or appraised value. The creditloss allowance for these assets is maintained forup to 25% of the loan principal and 100% of theinterest recovered. Also, in the case of foreclosedassets not added to the banks' functional fixedassets, an allowance must be set up to coverpossible losses thereon, based on a scale tied tothe net book value and the length of time elapsedsince obtention of the asset. This allowance is not
applicable for completed housing units andmultipurpose premises if the book value issupported by a current appraisal by anindependent appraisal entity other than that whichappraised the market value of the assets whenthey were repossessed.
The variations in foreclosed assets and therelated allowance in the last five years are shownbelow.
€ thousand
277,75876,07058,815
295,01361,26760,308
295,97278,96361,536
313,39971,72962,105
323,02355,47061,871
316,622
189,0367,4045,036
191,4048,1705,210
194,3644,7365,332
193,76816,1445,623
204,2895,6995,731
204,257
148,264(15,368)
313132,583(32,867)
27799,439
(35,192)242
64,005(10,615)
10853,282(5,731)
15047,401
615,05868,10664,164
619,00036,57065,795
589,77548,50767,110
571,17277,25867,836
580,59455,43867,752
568,280
Other TotalOwn use
BuildingsFurniture andinstallations
20002002 19992001 1998
82,9713,859
25,8301,302
262
100,7703,994
32,7711,351
179
137,9603,855
34,6661,138
197
175,3754,508
38,284998198
75,3124,047
23,8641,696
139
€ thousand
Beginning balance . . . . . . . . . . . . . . . . . . . . . . . . . . . . . . . . . .Increase . . . . . . . . . . . . . . . . . . . . . . . . . . . . . . . . . . . . . . .Decrease . . . . . . . . . . . . . . . . . . . . . . . . . . . . . . . . . . . . . .Period amortization . . . . . . . . . . . . . . . . . . . . . . . . . . . . . .
Ending balance . . . . . . . . . . . . . . . . . . . . . . . . . . . . . . . . . . . .
20002002 19992001
13,50016,76716,288
36413,615
13,61517,55410,012
36620,791
20,7919,977
12,675155
17,938
10,90829,39026,458
34013,500
4,04510,6863,522
30110,908
1998

107
Under the regulations for determination andcontrol of the minimum capital base, net tangibleassets cannot exceed 70% of computablecapital. The Banco Popular Group's tangibleassets at 2002 year-end, after distribution of theincome for the year, represented 16.14% of
computable capital. The percentage at the endof 2001 was 19.04%.
(15) Other asset and other liability accounts
The main items in "Other asset accounts" in theconsolidated balance sheets are disclosed below.
Balance at 12/31/97 . . . . . . . . . . . . . . . . . . . . . . . .Net variation in 1998 . . . . . . . . . . . . . . . . . . . . .
Balance at 12/31/98 . . . . . . . . . . . . . . . . . . . . . . . .Net variation in 1999 . . . . . . . . . . . . . . . . . . . . .
Balance at 12/31/99 . . . . . . . . . . . . . . . . . . . . . . . .Net variation in 2000 . . . . . . . . . . . . . . . . . . . . .
Balance at 12/31/00 . . . . . . . . . . . . . . . . . . . . . . . .Net variation in 2001 . . . . . . . . . . . . . . . . . . . . .
Balance at 12/31/01 . . . . . . . . . . . . . . . . . . . . . . . .Net variation in 2002 . . . . . . . . . . . . . . . . . . . . .
Balance at 12/31/02 . . . . . . . . . . . . . . . . . . . . . . . .
€ thousand
Checks on credit entities . . . . . . . . . . . . . . . . .Transactions in transit . . . . . . . . . . . . . . . . . . . .Interim dividends . . . . . . . . . . . . . . . . . . . . . . . .Prepaid taxes . . . . . . . . . . . . . . . . . . . . . . . . . .Other . . . . . . . . . . . . . . . . . . . . . . . . . . . . . . . . .
Total . . . . . . . . . . . . . . . . . . . . . . . . . . . . . . .
The detail of the "Other liability accounts" captionin the consolidated balance sheets is as follows:
€ thousand
Payment obligations . . . . . . . . . . . . . . . . . . . . .Factoring payables . . . . . . . . . . . . . . . . . . . . . .Transactions in transit . . . . . . . . . . . . . . . . . . . .Tax collection accounts . . . . . . . . . . . . . . . . . .Special accounts . . . . . . . . . . . . . . . . . . . . . . .Other . . . . . . . . . . . . . . . . . . . . . . . . . . . . . . . . .
Total . . . . . . . . . . . . . . . . . . . . . . . . . . . . . . .
(16) Prepayments and accrued income andaccruals and deferred income
The following table provides breakdowns of theasset and liability accrual accounts balances inthe consolidated balance sheets.
€ thousand
Allowance NetTotal
172,840(25,922)146,918(33,640)113,278(32,643)80,635
(17,123)63,512(3,724)59,788
Foreclosed assets
49,890(11,606)38,284(3,618)34,666(1,895)32,771(6,941)25,830(1,966)23,864
122,950(14,316)108,634(30,022)78,612(30,748)47,864(10,182)37,682(1,758)35,924
20002002 19992001 1998
188,83180,47685,537
339,343240,086
934,273
86,12440,26968,853
215,972171,835
583,053
119,26736,13263,158
175,461134,821
528,839
192,66646,40457,895
144,03968,119
509,123
179,39844,37297,040
342,277227,258
890,345
20002002 19992001 1998
66,19637,77846,574
454,93566,379
207,089
878,951
41,30210,32525,092
316,974133,05249,914
576,659
36,67914,46815,987
340,030130,40857,806
595,378
47,64615,72616,869
383,299158,65073,654
695,844
63,13229,66614,036
449,50080,784
286,591
923,709

unmatured accrued amounts, so that the balanceof accruals for discount transactions in thebalance sheet only includes the unaccruedadvanced amounts.
(17) Due to financial intermediaries
The following table presents breakdowns of thiscaption by nature, currency and companycategory, and by term for the term accounts.
108
20002002 19992001 1998
111,190
166,73362,229
(40,182)299,970
80,065
157,084102,786
(38,926)301,009
127,473
157,590101,982
(37,565)349,480
77,682
141,07593,449
(37,945)274,261
99,594
110,35743,682
(16,160)237,473
55,065
92,84872,561
(27,248)193,226
96,505
109,00621,930
(8,498)218,943
54,500
77,16473,035
(27,220)177,479
115,610
167,02767,560
(52,955)297,242
84,466
144,682112,574
(40,681)301,041
Assets:Prepaid interest on funds taken at a discount . . . . . . . . . .Accrued unmatured revenues from investments not
taken at a discount . . . . . . . . . . . . . . . . . . . . . . . . . . . .Other accruals . . . . . . . . . . . . . . . . . . . . . . . . . . . . . . . . . .Accrued unmatured costs of funds taken at a
discount . . . . . . . . . . . . . . . . . . . . . . . . . . . . . . . . . . . .Total . . . . . . . . . . . . . . . . . . . . . . . . . . . . . . . . . . . .
Liabilities:Deferred revenues from asset transactions at
a discount . . . . . . . . . . . . . . . . . . . . . . . . . . . . . . . . . .Accrued unmatured costs of funds not taken at
a discount . . . . . . . . . . . . . . . . . . . . . . . . . . . . . . . . . .Other accruals . . . . . . . . . . . . . . . . . . . . . . . . . . . . . . . . . .Accrued unmatured revenues from investments
taken at a discount . . . . . . . . . . . . . . . . . . . . . . . . . . . .Total . . . . . . . . . . . . . . . . . . . . . . . . . . . . . . . . . . . .
Under Bank of Spain accounting regulations forcredit institutions, interest revenues and expensesrelating to asset and liability discount transactionsmust be recorded in specific accounts at thetransaction date for the total amount concerned.Thereafter, the amounts accrued are reflected asunmatured accruals through maturity of thetransaction, at which time this account iseliminated against the first account in which thetotal amount of the discount was recorded. Forthis reason they are presented net of the
€ thousand
20002002 19992001
82,796922,177663,57683,714
684,9333,478,022
954,49755,362
6,925,077
4,683,2252,241,8526,925,077
–––
8,881–
6,916,1966,925,077
4,576,2361,118,543
814,092139,352
6,648,223
1998
184,001615,195896,115107,254620,961
1,621,477767,72075,865
4,888,588
3,682,1831,206,4054,888,588
–––
10,280–
4,878,3084,888,588
3,250,276772,986566,86296,290
4,686,414
–696,821579,838114,351562,206
1,368,5261,106,698
15,7434,444,183
3,482,368961,815
4,444,183
–––
9,583–
4,434,6004,444,183
2,980,528559,189615,14093,421
4,248,278
3,173623,268815,53795,110
519,695662,868
1,709,58513,668
4,442,904
3,799,295643,609
4,442,904
–––
21,516–
4,421,3884,442,904
3,175,303620,725349,278132,854
4,278,160
–833,517574,10872,874
767,2213,431,8681,187,952
98,4036,965,943
4,978,7581,987,1856,965,943
–––
15–
6,965,9286,965,943
3,439,8322,210,312
953,88071,568
6,675,592
By type:Bank of Spain . . . . . . . . . . . . . . . . . . . . . . . . . . . .Banks operating in Spain . . . . . . . . . . . . . . . . . . . .Savings banks . . . . . . . . . . . . . . . . . . . . . . . . . . . .Credit cooperatives . . . . . . . . . . . . . . . . . . . . . . . .Official Credit Institute . . . . . . . . . . . . . . . . . . . . . .Credit entities abroad . . . . . . . . . . . . . . . . . . . . . . .Asset repos . . . . . . . . . . . . . . . . . . . . . . . . . . . . . .Other . . . . . . . . . . . . . . . . . . . . . . . . . . . . . . . . . . .
Total . . . . . . . . . . . . . . . . . . . . . . . . . . . . . . . . .By currency:
Euros . . . . . . . . . . . . . . . . . . . . . . . . . . . . . . . . . . .Foreign currencies . . . . . . . . . . . . . . . . . . . . . . . . .
Total . . . . . . . . . . . . . . . . . . . . . . . . . . . . . . . . .By company category:
Group companiesBanks operating in Spain . . . . . . . . . . . . . . . . .Other resident credit entities . . . . . . . . . . . . . .Nonresident credit entities . . . . . . . . . . . . . . . .
Multigroup companies . . . . . . . . . . . . . . . . . . . . . .Associated companies . . . . . . . . . . . . . . . . . . . . . .Other . . . . . . . . . . . . . . . . . . . . . . . . . . . . . . . . . . .
Total . . . . . . . . . . . . . . . . . . . . . . . . . . . . . . . . .Distribution of term accounts:
Up to 3 months . . . . . . . . . . . . . . . . . . . . . . . . . . .3 months to 1 year . . . . . . . . . . . . . . . . . . . . . . . . .1 to 5 year . . . . . . . . . . . . . . . . . . . . . . . . . . . . . . .Over 5 years . . . . . . . . . . . . . . . . . . . . . . . . . . . . .
Total . . . . . . . . . . . . . . . . . . . . . . . . . . . . . . . . .
€ thousand

109
(19) Bonds and other marketable debtsecurities
The balance of this caption in the consolidatedbalance sheet as of December 31, 2002, relatesto the balance of the outstanding issues launchedby BPE Finance International under theEuronotes program described in Note 2 n), and to
the commercial paper issues described in thesame note, together with the bond issue of HellerFactoring Portuguesa.
The detail of the issues launched by BPE FinanceInternational, by currency, showing the amount inthe currency of issuance and the equivalent eurovalue at the end of 2002 and 2001, is shown below.
The amounts shown for the multigroup companiesare the balances not eliminated at the globalintegration method consolidated companies fortheir positions with the proportional integrationmethod (i.e. multigroup) companies.
(18) Customer deposits
In the balance sheets this caption is broken downinto savings deposits and other deposits, each ofwhich is subdivided into demand and termaccounts. The savings deposits category includes
those relating to Spanish public bodies, to otherresidents and nonresidents, in sight, savings andterm accounts.
The other deposits category reflects the balanceof the accounts of the sectors mentioned abovefor asset repo and other accounts.
The following table provides additionalbreakdowns by account type, depositor sector,currency and company category, and by term forthe term accounts.
€ thousand
By type:Sight accounts . . . . . . . . . . . . . . . . . . . . . .Savings accounts . . . . . . . . . . . . . . . . . . . .Time deposits . . . . . . . . . . . . . . . . . . . . . . .Asset repos . . . . . . . . . . . . . . . . . . . . . . . . .Other accounts . . . . . . . . . . . . . . . . . . . . . .
Total . . . . . . . . . . . . . . . . . . . . . . . . . . .By sector:
Public bodies . . . . . . . . . . . . . . . . . . . . . . .Other residents . . . . . . . . . . . . . . . . . . . . . .Nonresidents . . . . . . . . . . . . . . . . . . . . . . . .
Total . . . . . . . . . . . . . . . . . . . . . . . . . . .By currency:
Euros . . . . . . . . . . . . . . . . . . . . . . . . . . . . .Foreign currencies . . . . . . . . . . . . . . . . . . .
Total . . . . . . . . . . . . . . . . . . . . . . . . . . .By company category:
Group companiesConsolidated . . . . . . . . . . . . . . . . . . . . .Nonconsolidable . . . . . . . . . . . . . . . . . .
Multigroup companies . . . . . . . . . . . . . . . . .Associated companies . . . . . . . . . . . . . . . .Other . . . . . . . . . . . . . . . . . . . . . . . . . . . . . .
Total . . . . . . . . . . . . . . . . . . . . . . . . . . .Distribution of term accounts:
Up to 3 months . . . . . . . . . . . . . . . . . . . . . .3 months to 1 year . . . . . . . . . . . . . . . . . . .1 to 5 years . . . . . . . . . . . . . . . . . . . . . . . . .Over 5 years . . . . . . . . . . . . . . . . . . . . . . . .
Total . . . . . . . . . . . . . . . . . . . . . . . . . . .
In Euros:In foreign currencies:
US dollar . . . . . . . . . . . . . . . . . . . . . . . . . . . . .HK dollar . . . . . . . . . . . . . . . . . . . . . . . . . . . . .Japanese yen . . . . . . . . . . . . . . . . . . . . . . . . .
Bonds and debentures outstanding . . . . . . .
Issuance currency
20002002 19992001
7,751,6464,111,0649,481,8831,268,749
1,89422,615,236
311,13219,458,2652,845,839
22,615,236
21,725,307889,929
22,615,236
–25,0041,919
2322,588,29022,615,236
6,737,1063,097,989
914,4712,960
10,752,526
1998
6,880,5013,797,5877,893,5471,852,542
79820,424,975
355,11117,463,5292,606,335
20,424,975
19,569,236855,739
20,424,975
–21,936
14720,402,89220,424,975
6,093,4922,840,175
811,8301,390
9,746,887
6,228,9193,857,9255,983,4341,232,160
1,66317,304,101
338,72114,472,5812,492,799
17,304,101
16,483,659820,442
17,304,101
–18,885
2717,285,18917,304,101
5,000,7701,423,352
790,5382,597
7,217,257
5,600,4413,460,1475,347,8601,142,067
78715,551,302
234,16012,905,1902,411,952
15,551,302
14,710,019841,283
15,551,302
–16,756
6615,534,48015,551,302
5,060,4191,011,059
419,104120
6,490,702
8,095,5784,501,895
10,103,785987,124
1,94723,690,329
366,94620,432,2282,891,155
23,690,329
22,906,813783,516
23,690,329
–11,753
–14,046
23,664,53023,690,329
5,399,6174,374,7311,312,933
5,57511,092,856
€
Amounts in thousand
3,658,101
544,000100,000
1,000,000
3,658,101
518,73854,9488,039
4,239,826
2002€
1,430,734
444,000–
1,000,000
1,430,734
503,801–
8,6711,943,206
2001
110
The breakdown of the 2002 year-end balance bycontractual maturity and by issuance currency isas follows:
All the issues in foreign currencies are hedged byissuance currency/euro swaps (rate linked mainlyto Euribor and Libor) and therefore the real cost ofthe issues for the Group is in euros. The detail ofthe average rate of cost of the transactions in2002 and 2001, by type of instrument, is asfollows:
(In %)2002 2001
Fixed rate . . . . . . . . . . . . . . . . . . . . . .3.43 4.61Floating rate . . . . . . . . . . . . . . . . . . . .3.43 4.41Zero-coupon:
Fixed rate . . . . . . . . . . . . . . . . . . .3.38 4.54Floating rate . . . . . . . . . . . . . . . . .3.38 4.35
Average rate . . . . . . . . . . . . . . . . . . . .3.42 4.44
At December 31, 2002, Hel ler Factor ingPortuguesa had issued €24,940 thousand ofbonds matur ing in 2003 at a cost rate of4.98%.
At 2002 year end the outstanding balance ofthe commercial paper issued by the Groupbanks under the program described in Note 2n) was €1,745,202 thousand, with averagematurity of 39 days and an average rate ofcost of 3.08%. The matching figures for 2001were €1,018,320 thousand, 58 days and3.44%, respectively.
(20) Special allowances
In the consolidated balance sheet this caption isbroken down into "Pension allowance", "Provisionfor taxes" and "Other allowances".The allowances for credit losses and country risk(excluding that for off-balance sheet risks) arepresented in the balance sheets as deductions from theasset accounts covered by them, basically loans anddiscounts; the security price fluctuation allowanceprovided by charges to the income statement has beendeducted from the balances comprising the securitiesportfolio, with the allowance provided by charges to"Prepayments and accrued income" being netted offagainst this account; and the allowance for foreclosedassets has been deducted from tangible assets. Theallowance for off-balance sheet risks is presented onthe liability side under the "Other allowances" caption.In order to provide an overall picture, the followingparagraphs present general descriptions of the type ofcoverage provided by each allowance, regardless ofwhere it appears in the balance sheet, and, for ease ofanalysis, a detail of the variations in each year.
As indicated in Note 2.i), the pension allowanceappeared expressly on the liability side of thebalance sheets until it was externalized, at whichtime this account was canceled.
The variations in the last five years were as follows:
€ thousand
Beginning balances . . . . . . . . . . . . . . . . . . . . . . . . . . .Variations:
Net provisions . . . . . . . . . . . . . . . . . . . . . . . . . . . . .Amounts used:
For insurance premium payments . . . . . . . . . .For externalization payment . . . . . . . . . . . . . . .
Transfer from reserves, consolidation reserves andminority interests . . . . . . . . . . . . . . . . . . . . . . .
Prepaid taxes . . . . . . . . . . . . . . . . . . . . . . . . . . . . .Transfer to reserves, consolidation reserves and
minority interests . . . . . . . . . . . . . . . . . . . . . . .Other variations and transfers . . . . . . . . . . . . . . . .Accruals . . . . . . . . . . . . . . . . . . . . . . . . . . . . . . . . .
Ending balances . . . . . . . . . . . . . . . . . . . . . . . . . . . . . .
Currency
In Euros:In foreign currencies:
US dollar . . . . . . . . . . . . . .HK dollar . . . . . . . . . . . . . ...Japanese yen . . . . . . . . . .
Total . . . . . . . . . . . . . . . .
€ thousandSubsequent
years2003 2004 2005 2006 Total2007
1,975,214
95,356––
2,070,570
895,337
308,955 54,948
– 1,259,240
338,067
–– –
338,067
9,672
114,427– –
124,099
14,331
–––
14,331
425,480
– –
8,039433,519
3,658,101
518,73854,9488,039
4,239,826
20002002 19992001 1998
396,966
72,070
(3,872)(465,164)
––
––––
295,847
68,042
(8,129)–
––
––
41,206396,966
310,633
27,713
(132,579)–
93,00120,416
(22,997)(340)
295,847
307,838
23,878
(146,046)–
129,21823,187
(27,664)222
310,633
–
–
––
––
––––

111
Except for the allowance for contingent liabilitieswhich is recorded on the liability side of thebalance sheet, the allowances for credit lossesand country risk, the accounting treatment of
which is described in Note 2.c), are presented asdeductions from the following captions in theconsolidated balance sheets:
In 2002, the Group also wrote off certain balancesamounting to €7,677 thousand with a directcharge to income because they were not fullycovered by the special allowance.
At December 31, 2002 and 2001, the breakdownof the credit loss allowance into the special,
general and statistical provisions and the variationfrom year to year were as follows:
€ thousand
Due from banks . . . . . . . . . . . .Loans and discounts . . . . . . . .Private fixed-interest securitiesContingent liabilities . . . . . . . . .
Total . . . . . . . . . . . . . . . . . .
For credit losses For country risk
€ thousand
Beginning balances . . . . . . . .
Variations:Net provisions . . . . . . . . . . .Amount used . . . . . . . . . . .Other variations and transfers
Ending balances . . . . . . . . . . .
For credit losses For country risk
The security price f luctuation allowance,ref lect ing the coverage for the ordinaryinvestment and permanent shareholdingsportfolios and for financial futures, is presentedin the balance sheets as a deduction from the"Government debt securities", "Private fixed-interest securit ies", "Equity securit ies","Participating interests" and "Shares of Groupcompanies" captions, with the provisions forfinancial futures being included under "Otherallowances" on the liabil ity side. The jointpresentation of the various coverages provided
20002002 19992001
–450,062
2,08753,980
506,129
1998 20002002 19992001 1998
–344,202
2,55137,138
383,891
–296,990
2,35528,856
328,201
–265,839
2,00126,439
294,279
2411,577
–711
2,529
343968
––
1,311
5531,815
–420
2,788
378776
–1,5552,709
–609,517
2,52169,710
681,748
4,0561,255
–497
5,808
20002002 19992001 1998 20002002 19992001 1998
383,891
218,668(98,061)
1,631
506,129
328,201
133,664(77,515)
(459)
383,891
294,279
95,764(61,771)
(71)
328,201
295,320
80,522(81,491)
(72)
294,279
2,709
(178)–(2)
2,529
901
416–
(6)
1,311
1,311
1,478–(1)
2,788
2,788
(79)–(1)
2,709
506,129
254,221(95,683)17,081
681,748
2,529
3,278–1
5,808
€ thousandStatisticalSpecial General
Loans and discounts . . . . . . . . . . . .Private fixed interest securities . . . .Contingent liabilities . . . . . . . . . . . .
Total . . . . . . . . . . . . . . . . . . . . .
Total
Beginning balance . . . . . . . . . . . . .Net provisions . . . . . . . . . . . . . .Amounts used . . . . . . . . . . . . . .Other variations & transfers . . .
Balance at year-end . . . . . . . . . . . .
Credit loss allowance
by this allowance is for ease of analysis. Theprice f luctuation al lowance for the l istedsecurities in the ordinary investment portfolio isprovided part ly by charges to the incomestatement and also, since the entry into force ofBank of Spain Circular 6/1994, with a contra itemin an account under the "Prepayments andaccrued income" caption, for the negativedifferences net of the positive differences; thistreatment is not applied to securities loaned. Theyear-end coverage detail for each of theaccounts cited is as follows:
The variations in the last five years were asfollows:
254,1241,861
41,519297,504
89,054226
8,08797,367
450,0622,087
53,980506,129
106,884–
4,374111,258
245,56650,855
– 1,083
297,504
31,810 65,468
– 89
97,367
383,891218,668(98,061)
1,631506,129
106,515102,345(98,061)
459111,258
147,270–
4,128151,398
111,258138,051(95,683)(2,228)
151,398
323,3532,176
50,127375,656
297,50465,913
– 12,239
375,656
138,894345
15,455154,694
97,367 50,257
– 7,070
154,694
609,5172,521
69,710681,748
506,129254,221(95,683)
17,081681,748
20012002 20012002 20012002 20012002

112
The remaining special allowances include thefollowing: provisions for potential taxcontingencies; allowance for potential losses onforeclosed assets; and other special allowances.The allowance for potential losses on foreclosedassets is presented in the balance sheets as adeduction from "Tangible assets"; the other
special allowances are shown on the liability sideof the balance sheet under "Provision for taxes"and "Other allowances".
The year-end balances of these allowances wereas follows:
€ thousand
Government debt securities . . . . . . . . . . . . . .Private fixed interest securities . . . . . . . . . . . .Equity securities . . . . . . . . . . . . . . . . . . . . . . .Participating interests . . . . . . . . . . . . . . . . . . .Shares of Group companies . . . . . . . . . . . . . .Financial futures (memorandum accounts) . .
Total . . . . . . . . . . . . . . . . . . . . . . . . . . . . .
20002002 19992001
41267
7,039–
2,3921,297
11,036
1998
128917
8,067–
2,3921,530
13,034
96540
4,700–
2,5421,709
9,587
66
4,231–
2,542228
7,013
42113
10,972––
403
11,530
€ thousand
Beginning balance . . . . . . . . . . . . . . . . . . . . .Variations:
Net provisions . . . . . . . . . . . . . . . . . . . . . .Amount used . . . . . . . . . . . . . . . . . . . . . . .Accruals . . . . . . . . . . . . . . . . . . . . . . . . . .Other variations and transfers . . . . . . . . . .
Ending balance . . . . . . . . . . . . . . . . . . . . . . . .
20002002 19992001
13,034
1,723(3,723)
–2
11,036
1998
9,587
4,442(995)
––
13,034
7,013
3,395(841)
–20
9,587
3,173
3,973(144)
–11
7,013
11,036
8,852(5,894)
–(2,464)11,530
The variations in this allowance were as follows:
€ thousand
For tangible assets . . . . . . . . . . . . . . . . . . . . .For taxes . . . . . . . . . . . . . . . . . . . . . . . . . . . . .Other allowances . . . . . . . . . . . . . . . . . . . . . .
Total . . . . . . . . . . . . . . . . . . . . . . . . . . . . .
20002002 19992001
26,24812,207
214,185252,640
1998
33,0499,904
59,604102,557
35,0359,4794,329
48,843
38,9949,1771,954
50,125
24,35424,263
134,598183,215
"Other allowances" include €54 million in 2002and €73 million in 2001 relating to the transfersfrom reserves for the early retirements plansapproved in each of those years.
€ thousand
Beginning balance . . . . . . . . . . . . . . . . . . . . . .Variations:
Net provisions . . . . . . . . . . . . . . . . . . . . . .Amount used . . . . . . . . . . . . . . . . . . . . . . .Other variations and transfers . . . . . . . . . .
Ending balance . . . . . . . . . . . . . . . . . . . . . . . .
20002002 19992001
102,557
79,299(1,259)72,043
252,640
1998
48,843
(61,468)(3,301)(4,453)
102,557
50,125
(5,792)(3,328)(3,746)48,843
65,187
(4,808)(4,159)(6,095)50,125
252,640
(55,220)(1,182)
(13,023)183,215
The reconciliation detail of "Other allowances" inthe consolidated balance sheets, classified bycoverage nature, is as follows:
The variations in the last five years were asfollows:

113
(21) General banking risk allowance
The balance of this account is booked, afterpayment of the relevant taxes (since it is anondeductible expense), as a non-specificcoverage provision for possible fluctuations andextraordinary risks. The balances of theconsolidated companies other than Banco Popularare deemed to form part of net worth and aretherefore eliminated in the consolidated balancesheets, giving rise to consolidation reserves andminority interests at individual banking subsidiarylevel. Under current regulations, for so long as thisallowance is maintained as such, it is included inthe capital base. There was no balance in thisaccount at consolidated level at the end of 2002 or2001, reflecting the situation at Banco Popular, theGroup's parent company.
(22) Subordinated liabilities
The detail of the subordinated debt securitiesissued by BPE Capital International in 2001 and2000 and of the 2002 year-end on-balance sheetbalance is as follows:
Issue Amount InterestNº Currency date (thousand) Maturity rate
1 EUR 04.27.00 100,000 04.27.10 Euribor 3m+55bp
2 USD 05.30.00 50,000 05.30.10 Libor 3m+50bp
3 USD 06.15.00 50,000 06.15.10 Libor 3m+54bp
4 EUR 09.24.01 50,000 09.24.11 Euribor 3m+45bp
These issues are classified as subordinated debtand, for credit ranking purposes, after all commoncreditors; they are jointly and severally andirrevocably guaranteed by Banco Popular asregards principal and interest and are redeemableafter five years at the issuer's decision, with priorauthorization from the Bank of Spain.
The interest on subordinated liabilities in 2002and 2001 amounted to €10,247 thousand and€11,221 thousand, respectively, adjusted for theissues hedged by swaps, signifying that the actual
rate of cost for the Group was 3.97% and 5.06%in 2002 and 2001, respectively.
(23) Minority interests
The minority interests reflected in the 2002 and2001 consolidated balance sheets relate toshareholders not linked either directly or indirectlyto the Banco Popular Group.
Common shares:
The following tables disclose the balanceswhich arose at the global integration methodconsolidated companies and the minorityinterests which arose by equi ty methodconsolidation at the end of 2002 and 2001 asregards the common shares, and thevariations at each company in 2002, when theincreases were basically due to the allocationto reserves out of the prior year's income andthe prepaid taxes re la t ing to the ear lyretirements plans and the decreases were dueto implementation of the early retirementsplan. The other increases or decreases weredue fundamenta l ly to var ia t ions inshareholdings or adjustments in consolidation.It should be noted that although the minorityinterests at nonconsolidable and associatedequity method companies are generated bythese companies, they are attributed to theshareholder companies. No minority interestscan ar ise at the mul t igroup companiesconsolidated by the proportional integrationmethod.
The early retirements plans gave rise todecreases of €3,234 thousand in 2002 and€5,054 thousand in 2001 and the taxescapitalized increased minority interests by €1,132thousand in 2002 and €3,060 thousand in 2001.Also, €1,293 thousand were recorded in 2002 asthe net amount of the funds not used for the earlyretirements plan approved in 2001.
The variations under this heading were as follows:
€ thousand
In credit loss allowance:For contingent liabilities . . . . . . . . . . . . . . .
In security price fluctuation allowance:For financial futures . . . . . . . . . . . . . . . . . .
In other specific allowances:Other allowances . . . . . . . . . . . . . . . . . . .Total . . . . . . . . . . . . . . . . . . . . . . . . . . . . .
20002002 19992001
54,691
1,297
214,185270,173
1998
38,693
1,530
59,60499,827
29,276
1,709
4,32935,314
26,439
228
1,95428,621
70,207
403
134,598205,208

114
€ thousand
Beginning balance . . . . . . . . . . . . . . . . . . . . . . . . . . .Variations:
Inclusion of companies . . . . . . . . . . . . . . . . . . . . .Early retirement plan (net) . . . . . . . . . . . . . . . . . .Transfer from 2001 early retirements . . . . . . . . . .For capital increases . . . . . . . . . . . . . . . . . . . . . . .Transfer of prepaid taxes . . . . . . . . . . . . . . . . . . .Transfer to pension allowance . . . . . . . . . . . . . . .Transfer from pension allowance . . . . . . . . . . . . .Consolidation transactions (net) . . . . . . . . . . . . . .Net income for the year . . . . . . . . . . . . . . . . . . . . .Dividend for the year . . . . . . . . . . . . . . . . . . . . . . .
Ending balance, after the distribution of income . . . . .
Preferred shares:
The amount shown for BPE PreferenceInternational relates exactly to the issuance ofpreferred non-cumulative, non-voting sharesjointly and severally and irrevocably guaranteedby Banco Popular. These shares were subscribedby third parties outside the Group and can bewholly or partly cancelled by decision of theissuer, with prior authorization from the Bank ofSpain, at any time from the sixth year after thedisbursement date.
The detail of the balance of preferred shares atthe end of 2002 is as follows:
Issue Amount Interest Series Currency date (€ thousand) rate
A EUR 11.16.00 180,000 Euribor 3m+5bp
B EUR 12.21.01 120,000 Euribor 3m+5bp
C EUR 12.27.02 138,000 Euribor 3m+5bp
The holders of preferred shares are entitled tocollect a non-cumulative preferred dividend,payable quarterly in arrears, calculated at 3-monthEuribor plus a margin of 0.05 points; however,during the first three years of the issue the minimumannual nominal interest rate will be 2.25% for the2002 and 2001 issues and 4.50% for the 2000issue. The annual variations were as follows:
20002002 19992001 1998
191,928
12,975(3,286)
––
1,291––
(4,561)40,487
(20,657)218,177
178,393
––––
492––
(2,977)35,771
(19,751)191,928
169,928
–––
1,178–
(4,484)1,634
(4,640)33,055
(18,278)178,393
164,094
–––
1,178–
(8,210)2,452
(5,799)32,166
(15,953)169,928
218,177
10,310(2,102)1,293
––––
(2,604)41,972(21,546)245,500
€ thousand 2001 2000
Beginning balance . . . . . . . . . . . . . . . . . . . . . . . . . . . . . . . . . . . . . . . .Variations:
Issuance of preferred shares . . . . . . . . . . . . . . . . . . . . . . . . . . . . .Net income for the year attributable to preferred shares . . . . . . . .Dividend on preferred shares . . . . . . . . . . . . . . . . . . . . . . . . . . . . .
Ending balance, after distribution of income . . . . . . . . . . . . . . . . . . . .
–
180,0001,181(1,181)
180,000
180,000
120,0008,395(8,395)
300,000
2002
300,000
138,00012,273(12,273)438,000
The detail, by company, of the balances of thisaccount in the 2002 and 2001 balance sheets,
showing the variation in 2002, before thedistribution of income, is as follows:
€ thousand
DecreaseBalance at12/31/01 Increase
102,40014,52436,64918,6383,839
––––
–12,975
Deposit-taking entities:Banco de Andalucía . . . . . . . . . . . . . . . . . . . . . . . . . . . . . . .Banco de Castilla . . . . . . . . . . . . . . . . . . . . . . . . . . . . . . . . .Banco de Crédito Balear . . . . . . . . . . . . . . . . . . . . . . . . . . .Banco de Galicia . . . . . . . . . . . . . . . . . . . . . . . . . . . . . . . . .Banco de Vasconia . . . . . . . . . . . . . . . . . . . . . . . . . . . . . . .Bancopopular-e . . . . . . . . . . . . . . . . . . . . . . . . . . . . . . . . . .Banco Popular France . . . . . . . . . . . . . . . . . . . . . . . . . . . . .Banco Popular Hipotecario . . . . . . . . . . . . . . . . . . . . . . . . .Popular Banca Privada . . . . . . . . . . . . . . . . . . . . . . . . . . . .
Finance companies:Heller Factoring Español . . . . . . . . . . . . . . . . . . . . . . . . . . .Heller Factoring Portuguesa . . . . . . . . . . . . . . . . . . . . . . . .
Balance at12/31/02
Variation in 2002
12,7781,2383,6992,133
501–––
699
–916
1,924222
1,1801,047
482––––
––
113,25415,54039,16819,7243,858
–––
699
–13,891

115
(24) Common stock
Banco Popular's capital stock consists of217,154,116 shares of €0.50 face value each.
All the shares are listed on the Spanish stockexchanges and are traded on the continuousmarket.
The book value of the treasury stock bought andsold in the last five years, excluding the sharesbought back for cancellation for €147,893thousand in 1999, was as follows:
€ thousand
DecreaseBalance at12/31/01 Increase
Balance at 12/31/02
Variation in 2002
9,210–––––––––
–––––––––––
198,235
––
112–––––––––
––
–––
112198,347300,000300,000498,347
(Continuation)Portfolio and services companies:Europensiones . . . . . . . . . . . . . . . . . . . . . . . . . . . . . . . . . . .Fortior Holding . . . . . . . . . . . . . . . . . . . . . . . . . . . . . . . . . . .Gestión Premier Fund . . . . . . . . . . . . . . . . . . . . . . . . . . . . .Gestora Europea de Inversiones . . . . . . . . . . . . . . . . . . . .Gestora Popular . . . . . . . . . . . . . . . . . . . . . . . . . . . . . . . . . .Iberagentes Previsión . . . . . . . . . . . . . . . . . . . . . . . . . . . . .Popular Bolsa . . . . . . . . . . . . . . . . . . . . . . . . . . . . . . . . . . .Popular de Participaciones Financieras . . . . . . . . . . . . . . .Popular Gestión Privada . . . . . . . . . . . . . . . . . . . . . . . . . . .Sogeval . . . . . . . . . . . . . . . . . . . . . . . . . . . . . . . . . . . . . . . .Instrumental companies:Aliseda . . . . . . . . . . . . . . . . . . . . . . . . . . . . . . . . . . . . . . . . .Aula 2000 . . . . . . . . . . . . . . . . . . . . . . . . . . . . . . . . . . . . . . .BPE Finance International . . . . . . . . . . . . . . . . . . . . . . . . . . .BPE Capital International . . . . . . . . . . . . . . . . . . . . . . . . . . . .Finespa . . . . . . . . . . . . . . . . . . . . . . . . . . . . . . . . . . . . . . . .Iberagentes Servicios . . . . . . . . . . . . . . . . . . . . . . . . . . . . .Inmobiliaria Viagracia . . . . . . . . . . . . . . . . . . . . . . . . . . . . .Inmobiliaria Vivesa . . . . . . . . . . . . . . . . . . . . . . . . . . . . . . . .Intermediación y Servicios Tecnológicos . . . . . . . . . . . . . . . .Popular Asia Trade . . . . . . . . . . . . . . . . . . . . . . . . . . . . . . . . .Urbanizadora Española . . . . . . . . . . . . . . . . . . . . . . . . . . . . .
Subtotal global integration method companies . . . . . . . .Nonconsolidable companiesDesarrollo Aplicaciones Especiales . . . . . . . . . . . . . . . . . . . .Eurocorredores . . . . . . . . . . . . . . . . . . . . . . . . . . . . . . . . . . . .Eurovida . . . . . . . . . . . . . . . . . . . . . . . . . . . . . . . . . . . . . . . . .Inversiones Inmobiliarias Alprosa . . . . . . . . . . . . . . . . . . . . . .Panorama Ibicenca . . . . . . . . . . . . . . . . . . . . . . . . . . . . . . . . .Popular de Comunicaciones . . . . . . . . . . . . . . . . . . . . . . . . . .Popular de Informática . . . . . . . . . . . . . . . . . . . . . . . . . . . . . .Popular de Renting . . . . . . . . . . . . . . . . . . . . . . . . . . . . . . . . .Proassurances . . . . . . . . . . . . . . . . . . . . . . . . . . . . . . . . . . . .Promoción Social de Viviendas . . . . . . . . . . . . . . . . . . . . . . .Sicomi . . . . . . . . . . . . . . . . . . . . . . . . . . . . . . . . . . . . . . . . . .Other . . . . . . . . . . . . . . . . . . . . . . . . . . . . . . . . . . . . . . . . . .Nonconsolidable multigroup companiesDieznet . . . . . . . . . . . . . . . . . . . . . . . . . . . . . . . . . . . . . . . . .Sociedad preparatoria de medios de pago . . . . . . . . . . . . . .Associated companiesInmobiliaria Bami . . . . . . . . . . . . . . . . . . . . . . . . . . . . . . . . . .Sistema 4B . . . . . . . . . . . . . . . . . . . . . . . . . . . . . . . . . . . . . . .Sdad. conjunta para la emisión y gestión de medios de pago
Subtotal equity method companies . . . . . . . . . . . . . . . . . .Total common shares . . . . . . . . . . . . . . . . . . . . . . . . . . . . .BPE Preference International . . . . . . . . . . . . . . . . . . . . . . . .Total preferred shares . . . . . . . . . . . . . . . . . . . . . . . . . . . . .
Total . . . . . . . . . . . . . . . . . . . . . . . . . . . . . . . . . . . . . . . . .
–8,732
173––
40––
378–
–––––1––––
287
31,575
––7–––––––––
––
–––7
31,582138,000138,000169,582
––––––––––
–––––––––––
4,855
––––––––––––
––
––––
4,855––
4,855
9,2108,732
173––
40––
378–
–––––1––––
287
224,955
––
119–––––––––
––
–––
119225,074438,000438,000663,074

116
(25) Reserves
Under the legislation applicable to corporations inSpain, 10% of a company's income for each yearmust be transferred to the Legal Reserve until thebalance of this reserve reaches 20% of commonstock. The balance of the Legal Reserve inexcess of 10% of common stock can becapitalized. Except for such capitalization, until theLegal Reserve exceeds 20% of common stock itcan only be used to offset losses, if sufficientother reserves are not available for this purpose.
Companies in Spain are also legally required toset up restricted reserves for transactions involvingtheir own shares or the shares of their parentcompany, for amounts equal to the related assetbalances (acquisitions of such shares or financingprovided to acquire them) or to the effective valueof such shares held as collateral for loans. Thesereserves become unrestricted when the reasonsfor their recording cease to exist.
€ thousand
Increases:Distribution of prior year’s income . . . . .Transfer of prepaid taxes . . . . . . . . . . .Transfer from 2001 early retirements . .Transfer from pension allowance . . . . .Consolidation adjustments . . . . . . . . . .
Decreases:Capital increase . . . . . . . . . . . . . . . . . . .Cancellation of shares . . . . . . . . . . . . . .Transfer to pension allowance . . . . . . .Transfer to early retirements allowanceDistribution of reserves . . . . . . . . . . . . .Consolidations adjustments . . . . . . . . .
Net period variation . . . . . . . . . . . . . . . . . .
The detail of the variations in the aggregatereserves in the last five years is as follows:
€ thousand
Restricted reserves:Legal reserve . . . . . . . . . . . . . . . .Reserves for own shares:
For acquisition . . . . . . . . . . . .For collateral . . . . . . . . . . . . . .For share purchase loans . . . .
Other restricted reserves . . . . . . .Unrestricted reserves:
Bylaw reserve . . . . . . . . . . . . . . . .Paid-in surplus . . . . . . . . . . . . . . .Voluntary and other reserves . . . .
Total . . . . . . . . . . . . . . . . . . . .
Under Spanish corporate law, the paid-in surplusreserve can be capitalized and there are norestrictions on its use.
€34,000 thousand of Banco Popular Español'sunrestricted reserves were used in 2002 (€44,000thousand in 2001) to cover the financialrequirements arising from the execution of anextraordinary early retirements plan.
Transfers of €11,900 thousand in 2002 and €35,998thousand in 2001 were made to unrestrictedreserves in connection with the prepaid taxes arisingfrom retirement plans executed in 2002 and earlieryears. In 2002, €7,257 thousand were booked inreserves as the net amount of the funds not used forthe 2001 plan which concluded in March 2002.
The breakdown of the aggregate reservesincluded in the consolidated balance sheet underthe "Paid-in surplus", "Reserves" and"Revaluation reserves" captions is as follows:
20002002 19992001 1998
35,696
–10,829
7425,553
54,28921,164
929,0851,057,358
35,696
–11,298
94627,015
54,28921,164
780,791931,199
35,696
–8,951
73927,015
41,61121,164
691,183826,359
35,696
–6,756
40127,015
41,61148,717
796,309956,505
35,696
–8,775
849,303
54,28921,164
1,059,2561,188,567
20002002 19992001 1998
116,79135,998
––
17,370
–––
44,000––
126,159
89,7497,212
––
7,879
––––––
104,840
96,856––
15,596–
27,553145,69569,002
––
348(130,146)
92,604––
16,1852,982
––
90,152–
86,552–
(64,933)
151,27411,9007,257
––
–––
34,000–
5,222131,209
€ thousand
Beginning balance . . . . . . . . . . .Increase . . . . . . . . . . . . . . . .Decrease . . . . . . . . . . . . . . .
Ending balance . . . . . . . . . . . . .
20002002 19992001 1998
–85,34185,341
–
–134,061134,061
–
–17,28917,289
–
–763763
–
–117,464117,464
–

117
The increases due to capitalization of taxes relateto the prepaid taxes in connection with the earlyretirements transactions.
The variations in each account in 2002 were asfollows:
(26) Consolidation reserves
The reserves of companies consolidated by theglobal and proportional integration methods reflectthe differences disclosed in consolidation when theinvestment in the affiliates consolidated iseliminated against their equity. The equity methodconsists of valuing the Group's nonconsolidable,non-financial multigroup and associated companiesat their net worth per books and recording thedifference from the portfolio carrying value in theseaccounts. The differences disclosed by applicationof the aforementioned methods and procedure arecalculated from the date of each company'sinclusion within the scope of consolidation; thevariations relate to the accumulation of the portionof the company's earnings or losses which isattributable to the Group, net of the eliminationsand adjustments made in consolidation for internalbusiness relationships between the variouscompanies within that scope.
The reserves used for early retirements by Bancode Andalucía, Banco de Castilla, Banco deCrédito Balear, Banco de Galicia and Banco deVasconia gave rise to decreases in consolidationreserves of €16,766 thousand in 2002 and€23,934 thousand. These reserves increased by€5,868 thousand in 2002 and €8,378 thousand in2001 due to the return to the account of origin ofthe prepaid taxes in those years; the figure for2001 includes prepaid taxes of prior yearsamounting to €2,682 thousand (see Note 2.i).
€5,529 thousand were also recorded in 2002 asthe net amount of the funds not used for the 2001plan which concluded in March 2002.
The detail, by company, of the balance of theconsolidation reserves account in the last fiveyears is shown in the following table.
€ thousand
Amount in Banco Popular balance sheet . . . .Consolidation adjustments:
For dividends . . . . . . . . . . . . . . . . . . . . . . .For other items (net) . . . . . . . . . . . . . . . . .
Amount in consolidated balance sheet . . . . . .
€ thousand
Restricted reserves:Legal reserve . . . . . . . . . . . . . . . . . . . . . . . . .Reserves for own shares:
For acquisition . . . . . . . . . . . . . . . . . . . . .For collateral . . . . . . . . . . . . . . . . . . . . . .For share purchase loans . . . . . . . . . . . .
Other restricted reserves . . . . . . . . . . . . . . . .Unrestricted reserves:
Bylaw reserve . . . . . . . . . . . . . . . . . . . . . . . .Paid-in surplus . . . . . . . . . . . . . . . . . . . . . . . .Voluntary and other reserves . . . . . . . . . . . . .
Total . . . . . . . . . . . . . . . . . . . . . . . . . . . .Causes of the variations:
Distribution of the prior year’s income . . . . . .Transfers between reserves . . . . . . . . . . . . .Transfer of prepaid taxes . . . . . . . . . . . . . . . .Consolidation adjustments . . . . . . . . . . . . . . .Transfer for early retirements . . . . . . . . . . . .
Total . . . . . . . . . . . . . . . . . . . . . . . . . . . .
DecreaseBalance at12/31/01 Increase
Balance at 12/31/02
Variation in 2002
35,696
–10,828
7425,553
54,28921,164
929,0861,057,358
–
76,83913,003
667–
––
127,020217,529
–178,307
–5,222
34,000
217,529
35,696
–8,775
849,303
54,28921,164
1,059,2561,188,567
–
76,83910,950
93,750
––
257,190348,738
151,274178,30711,900
–7,257
348,738
20002002 19992001
1,001,08356,27568,032
(11,757)1,057,358
1998
925,13231,37342,041(10,668)956,505
795,33331,02642,926
(11,900)826,359
892,29438,90551,294(12,389)931,199
1,137,51451,05357,170(6,117)
1,188,567
The balances of the aggregate of these reservesin the consolidated balance sheets differ fromthose in Banco Popular's individual balancesheets (see Note 3) due to the inclusion of thecontra i tems for certain adjustments and
eliminations relating to intra-Group transactionsimputable to the parent company. The effect ofthese adjustments, which basically relates tointra-Group dividends, is shown below in thefollowing table.

118
€ thousandDeposit-taking entities:Banco de Andalucía ...................................................................Banco de Castilla........................................................................Banco de Crédito Balear ............................................................Banco de Galicia ........................................................................Banco de Vasconia.....................................................................Bancopopular-e ..........................................................................Banco Popular France ...............................................................Banco Popular Hipotecario.........................................................Popular Banca Privada...............................................................Finance companies:Heller Factoring Española ..........................................................Heller Factoring Portuguesa.......................................................Portfolio and service companies:Europensiones............................................................................Fortior Holding............................................................................Gestión Premier Fund ................................................................Gestora Europea de Inversiones................................................Gestora Popular .........................................................................Iberagentes Previsión.................................................................Popular Bolsa ............................................................................Popular de Participaciones Financieras .....................................Popular Gestión Privada.............................................................Sogeval.......................................................................................Instrumental companies:Aliseda........................................................................................Aula 2000 ...................................................................................BPE Finance International ...........................................................BPE Capital International ..............................................................BPE Preference International .......................................................Finespa.......................................................................................Iberagentes Servicios .................................................................Inmobiliaria Viagracia.................................................................Inmobiliaria Vivesa .....................................................................Intermediación y Servicios Tecnológicos ......................................Popular Asia Trade . ......................................................................Urbanizadora Española ................................................................Total global and proportional integration method companies (a) . .Nonconsolidable companiesDesarrollo Aplicaciones Especiales............................................Eurocorredores...........................................................................Eurovida .....................................................................................Inversiones Inmobiliarias Alprosa...............................................Panorama Ibicenca ....................................................................Popular de Comunicaciones.......................................................Popular de Informática ...............................................................Popular de Renting.....................................................................Proassurances............................................................................Promoción Social de Viviendas ..................................................Sicomi.........................................................................................Other companies ........................................................................
Subtotal nonconsolidable companies (b) . . . . . . . . . . . . . . . . . . . . . . .Nonconsolidable multigroup companiesDieznet ......................................................................................Sociedad preparatoria de medios de pago ................................
Subtotal nonconsolidable multigroup(c) ...............................Associated companies Inmobiliaria Bami ........................................................................Sistema 4B .................................................................................Sdad. Conjunta para la Emisión y Gestión de Medios de Pago
Subtotal associated companies (d) . . . . . . . . . . . . . . . . . . . . . . . . . . . . . .Total equity method companies (b)+(c)+(d) . . . . . . . . . . . . . . . .
Translation differencesBPE Finance International . . . . . . . . . . . . . . . . . . . . . . . . . . . . . . . . . . . . . . . . . . . . . .BPE Capital International . . . . . . . . . . . . . . . . . . . . . . . . . . . . . . . . . . . . . . . . . . . . . . . .BPE Preference International . . . . . . . . . . . . . . . . . . . . . . . . . . . . . . . . . . . . . . . . . .Banco Popular France . . . . . . . . . . . . . . . . . . . . . . . . . . . . . . . . . . . . . . . . . . . . . . . . . . .Popular Asia Trade . . . . . . . . . . . . . . . . . . . . . . . . . . . . . . . . . . . . . . . . . . . . . . . . . . . . . . . .Other companies . . . . . . . . . . . . . . . . . . . . . . . . . . . . . . . . . . . . . . . . . . . . . . . . . . . . . . . . . .
Total translation differences (e) . . . . . . . . . . . . . . . . . . . . . . . . . . . . . . . . . . .Consolidation reserves (a)+(b)+(c)+(d)+(e) . . . . . . . . . . . . . . . .
20002002 19992001
242,586213,42036,506
151,35174,279
–737
12,583–
7,842–
1,617––
2,770718
–91544–
92,596
1,6091– ––
1,795–
5,4921,452
41–
848,354
31318
3,482381
–––
15028653
9,98414,424
383
38314,807
11115
892––
919864,080
1998
208,596196,66633,856
133,41363,360
–14,0039,925
6,772
1,617
2,364663
857
79,667
1,6101– ––
1,769
5,1101,452
29–
761,730
31320
3,116164
–
58
–2
10,33814,011
383
38314,394
882
892
–910
777,034
178,333178,88528,210
116,47552,566
–13,8807,799
5,749
1,372
1,409850
718
64,994
1,6011
4–
2,010
5,2731,452
10
659,990
31317
3,0073–
19
32
11,92815,292
382
38215,674
892
–892
676,556
159,136165,96322,057
102,34045,707
12,8506,106
4,940
1,124
1,310643
571
54,008
1,605–
––
1,821
5,2051,454
6
585,241
31318
2,560––
–
6–
11,64114,538
385
38514,923
896
–896
601,060
288,549235,07241,221
172,30685,778
–2,249
20,906111
9,060–
1,617–
162,932
42613
923395104
101,479
1,5441– ––
1,738–
5,4721,452
59–
9,981983,404
31316
3,760409
–––
48342
1223–
5,148
– ––
1,100383
–1,4836,631
22–
892––
896990,931

119
The detail, by company, of losses at consolidatedcompanies in the last five years is shown below.
(27) Tax matters
The Banco Popular Group is not taxed on aconsolidated basis, and each company thereforefiles an individual tax return.
The amounts for the payment of the taxes applicableto each consolidated company are, as regulatorilyrequired, included under the "Other liabilityaccounts" caption on the liability side of the balancesheets, net of tax withholdings and prepayments.
In calculating the amount of corporate income tax,included under the "Income tax" caption in theconsolidated income statement, regard was hadto the various legally authorized tax credits.
The consolidated companies generally have the lastfive years open for inspection by the tax authoritieswith respect to the taxes applicable to them.
Global & proportional integration method companiesBancopopular-e . . . . . . . . . . . . . . . . . . . . . . . . . . . . . . . . . .BPE Finance International . . . . . . . . . . . . . . . . . . . . . . . . . .BPE Capital International . . . . . . . . . . . . . . . . . . . . . . . . . . .BPE Preference International . . . . . . . . . . . . . . . . . . . . . . .Fortior Holding . . . . . . . . . . . . . . . . . . . . . . . . . . . . . . . . . . .Heller Factoring Portuguesa . . . . . . . . . . . . . . . . . . . . . . . . .
Subtotal global and proportional integration method . . .
Equity method companiesDieznet . . . . . . . . . . . . . . . . . . . . . . . . . . . . . . . . . . . . . . . . .Panorama Ibicenca . . . . . . . . . . . . . . . . . . . . . . . . . . . . . . . .Popular de Comunicaciones . . . . . . . . . . . . . . . . . . . . . . . . .Popular de Informática . . . . . . . . . . . . . . . . . . . . . . . . . . . . .Sociedad Preparatoria de Medios de Pago . . . . . . . . . . . . .Other companies . . . . . . . . . . . . . . . . . . . . . . . . . . . . . . . . .
Subtotal equity method . . . . . . . . . . . . . . . . . . . . . . . . . .
Translation differencesBPE Preference International . . . . . . . . . . . . . . . . . . . . . . . .
Subtotal translation differences . . . . . . . . . . . . . . . . . . .
Losses at consolidated companies . . . . . . . . . . . . . .
€ thousand 19992001 199820002002
3,505–––––
3,505
–94–––
44138
––
3,643
–66–––
12
–96–––
30126
––
138
224–4–––
228
–93–––
32125
––
353
860–
11–––
871
–94–––
82176
––
1,047
4,161––1
4,460573
9,195
349511
25–
156
44
9,355
The differing interpretations that can be made ofthe tax regulations applicable to certainoperations might give rise to contingent taxliabilities. However, the consolidated companies'tax advisors consider that the possibility of theseliabilities materializing is remote and that, in anycase, the tax charges which might arise therefromwould not materially affect the consolidatedfinancial statements.
Although the 2002 corporate income tax returnhas not yet been fi led, the table belowsummarizes the calculations for determining,starting from the income before taxes, theconsolidated expense for income tax, taking intoaccount not only the pretax income but also thatarising from the permanent differences in thetaxable base. The tax credits for double taxation,for tax relief, for investments, for reinvestment andfor contributions to pension plans are treated as
€ thousandIncome before taxes . . . . . . . . . . . . . . . . . . . . . . . .Additions to the taxable base (per detail) . . . . . . . .Reductions of the taxable base (per detail) . . . . . . .Offset of prior years’ tax losses . . . . . . . . . . . . . . . .Taxable base (income for tax purposes) . . . . . . . . .Tax charge (35%) . . . . . . . . . . . . . . . . . . . . . . . . . .Tax credits:
For double taxation . . . . . . . . . . . . . . . . . . . . . .For tax relief . . . . . . . . . . . . . . . . . . . . . . . . . . . .For investments . . . . . . . . . . . . . . . . . . . . . . . . .For reinvestments . . . . . . . . . . . . . . . . . . . . . . .For contributions to pension plans . . . . . . . . . . .
Tax payable . . . . . . . . . . . . . . . . . . . . . . . . . . . . . . .Tax for timing differences (net) . . . . . . . . . . . . . . . .Other adjustments (net) . . . . . . . . . . . . . . . . . . . . . .Corporate income tax charge . . . . . . . . . . . . . . . . .
20002002 19992001 1998
852,194305,34487,623
791,069,836
374,443
33,862631439
––
339,511(9,458)
(94,592)235,461
810,414255,198108,932
–956,680334,838
52,123665815
––
281,23514,302(13,481)
282,056
704,626120,83778,420
–747,043261,465
27,620672863
––
232,31023,681(17,147)
238,844
655,740114,01873,924
–695,834243,542
32,821685902
––
209,13417,189
(10,271)216,052
1,055,429277,923191,589
1,0611,140,702
399,246
37,795592362
1,7841,024
357,68916,424(8,854)
365,259

120
Through the year 2001, the Group companiesavailed themselves of the possibility of deferringpayment of the corporate income tax on thecapital gains obtained on transfers of fixed assetsby reinvesting the proceeds of disposal.
As stipulated in the Third Transitory Provision ofLaw 24/2001, the 2001 corporate income taxreturn included the income omitted from thetaxable base because of the deferral referred to inthe previous paragraph and a tax credit of €7,229thousand was taken for reinvestment ofextraordinary gains pursuant to Article 36 ter ofthe Corporate Income Tax Law.
Capital gains qualifying for the tax credit forreinvestment of extraordinary gains were obtainedin 2002 and the reinvestment required for takingthis credit had not been made in full.
The following table details the capital gainsqualifying for reinvestment tax credits.
(€ thousand)
Qualifying Tax credit Year capital gains taken
1998 7,409 1,2601999 10,895 1,8522000 7,714 1,3112001 6,938 1,1792002 15,398 1,784
Apart from the taxes capitalized and recoveredin connection with the early retirements plans(see Note 2.i), other taxes of €4,596 thousandin 2002 and €98,814 thousand in 2001, which
were paid because contributions to the externalpension fund are not tax-deductible, werecapitalized with a credit to income. A further€4,118 thousand of taxes on period provisionswere also capitalized. As required by Bank ofSpain Circular 7/1991, only the taxes which areexpected to be recovered in the next ten yearsfor the contributions to the pension plan or forthe pension payments effectively made, asappropriate, have been capitalized. In thissame connection €35,647 thousand were usedin 2002. Taxes of €15,454 thousand in 2002and €21,393 thousand in 2001 were capitalizedas a result of the booking of a statistical creditloss allowance, the provisions to which are nota tax-deduct ible expense. Other t imingdifferences for €78 thousand in 2002 and €5thousand in 2001 were capitalized, and €51thousand were used in 2002.
There are €25,884 thousand of other balances tobe recovered from the Tax Administration, andprepaid taxes of €12,938 thousand relating topensions which have not been capitalizedbecause their recovery period exceeds ten years.
In 2002 and 2001, taxes of €738 thousand €325thousand were paid and deferred, respectively, inapplication of the authorization contained in RoyalDecree-Law 3/1993 for tax recognition of higherthan technical depreciation on new tangible fixedassets acquired.
€45,055 thousand of capital gains deferred underthe deferral regulations in force through 2001were reported as income in 2001.
€ thousand
Increases: . . . . . . . . . . . . . . . . . . . . . . . . . . . . .Permanent difference . . . . . . . . . . . . . . . . . .Current year timing difference . . . . . . . . . . .Prior years’ timing difference . . . . . . . . . . . .
Decreases: . . . . . . . . . . . . . . . . . . . . . . . . . . . . .Permanent difference . . . . . . . . . . . . . . . . . .Current year timing difference . . . . . . . . . . .Prior years’ timing difference . . . . . . . . . . . .
20002002 19992001 1998
305,344211,68491,0392,621
87,62320,9836,950
59,690
114,018110,406
1,5392,073
73,92421,1929,171
43,561
120,837119,626
1,211–
78,4209,542
15,11853,760
255,198223,70030,975
523108,93236,5718,451
63,910
277,923220,69055,1232,110
191,58988,611
–102,978
reductions of the period corporate income tax.Entitlement to these tax credits is conditionalupon compliance with the current regulatoryrequirements.
The tax expense arising from prior years wasnegative by €11,877 thousand in 2002 and€99,197 thousand in 2001.
The details referred to in the foregoing table,relating to increases and decreases in the taxablebase, based on their classification as timing orpermanent differences, are disclosed in thefollowing information.

121
The prepaid and deferred taxes which will revertin future years amount to €316,393 thousand and€3,465 thousand, respectively.
The table below also shows the detail of incometax on ordinary and extraordinary income. Thelatter consists of income from non-financial
business transactions and prior years' income.
The €2,436 thousand of foreign taxes similar tothe Spanish corporate income tax which werelevied on the income obtained outside Spain in2002 were recognized in the "Other taxes"account in the statement of income.
€ thousand
Forward foreign currency transactions:Purchases . . . . . . . . . . . . . . . . . . . . . . . . . .Sales . . . . . . . . . . . . . . . . . . . . . . . . . . . . . .
Foreign currency financial futures . . . . . . . . . . .Forward financial asset transactions:
Purchases . . . . . . . . . . . . . . . . . . . . . . . . . .Sales . . . . . . . . . . . . . . . . . . . . . . . . . . . . . .
Security and interest rate futures:Purchases . . . . . . . . . . . . . . . . . . . . . . . . . .Sales . . . . . . . . . . . . . . . . . . . . . . . . . . . . . .
Options:On securities:
Purchases . . . . . . . . . . . . . . . . . . . . . . .Sales . . . . . . . . . . . . . . . . . . . . . . . . . . .
On interest rates:Purchases . . . . . . . . . . . . . . . . . . . . . . .Sales . . . . . . . . . . . . . . . . . . . . . . . . . . .
On foreign currencies:Purchases . . . . . . . . . . . . . . . . . . . . . . .Sales . . . . . . . . . . . . . . . . . . . . . . . . . . .
Other interest rate transactions:FRAs . . . . . . . . . . . . . . . . . . . . . . . . . . . . . .Swaps . . . . . . . . . . . . . . . . . . . . . . . . . . . . .Other . . . . . . . . . . . . . . . . . . . . . . . . . . . . . .
Commodity futures transactions . . . . . . . . . . . .Unsettled on-credit securities transactions . . . .Coverage for futures transactions:
Allowance for futures . . . . . . . . . . . . . . . . . .
20002002 19992001 1998
1,606,154545,171
–
41526
223,73895,150
681,708846,375
––
––
–3,124,769
–––
1,297
792,439456,051
–
––
2,511,8872,445,618
38,22037,932
––
2,1922,192
–3,743,448
–––
1,530
680,177467,302
–
61,16261,150
136,800151,500
––
––
2,1872,187
150,0003,962,230
–––
1,709
2,264,1691,794,857
–
29,17324,323
408,316441,269
––
––
19,30519,305
132,5352,538,369
–––
228
1,824,840812,212
–
––
9,786114,221
923,153921,871
––
73,87173,871
–6,913,435
–––
403
€ thousand
Public-sector securities . . . . . . . . . . . . . . . . . . .Own buildings mortgaged . . . . . . . . . . . . . . . . .Other assets assigned in guarantee . . . . . . . . .
Total . . . . . . . . . . . . . . . . . . . . . . . . . . . . . . .Coverage allowance . . . . . . . . . . . . . . . . . . . . .
20002002 19992001 1998
18,27567
242,230260,572
7
34,985240
28,94564,170
289
25,289214
121,115146,618
246
18,05268
252,812270,932
130
18,17166
408,424426,661
8
(29) Futures transactions
The year-end data of the f inancial futurescontracts entered into by the Group in the
normal course of its business are shown in thefollowing table:
(28) Guarantees for Group and third-partycommitments
The following table details the assets assigned tosecure Group and third-party commitments at
each year-end in the Banco Popular Group'sconsolidated balance sheet.
€ thousand
Income tax:Ordinary income . . . . . . . . . . . . . . . . . . . . . .Extraordinary income . . . . . . . . . . . . . . . . . .
Total . . . . . . . . . . . . . . . . . . . . . . . . . . . .
20002002 19992001 1998
245,610(10,149)235,461
214,8261,226
216,052
238,977(133)
238,844
282,615(559)
282,056
372,943(7,684)
365,259

122
The information with respect to transactions inorganized and not organized (OTC) markets isshown in the following table:
As regards measurement of credit andcounterparty risk in transactions involvingfinancial derivatives on interest rates in OTCmarkets, the original risk method permitted as
an alternative by Bank of Spain Circular 5/1993on minimum capital requirements is used. Thestructure of these risks is as follows:
After adjustment of the term data and weightingby counterparty, and net of the speci f icallowance provided for these transactions, theweighted risks amounted to €107,972 thousandand €58,417 thousand in 2002 and 2001,
respectively, signifying a minimum capitalrequirement for transact ions of this typeamounting to €8,638 thousand and €4,673thousand, respectively, at the end of thoseyears.
€ thousand
2002 2001 2002 2001 2002 2001
Financial asset purchases and sales .Security & interest rate futures . . . . .Options:
On securities & interest rates . . . .On currencies . . . . . . . . . . . . . . . .
FRAs . . . . . . . . . . . . . . . . . . . . . . . .Swaps
Trading Balance sheet items Other derivatives
Hedge
– 30,059
–– –
1,198,987
441253,957
–– –
501,819
––
–––
2,762,006
––
–––
1,651,428
– 93,948
1,845,024 147,742
– 2,952,442
– 64,931
1,528,083 – –
971,522
€ thousand
FRAs . . . . . . . . . . . . . . . . . .Swaps . . . . . . . . . . . . . . . . . .
2002 2001 2002 2001 2002 2001
– 4,026,149
– 990,700
–572,990
–58,000
– 2,314,296
– 2,076,069
< 1 year up to 2 years > 2 years
Balances by term
€ thousand
2002 2001 2002 2001 2002 2001
Financial asset purchases and sales .Security & interest rate futures . . . . . .Options:
On securities & interest rates . . . .On currencies . . . . . . . . . . . . . . . .
FRAs . . . . . . . . . . . . . . . . . . . . . . . .Swaps . . . . . . . . . . . . . . . . . . . . . . . .
Spanish Foreign OTC
Market traded in
–115,538
6,124– ––
–79,221
78,083– ––
–8,469
–––
–239,667
3,602–––
– –
1,838,900 147,742
– 6,913,435
441 –
1,446,388 – –
3,124,769
Organized
The detail of the trading portfolio and hedgingoperations is as follows:

(30) Transactions with Group, multigroup andassociated companies
This note refers to the balances in theconsolidated balance sheets and incomestatements relating to transactions with Group,multigroup and associated companies.
The dividends collected from subsidiaries whichare not consolidable because of their line ofbusiness and from associated companies arerecorded in the consolidated income statementsas equity securities portfolio income and,simultaneously, as value adjustments for thecollection of dividends paid by equity methodcompanies, the breakdown being as follows:
123
€ thousand
Balance sheetAssets:
Due from financial intermediaries .Loans and discounts . . . . . . . . . . .Prepayments and accrued income
Liabilities:Due to financial intermediaries . . .Customer deposits . . . . . . . . . . . .Accruals and deferred income . . .
Memorandum accounts:Contingent liabilities . . . . . . . . . . .Commitments . . . . . . . . . . . . . . . .
Income statement:Interest and similar revenues . . . .Interest and similar charges . . . . .Fee revenues . . . . . . . . . . . . . . . .Fee expenses . . . . . . . . . . . . . . . .
Proportional integrationmethod companies
Equity method companies
Nonconsolidable Associated
20022002 20012001 2002
413,048–
3,294
8,8811,919
4
21926,106
13,854197
2,054193
2001
80,007–
354
15––
–143,620
2,992–
1,085–
(31) Income statement disclosures
Following are relevant disclosures relating to theconsolidated income statements.
a. Geographical distribution
The consolidated Group's financial activity outsideSpain is that conducted by the Banco Popular branch
–22,153
116
–25,004
102
26,90412,916
939504
15,2497,284
–73,479
332
–23–
8,5063,739
4,121–
288–
–180,731
1,514
–14,046
42
5,6955,808
8,877104
––
–78,474
386
–11,753
19
2029,252
2,137160
17,9528,046
€ thousand
Relating to income of:Current year . . . . . . . . . . . . . . . . . . . . . . . . .Prior years . . . . . . . . . . . . . . . . . . . . . . . . . .
Total . . . . . . . . . . . . . . . . . . . . . . . . . . . . . . . . . . .
20002002 19992001 1998
1838,0318,214
2286,5046,732
2,6263,2705,896
1073,5783,685
–7,7777,777
€ thousand
Credit entities Private sector
Counterparties
FRAs . . . . . . . . . . . . . . . . . . . . . . . . . . . . . . . . . .Swaps . . . . . . . . . . . . . . . . . . . . . . . . . . . . . . . . . .
2002 2001 2002 2001
–6,555,215
–3,111,547
– 358,220
– 13,222
The following table details the 2002 and 2001year-end balances, as reflected in theconsolidated balance sheets and incomestatements, of the transactions with companies
consolidated by the proportional integrationmethod, with companies not consolidablebecause of their l ine of business, and withassociated companies.

124
b. Nature of transactions
The detail of certain consolidated incomestatement captions by type of originatingtransactions is as follows:
€ thousand
Interest and similar revenuesSpain . . . . . . . . . . . . . . . . . . . . . . . . . . . . . . . .Rest of Europe . . . . . . . . . . . . . . . . . . . . . . . . . ..America . . . . . . . . . . . . . . . . . . . . . . . . . . . . . . ..
Service fee revenues (net)Spain . . . . . . . . . . . . . . . . . . . . . . . . . . . . . . . .Rest of Europe . . . . . . . . . . . . . . . . . . . . . . . . . ..America . . . . . . . . . . . . . . . . . . . . . . . . . . . . . . ..Asia . . . . . . . . . . . . . . . . . . . . . . . . . . . . . . . .
Asset trading and exchange profitsSpain . . . . . . . . . . . . . . . . . . . . . . . . . . . . . . . .Rest of Europe . . . . . . . . . . . . . . . . . . . . . . . . . ..America . . . . . . . . . . . . . . . . . . . . . . . . . . . . . . ..
Interest and similar chargesSpain . . . . . . . . . . . . . . . . . . . . . . . . . . . . . . . .Rest of Europe . . . . . . . . . . . . . . . . . . . . . . . . . ..America . . . . . . . . . . . . . . . . . . . . . . . . . . . . . . ..
20002002 19992001 1998
2,250,71333,406
–
558,6278,533
(1)188
44,97410–
799,35412,99680,228
1,754,40813,992
–
534,1163,305
––
119,47120–
579,3975,799
64,397
1,351,58111,281
–
464,1522,703
––
45,719118
–
317,8425,492
45,329
1,445,80714,869
–
410,2692,043
––
46,596727
–
480,32310,98025,020
2,326,85129,127
–
565,0347,517
–161
28,880671
675,67910,425
109,646
€ thousand
Interest and similar revenuesBank of Spain and other central banks . . . . . . . .Financial intermediaries . . . . . . . . . . . . . . . . . . .Fixed-interest securities . . . . . . . . . . . . . . . . . . .Loans and discounts . . . . . . . . . . . . . . . . . . . . . .
Total . . . . . . . . . . . . . . . . . . . . . . . . . . . . . . .Revenues from equity securitiesShares and other equity securities . . . . . . . . . . .Participating interests . . . . . . . . . . . . . . . . . . . . .Shares of Group companies . . . . . . . . . . . . . . . .
Total . . . . . . . . . . . . . . . . . . . . . . . . . . . . . . .Service fee revenuesContingent liabilities . . . . . . . . . . . . . . . . . . . . . .Collection and payment services . . . . . . . . . . . .Securities services . . . . . . . . . . . . . . . . . . . . . . .Other transactions . . . . . . . . . . . . . . . . . . . . . . .
Total . . . . . . . . . . . . . . . . . . . . . . . . . . . . . . .Asset trading and exchange profitsSpanish and foreign fixed-interest securities . . .Equity securities . . . . . . . . . . . . . . . . . . . . . . . . .Exchange and derivatives . . . . . . . . . . . . . . . . . .Asset securitization . . . . . . . . . . . . . . . . . . . . . . .
Total . . . . . . . . . . . . . . . . . . . . . . . . . . . . . . .Interest and similar chargesBank of Spain . . . . . . . . . . . . . . . . . . . . . . . . . . .Financial intermediaries . . . . . . . . . . . . . . . . . . .Depositors . . . . . . . . . . . . . . . . . . . . . . . . . . . . . .Debt securities and subordinated liabilities . . . . .Cost imputable to recorded pension
allowance . . . . . . . . . . . . . . . . . . . . . . . . . . .Other interest . . . . . . . . . . . . . . . . . . . . . . . . . . .
Total . . . . . . . . . . . . . . . . . . . . . . . . . . . . . . .
20002002 19992001 1998
18,522237,27950,604
1,977,7142,284,119
1,7861,0967,118
10,000
49,151228,779160,861128,556567,347
3,365(10,464)49,2062,877
44,984
3,241252,838506,301110,348
19,347503
892,578
14,642222,49653,548
1,477,7141,768,400
1,270768
5,9648,002
41,692198,034175,011122,684537,421
5,73081,23330,5881,940
119,491
10,431182,488368,48667,658
20,125405
649,593
8,478141,20434,325
1,178,8551,362,862
2,238162
3,5235,923
36,857165,608169,17995,211
466,855
6,92512,28619,3117,315
45,837
3,79996,600
232,10323,679
12,114368
368,663
156199,78236,716
1,224,0221,460,676
3,2751,1724,7249,171
34,841148,078150,62678,767
412,312
7,898372
38,158896
47,324
12,946112,762353,46722,484
14,262402
516,323
17,811149,50129,463
2,159,2032,355,978
23,3761,3536,424
31,153
57,042242,504153,155120,011572,712
6,676(79,505)98,0253,752
28,948
1,818193,029438,928161,211
–764
795,750
network in Portugal, Banco Popular France, HellerFactoring Portuguesa and the instrumental companiesBPE Finance International, BPE Capital International,BPE Preference International in the Cayman Islandsand Popular Asia Trade in Hong Kong.
The following table shows the split of thebalances of the main consolidated incomestatement captions for the last five yearsamong the countries where the Groupcompanies are located.

125
d. General administrative expenses.Personnel expenses
The breakdown of the balances of this consolidatedincome statement caption is as follows:
c. Asset trading and exchange profits, net
The detail of the balances of this incomestatement caption is as follows:
€ thousand
Exchange differences . . . . . . . . . . . . . . . . . . . .Fixed-interest securitiesTrading profit . . . . . . . . . . . . . . . . . . . . . . . . . . . .Portfolio writedown . . . . . . . . . . . . . . . . . . . . . . .
Subtotal . . . . . . . . . . . . . . . . . . . . . . . . . . . . .Equity securitiesTrading profit . . . . . . . . . . . . . . . . . . . . . . . . . . . .Portfolio writedown . . . . . . . . . . . . . . . . . . . . . . .
Subtotal . . . . . . . . . . . . . . . . . . . . . . . . . . . . .DerivativesTrading profit . . . . . . . . . . . . . . . . . . . . . . . . . . . .Writedown of futures . . . . . . . . . . . . . . . . . . . . . .
Subtotal . . . . . . . . . . . . . . . . . . . . . . . . . . . . .Asset securitization
Total . . . . . . . . . . . . . . . . . . . . . . . . . . . . . . .
20002002 19992001 1998
36,556
2,772(593)
3,365
(7,915)2,549
(10,464)
12,417(233)
12,6502,877
44,984
32,826
6,139409
5,730
85,4454,212
81,233
(2,417)(179)
(2,238)1,940
119,491
20,681
7,545620
6,925
13,5801,294
12,286
1111,481(1,370)7,315
45,837
36,998
7,886(12)
7,898
4,2913,919
372
1,22666
1,160896
47,324
36,028
6,600(76)
6,676
(69,683)9,822
(79,505)
61,103(894)
61,9973,752
28,948
€ thousand
Remmuneration. . . . . . . . . . . . . . . . . . . . . . . . . . . . . . .Social security charges . . . . . . . . . . . . . . . . . . . . . . . . .
Social security taxes . . . . . . . . . . . . . . . . . . . . . . . .Contribution to external pension fund . . . . . . . . . . .
Other . . . . . . . . . . . . . . . . . . . . . . . . . . . . . . . . . . . . . .Total. . . . . . . . . . . . . . . . . . . . . . . . . . . . . . . . . . . . .
Pension payments (charged to special allowance). . . .
20002002 19992001 1998
393,024132,391103,08729,30413,251
538,666
–
369,10997,05997,059
–10,853
477,021
–
356,64093,37193,371
–11,639
461,650
–
351,44891,60091,600
–12,477
455,525
–
407,342133,866106,18527,68111,146
552,354
–
The aggregate amount of gross remuneration paidto the members of the Group's senior management,which consists of 19 executives at or above thelevel of Deputy General Manager, was €4,006thousand in 2002.
This amount was made up of €3,778 thousand ofmonetary remuneration and €228 thousand ofcompensation in kind (basically life and healthinsurance premiums and use of housing).
The contributions made by the Group to thepension fund and supplementary insurancecontract for senior management executivesamounted to €2,111 thousand in 2002.
The Group does not have in place any executiveremuneration system directly or indirectly linked tothe price of Banco Popular shares or other Groupsecurities, or to stock options.
No amount is shown for pension payments sincethese payments are made by Allianz Seguros, SAunder the insurance contracts arranged with thiscompany for retired employees, as discussedelsewhere in these Notes.

126
e. Other operating income and expenses
The detail of "Other operating income" in the lastfive years is shown in the following table. The
property rental income figures are afterelimination of intra-Group rental income.
Data in %
Years of service
Under 6 . . . . . . . . . . . . . . . .6 - 10 . . . . . . . . . . . . . . . .11 - 20 . . . . . . . . . . . . . . . .21 - 30 . . . . . . . . . . . . . . . .31 - 40 . . . . . . . . . . . . . . . .41 - 50 . . . . . . . . . . . . . . . .Over 50Distribution by age group . .
Under 21 21-30 31-40 41-50 51-60Marginal
distribution ofyears of service
Over 60
Age
%
Under 20,000 . . . . . . . . . . . . . . . . .20,001 - 26,000 . . . . . . . . . . . . . . . .26,001 - 32,000 . . . . . . . . . . . . . . . .32,001 - 38,000 . . . . . . . . . . . . . . . .38,001 - 50,000 . . . . . . . . . . . . . . . .50,001 - 80,000 . . . . . . . . . . . . . . . .80,001 - 120,000 . . . . . . . . . . . . . . .120,001 - 180,000 . . . . . . . . . . . . . .Over 180,000 . . . . . . . . . . . . . . . . .
Totals . . . . . . . . . . . . . . . . . . . .
%
Average perbracket(Euros)
Personnel Remuneration
Bracket(€)
€ thousand
Net property rental income . . . . . . . . . . . . . . . . .Other sundry revenues . . . . . . . . . . . . . . . . . . .
Total . . . . . . . . . . . . . . . . . . . . . . . . . . . . . . .
20002002 19992001 1998
1,302172
1,474
1,351123
1,474
1,138195
1,333
99896
1,094
1,696205
1,901
0.02 ––––––
0.02
3.936.819.850.10
–––
20.69
0.620.322.56
19.644.91
––
28.05
0.310.300.619.32
14.080.65
– 25.27
0.01 0.01 0.010.070.230.09
– 0.42
29.248.61
13.0629.1319.220.74
– 100.00
24.351.170.03
––––
25.55
13.5414.3136.2016.4113.495.320.470.160.10
100.00
7.6010.9432.6717.9718.239.781.370.750.69
100.00
17,76624,19528,56834,65542,77658,22092,200
148,027216,615
31,651
The following tables show the variations in theGroup's year-end and average annual headcount,the distribution of the staff by age group and lengthof service, and the 2002 remuneration pyramid.
This latter table does not include the remunerationof the executives who are Board members, which isindividually disclosed in the earlier table showingthe composition of the Board.
Year-end Annual average
Authorized officers . . .Clerical staff . . . . . . . .General services . . . .
Total . . . . . . . . . . .
20002002 19992001 1998
7,4924,775
42
12,309
20002002 19992001 1998
7,1304,772
41
11,943
6,8434,650
46
11,539
6,7304,799
71
11,600
7,3524,792
38
12,182
6,9974,812
42
11,853
6,8254,750
50
11,625
6,6655,006
79
11,750
7,7154,710
39
12,464
7,5954,785
41
12,421
127
The items comprising "Other operating expenses"in the consolidated income statements of the lastfive years were as follows:
f. Extraordinary gains and losses
The main items comprising "Extraordinary gains"in the income statements of the last five yearswere as follows:
€ thousand
Net gains on fixed asset disposals . . . . . . . . . .Fee income for atypical services . . . . . . . . . . . .Prior years’ income . . . . . . . . . . . . . . . . . . . . . .Other . . . . . . . . . . . . . . . . . . . . . . . . . . . . . . . .Recovery of other specific allowances . . . . . . . ..
Total . . . . . . . . . . . . . . . . . . . . . . . . . . . . . . .
20002002 19992001 1998
9,566700
8,62510,2213,586
32,698
11,3331,4719,7805,777
–
28,361
13,487980
12,2614,6694,808
36,205
18,794689
10,2394,101
–
33,823
17,401952
15,99513,60655,220
103,174
The detail for "Extraordinary losses" is as follows:
€ thousand
Net losses on fixed asset disposals . . . . . . . . . .Provision to other special allowances (net) . . . . .Prior years’ losses . . . . . . . . . . . . . . . . . . . . . . . .Other losses . . . . . . . . . . . . . . . . . . . . . . . . . . . .Extraordinary provisions to pension plans . . . . .
Total . . . . . . . . . . . . . . . . . . . . . . . . . . . . . . .
20002002 19992001 1998
48282,8859,112
13,78439,993
146,256
1,48261,46812,12913,73847,917
136,734
1,887–
11,06510,1339,616
32,701
1,9765,792
12,2869,952
15,599
45,605
572–
13,08121,04018,098
52,791
€ thousand
Net property rental losses . . . . . . . . . . . . . . . . . . . .Contribution to Deposit Guarantee Fund . . . . . . .Directors’ fees . . . . . . . . . . . . . . . . . . . . . . . . . . . .Contributions to welfare foundations . . . . . . . . . .Other items . . . . . . . . . . . . . . . . . . . . . . . . . . . . . .
Total . . . . . . . . . . . . . . . . . . . . . . . . . . . . . . . .
20002002 19992001 1998
–17,389
20222,774
98741,352
–15,278
25322,774
83939,144
–13,830
24722,774
57937,430
–13,108
24622,7721,095
37,221
–12,361
16322,773
86036,157

128
(32) Statement of changesin financial position
€ thousand
Source of funds
Net income for the year . . . . . . . . . . . . . . . . . . . . . .
Amounts which reduce income but do not involve anapplication of funds:
Net provision to allowances:For credit loss . . . . . . . . . . . . . . . . . . . . . . .For country risk . . . . . . . . . . . . . . . . . . . . . .For pensions . . . . . . . . . . . . . . . . . . . . . . . .For other purposes . . . . . . . . . . . . . . . . . . . .
Writedown of securities portfolio . . . . . . . . . . . .Depreciation . . . . . . . . . . . . . . . . . . . . . . . . . . . .Gain on sale of permanent assets (-) . . . . . . . .Imputation of results of equity method
subsidiaries (-) . . . . . . . . . . . . . . . . . . . . . . .
Funds provided by operations . . . . . . . . . . .
Net increase in:
Subordinated debt securities . . . . . . . . . . . . . . .Due to banks (net) . . . . . . . . . . . . . . . . . . . . . . .Customer deposits . . . . . . . . . . . . . . . . . . . . . . .Other assets and liabilities (net) . . . . . . . . . . . .
Net decrease in:
Fixed-interest securities . . . . . . . . . . . . . . . . . . .Shares and nonpermanent participating interests
Sale of permanent assets . . . . . . . . . . . . . . . . . . . .
Total . . . . . . . . . . . . . . . . . . . . . . . . . . . . . . .
Application of funds
Prior year’s dividend . . . . . . . . . . . . . . . . . . . . . . . .
Equity reduction . . . . . . . . . . . . . . . . . . . . . . . . . . . .
Net increase in:Due from banks (net) . . . . . . . . . . . . . . . . . . . . .Loans and discounts . . . . . . . . . . . . . . . . . . . . .Fixed-interest securities . . . . . . . . . . . . . . . . . . .Shares and nonpermanent participating interestsOther assets and liabilities (net) . . . . . . . . . . . .
Net decrease in: . . . . . . . . . . . . . . . . . . . . . . . . . . . .Subordinated securities issued . . . . . . . . . . . . .
Acquisition of permanent assets . . . . . . . . . . . . . . .
Total . . . . . . . . . . . . . . . . . . . . . . . . . . . . . . .
20002002 19992001 1998
614,164
218,668(178)
72,07279,2991,723
76,261(11,880)
(9,347)
1,040,782
56,0001,135,9223,533,848
–
96,317–
39,973
5,902,842
280,431
–
–4,599,878
–61,616
478,077
–
482,840
5,902,842
527,509
133,664(79)
68,04261,4684,442
69,825(16,206)
(8,720)
839,945
207,469–
3,540,074250,534
69,281–
50,322
4,957,625
252,319
–
171,9664,427,718
–17,354
–
–
88,268
4,957,625
465,782
95,7641,478
27,7135,7923,395
67,594(17,171)
(6,977)
643,370
––
2,136,405–
45,69132,053
84,576
2,942,095
227,122
147,893
120,2622,105,178
––
222,494
–
119,146
2,942,095
439,129
80,522416
23,878(4,808)3,973
65,168(16,228)
(9,051)
582,999
–1,498,107
906,051–
––
102,605
3,089,762
211,088
–
–2,082,291
323,57355,215
264,193
–
153,402
3,089,762
687,735
254,2213,278
–(55,220)
8,852131,327(16,937)
(8,542)
1,004,714
–1,519,3074,094,175
197,172
445,391–
80,369
7,341,128
324,382
–
–6,572,912
–272,215
–
18,113
153,506
7,341,128

(32) Relevant events subsequent toDecember 31, 2002
On January 9, 2003, the Bank entered into anagreement in pr incip le wi th the Portuguesecorporate group headed by Mr. Américo Amorim forthe purchase from him of his 75.1% stake in thecapital of Banco Nacional de Crédito Imobiliário(BNC). Mr Amorim will also acquire a holding ofnear ly 4.5% in the capi ta l of Banco PopularEspañol and it will be proposed that he be elected amember of the Board of Directors.
The aforementioned agreements are subject to aset of conditions precedent and, in particular, to theconformity of the respective competent authoritiesin Portugal and Spain.
After purchase of the majority of the capital stock ofBNC has been completed, Banco Popular intendsto launch a public offering for the acquisition of theremaining shares of BNC on the same terms asagreed with Mr. Amorim.
BNC is a Portuguese bank which was founded in1991 and has a network of 111 branch officesthroughout Portugal. Per the consolidated financialstatements as of December 31, 2001, the latestapproved by its Shareholders Meeting, it has€3,280 million of total assets, €2,633 million ofloans and discounts, and €2,658 mi l l ion ofcustomer funds.
129
130
EXHIBIT I
Banco Popular Group. Companies comprising the consolidated group, the nonconsolidable groupand the multigroup companies at December 31, 2002
Registered offices , line of business and consolidation method
Address
Velázquez, 34 Madrid Banking Global integrationFernández y González, 4 Sevilla Banking Global integrationPl. de los Bandos, 10 Salamanca Banking Global integrationPl. de España, 1 P.Mallorca Banking Global integrationPolicarpo Sanz, 23 Vigo Banking Global integrationPl. del Castillo, 39 Pamplona Banking Global integrationVelázquez, 34 Madrid Banking Global integration8, Rue D´Anjou París Banking Global integrationVelázquez, 64-66 Madrid Banking Global integrationPº Castellana, 95 Madrid Banking Global integration
María de Molina, 54 Madrid Factoring Proportional integrationRua Castilho, 39 Lisboa Factoring Global integration
María de Molina, 34 Madrid Pension plan management Global integrationPº Castellana, 95 Madrid Share ownership Global integrationBoulevard Royal, 261 Luxemburgo Mutual fund management Global integrationVelázquez, 64-66 Madrid Portfolio management Global integrationJ.Ortega y Gasset, 29 Madrid Share portfolio & ownership Global integrationPº Castellana, 95 Madrid Pension plan management Global integrationVelázquez, 64-66 Madrid Stockbroking Global integrationVelázquez, 64-66 Madrid Venture capital company Global integrationPº Castellana, 95 Madrid Mutual fund management Global integrationVelázquez, 64-66 Madrid Mutual fund management Global integration
J.Ortega y Gasset, 29 Madrid Asset ownership Global integrationJ.Ortega y Gasset, 29 Madrid Services Global integrationUgland House George Town Finance Global integrationUgland House George Town Finance Global integrationUgland House George Town Finance Global integrationJ.Ortega y Gasset, 29 Madrid Property Global integrationPº Castellana, 95 Madrid Services Global integrationJ.Ortega y Gasset, 29 Madrid Property Global integrationJ.Ortega y Gasset, 29 Madrid Property Global integrationJ.Ignacio Luca de Tena, 13 Madrid Services Global integration13/F Tim Mei Avenue Hong Kong Finance Global integrationJ.Ortega y Gasset, 29 Madrid Property Global integration
Capitán Haya, 38 Madrid Data processing Equity method companiesJ.Ortega y Gasset, 29 Madrid Insurance broking Equity method companiesMaría de Molina, 34 Madrid Insurance Equity method companiesJ.Ortega y Gasset, 29 Madrid Property Equity method companiesSanta Eulalia del Río Ibiza Asset ownership Equity method companiesJ.Ortega y Gasset, 29 Madrid Communications services Equity method companiesJ.Ortega y Gasset, 29 Madrid IT services Equity method companiesVelázquez, 64-66 Madrid Renting Equity method companies8, Rue D’Anjou París Insurance broking Equity method companiesJ.Ortega y Gasset, 29 Madrid Asset ownership Equity method companiesJ.Ortega y Gasset, 29 Madrid Dormant Equity method companies
J.Ortega y Gasset, 29 Madrid E-commerce Equity method companiesVelázquez, 130 Madrid Means of payment Equity method companies
Deposit-taking entities:Banco Popular Español . . . . . . . . . . . .Banco de Andalucía . . . . . . . . . . . . . . .Banco de Castilla . . . . . . . . . . . . . . . . .Banco de Crédito Balear . . . . . . . . . . . .Banco de Galicia . . . . . . . . . . . . . . . . . .Banco de Vasconia . . . . . . . . . . . . . . . .Bancopopular-e . . . . . . . . . . . . . . . . . . .Banco Popular France . . . . . . . . . . . . .Banco Popular Hipotecario . . . . . . . . . .Popular Banca Privada . . . . . . . . . . . . .
Finance companies:Heller Factoring Española . . . . . . . . . . .Heller Factoring Portuguesa . . . . . . . . .
Portfolio and service companies:Europensiones . . . . . . . . . . . . . . . . . . .Fortior Holding . . . . . . . . . . . . . . . . . . .Gestión Premier Fund . . . . . . . . . . . . . .Gestora Europea de Inversiones . . . . .Gestora Popular . . . . . . . . . . . . . . . . . .Iberagentes Previsión . . . . . . . . . . . . . .Popular Bolsa . . . . . . . . . . . . . . . . . . . .Popular de Participaciones FinancierasPopular Gestión Privada . . . . . . . . . . . .Sogeval . . . . . . . . . . . . . . . . . . . . . . . . .
Instrumental companies:Aliseda . . . . . . . . . . . . . . . . . . . . . . . . .Aula 2000 . . . . . . . . . . . . . . . . . . . . . . .BPE Finance International . . . . . . . . . . .BPE Capital International . . . . . . . . . . . .BPE Preference International . . . . . . . . .Finespa . . . . . . . . . . . . . . . . . . . . . . . . .Iberagentes Servicios . . . . . . . . . . . . . .Inmobiliaria Viagracia . . . . . . . . . . . . . .Inmobiliaria Vivesa . . . . . . . . . . . . . . . .Intermediación y Servicios TecnológicosPopular Asia Trade . . . . . . . . . . . . . . . . .Urbanizadora Española . . . . . . . . . . . .
Nonconsolidable group
Desarrollo Aplicaciones Especiales . . .Eurocorredores . . . . . . . . . . . . . . . . . . .Eurovida . . . . . . . . . . . . . . . . . . . . . . . .Inversiones Inmobiliarias Alprosa . . . . .Panorama Ibicenca . . . . . . . . . . . . . . . .Popular de Comunicaciones . . . . . . . . .Popular de Informática . . . . . . . . . . . . .Popular de Renting . . . . . . . . . . . . . . . .Proassurances . . . . . . . . . . . . . . . . . . .Promoción Social de Viviendas . . . . . .Sicomi . . . . . . . . . . . . . . . . . . . . . . . . . .
Nonconsolidable multigroup companies
Dieznet Comercio Electrónico . . . . . . . .Sociedad Preparatoria de Medios de Pago
Line of businessConsolidation
method

EXHIBIT II
Banco Popular Group. Group and multigroup companies at December 31, 2002
Percentage of direct and indirect ownership and book value of holdings
% of ownership
Deposit-taking entities:Banco de Andalucía . . . . . . . . . . . . . . .Banco de Castilla . . . . . . . . . . . . . . . . .Banco de Crédito Balear . . . . . . . . . . . .Banco de Galicia . . . . . . . . . . . . . . . . . .Banco de Vasconia . . . . . . . . . . . . . . . .Bancopopular-e . . . . . . . . . . . . . . . . . . .Banco Popular France . . . . . . . . . . . . .Banco Popular Hipotecario . . . . . . . . . .Popular Banca Privada . . . . . . . . . . . . .
Finance companies:Heller Factoring Española . . . . . . . . . . .Heller Factoring Portuguesa . . . . . . . . .
Portfolio and service companies:Europensiones . . . . . . . . . . . . . . . . . . .Fortior Holding . . . . . . . . . . . . . . . . . . .Gestión Premier Fund . . . . . . . . . . . . . .Gestora Europea de Inversiones . . . . .Gestora Popular . . . . . . . . . . . . . . . . . .Iberagentes Previsión . . . . . . . . . . . . . .Popular Bolsa . . . . . . . . . . . . . . . . . . . .Popular de Participaciones FinancierasPopular Gestión Privada . . . . . . . . . . . .Sogeval . . . . . . . . . . . . . . . . . . . . . . . . .
Instrumental companies:Aliseda . . . . . . . . . . . . . . . . . . . . . . . . .Aula 2000 . . . . . . . . . . . . . . . . . . . . . . .BPE Finance International . . . . . . . . . . .BPE Capital International . . . . . . . . . . . .BPE Preference International . . . . . . . . .Finespa . . . . . . . . . . . . . . . . . . . . . . . . .Iberagentes Servicios . . . . . . . . . . . . . .Inmobiliaria Viagracia . . . . . . . . . . . . . .Inmobiliaria Vivesa . . . . . . . . . . . . . . . .Intermediación y Servicios TecnológicosPopular Asia Trade . . . . . . . . . . . . . . . . .Urbanizadora Española . . . . . . . . . . . .
Nonconsolidable group
Desarrollo Aplicaciones Especiales . . .Eurocorredores . . . . . . . . . . . . . . . . . . .Eurovida . . . . . . . . . . . . . . . . . . . . . . . .Inversiones Inmobiliarias Alprosa . . . . .Panorama Ibicenca . . . . . . . . . . . . . . . .Popular de Comunicaciones . . . . . . . . .Popular de Informática . . . . . . . . . . . . .Popular de Renting . . . . . . . . . . . . . . . .Proassurances . . . . . . . . . . . . . . . . . . .Promoción Social de Viviendas . . . . . .Sicomi . . . . . . . . . . . . . . . . . . . . . . . . . .
Nonconsolidable multigroup companies
Dieznet . . . . . . . . . . . . . . . . . . . . . . . . .Sociedad Preparatoria de Medios de Pago
Direct Indirect Total
Book value ofholding
(Euro thousand)
131
79.8195.1664.4492.0196.82
100.00100.0099.94
–
50.0049.76
51.0052.50
–100.00100.00
–100.00100.00
–100.00
100.00100.00100.00100.00100.00
4.19–
100.00100.00100.00100.0097.54
50.6790.0037.00
––
99.8499.84
100.00–––
50.0020.00
0.02–
0.030.010.02
––
0.0660.00
––
–7.50
60.00––
60.00––
60.00–
–––––
95.8160.00
–––––
–10.0010.47
100.00100.00
0.160.16
–100.0091.17
100.00
––
79.8395.1664.4792.0296.84
100.00100.00100.0060.00
50.0049.76
51.0060.0060.00
100.00100.0060.00
100.00100.0060.00
100.00
100.00100.00100.00100.00100.00100.0060.00
100.00100.00100.00100.0097.54
50.67100.0047.47
100.00100.00100.00100.00100.00100.0091.17
100.00
50.0020.00
162,73971,04730,45855,33232,46024,9089,538
106,47611,721
4,81519,469
7,96879,341
77651
6,805522
6,10036,0001,8033,002
2,5926
464652
8,05836
20,6323,1131,202
–10,381
4762
4,2763,453
3576161
1,5638
5507
500180
132
EXHIBIT II(continuation)
Banco Popular Group. Associated companies and other significant investees at December 31, 2002
Percentage of direct and indirect ownership and book value of holdings
% ownership
Associated companiesInmobiliaria Bami . . . . . . . . . . . . . . . . . . . . . . . . . . . . . . . . . . . . .Sistema 4B . . . . . . . . . . . . . . . . . . . . . . . . . . . . . . . . . . . . . . . . .Sociedad Conjunta para la Emisión y Gestión de Medios de Pago . .
Other significant investee companiesCorretaje e Información Monetaria y de Divisa . . . . . . . . . . . . . .Inversiones y Construcciones . . . . . . . . . . . . . . . . . . . . . . . . . . .Neva Rica Industrias . . . . . . . . . . . . . . . . . . . . . . . . . . . . . . . . . .
Direct Indirect Total
Book value ofholding
(Euro thousand)
Associated companies: those at least 20% owned, if unlisted, or at least 3% owned, if listed, or whose business activity is aclear prolongation of the Group’s financial activity, regardless of the percentage of ownership.
Other significant investee companies: those 5% or more and less than 20% owned, whose shares are unlisted.
6.9820.4520.00
–8.33
–
20,24717,0271,619
575290167
6.9820.4520.00
5.008.33
10.76
–––
5.00–
10.76

133
EXHIBIT III
Banco Popular Group, Consolidated companies at December 31, 2002
Common stock, reserves, income and dividends collected
(Data in € thousand, unless otherwise indicated)
Income for the year
Deposit-taking entities:Banco Popular Español . . . . . . . . . . . . . .Banco de Andalucía . . . . . . . . . . . . . . . . .Banco de Castilla . . . . . . . . . . . . . . . . . . .Banco de Crédito Balear . . . . . . . . . . . . .Banco de Galicia . . . . . . . . . . . . . . . . . . .Banco de Vasconia . . . . . . . . . . . . . . . . .Bancopopular-e . . . . . . . . . . . . . . . . . . . .Banco Popular France . . . . . . . . . . . . . . .Banco Popular Hipotecario . . . . . . . . . . .Popular Banca Privada . . . . . . . . . . . . . .
Finance companies:Heller Factoring Española (1) . . . . . . . .Heller Factoring Portuguesa . . . . . . . . . .
Portfolio and service companies:Europensiones . . . . . . . . . . . . . . . . . . . . .Fortior Holding . . . . . . . . . . . . . . . . . . . .Gestión Premier Fund . . . . . . . . . . . . . . .Gestora Europea de Inversiones . . . . . . .Gestora Popular . . . . . . . . . . . . . . . . . . . .Iberagentes Previsión . . . . . . . . . . . . . . .Popular Bolsa . . . . . . . . . . . . . . . . . . . . .Popular de Participaciones Financieras .Popular Gestión Privada . . . . . . . . . . . . .Sogeval . . . . . . . . . . . . . . . . . . . . . . . . . .
Instrumental companies:Aliseda . . . . . . . . . . . . . . . . . . . . . . . . . . .Aula 2000 . . . . . . . . . . . . . . . . . . . . . . . . .BPE Finance International (2) . . . . . . . . . .BPE Capital International (2) . . . . . . . . . . .BPE Preference International (2) . . . . . . . .Finespa . . . . . . . . . . . . . . . . . . . . . . . . . .Iberagentes Servicios . . . . . . . . . . . . . . .Inmobiliaria Viagracia . . . . . . . . . . . . . . .Inmobiliaria Vivesa . . . . . . . . . . . . . . . . . .Intermediación y Servicios Tecnológicos .Popular Asia Trade(3) . . . . . . . . . . . . . . . .Urbanizadora Española . . . . . . . . . . . . . . .
Capital stock Reserves Total
Dividendscollected
in the yearExtraordinary
(1) Consolidated by the proportional integration method.(2) Data in thousands of US $ (US $1=Euros 0.9536 at 12/31/2002).(3) Data in thousands of HK $ (HK $1=Euros 0.1223 at 12/31/2002).
108,57716,29726,03610,5729,1299,600
21,00019,10084,25019,535
6,91212,500
15,6264,485
124100
3,744870
4,51536,0003,006
962
2,0436
505050
1,29260
4,688902
1,2021
240
1,137,514543,217292,11898,371
237,804112,248
(534)15,14532,293
7
20,46215,400
3,16919,976
3673,5493,778
702,508
395698
103,439
1,89919––
(1)8,607
–22,607
26859–
11,411
491,947105,15746,30619,20242,25925,017
6721,7397,971
(1,208)
1,8282,717
15,377(2,828)
6962
33842
1,313(1,020)
3517,547
4484––
12,8221,365
–1,612
633–
101
53,814(6,238)(2,005)(1,089)
(113)(5,967)
(79)399284(45)
(243)7
3522
(1)615
–––
(3)32
417––––
11,457–
141–
(1)––
120,690488368127254247
––––
––
58––2
56–
285––
239
–––––
57–
824––––
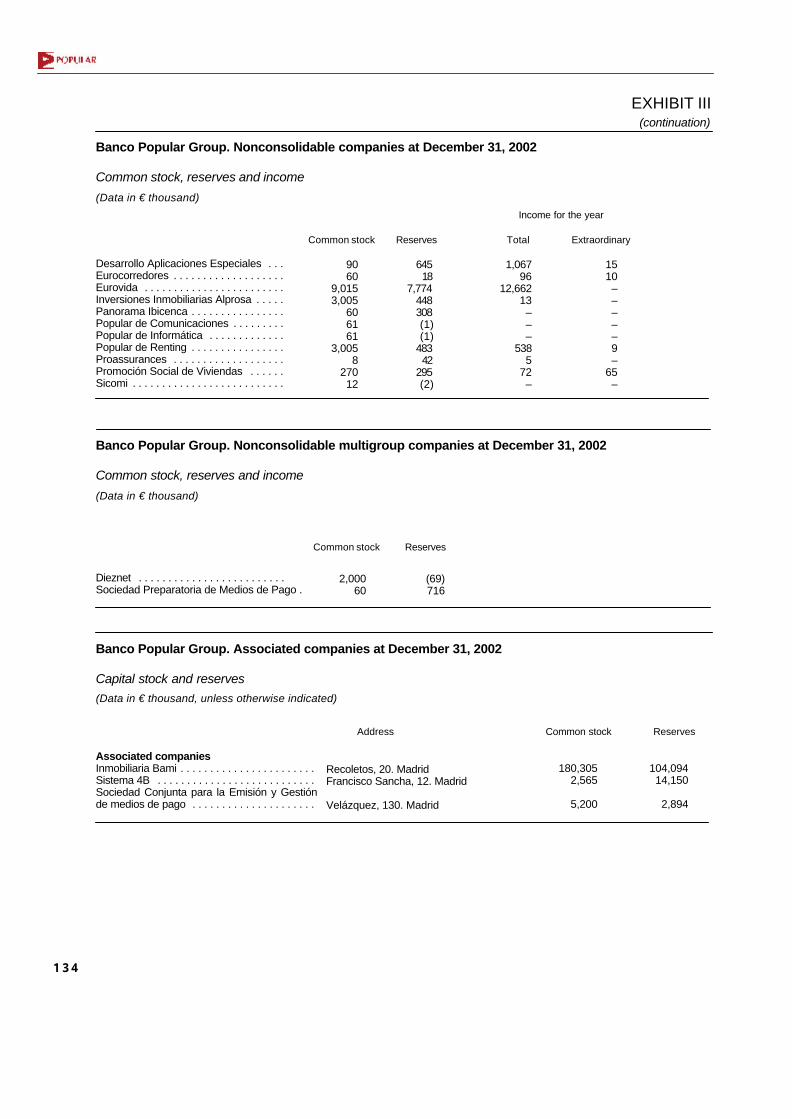
134
EXHIBIT III(continuation)
Banco Popular Group. Nonconsolidable companies at December 31, 2002
Common stock, reserves and income
(Data in € thousand)
Income for the year
Desarrollo Aplicaciones Especiales . . .Eurocorredores . . . . . . . . . . . . . . . . . . .Eurovida . . . . . . . . . . . . . . . . . . . . . . . .Inversiones Inmobiliarias Alprosa . . . . .Panorama Ibicenca . . . . . . . . . . . . . . . .Popular de Comunicaciones . . . . . . . . .Popular de Informática . . . . . . . . . . . . .Popular de Renting . . . . . . . . . . . . . . . .Proassurances . . . . . . . . . . . . . . . . . . .Promoción Social de Viviendas . . . . . .Sicomi . . . . . . . . . . . . . . . . . . . . . . . . . .
Common stock Reserves Total Extraordinary
Banco Popular Group. Associated companies at December 31, 2002
Capital stock and reserves(Data in € thousand, unless otherwise indicated)
Address
Recoletos, 20. MadridFrancisco Sancha, 12. Madrid
Velázquez, 130. Madrid
Common stock Reserves
Associated companiesInmobiliaria Bami . . . . . . . . . . . . . . . . . . . . . . .Sistema 4B . . . . . . . . . . . . . . . . . . . . . . . . . . .Sociedad Conjunta para la Emisión y Gestiónde medios de pago . . . . . . . . . . . . . . . . . . . . .
64518
7,774448308(1)(1)
48342
295(2)
1,06796
12,66213–––
5385
72–
1510–––––9–
65–
9060
9,0153,005
606161
3,0058
27012
180,3052,565
5,200
104,09414,150
2,894
Banco Popular Group. Nonconsolidable multigroup companies at December 31, 2002
Common stock, reserves and income
(Data in € thousand)
Dieznet . . . . . . . . . . . . . . . . . . . . . . . . .Sociedad Preparatoria de Medios de Pago .
Common stock Reserves
2,00060
(69)716
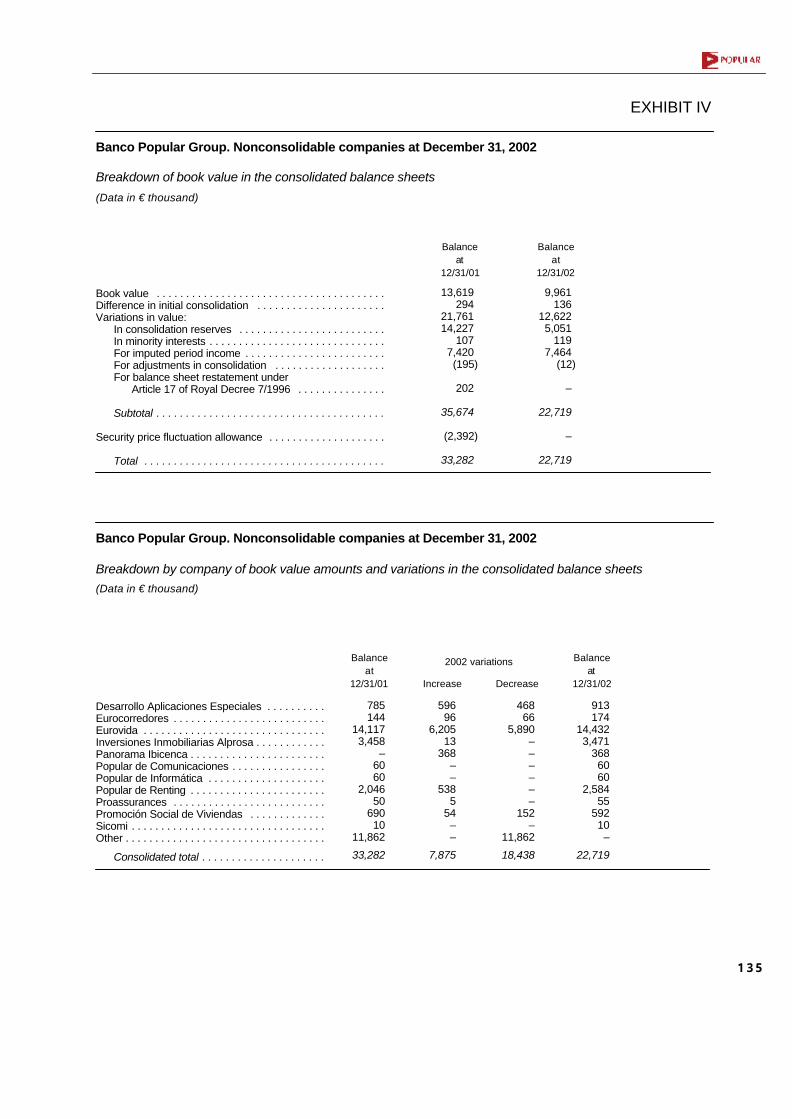
135
EXHIBIT IV
Banco Popular Group. Nonconsolidable companies at December 31, 2002
Breakdown of book value in the consolidated balance sheets
(Data in € thousand)
Book value . . . . . . . . . . . . . . . . . . . . . . . . . . . . . . . . . . . . . . .Difference in initial consolidation . . . . . . . . . . . . . . . . . . . . . .Variations in value:
In consolidation reserves . . . . . . . . . . . . . . . . . . . . . . . . .In minority interests . . . . . . . . . . . . . . . . . . . . . . . . . . . . . .For imputed period income . . . . . . . . . . . . . . . . . . . . . . . .For adjustments in consolidation . . . . . . . . . . . . . . . . . . .For balance sheet restatement under
Article 17 of Royal Decree 7/1996 . . . . . . . . . . . . . . .
Subtotal . . . . . . . . . . . . . . . . . . . . . . . . . . . . . . . . . . . . . . .
Security price fluctuation allowance . . . . . . . . . . . . . . . . . . . .
Total . . . . . . . . . . . . . . . . . . . . . . . . . . . . . . . . . . . . . . . . .
Balanceat
12/31/01
Balanceat
12/31/02
Banco Popular Group. Nonconsolidable companies at December 31, 2002
Breakdown by company of book value amounts and variations in the consolidated balance sheets(Data in € thousand)
Desarrollo Aplicaciones Especiales . . . . . . . . . .Eurocorredores . . . . . . . . . . . . . . . . . . . . . . . . . .Eurovida . . . . . . . . . . . . . . . . . . . . . . . . . . . . . . .Inversiones Inmobiliarias Alprosa . . . . . . . . . . . .Panorama Ibicenca . . . . . . . . . . . . . . . . . . . . . . .Popular de Comunicaciones . . . . . . . . . . . . . . . .Popular de Informática . . . . . . . . . . . . . . . . . . . .Popular de Renting . . . . . . . . . . . . . . . . . . . . . . .Proassurances . . . . . . . . . . . . . . . . . . . . . . . . . .Promoción Social de Viviendas . . . . . . . . . . . . .Sicomi . . . . . . . . . . . . . . . . . . . . . . . . . . . . . . . . .Other . . . . . . . . . . . . . . . . . . . . . . . . . . . . . . . . . .
Consolidated total . . . . . . . . . . . . . . . . . . . . .
Balanceat
12/31/01
Balanceat
12/31/02
2002 variations
DecreaseIncrease
13,619294
21,76114,227
1077,420(195)
202
35,674
(2,392)
33,282
9,961136
12,6225,051
1197,464
(12)
–
22,719
–
22,719
785144
14,1173,458
–6060
2,04650
69010
11,862
33,282
59696
6,20513
368––
5385
54––
7,875
46866
5,890––––––
152–
11,862
18,438
913174
14,4323,471
3686060
2,58455
59210–
22,719

136
EXHIBIT V
Banco Popular Group. Consolidated companies at December 31, 2002
Net income
(Data in € thousand)
Corresponding to
Consolidated companies:
Deposit-taking entities:Banco Popular Español . . . . . . . . . . . .Banco de Andalucía . . . . . . . . . . . . . . .Banco de Castilla . . . . . . . . . . . . . . . . .Banco de Crédito Balear . . . . . . . . . . .Banco de Galicia . . . . . . . . . . . . . . . . .Banco de Vasconia . . . . . . . . . . . . . . .Bancopopular-e . . . . . . . . . . . . . . . . . .Banco Popular France . . . . . . . . . . . .Banco Popular Hipotecario . . . . . . . . .Popular Banca Privada . . . . . . . . . . . .
Finance companies:Heller Factoring Española . . . . . . . . . .Heller Factoring Portuguesa . . . . . . . .
Portfolio and service companies:Europensiones . . . . . . . . . . . . . . . . . . .Fortior Holding . . . . . . . . . . . . . . . . . .Gestión Premier Fund . . . . . . . . . . . . .Gestora Europea de Inversiones . . . . .Gestora Popular . . . . . . . . . . . . . . . . . .Iberagentes Previsión . . . . . . . . . . . . .Popular Bolsa . . . . . . . . . . . . . . . . . . .Popular de Participaciones FinancierasPopular Gestión Privada . . . . . . . . . . .Sogeval . . . . . . . . . . . . . . . . . . . . . . . .
Instrumental companies:Aliseda . . . . . . . . . . . . . . . . . . . . . . . . .Aula 2000 . . . . . . . . . . . . . . . . . . . . . . .BPE Finance International . . . . . . . . . .BPE Capital International . . . . . . . . . . . .BPE Preference International . . . . . . . .Finespa . . . . . . . . . . . . . . . . . . . . . . . . .Iberagentes Servicios . . . . . . . . . . . . . .Inmobiliaria Viagracia . . . . . . . . . . . . . .Inmobiliaria Vivesa . . . . . . . . . . . . . . . .Intermediación y Servicios TecnológicosPopular Asia Trade . . . . . . . . . . . . . . . . .Urbanizadora Española . . . . . . . . . . . . .
Subtotal global and proportionalintegration methods companies . .
Net income BPE shareholders Minority interests
2002 2001 2002 2001 2002 2001
491,947105,15746,30619,20242,25925,017
6721,7397,971
(1,208)
9142,717
15,377(2,828)
6962
33842
1,313(1,020)
3517,547
4484––
12,2271,365
–1,612
633–
101
779,740
446,60394,31243,55016,81140,38523,408
(551)2,1673,623
140
1,2182,073
16,3341,661
2215674415
1,321351126
9,051
415––
8,393727
–2,764
1317–
715,480
491,94783,94744,06512,38038,88724,226
6721,7397,971(725)
9141,352
7,842(1,697)
4162
33825
1,313(1,020)
2117,547
4484––
(46)1,365
–1,612
6 33–
99
725,558
446,60375,09141,42910,81637,01722,589
(551)2,1673,623
140
1,2181,032
8,3301,661
2215674415
1,321351126
9,051
415––(2)
727–
2,76413 17–
666,516
–21,2102,2416,8223,372
791–––
(483)
–1,365
7,535(1,131)
28––
17––
140–
––––
12,273––––––2
54,182
–19,2212,1215,9953,368
819––––
–1,041
8,004–––––––––
––––
8,395––––––
48,964

137
EXHIBIT V(continuation)
Banco Popular Group. Nonconsolidable and associated companies at December 31, 2002
Net income
(Data in € thousand)
Nonconsolidable companies
Group companiesDesarrollo Aplicaciones Especiales . . . . . . . . . .Eurocorredores . . . . . . . . . . . . . . . . . . . . . . . . . .Eurovida . . . . . . . . . . . . . . . . . . . . . . . . . . . . . . .Inversiones Inmobiliarias Alprosa . . . . . . . . . . . .Panorama Ibicenca . . . . . . . . . . . . . . . . . . . . . . .Popular de Comunicaciones . . . . . . . . . . . . . . . .Popular de Informática . . . . . . . . . . . . . . . . . . . .Popular de Renting . . . . . . . . . . . . . . . . . . . . . . .Proassurances . . . . . . . . . . . . . . . . . . . . . . . . . .Promoción Social de Viviendas . . . . . . . . . . . . .Sicomi . . . . . . . . . . . . . . . . . . . . . . . . . . . . . . . . .Other . . . . . . . . . . . . . . . . . . . . . . . . . . . . . . . . . .
Subtotal equity methodnonconsolidable group companies
Equity method multigroup companies . . . . . . . . .Equity method associated companies . . . . . . . .Income of equity method companies imputableto third parties outside the Group . . . . . . . . . . . . . .
Subtotal equity method companies . . . . . . . . . . .
Total . . . . . . . . . . . . . . . . . . . . . . . . . . . . . . .
Adjustments and eliminations . . . . . . . . . . . . . . .
Total . . . . . . . . . . . . . . . . . . . . . . . . . . . . . . .
Corresponding to
Net income BPE shareholders Minority interests
* Earnings of these companies attributable to minority interests of the shareholder entities
2002 2001 2002 2001 2002 2001
*
1,06796
12,66213–––
5385
72––
14,453
(231)17,263
(22,931)
8,554
788,294
(100,559)
687,735
1,17664
12,60230
(1)(1)
3331476–
183
14,476
(69)19,147
(24,192)
9,362
724,842
(110,678)
614,164
54196
6,01113–––
5385
66––
7,270
(156)1,246
–
8,360
733,918
(100,428)
633,490
59664
5,97930
(1)(1)
3331469–
179
7,262
(35)1,939
–
9,166
675,682
(110,400)
565,282
––
194–––––––––
194
––
–
194
54,376
(131)
54,245
*
––
196–
–––––––
196
–
–
196
49,160
(278)
48,882
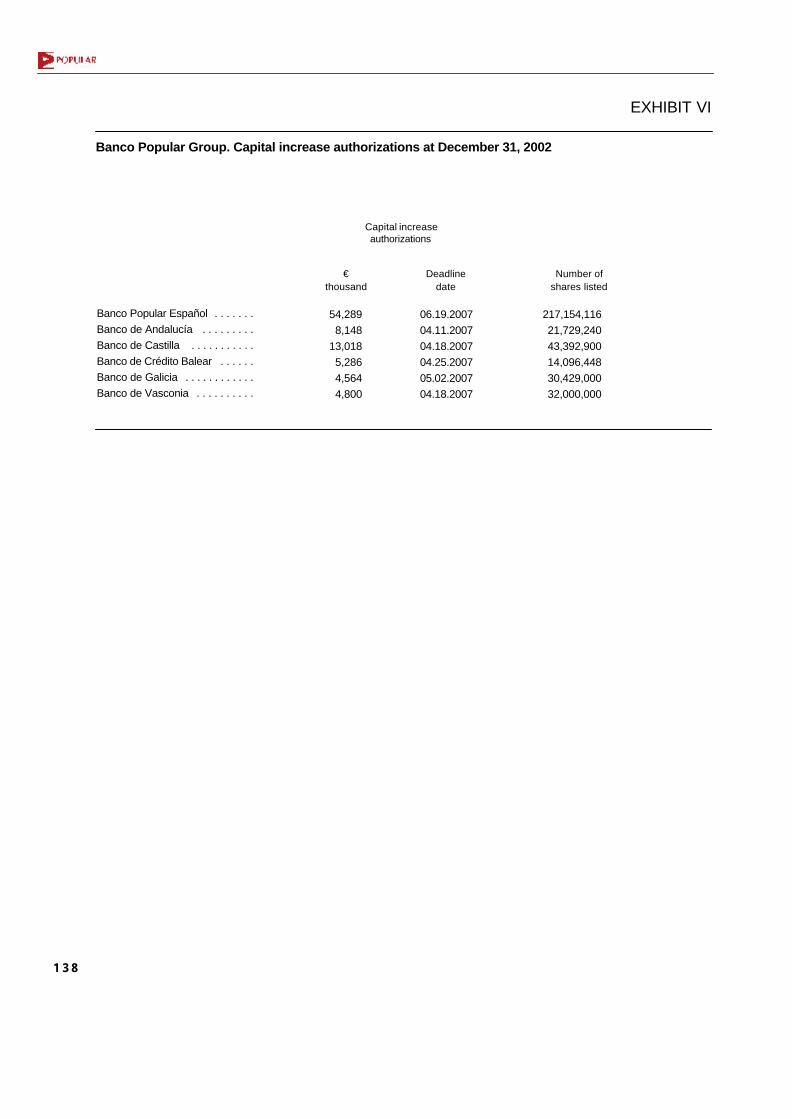
138
EXHIBIT VI
Banco Popular Group. Capital increase authorizations at December 31, 2002
Capital increaseauthorizations
Number of shares listed
€thousand
Deadlinedate
Banco Popular Español . . . . . . .Banco de Andalucía . . . . . . . . .Banco de Castilla . . . . . . . . . . .Banco de Crédito Balear . . . . . .Banco de Galicia . . . . . . . . . . . .Banco de Vasconia . . . . . . . . . .
54,2898,148
13,0185,2864,5644,800
06.19.200704.11.200704.18.200704.25.200705.02.200704.18.2007
217,154,11621,729,24043,392,90014,096,44830,429,00032,000,000

139
Corporate Governance Report
PART ONE: INTRODUCTION TO CORPORATEGOVERNANCE IN THE GROUP
A. Presentation:
The corporate culture of Banco Popular Españoland its Group is progressively documented yearby year in the related annual reports. Since 1998,a Corporate Governance Report has also beenprepared to enable shareholders, customers andanalysts to have an even more direct andtransparent knowledge of the corporate policy.
This Report deals with the criteria and principlesof corporate governance that guide theperformance of Banco Popular Español and itssubsidiaries and which constitute the Bank'sidentity profile as constructed over the years, withconstant updates as part of a firm process ofadjusting the corporate policy to adapt it to theimprovements and innovations arising in themarket.
B. New developments in 2002
2002 saw the establishment of the RegulatoryCompliance Office, whose mission is to overseethe Bank's ongoing adjustment to currentlegislation by setting up internal controlprocedures to insure the detection and remedyingof any kinds of behaviour that may jeopardize theBank's good name and reputation.
For this purpose, the Regulatory ComplianceOffice collaborates with the Bureau of Oversightof the Internal Regulations of Conduct in the fieldof securities markets in order to insurecompliance by the Group's staff and executiveswith the internal standards of conduct in thesecurities markets, with a watching brief to insurethat these standards conform to legalrequirements, to ethical criteria and to theprinciples of governance set by the Board ofDirectors.
In addition, the Regulatory Compliance Officecontributes to the implementation of the internalprocedures established to guarantee the correcttreatment of personal databases managed by theGroup.
Shaped basically as an office of supervision andcontrol, which per the Group's corporategovernance criteria are functions proper to the
Board of Directors, the Regulatory ComplianceOffice reports organically to the Board's Audit,Control and Remuneration Committee.
Also, on October 22, 2002, the Board of Directorsresolved to re-elect for a further one year periodthe chairmen and members of the specializedstanding committees of the Board of Directors setup in 1998 (the Audit, Control and RemunerationCommittee and the Nominations, Governanceand Conflicts of Interest Committee), on expirationof their extended one-year term of office.
PART TWO. CORPORATE GOVERNANCE ATBANCO POPULAR
Principles of Corporate Governance at BancoPopular
The governance criteria have progressively marked,with constant updates, the personality of BancoPopular in this sphere for nearly five decades andare the profile of the Bank's corporate governanceidentity after the start of the new century.
The Corporate Governance Report defines the roleof the Board in terms of the following missions:
1. Keep its finger on the pulse of banking.2. Manage the Bank by remote control.3. Merge into the collective background of theBank.4. Refrain from interfering individually in issuesrelating to personnel, loans, purchases, or insubsidiaries.5. Receive no remuneration.6. Refrain from speculating.7. Exercise the directors' right to expressthemselves freely and with critical judgmentbefore other directors, and to have regard to theirduty to avoid leaks of information and fissures,both outside the Bank and internally downwards. 8. Defend the long-term viability of the Bank andprotect its general interests.
Shareholders Meetings
In order to reconcile the legal requirements forperiodic reporting with the Bank's policy oftransparency, promptness, objectivity and in-depth information, the Shareholders Meetingsstart with the information published at the end ofJanuary and formally conclude with the annualgeneral meeting at the end of June. Themechanisms in place thus enable theshareholders to have relevant informationavailable over a long period of time.

140
Communications between the Bank and itsshareholders are conducted through theShareholders Office (c/ José Ortega y Gasset 29,28006 MADRID; telephone +34 91 5207265; fax+34915779209;e-mail [email protected])at two different but inter-related levels: that ofinformation and that of participation inmanagement, in both cases as often and in suchdepth as each shareholder may wish.Shareholders may also visit the Bank's websitewww.bancopopular.es.
The information provided, which goes beyond thatlegally required, is contained in the followingdocuments:
-Information Leaflet, containing the organizationchart, functional structure and administrativeoffices.
-Incidents of the Year, which as a counterpoint tothe Annual Report and Notes to the FinancialStatements that describe in detail the economicresults obtained during the year, sets out withfrankness and complete transparency the minorhappenings that also form part of the Bank'sactivities. Shareholders are entitled to know allabout what happens in the Bank, includingmisfortunes, errors and failures.
-Style Book, a glossary of terms defined in order toexplain the Bank's own principles and standardsas set up over the years, commonly comprisingwhat is known as its "corporate culture".
Shareholders may at any time exercise theirlegally recognized right to examine alldocumentation at the Bank's registered office orrequest that it be sent to them free of charge; maymake such enquiries or observations as theyconsider desirable, either in person or in writing,by telephone or e-mail; may formally express theirassent to or dissent from any proposals; maydiscriminately or selectively exercise their right tovote, or not to vote if they so wish, or to follow thedecision of others.
Shareholders Meetings may be attended byshareholders owning at least 0.1% of the capitalstock. Shareholders with holdings below thisthreshold may opt to be represented by anothershareholder entitled to attend, or by any of thosethat group themselves together in order to reachthe aforementioned threshold.
This obviously is no bar to exercise of the right tovote by all shareholders by means of proxies with
sufficient information about the resolutions tabledfor adoption by the Shareholders Meeting.
The maximum numbers of votes that can be castby a single shareholder or companies belongingto the same group is 10% of the votes that can becast at the Shareholders Meeting in question.
The strict separation of Board and management.
This is perhaps the most long-standing principleapplied at Banco Popular, as is borne out by thefact that it has been applied without interruptionfor almost five decades. It was at the beginning ofthis period that fortunately the criterion ofseparating directors from management wasimplemented, and the Bank began to note itspositive effects.
As stated many years ago, and quoting Peter F.Drucker: "What the Board is, and should be, is thebody which monitors that the company is beingmanaged effectively". Drucker went on to say that"management involves important decisions whichneed to be made quickly on issues that requireconsiderable training in the field of management,and this is something which it would be difficult forthe Board of Directors to fulfill".
The separation between the Board andmanagement in corporations thus becomes theideal arrangement for each to fulfill its role withmaximum efficiency, whereby the directors areresponsible for monitoring and insuring that thecompany is being managed efficiently, and themanagers are professional executives whoseperformance is not hindered by interference.
The various competencies incumbent upon theBoard are divided into areas, whose monitoringand control are the responsibility of the director orthe Committee best fitted by their personalcharacteristics and qualities to perform the task ofsupervision with which they are entrusted.
The General Management function, a technical andexecutive governance body chaired by the ChiefExecutive Officer, consists of a minimum of threeand a maximum of seven members appointed bythe Board of Directors from among the executivescomprising the Bank's top management.
No speculation by directors
Instead of feeling that "he owned the place", theBanco Popular director came to realize that in

141
order to feel "at home" he had to "keep the Bankand his private, family and social life completelyseparate" and observe the longstanding ruleforbidding speculation.
Non-remuneration of directors
This historically established principle emphasizesthat directors receive no remuneration as such;only those who exclusively serve the Bank (theChairmen, the CEO and the Secretary of theBoard) receive paychecks, and there is noallowance established for the others. Only certainretired persons with no significant income receivea small amount for services rendered in anadvisory capacity.
Composition of the Board
The composition of the Board has regard to thestructure of the Bank's capital stock, endeavoringto open it up to the various sensitivities of theshareholders, in order to insure representation onthe Board of the greatest possible percentage ofthe capital stock and protect the general interestsof the entity.
Some of the directors and groups of directors act,year after year, as "permanent" representatives ofdifferent groups of shareholders, such as families,companies, foundations, etc.
The present composition of the Board reflects anappropriate equilibrium between the in-housedirectors and all the other directors, the latterbeing a broad majority; this equilibrium has beenprogressively structured over time until it hasreached the present situation.
The Annual Report provides full details of theholdings in the capital stock of Board membersand of the most significant shareholdersrepresented on it.
Transparency of information
A shareholder with a sufficient shareholding maybe a member of the Board or not. The sameinformation is available in both cases, and is asfull as the shareholder wishes. The onlylimitations are those established personally,legally or in the bylaws.
The inclusion of directors representing foreignentities has spurred further improvements, both inthe decision-making process and in the system ofinformation to Board members.
Extraordinary Board meetings, conducted eitherwith personal attendance of directors or by writtencommunication without a formal meeting,generally serve to inform and take decisionsabout a specific matter.
Delegation to the Executive Committee
The Executive Committee, which originallyconsisted of six directors, now has eight memberswho meet frequently, attend meetings of theLoans Committee, and are responsible formonitoring, supervision and strategy.
This standing body substitutes for and aids theBoard of Directors in the performance of itsduties.
The Executive Committee met more than fiftytimes in 2002 and the transparency and fluidity ofinformation from it to the Board of Directors wereparticularly noteworthy.
Criteria of Corporate Governance at Banco Popular
In line with its own tradition of corporategovernance, the governance of Banco PopularEspañol and its group entities is based on thefollowing principles:
1. Duties of the Board
The Board of Directors explicitly accepts that itsfundamental role is that of general supervision, itexercises the responsibilities that this entails withoutdelegation to others, and understands that, withoutinterfering in the management of the company, thefollowing matters are reserved for its owncognizance and may not be delegated to others:
- the approval and supervision of the generalstrategies of the company;
- the appointment, remuneration and, asappropriate, removal of the company's seniorexecutives;
- the control of management activities and theevaluation and development of the executives; it isvigilant to insure that the style and conduct ofexecutives conform to the corporate culture expressedthrough the style book and the topics addressed eachyear in the "Incidents of the Year" document.
- the identification of the company's main risks andthe implementation and monitoring of the appropriateinternal control and information systems, and

142
- the establishment and supervision of policiesrelating to reporting to and communication withthe shareholders, the markets and public opinion.
2. Independence
The Bank's Board of Directors includes the CEO,linked to the executive line management; thedirectors representing significant shareholders (theAllianz group, the BPE Shareholders Syndicateand individuals in their own name andrepresenting others); others not connected withthe management team or with significantshareholders, with longstanding holdings in theshare capital which, though not significant, are ofrelevance; and others who do not own a significantshareholding and are not related to the executiveteam or the significant shareholders, but add theirprestige and professional experience to the Board.
3. Representativeness
In the Banco Popular Board of Directors thedirectors not from the executive line managementof the Bank constitute an ample majority overthose who may be considered to be related to theBank's executive team. The proportion has beenestablished taking into account the ratio of theamount of capital stock held in significantshareholdings to the rest.
4. Appropriate size
The Bank's Board of Directors is of the right sizeto insure it functions efficiently and with theappropriate degree of participation, whilecombining numerical moderation with theessential prerequisite for a large listed financialinstitution such as Banco Popular that itsshareholders and their diverse sensitivities can besufficiently represented on the Board.
5. Deconcentration
The Board of Directors considers that itstraditional criterion of not accumulating power inthe post of chairman is a basic precaution toreduce the risks involved, and thus the CEO hastraditionally been deemed to be the top executive.This line of action, adopted many years ago, wasreasserted once again in 2002.
6. Regulatory guarantee
The Secretary of the Board, as a specializedprofessional guaranteeing the formal and material
legality of the Board's actions, enjoys the fullsupport of the Board in discharging thosefunctions with full independence and stability, andis also entrusted with the task of insuring that theBank's principles and criteria of corporategovernance are complied with, that the directorsare correctly briefed about matters of theircompetence and facilitating the proper conduct ofBoard meetings. Accordingly, these functionshave been performed by a professional lawyersince June 1998 and throughout 2002.
7. Self-control
In addition to the Loans Committee, the BancoPopular Board of Directors also includes thefollowing special Standing Committees:
1.- The Executive Committee:
This committee, which was set up to providegreater operational flexibility for the Board indischarging its duties of monitoring day-to-daymanagement, is a standing body that substitutesfor and aids the Board of Directors in dischargingits duties, and may also propose to the Boardstrategic decisions of relevance for the Bank.
The Executive Committee endeavors to reflect theequilibrium existing in the Board of Directors,avoiding the inclusion among its members ofdirectors who may have business dealings withthe Bank that could give rise to conflicts of interest.
The relationship between the Board and theExecutive Committee is governed by the principleof transparency, whereby the Board has full andcomplete knowledge of all the matters dealt withand of the decisions adopted by the ExecutiveCommittee.
The Executive Committee regulatorily has thepowers of representation, administration,management and disposal and, in general, allthose legally and by bylaw assigned to the Board,except those not susceptible to delegation, so asto permit the necessary nimbleness in takingdecisions without waiting for the holding of formalBoard meetings. Accordingly, the Committeemeets each week, without prejudice to the holdingof extraordinary meetings if so required by thecircumstances.
The members of the Executive Committee and ofthe Board (except for the CEO) do not havegeneral powers of attorney of the Bank.

143
The members of the Executive Committee in 2002were:
Chairmen: Javier Valls TabernerLuis Valls Taberner
Member: Gabriel Gancedo de SerasMember: Luis Montuenga AguayoMember: José Ramón Rodríguez GarcíaMember: Eric Gancedo HolmerMember: Luis Herrando Prat de la RibaSecretary: Jesús Platero Paz
2.- Loans Committee
This Committee analyzes and decides aboutrequests for credit and guarantees which involveraising above €9 million the risk limit assumed bythe Bank with a single borrower or group ofborrowers, or above €3 million if the Bank'sfinancing to such borrower or group of borrowersinvolves more than 50% of its or theirindebtedness in the system.
By delegation from the Chairmen, the LoansCommittee is customarily chaired by the DeputyChairman of the Board of Directors, who performsthe function of "red pencil" to veto transactionswhose volume, term, type or nature may signifyan extraordinary risk.
The members of the Loans Committee includedirectors and executives, and at its weeklymeetings the Bank's general and sectorial riskpolicies are also discussed. As an opendiscussion body, the Loans Committee alsooccasionally invites other directors and executivesto attend its meetings if and when the matters tobe dealt with make it advisable to do so.
In general terms, the Loans Committee isresponsible for analyzing and monitoring the risksof the business.
3.- Special Standing Committees:
Since 1998 there have been two special StandingCommittees, whose existence in the practice ofthe Bank's corporate governance wasconsolidated in 2002, by making a significantcontribution to the tasks of study, monitoring,information and advice for the Board in the areasof particular relevance assigned to each of them.
The first is the Audit, Control and RemunerationStanding Committee. This checks that all theperiodic reporting to the markets is produced inaccordance with the same principles and
professional practices as the annual financialstatements, and supervises such reporting prior topublication. It also keeps a close watch forsituations which may pose a risk to theindependence of the Bank's external auditors. Itendeavors to insure that the accounts submitted bythe Board of Directors to the Shareholders Meetingcontain no reservations or qualifications in theauditors' report, and if that is unavoidable, that theauditors explain publicly, and in particular to theBank's shareholders, the content and scope of thediscrepancies. It also confirms the appropriatenessand integrity of the control systems. Finally, itreviews the compensation policy for the Bank'sexecutive management, its senior line managers,regional and general managers, and proposes tothe Board the measures it considers appropriate tomaintain, adjust or improve and, in particular, toadapt that policy to the principles of restraint andlinkage with the Bank's performance.
The second is the Nominations, Governance andConflicts of Interest Standing Committee. Thissupervises appointments to the Bank's executivemanagement and to the Board itself, seeking toinsure in both cases that vacancies are filled byindividuals who fulfill the requirements of the post. Italso insures that directors receive sufficientinformation, both in quantity and quality, to be ableto perform their duties properly. It seeks to identifycircumstances in which a director's relationship withthe Bank may adversely affect its functioning or itsstanding or reputation. It also identifies possibleconflicts of interest between directors or seniorexecutives and the Bank, insuring fulfillment of theobligations of confidentiality, diligence and loyalty bythe former and, as appropriate, by the significantshareholders. It takes the necessary measures toinsure that the Board approves an annual reportbased on the Bank's rules of corporate governance.
Each of these new Standing Committees consistsof a minimum of three directors (the current sizeof both) and a maximum of five. Notwithstandingthe foregoing, the Bank's executive managementattends committee meetings when requested todo so. Committee members and their chairmanare freely appointed by the Board of Directors.
The term of office is three years, following whichcommittee members may be re-elected forconsecutive periods of one year. The secretary ofthe Committees is the Director and Secretary ofthe Board, and his term of office and requirementsfor re-election are the same as those for theBoard. Members of the Standing Committeesreceive no remuneration for their services.
144
Each Standing Committee meets at least twice ayear, at the proposal of its chairman or a majorityof its members, although in practice bothCommittees met more frequently in 2002. TheSecretary takes care to insure that eachCommittee operates in accordance with therelevant resolutions of the Board of Directors.Similarly, the Secretary is responsible forcoordinating the work of the Committees with theBoard and with the Bank's executivemanagement. Any change in the operation,structure or objectives of a Standing Committeemust be explicitly approved by the Board ofDirectors. Each Standing Committee may submitto the Board any proposals for improvement that itconsiders appropriate on these issues.
On expiration of their extended one-year term ofoffice, in 2002 it was resolved to reappoint thepresent members of each committee for a furtherperiod of one year and the composition of the twoCommittees was therefore as follows:
Audit, Control and Remuneration Committee
Chairman: José Ramón Rodríguez GarcíaMember: Eric Gancedo HolmerSecretary: Jesús Platero Paz
Nominations, Governance and Conflicts ofInterest Committee
Chairman: Luis Herrando Prat de la RibaMember: Miguel Angel de Solís y
Martínez-CamposSecretary: Jesús Platero Paz
8. Documentation
Directors are provided with information specificallyproduced and designed to enable them to preparefor Board meetings sufficiently in advance,without any limitations other than those imposedby the current legal and regulatory frameworkregulating insider trading.
9. Frequency
The Board holds ordinary meetings at least onceevery quarter, which it may supplement asnecessary with extraordinary meetings for thebetter fulfillment of its role.
The Executive Committee of the Board meetsweekly, but extraordinary meetings may be calledif circumstances so require.
It is the Chairman's duty to insure that all thedirectors participate as actively as possible indiscussions and are free to adopt the positions oftheir choosing. The Secretary is responsible fordrafting the minutes in accordance with criteria ofclarity, accuracy and completeness.
The Board of Directors assesses each year thequality and efficiency of its work, and its analysisis reflected in the corporate governance report.
10. Appointments
When it is necessary to select a new, or re-elect an existing, director, the Nominations,Governance and Conf l ic ts of InterestCommittee submits a duly argued proposal tothe Board, so that the latter may proceed tomake the corresponding appointment (co-option) or accept such proposals for tabling atthe Shareholders Meeting, whose interventionis fully transparent.
The appointment of the new directors Mr. EricGancedo Holmer and Mr. Angel Carlos RonGüimil (Chief Executive Officer) by theShareholders Meeting on June 20, 2002, theappointment of Mr. Francisco Aparicio Valls asthe representative of the BPE Shareholders'Syndicate at the Board meeting on October 22,2002, and all the appointments of seniorexecutives of the Bank in 2002 were examinedand reported on by this Standing Committee at itsvarious meetings.
11. Obligation to resign
Members of Banco Popular's Board of Directorsundertake to offer their resignation to theShareholders Meeting when their continuance inoffice could adversely affect the running of theBoard or the standing and reputation of the Bankor of any of the Group entities.
12. Age limit
Members of Banco Popular's Board of Directorsundertake to continue in office for so long as theyremain fully in possession of the faculties,capabilities and availability which brought abouttheir election to the Board, or otherwise to resignif and when their personal circumstances hinderfull performance of their duties. This precaution isreinforced by the established practice of all theoffices on the Board being renewable by the entityevery year.

145
13. Advice and research
Each director has the right and the duty to seekand obtain appropriate information and advice forthe fulfillment of his duties of supervision, in thebroadest terms, and to channel any requests to thiseffect through the department of the Secretary ofthe Board, which will directly provide the necessaryinformation, propose appropriate interlocutors ortake such measures as may be required for thedirector to examine the information in situ.
14. Remuneration
The policy on the remuneration of directors, whichit is the responsibility of the Audit, Control andRemuneration Committee to propose, assess andreview, will continue to conform to the Bank'straditional criterion, and to follow the rule that onlydirectors who exclusively serve the Bank in aprofessional capacity (the Chairmen, the CEO andthe Secretary of the Board) receive remuneration.The remuneration received by these directors andany other fees or mandated appropriations paid tothem are detailed in full for each individual directorin the Bank's annual reporting documents.
The Annual Report identifies the members of theBank's senior management and discloses on anoverall basis the total cost of their remuneration.
The Group does not have in place any system ofremuneration involving the delivery of shares ofGroup companies, stock options, or any kind ofremuneration linked to the shares.
The Audit, Control and Remuneration Committeealso exhaustively evaluated and reviewed theremuneration of the senior management team ofthe Group and established criteria in this respect.
15. Loyalty of directors
The Report on Corporate Governance and theInternal Regulations of Conduct of Banco Populargive details of the obligations arising from thegeneral duties of diligence and loyalty incumbentupon directors and address, in particular, situationsof conflicts of interest, the duty to maintainconfidentiality, the non-exploitation of businessopportunities and the use of company assets.
16. Loyalty of significant shareholders and seniormanagement
The Board of Directors fosters the adoption ofappropriate measures to insure that significant
shareholders, whether or not they are on theBoard, and senior management personnel of theBank are subject to the same requirement forloyalty, and it applies maximum transparency andstrict control to any transactions between themand the Bank; specific information on this point isincluded in the Annual Report. The only commonbusiness activities currently conducted are thosewith the shareholder Allianz.
17. Transparency of information
The Board will maintain the transparency of themechanism for proxy voting and of the Bank'scommunications with all its shareholders whichhas always been an identifying feature of theGroup. Shareholders can also obtain in real-timeextensive information about the progress of theBank through the Shareholders Office or theBanco Popular website.
18. Full disclosure
Following its tradition of going beyond therequirements imposed by current legislation, in2002 the Board continued to provide the marketswith swift, precise and reliable informationregarding the Bank's shareholder structure andmodifications to the rules of governance, as wellas operations of special significance.
19. Reliability of information
All periodic financial reporting offered to themarkets, in addition to the annual reports,continues to be prepared following the sameprofessional principles and practices which applyto the financial statements, and is verified, prior topublication, by the Audit, Control andRemuneration Committee.
20. Independence of auditors
The Board of Directors and the Audit, Control andRemuneration Committee used a series ofchannels in 2002 to monitor the independence ofthe external auditors.
The Committee therefore requested theattendance at several of its meetings of thepractitioners responsible for auditing the Groupentities. Thus it was confirmed that the fees paidto the external auditors by the Bank and Groupentities under all headings did not represent asignificant percentage - in any case considerablybelow 10% - of the revenues of the audit firm,which is one of the world's Big Five accounting

146
firms. Fees relating to periodic or habitualprofessional services other than auditing, paid topractitioners or companies directly or indirectlyrelated to the audit firm, were also verified not tohave reached a significant level, nor to haveaffected at any time either the Bank's strategy orgeneral planning. In 2002 specific consultingservices were engaged for €85,000, and the totalexpenditure for audit services amounted to€873,000.
21. Accounting quality
The Board of Directors endeavors, by itself andthrough the Audit, Control and Remuneration
Committee, to insure that the accounts it preparesare not presented to the Shareholders Meetingwith reservations and qualifications in theauditors' report. During the joint meetings with theauditors referred to in the previous point, anexhaustive review was requested of various areasin the accounts in order to evaluate the quality ofthe effort applied in examining them.
22. Continuity
The Board of Directors, having adopted thisReport for 2002, undertakes to adopt a similarreport as a supplement to the Public AnnualReport for 2003.

147
Attachment
Director profiles(Year of birth of each director shown in bracketsat the end of each entry.)
Asociación de Directivos de BPE:Association set up in 1977, membership of whichis voluntary for executives of the Bank; there areat present 2,369 members.
Ayala, Ildefonso:Professional; has held various posts in the Banksince 1946, and has been a director since 1990;from 1990 to 1994 he was Managing Director.(1932)
Breipohl, Diethart:Professional; specialist in insurance, has heldimportant posts in the Allianz group and ispresently a member of its management board inMunich (this group owns 9.5% of the Bank'scapital stock) and its representative on the Bank'sBoard. (1939)
Catá, José María:Businessman; has been a board member since1980; Chairman of Iberpistas, SA, and Castellanade Autopistas, SA, director of Avasa, and, in thecultural field, a director of the BarcelonaContemporary Art Museum Foundation andConsortium. (1928)
Donate, Francisco:Professional; very active in the business worldsince 1947, holding important managementpositions and as director of chemical and financialfirms; was chairman of Eurobanco and generalmanager of RENFE; has been a director of theBank since 1985. (1922)
Gancedo, Gabriel:Businessman; very act ive in the businessworld, particularly at industrial, commercial andservice companies; connected with the groupsince 1964, became a Board member in 1971,was Secretary from 1974 to 1989, when hebecame Deputy Chairman of the Board and amember of the Executive Committee; performs
the function of "red penci l" in the LoansCommittee. (1930)
Gancedo, Eric:Graduate in law, businessman in the fields ofbanking and insurance and trade, wine-makingand property; a director of the Bank since June2002, and member of the Executive Committeeand the Audit, Control and RemunerationCommittee. (1959)
Herrando Prat de la Riba, Luis:Doctorate in industrial engineering and economicsdegree. Worked first at Babcock & Wilcox; joinedInduban (Banco Vizcaya) in 1965. Director ofcompanies in the insurance field such asAgrupación de Interés Económico RCCorredores, of which he is currently chairman.President of the Asociación para el Progreso dela Dirección (APD) in northern Spain and vicepresident in Madrid; currently a life director.Member of the Círculo de Empresarios Vascos;participated in the development of several venturecapital groups with Basque savings banks.Chairman of the Fundación del Instituto deEducación e Investigación, which has a 0.75%shareholding in the Bank; Chairman of theNominations, Governance and Conflicts ofInterest Standing Committee. (1941)
Laffón, Manuel:Professional; degrees in law and economics.Speaks English and French. Linked to the Banksince 1957, and has occupied important positionsin it. Chairman of Eurobanco in 1974 and a BancoPopular Board member since 1976. (1931)
Miralles, Luis:Law degree from Valencia university. Diploma incommerce from London College, 1948-49;maritime law specialization course in London andAntwerp, 1949; regional director of Banco PopularEspañol in Valencia, 1967. Executive of seatransport companies, fruit and canned productsexporter. Director of Intur Orange Hotels. Boardmember of Banco Popular since 1983. (1926)
Molins, Casimiro:Businessman; head of Cementos Molins, SA andinvolved in property and construction businessesin Spain and America; chairman of Banco

148
Atlántico from 1962 to 1983; Board member ofBanco Popular since 1987. (1920)
Montoro, Santos:Businessman; active mainly in theelectromechanical and automobile industries;Board member since 1988. (1933)
Montuenga, Luis:Businessman; has held senior executive andcorporate posts at chemical and pharmaceuticalcompanies; founder and promoter of NaardenIbérica, Naarden International (which owns340,000 shares of the Bank) and ProductosOrgánicos, SA. Currently chairman ofPopularinsa, SA (which owns 2,370,000 shares ofthe Bank) and of Unión Europea de Inversiones.Also active in socio-cultural projects (YouthFoundation, etc.); member of the Board and itsLoans Committee since 1987; member of theExecutive Committee since 1990. (1926)
Morillo, Manuel:Professional, with a long professional record inthe corporate world, particularly in the textile,property and construction sectors; currentlychairman of the Carmen y Mª José GodóFoundation, one of the leading welfare institutionsin Spain (which has a 0.34% holding in the Bank).Significantly involved in welfare projects incooperation with the Cataluña AutonomousGovernment and the Spanish Government.(1925)
Nigorra, Miguel:Businessman and professional; qualified PropertyRegistrar; apart from posts in the Group, has beenactive in public bodies (Palma de Mallorca HarborWorks Board) and in companies (Mare Nostrumand Inmobiliaria Urbis); chairman of Banco deCrédito Balear and of IMISA since 1970; directorof Banco Popular since 1974. (1929)
Parera, Alberto:Chemical engineer and businessman; formerchairman of the IESE members' association;chairman of Perfumería Parera, SA, director ofBanco Atlántico and Banco Comercial de Cataluña.Currently chairman of the Parera Group. Director ofBanco Popular since 1987. (1924)
Pérez Sala, Enrique:Professional; very active record in the propertybusiness sector, focusing on health andsustainabil i ty; Board member since 1983.(1949)
Platero, Jesús:Lawyer, specialist in corporate law; in privatepractice from 1964 to 1975; from 1975 to 1990held legal advisory and management posts inSpanish and American finance firms and entities;appointed representative on the Board of the BPEShareholders Syndicate in 1990 and elected tothe Executive Committee in 1991; he becameSecretary of the Board and its StandingCommittees in 1998. (1938)
Rodríguez, José Ramón:Engineer and businessman; apart fromprofessional practice as a civil engineer, has beenan executive and director of textile, food andconstruction companies; Board member since1987, Executive Committee member since 1989;chairman of the Audit, Control and RemunerationStanding Committee. (1947)
Ron Güimil, Angel Carlos:Professional, law degree from SantiagoUniversity, has held various posts in the Bankand at Spanish financial entities since 1984,appointed General Manager of Banco PopularEspañol in 1998 and Chief Executive Officer in2002. (1962)
BPE Shareholders Syndicate:Association of small BPE shareholders toprovide them with representation on the Board;obtained a seat on the Board in 1988, occupiedsince October 2002 by Francisco AparicioValls.
Solís y Martínez Campos, Miguel Angel de:Businessman; director, inter alia, of Guadacorte,SA; director of Banco de Castilla from 1992 to1996; chairman of Banco de Andalucía anddirector of Banco Popular since 1996; representsthe Solís family group which has a 0.86%shareholding in the Bank. Member of theNominations, Governance and Conflicts ofInterest Standing Committee. (1947)

Stecher, Jorge:Professional; has held important posts in Europeand America in the Allianz group. Banker in Brazilfrom 1958 to 1973. Member of the InternationalCouncil of INSEAD; member of the EU Economicand Social Committee (Brussels) inrepresentation of the Spanish BankingAssociation and heads this Committee'spermanent working group for the Economic &Monetary Union; member of the Monetary UnionCommittee of CEOE (Spanish employersassociation); member of the Board of BancoPopular since 1974. (1922)
Termes, Rafael:Academician; doctorate in industrial engineeringfrom Barcelona university and honorary doctoratefrom Universidad Francisco Marroquín,Guatemala. Full member of the Royal Academy ofMoral and Political Sciences and of the RoyalAcademy of Economic and Financial Sciences;honorary chairman of the Spanish Institute ofFinancial Analysts; faculty member at IESE since1958 and director of its Madrid Center from 1991,and subsequently Honorary Chairman. A Board
member since 1964 and managing director from1966 to 1977; chairman of the Spanish PrivateBanking Association from 1977 to 1990. (1918)
Valls, Javier:Businessman; full-time service to the Bank. Hasheld important posts in several insurancecompanies (AGF, AXA, Unión Popular deSeguros) and industrial and commercial firms(Henninger, La Seda de Barcelona, Gas Natural);director of Banco Popular since 1966, deputychairman from 1972 to 1989, and chairman since1989. (1930)
Valls, Luis:Businessman and professional; full-time service tothe Bank. From 1948 to 1956 faculty member inthe Law Schools of Barcelona and MadridUniversities and practitioner in the PublicationsDepartment of the Superior Council of ScientificResearch; director of Banco Popular since 1957,executive deputy chairman from 1957 to 1972,chairman from 1972 to 1989 and co-chairmanfrom 1989 to date. (1926)
149