annual irish report
TRANSCRIPT

®
Medtronic plcIrish Annual ReportFinancial Year Ended April 30, 2021

TABLE OF CONTENTSPage
Directors' Report 1Independent Auditors' Report 39Consolidated Profit and Loss Account 45Consolidated Statement of Comprehensive Income 46Consolidated Balance Sheet 47Consolidated Reconciliation of Movement in Shareholders' Funds 48Consolidated Statement of Cash Flows 49Notes to the Consolidated Financial Statements 50Company Balance Sheet 128Company Statement of Changes in Equity 129Notes to the Company Financial Statements 130

Directors' Report
For the Financial Year Ended April 30, 2021
The directors present their report, including the audited consolidated financial statements of Medtronic plc and its subsidiaries (the Group) for the financial year ended April 30, 2021, which are set out on pages 45 to 126, and audited entity financial statements of Medtronic plc (the Company or Medtronic) for the financial year ended April 30, 2021, which are set out on pages 127 to 138.
Statement of Directors' Responsibilities
The directors are responsible for preparing the directors' report and the financial statements in accordance with Irish law.
Irish law requires the directors to prepare financial statements for each financial year that give a true and fair view of the Group's and Company’s assets, liabilities and financial position as at the end of the financial year and of the profit or loss of the Group for the financial year. Under that law, the directors have prepared the consolidated financial statements in accordance with U.S. accounting standards, as defined in Section 279(1) of the Companies Act 2014, to the extent that the use of those principles in the preparation of the financial statements does not contravene any provision of the Companies Act, or of any regulations made thereunder, and the Company financial statements in accordance with Irish Generally Accepted Accounting Practice (accounting standards issued by the UK Financial Reporting Council, including Financial Reporting Standard 102 The Financial Reporting Standard applicable in the UK and Republic of Ireland and Irish law).
Under Irish law, the directors shall not approve the financial statements unless they are satisfied that they give a true and fair view of the Group's and Company's assets, liabilities and financial position as at the end of the financial year and the profit or loss of the Group for the financial year.
In preparing these financial statements, the directors are required to:
• select suitable accounting policies and then apply them consistently;• make judgments and estimates that are reasonable and prudent;• state that the consolidated financial statements of the Group comply with accounting principles generally accepted in
the United States of America (U.S.) (U.S. GAAP) to the extent that it does not contravene Irish Company Law, and that the entity financial statements of the Company comply with accounting standards issued by the UK Financial Reporting Council and Irish Law; and
• prepare the financial statements on the going concern basis, unless it is inappropriate to presume the Group will continue in business.
The directors are responsible for keeping adequate accounting records that are sufficient to:
• correctly record and explain the transactions of the Company;• enable, at any time, the assets, liabilities, financial position and profit or loss of the Company to be determined with
reasonable accuracy; and • enable the directors to ensure that the financial statements comply with the Companies Act 2014 and enable those
financial statements to be audited.
The directors are also responsible for safeguarding the assets of the Company and hence for taking reasonable steps for the prevention and detection of fraud and other irregularities.
The directors are responsible for the maintenance and integrity of the corporate and financial information included on the Company's website (www.medtronic.com). Legislation in Ireland governing the preparation and dissemination of financial statements may differ from legislation in other jurisdictions.
Accounting Records
The measures taken by the directors to secure compliance with the Company's obligation to keep adequate accounting records are the use of appropriate systems and procedures and employment of competent persons. The accounting records are kept at the Group’s registered office at 20 On Hatch, Lower Hatch Street, Dublin 2, Ireland.
1

Directors' Compliance Statement
As required by Section 225 of the Companies Act 2014, the directors acknowledge they are responsible for securing compliance by the Company with its Relevant Obligations as defined in the Companies Act 2014 (hereinafter called the Relevant Obligations).
The directors confirm the Company (i) has drawn up and adopted a compliance policy statement setting out the Company’s policies that, in the directors' opinion, are appropriate to the Company respecting compliance by the Company with its Relevant Obligations; and (ii) has put in place appropriate arrangements or structures that are, in the directors' opinion, designed to secure material compliance with the Company’s Relevant Obligations.
A review of the arrangements and structures in place to ensure compliance with the Company's Relevant Obligations has been conducted in the financial year to which this report relates.
Basis of Presentation
The following discussion and analysis provides information the directors believe to be relevant to understanding the financial condition and results of operations of the Group. The directors have elected to prepare the consolidated financial statements in accordance with Section 279 of the Companies Act 2014, which provides that a true and fair view of the assets and liabilities, financial position and profit or loss may be given by preparing the financial statements in accordance with U.S. GAAP, as defined in that section to the extent that the use of those principles in the preparation of the financial statements does not contravene any provision of Part 6 of the Companies Act 2014.
We report our results based on a 52/53 week fiscal year, ending the last Friday of April. The financial year ended April 30, 2021 (fiscal year 2021) was a 53-week fiscal year and the financial year ended April 24, 2020 (fiscal year 2020) was a 52-week fiscal year. Amounts reported in millions within this Irish annual report are computed based on the amounts in thousands, and therefore, the sum of the components may not equal the total amount reported in millions due to rounding. Additionally, certain columns and rows within tables may not sum due to rounding.
Principal Activities
Medtronic plc, headquartered in Dublin, Ireland, is among the world's largest medical technology, services, and solutions companies. Medtronic was founded in 1949 and today serves healthcare systems, physicians, clinicians, and patients in more than 150 countries worldwide. We remain committed to a mission written by our founder in 1960 that directs us “to contribute to human welfare by the application of biomedical engineering in the research, design, manufacture, and sale of products to alleviate pain, restore health, and extend life.”
Our Mission — to alleviate pain, restore health, and extend life — is one of our most powerful assets. We remain committed to being recognized as a company of dedication, honesty, integrity, and service. Building on this strong foundation, we are embracing our role as a healthcare technology leader and evolving our business strategy in four key areas:
• Leveraging our pipeline to win market share: The combination of our strong base business, recent product launches and robust pipeline is expected to continue accelerating our growth over both the near-and long-term. We aim to bring inventive and disruptive technology to large healthcare opportunities which enables us to better meet patient needs. Patients around the world deserve access to our life-saving products, and we are driven to use our local presence and scale to increase the adoption of our products and services in markets around the globe.
• Serving more patients by accelerating innovation driven growth and delivering shareholder value: We listen to our patients, customers, and employees to better understand the challenges they face. From the patient journey, to creating agile partnerships that produce novel solutions, to making it easier for our customers to deploy our therapies — everything we do is anchored in deep insight, and creates simpler, superior experiences for everyone.
2
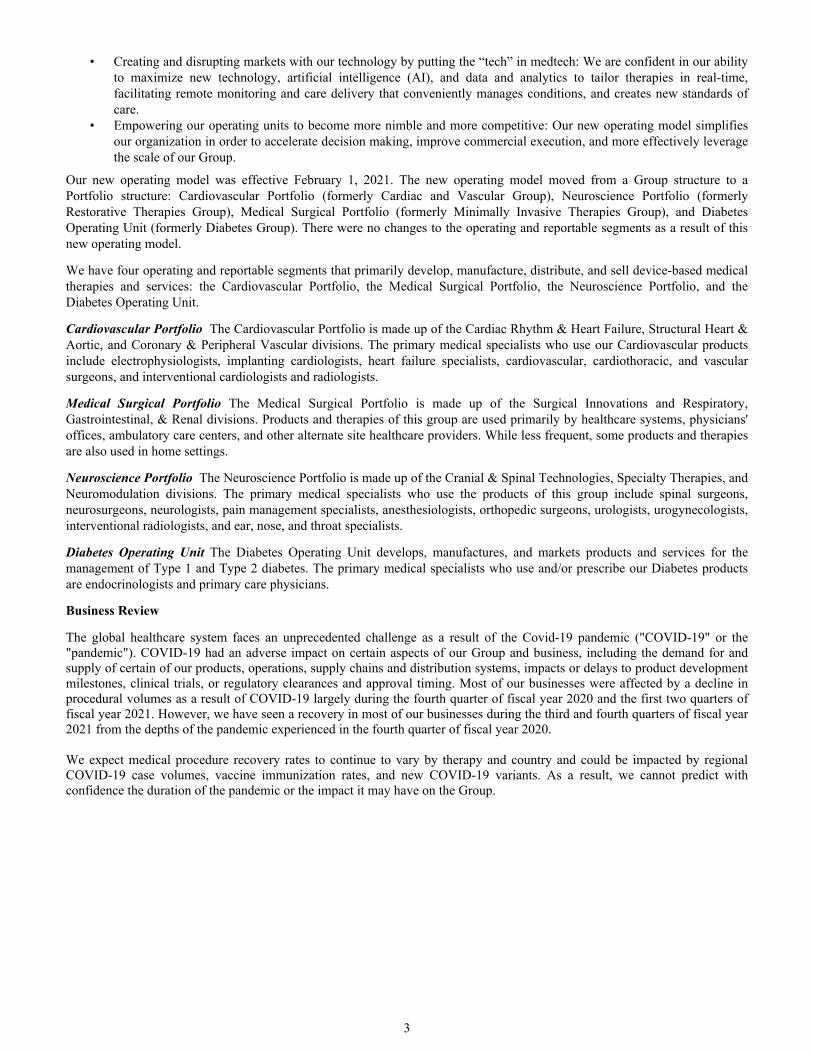
• Creating and disrupting markets with our technology by putting the “tech” in medtech: We are confident in our ability to maximize new technology, artificial intelligence (AI), and data and analytics to tailor therapies in real-time, facilitating remote monitoring and care delivery that conveniently manages conditions, and creates new standards of care.
• Empowering our operating units to become more nimble and more competitive: Our new operating model simplifies our organization in order to accelerate decision making, improve commercial execution, and more effectively leverage the scale of our Group.
Our new operating model was effective February 1, 2021. The new operating model moved from a Group structure to a Portfolio structure: Cardiovascular Portfolio (formerly Cardiac and Vascular Group), Neuroscience Portfolio (formerly Restorative Therapies Group), Medical Surgical Portfolio (formerly Minimally Invasive Therapies Group), and Diabetes Operating Unit (formerly Diabetes Group). There were no changes to the operating and reportable segments as a result of this new operating model.
We have four operating and reportable segments that primarily develop, manufacture, distribute, and sell device-based medical therapies and services: the Cardiovascular Portfolio, the Medical Surgical Portfolio, the Neuroscience Portfolio, and the Diabetes Operating Unit.
Cardiovascular Portfolio The Cardiovascular Portfolio is made up of the Cardiac Rhythm & Heart Failure, Structural Heart & Aortic, and Coronary & Peripheral Vascular divisions. The primary medical specialists who use our Cardiovascular products include electrophysiologists, implanting cardiologists, heart failure specialists, cardiovascular, cardiothoracic, and vascular surgeons, and interventional cardiologists and radiologists.
Medical Surgical Portfolio The Medical Surgical Portfolio is made up of the Surgical Innovations and Respiratory, Gastrointestinal, & Renal divisions. Products and therapies of this group are used primarily by healthcare systems, physicians' offices, ambulatory care centers, and other alternate site healthcare providers. While less frequent, some products and therapies are also used in home settings.
Neuroscience Portfolio The Neuroscience Portfolio is made up of the Cranial & Spinal Technologies, Specialty Therapies, and Neuromodulation divisions. The primary medical specialists who use the products of this group include spinal surgeons, neurosurgeons, neurologists, pain management specialists, anesthesiologists, orthopedic surgeons, urologists, urogynecologists, interventional radiologists, and ear, nose, and throat specialists.
Diabetes Operating Unit The Diabetes Operating Unit develops, manufactures, and markets products and services for the management of Type 1 and Type 2 diabetes. The primary medical specialists who use and/or prescribe our Diabetes products are endocrinologists and primary care physicians.
Business Review
The global healthcare system faces an unprecedented challenge as a result of the Covid-19 pandemic ("COVID-19" or the "pandemic"). COVID-19 had an adverse impact on certain aspects of our Group and business, including the demand for and supply of certain of our products, operations, supply chains and distribution systems, impacts or delays to product development milestones, clinical trials, or regulatory clearances and approval timing. Most of our businesses were affected by a decline in procedural volumes as a result of COVID-19 largely during the fourth quarter of fiscal year 2020 and the first two quarters of fiscal year 2021. However, we have seen a recovery in most of our businesses during the third and fourth quarters of fiscal year 2021 from the depths of the pandemic experienced in the fourth quarter of fiscal year 2020.
We expect medical procedure recovery rates to continue to vary by therapy and country and could be impacted by regional COVID-19 case volumes, vaccine immunization rates, and new COVID-19 variants. As a result, we cannot predict with confidence the duration of the pandemic or the impact it may have on the Group.
3
Key Performance Indicators
Consolidated Results of Operations
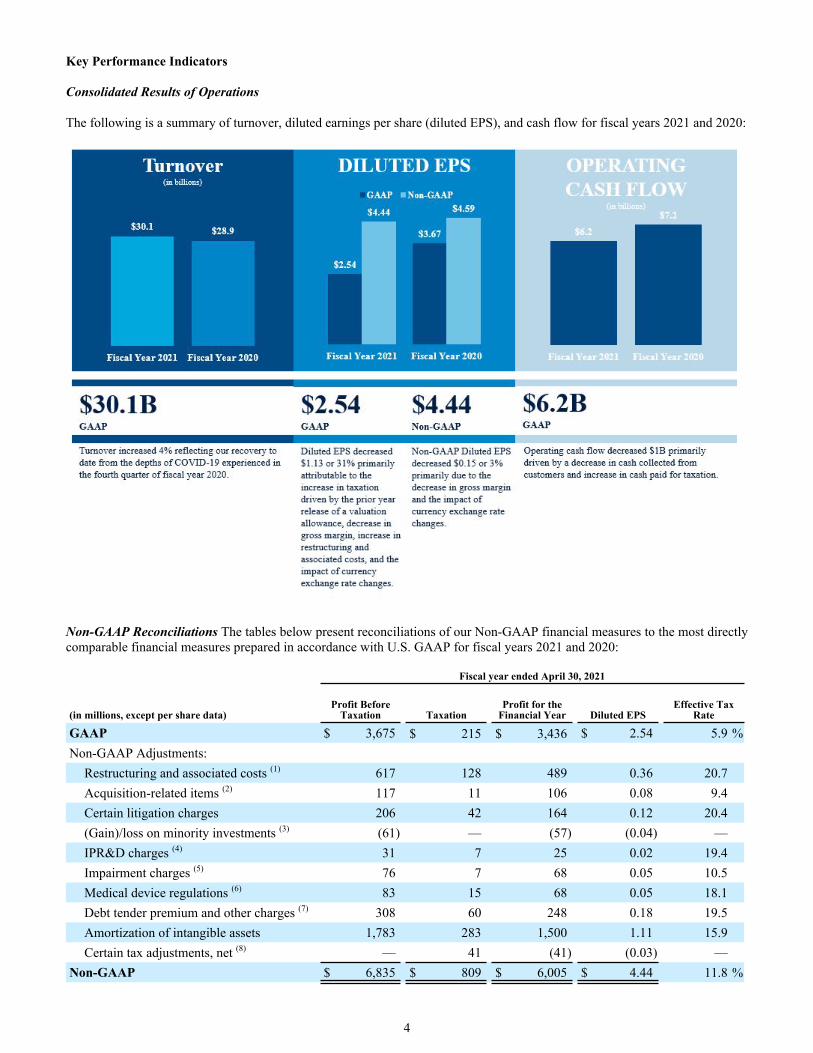
The following is a summary of turnover, diluted earnings per share (diluted EPS), and cash flow for fiscal years 2021 and 2020:
Non-GAAP Reconciliations The tables below present reconciliations of our Non-GAAP financial measures to the most directly comparable financial measures prepared in accordance with U.S. GAAP for fiscal years 2021 and 2020:
Fiscal year ended April 30, 2021
(in millions, except per share data)Profit Before
Taxation TaxationProfit for the
Financial Year Diluted EPSEffective Tax
Rate
GAAP $ 3,675 $ 215 $ 3,436 $ 2.54 5.9 %Non-GAAP Adjustments:
Restructuring and associated costs (1) 617 128 489 0.36 20.7 Acquisition-related items (2) 117 11 106 0.08 9.4 Certain litigation charges 206 42 164 0.12 20.4 (Gain)/loss on minority investments (3) (61) — (57) (0.04) — IPR&D charges (4) 31 7 25 0.02 19.4 Impairment charges (5) 76 7 68 0.05 10.5 Medical device regulations (6) 83 15 68 0.05 18.1 Debt tender premium and other charges (7) 308 60 248 0.18 19.5 Amortization of intangible assets 1,783 283 1,500 1.11 15.9 Certain tax adjustments, net (8) — 41 (41) (0.03) —
Non-GAAP $ 6,835 $ 809 $ 6,005 $ 4.44 11.8 %
4

Fiscal year ended April 24, 2020
(in millions, except per share data)Profit Before
Taxation TaxationProfit for the
Financial Year Diluted EPSEffective Tax
Rate
GAAP $ 4,275 $ (701) $ 4,959 $ 3.67 (16.4) %Non-GAAP Adjustments:
Restructuring and associated costs (1) 441 69 372 0.28 15.6 Acquisition-related items (9) (66) (18) (48) (0.04) 27.3 Certain litigation charges 225 40 185 0.12 17.8 (Gain)/loss on minority investments (3) 19 (3) 22 0.02 (15.8) Debt tender premium and other charges (10) 406 86 320 0.24 21.2 Medical device regulations (6) 48 6 42 0.03 12.5 Exit of businesses (11) 52 12 40 0.03 23.1 IPR&D charges (4) 25 3 22 0.02 12.0 Contribution to Medtronic Foundation 80 18 62 0.05 22.5 Amortization of intangible assets 1,756 284 1,472 1.09 16.2 Certain tax adjustments, net (12) — 1,242 (1,242) (0.92) —
Non-GAAP $ 7,261 $ 1,038 $ 6,206 $ 4.59 14.3 %
(1) Associated costs include costs incurred as a direct result of the restructuring program, such as salaries for employees supporting the program and consulting expenses.
(2) The charges primarily include business combination transaction-related costs, changes in fair value of contingent consideration, and a change in amounts accrued for certain contingent liabilities for recent acquisitions.
(3) We exclude unrealized and realized gains and losses on our minority investments as we do not believe these components of profit or expense have a direct correlation to our ongoing or future business operations.
(4) The charges represent acquired IPR&D in connection with asset acquisitions and certain license payments for unapproved technology.(5) The charges relate to the abandonment of certain intangible assets in our Neuroscience segment.(6) The charges represent estimated incremental costs of complying with the new European Union medical device regulations for previously registered
products and primarily include charges for contractors supporting the project and other direct third-party expenses.(7) The charges relate to the early redemption of approximately $6.0 billion of debt.(8) The net benefit primarily relates to the finalization of an audit at the IRS Appellate level for fiscal years 2012 through 2014 and the capitalization of
certain research and development costs for U.S. taxation purposes, which are partially offset by the impact of an intercompany sale of assets, and a tax basis adjustment and amortization of previously established deferred tax assets from intercompany intellectual property transactions.
(9) The charges primarily include costs incurred in connection with legacy-Covidien enterprise resource planning deployment activities, business combination related costs, and changes in fair value of contingent consideration.
(10) The charges, which include $413 million recognized in interest payable and similar expenses and ($7 million) recognized in other operating expense (income), net, primarily relates to the early redemption of approximately $5.2 billion of debt.
(11) The net charges relate to the exit of businesses and are primarily comprised of intangible asset impairments.(12) The net benefit primarily relates to the release of a valuation allowance on certain net operating losses, the impact of an intercompany sale of intellectual
property, and the impact of tax reform in Switzerland and the United States.
Free Cash Flow
Free cash flow, a non-GAAP financial measure, is calculated by subtracting additions to tangible assets from net cash provided by operating activities. Management uses this non-GAAP financial measure, in addition to U.S. GAAP financial measures, to evaluate our operating results. Free cash flow should be considered supplemental to, and not a substitute for, our reported financial results prepared in accordance with U.S. GAAP. Reconciliations between net cash provided by operating activities (the most comparable U.S. GAAP measure) and free cash flow are as follows:
Fiscal Year
(in millions) 2021 2020
Net cash provided by operating activities $ 6,240 $ 7,234 Additions to tangible assets (1,355) (1,213)
Free cash flow $ 4,885 $ 6,021
5
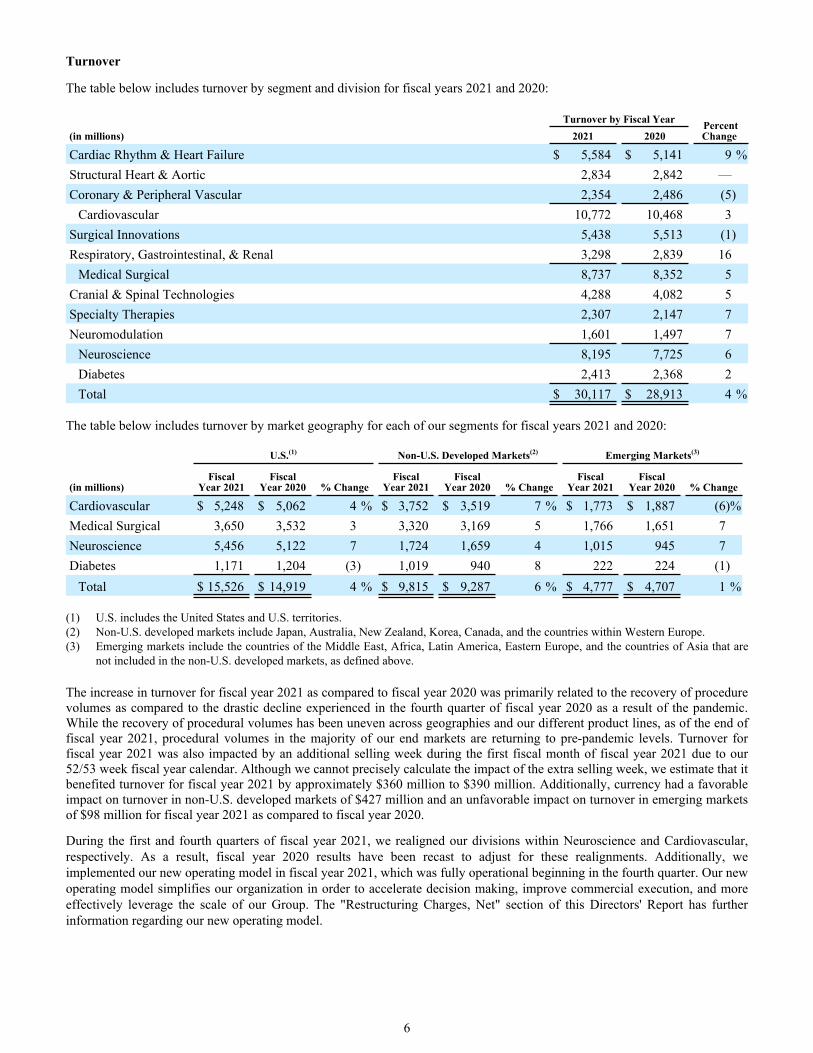
Turnover
The table below includes turnover by segment and division for fiscal years 2021 and 2020:
Turnover by Fiscal Year Percent Change (in millions) 2021 2020
Cardiac Rhythm & Heart Failure $ 5,584 $ 5,141 9 %Structural Heart & Aortic 2,834 2,842 — Coronary & Peripheral Vascular 2,354 2,486 (5)
Cardiovascular 10,772 10,468 3 Surgical Innovations 5,438 5,513 (1) Respiratory, Gastrointestinal, & Renal 3,298 2,839 16
Medical Surgical 8,737 8,352 5 Cranial & Spinal Technologies 4,288 4,082 5 Specialty Therapies 2,307 2,147 7 Neuromodulation 1,601 1,497 7
Neuroscience 8,195 7,725 6 Diabetes 2,413 2,368 2 Total $ 30,117 $ 28,913 4 %
The table below includes turnover by market geography for each of our segments for fiscal years 2021 and 2020:
U.S.(1) Non-U.S. Developed Markets(2) Emerging Markets(3)
(in millions)Fiscal
Year 2021Fiscal
Year 2020 % ChangeFiscal
Year 2021Fiscal
Year 2020 % ChangeFiscal
Year 2021Fiscal
Year 2020 % Change
Cardiovascular $ 5,248 $ 5,062 4 % $ 3,752 $ 3,519 7 % $ 1,773 $ 1,887 (6) %Medical Surgical 3,650 3,532 3 3,320 3,169 5 1,766 1,651 7 Neuroscience 5,456 5,122 7 1,724 1,659 4 1,015 945 7 Diabetes 1,171 1,204 (3) 1,019 940 8 222 224 (1)
Total $ 15,526 $ 14,919 4 % $ 9,815 $ 9,287 6 % $ 4,777 $ 4,707 1 %
(1) U.S. includes the United States and U.S. territories.(2) Non-U.S. developed markets include Japan, Australia, New Zealand, Korea, Canada, and the countries within Western Europe.(3) Emerging markets include the countries of the Middle East, Africa, Latin America, Eastern Europe, and the countries of Asia that are
not included in the non-U.S. developed markets, as defined above.
The increase in turnover for fiscal year 2021 as compared to fiscal year 2020 was primarily related to the recovery of procedure volumes as compared to the drastic decline experienced in the fourth quarter of fiscal year 2020 as a result of the pandemic. While the recovery of procedural volumes has been uneven across geographies and our different product lines, as of the end of fiscal year 2021, procedural volumes in the majority of our end markets are returning to pre-pandemic levels. Turnover for fiscal year 2021 was also impacted by an additional selling week during the first fiscal month of fiscal year 2021 due to our 52/53 week fiscal year calendar. Although we cannot precisely calculate the impact of the extra selling week, we estimate that it benefited turnover for fiscal year 2021 by approximately $360 million to $390 million. Additionally, currency had a favorable impact on turnover in non-U.S. developed markets of $427 million and an unfavorable impact on turnover in emerging markets of $98 million for fiscal year 2021 as compared to fiscal year 2020.
During the first and fourth quarters of fiscal year 2021, we realigned our divisions within Neuroscience and Cardiovascular, respectively. As a result, fiscal year 2020 results have been recast to adjust for these realignments. Additionally, we implemented our new operating model in fiscal year 2021, which was fully operational beginning in the fourth quarter. Our new operating model simplifies our organization in order to accelerate decision making, improve commercial execution, and more effectively leverage the scale of our Group. The "Restructuring Charges, Net" section of this Directors' Report has further information regarding our new operating model.
6

Cardiovascular
Cardiovascular products include pacemakers, insertable cardiac monitors, cardiac resynchronization therapy devices (CRT-D & CRT-P), implantable cardioverter defibrillators (ICD), leads and delivery systems, ventricular assist systems, ablation products, electrophysiology catheters, products for the treatment of atrial fibrillation, information systems for the management of patients with Cardiac Rhythm & Heart Failure devices, products designed to reduce surgical site infections, coronary and peripheral stents and related delivery systems, balloons and related delivery systems, endovascular stent graft systems, heart valve replacement technologies, cardiac tissue ablation systems, and open heart and coronary bypass grafting surgical products. Cardiovascular also includes Care Management Services and Cath Lab Managed Services (CLMS) within the Cardiac Rhythm & Heart Failure division. Cardiovascular's turnover for fiscal year 2021 was $10.8 billion, an increase of 3 percent as compared to fiscal year 2020. Currency had a favorable impact on turnover for fiscal year 2021 of $131 million. Cardiovascular's increase in turnover for fiscal year 2021, as compared to fiscal year 2020, was primarily due to the recovery of global procedural volumes from the downturn experienced in the fourth quarter of fiscal year 2020 resulting from the pandemic.
Cardiac Rhythm & Heart Failure (CRHF) turnover increased 9 percent in fiscal year 2021 as compared to fiscal year 2020. The increase was led by Cardiac Rhythm Management and Cardiac Ablation Solutions products, which included strong growth from the Micra leadless pacing system, Cobalt and Crome ICDs and CRT-Ds, TYRX antibacterial envelope, and Artic Front Advance Cryoballons. Partially offsetting this turnover growth were declines in Mechanical Circulatory Support products driven by slower recovery of procedure volumes and competitive dynamics.
Structural Heart & Aortic (SHA) turnover was flat in fiscal year 2021 as compared to fiscal year 2020 as growth in transcatheter aortic valve replacement (TAVR) was offset by declines within our Aortic and Cardiac Surgery businesses. The growth experienced in TAVR was driven by continued adoption of the Evolut Pro + valve. The declines experienced in Aortic and Cardiac Surgery were a result of slower recovery of procedure volumes as well our voluntary recall of the Valiant Navion Thoracic Stent Graft System in the fourth quarter of fiscal year 2021.
Coronary & Peripheral Vascular (CPV) turnover decreased 5 percent in fiscal year 2021 as compared to fiscal year 2020. The decline was a result of the generally more deferrable nature of peripheral and endovenous procedure categories as well as the negative impact of the Chinese national tender on turnover of drug-eluting stents. The Chinese national tender went into effect in January 2021 and resulted in significant price declines for drug-eluting stents in China, which negatively impacted our Coronary business. Partially offsetting these negative impacts was growth in drug-coated balloons and peripheral embolization coils. Drug-coated balloon growth was the result of strong adoption of the IN.PACT AV drug-coated balloon driven by its pivotal data published during the second quarter of fiscal year 2021.
Medical Surgical
Medical Surgical’s products span the entire continuum of patient care from diagnosis to recovery, with a focus on diseases of the gastrointestinal tract, lungs, pelvic region, kidneys, obesity, and preventable complications. The products include those for advanced and general surgical products, surgical stapling devices, vessel sealing instruments, wound closure, electrosurgery products, hernia mechanical devices, mesh implants, advanced ablation, interventional lung, ventilators, airway products, renal care products, and sensors and monitors for pulse oximetry, capnography, level of consciousness and cerebral oximetry. Medical Surgical’s turnover for fiscal year 2021 was $8.7 billion, an increase of 5 percent as compared to fiscal year 2020. Currency had a favorable impact on turnover of $87 million for fiscal year 2021. Turnover growth was primarily driven by the recovery in procedure volumes compared to the drastic downturn experienced in the fourth quarter of fiscal year 2020 from the pandemic. Additionally, increased demand for COVID-19 related diagnostics and therapies, particularly ventilator and airway products, contributed to turnover growth in fiscal year 2021.
Surgical Innovations turnover for fiscal year 2021 decreased 1 percent as compared to fiscal year 2020, with declines experienced across many product lines due to the deceleration of surgical procedure recovery. The decline in surgical volumes, particularly Bariatric, Colorectal, Hernia, and Thoracic procedures, resulted in lower demand for Advanced Stapling products and General Surgery products. This decline in demand was partially offset by new product launches driving growth in Advanced Energy.
Respiratory, Gastrointestinal, & Renal (RGR) turnover for fiscal year 2021 increased 16 percent as compared to fiscal year 2020. Turnover growth was primarily attributable to increased demand for Respiratory Interventions products due to COVID-19, driven by the Puritan Bennett high acuity ventilator portfolio.
7

Neuroscience
Neuroscience's products include various spinal implants, bone graft substitutes, biologic products, image-guided surgery and intra-operative imaging systems, robotic guidance systems used in the robot-assisted spine procedures, and systems that incorporate advanced energy surgical instruments. Neuroscience's products also focus on the treatment of overactive bladder, urinary retention, fecal incontinence, gastroparesis, as well as products to treat ear, nose, and throat (ENT), and therapies to treat the diseases of the vasculature in and around the brain, including coils, neurovascular stents and flow diversion products. Neuroscience also manufactures products related to implantable neurostimulation therapies and drug delivery systems for the treatment of chronic pain, movement disorders, and epilepsy. Neuroscience’s turnover for fiscal year 2021 was $8.2 billion, an increase of 6 percent as compared to fiscal year 2020. Currency had a favorable impact on turnover for fiscal year 2021 of $75 million. Neuroscience’s turnover growth was observed across all divisions and reflected the recovery of global procedural volumes, particularly on deferrable procedures, from the downturn experienced in the fourth quarter of fiscal year 2020 as a result of the pandemic.
Cranial & Spinal Technologies turnover for fiscal year 2021 increased 5 percent as compared to fiscal year 2020. Growth was experienced by both Enabling Technologies and Spine. Enabling Technologies results, though still impacted by the challenging environment for capital equipment due to COVID-19, were driven by recovery of turnover of the Midas Rex MR8 high-speed drill system and the StealthStation S8 Navigation System. Spine turnover growth was driven by recovery in procedural volumes in fiscal year 2021.
Specialty Therapies turnover for fiscal year 2021 increased 7 percent as compared to fiscal year 2020. Turnover growth was primarily driven by strength in Pelvic Health and Neurovascular. Pelvic Health saw continued recovery and growth throughout the fiscal year, driven by the launch of the InterStim Micro neurostimulator and SureScan MRI lead in the U.S. Neurovascular's growth continued to be driven by strength in coils and aspiration catheters, as well as general strength in emerging markets. This growth was partially offset by declines in flow diversion products due to recent competitive entrants. ENT experienced modest turnover growth due to the recovery of deferrable procedure volumes.
Neuromodulation turnover for fiscal year 2021 increased 7 percent as compared to fiscal year 2020. Turnover occurred in both Pain Therapies and Brain Modulation and reflected a recovery in procedural volumes. Turnover growth was driven by strong adoption of the DTM (differential target multiplexed) proprietary waveform in Pain Therapies, and the Percept PC deep brain stimulation (DBS) device with BrainSense technology in Brain Modulation.
Diabetes
Diabetes' products include insulin pumps, continuous glucose monitoring (CGM) systems, insulin pump consumables, and smart insulin pen systems. Diabetes' turnover for fiscal year 2021 was $2.4 billion, an increase of 2 percent as compared to fiscal year 2020. Currency had a favorable impact on turnover for fiscal year 2021 of $37 million. The increase in Diabetes' turnover for fiscal year 2021 was primarily attributable to growth in the MiniMed 780G insulin pump system and integrated CGM growth in the international markets. This growth was partially offset by declines in the U.S. due to new patient start delays and continued competitive pressures.
8

Cost and Expenses
The following is a summary of cost of sales, research and development, and distribution and administrative expenses as a percent of turnover:
34.8% 32.6%39.6% 41.0%
8.3% 8.1%
Cost of sales Distribution and administrative expense Research & development exepnse
Fiscal Year 2021 Fiscal Year 2020
Cost of Sales Cost of sales for fiscal years 2021 and 2020 was $10.5 billion and $9.4 billion, respectively. The increase in cost of sales as a percentage of turnover in fiscal year 2021, as compared to fiscal year 2020, was largely due to increased expenses as a result of a full fiscal year impact of COVID-19, primarily due to period expensing of some of our fixed overhead costs due to idle capacity at certain manufacturing facilities and increases in reserves for excess and obsolete inventory, as well as charges associated with recent field corrective actions. Going forward, we will continue to focus on reducing our cost of sales through supplier management, manufacturing improvements, and optimizing our manufacturing network.
Research and Development Expense We remain committed to accelerating the development of meaningful innovations to deliver better patient outcomes at appropriate costs that lead to enhanced quality of life and may be validated by clinical and economic evidence. We are also focused on expanding access to quality healthcare.
In fiscal year 2021, we entered into arrangements with third parties to fund the development of certain technologies in our Diabetes segment. As there is a substantive and genuine transfer of risk to the third parties, the development funding provided is recognized as an obligation to perform contractual services, and therefore is recorded as profit in other operating expense (income), net in the consolidated profit and loss account in the period the corresponding research and development expenses are incurred. If the technologies receive regulatory approval and are successfully commercialized, we will pay royalties to the third parties. During fiscal year 2021, no projects were significant, either individually or in aggregate, to our consolidated results.
Distribution and Administrative Expense Our goal is to continue to leverage distribution and administrative expense initiatives. Distribution and administrative expense primarily consists of salaries and wages, other administrative costs, such as professional fees and marketing expenses, and certain acquisition and restructuring expenses.
Distribution and administrative expense for fiscal years 2021 and 2020 was $11.9 billion. The decrease in distribution and administrative expense as a percentage of turnover in fiscal year 2021, as compared to 2020, was primarily due to turnover growth, coupled with reduced travel and discretionary spending due to the pandemic, offset by higher annual incentive accruals and increased restructuring and associated costs. Distribution and administrative expense in fiscal year 2021 includes $196 million of restructuring and associated costs, as compared to $168 million in fiscal year 2020. Additionally, for fiscal year 2020, distribution and administrative expense includes $103 million of acquisition-related costs, as compared to $3 million for fiscal year 2021.
9

The following is a summary of other costs and expenses (income):Fiscal Year
(in millions) 2021 2020
Restructuring charges, net $ 293 $ 118 Certain litigation charges, net 206 225 Other operating expense (income), net 447 (61) Other non-operating income, net (336) (356) Interest payable and similar expenses 925 1,092
Restructuring Charges, Net
Enterprise Excellence
In the third quarter of fiscal year 2018, we announced a multi-year global Enterprise Excellence Program designed to drive long-term business growth and sustainable efficiency. The Enterprise Excellence Program is expected to further leverage our global size and scale as well as enhance the customer and employee experience.
The Enterprise Excellence Program is focused on three objectives:
• Global Operations – integrating and enhancing global manufacturing and supply processes, systems and site presence to improve quality, delivery cost and cash flow
• Functional Optimization – enhancing and leveraging global operating models and systems across several enabling functions to improve productivity and employee experience
• Commercial Optimization – optimizing certain processes, systems and models to improve productivity and the customer experience
The Enterprise Excellence Program is designed to drive operating margin improvement as well as fund investment in strategic growth initiatives, with expected gross savings of more than $3.0 billion from cost reductions and leverage of our fixed infrastructure by the end of fiscal year 2022. Approximately $500 million to $700 million of gross annual savings are expected to be achieved through the end of fiscal year 2022.
The Enterprise Excellence Program is expected to result in pre-tax restructuring charges of approximately $1.6 billion to $1.8 billion, the vast majority of which are expected to be incurred by the end of fiscal year 2022 and result in cash outlays to be substantially complete by the end of fiscal year 2023. Approximately 40 percent of estimated charges are related to employee termination benefits. The remaining charges are costs associated with the restructuring program, such as salaries and benefits for employees supporting the program, including program management and transition teams, and strategic and operational consulting services related to the three objectives of the program discussed above. We expect these costs to be recognized within restructuring charges, net, cost of sales, and distribution and administrative expense in the consolidated profit and loss account.
During fiscal year 2021, we recognized net charges of $349 million, including $52 million recognized within restructuring charges, net in the consolidated profit and loss account, which were primarily comprised of employee termination benefits. For fiscal year 2021, charges also included costs incurred as a direct result of the restructuring program, such as salaries for employees supporting the program and consulting expenses, including $128 million recognized within cost of sales and $169 million recognized within distribution and administrative expense in the consolidated profit and loss account.
During fiscal year 2020, we recognized net charges of $441 million, including $118 million recognized within restructuring charges, net in the consolidated profit and loss account, primarily comprised of employee termination benefits. For fiscal year 2020, charges also included costs incurred as a direct result of the restructuring program, such as salaries for employees supporting the program and consulting expenses, including $149 million recognized within cost of sales and $165 million recognized within distribution and administrative expense in the consolidated profit and loss account.
Simplification
In the first quarter of fiscal year 2021, we initiated our Simplification restructuring program, designed to make the Group a more nimble and competitive organization focused on accelerating innovation, enhancing the customer experience, driving turnover growth, and winning market share, while also more efficiently and effectively leveraging our enterprise scale. Under the oversight of the portfolio leaders, this new operating model, which became fully operational the beginning of the fourth
10
quarter of fiscal year 2021, will simplify our organizational structure and accelerate decision-making and execution. Primary activities of the restructuring program will include reorganizing our business into a portfolio-level structure, including the creation of highly focused, accountable and empowered Operating Units (OUs), consolidating operations at the enterprise level, establishing Technology Development Centers in areas where we have deep core technology competencies to be leveraged by multiple OUs, and forming dedicated sales organizations that leverage our scale but move with the same agility as our smaller, local competitors.
The Simplification program is designed to streamline our operating model, improve competitiveness, and enhance the customer and employee experience and will result in substantial reduction in distribution and administrative expenses, the majority of which are expected to be achieved through the end of fiscal year 2022. Annual savings of approximately $450 million to $475 million are expected to be realized by the various components of the Simplification program.
We estimate that, in connection with the Simplification restructuring program, we will recognize pre-tax exit and disposal costs and other costs across all segments of approximately $400 million to $450 million, the majority of which are expected to be incurred by the end of fiscal year 2022. Approximately three quarters of the estimated charges are related to employee termination benefits. The remaining charges are costs associated with the restructuring program, such as salaries for employees supporting the program and consulting expenses to execute the reorganization of our business into a portfolio-like structure as discussed above. These charges are recognized within restructuring charges, net and distribution and administrative expense in the consolidated profit and loss account.
During fiscal year 2021, we recognized net charges of $268 million, including $241 million within restructuring charges, net in the consolidated profit and loss account. For fiscal year 2021, charges included $97 million of incremental defined benefit pension and post-retirement related expenses for employees that accepted voluntary early retirement packages within restructuring charges, net in the consolidated profit and loss account. For fiscal year 2021, charges also included costs incurred as a direct result of the restructuring program, such as salaries for employees supporting the program and consulting expenses, including $27 million recognized within distribution and administrative expense in the consolidated profit and loss account.
For additional information, see Note 3 to the consolidated financial statements.
Certain Litigation Charges We classify litigation charges and gains related to significant legal matters as certain litigation charges. During fiscal years 2021 and 2020, we recognized $206 million, and $225 million, respectively, of certain litigation charges related to probable and estimable damages for significant legal matters.
Other Operating Expense (Income), Net Other operating expense (income), net primarily includes royalty income and expense, currency remeasurement and derivative gains and losses, Puerto Rico excise taxes, changes in fair value of contingent consideration, changes in amounts accrued for certain contingent liabilities for a recent acquisition, a commitment to the Medtronic Foundation, charges associated with business exits, impairment charges, in-process research and development (IPR&D) charges, and profit from funded research and development arrangements.
The increase in other operating expense (income), net from fiscal year 2020 to 2021 was primarily driven by the impact of remeasurement and our hedging programs, which, combined, resulted in a loss of $47 million for fiscal year 2021 as compared to a gain of $295 million for fiscal year 2020. Also contributing to the increase were changes in fair value of contingent consideration resulting in a loss of $36 million for fiscal year 2021 as compared to a gain of $33 million for fiscal year 2020. Additionally, other operating expense (income), net for fiscal year 2021 includes impairment charges of $76 million related to the abandonment of certain intangible assets. For fiscal year 2020, other operating expense (income), net includes a $132 million gain related to amounts accrued for certain contingent liabilities for a recent acquisition, an $80 million charge associated with a commitment to the Medtronic Foundation, and charges of $52 million associated with the exit of businesses.
Other Non-Operating Income, Net Other non-operating income, net includes the non-service components of net periodic pension and postretirement benefit cost, investment gains and losses, and interest receivable and similar income.
The decrease in other non-operating income, net from fiscal year 2020 to 2021 was primarily attributable to the decrease in interest receivable and similar income as a result of the lower interest rate environment. Interest receivable and similar income was $192 million and $300 million for fiscal years 2021 and 2020, respectively. This decrease was partially offset by an increase in gains recognized on minority investments. Gains on minority investments were $61 million for fiscal year 2021 as compared to losses of $19 million for fiscal year 2020.
Interest Payable and Similar Expenses Interest payable and similar expenses includes interest incurred on our outstanding borrowings, amortization of debt issuance costs and debt premiums or discounts, amortization of gains or losses on terminated or de-designated interest rate derivative instruments, and charges recognized in connection with the tender and early redemption of senior notes. The decrease in interest payable and similar expenses from fiscal year 2020 to 2021 was primarily due to a decrease in charges related to debt tender and redemption transactions, which were $308 million for fiscal year 2021, as compared to $413 million for fiscal year 2020. Also contributing to the decrease was a decrease in the weighted-average
11

interest rate of outstanding debt obligations due to the aforementioned debt issuance and tender transactions. Refer to the "Debt and Capital" section of Directors' report for additional information on the debt issuances, tenders, and early redemptions.
Certain Tax Adjustments
During fiscal year 2021, the net benefit from certain tax adjustments of $41 million, recognized in taxation in the consolidated profit and loss account, included the following:
• A net benefit of $106 million associated with the resolution of an audit at the IRS Appellate level for fiscal years 2012, 2013, and 2014. The issues resolved relate to the utilization of certain net operating losses and the allocation of profit between Medtronic, Inc. and its wholly owned subsidiary operating in Puerto Rico for businesses that are not the subject of the U.S. Tax Court Case for fiscal years 2005 and 2006.
• A net cost of $73 million related to a tax basis adjustment of previously established deferred tax assets from intercompany intellectual property transactions. The cumulative amount of deferred tax benefit previously recognized from intercompany intellectual property transactions and recorded as Certain Tax Adjustments is $1.5 billion. The corresponding deferred tax assets will be amortized over a period of approximately 20 years.
• A cost of $50 million associated with the amortization of the previously established deferred tax assets from intercompany intellectual property transactions.
• A net cost of $25 million associated with an internal restructuring and intercompany sale of assets.
• A benefit of $83 million related to the capitalization of certain research and development costs for U.S. taxation purposes and the establishment of a deferred tax asset at the U.S. federal statutory tax rate.
During fiscal year 2020, the net benefit from certain tax adjustments of $1.2 billion, recognized in taxation in the consolidated profit and loss account, included the following:
• A net benefit of $63 million related to the finalization of certain state tax impacts from U.S. Tax Reform, and the issuance of certain final U.S. Treasury Regulations associated with U.S. Tax Reform. The primary impact of these regulations resulted in the Group re-establishing its permanently reinvested assertion on certain foreign profit and reversing the previously accrued tax provision. This benefit was partially offset by additional tax associated with a previously executed internal reorganization of certain foreign subsidiaries.
• A benefit of $252 million related to tax legislative changes in Switzerland, which abolished certain preferential tax regimes the Group benefited from and replaced them with a new set of internationally accepted measures. The legislation provided for higher effective tax rates but allowed for a transitional period whereby an amortizable asset was created for Swiss federal taxation purposes that will be amortized and deducted over a 10-year period.
• A benefit of $658 million related to the release of a valuation allowance previously recorded against certain net operating losses. Luxembourg enacted tax legislation during the year requiring the Group to reassess the realizability of certain net operating losses. The Group evaluated both the positive and negative evidence and released valuation allowance equal to the expected benefit from the utilization of certain net operating losses in connection with a planned intercompany sale of intellectual property.
• A net benefit of $269 million associated with the intercompany sale of intellectual property and the establishment of a deferred tax asset.
Certain tax adjustments will affect the comparability of our operating results between periods. Therefore, we consider these Non-GAAP Adjustments. Refer to the "Key Performance Indicators" section of this Directors' Report for further discussion of these adjustments.
12
LIQUIDITY AND CAPITAL RESOURCES
We are currently in a strong financial position, despite the impact COVID-19 had on our business and financial results during fiscal years 2021 and 2020. We believe our balance sheet and liquidity provide us with flexibility, and our cash at bank and in hand and current investments, along with our credit facility and related commercial paper programs will satisfy our foreseeable operating needs.
Our liquidity and capital structure are evaluated regularly within the context of our annual operating and strategic planning processes. We consider the liquidity necessary to fund our operations, which includes working capital needs, investments in research and development, tangible assets, and other operating costs. We also consider capital allocation alternatives that balance returning value to shareholders through dividends and share redemptions, satisfying maturing debt, and acquiring businesses and technology.
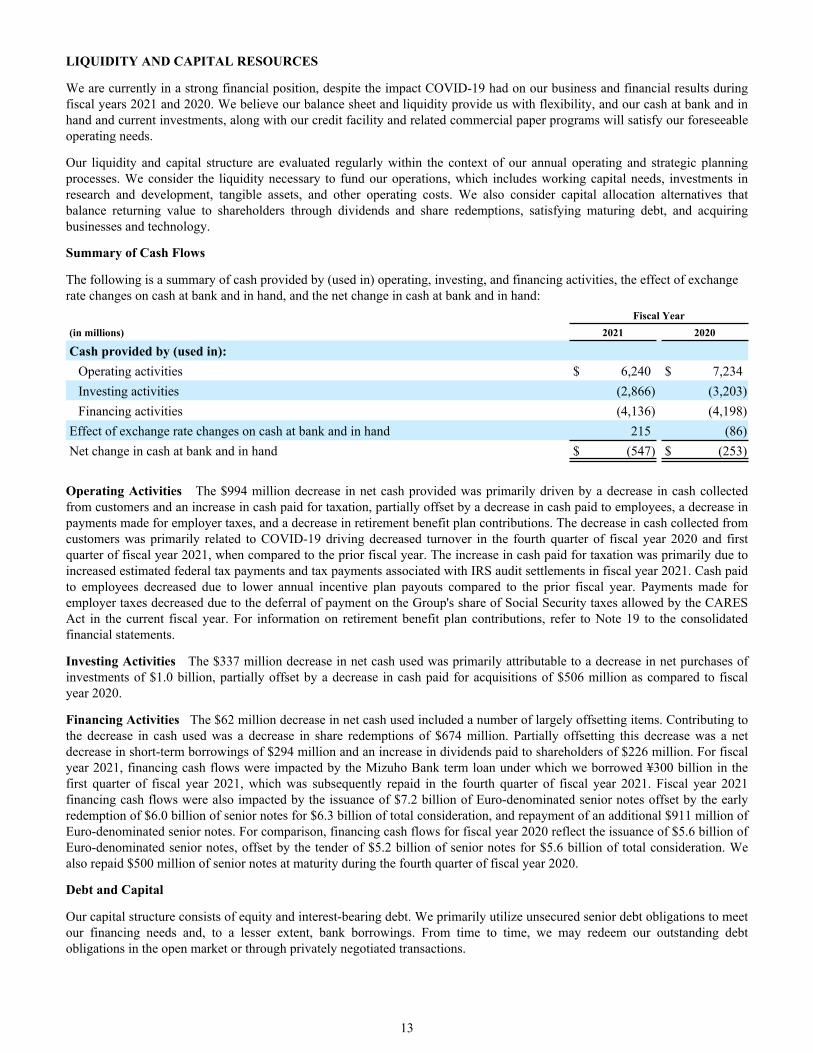
Summary of Cash Flows
The following is a summary of cash provided by (used in) operating, investing, and financing activities, the effect of exchange rate changes on cash at bank and in hand, and the net change in cash at bank and in hand: Fiscal Year(in millions) 2021 2020
Cash provided by (used in):
Operating activities $ 6,240 $ 7,234 Investing activities (2,866) (3,203) Financing activities (4,136) (4,198)
Effect of exchange rate changes on cash at bank and in hand 215 (86) Net change in cash at bank and in hand $ (547) $ (253)
Operating Activities The $994 million decrease in net cash provided was primarily driven by a decrease in cash collected from customers and an increase in cash paid for taxation, partially offset by a decrease in cash paid to employees, a decrease in payments made for employer taxes, and a decrease in retirement benefit plan contributions. The decrease in cash collected from customers was primarily related to COVID-19 driving decreased turnover in the fourth quarter of fiscal year 2020 and first quarter of fiscal year 2021, when compared to the prior fiscal year. The increase in cash paid for taxation was primarily due to increased estimated federal tax payments and tax payments associated with IRS audit settlements in fiscal year 2021. Cash paid to employees decreased due to lower annual incentive plan payouts compared to the prior fiscal year. Payments made for employer taxes decreased due to the deferral of payment on the Group's share of Social Security taxes allowed by the CARES Act in the current fiscal year. For information on retirement benefit plan contributions, refer to Note 19 to the consolidated financial statements.
Investing Activities The $337 million decrease in net cash used was primarily attributable to a decrease in net purchases of investments of $1.0 billion, partially offset by a decrease in cash paid for acquisitions of $506 million as compared to fiscal year 2020.
Financing Activities The $62 million decrease in net cash used included a number of largely offsetting items. Contributing to the decrease in cash used was a decrease in share redemptions of $674 million. Partially offsetting this decrease was a net decrease in short-term borrowings of $294 million and an increase in dividends paid to shareholders of $226 million. For fiscal year 2021, financing cash flows were impacted by the Mizuho Bank term loan under which we borrowed ¥300 billion in the first quarter of fiscal year 2021, which was subsequently repaid in the fourth quarter of fiscal year 2021. Fiscal year 2021 financing cash flows were also impacted by the issuance of $7.2 billion of Euro-denominated senior notes offset by the early redemption of $6.0 billion of senior notes for $6.3 billion of total consideration, and repayment of an additional $911 million of Euro-denominated senior notes. For comparison, financing cash flows for fiscal year 2020 reflect the issuance of $5.6 billion of Euro-denominated senior notes, offset by the tender of $5.2 billion of senior notes for $5.6 billion of total consideration. We also repaid $500 million of senior notes at maturity during the fourth quarter of fiscal year 2020.
Debt and Capital
Our capital structure consists of equity and interest-bearing debt. We primarily utilize unsecured senior debt obligations to meet our financing needs and, to a lesser extent, bank borrowings. From time to time, we may redeem our outstanding debt obligations in the open market or through privately negotiated transactions.
13

Total debt at April 30, 2021 was $26.4 billion, as compared to $24.8 billion at April 24, 2020. The increase in total debt was primarily driven by fluctuations in exchange rates as it pertains to our Euro-denominated senior notes and, to a lesser extent, the net impact of the issuance and redemption of senior notes, both of which are described below.
In September 2020, we issued six tranches of Euro-denominated senior notes with an aggregate principal of €6.3 billion, with maturities ranging from fiscal year 2023 to fiscal year 2051, resulting in cash proceeds of approximately $7.2 billion, net of discounts and issuance costs. The Euro-denominated debt is designated as a net investment hedge of certain of our European operations. We used the net proceeds of the offering to fund the early redemption of $6.0 billion of senior notes for $6.3 billion of total consideration in October 2020. Additionally, we used the proceeds to repay our €750 million floating rate senior notes at maturity in March 2021. We recognized a loss on debt extinguishment of $308 million in fiscal year 2021, which primarily included cash premiums and accelerated amortization of deferred financing costs and debt discounts and premiums. The loss on debt extinguishment was recognized in interest payable and similar expenses in the consolidated profit and loss account.
In May 2020, we entered into an unsecured term loan agreement with Mizuho Bank, Ltd. for an aggregate principal amount of up to ¥300 billion, or approximately $2.8 billion, with a term of six months and the option to extend for an additional six months. On May 13, 2020, Medtronic Luxco borrowed the entire amount of the term loan under the Loan Agreement. The proceeds of the loan were used for general corporate purposes. The Japanese Yen denominated debt was designated as a net investment hedge of certain of our Japanese operations. On November 12, 2020, we exercised our option to extend the term of the loan for an additional six months. During the fourth quarter of fiscal year 2021, we de-designated the Yen denominated debt as a net investment hedge and repaid the term loan in full, including interest.
We redeem our ordinary shares from time to time as part of our focus on returning value to our shareholders. In March 2019, the Board of Directors authorized the redemption of $6.0 billion of the Group's ordinary shares. There is no specific time period associated with these redemption authorizations. During fiscal years 2021 and 2020, we redeemed a total of 4 million and 12 million shares, respectively, under these programs at an average price of $126.80 and $106.22, respectively. At April 30, 2021, we had approximately $5.4 billion remaining under the share redemption programs authorized by our Board of Directors.
For more information on credit arrangements, see Note 17 of the consolidated financial statements.
Liquidity
Our liquidity sources at April 30, 2021 include $3.6 billion of cash at bank and in hand and $7.2 billion of current investments. Additionally, we maintain commercial paper programs (no commercial paper outstanding at April 30, 2021) and a Credit Facility.
Our investments primarily include available-for-sale debt securities, including U.S. and non-U.S. government and agency securities, corporate debt securities, mortgage-backed securities, and other asset-backed securities. See Note 12 to the consolidated financial statements.
We maintain multicurrency commercial paper programs for short-term financing, which allows us to issue unsecured commercial paper notes on a private placement basis up to a maximum aggregate amount outstanding at any time of $3.5 billion. At both April 30, 2021 and April 24, 2020, we had no commercial paper outstanding. The issuance of commercial paper reduces the amount of credit available under our existing line of credit, as explained below.
We also have a $3.5 billion five-year syndicated credit facility (Credit Facility), which expires in December 2025. The Credit Facility provides backup funding for the commercial paper programs and may also be used for general corporate purposes. The Credit Facility provides us with the ability to increase our borrowing capacity by an additional $1.0 billion at any time during the term of the agreement. At each anniversary date of the Credit Facility, but not more than twice prior to the maturity date, we could also request a one-year extension of the maturity date. At April 30, 2021 and April 24, 2020, no amounts were outstanding under the Credit Facility.
Interest rates on advances of our Credit Facility are determined by a pricing matrix based on our long-term debt ratings assigned by Standard & Poor's Rating Services (S&P) and Moody's Investor Service (Moody’s). Facility fees are payable on the Credit Facility and are determined in the same manner as the interest rates. We are in compliance with all covenants related to the Credit Facility.
14

The following table is a summary of our S&P and Moody's long-term debt ratings and short-term debt ratings:
Agency Rating (1)
April 30, 2021 April 24, 2020
Standard & Poor's Ratings Services Long-term debt A A Short-term debt A-1 A-1Moody's Investors Service Long-term debt A3 A3 Short-term debt P-2 P-2
(1) Agency ratings are subject to change, and there is no assurance that an agency will continue to provide ratings and/or maintain its current ratings. A security rating is not a recommendation to buy, sell or hold securities, and may be subject to revision or withdrawal at any time by the rating agency, and each rating should be evaluated independently of any other rating.
S&P and Moody's long-term debt ratings and short-term debt ratings at April 30, 2021 were unchanged as compared to the ratings at April 24, 2020. We do not expect the S&P and Moody's ratings to have a significant impact on our liquidity or future flexibility to access additional liquidity given our balance sheet, Credit Facility, and related commercial paper programs.
Financial Risk Management
Currency Exchange Rate Risk Due to the global nature of our operations, we are exposed to currency exchange rate changes which may cause fluctuations in profit and cash flows. We use operational and economic hedges, as well as currency exchange rate derivative instruments, to manage the impact of currency exchange rate fluctuations. In order to minimize profit and cash flow volatility resulting from currency exchange rate fluctuations, we enter into derivative instruments, principally forward currency exchange rate contracts. These contracts are designed to hedge anticipated transactions in other currencies and changes in the value of specific assets and liabilities. At inception of the contract, the derivative instrument is designated as either a freestanding derivative or a cash flow hedge. Currencies of our derivative instruments include the Euro, Japanese Yen, Chinese Yuan, and others. Fluctuations in the exchange rates of currency exposures that are unhedged, such as in certain emerging markets, may result in future profit and cash flow volatility. We do not enter into currency exchange rate derivative instruments for speculative purposes.
The gross notional amount of all currency exchange rate derivative instruments outstanding at April 30, 2021 and April 24, 2020 was $14.7 billion and $11.9 billion, respectively. At April 30, 2021, these contracts were in a net unrealized loss position of $211 million. A sensitivity analysis of changes in the fair value of all currency exchange rate derivative contracts at April 30, 2021 and April 24, 2020 indicates that, if the U.S. dollar uniformly strengthened/weakened by 10 percent against all currencies, it would have the following impact on the fair value of these contracts:
Increase (decrease)(in millions) 2021 2020
10% appreciation in the U.S. dollar $ 995 $ 750 10% depreciation in the U.S. dollar (995) (750)
Any gains and losses on the fair value of derivative contracts would generally be offset by gains and losses on the underlying transactions. These offsetting gains and losses are not reflected in the above analysis.
In the second quarter of fiscal year 2019, we began accounting for our operations in Argentina as highly inflationary, as the prior three-year cumulative inflation rate exceeded 100 percent. The change did not have a material impact on our results for fiscal year ended 2021.
Interest Rate Risk We are subject to interest rate risk on our investments and our borrowings. We manage interest rate risk in the aggregate, while focusing on our immediate and intermediate liquidity needs. Our debt portfolio at April 30, 2021 was comprised of debt predominately denominated in U.S. dollars and the Euro, of which substantially all is fixed rate debt. We are also exposed to interest rate changes affecting our investments in interest rate sensitive instruments, which include our marketable debt securities. We enter into marketable debt security positions for cash management purposes.
15

A sensitivity analysis of the impact on our interest rate-sensitive financial instruments of a hypothetical 10 basis point change in interest rates, as compared to interest rates at April 30, 2021 and April 24, 2020, would have the following impact on the fair value of these instruments:
Increase (decrease)(in millions) 2021 2020
10 basis point increase in interest rates $ 21 $ 34 10 basis point decrease in interest rates (21) (34)
Credit Risk Financial instruments, which potentially subject the Group to significant concentrations of credit risk, consist principally of interest-bearing investments, forward exchange derivative contracts, and trade debtors. Global concentrations of credit risk with respect to trade debtors are limited due to the large number of customers and their dispersion across many geographic areas. The Group monitors the creditworthiness of its customers to which it grants credit terms in the normal course of business.
Principal Risks and Uncertainties
Investing in our securities involves a variety of risks and uncertainties, known and unknown, including, among others, those discussed below. Each of the following risks should be carefully considered. Furthermore, additional risks and uncertainty not presently known to us or that we currently believe to be immaterial may also adversely affect our business. Our business, results of operations, financial condition, and cash flow and prospects could be materially and adversely affected by any of these risks or uncertainties.
Business and Operational Risks
We operate in a highly competitive industry and we may be unable to compete effectively.
We compete in both the therapeutic and diagnostic medical markets in more than 150 countries throughout the world. These markets are characterized by rapid change resulting from technological advances and scientific discoveries. In the product lines in which we compete, we face a range of competitors from large companies with multiple business lines to small, specialized manufacturers that offer a limited selection of niche products. Development by other companies of new or improved products, processes, technologies, or the introduction of reprocessed products or generic versions when our proprietary products lose their patent protection may make our existing or planned products less competitive. In addition, we face competition from providers of alternative medical therapies, such as pharmaceutical companies.
We believe our ability to compete depends upon many factors both within and beyond our control, including:
• product performance and reliability,• product technology and innovation, • product quality and safety,• breadth of product lines,• product support services,• customer support,• cost-effectiveness and price,• reimbursement approval from healthcare insurance providers, and• changes to the regulatory environment.
Competition may increase as additional companies enter our markets or modify their existing products to compete directly with ours. In addition, academic institutions, governmental agencies and other public and private research organizations also may conduct research, seek patent protection and establish collaborative arrangements for discovery, research, clinical development and marketing of products similar to ours. These companies and institutions compete with us in recruiting and retaining qualified scientific and management personnel, as well as in acquiring necessary product technologies. From time to time we have lost, and may in the future lose, market share in connection with product problems, physician advisories, safety alerts and publications about our products, which highlights the importance of product quality, product efficacy and quality systems to our business. In the current environment of managed care, consolidation among healthcare providers, increased competition, declining reimbursement rates, and national tender pricing, as recently experienced in China, competitively priced product offerings are essential to our success. Further, our continued growth and success depend on our ability to develop, acquire and market new and differentiated products, technologies and intellectual property, and as a result we also face competition for marketing, distribution, and collaborative development agreements, establishing relationships with academic and research
16

institutions and licenses to intellectual property. In order to continue to compete effectively, we must continue to create, invest in or acquire advanced technology, incorporate this technology into our proprietary products, obtain regulatory approvals in a timely manner, and manufacture and successfully market our products. Given these factors, we cannot guarantee that we will be able to compete effectively or continue our level of success.
The ongoing global COVID-19 pandemic has had, and may continue to have, an adverse effect on certain aspects of our business, results of operations, financial condition and cash flows. The nature and extent of future impacts are highly uncertain and unpredictable.
Our global operations and interactions with healthcare systems, providers and patients around the world expose us to risks associated with public health crises, including epidemics and pandemics such as COVID-19. In particular, the continuing preventative and precautionary measures that we and other businesses, communities, and governments have taken to mitigate the spread of the disease has led to restrictions on, disruptions in, and other related impacts on business and personal activities, including reduced customer demand for certain of our products and has resulted in many of our employees working remotely. We expect medical procedure rates to continue to vary by therapy and country, and could be impacted by regional COVID-19 case volumes, hospital and clinical occupancy and staffing levels, patient’s willingness to schedule deferrable procedures, travel restrictions, transportation limitations, quarantine restrictions, vaccine immunization rates, and new COVID-19 variants. While COVID-19 case volumes appear to be decreasing in the U.S and certain other countries as a result of higher vaccination rates, the global COVID-19 outlook remains uncertain as vaccination rates remain low in much of the world.
Together with the preventative and precautionary measures being taken, as well as the corresponding need to adapt to new and improved methods of conducting business, such as increased remote monitoring, COVID-19 is having, and may continue to have, an adverse impact on certain aspects of our Group and business, including the demand for and supply of certain of our products, operations, supply chains and distribution systems, impacts or delays to product development milestones, clinical trials, or regulatory clearances and approval timing, and our ability to generate cash flow, and may have an adverse impact on our ability to access capital. Some of our products are more sensitive to reductions in deferrable and emergent medical procedures, and, as hospital systems prioritize treatment of COVID-19 patients and otherwise comply with government guidelines, certain medical procedures have been and may continue to be suspended or postponed. The Group has certain product lines that are in higher demand as a result of COVID-19 such as ventilators, pulse oximetry, capnography, advanced parameter monitoring, and extracorporeal life support products. It is not possible to predict the timing of deferrable medical procedures and, to the extent individuals and hospital systems de-prioritize, delay or cancel these procedures, or if unemployment or loss of insurance coverage adversely impacts an individual’s ability to pay for our products and services, our business, results of operations, financial condition, and cash flows could continue to be negatively affected. Further, the COVID-19 pandemic has strained hospital systems around the world, resulting in adverse financial impacts to those systems that could result in reduced future expenditures for certain capital equipment and other products and services we provide, as well as potential disruption of product launches of our recently approved products.
A number of our global suppliers, vendors, and distributors have been adversely affected by the COVID-19 pandemic, including employee absenteeism. These impacts could impair our ability to move our products through distribution channels to end customers, and any such delay or shortage in the supply of components or materials may result in our inability to satisfy consumer demand for certain of our products in a timely manner or at all, which could harm our reputation, future turnover and profitability.
COVID-19 has impacted and may further impact the global economy and capital markets, including by negatively impacting demand for a number of our products, access to capital markets (including the commercial paper market), foreign currency exchange rates, and interest rates, each of which may adversely impact our business and liquidity. We could experience loss of turnover and profits due to delayed payments or insolvency of healthcare professionals, hospitals and other customers, suppliers and vendors facing liquidity issues. As a result, we may be compelled to take additional measures to preserve our cash flow.
COVID-19 could adversely impact our ability to retain key employees and the continued service and availability of skilled personnel necessary to run our complex productions and operations, including our executive officers and other key members of our management team.
While the impact of COVID-19 has had, and may continue to have, an adverse effect on our business, results of operations, financial condition and cash flows, the nature and extent of such impact is highly uncertain and unpredictable, as we cannot predict with confidence the duration of the pandemic.
Reduction or interruption in supply or other manufacturing difficulties may adversely affect our manufacturing operations and related product sales.
The manufacture of our products requires the timely delivery of a sufficient amount of quality components and materials and is highly exacting and complex, due in part to strict regulatory requirements. We manufacture the majority of our products and
17

procure important third-party services, such as sterilization services, at numerous facilities worldwide. We purchase many of the components, raw materials and services needed to manufacture these products from numerous suppliers in various countries. We seek to maintain continuity of supply by use of multiple options for sourcing where possible. We have generally been able to obtain adequate supplies of such raw materials, components and services. However, for reasons of quality assurance, cost effectiveness, or availability, certain components, raw materials and services needed to manufacture our products are obtained from a sole supplier. Although we work closely with our suppliers to try to ensure continuity of supply while maintaining high quality and reliability, the supply of these components, raw materials and services may be interrupted or insufficient. In addition, due to the stringent regulations and requirements of regulatory agencies, including the U.S. FDA, regarding the manufacture of our products, we may not be able to quickly establish additional or replacement sources. Additionally, many regulatory agencies are imposing regulatory requirements on safe use of chemicals and their potential impact on health and the environment which also may impact supply constraints. Furthermore, the prices of commodities and other materials used in our products, which are often volatile and outside of our control, could adversely impact our supply. We use resins, other petroleum-based materials and pulp as raw materials in some of our products, and the prices of oil and gas also significantly affect our costs for freight and utilities. A reduction or interruption in supply, and an inability to develop alternative sources for such supply, could adversely affect our ability to manufacture our products in a timely or cost-effective manner and could result in lost turnover.
Other disruptions in the manufacturing process or product sales and fulfillment systems for any reason, including equipment malfunction, failure to follow specific protocols and procedures, supplier facility shut-downs, defective raw materials, natural disasters such as hurricanes, tornadoes or wildfires, property damage or facility closures from riots or public protests, and other environmental factors and the impact of epidemics or pandemics, such as the COVID-19 pandemic, and actions by businesses, communities and governments in response, could lead to launch delays, product shortage, unanticipated costs, lost turnover and damage to our reputation. For example, in the past we have experienced a global information technology systems interruption that affected our customer ordering, distribution, and manufacturing processes, and we have been adversely impacted by, and may continue to be adversely impacted by, the global COVID-19 pandemic and the responses of governments and of our partners, including suppliers, manufacturers, distributors and other businesses. Furthermore, any failure to identify and address manufacturing problems prior to the release of products to our customers could result in quality or safety issues.
In addition, many of our products require sterilization before sale and several of our key products are manufactured or sterilized at a particular facility, with limited alternate facilities. If an event occurs that results in damage to or closure of one or more of such facilities, such as the damage caused by Hurricane Maria in Puerto Rico in September 2017 or Illinois Environmental Protection Agency's decision to close a supplier's sterilization facility in February 2019, we may be unable to manufacture or sterilize the relevant products to the required quality specifications or at all. Because of the time required to approve and license a manufacturing or sterilization facility, a third-party may not be available on a timely basis to replace production capacity in the event manufacturing or sterilization capacity is lost.
Our research and development efforts rely upon investments and investment collaborations, and we cannot guarantee that any previous or future investments or investment collaborations will be successful.
Our mission is to provide a broad range of therapies to restore patients to fuller, healthier lives, which requires a wide variety of technologies, products and capabilities. The rapid pace of technological development in the medical industry and the specialized expertise required in different areas of medicine make it difficult for one company alone to develop a broad portfolio of technological solutions. In addition to internally generated growth through our research and development efforts, historically we have relied, and expect to continue to rely, upon investments and investment collaborations to provide us access to new technologies both in areas served by our existing businesses as well as in new areas.
We expect to make future investments where we believe that we can stimulate the development or acquisition of new technologies and products to further our strategic objectives and strengthen our existing businesses. Investments and investment collaborations in and with medical technology companies are inherently risky, and we cannot guarantee that any of our previous or future investments or investment collaborations will be successful or will not materially adversely affect our business, results of operations, financial condition and cash flows.
The continuing development of many of our products depends upon us maintaining strong relationships with healthcare professionals.
If we fail to maintain our working relationships with healthcare professionals, many of our products may not be developed and marketed in line with the needs and expectations of the professionals who use and support our products, which could cause a decline in our profitability. The research, development, marketing and sales of many of our new and improved products depends on our maintaining working relationships with healthcare professionals. We rely on these professionals to provide us with considerable knowledge and experience regarding the development, marketing and sale of our products. Physicians assist us as researchers, marketing and product consultants, inventors and public speakers. In addition, as a result of the COVID-19
18

pandemic, our access to these professionals has been limited at times, and travel restrictions, shutdowns and similar measures have impacted our ability to maintain these relationships, thereby affecting our ability to develop, market and sell new and improved products. If we are unable to maintain strong relationships with these professionals, the development and marketing of our products could suffer, which could have a material adverse effect on our business, results of operations, financial condition, and cash flows.
Our substantial leverage and debt service obligations could adversely affect our business.
At April 30, 2021, we had approximately $26.4 billion of debt, of which all is noncurrent except $11.0 million. We may also incur additional indebtedness in the future. Our substantial indebtedness could have adverse consequences, including:
• making it more difficult for us to satisfy our financial obligations,• increasing our vulnerability to adverse economic, regulatory and industry conditions, and placing us at a
disadvantage compared to our competitors that are less leveraged,• limiting our ability to compete and our flexibility in planning for, or reacting to, changes in our business
and the industry in which we operate,• limiting our ability to borrow additional funds for working capital, capital expenditures, acquisitions and
general corporate or other purposes, and• exposing us to greater interest rate risk since the interest rate on floating rate borrowings is variable.
Our debt service obligations require us to use a portion of our operating cash flow to pay interest and principal on indebtedness instead of for other corporate purposes, including funding future expansion of our business, acquisitions, and ongoing capital expenditures, which could impede our growth. If our operating cash flow and capital resources are insufficient to service our debt obligations, we may be forced to sell assets, seek additional equity or debt financing or restructure our debt, which could harm our long-term business prospects. Our failure to comply with the terms of our revolving credit facility and other indebtedness could result in an event of default which, if not cured or waived, could result in the acceleration of all of our debt.
Failure to integrate acquired businesses into our operations successfully, as well as liabilities or claims relating to such acquired businesses, could adversely affect our business.
As part of our strategy to develop and identify new products and technologies, we have made several significant acquisitions in recent years, and may make additional acquisitions in the future. Our integration of the operations of acquired businesses requires significant efforts, including the coordination of information technologies, research and development, sales and marketing, operations, manufacturing, and finance. These efforts result in additional expenses and involve significant amounts of management’s time that cannot then be dedicated to other projects. Our failure to manage and coordinate the growth of acquired companies successfully could also have an adverse impact on our business. Further, acquired businesses may have liabilities, or be subject to claims, litigation or investigations that we did not anticipate or which exceed our estimates at the time of the acquisition. In addition, we cannot be certain that the businesses we acquire will become profitable or remain so. Factors that will affect the success of our acquisitions include:
• the presence or absence of adequate internal controls and/or significant fraud in the financial systems of acquired companies,
• our ability or inability to integrate information technology systems of acquired companies in a secure and reliable manner,
• liabilities, claims, litigation, investigations, or other adverse developments relating to acquired businesses or the business practices of acquired companies, including investigations by governmental entities, potential FCPA or product liability claims or other unanticipated liabilities,
• any decrease in customer loyalty and product orders caused by dissatisfaction with the combined companies’ product lines and sales and marketing practices, including price increases,
• our ability to retain key employees, and• the ability to achieve synergies among acquired companies, such as increasing turnover of the integrated
company’s products, achieving cost savings, and effectively combining technologies to develop new products.
We also could experience negative effects on our business, results of operations, financial condition, and cash flows from acquisition-related charges, amortization of intangible assets and asset impairment charges. These effects, individually or in the aggregate, could cause a deterioration of our credit rating and result in increased borrowing costs and interest payable and similar expenses.
19

Legal and Regulatory Risks
Climate change, or legal, regulatory or market measures to address climate change may materially adversely affect our financial condition and business operations.
Climate change resulting from increased concentrations of carbon dioxide and other greenhouse gases in the atmosphere could present risks to our future operations from natural disasters and extreme weather conditions, such as hurricanes, tornadoes, earthquakes, wildfires or flooding. Such extreme weather conditions could pose physical risks to our facilities and disrupt operation of our supply chain and may impact operational costs. The impacts of climate change on global water resources may result in water scarcity, which could in the future impact our ability to access sufficient quantities of water in certain locations and result in increased costs. Concern over climate change could result in new legal or regulatory requirements designed to mitigate the effects of climate change on the environment. If such laws or regulations are more stringent than current legal or regulatory requirements, we may experience increased compliance burdens and costs to meet the regulatory obligations and may adversely affect raw material sourcing, manufacturing operations and the distribution of our products.
We are subject to extensive and complex laws and governmental regulations and any adverse regulatory action may materially adversely affect our financial condition and business operations.
Our medical devices and technologies, as well as our business activities, are subject to a complex set of regulations and rigorous enforcement, including by the U.S. FDA, U.S. Department of Justice, Health and Human Services-Office of the Inspector General, and numerous other federal, state, and non-U.S. governmental authorities. To varying degrees, each of these agencies requires us to comply with laws and regulations governing the development, testing, manufacturing, labeling, marketing and distribution of our products. As a part of the regulatory process of obtaining marketing clearance for new products and new indications for existing products, we conduct and participate in numerous clinical trials with a variety of study designs, patient populations, and trial endpoints. Unfavorable clinical data from existing or future clinical trials may adversely impact our ability to obtain product approvals, our position in, and share of, the markets in which we participate, and our business, results of operations, financial condition, and cash flows. We cannot guarantee that we will be able to obtain or maintain marketing clearance for our new products or enhancements or modifications to existing products, and the failure to maintain approvals or obtain approval or clearance could have a material adverse effect on our business, results of operations, financial condition and cash flows. Even if we are able to obtain approval or clearance, it may:
• take a significant amount of time,• require the expenditure of substantial resources,• involve stringent clinical and pre-clinical testing, as well as increased post-market surveillance,• involve modifications, repairs or replacements of our products, and• limit the proposed uses of our products.
Both before and after a product is commercially released, we have ongoing responsibilities under the U.S. FDA and other applicable non-U.S. government agency regulations. For instance, many of our facilities and procedures and those of our suppliers are also subject to periodic inspections by the U.S. FDA to determine compliance with applicable regulations. The results of these inspections can include inspectional observations on the U.S. FDA’s Form-483, warning letters, or other forms of enforcement. If the U.S. FDA were to conclude that we are not in compliance with applicable laws or regulations, or that any of our medical products are ineffective or pose an unreasonable health risk, the U.S. FDA could ban such medical products, detain or seize adulterated or misbranded medical products, order a recall, repair, replacement, or refund of such products, refuse to grant pending pre-market approval applications or require certificates of non-U.S governments for exports, and/or require us to notify health professionals and others that the devices present unreasonable risks of substantial harm to the public health. The U.S. FDA and other non-U.S. government agencies may also assess civil or criminal penalties against us, our officers or employees and impose operating restrictions on a company-wide basis. The U.S. FDA may also recommend prosecution to the U.S. Department of Justice. Any adverse regulatory action, depending on its magnitude, may restrict us from effectively marketing and selling our products and limit our ability to obtain future pre-market clearances or approvals, and could result in a substantial modification to our business practices and operations. Furthermore, we occasionally receive subpoenas or other requests for information from state and federal governmental agencies, and while these investigations typically relate primarily to financial arrangements with healthcare providers, regulatory compliance and product promotional practices, we cannot predict the timing, outcome or impact of any such investigations. Any adverse outcome in one or more of these investigations could include the commencement of civil and/or criminal proceedings, substantial fines, penalties, and/or administrative remedies, including exclusion from government reimbursement programs and/or entry into Corporate Integrity Agreements (CIAs) with governmental agencies. In addition, resolution of any of these matters could involve the imposition of additional, costly compliance obligations. These potential consequences, as well as any adverse outcome from government investigations, could have a material adverse effect on our business, results of operations, financial condition, and cash flows.
20

In addition, the U.S. FDA has taken the position that device manufacturers are prohibited from promoting their products other than for the uses and indications set forth in the approved product labeling, and any failure to comply could subject us to significant civil or criminal exposure, administrative obligations and costs, and/or other potential penalties from, and/or agreements with, the federal government.
Governmental regulations outside the U.S. have, and may continue to, become increasingly stringent and common. In the European Union, for example, a new Medical Device Regulation which became effective in May 2021, includes significant additional premarket and post-market requirements. Penalties for regulatory non-compliance could be severe, including fines and revocation or suspension of a company’s business license, mandatory price reductions and criminal sanctions. Future laws and regulations may have a material adverse effect on us.
Our failure to comply with laws and regulations relating to reimbursement of healthcare goods and services may subject us to penalties and adversely impact our reputation, business, results of operations, financial condition and cash flows.
Our devices, products and therapies are purchased principally by hospitals or physicians that typically bill various third-party payers, such as governmental healthcare programs (e.g., Medicare, Medicaid and comparable non-U.S. programs), private insurance plans and managed care plans, for the healthcare services provided to their patients. The ability of our customers to obtain appropriate reimbursement for products and services from third-party payers is critical because it affects which products customers purchase and the prices they are willing to pay. As a result, our devices, products and therapies are subject to regulation regarding quality and cost by HHS, including the Centers for Medicare & Medicaid Services (CMS), as well as comparable state and non-U.S. agencies responsible for reimbursement and regulation of health are goods and services, including laws and regulations related to kickbacks, false claims, self-referrals and healthcare fraud. Many states have similar laws that apply to reimbursement by state Medicaid and other funded programs as well as in some cases to all payers. In certain circumstances, insurance companies attempt to bring a private cause of action against a manufacturer for causing false claims. In addition, as a manufacturer of U.S. FDA-approved devices reimbursable by federal healthcare programs, we are subject to the Physician Payments Sunshine Act, which requires us to annually report certain payments and other transfers of value we make to U.S.-licensed physicians or U.S. teaching hospitals. Any failure to comply with these laws and regulations could subject us or our officers and employees to criminal and civil financial penalties.
We are also subject to risks relating to changes in government and private medical reimbursement programs and policies, and changes in legal regulatory requirements in the U.S. and around the world. Implementation of further legislative or administrative reforms to these reimbursement systems, or adverse decisions relating to coverage of or reimbursement for our products by administrators of these systems, could have an impact on the acceptance of and demand for our products and the prices that our customers are willing to pay for them.
We are substantially dependent on patent and other proprietary rights and failing to protect such rights or to be successful in litigation related to our rights or the rights of others may result in our payment of significant monetary damages and/or royalty payments, negatively impacting our ability to sell current or future products.
We are substantially dependent on patent and other proprietary rights and rely on a combination of patents, trademarks, tradenames, copyrights, trade secrets, and agreements (such as employee, non-disclosure and non-competition agreements) to protect our business and proprietary intellectual property. We also operate in an industry characterized by extensive patent litigation. Patent litigation can result in significant damage awards and injunctions that could prevent our manufacture and sale of affected products or require us to pay significant royalties in order to continue to manufacture or sell affected products. At any given time, we are generally involved as both a plaintiff and a defendant in a number of patent infringement actions, the outcomes of which may not be known for prolonged periods of time. While it is not possible to predict the outcome of patent litigation, it is possible that the results of such litigation could require us to pay significant monetary damages and/or royalty payments, negatively impact our ability to sell current or future products, or that enforcement actions to protect our patent and proprietary rights against others could be unsuccessful, any of which could have a material adverse impact on our business, results of operations, financial condition, and cash flows.
While we intend to defend against any threats to our intellectual property, our patents, trademarks, tradenames, copyrights, trade secrets or agreements (such as employee, non-disclosure and non-competition agreements) may not adequately protect our intellectual property. Further, pending patent applications may not result in patents being issued to us, patents issued to or licensed by us may be challenged or circumvented by competitors and such patents may be found invalid, unenforceable or too limited in scope to protect our technology or provide us with any competitive advantage. Third parties could obtain patents that may require us to negotiate licenses to conduct our business, and such licenses may not be available on reasonable terms or at all. We also rely on non-disclosure and non-competition agreements with certain employees, consultants and other parties to protect, in part, trade secrets and other proprietary rights. We cannot be certain that these agreements will not be breached, that we will have adequate remedies for any breach, that others will not independently develop substantially equivalent proprietary information, or that third parties will not otherwise gain access to our trade secrets or proprietary knowledge.
21
In addition, the laws of certain countries in which we market or manufacture some of our products do not protect our intellectual property rights to the same extent as the laws of the U.S., which could make it easier for competitors to capture market position. Competitors also may harm our turnover by designing products that substantially mirror the capabilities of our products or technology without infringing our intellectual property rights. If we are unable to protect our intellectual property in these countries, it could have a material adverse effect on our business, results of operations, financial condition, and cash flows.
Quality problems and product liability claims could lead to recalls or safety alerts, reputational harm, adverse verdicts or costly settlements, and could have a material adverse effect on our business, results of operations, financial condition and cash flows.
Quality is extremely important to us and our customers due to the impact on patients, and the serious and potentially costly consequences of product failure. Our business exposes us to potential product liability risks that are inherent in the design, manufacture, and marketing of medical devices. In addition, many of our products are often used in intensive care settings with seriously ill patients and some of the medical devices we manufacture and sell are designed to be implanted in the human body for long periods of time or indefinitely. Component failures, manufacturing nonconformances, design defects, off-label use, or inadequate disclosure of product-related risks or product-related information with respect to our products, if they were to occur, could result in an unsafe condition or injury to, or death of, a patient. These problems could lead to recall of, or issuance of a safety alert relating to, our products, and could result in product liability claims and lawsuits, including class actions, which could ultimately result, in certain cases, in the removal from the body of such products and claims regarding costs associated therewith. Due to the strong name recognition of the Medtronic and Covidien brands, a material adverse event involving one of our products could result in reduced market acceptance and demand for all products within that brand, and could harm our reputation and ability to market products in the future. Further, we may be exposed to additional potential product liability risks related to products designed, manufactured and/or marketed in response to the COVID-19 pandemic, and unpredictable or accelerated changes in demand for certain of our products in connection with COVID-19 and its related impacts could impact development and production of products and services and could increase the risk of regulatory enforcement actions, product defects or related claims, as well as adversely impact our customer relationships and reputation.
Strong product quality is critical to the success of our goods and services. If we fall short of these standards and our products are the subject of recalls or safety alerts, our reputation could be damaged, we could lose customers and our turnover and results of operations could decline. Our success also can depend on our ability to manufacture to exact specification precision-engineered components, subassemblies and finished devices from multiple materials. If our components fail to meet these standards or fail to adapt to evolving standards, our reputation, competitive advantage and market share could be harmed. In certain situations, we may undertake a voluntary recall of products or temporarily shut down production lines based on performance relative to our own internal safety and quality monitoring and testing data.
Any of the foregoing problems, including future product liability claims or recalls, regardless of their ultimate outcome, could harm our reputation and have a material adverse effect on our business, results of operations, financial condition and cash flows.
Healthcare policy changes may have a material adverse effect on us.
In response to perceived increases in healthcare costs in recent years, there have been and continue to be proposals by several governments, regulators and third-party payers globally, including the U.S. federal and state governments, to control these costs and, more generally, to reform healthcare systems. Certain of these proposals could, among other things, limit the prices we are able to charge for our products or the amounts of reimbursement available for our products and could limit the acceptance and availability of our products. The adoption of some or all of these proposals could have a material adverse effect on our business, results of operations, financial condition and cash flows.
Our insurance program may not be adequate to cover future losses.
We have elected to self-insure most of our insurable risks across the Group, and we made this decision based on cost and availability factors in the insurance marketplace. We manage and maintain a portion of our self-insured program through a wholly-owned captive insurance company. We continue to maintain a directors and officers liability insurance policy with third-party insurers that provides coverage for the directors and officers of the Group. We continue to monitor the insurance marketplace to evaluate the value of obtaining insurance coverage for other categories of losses in the future. Although we believe, based on historical loss trends, that our self-insurance program accruals and our existing insurance coverage will be adequate to cover future losses, historical trends may not be indicative of future losses. The absence of third-party insurance coverage for other categories of losses increases our exposure to unanticipated claims and these losses could have a material adverse impact on our business, results of operations, financial condition and cash flows.
22

The failure to comply with anti-corruption laws could materially adversely affect our business and result in civil and/or criminal sanctions.
The U.S. Foreign Corrupt Practices Act (FCPA), the Irish Criminal Justice (Corruption Offences) Act 2018, and similar anti-corruption laws in other jurisdictions generally prohibit companies and their intermediaries from making improper payments to government officials for the purpose of obtaining or retaining business. Because of the predominance of government-administered healthcare systems in many jurisdictions around the world, many of our customer relationships outside of the U.S. are with governmental entities and are therefore potentially subject to such laws. We also participate in public-private partnerships and other commercial and policy arrangements with governments around the globe.
Global enforcement of anti-corruption laws has increased in recent years, including investigations and enforcement proceedings leading to assessment of significant fines and penalties against companies and individuals. Our international operations create a risk of unauthorized payments or offers of payments by one of our employees, consultants, sales agents, or distributors. We maintain policies and programs to implement safeguards to educate our employees and agents on these legal requirements, and to prevent and prohibit improper practices. However, existing safeguards and any future improvements may not always be effective, and our employees, consultants, sales agents or distributors may engage in conduct for which we could be held responsible. In addition, regulators could seek to hold us liable for conduct committed by companies in which we invest or that we acquire. Any alleged or actual violations of these regulations may subject us to government scrutiny, criminal or civil sanctions and other liabilities, including exclusion from government contracting, and could disrupt our business, adversely affect our reputation and result in a material adverse effect on our business, results of operations, financial condition and cash flows.
Laws and regulations governing international business operations could adversely impact our business.
The U.S. Department of the Treasury’s Office of Foreign Assets Control (OFAC), and the Bureau of Industry and Security at the U.S. Department of Commerce (BIS), administer certain laws and regulations that restrict U.S. persons and, in some instances, non-U.S. persons, in conducting activities, transacting business with or making investments in certain countries, governments, entities and individuals subject to U.S. economic sanctions. Our international operations subject us to these laws and regulations, which are complex, restrict our business dealings with certain countries, governments, entities, and individuals, and are constantly changing. Further restrictions may be enacted, amended, enforced or interpreted in a manner that materially impacts our operations.
From time to time, certain of our subsidiaries have limited business dealings in countries subject to comprehensive sanctions, including Iran, Sudan, Syria, Cuba and the region of Crimea. Certain of our subsidiaries sell medical devices, and may provide related services, to distributors and other purchasing bodies in such countries. These business dealings represent an insignificant amount of our consolidated turnover and profit, but expose us to a heightened risk of violating applicable sanctions regulations. Violations of these regulations are punishable by civil penalties, including fines, denial of export privileges, injunctions, asset seizures, debarment from government contracts and revocations or restrictions of licenses, as well as criminal fines and imprisonment. We have established policies and procedures designed to assist with our compliance with such laws and regulations. However, there can be no assurance that our policies and procedures will prevent us from violating these regulations in every transaction in which we may engage, and such a violation could adversely affect our reputation, business, results of operations, financial condition, and cash flows.
We are subject to environmental laws and regulations and the risk of environmental liabilities, violations and litigation.
We are subject to numerous U.S. federal, state, local and non-U.S. environmental, health and safety laws and regulations concerning, among other things, the health and safety of our employees, the generation, storage, use and transportation of hazardous materials, emissions or discharges of substances into the environment, investigation and remediation of hazardous substances or materials at various sites, chemical constituents in medical products and end-of-life disposal and take-back programs for medical devices. Our operations and those of certain third-party suppliers involve the use of substances subject to these laws and regulations, primarily those used in manufacturing and sterilization processes. If we or our suppliers violate these environmental laws and regulations, facilities could be shut down and violators could be fined, criminally charged or otherwise sanctioned. Furthermore, environmental laws outside of the U.S. are becoming more stringent, resulting in increased costs and compliance burdens.
In addition, certain environmental laws assess liability on current or previous owners or operators of real property for the costs of investigation, removal or remediation of hazardous substances or materials at their properties or at properties which they have disposed of hazardous substances. In addition to cleanup actions brought by governmental authorities, private parties could bring personal injury or other claims due to the presence of, or exposure to, hazardous substances. The ultimate cost of site cleanup and timing of future cash outflows is difficult to predict, given the uncertainties regarding the extent of the required cleanup, the interpretation of applicable laws and regulations, and alternative cleanup methods.
23

The costs of complying with current or future environmental protection and health and safety laws and regulations, or liabilities arising from past or future releases of, or exposures to, hazardous substances, may exceed our estimates, or have a material adverse effect on our business, results of operations, financial condition, and cash flows.
We rely on the proper function, security and availability of our information technology systems and data, as well as those of third parties throughout our global supply chain, to operate our business, and a breach, cyber-attack or other disruption to these systems or data could materially and adversely affect our business, results of operations, financial condition, cash flows, reputation or competitive position.
We are increasingly dependent on sophisticated information technology systems to operate our business. That technology includes systems that could be used to process, transmit and store sensitive data. Additionally, many of our products and services include integrated software and information technology that collects data regarding patients or connects to other internal systems. Like all organizations, we routinely experience attempted interference with the integrity of, and interruptions in, our technology systems via events such as cyber-attacks, malicious intrusions, or other breakdowns. The consequences could mean data breaches, interference with the integrity of our products and data, or other significant disruptions. Furthermore, we rely on third-party vendors to supply and/or support certain aspects of our information technology systems and resulting products. As we have seen with recent “Supply Chain Attacks,” these third-party systems could also become vulnerable to cyber-attack, malicious intrusions, breakdowns, interference or other significant disruptions, and may contain defects in design or manufacture or other problems that could result in system disruption or compromise the information security of our own systems. Lastly, we continue to grow in part through new business acquisitions and, as a result, may face risks associated with defects and vulnerabilities in their systems, or difficulties or other breakdowns or disruptions in connection with the integration of the acquisitions into our information technology systems.
Our worldwide operations mean that we are subject to laws and regulations, including data protection and cybersecurity laws and regulations, in many jurisdictions. For example, GDPR prefers that we manage personal data in the E.U. and may impose fines of up to four percent of our global turnover in the event of certain violations. Furthermore, there has been a developing trend of civil lawsuits and class actions relating to breaches of consumer data held by large companies or incidents arising from other cyber-attacks. Any data security breaches, cyber-attacks, malicious intrusions or significant disruptions could result in actions by regulatory bodies and/or civil litigation, any of which could materially and adversely affect our business, results of operations, financial condition, cash flows, reputation or competitive position.
In addition, our information technology systems require an ongoing commitment of significant resources to maintain, protect, and enhance existing systems and develop new systems. This enables us to keep pace with continuing changes in information processing technology, evolving legal and regulatory standards, the increasing need to protect patient and customer information, changes in the techniques used to obtain unauthorized access to data and information systems, and the information technology needs associated with our changing products and services. There can be no assurance that our extensive efforts (including, but not limited to, consolidating, protecting, upgrading and expanding our systems and capabilities, continuing to build security into the design of our products, and developing new systems to keep pace with continuing changes in information processing technology) will be successful or that additional systems issues will not arise in the future. Further, the COVID-19 pandemic and related government actions continues to mandate that our employees work remotely, which could expose us to greater risks related to cybersecurity and our information technologies systems.
If our information technology systems, products or services or sensitive data are compromised, there are many consequences that could result. Consequences include, but are not limited to patients or employees could be exposed to financial or medical identity theft or suffer a loss of product functionality, losing existing customers or have difficulty attracting new customers, experiencing difficulty preventing, detecting, and controlling fraud, be exposed to the loss or misuse of confidential information, have disputes with customers, physicians, and other healthcare professionals, suffer regulatory sanctions or penalties under federal laws, state laws, or the laws of other jurisdictions, experience increases in operating expenses or an impairment in our ability to conduct our operations, incur expenses or lose turnover as a result of a data privacy breach, product failure, information technology outages or disruptions, or suffer other adverse consequences including lawsuits or other legal action and damage to our reputation.
Changes in tax laws or exposure to additional income tax liabilities could have a material impact on our business, results of operations, financial condition and cash flows.
We are subject to income taxation, as well as non-income based taxation, in the U.S., Ireland, and various other jurisdictions in which we operate. The tax laws in the U.S., Ireland and other countries in which we and our affiliates do business could change on a prospective or retroactive basis, and any such changes could materially adversely affect our business and our effective tax rate. For example, on December 22, 2017, the U.S. enacted comprehensive tax legislation, commonly referred to as the Tax Cuts and Jobs Act (the "Tax Act"), which resulted in a significant charge to taxation during our fiscal year 2018 associated with U.S. taxation of accumulated foreign profit as well as the requirement to revalue U.S. deferred tax assets and liabilities resulting
24

from the reduction in the U.S. corporate tax rate. While the U.S. Treasury has issued a significant amount of guidance to date on the interpretation of the Tax Act, there remains regulations that have not yet been issued in final form. In addition, the Biden Administration has provided a framework for proposed U.S. tax law changes, which if enacted could have a material impact on our business, results of operations, financial condition, and cash flows.
In 2015, the Organization for Economic Cooperation and Development (OECD) published an action plan called Base Erosion and Profit Shifting (BEPS) with the purpose of tackling perceived tax abuses, inconsistency between taxing authorities, and their respective approach to international tax matters. Thereafter, many taxing authorities have adopted the BEPS guidelines into their local laws. In addition, the European Union (EU) expanded upon these guidelines with their Anti-Tax Avoidance Directive (ATAD 1 & 2) to be applied by all member states by 2020. In 2018, the OECD announced its intention to expand the scope of BEPS (BEPS 2.0) to provide a long-term solution to taxing right challenges arising from the global digital economy. Once the OECD releases the final agreed BEPS 2.0 guidelines, jurisdictions would then need to enact legislation to adopt the guidelines into law. Jurisdictions would then need to enact legislation to adopt the guidelines into law. The proposals, as currently drafted, are categorized into two groups (commonly referred to as Pillars). Pillar One is focused on providing a mechanism for taxing rights more closely with market engagement; generally where people or consumers are located. Pillar Two is focused on establishing a global minimum tax and would apply when a country’s income tax rate is below a still-to-be determined, minimum tax rate. These proposals are wide ranging and could affect all multinational enterprises across all industries without regard to their level of engagement with the digital economy. The aggressive nature of the timeline set by the OECD may mean that all implications for business may not have been fully worked through or fully understood by the OECD before final guidelines are issued. We continue to monitor the implications potentially resulting from this guidance. This action together with other legislative changes in many countries on the mandatory sharing of company information (financial and operational) with taxing authorities on a local and global basis under various information sharing initiatives, could lead to disagreements between jurisdictions associated with the proper allocation of profits between such jurisdictions.
We are subject to ongoing tax audits in the various jurisdictions in which we operate. Tax authorities may disagree with certain positions we have taken and assess additional taxes. We regularly assess the likely outcomes of these audits in order to determine the appropriateness of our tax provision. However, there can be no assurance that we will accurately predict the outcomes of these audits, and the actual outcomes of these audits could have a material impact on our business, results of operations, financial condition, and cash flows.
We have recorded reserves for potential payments of tax to various tax authorities related to uncertain tax positions. However, the calculation of such tax liabilities involves the application of complex tax laws, regulations and treaties (where applicable) in many jurisdictions. Therefore, any dispute with a tax authority may result in a payment that is significantly different from current estimates. If payment of these amounts ultimately proves to be less than the recorded amounts, the reversal of the liabilities generally would result in tax benefits being recognized in the period when we determine the liabilities are no longer necessary. If our estimate of tax liabilities proves to be less than the amount for which it is ultimately liable, we would incur additional charges, and such charges could have a material adverse effect on our business, results of operations, financial condition, and cash flows.
The Medtronic, Inc. tax court proceeding outcome could have a material adverse impact on our financial condition.
In March 2009, the IRS issued its audit report for Medtronic, Inc. for fiscal years 2005 and 2006. Medtronic, Inc. reached agreements with the IRS on some, but not all matters related to these fiscal years. The remaining unresolved issue for fiscal years 2005 and 2006 relates to the allocation of profit between Medtronic, Inc. and its wholly-owned subsidiary operating in Puerto Rico, which is one of our key manufacturing sites. An adverse outcome in this matter could materially and adversely affect our business, results of operations, financial condition, and cash flows. See Note 4 to the consolidated financial statements for additional information.
Future potential changes to the U.S. tax laws could result in us being treated as a U.S. corporation for U.S. federal tax purposes, and the IRS may not agree with the conclusion that we should be treated as a foreign corporation for U.S federal income tax purposes.
Because Medtronic plc is organized under the laws of Ireland, we would generally be classified as a foreign corporation under the general rule that a corporation is considered tax resident in the jurisdiction of its organization or incorporation for U.S. federal income tax purposes. Even so, the IRS may assert that we should be treated as a U.S. corporation (and, therefore, a U.S. tax resident) for U.S. federal income tax purposes pursuant to Section 7874 of the U.S. Internal Revenue Code of 1986, as amended (the Code). In addition, a retroactive change to U.S. tax laws in this area could change this classification. If we were to be treated as a U.S. corporation for federal tax purposes, we could be subject to substantially greater U.S. tax liability than currently contemplated as a non-U.S. corporation.
25

Legislative or other governmental action relating to the denial of U.S. federal or state governmental contracts to U.S. companies that redomicile abroad could adversely affect our business.
Various U.S. federal and state legislative proposals that would deny governmental contracts to U.S. companies that move their corporate location abroad may affect us. We are unable to predict the likelihood that, or final form in which, any such proposed legislation might become law, the nature of the regulations that may be promulgated under any future legislative enactments, or the effect such enactments and increased regulatory scrutiny may have on our business.
Risks Relating to Our Jurisdiction of Incorporation
We are incorporated in Ireland, and Irish law differs from the laws in effect in the U.S. and may afford less protection to holders of our securities.
Our shareholders may have more difficulty protecting their interests than would shareholders of a corporation incorporated in a jurisdiction of the United States. It may not be possible to enforce court judgments obtained in the U.S. against us in Ireland based on the civil liability provisions of the U.S. federal or state securities laws. In addition, there is some uncertainty as to whether the courts of Ireland would recognize or enforce judgments of U.S. courts obtained against us or our directors or officers based on the civil liabilities provisions of the U.S. federal or state securities laws or hear actions against us or those persons based on those laws. We have been advised that the U.S. currently does not have a treaty with Ireland providing for the reciprocal recognition and enforcement of judgments in civil and commercial matters. Therefore, a final judgment for the payment of money rendered by any U.S. federal or state court based on civil liability, whether or not based solely on U.S. federal or state securities laws, would not automatically be enforceable in Ireland.
As an Irish company, we are governed by the Irish Companies Act 2014, which differs in some material respects from laws generally applicable to U.S. corporations and shareholders, including, among others, differences relating to interested director and officer transactions and shareholder lawsuits. Likewise, the duties of directors and officers of an Irish company generally are owed to the company only. Shareholders of Irish companies generally do not have a personal right of action against directors or officers of the company and may exercise such rights of action on behalf of the company only in limited circumstances. Accordingly, holders of our securities may have more difficulty protecting their interests than would holders of securities of a corporation incorporated in the U.S.
As an Irish public limited company, certain capital structure decisions require shareholder approval, which may limit Medtronic’s flexibility to manage its capital structure.
Under Irish law, our authorized share capital can be increased by an ordinary resolution of our shareholders and the directors may issue new ordinary or preferred shares, without shareholder approval, once authorized to do so by our articles of association or by an ordinary resolution of our shareholders. Additionally, subject to specified exceptions, Irish law grants statutory preemption rights to existing shareholders where shares are being issued for cash consideration but allows shareholders to disapply such statutory preemption rights either in our articles of association or by way of special resolution. Such disapplication can either be generally applicable or be in respect of a particular allotment of shares. Accordingly, at our 2020 Annual General Meeting, our Shareholders authorized our Board of Directors to issue up to 33% of our issued ordinary shares and further authorized our Board of Directors to issue up to 10% of such shares for cash without first offering them to our existing shareholders (provided that with respect to 5% of such shares, such allotment is to be used for the purposes of a specified capital investment). Both of these authorizations will expire on June 11, 2022, unless renewed by shareholders for a further period. We anticipate seeking new authorizations at our 2021 Annual General Meeting and in subsequent years. We cannot provide any assurance that these authorizations will always be approved, which could limit our ability to issue equity and thereby adversely affect the holders of our securities.
A transfer of our shares, other than ones effected by means of the transfer of book-entry interests in the Depository Trust Company, may be subject to Irish stamp duty.
Transfers of our shares effected by means of the transfer of book entry interests in the Depository Trust Company (DTC) will not be subject to Irish stamp duty. However, if a shareholder holds our shares directly rather than beneficially through DTC, any transfer of shares could be subject to Irish stamp duty (currently at the rate of 1% of the higher of the price paid or the market value of the shares acquired). Payment of Irish stamp duty is generally a legal obligation of the transferee. The potential for stamp duty could adversely affect the price of shares.
26

In certain limited circumstances, dividends we pay may be subject to Irish dividend withholding tax and dividends received by Irish residents and certain other shareholders may be subject to Irish income tax.
In certain limited circumstances, dividend withholding tax (currently at a rate of 25%) may arise in respect of dividends paid on our shares. A number of exemptions from dividend withholding tax exist such that shareholders resident in the U.S. and other specified countries that have a tax treaty with Ireland may be entitled to exemptions from dividend withholding tax.
Shareholders resident in the U.S. that hold their shares through DTC will not be subject to dividend withholding tax, provided the addresses of the beneficial owners of such shares in the records of the brokers holding such shares are recorded as being in the U.S. (and such brokers have further transmitted the relevant information to a qualifying intermediary appointed by us). However, other shareholders may be subject to dividend withholding tax, which could adversely affect the price of their shares.
Shareholders entitled to an exemption from Irish dividend withholding tax on dividends received from us will not be subject to Irish income tax in respect of those dividends unless they have some connection with Ireland other than their shareholding in our Group (for example, they are resident in Ireland). Shareholders who receive dividends subject to Irish dividend withholding tax generally have no further liability to Irish income tax on those dividends.
Our shares received by means of a gift or inheritance could be subject to Irish capital acquisitions tax.
Irish capital acquisitions tax (CAT) could apply to a gift or inheritance of our shares irrespective of the place of residence, ordinary residence or domicile of the parties. This is because our shares will be regarded as property situated in Ireland. The person who receives the gift or inheritance has primary liability for CAT. Gifts and inheritances passing between spouses are exempt from CAT. Children have a tax-free threshold of €335,000 in respect of taxable gifts or inheritances received from their parents. Irish Revenue typically updates the amount of this tax-free threshold on an annual basis.
Economic and Industry Risks
If we experience decreasing prices for our goods and services and we are unable to reduce our expenses, there may be a material adverse effect on our business, results of operations, financial condition and cash flows.
We have experienced, and may continue to experience, decreasing prices for certain of our goods and services due to pricing pressure from managed care organizations and other third-party payers on our customers, increased market power of our customers as the medical device industry consolidates and increased competition among medical engineering and manufacturing services providers. If the prices for our goods and services decrease and we are unable to reduce our expenses, our business, results of operations, financial condition and cash flows will be adversely affected.
We are subject to a variety of risks associated with global operations that could adversely affect our profitability and operating results.
We develop, manufacture, distribute and sell our products globally. We intend to continue to expand our operations and to pursue growth opportunities outside the U.S., especially in emerging markets. Operations in different countries including emerging markets could expose us to additional and greater risks and potential costs, including:
• fluctuations in currency exchange rates,• healthcare reform legislation,• the need to comply with different regulatory regimes worldwide that are subject to change and that could
restrict our ability to manufacture and sell our products,• local product preferences and product requirements,• longer-term receivables than are typical in the U.S.,• trade protection measures, tariffs and other border taxes, and import or export licensing requirements,• less intellectual property protection in some countries outside the U.S. than exists in the U.S.,• different labor regulations and workforce instability,• political and economic instability,• the expiration and non-renewal of foreign tax rulings and/or grants,• potentially negative consequences from changes in or interpretations of tax laws, and• economic instability and inflation, recession or interest rate fluctuations.
The ongoing global economic competition and trade tensions between the U.S. and China present risk to Medtronic. Although we have been able to mitigate some of the impact on Medtronic from increased duties imposed by both sides (through petitioning both governments for tariff exclusions and other mitigations), the risk remains of additional tariffs and other kinds of restrictions. Tariff exclusions awarded to Medtronic by the U.S. Government require annual renewal, and policies for granting exclusions could shift. The U.S. and China could impose other types of restrictions such as limitations on government
27

procurement or technology export restrictions, which could affect Medtronic’s access to the markets. China comprises approximately eight percent of our total turnover.
More generally, several governments including the U.S. have raised the possibility of policies to induce “re-shoring” of supply chains, less reliance on imported supplies, and greater national production. Examples include potential “Buy America” requirements in the U.S. or U.S. withdrawal from the World Trade Organization Agreement on Government Procurement (GPA). If such steps triggered retaliation in other markets restricting access to foreign products in purchases by their government-owned healthcare systems, the result could be a significant impact on Medtronic.
Other significant changes or disruptions to international trade arrangements, such as termination or modifications of other existing trade agreements or the final implementation of the “Brexit” agreement between the United Kingdom and European Union, may adversely affect our business, results of operations, financial condition and cash flows.
In addition, a significant amount of our trade debtors are with national healthcare systems in many countries. Repayment of these trade debtors is dependent upon the political and financial stability of those countries. In light of these global economic fluctuations, we continue to monitor the creditworthiness of customers. Failure to receive payment of all or a significant portion of our trade debtors balances could adversely affect our business, results of operations, financial condition and cash flows.
In addition, COVID-19, and the responses of business and governments to the pandemic, have at times resulted in reduced availability of air transport, port closures, increased border controls or closures, increased transportation costs and increased security threats to our supply chain, and countries may continue to close borders, impose prolonged quarantines, and further restrict travel and other activities. Our business could be adversely impacted if we are unable to successfully manage these and other risks of global operations.
Finally, changes in currency exchange rates may impact the reported value of our turnover, expenses, and cash flows. We cannot predict changes in currency exchange rates, the impact of exchange rate changes, nor the degree to which we will be able to manage the impact of currency exchange rate changes.
Consolidation in the healthcare industry could have an adverse effect on our turnover and results of operations.
Many healthcare industry companies, including healthcare systems, distributors, manufacturers, providers, and insurers, are consolidating or have formed strategic alliances. As the healthcare industry consolidates, competition to provide goods and services to industry participants will become more intense. Further, this consolidation creates larger enterprises with greater negotiating power, which they can use to negotiate price concessions. If we must reduce our prices because of industry consolidation, or if we lose customers as a result of consolidation, our business, results of operations, financial condition, and cash flows could be adversely affected.
Healthcare industry cost-containment measures could result in reduced turnover of our medical devices and medical device components.
Most of our customers, and the healthcare providers to whom our customers supply medical devices, rely on third-party payers, including government programs and private health insurance plans, to reimburse some or all of the cost of the procedures in which medical devices that incorporate components we manufacture or assemble are used. The continuing efforts of governmental authorities, insurance companies and other payers of healthcare costs to contain or reduce these costs could lead to patients being unable to obtain approval for payment from these third-party payers. If third-party payer payment approval cannot be obtained by patients, sales of finished medical devices that include our components may decline significantly and our customers may reduce or eliminate purchases of our components. The cost-containment measures that healthcare providers are instituting, both in the U.S. and outside of the U.S., could harm our ability to operate profitably. For example, managed care organizations have successfully negotiated volume discounts for pharmaceuticals, and GPOs and IDNs have also concentrated purchasing decisions for some customers, which has led to downward pricing pressure for medical device companies, including us.
Directors
Richard H. Anderson, Craig Arnold, Scott C. Donnelly, Andrea Goldsmith, Randall J. Hogan, III, Omar Ishrak, Michael O. Leavitt, James T. Lenehan, Kevin E. Lofton, Geoffrey S. Martha, Elizabeth G. Nabel, Denise M. O'Leary, and Kendall J. Powell served as directors of the Group during fiscal year 2020 and each of their terms expire at the 2021 annual general meeting of shareholders. Mr. Lofton's service as a director of the Group became effective during fiscal year 2021, and Mr. Ishrak's service ended upon his retirement on December 11, 2020. Mr. Martha's service as a director of the Group became effective during fiscal year 2020. There were no other changes in directors holding office in fiscal years 2021 or 2020.
28

Directors' and Corporate Secretary's Interests in Shares
The interests of the directors and corporate secretary holding office at April 30, 2021 in the ordinary shares of the Group were as follows:
April 30, 2021 April 24, 2020 (or date of appointment)Ordinary
Shares OptionsDeferred
Share UnitsRestricted
Share UnitsOrdinary
Shares OptionsDeferred
Share UnitsRestricted
Share Units
Directors:Richard H. Anderson 78,826 — 30,171 — 71,246 — 29,554 2,042Craig Arnold 31,620 — — — 28,622 — — 2,042Scott C. Donnelly 9,999 — 2,262 — 7,001 — 2,216 2,042Andrea Goldsmith 1,652 — — — — — — 264Randall J. Hogan, III 38,432 — — — 35,434 — — 2,042Omar Ishrak(1) 218,425 1,966,945 294,676 100,325 139,910 1,807,627 288,648 155,134Michael O. Leavitt 12,434 — 8,012 — 8,617 — 7,848 2,042James T. Lenehan 33,216 — 23,300 — 30,218 — 22,823 2,042Kevin E. Lofton(2) — — — — — — — —Geoffrey S. Martha 23,629 696,153 — 58,319 17,518 424,178 — 44,449Elizabeth Nabel 9,019 — — — 6,021 — — 2,042Denise M. O'Leary 60,911 — 32,505 — 31,922 — 31,840 2,042Kendall J. Powell 14,800 — 22,333 — 11,883 — 21,876 2,042Corporate Secretary:Bradley E. Lerman 21,505 450,543 — 30,488 16,542 376,732 — 34,766
(1) Retired on December 11, 2020(2) Appointed as of September 15, 2020. Mr. Lofton had no interests as of the date of appointment.
Audit Committee
The Company has an audit committee and therefore meets the requirements of Section 167 of the Companies Act 2014.
Disclosure of Information to Auditor
Each of the persons who is a director at the date of approval of this report confirms that:• so far as the director is aware, there is no relevant audit information of which the Company's statutory auditor is
unaware, and• that director has taken all steps that ought to have been taken as a director in order to be aware of any relevant audit
information and to establish that the Company's statutory auditor is aware of that information.
This confirmation is given and should be interpreted in accordance with the provisions of Section 330 of the Companies Act 2014.
Political Donations
No political contributions that require disclosure under Irish law were made during fiscal years 2021 or 2020.
Dividends
Ordinary cash dividends declared and paid during fiscal years 2021 and 2020 were $3.1 billion and $2.9 billion, respectively. On a per share basis, ordinary cash dividends declared and paid totaled 58.0 cents per share for each quarter of fiscal year 2021 and 54.0 cents per share for each quarter of fiscal year 2020. The timing, declaration, and payment of future dividends to holders of the Group's ordinary and A Preferred shares falls within the discretion of the Board of Directors and depends upon many factors, including the statutory requirements of Irish law, the Group's profit and financial condition, the capital requirements of the Group's businesses, industry practice and any other factors the Board of Directors deems relevant.
29
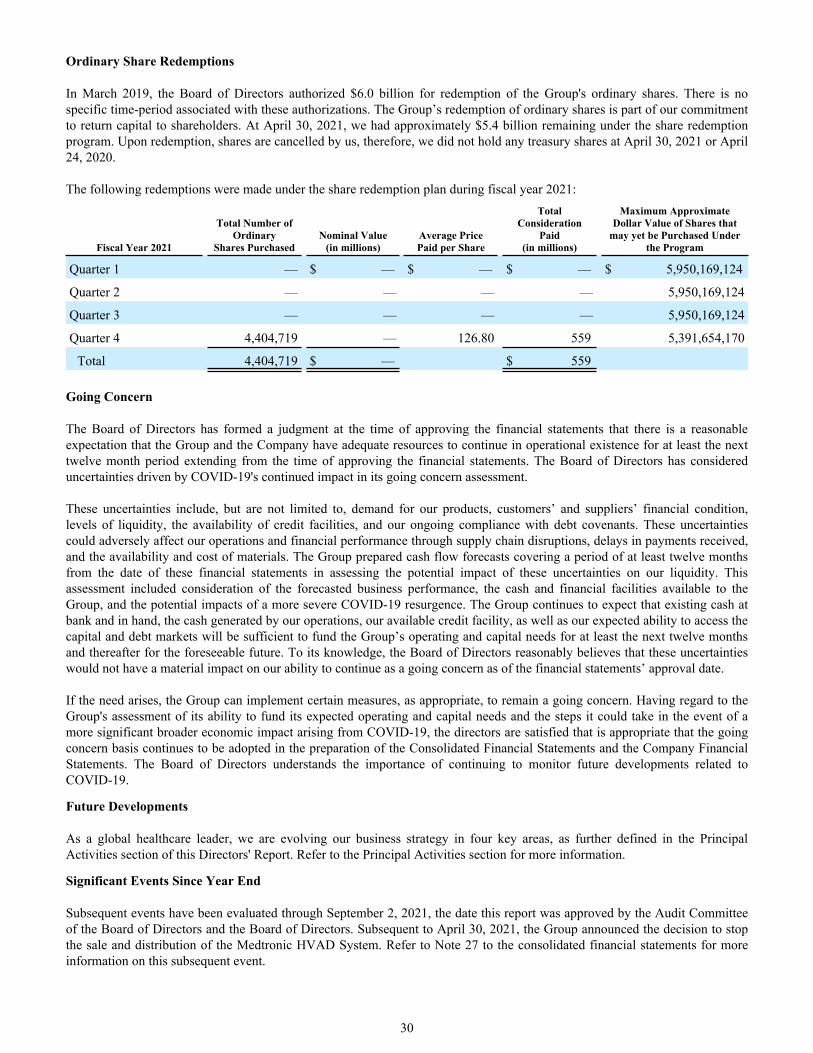
Ordinary Share Redemptions
In March 2019, the Board of Directors authorized $6.0 billion for redemption of the Group's ordinary shares. There is no specific time-period associated with these authorizations. The Group’s redemption of ordinary shares is part of our commitment to return capital to shareholders. At April 30, 2021, we had approximately $5.4 billion remaining under the share redemption program. Upon redemption, shares are cancelled by us, therefore, we did not hold any treasury shares at April 30, 2021 or April 24, 2020.
The following redemptions were made under the share redemption plan during fiscal year 2021:
Fiscal Year 2021
Total Number of Ordinary
Shares PurchasedNominal Value
(in millions)Average PricePaid per Share
Total Consideration
Paid(in millions)
Maximum Approximate Dollar Value of Shares that
may yet be Purchased Under the Program
Quarter 1 — $ — $ — $ — $ 5,950,169,124
Quarter 2 — — — — 5,950,169,124
Quarter 3 — — — — 5,950,169,124
Quarter 4 4,404,719 — 126.80 559 5,391,654,170
Total 4,404,719 $ — $ 559
Going Concern
The Board of Directors has formed a judgment at the time of approving the financial statements that there is a reasonable expectation that the Group and the Company have adequate resources to continue in operational existence for at least the next twelve month period extending from the time of approving the financial statements. The Board of Directors has considered uncertainties driven by COVID-19's continued impact in its going concern assessment.
These uncertainties include, but are not limited to, demand for our products, customers’ and suppliers’ financial condition, levels of liquidity, the availability of credit facilities, and our ongoing compliance with debt covenants. These uncertainties could adversely affect our operations and financial performance through supply chain disruptions, delays in payments received, and the availability and cost of materials. The Group prepared cash flow forecasts covering a period of at least twelve months from the date of these financial statements in assessing the potential impact of these uncertainties on our liquidity. This assessment included consideration of the forecasted business performance, the cash and financial facilities available to the Group, and the potential impacts of a more severe COVID-19 resurgence. The Group continues to expect that existing cash at bank and in hand, the cash generated by our operations, our available credit facility, as well as our expected ability to access the capital and debt markets will be sufficient to fund the Group’s operating and capital needs for at least the next twelve months and thereafter for the foreseeable future. To its knowledge, the Board of Directors reasonably believes that these uncertainties would not have a material impact on our ability to continue as a going concern as of the financial statements’ approval date.
If the need arises, the Group can implement certain measures, as appropriate, to remain a going concern. Having regard to the Group's assessment of its ability to fund its expected operating and capital needs and the steps it could take in the event of a more significant broader economic impact arising from COVID-19, the directors are satisfied that is appropriate that the going concern basis continues to be adopted in the preparation of the Consolidated Financial Statements and the Company Financial Statements. The Board of Directors understands the importance of continuing to monitor future developments related to COVID-19.
Future Developments
As a global healthcare leader, we are evolving our business strategy in four key areas, as further defined in the Principal Activities section of this Directors' Report. Refer to the Principal Activities section for more information.
Significant Events Since Year End
Subsequent events have been evaluated through September 2, 2021, the date this report was approved by the Audit Committee of the Board of Directors and the Board of Directors. Subsequent to April 30, 2021, the Group announced the decision to stop the sale and distribution of the Medtronic HVAD System. Refer to Note 27 to the consolidated financial statements for more information on this subsequent event.
30

Intersect ENT Pending Acquisition
On August 6, 2021, Medtronic and Intersect ENT entered into a definitive agreement to acquire all outstanding shares of Intersect for $28.25 per share in an all-cash transaction valued at approximately $1.1 billion. The acquisition is expected to close toward the end of FY22 pending clearance of anti-trust filings, approval by Intersect ENT’s stockholders, and other closing conditions.
Subsidiary Companies and Branches
Information regarding subsidiary undertakings, including information regarding branches, is provided in Note 26 to the consolidated financial statements.
Auditors
The statutory Auditor, PricewaterhouseCoopers, Chartered Accountants and Registered Auditors, has indicated their willingness to continue in office and a resolution that they be re-appointed will be proposed at the Annual General Meeting.
NON-FINANCIAL STATEMENT
These non-financial information disclosures are included for the purpose of complying with European Union (Disclosure of Non-Financial and Diversity Information by certain large undertakings and groups) Regulations 2017, Statutory Instrument 360 of 2017, as amended by Statutory Instrument 410 of 2018.
Business Model
Information regarding the Group’s business model is presented in the Principal Activities section of this Directors’ Report.
Human Capital
Medtronic Workforce Overview The Group’s employees deliver on our Mission every day. We strive to be the employer of choice for the best and brightest global talent, where employees can grow and develop fulfilling careers. We aspire to create a truly inclusive, diverse, and equitable workplace that fosters innovation and creativity, and where every employee feels a sense of belonging and well-being. More than 99 percent of the Group’s 90,000+ employees work full-time. Forty-four percent of our employees are based in the U.S. or Puerto Rico.
Inclusion, Diversity & Equity We believe that improving health for people from all walks of life depends on our ability to unleash the creative power of our diverse global employees. By breaking down barriers to Inclusion, Diversity and Equity, we open doors for everyone, driving progress and prosperity around the world. As of the end of fiscal year 2021, 38 percent of our U.S. workforce is ethnically diverse; women comprise 50 percent of our global workforce; and 40 percent of our people leaders, manager level and above, are women. We have five Diversity Networks — Medtronic Women's Network, Pride Network, African Descent Network, Hispanic Latino Network, and Asian Impact @ Medtronic — dedicated to helping employees succeed professionally and personally. Additionally, the Group's employee resource groups (ERGs) are employee-led affinity groups that provide career development and networking opportunities for members and strengthen ties between employees of many different backgrounds, cultures, and interests. In fiscal year 2021, there were 12 ERGs across 70 countries with more than 26,000 members.
Pay Equity For fiscal year 2021, in the United States we have achieved 100% pay equity for gender and 99% pay equity for ethnically diverse employees. Globally we have achieved 99% pay equity for gender. We are actively working to close any remaining pay gaps by continuing to expand the annual pay equity analyses for each country in which we operate.
Workforce Compensation Our compensation framework is designed to celebrate the value and contributions of our employees. We aim to create a feeling of personal and professional security at the Group and are committed to transparent communications on compensation. Our competitive approach to compensation reflects industry benchmarks and local market standards. Our programs include annual and long-term incentives that provide the means to share in the Group’s success. To attract the best leaders, we offer competitive benefits and cash and equity incentives. We reward high-performing employees with an ownership stake in the Group through restricted stock, and all employees have the opportunity to purchase stock at a discount.
Learning & Development The skills and dedication of our employees drive our business performance. Our comprehensive professional development programs empower our people to build rewarding careers and help us attract world-class talent. Our suite of professional development programs ensures that our employees, regardless of level, location, language or learning
31

preferences, have access to opportunities to develop and grow. Our investment in employee development has contributed to more than 30 percent of our open roles being filled with internal employees.
Employee Engagement Through our organizational health survey, we gain valuable insight into the employee experience and identify areas where we can improve in four key priority areas: 1) Employee Engagement, 2) Inclusion, 3) Innovation, and 4) Ethics. In our most recent survey ending in May 2021, more than 83 percent of our employees responded, an increase in participation over prior year (79 percent). The Group carefully reviews and implements actions based on employee feedback in order to partner and create an inclusive, innovative, and supportive environment.
Health & Safety As a large, global employer, it is our responsibility to maintain a safe workplace and support the well-being of our employees. As we navigate the COVID-19 pandemic, we have placed a high priority on employee health, providing accommodations and resources to support our workforce through this challenging time.
To help limit exposure to the coronavirus, we acted to ensure employees in business-critical functions who cannot work from home are protected, including those in research and development, quality, manufacturing, distribution, and sales. Personal protective equipment, increased sanitation, social distancing guidance, and facility updates (one-way hallways, cafeteria partitions and extra sinks) are provided to protect our employees.
The Medtronic Employee Assistance Program and the Medtronic Employee Emergency Assistance Fund have historically supported employees and their families when faced with difficult times by providing a variety of services such as mental health and financial counseling and support at no cost. Both programs have proven invaluable in navigating our employees through unique challenges during the pandemic.
Trade Unions and Work Councils We comply with global laws regarding freedom of association and collective bargaining agreements, including participation in work councils. Approximately 35 percent of our European workforce is represented by work councils, and roughly half is covered by collective bargaining agreements with trade unions. Our U.S. workforce is not unionized.
The non-financial information included in the following sections is based on our fiscal year 2020 performance disclosed in the 2020 Integrated Performance Report.
Sustainability Matters
Sustainability is central to our mission. By understanding and acting on our environmental, social, and governance (ESG) responsibilities, we can create positive change and deliver even greater long-term value for our business and stakeholders. Our approach focuses on identifying our material sustainability issues, tracking expectations and performance against them, and reporting our progress and aspirations.
Our Sustainability Steering Committee (SSC) guides our company-wide approach to sustainability, and we embed sustainability throughout our operations. Our Chief Financial Officer is the SSC’s executive champion, ensuring a close link between sustainability and economic oversight. The Nominating and Governance Committee of the Board of Directors also has formal oversight of the Group's ESG practices.
We focus on issues that have the potential to significantly impact our business growth, finances, or reputation, are important to our stakeholders, and are aligned with our mission. Based on this definition, we identified the following sustainability priorities and focus areas where we have a particular opportunity to make a difference:
• Innovation and Access: Increasing the availability of treatments through therapy innovation and new application of existing technologies, as well as accessibility to them through capacity building, infrastructure improvement, regulatory approval, and remote diagnosis or treatment.
• Product Quality and Safety: Managing product quality as it relates to all key stakeholders through Design, Reliability, Manufacturability (DRM), supplier quality, and global compliance and corrective action.
• Inclusion and Diversity: Advancing fair treatment and adequate representation of ethnicities and gender through equitable professional opportunities and pay and proactive inclusion of groups facing barriers.
In addition to proactively managing our sustainability priorities, we proactively manage the following sustainability risks:
Risks from product quality and patient safety issues:
• We embed DRM best practices in our product design and development processes. We use standardized systems to ingrain a consistent approach to quality in manufacturing processes and at our facilities.
• We track product use and collect patient outcome data to measure and improve safety and to inform future design.
32

• When alerted to regulatory or field safety issues with one of our products, we take prompt action to assess the situation and implement corrective measures, as appropriate, working to understand and resolve underlying issues and root causes.
Risks from climate risk and resilience:
• We manage transitional risks by monitoring carbon regulations, including carbon taxes, and we continue to install renewable and alternate energy sources as they become more cost-effective and readily available.
• We manage physical risk through our business continuity management, which includes hurricane readiness planning and infrastructure improvement as well as risk-exposure analyses that encompass hurricanes, earthquakes, and water stress.
Risks from unforeseen ethical, social, and environmental regulations:
• We monitor relevant regulations in global markets through our Government Affairs, Human Resources, Communications, Environmental, Health and Safety, and Procurement groups. Our Legal and Compliance teams oversee compliance with those regulations.
• We engage industry organizations and regulators to share our perspectives and prepare for potential and pending regulation.
Risk of failure to meet stakeholder or regulatory expectations of our ESG performance:
• We always aim to meet or surpass expectations and requirements on all aspects of our ESG and sustainability. We actively solicit input from stakeholders concerning our performance spanning product stewardship, human rights, ethical conduct, environmental responsibility, climate change, healthcare access, diversity, inclusion, equity, and more. For example, throughout the COVID-19 pandemic, we have acted swiftly to help relieve impacts on our employees, partners, communities, and other stakeholders.
• We regularly train employees on our Code of Conduct and have clear processes for reporting and acting on ethical concerns. We also set consistent expectations on key issues for employees and suppliers, such as through our Global Human Rights and Responsible Supply Management programs.
We also disclose key non-financial performance indicators related to the Group's most impactful sustainability issues, risks and opportunities in our annual Integrated Performance Report. These disclosures are based on global standards and frameworks for reporting and disclosure issued by the Global Reporting Initiative, the Sustainability Accounting Standards Board, Carbon Disclosure Project (CDP), and the Task Force on Climate-related Financial Disclosures.
A full listing of our principal risks and uncertainties are set out on pages 16 to 28 of this report.
Environmental Matters
Our global Environmental Health and Safety (EHS) Policy establishes a performance management system to set goals, measure progress, and integrate sustainability into decision-making. Our corporate EHS teams oversee our environmental management, compliance, remediation, health and safety, and training. They also collaborate with leaders who are responsible for policy and programs across our global regions. Manufacturing facilities account for most of our energy consumption, water use, and waste generation. We track EHS performance at these sites with management systems based on the ISO 14001 and OHSAS 18001 standards. Our impacts are detailed in our publicly available CDP response.
33

The Group has long-term environmental goals, from fiscal year 2013 through fiscal year 2020, for energy use, greenhouse gas (GHG) emissions, water use, and waste. The table below illustrates the Group's progress against those goals. As seen below, we met all five of the fiscal year 2020 environmental goals.
Fiscal YearPercentage Change for Fiscal Years
(1)
Goal for Fiscal Year 20202020 2019 2013 through 2020
Energy use (kilowatt hours/ $ million turnover) 29.4 28.2 (23) % (15) %GHG emissions (metric tons/ $ million turnover) 9.7 9.5 (36) (15) Non-regulated waste (metric tons/ $ billion turnover) 844 837 (32) (15) Regulated waste (metric tons/ $ billion turnover) 92 98 (13) (10) Water use (cubic meters/ $ million turnover) 72 69 (20) (10)
(1) All percentage reduction goals are based on a fiscal year 2013 baseline year recalculated to account for Covidien acquisition in fiscal year 2015. All data reflects Medtronic and Covidien operations.
To continue reducing our environmental footprint, we established new fiscal year 2025 environmental performance goals that will be measured against a fiscal year 2020 baseline. These new emissions and energy goals move us toward our ambition of going carbon neutral in our operations by fiscal year 2030. These goals are as follows:
• 20 percent reduction in energy intensity• 50 percent reduction in GHG emissions intensity• 50 percent increase in energy sourced from renewable and alternative sources• 15 percent reduction in waste intensity• 15 percent reduction in water use intensity
Emissions In fiscal year 2020, our Scope 1 and 2 GHG emissions were 281,000 metric tons (MT) of carbon dioxide equivalent, a 2.7 percent decrease from the prior year. In addition, our total energy use in fiscal year 2020 was 850,993 megawatt-hours (MWh), a 1.3 percent decrease from the prior year. During fiscal year 2020, we completed 79 projects that will conserve more than 20,000 MWh per year and reduce our operating costs by $2.8 million.
Waste In fiscal year 2020, we produced 24,414 MT of non-regulated waste and 2,669 MT of regulated waste, a 4.5 percent and 11 percent decrease from the prior year, respectively. The decrease in waste was a result of reduction initiatives throughout our manufacturing operations.
Water Use In fiscal year 2020, our water use totaled 2.1 million cubic meters. This represents a 1 percent decrease from the prior year. We achieved this reduction through continued investment in onsite water recycling systems and a multi-site plant water optimization project. During this optimization project, we assessed water consumption at 10 sites with significant water usage and implemented more than 20 efficiency projects, which we estimate will provide annual savings of 68,000 cubic meters of water per year.
A full listing of our regulatory environmental risks is included within the principal risks and uncertainties section on pages 16 to 28 of this report.
Climate Resilience and Business Continuity
Unexpected events, such as global health crises, political unrest, and extreme weather, have the potential to impact our employees' lives and disrupt our operations or supply chain. Our preparedness for unexpected events is key to our resilience as a business. Our Business Continuity Management program helps us to plan for the risk of unexpected events, with a focus on:
• Business continuity: We put the resources and contingency plans in place so we can continue to operate and meet the needs of our patients and customers in adverse circumstances.
• Crisis management: The Medtronic Crisis Management team prioritizes and coordinates resources and response activities during crisis situations.
• Emergency response: We prioritize keeping our people and assets safe and work to minimize environmental impact. • IT disaster response and recovery: We respond quickly to technological failures and work to reinstate affected
infrastructure.
34

Human Rights
We comply with all relevant human rights regulations. Our Global Human Rights and Labor Standards Policy applies to all of the Group’s locations and personnel and any third-party labor agencies providing employees on our behalf. We strive to ensure our suppliers adhere to the minimum standards outlined within this policy and to conduct our business in a manner that demonstrates a respect for internationally recognized human rights and the dignity of all people. Our Global Supplier Standards describe the minimum social, ethical, and environmental requirements and expectations of our suppliers. We incorporate these standards into supplier selection and management processes, supplier agreements, and purchase order terms and conditions.
In fiscal year 2019, we began a three-year process to expand our Global Supplier Standards Compliance Program. In its second year, our Global Supplier Standards Compliance Program is our mechanism for identifying and mitigating the potential risks in our supply chain. This approach helps us meet regulatory requirements and ensure our supply chain conforms with customer expectations.
We encourage our suppliers to report publicly on their social and environmental goals and performance. Every two years, we assess the sustainability reporting of our suppliers. Of the 202 suppliers assessed in our fiscal year 2019 review of supplier sustainability reporting, 35 percent published sustainability reports, 10 percent had sustainability-related goals published online, and 29 percent had information relating to sustainability on their website.
We also promote inclusive sourcing through employee business unit annual plans, and sponsorship of organizations that develop and promote small and diverse suppliers in the U.S. In fiscal year 2020, we directed approximately 19 percent, or $2.4 billion, of our U.S. supplier spend to small and diverse companies.
Conflict Minerals
Some of our products contain tin, tungsten, tantalum, or gold. In the Democratic Republic of Congo and neighboring countries, the mining and processing of these metals have been linked to the funding of armed conflict. To promote the use of responsibly sourced minerals, we continue to support the U.S. Dodd-Frank Act, which requires companies to disclose the use of any such conflict minerals. Additionally, we require suppliers to comply with the law and uphold responsible sourcing practices, and we reference conflict minerals requirements in supplier agreements and purchase orders. We follow the Organization for Economic Cooperation and Development (OECD) guidance on conflict minerals, including surveying suppliers to collect data on the smelters in their supply chains, as well as participate in the Responsible Minerals Initiative. Each year, we provide a report to the U.S. Securities and Exchange Commission, detailing the results of our supplier survey. The reporting periods of the annual reports are on a calendar basis. Compared to the 2019 reporting period, the Group observed a 3-percentage point decrease in the number of “red flag” smelters in our supply chain during the 2020 reporting period. We will continue to assess and work with suppliers to further reduce the risk of conflict minerals in our supply chain. Our Conflict Minerals Reports can be accessed at www.sec.gov, and our Conflict Minerals Policy is available on www.medtronic.com.
Customer Relations
Our relationship with healthcare professionals is instrumental to our success, as our partners at universities, hospitals, and healthcare systems help keep us focused on patient needs throughout the innovation and healthcare delivery processes. Enduring customer relationships are built on trust, aligned values, and shared goals. Sales and marketing employees are ambassadors for the Group, and we place the highest importance in ensuring integrity is at the core of their work. We promote our products based on their approved use, and employees must adhere to the policies made explicit in our Code of Conduct and AdvaMed’s Code of Ethics on Interactions with Healthcare Professionals. Our requirements for product marketing are also included in our Global Business Conduct Standards Policy and our Physician Collaboration policy. In fiscal year 2020, we implemented an updated Global Business Conduct Standards Policy with refreshed guidelines for employees who interact with healthcare professionals and patients. We localized this policy to ensure it meets or exceeds in-country regulations and translates across cultures. Our regular training and ongoing communications educate employees on our requirements.
During the COVID-19 pandemic, we trained sales and marketing employees on ethical virtual interactions due to the increased use of remote meetings. We also delivered training on how to avoid off-label use promotion, how to interact with U.S. government officials, and best practices for situations such as clinical research, therapy awareness, and interactions with certified product trainers. Our internal investigations program helps ensure that our marketing practices comply with internal policies and external regulations. In fiscal year 2020, our trainings reached 98 percent of employees in sales and marketing roles.
35

Anti-Corruption
The Board of Directors oversees our Anti-Bribery and Anti-Corruption program. The program is strengthened by feedback from regulators, third-party auditing, and benchmarks of other companies. We implement anti-corruption training to make internal and external stakeholders aware of relevant regulations and to explain how ethically challenging scenarios should be addressed. Anti-corruption training is covered in our required Code of Conduct training cycle. Our process ensures that new hires receive anti-corruption training upon joining the Group and when employees transition into customer-facing roles.
In some cases, we partner with third-party entities to distribute our products to customers. We hold these organizations to the same standards to which we hold ourselves and require them to implement their own anti-corruption programs. To ensure that distributors adhere to our ethical standards, we deliver annual anti-corruption training that covers our Distributor Code of Conduct, support and monitor compliance, conduct onsite monitoring, and assess corruption potential prior to renewing or entering contracts.
In fiscal year 2019, we launched an initiative to increase compliance with our Distributor Code of Conduct by establishing a commercial Distributor Relationship Owner who is responsible for holding distributors accountable to our anti-corruption requirements. The table below illustrates key metrics in our anti-corruption training efforts.
Fiscal Year2020 2019
Full-time equivalent employees supporting anti-corruption efforts 214 217Third-party distributors receiving anti-corruption training 98 % 95 %Third-party distributors receiving onsite monitoring 11.8 % 11.2 %
We also engage and educate our employees on ethics through our Code of Conduct annual review process, employee communications, Ethics Circles, and Ethics & Integrity Week. Our global Code of Conduct provides our employees with clear guidance on everyday actions. We provide versions of the Code in 22 languages, allowing 99 percent of our employees the ability to read it in their first language. We also deliver multilingual Code training for new employees and those joining the Group through acquisitions. Each year, we retrain employees on the Code and require employees to certify their understanding of its contents. The table below illustrates key metrics related to our Code of Conduct training efforts:
Fiscal Year2020 2019
Employees receiving code of conduct training and certification(1) 90 % 94 %New employees receiving code of conduct training and certification 99 % 99 %Employees joining through acquisitions receiving compliance and ethics training within 90 days of the transaction 95 % 95 %
(1) Live training at manufacturing facilities was suspended due to COVID-19, which depressed the training completion amount in fiscal year 2020.
When employees require ethical guidance or have concerns about potential violations, we strongly encourage them to speak up through one of several available channels:
• Their manager• Human Resources• Legal or Compliance representatives• The Board of Directors’ email inbox• Our third-party Voice Your Concern Line• Exit interviews
If our investigations confirm any employee misconduct, we take corrective action including coaching, discussion during performance reviews, change in job responsibilities (such as demotion), and, in serious cases, dismissal.
Patient Safety
Patients trust us to deliver products that are safe, effective, and reliable, and we pay close attention to quality across our entire value chain — design, manufacturing, pre-clinical and clinical trials, and post-market surveillance. All employees share this responsibility through our “Quality Begins with Me” culture. A patient-focused approach and an unwavering commitment to
36
excellence underpin our global quality strategy. We manufacture safe, high-quality products not only to further our mission, but also to build trust, reduce reputational risk, and improve operational efficiency.
Product Quality The Group utilizes the Medtronic DRM methodology as our set of best practices for ensuring product quality, safety, and dependability throughout product design and development. Our engineers use DRM to carry out predictive engineering, a process for simulating product use to forecast performance and identify areas for improvement. These measurements enable continuous improvement and reduce the time to market for vital treatments by helping us reach our quality, cost, and performance targets. We continually improve our predictive capabilities by refining our design practices and measuring predictive engineering outcomes for every new product.
We embed quality in our manufacturing processes using a set of standardized strategies, which include the Medtronic Operating System (MOS), First Time Quality (FTQ), and Supplier Optimization and Risk Reduction (SOAR). Our quality management systems are aligned to ISO 13485. FTQ has demonstrated a significant positive impact in reducing manufacturing nonconformances at our sites. Our FTQ methodology achieves up to 70 percent reduction in high business-impact risks and up to 90 percent reduction in certain quality instabilities.
Customer Data Security Protecting information is critically important for the Group, our customers, and most importantly, the patients who use our products. We have designed our security programs to safeguard data in a rapidly evolving environment. In a time of rapid adoption of connected data devices and powerful data analysis, big data is contributing to innovative products and faster research. It is critical to our business to protect information.
Our Global Cybersecurity program is designed to reflect ISO/IEC 27001 standard and the National Institute of Standards of Technology Cybersecurity Framework. To advance security practices, we collaborate with third-party organizations such as the Health Information Sharing and Analysis Center and AdvaMed. We also contribute to global product security and cybersecurity standards in collaboration with the U.S. Food and Drug Administration and other regulatory advocacy groups.
Medtronic employees and contingent workers play a crucial role in safeguarding data. We train all employees and contingent workers on data privacy and security to ensure they understand their role in identifying, protecting and preserving particular types of data. In both fiscal year 2019 and 2020, we expanded and improved our trainings to raise employee awareness of privacy and security obligations. We provided E.U. General Data Protection Regulation training for global corporate employees and non-corporate E.U. employees. We also delivered Privacy by Design training to the vast majority of E.U. employees and employees in key global functions, such as Legal and IT. U.S. employees completed additional trainings on U.S. privacy laws. When we acquire a company, we conduct privacy and security due diligence and implement an integration plan that includes training as well as policy and procedure standardization. Vendors must also adhere to our data security and privacy standards, and we evaluate privacy and security risks as part of our vendor assessment process.
Our product security programs align with regulatory standards, protect patients, and ensure the highest levels of product security and usability. Our robust security program is managed by the Medtronic Global Security Office and embedded in the full product lifecycle by subject-matter experts within each business unit. We regularly engage internal and external partners — including employees, regulators, peers, healthcare organizations, and security researchers — to monitor current security practices and emerging risks. Rigorous product development processes and vulnerability testing further inform our approach.
Clinical Trials Clinical trials are a key component in establishing the effectiveness and safety for our products. We are committed to robust, ethical practices in our studies, delivered by our team of more than 2,000 clinical employees. In addition to following our Code of Conduct and the Global Business Conduct Standards Policy, we adhere to all relevant laws and regulations relating to clinical trials.
We revise our internal guidelines and procedures to meet new and emerging regulatory requirements, including recent updates to take account of the E.U. Medical Device Regulation, effective May 2021 as well as the revised ISO14155:2020 standard for clinical research, which launched in July 2020.
Community Investment
Through the first tenet of our mission, we aim to alleviate pain, restore health, and extend life. Our philanthropy extends these benefits to the underserved and their communities who lack access to healthcare. We partner with local stakeholders to determine the resources we can provide to strengthen their health efforts. These include financial contributions (including contributions to the Medtronic Foundation), product donations, volunteerism, and charitable third-party medical education.
37

We have donated more than $1 billion throughout the years to support philanthropic efforts, including our contributions to the Medtronic Foundation. The table below illustrates the Group's contributions by fiscal year:
Fiscal Year(in millions) 2021 2020
Contributions to the Medtronic Foundation $ — $ 80Corporate cash donations 49 56Product donations 13 10
Approved by the Board of Directors and signed on its behalf on September 2, 2021 by:
/s/ Randall J. Hogan, III /s/ Geoff Martha Director Director
38

PART IIIndependent auditors’ report to the members of Medtronic plc
Report on the audit of the financial statements
Opinion
In our opinion:
• Medtronic plc’s consolidated financial statements and company financial statements (the “financial statements”) give a true and fair view of the group’s and the company’s assets, liabilities and financial position as at April 30, 2021 and of the group’s profit and cash flows for the period then ended;
• the consolidated financial statements have been properly prepared in accordance with accounting principles generally accepted in the United States of America (“US GAAP”), as defined in Section 279 of the Companies Act 2014, to the extent that the use of those principles in the preparation of consolidated financial statements does not contravene any provision of Part 6 of the Companies Act 2014;
• the company financial statements have been properly prepared in accordance with Generally Accepted Accounting Practice in Ireland (accounting standards issued by the Financial Reporting Council of the UK, including Financial Reporting Standard 102 “The Financial Reporting Standard applicable in the UK and Republic of Ireland” and Irish law); and
• the financial statements have been properly prepared in accordance with the requirements of the Companies Act 2014.
We have audited the financial statements, included within the Irish Annual Report, which comprise:
• the Consolidated Balance Sheet as at April 30, 2021;• the Company Balance Sheet as at April 30, 2021;• the Consolidated Profit and Loss Account and Consolidated Statement of Comprehensive Income for the period then
ended;• the Consolidated Statement of Cash Flows for the period then ended;• the Consolidated Reconciliation of Movement in Shareholders’ Funds for the period then ended;• the Company Statement of Changes in Equity for the period then ended;• the notes to the financial statements, which include a description of the significant accounting policies.
Basis for opinion
We conducted our audit in accordance with International Standards on Auditing (Ireland) (“ISAs (Ireland)”) and applicable law. Our responsibilities under ISAs (Ireland) are further described in the Auditors’ responsibilities for the audit of the financial statements section of our report. We believe that the audit evidence we have obtained is sufficient and appropriate to provide a basis for our opinion.
Independence
We remained independent of the group in accordance with the ethical requirements that are relevant to our audit of the financial statements in Ireland, which includes IAASA’s Ethical Standard as applicable to listed entities, and we have fulfilled our other ethical responsibilities in accordance with these requirements.
39

Our audit approach
Overview
Materiality
• Overall materiality for the consolidated financial statements: $250 million which equates to circa 0.8% of turnover (2020: $250 million circa 0.9% of turnover).
• Overall materiality for the company financial statements: $420 million (2020: $432 million) representing circa 0.5% of net assets. Financial statement line items that do not eliminate on consolidation have been audited to overall materiality for the consolidated financial statements.
Audit scope
• One component was identified as a significant component and a full scope audit was performed on this component.
• Audit procedures were performed on specific account balances or classes of transactions in 11 other components.
• Additionally, certain other activities controlled and managed centrally from Corporate such as acquisitions, intangible asset and goodwill accounting, investments, debt, derivative instruments, litigation contingencies, retirement benefit obligations and income taxes were audited as part of our group procedures.
• Overall, the components at which audit work was performed accounted for 84% of consolidated turnover and 90% of consolidated total assets.
Key audit matters
• Income tax reserves for uncertain tax positions related to Puerto Rico manufacturing.
The scope of our audit
As part of designing our audit, we determined materiality and assessed the risks of material misstatement in the financial statements. In particular, we looked at where the directors made subjective judgements, for example in respect of significant accounting estimates that involved making assumptions and considering future events that are inherently uncertain. As in all of our audits we also addressed the risk of management override of internal controls, including evaluating whether there was evidence of bias by the directors that represented a risk of material misstatement due to fraud.
Key audit matters
Key audit matters are those matters that, in the auditors’ professional judgement, were of most significance in the audit of the financial statements of the current period and include the most significant assessed risks of material misstatement (whether or not due to fraud) identified by the auditors, including those which had the greatest effect on: the overall audit strategy; the allocation of resources in the audit; and directing the efforts of the engagement team. These matters, and any comments we make on the results of our procedures thereon, were addressed in the context of our audit of the financial statements as a whole, and in forming our opinion thereon, and we do not provide a separate opinion on these matters. This is not a complete list of all risks identified by our audit.
40

Key audit matter How our audit addressed the key audit matter
Income tax reserves for uncertain tax positions related to Puerto Rico manufacturing Refer to Note 4 “Commitments and Contingencies” and Note 6 “Taxation”
As described in Notes 4 and 6 to the consolidated financial statements, the Group records reserves for uncertain tax positions related to unresolved matters with the Internal Revenue Service (IRS) of the United States (U.S.) and other taxing authorities. A significant remaining unresolved issue with the IRS, for which the Group has recorded a reserve, relates to the allocation of income between Medtronic, Inc. and its wholly owned subsidiary operating in Puerto Rico, which is one of the Group’s key manufacturing sites. These reserves are subject to a high degree of estimation and management judgement. Total reserves relating to uncertain tax positions as of April 30, 2021 were $1.668 billion, of which the Puerto Rico manufacturing reserve makes up a significant amount.
We determined the Group’s accounting for income tax reserves for uncertain tax positions related to Puerto Rico manufacturing to be a key audit matter due to the significant judgement exercised by management when determining the reserves and the inherent high degree of estimation uncertainty.
We tested the effectiveness of controls relating to the identification, recognition, and measurement of the Puerto Rico reserve for uncertain tax positions.
We evaluated management’s process to determine the estimate.
We evaluated the reasonableness of the underlying assumptions in management’s calculations to determine the reserves recorded, including whether the methodology and assumptions used by the Group are consistent with the tax court’s ruling as described in Note 4 to the consolidated financial statements and examined relevant documents related to the tax court case.
Professionals with specialized skill and knowledge were used to assist in these procedures.
We also considered the disclosures in the financial statements in relation to these matters.
How we tailored the audit scope
We tailored the scope of our audit to ensure that we performed enough work to be able to give an opinion on the financial statements as a whole, taking into account the structure of the group, the accounting processes and controls, and the industry in which the group operates.
The group functions in four operating segments, Cardiovascular Portfolio, Medical Surgical Portfolio, Neuroscience Portfolio and Diabetes Operating Unit. Reporting components comprise of legal entities with the majority of these components supported by shared service centres within the group.
In determining our audit scope we first focused on individual reporting components and determined the type of work that needed to be performed by us at the reporting components, as the Irish group engagement team, PwC U.S. as the global engagement team or other component auditors within other PwC network firms. One component was identified as a significant component and a full scope audit was performed on this component. Based on our risk assessment, audit procedures were performed on specific account balances or classes of transactions in 11 other components. Additionally, certain other activities controlled and managed centrally from Corporate such as acquisitions, intangible asset and goodwill accounting, investments, debt, derivative instruments, litigation contingencies, retirement benefit obligations and income taxes were audited as part of our group procedures. Where the work was performed by PwC U.S. and component auditors, we determined the level of involvement we needed to have in the audit work of those reporting components to be able to conclude whether sufficient appropriate audit evidence had been obtained as a basis for our opinion on the financial statements as a whole.
Overall, the components at which audit work was performed accounted for 84% of consolidated turnover and 90% of consolidated total assets. We allocated materiality levels and issued instructions to each component auditor. In addition to the audit report from each of the component auditors, we received memoranda of examination on work performed and relevant findings which supplemented our understanding of the component, its results and the audit findings and we participated in a number of audit clearance meetings with the component teams. This, together with the additional procedures performed at a group level, gave us the evidence we needed for our opinion on the financial statements as a whole.
Materiality
The scope of our audit was influenced by our application of materiality. We set certain quantitative thresholds for materiality. These, together with qualitative considerations, helped us to determine the scope of our audit and the nature, timing and extent of our audit procedures on the individual financial statement line items and disclosures and in evaluating the effect of misstatements, both individually and in aggregate on the financial statements as a whole.
41

Based on our professional judgement, we determined materiality for the financial statements as a whole as follows:
Consolidated financial statements Company financial statements
Overall materiality $250 million (2020: $250 million). $420 million (2020: $432 million).
How we determined it Equating to circa 0.8% of turnover (2020: circa 0.9% of turnover).
Based on circa 0.5% of net assets.
Rationale for benchmark applied
We considered a number of materiality benchmarks including "turnover", "profit before taxation", "profit before taxation adjusted for loss on debt extinguishment and redemption" and a four-year average of "profit before taxation adjusted for loss on debt extinguishment and redemption" in calculating our overall materiality level.
In considering the materiality levels calculated by reference to the various benchmarks we considered a materiality level of $250 million to be the most appropriate. We also considered the reasonableness of the amount of overall materiality calculated by reference to the materiality used in the prior period. We note the materiality level of $250 million equates to 0.8% of turnover.
As the Company is a holding company whose main activity is the management of investments in subsidiaries, net assets is considered the most appropriate benchmark.
Financial statement line items that do not eliminate on consolidation have been audited to overall materiality for the consolidated financial statements.
We agreed with the Audit Committee that we would report to them misstatements identified during our audit above $25 million (consolidated and company financial statements) (2020: $25 million) as well as misstatements below that amount that, in our view, warranted reporting for qualitative reasons.
Conclusions relating to going concern
Our evaluation of the directors’ assessment of the group and company’s ability to continue to adopt the going concern basis of accounting included:
• obtaining management’s going concern assessment for a period of twelve months from the date on which the financial statements are authorised for issue;
• agreeing the cash flow projections underlying management’s going concern assessment to board approved forecasts, assessing how these forecasts are compiled, and evaluating their key assumptions;
• considering the group’s and the company’s liquidity and available financial resources including financing arrangements;• evaluation of management’s assessment of the impact which COVID-19 may continue to have through the going concern
assessment period; and• reviewing the going concern disclosures within note 1 of the consolidated and company financial statements in order to
assess whether the disclosures were appropriate and in accordance with reporting standards.
Based on the work we have performed, we have not identified any material uncertainties relating to events or conditions that, individually or collectively, may cast significant doubt on the group’s or the company’s ability to continue as a going concern for a period of at least twelve months from the date on which the financial statements are authorised for issue.
In auditing the financial statements, we have concluded that the directors’ use of the going concern basis of accounting in the preparation of the financial statements is appropriate.
However, because not all future events or conditions can be predicted, this conclusion is not a guarantee as to the group’s or the company’s ability to continue as a going concern.
Our responsibilities and the responsibilities of the directors with respect to going concern are described in the relevant sections of this report.
Reporting on other information
The other information comprises all of the information in the Irish Annual Report other than the financial statements and our auditors’ report thereon. The directors are responsible for the other information. Our opinion on the financial statements does not cover the other information and, accordingly, we do not express an audit opinion or, except to the extent otherwise explicitly stated in this report, any form of assurance thereon.
42

In connection with our audit of the financial statements, our responsibility is to read the other information and, in doing so, consider whether the other information is materially inconsistent with the financial statements or our knowledge obtained in the audit, or otherwise appears to be materially misstated. If we identify an apparent material inconsistency or material misstatement, we are required to perform procedures to conclude whether there is a material misstatement of the financial statements or a material misstatement of the other information. If, based on the work we have performed, we conclude that there is a material misstatement of this other information, we are required to report that fact. We have nothing to report based on these responsibilities.
With respect to the Directors’ Report, we also considered whether the disclosures required by the Companies Act 2014 (excluding the information included in the “Non-Financial Statement” as defined by that Act on which we are not required to report) have been included.
Based on the responsibilities described above and our work undertaken in the course of the audit, ISAs (Ireland) and the Companies Act 2014 require us to also report certain opinions and matters as described below:
• In our opinion, based on the work undertaken in the course of the audit, the information given in the Directors’ Report (excluding the information included in the “Non-Financial Statement” on which we are not required to report) for the period ended April 30, 2021 is consistent with the financial statements and has been prepared in accordance with the applicable legal requirements.
• Based on our knowledge and understanding of the group and company and their environment obtained in the course of the audit, we have not identified any material misstatements in the Directors’ Report (excluding the information included in the “Non-Financial Statement” on which we are not required to report).
Responsibilities for the financial statements and the audit
Responsibilities of the directors for the financial statements
As explained more fully in the Statement of Directors’ Responsibilities set out on page 1, the directors are responsible for the preparation of the financial statements in accordance with the applicable framework and for being satisfied that they give a true and fair view.
The directors are also responsible for such internal control as they determine is necessary to enable the preparation of financial statements that are free from material misstatement, whether due to fraud or error.
In preparing the financial statements, the directors are responsible for assessing the group’s and the company’s ability to continue as a going concern, disclosing as applicable, matters related to going concern and using the going concern basis of accounting unless the directors either intend to liquidate the group or the company or to cease operations, or have no realistic alternative but to do so.
Auditors’ responsibilities for the audit of the financial statements
Our objectives are to obtain reasonable assurance about whether the financial statements as a whole are free from material misstatement, whether due to fraud or error, and to issue an auditors’ report that includes our opinion. Reasonable assurance is a high level of assurance but is not a guarantee that an audit conducted in accordance with ISAs (Ireland) will always detect a material misstatement when it exists. Misstatements can arise from fraud or error and are considered material if, individually or in the aggregate, they could reasonably be expected to influence the economic decisions of users taken on the basis of these financial statements.
Our audit testing might include testing complete populations of certain transactions and balances, possibly using data auditing techniques. However, it typically involves selecting a limited number of items for testing, rather than testing complete populations. We will often seek to target particular items for testing based on their size or risk characteristics. In other cases, we will use audit sampling to enable us to draw a conclusion about the population from which the sample is selected.
A further description of our responsibilities for the audit of the financial statements is located on the IAASA website at:
https://www.iaasa.ie/getmedia/b2389013-1cf6-458b-9b8f-a98202dc9c3a/Description_of_auditors_responsibilities_for_audit.pdf
This description forms part of our auditors’ report.
Use of this report
This report, including the opinions, has been prepared for and only for the company’s members as a body in accordance with section 391 of the Companies Act 2014 and for no other purpose. We do not, in giving these opinions, accept or assume responsibility for any other purpose or to any other person to whom this report is shown or into whose hands it may come save where expressly agreed by our prior consent in writing.
43

Other required reporting
Companies Act 2014 opinions on other matters
• We have obtained all the information and explanations which we consider necessary for the purposes of our audit.• In our opinion the accounting records of the company were sufficient to permit the company financial statements to be
readily and properly audited.• The Company Balance Sheet is in agreement with the accounting records.
Other exception reporting
Directors’ remuneration and transactions
Under the Companies Act 2014 we are required to report to you if, in our opinion, the disclosures of directors’ remuneration and transactions specified by sections 305 to 312 of that Act have not been made. We have no exceptions to report arising from this responsibility.
Prior financial period Non-Financial Statement
We are required to report if the company has not provided the information required by Regulation 5(2) to 5(7) of the European Union (Disclosure of Non-Financial and Diversity Information by certain large undertakings and groups) Regulations 2017 in respect of the prior financial period. We have nothing to report arising from this responsibility.
Paul Barriefor and on behalf of PricewaterhouseCoopersChartered Accountants and Statutory Audit FirmDublinSeptember 2, 2021
44

Medtronic plcConsolidated Profit and Loss Account Fiscal Year(in millions, except per share data) Note 2021 2020
Turnover 2 $ 30,117 $ 28,913 Cost of sales 10,483 9,424
Gross Profit 19,634 19,489 Distribution and administrative expense 11,931 11,865 Research and development expense 2,493 2,331 Restructuring charges, net 3 293 118 Certain litigation charges 4 206 225 Other operating expense (income), net 447 (61)
Operating profit 4,264 5,011 Other non-operating income, net (336) (356) Interest payable and similar expenses 5 925 1,092
Profit before taxation 3,675 4,275 Taxation 6 215 (701)
Profit after taxation 3,460 4,976 Noncontrolling interests (24) (17) Profit for the financial year $ 3,436 $ 4,959 Basic earnings per ordinary share 7 $ 2.55 $ 3.70 Diluted earnings per ordinary share 7 $ 2.54 $ 3.67
45

Medtronic plcConsolidated Statement of Comprehensive Income Fiscal Year(in millions) 2021 2020
Profit after taxation $ 3,460 $ 4,976
Other comprehensive income (loss), net of taxation:
Unrealized gain on investment securities 92 45 Translation adjustment 1,699 (829) Net investment hedge (1,694) 405 Net change in retirement obligations 505 (544) Unrealized (loss) gain on cash flow hedges (519) 72
Other comprehensive income (loss) 83 (851) Comprehensive income including noncontrolling interests 3,543 4,125
Comprehensive income attributable to noncontrolling interests (32) (15) Comprehensive income attributable to Medtronic $ 3,511 $ 4,110
46

Medtronic plcConsolidated Balance Sheet
(in millions) Note April 30, 2021 April 24, 2020
Fixed assetsIntangible assets 8 $ 59,701 $ 58,904 Tangible assets 10 5,221 4,828 Right of use assets 11 998 927 Financial assets 12 720 513
Total fixed assets 66,640 65,172 Current assets
Inventories 13 4,313 4,229 Debtors 14 11,311 10,340 Short-term investments 12 7,224 6,808 Cash at bank and in hand 3,593 4,140
Total current assets 26,441 25,517 Creditors (amounts falling due within one year) 16 6,873 8,882
Net current assets 19,568 16,635 Total assets less current liabilities 86,208 81,807
Creditors (amounts falling due after more than one year) 16 30,360 26,096 Provisions for liabilities 18 4,246 4,669
Net assets $ 51,602 $ 51,042
Capital and reservesCalled-up share capital presented as equity 20 $ — $ — Share premium account 37,637 37,268 Accumulated other comprehensive loss 22 (3,485) (3,560) Profit and loss account 17,276 17,199
Total shareholders' equity 51,428 50,907 Noncontrolling interests 174 135 Total equity $ 51,602 $ 51,042
Approved by the Board of Directors and signed on its behalf on September 2, 2021 by:
/s/ Randall J. Hogan, III /s/ Geoff Martha Director Director
47

Medtronic plcConsolidated Reconciliation of Movement in Shareholders' Funds
Ordinary Share
Number
Called-up Share
Capital Presented as Equity
Share Premium Account
Profit and Loss
Account
AccumulatedOther
ComprehensiveLoss
Total Shareholders’
EquityNoncontrolling
InterestsTotal
Equity(in millions)April 26, 2019 1,341 $ — $ 36,704 $ 16,098 $ (2,711) $ 50,091 $ 121 $ 50,212 Profit for the financial year — — — 4,959 — 4,959 17 4,976 Other comprehensive loss — — — — (849) (849) (2) (851) Dividends to shareholders ($2.16 per ordinary share) — — — (2,894) — (2,894) — (2,894) Issuance of shares under stock purchase and award plans 12 — 564 — — 564 — 564 Redemption and cancellation of ordinary shares (12) — (1,228) — (1,228) — (1,228) Stock-based compensation — — 297 — 297 — 297 Changes to noncontrolling ownership interests — — — — — — (1) (1) Cumulative effect of change in accounting principle(1) — — — (33) — (33) — (33) April 24, 2020 1,341 $ — $ 37,268 $ 17,199 $ (3,560) $ 50,907 $ 135 $ 51,042 Profit for the financial year — — — 3,436 — 3,436 24 3,460 Other comprehensive income — — — — 75 75 8 83 Dividends to shareholders ($2.32 per ordinary share) — — — (3,120) — (3,120) — (3,120) Issuance of shares under stock purchase and award plans 8 — 382 — — 382 — 382 Redemption and cancellation of ordinary shares (4) — — (559) — (559) — (559) Stock-based compensation — — — 344 — 344 — 344 Changes to noncontrolling ownership interests — — (13) — — (13) 7 (6) Cumulative effect of change in accounting principle(2) — — — (24) — (24) — (24) April 30, 2021 1,345 $ — $ 37,637 $ 17,276 $ (3,485) $ 51,428 $ 174 $ 51,602
(1) The cumulative effect of change in accounting principle in fiscal year 2020 resulted from the adoption of accounting guidance that requires lessees to recognize right-of-use assets and lease liabilities on the balance sheet. As a result of the adoption, the Group adjusted the opening balance of the profit and loss account for $33 million as of April 27, 2019.
(2) See Note 1 to the consolidated financial statements for discussion regarding the adoption of accounting standards during fiscal year 2021.
48

Medtronic plcConsolidated Statement of Cash Flows Fiscal Year(in millions) 2021 2020Operating Activities:
Profit after taxation $ 3,460 $ 4,976 Adjustments to reconcile profit for the financial year to net cash provided by operating activities:
Depreciation and amortization 2,702 2,663 Provision for doubtful debtors 128 99 Deferred taxation (472) (1,265) Stock-based compensation 344 297 Loss on debt extinguishment 308 406 Other, net 251 217 Change in operating assets and liabilities, net of acquisitions and divestitures:
Trade debtors (761) 1,291 Inventories 78 (577) Creditors and provisions 751 (264) Other operating assets and liabilities (549) (609)
Net cash provided by operating activities 6,240 7,234 Investing Activities:
Acquisitions, net of cash acquired (994) (488) Additions to tangible assets (1,355) (1,213) Purchases of short-term investments and financial assets (11,808) (11,039) Sales and maturities of short-term investments and financial assets 11,345 9,574 Other investing activities, net (54) (37)
Net cash used in investing activities (2,866) (3,203) Financing Activities:
Change in current debt obligations (311) (17) Proceeds from short-term borrowings (maturities greater than 90 days) 2,789 — Repayments from short-term borrowings (maturities greater than 90 days) (2,853) — Issuance of long-term debt 7,172 5,568 Payments on long-term debt (7,367) (6,110) Dividends to shareholders (3,120) (2,894) Issuance of ordinary shares 474 662 Redemption of ordinary shares (652) (1,326) Other financing activities (268) (81)
Net cash used in financing activities (4,136) (4,198) Effect of exchange rate changes on cash at bank and in hand 215 (86) Net change in cash at bank and in hand (547) (253) Cash at bank and in hand at beginning of period 4,140 4,393 Cash at bank and in hand at end of period $ 3,593 $ 4,140 Supplemental Cash Flow Information
Cash paid for: Taxation $ 1,250 $ 878 Interest 582 643
The accompanying notes are an integral part of these consolidated financial statements.
49

1. Summary of Significant Accounting Policies
Nature of Operations Medtronic plc and its subsidiaries (the Group) is among the world's largest medical technology, services, and solutions companies – alleviating pain, restoring health, and extending life for millions of people around the world. The Group provides innovative products and therapies to serve healthcare systems, physicians, clinicians, and patients. The Group was founded in 1949 and is headquartered in Dublin, Ireland. Medtronic plc is incorporated as a company limited by shares in the Republic of Ireland (registration number 545333). The address of its registered office is 20 On Hatch, Hatch Street Lower, Dublin 2, Ireland.
Basis of Presentation The directors have elected to prepare the consolidated financial statements in accordance with Section 279 of the Companies Act 2014, which provides that a true and fair view of the state of affairs and profit or loss may be given by preparing the financial statements in accordance with accounting principles generally accepted in the United States of America (U.S. GAAP), as defined in Section 279(1) of the Companies Act 2014, to the extent that the use of those principles in the preparation of the consolidated financial statements does not contravene any provision of Part 6 of the Companies Act 2014 or any regulations made thereunder.
Consolidated financial statements and notes prepared in accordance with U.S. GAAP were included in the Group’s Annual Report on Form 10-K for the year ended April 30, 2021, filed with the United States (U.S.) Securities and Exchange Commission (SEC). These consolidated financial statements were prepared in accordance with Irish Company Law, to present to the shareholders of the Group and to file with the Companies Registration Office in Ireland. Accordingly, these consolidated financial statements include presentation and additional disclosures required by the Companies Act 2014, in addition to those disclosures required under U.S. GAAP.
Rather than utilizing the terminology set out under Irish Company Law, some terminology typically utilized in a set of U.S. GAAP financial statements has been retained for the benefit of those users of these financial statements who also access the Group's Form 10-K U.S. GAAP financial statements. The following Irish Company Law references have the same meaning as the corresponding U.S. GAAP references throughout this report:
U.S. GAAP Terminology Irish Company Law Terminology
Net sales TurnoverAccounts receivable Trade debtorsProperty, plant, & equipment Tangible assetsLiabilities Creditors/ProvisionSelling, general, and administrative expense Distribution and administration expenseConsolidated Statements of Income Consolidated Profit and Loss AccountIncome tax provision TaxationInterest expense Interest payable and similar expenses
Irish Company Law contains specific requirements for the classification of any liability uncertain as to the amount at which it will be settled or as to the date on which it will be settled. These liabilities are classified as provisions. Refer to Note 18 for those liabilities which meet the provision classification requirements under Irish Company Law.
The consolidated financial statements include the accounts of Medtronic plc, its wholly-owned subsidiaries, entities for which the Group has a controlling financial interest, and variable interest entities for which the Group is the primary beneficiary. Intercompany transactions and balances have been fully eliminated in consolidation. Certain reclassifications have been made to prior year financial statements to conform to classifications used in the current year. Amounts reported in millions within this Irish annual report are computed based on the amounts in thousands, and therefore, the sum of the components may not equal the total amount reported in millions due to rounding. Additionally, certain columns and rows within tables may not sum due to rounding.
Use of Estimates The preparation of the consolidated financial statements in conformity with accounting principles generally accepted in the United States (U.S.) (U.S. GAAP) requires management to make estimates and assumptions that affect the amounts reported in the consolidated financial statements and accompanying notes. Estimates are used when accounting for items such as taxation, contingencies, intangible asset, and liability valuations. Actual results may or may not differ from those estimates.
Table of Contents
Medtronic plcNotes to the Consolidated Financial Statements
50

COVID-19 has had, and may continue to have, an adverse effect on our business, results of operations, financial condition, and cash flows, and its future impacts remain highly uncertain and unpredictable. The Group has considered the disruptions caused by COVID-19, including lower turnover and customer demand than the prior year in many businesses as well as macroeconomic factors. As a result, the Group has also assessed the potential impact on certain accounting estimates including, but not limited to, the allowance for doubtful accounts, inventory reserves, return reserves, the valuation of goodwill, intangible assets, other long-lived assets, investments and contingent consideration, as of April 30, 2021 and through the date of this report. There was not a material impact to accounting estimates associated with the Group’s consolidated financial statements as of and for the fiscal years ended April 30, 2021 and April 24, 2020.
Going Concern
The Board of Directors has formed a judgment at the time of approving the financial statements that there is a reasonable expectation that the Group and the Company have adequate resources to continue in operational existence for at least the next twelve month period extending from the time of approving the financial statements. The Board of Directors has considered uncertainties driven by COVID-19's continued impact in its going concern assessment.
These uncertainties include, but are not limited to, demand for our products, customers’ and suppliers’ financial condition, levels of liquidity, the availability of credit facilities, and our ongoing compliance with debt covenants. These uncertainties could adversely affect our operations and financial performance through supply chain disruptions, delays in payments received, and the availability and cost of materials. The Group prepared cash flow forecasts covering a period of at least twelve months from the date of these financial statements in assessing the potential impact of these uncertainties on our liquidity. This assessment included consideration of the forecasted business performance, the cash and financial facilities available to the Group, and the potential impacts of a more severe COVID-19 resurgence. The Group continues to expect that existing cash at bank and in hand, the cash generated by our operations, our available credit facility, as well as our expected ability to access the capital and debt markets will be sufficient to fund the Group’s operating and capital needs for at least the next twelve months and thereafter for the foreseeable future. To its knowledge, the Board of Directors reasonably believes that these uncertainties would not have a material impact on our ability to continue as a going concern as of the financial statements’ approval date.
If the need arises, the Group can implement certain measures, as appropriate, to remain a going concern. Having regard to the Group's assessment of its ability to fund its expected operating and capital needs and the steps it could take in the event of a more significant broader economic impact arising from a COVID-19 resurgence, the directors are satisfied that is appropriate that the going concern basis continues to be adopted in the preparation of the Consolidated Financial Statements and the Company Financial Statements. The Board of Directors understands the importance of continuing to monitor future developments related to COVID-19.
Fiscal Year-End The Group utilizes a 52/53-week fiscal year, ending the last Friday in April, for the presentation of its consolidated financial statements and related notes thereto at April 30, 2021 and April 24, 2020 and for each of the two fiscal years ended April 30, 2021 (fiscal year 2021) and April 24, 2020 (fiscal year 2020). Fiscal year 2021 was a 53-week year, with the extra week having occurred in the first fiscal month of the first quarter. Fiscal year 2020 was a 52-week year.
Cash Equivalents The Group considers highly liquid investments with maturities of three months or less from the date of purchase to be cash equivalents. These investments are carried at cost, which approximates fair value.
Investments The Group invests in marketable debt and equity securities, investments that do not have readily determinable fair values, and investments accounted for under the equity method.
Marketable debt securities are classified and accounted for as available-for-sale. These investments are recorded at fair value in the consolidated balance sheet. The change in fair value for available-for-sale securities is recorded, net of taxation, as a component of accumulated other comprehensive loss on the consolidated balance sheet. The Group determines the appropriate classification of its investments in marketable debt securities at the time of purchase and reevaluates such determinations at each balance sheet date. The classification of marketable debt securities as short-term or financial assets is based on the nature of the securities and the availability for use in current operations consistent with the Group's management of its capital structure and liquidity.
Certain of the Group’s investments in marketable equity securities and other securities are long-term, strategic investments in companies that are in various stages of development and are included in financial assets on the consolidated balance sheet. Marketable equity securities are recorded at fair value in the consolidated balance sheet. The change in fair value of marketable equity securities is recognized within other non-operating income, net in the consolidated profit and loss account. At each reporting period, the Group makes a qualitative assessment considering impairment indicators to evaluate whether the
Table of Contents
Medtronic plcNotes to the Consolidated Financial Statements
51

investment is impaired. Equity securities accounted for under the equity method are initially recorded at the amount of the Group’s investment and are adjusted each period for the Group’s share of the investee’s profit or loss and dividends paid. Securities accounted for under the equity method are reviewed quarterly for changes in circumstance or the occurrence of events that suggest other than temporary impairment has occurred.
Trade Debtors The Group grants credit to customers in the normal course of business and maintains an allowance for doubtful accounts for potential credit losses. When evaluating allowances for doubtful accounts, the Group considers various factors, including historical experience and customer-specific information. Uncollectible accounts are written-off against the allowance when it is deemed that a customer account is uncollectible.
Inventories Inventories are stated at the lower of cost or net realizable value, with cost determined on a first-in, first-out basis. The Group reduces the carrying value of inventories for items that are potentially excess, obsolete, or slow-moving based on changes in customer demand, technology developments, or other economic factors.
Tangible Assets Tangible assets are stated at cost and depreciated over the useful lives of the assets using the straight-line method. Additions and improvements that extend the lives of the assets are capitalized, while expenditures for repairs and maintenance are expensed as incurred. The Group assesses tangible assets for impairment whenever events or changes in circumstances indicate that the carrying amount of tangible asset groupings may not be recoverable. The cost of interest that is incurred in connection with significant ongoing construction projects is capitalized using a weighted average interest rate. These costs are included in tangible assets and amortized over the useful life of the related asset. Upon retirement or disposal of tangible assets, the costs and related amounts of accumulated depreciation or amortization are eliminated from the asset and accumulated depreciation accounts. The difference, if any, between the net asset value and the proceeds, is recognized in profit and loss. The Group utilizes the following estimated useful lives (in years):
Equipment Generally 2-7, up to 15Computer software Up to 5Land and land improvements Up to 20Buildings and leasehold improvements Up to 40
Goodwill and Intangible Assets Goodwill is the excess of the purchase price over the estimated fair value of net assets of acquired businesses. Irish Company Law requires goodwill and indefinite live intangible assets to be amortized. However, the Group does not believe this gives true and fair view, as not all goodwill and intangible assets decline in value, and goodwill is not amortized under U.S. GAAP. In addition, as goodwill that does decline in value rarely does so on a straight-line basis, straight-line amortization of goodwill and indefinite lived intangible assets over an arbitrary period does not reflect the economic reality. Therefore, goodwill and indefinite lived intangible assets are not amortized. The Group assesses goodwill for impairment annually in the third quarter of the financial year and whenever an event occurs or circumstances change that would indicate the carrying amount may be impaired. Impairment testing for goodwill is performed at a reporting unit level. The test for impairment of goodwill requires the Group to make several estimates about fair value, most of which are based on projected future cash flows. The Group calculates the excess of each reporting unit's fair value over its carrying amount, including goodwill, utilizing a discounted cash flow analysis. Internal operational budgets and long-range strategic plans are used as a basis for the cash flow analysis. The Group also utilizes assumptions for working capital, capital expenditures, and terminal growth rates. The discount rate applied to the cash flow analysis is based on the weighted average cost of capital (“WACC”) for each reporting unit. An impairment loss is recognized when the carrying amount of the reporting unit’s net assets exceeds the estimated fair value of the reporting unit.
Intangible assets include patents, trademarks, tradenames, customer relationships, purchased technology, and in-process research and development (IPR&D). Intangible assets with a definite life are amortized on a straight-line basis with estimated useful lives typically ranging from three to 20 years. Amortization is recognized within distribution and administrative expense in the consolidated profit and loss account. Intangible assets with a definite life are tested for impairment whenever events or changes in circumstances indicate that the carrying amount of an intangible asset (asset group) may not be recoverable. When events or changes in circumstances indicate that the carrying amount of an intangible asset may not be recoverable, the Group calculates the excess of an intangible asset's carrying value over its undiscounted future cash flows. If the carrying value is not recoverable, an impairment loss is recognized based on the amount by which the carrying value exceeds the fair value.
Acquired IPR&D represents the fair value assigned to those research and development projects that were acquired in a business combination for which the related products have not received regulatory approval and have no alternative future use. IPR&D is capitalized at its fair value as an indefinite-lived intangible asset, and any development costs incurred after the acquisition are
Table of Contents
Medtronic plcNotes to the Consolidated Financial Statements
52

expensed as incurred. The fair value of IPR&D is determined by estimating the future cash flows of each project and discounting the net cash flows back to their present values. Upon achieving regulatory approval or commercial viability for the related product, the indefinite-lived intangible asset is accounted for as a definite-lived asset and is amortized on a straight-line basis over the estimated useful life. If the project is not completed or is terminated or abandoned, the Group may have an impairment related to the IPR&D, which is charged to expense. Indefinite-lived intangible assets are tested for impairment annually in the third quarter of the fiscal year and whenever events or changes in circumstances indicate that the carrying amount may be impaired. Impairment is calculated as the excess of the asset’s carrying value over its fair value. Fair value is generally determined using a discounted future cash flow analysis. IPR&D acquired outside of a business combination is expensed immediately.
Contingent Consideration Certain of the Group’s business combinations involve potential payment of future consideration that is contingent upon the achievement of certain product development milestones and/or contingent on the acquired business reaching certain performance milestones. The Group records contingent consideration at fair value at the date of acquisition based on the consideration expected to be transferred, estimated as the probability-weighted future cash flows, discounted back to present value. The fair value of contingent consideration is measured using projected payment dates, discount rates, probabilities of payment, and projected turnover (for turnover-based considerations). Projected turnover is based on the Group’s most recent internal operational budgets and long-range strategic plans. The discount rate used is determined at the time of measurement in accordance with accepted valuation methodologies. Changes in projected turnover, probabilities of payment, discount rates, and projected payment dates may result in adjustments to the fair value measurements. Contingent consideration is remeasured each reporting period using Level 3 inputs, and the change in fair value, including accretion for the passage of time, is recognized as profit or expense within other operating expense, net in the consolidated profit and loss account. Contingent consideration payments made soon after the acquisition date are classified as investing activities in the consolidated statement of cash flows. Contingent consideration payments not made soon after the acquisition date that are related to the acquisition date fair value are reported as financing activities in the consolidated statement of cash flows, and amounts paid in excess of the original acquisition date fair value are reported as operating activities in the consolidated statement of cash flows.
Self-Insurance The Group self-insures the majority of its insurable risks, including medical and dental costs, disability coverage, physical loss to property, business interruptions, workers’ compensation, comprehensive general, and product liability. Insurance coverage is obtained for risks required to be insured by law or contract. The Group uses claims data and historical experience, as applicable, to estimate liabilities associated with the exposures that the Group has self-insured.
Retirement Benefit Plan Assumptions The Group sponsors various retirement benefit plans, including defined benefit pension plans, post-retirement medical plans, defined contribution savings plans, and termination indemnity plans, covering substantially all U.S. employees and many employees outside the U.S. See Note 19 for assumptions used in determining pension and post-retirement benefit costs and liabilities.
Derivatives The Group recognizes all derivative financial instruments in its consolidated financial statements at fair value in accordance with authoritative guidance on derivatives and hedging, and presents assets and liabilities associated with derivative financial instruments on a gross basis in the consolidated financial statements. For derivative instruments that are designated and qualify as hedging instruments, the hedging instrument must be designated as a fair value hedge or a cash flow hedge, based upon the exposure being hedged. See Note 15 for more information on the Group's derivative instruments and hedging programs.
Fair Value Measurements The Group follows the authoritative guidance on fair value measurements and disclosures with respect to assets and liabilities that are measured at fair value on both a recurring and nonrecurring basis. Fair value is defined as the exit price, or the amount that would be received to sell an asset or paid to transfer a liability in an orderly transaction between market participants as of the measurement date. The authoritative guidance also establishes a hierarchy for inputs used in measuring fair value that maximizes the use of observable inputs and minimizes the use of unobservable inputs by requiring that the most observable inputs be used when available. Observable inputs are inputs market participants would use in valuing the asset or liability, based on market data obtained from sources independent of the Group. Unobservable inputs are inputs that reflect the Group’s assumptions about the factors market participants would use in valuing the asset or liability developed based upon the best information available in the circumstances. The categorization of financial assets and financial liabilities within the valuation hierarchy is based upon the lowest level of input that is significant to the fair value measurement.
Table of Contents
Medtronic plcNotes to the Consolidated Financial Statements
53

The hierarchy is broken down into three levels defined as follows:
• Level 1 - Inputs are quoted prices in active markets for identical assets or liabilities.• Level 2 - Inputs include quoted prices for similar assets or liabilities in active markets, quoted prices for
identical or similar assets or liabilities in markets that are not active, and inputs (other than quoted prices) that are observable for the asset or liability, either directly or indirectly.
• Level 3 - Inputs are unobservable for the asset or liability.
Financial assets that are classified as Level 1 securities include highly liquid government bonds within U.S. government and agency securities and marketable equity securities for which quoted market prices are available. In addition, the Group classifies currency forward contracts as Level 1 since they are valued using quoted market prices in active markets which have identical assets or liabilities.
The valuation for most fixed maturity securities are classified as Level 2. Financial assets that are classified as Level 2 include corporate debt securities, government and agency securities, other asset-backed securities, debt funds, and mortgage-backed securities whose value is determined using inputs that are observable in the market or may be derived principally from, or corroborated by, observable market data such as pricing for similar securities, recently executed transactions, cash flow models with yield curves, and benchmark securities. In addition, interest rate swaps and total return swaps are included in Level 2 as the Group uses inputs other than quoted prices that are observable for the asset. The Level 2 derivative instruments are primarily valued using standard calculations and models that use readily observable market data as their basis.
Financial assets are considered Level 3 when their fair values are determined using pricing models, discounted cash flow methodologies, or similar techniques, and at least one significant model assumption or input is unobservable. Financial assets that are classified as Level 3 include certain investment securities for which there is limited market activity such that the determination of fair value requires significant judgment or estimation, certain corporate debt securities and auction rate securities. With the exception of auction rate securities, these securities are valued using third-party pricing sources that incorporate transaction details such as contractual terms, maturity, timing, and amount of expected future cash flows, as well as assumptions about liquidity and credit valuation adjustments by market participants. The fair value of auction rate securities is estimated by the Group using a discounted cash flow model, which incorporates significant unobservable inputs. The significant unobservable inputs used in the fair value measurement of the Group’s auction rate securities are years to principal recovery and the illiquidity premium that is incorporated into the discount rate. For goodwill, other intangible assets, and IPR&D, inputs used in the fair value analysis fall within Level 3 of the fair value hierarchy due to the use of significant unobservable inputs to determine fair value.
Certain investments for which the fair value is measured using the net asset value per share (or its equivalent) practical expedient are excluded from the fair value hierarchy. Financial assets for which the fair value is measured using the net asset value per share practical expedient include certain debt funds, equity and fixed income commingled trusts, and registered investment companies.
Turnover The Group sells its products through direct sales representatives and independent distributors. Additionally, a portion of the Group's turnover is generated from consignment inventory maintained at hospitals. The Group recognizes turnover when control is transferred to the customer. For products sold through direct sales representatives and independent distributors, control is transferred upon shipment or upon delivery, based on the contract terms and legal requirements. For consignment inventory, control is transferred when the product is used or implanted. Payment terms vary depending on the country of sale, type of customer, and type of product.
If a contract contains more than one performance obligation, the transaction price is allocated to each performance obligation based on relative standalone selling price. Shipping and handling is treated as a fulfillment activity rather than a promised service, and therefore, is not considered a performance obligation. Taxes assessed by a governmental authority that are both imposed on, and concurrent with, a specific turnover producing transaction and collected by the Group from customers (for example, sales, use, value added, and some excise taxes) are not included in turnover. For contracts that have an original duration of one year or less, the Group uses the practical expedient applicable to such contracts and does not adjust the transaction price for the time value of money.
The amount of turnover recognized reflects turnover rebates and returns, which are estimated based on sales terms, historical experience, and trend analysis. In estimating rebates, the Group considers the lag time between the point of sale and the payment of the rebate claim, the stated rebate rates, and other relevant information. The Group records adjustments to rebates and returns reserves as increases or decreases of turnover.
Table of Contents
Medtronic plcNotes to the Consolidated Financial Statements
54

The Group records a deferred revenue liability if a customer pays consideration before the Group transfers a good or service to the customer. Deferred revenue primarily represents remote monitoring services and equipment maintenance, for which consideration is received at the same time as consideration for the device or equipment. Turnover related to remote monitoring services and equipment maintenance is recognized over the service period as time elapses.
Remaining performance obligations include deferred revenue and amounts the Group expects to receive for goods and services that have not yet been delivered or provided under existing, noncancellable contracts with minimum purchase commitments, primarily related to consumables for previously sold equipment as well as remote monitoring services and equipment maintenance. For contracts that have an original duration of one year or less, the Group has elected the practical expedient applicable to such contracts and does not disclose the transaction price for remaining performance obligations at the end of each reporting period and when the Group expects to recognize this turnover.
Shipping and Handling Shipping and handling costs incurred to physically move product from the Group's premises to the customer's premises are recognized in distribution and administrative expense in the consolidated profit and loss account and were $308 million and $347 million in fiscal years 2021 and 2020, respectively. Other shipping and handling costs incurred to store, move, and prepare products for shipment are recognized in cost of sales in the consolidated profit and loss account.
Research and Development Research and development costs are expensed when incurred. Research and development costs include costs of research, engineering, and technical activities to develop a new product or service or make significant improvement to an existing product or manufacturing process. Research and development costs also include pre-approval regulatory and clinical trial expenses.
Contingencies The Group records a liability in the consolidated financial statements for loss contingencies when a loss is known or considered probable, and the amount may be reasonably estimated. If the reasonable estimate of a known or probable loss is a range, and no amount within the range is a better estimate than any other, the minimum amount of the range is accrued. If a loss is reasonably possible but not known or probable, and may be reasonably estimated, the estimated loss or range of loss is disclosed.
Taxation The Group has deferred taxation that arises as a result of the different treatment of transactions for U.S. GAAP and taxation accounting, known as temporary differences. The Group records the tax effect of these temporary differences as deferred tax assets and deferred tax provisions. Deferred tax assets generally represent items that may be used as a tax deduction or credit in a tax return in future years for which the Group has already recognized the tax benefit in the consolidated profit and loss account. The Group establishes valuation allowances for deferred tax assets when the amount of expected future taxable profit is not likely to support the use of the deduction or credit. Deferred tax provisions generally represent taxation recognized in the consolidated financial statements for which payment has been deferred or expense has already been taken as a deduction on the Group’s tax return but has not yet been recognized as an expense in the consolidated profit and loss account.
Other Operating Expense (Income), Net Other operating expense (income), net primarily includes royalty income and expense, currency remeasurement and derivative gains and losses, Puerto Rico excise taxes, changes in fair value of contingent consideration, changes in amounts accrued for certain contingent liabilities for a recent acquisition, a commitment to the Medtronic Foundation, charges associated with business exits, impairment charges, IPR&D charges, and profit from funded research and development arrangements.
Other Non-Operating Income, Net Other non-operating income, net includes the non-service component of net periodic pension and post-retirement benefit cost, investment gains and losses, and interest receivable and similar income.
Currency Translation Assets and liabilities of non-U.S. dollar functional currency entities are translated to U.S. dollars at period-end exchange rates, and the currency impacts arising from the translation of the assets and liabilities are recorded as a cumulative translation adjustment, a component of accumulated other comprehensive loss, on the consolidated balance sheet. Elements of the consolidated profit and loss account are translated at the average monthly currency exchange rates in effect during the period. Currency transaction gains and losses are included in other operating expense (income), net in the consolidated profit and loss account.
Comprehensive Income and Accumulated Other Comprehensive Loss In addition to profit for the financial year, comprehensive income includes changes in currency exchange rate translation adjustments, gains and losses on derivative and non-derivative instruments designated as net investment hedges, unrealized gains and losses on currency exchange rate derivative contracts and interest rate derivative instruments qualifying and designated as cash flow hedges, net changes in retirement obligation funded status, and unrealized gains and losses on investment securities. See Note 22 for discussion regarding taxation on cumulative translation adjustments.
Table of Contents
Medtronic plcNotes to the Consolidated Financial Statements
55

Stock-Based Compensation The Group measures stock-based compensation expense at the grant date based on the fair value of the award and recognizes the compensation expense over the requisite service period, which is generally the vesting period. The amount of stock-based compensation expense recognized during a period is based on the portion of the awards that are expected to vest. The Group estimates pre-vesting forfeitures at the time of grant and revises the estimates in subsequent periods.
Recently Adopted Accounting Standards
Current Expected Credit Losses
In June 2016, the Financial Accounting Standards Board (FASB) issued guidance changing the methodology to be used to measure credit losses for certain financial instruments and financial assets, including trade receivables. The new methodology requires the recognition of an allowance that reflects the current estimate of credit losses expected to be incurred over the life of the financial asset. The Group adopted this guidance using the modified retrospective method in the first quarter of fiscal year 2021. The adoption of this guidance did not have a material impact to the Group's consolidated financial statements.
Leases
In February 2016, the FASB issued guidance which requires lessees to recognize right-of-use assets and lease liabilities on the balance sheet. This guidance also requires additional qualitative and quantitative lease related disclosures in the notes to the consolidated financial statements. The Group adopted this guidance using the modified retrospective method in the first quarter of fiscal year 2020.
During the implementation, the Group elected the package of practical expedients available under the transition guidance that allowed an entity not to reassess whether any expired or existing contracts are or contain leases, the classification for any expired or existing leases or any initial direct costs for existing leases. Further, the Group made accounting policy elections to not apply the recognition requirements to short-term leases and to account for lease and nonlease components as a single lease component.
The adoption of this guidance resulted in the recognition of right-of-use assets and lease liabilities in an amount of approximately $1.0 billion, an immaterial cumulative-effect adjustment to profit and loss account as of April 27, 2019, and expansion of lease related disclosures. The adoption of this guidance did not have a material impact on the Group's consolidated profit and loss account or consolidated statement of cash flows.
2. Turnover
The Group's turnover is principally derived from device-based medical therapies and services related to cardiac rhythm disorders, cardiovascular disease, renal disease, neurological disorders and diseases, spinal conditions and musculoskeletal trauma, chronic pain, urological and digestive disorders, ear, nose, and throat conditions, and diabetes conditions as well as advanced and general surgical care products, respiratory and monitoring solutions, and neurological surgery technologies. The Group's primary customers include healthcare systems, clinics, third-party healthcare providers, distributors, and other institutions, including governmental healthcare programs and group purchasing organizations.
During the first and fourth quarters of fiscal year 2021, the Group realigned its divisions within Neuroscience and Cardiovascular, respectively. As a result, fiscal year 2020 turnover has been recast to adjust for these realignments. Additionally, the Group implemented a new operating model in fiscal year 2021, which was fully operational beginning in the fourth quarter.
Table of Contents
Medtronic plcNotes to the Consolidated Financial Statements
56

The table below illustrates turnover by segment and division for fiscal years 2021 and 2020.
Turnover by Fiscal Year
(in millions) 2021 2020
Cardiac Rhythm & Heart Failure $ 5,584 $ 5,141 Structural Heart & Aortic 2,834 2,842 Coronary & Peripheral Vascular 2,354 2,486
Cardiovascular 10,772 10,468 Surgical Innovations 5,438 5,513 Respiratory, Gastrointestinal, & Renal 3,298 2,839
Medical Surgical 8,737 8,352 Cranial & Spinal Technologies 4,288 4,082 Specialty Therapies 2,307 2,147 Neuromodulation 1,601 1,497
Neuroscience 8,195 7,725 Diabetes 2,413 2,368 Total $ 30,117 $ 28,913
The table below includes turnover by market geography and segment for fiscal years 2021 and 2020.
U.S.(1) Non-U.S. Developed Markets(2) Emerging Markets(3)
(in millions)Fiscal Year
2021Fiscal Year
2020Fiscal Year
2021Fiscal Year
2020Fiscal Year
2021Fiscal Year
2020
Cardiovascular $ 5,248 $ 5,062 $ 3,752 $ 3,519 $ 1,773 $ 1,887 Medical Surgical 3,650 3,532 3,320 3,169 1,766 1,651 Neuroscience 5,456 5,122 1,724 1,659 1,015 945 Diabetes 1,171 1,204 1,019 940 222 224
Total $ 15,526 $ 14,919 $ 9,815 $ 9,287 $ 4,777 $ 4,707
(1) U.S. includes the United States and U.S. territories.(2) Non-U.S. developed markets include Japan, Australia, New Zealand, Korea, Canada, and the countries within Western Europe.(3) Emerging markets include the countries of the Middle East, Africa, Latin America, Eastern Europe, and the countries of Asia that are
not included in the non-U.S. developed markets, as defined above.
At April 30, 2021, $906 million of rebates were classified as provisions for liabilities, and $485 million of rebates were classified as a reduction of debtors in the consolidated balance sheet. At April 24, 2020, $706 million of rebates were classified as provisions for liabilities, and $321 million of rebates were classified as a reduction of debtors in the consolidated balance sheet. During fiscal year 2021, adjustments to rebate and return reserves recognized in turnover that were included in the rebate and return reserves at the beginning of the period were not material.
Deferred Revenue and Remaining Performance Obligations
Deferred revenue at April 30, 2021 and April 24, 2020 was $368 million and $303 million, respectively. At April 30, 2021 and April 24, 2020, $276 million and $213 million was included in creditors (amounts falling due within one year), respectively, and $93 million and $90 million was included in creditors (amounts falling due after more than one year), respectively. During the fiscal year ended April 30, 2021, the Group recognized $236 million of turnover that was included in deferred revenue as of April 24, 2020.
At April 30, 2021, the estimated turnover expected to be recognized in future periods related to performance obligations that are unsatisfied for executed contracts with an original duration of one year or more was approximately $1.3 billion. The Group expects to recognize turnover on the majority of these remaining performance obligations over the next four years.
Table of Contents
Medtronic plcNotes to the Consolidated Financial Statements
57

3. Restructuring Charges
Enterprise Excellence
In the third quarter of fiscal year 2018, the Group announced its Enterprise Excellence restructuring program, which is expected to leverage the Group's global size and scale, as well as enhance the customer and employee experience, with a focus on three objectives: global operations, functional optimization, and commercial optimization. Primary activities of the restructuring program include integrating and enhancing global manufacturing and supply processes, systems and site presence, enhancing and leveraging global operating models across several enabling functions, and optimizing certain commercial processes, systems, and models.
The Group estimates that, in connection with its Enterprise Excellence restructuring program, it will recognize pre-tax exit and disposal costs and other costs across all segments of approximately $1.6 billion to $1.8 billion, the majority of which are expected to be incurred by the end of fiscal year 2022. Approximately 40 percent of the estimated charges are related to employee termination benefits. The remaining charges are costs associated with the restructuring program, such as salaries and benefits for employees supporting the program, including program management and transition teams, and strategic and operational consulting services related to the three objectives of the program discussed above. These charges are recognized within restructuring charges, net, cost of sales, and distribution and administrative expense in the consolidated profit and loss account.
For fiscal years 2021 and 2020 the Group recognized net charges of $349 million and $441 million, respectively. For fiscal years 2021 and 2020, charges included $128 million and $155 million, respectively, recognized within cost of sales, and $169 million and $168 million, respectively, recognized within distribution and administrative expense in the consolidated profit and loss account.
The following table summarizes the activity related to the Enterprise Excellence restructuring program for fiscal years 2021 and 2020:
(in millions)
Employee Termination
BenefitsAssociated
Costs(1)Asset
Write-downsOther Costs Total
April 26, 2019 $ 101 $ 9 $ — $ 12 $ 122 Charges 129 300 24 9 462 Cash payments (128) (290) — (9) (427) Settled non-cash — — (24) — (24) Provision adjustments(2) (13) — — (8) (21)
April 24, 2020 89 19 — 4 112 Charges 66 295 — 4 365 Cash payments (77) (296) — (5) (378) Provision adjustments(2) (14) — — (2) (16)
April 30, 2021 $ 64 $ 18 $ — $ 1 $ 83
(1) Associated costs include costs incurred as a direct result of the restructuring program, such as salaries for employees supporting the program and consulting expenses.
(2) Provision adjustments relate to certain employees identified for termination finding other positions within the Group and contract terminations being settled for less than originally estimated.
Table of Contents
Medtronic plcNotes to the Consolidated Financial Statements
58

Simplification
In the first quarter of fiscal year 2021, the Group initiated the Simplification restructuring program, designed to make the Group a more nimble and competitive organization focused on accelerating innovation, enhancing the customer experience, driving turnover growth, and winning market share, while also more efficiently and effectively leveraging the enterprise scale. Under the oversight of the portfolio leaders, this new operating model, which became fully operational the beginning of the fourth quarter of fiscal year 2021, will simplify the Group's organizational structure and accelerate decision-making and execution. Primary activities of the restructuring program will include reorganizing the Group into a portfolio-level structure, including the creation of highly focused, accountable, and empowered Operating Units (OUs), consolidating Operations at the enterprise level, establishing Technology Development Centers in areas where the Group has deep core technology competencies to be leveraged by multiple OUs, and forming dedicated sales organizations that leverage the Group's scale but move with the same agility as smaller, local competitors.
The Group estimates that, in connection with its Simplification restructuring program, it will recognize pre-tax exit and disposal costs and other costs across all segments of approximately $400 million to $450 million, the majority of which are expected to be incurred by the end of fiscal year 2022. Approximately three quarters of the estimated charges are related to employee termination benefits. The remaining charges are costs associated with the restructuring program, such as salaries for employees supporting the program and consulting expenses to execute the reorganization of our business into a portfolio-like structure as discussed above. These charges are recognized within restructuring charges, net and distribution and administrative expense in the consolidated profit and loss account.
For fiscal year 2021, the Group recognized net charges of $268 million, which included $97 million of incremental defined benefit pension and post-retirement related expenses for employees that accepted voluntary early retirement packages. These costs are not included in the table summarizing restructuring charges below, as they are associated with costs that are accounted for under the pension and post-retirement rules. See Note 19 for further discussion on the incremental defined benefit pension and post-retirement expenses. The charges recognized for fiscal year 2021 included $27 million recognized within distribution and administrative expense in the consolidated profit and loss account.
The following table summarizes the activity related to the Simplification restructuring program for fiscal year 2021:
(in millions)
Employee Termination
BenefitsAssociated
Costs(1) Total
April 24, 2020 $ — $ — $ — Charges 147 27 174 Cash payments (85) (23) (108) Provision adjustments(2) (3) — (3)
April 30, 2021 $ 59 $ 4 $ 63
(1) Associated costs include costs incurred as a direct result of the restructuring program, such as salaries for employees supporting the program and consulting expenses.
(2) Provision adjustments relate to certain employees identified for termination finding other positions within the Group.
4. Commitments and Contingencies
Legal Matters
The Group and its affiliates are involved in a number of legal actions involving product liability, intellectual property and commercial disputes, shareholder related matters, environmental proceedings, tax disputes, and governmental proceedings and investigations, including those described below. With respect to governmental proceedings and investigations, like other companies in our industry, the Group is subject to extensive regulation by national, state, and local governmental agencies in the United States and in other jurisdictions in which the Group and its affiliates operate. As a result, interaction with governmental agencies is ongoing. The Group’s standard practice is to cooperate with regulators and investigators in responding to inquiries. The outcomes of legal actions are not within the Group’s complete control and may not be known for prolonged periods of time. In some actions, the enforcement agencies or private claimants seek damages, as well as other civil or criminal remedies (including injunctions barring the sale of products that are the subject of the proceeding), that could require significant expenditures, result in lost turnover, or limit the Group's ability to conduct business in the applicable jurisdictions.
Table of Contents
Medtronic plcNotes to the Consolidated Financial Statements
59

The Group records a provision in the consolidated financial statements on an undiscounted basis for loss contingencies related to legal actions when a loss is known or considered probable and the amount may be reasonably estimated. If the reasonable estimate of a known or probable loss is a range, and no amount within the range is a better estimate than any other, the minimum amount of the range is accrued. If a loss is reasonably possible but not known or probable, and may be reasonably estimated, the estimated loss or range of loss is disclosed. When determining the estimated loss or range of loss, significant judgment is required. Estimates of probable losses resulting from litigation and governmental proceedings involving the Group are inherently difficult to predict, particularly when the matters are in early procedural stages with incomplete scientific facts or legal discovery, involve unsubstantiated or indeterminate claims for damages, potentially involve penalties, fines or punitive damages, or could result in a change in business practice. The Group classifies litigation charges and gains related to significant legal matters as certain litigation charges. During fiscal years 2021 and 2020, the Group recognized $206 million and $225 million, respectively, of certain litigation charges. At April 30, 2021 and April 24, 2020, accrued litigation was approximately $0.4 billion. The ultimate cost to the Group with respect to accrued litigation could be materially different than the amount of the current estimates and provisions and could have a material adverse impact on the Group’s consolidated profit, financial position, and/or cash flows. The Group includes accrued litigation in provisions for liabilities on the consolidated balance sheet. While it is not possible to predict the outcome for most of the legal matters discussed below, the Group believes it is possible that the costs associated with these matters could have a material adverse impact on the Group’s consolidated profit, financial position, and/or cash flows.
Product Liability Matters
Pelvic Mesh Litigation
The Group is currently involved in litigation in various state and federal courts against manufacturers of pelvic mesh products alleging personal injuries resulting from the implantation of those products. Two subsidiaries of Covidien supplied pelvic mesh products to one of the manufacturers, C.R. Bard (Bard), named in the litigation. The litigation includes a federal multi-district litigation in the U.S. District Court for the Northern District of West Virginia and cases in various state courts and jurisdictions outside the U.S. Generally, complaints allege design and manufacturing claims, failure to warn, breach of warranty, fraud, violations of state consumer protection laws and loss of consortium claims. In fiscal year 2016, Bard paid the Group $121 million towards the settlement of 11,000 of these claims. In May 2017, the agreement with Bard was amended to extend the terms to apply to up to an additional 5,000 claims. That agreement does not resolve the dispute between the Group and Bard with respect to claims that do not settle, if any. As part of the agreement, the Group and Bard agreed to dismiss without prejudice their pending litigation with respect to Bard’s obligation to defend and indemnify the Group. The Group estimates law firms representing approximately 16,200 claimants have asserted or may assert claims involving products manufactured by Covidien’s subsidiaries. As of August 4, 2021, the Group had reached agreements to settle approximately 15,900 of these claims. The Group's provisions for this matter are included within accrued litigation as discussed above.
Hernia Mesh Litigation
Starting in fiscal year 2020, plaintiffs filed lawsuits against certain subsidiaries of the Group in U.S. state and federal courts alleging personal injury from hernia mesh products sold by those subsidiaries. The majority of the pending cases are in Massachusetts state court, where they have been consolidated before a single judge. Certain plaintiffs' law firms have advised the Group that they may file a large volume of additional cases in the future. The pending lawsuits relate almost entirely to hernia mesh products that have not been subject to recalls, withdrawals or other adverse regulatory action. The Group has not recorded an expense related to damages in connection with these matters because any potential loss is not currently probable or reasonably estimable under U.S. GAAP. Additionally, the Group is unable to reasonably estimate the range of loss, if any, that may result from these matters.
Patent Litigation
Ethicon
On December 14, 2011, Ethicon filed an action against Covidien in the U.S. District Court for the Southern District of Ohio, alleging patent infringement and seeking monetary damages and injunctive relief. On January 22, 2014, the district court entered summary judgment in Covidien's favor, and the majority of this ruling was affirmed by the Federal Circuit on August 7, 2015. Following appeal, the case was remanded back to the District Court with respect to one patent. On January 21, 2016, Covidien filed a second action in the U.S. District Court for the Southern District of Ohio, seeking a declaration of non-infringement with respect to a second set of patents held by Ethicon. The court consolidated this second action with the remaining patent issues from the first action. Following consolidation of the cases, Ethicon dismissed six of the asserted
Table of Contents
Medtronic plcNotes to the Consolidated Financial Statements
60

patents, leaving a single asserted patent. In March 2021, the consolidated action was dismissed with prejudice, pursuant to a settlement agreement.
Sasso
The Group is involved in litigation in Indiana relating to certain patent and royalty disputes with Dr. Sasso under agreements originally entered into in 1999 and 2001. On November 28, 2018, a jury in Indiana state court returned a verdict against the Group for approximately $112 million. On June 15, 2021, pursuant to an order from the state court, the Group paid the judgment plus accrued interest to Dr. Sasso, subject to repayment if the Group's ongoing appeal is successful.
Shareholder Related Matters
Covidien Acquisition
On July 2, 2014, Lewis Merenstein filed a putative shareholder class action in Hennepin County, Minnesota, District Court seeking to enjoin the then-potential acquisition of Covidien. The lawsuit named Medtronic, Inc., Covidien, and each member of the Medtronic, Inc. Board of Directors at the time as defendants, and alleged that the directors breached their fiduciary duties to shareholders with regard to the then-potential acquisition. On August 21, 2014, Kenneth Steiner filed a putative shareholder class action in Hennepin County, Minnesota, District Court, also seeking an injunction to prevent the potential Covidien acquisition. In September 2014, the Merenstein and Steiner matters were consolidated. In April 2021, the parties reach an agreement to resolve this matter, bringing it to a conclusion.
Environmental Proceedings
The Group is involved in various stages of investigation and cleanup related to environmental remediation matters at a number of sites. These projects relate to a variety of activities, including removal of solvents, metals and other hazardous substances from soil and groundwater. The ultimate cost of site cleanup and timing of future cash flows is difficult to predict given uncertainties regarding the extent of the required cleanup, the interpretation of applicable laws and regulations, and alternative cleanup methods.
The Group is a successor to a company which owned and operated a chemical manufacturing facility in Orrington, Maine from 1967 until 1982, and is responsible for the costs of completing an environmental site investigation as required by the Maine Department of Environmental Protection (MDEP). MDEP served a compliance order on Mallinckrodt LLC and U.S. Surgical Corporation, subsidiaries of Covidien, in December 2008, which included a directive to remove a significant volume of soils at the site. After a hearing on the compliance order before the Maine Board of Environmental Protection (Maine Board) to challenge the terms of the compliance order, the Maine Board modified the MDEP order and issued a final order requiring removal of two landfills, capping of the remaining three landfills, installation of a groundwater extraction system and long-term monitoring of the site and the three remaining landfills.
The Group has proceeded with implementation of the investigation and remediation at the site in accordance with the MDEP order as modified by the Maine Board order.
Since the early 2000s, the Group or its predecessors have also been involved in a lawsuit filed in the U.S. District Court for the District of Maine by the Natural Resources Defense Council and the Maine People’s Alliance. Plaintiffs sought an injunction requiring the Group's predecessor to conduct extensive studies of mercury contamination of the Penobscot River and Bay and options for remediating such contamination, and to perform appropriate remedial activities, if necessary.
Following a trial in March 2002, the Court held that conditions in the Penobscot River and Bay may pose an imminent and substantial endangerment and that the Group’s predecessor was liable for the cost of performing a study of the River and Bay. Following a second trial in June 2014, the Court ordered that further engineering study and engineering design work was needed to determine the nature and extent of remediation in the Penobscot River and Bay. The Court also appointed an engineering firm to conduct such studies and issue a report on potential remediation alternatives. In connection with these proceedings, reports have been produced including a variety of cost estimates for a variety of potential remedial options. In March 2021, the parties notified the Court that they had agreed on a settlement in principle of all issues in this matter. Finalization of the proposed settlement remains subject to a fairness hearing and Court approval.
The Group's provisions for environmental proceedings are included within accrued litigation as discussed above.
Table of Contents
Medtronic plcNotes to the Consolidated Financial Statements
61

Taxation
In March 2009, the IRS issued its audit report on Medtronic, Inc. for fiscal years 2005 and 2006. Medtronic, Inc. reached agreement with the IRS on some, but not all matters related to these fiscal years. The remaining unresolved issue for fiscal years 2005 and 2006 relates to the allocation of income between Medtronic, Inc. and its wholly-owned subsidiary operating in Puerto Rico, which is one of the Group's key manufacturing sites. The U.S. Tax Court reviewed this dispute, and on June 9, 2016, issued its opinion with respect to the allocation of income between the parties for fiscal years 2005 and 2006. The U.S. Tax Court generally rejected the IRS’s position, but also made certain modifications to the Medtronic, Inc. tax returns as filed. On April 21, 2017, the IRS filed their Notice of Appeal to the U.S. Court of Appeals for the 8th Circuit regarding the Tax Court Opinion. Oral argument for the Appeal occurred on March 14, 2018. The 8th Circuit Court of Appeals issued their opinion on August 16, 2018 and remanded the case back to the U.S. Tax Court for additional factual findings. The U.S. Tax Court trial relating to the issues remanded by the 8th Circuit Court of Appeals concluded during June of 2021. The parties are awaiting the Tax Court decision, which will remain subject to appeal by either party upon its issuance.
The IRS has issued its audit reports on Medtronic, Inc. for fiscal years 2007 through 2016. Medtronic, Inc. and the IRS have reached agreement on all significant issues except for the allocation of income between Medtronic, Inc. and its wholly-owned subsidiary operating in Puerto Rico for the businesses that are the subject of the U.S. Tax Court Case for fiscal years 2005 and 2006.
Medtronic, Inc.’s fiscal years 2017, 2018, and 2019 U.S. federal income tax returns are currently being audited by the IRS.Covidien LP (a wholly owned subsidiary of Medtronic plc) has either reached agreement with the IRS or the statute of limitations has lapsed on their U.S. federal income tax returns through fiscal year 2017.
While it is not possible to predict the outcome for most of the taxation matters discussed above, the Group believes it is possible that charges associated with these matters could have a material adverse impact on the Group’s consolidated profit, financial position, and/or cash flows.
See Note 6 for additional discussion of taxation.
Guarantees
For the purpose of Section 357 of the Companies Act, 2014, the Company has undertaken to indemnify the creditors of the following subsidiaries incorporated in the Republic of Ireland, in respect of commitments entered into by those subsidiaries, including amounts shown as liabilities in their statutory financial statements as referred to in Section 357 of the Companies Act 2014 for the financial year ending on April 30, 2021 or any amended financial period incorporating the said financial year.
• Makani II Unlimited Company• Medtronic Irish Finco Unlimited Company• Covidien Limited• Covidien Holdings Ireland Limited• Covidien Services Europe Limited• Medtronic Vascular Holdings Unlimited Company• Medtronic Vascular Galway Unlimited Company• Nellcor Puritan Bennett Ireland Holdings Unlimited Company• Nellcor Puritan Bennett Ireland Unlimited Company• Mallinckrodt Medical Unlimited Company• Medtronic Ireland Limited• Medtronic Ireland Manufacturing Unlimited Company
In the normal course of business, the Group and/or its affiliates periodically enter into agreements that require one or more of the Group and/or its affiliates to indemnify customers or suppliers for specific risks, such as claims for injury or property damage arising as a result of the Group or its affiliates’ products, the negligence of the Group's personnel, or claims alleging that the Group's products infringe on third-party patents or other intellectual property. The Group also offers warranties on various products. The Group’s maximum exposure under these guarantees is unable to be estimated. Historically, the Group has not experienced significant losses on these types of guarantees.
The Group believes the ultimate resolution of the above guarantees is not expected to have a material effect on the Group’s consolidated profit, financial position, and/or cash flows.
Table of Contents
Medtronic plcNotes to the Consolidated Financial Statements
62

Other Commitments
The Group has various commitments and contractual obligations that are not reflected in the Group's consolidated balance sheet at April 30, 2021, primarily related to funding of minority investments, royalty and milestone payments, interest on debt obligations, and inventory purchase commitments.
At April 30, 2021, aggregate obligations for commitments related to the funding of minority investments, estimated milestone payments, and royalty obligations was $354 million, of which $157 million relates to fiscal year 2022. The Group acquires assets still in development, enters into research and development arrangements, and sponsors certain clinical trials that often require milestone and/or royalty payments to a third-party, contingent upon the occurrence of certain future events. In situations where the Group has no ability to influence the achievement of the milestone or otherwise avoid the payment, the milestone or minimum royalty payments have been included in the aggregate obligation. The majority of the arrangements give the Group the discretion to unilaterally make the decision to stop development of a product or cease progress of a clinical trial, which would allow the Group to avoid making the contingent payments. Due to the contingent nature of these payments, they are not included in the disclosed amount of contractual obligations.
The Group has contractual interest payments on outstanding debt obligations totaling $7.7 billion at April 30, 2021, of which $489 million relates to fiscal year 2022. See Note 17 for additional discussion of debt obligations.
The Group has certain research and development arrangements as well as inventory purchase commitments, which are legally binding and specify minimum purchase quantities or amounts for inventory to be used in the normal course of business. These commitments do not include open purchase orders with a remaining term of less than one year and do not exceed the Group's projected requirements. At April 30, 2021, aggregate obligations for these commitments was $1.0 billion, of which $550 million relates to fiscal year 2022.
5. Interest Payable and Similar Expenses
Interest payable and similar expenses is comprised of the following:
Fiscal Year
(in millions) 2021 2020
Interest charges related to financing arrangements $ 617 $ 679 Loss on debt extinguishment and redemption 308 413
Interest payable and similar expenses $ 925 $ 1,092
Table of Contents
Medtronic plcNotes to the Consolidated Financial Statements
63
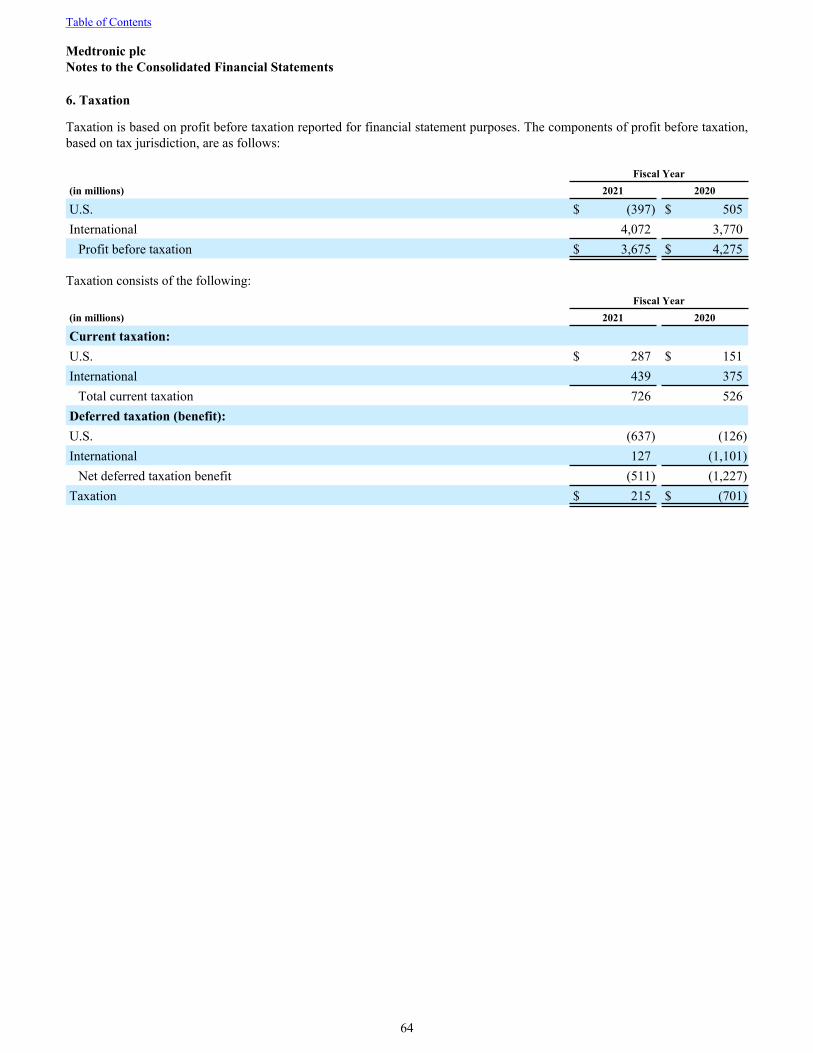
6. Taxation
Taxation is based on profit before taxation reported for financial statement purposes. The components of profit before taxation, based on tax jurisdiction, are as follows:
Fiscal Year(in millions) 2021 2020
U.S. $ (397) $ 505 International 4,072 3,770
Profit before taxation $ 3,675 $ 4,275
Taxation consists of the following: Fiscal Year(in millions) 2021 2020
Current taxation:
U.S. $ 287 $ 151 International 439 375
Total current taxation 726 526 Deferred taxation (benefit):U.S. (637) (126) International 127 (1,101)
Net deferred taxation benefit (511) (1,227) Taxation $ 215 $ (701)
Table of Contents
Medtronic plcNotes to the Consolidated Financial Statements
64
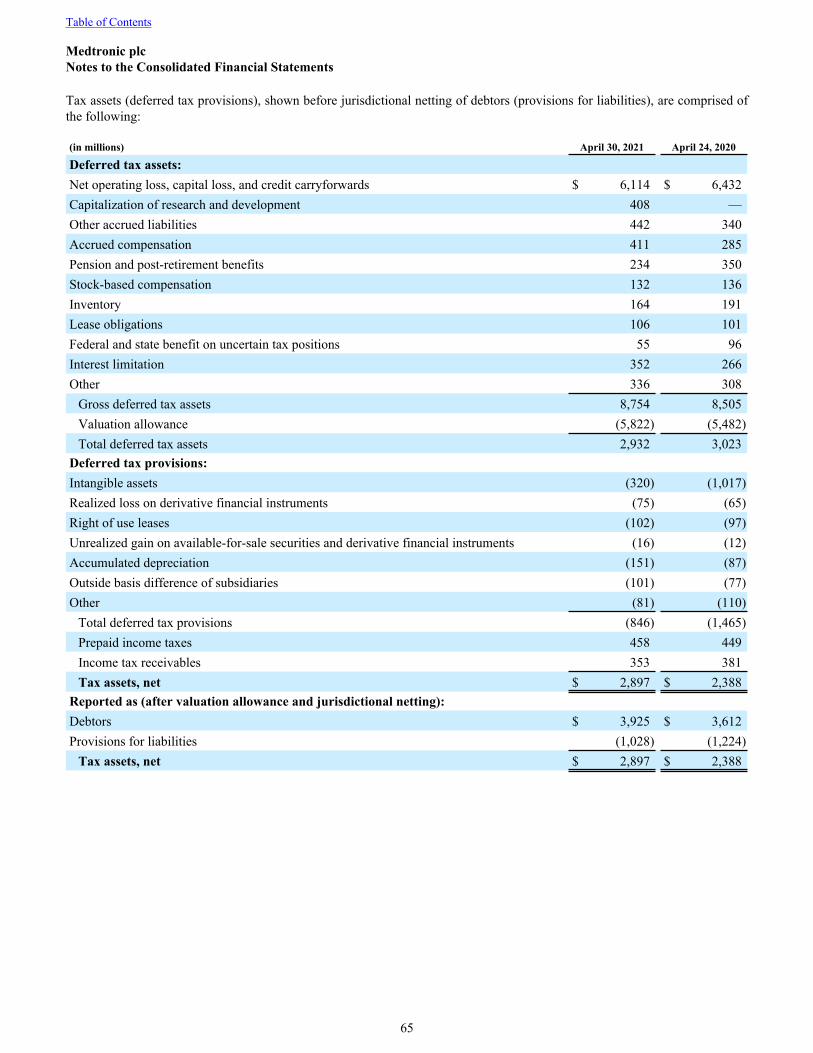
Tax assets (deferred tax provisions), shown before jurisdictional netting of debtors (provisions for liabilities), are comprised of the following:
(in millions) April 30, 2021 April 24, 2020
Deferred tax assets:
Net operating loss, capital loss, and credit carryforwards $ 6,114 $ 6,432 Capitalization of research and development 408 — Other accrued liabilities 442 340 Accrued compensation 411 285 Pension and post-retirement benefits 234 350 Stock-based compensation 132 136 Inventory 164 191 Lease obligations 106 101 Federal and state benefit on uncertain tax positions 55 96 Interest limitation 352 266 Other 336 308
Gross deferred tax assets 8,754 8,505 Valuation allowance (5,822) (5,482) Total deferred tax assets 2,932 3,023
Deferred tax provisions:
Intangible assets (320) (1,017) Realized loss on derivative financial instruments (75) (65) Right of use leases (102) (97) Unrealized gain on available-for-sale securities and derivative financial instruments (16) (12) Accumulated depreciation (151) (87) Outside basis difference of subsidiaries (101) (77) Other (81) (110)
Total deferred tax provisions (846) (1,465) Prepaid income taxes 458 449 Income tax receivables 353 381 Tax assets, net $ 2,897 $ 2,388
Reported as (after valuation allowance and jurisdictional netting):
Debtors $ 3,925 $ 3,612 Provisions for liabilities (1,028) (1,224)
Tax assets, net $ 2,897 $ 2,388
Table of Contents
Medtronic plcNotes to the Consolidated Financial Statements
65

Deferred taxation activity for fiscal year 2021 was as follows:
(in millions)Deferred Taxation
April 24, 2020 $ 2,388 Provisions 511Acquisitions (38)Charges to equity (60)Currency translation and other 96
April 30, 2021 $ 2,897
No deferred taxation has been provided on the approximately $74.2 billion and $69.9 billion of undistributed profits of the Group’s subsidiaries at April 30, 2021 and April 24, 2020, respectively, since these profits have been, and under current plans will continue to be, permanently reinvested in these subsidiaries. Due to the number of legal entities and jurisdictions involved, the complexity of the legal entity structure of the Group, and the complexity of the tax laws in the relevant jurisdictions, the Group believes it is not practicable to estimate, within any reasonable range, the amount of additional taxation which may be payable upon distribution of these undistributed profits.
At April 30, 2021, the Group had approximately $25.2 billion of net operating loss carryforwards in certain non-U.S. jurisdictions, of which $20.2 billion have no expiration, and the remaining $5.0 billion will expire during fiscal years 2022 through 2041. Included in these net operating loss carryforwards are $18.5 billion of net operating losses related to a subsidiary of the Group, substantially all of which were recorded in fiscal year 2008 as a result of the receipt of a favorable tax ruling from certain non-U.S. taxing authorities. The Group has recorded a full valuation allowance against these net operating losses, as management does not believe that it is more likely than not that these net operating losses will be utilized. Certain of the remaining non-U.S. net operating loss carryforwards of $6.7 billion have a valuation allowance recorded against the carryforwards, as management does not believe that it is more likely than not that these net operating losses will be utilized.
At April 30, 2021, the Group had $361 million of U.S. federal net operating loss carryforwards, of which $81 million have no expiration. The remaining loss carryforwards will expire during fiscal years 2022 through 2038. For U.S. state purposes, the Group had $1.4 billion of net operating loss carryforwards at April 30, 2021, $57 million of which have no expiration. The remaining U.S. state loss carryforwards will expire during fiscal years 2022 through 2041.
At April 30, 2021, the Group also had $270 million of tax credits available to reduce future income taxes payable, of which $107 million have no expiration. The remaining credits will expire during fiscal years 2022 through 2041.
Table of Contents
Medtronic plcNotes to the Consolidated Financial Statements
66

The Group has established valuation allowances of $5.8 billion and $5.5 billion at April 30, 2021 and April 24, 2020, respectively, primarily related to the uncertainty of the utilization of certain deferred tax assets which are primarily comprised of tax loss and credit carryforwards in various jurisdictions. The increase in the valuation allowance during fiscal year 2021 is primarily related to the generation of certain net operating losses and the effects of currency fluctuations. These valuation allowances would result in a taxation reduction in the consolidated profit and loss account if they are ultimately not required.
The Group’s effective income tax rate varied from the U.S. federal statutory tax rate as follows:
Fiscal Year 2021 2020
U.S. federal statutory tax rate 21.0 % 21.0 %Increase (decrease) in tax rate resulting from:
U.S. state taxes, net of federal tax benefit (1.2) 0.5 Research and development credit (2.4) (1.9) Puerto Rico Excise Tax (2.1) (1.5) International (13.4) (9.5) Stock based compensation (0.8) (1.5) Other, net 1.0 0.4 Interest on uncertain tax positions 1.0 1.2 Base Erosion Anti-Abuse Tax 0.4 2.5 Foreign Derived Intangible Income Benefit (2.0) (1.1) Certain tax adjustments (1.1) (29.2) Legal entity restructuring 1.9 — U.S. tax on foreign profit 3.6 2.7
Effective tax rate 5.9 % (16.4) %
During fiscal year 2021, the net benefit from certain tax adjustments of $41 million, recognized in taxation in the consolidated profit and loss account, included the following:
• A net benefit of $106 million associated with the resolution of an audit at the IRS Appellate level for fiscal years 2012, 2013, and 2014. The issues resolved relate to the utilization of certain net operating losses and the allocation of profit between Medtronic, Inc. and its wholly owned subsidiary operating in Puerto Rico for businesses that are not the subject of the U.S. Tax Court Case for fiscal years 2005 and 2006.
• A net cost of $73 million related to a tax basis adjustment of previously established deferred tax assets from intercompany intellectual property transactions. The cumulative amount of deferred tax benefit previously recognized from intercompany intellectual property transactions and recorded as Certain Tax Adjustments is $1.5 billion. The corresponding deferred tax assets will be amortized over a period of approximately 20 years.
• A cost of $50 million associated with the amortization of the previously established deferred tax assets from intercompany intellectual property transactions.
• A net cost of $25 million associated with an internal restructuring and intercompany sale of assets.
• A benefit of $83 million related to the capitalization of certain research and development costs for U.S. taxation purposes and the establishment of a deferred tax asset at the U.S. federal statutory tax rate.
During fiscal year 2020, the net benefit from certain tax adjustments of $1.2 billion, recognized in taxation in the consolidated profit and loss account, included the following:
• A net benefit of $63 million related to the finalization of certain state taxation from U.S. Tax Reform, and the issuance of certain final U.S. Treasury Regulations associated with U.S. Tax Reform. The primary impact of these regulations resulted in the Group re-establishing its permanently reinvested assertion on certain foreign profit and reversing the
Table of Contents
Medtronic plcNotes to the Consolidated Financial Statements
67
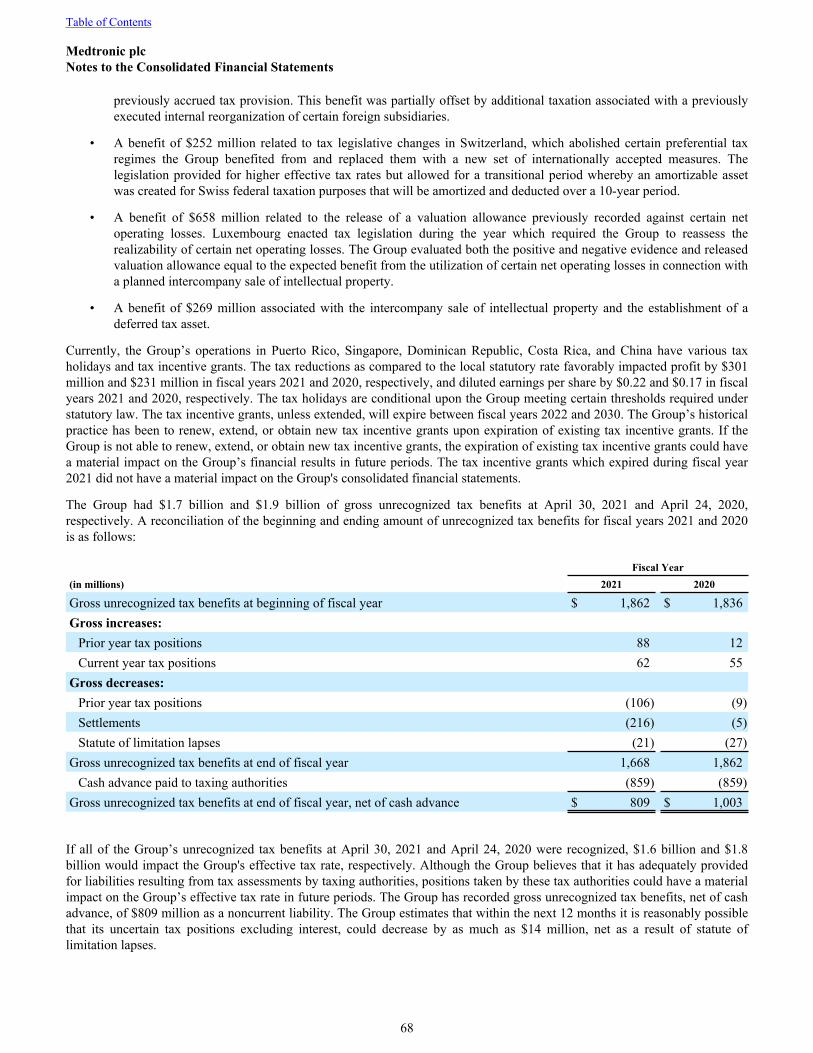
previously accrued tax provision. This benefit was partially offset by additional taxation associated with a previously executed internal reorganization of certain foreign subsidiaries.
• A benefit of $252 million related to tax legislative changes in Switzerland, which abolished certain preferential tax regimes the Group benefited from and replaced them with a new set of internationally accepted measures. The legislation provided for higher effective tax rates but allowed for a transitional period whereby an amortizable asset was created for Swiss federal taxation purposes that will be amortized and deducted over a 10-year period.
• A benefit of $658 million related to the release of a valuation allowance previously recorded against certain net operating losses. Luxembourg enacted tax legislation during the year which required the Group to reassess the realizability of certain net operating losses. The Group evaluated both the positive and negative evidence and released valuation allowance equal to the expected benefit from the utilization of certain net operating losses in connection with a planned intercompany sale of intellectual property.
• A benefit of $269 million associated with the intercompany sale of intellectual property and the establishment of a deferred tax asset.
Currently, the Group’s operations in Puerto Rico, Singapore, Dominican Republic, Costa Rica, and China have various tax holidays and tax incentive grants. The tax reductions as compared to the local statutory rate favorably impacted profit by $301 million and $231 million in fiscal years 2021 and 2020, respectively, and diluted earnings per share by $0.22 and $0.17 in fiscal years 2021 and 2020, respectively. The tax holidays are conditional upon the Group meeting certain thresholds required under statutory law. The tax incentive grants, unless extended, will expire between fiscal years 2022 and 2030. The Group’s historical practice has been to renew, extend, or obtain new tax incentive grants upon expiration of existing tax incentive grants. If the Group is not able to renew, extend, or obtain new tax incentive grants, the expiration of existing tax incentive grants could have a material impact on the Group’s financial results in future periods. The tax incentive grants which expired during fiscal year 2021 did not have a material impact on the Group's consolidated financial statements.
The Group had $1.7 billion and $1.9 billion of gross unrecognized tax benefits at April 30, 2021 and April 24, 2020, respectively. A reconciliation of the beginning and ending amount of unrecognized tax benefits for fiscal years 2021 and 2020 is as follows:
Fiscal Year(in millions) 2021 2020
Gross unrecognized tax benefits at beginning of fiscal year $ 1,862 $ 1,836 Gross increases:
Prior year tax positions 88 12 Current year tax positions 62 55
Gross decreases: Prior year tax positions (106) (9) Settlements (216) (5) Statute of limitation lapses (21) (27)
Gross unrecognized tax benefits at end of fiscal year 1,668 1,862 Cash advance paid to taxing authorities (859) (859)
Gross unrecognized tax benefits at end of fiscal year, net of cash advance $ 809 $ 1,003
If all of the Group’s unrecognized tax benefits at April 30, 2021 and April 24, 2020 were recognized, $1.6 billion and $1.8 billion would impact the Group's effective tax rate, respectively. Although the Group believes that it has adequately provided for liabilities resulting from tax assessments by taxing authorities, positions taken by these tax authorities could have a material impact on the Group’s effective tax rate in future periods. The Group has recorded gross unrecognized tax benefits, net of cash advance, of $809 million as a noncurrent liability. The Group estimates that within the next 12 months it is reasonably possible that its uncertain tax positions excluding interest, could decrease by as much as $14 million, net as a result of statute of limitation lapses.
Table of Contents
Medtronic plcNotes to the Consolidated Financial Statements
68

The Group recognizes interest and penalties related to income tax matters in taxation in the consolidated profit and loss account and records the liability in creditors (amounts falling due within one year) and creditors (amounts falling due after more than one year) in the consolidated balance sheet, as appropriate. The Group had $99 million and $225 million of accrued gross interest and penalties at April 30, 2021 and April 24, 2020, respectively. During fiscal years 2021 and 2020, the Group recognized gross interest receivable and similar income of $44 million and expense of $53 million, respectively, in taxation in the consolidated profit and loss account.
The Group reserves for uncertain tax positions related to unresolved matters with the IRS and other taxing authorities. These reserves are subject to a high degree of estimation and management judgment. Resolution of these significant unresolved matters, or positions taken by the IRS or other tax authorities during future tax audits, could have a material impact on the Group’s financial results in future periods. The Group continues to believe that its reserves for uncertain tax positions are appropriate and that it has meritorious defenses for its tax filings and will vigorously defend them during the audit process, appellate process, and through litigation in courts, as necessary.
The major tax jurisdictions where the Group conducts business which remain subject to examination are as follows:
Jurisdiction Earliest Year Open
United States - federal and state 2005Australia 2016Brazil 2016Canada 2013China 2015Costa Rica 2017Dominican Republic 2018France 2016Germany 2014India 2002Ireland 2012Israel 2010Italy 2005Japan 2017Korea 2017Luxembourg 2015Mexico 2007Puerto Rico 2011Singapore 2016Switzerland 2010United Kingdom 2017
See Note 4 for additional information regarding the status of current tax audits and proceedings.
7. Earnings Per Share
Earnings per share is calculated using the two-class method, as the Group's A Preferred Shares are considered participating securities. Accordingly, earnings are allocated to both ordinary shares and participating securities in determining earnings per ordinary share. Due to the limited number of A Preferred Shares outstanding, this allocation had no effect on the ordinary earnings per share; therefore, it is not presented below. Basic earnings per share is computed based on the weighted average number of ordinary shares outstanding. Diluted earnings per share is computed based on the weighted number of ordinary shares outstanding, increased by the number of additional shares that would have been outstanding had the potentially dilutive ordinary shares been issued, and reduced by the number of shares the Group could have repurchased with the proceeds from issuance of the potentially dilutive shares. Potentially dilutive ordinary shares include stock-based awards granted under stock-based compensation plans and shares committed to be purchased under the employee stock purchase plan.
Table of Contents
Medtronic plcNotes to the Consolidated Financial Statements
69

The table below sets forth the computation of basic and diluted earnings per share: Fiscal Year(in millions, except per share data) 2021 2020
Numerator:
Profit for the financial year attributable to ordinary shareholders $ 3,436 $ 4,959 Denominator:
Basic – weighted average shares outstanding 1,344.9 1,340.7 Effect of dilutive securities:
Employee stock options 6.6 7.2 Employee restricted stock units 2.1 2.8 Other 0.5 0.4
Diluted – weighted average shares outstanding 1,354.0 1,351.1
Basic earnings per share $ 2.55 $ 3.70 Diluted earnings per share $ 2.54 $ 3.67
The calculation of weighted average diluted shares outstanding excludes options to purchase approximately 4 million ordinary shares in fiscal years 2021 and 2020 because their effect would have been anti-dilutive on the Group’s earnings per share.
Table of Contents
Medtronic plcNotes to the Consolidated Financial Statements
70

8. Intangible Assets
Indefinite-lived intangible asset activity for fiscal year 2021 was as follows:
(in millions) Goodwill Acquired IPR&D Total
April 24, 2020 $ 39,841 $ 523 $ 40,364 Additions as a result of acquisitions 816 8 824 Transfers — (93) (93) Impairments — (45) (45) Purchase accounting adjustments (8) — (8) Currency translation 1,312 1 1,313
April 30, 2021 $ 41,961 $ 394 $ 42,355
During fiscal year 2021, the Group recognized $45 million of indefinite-lived intangible asset charges related to the abandonment of certain IPR&D projects in the Neuroscience segment. During fiscal year 2020, the Group recognized $35 million of indefinite-lived intangible asset charges, including $25 million relating to a partial impairment of an IPR&D project within the Neuroscience segment and $10 million in connection with the discontinuation of an IPR&D project within the Cardiovascular segment. Indefinite-lived intangible asset charges are recognized in other operating expense (income), net in the consolidated profit and loss account. Due to the nature of IPR&D projects, the Group may experience future delays or failures to obtain regulatory approvals to conduct clinical trials, failure of such clinical trials, delays or failures to obtain required market clearances, other failures to achieve a commercially viable product, or the discontinuation of certain projects, and as a result, may recognize impairment losses in the future. The Group did not recognize any goodwill impairments during fiscal year 2021 or 2020.
The following table presents the changes in the carrying amount of goodwill by segment:
(in millions) Cardiovascular Medical Surgical Neuroscience Diabetes Total
April 24, 2020 $ 6,831 $ 20,176 $ 10,920 $ 1,914 $ 39,841 Goodwill as a result of acquisitions 248 12 210 346 816 Purchase accounting adjustments (2) (5) 3 (4) (8) Currency translation and other 132 1,012 167 1 1,312
April 30, 2021 $ 7,209 $ 21,195 $ 11,300 $ 2,257 $ 41,961
Table of Contents
Medtronic plcNotes to the Consolidated Financial Statements
71

Definite-Lived Intangible Asset Carrying Value The following table presents the changes in gross carrying amount and accumulated amortization of definite-lived intangible assets:
(in millions)Customer-
related
Purchased Technology and
Patents Trademarks and
Tradenames Other Total
Cost:April 24, 2020 $ 16,963 $ 10,742 $ 464 $ 75 $ 28,244
Additions as a result of acquisitions 20 417 10 4 451 Transfers — 93 — — 93 Retired intangible assets — (21) — — (21) Impairments — (30) — — (30) Currency translation and other 53 85 1 3 142
April 30, 2021 $ 17,036 $ 11,286 $ 475 $ 82 $ 28,879 Accumulated Amortization:April 24, 2020 $ (5,065) $ (4,354) $ (232) $ (53) $ (9,704)
Amortization expense (976) (773) (19) (14) (1,782) Retired intangible assets — 21 — — 21 Currency translation and other (17) (50) — (1) (68)
April 30, 2021 $ (6,058) $ (5,156) $ (251) $ (68) $ (11,533) Net Book Value:April 24, 2020 $ 11,898 $ 6,388 $ 232 $ 22 $ 18,540 April 30, 2021 $ 10,978 $ 6,130 $ 224 $ 14 $ 17,346
During fiscal year 2021, the Group recognized $30 million of definite-lived intangible asset charges in connection with the abandonment of certain intangible assets within the Neuroscience segment. During fiscal year 2020, the Group recognized $37 million of definite-lived intangible asset charges, including $33 million and $4 million recognized in connection with business exits in the Neuroscience and Cardiovascular segments, respectively. Definite-lived intangible asset charges are recognized in other operating expense (income), net in the consolidated profit and loss account.
Definite-Lived Intangible Asset Amortization
Intangible asset amortization expense was $1.8 billion for fiscal years 2021 and 2020. Estimated aggregate amortization expense by fiscal year based on the current carrying value and remaining estimated useful lives of definite-lived intangible assets at April 30, 2021, excluding any possible future amortization associated with acquired IPR&D which has not met technological feasibility, is as follows:
(in millions)Amortization
Expense
2022 $ 1,758 2023 1,693 2024 1,662 2025 1,635 2026 1,623
Table of Contents
Medtronic plcNotes to the Consolidated Financial Statements
72

9. Acquisitions
The Group had acquisitions during fiscal years 2021 and 2020 that were accounted for as business combinations. The assets and liabilities of businesses acquired were recorded and consolidated on the acquisition date at their respective fair values. Goodwill resulting from business combinations is largely attributable to future yet to be defined technologies, new customer relationships, existing workforce of the acquired businesses, and synergies expected to arise after the Group's acquisition of these businesses. The pro forma impact of acquisitions during fiscal years 2021 and 2020 was not significant, either individually or in the aggregate, to the consolidated results of the Group. The results of operations of acquired businesses have been included in the Group’s consolidated profit and loss account since the date each business was acquired.
Fiscal Year 2021
The acquisition date fair value of net assets acquired during fiscal year 2021 was $1.2 billion, consisting of $1.4 billion of assets acquired and $161 million of liabilities assumed. Based upon preliminary valuations, assets acquired were primarily comprised of $417 million of technology-based intangible assets and $13 million of customer-related intangible assets with estimated useful lives ranging from 8 to 15 years, and $816 million of goodwill. The goodwill is not deductible for tax purposes. The Group recognized $253 million of contingent consideration liabilities in connection with business combinations during fiscal year 2021, which are comprised of turnover and regulatory milestone-based payments. Purchase price allocation adjustments for fiscal year 2021 business combinations were not significant.
Fiscal Year 2020
The acquisition date fair value of net assets acquired during fiscal year 2020 was $612 million, consisting of $679 million of assets acquired and $67 million of liabilities assumed. Assets acquired were primarily comprised of $236 million of technology-based intangible assets and $26 million of customer-related intangible assets with estimated useful lives ranging from 8 to 16 years, $333 million of goodwill, and $40 million of inventory. The goodwill is not deductible for tax purposes. The Group recognized $80 million of contingent consideration liabilities in connection with business combinations during fiscal year 2020, which are comprised of turnover and regulatory milestone-based payments. Additionally, the Group recognized a gain of $132 million related to a change in amounts accrued for certain contingent liabilities from a recent acquisition. The benefit was recognized in other operating expense (income), net in the consolidated profit and loss account. Purchase price allocation adjustments for fiscal year 2020 business combinations were not significant.
Table of Contents
Medtronic plcNotes to the Consolidated Financial Statements
73

Contingent Consideration
The fair value of contingent consideration at April 30, 2021 and April 24, 2020 was $270 million and $280 million, respectively. At April 30, 2021, $78 million was recorded in creditors (amounts falling due within one year), and $192 million was recorded in creditors (amounts falling due after more than one year) on the consolidated balance sheet. At April 24, 2020, $112 million was reflected in creditors (amounts falling due within one year), and $168 million was reflected in creditors (amounts falling due after more than one year) on the consolidated balance sheet.
The following table provides a reconciliation of the beginning and ending balances of contingent consideration:
Fiscal Year(in millions) 2021 2020
Beginning Balance $ 280 $ 222 Purchase price contingent consideration 253 125 Payments (299) (34) Change in fair value 36 (33)
Ending Balance $ 270 $ 280
The recurring Level 3 fair value measurements of contingent consideration for which a provision is recorded include the following significant unobservable inputs:
(in millions)Fair Value at April 30, 2021 Unobservable Input Range
Weighted Average (1)
Discount rate 11.2% - 31.6% 17.0%
Turnover and other performance-based payments $ 250 Probability of payment 30% - 100% 99.1%
Projected fiscal year of payment 2022 - 2027 2025
Discount rate 5.5% 5.5%
Product development and other milestone-based payments
$ 20 Probability of payment 100% 100%
Projected fiscal year of payment 2022 - 2027 2025(1) Unobservable inputs were weighted by the relative fair value of the contingent consideration provision. For projected fiscal year of payment, the amount represents the median of the inputs and is not a weighted average.
Table of Contents
Medtronic plcNotes to the Consolidated Financial Statements
74
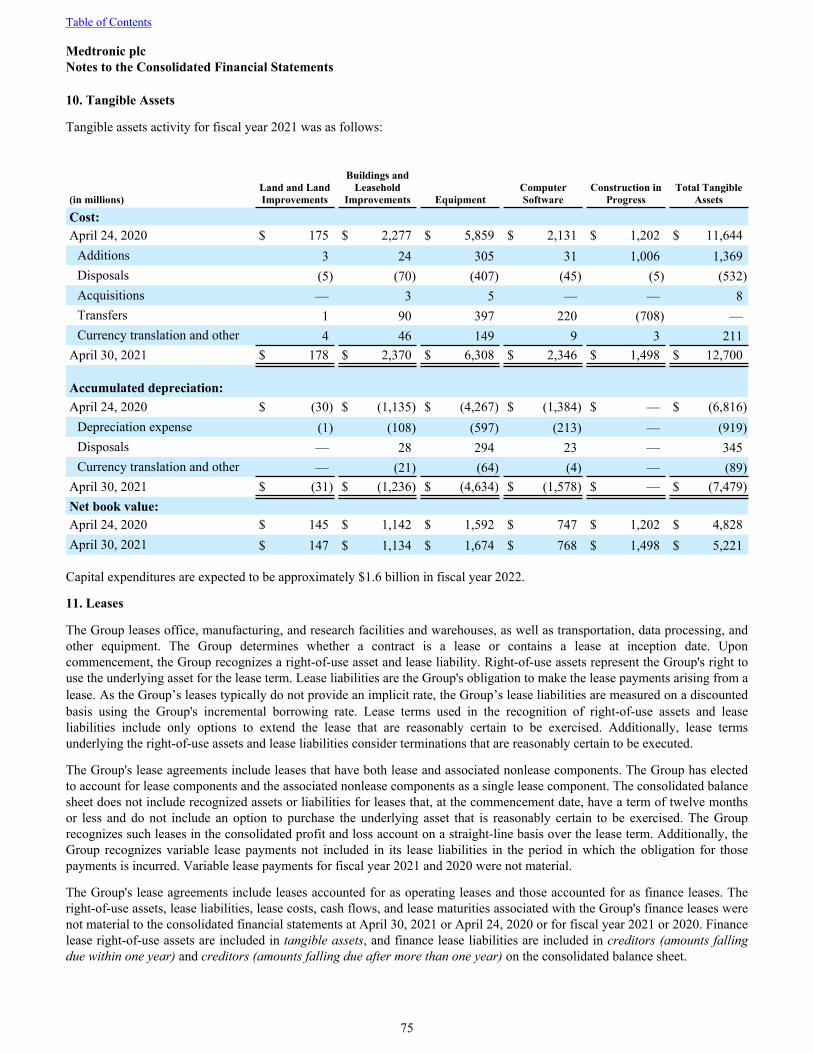
10. Tangible Assets
Tangible assets activity for fiscal year 2021 was as follows:
(in millions)Land and Land Improvements
Buildings and Leasehold
Improvements EquipmentComputer Software
Construction in Progress
Total Tangible Assets
Cost:April 24, 2020 $ 175 $ 2,277 $ 5,859 $ 2,131 $ 1,202 $ 11,644
Additions 3 24 305 31 1,006 1,369 Disposals (5) (70) (407) (45) (5) (532) Acquisitions — 3 5 — — 8 Transfers 1 90 397 220 (708) — Currency translation and other 4 46 149 9 3 211
April 30, 2021 $ 178 $ 2,370 $ 6,308 $ 2,346 $ 1,498 $ 12,700
Accumulated depreciation:April 24, 2020 $ (30) $ (1,135) $ (4,267) $ (1,384) $ — $ (6,816)
Depreciation expense (1) (108) (597) (213) — (919) Disposals — 28 294 23 — 345 Currency translation and other — (21) (64) (4) — (89)
April 30, 2021 $ (31) $ (1,236) $ (4,634) $ (1,578) $ — $ (7,479) Net book value:April 24, 2020 $ 145 $ 1,142 $ 1,592 $ 747 $ 1,202 $ 4,828 April 30, 2021 $ 147 $ 1,134 $ 1,674 $ 768 $ 1,498 $ 5,221
Capital expenditures are expected to be approximately $1.6 billion in fiscal year 2022.
11. Leases
The Group leases office, manufacturing, and research facilities and warehouses, as well as transportation, data processing, and other equipment. The Group determines whether a contract is a lease or contains a lease at inception date. Upon commencement, the Group recognizes a right-of-use asset and lease liability. Right-of-use assets represent the Group's right to use the underlying asset for the lease term. Lease liabilities are the Group's obligation to make the lease payments arising from a lease. As the Group’s leases typically do not provide an implicit rate, the Group’s lease liabilities are measured on a discounted basis using the Group's incremental borrowing rate. Lease terms used in the recognition of right-of-use assets and lease liabilities include only options to extend the lease that are reasonably certain to be exercised. Additionally, lease terms underlying the right-of-use assets and lease liabilities consider terminations that are reasonably certain to be executed.
The Group's lease agreements include leases that have both lease and associated nonlease components. The Group has elected to account for lease components and the associated nonlease components as a single lease component. The consolidated balance sheet does not include recognized assets or liabilities for leases that, at the commencement date, have a term of twelve months or less and do not include an option to purchase the underlying asset that is reasonably certain to be exercised. The Group recognizes such leases in the consolidated profit and loss account on a straight-line basis over the lease term. Additionally, the Group recognizes variable lease payments not included in its lease liabilities in the period in which the obligation for those payments is incurred. Variable lease payments for fiscal year 2021 and 2020 were not material.
The Group's lease agreements include leases accounted for as operating leases and those accounted for as finance leases. The right-of-use assets, lease liabilities, lease costs, cash flows, and lease maturities associated with the Group's finance leases were not material to the consolidated financial statements at April 30, 2021 or April 24, 2020 or for fiscal year 2021 or 2020. Finance lease right-of-use assets are included in tangible assets, and finance lease liabilities are included in creditors (amounts falling due within one year) and creditors (amounts falling due after more than one year) on the consolidated balance sheet.
Table of Contents
Medtronic plcNotes to the Consolidated Financial Statements
75

The following table summarizes the balance sheet classification of the Group's operating leases and amounts of the right-of-use assets and lease liabilities at April 30, 2021 and April 24, 2020:
(in millions) Balance Sheet Classification April 30, 2021 April 24, 2020
Right-of-use assets Right of use assets $ 998 $ 927 Current liability Creditors (amounts falling due within one year) 186 171 Non-current liability Creditors (amounts falling due after more than one year) 829 774
The following table summarizes the weighted-average remaining lease term and weighted-average discount rate for the Group's operating leases at April 30, 2021 and April 24, 2020:
April 30, 2021 April 24, 2020
Weighted-average remaining lease term 7.5 years 7.2 yearsWeighted-average discount rate 2.3% 3.0%
The following table summarizes the components of total operating lease cost for fiscal year 2021 and 2020:
Fiscal Year Fiscal Year(in millions) 2021 2020
Operating lease cost $ 216 $ 223 Short-term lease cost 35 46
Total operating lease cost $ 251 $ 269
Right of use asset activity for fiscal year 2021 was as follows:
Fiscal Year(in millions) 2021
April 24, 2020 $ 927 Additions 230 Amortization (232) Currency translation and other 73
April 30, 2021 $ 998
The following table summarizes the cash paid for amounts included in the measurement of operating lease liabilities and right-of-use assets obtained in exchange for operating lease liabilities for fiscal year 2021 and 2020:
Fiscal Year Fiscal Year(in millions) 2021 2020
Cash paid for amounts included in the measurement of operating lease liabilities $ 216 $ 221 Right-of-use assets obtained in exchange for operating lease liabilities 230 174
Table of Contents
Medtronic plcNotes to the Consolidated Financial Statements
76

The following table summarizes the maturities of the Group's operating leases at April 30, 2021:
(in millions)Fiscal Year Operating Leases
2022 $ 223 2023 166 2024 147 2025 119 2026 97 Thereafter 338
Total expected lease payments 1,090 Less: Imputed interest (75)
Total lease liability $ 1,015
The Group makes certain products available to customers under lease arrangements, including arrangements whereby equipment is placed with customers who then purchase consumable products to accompany the use of the equipment. Profit arising from arrangements where the Group is the lessor is recognized within turnover in the consolidated profit and loss account and the Group's net investments in sales-type leases are included in debtors in the consolidated balance sheet. Lessor profit and the related assets and lease maturities were not material to the consolidated financial statements at or for the fiscal year ended April 30, 2021 and April 24, 2020.
12. Financial Assets/Fair Value Measurement
Debt Securities
The Group holds investments in marketable debt securities that are classified and accounted for as available-for-sale and are remeasured on a recurring basis. The following tables summarize the Group's investments in available-for-sale debt securities by significant investment category and the related consolidated balance sheet classification at April 30, 2021 and April 24, 2020:
April 30, 2021Valuation Balance Sheet Classification
(in millions) CostUnrealized
GainsUnrealized
Losses Fair ValueShort-term Investments
Financial Assets
Level 1: U.S. government and agency securities $ 505 $ 26 $ (3) $ 528 $ 528 $ —
Level 2:Corporate debt securities 4,557 103 (13) 4,647 4,647 — U.S. government and agency securities 810 — (7) 804 804 — Mortgage-backed securities 645 21 (16) 650 650 — Non-U.S. government and agency securities 31 1 — 33 33 — Certificates of deposit 19 — — 19 19 Other asset-backed securities 534 4 (1) 537 537 — Debt funds 7 — — 7 7 —
Total Level 2 6,603 129 (36) 6,696 6,696 — Level 3:Auction rate securities 36 — (3) 33 — 33
Total available-for-sale debt securities $ 7,144 $ 155 $ (42) $ 7,257 $ 7,224 $ 33
Table of Contents
Medtronic plcNotes to the Consolidated Financial Statements
77

April 24, 2020Valuation Balance Sheet Classification
(in millions) CostUnrealized
GainsUnrealized
Losses Fair ValueShort-term Investments
Financial Assets
Level 1: U.S. government and agency securities $ 542 $ 47 $ — $ 589 $ 589 $ —
Level 2:Corporate debt securities 4,285 66 (90) 4,261 4,261 — U.S. government and agency securities 746 1 — 747 747 — Mortgage-backed securities 705 20 (28) 697 697 — Non-U.S. government and agency securities 34 — — 34 34 — Other asset-backed securities 499 1 (20) 480 480 —
Total Level 2 6,269 88 (138) 6,219 6,219 — Level 3:Auction rate securities 36 — (3) 33 — 33
Total available-for-sale debt securities $ 6,847 $ 135 $ (141) $ 6,841 $ 6,808 $ 33
The amortized cost of debt securities excludes accrued interest, which is reported in debtors in the consolidated balance sheet.
The following tables present the gross unrealized losses and fair values of the Group's available-for-sale debt securities that have been in a continuous unrealized loss position deemed to be temporary, aggregated by investment category at April 30, 2021 and April 24, 2020:
April 30, 2021 Less than 12 months More than 12 months
(in millions) Fair ValueUnrealized
Losses Fair ValueUnrealized
Losses
U.S. government and agency securities $ 946 $ (10) $ — $ — Corporate debt securities 1,437 — 3,209 (13) Mortgage-backed securities 1 — 650 (16) Other asset-backed securities 6 — 531 (1) Auction rate securities — — 33 (3)
Total $ 2,389 $ (10) $ 4,423 $ (32)
April 24, 2020 Less than 12 months More than 12 months
(in millions) Fair ValueUnrealized
Losses Fair ValueUnrealized
Losses
Corporate debt securities $ 1,368 $ (2) $ 2,893 $ (88) Mortgage-backed securities 35 (1) 663 (27) Other asset-backed securities 17 — 463 (20) Auction rate securities 33 (3) — — Total $ 1,453 $ (6) $ 4,019 $ (135)
The Group reviews the fair value hierarchy classification on a quarterly basis. Changes in the ability to observe valuation inputs may result in a reclassification of levels for certain securities within the fair value hierarchy. There were no transfers into or out of Level 3 during the fiscal years ended April 30, 2021 and April 24, 2020. When a determination is made to classify an asset or liability within Level 3, the determination is based upon the significance of the unobservable inputs to the overall fair value measurement.
Table of Contents
Medtronic plcNotes to the Consolidated Financial Statements
78

Activity related to the Group’s available for sale securities portfolio is as follows:
(in millions) April 30, 2021 April 24, 2020
Proceeds from sales and maturities $ 10,420 $ 9,559 Gross realized gains 15 25 Gross realized losses (14) (22)
During the fiscal year ended April 30, 2021, the Group had proceeds from maturities of investments classified as held to maturity of $911 million.
The April 30, 2021 balance of available-for-sale debt securities by contractual maturity is shown in the following table. Within the table, maturities of mortgage-backed securities have been allocated based upon timing of estimated cash flows assuming no change in the current interest rate environment. Actual maturities may differ from contractual maturities because the issuers of the securities may have the right to prepay obligations without prepayment penalties.
(in millions) April 30, 2021
Due in one year or less $ 1,891 Due after one year through five years 2,862 Due after five years through ten years 1,838 Due after ten years 666
Total debt securities $ 7,257
Equity Securities, Equity Method Investments, and Other Investments
The Group commonly holds investments in equity securities with readily determinable fair values, equity investments without readily determinable fair values, investments accounted for under the equity method, and other investments. Equity securities with readily determinable fair values are included within Level 1 of the fair value hierarchy, as they are measured using quoted market prices. Equity method investments and investments without readily determinable fair values are included within Level 3 of the fair value hierarchy due to the use of significant unobservable inputs to determine fair value. To determine the fair value of these investments, the Group uses all pertinent financial information available related to the investees, including financial statements, market participant valuations from recent and proposed equity offerings, and other third-party data.
The following table summarizes the Group's equity and other investments at April 30, 2021 and April 24, 2020, which are classified as financial assets in the consolidated balance sheet:
(in millions) April 30, 2021 April 24, 2020
Investments with readily determinable fair values (marketable equity securities) $ 74 $ 18 Investments without readily determinable fair values 537 391 Equity method and other investments 76 71
Total equity and other investments $ 687 $ 480
The table below includes activity related to the Group’s portfolio of equity and other investments. Gains and losses on equity and other investments are recognized in other non-operating income, net in the consolidated profit and loss account.
(in millions) April 30, 2021 April 24, 2020
Proceeds from sales $ 13 $ 15 Gross gains 68 17 Gross losses (3) (30) Recognized impairment losses (4) (4)
During the fiscal year ended April 30, 2021, there were $63 million of net unrealized gains on equity securities and other investments still held at April 30, 2021. During the fiscal year ended April 24, 2020, there were $15 million of net unrealized losses on equity securities and other investments still held at April 24, 2020.
Table of Contents
Medtronic plcNotes to the Consolidated Financial Statements
79

Financial assets and short-term investments activity for fiscal year 2021 was as follows:
(in millions) Debt Equity Total
April 24, 2020 $ 6,841 $ 480 $ 7,321 Purchases 11,623 185 11,808 Proceeds from sales (11,331) (13) (11,345) Realized gain, net 1 65 66 Impairments — (4) (4) Unrealized gain, net 119 — 119 Other 4 (26) (22)
April 30, 2021 $ 7,257 $ 687 $ 7,944
13. Inventories
Inventory balances were as follows:
(in millions) April 30, 2021 April 24, 2020
Finished goods $ 2,906 $ 2,874 Work-in-process 611 608 Raw materials 796 747
Total $ 4,313 $ 4,229
14. Debtors
Debtors consisted of the following:(in millions) April 30, 2021 April 24, 2020
Amounts falling due within one year:Trade debtors, less allowances and credit losses of $241 and $208, respectively $ 5,462 $ 4,645 Tax assets (note 6) 756 780Derivative contracts receivable (note 15) 81 299Interest receivable 31 35Other debtors and prepayments 1,087 1,095
Total amounts falling due within one year 7,417 6,854
Amounts falling due after more than one year:Long-term tax assets (note 6) 3,169 2,832Derivative contracts receivable (note 15) 22 103Other debtors 703 551
Total amounts falling due after more than one year 3,894 3,486Total debtors $ 11,311 $ 10,340
15. Derivatives and Currency Exchange Risk Management
The Group uses operational and economic hedges, including currency exchange rate derivative contracts and interest rate derivative instruments, to manage the impact of currency exchange and interest rate changes on profit and cash flows. In addition, the Group uses cross currency interest rate swaps to manage currency risk related to certain debt. In order to minimize profit and cash flow volatility resulting from currency exchange rate changes, the Group enters into derivative instruments, principally forward currency exchange rate contracts. These contracts are designed to hedge anticipated foreign currency transactions and changes in the value of specific assets and liabilities. At inception of the contract, the derivative is designated as either a freestanding derivative or a cash flow hedge. Currencies of our derivative instruments include the Euro, Japanese Yen, Chinese Yuan, and others. The Group does not enter into currency exchange rate derivative contracts for speculative
Table of Contents
Medtronic plcNotes to the Consolidated Financial Statements
80

purposes. The gross notional amount of all currency exchange rate derivative instruments outstanding was $14.7 billion and $11.9 billion at April 30, 2021 and April 24, 2020, respectively.
The Group also uses derivative and non-derivative instruments to manage the impact of currency exchange rate changes on net investments in foreign currency-denominated operations. The information that follows explains the various types of derivatives and financial instruments used by the Group, reasons the Group uses such instruments, and the impact such instruments have on the Group’s consolidated balance sheet and consolidated profit and loss account.
Freestanding Derivative Contracts
Freestanding derivative contracts are primarily used to offset the Group’s exposure to the change in value of specific foreign-currency-denominated assets and liabilities, and to offset variability of cash flows associated with forecasted transactions denominated in foreign currencies. The gross notional amount of the Group's freestanding currency exchange rate contracts outstanding at April 30, 2021 and April 24, 2020 was $5.7 billion and $4.9 billion, respectively. The Group's freestanding currency exchange rate contracts are not designated as hedges, and therefore, changes in the value of these contracts are recognized in profit, thereby offsetting the current profit effect of the related change in value of foreign-currency-denominated assets, liabilities, and cash flows.
The Group also uses total return swaps to hedge the liability of a non-qualified, deferred compensation plan. The gross notional amount of the Group's total return swaps outstanding at April 30, 2021 and April 24, 2020 was $243 million and $181 million, respectively. The Group's total return swaps are not designated as hedges, and therefore, changes in the value of these instruments are recognized in profit. The cash flows related to the Group's freestanding derivative contracts are reported as operating activities or financing activities, depending on the nature of the underlying hedged item, in the consolidated statement of cash flows.
The amounts and classification of the (gains) losses in the consolidated profit and loss account related to derivative instruments, not designated as hedging instruments, for fiscal years 2021 and 2020 were as follows:
Fiscal Year(in millions) Classification 2021 2020
Currency exchange rate contracts Other operating expense (income), net $ 247 $ (133) Total return swaps Other operating expense (income), net (81) 7
Total $ 166 $ (126)
Cash Flow Hedges
Forward contracts designated as cash flow hedges are designed to hedge the variability of cash flows associated with forecasted transactions denominated in a foreign currency that will take place in the future. The gross notional amount of these contracts, designated as cash flow hedges, outstanding at April 30, 2021 and April 24, 2020 was $9.0 billion and $7.0 billion, respectively, and will mature within the subsequent three-year period. For derivative instruments that are designated and qualify as a cash flow hedge, the gain or loss on the derivative instrument is reported as a component of accumulated other comprehensive loss. The gain or loss on the derivative instrument is reclassified into profit and is included in other operating expense (income), net or cost of sales in the consolidated profit and loss account in the same period or periods during which the hedged transaction affects profit. Amounts excluded from the measurement of hedge effectiveness are recognized in profit in the current period. The cash flows related to all of the Group's derivative instruments designated as cash flow hedges are reported as operating activities in the consolidated statement of cash flows. No components of the hedge contracts were excluded in the measurement of hedge effectiveness, and no forward contracts designated as cash flow hedges were derecognized or discontinued during fiscal years 2021 or 2020.
Table of Contents
Medtronic plcNotes to the Consolidated Financial Statements
81

The amount of the (gains) losses recognized in accumulated other comprehensive loss (AOCI) related to currency exchange rate contract derivative instruments designated as cash flow hedges for fiscal years 2021 and 2020 were as follows:
Fiscal Year(in millions) 2021 2020
Currency exchange rate contracts $ 627 $ (397)
The amount of the (gains) losses recognized in the consolidated profit and loss account related to derivative instruments designated as cash flow hedges for fiscal years 2021 and 2020 were as follows:
Fiscal Year2021 2020
(in millions)
Other operating expense
(income), net Cost of sales
Other operating expense
(income), net Cost of sales
Total amounts of profit and expense line items presented in the consolidated profit and loss account in which the effects of cash flow hedges are recorded $ 447 $ 10,483 $ (61) $ 9,424
Currency exchange rate contracts designated as cash flow hedges:
Amount of (gain) loss reclassified from AOCI into profit (17) 15 (335) —
Forecasted Debt Issuance Interest Rate Risk
Forward starting interest rate derivative instruments designated as cash flow hedges are designed to manage the exposure to interest rate volatility with regard to future issuances of fixed-rate debt. The gains or losses on forward starting interest rate derivative instruments that are designated and qualify as cash flow hedges are reported as a component of accumulated other comprehensive loss. Beginning in the period in which the planned debt issuance occurs and the related derivative instruments are terminated, the gains or losses are then reclassified into interest payable and similar expenses over the term of the related debt. For fiscal years 2021 and 2020 the reclassifications of net (gains) losses on forward starting interest rate derivative instruments from accumulated other comprehensive loss to interest payable and similar expenses were not significant.
At April 30, 2021 and April 24, 2020, the Group had $253 million in after-tax unrealized losses and $266 million in after-tax net unrealized gains, respectively, associated with cash flow hedging instruments recorded in accumulated other comprehensive loss. The Group expects that $146 million of after-tax net unrealized losses at April 30, 2021 will be recognized in the consolidated profit and loss account over the next 12 months.
Net Investment Hedges
The Group has designated Euro-denominated debt as a net investment hedge of certain of its European operations to manage the exposure to currency and exchange rate movements for foreign currency-denominated net investments in foreign operations. At April 30, 2021, the Group had €16.0 billion, or $19.3 billion, of outstanding Euro-denominated debt designated as a hedge of its net investment in certain of its European operations, which will mature in fiscal years 2023 through fiscal year 2051.
In February 2021, the Group de-designated ¥300 billion of outstanding Yen-denominated debt previously designated as a net investment hedge and concurrently entered into freestanding forward derivative contracts with a total notional value of ¥300 billion, or approximately $2.9 billion. These forward contracts were not designated as hedges. The Group used the proceeds from these forward derivative contracts to repay the ¥300 billion of Yen-denominated debt in conjunction with the maturity of these forward contracts in March and April of 2021.
Table of Contents
Medtronic plcNotes to the Consolidated Financial Statements
82

Additionally, during the first quarter of fiscal year 2020, the Group entered into and settled forward currency exchange rate contracts to manage the exposure to exchange rate movements in anticipation of the issuance of Euro-denominated senior notes. Certain of these forward currency exchange rate contracts were designated as a net investment hedge of certain of the Group's European operations. These contracts matured in conjunction with the issuance of the Euro-denominated debt in the first quarter of fiscal year 2020.
For instruments that are designated and qualify as net investment hedges, the gains or losses are reported as a component of accumulated other comprehensive loss. The gains or losses are reclassified into profit upon a liquidation event or deconsolidation of the foreign subsidiary. Amounts excluded from the assessment of effectiveness are recognized in other operating expense (income), net. The cash flows related to the Group's derivative instruments designated as net investment hedges are reported as investing activities in the consolidated statement of cash flows.
At April 30, 2021 and April 24, 2020, the Group had $1.5 billion in after-tax unrealized losses, and $236 million in after-tax unrealized gains associated with net investment hedges recorded in accumulated other comprehensive loss, respectively. The Group does not expect any of the after-tax unrealized losses at April 30, 2021 to be recognized in the consolidated profit and loss account over the next 12 months.
The Group did not recognize any gains or losses during fiscal years 2021 or 2020 on instruments that no longer qualify as net investment hedges.
The amount and classifications of the (gains) losses recognized in the consolidated profit and loss account for the portion of the net investment hedges excluded from the measurement of hedge effectiveness were as follows:
Fiscal Year(in millions) Classification 2021 2020
Net investment hedges Other operating expense (income), net $ — $ (9)
The amount of the (gains) losses recognized in AOCI related to instruments designated as net investment hedges for fiscal year 2021 and 2020 were as follows:
Fiscal Year
(in millions) 2021 2020
Net investment hedges $ (1,694) $ (405)
Table of Contents
Medtronic plcNotes to the Consolidated Financial Statements
83

Balance Sheet Presentation
The following tables summarize the balance sheet classification and fair value of derivative instruments included in the consolidated balance sheet at April 30, 2021 and April 24, 2020. The fair value amounts are presented on a gross basis, and are segregated between derivatives that are designated and qualify as hedging instruments and those that are not designated and do not qualify as hedging instruments, and are further segregated by type of contract within those two categories.
April 30, 2021 Derivative Assets Derivative Liabilities
(in millions) Balance Sheet Classification Fair Value Balance Sheet Classification Fair Value
Derivatives designated as hedging instruments
Currency exchange rate contracts Debtors $ 49 Creditors (amounts falling due within one year) $ 190
Currency exchange rate contracts Debtors 22
Creditors (amounts falling due after more than one year) 94
Total derivatives designated as hedging instruments 70 285
Derivatives not designated as hedging instruments
Currency exchange rate contracts Debtors 14 Creditors (amounts falling due within one year) 11
Total return swaps Debtors 18
Creditors (amounts falling due after more than one year) —
Total derivatives not designated as hedging instruments 32 11
Total derivatives $ 102 $ 296
April 24, 2020 Derivative Assets Derivative Liabilities
(in millions) Balance Sheet Classification Fair Value Balance Sheet Classification Fair Value
Derivatives designated as hedging instruments
Currency exchange rate contracts Debtors $ 271 Creditors (amounts falling due within one year) $ 2
Currency exchange rate contracts Debtors 103
Creditors (amounts falling due after more than one year) 2
Total derivatives designated as hedging instruments 374 4
Derivatives not designated as hedging instruments
Currency exchange rate contracts Debtors 25 Creditors (amounts falling due within one year) 13
Total return swaps Debtors — Creditors (amounts falling due within one year) 25
Cross-currency interest rate contracts Debtors 3 Creditors (amounts falling due within one year) —
Total derivatives not designated as hedging instruments 28 38
Total derivatives $ 402 $ 42
Table of Contents
Medtronic plcNotes to the Consolidated Financial Statements
84

The following table provides information by level for the derivative assets and liabilities that are measured at fair value on a recurring basis:
April 30, 2021 April 24, 2020(in millions) Level 1 Level 2 Level 1 Level 2
Derivative assets $ 85 $ 18 $ 399 $ 3 Derivative liabilities 296 — 17 25
The Group has elected to present the fair value of derivative assets and liabilities within the consolidated balance sheet on a gross basis, even when derivative transactions are subject to master netting arrangements and may otherwise qualify for net presentation. The cash flows related to collateral posted and received are reported gross as investing and financing activities, respectively, in the consolidated statement of cash flows.
The following tables provide information as if the Group had elected to offset the asset and liability balances of derivative instruments, netted in accordance with various criteria as stipulated by the terms of the master netting arrangements with each of the counterparties. Derivatives not subject to master netting arrangements are not eligible for net presentation.
April 30, 2021Gross Amount Not Offset on the
Balance Sheet
(in millions)
Gross Amount of Recognized Assets
(Liabilities)Financial
Instruments
Cash Collateral (Received)
Posted Net Amount
Derivative assets:Currency exchange rate contracts $ 85 $ (83) $ — $ 1 Total return swaps 18 — — 18
102 (83) — 19 Derivative liabilities:
Currency exchange rate contracts (296) 83 46 (167) Total $ 193 $ — $ 46 $ (148)
April 24, 2020Gross Amount Not Offset on the
Balance Sheet
(in millions)
Gross Amount of Recognized Assets
(Liabilities)Financial
Instruments
Cash Collateral (Received)
Posted Net Amount
Derivative assets:Currency exchange rate contracts $ 399 $ (17) $ (48) $ 334 Cross-currency interest rate contracts 3 — — 3
402 (17) (48) 337 Derivative liabilities:
Currency exchange rate contracts (17) 17 — — Total return swaps (25) — — (25)
(42) 17 — (25) Total $ 360 $ — $ (48) $ 312
Table of Contents
Medtronic plcNotes to the Consolidated Financial Statements
85

Concentrations of Credit Risk
Financial instruments, which potentially subject the Group to significant concentrations of credit risk, consist principally of interest-bearing investments, forward exchange derivative contracts, and trade debtors. Global concentrations of credit risk with respect to trade debtors are limited due to the large number of customers and their dispersion across many geographic areas. The Group monitors the creditworthiness of its customers to which it grants credit terms in the normal course of business.
The Group maintains cash at bank and in hand, investments, and certain other financial instruments (including currency exchange rate and interest rate derivative contracts) with various major financial institutions. The Group performs periodic evaluations of the relative credit standings of these financial institutions and limits the amount of credit exposure with any one institution. In addition, the Group has collateral credit agreements with its primary derivatives counterparties. Under these agreements, either party is required to post eligible collateral when the market value of transactions covered by the agreement exceeds specific thresholds, thus limiting credit exposure for both parties. As of April 30, 2021, the Group posted net cash collateral of $46 million to its counterparties. As of April 24, 2020, the Group received net cash collateral of $48 million from its counterparties. Cash collateral posted is recorded as a reduction in cash at bank and in hand with the offset recorded as an increase in debtors in the consolidated balance sheet. Cash collateral received is recorded as an increase in cash at bank and in hand with the offset recorded in creditors (amounts falling due within one year) in the consolidated balance sheet.
16. Creditors
Creditors consisted of the following:(in millions) April 30, 2021 April 24, 2020
Amounts falling due within one year:Accrued payroll and employee benefits $ 2,331 $ 1,957 Trade creditors 2,106 1,996 Income taxes payable (note 6) 435 502 Deferred revenue (note 2) 276 213 Payables on derivatives and hedges (note 15) 201 40 Operating lease liabilities (note 11) 186 171 Accrued interest 121 101 Financing arrangements (note 17) 11 2,776 Other creditors including tax and social insurance (1) 1,206 1,126
Total amounts falling due within one year $ 6,873 $ 8,882
Amounts falling due after more than one year:Financing arrangements (note 17) $ 26,378 $ 22,021 Income taxes payable (note 6) 2,251 2,682 Operating lease liabilities (note 11) 829 774 Accrued employee benefits 626 450 Payables on derivatives and hedges (note 15) 94 2 Deferred revenue (note 2) 93 90 Accruals and other creditors 89 77
Total amounts falling due after more than one year $ 30,360 $ 26,096
(1) Includes amounts for value added and other non-income related taxes of approximately $210 million and $222 million as well as social insurance of approximately $53 million and $54 million for fiscal years 2021 and 2020, respectively.
Table of Contents
Medtronic plcNotes to the Consolidated Financial Statements
86

17. Financing Arrangements
Financing arrangements falling due within one year consisted of the following:
(in millions) April 30, 2021 April 24, 2020
Bank borrowings $ 2 $ 325 0.000 percent two-year 2019 senior notes — 1,631 Floating rate two-year 2019 senior notes — 815 Finance lease obligations 9 5
Current debt obligations $ 11 $ 2,776
Bank Borrowings Outstanding bank borrowings at April 30, 2021 were not significant. Outstanding bank borrowings at April 24, 2020 were short-term advances primarily to non-U.S. subsidiaries under credit agreements with various banks. These bank borrowings consisted primarily of borrowings in Japanese Yen at an interest rate of 0.21%, and were a natural hedge of currency and exchange rate risk.
Commercial Paper On January 26, 2015, Medtronic Global Holdings S.C.A. (Medtronic Luxco), an entity organized under the laws of Luxembourg, entered into various agreements pursuant to which Medtronic Luxco may issue United States Dollar-denominated unsecured commercial paper notes (the 2015 CP Program) on a private placement basis, and on January 31, 2020 Medtronic Luxco entered into various agreements pursuant to which Medtronic Luxco may issue Euro-denominated unsecured commercial paper notes (the 2020 CP Program) on a private placement basis. The Maximum aggregate amount outstanding at any time under the 2015 CP Program and the 2020 CP Program together may not exceed the equivalent of $3.5 billion. The Group and Medtronic, Inc. have guaranteed the obligations of Medtronic Luxco under the 2015 CP Program and the 2020 CP Program.
There was no commercial paper outstanding at April 30, 2021 and April 24, 2020 or during fiscal year 2021. During fiscal year 2020, the weighted average original maturity of the commercial paper outstanding was approximately 7 days and the weighted average interest rate was 2.31 percent. The issuance of commercial paper reduces the amount of credit available under the Group's existing credit facility, defined below.
Line of Credit On December 12, 2020, Medtronic Luxco, as borrower, entered into an amendment to its amended and restated credit agreement (Credit Facility), by and among Medtronic plc, Medtronic, Inc., Medtronic Luxco, the lenders from time to time party thereto, and Bank of America, N.A., as administrative agent and issuing bank, extending the maturity date of the Credit Facility to December 2025.
The Credit Facility provides for a $3.5 billion five-year unsecured revolving credit facility (Credit Facility). At each anniversary date of the Credit Facility, but not more than twice prior to the maturity date, the Group could also request a one-year extension of the maturity date. The Credit Facility provides the Group with the ability to increase its borrowing capacity by an additional $1.0 billion at any time during the term of the agreement. The Group and Medtronic, Inc. have guaranteed the obligations of the borrowers under the Credit Facility, and Medtronic Luxco will also guarantee the obligations of any designated borrower. The Credit Facility includes a multi-currency borrowing feature for certain specified foreign currencies. At April 30, 2021 and April 24, 2020, no amounts were outstanding under the Credit Facility.
Interest rates on advances on the Credit Facility are determined by a pricing matrix based on the Group’s long-term debt ratings, assigned by Standard & Poor’s Ratings Services and Moody’s Investors Service. Facility fees are payable on the Credit Facility and are determined in the same manner as the interest rates. The Group is in compliance with all covenants related to the Credit Facility.
Table of Contents
Medtronic plcNotes to the Consolidated Financial Statements
87

Financing arrangements falling due after one year consisted of the following:
April 30, 2021 April 24, 2020
(in millions, except interest rates)Maturity by Fiscal Year Amount
Effective Interest Rate Amount
Effective Interest Rate
3.150 percent seven-year 2015 senior notes 2022 $ — — % $ 1,534 3.29 %3.200 percent ten-year 2012 CIFSA senior notes 2023 — — 650 2.72 2.750 percent ten-year 2013 senior notes 2023 — — 530 3.25 0.000 percent three-year 2019 senior notes 2023 907 0.08 815 0.09 0.375 percent four-year 2019 senior notes 2023 1,813 0.55 1,631 0.56 0.000 percent two-year 2020 senior notes 2023 1,511 0.12 — — 2.950 percent ten-year 2013 CIFSA senior notes 2024 — — 310 2.71 3.625 percent ten-year 2014 senior notes 2024 — — 432 3.61 3.500 percent ten-year 2015 senior notes 2025 1,890 3.74 2,700 3.74 0.250 percent six-year 2019 senior notes 2026 1,209 0.43 1,087 0.44 0.000 percent five-year 2020 senior notes 2026 1,209 0.22 — — 1.125 percent eight-year 2019 senior notes 2027 1,813 1.24 1,631 1.25 3.350 percent ten-year 2017 senior notes 2027 368 3.53 368 3.53 0.375 percent eight-year 2020 senior notes 2029 1,209 0.51 — — 1.625 percent twelve-year 2019 senior notes 2031 1,209 1.74 1,087 1.75 1.000 percent twelve-year 2019 senior notes 2032 1,209 1.05 1,087 1.06 0.750 percent twelve-year 2020 senior notes 2033 1,209 0.81 — — 4.375 percent twenty-year 2015 senior notes 2035 1,932 4.47 1,932 4.47 6.550 percent thirty-year 2007 CIFSA senior notes 2038 253 4.67 253 4.68 2.250 percent twenty-year 2019 senior notes 2039 1,209 2.34 1,087 2.34 6.500 percent thirty-year 2009 senior notes 2039 158 6.56 158 6.56 1.500 percent twenty-year 2019 senior notes 2040 1,209 1.58 1,087 1.58 5.550 percent thirty-year 2010 senior notes 2040 224 5.58 224 5.58 1.375 percent twenty-year 2020 senior notes 2041 1,209 1.46 — — 4.500 percent thirty-year 2012 senior notes 2042 105 4.54 105 4.54 4.000 percent thirty-year 2013 senior notes 2043 305 4.09 305 4.10 4.625 percent thirty-year 2014 senior notes 2044 127 4.67 127 4.67 4.625 percent thirty-year 2015 senior notes 2045 1,813 4.69 1,813 4.67 1.750 percent thirty-year 2019 senior notes 2050 1,209 1.87 1,087 1.87 1.625 percent thirty-year 2020 senior notes 2051 1,209 1.75 — — Bank borrowings N/A — — 55 2.11 Finance lease obligations 2022-2059 62 9.29 45 8.93 Debt discount, net 2022-2051 (75) — (15) — Deferred financing costs 2022-2051 (125) — (104) —
Long-term debt $ 26,378 $ 22,021
Table of Contents
Medtronic plcNotes to the Consolidated Financial Statements
88

Senior Notes The Group has outstanding unsecured senior obligations, described as senior notes in the tables above (collectively, the Senior Notes). The Senior Notes rank equally with all other unsecured and unsubordinated indebtedness of the Group. The Group is in compliance with all covenants related to the Seniors notes.
In June 2019, Medtronic Luxco issued six tranches of Euro-denominated Senior Notes with an aggregate principal of €5.0 billion, with maturities ranging from fiscal year 2021 to fiscal year 2050, resulting in cash proceeds of approximately $5.6 billion, net of discounts and issuance costs. The Group used the net proceeds of the offering to fund the cash tender offer and early redemption of $5.2 billion of Medtronic Inc., CIFSA, and Medtronic Luxco Senior Notes for $5.6 billion of total consideration. The Group recognized a loss on debt extinguishment of $413 million in fiscal year 2020, which primarily included cash premiums and accelerated amortization of deferred financing costs and debt discounts and premiums. The loss was recognized in interest payable and similar expenses in the consolidated profit and loss account.
In September 2020, Medtronic Luxco issued an additional six tranches of Euro-denominated Senior Notes with an aggregate principal of €6.3 billion, with maturities ranging from fiscal year 2023 to fiscal year 2051, resulting in cash proceeds of approximately $7.2 billion, net of discounts and issuance costs. The Group used the net proceeds of the offering to fund the early redemption of $4.3 billion of Medtronic Inc. and CIFSA Senior Notes and €1.5 billion of Medtronic Luxco Senior Notes for $6.3 billion of total consideration in October 2020. Additionally, the Group used the proceeds to repay its €750 million floating rate senior notes at maturity in March 2021. The Group recognized a loss on debt extinguishment of $308 million in fiscal year 2021, which primarily included cash premiums and accelerated amortization of deferred financing costs and debt discounts and premiums. The loss was recognized in interest payable and similar expenses in the consolidated profit and loss account.
The Euro-denominated debt issued in June 2019 and September 2020 is designated as a net investment hedge of certain of the Group's European operations. Refer to Note 15 for additional information regarding the net investment hedge.
Term Loan Agreements On May 12, 2020, Medtronic Luxco entered into a term loan agreement (Loan Agreement) by and among Medtronic Luxco, Medtronic plc, Medtronic, Inc., and Mizuho Bank, Ltd. as administrative agent and as lender. The Loan Agreement provided an unsecured term loan in an aggregate principal amount of up to ¥300 billion, with a term of six months and the option to extend for an additional six months at Medtronic Luxco’s option. On May 13, 2020, Medtronic Luxco borrowed the entire amount of the term loan under the Loan Agreement. The Japanese Yen-denominated debt was designated as a net investment hedge of certain of our Japanese operations. Borrowings under the Loan Agreement carried interest at the TIBOR Rate (as defined in the Loan Agreement) plus a margin of 0.50% per annum. Medtronic plc and Medtronic, Inc. guaranteed the obligations of Medtronic Luxco under the Loan Agreement. On November 12, 2020, the Group exercised its option to extend the term loan for an additional six months. During the fourth quarter of fiscal year 2021, the Group de-designated the Yen-denominated debt as a net investment hedge and repaid the term loan in full, including interest.
Contractual maturities of debt for the next five fiscal years and thereafter, excluding deferred financing costs and debt discount, net, are as follows:
(in millions)
2022 $ 11 2023 4,237 2024 6 2025 1,895 2026 2,423 Thereafter 18,016
Total $ 26,588
Financial Instruments Not Measured at Fair Value
At April 30, 2021, the estimated fair value of the Group’s Senior Notes was $28.6 billion compared to a principal value of $26.5 billion. At April 24, 2020 the estimated fair value was $27.1 billion compared to a principal value of $24.5 billion. The fair value was estimated using quoted market prices for the publicly registered Senior Notes, which are classified as Level 2 within the fair value hierarchy. The fair values and principal values consider the terms of the related debt and exclude the impacts of debt discounts and hedging activity.
Table of Contents
Medtronic plcNotes to the Consolidated Financial Statements
89

18. Provisions for Liabilities
Provisions for liabilities were as follows:
(in millions) April 30, 2021 April 24, 2020
Deferred taxes, as adjusted (note 6) $ 1,028 $ 1,224 Retirement benefit obligations (note 19) 916 1,438 Rebates 906 706 Accrued certain litigation charges 384 382 Contingent consideration liabilities (note 9) 270 280 Warranty obligations 204 153 Right of return 177 136 Restructuring reserves (note 3) 146 112 Other provisions 215 238
Total provision for liabilities $ 4,246 $ 4,669
Provisions activity for fiscal year 2021 was as follows:
(in millions)
Accrued Certain
Litigation Charges
Warranty Obligations Rebates Right of Return Other
April 24, 2020 $ 382 $ 153 $ 706 $ 136 $ 238 Provisions 206 100 1,867 295 606 Utilization and payments (194) (49) (1,681) (278) (609) Currency translation and other (10) — 14 24 (20)
April 30, 2021 $ 384 $ 204 $ 906 $ 177 $ 215
19. Retirement Benefit Obligations
Pension and similar obligations, net were as follows: (in millions) April 30, 2021 April 24, 2020
U.S. defined benefit pension plans $ 319 $ 741 Non-U.S. defined benefit pension plans 394 620 Post-retirement obligations, net — 43
Total pension and post-retirement obligations 713 1,404 Post-retirement assets, net 8 — Total pension and post-retirement obligations, net 705 1,404
Other 27 26 Total retirement benefit obligations, net(1) $ 732 $ 1,430
(1) Includes the net impact of total retirement benefit plan assets of approximately $184 million and $8 million for fiscal years 2021 and 2020, respectively. These plan assets are categorized as debtors within the consolidated balance sheet.
The Group sponsors various retirement benefit plans, including defined benefit pension plans, post-retirement medical plans, defined contribution savings plans, and termination indemnity plans, covering substantially all U.S. employees and many employees outside the U.S. The net expense related to these plans was $668 million and $467 million in fiscal years 2021 and 2020, respectively.
In the U.S., the Group maintain qualified pension plans designed to provide guaranteed minimum retirement benefits to all eligible U.S. participants. Pension coverage for non-U.S. employees is provided, to the extent deemed appropriate, through separate plans. In addition to the benefits provided under the qualified pension plan, retirement benefits associated with wages in excess of the IRS allowable limits are provided to certain employees under a non-qualified plan. U.S. and Puerto Rico
Table of Contents
Medtronic plcNotes to the Consolidated Financial Statements
90

employees are also eligible to receive a medical benefit component, in addition to normal retirement benefits, through the Group’s post-retirement benefits.
The amounts included in the Group's financial statements are based on the most recent actuarial valuations, which are generally as of the end of the fiscal year. The actuarial valuations are performed by the individual plan's independent and professionally qualified actuaries. The actuarial reports are not available for public inspection.
At April 30, 2021 and April 24, 2020, the net underfunded status of the Group’s benefit plans was $705 million and $1.4 billion, respectively.
During fiscal year 2021, as part of the Simplification restructuring program, the Group offered certain eligible U.S. employees voluntary early retirement packages, resulting in incremental expense of $97 million recognized. Of this amount, $73 million related to U.S. pension benefits, $11 million related to defined contribution plans, $11 million related to U.S. post-retirement benefits, and $2 million related to cash payments and administrative fees. See Note 3 for additional information on the Simplification restructuring program.
As of April 24, 2020, the Group announced the freezing of U.S. pension benefits beginning in 2027. Employees will continue to earn benefits as required by the plan until April 30, 2027, after which date benefits will no longer be earned and employees will earn benefits under a new defined contribution structure. The Group recognized curtailment benefits of $94 million in fiscal year 2020 as a result of this change.
Table of Contents
Medtronic plcNotes to the Consolidated Financial Statements
91

Defined Benefit Pension Plans The change in benefit obligation and funded status of the Group's U.S. and Non-U.S. pension benefits are as follows:
U.S. Pension Benefits Non-U.S. Pension Benefits
Fiscal Year Fiscal Year
(in millions) 2021 2020 2021 2020
Accumulated benefit obligation at end of year: $ 3,786 $ 3,440 $ 2,035 $ 1,785 Change in projected benefit obligation: Projected benefit obligation at beginning of year $ 3,723 $ 3,404 $ 2,024 $ 1,832
Service cost 106 106 70 59 Interest cost 109 126 28 28 Employee contributions — — 12 11 Plan curtailments and settlements — (94) (4) (2) Actuarial loss(1) 99 300 6 180 Benefits paid (129) (111) (41) (55) Special termination benefits 73 — — — Currency exchange rate changes and other — (8) 200 (29)
Projected benefit obligation at end of year $ 3,979 $ 3,723 $ 2,294 $ 2,024 Change in plan assets: Fair value of plan assets at beginning of year $ 2,982 $ 2,728 $ 1,404 $ 1,409
Actual return on plan assets 715 (72) 232 2 Employer contributions 95 444 149 54 Employee contributions — — 12 11 Plan settlements — — (4) (2) Benefits paid (129) (111) (41) (55) Currency exchange rate changes and other — (7) 149 (15)
Fair value of plan assets at end of year $ 3,660 $ 2,982 $ 1,900 $ 1,404 Funded status at end of year:
Fair value of plan assets $ 3,660 $ 2,982 $ 1,900 $ 1,404 Benefit obligations 3,979 3,723 2,294 2,024 Underfunded status of the plans (319) (741) (394) (620) Recognized liability $ (319) $ (741) $ (394) $ (620)
Amounts recognized on the consolidatedbalance sheet consist of:
Debtors falling due after one year $ 110 $ — $ 48 $ 7 Provisions falling due within one year (20) (17) (6) (6) Provisions falling due after one year (408) (724) (436) (621) Recognized liability $ (319) $ (741) $ (394) $ (620)
Amounts recognized in accumulated othercomprehensive loss:
Prior service cost $ — $ 1 $ (6) $ 7 Net actuarial loss 1,220 1,662 530 663 Ending balance $ 1,220 $ 1,663 $ 524 $ 670
(1) Actuarial gains and losses result from changes in actuarial assumptions (such as changes in the discount rate and revised mortality rates). The actuarial losses in fiscal years 2021 and 2020 were primarily related to decreases in discount rates.
Table of Contents
Medtronic plcNotes to the Consolidated Financial Statements
92
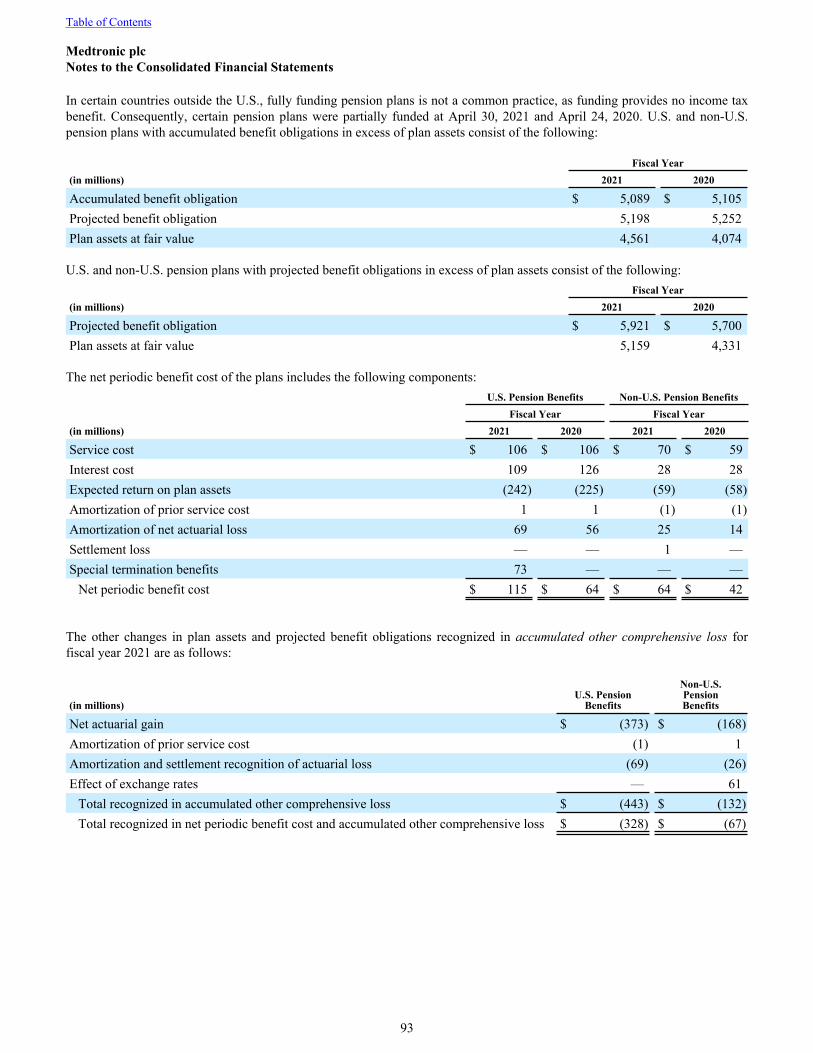
In certain countries outside the U.S., fully funding pension plans is not a common practice, as funding provides no income tax benefit. Consequently, certain pension plans were partially funded at April 30, 2021 and April 24, 2020. U.S. and non-U.S. pension plans with accumulated benefit obligations in excess of plan assets consist of the following:
Fiscal Year(in millions) 2021 2020
Accumulated benefit obligation $ 5,089 $ 5,105 Projected benefit obligation 5,198 5,252 Plan assets at fair value 4,561 4,074
U.S. and non-U.S. pension plans with projected benefit obligations in excess of plan assets consist of the following: Fiscal Year(in millions) 2021 2020
Projected benefit obligation $ 5,921 $ 5,700 Plan assets at fair value 5,159 4,331
The net periodic benefit cost of the plans includes the following components: U.S. Pension Benefits Non-U.S. Pension Benefits Fiscal Year Fiscal Year(in millions) 2021 2020 2021 2020
Service cost $ 106 $ 106 $ 70 $ 59 Interest cost 109 126 28 28 Expected return on plan assets (242) (225) (59) (58) Amortization of prior service cost 1 1 (1) (1) Amortization of net actuarial loss 69 56 25 14 Settlement loss — — 1 — Special termination benefits 73 — — —
Net periodic benefit cost $ 115 $ 64 $ 64 $ 42
The other changes in plan assets and projected benefit obligations recognized in accumulated other comprehensive loss for fiscal year 2021 are as follows:
(in millions)U.S. Pension
Benefits
Non-U.S.PensionBenefits
Net actuarial gain $ (373) $ (168) Amortization of prior service cost (1) 1 Amortization and settlement recognition of actuarial loss (69) (26) Effect of exchange rates — 61
Total recognized in accumulated other comprehensive loss $ (443) $ (132) Total recognized in net periodic benefit cost and accumulated other comprehensive loss $ (328) $ (67)
Table of Contents
Medtronic plcNotes to the Consolidated Financial Statements
93

The actuarial assumptions are as follows:
U.S. Pension Benefits Non-U.S. Pension Benefits Fiscal Year Fiscal Year 2021 2020 2021 2020
Critical assumptions – projected benefit obligation:
Discount rate2.80% -
3.50%3.10% -
3.70%0.30% - 13.30%
0.30% - 13.30%
Rate of compensation increase 4.83% 3.90% 2.90% 2.91% Critical assumptions – net periodic benefit cost:
Discount rate – benefit obligation3.10% -
3.70%3.90% -
4.30%0.30% - 13.90%
0.40% - 13.90%
Discount rate – service cost2.60% -
3.90%3.70% -
4.00%0.30% - 13.90%
0.40% - 13.90%
Discount rate – interest cost2.80% -
3.20%3.50% -
4.30%0.30% - 13.90%
0.40% - 13.90%
Expected return on plan assets 7.50% 7.90% 3.78% 4.19% Rate of compensation increase 3.90% 3.90% 2.91% 2.87%
The Group utilizes a full yield curve approach methodology to estimate the service and interest cost components of net periodic pension cost and net periodic post-retirement benefit cost for the Group’s pension and other post-retirement benefits. The full yield curve approach applies specific spot rates along the yield curve to their underlying projected cash flows in estimation of the cost components. The current yield curves represent high quality, long-term fixed income instruments.
The expected long-term rate of return on plan assets assumptions are determined using a building block approach, considering historical averages and real returns of each asset class. In certain countries, where historical returns are not meaningful, consideration is given to local market expectations of long-term returns.
Retirement Benefit Plan Investment Strategy The Group sponsors trusts that hold the assets for U.S. pension plans and other U.S. post-retirement benefit plans, primarily retiree medical benefits. For investment purposes, the U.S. pension and other U.S. post-retirement benefit plans employ similar investment strategies with different asset allocation targets.
The Group has a Qualified Plan Committee (the Plan Committee) that sets investment guidelines for U.S. pension plans and other U.S. post-retirement benefit plans with the assistance of external consultants. These guidelines are established based on market conditions, risk tolerance, funding requirements, and expected benefit payments. The Plan Committee also oversees the investment allocation process, selects the investment managers, and monitors asset performance. As pension liabilities are long-term in nature, the Group employs a long-term total return approach to maximize the long-term rate of return on plan assets for a prudent level of risk. An annual analysis on the risk versus the return of the investment portfolio is conducted to justify the expected long-term rate of return assumption.
The investment portfolios contain a diversified allocation of investment categories, including equities, fixed income securities, hedge funds, and private equity. Securities are also diversified in terms of domestic and international, short- and long-term, growth and value styles, large cap and small cap stocks, and active and passive management.
Outside the U.S., pension plan assets are typically managed by decentralized fiduciary committees. There is significant variation in policy asset allocation from country to country. Local regulations, funding rules, and financial and tax considerations are part of the funding and investment allocation process in each country. The weighted average target asset allocations at April 30, 2021 for the plans are 40% equity securities, 31% debt securities, and 29% other.
The plans did not hold any investments in the Group’s ordinary shares at April 30, 2021 or April 24, 2020.
Table of Contents
Medtronic plcNotes to the Consolidated Financial Statements
94

The Group’s U.S. plans target asset allocations at April 30, 2021, compared to the U.S. plans actual asset allocations at April 30, 2021 and April 24, 2020 by asset category, are as follows:
U.S. Plans Target Allocation Actual Allocation April 30, 2021 April 30, 2021 April 24, 2020
Asset Category:Equity securities 34 % 39 % 39 %Debt securities 51 32 27 Other 15 29 34 Total 100 % 100 % 100 %
Strong performance on equity securities during the fiscal year resulted in asset allocations different than targets. Management expects to move the allocations closer to target over the intermediate term.
Retirement Benefit Plan Asset Fair Values The following is a description of the valuation methodologies used for retirement benefit plan assets measured at fair value:
Short-term investments: Valued at the closing price reported in the active markets in which the individual security is traded.
Mutual funds: Comprised of investments in equity and fixed income securities held in pooled investment vehicles. The valuations of mutual funds are based on the respective net asset values which are determined by the fund daily at market close. The net asset values are calculated based on the valuation of the underlying assets which are determined using observable inputs. The net asset values are publicly reported.
Equity commingled trusts: Comprised of investments in equity securities held in pooled investment vehicles. The valuations of equity commingled trusts are based on the respective net asset values which are determined by the fund daily at market close. The net asset values are calculated based on the valuation of the underlying assets which are determined using observable inputs. The net asset values are not publicly reported, and funds are valued at the net asset value practical expedient.
Fixed income commingled trusts: Comprised of investments in fixed income securities held in pooled investment vehicles. The valuations of fixed income commingled trusts are based on the respective net asset values which are determined by the fund daily at market close. The net asset values are calculated based on the valuation of the underlying assets which are determined using observable inputs. The net asset values are not publicly reported, and funds are valued at the net asset value practical expedient.
Partnership units: Valued based on the year-end net asset values of the underlying partnerships. The net asset values of the partnerships are based on the fair values of the underlying investments of the partnerships. Quoted market prices are used to value the underlying investments of the partnerships, where the partnerships consist of the investment pools which invest primarily in common stocks. Partnership units include partnerships, private equity investments, and real asset investments. Partnerships primarily include long/short equity and absolute return strategies. These investments may be redeemed monthly with notice periods ranging from 45 to 95 days. At April 30, 2021, there are no funds in the process of liquidation. Private equity investments consist of common stock and debt instruments of private companies. For private equity funds, the sum of the unfunded commitments at April 30, 2021 is $171 million, and the estimated liquidation period of these funds is expected to be one to 15 years. Real asset investments consist of commodities, derivatives, Real Estate Investment Trusts, and illiquid real estate holdings. These investments have redemption and liquidation periods ranging from 30 days to 10 years. At April 30, 2021, there are no real estate investments in the process of liquidation. Valuation procedures are utilized to arrive at fair value if a quoted market price is not available for a partnership investment.
Registered investment companies: Valued at net asset values which are not publicly reported. The net asset values are calculated based on the valuation of the underlying assets. The underlying assets are valued at the quoted market prices of shares held by the plan at year-end in the active market on which the individual securities are traded.
Insurance contracts: Comprised of investments in collective (group) insurance contracts, consisting of individual insurance policies. The policyholder is the employer, and each member is the owner/beneficiary of their individual insurance policy. These policies are a part of the insurance company’s general portfolio and participate in the insurer’s profit-sharing policy on an excess yield basis.
Table of Contents
Medtronic plcNotes to the Consolidated Financial Statements
95

The methods described above may produce fair values that may not be indicative of net realizable value or reflective of future fair values. Furthermore, while the Group believes its valuation methodologies are appropriate and consistent with other market participants, the use of different methodologies or assumptions to determine fair value of certain financial instruments could result in a different fair value measurement at the reporting date.
The following tables provide information by level for the retirement benefit plan assets that are measured at fair value, as defined by U.S. GAAP. Certain investments for which the fair value is measured using the net asset value per share (or its equivalent) practical expedient are not presented within the fair value hierarchy. The fair value amounts presented for these investments are intended to permit reconciliation to the total fair value of plan assets at April 30, 2021 and April 24, 2020.
U.S. Pension Benefits
Fair Value at
Fair Value Measurements
Using Inputs Considered asInvestments Measured at
Net Asset Value(in millions) April 30, 2021 Level 1 Level 2 Level 3
Short-term investments $ 232 $ 232 $ — $ — $ — Mutual funds 99 99 — — — Equity commingled trusts 1,420 — — — 1,420 Fixed income commingled trusts 1,050 — — — 1,050 Partnership units 860 — — 860 —
$ 3,660 $ 331 $ — $ 860 $ 2,470
Fair Value atFair Value Measurements
Using Inputs Considered asInvestments Measured at
Net Asset Value(in millions) April 24, 2020 Level 1 Level 2 Level 3
Short-term investments $ 548 $ 548 $ — $ — $ — Equity commingled trusts 1,204 — — — 1,204 Fixed income commingled trusts 605 — — — 605 Partnership units 625 — — 625 —
$ 2,982 $ 548 $ — $ 625 $ 1,809
The following tables provide a reconciliation of the beginning and ending balances of U.S. pension benefit assets measured at fair value that used significant unobservable inputs (Level 3):
(in millions)Partnership
Units
April 26, 2019 $ 629 Total unrealized losses, net (45) Purchases and sales, net 41
April 24, 2020 625 Total realized gains, net 8 Total unrealized gains, net 89 Purchases and sales, net 139
April 30, 2021 $ 860
Table of Contents
Medtronic plcNotes to the Consolidated Financial Statements
96

Non-U.S. Pension Benefits
Fair Value atFair Value Measurements
Using Inputs Considered as Investments Measured at Net
Asset Value(in millions) April 30, 2021 Level 1 Level 2 Level 3
Registered investment companies $ 1,850 $ — $ — $ — $ 1,850 Insurance contracts 49 — — 49 —
$ 1,900 $ — $ — $ 49 $ 1,850
Fair Value atFair Value Measurements
Using Inputs Considered as Investments Measured at Net
Asset Value(in millions) April 24, 2020 Level 1 Level 2 Level 3
Registered investment companies $ 1,361 $ — $ — $ — $ 1,361 Insurance contracts 43 — — 43 —
$ 1,404 $ — $ — $ 43 $ 1,361
The following tables provide a reconciliation of the beginning and ending balances of non-U.S. pension benefit assets measured at fair value that used significant unobservable inputs (Level 3):
(in millions)Insurance Contracts
April 26, 2019 $ 41 Total unrealized gains, net 2 Purchases and sales, net 1 Currency exchange rate changes (1)
April 24, 2020 43 Total unrealized gains, net 2 Purchases and sales, net 1 Currency exchange rate changes 4
April 30, 2021 $ 49
There were no transfers into or out of Level 3 for both the U.S. and non-US pension plans during the fiscal years ended April 30, 2021 and April 24, 2020.
Retirement Benefit Plan Funding It is the Group's policy to fund retirement costs within the limits of allowable tax deductions. During fiscal year 2021, the Group made discretionary contributions of approximately $95 million to the U.S. pension plan. Internationally, the Group contributed approximately $149 million for pension benefits during fiscal year 2021. The Group anticipates that it will make contributions of $20 million and $78 million to its U.S. pension benefit plans and non-U.S. pension benefit plans, respectively, in fiscal year 2022. Based on the guidelines under the U.S. Employee Retirement Income Security Act of 1974 and the various guidelines which govern the plans outside the U.S., the majority of anticipated fiscal year 2022 contributions will be discretionary. The Group believes that pension assets, returns on invested pension assets, and Group contributions will be able to meet its pension and other post-retirement obligations in the future.
Table of Contents
Medtronic plcNotes to the Consolidated Financial Statements
97

Retiree benefit payments, which reflect expected future service, are anticipated to be paid as follows:
(in millions) Gross Payments
Fiscal YearU.S. Pension
BenefitsNon-U.S. Pension
Benefits
2022 $ 135 $ 62 2023 145 63 2024 157 62 2025 170 67 2026 182 67 2027 – 2031 1,068 395
Total $ 1,856 $ 717
Post-retirement Benefit Plans The net periodic benefit cost associated with the Group’s post-retirement benefit plans was profit of $6 million and $15 million in fiscal years 2021 and 2020, respectively. The Group’s projected benefit obligation for all post-retirement benefit plans was $337 million and $339 million at April 30, 2021 and April 24, 2020, respectively. The Group’s fair value of plan assets for all post-retirement benefit plans was $345 million and $296 million at April 30, 2021 and April 24, 2020, respectively. The post-retirement benefit plan assets at both April 30, 2021 and April 24, 2020 primarily comprised of equity and fixed commingled trusts, consistent with the U.S. retirement benefit plan assets outlined in the fair value leveling tables above.
Defined Contribution Savings Plans The Group has defined contribution savings plans that cover substantially all U.S. employees and certain non-U.S. employees. The general purpose of these plans is to provide additional financial security during retirement by providing employees with an incentive to make regular savings. Group contributions to the plans are based on employee contributions and Group performance. Expense recognized under these plans was $495 million and $376 million in fiscal years 2021 and 2020, respectively.
Effective May 1, 2005, the Group froze participation in the original defined benefit pension plan in the U.S. and implemented two new plans: an additional defined benefit pension plan, the Personal Pension Account (PPA), and a new defined contribution plan, the Personal Investment Account (PIA). Employees in the U.S. hired on or after May 1, 2005 but before January 1, 2016 had the option to participate in either the PPA or the PIA. Participants in the PPA receive an annual allocation of their salary and bonus on which they will receive an annual guaranteed rate of return, which is based on the ten-year Treasury bond rate. Participants in the PIA also receive an annual allocation of their salary and bonus; however, they are allowed to determine how to invest their funds among identified fund alternatives. The cost associated with the PPA is included in U.S. Pension Benefits in the tables presented earlier. The defined contribution cost associated with the PIA was approximately $50 million and $52 million in fiscal years 2021 and 2020, respectively.
Effective January 1, 2016, the Group froze participation in the existing defined benefit (PPA) and contribution (PIA) pension plans in the U.S. and implemented a new form of benefit under the existing defined contribution plan for legacy Covidien employees and employees in the U.S. hired on or after January 1, 2016 or rehired after July 1, 2020. Participants in the Medtronic Core Contribution (MCC) also receive an annual allocation of their salary and bonus and are allowed to determine how to invest their funds among identified fund alternatives. The defined contribution cost associated with the MCC was approximately $73 million and $66 million in fiscal years 2021 and 2020, respectively.
Table of Contents
Medtronic plcNotes to the Consolidated Financial Statements
98

20. Shareholders' Equity
Authorized and allotted shares were as follows:
(in millions, except share data) April 30, 2021 April 24, 2020
Authorized: Shares Amount Shares Amount
Ordinary Shares, $0.0001 par value 2,600,000,000 $ — 2,600,000,000 $ —Euro Deferred Shares, €1.00 par value 40,000 — 40,000 —Preferred Shares, $0.20 par value 127,500,000 26 127,500,000 26A Preferred Shares, $1.00 par value 500,000 1 500,000 1Total authorized $ 27 $ 27
Allotted, called up and fully paid:Ordinary Shares, $0.0001 par value 1,345,400,671 $ — 1,341,074,724 $ —A Preferred Shares, $1.00 par value 1,872 — 1,872 —Total allotted, called up and fully paid $ — $ —
The holder of A Preferred Shares are entitled to payment of dividends prior to any class of shares in the Group equal to twice the dividend to be paid per Group ordinary share. On a return of assets, whether on liquidation or otherwise, the A Preferred Shares are entitled to repayment of the capital paid up thereon in priority to any repayment of capital to the holders of any other shares and the holders of the A Preferred Shares shall not be entitled to any further participation in the assets or profits of the Group. The holders of the A Preferred Shares are not entitled to receive notice of, nor to attend, speak, or vote at any general meeting of the Group.
Dividends The timing, declaration, and payment of future dividends to holders of the Group's ordinary and A Preferred shares falls within the discretion of the Board of Directors and depends upon many factors, including the statutory requirements of Irish law, the Group's profit and financial condition, the capital requirements of the Group's businesses, industry practice and any other factors the Board of Directors deems relevant.
Ordinary Share Redemptions Shares are redeemed from time to time to support the Group’s stock-based compensation programs and to return capital to shareholders. During fiscal years 2021 and 2020, the Group redeemed approximately 4 million and 12 million shares, respectively, at an average price of $126.80 and $106.22, respectively.
In March 2019, the Board of Directors authorized $6.0 billion for redemption of the Group's ordinary shares. There is no specific time-period associated with these authorizations. At April 30, 2021, the Group had used $608 million of the $6.0 billion authorized under the program, leaving approximately $5.4 billion available for future redemptions. The Group accounts for redemptions of ordinary shares using the par value method, and shares redeemed are cancelled. The par value of the shares redeemed, cancelled, and transferred to the other undenominated capital reserve was insignificant at April 30, 2021 and April 24, 2020.
Profit and Loss Account The profit and loss account refers to the portion of net income which is retained by the Group rather than being distributed to shareholders as dividends, which is recorded in retained earnings within the consolidated statement of financial position.
Share Premium The share premium account reflects the fair value of consideration received in excess of the par value of shares issued for stock option exercises, vesting of restricted stock units and other issuances of shares and is recorded in capital in excess of par value within the consolidated statement of financial position.
21. Stock Purchase and Award Plans
In fiscal year 2021, the Group granted stock awards under the Medtronic plc 2013 Plan (2013 Plan). The 2013 Plan provides for the grant of non-qualified and incentive stock options, stock appreciation rights, restricted stock, restricted stock units, performance awards, and other stock and cash-based awards. At April 30, 2021, there were approximately 26 million shares available for future grants under the 2013 Plan.
Table of Contents
Medtronic plcNotes to the Consolidated Financial Statements
99

Stock-Based Compensation Expense The following table presents the components and classification of stock-based compensation expense recognized for stock options, restricted stock, performance share units, and employee stock purchase plan (ESPP) in fiscal years 2021 and 2020:
Fiscal Year(in millions) 2021 2020
Stock options $ 72 $ 61 Restricted stock 185 205 Performance share units 49 — Employee stock purchase plan 38 31
Total stock-based compensation expense $ 344 $ 297
Cost of sales $ 35 $ 28 Research and development expense 38 36 Distribution and administrative expense 272 233
Total stock-based compensation expense 344 297 Taxation (59) (51)
Total stock-based compensation expense, net of tax $ 285 $ 246
Stock Options Options are granted at the exercise price, which is equal to the closing price of the Group’s ordinary shares on the grant date. The majority of the Group's options are non-qualified options with a 10-year life and a 4-year ratable vesting term. The Group uses the Black-Scholes option pricing model (Black-Scholes model) to determine the fair value of stock options at the grant date. The fair value of stock options under the Black-Scholes model requires management to make assumptions regarding projected employee stock option exercise behaviors, risk-free interest rates, volatility of the Group’s stock price, and expected dividends.
The following table provides the weighted average fair value of options granted to employees and the related assumptions used in the Black-Scholes model:
Fiscal Year 2021 2020
Weighted average fair value of options granted $ 16.15 $ 15.49 Assumptions used:
Expected life (years) 6.0 6.1Risk-free interest rate 0.33 % 1.88 %Volatility 24.17 % 17.97 %Dividend yield 2.36 % 2.09 %
The following table summarizes stock option activity during fiscal year 2021:
Options
(in thousands)
Wtd. Avg.Exercise
Price
Wtd. Avg. Remaining Contractual
Term (in years)
Aggregate Intrinsic Value
(in millions)
Outstanding at April 24, 2020 27,068 $ 78.70 Granted 6,182 98.16 Exercised (4,370) 66.91 Expired/Forfeited (908) 95.54
Outstanding at April 30, 2021 27,972 84.38 5.7 $ 1,302 Expected to vest at April 30, 2021 9,184 97.01 8.5 311 Exercisable at April 30, 2021 18,149 77.48 4.2 970
Table of Contents
Medtronic plcNotes to the Consolidated Financial Statements
100

The following table summarizes the total cash received from the issuance of new shares upon stock option award exercises, the total intrinsic value of options exercised, and the related tax benefit during fiscal years 2021 and 2020:
Fiscal Year(in millions) 2021 2020
Cash proceeds from options exercised $ 277 $ 484 Intrinsic value of options exercised 205 349 Tax benefit related to options exercised 47 75
Unrecognized compensation expense related to outstanding stock options at April 30, 2021 was $76 million and is expected to be recognized over a weighted average period of 2.6 years.
Restricted Stock Restricted stock units are expensed over the vesting period and are subject to forfeiture if employment terminates prior to the lapse of the restrictions. The expense recognized for restricted stock units is equal to the grant date fair value, which is equal to the closing stock price on the date of grant. Beginning in fiscal year 2018, restricted stock units have a 4-year ratable vesting term. Restricted stock units issued prior to fiscal year 2018 cliff vest after four years. The Group also grants shares of performance-based restricted stock units that typically cliff vest after three years only if the Group has also achieved certain performance objectives. Performance awards are expensed over the performance period based on the probability of achieving the performance objectives. Restricted stock units are not considered issued or outstanding ordinary shares of the Group. Dividend equivalent units are accumulated on restricted stock units during the vesting period.
The following table summarizes restricted stock activity during fiscal year 2021:
Units
(in thousands)
Wtd. Avg.GrantPrice
Nonvested at April 24, 2020 7,625 $ 92.52 Granted 2,193 99.48 Vested (3,228) 86.89 Forfeited (610) 95.79
Nonvested at April 30, 2021 5,980 97.66
The following table summarizes the weighted-average grant date fair value of restricted stock granted, total fair value of restricted stock vested and related tax benefit during fiscal years 2021 and 2020:
Fiscal Year(in millions, except per share data) 2021 2020
Weighted-average grant-date fair value per restricted stock $ 99.48 $ 103.52 Fair value of restricted stock vested 280 242 Tax benefit related to restricted stock vested 65 62
Unrecognized compensation expense related to restricted stock as of April 30, 2021 was $316 million and is expected to be recognized over a weighted average period of 2.4 years.
Table of Contents
Medtronic plcNotes to the Consolidated Financial Statements
101

Performance Share Units Beginning in fiscal year 2021, the Group granted performance share units to officers and key employees. Performance share units typically cliff vest after three years. The awards include three metrics: relative total shareholder return (rTSR), turnover growth, and return on investor capital (ROIC). rTSR is considered a market condition metric, and the expense is determined at the grant date and will not be adjusted even if the market condition is not met. Turnover growth and ROIC are considered performance metrics, and the expense is recorded over the performance period, which will be reassessed each reporting period based on the probability of achieving the various performance conditions. The number of shares earned at the end of the three-year period will vary, based on only actual performance, from 0% to 200% of the target number of performance share units granted. Performance share units are subject to forfeiture if employment terminates prior to the lapse of the restrictions. Performance share units are not considered issued or outstanding ordinary shares of the Group. Dividend equivalent units are accumulated on performance share units for each component of the award during the vesting period.
The Group calculates the fair value of the performance share units for each component individually. The fair value of the rTSR metric will be determined using the Monte Carlo valuation model. The fair value of the turnover growth and ROIC metrics are equal to the closing stock price on the grant date.
The following table summarizes performance share unit activity during fiscal year 2021:
Units
(in thousands)
Wtd. Avg.GrantPrice
Nonvested at April 24, 2020 — $ — Granted 854 129.04 Forfeited (25) 128.51
Nonvested at April 30, 2021 828 129.05
The following table summarizes the weighted-average grant date fair value of performance share units granted, total fair value of performance share units vested and related tax benefit during fiscal year 2021:
Fiscal Year(in millions, except per share data) 2021
Weighted-average grant-date fair value per performance share units $ 129.04 Fair value of performance share units vested — Tax benefit related to performance share units vested —
Unrecognized compensation expense related to performance share units as of April 30, 2021 was $57 million and is expected to be recognized over a weighted average period of 2.2 years.
Employees Stock Purchase Plan The Medtronic plc Amended and Restated 2014 Employees Stock Purchase Plan allows participating employees to purchase the Group's ordinary shares at a discount through payroll deductions. The expense recognized for shares purchased under the Group’s ESPP is equal to the 15 percent discount the employee receives. Employees purchased 2 million shares at an average price of $90.16 per share in fiscal year 2021. At April 30, 2021, approximately 9 million ordinary shares were available for future purchase under the ESPP.
Table of Contents
Medtronic plcNotes to the Consolidated Financial Statements
102

22. Accumulated Other Comprehensive Loss
The following table provides changes in AOCI, net of taxation and by component:
(in millions)
Unrealized (Loss) Gain
on Investment Securities
Cumulative Translation Adjustments
Net Investment
Hedges
Net Change in Retirement Obligations
Unrealized (Loss) Gain
on Cash Flow Hedges
Total Accumulated
Other Comprehensive (Loss) Income
April 26, 2019 $ (45) $ (1,383) $ (169) $ (1,308) $ 194 $ (2,711) Other comprehensive income (loss) before reclassifications 43 (827) 405 (596) 309 (666) Reclassifications 2 — — 52 (237) (183)
Other comprehensive income (loss) 45 (827) 405 (544) 72 (849) April 24, 2020 — (2,210) 236 (1,852) 266 (3,560)
Other comprehensive income (loss) before reclassifications 92 1,691 (1,694) 432 (541) (20) Reclassifications — — — 73 22 95
Other comprehensive income (loss) 92 1,691 (1,694) 505 (519) 75 April 30, 2021 $ 92 $ (519) $ (1,458) $ (1,347) $ (253) $ (3,485)
The taxation on gains and losses on investment securities in other comprehensive income before reclassifications during fiscal years 2021 and 2020 was an expense of $31 million and a benefit of $13 million, respectively. Realized gains and losses on investment securities reclassified from AOCI were reduced by taxation of $2 million for fiscal year 2021 and $3 million for fiscal year 2020. When realized, gains and losses on investment securities reclassified from AOCI are recognized within other non-operating income, net. Refer to Note 12 for additional information.
During fiscal years 2021 and 2020 taxation on cumulative translation adjustment was an expense of $7 million and a benefit of $9 million, respectively.
During fiscal years 2021 and 2020 there were no tax impacts on net investment hedges. Refer to Note 15 for additional information.
The net change in retirement obligations in other comprehensive income includes amortization of net actuarial losses included in net periodic benefit cost. The taxation on the net change in retirement obligations in other comprehensive income before reclassifications during fiscal years 2021 and 2020 resulted in an expense of $115 million and a benefit of $159 million, respectively. During fiscal years 2021 and 2020 the gains and losses on defined benefit and pension items reclassified from AOCI were reduced by taxation of $16 million and $12 million, respectively. When realized, net gains and losses on defined benefit and pension items reclassified from AOCI are recognized within other non-operating income, net. Refer to Note 19 for additional information.
The taxation on unrealized gains and losses on cash flow hedges in other comprehensive income before reclassifications during fiscal years 2021 and 2020 was a benefit of $87 million and an expense of $88 million, respectively. Amounts reclassified from AOCI related to cash flow hedges included taxation of $14 million and $80 million for fiscal years 2021 and 2020, respectively. When realized, gains and losses on currency exchange rate contracts reclassified from AOCI are recognized within other operating expense (income), net and gains and losses on forward starting interest rate derivatives reclassified from AOCI are recognized within interest payable and similar expenses. Refer to Note 15 for additional information.
23. Segment, Geographic, and Employee Information
Effective February 1, 2021, the Group implemented a new operating model, moving from a Group structure to a Portfolio structure: Cardiovascular Portfolio (formerly Cardiac and Vascular Group), Neuroscience Portfolio (formerly Restorative Therapies Group), and Medical Surgical Portfolio (formerly Minimally Invasive Therapies Group). The Diabetes Operating Unit (formerly Diabetes Group) remains a separate operating and reportable segment in the new structure. There were no changes to the reportable segments during the fiscal year ended April 30, 2021, such that the four principal operating and reportable segments are as follows: Cardiovascular Portfolio, Neuroscience Portfolio, Medical Surgical Portfolio, and Diabetes Operating Unit.
Table of Contents
Medtronic plcNotes to the Consolidated Financial Statements
103

The Group's management has chosen to organize the entity based upon therapy solutions provided by each segment. The four principal segments are strategic businesses that are managed separately, as each one develops and manufactures products and provides services oriented toward targeted therapy solutions.
The primary products and services from which the Cardiovascular Portfolio segment derives its turnover include products for the diagnosis, treatment, and management of cardiac rhythm disorders and cardiovascular disease, as well as services to diagnose, treat, and manage heart and vascular-related disorders and diseases.
The primary products and services from which the Medical Surgical Portfolio segment derives its turnover include those focused on diseases of the respiratory system, gastrointestinal tract, renal system, lungs, pelvic region, kidneys, obesity, and other preventable complications.
The primary products and services from which the Neuroscience Portfolio segment derives its turnover include those focused on neurostimulation therapies and drug delivery systems for the treatment of chronic pain, as well as various areas of the spine and brain, along with pelvic health and conditions of the ear, nose, and throat.
The primary products from which the Diabetes Operating Unit segment derives its turnover include those focused on diabetes management, including insulin pumps, continuous glucose monitoring systems, smart insulin pens, and insulin pump consumables.
Segment disclosures are on a performance basis, consistent with internal management reporting. Turnover of the Group's segments include end-customer turnover from the sale of products the segment develops, manufactures, and distributes. There are certain corporate and centralized expenses that are not allocated to the segments. The Group's management evaluates the performance of the segments and allocates resources based on turnover and segment operating profit. Segment operating profit represents profit before taxation, excluding interest payable and similar expenses, amortization of intangible assets, centralized distribution costs, non-operating income or expense items, certain corporate charges, and other items not allocated to the segments.
Table of Contents
Medtronic plcNotes to the Consolidated Financial Statements
104

The accounting policies of the segments are the same as those described in Note 1. Certain depreciable assets may be recorded by one segment, while the depreciation expense is allocated to another segment. The allocation of depreciation expense is based on the proportion of the assets used by each segment.
Segment Operating Profit
Fiscal Year(in millions) 2021 2020
Cardiovascular $ 3,850 $ 3,719 Medical Surgical 3,021 3,044 Neuroscience 3,162 2,915 Diabetes 598 546
Segment operating profit 10,632 10,224 Interest payable and similar expenses (925) (1,092) Other non-operating income, net 336 356 Amortization of intangible assets (1,783) (1,756) Corporate (1,577) (1,239) Centralized distribution costs (1,877) (1,420) Restructuring and associated costs (617) (441) Acquisition-related items (117) 66 Certain litigation charges (206) (225) Impairment charges (76) — IPR&D charges (31) (25) Exit of businesses — (52) Debt tender premium and other charges — 7 Medical device regulations (83) (48) Contribution to Medtronic Foundation — (80)
Profit before taxation $ 3,675 $ 4,275
Total Assets and Depreciation Expense Total Assets Depreciation Expense
(in millions) April 30, 2021 April 24, 2020 2021 2020
Cardiovascular $ 15,027 $ 14,844 $ 212 $ 210 Medical Surgical 39,319 39,666 195 194 Neuroscience 17,151 16,850 236 233 Diabetes 3,671 3,165 53 38
Segments 75,168 74,525 696 675 Corporate 17,915 16,164 223 232
Total $ 93,083 $ 90,689 $ 919 $ 907
Table of Contents
Medtronic plcNotes to the Consolidated Financial Statements
105

Geographic Information
Turnover is attributed to the country based on the location of the customer taking possession of the products or in which the services are rendered. Geographic tangible assets are attributed to the country based on the physical location of the assets.
The following table presents turnover for fiscal years 2021 and 2020 and tangible assets at April 30, 2021 and April 24, 2020 for the Group's country of domicile, countries with significant concentrations, and all other countries:
Turnover Tangible assets(in millions) 2021 2020 April 30, 2021 April 24, 2020
Ireland $ 100 $ 85 $ 170 $ 164
United States 15,526 14,919 3,688 3,459 Rest of world 14,491 13,909 1,363 1,205 Total other countries, excluding Ireland 30,017 28,828 5,051 4,664
Total $ 30,117 $ 28,913 $ 5,221 $ 4,828
No single customer represented over 10 percent of the Group’s consolidated turnover in fiscal years 2021 or 2020.
Employee Information
The average number of full-time equivalent persons employed by the Group during the year was as follows: Fiscal Year
2021 2020
Cardiovascular 34,478 33,057 Medical Surgical 31,056 30,925 Neuroscience 19,658 19,597 Diabetes 8,218 8,116 Corporate 11,428 10,927
Total 104,838 102,622 Total employee costs consisted of the following:
Fiscal Year(in millions) 2021 2020
Wages and salaries $ 8,273 $ 7,732 Social insurance 736 683Stock-based compensation 344 297Retirement benefit obligations 668 467Other(1) 684 647
Total $ 10,705 $ 9,826
(1) Includes other employee benefits such as costs relating to group insurance, employee stock ownership plans, saving plans, and retirement plans.
Employee costs capitalized, and subsequently not expensed, during fiscal years 2021 and 2020 were $1.2 billion and $1.0 billion, respectively.
Table of Contents
Medtronic plcNotes to the Consolidated Financial Statements
106

24. Directors' Remuneration
Directors' remuneration is set forth in the table below. Mr. Ishrak retired from the position of CEO effective April 26, 2020, transitioned to the role of Executive Chairman effective April 27, 2020, and retired as Executive Chairman effective December 11, 2020. Mr. Martha was appointed CEO effective April 27, 2020. The amounts below include compensation for Mr Martha's service as President and Chief Executive Officer, Mr. Ishrak's service as Executive Chairman of the Board, as well as compensation to all non-employee directors in their capacities as such. Mr. Martha was not provided additional compensation for his service as a director. There were no contributions made to retirement benefit schemes or compensation paid for loss of office to non-executive directors during the periods presented.
Fiscal Year(in millions) 2021 2020
Aggregate emolument paid to or receivable by directors in respect of qualifying services $ 8 $ 6 Money or value of other assets, including shares but excluding share options, paid to or receivable by the directors under long-term incentive schemes 13 10 Aggregate amount of gains by the directors on the exercise of share options 2 — Contributions to defined contribution retirement benefit plans(1) — — Contributions to defined benefit retirement benefit plans(2) — —
Total remuneration $ 23 $ 16
(1) Includes contributions to the President and CEO and Executive Chairman of the Board; no contributions were made to non-executive directors in the periods presented. Contributions to Mr. Martha, President and CEO, were $74 thousand for fiscal year 2021. There were no contributions to Mr. Ishrak, Executive Chairman of the Board, in fiscal year 2021. Contributions to Mr. Martha and Mr. Ishrak in fiscal year 2020 was $47 thousand and $11 thousand, respectively. (2) Includes contributions to the Executive Chairman of the Board; no contributions were made to Mr. Martha or non-executive directors in the periods presented. Contributions to Mr. Ishrak were $46 thousand and $286 thousand for fiscal years 2021 and 2020, respectively.
Indemnification Agreements Medtronic has entered into deeds of indemnification (the “Deeds of Indemnification”) with the directors and corporate secretary of Medtronic. The Deeds of Indemnification provide indemnification to such directors and the corporate secretary to the fullest extent permitted by the laws of Ireland, and in accordance with Medtronic’s memorandum and articles of association, for all expenses and other amounts actually incurred in any action or proceeding in which the director or corporate secretary is or may be involved by reason of the fact that he or she is or was a Medtronic director or corporate secretary or otherwise serving Medtronic or other entities at Medtronic’s request, on the terms and conditions set forth in the Deeds of Indemnification. Further, Medtronic agrees, to the fullest extent permitted by the laws of Ireland, to advance expenses incurred in defense of these proceedings, on the terms and conditions set forth in the Deeds of Indemnification. The Deeds of Indemnification also provide procedures for requesting and obtaining indemnification and advancement of expenses.
Table of Contents
Medtronic plcNotes to the Consolidated Financial Statements
107

25. Auditors Remuneration
Auditors' remuneration (including expenses) for all professional services rendered by PricewaterhouseCoopers Ireland and its affiliated firms was as follows:
Fiscal Year(in millions) 2021 2020
Audit of the Group financial statements $ 15 $ 17 Tax advisory services 1 1
Total remuneration $ 17 $ 18
Auditors' remuneration (including expenses) for all professional services rendered by the statutory auditor PricewaterhouseCoopers Ireland was as follows:
Fiscal Year(in thousands) 2021 2020
Audit of the Group financial statements $ 577 $ 599 Other assurance services 12 14 Tax advisory services 4 —
Total remuneration $ 593 $ 613
26. Subsidiary Undertakings
NameNature ofBusiness
GroupShare
PercentRegistered Office and
Location of Incorporation2074417 Alberta ULC Healthcare 100 16771 Chemin Ste-Marie Kirkland H9H 5H3 Canada
Advanced Absorbent Products Holdings Limited
Holding Company
100 Building 9, Croxley Park, Hatters Lane, Watford WD18 8WW, United Kingdom
Advanced Medical Technologies GmbH
Healthcare 100 Kasteler Str 11 66620 Nonnweiler Germany
AI Biomed Corp Healthcare 100 710 Medtronic Parkway, Minneapolis, MN 55432
Aircraft Medical Ltd. Healthcare 100 10 St. Andrew Square, Edinburgh EH2 2AF, Scotland
Airox Healthcare 100 11 Rue Marechal Foch Pau 64000 France
Airox, Inc. Healthcare 100 15 Hampshire StreetMansfield, MA 02048 United States
Arterial Vascular Engineering Canada, Company
Healthcare 100 Brookfield Pl Ste 2100 181 Bay St Toronto, Ontario Canada
Arterial Vascular Engineering UK Limited
Healthcare 100 Cannon Place, 78 Cannon Street, London EC4N 6AF, United Kingdom
ATS Acquisition Corp. Healthcare 100 710 Medtronic Parkway Minneapolis, MN 55432 United States
Auto Suture do Brasil Ltda. Healthcare 100 900 Moema Sao Paula SP-CEP-04074-020 Sao Paula Brazil
Auto Suture Holdings Pty Ltd Healthcare 100 TMF Corporate Services (Aust) Pty Limited, Level 16, 201 Elizabeth Street, Sydney NSW 2000, Australia
Table of Contents
Medtronic plcNotes to the Consolidated Financial Statements
108

Auto Suture Puerto Rico, Inc. Healthcare 100 P.O. Box 7292 Sabanetas Industrial Park Ponce 00731 Puerto Rico
AV Medical Technologies Ltd. Healthcare 100 20 Hamagshimim St., Petah Tikva, IL 4934829
Avenu Medical, Inc. Healthcare 100 710 Medtronic Parkway Minneapolis, MN 55432
Beacon Endoscopic LLC Healthcare 100 15 Hampshire StreetMansfield, MA 02048 United States
Bellco Do Brasil Healthcare 100 Rue Sampaio Viana no, 277, conuncto 91, Paraiso, CEP.04.004-000, Sao Paulo, Brazil
Bellco Hoxen Medical (Hong Kong) Co. Limited
Healthcare 70 Suite 5501, 55th Floor, Central Plaza, 18 Harbour Road, Wanchai, Hong Kong
Bellco Hoxen Medical (Shanghai) Co. Ltd.
Healthcare 70 Room 906-909, No. 333, Jiujiang Road, Huangpu District, Shanghai, China
Bellco S.r.l. Healthcare 100 1 via Camurana, Mirandola 41037, Italy
Between Investeringsgroep B.V. Holding Company
51 Amersfoortseweg 43, Huis ter Heide 3712 BA, Netherlands
Biostar Biomedikal Mühendislik Anonim Sirketi
Healthcare 100 Saray Mh. Esnaf Cad. No:2 Da:6 Akkom Ofis Prk., Laodik Plz.B Bl Ümraniye, Istanbul 34768, Turkey
Bo Yao (Shanghai) Medical Device Co. Ltd.
Healthcare 100 Part A, 4th Floor, No. 180 Ri Jing Road, Pilot Free Trade Zone, Shanghai
CardioInsight Technologies Inc. Healthcare 100 710 Medtronic Parkway Minneapolis, MN 55432 United States
Carmel Biosensors Ltd. Healthcare 100 c/o Yigal Aron & Co., 1 Azriel Center, Tel Aviv 67021 Israel
CCI Istanbul Teknolojik Hizmetler Limited Sirketi
Healthcare 100 No:2 K-1/0/1/2, Umraniye Istanbul Turkey
CDK U.K. Limited Healthcare 100 Building 9, Croxley Park, Hatters Lane, Watford WD18 8WW, United Kingdom
Changzhou Kangdi Medical Stapler Co., Ltd.
Healthcare 100 No. 16 Kunlun Road, Zinbei Zone, Changzhou City Jiangsu Province China
Changzhou Kanghui Medical Innovation Co., Ltd.
Healthcare 100 No. 16 Kunlun Road, Zinbei Zone, Changzhou City Jiangsu Province China
CircuLite GmbH Healthcare 100 Langenhagen Geschäftsanschrift: Grovestraße 16, Langenhagen 30853, Germany
CircuLite, Inc. Healthcare 100 500 Old Connecticut PathFramingham, MA 01701 United States
Clearum GmBH Healthcare 100 Werkstrasse 2, Broderstorf, DE 18184, Germany
Comercial Kendall (Chile) Limitada Healthcare 100 VItacura 2763 Ofice 501 Las Condes Santiago Chile
Companion Medical, Inc. Healthcare 100 710 Medtronic Parkway Minneapolis, MN 55432
Corventis Pte. Ltd. Healthcare 100 101 Thomson Road, #14-02/03 United Square, Singapore 307591
Covidien (China) Medical Devices Technology Co., Ltd.
Healthcare 100 Room 302-16 No 8, 188 New Jun Hoan Rd., Minhang District, Shanghai, PR China
Covidien (Gibraltar) Limited Holding Company
100 57/63 Line Wall Road Gibraltar
Covidien (Shanghai) Management Consulting Co., Ltd.
Healthcare 100 3rd & 4th Floor Tyco Plaza Caohejing Hi-Tech Park, 99 Tian Zhou Road Shanghai 200233 China
Table of Contents
Medtronic plcNotes to the Consolidated Financial Statements
109
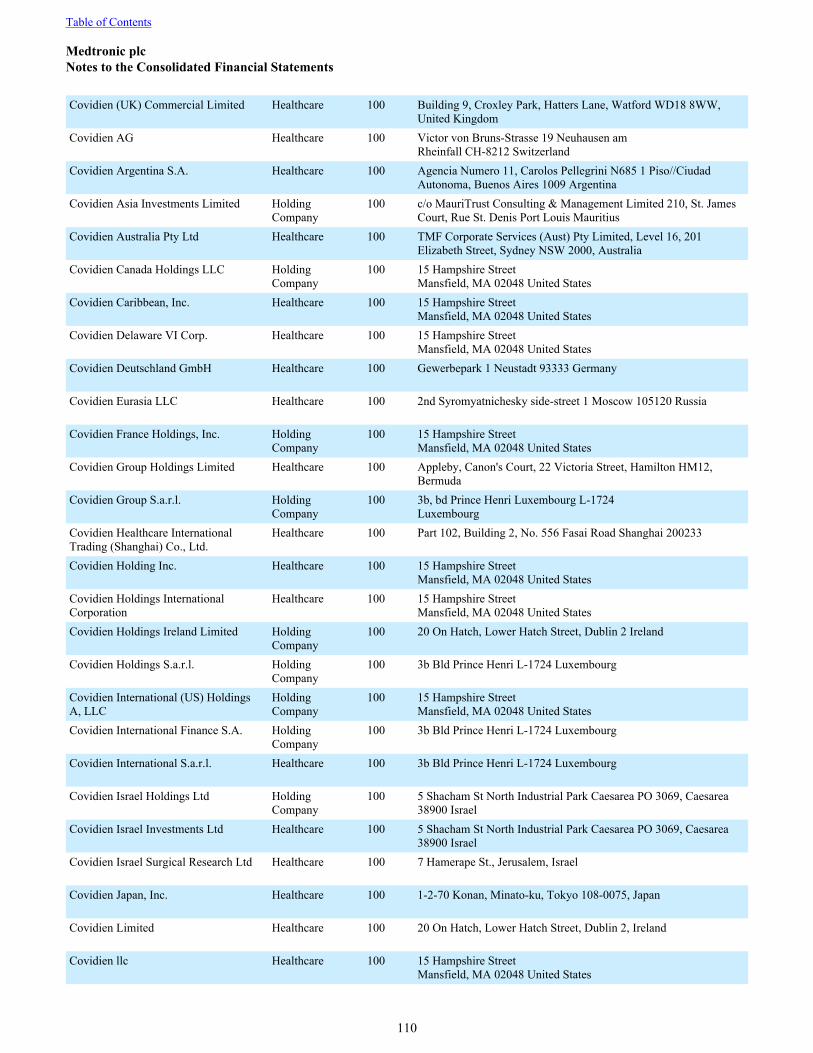
Covidien (UK) Commercial Limited Healthcare 100 Building 9, Croxley Park, Hatters Lane, Watford WD18 8WW, United Kingdom
Covidien AG Healthcare 100 Victor von Bruns-Strasse 19 Neuhausen amRheinfall CH-8212 Switzerland
Covidien Argentina S.A. Healthcare 100 Agencia Numero 11, Carolos Pellegrini N685 1 Piso//Ciudad Autonoma, Buenos Aires 1009 Argentina
Covidien Asia Investments Limited Holding Company
100 c/o MauriTrust Consulting & Management Limited 210, St. James Court, Rue St. Denis Port Louis Mauritius
Covidien Australia Pty Ltd Healthcare 100 TMF Corporate Services (Aust) Pty Limited, Level 16, 201 Elizabeth Street, Sydney NSW 2000, Australia
Covidien Canada Holdings LLC Holding Company
100 15 Hampshire StreetMansfield, MA 02048 United States
Covidien Caribbean, Inc. Healthcare 100 15 Hampshire StreetMansfield, MA 02048 United States
Covidien Delaware VI Corp. Healthcare 100 15 Hampshire StreetMansfield, MA 02048 United States
Covidien Deutschland GmbH Healthcare 100 Gewerbepark 1 Neustadt 93333 Germany
Covidien Eurasia LLC Healthcare 100 2nd Syromyatnichesky side-street 1 Moscow 105120 Russia
Covidien France Holdings, Inc. Holding Company
100 15 Hampshire StreetMansfield, MA 02048 United States
Covidien Group Holdings Limited Healthcare 100 Appleby, Canon's Court, 22 Victoria Street, Hamilton HM12, Bermuda
Covidien Group S.a.r.l. Holding Company
100 3b, bd Prince Henri Luxembourg L-1724Luxembourg
Covidien Healthcare International Trading (Shanghai) Co., Ltd.
Healthcare 100 Part 102, Building 2, No. 556 Fasai Road Shanghai 200233
Covidien Holding Inc. Healthcare 100 15 Hampshire StreetMansfield, MA 02048 United States
Covidien Holdings International Corporation
Healthcare 100 15 Hampshire StreetMansfield, MA 02048 United States
Covidien Holdings Ireland Limited Holding Company
100 20 On Hatch, Lower Hatch Street, Dublin 2 Ireland
Covidien Holdings S.a.r.l. Holding Company
100 3b Bld Prince Henri L-1724 Luxembourg
Covidien International (US) Holdings A, LLC
Holding Company
100 15 Hampshire StreetMansfield, MA 02048 United States
Covidien International Finance S.A. Holding Company
100 3b Bld Prince Henri L-1724 Luxembourg
Covidien International S.a.r.l. Healthcare 100 3b Bld Prince Henri L-1724 Luxembourg
Covidien Israel Holdings Ltd Holding Company
100 5 Shacham St North Industrial Park Caesarea PO 3069, Caesarea 38900 Israel
Covidien Israel Investments Ltd Healthcare 100 5 Shacham St North Industrial Park Caesarea PO 3069, Caesarea 38900 Israel
Covidien Israel Surgical Research Ltd Healthcare 100 7 Hamerape St., Jerusalem, Israel
Covidien Japan, Inc. Healthcare 100 1-2-70 Konan, Minato-ku, Tokyo 108-0075, Japan
Covidien Limited Healthcare 100 20 On Hatch, Lower Hatch Street, Dublin 2, Ireland
Covidien llc Healthcare 100 15 Hampshire StreetMansfield, MA 02048 United States
Table of Contents
Medtronic plcNotes to the Consolidated Financial Statements
110

Covidien LP Healthcare 100 15 Hampshire StreetMansfield, MA 02048 United States
Covidien Manufacturing Grenoble Healthcare 100 16 avenue du Général de Gaulle BP117F38 800 Le Pont de Claix France
Covidien Medical Products (Shanghai) Manufacturing L.L.C.
Healthcare 100 Building #10, No. 789 Puxing Road, Caohejing EPZ Pujiang Town, Minhang District Shanghai 201114 China
Covidien Peru S.A. Healthcare 100 Av.E. Cavenecia No. 225 of. 405, Lima 27, Peru
Covidien Philippines, Inc. Healthcare 100 Unit 1905-1906 Hanstm Sq, San Miguel Avenue Ortiqas Center, Pasig City, 1065 Philippines
Covidien Private Limited Healthcare 100 50 Pasir Panjang Road, #04-51 Mapletree Business City, Singapore 117384
Covidien Pty Limited Healthcare 100 TMF Corporate Services (Aust) Pty Ltd Level 16, 201 Elizabeth Street, Sydney NSW 2000
Covidien Sales LLC Healthcare 100 15 Hampshire StreetMansfield, MA 02048 United States
Covidien Services Europe Limited Healthcare 100 Block G, First Floor, Cherrywood Business Park Dublin, Ireland
Covidien Sigma Limited Holding Company
100 Appleby Hamilton Canon's Court, 22 Victoria Street HM12 Bermuda
Covidien Swiss Holding GmbH Holding Company
100 Victor von Bruns-Strasse 1919 8212 Neuhausen am Rheinfall Switzerland
Covidien UK Holding Ltd Holding Company
100 Building 9, Croxley Park, Hatters Lane, Watford WD18 8WW, United Kingdom
Covidien UK Limited Healthcare 100 Building 9, Croxley Park, Hatters Lane, Watford WD18 8WW, United Kingdom
Covidien Uruguay S.A. Healthcare 100 Sarandi #693, 3rd floor Montevideo 11000 Uruguay
Covidien US Holdings, Inc. Holding Company
100 15 Hampshire StreetMansfield, MA 02048 United States
Covidien Ventures Ltd. Healthcare 100 Appleby Hamilton Canon's Court, 22 Victoria Street HM12 Bermuda
Davis & Geck Caribe Limited Healthcare 100 Close Brothers (Cayman) Limited, PO Box 1034, Harbour Place, 103 South Church St, George Town KY1-1102 Grand Cayman
Diabeter Nederland B.V. Healthcare 100 Blaak 6 Rotterdam 3011 TA Netherlands
Digital Surgery Limited Healthcare 100 4th Floor 226-236 City Road London, GB EC1V 2QY
Epix Therapeutics, Inc. Healthcare 100 710 Medtronic Parkway, Minneapolis, MN 55432
ev3 Australia Pty Limited Healthcare 100 TMF Corporate Services (Aust) Pty Ltd Level 16, 201 Elizabeth Street, Sydney NSW 2000
ev3, Inc. Healthcare 100 3033 Campus Drive Plymouth, MN 55441 United States
First Lafayette Holdings LLC Holding Company
100 15 Hampshire Street Mansfield, MA 02048 United States
Floreane Medical Implants Healthcare 100 116 avenue du Formans Trevoux 016600 France
GC Holdings, Inc. Holding Company
100 15 Hampshire Street Mansfield, MA 02048 United States
Given Imaging (Los Angeles) LLC Healthcare 100 555 Long Wharf Drive New Haven, CT 06511 United States
Given Imaging B.V. Healthcare 100 Earl Bakkenstraat 10, Heerlen 6422PF, Netherlands
Table of Contents
Medtronic plcNotes to the Consolidated Financial Statements
111

Given Imaging do Brazil Ltda. Healthcare 100 Rua Cayowaa No 225mm Sala 20 Perdizes Sao Paolo CEP05018-000 Brazil
Given Imaging Ltd. Healthcare 100 2 Hacarmel Street, New Industrial Park, Yoqneam 20692 Israel
Given Imaging Pty Limited Healthcare 100 TMF Corporate Services (Aust) Pty Ltd Level 16, 201 Elizabeth Street, Sydney NSW 2000
Given Imaging Vietnam Co., Ltd. Healthcare 100 Unit 6A, 6th Fl, Standard Factory Building, 14th Street Ho Chi Minh City Vietnam
Given Imaging, Inc. Healthcare 100 15 Hampshire StreetMansfield, MA 02048 United States
Graphic Controls (Barbados), Ltd. Healthcare 100 PO Box 169W Bridgetown Barbados
Haemopharm Biofluids S.r.l. Healthcare 100 Via dell’Industria 6, Tovo di Sant’Agata (SO), 23030, Italy
HeartWare International, Inc. Healthcare 100 205 Newbury Street Suite 101 Framingham, MA 01701 United States
HeartWare, Inc. Healthcare 100 205 Newbury Street Suite 101 Framingham, MA 01701 United States
HET Systems, LLC Healthcare 100 15 Hampshire StreetMansfield, MA 02048 United States
IHS Argentina SA Healthcare 100 Cerrito 1070 Piso 3° Oficina 71, Ciudad Autónoma de Buenos Aires, Argentina
IHS Health Services Egypt LLC Healthcare 100 Southern room of apartment number 101 of building number 13 Mohamed Ali Ganah Street, Garden City, Cairo, Egypt
IHS Health Services Lebanon Sarl Healthcare 100 Achrafieh-29 Moumne Street-2nd Floor, section 4 of plot #/1214/Achrafieh, Beirut, Lebanon
IHS Health Services Pakistan (Private) Limited
Healthcare 100 Office No. 1301, 13th Floor, Dilkusha Forum, Tariq Road, Karachi, Pakistan
IHS LLC Healthcare 100 Building 5, 53 Dubininskaya Street, Moscow, RU 115054, Russian Federation
IHS Managed Services SAS Healthcare 100 Avenida Calle 116 No. 7-15 Oficina 1101 , Bogotá D.C. 110111, Colombia
IHS SAGLIK HIZMETLERI LTD STI Healthcare 100 Saray mah.Esnaf sok. Akkom Ofis ParkLaodik Plaza No: , 2 K.4, Ümraniye Istanbul,Istanbul, Turkey
Inbrand Holdings Limited Holding Company
100 Building 9, Croxley Park, Hatters Lane, Watford WD18 8WW, United Kingdom
Inbrand Limited Healthcare 100 Building 9, Croxley Park, Hatters Lane, Watford WD18 8WW, United Kingdom
Inbrand UK Limited Healthcare 100 Building 9, Croxley Park, Hatters Lane, Watford WD18 8WW, United Kingdom
India Medtronic Private Limited Healthcare 100 1241, Solitaire Corporate Pk, Bldg No 12, 4th fl, Andheri-Ghatkopar Link Rd, Andheri( E), Mumbai 400093, India
Integrated Health Solutions Chile S.A. Healthcare 100 Camino La Loica 5031 , Lo Barnechea, Santiago, Chile
Integrated Health Solutions International Sarl
Healthcare 100 Route du Molliau 31, Tolochenaz CH - 1131, Switzerland
Integrated Health Solutions Pty Ltd Healthcare 100 TMF Corporate Services (Aust) Pty Ltd Level 16, 201 Elizabeth Street, Sydney NSW 2000, Australia
Invatec S.p.A. Healthcare 100 Via Martiri della Liberta 7, Roncadelle, Brescia 25030, Italy
Invatec Technology Center GmbH Healthcare 100 Revisions und Steuerberatungsgesellschaft, Zweiniederlassung Weinfeldenm Markstrasse 28, Weinfelden 8570, Switzerland
Table of Contents
Medtronic plcNotes to the Consolidated Financial Statements
112

Kendall de Mexico, S.A. de C.V. Healthcare 100 Avenida Insurgentes Sur No. 863, Piso 15 y 16, Col. Napoles Mexico
Kendall de Venezuela, C.A. Healthcare 100 Calle Caroni Con Madrid, Edificio Centro Caroni, Piso #3Urb. Las Mercedes Caracas Venezuela
Kendall Innovadores en Cuidados al Paciente S.A.
Healthcare 100 Global Park, Parkway 50, LaAurora de Heredia, Costa Rica
Kendall SAS Healthcare 100 27-33 Quai Alphonse le Gallo, Immeuble Ileo, Boulogne Billancourt 92100, France
Kendall, S.A. (Panama) Healthcare 100 Corcione Business Plaza, Piso 8, Santa Maria Business District, Llano Bonito, Panama
Klue, Inc. Healthcare 100 710 Medtronic Parkway Minneapolis, MN 55432
KMS Colon, Panama, S.A. Healthcare 100 Avenida anta Isabel y Calle 20 Colon PO Box 0302-00504 Colon Zona Libre Panama
KMS Montevideo, Uruguay, S.A. Healthcare 100 Lavalleja Ruta 8 Km. 17500Edif. Costa Park ZonamericaMontevideo 33126 Uruguay
Kyphon South Africa (Proprietary) Ltd. Healthcare 100 Waterfall Distribution Campus, CNR K101 and Bridal Veil Road, Waterfall Midrand 1685, South Africa
Laboratoire Soludia SAS Healthcare 100 Route de Revel, Fourquevaux 31450 , France
Lazarus Effect LLC Healthcare 100 710 Medtronic Parkway Minneapolis, MN 55432 United States
Lazarus Effect, Inc. Healthcare 100 710 Medtronic Parkway Minneapolis, MN 55432 United States
Life Design Systems, Inc. Healthcare 100 15 Hampshire StreetMansfield, MA 02048 United States
Magnolia Medical, LLC Healthcare 100 710 Medtronic Parkway Minneapolis, MN 55432 United States
Makani II Unlimited Company Healthcare 100 20 Lower Hatch Street, Dublin 2 Ireland
Mallinckrodt DAR Srl Healthcare 100 Via G. Bove 2-4-6-8, 41037 Mirandola MO, Italy
Mallinckrodt Holdings B.V. Holding Company
100 Earl Bakkenstraat 10, Heerlen 6422PJ, Netherlands
Mallinckrodt Holdings, LLC Holding Company
100 15 Hampshire StreetMansfield, MA 02048 United States
Mallinckrodt Medical S.A. Healthcare 100 Avenida de San Pablo 28 Edificio II Poligono Industrial Coslada, Madrid Spain
Mallinckrodt Medical Unlimited Company
Healthcare 100 Cornamaddy Industrial Estate, Athlone, County Westmeath, Ireland
Mallinckrodt US LLC Healthcare 100 15 Hampshire StreetMansfield, MA 02048 United States
Marblehead Medical LLC Healthcare 100 710 Medtronic Parkway Minneapolis, MN 55432
Mazor Robotics Ltd Holding Company
100 45 Shaham Street, Caesarea, IL 3079567, Israel
MDT Turkey Finansal Danışmanlık Limited Şirketi
Healthcare 100 Saray Mah. Esnaf Cad. Akkom Ofis Prk., Laodik Plz. Sit. B Bl. Apt. No.2/8 Ümraniye, Istanbul, TR , Turkey
Medefield Pty Limited Healthcare 100 TMF Corporate Services (Aust) Pty Ltd Level 16, 201 Elizabeth Street, Sydney NSW 2000, Australia
Medical Education Y.K. Healthcare 100 Comodio Shidome, 2-14-1 Higashi Shimbashi Minato-Ku Tokyo 105-0021 Japan
Table of Contents
Medtronic plcNotes to the Consolidated Financial Statements
113
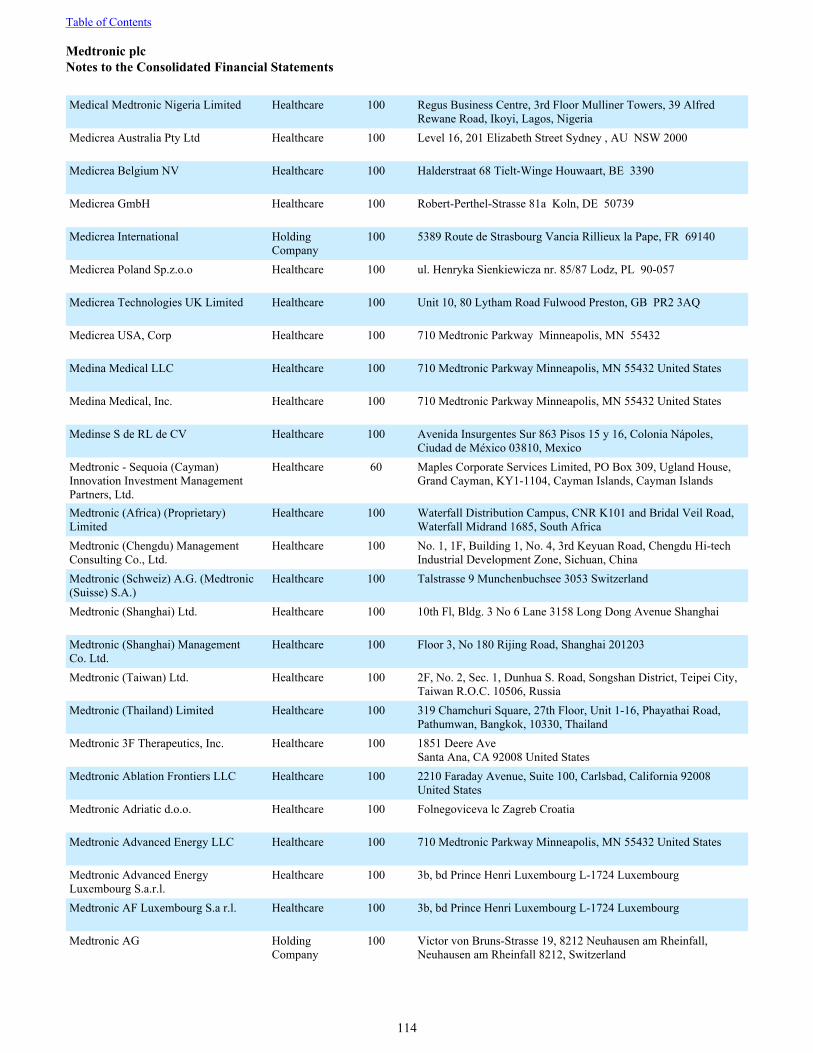
Medical Medtronic Nigeria Limited Healthcare 100 Regus Business Centre, 3rd Floor Mulliner Towers, 39 Alfred Rewane Road, Ikoyi, Lagos, Nigeria
Medicrea Australia Pty Ltd Healthcare 100 Level 16, 201 Elizabeth Street Sydney , AU NSW 2000
Medicrea Belgium NV Healthcare 100 Halderstraat 68 Tielt-Winge Houwaart, BE 3390
Medicrea GmbH Healthcare 100 Robert-Perthel-Strasse 81a Koln, DE 50739
Medicrea International Holding Company
100 5389 Route de Strasbourg Vancia Rillieux la Pape, FR 69140
Medicrea Poland Sp.z.o.o Healthcare 100 ul. Henryka Sienkiewicza nr. 85/87 Lodz, PL 90-057
Medicrea Technologies UK Limited Healthcare 100 Unit 10, 80 Lytham Road Fulwood Preston, GB PR2 3AQ
Medicrea USA, Corp Healthcare 100 710 Medtronic Parkway Minneapolis, MN 55432
Medina Medical LLC Healthcare 100 710 Medtronic Parkway Minneapolis, MN 55432 United States
Medina Medical, Inc. Healthcare 100 710 Medtronic Parkway Minneapolis, MN 55432 United States
Medinse S de RL de CV Healthcare 100 Avenida Insurgentes Sur 863 Pisos 15 y 16, Colonia Nápoles, Ciudad de México 03810, Mexico
Medtronic - Sequoia (Cayman) Innovation Investment Management Partners, Ltd.
Healthcare 60 Maples Corporate Services Limited, PO Box 309, Ugland House, Grand Cayman, KY1-1104, Cayman Islands, Cayman Islands
Medtronic (Africa) (Proprietary) Limited
Healthcare 100 Waterfall Distribution Campus, CNR K101 and Bridal Veil Road, Waterfall Midrand 1685, South Africa
Medtronic (Chengdu) Management Consulting Co., Ltd.
Healthcare 100 No. 1, 1F, Building 1, No. 4, 3rd Keyuan Road, Chengdu Hi-tech Industrial Development Zone, Sichuan, China
Medtronic (Schweiz) A.G. (Medtronic (Suisse) S.A.)
Healthcare 100 Talstrasse 9 Munchenbuchsee 3053 Switzerland
Medtronic (Shanghai) Ltd. Healthcare 100 10th Fl, Bldg. 3 No 6 Lane 3158 Long Dong Avenue Shanghai
Medtronic (Shanghai) Management Co. Ltd.
Healthcare 100 Floor 3, No 180 Rijing Road, Shanghai 201203
Medtronic (Taiwan) Ltd. Healthcare 100 2F, No. 2, Sec. 1, Dunhua S. Road, Songshan District, Teipei City, Taiwan R.O.C. 10506, Russia
Medtronic (Thailand) Limited Healthcare 100 319 Chamchuri Square, 27th Floor, Unit 1-16, Phayathai Road, Pathumwan, Bangkok, 10330, Thailand
Medtronic 3F Therapeutics, Inc. Healthcare 100 1851 Deere AveSanta Ana, CA 92008 United States
Medtronic Ablation Frontiers LLC Healthcare 100 2210 Faraday Avenue, Suite 100, Carlsbad, California 92008 United States
Medtronic Adriatic d.o.o. Healthcare 100 Folnegoviceva lc Zagreb Croatia
Medtronic Advanced Energy LLC Healthcare 100 710 Medtronic Parkway Minneapolis, MN 55432 United States
Medtronic Advanced Energy Luxembourg S.a.r.l.
Healthcare 100 3b, bd Prince Henri Luxembourg L-1724 Luxembourg
Medtronic AF Luxembourg S.a r.l. Healthcare 100 3b, bd Prince Henri Luxembourg L-1724 Luxembourg
Medtronic AG Holding Company
100 Victor von Bruns-Strasse 19, 8212 Neuhausen am Rheinfall, Neuhausen am Rheinfall 8212, Switzerland
Table of Contents
Medtronic plcNotes to the Consolidated Financial Statements
114

Medtronic Aktiebolag Healthcare 100 Farogatan 33, P.O. Box 1034, Kista 164 51, Sweden
Medtronic Angiolink, Inc. Healthcare 100 710 Medtronic Parkway Minneapolis, MN 55432 United States
Medtronic Ardian LLC Healthcare 100 710 Medtronic Parkway Minneapolis, MN 55432 United States
Medtronic Ardian Luxembourg S.a.r.l. Healthcare 100 3b, bd Prince Henri Luxembourg L-1724 Luxembourg
Medtronic Asia, Ltd. Healthcare 100 710 Medtronic Parkway Minneapolis, MN 55432 United States
Medtronic ATS Medical, Inc. Healthcare 100 710 Medtronic Parkway Minneapolis, MN 55432 United States
Medtronic Australasia Pty Ltd Healthcare 100 5 Alma Road, Macquarie Park, NSW 2113, Australia
Medtronic B.V. Healthcare 100 Earl Bakkenstraat 10, Heerlen 6422 PJ, Netherlands
Medtronic Bakken Research Center B.V.
Healthcare 100 Endepolsdomein 5, Maastricht 6229 GW, Netherlands
Medtronic Bangladesh Pvt. Ltd. Healthcare 100 Unit No 606, Level-6 Shanta Western Tower, 186, Gulshan-Tejgaon Link Road, Industrial Estate, Tejgaon, India
Medtronic Belgium S.A./N.V. Healthcare 100 Burgemeester Etienne De Munterlaan 5 (Avenue du Bourgmestre Etienne De Munter 5) Brussels 1090
Medtronic Bio-Medicus, Inc. Healthcare 100 710 Medtronic Parkway Minneapolis, MN 55432 United States
Medtronic BioPharma B.V. Healthcare 100 Earl Bakkenstraat 10, Heerlen 6422 PJ, Netherlands
Medtronic BioPharma Sàrl Healthcare 100 Route de Pierre-a-Bot 97 Neuchatel 2000, Switzerland
Medtronic Braun, Inc. Healthcare 100 710 Medtronic Parkway Minneapolis, MN 55432 United States
Medtronic Bulgaria EOOD Healthcare 100 22 Emile de Laveleye Street, Vazrazhdane Region, Sofia 1000, Bulgaria
Medtronic Canada ULC Healthcare 100 National Headquarters, 99 Hereford Street, Brampton, ON L6Y OR3, Canada
Medtronic Care Management Services, LLC
Healthcare 100 7980 Century BlvdChanhassen, MN 55317 United States
Medtronic Cash Pool LLC Holding Company
100 15 Hampshire Street Mansfield, MA 02048
Medtronic Changzhou Medical Device Co., Ltd.
Healthcare 100 11 #, North Changjiang Road, Xinbei District, Changzhou, Jiangsu, CN 213033
Medtronic China Kanghui Holdings Holding Company
100 Century Yard, Cricket Square, Hutchins Drive, P.O. Box 2681 GT, George Town, Grand Cayman
Medtronic China Venture Fund (Cayman), L.P.
Healthcare 67 P.O. Box 309, Ugland House, South Church Street, George Town, Cayman Islands
Medtronic China, LLC Healthcare 100 710 Medtronic Parkway Minneapolis, MN 55432 United States
Medtronic Colombia S.A. Healthcare 100 Avenida Calle 116 N° 7 15, Piso 11 Oficina 1101, Bogota D.C., CO , Colombia
Medtronic Comercial Ltda. Healthcare 100 Joaquim Floriano Street, 100-7th Floor, Sao Paulo CEP 04534-000, Brazil
Medtronic Communities Foundation Healthcare 100 710 Medtronic Parkway Minneapolis, MN 55432
Medtronic CoreValve LLC Healthcare 100 710 Medtronic Parkway Minneapolis, MN 55432 United States
Table of Contents
Medtronic plcNotes to the Consolidated Financial Statements
115

Medtronic CryoCath LP Healthcare 100 9000, Trans-Canada Highway, Pointe-Claire, Quebec H9R 5Z8, Canada
Medtronic CV Luxembourg S.a.r.l. Healthcare 100 3b, bd Prince Henri Luxembourg L-1724 Luxembourg
Medtronic Czechia s.r.o. Healthcare 100 Prosecka 852/66, Praha 9 - Prosek 190 00, Czech Republic
Medtronic Danmark A/S Healthcare 100 Arne Jacobsens Alle 17 Copenhagen S 2300 Denmark
Medtronic Diabetes (Chengdu) Co., Ltd.
Healthcare 100 58#, East Tianqin Road, Hi-tech District (West), Chengdu, Sichuan, 611731, China
Medtronic do Brasil Ltda. Healthcare 100 Rua Monsenhor Arruda, Carmara, Suite 2, Vila Ede 53 Sao Paulo Brazil
Medtronic Dominican Republic S.A.S. Healthcare 100 Ave. Sarasota Núm 20 esquina Ave. Abraham Lincoln Suite 1103 Torre Empresarial AIRD, Santo Domingo, Dominican Republic
Medtronic Dominicana (Manufactura), S.A.
Healthcare 100 Parque Zona Franca San Isidro, Santo Domingo, Dominican Republic
Medtronic Egypt llc Healthcare 100 Building no. 3, El Hak Fi El Hayah street, Block no. 1149, Sheraton, El Nozha,, Cairo, Egypt
Medtronic Empalme. S. de R.L.de C.V. Healthcare 100 Avenida Insurgentes Sur No. 863, Piso 15 y 16, Col. Napoles Deleg. Benito Juarez CP 03810 Mexico
Medtronic Engineering and Innovation Center Private Limited
Healthcare 100 DLF Cyber City, Block No. 3, Ground Floor, Plot No. 129 to 132, APHB Colony, Gachibowli Hyderabad 5000019 India
Medtronic Europe Ltd Healthcare 100 Burgemeester Etienne De Munterlaan 5 (Avenue du Bourgmestre Etienne De Munter 5) Brussels 1090 Belgium
Medtronic Europe Sàrl Healthcare 100 Route du Molliau 31 Case-postale Tolochenaz 1131 Switzerland
Medtronic Fabrication SAS Healthcare 100 Route d'Anor Zone Industrielle Fourmies 59610 France
Medtronic Finance Holdings ULC Holding Company
100 P.O. Box 309, Ugland House, Grand Cayman KY1-1104 Cayman Islands
Medtronic Finance Hungary Kft. Healthcare 100 Bocskai ut 134-146, Budapest, HU 1113, Hungary
Medtronic Finland Oy Healthcare 100 Lentäjäntie 3, Vantaa 01530, Finland
Medtronic France S.A.S. Healthcare 100 27/33 quai Alphonse le Gallo, Immeuble ILEO, Boulogne Billancourt 92100, France
Medtronic G.m.b.H. Healthcare 100 Earl-Bakken-Platz 1 Dusseldorf Meerbusch 40670 Germany
Medtronic Global Health Foundation Healthcare 100 710 Medtronic Parkway Minneapolis, MN 55432
Medtronic Global Holdings GP S.à r.l. Holding Company
100 40 Avenue Monterey, L-2163, Luxembourg
Medtronic Global Holdings S.C.A. Holding Company
100 3b Boulevard Prince Henri, L-1724, Luxembourg
Medtronic Group Holding, Inc. Holding Company
100 710 Medtronic Parkway Minneapolis, MN 55432 United States
Medtronic Hellas Medical Device Commercial S.A.
Healthcare 100 Kifisias Avenue 24, Maroussi, Attika 151 25, Greece
Medtronic Holding B.V. Holding Company
100 Earl Bakkenstraat 10, Heerlen 6422 PJ, Netherlands
Medtronic Holding Company Sarl Holding Company
100 Route Du Molliau 31, c/o Medtronic International Trading Sàrl, Tolochenaz 1131, Switzerland
Medtronic Holding Hungary Kft. Holding Company
100 Bocskai ut 134-146, Budapest, HU 1113, Hungary
Table of Contents
Medtronic plcNotes to the Consolidated Financial Statements
116

Medtronic Holding Switzerland G.m.b.H.
Holding Company
100 c/o Acton Treuhand AG, Gotthardstrasse 28, Zug 6304, Switzerland
Medtronic Holding, Inc. Holding Company
100 710 Medtronic Parkway Minneapolis, MN 55432 United States
Medtronic Holdings Sarl Holding Company
100 Route du Molliau 31 Tolochenaz, CH 1131
Medtronic Holdings Unlimited Holding Company
100 Citco B.V.I. Limited, Flemming House, Wickhams Cay, P.O. Box 662, Road Town, Tortola
Medtronic Hong Kong Limited Healthcare 100 Suite 1106-11 11/F, Tower 1 Slkotas ut Hong Kong
Medtronic Hong Kong Medical Limited
Healthcare 100 Suite 1106-11, 11/F., Tower 1, The Gateway, Harbour City, Tsim Sha Tsui, Kowloon, Hong Kong
Medtronic Hungaria Kereskedelmi Kft Healthcare 100 Bocskai ut 134-136, Budapest 1113 Hungary
Medtronic Ibérica S.A. Healthcare 100 Calle Maria de Portugal 11, 3rd Floor, Madrid 28050, Spain
Medtronic Innovation Center (Israel) Ltd
Healthcare 100 2 Hacarmel St Yokneam, IL 2066724
Medtronic Integrated Health Solutions LLC
Healthcare 100 710 Medtronic Parkway Minneapolis, MN 55432 United States
Medtronic International Holding LLC Holding Company
100 710 Medtronic Parkway Minneapolis, MN 55432 United States
Medtronic International Investment LLC
Healthcare 100 710 Medtronic Parkway Minneapolis, MN 55432 United States
Medtronic International Trading Holding LLC
Holding Company
100 710 Medtronic Parkway Minneapolis, MN 55432
Medtronic International Technology, Inc.
Healthcare 100 710 Medtronic Parkway Minneapolis, MN 55432 United States
Medtronic International Trading Pte. Ltd.
Healthcare 100 #49, Changi South Avenue 2, NASACO TECH CENTRE, Singapore 486056, Singapore
Medtronic International Trading Sàrl Healthcare 100 Route du Molliau 31, Tolochenaz CH-1131, Switzerland
Medtronic International Trading, Inc. Healthcare 100 710 Medtronic Parkway Minneapolis, MN 55432 United States
Medtronic International, Ltd. Healthcare 100 710 Medtronic Parkway Minneapolis, MN 55432 United States
Medtronic Interventional Vascular, Inc. Healthcare 100 35a Cherry Hill DriveDanvers, MA 01923 United States
Medtronic Invatec LLC Healthcare 100 710 Medtronic Parkway Minneapolis, MN 55432 United States
Medtronic IP Holding International Luxembourg S.a.r.l.
Holding Company
100 3b, bd Prince Henri Luxembourg L-1724 Luxembourg
Medtronic Ireland Limited Healthcare 100 Unit Ga, Swords Business Campus, Balheary Road, Swords, Co Dublin, Ireland
Medtronic Ireland Manufacturing Unlimited Company
Healthcare 100 Arthur Cox Building, Earlsfort Terrace, Dublin 2, Ireland
Medtronic Irish Finco Unlimited Company
Healthcare 100 20 Lower Hatch Street, Dublin 2 Ireland
Medtronic Italia S.p.A. Healthcare 100 Via Varesina 162 Milano 20156, Italy
Medtronic Japan Co., Ltd. Healthcare 100 1-2-70 Konan, Minato-ku, Tokyo 108-0075, Japan
Medtronic Jolife LLC Healthcare 100 710 Medtronic Parkway Minneapolis, MN 55432 United States
Table of Contents
Medtronic plcNotes to the Consolidated Financial Statements
117

Medtronic Kazakhstan Limited Liability Partnership
Healthcare 100 VP-2/1, Nursaya-1, D.Konayev Street, Yesil District, Astana, Kazakhstan
Medtronic KL Holdings LLC Holding Company
100 710 Medtronic Parkway Minneapolis, MN 55432 United States
Medtronic Korea Ltd. Healthcare 100 17th Floor (Glass Tower, Daechi-dong), 534, Teheran-ro, Gangnam-gu, Seoul, Korea
Medtronic Lateral, Inc. Healthcare 100 710 Medtronic Parkway NE, Minneapolis, MN 55432
Medtronic Latin America, Inc. Healthcare 100 710 Medtronic Parkway Minneapolis, MN 55432 United States
Medtronic Limited Healthcare 100 Building 9, Croxley Green Business Park, Hatters Lane, Watford WD18 8 WW, United Kingdom
Medtronic LLC Healthcare 100 Naberezhnaya Tower, Tower C, Presnenskaya Naberezhnaya 10, Moscow 123317, Russia Federation
Medtronic Logistics LLC Healthcare 100 710 Medtronic Parkway Minneapolis, MN 55432 United States
Medtronic Luxembourg Global Holdings S.à r.l.
Holding Company
100 40 Avenue Monterey, L-2163, Luxembourg
Medtronic Malaysia Sdn. Bhd. Healthcare 100 10th Floor Menara Hap Seng No. 1 & 3 Jalan P. Ramlee 50250 Kuala Lumpur, Malaysia
Medtronic Medical CR S de RL Healthcare 100 Building G, Unit B "Zeta" Industrial Park, Santo Domingo Santa Rosa Heredia, CR
Medtronic Medical Device (Chengdu) Co., Ltd.
Healthcare 100 3/F 180 Rijing Road, Shanghai Waigaoqiao Free Trade Zone, Shanghai
Medtronic Medikal Teknoloji Ticaret Limited Sirketi Gebze Subesi
Healthcare 100 Saray Mah. Dr. Adnan Buyukdeniz Cad., Akkom Ofis Park 2. Blok No: 4 Kat:18, Umraniye, Istanbul 34768, Turkey
Medtronic Mediterranean Offshore SAL
Healthcare 100 Regional Development Center, St. Charles City Center - 6th Floor, Omar Daouk Street, PO Box 13-6572, Beirut, Lebanon
Medtronic META FZ-LLC Healthcare 100 Dubai Technology & Media Free Zone, Dubai, United Arab Emirates
Medtronic Mexico S. de R.L. de C.V. Healthcare 100 Paseo Cucapa #10510 El Lago, Tijuana B.C. Mexico 22210
Medtronic MiniMed, Inc. Healthcare 100 18000 Devonshire Street Northridge, CA 91325 United States
Medtronic Mlab Management Co., Ltd Healthcare 100 Room 402-3 Building 3, No.2388 Chen Hang Road Min Hang Area Shanghai, CN 200000
Medtronic Monitoring, Inc. Healthcare 100 710 Medtronic Parkway Minneapolis, MN 55432 United States
Medtronic Navigation Israel Ltd. Healthcare 100 Kochav Yokneam, P.O. Box 548, Yokneam 20692, Israel
Medtronic Navigation, Inc. Healthcare 100 826 Coal Creek CircleLouisville, CO 80027 United States
Medtronic New Zealand Limited Healthcare 100 Webb Henderson, Level 3, 110 Customs Street West, Auckland 1010, New Zealand
Medtronic Norge AS Healthcare 100 Martin Linges vei 25, Fornegu 1364, Norway
Medtronic Oesterreich G.m.b.H. Healthcare 100 Handelska 94-96, Millenium Tower OG 20, Wien 1200, Austria
Medtronic Pacific Trading, Inc. Healthcare 100 710 Medtronic Parkway Minneapolis, MN 55432 United States
Medtronic Pakistan (Private) Limited Healthcare 100 Office No. 1301, 13th Floor , Dilkusha Forum, Tariq Road, Karachi, Pakistan
Medtronic Philippines, Inc. Healthcare 100 Unit 2901-B One World Place, 32nd Street, Bonifacio Global City, Taguig City, Philippines 1634
Table of Contents
Medtronic plcNotes to the Consolidated Financial Statements
118

Medtronic Poland Finance Sp.z.o.o. Healthcare 100 ul. Polna, 11, Warszawa, PL 00-633, Poland
Medtronic Poland Sp. z o.o. Healthcare 100 Polna 11 Street, B Building, Warsaw 00-633, Poland
Medtronic Portugal, Lda Healthcare 100 Rua Tomas da Fonseca, Torre E, 11, Lisboa, 1600-209 Portugal
Medtronic PS Medical, Inc. Healthcare 100 125 Cremona Drive Goleta, CA 93117 United States
Medtronic Puerto Rico Operations Co. Healthcare 100 Ceiba Norte Industrial Park, Road 31, Km. 24, HM 4, Call Box 4070, Juncos 00777-4070, Puerto Rico
Medtronic Romania SRL Healthcare 100 Baneasa Business & Technology Park, 42-44 Bucuresti-Ploiesti Road, Building A, Wing A1, Room 7 , Bucharest 013696, Romania
Medtronic S. de R.L. de C.V. Healthcare 100 Insurgentes Sur 863 Piso 15 y 16 Col. Nápoles, Del. Benito Juárez Ciudad de México, MX 03810
Medtronic S.A.I.C. Healthcare 99 Maipu Street 757, 6th Floor Buenos Aires Argentina
Medtronic Saudi Arabia Company Healthcare 50 PO Box 10213, Riyadh 11433, Saudi Arabia
Medtronic Servicios S. de R.L. de C.V. Healthcare 100 Varsovia No. 44 Piso II, Colonia Juarez 06600, Mexico
Medtronic SG, LLC Holding Company
100 710 Medtronic Parkway Minneapolis, MN 55432 United States
Medtronic Shared Services Americas, S.A.S.
Healthcare 100 Calle 116 No-7-15, Office 1101, Bogota D.C., CO 110111, Colombia
Medtronic Shared Services SRL Healthcare 100 Alajuela-Alajuela Distrito San Jose, El Coyol, Zona Franca El Coyol, Edificio B Veinte, Costa Rica
Medtronic Singapore Operations Pte. Ltd.
Healthcare 100 49 Changi South Avenue 2, Nasco Tech Centre, Singapore 486056, Singapore
Medtronic Slovakia s.r.o. Helathcare 100 Karadzicova 16, Bratislava 821 08, Slovakia
Medtronic Sofamor Danek Co., Ltd. Healthcare 100 KM Nishiumeda Bldg 3F 7-20-1 Fukushima Osaka 553-0003
Medtronic Sofamor Danek Deggendorf GmbH
Healthcare 100 Werfstrasse 17, Deggendorf 94469, Germany
Medtronic Sofamor Danek South Africa (Proprietary) Limited
Healthcare 100 Waterfall Distribution Campus, CNR K101 and Bridal Veil Road, Waterfall Midrand 1685, South Africa
Medtronic Sofamor Danek USA, Inc. Healthcare 100 2600 Sofamor Danek DriveMemphis, TN 38132 United States
Medtronic Sofamor Danek, Inc. Healthcare 100 1800 Pyramid PlaceMemphis, TN 38132 United States
Medtronic Srbija d.o.o. Beograd-Novi Beograd
Healthcare 100 Bulevar Zorana Dindica 64a, Belgrade 11070, Serbia
Medtronic Sweden Finance AB Healthcare 100 Box 1034, Kista, SE 164 21, Sweden
Medtronic Trading Ltd. Healthcare 100 5 Shacham Street, PO Box 3069 North Industrial Park Caesaria Israel
Medtronic Trading NL BV Healthcare 100 Larixplein 4, Eindhoven 5616 VB, Netherlands
Medtronic Ukraine Limited Liability Company
Healthcare 100 4 Mykoly Grinchenka Street, Kiev 03038, Ukraine
Medtronic USA, Inc. Healthcare 100 710 Medtronic Parkway Minneapolis, MN 55432 United States
Table of Contents
Medtronic plcNotes to the Consolidated Financial Statements
119

Medtronic Vascular Galway Unlimited Company
Healthcare 100 Arthur Cox Building, Earlsfort Terrace, Dublin 2, Ireland
Medtronic Vascular Holdings Unlimited Company
Holding Company
100 Parkmore Business Park West Ballybrit Galway Ireland
Medtronic Vascular, Inc. Healthcare 100 3576 Unocal PlaceSanta Rosa, CA 95403 United States
Medtronic Ventor Technologies Ltd. Healthcare 100 P.O. Box 548, Kochav Yokneam, Yokneam Elit 20692, Israel
Medtronic Vietnam Company Limited Healthcare 100 11th Floor, Tower B, Royal Center Building, 235 Nguyen Van Cu Street, Nguyen Cu Trinh Ward, District 1, Ho Chi Minh City, Vietnam
Medtronic VT, LLC Healthcare 100 710 Medtronic Parkway Minneapolis, MN 55432 United States
Medtronic World Trade Corporation Healthcare 100 710 Medtronic Parkway Minneapolis, MN 55432 United States
Medtronic Xomed LLC Healthcare 100 710 Medtronic Parkway Minneapolis, MN 55432 United States
Medtronic Xomed, Inc. Healthcare 100 6743 Southpoint Drive North Jacksonville, FL 32216 United States
Medtronic, Inc. Healthcare 100 710 Medtronic Parkway Minneapolis, MN 55432 United States
Medtronic, trgovina z medicinsko tehnologijo in opremo d.o.o.
Healthcare 100 Litostrojska cesta 46A, Ljubljana 1000, Slovenia
Micro Therapeutics, Inc. Healthcare 100 15 Hampshire StreetMansfield, MA 02048 United States
MiniMed Distribution Corp. Healthcare 100 18000 Devonshire Street Northridge, CA 91325 United States
MiniMed Pty Ltd. Healthcare 100 5 Alma Road, Macquarie Park, NSW 2113, Australia
MMJ, S.A. de C.V. Healthcare 100 Ave. Henequen #1181 Desarrollo Salvarcar Ciudad Juarez, Chihuahua 32573 Mexico
MSCH LLC Healthcare 100 15 Hampshire StreetMansfield, MA 02048 United States
M-Smart Electronic Equipment Trading (Shanghai) Co. Ltd.
Healthcare 100 Room 5v-5393, Building 2 Floor No. 753 Yuyuan Road, Chang Ning District Shanghai, CN 200000
N.G.C. Medical Srl Healthcare 100 Strada Provinciale Novedratese 35, Novedrate 22060, Italy
NayaMed International Sàrl Healthcare 100 Route du Molliau 31, 1131 Tolochenaz, Switzerland
Nederelandse Obesitas Kliniek Zuid B.V.
Healthcare 51 Amerfoortseweg 43,, Huis ter Heide, 3712BA, Netherlands
Nederlandse Obesitas Kliniek B.V. Healthcare 51 Amerfoortseweg 43,, Huis ter Heide, 3712BA, Netherlands
Nederlandse Obesitas Kliniek West B.V.
Healthcare 51 Amersfoortseweg 43, Huis ter Heide, 3712BA, Netherlands
Nederlandse Obesitas kliniek Zeeland B.V.
Healthcare 100 Amersfoortseweg 43 Huis ter Heide, NL 3712 BA
Nellcor Puritan Bennett Ireland Unlimited Company
Healthcare 100 Michael Collins Road, Mervue Galway Ireland
Nellcor Puritan Bennett Ireland Holdings Unlimited Company
Holding Company
100 Michael Collins Road, Mervue Galway Ireland
Nellcor Puritan Bennett LLC Healthcare 100 5920 Longbow Drive Boulder, CO 80301 United States
Table of Contents
Medtronic plcNotes to the Consolidated Financial Statements
120

Nellcor Puritan Bennett Mexico, S.A. de C.V.
Healthcare 100 Blvd Insurgentes 19030 Colonia Libramiento, CP 22225 Mexico
New Wave Surgical, LLC Healthcare 100 555 Long Wharf Drive New Haven, CT 06511 United States
Newport Medical Instruments, Inc. Healthcare 100 15 Hampshire StreetMansfield, MA 02048 United States
NGC Medical UK Limited Healthcare 100 Cannon Place, 78 Cannon Street, London, EC4N 6AF, United Kingdom
Nobles Medical Technology, Inc. Healthcare 100 710 Medtronic Parkway Minneapolis, MN 55432 United States
Nurtino Health Ltd. Holding Company
100 58 Harakevet, Tel Aviv-Jaffa, IL 6777016, Israel
Obesitas International B.V. Holding Company
51 Amersfoortseweg 43, Huis ter Heide 3712BA, Netherlands
Obesitas Nederland B.V. Holding Company
51 Amersfoortseweg 43, Huis ter Heide 3712BA, Netherlands
Old Colony State Insurance Company Healthcare 100 One Church Street Burlington Vermont 05401 United States
Oridion Capnography, Inc. Healthcare 100 15 Hampshire StreetMansfield, MA 02048 United States
Oridion Medical 1987 Ltd. Healthcare 100 7 Hamarpe Street, Jerusalem Israel
Oridion Systems Ltd. Healthcare 100 7 Hamarpe Street, Jerusalem Israel
Osteotech, Inc. Healthcare 100 710 Medtronic Parkway Minneapolis, MN 55432 United States
Panmedica Pty Limited Healthcare 100 TMF Corporate Services (Aust) Pty Limited, Level 16, 201 Elizabeth Street, Sydney NSW 2000, Australia
Polysuture Industria e Comercio Ltda. Healthcare 100 Avenida Gabriel Ramos da Silva, ar. 1245, Parque Industrial Joao Fernando Zanin Sao Schastio do Paraiso Minas Gerais Brazil
PT Medtronic Indonesia Healthcare 100 Gandaria 8 Office Tower 36th Floor, Unit A, Jalan Sultan Iskandar Muda, Kebayoran Lama, Jakarta Selatan 12240, Indonesia
PT. Covidien Indonesia Healthcare 100 Talavera Office Park, Suite Lantai 19, J1. Letjen TB Jakarta Selatan 12430 Indonesia
PTB International LLC Healthcare 100 15 Hampshire StreetMansfield, MA 02048 United States
Quro Obesity Marketing Management LLC
Healthcare 100 PO BOX 54045 Parcel ID 375-6402 , AE
Retail Group de Mexico S.A. de C.V. Healthcare 100 Calle 9NA Sur #125 Cd. Industrial Mesa de Otay Tijuana 22444 Mexico
Reverse Medical LLC Healthcare 100 15 Hampshire StreetMansfield, MA 02048 United States
RF Surgical Systems LLC Healthcare 100 710 Medtronic Parkway Minneapolis, MN 55432 United States
RIST Neurovascular, Inc. Healthcare 100 710 Medtronic Parkway Minneapolis, MN 55432
Sanatis GmbH Healthcare 100 Kirchstrasse 9, Rosbach 61190, Germany
Sapheon LLC Healthcare 100 15 Hampshire StreetMansfield, MA 02048 United States
Setagon, Inc. Healthcare 100 3576 Unocal PlaceSanta Rosa, CA 95403 United States
Shanghai Zhikang Medical Devices Co., Ltd.
Healthcare 100 Room 202, Block 4 No 2094 Ruanxiang Street Shanghai 201500 China
Table of Contents
Medtronic plcNotes to the Consolidated Financial Statements
121

Sherwood Medical Company I Healthcare 100 15 Hampshire StreetMansfield, MA 02048 United States
Sherwood Medical Industries Pty Ltd Healthcare 100 TMF Corporate Services (Aust) Pty Limited, Level 16, 201 Elizabeth Street, Sydney NSW 2000, Australia
Societe De Fabrication de Material Orthopedique En Abrege Sofamor
Healthcare 100 27/33, quai Alphonse le Gallo, Immeuble ILEO, Boulogne Billancourt 92100, France
Sofradim Production Healthcare 100 16 avenue du Formans Trevoux 01600 France
SonarMed Inc. Healthcare 100 Suite 150 12220 N Meridian Street Carmel, IN 46032
Sophono GmbH Healthcare 100 Landgrafenstrasse 54, Bad Neuenahr-Ahrweiler 53474, Germany
Sophono, Inc. Healthcare 100 710 Medtronic Parkway Minneapolis, MN 55432 United States
SpinalGraft Technologies, LLC Healthcare 100 4340 Swinnea RoadMemphis, TN 38118 United States
superDimension, Inc. Healthcare 100 555 Long Wharf DriveNew Haven, CT 06511 United States
Suzhou Medtronic Venture Capital Partnership Enterprise (L.P.)
Healthcare 34 Unit E99, 2F, North Building, A1, 218 Xinghu Str., Suzhou Industrial Park, 215123, China
Suzhou Medtronic - Sequoia Innovation Investment Management Co., Ltd.
Healthcare 60 Unit E99, 2F, North Building, A1, 218 Xinghu Str., Suzhou Industrial Park, 215123, China
Suzhou Mei Zhong Capital Investment Management Co., Ltd.
Healthcare 100 Unit E100, 2F, North Building, A1, 218 Xinghu Str., Suzhou Industrial Park, 215123, China
THC Holdings Limited Holding Company
95 140/38 ITF Tower Building, 17th Floor, Silom Road, Khwang Suriyawongse, Khet Bangrak, Bangkok Metropolis, Thailand
Tissue Science Laboratories Limited Healthcare 100 Building 9, Croxley Park, Hatters Lane, Watford WD18 8WW, United Kingdom
Titan Spine, Inc. Healthcare 100 710 Medtronic Parkway Minneapolis, MN 55432
Trigate (Pty.) Ltd. Healthcare 100 379 Roan Crescent Corporate Park North PO Box 8108 1685 South Africa
Twelve Australia Pty Ltd Healthcare 100 5 Alma Road, Macquarie Park, NSW 2113, Australia
Twelve Medical Limited Healthcare 100 Carrick House, Lypiatt Road, Cheltenham, GB GL50 20J, United Kingdom
Twelve, Inc. Healthcare 100 710 Medtronic Parkway Minneapolis, MN 55432 United States
U.S.S.C. Puerto Rico (NY), Inc. Healthcare 100 201 Sabanetas Industrial Park Ponce 00716-4401 United States
U.S.S.C. Puerto Rico, Inc. Healthcare 100 PO Box 309, Ugland House, South Church Street Grand Cayman
United States Surgical Corporation Healthcare 100 555 Long Wharf DriveNew Haven, CT 06511 United States
USSC Financial Services Inc. Healthcare 100 15 Hampshire StreetMansfield, MA 02048 United States
USSC FSC, Inc. Healthcare 100 400 Capability Green, Luton, Beds LU13AE
USSC Medical GmbH Healthcare 100 Earl-Bakken-Platz 1, Meerbusch 40670, Germany
Valera Holdings S.a.r.l. Holding Company
100 3b, bd Prince Henri Luxembourg L-1724 Luxembourg
Table of Contents
Medtronic plcNotes to the Consolidated Financial Statements
122

Valleylab (Australia) Pty. Ltd Healthcare 100 TMF Corporate Services (Aust) Pty Ltd Level 16, 201 Elizabeth Street, Sydney NSW 2000, Australia
Valleylab Holding Corporation Holding Company
100 5920 Longbow Drive Boulder, CO 80301 United States
Verdana Holdings Limited Holding Company
100 57/63 Line Wall Road Gibraltar
Visionsense Corp. Healthcare 100 710 Medtronic Parkway, Minneapolis, MN 55432
Visionsense Ltd Healthcare 100 20 Hamagshimim St. Petah Tikva, IL 4934829
Visualase, Inc. Healthcare 100 710 Medtronic Parkway Minneapolis, MN 55432 United States
Vitatron Holding B.V. Holding Company
100 Meander 1051 Arnhem The Netherlands 6825MJ
VNUS Medical Technologies II, Inc. Healthcare 100 15 Hampshire StreetMansfield, MA 02048 United States
Warsaw Orthopedic Inc. Healthcare 100 SDG Manufacturing 2500 Silveus Crossing Warsaw Indiana 46582-8598 United States
WEM Equipamentos Electronicos Ltda.
Healthcare 100 Rua Marechal Mascarenhas de Moraes 550 Ribeirao Preto, Sao Paolo 14095-120 Brazil
World Heart Corporation Healthcare 100 4750 Wiley Post Way Suite 120Salt Lake City, UT 84116 United States
Zephyr Technology LLC Healthcare 100 6135 Gunbarrel Avenue Boulder, CO 80301 United States
Zorginitiatieven B.V. Healthcare 51 Amersfoortseweg 43, Huis ter Heide, 3712BZ, Netherlands
Table of Contents
Medtronic plcNotes to the Consolidated Financial Statements
123

The following entities are subsidiaries held, but do not have any current operations:
Name Nature ofBusiness
GroupShare Percent
Registered Office andLocation of Incorporation
A&E Products de Honduras S.A. Non-operating 100 Zoli Zip Calpules Km.7, Carretera a La Lima San Pedtro Sula Honduras
A&E Products do Brasil Ltda. Non-operating 50 Rua Viscondde de Piraja Ipanema, Rio de Janerio, RJ 22410-002 Brazil
A&E Products Group, Inc. Non-operating 100 15 Hampshire StreetMansfield, MA 02048 United States
Batts LLC Non-operating 100 15 Hampshire StreetMansfield, MA 02048 United States
Batts, Inc. Non-operating 100 15 Hampshire StreetMansfield, MA 02048 United States
Carlisle Philippines, Inc. Non-Operating 100 Metropolitan Manila, Philippines
Covidien Adhesives Italia Srl Non-operating 100 Via San Bovio, 3 Localita San Felice Segret Milan 20090 Italy
Georgia Packaging, LLC Non-operating 100 918 8th Avenue PO Box 1158Columbus, GA 31902 United States
Kendall Ludlow Holding Corporation Non-Operating 100 15 Hampshire StreetMansfield, MA 02048 United States
Plastics Holding Corporation Non-operating 100 15 Hampshire StreetMansfield, MA 02048 United States
Polyken Technologies Europe, Inc. Non-operating 100 15 Hampshire StreetMansfield, MA 02048 United States
Raychem Tecnologias, S. de R.L. de C.V.
Non-operating 100 Calle 11 Norte No 11002 Cd. Industrial Neuter Tijuana, B.C. Calf Mexico 22500
At April 30, 2021, the Group had the following branches outside of Ireland:
Branch Location
Branch of Covidien International Sarl (Dubai Science Park) Dubai
Branch of Medtronic Saudi Arabia Company Saudi Arabia
Changzhou Kanghui Medical Innovation Co., Ltd. Shanghai Branch China
Commercial Representative Office of Medtronic AG in Ethiopia Ethiopia
Covidien AG (Kenya) Kenya
Covidien AG Bureau of Representation Morocco MoroccoCovidien AG Representative Office Jordan Jordan Covidien AG Representation Office Ukraine Ukraine Covidien AG Representative Office Lebanon LebanonCovidien AG Representative Office Saudi Arabia Saudi Arabia Covidien AG Scientific Office - Egypt Egypt
Covidien AG succursale de Tolochenaz Switzerland
Covidien AG, organizacni slozka Czechia
Covidien AG, Representative office in Kurdistan, Iraq Iraq
Covidien Caribbean, Inc. (Puerto Rico Branch) Puerto Rico
Covidien Group S.à.r.l., Luxembourg (LU)( Neuhausen am Rheinfall Branch) Switzerland
Covidien Healthcare International Trading (Shanghai) Co., Ltd., Beijing Branch China
Table of Contents
Medtronic plcNotes to the Consolidated Financial Statements
124

Covidien Healthcare International Trading (Shanghai) Co., Ltd., Chengdu Branch China
Covidien Healthcare International Trading (Shanghai) Co., Ltd., Guangzhou Branch China
Covidien Healthcare International Trading (Shanghai) Co., Ltd., Hangzhou Branch China
Covidien Healthcare International Trading (Shanghai) Co., Ltd., Jinan Branch China
Covidien Healthcare International Trading (Shanghai) Co., Ltd., Nanjing Branch China
Covidien Healthcare International Trading (Shanghai) Co., Ltd., Shenyang Branch China
Covidien Healthcare International Trading (Shanghai) Co., Ltd., Wuhan Branch China
Covidien Healthcare International Trading (Shanghai) Co., Ltd., Xi'an Branch China
Covidien Healthcare International Trading (Shanghai) Co.,Ltd. 1st Branch China
Covidien Private Limited, Bangladesh Liaison Office Bangladesh
Covidien Private Limited, Sri Lanka Liaison Office Sri Lanka
Davis & Geck Caribe Limited (Dominican Republic Branch) Dominican Republic
HeartWare International, Inc. (Australia Branch) Australia
Medtronic (Shanghai) Management Co., Ltd. Beijing Branch China
Medtronic (Shanghai) Management Co., Ltd. Branch China
Medtronic AG Branch in Tanzania Tanzania
Medtronic AG -Branch of Ghana Ghana
Medtronic AG Kuwait Representative Office Kuwait
Medtronic AG Liaison Office in Pakistan Pakistan
Medtronic AG Representative Office in Ivory Coast Ivory Coast
Medtronic B.V. Representative Office Baltics Latvia
Medtronic B.V. Representative Office Moscow Russian Federation
Medtronic B.V. Representative Office Ukraine Ukraine
Medtronic financial management office (DIFC), branch of Medtronic Finance Hungary Kft United Arab Emirates
Medtronic International, Ltd. (Singapore Branch) Singapore
Medtronic Latin America Inc. (Argentina Branch) Argentina
Medtronic Latin America Inc. Sucursal Colombia - En Liquidación Colombia
Medtronic Medikal Teknoloji Ticaret Limited Şirketi Gebze Şubesi TurkeyMedtronic Poland Spolka Z Organiczona Opdowiedzialnoscia -Oddzial SSC W Warszawie Poland
Medtronic Saudi Arabia Company - Jeddah Branch Saudi Arabia
Medtronic Saudi Arabia Company - Riyadh Branch Saudi Arabia
Medtronic Vietnam Company Limited - Branch in Hanoi City Vietnam
Medtronic World Trade Corporation (Israel Branch) Israel
Representative Office of Medtronic AG (Swiss Confederation) in the Republic of Belarus Republic of Belarus
Representative Office of Medtronic AG in Senegal Senegal
Representative Office of Medtronic Marketing AG in Angola Angola
The Representative Office of Covidien Private Limited in Hanoi Vietnam
The Representative Office of Covidien Private Limited in Ho Chi Minh City Vietnam
The Representative Office of Medtronic B.V. in Ho Chi Minh City Vietnam
Table of Contents
Medtronic plcNotes to the Consolidated Financial Statements
125

27. Post-Balance Sheet Events
Subsequent events have been evaluated through September 2, 2021, the date this report was approved by the Board of Directors. On June 3, 2021, the Group announced the decision to stop the distribution and sale of the Medtronic HVAD System in light of a growing body of observational clinical comparisons indicating a lower frequency of neurological adverse events and mortality with another circulatory support device available to patients compared to the HVAD system. Fiscal year 2021 HVAD system and associated accessory turnover was $141 million and is included in our Cardiovascular segment. Medtronic remains committed to serving the needs of the approximately 4,000 patients currently implanted with the HVAD system. In connection with this decision, the Group recorded charges of $726 million in the consolidated statement of profit during the first quarter of fiscal year 2022. The charges include $515 million of non-cash impairments primarily related to $409 million of intangible asset impairments and $58 million of inventory write-offs. The Group also recorded charges of $211 million for commitments and obligations associated with the decision, which include charges for patient support obligations, restructuring, and other associated costs. No adjustments to the consolidated financial statements within this Irish Annual Report were made as a result of this subsequent event.
28. Approval of Financial Statements
The Board of Directors approved the financial statements on September 2, 2021.
Table of Contents
Medtronic plcNotes to the Consolidated Financial Statements
126

Medtronic Public Limited CompanyCompany Financial Statements
Financial Year Ended April 30, 2021
127
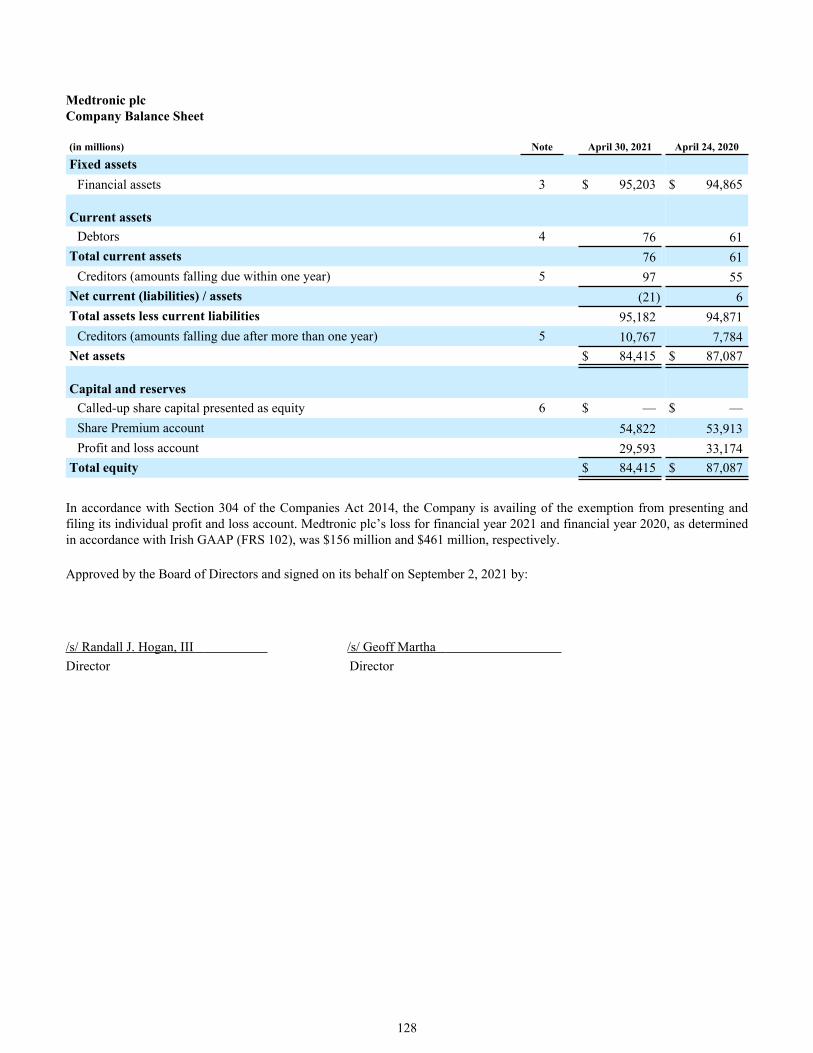
Medtronic plcCompany Balance Sheet
(in millions) Note April 30, 2021 April 24, 2020
Fixed assetsFinancial assets 3 $ 95,203 $ 94,865
Current assetsDebtors 4 76 61
Total current assets 76 61 Creditors (amounts falling due within one year) 5 97 55
Net current (liabilities) / assets (21) 6 Total assets less current liabilities 95,182 94,871
Creditors (amounts falling due after more than one year) 5 10,767 7,784 Net assets $ 84,415 $ 87,087
Capital and reservesCalled-up share capital presented as equity 6 $ — $ — Share Premium account 54,822 53,913 Profit and loss account 29,593 33,174
Total equity $ 84,415 $ 87,087
In accordance with Section 304 of the Companies Act 2014, the Company is availing of the exemption from presenting and filing its individual profit and loss account. Medtronic plc’s loss for financial year 2021 and financial year 2020, as determined in accordance with Irish GAAP (FRS 102), was $156 million and $461 million, respectively.
Approved by the Board of Directors and signed on its behalf on September 2, 2021 by:
/s/ Randall J. Hogan, III /s/ Geoff Martha Director Director
128

Medtronic plcCompany Statement of Changes in Equity
(in millions)
Ordinary Share
Number
Called-up Share Capital Presented as
Equity
Share Premium Account
Profit and Loss Account Total
April 26, 2019 1,341 $ — $ 52,660 $ 37,550 $ 90,210 Issuance of shares under stock purchase and award plans 12 — 1,253 (90) 1,163 Total comprehensive loss for the financial year — — — (461) (461) Dividends paid ($2.16 per ordinary share) — — — (2,894) (2,894) Share-based compensation — — — 297 297 Redemption and cancellation of shares (12) — — (1,228) (1,228)
April 24, 2020 1,341 $ — $ 53,913 $ 33,174 $ 87,087 Issuance of shares under stock purchase and award plans 8 — 909 (90) 819 Total comprehensive loss for the financial year — — — (156) (156) Dividends paid ($2.32 per ordinary share) — — — (3,120) (3,120) Share-based compensation — — — 344 344 Redemption and cancellation of shares (4) — — (559) (559)
April 30, 2021 1,345 $ — $ 54,822 $ 29,593 $ 84,415
129

1. Basis of Presentation and Summary of Significant Accounting Policies Medtronic plc (the Company), headquartered in Ireland, is among the world's largest medical technology, services, and solutions companies – alleviating pain, restoring health, and extending life for millions of people around the world. The Company was incorporated in Ireland on June 12, 2014 as a private limited company and was re-registered effective January 26, 2015 as a public limited company. The Company was established for the purpose of facilitating the acquisition of Covidien plc (Covidien), a public limited company organized under the laws of Ireland and Medtronic, Inc., a U.S. incorporated entity, (collectively, the Transaction). Upon completion of the Transaction on January 26, 2015, Medtronic plc replaced Medtronic, Inc., as the ultimate holding company of the Medtronic group.
Medtronic plc is incorporated as a company limited by shares in the Republic of Ireland (registration number 545333). The address of its registered office is 20 On Hatch, Hatch Street Lower, Dublin 2, D02 XH02, Ireland.
Statement of Compliance The entity financial statements have been prepared on a going concern basis and in accordance with accounting standards issued by the Financial Reporting Council of the UK and the Companies Act 2014. The entity financial statements comply with Financial Reporting Standard 102, ‘The Financial Reporting Standard applicable in the UK and Republic of Ireland’ (FRS 102) and the Companies Act 2014.
Significant Accounting Policies The significant accounting policies used in the preparation of the entity financial statements are set out below. These policies have been consistently applied to all financial years presented.
Basis of Preparation The entity financial statements have been prepared under the historical cost convention. The preparation of financial statements in conformity with FRS 102 requires the use of certain key assumptions concerning the future, and other key sources of estimation uncertainty at the reporting date. It also requires the directors to exercise their judgment in the process of applying the Company’s accounting policies. Estimates and judgments made in the process of preparing the entity financial statements are continually evaluated and are based on historical experience and other factors, including expectations of future events that are believed to be reasonable under the circumstances.
Exemption for Qualifying Entities Under FRS 102 FRS 102 allows a qualifying entity, certain disclosure exemptions, to a member of a group where the parent of that group prepares publicly available consolidated financial statements which are intended to give a true and fair view (of the assets, liabilities, financial position and profit or loss) and that member is included in the consolidation. The Company is a qualifying entity and has taken advantage of the below disclosure exemptions:
1. Exemption from the requirements of Section 7 of FRS 102 and FRS 102 paragraph 3.17(d) to present a statement of cash flows;
2. Exemption from the financial instrument disclosure requirements of Section 11 paragraphs 11.42, 11.44, 11.45, 11.47, 11.48(a)(iii), 11.48(a)(iv), 11.48(b), and 11.48(c) and Section 12 paragraphs 12.26, 12.27, 12.29(a), 12.29(b), and 12.29A of FRS 102 providing the equivalent disclosures are included in the consolidated financial statements of the group in which the entity is consolidated;
3. Exemption from certain disclosure requirements of Section 26 of FRS 102 (paragraphs 26.18(b), 26.19 to 26.21 and 26.23), in respect of share-based payments; and
4. Exemption from the requirement of FRS 102 paragraph 33.7 to disclose key management personnel compensation in total.
Critical Accounting Estimates The directors make estimates and assumptions concerning the future in the process of preparing the entity financial statements. The resulting accounting estimates will, by definition, seldom equal the related actual results. The estimates and assumptions that have a significant risk of causing a material adjustment to the carrying amounts of assets and liabilities within the next financial year primarily relate to the carrying value of the investment in subsidiary undertakings. See Note 2 for further information on critical accounting estimates for the Company.
Going Concern As the Company’s operational existence relies on the activities of the Company and its subsidiaries as a group (collectively, the “Group”), a going concern assessment performed at the Group level was deemed relevant to support the Company’s ability to continue as a going concern. The Company’s board of directors formed a judgment at the time of approving these financial statements that there was a reasonable expectation that the Company has adequate resources to continue in operational existence for at least the next twelve months. In arriving at this conclusion, the Company’s board of directors took account of current and anticipated uncertainties driven by the continuing COVID-19 pandemic (as described in
Medtronic plcNotes to the Company Financial Statements
130

greater detail under the heading “Going Concern” on page 30 of the Directors’ Report of the consolidated financial statements) in its going concern assessment and believed that these uncertainties would not have a material impact on the Company’s ability to continue as a going concern. For this reason, the going concern basis continues to be adopted in the preparation of the Company’s financial statements.
Currency Translation and Exchange Gains and Losses The Company’s functional and presentation currency is the U.S. dollar. Transactions denominated in currencies other than the functional currency are translated into U.S. dollars using the spot exchange rates at the dates of the transactions.
At the end of each financial year, monetary items are translated to the U.S. dollar using the closing exchange rate. Non-monetary items measured at historical cost are translated using the exchange rate at the date of the transaction, and non-monetary items measured at fair value are measured using the exchange rate when fair value was determined.
Currency exchange gains and losses are recognized in the profit and loss account as they arise.
Investment in Subsidiary Undertakings Investment in subsidiary undertakings is recorded at cost, which equaled fair value on the date of the completion of the Transaction, based on the market capitalization of Medtronic, Inc. and Covidien plc. This is the Company’s cost basis for its investment in its subsidiary undertakings. The investment is tested for impairment if circumstances or indicators suggest that an impairment may exist. There were no circumstances or indicators suggesting impairment of the Company’s investment in subsidiary undertakings in either the current or prior financial years.
Cash at Bank and In-Hand Cash at bank and in hand includes all cash balances and deposits which are repayable upon demand.
Share-based Payments The Company operates an equity-settled, share-based compensation plan for employees of some of its subsidiaries. The fair value of the employee services received in exchange for the equity instruments granted in each of the subsidiaries of the Company is recognized as an addition to the investment with a corresponding increase in equity as a contribution by the Company.
The proceeds received by the Company when share options are exercised are credited to share capital (nominal value) and the balance to share premium.
Financial Instruments The Company has chosen to apply the provisions of Sections 11 and 12 of FRS 102 to account for all of its financial instruments.
Financial assets
Basic financial assets, including trade and other debtors, cash at bank and in hand, receivables from fellow group companies and short-term deposits, are initially recognized at transaction price (including transaction costs), unless the arrangement constitutes a financing transaction. Where the arrangement constitutes a financing transaction the resulting financial asset is initially measured at the present value of the future receipts discounted at a market rate of interest for a similar debt instrument.
Trade and other debtors, cash at bank and in hand and financial assets from arrangements which constitute financing transactions are subsequently measured at amortized cost using the effective interest method.
At the end of each financial year, financial assets measured at amortized cost are assessed for impairment. If there is objective evidence that a financial asset measured at amortized cost is impaired, an impairment loss is recognized in the profit and loss account. The impairment loss is the difference between the financial asset’s carrying amount and the present value of the financial asset’s estimated cash inflows discounted at the asset’s original effective interest rate.
If, in a subsequent financial year, the amount of an impairment loss decreases, and the decrease can be objectively related to an event occurring after the impairment was recognized, the previously recognized impairment loss is reversed. The reversal is such that the current carrying amount does not exceed what the carrying amount would have been had the impairment loss not previously been recognized. Any impairment reversal is recognized in the profit and loss account.
Medtronic plcNotes to the Company Financial Statements
131

Financial assets are derecognized when (a) the contractual rights to the cash flows from the asset expire or are settled, (b) substantially all the risks and rewards of ownership of the financial asset are transferred to another party, or (c) control of the financial asset has been transferred to another party who has the practical ability to unilaterally sell the financial asset to an unrelated third party without imposing additional restrictions.
Financial liabilities
Basic financial liabilities, including trade and other creditors, bank loans, loans from fellow group companies and preference shares, are initially recognized at transaction price, unless the arrangement constitutes a financing transaction. Where the arrangement constitutes a financing transaction the resulting financial liability is initially measured at the present value of the future payments discounted at a market rate of interest for a similar debt instrument.
Trade and other creditors, bank loans, loans from fellow group companies, preference shares and financial liability from arrangements which constitute financing transactions are subsequently carried at amortized cost, using the effective interest method.
Fees paid on the establishment of loan facilities are recognized as transaction costs of the loan to the extent that it is probable that some or all of the facility will be drawn down. In this case, the fee is deferred until the draw-down occurs. To the extent there is no evidence that it is probable that some or all of the facility will be drawn down, the fee is treated as a prepayment for liquidity services and amortized over the period of the facility to which it relates.
Trade creditors are obligations to pay for goods or services that have been acquired in the ordinary course of business from suppliers. Trade creditors are classified as due within one year if payment is due within one year or less. If not, they are presented as falling due after more than one year. Trade creditors are recognized initially at transaction price and subsequently measured at amortized cost using the effective interest method.
Financial liabilities are derecognized when the liability is extinguished, that is when the contractual obligation is discharged, cancelled, or expires.
Contingencies Contingent liabilities, arising as a result of past events, are not recognized as a liability if it is not probable that the Company will be required to transfer economic benefits in settlement of the obligation, or the amount cannot be reliably measured. Possible but uncertain obligations are not recognized as liabilities but are contingent liabilities. Contingent liabilities are disclosed in the financial statements unless the probability of payment is remote. Contingent liabilities are considered a critical accounting estimate.
The Company has guaranteed certain liabilities and credit arrangements of the Company's subsidiaries. The Company reviews the status of these guarantees at each reporting date and considers whether it is required to make a provision for payment on those guarantees based on the probability of the commitment being called.
Share Capital Equity shares issued are recognized at the proceeds received. Incremental costs directly attributable to the issue of new equity shares or options are shown in equity as a deduction, net of tax, from the proceeds.
Taxation Taxation for the financial year comprises current and deferred tax recognized in the financial year. Current or deferred tax assets and provisions are not discounted.
Current tax is the amount of income tax payable in respect of the taxable profit for the financial year or past financial years. Current tax is measured at the amount of current tax that is expected to be paid using tax rates and laws that have been enacted or substantively enacted by the end of the financial year.
Deferred tax is recognized in respect of all timing differences, which are differences between taxable profits and total comprehensive income as stated in the financial statements except in certain circumstances. Unrelieved tax losses and other deferred tax assets are recognized only when it is probable that they will be recovered against the reversal of deferred tax provisions or other future taxable profits. These timing differences arise from the inclusion of income and expenses in tax assessments in financial years different from those in which they are recognized in financial statements. Deferred tax is measured using tax rates and laws that have been enacted or substantively enacted by the end of each financial year end and that are expected to apply to the reversal of the timing difference.
Medtronic plcNotes to the Company Financial Statements
132

Dividends Dividends may only be declared and paid out of the profits available for distribution in accordance with accounting practice generally accepted in Ireland and applicable Irish company law. Any dividends, if and when declared, will be declared and paid in U.S. dollars. Dividends declared by the directors are recognized when paid.
2. Critical Accounting Estimates and Judgments
Estimates and judgments are continually evaluated and are based on historical experience and other factors, including expectations of future events that are believed to be reasonable under the circumstances. The Company makes estimates and assumptions concerning the future. The resulting accounting estimates will, by definition, seldom equal the related actual results. The estimates and assumptions that have a significant risk of causing a material adjustment to the carrying amounts of assets and liabilities within the next financial year are addressed below:
Estimated impairment of investment in subsidiary undertakings
The Company assesses whether investment in subsidiary undertakings have suffered any impairment in line with the accounting policies stated. The determination of recoverable amounts requires the use of estimates. The Company’s judgments in relation to the impairment of investment in subsidiary undertakings are included in Note 3.
3. Financial Assets
Investment in subsidiary undertakings
The principal activity of the Company is investment holding.(in millions)
April 24, 2020 $ 94,865 Return of capital from subsidiary undertaking (6) Capital contribution in respect of share-based compensation plans 344
April 30, 2021 $ 95,203
During the financial year, Covidien Logistics BV (formerly Covidien Logistics BVBA), a direct subsidiary of the Company, returned funds of $10 million to the Company, of which $6 million was a return of capital. Subsequently, during March 2021, Covidien Logistics BV was fully liquidated.
The directors consider the recoverable amount of the investment in subsidiary undertakings to be in excess of the carrying value of the investments having considered the market capitalization of the Group.
Details of the Company's directly owned subsidiaries are as follows:
NameNature ofBusiness
GroupShare %
Registered Office andCountry of Incorporation
Medtronic Luxembourg Global Holdings S.a.r.l.
Holding Company
100 40 Avenue Monterey, L-2163, Luxembourg
Medtronic Irish Finco Unlimited Company Healthcare 100 20 on Hatch, Lower Hatch Street, Dublin 2, Ireland
Medtronic Global Holdings GP S.a.r.l Holding Company
100 40 Avenue Monterey, L-2163, Luxembourg
Integrated Health Solutions International S.a.r.l
Healthcare 100 Route du Molliau, 1131 Tolochenaz, Switzerland
Medtronic plcNotes to the Company Financial Statements
133

4. Debtors
Debtors consisted of the following:(in millions) April 30, 2021 April 24, 2020
Amounts falling due within one year:Due from subsidiary undertakings $ 63 $ 47 Other debtors and prepayments 13 14
Total amounts falling due within one year $ 76 $ 61
Amounts owed to the Company from subsidiary undertakings are unsecured, non-interest bearing, and payable on demand.
5. Creditors
Creditors consisted of the following for amounts falling due within one year:
(in millions) April 30, 2021 April 24, 2020
Amounts falling due within one year:Income taxes payable $ 30 $ 25 Accruals and other creditors 67 30
Total amounts falling due within one year $ 97 $ 55
Other creditors are payable at various dates after the end of the financial year in accordance with the creditors usual and customary credit terms. Creditors for tax are payable in the timeframe set down in the relevant legislation.
Creditors consisted of the following for amounts falling due after more than one year:
(in millions) April 30, 2021 April 24, 2020
Amounts falling due after more than one year:Due to subsidiary undertakings $ 10,767 $ 7,784
Total amounts falling due after more than one year $ 10,767 $ 7,784
At the balance sheet date, the amounts falling due after more than one year relate to two revolving loans the Company has with subsidiary undertakings. The total interest expense arising from the intercompany loans for financial years 2021 and 2020 was $102 million and $395 million, respectively. Both loans are due to mature in 2025 and have variable interest rates based on three-month U.S. dollar LIBOR plus a spread of 87 and 68 basis points, respectively.
Medtronic plcNotes to the Company Financial Statements
134

6. Shareholders' Funds
Authorized and allotted shares were as follows:(in millions, except share data) April 30, 2021 April 24, 2020
Authorized: Number Amount Number Amount
Ordinary Shares, $0.0001 par value 2,600,000,000 $ — 2,600,000,000 $ — Euro Deferred Shares, €1.00 par value 40,000 — 40,000 — Preferred Shares, $0.20 par value 127,500,000 26 127,500,000 26 A Preferred Shares, $1.00 par value 500,000 1 500,000 1
Total authorized $ 27 $ 27
Allotted, called up and fully paid:Ordinary Shares, $0.0001 par value 1,345,400,671 $ — 1,341,074,724 $ — A Preferred Shares, $1.00 par value 1,872 — 1,872 —
Total allotted, called up and fully paid $ — $ —
Ordinary Shares The rights and restrictions attaching to the Ordinary Shares shall be as follows: subject to the right of the Company to set record dates for the purposes of determining the identity of members entitled to notice of and/or to vote at a general meeting and any rules or regulations applicable to the conduct of any general meeting of the Company, the right to attend and speak at any general meeting of the Company and to exercise one vote per Ordinary Share held at any general meeting of the Company; the right to participate pro rata in all dividends declared by the Company with respect to the Ordinary Shares; and the right, in the event of the Company's winding up, to participate pro rata with all other Ordinary Shares in the total assets of the Company.
The rights attaching to the Ordinary Shares shall be subject to the terms of issue of any series or class of Preferred Shares allotted by the Directors from time to time. All Ordinary Shares shall rank pari passu with each other in all respects.
Euro Deferred Shares The authorized share of capital of the Company includes 40 thousand Euro Deferred Shares, with a par value of €1.00 per share. There are no Euro Deferred Shares issued or outstanding in either the current or prior financial years.Preferred Shares The Directors are authorized to issue all or any of the authorized but unissued Preferred Shares from time to time in one or more classes or series, and to fix for each such class or series such voting power, full or limited, or no voting power, and such designations, preferences and relative, participating, optional or other special rights and such qualifications, limitations or restrictions thereof, as shall be stated and expressed in the resolution or resolutions adopted by the Directors. No Preferred Shares are in issue in either the current or prior financial years.
A Preferred Shares The authorized share capital of the Company includes 500 thousand A Preferred Shares, with a par value of $1.00 per share. At April 30, 2021, 1,872 A Preferred Shares were outstanding. The holders of A Preferred Shares are entitled to payment of dividends prior to any other class of shares in the Company equal to twice the dividend to be paid per Company ordinary share. On a return of assets, whether on liquidation or otherwise, the A Preferred Shares are entitled to repayment of the capital paid up thereon in priority to any repayment of capital to the holders of any other shares and the holders of the A Preferred Shares shall not be entitled to any further participation in the assets or profits of the Company. The holders of the A Preferred Shares are not entitled to receive notice of, nor to attend, speak, or vote at any general meeting of the Company.
Share Premium and significant transactions impacting the share premium account In connection with the completion of the Transaction, the Company issued a total of 436 million Ordinary shares of $0.0001 each to the former Covidien shareholders and certain former Covidien award holders and the Company and Makani II Unlimited Company (Makani) paid, in aggregate, to the former Covidien shareholders and award holders approximately $16.0 billion in cash. In consideration for the issuance of such Ordinary shares, the Company and Makani received 455 million Ordinary shares of Covidien plc and the benefit of the cancellation of the share awards. As the price paid for the Covidien Ordinary shares in connection with the completion of the Transaction was $108.75 per share, the total value received by the Company and Makani, for the Covidien shares and for the benefit of the cancellation of the share awards, was in the amount of $49.4 billion, of which $33.3 billion was share premium on shares issued by the Company.
Medtronic plcNotes to the Company Financial Statements
135

In addition to the issue of Ordinary shares to the former Covidien shareholders and certain former Covidien award holders in connection with the Transaction, on January 26, 2015, on completion of the Transaction and pursuant to the terms of the merger, the Company also issued 986 million Ordinary shares of $0.0001 at a premium, which shares were, pursuant to the merger, transferred to the former Medtronic, Inc. shareholders on a one-for-one basis in exchange for each share of Medtronic, Inc. stock held immediately prior to the merger. As a result of the foregoing, Medtronic, Inc., became an indirect subsidiary of the Company. As the closing price of the Medtronic, Inc. common stock on the NYSE as at the trading day immediately prior to the completion of the Transaction was $76.95 per share, the total value of the consideration received by the Company as consideration for the Ordinary shares issued by the Company was in the amount of $75.9 billion of share premium.
On February 27, 2015, the Irish High Court approved the creation of distributable reserves of Medtronic plc through the reduction of the share premium account by $59.2 billion. This resulted in a transfer of reserves from the share premium account to the profit and loss account of the same amount.
Share premium records amounts received, greater than the par value on issuances of the Company’s ordinary share capital.
Profit and Loss Account The profit and loss account refers to the portion of accumulated comprehensive income and losses which are retained by the Company rather than being distributed to shareholders as dividends. Amounts related to the granting of shares under the stock compensation plan are also accounted for in this account.
Dividends The Company paid dividends of $3.1 billion and $2.9 billion during fiscal years 2021 and 2020, respectively. The dividend per Ordinary Share was $2.32 and $2.16 for fiscal years 2021 and 2020, respectively.
7. Guarantees and Contingencies
The Company has the following contingent liabilities, estimated to amount to a potential maximum of $26.5 billion and $24.5 billion at April 30, 2021 and April 24, 2020, respectively, arising from the Company's guarantee of the Group debt outlined below.
On January 26, 2015, Medtronic plc and Medtronic Global Holdings S.C.A., an entity organized under the laws of Luxembourg (“Medtronic Luxco”), each provided a full and unconditional guarantee of the obligations of Medtronic, Inc. under the Medtronic Senior Notes (as defined below) and of Covidien International Finance S.A., a Luxembourg company (“CIFSA”) under the CIFSA Senior Notes (as defined below). The Company also provides a full and unconditional guarantee of the obligations of Medtronic Global Holdings S.C.A under the Luxco Senior Notes (as defined below).
Of the $26.5 billion, Medtronic, Inc. has $6.5 billion aggregate principal amount issued and outstanding consisting of the following; $1.9 billion aggregate principal amount of 3.500 percent senior notes due 2025, $1.9 billion aggregate principal amount of 4.375 percent senior notes due 2035, $158 million aggregate principal amount of 6.500 percent senior notes due 2039, $224 million aggregate principal amount of 5.550 percent senior notes due 2040, $105 million aggregate principal amount of 4.500 percent senior notes due 2042, $305 million aggregate principal amount of 4.000 percent senior notes due 2043, $127 million aggregate principal amount of 4.625 percent senior notes due 2044, and $1.8 billion aggregate principal of 4.625 senior notes due 2045 (collectively, the "Medtronic Senior Notes").
CIFSA has $253 million aggregate principal amount issued and outstanding, consisting of $253 million aggregate principal of 6.550 percent senior notes due 2037 (the "CIFSA Senior Notes").
Medtronic Luxco has one tranche of USD-denominated Senior Notes (issued in March 2017) outstanding consisting of $368 million of 3.350 percent Senior Notes due 2027.
Medtronic Luxco has €5.0 billion, Euro-denominated Senior Notes, with an aggregate principal amount issued and outstanding consisting of the following: €1.5 billion of 0.375 percent Senior Notes due in fiscal year 2023, €1.5 billion of 1.125 percent Senior Notes due in fiscal year 2027, €1.0 billion of 1.625 percent Senior Notes due in fiscal year 2031, and €1.0 billion of 2.250 percent Senior Notes due in fiscal year 2039 (collectively, the 2019 Senior Notes). The Company is party to a guarantee for the obligations of Medtronic Luxco for these issuances. The original issuance also included €500 million of floating rate Senior Notes, which were repaid upon their maturity in fiscal year 2021, and €1.5 billion of 0.000 percent Senior Notes, which were repaid prior to their maturity date during fiscal year 2021.
Medtronic plcNotes to the Company Financial Statements
136

In June 2019, Medtronic Luxco issued six tranches of Euro-denominated Senior Notes with an aggregate principal of €5.0 billion, with maturities ranging from fiscal year 2021 to fiscal year 2050, resulting in cash proceeds of approximately $5.6 billion, net of discounts and issuance costs. The issuance included €750 million of 0.000 percent Senior Notes due in fiscal year 2023, €1.0 billion of 0.250 percent Senior Notes due in fiscal year 2026, €1.0 billion of 1.000 percent Senior Notes due in fiscal year 2032, €1.0 billion of 1.500 percent Senior Notes due in fiscal year 2040, and €1.0 billion of 1.750 percent Senior Notes due in fiscal year 2050. The Company is also a party to a guarantee for the obligations of Medtronic Luxco for these issuances. The original issuance also included €250 million of floating rate Senior Notes, which was repaid upon its maturity in fiscal year 2021.
In September 2020, Medtronic Luxco issued an additional six tranches of Euro-denominated Senior Notes with an aggregate principal of €6.3 billion, with maturities ranging from fiscal year 2023 to fiscal year 2051, resulting in cash proceeds of approximately $7.2 billion, net of discounts and issuance costs. The Company used the net proceeds of the offering to fund the early redemption of $4.3 billion of Medtronic Inc. and CIFSA Senior Notes and €1.5 billion of Medtronic Luxco Senior Notes for $6.3 billion of total consideration in October 2020. Additionally, the Company used the proceeds to repay its €750 million floating rate senior notes at maturity in March 2021. The issuance included €1.25 billion of 0.000 percent Senior Notes due in fiscal year 2023, €1.0 billion of 0.000 percent Senior Notes due in fiscal year 2026, €1.0 billion of 0.375 percent Senior Notes due in fiscal year 2029, €1.0 billion of 0.750 percent Senior Notes due in fiscal year 2033, €1.0 billion of 1.375 percent Senior Notes due in fiscal year 2041, and €1.0 billion of 1.625 percent Senior Notes due in fiscal year 2051. The Company is a party to a guarantee for the obligations of Medtronic Luxco for these issuances.
Also, on January 26, 2015, Medtronic Luxco entered into various agreements pursuant to which, it may issue United States Dollar denominated unsecured commercial paper notes (the 2015 CP Program) on a private placement basis and on January 31, 2020, Medtronic Luxco entered into various agreements pursuant to which Medtronic Luxco may issue Euro-denominated unsecured commercial paper notes (the 2020 CP Program) on a private placement basis. The Maximum aggregate amount outstanding at any time under the 2015 CP Program and the 2020 CP Program together may not exceed the equivalent of $3.5 billion. The Company is a party to a guarantee for the obligations of Medtronic Luxco under the 2015 CP Program and the 2020 CP Program. At April 30, 2021 and at April 24, 2020, the Company had no commercial paper outstanding.
On December 12, 2020, Medtronic Luxco, as borrower, entered into an amendment of its amended and restated credit agreement (Credit Facility), by and among the Company, Medtronic, Inc., Medtronic Luxco, the lenders from time to time party thereto, and Bank of America, N.A., as administrative agent and issuing bank, extending the maturity date of the Credit Facility to December 2025.
The Credit Facility provides for a $3.5 billion five-year unsecured revolving credit facility (Credit Facility). At each anniversary date of the Credit Facility, but not more than twice prior to the maturity date, the Company could also request a one-year extension of the maturity date. The Credit Facility provides the Company with the ability to increase its borrowing capacity by an additional $1.0 billion at any time during the term of the agreement. The Company and Medtronic, Inc. have guaranteed the obligations of the borrowers under the Credit Facility, and Medtronic Luxco will also guarantee the obligations of any designated borrower. The Credit Facility includes a multi-currency borrowing feature for certain specified foreign currencies. At April 30, 2021 and April 24, 2020, no amounts were outstanding under the Credit Facility.
On May 12, 2020, Medtronic Luxco entered into a Term Loan Agreement by and among Medtronic Luxco, Medtronic plc, Medtronic, Inc., and Mizuho Bank, Ltd. as administrative agent and as lender. The Loan Agreement provided an unsecured term loan in an aggregate principal amount of up to ¥300 billion, with a term of six months, and the option to extend for an additional six months at Medtronic Luxco’s option. On May 13, 2020, Medtronic Luxco borrowed the entire amount of the term loan under the Loan Agreement. Borrowings under the Loan Agreement carried interest at the TIBOR Rate (as defined in the Loan Agreement) plus a margin of 0.50% per annum. Medtronic plc and Medtronic, Inc. guaranteed the obligations of Medtronic Luxco under the Loan Agreement. On November 12, 2020, Medtronic Luxco exercised its option to extend the term loan for an additional six months. During the fourth quarter of fiscal year 2021, Medtronic Luxco repaid the term loan in full, including interest.
The Company provides a guarantee for intercompany liabilities totaling $26.0 billion, in relation to intercompany financing activities for a number of subsidiary entities. On August 5, 2021, the parties decided by mutual agreement to terminate the guarantee, and the Company is now released from all obligations under the guarantee.
Medtronic plcNotes to the Company Financial Statements
137

The Company and some of its subsidiaries are involved in a number of legal actions involving product liability, intellectual property disputes, shareholder derivative actions, securities class actions, and other class actions. The outcomes of these legal actions are not within the Company's complete control and may not be known for prolonged periods of time. In some actions, the claimants seek damages, as well as other relief (including injunctions barring the sale of products that are the subject of the lawsuit), that could require significant expenditures or result in lost revenues. The Company records a liability in its financial statements for loss contingencies when a loss to the Company is known or considered probable and the amount can be reliably estimated. Estimates of probable losses resulting from litigation and governmental proceedings involving the Company are inherently difficult to predict, particularly when the matters are in early procedural stages, with incomplete scientific facts or legal discovery; involve unsubstantiated or indeterminate claims for damages; potentially involve penalties, fines or punitive damages; or could result in a change in business practice. While it is not possible to predict the outcome for most of these matters, the Company believes it is possible that costs associated with them could have a material adverse impact on the Company's profit, financial position, or cash flows. For further information related to specific litigation the Company and its subsidiaries are involved in refer to the consolidated financial statements Note 4.
8. Related-Party Transactions
The Company has not disclosed related party transactions between the Company and subsidiaries of Medtronic Plc, as it has availed of the exemption available under Schedule 3(67), paragraph 3, Companies Act 2014, which exempts disclosure of transactions entered into between two or more members of a group, provided that any subsidiary undertaking which, is a party to the transaction, is wholly owned by a member of that group.
9. Auditors' Remuneration
Remuneration (including expenses) for the statutory audit carried out for the Company by the Company's auditors in respect of the parent company financial statements is as follows:
Fiscal Year(in thousands) 2021 2020
Audit of Company financial statements (including expenses) $ 26 $ 27
Note 25 to the consolidated financial statements provides additional details of fees paid by the Group to the statutory auditor, PricewaterhouseCoopers Ireland.
10. Subsequent Events
Subsequent events have been evaluated through September 2, 2021, the date this report was approved by the Board of Directors. There have been no material events of note, since year end, other than those noted in Note 27 of the consolidated financial statements.
11. Approval of Financial Statements
The Board of Directors approved the financial statements on September 2, 2021.
Medtronic plcNotes to the Company Financial Statements
138