annual fund report for the accounting year from … banka/cq-arts-trd-31-12-2013... ·...
TRANSCRIPT

C-QUADRAT Kapitalanlage AG
Stubenring 2, 1010 Vienna
Annual fund report for the accounting year from January 1, 2013 to December 31, 2013 for
C-QUADRAT ARTS Total Return Dynamic
a co-ownership fund pursuant to § 2 (2) InvFG 2011 of
C-QUADRAT Kapitalanlage AG

Annual fund report
C-QUADRAT ARTS Total Return Dynamic Page 2 of 29 January 1, 2013 – December 31, 2013
CURRENT ORGANS C-QUADRAT Kapitalanlage AG, Vienna
Stubenring 2, 1010 Vienna
Shareholder
C-QUADRAT Investment AG
State commissioners Oberrat Mag. Michael Kortus (bis 30. Juni 2013) Amtsdirektorin Christine Fruhstuck (Deputy (to 30. Juni 2013) MR Dr. Peter Ladislav (ab 01. Juli 2013) Mag. Andrea Delfauro-Bischof, MA (Deputy) (from 01. Juli 2013)
Supervisory board
Helmut Geil (Chairman) Gerd Alexander Schütz (Deputy Chairman)
Thomas Riess Manfred Köberlein (from August 29, 2013) Dr. Hubert Cussigh (from March 8, 2013 to August 29, 2013) Roland Starha (to January 25, 2013)
Management board
Christian Jost Markus A. Ullmer
Andreas Wimmer
Duly authorized officers
Eva Maria Prochazka Gunther Pahl
Dr. Robert Schneider (from June 17, 2013)
Custodian bank Raiffeisen Bank International AG
Annual fund report
C-QUADRAT ARTS Total Return Dynamic Page 3 of 29 January 1, 2013 – December 31, 2013
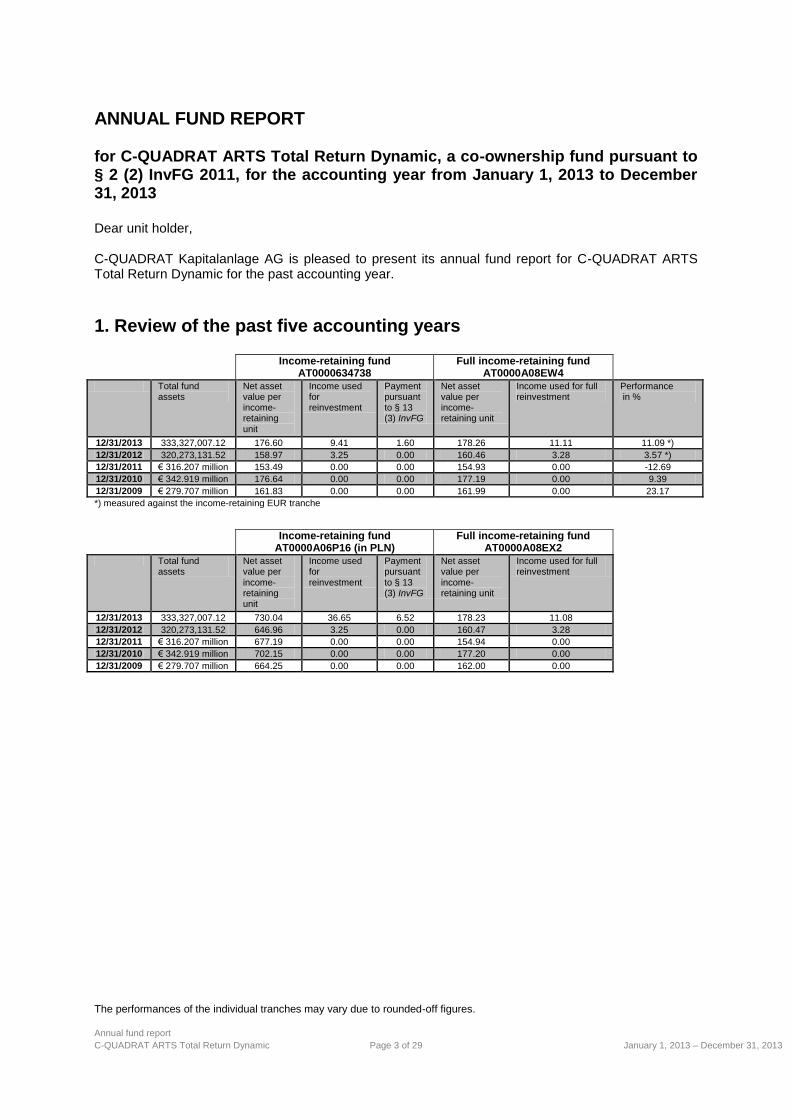
ANNUAL FUND REPORT for C-QUADRAT ARTS Total Return Dynamic, a co-ownership fund pursuant to § 2 (2) InvFG 2011, for the accounting year from January 1, 2013 to December 31, 2013 Dear unit holder, C-QUADRAT Kapitalanlage AG is pleased to present its annual fund report for C-QUADRAT ARTS Total Return Dynamic for the past accounting year.
1. Review of the past five accounting years
Income-retaining fund AT0000634738
Full income-retaining fund AT0000A08EW4
Total fund assets
Net asset value per income-retaining unit
Income used for reinvestment
Payment pursuant to § 13 (3) InvFG
Net asset value per income-retaining unit
Income used for full reinvestment
Performance in %
12/31/2013 333,327,007.12 176.60 9.41 1.60 178.26 11.11 11.09 *)
12/31/2012 320,273,131.52 158.97 3.25 0.00 160.46 3.28 3.57 *)
12/31/2011 € 316.207 million 153.49 0.00 0.00 154.93 0.00 -12.69
12/31/2010 € 342.919 million 176.64 0.00 0.00 177.19 0.00 9.39
12/31/2009 € 279.707 million 161.83 0.00 0.00 161.99 0.00 23.17
*) measured against the income-retaining EUR tranche
Income-retaining fund
AT0000A06P16 (in PLN) Full income-retaining fund
AT0000A08EX2 Total fund
assets Net asset value per income-retaining unit
Income used for reinvestment
Payment pursuant to § 13 (3) InvFG
Net asset value per income-retaining unit
Income used for full reinvestment
12/31/2013 333,327,007.12 730.04 36.65 6.52 178.23 11.08
12/31/2012 320,273,131.52 646.96 3.25 0.00 160.47 3.28
12/31/2011 € 316.207 million 677.19 0.00 0.00 154.94 0.00
12/31/2010 € 342.919 million 702.15 0.00 0.00 177.20 0.00
12/31/2009 € 279.707 million 664.25 0.00 0.00 162.00 0.00
The performances of the individual tranches may vary due to rounded-off figures.

Annual fund report
C-QUADRAT ARTS Total Return Dynamic Page 4 of 29 January 1, 2013 – December 31, 2013
2. Statement of income and performance of the fund assets
2.1. Performance in accounting year (fund performance)
Calculation acc. OeKB method per unit in fund currency excl. front-end load Income-retaining unit
Net asset value per unit at start of accounting year 158.97
Net asset value per unit at end of accounting year 176.60
Net income/net reduction per unit 17.63
Performance of one income-retaining unit during the accounting year 11.09%
2.1. Performance in accounting year (fund performance)
Calculation acc. OeKB method per unit in fund currency excl. front-end load Full income-retaining unit
Net asset value per unit at start of accounting year 160.46
Net asset value per unit at end of accounting year 178.26
Net income/net reduction per unit 17.80
Performance of one full income-retaining unit during the accounting year 11.09%
2.1. Performance in accounting year (fund performance)
Calculation acc. OeKB method per unit in fund currency excl. front-end load Full income-retaining unit
Net asset value per unit at start of accounting year 160.47
Net asset value per unit at end of accounting year 178.23
Net income/net reduction per unit 17.76
Performance of one full income-retaining unit during the accounting year 11.07%
2.1. Performance in accounting year (fund performance)
Calculation acc. OeKB method per unit in fund currency excl. front-end load Income-retaining unit
Net asset value per unit at start of accounting year 646.96
Net asset value per unit at end of accounting year 730.04
Net income/net reduction per unit 83.08
Performance of one income-retaining unit during the accounting year 12.84%

Annual fund report
C-QUADRAT ARTS Total Return Dynamic Page 5 of 29 January 1, 2013 – December 31, 2013
2.4. Fund earnings
A) Realized fund earnings
Ordinary fund earnings
Income (excl. profit or loss from price changes)
Dividend income incl. dividend equivalent 1,419,208.17
Income from subfunds (incl. actual distributions) 1,439,891.77
Interest expenses -2,661.27 2,856,438.67
Expenses
Costs for foreign licensing -26,112.59
Custodian bank fees -150,208.88
Custodian fees -82,290.14
Auditing fees -15,243.88
Reimbursement of management costs 1,037,087.53
Mandatory/publication costs -10,004.45
Management fees -6,564,622.84
Performance fees -15,088.60 -5,826,483.85
Ordinary fund earnings (excl. income adjustment) -2,970,045.18
Realized profit/loss from price changes
Realized profits 44,950,454.71
Realized losses -20,700,015.52
Realized profit or loss from price changes (excl. income adjustment) 24,250,439.19
Total realized fund earnings (excl. income adjustment) 21,280,394.01
B) Non-realized fund earnings 2) 3)
Change in non-realized profit or loss from price changes 6,476,618.39
Documented distribution-equivalent income 6,887,515.83
Total non-realized fund earnings 13,364,134.22
C) Income adjustment
Income adjustment for income during accounting year -530,288.93
Income adjustment for profit carryover during accounting year 0.00 -530,288.93
Overall fund earnings 34,114,239.30
2) Realized profits and losses are not specific to a particular period. Accordingly, like the change in the non-realized profit or loss from price changes, they may not relate to the fund’s performance in the past accounting year. 3) Total profit/loss from price changes without equalization of income (realized profit/loss from price changes, excl. net income, plus change in the non-realized profit/loss from price changes): EUR 37.602.547,83

Annual fund report
C-QUADRAT ARTS Total Return Dynamic Page 6 of 29 January 1, 2013 – December 31, 2013
The result for the accounting year includes explicitly indicated transaction costs in the amount of EUR 920,596.57.
2.3. Development of fund assets
Fund assets on December 31, 2012 (2,012,437.644 units) 320,273,131.52
Payment on April 30, 2013 (EUR 0.00 x 1,687,718.88 income-retaining units) 0.00
Payment on April 30, 2013 (EUR 0.00 x 24,654.00 income-retaining units) 0.00
Change in funds
Due to sales of certificates 32,734,933.18
Due to repurchases of certificates -54,325,585.81
Pro rata income adjustment 530,288.93 -21,060,363.70
Fund earnings from income statement 34,114,239.30
Fund assets on December 31, 2013 (1,885,379.378 units) 333,327,007.12
2.4. Appropriation of income
Payment pursuant to §13 (3) InvFG (EUR 1.60 x 1,619,296.245 income-retaining units) 2,590,873.99
Payment pursuant to §13 (3) InvFG (PLN 6.52 x 32,654.00 income-retaining units) 51,326.92
Reinvested income (income-retaining units) 15,229,510.12
Reinvested income (income-retaining units) 288,513.13
Reinvested income (full income-retaining units) 1,156,594.78
Reinvested income (full income-retaining units) 1,433,286.14 20,750,105.08
Total 20,750,105.08
Realized fund earnings (incl. income adjustment) 20,750,105.08
Asset-based loss and expense allowance
Change in profit carryover
Ordinary carryover from the previous year 0.00
Ordinary carryover into following period 0.00
Profit carryover from previous year 0.00
Profit carryover into following period 0.00 0.00
Total appropriation of income 20,750,105.08

Annual fund report
C-QUADRAT ARTS Total Return Dynamic Page 7 of 29 January 1, 2013 – December 31, 2013
Payment (AT0000634738) The distributed amount of EUR 1.60 per fund unit will be paid out on April 30, 2014 against surrender of the coupon to the custodial account providers.
Payment (AT0000A06P16) PLN 6.52 per income-retaining unit will be paid out on April 30, 2014 against surrender of the coupon to the custodial account providers. The fund’s subfunds are managed by an external investment fund management company which charged management fees of between 0.3 % and 2 % p.a. They did not charge any front-end load fees for the purchase of units.
Calculation method for overall risk: Value-at-risk Benchmark assets: NONE, as absolute VaR = 15 % Risk model: Historical simulation Minimum VaR: 4.39% Average VaR: 6.92% Maximum VaR: 8.61%
3. Financial markets The international financial markets started out positively in 2013. Japanese equities in particular appreciated strongly, buoyed by the Bank of Japan’s announcement that it would continue its securities-purchasing program indefinitely. However, European stock exchanges suffered a return to uncertainty in mid-March due to the outcome of the election in Italy, the United Kingdom’s downgrade by the ratings agency Moody’s and the threat of Cyprus’ bankruptcy, which prompted some European equity prices to fall sharply. The international markets subsequently recovered, however, and this upward trend remained intact until late May, when the American central bank announced that it might soon wind down its bond-purchasing program. This gave rise to a strong correction which continued up to late June, and the EuroSTOXX 50 fell by as much as -11.43%. In addition, the price of a fine ounce of gold dropped below USD 1,200, having last reached this level three years previously. The second half of the year was characterized by positive economic data from the United States and the FED’s decision to continue with its monthly bond-purchasing program, which triggered a rally for the international stock indexes. At the end of the year strong price losses initially resulted, mainly due to profit-taking and speculation over the international central banks’ future course of action. Nonetheless, December ended positively following a strong rebound in the last week of trading.
4. Investment policy
The investment objective of C-QUADRAT ARTS Total Return Dynamic is to achieve capital growth subject to higher risk. To implement the investment policy, the fund management makes particular use of a total return approach. Funds showing upward movement in the short to medium term are given the highest weighting in the portfolio. As opposed to most traditionally managed funds of funds, the investment strategy of C-QUADRAT ARTS Total Return Dynamic is not geared toward outperforming a benchmark but toward generating absolute growth over the long term. This management approach is intended to have its core strength in the combination of following short- to medium-term trends and continuously adapting the portfolio to developments in the markets the fund invests in. In bear markets, the equity exposure can be reduced to as far as zero. In such case the majority of resources are invested in funds containing short-term time deposits, bonds and products having a strong negative correlation with traditional equities indexes.

Annual fund report
C-QUADRAT ARTS Total Return Dynamic Page 8 of 29 January 1, 2013 – December 31, 2013
5. Makeup of the fund assets Fund assets incl. changes and liquidated positions ISIN Security Currency Holdings Additions
Nominal Disposals Nominal Price Market value in
EUR % share
EQUITIES IN EURO
DE0005190003 BAY.MOTOREN WERKE AG ST EUR 21,500 21,500 23,300 85 1,836,530.00 0.55
DE0005552004 DEUTSCHE POST AG NA O.N. EUR 70,000 70,000 96,000 26.71 1,869,700.00 0.56
DE0005557508 DT.TELEKOM AG NA EUR 138,000 138,000
12.60 1,738,800.00 0.52
DE0007100000 DAIMLER AG NA O.N. EUR 31,000 31,000
63.15 1,957,650.00 0.59
DE0007236101 SIEMENS AG NA EUR 18,800 38,200 19,400 100.25 1,884,700.00 0.57
FR0000125338 CAP GEMINI INH. EO 8 EUR 25,200 66,500 41,300 48.87 1,231,524.00 0.37
FR0000130007 ALCATEL-LUCENT EO 0,05 EUR 440,000 960,000 520,000 3.30 1,452,000.00 0.44
FR0000130338 VALEO SA INH. EO 3 EUR 14,000 21,200 7,200 80.72 1,130,080.00 0.34
IT0003242622 TERNA S.P.A. EO-0.22 EUR 410,000 410,000
3.63 1,488,300.00 0.44
NL0000009132 AKZO NOBEL EO 2 EUR 22,200 30,500 40,300 56.08 1,244,976.00 0.37
NL0000303709 AEGON NV (DEMAT.) EO-12 EUR 255,000 255,000
6.864 1,750,320.00 0.53
NL0009739416 POSTNL N.V. EO -,08 EUR 164,000 255,000 91,000 4.16 682,240.00 0.20
EQUITIES IN US DOLLARS
CH0102993182 TE CONNECTIV.LTD. SF 0,57 USD 42,000 94,000 52,000 54.53 1,662,319.00 0.50
GB00B5BT0K07 AON PLC A DL -,01 USD 27,900 59,400 68,000 83.41 1,689,086.55 0.50
GB00B8W67662 LIBERTY GLOBAL A DL-,01 USD 18,600 18,600
88.35 1,192,749.05 0.36
IE00B4Q5ZN47 JAZZ PHARMACEUT. DL-0.0001 USD 20,600 50,600 30,000 123.29 1,843,421.52 0.55
IE00BGH1M568 PERRIGO CO. PLCEO -,001 USD 25,596 25,596
152.12 2,826,103.08 0.85
NL0000200384 CORE LABORATORIES EO-,04 USD 8,100 14,500 6,400 190.83 1,121,918.35 0.34
NL0009538784 NXP SEMICONDUCTORS EO-,20 USD 53,000 53,000
45.32 1,743,393.21 0.52
US14149Y1082 CARDINAL HEALTH INC. USD 35,500 35,500
67.14 1,729,972.78 0.52
US6549022043 NOKIA CORP.A ADR 1/EO-,06 USD 360,000 360,000
8.06 2,106,042.46 0.63
US7865142084 SAFEWAY INC. DL-,01 USD 54,000 54,000
32.50 1,273,816.00 0.38
US8447411088 SOUTHW. AIRL. CO. DL 1 USD 124,000 124,000
18.74 1,686,634.00 0.51
US92857W2098 VODAFONE GRP ADR NEW/10 USD 64,000 64,000
39.25 1,823,262.57 0.55
EQUITIES IN BRITISH POUNDS
GB0030913577 BT GROUP PLC LS 0.05 GBP 384,000 894,000 510,000 4 1,749,675.57 0.53
JE00B2QKY057 SHIRE PLC LS-,05 GBP 51,000 113,000 62,000 28.53 1,741,925.06 0.52
EQUITIES IN JAPANESE YEN
JP3197600004 ONO PHARMACEUT. JPY 17,100 17,100
9,220.00 1,090,111.06 0.33
JP3311400000 CYBERAGENT INC. O.N. JPY 54,000 54,000
4,345.00 1,622,285.39 0.49
JP3414750004 SEIKO EPSON CORP. JPY 68,000 68,000
2,789.00 1,311,297.23 0.39
JP3551520004 DENTSU INC. JPY 51,000 51,000
4,275.00 1,507,474.63 0.45
JP3596200000 TOTO LTD JPY 63,000 96,000 33,000 1,662.00 723,961.19 0.22
JP3695200000 NGK INSULATORS JPY 80,000 80,000
1,990.00 1,100,745.15 0.33
JP3866800000 PANASONIC CORP. JPY 188,000 188,000
1,215.00 1,579,348.03 0.47
JP3906000009 MINEBEA CO. LTD JPY 270,000 270,000
768.00 1,433,734.38 0.43
EQUITIES IN CANADIAN DOLLARS
CA01626P4033 ALIMENTATION COUCHE-T. B CAD 18,100 18,100
78.75 967,438.15 0.29
CA13645T1003 CDN PACIFIC RAILWAY CAD 15,800 15,800 20,800 161.46 1,731,474.53 0.52
CA8667961053 SUN LIFE FINANCIAL INC. CAD 63,000 63,000
37.74 1,613,750.98 0.48
CA91911K1021 VALEANT PHARMA.INTL (NEW) CAD 5,200 28,000 22,800 121.60 429,171.62 0.13
EQUITIES IN SWEDISH CROWNS
SE0000164626 INVEST.KINNEVIK B SK 0,10 SEK 22,900 38,000 15,100 306.30 783,017.41 0.23
EQUITIES IN DANISH CROWNS
DK0010244508 A.P.MOELL.-M.NAM B DK1000 DKK 157 232 75 58,700.00 1,235,400.18
0.37

Annual fund report
C-QUADRAT ARTS Total Return Dynamic Page 9 of 29 January 1, 2013 – December 31, 2013
EQUITIES IN HONG KONG DOLLARS
CNE1000002L3 CHINA LIFE INS. H YC 1 HKD 480,000 480,000
24.35 1,093,890.39 0.33
EQUITIES IN MALAYSIAN RINGGIT
MYL5347OO009 TENAGA NASIONAL BHD MR 1 MYR 435,000 930,000 495,000 11.60 1,113,981.06 0.33
INVESTMENT CERTIFICATES ON OTHER ORGANIZED MARKETS
INVESTMENT CERTIFICATES ON OTHER ORGANIZED MARKETS IN EURO
BE0133741752 KBC ECO FD-WORLD CAP. EUR 273 650 377 636.30 173,709.90 0.05
BE0170241062 KBC EQ.FD-FOOD+PE.PR.CAP. EUR 2,020 3,900 1,880 1,227.25 2,479,045.00 0.74
BE0940704951 KBC EQ.FD-HIGH DIV. CAP. EUR 2,320 4,650 2,330 1,031.27 2,392,546.40 0.72
DE0008471020 FONDIS A EUR 79,000 79,000
52.47 4,145,130.00 1.24
DE0008474214 DWS TELEMEDIA TYP O EUR 55,800 55,800
114.81 6,406,398.00 1.92
DE0008490897 DWS US GROWTH EUR 46,000 46,000
108 4,949,140.00 1.48
DE0009771923 DEKA-TELEMEDIEN TF EUR 45,500 45,500
57.72 2,626,260.00 0.79
DE0009779736 PIONEER INV. TOP WORLD EUR 50,000 50,000
90.70 4,535,000.00 1.36
DE0009797274 ALL.STR.FDS WACHSTUM PLUS EUR 67,000 67,000
72.04 4,826,680.00 1.45
DE0009848036 E.ON AKTIENFONDS DWS EUR 10,300 48,000 37,700 32.78 337,634.00 0.10
DE000ETFL235 DK DAXPLUS MAX.DIVIDEND EUR 180,700 180,700
87.202 15,757,401.40 4.73
FR0010247783 ODDO AVENIR EURO B 3 DEC. EUR 57 57
196,286.87 11,188,351.59 3.36
FR0010344879 LYXOR ETF ST.EUR.600 HLTH EUR 70,000 105,000 35,000 61.90 4,333,000.00 1.30
IE00B3VWMM18 ISHSVII-MSCI EMU SC U.ETF EUR 31,000 31,000
121.21 3,757,510.00 1.13
LU0028119013 INVESCO PAN EUR.SM.CAP A EUR 220,000 314,000 94,000 18.31 4,028,200.00 1.21
LU0046217351 HEND.HOR.PAN EU.SM.C.A2 A EUR 76,000 552,000 476,000 32.24 2,450,240.00 0.74
LU0062624902 DEKALUX-DEUTSCHLAND TF(A) EUR 47,000 47,000
106.50 5,005,500.00 1.50
LU0106237406 SISF EUR.SMILL.COM.A ACC EUR 134,000 134,000 134,000 29.99 4,018,660.00 1.21
LU0120694483 VONTOBEL-EUR.M.+S.C. B-EO EUR 8,100 8,100
157.95 1,279,395.00 0.38
LU0124167924 FPM-STOCKP.GERM.ALL CAP C EUR 16,200 20,900 4,700 290.31 4,703,022.00 1.41
LU0133061175 JB MULTIP.-RS.SU.WAT.B EUR 20,700 41,500 20,800 192.35 3,981,645.00 1.19
LU0133414606 DWS GLOBAL VALUE INH. EUR 58,500 58,500
173.80 10,167,300.00 3.05
LU0136171559 SWISSCANTO LU PTF-G.I.E.B EUR 45,500 45,500
107.35 4,884,425.00 1.47
LU0137341359 STARCAPITAL-PRIAMOS A EUR EUR 295 1,180 885 1,497.15 441,659.25 0.13
LU0158903558 ACATIS CH.SEL.-AC.AK.DTSC EUR 3,550
3,450 211.94 752,387.00 0.23
LU0161305163 SISF EUR.EQ.ALPHA A ACC EUR 106,000 106,000
51.34 5,442,040.00 1.63
LU0171288334 BGF-GL SMALLC.NAM.A2 EO EUR 41,000 41,000
63.64 2,609,240.00 0.78
LU0200685153 BGF-US BAS.VAL.N.A2 EO H. EUR 57,000 114,000 57,000 48.52 2,765,640.00 0.83
LU0220663669 APO MEDICAL OPPORTUNITIES EUR 23,500 23,500
98.42 2,312,870.00 0.69
LU0227853388 DB PLATIN.BRANC.STARS I1C EUR 35 53 18 190,715.99 6,675,059.65 2.00
LU0248320664 PICTET-GENERICS NAM.HPEO EUR 33,500 33,500
147.45 4,939,575.00 1.48
LU0261951528 FID.FDS-EU.SM.C.A ACC.EUR EUR 1,036,000 1,036,000
14.40 14,918,400.00 4.48
LU0280770768 JB MULTIP.-RS.SU.H.L.B EO EUR 17,000 68,500 51,500 140 2,386,970.00 0.72
LU0289217050 JPM-US VALUE FD C ACC EOH EUR 330,000 330,000
15.00 4,950,000.00 1.49
LU0306804302 SISF GL CLIM.CHA.A AC.EOH EUR 240,000 480,000 240,000 11.12 2,668,800.00 0.80
LU0325075066 JPM-HIGHB.US ST.CAC.HD EO EUR 49,000 49,000
100.17 4,908,330.00 1.47
LU0347595612 AMU.-EQ.GL AGRIC.AHE(C)EO EUR 40,000 40,000
121.86 4,874,400.00 1.46
LU0414045822 AGIF-EUR.EQU.DIVID.AT EO EUR 8,800 8,800
218.77 1,925,176.00 0.58
LU0525202155 BL.STR.-B.E.D.E.A.R.A2 EO EUR 5,400 44,000 38,600 123.10 664,740.00 0.20
LU0533032008 MUL-LYX.U.ETF MSCI WCDCEO EUR 22,400 69,300 46,900 155.83 3,490,592.00 1.05
LU0568606817 AMUNDI-EQ.EURO.S.C.IE CAP EUR 7,850 12,350 4,500 1,363.06 10,700,021.00 3.21
LU0701926320 PIONEER-EUR.EQ.T.IN.AEOD. EUR 148,000 148,000
67.01 9,917,480.00 2.98
LU0736559278 ACMB.SEL.ABS.AL.P.AACCEOH EUR 516,000 516,000
17.64 9,102,240.00 2.73
INVESTMENT CERTIFICATES ON OTHER ORGANIZED MARKETS IN US DOLLARS
IE0005263466 OMGI-OLD M.WLD.EQ.ADLACC USD 6,360,000 6,360,000
1.1203 5,171,553.62 1.55
LU0240877869 SISF GL SMALL.CO.A ACC.DL USD 21,600 21,600
163.50 2,563,309.74 0.77
LU0607512778 INV.FDS-GL.SM.CO.EQ.ADL C USD 90,000 90,000
55.48 3,624,169.84 1.09
US4642872752 ISHS TR.-GL. TELECOM ETF USD 332,800 345,000 12,200 68.14 16,459,438.94 4.94

Annual fund report
C-QUADRAT ARTS Total Return Dynamic Page 10 of 29 January 1, 2013 – December 31, 2013
INVESTMENT CERTIFICATES ON OTHER ORGANIZED MARKETS IN SWISS FRANCS
CH0002779608 SWISSCANT.CH EQ.S.+M.C.S. CHF 3,750 3,750
460.21 1,410,533.31 0.42
LU0149524034 SISF SWISS S.M.CP A ACC CHF 160,000 160,000 137,000 28.29 3,699,550.47 1.11
LU0227177580 SISF SWISS EQU.OPPO.A ACC CHF 31,200 11,500 7,800 147.18 3,753,180.22 1.13
TOTAL SECURITIES ADMITTED TO OFFICIAL TRADING OR ANOTHER REGULATED MARKET 303,347,769.91 91.01
TOTAL SECURITIES NOT ADMITTED TO OFFICIAL TRADING OR ANOTHER REGULATED MARKET 0.00 0.00
BANK BALANCES
EUR balances
29,768,923.79 8.93
BALANCES IN OTHER EU CURRENCIES PLN
170.24 0.00
TOTAL 29,769,094.03 8.93
ACCRUALS/DEFERRALS
DIVIDEND CLAIMS
75,892.90 0.02
INTEREST CLAIMS
-1,245.41 0.00
PORTFOLIO COMMISSION CLAIMS
135,495.69 0.04
TOTAL ACCRUALS/DEFERRALS 210,143.18 0.06
TOTAL fund assets 333,327,007.12 100.00
NET ASSET VALUE C-QUADRAT ARTS Total Return Dynamic (TTH)
EUR 176.60
NET ASSET VALUE C-QUADRAT ARTS Total Return Dynamic (VTH) I
EUR 178.26
NET ASSET VALUE C-QUADRAT ARTS Total Return Dynamic (VTH) IT IA
EUR 178.23
NET ASSET VALUE C-QUADRAT ARTS Total Return Dynamic (TTH) PLN
EUR 730.04
UNITS IN CIRCULATION C-QUADRAT ARTS Total Return Dynamic (TTH)
UNITS 1,619,296.245
UNITS IN CIRCULATION C-QUADRAT ARTS Total Return Dynamic (VTH) I
UNITS 104,101.830
UNITS IN CIRCULATION C-QUADRAT ARTS Total Return Dynamic (VTH) IT IA
UNITS 129,327.303
UNITS IN CIRCULATION C-QUADRAT ARTS Total Return Dynamic (TTH) PLN
UNITS 32,654.000
CONVERSION RATES/EXCHANGE RATES
FOREIGN-CURRENCY ASSETS CONVERTED INTO EURO AT THE EXCHANGE RATES/CONVERSION RATES
AS OF DECEMBER 27, 2013
CURRENCY
UNIT PRICE
in EUR
Canadian dollar
1 = EUR 1.473350
Swiss franc 1 = EUR 1.223500
Danish crown
1 = EUR 7.459850
Euro
1 = EUR 1.000000
British pound
1 = EUR 0.835300
Hong Kong dollar
1 = EUR 10.684800
Japanese yen
1 = EUR 144.629300
Malaysian ringgit 1 = EUR 4.529700
Polish zloty
1 = EUR 4.148000
Swedish crown 1 = EUR 8.958000
US dollar
1 = EUR 1.377750
Annual fund report
C-QUADRAT ARTS Total Return Dynamic Page 11 of 29 January 1, 2013 – December 31, 2013
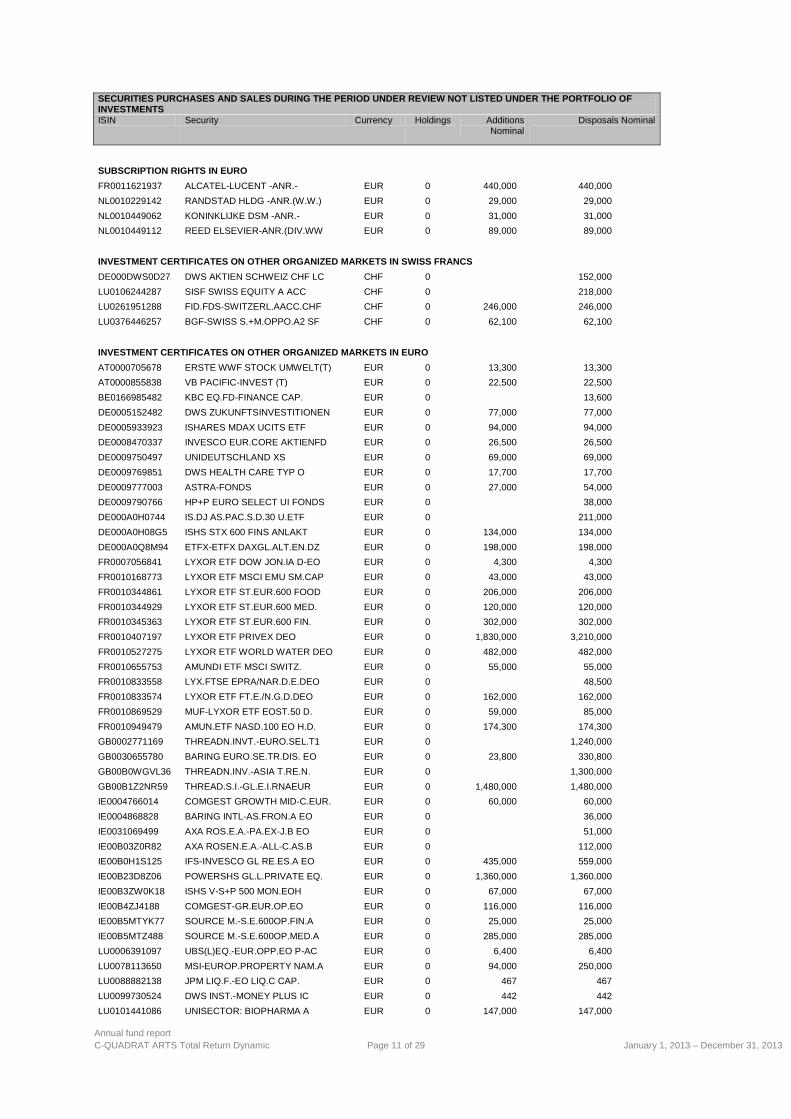
SECURITIES PURCHASES AND SALES DURING THE PERIOD UNDER REVIEW NOT LISTED UNDER THE PORTFOLIO OF INVESTMENTS ISIN Security Currency Holdings Additions
Nominal Disposals Nominal
SUBSCRIPTION RIGHTS IN EURO
FR0011621937 ALCATEL-LUCENT -ANR.- EUR 0 440,000 440,000
NL0010229142 RANDSTAD HLDG -ANR.(W.W.) EUR 0 29,000 29,000
NL0010449062 KONINKLIJKE DSM -ANR.- EUR 0 31,000 31,000
NL0010449112 REED ELSEVIER-ANR.(DIV.WW EUR 0 89,000 89,000
INVESTMENT CERTIFICATES ON OTHER ORGANIZED MARKETS IN SWISS FRANCS
DE000DWS0D27 DWS AKTIEN SCHWEIZ CHF LC CHF 0
152,000
LU0106244287 SISF SWISS EQUITY A ACC CHF 0
218,000
LU0261951288 FID.FDS-SWITZERL.AACC.CHF CHF 0 246,000 246,000
LU0376446257 BGF-SWISS S.+M.OPPO.A2 SF CHF 0 62,100 62,100
INVESTMENT CERTIFICATES ON OTHER ORGANIZED MARKETS IN EURO
AT0000705678 ERSTE WWF STOCK UMWELT(T) EUR 0 13,300 13,300
AT0000855838 VB PACIFIC-INVEST (T) EUR 0 22,500 22,500
BE0166985482 KBC EQ.FD-FINANCE CAP. EUR 0
13,600
DE0005152482 DWS ZUKUNFTSINVESTITIONEN EUR 0 77,000 77,000
DE0005933923 ISHARES MDAX UCITS ETF EUR 0 94,000 94,000
DE0008470337 INVESCO EUR.CORE AKTIENFD EUR 0 26,500 26,500
DE0009750497 UNIDEUTSCHLAND XS EUR 0 69,000 69,000
DE0009769851 DWS HEALTH CARE TYP O EUR 0 17,700 17,700
DE0009777003 ASTRA-FONDS EUR 0 27,000 54,000
DE0009790766 HP+P EURO SELECT UI FONDS EUR 0
38,000
DE000A0H0744 IS.DJ AS.PAC.S.D.30 U.ETF EUR 0
211,000
DE000A0H08G5 ISHS STX 600 FINS ANLAKT EUR 0 134,000 134,000
DE000A0Q8M94 ETFX-ETFX DAXGL.ALT.EN.DZ EUR 0 198,000 198,000
FR0007056841 LYXOR ETF DOW JON.IA D-EO EUR 0 4,300 4,300
FR0010168773 LYXOR ETF MSCI EMU SM.CAP EUR 0 43,000 43,000
FR0010344861 LYXOR ETF ST.EUR.600 FOOD EUR 0 206,000 206,000
FR0010344929 LYXOR ETF ST.EUR.600 MED. EUR 0 120,000 120,000
FR0010345363 LYXOR ETF ST.EUR.600 FIN. EUR 0 302,000 302,000
FR0010407197 LYXOR ETF PRIVEX DEO EUR 0 1,830,000 3,210,000
FR0010527275 LYXOR ETF WORLD WATER DEO EUR 0 482,000 482,000
FR0010655753 AMUNDI ETF MSCI SWITZ. EUR 0 55,000 55,000
FR0010833558 LYX.FTSE EPRA/NAR.D.E.DEO EUR 0
48,500
FR0010833574 LYXOR ETF FT.E./N.G.D.DEO EUR 0 162,000 162,000
FR0010869529 MUF-LYXOR ETF EOST.50 D. EUR 0 59,000 85,000
FR0010949479 AMUN.ETF NASD.100 EO H.D. EUR 0 174,300 174,300
GB0002771169 THREADN.INVT.-EURO.SEL.T1 EUR 0
1,240,000
GB0030655780 BARING EURO.SE.TR.DIS. EO EUR 0 23,800 330,800
GB00B0WGVL36 THREADN.INV.-ASIA T.RE.N. EUR 0
1,300,000
GB00B1Z2NR59 THREAD.S.I.-GL.E.I.RNAEUR EUR 0 1,480,000 1,480,000
IE0004766014 COMGEST GROWTH MID-C.EUR. EUR 0 60,000 60,000
IE0004868828 BARING INTL-AS.FRON.A EO EUR 0
36,000
IE0031069499 AXA ROS.E.A.-PA.EX-J.B EO EUR 0
51,000
IE00B03Z0R82 AXA ROSEN.E.A.-ALL-C.AS.B EUR 0
112,000
IE00B0H1S125 IFS-INVESCO GL RE.ES.A EO EUR 0 435,000 559,000
IE00B23D8Z06 POWERSHS GL.L.PRIVATE EQ. EUR 0 1,360,000 1,360,000
IE00B3ZW0K18 ISHS V-S+P 500 MON.EOH EUR 0 67,000 67,000
IE00B4ZJ4188 COMGEST-GR.EUR.OP.EO EUR 0 116,000 116,000
IE00B5MTYK77 SOURCE M.-S.E.600OP.FIN.A EUR 0 25,000 25,000
IE00B5MTZ488 SOURCE M.-S.E.600OP.MED.A EUR 0 285,000 285,000
LU0006391097 UBS(L)EQ.-EUR.OPP.EO P-AC EUR 0 6,400 6,400
LU0078113650 MSI-EUROP.PROPERTY NAM.A EUR 0 94,000 250,000
LU0088882138 JPM LIQ.F.-EO LIQ.C CAP. EUR 0 467 467
LU0099730524 DWS INST.-MONEY PLUS IC EUR 0 442 442
LU0101441086 UNISECTOR: BIOPHARMA A EUR 0 147,000 147,000

Annual fund report
C-QUADRAT ARTS Total Return Dynamic Page 12 of 29 January 1, 2013 – December 31, 2013
LU0114721508 FID.FDS-GL CONS.IND.A GL. EUR 0
83,000
LU0114722498 FID.FDS-GL FIN.SERV.A GL. EUR 0 358,000 358,000
LU0120689640 VONTOBEL-EURO MONEY B-EO EUR 0 69,000 69,000
LU0136043394 SISF EURO LIQUIDITY A ACC EUR 0 76,500 102,000
LU0148753444 VITRUVIUS-EM.M.EQ.B EUR EUR 0 8,400 11,600
LU0171307068 BGF-WLD HEALTHSC.NA.A2EO EUR 0 270,000 270,000
LU0171310443 BGF-WORLD TECH.N.A2 EO EUR 0 435,000 435,000
LU0198389784 SARASIN I.-RE.EST.EQ.GL.B EUR 0 20,800 20,800
LU0218912409 VONTOBEL-FAR E.EQ.H-EOH EUR 0
86,900
LU0224509132 SISF GL PR.SECS A ACC E H EUR 0 13,600 34,300
LU0240068089 CS(LUX)-EQUITY ENERGY R EUR 0 51,000 51,000
LU0246498066 CS(LUX)-EQ.INFRASTRUCT.R EUR 0 40,500 40,500
LU0247050130 LACUNA-ADAMANT AS.PA.HL.P EUR 0
2,450
LU0249326488 RBS MKT ACC.-ROG.INT.COM. EUR 0 84,000 84,000
LU0251127410 FID.FDS-AMER. A ACC.EO GL EUR 0 360,000 360,000
LU0258924702 JPM-GL.R.EST.USD A AC.EUR EUR 0
95,000
LU0260085492 JUPIT.GL.FD.-J.EU.GR.L EO EUR 0 99,000 189,000
LU0261948904 FID.FDS-IBERIA A ACC. EUR EUR 0 120,000 375,000
LU0261952419 FID.FDS-GL HTH C.A ACC.EO EUR 0 242,000 242,000
LU0261953490 FID.FDS-EURO C. A ACC.EUR EUR 0 2,600,000 2,600,000
LU0262307480 JUPIT.GL.FD.-J.GL.FIN.LEO EUR 0
156,000
LU0274221281 DB X-TR.SMI ETF 1D EUR 0
16,000
LU0289216672 JPM-AMERICA EQ.C ACC EOH EUR 0 540,000 540,000
LU0292105359 DB X-TR.ST.E.600 FO.+B.1C EUR 0 76,000 76,000
LU0315440411 EASYETF NMX30 INF.GL.EO A EUR 0 77,000 257,000
LU0316459139 SISF MIDDLE EAST A ACC EO EUR 0 194,000 296,000
LU0322250712 DB X-TR.LPX MM PR.EQ. 1C EUR 0 28,500 28,500
LU0322252338 DB X-TR.MSCI P.E.JP.I.1C EUR 0 495,000 495,000
LU0322253906 DB X-TR.MSCI EUR.S.C.I.1C EUR 0 54,000 54,000
LU0333595436 SARASIN IF.SUST.WATER P D EUR 0 63,400 63,400
LU0334662938 SISF HK EQU.BACC EO-H. EUR 0 104,400 104,400
LU0350714233 JPM-GL CONS.TREND.C AC.EO EUR 0 110,500 110,500
LU0360477987 MSI-US GROWTH FD ZH EO EUR 0 108,000 108,000
LU0360483019 MSI-GLOBAL BRANDS ZH EO EUR 0 100,000 100,000
LU0360484769 MSI-US ADVANTAGE FD ZH EUR 0 93,000 93,000
LU0366536711 PICT.-SOV.SH.TRM MM EUR P EUR 0 122,000 122,000
LU0366711900 UBS(L)E.-INFR.EO P-ACC EUR 0 3,000 3,000
LU0368678339 FID.FDS-PACIFIC A ACC. EO EUR 0 750,000 893,000
LU0378436363 COMS.-S.E.600 M.N.U.ETF I EUR 0 106,000 106,000
LU0390857398 NORDEA 1-EM.CONSUMER BIEO EUR 0 255,000 255,000
LU0407233740 PICTET-EMERG.MKTS HP(EO) EUR 0 13,600 13,600
LU0411704413 B.S.F.-B.EO ABS.RET.A2 EO EUR 0 40,000 40,000
LU0480488625 VITRUVIUS-ASIAN EQUIT.BEO EUR 0 34,000 34,000
LU0489337690 DB X-T.FTSE E/N DE.RE.1C EUR 0 152,000 277,000
LU0490619193 DB X-TR.S+P500 3CEO EUR 0 365,000 365,000
LU0505783646 ABERD.GL-EUR.EQ.INC.I2EO EUR 0 1,200 1,200
LU0505785005 ABERD.GL.-EAST.EU.EQ.S2EO EUR 0 49,000 49,000
LU0523223328 ABERD.GL-E.M.INF.EQ.A2EOH EUR 0 550,000 550,000
LU0533032263 MUL-LYX.ETF MSCI WCS C EO EUR 0 41,000 41,000
LU0533032859 MUL-LYX.ETF MSCI W.FI.CEO EUR 0 56,600 96,600
LU0533033238 MUL-LYX.U.E.MSCI W.HC CEO EUR 0 108,500 108,500
LU0533034558 MUL-LYX.ETF MSCI W.UT.CEO EUR 0 43,600 43,600
LU0540979720 DB X-TR.MSCI W.C.D.I.1CDL EUR 0 433,000 433,000
LU0540980066 DB X-TR.MSCI W.C.S.I.1CDL EUR 0 274,000 274,000
LU0540980140 DB X-T.MSCI W.FIN.I.1CDL EUR 0 362,000 362,000
LU0540980223 DB X-TR.MSCI W.H.C.I.1CDL EUR 0 464,000 464,000
LU0540980652 DB X-TR.MSCI W.UTI.I.1CDL EUR 0 122,000 122,000
LU0551348716 PIONEER-ABS.RET.AS.E.AEOC EUR 0 26,000 26,000
LU0559386015 SISF EUR.SM.+M.-C.V.A ACC EUR 0
47,000
LU0592216559 DB X-T.MSCI EM C.STA.1CDL EUR 0 2,250,000 2,250,000

Annual fund report
C-QUADRAT ARTS Total Return Dynamic Page 13 of 29 January 1, 2013 – December 31, 2013
INVESTMENT CERTIFICATES ON OTHER ORGANIZED MARKETS IN BRITISH POUNDS
GB00B0MY7199 BNY M.I.-NE.AS.IN.INS.INC GBP 0
305,000
IE0030382794 IFS-INVESCO UK EQUITY A GBP 0
390,000
IE00B60SWV01 SOURCE MKTS-FTSE 250 S. A GBP 0 85,000 85,000
INVESTMENT CERTIFICATES ON OTHER ORGANIZED MARKETS IN US DOLLARS
BE0170813936 KBC EQ.FD-MEDICAL TECH C. USD 0 1,290 1,290
IE0003708116 IFS4-INV.CONT.E.SM.CP.E.A USD 0
13,700
IE0005264431 SKAND.GL.-PACIF.EQU. A DL USD 0
510,000
LU0084408755 VONTOBEL-FAR EAST EQ.B-DL USD 0
4,700
LU0119217528 ING(L)-TELECOM P CAP. USD 0 7,400 7,400
LU0129463179 JPM-US VALUE FD C ACC USD 0 355,000 355,000
LU0129493754 JPM-EM.MI.EAST EQ.C AC DL USD 0
118,000
LU0158081363 AMU.-EQ.THAILAND IU(C) USD 0 990 990
LU0188438112 SISF ASIAN EQ.YIELD A ACC USD 0
275,000
LU0209137388 HEND.HORIZ.-GL.PPTY E.A2A USD 0 705,000 705,000
LU0229494975 HEND.HORIZ.-A.PAC.P.EQ.AA USD 0
455,000
LU0231459107 ABERD.GL.-ASIAN SM. A-2 USD 0
445,000
LU0264606111 HEND.HOR.-AS.DIV.I.A A.DL USD 0
255,000
LU0278937759 ABERD.GL-EM.MK.SM.CO.A-2A USD 0
1,029,000
LU0322252338 DB X-TR.MSCI P.E.JP.I.1C USD 0
495,000
LU0360485493 MSI-GLOBAL PPTY NAM. Z DL USD 0 51,000 51,000
LU0378449770 COMST.-NASDAQ-100 U.ETF I USD 0 58,000 58,000
LU0523223757 ABERD.GL-E.M.INFR.EQ.A2DL USD 0
524,000
LU0540980140 DB X-T.MSCI W.FIN.I.1CDL USD 0
270,000
LU0562313402 SISF FRONT.MKTS EQ.A A DL USD 0 25,500 25,500
LU0592216559 DB X-T.MSCI EM C.STA.1CDL USD 0
2,250,000
US4642866242 ISHARES-MSCI THAI.C.I.M.I USD 0 90,000 90,000
US4642884229 ISHSTR-INT.DEV.PROP.ETF USD 0
576,000
US4642884633 ISHARES-FTSE EP/NA DE.AS. USD 0
178,000
US4642887453 ISHS TR.-GL.CONS.DISC.ETF USD 0 325,000 325,000
EQUITIES IN CANADIAN DOLLARS
CA1360691010 CIBC CAD 0 26,500 26,500
CA1366812024 CANADIAN TIRE CORP.LTD.CL CAD 0 12,600 12,600
CA25675T1075 DOLLARAMA INC. CAD 0 30,600 30,600
CA39945C1095 CGI GROUP INC. A SV CAD 0 67,900 67,900
CA5394811015 LOBLAW COS LTD CAD 0 14,500 47,000
CA6837151068 OPEN TEXT CORP. CAD 0 17,000 17,000
CA7609751028 RES.IN MOT.DBA BLACKBERRY CAD 0 256,000 422,000
CA7751092007 ROGERS COMM.B CD 1,62478 CAD 0
46,500
CA82028K2002 SHAW COMM. N-VTG B CAD 0 69,000 69,000
CA82509W1032 SHOPPERS DRUG MART CAD 0 39,500 39,500
CA8672241079 SUNCOR ENERGY (NEW) CAD 0 60,000 60,000
CA8911605092 TORONTO-DOMINION BK CAD 0 24,700 24,700
CA89156V1067 TOURMALINE OIL CORP. CAD 0 25,500 25,500
EQUITIES IN DANISH CROWNS
DK0010268606 VESTAS WIND SYST. NAM.DK1 DKK 0 181,000 181,000
DK0010274414 DANSKE BK NAM. DK 10 DKK 0 87,000 87,000
DK0060228559 TDC A/S NAM. DK 1 DKK 0 156,000 156,000
DK0060252690 PANDORA A/S DK 1 DKK 0 29,500 29,500
DK0060336014 NOVOZYMES A/S NAM. B DK 2 DKK 0 32,000 32,000
EQUITIES IN EURO
BE0003562700 DELHAIZE GRP P.S. EUR 0 54,800 54,800
BE0003793107 AB INBEV PARTS S. EUR 0 21,900 21,900
DE0005200000 BEIERSDORF AG O.N. EUR 0
14,700
DE0005439004 CONTINENTAL AG O.N. EUR 0 14,500 33,200
DE0006231004 INFINEON TECH.AG NA O.N. EUR 0 228,000 228,000
DE0007164600 SAP AG O.N. EUR 0
26,000
DE0007257503 METRO AG ST O.N. EUR 0 51,000 51,000

Annual fund report
C-QUADRAT ARTS Total Return Dynamic Page 14 of 29 January 1, 2013 – December 31, 2013
DE0007664039 VOLKSWAGEN AG VZO O.N. EUR 0 9,100 9,100
DE0008232125 LUFTHANSA AG VNA O.N. EUR 0
124,000
DE000A1EWWW0 ADIDAS AG NA O.N. EUR 0 21,600 21,600
DE000BAY0017 BAYER AG NA EUR 0 21,500 21,500
DE000ENAG999 E.ON SE NA EUR 0 118,000 118,000
DE000KD88880 KABEL DT. HOLDING AG O.N. EUR 0 10,200 10,200
ES0109067019 AMADEUS IT HLDG EO 0,01 EUR 0 58,000 58,000
ES0111845014 ABERTIS INFRA. NOM. EO3 EUR 0 104,000 104,000
ES0113211835 BCO BIL.VIZ.ARG.NOM.EO-49 EUR 0 180,000 410,000
ES0113900J37 BCO SANTANDER N.EO0,5 EUR 0 204,000 204,000
ES0116870314 GAS NATURAL SDG INH. EO 1 EUR 0
89,000
ES0118900010 FERROVIAL S.A.INH. EO-,20 EUR 0
142,000
ES0130960018 ENAGAS INH. EO 1,50 EUR 0 23,200 92,200
ES0144580Y14 IBERDROLA INH. EO -,75 EUR 0 360,000 360,000
ES0171996012 GRIFOLS SA INH. A EO-,50 EUR 0 44,500 44,500
ES0173093115 RED ELECTRICA CORP.SA EO2 EUR 0 38,000 38,000
ES0182870214 SACYR S.A. INH. EO 1 EUR 0 250,000 250,000
FI0009003305 SAMPO OYJ A EUR 0 45,500 45,500
FI0009005987 UPM KYMMENE CORP. EUR 0 98,000 98,000
FI0009013403 KONE CORP.(NEW) B O.N. EUR 0 29,500 29,500
FR0000073272 SAFRAN INH. EO -,20 EUR 0 38,000 38,000
FR0000120503 BOUYGUES SA INH. EO 1 EUR 0 59,000 131,000
FR0000120537 LAFARGE EO 4 EUR 0 33,000 33,000
FR0000120628 AXA S.A. INH. EO 2,29 EUR 0
122,000
FR0000120644 DANONE S.A. EO-0.25 EUR 0 29,500 29,500
FR0000121261 MICHELIN NOM. EO2 EUR 0 22,300 22,300
FR0000121485 KERING S.A. INH. EO 4 EUR 0
11,100
FR0000121501 PEUGEOT SA EO 1 EUR 0 202,000 202,000
FR0000124141 VEOLIA ENVIRONNE. EO5 EUR 0 124,000 124,000
FR0000130809 STE GENERALE INH. EO 1,25 EUR 0 39,300 39,300
FR0000131906 RENAULT INH. EO 3,81 EUR 0 33,500 33,500
FR0010242511 ELECTRICI.D.FRANCE E0-,50 EUR 0 108,100 108,100
FR0010307819 LEGRAND S.A. INH. EO 4 EUR 0 37,000 37,000
IT0001063210 MEDIASET S.P.A. EO0.52 EUR 0 490,000 490,000
IT0001479374 LUXOTTICA GROUP EO 0,06 EUR 0
39,500
NL0000009165 HEINEKEN EO 1,60 EUR 0
30,000
NL0000009538 KONINKL. PHILIPS EO -,20 EUR 0
78,000
NL0000009827 KONINKLIJKE DSM EO 1,50 EUR 0 31,000 31,000
NL0000226223 STMICROELECTRONICS EUR 0 244,000 244,000
NL0000235190 AIRBUS GRP (LEGALLY EADS) EUR 0
53,000
NL0000379121 RANDSTAD HLDG NV EO-10 EUR 0 29,000 29,000
NL0000395903 WOLTERS KLUWER NAM. EO-12 EUR 0 55,000 55,000
NL0006033250 AHOLD, KON. EO-,30 EUR 0 228,000 228,000
NL0006144495 REED ELSEVIER NAM. EO-0.07 EUR 0 89,000 89,000
NL0010273215 ASML HOLDING EO-,09 EUR 0 71,900 71,900
PTBES0AM0007 BES SA PORT.NOM.+P.REG. EUR 0 820,000 820,000
EQUITIES IN BRITISH POUNDS
GB0000595859 ARM HLDGS PLC LS-,0005 GBP 0
168,000
GB0001411924 BRIT.SKY BROADC.GRP LS-50 GBP 0
90,000
GB0002162385 AVIVA PLC LS-,25 GBP 0 380,000 380,000
GB0004835483 SABMILLER DL-,10 GBP 0
45,500
GB0005603997 LEGAL GENL GRP PLCLS-,025 GBP 0
495,000
GB0006731235 ASSOC. BR. FOODS LS-,0568 GBP 0 43,000 43,000
GB0007980591 BP PLC DL-,25 GBP 0 280,000 280,000
GB0008706128 LLOYDS BKG GRP LS-,10 GBP 0 1,830,000 1,830,000
GB0009252882 GLAXOSMITHKLINE LS-,25 GBP 0 83,000 83,000
GB0031348658 BARCLAYS PLC LS 0,25 GBP 0 735,000 735,000
GB0033195214 KINGFISHER LS-,157142857 GBP 0 310,000 310,000
GB00B1VYCH82 THOMAS COOK GROUP EO-,01 GBP 0 530,000 530,000
GB00B24CGK77 RECKITT BENCK.GRP LS -,10 GBP 0
32,500
GB00B85KYF37 INTERCONT.HOTELS GRP GBP 0
49,100
Annual fund report
C-QUADRAT ARTS Total Return Dynamic Page 15 of 29 January 1, 2013 – December 31, 2013
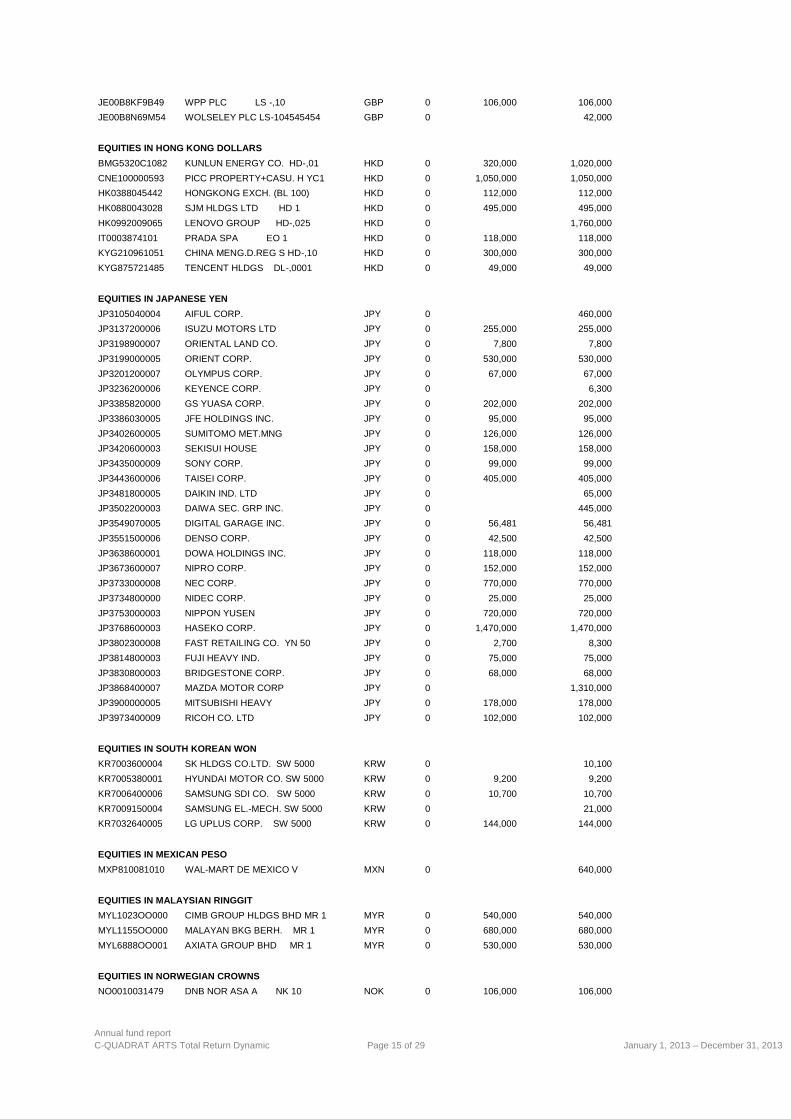
JE00B8KF9B49 WPP PLC LS -,10 GBP 0 106,000 106,000
JE00B8N69M54 WOLSELEY PLC LS-104545454 GBP 0
42,000
EQUITIES IN HONG KONG DOLLARS
BMG5320C1082 KUNLUN ENERGY CO. HD-,01 HKD 0 320,000 1,020,000
CNE100000593 PICC PROPERTY+CASU. H YC1 HKD 0 1,050,000 1,050,000
HK0388045442 HONGKONG EXCH. (BL 100) HKD 0 112,000 112,000
HK0880043028 SJM HLDGS LTD HD 1 HKD 0 495,000 495,000
HK0992009065 LENOVO GROUP HD-,025 HKD 0
1,760,000
IT0003874101 PRADA SPA EO 1 HKD 0 118,000 118,000
KYG210961051 CHINA MENG.D.REG S HD-,10 HKD 0 300,000 300,000
KYG875721485 TENCENT HLDGS DL-,0001 HKD 0 49,000 49,000
EQUITIES IN JAPANESE YEN
JP3105040004 AIFUL CORP. JPY 0
460,000
JP3137200006 ISUZU MOTORS LTD JPY 0 255,000 255,000
JP3198900007 ORIENTAL LAND CO. JPY 0 7,800 7,800
JP3199000005 ORIENT CORP. JPY 0 530,000 530,000
JP3201200007 OLYMPUS CORP. JPY 0 67,000 67,000
JP3236200006 KEYENCE CORP. JPY 0
6,300
JP3385820000 GS YUASA CORP. JPY 0 202,000 202,000
JP3386030005 JFE HOLDINGS INC. JPY 0 95,000 95,000
JP3402600005 SUMITOMO MET.MNG JPY 0 126,000 126,000
JP3420600003 SEKISUI HOUSE JPY 0 158,000 158,000
JP3435000009 SONY CORP. JPY 0 99,000 99,000
JP3443600006 TAISEI CORP. JPY 0 405,000 405,000
JP3481800005 DAIKIN IND. LTD JPY 0
65,000
JP3502200003 DAIWA SEC. GRP INC. JPY 0
445,000
JP3549070005 DIGITAL GARAGE INC. JPY 0 56,481 56,481
JP3551500006 DENSO CORP. JPY 0 42,500 42,500
JP3638600001 DOWA HOLDINGS INC. JPY 0 118,000 118,000
JP3673600007 NIPRO CORP. JPY 0 152,000 152,000
JP3733000008 NEC CORP. JPY 0 770,000 770,000
JP3734800000 NIDEC CORP. JPY 0 25,000 25,000
JP3753000003 NIPPON YUSEN JPY 0 720,000 720,000
JP3768600003 HASEKO CORP. JPY 0 1,470,000 1,470,000
JP3802300008 FAST RETAILING CO. YN 50 JPY 0 2,700 8,300
JP3814800003 FUJI HEAVY IND. JPY 0 75,000 75,000
JP3830800003 BRIDGESTONE CORP. JPY 0 68,000 68,000
JP3868400007 MAZDA MOTOR CORP JPY 0
1,310,000
JP3900000005 MITSUBISHI HEAVY JPY 0 178,000 178,000
JP3973400009 RICOH CO. LTD JPY 0 102,000 102,000
EQUITIES IN SOUTH KOREAN WON
KR7003600004 SK HLDGS CO.LTD. SW 5000 KRW 0
10,100
KR7005380001 HYUNDAI MOTOR CO. SW 5000 KRW 0 9,200 9,200
KR7006400006 SAMSUNG SDI CO. SW 5000 KRW 0 10,700 10,700
KR7009150004 SAMSUNG EL.-MECH. SW 5000 KRW 0
21,000
KR7032640005 LG UPLUS CORP. SW 5000 KRW 0 144,000 144,000
EQUITIES IN MEXICAN PESO
MXP810081010 WAL-MART DE MEXICO V MXN 0
640,000
EQUITIES IN MALAYSIAN RINGGIT
MYL1023OO000 CIMB GROUP HLDGS BHD MR 1 MYR 0 540,000 540,000
MYL1155OO000 MALAYAN BKG BERH. MR 1 MYR 0 680,000 680,000
MYL6888OO001 AXIATA GROUP BHD MR 1 MYR 0 530,000 530,000
EQUITIES IN NORWEGIAN CROWNS
NO0010031479 DNB NOR ASA A NK 10 NOK 0 106,000 106,000

Annual fund report
C-QUADRAT ARTS Total Return Dynamic Page 16 of 29 January 1, 2013 – December 31, 2013
EQUITIES IN POLISH ZLOTY
PLKGHM000017 KGHM POLSKA MIEDZ ZY 10 PLN 0
31,000
PLPZU0000011 POWSZECHNY ZAKLAD UBEZP. PLN 0
9,300
EQUITIES IN SWEDISH CROWNS
SE0000106270 HENNES + MAURITZ B SK-125 SEK 0 54,000 54,000
SE0000108227 SKF AKTIEB.B(FRIA)SK0,625 SEK 0 81,000 81,000
SE0000108656 ERICSSON B (FRIA) SEK 0 358,000 358,000
SE0000112724 SVENSKA CELL.B FRIA SK10 SEK 0 20,400 89,400
SE0000148884 SKAND.ENSK. BKN A FR.SK10 SEK 0 216,000 216,000
SE0000163628 ELEKTA AB B SK 2 SEK 0
74,000
SE0000242455 SWEDBANK A SEK 0 90,000 90,000
SE0000255648 ASSA-ABLOY AB B SK 1 SEK 0 33,500 33,500
SE0000427361 NORDEA BANK AB EO 0,40 SEK 0 190,000 190,000
SE0000667925 TELIASONERA AB SK 3,20 SEK 0 265,000 265,000
SE0000695876 ALFA LAVAL AB SK 2,5 SEK 0
59,000
EQUITIES IN SINGAPORE DOLLARS
SG1T75931496 SINGAPORE TELE. SD-,15 SGD 0
750,000
TH0902010014 THAI BEVERAGE -FGN- BA 1 SGD 0 2,820,000 2,820,000
EQUITIES IN US DOLLARS
CH0038838394 WEATHERFORD INT.NA.SF1,16 USD 0 140,000 140,000
CH0044328745 ACE LTD SF 27.04 USD 0 24,000 24,000
CH0048265513 TRANSOCEAN LTD. SF 15 USD 0 79,500 79,500
CH0100383485 TYCO INTL LTD NA SF 6,70 USD 0 57,000 57,000
CH0114405324 GARMIN LTD NAM.SF 10 USD 0 50,000 50,000
CH0193880173 PENTAIR LTD NA SF-,50 USD 0 34,500 34,500
IE00B4BNMY34 ACCENTURE PLC A DL-000025 USD 0
30,000
IE00B56GVS15 ALKERMES PLC DL-,01 USD 0 67,000 67,000
IE00B58JVZ52 SEAGATE TECHNO. DL-0.00001 USD 0 47,000 47,000
IE00B5LRLL25 XL GROUP PLC DL -,01 USD 0 138,000 138,000
IL0011213001 SODASTREAM INTL IS-,645 USD 0 26,000 26,000
JE00B783TY65 DELPHI AUTOMOTIVE DL -,01 USD 0 89,000 89,000
KYG814771047 SINA CORP. DL-0.133 USD 0 29,000 29,000
NL0009324904 SENSATA TECHNOLOG. EO-0.01 USD 0 56,000 56,000
NL0009805522 YANDEX N.V. CL.A DL -,01 USD 0 71,000 71,000
PAP310761054 COPA HOLDINGS CL.A O.N. USD 0 15,100 15,100
PR7331747001 POPULAR INC. NEW DL 6 USD 0 49,000 49,000
SG9999000020 FLEXTRONICS INTERNATIONAL USD 0 185,000 185,000
SG9999006241 AVAGO TECHNOL.LTD NPV USD 0 54,000 54,000
US0463531089 ASTRAZENECA DL-,25 SP.ADR USD 0 42,000 42,000
US0528001094 AUTOLIV INC. DL-,01 USD 0 28,500 28,500
US0572241075 BAKER HUGHES INC. DL 1 USD 0 39,500 39,500
US0673831097 BARD -C.R.- INC. DL -,25 USD 0 16,300 16,300
US14170T1016 CAREFUSION CORP. DL-0.01 USD 0 55,000 55,000
US1672501095 CHICAGO BRIDGE+IR. EO-0.01 USD 0 38,000 38,000
US17275R1023 CISCO SYSTEMS DL-,001 USD 0 85,000 85,000
US2053631048 COMPUTER SCIENCES DL 1 USD 0
53,000
US2228161004 COVANCE INC. DL 0,01 USD 0
23,200
US2841312083 ELAN CORP. PLC ADR/EO-,05 USD 0 144,000 144,000
US30303M1027 FACEBOOK INC.A DL-,000006 USD 0 49,000 49,000
US3364331070 FIRST SOLAR INC. D -,001 USD 0 47,500 47,500
US3444191064 FOM.ECO.MEX.S.D.CV ADR/10 USD 0 17,500 17,500
US3703341046 GENL MILLS DL -,10 USD 0 41,500 41,500
US3825501014 GOODYEAR TIRE RUBBER USD 0 97,000 97,000
US3994731079 GROUPON CLASS A DL-,0001 USD 0 190,000 190,000
US40415F1012 HDFC BANK LTD ADR/3 IR 10 USD 0
27,500
US4103451021 HANESBRANDS INC. DL -,01 USD 0 34,500 34,500
US43289P1066 HIMAX TECH.INC. ADR 1 USD 0 194,000 194,000
US45104G1040 ICICI BANK LTD ADR/2 USD 0
48,000
US46626D1081 JSC MMC NOR.NICK.ADR RL 1 USD 0
116,000

Annual fund report
C-QUADRAT ARTS Total Return Dynamic Page 17 of 29 January 1, 2013 – December 31, 2013
US5010441013 KROGER CO. DL 1 USD 0
77,000
US5486611073 LOWE'S COS INC. DL-,50 USD 0
58,000
US58733R1023 MERCADOLIBRE INC. DL-,001 USD 0 18,300 18,300
US6153691059 MOODY'S CORP DL-,01 USD 0 32,000 32,000
US66987V1098 NOVARTIS NAM. ADR USD 0 26,300 26,300
US6708371033 OGE EN. CORP. DL-0.01 USD 0 21,900 21,900
US67812M2070 NK ROSNEFT GDR REGS RL-01 USD 0
244,000
US7142901039 PERRIGO CO. USD 0 14,600 14,600
US7401891053 PRECISION CASTPARTS CORP. USD 0 9,500 9,500
US78390X1019 SAIC INC. DL-,0001 USD 0 152,000 152,000
US7954351067 SALIX PHARMACEUTIC.DL-001 USD 0 24,200 24,200
US80105N1054 SANOFI SA ADR 1/2 EO 2 USD 0 39,500 39,500
US8475601097 SPECTRA ENERGY DL -,001 USD 0 61,000 61,000
US8725901040 T-MOBILE US INC. USD 0 94,000 94,000
US8765685024 TATA MTRS LTD ADR/5 IR 2 USD 0 50,000 50,000
US87936R1068 TELEFONICA BRASIL PFD ADR USD 0 68,000 68,000
US88031M1099 TENARIS S.A. ADR/2DL 1 USD 0 34,500 34,500
US8962391004 TRIMBLE NAVIGATION USD 0 17,800 17,800
US9024941034 TYSON FOODS INC A DL-,10 USD 0
106,000
US9043111072 UNDER ARMOUR A DL-,000333 USD 0 26,500 26,500
US91913Y1001 VALERO ENERGY CORP.DL-,01 USD 0 33,500 33,500
US9843321061 YAHOO INC. DL-,001 USD 0
108,000
US9858171054 YELP INC.CL.A DL-,000001 USD 0 33,000 33,000
EQUITIES IN SOUTH AFRICAN RAND
ZAE000015889 NASPERS LTD. N RC-,02 ZAR 0 25,500 25,500
EQUITIES IN TURKISH LIRA
TRAPETKM91E0 PETKIM PETROKIMYA NAM.TN1 TRY 0 1,225,000 1,225,000
TRATHYAO91M5 TURK HAVA YOLLARI AS TRY 0
630,000
TRAYKBNK91N6 YAPI VE KREDI B.NA TN 1 TRY 0
700,000
TREAYKB00014 ASYA KATILIM BANK N. TN 1 TRY 0 1,250,000 1,250,000
TREMGTI00012 MIGROS TICARET NAM. TN 1 TRY 0
174,000
Vienna, April 15, 2014
C-QUADRAT Kapitalanlage AG
Christian Jost Markus A. Ullmer Andreas Wimmer

Annual fund report
C-QUADRAT ARTS Total Return Dynamic Page 18 of 29 January 1, 2013 – December 31, 2013
6. audit opinion We have audited the attached annual fund report (including the accounts) as of December 31, 2013 issued by C-QUADRAT Kapitalanlage AG, Vienna, (the management company) for its fund C-QUADRAT ARTS Total Return Dynamic, a co-ownership fund pursuant to § 2 (2) InvFG 2011, for the accounting year from January 1, 2013 to December 31, 2013. Responsibility of the statutory representatives for the annual fund report, management of the asset portfolio and the accounting The statutory representatives of the management company/the custodian bank are responsible for the accounting, valuation of the asset portfolio, calculation of withholding taxes, preparation of the annual fund report and management of the asset portfolio in accordance with the provisions of the Austrian Investment Fund Act, the supplementary provisions in the fund regulations and the tax regulations. This responsibility includes the setup, execution and maintenance of an internal control system where this is significant for the registration and valuation of the asset portfolio and preparation of the annual fund report so that this report is free from significant factual misstatements due to intentional or unintentional errors; selection and application of suitable valuation methods; performance of estimates which appear appropriate with consideration of the applicable outline conditions. Responsibility of the (bank) auditor and description of the type and scope of the statutory audit of the annual fund report We are responsible for providing an audit opinion for this annual fund report on the basis of our audit. We performed our audit pursuant to § 49 (5) of the Austrian Investment Fund Act 2011 whilst complying with the applicable Austrian statutory regulations and principles of proper balance-sheet auditing. These principles require our compliance with rules of professional conduct and our planning and execution of the audit so that we are able to form an opinion with a reasonable degree of certainty on whether the annual fund report is free from significant factual misstatements. An audit includes the performance of audit activities to obtain documentation of the figures and other disclosures in the annual fund report. The audit activities are chosen at the discretion of the (bank) auditor, with consideration of its assessment of the risk of significant factual misstatements due to intentional or unintentional errors. In performing the risk assessment, the (bank) auditor gives consideration to the internal control system where this is of significance for preparation of the annual fund report and valuation of the asset portfolio, so as to specify suitable audit activities with consideration of the applicable outline conditions. No audit opinion is provided on the effectiveness of the internal control measures implemented by the management company and the custodian bank, however. The audit also includes an assessment of the appropriateness of the valuation methods used and the key estimates made by the statutory representatives as well as an evaluation of the overall statement provided in the annual fund report. In our opinion we have obtained sufficient and suitable documentation for our audit, so that it provides an adequate degree of certainty on which to base our judgment.

Annual fund report
C-QUADRAT ARTS Total Return Dynamic Page 19 of 29 January 1, 2013 – December 31, 2013
Opinion Our audit has not given rise to any objections. On the basis of our audit findings, in our view the annual fund report as of December 31, 2013 for C-QUADRAT ARTS Total Return Dynamic, a co-ownership fund pursuant to § 2 (2) InvFG 2011, complies with the statutory regulations. Compliance with the Austrian Investment Fund Act and the fund regulations Pursuant to § 49 (5) InvFG 2011 our audit includes an assessment of whether this annual fund report complies with the Austrian Federal Act on Investment Funds (Austrian Investment Fund Act) and the fund regulations. We have implemented our audit in accordance with the above principles, so that we are able to determine with a sufficient level of certainty whether this annual fund report complies with the provisions of the Austrian Investment Fund Act and the fund regulations. According to our audit findings, the provisions of the Austrian Federal Act on Investment Funds (Austrian Investment Fund Act) and the fund regulations have been complied with. Report on activities performed during the past accounting year We have undertaken a critical assessment of the disclosures provided by the management company’s management in the annual fund report on its activities in the past accounting year, but these were not subject to special audit activities in accordance with the above principles. Accordingly, our audit opinion does not include an evaluation of this information. In the context of the overall picture set out in this annual fund report, the disclosures concerning the accounting year are consistent with the figures provided in the report. Vienna, April 15, 2014 Ernst & Young Wirtschaftsprüfungsgesellschaft m.b.H.
Alexander Wlasto Dr. Robert Wauschek Auditor Auditor
In case of the publication or forwarding of the annual fund report in a form which deviates from its confirmed (i.e. unabbreviated German) version (e.g. abbreviated version or translation), our audit opinion may not be cited or our audit referred to without our approval.

Annual fund report
C-QUADRAT ARTS Total Return Dynamic Page 20 of 29 January 1, 2013 – December 31, 2013
Tax treatment Further information on the tax treatment of the fund – prepared on the basis of the audited annual fund report – may be obtained from our website, www.c-quadrat.at.

Annual fund report
C-QUADRAT ARTS Total Return Dynamic Page 21 of 29 January 1, 2013 – December 31, 2013
Fund regulations pursuant to the 2011 Austrian Investment Fund Act (InvFG)
The Austrian Financial Market Authority (FMA) has approved the fund regulations for the investment
fund C-QUADRAT ARTS Total Return Dynamic, a Miteigentumsfonds (co-ownership fund) pursuant
to the 2011 Austrian Investment Fund Act (InvFG), as amended.
The investment fund is a fund complying with the Directive 85/611/EC and is managed by C-
QUADRAT Kapitalanlage AG (hereinafter: the “management company”) which is headquartered in
Vienna.
Article 1 Fund units
The fund units are embodied in unit certificates with the character of financial instruments which are
issued to bearer.
The unit certificates are represented by global certificates for each unit class. Therefore, actual
securities cannot be issued.
Article 2 Custodian bank (custodian)
The investment fund’s custodian bank (custodian) is Raiffeisen Bank International AG, Vienna.
The custodian bank (custodian) is the payment office for unit certificates.
Article 3 Investment instruments and principles
The following assets pursuant to InvFG may be selected for the investment fund.
C-QUADRAT ARTS Total Return Dynamic does not follow any benchmark in terms of its investment
strategy. It seeks to realize absolute long-term growth.
Through units in investment funds, the investment fund may indirectly purchase global equities (with
no restrictions as to credit rating, currency or sector) and equity-equivalent securities, particularly
profit-sharing certificates (with no restrictions as to credit rating, currency or sector). Direct acquisition
of global equity issues (with no restrictions as to credit rating, currency or sector) and equity-
equivalent securities, particularly profit-sharing certificates (with no restrictions as to credit rating,
currency or sector), is limited to 30 per cent of the fund’s assets.
The investment fund may invest directly or indirectly – via units of investment funds – in instruments
that are linked either directly or indirectly with the performance of an equity index, bond index or other
financial index. These types of investment funds will be allocated to the investment fund’s share of
equities, with the exception of those investment funds linked to the performance of a bond index as
described above.

Annual fund report
C-QUADRAT ARTS Total Return Dynamic Page 22 of 29 January 1, 2013 – December 31, 2013
The investment fund may also acquire investment fund units that are geared toward reflecting, either
directly or indirectly, a neutral to inverted yield curve of the categories of securities mentioned above.
The investment fund may moreover invest in securities linked to the performance of a security
reflecting another asset such as precious metals or commodities as long as it can be ensured that no
physical delivery will ensue. Therefore, physical delivery may not be foreseen nor may a right to same
exist. No derivatives in accordance with § 32 of the 4. Derivate-Risikoberechnungs- und
Meldeverordnung (4th FMA Regulation on Risk Calculation and Reporting of Derivative Instruments)
may be embedded in these securities.
Through units in investment funds, the investment fund may indirectly purchase global bonds (with no
restrictions as to credit rating, currency or sector). Direct acquisition of global bond issues (with no
restrictions as to credit rating, currency or sector) is limited to 30 per cent of the fund assets.
Up to 30 per cent of the assets of the investment fund may be invested in global certificates (with no
restrictions as to credit rating, currency or sector) and index certificate-equivalent securities.
Through units in investment funds, the investment fund may indirectly purchase global money market
instruments (with no restrictions as to credit rating or currency).
The investment fund must invest at least 70 per cent of its fund assets in units in investment funds,
including demand deposits and callable deposits.
The following investment instruments are purchased for the fund’s assets subject to compliance with
the above investment focus.
securities
Securities (including securities with embedded derivative instruments) may account for up to 30 per
cent of the fund assets.
Money market instruments
Not applicable.
Securities and money market instruments
The acquisition of securities not fully paid in and subscription rights on such instruments or the
acquisition of other financial instruments not fully paid in shall be permitted up to a maximum of 10 per
cent of the fund assets.
Securities may be acquired where they comply with the criteria for listing and trading on a regulated
market or a stock exchange pursuant to InvFG.
Securities which do not fulfill the criteria outlined in the above paragraph may account for up to 10 per
cent of the overall fund assets.
Units in investment funds
Units in investment funds (UCITS, UCI) may each amount to up to 20 per cent of the fund assets –
and up to 100 per cent of the fund assets in total – insofar as these UCITS or UCI do not for their
part invest more than 10 per cent of their fund assets in units in other investment funds.
Units in UCI may be purchased for up to 30 per cent of the fund assets in total.

Annual fund report
C-QUADRAT ARTS Total Return Dynamic Page 23 of 29 January 1, 2013 – December 31, 2013
Derivative instruments
Derivative instruments may exclusively be utilized for hedging purposes.
Investment fund’s risk measurement method:
The investment fund uses the following risk measurement method:
absolute value at risk
The VAR figure is calculated pursuant to the 4th chapter of the 4
th Austrian Derivatives Risk Calculation
and Reporting Ordinance (Derivate-Risikoberechnungs- und Meldeverordnung), as amended.
The allocable risk amount for the overall risk – calculated as the value-at-risk amount for the fund’s
investments – is limited to a maximum of 15 per cent of the total net value of the fund assets
(absolute VAR).
Please refer to the Prospectus for details and comments.
Demand deposits and callable deposits
Sight deposits and deposits at notice with notice periods not exceeding 12 months may amount to up
to 100 per cent of the fund assets.
No minimum bank balance need be maintained.
Short-term loans
The management company may take up short-term loans of up to 10 per cent of the fund assets for
account of the investment fund.
Repurchase agreements
Not applicable.
Securities lending
Not applicable.
Investment instruments may only be acquired uniformly for the entire investment fund, not for an
individual unit class or for a group of unit classes. However, this does not apply for currency hedge
transactions. These transactions may only be entered into in relation to a single unit class. Expenses
and income resulting from a currency hedge transaction shall exclusively be allocated to the relevant
unit class.
Please see the Prospectus for further information concerning Article 3.

Annual fund report
C-QUADRAT ARTS Total Return Dynamic Page 24 of 29 January 1, 2013 – December 31, 2013
Article 4 Issuance and redemption modalities
The unit value shall be calculated in EUR.
The value of units will be calculated on each day of stock market trading.
Issuance and subscription fee
The issue price is the unit value plus a fee per unit of up to 5.00 per cent to cover the management
company’s issuing costs, rounded up to the nearest cent.
Issue of the units shall not be limited in principle; however, the management company hereby
reserves the right to cease issuing unit certificates either temporarily or permanently.
Redemption and redemption fee
No redemption fee will be charged. The redemption price shall correspond to the unit value rounded
down to the nearest cent.
At the request of a unit holder, his unit shall be redeemed out of the investment fund at the applicable
redemption price against surrender of the unit certificate.
Article 5 Accounting year
The investment fund’s accounting year is the period from January 1 to December 31.
Article 6 Unit classes and appropriation of income
Income-retaining unit certificates with deduction of investment income tax at source and income-
retaining unit certificates without deduction of investment income tax at source may be issued for the
investment fund.
Various classes of unit certificates may be issued for this investment fund. The management company
may decide to establish unit classes or to issue units in a given unit class.
Please refer to the Prospectus for further details.

Annual fund report
C-QUADRAT ARTS Total Return Dynamic Page 25 of 29 January 1, 2013 – December 31, 2013
Appropriation of income in case of income-retaining unit certificates with investment income
tax deducted (income retention)
The income accumulating over the accounting year that remains after the deduction of expenses shall
not be distributed. From April 30 the amount calculated pursuant to InvFG shall be paid out on
income-retaining unit certificates to be used where applicable to meet any investment income tax
commitments on the distribution-equivalent return on those unit certificates.
Appropriation of income in the event of income-retaining unit certificates without deduction of
investment income tax at source (fully reinvesting tranche for resident
and non-resident investors exempt from withholding tax)
The income accumulating over the accounting year that remains after the deduction of expenses shall
not be distributed. No payment pursuant to InvFG will be made. April 30 of the following accounting
year shall be the key date pursuant to InvFG in case of failure to pay investment income tax on the
annual income.
The management company must ensure by furnishing evidence from the custodial account providers
that at the time of payment, the unit certificates are only held by unit holders who are either not subject
to Austrian personal income tax or corporate income tax or who fulfill the requirements for exemption
pursuant to the Austrian Personal Income Tax Act (§ 94).
If these preconditions have not been met as of the payment date, the amount calculated pursuant to
InvFG shall be paid out by the custodian in the form of credit.
Appropriation of income in the event of income-retaining unit certificates without deduction of
investment income tax at source (fully reinvesting tranche for non-
resident investors exempt from withholding tax)
Income-retaining unit certificates without deducted investment income tax shall only be sold outside
Austria.
The income accumulating over the accounting year that remains after the deduction of expenses shall
not be distributed. No payment pursuant to InvFG will be made.
The management company must ensure by furnishing evidence that, at the time of payment, the unit
certificates are only held by unit holders who are either not subject to Austrian personal income tax or
corporate income tax or who fulfill the requirements for exemption pursuant to the Austrian Personal
Income Tax Act (§ 94).
Article 7 Management fee, reimbursement of expenses,
liquidation fee
For its management activity the management company receives annual remuneration of up to 2.00
per cent of the fund assets, calculated on the basis of the values at the end of each month.
In addition, the management company receives a monthly variable management fee (performance
fee, performance-based fee) of 20 per cent of the fund’s net performance (development of the unit
value) in relation to the “high water mark”. The “high water mark” corresponds to the unit value at the
end of the previous month when a performance fee was last paid. It is continuously calculated on the

Annual fund report
C-QUADRAT ARTS Total Return Dynamic Page 26 of 29 January 1, 2013 – December 31, 2013
basis of the average fund value and will influence the calculated net asset value, within the scope of
income. The calculation shall be based on the number of units in circulation at the end of the relevant
month.
The costs arising at the introduction of new unit classes for existing asset portfolios shall be deducted
from the unit prices of the new unit classes.
At the liquidation of the investment fund, the custodian bank shall receive remuneration amounting to
0.50 per cent of the fund assets.
The management company is entitled to reimbursement of all expenses associated with its
management of the fund.
Please refer to the Prospectus for further details.
Annual fund report
C-QUADRAT ARTS Total Return Dynamic Page 27 of 29 January 1, 2013 – December 31, 2013
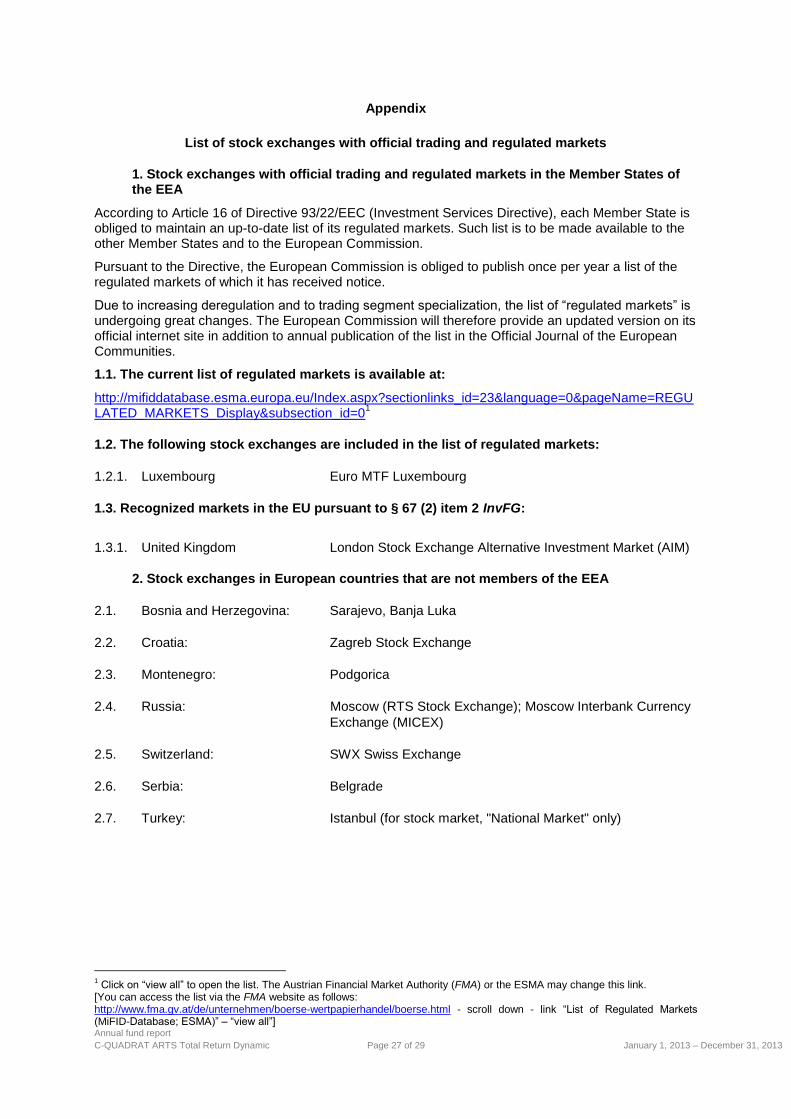
Appendix
List of stock exchanges with official trading and regulated markets
1. Stock exchanges with official trading and regulated markets in the Member States of the EEA
According to Article 16 of Directive 93/22/EEC (Investment Services Directive), each Member State is obliged to maintain an up-to-date list of its regulated markets. Such list is to be made available to the other Member States and to the European Commission.
Pursuant to the Directive, the European Commission is obliged to publish once per year a list of the regulated markets of which it has received notice.
Due to increasing deregulation and to trading segment specialization, the list of “regulated markets” is undergoing great changes. The European Commission will therefore provide an updated version on its official internet site in addition to annual publication of the list in the Official Journal of the European Communities.
1.1. The current list of regulated markets is available at:
http://mifiddatabase.esma.europa.eu/Index.aspx?sectionlinks_id=23&language=0&pageName=REGULATED_MARKETS_Display&subsection_id=0
1
1.2. The following stock exchanges are included in the list of regulated markets:
1.2.1. Luxembourg Euro MTF Luxembourg
1.3. Recognized markets in the EU pursuant to § 67 (2) item 2 InvFG:
1.3.1. United Kingdom London Stock Exchange Alternative Investment Market (AIM)
2. Stock exchanges in European countries that are not members of the EEA
2.1. Bosnia and Herzegovina: Sarajevo, Banja Luka
2.2. Croatia: Zagreb Stock Exchange
2.3. Montenegro: Podgorica
2.4. Russia: Moscow (RTS Stock Exchange); Moscow Interbank Currency
Exchange (MICEX)
2.5. Switzerland: SWX Swiss Exchange
2.6. Serbia: Belgrade
2.7. Turkey: Istanbul (for stock market, "National Market" only)
1 Click on “view all” to open the list. The Austrian Financial Market Authority (FMA) or the ESMA may change this link.
[You can access the list via the FMA website as follows: http://www.fma.gv.at/de/unternehmen/boerse-wertpapierhandel/boerse.html - scroll down - link “List of Regulated Markets (MiFID-Database; ESMA)” – “view all”]
Annual fund report
C-QUADRAT ARTS Total Return Dynamic Page 28 of 29 January 1, 2013 – December 31, 2013
3. Stock exchanges in non-European countries
3.1. Australia: Sydney, Hobart, Melbourne, Perth
3.2. Argentina: Buenos Aires
3.3. Brazil: Rio de Janeiro, Sao Paulo
3.4. Chile: Santiago
3.5. China: Shanghai Stock Exchange, Shenzhen Stock Exchange
3.6. Hong Kong Hong Kong Stock Exchange
3.7. India: Mumbai
3.8. Indonesia: Jakarta
3.9. Israel: Tel Aviv
3.10. Japan: Tokyo, Osaka, Nagoya, Kyoto, Fukuoka, Niigata, Sapporo, Hiroshima
3.11. Canada: Toronto, Vancouver, Montreal
3.12 Colombia: Bolsa de Valores de Colombia
3.13. South Korea: Korea Exchange (Seoul, Busan)
3.14. Malaysia: Kuala Lumpur, Bursa Malaysia Berhad
3.15. Mexico: Mexico City
3.16. New Zealand: Wellington, Christchurch/Invercargill, Auckland
3.17 Peru: Bolsa de Valores de Lima
3.18. Philippines: Manila
3.19. Singapore: Singapore Stock Exchange
3.20. South Africa: Johannesburg
3.21. Taiwan: Taipei
3.22. Thailand: Bangkok
3.23. USA: New York, American Stock Exchange (AMEX), New York Stock Exchange (NYSE), Los Angeles/Pacific Stock Exchange, San Francisco/Pacific Stock Exchange, Philadelphia, Chicago, Boston, Cincinnati
3.24. Venezuela: Caracas
3.25. United Arab
Emirates: Abu Dhabi Securities Exchange (ADX)
4. Organized markets in countries that are not members of the European Community
4.1. Japan: Over the Counter Market
4.2. Canada: Over the Counter Market
4.3. South Korea: Over the Counter Market
4.4. Switzerland: SWX Swiss Exchange, BX Berne eXchange; Over the Counter Market of the members of the International Capital Market Association (ICMA), Zurich
4.5. USA: Over the Counter Market in the NASDAQ system, Over the Counter Market (markets organized by NASD such as Over-the-Counter Equity Market, Municipal Bond Market, Government Securities Market, Corporate Bonds and Public

Annual fund report
C-QUADRAT ARTS Total Return Dynamic Page 29 of 29 January 1, 2013 – December 31, 2013
Direct Participation Programs) Over-the-Counter-Market for Agency Mortgage-Backed Securities
5. Stock exchanges with futures and options markets
5.1. Argentina: Bolsa de Comercio de Buenos Aires
5.2. Australia: Australian Options Market, Australian
Securities Exchange (ASX)
5.3. Brazil: Bolsa Brasiliera de Futuros, Bolsa de Mercadorias & Futuros, Rio de Janeiro Stock Exchange, Sao Paulo Stock Exchange
5.4. Hong Kong Hong Kong Futures Exchange Ltd.
5.5. Japan: Osaka Securities Exchange, Tokyo International Financial Futures Exchange, Tokyo Stock Exchange
5.6. Canada: Montreal Exchange, Toronto Futures Exchange
5.7. South Korea: Korea Exchange (KRX)
5.8. Mexico: Mercado Mexicano de Derivados
5.9. New Zealand: New Zealand Futures & Options Exchange
5.10. Philippines: Manila International Futures Exchange
5.11. Singapore: The Singapore Exchange Limited (SGX)
5.12. Slovakia: RM System Slovakia
5.13. South Africa: Johannesburg Stock Exchange (JSE), South African Futures Exchange (SAFEX)
5.14. Switzerland: EUREX
5.15. Turkey: TurkDEX
5.16. USA: American Stock Exchange, Chicago Board Options Exchange, Chicago, Board of Trade, Chicago Mercantile Exchange, Comex, FINEX, Mid America Commodity Exchange, ICE Future US Inc. New York, Pacific Stock Exchange, Philadelphia Stock Exchange, New York Stock Exchange, Boston Options Exchange (BOX)