annual financial statements - personal banking | bmo …€¦ · annual financial statements bmo...
TRANSCRIPT

Annual Financial Statements
BMO Private Portfolios
December 31, 2017
BMO Private International Equity Portfolio

Independent Auditor’s Report
To the Unitholders of
BMO Private Canadian Money Market Portfolio
BMO Private Canadian Special Equity Portfolio
BMO Private U.S. Equity Portfolio
BMO Private International Equity Portfolio
BMO Private U.S. Growth Equity Portfolio
BMO Private Canadian Income Equity Portfolio
BMO Private Canadian Short-Term Bond Portfolio
BMO Private Canadian Core Equity Portfolio
BMO Private Canadian Mid-Term Bond Portfolio
BMO Private Canadian Corporate Bond Portfolio
BMO Private Diversified Yield Portfolio
BMO Private Emerging Markets Equity Portfolio
BMO Private U.S. Special Equity Portfolio
(collectively the “Portfolios”)
____________________________________________________________________________________________________________
We have audited the accompanying financial statements of each of the Portfolios, which comprise the statements of financial
position as at December 31, 2017 and December 31, 2016 and the statements of comprehensive income, changes in net assets
attributable to holders of redeemable units and cash flows for the years ended December 31, 2017 and December 31, 2016, and the
related notes, which comprise a summary of significant accounting policies and other explanatory information.
Management’s responsibility for the financial statements
Management is responsible for the preparation and fair presentation of the financial statements of each of the Portfolios in
accordance with International Financial Reporting Standards, and for such internal control as management determines is
necessary to enable the preparation of financial statements that are free from material misstatement, whether due to fraud or
error.
Auditor’s responsibility
Our responsibility is to express an opinion on the financial statements of each of the Portfolios based on our audits. We conducted
our audits in accordance with Canadian generally accepted auditing standards. Those standards require that we comply with
ethical requirements and plan and perform the audit to obtain reasonable assurance about whether the financial statements are
free from material misstatement.
An audit involves performing procedures to obtain audit evidence about the amounts and disclosures in the financial statements.
The procedures selected depend on the auditor’s judgment, including the assessment of the risks of material misstatement of
the financial statements, whether due to fraud or error. In making those risk assessments, the auditor considers internal control
relevant to the entity’s preparation and fair presentation of the financial statements in order to design audit procedures that are
appropriate in the circumstances, but not for the purpose of expressing an opinion on the effectiveness of the entity’s internal
control. An audit also includes evaluating the appropriateness of accounting policies used and the reasonableness of accounting
estimates made by management, as well as evaluating the overall presentation of the financial statements.
We believe that the audit evidence we have obtained in each of our audits is sufficient and appropriate to provide a basis for our
audit opinion.

Independent Auditor’s Report
Opinion
In our opinion, the financial statements of each of the Portfolios present fairly, in all material respects, the financial position of
each of the Portfolios as at December 31, 2017 and December 31, 2016 and the financial performance and cash flows of each of the
Portfolios for the years ended December 31, 2017 and December 31, 2016 in accordance with International Financial Reporting
Standards.
Chartered Professional Accountants, Licensed Public
Accountants
Toronto, Ontario
March 23, 2018

BMO Private International Equity Portfolio
STATEMENT OF FINANCIAL POSITION(All amounts in thousands of Canadian dollars, except per unit data)
The accompanying notes are an integral part of these financial statements.
December 31 December 31As at 2017 2016
Assets
Current AssetsCash 113,818 108,154Investments
Non-derivative financial assets 2,332,257 1,574,123Derivative assets — 7
Receivable for investments sold — 313Subscriptions receivable 1,140 548Dividends receivable 2,632 1,756Total assets 2,449,847 1,684,901
Liabilities
Current LiabilitiesPayable for investments purchased — 4,239Redemptions payable 727 783Derivative liabilities — 2Distributions payable — 3Accrued expenses 3,628 3,596Total liabilities 4,355 8,623
Net assets attributable to holders of redeemable units 2,445,492 1,676,278
Net assets attributable to holders of redeemable units per unit $ 14.36 $ 12.57

BMO Private International Equity Portfolio
STATEMENT OF COMPREHENSIVE INCOME(All amounts in thousands of Canadian dollars, except per unit data)
The accompanying notes are an integral part of these financial statements.
December 31 December 31For the periods ended 2017 2016
IncomeInterest income 67 135Dividend income 60,283 43,065Other changes in fair value of investments and derivatives
Net realized gain (loss) 47,406 (5,020)Change in unrealized appreciation (depreciation) 209,981 (48,051)
Net gain (loss) in fair value of investments and derivatives 317,737 (9,871)
Securities lending (note 8) 555 189Foreign exchange loss (990) (538)
Total other loss (435) (349)
Total income (loss) 317,302 (10,220)
ExpensesSub-advisory fees 9,118 7,258Audit fees 19 20Independent review committee fees 8 6Withholding taxes 5,703 4,730Custodian fees 379 263Interest expense 10 1Legal and filing fees 100 77Unitholder servicing fees 549 529Printing and stationery fees 15 16Commissions and other portfolio transaction costs (note 6) 3,077 1,346Operating expenses absorbed by the Manager (3,191) (2,687)Total expenses 15,787 11,559
Increase (decrease) in net assets attributable to holders of redeemable units 301,515 (21,779)
Increase (decrease) in net assets attributable to holders of redeemable units per unit (note 8) 1.99 (0.17)

BMO Private International Equity Portfolio
STATEMENT OF CHANGES IN NET ASSETS ATTRIBUTABLE TO HOLDERS OF REDEEMABLE UNITS(All amounts in thousands of Canadian dollars)
The accompanying notes are an integral part of these financial statements.
December 31 December 31For the periods ended 2017 2016
Net assets attributable to holders of redeemable units at beginning of period 1,676,278 1,525,073
Increase (decrease) in net assets attributable to holders of redeemable units 301,515 (21,779)
Distributions to holders of redeemable unitsFrom net investment income (60,361) (36,706)Return of capital (302) (182)Total distributions paid to holders of redeemable units (60,663) (36,888)
Redeemable unit transactionsProceeds from redeemable units issued 691,128 477,157Reinvestments of distributions to holders of redeemable units 58,369 35,502Redemption of redeemable units (221,135) (302,787)Net increase from redeemable unit transactions 528,362 209,872
Net increase in net assets attributable to holders of redeemable units 769,214 151,205
Net assets attributable to holders of redeemable units at end of period 2,445,492 1,676,278

BMO Private International Equity Portfolio
STATEMENT OF CASH FLOWS(All amounts in thousands of Canadian dollars)
The accompanying notes are an integral part of these financial statements.
December 31 December 31For the periods ended 2017 2016
Cash flows from operating activitiesIncrease (decrease) in net assets attributable to holders of redeemable units 301,515 (21,779)Adjustments for:
Foreign exchange loss on cash 1,019 227Net realized (gain) loss on sale of investments and derivatives (47,406) 5,020Change in unrealized (appreciation) depreciation of investments and
derivatives (209,981) 48,051Increase in dividends receivable (876) (150)Increase in accrued expenses 32 1,588Return of capital dividend received 476 1,358Non-cash dividends (2,118) (519)Purchases of investments (1,045,735) (629,168)Proceeds from sale and maturity of investments 542,709 450,543Cash inflows on derivatives — 345
Net cash from operating activities (460,365) (144,484)
Cash flows from financing activitiesDistributions paid to holders of redeemable units, net of reinvested distributions (2,297) (1,388)Proceeds from issuances of redeemable units 690,536 477,495Amounts paid on redemption of redeemable units (221,191) (302,769)
Net cash from financing activities 467,048 173,338
Foreign exchange loss on cash (1,019) (227)Net increase in cash 6,683 28,854Cash at beginning of period 108,154 79,527
Cash at end of period 113,818 108,154
Supplementary InformationInterest received, net of withholding taxes* 67 135Dividends received, net of withholding taxes* 52,118 39,026Interest expense paid* 10 1*These items are from operating activities

BMO Private International Equity Portfolio
SCHEDULE OF INVESTMENT PORTFOLIOAs at December 31, 2017 (All amounts in thousands of Canadian dollars, unless otherwise noted)
SecurityNumber of
Shares or UnitsCost+*
($)Fair Value
($)
EQUITIESAustralia — 7.5%Brambles Industries Limited 1,835,993 16,324 18,092Computershare Limited 858,412 9,352 13,714CSL Limited 275,933 27,455 38,175Evolution Mining Limited 3,112,958 7,791 8,069Fortescue Metals Group Ltd. 3,423,513 16,408 16,352Newcrest Mining Limited 322,504 5,100 7,203Qantas Airways Limited 2,780,142 15,423 13,719QBE Insurance Group Limited 1,058,168 12,893 11,069Rio Tinto Limited 106,851 6,173 7,927St Barbara Limited 1,168,261 4,185 4,365Woodside Petroleum Ltd. 868,186 27,803 28,206Woolworths Limited 654,722 17,146 17,517
166,053 184,408Belgium — 0.4%bpost SA/NV 33,093 1,170 1,266Proximus SADP 201,945 7,466 8,332
8,636 9,598Brazil — 0.8%Raia Drogasil S.A. 539,200 15,676 18,701
15,676 18,701Canada — 2.0%Canadian Pacific Railway Limited 135,842 28,181 31,198Dollarama Inc. 106,051 16,897 16,655
45,078 47,853China — 1.4%CNOOC Limited 3,597,400 6,019 6,501Tencent Holdings Limited 408,900 10,572 26,570
16,591 33,071Denmark — 3.7%Chr. Hansen Holding A/S 204,278 13,824 24,083Coloplast A/S, Class B 123,103 11,568 12,270Danske Bank A/S 136,416 6,246 6,666Novo Nordisk A/S, Class B 316,466 19,317 21,380Novozymes A/S, B Shares 313,658 18,583 22,524Vestas Wind Systems A/S 45,988 4,442 3,962
73,980 90,885Egypt — 0.1%Centamin plc 825,179 2,082 2,213
2,082 2,213Finland — 1.4%KONE Oyj, B Shares 100,317 4,410 6,767Sampo Oyj, Class A 101,408 6,254 7,003UPM-Kymmene Corporation 524,985 14,304 20,475
24,968 34,245

BMO Private International Equity Portfolio
SCHEDULE OF INVESTMENT PORTFOLIO (cont’d)As at December 31, 2017 (All amounts in thousands of Canadian dollars, unless otherwise noted)
SecurityNumber of
Shares or UnitsCost+*
($)Fair Value
($)
France — 9.0%Arkema S.A. 65,761 7,500 10,045Bouygues S.A. 35,258 2,033 2,302Bureau Veritas S.A. 242,723 6,765 8,342Capgemini SE 16,477 1,902 2,451CNP Assurances S.A. 165,894 3,840 4,812Credit Agricole S.A. 394,929 7,293 8,201Eiffage S.A. 22,725 2,113 3,130Essilor International S.A. 109,737 18,268 19,021Hermes International 27,201 13,254 18,302L'Air Liquide S.A. 82,126 9,122 12,983Legrand S.A. 96,589 5,354 9,334LVMH Moet Hennessy Louis Vuitton S.A. 75,082 16,410 27,724Peugeot S.A. 691,713 16,077 17,663Rubis SCA 78,836 2,906 7,006Sanofi 261,750 30,354 28,330Societe Generale SA 177,608 10,689 11,510Total S.A. 183,411 11,777 12,720Valeo S.A. 58,078 4,164 5,440Vinci S.A. 92,312 8,634 11,839
178,455 221,155Germany — 5.1%adidas AG 66,223 14,198 16,617Allianz SE 80,914 19,207 23,292Bayer AG 37,742 5,685 5,901Brenntag AG 150,805 9,512 11,958Continental AG 6,632 1,827 2,251Deutsche Lufthansa AG 57,123 2,272 2,639Deutsche Post AG 168,035 5,769 10,034Fresenius AG 141,275 12,516 13,826Fresenius Medical Care AG & Co. KGaA 16,691 1,860 2,210Fuchs Petrolub SE, Preference 186,922 8,596 12,426GEA Group Aktiengesellschaft 123,920 6,265 7,469Merck KGaA 31,744 4,588 4,297SAP SE 76,417 6,131 10,771Talanx Aktiengesellschaft 41,062 1,785 2,105
100,211 125,796Hong Kong — 4.5%AIA Group Limited 3,377,600 30,234 36,207BOC Hong Kong (Holdings) Limited 1,660,500 10,057 10,557China Mobile Limited 870,000 11,301 11,070CK Asset Holdings Limited 1,597,500 17,277 17,552Galaxy Entertainment Group Limited 386,000 3,991 3,880Hang Seng Bank Limited 340,200 10,251 10,603Power Assets Holdings Limited 590,000 5,864 6,259Seaspan Corp. 118,074 1,713 1,002Sun Hung Kai Properties Limited 95,000 1,955 1,989VTech Holdings Limited 345,500 4,824 5,691WH Group Limited 1,595,500 2,072 2,261
BMO Private International Equity Portfolio
SCHEDULE OF INVESTMENT PORTFOLIO (cont’d)As at December 31, 2017 (All amounts in thousands of Canadian dollars, unless otherwise noted)
SecurityNumber of
Shares or UnitsCost+*
($)Fair Value
($)
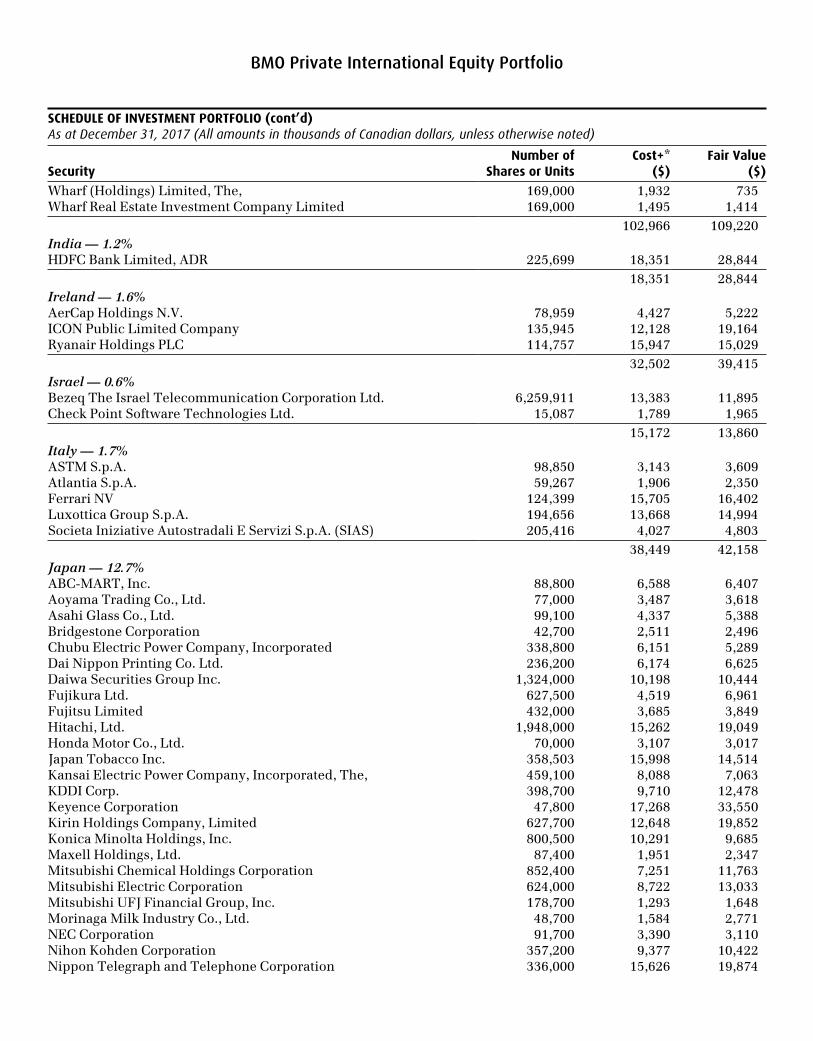
Wharf (Holdings) Limited, The, 169,000 1,932 735Wharf Real Estate Investment Company Limited 169,000 1,495 1,414
102,966 109,220India — 1.2%HDFC Bank Limited, ADR 225,699 18,351 28,844
18,351 28,844Ireland — 1.6%AerCap Holdings N.V. 78,959 4,427 5,222ICON Public Limited Company 135,945 12,128 19,164Ryanair Holdings PLC 114,757 15,947 15,029
32,502 39,415Israel — 0.6%Bezeq The Israel Telecommunication Corporation Ltd. 6,259,911 13,383 11,895Check Point Software Technologies Ltd. 15,087 1,789 1,965
15,172 13,860Italy — 1.7%ASTM S.p.A. 98,850 3,143 3,609Atlantia S.p.A. 59,267 1,906 2,350Ferrari NV 124,399 15,705 16,402Luxottica Group S.p.A. 194,656 13,668 14,994Societa Iniziative Autostradali E Servizi S.p.A. (SIAS) 205,416 4,027 4,803
38,449 42,158Japan — 12.7%ABC-MART, Inc. 88,800 6,588 6,407Aoyama Trading Co., Ltd. 77,000 3,487 3,618Asahi Glass Co., Ltd. 99,100 4,337 5,388Bridgestone Corporation 42,700 2,511 2,496Chubu Electric Power Company, Incorporated 338,800 6,151 5,289Dai Nippon Printing Co. Ltd. 236,200 6,174 6,625Daiwa Securities Group Inc. 1,324,000 10,198 10,444Fujikura Ltd. 627,500 4,519 6,961Fujitsu Limited 432,000 3,685 3,849Hitachi, Ltd. 1,948,000 15,262 19,049Honda Motor Co., Ltd. 70,000 3,107 3,017Japan Tobacco Inc. 358,503 15,998 14,514Kansai Electric Power Company, Incorporated, The, 459,100 8,088 7,063KDDI Corp. 398,700 9,710 12,478Keyence Corporation 47,800 17,268 33,550Kirin Holdings Company, Limited 627,700 12,648 19,852Konica Minolta Holdings, Inc. 800,500 10,291 9,685Maxell Holdings, Ltd. 87,400 1,951 2,347Mitsubishi Chemical Holdings Corporation 852,400 7,251 11,763Mitsubishi Electric Corporation 624,000 8,722 13,033Mitsubishi UFJ Financial Group, Inc. 178,700 1,293 1,648Morinaga Milk Industry Co., Ltd. 48,700 1,584 2,771NEC Corporation 91,700 3,390 3,110Nihon Kohden Corporation 357,200 9,377 10,422Nippon Telegraph and Telephone Corporation 336,000 15,626 19,874

BMO Private International Equity Portfolio
SCHEDULE OF INVESTMENT PORTFOLIO (cont’d)As at December 31, 2017 (All amounts in thousands of Canadian dollars, unless otherwise noted)
SecurityNumber of
Shares or UnitsCost+*
($)Fair Value
($)
Nishimatsu Construction Co., Ltd. 218,700 8,176 7,712Nissan Motor Co., Ltd. 89,300 1,131 1,119Nisshinbo Holdings Inc. 359,700 4,809 6,120NTT DoCoMo, Inc. 97,600 2,528 2,898ORIX Corporation 651,600 14,519 13,849Sumitomo Electric Industries, Ltd. 94,600 2,002 2,007Sumitomo Rubber Industries, Ltd. 447,300 7,414 10,446Sysmex Corporation 173,700 13,141 17,193Toho Holdings Co., Ltd. 50,200 1,406 1,427Toppan Printing Co., Ltd. 481,000 5,362 5,463Toyota Tsusho Corporation 160,300 4,856 8,098
254,560 311,585Luxembourg — 0.2%Ternium S.A., ADR 109,905 3,108 4,364
3,108 4,364Macau — 0.4%Sands China Ltd. 1,336,400 9,007 8,646
9,007 8,646Malaysia — 1.0%Axiata Group Berhad 7,122,239 12,966 12,118Malayan Banking Berhad 3,972,569 11,533 12,081
24,499 24,199Mexico — 0.8%Wal-Mart de Mexico S.A.B. de C.V., Series V 6,283,800 18,497 19,371
18,497 19,371Netherlands — 2.1%Core Laboratories N.V. 137,212 20,154 18,894Koninklijke Ahold Delhaize N.V. 72,347 2,041 1,996Koninklijke Vopak NV 194,643 11,335 10,732Royal Dutch Shell plc, B Shares 210,675 7,738 8,932Royal Dutch Shell plc, Class A 281,592 9,500 11,804
50,768 52,358New Zealand — 0.1%Air New Zealand Limited 635,534 1,654 1,799
1,654 1,799Norway — 0.8%Marine Harvest ASA 85,395 1,874 1,817SalMar ASA 94,545 2,608 3,551Telenor ASA 565,802 12,404 15,235
16,886 20,603Russia — 0.9%Yandex N.V. 525,530 12,150 21,634
12,150 21,634Singapore — 2.2%ComfortDelGro Corporation Limited 6,028,300 12,684 11,205DBS Group Holdings Limited 209,500 3,786 4,876Mapletree Industrial Trust 1,216,100 2,107 2,322

BMO Private International Equity Portfolio
SCHEDULE OF INVESTMENT PORTFOLIO (cont’d)As at December 31, 2017 (All amounts in thousands of Canadian dollars, unless otherwise noted)
SecurityNumber of
Shares or UnitsCost+*
($)Fair Value
($)
Oversea-Chinese Banking Corporation Limited 205,700 1,819 2,389Sembcorp Industries Ltd 2,261,864 7,619 6,429Singapore Airlines Ltd. 242,200 2,583 2,425Singapore Airport Terminal Services Limited 679,600 3,175 3,316Singapore Technologies Engineering Ltd. 2,849,200 8,861 8,716United Overseas Bank Limited 452,872 8,601 11,229
51,235 52,907Spain — 0.9%Banco Bilbao Vizcaya Argentaria, S.A. 317,507 2,770 3,397Grupo Empresarial Ence, S.A. 720,700 3,965 5,967Industria de Diseno Textil, S.A. 215,030 9,222 9,401Repsol S.A. 144,157 2,707 3,203Repsol S.A., Rights, January 5, 2018 144,157 74 82
18,738 22,050Sweden — 3.2%Assa Abloy AB, B Shares 228,724 4,274 5,966Atlas Copco AB, A Shares 720,298 30,036 38,996Essity Aktiebolag 387,956 11,356 13,810Nordea Bank AB 975,033 14,310 14,833Skandinaviska Enskilda Banken AB, A Shares 239,201 3,674 3,522
63,650 77,127Switzerland — 10.3%Chubb Limited 172,257 25,476 31,642Givaudan SA 1,891 2,512 5,483Lonza Group Ltd. 7,903 1,722 2,684Nestle S.A. 522,150 46,968 56,401Novartis AG 262,615 26,268 27,908Panalpina World Transport (Holding) Ltd. 35,113 4,526 6,843Roche Holding AG 149,289 46,292 47,466Schindler Holding Ltd. 18,543 2,959 5,364SGS S.A. 1,697 4,589 5,560Sika AG 1,698 16,561 16,919Swiss Re AG 32,620 3,578 3,838TE Connectivity Limited 110,590 9,262 13,212Wizz Air Holdings Plc 218,964 10,272 13,615Zurich Insurance Group AG 37,758 12,104 14,434
213,089 251,369Taiwan — 2.4%Advantech Co., Ltd. 647,482 6,062 5,752Chunghwa Telecom Co., Ltd. 2,346,000 10,899 10,501Merida Industry Co., Ltd. 519,000 3,128 2,734Taiwan Semiconductor Manufacturing Company, Ltd. 1,106,000 10,103 10,683Taiwan Semiconductor Manufacturing Company, Ltd., ADR 570,491 18,007 28,433
48,199 58,103United Kingdom — 13.9%Admiral Group plc 111,597 3,889 3,783Berkeley Group Holdings PLC, The, 127,660 7,550 9,087BP p.l.c. 869,003 7,010 7,704

BMO Private International Equity Portfolio
SCHEDULE OF INVESTMENT PORTFOLIO (cont’d)As at December 31, 2017 (All amounts in thousands of Canadian dollars, unless otherwise noted)
SecurityNumber of
Shares or UnitsCost+*
($)Fair Value
($)
British American Tobacco p.l.c. 185,365 13,490 15,726Compass Group PLC 1,197,968 29,300 32,561Experian plc 1,022,566 23,174 28,248Fiat Chrysler Automobiles N.V. 413,271 6,152 9,263GlaxoSmithKline plc 1,357,672 37,436 30,186Imperial Brands PLC 430,741 26,673 23,138Jupiter Fund Management plc 247,176 1,996 2,635Legal & General Group Plc 6,801,738 27,397 31,472National Grid PLC 1,107,215 19,573 16,349Paragon Group of Companies PLC, The, 260,473 1,902 2,162Persimmon PLC 169,653 7,455 7,875QinetiQ Group plc 846,575 4,138 3,311Reckitt Benckiser Group plc 250,784 29,676 29,447RELX NV 328,924 4,659 9,505RELX PLC 438,755 10,336 12,921Rio Tinto plc 96,208 4,460 6,383Royal Mail PLC 716,776 6,218 5,506SSE plc 446,997 10,949 10,010Unilever N.V. 189,178 10,338 13,360Unilever PLC 64,108 3,996 4,464United Utilities Group PLC 784,363 11,715 11,035Vodafone Group Public Limited Company 3,548,177 13,599 14,090WH Smith PLC 68,487 1,969 2,725
325,050 342,946United States — 2.5%Accenture plc, Class A 168,604 25,625 32,445Aptiv PLC 130,653 11,688 13,932Delphi Technologies PLC 43,550 2,268 2,872Seagate Technology Public Limited Company 238,155 10,387 12,525
49,968 61,774
Total Investment Portfolio — 95.4% 2,000,228 2,332,257
Other Assets Less Liabilities — 4.6% 113,235
NET ASSETS ATTRIBUTABLE TO HOLDERS OF REDEEMABLE UNITS — 100.0% 2,445,492
+ Where applicable, distributions received from holdings as a return of capital are used to reduce the adjusted cost base of the securities in the portfolio* For the purpose of the Schedule of Investment Portfolio, cost includes commissions and other portfolio transaction costs (note 2).

NOTES TO FINANCIAL STATEMENTS(All amounts in thousands of Canadian dollars, except per unit data)December 31, 2017
BMO Private International Equity Portfolio
1. The PortfolioBMO Private International Equity Portfolio (“the Portfolio”) is an open-ended mutual fund trust established by a Declaration of Trust under the laws of the Province of Ontario, most recently amended on July 8, 2016. BMO Private Investment Counsel Inc. (“the Manager”) is the Manager of the Portfolio. The address of the Portfolio’s registered office is 1 First Canadian Place, 41st Floor, Toronto, Ontario, M5X 1A1.
The Statement of Financial Position and related notes of each of the Portfolios are as at December 31, 2017 and December 31, 2016. The Statement of Comprehensive Income, Statement of Changes in Net Assets Attributable to Holders of Redeemable Units, Statement of Cash Flows and related notes are for the periods ended December 31, 2017 and December 31, 2016.
These financial statements were authorized for issuance by the Board of Directors of the Manager on March 8, 2018.
2. Basis of preparation and presentationThese audited financial statements have been prepared in accordance with International Financial Reporting Standards (“IFRS”), as issued by the International Accounting Standards Board (“IASB”).
3. Summary of significant accounting policiesFinancial instrumentsThe Portfolio records financial instruments at fair value. Investment transactions are accounted for on the trade date. The Portfolio’s investments are either designated at fair value through profit or loss (“FVTPL”) at inception or classified as held for trading. The changes in the investment fair values and related transaction costs are recorded in the Portfolio’s Statement of Comprehensive Income.
Financial assets and financial liabilities held for trading are those acquired or incurred principally for the purpose of selling or repurchasing in the near future, or on initial recognition, are part of a portfolio of identified financial instruments that the Portfolio manages together and that have a recent actual pattern of short-term profit taking. The Portfolio classifies all derivatives and short positions as held for trading. The Portfolio does not designate any derivatives as hedges in a hedging relationship.
The Portfolio designates all other investments at FVTPL, as they have reliably measurable fair values and are part of a group of financial assets or financial liabilities that are managed and have their performance
evaluated on a fair value basis in accordance with the Portfolio’s investment strategy.
The Portfolio’s outstanding redeemable units, which are puttable instruments, are entitled to a contractual obligation of annual distribution of any net income and net realized capital gains by the Portfolio. This annual distribution can be in cash at the option of the unitholders, and therefore the ongoing redemption feature is not the redeemable units’ only contractual obligation. Consequently, the units of the Portfolio do not meet the conditions to be classified as equity and therefore are classified as financial liabilities and presented at the redemption amounts.
All other financial assets and financial liabilities are measured at amortized cost. Under this method, financial assets and financial liabilities reflect the amount required to be received, paid or discounted, when appropriate, at the contract’s effective interest rate.
The Manager has determined that the Portfolio meets the definition of “investment entity” and as a result, the Portfolio measures subsidiaries, if any, at FVTPL.
Cost of investmentsThe cost of investments represents the amount paid for each security and is determined on an average cost basis.
Fair value measurementInvestments are recorded at their fair value with the change between this amount and their average cost being recorded as “Change in unrealized appreciation (depreciation)” in the Statement of Comprehensive Income.
For exchange-traded securities, close prices are considered to be fair value if they fall within the bid-ask spread. In circumstances where the close price is not within the bid-ask spread, the Manager determines the point within the bid-ask spread that is most representative of fair value based on the specific facts and circumstances.
Procedures are in place to fair value securities traded in countries outside of North America daily, to avoid stale prices and to take into account among other things, any significant events occurring after the close of a foreign market.
For bonds, debentures, asset-backed securities and other debt securities, fair value is represented by bid prices provided by independent security pricing

NOTES TO FINANCIAL STATEMENTS (cont’d)(All amounts in thousands of Canadian dollars, except per unit data)December 31, 2017
BMO Private International Equity Portfolio
services. Short-term investments, if any, are held at amortized cost which approximates fair value.
Unlisted warrants, if any, are valued based on a pricing model which considers factors such as the market value of the underlying security, strike price and terms of the warrant.
Mutual fund units held as investments are valued at their respective Net Asset Value (“NAV”) on each Valuation Date (the “Valuation Date” is each day on which the Toronto Stock Exchange is open for trading), as these values are the most readily and regularly available.
For securities where market quotes are not available, unreliable or not considered to reflect the current value, the Manager may determine another value which it considers to be fair and reasonable, or use a valuation technique that, to the extent possible, makes maximum use of inputs and assumptions based on observable market data including volatility, comparable companies, NAV (for exchange-traded funds) and other applicable rates or prices. These estimation techniques include discounted cash flows, internal models that utilize observable data or comparisons with other securities that are substantially similar. In limited circumstances, the Manager may use internal models where the inputs are not based on observable market data.
Derivative instrumentsDerivative instruments are financial contracts that derive their value from changes in underlying interest rates, foreign exchange rates or other financial or commodity prices or indices.
Derivative instruments are either regulated exchange-traded contracts or negotiated over-the-counter contracts. The Portfolio may use these instruments for trading purposes, as well as to manage the Portfolio’s risk exposures.
Derivatives are measured at fair value. Realized gains and losses are included in “Net realized gain (loss)” in the Statement of Comprehensive Income and unrealized gains and losses are included in “Change in unrealized appreciation (depreciation)” in the Statement of Comprehensive Income.
Forward currency contractsA forward currency contract is an agreement between two parties (the Portfolio and the counterparty) to purchase or sell a currency against another currency at
a set price on a future date. The Portfolio may enter into forward currency contracts for hedging purposes, which can include the economic hedging of all or a portion of the currency exposure of an investment or group of investments, either directly or indirectly. The Portfolio may also enter into these contracts for non-hedging purposes, which can include increasing the exposure to a foreign currency, or shifting the exposure to foreign currency fluctuations from one country to another. The value of forward currency contracts entered into by the Portfolio is recorded as the difference between the value of the contract on the Valuation Date and the value on the date the contract originated.
Income recognitionDividend income and distribution from investment trusts are recognized on the ex-dividend and ex-distribution date, respectively.
Interest income from interest bearing investments is recognized in the Statement of Comprehensive Income using the effective interest rate. Interest receivable shown in the Statement of Financial Position is accrued based on the interest bearing investments’ stated rates of interest.
Interest on inflation-indexed bonds is paid based on a principal value, which is adjusted for inflation. The inflation adjustment of the principal value is recognized as part of interest income in the Statement of Comprehensive Income. If held to maturity, the Portfolio will receive, in addition to a coupon interest payment, a final payment equal to the sum of the par value and the inflation compensation accrued from the original issue date. Interest is accrued on each Valuation Date based on the inflation adjusted par value at that time and is included in “Interest income” in the Statement of Comprehensive Income.
Foreign currency translationThe fair value of investments and other assets and liabilities in foreign currencies are translated into the Portfolio’s functional currency at the rates of exchange prevailing at the period-end date. Purchases and sales of investments, and income and expenses are translated at the rates of exchange prevailing on the respective dates of such transactions. Foreign exchange gains (losses) on completed transactions are included in “Net realized gain (loss)”in the Statement of Comprehensive Income and unrealized foreign exchange gains (losses) are included in “Change in unrealized appreciation (depreciation)” in the Statement of Comprehensive Income. Foreign exchange gains (losses) relating

NOTES TO FINANCIAL STATEMENTS (cont’d)(All amounts in thousands of Canadian dollars, except per unit data)December 31, 2017
BMO Private International Equity Portfolio
to cash, receivables and payables are included in "Foreign exchange gain (loss)" in the Statement of Comprehensive Income.
Securities lendingA Portfolio may engage in securities lending pursuant to the terms of an agreement with BNY Mellon (the “security lending agent”). The aggregate market value of all securities loaned by the Portfolio cannot exceed 50% of the NAV of the Portfolio. The Portfolio will receive collateral of at least 102% of the value of securities on loan. Collateral will generally be comprised of obligations of or guarantee by the Government of Canada or a province thereof, or by the United States government or its agencies, but it may include obligations of other governments with appropriate credit ratings. Further, the program entered into provides for 100% indemnification by the securities lending agent and parties related to the Portfolio’s custodian, to the Portfolio for the defaults by borrowers.
For those Portfolios participating in the program, aggregate values of securities on loan and the collateral held as at December 31, 2017 and December 31, 2016 are disclosed in Note 8(f).
Income from securities lending, where applicable, is included in the Statement of Comprehensive Income and is recognized when earned. The breakdown of the securities lending income is disclosed in Note 8(f), where applicable.
Short-term trading penaltyTo discourage excessive trading, the Portfolio may, at the Manager’s sole discretion, charge a short-term trading penalty. This penalty is paid directly to the Portfolio and is included in “Short-term trading penalty fees” in the Statement of Comprehensive Income.
CashCash is comprised of cash and deposits with banks which include bankers’ acceptances and overnight demand deposits. Cash is recorded at fair value. The carrying amount of cash approximates its fair value because it is short-term in nature.
Other assets and other liabilitiesReceivable for investments sold, dividends receivable, distribution receivable from investment trusts, and subscriptions receivable are initially recorded at fair value and subsequently measured at amortized cost. Similarly, payable for investments purchased,
redemptions payable, distributions payable and accrued expenses are measured at amortized cost. Other assets and liabilities are short-term in nature, and are carried at cost or amortized cost.
Increase or decrease in net assets attributable to holders of redeemable units“Increase (decrease) in net assets attributable to holders of redeemable units” in the Statement of Comprehensive Income represents the increase (decrease) in net assets attributable to holders of redeemable units (“Net Assets”) divided by the weighted average number of units outstanding during the period.
TaxationThe Portfolio qualifies as a unit trust under the provisions of the Income Tax Act (Canada). Distributions of all net taxable income and sufficient amounts of net realized capital gains for each taxation year will be paid to unitholders so that the Portfolio will not be subject to income tax. As a result, the Portfolio has determined that it is in substance not taxable and therefore does not record income taxes in the Statement of Comprehensive Income nor does it recognize any deferred tax assets or liabilities in the Statement of Financial Position.
The Portfolio may incur withholding taxes imposed by certain countries on investment income and capital gains. Such income and capital gains are recorded on a gross basis with the related withholding taxes shown as a separate expense in the Statement of Comprehensive Income.
Investments in subsidiaries, joint ventures and associatesSubsidiaries are entities over which the Portfolio has control through its exposure or rights to variable returns from its investment and has the ability to affect those returns through its power over the entity. The Manager has determined that the Portfolio is an investment entity and as such, it accounts for subsidiaries, if any, at fair value. Joint ventures are those where the Portfolio exercises joint control through an agreement with other shareholders, and associates are investments in which the Portfolio exerts significant influence over operating, investing, and financing decisions (such as entities in which the Portfolio owns 20% - 50% of voting shares), all of which, if any, have been designated at FVTPL.
Unconsolidated structured entitiesDuring the periods, the Portfolio had no sponsored unconsolidated structured entities. The Manager has

NOTES TO FINANCIAL STATEMENTS (cont’d)(All amounts in thousands of Canadian dollars, except per unit data)December 31, 2017
BMO Private International Equity Portfolio
determined that the underlying funds in which the Portfolio may invest are unconsolidated structured entities. This determination is based on the fact that decision making about the underlying funds is not governed by the voting right or other similar right held by the Portfolio. Similarly, investments in securitizations, asset-backed securities and mortgage-backed securities are determined to be interests in unconsolidated structured entities.
The Portfolio may invest in underlying funds whose investment objectives range from achieving short-term to long-term income and capital growth potential. Underlying funds may use leverage in a manner consistent with their respective investment objectives and as permitted by Canadian securities regulatory authorities. Underlying funds finance their operations by issuing redeemable units which are puttable at the holders’ option and entitles the holder to a proportionate stake in the respective fund’s Net Assets. The change in fair value of each of the underlying funds during the periods is included in “Change in unrealized appreciation (depreciation)” in the Statement of Comprehensive Income.
Mortgage-related securities are created from pools of residential or commercial mortgage loans, including mortgage loans made by savings and loan institutions, mortgage bankers, commercial banks and others. Asset-backed securities created from many types of assets, including auto loans, credit card receivables, home equity loans, and student loans.
The Portfolio does not provide and has not committed to providing any additional significant financial or other support to the unconsolidated structured entities other than its investment in the unconsolidated structured entities.
Additional information on the Portfolio’s interest in unconsolidated structured entities, where applicable, is provided in Note 8(i).
Offsetting of financial assets and financial liabilitiesFinancial instruments are presented at net or gross amounts on the Statement of Financial Position depending on the existence of intention and legal right to offset opposite positions of such instruments held with the same counterparties. Amounts offset in the Statement of Financial Position are transactions for which the Portfolio has legally enforceable rights to offset and intends to settle the positions on a net basis. Amounts not offset in the Statement of Financial
Position relate to transactions where a master netting arrangement or similar agreement is in place with a right to offset only in the event of default, insolvency or bankruptcy, or where the Portfolio has no intention of settling on a net basis. There were no master netting agreements during the periods.
Accounting standards issued but not yet adoptedIn July 2014, the IASB issued the final version of IFRS 9 Financial Instruments, which addresses classification and measurement, impairment and hedge accounting.
The new standard requires assets to be carried at amortized cost, FVTPL or fair value through other comprehensive income based on the entity’s business model for managing financial assets and the contractual cash flow characteristics of the financial asset. The classification and measurement of liabilities remains generally unchanged with the exception of liabilities recorded at FVTPL. For these liabilities, fair value changes attributable to changes in the entity’s own credit risk are to be presented in other comprehensive income unless they affect amounts recorded in income.
The new standard is effective for the Portfolio for its fiscal year beginning January 1, 2018. The Portfolio’s financial assets and financial liabilities are managed, and the performance of the Portfolio is evaluated on a fair value basis. Accordingly, the Manager has reached the preliminary conclusion that Fair Value Through Profit and Loss (FVTPL) in accordance with IFRS 9 provides the most appropriate measurement and presentation of the Portfolio’s financial assets and financial liabilities, which aligns with its current measurement and presentation, with little or no modification. Therefore, the Manager does not anticipate changes from the Portfolio’s current measurement of its financial assets and financial liabilities at FVTPL. There will be no significant impact on the Portfolio’s financial statements.
The Manager will continue to evaluate any further industry and or regulatory updates with respect to the implementation of this new standard.
4. Critical accounting judgements and estimatesThe preparation of financial statements requires the use of judgement in applying the Portfolio’s accounting policies and to make estimates and assumptions about the future. The following discusses the most significant accounting judgements and estimates that the Portfolio has made in preparing its financial statements:

NOTES TO FINANCIAL STATEMENTS (cont’d)(All amounts in thousands of Canadian dollars, except per unit data)December 31, 2017
BMO Private International Equity Portfolio
Accounting judgements:Functional and presentation currencyThe Portfolio’s unitholders are mainly Canadian residents, with the subscriptions and redemptions of the redeemable units denominated in Canadian dollars. The Portfolio invests in Canadian and U.S. dollars and other foreign denominated securities, as applicable. The performance of the Portfolio is measured and reported to the investors in Canadian dollars. The Manager considers the Canadian dollar as the currency that most faithfully represents the economic effects of the underlying transactions, events and conditions. The financial statements are presented in Canadian dollars, which is the Portfolio's functional and presentation currency.
Classification and measurement of financial instruments and application of fair value optionIn classifying and measuring financial instruments held by the Portfolio, the Manager is required to make significant judgements about whether or not the business of the Portfolio is to invest on a total return basis for the purpose of applying the fair value options for financial assets.
Accounting estimates:Fair value measurement of securities not quoted in an active marketThe Portfolio has established policies and control procedures that are intended to ensure these estimates are well controlled, independently reviewed, and consistently applied from period to period. The estimates of the value of the Portfolio’s assets and liabilities are believed to be appropriate as at the reporting date.
The Portfolio may hold financial instruments that are not quoted in active markets. Note 3 discusses the policies used by the Portfolio for the estimates used in determining fair value.
5. Units and unit transactionsThe redeemable units of the Portfolio are classified as liabilities.
The units have no par value and are entitled to distributions, if any. Upon redemption, a unit is entitled to a proportionate share of the Portfolio’s NAV. The Portfolio is required to pay distributions in an amount not less than the amount necessary to ensure the Portfolio will not be liable for income taxes on realized capital gains, dividends and interest. The Portfolio has no restrictions or specific capital requirements
on the subscriptions and redemptions of units except as disclosed in Note 8(a). The relevant movements in redeemable units are shown on the Statement of Changes in Net Assets Attributable to Holders of Redeemable Units. In accordance with its investment objectives and strategies, and the risk management practices outlined in Note 7, the Portfolio endeavours to invest the subscriptions received in appropriate investments, while maintaining sufficient liquidity to meet redemptions, with such liquidity being augmented by short-term borrowings or disposal of investments where necessary.
Redeemable units of the Portfolio are offered for sale on a continuous basis and may be purchased or redeemed on any Valuation Date at the NAV per unit. The NAV per unit for the purposes of subscription or redemption is computed by dividing the NAV of the Portfolio (that is, the total fair value of the assets less the liabilities) by the total number of units of the Portfolio outstanding at such time on each Valuation Date, in accordance with Part 14 of National Instruments (“NI”) 81-106 Investment Fund Continuous Disclosure for the purpose of unitholder transactions. Net Assets are determined in accordance with IFRS and may differ to the Portfolio’s NAV. Where the Portfolio’s NAV is not equal to its Net Assets, a reconciliation is shown in Note 8.
6. Related party transactions(a) Management FeesThe Manager is responsible for the day-to-day management of the Portfolio, including managing or arranging for the management of the Portfolio’s investment portfolio as well as providing and arranging for the provision of administrative services to the Portfolio such as valuation services, fund accounting and unitholder records. The Manager does not receive a fee from the Portfolio for its services. Instead, unitholders pay an investment management fee directly to BMO Trust Company and the Manager as arranged between the unitholder, BMO Trust Company and the Manager.
(b) Unitholder servicing, sub-advisory commissions and other portfolio transaction costsThe Portfolio is provided with certain facilities and services by affiliates of the Manager. Expenses incurred in the administration of the Portfolio were paid to BMO Trust Company (“the Trustee”) and to BMO Asset Management Inc. (“the Registrar”) and charged to the Portfolio. These expenses are included in “Unitholder

NOTES TO FINANCIAL STATEMENTS (cont’d)(All amounts in thousands of Canadian dollars, except per unit data)December 31, 2017
BMO Private International Equity Portfolio
servicing fees” in the Statement of Comprehensive Income.
The sub-advisors (including affiliates of the Manager, where applicable) engaged by the Manager provide investment advice and make investment decisions for the Portfolio’s investment portfolio. For these services the sub-advisors receive sub-advisory fees. These fees are paid monthly by the Manager on behalf of the Portfolio. These expenses are included in “Sub-advisory fees” in the Statement of Comprehensive Income. Any sub-advisory fees less than or equal to 0.15% of the NAV of the Portfolio are absorbed by the Manager.
(c) Portfolio expensesThe Portfolio also pays certain operating expenses directly, including compensation and expenses payable to Independent Review Committee (“IRC”) members and any independent counsel or other advisors employed by the IRC, the costs of the orientation and continuing education of IRC members and the costs and expenses associated with IRC meetings.
(d) Commissions and other portfolio transaction costsThe Portfolio may execute trades with and through BMO Nesbitt Burns Inc., an affiliate of the Manager based on established standard brokerage agreements at market prices. These fees are included in “Commissions and other portfolio transaction costs” in the Statement of Comprehensive Income. Refer to Note 8 for related party fees charged to the Portfolio during the periods ended December 31, 2017 and December 31, 2016.
(e) Other related party transactionsFrom time to time, the Manager may on behalf of the Portfolio, enter into transactions or arrangements with or involving subsidiaries and affiliates of Bank of Montreal, or certain other persons or companies that are related or connected to the Manager of the Portfolio. These transactions or arrangements may include transactions or arrangements with or involving subsidiaries and affiliates of Bank of Montreal, BMO Asset Management Inc., BMO Trust Company, BMO Nesbitt Burns Inc., BMO InvestorLine Inc., BMO Private Investment Counsel Inc., BMO Asset Management Corp., Pyrford International Limited, or other investment funds offered by Bank of Montreal, and may involve the purchase or sale of portfolio securities through or from a subsidiary or affiliates of Bank of Montreal, the purchase or sale of securities issued or guaranteed by a subsidiary or affiliates of Bank of Montreal, entering into forward contracts with a subsidiary or affiliates of Bank of Montreal acting as
counterparty, the purchase or redemption of units of other Bank of Montreal affiliated investment funds or the provision of services to the Manager.
7. Financial instruments risksThe Portfolio’s activities expose it to a variety of risks associated with the financial instruments, as follows: market risk (including currency risk, interest rate risk and other market risk), credit risk and liquidity risk. The concentration table groups securities by asset type, geographic location and/or market segment. The Portfolio’s risk management practice outlines the monitoring of compliance to investment guidelines.
The Manager manages the potential effects of these financial risks on the Portfolio’s performance by employing and overseeing professional and experienced portfolio managers that regularly monitor the Portfolio’s positions, market events and diversify investment portfolios within the constraints of the investment guidelines.
(a) Currency riskCurrency risk is the risk that the value of financial instruments denominated in currencies, other than the functional currency of the Portfolio, will fluctuate due to changes in foreign exchange rates. Investments in foreign markets are exposed to currency risk as the prices denominated in foreign currencies are converted to the Portfolio’s functional currency in determining fair value. The Portfolio may enter into forward currency contracts for hedging purposes to reduce foreign currency exposure or to establish exposure to foreign currencies. The Portfolio’s exposure to currency risk, if any, is further disclosed in Note 8.
(b) Interest rate riskInterest rate risk is the risk that the fair value of the Portfolio's interest bearing investments will fluctuate due to changes in market interest rates. The Portfolio's exposure to interest rate risk is concentrated in its investment in debt securities (such as bonds, money market investments, short-term investments and debentures) and interest rate derivative instruments, if any. Other assets and liabilities are short-term in nature and/or non-interest bearing. The Portfolio's exposure to interest rate risk, if any, is further discussed in Note 8.
(c) Other market riskOther market risk is the risk that the fair value of a financial instrument will fluctuate as a result of changes in market prices (other than those arising from interest rate risk or currency risk), whether those changes are

NOTES TO FINANCIAL STATEMENTS (cont’d)(All amounts in thousands of Canadian dollars, except per unit data)December 31, 2017
BMO Private International Equity Portfolio
caused by factors specific to the individual financial instrument or its issuer, or factors affecting all similar financial instruments traded in a market. Other assets and liabilities are monetary items that are short-term in nature, as such they are not subject to other market risk. The Portfolio's exposure to other market risk, if any, is further discussed in Note 8.
(d) Credit riskCredit risk is the risk that a loss could arise from a security issuer or counterparty to a financial instrument not being able to meet its financial obligations. The fair value of debt securities includes consideration of the credit worthiness of the debt issuer. Credit risk exposure for over-the-counter derivative instruments is based on the Portfolio's unrealized gain of the contractual obligations with the counterparty as at the reporting date. The credit exposure of other assets is represented by its carrying amount. The Portfolio's exposure to credit risk, if any, is further discussed in Note 8.
The Portfolio may enter into securities lending transactions with approved counterparties. Credit risk associated with these transactions is considered minimal as all counterparties have a sufficient approved credit rating and the market value of collateral held by the Portfolio must be at least 102% of the fair value of securities loaned, as disclosed in Note 8.
(e) Liquidity riskThe Portfolio's exposure to liquidity risk is concentrated in the daily cash redemptions of units. The Portfolio primarily invests in securities that are traded in active markets and can be readily disposed. In addition, the Portfolio retains sufficient cash and cash equivalent positions to maintain liquidity. The Portfolio may, from time to time, enter into over-the-counter derivative contracts or invest in unlisted securities, which are not traded in an organized market and may be illiquid. Securities for which a market quotation could not be obtained and may be illiquid are identified on the Schedule of Investment Portfolio. The proportion of illiquid securities to the NAV of the Portfolio is monitored by the Manager to ensure it does not exceed the regulatory limit and does not significantly affect the liquidity required to meet the Portfolio's financial obligations.

NOTES TO THE FINANCIAL STATEMENTS (cont’d)(All amounts in thousands of Canadian dollars, except per unit data)December 31, 2017
BMO Private International Equity Portfolio
8. Portfolio specific information(a) Portfolio information and change in unitsThe Portfolio’s inception date was January 28, 1998.
The number of units that have been issued and are outstanding are disclosed in the table below.
For the periods ended (in thousands of units)
Dec. 31,
2017
Dec. 31,
2016Units issued and outstanding, beginning of
period 133,312 116,305Issued for cash 48,760 38,230Issued on reinvestment of distributions 4,014 2,847Redeemed during the period (15,838) (24,070)Units issued and outstanding, end of period 170,248 133,312
Revision of comparative informationPrior year amounts have been revised to conform to current year presentation from “Proceeds from redeemable units issued” to “Reinvestments of distributions to holders of redeemable units” in the Statement of Changes in Net Assets Attributable to Holders of Redeemable Units and as a result from "Proceeds from issuances of redeemable units" to "Distributions paid to holders of redeemable units, net of reinvested distributions" in the Statement of Cash Flows in the amount of $2,951.
(b) Reconciliation of NAV to Net AssetsAs at December 31, 2017 and December 31, 2016, there were no differences between the Portfolio’s NAV per unit and its Net Assets per unit calculated in accordance with IFRS.
(c) Increase (decrease) in net assets attributable to holders of redeemable units per unitThe increase (decrease) in net assets attributable to holders of redeemable units per unit for the periods ended December 31, 2017 and December 31, 2016 is calculated as follows:
Dec. 31, Dec. 31,For the periods ended 2017 2016
Increase (decrease) in net assets attributable
to holders of redeemable units 301,515 (21,779)
Weighted average units outstanding during
the period (in thousands of units) 151,500 127,659
Increase (decrease) in net assets attributable to holders of redeemable
units per unit 1.99 (0.17)
(d) Income taxesAs at the tax year-ended December 2017, the Portfolio had the following estimated capital and non-capital losses for income tax purposes:
Total Capital Losses
($)
Total Non-Capital Losses
($) Non-Capital Losses That Expire in
2028 ($)
2029 ($)
2030 and
thereafter ($)
6,848 — — — —
(e) Related party transactionsUnitholder servicingThe related party fees charged for unitholder servicing fees are as follows:
Dec. 31, Dec. 31,For the periods ended 2017 2016
Unitholder servicing ($) 307 299
Brokerage commissions and soft dollarsBrokerage commissions paid (excluding transaction costs) on security transactions and amounts paid to related parties of the Manager for brokerage services provided to the Portfolio for the periods are as follows:
Dec. 31, Dec. 31,For the periods ended 2017 2016
Total brokerage amounts paid ($) 1,893 949
Total brokerage amounts paid to related
parties ($) — —
The Manager may select brokers who charge a commission in “soft dollars” if they determine in good faith that the commission is reasonable in relation to the order execution and research services utilized. The ascertainable soft dollar value of services received as a percentage of total brokerage commissions paid under the soft dollar arrangement entered into by the portfolio advisor for the periods ended is as follows:
Dec. 31, Dec. 31,
For the periods ended 2017 2016
Total soft dollars ($) 264 54
Total soft dollars as a percentage of total
commissions (%) 14 6

NOTES TO THE FINANCIAL STATEMENTS (cont’d)(All amounts in thousands of Canadian dollars, except per unit data)December 31, 2017
BMO Private International Equity Portfolio
(f) Financial instruments risksThe Portfolio’s objective is to provide a long term capital appreciation by investing in a diversified portfolio of primarily equity securities of issuers throughout the world, other than in Canada and the United States.
No changes affecting the overall level of risk of investing in the Portfolio were made during the period.
Currency riskThe Portfolio’s exposure to currency risk is summarized in the tables below. Amounts shown are based on the carrying value of monetary and non-monetary assets (including derivatives and the underlying principle (notional) amount of forward currency contracts, if any).
As at Dec. 31, 2017
Cash and other
current receivables & payables
($)
Invest- ments
(monetary &
non-monetary)
($)
Forward currency contracts
($)
Net currency exposure
($)
As a % of Net Assets
(%)
Australian Dollar 29 184,408 — 184,437 7.5
Brazilian Real 53 18,701 — 18,754 0.8
Danish Krone — 90,885 — 90,885 3.7
Euro 800 511,662 — 512,462 21.0
Hong Kong
Dollar — 149,935 — 149,935 6.1
Israel Shekel — 11,895 — 11,895 0.5
Japanese Yen 818 311,585 — 312,403 12.8
Malaysian
Ringgit — 24,199 — 24,199 1.0
Mexican Peso — 19,371 — 19,371 0.8
New Zealand
Dollar — 1,799 — 1,799 0.1
Norwegian
Krone 82 20,603 — 20,685 0.8
Pound Sterling 1,862 335,578 — 337,440 13.8
Singapore Dollar 2 52,907 — 52,909 2.2
Swedish Krona — 77,127 — 77,127 3.2
Swiss Franc 891 192,900 — 193,791 7.9
Taiwan Dollar 33 29,670 — 29,703 1.2
U.S. Dollar 48,558 251,179 — 299,737 12.3
Total 53,128 2,284,404 — 2,337,532 95.7
All amounts in Canadian Dollars
As at Dec. 31, 2016
Cash and other
current receivables & payables
($)
Invest- ments
(monetary &
non-monetary)
($)
Forward currency contracts
($)
Net currency exposure
($)
As a % of Net Assets
(%)
Australian Dollar 28 109,920 — 109,948 6.6
Danish Krone — 55,058 — 55,058 3.3
Euro 215 371,615 — 371,830 22.2
Hong Kong
Dollar (1,579) 54,771 1,579 54,771 3.3
Israel Shekel — 10,058 — 10,058 0.6
Japanese Yen 570 200,179 — 200,749 12.0
Malaysian
Ringgit 18 13,831 — 13,849 0.8
Mexican Peso — 7,179 — 7,179 0.4
New Zealand
Dollar — 2,110 — 2,110 0.1
Norwegian
Krone — 16,608 — 16,608 1.0
Pound Sterling (507) 241,876 1,542 242,911 14.5
Singapore Dollar — 37,394 — 37,394 2.2
South African
Rand 313 12,522 (313) 12,522 0.7
Swedish Krona — 31,615 — 31,615 1.9
Swiss Franc — 143,004 — 143,004 8.5
Taiwan Dollar 64 19,132 — 19,196 1.1
U.S. Dollar 34,033 209,076 (2,803) 240,306 14.3
Total 33,155 1,535,948 5 1,569,108 93.6
All amounts in Canadian Dollars
As at December 31, 2017 and December 31, 2016, if the Canadian dollar had strengthened or weakened by 5% in relation to all foreign currencies, with all variables held constant, the Net Assets of the Portfolio could possibly have increased or decreased, respectively, by approximately $116,877 (December 31, 2016 — $78,455). In practice, actual results may differ from this sensitivity analysis and the difference could be material.
Interest rate riskAs at December 31, 2017 and December 31, 2016 , the Portfolio did not have any significant exposure to interest rate risk.

NOTES TO THE FINANCIAL STATEMENTS (cont’d)(All amounts in thousands of Canadian dollars, except per unit data)December 31, 2017
BMO Private International Equity Portfolio
Other market riskThe Portfolio has a significant exposure to other market risk arising from its investment in equity securities. Using historical correlation between the Portfolio's return and the return of its benchmark, if the benchmark, MSCI EAFE Index (CAD), had increased or decreased by 10%, with all other variables held constant, the Net Assets of the Portfolio would have increased or decreased, respectively, by $196,814 (December 31, 2016 — $132,413). Historical correlation may not be representative of future correlation, and accordingly, actual results may differ and the difference could be material.
Credit riskAs at December 31, 2017 and December 31, 2016, the Portfolio did not have any significant exposure to credit risk.
Securities lendingThe Portfolio had assets involved in securities lending transactions outstanding as at December 31, 2017 and December 31, 2016 as follows:
Aggregate Value of Securities on Loan
($)
Aggregate Value of Collateral
Received for the Loan
($)
December 31, 2017 110,784 117,294December 31, 2016 28,465 30,583
The table below is a reconciliation of the gross amount generated from securities lending transactions to the security lending revenue for the periods ended December 31, 2017 and December 31, 2016:
For the periods ended Dec. 31, 2017 Dec. 31, 2016
Amount
% of Gross Securities Lending
Revenue Amount
% of Gross Securities Lending
Revenue Gross securities lending
revenue 769 100.0 269 100.0
Withholding taxes 56 7.3 2 0.6
713 92.7 267 99.4
Payment to securities
lending agents 214 27.8 80 29.8
Net securities lending
revenue* 499 64.9 187 69.6
* Amount shown on the Statement of Comprehensive Income is gross of withholding taxes of $56 (December 31, 2016 — $2).
Concentration riskThe Portfolio's concentration risk is summarized in the following table:
As at
Dec. 31,
2017
Dec. 31,
2016
EquitiesAustralia 7.5% 6.6%Austria —% 0.3%Belgium 0.4% 0.4%Bermuda —% 0.7%Brazil 0.8% 0.7%Canada 2.0% 2.3%China 1.4% 2.4%Denmark 3.7% 3.3%Egypt 0.1% 0.1%Finland 1.4% 1.6%France 9.0% 10.2%Germany 5.1% 5.3%Hong Kong 4.5% 1.8%India 1.2% 1.0%Ireland 1.6% 2.1%Israel 0.6% 0.7%Italy 1.7% 0.8%Japan 12.7% 11.9%Luxembourg 0.2% 0.3%Macau 0.4% —%Malaysia 1.0% 0.8%Mexico 0.8% 0.4%Netherlands 2.1% 4.5%New Zealand 0.1% 0.1%Norway 0.8% 0.9%Portugal —% 0.3%Russia 0.9% 0.7%Singapore 2.2% 2.2%South Africa —% 0.7%Spain 0.9% 0.6%Sweden 3.2% 1.9%Switzerland 10.3% 10.6%Taiwan 2.4% 2.6%United Kingdom 13.9% 14.5%United States 2.5% 0.6%
Other Assets Less Liabilities 4.6% 6.1%
100.0% 100.0%

NOTES TO THE FINANCIAL STATEMENTS (cont’d)(All amounts in thousands of Canadian dollars, except per unit data)December 31, 2017
BMO Private International Equity Portfolio
(g) Financial assets and financial liabilitiesCategories of financial assets and financial liabilities
The categories of financial assets and financial liabilities, except cash, are summarized in the following table:
Dec. 31, Dec. 31,As at 2017 2016
Financial assets designated at FVTPL 2,332,257 1,574,123Financial assets held for trading — 7Loans and receivables 3,772 2,617Financial liabilities held for trading — 2Financial liabilities measured at amortized
cost 4,355 8,621
Net gains and losses on financial assets and financial liabilities at fair value
Dec. 31, Dec. 31,For the periods ended 2017 2016
Net realized gains (losses) on financial
assets
Held for trading — 345
Designated at FVTPL 107,756 37,835
107,756 38,180
Total net realized gains (losses) on
financial assets and financial liabilities 107,756 38,180
Change in unrealized gains (losses) on
financial assets
Held for trading — 5
Designated at FVTPL 209,986 (48,056)
209,986 (48,051)
Change in unrealized gains (losses) on
financial liabilities
Held for trading (5) —
Total change in unrealized gains (losses) on financial assets and financial
liabilities 209,981 (48,051)
(h) Fair value hierarchyThe Portfolio classifies its financial instruments into three levels based on the inputs used to value the financial instruments. Level 1 securities are valued based on quoted prices in active markets for identical securities. Level 2 securities are valued based on significant observable market inputs, such as quoted prices from similar securities and quoted prices in inactive markets or based on observable
inputs to models. Level 3 securities are valued based on significant unobservable inputs that reflect the Manager's determination of assumptions that market participants might reasonably use in valuing the securities. The tables below show the relevant disclosure.
As at Dec. 31, 2017
Financial assets Level 1 Level 2 Level 3 Total Equity Securities 258,258 2,073,999 — 2,332,257
As at Dec. 31, 2016
Financial assets Level 1 Level 2 Level 3 Total Equity Securities 183,259 1,390,864 — 1,574,123 Derivatives — 7 — 7Total 183,259 1,390,871 — 1,574,130
Financial liabilities Derivatives — (2) — (2)
Transfers between levelsThere were no transfers between the levels during the periods.

Management’s Responsibility for Financial Reporting
The accompanying financial statements have been prepared by management of BMO Private Investment Counsel Inc. Management is responsible for the information and representations contained in these financial statements.
Management has maintained appropriate processes to ensure that relevant and reliable information is produced. The financial statements have been prepared in accordance with International Financial Reporting Standards (IFRS) as issued by the International Accounting Standards Board (IASB) and include certain amounts that are based on estimates and judgements. The significant accounting policies which management believes are appropriate for the Portfolio are described in Note 3 of the financial statements. The Trustee (BMO Trust Company) is responsible for reviewing and approving the financial statements and overseeing management’s performance of its financial reporting responsibilities. The Trustee reviews the financial statements of the Portfolios, adequacy of the internal controls, the audit process and financial reporting with management and external auditor.
PricewaterhouseCoopers LLP is the external auditor of the Portfolios. The auditor has been appointed by Board of the Manager and of the Trustees and cannot be changed without the prior approval for the Independent Review Committee and 60 days notice to the Unitholders. They have audited the financial statements in accordance with generally accepted auditing standards in Canada to enable them to express to the unitholders their opinion on the financial statements. Their report is included as an integral part of the financial statements.
Tony BennettPresident and Chief Executive OfficerBMO Private Investment Counsel Inc.March 8, 2018
Robert J. SchauerChief Financial OfficerBMO Private PortfoliosMarch 8, 2018

BMO Private Banking is part of BMO Wealth Management and is a brand name under which banking services are offered through Bank of Montreal, investment management services are offered through BMO Private Investment Counsel Inc., a wholly-owned indirect subsidiary of Bank of Montreal, and estate, trust, planning and custodial services are offered through BMO Trust Company, a wholly-owned subsidiary of Bank of Montreal.
BMO Wealth Management is a brand name that refers to Bank of Montreal and certain of its affiliates in providing wealth management products and services.
BMO (M-bar roundel symbol), BMO Private Banking registered trademarks, and BMO Wealth Management trademark are owned by Bank of Montreal, used under licence.
ManagerBMO Private InvestmentCounsel Inc.1 First Canadian Place100 King Street West, 41st Floor Toronto, Ontario M5X 1A1
TrusteeBMO Trust Company1 First Canadian Place100 King Street West, 41st Floor Toronto, Ontario M5X 1A1
Independent AuditorPricewaterhouseCoopers LLP PwC Tower18 York Street, Suite 2600Toronto, Ontario M5J 0B2
www.bmoprivatebanking.comFor more information please call 1-855-852-1026